UNITED STATES
SECURITIES AND EXCHANGE COMMISSION
Washington, D.C. 20549
FORM N-CSR
CERTIFIED SHAREHOLDER REPORT OF REGISTERED
MANAGEMENT INVESTMENT COMPANIES
Investment Company Act file number | 811-01829 |
|
Columbia Acorn Trust |
(Exact name of registrant as specified in charter) |
|
227 W. Monroe Street Suite 3000 Chicago, IL | | 60606 |
(Address of principal executive offices) | | (Zip code) |
|
Mary C. Moynihan Perkins Coie LLP 700 13th Street, NW Suite 600 Washington, DC 20005 Paul B. Goucher, Esq. Columbia Management Investment Advisers, LLC 100 Park Avenue New York, New York 10017 P. Zachary Egan Columbia Acorn Trust 227 West Monroe Street, Suite 3000 Chicago, Illinois 60606 |
(Name and address of agent for service) |
|
Registrant’s telephone number, including area code: | (312) 634-9200 | |
|
Date of fiscal year end: | December 31 | |
|
Date of reporting period: | June 30, 2016 | |
| | | | | | | | |
Form N-CSR is to be used by management investment companies to file reports with the Commission not later than 10 days after the transmission to stockholders of any report that is required to be transmitted to stockholders under Rule 30e-1 under the Investment Company Act of 1940 (17 CFR 270.30e-1). The Commission may use the information provided on Form N-CSR in its regulatory, disclosure review, inspection, and policymaking roles.
A registrant is required to disclose the information specified by Form N-CSR, and the Commission will make this information public. A registrant is not required to respond to the collection of information contained in Form N-CSR unless the Form displays a currently valid Office of Management and Budget (“OMB”) control number. Please direct comments concerning the accuracy of the information collection burden estimate and any suggestions for reducing the burden to Secretary, Securities and Exchange Commission, 450 Fifth Street, NW, Washington, DC 20549-0609. The OMB has reviewed this collection of information under the clearance requirements of 44 U.S.C. § 3507.
Item 1. Reports to Stockholders.

SEMIANNUAL REPORT
June 30, 2016


COLUMBIA ACORN FAMILY OF FUNDS
Class A, B, C, I, R, R4, R5, Y and Z Shares
Managed by Columbia Wanger Asset Management, LLC
Columbia Acorn® Fund
Columbia Acorn International®
Columbia Acorn USA®
Columbia Acorn International SelectSM
Columbia Acorn SelectSM
Columbia Thermostat FundSM
Columbia Acorn Emerging Markets FundSM
Columbia Acorn European FundSM

COLUMBIA ACORN FAMILY OF FUNDS
>NET ASSET VALUE PER SHARE as of 6/30/16
| | Columbia
Acorn Fund® | | Columbia
Acorn
International® | | Columbia
Acorn
USA® | | Columbia
Acorn
International
SelectSM | | Columbia
Acorn
SelectSM | | Columbia
Thermostat
FundSM | | Columbia
Acorn
Emerging
Markets
FundSM | | Columbia
Acorn
European
FundSM | |
Class A | | $ | 15.57 | | | $ | 38.28 | | | $ | 17.80 | | | $ | 20.93 | | | $ | 12.58 | | | $ | 14.50 | | | $ | 10.36 | | | $ | 14.16 | | |
Class B | | | N/A | | | $ | 36.88 | | | | N/A | | | | N/A | | | | N/A | | | | N/A | | | | N/A | | | | N/A | | |
Class C | | $ | 11.07 | | | $ | 36.73 | | | $ | 13.46 | | | $ | 19.51 | | | $ | 9.15 | | | $ | 14.55 | | | $ | 10.28 | | | $ | 14.00 | | |
Class I | | $ | 17.40 | | | $ | 38.42 | | | $ | 20.01 | | | $ | 21.22 | | | $ | 14.01 | | | | N/A | | | $ | 10.41 | | | $ | 14.17 | | |
Class R | | | N/A | | | $ | 38.20 | | | | N/A | | | | N/A | | | | N/A | | | | N/A | | | | N/A | | | | N/A | | |
Class R4 | | $ | 17.80 | | | $ | 38.64 | | | $ | 20.44 | | | $ | 21.36 | | | $ | 14.33 | | | $ | 14.39 | | | $ | 10.46 | | | $ | 14.24 | | |
Class R5 | | $ | 17.89 | | | $ | 38.36 | | | $ | 20.50 | | | $ | 21.35 | | | $ | 14.38 | | | $ | 14.41 | | | $ | 10.46 | | | $ | 14.31 | | |
Class Y | | $ | 17.97 | | | $ | 38.68 | | | $ | 20.61 | | | $ | 21.34 | | | $ | 14.47 | | | $ | 14.39 | | | $ | 10.37 | | | | N/A | | |
Class Z | | $ | 17.31 | | | $ | 38.37 | | | $ | 19.78 | | | $ | 21.21 | | | $ | 13.88 | | | $ | 14.32 | | | $ | 10.39 | | | $ | 14.18 | | |
Class I shares are available only to the Columbia funds, such as Columbia Thermostat Fund, and are not available to individual investors. Class R, R4, R5, Y and Z shares are sold at net asset value and have limited eligibility. Please see the Funds' prospectuses for details. The Columbia Acorn Family of Funds offer multiple share classes, not all necessarily available through all financial intermediaries, and the ratings assigned to the various share classes by mutual fund rating agencies may vary. Contact us for details.
2016 MID-YEAR DISTRIBUTIONS
The following table lists the mid-year distributions for the Columbia Acorn Family of Funds. The record date was June 6, 2016, and the ex-dividend and payable date was June 7, 2016. The information provided for each Fund applies to all share classes of the Fund.
| Fund (all share classes) | | Short-Term
Capital Gain | | Long-Term
Capital Gain | | Ordinary
Income | |
Columbia Acorn Fund | | | None | | | | 2.05420 | | | | None | | |
Columbia Acorn International | | | None | | | | 0.25773 | | | | None | | |
Columbia Acorn USA | | | None | | | | 2.67186 | | | | None | | |
Columbia Acorn International Select | | | None | | | | None | | | | None | | |
Columbia Acorn Select | | | None | | | | 1.22021 | | | | None | | |
Columbia Thermostat Fund | | | None | | | | 0.27114 | | | | 0.04997 | | |
Columbia Acorn Emerging Markets Fund | | | None | | | | None | | | | None | | |
Columbia Acorn European Fund | | | None | | | | None | | | | 0.02638 | | |
The views expressed in the report commentaries reflect the current views of the respective authors. These views are not guarantees of future performance and involve certain risks, uncertainties and assumptions that are difficult to predict, so actual outcomes and results may differ significantly from the views expressed. These views are subject to change at any time based upon economic, market or other conditions and the respective authors disclaim any responsibility to update such views. These views may not be relied upon as investment advice and, because investment decisions for a Columbia Acorn Fund are based on numerous factors, may not be relied upon as an indication of trading intent on behalf of any particular Columbia Acorn Fund. References to a specific company's securities should not be construed as a recommendation or investment advice and there can be no assurance that as of the date of publication of this report, the securities mentioned in each Fund's portfolio are still held or that the securities sold have not been repurchased.
Acorn®, Acorn USA® and Acorn International® are service marks owned and registered by Columbia Acorn Trust.

Global equity markets were caught on the back foot by the outcome of the UK referendum on continued European Union (EU) membership. The long-term political and economic implications of this decision are potentially vast and impossible to discern at this stage, not least because they will be shaped by how policymakers respond. As investors globally reprice risk and reposition portfolios in light of currency sensitivity and how they expect this outcome to bear differently on sectors, countries and companies, there will be mispricing opportunities. This is good for stock pickers and we expect to be active. We will be looking closely at how strong players in diverse industries might improve their competitive positions, as growth opportunities become more scarce and costs of capital among competitors more differentiated. We expect the relatively high balance sheet and business model quality of the stocks that we hold in the Columbia Acorn Funds to prove helpful in coming quarters because the risk premium has gone up, as evidenced by increased volatility, compressed multiples in some pockets of the market such as European banks, and sharp currency swings.
This political development is nonetheless clearly a negative one. The United Kingdom is the fifth largest economy in the world and the second largest within the EU. It has been a member of the European Economic Community (precursor to the EU) since 1973.i The UK exit raises uncertainties about global growth, heightens risk aversion, and it will preoccupy European policymakers at a time when they are already challenged by anemic growth, high unemployment, refugee immigration flows, and international and domestic security concerns.
While many market observers view the outcome of the referendum as a comment on, and existential threat to, the overall European integration project, it may, rather, reflect a larger process at work, namely increasing middle-class discontent with the perceived consequences of globalization in industrialized democracies. Rising populism and nativist resentments in Europe and the United States could be harbingers of future policy regimes that place less value on minimizing trade friction, and the mobility of capital and labor, all of which have contributed to global prosperity. The evolving framework for global trade and investment over the last 25 years has been an enormous engine of global growth. During this period, a substantial percentage of the world's population once living within largely economically isolated communist states was integrated into the modern global economy as producers and consumers. This has
raised standards of living in emerging markets and reduced the cost of consumer goods in industrialized countries, while creating new and growing markets for the sort of technologically sophisticated exports that support high-paying jobs in industrialized countries.
The Columbia Acorn Funds have benefited meaningfully from these trends. With Brexit, the EU will lose its strongest advocate of economic liberalism, which has served as an important counterpoint to statist perspectives in Germany and France. At a minimum, it appears that domestic policies are poised to pivot toward the populist issue of economic inequality, which in Europe may manifest itself in a slowdown or reversal of structural reforms in EU labor markets, with negative consequences for productivity and, with it, standards of living. Fiscal tightening, where necessary, could be scaled back as a salve to populists, and it seems likely that industrialized countries will see increased constraints on immigration, even where demographically driven labor shortages exist.
While this could well be regarded as overall bad news for asset owners, opportunities will likely present themselves. For many years, the Columbia Acorn Funds have explored how factory automation is deployed to reduce labor costs or to replace labor altogether, trends which could be accelerated by a reduction in immigration. London will fight hard to retain its role as the center of European finance, but bank chiefs are already talking about decamping elsewhere, which could create opportunity in continental European real estate and construction. As corporate investment decision-making and household spending slow amidst the uncertainty, fiscal stimulus could be sought via public infrastructure projects, which would be good for constructors and suppliers of building materials. Public policy that increases labor's share of income would benefit consumer companies oriented to a lower middle class demographic. Other policy interventions could result in continued ultra-low interest rates, with implications for interest-rate sensitive businesses. In any case, it seems that earnings growth will continue to be a scarce factor in a low-growth world.

P. Zachary Egan
President and Global Chief Investment Officer
Columbia Wanger Asset Management, LLC
i http://ukandeu.ac.uk/fact-figures/when-did-britain-decide-to-join-the-european-union/
COLUMBIA ACORN FAMILY OF FUNDS
TABLE OF CONTENTS
Description of Indexes | | | 1 | | |
Share Class Performance | | | 2 | | |
Fund Performance vs. Benchmarks | | | 3 | | |
Columbia Acorn® Fund | |
In a Nutshell | | | 4 | | |
At a Glance | | | 5 | | |
Statement of Investments | | | 23 | | |
Columbia Acorn International® | |
In a Nutshell | | | 6 | | |
At a Glance | | | 7 | | |
Statement of Investments | | | 30 | | |
Portfolio Diversification | | | 36 | | |
Columbia Acorn USA® | |
In a Nutshell | | | 8 | | |
At a Glance | | | 9 | | |
Statement of Investments | | | 37 | | |
Columbia Acorn International SelectSM | |
In a Nutshell | | | 10 | | |
At a Glance | | | 11 | | |
Statement of Investments | | | 42 | | |
Portfolio Diversification | | | 45 | | |
Columbia Acorn SelectSM | |
In a Nutshell | | | 12 | | |
At a Glance | | | 13 | | |
Statement of Investments | | | 46 | | |
Columbia Thermostat FundSM | |
In a Nutshell | | | 14 | | |
At a Glance | | | 15 | | |
Statement of Investments | | | 49 | | |
Columbia Acorn Emerging Markets FundSM | |
In a Nutshell | | | 16 | | |
At a Glance | | | 17 | | |
Statement of Investments | | | 51 | | |
Portfolio Diversification | | | 55 | | |
Columbia Acorn European FundSM | |
In a Nutshell | | | 18 | | |
At a Glance | | | 19 | | |
Statement of Investments | | | 56 | | |
Portfolio Diversification | | | 59 | | |
Understanding Your Expenses | | | 20 | | |
Columbia Acorn Family of Funds | |
Statements of Assets and Liabilities | | | 60 | | |
Statements of Operations | | | 62 | | |
Statements of Changes in Net Assets | | | 64 | | |
Financial Highlights | | | 70 | | |
Notes to Financial Statements | | | 86 | | |
Board Approval of the Advisory Agreement | | | 97 | | |
Expense Information | | | 102 | | |
COLUMBIA ACORN FAMILY OF FUNDS
DESCRIPTIONS OF INDEXES INCLUDED IN THIS REPORT
• 50/50 Blended Benchmark, established by the Fund's investment manager, is an equally weighted custom composite of Columbia Thermostat Fund's primary equity and primary debt benchmarks, the S&P 500® Index and the Barclays U.S. Aggregate Bond Index, respectively. The percentage of the Fund's assets allocated to underlying stock and bond portfolio funds will vary, and accordingly the composition of the Fund's portfolio will not always reflect the composition of the 50/50 Blended Benchmark.
• Barclays U.S. Aggregate Bond Index is a market value-weighted index that tracks the daily price, coupon, pay-downs and total return performance of fixed-rate, publicly placed, dollar-denominated and non-convertible investment grade debt issues with at least $250 million par amount outstanding and with at least one year to final maturity.
• MSCI AC Europe Small Cap Index (Net) captures a small-cap representation across 21 markets in Europe. The index covers approximately 14% of the free float-adjusted market capitalization across each market country in Europe.
• MSCI ACWI ex USA Index (Net) captures a large- and mid-cap representation across 22 of 23 developed market countries (excluding the U.S.) and 23 emerging market countries. The index covers approximately 85% of the global equity opportunity set outside the United States.
• MSCI ACWI ex USA SMID Cap Index (Net) captures a mid- and small-cap representation across 22 of 23 developed market countries (excluding the U.S.) and 23 emerging market countries. The index covers approximately 28% of the free float-adjusted market capitalization in each country.
• MSCI Emerging Markets SMID Cap Index (Net) captures a mid- and small-cap representation across 23 emerging market countries. The index covers approximately 29% of the free float-adjusted market capitalization in each country.
• Russell 2000 Index measures the performance of the 2,000 smallest companies in the Russell 3000 Index, which represents approximately 10% of the total market capitalization of the Russell 3000 Index.
• Russell 2500 Index measures the performance of the 2,500 smallest companies in the Russell 3000 Index, which represents approximately 17% of the total market capitalization of the Russell 3000 Index.
• Standard & Poor's (S&P) 500® Index tracks the performance of 500 widely held, large-capitalization U.S. stocks.
• S&P Developed Ex-U.S. Between $2B and $10B® Index is a subset of the broad market selected by the index sponsor that represents the mid-cap developed market, excluding the United States.
• S&P Emerging Markets Between $500M and $5B® Index represents the institutionally investable capital of 22 emerging market countries, as determined by S&P, with market caps ranging between $500 million to $5 billion. The index currently consists of the following emerging market country indexes: Brazil, Chile, China, Colombia, Czech Republic, Egypt, Greece, Hungary, India, Indonesia, Malaysia, Mexico, Peru, Philippines, Poland, Qatar, Russia, South Africa, Taiwan, Thailand, Turkey and United Arab Emirates.
• S&P Europe Between $500M and $5B® Index represents the institutionally investable capital of 16 European countries, as determined by S&P, with market caps ranging between $500 million to $5 billion. The index consists of the following European countries: Austria, Belgium, Denmark, Finland, France, Germany, Ireland, Italy, Luxembourg, the Netherlands, Norway, Portugal, Spain, Sweden, Switzerland and the United Kingdom.
• S&P Global Ex-U.S. Between $500M and $5B® Index is a subset of the broad market selected by the index sponsor that represents the mid- and small-cap developed and emerging markets, excluding the United States.
• S&P MidCap 400® Index is a market value-weighted index that tracks the performance of 400 mid-cap U.S. companies.
Unlike mutual funds, indexes are not managed and do not incur fees or expenses. It is not possible to invest directly in an index.
1
COLUMBIA ACORN FAMILY OF FUNDS
SHARE CLASS PERFORMANCE Average Annual Total Returns through 6/30/16
| | Class A | | Class B | | Class C | | Class I | | Class R | | Class R4 | | Class R5 | | Class Y | | Class Z | |
| | Without
Sales
Charge | | With
Sales
Charge | | Without
Sales
Charge | | With
Sales
Charge | | Without
Sales
Charge | | With
Sales
Charge | | | | | | | | | | | | | |
Columbia Acorn® Fund | |
Year to date* | | | -0.37 | % | | | -6.13 | % | | | N/A | | | | N/A | | | | -0.74 | % | | | -1.58 | % | | | -0.18 | % | | | N/A | | | | -0.23 | % | | | -0.18 | % | | | -0.18 | % | | | -0.18 | % | |
| 1 year | | | -8.16 | % | | | -13.44 | % | | | N/A | | | | N/A | | | | -8.82 | % | | | -9.24 | % | | | -7.82 | % | | | N/A | | | | -8.01 | % | | | -7.85 | % | | | -7.83 | % | | | -7.84 | % | |
| 5 years | | | 6.05 | % | | | 4.80 | % | | | N/A | | | | N/A | | | | 5.28 | % | | | 5.28 | % | | | 6.42 | % | | | N/A | | | | 6.30 | % | | | 6.37 | % | | | 6.41 | % | | | 6.36 | % | |
| 10 years | | | 5.96 | % | | | 5.34 | % | | | N/A | | | | N/A | | | | 5.16 | % | | | 5.16 | % | | | 6.31 | % | | | N/A | | | | 6.24 | % | | | 6.28 | % | | | 6.30 | % | | | 6.27 | % | |
Columbia Acorn International® | |
Year to date* | | | -1.42 | % | | | -7.08 | % | | | -1.78 | % | | | -6.66 | % | | | -1.79 | % | | | -2.77 | % | | | -1.24 | % | | | -1.60 | % | | | -1.33 | % | | | -1.26 | % | | | -1.23 | % | | | -1.29 | % | |
| 1 year | | | -7.65 | % | | | -12.96 | % | | | -8.49 | % | | | -12.90 | % | | | -8.33 | % | | | -9.21 | % | | | -7.30 | % | | | -8.01 | % | | | -7.46 | % | | | -7.34 | % | | | -7.30 | % | | | -7.40 | % | |
| 5 years | | | 2.65 | % | | | 1.44 | % | | | 1.85 | % | | | 1.51 | % | | | 1.89 | % | | | 1.89 | % | | | 3.04 | % | | | 2.28 | % | | | 2.90 | % | | | 2.99 | % | | | 3.02 | % | | | 2.96 | % | |
| 10 years | | | 4.79 | % | | | 4.17 | % | | | 4.06 | % | | | 4.06 | % | | | 3.99 | % | | | 3.99 | % | | | 5.18 | % | | | 4.46 | % | | | 5.10 | % | | | 5.14 | % | | | 5.16 | % | | | 5.13 | % | |
Columbia Acorn USA® | |
Year to date* | | | 0.82 | % | | | -5.00 | % | | | N/A | | | | N/A | | | | 0.46 | % | | | -0.38 | % | | | 1.01 | % | | | N/A | | | | 0.90 | % | | | 0.94 | % | | | 1.03 | % | | | 0.92 | % | |
| 1 year | | | -7.40 | % | | | -12.72 | % | | | N/A | | | | N/A | | | | -8.05 | % | | | -8.57 | % | | | -7.02 | % | | | N/A | | | | -7.21 | % | | | -7.10 | % | | | -7.03 | % | | | -7.18 | % | |
| 5 years | | | 6.97 | % | | | 5.72 | % | | | N/A | | | | N/A | | | | 6.23 | % | | | 6.23 | % | | | 7.40 | % | | | N/A | | | | 7.25 | % | | | 7.30 | % | | | 7.35 | % | | | 7.24 | % | |
| 10 years | | | 5.75 | % | | | 5.13 | % | | | N/A | | | | N/A | | | | 4.97 | % | | | 4.97 | % | | | 6.12 | % | | | N/A | | | | 6.04 | % | | | 6.07 | % | | | 6.09 | % | | | 6.04 | % | |
Columbia Acorn International SelectSM | |
Year to date* | | | -1.88 | % | | | -7.51 | % | | | N/A | | | | N/A | | | | -2.25 | % | | | -3.23 | % | | | -1.62 | % | | | N/A | | | | -1.75 | % | | | -1.70 | % | | | -1.70 | % | | | -1.71 | % | |
| 1 year | | | -6.61 | % | | | -11.98 | % | | | N/A | | | | N/A | | | | -7.37 | % | | | -8.28 | % | | | -6.21 | % | | | N/A | | | | -6.35 | % | | | -6.29 | % | | | -6.24 | % | | | -6.36 | % | |
| 5 years | | | 1.76 | % | | | 0.57 | % | | | N/A | | | | N/A | | | | 0.97 | % | | | 0.97 | % | | | 2.14 | % | | | N/A | | | | 2.05 | % | | | 2.10 | % | | | 2.13 | % | | | 2.07 | % | |
| 10 years | | | 4.28 | % | | | 3.66 | % | | | N/A | | | | N/A | | | | 3.45 | % | | | 3.45 | % | | | 4.66 | % | | | N/A | | | | 4.60 | % | | | 4.63 | % | | | 4.64 | % | | | 4.61 | % | |
Columbia Acorn SelectSM | |
Year to date* | | | -1.32 | % | | | -7.00 | % | | | N/A | | | | N/A | | | | -1.77 | % | | | -2.64 | % | | | -1.13 | % | | | N/A | | | | -1.17 | % | | | -1.17 | % | | | -1.17 | % | | | -1.21 | % | |
| 1 year | | | -7.56 | % | | | -12.86 | % | | | N/A | | | | N/A | | | | -8.25 | % | | | -8.79 | % | | | -7.21 | % | | | N/A | | | | -7.33 | % | | | -7.27 | % | | | -7.24 | % | | | -7.28 | % | |
| 5 years | | | 5.48 | % | | | 4.24 | % | | | N/A | | | | N/A | | | | 4.70 | % | | | 4.70 | % | | | 5.89 | % | | | N/A | | | | 5.75 | % | | | 5.80 | % | | | 5.83 | % | | | 5.78 | % | |
| 10 years | | | 5.17 | % | | | 4.55 | % | | | N/A | | | | N/A | | | | 4.36 | % | | | 4.36 | % | | | 5.54 | % | | | N/A | | | | 5.46 | % | | | 5.49 | % | | | 5.50 | % | | | 5.48 | % | |
Columbia Thermostat FundSM | |
Year to date* | | | 3.57 | % | | | -2.37 | % | | | N/A | | | | N/A | | | | 3.20 | % | | | 2.20 | % | | | N/A | | | | N/A | | | | 3.67 | % | | | 3.74 | % | | | 3.74 | % | | | 3.69 | % | |
| 1 year | | | 2.53 | % | | | -3.37 | % | | | N/A | | | | N/A | | | | 1.74 | % | | | 0.75 | % | | | N/A | | | | N/A | | | | 2.75 | % | | | 2.82 | % | | | 2.81 | % | | | 2.76 | % | |
| 5 years | | | 6.21 | % | | | 4.96 | % | | | N/A | | | | N/A | | | | 5.42 | % | | | 5.42 | % | | | N/A | | | | N/A | | | | 6.45 | % | | | 6.48 | % | | | 6.51 | % | | | 6.46 | % | |
| 10 years | | | 5.88 | % | | | 5.25 | % | | | N/A | | | | N/A | | | | 5.08 | % | | | 5.08 | % | | | N/A | | | | N/A | | | | 6.13 | % | | | 6.15 | % | | | 6.16 | % | | | 6.13 | % | |
Columbia Acorn Emerging Markets FundSM | |
Year to date* | | | 1.17 | % | | | -4.60 | % | | | N/A | | | | N/A | | | | 0.78 | % | | | -0.22 | % | | | 1.46 | % | | | N/A | | | | 1.36 | % | | | 1.36 | % | | | 1.37 | % | | | 1.27 | % | |
| 1 year | | | -14.75 | % | | | -19.63 | % | | | N/A | | | | N/A | | | | -15.39 | % | | | -16.23 | % | | | -14.33 | % | | | N/A | | | | -14.46 | % | | | -14.37 | % | | | -14.35 | % | | | -14.52 | % | |
Life of Fund | | | 1.44 | % | | | 0.21 | % | | | N/A | | | | N/A | | | | 0.71 | % | | | 0.71 | % | | | 1.84 | % | | | N/A | | | | 1.77 | % | | | 1.80 | % | | | 1.83 | % | | | 1.72 | % | |
Columbia Acorn European FundSM | |
Year to date* | | | -3.84 | % | | | -9.37 | % | | | N/A | | | | N/A | | | | -4.14 | % | | | -5.10 | % | | | -3.70 | % | | | N/A | | | | -3.75 | % | | | -3.73 | % | | | N/A | | | | -3.70 | % | |
| 1 year | | | -6.08 | % | | | -11.49 | % | | | N/A | | | | N/A | | | | -6.74 | % | | | -7.67 | % | | | -5.78 | % | | | N/A | | | | -5.82 | % | | | -5.83 | % | | | N/A | | | | -5.84 | % | |
Life of Fund | | | 8.27 | % | | | 6.96 | % | | | N/A | | | | N/A | | | | 7.48 | % | | | 7.48 | % | | | 8.59 | % | | | N/A | | | | 8.56 | % | | | 8.55 | % | | | N/A | | | | 8.55 | % | |
*Not annualized.
Returns for Class A shares are shown with and without the maximum initial sales charge of 5.75%. Returns for Class B shares are shown with and without the applicable contingent deferred sales charge (CDSC) of 5.00% in the first year, declining to 1.00% in the sixth year and eliminated thereafter. Returns for Class C shares are shown with and without the maximum CDSC of 1.00% for the first year after purchase. The Funds' other classes are not subject to sales charges and have limited eligibility. Please see the Funds' prospectuses for details. Performance for different share classes will vary based on differences in sales charges and certain fees associated with each class.
All results shown assume reinvestment of distributions during the period. Returns do not reflect the deduction of taxes that a shareholder may pay on Fund distributions or on the redemption of Fund shares. Performance results may reflect the effect of any fee waivers or reimbursements of Fund expenses by the investment manager and/or any of its affiliates. Absent these fee waivers and/or expense reimbursement arrangements, performance results may have been lower. Please see Note 4, "Fees and Other Transactions With Affiliates" in the Notes to Financial Statements of this report for information on contractual fee waiver and expense reimbursement agreements in place on June 30, 2016, for Columbia Acorn International, Columbia Acorn Select, Columbia Thermostat Fund, Columbia Acorn Emerging Markets Fund and Columbia Acorn European Fund and voluntary fee waiver and expense reimbursement arrangements in place for Columbia Acorn International, Columbia Acorn International Select and Columbia Acorn Select.
The performance information shown represents past performance and is not a guarantee of future results. The investment return and principal value of your investment will fluctuate so that shares, when redeemed, may be worth more or less than their original cost. Current performance may be lower or higher than the performance data shown. You may obtain performance information current to the most recent month-end by contacting your financial intermediary, visiting investor.columbiathreadneedleus.com or calling 800.922.6769.
The returns shown include the returns of each Fund's Class Z shares, each Fund's oldest share class, in cases where the inception date of the Fund is earlier than the inception date of the particular share class or where a period shown dates to before the inception date of the share class. These returns are adjusted to reflect any higher class-related operating expenses of the newer share classes, as applicable. Please visit investor.columbiathreadneedle.com/us/investment-products/mutual-funds/appended-performance for more information.
Continued on Page 3.
2
FUND PERFORMANCE VS. BENCHMARKS Class Z Average Annual Total Returns through 6/30/16
| Class Z Shares | | 2nd
quarter* | | Year to
date* | | 1 year | | 5 years | | 10 years | | Life of
Fund | |
| Columbia Acorn® Fund (ACRNX) (6/10/70) | | | 2.58 | % | | | -0.18 | % | | | -7.84 | % | | | 6.36 | % | | | 6.27 | % | | | 14.04 | % | |
Russell 2500 Index | | | 3.57 | % | | | 3.98 | % | | | -3.67 | % | | | 9.48 | % | | | 7.32 | % | | | N/A | | |
S&P 500 Index** | | | 2.46 | % | | | 3.84 | % | | | 3.99 | % | | | 12.10 | % | | | 7.42 | % | | | 10.80 | % | |
| Columbia Acorn International® (ACINX) (9/23/92) | | | -1.41 | % | | | -1.29 | % | | | -7.40 | % | | | 2.96 | % | | | 5.13 | % | | | 10.04 | % | |
MSCI ACWI Ex USA SMID Cap Index (Net) | | | -1.32 | % | | | -0.31 | % | | | -6.13 | % | | | 1.76 | % | | | 3.43 | % | | | N/A | | |
S&P Global Ex-U.S. Between $500M and $5B Index | | | 0.24 | % | | | 1.98 | % | | | -5.35 | % | | | 2.49 | % | | | 4.76 | % | | | 7.86 | % | |
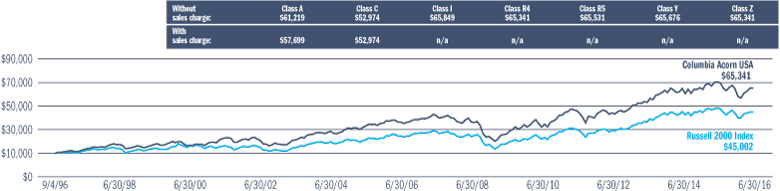
| Columbia Acorn USA® (AUSAX) (9/4/96) | | | 7.41 | % | | | 0.92 | % | | | -7.18 | % | | | 7.24 | % | | | 6.04 | % | | | 9.93 | % | |
Russell 2000 Index | | | 3.79 | % | | | 2.22 | % | | | -6.73 | % | | | 8.35 | % | | | 6.20 | % | | | 7.88 | % | |
| Columbia Acorn Int'l SelectSM (ACFFX) (11/23/98) | | | 0.19 | % | | | -1.71 | % | | | -6.36 | % | | | 2.07 | % | | | 4.61 | % | | | 7.85 | % | |
MSCI ACWI Ex USA Index (Net) | | | -0.64 | % | | | -1.02 | % | | | -10.24 | % | | | 0.10 | % | | | 1.87 | % | | | N/A | | |
S&P Developed Ex-U.S. Between $2B and $10B Index | | | -1.12 | % | | | -0.29 | % | | | -4.03 | % | | | 3.58 | % | | | 3.66 | % | | | 6.98 | % | |
| Columbia Acorn SelectSM (ACTWX) (11/23/98) | | | -0.89 | % | | | -1.21 | % | | | -7.28 | % | | | 5.78 | % | | | 5.48 | % | | | 9.27 | % | |
S&P MidCap 400 Index | | | 3.99 | % | | | 7.93 | % | | | 1.33 | % | | | 10.55 | % | | | 8.55 | % | | | 10.01 | % | |
| Columbia Thermostat FundSM (COTZX) (9/25/02) | | | 1.81 | % | | | 3.69 | % | | | 2.76 | % | | | 6.46 | % | | | 6.13 | % | | | 7.40 | % | |
S&P 500 Index | | | 2.46 | % | | | 3.84 | % | | | 3.99 | % | | | 12.10 | % | | | 7.42 | % | | | 9.29 | % | |
Barclays U.S. Aggregate Bond Index | | | 2.21 | % | | | 5.31 | % | | | 6.00 | % | | | 3.76 | % | | | 5.13 | % | | | 4.59 | % | |
50/50 Blended Benchmark | | | 2.34 | % | | | 4.68 | % | | | 5.25 | % | | | 8.07 | % | | | 6.60 | % | | | 7.20 | % | |
| Columbia Acorn Emerging Markets FundSM (CEFZX) (8/19/11) | | | 1.86 | % | | | 1.27 | % | | | -14.52 | % | | | — | | | | — | | | | 1.72 | % | |
MSCI Emerging Markets SMID Cap Index (Net) | | | 0.15 | % | | | 3.21 | % | | | -12.19 | % | | | — | | | | — | | | | -1.35 | % | |
S&P Emerging Markets Between $500M and $5B Index | | | 1.96 | % | | | 6.78 | % | | | -10.01 | % | | | — | | | | — | | | | 0.71 | % | |
| Columbia Acorn European FundSM (CAEZX) (8/19/11) | | | -4.80 | % | | | -3.70 | % | | | -5.84 | % | | | — | | | | — | | | | 8.55 | % | |
MSCI AC Europe Small Cap Index (Net) | | | -6.71 | % | | | -7.52 | % | | | -7.58 | % | | | — | | | | — | | | | 9.66 | % | |
S&P Europe Between $500M and $5B Index | | | -6.07 | % | | | -7.22 | % | | | -7.87 | % | | | — | | | | — | | | | 9.79 | % | |
The inception dates for Class A, B and C shares (if offered) are as follows: Columbia Acorn Fund, Columbia Acorn International, Columbia Acorn USA, Columbia Acorn International Select and Columbia Acorn Select, 10/16/00; Columbia Thermostat Fund, 3/3/03; Columbia Acorn Emerging Markets Fund and Columbia Acorn European Fund, 8/19/11. The inception dates for Class I shares are as follows: Columbia Acorn Fund, Columbia Acorn International, Columbia Acorn USA, Columbia Acorn International Select and Columbia Acorn Select, 9/27/10; Columbia Acorn Emerging Markets Fund and Columbia Acorn European Fund, 8/19/11. The inception date for Class R shares for Columbia Acorn International is 8/2/11. The inception date for Class R4, R5 and Y shares (if offered) is as follows: Columbia Acorn Fund, Columbia Acorn USA, Columbia Acorn International Select, Columbia Acorn Select, Columbia Thermostat Fund, Columbia Acorn Emerging Markets Fund and Columbia Acorn European Fund, 11/8/12, except that Class Y shares of Columbia Acorn Emerging Markets Fund commenced operations on 6/13/13 and Class R4 shares of Columbia Acorn European Fund commenced operations on 6/25/14. The inception date for Class R5 shares of Columbia Acorn International is 8/2/11. The inception date for Class R4 and Y shares of Columbia Acorn International is 11/8/12. The inception date for Class Z shares is as follows: Columbia Acorn Fund, 6/10/70; Columbia Acorn International, 9/23/92; Columbia Acorn USA, 9/4/96; Columbia Acorn International Select and Columbia Acorn Select, 11/23/98; Columbia Thermostat Fund, 9/25/02; Columbia Acorn Emerging Markets Fund and Columbia Acorn European Fund, 8/19/11. Class Y shares for Columbia Acorn European Fund are not currently available for purchase.
*Not annualized.
**Although the Fund typically invests in small- and mid-sized companies, the comparison to the S&P 500® Index is presented to show performance against a widely recognized market index over the life of the Fund.
Please see Page 1 for a description of the indexes listed above.
3
COLUMBIA ACORN® FUND
IN A NUTSHELL

| | 
| |
P. Zachary Egan
Co-Portfolio Manager | | Fritz Kaegi
Co-Portfolio Manager | |

| |
Matthew A. Litfin
Co-Portfolio Manager | |
Market risk may affect a single issuer, sector of the economy, industry or the market as a whole. Investments in small- and mid-cap companies involve risks and volatility and possible illiquidity greater than investments in larger, more established companies. Foreign investments subject the Fund to political, economic, market, social and other risks within a particular country, as well as to potential currency instabilities and less stringent financial and accounting standards generally applicable to U.S. issuers. Risks are enhanced for emerging market issuers. The Fund may invest significantly in issuers within a particular sector, which may be negatively affected by market, economic or other conditions, making the Fund more vulnerable to unfavorable developments in the sector.
Columbia Acorn Fund Class Z shares gained 2.58% in the second quarter of 2016, compared to a 3.57% gain of the Fund's primary benchmark, the Russell 2500 Index. For the first six months of the year, the Fund posted a slight loss of 0.18%, while the benchmark gained 3.98%. During the second quarter, U.S. small-cap stocks outpaced global equities, as smaller U.S. companies were aided by their lower sensitivity to both a rising U.S. dollar and concerns about the potential fallout from the Brexit vote.†
The Fund's relative performance in the quarter was negatively impacted by its overweight in the transportation and biotech industries, and its long-standing underweight in real estate investment trusts and utilities during a quarter in which a global search for yield fueled dividend-paying stocks. The more growth-oriented, profitable names that the Fund typically owns were out of favor in the second quarter, as value continued to outperform growth, as it did year to date. While these market shifts were not ideal for our growth-at-a reasonable-price approach, market leadership ebbs and flows over time, and we were pleased to see that, while sector allocation detracted from overall performance, strong stock selection added over 100 basis points to Fund returns in the quarter. We view this as confirmation that our recent repositioning efforts are taking the Fund in the right direction. We added 22 new positions in the second quarter and sold 20 names. We continue to move away from lower-conviction, sub-scale positions, and toward meaningful exposure to higher-quality names that we believe have significant future growth potential and strong prospects for outsized return on capital profiles.
The Fund's top two contributors to performance in the second quarter were IT stocks that had strong gains on acquisition news. Demandware, an e-commerce website platform for retailers, gained 91% after agreeing to be acquired by Salesforce.com. Cvent, a provider of software used by corporate event planners and hotels, saw its stock rise 60% following the announcement of its agreement to be acquired by Vista Equity Partners. We sold both positions, capturing nice gains for the Fund.
We shifted assets toward health care equipment names, increasing the Fund's overweight in the health care sector. We believe this area of the health care industry offers solid growth potential through companies with good reinvestment possibilities and high rates of return. We also increased the Fund's exposure to diversified financial services companies in the quarter, although the market has punished companies like Lazard and Jones Lang
LaSalle for a slowdown in transaction-oriented business. These holdings were the top two detractors from performance in the quarter, with Lazard, a provider of corporate advisory and asset management services, falling 22% and Jones Lang LaSalle, a provider of real estate services, declining 17%. We took advantage of the declines to add to both positions in the first half of the year, as we believe both companies are high-quality franchises with strong long-term outlooks.
We are excited about the potential that we feel exists in the Fund's newly repositioned portfolio. Looking at trailing three-year weighted average earnings per share (EPS) growth in the portfolio at quarter end, the portfolio showed EPS growth of 18%, which is significantly higher than the benchmark's 10%. Last year at this time, the same number was 12% for the Fund, so we have tilted the portfolio toward faster growers. Our renewed emphasis on high-quality growth names in the Fund has led us to companies that we believe not only have high rates of return, but that are industry leaders with consistent long-term performance, future growth potential, and that have the ability to reinvest new capital at above-average rates of return.
†The Russell 2500 Index gained 3.57% in the second quarter, which compares to a 2.46% return for the U.S. large-cap S&P 500 Index and a 1.46% decline of the MSCI EAFE Index (Net), a measure of large-cap international equity performance. The S&P Global Ex-U.S. Small Cap Index, which is made up of the bottom 20% of institutionally investable capital outside the United States, was down 0.69% in the second quarter.
Fund holdings are as of the date given, are subject to change at any time, and are not recommendations to buy or sell any security.
4
COLUMBIA ACORN® FUND
AT A GLANCE
Total Net Assets of the Fund:
$5.7 billion
Performance data shown below represents past performance, does not guarantee future results, assumes reinvestment of dividends and distributions and does not reflect the deduction of taxes that a shareholder may pay on Fund distributions or the redemption of Fund shares. The investment return and principal value of an investment will fluctuate so that shares, when redeemed, may be worth more or less than their original cost. Current performance may be lower or higher than the performance data shown. Performance data reflects fee waivers or reimbursements of Fund expenses, if any; in their absence, performance results would have been lower. Indexes are unmanaged; their results do not reflect the effect of expenses or sales charges. Securities in the Fund may not match those in an index. Please visit investor.columbiathreadneedleus.com for performance data current to the most recent month-end.
The Growth of a $10,000 Investment in Columbia Acorn® Fund Class Z Shares
June 10, 1970 (Fund inception) through June 30, 2016
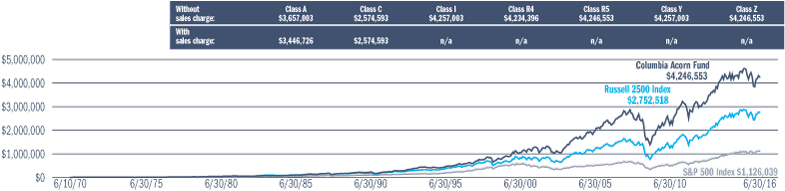
This chart shows the change in value of a hypothetical $10,000 investment in Class Z shares of the Fund during the stated time period. A $10,000 investment in Columbia Acorn Fund at inception appreciated to $31,777 on December 31, 1978, the inception date of the Russell 2500 Index. For comparison with the Russell 2500 Index, we assigned the index the same value as the Fund at index inception. Although the Fund typically invests in small- and mid-sized companies, the comparison to the S&P 500 Index is presented to show performance against a widely recognized market index over the life of the Fund.
Average Annual Total Returns for period ended June 30, 2016
| | | 2nd
quarter | | Year to
date | | 1 year | | 5 years | | 10 years | | Life of
Fund | |
| Class Z (6/10/70 inception) | | | 2.58 | % | | | -0.18 | % | | | -7.84 | % | | | 6.36 | % | | | 6.27 | % | | | 14.04 | % | |
| Class A (10/16/00 inception) | |
without sales charge | | | 2.47 | | | | -0.37 | | | | -8.16 | | | | 6.05 | | | | 5.96 | | | | 13.67 | | |
with sales charge | | | -3.44 | | | | -6.13 | | | | -13.44 | | | | 4.80 | | | | 5.34 | | | | 13.53 | | |
Russell 2500 Index* | | | 3.57 | | | | 3.98 | | | | -3.67 | | | | 9.48 | | | | 7.32 | | | | N/A | | |
Results for other share classes can be found on Page 2.
*The Fund's primary benchmark. Please see Page 1 for index descriptions.
Returns for Class A shown with and without the maximum initial sales charge of 5.75%. As stated in the May 1, 2016, prospectus, as supplemented June 27, 2016, the Fund's annual operating expense ratio is 0.82% for Class Z shares and 1.07% for Class A shares. The returns shown for periods prior to the inception of the Fund's Class A shares append the returns of the Fund's Class Z shares, the Fund's oldest share class. These returns are adjusted to reflect any higher class-related operating expenses of the newer share classes, as applicable. Please visit investor.columbiathreadneedle.com/us/investment-products/mutual-funds/appended-performance for more information.
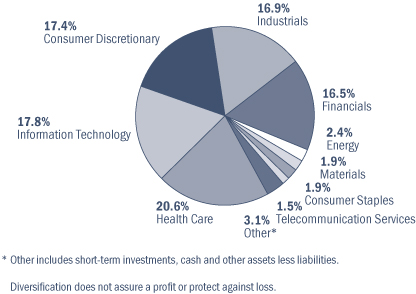
Portfolio Diversification
as a percentage of net assets, as of 6/30/16
Top 10 Holdings
as a percentage of net assets, as of 6/30/16
1. | | Align Technology
Invisalign System to Correct Malocclusion
(Crooked Teeth) | | | 2.6
| % | |
2. | | EdR
Student Housing | | | 1.6
| % | |
3. | | Expeditors International of Washington
International Freight Forwarder | | | 1.6
| % | |
4. | | Vail Resorts
Ski Resort Operator & Developer | | | 1.5
| % | |
5. | | VWR
Distributor of Lab Supplies | | | 1.4
| % | |
6. | | Robert Half International
Temporary & Permanent Staffing in Finance,
Accounting & Other Professions | | | 1.4
| % | |
7. | | HealthSouth
Inpatient Rehabilitation Facilities &
Home Health Care | | | 1.3
| % | |
8. | | Acuity Brands
Commercial Lighting Fixtures | | | 1.2
| % | |
9. | | Lazard
Corporate Advisory & Asset Management | | | 1.2
| % | |
10. | | Toro
Turf Maintenance Equipment | | | 1.2
| % | |
The Fund's top 10 holdings and portfolio diversification vary with changes in portfolio investments. See the Statement of Investments for a complete list of the Fund's holdings.
5
COLUMBIA ACORN INTERNATIONAL®
IN A NUTSHELL

| | 
| |
P. Zachary Egan
Co-Portfolio Manager | | Louis J. Mendes
Co-Portfolio Manager | |
Market risk may affect a single issuer, sector of the economy, industry or the market as a whole. International investing involves certain risks and volatility due to potential political, economic or currency instabilities and different, potentially less stringent, financial and accounting standards than those generally applicable to U.S. issuers. Risks are enhanced for emerging market issuers. Investments in small- and mid-cap companies involve risks and volatility and possible illiquidity greater than investments in larger, more established companies.
Columbia Acorn International Class Z shares ended the second quarter down 1.41%, performing in line with the Fund's primary benchmark, the MSCI ACWI Ex USA SMID Cap Index (Net), which was down 1.32%. For the semiannual period, the Fund declined 1.29% versus a 0.31% drop for the benchmark. Major factors impacting markets in the quarter were the surprise outcome of the Brexit vote in the United Kingdom, continued strong performance from the commodities sector, and signs of strength in a number of developing economies, particularly in Southeast Asia.
As discussed in our letter at the front of this report, the United Kingdom's decision to exit the European Union was somewhat unexpected by global markets and triggered a short-term flight to safety as investors considered the potential consequences of this action. The immediate reaction was a rise in the U.S. dollar and the Japanese yen, while the UK pound fell to its lowest levels in the last 30 years. Renewed discussions of a prolonged low interest rate environment in most developed economies provided a positive jolt to many emerging markets with economies sensitive to global rates. While the Fund declined nearly 9% over the two trading days following the Brexit vote, it regained over half of this drop within a week. As long-term investors, our focus remained on the medium-term impacts this decision could have on Fund holdings, and the adjustments we made to the portfolio were modest. We did exit low-cost airline EasyJet, as we believe Brexit could impair business prospects on a two-year-plus view. Brexit makes it unclear how regulation might bear on EasyJet's ability to operate in and out of the United Kingdom, and also raises concerns about potential constraints on labor mobility, as continental Europeans working in the United Kingdom constitute an important part of EasyJet's customer base. Its stock declined 39% in the quarter. We took advantage of the short-term price volatility around the Brexit vote to add to the Fund's position in Rightmove soon after the quarter end. Rightmove is a UK provider of real estate listings via the Internet, and we struggle to see how Brexit will materially change prospects for the company going forward. In continental Europe, the Fund's long-standing strategic underweight in European banks proved positive, as the uncertainty raised by the referendum weighed heavily on these stocks.
One area that continued to perform well in the second quarter was commodities. Year to date, the energy and basic materials sectors of the benchmark were up over 13% in U.S. dollars (USD). Continued stable economic growth and very low interest rates across developed economies, combined with the positive effects of China's stimulus policies enacted in 2015, have reignited confidence in the underlying price for a number of basic materials. Those emerging markets dependent upon
commodity exports outperformed, but were modest weights within the Fund and benchmark. Year to date within the Fund's small- to mid-cap equity benchmark, Brazil (+49% in USD), Russia (+38% in USD) and South Africa (+20% in USD) all rallied with strengthening currencies after mostly dismal 2015 performance. Tahoe Resources, a low-cost silver miner based in Guatemala, was the Fund's top contributor to performance, rising 50% in the quarter on the rebound in silver prices.
Current political uncertainty appears likely to drive a continuation of loose monetary policy in Japan and Europe for the near term. The low interest rate environment is fueling a global search for yield, buoying the prices of stable, cash-generative and dividend-paying stocks. Unprecedented intervention to keep interest rates low will eventually reverse, which we believe will make current valuations assigned to these "safe haven" securities hard to justify, particularly where there is little earnings growth. Accordingly, we have worked hard over recent quarters to increase the Fund's exposure to companies with solid earnings growth. We expect these businesses to prove more resilient should interest rates normalize. If this mean reversion takes longer than expected, this will likely be because of ongoing weak demand globally, in which case companies with growing earnings should command a valuation premium, also not a bad outcome for long-term growth investors. New Fund positions that reflect this focus on growth include DIP, an operator of online websites and mobile applications for temporary job listings in Japan. DIP is capitalizing on an aging Japanese population that is driving a labor shortage; a corporate preference for temporary workers to maintain flexibility and curb costs; and increased user preference for Internet and mobile job listings. Since 2009, full-time workers in Japan have declined by 2.35 million, while part-time jobs have increased by 1.17 million. Another new idea during the first half of 2016 was Actelion, a Swiss-based biopharmaceutical company focused on the discovery, development and commercialization of drugs for orphan diseases. Actelion is in the early innings of what we believe to be a strong and sustainable growth cycle fueled by two new drug therapies that are rapidly gaining share in the $5 billion-plus pulmonary hypertension market.
Fund holdings are as of the date given, are subject to change at any time, and are not recommendations to buy or sell any security.
6
COLUMBIA ACORN INTERNATIONAL®
AT A GLANCE
Total Net Assets of the Fund:
$5.7 billion
Performance data shown below represents past performance, does not guarantee future results, assumes reinvestment of dividends and distributions and does not reflect the deduction of taxes that a shareholder may pay on Fund distributions or the redemption of Fund shares. The investment return and principal value of an investment will fluctuate so that shares, when redeemed, may be worth more or less than their original cost. Current performance may be lower or higher than the performance data shown. Performance data reflects fee waivers or reimbursements of Fund expenses, if any; in their absence, performance results would have been lower. Indexes are unmanaged; their results do not reflect the effect of expenses or sales charges. Securities in the Fund may not match those in an index. Please visit investor.columbiathreadneedleus.com for performance data current to the most recent month-end.
The Growth of a $10,000 Investment in Columbia Acorn International® Class Z Shares
September 23, 1992 (Fund inception) through June 30, 2016
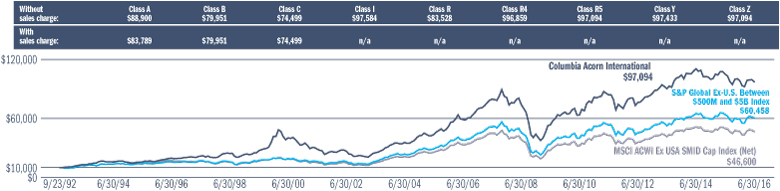
This chart shows the change in value of a hypothetical $10,000 investment in Class Z shares of the Fund during the stated time period. A $10,000 investment in Columbia Acorn International at inception appreciated to $15,870 on May 31, 1994, the inception date of the MSCI ACWI Ex USA SMID Cap Index (Net). For comparison with the MSCI ACWI Ex USA SMID Cap Index (Net), we assigned the index the same value as the Fund at index inception.
Average Annual Total Returns for period ended June 30, 2016
| | | 2nd
quarter | | Year to
date | | 1 year | | 5 years | | 10 years | | Life of
Fund | |
| Class Z (9/23/92 inception) | | | -1.41 | % | | | -1.29 | % | | | -7.40 | % | | | 2.96 | % | | | 5.13 | % | | | 10.04 | % | |
| Class A (10/16/00 inception) | |
without sales charge | | | -1.47 | | | | -1.42 | | | | -7.65 | | | | 2.65 | | | | 4.79 | | | | 9.63 | | |
with sales charge | | | -7.14 | | | | -7.08 | | | | -12.96 | | | | 1.44 | | | | 4.17 | | | | 9.35 | | |
MSCI ACWI Ex USA SMID Cap
Index (Net)* | | | -1.32 | | | | -0.31 | | | | -6.13 | | | | 1.76 | | | | 3.43 | | | | N/A | | |
S&P Global Ex-U.S.
Between $500M and $5B | | | 0.24 | | | | 1.98 | | | | -5.35 | | | | 2.49 | | | | 4.76 | | | | 7.86 | | |
Results for other share classes can be found on Page 2.
*The Fund's primary benchmark effective January 1, 2016. Prior to January 1, 2016, the S&P Global Ex-U.S. Between $500M and $5B Index was the Fund's primary benchmark. Please see Page 1 for index descriptions.
Returns for Class A shown with and without the maximum initial sales charge of 5.75%. As stated in the May 1, 2016, prospectus, as supplemented June 27, 2016, the Fund's annual operating expense ratio is 0.99% for Class Z shares and 1.24% for Class A shares. The returns shown for periods prior to the inception of the Fund's Class A shares append the returns of the Fund's Class Z shares, the Fund's oldest share class. These returns are adjusted to reflect any higher class-related operating expenses of the newer share classes, as applicable. Please visit investor.columbiathreadneedle.com/us/investment-products/mutual-funds/appended-performance for more information.
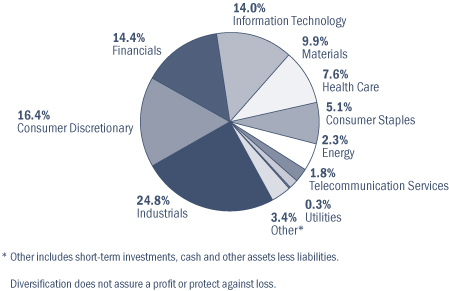
Portfolio Diversification
as a percentage of net assets, as of 6/30/16
Top 10 Holdings
as a percentage of net assets, as of 6/30/16
1. | | Novozymes (Denmark)
Industrial Enzymes | | | 2.4
| % | |
| 2. | | CCL Industries (Canada)
Global Label Converter | | | 2.1
| % | |
3. | | Wirecard (Germany)
Online Payment Processing & Risk Management | | | 1.6
| % | |
4. | | Hexagon (Sweden)
Design, Measurement & Visualization
Software & Equipment | | | 1.5
| % | |
5. | | Partners Group (Switzerland)
Private Markets Asset Management | | | 1.5
| % | |
6. | | Domino's Pizza Enterprise (Australia)
Domino's Pizza Operator in Australia & New Zealand | | | 1.4
| % | |
7. | | Trelleborg (Sweden)
Manufacturer of Sealing, Dampening &
Protective Solutions for Industry | | | 1.4
| % | |
8. | | Halma (United Kingdom)
Health & Safety Sensor Technology | | | 1.4
| % | |
9. | | Rightmove (United Kingdom)
Internet Real Estate Listings | | | 1.3
| % | |
10. | | Recruit Holdings (Japan)
Recruitment & Media Services | | | 1.3
| % | |
The Fund's top 10 holdings and portfolio diversification vary with changes in portfolio investments. See the Statement of Investments for a complete list of the Fund's holdings.
7
COLUMBIA ACORN USA®
IN A NUTSHELL

| | 
| |
Matthew A. Litfin
Lead Portfolio Manager | | William J. Doyle
Co-Portfolio Manager | |
Market risk may affect a single issuer, sector of the economy, industry or the market as a whole. Investments in small- and mid-cap companies involve risks and volatility and possible illiquidity greater than investments in larger, more established companies. The Fund may invest significantly in issuers within a particular sector, which may be negatively affected by market, economic or other conditions, making the Fund more vulnerable to unfavorable developments in the sector.
Columbia Acorn USA Class Z shares gained 7.41% in the second quarter of 2016, strongly outperforming the 3.79% gain of the Fund's primary benchmark, the Russell 2000 Index. The quarter's large lead over its benchmark was the result of strong individual stock performance across nearly all industry sectors. Year to date, the Fund's 0.92% gain was behind the benchmark's 2.22% return. Value stocks outpaced growth stocks during the semiannual period, holding back the relative performance of the Fund's growth-oriented portfolio.
Our analysts have been working hard for Fund shareholders and we have, in recent months, found many new opportunities to add higher-quality names to the Fund's portfolio. As noted above, our efforts paid off in the second quarter, as strong stock selection drove the Fund's performance more than three full percentage points above the benchmark's positive return. When we looked at the stock selection portion of Columbia Acorn USA's performance, we found that our analyst team had its best stock-picking quarter of the past decade in the second quarter for the Fund. We believe the portfolio that we established (and that we will continue to monitor and strive to improve upon) in the first half of 2016 should allow us to focus even more tightly on value creation and risk-adjusted performance for shareholders.
On an industry and sector basis in the quarter, real estate investment trusts (REITs) and utilities were strong performers within the benchmark, as investors went searching for yield. Material stocks were also strong in the Russell 2000, benefiting from the quarter's recovery in commodity prices. The Fund's underweight in these sectors detracted from performance; however, its overweight positions in the health care and information technology (IT) sectors contributed to relative outperformance in the quarter. The Fund has little exposure to REITs and utilities because many do not fit its growth-oriented style.
Within the IT sector in the Fund, Demandware, an e-commerce website platform for retailers and apparel manufacturers, and Cvent, a developer of software used by corporate event planners and hotels, gained 91% and 65% during the quarter, respectively, both on acquisition news. Demandware agreed to be acquired by Salesforce.com, and Cvent announced it was to be acquired by Vista Equity Partners. We sold both positions on the news. SPS Commerce, a provider of supply chain management software, was a large detractor in the first quarter but rebounded in the second, gaining 41%, as previous concerns related to a temporary disruption in its sales force abated.
The Fund participated in the June 23, 2016, initial public offering (IPO) of Twilio, a business software company offering an in-application communications software platform. Our analysis of the stock suggested the company had a competitive advantage in its market niche and would enjoy strong revenue growth for the long term. The market agreed with our assessment, and the stock rose dramatically following the IPO, gaining 139% in just one week. Applying our valuation discipline, we sold the position.
On the downside, Fiesta Restaurant Group, an owner/operator of two restaurant chains, was the top detractor in the quarter, falling 34%. The company experienced a slower start to the year, but we believe significant opportunity remains to expand its high-volume and differentiated Pollo Tropical restaurants. Virtu Financial, a high-speed trader, was also among the detractors, declining 18% in the quarter on disappointing year-over-year results. IPG Photonics fell 17% in the quarter; while IPG's position in fiber lasers remains solid, the company cut its outlook for 2016 due to weak demand from auto-related customers in Japan and on currency concerns. We will continue to monitor the performance of these companies and their stocks.
During the second quarter, Fund shareholders enjoyed the benefits of some of the repositioning that we implemented earlier in the year. We believe the companies that Columbia Acorn USA holds have strong prospects for solid earnings growth and stock price performance as we move into the second half of the year. Applying our time-tested valuation discipline, we will continue to scour the landscape to find the very best small-cap companies across industries.
Fund holdings are as of the date given, are subject to change at any time, and are not recommendations to buy or sell any security.
8
COLUMBIA ACORN USA®
AT A GLANCE
Total Net Assets of the Fund:
$679.3 million
Performance data shown below represents past performance, does not guarantee future results, assumes reinvestment of dividends and distributions and does not reflect the deduction of taxes that a shareholder may pay on Fund distributions or the redemption of Fund shares. The investment return and principal value of an investment will fluctuate so that shares, when redeemed, may be worth more or less than their original cost. Current performance may be lower or higher than the performance data shown. Performance data reflects fee waivers or reimbursements of Fund expenses, if any; in their absence, performance results would have been lower. Indexes are unmanaged; their results do not reflect the effect of expenses or sales charges. Securities in the Fund may not match those in an index. Please visit investor.columbiathreadneedleus.com for performance data current to the most recent month-end.
The Growth of a $10,000 Investment in Columbia Acorn USA® Class Z Shares
September 4, 1996 (Fund inception) through June 30, 2016
This chart shows the change in value of a hypothetical $10,000 investment in Class Z shares of the Fund during the stated time period.
Average Annual Total Returns for period ended June 30, 2016
| | | 2nd
quarter | | Year to
date | | 1 year | | 5 years | | 10 years | | Life of
Fund | |
| Class Z (9/4/96 inception) | | | 7.41 | % | | | 0.92 | % | | | -7.18 | % | | | 7.24 | % | | | 6.04 | % | | | 9.93 | % | |
| Class A (10/16/00 inception) | |
without sales charge | | | 7.40 | | | | 0.82 | | | | -7.40 | | | | 6.97 | | | | 5.75 | | | | 9.57 | | |
with sales charge | | | 1.22 | | | | -5.00 | | | | -12.72 | | | | 5.72 | | | | 5.13 | | | | 9.24 | | |
Russell 2000 Index* | | | 3.79 | | | | 2.22 | | | | -6.73 | | | | 8.35 | | | | 6.20 | | | | 7.88 | | |
Results for other share classes can be found on Page 2.
*The Fund's primary benchmark. Please see Page 1 for index descriptions.
Returns for Class A shown with and without the maximum initial sales charge of 5.75%. As stated in the May 1, 2016, prospectus, as supplemented June 27, 2016, the Fund's annual operating expense ratio is 1.18% for Class Z shares and 1.43% for Class A shares. The returns shown for periods prior to the inception of the Fund's Class A shares append the returns of the Fund's Class Z shares, the Fund's oldest share class. These returns are adjusted to reflect any higher class-related operating expenses of the newer share classes, as applicable. Please visit investor.columbiathreadneedle.com/us/investment-products/mutual-funds/appended-performance for more information.
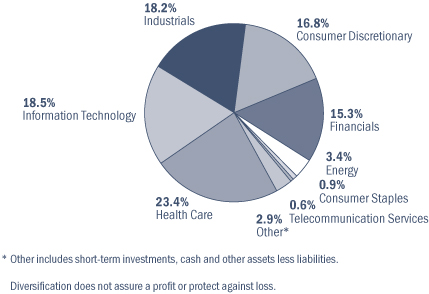
Portfolio Diversification
as a percentage of net assets, as of 6/30/16
Top 10 Holdings
as a percentage of net assets, as of 6/30/16
1. | | Toro
Turf Maintenance Equipment | | | 2.4
| % | |
2. | | Drew Industries
RV & Manufactured Home Components | | | 2.1
| % | |
3. | | VWR
Distributor of Lab Supplies | | | 1.9
| % | |
4. | | Papa John's International
Franchisor of Pizza Restaurants | | | 1.9
| % | |
5. | | HealthSouth
Inpatient Rehabilitation Facilities & Home
Health Care | | | 1.8
| % | |
6. | | MarketAxess
Bond Exchange | | | 1.8
| % | |
7. | | Medidata Solutions
Cloud-based Software for Drug Studies | | | 1.8
| % | |
8. | | UniFirst
Uniform Rental | | | 1.6
| % | |
9. | | CoStar Group
Commercial Real Estate Data Aggregator & Web
Marketing for Retail Landlords | | | 1.6
| % | |
10. | | Ligand Pharmaceuticals
Royalties from Licensing Drug Delivery Technology | | | 1.6
| % | |
The Fund's top 10 holdings and portfolio diversification vary with changes in portfolio investments. See the Statement of Investments for a complete list of the Fund's holdings.
9
COLUMBIA ACORN INTERNATIONAL SELECTSM
IN A NUTSHELL

| | 
| |
Stephen Kusmierczak
Co-Portfolio Manager | | Andreas Waldburg-Wolfegg
Co-Portfolio Manager | |
Market risk may affect a single issuer, sector of the economy, industry or the market as a whole. Foreign investments subject the Fund to political, economic, market, social and other risks within a particular country, as well as to potential currency instabilities and less stringent financial and accounting standards generally applicable to U.S. issuers. Risks are enhanced for emerging market issuers. Investments in small- and mid-cap companies involve risks and volatility and possible illiquidity greater than investments in larger, more established companies. The Fund may invest significantly in issuers within a particular sector, which may be negatively affected by market, economic or other conditions, making the Fund more vulnerable to unfavorable developments in the sector.
Columbia Acorn International Select Class Z shares ended the second quarter of 2016 up 0.19%, while the Fund's primary benchmark, the MSCI ACWI Ex USA Index (Net), fell 0.64%. Year to date through June 30, the Fund was down 1.71% versus a benchmark decline of 1.02%. The Fund's stock performance in the Asia ex Japan region helped to drive outperformance in the second quarter, as did stock selection and a modest overweight in Europe. Not surprising given the Brexit vote results, the Fund's exposure to the United Kingdom and Ireland was the largest regional detractor in the quarter, though we were underweight versus the benchmark in these markets.
On a sector basis, the Fund had strong performance in the information technology (IT) sector, benefiting from both its overweight exposure to the sector and its stock selection. The Fund had a U.S. dollar-adjusted gain of 9% in the IT sector, compared to a benchmark gain of 0.3%. The Fund's overweight in the consumer discretionary sector detracted from relative performance but returns benefited from good stock selection in the sector. We took advantage of weakness in the consumer discretionary sector to add to select, high-quality names that we believe have strong, long-term prospects.
Reflecting the Fund's IT strength, its three top contributors to performance in the quarter were IT names. NetEase.com, a Chinese provider of online gaming services, gained 35%. The company continued to deliver solid gaming revenue growth and improving e-commerce margins in the second quarter after gaining exclusive Chinese operating rights to such blockbuster games as Activision's "Overwatch" and Microsoft's "Minecraft." Wirecard, a German provider of online payment processing risk management services, declined in the first quarter on allegations of criminal misconduct. We did not believe the allegations had merit and added to the Fund's position on the decline. The market echoed our skepticism in the second quarter, driving a 16% rebound in the stock. Taiwan's Largan Precision, a manufacturer of mobile device camera lenses and modules, continued to dominate the high-end miniature lens business used in handsets and mobile devices, expanding its operating margin from 50% to 57% and enjoying a 19% gain in its stock in the quarter.
Other top contributors in the quarter included Japan's Bandai Namco, a maker of branded toys and related content. Up 18% in the quarter, the company continues to leverage its strong toy brands to enter new categories, such as mobile, and geographies beyond Japan. Up 13% in the quarter, KDDI, a mobile and fixed-line communication services provider in Japan, delivered steady growth by improving its average revenue per user, and its outlook remains stable.
On the downside, Eutelsat, a French provider of fixed satellite services, issued a profit warning for the current year, sending its stock down 42% in the quarter. Down 22%, Ryanair, a European low-cost airline based in Ireland, fell on uncertainties created by the Brexit decision. CCL Industries, a Canadian global label converter, was a strong outperformer last year, but so far this year a large rotation in the Canadian market toward energy and basic materials and out of the consumer space has hurt the stock, leading to an 8% decline in the second quarter. Fundamentals remain strong at CCL, and we expect that synergies following its acquisition of Checkpoint Systems will be substantially higher than official guidance. Rightmove, a UK provider of Internet real estate listings, fell 18% in the second quarter, moving sharply downward in the wake of Brexit.
In the second quarter, we saw a continuation of economic uncertainty around the world and increased political nervousness. We expect that there will continue to be uncertainties over the next 18 months, as some of the world's large democracies elect new presidents, and investors reposition portfolios in light of how they expect Brexit to impact different sectors, countries and companies. We have positioned the Fund defensively in the United Kingdom, focusing on companies that stand to benefit from pound weakness and taking advantage of market weakness to build exposure to select, high-quality consumer names. The Fund's more mid-cap focus allows us to fish in a pond where liquidity is high, making it possible for us to trade to take advantage of market volatility.
Fund holdings are as of the date given, are subject to change at any time, and are not recommendations to buy or sell any security.
10
COLUMBIA ACORN INTERNATIONAL SELECTSM
AT A GLANCE
Total Net Assets of the Fund:
$110.0 million
Performance data shown below represents past performance, does not guarantee future results, assumes reinvestment of dividends and distributions and does not reflect the deduction of taxes that a shareholder may pay on Fund distributions or the redemption of Fund shares. The investment return and principal value of an investment will fluctuate so that shares, when redeemed, may be worth more or less than their original cost. Current performance may be lower or higher than the performance data shown. Performance data reflects fee waivers or reimbursements of Fund expenses, if any; in their absence, performance results would have been lower. Indexes are unmanaged; their results do not reflect the effect of expenses or sales charges. Securities in the Fund may not match those in an index. Please visit investor.columbiathreadneedleus.com for performance data current to the most recent month-end.
The Growth of a $10,000 Investment in Columbia Acorn International SelectSM Class Z Shares
November 23, 1998 (Fund inception) through June 30, 2016

This chart shows the change in value of a hypothetical $10,000 investment in Class Z shares of the Fund during the stated time period. A $10,000 investment in Columbia Acorn International Select at inception appreciated to $17,309 on December 31, 2000, the month-end of the inception date of the MSCI ACWI Ex USA Index (Net). For comparison with the MSCI ACWI Ex USA Index (Net), we assigned the index the same value as the Fund at month-end of the index inception date.
Average Annual Total Returns for period ended June 30, 2016
| | | 2nd
quarter | | Year to
date | | 1 year | | 5 years | | 10 years | | Life of
Fund | |
| Class Z (11/23/98 inception) | | | 0.19 | % | | | -1.71 | % | | | -6.36 | % | | | 2.07 | % | | | 4.61 | % | | | 7.85 | % | |
| Class A (10/16/00 inception) | |
without sales charge | | | 0.14 | | | | -1.88 | | | | -6.61 | | | | 1.76 | | | | 4.28 | | | | 7.50 | | |
with sales charge | | | -5.64 | | | | -7.51 | | | | -11.98 | | | | 0.57 | | | | 3.66 | | | | 7.14 | | |
MSCI ACWI Ex USA Index (Net)* | | | -0.64 | | | | -1.02 | | | | -10.24 | | | | 0.10 | | | | 1.87 | | | | N/A | | |
S&P Developed Ex-U.S.
Between $2B and $10B Index | | | -1.12 | | | | -0.29 | | | | -4.03 | | | | 3.58 | | | | 3.66 | | | | 6.98 | | |
Results for other share classes can be found on Page 2.
*The Fund's primary benchmark effective January 1, 2016. Prior to January 1, 2016, the S&P Developed Ex-U.S. Between $2B and $10B Index was the Fund's primary benchmark. Please see Page 1 for index descriptions.
Returns for Class A shown with and without the maximum initial sales charge of 5.75%. As stated in the May 1, 2016, prospectus, as supplemented June 27, 2016, the Fund's annual operating expense ratio is 1.15% for Class Z shares and 1.40% for Class A shares. The returns shown for periods prior to the inception of the Fund's Class A shares append the returns of the Fund's Class Z shares, the Fund's oldest share class. These returns are adjusted to reflect any higher class-related operating expenses of the newer share classes, as applicable. Please visit investor.columbiathreadneedle.com/us/investment-products/mutual-funds/appended-performance for more information.
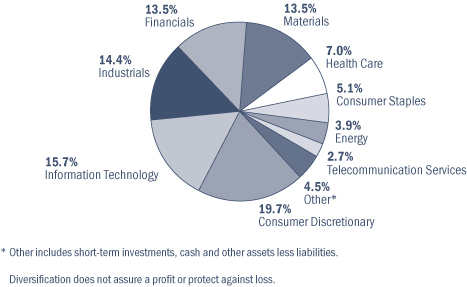
Portfolio Diversification
as a percentage of net assets, as of 6/30/16
Top 10 Holdings
as a percentage of net assets, as of 6/30/16
1. | | Novozymes (Denmark)
Industrial Enzymes | | | 5.2
| % | |
2. | | CCL Industries (Canada)
Global Label Converter | | | 5.2
| % | |
3. | | Partners Group (Switzerland)
Private Markets Asset Management | | | 4.5
| % | |
4. | | Wirecard (Germany)
Online Payment Processing & Risk Management | | | 4.1
| % | |
5. | | Hexagon (Sweden)
Design, Measurement & Visualization
Software & Equipment | | | 3.5
| % | |
6. | | Aeon Mall (Japan)
Suburban Shopping Mall Developer,
Owner & Operator | | | 3.5
| % | |
7. | | Largan Precision (Taiwan)
Mobile Device Camera Lenses & Modules | | | 3.4
| % | |
| 8. | | Amcor (Australia)
Flexible & Rigid Packaging | | | 3.1
| % | |
9. | | NetEase.com (China)
Chinese Online Gaming Services | | | 3.0
| % | |
10. | | Bandai Namco (Japan)
Branded Toys & Related Content | | | 3.0
| % | |
The Fund's top 10 holdings and portfolio diversification vary with changes in portfolio investments. See the Statement of Investments for a complete list of the Fund's holdings.
11
COLUMBIA ACORN SELECTSM
IN A NUTSHELL

| | 
| |
David L. Frank
Co-Portfolio Manager | | Matthew S. Szafranski
Co-Portfolio Manager | |
Market risk may affect a single issuer, sector of the economy, industry or the market as a whole. Investments in small- and mid-cap companies involve risks and volatility and possible illiquidity greater than investments in larger, more established companies. Foreign investments subject the Fund to risks, including political, economic, market, social and other risks, within a particular country, as well as to potential currency instabilities and less stringent financial and accounting standards generally applicable to U.S. issuers. Risks are enhanced for emerging market issuers. The Fund may invest significantly in issuers within a particular sector, which may be negatively affected by market, economic or other conditions, making the Fund more vulnerable to unfavorable developments in the sector.
Columbia Acorn Select Class Z shares ended the second quarter of 2016 down 0.89%, underperforming the 3.99% gain of the Fund's primary benchmark, the S&P MidCap 400 Index. For the first half of the year, the Fund was down 1.21%, while the benchmark gained 7.93%. The Fund's growth-oriented portfolio struggled in an investment environment that favored value during much of the six-month period. In the second quarter, we saw a continuation of the move toward more defensive areas of the market like utility and material stocks, which were top-performing sectors within the benchmark but are significant underweights in the Fund. At the end of the second quarter, the United Kingdom's vote to exit the European Union negatively impacted three Fund holdings with European exposure and detracted approximately 1.5% from Fund performance in the quarter. CWAM's global chief investment officer offers additional thoughts on Brexit at the beginning of this report.
The biggest detractor from performance in the second quarter and year to date was Union Agriculture, a farmland operator in Uruguay. Down 36% in the quarter, we decided to exit the position. For the sixth months ended June 30, this stock was down 55% and detracted 1.5% from performance.
As mentioned, the Fund owned stock in three U.S. companies that were hurt in the quarter by their exposure to Europe and the United Kingdom. Lazard, a provider of corporate advisory and asset management services, ended the quarter down 16%. The company's merger advisory services in Europe are expected to see sharp declines through the rest of 2016, and a strong dollar could negatively impact its asset management business in the near term. Jones Lang LaSalle, a provider of commercial real estate services worldwide, fell 17% on concerns of a decline in commercial real estate transaction and leasing volumes in China. Following the Brexit vote, these concerns expanded to include the United Kingdom and Europe. Liberty Global, a provider of cable TV franchises outside of the United States, fell 14%, as roughly 40% of its revenue is generated in the United Kingdom and the rest is generated in Europe. We do not believe that Brexit has diminished the long-term value of these companies.
Leading performance in the quarter, pizza franchisor Papa John's International gained 26%, as the company proved its ability to drive solid earnings in a promotional pizza environment. Communications towers owner Crown Castle International gained 18% in the quarter. The company benefited from both an increase in mobile data usage and, as a real estate investment trust, from the popularity of dividend-paying stocks among yield-hungry investors.
Nordson, a manufacturer of dispensing systems for adhesives and coatings, ended the quarter up 10%. After experiencing lackluster sales in 2015 like many industrials dependent on overseas revenues, Nordson returned to growth in the first half of 2016, benefiting from launches in new technology like mobile phones that utilize the company's cutting edge dispensing and testing technologies.
While we are disappointed with the Fund's underperformance in the first two quarters of the year, we believe it is important to remember that in a concentrated portfolio like Columbia Acorn Select's returns can fluctuate. As we've reshaped and concentrated the Fund's portfolio in the first half of the year, we have moved away from owning more speculative names, and we have focused on creating a portfolio of our analyst team's current top ideas. Eight of the Fund's 10 largest detractors from performance year to date were sold during the first half of the year, making way for higher-quality, higher-conviction stocks. At June 30, the Fund held 34 names, nearly half of which were added to the portfolio in the first six months of the year. The Fund's tilt toward the consumer discretionary and industrial sectors continues. Most importantly, we have refocused on durable, growth-at-a-reasonable price businesses that we believe will outperform over time.
Fund holdings are as of the date given, are subject to change at any time, and are not recommendations to buy or sell any security.
12
COLUMBIA ACORN SELECTSM
AT A GLANCE
Total Net Assets of the Fund:
$335.7 million
Performance data shown below represents past performance, does not guarantee future results, assumes reinvestment of dividends and distributions and does not reflect the deduction of taxes that a shareholder may pay on Fund distributions or the redemption of Fund shares. The investment return and principal value of an investment will fluctuate so that shares, when redeemed, may be worth more or less than their original cost. Current performance may be lower or higher than the performance data shown. Performance data reflects fee waivers or reimbursements of Fund expenses, if any; in their absence, performance results would have been lower. Indexes are unmanaged; their results do not reflect the effect of expenses or sales charges. Securities in the Fund may not match those in an index. Please visit investor.columbiathreadneedleus.com for performance data current to the most recent month-end.
The Growth of a $10,000 Investment in Columbia Acorn SelectSM Class Z Shares
November 23, 1998 (Fund inception) through June 30, 2016
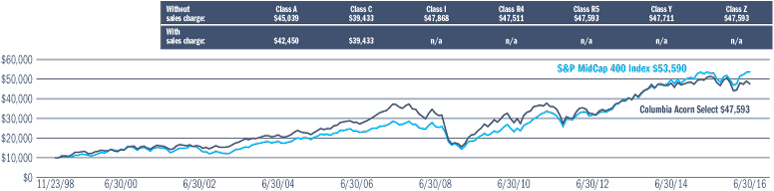
This chart shows the change in value of a hypothetical $10,000 investment in Class Z shares of the Fund during the stated time period.
Average Annual Total Returns for period ended June 30, 2016
| | 2nd
quarter | | Year to
date | | 1 year | | 5 years | | 10 years | | Life of
Fund | |
| Class Z (11/23/98 inception) | | | -0.89 | % | | | -1.21 | % | | | -7.28 | % | | | 5.78 | % | | | 5.48 | % | | | 9.27 | % | |
| Class A (10/16/00 inception) | |
without sales charge | | | -0.97 | | | | -1.32 | | | | -7.56 | | | | 5.48 | | | | 5.17 | | | | 8.93 | | |
with sales charge | | | -6.68 | | | | -7.00 | | | | -12.86 | | | | 4.24 | | | | 4.55 | | | | 8.56 | | |
S&P MidCap 400 Index* | | | 3.99 | | | | 7.93 | | | | 1.33 | | | | 10.55 | | | | 8.55 | | | | 10.01 | | |
Results for other share classes can be found on Page 2.
*The Fund's primary benchmark. Please see Page 1 for index descriptions.
Returns for Class A shown with and without the maximum initial sales charge of 5.75%. As stated in the May 1, 2016, prospectus, as supplemented June 27, 2016, the Fund's annual operating expense ratio is 0.88% for Class Z shares and 1.13% for Class A shares. The returns shown for periods prior to the inception of the Fund's Class A shares append the returns of the Fund's Class Z shares, the Fund's oldest share class. These returns are adjusted to reflect any higher class-related operating expenses of the newer share classes, as applicable. Please visit investor.columbiathreadneedle.com/us/investment-products/mutual-funds/appended-performance for more information.
Portfolio Diversification
as a percentage of net assets, as of 6/30/16
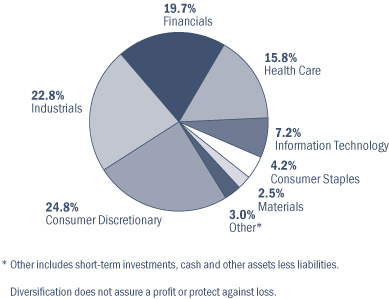
Top 10 Holdings
as a percentage of net assets, as of 6/30/16
1. | | LKQ
Alternative Auto Parts Distribution | | | 5.2
| % | |
2. | | Align Technology
Invisalign System to Correct Malocclusion
(Crooked Teeth) | | | 4.4
| % | |
3. | | SVB Financial Group
Bank to Venture Capitalists | | | 4.3
| % | |
4. | | HRG Group
Holding Company | | | 4.1
| % | |
5. | | HealthSouth
Inpatient Rehabilitation Facilities & Home
Health Care | | | 4.1
| % | |
6. | | Amerco
North American Moving & Storage | | | 4.1
| % | |
7. | | Papa John's International
Franchisor of Pizza Restaurants | | | 3.9
| % | |
8. | | Crown Castle International
Communications Towers | | | 3.8
| % | |
9. | | EdR
Student Housing | | | 3.8
| % | |
10. | | Nordson
Dispensing Systems for Adhesives & Coatings | | | 3.5
| % | |
The Fund's top 10 holdings and portfolio diversification vary with changes in portfolio investments. See the Statement of Investments for a complete list of the Fund's holdings.
13
COLUMBIA THERMOSTAT FUNDSM
IN A NUTSHELL

| | 
| |
David L. Frank
Co-Portfolio Manager | | Christopher J. Olson
Co-Portfolio Manager | |
A "fund of fund" bears its allocable share of the costs and expenses of the underlying funds in which it invests. Such funds are thus subject to two levels of fees and potentially higher expense ratios than would be associated with a fund that invests and trades directly in financial instruments under the direction of a single manager.
The value of an investment in the Fund is based primarily on the performance of the underlying funds in which it invests. The Fund is subject to the risk that the investment manager's decisions regarding asset classes and underlying funds will not anticipate market trends successfully, resulting in a failure to preserve capital or lower total return. The Investment Manager may prefer an underlying fund in the Columbia Acorn Family of Funds over alternative investments. There can be no assurance that the Columbia Acorn Funds will outperform similar funds managed by the Investment Manager's affiliates. This is not an offer of the shares of any other mutual fund mentioned herein.
Class Z shares of Columbia Thermostat Fund, our fund of funds, ended the second quarter of 2016 up 1.81%. This compares to a 2.46% gain of the Fund's primary equity benchmark, the S&P 500 Index, and a 2.21% gain of the Fund's primary debt benchmark, the Barclays U.S. Aggregate Bond Index. The Fund's custom 50/50 Blended Benchmark gained 2.34% in the quarter. For the first half of the year, the Fund was up 3.69%, which compares to an S&P 500 return of 3.84%, a 5.31% gain of the Barclays index, and a 4.68% return of the Fund's custom blended benchmark.
The Fund's equity portfolio had a weighted average gain of 1.68% in the second quarter. Columbia Select Large Cap Growth Fund led equity gains, increasing 5.28% in the quarter. The weighted average gain for the bond portion of the Fund was 1.97%, with Columbia Total Return Bond Fund offering the top return of 2.95%.
The Fund hit three reallocation triggers in the second quarter. Buying equities when the market declined and selling them when the market rose, the Fund decreased exposure to its stock funds in April and June and increased its exposure in May.
As we mentioned last quarter, following our periodic review of underlying funds called for by Columbia Thermostat Fund's prospectus, we made several changes that were implemented on May 1, 2016. Columbia Income Opportunities Fund now has a 10% weight in the bond portfolio, down from 20%. Columbia U.S. Treasury Index Fund, a U.S. Treasury notes/bonds fund, was added to the bond portfolio with a 10% weight in the portfolio. We also adjusted the stock/bond allocation table levels up by 25 points.
So far in 2016, we have witnessed the remarkable, ongoing strength of longer duration bonds, especially U.S. Treasuries. At the same time, there has been a persistent choppiness in equity markets—early in the year due to worries over a slowdown in the United States as well as emerging markets economies, and then later on concerns about a slowdown in Europe following the Brexit vote. Given Columbia Thermostat Fund's ability to move money into and out of equities, the current volatile equity market environment caters to the Fund's investment style.
Results of the Underlying Funds Owned in Columbia Thermostat Fund
as of June 30, 2016
Stock Funds
| Fund | | Weightings
in category | | 2nd quarter
performance | | Year-to-date
performance | |
Columbia Acorn
International, Class I | | | 20 | % | | | -1.41 | % | | | -1.24 | % | |
Columbia Contrarian
Core Fund, Class I | | | 20 | % | | | 1.75 | % | | | 2.38 | % | |
Columbia Dividend
Income Fund, Class I | | | 20 | % | | | 3.92 | % | | | 7.40 | % | |
Columbia Acorn Fund,
Class I | | | 10 | % | | | 2.56 | % | | | -0.18 | % | |
Columbia Acorn Select,
Class I | | | 10 | % | | | -0.81 | % | | | -1.13 | % | |
Columbia Large Cap
Enhanced Core Fund,
Class I | | | 10 | % | | | 1.25 | % | | | 1.64 | % | |
Columbia Select
Large Cap Growth Fund,
Class I | | | 10 | % | | | 5.28 | % | | | -7.03 | % | |
Weighted Average
Equity Gain | | | 100 | % | | | 1.68 | % | | | 1.05 | % | |
Bond Funds
| Fund | | Weightings
in category | | 2nd quarter
performance | | Year-to-date
performance | |
Columbia Short Term
Bond Fund, Class I | | | 40 | % | | | 0.84 | % | | | 1.86 | % | |
Columbia Total Return
Bond Fund, Class I | | | 20 | % | | | 2.95 | % | | | 5.96 | % | |
Columbia U.S. Government
Mortgage Fund, Class I | | | 20 | % | | | 1.73 | % | | | 3.14 | % | |
Columbia Income
Opportunities Fund,
Class I | | | 10 | %* | | | 2.57 | % | | | 5.41 | % | |
Columbia U.S. Treasury
Index Fund, Class I | | | 10 | %* | | | 2.02 | % | | | 5.25 | % | |
Weighted Average
Income Gain | | | 100 | % | | | 1.97 | % | | | 3.83 | % | |
*Changed effective May 1, 2016. Weighted average returns through the end of the period reflect linked returns between the previous fund weightings and the current weights in these positions.
Columbia Thermostat Fund Rebalancing in the Second Quarter
April 14, 2016 | | 20% stocks, 80% bonds | |
May 16, 2016 | | 25% stocks, 75% bonds | |
June 24, 2016 | | 20% stocks, 80% bonds | |
The Fund's investments in the underlying funds may present certain risks, including the following. Market risk may affect a single issuer, sector of the economy, industry or the market as a whole. The Fund's investment in other funds subjects it to the investment performance (positive or negative), risks and expenses of these underlying funds. Investments in small- and mid-cap companies involve risks and volatility and possible illiquidity greater than in investments in larger, more established companies. There are risks associated with fixed income investments, including credit risk, market risk, interest rate risk and prepayment and extension risk. In general, bond prices fall when interest rates rise and vice versa. This effect is more pronounced for longer term securities. Non-investment-grade (high-yield or junk) securities present greater price volatility and more risk to principal and income than higher rated securities. Foreign investments subject the Fund to political, economic, market, social and other risks within a particular country, as well as to potential currency instabilities and less stringent financial and accounting standards generally applicable to U.S. issuers. Risks are enhanced for emerging market issuers.
14
COLUMBIA THERMOSTAT FUNDSM
AT A GLANCE
Total Net Assets of the Fund:
$1.2 billion
Performance data shown below represents past performance, does not guarantee future results, assumes reinvestment of dividends and distributions and does not reflect the deduction of taxes that a shareholder may pay on Fund distributions or the redemption of Fund shares. The investment return and principal value of an investment will fluctuate so that shares, when redeemed, may be worth more or less than their original cost. Current performance may be lower or higher than the performance data shown. Performance data reflects fee waivers or reimbursements of Fund expenses, if any; in their absence, performance results would have been lower. Indexes are unmanaged; their results do not reflect the effect of expenses or sales charges. Securities in the Fund may not match those in an index. Please visit investor.columbiathreadneedleus.com for performance data current to the most recent month-end.
The Growth of a $10,000 Investment in Columbia Thermostat FundSM Class Z Shares
September 25, 2002 (Fund inception) through June 30, 2016
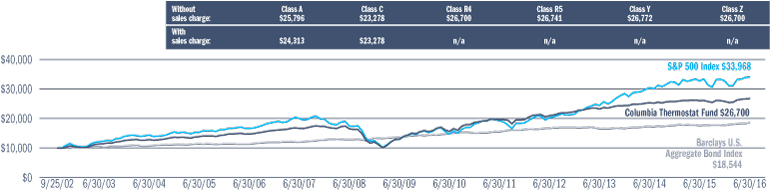
This chart shows the change in value of a hypothetical $10,000 investment in Class Z shares of the Fund during the stated time period.
Average Annual Total Returns for period ended June 30, 2016
| | | 2nd
quarter | | Year to
date | | 1 year | | 5 years | | 10 years | | Life of
Fund | |
| Class Z (9/25/02 inception) | | | 1.81 | % | | | 3.69 | % | | | 2.76 | % | | | 6.46 | % | | | 6.13 | % | | | 7.40 | % | |
| Class A (3/3/03 inception) | |
without sales charge | | | 1.79 | | | | 3.57 | | | | 2.53 | | | | 6.21 | | | | 5.88 | | | | 7.13 | | |
with sales charge | | | -4.07 | | | | -2.37 | | | | -3.37 | | | | 4.96 | | | | 5.25 | | | | 6.67 | | |
S&P 500 Index* | | | 2.46 | | | | 3.84 | | | | 3.99 | | | | 12.10 | | | | 7.42 | | | | 9.29 | | |
Barclays U.S. Aggregate
Bond Index* | | | 2.21 | | | | 5.31 | | | | 6.00 | | | | 3.76 | | | | 5.13 | | | | 4.59 | | |
Results for other share classes can be found on Page 2.
*The Fund's primary benchmarks. Please see Page 1 for index descriptions.
Returns for Class A shown with and without the maximum initial sales charge of 5.75%. As stated in the May 1, 2016, prospectus, as supplemented June 27, 2016, the Fund's annual operating expense ratio is 0.77% for Class Z shares and 1.02% for Class A shares. The returns shown for periods prior to the inception of the Fund's Class A shares append the returns of the Fund's Class Z shares, the Fund's oldest share class. These returns are adjusted to reflect any higher class-related operating expenses of the newer share classes, as applicable. Please visit investor.columbiathreadneedle.com/us/investment-products/mutual-funds/appended-performance for more information.
Asset Allocation
as a percentage of net assets, as of 6/30/16
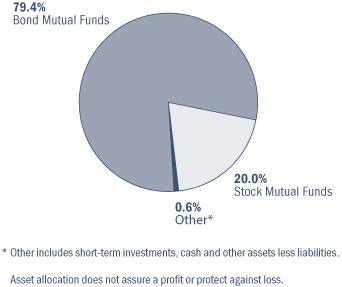
Portfolio Weightings
as a percentage of assets in each investment category, as of 6/30/16
Stock Mutual Funds
Columbia Acorn International, Class I | | | 20 | % | |
Columbia Contrarian Core Fund, Class I | | | 20 | % | |
Columbia Dividend Income Fund, Class I | | | 20 | % | |
Columbia Acorn Fund, Class I | | | 10 | % | |
Columbia Acorn Select, Class I | | | 10 | % | |
Columbia Large Cap Enhanced Core Fund,
Class I | | | 10 | % | |
Columbia Select Large Cap Growth Fund,
Class I | | | 10 | % | |
Bond Mutual Funds
Columbia Short Term Bond Fund, Class I | | | 40 | % | |
Columbia Total Return Bond Fund, Class I | | | 20 | % | |
Columbia U.S. Government Mortgage Fund,
Class I | | | 20 | % | |
Columbia Income Opportunities Fund,
Class I | | | 10 | % | |
Columbia U.S. Treasury Index Fund, Class I | | | 10 | % | |
15
COLUMBIA ACORN EMERGING MARKETS FUNDSM
IN A NUTSHELL

| | 
| |
Fritz Kaegi
Co-Portfolio Manager | | Stephen Kusmierczak
Co-Portfolio Manager | |

| | 
| |
Louis J. Mendes
Co-Portfolio Manager | | Satoshi Matsunaga
Co-Portfolio Manager | |
Market risk may affect a single issuer, sector of the economy, industry or the market as a whole. International investing involves certain risks and volatility due to potential political, economic or currency instabilities and different, potentially less stringent, financial and accounting standards than those generally applicable to U.S. issuers. Risks are enhanced for emerging and frontier market issuers. Investments in small- and mid-cap companies involve risks and volatility and possible illiquidity greater than investments in larger, more established companies.
Columbia Acorn Emerging Markets Fund Class Z shares gained 1.86% in the second quarter of 2016, outperforming the 0.15% return of the Fund's primary benchmark, the MSCI Emerging Markets SMID Cap Index (Net). Year to date through June 30, the Fund was up 1.27%, which compares to a 3.21% gain for the benchmark. During the second quarter, the Fund benefited from its large overweight in Southeast Asia and from our stock selection in this region. Good stock selection in the consumer discretionary sector also bolstered relative returns. For the year-to-date period, Fund performance relative to the benchmark was hurt by poor stock performance in China and India. There has been a significant divergence in performance between the more developing end of the emerging markets and the large continental economies of China and India, as the smaller, more developing markets have outperformed so far in 2016 on strengthening local currencies and a rebound in commodity prices.
On June 24, 2016, the Brexit bombshell hit the markets. Investors' initial reaction was to sell riskier assets, including emerging market equities, but, within a week, the Fund's benchmark closed above pre-Brexit levels. In contrast to the political uncertainties being felt in much of the developed world, the election of Rodrigo Duterte in the Philippines sparked a post-election rally in that country on hopes that the new president will implement needed infrastructure projects and tap into growth potential within the country. The Fund benefited from the rally and from our strong stock picking in this market, as Fund holdings in the Philippines provided a U.S. dollar-adjusted gain of 22% compared to an 8% gain in the benchmark for the quarter. The Fund also benefited from economic policies implemented by reform-oriented political leadership in Indonesia, where the Fund has a significant overweight relative to the benchmark and also outperformed in the second quarter.
We have maintained an emphasis in the Fund on companies benefiting from the rising aspirations and incomes of a growing middle class. This theme is behind the Fund's long-standing overweight in the consumer discretionary sector, which was the top-performing sector in the Fund in the second quarter. Four of the Fund's five top contributors to performance in the quarter were consumer discretionary stocks. Melco Crown (Philippines) Resorts, an integrated resort operator in Manila, declined last year on negative sentiment toward gaming in China. During the second quarter, the market took note of the company's solid fundamentals and its more domestic-driven business, leading to a 48% gain in the stock. Up 16%, Zee Entertainment Enterprises, an Indian
programmer of pay TV content, rebounded from a first-quarter drop, benefiting from positive growth expectations. Tahoe Resources, a silver and gold miner in Guatemala, Canada and Peru, gained 51% on the back of significant increases in silver and gold prices. Xinhua Winshare Publishing, a Sichuan publisher, distributor and retailer, reported good results and also announced that officials approved its application to list on China's A-share market. Its stock gained 25% in the quarter.
On the downside, Sihuan Pharmaceutical Holdings Group, a Chinese generic drug manufacturer, was the biggest detractor during the second quarter and for the half year. Down 30% in the second quarter, the company was negatively impacted by a slowdown in health care spending in China and increasing price competition in the pharmaceutical industry. Going against the upward trend of the Fund's consumer discretionary holdings, Hoteles City Express, the leading budget hotel operator in Mexico, declined 19% in the quarter despite reporting positive year-over-year results. Adani Ports & Special Economic Zone, an Indian port operator, fell 19% on mixed first quarter results.
While growth rates have decelerated in most developed markets around the world, many emerging markets are offering accelerating growth in evolving and strengthening markets. We believe that emerging market economies benefiting from strong domestic demand fueled by reform-oriented political leadership—countries like the Philippines, India and Indonesia—offer distinct advantages and have minimal exposure to the political uncertainty in Europe and beyond. Over the long term, we believe the Fund should benefit from investing in high-quality businesses with good growth prospects at reasonable valuations, which can be found within our emerging market universe.
Fund holdings are as of the date given, are subject to change at any time, and are not recommendations to buy or sell any security.
16
COLUMBIA ACORN EMERGING MARKETS FUNDSM
AT A GLANCE
Total Net Assets of the Fund:
$158.7 million
Performance data shown below represents past performance, does not guarantee future results, assumes reinvestment of dividends and distributions and does not reflect the deduction of taxes that a shareholder may pay on Fund distributions or the redemption of Fund shares. The investment return and principal value of an investment will fluctuate so that shares, when redeemed, may be worth more or less than their original cost. Current performance may be lower or higher than the performance data shown. Performance data reflects fee waivers or reimbursements of Fund expenses, if any; in their absence, performance results would have been lower. Indexes are unmanaged; their results do not reflect the effect of expenses or sales charges. Securities in the Fund may not match those in an index. Please visit investor.columbiathreadneedleus.com for performance data current to the most recent month-end.
The Growth of a $10,000 Investment in Columbia Acorn Emerging Markets FundSM Class Z Shares
August 19, 2011 (Fund inception) through June 30, 2016
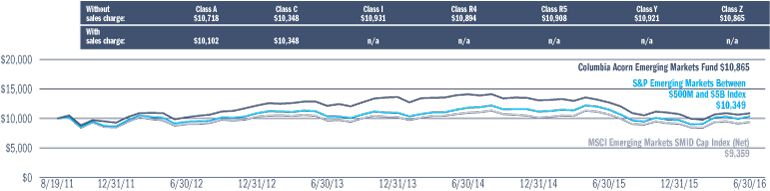
This chart shows the change in value of a hypothetical $10,000 investment in Class Z shares of the Fund during the stated time period.
Average Annual Total Returns for period ended June 30, 2016
| | | 2nd
quarter | | Year to
date | | 1 year | | Life of
Fund | |
| Class Z (8/19/11 inception) | | | 1.86 | % | | | 1.27 | % | | | -14.52 | % | | | 1.72 | % | |
| Class A (8/19/11 inception) | | | | | | | | | |
without sales charge | | | 1.77 | | | | 1.17 | | | | -14.75 | | | | 1.44 | | |
with sales charge | | | -4.07 | | | | -4.60 | | | | -19.63 | | | | 0.21 | | |
MSCI Emerging Markets
SMID Cap Index (Net)* | | | 0.15 | | | | 3.21 | | | | -12.19 | | | | -1.35 | | |
S&P Emerging Markets Between
$500M and $5B Index | | | 1.96 | | | | 6.78 | | | | -10.01 | | | | 0.71 | | |
Results for other share classes can be found on Page 2.
*The Fund's primary benchmark effective January 1, 2016. Prior to January 1, 2016, the S&P Emerging Markets Between $500M and $5B Index was the Fund's primary benchmark. Please see Page 1 for index descriptions.
Returns for Class A shown with and without the maximum initial sales charge of 5.75%. As stated in the May 1, 2016, prospectus, as supplemented June 27, 2016, the Fund's annual operating expense ratio is 1.55% for Class Z shares and 1.80% for Class A shares.
Portfolio Diversification
as a percentage of net assets, as of 6/30/16
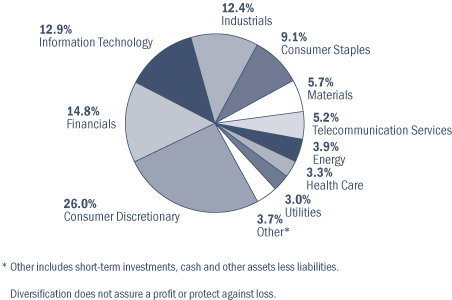
Top 10 Holdings
as a percentage of net assets, as of 6/30/16
1. | | Zee Entertainment Enterprises (India)
Indian Programmer of Pay Television Content | | | 4.0
| % | |
| 2. | | Media Nusantara Citra (Indonesia)
Media Company in Indonesia | | | 3.5
| % | |
3. | | Samui Airport Property Fund (Thailand)
Thai Airport Operator | | | 2.7
| % | |
4. | | ModeTour Network (Korea)
Travel Services | | | 2.7
| % | |
5. | | Grupo Aeroportuario del Sureste - ADR
(Mexico)
Mexican Airport Operator | | | 2.6
| % | |
6. | | Koh Young Technology (Korea)
Inspection Systems for Printed Circuit Boards | | | 2.6
| % | |
7. | | Link Net (Indonesia)
Fixed Broadband & CATV Service Provider | | | 2.6
| % | |
8. | | Commercial International Bank of
Egypt (Egypt)
Private Universal Bank in Egypt | | | 2.3
| % | |
9. | | Tikkurila (Finland)
Decorative & Industrial Paint in Scandinavia,
Central & Eastern Europe | | | 2.3
| % | |
10. | | NewOcean Energy (China)
Southern China Liquefied Petroleum
Gas Distributor | | | 2.3
| % | |
The Fund's top 10 holdings and portfolio diversification vary with changes in portfolio investments. See the Statement of Investments for a complete list of the Fund's holdings.
17
COLUMBIA ACORN EUROPEAN FUNDSM
IN A NUTSHELL

| | 
| |
Andreas Waldburg-Wolfegg
Co-Portfolio Manager | | Stephen
Kusmierczak
Co-Portfolio Manager | |
Market risk may affect a single issuer, sector of the economy, industry or the market as a whole. International investing involves certain risks and volatility due to potential political, economic or currency instabilities and different, potentially less stringent, financial and accounting standards than those generally applicable to U.S. issuers. Investments in small- and mid-cap companies involve risks and volatility and possible illiquidity greater than investments in larger, more established companies.
Columbia Acorn European Fund Class Z shares fell 4.80% in the second quarter of 2016, while the Fund's primary benchmark, the MSCI AC Europe Small Cap Index (Net), dropped 6.71%. The Fund also performed better than the benchmark year to date through June 30, falling 3.70% compared to the benchmark's decline of 7.52%. For both periods, the Fund's performance was helped by good relative results in the Mediterranean region, which includes France, Greece, Italy, Portugal and Spain. The Fund's outperformance in this region was largely tied to our underweight and stock selection in the financials sector, where we have focused on brokerage, asset management and real estate names and away from European banks. As we've noted previously, we are skeptical about the long-term health of European banks, particularly those in Italy, and our concern has been shared by the market in recent quarters.
The June 23, 2016, vote by the United Kingdom to exit the European Union was a significant event in the second quarter. The economic implications for the United Kingdom and the European Union are potentially vast and will take years to address. In the aftermath of the vote, we have already seen the British pound decline to its lowest level in decades, while the Bank of England predicts a decline in GDP and rise in unemployment tied to Brexit. CWAM's global chief investment officer's thoughts on Brexit are presented in a more extensive letter at the beginning of this quarterly report.
Columbia Acorn European Fund was underweight the United Kingdom versus the benchmark going into the vote and did benefit slightly from this positioning. This underweight was the result of our bottom up, fundamental analysis on UK companies and relative valuations, not a prediction on the Brexit vote. We did, however, take advantage of the volatility caused by the Brexit debate prior to the vote to add to positions like Rightmove, a UK Internet real estate listing site, and WH Smith, a newsprint, book and general stationary retailer. While both stocks ended the quarter among the Fund's worst detractors, we don't see a meaningful, long-term impairment of their businesses due to Brexit. The Fund's one UK sale in the quarter was natural sweetener manufacturer PureCircle, which fell 27% in the quarter on concerns unrelated to the referendum results.
Despite the volatile macroeconomic climate in the United Kingdom, Abcam, a UK company that sells antibodies online, ended the quarter up 21% and was the third largest contributor to Fund performance. Abcam actually benefits from a weaker pound, as only 4% of its revenues are generated in the United Kingdom but 20% of its costs are incurred there. During the second quarter, the company
also reported strong growth of 18% driven by business in China and its proprietary solution, Rabmab. News that a competitor had its license suspended also supported Abcam's stock. Another top-contributing name was Wirecard, an online payment processing and risk management company based in Germany, which gained 16% in the quarter. Allegations against Wirecard published earlier in the year caused a first-quarter downturn in the stock. Further investigation—both our own and by the broader market—contradicted the report and led to an uptick in the stock in the second quarter. We added to Wirecard on the decline and were pleased to see our conviction in the stock echoed by the broader market in the second quarter.
We believe that macroeconomic and political risks have increased in Europe, and we expect two important outcomes to follow. First, there will be a continuation of low interest rate policies. The Bank of England and the European Central Bank both held interest rates at current, record-low levels at their meetings following the quarter end. This lower-for-longer environment could help support high valuations in equity markets. Second, there appears to be at least a temporary decline in anti-EU sentiment. Following the Brexit vote and the resulting sharp, negative market reaction, continental European populist parties promoting an EU exit saw their support in polls decline. This shift was apparent in the results of the June 26 elections in Spain and in polling conducted in Germany, France and the Netherlands. Furthermore, outcomes of French and Italian elections in 2017 will provide indications of the direction Europe is likely to take without the United Kingdom. The path of the UK's exit from the EU will be tedious and complicated, and the long-term impacts difficult to assess. Our focus will continue to be on identifying companies that can outgrow their peers in most economic conditions and offer good value to long-term investors.
Fund holdings are as of the date given, are subject to change at any time, and are not recommendations to buy or sell any security.
18
COLUMBIA ACORN EUROPEAN FUNDSM
AT A GLANCE
Total Net Assets of the Fund:
$58.2 million
Performance data shown below represents past performance, does not guarantee future results, assumes reinvestment of dividends and distributions and does not reflect the deduction of taxes that a shareholder may pay on Fund distributions or the redemption of Fund shares. The investment return and principal value of an investment will fluctuate so that shares, when redeemed, may be worth more or less than their original cost. Current performance may be lower or higher than the performance data shown. Performance data reflects fee waivers or reimbursements of Fund expenses, if any; in their absence, performance results would have been lower. Indexes are unmanaged; their results do not reflect the effect of expenses or sales charges. Securities in the Fund may not match those in an index. Please visit investor.columbiathreadneedleus.com for performance data current to the most recent month-end.
The Growth of a $10,000 Investment in Columbia Acorn European FundSM Class Z Shares
August 19, 2011 (Fund inception) through June 30, 2016
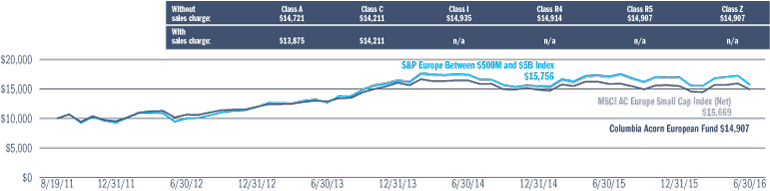
This chart shows the change in value of a hypothetical $10,000 investment in Class Z shares of the Fund during the stated time period.
Average Annual Total Returns for period ended June 30, 2016
| | | 2nd
quarter | | Year to
date | | 1 year | | Life of
Fund | |
| Class Z (8/19/11 inception) | | | -4.80 | % | | | -3.70 | % | | | -5.84 | % | | | 8.55 | % | |
| Class A (8/19/11 inception) | | | | | | | | | |
without sales charge | | | -4.87 | | | | -3.84 | | | | -6.08 | | | | 8.27 | | |
with sales charge | | | -10.34 | | | | -9.37 | | | | -11.49 | | | | 6.96 | | |
MSCI AC Europe Small Cap Index (Net)* | | | -6.71 | | | | -7.52 | | | | -7.58 | | | | 9.66 | | |
S&P Europe Between $500M and
$5B Index | | | -6.07 | | | | -7.22 | | | | -7.87 | | | | 9.79 | | |
Results for other share classes can be found on Page 2.
*The Fund's primary benchmark effective January 1, 2016. Prior to January 1, 2016, the S&P Europe Between $500M and $5B Index was the Fund's primary benchmark. Please see Page 1 for index descriptions.
Returns for Class A shown with and without the maximum initial sales charge of 5.75%. As stated in the May 1, 2016, prospectus, as supplemented June 27, 2016, the Fund's annual operating expense ratio is 1.51% for Class Z shares and 1.76% for Class A shares.
Portfolio Diversification
as a percentage of net assets, as of 6/30/16
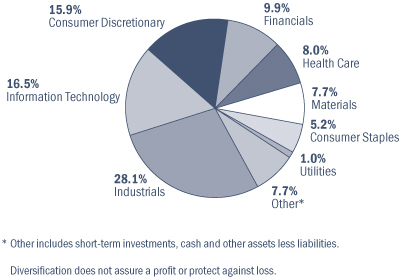
Top 10 Holdings
as a percentage of net assets, as of 6/30/16
1. | | Munksjo (Finland)†
Specialty Paper Maker | | | 3.6
| % | |
2. | | Wirecard (Germany)
Online Payment Processing & Risk Management | | | 3.0
| % | |
3. | | Halma (United Kingdom)
Health & Safety Sensor Technology | | | 3.0
| % | |
| 4. | | SimCorp (Denmark)
Software for Investment Managers | | | 2.6
| % | |
| 5. | | Aurelius (Germany)
European Turnaround Investor | | | 2.5
| % | |
| 6. | | Trelleborg (Sweden)
Manufacturer of Sealing, Dampening &
Protective Solutions for Industry | | | 2.5
| % | |
| 7. | | Recipharm (Sweden)
Contract Development Manufacturing Organization | | | 2.5
| % | |
| 8. | | Prosegur (Spain)
Security Guards | | | 2.4
| % | |
| 9. | | Unibet (Sweden)
European Online Gaming Operator | | | 2.3
| % | |
| 10. | | Partners Group (Switzerland)
Private Markets Asset Management | | | 2.3
| % | |
| | †The Fund holds shares traded on both the Swedish and Finnish exchanges. | | |
The Fund's top 10 holdings and portfolio diversification vary with changes in portfolio investments. See the Statement of Investments for a complete list of the Fund's holdings.
19
UNDERSTANDING YOUR EXPENSES
As a shareholder, you incur two types of costs. There are transaction costs, which generally include sales charges on purchases and may include redemption fees. There are also ongoing costs, which generally include management fees, distribution and service (Rule 12b-1) fees, and other Fund expenses. The following information is intended to help you understand your ongoing costs (in dollars) of investing in the Fund and to help you compare these costs with the ongoing costs of investing in other mutual funds.
Analyzing Your Fund's Expenses
To illustrate these ongoing costs, we have provided examples and calculated the expenses paid by investors in Class A, B, C, I, R, R4, R5, Y and Z shares of the Funds during the period. The actual and hypothetical information in the tables is based on an initial investment of $1,000 at the beginning of the period indicated and held for the entire period. Expense information is calculated two ways and each method provides you with different information. The amount listed in the "Actual" column is calculated using the Funds' actual operating expenses and total return for the period. You may use the Actual information, together with the amount invested, to estimate the expenses that you paid over the period. Simply divide your account value by $1,000 (for example, an $8,600 account value divided by $1,000 = 8.6), then multiply the results by the expenses paid during the period under the Actual column. The amount listed in the "Hypothetical" column assumes a 5% annual rate of return before expenses (which is not the Funds' actual return) and then applies the Funds' actual expense ratio for the period to the hypothetical return. You should not use the hypothetical account values and expenses to estimate either your actual account balance at the end of the period or the expenses you paid during the period. See "Compare With Other Funds" below for details on how to use the hypothetical data.
In addition to the ongoing expenses which the Funds bear directly, Columbia Thermostat Fund's shareholders indirectly bear the Fund's allocable share of the costs and expenses of each underlying fund in which the Fund invests. You can also estimate the effective expenses paid during the period, which includes the indirect fees associated with investing in the underlying funds, by using the amounts listed in the effective expenses paid during the period column in the "Fund of Funds" table.
Compare With Other Funds
Since all mutual funds are required to include the same hypothetical calculations about expenses in shareholder reports, you can use this information to compare the ongoing cost of investing in the Funds with other funds. To do so, compare the hypothetical example with the 5% hypothetical examples that appear in the shareholder reports of other funds. As you compare hypothetical examples of other funds, it is important to note that hypothetical examples are meant to highlight the ongoing costs of investing in a fund only and do not reflect any transaction costs, such as sales charges, or redemption or exchange fees. Therefore, the hypothetical calculations are useful in comparing ongoing costs only, and will not help you determine the relative total costs of owning different funds. If transaction costs were included in these calculations, your costs would be higher.
January 1, 2016 – June 30, 2016
| | Account value at
the beginning of
the period ($) | | Account value at
the end of
the period ($) | | Expenses paid
during the period ($) | | Fund's
annualized
expense
ratio (%) | |
| | Actual | | Hypothetical | | Actual | | Hypothetical | | Actual | | Hypothetical | | Actual | |
Columbia Acorn® Fund | |
Class A | | | 1,000.00 | | | | 1,000.00 | | | | 996.30 | | | | 1,019.14 | | | | 5.71 | | | | 5.77 | | | | 1.15 | | |
Class C | | | 1,000.00 | | | | 1,000.00 | | | | 992.60 | | | | 1,015.56 | | | | 9.26 | | | | 9.37 | | | | 1.87 | | |
Class I | | | 1,000.00 | | | | 1,000.00 | | | | 998.20 | | | | 1,020.98 | | | | 3.88 | | | | 3.92 | | | | 0.78 | | |
Class R4 | | | 1,000.00 | | | | 1,000.00 | | | | 997.70 | | | | 1,020.04 | | | | 4.82 | | | | 4.87 | | | | 0.97 | | |
Class R5 | | | 1,000.00 | | | | 1,000.00 | | | | 998.20 | | | | 1,020.74 | | | | 4.12 | | | | 4.17 | | | | 0.83 | | |
Class Y | | | 1,000.00 | | | | 1,000.00 | | | | 998.20 | | | | 1,020.98 | | | | 3.88 | | | | 3.92 | | | | 0.78 | | |
Class Z | | | 1,000.00 | | | | 1,000.00 | | | | 998.20 | | | | 1,020.69 | | | | 4.17 | | | | 4.22 | | | | 0.84 | | |
20
UNDERSTANDING YOUR EXPENSES, continued
| | Account value at
the beginning of
the period ($) | | Account value at
the end of
the period ($) | | Expenses paid
during the period ($) | | Fund's
annualized
expense
ratio (%) | |
| | Actual | | Hypothetical | | Actual | | Hypothetical | | Actual | | Hypothetical | | Actual | |
Columbia Acorn International® | |
Class A | | | 1,000.00 | | | | 1,000.00 | | | | 985.80 | | | | 1,018.45 | | | | 6.37 | | | | 6.47 | | | | 1.29 | | |
Class B | | | 1,000.00 | | | | 1,000.00 | | | | 982.20 | | | | 1,014.32 | | | | 10.45 | | | | 10.62 | | | | 2.12 | | |
Class C | | | 1,000.00 | | | | 1,000.00 | | | | 982.10 | | | | 1,014.77 | | | | 10.00 | | | | 10.17 | | | | 2.03 | | |
Class I | | | 1,000.00 | | | | 1,000.00 | | | | 987.60 | | | | 1,020.39 | | | | 4.45 | | | | 4.52 | | | | 0.90 | | |
Class R | | | 1,000.00 | | | | 1,000.00 | | | | 984.00 | | | | 1,016.66 | | | | 8.14 | | | | 8.27 | | | | 1.65 | | |
Class R4 | | | 1,000.00 | | | | 1,000.00 | | | | 986.70 | | | | 1,019.39 | | | | 5.43 | | | | 5.52 | | | | 1.10 | | |
Class R5 | | | 1,000.00 | | | | 1,000.00 | | | | 987.40 | | | | 1,020.14 | | | | 4.69 | | | | 4.77 | | | | 0.95 | | |
Class Y | | | 1,000.00 | | | | 1,000.00 | | | | 987.70 | | | | 1,020.39 | | | | 4.45 | | | | 4.52 | | | | 0.90 | | |
Class Z | | | 1,000.00 | | | | 1,000.00 | | | | 987.10 | | | | 1,019.89 | | | | 4.94 | | | | 5.02 | | | | 1.00 | | |
Columbia Acorn USA® | |
Class A | | | 1,000.00 | | | | 1,000.00 | | | | 1,008.20 | | | | 1,017.70 | | | | 7.19 | | | | 7.22 | | | | 1.44 | | |
Class C | | | 1,000.00 | | | | 1,000.00 | | | | 1,004.60 | | | | 1,014.22 | | | | 10.67 | | | | 10.72 | | | | 2.14 | | |
Class I | | | 1,000.00 | | | | 1,000.00 | | | | 1,010.10 | | | | 1,019.99 | | | | 4.90 | | | | 4.92 | | | | 0.98 | | |
Class R4 | | | 1,000.00 | | | | 1,000.00 | | | | 1,009.00 | | | | 1,018.80 | | | | 6.09 | | | | 6.12 | | | | 1.22 | | |
Class R5 | | | 1,000.00 | | | | 1,000.00 | | | | 1,009.40 | | | | 1,019.49 | | | | 5.40 | | | | 5.42 | | | | 1.08 | | |
Class Y | | | 1,000.00 | | | | 1,000.00 | | | | 1,010.30 | | | | 1,019.69 | | | | 5.20 | | | | 5.22 | | | | 1.04 | | |
Class Z | | | 1,000.00 | | | | 1,000.00 | | | | 1,009.20 | | | | 1,018.95 | | | | 5.94 | | | | 5.97 | | | | 1.19 | | |
Columbia Acorn International SelectSM | |
Class A | | | 1,000.00 | | | | 1,000.00 | | | | 981.20 | | | | 1,016.61 | | | | 8.18 | | | | 8.32 | | | | 1.66 | | |
Class C | | | 1,000.00 | | | | 1,000.00 | | | | 977.50 | | | | 1,012.68 | | | | 12.05 | | | | 12.26 | | | | 2.45 | | |
Class I | | | 1,000.00 | | | | 1,000.00 | | | | 983.80 | | | | 1,018.95 | | | | 5.87 | | | | 5.97 | | | | 1.19 | | |
Class R4 | | | 1,000.00 | | | | 1,000.00 | | | | 982.50 | | | | 1,017.90 | | | | 6.90 | | | | 7.02 | | | | 1.40 | | |
Class R5 | | | 1,000.00 | | | | 1,000.00 | | | | 983.00 | | | | 1,018.45 | | | | 6.36 | | | | 6.47 | | | | 1.29 | | |
Class Y | | | 1,000.00 | | | | 1,000.00 | | | | 983.00 | | | | 1,018.70 | | | | 6.11 | | | | 6.22 | | | | 1.24 | | |
Class Z | | | 1,000.00 | | | | 1,000.00 | | | | 982.90 | | | | 1,018.10 | | | | 6.71 | | | | 6.82 | | | | 1.36 | | |
Columbia Acorn SelectSM | |
Class A | | | 1,000.00 | | | | 1,000.00 | | | | 986.80 | | | | 1,018.85 | | | | 5.98 | | | | 6.07 | | | | 1.21 | | |
Class C | | | 1,000.00 | | | | 1,000.00 | | | | 982.30 | | | | 1,015.22 | | | | 9.56 | | | | 9.72 | | | | 1.94 | | |
Class I | | | 1,000.00 | | | | 1,000.00 | | | | 988.70 | | | | 1,020.79 | | | | 4.05 | | | | 4.12 | | | | 0.82 | | |
Class R4 | | | 1,000.00 | | | | 1,000.00 | | | | 988.30 | | | | 1,019.99 | | | | 4.84 | | | | 4.92 | | | | 0.98 | | |
Class R5 | | | 1,000.00 | | | | 1,000.00 | | | | 988.30 | | | | 1,020.54 | | | | 4.30 | | | | 4.37 | | | | 0.87 | | |
Class Y | | | 1,000.00 | | | | 1,000.00 | | | | 988.30 | | | | 1,020.79 | | | | 4.05 | | | | 4.12 | | | | 0.82 | | |
Class Z | | | 1,000.00 | | | | 1,000.00 | | | | 987.90 | | | | 1,020.29 | | | | 4.55 | | | | 4.62 | | | | 0.92 | | |
21
UNDERSTANDING YOUR EXPENSES, continued
| | Account value at
the beginning of
the period ($) | | Account value at
the end of
the period ($) | | Expenses paid
during the period ($) | | Fund's
annualized
expense
ratio (%) | |
| | Actual | | Hypothetical | | Actual | | Hypothetical | | Actual | | Hypothetical | | Actual | |
Columbia Acorn Emerging Markets FundSM | |
Class A | | | 1,000.00 | | | | 1,000.00 | | | | 1,011.70 | | | | 1,015.76 | | | | 9.15 | | | | 9.17 | | | | 1.83 | | |
Class C | | | 1,000.00 | | | | 1,000.00 | | | | 1,007.80 | | | | 1,011.93 | | | | 12.98 | | | | 13.01 | | | | 2.60 | | |
Class I | | | 1,000.00 | | | | 1,000.00 | | | | 1,014.60 | | | | 1,017.70 | | | | 7.21 | | | | 7.22 | | | | 1.44 | | |
Class R4 | | | 1,000.00 | | | | 1,000.00 | | | | 1,013.60 | | | | 1,017.11 | | | | 7.81 | | | | 7.82 | | | | 1.56 | | |
Class R5 | | | 1,000.00 | | | | 1,000.00 | | | | 1,013.60 | | | | 1,017.60 | | | | 7.31 | | | | 7.32 | | | | 1.46 | | |
Class Y | | | 1,000.00 | | | | 1,000.00 | | | | 1,013.70 | | | | 1,017.90 | | | | 7.01 | | | | 7.02 | | | | 1.40 | | |
Class Z | | | 1,000.00 | | | | 1,000.00 | | | | 1,012.70 | | | | 1,017.01 | | | | 7.91 | | | | 7.92 | | | | 1.58 | | |
Columbia Acorn European FundSM | |
Class A | | | 1,000.00 | | | | 1,000.00 | | | | 961.60 | | | | 1,016.16 | | | | 8.54 | | | | 8.77 | | | | 1.75 | | |
Class C | | | 1,000.00 | | | | 1,000.00 | | | | 958.60 | | | | 1,012.43 | | | | 12.17 | | | | 12.51 | | | | 2.50 | | |
Class I | | | 1,000.00 | | | | 1,000.00 | | | | 963.00 | | | | 1,017.85 | | | | 6.88 | | | | 7.07 | | | | 1.41 | | |
Class R4 | | | 1,000.00 | | | | 1,000.00 | | | | 962.50 | | | | 1,017.40 | | | | 7.32 | | | | 7.52 | | | | 1.50 | | |
Class R5 | | | 1,000.00 | | | | 1,000.00 | | | | 962.70 | | | | 1,017.60 | | | | 7.12 | | | | 7.32 | | | | 1.46 | | |
Class Z | | | 1,000.00 | | | | 1,000.00 | | | | 963.00 | | | | 1,017.40 | | | | 7.32 | | | | 7.52 | | | | 1.50 | | |
Fund of Funds—Columbia Thermostat Fund
January 1, 2016 – June 30, 2016
| | Account value at
the beginning of
the period ($) | | Account value at
the end of
the period ($) | | Expenses paid
during the period ($) | | Fund's
annualized
expense
ratio (%) | | Effective
expenses
paid during
the period ($) | | Fund's
effective
annualized
expense
ratio (%) | |
| | Actual | | Hypothetical | | Actual | | Hypothetical | | Actual | | Hypothetical | | Actual | | Actual | | Hypothetical | | Actual | |
Columbia Thermsotat FundSM | |
Class A | | | 1,000.00 | | | | 1,000.00 | | | | 1,035.70 | | | | 1,022.38 | | | | 2.53 | | | | 2.51 | | | | 0.50 | | | | 5.21 | | | | 5.18 | | | | 1.03 | | |
Class C | | | 1,000.00 | | | | 1,000.00 | | | | 1,032.00 | | | | 1,018.65 | | | | 6.32 | | | | 6.27 | | | | 1.25 | | | | 8.99 | | | | 8.93 | | | | 1.78 | | |
Class R4 | | | 1,000.00 | | | | 1,000.00 | | | | 1,036.70 | | | | 1,023.62 | | | | 1.27 | | | | 1.26 | | | | 0.25 | | | | 3.95 | | | | 3.92 | | | | 0.78 | | |
Class R5 | | | 1,000.00 | | | | 1,000.00 | | | | 1,037.40 | | | | 1,023.67 | | | | 1.22 | | | | 1.21 | | | | 0.24 | | | | 3.90 | | | | 3.87 | | | | 0.77 | | |
Class Y | | | 1,000.00 | | | | 1,000.00 | | | | 1,037.40 | | | | 1,023.92 | | | | 0.96 | | | | 0.96 | | | | 0.19 | | | | 3.65 | | | | 3.62 | | | | 0.72 | | |
Class Z | | | 1,000.00 | | | | 1,000.00 | | | | 1,036.90 | | | | 1,023.62 | | | | 1.27 | | | | 1.26 | | | | 0.25 | | | | 3.95 | | | | 3.92 | | | | 0.78 | | |
Expenses paid during the period are equal to the annualized expense ratio, multiplied by the average account value over the period and then multiplied by the number of days in the Fund's most recent fiscal half year and divided by 366.
Except with respect to Columbia Thermostat Fund, expenses do not include any fees and expenses incurred indirectly by a Fund from the underlying funds in which the Fund may invest (also referred to as "acquired funds"), including affiliated and non-affiliated pooled investments vehicles (including mutual funds and exchange traded funds).
In the case of Columbia Thermostat Fund, effective expenses paid during the period and the Fund's effective annualized expense ratio include expenses borne directly by the class plus the Fund's pro rata portion of the ongoing expenses charged by the underlying funds in which it invests using the expense ratio of each class of each underlying fund as of the underlying fund's most recent shareholder report.
Had the investment manager and/or certain of its affiliates not waived/reimbursed certain fees and expenses for Columbia Acorn International, Columbia Acorn International Select, Columbia Acorn Select, Columbia Thermostat Fund, Columbia Acorn Emerging Markets Fund and Columbia Acorn European Fund, account value at the end of the period would have been reduced.
22
COLUMBIA ACORN® FUND
STATEMENT OF INVESTMENTS (UNAUDITED), JUNE 30, 2016
Number of Shares | | | | Value | |
| | | | | | | Equities: 96.9% | |
Health Care 20.6% | | | |
| | | > Health Care Equipment & Supplies 7.0% | |
| | 1,846,644 | | | Align Technology (a) | | $ | 148,747,174 | | |
| | | | | Invisalign System to Correct
Malocclusion (Crooked Teeth) | | | | | |
| | 904,999 | | | ResMed | | | 57,223,087 | | |
| | | | | Medical Devices for Sleep
Apnea Treatment | | | | | |
| | 904,861 | | | LivaNova (a) | | | 45,451,168 | | |
| | | | | Neuromodulation & Cardiac Devices | | | | | |
| | 577,894 | | | West Pharmaceutical Services | | | 43,850,597 | | |
| | | | | Components & Systems for Injectable
Drug Delivery | | | | | |
| | 669,310 | | | Dentsply Sirona | | | 41,523,992 | | |
| | | | | Dental Supplies Manufacturer | | | | | |
| | 320,439 | | | IDEXX Laboratories | | | 29,755,966 | | |
| | | | | Diagnostic Equipment & Services
for Veterinarians | | | | | |
| | 262,601 | | | Abiomed (a) | | | 28,699,663 | | |
| | | | | Medical Devices for Cardiac
Conditions | | | | | |
| | | | 395,251,647 | | |
| | | > Life Sciences Tools & Services 5.9% | |
| | 2,811,815 | | | VWR (a) | | | 81,261,454 | | |
| | | | | Distributor of Lab Supplies | | | | | |
| | 875,406 | | | Quintiles Transnational
Holdings (a) | | | 57,181,520 | | |
| | | | | Contract Research Organization | | | | | |
| | 144,146 | | | Mettler-Toledo International (a) | | | 52,601,758 | | |
| | | | | Laboratory Equipment | | | | | |
| | 465,675 | | | Bio-Techne | | | 52,514,170 | | |
| | | | | Maker of Consumables & Systems for
the Life Science Market | | | | | |
| | 962,291 | | | PRA Health Sciences (a) | | | 40,185,272 | | |
| | | | | Contract Research Organization | | | | | |
| | 766,642 | | | Agilent Technologies | | | 34,008,239 | | |
| | | | | Provider of Systems, Consumables,
Services for Life Science Labs | | | | | |
| | 1,527,403 | | | Fluidigm (a)(b) | | | 13,792,449 | | |
| | | | | Life Sciences Equipment & Consumables | | | | | |
| | | | 331,544,862 | | |
| | | > Biotechnology 3.2% | |
| | 964,479 | | | Seattle Genetics (a) | | | 38,974,596 | | |
| | | | | Antibody-based Therapies for Cancer | | | | | |
| | 592,772 | | | Ultragenyx Pharmaceutical (a) | | | 28,992,478 | | |
| | | | | Biotech Focused on "Ultra-Orphan"
Drugs | | | | | |
| | 934,605 | | | Cepheid (a) | | | 28,739,104 | | |
| | | | | Molecular Diagnostics | | | | | |
| | 172,764 | | | Intercept Pharmaceuticals (c) | | | 24,649,967 | | |
| | | | | Biotech Developing Drugs for Several
Diseases | | | | | |
| | 367,944 | | | Medivation (a) | | | 22,187,023 | | |
| | | | | Develops & Markets Cancer Drugs | | | | | |
| | 4,579,804 | | | Celldex Therapeutics (a)(c) | | | 20,105,340 | | |
| | | | | Biotech Developing Drugs for Cancer | | | | | |
Number of Shares | | | | Value | |
| | 243,392 | | | Agios Pharmaceuticals (a)(c) | | $ | 10,196,908 | | |
| | | | | Biotech Focused on Cancer & Orphan
Diseases | | | | | |
| | 414,222 | | | Sarepta Therapeutics (a)(c) | | | 7,899,214 | | |
| | | | | Biotech Focused on Rare Diseases | | | | | |
| | | | 181,744,630 | | |
| | | > Health Care Providers & Services 3.0% | |
| | 1,941,263 | | | HealthSouth | | | 75,359,830 | | |
| | | | | Inpatient Rehabilitation Facilities &
Home Health Care | | | | | |
| | 765,393 | | | Centene (a) | | | 54,626,098 | | |
| | | | | Managed Care Organization | | | | | |
| | 570,983 | | | Mednax (a) | | | 41,356,299 | | |
| | | | | Physician Management for Pediatric &
Anesthesia Practices | | | | | |
| | | | 171,342,227 | | |
| | | > Health Care Technology 0.8% | |
| | 1,012,699 | | | Medidata Solutions (a) | | | 47,465,202 | | |
| | | | | Cloud-based Software for Drug Studies | | | | | |
| | | | 47,465,202 | | |
| | | > Pharmaceuticals 0.7% | |
| | 1,312,030 | | | Akorn (a) | | | 37,373,175 | | |
| | | | | Developer, Manufacturer & Distributor
of Specialty Generic Drugs | | | | | |
| | | | 37,373,175 | | |
Health Care: Total | | | 1,164,721,743 | | |
Information Technology 17.8% | | | |
| | | > IT Services 6.4% | |
| | 1,978,136 | | | Booz Allen Hamilton | | | 58,631,951 | | |
| | | | | IT Consulting for US Government | | | | | |
| | 901,828 | | | Vantiv (a) | | | 51,043,465 | | |
| | | | | Credit Card Processor | | | | | |
| | 639,224 | | | Broadridge Financial Solutions | | | 41,677,405 | | |
| | | | | Proxy, Mutual Fund Interim Processing,
Distribution & Trade Processing | | | | | |
| | 1,005,396 | | | CoreLogic (a) | | | 38,687,638 | | |
| | | | | Data Processing Services for Real
Estate, Insurance & Mortgages | | | | | |
| | 1,389,103 | | | WNS - ADR (a) | | | 37,505,781 | | |
| | | | | Offshore Business Process Outsourcing
Services | | | | | |
| | 524,152 | | | Global Payments | | | 37,413,970 | | |
| | | | | Credit Card Processor | | | | | |
| | 377,164 | | | Gartner (a) | | | 36,739,545 | | |
| | | | | IT Research & Consulting Services | | | | | |
| | 1,199,405 | | | Genpact (a) | | | 32,192,030 | | |
| | | | | Business Process Outsourcing | | | | | |
| | 532,406 | | | ExlService Holdings (a) | | | 27,903,398 | | |
| | | | | Business Process Outsourcing | | | | | |
| | | | 361,795,183 | | |
| | | > Software 4.3% | |
| | 271,301 | | | Ultimate Software (a) | | | 57,051,887 | | |
| | | | | Human Capital Management Systems | | | | | |
| | 623,996 | | | Ansys (a) | | | 56,627,637 | | |
| | | | | Simulation Software for Engineers &
Designers | | | | | |
| | 754,347 | | | Manhattan Associates (a) | | | 48,376,273 | | |
| | | | | Supply Chain Management Software &
Services | | | | | |
See accompanying notes to financial statements.
23
COLUMBIA ACORN® FUND
STATEMENT OF INVESTMENTS (UNAUDITED), CONTINUED
Number of Shares | | | | Value | |
| | | > Software—continued | |
| | 528,044 | | | Synopsis (a) | | $ | 28,556,620 | | |
| | | | | Software for Designing Semicondutor
Chips | | | | | |
| | 388,562 | | | NetSuite (a) | | | 28,287,314 | | |
| | | | | Enterprise Software Delivered via
the Web | | | | | |
| | 1,115,281 | | | Cadence Design Systems (a) | | | 27,101,328 | | |
| | | | | Electronic Design Automation Software | | | | | |
| | | | 246,001,059 | | |
| | | > Internet Software & Services 3.5% | |
| | 3,954,882 | | | Quotient Technology (a)(c) | | | 53,034,968 | | |
| | | | | Allows CPGs to Digitally Distribute
Coupons, Advertising & Trade
Promotion | | | | | |
| | 542,830 | | | Verisign (a) | | | 46,933,082 | | |
| | | | | Internet Domain Registry
for .COM/.NET | | | | | |
| | 697,996 | | | SPS Commerce (a) | | | 42,298,557 | | |
| | | | | Supply Chain Management Software
Delivered via the Web | | | | | |
| | 1,031,642 | | | GoDaddy (a) | | | 32,176,914 | | |
| | | | | Website Management for Small- &
Medium-size Companies | | | | | |
| | 1,181,254 | | | NIC | | | 25,916,713 | | |
| | | | | Government Web Portal Development &
Management Outsourcing | | | | | |
| | | | 200,360,234 | | |
| | | > Electronic Equipment, Instruments & Components 2.2% | |
| | 1,364,926 | | | CDW | | | 54,706,234 | | |
| | | | | Value Added Reseller of IT Products &
Services | | | | | |
| | 1,338,402 | | | FLIR Systems | | | 41,423,542 | | |
| | | | | Infrared Cameras | | | | | |
| | 331,699 | | | IPG Photonics (a) | | | 26,535,920 | | |
| | | | | Fiber Lasers | | | | | |
| | | | 122,665,696 | | |
| | | > Communications Equipment 0.7% | |
| | 348,367 | | | F5 Networks (a) | | | 39,658,099 | | |
| | | | | Internet Traffic Management
Equipment | | | | | |
| | | | 39,658,099 | | |
| | | > Semiconductors & Semiconductor
Equipment 0.7% | |
| | 672,741 | | | MACOM Technology
Solutions (a) | | | 22,186,998 | | |
| | | | | Radio Frequency, Microwave, &
Millimeterwave Semiconductors | | | | | |
| | 252,220 | | | Monolithic Power Systems | | | 17,231,671 | | |
| | | | | High Performance Analog & Mixed
Signal Integrated Circuits | | | | | |
| | | | 39,418,669 | | |
Information Technology: Total | | | 1,009,898,940 | | |
Consumer Discretionary 17.4% | | | |
| | | > Hotels, Restaurants & Leisure 5.4% | |
| | 630,995 | | | Vail Resorts | | | 87,222,439 | | |
| | | | | Ski Resort Operator & Developer | | | | | |
Number of Shares | | | | Value | |
| | 410,500 | | | Domino's Pizza | | $ | 53,931,490 | | |
| | | | | Franchisor of Pizza Restaurants | | | | | |
| | 777,610 | | | Papa John's International | | | 52,877,480 | | |
| | | | | Franchisor of Pizza Restaurants | | | | | |
| | 752,647 | | | Dunkin Brands | | | 32,830,462 | | |
| | | | | Franchisor of Quick Service Restaurants | | | | | |
| | 649,669 | | | Choice Hotels | | | 30,937,238 | | |
| | | | | Franchisor of Budget Hotel Brands | | | | | |
| | 1,229,183 | | | Fiesta Restaurant Group (a) | | | 26,808,481 | | |
| | | | | Owner/Operator of Two Restaurant
Chains: Pollo Tropical & Taco Cabana | | | | | |
| | 452,300 | | | Popeyes Louisiana Kitchen (a) | | | 24,713,672 | | |
| | | | | Popeyes Restaurants | | | | | |
| | | | 309,321,262 | | |
| | | > Specialty Retail 3.4% | |
| | 248,781 | | | Ulta Salon Cosmetics &
Fragrance (a) | | | 60,613,003 | | |
| | | | | Specialty Beauty Product Retailer | | | | | |
| | 1,073,613 | | | Williams-Sonoma | | | 55,967,446 | | |
| | | | | Home Goods & Furnishing Retailer | | | | | |
| | 722,513 | | | Cato | | | 27,253,190 | | |
| | | | | Women's Apparel Retailing, Focusing
on Private Labels & Low Prices | | | | | |
| | 524,322 | | | Five Below (a) | | | 24,333,784 | | |
| | | | | Low-price Specialty Retailer Targeting
Pre-Teens, Teens & Parents | | | | | |
| | 374,896 | | | Monro Muffler Brake | | | 23,828,390 | | |
| | | | | Automotive Services | | | | | |
| | | | 191,995,813 | | |
| | | > Auto Components 2.4% | |
| | 737,970 | | | Drew Industries | | | 62,609,375 | | |
| | | | | RV & Manufactured Home Components | | | | | |
| | 1,089,458 | | | Tenneco (a) | | | 50,779,637 | | |
| | | | | Auto Parts for Emission Control,
Suspension | | | | | |
| | 1,676,082 | | | Gentex | | | 25,895,467 | | |
| | | | | Manufacturer of Auto Parts | | | | | |
| | | | 139,284,479 | | |
| | | > Household Durables 1.7% | |
| | 25,300 | | | NVR (a) | | | 45,042,602 | | |
| | | | | Homebuilder | | | | | |
| | 848,219 | | | iRobot | | | 29,755,523 | | |
| | | | | Home Robots (Vacuums, Pool Cleaners) &
Battlefield Reconnaissance Robots | | | | | |
| | 243,386 | | | Cavco Industries (a) | | | 22,805,268 | | |
| | | | | Manufactured Homes | | | | | |
| | | | 97,603,393 | | |
| | | > Textiles, Apparel & Luxury Goods 1.1% | |
| | 1,593,753 | | | Hanesbrands | | | 40,051,013 | | |
| | | | | Apparel Wholesaler | | | | | |
| | 266,485 | | | Under Armour (a)(c) | | | 10,694,043 | | |
| | | | | Athletic Apparel, Footwear & Accessories | | | | | |
| | 275,269 | | | Under Armour (a) | | | 10,019,816 | | |
| | | | | Athletic Apparel, Footwear & Accessories | | | | | |
| | | | 60,764,872 | | |
| | | > Media 1.1% | |
| | 1,274,157 | | | Starz (a) | | | 38,122,777 | | |
| | | | | Premium CATV Channel Network | | | | | |
See accompanying notes to financial statements.
24
Number of Shares | | | | Value | |
| | | > Media—continued | |
| | 3,368,565 | | | Global Eagle Entertainment (a) | | $ | 22,367,272 | | |
| | | | | Provider of Entertainment & Wi-Fi
on Airplanes | | | | | |
| | | | 60,490,049 | | |
| | | > Distributors 1.0% | |
| | 1,724,635 | | | LKQ | | | 54,670,929 | | |
| | | | | Alternative Auto Parts Distribution | | | | | |
| | | > Leisure Products 0.8% | |
| | 539,539 | | | Polaris Industries (c) | | | 44,112,709 | | |
| | | | | Leisure Vehicles & Related Products | | | | | |
| | | > Internet & Catalog Retail 0.5% | |
| | 1,368,040 | | | Liberty TripAdvisor Holdings
Class A (a) | | | 29,932,715 | | |
| | | | | Holding Company for Trip
Advisor | | | | | |
Consumer Discretionary: Total | | | 988,176,221 | | |
Industrials 16.9% | | | |
| | | > Machinery 4.6% | |
| | 769,858 | | | Toro | | | 67,901,476 | | |
| | | | | Turf Maintenance Equipment | | | | | |
| | 865,919 | | | Oshkosh Corporation | | | 41,312,995 | | |
| | | | | Specialty Truck Manufacturer | | | | | |
| | 356,535 | | | Middleby (a) | | | 41,090,659 | | |
| | | | | Manufacturer of Cooking Equipment | | | | | |
| | 451,777 | | | Graco | | | 35,685,865 | | |
| | | | | Manufacturer of Dispensing Equipment | | | | | |
| | 346,516 | | | Nordson | | | 28,972,203 | | |
| | | | | Dispensing Systems for Adhesives &
Coatings | | | | | |
| | 276,269 | | | WABCO Holdings (a) | | | 25,297,952 | | |
| | | | | Truck & Bus Component Supplier | | | |
| | 653,661 | | | Donaldson | | | 22,459,792 | | |
| | | | | Industrial Air Filtration | | | |
| | | | 262,720,942 | | |
| | | > Professional Services 3.2% | |
| | 2,027,745 | | | Robert Half International | | | 77,378,749 | | |
| | | | | Temporary & Permanent Staffing in
Finance, Accounting & Other
Professions | | | | | |
| | 728,197 | | | WageWorks (a) | | | 43,553,463 | | |
| | | | | Healthcare Consumer Directed
Benefits & Commuter Account
Management | | | | | |
| | 2,004,399 | | | Navigant Consulting (a) | | | 32,371,044 | | |
| | | | | Financial Consulting Firm | | | | | |
| | 446,289 | | | Manpower | | | 28,714,234 | | |
| | | | | Global Temporary Staffing Provider | | | | | |
| | | | 182,017,490 | | |
| | | > Electrical Equipment 2.6% | |
| | 284,197 | | | Acuity Brands | | | 70,469,488 | | |
| | | | | Commercial Lighting Fixtures | | | | | |
| | 911,455 | | | Ametek | | | 42,136,565 | | |
| | | | | Aerospace/Industrial Instruments | | | | | |
| | 996,643 | | | Generac (a) | | | 34,842,639 | | |
| | | | | Standby Power Generators | | | |
| | | | 147,448,692 | | |
Number of Shares | | | | Value | |
| | | > Road & Rail 2.0% | |
| | 146,681 | | | Amerco | | $ | 54,939,368 | | |
| | | | | North American Moving & Storage | | | | | |
| | 537,854 | | | Old Dominion Freight Lines (a) | | | 32,437,975 | | |
| | | | | LTL Trucker | | | | | |
| | 306,756 | | | JB Hunt Transport Services | | | 24,825,763 | | |
| | | | | Truck & Intermodal Carrier | | | | | |
| | | | 112,203,106 | | |
| | | > Air Freight & Logistics 1.6% | |
| | 1,836,990 | | | Expeditors International of
Washington | | | 90,085,990 | | |
| | | | | International Freight Forwarder | | | | | |
| | | | 90,085,990 | | |
| | | > Aerospace & Defense 0.9% | |
| | 918,200 | | | HEICO | | | 49,261,430 | | |
| | | | | FAA-Approved Aircraft Replacement
Parts | | | | | |
| | | | 49,261,430 | | |
| | | > Industrial Conglomerates 0.7% | |
| | 389,188 | | | Carlisle Cos | | | 41,129,388 | | |
| | | | | Industrial Conglomerate | | | | | |
| | | | 41,129,388 | | |
| | | > Trading Companies & Distributors 0.5% | |
| | 208,182 | | | Watsco | | | 29,289,126 | | |
| | | | | HVAC Distribution | | | | | |
| | | | 29,289,126 | | |
| | | > Commercial Services & Supplies 0.5% | |
| | 993,674 | | | Rollins | | | 29,084,838 | | |
| | | | | Pest Control & Wildlife Removal
Services | | | | | |
| | | | 29,084,838 | | |
| | | > Building Products 0.3% | |
| | 1,361,087 | | | PGT (a) | | | 14,019,196 | | |
| | | | | Wind Resistant Windows & Doors | | | | | |
| | | | 14,019,196 | | |
Industrials: Total | | | 957,260,198 | | |
Financials 16.5% | | | |
| | | > Capital Markets 5.1% | |
| | 2,311,020 | | | Lazard | | | 68,822,176 | | |
| | | | | Corporate Advisory & Asset
Management | | | | | |
| | 414,346 | | | Affiliated Managers Group (a) | | | 58,327,486 | | |
| | | | | Asset Manager Holding Company | | | | | |
| | 1,094,996 | | | Raymond James Financial | | | 53,983,303 | | |
| | | | | Full Service Wealth Management | | | | | |
| | 909,825 | | | SEI Investments | | | 43,771,681 | | |
| | | | | Mutual Fund Administration &
Investment Management | | | | | |
| | 1,213,832 | | | Eaton Vance | | | 42,896,823 | | |
| | | | | Specialty Mutual Funds | | | | | |
| | 705,876 | | | Interactive Brokers Group | | | 24,988,010 | | |
| | | | | Electronic Brokerage & Market Maker | | | | | |
| | | | 292,789,479 | | |
See accompanying notes to financial statements.
25
COLUMBIA ACORN® FUND
STATEMENT OF INVESTMENTS (UNAUDITED), CONTINUED
Number of Shares | | | | Value | |
| | | > Real Estate Investment Trusts
(REITs) 3.9% | |
| | 1,986,963 | | | EdR | | $ | 91,678,473 | | |
| | | | | Student Housing | | | | | |
| | 277,645 | | | Federal Realty | | | 45,964,130 | | |
| | | | | Shopping Centers & Mixed Use
Projects | | | | | |
| | 448,320 | | | Equity LifeStyle Properties | | | 35,888,016 | | |
| | | | | Manufactured Home & RV
Communities | | | | | |
| | 268,971 | | | Extra Space Storage | | | 24,890,576 | | |
| | | | | Self Storage Facilities | | | | | |
| | 361,288 | | | Lamar Advertising | | | 23,953,394 | | |
| | | | | Outdoor Advertising | | | | | |
| | | | 222,374,589 | | |
| | | > Banks 2.9% | |
| | 292,607 | | | Signature Bank (a) | | | 36,552,467 | | |
| | | | | New York City Metro Area Bank | | | | | |
| | 365,056 | | | SVB Financial Group (a) | | | 34,738,729 | | |
| | | | | Bank to Venture Capitalists | | | | | |
| | 1,900,833 | | | Associated Banc-Corp | | | 32,599,286 | | |
| | | | | Midwest Bank | | | | | |
| | 507,599 | | | BOK Financial (c) | | | 31,826,457 | | |
| | | | | Tulsa-based Southwest Bank | | | | | |
| | 780,625 | | | MB Financial | | | 28,321,075 | | |
| | | | | Chicago Bank | | | | | |
| | | | 164,038,014 | | |
| | | > Diversified Financial Services 2.4% | |
| | 814,391 | | | CBOE Holdings | | | 54,254,728 | | |
| | | | | Marketplace for Trading Options &
Futures | | | | | |
| | 269,773 | | | Factset Research Systems | | | 43,546,758 | | |
| | | | | Securities Data Purveyor | | | | | |
| | 252,234 | | | MarketAxess | | | 36,674,824 | | |
| | | | | Bond Exchange | | | | | |
| | 359,944 | | | MicroDose Therapeutx (a)(d)(e) | | | — | | |
| | | | | Drug Inhaler Development | | | |
| | | | 134,476,310 | | |
| | | > Real Estate Management &
Development 1.2% | |
| | 693,507 | | | Jones Lang LaSalle | | | 67,582,257 | | |
| | | | | Real Estate Services | | | |
| | | | 67,582,257 | | |
| | | > Insurance 1.0% | |
| | 1,899,138 | | | CNO Financial Group | | | 33,158,949 | | |
| | | | | Life, Long-term Care & Medical
Supplement Insurance | | | | | |
| | 623,556 | | | Allied World Assurance
Company Holdings | | | 21,911,758 | | |
| | | | | Commercial Lines Insurance/
Reinsurance | | | | | |
| | | | 55,070,707 | | |
Financials: Total | | | 936,331,356 | | |
Number of Shares | | | | Value | |
Energy 2.4% | | | |
| | | > Oil, Gas & Consumable Fuels 1.9% | |
| | 390,706 | | | Diamondback Energy (a) | | $ | 35,636,294 | | |
| | | | | Oil & Gas Producer in Texas | | | | | |
| | 269,014 | | | Cimarex Energy | | | 32,098,751 | | |
| | | | | Oil & Gas Producer in Texas, New
Mexico & Oklahoma | | | | | |
| | 565,180 | | | Carrizo Oil & Gas (a) | | | 20,261,703 | | |
| | | | | Oil & Gas Producer | | | | | |
| | 318,595 | | | PDC Energy (a) | | | 18,354,258 | | |
| | | | | Oil & Gas Producer in the
United States | | | | | |
| | | | 106,351,006 | | |
| | | > Energy Equipment & Services 0.5% | |
| | 1,152,538 | | | ShawCor (Canada) | | | 28,573,700 | | |
| | | | | Oil & Gas Pipeline Products | | | | | |
| | | | 28,573,700 | | |
Energy: Total | | | 134,924,706 | | |
Materials 1.9% | | | |
| | | > Chemicals 1.9% | |
| | 620,730 | | | Celanese | | | 40,626,778 | | |
| | | | | Commodity & Specialty Chemicals
Provider | | | | | |
| | 318,353 | | | International Flavors &
Fragrances | | | 40,134,763 | | |
| | | | | Flavors & Fragrances | | | | | |
| | 991,138 | | | Axalta Coating Systems (a) | | | 26,294,891 | | |
| | | | | Global Manufacturer of High
Performance Coatings | | | | | |
| | | | 107,056,432 | | |
Materials: Total | | | 107,056,432 | | |
Consumer Staples 1.9% | | | |
| | | > Household Products 1.3% | |
| | 329,195 | | | WD-40 | | | 38,663,953 | | |
| | | | | Manufacturer of Industrial
Lubrications | | | | | |
| | 2,506,595 | | | HRG Group (a) | | | 34,415,549 | | |
| | | | | Holding Company | | | | | |
| | | | 73,079,502 | | |
| | | > Food & Staples Retailing 0.6% | |
| | 1,326,614 | | | US Foods (a)(c) | | | 32,157,123 | | |
| | | | | Food Services Distribution Company | | | | | |
| | | | 32,157,123 | | |
Consumer Staples: Total | | | 105,236,625 | | |
Telecommunication Services 1.5% | | | |
| | | > Diversified Telecommunication
Services 1.1% | |
| | 380,984 | | | SBA Communications (a) | | | 41,123,413 | | |
| | | | | Communications Towers | | | | | |
| | 859,781 | | | Zayo Group (a) | | | 24,013,683 | | |
| | | | | Fiber Optic Data Communications | | | | | |
| | | | 65,137,096 | | |
See accompanying notes to financial statements.
26
Number of Shares | | | | Value | |
| | | > Wireless Telecommunication Services 0.4% | |
| | 2,306,438 | | | Boingo Wireless (a)(b) | | $ | 20,573,427 | | |
| | | Wi-Fi & Cellular Communications
Networks | | | | | |
| | | | 20,573,427 | | |
Telecommunication Services: Total | | | 85,710,523 | | |
Total Equities: 96.9%
(Cost: $3,922,681,543) | | | 5,489,316,744 | (f) | |
Short-Term Investments 1.4% | |
| | 82,228,860 | | | JPMorgan U.S. Government
Money Market Fund, IM
Shares (7 day yield of 0.29%) | | | 82,228,860 | | |
Total Short-Term Investments: 1.4%
(Cost: $82,228,860) | | | 82,228,860 | | |
Number of Shares | | | | Value | |
Securities Lending Collateral 2.0% | |
| | 111,180,975 | | | Dreyfus Government Cash
Management Fund,
Institutional Shares
(7 day yield of 0.24%) (g) | | $ | 111,180,975 | | |
Total Securities Lending Collateral: 2.0%
(Cost: $111,180,975) | | | 111,180,975 | | |
Total Investments: 100.3%
(Cost: $4,116,091,378)(h) | | | 5,682,726,579 | | |
Obligation to Return Collateral for
Securities Loaned: (2.0)% | | | (111,180,975 | ) | |
Cash and Other Assets Less Liabilities: 1.7% | | | 91,683,789 | | |
Net Assets: 100.0% | | $ | 5,663,229,393 | | |
ADR - American Depositary Receipts
> Notes to Statement of Investments
(a) Non-income producing security.
(b) An affiliated person of the Fund, as defined in the Investment Company Act of 1940, may include any company in which the Fund owns five percent or more of its outstanding voting shares. Holdings and transactions in these affiliated companies during the period ended June 30, 2016, are as follows:
Security | | Balance of
Shares Held
12/31/15 | | Purchases/
Additions | | Sales/
Reductions | | Balance of
Shares Held
6/30/16 | | Value | | Dividend | |
Quotient Technology (1) | | | 4,634,954 | | | | 1,399,000 | | | | 2,079,072 | | | | 3,954,882 | | | $ | 53,034,968 | | | $ | - | | |
Fiesta Restaurant Group (1) | | | 1,453,484 | | | | - | | | | 224,301 | | | | 1,229,183 | | | | 26,808,481 | | | | - | | |
Boingo Wireless | | | 2,727,319 | | | | - | | | | 420,881 | | | | 2,306,438 | | | | 20,573,427 | | | | - | | |
Fluidigm | | | 879,013 | | | | 927,112 | | | | 278,722 | | | | 1,527,403 | | | | 13,792,449 | | | | - | | |
Vonage (1) | | | 13,576,409 | | | | - | | | | 13,576,409 | | | | - | | | | - | | | | - | | |
Bankrate (1) | | | 7,126,562 | | | | - | | | | 7,126,562 | | | | - | | | | - | | | | - | | |
Gaiam (1) | | | 1,893,824 | | | | - | | | | 1,893,824 | | | | - | | | | - | | | | - | | |
Hackett Group (1) | | | 1,899,313 | | | | - | | | | 1,899,313 | | | | - | | | | - | | | | - | | |
Kirkland Lake Gold (1) | | | 5,119,843 | | | | - | | | | 5,119,843 | | | | - | | | | - | | | | - | | |
ShaMaran Petroleum (1) | | | 90,046,000 | | | | - | | | | 90,046,000 | | | | - | | | | - | | | | - | | |
Total of Affiliated Transactions | | | 129,356,721 | | | | 2,326,112 | | | | 122,664,927 | | | | 9,017,906 | | | $ | 114,209,325 | | | $ | - | | |
(1) At June 30, 2016, the Fund owned less than five percent of the company's outstanding voting shares.
The aggregate cost and value of these companies at June 30, 2016, was $31,559,999 and $34,365,876, respectively. Investments in affiliated companies represented 0.61% of the Fund's total net assets at June 30, 2016.
(c) All or a portion of this security was on loan at June 30, 2016. The total market value of securities on loan at June 30, 2016 was $108,642,869.
(d) Security has no value.
(e) Denotes a restricted security, which is subject to restrictions on resale under federal securities laws. This security is valued at fair value determined in good faith under consistently applied procedures established by the Fund's Board of Trustees. At June 30, 2016, the market value of this security amounted to $0.36, which represented less than 0.01% of total net assets. Additional information on this security is as follows:
Security | | Acquisition
Dates | | Shares | | Cost | | Value | |
MicroDose Therapeutx | | 8/14/13 | | | 359,944 | | | $ | - | | | $ | - | | |
See accompanying notes to financial statements.
27
COLUMBIA ACORN® FUND
STATEMENT OF INVESTMENTS (UNAUDITED), CONTINUED
> Notes to Statement of Investments
(f) On June 30, 2016, the market value of foreign securities represented 0.50% of total net assets. The Fund's foreign portfolio was diversified as follows:
Country | | Value | | Percentage
of Net Assets | |
Canada | | $ | 28,573,700 | | | | 0.50 | | |
(g) Investment made with cash collateral received from securities lending activity.
(h) At June 30, 2016, for federal income tax purposes, the cost of investments was approximately $4,116,091,378 and net unrealized appreciation was $1,566,635,201 consisting of gross unrealized appreciation of $1,740,632,932 and gross unrealized depreciation of $173,997,731.
Fair Value Measurements
Various inputs are used in determining the value of the Fund's investments, following the input prioritization hierarchy established by accounting principles generally accepted in the United States of America (GAAP). These inputs are summarized in the three broad levels listed below:
• Level 1 - quoted prices in active markets for identical securities
• Level 2 - prices determined using other significant observable inputs (including quoted prices for similar securities, interest rates, prepayment speeds, credit risk and others)
• Level 3 - prices determined using significant unobservable inputs where quoted prices or observable inputs are unavailable or less reliable (including management's own assumptions about the factors market participants would use in pricing an investment)
The inputs or methodology used for valuing securities are not necessarily an indication of the risk associated with investing in those securities.
Examples of the types of securities in which the Fund would typically invest and how they are classified within this hierarchy are as follows. Typical Level 1 securities include exchange traded domestic equities, mutual funds whose NAVs are published each day and exchange traded foreign equities that are not statistically fair valued. Typical Level 2 securities include exchange traded foreign equities that are statistically fair valued, forward foreign currency exchange contracts and short-term investments valued at amortized cost. Additionally, securities fair valued by CWAM's Valuation Committee (the Committee) that rely on significant observable inputs are also included in Level 2. Typical Level 3 securities include any security fair valued by the Committee that relies on significant unobservable inputs.
The Committee is responsible for applying the Trust's Portfolio Pricing Policy and the CWAM pricing procedures (the Policies), which are approved by and subject to the oversight of the Board.
The Committee meets as necessary, and no less frequently than quarterly, to determine fair values for securities for which market quotations are not readily available or for which CWAM believes that available market quotations are unreliable. The Committee also reviews the continuing appropriateness of the Policies. In circumstances where a security has been fair valued, the Committee will also review the continuing appropriateness of the current value of the security. The Policies address, among other things: circumstances under which market quotations will be deemed readily available; selection of third party pricing vendors; appropriate pricing methodologies; events that require fair valuation and fair value techniques; circumstances under which securities will be deemed to pose a potential for stale pricing, including when securities are illiquid, restricted, or in default; and certain delegations of authority to determine fair values to the Fund's investment manager. The Committee may also meet to discuss additional valuation matters, which may include review of back-testing results, review of time-sensitive information or approval of other valuation related actions, and to review the appropriateness of the Policies.
For investments categorized as Level 3, the significant unobservable inputs used in the fair value measurement of the Fund's securities may include: (i) data specific to the issuer or comparable issuers, (ii) general market or specific sector news and (iii) quoted prices and specific or similar security transactions. The Committee considers this data and any changes from prior periods in order to assess the reasonableness of observable and unobservable inputs, any assumptions or internal models used to value those securities and changes in fair value. Significant changes in any of these factors could result in lower or higher fair value measurements. Various factors impact the frequency of monitoring (which may occur as often as daily), however the Committee may determine that changes to inputs, assumptions and models are not required with the same frequency.
The following table summarizes the inputs used, as of June 30, 2016, in valuing the Fund's assets:
Investment Type | | Quoted Prices
(Level 1) | | Other
Significant
Observable
Inputs
(Level 2) | | Significant
Unobservable
Inputs
(Level 3) | | Total | |
Equities | |
Health Care | | $ | 1,164,721,743 | | | $ | - | | | $ | - | | | $ | 1,164,721,743 | | |
Information Technology | | | 1,009,898,940 | | | | - | | | | - | | | | 1,009,898,940 | | |
Consumer Discretionary | | | 988,176,221 | | | | - | | | | - | | | | 988,176,221 | | |
Industrials | | | 957,260,198 | | �� | | - | | | | - | | | | 957,260,198 | | |
Financials | | | 936,331,356 | | | | - | | | | 0 | (a) | | | 936,331,356 | | |
Energy | | | 134,924,706 | | | | - | | | | - | | | | 134,924,706 | | |
Materials | | | 107,056,432 | | | | - | | | | - | | | | 107,056,432 | | |
Consumer Staples | | | 105,236,625 | | | | - | | | | - | | | | 105,236,625 | | |
Telecommunication Services | | | 85,710,523 | | | | - | | | | - | | | | 85,710,523 | | |
Total Equities | | | 5,489,316,744 | | | | - | | | | 0 | (a) | | | 5,489,316,744 | | |
See accompanying notes to financial statements.
28
> Notes to Statement of Investments
Investment Type | | Quoted Prices
(Level 1) | | Other
Significant
Observable
Inputs
(Level 2) | | Significant
Unobservable
Inputs
(Level 3) | | Total | |
Total Short-Term Investments | | $ | 82,228,860 | | | $ | - | | | $ | - | | | $ | 82,228,860 | | |
Total Securities Lending Collateral | | | 111,180,975 | | | | - | | | | - | | | | 111,180,975 | | |
Total Investments | | $ | 5,682,726,579 | | | $ | - | | | $ | 0 | (a) | | $ | 5,682,726,579 | | |
(a) Rounds to zero
There were no transfers of financial assets between levels during the period.
The Fund does not hold any significant investments (greater than one percent of net assets) categorized as Level 3.
Certain securities classified as Level 3 are valued by the Committee at fair value, using a market approach, as determined in good faith under consistently applied procedures established by and under the general supervision of the Board. To determine fair value for these securities, for which no market exists, the Committee utilizes the valuation technique it deems most appropriate in the circumstances, using some unobservable inputs, which may include, but are not limited to estimated earnings of the company and the position of the security within the company's capital structure. The Committee also may use some observable inputs, which may include, but are not limited to, trades of similar securities. Significant increases or decreases to any of these inputs could result in a significantly lower or higher fair value measurement.
See accompanying notes to financial statements.
29
COLUMBIA ACORN INTERNATIONAL®
STATEMENT OF INVESTMENTS (UNAUDITED), JUNE 30, 2016
Number of Shares | | | | Value | |
| | | | | | | Equities: 96.6% | |
Europe 43.4% | | | |
| | | > United Kingdom 12.2% | |
| | 5,715,171 | | | Halma | | $ | 77,732,105 | | |
| | | | | Health & Safety Sensor Technology | | | | | |
| | 1,571,000 | | | Rightmove | | | 76,729,112 | | |
| | | | | Internet Real Estate Listings | | | | | |
| | 4,852,498 | | | Shaftesbury | | | 57,102,261 | | |
| | | | | London Prime Retail REIT | | | | | |
| | 21,000,000 | | | Rentokil Initial | | | 54,230,603 | | |
| | | | | Pest Control, Washroom &
Workwear Service Provider | | | | | |
| | 13,804,858 | | | Regus | | | 53,378,482 | | |
| | | | | Rental Office Space in Full Service
Business Center | | | | | |
| | 2,458,480 | | | WH Smith | | | 51,648,994 | | |
| | | | | Newsprint, Books & General
Stationery Retailer | | | | | |
| | 2,915,904 | | | Smith & Nephew | | | 49,515,460 | | |
| | | | | Medical Equipment & Supplies | | | | | |
| | 1,055,758 | | | Croda International | | | 44,319,012 | | |
| | | | | Oleochemicals & Industrial Chemicals | | | | | |
| | 638,583 | | | Next | | | 42,194,923 | | |
| | | | | Clothes & Home Retailer in the UK | | | | | |
| | 4,045,828 | | | Abcam | | | 41,680,047 | | |
| | | | | Online Sales of Antibodies | | | | | |
| | 9,222,000 | | | Domino's Pizza UK & Ireland | | | 40,972,375 | | |
| | | | | Pizza Delivery in the UK, Ireland &
Switzerland | | | | | |
| | 602,203 | | | Spirax Sarco | | | 30,155,007 | | |
| | | | | Steam Systems & Pumps for
Manufacturing & Process Industries | | | | | |
| | 5,797,788 | | | DS Smith | | | 29,996,086 | | |
| | | | | Packaging | | | | | |
| | 8,152,866 | | | Ocado (a)(b) | | | 25,155,729 | | |
| | | | | Online Grocery Retailer | | | | | |
| | 5,141,710 | | | Halfords | | | 22,107,018 | | |
| | | | | UK Retailer of Leisure Goods &
Auto Parts | | | | | |
| | 704,677 | | | PureCircle (a)(b) | | | 2,753,326 | | |
| | | | | Natural Sweeteners | | | | | |
| | | | 699,670,540 | | |
| | | > Sweden 6.1% | |
| | 2,399,596 | | | Hexagon | | | 87,815,523 | | |
| | | | | Design, Measurement & Visualization
Software & Equipment | | | | | |
| | 4,611,015 | | | Trelleborg | | | 81,824,623 | | |
| | | | | Manufacturer of Sealing, Dampening &
Protective Solutions for Industry | | | | | |
| | 7,374,685 | | | Unibet | | | 67,749,270 | | |
| | | | | European Online Gaming Operator | | | | | |
| | 826,173 | | | Millicom | | | 50,676,910 | | |
| | | | | Telecoms Operator in Latin America &
Africa | | | | | |
| | 1,935,822 | | | Sweco | | | 33,584,542 | | |
| | | | | Engineering Consultants | | | | | |
| | 819,437 | | | Mekonomen (a) | | | 17,627,092 | | |
| | | | | Nordic Integrated Wholesaler/Retailer
of Automotive Parts & Service | | | | | |
Number of Shares | | | | Value | |
| | 733,109 | | | Recipharm (a) | | $ | 10,246,214 | | |
| | | | | Contract Development Manufacturing
Organization | | | | | |
| | | | 349,524,174 | | |
| | | > Germany 5.6% | |
| | 2,052,434 | | | Wirecard (a) | | | 90,401,322 | | |
| | | | | Online Payment Processing & Risk
Management | | | | | |
| | 671,630 | | | MTU Aero Engines | | | 62,748,993 | | |
| | | | | Airplane Engine Components &
Services | | | | | |
| | 636,639 | | | Fielmann | | | 46,563,388 | | |
| | | | | Retail Optician Chain | | | | | |
| | 853,000 | | | Ströer (a) | | | 39,237,313 | | |
| | | | | Out of Home & Online Advertising | | | | | |
| | 58,610 | | | Rational | | | 27,124,092 | | |
| | | | | Commercial Ovens | | | | | |
| | 1,010,000 | | | Zalando (b) | | | 26,731,082 | | |
| | | | | Online Platform for Apparel Sales | | | | | |
| | 553,612 | | | NORMA Group | | | 26,230,462 | | |
| | | | | Clamps for Automotive & Industrial
Applications | | | | | |
| | | | 319,036,652 | | |
| | | > Switzerland 4.7% | |
| | 204,500 | | | Partners Group | | | 87,641,648 | | |
| | | | | Private Markets Asset Management | | | | | |
| | 194,100 | | | Geberit | | | 73,517,791 | | |
| | | | | Plumbing Systems | | | | | |
| | 28,285 | | | Givaudan | | | 56,952,538 | | |
| | | | | Fragrances & Flavors | | | | | |
| | 301,310 | | | Actelion | | | 50,739,880 | | |
| | | | | Swiss Orphan Drug Company | | | | | |
| | | | 268,851,857 | | |
| | | > Denmark 4.5% | |
| | 2,827,011 | | | Novozymes | | | 135,755,578 | | |
| | | | | Industrial Enzymes | | | | | |
| | 1,263,620 | | | SimCorp | | | 62,014,101 | | |
| | | | | Software for Investment Managers | | | | | |
| | 2,966,887 | | | William Demant Holding | | | 57,752,796 | | |
| | | | | Manufacture & Distribution of
Hearing Aids & Diagnostic Equipment | | | | | |
| | | | 255,522,475 | | |
| | | > Spain 3.5% | |
| | 12,927,171 | | | Distribuidora Internacional de
Alimentación | | | 75,454,519 | | |
| | | | | Discount Retailer in Spain & Latin
America | | | | | |
| | 10,392,279 | | | Prosegur | | | 62,629,401 | | |
| | | | | Security Guards | | | | | |
| | 609,424 | | | Viscofan | | | 33,823,445 | | |
| | | | | Sausage Casings Maker | | | | | |
| | 948,207 | | | Bolsas y Mercados Españoles | | | 26,648,855 | | |
| | | | | Spanish Stock Markets | | | | | |
| | | | 198,556,220 | | |
| | | > France 2.6% | |
| | 880,603 | | | Legrand | | | 45,079,242 | | |
| | | | | Electrical Components | | | | | |
| | 1,966,291 | | | Elior Group | | | 42,666,841 | | |
| | | | | Contract Caterer & Travel Concessionary | | | | | |
See accompanying notes to financial statements.
30
Number of Shares | | | | Value | |
| | | > France—continued | |
| | 1,657,205 | | | Eutelsat | | $ | 31,279,897 | | |
| | | | | Fixed Satellite Services | | | | | |
| | 78,730 | | | Eurofins Scientific | | | 29,167,294 | | |
| | | | | Food, Pharmaceuticals &
Materials Screening & Testing | | | | | |
| | | | 148,193,274 | | |
| | | > Netherlands 2.6% | |
| | 2,044,797 | | | Aalberts Industries | | | 61,299,465 | | |
| | | | | Flow Control & Heat Treatment | | | | | |
| | 734,808 | | | Gemalto (a) | | | 44,517,561 | | |
| | | | | Digital Security Solutions | | | | | |
| | 693,013 | | | ASM International | | | 26,749,205 | | |
| | | | | Semiconductor Manufacturing
Equipment Provider | | | | | |
| | 845,823 | | | Brunel (a) | | | 15,442,142 | | |
| | | | | Temporary Specialist & Energy
Staffing | | | | | |
| | | | 148,008,373 | | |
| | | > Italy 1.0% | |
| | 1,048,543 | | | Brembo | | | 57,759,672 | | |
| | | | | High Performance Auto Braking
Systems Supplier | | | | | |
| | | > Finland 0.6% | |
| | 1,348,120 | | | Konecranes (a) | | | 34,223,443 | | |
| | | | | Manufacture & Service of
Industrial Cranes & Port
Handling Equipment | | | | | |
Europe: Total | | | 2,479,346,680 | | |
Asia 38.4% | | | |
| | | > Japan 21.7% | |
| | 2,072,700 | | | Recruit Holdings | | | 75,724,270 | | |
| | | | | Recruitment & Media Services | | | | | |
| | 1,212,900 | | | FamilyMart | | | 73,915,685 | | |
| | | | | Convenience Store Operator | | | | | |
| | 5,117,500 | | | Aeon Mall | | | 66,957,580 | | |
| | | | | Suburban Shopping Mall
Developer, Owner & Operator | | | | | |
| | 2,289,700 | | | Bandai Namco | | | 59,089,179 | | |
| | | | | Branded Toys & Related Content | | | | | |
| | 2,996,600 | | | Santen Pharmaceutical | | | 47,098,119 | | |
| | | | | Specialty Pharma
(Ophthalmic Medicine) | | | | | |
| | 2,041,200 | | | Suruga Bank | | | 46,129,398 | | |
| | | | | Regional Bank | | | | | |
| | 536,300 | | | Hikari Tsushin | | | 44,927,694 | | |
| | | | | Office IT/Mobiles/Insurance
Distribution | | | | | |
| | 437,400 | | | Hoshizaki Electric | | | 42,818,907 | | |
| | | | | Commercial Kitchen Equipment | | | | | |
| | 3,499,100 | | | Ushio | | | 41,109,471 | | |
| | | | | Industrial Light Sources | | | | | |
| | 15,746 | | | Japan Retail Fund | | | 40,206,899 | | |
| | | | | Retail REIT in Japan | | | | | |
| | 1,430,800 | | | Glory | | | 38,931,452 | | |
| | | | | Currency Handling Systems &
Related Equipment | | | | | |
| | 409,600 | | | Disco | | | 37,044,149 | | |
| | | | | Semiconductor Dicing & Grinding
Equipment | | | | | |
Number of Shares | | | | Value | |
| | 3,264,700 | | | Sony Financial Holdings | | $ | 36,913,553 | | |
| | | | | Life Insurance, Assurance &
Internet Banking | | | | | |
| | 4,427,000 | | | NOF | | | 36,743,903 | | |
| | | | | Specialty Chemicals, Life Science &
Rocket Fuels | | | | | |
| | 11,663,700 | | | Seven Bank | | | 36,203,105 | | |
| | | | | ATM Processing Services | | | | | |
| | 290,320 | | | Hirose Electric | | | 35,699,479 | | |
| | | | | Electrical Connectors | | | | | |
| | 5,977 | | | Kenedix Office Investment | | | 35,622,364 | | |
| | | | | Tokyo Mid-size Office REIT | | | | | |
| | 1,319,100 | | | DIP | | | 35,588,883 | | |
| | | | | Mobile Temporary Job Information
Provider | | | | | |
| | 534,600 | | | Makita | | | 35,495,878 | | |
| | | | | Power Tools | | | | | |
| | 721,300 | | | Otsuka | | | 33,728,956 | | |
| | | | | One-stop IT Services & Office
Supplies Provider | | | | | |
| | 1,549,400 | | | Aeon Financial Service | | | 33,549,064 | | |
| | | | | Diversified Consumer-related
Finance Company in Japan | | | | | |
| | 561,900 | | | Ezaki Glico | | | 32,871,033 | | |
| | | | | Confectionary, Ice Cream &
Dairy Products | | | | | |
| | 887,500 | | | Japan Airport Terminal (a) | | | 32,199,619 | | |
| | | | | Airport Terminal Operator at Haneda | | | | | |
| | 1,396,800 | | | Aica Kogyo | | | 31,921,532 | | |
| | | | | Laminated Sheets, Building
Materials & Chemical Adhesives | | | | | |
| | 780,600 | | | JIN (a) | | | 30,635,432 | | |
| | | | | Eyeglasses Retailer | | | | | |
| | 551,200 | | | OBIC | | | 30,341,532 | | |
| | | | | Computer Software | | | | | |
| | 1,749,600 | | | OSG (a) | | | 29,145,388 | | |
| | | | | Consumable Cutting Tools | | | | | |
| | 844,700 | | | MonotaRO | | | 27,926,581 | | |
| | | | | Online Maintenance, Repair &
Operations Goods Distributor in Japan | | | | | |
| | 548,200 | | | Asahi Intecc | | | 26,788,576 | | |
| | | | | Medical Guidewires for Surgery | | | | | |
| | 4,860,000 | | | Dowa Holdings | | | 25,050,067 | | |
| | | | | Environmental/Recycling,
Nonferrous Metals, Electronic
Material & Metal Processing | | | | | |
| | 1,506,600 | | | NGK Spark Plug | | | 22,741,798 | | |
| | | | | Automobile Parts | | | | | |
| | 771,000 | | | Sega Sammy Holdings | | | 8,303,748 | | |
| | | | | Gaming Software/Hardware &
Leisure Facilities | | | | | |
| | 289,600 | | | Doshisha | | | 5,563,650 | | |
| | | | | Consumer Goods Wholesaler | | | | | |
| | 57,400 | | | Seria | | | 4,750,766 | | |
| | | | | 100 Yen Discount Stores | | | | | |
| | | | 1,241,737,710 | | |
| | | > Taiwan 3.7% | |
| | 21,384,000 | | | Far EasTone Telecom | | | 51,779,161 | | |
| | | | | Mobile Operator in Taiwan | | | | | |
| | 425,000 | | | Largan Precision | | | 39,305,382 | | |
| | | | | Mobile Device Camera Lenses &
Modules | | | | | |
See accompanying notes to financial statements.
31
COLUMBIA ACORN INTERNATIONAL®
STATEMENT OF INVESTMENTS (UNAUDITED), CONTINUED
Number of Shares | | | | Value | |
| | | > Taiwan—continued | |
| | 1,526,000 | | | St. Shine Optical | | $ | 34,484,737 | | |
| | | | | Disposable Contact Lens Original
Equipment Manufacturer | | | | | |
| | 4,125,686 | | | Advantech | | | 31,459,447 | | |
| | | | | Industrial PC & Components | | | | | |
| | 17,868,352 | | | Vanguard International
Semiconductor | | | 29,535,533 | | |
| | | | | Semiconductor Foundry | | | | | |
| | 1,189,000 | | | PChome Online | | | 13,179,726 | | |
| | | | | Taiwanese E-commerce Company | | | | | |
| | 722,000 | | | Silergy | | | 8,540,231 | | |
| | | | | Chinese Provider of Analog & Mixed
Digital Integrated Circuits | | | | | |
| | 1,031,000 | | | Novatek Microelectronics | | | 3,864,073 | | |
| | | | | Display Related Integrated Circuit
Designer | | | | | |
| | | | 212,148,290 | | |
| | | > Korea 3.3% | |
| | 456,161 | | | KT&G | | | 54,025,450 | | |
| | | | | Tobacco & Ginseng Products | | | | | |
| | 781,101 | | | KEPCO Plant Service &
Engineering | | | 44,161,307 | | |
| | | | | Power Plant & Grid Maintenance | | | | | |
| | 132,137 | | | KCC | | | 43,950,845 | | |
| | | | | Paint & Housing Material
Manufacturer | | | | | |
| | 1,096,382 | | | Korea Investment Holdings | | | 40,420,393 | | |
| | | | | Brokerage & Asset Management | | | | | |
| | 10,393 | | | Orion Corp | | | 8,530,832 | | |
| | | | | Confectionery & Snack Manufacturer | | | | | |
| | | | 191,088,827 | | |
| | | > China 3.0% | |
| | 62,206,000 | | | China Everbright International | | | 69,555,539 | | |
| | | | | Municipal Waste Operator | | | | | |
| | 19,778,000 | | | TravelSky Technology | | | 38,235,261 | | |
| | | | | Chinese Air Travel Transaction
Processor | | | | | |
| | 3,028,652 | | | Vipshop - ADR | | | 33,830,043 | | |
| | | | | Internet Discount Retailer | | | | | |
| | 71,394,000 | | | Sihuan Pharmaceutical
Holdings Group | | | 13,637,265 | | |
| | | | | Chinese Generic Drug Manufacturer | | | | | |
| | 28,178,000 | | | NewOcean Energy | | | 9,253,811 | | |
| | | | | Southern China Liquefied Petroleum
Gas Distributor | | | | | |
| | 250,768 | | | 51job - ADR (b) | | | 7,350,010 | | |
| | | | | Integrated Human Resource Services | | | | | |
| | | | 171,861,929 | | |
| | | > Hong Kong 2.0% | |
| | 66,074,000 | | | Value Partners | | | 61,184,153 | | |
| | | | | Mutual Fund Management | | | | | |
| | 19,439,600 | | | Samsonite International | | | 53,825,566 | | |
| | | | | Mass Market Luggage & Travel
Accessories | | | | | |
| | | | 115,009,719 | | |
| | | > India 1.9% | |
| | 7,930,285 | | | Zee Entertainment Enterprises | | | 53,829,115 | | |
| | | | | Indian Programmer of Pay Television
Content | | | | | |
Number of Shares | | | | Value | |
| | 6,416,931 | | | TVS Motor | | $ | 29,531,324 | | |
| | | | | Indian Maker of Scooters, Mopeds,
Motorcycles, & Three-wheelers | | | | | |
| | 1,271,334 | | | United Breweries | | | 14,191,175 | | |
| | | | | Indian Brewer | | | | | |
| | 3,858,634 | | | Adani Ports & Special
Economic Zone | | | 11,876,152 | | |
| | | | | Indian Ports | | | | | |
| | | | 109,427,766 | | |
| | | > Singapore 1.1% | |
| | 7,897,000 | | | Singapore Exchange | | | 44,983,759 | | |
| | | | | Singapore Equity & Derivatives
Market Operator | | | | | |
| | 34,018,900 | | | SIIC Environment (b) | | | 15,694,251 | | |
| | | | | Waste Water Treatment Operator | | | | | |
| | | | 60,678,010 | | |
| | | > Thailand 1.0% | |
| | 4,859,900 | | | Airports of Thailand | | | 54,039,401 | | |
| | | | | Airport Operator of Thailand | | | | | |
| | | > Indonesia 0.7% | |
| | 24,382,400 | | | Matahari Department Store | | | 37,161,428 | | |
| | | | | Department Store Chain in
Indonesia | | | | | |
| | 30,593,900 | | | Media Nusantara Citra | | | 5,132,665 | | |
| | | | | Media Company in Indonesia | | | | | |
| | | | 42,294,093 | | |
Asia: Total | | | 2,198,285,745 | | |
Other Countries 13.7% | | | |
| | | > Canada 5.4% | |
| | 692,939 | | | CCL Industries | | | 120,593,215 | | |
| | | | | Global Label Converter | | | | | |
| | 1,604,719 | | | Vermilion Energy | | | 51,099,609 | | |
| | | | | Canadian Exploration &
Production Company | | | | | |
| | 934,319 | | | Boardwalk Real Estate
Investment Trust | | | 41,626,535 | | |
| | | | | Canadian Residential REIT | | | | | |
| | 2,146,105 | | | Prairie Sky Royalty (a) | | | 40,731,061 | | |
| | | | | Canadian Owner of Oil & Gas
Mineral Interests | | | | | |
| | 1,185,000 | | | ShawCor | | | 29,378,498 | | |
| | | | | Oil & Gas Pipeline Products | | | | | |
| | 2,295,066 | | | CAE | | | 27,730,160 | | |
| | | | | Flight Simulator Equipment &
Training Centers | | | | | |
| | | | 311,159,078 | | |
| | | > Australia 3.8% | |
| | 1,602,353 | | | Domino's Pizza Enterprises | | | 82,453,102 | | |
| | | | | Domino's Pizza Operator in
Australia & New Zealand | | | | | |
| | 16,134,664 | | | IAG | | | 66,463,011 | | |
| | | | | General Insurance Provider | | | | | |
| | 5,783,208 | | | Amcor | | | 65,024,064 | | |
| | | | | Flexible & Rigid Packaging | | | | | |
See accompanying notes to financial statements.
32
Number of Shares | | | | Value | |
| | | > Australia—continued | |
| | 3,101,489 | | | Spotless | | $ | 2,624,823 | | |
| | | | | Facility Management & Catering
Company | | | | | |
| | | | 216,565,000 | | |
| | | > United States 1.3% | |
| | 883,514 | | | LivaNova | | | 44,378,908 | | |
| | | | | Neuromodulation & Cardiac Devices | | | | | |
| | 1,034,174 | | | Cepheid (b) | | | 31,800,851 | | |
| | | | | Molecular Diagnostics | | | | | |
| | | | 76,179,759 | | |
| | | > South Africa 1.2% | |
| | 8,281,610 | | | Coronation Fund Managers | | | 37,567,060 | | |
| | | | | South African Fund Manager | | | | | |
| | 10,864,098 | | | Rand Merchant Insurance | | | 30,465,640 | | |
| | | | | Directly Sold Property & Casualty
Insurance; Holdings in Other Insurers | | | | | |
| | | | 68,032,700 | | |
| | | > Guatemala 0.8% | |
| | 3,151,582 | | | Tahoe Resources | | | 47,202,378 | | |
| | | | | Silver & Gold Projects in Guatemala,
Canada & Peru | | | | | |
| | | > New Zealand 0.6% | |
| | 7,017,369 | | | Auckland International Airport | | | 32,644,018 | | |
| | | | | Auckland Airport Operator | | | | | |
| | | > Egypt 0.6% | |
| | 7,245,497 | | | Commercial International Bank
of Egypt | | | 32,618,619 | | |
| | | | | Private Universal Bank in Egypt | | | | | |
Other Countries: Total | | | 784,401,552 | | |
Latin America 1.1% | | | |
| | | > Mexico 1.1% | |
| | 384,900 | | | Grupo Aeroportuario del
Sureste - ADR | | | 61,410,795 | | |
| | | | | Mexican Airport Operator | | | | | |
Latin America: Total | | | 61,410,795 | | |
Total Equities: 96.6%
(Cost: $4,560,262,966) | | | 5,523,444,772 | (c) | |
Number of Shares | | | | Value | |
Short-Term Investments 3.4% | |
| | 193,410,296 | | | JPMorgan U.S. Government
Money Market Fund, IM
Shares (7 day yield of 0.29%) | | $ | 193,410,296 | | |
Total Short-Term Investments: 3.4%
(Cost: $193,410,296) | | | 193,410,296 | | |
Securities Lending Collateral 4.3% | |
| | 244,741,965 | | | Dreyfus Government Cash
Management Fund,
Institutional Shares
(7 day yield of 0.24%) (d) | | | 244,741,965 | | |
Total Securities Lending Collateral: 4.3%
(Cost: $244,741,965) | | | 244,741,965 | | |
Total Investments: 104.3%
(Cost: $4,998,415,227)(e) | | | 5,961,597,033 | (f) | |
Obligation to Return Collateral for
Securities Loaned: (4.3)% | | | (244,741,965 | ) | |
Cash and Other Assets Less Liabilities: —% | | | (3,008,540 | ) | |
Net Assets: 100.0% | | $ | 5,713,846,528 | | |
ADR - American Depositary Receipts
REIT - Real Estate Investment Trust
> Notes to Statement of Investments
(a) All or a portion of this security was on loan at June 30, 2016. The total market value of securities on loan at June 30, 2016 was $235,235,982.
(b) Non-income producing security.
(c) On June 30, 2016, the Fund's total equity investments were denominated in currencies as follows:
Currency | | Value | | Percentage of
Net Assets | |
Japanese Yen | | $ | 1,241,737,710 | | | | 21.7 | | |
Euro | | | 905,777,634 | | | | 15.9 | | |
British Pound | | | 699,670,540 | | | | 12.2 | | |
Canadian Dollar | | | 358,361,456 | | | | 6.3 | | |
Swedish Krona | | | 349,524,174 | | | | 6.1 | | |
Other currencies less
than 5% of total net assets | | | 1,968,373,258 | | | | 34.4 | | |
Total Equities | | $ | 5,523,444,772 | | | | 96.6 | | |
See accompanying notes to financial statements.
33
COLUMBIA ACORN INTERNATIONAL®
STATEMENT OF INVESTMENTS (UNAUDITED), CONTINUED
> Notes to Statement of Investments
(d) Investment made with cash collateral received from securities lending activity.
(e) At June 30, 2016, for federal income tax purposes, the cost of investments was approximately $4,998,415,227 and net unrealized appreciation was $963,181,806 consisting of gross unrealized appreciation of $1,316,377,183 and gross unrealized depreciation of $353,195,377.
(f) An affiliated person of the Fund, as defined in the Investment Company Act of 1940, may include any company in which the Fund owns five percent or more of its outstanding voting shares. Holdings and transactions in these affiliated companies during the period ended June 30, 2016, are as follows:
Security | | Balance of
Shares Held
12/31/15 | | Purchases/
Additions | | Sales/
Reductions | | Balance of
Shares Held
6/30/16 | | Value | | Dividend | |
Spotless | | | 63,000,000 | | | | - | | | | 59,898,511 | | | | 3,101,489 | | | $ | 2,624,823 | | | $ | 1,686,164 | | |
At June 30, 2016, the fund did not hold any investments in affiliated companies.
Fair Value Measurements
Various inputs are used in determining the value of the Fund's investments, following the input prioritization hierarchy established by accounting principles generally accepted in the United States of America (GAAP). These inputs are summarized in the three broad levels listed below:
• Level 1 - quoted prices in active markets for identical securities
• Level 2 - prices determined using other significant observable inputs (including quoted prices for similar securities, interest rates, prepayment speeds, credit risk and others)
• Level 3 - prices determined using significant unobservable inputs where quoted prices or observable inputs are unavailable or less reliable (including management's own assumptions about the factors market participants would use in pricing an investment)
The inputs or methodology used for valuing securities are not necessarily an indication of the risk associated with investing in those securities.
Examples of the types of securities in which the Fund would typically invest and how they are classified within this hierarchy are as follows. Typical Level 1 securities include exchange traded domestic equities, mutual funds whose NAVs are published each day and exchange traded foreign equities that are not statistically fair valued. Typical Level 2 securities include exchange traded foreign equities that are statistically fair valued, forward foreign currency exchange contracts and short-term investments valued at amortized cost. Additionally, securities fair valued by CWAM's Valuation Committee (the Committee) that rely on significant observable inputs are also included in Level 2. Typical Level 3 securities include any security fair valued by the Committee that relies on significant unobservable inputs.
The Committee is responsible for applying the Trust's Portfolio Pricing Policy and the CWAM pricing procedures (the Policies), which are approved by and subject to the oversight of the Board.
The Committee meets as necessary, and no less frequently than quarterly, to determine fair values for securities for which market quotations are not readily available or for which CWAM believes that available market quotations are unreliable. The Committee also reviews the continuing appropriateness of the Policies. In circumstances where a security has been fair valued, the Committee will also review the continuing appropriateness of the current value of the security. The Policies address, among other things: circumstances under which market quotations will be deemed readily available; selection of third party pricing vendors; appropriate pricing methodologies; events that require fair valuation and fair value techniques; circumstances under which securities will be deemed to pose a potential for stale pricing, including when securities are illiquid, restricted, or in default; and certain delegations of authority to determine fair values to the Fund's investment manager. The Committee may also meet to discuss additional valuation matters, which may include review of back-testing results, review of time-sensitive information or approval of other valuation related actions, and to review the appropriateness of the Policies.
For investments categorized as Level 3, the significant unobservable inputs used in the fair value measurement of the Fund's securities may include: (i) data specific to the issuer or comparable issuers, (ii) general market or specific sector news and (iii) quoted prices and specific or similar security transactions. The Committee considers this data and any changes from prior periods in order to assess the reasonableness of observable and unobservable inputs, any assumptions or internal models used to value those securities and changes in fair value. Significant changes in any of these factors could result in lower or higher fair value measurements. Various factors impact the frequency of monitoring (which may occur as often as daily), however the Committee may determine that changes to inputs, assumptions and models are not required with the same frequency.
The following table summarizes the inputs used, as of June 30, 2016, in valuing the Fund's assets:
Investment Type | | Quoted Prices
(Level 1) | | Other
Significant
Observable
Inputs
(Level 2) | | Significant
Unobservable
Inputs
(Level 3) | | Total | |
Equities | |
Europe | | $ | - | | | $ | 2,479,346,680 | | | $ | - | | | $ | 2,479,346,680 | | |
Asia | | | 41,180,053 | | | | 2,157,105,692 | | | | - | | | | 2,198,285,745 | | |
Other Countries | | | 434,541,215 | | | | 349,860,337 | | | | - | | | | 784,401,552 | | |
Latin America | | | 61,410,795 | | | | - | | | | - | | | | 61,410,795 | | |
Total Equities | | | 537,132,063 | | | | 4,986,312,709 | | | | - | | | | 5,523,444,772 | | |
Total Short-Term Investments | | | 193,410,296 | | | | - | | | | - | | | | 193,410,296 | | |
Total Securities Lending Collateral | | | 244,741,965 | | | | - | | | | - | | | | 244,741,965 | | |
Total Investments | | $ | 975,284,324 | | | $ | 4,986,312,709 | | | $ | - | | | $ | 5,961,597,033 | | |
See accompanying notes to financial statements.
34
> Notes to Statement of Investments
The Fund's assets assigned to the Level 2 input category are generally valued using a market approach, in which a security's value is determined through its correlation to prices and information from observable market transactions for similar or identical assets. Foreign equities are generally valued at the last sale price on the foreign exchange or market on which they trade. The Fund may use a statistical fair valuation model, in accordance with the policy adopted by the Board, provided by an independent third party to value securities principally traded in foreign markets in order to adjust for possible stale pricing that may occur between the close of the foreign exchanges and the time for valuation. These models take into account available market data including intraday index, ADR, and ETF movements.
There were no transfers of financial assets between Levels 1 and 2 during the period.
Financial assets were transferred from Level 3 to Level 2 as trading resumed during the period. As a result, as of period end, the Committee determined to value the security(s) under consistently applied procedures established by and under the general supervision of the Board.
The following table shows transfers between Level 2 and Level 3 of the fair value hierarchy:
Transfers In | | Transfers Out | |
| Level 2 | | Level 3 | | Level 2 | | Level 3 | |
| $ | 34,937,684 | | | $ | - | | | $ | - | | | $ | 34,937,684 | | |
Transfers into and/or out of Level 3 are determined based on the fair value at the beginning of the period for security positions held throughout the period.
See accompanying notes to financial statements.
35
COLUMBIA ACORN INTERNATIONAL®
PORTFOLIO DIVERSIFICATION (UNAUDITED)
At June 30, 2016, the Fund's portfolio investments as a percentage of net assets were diversified as follows:
| | | Value | | Percentage
of Net Assets | |
| > Industrials | |
Machinery | | $ | 407,248,719 | | | | 7.1 | | |
Commercial Services & Supplies | | | 329,246,996 | | | | 5.8 | | |
Transportation Infrastructure | | | 192,169,986 | | | | 3.4 | | |
Building Products | | | 149,390,168 | | | | 2.6 | | |
Professional Services | | | 98,516,422 | | | | 1.7 | | |
Aerospace & Defense | | | 90,479,153 | | | | 1.6 | | |
Electrical Equipment | | | 86,188,712 | | | | 1.5 | | |
Construction & Engineering | | | 33,584,542 | | | | 0.6 | | |
Trading Companies & Distributors | | | 27,926,581 | | | | 0.5 | | |
| | | 1,414,751,279 | | | | 24.8 | | |
| > Consumer Discretionary | |
Specialty Retail | | | 213,509,617 | | | | 3.7 | | |
Hotels, Restaurants & Leisure | | | 191,174,747 | | | | 3.3 | | |
Media | | | 129,478,991 | | | | 2.3 | | |
Internet & Catalog Retail | | | 85,716,854 | | | | 1.5 | | |
Multiline Retail | | | 84,107,117 | | | | 1.5 | | |
Auto Components | | | 80,501,470 | | | | 1.4 | | |
Leisure Products | | | 67,392,927 | | | | 1.2 | | |
Textiles, Apparel & Luxury Goods | | | 53,825,567 | | | | 0.9 | | |
Automobiles | | | 29,531,324 | | | | 0.5 | | |
Distributors | | | 5,563,650 | | | | 0.1 | | |
| | | 940,802,264 | | | | 16.4 | | |
| > Financials | |
Capital Markets | | | 226,813,253 | | | | 4.0 | | |
Real Estate Investment Trusts
(REITs) | | | 174,558,058 | | | | 3.1 | | |
Insurance | | | 133,842,204 | | | | 2.3 | | |
Banks | | | 114,951,121 | | | | 2.0 | | |
Diversified Financial Services | | | 71,632,614 | | | | 1.2 | | |
Real Estate Management &
Development | | | 66,957,580 | | | | 1.2 | | |
Consumer Finance | | | 33,549,064 | | | | 0.6 | | |
| | | 822,303,894 | | | | 14.4 | | |
| > Information Technology | |
Electronic Equipment, Instruments &
Components | | | 240,552,489 | | | | 4.2 | | |
IT Services | | | 192,707,070 | | | | 3.4 | | |
Internet Software & Services | | | 125,497,720 | | | | 2.2 | | |
Software | | | 106,531,661 | | | | 1.9 | | |
Semiconductors & Semiconductor
Equipment | | | 105,733,192 | | | | 1.8 | | |
Technology Hardware, Storage &
Peripherals | | | 31,459,447 | | | | 0.5 | | |
| | | 802,481,579 | | | | 14.0 | | |
| | | Value | | Percentage
of Net Assets | |
| > Materials | |
Chemicals | | $ | 273,771,032 | | | | 4.8 | | |
Containers & Packaging | | | 215,613,365 | | | | 3.8 | | |
Metals & Mining | | | 72,252,445 | | | | 1.3 | | |
| | | 561,636,842 | | | | 9.9 | | |
| > Health Care | |
Health Care Equipment & Supplies | | | 212,920,477 | | | | 3.7 | | |
Biotechnology | | | 124,220,778 | | | | 2.2 | | |
Pharmaceuticals | | | 70,981,598 | | | | 1.2 | | |
Life Sciences Tools & Services | | | 29,167,294 | | | | 0.5 | | |
| | | 437,290,147 | | | | 7.6 | | |
| > Consumer Staples | |
Food & Staples Retailing | | | 149,370,205 | | | | 2.6 | | |
Food Products | | | 77,978,636 | | | | 1.4 | | |
Tobacco | | | 54,025,450 | | | | 0.9 | | |
Beverages | | | 14,191,175 | | | | 0.2 | | |
| | | 295,565,466 | | | | 5.1 | | |
| > Energy | |
Oil, Gas & Consumable Fuels | | | 101,084,481 | | | | 1.8 | | |
Energy Equipment & Services | | | 29,378,498 | | | | 0.5 | | |
| | | 130,462,979 | | | | 2.3 | | |
| > Telecommunication Services | |
Wireless Telecommunication
Services | | | 102,456,071 | | | | 1.8 | | |
| | | 102,456,071 | | | | 1.8 | | |
| > Utilities | |
Water Utilities | | | 15,694,251 | | | | 0.3 | | |
| | | 15,694,251 | | | | 0.3 | | |
Total Equities: | | | 5,523,444,772 | | | | 96.6 | | |
Short-Term Investments: | | | 193,410,296 | | | | 3.4 | | |
Securities Lending Collateral: | | | 244,741,965 | | | | 4.3 | | |
Total Investments: | | | 5,961,597,033 | | | | 104.3 | | |
Obligation to Return
Collateral for Securities
Loaned: | | | (244,741,965 | ) | | | (4.3 | ) | |
Cash and Other Assets
Less Liabilities: | | | (3,008,540 | ) | | | (0.0 | )* | |
Net Assets: | | $ | 5,713,846,528 | | | | 100.0 | | |
* Rounds to zero
See accompanying notes to financial statements.
36
COLUMBIA ACORN USA®
STATEMENT OF INVESTMENTS (UNAUDITED), JUNE 30, 2016
Number of Shares | | | | Value | |
| | | | | | | Equities: 97.1% | |
Health Care 23.4% | | | |
| | | > Biotechnology 5.8% | |
| | 89,812 | | | Ligand Pharmaceuticals | | $ | 10,711,877 | | |
| | | | | Royalties from Licensing Drug
Delivery Technology | | | | | |
| | 355,480 | | | Repligen | | | 9,725,933 | | |
| | | | | Supplier to Biopharma Industry | | | | | |
| | 148,120 | | | Seattle Genetics | | | 5,985,529 | | |
| | | | | Antibody-based Therapies for Cancer | | | | | |
| | 341,000 | | | Exact Sciences (a) | | | 4,177,250 | | |
| | | | | Molecular Diagnostics | | | | | |
| | 64,643 | | | Ultragenyx Pharmaceutical | | | 3,161,689 | | |
| | | | | Biotech Focused on "Ultra-Orphan" Drugs | | | | | |
| | 53,442 | | | Agios Pharmaceuticals (a)(b) | | | 2,238,953 | | |
| | | | | Biotech Focused on Cancer &
Orphan Diseases | | | | | |
| | 14,805 | | | Intercept Pharmaceuticals (a) | | | 2,112,377 | | |
| | | | | Biotech Developing Drugs for Several
Diseases | | | | | |
| | 72,784 | | | Sarepta Therapeutics (a) | | | 1,387,991 | | |
| | | | | Biotech Focused on Rare Diseases | | | | | |
| | | | 39,501,599 | | |
| | | > Health Care Providers & Services 5.6% | |
| | 322,171 | | | HealthSouth | | | 12,506,678 | | |
| | | | | Inpatient Rehabilitation Facilities &
Home Health Care | | | | | |
| | 136,639 | | | Mednax | | | 9,896,763 | | |
| | | | | Physician Management for Pediatric &
Anesthesia Practices | | | | | |
| | 170,046 | | | AMN Healthcare Services (b) | | | 6,796,738 | | |
| | | | | Temporary Healthcare Staffing | | | | | |
| | 89,121 | | | VCA | | | 6,025,471 | | |
| | | | | Animal Hospitals & Laboratory Services | | | | | |
| | 72,795 | | | TeamHealth | | | 2,960,573 | | |
| | | | | Healthcare Professionals Outsourcing | | | | | |
| | | | 38,186,223 | | |
| | | > Life Sciences Tools & Services 4.9% | |
| | 447,477 | | | VWR | | | 12,932,086 | | |
| | | | | Distributor of Lab Supplies | | | | | |
| | 83,835 | | | Bio-Techne | | | 9,454,073 | | |
| | | | | Maker of Consumables & Systems for
the Life Science Market | | | | | |
| | 139,777 | | | Cambrex | | | 7,230,664 | | |
| | | | | Developer of Active Pharmaceutical
Ingredients for Small Molecule Drugs | | | | | |
| | 9,485 | | | Mettler-Toledo International | | | 3,461,266 | | |
| | | | | Laboratory Equipment | | | | | |
| | | | 33,078,089 | | |
| | | > Health Care Equipment & Supplies 4.3% | |
| | 114,285 | | | West Pharmaceutical Services | | | 8,671,946 | | |
| | | | | Components & Systems for Injectable
Drug Delivery | | | | | |
| | 236,669 | | | ZELTIQ Aesthetics | | | 6,468,164 | | |
| | | | | Systems & Consumables for Aesthetics | | | | | |
| | 510,417 | | | Endologix | | | 6,359,796 | | |
| | | | | Minimally Invasive Treatment of
Abdominal Aortic Aneurysm (AAA) | | | | | |
Number of Shares | | | | Value | |
| | 36,747 | | | Abiomed (b) | | $ | 4,016,079 | | |
| | | | | Medical Devices for Cardiac Conditions | | | | | |
| | 248,492 | | | LeMaitre Vascular | | | 3,545,981 | | |
| | | | | Medical Devices for Peripheral
Vascular Disease | | | | | |
| | | | 29,061,966 | | |
| | | > Health Care Technology 1.8% | |
| | 256,527 | | | Medidata Solutions | | | 12,023,420 | | |
| | | | | Cloud-based Software for Drug Studies | | | | | |
| | | | 12,023,420 | | |
| | | > Pharmaceuticals 1.0% | |
| | 252,481 | | | Akorn (b) | | | 7,191,921 | | |
| | | | | Developer, Manufacturer & Distributor of
Specialty Generic Drugs | | | | | |
| | | | 7,191,921 | | |
Health Care: Total | | | 159,043,218 | | |
Information Technology 18.5% | | | |
| | | > Internet Software & Services 6.8% | |
| | 49,130 | | | CoStar Group | | | 10,742,766 | | |
| | | | | Commercial Real Estate Data
Aggregator & Web Marketing for
Retail Landlords | | | | | |
| | 164,715 | | | SPS Commerce | | | 9,981,729 | | |
| | | | | Supply Chain Management Software
Delivered via the Web | | | | | |
| | 434,313 | | | NIC | | | 9,528,827 | | |
| | | | | Government Web Portal Development &
Management Outsourcing | | | | | |
| | 306,159 | | | Q2 Holdings | | | 8,578,575 | | |
| | | | | Online & Mobile Banking Software | | | | | |
| | 120,252 | | | J2 Global Communications | | | 7,596,319 | | |
| | | | | Communication Technology &
Digital Media | | | | | |
| | | | 46,428,216 | | |
| | | > Software 5.2% | |
| | 145,368 | | | Guidewire | | | 8,977,928 | | |
| | | | | Software for Global Property &
Casualty Insurance Carriers | | | | | |
| | 131,643 | | | Manhattan Associates | | | 8,442,266 | | |
| | | | | Supply Chain Management Software &
Services | | | | | |
| | 80,438 | | | Ansys (b) | | | 7,299,748 | | |
| | | | | Simulation Software for Engineers &
Designers | | | | | |
| | 42,988 | | | Tyler Technologies | | | 7,166,529 | | |
| | | | | Financial, Tax, Court & Document
Management Systems for Local
Governments | | | | | |
| | 49,719 | | | NetSuite | | | 3,619,543 | | |
| | | | | Enterprise Software Delivered
via the Web | | | | | |
| | | | 35,506,014 | | |
| | | > IT Services 4.3% | |
| | 163,494 | | | ExlService Holdings | | | 8,568,721 | | |
| | | | | Business Process Outsourcing | | | | | |
| | 129,713 | | | Maximus | | | 7,182,209 | | |
| | | | | Outsourcer for Government Program
Administration | | | | | |
See accompanying notes to financial statements.
37
COLUMBIA ACORN USA®
STATEMENT OF INVESTMENTS (UNAUDITED), CONTINUED
Number of Shares | | | | Value | |
| | | > IT Services—continued | |
| | 249,425 | | | WNS - ADR | | $ | 6,734,475 | | |
| | | | | Offshore Business Process Outsourcing
Services | | | | | |
| | 163,907 | | | CoreLogic | | | 6,307,141 | | |
| | | | | Data Processing Services for Real
Estate, Insurance & Mortgages | | | | | |
| | | | 28,792,546 | | |
| | | > Semiconductors & Semiconductor
Equipment 1.2% | |
| | 121,008 | | | Monolithic Power Systems | | | 8,267,267 | | |
| | | | | High Performance Analog & Mixed
Signal Integrated Circuits | | | | | |
| | | | 8,267,267 | | |
| | | > Electronic Equipment, Instruments & Components 1.0% | |
| | 41,657 | | | IPG Photonics | | | 3,332,560 | | |
| | | | | Fiber Lasers | | | | | |
| | 50,972 | | | Rogers | | | 3,114,389 | | |
| | | | | Printed Circuit Materials & High
Performance Foams | | | | | |
| | | | 6,446,949 | | |
Information Technology: Total | | | 125,440,992 | | |
Industrials 18.2% | | | |
| | | > Machinery 6.1% | |
| | 181,163 | | | Toro | | | 15,978,577 | | |
| | | | | Turf Maintenance Equipment | | | | | |
| | 184,646 | | | ESCO Technologies | | | 7,374,761 | | |
| | | | | Industrial Filtration & Advanced
Measurement Equipment | | | | | |
| | 151,263 | | | Oshkosh Corporation | | | 7,216,758 | | |
| | | | | Specialty Truck Manufacturer | | | | | |
| | 48,602 | | | Middleby | | | 5,601,380 | | |
| | | | | Manufacturer of Cooking Equipment | | | | | |
| | 63,653 | | | Nordson | | | 5,322,027 | | |
| | | | | Dispensing Systems for Adhesives &
Coatings | | | | | |
| | | | 41,493,503 | | |
| | | > Commercial Services & Supplies 4.4% | |
| | 95,469 | | | UniFirst | | | 11,047,673 | | |
| | | | | Uniform Rental | | | | | |
| | 306,652 | | | Knoll | | | 7,445,510 | | |
| | | | | Office & Residential Furniture | | | | | |
| | 147,837 | | | Healthcare Services Group | | | 6,117,495 | | |
| | | | | Outsourced Services to Long-term
Care Industry | | | | | |
| | 103,800 | | | Copart | | | 5,087,238 | | |
| | | | | Auto Salvage Services | | | | | |
| | | | 29,697,916 | | |
| | | > Professional Services 3.7% | |
| | 230,194 | | | ICF International | | | 9,414,934 | | |
| | | | | Professional Service Company | | | | | |
| | 74,000 | | | WageWorks | | | 4,425,940 | | |
| | | | | Healthcare Consumer Directed
Benefits & Commuter Account
Management | | | | | |
| | 69,501 | | | Corporate Executive Board | | | 4,286,822 | | |
| | | | | Best Practices Advisory &
HR Solutions/Analytics | | | | | |
Number of Shares | | | | Value | |
| | 241,758 | | | Navigant Consulting | | $ | 3,904,392 | | |
| | | | | Financial Consulting Firm | | | | | |
| | 162,141 | | | Korn/Ferry International | | | 3,356,319 | | |
| | | | | Executive Search & Corporate
Leadership/Talent Consulting | | | | | |
| | | | 25,388,407 | | |
| | | > Aerospace & Defense 2.9% | |
| | 126,699 | | | HEICO | | | 6,797,401 | | |
| | | | | FAA-Approved Aircraft
Replacement Parts | | | | | |
| | 188,000 | | | Taser | | | 4,677,440 | | |
| | | | | Manufacturer of Electrical Weapons &
Body Cameras | | | | | |
| | 83,815 | | | Moog | | | 4,519,305 | | |
| | | | | Motion Control Products for Aerospace,
Defense & Industrial Markets | | | | | |
| | 114,000 | | | Astronics (b) | | | 3,791,640 | | |
| | | | | Designer & Manufacturer of Aircraft
Electrical Components &
Testing Equipment | | | | | |
| | | | 19,785,786 | | |
| | | > Trading Companies & Distributors 0.8% | |
| | 38,269 | | | Watsco | | | 5,384,066 | | |
| | | | | HVAC Distribution | | | | | |
| | | | 5,384,066 | | |
| | | > Building Products 0.3% | |
| | 199,713 | | | PGT | | | 2,057,044 | | |
| | | | | Wind Resistant Windows & Doors | | | | | |
| | | | 2,057,044 | | |
Industrials: Total | | | 123,806,722 | | |
Consumer Discretionary 16.8% | | | |
| | | > Hotels, Restaurants & Leisure 6.3% | |
| | 186,677 | | | Papa John's International | | | 12,694,036 | | |
| | | | | Franchisor of Pizza Restaurants | | | | | |
| | 71,870 | | | Vail Resorts | | | 9,934,590 | | |
| | | | | Ski Resort Operator & Developer | | | | | |
| | 169,968 | | | Texas Roadhouse | | | 7,750,541 | | |
| | | | | Rural-focused Full Service Steakhouse | | | | | |
| | 142,150 | | | Zoe's Kitchen (a) | | | 5,155,781 | | |
| | | | | Fast, Casual Mediterranean Food | | | | | |
| | 75,663 | | | Choice Hotels | | | 3,603,072 | | |
| | | | | Franchisor of Budget Hotel Brands | | | | | |
| | 149,841 | | | Fiesta Restaurant Group | | | 3,268,032 | | |
| | | | | Owner/Operator of Two Restaurant
Chains: Pollo Tropical & Taco Cabana | | | | | |
| | | | 42,406,052 | | |
| | | > Auto Components 4.5% | |
| | 164,141 | | | Drew Industries | | | 13,925,722 | | |
| | | | | RV & Manufactured Home Components | | | | | |
| | 140,876 | | | Dorman Products | | | 8,058,107 | | |
| | | | | Aftermarket Auto Parts Distributor | | | | | |
| | 152,495 | | | Gentherm | | | 5,222,954 | | |
| | | | | Climate Control Systems for
Car Seats, Mattresses & Other | | | | | |
| | 230,449 | | | Gentex | | | 3,560,437 | | |
| | | | | Manufacturer of Auto Parts | | | | | |
| | | | 30,767,220 | | |
See accompanying notes to financial statements.
38
Number of Shares | | | | Value | |
| | | > Household Durables 2.0% | |
| | 105,984 | | | Cavco Industries | | $ | 9,930,701 | | |
| | | | | Manufactured Homes | | | | | |
| | 109,242 | | | iRobot | | | 3,832,209 | | |
| | | | | Home Robots (Vacuums, Pool
Cleaners) & Battlefield
Reconnaissance Robots | | | | | |
| | | | 13,762,910 | | |
| | | > Specialty Retail 1.3% | |
| | 108,874 | | | Five Below | | | 5,052,842 | | |
| | | | | Low-price Specialty Retailer Targeting
Pre-Teens, Teens & Parents | | | | | |
| | 59,000 | | | Monro Muffler Brake | | | 3,750,040 | | |
| | | | | Automotive Services | | | | | |
| | | | 8,802,882 | | |
| | | > Leisure Products 1.0% | |
| | 147,861 | | | Brunswick Corp | | | 6,701,061 | | |
| | | | | Boats, Boat Engines, Exercise &
Bowling Equipment | | | | | |
| | | > Distributors 0.9% | |
| | 63,439 | | | Pool | | | 5,965,169 | | |
| | | | | Swimming Pool Supplies &
Equipment Distributor | | | | | |
| | | > Diversified Consumer Services 0.8% | |
| | 138,612 | | | ServiceMaster | | | 5,516,758 | | |
| | | | | Pest & Termite Control, Home
Warranty & Other Home Services | | | | | |
Consumer Discretionary: Total | | | 113,922,052 | | |
Financials 15.3% | | | |
| | | > Banks 7.3% | |
| | 96,580 | | | SVB Financial Group | | | 9,190,553 | | |
| | | | | Bank to Venture Capitalists | | | | | |
| | 223,584 | | | MB Financial | | | 8,111,628 | | |
| | | | | Chicago Bank | | | | | |
| | 407,739 | | | Associated Banc-Corp | | | 6,992,724 | | |
| | | | | Midwest Bank | | | | | |
| | 140,915 | | | Lakeland Financial | | | 6,624,414 | | |
| | | | | Indiana Bank | | | | | |
| | 268,010 | | | First Busey | | | 5,732,734 | | |
| | | | | Illinois Bank | | | | | |
| | 172,943 | | | LegacyTexas | | | 4,653,896 | | |
| | | | | Texas Thrift | | | | | |
| | 156,656 | | | Sandy Spring Bancorp | | | 4,552,423 | | |
| | | | | Baltimore & Washington, D.C. Bank | | | | | |
| | 140,000 | | | TriCo Bancshares | | | 3,864,000 | | |
| | | | | California Central Valley Bank | | | | | |
| | | | 49,722,372 | | |
| | | > Diversified Financial Services 2.6% | |
| | 84,984 | | | MarketAxess | | | 12,356,673 | | |
| | | | | Bond Exchange | | | | | |
| | 201,062 | | | BATS Global Markets | | | 5,165,283 | | |
| | | | | U.S. & European Equity, U.S. Options, &
Global FX Exchange | | | | | |
| | | | 17,521,956 | | |
Number of Shares | | | | Value | |
| | | > Capital Markets 2.1% | |
| | 420,816 | | | Virtu Financial | | $ | 7,574,688 | | |
| | | | | High Speed Trader | | | | | |
| | 146,478 | | | SEI Investments | | | 7,047,057 | | |
| | | | | Mutual Fund Administration &
Investment Management | | | | | |
| | | | 14,621,745 | | |
| | | > Real Estate Management &
Development 1.6% | |
| | 131,061 | | | FirstService | | | 6,006,526 | | |
| | | | | Owner, Operator & Manager of
Residential & Commercial Properties | | | | | |
| | 147,574 | | | Colliers International Group | | | 5,038,176 | | |
| | | | | Real Estate Services | | | | | |
| | | | 11,044,702 | | |
| | | > Real Estate Investment Trusts
(REITs) 1.2% | |
| | 130,000 | | | Corrections Corp of America | | | 4,552,600 | | |
| | | | | Prison Owner & Operator | | | | | |
| | 37,582 | | | Extra Space Storage | | | 3,477,838 | | |
| | | | | Self Storage Facilities | | | | | |
| | | | 8,030,438 | | |
| | | > Insurance 0.5% | |
| | 94,479 | | | Allied World Assurance Company
Holdings | | | 3,319,992 | | |
| | | | | Commercial Lines Insurance/
Reinsurance | | | | | |
| | | | 3,319,992 | | |
Financials: Total | | | 104,261,205 | | |
Energy 3.4% | | | |
| | | > Energy Equipment & Services 1.8% | |
| | 58,460 | | | Core Labs (Netherlands) | | | 7,242,609 | | |
| | | | | Oil & Gas Reservoir Consulting | | | | | |
| | 326,080 | | | Frank's International
(Netherlands) (a) | | | 4,764,029 | | |
| | | | | Global Provider of Casing Running
Services Post Drilling of Wells | | | | | |
| | | | 12,006,638 | | |
| | | > Oil, Gas & Consumable Fuels 1.6% | |
| | 177,854 | | | Carrizo Oil & Gas | | | 6,376,066 | | |
| | | | | Oil & Gas Producer | | | | | |
| | 78,760 | | | PDC Energy | | | 4,537,364 | | |
| | | | | Oil & Gas Producer in the
United States | | | | | |
| | | | 10,913,430 | | |
Energy: Total | | | 22,920,068 | | |
Consumer Staples 0.9% | | | |
| | | > Household Products 0.9% | |
| | 53,000 | | | WD-40 | | | 6,224,850 | | |
| | | | | Manufacturer of Industrial
Lubrications | | | | | |
| | | | 6,224,850 | | |
Consumer Staples: Total | | | 6,224,850 | | |
See accompanying notes to financial statements.
39
COLUMBIA ACORN USA®
STATEMENT OF INVESTMENTS (UNAUDITED), CONTINUED
Number of Shares | | | | Value | |
Telecommunication Services 0.6% | |
| | | > Diversified Telecommunication
Services 0.6% | |
| | 344,808 | | | Lumos Networks | | $ | 4,172,177 | | |
| | | Telephone & Fiber Optic
Data Services | | | | | |
| | | | 4,172,177 | | |
Telecommunication Services: Total | | | 4,172,177 | | |
Total Equities: 97.1%
(Cost: $484,970,330) | | | 659,791,284 | (c) | |
Short-Term Investments 1.7% | |
| | 11,332,469 | | | JPMorgan U.S. Government
Money Market Fund, Agency
Shares (7 day yield of 0.20%) | | | 11,332,469 | | |
Total Short-Term Investments: 1.7%
(Cost: $11,332,469) | | | 11,332,469 | | |
Number of Shares | | | | Value | |
Securities Lending Collateral 2.1% | |
| | 14,582,425 | | | Dreyfus Government Cash
Management Fund,
Institutional Shares
(7 day yield of 0.24%) (d) | | $ | 14,582,425 | | |
Total Securities Lending Collateral: 2.1%
(Cost: $14,582,425) | | | 14,582,425 | | |
Total Investments: 100.9%
(Cost: $510,885,224)(e) | | | 685,706,178 | (f) | |
Obligation to Return Collateral for
Securities Loaned: (2.1)% | | | (14,582,425 | ) | |
Cash and Other Assets Less Liabilities: 1.2% | | | 8,147,587 | | |
Net Assets: 100.0% | | $ | 679,271,340 | | |
ADR - American Depositary Receipts
> Notes to Statement of Investments
(a) All or a portion of this security was on loan at June 30, 2016. The total market value of securities on loan at June 30, 2016 was $14,187,390.
(b) Non-income producing security.
(c) On June 30, 2016, the market value of foreign securities represented 1.77% of total net assets. The Fund's foreign portfolio was diversified as follows:
Country | | Value | | Percentage
of Net Assets | |
Netherlands | | $ | 12,006,638 | | | | 1.77 | | |
(d) Investment made with cash collateral received from securities lending activity.
(e) At June 30, 2016, for federal income tax purposes, the cost of investments was approximately $510,885,224 and net unrealized appreciation was $174,820,954 consisting of gross unrealized appreciation of $189,895,362 and gross unrealized depreciation of $15,074,408.
(f) An affiliated person of the Fund, as defined in the Investment Company Act of 1940, may include any company in which the Fund owns five percent or more of its outstanding voting shares. Holdings and transactions in these affiliated companies during the period ended June 30, 2016, are as follows:
Security | | Balance of
Shares Held
12/31/15 | | Purchases/
Additions | | Sales/
Reductions | | Balance of
Shares Held
6/30/16 | | Value | | Dividend | |
Rubicon Technology | | | 1,354,071 | | | | - | | | | 1,354,071 | | | | - | | | $ | - | | | $ | - | | |
At June 30, 2016, the Fund did not hold any investments in affiliated companies.
Fair Value Measurements
Various inputs are used in determining the value of the Fund's investments, following the input prioritization hierarchy established by accounting principles generally accepted in the United States of America (GAAP). These inputs are summarized in the three broad levels listed below:
• Level 1 – quoted prices in active markets for identical securities
• Level 2 – prices determined using other significant observable inputs (including quoted prices for similar securities, interest rates, prepayment speeds, credit risk and others)
• Level 3 – prices determined using significant unobservable inputs where quoted prices or observable inputs are unavailable or less reliable (including management's own assumptions about the factors market participants would use in pricing an investment)
The inputs or methodology used for valuing securities are not necessarily an indication of the risk associated with investing in those securities.
Examples of the types of securities in which the Fund would typically invest and how they are classified within this hierarchy are as follows. Typical Level 1 securities include exchange traded domestic equities, mutual funds whose NAVs are published each day and exchange traded foreign equities that are not statistically fair valued. Typical Level 2 securities include exchange traded foreign equities that are statistically fair valued, forward foreign currency exchange contracts and short-term investments valued at amortized cost. Additionally, securities fair valued by CWAM's Valuation Committee (the Committee) that rely on significant observable inputs are also included in Level 2. Typical Level 3 securities include any security fair valued by the Committee that relies on significant unobservable inputs.
See accompanying notes to financial statements.
40
> Notes to Statement of Investments
The Committee is responsible for applying the Trust's Portfolio Pricing Policy and the CWAM pricing procedures (the Policies), which are approved by and subject to the oversight of the Board.
The Committee meets as necessary, and no less frequently than quarterly, to determine fair values for securities for which market quotations are not readily available or for which CWAM believes that available market quotations are unreliable. The Committee also reviews the continuing appropriateness of the Policies. In circumstances where a security has been fair valued, the Committee will also review the continuing appropriateness of the current value of the security. The Policies address, among other things: circumstances under which market quotations will be deemed readily available; selection of third party pricing vendors; appropriate pricing methodologies; events that require fair valuation and fair value techniques; circumstances under which securities will be deemed to pose a potential for stale pricing, including when securities are illiquid, restricted, or in default; and certain delegations of authority to determine fair values to the Fund's investment manager. The Committee may also meet to discuss additional valuation matters, which may include review of back-testing results, review of time-sensitive information or approval of other valuation related actions, and to review the appropriateness of the Policies.
For investments categorized as Level 3, the significant unobservable inputs used in the fair value measurement of the Fund's securities may include: (i) data specific to the issuer or comparable issuers, (ii) general market or specific sector news and (iii) quoted prices and specific or similar security transactions. The Committee considers this data and any changes from prior periods in order to assess the reasonableness of observable and unobservable inputs, any assumptions or internal models used to value those securities and changes in fair value. Significant changes in any of these factors could result in lower or higher fair value measurements. Various factors impact the frequency of monitoring (which may occur as often as daily), however the Committee may determine that changes to inputs, assumptions and models are not required with the same frequency.
The following table summarizes the inputs used, as of June 30, 2016, in valuing the Fund's assets:
Investment Type | | Quoted Prices
(Level 1) | | Other
Significant
Observable
Inputs
(Level 2) | | Significant
Unobservable
Inputs
(Level 3) | | Total | |
Equities | |
Health Care | | $ | 159,043,218 | | | $ | - | | | $ | - | | | $ | 159,043,218 | | |
Information Technology | | | 125,440,992 | | | | - | | | | - | | | | 125,440,992 | | |
Industrials | | | 123,806,722 | | | | - | | | | - | | | | 123,806,722 | | |
Consumer Discretionary | | | 113,922,052 | | | | - | | | | - | | | | 113,922,052 | | |
Financials | | | 104,261,205 | | | | - | | | | - | | | | 104,261,205 | | |
Energy | | | 22,920,068 | | | | - | | | | - | | | | 22,920,068 | | |
Consumer Staples | | | 6,224,850 | | | | - | | | | - | | | | 6,224,850 | | |
Telecommunication Services | | | 4,172,177 | | | | - | | | | - | | | | 4,172,177 | | |
Total Equities | | | 659,791,284 | | | | - | | | | - | | | | 659,791,284 | | |
Total Short-Term Investments | | | 11,332,469 | | | | - | | | | - | | | | 11,332,469 | | |
Total Securities Lending Collateral | | | 14,582,425 | | | | - | | | | - | | | | 14,582,425 | | |
Total Investments | | $ | 685,706,178 | | | $ | - | | | $ | - | | | $ | 685,706,178 | | |
There were no transfers of financial assets between levels during the period.
See accompanying notes to financial statements.
41
COLUMBIA ACORN INTERNATIONAL SELECTSM
STATEMENT OF INVESTMENTS (UNAUDITED), JUNE 30, 2016
Number of Shares | | | | Value | |
| | | | | | | Equities: 95.5% | |
Europe 39.9% | | | |
| | | > United Kingdom 8.4% | |
| | 141,000 | | | Compass Group | | $ | 2,682,579 | | |
| | | | | Catering & Support Services | | | | | |
| | 38,000 | | | Next | | | 2,510,883 | | |
| | | | | Clothes & Home Retailer in the UK | | | | | |
| | 102,930 | | | WH Smith | | | 2,162,406 | | |
| | | | | Newsprint, Books & General Stationery
Retailer | | | | | |
| | 39,000 | | | Rightmove | | | 1,904,796 | | |
| | | | | Internet Real Estate Listings | | | | | |
| | | | 9,260,664 | | |
| | | > Switzerland 7.5% | |
| | 11,654 | | | Partners Group | | | 4,994,503 | | |
| | | | | Private Markets Asset Management | | | | | |
| | 8,540 | | | Geberit | | | 3,234,631 | | |
| | | | | Plumbing Systems | | | | | |
| | | | 8,229,134 | | |
| | | > Germany 6.6% | |
| | 101,204 | | | Wirecard (a) | | | 4,457,622 | | |
| | | | | Online Payment Processing &
Risk Management | | | | | |
| | 29,500 | | | MTU Aero Engines | | | 2,756,124 | | |
| | | | | Airplane Engine Components & Services | | | | | |
| | | | 7,213,746 | | |
| | | > Denmark 5.2% | |
| | 118,955 | | | Novozymes | | | 5,712,325 | | |
| | | | | Industrial Enzymes | | | | | |
| | | > France 4.4% | |
| | 19,000 | | | Essilor International | | | 2,497,152 | | |
| | | | | Eyeglass Lenses | | | | | |
| | 125,000 | | | Eutelsat | | | 2,359,387 | | |
| | | | | Fixed Satellite Services | | | | | |
| | | | 4,856,539 | | |
| | | > Sweden 3.5% | |
| | 106,000 | | | Hexagon | | | 3,879,172 | | |
| | | | | Design, Measurement & Visualization
Software & Equipment | | | | | |
| | | > Spain 2.5% | |
| | 477,000 | | | Distribuidora Internacional de
Alimentación | | | 2,784,198 | | |
| | | | | Discount Retailer in Spain & Latin America | | | | | |
| | | > Ireland 1.8% | |
| | 158,000 | | | Ryanair | | | 1,994,902 | | |
| | | | | European Low Cost Airline | | | | | |
Europe: Total | | | 43,930,680 | | |
Asia 37.5% | | | |
| | | > Japan 21.5% | |
| | 291,000 | | | Aeon Mall | | | 3,807,456 | | |
| | | | | Suburban Shopping Mall Developer,
Owner & Operator | | | | | |
| | 126,800 | | | Bandai Namco | | | 3,272,266 | | |
| | | | | Branded Toys & Related Content | | | | | |
Number of Shares | | | | Value | |
| | 96,000 | | | KDDI | | $ | 2,919,335 | | |
| | | | | Mobile & Fixed Line Communication
Service Provider in Japan | | | | | |
| | 254,400 | | | Sony Financial Holdings | | | 2,876,469 | | |
| | | | | Life Insurance, Assurance & Internet
Banking | | | | | |
| | 77,300 | | | Recruit Holdings | | | 2,824,087 | | |
| | | | | Recruitment & Media Services | | | | | |
| | 45,600 | | | FamilyMart | | | 2,778,923 | | |
| | | | | Convenience Store Operator | | | | | |
| | 173,000 | | | Santen Pharmaceutical | | | 2,719,073 | | |
| | | | | Specialty Pharma (Ophthalmic Medicine) | | | | | |
| | 68,000 | | | Hoya | | | 2,428,688 | | |
| | | | | Opto-electrical Components &
Eyeglass Lenses | | | | | |
| | | | 23,626,297 | | |
| | | > China 7.4% | |
| | 17,000 | | | NetEase.com - ADR | | | 3,284,740 | | |
| | | | | Chinese Online Gaming Services | | | | | |
| | 2,191,000 | | | China Everbright International | | | 2,449,863 | | |
| | | | | Municipal Waste Operator | | | | | |
| | 217,000 | | | Vipshop - ADR (b) | | | 2,423,890 | | |
| | | | | Internet Discount Retailer | | | | | |
| | | | 8,158,493 | | |
| | | > Taiwan 3.4% | |
| | 41,000 | | | Largan Precision | | | 3,791,813 | | |
| | | | | Mobile Device Camera Lenses & Modules | | | | | |
| | | > India 2.9% | |
| | 463,000 | | | Zee Entertainment Enterprises | | | 3,142,747 | | |
| | | | | Indian Programmer of Pay Television
Content | | | | | |
| | | > Thailand 2.3% | |
| | 228,000 | | | Airports of Thailand | | | 2,535,234 | | |
| | | | | Airport Operator of Thailand | | | | | |
Asia: Total | | | 41,254,584 | | |
Other Countries 18.1% | | | |
| | | > Canada 7.1% | |
| | 32,641 | | | CCL Industries | | | 5,680,562 | | |
| | | | | Global Label Converter | | | | | |
| | 66,240 | | | Vermilion Energy | | | 2,109,303 | | |
| | | | | Canadian Exploration & Production
Company | | | | | |
| | | | 7,789,865 | | |
| | | > Australia 6.1% | |
| | 305,000 | | | Amcor | | | 3,429,297 | | |
| | | | | Flexible & Rigid Packaging | | | | | |
| | 778,268 | | | IAG | | | 3,205,895 | | |
| | | | | General Insurance Provider | | | | | |
| | | | 6,635,192 | | |
| | | > South Africa 2.9% | |
| | 21,000 | | | Naspers | | | 3,206,597 | | |
| | | | | Media in Africa, China, Russia & Other
Emerging Markets | | | | | |
See accompanying notes to financial statements.
42
Number of Shares | | | | Value | |
| | | > United States 2.0% | |
| | 41,840 | | | Anadarko Petroleum | | $ | 2,227,980 | | |
| | | Worldwide Production of Oil & Gas | | | | | |
Other Countries: Total | | | 19,859,634 | | |
Total Equities: 95.5%
(Cost: $90,481,062) | | | 105,044,898 | (c) | |
Short-Term Investments 2.7% | |
| | 3,011,768 | | | JPMorgan U.S. Government
Money Market Fund, IM Shares
(7 day yield of 0.29%) | | | 3,011,768 | | |
Total Short-Term Investments: 2.7%
(Cost: $3,011,768) | | | 3,011,768 | | |
Number of Shares | | | | Value | |
Securities Lending Collateral 3.7% | |
| | 4,028,509 | | | Dreyfus Government Cash
Management Fund,
Institutional Shares
(7 day yield of 0.24%) (d) | | $ | 4,028,509 | | |
Total Securities Lending Collateral: 3.7%
(Cost: $4,028,509) | | | 4,028,509 | | |
Total Investments: 101.9%
(Cost: $97,521,339)(e) | | | 112,085,175 | | |
Obligation to Return Collateral for
Securities Loaned: (3.7)% | | | (4,028,509 | ) | |
Cash and Other Assets Less Liabilities: 1.8% | | | 1,922,295 | | |
Net Assets: 100.0% | | $ | 109,978,961 | | |
ADR - American Depositary Receipts
> Notes to Statement of Investments
(a) All or a portion of this security was on loan at June 30, 2016. The total market value of securities on loan at June 30, 2016 was $3,911,451.
(b) Non-income producing security.
(c) On June 30, 2016, the Fund's total equity investments were denominated in currencies as follows:
Currency | | Value | | Percentage
of Net Assets | |
Japanese Yen | | $ | 23,626,297 | | | | 21.5 | | |
Euro | | | 16,849,385 | | | | 15.3 | | |
British Pound | | | 9,260,664 | | | | 8.4 | | |
Swiss Franc | | | 8,229,134 | | | | 7.5 | | |
Canadian Dollar | | | 7,789,865 | | | | 7.1 | | |
Australian Dollar | | | 6,635,192 | | | | 6.0 | | |
U.S. Dollar | | | 7,936,610 | | | | 7.2 | | |
Danish Krone | | | 5,712,325 | | | | 5.2 | | |
Other currencies less
than 5% of total net assets | | | 19,005,426 | | | | 17.3 | | |
Total Equities | | $ | 105,044,898 | | | | 95.5 | | |
(d) Investment made with cash collateral received from securities lending activity.
(e) At June 30, 2016, for federal income tax purposes, the cost of investments was approximately $97,521,339 and net unrealized appreciation was $14,563,836 consisting of gross unrealized appreciation of $23,193,065 and gross unrealized depreciation of $8,629,229.
Fair Value Measurements
Various inputs are used in determining the value of the Fund's investments, following the input prioritization hierarchy established by accounting principles generally accepted in the United States of America (GAAP). These inputs are summarized in the three broad levels listed below:
• Level 1 – quoted prices in active markets for identical securities
• Level 2 – prices determined using other significant observable inputs (including quoted prices for similar securities, interest rates, prepayment speeds, credit risk and others)
• Level 3 – prices determined using significant unobservable inputs where quoted prices or observable inputs are unavailable or less reliable (including management's own assumptions about the factors market participants would use in pricing an investment)
The inputs or methodology used for valuing securities are not necessarily an indication of the risk associated with investing in those securities.
See accompanying notes to financial statements.
43
COLUMBIA ACORN INTERNATIONAL SELECTSM
STATEMENT OF INVESTMENTS (UNAUDITED), CONTINUED
> Notes to Statement of Investments
Examples of the types of securities in which the Fund would typically invest and how they are classified within this hierarchy are as follows. Typical Level 1 securities include exchange traded domestic equities, mutual funds whose NAVs are published each day and exchange traded foreign equities that are not statistically fair valued. Typical Level 2 securities include exchange traded foreign equities that are statistically fair valued, forward foreign currency exchange contracts and short-term investments valued at amortized cost. Additionally, securities fair valued by CWAM's Valuation Committee (the Committee) that rely on significant observable inputs are also included in Level 2. Typical Level 3 securities include any security fair valued by the Committee that relies on significant unobservable inputs.
The Committee is responsible for applying the Trust's Portfolio Pricing Policy and the CWAM pricing procedures (the Policies), which are approved by and subject to the oversight of the Board.
The Committee meets as necessary, and no less frequently than quarterly, to determine fair values for securities for which market quotations are not readily available or for which CWAM believes that available market quotations are unreliable. The Committee also reviews the continuing appropriateness of the Policies. In circumstances where a security has been fair valued, the Committee will also review the continuing appropriateness of the current value of the security. The Policies address, among other things: circumstances under which market quotations will be deemed readily available; selection of third party pricing vendors; appropriate pricing methodologies; events that require fair valuation and fair value techniques; circumstances under which securities will be deemed to pose a potential for stale pricing, including when securities are illiquid, restricted, or in default; and certain delegations of authority to determine fair values to the Fund's investment manager. The Committee may also meet to discuss additional valuation matters, which may include review of back-testing results, review of time-sensitive information or approval of other valuation related actions, and to review the appropriateness of the Policies.
For investments categorized as Level 3, the significant unobservable inputs used in the fair value measurement of the Fund's securities may include: (i) data specific to the issuer or comparable issuers, (ii) general market or specific sector news and (iii) quoted prices and specific or similar security transactions. The Committee considers this data and any changes from prior periods in order to assess the reasonableness of observable and unobservable inputs, any assumptions or internal models used to value those securities and changes in fair value. Significant changes in any of these factors could result in lower or higher fair value measurements. Various factors impact the frequency of monitoring (which may occur as often as daily), however the Committee may determine that changes to inputs, assumptions and models are not required with the same frequency.
The following table summarizes the inputs used, as of June 30, 2016, in valuing the Fund's assets:
Investment Type | | Quoted Prices
(Level 1) | | Other
Significant
Observable
Inputs
(Level 2) | | Significant
Unobservable
Inputs
(Level 3) | | Total | |
Equities | |
Europe | | $ | - | | | $ | 43,930,680 | | | $ | - | | | $ | 43,930,680 | | |
Asia | | | 5,708,630 | | | | 35,545,954 | | | | - | | | | 41,254,584 | | |
Other Countries | | | 10,017,845 | | | | 9,841,789 | | | | - | | | | 19,859,634 | | |
Total Equities | | | 15,726,475 | | | | 89,318,423 | | | | - | | | | 105,044,898 | | |
Total Short-Term Investments | | | 3,011,768 | | | | - | | | | - | | | | 3,011,768 | | |
Total Securities Lending Collateral | | | 4,028,509 | | | | - | | | | - | | | | 4,028,509 | | |
Total Investments | | $ | 22,766,752 | | | $ | 89,318,423 | | | $ | - | | | $ | 112,085,175 | | |
The Fund's assets assigned to the Level 2 input category are generally valued using a market approach, in which a security's value is determined through its correlation to prices and information from observable market transactions for similar or identical assets. Foreign equities are generally valued at the last sale price on the foreign exchange or market on which they trade. The Fund may use a statistical fair valuation model, in accordance with the policy adopted by the Board, provided by an independent third party to value securities principally traded in foreign markets in order to adjust for possible stale pricing that may occur between the close of the foreign exchanges and the time for valuation. These models take into account available market data including intraday index, ADR, and ETF movements.
There were no transfers of financial assets between levels during the period.
See accompanying notes to financial statements.
44
COLUMBIA ACORN INTERNATIONAL SELECTSM
PORTFOLIO DIVERSIFICATION (UNAUDITED)
At June 30, 2016, the Fund's portfolio investments as a percentage of net assets were diversified as follows:
| | Value | | Percentage
of Net Assets | |
| > Consumer Discretionary | |
Media | | $ | 8,708,729 | | | | 7.8 | | |
Leisure Products | | | 3,272,266 | | | | 3.0 | | |
Hotels, Restaurants & Leisure | | | 2,682,580 | | | | 2.4 | | |
Multiline Retail | | | 2,510,883 | | | | 2.3 | | |
Internet & Catalog Retail | | | 2,423,890 | | | | 2.2 | | |
Specialty Retail | | | 2,162,406 | | | | 2.0 | | |
| | | 21,760,754 | | | | 19.7 | | |
| > Information Technology | |
Electronic Equipment, Instruments &
Components | | | 7,670,985 | | | | 7.0 | | |
Internet Software & Services | | | 5,189,537 | | | | 4.6 | | |
IT Services | | | 4,457,622 | | | | 4.1 | | |
| | | 17,318,144 | | | | 15.7 | | |
| > Industrials | |
Building Products | | | 3,234,631 | | | | 2.9 | | |
Professional Services | | | 2,824,087 | | | | 2.6 | | |
Aerospace & Defense | | | 2,756,124 | | | | 2.5 | | |
Transportation Infrastructure | | | 2,535,234 | | | | 2.3 | | |
Commercial Services & Supplies | | | 2,449,863 | | | | 2.3 | | |
Airlines | | | 1,994,903 | | | | 1.8 | | |
| | | 15,794,842 | | | | 14.4 | | |
| > Financials | |
Insurance | | | 6,082,364 | | | | 5.5 | | |
Capital Markets | | | 4,994,503 | | | | 4.5 | | |
Real Estate Management &
Development | | | 3,807,454 | | | | 3.5 | | |
| | | 14,884,321 | | | | 13.5 | | |
| | Value | | Percentage
of Net Assets | |
| > Materials | |
Containers & Packaging | | $ | 9,109,860 | | | | 8.3 | | |
Chemicals | | | 5,712,325 | | | | 5.2 | | |
| | | 14,822,185 | | | | 13.5 | | |
| > Health Care | |
Health Care Equipment & Supplies | | | 4,925,840 | | | | 4.5 | | |
Pharmaceuticals | | | 2,719,073 | | | | 2.5 | | |
| | | 7,644,913 | | | | 7.0 | | |
| > Consumer Staples | |
Food & Staples Retailing | | | 5,563,121 | | | | 5.1 | | |
| | | 5,563,121 | | | | 5.1 | | |
| > Energy | |
Oil, Gas & Consumable Fuels | | | 4,337,283 | | | | 3.9 | | |
| | | 4,337,283 | | | | 3.9 | | |
| > Telecommunication Services | |
Wireless Telecommunication Services | | | 2,919,335 | | | | 2.7 | | |
| | | 2,919,335 | | | | 2.7 | | |
Total Equities: | | | 105,044,898 | | | | 95.5 | | |
Short-Term Investments: | | | 3,011,768 | | | | 2.7 | | |
Securities Lending Collateral: | | | 4,028,509 | | | | 3.7 | | |
Total Investments: | | | 112,085,175 | | | | 101.9 | | |
Obligation to Return
Collateral for Securities
Loaned: | | | (4,028,509 | ) | | | (3.7 | ) | |
Cash and Other Assets
Less Liabilities: | | | 1,922,295 | | | | 1.8 | | |
Net Assets: | | $ | 109,978,961 | | | | 100.0 | | |
See accompanying notes to financial statements.
45
COLUMBIA ACORN SELECTSM
STATEMENT OF INVESTMENTS (UNAUDITED), JUNE 30, 2016
Number of Shares | | | | Value | |
| | | | | | | Equities: 97.0% | |
Consumer Discretionary 24.8% | | | |
| | | > Hotels, Restaurants & Leisure 7.2% | |
| | 193,600 | | | Papa John's International | | $ | 13,164,800 | | |
| | | | | Franchisor of Pizza Restaurants | | | | | |
| | 79,584 | | | Vail Resorts | | | 11,000,896 | | |
| | | | | Ski Resort Operator & Developer | | | | | |
| | | | 24,165,696 | | |
| | | > Distributors 5.2% | |
| | 553,620 | | | LKQ (a) | | | 17,549,754 | | |
| | | | | Alternative Auto Parts Distribution | | | | | |
| | | > Media 3.8% | |
| | 384,000 | | | Liberty Global Series A (a) | | | 11,159,040 | | |
| | | | | Cable TV Franchises Outside of the
United States | | | | | |
| | 47,911 | | | Liberty Global Latin America
Group (a) | | | 1,545,617 | | |
| | | | | Cable TV & Broadband in
Latin America | | | | | |
| | | | 12,704,657 | | |
| | | > Textiles, Apparel & Luxury Goods 2.9% | |
| | 392,000 | | | Hanesbrands | | | 9,850,960 | | |
| | | | | Apparel Wholesaler | | | | | |
| | | > Household Durables 2.4% | |
| | 229,000 | | | iRobot (a) | | | 8,033,320 | | |
| | | | | Home Robots (Vacuums, Pool Cleaners) &
Battlefield Reconnaissance Robots | | | | | |
| | | > Internet & Catalog Retail 2.0% | |
| | 300,000 | | | Liberty TripAdvisor Holdings
Class A (a) | | | 6,564,000 | | |
| | | | | Holding Company for Trip Advisor | | | | | |
| | | > Specialty Retail 1.3% | |
| | 113,393 | | | Cato | | | 4,277,184 | | |
| | | | | Women's Apparel Retailing, Focusing
on Private Labels & Low Prices | | | | | |
Consumer Discretionary: Total | | | 83,145,571 | | |
Industrials 22.8% | | | |
| | | > Machinery 9.0% | |
| | 142,256 | | | Nordson | | | 11,894,024 | | |
| | | | | Dispensing Systems for Adhesives &
Coatings | | | | | |
| | 88,400 | | | Middleby (a) | | | 10,188,100 | | |
| | | | | Manufacturer of Cooking Equipment | | | | | |
| | 116,000 | | | Wabtec | | | 8,146,680 | | |
| | | | | Freight & Transit Component Supplier | | | | | |
| | | | 30,228,804 | | |
| | | > Road & Rail 7.6% | |
| | 37,000 | | | Amerco | | | 13,858,350 | | |
| | | | | North American Moving & Storage | | | | | |
| | 145,000 | | | JB Hunt Transport Services | | | 11,734,850 | | |
| | | | | Truck & Intermodal Carrier | | | | | |
| | | | 25,593,200 | | |
| | | > Electrical Equipment 3.1% | |
| | 297,530 | | | Generac (a) | | | 10,401,649 | | |
| | | | | Standby Power Generators | | | | | |
| | | | 10,401,649 | | |
Number of Shares | | | | Value | |
| | | > Professional Services 3.1% | |
| | 270,395 | | | Robert Half International | | $ | 10,318,273 | | |
| | | | | Temporary & Permanent Staffing in
Finance, Accounting &
Other Professions | | | | | |
| | | | 10,318,273 | | |
Industrials: Total | | | 76,541,926 | | |
Financials 19.7% | | | |
| | | > Real Estate Investment Trusts
(REITs) 8.7% | |
| | 125,161 | | | Crown Castle International | | | 12,695,080 | | |
| | | | | Communications Towers | | | | | |
| | 273,566 | | | EdR | | | 12,622,335 | | |
| | | | | Student Housing | | | | | |
| | 40,426 | | | Extra Space Storage | | | 3,741,022 | | |
| | | | | Self Storage Facilities | | | | | |
| | | | 29,058,437 | | |
| | | > Capital Markets 4.4% | |
| | 263,000 | | | Lazard | | | 7,832,140 | | |
| | | | | Corporate Advisory &
Asset Management | | | | | |
| | 198,237 | | | Eaton Vance | | | 7,005,696 | | |
| | | | | Specialty Mutual Funds | | | | | |
| | | | 14,837,836 | | |
| | | > Banks 4.3% | |
| | 152,600 | | | SVB Financial Group (a) | | | 14,521,416 | | |
| | | | | Bank to Venture Capitalists | | | | | |
| | | | 14,521,416 | | |
| | | > Real Estate Management &
Development 2.3% | |
| | 77,300 | | | Jones Lang LaSalle | | | 7,532,885 | | |
| | | | | Real Estate Services | | | | | |
| | | | 7,532,885 | | |
Financials: Total | | | 65,950,574 | | |
Health Care 15.8% | | | |
| | | > Health Care Equipment & Supplies 5.8% | |
| | 182,177 | | | Align Technology (a) | | | 14,674,357 | | |
| | | | | Invisalign System to Correct
Malocclusion (Crooked Teeth) | | | | | |
| | 94,397 | | | LivaNova (a) | | | 4,741,561 | | |
| | | | | Neuromodulation & Cardiac Devices | | | | | |
| | | | 19,415,918 | | |
| | | > Health Care Providers & Services 4.1% | |
| | 357,000 | | | HealthSouth | | | 13,858,740 | | |
| | | | | Inpatient Rehabilitation Facilities &
Home Health Care | | | | | |
| | | | 13,858,740 | | |
| | | > Life Sciences Tools & Services 3.3% | |
| | 386,603 | | | VWR (a) | | | 11,172,827 | | |
| | | | | Distributor of Lab Supplies | | | | | |
| | | | 11,172,827 | | |
| | | > Biotechnology 2.6% | |
| | 242,166 | | | Cepheid (a) | | | 7,446,605 | | |
| | | | | Molecular Diagnostics | | | | | |
See accompanying notes to financial statements.
46
Number of Shares | | | | Value | |
| | | > Biotechnology—continued | |
| | 26,186 | | | Ultragenyx Pharmaceutical (a) | | $ | 1,280,757 | | |
| | | | | Biotech Focused on "Ultra-Orphan"
Drugs | | | | | |
| | | | 8,727,362 | | |
Health Care: Total | | | 53,174,847 | | |
Information Technology 7.2% | | | |
| | | > Software 5.0% | |
| | 113,158 | | | Ansys (a) | | | 10,269,088 | | |
| | | | | Simulation Software for Engineers &
Designers | | | | | |
| | 31,057 | | | Ultimate Software (a) | | | 6,530,977 | | |
| | | | | Human Capital Management Systems | | | | | |
| | | | 16,800,065 | | |
| | | > Internet Software & Services 2.2% | |
| | 124,000 | | | SPS Commerce (a) | | | 7,514,400 | | |
| | | | | Supply Chain Management Software
Delivered via the Web | | | | | |
| | | | 7,514,400 | | |
Information Technology: Total | | | 24,314,465 | | |
Consumer Staples 4.2% | | | |
| | | > Household Products 4.2% | |
| | 1,014,000 | | | HRG Group (a) | | | 13,922,220 | | |
| | | | | Holding Company | | | | | |
| | | | 13,922,220 | | |
Consumer Staples: Total | | | 13,922,220 | | |
Number of Shares | | | | Value | |
Materials 2.5% | |
| | | > Chemicals 2.5% | |
| | 320,681 | | | Axalta Coating Systems (a) | | $ | 8,507,667 | | |
| | | Global Manufacturer of High
Performance Coatings | | | | | |
| | | | 8,507,667 | | |
Materials: Total | | | 8,507,667 | | |
Total Equities: 97.0%
(Cost: $292,517,126) | | | 325,557,270 | | |
Short-Term Investments 4.1% | |
| | 13,625,892 | | | JPMorgan U.S. Government
Money Market Fund, Agency
Shares (7 day yield of 0.20%) | | | 13,625,892 | | |
Total Short-Term Investments: 4.1%
(Cost: $13,625,892) | | | 13,625,892 | | |
Total Investments: 101.1%
(Cost: $306,143,018)(b) | | | 339,183,162 | | |
Cash and Other Assets Less Liabilities: (1.1)% | | | (3,526,586 | ) | |
Net Assets: 100.0% | | $ | 335,656,576 | | |
> Notes to Statement of Investments
(a) Non-income producing security.
(b) At June 30, 2016, for federal income tax purposes, the cost of investments was approximately $306,143,018 and net unrealized appreciation was $33,040,144 consisting of gross unrealized appreciation of $45,223,436 and gross unrealized depreciation of $12,183,292.
Fair Value Measurements
Various inputs are used in determining the value of the Fund's investments, following the input prioritization hierarchy established by accounting principles generally accepted in the United States of America (GAAP). These inputs are summarized in the three broad levels listed below:
• Level 1 – quoted prices in active markets for identical securities
• Level 2 – prices determined using other significant observable inputs (including quoted prices for similar securities, interest rates, prepayment speeds, credit risk and others)
• Level 3 – prices determined using significant unobservable inputs where quoted prices or observable inputs are unavailable or less reliable (including management's own assumptions about the factors market participants would use in pricing an investment)
The inputs or methodology used for valuing securities are not necessarily an indication of the risk associated with investing in those securities.
Examples of the types of securities in which the Fund would typically invest and how they are classified within this hierarchy are as follows. Typical Level 1 securities include exchange traded domestic equities, mutual funds whose NAVs are published each day and exchange traded foreign equities that are not statistically fair valued. Typical Level 2 securities include exchange traded foreign equities that are statistically fair valued, forward foreign currency exchange contracts and short-term investments valued at amortized cost. Additionally, securities fair valued by CWAM's Valuation Committee (the Committee) that rely on significant observable inputs are also included in Level 2. Typical Level 3 securities include any security fair valued by the Committee that relies on significant unobservable inputs.
The Committee is responsible for applying the Trust's Portfolio Pricing Policy and the CWAM pricing procedures (the Policies), which are approved by and subject to the oversight of the Board.
See accompanying notes to financial statements.
47
COLUMBIA ACORN SELECTSM
STATEMENT OF INVESTMENTS (UNAUDITED), CONTINUED
> Notes to Statement of Investments
The Committee meets as necessary, and no less frequently than quarterly, to determine fair values for securities for which market quotations are not readily available or for which CWAM believes that available market quotations are unreliable. The Committee also reviews the continuing appropriateness of the Policies. In circumstances where a security has been fair valued, the Committee will also review the continuing appropriateness of the current value of the security. The Policies address, among other things: circumstances under which market quotations will be deemed readily available; selection of third party pricing vendors; appropriate pricing methodologies; events that require fair valuation and fair value techniques; circumstances under which securities will be deemed to pose a potential for stale pricing, including when securities are illiquid, restricted, or in default; and certain delegations of authority to determine fair values to the Fund's investment manager. The Committee may also meet to discuss additional valuation matters, which may include review of back-testing results, review of time-sensitive information or approval of other valuation related actions, and to review the appropriateness of the Policies.
For investments categorized as Level 3, the significant unobservable inputs used in the fair value measurement of the Fund's securities may include: (i) data specific to the issuer or comparable issuers, (ii) general market or specific sector news and (iii) quoted prices and specific or similar security transactions. The Committee considers this data and any changes from prior periods in order to assess the reasonableness of observable and unobservable inputs, any assumptions or internal models used to value those securities and changes in fair value. Significant changes in any of these factors could result in lower or higher fair value measurements. Various factors impact the frequency of monitoring (which may occur as often as daily), however the Committee may determine that changes to inputs, assumptions and models are not required with the same frequency.
The following table summarizes the inputs used, as of June 30, 2016, in valuing the Fund's assets:
Investment Type | | Quoted Prices
(Level 1) | | Other
Significant
Observable
Inputs
(Level 2) | | Significant
Unobservable
Inputs
(Level 3) | | Total | |
Equities | |
Consumer Discretionary | | $ | 83,145,571 | | | $ | - | | | $ | - | | | $ | 83,145,571 | | |
Industrials | | | 76,541,926 | | | | - | | | | - | | | | 76,541,926 | | |
Financials | | | 65,950,574 | | | | - | | | | - | | | | 65,950,574 | | |
Health Care | | | 53,174,847 | | | | - | | | | - | | | | 53,174,847 | | |
Information Technology | | | 24,314,465 | | | | - | | | | - | | | | 24,314,465 | | |
Consumer Staples | | | 13,922,220 | | | | - | | | | - | | | | 13,922,220 | | |
Materials | | | 8,507,667 | | | | - | | | | - | | | | 8,507,667 | | |
Total Equities | | | 325,557,270 | | | | - | | | | - | | | | 325,557,270 | | |
Total Short-Term Investments | | | 13,625,892 | | | | - | | | | - | | | | 13,625,892 | | |
Total Investments | | $ | 339,183,162 | | | $ | - | | | $ | - | | | $ | 339,183,162 | | |
There were no transfers of financial assets between levels during the period.
The following table reconciles asset balances for the period ending June 30, 2016, in which significant observable and/or unobservable inputs (Level 3) were used in determining value:
Investments in Securities | | Balance as
of December 31,
2015 | | Realized
Gain (Loss) | | Change
in Unrealized
Appreciation
(Depreciation) | | Purchases | | Sales | | Transfers
Into
Level 3 | | Transfers
out of
Level 3 | | Balance as
of June 30,
2016 | |
Equities | |
| Food Products | | $ | 8,851,514 | | | $ | (16,166,667 | ) | | $ | 11,148,486 | | | $ | - | | | $ | (3,833,333 | ) | | $ | - | | | $ | - | | | $ | - | | |
The information in the above reconciliation table represents fiscal year to date activity for any securities identified as using Level 3 inputs at either the beginning or the end of the current fiscal period.
The Fund does not hold any significant investments (greater than one percent of net assets) categorized as Level 3.
Certain securities classified as Level 3 are valued by the Committee at fair value, using a market approach, as determined in good faith under consistently applied procedures established by and under the general supervision of the Board. To determine fair value for these securities, for which no market exists, the Committee utilizes the valuation technique it deems most appropriate in the circumstances, using some unobservable inputs, which may include, but are not limited to estimated earnings of the company and the position of the security within the company's capital structure. The Committee also may use some observable inputs, which may include, but are not limited to, trades of similar securities and market multiples derived from a set of comparable companies. Significant increases or decreases to any of these inputs could result in a significantly lower or higher fair value measurement.
See accompanying notes to financial statements.
48
COLUMBIA THERMOSTAT FUNDSM
STATEMENT OF INVESTMENTS (UNAUDITED), JUNE 30, 2016
Number of Shares | | | | Value | |
| | | > Affiliated Bond Funds 79.4% | |
| | 36,505,570 | | | Columbia Short Term Bond
Fund, Class I Shares (a) | | $ | 365,420,757 | | |
| | 19,757,031 | | | Columbia Total Return Bond
Fund, Class I Shares (a) | | | 184,135,530 | | |
| | 33,247,430 | | | Columbia U.S. Government
Mortgage Fund,
Class I Shares (a) | | | 183,525,812 | | |
| | 7,995,207 | | | Columbia U.S. Treasury Index
Fund, Class I Shares (a) | | | 92,424,597 | | |
| | 9,533,807 | | | Columbia Income Opportunities
Fund, Class I Shares (a) | | | 91,047,851 | | |
Total Affiliated Bond Funds:
(Cost: $903,925,415) | | | 916,554,547 | | |
| | | > Affiliated Stock Funds 20.0% | |
| | 2,142,317 | | | Columbia Contrarian Core
Fund, Class I Shares (a) | | | 46,124,084 | | |
| | 2,465,813 | | | Columbia Dividend Income
Fund, Class I Shares (a) | | | 46,110,701 | | |
| | 1,198,860 | | | Columbia Acorn International,
Class I Shares (a) | | | 46,060,193 | | |
| | 1,330,061 | | | Columbia Acorn Fund,
Class I Shares (a)(b) | | | 23,143,058 | | |
| | 1,471,216 | | | Columbia Select Large Cap
Growth Fund,
Class I Shares (a)(b) | | | 23,053,955 | | |
Number of Shares | | | | Value | |
| | 1,645,269 | | | Columbia Acorn Select,
Class I Shares (a)(b) | | $ | 23,050,225 | | |
| | 1,089,821 | | | Columbia Large Cap
Enhanced Core Fund,
Class I Shares (a) | | | 23,017,026 | | |
Total Affiliated Stock Funds:
(Cost: $197,906,220) | | | 230,559,242 | | |
| | | > Short-Term Investments 0.5% | |
| | 5,910,720 | | | JPMorgan U.S. Government
Money Market Fund, Agency
Shares (7 day yield of 0.20%) | | | 5,910,720 | | |
Total Short-Term Investments:
(Cost: $5,910,720) | | | 5,910,720 | | |
Total Investments: 99.9%
(Cost: $1,107,742,355)(c) | | | 1,153,024,509 | | |
Cash and Other Assets Less Liabilities: 0.1% | | | 1,332,875 | | |
Net Assets: 100.0% | | $ | 1,154,357,384 | | |
> Notes to Statement of Investments
(a) An affiliated person of the Fund, as defined in the Investment Company Act of 1940, may include any company in which the Fund owns five percent or more of its outstanding voting shares. Holdings and transactions in these affiliated companies during the period ended June 30, 2016, are as follows:
Security | | Balance of
Shares Held
12/31/15 | | Purchases/
Additions | | Sales/
Reductions | | Balance of
Shares Held
06/30/16 | | Value | | Dividend | |
Columbia Short Term Bond Fund, Class I Shares | | | 33,379,127 | | | | 13,543,572 | | | | 10,417,129 | | | | 36,505,570 | | | $ | 365,420,757 | | | $ | 1,381,920 | | |
Columbia Total Return Bond Fund, Class I Shares | | | 18,493,046 | | | | 7,195,882 | | | | 5,931,897 | | | | 19,757,031 | | | | 184,135,530 | | | | 2,247,435 | | |
Columbia U.S. Government Mortgage Fund, Class I Shares | | | 30,509,848 | | | | 12,323,617 | | | | 9,586,035 | | | | 33,247,430 | | | | 183,525,812 | | | | 2,007,546 | | |
Columbia U.S. Treasury Index Fund, Class I Shares | | | - | | | | 8,610,101 | | | | 614,894 | | | | 7,995,207 | | | | 92,424,597 | | | | 193,354 | | |
Columbia Income Opportunities Fund, Class I Shares | | | 17,570,413 | | | | 5,518,839 | | | | 13,555,445 | | | | 9,533,807 | | | | 91,047,851 | | | | 3,455,489 | | |
Columbia Contrarian Core Fund, Class I Shares | | | 2,628,205 | | | | 2,443,024 | | | | 2,928,912 | | | | 2,142,317 | | | | 46,124,084 | | | | - | | |
Columbia Dividend Income Fund, Class I Shares | | | 3,143,436 | | | | 2,616,279 | | | | 3,293,902 | | | | 2,465,813 | | | | 46,110,701 | | | | 638,644 | | |
Columbia Acorn International, Class I Shares | | | 1,389,031 | | | | 1,385,911 | | | | 1,576,082 | | | | 1,198,860 | | | | 46,060,193 | | | | - | | |
Columbia Acorn Fund, Class I Shares | | | 1,397,374 | | | | 1,720,755 | | | | 1,788,068 | | | | 1,330,061 | | | | 23,143,058 | | | | - | | |
Columbia Select Large Cap Growth Fund, Class I Shares | | | 1,625,974 | | | | 2,101,386 | | | | 2,256,144 | | | | 1,471,216 | | | | 23,053,955 | | | | - | | |
Columbia Acorn Select, Class I Shares | | | 1,752,426 | | | | 2,066,986 | | | | 2,174,143 | | | | 1,645,269 | | | | 23,050,225 | | | | - | | |
Columbia Large Cap Enhanced Core Fund, Class I Shares | | | 1,322,181 | | | | 1,274,746 | | | | 1,507,106 | | | | 1,089,821 | | | | 23,017,026 | | | | 69,064 | | |
Total of Affiliated Transactions | | | 113,211,061 | | | | 60,801,098 | | | | 55,629,757 | | | | 118,382,402 | | | $ | 1,147,113,789 | | | $ | 9,993,452 | | |
The aggregate cost and value of these companies at June 30, 2016, was $1,101,831,635 and $1,147,113,789, respectively. Investments in affiliated companies represented 99.37% of the Fund's total net assets at June 30, 2016.
(b) Non-income producing security.
(c) At June 30, 2016, for federal income tax purposes, the cost of investments was approximately $1,107,742,355 and net unrealized appreciation was $45,282,154 consisting of gross unrealized appreciation of $45,357,450 and gross unrealized depreciation of $75,296.
See accompanying notes to financial statements.
49
COLUMBIA THERMOSTAT FUNDSM
STATEMENT OF INVESTMENTS (UNAUDITED), CONTINUED
> Notes to Statement of Investments
Fair Value Measurements
Various inputs are used in determining the value of the Fund's investments, following the input prioritization hierarchy established by accounting principles generally accepted in the United States of America (GAAP). These inputs are summarized in the three broad levels listed below:
• Level 1 – quoted prices in active markets for identical securities
• Level 2 – prices determined using other significant observable inputs (including quoted prices for similar securities, interest rates, prepayment speeds, credit risk and others)
• Level 3 – prices determined using significant unobservable inputs where quoted prices or observable inputs are unavailable or less reliable (including management's own assumptions about the factors market participants would use in pricing an investment)
The inputs or methodology used for valuing securities are not necessarily an indication of the risk associated with investing in those securities.
Examples of the types of securities in which the Fund would typically invest and how they are classified within this hierarchy are as follows. Typical Level 1 securities include mutual funds whose NAVs are published each day.
CWAM's Valuation Committee (the Committee) is responsible for applying the Trust's Portfolio Pricing Policy and the CWAM pricing procedures (the Policies), which are approved by and subject to the oversight of the Board.
The Committee meets as necessary, and no less frequently than quarterly, to determine fair values for securities for which market quotations are not readily available or for which CWAM believes that available market quotations are unreliable. The Committee also reviews the continuing appropriateness of the Policies. In circumstances where a security has been fair valued, the Committee will also review the continuing appropriateness of the current value of the security. The Policies address, among other things: circumstances under which market quotations will be deemed readily available; selection of third party pricing vendors; appropriate pricing methodologies; events that require fair valuation and fair value techniques; circumstances under which securities will be deemed to pose a potential for stale pricing, including when securities are illiquid, restricted, or in default; and certain delegations of authority to determine fair values to the Fund's investment manager. The Committee may also meet to discuss additional valuation matters, which may include review of back-testing results, review of time-sensitive information or approval of other valuation related actions, and to review the appropriateness of the Policies.
For investments categorized as Level 3, the significant unobservable inputs used in the fair value measurement of the Fund's securities may include: (i) data specific to the issuer or comparable issuers, (ii) general market or specific sector news and (iii) quoted prices and specific or similar security transactions. The Committee considers this data and any changes from prior periods in order to assess the reasonableness of observable and unobservable inputs, any assumptions or internal models used to value those securities and changes in fair value. Significant changes in any of these factors could result in lower or higher fair value measurements. Various factors impact the frequency of monitoring (which may occur as often as daily), however the Committee may determine that changes to inputs, assumptions and models are not required with the same frequency.
The following table summarizes the inputs used, as of June 30, 2016, in valuing the Fund's assets:
Investment Type | | Quoted Prices
(Level 1) | | Other
Significant
Observable
Inputs
(Level 2) | | Significant
Unobservable
Inputs
(Level 3) | | Total | |
Total Affiliated Bond Funds | | $ | 916,554,547 | | | $ | - | | | $ | - | | | $ | 916,554,547 | | |
Total Affiliated Stock Funds | | | 230,559,242 | | | | - | | | | - | | | | 230,559,242 | | |
Total Short-Term Investments | | | 5,910,720 | | | | - | | | | - | | | | 5,910,720 | | |
Total Investments | | $ | 1,153,024,509 | | | $ | - | | | $ | - | | | $ | 1,153,024,509 | | |
There were no transfers of financial assets between levels during the period.
See accompanying notes to financial statements.
50
COLUMBIA ACORN EMERGING MARKETS FUNDSM
STATEMENT OF INVESTMENTS (UNAUDITED), JUNE 30, 2016
Number of Shares | | | | Value | |
| | | | | | | Equities: 96.3% | |
Asia 71.5% | | | |
| | | > China 13.3% | |
| | 11,060,000 | | | NewOcean Energy | | $ | 3,632,165 | | |
| | | | | Southern China Liquefied Petroleum
Gas Distributor | | | | | |
| | 3,020,000 | | | Xinhua Winshare Publishing | | | 3,273,213 | | |
| | | | | Sichuan Publisher, Distributor & Retailer | | | | | |
| | 245,083 | | | Vipshop - ADR (a) | | | 2,737,577 | | |
| | | | | Internet Discount Retailer | | | | | |
| | 6,560,000 | | | AMVIG Holdings | | | 2,586,694 | | |
| | | | | Chinese Tobacco Packaging Material
Supplier | | | | | |
| | 87,444 | | | BitAuto - ADR (a)(b) | | | 2,357,490 | | |
| | | | | Automotive Information Website for
Buyers & Dealers | | | | | |
| | 1,869,000 | | | China Everbright International | | | 2,089,819 | | |
| | | | | Municipal Waste Operator | | | | | |
| | 59,912 | | | 51job - ADR (a) | | | 1,756,021 | | |
| | | | | Integrated Human Resource Services | | | | | |
| | 836,000 | | | Travelsky Technology | | | 1,616,174 | | |
| | | | | Chinese Air Travel Transaction Processor | | | | | |
| | 5,530,000 | | | Sihuan Pharmaceutical
Holdings Group | | | 1,056,308 | | |
| | | | | Chinese Generic Drug Manufacturer | | | | | |
| | | | 21,105,461 | | |
| | | > Korea 13.0% | |
| | 174,419 | | | ModeTour Network | | | 4,209,981 | | |
| | | | | Travel Services | | | | | |
| | 114,626 | | | Koh Young Technology | | | 4,094,879 | | |
| | | | | Inspection Systems for Printed
Circuit Boards | | | | | |
| | 28,048 | | | Nongshim Holdings | | | 3,586,507 | | |
| | | | | Holding Company of Food Conglomerate | | | | | |
| | 86,671 | | | Korea Investment Holdings | | | 3,195,306 | | |
| | | | | Brokerage & Asset Management | | | | | |
| | 6,527 | | | KCC | | | 2,170,983 | | |
| | | | | Paint & Housing Material Manufacturer | | | | | |
| | 32,351 | | | KEPCO Plant Service &
Engineering | | | 1,829,037 | | |
| | | | | Power Plant & Grid Maintenance | | | | | |
| | 58,203 | | | Sam Yung Trading | | | 1,113,432 | | |
| | | | | Ophthalmic Lenses | | | | | |
| | 543 | | | Orion Corp | | | 445,708 | | |
| | | | | Confectionery & Snack Manufacturer | | | | | |
| | | | 20,645,833 | | |
| | | > Taiwan 10.4% | |
| | 210,000 | | | Silergy | | | 2,484,001 | | |
| | | | | Chinese Provider of Analog & Mixed
Digital Integrated Circuits | | | | | |
| | 224,000 | | | Ginko International | | | 2,340,246 | | |
| | | | | Contact Lens Maker in China | | | | | |
| | 25,000 | | | Largan Precision | | | 2,312,081 | | |
| | | | | Mobile Device Camera Lenses & Modules | | | | | |
| | 78,000 | | | St. Shine Optical | | | 1,762,654 | | |
| | | | | Disposable Contact Lens Original
Equipment Manufacturer | | | | | |
| | 221,988 | | | Advantech | | | 1,692,717 | | |
| | | | | Industrial PC & Components | | | | | |
Number of Shares | | | | Value | |
| | 448,000 | | | Novatek Microelectronics | | $ | 1,679,054 | | |
| | | | | Display Related Integrated Circuit
Designer | | | | | |
| | 1,006,000 | | | Vanguard International
Semiconductor | | | 1,662,870 | | |
| | | | | Semiconductor Foundry | | | | | |
| | 127,000 | | | PChome Online | | | 1,407,759 | | |
| | | | | Taiwanese E-commerce Company | | | | | |
| | 167,000 | | | Addcn Technology | | | 1,228,363 | | |
| | | | | Largest Real Estate, Online Game
Items & Auto Portal | | | | | |
| | | | 16,569,745 | | |
| | | > India 10.2% | |
| | 936,472 | | | Zee Entertainment Enterprises | | | 6,356,576 | | |
| | | | | Indian Programmer of Pay
Television Content | | | | | |
| | 771,523 | | | TVS Motor | | | 3,550,622 | | |
| | | | | Indian Maker of Scooters, Mopeds,
Motorcycles, & Three-wheelers | | | | | |
| | 246,667 | | | Amara Raja | | | 3,181,678 | | |
| | | | | Indian Maker of Auto & Industrial
Batteries, Mostly for the Replacement
Market | | | | | |
| | 177,038 | | | United Breweries | | | 1,976,174 | | |
| | | | | Indian Brewer | | | | | |
| | 377,464 | | | Adani Ports & Special Economic
Zone | | | 1,161,763 | | |
| | | | | Indian Ports | | | | | |
| | | | 16,226,813 | | |
| | | > Indonesia 9.0% | |
| | 33,370,300 | | | Media Nusantara Citra | | | 5,598,455 | | |
| | | | | Media Company in Indonesia | | | | | |
| | 13,234,500 | | | Link Net | | | 4,078,627 | | |
| | | | | Fixed Broadband & CATV Service
Provider | | | | | |
| | 1,790,500 | | | Matahari Department Store | | | 2,728,917 | | |
| | | | | Department Store Chain in Indonesia | | | | | |
| | 3,627,200 | | | Tower Bersama Infrastructure | | | 1,818,260 | | |
| | | | | Communications Towers | | | | | |
| | | | 14,224,259 | | |
| | | > Philippines 4.6% | |
| | 40,689,000 | | | Melco Crown (Philippines)
Resorts (a) | | | 3,292,999 | | |
| | | | | Integrated Resort Operator in Manila | | | | | |
| | 27,197,000 | | | RFM Corporation | | | 2,416,355 | | |
| | | | | Flour, Bread, Pasta & Ice Cream Manufacturer/Distributor in the
Philippines | | | | | |
| | 1,764,600 | | | Puregold Price Club | | | 1,580,911 | | |
| | | | | Supermarket Operator in the Philippines | | | | | |
| | | | 7,290,265 | | |
| | | > Hong Kong 3.1% | |
| | 1,616,000 | | | Vitasoy International | | | 2,939,777 | | |
| | | | | Hong Kong Soy Food Brand | | | | | |
| | 2,078,000 | | | Value Partners | | | 1,924,216 | | |
| | | | | Mutual Fund Management | | | | | |
| | | | 4,863,993 | | |
See accompanying notes to financial statements.
51
COLUMBIA ACORN EMERGING MARKETS FUNDSM
STATEMENT OF INVESTMENTS (UNAUDITED), CONTINUED
Number of Shares | | | | Value | |
| | | > Singapore 3.0% | |
| | 5,892,800 | | | China Everbright Water | | $ | 2,791,252 | | |
| | | | | Waste Water Treatment Operator | | | | | |
| | 4,366,000 | | | SIIC Environment (a) | | | 2,014,207 | | |
| | | | | Waste Water Treatment Operator | | | | | |
| | | | 4,805,459 | | |
| | | > Thailand 2.7% | |
| | 6,182,100 | | | Samui Airport Property Fund | | | 4,327,822 | | |
| | | | | Thai Airport Operator | | | | | |
| | | > Cambodia 2.2% | |
| | 5,163,000 | | | Nagacorp | | | 3,447,504 | | |
| | | | | Casino & Entertainment Complex
in Cambodia | | | | | |
Asia: Total | | | 113,507,154 | | |
Other Countries 12.2% | | | |
| | | > South Africa 4.7% | |
| | 342,136 | | | Famous Brands | | | 2,950,249 | | |
| | | | | Quick Service Restaurant & Cafe
Franchise System in Africa | | | | | |
| | 882,911 | | | Rand Merchant Insurance | | | 2,475,903 | | |
| | | | | Directly Sold Property & Casualty
Insurance; Holdings in
Other Insurers | | | | | |
| | 450,885 | | | Coronation Fund Managers | | | 2,045,306 | | |
| | | | | South African Fund Manager | | | | | |
| | | | 7,471,458 | | |
| | | > Egypt 2.3% | |
| | 820,100 | | | Commercial International
Bank of Egypt | | | 3,692,021 | | |
| | | | | Private Universal Bank in Egypt | | | | | |
| | | > United States 1.8% | |
| | 107,457 | | | Bladex | | | 2,847,610 | | |
| | | | | Latin American Trade Financing
House | | | | | |
| | | > Guatemala 1.8% | |
| | 189,900 | | | Tahoe Resources | | | 2,844,201 | | |
| | | | | Silver & Gold Projects in
Guatemala, Canada & Peru | | | | | |
| | | > Canada 1.6% | |
| | 259,201 | | | Parex Resources (a) | | | 2,509,853 | | |
| | | | | Canadian Listed Exploration &
Production Company Operating
in Colombia | | | | | |
Other Countries: Total | | | 19,365,143 | | |
Latin America 6.5% | | | |
| | | > Mexico 6.5% | |
| | 26,105 | | | Grupo Aeroportuario del
Sureste - ADR | | | 4,165,053 | | |
| | | | | Mexican Airport Operator | | | | | |
| | 3,134,000 | | | Hoteles City Express (a) | | | 3,136,991 | | |
| | | | | Budget Hotel Operator in Mexico | | | | | |
| | 2,093,300 | | | Qualitas | | | 2,971,201 | | |
| | | | | Auto Insurer in Mexico &
Central America | | | | | |
| | | | 10,273,245 | | |
Latin America: Total | | | 10,273,245 | | |
Number of Shares | | | | Value | |
Europe 6.1% | | | |
| | | > Finland 2.3% | |
| | 202,395 | | | Tikkurila | | $ | 3,664,883 | | |
| | | | | Decorative & Industrial Paint in
Scandinavia, Central &
Eastern Europe | | | | | |
| | | > Sweden 1.4% | |
| | 37,336 | | | Millicom | | | 2,290,166 | | |
| | | | | Telecoms Operator in Latin
America & Africa | | | | | |
| | | > Spain 1.4% | |
| | 376,017 | | | Prosegur | | | 2,266,078 | | |
| | | | | Security Guards | | | | | |
| | | > Poland 1.0% | |
| | 6,000 | | | Wawel | | | 1,509,504 | | |
| | | | | Chocolate & Confectionery Maker
in Poland | | | | | |
Europe: Total | | | 9,730,631 | | |
Total Equities: 96.3%
(Cost: $163,805,191) | | | 152,876,173 | (c) | |
Short-Term Investments 1.9% | | | |
| | 3,051,300 | | | JPMorgan U.S. Government
Money Market Fund, IM Shares
(7 day yield of 0.29%) | | | 3,051,300 | | |
Total Short-Term Investments: 1.9%
(Cost: $3,051,300) | | | 3,051,300 | | |
Securities Lending Collateral 1.2% | | | |
| | 1,850,375 | | | Dreyfus Government Cash
Management Fund,
Institutional Shares
(7 day yield of 0.24%) (d) | | | 1,850,375 | | |
Total Securities Lending Collateral: 1.2%
(Cost: $1,850,375) | | | 1,850,375 | | |
Total Investments: 99.4%
(Cost: $168,706,866)(e) | | | 157,777,848 | | |
Obligation to Return Collateral for
Securities Loaned: (1.2)% | | | (1,850,375 | ) | |
Cash and Other Assets Less Liabilities: 1.8% | | | 2,798,084 | | |
Net Assets: 100.0% | | $ | 158,725,557 | | |
ADR - American Depositary Receipts
See accompanying notes to financial statements.
52
> Notes to Statement of Investments
(a) Non-income producing security.
(b) All or a portion of this security was on loan at June 30, 2016. The total market value of securities on loan at June 30, 2016 was $1,765,880.
(c) On June 30, 2016, the Fund's total equity investments were denominated in currencies as follows:
Currency | | Value | | Percentage
of Net Assets | |
Hong Kong Dollar | | $ | 22,565,870 | | | | 14.2 | | |
Korean Won | | | 20,645,833 | | | | 13.0 | | |
Taiwan Dollar | | | 16,569,745 | | | | 10.4 | | |
Indian Rupee | | | 16,226,813 | | | | 10.2 | | |
Indonesian Rupiah | | | 14,224,259 | | | | 9.0 | | |
U.S. Dollar | | | 13,863,751 | | | | 8.8 | | |
Other Currencies less
than 5% of total net assets | | | 48,779,902 | | | | 30.7 | | |
Total Equities | | $ | 152,876,173 | | | | 96.3 | | |
(d) Investment made with cash collateral received from securities lending activity.
(e) At June 30, 2016, for federal income tax purposes, the cost of investments was approximately $168,706,866 and net unrealized depreciation was $10,929,018 consisting of gross unrealized appreciation of $16,825,857 and gross unrealized depreciation of $27,754,875.
Fair Value Measurements
Various inputs are used in determining the value of the Fund's investments, following the input prioritization hierarchy established by accounting principles generally accepted in the United States of America (GAAP). These inputs are summarized in the three broad levels listed below:
• Level 1 – quoted prices in active markets for identical securities
• Level 2 – prices determined using other significant observable inputs (including quoted prices for similar securities, interest rates, prepayment speeds, credit risk and others)
• Level 3 – prices determined using significant unobservable inputs where quoted prices or observable inputs are unavailable or less reliable (including management's own assumptions about the factors market participants would use in pricing an investment)
The inputs or methodology used for valuing securities are not necessarily an indication of the risk associated with investing in those securities.
Examples of the types of securities in which the Fund would typically invest and how they are classified within this hierarchy are as follows. Typical Level 1 securities include exchange traded domestic equities, mutual funds whose NAVs are published each day and exchange traded foreign equities that are not statistically fair valued. Typical Level 2 securities include exchange traded foreign equities that are statistically fair valued, forward foreign currency exchange contracts and short-term investments valued at amortized cost. Additionally, securities fair valued by CWAM's Valuation Committee (the Committee) that rely on significant observable inputs are also included in Level 2. Typical Level 3 securities include any security fair valued by the Committee that relies on significant unobservable inputs.
The Committee is responsible for applying the Trust's Portfolio Pricing Policy and the CWAM pricing procedures (the Policies), which are approved by and subject to the oversight of the Board.
The Committee meets as necessary, and no less frequently than quarterly, to determine fair values for securities for which market quotations are not readily available or for which CWAM believes that available market quotations are unreliable. The Committee also reviews the continuing appropriateness of the Policies. In circumstances where a security has been fair valued, the Committee will also review the continuing appropriateness of the current value of the security. The Policies address, among other things: circumstances under which market quotations will be deemed readily available; selection of third party pricing vendors; appropriate pricing methodologies; events that require fair valuation and fair value techniques; circumstances under which securities will be deemed to pose a potential for stale pricing, including when securities are illiquid, restricted, or in default; and certain delegations of authority to determine fair values to the Fund's investment manager. The Committee may also meet to discuss additional valuation matters, which may include review of back-testing results, review of time-sensitive information or approval of other valuation related actions, and to review the appropriateness of the Policies.
For investments categorized as Level 3, the significant unobservable inputs used in the fair value measurement of the Fund's securities may include: (i) data specific to the issuer or comparable issuers, (ii) general market or specific sector news and (iii) quoted prices and specific or similar security transactions. The Committee considers this data and any changes from prior periods in order to assess the reasonableness of observable and unobservable inputs, any assumptions or internal models used to value those securities and changes in fair value. Significant changes in any of these factors could result in lower or higher fair value measurements. Various factors impact the frequency of monitoring (which may occur as often as daily), however the Committee may determine that changes to inputs, assumptions and models are not required with the same frequency.
See accompanying notes to financial statements.
53
COLUMBIA ACORN EMERGING MARKETS FUNDSM
STATEMENT OF INVESTMENTS (UNAUDITED), CONTINUED
> Notes to Statement of Investments
The following table summarizes the inputs used, as of June 30, 2016, in valuing the Fund's assets:
Investment Type | | Quoted Prices
(Level 1) | | Other
Significant
Observable
Inputs
(Level 2) | | Significant
Unobservable
Inputs
(Level 3) | | Total | |
Equities | |
Asia | | $ | 6,851,088 | | | $ | 106,656,066 | | | $ | - | | | $ | 113,507,154 | | |
Other Countries | | | 8,201,664 | | | | 11,163,479 | | | | - | | | | 19,365,143 | | |
Latin America | | | 10,273,245 | | | | - | | | | - | | | | 10,273,245 | | |
Europe | | | - | | | | 9,730,631 | | | | - | | | | 9,730,631 | | |
Total Equities | | | 25,325,997 | | | | 127,550,176 | | | | - | | | | 152,876,173 | | |
Total Short-Term Investments | | | 3,051,300 | | | | - | | | | - | | | | 3,051,300 | | |
Total Securities Lending Collateral | | | 1,850,375 | | | | - | | | | - | | | | 1,850,375 | | |
Total Investments | | $ | 30,227,672 | | | $ | 127,550,176 | | | $ | - | | | $ | 157,777,848 | | |
The Fund's assets assigned to the Level 2 input category are generally valued using a market approach, in which a security's value is determined through its correlation to prices and information from observable market transactions for similar or identical assets. Foreign equities are generally valued at the last sale price on the foreign exchange or market on which they trade. The Fund may use a statistical fair valuation model, in accordance with the policy adopted by the Board, provided by an independent third party to value securities principally traded in foreign markets in order to adjust for possible stale pricing that may occur between the close of the foreign exchanges and the time for valuation. These models take into account available market data including intraday index, ADR, and ETF movements.
There were no transfers of financial assets between Levels 1 and 2 during the period.
The following table reconciles asset balances for the period ending June 30, 2016, in which significant observable and/or unobservable inputs (Level 3) were used in determining value:
Investments in Securities | | Balance as
of December 31,
2015 | | Realized
Gain (Loss) | | Change
in Unrealized
Appreciation
(Depreciation) | | Purchases | | Sales | | Transfers
Into
Level 3 | | Transfers
out of
Level 3 | | Balance as
of June 30,
2016 | |
Equities | |
| Asia | | $ | 4,620,853 | | | $ | - | | | $ | - | | | $ | - | | | $ | - | | | $ | - | | | $ | (4,620,853 | ) | | $ | - | | |
The information in the above reconciliation table represents fiscal year to date activity for any securities identified as using Level 3 inputs at either the beginning or the end of the current fiscal period.
The Fund does not hold any significant investments (greater than one percent of net assets) categorized as Level 3.
Financial assets were transferred from Level 3 to Level 2 as trading resumed during the period. As a result, as of period end, the Committee determined to value the security(s) under consistently applied procedures established by and under the general supervision of the Board.
The following table shows transfers between Level 2 and Level 3 of the fair value hierarchy:
Transfers In | | Transfers Out | |
| Level 2 | | Level 3 | | Level 2 | | Level 3 | |
| $ | 4,620,853 | | | $ | - | | | $ | - | | | $ | 4,620,853 | | |
Transfers into and/or out of Level 3 are determined based on the fair value at the beginning of the period for security positions held throughout the period.
Certain securities classified as Level 3 are valued by the Committee at fair value, using a market approach, as determined in good faith under consistently applied procedures established by and under the general supervision of the Board. To determine fair value for these securities, for which no market exists, the Committee utilizes the valuation technique it deems most appropriate in the circumstances, using some unobservable inputs, which may include, but are not limited to estimated earnings of the company and the position of the security within the company's capital structure. The Committee also may use some observable inputs, which may include, but are not limited to, trades of similar securities or indices and market multiples derived from a set of comparable companies. Significant increases or decreases to any of these inputs could result in a significantly lower or higher fair value measurement.
See accompanying notes to financial statements.
54
COLUMBIA ACORN EMERGING MARKETS FUNDSM
PORTFOLIO DIVERSIFICATION (UNAUDITED)
At June 30, 2016, the Fund's portfolio investments as a percentage of net assets were diversified as follows:
| | | Value | | Percentage
of Net Assets | |
| > Consumer Discretionary | |
Hotels, Restaurants & Leisure | | $ | 17,037,725 | | | | 10.7 | | |
Media | | | 11,955,031 | | | | 7.5 | | |
Automobiles | | | 3,550,622 | | | | 2.3 | | |
Distributors | | | 3,273,213 | | | | 2.1 | | |
Internet & Catalog Retail | | | 2,737,577 | | | | 1.7 | | |
Multiline Retail | | | 2,728,917 | | | | 1.7 | | |
| | | | 41,283,085 | | | | 26.0 | | |
| > Financials | |
Capital Markets | | | 7,164,828 | | | | 4.5 | | |
Banks | | | 6,539,631 | | | | 4.1 | | |
Insurance | | | 5,447,104 | | | | 3.5 | | |
Real Estate Investment Trusts (REITs) | | | 4,327,822 | | | | 2.7 | | |
| | | | 23,479,385 | | | | 14.8 | | |
| > Information Technology | |
Semiconductors & Semiconductor
Equipment | | | 9,920,804 | | | | 6.3 | | |
Internet Software & Services | | | 4,993,612 | | | | 3.1 | | |
Electronic Equipment, Instruments &
Components | | | 2,312,081 | | | | 1.4 | | |
Technology Hardware, Storage &
Peripherals | | | 1,692,717 | | | | 1.1 | | |
IT Services | | | 1,616,174 | | | | 1.0 | | |
| | | | 20,535,388 | | | | 12.9 | | |
| > Industrials | |
Commercial Services & Supplies | | | 6,184,934 | | | | 3.9 | | |
Transportation Infrastructure | | | 5,326,816 | | | | 3.3 | | |
Electrical Equipment | | | 3,181,678 | | | | 2.0 | | |
Building Products | | | 2,170,983 | | | | 1.4 | | |
Professional Services | | | 1,756,021 | | | | 1.1 | | |
Trading Companies & Distributors | | | 1,113,432 | | | | 0.7 | | |
| | | | 19,733,864 | | | | 12.4 | | |
| > Consumer Staples | |
Food Products | | | 10,897,851 | | | | 6.9 | | |
Beverages | | | 1,976,174 | | | | 1.2 | | |
Food & Staples Retailing | | | 1,580,911 | | | | 1.0 | | |
| | | | 14,454,936 | | | | 9.1 | | |
| | | Value | | Percentage
of Net Assets | |
| > Materials | |
Chemicals | | $ | 3,664,883 | | | | 2.3 | | |
Metals & Mining | | | 2,844,201 | | | | 1.8 | | |
Containers & Packaging | | | 2,586,693 | | | | 1.6 | | |
| | | | 9,095,777 | | | | 5.7 | | |
| > Telecommunication Services | |
Wireless Telecommunication Services | | | 4,108,426 | | | | 2.6 | | |
Diversified Telecommunication Services | | | 4,078,627 | | | | 2.6 | | |
| | | | 8,187,053 | | | | 5.2 | | |
| > Energy | |
Oil, Gas & Consumable Fuels | | | 6,142,018 | | | | 3.9 | | |
| | | | 6,142,018 | | | | 3.9 | | |
| > Health Care | |
Health Care Equipment & Supplies | | | 4,102,900 | | | | 2.6 | | |
Pharmaceuticals | | | 1,056,308 | | | | 0.7 | | |
| | | | 5,159,208 | | | | 3.3 | | |
| > Utilities | |
Water Utilities | | | 4,805,459 | | | | 3.0 | | |
| | | | 4,805,459 | | | | 3.0 | | |
Total Equities: | | | 152,876,173 | | | | 96.3 | | |
Short-Term Investments: | | | 3,051,300 | | | | 1.9 | | |
Securities Lending Collateral: | | | 1,850,375 | | | | 1.2 | | |
Total Investments: | | | 157,777,848 | | | | 99.4 | | |
Obligation to Return
Collateral for Securities
Loaned: | | | (1,850,375 | ) | | | (1.2 | ) | |
Cash and Other Assets
Less Liabilities: | | | 2,798,084 | | | | 1.8 | | |
Net Assets: | | $ | 158,725,557 | | | | 100.0 | | |
See accompanying notes to financial statements.
55
COLUMBIA ACORN EUROPEAN FUNDSM
STATEMENT OF INVESTMENTS (UNAUDITED), JUNE 30, 2016
Number of Shares | | | | Value | |
| | | | | | | Equities: 92.3% | |
Europe 91.2% | | | |
| | | > United Kingdom 24.2% | |
| | 126,231 | | | Halma | | $ | 1,716,869 | | |
| | | | | Health & Safety Sensor Technology | | | | | |
| | 26,655 | | | Rightmove | | | 1,301,855 | | |
| | | | | Internet Real Estate Listings | | | | | |
| | 479,518 | | | Rentokil Initial | | | 1,238,312 | | |
| | | | | Pest Control, Washroom & Workwear
Service Provider | | | | | |
| | 94,669 | | | Shaftesbury | | | 1,114,027 | | |
| | | | | London Prime Retail REIT | | | | | |
| | 285,623 | | | Regus | | | 1,104,403 | | |
| | | | | Rental Office Space in Full Service
Business Center | | | | | |
| | 221,795 | | | Domino's Pizza UK & Ireland | | | 985,412 | | |
| | | | | Pizza Delivery in the UK, Ireland &
Switzerland | | | | | |
| | 440,355 | | | Connect Group | | | 868,110 | | |
| | | | | Newspaper & Magazine Distributor | | | | | |
| | 39,357 | | | WH Smith | | | 826,832 | | |
| | | | | Newsprint, Books & General Stationery
Retailer | | | | | |
| | 1,013,550 | | | Assura | | | 742,026 | | |
| | | | | UK Primary Health Care Property REIT | | | | | |
| | 67,733 | | | Abcam | | | 697,784 | | |
| | | | | Online Sales of Antibodies | | | | | |
| | 14,411 | | | Croda International | | | 604,950 | | |
| | | | | Oleochemicals & Industrial Chemicals | | | | | |
| | 116,626 | | | DS Smith | | | 603,389 | | |
| | | | | Packaging | | | | | |
| | 53,309 | | | Big Yellow | | | 555,105 | | |
| | | | | UK Self Storage | | | | | |
| | 163,556 | | | Ocado (a)(b) | | | 504,653 | | |
| | | | | Online Grocery Retailer | | | | | |
| | 104,779 | | | Halfords | | | 450,502 | | |
| | | | | UK Retailer of Leisure Goods & Auto Parts | | | | | |
| | 126,691 | | | Polypipe | | | 439,184 | | |
| | | | | Manufacturer of Plastic Piping & Fittings | | | | | |
| | 6,452 | | | Spirax Sarco | | | 323,081 | | |
| | | | | Steam Systems & Pumps for Manufacturing &
Process Industries | | | | | |
| | | | 14,076,494 | | |
| | | > Germany 13.7% | |
| | 40,165 | | | Wirecard (b) | | | 1,769,104 | | |
| | | | | Online Payment Processing & Risk
Management | | | | | |
| | 25,147 | | | Aurelius | | | 1,477,898 | | |
| | | | | European Turnaround Investor | | | | | |
| | 12,860 | | | MTU Aero Engines | | | 1,201,483 | | |
| | | | | Airplane Engine Components & Services | | | | | |
| | 24,155 | | | NORMA Group | | | 1,144,478 | | |
| | | | | Clamps for Automotive & Industrial
Applications | | | | | |
| | 9,559 | | | Fielmann | | | 699,140 | | |
| | | | | Retail Optician Chain | | | | | |
| | 12,323 | | | Ströer (b) | | | 566,848 | | |
| | | | | Out of Home & Online Advertising | | | | | |
| | 28,182 | | | Elringklinger | | | 554,793 | | |
| | | | | Automobile Components | | | | | |
Number of Shares | | | | Value | |
| | 1,158 | | | Rational | | $ | 535,910 | | |
| | | | | Commercial Ovens | | | | | |
| | | | 7,949,654 | | |
| | | > Sweden 11.5% | |
| | 82,952 | | | Trelleborg | | | 1,472,022 | | |
| | | | | Manufacturer of Sealing, Dampening &
Protective Solutions for Industry | | | | | |
| | 103,273 | | | Recipharm (a)(b) | | | 1,443,383 | | |
| | | | | Contract Development Manufacturing
Organization | | | | | |
| | 144,040 | | | Unibet | | | 1,323,257 | | |
| | | | | European Online Gaming Operator | | | | | |
| | 72,489 | | | Sweco (b) | | | 1,257,611 | | |
| | | | | Engineering Consultants | | | | | |
| | 55,221 | | | Mekonomen (b) | | | 1,187,871 | | |
| | | | | Nordic Integrated Wholesaler/Retailer of
Automotive Parts & Service | | | | | |
| | 4,925 | | | Byggmax | | | 37,400 | | |
| | | | | Nordic Discount DIY Retail Chain | | | | | |
| | | | 6,721,544 | | |
| | | > Finland 7.4% | |
| | 128,795 | | | Munksjo | | | 1,358,463 | | |
| | 68,560 | | | Munksjo (c) | | | 729,301 | | |
| | | | | Specialty Paper Maker | | | | | |
| | 65,166 | | | Tikkurila | | | 1,179,998 | | |
| | | | | Decorative & Industrial Paint in
Scandinavia, Central & Eastern Europe | | | | | |
| | 40,961 | | | Konecranes (b) | | | 1,039,838 | | |
| | | | | Manufacture & Service of Industrial
Cranes & Port Handling Equipment | | | | | |
| | | | 4,307,600 | | |
| | | > Spain 6.7% | |
| | 235,945 | | | Prosegur | | | 1,421,930 | | |
| | | | | Security Guards | | | | | |
| | 219,512 | | | Distribuidora Internacional de
Alimentación | | | 1,281,268 | | |
| | | | | Discount Retailer in Spain & Latin America | | | | | |
| | 11,867 | | | Viscofan | | | 658,627 | | |
| | | | | Sausage Casings Maker | | | | | |
| | 19,771 | | | Bolsas y Mercados Españoles | | | 555,653 | | |
| | | | | Spanish Stock Markets | | | | | |
| | | | 3,917,478 | | |
| | | > France 6.7% | |
| | 36,969 | | | AKKA Technologies | | | 1,136,722 | | |
| | | | | Engineering Consultancy | | | | | |
| | 42,694 | | | Elior Group | | | 926,424 | | |
| | | | | Contract Caterer & Travel Concessionary | | | | | |
| | 34,008 | | | Eutelsat | | | 641,904 | | |
| | | | | Fixed Satellite Services | | | | | |
| | 1,710 | | | Eurofins Scientific | | | 633,508 | | |
| | | | | Food, Pharmaceuticals & Materials
Screening & Testing | | | | | |
| | 22,878 | | | Bonduelle | | | 550,430 | | |
| | | | | Producer of Canned, Deep-frozen &
Fresh Vegetables | | | | | |
| | | | 3,888,988 | | |
See accompanying notes to financial statements.
56
Number of Shares | | | | Value | |
| | | > Denmark 4.7% | |
| | 30,589 | | | SimCorp | | $ | 1,501,202 | | |
| | | | | Software for Investment Managers | | | | | |
| | 61,898 | | | William Demant Holding (a) | | | 1,204,894 | | |
| | | | | Manufacture & Distribution of Hearing
Aids & Diagnostic Equipment | | | | | |
| | | | 2,706,096 | | |
| | | > Netherlands 4.6% | |
| | 36,701 | | | Aalberts Industries | | | 1,100,232 | | |
| | | | | Flow Control & Heat Treatment | | | | | |
| | 13,475 | | | Gemalto | | | 816,369 | | |
| | | | | Digital Security Solutions | | | | | |
| | 42,373 | | | Brunel | | | 773,601 | | |
| | | | | Temporary Specialist & Energy Staffing | | | | | |
| | | | 2,690,202 | | |
| | | > Italy 4.1% | |
| | 20,157 | | | Industria Macchine Automatiche | | | 1,213,359 | | |
| | | | | Food & Drugs Packaging & Machinery | | | | | |
| | 222,177 | | | Hera | | | 606,404 | | |
| | | | | Northern Italian Utility | | | | | |
| | 10,622 | | | Brembo | | | 585,120 | | |
| | | | | High Performance Auto Braking
Systems Supplier | | | | | |
| | | | 2,404,883 | | |
| | | > Switzerland 3.3% | |
| | 3,077 | | | Partners Group | | | 1,318,696 | | |
| | | | | Private Markets Asset Management | | | | | |
| | 1,715 | | | Inficon | | | 580,489 | | |
| | | | | Gas Detection Instruments | | | | | |
| | | | 1,899,185 | | |
| | | > Norway 2.1% | |
| | 130,307 | | | Atea | | | 1,241,761 | | |
| | | | | Nordic IT Hardware/Software
Reseller & Integrator | | | | | |
| | | > Belgium 1.2% | |
| | 11,030 | | | Melexis | | | 693,106 | | |
| | | | | Analog & Custom IC Designer | | | | | |
Number of Shares | | | | Value | |
| | | > Poland 1.0% | |
| | 2,244 | | | Wawel | | $ | 564,554 | | |
| | | | | Chocolate & Confectionery Maker
in Poland | | | | | |
Europe: Total | | | 53,061,545 | | |
Other Countries 1.1% | | | |
| | | > United States 1.1% | |
| | 13,451 | | | LivaNova (a) | | | 675,644 | | |
| | | | | Neuromodulation & Cardiac Devices | | | | | |
Other Countries: Total | | | 675,644 | | |
Total Equities: 92.3%
(Cost: $50,608,548) | | | 53,737,189 | (d) | |
Short-Term Investments 2.2% | | | |
| | 1,249,310 | | | JPMorgan U.S. Government
Money Market Fund, IM Shares
(7 day yield of 0.29%) | | | 1,249,310 | | |
Total Short-Term Investments: 2.2%
(Cost: $1,249,310) | | | 1,249,310 | | |
Securities Lending Collateral 5.5% | | | |
| | 3,224,760 | | | Dreyfus Government Cash
Management Fund,
Institutional Shares
(7 day yield of 0.24%) (e) | | | 3,224,760 | | |
Total Securities Lending Collateral: 5.5%
(Cost: $3,224,760) | | | 3,224,760 | | |
Total Investments: 100.0%
(Cost: $55,082,618)(f) | | | 58,211,259 | | |
Obligation to Return Collateral for
Securities Loaned: (5.5)% | | | (3,224,760 | ) | |
Cash and Other Assets Less Liabilities: 5.5% | | | 3,209,809 | | |
Net Assets: 100.0% | | $ | 58,196,308 | | |
REIT - Real Estate Investment Trust
> Notes to Statement of Investments
(a) Non-income producing security.
(b) All or a portion of this security was on loan at June 30, 2016. The total market value of securities on loan at June 30, 2016 was $3,110,032.
(c) Security is traded on a Swedish exchange.
(d) On June 30, 2016, the Fund's total equity investments were denominated in currencies as follows:
Currency | | Value | | Percentage
of Net Assets | |
Euro | | $ | 25,122,610 | | | | 43.2 | | |
British Pound | | | 14,076,494 | | | | 24.1 | | |
Swedish Krona | | | 7,450,846 | | | | 12.8 | | |
Other currencies less
than 5% of total net assets | | | 7,087,239 | | | | 12.2 | | |
Total Equities | | $ | 53,737,189 | | | | 92.3 | | |
See accompanying notes to financial statements.
57
COLUMBIA ACORN EUROPEAN FUNDSM
STATEMENT OF INVESTMENTS (UNAUDITED), CONTINUED
> Notes to Statement of Investments
(e) Investment made with cash collateral received from securities lending activity.
(f) At June 30, 2016, for federal income tax purposes, the cost of investments was approximately $55,082,618 and net unrealized appreciation was $3,128,641 consisting of gross unrealized appreciation of $5,940,210 and gross unrealized depreciation of $2,811,569.
Fair Value Measurements
Various inputs are used in determining the value of the Fund's investments, following the input prioritization hierarchy established by accounting principles generally accepted in the United States of America (GAAP). These inputs are summarized in the three broad levels listed below:
• Level 1 – quoted prices in active markets for identical securities
• Level 2 – prices determined using other significant observable inputs (including quoted prices for similar securities, interest rates, prepayment speeds, credit risk and others)
• Level 3 – prices determined using significant unobservable inputs where quoted prices or observable inputs are unavailable or less reliable (including management's own assumptions about the factors market participants would use in pricing an investment)
The inputs or methodology used for valuing securities are not necessarily an indication of the risk associated with investing in those securities.
Examples of the types of securities in which the Fund would typically invest and how they are classified within this hierarchy are as follows. Typical Level 1 securities include exchange traded domestic equities, mutual funds whose NAVs are published each day and exchange traded foreign equities that are not statistically fair valued. Typical Level 2 securities include exchange traded foreign equities that are statistically fair valued, forward foreign currency exchange contracts and short-term investments valued at amortized cost. Additionally, securities fair valued by CWAM's Valuation Committee (the Committee) that rely on significant observable inputs are also included in Level 2. Typical Level 3 securities include any security fair valued by the Committee that relies on significant unobservable inputs.
The Committee is responsible for applying the Trust's Portfolio Pricing Policy and the CWAM pricing procedures (the Policies), which are approved by and subject to the oversight of the Board.
The Committee meets as necessary, and no less frequently than quarterly, to determine fair values for securities for which market quotations are not readily available or for which CWAM believes that available market quotations are unreliable. The Committee also reviews the continuing appropriateness of the Policies. In circumstances where a security has been fair valued, the Committee will also review the continuing appropriateness of the current value of the security. The Policies address, among other things: circumstances under which market quotations will be deemed readily available; selection of third party pricing vendors; appropriate pricing methodologies; events that require fair valuation and fair value techniques; circumstances under which securities will be deemed to pose a potential for stale pricing, including when securities are illiquid, restricted, or in default; and certain delegations of authority to determine fair values to the Fund's investment manager. The Committee may also meet to discuss additional valuation matters, which may include review of back-testing results, review of time-sensitive information or approval of other valuation related actions, and to review the appropriateness of the Policies.
For investments categorized as Level 3, the significant unobservable inputs used in the fair value measurement of the Fund's securities may include: (i) data specific to the issuer or comparable issuers, (ii) general market or specific sector news and (iii) quoted prices and specific or similar security transactions. The Committee considers this data and any changes from prior periods in order to assess the reasonableness of observable and unobservable inputs, any assumptions or internal models used to value those securities and changes in fair value. Significant changes in any of these factors could result in lower or higher fair value measurements. Various factors impact the frequency of monitoring (which may occur as often as daily), however the Committee may determine that changes to inputs, assumptions and models are not required with the same frequency.
The following table summarizes the inputs used, as of June 30, 2016, in valuing the Fund's assets:
Investment Type | | Quoted Prices
(Level 1) | | Other
Significant
Observable
Inputs
(Level 2) | | Significant
Unobservable
Inputs
(Level 3) | | Total | |
Equities | |
Europe | | $ | - | | | $ | 53,061,545 | | | $ | - | | | $ | 53,061,545 | | |
Other Countries | | | 675,644 | | | | - | | | | - | | | | 675,644 | | |
Total Equities | | | 675,644 | | | | 53,061,545 | | | | - | | | | 53,737,189 | | |
Total Short-Term Investments | | | 1,249,310 | | | | - | | | | - | | | | 1,249,310 | | |
Total Securities Lending Collateral | | | 3,224,760 | | | | - | | | | - | | | | 3,224,760 | | |
Total Investments | | $ | 5,149,714 | | | $ | 53,061,545 | | | $ | - | | | $ | 58,211,259 | | |
The Fund's assets assigned to the Level 2 input category are generally valued using a market approach, in which a security's value is determined through its correlation to prices and information from observable market transactions for similar or identical assets. Foreign equities are generally valued at the last sale price on the foreign exchange or market on which they trade. The Fund may use a statistical fair valuation model, in accordance with the policy adopted by the Board, provided by an independent third party to value securities principally traded in foreign markets in order to adjust for possible stale pricing that may occur between the close of the foreign exchanges and the time for valuation. These models take into account available market data including intraday index, ADR, and ETF movements.
There were no transfers of financial assets between levels during the period.
See accompanying notes to financial statements.
58
COLUMBIA ACORN EUROPEAN FUNDSM
PORTFOLIO DIVERSIFICATION (UNAUDITED)
At June 30, 2016, the Fund's portfolio investments as a percentage of net assets were diversified as follows:
| | | Value | | Percentage
of Net Assets | |
| > Industrials | |
Machinery | | $ | 6,828,920 | | | | 11.7 | | |
Commercial Services & Supplies | | | 4,691,068 | | | | 8.1 | | |
Professional Services | | | 1,910,324 | | | | 3.3 | | |
Construction & Engineering | | | 1,257,610 | | | | 2.2 | | |
Aerospace & Defense | | | 1,201,483 | | | | 2.1 | | |
Building Products | | | 439,184 | | | | 0.7 | | |
| | | 16,328,589 | | | | 28.1 | | |
| > Information Technology | |
IT Services | | | 3,010,865 | | | | 5.2 | | |
Software | | | 2,317,571 | | | | 4.0 | | |
Electronic Equipment, Instruments &
Components | | | 2,297,358 | | | | 3.9 | | |
Internet Software & Services | | | 1,301,855 | | | | 2.2 | | |
Semiconductors & Semiconductor
Equipment | | | 693,106 | | | | 1.2 | | |
| | | 9,620,755 | | | | 16.5 | | |
| > Consumer Discretionary | |
Specialty Retail | | | 3,201,745 | | | | 5.5 | | |
Hotels, Restaurants & Leisure | | | 2,308,669 | | | | 4.0 | | |
Media | | | 1,208,752 | | | | 2.1 | | |
Auto Components | | | 1,139,913 | | | | 1.9 | | |
Distributors | | | 868,110 | | | | 1.5 | | |
Internet & Catalog Retail | | | 504,653 | | | | 0.9 | | |
| | | 9,231,842 | | | | 15.9 | | |
| > Financials | |
Capital Markets | | | 2,796,594 | | | | 4.8 | | |
Real Estate Investment Trusts (REITs) | | | 2,411,158 | | | | 4.1 | | |
Diversified Financial Services | | | 555,653 | | | | 1.0 | | |
| | | 5,763,405 | | | | 9.9 | | |
| | | Value | | Percentage
of Net Assets | |
| > Health Care | |
Health Care Equipment & Supplies | | $ | 1,880,537 | | | | 3.2 | | |
Pharmaceuticals | | | 1,443,383 | | | | 2.5 | | |
Biotechnology | | | 697,784 | | | | 1.2 | | |
Life Sciences Tools & Services | | | 633,508 | | | | 1.1 | | |
Health Care Technology | | | 4,655,212 | | | | 8.0 | | |
| > Materials | |
Paper & Forest Products | | | 2,087,764 | | | | 3.6 | | |
Chemicals | | | 1,784,949 | | | | 3.1 | | |
Containers & Packaging | | | 603,389 | | | | 1.0 | | |
| | | 4,476,102 | | | | 7.7 | | |
| > Consumer Staples | |
Food Products | | | 1,773,611 | | | | 3.0 | | |
Food & Staples Retailing | | | 1,281,268 | | | | 2.2 | | |
| | | 3,054,879 | | | | 5.2 | | |
| > Utilities | |
Multi-Utilities | | | 606,405 | | | | 1.0 | | |
| | | 606,405 | | | | 1.0 | | |
Total Equities: | | | 53,737,189 | | | | 92.3 | | |
Short-Term Investments: | | | 1,249,310 | | | | 2.2 | | |
Securities Lending Collateral: | | | 3,224,760 | | | | 5.5 | | |
Total Investments: | | | 58,211,259 | | | | 100.0 | | |
Obligation to Return
Collateral for Securities
Loaned: | | | (3,224,760 | ) | | | (5.5 | ) | |
Cash and Other Assets
Less Liabilities: | | | 3,209,809 | | | | 5.5 | | |
Net Assets: | | $ | 58,196,308 | | | | 100.0 | | |
See accompanying notes to financial statements.
59
COLUMBIA ACORN FAMILY OF FUNDS
STATEMENTS OF ASSETS AND LIABILITIES (UNAUDITED)
June 30, 2016 | | Columbia
Acorn®
Fund | | Columbia
Acorn
International® | | Columbia
Acorn
USA® | | Columbia
Acorn
International
SelectSM | |
Assets: | |
Unaffiliated investments, at cost | | $ | 4,084,531,379 | | | $ | 4,998,415,227 | | | $ | 510,885,224 | | | $ | 97,521,339 | | |
Affiliated investments, at cost | | | 31,559,999 | | | | — | | | | — | | | | — | | |
Unaffiliated investments, at value (including securities on loan: Columbia Acorn Fund $108,642,869;
Columbia Acorn International $235,235,982; Columbia Acorn USA $14,187,390; Columbia Acorn
International Select $3,911,451; Columbia Acorn Emerging Markets Fund $1,765,880; Columbia
Acorn European Fund $3,110,032) | | $ | 5,648,360,703 | | | $ | 5,961,597,033 | | | $ | 685,706,178 | | | $ | 112,085,175 | | |
Affiliated investments, at value | | | 34,365,876 | | | | — | | | | — | | | | — | | |
Cash | | | — | | | | 4,369 | | | | — | | | | — | | |
Foreign currency (cost: Columbia Acorn International $4,322,324; Columbia Acorn International
Select $102; Columbia Acorn Emerging Markets Fund $1,970,244) | | | — | | | | 4,322,465 | | | | — | | | | 101 | | |
Receivable for: | |
Investments sold | | | 152,643,645 | | | | 65,185,776 | | | | 10,118,008 | | | | 2,097,515 | | |
Fund shares sold | | | 1,484,460 | | | | 6,231,025 | | | | 260,792 | | | | 49,509 | | |
Dividends | | | 2,755,051 | | | | 6,164,897 | | | | 389,918 | | | | 23,546 | | |
Securities lending income | | | 141,987 | | | | 1,172,078 | | | | 9,782 | | | | 55,733 | | |
Foreign tax reclaims | | | — | | | | 3,359,729 | | | | 2,180 | | | | 197,529 | | |
Expense reimbursement due from Investment Manager | | | — | | | | 52,240 | | | | — | | | | 3 | | |
Trustees' deferred compensation plan | | | 3,567,163 | | | | 1,360,340 | | | | 318,744 | | | | — | | |
Prepaid expenses | | | 393,856 | | | | 396,694 | | | | 50,602 | | | | 7,777 | | |
Other assets | | | 6,704 | | | | 6,768 | | | | 153 | | | | 1,219 | | |
Total Assets | | | 5,843,719,445 | | | | 6,049,853,414 | | | | 696,856,357 | | | | 114,518,107 | | |
Liabilities: | |
Collateral on securities loaned | | | 111,180,975 | | | | 244,741,965 | | | | 14,582,425 | | | | 4,028,509 | | |
Payable for: | |
Investments purchased | | | 43,501,153 | | | | 47,493,041 | | | | — | | | | 373 | | |
Fund shares redeemed | | | 20,586,481 | | | | 40,318,016 | | | | 2,359,742 | | | | 349,993 | | |
Investment advisory fee | | | 101,743 | | | | 118,349 | | | | 16,320 | | | | 2,794 | | |
Administration fee | | | 7,019 | | | | 7,115 | | | | 838 | | | | 136 | | |
12b-1 Service and Distribution fees | | | 17,004 | | | | 6,853 | | | | 959 | | | | 277 | | |
Reports to shareholders | | | 422,098 | | | | 451,991 | | | | 54,514 | | | | 24,477 | | |
Transfer agent fees | | | 731,732 | | | | 782,856 | | | | 192,437 | | | | 11,784 | | |
Trustees' fees | | | 72,953 | | | | 41,654 | | | | 8,824 | | | | 67,926 | | |
Custody fees | | | 22,749 | | | | 421,935 | | | | 4,663 | | | | 9,190 | | |
Audit fees | | | 56,574 | | | | 58,204 | | | | 25,644 | | | | 27,881 | | |
Legal fees | | | 152,576 | | | | 140,788 | | | | 17,313 | | | | 2,834 | | |
Deferred foreign capital gains tax payable | | | — | | | | — | | | | — | | | | 12,972 | | |
Trustees' deferred compensation plan | | | 3,567,163 | | | | 1,360,340 | | | | 318,744 | | | | — | | |
Other liabilities | | | 69,832 | | | | 63,779 | | | | 2,594 | | | | — | | |
Total Liabilities | | | 180,490,052 | | | | 336,006,886 | | | | 17,585,017 | | | | 4,539,146 | | |
Net Assets | | $ | 5,663,229,393 | | | $ | 5,713,846,528 | | | $ | 679,271,340 | | | $ | 109,978,961 | | |
Composition of Net Assets: | |
Paid-in capital | | $ | 3,316,044,598 | | | $ | 4,859,539,747 | | | $ | 398,883,138 | | | $ | 112,000,783 | | |
Undistributed (Overdistributed) net investment income (loss) | | | (6,039,310 | ) | | | 12,612,752 | | | | (1,381,443 | ) | | | 600,406 | | |
Accumulated net realized gain (loss) | | | 786,588,770 | | | | (121,466,472 | ) | | | 106,948,691 | | | | (17,162,131 | ) | |
Net unrealized appreciation (depreciation) on: | |
Unaffiliated investments | | | 1,563,829,324 | | | | 963,181,806 | | | | 174,820,954 | | | | 14,563,836 | | |
Affiliated investments | | | 2,805,877 | | | | — | | | | — | | | | — | | |
Foreign currency translations | | | 134 | | | | (21,305 | ) | | | — | | | | (10,961 | ) | |
Foreign capital gains tax | | | — | | | | — | | | | — | | | | (12,972 | ) | |
Net Assets | | $ | 5,663,229,393 | | | $ | 5,713,846,528 | | | $ | 679,271,340 | | | $ | 109,978,961 | | |
Net asset value per share – Class A (a) | | $ | 15.57 | | | $ | 38.28 | | | $ | 17.80 | | | $ | 20.93 | | |
(Net assets/shares)
| | ($ | 1,081,391,542/
69,431,733) | | | ($ | 690,105,532/
18,029,118) | | | ($ | 85,727,264/
4,817,449) | | | ($ | 22,809,241/
1,089,871) | | |
Maximum offering price per share – Class A (b) | | $ | 16.52 | | | $ | 40.62 | | | $ | 18.89 | | | $ | 22.21 | | |
(Net asset value per share/front-end sales charge) | | ($15.57/0.9425) | | ($38.28/0.9425) | | ($17.80/0.9425) | | ($20.93/0.9425) | |
Net asset value and offering price per share – Class B (a) | | $ | — | | | $ | 36.88 | | | $ | — | | | $ | — | | |
(Net assets/shares) | | ($ | —/— | ) | | ($893,062/24,218) | | ($ | —/— | ) | | ($ | —/— | ) | |
Net asset value and offering price per share – Class C (a) | | $ | 11.07 | | | $ | 36.73 | | | $ | 13.46 | | | $ | 19.51 | | |
(Net assets/shares)
| | ($ | 357,280,031/
32,263,985) | | | ($ | 77,841,444/
2,119,419) | | | ($ | 14,228,181/
1,057,207) | | | ($ | 4,574,019/
234,416) | | |
Net asset value and offering price per share – Class I (c) | | $ | 17.40 | | | $ | 38.42 | | | $ | 20.01 | (d) | | $ | 21.22 | (d) | |
(Net assets/shares)
| | ($ | 23,149,341/
1,330,127) | | | ($ | 46,065,357/
1,198,914) | | | ($1,405/70)
| | ($1,956/92)
| |
Net asset value and offering price per share – Class R (c) | | $ | — | | | $ | 38.20 | | | $ | — | | | $ | — | | |
(Net assets/shares) | | ($ | —/— | ) | | ($4,515,360/118,192) | | ($ | —/— | ) | | ($ | —/— | ) | |
Net asset value and offering price per share – Class R4 (c) | | $ | 17.80 | | | $ | 38.64 | | | $ | 20.44 | | | $ | 21.36 | | |
(Net assets/shares)
| | ($ | 35,479,720/
1,993,439) | | | ($ | 477,953,445/
12,370,613) | | | ($ | 8,266,755/
404,451) | | | ($ | 1,372,787/
64,271) | | |
Net asset value and offering price per share – Class R5 (c) | | $ | 17.89 | | | $ | 38.36 | | | $ | 20.50 | | | $ | 21.35 | | |
(Net assets/shares)
| | ($ | 54,309,487/
3,035,559) | | | ($ | 309,222,351/
8,061,028) | | | ($ | 27,442,912/
1,338,516) | | | ($ | 661,396/
30,975) | | |
Net asset value and offering price per share – Class Y (c) | | $ | 17.97 | | | $ | 38.68 | | | $ | 20.61 | | | $ | 21.34 | | |
(Net assets/shares)
| | ($ | 95,673,170/
5,322,766) | | | ($ | 217,850,945/
5,632,558) | | | ($ | 41,295,843/
2,004,135) | | | ($ | 179,817/
8,425) | | |
Net asset value and offering price per share – Class Z (c) | | $ | 17.31 | | | $ | 38.37 | | | $ | 19.78 | | | $ | 21.21 | | |
(Net assets/shares)
| | ($ | 4,015,946,102/
232,053,129) | | | ($ | 3,889,399,032/
101,365,648) | | | ($ | 502,308,980/
25,394,049) | | | ($ | 80,379,745/
3,789,319) | | |
(a) Redemption price per share is equal to net asset value less any applicable contingent deferred sales charge.
(b) On sales of $50,000 or more the offering price is reduced.
(c) Redemption price per share is equal to net asset value.
(d) Net asset value per share rounds to this amount due to fractional shares outstanding.
See accompanying notes to financial statements.
60
June 30, 2016 | | Columbia
Acorn
SelectSM | | Columbia
Thermostat
FundSM | | Columbia
Acorn
Emerging Markets
FundSM | | Columbia
Acorn
European
FundSM | |
Assets: | |
Unaffiliated investments, at cost | | $ | 306,143,018 | | | $ | 5,910,720 | | | $ | 168,706,866 | | | $ | 55,082,618 | | |
Affiliated investments, at cost | | | — | | | | 1,101,831,635 | | | | — | | | | — | | |
Unaffiliated investments, at value (including securities on loan: Columbia Acorn Fund $108,642,869;
Columbia Acorn International $235,235,982; Columbia Acorn USA $14,187,390; Columbia Acorn
International Select $3,911,451; Columbia Acorn Emerging Markets Fund $1,765,880; Columbia
Acorn European Fund $3,110,032) | | $ | 339,183,162 | | | $ | 5,910,720 | | | $ | 157,777,848 | | | $ | 58,211,259 | | |
Affiliated investments, at value | | | — | | | | 1,147,113,789 | | | | — | | | | — | | |
Cash | | | — | | | | — | | | | — | | | | — | | |
Foreign currency (cost: Columbia Acorn International $4,322,324; Columbia Acorn International
Select $102; Columbia Acorn Emerging Markets Fund $1,970,244) | | | — | | | | — | | | | 1,354,865 | | | | — | | |
Receivable for: | |
Investments sold | | | — | | | | — | | | | 1,783,733 | | | | 3,226,554 | | |
Fund shares sold | | | 76,412 | | | | 3,714,108 | | | | 87,463 | | | | 111,001 | | |
Dividends | | | 167,866 | | | | 1,517,763 | | | | 162,438 | | | | 67,235 | | |
Securities lending income | | | 62 | | | | — | | | | 1,150 | | | | 30,731 | | |
Foreign tax reclaims | | | — | | | | — | | | | 3,626 | | | | 82,837 | | |
Expense reimbursement due from Investment Manager | | | — | | | | 1,375 | | | | 26 | | | | 417 | | |
Trustees' deferred compensation plan | | | 304,045 | | | | — | | | | — | | | | — | | |
Prepaid expenses | | | 23,013 | | | | 68,243 | | | | 15,220 | | | | 3,776 | | |
Other assets | | | — | | | | 28,236 | | | | 4,964 | | | | 8,032 | | |
Total Assets | | | 339,754,560 | | | | 1,158,354,234 | | | | 161,191,333 | | | | 61,741,842 | | |
Liabilities: | |
Collateral on securities loaned | | | — | | | | — | | | | 1,850,375 | | | | 3,224,760 | | |
Payable for: | |
Investments purchased | | | 2,909,942 | | | | 1,517,763 | | | | 168,825 | | | | 70,536 | | |
Fund shares redeemed | | | 747,054 | | | | 2,152,529 | | | | 266,305 | | | | 195,453 | | |
Investment advisory fee | | | 5,901 | | | | 3,141 | | | | 4,988 | | | | 1,873 | | |
Administration fee | | | 416 | | | | 1,439 | | | | 197 | | | | 72 | | |
12b-1 Service and Distribution fees | | | 1,637 | | | | 12,862 | | | | 1,019 | | | | 444 | | |
Reports to shareholders | | | 56,445 | | | | 64,084 | | | | 34,946 | | | | 10,841 | | |
Transfer agent fees | | | 34,596 | | | | 75,175 | | | | 20,580 | | | | 5,160 | | |
Trustees' fees | | | 2,641 | | | | 128,425 | | | | 32,425 | | | | 5,033 | | |
Custody fees | | | 2,057 | | | | 366 | | | | 44,070 | | | | 4,813 | | |
Audit fees | | | 25,561 | | | | 15,447 | | | | 36,126 | | | | 25,396 | | |
Legal fees | | | 6,045 | | | | 22,909 | | | | 5,920 | | | | 1,153 | | |
Deferred foreign capital gains tax payable | | | — | | | | — | | | | — | | | | — | | |
Trustees' deferred compensation plan | | | 304,045 | | | | — | | | | — | | | | — | | |
Other liabilities | | | 1,644 | | | | 2,710 | | | | — | | | | — | | |
Total Liabilities | | | 4,097,984 | | | | 3,996,850 | | | | 2,465,776 | | | | 3,545,534 | | |
Net Assets | | $ | 335,656,576 | | | $ | 1,154,357,384 | | | $ | 158,725,557 | | | $ | 58,196,308 | | |
Composition of Net Assets: | |
Paid-in capital | | $ | 278,626,448 | | | $ | 1,128,184,206 | | | $ | 242,511,373 | | | $ | 62,827,445 | | |
Undistributed (Overdistributed) net investment income (loss) | | | (420,920 | ) | | | 6,058,104 | | | | (478,151 | ) | | | 407,506 | | |
Accumulated net realized gain (loss) | | | 24,410,904 | | | | (25,167,080 | ) | | | (72,377,697 | ) | | | (8,155,328 | ) | |
Net unrealized appreciation (depreciation) on: | |
Unaffiliated investments | | | 33,040,144 | | | | — | | | | (10,929,018 | ) | | | 3,128,641 | | |
Affiliated investments | | | — | | | | 45,282,154 | | | | — | | | | — | | |
Foreign currency translations | | | — | | | | — | | | | (950 | ) | | | (11,956 | ) | |
Foreign capital gains tax | | | — | | | | — | | | | — | | | | — | | |
Net Assets | | $ | 335,656,576 | | | $ | 1,154,357,384 | | | $ | 158,725,557 | | | $ | 58,196,308 | | |
Net asset value per share – Class A (a) | | $ | 12.58 | | | $ | 14.50 | | | $ | 10.36 | | | $ | 14.16 | | |
(Net assets/shares)
| | ($ | 124,457,349/
9,895,807) | | | ($ | 406,836,684/
28,061,356) | | | ($ | 71,485,069/
6,897,364) | | | ($ | 35,446,448/
2,502,508) | | |
Maximum offering price per share – Class A (b) | | $ | 13.35 | | | $ | 15.38 | | | $ | 10.99 | | | $ | 15.02 | | |
(Net asset value per share/front-end sales charge) | | ($12.58/0.9425) | | ($14.50/0.9425) | | ($10.36/0.9425) | | ($14.16/0.9425) | |
Net asset value and offering price per share – Class B (a) | | $ | — | | | $ | — | | | $ | — | | | $ | — | | |
(Net assets/shares) | | ($ | —/— | ) | | ($ | —/— | ) | | ($ | —/— | ) | | ($ | —/— | ) | |
Net asset value and offering price per share – Class C (a) | | $ | 9.15 | | | $ | 14.55 | | | $ | 10.28 | | | $ | 14.00 | | |
(Net assets/shares)
| | ($ | 29,369,528/
3,209,069) | | | ($ | 370,515,694/
25,466,168) | | | ($ | 19,682,755/
1,913,927) | | | ($ | 7,572,159/
540,923) | | |
Net asset value and offering price per share – Class I (c) | | $ | 14.01 | | | $ | — | | | $ | 10.41 | (d) | | $ | 14.17 | (d) | |
(Net assets/shares)
| | ($ | 23,044,449/
1,645,363) | | | ($ | —/—
| ) | | ($2,111/203)
| | ($2,422/171)
| |
Net asset value and offering price per share – Class R (c) | | $ | — | | | $ | — | | | $ | — | | | $ | — | | |
(Net assets/shares) | | ($ | —/— | ) | | ($ | —/— | ) | | ($ | —/— | ) | | ($ | —/— | ) | |
Net asset value and offering price per share – Class R4 (c) | | $ | 14.33 | | | $ | 14.39 | | | $ | 10.46 | | | $ | 14.24 | | |
(Net assets/shares)
| | ($ | 804,732/
56,176) | | | ($ | 14,599,954/
1,014,371) | | | ($ | 2,090,044/
199,790) | | | ($ | 371,732/
26,098) | | |
Net asset value and offering price per share – Class R5 (c) | | $ | 14.38 | | | $ | 14.41 | | | $ | 10.46 | | | $ | 14.31 | | |
(Net assets/shares)
| | ($ | 1,020,557/
70,983) | | | ($ | 12,309,354/
854,389) | | | ($ | 1,240,191/
118,530) | | | ($ | 1,437,905/
100,450) | | |
Net asset value and offering price per share – Class Y (c) | | $ | 14.47 | | | $ | 14.39 | | | $ | 10.37 | (d) | | $ | — | | |
(Net assets/shares)
| | ($ | 5,117,499/
353,545) | | | ($ | 367,447/
25,538) | | | ($1,966/190)
| | ($ | —/—
| ) | |
Net asset value and offering price per share – Class Z (c) | | $ | 13.88 | | | $ | 14.32 | | | $ | 10.39 | | | $ | 14.18 | | |
(Net assets/shares)
| | ($ | 151,842,462/
10,941,168) | | | ($ | 349,728,251/
24,422,230) | | | ($ | 64,223,421/
6,179,259) | | | ($ | 13,365,642/
942,548) | | |
See accompanying notes to financial statements.
61
COLUMBIA ACORN FAMILY OF FUNDS
STATEMENTS OF OPERATIONS (UNAUDITED) FOR THE SIX MONTHS ENDED JUNE 30, 2016
| | | Columbia
Acorn®
Fund | | Columbia
Acorn
International® | | Columbia
Acorn
USA® | | Columbia
Acorn
International
SelectSM | |
Investment Income: | |
Dividends | | $ | 26,644,581 | | | $ | 85,118,773 | | | $ | 2,817,182 | | | $ | 1,518,840 | | |
Dividends from affiliated investment company shares | | | — | | | | — | | | | — | | | | — | | |
Interest | | | — | | | | 101 | | | | — | | | | 12 | | |
Income from securities lending – net | | | 828,049 | | | | 3,974,962 | | | | 96,095 | | | | 150,114 | | |
Other income | | | 4,148 | | | | 122 | | | | 432 | | | | — | | |
| | | | 27,476,778 | | | | 89,093,958 | | | | 2,913,709 | | | | 1,668,966 | | |
Foreign taxes withheld | | | (67,714 | ) | | | (8,500,849 | ) | | | (19,519 | ) | | | (132,498 | ) | |
Total Investment Income | | | 27,409,064 | | | | 80,593,109 | | | | 2,894,190 | | | | 1,536,468 | | |
Expenses: | |
Investment advisory fee | | | 20,371,476 | | | | 23,197,705 | | | | 3,104,611 | | | | 556,482 | | |
Administration fee | | | 1,396,872 | | | | 1,383,800 | | | | 158,194 | | | | 26,850 | | |
12b-1 Service and Distribution fees: | |
Class A | | | 1,469,614 | | | | 926,929 | | | | 104,921 | | | | 33,626 | | |
Class B | | | 1,617 | | | | 4,205 | | | | 17 | | | | 14 | | |
Class C | | | 1,953,961 | | | | 406,762 | | | | 74,352 | | | | 24,407 | | |
Class R | | | — | | | | 11,842 | | | | — | | | | — | | |
Transfer agency fees: | |
Class A | | | 705,321 | | | | 656,669 | | | | 66,583 | | | | 22,032 | | |
Class B | | | 1,689 | | | | 2,750 | | | | 141 | | | | 36 | | |
Class C | | | 184,302 | | | | 62,260 | | | | 7,756 | | | | 4,784 | | |
Class R | | | — | | | | 6,028 | | | | — | | | | — | | |
Class R4 | | | 36,904 | | | | 480,840 | | | | 7,156 | | | | 988 | | |
Class R5 | | | 14,873 | | | | 74,943 | | | | 6,146 | | | | 311 | | |
Class Z | | | 1,318,582 | | | | 2,153,148 | | | | 414,948 | | | | 45,466 | | |
Trustees' fees | | | 355,550 | | | | 308,298 | | | | 41,413 | | | | 7,054 | | |
Custody fees | | | 43,793 | | | | 612,410 | | | | 13,658 | | | | 19,227 | | |
Registration and blue sky fees | | | 64,402 | | | | 81,118 | | | | 44,608 | | | | 43,362 | | |
Reports to shareholders | | | 494,313 | | | | 648,664 | | | | 61,744 | | | | 30,336 | | |
Audit fees | | | 57,368 | | | | 67,645 | | | | 20,428 | | | | 23,798 | | |
Legal fees | | | 565,071 | | | | 585,401 | | | | 69,949 | | | | 11,099 | | |
Interest expense (Note 5) | | | 1,516 | | | | — | | | | — | | | | — | | |
Chief compliance officer expenses | | | 303,491 | | | | 284,141 | | | | 37,612 | | | | 5,938 | | |
Other expenses | | | 331,404 | | | | 245,814 | | | | 44,182 | | | | 15,147 | | |
Total Expenses | | | 29,672,119 | | | | 32,201,372 | | | | 4,278,419 | | | | 870,957 | | |
Less reimbursement of expenses by Investment Manager | | | — | | | | — | | | | — | | | | (39 | ) | |
Less advisory fee waiver | | | — | | | | — | | | | — | | | | — | | |
Less transfer agency fee waiver | | | — | | | | (156,525 | ) | | | — | | | | — | | |
Net Expenses | | | 29,672,119 | | | | 32,044,847 | | | | 4,278,419 | | | | 870,918 | | |
Net Investment Income (Loss) | | | (2,263,055 | ) | | | 48,548,262 | | | | (1,384,229 | ) | | | 665,550 | | |
Net Realized and Unrealized Gain (Loss) on Investments: | |
Net realized gain (loss) on: | |
Unaffiliated investments | | | 842,640,928 | | | | (87,819,619 | ) | | | 119,618,984 | | | | (2,103,563 | ) | |
Affiliated investments | | | (11,260,681 | ) | | | — | | | | — | | | | — | | |
Distributions from affiliated investment company shares | | | — | | | | — | | | | — | | | | — | | |
Foreign currency translations | | | (12,115 | ) | | | 1,003,070 | | | | — | | | | 34,114 | | |
Futures contracts | | | (21,684,530 | ) | | | — | | | | (11,300,776 | ) | | | — | | |
Net realized gain (loss) | | | 809,683,602 | | | | (86,816,549 | ) | | | 108,318,208 | | | | (2,069,449 | ) | |
Net change in net unrealized appreciation (depreciation) on: | |
Unaffiliated investments | | | (864,079,170 | ) | | | (120,570,163 | ) | | | (128,419,543 | ) | | | (1,623,576 | ) | |
Affiliated investments | | | (11,104,807 | ) | | | 48,595,971 | | | | 1,467,113 | | | | — | | |
Foreign currency translations | | | 2,344 | | | | 210,682 | | | | — | | | | 12,044 | | |
Futures contracts | | | (4,292,591 | ) | | | — | | | | (465,285 | ) | | | — | | |
Foreign capital gains tax | | | — | | | | — | | | | — | | | | (8,585 | ) | |
Net change in unrealized appreciation (depreciation) | | | (879,474,224 | ) | | | (71,763,510 | ) | | | (127,417,715 | ) | | | (1,620,117 | ) | |
Net realized and unrealized gain (loss) | | | (69,790,622 | ) | | | (158,580,059 | ) | | | (19,099,507 | ) | | | (3,689,566 | ) | |
Net Increase (Decrease) in Net Assets from Operations | | $ | (72,053,677 | ) | | $ | (110,031,797 | ) | | $ | (20,483,736 | ) | | $ | (3,024,016 | ) | |
See accompanying notes to financial statements.
62
| | | Columbia
Acorn
SelectSM | | Columbia
Thermostat
FundSM | | Columbia
Acorn
Emerging Markets
FundSM | | Columbia
Acorn
European
FundSM | |
Investment Income: | |
Dividends | | $ | 1,900,547 | | | $ | 3,278 | | | $ | 1,717,505 | | | $ | 1,330,102 | | |
Dividends from affiliated investment company shares | | | — | | | | 9,993,452 | | | | — | | | | — | | |
Interest | | | — | | | | — | | | | 226 | | | | — | | |
Income from securities lending – net | | | 5,947 | | | | — | | | | 20,846 | | | | 87,489 | | |
Other income | | | — | | | | — | | | | — | | | | — | | |
| | | | 1,906,494 | | | | 9,996,730 | | | | 1,738,577 | | | | 1,417,591 | | |
Foreign taxes withheld | | | (5,800 | ) | | | — | | | | (174,724 | ) | | | (143,342 | ) | |
Total Investment Income | | | 1,900,694 | | | | 9,996,730 | | | | 1,563,853 | | | | 1,274,249 | | |
Expenses: | |
Investment advisory fee | | | 1,535,526 | | | | 553,344 | | | | 1,089,685 | | | | 371,787 | | |
Administration fee | | | 81,939 | | | | 251,034 | | | | 43,768 | | | | 14,174 | | |
12b-1 Service and Distribution fees: | |
Class A | | | 163,687 | | | | 487,611 | | | | 96,571 | | | | 48,791 | | |
Class B | | | 413 | | | | 399 | | | | — | | | | — | | |
Class C | | | 154,519 | | | | 1,818,156 | | | | 101,663 | | | | 36,374 | | |
Class R | | | — | | | | — | | | | — | | | | — | | |
Transfer agency fees: | |
Class A | | | 91,117 | | | | 154,673 | | | | 61,826 | | | | 22,995 | | |
Class B | | | 508 | | | | 248 | | | | — | | | | — | | |
Class C | | | 17,959 | | | | 131,422 | | | | 17,948 | | | | 4,603 | | |
Class R | | | — | | | | — | | | | — | | | | — | | |
Class R4 | | | 719 | | | | 7,998 | | | | 1,897 | | | | 414 | | |
Class R5 | | | 275 | | | | 2,561 | | | | 1,976 | | | | 445 | | |
Class Z | | | 81,153 | | | | 102,921 | | | | 61,613 | | | | 5,839 | | |
Trustees' fees | | | 18,817 | | | | 53,164 | | | | 12,448 | | | | 2,966 | | |
Custody fees | | | 3,919 | | | | 680 | | | | 72,364 | | | | 20,924 | | |
Registration and blue sky fees | | | 45,490 | | | | 58,960 | | | | 41,464 | | | | 38,533 | | |
Reports to shareholders | | | 65,633 | | | | 96,705 | | | | 38,766 | | | | 15,865 | | |
Audit fees | | | 20,345 | | | | 11,856 | | | | 37,025 | | | | 19,880 | | |
Legal fees | | | 30,758 | | | | 101,844 | | | | 19,979 | | | | 5,868 | | |
Interest expense (Note 5) | | | — | | | | — | | | | 335 | | | | — | | |
Chief compliance officer expenses | | | 16,915 | | | | 48,164 | | | | 11,547 | | | | 2,595 | | |
Other expenses | | | 25,134 | | | | 43,937 | | | | 18,471 | | | | 10,355 | | |
Total Expenses | | | 2,354,826 | | | | 3,925,677 | | | | 1,729,346 | | | | 622,408 | | |
Less reimbursement of expenses by Investment Manager | | | (204 | ) | | | (236,782 | ) | | | (9,643 | ) | | | (69,253 | ) | |
Less advisory fee waiver | | | (361,300 | ) | | | — | | | | — | | | | — | | |
Less transfer agency fee waiver | | | — | | | | — | | | | — | | | | — | | |
Net Expenses | | | 1,993,322 | | | | 3,688,895 | | | | 1,719,703 | | | | 553,155 | | |
Net Investment Income (Loss) | | | (92,628 | ) | | | 6,307,835 | | | | (155,850 | ) | | | 721,094 | | |
Net Realized and Unrealized Gain (Loss) on Investments: | |
Net realized gain (loss) on: | |
Unaffiliated investments | | | 25,765,340 | | | | — | | | | (34,183,495 | ) | | | (2,883,549 | ) | |
Affiliated investments | | | — | | | | (27,985,922 | ) | | | — | | | | — | | |
Distributions from affiliated investment company shares | | | — | | | | 5,837,780 | | | | — | | | | — | | |
Foreign currency translations | | | (3,316 | ) | | | — | | | | (83,537 | ) | | | 1,694 | | |
Futures contracts | | | — | | | | — | | | | 2,885,350 | | | | — | | |
Net realized gain (loss) | | | 25,762,024 | | | | (22,148,142 | ) | | | (31,381,682 | ) | | | (2,881,855 | ) | |
Net change in net unrealized appreciation (depreciation) on: | |
Unaffiliated investments | | | (30,578,371 | ) | | | — | | | | 26,651,662 | | | | (236,173 | ) | |
Affiliated investments | | | — | | | | 54,472,232 | | | | — | | | | — | | |
Foreign currency translations | | | (1,531 | ) | | | — | | | | (24 | ) | | | (6,255 | ) | |
Futures contracts | | | — | | | | — | | | | — | | | | — | | |
Foreign capital gains tax | | | — | | | | — | | | | — | | | | — | | |
Net change in unrealized appreciation (depreciation) | | | (30,579,902 | ) | | | 54,472,232 | | | | 26,651,638 | | | | (242,428 | ) | |
Net realized and unrealized gain (loss) | | | (4,817,878 | ) | | | 32,324,090 | | | | (4,730,044 | ) | | | (3,124,283 | ) | |
Net Increase (Decrease) in Net Assets from Operations | | $ | (4,910,506 | ) | | $ | 38,631,925 | | | $ | (4,885,894 | ) | | $ | (2,403,189 | ) | |
See accompanying notes to financial statements.
63
COLUMBIA ACORN FAMILY OF FUNDS
STATEMENTS OF CHANGES IN NET ASSETS
| | Columbia
Acorn® Fund | | Columbia Acorn
International® | | Columbia
Acorn USA® | | Columbia Acorn
International SelectSM | |
Increase (Decrease) in Net Assets | | (Unaudited)
Six months
ended
June 30, | | Year ended
December 31, | | (Unaudited)
Six months
ended
June 30, | | Year ended
December 31, | | (Unaudited)
Six months
ended
June 30, | | Year ended
December 31, | | (Unaudited)
Six months
ended
June 30, | | Year ended
December 31, | |
| | | 2016 | | 2015 | | 2016 | | 2015 | | 2016 | | 2015 | | 2016 | | 2015 | |
Operations: | |
Net investment income (loss) | | $ | (2,263,055 | ) | | $ | (26,090,948 | ) | | $ | 48,548,262 | | | $ | 88,208,011 | | | $ | (1,384,229 | ) | | $ | (5,534,984 | ) | | $ | 665,550 | | | $ | 2,055,038 | | |
Net realized gain (loss) on investments, foreign
currency translations, forward foreign currency
exchange contracts, futures contracts and foreign
capital gains tax | | | 820,944,283 | | | | 4,067,021,891 | | | | (86,816,549 | ) | | | 309,903,232 | | | | 108,318,208 | | | | 349,137,953 | | | | (2,069,449 | ) | | | 1,724,919 | | |
Net realized gain (loss) on affiliated investments
and distributions from affiliated investment
company shares | | | (11,260,681 | ) | | | 661,243,725 | | | | — | | | | (6,289,915 | ) | | | — | | | | (51,344 | ) | | | — | | | | — | | |
Net change in net unrealized appreciation (depreciation)
on investments, foreign currency translations, forward
foreign currency exchange contracts, futures contracts,
options and foreign capital gains tax | | | (868,369,417 | ) | | | (3,412,345,084 | ) | | | (120,359,481 | ) | | | (439,613,018 | ) | | | (128,884,828 | ) | | | (347,361,237 | ) | | | (1,620,117 | ) | | | (4,516,259 | ) | |
Net change in net unrealized appreciation (depreciation)
on affiliated investments, affiliated options and affiliated
investment company shares | | | (11,104,807 | ) | | | (1,230,821,970 | ) | | | 48,595,971 | | | | (41,744,516 | ) | | | 1,467,113 | | | | (1,467,113 | ) | | | — | | | | — | | |
Net Increase (Decrease) in Net Assets from Operations | | | (72,053,677 | ) | | | 59,007,614 | | | | (110,031,797 | ) | | | (89,536,206 | ) | | | (20,483,736 | ) | | | (5,276,725 | ) | | | (3,024,016 | ) | | | (736,302 | ) | |
Distributions to Shareholders From: | |
Net investment income – Class A | | | — | | | | — | | | | — | | | | (8,205,224 | ) | | | — | | | | — | | | | — | | | | (736,335 | ) | |
Net realized gain – Class A | | | (131,369,765 | ) | | | (686,509,674 | ) | | | (4,791,683 | ) | | | (33,019,639 | ) | | | (11,441,305 | ) | | | (31,255,985 | ) | | | — | | | | — | | |
Tax return of capital – Class A | | | — | | | | — | | | | — | | | | — | | | | — | | | | �� | | | | — | | | | (11,066 | ) | |
Net investment income – Class B | | | — | | | | — | | | | — | | | | (1,139 | ) | | | — | | | | — | | | | — | | | | (522 | ) | |
Net realized gain – Class B | | | — | | | | (1,036,254 | ) | | | (6,422 | ) | | | (98,847 | ) | | | — | | | | (16,747 | ) | | | — | | | | — | | |
Tax return of capital – Class B | | | — | | | | — | | | | — | | | | — | | | | — | | | | — | | | | — | | | | (45 | ) | |
Net investment income – Class C | | | — | | | | — | | | | — | | | | (181,949 | ) | | | — | | | | — | | | | — | | | | (42,697 | ) | |
Net realized gain – Class C | | | (58,233,028 | ) | | | (272,289,441 | ) | | | (553,766 | ) | | | (3,721,075 | ) | | | (2,509,821 | ) | | | (7,350,636 | ) | | | — | | | | — | | |
Tax return of capital – Class C | | | — | | | | — | | | | — | | | | — | | | | — | | | | — | | | | — | | | | (1,883 | ) | |
Net investment income – Class I | | | — | | | | — | | | | — | | | | (739,480 | ) | | | — | | | | — | | | | — | | | | (46 | ) | |
Net realized gain – Class I | | | (2,959,653 | ) | | | (10,763,307 | ) | | | (367,390 | ) | | | (1,983,081 | ) | | | (188 | ) | | | (598 | ) | | | — | | | | — | | |
Tax return of capital – Class I | | | — | | | | — | | | | — | | | | — | | | | — | | | | — | | | | — | | | | (1 | ) | |
Net investment income – Class R | | | — | | | | — | | | | — | | | | (28,701 | ) | | | — | | | | — | | | | — | | | | — | | |
Net realized gain – Class R | | | — | | | | — | | | | (30,861 | ) | | | (184,807 | ) | | | — | | | | — | | | | — | | | | — | | |
Net investment income – Class R4 | | | — | | | | — | | | | — | | | | (5,718,822 | ) | | | — | | | | — | | | | — | | | | (20,748 | ) | |
Net realized gain – Class R4 | | | (3,804,882 | ) | | | (27,922,528 | ) | | | (3,191,551 | ) | | | (18,460,175 | ) | | | (958,736 | ) | | | (2,417,938 | ) | | | — | | | | — | | |
Tax return of capital – Class R4 | | | — | | | | — | | | | — | | | | — | | | | — | | | | — | | | | — | | | | (255 | ) | |
Net investment income – Class R5 | | | — | | | | — | | | | — | | | | (4,463,810 | ) | | | — | | | | — | | | | — | | | | (80,237 | ) | |
Net realized gain – Class R5 | | | (5,615,964 | ) | | | (38,850,876 | ) | | | (2,010,528 | ) | | | (13,614,854 | ) | | | (2,965,897 | ) | | | (7,965,886 | ) | | | — | | | | — | | |
Tax return of capital – Class R5 | | | — | | | | — | | | | — | | | | — | | | | — | | | | — | | | | — | | | | (924 | ) | |
Net investment income – Class Y | | | — | | | | — | | | | — | | | | (3,895,860 | ) | | | — | | | | — | | | | — | | | | (55,291 | ) | |
Net realized gain – Class Y | | | (9,962,545 | ) | | | (55,761,205 | ) | | | (1,662,628 | ) | | | (10,490,604 | ) | | | (4,782,483 | ) | | | (11,343,762 | ) | | | — | | | | — | | |
Tax return of capital – Class Y | | | — | | | | — | | | | — | | | | — | | | | — | | | | — | | | | — | | | | (2,370 | ) | |
Net investment income – Class Z | | | — | | | | — | | | | — | | | | (61,075,291 | ) | | | — | | | | — | | | | — | | | | (2,757,476 | ) | |
Net realized gain – Class Z | | | (451,018,562 | ) | | | (2,491,951,313 | ) | | | (27,548,636 | ) | | | (189,765,735 | ) | | | (61,594,985 | ) | | | (239,084,391 | ) | | | — | | | | — | | |
Tax return of capital – Class Z | | | — | | | | — | | | | — | | | | — | | | | — | | | | — | | | | — | | | | (36,925 | ) | |
Total Distributions to Shareholders | | | (662,964,399 | ) | | | (3,585,084,598 | ) | | | (40,163,465 | ) | | | (355,649,093 | ) | | | (84,253,415 | ) | | | (299,435,943 | ) | | | — | | | | (3,746,821 | ) | |
Share Transactions: | |
Subscriptions – Class A | | | 40,973,211 | | | | 174,900,524 | | | | 45,245,273 | | | | 162,684,349 | | | | 5,282,548 | | | | 12,442,691 | | | | 1,128,953 | | | | 7,109,433 | | |
Distributions reinvested – Class A | | | 121,868,578 | | | | 637,395,152 | | | | 4,651,613 | | | | 40,031,526 | | | | 10,826,489 | | | | 29,525,556 | | | | — | | | | 729,830 | | |
Redemptions – Class A | | | (322,316,302 | ) | | | (1,430,796,125 | ) | | | (154,965,694 | ) | | | (282,908,269 | ) | | | (14,050,661 | ) | | | (62,632,427 | ) | | | (11,311,624 | ) | | | (26,641,940 | ) | |
Net Increase (Decrease) – Class A | | | (159,474,513 | ) | | | (618,500,449 | ) | | | (105,068,808 | ) | | | (80,192,394 | ) | | | 2,058,376 | | | | (20,664,180 | ) | | | (10,182,671 | ) | | | (18,802,677 | ) | |
Distributions reinvested – Class B | | | — | | | | 980,657 | | | | 6,408 | | | | 101,400 | | | | — | | | | 18,478 | | | | — | | | | 3,044 | | |
Redemptions – Class B | | | (1,194,419 | ) | | | (5,952,788 | ) | | | (678,760 | ) | | | (4,964,593 | ) | | | (21,538 | ) | | | (214,967 | ) | | | (18,165 | ) | | | (342,841 | ) | |
Net Increase (Decrease) – Class B | | | (1,194,419 | ) | | | (4,972,131 | ) | | | (672,352 | ) | | | (4,863,193 | ) | | | (21,538 | ) | | | (196,489 | ) | | | (18,165 | ) | | | (339,797 | ) | |
Subscriptions – Class C | | | 14,461,288 | | | | 56,969,500 | | | | 1,712,893 | | | | 10,738,058 | | | | 541,342 | | | | 1,973,916 | | | | 42,045 | | | | 547,068 | | |
Distributions reinvested – Class C | | | 50,515,703 | | | | 233,591,330 | | | | 497,985 | | | | 3,513,911 | | | | 2,368,968 | | | | 6,862,553 | | | | — | | | | 41,842 | | |
Redemptions – Class C | | | (99,162,012 | ) | | | (328,691,291 | ) | | | (10,745,965 | ) | | | (23,313,955 | ) | | | (3,326,018 | ) | | | (20,683,050 | ) | | | (721,650 | ) | | | (3,102,184 | ) | |
Net Increase (Decrease) – Class C | | | (34,185,021 | ) | | | (38,130,461 | ) | | | (8,535,087 | ) | | | (9,061,986 | ) | | | (415,708 | ) | | | (11,846,581 | ) | | | (679,605 | ) | | | (2,513,274 | ) | |
See accompanying notes to financial statements.
64
| | | Columbia
Acorn SelectSM | | Columbia
Thermostat FundSM | | Columbia Acorn
Emerging Markets FundSM | | Columbia Acorn
European FundSM | |
Increase (Decrease) in Net Assets | | (Unaudited)
Six months
ended
June 30, | | Year ended
December 31, | | (Unaudited)
Six months
ended
June 30, | | Year ended
December 31, | | (Unaudited)
Six months
ended
June 30, | | Year ended
December 31, | | (Unaudited)
Six months
ended
June 30, | | Year ended
December 31, | |
| | | 2016 | | 2015 | | 2016 | | 2015 | | 2016 | | 2015 | | 2016 | | 2015 | |
Operations: | |
Net investment income (loss) | | $ | (92,628 | ) | | $ | (1,864,930 | ) | | $ | 6,307,835 | | | $ | 19,698,061 | | | $ | (155,850 | ) | | $ | 3,811,610 | | | $ | 721,094 | | | $ | 361,772 | | |
Net realized gain (loss) on investments, foreign
currency translations, forward foreign currency
exchange contracts, futures contracts and foreign
capital gains tax | | | 25,762,024 | | | | 169,755,684 | | | | — | | | | — | | | | (31,381,682 | ) | | | (24,300,516 | ) | | | (2,881,855 | ) | | | (2,562,808 | ) | |
Net realized gain (loss) on affiliated investments
and distributions from affiliated investment
company shares | | | — | | | | (22,763,588 | ) | | | (22,148,142 | ) | | | 26,208,927 | | | | — | | | | — | | | | — | | | | — | | |
Net change in net unrealized appreciation (depreciation)
on investments, foreign currency translations, forward
foreign currency exchange contracts, futures contracts,
options and foreign capital gains tax | | | (30,579,902 | ) | | | (163,774,818 | ) | | | — | | | | — | | | | 26,651,638 | | | | (54,447,576 | ) | | | (242,428 | ) | | | 2,934,381 | | |
Net change in net unrealized appreciation (depreciation)
on affiliated investments, affiliated options and affiliated
investment company shares | | | — | | | | 20,976,010 | | | | 54,472,232 | | | | (45,495,635 | ) | | | — | | | | — | | | | — | | | | — | | |
Net Increase (Decrease) in Net Assets from Operations | | | (4,910,506 | ) | | | 2,328,358 | | | | 38,631,925 | | | | 411,353 | | | | (4,885,894 | ) | | | (74,936,482 | ) | | | (2,403,189 | ) | | | 733,345 | | |
Distributions to Shareholders From: | |
Net investment income – Class A | | | — | | | | — | | | | (1,350,920 | ) | | | (7,632,819 | ) | | | — | | | | (1,341,423 | ) | | | (73,111 | ) | | | (485,566 | ) | |
Net realized gain – Class A | | | (11,300,807 | ) | | | (62,803,525 | ) | | | (7,330,164 | ) | | | (8,171,921 | ) | | | — | | | | — | | | | — | | | | — | | |
Tax return of capital – Class A | | | — | | | | — | | | | — | | | | — | | | | — | | | | (67,571 | ) | | | — | | | | — | | |
Net investment income – Class B | | | — | | | | — | | | | — | | | | (5,291 | ) | | | — | | | | — | | | | — | | | | — | | |
Net realized gain – Class B | | | — | | | | (166,590 | ) | | | — | | | | (18,462 | ) | | | — | | | | — | | | | — | | | | — | | |
Tax return of capital – Class B | | | — | | | | — | | | | — | | | | — | | | | — | | | | — | | | | — | | | | — | | |
Net investment income – Class C | | | — | | | | — | | | | (1,254,583 | ) | | | (4,362,350 | ) | | | — | | | | (140,907 | ) | | | (14,070 | ) | | | (6,023 | ) | |
Net realized gain – Class C | | | (3,565,210 | ) | | | (16,611,457 | ) | | | (6,807,438 | ) | | | (7,171,479 | ) | | | — | | | | — | | | | — | | | | — | | |
Tax return of capital – Class C | | | — | | | | — | | | | — | | | | — | | | | — | | | | (17,434 | ) | | | — | | | | — | | |
Net investment income – Class I | | | — | | | | — | | | | — | | | | — | | | | — | | | | (39 | ) | | | — | | | | (41 | ) | |
Net realized gain – Class I | | | (2,225,323 | ) | | | (8,765,892 | ) | | | — | | | | — | | | | — | | | | — | | | | — | | | | — | | |
Tax return of capital – Class I | | | — | | | | — | | | | — | | | | — | | | | — | | | | (1 | ) | | | — | | | | — | | |
Net investment income – Class R | | | — | | | | — | | | | — | | | | — | | | | — | | | | — | | | | — | | | | — | | |
Net realized gain – Class R | | | — | | | | — | | | | — | | | | — | | | | — | | | | — | | | | — | | | | — | | |
Net investment income – Class R4 | | | — | | | | — | | | | (49,875 | ) | | | (414,095 | ) | | | — | | | | (65,129 | ) | | | (731 | ) | | | (11,283 | ) | |
Net realized gain – Class R4 | | | (78,221 | ) | | | (363,113 | ) | | | (270,622 | ) | | | (420,695 | ) | | | — | | | | — | | | | — | | | | — | | |
Tax return of capital – Class R4 | | | — | | | | — | | | | — | | | | — | | | | — | | | | (5,437 | ) | | | — | | | | — | | |
Net investment income – Class R5 | | | — | | | | — | | | | (41,839 | ) | | | (130,360 | ) | | | — | | | | (215,834 | ) | | | (2,799 | ) | | | (30,715 | ) | |
Net realized gain – Class R5 | | | (96,403 | ) | | | (483,970 | ) | | | (227,023 | ) | | | (87,538 | ) | | | — | | | | — | | | | — | | | | — | | |
Tax return of capital – Class R5 | | | — | | | | — | | | | — | | | | — | | | | — | | | | (8,955 | ) | | | — | | | | — | | |
Net investment income – Class Y | | | — | | | | — | | | | (1,279 | ) | | | (7,982 | ) | | | — | | | | (38 | ) | | | — | | | | — | | |
Net realized gain – Class Y | | | (391,764 | ) | | | (1,604,075 | ) | | | (6,939 | ) | | | (6,396 | ) | | | — | | | | — | | | | — | | | | — | | |
Tax return of capital – Class Y | | | — | | | | — | | | | — | | | | — | | | | — | | | | (1 | ) | | | — | | | | — | | |
Net investment income – Class Z | | | — | | | | — | | | | (1,183,422 | ) | | | (7,332,645 | ) | | | — | | | | (2,691,733 | ) | | | (26,637 | ) | | | (213,540 | ) | |
Net realized gain – Class Z | | | (12,630,659 | ) | | | (73,806,494 | ) | | | (6,421,312 | ) | | | (6,594,710 | ) | | | — | | | | — | | | | — | | | | — | | |
Tax return of capital – Class Z | | | — | | | | — | | | | — | | | | — | | | | — | | | | (104,559 | ) | | | — | | | | — | | |
Total Distributions to Shareholders | | | (30,288,387 | ) | | | (164,605,116 | ) | | | (24,945,416 | ) | | | (42,356,743 | ) | | | — | | | | (4,659,061 | ) | | | (117,348 | ) | | | (747,168 | ) | |
Share Transactions: | |
Subscriptions – Class A | | | 3,528,693 | | | | 16,532,728 | | | | 59,041,483 | | | | 86,714,257 | | | | 3,421,654 | | | | 12,073,817 | | | | 6,671,963 | | | | 29,232,277 | | |
Distributions reinvested – Class A | | | 10,259,655 | | | | 57,876,468 | | | | 8,049,918 | | | | 14,298,982 | | | | — | | | | 1,402,102 | | | | 73,064 | | | | 477,264 | | |
Redemptions – Class A | | | (22,550,003 | ) | | | (129,581,359 | ) | | | (53,619,554 | ) | | | (148,233,887 | ) | | | (20,884,202 | ) | | | (59,731,096 | ) | | | (10,065,782 | ) | | | (10,345,904 | ) | |
Net Increase (Decrease) – Class A | | | (8,761,655 | ) | | | (55,172,163 | ) | | | 13,471,847 | | | | (47,220,648 | ) | | | (17,462,548 | ) | | | (46,255,177 | ) | | | (3,320,755 | ) | | | 19,363,637 | | |
Distributions reinvested – Class B | | | — | | | | 169,957 | | | | — | | | | 25,841 | | | | — | | | | — | | | | — | | | | — | | |
Redemptions – Class B | | | (277,345 | ) | | | (737,583 | ) | | | (294,082 | ) | | | (939,051 | ) | | | — | | | | — | | | | — | | | | — | | |
Net Increase (Decrease) – Class B | | | (277,345 | ) | | | (567,626 | ) | | | (294,082 | ) | | | (913,210 | ) | | | — | | | | — | | | | — | | | | — | | |
Subscriptions – Class C | | | 1,157,135 | | | | 4,700,279 | | | | 34,021,568 | | | | 60,530,214 | | | | 538,569 | | | | 1,573,003 | | | | 1,620,465 | | | | 3,486,085 | | |
Distributions reinvested – Class C | | | 2,935,835 | | | | 13,758,410 | | | | 6,322,201 | | | | 8,934,025 | | | | — | | | | 152,813 | | | | 14,070 | | | | 6,019 | | |
Redemptions – Class C | | | (5,062,064 | ) | | | (15,566,161 | ) | | | (37,956,603 | ) | | | (95,550,794 | ) | | | (3,830,643 | ) | | | (13,305,273 | ) | | | (942,365 | ) | | | (1,478,139 | ) | |
Net Increase (Decrease) – Class C | | | (969,094 | ) | | | 2,892,528 | | | | 2,387,166 | | | | (26,086,555 | ) | | | (3,292,074 | ) | | | (11,579,457 | ) | | | 692,170 | | | | 2,013,965 | | |
See accompanying notes to financial statements.
65
COLUMBIA ACORN FAMILY OF FUNDS
STATEMENTS OF CHANGES IN NET ASSETS, CONTINUED
| | Columbia
Acorn® Fund | | Columbia Acorn
International® | | Columbia
Acorn USA® | | Columbia Acorn
International SelectSM | |
Increase (Decrease) in Net Assets | | (Unaudited)
Six months
ended
June 30, | | Year ended
December 31, | | (Unaudited)
Six months
ended
June 30, | | Year ended
December 31, | | (Unaudited)
Six months
ended
June 30, | | Year ended
December 31, | | (Unaudited)
Six months
ended
June 30, | | Year ended
December 31, | |
| | | 2016 | | 2015 | | 2016 | | 2015 | | 2016 | | 2015 | | 2016 | | 2015 | |
Subscriptions – Class I | | | 27,641,612 | | | | 37,441,664 | | | | 51,028,780 | | | | 84,152,189 | | | | — | | | | — | | | | — | | | | — | | |
Distributions reinvested – Class I | | | 2,959,516 | | | | 10,762,488 | | | | 367,376 | | | | 2,722,446 | | | | — | | | | — | | | | — | | | | — | | |
Redemptions – Class I | | | (32,712,753 | ) | | | (37,821,638 | ) | | | (60,490,526 | ) | | | (67,063,363 | ) | | | — | | | | — | | | | — | | | | — | | |
Net Increase (Decrease) – Class I | | | (2,111,625 | ) | | | 10,382,514 | | | | (9,094,370 | ) | | | 19,811,272 | | | | — | | | | — | | | | — | | | | — | | |
Subscriptions – Class R | | | — | | | | — | | | | 739,595 | | | | 1,781,071 | | | | — | | | | — | | | | — | | | | — | | |
Distributions reinvested – Class R | | | — | | | | — | | | | 26,567 | | | | 189,988 | | | | — | | | | — | | | | — | | | | — | | |
Redemptions – Class R | | | — | | | | — | | | | (1,100,540 | ) | | | (2,268,431 | ) | | | — | | | | — | | | | — | | | | — | | |
Net Increase (Decrease) – Class R | | | — | | | | — | | | | (334,378 | ) | | | (297,372 | ) | | | — | | | | — | | | | — | | | | — | | |
Subscriptions – Class R4 | | | 5,223,381 | | | | 41,454,333 | | | | 62,450,235 | | | | 168,556,060 | | | | 718,753 | | | | 7,383,504 | | | | 711,302 | | | | 375,431 | | |
Distributions reinvested – Class R4 | | | 3,448,769 | | | | 26,538,222 | | | | 3,189,572 | | | | 24,099,699 | | | | 958,736 | | | | 2,417,938 | | | | — | | | | 20,953 | | |
Redemptions – Class R4 | | | (18,531,839 | ) | | | (246,875,440 | ) | | | (65,401,698 | ) | | | (96,973,701 | ) | | | (738,542 | ) | | | (6,906,266 | ) | | | (241,175 | ) | | | (437,431 | ) | |
Net Increase (Decrease) – Class R4 | | | (9,859,689 | ) | | | (178,882,885 | ) | | | 238,109 | | | | 95,682,058 | | | | 938,947 | | | | 2,895,176 | | | | 470,127 | | | | (41,047 | ) | |
Subscriptions – Class R5 | | | 10,342,714 | | | | 54,491,036 | | | | 51,490,872 | | | | 117,463,579 | | | | 3,276,256 | | | | 6,662,313 | | | | 62,241 | | | | 4,024,111 | | |
Distributions reinvested – Class R5 | | | 5,611,050 | | | | 38,794,589 | | | | 1,987,611 | | | | 17,910,363 | | | | 2,965,711 | | | | 7,965,293 | | | | — | | | | 80,764 | | |
Redemptions – Class R5 | | | (30,662,477 | ) | | | (434,966,772 | ) | | | (57,947,964 | ) | | | (191,668,981 | ) | | | (3,099,006 | ) | | | (16,334,571 | ) | | | (1,564,700 | ) | | | (4,219,124 | ) | |
Net Increase (Decrease) – Class R5 | | | (14,708,713 | ) | | | (341,681,147 | ) | | | (4,469,481 | ) | | | (56,295,039 | ) | | | 3,142,961 | | | | (1,706,965 | ) | | | (1,502,459 | ) | | | (114,249 | ) | |
Subscriptions – Class Y | | | 9,976,022 | | | | 36,748,801 | | | | 21,424,073 | | | | 141,178,249 | | | | 2,060,089 | | | | 12,436,567 | | | | 26,762 | | | | 5,050,810 | | |
Distributions reinvested – Class Y | | | 9,962,545 | | | | 55,761,205 | | | | 1,661,744 | | | | 14,382,629 | | | | 4,782,297 | | | | 11,343,169 | | | | — | | | | 57,614 | | |
Redemptions – Class Y | | | (43,580,792 | ) | | | (289,533,536 | ) | | | (112,254,562 | ) | | | (40,252,596 | ) | | | (2,780,428 | ) | | | (5,465,477 | ) | | | (488,437 | ) | | | (16,103,000 | ) | |
Net Increase (Decrease) – Class Y | | | (23,642,225 | ) | | | (197,023,530 | ) | | | (89,168,745 | ) | | | 115,308,282 | | | | 4,061,958 | | | | 18,314,259 | | | | (461,675 | ) | | | (10,994,576 | ) | |
Subscriptions – Class Z | | | 85,485,730 | | | | 544,389,234 | | | | 282,354,509 | | | | 545,406,592 | | | | 12,698,760 | | | | 116,284,123 | | | | 4,993,731 | | | | 10,515,929 | | |
Distributions reinvested – Class Z | | | 395,054,065 | | | | 2,072,475,933 | | | | 21,435,768 | | | | 191,876,849 | | | | 57,489,828 | | | | 216,649,809 | | | | — | | | | 1,699,575 | | |
Redemptions – Class Z | | | (1,030,399,993 | ) | | | (6,463,272,247 | ) | | | (955,821,141 | ) | | | (1,372,490,139 | ) | | | (253,927,020 | ) | | | (454,250,844 | ) | | | (18,937,182 | ) | | | (88,558,864 | ) | �� |
Net Increase (Decrease) – Class Z | | | (549,860,198 | ) | | | (3,846,407,080 | ) | | | (652,030,864 | ) | | | (635,206,698 | ) | | | (183,738,432 | ) | | | (121,316,912 | ) | | | (13,943,451 | ) | | | (76,343,360 | ) | |
Net Increase (Decrease) from Share Transactions | | | (795,036,403 | ) | | | (5,215,215,169 | ) | | | (869,135,976 | ) | | | (555,115,070 | ) | | | (173,973,436 | ) | | | (134,521,692 | ) | | | (26,317,899 | ) | | | (109,148,980 | ) | |
Proceeds from regulatory settlements (Note 7) | | | — | | | | — | | | | — | | | | — | | | | — | | | | — | | | | — | | | | 33,279 | | |
Total Increase (Decrease) in Net Assets | | | (1,530,054,479 | ) | | | (8,741,292,153 | ) | | | (1,019,331,238 | ) | | | (1,000,300,369 | ) | | | (278,710,587 | ) | | | (439,234,360 | ) | | | (29,341,915 | ) | | | (113,598,824 | ) | |
Net Assets: | |
Beginning of period | | | 7,193,283,872 | | | | 15,934,576,025 | | | | 6,733,177,766 | | | | 7,733,478,135 | | | | 957,981,927 | | | | 1,397,216,287 | | | | 139,320,876 | | | | 252,919,700 | | |
End of period | | $ | 5,663,229,393 | | | $ | 7,193,283,872 | | | $ | 5,713,846,528 | | | $ | 6,733,177,766 | | | $ | 679,271,340 | | | $ | 957,981,927 | | | $ | 109,978,961 | | | $ | 139,320,876 | | |
Undistributed (Overdistributed) net investment income (loss) | | $ | (6,039,310 | ) | | $ | (3,776,255 | ) | | $ | 12,612,752 | | | $ | (35,935,510 | ) | | $ | (1,381,443 | ) | | $ | 2,786 | | | $ | 600,406 | | | $ | (65,144 | ) | |
See accompanying notes to financial statements.
66
| | | Columbia
Acorn SelectSM | | Columbia
Thermostat FundSM | | Columbia Acorn
Emerging Markets FundSM | | Columbia Acorn
European FundSM | |
Increase (Decrease) in Net Assets | | (Unaudited)
Six months
ended
June 30, | | Year ended
December 31, | | (Unaudited)
Six months
ended
June 30, | | Year ended
December 31, | | (Unaudited)
Six months
ended
June 30, | | Year ended
December 31, | | (Unaudited)
Six months
ended
June 30, | | Year ended
December 31, | |
| | | 2016 | | 2015 | | 2016 | | 2015 | | 2016 | | 2015 | | 2016 | | 2015 | |
Subscriptions – Class I | | | 27,214,325 | | | | 43,166,378 | | | | — | | | | — | | | | — | | | | — | | | | — | | | | — | | |
Distributions reinvested – Class I | | | 2,225,208 | | | | 8,765,223 | | | | — | | | | — | | | | — | | | | 40 | | | | — | | | | 41 | | |
Redemptions – Class I | | | (32,076,295 | ) | | | (34,630,444 | ) | | | — | | | | — | | | | — | | | | — | | | | — | | | | — | | |
Net Increase (Decrease) – Class I | | | (2,636,762 | ) | | | 17,301,157 | | | | — | | | | — | | | | — | | | | 40 | | | | — | | | | 41 | | |
Subscriptions – Class R | | | — | | | | — | | | | — | | | | — | | | | — | | | | — | | | | — | | | | — | | |
Distributions reinvested – Class R | | | — | | | | — | | | | — | | | | — | | | | — | | | | — | | | | — | | | | — | | |
Redemptions – Class R | | | — | | | | — | | | | — | | | | — | | | | — | | | | — | | | | — | | | | — | | |
Net Increase (Decrease) – Class R | | | — | | | | — | | | | — | | | | — | | | | — | | | | — | | | | — | | | | — | | |
Subscriptions – Class R4 | | | 153,591 | | | | 391,188 | | | | 4,655,331 | | | | 9,737,619 | | | | 165,097 | | | | 1,210,590 | | | | 44,259 | | | | 1,189,747 | | |
Distributions reinvested – Class R4 | | | 78,221 | | | | 363,113 | | | | 320,435 | | | | 834,675 | | | | — | | | | 70,526 | | | | 727 | | | | 11,246 | | |
Redemptions – Class R4 | | | (276,585 | ) | | | (653,792 | ) | | | (7,953,458 | ) | | | (15,839,006 | ) | | | (1,548,205 | ) | | | (11,090,725 | ) | | | (63,671 | ) | | | (1,109,125 | ) | |
Net Increase (Decrease) – Class R4 | | | (44,773 | ) | | | 100,509 | | | | (2,977,692 | ) | | | (5,266,712 | ) | | | (1,383,108 | ) | | | (9,809,609 | ) | | | (18,685 | ) | | | 91,868 | | |
Subscriptions – Class R5 | | | 379,899 | | | | 1,367,998 | | | | 6,435,278 | | | | 3,638,685 | | | | 592,389 | | | | 4,899,598 | | | | 132,466 | | | | 661,788 | | |
Distributions reinvested – Class R5 | | | 96,290 | | | | 483,307 | | | | 268,099 | | | | 217,898 | | | | — | | | | 222,723 | | | | 2,795 | | | | 30,678 | | |
Redemptions – Class R5 | | | (280,752 | ) | | | (11,631,849 | ) | | | (746,837 | ) | | | (1,059,811 | ) | | | (12,127,321 | ) | | | (8,484,365 | ) | | | (751,493 | ) | | | (232,666 | ) | |
Net Increase (Decrease) – Class R5 | | | 195,437 | | | | (9,780,544 | ) | | | 5,956,540 | | | | 2,796,772 | | | | (11,534,932 | ) | | | (3,362,044 | ) | | | (616,232 | ) | | | 459,800 | | |
Subscriptions – Class Y | | | 766,438 | | | | 3,036,144 | | | | 41,480 | | | | 451,230 | | | | — | | | | — | | | | — | | | | — | | |
Distributions reinvested – Class Y | | | 391,651 | | | | 1,603,413 | | | | 8,161 | | | | 14,270 | | | | — | | | | — | | | | — | | | | — | | |
Redemptions – Class Y | | | (646,008 | ) | | | (1,511,253 | ) | | | (39,335 | ) | | | (504,325 | ) | | | — | | | | — | | | | — | | | | — | | |
Net Increase (Decrease) – Class Y | | | 512,081 | | | | 3,128,304 | | | | 10,306 | | | | (38,825 | ) | | | — | | | | — | | | | — | | | | — | | |
Subscriptions – Class Z | | | 3,809,006 | | | | 14,738,554 | | | | 62,582,891 | | | | 91,578,896 | | | | 7,622,261 | | | | 35,528,290 | | | | 8,809,656 | | | | 9,065,450 | | |
Distributions reinvested – Class Z | | | 11,134,192 | | | | 61,844,603 | | | | 5,120,002 | | | | 9,468,573 | | | | — | | | | 2,739,444 | | | | 26,473 | | | | 212,045 | | |
Redemptions – Class Z | | | (31,308,288 | ) | | | (139,582,680 | ) | | | (47,611,929 | ) | | | (140,760,136 | ) | | | (85,658,660 | ) | | | (94,680,539 | ) | | | (6,742,173 | ) | | | (5,939,400 | ) | |
Net Increase (Decrease) – Class Z | | | (16,365,090 | ) | | | (62,999,523 | ) | | | 20,090,964 | | | | (39,712,667 | ) | | | (78,036,399 | ) | | | (56,412,805 | ) | | | 2,093,956 | | | | 3,338,095 | | |
Net Increase (Decrease) from Share Transactions | | | (28,347,201 | ) | | | (105,097,358 | ) | | | 38,645,049 | | | | (116,441,845 | ) | | | (111,709,061 | ) | | | (127,419,052 | ) | | | (1,169,546 | ) | | | 25,267,406 | | |
Proceeds from regulatory settlements (Note 7) | | | — | | | | — | | | | — | | | | — | | | | — | | | | — | | | | — | | | | — | | |
Total Increase (Decrease) in Net Assets | | | (63,546,094 | ) | | | (267,374,116 | ) | | | 52,331,558 | | | | (158,387,235 | ) | | | (116,594,955 | ) | | | (207,014,595 | ) | | | (3,690,083 | ) | | | 25,253,583 | | |
Net Assets: | |
Beginning of period | | | 399,202,670 | | | | 666,576,786 | | | | 1,102,025,826 | | | | 1,260,413,061 | | | | 275,320,512 | | | | 482,335,107 | | | | 61,886,391 | | | | 36,632,808 | | |
End of period | | $ | 335,656,576 | | | $ | 399,202,670 | | | $ | 1,154,357,384 | | | $ | 1,102,025,826 | | | $ | 158,725,557 | | | $ | 275,320,512 | | | $ | 58,196,308 | | | $ | 61,886,391 | | |
Undistributed (Overdistributed) net investment income (loss) | | $ | (420,920 | ) | | $ | (328,292 | ) | | $ | 6,058,104 | | | $ | 3,632,187 | | | $ | (478,151 | ) | | $ | (322,301 | ) | | $ | 407,506 | | | $ | (196,240 | ) | |
See accompanying notes to financial statements.
67
COLUMBIA ACORN FAMILY OF FUNDS
STATEMENTS OF CHANGES IN NET ASSETS, CONTINUED
| | Columbia
Acorn® Fund | | Columbia Acorn
International® | | Columbia
Acorn USA® | | Columbia Acorn
International SelectSM | |
Changes in Shares of Beneficial Interest: | | (Unaudited)
Six months
ended
June 30, | | Year ended
December 31, | | (Unaudited)
Six months
ended
June 30, | | Year ended
December 31, | | (Unaudited)
Six months
ended
June 30, | | Year ended
December 31, | | (Unaudited)
Six months
ended
June 30, | | Year ended
December 31, | |
| | | 2016 | | 2015 | | 2016 | | 2015 | | 2016 | | 2015 | | 2016 | | 2015 | |
Subscriptions – Class A | | | 2,497,749 | | | | 6,733,437 | | | | 1,195,327 | | | | 3,850,541 | | | | 285,724 | | | | 446,799 | | | | 55,053 | | | | 315,553 | | |
Shares issued in reinvestment and capital gains – Class A | | | 7,597,791 | | | | 33,406,680 | | | | 116,029 | | | | 997,927 | | | | 595,516 | | | | 1,394,063 | | | | — | | | | 33,425 | | |
Less shares redeemed – Class A | | | (19,448,891 | ) | | | (50,291,120 | ) | | | (4,073,476 | ) | | | (6,766,388 | ) | | | (757,593 | ) | | | (2,231,122 | ) | | | (548,653 | ) | | | (1,189,717 | ) | |
Net Increase (Decrease) – Class A | | | (9,353,351 | ) | | | (10,151,003 | ) | | | (2,762,120 | ) | | | (1,917,920 | ) | | | 123,647 | | | | (390,260 | ) | | | (493,600 | ) | | | (840,739 | ) | |
Shares issued in reinvestment and capital gains – Class B | | | — | | | | 63,442 | | | | 166 | | | | 2,547 | | | | — | | | | 979 | | | | — | | | | 145 | | |
Less shares redeemed – Class B | | | (93,870 | ) | | | (241,010 | ) | | | (19,001 | ) | | | (120,833 | ) | | | (1,541 | ) | | | (8,693 | ) | | | (984 | ) | | | (16,329 | ) | |
Net Increase (Decrease) – Class B | | | (93,870 | ) | | | (177,568 | ) | | | (18,835 | ) | | | (118,286 | ) | | | (1,541 | ) | | | (7,714 | ) | | | (984 | ) | | | (16,184 | ) | |
Subscriptions – Class C | | | 1,225,508 | | | | 3,327,736 | | | | 47,087 | | | | 262,906 | | | | 38,165 | | | | 92,994 | | | | 2,204 | | | | 26,260 | | |
Shares issued in reinvestment and capital gains – Class C | | | 4,427,318 | | | | 16,310,940 | | | | 12,938 | | | | 90,497 | | | | 172,163 | | | | 401,417 | | | | — | | | | 2,092 | | |
Less shares redeemed – Class C | | | (8,069,229 | ) | | | (14,910,753 | ) | | | (294,302 | ) | | | (579,254 | ) | | | (231,546 | ) | | | (876,405 | ) | | | (37,793 | ) | | | (150,553 | ) | |
Net Increase (Decrease) – Class C | | | (2,416,403 | ) | | | 4,727,923 | | | | (234,277 | ) | | | (225,851 | ) | | | (21,218 | ) | | | (381,994 | ) | | | (35,589 | ) | | | (122,201 | ) | |
Subscriptions – Class I | | | 1,555,604 | | | | 1,198,874 | | | | 1,376,781 | | | | 1,994,133 | | | | — | | | | — | | | | — | | | | — | | |
Shares issued in reinvestment and capital gains – Class I | | | 165,152 | | | | 528,459 | | | | 9,130 | | | | 68,257 | | | | — | | | | — | | | | — | | | | — | | |
Less shares redeemed – Class I | | | (1,788,070 | ) | | | (1,209,267 | ) | | | (1,576,082 | ) | | | (1,602,514 | ) | | | — | | | | — | | | | — | | | | — | | |
Net Increase (Decrease) – Class I | | | (67,314 | ) | | | 518,066 | | | | (190,171 | ) | | | 459,876 | | | | — | | | | — | | | | — | | | | — | | |
Subscriptions – Class R | | | — | | | | — | | | | 19,797 | | | | 42,773 | | | | — | | | | — | | | | — | | | | — | | |
Shares issued in reinvestment and capital gains – Class R | | | — | | | | — | | | | 664 | | | | 4,738 | | | | — | | | | — | | | | — | | | | — | | |
Less shares redeemed – Class R | | | — | | | | — | | | | (28,818 | ) | | | (54,390 | ) | | | — | | | | — | | | | — | | | | — | | |
Net Increase (Decrease) – Class R | | | — | | | | — | | | | (8,357 | ) | | | (6,879 | ) | | | — | | | | — | | | | — | | | | — | | |
Subscriptions – Class R4 | | | 278,676 | | | | 1,294,282 | | | | 1,634,032 | | | | 3,958,217 | | | | 34,219 | | | | 230,470 | | | | 34,498 | | | | 16,419 | | |
Shares issued in reinvestment and capital gains – Class R4 | | | 188,149 | | | | 1,141,383 | | | | 78,813 | | | | 598,103 | | | | 45,916 | | | | 101,221 | | | | — | | | | 945 | | |
Less shares redeemed – Class R4 | | | (1,010,345 | ) | | | (7,603,327 | ) | | | (1,694,751 | ) | | | (2,304,606 | ) | | | (35,628 | ) | | | (222,569 | ) | | | (11,558 | ) | | | (19,415 | ) | |
Net Increase (Decrease) – Class R4 | | | (543,520 | ) | | | (5,167,662 | ) | | | 18,094 | | | | 2,251,714 | | | | 44,507 | | | | 109,122 | | | | 22,940 | | | | (2,051 | ) | |
Subscriptions – Class R5 | | | 567,114 | | | | 1,667,147 | | | | 1,365,278 | | | | 2,779,508 | | | | 159,899 | | | | 206,312 | | | | 3,008 | | | | 176,316 | | |
Shares issued in reinvestment and capital gains – Class R5 | | | 304,452 | | | | 1,754,796 | | | | 49,480 | | | | 446,370 | | | | 141,629 | | | | 332,383 | | | | — | | | | 3,656 | | |
Less shares redeemed – Class R5 | | | (1,671,767 | ) | | | (13,665,627 | ) | | | (1,545,000 | ) | | | (4,574,960 | ) | | | (147,171 | ) | | | (511,388 | ) | | | (76,448 | ) | | | (191,151 | ) | |
Net Increase (Decrease) – Class R5 | | | (800,201 | ) | | | (10,243,684 | ) | | | (130,242 | ) | | | (1,349,082 | ) | | | 154,357 | | | | 27,307 | | | | (73,440 | ) | | | (11,179 | ) | |
Subscriptions – Class Y | | | 546,935 | | | | 1,179,273 | | | | 554,019 | | | | 3,320,852 | | | | 97,466 | | | | 386,715 | | | | 1,282 | | | | 221,884 | | |
Shares issued in reinvestment and capital gains – Class Y | | | 538,225 | | | | 2,581,951 | | | | 41,031 | | | | 358,119 | | | | 227,188 | | | | 479,575 | | | | — | | | | 2,474 | | |
Less shares redeemed – Class Y | | | (2,289,899 | ) | | | (8,850,384 | ) | | | (3,040,044 | ) | | | (955,967 | ) | | | (132,420 | ) | | | (172,401 | ) | | | (23,267 | ) | | | (718,353 | ) | |
Net Increase (Decrease) – Class Y | | | (1,204,739 | ) | | | (5,089,160 | ) | | | (2,444,994 | ) | | | 2,723,004 | | | | 192,234 | | | | 693,889 | | | | (21,985 | ) | | | (493,995 | ) | |
Subscriptions – Class Z | | | 4,776,526 | | | | 18,745,346 | | | | 7,326,526 | | | | 12,874,531 | | | | 632,075 | | | | 3,763,553 | | | | 242,369 | | | | 465,219 | | |
Shares issued in reinvestment and capital gains – Class Z | | | 22,169,616 | | | | 99,426,548 | | | | 533,493 | | | | 4,784,539 | | | | 2,844,623 | | | | 9,392,001 | | | | — | | | | 76,982 | | |
Less shares redeemed – Class Z | | | (56,696,144 | ) | | | (211,292,321 | ) | | | (25,261,482 | ) | | | (32,736,392 | ) | | | (12,721,053 | ) | | | (15,006,327 | ) | | | (915,135 | ) | | | (3,963,435 | ) | |
Net Increase (Decrease) – Class Z | | | (29,750,002 | ) | | | (93,120,427 | ) | | | (17,401,463 | ) | | | (15,077,322 | ) | | | (9,244,355 | ) | | | (1,850,773 | ) | | | (672,766 | ) | | | (3,421,234 | ) | |
Net Increase (Decrease) in Shares of Beneficial Interest | | | (44,229,400 | ) | | | (118,703,515 | ) | | | (23,172,365 | ) | | | (13,260,746 | ) | | | (8,752,369 | ) | | | (1,800,423 | ) | | | (1,275,424 | ) | | | (4,907,583 | ) | |
See accompanying notes to financial statements.
68
| | | Columbia
Acorn SelectSM | | Columbia
Thermostat FundSM | | Columbia Acorn
Emerging Markets FundSM | | Columbia Acorn
European FundSM | |
Changes in Shares of Beneficial Interest: | | (Unaudited)
Six months
ended
June 30, | | Year ended
December 31, | | (Unaudited)
Six months
ended
June 30, | | Year ended
December 31, | | (Unaudited)
Six months
ended
June 30, | | Year ended
December 31, | | (Unaudited)
Six months
ended
June 30, | | Year ended
December 31, | |
| | | 2016 | | 2015 | | 2016 | | 2015 | | 2016 | | 2015 | | 2016 | | 2015 | |
Subscriptions – Class A | | | 268,864 | | | | 909,174 | | | | 4,120,685 | | | | 5,851,778 | | | | 347,119 | | | | 1,020,306 | | | | 466,586 | | | | 1,928,835 | | |
Shares issued in reinvestment and capital gains – Class A | | | 785,578 | | | | 3,674,508 | | | | 554,402 | | | | 982,225 | | | | — | | | | 137,596 | | | | 4,757 | | | | 31,377 | | |
Less shares redeemed – Class A | | | (1,693,507 | ) | | | (6,612,989 | ) | | | (3,726,270 | ) | | | (10,018,194 | ) | | | (2,095,577 | ) | | | (5,165,530 | ) | | | (705,129 | ) | | | (695,460 | ) | |
Net Increase (Decrease) – Class A | | | (639,065 | ) | | | (2,029,307 | ) | | | 948,817 | | | | (3,184,191 | ) | | | (1,748,458 | ) | | | (4,007,628 | ) | | | (233,786 | ) | | | 1,264,752 | | |
Shares issued in reinvestment and capital gains – Class B | | | — | | | | 13,401 | | | | — | | | | 1,746 | | | | — | | | | — | | | | — | | | | — | | |
Less shares redeemed – Class B | | | (26,947 | ) | | | (42,677 | ) | | | (20,546 | ) | | | (63,415 | ) | | | — | | | | — | | | | — | | | | — | | |
Net Increase (Decrease) – Class B | | | (26,947 | ) | | | (29,276 | ) | | | (20,546 | ) | | | (61,669 | ) | | | — | | | | — | | | | — | | | | — | | |
Subscriptions – Class C | | | 121,358 | | | | 382,060 | | | | 2,352,362 | | | | 4,088,021 | | | | 55,654 | | | | 131,810 | | | | 114,705 | | | | 233,273 | | |
Shares issued in reinvestment and capital gains – Class C | | | 308,710 | | | | 1,164,079 | | | | 433,621 | | | | 607,884 | | | | — | | | | 15,055 | | | | 926 | | | | 407 | | |
Less shares redeemed – Class C | | | (513,416 | ) | | | (1,000,597 | ) | | | (2,623,242 | ) | | | (6,421,982 | ) | | | (391,659 | ) | | | (1,153,597 | ) | | | (68,073 | ) | | | (100,084 | ) | |
Net Increase (Decrease) – Class C | | | (83,348 | ) | | | 545,542 | | | | 162,741 | | | | (1,726,077 | ) | | | (336,005 | ) | | | (1,006,732 | ) | | | 47,558 | | | | 133,596 | | |
Subscriptions – Class I | | | 1,913,946 | | | | 2,004,428 | | | | — | | | | — | | | | — | | | | — | | | | — | | | | — | | |
Shares issued in reinvestment and capital gains – Class I | | | 153,040 | | | | 528,929 | | | | — | | | | — | | | | — | | | | 4 | | | | — | | | | 3 | | |
Less shares redeemed – Class I | | | (2,174,142 | ) | | | (1,617,045 | ) | | | — | | | | — | | | | — | | | | — | | | | — | | | | — | | |
Net Increase (Decrease) – Class I | | | (107,156 | ) | | | 916,312 | | | | — | | | | — | | | | — | | | | 4 | | | | — | | | | 3 | | |
Subscriptions – Class R | | | — | | | | — | | | | — | | | | — | | | | — | | | | — | | | | — | | | | — | | |
Shares issued in reinvestment and capital gains – Class R | | | — | | | | — | | | | — | | | | — | | | | — | | | | — | | | | — | | | | — | | |
Less shares redeemed – Class R | | | — | | | | — | | | | — | | | | — | | | | — | | | | — | | | | — | | | | — | | |
Net Increase (Decrease) – Class R | | | — | | | | — | | | | — | | | | — | | | | — | | | | — | | | | — | | | | — | | |
Subscriptions – Class R4 | | | 10,426 | | | | 17,318 | | | | 324,293 | | | | 658,898 | | | | 16,823 | | | | 97,765 | | | | 2,979 | | | | 78,479 | | |
Shares issued in reinvestment and capital gains – Class R4 | | | 5,260 | | | | 21,008 | | | | 22,222 | | | | 57,808 | | | | — | | | | 6,867 | | | | 47 | | | | 726 | | |
Less shares redeemed – Class R4 | | | (18,868 | ) | | | (31,405 | ) | | | (562,181 | ) | | | (1,074,830 | ) | | | (152,095 | ) | | | (975,288 | ) | | | (4,490 | ) | | | (72,632 | ) | |
Net Increase (Decrease) – Class R4 | | | (3,182 | ) | | | 6,921 | | | | (215,666 | ) | | | (358,124 | ) | | | (135,272 | ) | | | (870,656 | ) | | | (1,464 | ) | | | 6,573 | | |
Subscriptions – Class R5 | | | 25,883 | | | | 59,903 | | | | 457,540 | | | | 247,793 | | | | 60,564 | | | | 420,340 | | | | 9,016 | | | | 43,183 | | |
Shares issued in reinvestment and capital gains – Class R5 | | | 6,454 | | | | 27,179 | | | | 18,579 | | | | 15,133 | | | | — | | | | 21,708 | | | | 180 | | | | 2,003 | | |
Less shares redeemed – Class R5 | | | (19,250 | ) | | | (498,817 | ) | | | (52,191 | ) | | | (72,101 | ) | | | (1,166,928 | ) | | | (748,449 | ) | | | (51,256 | ) | | | (15,534 | ) | |
Net Increase (Decrease) – Class R5 | | | 13,087 | | | | (411,735 | ) | | | 423,928 | | | | 190,825 | | | | (1,106,364 | ) | | | (306,401 | ) | | | (42,060 | ) | | | 29,652 | | |
Subscriptions – Class Y | | | 50,877 | | | | 135,278 | | | | 2,877 | | | | 31,010 | | | | — | | | | — | | | | — | | | | — | | |
Shares issued in reinvestment and capital gains – Class Y | | | 26,075 | | | | 94,278 | | | | 566 | | | | 991 | | | | — | | | | — | | | | — | | | | — | | |
Less shares redeemed – Class Y | | | (42,729 | ) | | | (69,617 | ) | | | (2,726 | ) | | | (34,405 | ) | | | — | | | | — | | | | — | | | | — | | |
Net Increase (Decrease) – Class Y | | | 34,223 | | | | 159,939 | | | | 717 | | | | (2,404 | ) | | | — | | | | — | | | | — | | | | — | | |
Subscriptions – Class Z | | | 263,702 | | | | 737,164 | | | | 4,400,984 | | | | 6,272,816 | | | | 773,927 | | | | 2,978,393 | | | | 618,829 | | | | 595,443 | | |
Shares issued in reinvestment and capital gains – Class Z | | | 772,671 | | | | 3,661,677 | | | | 357,043 | | | | 659,729 | | | | — | | | | 268,573 | | | | 1,721 | | | | 13,964 | | |
Less shares redeemed – Class Z | | | (2,147,154 | ) | | �� | (6,642,121 | ) | | | (3,363,902 | ) | | | (9,607,125 | ) | | | (8,990,962 | ) | | | (8,078,655 | ) | | | (475,657 | ) | | | (404,473 | ) | |
Net Increase (Decrease) – Class Z | | | (1,110,781 | ) | | | (2,243,280 | ) | | | 1,394,125 | | | | (2,674,580 | ) | | | (8,217,035 | ) | | | (4,831,689 | ) | | | 144,893 | | | | 204,934 | | |
Net Increase (Decrease) in Shares of Beneficial Interest | | | (1,923,169 | ) | | | (3,084,884 | ) | | | 2,694,117 | | | | (7,816,220 | ) | | | (11,543,134 | ) | | | (11,023,102 | ) | | | (84,859 | ) | | | 1,639,510 | | |
See accompanying notes to financial statements.
69
COLUMBIA ACORN FAMILY OF FUNDS
FINANCIAL HIGHLIGHTS
The following tables are intended to help you understand the Fund's financial performance. Certain information reflects financial results for a single share of a class held for the periods shown. Per share net investment income (loss) amounts are calculated based on average shares outstanding during the period. Total return assumes reinvestment of all dividends and distributions, if any. Total return does not reflect payment of sales charges, if any. Total return and portfolio turnover are not annualized for periods of less than one year. The portfolio turnover rate is calculated without regard to purchase and sales transactions of short-term instruments and certain derivatives, if any. If such transactions were included, the Fund's portfolio turnover rate may be higher.
Columbia Acorn® Fund
| | | | | Income from Investment Operations | | | | Less Distributions to Shareholders | | | |
(Selected data for a share outstanding
throughout each period) | | Net Asset
Value,
Beginning of
Period | | Net
investment
income (loss) | | Net realized
and
unrealized
gain (loss) | | Total from
Investment
Operations | | Net
investment
income | | Net
realized
gains | | Total
Distributions to
Shareholders | |
Class A | |
Six Months Ended June 30, 2016 (Unaudited) | | $ | 17.63 | | | | (0.02 | ) | | | 0.01 | (b) | | | (0.01 | ) | | | — | | | | (2.05 | ) | | | (2.05 | ) | |
Year Ended December 31, 2015 | | $ | 30.30 | | | | (0.12 | ) | | | (0.27 | )(b) | | | (0.39 | ) | | | — | | | | (12.28 | ) | | | (12.28 | ) | |
Year Ended December 31, 2014 | | $ | 35.78 | | | | (0.08 | ) | | | 0.21 | | | | 0.13 | | | | — | | | | (5.61 | ) | | | (5.61 | ) | |
Year Ended December 31, 2013 | | $ | 29.36 | | | | (0.06 | ) | | | 8.84 | | | | 8.78 | | | | (0.04 | ) | | | (2.32 | ) | | | (2.36 | ) | |
Year Ended December 31, 2012 | | $ | 26.63 | | | | 0.08 | | | | 4.53 | | | | 4.61 | | | | (0.06 | ) | | | (1.82 | ) | | | (1.88 | ) | |
Year Ended December 31, 2011 | | $ | 29.24 | | | | (0.10 | ) | | | (1.30 | ) | | | (1.40 | ) | | | (0.02 | ) | | | (1.19 | ) | | | (1.21 | ) | |
Class C | |
Six Months Ended June 30, 2016 (Unaudited) | | $ | 13.16 | | | | (0.06 | ) | | | 0.02 | (b) | | | (0.04 | ) | | | — | | | | (2.05 | ) | | | (2.05 | ) | |
Year Ended December 31, 2015 | | $ | 25.92 | | | | (0.27 | ) | | | (0.21 | )(b) | | | (0.48 | ) | | | — | | | | (12.28 | ) | | | (12.28 | ) | |
Year Ended December 31, 2014 | | $ | 31.64 | | | | (0.28 | ) | | | 0.17 | | | | (0.11 | ) | | | — | | | | (5.61 | ) | | | (5.61 | ) | |
Year Ended December 31, 2013 | | $ | 26.34 | | | | (0.26 | ) | | | 7.88 | | | | 7.62 | | | | — | | | | (2.32 | ) | | | (2.32 | ) | |
Year Ended December 31, 2012 | | $ | 24.18 | | | | (0.12 | ) | | | 4.10 | | | | 3.98 | | | | — | | | | (1.82 | ) | | | (1.82 | ) | |
Year Ended December 31, 2011 | | $ | 26.85 | | | | (0.29 | ) | | | (1.19 | ) | | | (1.48 | ) | | | — | | | | (1.19 | ) | | | (1.19 | ) | |
Class I | |
Six Months Ended June 30, 2016 (Unaudited) | | $ | 19.43 | | | | 0.01 | | | | 0.01 | (b) | | | 0.02 | | | | — | | | | (2.05 | ) | | | (2.05 | ) | |
Year Ended December 31, 2015 | | $ | 32.03 | | | | (0.01 | ) | | | (0.31 | )(b) | | | (0.32 | ) | | | — | | | | (12.28 | ) | | | (12.28 | ) | |
Year Ended December 31, 2014 | | $ | 37.37 | | | | 0.05 | | | | 0.22 | | | | 0.27 | | | | — | | | | (5.61 | ) | | | (5.61 | ) | |
Year Ended December 31, 2013 | | $ | 30.47 | | | | 0.06 | | | | 9.20 | | | | 9.26 | | | | (0.04 | ) | | | (2.32 | ) | | | (2.36 | ) | |
Year Ended December 31, 2012 | | $ | 27.57 | | | | 0.26 | | | | 4.62 | | | | 4.88 | | | | (0.16 | ) | | | (1.82 | ) | | | (1.98 | ) | |
Year Ended December 31, 2011 | | $ | 30.19 | | | | 0.01 | | | | (1.35 | ) | | | (1.34 | ) | | | (0.09 | ) | | | (1.19 | ) | | | (1.28 | ) | |
Class R4 | |
Six Months Ended June 30, 2016 (Unaudited) | | $ | 19.84 | | | | (0.01 | ) | | | 0.02 | (b) | | | 0.01 | | | | — | | | | (2.05 | ) | | | (2.05 | ) | |
Year Ended December 31, 2015 | | $ | 32.51 | | | | (0.07 | ) | | | (0.32 | )(b) | | | (0.39 | ) | | | — | | | | (12.28 | ) | | | (12.28 | ) | |
Year Ended December 31, 2014 | | $ | 37.88 | | | | 0.02 | | | | 0.22 | | | | 0.24 | | | | — | | | | (5.61 | ) | | | (5.61 | ) | |
Year Ended December 31, 2013 | | $ | 30.90 | | | | 0.06 | | | | 9.29 | | | | 9.35 | | | | (0.05 | ) | | | (2.32 | ) | | | (2.37 | ) | |
Year Ended December 31, 2012 (f) | | $ | 30.59 | | | | 0.05 | | | | 1.84 | | | | 1.89 | | | | (0.12 | ) | | | (1.46 | ) | | | (1.58 | ) | |
Class R5 | |
Six Months Ended June 30, 2016 (Unaudited) | | $ | 19.92 | | | | 0.00 | (g) | | | 0.02 | (b) | | | 0.02 | | | | — | | | | (2.05 | ) | | | (2.05 | ) | |
Year Ended December 31, 2015 | | $ | 32.55 | | | | (0.04 | ) | | | (0.31 | )(b) | | | (0.35 | ) | | | — | | | | (12.28 | ) | | | (12.28 | ) | |
Year Ended December 31, 2014 | | $ | 37.89 | | | | 0.04 | | | | 0.23 | | | | 0.27 | | | | — | | | | (5.61 | ) | | | (5.61 | ) | |
Year Ended December 31, 2013 | | $ | 30.88 | | | | 0.07 | | | | 9.30 | | | | 9.37 | | | | (0.04 | ) | | | (2.32 | ) | | | (2.36 | ) | |
Year Ended December 31, 2012 (h) | | $ | 30.59 | | | | 0.06 | | | | 1.83 | | | | 1.89 | | | | (0.14 | ) | | | (1.46 | ) | | | (1.60 | ) | |
Class Y | |
Six Months Ended June 30, 2016 (Unaudited) | | $ | 20.00 | | | | 0.01 | | | | 0.01 | (b) | | | 0.02 | | | | — | | | | (2.05 | ) | | | (2.05 | ) | |
Year Ended December 31, 2015 | | $ | 32.61 | | | | (0.02 | ) | | | (0.31 | )(b) | | | (0.33 | ) | | | — | | | | (12.28 | ) | | | (12.28 | ) | |
Year Ended December 31, 2014 | | $ | 37.93 | | | | 0.05 | | | | 0.24 | | | | 0.29 | | | | — | | | | (5.61 | ) | | | (5.61 | ) | |
Year Ended December 31, 2013 | | $ | 30.90 | | | | 0.09 | | | | 9.31 | | | | 9.40 | | | | (0.05 | ) | | | (2.32 | ) | | | (2.37 | ) | |
Year Ended December 31, 2012 (i) | | $ | 30.62 | | | | 0.09 | | | | 1.80 | | | | 1.89 | | | | (0.15 | ) | | | (1.46 | ) | | | (1.61 | ) | |
Class Z | |
Six Months Ended June 30, 2016 (Unaudited) | | $ | 19.34 | | | | 0.00 | (g) | | | 0.02 | (b) | | | 0.02 | | | | — | | | | (2.05 | ) | | | (2.05 | ) | |
Year Ended December 31, 2015 | | $ | 31.95 | | | | (0.04 | ) | | | (0.29 | )(b) | | | (0.33 | ) | | | — | | | | (12.28 | ) | | | (12.28 | ) | |
Year Ended December 31, 2014 | | $ | 37.32 | | | | 0.02 | | | | 0.22 | | | | 0.24 | | | | — | | | | (5.61 | ) | | | (5.61 | ) | |
Year Ended December 31, 2013 | | $ | 30.45 | | | | 0.04 | | | | 9.19 | | | | 9.23 | | | | (0.04 | ) | | | (2.32 | ) | | | (2.36 | ) | |
Year Ended December 31, 2012 | | $ | 27.56 | | | | 0.17 | | | | 4.69 | | | | 4.86 | | | | (0.15 | ) | | | (1.82 | ) | | | (1.97 | ) | |
Year Ended December 31, 2011 | | $ | 30.19 | | | | (0.01 | ) | | | (1.34 | ) | | | (1.35 | ) | | | (0.09 | ) | | | (1.19 | ) | | | (1.28 | ) | |
Notes to Financial Highlights
(a) In addition to the fees and expenses that the Fund bears directly, the Fund indirectly bears a pro rata share of the fees and expenses of any other funds in which it invests, if any. Such indirect expenses are not included in the Fund's reported expense ratios.
(b) Calculation of the net gain (loss) per share (both realized and unrealized) does not correlate to the aggregate realized and unrealized gain (loss) presented in the Statements of Operations due to the timing of subscriptions and redemptions of Fund shares in relation to fluctuations in the market value of the portfolio.
(c) Annualized.
(d) Ratios include line of credit interest expense which is less than 0.01%.
(e) The benefits derived from custody fees paid indirectly had an impact of less than 0.01%.
(f) Class R4 shares commenced operations on November 8, 2012. Per share data and total return reflect activity from that date.
(g) Rounds to zero.
(h) Class R5 shares commenced operations on November 8, 2012. Per share data and total return reflect activity from that date.
(i) Class Y shares commenced operations on November 8, 2012. Per share data and total return reflect activity from that date.
See accompanying notes to financial statements.
70
| | | | | | Ratio to Average Net Assets | | Supplemental Data | |
(Selected data for a share outstanding
throughout each period) | | Net Asset
Value, End of
Period | | Total Return | | Total gross
expenses
(a) | | Total net
expenses
(a) | | Net
investment
income (loss) | | Portfolio
turnover rate | | Net assets,
end of period
(000s) | |
Class A | |
Six Months Ended June 30, 2016 (Unaudited) | | $ | 15.57 | | | | (0.37 | )% | | | 1.15 | %(c)(d) | | | 1.15 | %(c)(d) | | | (0.26 | )%(c) | | | 53 | % | | $ | 1,081,392 | | |
Year Ended December 31, 2015 | | $ | 17.63 | | | | (1.87 | )% | | | 1.08 | % | | | 1.08 | % | | | (0.39 | )% | | | 21 | % | | $ | 1,388,893 | | |
Year Ended December 31, 2014 | | $ | 30.30 | | | | 0.55 | % | | | 1.08 | % | | | 1.08 | % | | | (0.22 | )% | | | 17 | % | | $ | 2,694,610 | | |
Year Ended December 31, 2013 | | $ | 35.78 | | | | 30.53 | % | | | 1.07 | % | | | 1.07 | % | | | (0.17 | )% | | | 18 | % | | $ | 3,869,734 | | |
Year Ended December 31, 2012 | | $ | 29.36 | | | | 17.62 | % | | | 1.06 | % | | | 1.06 | %(e) | | | 0.27 | % | | | 16 | % | | $ | 3,233,494 | | |
Year Ended December 31, 2011 | | $ | 26.63 | | | | (4.91 | )% | | | 1.06 | % | | | 1.06 | %(e) | | | (0.33 | )% | | | 18 | % | | $ | 3,246,833 | | |
Class C | |
Six Months Ended June 30, 2016 (Unaudited) | | $ | 11.07 | | | | (0.74 | )% | | | 1.87 | %(c)(d) | | | 1.87 | %(c)(d) | | | (0.98 | )%(c) | | | 53 | % | | $ | 357,280 | | |
Year Ended December 31, 2015 | | $ | 13.16 | | | | (2.57 | )% | | | 1.80 | % | | | 1.80 | % | | | (1.11 | )% | | | 21 | % | | $ | 456,348 | | |
Year Ended December 31, 2014 | | $ | 25.92 | | | | (0.16 | )% | | | 1.77 | % | | | 1.77 | % | | | (0.92 | )% | | | 17 | % | | $ | 776,370 | | |
Year Ended December 31, 2013 | | $ | 31.64 | | | | 29.58 | % | | | 1.78 | % | | | 1.78 | % | | | (0.88 | )% | | | 18 | % | | $ | 938,644 | | |
Year Ended December 31, 2012 | | $ | 26.34 | | | | 16.77 | % | | | 1.80 | % | | | 1.80 | %(e) | | | (0.46 | )% | | | 16 | % | | $ | 756,709 | | |
Year Ended December 31, 2011 | | $ | 24.18 | | | | (5.63 | )% | | | 1.82 | % | | | 1.82 | %(e) | | | (1.10 | )% | | | 18 | % | | $ | 721,446 | | |
Class I | |
Six Months Ended June 30, 2016 (Unaudited) | | $ | 17.40 | | | | (0.18 | )% | | | 0.78 | %(c)(d) | | | 0.78 | %(c)(d) | | | 0.12 | %(c) | | | 53 | % | | $ | 23,149 | | |
Year Ended December 31, 2015 | | $ | 19.43 | | | | (1.53 | )% | | | 0.73 | % | | | 0.73 | % | | | (0.02 | )% | | | 21 | % | | $ | 27,151 | | |
Year Ended December 31, 2014 | | $ | 32.03 | | | | 0.91 | % | | | 0.70 | % | | | 0.70 | % | | | 0.14 | % | | | 17 | % | | $ | 28,164 | | |
Year Ended December 31, 2013 | | $ | 37.37 | | | | 30.99 | % | | | 0.70 | % | | | 0.70 | % | | | 0.16 | % | | | 18 | % | | $ | 20,383 | | |
Year Ended December 31, 2012 | | $ | 30.47 | | | | 18.02 | % | | | 0.72 | % | | | 0.72 | %(e) | | | 0.86 | % | | | 16 | % | | $ | 58,652 | | |
Year Ended December 31, 2011 | | $ | 27.57 | | | | (4.57 | )% | | | 0.72 | % | | | 0.72 | %(e) | | | 0.02 | % | | | 18 | % | | $ | 16,397 | | |
Class R4 | |
Six Months Ended June 30, 2016 (Unaudited) | | $ | 17.80 | | | | (0.23 | )% | | | 0.97 | %(c)(d) | | | 0.97 | %(c)(d) | | | (0.09 | )%(c) | | | 53 | % | | $ | 35,480 | | |
Year Ended December 31, 2015 | | $ | 19.84 | | | | (1.75 | )% | | | 0.89 | % | | | 0.89 | % | | | (0.23 | )% | | | 21 | % | | $ | 50,335 | | |
Year Ended December 31, 2014 | | $ | 32.51 | | | | 0.81 | % | | | 0.84 | % | | | 0.84 | % | | | 0.05 | % | | | 17 | % | | $ | 250,457 | | |
Year Ended December 31, 2013 | | $ | 37.88 | | | | 30.85 | % | | | 0.80 | % | | | 0.80 | % | | | 0.16 | % | | | 18 | % | | $ | 74,188 | | |
Year Ended December 31, 2012 (f) | | $ | 30.90 | | | | 6.31 | % | | | 0.87 | %(c) | | | 0.86 | %(c)(e) | | | 1.24 | %(c) | | | 16 | % | | $ | 17 | | |
Class R5 | |
Six Months Ended June 30, 2016 (Unaudited) | | $ | 17.89 | | | | (0.18 | )% | | | 0.83 | %(c)(d) | | | 0.83 | %(c)(d) | | | 0.05 | %(c) | | | 53 | % | | $ | 54,309 | | |
Year Ended December 31, 2015 | | $ | 19.92 | | | | (1.60 | )% | | | 0.77 | % | | | 0.77 | % | | | (0.11 | )% | | | 21 | % | | $ | 76,412 | | |
Year Ended December 31, 2014 | | $ | 32.55 | | | | 0.89 | % | | | 0.76 | % | | | 0.76 | % | | | 0.10 | % | | | 17 | % | | $ | 458,223 | | |
Year Ended December 31, 2013 | | $ | 37.89 | | | | 30.94 | % | | | 0.75 | % | | | 0.75 | % | | | 0.20 | % | | | 18 | % | | $ | 496,906 | | |
Year Ended December 31, 2012 (h) | | $ | 30.88 | | | | 6.33 | % | | | 0.82 | %(c) | | | 0.81 | %(c)(e) | | | 1.29 | %(c) | | | 16 | % | | $ | 3 | | |
Class Y | |
Six Months Ended June 30, 2016 (Unaudited) | | $ | 17.97 | | | | (0.18 | )% | | | 0.78 | %(c)(d) | | | 0.78 | %(c)(d) | | | 0.10 | %(c) | | | 53 | % | | $ | 95,673 | | |
Year Ended December 31, 2015 | | $ | 20.00 | | | | (1.54 | )% | | | 0.73 | % | | | 0.73 | % | | | (0.06 | )% | | | 21 | % | | $ | 130,546 | | |
Year Ended December 31, 2014 | | $ | 32.61 | | | | 0.94 | % | | | 0.70 | % | | | 0.70 | % | | | 0.13 | % | | | 17 | % | | $ | 378,780 | | |
Year Ended December 31, 2013 | | $ | 37.93 | | | | 30.99 | % | | | 0.70 | % | | | 0.70 | % | | | 0.26 | % | | | 18 | % | | $ | 1,227,891 | | |
Year Ended December 31, 2012 (i) | | $ | 30.90 | | | | 6.34 | % | | | 0.75 | %(c) | | | 0.75 | %(c)(e) | | | 2.21 | %(c) | | | 16 | % | | $ | 67,012 | | |
Class Z | |
Six Months Ended June 30, 2016 (Unaudited) | | $ | 17.31 | | | | (0.18 | )% | | | 0.84 | %(c)(d) | | | 0.84 | %(c)(d) | | | 0.05 | %(c) | | | 53 | % | | $ | 4,015,946 | | |
Year Ended December 31, 2015 | | $ | 19.34 | | | | (1.57 | )% | | | 0.80 | % | | | 0.80 | % | | | (0.11 | )% | | | 21 | % | | $ | 5,062,313 | | |
Year Ended December 31, 2014 | | $ | 31.95 | | | | 0.82 | % | | | 0.79 | % | | | 0.79 | % | | | 0.07 | % | | | 17 | % | | $ | 11,340,770 | | |
Year Ended December 31, 2013 | | $ | 37.32 | | | | 30.90 | % | | | 0.78 | % | | | 0.78 | % | | | 0.12 | % | | | 18 | % | | $ | 14,703,948 | | |
Year Ended December 31, 2012 | | $ | 30.45 | | | | 17.93 | % | | | 0.78 | % | | | 0.78 | %(e) | | | 0.57 | % | | | 16 | % | | $ | 13,374,355 | | |
Year Ended December 31, 2011 | | $ | 27.56 | | | | (4.61 | )% | | | 0.76 | % | | | 0.76 | %(e) | | | (0.03 | )% | | | 18 | % | | $ | 12,284,748 | | |
See accompanying notes to financial statements.
71
COLUMBIA ACORN FAMILY OF FUNDS
FINANCIAL HIGHLIGHTS, CONTINUED
Columbia Acorn International®
| | | | | Income from Investment Operations | | | | Less Distributions to Shareholders | | | |
(Selected data for a share outstanding
throughout each period) | | Net Asset
Value,
Beginning of
Period | | Net
investment
income (loss) | | Net realized
and
unrealized
gain (loss) | | Reimbursement
from
affiliate | | Total from
Investment
Operations | | Net
investment
income | | Net
realized
gains | | Total
Distributions to
Shareholders | |
Class A | |
Six Months Ended June 30,
2016 (Unaudited) | | $ | 39.08 | | | | 0.26 | | | | (0.80 | ) | | | — | | | | (0.54 | ) | | | — | | | | (0.26 | ) | | | (0.26 | ) | |
Year Ended December 31, 2015 | | $ | 41.68 | | | | 0.39 | | | | (1.02 | ) | | | — | | | | (0.63 | ) | | | (0.40 | ) | | | (1.57 | ) | | | (1.97 | ) | |
Year Ended December 31, 2014 | | $ | 46.63 | | | | 0.42 | | | | (2.51 | ) | | | — | | | | (2.09 | ) | | | (0.55 | ) | | | (2.31 | ) | | | (2.86 | ) | |
Year Ended December 31, 2013 | | $ | 40.79 | | | | 0.45 | | | | 8.37 | | | | — | | | | 8.82 | | | | (1.05 | ) | | | (1.93 | ) | | | (2.98 | ) | |
Year Ended December 31, 2012 | | $ | 34.15 | | | | 0.47 | | | | 6.75 | | | | — | | | | 7.22 | | | | (0.58 | ) | | | — | | | | (0.58 | ) | |
Year Ended December 31, 2011 | | $ | 40.87 | | | | 0.32 | | | | (6.02 | ) | | | 0.00 | (d) | | | (5.70 | ) | | | (1.02 | ) | | | — | | | | (1.02 | ) | |
Class B | |
Six Months Ended June 30,
2016 (Unaudited) | | $ | 37.80 | | | | 0.06 | | | | (0.72 | ) | | | — | | | | (0.66 | ) | | | — | | | | (0.26 | ) | | | (0.26 | ) | |
Year Ended December 31, 2015 | | $ | 40.38 | | | | 0.02 | | | | (1.01 | ) | | | — | | | | (0.99 | ) | | | (0.02 | ) | | | (1.57 | ) | | | (1.59 | ) | |
Year Ended December 31, 2014 | | $ | 45.24 | | | | 0.07 | | | | (2.42 | ) | | | — | | | | (2.35 | ) | | | (0.20 | ) | | | (2.31 | ) | | | (2.51 | ) | |
Year Ended December 31, 2013 | | $ | 39.67 | | | | 0.12 | | | | 8.10 | | | | — | | | | 8.22 | | | | (0.72 | ) | | | (1.93 | ) | | | (2.65 | ) | |
Year Ended December 31, 2012 | | $ | 33.17 | | | | 0.19 | | | | 6.55 | | | | — | | | | 6.74 | | | | (0.24 | ) | | | — | | | | (0.24 | ) | |
Year Ended December 31, 2011 | | $ | 39.96 | | | | 0.06 | | | | (5.85 | ) | | | 0.00 | (d) | | | (5.79 | ) | | | (1.00 | ) | | | — | | | | (1.00 | ) | |
Class C | |
Six Months Ended June 30,
2016 (Unaudited) | | $ | 37.65 | | | | 0.11 | | | | (0.77 | ) | | | — | | | | (0.66 | ) | | | — | | | | (0.26 | ) | | | (0.26 | ) | |
Year Ended December 31, 2015 | | $ | 40.20 | | | | 0.07 | | | | (0.97 | ) | | | — | | | | (0.90 | ) | | | (0.08 | ) | | | (1.57 | ) | | | (1.65 | ) | |
Year Ended December 31, 2014 | | $ | 45.04 | | | | 0.07 | | | | (2.40 | ) | | | — | | | | (2.33 | ) | | | (0.20 | ) | | | (2.31 | ) | | | (2.51 | ) | |
Year Ended December 31, 2013 | | $ | 39.50 | | | | 0.10 | | | | 8.08 | | | | — | | | | 8.18 | | | | (0.71 | ) | | | (1.93 | ) | | | (2.64 | ) | |
Year Ended December 31, 2012 | | $ | 33.03 | | | | 0.18 | | | | 6.52 | | | | — | | | | 6.70 | | | | (0.23 | ) | | | — | | | | (0.23 | ) | |
Year Ended December 31, 2011 | | $ | 39.79 | | | | 0.04 | | | | (5.86 | ) | | | 0.00 | (d) | | | (5.82 | ) | | | (0.94 | ) | | | — | | | | (0.94 | ) | |
Class I | |
Six Months Ended June 30,
2016 (Unaudited) | | $ | 39.15 | | | | 0.29 | | | | (0.76 | ) | | | — | | | | (0.47 | ) | | | — | | | | (0.26 | ) | | | (0.26 | ) | |
Year Ended December 31, 2015 | | $ | 41.76 | | | | 0.52 | | | | (1.00 | ) | | | — | | | | (0.48 | ) | | | (0.56 | ) | | | (1.57 | ) | | | (2.13 | ) | |
Year Ended December 31, 2014 | | $ | 46.71 | | | | 0.59 | | | | (2.51 | ) | | | — | | | | (1.92 | ) | | | (0.72 | ) | | | (2.31 | ) | | | (3.03 | ) | |
Year Ended December 31, 2013 | | $ | 40.86 | | | | 0.66 | | | | 8.34 | | | | — | | | | 9.00 | | | | (1.22 | ) | | | (1.93 | ) | | | (3.15 | ) | |
Year Ended December 31, 2012 | | $ | 34.33 | | | | 0.57 | | | | 6.83 | | | | — | | | | 7.40 | | | | (0.87 | ) | | | — | | | | (0.87 | ) | |
Year Ended December 31, 2011 | | $ | 40.92 | | | | 0.37 | | | | (5.94 | ) | | | 0.00 | (d) | | | (5.57 | ) | | | (1.02 | ) | | | — | | | | (1.02 | ) | |
Class R | |
Six Months Ended June 30,
2016 (Unaudited) | | $ | 39.07 | | | | 0.19 | | | | (0.80 | ) | | | — | | | | (0.61 | ) | | | — | | | | (0.26 | ) | | | (0.26 | ) | |
Year Ended December 31, 2015 | | $ | 41.67 | | | | 0.23 | | | | (1.02 | ) | | | — | | | | (0.79 | ) | | | (0.24 | ) | | | (1.57 | ) | | | (1.81 | ) | |
Year Ended December 31, 2014 | | $ | 46.60 | | | | 0.24 | | | | (2.50 | ) | | | — | | | | (2.26 | ) | | | (0.36 | ) | | | (2.31 | ) | | | (2.67 | ) | |
Year Ended December 31, 2013 | | $ | 40.79 | | | | 0.26 | | | | 8.36 | | | | — | | | | 8.62 | | | | (0.88 | ) | | | (1.93 | ) | | | (2.81 | ) | |
Year Ended December 31, 2012 | | $ | 34.11 | | | | 0.21 | | | | 6.89 | | | | — | | | | 7.10 | | | | (0.42 | ) | | | — | | | | (0.42 | ) | |
Year Ended December 31, 2011 (g) | | $ | 40.11 | | | | (0.00 | )(d) | | | (6.00 | ) | | | 0.00 | (d) | | | (6.00 | ) | | | — | | | | — | | | | — | | |
Class R4 | |
Six Months Ended June 30,
2016 (Unaudited) | | $ | 39.41 | | | | 0.30 | | | | (0.81 | ) | | | — | | | | (0.51 | ) | | | — | | | | (0.26 | ) | | | (0.26 | ) | |
Year Ended December 31, 2015 | | $ | 42.02 | | | | 0.47 | | | | (1.03 | ) | | | — | | | | (0.56 | ) | | | (0.48 | ) | | | (1.57 | ) | | | (2.05 | ) | |
Year Ended December 31, 2014 | | $ | 46.99 | | | | 0.50 | | | | (2.52 | ) | | | — | | | | (2.02 | ) | | | (0.64 | ) | | | (2.31 | ) | | | (2.95 | ) | |
Year Ended December 31, 2013 | | $ | 41.08 | | | | 0.34 | | | | 8.67 | | | | — | | | | 9.01 | | | | (1.17 | ) | | | (1.93 | ) | | | (3.10 | ) | |
Year Ended December 31, 2012 (h) | | $ | 39.86 | | | | (0.00 | )(d) | | | 1.81 | | | | — | | | | 1.81 | | | | (0.59 | ) | | | — | | | | (0.59 | ) | |
Class R5 | |
Six Months Ended June 30,
2016 (Unaudited) | | $ | 39.10 | | | | 0.32 | | | | (0.80 | ) | | | — | | | | (0.48 | ) | | | — | | | | (0.26 | ) | | | (0.26 | ) | |
Year Ended December 31, 2015 | | $ | 41.71 | | | | 0.54 | | | | (1.05 | ) | | | — | | | | (0.51 | ) | | | (0.53 | ) | | | (1.57 | ) | | | (2.10 | ) | |
Year Ended December 31, 2014 | | $ | 46.66 | | | | 0.57 | | | | (2.51 | ) | | | — | | | | (1.94 | ) | | | (0.70 | ) | | | (2.31 | ) | | | (3.01 | ) | |
Year Ended December 31, 2013 | | $ | 40.81 | | | | 0.63 | | | | 8.34 | | | | — | | | | 8.97 | | | | (1.19 | ) | | | (1.93 | ) | | | (3.12 | ) | |
Year Ended December 31, 2012 | | $ | 34.31 | | | | 0.75 | | | | 6.62 | | | | — | | | | 7.37 | | | | (0.87 | ) | | | — | | | | (0.87 | ) | |
Year Ended December 31, 2011 (i) | | $ | 40.24 | | | | 0.09 | | | | (6.02 | ) | | | 0.00 | (d) | | | (5.93 | ) | | | — | | | | — | | | | — | | |
Class Y | |
Six Months Ended June 30,
2016 (Unaudited) | | $ | 39.41 | | | | 0.32 | | | | (0.79 | ) | | | — | | | | (0.47 | ) | | | — | | | | (0.26 | ) | | | (0.26 | ) | |
Year Ended December 31, 2015 | | $ | 42.02 | | | | 0.53 | | | | (1.01 | ) | | | — | | | | (0.48 | ) | | | (0.56 | ) | | | (1.57 | ) | | | (2.13 | ) | |
Year Ended December 31, 2014 | | $ | 46.99 | | | | 0.58 | | | | (2.52 | ) | | | — | | | | (1.94 | ) | | | (0.72 | ) | | | (2.31 | ) | | | (3.03 | ) | |
Year Ended December 31, 2013 | | $ | 41.08 | | | | 0.57 | | | | 8.48 | | | | — | | | | 9.05 | | | | (1.21 | ) | | | (1.93 | ) | | | (3.14 | ) | |
Year Ended December 31, 2012 (j) | | $ | 39.90 | | | | 0.04 | | | | 1.78 | | | | — | | | | 1.82 | | | | (0.64 | ) | | | — | | | | (0.64 | ) | |
Class Z | |
Six Months Ended June 30,
2016 (Unaudited) | | $ | 39.12 | | | | 0.31 | | | | (0.80 | ) | | | — | | | | (0.49 | ) | | | — | | | | (0.26 | ) | | | (0.26 | ) | |
Year Ended December 31, 2015 | | $ | 41.73 | | | | 0.51 | | | | (1.03 | ) | | | — | | | | (0.52 | ) | | | (0.52 | ) | | | (1.57 | ) | | | (2.09 | ) | |
Year Ended December 31, 2014 | | $ | 46.68 | | | | 0.56 | | | | (2.51 | ) | | | — | | | | (1.95 | ) | | | (0.69 | ) | | | (2.31 | ) | | | (3.00 | ) | |
Year Ended December 31, 2013 | | $ | 40.84 | | | | 0.58 | | | | 8.38 | | | | — | | | | 8.96 | | | | (1.19 | ) | | | (1.93 | ) | | | (3.12 | ) | |
Year Ended December 31, 2012 | | $ | 34.31 | | | | 0.59 | | | | 6.78 | | | | — | | | | 7.37 | | | | (0.84 | ) | | | — | | | | (0.84 | ) | |
Year Ended December 31, 2011 | | $ | 40.92 | | | | 0.48 | | | | (6.07 | ) | | | 0.00 | (d) | | | (5.59 | ) | | | (1.02 | ) | | | — | | | | (1.02 | ) | |
Notes to Financial Highlights
(a) In addition to the fees and expenses that the Fund bears directly, the Fund indirectly bears a pro rata share of the fees and expenses of any other funds in which it invests, if any. Such indirect expenses are not included in the Fund's reported expense ratios.
(b) Annualized.
(c) Had the Investment Manager and/or Transfer Agent not waived fees and/or reimbursed a portion of expenses, total return would have been reduced.
(d) Rounds to zero.
(e) The benefits derived from custody fees paid indirectly had an impact of 0.01%.
(f) During the year ended December 31, 2011, Columbia Management reimbursed the Fund for a loss on a trading error. Had the Fund not received this reimbursement, total return would have been lower by less than 0.01%.
(g) Class R shares commenced operations on August 2, 2011. Per share data and total return reflect activity from that date.
(h) Class R4 shares commenced operations on November 8, 2012. Per share data and total return reflect activity from that date.
(i) Class R5 shares commenced operations on August 2, 2011. Per share data and total return reflect activity from that date.
(j) Class Y shares commenced operations on November 8, 2012. Per share data and total return reflect activity from that date.
See accompanying notes to financial statements.
72
| | | | | | | | | Ratio to Average Net Assets | | Supplemental Data | |
(Selected data for a share outstanding
throughout each period) | | Proceeds from
regulatory
settlements | | Net Asset
Value, End of
Period | | Total Return | | Total gross
expenses
(a) | | Total net
expenses
(a) | | Net
investment
income (loss) | | Portfolio
turnover rate | | Net assets,
end of period
(000s) | |
Class A | |
Six Months Ended June 30,
2016 (Unaudited) | | | — | | | $ | 38.28 | | | | (1.42 | )% | | | 1.33 | %(b) | | | 1.29 | %(b) | | | 1.37 | %(b) | | | 28 | % | | $ | 690,106 | | |
Year Ended December 31, 2015 | | | — | | | $ | 39.08 | | | | (1.59 | )%(c) | | | 1.28 | % | | | 1.24 | % | | | 0.93 | % | | | 50 | % | | $ | 812,479 | | |
Year Ended December 31, 2014 | | | — | | | $ | 41.68 | | | | (4.58 | )%(c) | | | 1.26 | % | | | 1.22 | % | | | 0.91 | % | | | 28 | % | | $ | 946,553 | | |
Year Ended December 31, 2013 | | | — | | | $ | 46.63 | | | | 22.00 | %(c) | | | 1.27 | % | | | 1.23 | % | | | 1.02 | % | | | 45 | % | | $ | 1,089,263 | | |
Year Ended December 31, 2012 | | | 0.00 | (d) | | $ | 40.79 | | | | 21.21 | %(c) | | | 1.28 | % | | | 1.24 | %(e) | | | 1.22 | % | | | 33 | % | | $ | 1,007,236 | | |
Year Ended December 31, 2011 | | | 0.00 | (d) | | $ | 34.15 | | | | (14.37 | )%(c)(f) | | | 1.32 | % | | | 1.30 | %(e) | | | 0.84 | % | | | 32 | % | | $ | 918,112 | | |
Class B | |
Six Months Ended June 30,
2016 (Unaudited) | | | — | | | $ | 36.88 | | | | (1.78 | )%(c) | | | 2.13 | %(b) | | | 2.12 | %(b) | | | 0.35 | %(b) | | | 28 | % | | $ | 893 | | |
Year Ended December 31, 2015 | | | — | | | $ | 37.80 | | | | (2.53 | )%(c) | | | 2.17 | % | | | 2.14 | % | | | 0.05 | % | | | 50 | % | | $ | 1,628 | | |
Year Ended December 31, 2014 | | | — | | | $ | 40.38 | | | | (5.29 | )%(c) | | | 2.00 | % | | | 1.97 | % | | | 0.16 | % | | | 28 | % | | $ | 6,516 | | |
Year Ended December 31, 2013 | | | — | | | $ | 45.24 | | | | 21.08 | %(c) | | | 2.00 | % | | | 1.97 | % | | | 0.27 | % | | | 45 | % | | $ | 13,218 | | |
Year Ended December 31, 2012 | | | 0.00 | (d) | | $ | 39.67 | | | | 20.33 | %(c) | | | 2.00 | % | | | 1.97 | %(e) | | | 0.51 | % | | | 33 | % | | $ | 17,910 | | |
Year Ended December 31, 2011 | | | 0.00 | (d) | | $ | 33.17 | | | | (14.92 | )%(c)(f) | | | 1.98 | % | | | 1.96 | %(e) | | | 0.15 | % | | | 32 | % | | $ | 24,510 | | |
Class C | |
Six Months Ended June 30,
2016 (Unaudited) | | | — | | | $ | 36.73 | | | | (1.79 | )% | | | 2.05 | %(b) | | | 2.03 | %(b) | | | 0.62 | %(b) | | | 28 | % | | $ | 77,841 | | |
Year Ended December 31, 2015 | | | — | | | $ | 37.65 | | | | (2.33 | )%(c) | | | 2.01 | % | | | 1.99 | % | | | 0.18 | % | | | 50 | % | | $ | 88,606 | | |
Year Ended December 31, 2014 | | | — | | | $ | 40.20 | | | | (5.27 | )%(c) | | | 1.99 | % | | | 1.97 | % | | | 0.16 | % | | | 28 | % | | $ | 103,691 | | |
Year Ended December 31, 2013 | | | — | | | $ | 45.04 | | | | 21.07 | %(c) | | | 2.01 | % | | | 1.99 | % | | | 0.23 | % | | | 45 | % | | $ | 110,875 | | |
Year Ended December 31, 2012 | | | 0.00 | (d) | | $ | 39.50 | | | | 20.31 | %(c) | | | 2.02 | % | | | 2.00 | %(e) | | | 0.48 | % | | | 33 | % | | $ | 92,748 | | |
Year Ended December 31, 2011 | | | 0.00 | (d) | | $ | 33.03 | | | | (15.02 | )%(c)(f) | | | 2.07 | % | | | 2.06 | %(e) | | | 0.10 | % | | | 32 | % | | $ | 97,328 | | |
Class I | |
Six Months Ended June 30,
2016 (Unaudited) | | | — | | | $ | 38.42 | | | | (1.24 | )% | | | 0.90 | %(b) | | | 0.90 | %(b) | | | 1.56 | %(b) | | | 28 | % | | $ | 46,065 | | |
Year Ended December 31, 2015 | | | — | | | $ | 39.15 | | | | (1.23 | )% | | | 0.88 | % | | | 0.88 | % | | | 1.23 | % | | | 50 | % | | $ | 54,382 | | |
Year Ended December 31, 2014 | | | — | | | $ | 41.76 | | | | (4.20 | )% | | | 0.85 | % | | | 0.85 | % | | | 1.26 | % | | | 28 | % | | $ | 38,804 | | |
Year Ended December 31, 2013 | | | — | | | $ | 46.71 | | | | 22.43 | % | | | 0.85 | % | | | 0.85 | % | | | 1.49 | % | | | 45 | % | | $ | 29,418 | | |
Year Ended December 31, 2012 | | | 0.00 | (d) | | $ | 40.86 | | | | 21.69 | % | | | 0.88 | % | | | 0.88 | %(e) | | | 1.48 | % | | | 33 | % | | $ | 97,484 | | |
Year Ended December 31, 2011 | | | 0.00 | (d) | | $ | 34.33 | | | | (14.02 | )%(f) | | | 0.91 | % | | | 0.91 | %(e) | | | 0.99 | % | | | 32 | % | | $ | 50,335 | | |
Class R | |
Six Months Ended June 30,
2016 (Unaudited) | | | — | | | $ | 38.20 | | | | (1.60 | )% | | | 1.65 | %(b) | | | 1.65 | %(b) | | | 1.03 | %(b) | | | 28 | % | | $ | 4,515 | | |
Year Ended December 31, 2015 | | | — | | | $ | 39.07 | | | | (1.98 | )% | | | 1.62 | % | | | 1.62 | % | | | 0.54 | % | | | 50 | % | | $ | 4,945 | | |
Year Ended December 31, 2014 | | | — | | | $ | 41.67 | | | | (4.95 | )% | | | 1.63 | % | | | 1.63 | % | | | 0.52 | % | | | 28 | % | | $ | 5,560 | | |
Year Ended December 31, 2013 | | | — | | | $ | 46.60 | | | | 21.50 | % | | | 1.63 | % | | | 1.63 | % | | | 0.58 | % | | | 45 | % | | $ | 5,822 | | |
Year Ended December 31, 2012 | | | 0.00 | (d) | | $ | 40.79 | | | | 20.83 | % | | | 1.52 | % | | | 1.51 | %(e) | | | 0.54 | % | | | 33 | % | | $ | 2,799 | | |
Year Ended December 31, 2011 (g) | | | 0.00 | (d) | | $ | 34.11 | | | | (14.96 | )% | | | 1.59 | %(b) | | | 1.59 | %(b)(e) | | | (0.02 | )%(b) | | | 32 | % | | $ | 2,130 | | |
Class R4 | |
Six Months Ended June 30,
2016 (Unaudited) | | | — | | | $ | 38.64 | | | | (1.33 | )% | | | 1.10 | %(b) | | | 1.10 | %(b) | | | 1.59 | %(b) | | | 28 | % | | $ | 477,953 | | |
Year Ended December 31, 2015 | | | — | | | $ | 39.41 | | | | (1.41 | )% | | | 1.06 | % | | | 1.06 | % | | | 1.10 | % | | | 50 | % | | $ | 486,763 | | |
Year Ended December 31, 2014 | | | — | | | $ | 42.02 | | | | (4.39 | )% | | | 1.04 | % | | | 1.04 | % | | | 1.07 | % | | | 28 | % | | $ | 424,425 | | |
Year Ended December 31, 2013 | | | — | | | $ | 46.99 | | | | 22.32 | % | | | 1.03 | % | | | 1.03 | % | | | 0.73 | % | | | 45 | % | | $ | 355,616 | | |
Year Ended December 31, 2012 (h) | | | — | | | $ | 41.08 | | | | 4.57 | % | | | 1.03 | %(b) | | | 1.02 | %(b)(e) | | | (0.02 | )%(b) | | | 33 | % | | $ | 15 | | |
Class R5 | |
Six Months Ended June 30,
2016 (Unaudited) | | | — | | | $ | 38.36 | | | | (1.26 | )% | | | 0.95 | %(b) | | | 0.95 | %(b) | | | 1.71 | %(b) | | | 28 | % | | $ | 309,222 | | |
Year Ended December 31, 2015 | | | — | | | $ | 39.10 | | | | (1.29 | )% | | | 0.92 | % | | | 0.92 | % | | | 1.26 | % | | | 50 | % | | $ | 320,252 | | |
Year Ended December 31, 2014 | | | — | | | $ | 41.71 | | | | (4.25 | )% | | | 0.90 | % | | | 0.90 | % | | | 1.23 | % | | | 28 | % | | $ | 397,882 | | |
Year Ended December 31, 2013 | | | — | | | $ | 46.66 | | | | 22.38 | % | | | 0.91 | % | | | 0.91 | % | | | 1.40 | % | | | 45 | % | | $ | 274,415 | | |
Year Ended December 31, 2012 | | | 0.00 | (d) | | $ | 40.81 | | | | 21.61 | % | | | 0.89 | % | | | 0.89 | %(e) | | | 1.99 | % | | | 33 | % | | $ | 242 | | |
Year Ended December 31, 2011 (i) | | | 0.00 | (d) | | $ | 34.31 | | | | (14.74 | )% | | | 0.91 | %(b) | | | 0.91 | %(b)(e) | | | 0.65 | %(b) | | | 32 | % | | $ | 2,038 | | |
Class Y | |
Six Months Ended June 30,
2016 (Unaudited) | | | — | | | $ | 38.68 | | | | (1.23 | )% | | | 0.90 | %(b) | | | 0.90 | %(b) | | | 1.68 | %(b) | | | 28 | % | | $ | 217,851 | | |
Year Ended December 31, 2015 | | | — | | | $ | 39.41 | | | | (1.23 | )% | | | 0.88 | % | | | 0.88 | % | | | 1.26 | % | | | 50 | % | | $ | 318,326 | | |
Year Ended December 31, 2014 | | | — | | | $ | 42.02 | | | | (4.21 | )% | | | 0.85 | % | | | 0.85 | % | | | 1.25 | % | | | 28 | % | | $ | 225,012 | | |
Year Ended December 31, 2013 | | | — | | | $ | 46.99 | | | | 22.44 | % | | | 0.86 | % | | | 0.86 | % | | | 1.26 | % | | | 45 | % | | $ | 155,140 | | |
Year Ended December 31, 2012 (j) | | | — | | | $ | 41.08 | | | | 4.59 | % | | | 0.91 | %(b) | | | 0.90 | %(b)(e) | | | 0.75 | %(b) | | | 33 | % | | $ | 30,856 | | |
Class Z | |
Six Months Ended June 30,
2016 (Unaudited) | | | — | | | $ | 38.37 | | | | (1.29 | )% | | | 1.00 | %(b) | | | 1.00 | %(b) | | | 1.64 | %(b) | | | 28 | % | | $ | 3,889,399 | | |
Year Ended December 31, 2015 | | | — | | | $ | 39.12 | | | | (1.33 | )% | | | 0.97 | % | | | 0.97 | % | | | 1.21 | % | | | 50 | % | | $ | 4,645,797 | | |
Year Ended December 31, 2014 | | | — | | | $ | 41.73 | | | | (4.28 | )% | | | 0.93 | % | | | 0.93 | % | | | 1.20 | % | | | 28 | % | | $ | 5,585,035 | | |
Year Ended December 31, 2013 | | | — | | | $ | 46.68 | | | | 22.33 | % | | | 0.93 | % | | | 0.93 | % | | | 1.30 | % | | | 45 | % | | $ | 6,293,552 | | |
Year Ended December 31, 2012 | | | 0.00 | (d) | | $ | 40.84 | | | | 21.60 | % | | | 0.93 | % | | | 0.93 | %(e) | | | 1.53 | % | | | 33 | % | | $ | 5,494,506 | | |
Year Ended December 31, 2011 | | | 0.00 | (d) | | $ | 34.31 | | | | (14.06 | )%(f) | | | 0.95 | % | | | 0.95 | %(e) | | | 1.24 | % | | | 32 | % | | $ | 4,322,500 | | |
See accompanying notes to financial statements.
73
COLUMBIA ACORN FAMILY OF FUNDS
FINANCIAL HIGHLIGHTS, CONTINUED
Columbia Acorn USA®
| | | | | Income from Investment Operations | | | | Less Distributions to Shareholders | | | |
(Selected data for a share outstanding
throughout each period) | | Net Asset
Value,
Beginning of
Period | | Net
investment
income (loss) | | Net realized
and
unrealized
gain (loss) | | Total from
Investment
Operations | | Net
investment
income | | Net
realized
gains | | Total
Distributions to
Shareholders | |
Class A | |
Six Months Ended June 30, 2016 (Unaudited) | | $ | 20.25 | | | | (0.05 | ) | | | 0.27 | (b) | | | 0.22 | | | | — | | | | (2.67 | ) | | | (2.67 | ) | |
Year Ended December 31, 2015 | | $ | 29.13 | | | | (0.18 | ) | | | (0.18 | )(b) | | | (0.36 | ) | | | — | | | | (8.52 | ) | | | (8.52 | ) | |
Year Ended December 31, 2014 | | $ | 34.15 | | | | (0.20 | ) | | | 1.22 | | | | 1.02 | | | | — | | | | (6.04 | ) | | | (6.04 | ) | |
Year Ended December 31, 2013 | | $ | 28.21 | | | | (0.15 | ) | | | 9.09 | | | | 8.94 | | | | — | | | | (3.00 | ) | | | (3.00 | ) | |
Year Ended December 31, 2012 | | $ | 25.94 | | | | 0.02 | | | | 4.73 | | | | 4.75 | | | | (0.11 | ) | | | (2.37 | ) | | | (2.48 | ) | |
Year Ended December 31, 2011 | | $ | 27.54 | | | | (0.22 | ) | | | (1.21 | ) | | | (1.43 | ) | | | — | | | | (0.17 | ) | | | (0.17 | ) | |
Class C | |
Six Months Ended June 30, 2016 (Unaudited) | | $ | 16.00 | | | | (0.09 | ) | | | 0.22 | (b) | | | 0.13 | | | | — | | | | (2.67 | ) | | | (2.67 | ) | |
Year Ended December 31, 2015 | | $ | 24.98 | | | | (0.33 | ) | | | (0.13 | )(b) | | | (0.46 | ) | | | — | | | | (8.52 | ) | | | (8.52 | ) | |
Year Ended December 31, 2014 | | $ | 30.33 | | | | (0.37 | ) | | | 1.06 | | | | 0.69 | | | | — | | | | (6.04 | ) | | | (6.04 | ) | |
Year Ended December 31, 2013 | | $ | 25.49 | | | | (0.33 | ) | | | 8.17 | | | | 7.84 | | | | — | | | | (3.00 | ) | | | (3.00 | ) | |
Year Ended December 31, 2012 | | $ | 23.72 | | | | (0.16 | ) | | | 4.30 | | | | 4.14 | | | | — | | | | (2.37 | ) | | | (2.37 | ) | |
Year Ended December 31, 2011 | | $ | 25.39 | | | | (0.39 | ) | | | (1.11 | ) | | | (1.50 | ) | | | — | | | | (0.17 | ) | | | (0.17 | ) | |
Class I | |
Six Months Ended June 30, 2016 (Unaudited) | | $ | 22.40 | | | | (0.01 | ) | | | 0.29 | (b) | | | 0.28 | | | | — | | | | (2.67 | ) | | | (2.67 | ) | |
Year Ended December 31, 2015 | | $ | 31.19 | | | | (0.07 | ) | | | (0.20 | )(b) | | | (0.27 | ) | | | — | | | | (8.52 | ) | | | (8.52 | ) | |
Year Ended December 31, 2014 | | $ | 35.99 | | | | (0.06 | ) | | | 1.30 | | | | 1.24 | | | | — | | | | (6.04 | ) | | | (6.04 | ) | |
Year Ended December 31, 2013 | | $ | 29.47 | | | | (0.02 | ) | | | 9.54 | | | | 9.52 | | | | — | | | | (3.00 | ) | | | (3.00 | ) | |
Year Ended December 31, 2012 | | $ | 27.00 | | | | (0.10 | ) | | | 5.16 | | | | 5.06 | | | | (0.22 | ) | | | (2.37 | ) | | | (2.59 | ) | |
Year Ended December 31, 2011 | | $ | 28.56 | | | | (0.14 | ) | | | (1.25 | ) | | | (1.39 | ) | | | — | | | | (0.17 | ) | | | (0.17 | ) | |
Class R4 | |
Six Months Ended June 30, 2016 (Unaudited) | | $ | 22.85 | | | | (0.04 | ) | | | 0.30 | (b) | | | 0.26 | | | | — | | | | (2.67 | ) | | | (2.67 | ) | |
Year Ended December 31, 2015 | | $ | 31.70 | | | | (0.13 | ) | | | (0.20 | )(b) | | | (0.33 | ) | | | — | | | | (8.52 | ) | | | (8.52 | ) | |
Year Ended December 31, 2014 | | $ | 36.55 | | | | (0.11 | ) | | | 1.30 | | | | 1.19 | | | | — | | | | (6.04 | ) | | | (6.04 | ) | |
Year Ended December 31, 2013 | | $ | 29.92 | | | | 0.00 | (f) | | | 9.63 | | | | 9.63 | | | | — | | | | (3.00 | ) | | | (3.00 | ) | |
Year Ended December 31, 2012 (g) | | $ | 30.06 | | | | 0.06 | | | | 2.28 | | | | 2.34 | | | | (0.16 | ) | | | (2.32 | ) | | | (2.48 | ) | |
Class R5 | |
Six Months Ended June 30, 2016 (Unaudited) | | $ | 22.90 | | | | (0.02 | ) | | | 0.29 | (b) | | | 0.27 | | | | — | | | | (2.67 | ) | | | (2.67 | ) | |
Year Ended December 31, 2015 | | $ | 31.71 | | | | (0.10 | ) | | | (0.19 | )(b) | | | (0.29 | ) | | | — | | | | (8.52 | ) | | | (8.52 | ) | |
Year Ended December 31, 2014 | | $ | 36.53 | | | | (0.06 | ) | | | 1.28 | | | | 1.22 | | | | — | | | | (6.04 | ) | | | (6.04 | ) | |
Year Ended December 31, 2013 | | $ | 29.90 | | | | 0.02 | | | | 9.61 | | | | 9.63 | | | | — | | | | (3.00 | ) | | | (3.00 | ) | |
Year Ended December 31, 2012 (h) | | $ | 30.06 | | | | 0.07 | | | | 2.27 | | | | 2.34 | | | | (0.18 | ) | | | (2.32 | ) | | | (2.50 | ) | |
Class Y | |
Six Months Ended June 30, 2016 (Unaudited) | | $ | 22.99 | | | | (0.02 | ) | | | 0.31 | (b) | | | 0.29 | | | | — | | | | (2.67 | ) | | | (2.67 | ) | |
Year Ended December 31, 2015 | | $ | 31.80 | | | | (0.08 | ) | | | (0.21 | )(b) | | | (0.29 | ) | | | — | | | | (8.52 | ) | | | (8.52 | ) | |
Year Ended December 31, 2014 | | $ | 36.59 | | | | (0.07 | ) | | | 1.32 | | | | 1.25 | | | | — | | | | (6.04 | ) | | | (6.04 | ) | |
Year Ended December 31, 2013 | | $ | 29.93 | | | | 0.02 | | | | 9.64 | | | | 9.66 | | | | — | | | | (3.00 | ) | | | (3.00 | ) | |
Year Ended December 31, 2012 (i) | | $ | 30.10 | | | | 0.07 | | | | 2.27 | | | | 2.34 | | | | (0.19 | ) | | | (2.32 | ) | | | (2.51 | ) | |
Class Z | |
Six Months Ended June 30, 2016 (Unaudited) | | $ | 22.19 | | | | (0.04 | ) | | | 0.30 | (b) | | | 0.26 | | | | — | | | | (2.67 | ) | | | (2.67 | ) | |
Year Ended December 31, 2015 | | $ | 31.03 | | | | (0.12 | ) | | | (0.20 | )(b) | | | (0.32 | ) | | | — | | | | (8.52 | ) | | | (8.52 | ) | |
Year Ended December 31, 2014 | | $ | 35.90 | | | | (0.12 | ) | | | 1.29 | | | | 1.17 | | | | — | | | | (6.04 | ) | | | (6.04 | ) | |
Year Ended December 31, 2013 | | $ | 29.45 | | | | (0.07 | ) | | | 9.52 | | | | 9.45 | | | | — | | | | (3.00 | ) | | | (3.00 | ) | |
Year Ended December 31, 2012 | | $ | 26.98 | | | | 0.11 | | | | 4.92 | | | | 5.03 | | | | (0.19 | ) | | | (2.37 | ) | | | (2.56 | ) | |
Year Ended December 31, 2011 | | $ | 28.56 | | | | (0.14 | ) | | | (1.27 | ) | | | (1.41 | ) | | | — | | | | (0.17 | ) | | | (0.17 | ) | |
Notes to Financial Highlights
(a) In addition to the fees and expenses that the Fund bears directly, the Fund indirectly bears a pro rata share of the fees and expenses of any other funds in which it invests, if any. Such indirect expenses are not included in the Fund's reported expense ratios.
(b) Calculation of the net gain (loss) per share (both realized and unrealized) does not correlate to the aggregate realized and unrealized gain (loss) presented in the Statements of Operations due to the timing of subscriptions and redemptions of Fund shares in relation to fluctuations in the market value of the portfolio.
(c) Annualized.
(d) Ratios include line of credit interest expense which is less than 0.01%.
(e) The benefits derived from custody fees paid indirectly had an impact of less than 0.01%.
(f) Rounds to zero.
(g) Class R4 shares commenced operations on November 8, 2012. Per share data and total return reflect activity from that date.
(h) Class R5 shares commenced operations on November 8, 2012. Per share data and total return reflect activity from that date.
(i) Class Y shares commenced operations on November 8, 2012. Per share data and total return reflect activity from that date.
See accompanying notes to financial statements.
74
| | | | | | Ratio to Average Net Assets | | Supplemental Data | |
(Selected data for a share outstanding
throughout each period) | | Net Asset
Value, End of
Period | | Total Return | | Total gross
expenses
(a) | | Total net
expenses
(a) | | Net
investment
income (loss) | | Portfolio
turnover rate | | Net assets,
end of period
(000s) | |
Class A | |
Six Months Ended June 30, 2016 (Unaudited) | | $ | 17.80 | | | | 0.82 | % | | | 1.44 | %(c) | | | 1.44 | %(c) | | | (0.59 | )%(c) | | | 59 | % | | $ | 85,727 | | |
Year Ended December 31, 2015 | | $ | 20.25 | | | | (1.60 | )% | | | 1.34 | % | | | 1.34 | % | | | (0.63 | )% | | | 35 | % | | $ | 95,048 | | |
Year Ended December 31, 2014 | | $ | 29.13 | | | | 3.35 | % | | | 1.33 | % | | | 1.33 | % | | | (0.60 | )% | | | 12 | % | | $ | 148,089 | | |
Year Ended December 31, 2013 | | $ | 34.15 | | | | 32.34 | % | | | 1.32 | % | | | 1.32 | % | | | (0.46 | )% | | | 17 | % | | $ | 201,559 | | |
Year Ended December 31, 2012 | | $ | 28.21 | | | | 18.67 | % | | | 1.32 | %(d) | | | 1.32 | %(d)(e) | | | 0.08 | % | | | 14 | % | | $ | 152,164 | | |
Year Ended December 31, 2011 | | $ | 25.94 | | | | (5.21 | )% | | | 1.30 | % | | | 1.30 | %(e) | | | (0.78 | )% | | | 20 | % | | $ | 167,038 | | |
Class C | |
Six Months Ended June 30, 2016 (Unaudited) | | $ | 13.46 | | | | 0.46 | % | | | 2.14 | %(c) | | | 2.14 | %(c) | | | (1.30 | )%(c) | | | 59 | % | | $ | 14,228 | | |
Year Ended December 31, 2015 | | $ | 16.00 | | | | (2.28 | )% | | | 2.02 | % | | | 2.02 | % | | | (1.32 | )% | | | 35 | % | | $ | 17,255 | | |
Year Ended December 31, 2014 | | $ | 24.98 | | | | 2.67 | % | | | 2.00 | % | | | 2.00 | % | | | (1.26 | )% | | | 12 | % | | $ | 36,476 | | |
Year Ended December 31, 2013 | | $ | 30.33 | | | | 31.47 | % | | | 2.00 | % | | | 2.00 | % | | | (1.14 | )% | | | 17 | % | | $ | 40,395 | | |
Year Ended December 31, 2012 | | $ | 25.49 | | | | 17.82 | % | | | 2.05 | %(d) | | | 2.05 | %(d)(e) | | | (0.61 | )% | | | 14 | % | | $ | 31,410 | | |
Year Ended December 31, 2011 | | $ | 23.72 | | | | (5.92 | )% | | | 2.05 | % | | | 2.05 | %(e) | | | (1.53 | )% | | | 20 | % | | $ | 30,584 | | |
Class I | |
Six Months Ended June 30, 2016 (Unaudited) | | $ | 20.01 | | | | 1.01 | % | | | 0.98 | %(c) | | | 0.98 | %(c) | | | (0.15 | )%(c) | | | 59 | % | | $ | 1 | | |
Year Ended December 31, 2015 | | $ | 22.40 | | | | (1.19 | )% | | | 0.92 | % | | | 0.92 | % | | | (0.23 | )% | | | 35 | % | | $ | 2 | | |
Year Ended December 31, 2014 | | $ | 31.19 | | | | 3.80 | % | | | 0.88 | % | | | 0.88 | % | | | (0.17 | )% | | | 12 | % | | $ | 2 | | |
Year Ended December 31, 2013 | | $ | 35.99 | | | | 32.93 | % | | | 0.90 | % | | | 0.90 | % | | | (0.04 | )% | | | 17 | % | | $ | 4 | | |
Year Ended December 31, 2012 | | $ | 29.47 | | | | 19.10 | % | | | 0.96 | % | | | 0.96 | %(e) | | | (0.33 | )% | | | 14 | % | | $ | 3 | | |
Year Ended December 31, 2011 | | $ | 27.00 | | | | (4.88 | )% | | | 0.94 | % | | | 0.94 | %(e) | | | (0.47 | )% | | | 20 | % | | $ | 2,635 | | |
Class R4 | |
Six Months Ended June 30, 2016 (Unaudited) | | $ | 20.44 | | | | 0.90 | % | | | 1.22 | %(c) | | | 1.22 | %(c) | | | (0.37 | )%(c) | | | 59 | % | | $ | 8,267 | | |
Year Ended December 31, 2015 | | $ | 22.85 | | | | (1.36 | )% | | | 1.12 | % | | | 1.12 | % | | | (0.40 | )% | | | 35 | % | | $ | 8,224 | | |
Year Ended December 31, 2014 | | $ | 31.70 | | | | 3.60 | % | | | 1.07 | % | | | 1.07 | % | | | (0.32 | )% | | | 12 | % | | $ | 7,952 | | |
Year Ended December 31, 2013 | | $ | 36.55 | | | | 32.80 | % | | | 1.00 | % | | | 1.00 | % | | | 0.01 | % | | | 17 | % | | $ | 6,441 | | |
Year Ended December 31, 2012 (g) | | $ | 29.92 | | | | 8.06 | % | | | 1.14 | %(c)(d) | | | 1.14 | %(c)(d)(e) | | | 1.51 | %(c) | | | 14 | % | | $ | 15 | | |
Class R5 | |
Six Months Ended June 30, 2016 (Unaudited) | | $ | 20.50 | | | | 0.94 | % | | | 1.08 | %(c) | | | 1.08 | %(c) | | | (0.23 | )%(c) | | | 59 | % | | $ | 27,443 | | |
Year Ended December 31, 2015 | | $ | 22.90 | | | | (1.23 | )% | | | 1.01 | % | | | 1.01 | % | | | (0.30 | )% | | | 35 | % | | $ | 27,112 | | |
Year Ended December 31, 2014 | | $ | 31.71 | | | | 3.68 | % | | | 0.99 | % | | | 0.99 | % | | | (0.17 | )% | | | 12 | % | | $ | 36,689 | | |
Year Ended December 31, 2013 | | $ | 36.53 | | | | 32.83 | % | | | 0.97 | % | | | 0.97 | % | | | 0.06 | % | | | 17 | % | | $ | 6,068 | | |
Year Ended December 31, 2012 (h) | | $ | 29.90 | | | | 8.06 | % | | | 1.12 | %(c) | | | 1.12 | %(c)(e) | | | 1.53 | %(c) | | | 14 | % | | $ | 2 | | |
Class Y | |
Six Months Ended June 30, 2016 (Unaudited) | | $ | 20.61 | | | | 1.03 | % | | | 1.04 | %(c) | | | 1.04 | %(c) | | | (0.18 | )%(c) | | | 59 | % | | $ | 41,296 | | |
Year Ended December 31, 2015 | | $ | 22.99 | | | | (1.23 | )% | | | 0.97 | % | | | 0.97 | % | | | (0.25 | )% | | | 35 | % | | $ | 41,658 | | |
Year Ended December 31, 2014 | | $ | 31.80 | | | | 3.76 | % | | | 0.93 | % | | | 0.93 | % | | | (0.19 | )% | | | 12 | % | | $ | 35,551 | | |
Year Ended December 31, 2013 | | $ | 36.59 | | | | 32.89 | % | | | 0.93 | % | | | 0.93 | % | | | 0.07 | % | | | 17 | % | | $ | 48,479 | | |
Year Ended December 31, 2012 (i) | | $ | 29.93 | | | | 8.07 | % | | | 1.04 | %(c) | | | 1.04 | %(c)(e) | | | 1.62 | %(c) | | | 14 | % | | $ | 2 | | |
Class Z | |
Six Months Ended June 30, 2016 (Unaudited) | | $ | 19.78 | | | | 0.92 | % | | | 1.19 | %(c) | | | 1.19 | %(c) | | | (0.36 | )%(c) | | | 59 | % | | $ | 502,309 | | |
Year Ended December 31, 2015 | | $ | 22.19 | | | | (1.36 | )% | | | 1.10 | % | | | 1.10 | % | | | (0.40 | )% | | | 35 | % | | $ | 768,658 | | |
Year Ended December 31, 2014 | | $ | 31.03 | | | | 3.61 | % | | | 1.08 | % | | | 1.08 | % | | | (0.34 | )% | | | 12 | % | | $ | 1,132,223 | | |
Year Ended December 31, 2013 | | $ | 35.90 | | | | 32.72 | % | | | 1.06 | % | | | 1.06 | % | | | (0.20 | )% | | | 17 | % | | $ | 1,496,775 | | |
Year Ended December 31, 2012 | | $ | 29.45 | | | | 18.98 | % | | | 1.07 | %(d) | | | 1.07 | %(d)(e) | | | 0.36 | % | | | 14 | % | | $ | 1,415,442 | | |
Year Ended December 31, 2011 | | $ | 26.98 | | | | (4.95 | )% | | | 1.00 | % | | | 1.00 | %(e) | | | (0.48 | )% | | | 20 | % | | $ | 1,355,934 | | |
See accompanying notes to financial statements.
75
COLUMBIA ACORN FAMILY OF FUNDS
FINANCIAL HIGHLIGHTS, CONTINUED
Columbia Acorn International SelectSM
| | | | | Income from Investment Operations | | | | Less Distributions to Shareholders | | | | | |
(Selected data for a share outstanding
throughout each period) | | Net Asset
Value,
Beginning of
Period | | Net
investment
income (loss) | | Net realized
and
unrealized
gain (loss) | | Total from
Investment
Operations | | Net
investment
income | | Net
realized
gains | | Tax
return of
capital | | Total
Distributions to
Shareholders | |
Class A | |
Six Months Ended June 30,
2016 (Unaudited) | | $ | 21.33 | | | | 0.09 | | | | (0.49 | ) | | | (0.40 | ) | | | — | | | | — | | | | — | | | | — | | |
Year Ended December 31, 2015 | | $ | 22.04 | | | | 0.17 | | | | (0.45 | ) | | | (0.28 | ) | | | (0.42 | ) | | | — | | | | (0.01 | ) | | | (0.43 | ) | |
Year Ended December 31, 2014 | | $ | 26.91 | | | | 0.29 | | | | (2.17 | ) | | | (1.88 | ) | | | (0.10 | ) | | | (2.89 | ) | | | — | | | | (2.99 | ) | |
Year Ended December 31, 2013 | | $ | 25.61 | | | | 0.29 | | | | 3.29 | | | | 3.58 | | | | (0.37 | ) | | | (1.91 | ) | | | — | | | | (2.28 | ) | |
Year Ended December 31, 2012 | | $ | 24.26 | | | | 0.39 | | | | 4.92 | | | | 5.31 | | | | (1.75 | ) | | | (2.21 | ) | | | — | | | | (3.96 | ) | |
Year Ended December 31, 2011 | | $ | 28.01 | | | | 0.18 | | | | (2.95 | ) | | | (2.77 | ) | | | (0.59 | ) | | | (0.39 | ) | | | — | | | | (0.98 | ) | |
Class C | |
Six Months Ended June 30,
2016 (Unaudited) | | $ | 19.96 | | | | 0.02 | | | | (0.47 | ) | | | (0.45 | ) | | | — | | | | — | | | | — | | | | — | | |
Year Ended December 31, 2015 | | $ | 20.54 | | | | (0.01 | ) | | | (0.41 | ) | | | (0.42 | ) | | | (0.15 | ) | | | — | | | | (0.01 | ) | | | (0.16 | ) | |
Year Ended December 31, 2014 | | $ | 25.39 | | | | 0.07 | | | | (2.03 | ) | | | (1.96 | ) | | | — | | | | (2.89 | ) | | | — | | | | (2.89 | ) | |
Year Ended December 31, 2013 | | $ | 24.28 | | | | 0.08 | | | | 3.10 | | | | 3.18 | | | | (0.16 | ) | | | (1.91 | ) | | | — | | | | (2.07 | ) | |
Year Ended December 31, 2012 | | $ | 23.17 | | | | 0.18 | | | | 4.67 | | | | 4.85 | | | | (1.53 | ) | | | (2.21 | ) | | | — | | | | (3.74 | ) | |
Year Ended December 31, 2011 | | $ | 26.58 | | | | (0.04 | ) | | | (2.81 | ) | | | (2.85 | ) | | | (0.17 | ) | | | (0.39 | ) | | | — | | | | (0.56 | ) | |
Class I | |
Six Months Ended June 30,
2016 (Unaudited) | | $ | 21.57 | | | | 0.15 | | | | (0.50 | ) | | | (0.35 | ) | | | — | | | | — | | | | — | | | | — | | |
Year Ended December 31, 2015 | | $ | 22.29 | | | | 0.24 | | | | (0.45 | ) | | | (0.21 | ) | | | (0.50 | ) | | | — | | | | (0.01 | ) | | | (0.51 | ) | |
Year Ended December 31, 2014 | | $ | 27.19 | | | | 0.39 | | | | (2.20 | ) | | | (1.81 | ) | | | (0.20 | ) | | | (2.89 | ) | | | — | | | | (3.09 | ) | |
Year Ended December 31, 2013 | | $ | 25.85 | | | | 0.39 | | | | 3.32 | | | | 3.71 | | | | (0.46 | ) | | | (1.91 | ) | | | — | | | | (2.37 | ) | |
Year Ended December 31, 2012 | | $ | 24.45 | | | | 0.51 | | | | 4.94 | | | | 5.45 | | | | (1.84 | ) | | | (2.21 | ) | | | — | | | | (4.05 | ) | |
Year Ended December 31, 2011 | | $ | 28.33 | | | | 0.31 | | | | (2.97 | ) | | | (2.66 | ) | | | (0.83 | ) | | | (0.39 | ) | | | — | | | | (1.22 | ) | |
Class R4 | |
Six Months Ended June 30,
2016 (Unaudited) | | $ | 21.74 | | | | 0.14 | | | | (0.52 | ) | | | (0.38 | ) | | | — | | | | — | | | | — | | | | — | | |
Year Ended December 31, 2015 | | $ | 22.45 | | | | 0.22 | | | | (0.44 | ) | | | (0.22 | ) | | | (0.48 | ) | | | — | | | | (0.01 | ) | | | (0.49 | ) | |
Year Ended December 31, 2014 | | $ | 27.36 | | | | 0.37 | | | | (2.22 | ) | | | (1.85 | ) | | | (0.17 | ) | | | (2.89 | ) | | | — | | | | (3.06 | ) | |
Year Ended December 31, 2013 | | $ | 25.99 | | | | 0.29 | | | | 3.42 | | | | 3.71 | | | | (0.43 | ) | | | (1.91 | ) | | | — | | | | (2.34 | ) | |
Year Ended December 31, 2012 (i) | | $ | 29.98 | | | | (0.02 | ) | | | (0.09 | )(j) | | | (0.11 | ) | | | (1.79 | ) | | | (2.09 | ) | | | — | | | | (3.88 | ) | |
Class R5 | |
Six Months Ended June 30,
2016 (Unaudited) | | $ | 21.72 | | | | 0.10 | | | | (0.47 | ) | | | (0.37 | ) | | | — | | | | — | | | | — | | | | — | | |
Year Ended December 31, 2015 | | $ | 22.43 | | | | 0.22 | | | | (0.42 | ) | | | (0.20 | ) | | | (0.50 | ) | | | — | | | | (0.01 | ) | | | (0.51 | ) | |
Year Ended December 31, 2014 | | $ | 27.34 | | | | 0.36 | | | | (2.19 | ) | | | (1.83 | ) | | | (0.19 | ) | | | (2.89 | ) | | | — | | | | (3.08 | ) | |
Year Ended December 31, 2013 | | $ | 25.98 | | | | 0.38 | | | | 3.35 | | | | 3.73 | | | | (0.46 | ) | | | (1.91 | ) | | | — | | | | (2.37 | ) | |
Year Ended December 31, 2012 (k) | | $ | 29.98 | | | | (0.02 | ) | | | (0.09 | )(j) | | | (0.11 | ) | | | (1.80 | ) | | | (2.09 | ) | | | — | | | | (3.89 | ) | |
Class Y | |
Six Months Ended June 30,
2016 (Unaudited) | | $ | 21.71 | | | | 0.13 | | | | (0.50 | ) | | | (0.37 | ) | | | — | | | | — | | | | — | | | | — | | |
Year Ended December 31, 2015 | | $ | 22.42 | | | | 0.28 | | | | (0.47 | ) | | | (0.19 | ) | | | (0.51 | ) | | | — | | | | (0.01 | ) | | | (0.52 | ) | |
Year Ended December 31, 2014 | | $ | 27.33 | | | | 0.40 | | | | (2.21 | ) | | | (1.81 | ) | | | (0.21 | ) | | | (2.89 | ) | | | — | | | | (3.10 | ) | |
Year Ended December 31, 2013 | | $ | 25.98 | | | | 0.11 | | | | 3.62 | | | | 3.73 | | | | (0.47 | ) | | | (1.91 | ) | | | — | | | | (2.38 | ) | |
Year Ended December 31, 2012 (l) | | $ | 29.99 | | | | (0.02 | ) | | | (0.09 | )(j) | | | (0.11 | ) | | | (1.81 | ) | | | (2.09 | ) | | | — | | | | (3.90 | ) | |
Class Z | |
Six Months Ended June 30,
2016 (Unaudited) | | $ | 21.58 | | | | 0.13 | | | | (0.50 | ) | | | (0.37 | ) | | | — | | | | — | | | | — | | | | — | | |
Year Ended December 31, 2015 | | $ | 22.30 | | | | 0.24 | | | | (0.46 | ) | | | (0.22 | ) | | | (0.49 | ) | | | — | | | | (0.01 | ) | | | (0.50 | ) | |
Year Ended December 31, 2014 | | $ | 27.20 | | | | 0.38 | | | | (2.21 | ) | | | (1.83 | ) | | | (0.18 | ) | | | (2.89 | ) | | | — | | | | (3.07 | ) | |
Year Ended December 31, 2013 | | $ | 25.86 | | | | 0.37 | | | | 3.33 | | | | 3.70 | | | | (0.45 | ) | | | (1.91 | ) | | | — | | | | (2.36 | ) | |
Year Ended December 31, 2012 | | $ | 24.46 | | | | 0.49 | | | | 4.95 | | | | 5.44 | | | | (1.83 | ) | | | (2.21 | ) | | | — | | | | (4.04 | ) | |
Year Ended December 31, 2011 | | $ | 28.33 | | | | 0.29 | | | | (2.98 | ) | | | (2.69 | ) | | | (0.79 | ) | | | (0.39 | ) | | | — | | | | (1.18 | ) | |
Notes to Financial Highlights
(a) In addition to the fees and expenses that the Fund bears directly, the Fund indirectly bears a pro rata share of the fees and expenses of any other funds in which it invests, if any. Such indirect expenses are not included in the Fund's reported expense ratios.
(b) Annualized.
(c) Rounds to zero.
(d) The Fund received proceeds from regulatory settlements. Had the Fund not received these proceeds, the total return would have been lower by 0.02%.
(e) Ratios include line of credit interest expense which is less than 0.01%.
(f) The benefits derived from custody fees paid indirectly had an impact of 0.01%.
(g) The benefits derived from custody fees paid indirectly had an impact of less than 0.01%.
(h) Had the Investment Manager and/or Transfer Agent not waived fees and/or reimbursed a portion of expenses, total return would have been reduced.
(i) Class R4 shares commenced operations on November 8, 2012. Per share data and total return reflect activity from that date.
(j) Calculation of the net gain (loss) per share (both realized and unrealized) does not correlate to the aggregate realized and unrealized gain (loss) presented in the Statements of Operations due to the timing of subscriptions and redemptions of Fund shares in relation to fluctuations in the market value of the portfolio.
(k) Class R5 shares commenced operations on November 8, 2012. Per share data and total return reflect activity from that date.
(l) Class Y shares commenced operations on November 8, 2012. Per share data and total return reflect activity from that date.
See accompanying notes to financial statements.
76
| | | | | | | | | Ratio to Average Net Assets | | Supplemental Data | |
(Selected data for a share outstanding
throughout each period) | | Proceeds from
regulatory
settlements | | Net Asset
Value, End of
Period | | Total Return | | Total gross
expenses
(a) | | Total net
expenses
(a) | | Net
investment
income (loss) | | Portfolio
turnover rate | | Net assets,
end of period
(000s) | |
Class A | |
Six Months Ended June 30,
2016 (Unaudited) | | | — | | | $ | 20.93 | | | | (1.88 | )%(h) | | | 1.66 | %(b) | | | 1.66 | %(b) | | | 0.92 | %(b) | | | 30 | % | | $ | 22,809 | | |
Year Ended December 31, 2015 | | | 0.00 | (c) | | $ | 21.33 | | | | (1.30 | )%(d) | | | 1.55 | % | | | 1.55 | % | | | 0.74 | % | | | 59 | % | | $ | 33,772 | | |
Year Ended December 31, 2014 | | | — | | | $ | 22.04 | | | | (7.06 | )% | | | 1.47 | % | | | 1.47 | % | | | 1.05 | % | | | 58 | % | | $ | 53,419 | | |
Year Ended December 31, 2013 | | | — | | | $ | 26.91 | | | | 14.42 | % | | | 1.47 | % | | | 1.47 | % | | | 1.08 | % | | | 72 | % | | $ | 73,911 | | |
Year Ended December 31, 2012 | | | — | | | $ | 25.61 | | | | 22.05 | % | | | 1.49 | %(e) | | | 1.49 | %(e)(f) | | | 1.43 | % | | | 63 | % | | $ | 74,167 | | |
Year Ended December 31, 2011 | | | — | | | $ | 24.26 | | | | (10.11 | )% | | | 1.51 | % | | | 1.51 | %(g) | | | 0.66 | % | | | 44 | % | | $ | 56,350 | | |
Class C | |
Six Months Ended June 30,
2016 (Unaudited) | | | — | | | $ | 19.51 | | | | (2.25 | )%(h) | | | 2.45 | %(b) | | | 2.45 | %(b) | | | 0.18 | %(b) | | | 30 | % | | $ | 4,574 | | |
Year Ended December 31, 2015 | | | 0.00 | (c) | | $ | 19.96 | | | | (2.05 | )%(d) | | | 2.32 | % | | | 2.32 | % | | | (0.06 | )% | | | 59 | % | | $ | 5,390 | | |
Year Ended December 31, 2014 | | | — | | | $ | 20.54 | | | | (7.80 | )% | | | 2.23 | % | | | 2.23 | % | | | 0.29 | % | | | 58 | % | | $ | 8,057 | | |
Year Ended December 31, 2013 | | | — | | | $ | 25.39 | | | | 13.52 | % | | | 2.26 | % | | | 2.26 | % | | | 0.32 | % | | | 72 | % | | $ | 10,311 | | |
Year Ended December 31, 2012 | | | — | | | $ | 24.28 | | | | 21.10 | % | | | 2.28 | %(e) | | | 2.27 | %(e)(f) | | | 0.67 | % | | | 63 | % | | $ | 9,786 | | |
Year Ended December 31, 2011 | | | — | | | $ | 23.17 | | | | (10.81 | )% | | | 2.31 | % | | | 2.31 | %(g) | | | (0.14 | )% | | | 44 | % | | $ | 8,704 | | |
Class I | |
Six Months Ended June 30,
2016 (Unaudited) | | | — | | | $ | 21.22 | | | | (1.62 | )%(h) | | | 1.19 | %(b) | | | 1.19 | %(b) | | | 1.45 | %(b) | | | 30 | % | | $ | 2 | | |
Year Ended December 31, 2015 | | | 0.00 | (c) | | $ | 21.57 | | | | (0.97 | )%(d) | | | 1.18 | % | | | 1.18 | % | | | 1.05 | % | | | 59 | % | | $ | 2 | | |
Year Ended December 31, 2014 | | | — | | | $ | 22.29 | | | | (6.72 | )% | | | 1.11 | % | | | 1.11 | % | | | 1.41 | % | | | 58 | % | | $ | 2 | | |
Year Ended December 31, 2013 | | | — | | | $ | 27.19 | | | | 14.82 | % | | | 1.13 | % | | | 1.13 | % | | | 1.43 | % | | | 72 | % | | $ | 3 | | |
Year Ended December 31, 2012 | | | — | | | $ | 25.85 | | | | 22.48 | % | | | 1.15 | % | | | 1.14 | %(f) | | | 1.84 | % | | | 63 | % | | $ | 2 | | |
Year Ended December 31, 2011 | | | — | | | $ | 24.45 | | | | (9.68 | )% | | | 1.04 | % | | | 1.04 | %(g) | | | 1.12 | % | | | 44 | % | | $ | 2 | | |
Class R4 | |
Six Months Ended June 30,
2016 (Unaudited) | | | — | | | $ | 21.36 | | | | (1.75 | )%(h) | | | 1.40 | %(b) | | | 1.40 | %(b) | | | 1.32 | %(b) | | | 30 | % | | $ | 1,373 | | |
Year Ended December 31, 2015 | | | 0.00 | (c) | | $ | 21.74 | | | | (1.00 | )%(d) | | | 1.27 | % | | | 1.27 | % | | | 0.97 | % | | | 59 | % | | $ | 898 | | |
Year Ended December 31, 2014 | | | — | | | $ | 22.45 | | | | (6.83 | )% | | | 1.21 | % | | | 1.21 | % | | | 1.33 | % | | | 58 | % | | $ | 974 | | |
Year Ended December 31, 2013 | | | — | | | $ | 27.36 | | | | 14.72 | % | | | 1.24 | % | | | 1.24 | % | | | 1.06 | % | | | 72 | % | | $ | 417 | | |
Year Ended December 31, 2012 (i) | | | — | | | $ | 25.99 | | | | (0.27 | )% | | | 1.30 | %(b)(e) | | | 1.30 | %(b)(e)(f) | | | (0.55 | )%(b) | | | 63 | % | | $ | 13 | | |
Class R5 | |
Six Months Ended June 30,
2016 (Unaudited) | | | — | | | $ | 21.35 | | | | (1.70 | )%(h) | | | 1.29 | %(b) | | | 1.29 | %(b) | | | 0.94 | %(b) | | | 30 | % | | $ | 661 | | |
Year Ended December 31, 2015 | | | 0.00 | (c) | | $ | 21.72 | | | | (0.94 | )%(d) | | | 1.21 | % | | | 1.21 | % | | | 0.96 | % | | | 59 | % | | $ | 2,268 | | |
Year Ended December 31, 2014 | | | — | | | $ | 22.43 | | | | (6.77 | )% | | | 1.15 | % | | | 1.15 | % | | | 1.30 | % | | | 58 | % | | $ | 2,593 | | |
Year Ended December 31, 2013 | | | — | | | $ | 27.34 | | | | 14.80 | %(h) | | | 1.15 | % | | | 1.15 | % | | | 1.40 | % | | | 72 | % | | $ | 956 | | |
Year Ended December 31, 2012 (k) | | | — | | | $ | 25.98 | | | | (0.27 | )% | | | 1.29 | %(b) | | | 1.28 | %(b)(f) | | | (0.55 | )%(b) | | | 63 | % | | $ | 2 | | |
Class Y | |
Six Months Ended June 30,
2016 (Unaudited) | | | — | | | $ | 21.34 | | | | (1.70 | )%(h) | | | 1.24 | %(b) | | | 1.24 | %(b) | | | 1.24 | %(b) | | | 30 | % | | $ | 180 | | |
Year Ended December 31, 2015 | | | 0.00 | (c) | | $ | 21.71 | | | | (0.89 | )%(d) | | | 1.14 | % | | | 1.14 | % | | | 1.21 | % | | | 59 | % | | $ | 660 | | |
Year Ended December 31, 2014 | | | — | | | $ | 22.42 | | | | (6.71 | )% | | | 1.09 | % | | | 1.09 | % | | | 1.43 | % | | | 58 | % | | $ | 11,755 | | |
Year Ended December 31, 2013 | | | — | | | $ | 27.33 | | | | 14.82 | % | | | 1.09 | % | | | 1.09 | % | | | 0.40 | % | | | 72 | % | | $ | 13,318 | | |
Year Ended December 31, 2012 (l) | | | — | | | $ | 25.98 | | | | (0.25 | )% | | | 1.21 | %(b) | | | 1.20 | %(b)(f) | | | (0.48 | )%(b) | | | 63 | % | | $ | 2 | | |
Class Z | |
Six Months Ended June 30,
2016 (Unaudited) | | | — | | | $ | 21.21 | | | | (1.71 | )%(h) | | | 1.36 | %(b) | | | 1.36 | %(b) | | | 1.24 | %(b) | | | 30 | % | | $ | 80,380 | | |
Year Ended December 31, 2015 | | | 0.00 | (c) | | $ | 21.58 | | | | (1.03 | )%(d) | | | 1.24 | % | | | 1.24 | % | | | 1.05 | % | | | 59 | % | | $ | 96,311 | | |
Year Ended December 31, 2014 | | | — | | | $ | 22.30 | | | | (6.79 | )% | | | 1.17 | % | | | 1.17 | % | | | 1.36 | % | | | 58 | % | | $ | 175,764 | | |
Year Ended December 31, 2013 | | | — | | | $ | 27.20 | | | | 14.75 | % | | | 1.19 | % | | | 1.19 | % | | | 1.37 | % | | | 72 | % | | $ | 256,100 | | |
Year Ended December 31, 2012 | | | — | | | $ | 25.86 | | | | 22.42 | % | | | 1.20 | %(e) | | | 1.19 | %(e)(f) | | | 1.77 | % | | | 63 | % | | $ | 295,231 | | |
Year Ended December 31, 2011 | | | — | | | $ | 24.46 | | | | (9.76 | )% | | | 1.14 | % | | | 1.14 | %(g) | | | 1.03 | % | | | 44 | % | | $ | 259,553 | | |
See accompanying notes to financial statements.
77
COLUMBIA ACORN FAMILY OF FUNDS
FINANCIAL HIGHLIGHTS, CONTINUED
Columbia Acorn SelectSM
| | | | | Income from Investment Operations | | | | Less Distributions to Shareholders | | | |
(Selected data for a share outstanding
throughout each period) | | Net Asset
Value,
Beginning of
Period | | Net
investment
income (loss) | | Net realized
and
unrealized
gain (loss) | | Reimbursement
from
affiliate | | Total from
Investment
Operations | | Net
investment
income | | Net
realized
gains | | Total
Distributions to
Shareholders | |
Class A | |
Six Months Ended June 30,
2016 (Unaudited) | | $ | 13.94 | | | | (0.01 | ) | | | (0.13 | ) | | | — | | | | (0.14 | ) | | | — | | | | (1.22 | ) | | | (1.22 | ) | |
Year Ended December 31, 2015 | | $ | 21.03 | | | | (0.09 | ) | | | 0.14 | | | | — | | | | 0.05 | | | | — | | | | (7.14 | ) | | | (7.14 | ) | |
Year Ended December 31, 2014 | | $ | 25.57 | | | | (0.14 | ) | | | 0.64 | | | | — | | | | 0.50 | | | | — | | | | (5.04 | ) | | | (5.04 | ) | |
Year Ended December 31, 2013 | | $ | 24.72 | | | | (0.15 | ) | | | 7.92 | | | | — | | | | 7.77 | | | | (0.07 | ) | | | (6.85 | ) | | | (6.92 | ) | |
Year Ended December 31, 2012 | | $ | 22.95 | | | | 0.03 | | | | 3.78 | | | | — | | | | 3.81 | | | | — | | | | (2.04 | ) | | | (2.04 | ) | |
Year Ended December 31, 2011 | | $ | 27.94 | | | | (0.15 | ) | | | (4.46 | ) | | | — | | | | (4.61 | ) | | | (0.38 | ) | | | — | | | | (0.38 | ) | |
Class C | |
Six Months Ended June 30,
2016 (Unaudited) | | $ | 10.51 | | | | (0.04 | ) | | | (0.10 | ) | | | — | | | | (0.14 | ) | | | — | | | | (1.22 | ) | | | (1.22 | ) | |
Year Ended December 31, 2015 | | $ | 17.69 | | | | (0.19 | ) | | | 0.15 | | | | — | | | | (0.04 | ) | | | — | | | | (7.14 | ) | | | (7.14 | ) | |
Year Ended December 31, 2014 | | $ | 22.46 | | | | (0.28 | ) | | | 0.55 | | | | — | | | | 0.27 | | | | — | | | | (5.04 | ) | | | (5.04 | ) | |
Year Ended December 31, 2013 | | $ | 22.48 | | | | (0.32 | ) | | | 7.15 | | | | — | | | | 6.83 | | | | — | | | | (6.85 | ) | | | (6.85 | ) | |
Year Ended December 31, 2012 | | $ | 21.20 | | | | (0.14 | ) | | | 3.46 | | | | — | | | | 3.32 | | | | — | | | | (2.04 | ) | | | (2.04 | ) | |
Year Ended December 31, 2011 | | $ | 25.83 | | | | (0.32 | ) | | | (4.12 | ) | | | — | | | | (4.44 | ) | | | (0.19 | ) | | | — | | | | (0.19 | ) | |
Class I | |
Six Months Ended June 30,
2016 (Unaudited) | | $ | 15.36 | | | | 0.02 | | | | (0.15 | ) | | | — | | | | (0.13 | ) | | | — | | | | (1.22 | ) | | | (1.22 | ) | |
Year Ended December 31, 2015 | | $ | 22.38 | | | | 0.01 | | | | 0.11 | | | | — | | | | 0.12 | | | | — | | | | (7.14 | ) | | | (7.14 | ) | |
Year Ended December 31, 2014 | | $ | 26.81 | | | | (0.05 | ) | | | 0.66 | | | | — | | | | 0.61 | | | | — | | | | (5.04 | ) | | | (5.04 | ) | |
Year Ended December 31, 2013 | | $ | 25.63 | | | | (0.06 | ) | | | 8.25 | | | | — | | | | 8.19 | | | | (0.16 | ) | | | (6.85 | ) | | | (7.01 | ) | |
Year Ended December 31, 2012 | | $ | 23.65 | | | | 0.23 | | | | 3.79 | | | | — | | | | 4.02 | | | | — | | | | (2.04 | ) | | | (2.04 | ) | |
Year Ended December 31, 2011 | | $ | 28.74 | | | | (0.03 | ) | | | (4.59 | ) | | | — | | | | (4.62 | ) | | | (0.47 | ) | | | — | | | | (0.47 | ) | |
Class R4 | |
Six Months Ended June 30,
2016 (Unaudited) | | $ | 15.69 | | | | 0.01 | | | | (0.15 | ) | | | — | | | | (0.14 | ) | | | — | | | | (1.22 | ) | | | (1.22 | ) | |
Year Ended December 31, 2015 | | $ | 22.75 | | | | (0.04 | ) | | | 0.12 | | | | — | | | | 0.08 | | | | — | | | | (7.14 | ) | | | (7.14 | ) | |
Year Ended December 31, 2014 | | $ | 27.20 | | | | (0.10 | ) | | | 0.69 | | | | — | | | | 0.59 | | | | — | | | | (5.04 | ) | | | (5.04 | ) | |
Year Ended December 31, 2013 | | $ | 25.92 | | | | (0.06 | ) | | | 8.32 | | | | — | | | | 8.26 | | | | (0.13 | ) | | | (6.85 | ) | | | (6.98 | ) | |
Year Ended December 31, 2012 (f) | | $ | 25.91 | | | | 0.00 | (g) | | | 1.52 | | | | — | | | | 1.52 | | | | — | | | | (1.51 | ) | | | (1.51 | ) | |
Class R5 | |
Six Months Ended June 30,
2016 (Unaudited) | | $ | 15.74 | | | | 0.02 | | | | (0.16 | ) | | | — | | | | (0.14 | ) | | | — | | | | (1.22 | ) | | | (1.22 | ) | |
Year Ended December 31, 2015 | | $ | 22.78 | | | | (0.08 | ) | | | 0.18 | | | | — | | | | 0.10 | | | | — | | | | (7.14 | ) | | | (7.14 | ) | |
Year Ended December 31, 2014 | | $ | 27.20 | | | | (0.07 | ) | | | 0.69 | | | | — | | | | 0.62 | | | | — | | | | (5.04 | ) | | | (5.04 | ) | |
Year Ended December 31, 2013 | | $ | 25.93 | | | | (0.04 | ) | | | 8.31 | | | | — | | | | 8.27 | | | | (0.15 | ) | | | (6.85 | ) | | | (7.00 | ) | |
Year Ended December 31, 2012 (h) | | $ | 25.91 | | | | 0.00 | (g) | | | 1.53 | | | | — | | | | 1.53 | | | | — | | | | (1.51 | ) | | | (1.51 | ) | |
Class Y | |
Six Months Ended June 30,
2016 (Unaudited) | | $ | 15.83 | | | | 0.02 | | | | (0.16 | ) | | | — | | | | (0.14 | ) | | | — | | | | (1.22 | ) | | | (1.22 | ) | |
Year Ended December 31, 2015 | | $ | 22.86 | | | | 0.00 | (g) | | | 0.11 | | | | — | | | | 0.11 | | | | — | | | | (7.14 | ) | | | (7.14 | ) | |
Year Ended December 31, 2014 | | $ | 27.27 | | | | (0.06 | ) | | | 0.69 | | | | — | | | | 0.63 | | | | — | | | | (5.04 | ) | | | (5.04 | ) | |
Year Ended December 31, 2013 | | $ | 25.98 | | | | (0.03 | ) | | | 8.34 | | | | — | | | | 8.31 | | | | (0.17 | ) | | | (6.85 | ) | | | (7.02 | ) | |
Year Ended December 31, 2012 (i) | | $ | 25.96 | | | | 0.01 | | | | 1.52 | | | | — | | | | 1.53 | | | | — | | | | (1.51 | ) | | | (1.51 | ) | |
Class Z | |
Six Months Ended June 30,
2016 (Unaudited) | | $ | 15.24 | | | | 0.01 | | | | (0.15 | ) | | | — | | | | (0.14 | ) | | | — | | | | (1.22 | ) | | | (1.22 | ) | |
Year Ended December 31, 2015 | | $ | 22.28 | | | | (0.03 | ) | | | 0.13 | | | | — | | | | 0.10 | | | | — | | | | (7.14 | ) | | | (7.14 | ) | |
Year Ended December 31, 2014 | | $ | 26.72 | | | | (0.08 | ) | | | 0.68 | | | | — | | | | 0.60 | | | | — | | | | (5.04 | ) | | | (5.04 | ) | |
Year Ended December 31, 2013 | | $ | 25.57 | | | | (0.07 | ) | | | 8.21 | | | | — | | | | 8.14 | | | | (0.14 | ) | | | (6.85 | ) | | | (6.99 | ) | |
Year Ended December 31, 2012 | | $ | 23.62 | | | | 0.11 | | | | 3.88 | | | | — | | | | 3.99 | | | | — | | | | (2.04 | ) | | | (2.04 | ) | |
Year Ended December 31, 2011 | | $ | 28.73 | | | | (0.07 | ) | | | (4.58 | ) | | | 0.00 | (g) | | | (4.65 | ) | | | (0.46 | ) | | | — | | | | (0.46 | ) | |
Notes to Financial Highlights
(a) In addition to the fees and expenses that the Fund bears directly, the Fund indirectly bears a pro rata share of the fees and expenses of any other funds in which it invests, if any. Such indirect expenses are not included in the Fund's reported expense ratios.
(b) Had the Investment Manager and/or Transfer Agent not waived fees and/or reimbursed a portion of expenses, total return would have been reduced.
(c) Annualized.
(d) Ratios include line of credit interest expense which is less than 0.01%.
(e) The benefits derived from custody fees paid indirectly had an impact of less than 0.01%.
(f) Class R4 shares commenced operations on November 8, 2012. Per share data and total return reflect activity from that date.
(g) Rounds to zero.
(h) Class R5 shares commenced operations on November 8, 2012. Per share data and total return reflect activity from that date.
(i) Class Y shares commenced operations on November 8, 2012. Per share data and total return reflect activity from that date.
(j) During the year ended December 31, 2011, the Fund received a reimbursement from an affiliate. Had the Fund not received this payment, the total return would have been lower by 0.01%.
See accompanying notes to financial statements.
78
| | | | | | Ratio to Average Net Assets | | Supplemental Data | |
(Selected data for a share outstanding
throughout each period) | | Net Asset
Value, End of
Period | | Total Return | | Total gross
expenses
(a) | | Total net
expenses
(a) | | Net
investment
income (loss) | | Portfolio
turnover rate | | Net assets,
end of period
(000s) | |
Class A | |
Six Months Ended June 30,
2016 (Unaudited) | | $ | 12.58 | | | | (1.32 | )%(b) | | | 1.41 | %(c) | | | 1.21 | %(c) | | | (0.16 | )%(c) | | | 53 | % | | $ | 124,457 | | |
Year Ended December 31, 2015 | | $ | 13.94 | | | | (0.73 | )%(b) | | | 1.35 | %(d) | | | 1.22 | %(d) | | | (0.42 | )% | | | 55 | % | | $ | 146,864 | | |
Year Ended December 31, 2014 | | $ | 21.03 | | | | 2.17 | % | | | 1.32 | % | | | 1.32 | % | | | (0.58 | )% | | | 17 | % | | $ | 264,234 | | |
Year Ended December 31, 2013 | | $ | 25.57 | | | | 33.77 | % | | | 1.31 | %(d) | | | 1.31 | %(d) | | | (0.54 | )% | | | 20 | % | | $ | 333,193 | | |
Year Ended December 31, 2012 | | $ | 24.72 | | | | 16.87 | % | | | 1.31 | %(d) | | | 1.31 | %(d)(e) | | | 0.13 | % | | | 15 | % | | $ | 271,628 | | |
Year Ended December 31, 2011 | | $ | 22.95 | | | | (16.65 | )% | | | 1.28 | % | | | 1.28 | %(e) | | | (0.57 | )% | | | 21 | % | | $ | 340,325 | | |
Class C | |
Six Months Ended June 30,
2016 (Unaudited) | | $ | 9.15 | | | | (1.77 | )%(b) | | | 2.14 | %(c) | | | 1.94 | %(c) | | | (0.88 | )%(c) | | | 53 | % | | $ | 29,370 | | |
Year Ended December 31, 2015 | | $ | 10.51 | | | | (1.41 | )%(b) | | | 2.08 | %(d) | | | 1.95 | %(d) | | | (1.15 | )% | | | 55 | % | | $ | 34,589 | | |
Year Ended December 31, 2014 | | $ | 17.69 | | | | 1.42 | % | | | 2.04 | % | | | 2.04 | % | | | (1.30 | )% | | | 17 | % | | $ | 48,591 | | |
Year Ended December 31, 2013 | | $ | 22.46 | | | | 32.85 | % | | | 2.04 | %(d) | | | 2.04 | %(d) | | | (1.28 | )% | | | 20 | % | | $ | 61,537 | | |
Year Ended December 31, 2012 | | $ | 22.48 | | | | 15.93 | % | | | 2.07 | %(d) | | | 2.06 | %(d)(e) | | | (0.59 | )% | | | 15 | % | | $ | 57,309 | | |
Year Ended December 31, 2011 | | $ | 21.20 | | | | (17.27 | )% | | | 2.05 | % | | | 2.05 | %(e) | | | (1.34 | )% | | | 21 | % | | $ | 62,887 | | |
Class I | |
Six Months Ended June 30,
2016 (Unaudited) | | $ | 14.01 | | | | (1.13 | )%(b) | | | 1.02 | %(c) | | | 0.82 | %(c) | | | 0.21 | %(c) | | | 53 | % | | $ | 23,044 | | |
Year Ended December 31, 2015 | | $ | 15.36 | | | | (0.34 | )%(b) | | | 0.99 | %(d) | | | 0.83 | %(d) | | | 0.06 | % | | | 55 | % | | $ | 26,917 | | |
Year Ended December 31, 2014 | | $ | 22.38 | | | | 2.49 | % | | | 0.94 | % | | | 0.94 | % | | | (0.20 | )% | | | 17 | % | | $ | 18,718 | | |
Year Ended December 31, 2013 | | $ | 26.81 | | | | 34.31 | % | | | 0.94 | %(d) | | | 0.94 | %(d) | | | (0.21 | )% | | | 20 | % | | $ | 13,660 | | |
Year Ended December 31, 2012 | | $ | 25.63 | | | | 17.26 | % | | | 0.96 | %(d) | | | 0.95 | %(d)(e) | | | 0.89 | % | | | 15 | % | | $ | 39,054 | | |
Year Ended December 31, 2011 | | $ | 23.65 | | | | (16.25 | )% | | | 0.92 | % | | | 0.92 | %(e) | | | (0.12 | )% | | | 21 | % | | $ | 10,944 | | |
Class R4 | |
Six Months Ended June 30,
2016 (Unaudited) | | $ | 14.33 | | | | (1.17 | )%(b) | | | 1.18 | %(c) | | | 0.98 | %(c) | | | 0.09 | %(c) | | | 53 | % | | $ | 805 | | |
Year Ended December 31, 2015 | | $ | 15.69 | | | | (0.53 | )%(b) | | | 1.12 | %(d) | | | 0.99 | %(d) | | | (0.18 | )% | | | 55 | % | | $ | 932 | | |
Year Ended December 31, 2014 | | $ | 22.75 | | | | 2.39 | % | | | 1.12 | % | | | 1.12 | % | | | (0.37 | )% | | | 17 | % | | $ | 1,193 | | |
Year Ended December 31, 2013 | | $ | 27.20 | | | | 34.16 | % | | | 1.02 | %(d) | | | 1.02 | %(d) | | | (0.20 | )% | | | 20 | % | | $ | 1,383 | | |
Year Ended December 31, 2012 (f) | | $ | 25.92 | | | | 5.92 | % | | | 1.07 | %(c) | | | 1.06 | %(c)(e) | | | 0.02 | %(c) | | | 15 | % | | $ | 15 | | |
Class R5 | |
Six Months Ended June 30,
2016 (Unaudited) | | $ | 14.38 | | | | (1.17 | )%(b) | | | 1.07 | %(c) | | | 0.87 | %(c) | | | 0.21 | %(c) | | | 53 | % | | $ | 1,021 | | |
Year Ended December 31, 2015 | | $ | 15.74 | | | | (0.44 | )%(b) | | | 1.02 | %(d) | | | 0.95 | %(d) | | | (0.33 | )% | | | 55 | % | | $ | 911 | | |
Year Ended December 31, 2014 | | $ | 22.78 | | | | 2.50 | % | | | 1.00 | % | | | 1.00 | % | | | (0.26 | )% | | | 17 | % | | $ | 10,697 | | |
Year Ended December 31, 2013 | | $ | 27.20 | | | | 34.21 | % | | | 0.97 | %(d) | | | 0.97 | %(d) | | | (0.13 | )% | | | 20 | % | | $ | 11,996 | | |
Year Ended December 31, 2012 (h) | | $ | 25.93 | | | | 5.96 | % | | | 0.99 | %(c) | | | 0.99 | %(c)(e) | | | 0.08 | %(c) | | | 15 | % | | $ | 3 | | |
Class Y | |
Six Months Ended June 30,
2016 (Unaudited) | | $ | 14.47 | | | | (1.17 | )%(b) | | | 1.02 | %(c) | | | 0.82 | %(c) | | | 0.24 | %(c) | | | 53 | % | | $ | 5,117 | | |
Year Ended December 31, 2015 | | $ | 15.83 | | | | (0.39 | )%(b) | | | 0.98 | %(d) | | | 0.85 | %(d) | | | 0.02 | % | | | 55 | % | | $ | 5,056 | | |
Year Ended December 31, 2014 | | $ | 22.86 | | | | 2.53 | % | | | 0.95 | % | | | 0.95 | % | | | (0.22 | )% | | | 17 | % | | $ | 3,644 | | |
Year Ended December 31, 2013 | | $ | 27.27 | | | | 34.30 | % | | | 0.93 | %(d) | | | 0.93 | %(d) | | | (0.09 | )% | | | 20 | % | | $ | 4,847 | | |
Year Ended December 31, 2012 (i) | | $ | 25.98 | | | | 5.94 | % | | | 0.92 | %(c) | | | 0.92 | %(c)(e) | | | 0.15 | %(c) | | | 15 | % | | $ | 3 | | |
Class Z | |
Six Months Ended June 30,
2016 (Unaudited) | | $ | 13.88 | | | | (1.21 | )%(b) | | | 1.12 | %(c) | | | 0.92 | %(c) | | | 0.09 | %(c) | | | 53 | % | | $ | 151,842 | | |
Year Ended December 31, 2015 | | $ | 15.24 | | | | (0.44 | )%(b) | | | 1.07 | %(d) | | | 0.95 | %(d) | | | (0.15 | )% | | | 55 | % | | $ | 183,642 | | |
Year Ended December 31, 2014 | | $ | 22.28 | | | | 2.47 | % | | | 1.04 | % | | | 1.04 | % | | | (0.30 | )% | | | 17 | % | | $ | 318,487 | | |
Year Ended December 31, 2013 | | $ | 26.72 | | | | 34.16 | % | | | 1.02 | %(d) | | | 1.02 | %(d) | | | (0.26 | )% | | | 20 | % | | $ | 431,990 | | |
Year Ended December 31, 2012 | | $ | 25.57 | | | | 17.15 | % | | | 1.03 | %(d) | | | 1.03 | %(d)(e) | | | 0.40 | % | | | 15 | % | | $ | 587,678 | | |
Year Ended December 31, 2011 | | $ | 23.62 | | | | (16.37 | )%(j) | | | 0.97 | % | | | 0.97 | %(e) | | | (0.28 | )% | | | 21 | % | | $ | 850,338 | | |
See accompanying notes to financial statements.
79
COLUMBIA ACORN FAMILY OF FUNDS
FINANCIAL HIGHLIGHTS, CONTINUED
Columbia Thermostat FundSM
| | | | | Income from Investment Operations | | | | Less Distributions to Shareholders | | | |
(Selected data for a share outstanding
throughout each period) | | Net Asset
Value,
Beginning of
Period | | Net
investment
income | | Net realized
and
unrealized
gain (loss) | | Total from
Investment
Operations | | Net
investment
income | | Net
realized
gains | | Total
Distributions to
Shareholders | |
Class A | |
Six Months Ended June 30, 2016 (Unaudited) | | $ | 14.31 | | | | 0.09 | | | | 0.42 | | | | 0.51 | | | | (0.05 | ) | | | (0.27 | ) | | | (0.32 | ) | |
Year Ended December 31, 2015 | | $ | 14.86 | | | | 0.27 | | | | (0.26 | ) | | | 0.01 | | | | (0.28 | ) | | | (0.28 | ) | | | (0.56 | ) | |
Year Ended December 31, 2014 | | $ | 14.58 | | | | 0.28 | | | | 0.49 | | | | 0.77 | | | | (0.28 | ) | | | (0.21 | ) | | | (0.49 | ) | |
Year Ended December 31, 2013 | | $ | 14.29 | | | | 0.29 | | | | 1.00 | | | | 1.29 | | | | (0.25 | ) | | | (0.75 | ) | | | (1.00 | ) | |
Year Ended December 31, 2012 | | $ | 12.82 | | | | 0.32 | | | | 1.39 | | | | 1.71 | | | | (0.24 | ) | | | — | | | | (0.24 | ) | |
Year Ended December 31, 2011 | | $ | 12.58 | | | | 0.28 | | | | 0.30 | | | | 0.58 | | | | (0.34 | ) | | | — | | | | (0.34 | ) | |
Class C | |
Six Months Ended June 30, 2016 (Unaudited) | | $ | 14.41 | | | | 0.04 | | | | 0.42 | | | | 0.46 | | | | (0.05 | ) | | | (0.27 | ) | | | (0.32 | ) | |
Year Ended December 31, 2015 | | $ | 14.96 | | | | 0.16 | | | | (0.26 | ) | | | (0.10 | ) | | | (0.17 | ) | | | (0.28 | ) | | | (0.45 | ) | |
Year Ended December 31, 2014 | | $ | 14.68 | | | | 0.17 | | | | 0.49 | | | | 0.66 | | | | (0.17 | ) | | | (0.21 | ) | | | (0.38 | ) | |
Year Ended December 31, 2013 | | $ | 14.39 | | | | 0.18 | | | | 1.00 | | | | 1.18 | | | | (0.14 | ) | | | (0.75 | ) | | | (0.89 | ) | |
Year Ended December 31, 2012 | | $ | 12.91 | | | | 0.22 | | | | 1.39 | | | | 1.61 | | | | (0.13 | ) | | | — | | | | (0.13 | ) | |
Year Ended December 31, 2011 | | $ | 12.62 | | | | 0.18 | | | | 0.31 | | | | 0.49 | | | | (0.20 | ) | | | — | | | | (0.20 | ) | |
Class R4 | |
Six Months Ended June 30, 2016 (Unaudited) | | $ | 14.19 | | | | 0.11 | | | | 0.41 | | | | 0.52 | | | | (0.05 | ) | | | (0.27 | ) | | | (0.32 | ) | |
Year Ended December 31, 2015 | | $ | 14.74 | | | | 0.30 | | | | (0.25 | ) | | | 0.05 | | | | (0.32 | ) | | | (0.28 | ) | | | (0.60 | ) | |
Year Ended December 31, 2014 | | $ | 14.46 | | | | 0.32 | | | | 0.49 | | | | 0.81 | | | | (0.32 | ) | | | (0.21 | ) | | | (0.53 | ) | |
Year Ended December 31, 2013 | | $ | 14.19 | | | | 0.36 | | | | 0.95 | | | | 1.31 | | | | (0.29 | ) | | | (0.75 | ) | | | (1.04 | ) | |
Year Ended December 31, 2012 (e) | | $ | 14.08 | | | | 0.09 | | | | 0.28 | | | | 0.37 | | | | (0.26 | ) | | | — | | | | (0.26 | ) | |
Class R5 | |
Six Months Ended June 30, 2016 (Unaudited) | | $ | 14.20 | | | | 0.11 | | | | 0.42 | | | | 0.53 | | | | (0.05 | ) | | | (0.27 | ) | | | (0.32 | ) | |
Year Ended December 31, 2015 | | $ | 14.75 | | | | 0.31 | | | | (0.26 | ) | | | 0.05 | | | | (0.32 | ) | | | (0.28 | ) | | | (0.60 | ) | |
Year Ended December 31, 2014 | | $ | 14.47 | | | | 0.31 | | | | 0.50 | | | | 0.81 | | | | (0.32 | ) | | | (0.21 | ) | | | (0.53 | ) | |
Year Ended December 31, 2013 | | $ | 14.19 | | | | 0.37 | | | | 0.96 | | | | 1.33 | | | | (0.30 | ) | | | (0.75 | ) | | | (1.05 | ) | |
Year Ended December 31, 2012 (f) | | $ | 14.08 | | | | 0.09 | | | | 0.27 | | | | 0.36 | | | | (0.25 | ) | | | — | | | | (0.25 | ) | |
Class Y | |
Six Months Ended June 30, 2016 (Unaudited) | | $ | 14.18 | | | | 0.12 | | | | 0.41 | | | | 0.53 | | | | (0.05 | ) | | | (0.27 | ) | | | (0.32 | ) | |
Year Ended December 31, 2015 | | $ | 14.74 | | | | 0.31 | | | | (0.26 | ) | | | 0.05 | | | | (0.33 | ) | | | (0.28 | ) | | | (0.61 | ) | |
Year Ended December 31, 2014 | | $ | 14.46 | | | | 0.32 | | | | 0.50 | | | | 0.82 | | | | (0.33 | ) | | | (0.21 | ) | | | (0.54 | ) | |
Year Ended December 31, 2013 | | $ | 14.18 | | | | 0.33 | | | | 1.01 | | | | 1.34 | | | | (0.31 | ) | | | (0.75 | ) | | | (1.06 | ) | |
Year Ended December 31, 2012 (g) | | $ | 14.08 | | | | 0.09 | | | | 0.27 | | | | 0.36 | | | | (0.26 | ) | | | — | | | | (0.26 | ) | |
Class Z | |
Six Months Ended June 30, 2016 (Unaudited) | | $ | 14.12 | | | | 0.11 | | | | 0.41 | | | | 0.52 | | | | (0.05 | ) | | | (0.27 | ) | | | (0.32 | ) | |
Year Ended December 31, 2015 | | $ | 14.67 | | | | 0.31 | | | | (0.26 | ) | | | 0.05 | | | | (0.32 | ) | | | (0.28 | ) | | | (0.60 | ) | |
Year Ended December 31, 2014 | | $ | 14.40 | | | | 0.32 | | | | 0.48 | | | | 0.80 | | | | (0.32 | ) | | | (0.21 | ) | | | (0.53 | ) | |
Year Ended December 31, 2013 | | $ | 14.13 | | | | 0.32 | | | | 0.99 | | | | 1.31 | | | | (0.29 | ) | | | (0.75 | ) | | | (1.04 | ) | |
Year Ended December 31, 2012 | | $ | 12.67 | | | | 0.34 | | | | 1.39 | | | | 1.73 | | | | (0.27 | ) | | | — | | | | (0.27 | ) | |
Year Ended December 31, 2011 | | $ | 12.44 | | | | 0.31 | | | | 0.29 | | | | 0.60 | | | | (0.37 | ) | | | — | | | | (0.37 | ) | |
Notes to Financial Highlights
(a) Had the Investment Manager and/or Transfer Agent not waived fees and/or reimbursed a portion of expenses, total return would have been reduced.
(b) In addition to the fees and expenses that the Fund bears directly, the Fund indirectly bears a pro rata share of the fees and expenses of the underlying funds in which the Fund invests, if any. Such indirect expenses are not included in the Fund's reported expense ratios.
(c) Annualized.
(d) The benefits derived from custody fees paid indirectly had an impact of less than 0.01%.
(e) Class R4 shares commenced operations on November 8, 2012. Per share data and total return reflect activity from that date.
(f) Class R5 shares commenced operations on November 8, 2012. Per share data and total return reflect activity from that date.
(g) Class Y shares commenced operations on November 8, 2012. Per share data and total return reflect activity from that date.
See accompanying notes to financial statements.
80
| | | | | | Ratio to Average Net Assets | | Supplemental Data | |
(Selected data for a share outstanding
throughout each period) | | Net Asset
Value, End of
Period | | Total Return
(a) | | Total gross
expenses
(b) | | Total net
expenses
(b) | | Net
investment
income | | Portfolio
turnover rate | | Net assets,
end of period
(000s) | |
Class A | |
Six Months Ended June 30, 2016 (Unaudited) | | $ | 14.50 | | | | 3.57 | % | | | 0.55 | %(c) | | | 0.50 | %(c) | | | 1.31 | %(c) | | | 59 | % | | $ | 406,837 | | |
Year Ended December 31, 2015 | | $ | 14.31 | | | | 0.07 | % | | | 0.52 | % | | | 0.50 | % | | | 1.82 | % | | | 69 | % | | $ | 387,967 | | |
Year Ended December 31, 2014 | | $ | 14.86 | | | | 5.30 | % | | | 0.51 | % | | | 0.50 | % | | | 1.88 | % | | | 95 | % | | $ | 450,258 | | |
Year Ended December 31, 2013 | | $ | 14.58 | | | | 9.07 | % | | | 0.52 | % | | | 0.50 | % | | | 1.91 | % | | | 92 | % | | $ | 513,293 | | |
Year Ended December 31, 2012 | | $ | 14.29 | | | | 13.34 | % | | | 0.58 | % | | | 0.50 | %(d) | | | 2.28 | % | | | 109 | % | | $ | 323,750 | | |
Year Ended December 31, 2011 | | $ | 12.82 | | | | 4.62 | % | | | 0.67 | % | | | 0.50 | %(d) | | | 2.17 | % | | | 130 | % | | $ | 79,744 | | |
Class C | |
Six Months Ended June 30, 2016 (Unaudited) | | $ | 14.55 | | | | 3.20 | % | | | 1.29 | %(c) | | | 1.25 | %(c) | | | 0.56 | %(c) | | | 59 | % | | $ | 370,516 | | |
Year Ended December 31, 2015 | | $ | 14.41 | | | | (0.68 | )% | | | 1.27 | % | | | 1.25 | % | | | 1.08 | % | | | 69 | % | | $ | 364,684 | | |
Year Ended December 31, 2014 | | $ | 14.96 | | | | 4.50 | % | | | 1.26 | % | | | 1.25 | % | | | 1.14 | % | | | 95 | % | | $ | 404,456 | | |
Year Ended December 31, 2013 | | $ | 14.68 | | | | 8.23 | % | | | 1.27 | % | | | 1.25 | % | | | 1.16 | % | | | 92 | % | | $ | 430,173 | | |
Year Ended December 31, 2012 | | $ | 14.39 | | | | 12.52 | % | | | 1.32 | % | | | 1.25 | %(d) | | | 1.56 | % | | | 109 | % | | $ | 253,641 | | |
Year Ended December 31, 2011 | | $ | 12.91 | | | | 3.87 | % | | | 1.43 | % | | | 1.25 | %(d) | | | 1.40 | % | | | 130 | % | | $ | 33,378 | | |
Class R4 | |
Six Months Ended June 30, 2016 (Unaudited) | | $ | 14.39 | | | | 3.67 | % | | | 0.33 | %(c) | | | 0.25 | %(c) | | | 1.55 | %(c) | | | 59 | % | | $ | 14,600 | | |
Year Ended December 31, 2015 | | $ | 14.19 | | | | 0.33 | % | | | 0.28 | % | | | 0.25 | % | | | 2.06 | % | | | 69 | % | | $ | 17,453 | | |
Year Ended December 31, 2014 | | $ | 14.74 | | | | 5.61 | % | | | 0.26 | % | | | 0.25 | % | | | 2.14 | % | | | 95 | % | | $ | 23,412 | | |
Year Ended December 31, 2013 | | $ | 14.46 | | | | 9.26 | % | | | 0.28 | % | | | 0.25 | % | | | 2.39 | % | | | 92 | % | | $ | 14,651 | | |
Year Ended December 31, 2012 (e) | | $ | 14.19 | | | | 2.60 | % | | | 0.42 | %(c) | | | 0.25 | %(c)(d) | | | 4.59 | %(c) | | | 109 | % | | $ | 15 | | |
Class R5 | |
Six Months Ended June 30, 2016 (Unaudited) | | $ | 14.41 | | | | 3.74 | % | | | 0.27 | %(c) | | | 0.24 | %(c) | | | 1.58 | %(c) | | | 59 | % | | $ | 12,309 | | |
Year Ended December 31, 2015 | | $ | 14.20 | | | | 0.33 | % | | | 0.25 | % | | | 0.24 | % | | | 2.14 | % | | | 69 | % | | $ | 6,114 | | |
Year Ended December 31, 2014 | | $ | 14.75 | | | | 5.62 | % | | | 0.24 | % | | | 0.23 | % | | | 2.11 | % | | | 95 | % | | $ | 3,536 | | |
Year Ended December 31, 2013 | | $ | 14.47 | | | | 9.35 | % | | | 0.25 | % | | | 0.23 | % | | | 2.44 | % | | | 92 | % | | $ | 979 | | |
Year Ended December 31, 2012 (f) | | $ | 14.19 | | | | 2.58 | % | | | 0.35 | %(c) | | | 0.27 | %(c)(d) | | | 4.60 | %(c) | | | 109 | % | | $ | 3 | | |
Class Y | |
Six Months Ended June 30, 2016 (Unaudited) | | $ | 14.39 | | | | 3.74 | % | | | 0.22 | %(c) | | | 0.19 | %(c) | | | 1.64 | %(c) | | | 59 | % | | $ | 367 | | |
Year Ended December 31, 2015 | | $ | 14.18 | | | | 0.32 | % | | | 0.20 | % | | | 0.19 | % | | | 2.08 | % | | | 69 | % | | $ | 352 | | |
Year Ended December 31, 2014 | | $ | 14.74 | | | | 5.68 | % | | | 0.19 | % | | | 0.18 | % | | | 2.19 | % | | | 95 | % | | $ | 401 | | |
Year Ended December 31, 2013 | | $ | 14.46 | | | | 9.46 | % | | | 0.14 | % | | | 0.14 | % | | | 2.23 | % | | | 92 | % | | $ | 3 | | |
Year Ended December 31, 2012 (g) | | $ | 14.18 | | | | 2.55 | % | | | 0.30 | %(c) | | | 0.22 | %(c)(d) | | | 4.63 | %(c) | | | 109 | % | | $ | 3 | | |
Class Z | |
Six Months Ended June 30, 2016 (Unaudited) | | $ | 14.32 | | | | 3.69 | % | | | 0.28 | %(c) | | | 0.25 | %(c) | | | 1.55 | %(c) | | | 59 | % | | $ | 349,728 | | |
Year Ended December 31, 2015 | | $ | 14.12 | | | | 0.33 | % | | | 0.26 | % | | | 0.25 | % | | | 2.08 | % | | | 69 | % | | $ | 325,159 | | |
Year Ended December 31, 2014 | | $ | 14.67 | | | | 5.57 | % | | | 0.25 | % | | | 0.24 | % | | | 2.16 | % | | | 95 | % | | $ | 377,119 | | |
Year Ended December 31, 2013 | | $ | 14.40 | | | | 9.30 | % | | | 0.26 | % | | | 0.25 | % | | | 2.14 | % | | | 92 | % | | $ | 375,444 | | |
Year Ended December 31, 2012 | | $ | 14.13 | | | | 13.69 | % | | | 0.30 | % | | | 0.25 | %(d) | | | 2.48 | % | | | 109 | % | | $ | 292,732 | | |
Year Ended December 31, 2011 | | $ | 12.67 | | | | 4.85 | % | | | 0.34 | % | | | 0.25 | %(d) | | | 2.43 | % | | | 130 | % | | $ | 65,167 | | |
See accompanying notes to financial statements.
81
COLUMBIA ACORN FAMILY OF FUNDS
FINANCIAL HIGHLIGHTS, CONTINUED
Columbia Acorn Emerging Markets FundSM
| | | | | Income from Investment Operations | | | | Less Distributions
to Shareholders | | | | | |
(Selected data for a share outstanding
throughout each period) | | Net Asset
Value,
Beginning of
Period | | Net
investment
income (loss) | | Net realized
and
unrealized
gain (loss) | | Total from
Investment
Operations | | Net
investment
income | | Tax
return of
capital | | Total
Distributions to
Shareholders | |
Class A | |
Six Months Ended June 30, 2016 (Unaudited) | | $ | 10.24 | | | | (0.00 | )(h) | | | 0.12 | (a) | | | 0.12 | | | | — | | | | — | | | | — | | |
Year Ended December 31, 2015 | | $ | 12.72 | | | | 0.10 | | | | (2.42 | ) | | | (2.32 | ) | | | (0.15 | ) | | | (0.01 | ) | | | (0.16 | ) | |
Year Ended December 31, 2014 | | $ | 13.37 | | | | 0.06 | | | | (0.63 | ) | | | (0.57 | ) | | | (0.08 | ) | | | — | | | | (0.08 | ) | |
Year Ended December 31, 2013 | | $ | 12.04 | | | | 0.07 | | | | 1.34 | | | | 1.41 | | | | (0.08 | ) | | | — | | | | (0.08 | ) | |
Year Ended December 31, 2012 | | $ | 9.26 | | | | 0.08 | | | | 2.78 | | | | 2.86 | | | | (0.08 | ) | | | — | | | | (0.08 | ) | |
Year Ended December 31, 2011 (g) | | $ | 10.00 | | | | (0.00 | )(h) | | | (0.74 | ) | | | (0.74 | ) | | | — | | | | — | | | | — | | |
Class C | |
Six Months Ended June 30, 2016 (Unaudited) | | $ | 10.20 | | | | (0.04 | ) | | | 0.12 | (a) | | | 0.08 | | | | — | | | | — | | | | — | | |
Year Ended December 31, 2015 | | $ | 12.65 | | | | 0.01 | | | | (2.39 | ) | | | (2.38 | ) | | | (0.06 | ) | | | (0.01 | ) | | | (0.07 | ) | |
Year Ended December 31, 2014 | | $ | 13.32 | | | | (0.05 | ) | | | (0.62 | ) | | | (0.67 | ) | | | — | | | | — | | | | — | | |
Year Ended December 31, 2013 | | $ | 12.01 | | | | (0.03 | ) | | | 1.34 | | | | 1.31 | | | | — | | | | — | | | | — | | |
Year Ended December 31, 2012 | | $ | 9.24 | | | | (0.02 | ) | | | 2.79 | | | | 2.77 | | | | — | | | | — | | | | — | | |
Year Ended December 31, 2011 (j) | | $ | 10.00 | | | | (0.02 | ) | | | (0.74 | ) | | | (0.76 | ) | | | — | | | | — | | | | — | | |
Class I | |
Six Months Ended June 30, 2016 (Unaudited) | | $ | 10.26 | | | | 0.02 | | | | 0.13 | (a) | | | 0.15 | | | | — | | | | — | | | | — | | |
Year Ended December 31, 2015 | | $ | 12.75 | | | | 0.14 | | | | (2.43 | ) | | | (2.29 | ) | | | (0.19 | ) | | | (0.01 | ) | | | (0.20 | ) | |
Year Ended December 31, 2014 | | $ | 13.41 | | | | 0.06 | | | | (0.60 | ) | | | (0.54 | ) | | | (0.12 | ) | | | — | | | | (0.12 | ) | |
Year Ended December 31, 2013 | | $ | 12.08 | | | | 0.08 | | | | 1.37 | | | | 1.45 | | | | (0.12 | ) | | | — | | | | (0.12 | ) | |
Year Ended December 31, 2012 | | $ | 9.29 | | | | 0.11 | | | | 2.80 | | | | 2.91 | | | | (0.12 | ) | | | — | | | | (0.12 | ) | |
Year Ended December 31, 2011 (k) | | $ | 10.00 | | | | 0.01 | | | | (0.72 | ) | | | (0.71 | ) | | | — | | | | — | | | | — | | |
Class R4 | |
Six Months Ended June 30, 2016 (Unaudited) | | $ | 10.32 | | | | 0.01 | | | | 0.13 | (a) | | | 0.14 | | | | — | | | | — | | | | — | | |
Year Ended December 31, 2015 | | $ | 12.83 | | | | 0.17 | | | | (2.49 | ) | | | (2.32 | ) | | | (0.18 | ) | | | (0.01 | ) | | | (0.19 | ) | |
Year Ended December 31, 2014 | | $ | 13.49 | | | | 0.09 | | | | (0.63 | ) | | | (0.54 | ) | | | (0.12 | ) | | | — | | | | (0.12 | ) | |
Year Ended December 31, 2013 | | $ | 12.14 | | | | 0.12 | | | | 1.35 | | | | 1.47 | | | | (0.12 | ) | | | — | | | | (0.12 | ) | |
Year Ended December 31, 2012 (l) | | $ | 11.44 | | | | (0.01 | ) | | | 0.81 | | | | 0.80 | | | | (0.10 | ) | | | — | | | | (0.10 | ) | |
Class R5 | |
Six Months Ended June 30, 2016 (Unaudited) | | $ | 10.32 | | | | (0.01 | ) | | | 0.15 | (a) | | | 0.14 | | | | — | | | | — | | | | — | | |
Year Ended December 31, 2015 | | $ | 12.82 | | | | 0.15 | | | | (2.45 | ) | | | (2.30 | ) | | | (0.19 | ) | | | (0.01 | ) | | | (0.20 | ) | |
Year Ended December 31, 2014 | | $ | 13.48 | | | | 0.10 | | | | (0.64 | ) | | | (0.54 | ) | | | (0.12 | ) | | | — | | | | (0.12 | ) | |
Year Ended December 31, 2013 | | $ | 12.14 | | | | 0.12 | | | | 1.34 | | | | 1.46 | | | | (0.12 | ) | | | — | | | | (0.12 | ) | |
Year Ended December 31, 2012 (m) | | $ | 11.44 | | | | (0.00 | )(h) | | | 0.81 | | | | 0.81 | | | | (0.11 | ) | | | — | | | | (0.11 | ) | |
Class Y | |
Six Months Ended June 30, 2016 (Unaudited) | | $ | 10.23 | | | | 0.02 | | | | 0.12 | (a) | | | 0.14 | | | | — | | | | — | | | | — | | |
Year Ended December 31, 2015 | | $ | 12.71 | | | | 0.15 | | | | (2.43 | ) | | | (2.28 | ) | | | (0.19 | ) | | | (0.01 | ) | | | (0.20 | ) | |
Year Ended December 31, 2014 | | $ | 13.36 | | | | 0.09 | | | | (0.62 | ) | | | (0.53 | ) | | | (0.12 | ) | | | — | | | | (0.12 | ) | |
Year Ended December 31, 2013 (n) | | $ | 12.22 | | | | 0.07 | | | | 1.20 | | | | 1.27 | | | | (0.13 | ) | | | — | | | | (0.13 | ) | |
Class Z | |
Six Months Ended June 30, 2016 (Unaudited) | | $ | 10.26 | | | | (0.00 | )(h) | | | 0.13 | (a) | | | 0.13 | | | | — | | | | — | | | | — | | |
Year Ended December 31, 2015 | | $ | 12.74 | | | | 0.13 | | | | (2.42 | ) | | | (2.29 | ) | | | (0.18 | ) | | | (0.01 | ) | | | (0.19 | ) | |
Year Ended December 31, 2014 | | $ | 13.40 | | | | 0.08 | | | | (0.63 | ) | | | (0.55 | ) | | | (0.11 | ) | | | — | | | | (0.11 | ) | |
Year Ended December 31, 2013 | | $ | 12.07 | | | | 0.11 | | | | 1.33 | | | | 1.44 | | | | (0.11 | ) | | | — | | | | (0.11 | ) | |
Year Ended December 31, 2012 | | $ | 9.28 | | | | 0.12 | | | | 2.79 | | | | 2.91 | | | | (0.12 | ) | | | — | | | | (0.12 | ) | |
Year Ended December 31, 2011 (o) | | $ | 10.00 | | | | 0.01 | | | | (0.73 | ) | | | (0.72 | ) | | | — | | | | — | | | | — | | |
Notes to Financial Highlights
(a) Calculation of the net gain (loss) per share (both realized and unrealized) does not correlate to the aggregate realized and unrealized gain (loss) presented in the Statements of Operations due to the timing of subscriptions and redemptions of Fund shares in relation to fluctuations in the market value of the portfolio.
(b) Annualized.
(c) Ratios include line of credit interest expense which is less than 0.01%.
(d) In addition to the fees and expenses that the Fund bears directly, the Fund indirectly bears a pro rata share of the fees and expenses of any other funds in which it invests, if any. Such indirect expenses are not included in the Fund's reported expense ratios.
(e) Had the Investment Manager and/or Transfer Agent not waived fees and/or reimbursed a portion of expenses, total return would have been reduced.
(f) The benefits derived from custody fees paid indirectly had an impact of 0.01%.
(g) Class A shares commenced operations on August 19, 2011. Per share data and total return reflect activity from that date.
(h) Rounds to zero.
(i) The benefits derived from custody fees paid indirectly had an impact of less than 0.01%.
(j) Class C shares commenced operations on August 19, 2011. Per share data and total return reflect activity from that date.
(k) Class I shares commenced operations on August 19, 2011. Per share data and total return reflect activity from that date.
(l) Class R4 shares commenced operations on November 8, 2012. Per share data and total return reflect activity from that date.
(m) Class R5 shares commenced operations on November 8, 2012. Per share data and total return reflect activity from that date.
(n) Class Y shares commenced operations on June 13, 2013. Per share data and total return reflect activity from that date.
(o) Class Z shares commenced operations on August 19, 2011. Per share data and total return reflect activity from that date.
See accompanying notes to financial statements.
82
| | | | | | | Ratio to Average Net Assets | | Supplemental Data | |
(Selected data for a share outstanding
throughout each period) | | Net Asset
Value, End of
Period | | Total Return | | Total gross
expenses | | Total net
expenses | | Net
investment
income (loss) | | Portfolio
turnover rate | | Net assets,
end of period
(000s) | |
Class A | |
Six Months Ended June 30, 2016 (Unaudited) | | $ | 10.36 | | | | 1.17 | %(e) | | | 1.83 | %(b)(c)(d) | | | 1.83 | %(b)(c)(d) | | | (0.06 | )%(b) | | | 22 | % | | $ | 71,485 | | |
Year Ended December 31, 2015 | | $ | 10.24 | | | | (18.25 | )% | | | 1.67 | %(d) | | | 1.67 | %(d) | | | 0.88 | % | | | 58 | % | | $ | 88,574 | | |
Year Ended December 31, 2014 | | $ | 12.72 | | | | (4.28 | )% | | | 1.56 | %(d) | | | 1.56 | %(d) | | | 0.42 | % | | | 45 | % | | $ | 160,969 | | |
Year Ended December 31, 2013 | | $ | 13.37 | | | | 11.73 | %(e) | | | 1.80 | %(d) | | | 1.76 | %(d) | | | 0.52 | % | | | 36 | % | | $ | 177,158 | | |
Year Ended December 31, 2012 | | $ | 12.04 | | | | 30.86 | %(e) | | | 6.42 | %(d) | | | 1.77 | %(d)(f) | | | 0.77 | % | | | 30 | % | | $ | 3,103 | | |
Year Ended December 31, 2011 (g) | | $ | 9.26 | | | | (7.40 | )%(e) | | | 20.13 | %(b) | | | 1.85 | %(b)(i) | | | (0.01 | )%(b) | | | 9 | % | | $ | 332 | | |
Class C | |
Six Months Ended June 30, 2016 (Unaudited) | | $ | 10.28 | | | | 0.78 | %(e) | | | 2.60 | %(b)(c)(d) | | | 2.60 | %(b)(c)(d) | | | (0.82 | )%(b) | | | 22 | % | | $ | 19,683 | | |
Year Ended December 31, 2015 | | $ | 10.20 | | | | (18.83 | )% | | | 2.42 | %(d) | | | 2.42 | %(d) | | | 0.12 | % | | | 58 | % | | $ | 22,953 | | |
Year Ended December 31, 2014 | | $ | 12.65 | | | | (5.03 | )% | | | 2.33 | %(d) | | | 2.33 | %(d) | | | (0.36 | )% | | | 45 | % | | $ | 41,208 | | |
Year Ended December 31, 2013 | | $ | 13.32 | | | | 10.91 | %(e) | | | 2.55 | %(d) | | | 2.51 | %(d) | | | (0.23 | )% | | | 36 | % | | $ | 32,636 | | |
Year Ended December 31, 2012 | | $ | 12.01 | | | | 29.98 | %(e) | | | 7.18 | %(d) | | | 2.56 | %(d)(f) | | | (0.15 | )% | | | 30 | % | | $ | 615 | | |
Year Ended December 31, 2011 (j) | | $ | 9.24 | | | | (7.60 | )%(e) | | | 25.06 | %(b) | | | 2.60 | %(b)(i) | | | (0.68 | )%(b) | | | 9 | % | | $ | 127 | | |
Class I | |
Six Months Ended June 30, 2016 (Unaudited) | | $ | 10.41 | | | | 1.46 | %(e) | | | 1.46 | %(b)(c)(d) | | | 1.44 | %(b)(c)(d) | | | 0.38 | %(b) | | | 22 | % | | $ | 2 | | |
Year Ended December 31, 2015 | | $ | 10.26 | | | | (17.95 | )% | | | 1.31 | %(d) | | | 1.31 | %(d) | | | 1.21 | % | | | 58 | % | | $ | 2 | | |
Year Ended December 31, 2014 | | $ | 12.75 | | | | (4.01 | )% | | | 1.22 | %(d) | | | 1.22 | %(d) | | | 0.44 | % | | | 45 | % | | $ | 3 | | |
Year Ended December 31, 2013 | | $ | 13.41 | | | | 12.06 | %(e) | | | 1.73 | %(d) | | | 1.39 | %(d) | | | 0.65 | % | | | 36 | % | | $ | 7 | | |
Year Ended December 31, 2012 | | $ | 12.08 | | | | 31.39 | %(e) | | | 6.18 | %(d) | | | 1.41 | %(d)(f) | | | 1.05 | % | | | 30 | % | | $ | 6 | | |
Year Ended December 31, 2011 (k) | | $ | 9.29 | | | | (7.10 | )%(e) | | | 19.31 | %(b) | | | 1.41 | %(b)(i) | | | 0.17 | %(b) | | | 9 | % | | $ | 5 | | |
Class R4 | |
Six Months Ended June 30, 2016 (Unaudited) | | $ | 10.46 | | | | 1.36 | %(e) | | | 1.56 | %(b)(c)(d) | | | 1.56 | %(b)(c)(d) | | | 0.12 | %(b) | | | 22 | % | | $ | 2,090 | | |
Year Ended December 31, 2015 | | $ | 10.32 | | | | (18.04 | )% | | | 1.36 | %(d) | | | 1.36 | %(d) | | | 1.37 | % | | | 58 | % | | $ | 3,459 | | |
Year Ended December 31, 2014 | | $ | 12.83 | | | | (4.03 | )% | | | 1.28 | %(d) | | | 1.28 | %(d) | | | 0.66 | % | | | 45 | % | | $ | 15,467 | | |
Year Ended December 31, 2013 | | $ | 13.49 | | | | 12.13 | %(e) | | | 1.44 | %(d) | | | 1.44 | %(d) | | | 0.92 | % | | | 36 | % | | $ | 13,583 | | |
Year Ended December 31, 2012 (l) | | $ | 12.14 | | | | 7.04 | %(e) | | | 5.86 | %(b)(d) | | | 1.54 | %(b)(d)(f) | | | (0.31 | )%(b) | | | 30 | % | | $ | 16 | | |
Class R5 | |
Six Months Ended June 30, 2016 (Unaudited) | | $ | 10.46 | | | | 1.36 | %(e) | | | 1.46 | %(b)(c)(d) | | | 1.46 | %(b)(c)(d) | | | (0.28 | )%(b) | | | 22 | % | | $ | 1,240 | | |
Year Ended December 31, 2015 | | $ | 10.32 | | | | (17.96 | )% | | | 1.34 | %(d) | | | 1.34 | %(d) | | | 1.22 | % | | | 58 | % | | $ | 12,643 | | |
Year Ended December 31, 2014 | | $ | 12.82 | | | | (4.02 | )% | | | 1.26 | %(d) | | | 1.26 | %(d) | | | 0.72 | % | | | 45 | % | | $ | 19,632 | | |
Year Ended December 31, 2013 | | $ | 13.48 | | | | 12.07 | %(e) | | | 1.42 | %(d) | | | 1.42 | %(d) | | | 0.94 | % | | | 36 | % | | $ | 13,625 | | |
Year Ended December 31, 2012 (m) | | $ | 12.14 | | | | 7.11 | %(e) | | | 5.81 | %(b)(d) | | | 1.46 | %(b)(d)(f) | | | (0.22 | )%(b) | | | 30 | % | | $ | 3 | | |
Class Y | |
Six Months Ended June 30, 2016 (Unaudited) | | $ | 10.37 | | | | 1.37 | %(e) | | | 1.40 | %(b)(c)(d) | | | 1.40 | %(b)(c)(d) | | | 0.42 | %(b) | | | 22 | % | | $ | 2 | | |
Year Ended December 31, 2015 | | $ | 10.23 | | | | (17.90 | )% | | | 1.27 | %(d) | | | 1.27 | %(d) | | | 1.24 | % | | | 58 | % | | $ | 2 | | |
Year Ended December 31, 2014 | | $ | 12.71 | | | | (3.95 | )% | | | 1.22 | %(d) | | | 1.22 | %(d) | | | 0.68 | % | | | 45 | % | | $ | 2 | | |
Year Ended December 31, 2013 (n) | | $ | 13.36 | | | | 10.43 | %(e) | | | 1.36 | %(b)(d) | | | 1.36 | %(b)(d) | | | 0.97 | %(b) | | | 36 | % | | $ | 3 | | |
Class Z | |
Six Months Ended June 30, 2016 (Unaudited) | | $ | 10.39 | | | | 1.27 | %(e) | | | 1.60 | %(b)(c)(d) | | | 1.58 | %(b)(c)(d) | | | (0.09 | )%(b) | | | 22 | % | | $ | 64,223 | | |
Year Ended December 31, 2015 | | $ | 10.26 | | | | (17.98 | )% | | | 1.42 | %(d) | | | 1.42 | %(d) | | | 1.12 | % | | | 58 | % | | $ | 147,688 | | |
Year Ended December 31, 2014 | | $ | 12.74 | | | | (4.12 | )% | | | 1.33 | %(d) | | | 1.33 | %(d) | | | 0.62 | % | | | 45 | % | | $ | 245,053 | | |
Year Ended December 31, 2013 | | $ | 13.40 | | | | 11.92 | %(e) | | | 1.58 | %(d) | | | 1.54 | %(d) | | | 0.89 | % | | | 36 | % | | $ | 177,693 | | |
Year Ended December 31, 2012 | | $ | 12.07 | | | | 31.35 | %(e) | | | 6.15 | %(d) | | | 1.46 | %(d)(f) | | | 1.07 | % | | | 30 | % | | $ | 6,846 | | |
Year Ended December 31, 2011 (o) | | $ | 9.28 | | | | (7.20 | )%(e) | | | 19.52 | %(b) | | | 1.46 | %(b)(i) | | | 0.15 | %(b) | | | 9 | % | | $ | 2,765 | | |
See accompanying notes to financial statements.
83
COLUMBIA ACORN FAMILY OF FUNDS
FINANCIAL HIGHLIGHTS, CONTINUED
Columbia Acorn European FundSM
| | | | | Income from Investment Operations | | | | Less Distributions to Shareholders | | | |
(Selected data for a share outstanding
throughout each period) | | Net Asset
Value,
Beginning of
Period | | Net
investment
income (loss) | | Net realized
and
unrealized
gain (loss) | | Total from
Investment
Operations | | Net
investment
income | | Net
realized
gains | | Total
Distributions to
Shareholders | |
Class A | |
Six Months Ended June 30, 2016 (Unaudited) | | $ | 14.75 | | | | 0.17 | | | | (0.73 | ) | | | (0.56 | ) | | | (0.03 | ) | | | — | | | | (0.03 | ) | |
Year Ended December 31, 2015 | | $ | 14.34 | | | | 0.10 | | | | 0.50 | | | | 0.60 | | | | (0.19 | ) | | | — | | | | (0.19 | ) | |
Year Ended December 31, 2014 | | $ | 15.68 | | | | 0.13 | | | | (1.34 | ) | | | (1.21 | ) | | | (0.05 | ) | | | (0.08 | ) | | | (0.13 | ) | |
Year Ended December 31, 2013 | | $ | 11.76 | | | | (0.02 | ) | | | 3.97 | | | | 3.95 | | | | (0.01 | ) | | | (0.02 | ) | | | (0.03 | ) | |
Year Ended December 31, 2012 | | $ | 9.43 | | | | 0.03 | | | | 2.37 | | | | 2.40 | | | | (0.07 | ) | | | (0.00 | )(d) | | | (0.07 | ) | |
Year Ended December 31, 2011 (f) | | $ | 10.00 | | | | (0.03 | ) | | | (0.46 | ) | | | (0.49 | ) | | | (0.06 | ) | | | (0.02 | ) | | | (0.08 | ) | |
Class C | |
Six Months Ended June 30, 2016 (Unaudited) | | $ | 14.63 | | | | 0.11 | | | | (0.71 | ) | | | (0.60 | ) | | | (0.03 | ) | | | — | | | | (0.03 | ) | |
Year Ended December 31, 2015 | | $ | 14.16 | | | | (0.00 | )(d) | | | 0.48 | | | | 0.48 | | | | (0.01 | ) | | | — | | | | (0.01 | ) | |
Year Ended December 31, 2014 | | $ | 15.54 | | | | (0.01 | ) | | | (1.29 | ) | | | (1.30 | ) | | | — | | | | (0.08 | ) | | | (0.08 | ) | |
Year Ended December 31, 2013 | | $ | 11.73 | | | | (0.15 | ) | | | 3.98 | | | | 3.83 | | | | — | | | | (0.02 | ) | | | (0.02 | ) | |
Year Ended December 31, 2012 | | $ | 9.44 | | | | (0.15 | ) | | | 2.46 | | | | 2.31 | | | | (0.02 | ) | | | (0.00 | )(d) | | | (0.02 | ) | |
Year Ended December 31, 2011 (h) | | $ | 10.00 | | | | (0.06 | ) | | | (0.45 | ) | | | (0.51 | ) | | | (0.03 | ) | | | (0.02 | ) | | | (0.05 | ) | |
Class I | |
Six Months Ended June 30, 2016 (Unaudited) | | $ | 14.74 | | | | 0.19 | | | | (0.73 | ) | | | (0.54 | ) | | | (0.03 | ) | | | — | | | | (0.03 | ) | |
Year Ended December 31, 2015 | | $ | 14.33 | | | | 0.16 | | | | 0.49 | | | | 0.65 | | | | (0.24 | ) | | | — | | | | (0.24 | ) | |
Year Ended December 31, 2014 | | $ | 15.67 | | | | 0.11 | | | | (1.27 | ) | | | (1.16 | ) | | | (0.10 | ) | | | (0.08 | ) | | | (0.18 | ) | |
Year Ended December 31, 2013 | | $ | 11.75 | | | | 0.12 | | | | 3.88 | | | | 4.00 | | | | (0.06 | ) | | | (0.02 | ) | | | (0.08 | ) | |
Year Ended December 31, 2012 | | $ | 9.43 | | | | 0.10 | | | | 2.32 | | | | 2.42 | | | | (0.10 | ) | | | (0.00 | )(d) | | | (0.10 | ) | |
Year Ended December 31, 2011 (i) | | $ | 10.00 | | | | (0.02 | ) | | | (0.46 | ) | | | (0.48 | ) | | | (0.07 | ) | | | (0.02 | ) | | | (0.09 | ) | |
Class R4 | |
Six Months Ended June 30, 2016 (Unaudited) | | $ | 14.82 | | | | 0.18 | | | | (0.73 | ) | | | (0.55 | ) | | | (0.03 | ) | | | — | | | | (0.03 | ) | |
Year Ended December 31, 2015 | | $ | 14.40 | | | | 0.24 | | | | 0.41 | | | | 0.65 | | | | (0.23 | ) | | | — | | | | (0.23 | ) | |
Year Ended December 31, 2014 (j) | | $ | 15.85 | | | | (0.02 | ) | | | (1.34 | ) | | | (1.36 | ) | | | (0.09 | ) | | | — | | | | (0.09 | ) | |
Class R5 | |
Six Months Ended June 30, 2016 (Unaudited) | | $ | 14.89 | | | | 0.17 | | | | (0.72 | ) | | | (0.55 | ) | | | (0.03 | ) | | | — | | | | (0.03 | ) | |
Year Ended December 31, 2015 | | $ | 14.47 | | | | 0.15 | | | | 0.50 | | | | 0.65 | | | | (0.23 | ) | | | — | | | | (0.23 | ) | |
Year Ended December 31, 2014 | | $ | 15.82 | | | | 0.14 | | | | (1.32 | ) | | | (1.18 | ) | | | (0.09 | ) | | | (0.08 | ) | | | (0.17 | ) | |
Year Ended December 31, 2013 | | $ | 11.86 | | | | (0.04 | ) | | | 4.06 | | | | 4.02 | | | | (0.04 | ) | | | (0.02 | ) | | | (0.06 | ) | |
Year Ended December 31, 2012 (k) | | $ | 11.19 | | | | (0.02 | ) | | | 0.77 | | | | 0.75 | | | | (0.08 | ) | | | — | | | | (0.08 | ) | |
Class Z | |
Six Months Ended June 30, 2016 (Unaudited) | | $ | 14.75 | | | | 0.19 | | | | (0.73 | ) | | | (0.54 | ) | | | (0.03 | ) | | | — | | | | (0.03 | ) | |
Year Ended December 31, 2015 | | $ | 14.34 | | | | 0.15 | | | | 0.49 | | | | 0.64 | | | | (0.23 | ) | | | — | | | | (0.23 | ) | |
Year Ended December 31, 2014 | | $ | 15.68 | | | | 0.15 | | | | (1.32 | ) | | | (1.17 | ) | | | (0.09 | ) | | | (0.08 | ) | | | (0.17 | ) | |
Year Ended December 31, 2013 | | $ | 11.76 | | | | 0.11 | | | | 3.88 | | | | 3.99 | | | | (0.05 | ) | | | (0.02 | ) | | | (0.07 | ) | |
Year Ended December 31, 2012 | | $ | 9.44 | | | | 0.08 | | | | 2.34 | | | | 2.42 | | | | (0.10 | ) | | | (0.00 | )(d) | | | (0.10 | ) | |
Year Ended December 31, 2011 (l) | | $ | 10.00 | | | | (0.02 | ) | | | (0.46 | ) | | | (0.48 | ) | | | (0.06 | ) | | | (0.02 | ) | | | (0.08 | ) | |
Notes to Financial Highlights
(a) Had the Investment Manager and/or Transfer Agent not waived fees and/or reimbursed a portion of expenses, total return would have been reduced.
(b) Annualized.
(c) In addition to the fees and expenses that the Fund bears directly, the Fund indirectly bears a pro rata share of the fees and expenses of any other funds in which it invests, if any. Such indirect expenses are not included in the Fund's reported expense ratios.
(d) Rounds to zero.
(e) The benefits derived from custody fees paid indirectly had an impact of 0.01%.
(f) Class A shares commenced operations on August 19, 2011. Per share data and total return reflect activity from that date.
(g) The benefits derived from custody fees paid indirectly had an impact of 0.02%.
(h) Class C shares commenced operations on August 19, 2011. Per share data and total return reflect activity from that date.
(i) Class I shares commenced operations on August 19, 2011. Per share data and total return reflect activity from that date.
(j) Class R4 shares commenced operations on June 25, 2014. Per share data and total return reflect activity from that date.
(k) Class R5 shares commenced operations on November 8, 2012. Per share data and total return reflect activity from that date.
(l) Class Z shares commenced operations on August 19, 2011. Per share data and total return reflect activity from that date.
See accompanying notes to financial statements.
84
| | | | | | | Ratio to Average Net Assets | | Supplemental Data | |
(Selected data for a share outstanding
throughout each period) | | Net Asset
Value, End of
Period | | Total Return
(a) | | Total gross
expenses | | Total net
expenses | | Net
investment
income (loss) | | Portfolio
turnover rate | | Net assets,
end of period
(000s) | |
Class A | |
Six Months Ended June 30, 2016 (Unaudited) | | $ | 14.16 | | | | (3.84 | )% | | | 1.98 | %(b)(c) | | | 1.75 | %(b)(c) | | | 2.31 | %(b) | | | 30 | % | | $ | 35,446 | | |
Year Ended December 31, 2015 | | $ | 14.75 | | | | 4.17 | % | | | 2.06 | %(c) | | | 1.75 | %(c) | | | 0.67 | % | | | 37 | % | | $ | 40,368 | | |
Year Ended December 31, 2014 | | $ | 14.34 | | | | (7.77 | )% | | | 2.05 | %(c) | | | 1.75 | %(c) | | | 0.86 | % | | | 74 | % | | $ | 21,101 | | |
Year Ended December 31, 2013 | | $ | 15.68 | | | | 33.64 | % | | | 3.33 | %(c) | | | 1.74 | %(c) | | | (0.11 | )% | | | 42 | % | | $ | 19,078 | | |
Year Ended December 31, 2012 | | $ | 11.76 | | | | 25.46 | % | | | 12.35 | %(c) | | | 1.61 | %(c)(e) | | | 0.23 | % | | | 37 | % | | $ | 453 | | |
Year Ended December 31, 2011 (f) | | $ | 9.43 | | | | (4.97 | )% | | | 33.59 | %(b) | | | 1.75 | %(b)(g) | | | (0.84 | )%(b) | | | 17 | % | | $ | 154 | | |
Class C | |
Six Months Ended June 30, 2016 (Unaudited) | | $ | 14.00 | | | | (4.14 | )% | | | 2.74 | %(b)(c) | | | 2.50 | %(b)(c) | | | 1.60 | %(b) | | | 30 | % | | $ | 7,572 | | |
Year Ended December 31, 2015 | | $ | 14.63 | | | | 3.41 | % | | | 2.82 | %(c) | | | 2.50 | %(c) | | | (0.02 | )% | | | 37 | % | | $ | 7,220 | | |
Year Ended December 31, 2014 | | $ | 14.16 | | | | (8.44 | )% | | | 2.84 | %(c) | | | 2.50 | %(c) | | | (0.10 | )% | | | 74 | % | | $ | 5,096 | | |
Year Ended December 31, 2013 | | $ | 15.54 | | | | 32.63 | % | | | 4.19 | %(c) | | | 2.50 | %(c) | | | (1.10 | )% | | | 42 | % | | $ | 1,400 | | |
Year Ended December 31, 2012 | | $ | 11.73 | | | | 24.46 | % | | | 12.83 | %(c) | | | 2.32 | %(c)(e) | | | (1.33 | )% | | | 37 | % | | $ | 89 | | |
Year Ended December 31, 2011 (h) | | $ | 9.44 | | | | (5.14 | )% | | | 35.79 | %(b) | | | 2.50 | %(b)(g) | | | (1.66 | )%(b) | | | 17 | % | | $ | 5 | | |
Class I | |
Six Months Ended June 30, 2016 (Unaudited) | | $ | 14.17 | | | | (3.70 | )% | | | 1.59 | %(b)(c) | | | 1.41 | %(b)(c) | | | 2.62 | %(b) | | | 30 | % | | $ | 2 | | |
Year Ended December 31, 2015 | | $ | 14.74 | | | | 4.50 | % | | | 1.71 | %(c) | | | 1.43 | %(c) | | | 1.09 | % | | | 37 | % | | $ | 3 | | |
Year Ended December 31, 2014 | | $ | 14.33 | | | | (7.49 | )% | | | 1.71 | %(c) | | | 1.46 | %(c) | | | 0.74 | % | | | 74 | % | | $ | 2 | | |
Year Ended December 31, 2013 | | $ | 15.67 | | | | 34.06 | % | | | 3.99 | %(c) | | | 1.41 | %(c) | | | 0.88 | % | | | 42 | % | | $ | 8 | | |
Year Ended December 31, 2012 | | $ | 11.75 | | | | 25.71 | % | | | 12.05 | %(c) | | | 1.31 | %(c)(e) | | | 0.94 | % | | | 37 | % | | $ | 6 | | |
Year Ended December 31, 2011 (i) | | $ | 9.43 | | | | (4.81 | )% | | | 30.00 | %(b) | | | 1.31 | %(b)(g) | | | (0.47 | )%(b) | | | 17 | % | | $ | 5 | | |
Class R4 | |
Six Months Ended June 30, 2016 (Unaudited) | | $ | 14.24 | | | | (3.75 | )% | | | 1.82 | %(b)(c) | | | 1.50 | %(b)(c) | | | 2.54 | %(b) | | | 30 | % | | $ | 372 | | |
Year Ended December 31, 2015 | | $ | 14.82 | | | | 4.48 | % | | | 1.81 | %(c) | | | 1.50 | %(c) | | | 1.59 | % | | | 37 | % | | $ | 408 | | |
Year Ended December 31, 2014 (j) | | $ | 14.40 | | | | (8.60 | )% | | | 1.87 | %(b)(c) | | | 1.50 | %(b)(c) | | | (0.30 | )%(b) | | | 74 | % | | $ | 302 | | |
Class R5 | |
Six Months Ended June 30, 2016 (Unaudited) | | $ | 14.31 | | | | (3.73 | )% | | | 1.66 | %(b)(c) | | | 1.46 | %(b)(c) | | | 2.36 | %(b) | | | 30 | % | | $ | 1,438 | | |
Year Ended December 31, 2015 | | $ | 14.89 | | | | 4.48 | % | | | 1.75 | %(c) | | | 1.48 | %(c) | | | 0.98 | % | | | 37 | % | | $ | 2,122 | | |
Year Ended December 31, 2014 | | $ | 14.47 | | | | (7.54 | )% | | | 1.75 | %(c) | | | 1.52 | %(c) | | | 0.92 | % | | | 74 | % | | $ | 1,633 | | |
Year Ended December 31, 2013 | | $ | 15.82 | | | | 33.97 | % | | | 2.76 | %(c) | | | 1.51 | %(c) | | | (0.29 | )% | | | 42 | % | | $ | 1,891 | | |
Year Ended December 31, 2012 (k) | | $ | 11.86 | | | | 6.70 | % | | | 14.07 | %(b)(c) | | | 1.36 | %(b)(c)(e) | | | (1.07 | )%(b) | | | 37 | % | | $ | 3 | | |
Class Z | |
Six Months Ended June 30, 2016 (Unaudited) | | $ | 14.18 | | | | (3.70 | )% | | | 1.69 | %(b)(c) | | | 1.50 | %(b)(c) | | | 2.67 | %(b) | | | 30 | % | | $ | 13,366 | | |
Year Ended December 31, 2015 | | $ | 14.75 | | | | 4.43 | % | | | 1.78 | %(c) | | | 1.50 | %(c) | | | 1.01 | % | | | 37 | % | | $ | 11,766 | | |
Year Ended December 31, 2014 | | $ | 14.34 | | | | (7.52 | )% | | | 1.79 | %(c) | | | 1.50 | %(c) | | | 0.97 | % | | | 74 | % | | $ | 8,499 | | |
Year Ended December 31, 2013 | | $ | 15.68 | | | | 33.98 | % | | | 3.98 | %(c) | | | 1.45 | %(c) | | | 0.83 | % | | | 42 | % | | $ | 4,407 | | |
Year Ended December 31, 2012 | | $ | 11.76 | | | | 25.66 | % | | | 12.07 | %(c) | | | 1.33 | %(c)(e) | | | 0.76 | % | | | 37 | % | | $ | 2,727 | | |
Year Ended December 31, 2011 (l) | | $ | 9.44 | | | | (4.78 | )% | | | 30.26 | %(b) | | | 1.37 | %(b)(g) | | | (0.52 | )%(b) | | | 17 | % | | $ | 1,516 | | |
See accompanying notes to financial statements.
85
COLUMBIA ACORN FAMILY OF FUNDS
NOTES TO FINANCIAL STATEMENTS
1. Nature of Operations
Columbia Acorn Fund, Columbia Acorn International, Columbia Acorn USA, Columbia Acorn International Select, Columbia Acorn Select, Columbia Thermostat Fund, Columbia Acorn Emerging Markets Fund and Columbia Acorn European Fund (each a Fund and collectively, the Funds) are each a series of Columbia Acorn Trust (the Trust). The Trust is registered under the Investment Company Act of 1940, as amended (the 1940 Act), as an open-end management investment company organized as a Massachusetts business trust. The investment objective of each Fund is to seek long-term capital appreciation.
Columbia Thermostat Fund pursues its investment objective by investing in shares of other mutual funds. As a "fund of funds", under normal circumstances, the Fund allocates at least 95% of its net assets among a selected group of affiliated stock and bond mutual funds (underlying funds) according to the current level of the Standard & Poor's (S&P) 500 Index in relation to predetermined ranges set by Columbia Wanger Asset Management, LLC (the Investment Manager or CWAM). The Fund may invest up to 5% of its net assets plus any cash received that day in cash, repurchase agreements, high quality short-term paper and government securities.
Each Fund may issue an unlimited number of shares. Columbia Acorn Fund, Columbia Acorn USA, Columbia Acorn International Select and Columbia Acorn Select each currently offers Class A, Class C, Class I, Class R4, Class R5, Class Y and Class Z shares. Columbia Acorn International currently offers Class A, Class B, Class C, Class I, Class R, Class R4, Class R5, Class Y and Class Z shares. Columbia Thermostat Fund currently offers Class A, Class C, Class R4, Class R5, Class Y and Class Z shares. Columbia Acorn Emerging Markets Fund currently offers Class A, Class C, Class I, Class R4, Class R5, Class Y and Class Z shares. Columbia Acorn European Fund currently offers Class A, Class C, Class I, Class R4, Class R5 and Class Z shares. Columbia Acorn International Fund generally no longer accepts investments by new or existing investors in the Fund's Class B shares, except in connection with the reinvestment of any dividend and/or capital gain distributions in Class B shares of the Fund. Prior to February 1, 2016, Columbia Acorn Emerging Markets Fund was closed to most new investors and new accounts with certain exceptions.
Class A shares are sold with a front-end sales charge. Class A shares bought without an initial sales charge in accounts aggregating $1 million to $50 million at the time of purchase are subject to a 1.00% contingent deferred sales
charge (CDSC) if the shares are redeemed within 12 months after purchase, and a 0.50% CDSC if the shares are redeemed more than 12, but less than 18, months after purchase, with certain limited exceptions.
Class B shares are subject to CDSC if redeemed within six years after purchase. Class B shares will convert to Class A shares automatically eight years after purchase.
Class C shares are offered at net asset value but are subject to a CDSC on redemptions made within one year after purchase.
Class I, Class R, Class R4, Class R5 and Class Y shares are offered at net asset value. There are certain restrictions on who may purchase these share classes.
Class Z shares are offered at net asset value. There are certain restrictions on who may purchase Class Z shares. Generally, Class Z shares of a Fund may be exchanged for shares of another fund distributed by Columbia Management Investment Distributors, Inc. (CMID) at no additional charge.
Investment income, realized and unrealized gains and losses, and certain fund-level expenses are allocated pro rata on the basis of the relative net assets of all classes, except that each class bears certain expenses specific to that class such as distribution services, transfer agent fees, and certain other class specific expenses. Differences in class expenses may result in payment of different dividend distributions for each class. All of the Funds' share classes have equal rights with respect to voting, subject to Fund or class-specific matters.
2. Summary of Significant Accounting Policies
>Basis of Preparation
Each Fund is an investment company that applies the accounting and reporting guidance in the Financial Accounting Standards Board (FASB) Accounting Standards Codification Topic 946, Financial Services — Investment Companies (ASC 946). The financial statements are prepared in accordance with U.S. generally accepted accounting principles (GAAP) which requires management to make certain estimates and assumptions that affect the reported amounts of assets and liabilities, the disclosure of contingent assets and liabilities at the date of the financial statements and the reported amounts of income and expenses during the reporting period. Actual results could differ from those estimates.
The following is a summary of significant accounting policies followed by the Funds in the preparation of their financial statements.
86
>Security valuation
Securities of the Funds are valued at market value or, if a market quotation for a security is not readily available or is deemed not to be reliable because of events or circumstances that have occurred between the market quotation and the time as of which the security is to be valued, the security is valued at a fair value determined in good faith under consistently applied procedures established by the Board of Trustees (the Board). With respect to Columbia Thermostat Fund, investments in underlying funds are valued at their net asset values as reported by the underlying funds. A security traded on a securities exchange or in an over-the-counter market in which transaction prices are reported is valued at the last sales price at the time of valuation. A security traded principally on NASDAQ is valued at the NASDAQ official closing price. Exchange traded funds are valued at their closing net asset value as reported on the applicable exchange.
Short-term investments maturing in 60 days or less are valued at amortized cost, which approximates market value.
The Trust has retained an independent statistical fair value pricing service that employs a systematic methodology to assist in the fair valuation process for securities principally traded in a foreign market in order to adjust for possible changes in value that may occur between the close of the foreign exchange and the time as of which the securities are to be valued. If a security is valued at fair value, that value may be different from the last quoted market price for the security. A security for which there is no reported sale on the valuation date is valued at the mean of the latest bid and ask quotations.
>Foreign currency translations
Values of investments denominated in foreign currencies are converted into U.S. dollars using the New York spot market rate of exchange at the time of valuation. Purchases and sales of investments and dividend and interest income are translated into U.S. dollars using the spot market rate of exchange prevailing on the respective dates of such transactions. The gain or loss resulting from changes in foreign exchange rates is included with net realized and unrealized gain or loss from investments, as appropriate.
>Restricted securities
Restricted securities are securities that may only be resold upon registration under federal securities laws or in transactions exempt from registration. In some cases, the issuer of restricted securities has agreed to register such securities for resale at the issuer's expense either upon demand by the Fund or in connection with another registered offering of the securities.
Many restricted securities may be resold in the secondary market in transactions exempt from registration. Such restricted securities may be determined to be liquid under criteria established by the Board.
>Derivative instruments
Columbia Acorn Fund, Columbia Acorn USA and Columbia Acorn Emerging Markets Fund invested in futures contracts on a limited basis during the six months ended June 30, 2016, as detailed below. Derivatives may involve various risks, including the potential inability of the counterparty to fulfill its obligation under the terms of the contract, the potential for an illiquid secondary market (making it difficult for the Fund to sell, including at favorable prices) and the potential for market movements which may expose the Fund to gains or losses in excess of the amount shown in the Statements of Assets and Liabilities.
For financial reporting purposes, the Funds do not offset derivative assets and derivative liabilities that are subject to netting arrangements in the Statements of Assets and Liabilities.
>Futures Contracts
Futures contracts are exchange traded and represent commitments for the future purchase or sale of an asset at a specified price on a specified date. Columbia Acorn Fund, Columbia Acorn USA and Columbia Acorn Emerging Markets Fund bought and sold futures contracts to maintain appropriate equity market exposure while keeping sufficient cash to accommodate daily redemptions. These instruments may be used for other purposes in future periods. Upon entering into futures contracts, the Fund bears risks that it may not achieve the anticipated benefits of the futures contracts and may realize a loss. Additional risks include counterparty credit risk, the possibility of an illiquid market, and that a change in the value of the contract or option may not correlate with changes in the value of the underlying asset.
Upon entering into a futures contract, the Fund pledges cash or securities with the broker in an amount sufficient to meet the initial margin requirement. The initial margin deposit must be maintained at an established level over the life of the contract. Cash deposited as initial margin is recorded in the Statement of Assets and Liabilities as margin deposits. Securities deposited as initial margin are designated in the Portfolio of Investments. Subsequent payments (variation margin) are made or received by the Fund each day. The variation margin payments are equal to the daily change in the contract value and are recorded as variation margin receivable or payable and are offset in unrealized gains or losses. The Fund recognizes a realized gain or loss when the contract is
87
COLUMBIA ACORN FAMILY OF FUNDS
NOTES TO FINANCIAL STATEMENTS, CONTINUED
closed or expires. Futures contracts involve, to varying degrees, risk of loss in excess of the variation margin disclosed in the Statement of Assets and Liabilities.
>Effects of derivative transactions in the financial statements
The following tables are intended to provide additional information about the effect of derivatives on the financial statements of Columbia Acorn Fund, Columbia Acorn USA and Columbia Acorn Emerging Markets Fund, including: the fair value of derivatives by risk category and the location of those fair values in the Statements of Assets and Liabilities; and the impact of derivative transactions over the period in the Statements of Operations, including realized gains or losses and unrealized gains or losses. The derivative schedules following the Statements of Investments present additional information regarding derivative instruments outstanding at the end of the period, if any.
Columbia Acorn Fund
At June 30, 2016, the Fund had no outstanding derivatives.
The following table indicates the effect of derivative instruments (not considered to be hedging instruments for accounting disclosure purposes) in the Statement of Operations for the six months ended June 30, 2016:
Amount of Realized Gain (Loss) on
Derivatives Recognized in Income
Risk Exposure Category | | Futures Contracts ($) | |
Equity risk | | | (21,684,530 | ) | |
Change in Unrealized Appreciation (Depreciation)
on Derivatives Recognized in Income
Risk Exposure Category | | Futures Contracts ($) | |
Equity risk | | | (4,292,591 | ) | |
Columbia Acorn USA
At June 30, 2016, the Fund had no outstanding derivatives.
The following table indicates the effect of derivative instruments (not considered to be hedging instruments for accounting disclosure purposes) in the Statement of Operations for the six months ended June 30, 2016:
Amount of Realized Gain (Loss) on
Derivatives Recognized in Income
Risk Exposure Category | | Futures Contracts ($) | |
Equity risk | | | (11,300,776 | ) | |
Change in Unrealized Appreciation (Depreciation)
on Derivatives Recognized in Income
Risk Exposure Category | | Futures Contracts ($) | |
Equity risk | | | (465,285 | ) | |
Columbia Acorn Emerging Markets Fund
At June 30, 2016, the Fund had no outstanding derivatives.
The following table indicates the effect of derivative instruments (not considered to be hedging instruments for accounting disclosure purposes) in the Statement of Operations for the six months ended June 30, 2016:
Amount of Realized Gain (Loss) on
Derivatives Recognized in Income
Risk Exposure Category | | Futures Contracts ($) | |
Equity risk | | | 2,885,350 | | |
>Security transactions and investment income
Security transactions, investment income and shareholder fund transactions are accounted for on the trade date (date the order to buy or sell is executed) and dividend income and realized gain distributions from other funds are recorded on the ex-dividend date, except that certain dividends from foreign securities are recorded as soon as the information is available to the Funds. Interest income is recorded on the accrual basis and includes amortization of discounts on debt obligations when required for federal income tax purposes. Realized gains and losses from security transactions are recorded on an identified cost basis.
Awards, if any, from class action litigation related to securities owned may be recorded as a reduction of cost of those securities. If the applicable securities are no longer owned, the proceeds are recorded as realized gains.
The Funds may receive distributions from holdings in equity securities, exchange-traded funds (ETFs), other regulated investment companies (RICs), and real estate investment trusts (REITs), which report information on the tax character of their distributions annually. These distributions are allocated to dividend income, capital gain and return of capital based on actual information reported. Return of capital is recorded as a reduction of the cost basis of securities held. If the Funds no longer own the applicable securities, return of capital is recorded as a realized gain. With respect to REITs, to the extent actual information has not yet been reported, estimates for return of capital may be made by the Funds' management. Management's estimates are subsequently adjusted when the actual character of the distributions is disclosed by the REITs, which could result in a proportionate change in return of capital to shareholders.
>Fund share valuation
Fund shares are sold and redeemed on a daily basis at net asset value, subject to any applicable sales charge. Net asset value per share is determined daily as of the close of trading on the New York Stock Exchange (NYSE) on each day the NYSE
88
is open for trading. Generally, income, expenses and realized and unrealized gain/(losses) of a Fund are allocated to each class proportionately on a daily basis for purposes of determining the net asset value of each class. The distribution and service fees and transfer agent fees are charged to each specific class as expenses are incurred. Redemption fees are accounted for as an addition to paid in capital for purposes of determining the net asset value of each class.
>Securities lending
Each Fund, except Columbia Thermostat Fund, may lend securities up to one-third of the value of its total assets to certain approved brokers, dealers and other financial institutions to earn additional income. The Funds retain the benefits of owning the securities, including the economic equivalent of dividends or interest generated by the security. The Funds also receive a fee for the loan. The Funds have the ability to recall the loans at any time and could do so in order to vote proxies or to sell the loaned securities. Each loan is collateralized by cash that exceeds the value of the securities on loan. The market value
of the loaned securities is determined daily at the close of business of a Fund and any additional required collateral is delivered to the Fund on the next business day. The Funds have elected to invest the cash collateral in the Dreyfus Government Cash Management Fund. The income earned from the securities lending program is paid to each Fund, net of any fees remitted to Goldman Sachs Agency Lending, the Funds' lending agent, and net of any borrower rebates. The Investment Manager does not retain any fees earned by the lending program. Generally, in the event of borrower default, a Fund has the right to use the collateral to offset any losses incurred. In the event a Fund is delayed or prevented from exercising its right to dispose of the collateral, there may be a potential loss to the Fund. Some of these losses may be indemnified by the lending agent. The Funds bear the risk of loss with respect to the investment of collateral. The net securities lending income earned as of June 30, 2016 by each Fund is included in the Statements of Operations.
>Offsetting of Assets and Liabilities
The following table presents each Fund's gross and net amount of assets and liabilities available for offset under netting agreements and under a securities lending agreement as well as the related collateral received by each Fund as of June 30, 2016:
| | | Columbia
Acorn
Fund | | Columbia
Acorn
International | | Columbia
Acorn
USA | | Columbia
Acorn
International
Select | | Columbia
Acorn
Emerging
Markets
Fund | | Columbia
Acorn
European
Fund | |
| | | Goldman
Sachs ($) | | Goldman
Sachs ($) | | Goldman
Sachs ($) | | Goldman
Sachs ($) | | Goldman
Sachs ($) | | Goldman
Sachs ($) | |
Liabilities | |
Collateral on Securities loaned | | | 111,180,975 | | | | 244,741,965 | | | | 14,582,425 | | | | 4,028,509 | | | | 1,850,375 | | | | 3,224,760 | | |
Total Liabilities | | | 111,180,975 | | | | 244,741,965 | | | | 14,582,425 | | | | 4,028,509 | | | | 1,850,375 | | | | 3,224,760 | | |
Total Financial and Derivative
Net Assets | | | (111,180,975 | ) | | | (244,741,965 | ) | | | (14,582,425 | ) | | | (4,028,509 | ) | | | (1,850,375 | ) | | | (3,224,760 | ) | |
Financial Instruments | | | 108,642,869 | | | | 235,235,982 | | | | 14,187,390 | | | | 3,911,451 | | | | 1,765,880 | | | | 3,110,032 | | |
Net Amount(a) | | | (2,538,106 | ) | | | (9,505,983 | ) | | | (395,035 | ) | | | (117,058 | ) | | | (84,495 | ) | | | (114,728 | ) | |
(a) Represents the net amount due from/(to) counterparties in the event of default.
>Securities Lending Transactions
The following table indicates the total amount of securities loaned by type, reconciled to gross liability payable upon return of the securities loaned by the Fund as of June 30, 2016:
| | | Overnight and
Continuous | | Up to
30 Days | | 30 - 90
Days | | Greater than
90 Days | | Total | |
Columbia Acorn Fund | |
Securities lending transactions | |
Equity securities | | $ | 108,642,869 | | | $ | — | | | $ | — | | | $ | — | | | $ | 108,642,869 | | |
Gross amount of recognized liabilities for securities lending (collateral received) | | | | | | | | | | | 111,180,975 | | |
Amounts due to counterparty | | | | | | | | | | $ | 2,538,106 | | |
89
COLUMBIA ACORN FAMILY OF FUNDS
NOTES TO FINANCIAL STATEMENTS, CONTINUED
| | | Overnight and
Continuous | | Up to
30 Days | | 30 - 90
Days | | Greater than
90 Days | | Total | |
Columbia Acorn International | |
Securities lending transactions | |
Equity securities | | $ | 235,235,982 | | | $ | — | | | $ | — | | | $ | — | | | $ | 235,235,982 | | |
Gross amount of recognized liabilities for securities lending (collateral received) | | | | | | | | | | | 244,741,965 | | |
Amounts due to counterparty | | | | | | | | | | $ | 9,505,983 | | |
Columbia Acorn USA | |
Securities lending transactions | |
Equity securities | | $ | 14,187,390 | | | $ | — | | | $ | — | | | $ | — | | | $ | 14,187,390 | | |
Gross amount of recognized liabilities for securities lending (collateral received) | | | | | | | | | | | 14,582,425 | | |
Amounts due to counterparty | | | | | | | | | | $ | 395,035 | | |
Columbia Acorn International Select | |
Securities lending transactions | |
Equity securities | | $ | 3,911,451 | | | $ | — | | | $ | — | | | $ | — | | | $ | 3,911,451 | | |
Gross amount of recognized liabilities for securities lending (collateral received) | | | | | | | | | | | 4,028,509 | | |
Amounts due to counterparty | | | | | | | | | | $ | 117,058 | | |
Columbia Acorn Emerging Markets Fund | |
Securities lending transactions | |
Equity securities | | $ | 1,765,880 | | | $ | — | | | $ | — | | | $ | — | | | $ | 1,765,880 | | |
Gross amount of recognized liabilities for securities lending (collateral received) | | | | | | | | | | | 1,850,375 | | |
Amounts due to counterparty | | | | | | | | | | $ | 84,495 | | |
Columbia Acorn European Fund | |
Securities lending transactions | |
Equity securities | | $ | 3,110,032 | | | $ | — | | | $ | — | | | $ | — | | | $ | 3,110,032 | | |
Gross amount of recognized liabilities for securities lending (collateral received) | | | | | | | | | | | 3,224,760 | | |
Amounts due to counterparty | | | | | | | | | | $ | 114,728 | | |
>Federal income taxes
It is each Fund's policy to comply with the provisions of the Internal Revenue Code available to regulated investment companies and, in the manner provided therein, distribute substantially all their taxable income, as well as any net realized gain on sales of investments and foreign currency transactions reportable for federal income tax purposes. Columbia Thermostat Fund distributes all of its taxable income, as well as any net realized gain on sales of portfolio fund shares and any distributions of net realized gains received by the Fund from its portfolio funds, reportable for federal income tax purposes. Accordingly, the Funds paid no federal income taxes and no federal income tax provision was required.
>Foreign capital gains taxes
Realized gains in certain countries may be subject to foreign taxes at the fund level. The Funds accrue for such foreign taxes on realized and unrealized gains at the appropriate rate for each jurisdiction. The amount, if any, is disclosed as a liability on the Statements of Assets and Liabilities.
>Distributions to shareholders
Distributions to shareholders are recorded on the ex-dividend date.
>Indemnification
In the normal course of business, the Trust on behalf of the Funds enters into contracts that contain a variety of representations and warranties and that provide general indemnities. A Fund's maximum exposure under these arrangements is unknown, as this would involve future claims against the Fund. Also, under the Trust's organizational documents, the trustees and officers of the Trust are indemnified against certain liabilities that may arise out of their duties to the Trust. However, based on experience, the Funds expect the risk of loss due to these warranties and indemnities to be remote.
3. Federal Tax Information
The timing and character of income and capital gain distributions are determined in accordance with income tax regulations, which may differ from GAAP. Reclassifications are made to the Funds' capital accounts for permanent tax differences to reflect income and gains available for distribution (or available capital loss carryforwards) under income tax regulations.
90
The following capital loss carryforward, determined as of December 31, 2015, may be available to reduce taxable income arising from future net realized gains on investments, if any, to the extent permitted by the Internal Revenue Code:
| | | 2016 | | No
Expiration
Short-Term | | No
Expiration
Long-Term | | Total | |
Columbia Acorn International | | $ | 15,589,450 | | | $ | — | | | $ | — | | | $ | 15,589,450 | | |
Columbia Acorn International Select | | | — | | | | 14,998,452 | | | | — | | | | 14,998,452 | | |
Columbia Acorn Emerging Markets Fund | | | — | | | | 27,217,407 | | | | — | | | | 27,217,407 | | |
Columbia Acorn European Fund | | | — | | | | 3,973,318 | | | | 913,355 | | | | 4,886,673 | | |
Capital loss carryforwards with no expiration are required to be utilized prior to any capital losses which carry an expiration date. As a result of this ordering rule, capital loss carryforwards which carry an expiration date may be more likely to expire unused.
Under current tax rules, Regulated Investment Companies can elect to treat certain late-year ordinary losses incurred and post-October capital losses (capital losses realized after October 31) as arising on the first day of the following taxable year. The Funds have elected to treat the following late-year ordinary losses and post-October capital losses at December 31, 2015, as arising on January 1, 2016:
Fund | | Late-Year
Ordinary
Losses | | Post-October
Capital
Losses | |
Columbia Acorn International | | $ | 5,671,008 | | | $ | — | | |
Columbia Acorn Emerging
Markets Fund | | | 51,105 | | | | 11,581,957 | | |
Management of the Funds has concluded that there are no significant uncertain tax positions in any Fund that would require recognition in the financial statements. However, management's conclusion may be subject to review and adjustment at a later date based on factors including, but not limited to, new tax laws, regulations, and administrative interpretations (including relevant court decisions). Generally, the Funds' federal tax returns for the prior three fiscal years remain subject to examination by the Internal Revenue Service.
4. Fees and Other Transactions With Affiliates
>Investment management fees
CWAM is a wholly-owned subsidiary of Columbia Management Investment Advisers, LLC (Columbia Management), which is a wholly-owned subsidiary of Ameriprise Financial, Inc. (Ameriprise Financial). CWAM furnishes continuing investment supervision to the Funds and is responsible for the overall management of the Funds' business affairs.
CWAM receives a monthly advisory fee based on each Fund's average daily net assets at the following annual rates:
Columbia Acorn Fund
Average Daily Net Assets | | Annual
Fee Rate | |
Up to $700 million | | | 0.74 | % | |
$700 million to $2 billion | | | 0.69 | % | |
$2 billion to $6 billion | | | 0.64 | % | |
| $6 billion and over | | | 0.63 | % | |
Columbia Acorn International
Average Daily Net Assets | | Annual
Fee Rate | |
Up to $100 million | | | 1.19 | % | |
$100 million to $500 million | | | 0.94 | % | |
| $500 million and over | | | 0.74 | % | |
Columbia Acorn USA
Average Daily Net Assets | | Annual
Fee Rate | |
Up to $200 million | | | 0.94 | % | |
$200 million to $500 million | | | 0.89 | % | |
$500 million to $2 billion | | | 0.84 | % | |
$2 billion to $3 billion | | | 0.80 | % | |
| $3 billion and over | | | 0.70 | % | |
Columbia Acorn International Select, prior to July 1, 2016
| Average Daily Net Assets | | Annual
Fee Rate | |
Up to $500 million | | | 0.94 | % | |
| $500 million and over | | | 0.90 | % | |
Columbia Acorn International Select, effective July 1, 2016
Average Daily Net Assets | | Annual
Fee Rate | |
Up to $500 million | | | 0.89 | % | |
| $500 million and over | | | 0.85 | % | |
Columbia Acorn Select
Average Daily Net Assets | | Annual
Fee Rate | |
Up to $700 million | | | 0.85 | % | |
$700 million to $2 billion | | | 0.80 | % | |
$2 billion to $3 billion | | | 0.75 | % | |
| $3 billion and over | | | 0.70 | % | |
Columbia Thermostat Fund
| | | Annual
Fee Rate | |
All Average Daily Net Assets | | | 0.10 | % | |
91
COLUMBIA ACORN FAMILY OF FUNDS
NOTES TO FINANCIAL STATEMENTS, CONTINUED
Columbia Acorn Emerging Markets Fund
Average Daily Net Assets | | Annual
Fee Rate | |
Up to $100 million | | | 1.25 | % | |
$100 million to $500 million | | | 1.00 | % | |
| $500 million and over | | | 0.80 | % | |
Columbia Acorn European Fund
Average Daily Net Assets | | Annual
Fee Rate | |
Up to $100 million | | | 1.19 | % | |
$100 million to $500 million | | | 0.94 | % | |
| $500 million and over | | | 0.74 | % | |
Through April 30, 2017, CWAM has contractually agreed to waive 0.20% of the advisory fee otherwise payable to it by Columbia Acorn Select. When determining whether the Fund's total expenses exceed the voluntary expense cap described
below, the Fund's net advisory fee, reflecting application of the 0.20% waiver, will be used to calculate the Fund's total expenses. This arrangement may be modified or amended with approval from all parties to the arrangement, including the Fund and CWAM.
For the six months ended June 30, 2016, the annualized effective investment advisory fee rates (net of the advisory fee waiver for Columbia Acorn Select) were as follows:
Fund | |
Columbia Acorn Fund | | | 0.66 | % | |
Columbia Acorn International | | | 0.76 | % | |
Columbia Acorn USA | | | 0.89 | % | |
Columbia Acorn International Select | | | 0.94 | % | |
Columbia Acorn Select | | | 0.65 | % | |
Columbia Thermostat Fund | | | 0.10 | % | |
Columbia Acorn Emerging Markets Fund | | | 1.13 | % | |
Columbia Acorn European Fund | | | 1.19 | % | |
>Expenses waived/reimbursed by the investment manager and its affiliates
Effective July 1, 2016, CWAM has contractually agreed to waive fees indefinitely and reimburse expenses so that the Funds' ordinary operating expenses (excluding transaction costs and certain other investment-related expenses, interest and fees on borrowings and expenses associated with the Fund's investments in other investment companies, if any) do not exceed the following annual rates as a percentage of each class' average daily net assets:
Fund | | Class A | | Class C | | Class I | | Class R4 | | Class R5 | | Class Y | | Class Z | |
Columbia Acorn International Select | | | 1.40 | % | | | 2.15 | % | | | 1.02 | % | | | 1.15 | % | | | 1.07 | % | | | 1.02 | % | | | 1.15 | % | |
This arrangement may not be modified or terminated, except by a vote of the Fund's Board and CWAM.
Effective May 1, 2016, CWAM has voluntarily agreed to reimburse expenses so that the Funds' ordinary operating expenses (excluding transaction costs and certain other investment-related expenses, interest and fees on borrowings and expenses associated with each Fund's investments in other investment companies, if any) after giving effect to any balance credits or overdraft charges from the Funds' custodian, do not exceed the following annual rates as a percentage of each class' average daily net assets:
Fund | | Class A | | Class C | | Class I | | Class R4 | | Class R5 | | Class Y | | Class Z | |
Columbia Acorn International Select | | | 1.70 | % | | | 2.45 | % | | | 1.34 | % | | | 1.45 | % | | | 1.39 | % | | | 1.34 | % | | | 1.45 | % | |
Columbia Acorn Select | | | 1.60 | % | | | 2.35 | % | | | 1.25 | % | | | 1.35 | % | | | 1.30 | % | | | 1.25 | % | | | 1.35 | % | |
These arrangements may be modified or terminated by either the Funds or CWAM on 30 days notice.
Through April 30, 2016, CWAM voluntarily agreed to reimburse expenses so that the Funds' ordinary operating expenses (excluding transaction costs and certain other investment-related expenses, interest and fees on borrowings and expenses associated with each Fund's investments in other investment companies, if any) after giving effect to any balance credits or overdraft charges from the Funds' custodian, do not exceed the following annual rates as a percentage of each class' average daily net assets:
Fund | | Class A | | Class C | | Class I | | Class R4 | | Class R5 | | Class Y | | Class Z | |
Columbia Acorn International Select | | | 1.70 | % | | | 2.45 | % | | | 1.37 | % | | | 1.45 | % | | | 1.42 | % | | | 1.37 | % | | | 1.45 | % | |
Columbia Acorn Select | | | 1.60 | % | | | 2.35 | % | | | 1.25 | % | | | 1.35 | % | | | 1.30 | % | | | 1.25 | % | | | 1.35 | % | |
Effective May 1, 2016, CWAM has contractually agreed to waive fees and/or reimburse expenses through April 30, 2017, so that the Funds' ordinary operating expenses (excluding transaction costs and certain other investment-related expenses, interest and fees on borrowings and expenses associated with each Fund's investments in other investment companies, if any, and in the case of Columbia Thermostat Fund its underlying portfolio funds), do not exceed the following annual rates as a percentage of each class' average daily net assets:
Fund | | Class A | | Class C | | Class I | | Class R4 | | Class R5 | | Class Y | | Class Z | |
Columbia Thermostat Fund | | | 0.50 | % | | | 1.25 | % | | | — | | | | 0.25 | % | | | 0.24 | % | | | 0.19 | % | | | 0.25 | % | |
Columbia Acorn Emerging Markets Fund | | | 1.85 | % | | | 2.60 | % | | | 1.45 | % | | | 1.60 | % | | | 1.50 | % | | | 1.45 | % | | | 1.60 | % | |
Columbia Acorn European Fund | | | 1.75 | % | | | 2.50 | % | | | 1.42 | % | | | 1.50 | % | | | 1.47 | % | �� | | — | | | | 1.50 | % | |
There is no guarantee that these agreements will continue thereafter.
92
Through April 30, 2016, CWAM contractually waived fees and/or reimburse expenses so that the Funds' ordinary operating expenses (excluding transaction costs and certain other investment-related expenses, interest and fees on borrowings and expenses associated with each Fund's investments in other investment companies, if any, and in the case of Columbia Thermostat Fund its underlying portfolio funds), did not exceed the following annual rates as a percentage of each class' average daily net assets:
Fund | | Class A | | Class C | | Class I | | Class R4 | | Class R5 | | Class Y | | Class Z | |
Columbia Thermostat Fund | | | 0.50 | % | | | 1.25 | % | | | — | | | | 0.25 | % | | | 0.24 | % | | | 0.19 | % | | | 0.25 | % | |
Columbia Acorn Emerging Markets Fund | | | 1.85 | % | | | 2.60 | % | | | 1.48 | % | | | 1.60 | % | | | 1.53 | % | | | 1.48 | % | | | 1.60 | % | |
Columbia Acorn European Fund | | | 1.75 | % | | | 2.50 | % | | | 1.41 | % | | | 1.50 | % | | | 1.46 | % | | | — | | | | 1.50 | % | |
Expenses waived and/or reimbursed by CWAM and its affiliates for the six months ended June 30, 2016, were as follows:
Fund | | Expenses
Reimbursed | |
Columbia Acorn Fund | | $ | — | | |
Columbia Acorn International | | | 156,525 | | |
Columbia Acorn USA | | | — | | |
Columbia Acorn International Select | | | 39 | | |
Columbia Acorn Select | | | 361,504 | | |
Columbia Acorn Emerging Markets Fund | | | 9,643 | | |
Columbia Thermostat Fund | | | 236,782 | | |
Columbia Acorn European Fund | | | 69,253 | | |
CWAM is contractually entitled to recoup from each of Columbia Acorn Emerging Markets Fund and Columbia Acorn European Fund any fees waived and/or expenses reimbursed with respect to any share class offered by Columbia Acorn Emerging Markets Fund and Columbia Acorn European Fund for a one year period following the date of such fee waiver and/or reimbursement, if such recovery does not cause the ordinary operating expenses of the Fund (excluding transaction costs and certain other investment-related expenses, interest and fees on borrowings and expenses associated with the Fund's investment in other investment companies, if any) to exceed the annual rates set forth above, or to exceed such annual rate as may be in place at the time of the recoupment, whichever is less. For the six months ended June 30, 2016, there was no recoupment of fees.
>Administration fees
CWAM provides administrative services and receives an administration fee from the Funds at the following annual rates:
Columbia Acorn Trust
Aggregate Average Daily
Net Assets of the Trust | | Annual
Fee Rate | |
Up to $8 billion | | | 0.050 | % | |
$8 billion to $16 billion | | | 0.040 | % | |
$16 billion to $35 billion | | | 0.030 | % | |
$35 billion to $45 billion | | | 0.025 | % | |
| $45 billion and over | | | 0.015 | % | |
For the six months ended June 30, 2016, the annualized effective administration fee rate was 0.05% of each Fund's average daily net assets. CWAM has delegated to Columbia Management responsibility to provide certain sub-administrative services to the Funds.
CMID, a wholly owned subsidiary of Ameriprise Financial, is the distributor of the Funds.
>Sales charges
Sales charges, including front-end and CDSCs, received by the Distributor for distributing each Fund's shares for the six months ended June 30, 2016 are as follows:
| | | Underwriting
Discounts | | CDSCs | |
(Unaudited) | | Class A | | Class A | | Class B | | Class C | |
Columbia Acorn Fund | | $ | 193,330 | | | $ | 17 | | | $ | — | | | $ | 2,599 | | |
Columbia Acorn
International | | | 132,241 | | | | 154 | | | | 6 | | | | 1,772 | | |
Columbia Acorn USA | | | 18,537 | | | | 50 | | | | — | | | | 40 | | |
Columbia Acorn
International Select | | | 6,211 | | | | 1 | | | | — | | | | 262 | | |
Columbia Acorn Select | | | 20,275 | | | | 56 | | | | — | | | | 103 | | |
Columbia
Thermostat Fund | | | 444,428 | | | | — | | | | — | | | | 11,784 | | |
Columbia Acorn
Emerging Markets Fund | | | 11,632 | | | | 22 | | | | — | | | | 304 | | |
Columbia Acorn
European Fund | | | 19,279 | | | | — | | | | — | | | | — | | |
>Distribution and service fees
Each Fund has adopted a distribution and service plan which requires it to pay CMID a monthly service fee equal to 0.25% annually of the average daily net assets attributable to Class A, Class B and Class C shares and a monthly distribution fee equal to 0.50%, 0.75% and 0.50%, annually, of the average daily net assets attributable to Class B, Class C and Class R shares, respectively. CMID receives no compensation with respect to Class R4, Class R5, Class Y and Class Z shares.
>Transfer agency fees
Columbia Management Investment Services Corp. (CMIS), a wholly owned subsidiary of Ameriprise Financial, is the transfer
93
COLUMBIA ACORN FAMILY OF FUNDS
NOTES TO FINANCIAL STATEMENTS, CONTINUED
agent of the Funds. CMIS receives monthly account-based service fees based on the number of open Fund accounts. Each Fund pays CMIS a monthly fee at the annual rate of $20.00 per open account. Subject to certain limitations, the Funds reimburse payments made by CMIS to financial intermediaries for the shareholder services that the intermediaries provide, in amounts that vary by share class and with the type of intermediary and type of shareholder services provided.
The Transfer Agent also receives compensation from fees for various shareholder services and reimbursements for certain out-of-pocket fees. Total transfer agency fees for Class R5 shares are subject to an annual limitation of not more than 0.05% of the average daily net assets attributable to Class R5 shares. Class I shares and Class Y shares do not pay transfer agency fees.
For the six months ended June 30, 2016, the Funds' effective transfer agency fee rates as a percentage of average daily net assets of each class were as follows:
Fund | | Class A | | Class B | | Class C | | Class R | | Class R4 | | Class R5 | | Class Z | |
Columbia Acorn Fund | | | 0.12 | % | | | — | | | | 0.09 | % | | | — | | | | 0.19 | % | | | 0.05 | % | | | 0.06 | % | |
Columbia Acorn International | | | 0.18 | % | | | 0.49 | % | | | 0.15 | % | | | 0.25 | % | | | 0.20 | % | | | 0.05 | % | | | 0.10 | % | |
Columbia Acorn USA | | | 0.16 | % | | | — | | | | 0.10 | % | | | — | | | | 0.19 | % | | | 0.05 | % | | | 0.16 | % | |
Columbia Acorn International Select | | | 0.16 | % | | | — | | | | 0.20 | % | | | — | | | | 0.15 | % | | | 0.05 | % | | | 0.11 | % | |
Columbia Acorn Select | | | 0.14 | % | | | — | | | | 0.12 | % | | | — | | | | 0.15 | % | | | 0.05 | % | | | 0.10 | % | |
Columbia Thermostat Fund | | | 0.08 | % | | | — | | | | 0.07 | % | | | — | | | | 0.11 | % | | | 0.05 | % | | | 0.06 | % | |
Columbia Acorn Emerging Markets Fund | | | 0.16 | % | | | — | | | | 0.18 | % | | | — | | | | 0.14 | % | | | 0.05 | % | | | 0.15 | % | |
Columbia Acorn European Fund | | | 0.12 | % | | | — | | | | 0.13 | % | | | — | | | | 0.21 | % | | | 0.05 | % | | | 0.08 | % | |
Columbia Acorn International and certain other associated investment companies, have severally, but not jointly, guaranteed the performance and observance of all the terms and conditions of a lease entered into by Seligman Data Corp. (SDC), the former transfer agent to certain associated investment companies, including the payment of rent by SDC (the Guaranty). The lease and the Guaranty expire in January 2019. At June 30, 2016, Columbia Acorn International's total potential future obligation over the life of the Guaranty is $52,739. The liability remaining at June 30, 2016 for non-recurring charges associated with the lease amounted to $32,241 and is included within the "Payable for Other liabilities" in the Statements of Assets and Liabilities.
CMIS has contractually agreed to waive transfer agency fees payable by Class B shares of Columbia Acorn International through April 30, 2017. This fee waiver may only be modified or amended with approval from the Fund's Board and CMIS. CMIS also has voluntarily agreed to waive a portion of the total annual Fund operating expenses attributable to transfer agency fees incurred by Class A and Class C shares of Columbia Acorn International such that the Fund's total annual Fund operating expenses will be reduced by 0.04% and 0.02% for Class A and Class C shares of the Fund, respectively. Prior to March 18, 2016, CMIS voluntarily agreed to waive a portion of the total annual Fund operating expenses attributable to transfer agency fees incurred by Class B shares of Columbia Acorn International such that the Fund's total annual Fund operating expenses was reduced by 0.03%.
>Compensation of board members
Certain officers and trustees of the Trust are also officers of CWAM. The Trust makes no direct payments to its officers and trustees who are affiliated with CWAM. The Trust offers a deferred compensation plan for its independent trustees. Under that plan, a trustee may elect to defer all or a portion of his or her compensation. Amounts deferred are retained by the Trust and may represent an unfunded obligation of the Trust. The value of amounts deferred is determined by reference to the change in value of Class Z shares of one or more series of the Trust or a money market fund as specified by the trustee. Benefits under the deferred compensation plan are payable in accordance with the plan.
>Compensation of chief compliance officer
The Board has appointed a Chief Compliance Officer of the Trust in accordance with federal securities regulations. The Funds, along with other affiliated funds are allocated a portion of certain of the expenses associated with the office of the Chief Compliance Officer based on relative net assets of each fund.
>Transactions with affiliates
An affiliated person of a Fund may include any company in which a Fund owns five percent or more of its outstanding voting shares during the year. On June 30, 2016, Columbia Acorn Fund and Columbia Thermostat Fund held five percent or more of the outstanding voting securities of one or more companies or a company which is under common ownership or control with the Funds. Details of investments in those affiliated companies are presented in the Notes to Statement of Investments of each Fund listed above.
94
For the six months ended June 30, 2016, the Funds engaged in purchase and sales transactions with funds that have a common investment manager (or affiliated investment managers), common directors/trustees, and/or common officers. Those transactions complied with Rule 17a-7 under the 1940 Act and totaled as follows:
| | | Purchases | | Sales | | Realized
gain/(loss)
from sale
transactions | |
| Columbia Acorn Fund $43,059,057 | | $ | 1,448,999 | | | | $( | | | | 4,995,001 | ) | |
Columbia Acorn
International | | | 7,548,762 | | | | 35,440,971 | | | | (7,377,649 | ) | |
Columbia Acorn USA | | | — | | | | 17,716,509 | | | | 1,729,819 | | |
Columbia Acorn
International Select | | | 229,440 | | | | 212,520 | | | | (732,611 | ) | |
Columbia Acorn Select | | | — | | | | 1,931,604 | | | | (6,658,029 | ) | |
Columbia Acorn
Emerging
Markets Fund | | | 559,014 | | | | 357,940 | | | | (320,047 | ) | |
Columbia Acorn
European Fund | | | 544,146 | | | | — | | | | — | | |
5. Borrowing Arrangements
During the period January 1, 2016 through April 28, 2016, the Trust participated in a revolving credit facility in the amount of $400 million with a syndicate of banks led by JPMorgan Chase Bank, N.A., along with Wanger Advisors Trust, another trust managed by CWAM. Effective April 28, 2016, the credit facility was renewed in the amount of $200 million with a syndicate of banks led by JPMorgan Chase Bank, N.A. Under each facility, interest is charged to each participating Fund based on its borrowings at a rate per annum equal to the Federal Funds Rate plus 1.00%. In addition, a commitment fee of 0.08% (before April 28, 2016) and 0.15% (after April 28, 2016) per annum of the unutilized line of credit is accrued and apportioned among the participating Funds based on their relative net assets. The commitment fee is disclosed as a part of "Other expenses" in the Statement of Operations. The Trust expects to renew this line of credit for one year durations each April at then current market rates and terms.
For the six months ended June 30, 2016, the average daily loan balance outstanding on days when borrowing existed was as follows. Interest expense incurred by the Fund is recorded as Interest expense in the Statements of Operations.
Fund Name | | Average Daily
Loan Balance
Outstanding | | Weighted Average
Interest Rate | |
Columbia Acorn Fund | | $ | 9,500,000 | | | | 1.44 | % | |
Columbia Acorn
Emerging Markets Fund | | | 8,800,000 | | | | 1.37 | | |
6. Investment Transactions
The aggregate cost of purchases and proceeds from sales, other than short-term obligations, for the six months ended June 30, 2016, were:
| | | Purchases | | Proceeds from
Sales | |
Columbia Acorn Fund | | $ | 3,167,685,093 | | | $ | 4,095,350,546 | | |
Columbia Acorn
International | | | 1,661,826,449 | | | | 2,394,062,800 | | |
Columbia Acorn USA | | | 404,304,415 | | | | 605,545,747 | | |
Columbia Acorn
International Select | | | 35,060,086 | | | | 61,508,449 | | |
Columbia Acorn Select | | | 189,370,349 | | | | 251,956,230 | | |
Columbia Thermostat Fund | | | 678,522,893 | | | | 655,380,815 | | |
Columbia Acorn
Emerging Markets Fund | | | 39,274,798 | | | | 144,051,744 | | |
Columbia Acorn
European Fund | | | 17,658,528 | | | | 21,656,389 | | |
The amount of purchase and sales activity impacts the portfolio turnover rate reported in the Financial Highlights.
7. Regulatory Settlements
During the period ended December 31, 2015, Columbia Acorn International Select recorded a receivable of $33,279 as a result of a regulatory settlement proceeding brought by the Securities and Exchange Commission against third parties relating to market timing and/or late trading of mutual funds. This amount represented the Fund's portion of the proceeds from the settlement (neither the Fund nor the Investment Manager were a party to the proceeding). The payments have been included in Proceeds from regulatory settlements in the Statement of Changes in Net Assets.
8. Shareholder Concentration
At June 30, 2016, the table below details the affiliated and significant unaffiliated shareholder account ownership of outstanding shares of each Fund. The Funds have no knowledge about whether any portion of these unaffiliated shares were owned beneficially. Subscription and redemption activity of these accounts may have a significant effect on the operations of the Funds.
Fund | | Number of
unaffiliated
accounts | | Percentage of
shares
outstanding
held –
unaffiliated | | Percentage of
shares
outstanding
held –
affiliated | |
Columbia Acorn Fund | | | 1 | | | | — | % | | | 10.6 | % | |
Columbia Acorn International | | | 2 | | | | 27.8 | % | | | — | % | |
Columbia Acorn USA | | | 2 | | | | 55.1 | % | | | — | % | |
Columbia Acorn
International Select | | | 2 | | | | 33.0 | % | | | 13.1 | % | |
Columbia Acorn Select | | | 1 | | | | 17.6 | % | | | 17.1 | % | |
Columbia Thermostat Fund | | | 1 | | | | 18.9 | % | | | 23.9 | | |
Columbia Acorn Emerging
Markets Fund | | | 1 | | | | 10.1 | % | | | 34.4 | % | |
Columbia Acorn European Fund | | | — | | | | — | % | | | 47.7 | % | |
95
COLUMBIA ACORN FAMILY OF FUNDS
NOTES TO FINANCIAL STATEMENTS, CONTINUED
9. Subsequent Events
Management has evaluated the events and transactions that have occurred through the date the financial statements were issued and noted no items requiring adjustment of the financial statements or additional disclosure.
10. Information Regarding Pending and Settled Legal Proceedings
Ameriprise Financial and certain of its affiliates have historically been involved in a number of legal, arbitration and regulatory proceedings, including routine litigation, class actions, and governmental actions, concerning matters arising in connection with the conduct of their business activities. Ameriprise Financial believes that the Funds are not currently the subject of, and that neither Ameriprise Financial nor any of its affiliates are the subject of, any pending legal, arbitration or regulatory proceedings that are likely to have a material adverse effect on the Funds or the ability of Ameriprise Financial or its affiliates to perform under their contracts with the Funds. Ameriprise Financial is required to make quarterly (10-Q), annual (10-K) and, as necessary, 8-K filings with the Securities and Exchange Commission on legal and regulatory matters that relate to Ameriprise Financial and its affiliates. Copies of these filings may be obtained by accessing the SEC website at www.sec.gov.
There can be no assurance that these matters, or the adverse publicity associated with them, will not result in increased fund redemptions, reduced sale of fund shares or other adverse consequences to the Funds. Further, although we believe proceedings are not likely to have a material adverse effect on the Funds or the ability of Ameriprise Financial or its affiliates to perform under their contracts with the Funds, these proceedings are subject to uncertainties and, as such, we are unable to estimate the possible loss or range of loss that may result. An adverse outcome in one or more of these proceedings could result in adverse judgments, settlements, fines, penalties or other relief that could have a material adverse effect on the consolidated financial condition or results of operations of Ameriprise Financial.
96
BOARD APPROVAL OF THE ADVISORY AGREEMENT
Columbia Acorn Trust (the "Trust") has an investment advisory agreement (the "Advisory Agreement") with Columbia Wanger Asset Management, LLC ("CWAM") under which CWAM manages the Columbia Acorn Funds (each, a "Fund," and together, the "Funds"). More than 75% of the trustees of the Trust (the "Trustees") are persons who have no direct or indirect interest in the Advisory Agreement and are not "interested persons" (as defined in the Investment Company Act of 1940, as amended (the "1940 Act")) of the Trust (the "Independent Trustees"). The Trustees oversee the management of each Fund and, as required by law, determine at least annually whether to continue the Advisory Agreement for each Fund.
The Contract Committee (the "Contract Committee") of the Board of Trustees (the "Board"), which is comprised solely of Independent Trustees, makes recommendations to the Board regarding any proposed continuation of the Advisory Agreement. After the Contract Committee has made its recommendations, the full Board determines whether to approve continuation of the Advisory Agreement. The Board also considers matters bearing on the Advisory Agreement at its various meetings throughout the year, meets at least quarterly with CWAM investment personnel (as does the Board's Investment Performance Analysis Committee (the "Performance Committee")), and receives monthly reports from CWAM on the performance of the Funds.
In connection with their most recent consideration of the Advisory Agreement for each Fund, the Contract Committee and all Trustees received and reviewed a substantial amount of information provided by CWAM, Columbia Management Investment Advisers, LLC ("Columbia Management") and the parent of CWAM and Columbia Management, Ameriprise Financial, Inc. ("Ameriprise"), in response to written requests from the Independent Trustees and their independent legal counsel. Throughout the process, the Trustees had numerous opportunities to ask questions of and request additional materials from CWAM, Columbia Management and Ameriprise.
During each meeting at which the Contract Committee or the Independent Trustees considered the Advisory Agreement, they met in at least one executive session with their independent legal counsel. The Contract Committee also met with representatives of CWAM, Columbia Management and Ameriprise on several occasions. In all,
the Contract Committee convened formally on seven separate occasions to consider the continuation of the Advisory Agreement. The Board and/or some or all of the Independent Trustees met on other occasions to receive the Contract Committee's status reports, receive presentations from CWAM, Columbia Management and Ameriprise representatives, and/or to discuss outstanding issues. In addition, the Performance Committee, also comprised exclusively of Independent Trustees, reviewed the performance of the Funds, met in joint meetings with the Contract Committee, and reported to the Board and/or the Contract Committee throughout the year. The chair of the Compliance Committee of the Board (the "Compliance Committee") serves on the Contract Committee and made available relevant information with respect to matters within the realm of its oversight responsibilities.
The materials reviewed by the Contract Committee and the Trustees included, among other items, (i) information on the investment performance of each Fund relative to independently selected peer groups of funds and the Funds' performance benchmarks over various time periods, as presented and analyzed by independent consultants, (ii) information on each Fund's advisory fees and other expenses, including information comparing the Fund's fees and expenses to those of peer groups of funds and information about any applicable expense limitations and fee breakpoints, (iii) data on sales and redemptions of Fund shares, and (iv) information on the profitability to CWAM and Ameriprise, as well as potential "fall-out" or ancillary benefits that CWAM and its affiliates may receive as a result of their relationships with the Funds. The Contract Committee and the Trustees also considered other information such as (i) CWAM's financial condition, (ii) each Fund's investment objective and strategy, (iii) the size, education and experience of CWAM's investment staff and its use of technology, external research and trading cost measurement tools and level of resources devoted to the Funds, (iv) the portfolio manager compensation framework, (v) the allocation of the Funds' brokerage, and the use of "soft" commission dollars to pay for research products and services, (vi) CWAM's risk management program, (vii) the resources devoted to, and the record of compliance with, the Funds' investment policies and restrictions, policies on personal securities transactions and other compliance policies and procedures, and (viii) CWAM's and its affiliates' conflicts of interest.
97
BOARD APPROVAL OF THE ADVISORY AGREEMENT, continued
At a meeting held on June 7, 2016, the Board considered and unanimously approved the continuation of the Advisory Agreement. In considering the continuation of the Advisory Agreement, the Trustees reviewed and analyzed various factors that they determined were relevant, none of which by itself was considered dispositive. The material factors and conclusions that formed the basis for the Trustees' determination to approve the continuation of the Advisory Agreement are discussed below.
Nature, quality and extent of services. The Trustees reviewed the nature, quality and extent of the services provided by CWAM and its affiliates to the Funds under the Advisory Agreement, taking into account the investment objective and strategy of each Fund, their shareholder base, and knowledge gained from meetings with management, which were held on at least a quarterly basis. In addition, the Trustees reviewed the available resources and key personnel of CWAM and its affiliates, especially those providing investment management services to the Funds. The Trustees also considered other services provided to the Funds by CWAM and its affiliates, including: managing the execution of portfolio transactions and selecting broker-dealers for those transactions; monitoring adherence to the Funds' investment restrictions; producing shareholder reports; providing support services for the Board and committees of the Board; managing the Funds' securities lending program; communicating with shareholders; serving as the Funds' administrator; and overseeing the activities of the Funds' other service providers, including monitoring for compliance with various policies and procedures as well as applicable securities laws and regulations. The Trustees also noted the quality of CWAM's compliance record.
The Trustees took into account the extensive process changes made by CWAM affecting Columbia Acorn Fund, Columbia Acorn USA and Columbia Acorn Select in the past year to improve Fund performance, including but not limited to: the hiring of a new portfolio manager for Columbia Acorn Fund and Columbia Acorn USA and director of research (U.S.); the addition of more systematic and quantitative tools and risk-based analysis into the portfolio management process; the significant reduction in the number of Fund holdings in 2015, enhancements to the research process, and increased concentration of the portfolio in high conviction names; and certain other portfolio manager and analyst
changes. The Trustees believed that CWAM's extensive and focused efforts to improve these domestic Funds' performance were reasonable and appropriate. For the four international Funds, the Trustees took into account changes made by CWAM in the past year to improve Fund performance, including but not limited to: changes to Fund portfolio holdings in 2015; the addition of more systematic and quantitative tools and risk-based analysis into the portfolio management process; an emphasis on more liquid stocks with more growth potential; and changing certain portfolio managers and analysts.
The Trustees concluded that the nature, quality and extent of the services provided by CWAM and its affiliates to each Fund under the Advisory Agreement were appropriate for the Funds and that the Funds were likely to benefit from the continued provision of those services by CWAM. They also concluded that CWAM currently had sufficient personnel, with appropriate education and experience, to serve the Funds effectively, and that the firm had demonstrated its continuing ability to attract and retain well-qualified personnel. The Trustees also considered that Ameriprise had previously committed to the Board that CWAM would have sufficient investment management resources to continue to improve performance, including but not limited to resources to continue hiring additional analysts and other investment and operational personnel. Based on these changes and assurances, the Trustees believed that CWAM would have sufficient resources to attract and retain personnel as necessary to improve performance.
Performance of the Funds. The Trustees received and considered detailed performance information at various meetings of the Board, the Contract Committee and the Performance Committee throughout the year. They reviewed information comparing each Fund's performance with that of its benchmark(s) and with the performance of comparable funds and peer groups as identified by independent consultants Broadridge Financial Solutions, Inc. ("Broadridge") and Morningstar, Inc. ("Morningstar") taking into account that each service had a different methodology for calculating the Funds' total returns. The Trustees evaluated the performance and risk characteristics of the Funds over various time periods, including over the one-, three- and five-year periods ended December 31, 2015 as well as longer periods in some cases. The Trustees also considered peer performance
98
rankings for similar time periods and with respect to the changes to the international Funds' primary benchmarks effective January 1, 2016.
The Trustees noted that Columbia Acorn International was ranked below median against its Morningstar and Broadridge peers over the one-, three- and five-year periods. The Trustees noted that the Fund's performance was being monitored closely by the Board and the Performance Committee and that CWAM had discussed with the Performance Committee the reasons for the underperformance and the measures being taken to enhance the Fund's performance as described above.
The Trustees considered that Columbia Acorn International Select's performance was ranked below median among its Broadridge and Morningstar peers for the one-, three- and five-year periods ended December 31, 2015. The Trustees considered CWAM's explanation for the underperformance and the steps being taken to improve the performance of the Fund, which included portfolio management changes, repositioning the Fund to hold higher capitalization stocks and the other changes discussed above.
The Trustees reviewed the performance for Columbia Acorn Emerging Markets Fund and noted that the Fund had outperformed the median for its Broadridge peer group for the three-year period but had underperformed its Broadridge peer group median for the one-year period and its Morningstar peer group median for the one- and three-year periods. The Board considered CWAM's assessment of the reasons for the Fund's underperformance and the steps currently being undertaken to improve performance.
The Trustees noted that Columbia Acorn European Fund had outperformed the median of the Morningstar peer rankings for the one- and three-year periods, performed below the Broadridge peer group median for the one-year period but outperformed the Broadridge peer group median for the three-year period The Trustees considered the explanation for the Fund's underperformance and the plan being implemented to improve its performance as provided by CWAM.
The Trustees considered that the domestic Funds generally had unsatisfactory performance as of December 31, 2015, but that a number of intensive remediation plans were in place to improve performance, as described above. The Trustees noted that CWAM had shown satisfactory focus on improving the performance of the
domestic Funds through the addition of many new resources, but that some time needed to pass before the impact on performance could be determined.
The Trustees took into account that Columbia Acorn Fund had underperformed its Morningstar and Broadridge peer medians over the one-, three- and five-year periods, ended December 31, 2015, although its performance had shown improvement in the one-year period versus its peers. The Trustees also evaluated the Fund's risk ratings. They considered CWAM's explanation for the Fund's underperformance and steps being taken to improve performance, including emphasizing a more disciplined stock selection and portfolio construction process, along with the other changes discussed above. The Trustees believed that CWAM's performance remediation plan was reasonably designed to improve Columbia Acorn Fund's performance.
The Trustees considered that Columbia Acorn Select had outperformed its Morningstar and Broadridge peer medians over the one-year period ended December 31, 2015, and had outperformed its Broadridge peer median for the three-year period, but had underperformed its Morningstar peer medians for the three- and five-year periods. The Trustees considered that CWAM had taken steps to reduce risk and volatility in the Fund's portfolio and added additional resources to the management of the Fund in the past two years in order to improve performance. The Trustees believed that CWAM was continuing to devote appropriate resources to remediating Columbia Acorn Select's underperformance.
The Trustees considered that Columbia Acorn USA fell short of the medians of its Morningstar and Broadridge peers for the one-, three- and five-year periods ended December 31, 2015, although performance had improved during the immediately prior one-year period. The Trustees noted Columbia Acorn USA's risk ratings versus peers. They considered CWAM's explanation for the Fund's underperformance and believed the performance remediation plan provided by CWAM was reasonably designed to improve the Fund's performance, as described above.
The Trustees considered that Columbia Thermostat Fund ranked well versus its Morningstar peer group, outperforming the median over the one-year period, but underperformed its peer medians over the three- and five-year periods. The Trustees noted that Broadridge could not
99
BOARD APPROVAL OF THE ADVISORY AGREEMENT, continued
construct an appropriate peer group for the Fund because of its unique strategy. The Trustees also noted that Columbia Thermostat Fund's more recent performance had improved versus its peers.
The Trustees also took into consideration each Fund's performance versus its current benchmark as of January 1, 2016, and its former benchmark, as applicable, as reported by both Morningstar and Broadridge, noting that each service calculated the Funds' total returns using a different methodology with varying results.
The Trustees concluded that CWAM had taken, and continued to take, a number of corrective steps to improve performance of the underperforming Funds, although it would take some time to determine their effectiveness, and that the Performance Committee was monitoring the underperforming Funds' performance closely. In addition the Trustees considered that the Chief Investment Officer (the "CIO") of CWAM had reported to them at numerous Contract Committee, Performance Committee and Board meetings on the corrective steps being taken to improve Fund performance, and that members of the Contract Committee had met separately with the CIO on multiple occasions to discuss the underperforming Funds. The Trustees also took into account that the new director of research (U.S.) had met several times with the Contract Committee and the Performance Committee to review the changes made to the domestic Funds' investment process to improve performance.
Costs of Services and Profits Realized by CWAM. At various Committee and Board meetings, the Trustees examined detailed information on the fees and expenses of each Fund in comparison to information for comparable funds provided by Broadridge and Morningstar. The Trustees reviewed data from Broadridge and Morningstar and believed that in general the Funds' total net operating expenses were competitive with peers for Columbia Acorn Fund, Columbia Acorn Select, Columbia Acorn Emerging Markets Fund, Columbia Acorn International, Columbia Acorn International Select and Columbia Thermostat Fund and that Columbia Acorn USA had total net operating expenses that were lower than the median in one service but higher than the median in the other service. They also considered that Columbia Acorn European Fund had total net expenses that were less competitive with its peer groups in both services.
The Trustees also took into account that: the actual advisory fees paid by Columbia Acorn Fund, Columbia Acorn International and Columbia Acorn International Select were lower than both their Morningstar and Broadridge peer group medians or close to the median; the actual advisory fees paid by Columbia Acorn European Fund were higher than the median advisory fee of the Fund's Broadridge and Morningstar peer groups; and the actual advisory fee paid by Columbia Acorn Select, Columbia Acorn USA, Columbia Acorn Emerging Markets Fund and Columbia Thermostat Fund were equal to or below one service's peer group, but above the other service's peer group. The Trustees considered that CWAM had contractually waived 20 basis points of its advisory fee for Columbia Acorn Select for the years ended April 30, 2016 and April 30, 2017. The Trustees also considered that for Columbia Acorn International Select, CWAM had agreed as of July 1, 2016 to permanently reduce its advisory fee by five basis points and to implement an expense cap that reduced the Fund's expenses by an additional 15 basis points.
The Trustees also reviewed the advisory fee rates charged by CWAM for managing other investment companies, sub-advised funds and other institutional separate accounts, as detailed in materials provided to the Contract Committee by CWAM. The Trustees noted that the Funds' advisory fees were generally comparable to the Columbia Wanger Funds' advisory fees at the same asset levels. The Trustees also examined CWAM's institutional separate account fees for various investment strategies and determined that institutional account advisory fees tended to be lower than the Funds with parallel investment strategies. The Trustees considered the information provided by CWAM that it performed significant additional services for the Funds that it does not provide to sub-advised funds or non-mutual fund clients, including administrative and fund accounting services, oversight of the Funds' other service providers, Trustee support, regulatory compliance and numerous other services, and that, in servicing the Funds, CWAM assumes many legal and business risks that it does not assume in servicing many of its non-fund clients.
The Trustees reviewed the analysis of the historic profitability of CWAM in serving as each Fund's investment manager and of CWAM and its affiliates in their relationships with each Fund. The Contract Committee and Trustees met
100
with representatives from Ameriprise to discuss its methodologies for calculating profitability and allocating costs. They considered that Ameriprise calculated profitability and allocated costs on a contract-by-contract and Fund-by-Fund basis. The Trustees also reviewed the methodology used by CWAM and Ameriprise in determining compensation payable to portfolio managers and the competitive market for investment management talent. The Trustees were also provided with profitability information from third-party consultant Strategic Insight, which compared CWAM's profitability to other similar investment managers in the mutual fund industry. The Trustees discussed, however, that profitability comparisons among fund managers may not always be meaningful due to the lack of consistency in data, small number of publicly-owned managers, and the fact that profitability of any investment manager is affected by numerous factors, including its particular organizational structure, the types of funds and other accounts managed, other lines of business, expense allocation methodology, capital structure and other factors. The Trustees evaluated CWAM's profitability in light of the additional resources that had been, and would continue to be, provided to it by Ameriprise to assist in improving performance.
Economies of Scale. At various Committee and Board meetings and other informal meetings, the Trustees considered information about the extent to which CWAM realizes economies of scale in connection with an increase in Fund assets. The Trustees noted that the advisory fee schedule for each Fund, other than Columbia Thermostat Fund, includes breakpoints in the rate of fees at various asset levels. The Trustees concluded that the fee structure of the Advisory Agreement for each Fund reflected a sharing of economies of scale between CWAM and the Funds.
Other Benefits to CWAM. The Trustees also reviewed benefits that accrue to CWAM and its affiliates from their relationships with the Funds, based upon information provided to them by Ameriprise. They noted that the Funds' transfer agency services are performed by Columbia Management Investment Services Corp., an affiliate of Ameriprise, which receives compensation from the Funds for its transfer agent services. They considered that another affiliate of Ameriprise, Columbia Management Investment Distributors, Inc. ("CMID"), serves as the Funds' distributor under a distribution agreement, and that it receives fees under the Columbia Acorn Trust's Rule 12b-1 Plan, most of
which CMID pays to broker-dealers, but receives no additional compensation for its services to the Funds. In addition, Columbia Management provides sub-administration services to the Funds. The Contract Committee and the Board received information regarding the profitability of these Fund agreements to the CWAM affiliates and also reviewed information about and discussed the capabilities of each affiliated entity in performing its respective duties.
The Trustees considered other ways that the Funds and CWAM may potentially benefit from their relationship with each other. For example, the Trustees considered CWAM's use of commissions paid by each Fund on its portfolio brokerage transactions to obtain research products and services benefiting the Funds and/or other clients of CWAM. They noted that the Compliance Committee reviewed CWAM's annual "soft dollar" report during the year and met with representatives from CWAM to review CWAM's soft dollar spending. The Trustees also considered that the Compliance Committee regularly reviewed third-party prepared reports that evaluated the quality of CWAM's execution of the Funds' portfolio transactions. The Trustees noted that these reports showed that CWAM's execution capabilities were generally better than industry peers. The Trustees determined that CWAM's use of the Funds' "soft" commission dollars to obtain research products and services was consistent with current regulatory requirements and guidance. They also concluded that CWAM benefits from the receipt of proprietary research products and services acquired through commissions paid on portfolio transactions of the Funds, and that the Funds benefitted from CWAM's receipt of those products and services as well as research products and services acquired through commissions paid by other clients of CWAM. Finally, the Trustees considered that CWAM's affiliates benefit from management fees received from Columbia Thermostat Fund's investment in other Columbia mutual funds.
After full consideration of the above factors, as well as other factors that were instructive in evaluating the Advisory Agreement, the Trustees, including the Independent Trustees by separate vote, concluded that the advisory fees were reasonable and that the continuation of the Advisory Agreement was in the best interest of each Fund. At the Board meeting held on June 7, 2016, the Trustees approved continuation of the Advisory Agreement through July 31, 2017.
101
COLUMBIA ACORN FAMILY OF FUNDS
EXPENSE INFORMATION, AS OF 6/30/16
Columbia Acorn® Fund | | Class A | | Class B(a) | | Class C | | Class I | | Class R | | Class R4 | | Class R5 | | Class Y | | Class Z | |
Management Fees | | | 0.66 | % | | | | | | | 0.66 | % | | | 0.66 | % | | | | | | | 0.66 | % | | | 0.66 | % | | | 0.66 | % | | | 0.66 | % | |
Distribution and Service (12b-1) Fees | | | 0.25 | % | | | | | | | 1.00 | % | | | 0.00 | % | | | | | | | 0.00 | % | | | 0.00 | % | | | 0.00 | % | | | 0.00 | % | |
Other Expenses | | | 0.24 | % | | | | | | | 0.21 | % | | | 0.12 | % | | | | | | | 0.31 | % | | | 0.17 | % | | | 0.12 | % | | | 0.18 | % | |
Net Expense Ratio | | | 1.15 | % | | | | | | | 1.87 | % | | | 0.78 | % | | | | | | | 0.97 | % | | | 0.83 | % | | | 0.78 | % | | | 0.84 | % | |
Columbia Acorn International® | |
Management Fees | | | 0.76 | % | | | 0.76 | % | | | 0.76 | % | | | 0.76 | % | | | 0.76 | % | | | 0.76 | % | | | 0.76 | % | | | 0.76 | % | | | 0.76 | % | |
Distribution and Service (12b-1) Fees | | | 0.25 | % | | | 0.75 | % | | | 1.00 | % | | | 0.00 | % | | | 0.50 | % | | | 0.00 | % | | | 0.00 | % | | | 0.00 | % | | | 0.00 | % | |
Other Expenses | | | 0.28 | % | | | 0.61 | % | | | 0.27 | % | | | 0.14 | % | | | 0.39 | % | | | 0.34 | % | | | 0.19 | % | | | 0.14 | % | | | 0.24 | % | |
Net Expense Ratio | | | 1.29 | % | | | 2.12 | % | | | 2.03 | % | | | 0.90 | % | | | 1.65 | % | | | 1.10 | % | | | 0.95 | % | | | 0.90 | % | | | 1.00 | % | |
Columbia Acorn USA® | |
Management Fees | | | 0.89 | % | | | | | | | 0.89 | % | | | 0.89 | % | | | | | | | 0.89 | % | | | 0.89 | % | | | 0.89 | % | | | 0.89 | % | |
Distribution and Service (12b-1) Fees | | | 0.25 | % | | | | | | | 1.00 | % | | | 0.00 | % | | | | | | | 0.00 | % | | | 0.00 | % | | | 0.00 | % | | | 0.00 | % | |
Other Expenses | | | 0.30 | % | | | | | | | 0.25 | % | | | 0.09 | % | | | | | | | 0.33 | % | | | 0.19 | % | | | 0.15 | % | | | 0.30 | % | |
Net Expense Ratio | | | 1.44 | % | | | | | | | 2.14 | % | | | 0.98 | % | | | | | | | 1.22 | % | | | 1.08 | % | | | 1.04 | % | | | 1.19 | % | |
Columbia Acorn International SelectSM | |
Management Fees | | | 0.94 | % | | | | | | | 0.94 | % | | | 0.94 | % | | | | | | | 0.94 | % | | | 0.94 | % | | | 0.94 | % | | | 0.94 | % | |
Distribution and Service (12b-1) Fees | | | 0.25 | % | | | | | | | 1.00 | % | | | 0.00 | % | | | | | | | 0.00 | % | | | 0.00 | % | | | 0.00 | % | | | 0.00 | % | |
Other Expenses | | | 0.47 | % | | | | | | | 0.51 | % | | | 0.25 | % | | | | | | | 0.46 | % | | | 0.35 | % | | | 0.30 | % | | | 0.42 | % | |
Net Expense Ratio | | | 1.66 | % | | | | | | | 2.45 | % | | | 1.19 | % | | | | | | | 1.40 | % | | | 1.29 | % | | | 1.24 | % | | | 1.36 | % | |
Columbia Acorn SelectSM | |
Management Fees | | | 0.65 | % | | | | | | | 0.65 | % | | | 0.65 | % | | | | | | | 0.65 | % | | | 0.65 | % | | | 0.65 | % | | | 0.65 | % | |
Distribution and Service (12b-1) Fees | | | 0.25 | % | | | | | | | 1.00 | % | | | 0.00 | % | | | | | | | 0.00 | % | | | 0.00 | % | | | 0.00 | % | | | 0.00 | % | |
Other Expenses | | | 0.31 | % | | | | | | | 0.29 | % | | | 0.17 | % | | | | | | | 0.33 | % | | | 0.22 | % | | | 0.17 | % | | | 0.27 | % | |
Net Expense Ratio | | | 1.21 | % | | | | | | | 1.94 | % | | | 0.82 | % | | | | | | | 0.98 | % | | | 0.87 | % | | | 0.82 | % | | | 0.92 | % | |
Columbia Thermostat FundSM | |
Management Fees | | | 0.10 | % | | | | | | | 0.10 | % | | | | | | | | | | | 0.10 | % | | | 0.10 | % | | | 0.10 | % | | | 0.10 | % | |
Distribution and Service (12b-1) Fees | | | 0.25 | % | | | | | | | 1.00 | % | | | | | | | | | | | 0.00 | % | | | 0.00 | % | | | 0.00 | % | | | 0.00 | % | |
Other Expenses | | | 0.15 | % | | | | | | | 0.15 | % | | | | | | | | | | | 0.15 | % | | | 0.14 | % | | | 0.09 | % | | | 0.15 | % | |
Net Expense Ratio(b) | | | 0.50 | % | | | | | | | 1.25 | % | | | | | | | | | | | 0.25 | % | | | 0.24 | % | | | 0.19 | % | | | 0.25 | % | |
Columbia Acorn Emerging Markets FundSM | |
Management Fees | | | 1.13 | % | | | | | | | 1.13 | % | | | 1.13 | % | | | | | | | 1.13 | % | | | 1.13 | % | | | 1.13 | % | | | 1.13 | % | |
Distribution and Service (12b-1) Fees | | | 0.25 | % | | | | | | | 1.00 | % | | | 0.00 | % | | | | | | | 0.00 | % | | | 0.00 | % | | | 0.00 | % | | | 0.00 | % | |
Other Expenses | | | 0.45 | % | | | | | | | 0.47 | % | | | 0.31 | % | | | | | | | 0.43 | % | | | 0.33 | % | | | 0.27 | % | | | 0.45 | % | |
Net Expense Ratio | | | 1.83 | % | | | | | | | 2.60 | % | | | 1.44 | % | | | | | | | 1.56 | % | | | 1.46 | % | | | 1.40 | % | | | 1.58 | % | |
Columbia Acorn European FundSM | |
Management Fees | | | 1.19 | % | | | | | | | 1.19 | % | | | 1.19 | % | | | | | | | 1.19 | % | | | 1.19 | % | | | | | | | 1.19 | % | |
Distribution and Service (12b-1) Fees | | | 0.25 | % | | | | | | | 1.00 | % | | | 0.00 | % | | | | | | | 0.00 | % | | | 0.00 | % | | | | | | | 0.00 | % | |
Other Expenses | | | 0.31 | % | | | | | | | 0.31 | % | | | 0.22 | % | | | | | | | 0.31 | % | | | 0.27 | % | | | | | | | 0.31 | % | |
Net Expense Ratio | | | 1.75 | % | | | | | | | 2.50 | % | | | 1.41 | % | | | | | | | 1.50 | % | | | 1.46 | % | | | | | | | 1.50 | % | |
See the Funds' prospectuses for information on minimum initial investment amounts and other details of buying, selling and exchanging shares of the Funds.
Fees and expenses are for the six months ended June 30, 2016. Please see Note 4, "Fees and Other Transactions With Affiliates" in the Notes to Financial Statements of this report for information on fee waivers and/or expense reimbursements in place for Columbia Acorn International, Columbia Acorn International Select, Columbia Acorn Select, Columbia Acorn Emerging Markets Fund, Columbia Acorn European Fund and Columbia Thermostat Fund.
(a) Effective April 26, 2016, only Columbia Acorn International continues to offer Class B shares.
(b) Does not include estimated fees and expenses of 0.52% incurred by the Fund from the underlying portfolio funds in which it invests.
102
COLUMBIA ACORN FAMILY OF FUNDS
Trustees
Laura M. Born
Chair of the Board
David J. Rudis
Vice Chair of the Board
Maureen M. Culhane
P. Zachary Egan
Margaret M. Eisen
Thomas M. Goldstein
John C. Heaton
Steven N. Kaplan
Charles R. Phillips
Ralph Wanger (Trustee Emeritus)
Officers
P. Zachary Egan
President
Alan G. Berkshire
Vice President
Michael G. Clarke
Assistant Treasurer
William J. Doyle
Vice President
David L. Frank
Vice President
Paul B. Goucher
Assistant Secretary
Fritz Kaegi
Vice President
John M. Kunka
Vice President, Treasurer and Principal Accounting and Financial Officer
Stephen Kusmierczak
Vice President
Joseph C. LaPalm
Vice President
Ryan C. Larrenaga
Assistant Secretary
Matthew A. Litfin
Vice President
Satoshi Matsunaga
Vice President
Thomas P. McGuire
Chief Compliance Officer
Louis J. Mendes
Vice President
Christopher J. Olson
Vice President
Julian Quero
Assistant Treasurer
Martha A. Skinner
Assistant Treasurer
Matthew S. Szafranski
Vice President
Andreas Waldburg-Wolfegg
Vice President
Linda K. Roth-Wiszowaty
Secretary
Investment Manager
Columbia Wanger Asset Management, LLC
227 West Monroe Street, Suite 3000
Chicago, Illinois 60606
1-800-922-6769
Distributor
Columbia Management Investment Distributors, Inc.
225 Franklin Street
Boston, Massachusetts 02110
Transfer Agent, Dividend Disbursing Agent
Columbia Management Investment Services Corp.
P. O. Box 8081
Boston, Massachusetts 02266-8081
1-800-345-6611
Legal Counsel to the Funds
Perkins Coie LLP
Washington, DC
Legal Counsel to the Independent Trustees
Drinker Biddle & Reath LLP
Philadelphia, Pennsylvania
Independent Registered Public Accounting Firm
PricewaterhouseCoopers LLP
Chicago, Illinois
This report, including the schedules of investments, is submitted for the general information of the shareholders of Columbia Acorn Trust.
A description of the policies and procedures that the Funds use to determine how to vote proxies and a copy of the Funds' voting record are available (i) without charge, upon request, by calling 800-922-6769 and (ii) on the Securities and Exchange Commission's website at www.sec.gov. Information regarding how the Funds voted proxies relating to portfolio securities during the 12-month period ended June 30, is available from the SEC's website. Information regarding how the Funds voted proxies relating to portfolio securities is also available at investor.columbiathreadneedleus.com/disclosures/proxy-voting-report.
The Funds file a complete schedule of portfolio holdings with the SEC for the first and third quarters of each fiscal year on Form N-Q. The Funds' Form N-Q is available on the SEC's website at www.sec.gov and may be reviewed and copied at the SEC's Public Reference Room in Washington, D.C. Information on the operation of the Public Reference Room may be obtained by calling 1-800-SEC-0330. The Funds' complete portfolio holdings are disclosed at investor.columbiathreadneedleus.com approximately 30 to 40 days after each month-end.
Investors should consider the investment objectives, risks, charges and expenses of a mutual fund carefully before investing. For a free prospectus and, if available, a summary prospectus, which contains this and other important information about the funds, visit investor.columbiathreadneedleus.com. Read the prospectus carefully before investing.
Columbia Acorn Family of Funds are distributed by Columbia Management Investment Distributors, Inc., member FINRA and managed by Columbia Wanger Asset Management, LLC.
Find out what's new – visit our website at:
investor.columbiathreadneedleus.com
Our e-mail address is:
serviceinquiries@columbiathreadneedle.com
Shareholders should not include personal information such as account numbers, Social Security numbers or taxpayer identification numbers in e-mail. We are unable to accept account transactions sent via e-mail.
This document contains Global Industry Classification Standard data. The Global Industry Classification Standard ("GICS") was developed by and is the exclusive property and a service mark of MSCI Inc. ("MSCI") and Standard & Poor's Financial Services LLC ("S&P") and is licensed for use by Columbia Wanger Asset Management, LLC. Neither MSCI, S&P, nor any other party involved in making or compiling the GICS or any GICS classifications makes any express or implied warranties or representations with respect to such standard or classification (or the results to be obtained by the use thereof), and all such parties hereby expressly disclaim all warranties of originality, accuracy, completeness, merchantability and fitness for a particular purpose with respect to any of such standard or classification. Without limiting any of the foregoing, in no event shall MSCI, S&P, any of their affiliates or any third party involved in making or compiling the GICS or any GICS classifications have any liability for any direct, indirect, special, punitive, consequential or any other damages (including lost profits) even if notified of the possibility of such damages.
Columbia Acorn Family of Funds
Class A, B, C, I, R, R4, R5, Y and Z Shares
Semiannual Report, June 30, 2016
225 Franklin Street, Boston, MA 02110

For More Information
You'll find more information about the Columbia Acorn Family of Funds in the documents described below. Contact Columbia Funds as follows to obtain these documents free of charge:
By Mail: Columbia Funds
c/o Columbia Management Investment Services Corp.
P.O. Box 8081
Boston, MA 02266-8081
By Telephone: 800.345.6611
Online: investor.columbiathreadneedleus.com
Shareholder Communications with the Board
The Funds' Board of Trustees has adopted procedures by which shareholders may communicate with the Board. Shareholders who wish to communicate with the Board should send their written communications to the Board by mail, c/o Columbia Wanger Asset Management, LLC, 227 West Monroe Street, Suite 3000, Chicago, Illinois 60606, Attention: Secretary. Shareholder communications must (i) be in writing, (ii) identify the Columbia Acorn Fund to which the communication relates and (iii) state the particular class of shares and number of shares held by the communicating shareholder.
Prospectuses and the Statement of Additional Information (SAI)
The prospectuses and the SAI provide more detailed information about the Funds and their policies. The SAI is legally part of each prospectus (it's incorporated by reference). A copy of each has been filed with the SEC.
You can review and copy information about the Funds (including their prospectuses, the SAI and shareholder reports) at the SEC's Public Reference Room in Washington, DC. To find out more about the operation of the Public Reference Room, call the SEC at 202.551.8090. Reports and other information about the Fund are also available in the EDGAR Database on the SEC's website at http://www.sec.gov, or you can receive copies of this information, for a fee, by electronic request at the following e-mail address: publicinfo@sec.gov. You can also obtain copies of this information by writing the Public Reference Section, Securities and Exchange Commission, Washington, DC 20549-0102.
The investment company registration number of Columbia Acorn Trust, of which each of these Funds is a series, is 811-01829.
© 2016 Columbia Management Investment Advisers, LLC. All rights reserved.
800.345.6611 investor.columbiathreadneedleus.com
SAR 110_12_F01_(08/16) 1568553

Item 2. Code of Ethics.
Not applicable for semiannual reports.
Item 3. Audit Committee Financial Expert.
Not applicable for semiannual reports.
Item 4. Principal Accountant Fees and Services.
Not applicable for semiannual reports.
Item 5. Audit Committee of Listed Registrants.
Not applicable.
Item 6. Investments
(a) The registrant’s “Schedule I — Investments in securities of unaffiliated issuers” (as set forth in 17 CFR 210.12-12) is included in Item 1 of this Form N-CSR.
(b) Not applicable.
Item 7. Disclosure of Proxy Voting Policies and Procedures for Closed-End Management Investment Companies.
Not applicable.
Item 8. Portfolio Managers of Closed-End Management Investment Companies.
Not applicable.
Item 9. Purchases of Equity Securities by Closed-End Management Investment Company and Affiliated Purchasers.
Not applicable.
Item 10. Submission of Matters to a Vote of Security Holders.
There were no material changes to the procedures by which shareholders may recommend nominees to the registrant’s board of directors.
Item 11. Controls and Procedures.
(a) The registrant’s principal executive officer and principal financial officers, based on their evaluation of the registrant’s disclosure controls and procedures as of a date within 90 days of the filing of this report, have concluded that such controls and procedures are adequately designed to ensure that material information required to be disclosed by the registrant in Form N-CSR is accumulated and communicated to the registrant’s management, including the principal executive officer and principal financial officer, or persons performing similar functions, as appropriate to allow timely decisions regarding required disclosure.
(b) There was no change in the registrant’s internal control over financial reporting that occurred during the registrant’s second fiscal quarter of the period covered by this report that has materially affected, or is reasonably likely to materially affect, the registrant’s internal control over financial reporting.
Item 12. Exhibits.
(a)(1) Code of ethics required to be disclosed under Item 2 of Form N-CSR: Not applicable for semiannual reports.
(a)(2) Certifications pursuant to Rule 30a-2(a) under the Investment Company Act of 1940 (17 CFR 270.30a-2(a)) attached hereto as Exhibit 99.CERT.
(a)(3) Not applicable.
(b) Certification pursuant to Rule 30a-2(b) under the Investment Company Act of 1940 (17 CFR 270.30a-2(b)) attached hereto as Exhibit 99.906CERT.
SIGNATURES
Pursuant to the requirements of the Securities Exchange Act of 1934 and the Investment Company Act of 1940, the registrant has duly caused this report to be signed on its behalf by the undersigned, thereunto duly authorized.
(registrant) | | Columbia Acorn Trust | |
| | |
| | |
By (Signature and Title) | | /s/ P. Zachary Egan | |
| P. Zachary Egan, President and Principal Executive Officer |
| | |
| | |
Date | | August 19, 2016 | |
| | | | | |
Pursuant to the requirements of the Securities Exchange Act of 1934 and the Investment Company Act of 1940, this report has been signed below by the following persons on behalf of the registrant and in the capacities and on the dates indicated.
By (Signature and Title) | | /s/ P. Zachary Egan | |
| P. Zachary Egan, President and Principal Executive Officer |
| | |
| | |
Date | | August 19, 2016 | |
| | |
| | |
By (Signature and Title) | | /s/ John M. Kunka | |
| John M. Kunka, Treasurer and Principal Accounting and
Financial Officer |
| | |
| | |
Date | | August 19, 2016 | |
| | | | |