UNITED STATES
SECURITIES AND EXCHANGE COMMISSION
Washington, D.C. 20549
FORM N-CSR
CERTIFIED SHAREHOLDER REPORT OF REGISTERED
MANAGEMENT INVESTMENT COMPANIES
Investment Company Act file number | 811-01829 | |||||||
| ||||||||
Columbia Acorn Trust | ||||||||
(Exact name of registrant as specified in charter) | ||||||||
| ||||||||
227 W. Monroe Street Suite 3000 Chicago, IL |
| 60606 | ||||||
(Address of principal executive offices) |
| (Zip code) | ||||||
| ||||||||
Mary C. Moynihan Perkins Coie LLP 700 13th Street, NW Suite 600 Washington, DC 20005 | ||||||||
(Name and address of agent for service) | ||||||||
| ||||||||
Registrant’s telephone number, including area code: | 312-634-9200 |
| ||||||
| ||||||||
Date of fiscal year end: | December 31 |
| ||||||
| ||||||||
Date of reporting period: | June 30, 2013 |
| ||||||
Form N-CSR is to be used by management investment companies to file reports with the Commission not later than 10 days after the transmission to stockholders of any report that is required to be transmitted to stockholders under Rule 30e-1 under the Investment Company Act of 1940 (17 CFR 270.30e-1). The Commission may use the information provided on Form N-CSR in its regulatory, disclosure review, inspection, and policymaking roles.
A registrant is required to disclose the information specified by Form N-CSR, and the Commission will make this information public. A registrant is not required to respond to the collection of information contained in Form N-CSR unless the Form displays a currently valid Office of Management and Budget (“OMB”) control number. Please direct comments concerning the accuracy of the information collection burden estimate and any suggestions for reducing the burden to Secretary, Securities and Exchange Commission, 450 Fifth Street, NW, Washington, DC 20549-0609. The OMB has reviewed this collection of information under the clearance requirements of 44 U.S.C. § 3507.
Item 1. Reports to Stockholders.
Q2 2013

Columbia Acorn Family of Funds
Class A, B, C, I, R, R4, R5, Y and Z Shares
Managed by Columbia Wanger Asset Management, LLC
Semiannual Report
June 30, 2013
n Columbia
Acorn® Fund
n Columbia
Acorn International®
n Columbia
Acorn USA®
n Columbia
Acorn International SelectSM
n Columbia
Acorn SelectSM
n Columbia
Thermostat FundSM
n Columbia
Acorn Emerging Markets FundSM
n Columbia
Acorn European FundSM
Not FDIC insured • No bank guarantee • May lose value
Columbia Acorn Family of Funds
Descriptions of Indexes Included in this Report
• 50/50 Blended Benchmark, established by the Fund's investment manager, is an equally weighted custom composite of Columbia Thermostat Fund's primary equity and primary debt benchmarks, the S&P 500 Index and the Barclays U.S. Aggregate Bond Index, respectively. The percentage of the Fund's assets allocated to underlying stock and bond portfolio funds will vary, and accordingly the composition of the Fund's portfolio will not always reflect the composition of the 50/50 Blended Benchmark.
• Barclays U.S. Aggregate Bond Index is a market value-weighted index that tracks the daily price, coupon, pay-downs and total return performance of fixed-rate, publicly placed, dollar-denominated and non-convertible investment grade debt issues with at least $250 million par amount outstanding and with at least one year to final maturity.
• HSBC Smaller European Companies (inc UK) Index is a weighted combination of two indexes: the HSBC Smaller Europe (ex UK) Index and the HSBC Smaller UK Index. The index is rebalanced on a quarterly basis.
• Lipper Indexes include the largest funds tracked by Lipper, Inc. in the named category. Lipper Mid-Cap Growth Funds Index, 30 largest mid-cap growth funds, including Columbia Acorn Fund; Lipper International Small/Mid Growth Funds Index, 10 largest non-U.S. small/mid growth funds, including Columbia Acorn International; Lipper Small-Cap Growth Funds Index, 30 largest small-cap growth funds, including Columbia Acorn USA; Lipper Mid-Cap Core Funds Index, 30 largest mid-cap core funds; Lipper Flexible Portfolio Funds Index, an equal-weighted index of the 30 largest mutual funds within the Flexible Portfolio fund classification, as defined by Lipper. Lipper Emerging Markets Index, 30 largest emerging markets funds; Lipper European Region Index, 10 largest European funds.
• MSCI Europe, Australasia, Far East (EAFE) Index (Net) is a capitalization-weighted index that tracks the total return of common stocks in 22 developed-market countries within Europe, Australasia and the Far East. The returns of the MSCI EAFE Index (Net) are presented net of the withholding tax rate applicable to foreign non-resident institutional investors in the foreign companies included in the index who do not benefit from double taxation treaties.
• MSCI Emerging Markets Small Cap Index, a widely recognized international benchmark, is a free float-adjusted market capitalization index that is designed to measure small-cap emerging market equity performance. The MSCI Emerging Markets Small Cap Index currently consists of the following 21 emerging market country indexes: Brazil, Chile, China, Colombia, Czech Republic, Egypt, Hungary, India, Indonesia, Korea, Malaysia, Mexico, Morocco, Peru, Philippines, Poland, Russia, South Africa, Taiwan, Thailand and Turkey.
• Russell 2000 Index measures the performance of the 2,000 smallest companies in the Russell 3000 Index, which represents approximately 10% of the total market capitalization of the Russell 3000 Index.
• Russell 2500 Index measures the performance of the 2,500 smallest companies in the Russell 3000 Index, which represents approximately 17% of the total market capitalization of the Russell 3000 Index.
• Standard & Poor's (S&P) 500 Index tracks the performance of 500 widely held, large-capitalization U.S. stocks.
• Standard & Poor's (S&P) MidCap 400 Index is a market value-weighted index that tracks the performance of 400 mid-cap U.S. companies.
• S&P Developed Ex-U.S. Between $2B and $10B Index is a subset of the broad market selected by the index sponsor representing the mid-cap developed market, excluding the United States.
• S&P Emerging Markets Between $500M and $5B Index represents the institutionally investable capital of emerging market countries with market caps ranging between $500 million to $5 billion, as selected by S&P. The index currently consists of the following 21 emerging market country indexes: Brazil, Chile, China, Colombia, Czech Republic, Egypt, Hungary, India, Indonesia, Korea, Malaysia, Mexico, Morocco, Peru, Philippines, Poland, Russia, South Africa, Taiwan, Thailand and Turkey.
• S&P Europe Between $500M and $5B Index represents the institutionally investable capital of European countries with market caps ranging between $500 million to $5 billion, as selected by S&P. The index currently consists of the following 17 developed market country indexes: Austria, Belgium, Denmark, Finland, France, Germany, Greece, Ireland, Italy, Luxembourg, the Netherlands, Norway, Portugal, Spain, Sweden, Switzerland and the United Kingdom.
• S&P Global Ex-U.S. SmallCap Index consists of the bottom 20% of institutionally investable capital of developed and emerging countries, excluding the United States.
• S&P Global Ex-U.S. Between $500M and $5B Index is a subset of the broad market selected by the index sponsor representing the mid- and small-cap developed and emerging markets, excluding the United States.
Unlike mutual funds, indexes are not managed and do not incur fees or expenses. It is not possible to invest directly in an index.
You are invited to the 2013 Columbia Acorn Funds Shareholder Information Meeting
Join us to hear presentations by Columbia Acorn Fund's lead portfolio manager Chuck McQuaid and other members of the Columbia Wanger Asset Management investment team.
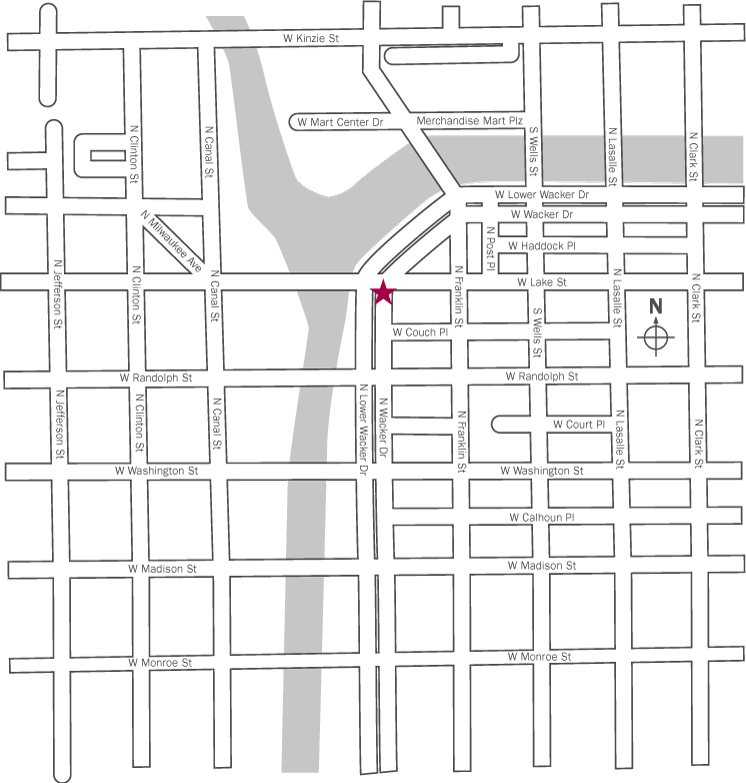
Where: Drinker Biddle & Reath LLP
191 North Wacker Drive, Suite 3700
Chicago, IL
When: Wednesday, September 18, 2013
12 p.m. CDT
A buffet lunch will be served beginning at 11:30.
RSVP: By calling 800.922.6769 or online at columbiamanagement.com. Please respond by September 13, 2013.
Webcast Replay: Available at columbiamanagement.com in October.
 Public Transportation
For directions using public transportation, call 312.836.7000 or visit the Chicago Transit Authority website at transitchicago.com. Metra information is also available by calling this number or can be found at metrarail.com.
 Parking Information
Two parking options are located on Lake Street in the same block as the meeting location, which is between N. Wacker Drive and N. Franklin Street. Lake Street runs one way east after crossing N. Wacker Drive. Hourly parking rates apply at both locations. The first, with signage stating "Public Parking," provides direct access to the building in which the meeting will be held. The second option is a "Self Park" garage located next to the first but without direct access to the building.
 Driving Directions
From the south:
Take 1-57 to the Dan Ryan Expressway. Follow the signs for the Kennedy Expressway West. Travel on the Kennedy and exit using the Washington Blvd. exit (Exit 51C). Turn right onto W. Washington. Turn left onto N. Upper Wacker Drive. Destination will be on the right.
From the north:
Take the Kennedy Expressway (I-90/94) south to Chicago. Travel on the Kennedy and exit using the Washington Blvd. exit (Exit 51C). Turn left onto W. Washington. Turn left onto N. Upper Wacker Drive. Destination will be on the right.
From the west:
Take the Eisenhower Expressway (I-290) from the west. Follow the signs for the Kennedy Expressway West. Travel on the Kennedy and exit using the Washington Blvd. exit (Exit 51C). Turn right onto W. Washington. Turn left onto N. Upper Wacker Drive. Destination will be on the right.
From the southwest:
Take the Stevenson Expressway (I-55). Exit to the Kennedy Expressway (North-Wisconsin). Travel on the Kennedy and exit using the Washington Blvd. exit (Exit 51C). Turn right onto W. Washington. Turn left onto N. Upper Wacker Drive. Destination will be on the right.
Columbia Acorn Family of Funds
Table of Contents
2013 Mid-year Distributions | 1 | ||||||
Net Asset Value Per Share | 2 | ||||||
Understanding Your Expenses | 3 | ||||||
Share Class Performance | 6 | ||||||
Fund Performance vs. Benchmarks | 7 | ||||||
Squirrel Chatter II: Health Care in the United States | 8 | ||||||
Columbia Acorn Fund | |||||||
In a Nutshell | 12 | ||||||
At a Glance | 13 | ||||||
Major Portfolio Changes | 28 | ||||||
Statement of Investments | 30 | ||||||
Columbia Acorn International | |||||||
In a Nutshell | 14 | ||||||
At a Glance | 15 | ||||||
Major Portfolio Changes | 43 | ||||||
Statement of Investments | 46 | ||||||
Portfolio Diversification | 55 | ||||||
Columbia Acorn USA | |||||||
In a Nutshell | 16 | ||||||
At a Glance | 17 | ||||||
Major Portfolio Changes | 56 | ||||||
Statement of Investments | 57 | ||||||
Columbia Acorn International Select | |||||||
In a Nutshell | 18 | ||||||
At a Glance | 19 | ||||||
Major Portfolio Changes | 64 | ||||||
Statement of Investments | 65 | ||||||
Portfolio Diversification | 69 | ||||||
Columbia Acorn Select | |||||||
In a Nutshell | 20 | ||||||
At a Glance | 21 | ||||||
Major Portfolio Changes | 70 | ||||||
Statement of Investments | 71 | ||||||
Columbia Thermostat Fund | |||||||
In a Nutshell | 22 | ||||||
At a Glance | 23 | ||||||
Statement of Investments | 76 | ||||||
Columbia Acorn Emerging Markets Fund | |||||||
In a Nutshell | 24 | ||||||
At a Glance | 25 | ||||||
Major Portfolio Changes | 78 | ||||||
Statement of Investments | 80 | ||||||
Portfolio Diversification | 84 | ||||||
Columbia Acorn European Fund | |||||||
In a Nutshell | 26 | ||||||
At a Glance | 27 | ||||||
Major Portfolio Changes | 85 | ||||||
Statement of Investments | 87 | ||||||
Portfolio Diversification | 91 | ||||||
Columbia Acorn Family of Funds | |||||||
Statements of Assets and Liabilities | 92 | ||||||
Statements of Operations | 94 | ||||||
Statements of Changes in Net Assets | 96 | ||||||
Financial Highlights | 102 | ||||||
Notes to Financial Statements | 118 | ||||||
Board Approval of the Advisory Agreement | 128 | ||||||
Expense Information | 133 | ||||||
The views expressed in the "Squirrel Chatter II" and "In a Nutshell" commentaries reflect the current views of the respective authors. These views are not guarantees of future performance and involve certain risks, uncertainties and assumptions that are difficult to predict so actual outcomes and results may differ significantly from the views expressed. These views are subject to change at any time based upon economic, market or other conditions and the respective authors disclaim any responsibility to update such views. These views may not be relied upon as investment advice and, because investment decisions for a Columbia Acorn Fund are based on numerous factors, may not be relied upon as an indication of trading intent on behalf of any particular Columbia Acorn Fund. References to specific company's securities should not be construed as a recommendation or investment advice and there can be no assurance that as of the date of publication of this report, the securities mentioned in each Fund's portfolio are still held or that the securities sold have not been repurchased.
Acorn®, Acorn USA® and Acorn International® are service marks owned and registered by Columbia Acorn Trust.
Columbia Acorn Family of Funds
2013 Mid-year Distributions
The following table lists the mid-year distributions for the Columbia Acorn Funds. The record date was June 4, 2013, and the ex-dividend date and the payable date was June 5, 2013. Columbia Acorn Emerging Markets Fund and Columbia Acorn European Fund did not have any distributions at mid-year.
Fund | Short-term Capital Gain | Long-term Capital Gain | Ordinary Income | Reinvestment Price | |||||||||||||||
Columbia Acorn Fund | |||||||||||||||||||
Class A | None | $ | 0.38297 | $ | 0.04178 | $ | 31.93 | ||||||||||||
Class B | None | $ | 0.38297 | None | $ | 29.06 | |||||||||||||
Class C | None | $ | 0.38297 | None | $ | 28.55 | |||||||||||||
Class I | None | $ | 0.38297 | $ | 0.04182 | $ | 33.20 | ||||||||||||
Class R4 | None | $ | 0.38297 | $ | 0.05083 | $ | 33.65 | ||||||||||||
Class R5 | None | $ | 0.38297 | $ | 0.04181 | $ | 33.65 | ||||||||||||
Class Y | None | $ | 0.38297 | $ | 0.04482 | $ | 33.67 | ||||||||||||
Class Z | None | $ | 0.38297 | $ | 0.03881 | $ | 33.17 | ||||||||||||
Columbia Acorn International | |||||||||||||||||||
Class A | None | None | $ | 0.47714 | $ | 43.39 | |||||||||||||
Class B | None | None | $ | 0.47714 | $ | 42.06 | |||||||||||||
Class C | None | None | $ | 0.47714 | $ | 41.87 | |||||||||||||
Class I | None | None | $ | 0.47714 | $ | 43.53 | |||||||||||||
Class R | None | None | $ | 0.47714 | $ | 43.32 | |||||||||||||
Class R4 | None | None | $ | 0.47714 | $ | 43.75 | |||||||||||||
Class R5 | None | None | $ | 0.47714 | $ | 43.48 | |||||||||||||
Class Y | None | None | $ | 0.47714 | $ | 43.77 | |||||||||||||
Class Z | None | None | $ | 0.47714 | $ | 43.50 | |||||||||||||
Columbia Acorn USA | |||||||||||||||||||
Class A | None | $ | 0.04426 | None | $ | 31.10 | |||||||||||||
Class B | None | $ | 0.04426 | None | $ | 28.36 | |||||||||||||
Class C | None | $ | 0.04426 | None | $ | 28.02 | |||||||||||||
Class I | None | $ | 0.04426 | None | $ | 32.56 | |||||||||||||
Class R4 | None | $ | 0.04426 | None | $ | 33.04 | |||||||||||||
Class R5 | None | $ | 0.04426 | None | $ | 33.02 | |||||||||||||
Class Y | None | $ | 0.04426 | None | $ | 33.07 | |||||||||||||
Class Z | None | $ | 0.04426 | None | $ | 32.51 | |||||||||||||
Columbia Acorn International Select | |||||||||||||||||||
Class A | None | $ | 0.52948 | None | $ | 25.76 | |||||||||||||
Class B | None | $ | 0.52948 | None | $ | 24.45 | |||||||||||||
Class C | None | $ | 0.52948 | None | $ | 24.31 | |||||||||||||
Class I | None | $ | 0.52948 | None | $ | 26.04 | |||||||||||||
Class R4 | None | $ | 0.52948 | None | $ | 26.18 | |||||||||||||
Class R5 | None | $ | 0.52948 | None | $ | 26.18 | |||||||||||||
Class Y | None | $ | 0.52948 | None | $ | 26.18 | |||||||||||||
Class Z | None | $ | 0.52948 | None | $ | 26.04 | |||||||||||||
1
Columbia Acorn Family of Funds
2013 Mid-year Distributions, continued
Fund | Short-term Capital Gain | Long-term Capital Gain | Ordinary Income | Reinvestment Price | |||||||||||||||
Columbia Acorn Select | |||||||||||||||||||
Class A | None | $ | 1.35142 | $ | 0.07036 | $ | 26.25 | ||||||||||||
Class B | None | $ | 1.35142 | None | $ | 24.05 | |||||||||||||
Class C | None | $ | 1.35142 | None | $ | 23.74 | |||||||||||||
Class I | None | $ | 1.35142 | $ | 0.16264 | $ | 27.22 | ||||||||||||
Class R4 | None | $ | 1.35142 | $ | 0.13444 | $ | 27.57 | ||||||||||||
Class R5 | None | $ | 1.35142 | $ | 0.15239 | $ | 27.56 | ||||||||||||
Class Y | None | $ | 1.35142 | $ | 0.17033 | $ | 27.61 | ||||||||||||
Class Z | None | $ | 1.35142 | $ | 0.14213 | $ | 27.17 | ||||||||||||
Columbia Thermostat Fund | |||||||||||||||||||
Class A | None | None | $ | 0.00911 | $ | 14.99 | |||||||||||||
Class B | None | None | $ | 0.00911 | $ | 15.06 | |||||||||||||
Class C | None | None | $ | 0.00911 | $ | 15.04 | |||||||||||||
Class R4 | None | None | $ | 0.00911 | $ | 14.89 | |||||||||||||
Class R5 | None | None | $ | 0.00911 | $ | 14.90 | |||||||||||||
Class Y | None | None | $ | 0.00911 | $ | 14.90 | |||||||||||||
Class Z | None | None | $ | 0.00911 | $ | 14.83 | |||||||||||||
Net Asset Value Per Share as of 6/30/13
| Columbia Acorn Fund | Columbia Acorn International | Columbia Acorn USA | Columbia Acorn International Select | Columbia Acorn Select | Columbia Thermostat Fund | Columbia Acorn Emerging Markets Fund | Columbia Acorn European Fund | ||||||||||||||||||||||||||||
Class A | $ | 31.98 | $ | 42.65 | $ | 31.36 | $ | 25.53 | $ | 26.26 | $ | 14.86 | $ | 11.99 | $ | 12.63 | |||||||||||||||||||
Class B | $ | 29.09 | $ | 41.31 | $ | 28.57 | $ | 24.21 | $ | 24.05 | $ | 14.93 | NA | NA | |||||||||||||||||||||
Class C | $ | 28.58 | $ | 41.13 | $ | 28.23 | $ | 24.08 | $ | 23.74 | $ | 14.91 | $ | 11.92 | $ | 12.55 | |||||||||||||||||||
Class I | $ | 33.26 | $ | 42.79 | $ | 32.83 | $ | 25.81 | $ | 27.25 | NA | $ | 12.04 | $ | 12.64 | ||||||||||||||||||||
Class R | NA | $ | 42.57 | NA | NA | NA | NA | NA | NA | ||||||||||||||||||||||||||
Class R4 | $ | 33.71 | $ | 43.01 | $ | 33.31 | $ | 25.95 | $ | 27.59 | $ | 14.77 | $ | 12.11 | NA | ||||||||||||||||||||
Class R5 | $ | 33.71 | $ | 42.74 | $ | 33.30 | $ | 25.94 | $ | 27.58 | $ | 14.78 | $ | 12.10 | $ | 12.75 | |||||||||||||||||||
Class Y | $ | 33.74 | $ | 43.03 | $ | 33.34 | $ | 25.94 | $ | 27.63 | $ | 14.78 | $ | 12.00 | NA | ||||||||||||||||||||
Class Z | $ | 33.23 | $ | 42.76 | $ | 32.78 | $ | 25.81 | $ | 27.19 | $ | 14.71 | $ | 12.02 | $ | 12.64 | |||||||||||||||||||
Class B shares of the Columbia Acorn Funds are closed to new investors. Class R, Class R4, Class R5, Class Y and Class Z shares of the Columbia Acorn Funds are available only to certain eligible investors described in the Funds' prospectuses. Class I shares of the Columbia Acorn Funds are only available to other Columbia Funds and are not available to individual investors.
2
Understanding Your Expenses
As a shareholder, you incur two types of costs. There are transaction costs, which generally include sales charges on purchases and may include redemption fees. There are also ongoing costs, which generally include management fees, distribution and service (Rule 12b-1) fees, and other Fund expenses. The following information is intended to help you understand your ongoing costs (in dollars) of investing in the Fund and to help you compare these costs with the ongoing costs of investing in other mutual funds.
Analyzing Your Fund's Expenses
To illustrate these ongoing costs, we have provided examples and calculated the expenses paid by investors in Class A, B, C, I, R, R4, R5, Y and Z shares of the Funds during the period. The actual and hypothetical information in the tables is based on an initial investment of $1,000 at the beginning of the period indicated and held for the entire period. Expense information is calculated two ways and each method provides you with different information. The amount listed in the "Actual" column is calculated using the Funds' actual operating expenses and total return for the period. You may use the Actual information, together with the amount invested, to estimate the expenses that you paid over the period. Simply divide your account value by $1,000 (for example, an $8,600 account value divided by $1,000 = 8.6), then multiply the results by the expenses paid during the period under the Actual column. The amount listed in the "Hypothetical" column assumes a 5% annual rate of return before expenses (which is not the Funds' actual return) and then applies the Funds' actual expense ratio for the period to the hypothetical return. You should not use the hypothetical account values and expenses to estimate either your actual account balance at the end of the period or the expenses you paid during the period. See "Compare With Other Funds" below for details on how to use the hypothetical data.
In addition to the ongoing expenses which the Funds bear directly, Columbia Thermostat Fund's shareholders indirectly bear the Fund's allocable share of the costs and expenses of each underlying fund in which the Fund invests. You can also estimate the effective expenses paid during the period, which includes the indirect fees associated with investing in the underlying funds, by using the amounts listed in the effective expenses paid during the period column in the "Fund of Funds" table.
Compare With Other Funds
Since all mutual funds are required to include the same hypothetical calculations about expenses in shareholder reports, you can use this information to compare the ongoing cost of investing in the Funds with other funds. To do so, compare the hypothetical example with the 5% hypothetical examples that appear in the shareholder reports of other funds. As you compare hypothetical examples of other funds, it is important to note that hypothetical examples are meant to highlight the ongoing costs of investing in a fund only and do not reflect any transaction costs, such as sales charges, or redemption or exchange fees. Therefore, the hypothetical calculations are useful in comparing ongoing costs only, and will not help you determine the relative total costs of owning different funds. If transaction costs were included in these calculations, your costs would be higher.
January 1, 2013 — June 30, 2013
| Account value at the beginning of the period ($) | Account value at the end of the period ($) | Expenses paid during the period ($) | Fund's annualized expense ratio (%) | ||||||||||||||||||||||||||||
Actual | Hypothetical | Actual | Hypothetical | Actual | Hypothetical | Actual | |||||||||||||||||||||||||
Columbia Acorn Fund | |||||||||||||||||||||||||||||||
Class A | 1,000.00 | 1,000.00 | 1,103.70 | 1,019.27 | 5.52 | 5.30 | 1.07 | ||||||||||||||||||||||||
Class B | 1,000.00 | 1,000.00 | 1,099.80 | 1,016.13 | 8.80 | 8.45 | 1.71 | ||||||||||||||||||||||||
Class C | 1,000.00 | 1,000.00 | 1,099.60 | 1,015.74 | 9.22 | 8.85 | 1.79 | ||||||||||||||||||||||||
Class I | 1,000.00 | 1,000.00 | 1,105.50 | 1,021.04 | 3.67 | 3.52 | 0.71 | ||||||||||||||||||||||||
Class R4 | 1,000.00 | 1,000.00 | 1,105.00 | 1,020.74 | 3.97 | 3.82 | 0.77 | ||||||||||||||||||||||||
Class R5 | 1,000.00 | 1,000.00 | 1,105.40 | 1,020.94 | 3.77 | 3.62 | 0.73 | ||||||||||||||||||||||||
Class Y | 1,000.00 | 1,000.00 | 1,105.80 | 1,020.99 | 3.72 | 3.57 | 0.72 | ||||||||||||||||||||||||
Class Z | 1,000.00 | 1,000.00 | 1,105.20 | 1,020.70 | 4.03 | 3.86 | 0.78 | ||||||||||||||||||||||||
3
Understanding Your Expenses, continued
| Account value at the beginning of the period ($) | Account value at the end of the period ($) | Expenses paid during the period ($) | Fund's annualized expense ratio (%) | ||||||||||||||||||||||||||||
Actual | Hypothetical | Actual | Hypothetical | Actual | Hypothetical | Actual | |||||||||||||||||||||||||
Columbia Acorn International | |||||||||||||||||||||||||||||||
Class A | 1,000.00 | 1,000.00 | 1,057.10 | 1,018.54 | 6.15 | 6.04 | 1.22 | ||||||||||||||||||||||||
Class B | 1,000.00 | 1,000.00 | 1,053.20 | 1,014.96 | 9.82 | 9.63 | 1.95 | ||||||||||||||||||||||||
Class C | 1,000.00 | 1,000.00 | 1,053.10 | 1,014.76 | 10.02 | 9.83 | 1.99 | ||||||||||||||||||||||||
Class I | 1,000.00 | 1,000.00 | 1,058.70 | 1,020.30 | 4.34 | 4.26 | 0.86 | ||||||||||||||||||||||||
Class R | 1,000.00 | 1,000.00 | 1,055.10 | 1,016.87 | 7.86 | 7.71 | 1.56 | ||||||||||||||||||||||||
Class R4 | 1,000.00 | 1,000.00 | 1,058.40 | 1,020.01 | 4.64 | 4.56 | 0.92 | ||||||||||||||||||||||||
Class R5 | 1,000.00 | 1,000.00 | 1,058.80 | 1,020.11 | 4.54 | 4.46 | 0.90 | ||||||||||||||||||||||||
Class Y | 1,000.00 | 1,000.00 | 1,058.90 | 1,020.30 | 4.34 | 4.26 | 0.86 | ||||||||||||||||||||||||
Class Z | 1,000.00 | 1,000.00 | 1,058.50 | 1,020.01 | 4.64 | 4.56 | 0.92 | ||||||||||||||||||||||||
Columbia Acorn USA | |||||||||||||||||||||||||||||||
Class A | 1,000.00 | 1,000.00 | 1,113.20 | 1,018.00 | 6.89 | 6.58 | 1.33 | ||||||||||||||||||||||||
Class B | 1,000.00 | 1,000.00 | 1,108.70 | 1,014.12 | 10.96 | 10.47 | 2.12 | ||||||||||||||||||||||||
Class C | 1,000.00 | 1,000.00 | 1,109.20 | 1,014.61 | 10.45 | 9.98 | 2.02 | ||||||||||||||||||||||||
Class I | 1,000.00 | 1,000.00 | 1,115.50 | 1,020.06 | 4.72 | 4.51 | 0.91 | ||||||||||||||||||||||||
Class R4 | 1,000.00 | 1,000.00 | 1,114.80 | 1,019.57 | 5.24 | 5.00 | 1.01 | ||||||||||||||||||||||||
Class R5 | 1,000.00 | 1,000.00 | 1,115.20 | 1,019.62 | 5.19 | 4.95 | 1.00 | ||||||||||||||||||||||||
Class Y | 1,000.00 | 1,000.00 | 1,115.40 | 1,019.76 | 5.03 | 4.80 | 0.97 | ||||||||||||||||||||||||
Class Z | 1,000.00 | 1,000.00 | 1,114.60 | 1,019.27 | 5.55 | 5.30 | 1.07 | ||||||||||||||||||||||||
Columbia Acorn International Select | |||||||||||||||||||||||||||||||
Class A | 1,000.00 | 1,000.00 | 1,017.40 | 1,017.26 | 7.32 | 7.32 | 1.48 | ||||||||||||||||||||||||
Class B | 1,000.00 | 1,000.00 | 1,014.10 | 1,014.03 | 10.57 | 10.57 | 2.14 | ||||||||||||||||||||||||
Class C | 1,000.00 | 1,000.00 | 1,013.40 | 1,013.39 | 11.21 | 11.21 | 2.27 | ||||||||||||||||||||||||
Class I | 1,000.00 | 1,000.00 | 1,019.10 | 1,018.83 | 5.74 | 5.74 | 1.16 | ||||||||||||||||||||||||
Class R4 | 1,000.00 | 1,000.00 | 1,018.70 | 1,018.34 | 6.24 | 6.24 | 1.26 | ||||||||||||||||||||||||
Class R5 | 1,000.00 | 1,000.00 | 1,018.70 | 1,018.34 | 6.24 | 6.24 | 1.26 | ||||||||||||||||||||||||
Class Y | 1,000.00 | 1,000.00 | 1,018.70 | 1,018.83 | 5.74 | 5.74 | 1.16 | ||||||||||||||||||||||||
Class Z | 1,000.00 | 1,000.00 | 1,018.40 | 1,018.59 | 5.99 | 5.99 | 1.21 | ||||||||||||||||||||||||
Columbia Acorn Select | |||||||||||||||||||||||||||||||
Class A | 1,000.00 | 1,000.00 | 1,119.80 | 1,018.05 | 6.86 | 6.53 | 1.32 | ||||||||||||||||||||||||
Class B | 1,000.00 | 1,000.00 | 1,116.50 | 1,014.71 | 10.38 | 9.88 | 2.00 | ||||||||||||||||||||||||
Class C | 1,000.00 | 1,000.00 | 1,116.20 | 1,014.37 | 10.74 | 10.22 | 2.07 | ||||||||||||||||||||||||
Class I | 1,000.00 | 1,000.00 | 1,122.30 | 1,019.81 | 5.00 | 4.75 | 0.96 | ||||||||||||||||||||||||
Class R4 | 1,000.00 | 1,000.00 | 1,121.80 | 1,019.22 | 5.62 | 5.35 | 1.08 | ||||||||||||||||||||||||
Class R5 | 1,000.00 | 1,000.00 | 1,121.70 | 1,019.62 | 5.20 | 4.95 | 1.00 | ||||||||||||||||||||||||
Class Y | 1,000.00 | 1,000.00 | 1,122.10 | 1,019.18 | 5.67 | 5.40 | 1.09 | ||||||||||||||||||||||||
Class Z | 1,000.00 | 1,000.00 | 1,121.80 | 1,019.37 | 5.46 | 5.20 | 1.05 | ||||||||||||||||||||||||
4
| Account value at the beginning of the period ($) | Account value at the end of the period ($) | Expenses paid during the period ($) | Fund's annualized expense ratio (%) | ||||||||||||||||||||||||||||
Actual | Hypothetical | Actual | Hypothetical | Actual | Hypothetical | Actual | |||||||||||||||||||||||||
Columbia Acorn Emerging Markets Fund | |||||||||||||||||||||||||||||||
Class A | 1,000.00 | 1,000.00 | 995.80 | 1,015.60 | 8.91 | 9.00 | 1.82 | ||||||||||||||||||||||||
Class C | 1,000.00 | 1,000.00 | 992.50 | 1,011.82 | 12.65 | 12.78 | 2.59 | ||||||||||||||||||||||||
Class I | 1,000.00 | 1,000.00 | 996.70 | 1,017.41 | 7.10 | 7.17 | 1.45 | ||||||||||||||||||||||||
Class R4 | 1,000.00 | 1,000.00 | 997.50 | 1,016.97 | 7.54 | 7.62 | 1.54 | ||||||||||||||||||||||||
Class R5 | 1,000.00 | 1,000.00 | 996.70 | 1,016.87 | 7.64 | 7.71 | 1.56 | ||||||||||||||||||||||||
Class Y | 1,000.00 | 1,000.00 | 982.00 | * | 1,016.97 | 0.59 | * | 7.62 | 1.54 | * | |||||||||||||||||||||
Class Z | 1,000.00 | 1,000.00 | 995.90 | 1,016.92 | 7.59 | 7.67 | 1.55 | ||||||||||||||||||||||||
Columbia Acorn European Fund | |||||||||||||||||||||||||||||||
Class A | 1,000.00 | 1,000.00 | 1,074.00 | 1,016.13 | 8.70 | 8.45 | 1.71 | ||||||||||||||||||||||||
Class C | 1,000.00 | 1,000.00 | 1,069.90 | 1,012.26 | 12.69 | 12.34 | 2.50 | ||||||||||||||||||||||||
Class I | 1,000.00 | 1,000.00 | 1,075.70 | 1,017.85 | 6.92 | 6.73 | 1.36 | ||||||||||||||||||||||||
Class R5 | 1,000.00 | 1,000.00 | 1,075.00 | 1,017.31 | 7.48 | 7.27 | 1.47 | ||||||||||||||||||||||||
Class Z | 1,000.00 | 1,000.00 | 1,074.80 | 1,017.65 | 7.12 | 6.93 | 1.40 | ||||||||||||||||||||||||
Fund of Funds—Columbia Thermostat Fund
January 1, 2013 – June 30, 2013
| Account value at the beginning of the period ($) | Account value at the end of the period ($) | Expenses paid during the period ($) | Fund's annualized expense ratio (%) | Effective expenses paid during the period ($) | Fund's effective annualized expense ratio (%) | ||||||||||||||||||||||||||||||||||||||
Actual | Hypothetical | Actual | Hypothetical | Actual | Hypothetical | Actual | Actual | Hypothetical | Actual | ||||||||||||||||||||||||||||||||||
Columbia Thermostat Fund | |||||||||||||||||||||||||||||||||||||||||||
Class A | 1,000.00 | 1,000.00 | 1,040.50 | 1,022.07 | 2.50 | 2.48 | 0.50 | 5.35 | 5.31 | 1.07 | |||||||||||||||||||||||||||||||||
Class B | 1,000.00 | 1,000.00 | 1,038.20 | 1,019.62 | 5.00 | 4.95 | 1.00 | 7.85 | 7.77 | 1.57 | |||||||||||||||||||||||||||||||||
Class C | 1,000.00 | 1,000.00 | 1,036.80 | 1,018.39 | 6.24 | 6.19 | 1.25 | 9.09 | 9.01 | 1.82 | |||||||||||||||||||||||||||||||||
Class R4 | 1,000.00 | 1,000.00 | 1,041.50 | 1,023.44 | 1.10 | 1.09 | 0.22 | 3.95 | 3.92 | 0.79 | |||||||||||||||||||||||||||||||||
Class R5 | 1,000.00 | 1,000.00 | 1,042.20 | 1,023.39 | 1.15 | 1.14 | 0.23 | 4.01 | 3.97 | 0.80 | |||||||||||||||||||||||||||||||||
Class Y | 1,000.00 | 1,000.00 | 1,043.00 | 1,023.83 | 0.70 | 0.69 | 0.14 | 3.56 | 3.52 | 0.71 | |||||||||||||||||||||||||||||||||
Class Z | 1,000.00 | 1,000.00 | 1,041.70 | 1,023.29 | 1.25 | 1.24 | 0.25 | 4.11 | 4.07 | 0.82 | |||||||||||||||||||||||||||||||||
Expenses paid during the period are equal to the annualized expense ratio, multiplied by the average account value over the period and then multiplied by the number of days in the Fund's most recent fiscal half year and divided by 365.
Except with respect to Columbia Thermostat Fund, expenses do not include any fees and expenses incurred indirectly by a Fund from the underlying funds in which the Fund may invest (also referred to as "acquired funds"), including affiliated and non-affiliated pooled investments vehicles (including mutual funds and exchange traded funds).
In the case of Columbia Thermostat Fund, effective expenses paid during the period and the Fund's effective annualized expense ratio include expenses borne directly by the class plus the Fund's pro rata portion of the ongoing expenses charged by the underlying funds using the expense ratio of each class of the underlying funds as of the underlying fund's most recent shareholder report.
Had the investment manager and/or certain of its affiliates not waived/reimbursed certain fees and expenses for Columbia Acorn International, Columbia Acorn International Select, Columbia Acorn Select, Columbia Thermostat Fund, Columbia Acorn Emerging Markets Fund and Columbia Acorn European Fund, account value at the end of the period would have been reduced.
* For the period from June 13, 2013 (commencement of operations) through June 30, 2013.
5
Columbia Acorn Family of Funds
Share Class Performance Average Annual Total Returns through 6/30/13
Class A | Class B | Class C | Class I | Class R | Class R4 | Class R5 | Class Y | Class Z | |||||||||||||||||||||||||||||||||||||||||||
| Without Sales Charge | With Sales Charge | Without Sales Charge | With Sales Charge | Without Sales Charge | With Sales Charge | ||||||||||||||||||||||||||||||||||||||||||||||
Columbia Acorn Fund | |||||||||||||||||||||||||||||||||||||||||||||||||||
Year to date* | 10.37 | % | 4.03 | % | 9.98 | % | 4.98 | % | 9.96 | % | 8.96 | % | 10.55 | % | NA | 10.50 | % | 10.54 | % | 10.58 | % | 10.52 | % | ||||||||||||||||||||||||||||
| 1 year | 18.98 | % | 12.14 | % | 18.27 | % | 13.27 | % | 18.12 | % | 17.12 | % | 19.41 | % | NA | 19.29 | % | 19.36 | % | 19.41 | % | 19.32 | % | ||||||||||||||||||||||||||||
| 5 years | 7.82 | % | 6.54 | % | 7.18 | % | 6.88 | % | 6.99 | % | 6.99 | % | 8.17 | % | NA | 8.13 | % | 8.14 | % | 8.15 | % | 8.13 | % | ||||||||||||||||||||||||||||
| 10 years | 10.66 | % | 10.00 | % | 9.97 | % | 9.97 | % | 9.81 | % | 9.81 | % | 11.02 | % | NA | 11.00 | % | 11.00 | % | 11.01 | % | 11.00 | % | ||||||||||||||||||||||||||||
Columbia Acorn International | |||||||||||||||||||||||||||||||||||||||||||||||||||
Year to date* | 5.71 | % | -0.37 | % | 5.32 | % | 0.32 | % | 5.31 | % | 4.31 | % | 5.87 | % | 5.51 | % | 5.84 | % | 5.88 | % | 5.89 | % | 5.85 | % | |||||||||||||||||||||||||||
| 1 year | 18.03 | % | 11.24 | % | 17.16 | % | 12.16 | % | 17.12 | % | 16.12 | % | 18.43 | % | 17.63 | % | 18.35 | % | 18.38 | % | 18.42 | % | 18.39 | % | |||||||||||||||||||||||||||
| 5 years | 3.62 | % | 2.40 | % | 2.93 | % | 2.57 | % | 2.82 | % | 2.82 | % | 4.03 | % | 3.33 | % | 3.98 | % | 3.99 | % | 3.99 | % | 3.99 | % | |||||||||||||||||||||||||||
| 10 years | 13.22 | % | 12.55 | % | 12.47 | % | 12.47 | % | 12.36 | % | 12.36 | % | 13.64 | % | 12.91 | % | 13.62 | % | 13.62 | % | 13.63 | % | 13.62 | % | |||||||||||||||||||||||||||
Columbia Acorn USA | |||||||||||||||||||||||||||||||||||||||||||||||||||
Year to date* | 11.32 | % | 4.93 | % | 10.87 | % | 5.87 | % | 10.92 | % | 9.92 | % | 11.55 | % | NA | 11.48 | % | 11.52 | % | 11.54 | % | 11.46 | % | ||||||||||||||||||||||||||||
| 1 year | 19.94 | % | 13.04 | % | 19.05 | % | 14.05 | % | 19.03 | % | 18.03 | % | 20.36 | % | NA | 20.19 | % | 20.23 | % | 20.26 | % | 20.18 | % | ||||||||||||||||||||||||||||
| 5 years | 7.55 | % | 6.28 | % | 6.85 | % | 6.54 | % | 6.73 | % | 6.73 | % | 7.90 | % | NA | 7.84 | % | 7.85 | % | 7.86 | % | 7.84 | % | ||||||||||||||||||||||||||||
| 10 years | 9.25 | % | 8.60 | % | 8.54 | % | 8.54 | % | 8.43 | % | 8.43 | % | 9.62 | % | NA | 9.59 | % | 9.59 | % | 9.59 | % | 9.59 | % | ||||||||||||||||||||||||||||
Columbia Acorn International Select | |||||||||||||||||||||||||||||||||||||||||||||||||||
Year to date* | 1.74 | % | -4.10 | % | 1.37 | % | -3.59 | % | 1.34 | % | 0.34 | % | 1.88 | % | NA | 1.87 | % | 1.87 | % | 1.87 | % | 1.84 | % | ||||||||||||||||||||||||||||
| 1 year | 12.64 | % | 6.18 | % | 11.88 | % | 7.12 | % | 11.76 | % | 10.81 | % | 12.99 | % | NA | 12.93 | % | 12.93 | % | 12.95 | % | 12.93 | % | ||||||||||||||||||||||||||||
| 5 years | 1.11 | % | -0.07 | % | 0.46 | % | 0.13 | % | 0.31 | % | 0.31 | % | 1.51 | % | NA | 1.47 | % | 1.47 | % | 1.48 | % | 1.47 | % | ||||||||||||||||||||||||||||
| 10 years | 12.01 | % | 11.35 | % | 11.29 | % | 11.29 | % | 11.14 | % | 11.14 | % | 12.39 | % | NA | 12.37 | % | 12.37 | % | 12.37 | % | 12.37 | % | ||||||||||||||||||||||||||||
Columbia Acorn Select | |||||||||||||||||||||||||||||||||||||||||||||||||||
Year to date* | 11.98 | % | 5.54 | % | 11.65 | % | 6.65 | % | 11.62 | % | 10.62 | % | 12.23 | % | NA | 12.18 | % | 12.17 | % | 12.21 | % | 12.18 | % | ||||||||||||||||||||||||||||
| 1 year | 21.59 | % | 14.62 | % | 20.82 | % | 15.82 | % | 20.68 | % | 19.68 | % | 22.09 | % | NA | 21.91 | % | 21.95 | % | 21.98 | % | 21.96 | % | ||||||||||||||||||||||||||||
| 5 years | 3.59 | % | 2.37 | % | 2.94 | % | 2.58 | % | 2.78 | % | 2.78 | % | 3.97 | % | NA | 3.89 | % | 3.90 | % | 3.90 | % | 3.90 | % | ||||||||||||||||||||||||||||
| 10 years | 7.88 | % | 7.24 | % | 7.17 | % | 7.17 | % | 7.03 | % | 7.03 | % | 8.24 | % | NA | 8.20 | % | 8.21 | % | 8.21 | % | 8.21 | % | ||||||||||||||||||||||||||||
Columbia Thermostat Fund | |||||||||||||||||||||||||||||||||||||||||||||||||||
Year to date* | 4.05 | % | -1.92 | % | 3.82 | % | -1.18 | % | 3.68 | % | 2.68 | % | NA | NA | 4.15 | % | 4.22 | % | 4.30 | % | 4.17 | % | |||||||||||||||||||||||||||||
| 1 year | 10.61 | % | 4.27 | % | 10.11 | % | 5.11 | % | 9.86 | % | 8.86 | % | NA | NA | 10.89 | % | 10.94 | % | 11.00 | % | 10.92 | % | |||||||||||||||||||||||||||||
| 5 years | 6.79 | % | 5.53 | % | 6.26 | % | 5.94 | % | 6.00 | % | 6.00 | % | NA | NA | 7.05 | % | 7.06 | % | 7.07 | % | 7.05 | % | |||||||||||||||||||||||||||||
| 10 years | 7.13 | % | 6.50 | % | 6.55 | % | 6.55 | % | 6.34 | % | 6.34 | % | NA | NA | 7.40 | % | 7.40 | % | 7.41 | % | 7.40 | % | |||||||||||||||||||||||||||||
Columbia Acorn Emerging Markets Fund | |||||||||||||||||||||||||||||||||||||||||||||||||||
Year to date* | -0.42 | % | -6.11 | % | NA | NA | -0.75 | % | -1.74 | % | -0.33 | % | NA | -0.25 | % | -0.33 | % | -0.34 | % | -0.41 | % | ||||||||||||||||||||||||||||||
| 1 year | 18.89 | % | 12.05 | % | NA | NA | 18.02 | % | 17.02 | % | 19.31 | % | NA | 19.24 | % | 19.22 | % | 19.17 | % | 19.07 | % | ||||||||||||||||||||||||||||||
Life of Fund | 10.58 | % | 7.13 | % | NA | NA | 9.86 | % | 9.86 | % | 11.06 | % | NA | 11.02 | % | 11.00 | % | 10.98 | % | 10.93 | % | ||||||||||||||||||||||||||||||
Columbia Acorn European Fund | |||||||||||||||||||||||||||||||||||||||||||||||||||
Year to date* | 7.40 | % | 1.20 | % | NA | NA | 6.99 | % | 5.99 | % | 7.57 | % | NA | NA | 7.50 | % | NA | 7.48 | % | ||||||||||||||||||||||||||||||||
| 1 year | 20.82 | % | 13.88 | % | NA | NA | 19.98 | % | 18.98 | % | 21.14 | % | NA | NA | 21.03 | % | NA | 21.00 | % | ||||||||||||||||||||||||||||||||
Life of Fund | 14.15 | % | 10.59 | % | NA | NA | 13.32 | % | 13.32 | % | 14.47 | % | NA | NA | 14.43 | % | NA | 14.41 | % | ||||||||||||||||||||||||||||||||
Returns for Class A shares are shown with and without the maximum initial sales charge of 5.75%. Returns for Class B shares are shown with and without the applicable contingent deferred sales charge (CDSC) of 5.00% in the first year, declining to 1.00% in the sixth year and eliminated thereafter. Returns for Class C shares are shown with and without the maximum CDSC of 1.00% for the first year after purchase. The Funds' other classes are not subject to sales charges and have limited eligibility. Please see the Funds' prospectuses for details. Performance for different share classes will vary based on differences in sales charges and certain fees associated with each class.
All results shown assume reinvestment of distributions during the period. Returns do not reflect the deduction of taxes that a shareholder may pay on Fund distributions or on the redemption of Fund shares. Performance results may reflect the effect of any fee waivers or reimbursements of Fund expenses by the investment manager and/or any of its affiliates. Absent these fee waivers and/or expense reimbursement arrangements, performance results would have been lower. Please see Page 133 of this report for information on contractual fee waiver and expense reimbursement agreements in place for Columbia Acorn International, Columbia Thermostat Fund, Columbia Acorn Emerging Markets Fund and Columbia Acorn European Fund and voluntary fee waiver and expense reimbursement arrangements in place for Columbia Acorn Select and Columbia Acorn International Select as of June 30, 2013.
The performance information shown represents past performance and is not a guarantee of future results. The investment return and principal value of your investment will fluctuate so that shares, when redeemed, may be worth more or less than their original cost. Current performance may be lower or higher than the performance data shown. You may obtain performance information current to the most recent month-end by contacting your financial intermediary, visiting columbiamanagement.com or calling 800.922.6769.
The returns shown include the returns of each Fund's Class Z shares, each Fund's oldest share class, in cases where the inception date of the Fund is earlier than the inception date of the particular share class or where a period shown dates to before the inception date of the share class. These returns are adjusted to reflect any higher class-related operating expenses of the newer share classes, as applicable. Please visit columbiamanagement.com/mutual-funds/appended-performance for more information.
Continued on Page 7.
6
Fund Performance vs. Benchmarks Class Z Average Annual Total Returns through 6/30/13
Class Z Shares | 2nd quarter* | Year to date* | 1 year | 5 years | 10 years | Life of Fund | |||||||||||||||||||||
| Columbia Acorn Fund (ACRNX) (6/10/70) | 0.64 | % | 10.52 | % | 19.32 | % | 8.13 | % | 11.00 | % | 14.66 | % | |||||||||||||||
Russell 2500 Index | 2.27 | % | 15.42 | % | 25.61 | % | 9.21 | % | 10.34 | % | NA | ||||||||||||||||
S&P 500 Index** | 2.91 | % | 13.82 | % | 20.60 | % | 7.01 | % | 7.30 | % | 10.77 | % | |||||||||||||||
Russell 2000 Index | 3.08 | % | 15.86 | % | 24.21 | % | 8.77 | % | 9.53 | % | NA | ||||||||||||||||
Lipper Mid-Cap Growth Funds Index | 2.36 | % | 14.26 | % | 20.24 | % | 6.09 | % | 9.26 | % | NA | ||||||||||||||||
| Columbia Acorn International (ACINX) (9/23/92) | -1.10 | % | 5.85 | % | 18.39 | % | 3.99 | % | 13.62 | % | 11.17 | % | |||||||||||||||
S&P Global Ex-U.S. Between $500M and $5B Index | -3.46 | % | 1.95 | % | 15.91 | % | 2.88 | % | 12.36 | % | 8.32 | % | |||||||||||||||
S&P Global Ex-U.S. SmallCap Index | -3.72 | % | 2.13 | % | 17.11 | % | 2.02 | % | 11.60 | % | 7.64 | % | |||||||||||||||
MSCI EAFE Index (Net) | -0.98 | % | 4.10 | % | 18.62 | % | -0.63 | % | 7.67 | % | 5.83 | % | |||||||||||||||
Lipper International Small/Mid Growth Funds Index | -0.30 | % | 7.11 | % | 22.73 | % | 3.39 | % | 12.31 | % | NA | ||||||||||||||||
| Columbia Acorn USA (AUSAX) (9/4/96) | 0.91 | % | 11.46 | % | 20.18 | % | 7.84 | % | 9.59 | % | 10.45 | % | |||||||||||||||
Russell 2000 Index | 3.08 | % | 15.86 | % | 24.21 | % | 8.77 | % | 9.53 | % | 8.03 | % | |||||||||||||||
Lipper Small-Cap Growth Funds Index | 3.70 | % | 15.86 | % | 22.24 | % | 8.01 | % | 8.29 | % | 6.54 | % | |||||||||||||||
| Columbia Acorn Int'l Select (ACFFX) (11/23/98) | -1.26 | % | 1.84 | % | 12.93 | % | 1.47 | % | 12.37 | % | 9.37 | % | |||||||||||||||
S&P Developed Ex-U.S. Between $2B and $10B Index | -1.05 | % | 4.30 | % | 17.71 | % | 1.17 | % | 10.30 | % | 7.23 | % | |||||||||||||||
MSCI EAFE Index (Net) | -0.98 | % | 4.10 | % | 18.62 | % | -0.63 | % | 7.67 | % | 3.77 | % | |||||||||||||||
Lipper International Small/Mid Growth Funds Index | -0.30 | % | 7.11 | % | 22.73 | % | 3.39 | % | 12.31 | % | 10.23 | % | |||||||||||||||
| Columbia Acorn Select (ACTWX) (11/23/98) | 1.40 | % | 12.18 | % | 21.96 | % | 3.90 | % | 8.21 | % | 9.86 | % | |||||||||||||||
S&P MidCap 400 Index | 1.00 | % | 14.59 | % | 25.18 | % | 8.91 | % | 10.74 | % | 9.90 | % | |||||||||||||||
S&P 500 Index** | 2.91 | % | 13.82 | % | 20.60 | % | 7.01 | % | 7.30 | % | 4.13 | % | |||||||||||||||
Lipper Mid-Cap Core Funds Index | 2.02 | % | 14.64 | % | 24.58 | % | 7.50 | % | 9.32 | % | 8.35 | % | |||||||||||||||
| Columbia Thermostat Fund (COTZX) (9/25/02) | 0.06 | % | 4.17 | % | 10.92 | % | 7.05 | % | 7.40 | % | 8.12 | % | |||||||||||||||
S&P 500 Index | 2.91 | % | 13.82 | % | 20.60 | % | 7.01 | % | 7.30 | % | 8.64 | % | |||||||||||||||
Barclays U.S. Aggregate Bond Index | -2.32 | % | -2.44 | % | -0.69 | % | 5.19 | % | 4.52 | % | 4.74 | % | |||||||||||||||
Lipper Flexible Portfolio Funds Index | -0.99 | % | 3.86 | % | 11.32 | % | 4.49 | % | 6.72 | % | 7.71 | % | |||||||||||||||
50/50 Blended Benchmark | 0.28 | % | 5.46 | % | 9.55 | % | 6.55 | % | 6.20 | % | 6.99 | % | |||||||||||||||
| Columbia Acorn Emerging Markets Fund (CEFZX) (8/19/11) | -3.69 | % | -0.41 | % | 19.07 | % | — | — | 10.93 | % | |||||||||||||||||
S&P Emerging Markets Between $500M and $5B Index | -6.55 | % | -4.74 | % | 9.98 | % | — | — | 1.93 | % | |||||||||||||||||
MSCI Emering Markets Small Cap Index | -7.47 | % | -3.58 | % | 9.86 | % | — | — | -0.95 | % | |||||||||||||||||
Lipper Emerging Markets Index | -7.48 | % | -8.01 | % | 4.66 | % | — | — | 1.57 | % | |||||||||||||||||
| Columbia Acorn European Fund (CAEZX) (8/19/11) | 3.10 | % | 7.48 | % | 21.00 | % | — | — | 14.41 | % | |||||||||||||||||
S&P Europe Between $500M and $5B Index | 1.50 | % | 6.46 | % | 26.83 | % | — | — | 13.52 | % | |||||||||||||||||
HSBC Smaller European Companies Index | 2.23 | % | 6.37 | % | 26.89 | % | — | — | 10.81 | % | |||||||||||||||||
Lipper European Region Index | 1.65 | % | 5.29 | % | 22.35 | % | — | — | 13.62 | % | |||||||||||||||||
The inception dates for Class A, B and C shares (if offered) are as follows: Columbia Acorn Fund, Columbia Acorn International, Columbia Acorn USA, Columbia Acorn International Select and Columbia Acorn Select, 10/16/00; Columbia Thermostat Fund, 3/3/03; Columbia Acorn Emerging Markets Fund and Columbia Acorn European Fund, 8/19/11. The inception dates for Class I shares are as follows: Columbia Acorn Fund, Columbia Acorn International, Columbia Acorn USA, Columbia Acorn International Select and Columbia Acorn Select, 9/27/10; Columbia Acorn Emerging Markets Fund and Columbia Acorn European Fund, 8/19/11. The inception date for Class R shares for Columbia Acorn International is 8/15/11. The inception date for Class R4, R5 and Y shares (if offered) is as follows: Columbia Acorn Fund, Columbia Acorn USA, Columbia Acorn International Select, Columbia Acorn Select, Columbia Thermostat Fund, Columbia Acorn Emerging Markets Fund and Columbia Acorn European Fund, 11/8/12, except that Class Y shares of Columbia Acorn Emerging Markets Fund commenced operations on June 13, 2013. The inception date for Class R5 shares of Columbia Acorn International is 8/15/11. The inception date for Class R4 and Y shares of Columbia Acorn International is 11/8/12. The inception date for Class Z shares is as follows: Columbia Acorn Fund, 6/10/70; Columbia Acorn International, 9/23/92; Columbia Acorn USA, 9/4/96; Columbia Acorn International Select and Columbia Acorn Select, 11/23/98; Columbia Thermostat Fund, 9/25/02; Columbia Acorn Emerging Markets Fund and Columbia Acorn European Fund, 8/19/11.
*Not annualized
**Although the Fund typically invests in small- and mid-sized companies, the comparison to the S&P 500 Index is presented to show performance against a widely recognized market index over the life of the Fund.
Please see inside front cover for a description of the indexes listed above.
7
Squirrel Chatter II: Health Care in the United States
 Critics of the U.S. health care system note that the World Health Organization (WHO) ranked the United States thirtieth in the world in life expectancy1 despite the fact that the United States spends more money per capita on health care than any other country. They argue that health care in the United States is inferior to health care in many other developed countries.
Scott W. Atlas's book, In Excellent Health, Setting the Record Straight on America's Health Care,2 analyzes the consequences of poor lifestyle choices made by many Americans and how the U.S. health care system operates compared to health care systems elsewhere. His book cites numerous studies indicating the U.S. health care system does a great job addressing the health concerns of Americans and is likely the best system in the world.
Life Expectancy
The United States is much more violent and accident-prone than other developed countries. Homicide rates in the United States are ten times that of the United Kingdom and five times that of Canada.3 Death rates from transportation accidents in the United States are 250% that of the United Kingdom and 160% that of Canada.4 Murder and accidents account for the majority of deaths among young adults in the United States,5 and deaths at young ages substantially impact life expectancies.
Robert Ohsfeldt's and John Schneider's book, The Business of Health,6 attempts to quantify the impact of fatal injuries on life expectancy. Using linear regression, they calculate that after standardizing for fatal injuries alone, the United States would edge out Switzerland by 0.3 years and have the highest life expectancy of any country in the world.7
Other studies indicate that violence and accidents account for much, but not all, of the life expectancy shortfall in the United States. A National Academy of Sciences panel addressing cross-national health differences issued a paper that indicated 57% of the life expectancy gap for males under age 50 and 38% for females under 50 is
explained by higher violence and accidents in the United States.8
The United States has a much higher incidence of obesity than other developed countries. Atlas notes that in 2010 34% of people in the United States were obese compared to 15% in Canada, 17% in Western Europe and about 24% in the United Kingdom.9 The Organization for Economic Cooperation and Development (OECD) estimates that obesity reduces life spans by up to eight to ten years.10 Sadly, the worst is yet to come for the United States, as obesity rates have increased and there appears to be a 25-year time lag between becoming obese and suffering premature death.11
Cigarette use in the United States is down substantially; smoking rates are now lower than most other OECD countries.12 However, studies have found a time lag of roughly 25 to 30 years between smoking and lung cancer mortality.13 The United States had the highest rate of smoking in the developed world from the 1930s to the mid-1980s and, according to a 2007 study, 53% of Americans were current or former smokers, compared to 43% of Western Europeans.14 Clearly the United States' legacy of smoking continues to impact health. The Surgeon General estimates that cigarette smoking causes 443,000 deaths in the United States yearly, nearly one-fifth of all deaths.15
With respect to neonatal mortality, Atlas writes that the United States has stringent reporting requirements and definitions. Birth registrations in the United States are done by hospitals and health care professionals, while many other countries rely on reporting by families or surveys.16 In the United States, a live birth is tabulated should a newborn breathe, have a beating heart, move voluntary muscles or show any other evidence of life.17 According to WHO, countries representing only 13% of births worldwide had reliable data meeting this definition.18
Elsewhere, definitions for live births vary greatly. Some countries consider births as live only if 28 weeks gestation was achieved, if a baby is 30 centimeters long, or if a baby survives 24 hours.19 Otherwise, the baby is classified as stillborn and is not considered an infant mortality.
8
Atlas states, "... considering that roughly half of all U.S. infant mortality occurs in the first twenty-four hours, the single criterion of omitting deaths within the first twenty-four hours by many European nations generates their falsely superior infant mortality rates."20
Data from 2004 indicated that the United States had 12% of births classified as preterm (under 32 weeks gestation), a rate 50% to 100% higher than most European countries.21 These figures are impacted by the fact the United States has more multiple gestation pregnancies. Since the early 1980s, the incidence of triplets in the United States has more than tripled to over 140 births per 100,000.22 Atlas notes that in 2007, 17% of twins and 40% of triplets in the United States were associated with fertility treatments.
The U.S. health care system should be applauded for its efforts to save premature babies rather than write them off as stillborn, as many other countries do. Except for a very limited number of abusive cases, fertility treatment should be considered a virtue of the U.S. health care system. Yet, coupled with superior record keeping, these efforts depress the country's life expectancy ranking.
Diagnosis, Treatment and Outcomes
The Centers for Disease Control and Prevention (CDC) lists heart disease as the top killer in the United States, accounting for 25% of deaths, followed by cancer at 23%, and stroke a distant third at 6%.23 Rather than judge a health care system on reported life expectancy, Atlas assesses health care quality in the United States based on actual medical care, especially diagnosis and treatment of important diseases, using objective data.
Atlas notes the challenges facing the health care system due to the poor lifestyle choices of many Americans. The CDC estimates that 80% of diabetes, heart disease and stroke, and 40% of cancer, could be eliminated through reduction in obesity and smoking.24 The rate of diabetes in the United States is typically 33% to 100% higher than other developed countries.25 A 2007 study indicated that 12% of Americans over age 50 were diagnosed with cancer, compared to only 5% in a composite of 10 European countries.26
Atlas cites data showing more timely diagnosis and treatment in the United States as compared to other countries. He writes that, "... prolonged wait times are commonly found in health systems with government-controlled nationalized health insurance."27 Numerous countries with single payer systems had to create policies to address prolonged wait times, including Canada, England, Italy, Sweden and Spain.
The United States is among the world's leaders in per capita computerized tomography (CT) and magnetic resonance imaging (MRI) scanners,28 which are crucial to accurately diagnosing leading fatal diseases and guiding lower risk and more effective treatments. In the United States, referring doctors book CT and MRI appointments within days. In other countries, people wait. In 2010, the average wait time in Canada for a CT scan was four weeks and for an MRI, ten weeks.29 A 2011 study in the United Kingdom indicated thousands of people waited over six weeks for an MRI scan. With respect to breast cancer biopsies, another survey indicated that only 1% of U.S. patients waited three weeks or more while 44% of Canadian and 20% of U.K. patients waited that long.30
Treatment of diseases also tends to be very timely in the United States. One study indicated that no elective (non-emergency) cardiac bypass patients in the United States were known to have waited more than three months, while 47% in Canada and 89% in the United Kingdom waited at least that long.31
Furthermore, treatments in the United States tend to be aggressive. A 2009 paper written by University of Pennsylvania professor Samuel Preston and doctoral candidate Jessica Ho states that 88% of Americans with high cholesterol are being medicated versus 62% of Europeans. Likewise a higher percentage of Americans over age 50 with heart disease receive medication. Among those with hypertension in the United States, 66% were being successfully treated, versus 25% to 49% in other countries.32
With respect to cancer, Preston and Ho cite studies showing that the United States tends to have the highest percentage of screenings for breast, cervical, prostate and colon cancer.33 If cancer is detected, Americans tend to receive more surgery, chemotherapy and advanced cancer drugs. A 2008 study calculated five-year survival rates for
9
breast, colorectal and prostate cancers. Patients in the United States lead the world with a 74% survival rate. Second-best Canada came in at 71% and the United Kingdom was a laggard at 52%.
Atlas adds that new oncology drugs are most often approved and first used in the United States.34 Some 80% of worldwide medical innovation originates in the United States and, since the mid-1970s, U.S. scientists have won more than half of Nobel Prize awards in medicine and physiology.
The statistics are clear. Sick Americans are more likely to receive timely and aggressive health care than citizens of other countries. Atlas writes, "Availability of state-of-the-art medical technology, timely access to specialists, the most effective screening, the shortest wait times for life-changing surgeries, the newest, most effective drugs for more accurate, safer diagnosis and for the most advanced treatment are all superior in the United States."35
Many people appear to agree. In 2008, a McKinsey & Company study estimated that up to 85,000 patients sought in-patient treatment outside their home country. Of that number, 87% traveled to the United States for advanced medical technology, better quality care or quicker access to care. In contrast, critics of the U.S. health care system don't appear to be traveling to Cuba for treatment. Based on the facts, I agree with Atlas.
Health Care Economics and Investment Implications
Atlas states that the, "... only real crisis in America's health care today is the unsustainable and increasing burden of health care costs..."36 and recommends free market reforms. Health care costs are not the topic of this essay, but world-class health care clearly is expensive, and costs in the United States are exacerbated by detrimental lifestyle choices. I also believe that poor government policies result in few incentives for cost restraint.
Columbia Wanger Asset Management, the investment manager of the Columbia Acorn Funds, strives to provide Columbia Acorn Funds' shareholders with investments in health care companies that are pursuing breakthrough drugs and devices, with the potential to transform treatment of serious and poorly managed diseases. For example, in pivotal studies Seattle Genetics' drug
Adcetris delivered 80% response rates in advanced Hodgkin's lymphoma patients who had exhausted all other treatment options.37 In addition, we seek to invest in companies with products and services that we believe increase the cost effectiveness of health care delivery. We attempt to avoid investing in health care companies that may be more likely to be subject to cost cuts or price controls.

Charles P. McQuaid
President and Chief Investment Officer
Columbia Wanger Asset Management, LLC
The information and data provided in this analysis are derived from sources that we deem to be reliable and accurate. These views are not guarantees of future performance and involve certain risks, uncertainties and assumptions that are difficult to predict so actual outcomes and results may differ significantly from the views expressed. The views/opinions expressed here are those of the author and not of the Columbia Acorn Trust Board, are subject to change at any time based upon economic, market or other conditions, may differ from views expressed by other Columbia Management associates and the respective parties disclaim any responsibility to update such views. These views may not be relied on as investment advice and, because investment decisions for a Columbia Acorn Fund are based on numerous factors, may not be relied on as an indication of trading intent on behalf of any particular Columbia Acorn Fund.
1 Atlas, Scott W., In Excellent Health, Setting the Record Straight on American's Heath Care, (Stanford, California, Hoover Institution Press), p. 2.
2 Ibid.
3 Ohsfeldt, Robert L., and Schneider, John E., The Business of Health, The Role of Competition, Markets, and Regulation, (Washington, D.C., The AEI Press), p. 19.
4 Atlas, Scott W., op. cit., p. 28.
5 Ibid., p. 28.
6 Ohsfeldt, Robert L., and Schneider, John E., op. cit.
7 Ibid., p. 22.
8 Steven H. Woolf and Laudan Aron, Editors; Panel on Understanding Cross-National Health Differences Among High-Income Countries; Committee on Population; Division of Behavioral and Social Sciences and Education; National Research Council; Board on Population Health and Public Health Practice; Institute of Medicine, www.nap.edu.
9 Atlas, Scott W., op. cit., p. 105.
10 Ibid., p. 31.
11 Ibid., p. 107.
12 Ibid., p. 40.
13 Ibid., p. 41.
14 Ibid., p. 111.
15 Ibid., p. 108.
16 Ibid., p. 60.
17 Ibid., p. 67.
18 Ibid., p. 71.
19 Ibid., p. 68.
20 Ibid., p. 70.
10
21 Ibid., p. 73.
22 Ibid., p. 89.
23 Ibid., p. 119.
24 Ibid., p. 103.
25 Ibid., p. 113.
26 Preston, Samuel H., and Ho, Jessica Y., "Low Life Expectancy in the United States: Is the Health Care System at Fault?" University of Pennsylvania Scholarly Commons Working Paper Series, July 1, 2009, p. 4, http://repository.upenn.edu/psc_working_papers/13/. Accessed July 24, 2013.
27 Atlas, Scott W., op. cit., p. 159.
28 Ibid., p. 192-193.
29 Ibid., p. 194.
30 Ibid., p. 175.
31 Ibid., p. 187.
32 Preston, Samuel H., and Ho, Jessica Y., op. cit., p. 6.
33 Ibid., p. 3.
34 Atlas, Scott W., op. cit., p. 222.
35 Ibid., p. 233.
36 Ibid., p. 245.
37 Seattle Genetics is held in the following Columbia Acorn Funds: Columbia Acorn Fund, 1.0%; Columbia Acorn USA, 1.3%; Columbia Acorn Select, 1.4%. Please refer to Columbia Acorn Fund's and Columbia Acorn USA's "nutshell" commentaries for more on this stock's performance.
11
Columbia Acorn Fund
In a Nutshell
|
| ||||||
| Charles P. McQuaid Lead Portfolio Manager | Robert A. Mohn Co-Portfolio Manager | ||||||


Performance data shown represents past performance and is not a guarantee of future results. The investment return and principal value will fluctuate so that shares, when redeemed, may be worth more or less than the original cost. Current performance may be lower or higher than the performance data shown. Please visit columbiamanagement.com for most recent month-end performance updates.
Columbia Acorn Fund Class Z shares rose 0.64% in the second quarter and 10.52% in the first half of 2013. The Russell 2500 Index, the Fund's primary benchmark, rose 2.27% in the quarter and 15.42% in the half. As shown on Page 7, the Fund also underperformed its other benchmarks. We are pleased with the absolute return for the half, but disappointed that the gain fell short of the benchmarks.
Shutterfly, an Internet photo-centric retailer, jumped 26% in the second quarter and 87% in the half on strong market share gains, surging revenues and improving margins. It was the Fund's top dollar winner in the half.
Rental car companies Hertz and Avis Budget Group were also big winners; Hertz was up 11% in the second quarter and drove home a 52% gain in the half. Avis still needs to try a bit harder; it moved up 3% in the quarter and a fine 45% in the half. We've liked the car rental business for a while because the industry has been consolidating and companies in it can adjust capacity quickly. Also, rental car rates and car resale pricing have been bolstered by less aggressive discounting of new car prices by automakers.
Biotech stocks were generally nice winners in the first quarter, but several moderately corrected in the second quarter. Drug developers Seattle Genetics and BioMarin Pharmaceutical each fell about 10% in the second quarter, reducing Seattle Genetics' first-half gain to 36% and BioMarin's first-half gain to 13%. Equipment maker Cepheid fell 10% in the quarter, cutting its gain for the half to just 2%, on fears that demand may slow and competition could increase. Synageva Biopharma, a biotech company focused on orphan diseases, fell 23% in the second quarter and 9% in the half on rumors that a key drug study is progressing more slowly than expected. In contrast, NPS Pharmaceuticals jumped 48% in the quarter and 66% in the six-month period on optimism concerning the launch of a gastrointestinal drug.
Columbia Acorn Fund's international stocks were down 5.83% in the second quarter and 3.73% for the half year.* Netherlands-based Imtech, a technical installation and maintenance services provider, plunged 35% in the second quarter and 68% for the half year. Imtech had reported a fraud in its German and Polish operations in the first quarter, and in the second quarter disclosed that the fraud would be more costly than expected. Other international losers included Pacific Rubiales Energy, off 16% in the quarter and 24% in the six-month period on a slow environmental licensing process in Colombia, which in turn is delaying the company's oil exploration and production. Athabasca Oil Sands, another oil development company, fell 31% in the second quarter and 41% in the half on a regulatory ruling concerning an oil sands
property. Fertilizer company Sociedad Quimica y Minera de Chile dropped 27% in the quarter and 30% in the half. We've kept the Fund's international stock weighting toward the lower end of its 10-year range, and ended the quarter with a 7.8% weight.
We've spent some time analyzing Fund performance. It appears that the highest and lowest valued stocks in the Fund's benchmark tended to perform best in the second quarter and six months. Our style, growth-at-a-reasonable-price (GARP), results in Columbia Acorn Fund having a relatively low weighting of such stocks, which hurt performance somewhat during these periods. These market anomalies tend to be transitory, and we continue to believe that our GARP style should provide favorable long-term results. We also believe that our research process is sound and that we have an excellent core group of analysts. We've modestly downsized the domestic analyst team and increased coverage areas for some analysts. We think, but cannot guarantee, that this will result in more selectivity and improved relative performance.
*These returns are not comparable to mutual fund returns, as they are gross of fees and other expenses and do not portray the cash effects incurred by actual mutual funds. Columbia Acorn Fund's foreign stockholdings were not purchased as a balanced, stand-alone portfolio.
Stocks of small- and mid-cap companies pose special risks, including possible illiquidity and greater price volatility than stocks of larger, more established companies. International investing involves special risks, including foreign taxation, currency risks, risks associated with possible differences in financial standards, operational and settlement risks and other risks associated with future political and economic developments.
Portfolio holdings are subject to change periodically and may not be representative of current holdings.
Fund Positions in Mentioned Holdings
As a percentage of net assets, as of 6/30/13
Cepheid | 1.1 | % | |||||
Seattle Genetics | 1.0 | ||||||
Avis Budget Group | 0.7 | ||||||
BioMarin Pharmaceutical | 0.7 | ||||||
Shutterfly | 0.6 | ||||||
Hertz | 0.5 | ||||||
Synageva Biopharma | 0.4 | ||||||
NPS Pharmaceuticals | 0.3 | ||||||
Pacific Rubiales Energy | 0.3 | ||||||
Sociedad Quimica y Minera de Chile | 0.1 | ||||||
Athabasca Oil Sands | 0.1 | ||||||
Imtech | 0.1 | ||||||
12
Columbia Acorn Fund
At a Glance
Total Net Assets of the Fund:
$18.8 billion
Performance data shown in the table and graph below represent past performance, do not guarantee future results, assume reinvestment of dividends and distributions and do not reflect the deduction of taxes that a shareholder may pay on Fund distributions or the redemption of Fund shares. The investment return and principal value of an investment will fluctuate so that shares, when redeemed, may be worth more or less than their original cost. Current performance may be lower or higher than the performance data shown. Performance data reflect fee waivers or reimbursements of Fund expenses, if any; in their absence, performance results would have been lower. Indexes are unmanaged; their results do not reflect the effect of expenses or sales charges. Securities in the Fund may not match those in an index. Please visit columbiamanagement.com for performance data current to the most recent month-end.
The Growth of a $10,000 Investment in Columbia Acorn Fund Class Z Shares
June 10, 1970 (Fund inception) through June 30, 2013
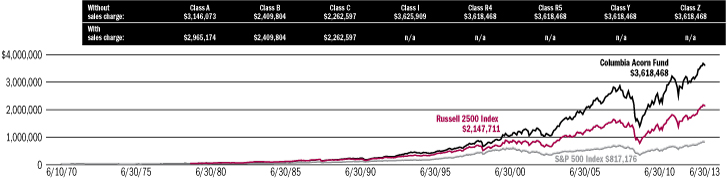
This chart shows the change in value of a hypothetical $10,000 investment in Class Z shares of the Fund during the stated time period. A $10,000 investment in Columbia Acorn Fund at inception appreciated to $31,777 on December 31, 1978, the inception date of the Russell 2500 Index. For comparison with the Russell 2500 Index, we assigned the index the same value as the Fund at index inception. Although the Fund typically invests in small- and mid-sized companies, the comparison to the S&P 500 Index is presented to show performance against a widely recognized market index over the life of the Fund.
Average Annual Total Returns for period ended June 30, 2013
| 2nd quarter* | Year to date* | 1 year | 5 years | 10 years | Life of Fund | ||||||||||||||||||||||
| Class Z (6/10/70 inception) | 0.64 | % | 10.52 | % | 19.32 | % | 8.13 | % | 11.00 | % | 14.66 | % | |||||||||||||||
| Class A (10/16/00 inception) | |||||||||||||||||||||||||||
without sales charge | 0.54 | 10.37 | 18.98 | 7.82 | 10.66 | 14.29 | |||||||||||||||||||||
with sales charge | -5.25 | 4.03 | 12.14 | 6.54 | 10.00 | 14.13 | |||||||||||||||||||||
Russell 2500 Index** | 2.27 | 15.42 | 25.61 | 9.21 | 10.34 | N/A | |||||||||||||||||||||
Results for other share classes can be found on Page 6.
*Not annualized.
**The Fund's primary benchmark. Please see the inside front cover for index descriptions.
Returns for Class A shown with and without the maximum initial sales charge of 5.75%. As stated in the May 1, 2013, prospectus, the Fund's annual operating expense ratio is 0.82% for Class Z shares and 1.10% for Class A shares. The returns shown for periods prior to the inception of the Fund's Class A shares append the returns of the Fund's Class Z shares, the Fund's oldest share class. These returns are adjusted to reflect any higher class-related operating expenses of the newer share classes, as applicable. Please visit columbiamanagement.com/mutual-funds/
appended-performance for more information.
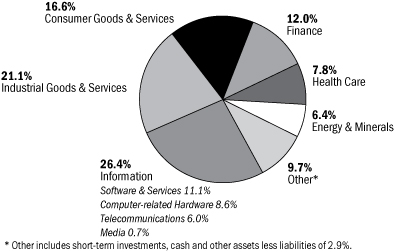
Portfolio Breakdown
as a percentage of net assets, as of 6/30/13
Top 10 Holdings
as a percentage of net assets, as of 6/30/13
| 1. | Ametek Aerospace/Industrial Instruments | 2.2 | % | ||||||||
| 2. | Mettler-Toledo International Laboratory Equipment | 1.7 | % | ||||||||
| 3. | Donaldson Industrial Air Filtration | 1.6 | % | ||||||||
| 4. | Crown Castle International Communications Towers | 1.5 | % | ||||||||
| 5. | tw telecom Fiber Optic Telephone/Data Services | 1.4 | % | ||||||||
| 6. | Amphenol Electronic Connectors | 1.4 | % | ||||||||
| 7. | FMC Technologies Oil & Gas Well Head Manufacturer | 1.4 | % | ||||||||
| 8. | SBA Communications Communications Towers | 1.3 | % | ||||||||
| 9. | Nordson Dispensing Systems for Adhesives & Coatings | 1.3 | % | ||||||||
| 10. | Cepheid Molecular Diagnostics | 1.1 | % | ||||||||
The Fund's top 10 holdings and portfolio diversification vary with changes in portfolio investments. See the Statement of Investments for a complete list of the Fund's holdings.
13
Columbia Acorn International
In a Nutshell
|
| ||||||
| P. Zachary Egan Co-Portfolio Manager | Louis J. Mendes III Co-Portfolio Manager | ||||||


Performance data shown represents past performance and is not a guarantee of future results. The investment return and principal value will fluctuate so that shares, when redeemed, may be worth more or less than the original cost. Current performance may be lower or higher than the performance data shown. Please visit columbiamanagement.com for most recent month-end performance updates.
Columbia Acorn International Class Z shares fell 1.10% in the second quarter of 2013, 2.36% better than the Fund's primary benchmark, the S&P Global Ex-U.S. Between $500M and $5B Index, which fell 3.46%. This comes on the heels of a solid first quarter, during which the Fund rose 7.03%. The Fund's return for the semiannual period was 5.85%, 3.90% ahead of its primary benchmark. For comparison, the large-cap, developed market MSCI EAFE Index (Net) rose 4.10% during the period.
In the second quarter, many bond markets experienced a sharp rise in mid-term interest rates following the mid-May remarks by U.S. Federal Reserve Bank Chairman Ben Bernanke that the Fed could "take a step down in our pace of purchase" of bonds, an unconventional practice that has supported low interest rates through the present financial crisis. How the Fed will manage this policy shift is of critical importance to investors globally, since many risk assets are priced off of U.S. government bonds. While Bernanke's remarks are grounded in signs of a normalizing U.S. economy—ostensibly good news—10-year bond rates rose on average 100 basis points in the ensuing weeks, which triggered a sell-off in international equities as investors discounted the impact more expensive money would have on economic activity and asset values in diverse markets. While the outlook for the U.S. economy may be brightening, things still appear grim in many parts of the world. In June, fears of stagflation in Brazil sent over one million people into the streets demanding more accountability from a government whose popularity has reached historic lows. Slowing economic growth in China upset already weak commodity markets and sent resources shares tumbling in the second quarter. Japanese stocks also took a breather in the quarter as the initial euphoria of "Abenomics" began to fade following two prior quarters of sharply rising markets. Despite the ebb and flow of market sentiment, many of the Fund's holdings have continued to post growth in earnings.
The Fund's top performer for the second quarter and the half year was Start Today, a Japanese online apparel retailer that has successfully managed costs to return the company to strong profitability after a rough 2012, during which its shares declined 60%. Start Today rose 54% in the second quarter and was up 114% for the six-month period. Siam Makro, a Thai-based cash and carry retailer of goods and produce, rose 41% in the quarter and 75% for the half year following a takeover bid from fellow Thai retailer CP-ALL. In recent years, Thailand has had a strong domestic economy as government policies and foreign investment have continued to increase the purchasing power of the rising middle class outside of urban Bangkok. Taiwan's St. Shine Optical, the world's leading manufacturer of daily disposable contact lenses,
rose 32% in the second quarter and ended the six-month period up 69%. Continued expansion of its overseas presence and increasing penetration of daily-wear contact lenses, which have become more affordable with rising regional incomes, drove gains.
Commodity-related holdings, namely in energy and basic materials, came under pressure as anxiety about the macroeconomic outlook spiked. Coal miner Mongolian Mining fell nearly 50% in the second quarter and was off 63% for the half year on disappointing volume throughput to China as logistic improvements continue to be delayed. Brazilian gold miner Beadell Resources and Australia's Regis Resources declined 51% and 39%, respectively, in the second quarter and were both off more than 50% for the half year as gold prices dropped over 25% in the first six months of 2013. Imtech, a Dutch technical installation and maintenance services provider, fell 35% in the second quarter as it became clear an earnings-dilutive rights issue was in the offing. This offering became necessary following news of fraud in Imtech's German and Polish operations. Year to date through June 30, Imtech's stock was down 68%. In Korea, Samsung Engineering fell 32% during the second quarter and was off 49% for the half year as the outlook for earnings declined amidst weakening overseas construction orders. We opted to sell the Fund's position in this stock.
Considerable uncertainties mar the international landscape. We expect continued high volatility in the second half of the year. We believe that, while unsettling, volatility provides opportunities to buy good companies at attractive prices.
International investing involves special risks, including foreign taxation, currency risks, risks associated with possible differences in financial standards, operational and settlement risks and other risks associated with future political and economic developments. Stocks of small- and mid-cap companies pose special risks, including possible illiquidity and greater price volatility than stocks of larger, more established companies. Investing in emerging markets may involve greater risks than investing in more developed countries. In addition, concentration of investments in a single region may result in greater volatility.
Portfolio holdings are subject to change periodically and may not be representative of current holdings.
Fund's Positions in Mentioned Holdings
As a percentage of net assets, as of 6/30/13
Start Today | 0.8 | % | |||||
St. Shine Optical | 0.8 | ||||||
Beadell Resources | 0.4 | ||||||
Regis Resources | 0.2 | ||||||
Imtech | 0.2 | ||||||
Mongolian Mining | 0.2 | ||||||
14
Columbia Acorn International
At a Glance
Total Net Assets of the Fund:
$7.3 billion
Performance data shown in the table and graph below represent past performance, do not guarantee future results, assume reinvestment of dividends and distributions and do not reflect the deduction of taxes that a shareholder may pay on Fund distributions or the redemption of Fund shares. The investment return and principal value of an investment will fluctuate so that shares, when redeemed, may be worth more or less than their original cost. Current performance may be lower or higher than the performance data shown. Performance data reflect fee waivers or reimbursements of Fund expenses, if any; in their absence, performance results would have been lower. Indexes are unmanaged; their results do not reflect the effect of expenses or sales charges. Securities in the Fund may not match those in an index. Please visit columbiamanagement.com for performance data current to the most recent month-end.
The Growth of a $10,000 Investment in Columbia Acorn International Class Z Shares
September 23, 1992 (Fund inception) through June 30, 2013
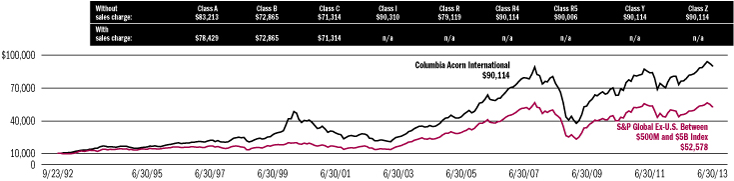
This chart shows the change in value of a hypothetical $10,000 investment in Class Z shares of the Fund during the stated time period.
Average Annual Total Returns for period ended June 30, 2013
| 2nd quarter* | Year to date* | 1 year | 5 years | 10 years | Life of Fund | ||||||||||||||||||||||
| Class Z (9/23/92 inception) | -1.10 | % | 5.85 | % | 18.39 | % | 3.99 | % | 13.62 | % | 11.17 | % | |||||||||||||||
| Class A (10/16/00 inception) | |||||||||||||||||||||||||||
without sales charge | -1.17 | 5.71 | 18.03 | 3.62 | 13.22 | 10.74 | |||||||||||||||||||||
with sales charge | -6.85 | -0.37 | 11.24 | 2.40 | 12.55 | 10.42 | |||||||||||||||||||||
| S&P Global Ex-U.S. Between $500M and $5B** | -3.46 | 1.95 | 15.91 | 2.88 | 12.36 | 8.32 | |||||||||||||||||||||
Results for other share classes can be found on Page 6.
*Not annualized.
**The Fund's primary benchmark. Please see the inside front cover for index descriptions.
Returns for Class A shown with and without the maximum initial sales charge of 5.75%. As stated in the May 1, 2013, prospectus, the Fund's annual operating expense ratio is 0.95% for Class Z shares and 1.31% for Class A shares. The returns shown for periods prior to the inception of the Fund's Class A shares append the returns of the Fund's Class Z shares, the Fund's oldest share class. These returns are adjusted to reflect any higher class-related operating expenses of the newer share classes, as applicable. Please visit columbiamanagement.com/mutual-funds/
appended-performance for more information.
Portfolio Breakdown
as a percentage of net assets, as of 6/30/13
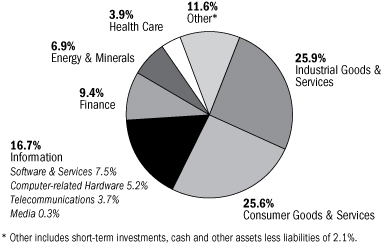
Top 10 Holdings
as a percentage of net assets, as of 6/30/13
| 1. | Far EasTone Telecom (Taiwan) Taiwan Third Largest Mobile Operator | 1.5 | % | ||||||||
| 2. | Coronation Fund Managers (South Africa) South African Fund Manager | 1.2 | % | ||||||||
| 3. | Hexagon (Sweden) Design, Measurement & Visualization Software & Equipment | 1.1 | % | ||||||||
| 4. | CCL Industries (Canada) Leading Global Label Converter | 1.1 | % | ||||||||
| 5. | Melco Crown Entertainment - ADR (Hong Kong) Macau Casino Operator | 1.1 | % | ||||||||
| 6. | Eurofins Scientific (France) Food, Pharmaceuticals & Materials Screening & Testing | 1.0 | % | ||||||||
| 7. | Neopost (France) Postage Meter Machines | 1.0 | % | ||||||||
| 8. | Partners Group (Switzerland) Private Markets Asset Management | 1.0 | % | ||||||||
| 9. | Taiwan Mobile (Taiwan) Taiwan's Second Largest Mobile Operator | 1.0 | % | ||||||||
| 10. | Aalberts Industries (Netherlands) Flow Control & Heat Treatment | 0.9 | % | ||||||||
The Fund's top 10 holdings and portfolio diversification vary with changes in portfolio investments. See the Statement of Investments for a complete list of the Fund's holdings.
15
Columbia Acorn USA
In a Nutshell
| |||
| Robert A. Mohn Lead Portfolio Manager | |||

Performance data shown represents past performance and is not a guarantee of future results. The investment return and principal value will fluctuate so that shares, when redeemed, may be worth more or less than the original cost. Current performance may be lower or higher than the performance data shown. Please visit columbiamanagement.com for daily and most recent month-end performance updates.
Columbia Acorn USA Class Z shares ended the second quarter of 2013 up 0.91%, underperforming the 3.08% gain of the Fund's primary benchmark, the Russell 2000 Index. Year to date through June 30, 2013, the Fund was up 11.46% compared to its benchmark's gain of 15.86%. The Fund underperformed its benchmark due, in part, to our growth-at-a-reasonable-price (GARP) style of investing. This style tends to lag the benchmark during a strong market spurt like that experienced during the first half of 2013.
Top contributors in the quarter included tw telecom, a fiber optic telephone and data services provider, up 12% in the second quarter and 10% for the half year. Rumblings of a potential sale of the company sent the stock up in the second quarter. NPS Pharmaceuticals bucked the downward trend of some Fund health care stocks, gaining 48% in the second quarter and ending the half up 65%. NPS successfully launched a new drug to treat short bowel syndrome. SPS Commerce, a developer of supply chain management software delivered via the web, gained 29% in the second quarter and 48% for the half year on strong growth in revenue.
Year to date, rental car companies Avis Budget Group and Hertz were strong contributors with gains of 45% and 52%, respectively, for the six-month period. The rental car industry has benefited from consolidation and positive trends in rental car pricing. Bally Technologies, a slot machine manufacturer and software developer, gained 26% in the half after reporting a strong first quarter fueled by increased demand for replacement slot machines. Internet photo-centric retailer Shutterfly ended the half year up 87% and gained 26% in the second quarter after reporting solid market share gains.
Health care stocks Synageva Biopharma, Seattle Genetics and Cepheid had losses ranging from 10% to 23% in the second quarter. The stock of Synageva Biopharma, a biotech focused on rare diseases, suffered from investor concerns over potential delays. Seattle Genetics dropped 11% in the second quarter as biotech stocks in general corrected. Cepheid, a provider of molecular diagnostic supplies, fell after a medical journal article suggested screening using a test similar to one offered by Cepheid was an ineffective approach to addressing hospital
infections. For the half year, Synageva Biopharma was down 9%, while Seattle Genetics' strong first quarter left the stock with a 36% six-month gain and Cepheid held onto a 2% gain for the half.
While its stock bounced back 4% in the second quarter, premium active apparel retailer lululemon athletica was down 15% for the six months as investors reacted negatively to the resignation of the company's CEO. Fiber laser manufacturer IPG Photonics was off over 8% for the second quarter and the half on weaker than expected revenue growth and concerns about China, the source of 17% of the company's revenue. Plagued by a number of project delays, ESCO Technologies, a manufacturer of automatic electric meter readers, fell 13% for the half year and was off 21% in the second quarter.
The Fund's double-digit gain for the first half of the year was impressive, but we were disappointed that its return lagged the small-cap benchmarks. As mentioned above, our GARP style was somewhat out of favor for both the quarter and the half year, as stocks at the top and bottom of the valuation spectrum brought top gains. Investing styles ebb and flow during market cycles, but our GARP approach has historically worked well over the long term.
Stocks of small- and mid-cap companies pose special risks, including possible illiquidity and greater price volatility than stocks of larger, more established companies.
Portfolio holdings are subject to change periodically and may not be representative of current holdings.
Fund's Positions in Mentioned Holdings
As a percentage of net assets, as of 6/30/13
tw telecom | 2.4 | % | |||||
Avis Budget Group | 2.2 | ||||||
Bally Technologies | 2.2 | ||||||
IPG Photonics | 1.8 | ||||||
ESCO Technologies | 1.6 | ||||||
Cepheid | 1.3 | ||||||
Seattle Genetics | 1.3 | ||||||
SPS Commerce | 1.0 | ||||||
Hertz | 1.0 | ||||||
Shutterfly | 0.8 | ||||||
NPS Pharmaceuticals | 0.7 | ||||||
Synageva Biopharma | 0.7 | ||||||
lululemon athletica | 0.5 | ||||||
16
Columbia Acorn USA
At a Glance
Total Net Assets of the Fund:
$1.5 billion
Performance data shown in the table and graph below represent past performance, do not guarantee future results, assume reinvestment of dividends and distributions and do not reflect the deduction of taxes that a shareholder may pay on Fund distributions or the redemption of Fund shares. The investment return and principal value of an investment will fluctuate so that shares, when redeemed, may be worth more or less than their original cost. Current performance may be lower or higher than the performance data shown. Performance data reflect fee waivers or reimbursements of Fund expenses, if any; in their absence, performance results would have been lower. Indexes are unmanaged; their results do not reflect the effect of expenses or sales charges. Securities in the Fund may not match those in an index. Please visit columbiamanagement.com for performance data current to the most recent month-end.
The Growth of a $10,000 Investment in Columbia Acorn USA Class Z Shares
September 4, 1996 (Fund inception) through June 30, 2013
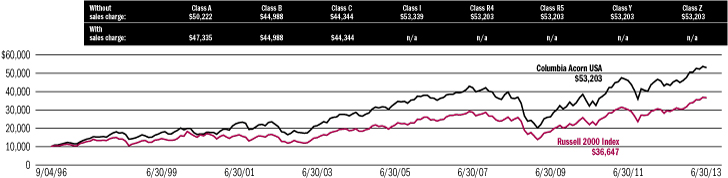
This chart shows the change in value of a hypothetical $10,000 investment in Class Z shares of the Fund during the stated time period.
Average Annual Total Returns for period ended June 30, 2013
| 2nd quarter* | Year to date* | 1 year | 5 years | 10 years | Life of Fund | ||||||||||||||||||||||
| Class Z (9/4/96 inception) | 0.91 | % | 11.46 | % | 20.18 | % | 7.84 | % | 9.59 | % | 10.45 | % | |||||||||||||||
| Class A (10/16/00 inception) | |||||||||||||||||||||||||||
without sales charge | 0.85 | 11.32 | 19.94 | 7.55 | 9.25 | 10.07 | |||||||||||||||||||||
with sales charge | -4.95 | 4.93 | 13.04 | 6.28 | 8.60 | 9.68 | |||||||||||||||||||||
Russell 2000 Index** | 3.08 | 15.86 | 24.21 | 8.77 | 9.53 | 8.03 | |||||||||||||||||||||
Results for other share classes can be found on Page 6.
*Not annualized.
**The Fund's primary benchmark. Please see the inside front cover for index descriptions.
Returns for Class A shown with and without the maximum initial sales charge of 5.75%. As stated in the May 1, 2013, prospectus, the Fund's annual operating expense ratio is 1.15% for Class Z shares and 1.38% for Class A shares. The returns shown for periods prior to the inception of the Fund's Class A shares append the returns of the Fund's Class Z shares, the Fund's oldest share class. These returns are adjusted to reflect any higher class-related operating expenses of the newer share classes, as applicable. Please visit columbiamanagement.com/mutual-funds/
appended-performance for more information.
Portfolio Breakdown
as a percentage of net assets, as of 6/30/13
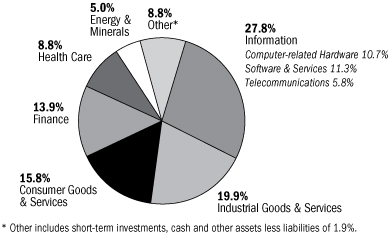
Top 10 Holdings
as a percentage of net assets, as of 6/30/13
| 1. | Nordson Dispensing Systems for Adhesives & Coatings | 3.0 | % | ||||||||
| 2. | tw telecom Fiber Optic Telephone/Data Services | 2.4 | % | ||||||||
| 3. | Ametek Aerospace/Industrial Instruments | 2.3 | % | ||||||||
| 4. | Extra Space Storage Self Storage Facilities | 2.2 | % | ||||||||
| 5. | Avis Budget Group Second Largest Car Rental Company | 2.2 | % | ||||||||
| 6. | Bally Technologies Slot Machines & Software | 2.2 | % | ||||||||
| 7. | Mettler-Toledo International Laboratory Equipment | 2.1 | % | ||||||||
| 8. | Donaldson Industrial Air Filtration | 1.9 | % | ||||||||
| 9. | Atwood Oceanics Offshore Drilling Contractor | 1.9 | % | ||||||||
| 10. | IPG Photonics Fiber Lasers | 1.8 | % | ||||||||
The Fund's top 10 holdings and portfolio diversification vary with changes in portfolio investments. See the Statement of Investments for a complete list of the Fund's holdings.
17
Columbia Acorn International Select
In a Nutshell
| |||
| Christopher J. Olson Lead Portfolio Manager | |||

Performance data shown represents past performance and is not a guarantee of future results. The investment return and principal value will fluctuate so that shares, when redeemed, may be worth more or less than the original cost. Current performance may be lower or higher than the performance data shown. Please visit columbiamanagement.com for daily and most recent month-end performance updates.
Columbia Acorn International Select Class Z shares ended the second quarter of 2013 down 1.26% versus a 1.05% drop for the Fund's primary benchmark, the S&P Developed Ex-U.S. Between $2B and $10B Index. For the first half, the Fund gained 1.84% while its benchmark rose 4.30%. Overall for both periods, the Fund's very strong stock performance in Japan was more than offset by an overweight in the underperforming materials sector.
Start Today, a Japanese online apparel retailer, was the top contributor to Fund gains in the second quarter and the half year. Up 54% in the second quarter and 114% year to date as of June 30, the company continued to benefit from improved marketing and cost cutting, combined with strong revenue growth. NGK Spark Plug, a Japanese auto parts manufacturer, ended the quarter up 30% and the half up 53%, as exporters continued to benefit from a weaker yen. Rounding out the Japanese winners, Seven Bank, a provider of ATM processing services, enjoyed a 13% gain in the second quarter and was up 39% for the half as the company continued expansion of ATMs in the 7-11 store network in Japan.
Far EasTone Telecom, Taiwan's third largest mobile operator, and Taiwan Mobile, its second largest, rebounded from first quarter declines during the period. Far EasTone Telecom was up 18% for the second quarter and ended the half with a 5% gain. Taiwan Mobile was up 16% for the quarter and 7% for the half. Both companies continue to report very steady earnings growth driven by increasing smartphone usage and subsequent data growth.
As mentioned, the Fund's performance during the period was dampened by its overweight in the materials sector. The laggards list for the second quarter and for the half year was dominated by mining stocks. Brazilian gold miner Beadell Resources was down more than 50% for the second quarter and the half year. Fresnillo, a silver and metal byproduct miner in Mexico, fell 33% in the second quarter and was off 54% year to date as of June 30. Australian gold miner Regis Resources fell 39% in the quarter and was down 50% for the half-year period. Falling gold and silver prices drove the sector's underperformance despite the good operating results reported by these companies. The Fund cut back on its exposure in the materials sector earlier this year, but we believe that historically low valuations at this point argue for leaving its current weighting in place.
Real estate stocks pulled back in the second quarter on fears of higher interest rates. Singapore's industrial property landlords Ascendas REIT and Mapletree Logistics Trust fell 17% and 10%, respectively, while Japan's Nippon Prologis REIT and Orix JREIT both fell 19% in the second quarter. Operationally, all the REITs held by the Fund continue to perform well.
Monetary policy has been one of the main drivers of stock market performance and those countries with significant easing programs (Japan and the United States, for example) have reported strong returns while those countries that have not opted for such programs (Hong Kong, Korea, many emerging markets) have been decidedly weak. Fund holdings reflected this trend with strength coming from Japanese names, while those listed in emerging markets struggled during the period. The Fund will continue to focus on companies with strong fundamentals but will seek to be mindful of the impact that government fiscal policies are having on the investment environment.
International investing involves special risks, including foreign taxation, currency risks, risks associated with possible differences in financial standards, operational and settlement risks and other risks associated with future political and economic developments. Stocks of small- and mid-cap companies pose special risks, including possible illiquidity and greater price volatility than stocks of larger, more established companies. The Fund has potentially greater price volatility due to its concentration in a limited number of stocks of small- and mid-size companies. Investing in emerging markets may involve greater risks than investing in more developed countries.
Portfolio holdings are subject to change periodically and may not be representative of current holdings.
Fund's Positions in Mentioned Holdings
As a percentage of net assets, as of 6/30/13
Far EasTone Telecom | 7.9 | % | |||||
Taiwan Mobile | 5.4 | ||||||
Ascendas REIT | 4.9 | ||||||
Start Today | 4.6 | ||||||
NGK Spark Plug | 4.5 | ||||||
Seven Bank | 3.0 | ||||||
Mapletree Logistics Trust | 2.8 | ||||||
Nippon Prologis REIT | 2.2 | ||||||
Beadell Resources | 1.6 | ||||||
Regis Resources | 1.3 | ||||||
Orix JREIT | 1.2 | ||||||
Fresnillo | 1.0 | ||||||
18
Columbia Acorn International Select
At a Glance
Total Net Assets of the Fund:
$339.6 million
Performance data shown in the table and graph below represent past performance, do not guarantee future results, assume reinvestment of dividends and distributions and do not reflect the deduction of taxes that a shareholder may pay on Fund distributions or the redemption of Fund shares. The investment return and principal value of an investment will fluctuate so that shares, when redeemed, may be worth more or less than their original cost. Current performance may be lower or higher than the performance data shown. Performance data reflect fee waivers or reimbursements of Fund expenses, if any; in their absence, performance results would have been lower. Indexes are unmanaged; their results do not reflect the effect of expenses or sales charges. Securities in the Fund may not match those in an index. Please visit columbiamanagement.com for performance data current to the most recent month-end.
The Growth of a $10,000 Investment in Columbia Acorn International Select Class Z Shares
November 23, 1998 (Fund inception) through June 30, 2013
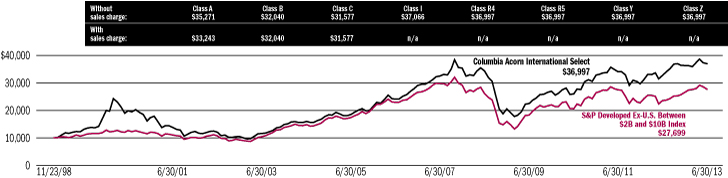
This chart shows the change in value of a hypothetical $10,000 investment in Class Z shares of the Fund during the stated time period.
Average Annual Total Returns for period ended June 30, 2013
| 2nd quarter* | Year to date* | 1 year | 5 years | 10 years | Life of Fund | ||||||||||||||||||||||
| Class Z (11/23/98 inception) | -1.26 | % | 1.84 | % | 12.93 | % | 1.47 | % | 12.37 | % | 9.37 | % | |||||||||||||||
| Class A (10/16/00 inception) | |||||||||||||||||||||||||||
without sales charge | -1.31 | 1.74 | 12.64 | 1.11 | 12.01 | 9.02 | |||||||||||||||||||||
with sales charge | -6.98 | -4.10 | 6.18 | -0.07 | 11.35 | 8.57 | |||||||||||||||||||||
| S&P Developed Ex-U.S. Between $2B and $10B Index** | -1.05 | 4.30 | 17.71 | 1.17 | 10.30 | 7.23 | |||||||||||||||||||||
Results for other share classes can be found on Page 6.
*Not annualized.
**The Fund's primary benchmark. Please see the inside front cover for index descriptions.
Returns for Class A shown with and without the maximum initial sales charge of 5.75%. As stated in the May 1, 2013, prospectus, the Fund's annual operating expense ratio is 1.26% for Class Z shares and 1.51% for Class A shares. The returns shown for periods prior to the inception of the Fund's Class A shares append the returns of the Fund's Class Z shares, the Fund's oldest share class. These returns are adjusted to reflect any higher class-related operating expenses of the newer share classes, as applicable. Please visit columbiamanagement.com/mutual-funds/
appended-performance for more information.
Portfolio Breakdown
as a percentage of net assets, as of 6/30/13

Top 10 Holdings
as a percentage of net assets, as of 6/30/13
| 1. | Far EasTone Telecom (Taiwan) Taiwan's Third Largest Mobile Operator | 7.9 | % | ||||||||
| 2. | Taiwan Mobile (Taiwan) Taiwan's Second Largest Mobile Operator | 5.4 | % | ||||||||
| 3. | Ascendas REIT (Singapore) Industrial Property Landlord | 4.9 | % | ||||||||
| 4. | Start Today (Japan) Online Japanese Apparel Retailer | 4.6 | % | ||||||||
| 5. | NGK Spark Plug (Japan) Automobile Parts | 4.5 | % | ||||||||
| 6. | Jardine Lloyd Thompson Group (United Kingdom) International Business Insurance Broker | 4.0 | % | ||||||||
| 7. | CCL Industries (Canada) Largest Global Label Converter | 4.0 | % | ||||||||
| 8. | Seven Bank (Japan) ATM Processing Services | 3.0 | % | ||||||||
| 9. | Mapletree Logistics Trust (Singapore) Industrial Property Landlord | 2.8 | % | ||||||||
| 10. | Archipelago Resources (Indonesia) Gold Mining Projects in Indonesia, Vietnam & the Philippines | 2.5 | % | ||||||||
The Fund's top 10 holdings and portfolio diversification vary with changes in portfolio investments. See the Statement of Investments for a complete list of the Fund's holdings.
19
Columbia Acorn Select
In a Nutshell
| |||
| Robert A. Chalupnik Lead Portfolio Manager | |||

Performance data shown represents past performance and is not a guarantee of future results. The investment return and principal value will fluctuate so that shares, when redeemed, may be worth more or less than the original cost. Current performance may be lower or higher than the performance data shown. Please visit columbiamanagement.com for most recent month-end performance updates.
Columbia Acorn Select Class Z shares ended the second quarter of 2013 up 1.40%, outperforming the 1.00% gain of its primary benchmark, the S&P MidCap 400 Index. For the semiannual period, the Fund was up 12.18%, falling short of the 14.59% gain of the benchmark. While the Fund gained ground in the second quarter, poor stock performance in the energy sector dampened six-month gains. The Fund was underweight in energy versus the benchmark and its investments in smaller energy companies lagged the sector.
Three holdings discussed last quarter continued to show strength through the second quarter. U.S. car rental company Hertz gained 11% in the quarter and was up 52% for the half year. The rental car industry is benefiting from consolidation and its ability to quickly adjust capacity. WNS, an offshore business process outsourcing company, ended the quarter up 13% and the half up nearly 60% on solid revenue growth. Insurance provider CNO Financial was up 14% for the quarter and 39% for the half year, as an increase in interest rates sparked investor interest in life insurance companies.
Other strong contributors included Sanmina, a provider of electronic manufacturing services, which bounced with the tech sector and gained 26% in the second quarter and ended the half up 29%. Globalstar, a satellite mobile voice and data carrier, provided a 75% gain for the Fund in the quarter and ended the half up 78%. Real Goods Solar, a residential solar energy installer, rose 211% in the quarter and 646% in the Fund for the half. We sold Globalstar and Real Goods Solar during the period, capturing the surge in their stock prices. Both stocks dropped after we sold them. Removing these two holdings from the portfolio was also in keeping with our effort to reposition the portfolio away from riskier, micro-cap names.
On the downside, convention hotel operator Ryman Hospitality Properties pulled back in the second quarter, falling 13% on reduced group bookings. Year to date through the end of June, the stock held onto a 4% gain. Petrodorado Energy, an oil and gas exploration company, fell 68% in the second quarter, leaving the stock with a 53% loss for the half year. Petrodorado hit oil in Colombia, but uncertainty as to whether the find would be commercially viable caused investors to move away from the stock. Also in the oil exploration sector, Pacific Rubiales Energy was off 16% in the quarter and down 24% for the half year due to delays caused by a slow environmental licensing process in Colombia. F5 Networks, a provider of Internet traffic management equipment, fell 23% in the second quarter and 30% in the half on a slight earnings miss and lowered guidance.
Four new names were added to the portfolio including PVH, an apparel wholesaler and retailer with global mega-brands including Calvin Klein and Tommy Hilfiger. Another new holding, Blackhawk Network, is a third-party distributor of prepaid content like gift cards. Blackhawk was spun out of former Fund holding Safeway grocery stores. Since we have covered Safeway for years, we know this piece of their business well and we believe it has growth potential. Trimble Navigation, a manufacturer of global positioning satellites (GPS) instruments, was also added during the second quarter. We believe increased use of GPS technology in many areas including agriculture, engineering and construction provides a nice runway of growth for Trimble. The final new addition was consumer electronics specialty retailer Best Buy, which offers a turnaround opportunity driven by new company management.
The stock market rally continued into the second quarter while gold and bond prices retreated on concerns that the Federal Reserve will taper off its bond buying program. Although we think about macro issues including global growth rates, government deficits and interest rate changes, our primary focus is on finding companies that have strong prospects for growing sales and earnings through product innovation, market share gains and manufacturing efficiencies, while paying a reasonable price for that outlook. The trades we made during the quarter continue to focus the Fund on this strategy. Thank you for your investment in the Fund.
Risks include stock market fluctuations due to economic and business developments. The Fund also has potentially greater price volatility due to the Fund's concentration in a limited number of stocks of mid-size companies. International investing involves special risks, including foreign taxation, currency risks, risks associated with possible differences in financial standards, operational and settlement risks and other risks associated with future political and economic developments.
Portfolio holdings are subject to change periodically and may not be representative of current holdings.
Fund's Positions in Mentioned Holdings
As a percentage of net assets, as of 6/30/13
CNO Financial Group | 5.8 | % | |||||
Hertz | 5.4 | ||||||
WNS | 4.8 | ||||||
Ryman Hospitality Properties | 2.0 | ||||||
Sanmina | 1.8 | ||||||
F5 Networks | 1.6 | ||||||
Pacific Rubiales Energy | 1.4 | ||||||
PVH | 1.3 | ||||||
Blackhawk Network | 1.2 | ||||||
Trimble Navigation | 1.0 | ||||||
Best Buy | 0.7 | ||||||
Petrodorado Energy | 0.2 | ||||||
20
Columbia Acorn Select
At a Glance
Total Net Assets of the Fund:
$857.4 million
Performance data shown in the table and graph below represent past performance, do not guarantee future results, assume reinvestment of dividends and distributions and do not reflect the deduction of taxes that a shareholder may pay on Fund distributions or the redemption of Fund shares. The investment return and principal value of an investment will fluctuate so that shares, when redeemed, may be worth more or less than their original cost. Current performance may be lower or higher than the performance data shown. Performance data reflect fee waivers or reimbursements of Fund expenses, if any; in their absence, performance results would have been lower. Indexes are unmanaged; their results do not reflect the effect of expenses or sales charges. Securities in the Fund may not match those in an index. Please visit columbiamanagement.com for performance data current to the most recent month-end.
The Growth of a $10,000 Investment in Columbia Acorn Select Class Z Shares
November 23, 1998 (Fund inception) through June 30, 2013
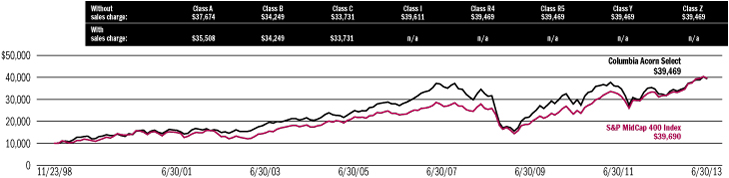
This chart shows the change in value of a hypothetical $10,000 investment in Class Z shares of the Fund during the stated time period.
Average Annual Total Returns for period ended June 30, 2013
| 2nd quarter* | Year to date* | 1 year | 5 years | 10 years | Life of Fund | ||||||||||||||||||||||
| Class Z (11/23/98 inception) | 1.40 | % | 12.18 | % | 21.96 | % | 3.90 | % | 8.21 | % | 9.86 | % | |||||||||||||||
| Class A (10/16/00 inception) | |||||||||||||||||||||||||||
without sales charge | 1.33 | 11.98 | 21.59 | 3.59 | 7.88 | 9.51 | |||||||||||||||||||||
with sales charge | -4.51 | 5.54 | 14.62 | 2.37 | 7.24 | 9.07 | |||||||||||||||||||||
S&P MidCap 400 Index** | 1.00 | 14.59 | 25.18 | 8.91 | 10.74 | 9.90 | |||||||||||||||||||||
Results for other share classes can be found on Page 6.
*Not annualized.
**The Fund's primary benchmark. Please see the inside front cover for index descriptions.
Returns for Class A shown with and without the maximum initial sales charge of 5.75%. As stated in the May 1, 2013, prospectus, the Fund's annual operating expense ratio is 1.07% for Class Z shares and 1.35% for Class A shares. The returns shown for periods prior to the inception of the Fund's Class A shares append the returns of the Fund's Class Z shares, the Fund's oldest share class. These returns are adjusted to reflect any higher class-related operating expenses of the newer share classes, as applicable. Please visit columbiamanagement.com/mutual-funds/
appended-performance for more information.
Portfolio Breakdown
as a percentage of net assets, as of 6/30/13
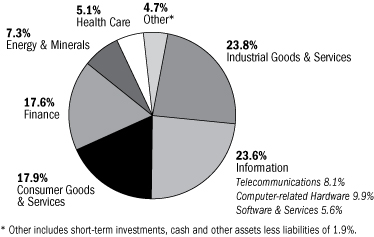
Top 10 Holdings
as a percentage of net assets, as of 6/30/13
| 1. | Ametek Aerospace/Industrial Instruments | 6.0 | % | ||||||||
| 2. | CNO Financial Group Life, Long-term Care & Medical Supplement Insurance | 5.8 | % | ||||||||
| 3. | Hertz Largest U.S. Rental Car Operator | 5.4 | % | ||||||||
| 4. | WNS - ADR (India) Offshore Business Process Outsourcing Services | 4.8 | % | ||||||||
| 5. | Discover Financial Services Credit Card Company | 4.2 | % | ||||||||
| 6. | Amphenol Electronic Connectors | 4.0 | % | ||||||||
| 7. | Donaldson Industrial Air Filtration | 3.9 | % | ||||||||
| 8. | City National Bank & Asset Manager | 3.5 | % | ||||||||
| 9. | Crown Castle International Communications Towers | 3.3 | % | ||||||||
| 10. | SBA Communications Communications Towers | 3.1 | % | ||||||||
The Fund's top 10 holdings and portfolio diversification vary with changes in portfolio investments. See the Statement of Investments for a complete list of the Fund's holdings.
21
Columbia Thermostat Fund
In a Nutshell
| |||
| Charles P. McQuaid Lead Portfolio Manager | |||

Performance data shown represents past performance and is not a guarantee of future results. The investment return and principal value will fluctuate so that shares, when redeemed, may be worth more or less than the original cost. Current performance may be lower or higher than the performance data shown. Please visit columbiamanagement.com for daily and most recent month-end performance updates.
A "fund of fund" bears its allocable share of the costs and expenses of the underlying funds in which it invests. Such funds are thus subject to two levels of fees and potentially higher expense ratios than would be associated with a fund that invests and trades directly in financial instruments under the direction of a single manager.
Columbia Thermostat Fund Class Z shares ended the second quarter of 2013 with a slight gain of 0.06%. This compares to a 2.91% return for the Fund's primary equity benchmark, the S&P 500 Index, and a 2.32% decline for its primary debt benchmark, the Barclays U.S. Aggregate Bond Index. Year to date through June 30, the Fund was up 4.17% versus a 13.82% return for the S&P 500 Index and a 2.44% drop in the Barclays U.S. Aggregate Bond Index.
The Fund hit four reallocation triggers during the second quarter. Responding to market moves, stock exposure was increased to 35% in April, reduced to 20% in May and increased twice in June, ultimately to 30%. In keeping with the "31-day Rule" defined in the Fund's prospectus, the Fund makes additional reallocations within a 31-day period as long as the reallocation is in the same direction, but does not switch directions within that period of time. The 31-day Rule fortuitously delayed the Fund from selling stocks while the market rallied in late April and early May.
The equity portion of the portfolio provided a 1.51% weighted average gain for the second quarter and was up 11.80% year to date through the end of June. Columbia Large Cap Enhanced Core Fund led performance in the quarter with a 3.74% gain, while Columbia Dividend Income Fund was the half year winner with a 15.27% return.
The bond portion of the Fund had a weighted average loss for both the second quarter and the six months, down 1.45% and 0.74%, respectively. Columbia Short Term Bond Fund was down 0.38% in the second quarter and was the best performing bond fund in the portfolio. Columbia Income Opportunities Fund eked out a 0.03% gain for the half year, the highest bond fund return within the portfolio for that period.
Once again, the Fund ended the quarter with an equity weight of 30%. As we mentioned in our first quarter shareholder report, this is substantially greater than the Fund's minimum
allocation of 10%, which the Fund would reach if the S&P 500 exceeds 1,750. At press time, the S&P 500 had reached new record highs but remained below the 1,750 level.
Results of the Funds Owned in Columbia Thermostat Fund
as of June 30, 2013
Stock Funds
| Fund | Weightings in category | 2nd quarter | Year to date | ||||||||||||
| Columbia Acorn International, Class I | 20 | % | -1.10 | % | 5.87 | % | |||||||||
| Columbia Dividend Income Fund, Class I | 20 | % | 3.41 | % | 15.27 | % | |||||||||
Columbia Acorn Fund, Class I | 15 | % | 0.64 | % | 10.55 | % | |||||||||
| Columbia Contrarian Core Fund, Class I | 15 | % | 3.28 | % | 15.17 | % | |||||||||
Columbia Acorn Select, Class I | 10 | % | 1.43 | % | 12.23 | % | |||||||||
| Columbia Large Cap Enhanced Core Fund, Class I | 10 | % | 3.74 | % | 14.56 | % | |||||||||
| Columbia Select Large Cap Growth Fund, Class I | 10 | % | -0.77 | % | 10.48 | % | |||||||||
Weighted Average Equity Gain | 100 | % | 1.51 | % | 11.80 | % | |||||||||
Bond Funds
| Fund | Weightings in category | 2nd quarter | Year to date | ||||||||||||
| Columbia Short Term Bond Fund, Class I | 40 | % | -0.38 | % | -0.05 | % | |||||||||
| Columbia Intermediate Bond Fund, Class I | 30 | % | -2.63 | % | -2.44 | % | |||||||||
| Columbia Income Opportunities Fund, Class I | 30 | % | -1.74 | % | 0.03 | % | |||||||||
Weighted Average Income Loss | 100 | % | -1.45 | % | -0.74 | % | |||||||||
Columbia Thermostat Fund Rebalancing in the Second Quarter
April 19, 2013 | 35% stocks, 65% bonds | ||||||
May 20, 2013 | 20% stocks, 80% bonds | ||||||
June 20, 2013 | 25% stocks, 75% bonds | ||||||
June 21, 2013 | 30% stocks, 70% bonds | ||||||
The value of an investment in the Fund is based primarily on the performance of the underlying funds in which it invests. The Fund is subject to the risk that the investment manager's decisions regarding asset classes and underlying funds will not anticipate market trends successfully, resulting in a failure to preserve capital or lower total return.
The Fund's investments in the underlying funds may also present certain risks, including the following: Investments made by underlying funds in foreign securities, particularly those in emerging markets countries, are subject to special risks, including, but not limited to, a greater degree of social, political and economic volatility than is associated with domestic investments, as well as the risks associated with any differences in financial standards, including foreign taxation. Investments by the underlying funds in small- and mid-cap companies, as well as in restricted securities, pose special risks, including potential illiquidity and price volatility. Underlying funds that concentrate their investments in a single industry sector, such as technology or healthcare, are subject to the risk that companies in the same sector may be similarly affected by economic or market downturns. Risks associated with investments in bond funds include credit risk, interest rate risk, and prepayment and extension risk. Debt securities with the lowest investment grade ratings and unrated securities of comparable quality are more speculative than securities with higher ratings and may experience greater price fluctuations. These securities also tend to be more sensitive to credit risk than higher-rated securities. This is not an offer of the shares of any other mutual fund mentioned herein.
22
Columbia Thermostat Fund
At a Glance
Total Net Assets of the Fund:
$1.2 billion
Performance data shown in the table and graph below represent past performance, do not guarantee future results, assume reinvestment of dividends and distributions and do not reflect the deduction of taxes that a shareholder may pay on Fund distributions or the redemption of Fund shares. The investment return and principal value of an investment will fluctuate so that shares, when redeemed, may be worth more or less than their original cost. Current performance may be lower or higher than the performance data shown. Performance data reflect fee waivers or reimbursements of Fund expenses, if any; in their absence, performance results would have been lower. Indexes are unmanaged; their results do not reflect the effect of expenses or sales charges. Securities in the Fund may not match those in an index. Please visit columbiamanagement.com for performance data current to the most recent month-end.
The Growth of a $10,000 Investment in Columbia Thermostat Fund Class Z Shares
September 25, 2002 (Fund inception) through June 30, 2013
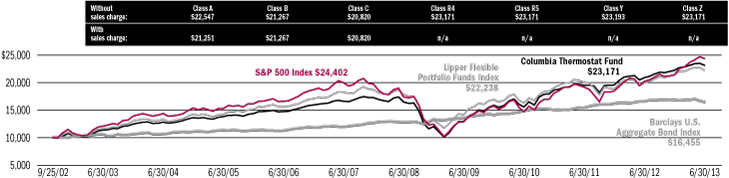
This chart shows the change in value of a hypothetical $10,000 investment in Class Z shares of the Fund during the stated time period.
Average Annual Total Returns for period ended June 30, 2013
| 2nd quarter* | Year to date* | 1 year | 5 years | 10 years | Life of Fund | ||||||||||||||||||||||
| Class Z (9/25/02 inception) | 0.06 | % | 4.17 | % | 10.92 | % | 7.05 | % | 7.40 | % | 8.12 | % | |||||||||||||||
| Class A (3/3/03 inception) | |||||||||||||||||||||||||||
without sales charge | -0.07 | 4.05 | 10.61 | 6.79 | 7.13 | 7.85 | |||||||||||||||||||||
with sales charge | -5.83 | -1.92 | 4.27 | 5.53 | 6.50 | 7.25 | |||||||||||||||||||||
S&P 500 Index** | 2.91 | 13.82 | 20.60 | 7.01 | 7.30 | 8.64 | |||||||||||||||||||||
Barclays U.S. Aggregate Bond Index** | -2.32 | -2.44 | -0.69 | 5.19 | 4.52 | 4.74 | |||||||||||||||||||||
Results for other share classes can be found on Page 6.
*Not annualized.
**The Fund's primary stock and primary bond benchmarks. Please see inside front cover for index descriptions.
Returns for Class A shown with and without the maximum initial sales charge of 5.75%. As stated in the May 1, 2013, prospectus, the Fund's annual operating expense ratio is 0.85% for Class Z shares and 1.10% for Class A shares. The returns shown for periods prior to the inception of the Fund's Class A shares append the returns of the Fund's Class Z shares, the Fund's oldest share class. These returns are adjusted to reflect any higher class-related operating expenses of the newer share classes, as applicable. Please visit columbiamanagement.com/mutual-funds/
appended-performance for more information.
Asset Allocation
as a percentage of net assets, as of 6/30/13
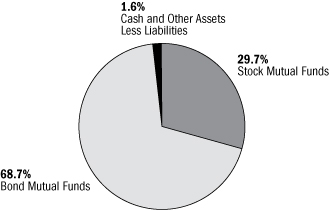
Portfolio Weightings
as a percentage of assets in each investment category, as of 6/30/13
Stock Mutual Funds
Columbia Acorn International, Class I | 20 | % | |||||
Columbia Dividend Income Fund, Class I | 20 | % | |||||
Columbia Acorn Fund, Class I | 15 | % | |||||
Columbia Contrarian Core Fund, Class I | 15 | % | |||||
Columbia Acorn Select, Class I | 10 | % | |||||
| Columbia Large Cap Enhanced Core Fund, Class I | 10 | % | |||||
| Columbia Select Large Cap Growth Fund, Class I | 10 | % | |||||
Bond Mutual Funds
Columbia Short Term Bond Fund, Class I | 40 | % | |||||
Columbia Intermediate Bond Fund, Class I | 30 | % | |||||
Columbia Income Opportunities Fund, Class I | 30 | % | |||||
23
Columbia Acorn Emerging Markets Fund
In a Nutshell
|
| ||||||
| Fritz Kaegi Lead Portfolio Manager | Stephen Kusmierczak Lead Portfolio Manager | ||||||
|
| ||||||
| P. Zachary Egan Co-Portfolio Manager | Louis J. Mendes III Co-Portfolio Manager | ||||||


Performance data shown represents past performance and is not a guarantee of future results. The investment return and principal value will fluctuate so that shares, when redeemed, may be worth more or less than the original cost. Current performance may be lower or higher than the performance data shown. Please visit columbiamanagement.com for most recent month-end performance updates.
Columbia Acorn Emerging Markets Fund Class Z shares declined 3.69% in the second quarter of 2013, less than the 6.55% drop of its primary benchmark, the S&P Emerging Markets Between $500M and $5B Index. The Fund also outperformed for the six month period, falling 0.41% versus the benchmark's decline of 4.74%. Since its inception in August 2011, the Fund had an annualized gain of 10.93%, nine percentage points ahead of the benchmark's 1.93% return.
The Fund's two Russian holdings had the highest returns in the second quarter. Internet search engine Yandex rose 38% as solid growth in the amount that advertisers pay per click drove strong first quarter results and higher expectations for the full year. QIWI, a Russian electronic payments processor, rose 37% after its May IPO on better expectations for growth in digital payments volume. Other winners in the second quarter included WuXi Pharma Tech, a new stock added to the Fund. It is the largest contract research organization to the pharmaceutical, biotech and medical device industries in China. The stock was up 24% in the quarter on expectations that investments in biologic manufacturing will start to pay off.
In Taiwan, St. Shine Optical, the world's leading disposable contact lens manufacturer, was up 31% in the second quarter and 68% for the first half of the year. The company has benefited from continued strong orders from Japan. South Africa's Coronation Fund Managers, an independent mutual fund company, gained 25% in the second quarter and 39% for the half year as strong retail inflows and good fund performance have boosted both assets under management and the firm's average overall fees. First half top percentage gainers also included miniature acoustic components manufacturer AAC Technologies in Hong Kong, up 64%, and Hong Kong casino operator Melco International, up 58%.
Fund resources stocks were the biggest losers in the second quarter and for the semiannual period. Brazilian gold miner Beadell Resources fell 55% in the second quarter and 58% in the first half due to falling gold prices and declining valuations for gold miners. As one of the lowest-cost miners in the industry, we believe Beadell should be profitable even with significantly lower gold prices. Coal miner Mongolian Mining fell 50% in the quarter and 63% over the six months, hurt by uncertainty surrounding operating conditions, falling coking coal prices, Chinese demand, and the health of the company's balance sheet. We are hopeful that the Mongolian government will adopt a standard-gauge rail link to China and thus reduce logistics costs.
Melco Crown (Philippines) Resorts executed an initial public offering at the market peak in April, and the stock proceeded to drop 44% in the second quarter on worries about a potential increase in the local gaming tax. CHC Healthcare, a distributor of medical devices in Taiwan and China, fell 36%
during the quarter due to license delays and project cost overruns. Chilean retailer Empresas Hites fell roughly 35% in the quarter and the half year following the announcement of an investigation by the local consumer protection agency. Brazilian loyalty program operator Multiplus dropped 35% over the six-month period due to increased competition for its leading airline partner TAM and a weakening local economy.
Emerging markets stocks have been shaken by worries about tightening liquidity and real investment outflows. Such volatility is part of the challenge in emerging markets investing and, as seen in the last half decade, also describes the experience of investing in developed markets. While we possess no proven edge in outguessing the macroeconomics driving the emerging markets group, we believe that our fundamental research, investment process and long-term ownership horizon do provide the chance to outperform in individual stock selection. We have responded to seeming valuation discrepancies and significant recent price swings by adjusting the Fund's position weights and adding a total of 14 new stocks during the second quarter. The Fund's total net assets reached $177 million at the end of the period, up from $23 million at the end of the first quarter. As we write these comments in mid-August, Fund assets have risen to approximately $240 million. While we believe these strong inflows have been manageable and have not adversely impacted Fund performance, we recognize that there are capacity limitations to the Fund's strategy and we are monitoring the Fund's growth carefully, mindful of those limitations. The team is encouraged that the Fund has substantially outperformed the benchmark in this volatile first half of 2013, proving, we believe, the merit of our focus on higher quality business models.
International investing involves special risks, including foreign taxation, currency risks, risks associated with possible differences in financial standards, operational and settlement risks and other risks associated with future political and economic developments. Stocks of small- and mid-cap companies pose special risks, including possible illiquidity and greater price volatility than stocks of larger, more established companies. Investing in emerging markets may involve greater risks than investing in more developed countries.
Portfolio holdings are subject to change periodically and may not be representative of current holdings.
Fund's Positions in Mentioned Holdings
As a percentage of net assets, as of 6/30/13
Coronation Fund Managers | 2.7 | % | |||||
Melco International | 2.4 | ||||||
St. Shine Optical | 1.3 | ||||||
Yandex | 1.2 | ||||||
AAC Technologies | 1.2 | ||||||
QIWI | 1.2 | ||||||
Empresas Hites | 0.9 | ||||||
WuXi Pharma Tech | 0.9 | ||||||
Multiplus | 0.9 | ||||||
CHC Healthcare | 0.8 | ||||||
Mongolian Mining | 0.8 | ||||||
Melco Crown (Philippines) Resorts | 0.8 | ||||||
Beadell Resources | 0.7 | ||||||
24
Columbia Acorn Emerging Markets Fund
At a Glance
Total Net Assets of the Fund:
$177.4 million
Performance data shown in the table and graph below represent past performance, do not guarantee future results, assume reinvestment of dividends and distributions and do not reflect the deduction of taxes that a shareholder may pay on Fund distributions or the redemption of Fund shares. The investment return and principal value of an investment will fluctuate so that shares, when redeemed, may be worth more or less than their original cost. Current performance may be lower or higher than the performance data shown. Performance data reflect fee waivers or reimbursements of Fund expenses, if any; in their absence, performance results would have been lower. Indexes are unmanaged; their results do not reflect the effect of expenses or sales charges. Securities in the Fund may not match those in an index. Please visit columbiamanagement.com for performance data current to the most recent month-end.
The Growth of a $10,000 Investment in Columbia Acorn Emerging Markets Fund Class Z Shares
August 19, 2011 (Fund inception) through June 30, 2013
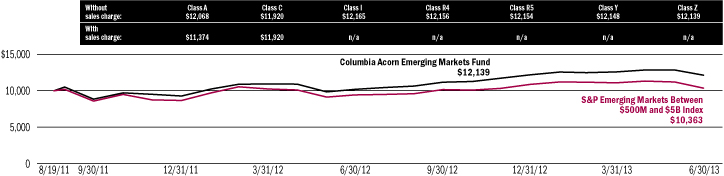
This chart shows the change in value of a hypothetical $10,000 investment in Class Z shares of the Fund during the stated time period.
Average Annual Total Returns for period ended June 30, 2013
| 2nd quarter* | Year to date* | 1 year | Life of Fund | ||||||||||||||||
| Class Z (8/19/11 inception) | -3.69 | % | -0.41 | % | 19.07 | % | 10.93 | % | |||||||||||
| Class A (8/19/11 inception) | |||||||||||||||||||
without sales charge | -3.69 | -0.42 | 18.89 | 10.58 | |||||||||||||||
with sales charge | -9.24 | -6.11 | 12.05 | 7.13 | |||||||||||||||
S&P Emerging Markets Between $500M and $5B Index** | -6.55 | -4.74 | 9.98 | 1.93 | |||||||||||||||
Results for other share classes can be found on Page 6.
*Not annualized.
**The Fund's primary benchmark. Please see inside front cover for index descriptions.
Returns for Class A shown with and without the maximum initial sales charge of 5.75%. As stated in the May 1, 2013, prospectus, the Fund's annual operating expense ratio is 1.60% for Class Z shares and 1.85% for Class A shares.
Portfolio Breakdown
as a percentage of net assets, as of 6/30/13
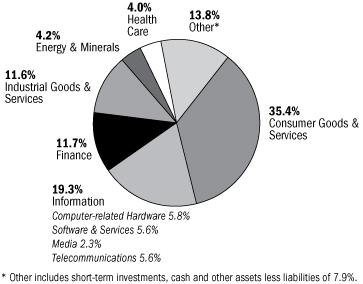
Top 10 Holdings
as a percentage of net assets, as of 6/30/13
| 1. | Far EasTone Telecom (Taiwan) Taiwan's Third Largest Mobile Operator | 2.9 | % | ||||||||
| 2. | Coronation Fund Managers (South Africa) South African Fund Manager | 2.7 | % | ||||||||
| 3. | Melco International (Hong Kong) Macau Casino Operator | 2.4 | % | ||||||||
| 4. | Hexagon (Sweden) Design, Measurement & Visualization Software & Equipment | 2.1 | % | ||||||||
| 5. | Nagacorp (Cambodia) Casino/Entertainment Complex in Cambodia | 2.0 | % | ||||||||
| 6. | Rand Merchant Insurance (South Africa) Directly Sold Property & Casualty Insurance; Holdings in Other Insurers | 1.9 | % | ||||||||
| 7. | Halyk Savings Bank of Kazakhstan - GDR (Kazakhstan) Largest Retail Bank & Insurer in Kazakhstan | 1.8 | % | ||||||||
| 8. | Lifestyle International (Hong Kong) Mid to High-end Department Store Operator in Hong Kong & China | 1.8 | % | ||||||||
| 9. | Tower Bersama Infrastructure (Indonesia) Communications Towers | 1.8 | % | ||||||||
| 10. | Samui Airport Property Fund (Thailand) Thai Airport Operator | 1.7 | % | ||||||||
The Fund's top 10 holdings and portfolio diversification vary with changes in portfolio investments. See the Statement of Investments for a complete list of the Fund's holdings.
25
Columbia Acorn European Fund
In a Nutshell
|
| ||||||
| Andreas Waldburg-Wolfegg Lead Portfolio Manager | Stephen Kusmierczak Co-Portfolio Manager | ||||||


Performance data shown represents past performance and is not a guarantee of future results. The investment return and principal value will fluctuate so that shares, when redeemed, may be worth more or less than the original cost. Current performance may be lower or higher than the performance data shown. Please visit columbiamanagement.com for daily and most recent month-end performance updates.
Columbia Acorn European Fund Class Z shares closed the second quarter of 2013 up 3.10% and the semiannual period up 7.48%. The Fund outperformed its primary benchmark, the S&P Europe Between $500M and $5B Index, for both periods. The benchmark was up 1.50% in the second quarter and 6.46% year to date through June.
The information technology sector contributed the most to performance in the second quarter and industrial stocks were the main detractor. From a country perspective, our stock picks in the United Kingdom, Switzerland and Finland did well, while holdings of companies located in Iceland, Italy, Norway and the Asian markets struggled.
For the half year, information technology again did well, as did financials and consumer discretionary stocks. Industrials remained a major detractor. In country terms, U.K. holdings were strong, followed by those listed in Finland and France. Major detractors were again located in Asian markets and Norway, as well as the Netherlands.
In terms of individual stocks, U.K. Internet grocer Ocado, up 91%, was the top contributor in the second quarter. QIWI, a Russian Internet electronic payment provider quoted in London, had a 35% gain in the quarter. Whitbread, a British budget hotel and coffee shop operator, rounded out the quarterly winner list with a 21% gain.
Detractors in the second quarter included Dutch technical installation and maintenance service provider Imtech, off 35%. L'Occitane International, a skin care and cosmetics producer listed in Hong Kong, fell 13%. Icelandic poultry and fish processing equipment manufacturer Marel fell 16%.
For the first six months of the year, Ocado again was the largest contributor to gains, rising 220%. In the Netherlands, Core Labs, a provider of oil and gas reservoir consulting services, gained 40%. French testing company Eurofins Scientific rose 29% for the half year and Rightmove, a U.K. Internet real estate listings service, gained 37%.
Detractors for the six-month period included Imtech, down 68%. Archipelago Resources, an Indonesian gold miner listed in the United Kingdom, fell 26% and Subsea 7, a Norwegian offshore subsea contractor, fell 27%.
Looking more closely at the reasons for top gains and losses, Ocado recently signed a deal with U.K. grocer Morrison's to provide warehouse space and white label products that will allow Morrison's to enter the Internet grocery trade quickly. The deal came with a large amount of cash for Ocado, the likelihood of breaking even much
earlier than expected, and the expectation that the company may evolve from a pure provider of groceries to the general public to a provider of solutions to the trade. The announcement of the Morrison's deal and the change in perception made the stock perform strongly.
QIWI went public at the beginning of May as mail.ru, a former Fund holding, sold a large part of its stake in QIWI. The IPO was priced in the middle of the range, which we took as an indication that management wanted a solid after market. QIWI has a strong market share and innovative products and reported solid operating results at the beginning of June, which drove strong demand for the shares.
In April, Whitbread reported very strong results for the full year. This announcement sent its stock up after being range bound in the first four months of the year.
Imtech uncovered a serious case of accounting fraud and mismanagement in its Polish and German operations. The stock more than halved in February, when the fraud was first discovered, and took another 40% hit in June after the terms of the rights issue were announced, which is necessary to restore the balance sheet.
International investing involves special risks, including foreign taxation, currency risks, risks associated with possible differences in financial standards, operational and settlement risks and other risks associated with future political and economic developments. Stocks of small- and mid-cap companies pose special risks, including possible illiquidity and greater price volatility than stocks of larger, more established companies. Investing in emerging markets may involve greater risks than investing in more developed countries.
Portfolio holdings are subject to change periodically and may not be representative of current holdings.
Fund's Positions in Mentioned Holdings
As a percentage of net assets, as of 6/30/13
Eurofins Scientific | 2.8 | % | |||||
Whitbread | 1.8 | ||||||
Ocado | 1.7 | ||||||
Rightmove | 1.6 | ||||||
QIWI | 1.4 | ||||||
Archipelago Resources | 1.3 | ||||||
L'Occitane International | 1.1 | ||||||
Core Labs | 1.0 | ||||||
Subsea 7 | 0.8 | ||||||
Imtech | 0.7 | ||||||
Marel | 0.6 | ||||||
26
Columbia Acorn
European Fund
At a Glance
Total Net Assets of the Fund:
$8.0 million
Performance data shown in the table and graph below represent past performance, do not guarantee future results, assume reinvestment of dividends and distributions and do not reflect the deduction of taxes that a shareholder may pay on Fund distributions or the redemption of Fund shares. The investment return and principal value of an investment will fluctuate so that shares, when redeemed, may be worth more or less than their original cost. Current performance may be lower or higher than the performance data shown. Performance data reflect fee waivers or reimbursements of Fund expenses, if any; in their absence, performance results would have been lower. Indexes are unmanaged; their results do not reflect the effect of expenses or sales charges. Securities in the Fund may not match those in an index. Please visit columbiamanagement.com for performance data current to the most recent month-end.
The Growth of a $10,000 Investment in Columbia Acorn European Fund Class Z Shares
August 19, 2011 (Fund inception) through June 30, 2013
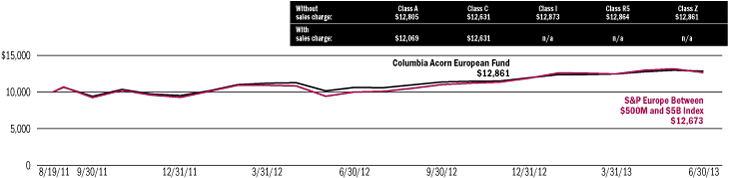
This chart shows the change in value of a hypothetical $10,000 investment in Class Z shares of the Fund during the stated time period.
Average Annual Total Returns for period ended June 30, 2013
| 2nd quarter* | Year to date* | 1 year | Life of Fund | ||||||||||||||||
| Class Z (8/19/11 inception) | 3.10 | % | 7.48 | % | 21.00 | % | 14.41 | % | |||||||||||
| Class A (8/19/11 inception) | |||||||||||||||||||
without sales charge | 3.10 | 7.40 | 20.82 | 14.15 | |||||||||||||||
with sales charge | -2.85 | 1.20 | 13.88 | 10.59 | |||||||||||||||
S&P Europe Between $500M and $5B Index** | 1.50 | 6.46 | 26.83 | 13.52 | |||||||||||||||
Results for other share classes can be found on Page 6.
*Not annualized.
**The Fund's primary benchmark. Please see inside front cover for index descriptions.
Returns for Class A shown with and without the maximum initial sales charge of 5.75%. As stated in the May 1, 2013, prospectus, the Fund's annual operating expense ratio is 1.50% for Class Z shares and 1.75% for Class A shares.
Portfolio Breakdown
as a percentage of net assets, as of 6/30/13
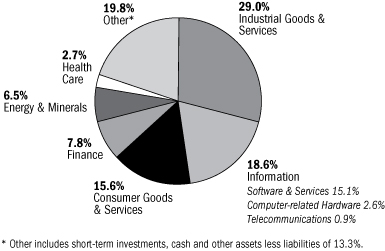
Top 10 Holdings
as a percentage of net assets, as of 6/30/13
| 1. | Eurofins Scientific (France) Food, Pharmaceuticals & Materials Screening & Testing | 2.8 | % | ||||||||
| 2. | Jardine Lloyd Thompson Group (United Kingdom) International Business Insurance Broker | 2.7 | % | ||||||||
| 3. | 1000 mercis (France) Interactive Advertising and Marketing | 2.2 | % | ||||||||
| 4. | Assura (United Kingdom) UK Primary Health Care Property Developer | 2.2 | % | ||||||||
| 5. | Neopost (France) Postage Meter Machines | 2.2 | % | ||||||||
| 6. | Partners Group (Switzerland) Private Markets Asset Management | 2.1 | % | ||||||||
| 7. | Charles Taylor (United Kingdom) Insurance Services | 2.0 | % | ||||||||
| 8. | Telecity (United Kingdom) European Data Center Provider | 1.9 | % | ||||||||
| 9. | Aalberts Industries (Netherlands) Flow Control & Heat Treatment | 1.9 | % | ||||||||
| 10. | Domino's Pizza UK & Ireland (United Kingdom) Pizza Delivery in UK, Ireland & Germany | 1.8 | % | ||||||||
The Fund's top 10 holdings and portfolio diversification vary with changes in portfolio investments. See the Statement of Investments for a complete list of the Fund's holdings.
27
Columbia Acorn Fund
Major Portfolio Changes in the Second Quarter (Unaudited)
Number of Shares | |||||||||||
3/31/13 | 6/30/13 | ||||||||||
Purchases | |||||||||||
Information | |||||||||||
Boingo Wireless | 1,900,000 | 2,200,000 | |||||||||
CalAmp | 0 | 560,298 | |||||||||
ChannelAdvisor | 0 | 229,059 | |||||||||
DemandWare | 566,412 | 1,310,000 | |||||||||
E2Open | 0 | 603,799 | |||||||||
Envestnet | 214,200 | 610,000 | |||||||||
Far EasTone Telecom (Taiwan) | 0 | 13,200,000 | |||||||||
Finisar | 1,675,000 | 2,025,000 | |||||||||
Gemalto (France) | 169,000 | 280,000 | |||||||||
Globalstar | 910,254 | 21,942,200 | |||||||||
iGATE | 3,718,400 | 4,500,000 | |||||||||
Liquidity Services | 600,000 | 750,000 | |||||||||
Navigant Consulting | 3,924,100 | 4,020,891 | |||||||||
RealPage | 1,500,000 | 2,000,000 | |||||||||
| RPX | 1,921,382 | 2,561,123 | |||||||||
Solera Holdings | 350,000 | 697,000 | |||||||||
Telecity (United Kingdom) | 0 | 1,100,000 | |||||||||
Towerstream | 2,800,000 | 3,000,000 | |||||||||
Webgroup.com | 0 | 801,748 | |||||||||
Windstream | 3,000,000 | 3,500,000 | |||||||||
Industrial Goods & Services | |||||||||||
| Aalberts Industries (Netherlands) | 2,695,419 | 2,747,253 | |||||||||
CAE (Canada) | 0 | 2,400,000 | |||||||||
Echo Global Logistics | 0 | 400,000 | |||||||||
ESCO Technologies | 2,200,000 | 2,300,000 | |||||||||
KAR Auction Services | 0 | 1,375,000 | |||||||||
Middleby | 201,220 | 247,000 | |||||||||
MRC Global | 700,000 | 1,900,000 | |||||||||
Neopost (France) | 400,000 | 600,000 | |||||||||
Novozymes (Denmark) | 1,000,000 | 1,288,000 | |||||||||
NVR | 72,000 | 82,000 | |||||||||
Owens-Illinois | 0 | 400,000 | |||||||||
RockTenn | 125,000 | 300,000 | |||||||||
Titan Machinery | 0 | 393,100 | |||||||||
TrueBlue | 0 | 1,000,000 | |||||||||
Consumer Goods & Services | |||||||||||
B&G Foods | 700,000 | 1,143,265 | |||||||||
Blackhawk Network | 0 | 800,000 | |||||||||
Bon-Ton Stores | 0 | 300,000 | |||||||||
Caesarstone (Israel) | 215,000 | 812,360 | |||||||||
Casey's General Stores | 538,104 | 604,000 | |||||||||
Choice Hotels | 1,650,000 | 1,893,000 | |||||||||
Churchill Downs | 0 | 28,508 | |||||||||
Fiesta Restaurant Group | 0 | 285,000 | |||||||||
Melco International (Hong Kong) | 0 | 20,000,000 | |||||||||
Number of Shares | |||||||||||
3/31/13 | 6/30/13 | ||||||||||
Nagacorp (Cambodia) | 25,000,000 | 40,000,000 | |||||||||
Quiksilver | 1,500,000 | 2,620,000 | |||||||||
Restoration Hardware Holdings | 0 | 125,000 | |||||||||
Select Comfort | 0 | 450,000 | |||||||||
Tile Shop Holdings | 200,000 | 446,000 | |||||||||
ULTA | 1,065,627 | 1,185,000 | |||||||||
Urban Outfitters | 790,000 | 1,000,000 | |||||||||
Finance | |||||||||||
Associated Banc-Corp | 7,756,800 | 9,000,000 | |||||||||
CAI International | 1,400,000 | 1,500,000 | |||||||||
H & E Equipment Services | 3,400,000 | 3,422,749 | |||||||||
OFG Bancorp | 733,896 | 900,000 | |||||||||
| Rand Merchant Insurance (South Africa) | 0 | 10,837,000 | |||||||||
RLI | 0 | 400,000 | |||||||||
Health Care | |||||||||||
Allscripts Healthcare Solutions | 0 | 5,600,000 | |||||||||
Cepheid | 5,670,000 | 6,170,000 | |||||||||
Coronado Biosciences | 406,343 | 1,027,000 | |||||||||
HealthSouth | 825,000 | 1,450,000 | |||||||||
Other Industries | |||||||||||
American Residential Properties | 0 | 950,000 | |||||||||
Coresite Realty | 317,440 | 1,050,000 | |||||||||
EdR | 5,744,300 | 6,650,000 | |||||||||
| Mapletree Commercial Trust (Singapore) | 10,000,000 | 20,000,000 | |||||||||
Terreno Realty | 786,000 | 1,050,000 | |||||||||
World Fuel Services | 627,000 | 750,000 | |||||||||
Energy & Minerals | |||||||||||
Atwood Oceanics | 2,193,000 | 2,400,000 | |||||||||
Gulfmark Offshore | 300,000 | 511,000 | |||||||||
Hornbeck Offshore | 499,000 | 661,000 | |||||||||
Real Goods Solar | 0 | 2,000,000 | |||||||||
Rowan | 684,000 | 1,008,000 | |||||||||
SM Energy | 590,000 | 940,000 | |||||||||
See accompanying notes to financial statements.
28
Number of Shares | |||||||||||
3/31/13 | 6/30/13 | ||||||||||
Sales | |||||||||||
Information | |||||||||||
Active Network | 900,000 | 0 | |||||||||
Atmel | 6,614,000 | 5,390,000 | |||||||||
Concur Technologies | 1,010,000 | 700,000 | |||||||||
Crown Castle International | 4,200,000 | 4,000,000 | |||||||||
Entegris | 4,000,000 | 2,545,680 | |||||||||
Entravision Communications | 2,361,062 | 0 | |||||||||
Equinix | 250,000 | 175,000 | |||||||||
IPG Photonics | 2,620,000 | 2,286,000 | |||||||||
IXYS | 850,000 | 587,529 | |||||||||
Lamar Advertising | 1,200,000 | 1,000,000 | |||||||||
Microsemi | 2,160,000 | 0 | |||||||||
Monolithic Power Systems | 1,415,000 | 1,113,389 | |||||||||
NetSuite | 700,000 | 550,000 | |||||||||
Nice Systems - ADR (Israel) | 800,000 | 0 | |||||||||
ON Semiconductor | 7,932,000 | 2,430,000 | |||||||||
Pericom Semiconductor | 1,471,224 | 0 | |||||||||
TIBCO | 1,000,000 | 0 | |||||||||
TriQuint Semiconductor | 2,290,000 | 0 | |||||||||
Industrial Goods & Services | |||||||||||
Albemarle | 1,430,000 | 1,250,000 | |||||||||
Ashland | 775,000 | 550,000 | |||||||||
Clarcor | 1,750,000 | 1,670,000 | |||||||||
| Expeditors International of Washington | 2,000,000 | 1,800,000 | |||||||||
| Fortune Brands Home & Security | 1,050,000 | 930,000 | |||||||||
Polypore International | 1,600,000 | 1,225,000 | |||||||||
Spartan Motors | 369,758 | 0 | |||||||||
UTI Worldwide | 500,000 | 0 | |||||||||
Consumer Goods & Services | |||||||||||
Abercrombie & Fitch | 2,231,000 | 1,816,000 | |||||||||
Crimson Wine Group | 282,000 | 0 | |||||||||
CTS Eventim (Germany) | 64,727 | 0 | |||||||||
Helen of Troy | 1,600,000 | 1,233,851 | |||||||||
Jarden | 892,500 | 472,500 | |||||||||
lululemon athletica | 2,718,427 | 1,730,000 | |||||||||
| Melco Crown Entertainment - ADR (Hong Kong) | 3,000,000 | 2,500,000 | |||||||||
Monster Beverage | 320,845 | 0 | |||||||||
Olam International (Singapore) | 14,000,000 | 0 | |||||||||
Pinnacle Entertainment | 3,950,000 | 1,947,000 | |||||||||
Ryman Hospitality Properties | 4,520,690 | 2,707,000 | |||||||||
Saks | 4,100,000 | 3,700,000 | |||||||||
Tesla Motors | 550,000 | 0 | |||||||||
Number of Shares | |||||||||||
3/31/13 | 6/30/13 | ||||||||||
Finance | |||||||||||
Artio Global Investors | 1,000,000 | 0 | |||||||||
Berkshire Hills Bancorp | 65,991 | 0 | |||||||||
CVB Financial | 850,000 | 0 | |||||||||
Eagle Bancorp | 635,000 | 0 | |||||||||
Financial Engines | 400,000 | 0 | |||||||||
Hancock Holding | 2,337,313 | 1,900,000 | |||||||||
Kemper | 925,000 | 0 | |||||||||
Provident New York Bancorp | 1,010,000 | 505,000 | |||||||||
The Hanover Insurance Group | 1,400,000 | 500,000 | |||||||||
TriCo Bancshares | 1,350,000 | 1,314,800 | |||||||||
Wintrust Financial | 550,000 | 0 | |||||||||
World Acceptance | 1,285,000 | 1,050,000 | |||||||||
Heath Care | |||||||||||
BioMarin Pharmaceutical | 2,540,000 | 2,230,000 | |||||||||
| Chelsea Therapeutics International | 2,798,416 | 0 | |||||||||
DENTSPLY International | 1,950,000 | 0 | |||||||||
Health Management Associates | 1,875,000 | 0 | |||||||||
Orthofix International | 725,000 | 0 | |||||||||
PerkinElmer | 1,475,000 | 925,000 | |||||||||
Seattle Genetics | 6,550,000 | 6,050,000 | |||||||||
Other Industries | |||||||||||
Ascendas REIT (Singapore) | 22,000,000 | 17,000,000 | |||||||||
Digital Realty Trust | 558,886 | 230,000 | |||||||||
| Mapletree Industrial Trust (Singapore) | 10,000,000 | 0 | |||||||||
| Mapletree Logistics Trust (Singapore) | 50,000,000 | 33,000,000 | |||||||||
Energy & Minerals | |||||||||||
Allied Nevada Gold | 1,150,000 | 0 | |||||||||
Oil States International | 119,000 | 0 | |||||||||
Petroamerica Oil (Colombia) | 24,774,500 | 22,250,500 | |||||||||
Regis Resources (Australia) | 3,524,000 | 0 | |||||||||
Silver Wheaton (Canada) | 1,000,000 | 700,000 | |||||||||
See accompanying notes to financial statements.
29
Columbia Acorn Fund
Statement of Investments (Unaudited), June 30, 2013
Number of Shares | Value | ||||||||||
Equities: 97.1% | |||||||||||
Information 26.4% | |||||||||||
| > Business Software 6.1% | |||||||||||
2,350,000 | Ansys (a) | $ | 171,785,000 | ||||||||
| Simulation Software for Engineers & Designers | |||||||||||
4,500,000 | Informatica (a) | 157,410,000 | |||||||||
Enterprise Data Integration Software | |||||||||||
4,862,000 | Hexagon (Sweden) | 129,967,975 | |||||||||
| Design, Measurement & Visualization Software & Equipment | |||||||||||
2,700,000 | Micros Systems (a) | 116,505,000 | |||||||||
| Information Systems for Hotels, Restaurants & Retailers | |||||||||||
700,000 | Concur Technologies (a) | 56,966,000 | |||||||||
| Web Enabled Cost & Expense Management Software | |||||||||||
1,310,000 | DemandWare (a)(b) | 55,557,100 | |||||||||
| eCommerce Website Solution for Retailers & Apparel Manufacturers | |||||||||||
800,000 | Tyler Technologies (a) | 54,840,000 | |||||||||
| Financial, Tax, Court & Document Management Systems for Local Governments | |||||||||||
550,000 | NetSuite (a) | 50,457,000 | |||||||||
| End-to-end IT Systems Solution Delivered Over the Web | |||||||||||
900,000 | SPS Commerce (a)(c) | 49,500,000 | |||||||||
| Supply Chain Management Software Delivered Via the Web | |||||||||||
697,000 | Solera Holdings | 38,788,050 | |||||||||
| Software for Automotive Insurance Claims Processing | |||||||||||
2,000,000 | RealPage (a)(b) | 36,680,000 | |||||||||
| Software for Managing Rental Properties Delivered Via the Web | |||||||||||
750,000 | Jack Henry & Associates | 35,347,500 | |||||||||
| IT Systems & Outsourced IT Solutions for Financial Institutions | |||||||||||
700,000 | Red Hat (a) | 33,474,000 | |||||||||
| Maintenance & Support for Opensource Operating System & Middleware | |||||||||||
900,000 | Blackbaud | 29,313,000 | |||||||||
Software & Services for Non-profits | |||||||||||
2,761,147 | InContact (a)(c) | 22,696,628 | |||||||||
| Call Center Systems Delivered Via the Web & Telecommunications Services | |||||||||||
801,748 | Webgroup.com (a) | 20,524,749 | |||||||||
| Website Creation & Management for Small Businesses | |||||||||||
1,200,000 | Constant Contact (a) | 19,284,000 | |||||||||
| Email & Other Marketing Campaign Management Systems Delivered Over Web | |||||||||||
1,700,000 | Bazaarvoice (a)(b) | 16,014,000 | |||||||||
| Platform for Managing Consumer Interaction Via the Web | |||||||||||
610,000 | Envestnet (a) | 15,006,000 | |||||||||
Technology Platform for Investment Advisors | |||||||||||
603,799 | E2Open (a)(b) | 10,566,483 | |||||||||
| Supply Chain Management Software & Supplier/Partner Network | |||||||||||
1,000,000 | Exa (a)(c) | 10,300,000 | |||||||||
Simulation Software | |||||||||||
Number of Shares | Value | ||||||||||
3,700,000 | Velti (a)(b) | $ | 5,180,000 | ||||||||
Mobile Marketing Software Platform | |||||||||||
229,059 | ChannelAdvisor (a) | 3,603,098 | |||||||||
eCommerce Software | |||||||||||
8,443 | SciQuest (a) | 211,497 | |||||||||
| Procurement Management Software & Vendor Network | |||||||||||
1,139,977,080 | |||||||||||
| > Mobile Communications 3.1% | |||||||||||
4,000,000 | Crown Castle International (a) | 289,560,000 | |||||||||
Communications Towers | |||||||||||
3,400,000 | SBA Communications (a) | 252,008,000 | |||||||||
Communications Towers | |||||||||||
13,200,000 | Far EasTone Telecom (Taiwan) | 35,377,401 | |||||||||
Taiwan's Third Largest Mobile Operator | |||||||||||
21,942,200 | Globalstar (a)(c) | 12,068,210 | |||||||||
Satellite Mobile Voice & Data Carrier | |||||||||||
589,013,611 | |||||||||||
| > Instrumentation 3.0% | |||||||||||
1,600,000 | Mettler-Toledo International (a)(c) | 321,920,000 | |||||||||
Laboratory Equipment | |||||||||||
2,286,000 | IPG Photonics (b) | 138,828,780 | |||||||||
Fiber Lasers | |||||||||||
4,070,000 | Trimble Navigation (a) | 105,860,700 | |||||||||
GPS-based Instruments | |||||||||||
566,609,480 | |||||||||||
| > Computer Hardware & Related Equipment 2.6% | |||||||||||
3,415,000 | Amphenol | 266,165,100 | |||||||||
Electronic Connectors | |||||||||||
4,550,000 | II-VI (a)(c) | 73,983,000 | |||||||||
Laser Optics & Specialty Materials | |||||||||||
1,365,000 | Zebra Technologies (a) | 59,295,600 | |||||||||
Bar Code Printers | |||||||||||
900,000 | Netgear (a) | 27,486,000 | |||||||||
| Networking Products for Small Business & Home | |||||||||||
310,000 | Stratasys (a)(b) | 25,959,400 | |||||||||
| Rapid Prototyping & Direct Digital Manufacturing Systems | |||||||||||
280,000 | Gemalto (France) (b) | 25,351,966 | |||||||||
Digital Security Solutions | |||||||||||
250,000 | Rogers (a) | 11,830,000 | |||||||||
| Printed Circuit Materials & High-performance Foams | |||||||||||
490,071,066 | |||||||||||
| > Telephone & Data Services 2.1% | |||||||||||
9,500,000 | tw telecom (a)(c) | 267,330,000 | |||||||||
Fiber Optic Telephone/Data Services | |||||||||||
2,200,000 | Cogent Communications | 61,930,000 | |||||||||
Internet Data Pipelines | |||||||||||
3,500,000 | Windstream (b) | 26,985,000 | |||||||||
Business & Rural Telecom Services | |||||||||||
2,200,000 | Boingo Wireless (a)(c) | 13,662,000 | |||||||||
Wholesale & Retail WiFi Networks | |||||||||||
1,500,000 | General Communications (a) | 11,745,000 | |||||||||
| Commercial Communications & Consumer CATV, Web & Phone in Alaska | |||||||||||
See accompanying notes to financial statements.
30
Number of Shares | Value | ||||||||||
| > Telephone & Data Services—continued | |||||||||||
3,000,000 | Towerstream (a)(b) | $ | 7,650,000 | ||||||||
| High Speed Wireless, Rooftop Antenna Space & WIFI Offload | |||||||||||
389,302,000 | |||||||||||
| > Computer Services 1.8% | |||||||||||
4,500,000 | iGATE (a)(c) | 73,890,000 | |||||||||
IT & Business Process Outsourcing Services | |||||||||||
3,419,000 | Genpact | 65,781,560 | |||||||||
Business Process Outsourcing | |||||||||||
1,618,000 | ExlService Holdings (a) | 47,828,080 | |||||||||
Business Process Outsourcing | |||||||||||
2,125,000 | Virtusa (a)(c) | 47,090,000 | |||||||||
Offshore IT Outsourcing | |||||||||||
2,000,000 | WNS - ADR (India) (a) | 33,380,000 | |||||||||
| Offshore Business Process Outsourcing Services | |||||||||||
430,000 | Syntel | 27,034,100 | |||||||||
Offshore IT Services | |||||||||||
3,849,207 | Hackett Group (c) | 19,977,384 | |||||||||
IT Integration & Best Practice Research | |||||||||||
1,100,000 | Telecity (United Kingdom) | 16,951,073 | |||||||||
European Data Center Provider | |||||||||||
331,932,197 | |||||||||||
| > Semiconductors & Related Equipment 1.4% | |||||||||||
720,000 | Cree (a) | 45,979,200 | |||||||||
LED Lighting, Components & Chips | |||||||||||
5,390,000 | Atmel (a) | 39,616,500 | |||||||||
| Microcontrollers, Radio Frequency & Memory Semiconductors | |||||||||||
420,000 | Littelfuse | 31,336,200 | |||||||||
Little Fuses | |||||||||||
1,113,389 | Monolithic Power Systems | 26,843,809 | |||||||||
| High Performance Analog & Mixed Signal Integrated Circuits | |||||||||||
2,545,680 | Entegris (a) | 23,903,935 | |||||||||
| Semiconductor Materials Management Products | |||||||||||
400,000 | Hittite Microwave (a) | 23,200,000 | |||||||||
| Radio Frequency, Microwave & Millimeterwave Semiconductors | |||||||||||
650,000 | Semtech (a) | 22,769,500 | |||||||||
Analog Semiconductors | |||||||||||
615,000 | Ultratech (a) | 22,582,800 | |||||||||
Semiconductor Equipment | |||||||||||
2,430,000 | ON Semiconductor (a) | 19,634,400 | |||||||||
| Mixed Signal & Power Management Semiconductors | |||||||||||
587,529 | IXYS | 6,498,071 | |||||||||
Power Semiconductors | |||||||||||
262,364,415 | |||||||||||
| > Gaming Equipment & Services 1.1% | |||||||||||
3,725,000 | Bally Technologies (a)(c) | 210,164,500 | |||||||||
Slot Machines & Software | |||||||||||
| > Business Information & Marketing Services 1.1% | |||||||||||
1,900,000 | Verisk Analytics (a) | 113,430,000 | |||||||||
Risk & Decision Analytics | |||||||||||
Number of Shares | Value | ||||||||||
4,020,891 | Navigant Consulting (a)(c) | $ | 48,250,692 | ||||||||
Financial Consulting Firm | |||||||||||
2,561,123 | RPX (a) | 43,026,866 | |||||||||
| Patent Aggregation & Defensive Patent Consulting | |||||||||||
100,000 | Bankrate (a) | 1,436,000 | |||||||||
Internet Advertising | |||||||||||
206,143,558 | |||||||||||
| > Telecommunications Equipment 0.8% | |||||||||||
640,000 | F5 Networks (a) | 44,032,000 | |||||||||
Internet Traffic Management Equipment | |||||||||||
2,030,000 | Ixia (a) | 37,352,000 | |||||||||
Telecom Network Test Equipment | |||||||||||
2,025,000 | Finisar (a) | 34,323,750 | |||||||||
Optical Subsystems & Components | |||||||||||
1,925,000 | Infinera (a)(b) | 20,539,750 | |||||||||
Optical Networking Equipment | |||||||||||
560,298 | CalAmp (a) | 8,180,351 | |||||||||
Machine-to-machine Communications | |||||||||||
144,427,851 | |||||||||||
| > Internet Related 0.7% | |||||||||||
1,325,000 | TripAdvisor (a) | 80,652,750 | |||||||||
Online Travel Research | |||||||||||
175,000 | Equinix (a) | 32,326,000 | |||||||||
Network Neutral Data Centers | |||||||||||
727,000 | Yandex (Russia) (a) | 20,087,010 | |||||||||
| Search Engine for Russian & Turkish Languages | |||||||||||
133,065,760 | |||||||||||
| > Financial Processors 0.7% | |||||||||||
1,700,000 | Global Payments | 78,744,000 | |||||||||
Credit Card Processor | |||||||||||
5,000,000 | Singapore Exchange (Singapore) | 27,636,978 | |||||||||
| Singapore Equity & Derivatives Market Operator | |||||||||||
750,000 | Liquidity Services (a)(b) | 26,002,500 | |||||||||
E-Auctions for Surplus & Salvage Goods | |||||||||||
132,383,478 | |||||||||||
| > CATV 0.6% | |||||||||||
800,000 | Liberty Global Series A (a) | 59,264,000 | |||||||||
Cable TV Franchises Outside the U.S. | |||||||||||
720,000 | Discovery Series C (a) | 50,155,200 | |||||||||
Cable TV Programming | |||||||||||
109,419,200 | |||||||||||
| > Electronics Distribution 0.6% | |||||||||||
3,125,000 | Avnet (a) | 105,000,000 | |||||||||
Electronic Components Distribution | |||||||||||
| > Contract Manufacturing 0.4% | |||||||||||
3,800,000 | Sanmina-SCI (a) | 54,530,000 | |||||||||
Electronic Manufacturing Services | |||||||||||
960,000 | Plexus (a) | 28,694,400 | |||||||||
Electronic Manufacturing Services | |||||||||||
83,224,400 | |||||||||||
| > Advertising 0.2% | |||||||||||
1,000,000 | Lamar Advertising (a) | 43,400,000 | |||||||||
Outdoor Advertising | |||||||||||
See accompanying notes to financial statements.
31
Columbia Acorn Fund
Statement of Investments (Unaudited), continued
Number of Shares | Value | ||||||||||
| > Advertising—continued | |||||||||||
100,000 | Tree.com | $ | 1,714,000 | ||||||||
| Advertising Lead Generation for the Mortgage, Education & Auto Markets | |||||||||||
45,114,000 | |||||||||||
| > Entertainment Programming 0.1% | |||||||||||
1,100,000 | IMAX (Canada) (a) | 27,346,000 | |||||||||
| IMAX Movies, Theatre Equipment & Theatre Joint Ventures | |||||||||||
Information: Total | 4,965,558,596 | ||||||||||
Industrial Goods & Services 21.1% | |||||||||||
| > Machinery 11.9% | |||||||||||
9,900,000 | Ametek | 418,770,000 | |||||||||
Aerospace/Industrial Instruments | |||||||||||
8,400,000 | Donaldson (c) | 299,544,000 | |||||||||
Industrial Air Filtration | |||||||||||
3,400,000 | Nordson (c) | 235,654,000 | |||||||||
| Dispensing Systems for Adhesives & Coatings | |||||||||||
3,230,000 | Moog (a)(c) | 166,441,900 | |||||||||
| Motion Control Products for Aerospace, Defense & Industrial Markets | |||||||||||
3,725,000 | Kennametal | 144,641,750 | |||||||||
Consumable Cutting Tools | |||||||||||
3,063,000 | HEICO (c) | 113,055,330 | |||||||||
| FAA-approved Aircraft Replacement Parts | |||||||||||
1,660,000 | Pall | 110,273,800 | |||||||||
| Life Science, Water & Industrial Filtration | |||||||||||
2,728,000 | Generac | 100,963,280 | |||||||||
Standby Power Generators | |||||||||||
2,400,000 | Oshkosh Corporation (a) | 91,128,000 | |||||||||
Specialty Truck Manufacturer | |||||||||||
1,670,000 | Clarcor | 87,190,700 | |||||||||
Mobile Equipment & Industrial Filters | |||||||||||
2,300,000 | ESCO Technologies (c) | 74,474,000 | |||||||||
Automatic Electric Meter Readers | |||||||||||
1,610,000 | Toro | 73,110,100 | |||||||||
Turf Maintenance Equipment | |||||||||||
1,200,000 | Wabtec | 64,116,000 | |||||||||
Freight & Transit Component Supplier | |||||||||||
435,000 | Valmont Industries | 62,244,150 | |||||||||
| Center Pivot Irrigation Systems & Utility Poles | |||||||||||
750,000 | WABCO Holdings (a) | 56,017,500 | |||||||||
Truck & Bus Component Supplier | |||||||||||
1,225,000 | Polypore International (a)(b) | 49,367,500 | |||||||||
Battery Separators & Filtration Media | |||||||||||
247,000 | Middleby (a) | 42,012,230 | |||||||||
Manufacturer of Cooking Equipment | |||||||||||
600,000 | Neopost (France) | 39,727,029 | |||||||||
Postage Meter Machines | |||||||||||
10,000,000 | Marel (Iceland) | 10,579,447 | |||||||||
| Largest Manufacturer of Poultry & Fish Processing Equipment | |||||||||||
2,239,310,716 | |||||||||||
Number of Shares | Value | ||||||||||
| > Industrial Materials & Specialty Chemicals 2.4% | |||||||||||
1,250,000 | Albemarle | $ | 77,862,500 | ||||||||
| Specialty Chemicals for Refineries, Plastics, Pharma, Food | |||||||||||
1,880,000 | Drew Industries (c) | 73,921,600 | |||||||||
RV & Manufactured Home Components | |||||||||||
1,050,000 | FMC Corporation | 64,113,000 | |||||||||
Niche Specialty Chemicals | |||||||||||
550,000 | Ashland | 45,925,000 | |||||||||
Diversified Chemicals Company | |||||||||||
1,288,000 | Novozymes (Denmark) | 41,254,918 | |||||||||
Industrial Enzymes | |||||||||||
300,000 | RockTenn | 29,964,000 | |||||||||
Paper-based Packaging | |||||||||||
1,200,000 | Polyone | 29,736,000 | |||||||||
Intermediate Stage Chemicals Producer | |||||||||||
2,218,700 | Kansai Paint (Japan) | 28,322,053 | |||||||||
| Paint Producer in Japan, India, China & Southeast Asia | |||||||||||
673,000 | Sociedad Quimica y Minera de Chile - ADR (Chile) | 27,189,200 | |||||||||
| Producer of Specialty Fertilizers, Lithium & Iodine | |||||||||||
400,000 | Owens-Illinois (a) | 11,116,000 | |||||||||
Glass Packaging for Food & Beverages | |||||||||||
200,000 | Silgan Holdings | 9,392,000 | |||||||||
Metal & Plastic Packaging | |||||||||||
438,796,271 | |||||||||||
| > Other Industrial Services 1.9% | |||||||||||
2,700,000 | LKQ (a) | 69,525,000 | |||||||||
Alternative Auto Parts Distribution | |||||||||||
1,800,000 | Expeditors International of Washington | 68,418,000 | |||||||||
International Freight Forwarder | |||||||||||
1,500,000 | Forward Air | 57,420,000 | |||||||||
Freight Transportation Between Airports | |||||||||||
1,600,000 | Mobile Mini (a) | 53,040,000 | |||||||||
Portable Storage Units Leasing | |||||||||||
1,375,000 | KAR Auction Services | 31,446,250 | |||||||||
Auto Auctions | |||||||||||
2,400,000 | CAE (Canada) | 24,896,834 | |||||||||
| Flight Simulator Equipment & Training Centers | |||||||||||
1,000,000 | TrueBlue (a) | 21,050,000 | |||||||||
Temporary Industrial Labor | |||||||||||
1,948,368 | Imtech (Netherlands) (a)(b) | 14,341,994 | |||||||||
Technical Installation & Maintenance | |||||||||||
1,520,957 | Acorn Energy (c) | 12,836,877 | |||||||||
| Frac Well Exploration/Monitoring Device, Sonar Security & Electric Grid Monitoring | |||||||||||
400,000 | Echo Global Logistics (a) | 7,796,000 | |||||||||
Third Party Logisitics | |||||||||||
360,770,955 | |||||||||||
| > Construction 1.6% | |||||||||||
2,850,000 | Chicago Bridge & Iron | 170,031,000 | |||||||||
| Engineering & Construction for Liquefied Natural Gas & Petrochemicals | |||||||||||
See accompanying notes to financial statements.
32
Number of Shares | Value | ||||||||||
| > Construction—continued | |||||||||||
82,000 | NVR (a) | $ | 75,604,000 | ||||||||
Homebuilder | |||||||||||
930,000 | Fortune Brands Home & Security | 36,028,200 | |||||||||
Home Building Supplies & Small Locks | |||||||||||
1,800,000 | Mills Estruturas e Servicos de Engenharia (Brazil) | 24,394,201 | |||||||||
Civil Engineering & Construction | |||||||||||
306,057,401 | |||||||||||
| > Electrical Components 0.9% | |||||||||||
1,765,000 | Acuity Brands | 133,292,800 | |||||||||
Commercial Lighting Fixtures | |||||||||||
1,065,000 | Thermon (a) | 21,726,000 | |||||||||
Global Engineered Thermal Solutions | |||||||||||
1,500,000 | Ushio (Japan) | 19,805,583 | |||||||||
Industrial Light Sources | |||||||||||
174,824,383 | |||||||||||
| > Industrial Distribution 0.9% | |||||||||||
1,200,000 | WESCO International (a) | 81,552,000 | |||||||||
Industrial Distributor | |||||||||||
1,900,000 | MRC Global (a) | 52,478,000 | |||||||||
Industrial Distributor | |||||||||||
294,180 | Airgas | 28,082,423 | |||||||||
Industrial Gas Distributor | |||||||||||
393,100 | Titan Machinery (a) | 7,716,553 | |||||||||
Agriculture & Construction Dealerships | |||||||||||
169,828,976 | |||||||||||
| > Outsourcing Services 0.7% | |||||||||||
3,000,000 | Quanta Services (a) | 79,380,000 | |||||||||
Electrical & Telecom Construction Services | |||||||||||
1,400,000 | Insperity (c) | 42,420,000 | |||||||||
Professional Employer Organization | |||||||||||
600,000 | GP Strategies (a) | 14,292,000 | |||||||||
Outsourced Training Services | |||||||||||
136,092,000 | |||||||||||
| > Waste Management 0.5% | |||||||||||
2,050,000 | Waste Connections | 84,337,000 | |||||||||
Solid Waste Management | |||||||||||
| > Conglomerates 0.3% | |||||||||||
2,747,253 | Aalberts Industries (Netherlands) | 61,400,473 | |||||||||
Flow Control & Heat Treatment | |||||||||||
Industrial Goods & Services: Total | 3,971,418,175 | ||||||||||
Consumer Goods & Services 16.6% | |||||||||||
| > Retail 5.5% | |||||||||||
7,185,000 | Pier 1 Imports (c) | 168,775,650 | |||||||||
Home Furnishing Retailer | |||||||||||
1,185,000 | ULTA (a) | 118,689,600 | |||||||||
Specialty Beauty Product Retailer | |||||||||||
1,730,000 | lululemon athletica (a)(b) | 113,349,600 | |||||||||
Premium Active Apparel Retailer | |||||||||||
1,975,000 | Shutterfly (a)(c) | 110,185,250 | |||||||||
Internet Photo-centric Retailer | |||||||||||
1,675,000 | Williams-Sonoma | 93,615,750 | |||||||||
Home Goods & Furnishing Retailer | |||||||||||
822,845 | Fossil (a) | 85,008,117 | |||||||||
Watch Designer & Retailer | |||||||||||
Number of Shares | Value | ||||||||||
1,816,000 | Abercrombie & Fitch | $ | 82,174,000 | ||||||||
Teen Apparel Retailer | |||||||||||
3,700,000 | Saks (a) | 50,468,000 | |||||||||
Luxury Department Store Retailer | |||||||||||
1,000,000 | Urban Outfitters (a) | 40,220,000 | |||||||||
| Multi-Channel Apparrel & Accessory Retailer | |||||||||||
525,000 | DSW | 38,571,750 | |||||||||
Branded Footwear Retailer | |||||||||||
604,000 | Casey's General Stores | 36,336,640 | |||||||||
Owner/Operator of Convenience Stores | |||||||||||
1,925,000 | American Eagle Outfitters | 35,150,500 | |||||||||
Teen Apparel Retailer | |||||||||||
450,000 | Five Below | 16,542,000 | |||||||||
| Specialty Retailer Targeting Pre-Teen & Teen | |||||||||||
852,000 | Massmart Holdings (South Africa) | 15,454,004 | |||||||||
| General Merchandise, Food & Home Improvement Stores; Wal-Mart Subsidiary | |||||||||||
446,000 | Tile Shop Holdings (a) | 12,916,160 | |||||||||
| Specialty Retailer of Tiles & Related Accessories | |||||||||||
125,000 | Restoration Hardware Holdings (a) | 9,375,000 | |||||||||
Specialty Home Furnishing Retailer | |||||||||||
1,371,366 | Gaiam (a)(c) | 6,116,292 | |||||||||
| Healthy Living Catalogs & E-Commerce, Non-theatrical Media | |||||||||||
300,000 | Bon-Ton Stores (b) | 5,415,000 | |||||||||
Regional Department Stores | |||||||||||
1,038,363,313 | |||||||||||
| > Travel 3.4% | |||||||||||
4,400,000 | Avis Budget Group (a) | 126,500,000 | |||||||||
Second Largest Car Rental Company | |||||||||||
2,707,000 | Ryman Hospitality Properties (b)(c) | 105,600,070 | |||||||||
Convention Hotels | |||||||||||
3,750,000 | Hertz (a) | 93,000,000 | |||||||||
Largest U.S. Rental Car Operator | |||||||||||
1,430,000 | Vail Resorts | 87,973,600 | |||||||||
Ski Resort Operator & Developer | |||||||||||
1,893,000 | Choice Hotels | 75,133,170 | |||||||||
Franchisor of Budget Hotel Brands | |||||||||||
1,100,000 | Expedia | 66,165,000 | |||||||||
Online Travel Services Company | |||||||||||
1,600,000 | HomeAway (a) | 51,744,000 | |||||||||
Vacation Rental Online Marketplace | |||||||||||
2,100,000 | Localiza Rent A Car (Brazil) | 29,692,787 | |||||||||
Car Rental | |||||||||||
635,808,627 | |||||||||||
| > Apparel 1.3% | |||||||||||
1,296,000 | PVH | 162,064,800 | |||||||||
Apparel Wholesaler & Retailer | |||||||||||
810,000 | Deckers Outdoor (a)(b) | 40,913,100 | |||||||||
Fashion Footwear Wholesaler | |||||||||||
600,000 | Steven Madden (a) | 29,028,000 | |||||||||
Wholesaler/Retailer of Fashion Footwear | |||||||||||
2,620,000 | Quiksilver (a) | 16,872,800 | |||||||||
| Action Sports Lifestyle Branded Apparel & Footwear | |||||||||||
248,878,700 | |||||||||||
See accompanying notes to financial statements.
33
Columbia Acorn Fund
Statement of Investments (Unaudited), continued
Number of Shares | Value | ||||||||||
| > Casinos & Gaming 1.3% | |||||||||||
2,500,000 | Melco Crown Entertainment - ADR (Hong Kong) (a) | $ | 55,900,000 | ||||||||
Macau Casino Operator | |||||||||||
850,000 | Penn National Gaming (a) | 44,931,000 | |||||||||
Regional Casino Operator | |||||||||||
1,947,000 | Pinnacle Entertainment (a) | 38,297,490 | |||||||||
Regional Casino Operator | |||||||||||
20,000,000 | Melco International (Hong Kong) | 37,526,798 | |||||||||
Macau Casino Operator | |||||||||||
12,000,000 | MGM China Holdings (Hong Kong) | 31,843,877 | |||||||||
Macau Casino Operator | |||||||||||
40,000,000 | Nagacorp (Cambodia) | 31,090,006 | |||||||||
Casino/Entertainment Complex in Cambodia | |||||||||||
28,508 | Churchill Downs | 2,247,856 | |||||||||
| Owner/Operator of Horse Racing Tracks & Regional Casinos | |||||||||||
241,837,027 | |||||||||||
| > Consumer Goods Distribution 1.2% | |||||||||||
2,015,000 | Pool | 105,606,150 | |||||||||
| Swimming Pool Supplies & Equipment Distributor | |||||||||||
2,305,000 | GNC Holdings | 101,904,050 | |||||||||
| Specialty Retailer of Health & Wellness Products | |||||||||||
625,000 | United Stationers | 20,968,750 | |||||||||
Wholesale Distributor of Business Products | |||||||||||
228,478,950 | |||||||||||
| > Other Consumer Services 1.0% | |||||||||||
2,280,000 | Lifetime Fitness (a)(c) | 114,250,800 | |||||||||
Sport & Fitness Club Operator | |||||||||||
17,000,000 | Lifestyle International (Hong Kong) | 35,482,190 | |||||||||
| Mid to High-end Department Store Operator in Hong Kong & China | |||||||||||
800,000 | Blackhawk Network (a)(c) | 18,560,000 | |||||||||
| Third Party Distributer of Prepaid Content, Mostly Gift Cards | |||||||||||
1,062,500 | Move (a) | 13,621,250 | |||||||||
Real Estate Internet Websites | |||||||||||
450,000 | IFM Investments (Century 21 China RE) - ADR (China) (a) | 1,048,500 | |||||||||
Provide Real Estate Services in China | |||||||||||
182,962,740 | |||||||||||
| > Furniture & Textiles 0.9% | |||||||||||
2,250,000 | Herman Miller | 60,907,500 | |||||||||
Office Furniture | |||||||||||
3,669,000 | Knoll (c) | 52,136,490 | |||||||||
Office Furniture | |||||||||||
2,325,000 | Interface | 39,455,250 | |||||||||
Modular Carpet | |||||||||||
812,360 | Caesarstone (Israel) (a) | 22,120,563 | |||||||||
Quartz Countertops | |||||||||||
174,619,803 | |||||||||||
| > Restaurants 0.7% | |||||||||||
2,000,000 | AFC Enterprises (a)(c) | 71,880,000 | |||||||||
Popeye's Restaurants | |||||||||||
Number of Shares | Value | ||||||||||
630,000 | Domino's Pizza | $ | 36,634,500 | ||||||||
Franchisor of Pizza Restaurants | |||||||||||
675,000 | Bravo Brio Restaurant Group (a) | 12,028,500 | |||||||||
Upscale Casual Italian Restaurants | |||||||||||
285,000 | Fiesta Restaurant Group (a) | 9,801,150 | |||||||||
| Owns/Operates Two Restaurant Chains: Pollo Tropical & Taco Cabana | |||||||||||
130,344,150 | |||||||||||
| > Food & Beverage 0.5% | |||||||||||
1,143,265 | B&G Foods | 38,928,173 | |||||||||
Acquiror of Small Food Brands | |||||||||||
2,475,000 | Boulder Brands (a) | 29,823,750 | |||||||||
Healthy Food Products | |||||||||||
1,800,000 | Arcos Dorados (Brazil) (b) | 21,024,000 | |||||||||
| McDonald's Master Franchise for Latin America | |||||||||||
1,665,270 | GLG Life Tech (Canada) (a)(c) | 666,108 | |||||||||
| Produce an All-natural Sweetener Extracted from the Stevia Plant | |||||||||||
90,442,031 | |||||||||||
| > Other Durable Goods 0.3% | |||||||||||
460,000 | Cavco Industries (a)(c) | 23,207,000 | |||||||||
Manufactured Homes | |||||||||||
472,500 | Jarden (a) | 20,671,875 | |||||||||
Branded Household Products | |||||||||||
450,000 | Select Comfort (a) | 11,277,000 | |||||||||
Specialty Mattresses | |||||||||||
55,155,875 | |||||||||||
| > Educational Services 0.3% | |||||||||||
1,300,000 | DeVry | 40,326,000 | |||||||||
Post-secondary Degree Services | |||||||||||
500,000 | ITT Educational Services (a)(b) | 12,200,000 | |||||||||
Postsecondary Degree Services | |||||||||||
52,526,000 | |||||||||||
| > Nondurables 0.2% | |||||||||||
1,233,851 | Helen of Troy (a) | 47,342,863 | |||||||||
| Personal Care, Housewares, Healthcare & Home Environment Products | |||||||||||
Consumer Goods & Services: Total | 3,126,760,079 | ||||||||||
Finance 12.0% | |||||||||||
| > Banks 4.4% | |||||||||||
2,638,000 | BOK Financial | 168,963,900 | |||||||||
Tulsa-based Southwest Bank | |||||||||||
9,000,000 | Associated Banc-Corp (c) | 139,950,000 | |||||||||
Midwest Bank | |||||||||||
1,348,000 | City National | 85,422,760 | |||||||||
Bank & Asset Manager | |||||||||||
985,000 | SVB Financial Group (a) | 82,070,200 | |||||||||
Bank to Venture Capitalists | |||||||||||
2,860,000 | MB Financial (c) | 76,648,000 | |||||||||
Chicago Bank | |||||||||||
1,900,000 | Hancock Holding | 57,133,000 | |||||||||
Gulf Coast Bank | |||||||||||
5,323,500 | Valley National Bancorp (b) | 50,413,545 | |||||||||
New Jersey/New York Bank | |||||||||||
2,200,000 | TCF Financial | 31,196,000 | |||||||||
Great Lakes Bank | |||||||||||
See accompanying notes to financial statements.
34
Number of Shares | Value | ||||||||||
| > Banks—continued | |||||||||||
1,314,800 | TriCo Bancshares (c) | $ | 28,044,684 | ||||||||
California Central Valley Bank | |||||||||||
1,162,000 | Sandy Spring Bancorp | 25,122,440 | |||||||||
Baltimore & Washington, D.C. Bank | |||||||||||
4,299,507 | First Busey | 19,347,782 | |||||||||
Illinois Bank | |||||||||||
2,500,000 | First Commonwealth | 18,425,000 | |||||||||
Western Pennsylvania Bank | |||||||||||
900,000 | OFG Bancorp | 16,299,000 | |||||||||
Puerto Rican Bank | |||||||||||
811,295 | Hudson Valley | 13,775,789 | |||||||||
Metro New York City Bank | |||||||||||
2,136,500 | TrustCo Bank | 11,622,560 | |||||||||
New York State Bank | |||||||||||
— | Eagle Bancorp (a) | 4 | |||||||||
Metro Washington D.C. Bank | |||||||||||
824,434,664 | |||||||||||
| > Insurance 2.9% | |||||||||||
8,900,000 | CNO Financial Group | 115,344,000 | |||||||||
| Life, Long-term Care & Medical Supplement Insurance | |||||||||||
3,738,900 | Tower Group (c) | 76,684,839 | |||||||||
Commercial & Personal Lines Insurance | |||||||||||
833,000 | Allied World Holdings | 76,227,830 | |||||||||
Commerical Lines Insurance/Reinsurance | |||||||||||
2,625,000 | Selective Insurance Group | 60,427,500 | |||||||||
Commercial & Personal Lines Insurance | |||||||||||
1,500,000 | Brown & Brown | 48,360,000 | |||||||||
Insurance Broker | |||||||||||
1,100,000 | HCC Insurance Holdings | 47,421,000 | |||||||||
Specialty Insurance | |||||||||||
250,000 | Enstar Group (a) | 33,245,000 | |||||||||
Insurance/Reinsurance & Related Services | |||||||||||
400,000 | RLI | 30,564,000 | |||||||||
Specialty Insurance | |||||||||||
10,837,000 | Rand Merchant Insurance (South Africa) | 27,595,523 | |||||||||
| Directly Sold Property & Casualty Insurance; Holdings in Other Insurers | |||||||||||
500,000 | The Hanover Insurance Group | 24,465,000 | |||||||||
Commercial & Personal Lines Insurance | |||||||||||
540,334,692 | |||||||||||
| > Finance Companies 1.8% | |||||||||||
1,050,000 | World Acceptance (a)(c) | 91,287,000 | |||||||||
Personal Loans | |||||||||||
2,150,000 | McGrath Rentcorp (c) | 73,444,000 | |||||||||
Temporary Space & IT Rentals | |||||||||||
3,422,749 | H & E Equipment Services (c) | 72,117,322 | |||||||||
Heavy Equipment Leasing | |||||||||||
1,500,000 | CAI International (a)(c) | 35,355,000 | |||||||||
International Container Leasing | |||||||||||
1,091,000 | Marlin Business Services (c) | 24,852,980 | |||||||||
Small Equipment Leasing | |||||||||||
450,000 | Onex Capital (Canada) | 20,418,370 | |||||||||
Private Equity | |||||||||||
228,500 | Textainer Group Holdings | 8,783,540 | |||||||||
Top International Container Leasor | |||||||||||
Number of Shares | Value | ||||||||||
100,000 | Green Dot (a)(b) | $ | 1,995,000 | ||||||||
| Provider of Reloadable Prepaid Debt Cards & Online Banking | |||||||||||
328,253,212 | |||||||||||
| > Brokerage & Money Management 1.7% | |||||||||||
7,100,000 | SEI Investments | 201,853,000 | |||||||||
| Mutual Fund Administration & Investment Management | |||||||||||
3,052,000 | Eaton Vance | 114,724,680 | |||||||||
Specialty Mutual Funds | |||||||||||
380,446 | Kennedy-Wilson Holdings | 6,330,621 | |||||||||
Global Distressed Real Estate | |||||||||||
322,908,301 | |||||||||||
| > Credit Cards 0.7% | |||||||||||
550,000 | Alliance Data Systems (a) | 99,566,500 | |||||||||
Diversified Credit Card Provider | |||||||||||
500,000 | WEX Corp (a) | 38,350,000 | |||||||||
Pay Card Processor | |||||||||||
137,916,500 | |||||||||||
| > Diversified Financial Companies 0.4% | |||||||||||
2,820,000 | Leucadia National | 73,940,400 | |||||||||
Holding Company | |||||||||||
| > Savings & Loans 0.1% | |||||||||||
470,000 | ViewPoint Financial | 9,780,700 | |||||||||
Texas Thrift | |||||||||||
452,146 | Simplicity Bancorp (c) | 6,556,117 | |||||||||
Los Angeles Savings & Loan | |||||||||||
505,000 | Provident New York Bancorp | 4,716,700 | |||||||||
New York State Thrift | |||||||||||
21,053,517 | |||||||||||
Finance: Total | 2,248,841,286 | ||||||||||
Health Care 7.8% | |||||||||||
| > Biotechnology & Drug Delivery 4.1% | |||||||||||
6,050,000 | Seattle Genetics (a) | 190,333,000 | |||||||||
Antibody-based Therapies for Cancer | |||||||||||
2,230,000 | BioMarin Pharmaceutical (a) | 124,411,700 | |||||||||
Biotech Focused on Orphan Diseases | |||||||||||
950,000 | Henry Schein (a) | 90,962,500 | |||||||||
Largest Distributor of Healthcare Products | |||||||||||
1,812,575 | Synageva Biopharma (a)(c) | 76,128,150 | |||||||||
Biotech Focused on Orphan Diseases | |||||||||||
870,000 | Onyx Pharmaceuticals (a) | 75,533,400 | |||||||||
Commercial-stage Biotech Focused on Cancer | |||||||||||
3,130,000 | ARIAD Pharmaceuticals (a) | 54,743,700 | |||||||||
Biotech Focused on Cancer | |||||||||||
1,310,000 | Sarepta Therapeutics (a)(b) | 49,845,500 | |||||||||
Biotech Focused on Rare Diseases | |||||||||||
3,283,000 | NPS Pharmaceuticals (a) | 49,573,300 | |||||||||
Orphan Drugs & Healthy Royalties | |||||||||||
730,000 | Alnylam Pharmaceuticals (a) | 22,637,300 | |||||||||
Biotech Developing Drugs for Rare Diseases | |||||||||||
2,025,000 | InterMune (a) | 19,480,500 | |||||||||
Drugs for Pulmonary Fibrosis & Hepatitis C | |||||||||||
3,610,890 | Ultragenyx (a)(d)(e) | 11,988,155 | |||||||||
Biotech Focused On Ultra-Orphan Drugs | |||||||||||
1,027,000 | Coronado Biosciences (a)(b) | 8,832,200 | |||||||||
Development-stage Biotech | |||||||||||
See accompanying notes to financial statements.
35
Columbia Acorn Fund
Statement of Investments (Unaudited), continued
Number of Shares | Value | ||||||||||
| > Biotechnology & Drug Delivery—continued | |||||||||||
359,944 | MicroDose Therapeutx (a)(d)(e) | $ | 1,745,728 | ||||||||
Drug Inhaler Development | |||||||||||
776,215,133 | |||||||||||
| > Medical Supplies 1.6% | |||||||||||
6,170,000 | Cepheid (a)(c) | 212,371,400 | |||||||||
Molecular Diagnostics | |||||||||||
1,676,000 | Patterson Companies | 63,017,600 | |||||||||
Dental/Veterinary/Medical Distributor | |||||||||||
375,000 | Techne | 25,905,000 | |||||||||
| Cytokines, Antibodies & Other Reagents for Life Science | |||||||||||
301,294,000 | |||||||||||
| > Health Care Services 0.9% | |||||||||||
5,600,000 | Allscripts Healthcare Solutions (a) | 72,464,000 | |||||||||
Health Care IT | |||||||||||
665,000 | Mednax (a) | 60,900,700 | |||||||||
| Physician Management for Pediatric & Anesthesia Practices | |||||||||||
1,450,000 | HealthSouth (a) | 41,760,000 | |||||||||
Inpatient Rehabalitation Facilities | |||||||||||
175,124,700 | |||||||||||
| > Medical Equipment & Devices 0.8% | |||||||||||
1,025,000 | Sirona Dental Systems (a) | 67,527,000 | |||||||||
Manufacturer of Dental Equipment | |||||||||||
1,100,000 | Haemonetics (a) | 45,485,000 | |||||||||
Blood & Plasma Collection Equipment | |||||||||||
925,000 | PerkinElmer | 30,062,500 | |||||||||
Analytical Instruments for Life Sciences | |||||||||||
143,074,500 | |||||||||||
| > Pharmaceuticals 0.4% | |||||||||||
4,000,000 | Akorn (a) | 54,080,000 | |||||||||
| Develops, Manufactures & Sells Specialty Generic Drugs | |||||||||||
2,040,000 | Alimera Sciences (a)(b)(c) | 9,955,200 | |||||||||
| Ophthalmology-focused Pharmaceutical Company | |||||||||||
64,035,200 | |||||||||||
Health Care: Total | 1,459,743,533 | ||||||||||
Other Industries 6.8% | |||||||||||
| > Real Estate 4.5% | |||||||||||
3,625,000 | Dupont Fabros Technology (b)(c) | 87,543,750 | |||||||||
Data Centers | |||||||||||
750,000 | Federal Realty | 77,760,000 | |||||||||
Shopping Centers | |||||||||||
1,850,000 | Extra Space Storage | 77,570,500 | |||||||||
Self Storage Facilities | |||||||||||
1,435,000 | Post Properties | 71,018,150 | |||||||||
Multi-family Properties | |||||||||||
6,650,000 | EdR (c) | 68,029,500 | |||||||||
Student Housing | |||||||||||
2,450,000 | Biomed Realty Trust | 49,563,500 | |||||||||
Life Science-focused Office Buildings | |||||||||||
3,000,000 | Associated Estates Realty (c) | 48,240,000 | |||||||||
Multi-family Properties | |||||||||||
Number of Shares | Value | ||||||||||
1,050,000 | Coresite Realty | $ | 33,400,500 | ||||||||
Data Centers | |||||||||||
1,500,000 | St. Joe (a) | 31,575,000 | |||||||||
Florida Panhandle Landowner | |||||||||||
17,000,000 | Ascendas REIT (Singapore) | 29,792,235 | |||||||||
Industrial Property Landlord | |||||||||||
325,000 | Jones Lang LaSalle | 29,620,500 | |||||||||
Real Estate Services | |||||||||||
33,000,000 | Mapletree Logistics Trust (Singapore) | 28,601,198 | |||||||||
Industrial Property Landlord | |||||||||||
1,300,000 | Hudson Pacific Properties | 27,664,000 | |||||||||
| West Coast Office Buildings & Production Studios | |||||||||||
2,850,000 | Summit Hotel Properties | 26,932,500 | |||||||||
Owner of Select Service Hotels | |||||||||||
3,750,000 | DCT Industrial Trust | 26,812,500 | |||||||||
Industrial Properties | |||||||||||
4,000,000 | Kite Realty Group | 24,120,000 | |||||||||
Community Shopping Centers | |||||||||||
1,050,000 | Terreno Realty (c) | 19,456,500 | |||||||||
Industrial Properties | |||||||||||
20,000,000 | Mapletree Commercial Trust (Singapore) | 18,639,053 | |||||||||
Retail & Office Property Landlord | |||||||||||
24,664,000 | Mapletree Greater China Commercial Trust (Hong Kong) (a) | 18,331,472 | |||||||||
Retail & Office Property Landlord | |||||||||||
950,000 | American Residential Properties (a)(b) | 16,340,000 | |||||||||
Single-family Rental Properties | |||||||||||
14,000 | Orix JREIT (Japan) | 15,979,473 | |||||||||
Diversified Real Estate Investment Trust | |||||||||||
11,655,000 | CDL Hospitality Trust (Singapore) | 15,595,678 | |||||||||
Hotel Owner/Operator | |||||||||||
230,000 | Digital Realty Trust (b) | 14,030,000 | |||||||||
Data Centers | |||||||||||
856,616,009 | |||||||||||
| > Transportation 1.5% | |||||||||||
| 3,100,000 | Rush Enterprises, Class A (a)(c) | 76,725,000 | |||||||||
| 550,000 | Rush Enterprises, Class B (a)(c) | 11,836,000 | |||||||||
Truck Sales & Service | |||||||||||
1,155,000 | JB Hunt Transport Services | 83,437,200 | |||||||||
Truck & Intermodal Carrier | |||||||||||
| 602,000 | Kirby (a) | 47,883,080 | |||||||||
| Largest Operator of U.S. (Jones Act) Liquid Tank Barges | |||||||||||
750,000 | World Fuel Services | 29,985,000 | |||||||||
Global Fuel Broker | |||||||||||
300,000 | Genesee & Wyoming (a) | 25,452,000 | |||||||||
Short-line Operator | |||||||||||
275,318,280 | |||||||||||
| > Regulated Utilities 0.8% | |||||||||||
2,000,000 | Northeast Utilities | 84,040,000 | |||||||||
Regulated Electric Utility | |||||||||||
2,200,000 | Pepco Holdings | 44,352,000 | |||||||||
Regulated Utility | |||||||||||
See accompanying notes to financial statements.
36
Number of Shares | Value | ||||||||||
| > Regulated Utilities—continued | |||||||||||
700,000 | Wisconsin Energy | $ | 28,693,000 | ||||||||
Wisconsin Utility | |||||||||||
157,085,000 | |||||||||||
Other Industries: Total | 1,289,019,288 | ||||||||||
Energy & Minerals 6.4% | |||||||||||
| > Oil Services 3.5% | |||||||||||
4,635,000 | FMC Technologies (a) | 258,076,800 | |||||||||
Oil & Gas Well Head Manufacturer | |||||||||||
2,400,000 | Atwood Oceanics (a) | 124,920,000 | |||||||||
Offshore Drilling Contractor | |||||||||||
1,031,106 | Fugro (Netherlands) | 56,026,529 | |||||||||
Subsea Oilfield Services | |||||||||||
1,334,000 | ShawCor (Canada) | 52,715,641 | |||||||||
Oil & Gas Pipeline Products | |||||||||||
661,000 | Hornbeck Offshore (a) | 35,363,500 | |||||||||
| Supply Vessel Operator in U.S. Gulf of Mexico | |||||||||||
1,008,000 | Rowan (a) | 34,342,560 | |||||||||
Contract Offshore Driller | |||||||||||
268,000 | Chart Industries (a) | 25,216,120 | |||||||||
| Manufacturer of Natural Gas Processing/Storage Equipment | |||||||||||
400,000 | Dresser-Rand Group (a) | 23,992,000 | |||||||||
Manufactures & Services Compressors | |||||||||||
511,000 | Gulfmark Offshore | 23,040,990 | |||||||||
Operator of Offshore Supply Vessels | |||||||||||
2,601,900 | Horizon North Logistics (Canada) (b) | 15,709,865 | |||||||||
| Diversified Oil Services Offering in Northern Canada | |||||||||||
596,600 | Black Diamond Group (Canada) | 12,678,530 | |||||||||
| Provides Accommodations/Equipment for Oil Sands Development | |||||||||||
662,082,535 | |||||||||||
| > Oil & Gas Producers 2.0% | |||||||||||
940,000 | SM Energy | 56,381,200 | |||||||||
Oil & Gas Producer | |||||||||||
695,000 | Range Resources | 53,737,400 | |||||||||
Oil & Gas Producer | |||||||||||
1,153,600 | Rosetta Resources (a) | 49,051,072 | |||||||||
Oil & Gas Producer Exploring in Texas | |||||||||||
2,700,000 | Pacific Rubiales Energy (Colombia) | 47,417,515 | |||||||||
| Oil Production & Exploration in Colombia | |||||||||||
443,000 | Cabot Oil and Gas | 31,461,860 | |||||||||
| Large Natural Gas Producer in Appalachia & Gulf Coast | |||||||||||
1,477,000 | Denbury Resources (a) | 25,581,640 | |||||||||
Oil Producer Using Co2 Injection | |||||||||||
1,159,000 | Laredo Petroleum (a) | 23,829,040 | |||||||||
Permian Basin Oil Producer | |||||||||||
3,095,000 | Athabasca Oil Sands (Canada) (a) | 19,157,982 | |||||||||
Oil Sands & Unconventional Oil Development | |||||||||||
340,000 | PDC Energy (a) | 17,503,200 | |||||||||
Oil & Gas Producer in U.S. | |||||||||||
361,000 | Baytex (Canada) | 13,009,318 | |||||||||
Oil & Gas Producer in Canada | |||||||||||
Number of Shares | Value | ||||||||||
850,000 | Tullow Oil (United Kingdom) | $ | 12,939,392 | ||||||||
Oil & Gas Producer | |||||||||||
27,000,000 | Shamaran Petroleum (Iraq) (a) | 9,242,179 | |||||||||
Oil Exploration & Production in Kurdistan | |||||||||||
22,250,500 | Petroamerica Oil (Colombia) (a)(b) | 5,394,958 | |||||||||
Oil Exploration & Production in Colombia | |||||||||||
37,500,000 | Petromanas (Canada) (a)(c) | 3,743,939 | |||||||||
Exploring for Oil in Albania | |||||||||||
493,000 | Crew Energy (Canada) (a) | 2,428,202 | |||||||||
Canadian Oil & Gas Producer | |||||||||||
1,198,100 | Pan Orient (Canada) | 1,856,901 | |||||||||
Asian Oil & Gas Explorer | |||||||||||
26,000,000 | Petrodorado Energy (Colombia) (a)(c) | 1,483,313 | |||||||||
| Oil & Gas Exploration & Production in Colombia, Peru & Paraguay | |||||||||||
511,600 | Canacol (Colombia) (a) | 1,425,300 | |||||||||
Oil Producer in South America | |||||||||||
8,400,000 | Canadian Overseas Petroleum (United Kingdom) (a)(e) | 1,365,789 | |||||||||
| 4,200,000 | Canadian Overseas Petroleum - Warrants (United Kingdom) (a)(d)(e) | 20,239 | |||||||||
| Oil & Gas Exploration/Production in the North Sea | |||||||||||
| 50,000,000 | Gulf United Energy (Colombia) (a)(c) | 245,000 | |||||||||
| Prospecting for Oil Alongside Large Producers in Colombia | |||||||||||
4,110,000 | Santa Maria Petroleum (Colombia) (a)(c)(e) | 102,584 | |||||||||
| 890,000 | Santa Maria Petroleum (Colombia) (a)(c) | 29,619 | |||||||||
Explores for Oil & Gas in Latin America | |||||||||||
377,407,642 | |||||||||||
| > Mining 0.7% | |||||||||||
387,000 | Core Labs (Netherlands) | 58,692,420 | |||||||||
Oil & Gas Reservoir Consulting | |||||||||||
6,044,000 | Northam Platinum (South Africa) (a) | 19,517,302 | |||||||||
Platinum Mining in South Africa | |||||||||||
1,600,000 | Alamos Gold (Canada) | 19,381,953 | |||||||||
Gold Mining | |||||||||||
700,000 | Silver Wheaton (Canada) | 13,769,000 | |||||||||
Silver Mining Royalty Company | |||||||||||
7,500,000 | Duluth Metals (Canada) (a)(c) | 9,841,209 | |||||||||
Copper & Nickel Miner | |||||||||||
1,900,000 | Kirkland Lake Gold (Canada) (a)(b) | 7,985,167 | |||||||||
Gold Mining | |||||||||||
1,150,000 | Turquoise Hill Resources (Mongolia) (a) | 6,823,239 | |||||||||
Copper Mine Project in Mongolia | |||||||||||
16,000,000 | Mongolian Mining (Mongolia) (a) | 2,968,317 | |||||||||
Coking Coal Mining in Mongolia | |||||||||||
3,000,000 | Kaminak Gold (a)(b) | 2,310,545 | |||||||||
Exploration Stage Canadian Gold Miner | |||||||||||
2,050,000 | Alexco Resource (a) | 2,296,000 | |||||||||
Mining, Exploration & Environmental Services | |||||||||||
800,000 | Augusta Resource (a) | 1,680,000 | |||||||||
US Copper/Molybdenum Mine | |||||||||||
See accompanying notes to financial statements.
37
Columbia Acorn Fund
Statement of Investments (Unaudited), continued
Number of Shares | Value | ||||||||||
| > Mining—continued | |||||||||||
500,000 | Duluth Exploration - Special Warrants (Canada) (a)(d)(e) | $ | — | ||||||||
Copper & Nickel Miner | |||||||||||
145,265,152 | |||||||||||
| > Alternative Energy 0.1% | |||||||||||
2,000,000 | GT Advanced Technologies (a)(b) | 8,300,000 | |||||||||
| Largest Manufacturer of Furnaces & Reactors to Produce & Cast Polysilicon | |||||||||||
2,000,000 | Real Goods Solar (a)(b)(c) | 5,080,000 | |||||||||
Residential Solar Energy Installer | |||||||||||
1,210,300 | Synthesis Energy Systems (China) (a) | 940,403 | |||||||||
Owner/Operator of Gasification Plants | |||||||||||
14,320,403 | |||||||||||
| > Agricultural Commodities 0.1% | |||||||||||
1,306,818 | Union Agriculture Group (Uruguay) (a)(d)(e) | 13,525,566 | |||||||||
Farmland Operator in Uruguay | |||||||||||
Energy & Minerals: Total | 1,212,601,299 | ||||||||||
| Total Equities: 97.1% (Cost: $10,429,978,659) | 18,273,942,256 | (f) | |||||||||
Short-Term Investments 3.0% | |||||||||||
422,654,855 | JPMorgan U.S. Government Money Market Fund, Agency Shares (7 day yield of 0.01%) | 422,654,855 | |||||||||
140,420,394 | JPMorgan U.S. Government Money Market Fund, Capital Shares (7 day yield of 0.01%) | 140,420,394 | |||||||||
| Total Short-Term Investments: 3.0% (Cost: $563,075,249) | 563,075,249 | ||||||||||
Number of Shares | Value | ||||||||||
Securities Lending Collateral 2.4% | |||||||||||
454,607,005 | Dreyfus Government Cash Management Fund, Institutional Shares (7 day yield of 0.01%) (g) | $ | 454,607,005 | ||||||||
| Total Securities Lending Collateral: (Cost: $454,607,005) | 454,607,005 | ||||||||||
| Total Investments: 102.5% (Cost: $11,447,660,913)(h) | 19,291,624,510 | ||||||||||
| Obligation to Return Collateral for Securities Loaned: (2.4)% | (454,607,005 | ) | |||||||||
Cash and Other Assets Less Liabilities: (0.1)% | (20,020,576 | ) | |||||||||
Net Assets: 100.0% | $ | 18,816,996,929 | |||||||||
ADR - American Depositary Receipts
REIT - Real Estate Investment Trust
> Notes to Statement of Investments
(a) Non-income producing security.
(b) All or a portion of this security was on loan at June 30, 2013. The total market value of securities on loan at June 30, 2013 was $447,311,479.
(c) An affiliated person of the Fund may include any company in which the Fund owns five percent or more of its outstanding voting shares. Holdings and transactions in these affiliated companies during the period ended June 30, 2013, are as follows:
Security | Balance of Shares Held 12/31/12 | Purchases/ Additions | Sales/ Reductions | Balance of Shares Held 6/30/13 | Value | Dividend | |||||||||||||||||||||
Mettler-Toledo International | 1,600,000 | - | - | 1,600,000 | $ | 321,920,000 | $ | - | |||||||||||||||||||
Donaldson | 8,400,000 | - | - | 8,400,000 | 299,544,000 | 1,932,000 | |||||||||||||||||||||
tw telecom | 9,500,000 | - | - | 9,500,000 | 267,330,000 | - | |||||||||||||||||||||
Nordson | 3,125,000 | 275,000 | - | 3,400,000 | 235,654,000 | 978,750 | |||||||||||||||||||||
Cepheid | 4,970,000 | 1,200,000 | - | 6,170,000 | 212,371,400 | - | |||||||||||||||||||||
Bally Technologies | 3,725,000 | - | - | 3,725,000 | 210,164,500 | - | |||||||||||||||||||||
Seattle Genetics (1) | 6,550,000 | - | 500,000 | 6,050,000 | 190,333,000 | - | |||||||||||||||||||||
Pier 1 Imports | 7,185,000 | - | - | 7,185,000 | 168,775,650 | 718,500 | |||||||||||||||||||||
Moog | 3,230,000 | - | - | 3,230,000 | 166,441,900 | - | |||||||||||||||||||||
Associated Banc-Corp | 7,756,800 | 1,243,200 | - | 9,000,000 | 139,950,000 | 1,338,544 | |||||||||||||||||||||
IPG Photonics (1) | 2,780,000 | - | 494,000 | 2,286,000 | 138,828,780 | - | |||||||||||||||||||||
Lifetime Fitness | 2,280,000 | - | - | 2,280,000 | 114,250,800 | - | |||||||||||||||||||||
HEICO | 3,063,000 | - | - | 3,063,000 | 113,055,330 | - | |||||||||||||||||||||
Shutterfly | 2,835,000 | - | 860,000 | 1,975,000 | 110,185,250 | - | |||||||||||||||||||||
See accompanying notes to financial statements.
38
> Notes to Statement of Investments
Security | Balance of Shares Held 12/31/12 | Purchases/ Additions | Sales/ Reductions | Balance of Shares Held 6/30/13 | Value | Dividend | |||||||||||||||||||||
Ryman Hospitality Properties | 4,520,690 | - | 1,813,690 | 2,707,000 | $ | 105,600,070 | $ | 3,613,845 | |||||||||||||||||||
World Acceptance | 1,285,000 | - | 235,000 | 1,050,000 | 91,287,000 | - | |||||||||||||||||||||
Rush Enterprises | 3,650,000 | - | - | 3,650,000 | 88,561,000 | - | |||||||||||||||||||||
Dupont Fabros Technology | 3,625,000 | - | - | 3,625,000 | 87,543,750 | 725,000 | |||||||||||||||||||||
Tower Group (2) | 3,300,000 | 438,900 | - | 3,738,900 | 76,684,839 | 1,235,669 | |||||||||||||||||||||
MB Financial | 2,860,000 | - | - | 2,860,000 | 76,648,000 | 572,000 | |||||||||||||||||||||
Synageva Biopharma | 1,165,000 | 647,575 | - | 1,812,575 | 76,128,150 | - | |||||||||||||||||||||
ESCO Technologies | 2,200,000 | 100,000 | - | 2,300,000 | 74,474,000 | 352,000 | |||||||||||||||||||||
II-VI | 4,550,000 | - | - | 4,550,000 | 73,983,000 | - | |||||||||||||||||||||
Drew Industries | 1,880,000 | - | - | 1,880,000 | 73,921,600 | - | |||||||||||||||||||||
iGATE | 3,700,000 | 800,000 | - | 4,500,000 | 73,890,000 | - | |||||||||||||||||||||
McGrath Rentcorp | 2,150,000 | - | - | 2,150,000 | 73,444,000 | 1,021,250 | |||||||||||||||||||||
H & E Equipment Services | 3,400,000 | 22,749 | - | 3,422,749 | 72,117,322 | - | |||||||||||||||||||||
AFC Enterprises | 2,000,000 | - | - | 2,000,000 | 71,880,000 | - | |||||||||||||||||||||
EdR | 5,744,300 | 905,700 | - | 6,650,000 | 68,029,500 | 1,148,860 | |||||||||||||||||||||
Forward Air (1) | 1,500,000 | - | - | 1,500,000 | 57,420,000 | 300,000 | |||||||||||||||||||||
Knoll | 4,200,000 | - | 531,000 | 3,669,000 | 52,136,490 | 924,857 | |||||||||||||||||||||
NPS Pharmaceuticals (1) | 6,000,000 | - | 2,717,000 | 3,283,000 | 49,573,300 | - | |||||||||||||||||||||
SPS Commerce | 900,000 | - | - | 900,000 | 49,500,000 | - | |||||||||||||||||||||
Navigant Consulting | 3,704,600 | 316,291 | - | 4,020,891 | 48,250,692 | - | |||||||||||||||||||||
Associated Estates Realty | 3,000,000 | - | - | 3,000,000 | 48,240,000 | 1,140,000 | |||||||||||||||||||||
ExlService Holdings (1) | 1,618,000 | - | - | 1,618,000 | 47,828,080 | - | |||||||||||||||||||||
Helen of Troy (1) | 1,600,000 | - | 366,149 | 1,233,851 | 47,342,863 | - | |||||||||||||||||||||
Virtusa | 2,125,000 | - | - | 2,125,000 | 47,090,000 | - | |||||||||||||||||||||
Insperity | 1,800,000 | - | 400,000 | 1,400,000 | 42,420,000 | 504,733 | |||||||||||||||||||||
Pinnacle Entertainment (1) | 3,950,000 | - | 2,003,000 | 1,947,000 | 38,297,490 | - | |||||||||||||||||||||
CAI International | 1,397,834 | 102,166 | - | 1,500,000 | 35,355,000 | - | |||||||||||||||||||||
TriCo Bancshares | 1,350,000 | - | 35,200 | 1,314,800 | 28,044,684 | 270,000 | |||||||||||||||||||||
Summit Hotel Properties (1) | 2,850,000 | - | - | 2,850,000 | 26,932,500 | 641,250 | |||||||||||||||||||||
Marlin Business Services | 1,091,000 | - | - | 1,091,000 | 24,852,980 | 218,200 | |||||||||||||||||||||
Kite Realty Group (1) | 4,000,000 | - | - | 4,000,000 | 24,120,000 | 480,000 | |||||||||||||||||||||
Cavco Industries | 460,000 | - | - | 460,000 | 23,207,000 | - | |||||||||||||||||||||
InContact | 2,200,000 | 561,147 | - | 2,761,147 | 22,696,628 | - | |||||||||||||||||||||
Hackett Group | 3,849,207 | - | - | 3,849,207 | 19,977,384 | - | |||||||||||||||||||||
Terreno Realty | 358,151 | 691,849 | - | 1,050,000 | 19,456,500 | 94,320 | |||||||||||||||||||||
Blackhawk Network | - | 800,000 | - | 800,000 | 18,560,000 | - | |||||||||||||||||||||
Boingo Wireless | 1,900,000 | 300,000 | - | 2,200,000 | 13,662,000 | - | |||||||||||||||||||||
Acorn Energy | 1,512,352 | 8,605 | - | 1,520,957 | 12,836,877 | 52,932 | |||||||||||||||||||||
Globalstar | 1,200,000 | 21,031,946 | 289,746 | 21,942,200 | 12,068,210 | ||||||||||||||||||||||
Exa | 872,060 | 127,940 | - | 1,000,000 | 10,300,000 | - | |||||||||||||||||||||
Alimera Sciences | 2,040,000 | - | - | 2,040,000 | 9,955,200 | - | |||||||||||||||||||||
Duluth Metals | 7,500,000 | - | - | 7,500,000 | 9,841,209 | - | |||||||||||||||||||||
Simplicity Bancorp | 452,146 | - | - | 452,146 | 6,556,117 | 72,343 | |||||||||||||||||||||
Gaiam | 1,371,366 | - | - | 1,371,366 | 6,116,292 | - | |||||||||||||||||||||
Real Goods Solar | - | 2,000,000 | - | 2,000,000 | 5,080,000 | ||||||||||||||||||||||
Petromanas | 37,500,000 | - | - | 37,500,000 | 3,743,939 | - | |||||||||||||||||||||
Petrodorado Energy | 26,000,000 | - | - | 26,000,000 | 1,483,313 | - | |||||||||||||||||||||
GLG Life Tech | 1,665,270 | - | - | 1,665,270 | 666,108 | - | |||||||||||||||||||||
Gulf United Energy | 50,000,000 | - | - | 50,000,000 | 245,000 | - | |||||||||||||||||||||
Santa Maria Petroleum | 5,000,000 | - | - | 5,000,000 | 132,203 | - | |||||||||||||||||||||
Chelsea Therapeutics International (1) | 4,949,000 | - | 4,949,000 | - | - | - | |||||||||||||||||||||
Pericom Semiconductor (1) | 1,765,000 | - | 1,765,000 | - | - | - | |||||||||||||||||||||
Raptor Pharmaceutical (1) | 3,000,000 | - | 3,000,000 | - | - | - | |||||||||||||||||||||
Wolverine Minerals (1)(2) | 4,000,000 | - | 4,000,000 | - | - | - | |||||||||||||||||||||
Total of Affiliated Transactions | 311,710,776 | 31,573,068 | 23,958,785 | 319,325,059 | $ | 4,736,984,900 | $ | 18,335,053 | |||||||||||||||||||
(1) At June 30, 2013, the Fund owned less than five percent of the company's outstanding voting shares.
(2) Includes the effects of a stock split.
The aggregate cost and value of these companies at June 30, 2013, were $2,405,816,179 and $4,116,308,887, respectively. Investments in affiliated companies represented 21.88% of the Fund's total net assets at June 30, 2013.
(d) Illiquid security.
See accompanying notes to financial statements.
39
Columbia Acorn Fund
Statement of Investments (Unaudited), continued
> Notes to Statement of Investments
(e) Denotes a restricted security, which is subject to restrictions on resale under federal securities laws. These securities are valued at fair value determined in good faith under consistently applied procedures established by the Board of Trustees. At June 30, 2013, the market value of these securities amounted to $28,748,061, which represented 0.15% of total net assets. Additional information on these securities is as follows:
Security | Acquisition Dates | Shares | Cost | Value | |||||||||||||||
Union Agriculture Group | 12/8/10-6/27/12 | 1,306,818 | $ | 15,000,000 | $ | 13,525,566 | |||||||||||||
Ultragenyx | 12/19/12 | 3,610,890 | 9,999,999 | 11,988,155 | |||||||||||||||
MicroDose Therapeutx | 11/24/00 | 359,944 | 2,004,900 | 1,745,728 | |||||||||||||||
Canadian Overseas Petroleum | 11/24/10 | 8,400,000 | 3,591,152 | 1,365,789 | |||||||||||||||
Santa Maria Petroleum | 1/14/11 | 4,110,000 | 5,193,292 | 102,584 | |||||||||||||||
Canadian Overseas Petroleum - Warrants | 11/24/10 | 4,200,000 | 525,688 | 20,239 | |||||||||||||||
Duluth Exploration - Special Warrants | 8/19/11 | 500,000 | - | - | |||||||||||||||
$ | 36,315,031 | $ | 28,748,061 | ||||||||||||||||
(f) On June 30, 2013, the market value of foreign securities represented 7.84% of total net assets. The Fund's foreign portfolio was diversified as follows:
Country | Value | Percentage of Net Assets | |||||||||
Canada | $ | 245,605,019 | 1.30 | ||||||||
Netherlands | 190,461,416 | 1.01 | |||||||||
Hong Kong | 179,084,337 | 0.95 | |||||||||
Sweden | 129,967,975 | 0.69 | |||||||||
Singapore | 120,265,148 | 0.64 | |||||||||
Brazil | 75,110,988 | 0.40 | |||||||||
France | 65,078,995 | 0.35 | |||||||||
Japan | 64,107,109 | 0.33 | |||||||||
South Africa | 62,566,829 | 0.33 | |||||||||
Colombia | 56,098,289 | 0.30 | |||||||||
Denmark | 41,254,918 | 0.22 | |||||||||
Taiwan | 35,377,401 | 0.19 | |||||||||
India | 33,380,000 | 0.18 | |||||||||
United Kingdom | 31,276,493 | 0.17 | |||||||||
Cambodia | 31,090,006 | 0.17 | |||||||||
Chile | 27,189,200 | 0.14 | |||||||||
Israel | 22,120,563 | 0.12 | |||||||||
Russia | 20,087,010 | 0.11 | |||||||||
Uruguay | 13,525,566 | 0.07 | |||||||||
Iceland | 10,579,447 | 0.06 | |||||||||
Mongolia | 9,791,556 | 0.05 | |||||||||
Iraq | 9,242,179 | 0.05 | |||||||||
China | 1,988,903 | 0.01 | |||||||||
Total Foreign Portfolio | $ | 1,475,249,341 | 7.84 | ||||||||
(g) Investment made with cash collateral received from securities lending activity.
(h) At June 30, 2013, for federal income tax purposes, the cost of investments was $11,447,660,913 and net unrealized appreciation was $7,843,963,597 consisting of gross unrealized appreciation of $8,275,688,774 and gross unrealized depreciation of $431,725,177.
Fair Value Measurements
Various inputs are used in determining the value of the Fund's investments, following the input prioritization hierarchy established by accounting principles generally accepted in the United States of America (GAAP). These inputs are summarized in the three broad levels listed below:
• Level 1 – quoted prices in active markets for identical securities
• Level 2 – prices determined using other significant observable inputs (including quoted prices for similar securities, interest rates, prepayment speeds, credit risk and others)
• Level 3 – prices determined using significant unobservable inputs where quoted prices or observable inputs are unavailable or less reliable (including management's own assumptions about the factors market participants would use in pricing an investment)
The inputs or methodology used for valuing securities are not necessarily an indication of the risk associated with investing in those securities.
See accompanying notes to financial statements.
40
> Notes to Statement of Investments
Examples of the types of securities in which the Fund would typically invest and how they are classified within this hierarchy are as follows. Typical Level 1 securities include exchange traded domestic equities, mutual funds whose NAVs are published each day and exchange traded foreign equities that are not statistically fair valued. Typical Level 2 securities include exchange traded foreign equities that are statistically fair valued, forward foreign currency exchange contracts and short-term investments valued at amortized cost. Additionally, securities fair valued by the Valuation Committee (the Committee) of the Fund's Board of Trustees (the Board) that rely on significant observable inputs are also included in Level 2. Typical Level 3 securities include any security fair valued by the Committee that relies on significant unobservable inputs.
Under the direction of the Board, the Committee is responsible for carrying out the valuation procedures approved by the Board.
The Committee meets as necessary, and no less frequently than quarterly, to determine fair values for securities for which market quotations are not readily available or for which the investment manager believes that available market quotations are unreliable, to review the appropriateness of the Trust's Portfolio Pricing Policy and the pricing procedures of the investment manager (the Policies), and to review the continuing appropriateness of the current value of any security subject to the Policies. The Policies address, among other things: circumstances under which market quotations will be deemed readily available; selection of third party pricing vendors; appropriate pricing methodologies; events that require fair valuation and fair value techniques; and circumstances under which securities will be deemed to pose a potential for stale pricing, including when securities are illiquid, restricted, or in default. The Committee may also meet to discuss additional valuation matters, which may include review of back-testing results, review of time-sensitive information or approval of other valuation related actions, and to review the appropriateness of the Policies.
For investments categorized as Level 3, the significant unobservable inputs used in the fair value measurement of the Funds' securities may include: (i) data specific to the issuer or comparable issuers, (ii) general market or specific sector news and (iii) quoted prices and specific or similar security transactions. The Committee considers this data and any changes from prior periods in order to assess the reasonableness of observable and unobservable inputs, any assumptions or internal models used to value those securities and changes in fair value. Significant changes in any of these factors could result in lower or higher fair value measurements. Various factors impact the frequency of monitoring (which may occur as often as daily), however the Committee may determine that changes to inputs, assumptions and models are not required with the same frequency.
The following table summarizes the inputs used, as of June 30, 2013, in valuing the Fund's assets:
Investment Type | Quoted Prices (Level 1) | Other Significant Observable Inputs (Level 2) | Significant Unobservable Inputs (Level 3) | Total | |||||||||||||||
Equities | |||||||||||||||||||
Information | $ | 4,730,273,203 | $ | 235,285,393 | $ | - | $ | 4,965,558,596 | |||||||||||
Industrial Goods & Services | 3,755,986,678 | 215,431,497 | - | 3,971,418,175 | |||||||||||||||
Consumer Goods & Services | 2,975,363,204 | 151,396,875 | - | 3,126,760,079 | |||||||||||||||
Finance | 2,221,245,763 | 27,595,523 | - | 2,248,841,286 | |||||||||||||||
Health Care | 1,446,009,650 | - | 13,733,883 | 1,459,743,533 | |||||||||||||||
Other Industries | 1,162,080,180 | 126,939,108 | - | 1,289,019,288 | |||||||||||||||
Energy & Minerals | 1,106,135,580 | 92,940,153 | 13,525,566 | 1,212,601,299 | |||||||||||||||
Total Equities | 17,397,094,258 | 849,588,549 | 27,259,449 | 18,273,942,256 | |||||||||||||||
Total Short-Term Investments | 563,075,249 | - | - | 563,075,249 | |||||||||||||||
Total Securities Lending Collateral | 454,607,005 | - | - | 454,607,005 | |||||||||||||||
Total Investments | $ | 18,414,776,512 | $ | 849,588,549 | $ | 27,259,449 | $ | 19,291,624,510 | |||||||||||
The Fund's assets assigned to the Level 2 input category are generally valued using a market approach, in which a security's value is determined through its correlation to prices and information from observable market transactions for similar or identical assets. Foreign equities are generally valued at the last sale price on the foreign exchange or market on which they trade. The Fund may use a statistical fair valuation model, in accordance with the policy adopted by the Board, provided by an independent third party to value securities principally traded in foreign markets in order to adjust for possible stale pricing that may occur between the close of the foreign exchanges and the time for valuation. These models take into account available market data including intraday index, ADR, and ETF movements. Securities acquired via private placement that have a holding period or an extended settlement period are valued at a discount to the same shares that are trading freely on the market. These discounts are determined by the investment manager's experience with similar securities or situations. Factors may include, but are not limited to, trade volume, shares outstanding and stock price. Warrants which do not trade are valued as a percentage of the actively trading common stock using a model, based on Black Scholes.
The following table shows transfers between Level 1 and Level 2 of the fair value hierarchy:
| Transfers In | Transfers Out | ||||||||||||||
| Level 1 | Level 2 | Level 1 | Level 2 | ||||||||||||
| $ | 434,636 | $ | - | $ | - | $ | 434,636 | ||||||||
Financial assets were transferred from Level 2 to Level 1 as trading resumed during the period.
The Fund does not hold any significant investments categorized as Level 3.
See accompanying notes to financial statements.
41
Columbia Acorn Fund
Statement of Investments (Unaudited), continued
> Notes to Statement of Investments
Certain common stocks classified as Level 3 are valued at fair value, using a market approach, as determined in good faith under consistently applied procedures established by and under the general supervision of the Board. To determine fair value for these securities, for which no market exists, the Committee utilizes the valuation technique it deems most appropriate in the circumstances, using some unobservable inputs, which may include, but are not limited to, trades of similar securities, estimated earnings of the company, market multiples derived from a set of comparable companies, and the position of the security within the company's capital structure. Significant increases or decreases to any of these inputs could result in a significantly lower or higher fair value measurement.
See accompanying notes to financial statements.
42
Columbia Acorn International
Major Portfolio Changes in the Second Quarter (Unaudited)
Number of Shares | |||||||||||
3/31/13 | 6/30/13 | ||||||||||
Purchases | |||||||||||
Asia | |||||||||||
| > Japan | |||||||||||
Aica Kogyo | 0 | 1,102,500 | |||||||||
Ariake Japan | 918,500 | 1,448,500 | |||||||||
Asahi Diamond Industrial | 1,885,600 | 2,100,000 | |||||||||
Benesse | 637,300 | 790,000 | |||||||||
FP Corporation | 345,000 | 355,800 | |||||||||
Hirose Electric | 0 | 221,000 | |||||||||
Icom | 732,108 | 835,000 | |||||||||
Japan Airport Terminal | 2,380,000 | 2,460,000 | |||||||||
Kuraray | 2,981,100 | 3,448,100 | |||||||||
Nakanishi | 295,762 | 315,162 | |||||||||
NGK Spark Plug | 2,255,000 | 2,640,000 | |||||||||
Nihon Parkerizing | 1,346,080 | 1,448,080 | |||||||||
Nippon Kayaku | 808,000 | 2,130,500 | |||||||||
Omron | 0 | 734,800 | |||||||||
OSG | 0 | 1,355,400 | |||||||||
Rinnai | 340,000 | 370,000 | |||||||||
Santen Pharmaceutical | 321,500 | 524,600 | |||||||||
Shimano | 150,900 | 225,900 | |||||||||
Suruga Bank | 0 | 1,500,000 | |||||||||
Toyo Suisan Kaisha | 0 | 735,000 | |||||||||
Ushio | 1,900,000 | 2,350,000 | |||||||||
| > Taiwan | |||||||||||
CHC Healthcare | 3,291,000 | 4,048,000 | |||||||||
Chipbond | 2,503,230 | 5,865,230 | |||||||||
Delta Electronics | 5,429,000 | 6,995,000 | |||||||||
Far EasTone Telecom | 39,592,000 | 40,480,000 | |||||||||
Ginko International | 743,000 | 1,345,000 | |||||||||
Lite-On Technology | 0 | 9,078,000 | |||||||||
President Chain Store | 2,491,000 | 2,673,000 | |||||||||
Taiwan Mobile | 17,000,000 | 18,206,000 | |||||||||
| > Hong Kong | |||||||||||
| ASM Pacific | 0 | 1,660,100 | |||||||||
Vitasoy International | 13,767,900 | 18,000,000 | |||||||||
| > Singapore | |||||||||||
Super Group | 0 | 4,856,000 | |||||||||
| > Korea | |||||||||||
LS Industrial Systems | 0 | 416,998 | |||||||||
| > India | |||||||||||
| Adani Ports & Special Economic Zone | 0 | 7,222,544 | |||||||||
Colgate Palmolive India | 840,000 | 920,000 | |||||||||
| > Indonesia | |||||||||||
Arwana Citramulia | 0 | 17,357,000 | |||||||||
Surya Citra Media | 38,065,000 | 43,599,000 | |||||||||
Number of Shares | |||||||||||
3/31/13 | 6/30/13 | ||||||||||
| > China | |||||||||||
AMVIG Holdings | 30,000,000 | 34,418,000 | |||||||||
Biostime | 0 | 1,377,000 | |||||||||
WuXi PharmaTech - ADR | 0 | 2,143,203 | |||||||||
| > Thailand | |||||||||||
Airports of Thailand | 0 | 4,500,000 | |||||||||
Robinson's Department Store | 4,548,800 | 8,775,000 | |||||||||
Samui Airport Property Fund | 5,000,000 | 9,053,600 | |||||||||
| > Philippines | |||||||||||
Melco Crown (Philippines) Resorts | 0 | 60,000,000 | |||||||||
Europe | |||||||||||
| > United Kingdom | |||||||||||
Babcock International | 0 | 1,198,263 | |||||||||
Croda | 650,000 | 795,000 | |||||||||
Fidessa Group | 27,508 | 473,246 | |||||||||
Halford's | 0 | 4,577,000 | |||||||||
Jardine Lloyd Thompson Group | 4,106,842 | 4,561,000 | |||||||||
Ocado | 1,576,984 | 1,864,319 | |||||||||
Smiths News | 2,537,212 | 8,141,000 | |||||||||
Spirax Sarco | 965,000 | 1,130,000 | |||||||||
Telecity | 2,125,000 | 3,560,000 | |||||||||
Telecom Plus | 0 | 57,745 | |||||||||
Whitbread | 617,000 | 952,000 | |||||||||
| > Netherlands | |||||||||||
Aalberts Industries | 2,915,700 | 2,971,770 | |||||||||
| > France | |||||||||||
Neopost | 1,086,100 | 1,100,000 | |||||||||
Saft | 971,800 | 1,002,314 | |||||||||
| > Germany | |||||||||||
Aurelius | 0 | 597,726 | |||||||||
| > Denmark | |||||||||||
Jyske Bank | 1,064,013 | 1,117,000 | |||||||||
Novozymes | 1,049,800 | 1,315,800 | |||||||||
| > Finland | |||||||||||
Tikkurila | 0 | 1,084,000 | |||||||||
Vacon | 520,664 | 551,816 | |||||||||
| > Spain | |||||||||||
Dia | 4,771,000 | 6,064,000 | |||||||||
| > Russia | |||||||||||
QIWI - ADR | 0 | 400,000 | |||||||||
Other Countries | |||||||||||
| > Canada | |||||||||||
CAE | 3,047,000 | 3,188,000 | |||||||||
DeeThree Exploration | 1,142,377 | 1,436,127 | |||||||||
See accompanying notes to financial statements.
43
Columbia Acorn International
Major Portfolio Changes in the Second Quarter (Unaudited), continued
Number of Shares | |||||||||||
3/31/13 | 6/30/13 | ||||||||||
Purchases (continued) | |||||||||||
Other Countries—continued | |||||||||||
| > Australia | |||||||||||
Austbrokers | 572,051 | 928,701 | |||||||||
Domino's Pizza Enterprises | 2,500,000 | 2,800,000 | |||||||||
Regis Resources | 5,057,000 | 6,440,000 | |||||||||
SAI Global | 6,096,515 | 8,000,000 | |||||||||
| > Israel | |||||||||||
Caesarstone | 625,000 | 791,000 | |||||||||
Latin America | |||||||||||
| > Brazil | |||||||||||
Beadell Resources | 41,525,340 | 55,632,340 | |||||||||
Linx | 955,000 | 1,000,000 | |||||||||
Multiplus | 1,200,000 | 1,400,000 | |||||||||
| > Mexico | |||||||||||
Bolsa Mexicana de Valores | 6,273,000 | 8,361,000 | |||||||||
Genomma Lab Internacional | 11,945,000 | 17,626,000 | |||||||||
Gruma | 0 | 6,090,000 | |||||||||
Qualitas | 0 | 6,569,005 | |||||||||
| > Chile | |||||||||||
Empresas Hites | 8,366,013 | 23,280,000 | |||||||||
| Sociedad Quimica y Minera de Chile - ADR | 0 | 671,499 | |||||||||
| > Guatemala | |||||||||||
Tahoe Resources | 1,434,600 | 1,626,600 | |||||||||
| > Colombia | |||||||||||
Isagen | 7,720,411 | 14,729,000 | |||||||||
Number of Shares | |||||||||||
3/31/13 | 6/30/13 | ||||||||||
Sales | |||||||||||
Asia | |||||||||||
| > Japan | |||||||||||
Glory | 1,817,562 | 1,500,000 | |||||||||
Horiba | 765,000 | 243,100 | |||||||||
Hoshizaki Electric | 1,430,000 | 1,350,000 | |||||||||
Kintetsu World Express | 937,651 | 920,951 | |||||||||
Miraca Holdings | 720,506 | 603,706 | |||||||||
Misumi Group | 772,000 | 0 | |||||||||
Park24 | 2,400,000 | 2,057,000 | |||||||||
Sanrio | 900,000 | 640,000 | |||||||||
Seven Bank | 19,233,000 | 13,822,000 | |||||||||
Start Today | 3,287,962 | 3,020,000 | |||||||||
Wacom | 7,400,000 | 5,150,200 | |||||||||
| > Taiwan | |||||||||||
Chroma Ate | 7,587,000 | 7,568,000 | |||||||||
Simplo Technology | 2,654,713 | 0 | |||||||||
Tripod Technologies | 1,406,283 | 0 | |||||||||
| > Hong Kong | |||||||||||
AAC Technologies | 8,518,000 | 7,581,000 | |||||||||
Lifestyle International | 22,000,000 | 18,223,000 | |||||||||
| Mapletree Greater China Commercial Trust | 47,558,000 | 40,000,000 | |||||||||
| Melco Crown Entertainment - ADR | 5,000,000 | 3,500,000 | |||||||||
| > Singapore | |||||||||||
Olam International | 14,000,000 | 0 | |||||||||
Ascendas REIT | 19,000,000 | 13,500,000 | |||||||||
CDL Hospitality Trust | 22,000,000 | 20,000,000 | |||||||||
Goodpack Limited | 15,000,000 | 13,640,000 | |||||||||
Mapletree Logistics Trust | 33,000,000 | 30,000,000 | |||||||||
| > Korea | |||||||||||
BS Financial Group | 1,726,000 | 145,370 | |||||||||
Hite Jinro | 567,600 | 0 | |||||||||
Hyundai Glovis | 66,070 | 0 | |||||||||
Samsung Engineering | 132,000 | 0 | |||||||||
| > India | |||||||||||
Titan Industries | 1,600,000 | 0 | |||||||||
Bharti Infratel | 6,000,000 | 5,514,527 | |||||||||
United Breweries | 2,262,300 | 1,875,000 | |||||||||
| > Indonesia | |||||||||||
Ace Indonesia | 300,000,000 | 250,000,000 | |||||||||
Indosiair Karya Media | 12,719,500 | 0 | |||||||||
Mitra Adiperkasa | 12,488,000 | 6,622,000 | |||||||||
Tower Bersama Infrastructure | 60,516,300 | 58,000,000 | |||||||||
| > China | |||||||||||
| 51job - ADR | 162,939 | 0 | |||||||||
Digital China | 22,168,300 | 4,561,300 | |||||||||
RexLot Holdings | 200,000,000 | 193,550,000 | |||||||||
Want Want | 28,736,000 | 16,769,000 | |||||||||
See accompanying notes to financial statements.
44
Number of Shares | |||||||||||
3/31/13 | 6/30/13 | ||||||||||
Sales (continued) | |||||||||||
Asia—continued | |||||||||||
| > Thailand | |||||||||||
Home Product Center | 106,813,700 | 100,000,000 | |||||||||
Siam Makro | 1,920,300 | 0 | |||||||||
| > Philippines | |||||||||||
Int'l Container Terminal | 7,931,700 | 7,570,000 | |||||||||
Manila Water Company | 19,454,700 | 18,600,000 | |||||||||
SM Prime Holdings | 73,221,250 | 64,283,000 | |||||||||
Europe | |||||||||||
| > United Kingdom | |||||||||||
BBA Aviation | 8,785,000 | 5,815,000 | |||||||||
Domino's Pizza UK & Ireland | 4,181,000 | 3,583,000 | |||||||||
Greggs | 2,843,000 | 0 | |||||||||
Intertek Group | 693,000 | 322,000 | |||||||||
Premier Oil | 1,403,932 | 0 | |||||||||
Rightmove | 1,602,000 | 1,147,000 | |||||||||
WH Smith | 3,306,211 | 3,229,068 | |||||||||
| > Germany | |||||||||||
Bertrandt | 165,400 | 90,000 | |||||||||
CTS Eventim | 152,654 | 0 | |||||||||
Dürr | 61,078 | 0 | |||||||||
Pfeiffer Vacuum | 215,000 | 113,662 | |||||||||
| > Switzerland | |||||||||||
Dufry Group | 400,000 | 232,576 | |||||||||
Geberit | 240,500 | 212,500 | |||||||||
| > Sweden | |||||||||||
Hexagon | 3,426,522 | 3,130,522 | |||||||||
Other Countries | |||||||||||
| > South Africa | |||||||||||
Naspers | 1,170,188 | 858,188 | |||||||||
| > Canada | |||||||||||
Americas Petrogas | 1,611,000 | 284,865 | |||||||||
CCL Industries | 1,403,772 | 1,303,772 | |||||||||
| > Australia | |||||||||||
Challenger Financial | 15,714,426 | 11,155,000 | |||||||||
| Commonwealth Property Office Fund | 52,500,000 | 37,464,000 | |||||||||
IAG | 7,059,010 | 5,814,100 | |||||||||
Number of Shares | |||||||||||
3/31/13 | 6/30/13 | ||||||||||
Latin America | |||||||||||
| > Brazil | |||||||||||
Localiza Rent A Car | 3,700,000 | 3,350,000 | |||||||||
| Mills Estruturas e Servicos de Engenharia | 1,800,000 | 1,206,000 | |||||||||
| > Mexico | |||||||||||
| Grupo Aeroportuario del Sureste - ADR | 430,000 | 300,000 | |||||||||
| > Argentina | |||||||||||
Madalena Ventures | 7,425,000 | 3,769,500 | |||||||||
See accompanying notes to financial statements.
45
Columbia Acorn International
Statement of Investments (Unaudited), June 30, 2013
Number of Shares | Value | ||||||||||
Equities: 97.9% | |||||||||||
Asia 47.3% | |||||||||||
| > Japan 21.1% | |||||||||||
4,784,600 | Kansai Paint | $ | 61,076,168 | ||||||||
| Paint Producer in Japan, India, China & Southeast Asia | |||||||||||
3,020,000 | Start Today (a) | 59,136,399 | |||||||||
Online Japanese Apparel Retailer | |||||||||||
5,150,200 | Wacom | 56,930,402 | |||||||||
Computer Graphic Illustration Devices | |||||||||||
2,640,000 | NGK Spark Plug | 52,839,297 | |||||||||
Automobile Parts | |||||||||||
13,822,000 | Seven Bank | 50,105,924 | |||||||||
ATM Processing Services | |||||||||||
43,612 | Orix JREIT | 49,778,341 | |||||||||
| Diversified Real Estate Investment Trust | |||||||||||
3,448,100 | Kuraray | 48,325,816 | |||||||||
| Special Resin, Fine Chemical, Fibers & Textures | |||||||||||
1,350,000 | Hoshizaki Electric | 43,232,986 | |||||||||
Commercial Kitchen Equipment | |||||||||||
315,162 | Nakanishi (b) | 40,172,035 | |||||||||
Dental Tools & Machinery | |||||||||||
2,460,000 | Japan Airport Terminal | 38,935,712 | |||||||||
Airport Terminal Operator at Haneda | |||||||||||
2,057,000 | Park24 | 37,318,155 | |||||||||
Parking Lot Operator | |||||||||||
920,951 | Kintetsu World Express | 36,852,242 | |||||||||
Airfreight Logistics | |||||||||||
1,448,500 | Ariake Japan | 35,273,360 | |||||||||
| Manufacturer of Soup/Sauce Extracts for Business-to-business Use | |||||||||||
1,500,000 | Glory | 35,192,320 | |||||||||
| Currency Handling Systems & Related Equipment | |||||||||||
8,700 | Kenedix Realty Investment | 34,632,713 | |||||||||
| Tokyo Mid-size Office Real Estate Investment Trust | |||||||||||
2,350,000 | Ushio | 31,028,747 | |||||||||
Industrial Light Sources | |||||||||||
1,750,000 | Daiseki | 30,614,739 | |||||||||
Waste Disposal & Recycling | |||||||||||
640,000 | Sanrio | 29,688,201 | |||||||||
Character Goods & Licensing | |||||||||||
2,390,000 | NGK Insulators | 29,534,589 | |||||||||
| Ceramic Products for Auto, Power & Electronics | |||||||||||
221,000 | Hirose Electric | 29,107,950 | |||||||||
Electrical Connectors | |||||||||||
1,448,080 | Nihon Parkerizing | 28,676,368 | |||||||||
| Metal Surface Treatment Agents & Processing Service | |||||||||||
790,000 | Benesse | 28,500,777 | |||||||||
Education Service Provider | |||||||||||
603,706 | Miraca Holdings | 27,742,059 | |||||||||
| Outsourced Lab Testing, Diagnostic Equipment & Reagents | |||||||||||
398,400 | Disco | 27,478,797 | |||||||||
| Semiconductor Dicing & Grinding Equipment | |||||||||||
Number of Shares | Value | ||||||||||
1,500,000 | Suruga Bank | $ | 27,201,721 | ||||||||
Regional Bank | |||||||||||
2,130,500 | Nippon Kayaku (a) | 26,543,426 | |||||||||
| Functional Chemicals, Pharmaceuticals & Auto Safety Systems | |||||||||||
1,268,000 | Nabtesco | 26,327,177 | |||||||||
Machinery Components | |||||||||||
370,000 | Rinnai | 26,309,060 | |||||||||
| Gas Appliances for Household & Commercial Use | |||||||||||
709,500 | Hamamatsu Photonics | 25,622,338 | |||||||||
| Optical Sensors for Medical & Industrial Applications | |||||||||||
2,940 | Nippon Prologis REIT | 25,511,120 | |||||||||
| Logistics Real Estate Investment Trust in Japan | |||||||||||
2,580 | Industrial & Infrastructure Fund (a) | 25,092,235 | |||||||||
| Industrial Real Estate Investment Trust in Japan | |||||||||||
355,800 | FP Corporation | 24,669,046 | |||||||||
Disposable Food Trays & Containers | |||||||||||
594,700 | Itochu Techno-Science | 24,617,999 | |||||||||
IT Network Equipment Sales & Services | |||||||||||
735,000 | Toyo Suisan Kaisha | 24,455,457 | |||||||||
Instant Noodle Manufacturer | |||||||||||
11,200 | Advance Residence Investment | 24,281,448 | |||||||||
Residential REIT | |||||||||||
1,676,000 | Doshisha | 23,871,216 | |||||||||
Wholesaler of Household Products | |||||||||||
3,730 | Mori Hills REIT Investment (a) | 23,293,267 | |||||||||
| Tokyo Centric Diversified Real Estate Investment Trust | |||||||||||
524,600 | Santen Pharmaceutical | 22,701,958 | |||||||||
| Specialty Pharma (Ophthalmic Medicine) | |||||||||||
532,000 | Familymart | 22,699,611 | |||||||||
Convenience Store Operator | |||||||||||
3,850 | Global One Real Estate | 22,367,032 | |||||||||
Office Real Estate Investment Trust | |||||||||||
1,102,500 | Aica Kogyo | 22,098,228 | |||||||||
| Laminated Sheets, Building Materials & Chemical Adhesives | |||||||||||
734,800 | Omron | 21,906,599 | |||||||||
| Electric Components for Factory Automation | |||||||||||
488,892 | Ain Pharmaciez | 21,072,931 | |||||||||
| Dispensing Pharmacy/Drugstore Operator | |||||||||||
1,355,400 | OSG | 20,277,410 | |||||||||
Consumable Cutting Tools | |||||||||||
835,000 | Icom (b) | 20,254,170 | |||||||||
| Two Way Radio Communication Equipment | |||||||||||
2,100,000 | Asahi Diamond Industrial | 19,849,549 | |||||||||
Consumable Diamond Tools | |||||||||||
225,900 | Shimano | 19,243,259 | |||||||||
Bicycle Components & Fishing Tackle | |||||||||||
1,940,200 | Sintokogio | 16,039,733 | |||||||||
| Automated Casting Machines, Surface Treatment System & Consumables | |||||||||||
See accompanying notes to financial statements.
46
Number of Shares | Value | ||||||||||
| > Japan—continued | |||||||||||
446,400 | Milbon | $ | 15,739,483 | ||||||||
| Manufacturer of Hair Products for Business-to-business Use | |||||||||||
1,575,000 | Lifenet Insurance (a)(c) | 12,858,331 | |||||||||
| Online Life Insurance Company in Japan | |||||||||||
243,100 | Horiba | 8,866,523 | |||||||||
Test & Measurement Instruments | |||||||||||
350,000 | MonotaRO (a) | 8,521,766 | |||||||||
| Online MRO (Maintenance, Repair, Operations) Goods Distributor in Japan | |||||||||||
1,544,466,190 | |||||||||||
| > Taiwan 7.2% | |||||||||||
40,480,000 | Far EasTone Telecom | 108,490,695 | |||||||||
| Taiwan's Third Largest Mobile Operator | |||||||||||
18,206,000 | Taiwan Mobile | 71,725,361 | |||||||||
| Taiwan's Second Largest Mobile Operator | |||||||||||
2,270,000 | St. Shine Optical | 58,678,512 | |||||||||
| World's Leading Disposable Contact Lens OEM (Original Equipment Manufacturer) | |||||||||||
23,043,000 | CTCI Corp | 41,792,382 | |||||||||
International Engineering Firm | |||||||||||
6,995,000 | Delta Electronics | 31,767,668 | |||||||||
| Industrial Automation, Switching Power Supplies & Passive Components | |||||||||||
6,258,000 | Advantech | 29,681,321 | |||||||||
Industrial PC & Components | |||||||||||
12,488,000 | Taiwan Hon Chuan | 29,141,451 | |||||||||
| Beverage Packaging (Bottles, Caps, Labels) Manufacturer | |||||||||||
7,401,000 | Flexium Interconnect | 25,143,638 | |||||||||
| Flexible Printed Circuit for Mobile Electronics | |||||||||||
1,345,000 | Ginko International | 22,538,714 | |||||||||
Largest Contact Lens Maker in China | |||||||||||
6,173,000 | Lung Yen | 20,050,573 | |||||||||
Funeral Services & Columbaria | |||||||||||
2,673,000 | President Chain Store | 17,472,922 | |||||||||
| Taiwan's Number One Convenience Chain Store Operator | |||||||||||
9,078,000 | Lite-On Technology | 15,867,974 | |||||||||
| Mobile Device, LED & IT Component Supplier | |||||||||||
3,034,000 | PC Home | 15,820,969 | |||||||||
Taiwanese Internet Retail Company | |||||||||||
5,865,230 | Chipbond | 14,272,169 | |||||||||
| Semiconductor Back-end Packaging Services | |||||||||||
7,568,000 | Chroma Ate | 12,807,203 | |||||||||
| Automatic Test Systems, Testing & Measurement Instruments | |||||||||||
4,048,000 | CHC Healthcare | 10,715,007 | |||||||||
Medical Device Distributor | |||||||||||
525,966,559 | |||||||||||
| > Hong Kong 5.0% | |||||||||||
3,500,000 | Melco Crown Entertainment - ADR (c) | 78,260,000 | |||||||||
Macau Casino Operator | |||||||||||
Number of Shares | Value | ||||||||||
7,581,000 | AAC Technologies | $ | 42,533,006 | ||||||||
Miniature Acoustic Components | |||||||||||
15,625,000 | L'Occitane International | 41,973,748 | |||||||||
Skin Care & Cosmetics Producer | |||||||||||
18,223,000 | Lifestyle International | 38,034,821 | |||||||||
| Mid to High-end Department Store Operator in Hong Kong & China | |||||||||||
20,000,000 | Melco International | 37,526,798 | |||||||||
Macau Casino Operator | |||||||||||
40,000,000 | Mapletree Greater China Commercial Trust (c) | 29,729,925 | |||||||||
Retail & Office Property Landlord | |||||||||||
30,000,000 | Sa Sa International | 29,625,606 | |||||||||
Cosmetics Retailer | |||||||||||
10,000,000 | MGM China Holdings | 26,536,564 | |||||||||
Macau Casino Operator | |||||||||||
18,000,000 | Vitasoy International | 21,667,342 | |||||||||
| Well Known Hong Kong Soy Food Brand Reinventing Brand | |||||||||||
1,660,100 | ASM Pacific | 18,224,174 | |||||||||
| Semi Backend & Surface Mounting Equipment | |||||||||||
364,111,984 | |||||||||||
| > Singapore 2.8% | |||||||||||
40,000,000 | Mapletree Commercial Trust | 37,278,106 | |||||||||
Retail & Office Property Landlord | |||||||||||
20,000,000 | CDL Hospitality Trust | 26,762,209 | |||||||||
Hotel Owner/Operator | |||||||||||
30,000,000 | Mapletree Logistics Trust | 26,001,089 | |||||||||
Industrial Property Landlord | |||||||||||
25,000,000 | Mapletree Industrial Trust | 25,980,789 | |||||||||
Industrial Property Landlord | |||||||||||
13,500,000 | Ascendas REIT | 23,658,539 | |||||||||
Industrial Property Landlord | |||||||||||
3,500,000 | Singapore Exchange | 19,345,885 | |||||||||
| Singapore Equity & Derivatives Market Operator | |||||||||||
4,856,000 | Super Group | 17,037,185 | |||||||||
| Instant Food & Beverages in Southeast Asia | |||||||||||
13,640,000 | Goodpack Limited | 16,895,306 | |||||||||
International Bulk Container Leasing | |||||||||||
4,772,000 | Petra Foods | 14,246,952 | |||||||||
| Cocoa Processor & Chocolate Manufacturer | |||||||||||
207,206,060 | |||||||||||
| > Korea 2.7% | |||||||||||
834,580 | Coway | 40,555,792 | |||||||||
| Household Appliance Rental Service Provider | |||||||||||
1,617,261 | Paradise Co | 32,643,745 | |||||||||
| Korean 'Foreigner Only' Casino Operator | |||||||||||
74,400 | KCC | 21,268,787 | |||||||||
| Paint & Housing Material Manufacturer | |||||||||||
465,540 | Kepco Plant Service & Engineering | 21,196,992 | |||||||||
Power Plant & Grid Maintenance | |||||||||||
See accompanying notes to financial statements.
47
Columbia Acorn International
Statement of Investments (Unaudited), continued
Number of Shares | Value | ||||||||||
| > Korea—continued | |||||||||||
416,998 | LS Industrial Systems | $ | 20,839,457 | ||||||||
| Manufacturer of Electrical & Automation Equipment | |||||||||||
16,200 | Lotte Chilsung Beverage | 19,510,059 | |||||||||
Beverages & Liquor Manufacturer | |||||||||||
886,204 | iMarketKorea | 17,074,215 | |||||||||
| Procurement, Distribution of MRO (Maintenance, Repair, Operations) Goods | |||||||||||
624,441 | Handsome | 15,831,661 | |||||||||
High-end Apparel Company | |||||||||||
704,000 | Nexen Tire | 10,008,850 | |||||||||
Tire Manufacturer | |||||||||||
145,370 | BS Financial Group | 1,829,325 | |||||||||
| Regional Bank in Busan (Korea's Second Largest City) | |||||||||||
200,758,883 | |||||||||||
| > India 2.2% | |||||||||||
341,652 | Asian Paints | 26,585,740 | |||||||||
India's Largest Paint Company | |||||||||||
1,875,000 | United Breweries | 22,778,747 | |||||||||
India's Largest Brewer | |||||||||||
2,765,000 | Yes Bank | 21,374,317 | |||||||||
Commercial Banking in India | |||||||||||
920,000 | Colgate Palmolive India | 21,016,183 | |||||||||
Consumer Products in Oral Care | |||||||||||
7,222,544 | Adani Ports & Special Economic Zone | 18,235,366 | |||||||||
Indian West Coast Shipping Port | |||||||||||
13,195,000 | Redington India | 15,930,587 | |||||||||
| Supply Chain Solutions for IT & Mobile Handsets in Emerging Markets | |||||||||||
5,514,527 | Bharti Infratel | 14,100,634 | |||||||||
Communication Towers | |||||||||||
85,000 | Bosch | 12,903,517 | |||||||||
Automotive Parts | |||||||||||
125,000 | TTK Prestige | 6,622,824 | |||||||||
Branded Cooking Equipment | |||||||||||
1,650,000 | SKIL Ports and Logistics (c) | 2,471,923 | |||||||||
Indian Container Port Project | |||||||||||
162,019,838 | |||||||||||
| > Indonesia 1.8% | |||||||||||
58,000,000 | Tower Bersama Infrastructure (c) | 30,287,954 | |||||||||
Communications Towers | |||||||||||
31,764,600 | Archipelago Resources (b)(c) | 22,827,587 | |||||||||
| Gold Mining Projects in Indonesia, Vietnam & the Philippines | |||||||||||
250,000,000 | Ace Indonesia | 18,594,030 | |||||||||
Home Improvement Retailer | |||||||||||
5,003,500 | Mayora Indah | 15,163,329 | |||||||||
Consumer Branded Food Manufacturer | |||||||||||
43,599,000 | Surya Citra Media | 11,965,120 | |||||||||
Free to Air TV Station in Indonesia | |||||||||||
9,720,000 | Matahari Department Store (c) | 11,365,495 | |||||||||
| Largest Department Store Chain in Indonesia | |||||||||||
Number of Shares | Value | ||||||||||
44,420,000 | MNC Skyvision (c) | $ | 10,476,701 | ||||||||
| Largest Satellite Pay TV Operator in Indonesia | |||||||||||
17,357,000 | Arwana Citramulia | 5,586,348 | |||||||||
Ceramic Tiles for Home Decoration | |||||||||||
6,622,000 | Mitra Adiperkasa | 4,649,184 | |||||||||
| Operator of Department Store & Specialty Retail Stores | |||||||||||
5,719,500 | Southern Arc Minerals (b)(c) | 652,600 | |||||||||
Gold & Copper Exploration in Indonesia | |||||||||||
131,568,348 | |||||||||||
| > China 1.5% | |||||||||||
2,143,203 | WuXi PharmaTech - ADR (c) | 45,007,263 | |||||||||
| Largest Contract Research Organization Business in China | |||||||||||
16,769,000 | Want Want | 23,504,153 | |||||||||
| Chinese Branded Consumer Food Company | |||||||||||
34,418,000 | AMVIG Holdings | 13,312,705 | |||||||||
| Chinese Tobacco Packaging Material Supplier | |||||||||||
193,550,000 | RexLot Holdings | 12,692,865 | |||||||||
Lottery Equipment Supplier in China | |||||||||||
1,377,000 | Biostime | 7,700,294 | |||||||||
| Pediatric Nutrition & Baby Care Products Provider | |||||||||||
4,561,300 | Digital China | 5,421,852 | |||||||||
| IT Distribution & Systems Integration Services | |||||||||||
107,639,132 | |||||||||||
| > Thailand 1.1% | |||||||||||
100,000,000 | Home Product Center | 36,924,798 | |||||||||
Home Improvement Retailer | |||||||||||
4,500,000 | Airports of Thailand | 24,318,775 | |||||||||
Airport Operator of Thailand | |||||||||||
8,775,000 | Robinson's Department Store | 17,149,305 | |||||||||
| Mass-market Department Store Operator in Thailand | |||||||||||
9,053,600 | Samui Airport Property Fund | 5,126,112 | |||||||||
Thai Airport Operator | |||||||||||
83,518,990 | |||||||||||
| > Philippines 0.9% | |||||||||||
64,283,000 | SM Prime Holdings | 24,148,616 | |||||||||
Shopping Mall Operator | |||||||||||
7,570,000 | Int'l Container Terminal | 15,173,544 | |||||||||
| Container Handling Terminals & Port Management | |||||||||||
18,600,000 | Manila Water Company | 13,935,799 | |||||||||
Water Utility Company in Philippines | |||||||||||
60,000,000 | Melco Crown (Philippines) Resorts (c) | 11,527,778 | |||||||||
Integrated Resort Operator in Manila | |||||||||||
64,785,737 | |||||||||||
| > Cambodia 0.6% | |||||||||||
60,000,000 | Nagacorp | 46,635,009 | |||||||||
| Casino/Entertainment Complex in Cambodia | |||||||||||
See accompanying notes to financial statements.
48
Number of Shares | Value | ||||||||||
| > Mongolia 0.4% | |||||||||||
74,865,700 | Mongolian Mining (c) | $ | 13,889,071 | ||||||||
Coking Coal Mining in Mongolia | |||||||||||
1,049,943 | Turquoise Hill Resources (c) | 6,229,575 | |||||||||
| 914,678 | Turquoise Hill Resources (c)(d) | 5,424,041 | |||||||||
Copper Mine Project in Mongolia | |||||||||||
25,542,687 | |||||||||||
Asia: Total | 3,464,219,417 | ||||||||||
Europe 31.0% | |||||||||||
| > United Kingdom 8.9% | |||||||||||
4,561,000 | Jardine Lloyd Thompson Group | 63,175,508 | |||||||||
International Business Insurance Broker | |||||||||||
3,560,000 | Telecity | 54,859,836 | |||||||||
European Data Center Provider | |||||||||||
1,130,000 | Spirax Sarco | 46,311,712 | |||||||||
| Steam Systems for Manufacturing & Process Industries | |||||||||||
952,000 | Whitbread | 44,286,718 | |||||||||
| The UK's Leading Hotelier & Coffee Shop | |||||||||||
3,583,000 | Domino's Pizza UK & Ireland | 36,526,280 | |||||||||
Pizza Delivery in UK, Ireland & Germany | |||||||||||
1,147,000 | Rightmove | 36,363,400 | |||||||||
Internet Real Estate Listings | |||||||||||
3,229,068 | WH Smith (a) | 35,263,931 | |||||||||
| Newsprint, Books & General Stationery Retailer | |||||||||||
3,565,000 | Shaftesbury | 32,301,258 | |||||||||
| London Prime Retail Real Estate Investment Trust | |||||||||||
2,709,000 | Smith & Nephew | 30,340,422 | |||||||||
Medical Equipment & Supplies | |||||||||||
795,000 | Croda | 29,979,531 | |||||||||
Oleochemicals & Industrial Chemicals | |||||||||||
7,760,000 | Elementis | 25,893,643 | |||||||||
Clay-based Additives | |||||||||||
3,715,000 | Abcam | 25,624,236 | |||||||||
Online Sales of Antibodies | |||||||||||
5,815,000 | BBA Aviation | 24,765,816 | |||||||||
Aviation Support Services | |||||||||||
4,577,000 | Halford's | 22,013,511 | |||||||||
| The UK's Leading Retailer for Leisure Goods & Auto Parts | |||||||||||
875,000 | Aggreko | 21,870,170 | |||||||||
| Temporary Power & Temperature Control Services | |||||||||||
34,752,000 | Cable and Wireless | 21,632,920 | |||||||||
| Leading Telecoms Service Provider in the Caribbean | |||||||||||
1,198,263 | Babcock International | 20,119,923 | |||||||||
Public Sector Outsourcer | |||||||||||
8,141,000 | Smiths News | 18,727,851 | |||||||||
Newspaper & Magazine Distributor | |||||||||||
3,100,000 | PureCircle (a)(c) | 16,502,303 | |||||||||
Natural Sweeteners | |||||||||||
322,000 | Intertek Group | 14,313,413 | |||||||||
| Testing, Inspection & Certification Services | |||||||||||
Number of Shares | Value | ||||||||||
473,246 | Fidessa Group | $ | 13,879,665 | ||||||||
Software for Financial Trading Systems | |||||||||||
1,864,319 | Ocado (a)(c) | 8,458,401 | |||||||||
Leading Online Grocery Retailer | |||||||||||
382,581 | Tullow Oil | 5,823,960 | |||||||||
Oil & Gas Producer | |||||||||||
57,745 | Telecom Plus | 1,096,084 | |||||||||
UK Multi Utility | |||||||||||
650,130,492 | |||||||||||
| > Netherlands 3.5% | |||||||||||
2,971,770 | Aalberts Industries | 66,418,376 | |||||||||
Flow Control & Heat Treatment | |||||||||||
1,514,545 | UNIT4 (b) | 49,086,350 | |||||||||
Business Software Development | |||||||||||
1,178,288 | TKH Group | 30,297,920 | |||||||||
Dutch Industrial Conglomerate | |||||||||||
1,068,478 | Arcadis | 28,771,297 | |||||||||
Engineering Consultants | |||||||||||
520,900 | Fugro | 28,303,801 | |||||||||
Subsea Oilfield Services | |||||||||||
143,395 | Core Labs | 21,747,286 | |||||||||
Oil & Gas Reservoir Consulting | |||||||||||
266,124 | Vopak | 15,707,549 | |||||||||
| World's Largest Operator of Petroleum & Chemical Storage Terminals | |||||||||||
2,114,073 | Imtech (a)(c) | 15,561,754 | |||||||||
Technical Installation & Maintenance | |||||||||||
255,894,333 | |||||||||||
| > France 3.3% | |||||||||||
349,000 | Eurofins Scientific (c) | 73,646,945 | |||||||||
| Food, Pharmaceuticals & Materials Screening & Testing | |||||||||||
1,100,000 | Neopost | 72,832,888 | |||||||||
Postage Meter Machines | |||||||||||
445,700 | Gemalto (a) | 40,354,897 | |||||||||
Digital Security Solutions | |||||||||||
308,400 | Norbert Dentressangle | 25,089,293 | |||||||||
| Leading European Logistics & Transport Group | |||||||||||
1,002,314 | Saft | 23,816,045 | |||||||||
Niche Battery Manufacturer | |||||||||||
1,831,204 | Hi-Media (a)(c) | 3,982,843 | |||||||||
Online Advertiser in Europe | |||||||||||
239,722,911 | |||||||||||
| > Germany 2.9% | |||||||||||
2,000,000 | Wirecard | 54,419,897 | |||||||||
| Online Payment Processing & Risk Management | |||||||||||
148,295 | Rational | 49,646,568 | |||||||||
Commercial Ovens | |||||||||||
685,000 | NORMA Group | 24,774,048 | |||||||||
| Clamps for Automotive & Industrial Applications | |||||||||||
2,130,000 | TAG Immobilien | 23,215,518 | |||||||||
| Owner of Residential Properties in Germany | |||||||||||
475,000 | Elringklinger | 15,828,930 | |||||||||
Automobile Components | |||||||||||
See accompanying notes to financial statements.
49
Columbia Acorn International
Statement of Investments (Unaudited), continued
Number of Shares | Value | ||||||||||
| > Germany—continued | |||||||||||
597,726 | Aurelius | $ | 14,362,429 | ||||||||
European Turnaround Investor | |||||||||||
113,662 | Pfeiffer Vacuum | 11,770,013 | |||||||||
Vacuum Pumps | |||||||||||
90,000 | Bertrandt | 9,672,927 | |||||||||
Outsourced Engineering | |||||||||||
260,000 | Deutsche Beteiligungs | 6,254,652 | |||||||||
Private Equity Investment Management | |||||||||||
209,944,982 | |||||||||||
| > Switzerland 2.8% | |||||||||||
267,500 | Partners Group | 72,406,589 | |||||||||
Private Markets Asset Management | |||||||||||
212,500 | Geberit | 52,641,275 | |||||||||
Plumbing Supplies | |||||||||||
15,250 | Sika | 39,432,521 | |||||||||
| Chemicals for Construction & Industrial Applications | |||||||||||
232,576 | Dufry Group (c) | 28,173,474 | |||||||||
| Operates Airport Duty Free & Duty Paid Shops | |||||||||||
380,000 | Zehnder | 16,937,166 | |||||||||
| Radiators & Heat Recovery Ventilation Systems | |||||||||||
209,591,025 | |||||||||||
| > Sweden 2.2% | |||||||||||
3,130,522 | Hexagon | 83,683,177 | |||||||||
| Design, Measurement & Visualization Software & Equipment | |||||||||||
4,150,024 | Sweco (b) | 47,186,789 | |||||||||
Engineering Consultants | |||||||||||
868,700 | Unibet | 29,081,456 | |||||||||
European Online Gaming Operator | |||||||||||
159,951,422 | |||||||||||
| > Denmark 1.9% | |||||||||||
1,849,420 | SimCorp | 54,968,998 | |||||||||
Software for Investment Managers | |||||||||||
1,315,800 | Novozymes | 42,145,358 | |||||||||
Industrial Enzymes | |||||||||||
1,117,000 | Jyske Bank (c) | 42,014,811 | |||||||||
Danish Bank | |||||||||||
139,129,167 | |||||||||||
| > Italy 0.9% | |||||||||||
3,658,000 | Pirelli (a) | 42,286,993 | |||||||||
Global Tire Supplier | |||||||||||
8,501,000 | Geox (a) | 21,130,250 | |||||||||
Apparel & Shoe Maker | |||||||||||
63,417,243 | |||||||||||
| > Finland 0.8% | |||||||||||
551,816 | Vacon | 36,595,907 | |||||||||
| Leading Independent Manufacturer of Variable Speed Alternating Current Drives | |||||||||||
1,084,000 | Tikkurila | 24,464,397 | |||||||||
| Decorative & Industrial Paint in Scandinavia & Central & Eastern Europe | |||||||||||
61,060,304 | |||||||||||
Number of Shares | Value | ||||||||||
| > Norway 0.7% | |||||||||||
3,281,864 | Atea | $ | 33,092,293 | ||||||||
| Leading Nordic IT Hardware/Software Reseller & Installation Company | |||||||||||
906,000 | Subsea 7 (c) | 15,884,662 | |||||||||
Offshore Subsea Contractor | |||||||||||
48,976,955 | |||||||||||
| > Spain 0.6% | |||||||||||
6,064,000 | Dia | 45,809,107 | |||||||||
| Leading Hard Discounter in Spain, Latin America & the Eastern Mediterranean | |||||||||||
| > Russia 0.6% | |||||||||||
1,167,000 | Yandex (c) | 32,244,210 | |||||||||
| Search Engine for Russian & Turkish Languages | |||||||||||
400,000 | QIWI - ADR | 9,280,000 | |||||||||
| Electronic Payments Network Serving Russia & the Commonwealth of Independent States | |||||||||||
41,524,210 | |||||||||||
| > Kazakhstan 0.5% | |||||||||||
5,143,000 | Halyk Savings Bank of Kazakhstan - GDR | 37,955,340 | |||||||||
| Largest Retail Bank & Insurer in Kazakhstan | |||||||||||
| > Belgium 0.4% | |||||||||||
438,880 | EVS Broadcast Equipment | 30,428,142 | |||||||||
| Digital Live Mobile Production Software & Systems | |||||||||||
| > Iceland 0.4% | |||||||||||
28,312,499 | Marel (e) | 20,256,367 | |||||||||
| 7,670,000 | Marel (e) | 8,114,436 | |||||||||
| Largest Manufacturer of Poultry & Fish Processing Equipment | |||||||||||
28,370,803 | |||||||||||
| > Portugal 0.3% | |||||||||||
8,635,000 | Redes Energéticas Nacionais | 24,761,154 | |||||||||
| Portuguese Power Transmission & Gas Transportation | |||||||||||
| > Turkey 0.3% | |||||||||||
1,426,000 | Bizim Toptan | 23,215,845 | |||||||||
Cash & Carry Stores in Turkey | |||||||||||
Europe: Total | 2,269,883,435 | ||||||||||
Other Countries 14.1% | |||||||||||
| > South Africa 4.2% | |||||||||||
13,935,448 | Coronation Fund Managers | 88,468,422 | |||||||||
South African Fund Manager | |||||||||||
858,188 | Naspers | 63,344,299 | |||||||||
| Media in Africa, China, Russia & Other Emerging Markets | |||||||||||
19,098,300 | Rand Merchant Insurance | 48,632,239 | |||||||||
| Directly Sold Property & Casualty Insurance; Holdings in Other Insurers | |||||||||||
2,230,504 | Massmart Holdings | 40,458,001 | |||||||||
| General Merchandise, Food & Home Improvement Stores; Wal-Mart Subsidiary | |||||||||||
See accompanying notes to financial statements.
50
Number of Shares | Value | ||||||||||
| > South Africa—continued | |||||||||||
2,644,083 | Mr. Price | $ | 36,040,775 | ||||||||
| South African Retailer of Apparel, Household & Sporting Goods | |||||||||||
8,679,940 | Northam Platinum (c) | 28,029,287 | |||||||||
Platinum Mining in South Africa | |||||||||||
304,973,023 | |||||||||||
| > Canada 3.8% | |||||||||||
1,303,772 | CCL Industries (c) | 80,430,472 | |||||||||
Largest Global Label Converter | |||||||||||
1,084,597 | ShawCor | 42,859,990 | |||||||||
Oil & Gas Pipeline Products | |||||||||||
3,188,000 | CAE | 33,071,294 | |||||||||
| Flight Simulator Equipment & Training Centers | |||||||||||
653,200 | Onex Capital | 29,638,399 | |||||||||
Private Equity | |||||||||||
590,228 | AG Growth | 19,159,821 | |||||||||
| Leading Manufacturer of Augers & Grain Handling Equipment | |||||||||||
| 1,436,127 | DeeThree Exploration (c) | 10,378,021 | |||||||||
| 1,130,000 | DeeThree Exploration (c)(f) | 8,002,510 | |||||||||
Canadian Oil & Gas Producer | |||||||||||
709,576 | Black Diamond Group | 15,079,418 | |||||||||
| Provides Accommodations/Equipment for Oil Sands Development | |||||||||||
984,500 | Alliance Grain Traders | 13,713,916 | |||||||||
| Global Leader in Pulse Processing & Distribution | |||||||||||
1,901,514 | Horizon North Logistics (a) | 11,481,044 | |||||||||
| Diversified Oil Services Offering in Northern Canada | |||||||||||
| 263,857 | Baytex | 9,508,586 | |||||||||
Oil & Gas Producer in Canada | |||||||||||
| 450,000 | Athabasca Oil Sands (c) | 2,785,490 | |||||||||
| Oil Sands & Unconventional Oil Development | |||||||||||
1,607,306 | Pan Orient | 2,491,118 | |||||||||
Asian Oil & Gas Explorer | |||||||||||
332,700 | Crew Energy (c) | 1,638,667 | |||||||||
Canadian Oil & Gas Producer | |||||||||||
284,865 | Americas Petrogas (c) | 241,067 | |||||||||
| Oil & Gas Exploration in Argentina, Potash in Peru | |||||||||||
280,479,813 | |||||||||||
| > United States 2.8% | |||||||||||
952,080 | Atwood Oceanics (c) | 49,555,764 | |||||||||
Offshore Drilling Contractor | |||||||||||
1,272,297 | Textainer Group Holdings (a) | 48,907,097 | |||||||||
Top International Container Leasor | |||||||||||
1,052,900 | Rowan (c) | 35,872,303 | |||||||||
Contract Offshore Driller | |||||||||||
601,213 | FMC Technologies (c) | 33,475,540 | |||||||||
Oil & Gas Well Head Manufacturer | |||||||||||
439,500 | Hornbeck Offshore (c) | 23,513,250 | |||||||||
| Supply Vessel Operator in U.S. Gulf of Mexico | |||||||||||
428,228 | World Fuel Services | 17,120,555 | |||||||||
Global Fuel Broker | |||||||||||
208,444,509 | |||||||||||
Number of Shares | Value | ||||||||||
| > Australia 2.6% | |||||||||||
11,155,000 | Challenger Financial | $ | 40,676,982 | ||||||||
Largest Annuity Provider | |||||||||||
37,464,000 | Commonwealth Property Office Fund | 37,546,916 | |||||||||
| Australia Prime Office Real Estate Investment Trust | |||||||||||
5,814,100 | IAG | 28,859,446 | |||||||||
General Insurance Provider | |||||||||||
2,800,000 | Domino's Pizza Enterprises | 28,627,809 | |||||||||
| Domino's Pizza Operator in Australia/New Zealand & France/Benelux | |||||||||||
8,000,000 | SAI Global | 26,501,140 | |||||||||
| Publishing, Certification & Compliance Services | |||||||||||
6,440,000 | Regis Resources (c) | 17,047,565 | |||||||||
Gold Mining in Australia | |||||||||||
928,701 | Austbrokers | 9,213,620 | |||||||||
| Local Australian Small Business Insurance Broker | |||||||||||
188,473,478 | |||||||||||
| > Israel 0.7% | |||||||||||
3,145,527 | Israel Chemicals | 30,890,441 | |||||||||
| Producer of Potash, Phosphates, Bromine & Specialty Chemicals | |||||||||||
791,000 | Caesarstone (c) | 21,538,930 | |||||||||
Quartz Countertops | |||||||||||
52,429,371 | |||||||||||
Other Countries: Total | 1,034,800,194 | ||||||||||
Latin America 5.5% | |||||||||||
| > Brazil 2.3% | |||||||||||
3,350,000 | Localiza Rent A Car | 47,367,065 | |||||||||
Car Rental | |||||||||||
55,632,340 | Beadell Resources (b)(c) | 25,954,829 | |||||||||
Gold Mining in Brazil | |||||||||||
1,800,000 | Arcos Dorados (a) | 21,024,000 | |||||||||
| McDonald's Master Franchise for Latin America | |||||||||||
1,400,000 | Multiplus | 20,686,132 | |||||||||
Loyalty Program Operator in Brazil | |||||||||||
5,000,000 | Odontoprev | 20,592,915 | |||||||||
Dental Insurance | |||||||||||
1,000,000 | Linx | 16,734,264 | |||||||||
Retail Management Software in Brazil | |||||||||||
1,206,000 | Mills Estruturas e Servicos de Engenharia | 16,344,114 | |||||||||
Civil Engineering & Construction | |||||||||||
168,703,319 | |||||||||||
| > Mexico 1.8% | |||||||||||
17,626,000 | Genomma Lab Internacional (c) | 34,810,039 | |||||||||
| Develops, Markets & Distributes Consumer Products | |||||||||||
300,000 | Grupo Aeroportuario del Sureste - ADR | 33,372,000 | |||||||||
Mexican Airport Operator | |||||||||||
6,090,000 | Gruma (c) | 27,682,993 | |||||||||
Tortilla Producer & Distributor | |||||||||||
See accompanying notes to financial statements.
51
Columbia Acorn International
Statement of Investments (Unaudited), continued
Number of Shares | Value | ||||||||||
| > Mexico—continued | |||||||||||
8,361,000 | Bolsa Mexicana de Valores | $ | 20,790,466 | ||||||||
Mexico's Stock Exchange | |||||||||||
6,569,005 | Qualitas | 15,715,990 | |||||||||
| Leading Auto Insurer in Mexico & Central America | |||||||||||
132,371,488 | |||||||||||
| > Chile 0.6% | |||||||||||
671,499 | Sociedad Quimica y Minera de Chile - ADR | 27,128,559 | |||||||||
| Producer of Specialty Fertilizers, Lithium & Iodine | |||||||||||
23,280,000 | Empresas Hites (b) | 18,287,665 | |||||||||
| Mass Retailer for the Lower Income Strata | |||||||||||
45,416,224 | |||||||||||
| > Guatemala 0.3% | |||||||||||
1,626,600 | Tahoe Resources (c) | 23,060,384 | |||||||||
Silver Project in Guatemala | |||||||||||
| > Colombia 0.3% | |||||||||||
14,729,000 | Isagen (c) | 19,736,416 | |||||||||
Leading Colombian Electricity Provider | |||||||||||
| > Uruguay 0.2% | |||||||||||
1,306,818 | Union Agriculture Group (c)(f)(g) | 13,525,567 | |||||||||
Farmland Operator in Uruguay | |||||||||||
| > Argentina —% | |||||||||||
3,769,500 | Madalena Ventures (c) | 1,003,575 | |||||||||
| Oil & Gas Exploration in Argentina | |||||||||||
Latin America: Total | 403,816,973 | ||||||||||
| Total Equities: 97.9% (Cost: $5,652,916,839) | 7,172,720,019 | (h) | |||||||||
Number of Shares | Value | ||||||||||
Short-Term Investments 1.7% | |||||||||||
87,517,862 | JPMorgan U.S. Government Money Market Fund, Agency Shares (7 day yield of 0.01%) | $ | 87,517,862 | ||||||||
40,633,751 | JPMorgan U.S. Government Money Market Fund, Capital Shares (7 day yield of 0.01%) | 40,633,751 | |||||||||
| Total Short-Term Investments: 1.7% (Cost: $128,151,613) | 128,151,613 | ||||||||||
Securities Lending Collateral 1.7% | |||||||||||
128,096,564 | Dreyfus Government Cash Management Fund, Institutional Shares (7 day yield of 0.01%) (i) | 128,096,564 | |||||||||
| Total Securities Lending Collateral: (Cost: $128,096,564) | 128,096,564 | ||||||||||
| Total Investments: 101.3% (Cost: $5,909,165,016)(j) | 7,428,968,196 | ||||||||||
| Obligation to Return Collateral for Securities Loaned: (1.7)% | (128,096,564 | ) | |||||||||
Cash and Other Assets Less Liabilities: 0.4% | 29,519,826 | ||||||||||
Net Assets: 100.0% | $ | 7,330,391,458 | |||||||||
ADR - American Depositary Receipts
GDR - Global Depositary Receipts
REIT - Real Estate Investment Trust
> Notes to Statement of Investments
(a) All or a portion of this security was on loan at June 30, 2013. The total market value of securities on loan at June 30, 2013 was $122,061,343.
(b) An affiliated person of the Fund may include any company in which the Fund owns five percent or more of its outstanding voting shares. Holdings and transactions in these affiliated companies during the period ended June 30, 2013, are as follows:
Security | Balance of Shares Held 12/31/12 | Purchases/ Additions | Sales/ Reductions | Balance of Shares Held 6/30/13 | Value | Dividend | |||||||||||||||||||||
Wacom (1)(2) | 21,500 | 5,337,600 | 208,900 | 5,150,200 | $ | 56,930,402 | $ | 881,792 | |||||||||||||||||||
UNIT4 | 1,574,145 | - | 59,600 | 1,514,545 | 49,086,350 | 881,545 | |||||||||||||||||||||
Sweco | 4,150,024 | - | - | 4,150,024 | 47,186,789 | 2,061,879 | |||||||||||||||||||||
Nakanishi | 295,762 | 25,400 | 6,000 | 315,162 | 40,172,035 | (40 | ) | ||||||||||||||||||||
Beadell Resources | 17,793,303 | 37,839,037 | - | 55,632,340 | 25,954,829 | - | |||||||||||||||||||||
Archipelago Resources | 31,764,600 | - | - | 31,764,600 | 22,827,587 | - | |||||||||||||||||||||
Icom | 732,108 | 102,892 | - | 835,000 | 20,254,170 | 148,428 | |||||||||||||||||||||
Empresas Hites | - | 23,280,000 | - | 23,280,000 | 18,287,665 | 264,187 | |||||||||||||||||||||
Southern Arc Minerals | 6,217,500 | - | 498,000 | 5,719,500 | 652,600 | - | |||||||||||||||||||||
Total of Affiliated Transactions | 62,548,942 | 66,584,929 | 772,500 | 128,361,371 | $ | 281,352,427 | $ | 4,237,791 | |||||||||||||||||||
(1) At June 30, 2013, the Fund owned less than five percent of the company's outstanding voting shares.
(2) Includes the effects of a stock split.
The aggregate cost and value of these companies at June 30, 2013, were $208,516,589 and $224,422,025, respectively. Investments in affiliated companies represented 3.06% of the Fund's total net assets at June 30, 2013.
See accompanying notes to financial statements.
52
> Notes to Statement of Investments
(c) Non-income producing security.
(d) Security is traded on a U.S. exchange.
(e) The common stock equity holdings of Marel are stated separately on the Statement of Investments due to the application of the onshore or offshore foreign currency exchange rate. The appropriate exchange rate is applied to each purchased security lot based on the applicable registration obtained from Marel's regulatory governing body, the Icelandic Central Bank.
(f) Denotes a restricted security, which is subject to restrictions on resale under federal securities laws. These securities are valued at fair value determined in good faith under consistently applied procedures established by the Board of Trustees. At June 30, 2013, the market value of these securities amounted to $21,528,077, which represented 0.29% of total net assets. Additional information on these securities is as follows:
Security | Acquisition Dates | Shares | Cost | Value | |||||||||||||||
Union Agriculture Group | 12/8/10-6/27/12 | 1,306,818 | $ | 15,000,000 | $ | 13,525,567 | |||||||||||||
DeeThree Exploration | 9/7/10 | 1,130,000 | 2,950,812 | 8,002,510 | |||||||||||||||
$ | 17,950,812 | $ | 21,528,077 | ||||||||||||||||
(g) Illiquid security.
(h) On June 30, 2013, the Fund's total investments were denominated in currencies as follows:
Currency | Value | Percentage of Net Assets | |||||||||
Japanese Yen | $ | 1,544,466,190 | 21.1 | ||||||||
Euro | 909,290,890 | 12.4 | |||||||||
British Pound | 675,430,002 | 9.2 | |||||||||
United States Dollar | 554,951,704 | 7.6 | |||||||||
Taiwan Dollar | 525,966,559 | 7.2 | |||||||||
Hong Kong Dollar | 379,278,007 | 5.2 | |||||||||
| Other currencies less than 5% of total net assets | 2,583,336,667 | 35.2 | |||||||||
Total Equities | $ | 7,172,720,019 | 97.9 | ||||||||
(i) Investment made with cash collateral received from securities lending activity.
(j) At June 30, 2013, for federal income tax purposes, the cost of investments was $5,909,165,016 and net unrealized appreciation was $1,519,803,180 consisting of gross unrealized appreciation of $1,897,242,868 and gross unrealized depreciation of $377,439,688.
Fair Value Measurements
Various inputs are used in determining the value of the Fund's investments, following the input prioritization hierarchy established by accounting principles generally accepted in the United States of America (GAAP). These inputs are summarized in the three broad levels listed below:
• Level 1 – quoted prices in active markets for identical securities
• Level 2 – prices determined using other significant observable inputs (including quoted prices for similar securities, interest rates, prepayment speeds, credit risk and others)
• Level 3 – prices determined using significant unobservable inputs where quoted prices or observable inputs are unavailable or less reliable (including management's own assumptions about the factors market participants would use in pricing an investment)
The inputs or methodology used for valuing securities are not necessarily an indication of the risk associated with investing in those securities.
Examples of the types of securities in which the Fund would typically invest and how they are classified within this hierarchy are as follows. Typical Level 1 securities include exchange traded domestic equities, mutual funds whose NAVs are published each day and exchange traded foreign equities that are not statistically fair valued. Typical Level 2 securities include exchange traded foreign equities that are statistically fair valued, forward foreign currency exchange contracts and short-term investments valued at amortized cost. Additionally, securities fair valued by the Valuation Committee (the Committee) of the Fund's Board of Trustees (the Board) that rely on significant observable inputs are also included in Level 2. Typical Level 3 securities include any security fair valued by the Committee that relies on significant unobservable inputs.
Under the direction of the Board, the Committee is responsible for carrying out the valuation procedures approved by the Board.
The Committee meets as necessary, and no less frequently than quarterly, to determine fair values for securities for which market quotations are not readily available or for which the investment manager believes that available market quotations are unreliable, to review the appropriateness of the Trust's Portfolio Pricing Policy and the pricing procedures of the investment manager (the Policies), and to review the continuing appropriateness of the current value of any security subject to the Policies. The Policies address, among other things: circumstances under which market quotations will be deemed readily available; selection of third party pricing vendors; appropriate pricing methodologies; events that require fair valuation and fair value techniques; and circumstances under which securities will be deemed to pose a potential for stale pricing, including when securities are illiquid, restricted, or in default. The Committee may also meet to discuss additional valuation matters, which may include review of back-testing results, review of time-sensitive information or approval of other valuation related actions, and to review the appropriateness of the Policies.
See accompanying notes to financial statements.
53
Columbia Acorn International
Statement of Investments (Unaudited), continued
> Notes to Statement of Investments
For investments categorized as Level 3, the significant unobservable inputs used in the fair value measurement of the Funds' securities may include: (i) data specific to the issuer or comparable issuers, (ii) general market or specific sector news and (iii) quoted prices and specific or similar security transactions. The Committee considers this data and any changes from prior periods in order to assess the reasonableness of observable and unobservable inputs, any assumptions or internal models used to value those securities and changes in fair value. Significant changes in any of these factors could result in lower or higher fair value measurements. Various factors impact the frequency of monitoring (which may occur as often as daily), however the Committee may determine that changes to inputs, assumptions and models are not required with the same frequency.
The following table summarizes the inputs used, as of June 30, 2013, in valuing the Fund's assets:
Investment Type | Quoted Prices (Level 1) | Other Significant Observable Inputs (Level 2) | Significant Unobservable Inputs (Level 3) | Total | |||||||||||||||
Equities | |||||||||||||||||||
Asia | $ | 135,573,479 | $ | 3,328,645,938 | $ | - | $ | 3,464,219,417 | |||||||||||
Europe | 63,271,496 | 2,206,611,939 | - | 2,269,883,435 | |||||||||||||||
Other Countries | 502,460,742 | 532,339,452 | - | 1,034,800,194 | |||||||||||||||
Latin America | 364,336,577 | 25,954,829 | 13,525,567 | 403,816,973 | |||||||||||||||
Total Equities | 1,065,642,294 | 6,093,552,158 | 13,525,567 | 7,172,720,019 | |||||||||||||||
Total Short-Term Investments | 128,151,613 | - | - | 128,151,613 | |||||||||||||||
Total Securities Lending Collateral | 128,096,564 | - | - | 128,096,564 | |||||||||||||||
Total Investments | $ | 1,321,890,471 | $ | 6,093,552,158 | $ | 13,525,567 | $ | 7,428,968,196 | |||||||||||
The Fund's assets assigned to the Level 2 input category are generally valued using a market approach, in which a security's value is determined through its correlation to prices and information from observable market transactions for similar or identical assets. Foreign equities are generally valued at the last sale price on the foreign exchange or market on which they trade. The Fund may use a statistical fair valuation model, in accordance with the policy adopted by the Board, provided by an independent third party to value securities principally traded in foreign markets in order to adjust for possible stale pricing that may occur between the close of the foreign exchanges and the time for valuation. These models take into account available market data including intraday index, ADR, and ETF movements. Securities acquired via private placement that have a holding period or an extended settlement period are valued at a discount to the same shares that are trading freely on the market. These discounts are determined by the investment manager's experience with similar securities or situations. Factors may include, but are not limited to, trade volume, shares outstanding and stock price.
There were no transfers of financial assets between levels 1 and 2 during the period.
The Fund does not hold any significant investments categorized as Level 3.
Certain common stocks classified as Level 3 are valued at fair value, using a market approach, as determined in good faith under consistently applied procedures established by and under the general supervision of the Board. To determine fair value for these securities, for which no market exists, the Committee utilizes the valuation technique it deems most appropriate in the circumstances, using some unobservable inputs, which may include, but are not limited to, trades of similar securities, estimated earnings of the company, market multiples derived from a set of comparable companies, and the position of the security within the company's capital structure. Significant increases or decreases to any of these inputs could result in a significantly lower or higher fair value measurement.
See accompanying notes to financial statements.
54
Columbia Acorn International
Portfolio Diversification (Unaudited)
At June 30, 2013, the Fund's portfolio investments as a percentage of net assets were diversified as follows:
Value | Percentage of Net Assets | ||||||||||
| > Industrial Goods & Services | |||||||||||
| Industrial Materials & Specialty Chemicals | $ | 543,047,465 | 7.4 | ||||||||
Machinery | 426,688,544 | 5.8 | |||||||||
Other Industrial Services | 426,354,591 | 5.8 | |||||||||
Electrical Components | 192,829,293 | 2.6 | |||||||||
Conglomerates | 111,078,725 | 1.5 | |||||||||
Construction | 110,777,772 | 1.5 | |||||||||
Outsourcing Services | 50,989,842 | 0.7 | |||||||||
Industrial Distribution | 42,491,287 | 0.6 | |||||||||
1,904,257,519 | 25.9 | ||||||||||
| > Consumer Goods & Services | |||||||||||
Retail | 541,920,160 | 7.4 | |||||||||
Food & Beverage | 287,232,306 | 3.9 | |||||||||
Casinos & Gaming | 274,904,214 | 3.8 | |||||||||
Other Durable Goods | 174,247,448 | 2.4 | |||||||||
Nondurables | 172,953,742 | 2.4 | |||||||||
Restaurants | 109,440,806 | 1.5 | |||||||||
Other Consumer Services | 98,641,186 | 1.3 | |||||||||
Consumer Goods Distribution | 79,545,837 | 1.1 | |||||||||
Travel | 47,367,065 | 0.6 | |||||||||
Apparel | 36,961,911 | 0.5 | |||||||||
Educational Services | 28,500,777 | 0.4 | |||||||||
Furniture & Textiles | 21,538,930 | 0.3 | |||||||||
1,873,254,382 | 25.6 | ||||||||||
| > Information | |||||||||||
| Computer Hardware & Related Equipment | 247,563,411 | 3.4 | |||||||||
Mobile Communications | 244,858,814 | 3.3 | |||||||||
Business Software | 218,352,454 | 3.0 | |||||||||
Internet Related | 131,951,908 | 1.8 | |||||||||
Computer Services | 112,570,127 | 1.5 | |||||||||
| Semiconductors & Related Equipment | 85,118,777 | 1.2 | |||||||||
Financial Processors | 83,045,781 | 1.1 | |||||||||
Instrumentation | 47,296,064 | 0.6 | |||||||||
Telephone & Data Services | 21,632,920 | 0.3 | |||||||||
TV Broadcasting | 11,965,120 | 0.2 | |||||||||
Satellite Broadcasting & Services | 10,476,701 | 0.1 | |||||||||
Electronics Distribution | 5,421,852 | 0.1 | |||||||||
Advertising | 3,982,843 | 0.1 | |||||||||
1,224,236,772 | 16.7 | ||||||||||
Value | Percentage of Net Assets | ||||||||||
| > Other Industries | |||||||||||
Real Estate | $ | 491,579,122 | 6.7 | ||||||||
Transportation | 143,962,449 | 2.0 | |||||||||
Regulated Utilities | 59,529,453 | 0.8 | |||||||||
695,071,024 | 9.5 | ||||||||||
| > Finance | |||||||||||
Insurance | 239,725,031 | 3.2 | |||||||||
Banks | 180,481,437 | 2.5 | |||||||||
Brokerage & Money Management | 167,129,663 | 2.3 | |||||||||
Finance Companies | 78,545,495 | 1.1 | |||||||||
Specialized Finance | 20,790,466 | 0.3 | |||||||||
686,672,092 | 9.4 | ||||||||||
| > Energy & Minerals | |||||||||||
Oil Services | 256,025,772 | 3.5 | |||||||||
Mining | 164,862,226 | 2.2 | |||||||||
Oil & Gas Producers | 41,872,995 | 0.6 | |||||||||
Agricultural Commodities | 27,239,482 | 0.4 | |||||||||
| Oil Refining, Marketing & Distribution | 15,707,549 | 0.2 | |||||||||
505,708,024 | 6.9 | ||||||||||
| > Health Care | |||||||||||
Medical Supplies | 106,841,462 | 1.5 | |||||||||
Medical Equipment & Devices | 81,227,464 | 1.1 | |||||||||
Pharmaceuticals | 67,709,221 | 0.9 | |||||||||
Health Care Services | 27,742,059 | 0.4 | |||||||||
283,520,206 | 3.9 | ||||||||||
Total Equities: | 7,172,720,019 | 97.9 | |||||||||
Short-Term Investments: | 128,151,613 | 1.7 | |||||||||
Securities Lending Collateral: | 128,096,564 | 1.7 | |||||||||
Total Investments: | 7,428,968,196 | 101.3 | |||||||||
| Obligation to Return Collateral for Securities Loaned: | (128,096,564 | ) | (1.7 | ) | |||||||
| Cash and Other Assets Less Liabilities: | 29,519,826 | 0.4 | |||||||||
Net Assets: | $ | 7,330,391,458 | 100.0 | ||||||||
See accompanying notes to financial statements.
55
Columbia Acorn USA
Major Portfolio Changes in the Second Quarter (Unaudited)
Number of Shares | |||||||||||
3/31/13 | 6/30/13 | ||||||||||
Purchases | |||||||||||
Information | |||||||||||
CalAmp | 0 | 173,015 | |||||||||
ChannelAdvisor | 0 | 44,119 | |||||||||
DemandWare | 0 | 72,000 | |||||||||
E2Open | 0 | 125,685 | |||||||||
Envestnet | 28,561 | 82,000 | |||||||||
RealPage | 158,542 | 330,000 | |||||||||
| RPX | 155,948 | 228,294 | |||||||||
Webgroup.com | 0 | 81,192 | |||||||||
Industrial Goods & Services | |||||||||||
KAR Auction Services | 0 | 151,000 | |||||||||
Kennametal | 224,000 | 264,000 | |||||||||
Middleby | 26,000 | 46,000 | |||||||||
MRC Global | 0 | 217,000 | |||||||||
Polyone | 164,000 | 290,000 | |||||||||
TrueBlue | 0 | 151,000 | |||||||||
Consumer Goods & Services | |||||||||||
B&G Foods | 0 | 70,764 | |||||||||
Blackhawk Network | 0 | 252,000 | |||||||||
Caesarstone (Israel) | 243,814 | 333,814 | |||||||||
Fiesta Restaurant Group | 0 | 92,000 | |||||||||
Select Comfort | 0 | 145,000 | |||||||||
Finance | |||||||||||
CAI International | 569,208 | 673,208 | |||||||||
H & E Equipment Services | 189,000 | 264,072 | |||||||||
Health Care | |||||||||||
Allscripts Healthcare Solutions | 0 | 468,000 | |||||||||
Cepheid | 574,600 | 612,600 | |||||||||
Coronado Biosciences | 67,263 | 170,000 | |||||||||
HealthSouth | 0 | 114,000 | |||||||||
Synageva Biopharma | 210,553 | 258,773 | |||||||||
Other Industries | |||||||||||
American Residential Properties | 0 | 90,000 | |||||||||
Coresite Realty | 42,628 | 223,000 | |||||||||
World Fuel Services | 0 | 79,000 | |||||||||
Energy & Minerals | |||||||||||
Gulfmark Offshore | 0 | 84,000 | |||||||||
Hornbeck Offshore | 74,000 | 182,000 | |||||||||
SM Energy | 90,000 | 116,000 | |||||||||
Number of Shares | |||||||||||
3/31/13 | 6/30/13 | ||||||||||
Sales | |||||||||||
Information | |||||||||||
Nice Systems - ADR (Israel) | 146,000 | 0 | |||||||||
Microsemi | 628,000 | 0 | |||||||||
IPG Photonics | 504,000 | 454,000 | |||||||||
ON Semiconductor | 874,000 | 260,000 | |||||||||
TriQuint Semiconductor | 978,000 | 0 | |||||||||
Industrial Goods & Services | |||||||||||
Ametek | 984,000 | 871,000 | |||||||||
Fortune Brands Home & Security | 164,000 | 86,000 | |||||||||
Nordson | 718,200 | 675,200 | |||||||||
Polypore International | 207,000 | 130,000 | |||||||||
Consumer Goods & Services | |||||||||||
Abercrombie & Fitch | 362,500 | 179,500 | |||||||||
Helen of Troy | 238,000 | 183,843 | |||||||||
lululemon athletica | 198,000 | 113,000 | |||||||||
Pinnacle Entertainment | 635,000 | 321,913 | |||||||||
Ryman Hospitality Properties | 907,722 | 569,722 | |||||||||
Finance | |||||||||||
Eagle Bancorp | 191,000 | 1 | |||||||||
TriCo Bancshares | 82,000 | 67,569 | |||||||||
World Acceptance | 287,000 | 234,000 | |||||||||
Heath Care | |||||||||||
Health Management Associates | 604,900 | 0 | |||||||||
BioMarin Pharmaceutical | 228,000 | 193,000 | |||||||||
Chelsea Therapeutics International | 419,511 | 0 | |||||||||
Sirona Dental Systems | 224,012 | 135,000 | |||||||||
Other Industries | |||||||||||
Biomed Realty Trust | 496,200 | 352,200 | |||||||||
Dupont Fabros Technology | 356,738 | 0 | |||||||||
Energy & Minerals | |||||||||||
Atwood Oceanics | 660,000 | 584,000 | |||||||||
See accompanying notes to financial statements.
56
Columbia Acorn USA
Statement of Investments (Unaudited), June 30, 2013
Number of Shares | Value | ||||||||||
Equities: 98.1% | |||||||||||
Information 27.8% | |||||||||||
| > Business Software 8.3% | |||||||||||
745,000 | Informatica (a) | $ | 26,060,100 | ||||||||
Enterprise Data Integration Software | |||||||||||
299,000 | Ansys (a) | 21,856,900 | |||||||||
| Simulation Software for Engineers & Designers | |||||||||||
290,000 | SPS Commerce (a) | 15,950,000 | |||||||||
| Supply Chain Management Software Delivered Via the Web | |||||||||||
170,000 | NetSuite (a) | 15,595,800 | |||||||||
| End-to-end IT Systems Solution Delivered Over the Web | |||||||||||
340,000 | Micros Systems (a) | 14,671,000 | |||||||||
| Information Systems for Hotels, Restaurants & Retailers | |||||||||||
178,000 | Concur Technologies (a)(b) | 14,485,640 | |||||||||
| Web Enabled Cost & Expense Management Software | |||||||||||
330,000 | RealPage (a)(b) | 6,052,200 | |||||||||
| Software for Managing Rental Properties Delivered Via the Web | |||||||||||
310,000 | Exa (a) | 3,193,000 | |||||||||
Simulation Software | |||||||||||
72,000 | DemandWare (a)(b) | 3,053,520 | |||||||||
| eCommerce Website Solution for Retailers & Apparel Manufacturers | |||||||||||
125,685 | E2Open (a)(b) | 2,199,487 | |||||||||
| Supply Chain Management Software & Supplier/Partner Network | |||||||||||
81,192 | Webgroup.com (a) | 2,078,515 | |||||||||
| Website Creation & Management for Small Businesses | |||||||||||
82,000 | Envestnet (a) | 2,017,200 | |||||||||
| Technology Platform for Investment Advisors | |||||||||||
160,200 | InContact (a) | 1,316,844 | |||||||||
| Call Center Systems Delivered Via the Web & Telecommunications Services | |||||||||||
44,119 | ChannelAdvisor (a) | 693,992 | |||||||||
eCommerce Software | |||||||||||
364,000 | Velti (a)(b) | 509,600 | |||||||||
Mobile Marketing Software Platform | |||||||||||
1,090 | SciQuest (a) | 27,305 | |||||||||
| Procurement Management Software & Vendor Network | |||||||||||
129,761,103 | |||||||||||
| > Instrumentation 4.3% | |||||||||||
164,000 | Mettler-Toledo International (a) | 32,996,800 | |||||||||
Laboratory Equipment | |||||||||||
454,000 | IPG Photonics (b) | 27,571,420 | |||||||||
Fiber Lasers | |||||||||||
274,000 | Trimble Navigation (a) | 7,126,740 | |||||||||
GPS-based Instruments | |||||||||||
67,694,960 | |||||||||||
| > Telephone & Data Services 2.5% | |||||||||||
1,325,000 | tw telecom (a) | 37,285,500 | |||||||||
Fiber Optic Telephone/Data Services | |||||||||||
364,000 | Boingo Wireless (a) | 2,260,440 | |||||||||
Wholesale & Retail WiFi Networks | |||||||||||
39,545,940 | |||||||||||
Number of Shares | Value | ||||||||||
| > Semiconductors & Related Equipment 2.2% | |||||||||||
238,000 | Ultratech (a) | $ | 8,739,360 | ||||||||
Semiconductor Equipment | |||||||||||
1,189,000 | Atmel (a) | 8,739,150 | |||||||||
| Microcontrollers, Radio Frequency & Memory Semiconductors | |||||||||||
333,000 | Monolithic Power Systems | 8,028,630 | |||||||||
| High Performance Analog & Mixed Signal Integrated Circuits | |||||||||||
118,000 | Semtech (a) | 4,133,540 | |||||||||
Analog Semiconductors | |||||||||||
45,000 | Hittite Microwave (a) | 2,610,000 | |||||||||
| Radio Frequency, Microwave & Millimeterwave Semiconductors | |||||||||||
260,000 | ON Semiconductor (a) | 2,100,800 | |||||||||
| Mixed Signal & Power Management Semiconductors | |||||||||||
34,351,480 | |||||||||||
| > Gaming Equipment & Services 2.2% | |||||||||||
600,000 | Bally Technologies (a)(b) | 33,852,000 | |||||||||
Slot Machines & Software | |||||||||||
| > Computer Services 2.0% | |||||||||||
506,000 | ExlService Holdings (a) | 14,957,360 | |||||||||
Business Process Outsourcing | |||||||||||
327,000 | WNS - ADR (India) (a) | 5,457,630 | |||||||||
| Offshore Business Process Outsourcing Services | |||||||||||
175,000 | Virtusa (a) | 3,878,000 | |||||||||
Offshore IT Outsourcing | |||||||||||
706,766 | Hackett Group | 3,668,116 | |||||||||
| IT Integration & Best Practice Research | |||||||||||
582,000 | RCM Technologies | 3,160,260 | |||||||||
Technology & Engineering Services | |||||||||||
31,121,366 | |||||||||||
| > Telecommunications Equipment 2.0% | |||||||||||
740,000 | Ixia (a) | 13,616,000 | |||||||||
Telecom Network Test Equipment | |||||||||||
666,000 | Finisar (a) | 11,288,700 | |||||||||
Optical Subsystems & Components | |||||||||||
294,278 | Infinera (a) | 3,139,946 | |||||||||
Optical Networking Equipment | |||||||||||
173,015 | CalAmp (a) | 2,526,019 | |||||||||
Machine-to-machine Communications | |||||||||||
30,570,665 | |||||||||||
| > Computer Hardware & Related Equipment 1.7% | |||||||||||
1,242,000 | II-VI (a) | 20,194,920 | |||||||||
Laser Optics & Specialty Materials | |||||||||||
67,000 | Rogers (a) | 3,170,440 | |||||||||
| Printed Circuit Materials & High-performance Foams | |||||||||||
88,000 | Netgear (a) | 2,687,520 | |||||||||
| Networking Products for Small Business & Home | |||||||||||
26,052,880 | |||||||||||
| > Mobile Communications 1.3% | |||||||||||
273,000 | SBA Communications (a) | 20,234,760 | |||||||||
Communications Towers | |||||||||||
See accompanying notes to financial statements.
57
Columbia Acorn USA
Statement of Investments (Unaudited), continued
Number of Shares | Value | ||||||||||
| > Financial Processors 0.7% | |||||||||||
139,000 | Global Payments | $ | 6,438,480 | ||||||||
Credit Card Processor | |||||||||||
153,000 | Liquidity Services (a)(b) | 5,304,510 | |||||||||
| E-Auctions for Surplus & Salvage Goods | |||||||||||
11,742,990 | |||||||||||
| > Contract Manufacturing 0.4% | |||||||||||
215,000 | Plexus (a) | 6,426,350 | |||||||||
Electronic Manufacturing Services | |||||||||||
| > Business Information & Marketing Services 0.2% | |||||||||||
228,294 | RPX (a) | 3,835,339 | |||||||||
| Patent Aggregation & Defensive Patent Consulting | |||||||||||
Information: Total | 435,189,833 | ||||||||||
Industrial Goods & Services 19.9% | |||||||||||
| > Machinery 14.6% | |||||||||||
675,200 | Nordson | 46,798,112 | |||||||||
| Dispensing Systems for Adhesives & Coatings | |||||||||||
871,000 | Ametek | 36,843,300 | |||||||||
Aerospace/Industrial Instruments | |||||||||||
855,000 | Donaldson | 30,489,300 | |||||||||
Industrial Air Filtration | |||||||||||
760,000 | ESCO Technologies | 24,608,800 | |||||||||
Automatic Electric Meter Readers | |||||||||||
436,000 | Moog (a) | 22,467,080 | |||||||||
| Motion Control Products for Aerospace, Defense & Industrial Markets | |||||||||||
606,000 | HEICO | 22,367,460 | |||||||||
| FAA-approved Aircraft Replacement Parts | |||||||||||
237,000 | Toro | 10,762,170 | |||||||||
Turf Maintenance Equipment | |||||||||||
264,000 | Kennametal | 10,251,120 | |||||||||
Consumable Cutting Tools | |||||||||||
46,000 | Middleby (a) | 7,824,140 | |||||||||
Manufacturer of Cooking Equipment | |||||||||||
168,000 | Generac | 6,217,680 | |||||||||
Standby Power Generators | |||||||||||
130,000 | Polypore International (a)(b) | 5,239,000 | |||||||||
Battery Separators & Filtration Media | |||||||||||
97,000 | Dorman Products | 4,426,110 | |||||||||
Aftermarket Auto Parts Distributor | |||||||||||
228,294,272 | |||||||||||
| > Industrial Materials & Specialty Chemicals 1.8% | |||||||||||
539,000 | Drew Industries | 21,193,480 | |||||||||
| RV & Manufactured Home Components | |||||||||||
290,000 | Polyone | 7,186,200 | |||||||||
Intermediate Stage Chemicals Producer | |||||||||||
28,379,680 | |||||||||||
| > Electrical Components 1.4% | |||||||||||
190,000 | Acuity Brands | 14,348,800 | |||||||||
Commercial Lighting Fixtures | |||||||||||
Number of Shares | Value | ||||||||||
386,000 | Thermon (a) | $ | 7,874,400 | ||||||||
Global Engineered Thermal Solutions | |||||||||||
22,223,200 | |||||||||||
| > Other Industrial Services 1.1% | |||||||||||
188,000 | Forward Air | 7,196,640 | |||||||||
| Freight Transportation Between Airports | |||||||||||
496,643 | Acorn Energy | 4,191,667 | |||||||||
| Frac Well Exploration/Monitoring Device, Sonar Security & Electric Grid Monitoring | |||||||||||
151,000 | KAR Auction Services | 3,453,370 | |||||||||
Auto Auctions | |||||||||||
151,000 | TrueBlue (a) | 3,178,550 | |||||||||
Temporary Industrial Labor | |||||||||||
18,020,227 | |||||||||||
| > Industrial Distribution 0.6% | |||||||||||
217,000 | MRC Global (a) | 5,993,540 | |||||||||
Industrial Distributor | |||||||||||
41,000 | WESCO International (a) | 2,786,360 | |||||||||
Industrial Distributor | |||||||||||
8,779,900 | |||||||||||
| > Waste Management 0.2% | |||||||||||
82,000 | Waste Connections | 3,373,480 | |||||||||
Solid Waste Management | |||||||||||
| > Construction 0.2% | |||||||||||
86,000 | Fortune Brands Home & Security | 3,331,640 | |||||||||
| Home Building Supplies & Small Locks | |||||||||||
Industrial Goods & Services: Total | 312,402,399 | ||||||||||
Consumer Goods & Services 15.8% | |||||||||||
| > Travel 5.4% | |||||||||||
1,183,950 | Avis Budget Group (a) | 34,038,563 | |||||||||
Second Largest Car Rental Company | |||||||||||
569,722 | Ryman Hospitality Properties (b) | 22,224,855 | |||||||||
Convention Hotels | |||||||||||
614,000 | Hertz (a) | 15,227,200 | |||||||||
Largest U.S. Rental Car Operator | |||||||||||
173,000 | Choice Hotels | 6,866,370 | |||||||||
Franchisor of Budget Hotel Brands | |||||||||||
135,000 | HomeAway (a) | 4,365,900 | |||||||||
Vacation Rental Online Marketplace | |||||||||||
29,000 | Vail Resorts | 1,784,080 | |||||||||
Ski Resort Operator & Developer | |||||||||||
84,506,968 | |||||||||||
| > Retail 3.7% | |||||||||||
805,000 | Pier 1 Imports | 18,909,450 | |||||||||
Home Furnishing Retailer | |||||||||||
224,000 | Shutterfly (a) | 12,496,960 | |||||||||
Internet Photo-centric Retailer | |||||||||||
179,500 | Abercrombie & Fitch | 8,122,375 | |||||||||
Teen Apparel Retailer | |||||||||||
113,000 | lululemon athletica (a)(b) | 7,403,760 | |||||||||
Premium Active Apparel Retailer | |||||||||||
113,000 | Casey's General Stores | 6,798,080 | |||||||||
Owner/Operator of Convenience Stores | |||||||||||
See accompanying notes to financial statements.
58
Number of Shares | Value | ||||||||||
| > Retail—continued | |||||||||||
351,000 | Saks (a) | $ | 4,787,640 | ||||||||
Luxury Department Store Retailer | |||||||||||
58,518,265 | |||||||||||
| > Furniture & Textiles 1.9% | |||||||||||
688,000 | Interface | 11,675,360 | |||||||||
Modular Carpet | |||||||||||
657,000 | Knoll | 9,335,970 | |||||||||
Office Furniture | |||||||||||
333,814 | Caesarstone (Israel) (a) | 9,089,755 | |||||||||
Quartz Countertops | |||||||||||
30,101,085 | |||||||||||
| > Consumer Goods Distribution 1.2% | |||||||||||
358,000 | Pool | 18,762,780 | |||||||||
| Swimming Pool Supplies & Equipment Distributor | |||||||||||
| > Other Consumer Services 1.1% | |||||||||||
233,000 | Lifetime Fitness (a) | 11,675,630 | |||||||||
Sport & Fitness Club Operator | |||||||||||
252,000 | Blackhawk Network (a) | 5,846,400 | |||||||||
| Third Party Distributer of Prepaid Content, Mostly Gift Cards | |||||||||||
17,522,030 | |||||||||||
| > Other Durable Goods 0.8% | |||||||||||
187,000 | Cavco Industries (a) | 9,434,150 | |||||||||
Manufactured Homes | |||||||||||
145,000 | Select Comfort (a) | 3,633,700 | |||||||||
Specialty Mattresses | |||||||||||
13,067,850 | |||||||||||
| > Nondurables 0.5% | |||||||||||
183,843 | Helen of Troy (a) | 7,054,056 | |||||||||
| Personal Care, Housewares, Healthcare & Home Environment Products | |||||||||||
| > Casinos & Gaming 0.4% | |||||||||||
321,913 | Pinnacle Entertainment (a) | 6,332,029 | |||||||||
Regional Casino Operator | |||||||||||
4,378 | Churchill Downs | 345,205 | |||||||||
| Owner/Operator of Horse Racing Tracks & Regional Casinos | |||||||||||
6,677,234 | |||||||||||
| > Food & Beverage 0.3% | |||||||||||
70,764 | B&G Foods | 2,409,514 | |||||||||
Acquiror of Small Food Brands | |||||||||||
136,000 | Boulder Brands (a) | 1,638,800 | |||||||||
Healthy Food Products | |||||||||||
4,048,314 | |||||||||||
| > Restaurants 0.2% | |||||||||||
92,000 | Fiesta Restaurant Group (a) | 3,163,880 | |||||||||
| Owns/Operates Two Restaurant Chains: Pollo Tropical & Taco Cabana | |||||||||||
| > Apparel 0.2% | |||||||||||
475,000 | Quiksilver (a) | 3,059,000 | |||||||||
| Action Sports Lifestyle Branded Apparel & Footwear | |||||||||||
Number of Shares | Value | ||||||||||
| > Educational Services 0.1% | |||||||||||
34,350 | ITT Educational Services (a)(b) | $ | 838,140 | ||||||||
Postsecondary Degree Services | |||||||||||
Consumer Goods & Services: Total | 247,319,602 | ||||||||||
Finance 13.9% | |||||||||||
| > Banks 7.3% | |||||||||||
801,000 | MB Financial | 21,466,800 | |||||||||
Chicago Bank | |||||||||||
993,000 | Associated Banc-Corp | 15,441,150 | |||||||||
Midwest Bank | |||||||||||
164,000 | SVB Financial Group (a) | 13,664,480 | |||||||||
Bank to Venture Capitalists | |||||||||||
173,000 | City National | 10,963,010 | |||||||||
Bank & Asset Manager | |||||||||||
392,597 | Lakeland Financial | 10,894,567 | |||||||||
Indiana Bank | |||||||||||
487,000 | TCF Financial | 6,905,660 | |||||||||
Great Lakes Bank | |||||||||||
228,000 | Hancock Holding | 6,855,960 | |||||||||
Gulf Coast Bank | |||||||||||
1,345,199 | First Busey | 6,053,400 | |||||||||
Illinois Bank | |||||||||||
738,000 | First Commonwealth | 5,439,060 | |||||||||
Western Pennsylvania Bank | |||||||||||
566,750 | Valley National Bancorp (b) | 5,367,122 | |||||||||
New Jersey/New York Bank | |||||||||||
695,000 | TrustCo Bank | 3,780,800 | |||||||||
New York State Bank | |||||||||||
171,826 | Sandy Spring Bancorp | 3,714,878 | |||||||||
Baltimore & Washington, D.C. Bank | |||||||||||
154,849 | Guaranty Bancorp | 1,757,536 | |||||||||
Colorado Bank | |||||||||||
89,700 | Hudson Valley | 1,523,106 | |||||||||
Metro New York City Bank | |||||||||||
67,569 | TriCo Bancshares | 1,441,247 | |||||||||
California Central Valley Bank | |||||||||||
1 | Eagle Bancorp (a) | 11 | |||||||||
Metro Washington D.C. Bank | |||||||||||
115,268,787 | |||||||||||
| > Finance Companies 4.4% | |||||||||||
234,000 | World Acceptance (a) | 20,343,960 | |||||||||
Personal Loans | |||||||||||
673,208 | CAI International (a) | 15,867,513 | |||||||||
International Container Leasing | |||||||||||
389,000 | Textainer Group Holdings (b) | 14,953,160 | |||||||||
Top International Container Leasor | |||||||||||
315,000 | McGrath Rentcorp | 10,760,400 | |||||||||
Temporary Space & IT Rentals | |||||||||||
264,072 | H & E Equipment Services | 5,563,997 | |||||||||
Heavy Equipment Leasing | |||||||||||
91,000 | Marlin Business Services | 2,072,980 | |||||||||
Small Equipment Leasing | |||||||||||
69,562,010 | |||||||||||
| > Savings & Loans 1.1% | |||||||||||
548,487 | ViewPoint Financial | 11,414,014 | |||||||||
Texas Thrift | |||||||||||
128,000 | Berkshire Hills Bancorp | 3,553,280 | |||||||||
Northeast Thrift | |||||||||||
See accompanying notes to financial statements.
59
Columbia Acorn USA
Statement of Investments (Unaudited), continued
Number of Shares | Value | ||||||||||
| > Savings & Loans—continued | |||||||||||
157,073 | Simplicity Bancorp | $ | 2,277,559 | ||||||||
Los Angeles Savings & Loan | |||||||||||
17,244,853 | |||||||||||
| > Insurance 0.6% | |||||||||||
35,000 | Enstar Group (a) | 4,654,300 | |||||||||
| Insurance/Reinsurance & Related Services | |||||||||||
45,000 | Allied World Holdings | 4,117,950 | |||||||||
| Commerical Lines Insurance/Reinsurance | |||||||||||
8,772,250 | |||||||||||
| > Brokerage & Money Management 0.5% | |||||||||||
139,000 | SEI Investments | 3,951,770 | |||||||||
| Mutual Fund Administration & Investment Management | |||||||||||
200,000 | Kennedy-Wilson Holdings | 3,328,000 | |||||||||
Global Distressed Real Estate | |||||||||||
7,279,770 | |||||||||||
Finance: Total | 218,127,670 | ||||||||||
Health Care 8.8% | |||||||||||
| > Biotechnology & Drug Delivery 5.4% | |||||||||||
645,000 | Seattle Genetics (a) | 20,291,700 | |||||||||
Antibody-based Therapies for Cancer | |||||||||||
729,000 | NPS Pharmaceuticals (a) | 11,007,900 | |||||||||
Orphan Drugs & Healthy Royalties | |||||||||||
258,773 | Synageva Biopharma (a) | 10,868,466 | |||||||||
Biotech Focused on Orphan Diseases | |||||||||||
193,000 | BioMarin Pharmaceutical (a) | 10,767,470 | |||||||||
Biotech Focused on Orphan Diseases | |||||||||||
91,000 | Onyx Pharmaceuticals (a) | 7,900,620 | |||||||||
| Commercial-stage Biotech Focused on Cancer | |||||||||||
186,000 | Sarepta Therapeutics (a)(b) | 7,077,300 | |||||||||
Biotech Focused on Rare Diseases | |||||||||||
388,000 | ARIAD Pharmaceuticals (a) | 6,786,120 | |||||||||
Biotech Focused on Cancer | |||||||||||
145,000 | Alnylam Pharmaceuticals (a) | 4,496,450 | |||||||||
| Biotech Developing Drugs for Rare Diseases | |||||||||||
364,000 | InterMune (a) | 3,501,680 | |||||||||
| Drugs for Pulmonary Fibrosis & Hepatitis C | |||||||||||
170,000 | Coronado Biosciences (a)(b) | 1,462,000 | |||||||||
Development-stage Biotech | |||||||||||
18,181 | Metabolex (a)(c)(d) | 1,273 | |||||||||
Diabetes Drug Development | |||||||||||
84,160,979 | |||||||||||
| > Medical Supplies 1.7% | |||||||||||
612,600 | Cepheid (a) | 21,085,692 | |||||||||
Molecular Diagnostics | |||||||||||
87,000 | Techne | 6,009,960 | |||||||||
| Cytokines, Antibodies & Other Reagents for Life Science | |||||||||||
27,095,652 | |||||||||||
Number of Shares | Value | ||||||||||
| > Health Care Services 0.6% | |||||||||||
468,000 | Allscripts Healthcare Solutions (a) | $ | 6,055,920 | ||||||||
Health Care IT | |||||||||||
114,000 | HealthSouth (a) | 3,283,200 | |||||||||
Inpatient Rehabalitation Facilities | |||||||||||
9,339,120 | |||||||||||
| > Medical Equipment & Devices 0.6% | |||||||||||
135,000 | Sirona Dental Systems (a) | 8,893,800 | |||||||||
Manufacturer of Dental Equipment | |||||||||||
| > Pharmaceuticals 0.5% | |||||||||||
584,000 | Akorn (a) | 7,895,680 | |||||||||
| Develops, Manufactures & Sells Specialty Generic Drugs | |||||||||||
121,180 | Alimera Sciences (a)(b) | 591,358 | |||||||||
| Ophthalmology-focused Pharmaceutical Company | |||||||||||
8,487,038 | |||||||||||
Health Care: Total | 137,976,589 | ||||||||||
Other Industries 6.9% | |||||||||||
| > Real Estate 5.8% | |||||||||||
832,000 | Extra Space Storage | 34,885,760 | |||||||||
Self Storage Facilities | |||||||||||
986,800 | EdR | 10,094,964 | |||||||||
Student Housing | |||||||||||
491,000 | Associated Estates Realty | 7,895,280 | |||||||||
Multi-family Properties | |||||||||||
1,255,000 | Kite Realty Group | 7,567,650 | |||||||||
Community Shopping Centers | |||||||||||
352,200 | Biomed Realty Trust | 7,125,006 | |||||||||
Life Science-focused Office Buildings | |||||||||||
223,000 | Coresite Realty | 7,093,630 | |||||||||
Data Centers | |||||||||||
871,000 | DCT Industrial Trust | 6,227,650 | |||||||||
Industrial Properties | |||||||||||
91,000 | Post Properties | 4,503,590 | |||||||||
Multi-family Properties | |||||||||||
182,000 | St. Joe (a) | 3,831,100 | |||||||||
Florida Panhandle Landowner | |||||||||||
90,000 | American Residential Properties (a)(b) | 1,548,000 | |||||||||
Single-family Rental Properties | |||||||||||
90,772,630 | |||||||||||
| > Transportation 1.1% | |||||||||||
468,091 | Rush Enterprises, Class A (a) | 11,585,252 | |||||||||
| 105,000 | Rush Enterprises, Class B (a) | 2,259,600 | |||||||||
Truck Sales & Service | |||||||||||
| 79,000 | World Fuel Services | 3,158,420 | |||||||||
Global Fuel Broker | |||||||||||
17,003,272 | |||||||||||
Other Industries: Total | 107,775,902 | ||||||||||
See accompanying notes to financial statements.
60
Number of Shares | Value | ||||||||||
Energy & Minerals 5.0% | |||||||||||
| > Oil Services 2.8% | |||||||||||
584,000 | Atwood Oceanics (a) | $ | 30,397,200 | ||||||||
Offshore Drilling Contractor | |||||||||||
182,000 | Hornbeck Offshore (a) | 9,737,000 | |||||||||
| Supply Vessel Operator in U.S. Gulf of Mexico | |||||||||||
84,000 | Gulfmark Offshore | 3,787,560 | |||||||||
Operator of Offshore Supply Vessels | |||||||||||
43,921,760 | |||||||||||
| > Oil & Gas Producers 1.5% | |||||||||||
166,000 | PDC Energy (a) | 8,545,680 | |||||||||
Oil & Gas Producer in U.S. | |||||||||||
116,000 | SM Energy | 6,957,680 | |||||||||
Oil & Gas Producer | |||||||||||
158,000 | Approach Resources (a) | 3,882,060 | |||||||||
| Oil & Gas Producer in West Texas Permian | |||||||||||
83,000 | Rosetta Resources (a) | 3,529,160 | |||||||||
| Oil & Gas Producer Exploring in Texas | |||||||||||
464,000 | Quicksilver Resources (a)(b) | 779,520 | |||||||||
| Natural Gas & Coal Seam Gas Producer | |||||||||||
23,694,100 | |||||||||||
| > Mining 0.7% | |||||||||||
70,000 | Core Labs (Netherlands) | 10,616,200 | |||||||||
Oil & Gas Reservoir Consulting | |||||||||||
546,000 | Alexco Resource (a) | 611,520 | |||||||||
| Mining, Exploration & Environmental Services | |||||||||||
11,227,720 | |||||||||||
Energy & Minerals: Total | 78,843,580 | ||||||||||
| Total Equities: 98.1% (Cost: $897,717,035) | 1,537,635,575 | (e)(f) | |||||||||
Number of Shares | Value | ||||||||||
Short-Term Investments 1.9% | |||||||||||
30,437,673 | JPMorgan U.S. Government Money Market Fund, Agency Shares (7 day yield of 0.01%) | $ | 30,437,673 | ||||||||
| Total Short-Term Investments: 1.9% (Cost: $30,437,673) | 30,437,673 | ||||||||||
Securities Lending Collateral 4.1% | |||||||||||
63,738,529 | Dreyfus Government Cash Management Fund, Institutional Shares (7 day yield of 0.01%) (g) | 63,738,529 | |||||||||
| Total Securities Lending Collateral: (Cost: $63,738,529) | 63,738,529 | ||||||||||
| Total Investments: 104.1% (Cost: $991,893,237)(h) | 1,631,811,777 | ||||||||||
| Obligation to Return Collateral for Securities Loaned: (4.1)% | (63,738,529 | ) | |||||||||
Cash and Other Assets Less Liabilities: —% | 102,768 | ||||||||||
Net Assets: 100.0% | $ | 1,568,176,016 | |||||||||
ADR - American Depositary Receipts
> Notes to Statement of Investments
(a) Non-income producing security.
(b) All or a portion of this security was on loan at June 30, 2013. The total market value of securities on loan at June 30, 2013 was $63,089,988.
(c) Illiquid security.
(d) Denotes a restricted security, which is subject to restrictions on resale under federal securities laws. This security is valued at fair value determined in good faith under consistently applied procedures established by the Board of Trustees. At June 30, 2013, the market value of this security amounted to $1,273, which represented less than 0.01% of total net assets. Additional information on this security is as follows:
Security | Acquisition Dates | Shares | Cost | Value | |||||||||||||||
Metabolex | 2/11/00 | 18,181 | $ | 1,999,910 | $ | 1,273 | |||||||||||||
(e) An affiliated person of the Fund may include any company in which the Fund owns five percent or more of its outstanding voting shares. Holdings and transactions in these affiliated companies during the period ended June 30, 2013, are as follows:
Security | Balance of Shares Held 12/31/12 | Purchases/ Additions | Sales/ Reductions | Balance of Shares Held 6/30/13 | Value | Dividend | |||||||||||||||||||||
RCM Technologies (1) | 640,000 | - | 58,000 | 582,000 | $ | 3,160,260 | $ | - | |||||||||||||||||||
(1) At June 30, 2013 the Fund owned less than five percent of the company's outstanding voting shares.
See accompanying notes to financial statements.
61
Columbia Acorn USA
Statement of Investments (Unaudited), continued
> Notes to Statement of Investments
(f) On June 30, 2013, the market value of foreign securities represented 1.60% of total net assets. The Fund's foreign portfolio was diversified as follows:
Country | Value | Percentage of Net Assets | |||||||||
Netherlands | $ | 10,616,200 | 0.67 | ||||||||
Israel | 9,089,755 | 0.58 | |||||||||
India | 5,457,630 | 0.35 | |||||||||
Total Foreign Portfolio | $ | 25,163,585 | 1.60 | ||||||||
(g) Investment made with cash collateral received from securities lending activity.
(h) At June 30, 2013, for federal income tax purposes, the cost of investments was $991,893,237 and net unrealized appreciation was $639,918,540 consisting of gross unrealized appreciation of $669,973,504 and gross unrealized depreciation of $30,054,964.
Fair Value Measurements
Various inputs are used in determining the value of the Fund's investments, following the input prioritization hierarchy established by accounting principles generally accepted in the United States of America (GAAP). These inputs are summarized in the three broad levels listed below:
• Level 1 – quoted prices in active markets for identical securities
• Level 2 – prices determined using other significant observable inputs (including quoted prices for similar securities, interest rates, prepayment speeds, credit risk and others)
• Level 3 – prices determined using significant unobservable inputs where quoted prices or observable inputs are unavailable or less reliable (including management's own assumptions about the factors market participants would use in pricing an investment)
The inputs or methodology used for valuing securities are not necessarily an indication of the risk associated with investing in those securities.
Examples of the types of securities in which the Fund would typically invest and how they are classified within this hierarchy are as follows. Typical Level 1 securities include exchange traded domestic equities, mutual funds whose NAVs are published each day and exchange traded foreign equities that are not statistically fair valued. Typical Level 2 securities include exchange traded foreign equities that are statistically fair valued, forward foreign currency exchange contracts and short-term investments valued at amortized cost. Additionally, securities fair valued by the Valuation Committee (the Committee) of the Fund's Board of Trustees (the Board) that rely on significant observable inputs are also included in Level 2. Typical Level 3 securities include any security fair valued by the Committee that relies on significant unobservable inputs.
Under the direction of the Board, the Committee is responsible for carrying out the valuation procedures approved by the Board.
The Committee meets as necessary, and no less frequently than quarterly, to determine fair values for securities for which market quotations are not readily available or for which the investment manager believes that available market quotations are unreliable, to review the appropriateness of the Trust's Portfolio Pricing Policy and the pricing procedures of the investment manager (the Policies), and to review the continuing appropriateness of the current value of any security subject to the Policies. The Policies address, among other things: circumstances under which market quotations will be deemed readily available; selection of third party pricing vendors; appropriate pricing methodologies; events that require fair valuation and fair value techniques; and circumstances under which securities will be deemed to pose a potential for stale pricing, including when securities are illiquid, restricted, or in default. The Committee may also meet to discuss additional valuation matters, which may include review of back-testing results, review of time-sensitive information or approval of other valuation related actions, and to review the appropriateness of the Policies.
For investments categorized as Level 3, the significant unobservable inputs used in the fair value measurement of the Funds' securities may include: (i) data specific to the issuer or comparable issuers, (ii) general market or specific sector news and (iii) quoted prices and specific or similar security transactions. The Committee considers this data and any changes from prior periods in order to assess the reasonableness of observable and unobservable inputs, any assumptions or internal models used to value those securities and changes in fair value. Significant changes in any of these factors could result in lower or higher fair value measurements. Various factors impact the frequency of monitoring (which may occur as often as daily), however the Committee may determine that changes to inputs, assumptions and models are not required with the same frequency.
See accompanying notes to financial statements.
62
> Notes to Statement of Investments
The following table summarizes the inputs used, as of June 30, 2013, in valuing the Fund's assets:
Investment Type | Quoted Prices (Level 1) | Other Significant Observable Inputs (Level 2) | Significant Unobservable Inputs (Level 3) | Total | |||||||||||||||
Equities | |||||||||||||||||||
Information | $ | 435,189,833 | $ | - | $ | - | $ | 435,189,833 | |||||||||||
Industrial Goods & Services | 312,402,399 | - | - | 312,402,399 | |||||||||||||||
Consumer Goods & Services | 247,319,602 | - | - | 247,319,602 | |||||||||||||||
Finance | 218,127,670 | - | - | 218,127,670 | |||||||||||||||
Health Care | 137,975,316 | - | 1,273 | 137,976,589 | |||||||||||||||
Other Industries | 107,775,902 | - | - | 107,775,902 | |||||||||||||||
Energy & Minerals | 78,843,580 | - | - | 78,843,580 | |||||||||||||||
Total Equities | 1,537,634,302 | - | 1,273 | 1,537,635,575 | |||||||||||||||
Total Short-Term Investments | 30,437,673 | - | - | 30,437,673 | |||||||||||||||
Total Securities Lending Collateral | 63,738,529 | - | - | 63,738,529 | |||||||||||||||
Total Investments | $ | 1,631,810,504 | $ | - | $ | 1,273 | $ | 1,631,811,777 | |||||||||||
There were no transfers of financial assets between levels 1 and 2 during the period.
The Fund does not hold any significant investments categorized as Level 3.
Certain common stocks classified as Level 3 are valued at fair value, using a market approach, as determined in good faith under consistently applied procedures established by and under the general supervision of the Board. To determine fair value for these securities, for which no market exists, the Committee utilizes the valuation technique it deems most appropriate in the circumstances, using some unobservable inputs, which may include, but are not limited to, trades of similar securities, estimated earnings of the company, market multiples derived from a set of comparable companies, and the position of the security within the company's capital structure. Significant increases or decreases to any of these inputs could result in a significantly lower or higher fair value measurement.
See accompanying notes to financial statements.
63
Columbia Acorn International Select
Major Portfolio Changes in the Second Quarter (Unaudited)
Number of Shares | |||||||||||
3/31/13 | 6/30/13 | ||||||||||
Purchases | |||||||||||
Asia | |||||||||||
| > Japan | |||||||||||
NGK Spark Plug | 632,000 | 759,000 | |||||||||
Rinnai | 79,000 | 104,500 | |||||||||
Toyo Suisan Kaisha | 0 | 125,000 | |||||||||
| > Taiwan | |||||||||||
Taiwan Mobile | 4,242,000 | 4,622,000 | |||||||||
Europe | |||||||||||
| > United Kingdom | |||||||||||
Babcock International | 0 | 186,936 | |||||||||
Jardine Lloyd Thompson Group | 812,116 | 993,000 | |||||||||
Smith & Nephew | 314,515 | 688,000 | |||||||||
Telecity | 0 | 270,000 | |||||||||
Whitbread | 0 | 95,000 | |||||||||
| > Denmark | |||||||||||
Jyske Bank | 113,356 | 119,000 | |||||||||
Novozymes | 0 | 109,000 | |||||||||
| > France | |||||||||||
Neopost | 65,000 | 117,000 | |||||||||
Other Countries | |||||||||||
| > Australia | |||||||||||
Regis Resources | 1,213,715 | 1,700,000 | |||||||||
| > Canada | |||||||||||
CCL Industries | 91,400 | 221,000 | |||||||||
Latin America | |||||||||||
| > Brazil | |||||||||||
Beadell Resources | 6,667,760 | 11,561,000 | |||||||||
| > Mexico | |||||||||||
Fresnillo | 200,326 | 243,000 | |||||||||
Number of Shares | |||||||||||
3/31/13 | 6/30/13 | ||||||||||
Sales | |||||||||||
Asia | |||||||||||
| > Japan | |||||||||||
Familymart | 95,000 | 91,000 | |||||||||
FP Corporation | 59,000 | 0 | |||||||||
Itochu Techno-Science | 134,000 | 0 | |||||||||
Park24 | 210,000 | 205,000 | |||||||||
Seven Bank | 4,520,000 | 2,837,000 | |||||||||
Start Today | 936,100 | 796,000 | |||||||||
| > Taiwan | |||||||||||
CTCI Corp | 3,947,000 | 3,630,000 | |||||||||
| > Singapore | |||||||||||
Ascendas REIT | 11,081,000 | 9,514,000 | |||||||||
CDL Hospitality Trust | 2,349,000 | 0 | |||||||||
Mapletree Industrial Trust | 13,429,000 | 5,869,000 | |||||||||
Mapletree Logistics Trust | 11,748,000 | 10,847,000 | |||||||||
| > Korea | |||||||||||
Hite Jinro | 118,360 | 0 | |||||||||
Hyundai Motor | 51,000 | 0 | |||||||||
| Kepco Plant Service & Engineering | 157,000 | 76,000 | |||||||||
| > Hong Kong | |||||||||||
| Mapletree Greater China Commercial Trust | 4,932,000 | 4,288,000 | |||||||||
| > China | |||||||||||
Want Want | 2,770,000 | 0 | |||||||||
Europe | |||||||||||
| > United Kingdom | |||||||||||
Intertek Group | 74,000 | 0 | |||||||||
Other Countries | |||||||||||
| > Australia | |||||||||||
Challenger Financial | 3,214,907 | 1,836,000 | |||||||||
| Commonwealth Property Office Fund | 3,310,000 | 0 | |||||||||
IAG | 1,089,000 | 690,000 | |||||||||
| > Canada | |||||||||||
Alamos Gold | 25,180 | 0 | |||||||||
| > South Africa | |||||||||||
Naspers | 95,700 | 50,000 | |||||||||
| > United States | |||||||||||
Allied Nevada Gold | 161,000 | 0 | |||||||||
| > Israel | |||||||||||
Israel Chemicals | 307,000 | 0 | |||||||||
See accompanying notes to financial statements.
64
Columbia Acorn International Select
Statement of Investments (Unaudited), June 30, 2013
Number of Shares | Value | ||||||||||
Equities: 94.2% | |||||||||||
Asia 53.6% | |||||||||||
| > Japan 21.1% | |||||||||||
796,000 | Start Today (a) | $ | 15,586,945 | ||||||||
Online Japanese Apparel Retailer | |||||||||||
759,000 | NGK Spark Plug | 15,191,298 | |||||||||
Automobile Parts | |||||||||||
2,837,000 | Seven Bank | 10,284,366 | |||||||||
ATM Processing Services | |||||||||||
104,500 | Rinnai | 7,430,532 | |||||||||
| Gas Appliances for Household & Commercial Use | |||||||||||
855 | Nippon Prologis REIT (a) | 7,419,050 | |||||||||
| Logistics Real Estate Investment Trust in Japan | |||||||||||
125,000 | Toyo Suisan Kaisha | 4,159,091 | |||||||||
Instant Noodle Manufacturer | |||||||||||
3,435 | Orix JREIT | 3,920,678 | |||||||||
Diversified Real Estate Investment Trust | |||||||||||
91,000 | Familymart | 3,882,828 | |||||||||
Convenience Store Operator | |||||||||||
205,000 | Park24 | 3,719,116 | |||||||||
Parking Lot Operator | |||||||||||
71,593,904 | |||||||||||
| > Taiwan 15.2% | |||||||||||
9,985,000 | Far EasTone Telecom | 26,760,859 | |||||||||
Taiwan's Third Largest Mobile Operator | |||||||||||
4,622,000 | Taiwan Mobile | 18,209,086 | |||||||||
Taiwan's Second Largest Mobile Operator | |||||||||||
3,630,000 | CTCI Corp | 6,583,620 | |||||||||
International Engineering Firm | |||||||||||
51,553,565 | |||||||||||
| > Singapore 10.3% | |||||||||||
9,514,000 | Ascendas REIT | 16,673,137 | |||||||||
Industrial Property Landlord | |||||||||||
10,847,000 | Mapletree Logistics Trust | 9,401,127 | |||||||||
Industrial Property Landlord | |||||||||||
5,869,000 | Mapletree Industrial Trust | 6,099,250 | |||||||||
Industrial Property Landlord | |||||||||||
3,012,000 | Mapletree Commercial Trust | 2,807,041 | |||||||||
Retail & Office Property Landlord | |||||||||||
34,980,555 | |||||||||||
| > Indonesia 2.5% | |||||||||||
11,903,000 | Archipelago Resources (b) | 8,554,075 | |||||||||
| Gold Mining Projects in Indonesia, Vietnam & the Philippines | |||||||||||
| > Korea 2.3% | |||||||||||
88,800 | Coway | 4,315,170 | |||||||||
| Household Appliance Rental Service Provider | |||||||||||
76,000 | Kepco Plant Service & Engineering | 3,460,436 | |||||||||
Power Plant & Grid Maintenance | |||||||||||
7,775,606 | |||||||||||
Number of Shares | Value | ||||||||||
| > Hong Kong 2.2% | |||||||||||
2,391,000 | Melco International | $ | 4,486,329 | ||||||||
Macau Casino Operator | |||||||||||
4,288,000 | Mapletree Greater China Commercial Trust (b) | 3,187,048 | |||||||||
Retail & Office Property Landlord | |||||||||||
7,673,377 | |||||||||||
Asia: Total | 182,131,082 | ||||||||||
Europe 21.4% | |||||||||||
| > United Kingdom 9.8% | |||||||||||
993,000 | Jardine Lloyd Thompson Group | 13,754,282 | |||||||||
International Business Insurance Broker | |||||||||||
688,000 | Smith & Nephew | 7,705,504 | |||||||||
Medical Equipment & Supplies | |||||||||||
95,000 | Whitbread | 4,419,368 | |||||||||
| The UK's Leading Hotelier & Coffee Shop | |||||||||||
270,000 | Telecity | 4,160,718 | |||||||||
European Data Center Provider | |||||||||||
186,936 | Babcock International | 3,138,825 | |||||||||
Public Sector Outsourcer | |||||||||||
33,178,697 | |||||||||||
| > Denmark 3.6% | |||||||||||
119,000 | Jyske Bank (b) | 4,476,063 | |||||||||
Danish Bank | |||||||||||
144,000 | SimCorp | 4,280,010 | |||||||||
Software for Investment Managers | |||||||||||
109,000 | Novozymes | 3,491,293 | |||||||||
Industrial Enzymes | |||||||||||
12,247,366 | |||||||||||
| > France 2.3% | |||||||||||
117,000 | Neopost | 7,746,771 | |||||||||
Postage Meter Machines | |||||||||||
| > Switzerland 1.9% | |||||||||||
24,000 | Partners Group | 6,496,292 | |||||||||
Private Markets Asset Management | |||||||||||
| > Germany 1.2% | |||||||||||
150,000 | Wirecard | 4,081,492 | |||||||||
| Online Payment Processing & Risk Management | |||||||||||
| > Sweden 1.1% | |||||||||||
140,000 | Hexagon | 3,742,393 | |||||||||
| Design, Measurement & Visualization Software & Equipment | |||||||||||
| > Iceland 1.1% | |||||||||||
3,488,000 | Marel | 3,690,111 | |||||||||
| Largest Manufacturer of Poultry & Fish Processing Equipment | |||||||||||
| > Netherlands 0.4% | |||||||||||
176,586 | Imtech (a)(b) | 1,299,855 | |||||||||
Technical Installation & Maintenance | |||||||||||
Europe: Total | 72,482,977 | ||||||||||
See accompanying notes to financial statements.
65
Columbia Acorn International Select
Statement of Investments (Unaudited), continued
Number of Shares | Value | ||||||||||
Other Countries 13.6% | |||||||||||
| > Australia 4.3% | |||||||||||
1,836,000 | Challenger Financial | $ | 6,695,019 | ||||||||
Largest Annuity Provider | |||||||||||
1,700,000 | Regis Resources (b) | 4,500,134 | |||||||||
Gold Mining in Australia | |||||||||||
690,000 | IAG | 3,424,953 | |||||||||
General Insurance Provider | |||||||||||
14,620,106 | |||||||||||
| > Canada 4.2% | |||||||||||
221,000 | CCL Industries (b) | 13,633,622 | |||||||||
Largest Global Label Converter | |||||||||||
21,500 | Goldcorp | 531,695 | |||||||||
Gold Mining | |||||||||||
14,165,317 | |||||||||||
| > South Africa 2.7% | |||||||||||
846,448 | Coronation Fund Managers | 5,373,628 | |||||||||
South African Fund Manager | |||||||||||
50,000 | Naspers | 3,690,584 | |||||||||
| Media in Africa, China, Russia & Other Emerging Markets | |||||||||||
9,064,212 | |||||||||||
| > United States 2.4% | |||||||||||
82,000 | Atwood Oceanics (b) | 4,268,100 | |||||||||
Offshore Drilling Contractor | |||||||||||
66,000 | SM Energy | 3,958,680 | |||||||||
Oil & Gas Producer | |||||||||||
8,226,780 | |||||||||||
Other Countries: Total | 46,076,415 | ||||||||||
Latin America 5.6% | |||||||||||
| > Guatemala 2.4% | |||||||||||
588,000 | Tahoe Resources (b) | 8,336,104 | |||||||||
Silver Project in Guatemala | |||||||||||
| > Brazil 1.6% | |||||||||||
11,561,000 | Beadell Resources (b) | 5,393,693 | |||||||||
Gold Mining in Brazil | |||||||||||
| > Mexico 1.0% | |||||||||||
243,000 | Fresnillo | 3,280,703 | |||||||||
| Silver & Metal Byproduct Mining in Mexico | |||||||||||
Number of Shares | Value | ||||||||||
| > Uruguay 0.6% | |||||||||||
191,666 | Union Agriculture Group (b)(c)(d) | $ | 1,983,743 | ||||||||
Farmland Operator in Uruguay | |||||||||||
| > Colombia —% | |||||||||||
1,880,000 | Santa Maria Petroleum (b)(c) | 46,924 | |||||||||
| Explores for Oil & Gas in Latin America | |||||||||||
Latin America: Total | 19,041,167 | ||||||||||
| Total Equities: 94.2% (Cost: $276,197,649) | 319,731,641 | (e) | |||||||||
Short-Term Investments 5.1% | |||||||||||
12,032,155 | JPMorgan U.S. Government Money Market Fund, Agency Shares (7 day yield of 0.01%) | 12,032,155 | |||||||||
5,432,560 | JPMorgan U.S. Government Money Market Fund, Capital Shares (7 day yield of 0.01%) | 5,432,560 | |||||||||
| Total Short-Term Investments: 5.1% (Cost: $17,464,715) | 17,464,715 | ||||||||||
Securities Lending Collateral 1.3% | |||||||||||
4,332,824 | Dreyfus Government Cash Management Fund, Institutional Shares (7 day yield of 0.01%) (f) | 4,332,824 | |||||||||
| Total Securities Lending Collateral: (Cost: $4,332,824) | 4,332,824 | ||||||||||
| Total Investments: 100.6% (Cost: $297,995,188)(g) | 341,529,180 | ||||||||||
| Obligation to Return Collateral for Securities Loaned: (1.3)% | (4,332,824 | ) | |||||||||
Cash and Other Assets Less Liabilities: 0.7% | 2,423,092 | ||||||||||
Net Assets: 100.0% | $ | 339,619,448 | |||||||||
REIT - Real Estate Investment Trust
See accompanying notes to financial statements.
> Notes to Statement of Investments
(a) All or a portion of this security was on loan at June 30, 2013. The total market value of securities on loan at June 30, 2013 was $4,098,939.
(b) Non-income producing security.
(c) Denotes a restricted security, which is subject to restrictions on resale under federal securities laws. These securities are valued at fair value determined in good faith under consistently applied procedures established by the Board of Trustees. At June 30, 2013, the market value of these securities amounted to $2,030,667, which represented 0.60% of total net assets. Additional information on these securities is as follows:
Security | Acquisition Dates | Shares | Cost | Value | |||||||||||||||
Union Agriculture Group | 12/8/10-6/27/12 | 191,666 | $ | 2,200,000 | $ | 1,983,743 | |||||||||||||
Santa Maria Petroleum | 1/14/11 | 1,880,000 | 2,375,897 | 46,924 | |||||||||||||||
$ | 4,575,897 | $ | 2,030,667 | ||||||||||||||||
66
> Notes to Statement of Investments
(d) Illiquid security.
(e) On June 30, 2013, the Fund's total investments were denominated in currencies as follows:
Currency | Value | Percentage of Net Assets | |||||||||
Japanese Yen | $ | 71,593,904 | 21.1 | ||||||||
Taiwan Dollar | 51,553,565 | 15.2 | |||||||||
British Pound | 45,013,475 | 13.3 | |||||||||
Hong Kong Dollar | 38,167,603 | 11.2 | |||||||||
Canadian Dollar | 22,016,649 | 6.5 | |||||||||
Australian Dollar | 20,013,799 | 5.9 | |||||||||
| Other currencies less than 5% of total net assets | 71,372,646 | 21.0 | |||||||||
Total Equities | $ | 319,731,641 | 94.2 | ||||||||
(f) Investment made with cash collateral received from securities lending activity.
(g) At June 30, 2013, for federal income tax purposes, the cost of investments was $297,995,188 and net unrealized appreciation was $43,533,992 consisting of gross unrealized appreciation of $65,324,272 and gross unrealized depreciation of $21,790,280.
At June 30, 2013, the Fund had entered into the following forward foreign currency exchange contracts:
| Forward Foreign Currency Exchange Contracts to Buy | Forward Foreign Currency Exchange Contracts to Sell | Principal Amount in Foreign Currency | Principal Amount in U.S. Dollar | Settlement Date | Unrealized Appreciation (Depreciation) | ||||||||||||||||||
USD | ZAR | 89,655,300 | $ | 9,000,000 | 7/15/13 | $ | (52,114 | ) | |||||||||||||||
The counterparty for all forward foreign currency exchange contracts is State Street Bank and Trust Company.
USD - United States Dollar
ZAR - South African Rand
Fair Value Measurements
Various inputs are used in determining the value of the Fund's investments, following the input prioritization hierarchy established by accounting principles generally accepted in the United States of America (GAAP). These inputs are summarized in the three broad levels listed below:
• Level 1 – quoted prices in active markets for identical securities
• Level 2 – prices determined using other significant observable inputs (including quoted prices for similar securities, interest rates, prepayment speeds, credit risk and others)
• Level 3 – prices determined using significant unobservable inputs where quoted prices or observable inputs are unavailable or less reliable (including management's own assumptions about the factors market participants would use in pricing an investment)
The inputs or methodology used for valuing securities are not necessarily an indication of the risk associated with investing in those securities.
Examples of the types of securities in which the Fund would typically invest and how they are classified within this hierarchy are as follows. Typical Level 1 securities include exchange traded domestic equities, mutual funds whose NAVs are published each day and exchange traded foreign equities that are not statistically fair valued. Typical Level 2 securities include exchange traded foreign equities that are statistically fair valued, forward foreign currency exchange contracts and short-term investments valued at amortized cost. Additionally, securities fair valued by the Valuation Committee (the Committee) of the Fund's Board of Trustees (the Board) that rely on significant observable inputs are also included in Level 2. Typical Level 3 securities include any security fair valued by the Committee that relies on significant unobservable inputs.
Under the direction of the Board, the Committee is responsible for carrying out the valuation procedures approved by the Board.
The Committee meets as necessary, and no less frequently than quarterly, to determine fair values for securities for which market quotations are not readily available or for which the investment manager believes that available market quotations are unreliable, to review the appropriateness of the Trust's Portfolio Pricing Policy and the pricing procedures of the investment manager (the Policies), and to review the continuing appropriateness of the current value of any security subject to the Policies. The Policies address, among other things: circumstances under which market quotations will be deemed readily available; selection of third party pricing vendors; appropriate pricing methodologies; events that require fair valuation and fair value techniques; and circumstances under which securities will be deemed to pose a potential for stale pricing, including when securities are illiquid, restricted, or in default. The Committee may also meet to discuss additional valuation matters, which may include review of back-testing results, review of time-sensitive information or approval of other valuation related actions, and to review the appropriateness of the Policies.
For investments categorized as Level 3, the significant unobservable inputs used in the fair value measurement of the Funds' securities may include: (i) data specific to the issuer or comparable issuers, (ii) general market or specific sector news and (iii) quoted prices and specific or similar security transactions. The Committee considers this data and any changes from prior periods in order to assess the reasonableness of observable and unobservable inputs, any assumptions or internal models used to value those securities and changes in fair value. Significant changes in any of these factors could result in lower or higher fair value measurements. Various factors impact the frequency of monitoring (which may occur as often as daily), however the Committee may determine that changes to inputs, assumptions and models are not required with the same frequency.
See accompanying notes to financial statements.
67
Columbia Acorn International Select
Statement of Investments (Unaudited), continued
> Notes to Statement of Investments
The following table summarizes the inputs used, as of June 30, 2013, in valuing the Fund's assets:
Investment Type | Quoted Prices (Level 1) | Other Significant Observable Inputs (Level 2) | Significant Unobservable Inputs (Level 3) | Total | |||||||||||||||
Equities | |||||||||||||||||||
Asia | $ | – | $ | 182,131,082 | $ | – | $ | 182,131,082 | |||||||||||
Europe | – | 72,482,977 | – | 72,482,977 | |||||||||||||||
Other Countries | 22,392,097 | 23,684,318 | – | 46,076,415 | |||||||||||||||
Latin America | 8,336,104 | 8,721,320 | 1,983,743 | 19,041,167 | |||||||||||||||
Total Equities | 30,728,201 | 287,019,697 | 1,983,743 | 319,731,641 | |||||||||||||||
Total Short-Term Investments | 17,464,715 | – | – | 17,464,715 | |||||||||||||||
Total Securities Lending Collateral | 4,332,824 | – | – | 4,332,824 | |||||||||||||||
Total Investments | $ | 52,525,740 | $ | 287,019,697 | $ | 1,983,743 | $ | 341,529,180 | |||||||||||
| Unrealized Depreciation on Forward Foreign Currency Exchange Contracts | – | (52,114 | ) | – | (52,114 | ) | |||||||||||||
Total | $ | 52,525,740 | $ | 286,967,583 | $ | 1,983,743 | $ | 341,477,066 | |||||||||||
The Fund's assets assigned to the Level 2 input category are generally valued using a market approach, in which a security's value is determined through its correlation to prices and information from observable market transactions for similar or identical assets. Foreign equities are generally valued at the last sale price on the foreign exchange or market on which they trade. The Fund may use a statistical fair valuation model, in accordance with the policy adopted by the Board, provided by an independent third party to value securities principally traded in foreign markets in order to adjust for possible stale pricing that may occur between the close of the foreign exchanges and the time for valuation. These models take into account available market data including intraday index, ADR, and ETF movements. Forward foreign currency exchange contracts are valued at the prevailing forward exchange rate of the underlying currencies. Securities acquired via private placement that have a holding period or an extended settlement period are valued at a discount to the same shares that are trading freely on the market. These discounts are determined by the investment manager's experience with similar securities or situations. Factors may include, but are not limited to, trade volume, shares outstanding and stock price.
There were no transfers of financial assets between levels 1 and 2 during the period.
The Fund does not hold any significant investments categorized as Level 3.
Certain common stocks classified as Level 3 are valued at fair value, using a market approach, as determined in good faith under consistently applied procedures established by and under the general supervision of the Board. To determine fair value for these securities, for which no market exists, the Committee utilizes the valuation technique it deems most appropriate in the circumstances, using some unobservable inputs, which may include, but are not limited to, trades of similar securities, estimated earnings of the company, market multiples derived from a set of comparable companies, and the position of the security within the company's capital structure. Significant increases or decreases to any of these inputs could result in a significantly lower or higher fair value measurement.
See accompanying notes to financial statements.
68
Columbia Acorn International Select
Portfolio Diversification (Unaudited)
At June 30, 2013, the Fund's portfolio investments as a percentage of net assets were diversified as follows:
Value | Percentage of Net Assets | ||||||||||
| > Consumer Goods & Services | |||||||||||
Other Durable Goods | $ | 22,621,830 | 6.7 | ||||||||
Retail | 19,469,773 | 5.7 | |||||||||
Nondurables | 13,633,622 | 4.0 | |||||||||
Casinos & Gaming | 4,486,328 | 1.3 | |||||||||
Restaurants | 4,419,368 | 1.3 | |||||||||
Other Consumer Services | 4,315,170 | 1.3 | |||||||||
Food & Beverage | 4,159,091 | 1.2 | |||||||||
73,105,182 | 21.5 | ||||||||||
| > Information | |||||||||||
Mobile Communications | 44,969,946 | 13.2 | |||||||||
Business Software | 8,022,403 | 2.4 | |||||||||
Computer Services | 4,160,718 | 1.2 | |||||||||
Financial Processors | 4,081,492 | 1.2 | |||||||||
Internet Related | 3,690,584 | 1.1 | |||||||||
64,925,143 | 19.1 | ||||||||||
| > Finance | |||||||||||
Insurance | 23,874,254 | 7.0 | |||||||||
Banks | 14,760,429 | 4.4 | |||||||||
Brokerage & Money Management | 11,869,920 | 3.5 | |||||||||
50,504,603 | 14.9 | ||||||||||
| > Other Industries | |||||||||||
Real Estate | 49,507,331 | 14.6 | |||||||||
49,507,331 | 14.6 | ||||||||||
| > Energy & Minerals | |||||||||||
Mining | 30,596,404 | 9.0 | |||||||||
Oil Services | 4,268,100 | 1.2 | |||||||||
Oil & Gas Producers | 4,005,604 | 1.2 | |||||||||
Agricultural Commodities | 1,983,743 | 0.6 | |||||||||
40,853,851 | 12.0 | ||||||||||
Value | Percentage of Net Assets | ||||||||||
| > Industrial Goods & Services | |||||||||||
Machinery | $ | 11,436,882 | 3.4 | ||||||||
Outsourcing Services | 6,599,261 | 2.0 | |||||||||
Construction | 6,583,620 | 1.9 | |||||||||
Other Industrial Services | 5,018,971 | 1.5 | |||||||||
| Industrial Materials & Specialty Chemicals | 3,491,293 | 1.0 | |||||||||
33,130,027 | 9.8 | ||||||||||
| > Health Care | |||||||||||
Medical Equipment & Devices | 7,705,504 | 2.3 | |||||||||
7,705,504 | 2.3 | ||||||||||
Total Equities: | 319,731,641 | 94.2 | |||||||||
Short-Term Investments: | 17,464,715 | 5.1 | |||||||||
Securities Lending Collateral: | 4,332,824 | 1.3 | |||||||||
Total Investments: | 341,529,180 | 100.6 | |||||||||
| Obligation to Return Collateral for Securities Loaned: | (4,332,824 | ) | (1.3 | ) | |||||||
| Cash and Other Assets Less Liabilities: | 2,423,092 | 0.7 | |||||||||
Net Assets: | $ | 339,619,448 | 100.0 | ||||||||
See accompanying notes to financial statements.
69
Columbia Acorn Select
Major Portfolio Changes in the Second Quarter (Unaudited)
Number of Shares | |||||||||||
3/31/13 | 6/30/13 | ||||||||||
Purchases | |||||||||||
Industrial Goods & Services | |||||||||||
Nordson | 240,000 | 288,000 | |||||||||
Information | |||||||||||
Ansys | 74,000 | 102,000 | |||||||||
F5 Networks | 165,000 | 195,000 | |||||||||
Trimble Navigation | 0 | 330,000 | |||||||||
Consumer Goods & Services | |||||||||||
Best Buy | 0 | 215,000 | |||||||||
Blackhawk Network | 0 | 435,000 | |||||||||
Choice Hotels | 155,000 | 220,000 | |||||||||
Lifetime Fitness | 170,000 | 233,000 | |||||||||
PVH | 0 | 89,000 | |||||||||
Health Care | |||||||||||
Cepheid | 385,000 | 464,000 | |||||||||
Number of Shares | |||||||||||
3/31/13 | 6/30/13 | ||||||||||
Sales | |||||||||||
Industrial Goods & Services | |||||||||||
Ametek | 1,270,000 | 1,210,000 | |||||||||
Donaldson | 988,000 | 940,000 | |||||||||
Kennametal | 615,000 | 587,000 | |||||||||
Pall | 412,000 | 375,000 | |||||||||
Information | |||||||||||
Crown Castle International | 488,000 | 395,000 | |||||||||
Globalstar | 17,458,546 | 0 | |||||||||
Sanmina-SCI | 1,880,000 | 1,076,926 | |||||||||
SBA Communications | 377,000 | 364,000 | |||||||||
Consumer Goods & Services | |||||||||||
Abercrombie & Fitch | 345,000 | 0 | |||||||||
Hertz | 2,260,000 | 1,870,000 | |||||||||
lululemon athletica | 107,000 | 38,000 | |||||||||
RexLot Holdings (China) | 119,425,000 | 57,875,000 | |||||||||
Ryman Hospitality Properties | 875,783 | 444,783 | |||||||||
Finance | |||||||||||
City National | 480,000 | 468,000 | |||||||||
CNO Financial Group | 4,100,000 | 3,863,000 | |||||||||
Discover Financial Services | 970,000 | 750,000 | |||||||||
Energy & Minerals | |||||||||||
Real Goods Solar | 1,165,000 | 0 | |||||||||
| Tuscany International Drilling (Colombia) | 8,259,800 | 0 | |||||||||
Other Industries | |||||||||||
Biomed Realty Trust | 924,000 | 852,000 | |||||||||
Dupont Fabros Technology | 456,000 | 300,000 | |||||||||
See accompanying notes to financial statements.
70
Columbia Acorn Select
Statement of Investments (Unaudited), June 30, 2013
Number of Shares | Value | ||||||||||
Equities: 98.1% | |||||||||||
Industrial Goods & Services 23.8% | |||||||||||
| > Machinery 17.8% | |||||||||||
1,210,000 | Ametek | $ | 51,183,000 | ||||||||
Aerospace/Industrial Instruments | |||||||||||
940,000 | Donaldson | 33,520,400 | |||||||||
Industrial Air Filtration | |||||||||||
375,000 | Pall | 24,911,250 | |||||||||
| Life Science, Water & Industrial Filtration | |||||||||||
587,000 | Kennametal | 22,793,210 | |||||||||
Consumable Cutting Tools | |||||||||||
288,000 | Nordson | 19,961,280 | |||||||||
| Dispensing Systems for Adhesives & Coatings | |||||||||||
152,369,140 | |||||||||||
| > Outsourcing Services 2.6% | |||||||||||
839,000 | Quanta Services (a) | 22,199,940 | |||||||||
| Electrical & Telecom Construction Services | |||||||||||
| > Industrial Materials & Specialty Chemicals 1.9% | |||||||||||
265,000 | FMC Corporation | 16,180,900 | |||||||||
Niche Specialty Chemicals | |||||||||||
| > Industrial Distribution 0.8% | |||||||||||
74,233 | Airgas | 7,086,282 | |||||||||
Industrial Gas Distributor | |||||||||||
| > Other Industrial Services 0.7% | |||||||||||
160,000 | Forward Air | 6,124,800 | |||||||||
| Freight Transportation Between Airports | |||||||||||
Industrial Goods & Services: Total | 203,961,062 | ||||||||||
Information 23.6% | |||||||||||
| > Mobile Communications 6.5% | |||||||||||
395,000 | Crown Castle International (a) | 28,594,050 | |||||||||
Communications Towers | |||||||||||
364,000 | SBA Communications (a) | 26,979,680 | |||||||||
Communications Towers | |||||||||||
55,573,730 | |||||||||||
| > Computer Services 4.8% | |||||||||||
2,470,000 | WNS - ADR (India) (a) | 41,224,300 | |||||||||
| Offshore Business Process Outsourcing Services | |||||||||||
| > Computer Hardware & Related Equipment 4.0% | |||||||||||
445,000 | Amphenol | 34,683,300 | |||||||||
Electronic Connectors | |||||||||||
| > Instrumentation 3.5% | |||||||||||
107,000 | Mettler-Toledo International (a) | 21,528,400 | |||||||||
Laboratory Equipment | |||||||||||
330,000 | Trimble Navigation (a) | 8,583,300 | |||||||||
GPS-based Instruments | |||||||||||
30,111,700 | |||||||||||
Number of Shares | Value | ||||||||||
| > Contract Manufacturing 1.8% | |||||||||||
1,076,926 | Sanmina-SCI (a) | $ | 15,453,888 | ||||||||
Electronic Manufacturing Services | |||||||||||
| > Telecommunications Equipment 1.6% | |||||||||||
195,000 | F5 Networks (a) | 13,416,000 | |||||||||
Internet Traffic Management Equipment | |||||||||||
| > Business Software 0.9% | |||||||||||
102,000 | Ansys (a) | 7,456,200 | |||||||||
| Simulation Software for Engineers & Designers | |||||||||||
| > Semiconductors & Related Equipment 0.5% | |||||||||||
575,000 | Atmel (a) | 4,226,250 | |||||||||
| Microcontrollers, Radio Frequency & Memory Semiconductors | |||||||||||
Information: Total | 202,145,368 | ||||||||||
Consumer Goods & Services 17.9% | |||||||||||
| > Travel 10.1% | |||||||||||
1,870,000 | Hertz (a) | 46,376,000 | |||||||||
Largest U.S. Rental Car Operator | |||||||||||
444,783 | Ryman Hospitality Properties (b) | 17,350,985 | |||||||||
Convention Hotels | |||||||||||
238,000 | Vail Resorts | 14,641,760 | |||||||||
Ski Resort Operator & Developer | |||||||||||
220,000 | Choice Hotels | 8,731,800 | |||||||||
Franchisor of Budget Hotel Brands | |||||||||||
87,100,545 | |||||||||||
| > Other Consumer Services 2.9% | |||||||||||
233,000 | Lifetime Fitness (a) | 11,675,630 | |||||||||
Sport & Fitness Club Operator | |||||||||||
435,000 | Blackhawk Network (a) | 10,092,000 | |||||||||
| Third Party Distributer of Prepaid Content, Mostly Gift Cards | |||||||||||
1,197,322 | IFM Investments (Century 21 China RE) - ADR (China) (a)(c) | 2,789,760 | |||||||||
Provide Real Estate Services in China | |||||||||||
24,557,390 | |||||||||||
| > Retail 2.5% | |||||||||||
129,000 | ULTA (a) | 12,920,640 | |||||||||
Specialty Beauty Product Retailer | |||||||||||
215,000 | Best Buy | 5,875,950 | |||||||||
Consumer Electronic Specialty Retailer | |||||||||||
38,000 | lululemon athletica (a)(b) | 2,489,760 | |||||||||
Premium Active Apparel Retailer | |||||||||||
21,286,350 | |||||||||||
| > Apparel 1.3% | |||||||||||
89,000 | PVH | 11,129,450 | |||||||||
Apparel Wholesaler & Retailer | |||||||||||
| > Educational Services 0.6% | |||||||||||
198,000 | ITT Educational Services (a)(b) | 4,831,200 | |||||||||
Postsecondary Degree Services | |||||||||||
| > Casinos & Gaming 0.4% | |||||||||||
57,875,000 | RexLot Holdings (China) | 3,795,400 | |||||||||
Lottery Equipment Supplier in China | |||||||||||
See accompanying notes to financial statements.
71
Columbia Acorn Select
Statement of Investments (Unaudited), continued
Number of Shares | Value | ||||||||||
| > Food & Beverage 0.1% | |||||||||||
1,500,000 | GLG Life Tech (Canada) (a) | $ | 600,000 | ||||||||
| Produce an All-natural Sweetener Extracted from the Stevia Plant | |||||||||||
Consumer Goods & Services: Total | 153,300,335 | ||||||||||
Finance 17.6% | |||||||||||
| > Insurance 5.8% | |||||||||||
3,863,000 | CNO Financial Group | 50,064,480 | |||||||||
| Life, Long-term Care & Medical Supplement Insurance | |||||||||||
| > Banks 5.3% | |||||||||||
468,000 | City National | 29,657,160 | |||||||||
Bank & Asset Manager | |||||||||||
1,043,000 | Associated Banc-Corp | 16,218,650 | |||||||||
Midwest Bank | |||||||||||
45,875,810 | |||||||||||
| > Credit Cards 4.2% | |||||||||||
750,000 | Discover Financial Services | 35,730,000 | |||||||||
Credit Card Company | |||||||||||
| > Brokerage & Money Management 2.3% | |||||||||||
687,000 | SEI Investments | 19,531,410 | |||||||||
| Mutual Fund Administration & Investment Management | |||||||||||
Finance: Total | 151,201,700 | ||||||||||
Energy & Minerals 7.3% | |||||||||||
| > Oil & Gas Producers 4.2% | |||||||||||
690,000 | Pacific Rubiales Energy (Colombia) | 12,117,809 | |||||||||
| Oil Production & Exploration in Colombia | |||||||||||
3,600,000 | Canacol (Colombia) (a) | 10,029,476 | |||||||||
Oil Producer in South America | |||||||||||
20,600,000 | Shamaran Petroleum (Iraq) (a) | 7,051,441 | |||||||||
| Oil Exploration & Production in Kurdistan | |||||||||||
24,000,000 | Canadian Overseas Petroleum (United Kingdom) (a)(c)(d) | 3,902,254 | |||||||||
| 12,000,000 | Canadian Overseas Petroleum - Warrants (United Kingdom) (a)(d)(e) | 57,826 | |||||||||
| Oil & Gas Exploration/Production in the North Sea | |||||||||||
33,700,000 | Petrodorado Energy (Colombia) (a)(c) | 1,922,602 | |||||||||
| Oil & Gas Exploration & Production in Colombia, Peru & Paraguay | |||||||||||
12,000,000 | Petromanas (Canada) (a) | 1,198,060 | |||||||||
Exploring for Oil in Albania | |||||||||||
36,279,468 | |||||||||||
| > Agricultural Commodities 2.1% | |||||||||||
1,742,424 | Union Agriculture Group (Uruguay) (a)(d)(e) | 18,034,088 | |||||||||
Farmland Operator in Uruguay | |||||||||||
| > Mining 0.8% | |||||||||||
1,550,000 | Kirkland Lake Gold (Canada) (a)(b) | 6,514,215 | |||||||||
Gold Mining | |||||||||||
Number of Shares | Value | ||||||||||
| > Alternative Energy 0.2% | |||||||||||
2,000,000 | Synthesis Energy Systems (China) (a) | $ | 1,554,000 | ||||||||
Owner/Operator of Gasification Plants | |||||||||||
Energy & Minerals: Total | 62,381,771 | ||||||||||
Health Care 5.1% | |||||||||||
| > Biotechnology & Drug Delivery 3.2% | |||||||||||
163,000 | Henry Schein (a) | 15,607,250 | |||||||||
Largest Distributor of Healthcare Products | |||||||||||
388,000 | Seattle Genetics (a) | 12,206,480 | |||||||||
Antibody-based Therapies for Cancer | |||||||||||
27,813,730 | |||||||||||
| > Medical Supplies 1.9% | |||||||||||
464,000 | Cepheid (a) | 15,970,880 | |||||||||
Molecular Diagnostics | |||||||||||
Health Care: Total | 43,784,610 | ||||||||||
Other Industries 2.8% | |||||||||||
| > Real Estate 2.8% | |||||||||||
852,000 | Biomed Realty Trust | 17,235,960 | |||||||||
Life Science-focused Office Buildings | |||||||||||
300,000 | Dupont Fabros Technology (b) | 7,245,000 | |||||||||
Data Centers | |||||||||||
24,480,960 | |||||||||||
Other Industries: Total | 24,480,960 | ||||||||||
| Total Equities: 98.1% (Cost: $559,948,704) | 841,255,806 | (f) | |||||||||
Short-Term Investments 1.9% | |||||||||||
16,628,709 | JPMorgan U.S. Government Money Market Fund, Agency Shares (7 day yield of 0.01%) | 16,628,709 | |||||||||
| Total Short-Term Investments: 1.9% (Cost: $16,628,709) | 16,628,709 | ||||||||||
Securities Lending Collateral 3.0% | |||||||||||
25,736,169 | Dreyfus Government Cash Management Fund, Institutional Shares (7 day yield of 0.01%) (g) | 25,736,169 | |||||||||
| Total Securities Lending Collateral: (Cost: $25,736,169) | 25,736,169 | ||||||||||
| Total Investments: 103.0% (Cost: $602,313,582)(h) | 883,620,684 | ||||||||||
| Obligation to Return Collateral for Securities Loaned: (3.0)% | (25,736,169 | ) | |||||||||
Cash and Other Assets Less Liabilities: —% | (407,592 | ) | |||||||||
Net Assets: 100.0% | $ | 857,476,923 | |||||||||
ADR - American Depositary Receipts
See accompanying notes to financial statements.
72
> Notes to Statement of Investments
(a) Non-income producing security.
(b) All or a portion of this security was on loan at June 30, 2013. The total market value of securities on loan at June 30, 2013 was $25,615,118.
(c) An affiliated person of the Fund may include any company in which the Fund owns five percent or more of its outstanding voting shares. Holdings and transactions in these affiliated companies during the period ended June 30, 2013, are as follows:
Security | Balance of Shares Held 12/31/12 | Purchases/ Additions | Sales/ Reductions | Balance of Shares Held 6/30/13 | Value | Dividend | |||||||||||||||||||||
WNS - ADR (1) | 3,034,100 | - | 564,100 | 2,470,000 | $ | 41,224,300 | $ | - | |||||||||||||||||||
Canadian Overseas Petroleum | 24,000,000 | - | - | 24,000,000 | 3,902,254 | - | |||||||||||||||||||||
| IFM Investments (Century 21 China RE) - ADR | 1,300,000 | - | 102,678 | 1,197,322 | 2,789,760 | - | |||||||||||||||||||||
Petrodorado Energy | 33,700,000 | - | - | 33,700,000 | 1,922,602 | - | |||||||||||||||||||||
Globalstar (1) | 19,000,000 | - | 19,000,000 | - | - | - | |||||||||||||||||||||
Total of Affiliated Transactions | 81,034,100 | - | 19,666,778 | 61,367,322 | $ | 49,838,916 | $ | - | |||||||||||||||||||
(1) At June 30, 2013, the Fund owned less than five percent of the company's outstanding voting shares.
The aggregate cost and value of these companies at June 30, 2013, were $36,232,543 and $8,614,616, respectively. Investments in affiliated companies represented 1.00% of the Fund's total net assets at June 30, 2013.
(d) Denotes a restricted security, which is subject to restrictions on resale under federal securities laws. These securities are valued at fair value determined in good faith under consistently applied procedures established by the Board of Trustees. At June 30, 2013, the market value of these securities amounted to $21,994,168, which represented 2.56% of total net assets. Additional information on these securities is as follows:
Security | Acquisition Dates | Shares | Cost | Value | |||||||||||||||
Union Agriculture Group | 12/8/10-6/27/12 | 1,742,424 | $ | 20,000,000 | $ | 18,034,088 | |||||||||||||
Canadian Overseas Petroleum | 11/24/10 | 24,000,000 | 10,260,435 | 3,902,254 | |||||||||||||||
Canadian Overseas Petroleum - Warrants | 11/24/10 | 12,000,000 | 1,501,964 | 57,826 | |||||||||||||||
$ | 31,762,399 | $ | 21,994,168 | ||||||||||||||||
(e) Illiquid security.
(f) On June 30, 2013, the market value of foreign securities represented 12.92% of total net assets. The Fund's foreign portfolio was diversified as follows:
Country | Value | Percentage of Net Assets | |||||||||
India | $ | 41,224,300 | 4.81 | ||||||||
Colombia | 24,069,887 | 2.81 | |||||||||
Uruguay | 18,034,088 | 2.10 | |||||||||
Canada | 8,312,275 | 0.97 | |||||||||
China | 8,139,160 | 0.95 | |||||||||
Iraq | 7,051,441 | 0.82 | |||||||||
United Kingdom | 3,960,080 | 0.46 | |||||||||
Total Foreign Portfolio | $ | 110,791,231 | 12.92 | ||||||||
(g) Investment made with cash collateral received from securities lending activity.
(h) At June 30, 2013, for federal income tax purposes, the cost of investments was $602,313,582 and net unrealized appreciation was $281,307,102 consisting of gross unrealized appreciation of $344,105,645 and gross unrealized depreciation of $62,798,543.
Fair Value Measurements
Various inputs are used in determining the value of the Fund's investments, following the input prioritization hierarchy established by accounting principles generally accepted in the United States of America (GAAP). These inputs are summarized in the three broad levels listed below:
• Level 1 – quoted prices in active markets for identical securities
• Level 2 – prices determined using other significant observable inputs (including quoted prices for similar securities, interest rates, prepayment speeds, credit risk and others)
• Level 3 – prices determined using significant unobservable inputs where quoted prices or observable inputs are unavailable or less reliable (including management's own assumptions about the factors market participants would use in pricing an investment)
The inputs or methodology used for valuing securities are not necessarily an indication of the risk associated with investing in those securities.
See accompanying notes to financial statements.
73
Columbia Acorn Select
Statement of Investments (Unaudited), continued
> Notes to Statement of Investments
Examples of the types of securities in which the Fund would typically invest and how they are classified within this hierarchy are as follows. Typical Level 1 securities include exchange traded domestic equities, mutual funds whose NAVs are published each day and exchange traded foreign equities that are not statistically fair valued. Typical Level 2 securities include exchange traded foreign equities that are statistically fair valued, forward foreign currency exchange contracts and short-term investments valued at amortized cost. Additionally, securities fair valued by the Valuation Committee (the Committee) of the Fund's Board of Trustees (the Board) that rely on significant observable inputs are also included in Level 2. Typical Level 3 securities include any security fair valued by the Committee that relies on significant unobservable inputs.
Under the direction of the Board, the Committee is responsible for carrying out the valuation procedures approved by the Board.
The Committee meets as necessary, and no less frequently than quarterly, to determine fair values for securities for which market quotations are not readily available or for which the investment manager believes that available market quotations are unreliable, to review the appropriateness of the Trust's Portfolio Pricing Policy and the pricing procedures of the investment manager (the Policies), and to review the continuing appropriateness of the current value of any security subject to the Policies. The Policies address, among other things: circumstances under which market quotations will be deemed readily available; selection of third party pricing vendors; appropriate pricing methodologies; events that require fair valuation and fair value techniques; and circumstances under which securities will be deemed to pose a potential for stale pricing, including when securities are illiquid, restricted, or in default. The Committee may also meet to discuss additional valuation matters, which may include review of back-testing results, review of time-sensitive information or approval of other valuation related actions, and to review the appropriateness of the Policies.
For investments categorized as Level 3, the significant unobservable inputs used in the fair value measurement of the Funds' securities may include: (i) data specific to the issuer or comparable issuers, (ii) general market or specific sector news and (iii) quoted prices and specific or similar security transactions. The Committee considers this data and any changes from prior periods in order to assess the reasonableness of observable and unobservable inputs, any assumptions or internal models used to value those securities and changes in fair value. Significant changes in any of these factors could result in lower or higher fair value measurements. Various factors impact the frequency of monitoring (which may occur as often as daily), however the Committee may determine that changes to inputs, assumptions and models are not required with the same frequency.
The following table summarizes the inputs used, as of June 30, 2013, in valuing the Fund's assets:
Investment Type | Quoted Prices (Level 1) | Other Significant Observable Inputs (Level 2) | Significant Unobservable Inputs (Level 3) | Total | |||||||||||||||
Equities | |||||||||||||||||||
Industrial Goods & Services | $ | 203,961,062 | $ | - | $ | - | $ | 203,961,062 | |||||||||||
Information | 202,145,368 | - | - | 202,145,368 | |||||||||||||||
Consumer Goods & Services | 149,504,935 | 3,795,400 | - | 153,300,335 | |||||||||||||||
Finance | 151,201,700 | - | - | 151,201,700 | |||||||||||||||
Energy & Minerals | 40,387,603 | 3,960,080 | 18,034,088 | 62,381,771 | |||||||||||||||
Health Care | 43,784,610 | - | - | 43,784,610 | |||||||||||||||
Other Industries | 24,480,960 | - | - | 24,480,960 | |||||||||||||||
Total Equities | 815,466,238 | 7,755,480 | 18,034,088 | 841,255,806 | |||||||||||||||
Total Short-Term Investments | 16,628,709 | - | - | 16,628,709 | |||||||||||||||
Total Securities Lending Collateral | 25,736,169 | - | - | 25,736,169 | |||||||||||||||
Total Investments | $ | 857,831,116 | $ | 7,755,480 | $ | 18,034,088 | $ | 883,620,684 | |||||||||||
The Fund's assets assigned to the Level 2 input category are generally valued using a market approach, in which a security's value is determined through its correlation to prices and information from observable market transactions for similar or identical assets. Foreign equities are generally valued at the last sale price on the foreign exchange or market on which they trade. The Fund may use a statistical fair valuation model, in accordance with the policy adopted by the Board, provided by an independent third party to value securities principally traded in foreign markets in order to adjust for possible stale pricing that may occur between the close of the foreign exchanges and the time for valuation. These models take into account available market data including intraday index, ADR, and ETF movements. Securities acquired via private placement that have a holding period or an extended settlement period are valued at a discount to the same shares that are trading freely on the market. These discounts are determined by the investment manager's experience with similar securities or situations. Factors may include, but are not limited to, trade volume, shares outstanding and stock price. Warrants which do not trade are valued as a percentage of the actively trading common stock using a model, based on Black Scholes.
The following table shows transfers between Level 1 and Level 2 of the fair value hierarchy:
| Transfers In | Transfers Out | ||||||||||||||
| Level 1 | Level 2 | Level 1 | Level 2 | ||||||||||||
| $ | 391,500 | $ | - | $ | - | $ | 391,500 | ||||||||
Financial assets were transferred from Level 2 to Level 1 as trading resumed during the period.
See accompanying notes to financial statements.
74
> Notes to Statement of Investments
The following table reconciles asset balances for the period ending June 30, 2013, in which significant observable and/or unobservable inputs (Level 3) were used in determining value:
| Investments in Securities | Balance as of December 31, 2012 | Realized Gain/(Loss) | Change in Unrealized Appreciation (Depreciation) | Purchases | Sales | Transfers into Level 3 | Transfers out of Level 3 | Balance as of June 30, 2013 | |||||||||||||||||||||||||||
Equities | |||||||||||||||||||||||||||||||||||
Energy & Materials | $ | 17,842,422 | $ | - | $ | 191,666 | $ | - | $ | - | $ | - | $ | - | $ | 18,034,088 | |||||||||||||||||||
$ | 17,842,422 | $ | - | $ | 191,666 | $ | - | $ | - | $ | - | $ | - | $ | 18,034,088 | ||||||||||||||||||||
The information in the above reconciliation table represents fiscal year to date activity for any securities identified as using Level 3 inputs at either the beginning or the end of the current fiscal period.
The change in unrealized appreciation attributed to securities owned at June 30, 2013, which were valued using significant unobservable inputs (Level 3), amounted to $191,666.
Quantitative information pertaining to Level 3 unobservable fair value measurements
| Fair Value at 6/30/13 | Valuation Technique(s) | Unobservable Input(s) | Range (Weighted Average) | ||||||||||||||||
Equities | $ | 18,034,088 | Market comparable companies | Discount for lack of marketability | -14 | % to +19% (-10%) | |||||||||||||
Certain common stocks classified as Level 3 are valued at fair value, using a market approach, as determined in good faith under consistently applied procedures established by and under the general supervision of the Board. To determine fair value for these securities, for which no market exists, the Committee utilizes the valuation technique it deems most appropriate in the circumstances, using some unobservable inputs, which may include, but are not limited to, trades of similar securities, estimated earnings of the company, market multiples derived from a set of comparable companies, and the position of the security within the company's capital structure. Significant increases or decreases to any of these inputs could result in a significantly lower or higher fair value measurement.
See accompanying notes to financial statements.
75
Columbia Thermostat Fund
Statement of Investments (Unaudited), June 30, 2013
Number of Shares | Value | ||||||||||
| > Affiliated Bond Funds 68.7% | |||||||||||
34,536,078 | Columbia Short Term Bond Fund, Class I | $ | 343,633,973 | ||||||||
26,546,731 | Columbia Income Opportunities Fund, Class I | 260,423,434 | |||||||||
28,357,889 | Columbia Intermediate Bond Fund, Class I | 258,623,948 | |||||||||
| Total Affiliated Bond Funds: (Cost: $873,246,232) | 862,681,355 | ||||||||||
| > Affiliated Stock Funds 29.7% | |||||||||||
1,749,663 | Columbia Acorn International, Class I | 74,868,079 | |||||||||
4,413,636 | Columbia Dividend Income Fund, Class I | 74,237,363 | |||||||||
1,685,233 | Columbia Acorn Fund, Class I | 56,050,846 | |||||||||
2,987,092 | Columbia Contrarian Core Fund, Class I | 55,559,899 | |||||||||
1,374,079 | Columbia Acorn Select, Class I | 37,443,649 | |||||||||
2,427,574 | Columbia Select Large Cap Growth Fund, Class I (a) | 37,360,362 | |||||||||
2,301,420 | Columbia Large Cap Enhanced Core Fund, Class I | 37,029,847 | |||||||||
| Total Affiliated Stock Funds: (Cost: $326,357,653) | 372,550,045 | ||||||||||
Number of Shares | Value | ||||||||||
| > Short-Term Investments 0.5% | |||||||||||
6,705,042 | JPMorgan U.S. Government Money Market Fund, Agency Shares (7 day yield of 0.01%) | $ | 6,705,042 | ||||||||
| Total Short-Term Investments: (Cost: $6,705,042) | 6,705,042 | ||||||||||
| Total Investments: 98.9% (Cost: $1,206,308,927)(b) | 1,241,936,442 | ||||||||||
Cash and Other Assets Less Liabilities: 1.1% | 14,203,880 | ||||||||||
Net Assets: 100.0% | $ | 1,256,140,322 | |||||||||
> Notes to Statement of Investments
(a) Non-income producing security.
(b) At June 30, 2013, for federal income tax purposes, the cost of investments was $1,206,308,927 and net unrealized appreciation was $35,627,515 consisting of gross unrealized appreciation of $46,192,392 and gross unrealized depreciation of $10,564,877.
Fair Value Measurements
Various inputs are used in determining the value of the Fund's investments, following the input prioritization hierarchy established by accounting principles generally accepted in the United States of America (GAAP). These inputs are summarized in the three broad levels listed below:
• Level 1 – quoted prices in active markets for identical securities
• Level 2 – prices determined using other significant observable inputs (including quoted prices for similar securities, interest rates, prepayment speeds, credit risk and others)
• Level 3 – prices determined using significant unobservable inputs where quoted prices or observable inputs are unavailable or less reliable (including management's own assumptions about the factors market participants would use in pricing an investment)
The inputs or methodology used for valuing securities are not necessarily an indication of the risk associated with investing in those securities.
Examples of the types of securities in which the Fund would typically invest and how they are classified within this hierarchy are as follows. Typical Level 1 securities include, mutual funds whose NAVs are published each day. Under the direction of the Board, the Committee is responsible for carrying out the valuation procedures approved by the Board.
The Committee meets as necessary, and no less frequently than quarterly, to determine fair values for securities for which market quotations are not readily available or for which the investment manager believes that available market quotations are unreliable, to review the appropriateness of the Trust's Portfolio Pricing Policy and the pricing procedures of the investment manager (the Policies), and to review the continuing appropriateness of the current value of any security subject to the Policies. The Policies address, among other things: circumstances under which market quotations will be deemed readily available; selection of third party pricing vendors; appropriate pricing methodologies; events that require fair valuation and fair value techniques; and circumstances under which securities will be deemed to pose a potential for stale pricing, including when securities are illiquid, restricted, or in default. The Committee may also meet to discuss additional valuation matters, which may include review of back-testing results, review of time-sensitive information or approval of other valuation related actions, and to review the appropriateness of the Policies.
See accompanying notes to financial statements.
76
> Notes to Statement of Investments
For investments categorized as Level 3, the significant unobservable inputs used in the fair value measurement of the Funds' securities may include: (i) data specific to the issuer or comparable issuers, (ii) general market or specific sector news and (iii) quoted prices and specific or similar security transactions. The Committee considers this data and any changes from prior periods in order to assess the reasonableness of observable and unobservable inputs, any assumptions or internal models used to value those securities and changes in fair value. Significant changes in any of these factors could result in lower or higher fair value measurements. Various factors impact the frequency of monitoring (which may occur as often as daily), however the Committee may determine that changes to inputs, assumptions and models are not required with the same frequency.
The following table summarizes the inputs used, as of June 30, 2013, in valuing the Fund's assets:
Investment Type | Quoted Prices (Level 1) | Other Significant Observable Inputs (Level 2) | Significant Unobservable Inputs (Level 3) | Total | |||||||||||||||
Total Affiliated Bond Funds | $ | 862,681,355 | $ | - | $ | - | $ | 862,681,355 | |||||||||||
Total Affiliated Stock Funds | 372,550,045 | - | - | 372,550,045 | |||||||||||||||
Total Short-Term Investments | 6,705,042 | - | - | 6,705,042 | |||||||||||||||
Total Investments | $ | 1,241,936,442 | $ | - | $ | - | $ | 1,241,936,442 | |||||||||||
There were no transfers of financial assets between levels 1 and 2 during the period.
See accompanying notes to financial statements.
77
Columbia Acorn Emerging Markets Fund
Major Portfolio Changes in the Second Quarter (Unaudited)
Number of Shares | |||||||||||
3/31/13 | 6/30/13 | ||||||||||
Purchases | |||||||||||
Asia | |||||||||||
| > Taiwan | |||||||||||
Advantech | 76,169 | 493,169 | |||||||||
CHC Healthcare | 39,000 | 565,000 | |||||||||
Chroma Ate | 88,990 | 888,990 | |||||||||
CTCI Corp | 201,000 | 1,413,000 | |||||||||
Far EasTone Telecom | 289,000 | 1,896,000 | |||||||||
Flexium Interconnect | 98,000 | 431,000 | |||||||||
Ginko International | 11,000 | 98,000 | |||||||||
Lite-On Technology | 0 | 573,000 | |||||||||
Lung Yen | 63,500 | 498,500 | |||||||||
PC Home | 55,000 | 318,000 | |||||||||
St. Shine Optical | 15,000 | 92,000 | |||||||||
Taiwan Hon Chuan | 126,000 | 974,000 | |||||||||
| > Hong Kong | |||||||||||
AAC Technologies | 80,527 | 386,527 | |||||||||
| ASM Pacific | 0 | 167,700 | |||||||||
Lifestyle International | 195,589 | 1,526,089 | |||||||||
L'Occitane International | 73,250 | 711,250 | |||||||||
| Mapletree Greater China Commercial Trust | 259,000 | 2,123,000 | |||||||||
Melco International | 379,000 | 2,286,000 | |||||||||
Sa Sa International | 231,799 | 1,595,799 | |||||||||
| > Indonesia | |||||||||||
Ace Indonesia | 6,656,690 | 20,804,690 | |||||||||
Archipelago Resources | 350,164 | 1,591,929 | |||||||||
Arwana Citramulia | 0 | 4,654,500 | |||||||||
Matahari Department Store | 236,500 | 1,443,000 | |||||||||
Mayora Indah | 121,500 | 530,000 | |||||||||
MNC Skyvision | 1,420,000 | 8,495,500 | |||||||||
Surya Citra Media | 781,440 | 7,556,079 | |||||||||
Tower Bersama Infrastructure | 966,609 | 6,061,109 | |||||||||
| > India | |||||||||||
| Adani Ports & Special Economic Zone | 0 | 633,723 | |||||||||
Bosch | 1,986 | 10,503 | |||||||||
Colgate Palmolive India | 9,617 | 71,675 | |||||||||
Redington India | 181,621 | 1,948,273 | |||||||||
TTK Prestige | 3,725 | 31,154 | |||||||||
United Breweries | 34,532 | 217,891 | |||||||||
Yes Bank | 28,042 | 308,035 | |||||||||
| > Thailand | |||||||||||
Home Product Center | 579,900 | 6,255,500 | |||||||||
Robinson's Department Store | 84,400 | 1,181,500 | |||||||||
Samui Airport Property Fund | 350,700 | 5,178,500 | |||||||||
| > Philippines | |||||||||||
Int'l Container Terminal | 104,387 | 836,317 | |||||||||
Manila Water Company | 234,865 | 1,929,065 | |||||||||
Melco Crown (Philippines) Resorts | 0 | 6,983,200 | |||||||||
Number of Shares | |||||||||||
3/31/13 | 6/30/13 | ||||||||||
| > China | |||||||||||
AMVIG Holdings | 578,000 | 3,644,000 | |||||||||
Biostime | 0 | 98,500 | |||||||||
WuXi PharmaTech - ADR | 0 | 76,213 | |||||||||
| > Cambodia | |||||||||||
Nagacorp | 784,000 | 4,518,000 | |||||||||
| > Korea | |||||||||||
Paradise Co | 19,125 | 131,006 | |||||||||
| > Japan | |||||||||||
Kansai Paint | 28,760 | 139,760 | |||||||||
| > Singapore | |||||||||||
Super Group | 0 | 494,000 | |||||||||
| > Mongolia | |||||||||||
Mongolian Mining | 579,600 | 7,965,100 | |||||||||
Europe | |||||||||||
| > Finland | |||||||||||
Tikkurila | 0 | 80,474 | |||||||||
Vacon | 5,016 | 40,871 | |||||||||
| > Russia | |||||||||||
QIWI - ADR | 0 | 91,058 | |||||||||
Yandex | 0 | 79,673 | |||||||||
| > Kazakhstan | |||||||||||
| Halyk Savings Bank of Kazakhstan - GDR | 57,785 | 432,482 | |||||||||
| > Italy | |||||||||||
Pirelli | 31,152 | 200,846 | |||||||||
| > Turkey | |||||||||||
Bizim Toptan | 13,675 | 139,435 | |||||||||
| > United Kingdom | |||||||||||
Cable and Wireless | 413,481 | 2,776,258 | |||||||||
| > Switzerland | |||||||||||
Dufry Group | 4,348 | 12,870 | |||||||||
| Latin America | |||||||||||
| > Brazil | |||||||||||
Arcos Dorados | 16,317 | 131,431 | |||||||||
Beadell Resources | 320,191 | 2,791,286 | |||||||||
Linx | 13,900 | 102,100 | |||||||||
Localiza Rent A Car | 24,100 | 119,670 | |||||||||
Multiplus | 15,600 | 105,500 | |||||||||
Odontoprev | 47,300 | 399,100 | |||||||||
See accompanying notes to financial statements.
78
Number of Shares | |||||||||||
3/31/13 | 6/30/13 | ||||||||||
Purchases (continued) | |||||||||||
| Latin America—continued | |||||||||||
| > Mexico | |||||||||||
Bolsa Mexicana de Valores | 77,000 | 673,800 | |||||||||
Genomma Lab Internacional | 90,400 | 872,100 | |||||||||
Gruma | 0 | 418,000 | |||||||||
| Grupo Aeroportuario del Sureste - ADR | 2,447 | 15,922 | |||||||||
Qualitas | 0 | 449,700 | |||||||||
| > Colombia | |||||||||||
Isagen | 135,457 | 2,106,605 | |||||||||
| > Chile | |||||||||||
Empresas Hites | 155,147 | 2,134,691 | |||||||||
| Other Countries | |||||||||||
| > South Africa | |||||||||||
Coronation Fund Managers | 109,663 | 764,187 | |||||||||
Massmart Holdings | 18,011 | 158,152 | |||||||||
Mr. Price | 18,556 | 144,531 | |||||||||
Rand Merchant Insurance | 161,832 | 1,296,769 | |||||||||
| > United States | |||||||||||
Atwood Oceanics | 6,014 | 37,826 | |||||||||
Textainer Group Holdings | 9,393 | 69,220 | |||||||||
| > Canada | |||||||||||
Alliance Grain Traders | 17,199 | 114,251 | |||||||||
CAE | 0 | 157,990 | |||||||||
Number of Shares | |||||||||||
3/31/13 | 6/30/13 | ||||||||||
Sales | |||||||||||
Asia | |||||||||||
| > Indonesia | |||||||||||
Indosiair Karya Media | 1,358,000 | 0 | |||||||||
| > Thailand | |||||||||||
Siam Makro | 10,300 | 0 | |||||||||
| > China | |||||||||||
Digital China | 235,151 | 67,151 | |||||||||
| Latin America | |||||||||||
| > Argentina | |||||||||||
Madalena Ventures | 635,500 | 0 | |||||||||
| Other Countries | |||||||||||
| > Canada | |||||||||||
Americas Petrogas | 67,105 | 0 | |||||||||
See accompanying notes to financial statements.
79
Columbia Acorn Emerging Markets Fund
Statement of Investments (Unaudited), June 30, 2013
Number of Shares | Value | ||||||||||
Equities: 92.1% | |||||||||||
Asia 54.6% | |||||||||||
| > Taiwan 14.1% | |||||||||||
1,896,000 | Far EasTone Telecom | $ | 5,081,481 | ||||||||
Taiwan's Third Largest Mobile Operator | |||||||||||
1,413,000 | CTCI Corp | 2,562,715 | |||||||||
International Engineering Firm | |||||||||||
92,000 | St. Shine Optical | 2,378,160 | |||||||||
| World's Leading Disposable Contact Lens OEM (Original Equipment Manufacturer) | |||||||||||
493,169 | Advantech | 2,339,071 | |||||||||
Industrial PC & Components | |||||||||||
974,000 | Taiwan Hon Chuan | 2,272,884 | |||||||||
| Beverage Packaging (Bottles, Caps, Labels) Manufacturer | |||||||||||
318,000 | PC Home | 1,658,230 | |||||||||
Taiwanese Internet Retail Company | |||||||||||
98,000 | Ginko International | 1,642,226 | |||||||||
Largest Contact Lens Maker in China | |||||||||||
498,500 | Lung Yen | 1,619,182 | |||||||||
Funeral Services & Columbaria | |||||||||||
888,990 | Chroma Ate | 1,504,423 | |||||||||
| Automatic Test Systems, Testing & Measurement Instruments | |||||||||||
565,000 | CHC Healthcare | 1,495,548 | |||||||||
Medical Device Distributor | |||||||||||
431,000 | Flexium Interconnect | 1,464,249 | |||||||||
| Flexible Printed Circuit for Mobile Electronics | |||||||||||
573,000 | Lite-On Technology | 1,001,581 | |||||||||
| Mobile Device, LED & IT Component Supplier | |||||||||||
25,019,750 | |||||||||||
| > Hong Kong 9.3% | |||||||||||
2,286,000 | Melco International | 4,289,313 | |||||||||
Macau Casino Operator | |||||||||||
1,526,089 | Lifestyle International | 3,185,234 | |||||||||
| Mid to High-end Department Store Operator in Hong Kong & China | |||||||||||
386,527 | AAC Technologies | 2,168,600 | |||||||||
Miniature Acoustic Components | |||||||||||
711,250 | L'Occitane International | 1,910,645 | |||||||||
Skin Care & Cosmetics Producer | |||||||||||
167,700 | ASM Pacific | 1,840,970 | |||||||||
| Semi Backend & Surface Mounting Equipment | |||||||||||
2,123,000 | Mapletree Greater China Commercial Trust (a) | 1,577,916 | |||||||||
Retail & Office Property Landlord | |||||||||||
1,595,799 | Sa Sa International | 1,575,883 | |||||||||
Cosmetics Retailer | |||||||||||
16,548,561 | |||||||||||
| > Indonesia 8.3% | |||||||||||
6,061,109 | Tower Bersama Infrastructure (a) | 3,165,148 | |||||||||
Communications Towers | |||||||||||
7,556,079 | Surya Citra Media | 2,073,657 | |||||||||
Free to Air TV Station in Indonesia | |||||||||||
Number of Shares | Value | ||||||||||
8,495,500 | MNC Skyvision (a) | $ | 2,003,710 | ||||||||
| Largest Satellite Pay TV Operator in Indonesia | |||||||||||
1,443,000 | Matahari Department Store (a) | 1,687,285 | |||||||||
| Largest Department Store Chain in Indonesia | |||||||||||
530,000 | Mayora Indah | 1,606,189 | |||||||||
Consumer Branded Food Manufacturer | |||||||||||
20,804,690 | Ace Indonesia | 1,547,372 | |||||||||
Home Improvement Retailer | |||||||||||
4,654,500 | Arwana Citramulia | 1,498,050 | |||||||||
Ceramic Tiles for Home Decoration | |||||||||||
1,591,929 | Archipelago Resources (a) | 1,144,038 | |||||||||
| Gold Mining Projects in Indonesia, Vietnam & the Philippines | |||||||||||
14,725,449 | |||||||||||
| > India 7.8% | |||||||||||
217,891 | United Breweries | 2,647,085 | |||||||||
India's Largest Brewer | |||||||||||
308,035 | Yes Bank | 2,381,207 | |||||||||
Commercial Banking in India | |||||||||||
1,948,273 | Redington India | 2,352,189 | |||||||||
| Supply Chain Solutions for IT & Mobile Handsets in Emerging Markets | |||||||||||
31,154 | TTK Prestige | 1,650,620 | |||||||||
Branded Cooking Equipment | |||||||||||
71,675 | Colgate Palmolive India | 1,637,320 | |||||||||
Consumer Products in Oral Care | |||||||||||
633,723 | Adani Ports & Special Economic Zone | 1,600,014 | |||||||||
Indian West Coast Shipping Port | |||||||||||
10,503 | Bosch | 1,594,419 | |||||||||
Automotive Parts | |||||||||||
13,862,854 | |||||||||||
| > Thailand 4.3% | |||||||||||
5,178,500 | Samui Airport Property Fund | 2,932,046 | |||||||||
Thai Airport Operator | |||||||||||
6,255,500 | Home Product Center | 2,309,831 | |||||||||
Home Improvement Retailer | |||||||||||
1,181,500 | Robinson's Department Store | 2,309,049 | |||||||||
| Mass-market Department Store Operator in Thailand | |||||||||||
7,550,926 | |||||||||||
| > Philippines 2.5% | |||||||||||
836,317 | Int'l Container Terminal | 1,676,340 | |||||||||
| Container Handling Terminals & Port Management | |||||||||||
1,929,065 | Manila Water Company | 1,445,326 | |||||||||
Water Utility Company in Philippines | |||||||||||
6,983,200 | Melco Crown (Philippines) Resorts (a) | 1,341,679 | |||||||||
Integrated Resort Operator in Manila | |||||||||||
4,463,345 | |||||||||||
| > China 2.0% | |||||||||||
76,213 | WuXi PharmaTech - ADR (a) | 1,600,473 | |||||||||
| Largest Contract Research Organization Business in China | |||||||||||
3,644,000 | AMVIG Holdings | 1,409,480 | |||||||||
| Chinese Tobacco Packaging Material Supplier | |||||||||||
See accompanying notes to financial statements.
80
Number of Shares | Value | ||||||||||
| > China—continued | |||||||||||
98,500 | Biostime | $ | 550,820 | ||||||||
| Pediatric Nutrition & Baby Care Products Provider | |||||||||||
67,151 | Digital China | 79,820 | |||||||||
| IT Distribution & Systems Integration Services | |||||||||||
3,640,593 | |||||||||||
| > Cambodia 2.0% | |||||||||||
4,518,000 | Nagacorp | 3,511,616 | |||||||||
| Casino/Entertainment Complex in Cambodia | |||||||||||
| > Korea 1.5% | |||||||||||
131,006 | Paradise Co | 2,644,302 | |||||||||
Korean 'Foreigner Only' Casino Operator | |||||||||||
| > Japan 1.0% | |||||||||||
139,760 | Kansai Paint | 1,784,058 | |||||||||
| Paint Producer in Japan, India, China & Southeast Asia | |||||||||||
| > Singapore 1.0% | |||||||||||
494,000 | Super Group | 1,733,190 | |||||||||
| Instant Food & Beverages in Southeast Asia | |||||||||||
| > Mongolia 0.8% | |||||||||||
7,965,100 | Mongolian Mining (a) | 1,477,684 | |||||||||
Coking Coal Mining in Mongolia | |||||||||||
Asia: Total | 96,962,328 | ||||||||||
Europe 13.3% | |||||||||||
| > Finland 2.5% | |||||||||||
40,871 | Vacon | 2,710,525 | |||||||||
| Leading Independent Manufacturer of Variable Speed Alternating Current Drives | |||||||||||
80,474 | Tikkurila | 1,816,188 | |||||||||
| Decorative & Industrial Paint in Scandinavia & Central & Eastern Europe | |||||||||||
4,526,713 | |||||||||||
| > Russia 2.4% | |||||||||||
79,673 | Yandex (a) | 2,201,365 | |||||||||
| Search Engine for Russian & Turkish Languages | |||||||||||
91,058 | QIWI - ADR | 2,112,546 | |||||||||
| Electronic Payments Network Serving Russia & the Commonwealth of Independent States | |||||||||||
4,313,911 | |||||||||||
| > Sweden 2.1% | |||||||||||
138,010 | Hexagon | 3,689,198 | |||||||||
| Design, Measurement & Visualization Software & Equipment | |||||||||||
| > Kazakhstan 1.8% | |||||||||||
432,482 | Halyk Savings Bank of Kazakhstan - GDR | 3,191,717 | |||||||||
| Largest Retail Bank & Insurer in Kazakhstan | |||||||||||
Number of Shares | Value | ||||||||||
| > Italy 1.3% | |||||||||||
200,846 | Pirelli | $ | 2,321,808 | ||||||||
Global Tire Supplier | |||||||||||
| > Turkey 1.3% | |||||||||||
139,435 | Bizim Toptan | 2,270,057 | |||||||||
Cash & Carry Stores in Turkey | |||||||||||
| > United Kingdom 1.0% | |||||||||||
2,776,258 | Cable and Wireless | 1,728,205 | |||||||||
| Leading Telecoms Service Provider in the Caribbean | |||||||||||
| > Switzerland 0.9% | |||||||||||
12,870 | Dufry Group (a) | 1,559,028 | |||||||||
| Operates Airport Duty Free & Duty Paid Shops | |||||||||||
Europe: Total | 23,600,637 | ||||||||||
Latin America 12.4% | |||||||||||
| > Brazil 5.3% | |||||||||||
102,100 | Linx | 1,708,568 | |||||||||
Retail Management Software in Brazil | |||||||||||
119,670 | Localiza Rent A Car | 1,692,065 | |||||||||
Car Rental | |||||||||||
399,100 | Odontoprev | 1,643,726 | |||||||||
Dental Insurance | |||||||||||
105,500 | Multiplus | 1,558,848 | |||||||||
Loyalty Program Operator in Brazil | |||||||||||
131,431 | Arcos Dorados (b) | 1,535,114 | |||||||||
| McDonald's Master Franchise for Latin America | |||||||||||
2,791,286 | Beadell Resources (a) | 1,302,253 | |||||||||
Gold Mining in Brazil | |||||||||||
9,440,574 | |||||||||||
| > Mexico 4.6% | |||||||||||
418,000 | Gruma (a) | 1,900,081 | |||||||||
Tortilla Producer & Distributor | |||||||||||
15,922 | Grupo Aeroportuario del Sureste - ADR | 1,771,163 | |||||||||
Mexican Airport Operator | |||||||||||
872,100 | Genomma Lab Internacional (a) | 1,722,333 | |||||||||
| Develops, Markets & Distributes Consumer Products | |||||||||||
673,800 | Bolsa Mexicana de Valores | 1,675,471 | |||||||||
Mexico's Stock Exchange | |||||||||||
449,700 | Qualitas | 1,075,883 | |||||||||
| Leading Auto Insurer in Mexico & Central America | |||||||||||
8,144,931 | |||||||||||
| > Colombia 1.6% | |||||||||||
2,106,605 | Isagen (a) | 2,822,787 | |||||||||
Leading Colombian Electricity Provider | |||||||||||
| > Chile 0.9% | |||||||||||
2,134,691 | Empresas Hites | 1,676,912 | |||||||||
Mass Retailer for the Lower Income Strata | |||||||||||
Latin America: Total | 22,085,204 | ||||||||||
See accompanying notes to financial statements.
81
Columbia Acorn Emerging Markets Fund
Statement of Investments (Unaudited), continued
Number of Shares | Value | ||||||||||
Other Countries 11.8% | |||||||||||
| > South Africa 7.4% | |||||||||||
764,187 | Coronation Fund Managers | $ | 4,851,399 | ||||||||
South African Fund Manager | |||||||||||
1,296,769 | Rand Merchant Insurance | 3,302,115 | |||||||||
| Directly Sold Property & Casualty Insurance; Holdings in Other Insurers | |||||||||||
158,152 | Massmart Holdings | 2,868,640 | |||||||||
| General Merchandise, Food & Home Improvement Stores; Wal-Mart Subsidiary | |||||||||||
144,531 | Mr. Price | 1,970,063 | |||||||||
| South African Retailer of Apparel, Household & Sporting Goods | |||||||||||
12,992,217 | |||||||||||
| > United States 2.6% | |||||||||||
69,220 | Textainer Group Holdings (b) | 2,660,817 | |||||||||
Top International Container Leasor | |||||||||||
37,826 | Atwood Oceanics (a) | 1,968,843 | |||||||||
Offshore Drilling Contractor | |||||||||||
4,629,660 | |||||||||||
| > Canada 1.8% | |||||||||||
157,990 | CAE | 1,638,938 | |||||||||
Flight Simulator Equipment & Training Centers | |||||||||||
114,251 | Alliance Grain Traders | 1,591,497 | |||||||||
Global Leader in Pulse Processing & Distribution | |||||||||||
3,230,435 | |||||||||||
Other Countries: Total | 20,852,312 | ||||||||||
| Total Equities: 92.1% (Cost: $170,635,438) | 163,500,481 | (c) | |||||||||
Number of Shares | Value | ||||||||||
Short-Term Investments 5.2% | |||||||||||
9,182,579 | JPMorgan U.S. Government Money Market Fund, Capital Shares (7 day yield of 0.01%) | $ | 9,182,579 | ||||||||
| Total Short-Term Investments: 5.2% (Cost: $9,182,579) | 9,182,579 | ||||||||||
Securities Lending Collateral 0.9% | |||||||||||
1,624,977 | Dreyfus Government Cash Management Fund, Institutional Shares (7 day yield of 0.01%) (d) | 1,624,977 | |||||||||
| Total Securities Lending Collateral: (Cost: $1,624,977) | 1,624,977 | ||||||||||
| Total Investments: 98.2% (Cost: $181,442,994)(e) | 174,308,037 | ||||||||||
| Obligation to Return Collateral for Securities Loaned: (0.9)% | (1,624,977 | ) | |||||||||
Cash and Other Assets Less Liabilities: 2.7% | 4,796,780 | ||||||||||
Net Assets: 100.0% | $ | 177,479,840 | |||||||||
ADR – American Depositary Receipts
GDR – Global Depositary Receipts
> Notes to Statement of Investments
(a) Non-income producing security.
(b) All or a portion of this security was on loan at June 30, 2013. The total market value of securities on loan at June 30, 2013 was $1,581,515.
(c) On June 30, 2013, the Fund's total investments were denominated in currencies as follows:
Currency | Value | Percentage of Net Assets | |||||||||
Taiwan Dollar | $ | 25,019,750 | 14.1 | ||||||||
Hong Kong Dollar | 16,548,561 | 9.3 | |||||||||
Indonesia Rupiah | 14,725,449 | 8.3 | |||||||||
Indian Rupee | 13,862,854 | 7.8 | |||||||||
South African Rand | 12,992,217 | 7.4 | |||||||||
Brazilian Real | 9,440,574 | 5.3 | |||||||||
| Other currencies less than 5% of total net assets | 70,911,076 | 39.9 | |||||||||
Total Equities | $ | 163,500,481 | 92.1 | ||||||||
(d) Investment made with cash collateral received from securities lending activity.
(e) At June 30, 2013, for federal income tax purposes, the cost of investments was $181,442,994 and net unrealized depreciation was $7,134,957 consisting of gross unrealized appreciation of $3,826,193 and gross unrealized depreciation of $10,961,150.
Fair Value Measurements
Various inputs are used in determining the value of the Fund's investments, following the input prioritization hierarchy established by accounting principles generally accepted in the United States of America (GAAP). These inputs are summarized in the three broad levels listed below:
• Level 1 – quoted prices in active markets for identical securities
See accompanying notes to financial statements.
82
> Notes to Statement of Investments
• Level 2 – prices determined using other significant observable inputs (including quoted prices for similar securities, interest rates, prepayment speeds, credit risk and others)
• Level 3 – prices determined using significant unobservable inputs where quoted prices or observable inputs are unavailable or less reliable (including management's own assumptions about the factors market participants would use in pricing an investment)
The inputs or methodology used for valuing securities are not necessarily an indication of the risk associated with investing in those securities.
Examples of the types of securities in which the Fund would typically invest and how they are classified within this hierarchy are as follows. Typical Level 1 securities include exchange traded domestic equities, mutual funds whose NAVs are published each day and exchange traded foreign equities that are not statistically fair valued. Typical Level 2 securities include exchange traded foreign equities that are statistically fair valued, forward foreign currency exchange contracts and short-term investments valued at amortized cost. Additionally, securities fair valued by the Valuation Committee (the Committee) of the Fund's Board of Trustees (the Board) that rely on significant observable inputs are also included in Level 2. Typical Level 3 securities include any security fair valued by the Committee that relies on significant unobservable inputs.
Under the direction of the Board, the Committee is responsible for carrying out the valuation procedures approved by the Board.
The Committee meets as necessary, and no less frequently than quarterly, to determine fair values for securities for which market quotations are not readily available or for which the investment manager believes that available market quotations are unreliable, to review the appropriateness of the Trust's Portfolio Pricing Policy and the pricing procedures of the investment manager (the Policies), and to review the continuing appropriateness of the current value of any security subject to the Policies. The Policies address, among other things: circumstances under which market quotations will be deemed readily available; selection of third party pricing vendors; appropriate pricing methodologies; events that require fair valuation and fair value techniques; and circumstances under which securities will be deemed to pose a potential for stale pricing, including when securities are illiquid, restricted, or in default. The Committee may also meet to discuss additional valuation matters, which may include review of back-testing results, review of time-sensitive information or approval of other valuation related actions, and to review the appropriateness of the Policies.
For investments categorized as Level 3, the significant unobservable inputs used in the fair value measurement of the Funds' securities may include: (i) data specific to the issuer or comparable issuers, (ii) general market or specific sector news and (iii) quoted prices and specific or similar security transactions. The Committee considers this data and any changes from prior periods in order to assess the reasonableness of observable and unobservable inputs, any assumptions or internal models used to value those securities and changes in fair value. Significant changes in any of these factors could result in lower or higher fair value measurements. Various factors impact the frequency of monitoring (which may occur as often as daily), however the Committee may determine that changes to inputs, assumptions and models are not required with the same frequency.
The following table summarizes the inputs used, as of June 30, 2013, in valuing the Fund's assets:
Investment Type | Quoted Prices (Level 1) | Other Significant Observable Inputs (Level 2) | Significant Unobservable Inputs (Level 3) | Total | |||||||||||||||
Equities | |||||||||||||||||||
Asia | $ | 1,600,473 | $ | 95,361,855 | $ | - | $ | 96,962,328 | |||||||||||
Europe | 4,313,911 | 19,286,726 | - | 23,600,637 | |||||||||||||||
Latin America | 20,782,951 | 1,302,253 | - | 22,085,204 | |||||||||||||||
Other Countries | 7,860,095 | 12,992,217 | - | 20,852,312 | |||||||||||||||
Total Equities | 34,557,430 | 128,943,051 | - | 163,500,481 | |||||||||||||||
Total Short-Term Investments | 9,182,579 | - | - | 9,182,579 | |||||||||||||||
Total Securities Lending Collateral | 1,624,977 | - | - | 1,624,977 | |||||||||||||||
Total Investments | $ | 45,364,986 | $ | 128,943,051 | $ | - | $ | 174,308,037 | |||||||||||
The Fund's assets assigned to the Level 2 input category are generally valued using a market approach, in which a security's value is determined through its correlation to prices and information from observable market transactions for similar or identical assets. Foreign equities are generally valued at the last sale price on the foreign exchange or market on which they trade. The Fund may use a statistical fair valuation model, in accordance with the policy adopted by the Board, provided by an independent third party to value securities principally traded in foreign markets in order to adjust for possible stale pricing that may occur between the close of the foreign exchanges and the time for valuation. These models take into account available market data including intraday index, ADR, and ETF movements.
There were no transfers of financial assets between levels 1 and 2 during the period.
See accompanying notes to financial statements.
83
Columbia Acorn Emerging Markets Fund
Portfolio Diversification (Unaudited)
At June 30, 2013, the Fund's portfolio investments as a percentage of net assets were diversified as follows:
Value | Percentage of Net Assets | ||||||||||
| > Consumer Goods & Services | |||||||||||
Retail | $ | 21,432,350 | 12.1 | ||||||||
Casinos & Gaming | 11,786,910 | 6.6 | |||||||||
Food & Beverage | 11,531,327 | 6.5 | |||||||||
Other Consumer Services | 4,804,416 | 2.7 | |||||||||
Consumer Goods Distribution | 3,989,509 | 2.3 | |||||||||
Other Durable Goods | 3,972,428 | 2.2 | |||||||||
Nondurables | 3,632,978 | 2.0 | |||||||||
Travel | 1,692,065 | 1.0 | |||||||||
62,841,983 | 35.4 | ||||||||||
| > Information | |||||||||||
Mobile Communications | 8,246,629 | 4.7 | |||||||||
| Computer Hardware & Related Equipment | 5,509,252 | 3.1 | |||||||||
Business Software | 5,397,766 | 3.0 | |||||||||
Semiconductors & Related Equipment | 3,305,219 | 1.9 | |||||||||
Internet Related | 2,201,365 | 1.2 | |||||||||
Financial Processors | 2,112,546 | 1.2 | |||||||||
TV Broadcasting | 2,073,657 | 1.2 | |||||||||
Satellite Broadcasting & Services | 2,003,710 | 1.1 | |||||||||
Telephone & Data Services | 1,728,205 | 1.0 | |||||||||
Instrumentation | 1,504,423 | 0.9 | |||||||||
Electronics Distribution | 79,820 | 0.0 | * | ||||||||
34,162,592 | 19.3 | ||||||||||
| > Finance | |||||||||||
Insurance | 6,021,724 | 3.4 | |||||||||
Banks | 5,572,924 | 3.2 | |||||||||
Brokerage & Money Management | 4,851,399 | 2.7 | |||||||||
Finance Companies | 2,660,817 | 1.5 | |||||||||
Specialized Finance | 1,675,471 | 0.9 | |||||||||
20,782,335 | 11.7 | ||||||||||
| > Industrial Goods & Services | |||||||||||
| Industrial Materials & Specialty Chemicals | 8,780,660 | 5.0 | |||||||||
Other Industrial Services | 4,915,292 | 2.8 | |||||||||
Electrical Components | 2,710,525 | 1.5 | |||||||||
Construction | 2,562,715 | 1.4 | |||||||||
Machinery | 1,594,419 | 0.9 | |||||||||
20,563,611 | 11.6 | ||||||||||
Value | Percentage of Net Assets | ||||||||||
| > Other Industries | |||||||||||
Transportation | $ | 4,703,209 | 2.6 | ||||||||
Regulated Utilities | 4,268,113 | 2.4 | |||||||||
Real Estate | 1,577,916 | 0.9 | |||||||||
10,549,238 | 5.9 | ||||||||||
| > Energy & Minerals | |||||||||||
Mining | 3,923,975 | 2.2 | |||||||||
Oil Services | 1,968,843 | 1.1 | |||||||||
Agricultural Commodities | 1,591,497 | 0.9 | |||||||||
7,484,315 | 4.2 | ||||||||||
| > Health Care | |||||||||||
Medical Supplies | 4,020,386 | 2.3 | |||||||||
Pharmaceuticals | 1,600,473 | 0.9 | |||||||||
Medical Equipment & Devices | 1,495,548 | 0.8 | |||||||||
7,116,407 | 4.0 | ||||||||||
Total Equities: | 163,500,481 | 92.1 | |||||||||
Short-Term Investments: | 9,182,579 | 5.2 | |||||||||
Securities Lending Collateral: | 1,624,977 | 0.9 | |||||||||
Total Investments: | 174,308,037 | 98.2 | |||||||||
| Obligation to Return Collateral for Securities Loaned: | (1,624,977 | ) | (0.9 | ) | |||||||
| Cash and Other Assets Less Liabilities: | 4,796,780 | 2.7 | |||||||||
Net Assets: | $ | 177,479,840 | 100.0 | ||||||||
* Rounds to zero.
See accompanying notes to financial statements.
84
Columbia Acorn European Fund
Major Portfolio Changes in the Second Quarter (Unaudited)
Number of Shares | |||||||||||
3/31/13 | 6/30/13 | ||||||||||
Purchases | |||||||||||
Europe | |||||||||||
| > United Kingdom | |||||||||||
Abcam | 6,313 | 11,580 | |||||||||
Aggreko | 1,535 | 3,000 | |||||||||
Assura | 160,400 | 326,990 | |||||||||
BBA Aviation | 10,870 | 17,410 | |||||||||
Cable and Wireless | 81,000 | 118,770 | |||||||||
Charles Taylor | 28,121 | 56,105 | |||||||||
Croda | 0 | 3,000 | |||||||||
Domino's Pizza UK & Ireland | 10,550 | 14,470 | |||||||||
Elementis | 11,113 | 19,390 | |||||||||
Fidessa Group | 8 | 786 | |||||||||
Halford's | 0 | 14,870 | |||||||||
Jardine Lloyd Thompson Group | 8,535 | 15,790 | |||||||||
Rightmove | 3,500 | 4,000 | |||||||||
Shaftesbury | 6,100 | 10,860 | |||||||||
Smiths News | 4,676 | 29,430 | |||||||||
Spirax Sarco | 2,013 | 3,364 | |||||||||
Telecity | 4,360 | 9,910 | |||||||||
WH Smith | 5,790 | 9,540 | |||||||||
Whitbread | 1,600 | 3,130 | |||||||||
| > France | |||||||||||
| 1000 mercis | 1,914 | 3,100 | |||||||||
AKKA Technologies | 0 | 2,500 | |||||||||
Eurofins Scientific | 671 | 1,060 | |||||||||
Gemalto | 760 | 1,410 | |||||||||
Hi-Media | 21,200 | 31,230 | |||||||||
Neopost | 1,530 | 2,640 | |||||||||
Norbert Dentressangle | 830 | 1,200 | |||||||||
Saft | 2,407 | 3,341 | |||||||||
| > Netherlands | |||||||||||
Aalberts Industries | 3,617 | 6,699 | |||||||||
Arcadis | 1,474 | 3,935 | |||||||||
Core Labs | 346 | 550 | |||||||||
Fugro | 900 | 1,430 | |||||||||
Imtech | 2,596 | 7,116 | |||||||||
TKH Group | 2,156 | 3,069 | |||||||||
UNIT4 | 2,062 | 3,090 | |||||||||
| > Germany | |||||||||||
Aurelius | 0 | 4,610 | |||||||||
NORMA Group | 1,283 | 2,170 | |||||||||
Stratec Biomedical Systems | 1,038 | 3,100 | |||||||||
TAG Immobilien | 3,900 | 6,670 | |||||||||
Wirecard | 2,310 | 2,950 | |||||||||
| > Switzerland | |||||||||||
Geberit | 339 | 440 | |||||||||
Partners Group | 393 | 620 | |||||||||
Number of Shares | |||||||||||
3/31/13 | 6/30/13 | ||||||||||
| > Sweden | |||||||||||
Hexagon | 2,547 | 3,570 | |||||||||
Sweco | 5,861 | 7,840 | |||||||||
Unibet | 1,506 | 2,540 | |||||||||
| > Finland | |||||||||||
Tikkurila | 0 | 4,628 | |||||||||
Vacon | 1,151 | 1,829 | |||||||||
| > Russia | |||||||||||
QIWI - ADR | 0 | 4,690 | |||||||||
Yandex | 2,381 | 3,110 | |||||||||
| > Norway | |||||||||||
Atea | 6,744 | 10,610 | |||||||||
Subsea 7 | 2,000 | 3,710 | |||||||||
| > Italy | |||||||||||
Pirelli | 6,000 | 7,680 | |||||||||
| > Denmark | |||||||||||
Jyske Bank | 1,000 | 1,990 | |||||||||
SimCorp | 2,000 | 2,700 | |||||||||
| > Spain | |||||||||||
Dia | 8,524 | 13,680 | |||||||||
| > Belgium | |||||||||||
EVS Broadcast Equipment | 728 | 1,110 | |||||||||
| > Portugal | |||||||||||
Redes Energéticas Nacionais | 14,342 | 26,550 | |||||||||
| > Turkey | |||||||||||
Bizim Toptan | 1,994 | 4,560 | |||||||||
Other Countries | |||||||||||
| > Canada | |||||||||||
Alliance Grain Traders | 3,632 | 7,510 | |||||||||
| > United States | |||||||||||
Gulfmark Offshore | 0 | 2,000 | |||||||||
Asia | |||||||||||
| > Indonesia | |||||||||||
Archipelago Resources | 98,638 | 139,538 | |||||||||
| > Hong Kong | |||||||||||
L'Occitane International | 22,800 | 32,990 | |||||||||
See accompanying notes to financial statements.
85
Columbia Acorn European Fund
Major Portfolio Changes in the Second Quarter (Unaudited), continued
Number of Shares | |||||||||||
3/31/13 | 6/30/13 | ||||||||||
Sales | |||||||||||
Europe | |||||||||||
| > United Kingdom | |||||||||||
Greggs | 8,700 | 0 | |||||||||
| > Germany | |||||||||||
Bertrandt | 454 | 0 | |||||||||
Pfeiffer Vacuum | 360 | 0 | |||||||||
| > Switzerland | |||||||||||
Dufry Group | 660 | 530 | |||||||||
| > Sweden | |||||||||||
Cavotec | 16,100 | 0 | |||||||||
| |||
See accompanying notes to financial statements.
86
Columbia Acorn European Fund
Statement of Investments (Unaudited), June 30, 2013
Number of Shares | Value | ||||||||||
Equities: 86.7% | |||||||||||
Europe 81.9% | |||||||||||
| > United Kingdom 28.7% | |||||||||||
15,790 | Jardine Lloyd Thompson Group | $ | 218,711 | ||||||||
International Business Insurance Broker | |||||||||||
326,990 | Assura | 175,932 | |||||||||
UK Primary Health Care Property Developer | |||||||||||
56,105 | Charles Taylor | 160,426 | |||||||||
Insurance Services | |||||||||||
9,910 | Telecity | 152,714 | |||||||||
European Data Center Provider | |||||||||||
14,470 | Domino's Pizza UK & Ireland | 147,512 | |||||||||
Pizza Delivery in UK, Ireland & Germany | |||||||||||
3,130 | Whitbread | 145,606 | |||||||||
The UK's Leading Hotelier & Coffee Shop | |||||||||||
3,364 | Spirax Sarco | 137,870 | |||||||||
| Steam Systems for Manufacturing & Process Industries | |||||||||||
30,300 | Ocado (a)(b) | 137,471 | |||||||||
Leading Online Grocery Retailer | |||||||||||
4,000 | Rightmove | 126,812 | |||||||||
Internet Real Estate Listings | |||||||||||
3,000 | Croda | 113,130 | |||||||||
Oleochemicals & Industrial Chemicals | |||||||||||
9,540 | WH Smith (b) | 104,184 | |||||||||
| Newsprint, Books & General Stationery Retailer | |||||||||||
10,860 | Shaftesbury | 98,399 | |||||||||
| London Prime Retail Real Estate Investment Trust | |||||||||||
11,580 | Abcam | 79,873 | |||||||||
Online Sales of Antibodies | |||||||||||
3,000 | Aggreko | 74,983 | |||||||||
| Temporary Power & Temperature Control Services | |||||||||||
17,410 | BBA Aviation | 74,148 | |||||||||
Aviation Support Services | |||||||||||
118,770 | Cable and Wireless | 73,934 | |||||||||
| Leading Telecoms Service Provider in the Caribbean | |||||||||||
14,870 | Halford's | 71,519 | |||||||||
| The UK's Leading Retailer for Leisure Goods & Auto Parts | |||||||||||
29,430 | Smiths News | 67,702 | |||||||||
Newspaper & Magazine Distributor | |||||||||||
19,390 | Elementis | 64,701 | |||||||||
Clay-based Additives | |||||||||||
1,065 | Intertek Group | 47,341 | |||||||||
Testing, Inspection & Certification Services | |||||||||||
786 | Fidessa Group | 23,052 | |||||||||
Software for Financial Trading Systems | |||||||||||
116 | Telecom Plus | 2,202 | |||||||||
UK Multi Utility | |||||||||||
2,298,222 | |||||||||||
| > France 12.9% | |||||||||||
1,060 | Eurofins Scientific (a) | 223,684 | |||||||||
| Food, Pharmaceuticals & Materials Screening & Testing | |||||||||||
Number of Shares | Value | ||||||||||
3,100 | 1000 | mercis | $ | 178,352 | |||||||
Interactive Advertising & Marketing | |||||||||||
2,640 | Neopost | 174,799 | |||||||||
Postage Meter Machines | |||||||||||
1,410 | Gemalto | 127,665 | |||||||||
Digital Security Solutions | |||||||||||
1,200 | Norbert Dentressangle | 97,624 | |||||||||
Leading European Logistics & Transport Group | |||||||||||
2,500 | AKKA Technologies | 84,852 | |||||||||
Engineering Consultancy | |||||||||||
3,341 | Saft | 79,386 | |||||||||
Niche Battery Manufacturer | |||||||||||
31,230 | Hi-Media (a) | 67,925 | |||||||||
Online Advertiser in Europe | |||||||||||
1,034,287 | |||||||||||
| > Netherlands 8.1% | |||||||||||
6,699 | Aalberts Industries | 149,721 | |||||||||
Flow Control & Heat Treatment | |||||||||||
3,935 | Arcadis | 105,959 | |||||||||
Engineering Consultants | |||||||||||
3,090 | UNIT4 | 100,147 | |||||||||
Business Software Development | |||||||||||
550 | Core Labs | 83,413 | |||||||||
Oil & Gas Reservoir Consulting | |||||||||||
3,069 | TKH Group | 78,915 | |||||||||
Dutch Industrial Conglomerate | |||||||||||
1,430 | Fugro | 77,701 | |||||||||
Subsea Oilfield Services | |||||||||||
7,116 | Imtech (a)(b) | 52,381 | |||||||||
Technical Installation & Maintenance | |||||||||||
648,237 | |||||||||||
| > Germany 7.1% | |||||||||||
3,100 | Stratec Biomedical Systems | 138,546 | |||||||||
Diagnostic Instrumentation | |||||||||||
4,610 | Aurelius | 110,771 | |||||||||
European Turnaround Investor | |||||||||||
260 | Rational | 87,044 | |||||||||
Commercial Ovens | |||||||||||
2,950 | Wirecard | 80,269 | |||||||||
Online Payment Processing & Risk Management | |||||||||||
2,170 | NORMA Group | 78,481 | |||||||||
Clamps for Automotive & Industrial Applications | |||||||||||
6,670 | TAG Immobilien | 72,698 | |||||||||
Owner of Residential Properties in Germany | |||||||||||
567,809 | |||||||||||
| > Switzerland 5.7% | |||||||||||
620 | Partners Group | 167,821 | |||||||||
Private Markets Asset Management | |||||||||||
45 | Sika | 116,358 | |||||||||
| Chemicals for Construction & Industrial Applications | |||||||||||
440 | Geberit | 108,998 | |||||||||
Plumbing Supplies | |||||||||||
530 | Dufry Group (a) | 64,203 | |||||||||
Operates Airport Duty Free & Duty Paid Shops | |||||||||||
457,380 | |||||||||||
See accompanying notes to financial statements.
87
Columbia Acorn European Fund
Statement of Investments (Unaudited), continued
Number of Shares | Value | ||||||||||
| > Sweden 3.4% | |||||||||||
3,570 | Hexagon | $ | 95,431 | ||||||||
| Design, Measurement & Visualization Software & Equipment | |||||||||||
7,840 | Sweco | 89,143 | |||||||||
Engineering Consultants | |||||||||||
2,540 | Unibet | 85,031 | |||||||||
European Online Gaming Operator | |||||||||||
269,605 | |||||||||||
| > Finland 2.8% | |||||||||||
1,829 | Vacon | 121,297 | |||||||||
| Leading Independent Manufacturer of Variable Speed Alternating Current Drives | |||||||||||
4,628 | Tikkurila | 104,448 | |||||||||
| Decorative & Industrial Paint in Scandinavia & Central & Eastern Europe | |||||||||||
225,745 | |||||||||||
| > Russia 2.4% | |||||||||||
4,690 | QIWI - ADR | 108,808 | |||||||||
| Electronic Payments Network Serving Russia & the Commonwealth of Independent States | |||||||||||
3,110 | Yandex (a) | 85,929 | |||||||||
Search Engine for Russian & Turkish Languages | |||||||||||
194,737 | |||||||||||
| > Norway 2.1% | |||||||||||
10,610 | Atea | 106,985 | |||||||||
| Leading Nordic IT Hardware/Software Reseller & Installation Company | |||||||||||
3,710 | Subsea 7 | 65,046 | |||||||||
Offshore Subsea Contractor | |||||||||||
172,031 | |||||||||||
| > Italy 2.0% | |||||||||||
7,680 | Pirelli | 88,782 | |||||||||
Global Tire Supplier | |||||||||||
27,900 | Geox | 69,349 | |||||||||
Apparel & Shoe Maker | |||||||||||
158,131 | |||||||||||
| > Denmark 1.9% | |||||||||||
2,700 | SimCorp | 80,250 | |||||||||
Software for Investment Managers | |||||||||||
1,990 | Jyske Bank (a) | 74,852 | |||||||||
Danish Bank | |||||||||||
155,102 | |||||||||||
| > Spain 1.3% | |||||||||||
13,680 | Dia | 103,343 | |||||||||
| Leading Hard Discounter in Spain, Latin America & the Eastern Mediterranean | |||||||||||
| > Belgium 1.0% | |||||||||||
1,110 | EVS Broadcast Equipment | 76,958 | |||||||||
Digital Live Mobile Production Software & Systems | |||||||||||
| > Portugal 1.0% | |||||||||||
26,550 | Redes Energéticas Nacionais | 76,133 | |||||||||
| Portuguese Power Transmission & Gas Transportation | |||||||||||
| > Turkey 0.9% | |||||||||||
4,560 | Bizim Toptan | 74,239 | |||||||||
Cash & Carry Stores in Turkey | |||||||||||
Number of Shares | Value | ||||||||||
| > Iceland 0.6% | |||||||||||
43,750 | Marel | $ | 46,285 | ||||||||
| Largest Manufacturer of Poultry & Fish Processing Equipment | |||||||||||
Europe: Total | 6,558,244 | ||||||||||
Other Countries 2.4% | |||||||||||
| > Canada 1.3% | |||||||||||
7,510 | Alliance Grain Traders | 104,613 | |||||||||
| Global Leader in Pulse Processing & Distribution | |||||||||||
| > United States 1.1% | |||||||||||
2,000 | Gulfmark Offshore | 90,180 | |||||||||
Operator of Offshore Supply Vessels | |||||||||||
Other Countries: Total | 194,793 | ||||||||||
Asia 2.4% | |||||||||||
| > Indonesia 1.3% | |||||||||||
139,538 | Archipelago Resources (a) | 100,279 | |||||||||
| Gold Mining Projects in Indonesia, Vietnam & the Philippines | |||||||||||
| > Hong Kong 1.1% | |||||||||||
32,990 | L'Occitane International | 88,621 | |||||||||
Skin Care & Cosmetics Producer | |||||||||||
Asia: Total | 188,900 | ||||||||||
| Total Equities: 86.7% (Cost: $6,448,189) | 6,941,937 | (c) | |||||||||
Short-Term Investments 12.8% | |||||||||||
1,024,159 | JPMorgan U.S. Government Money Market Fund, Capital Shares (7 day yield of 0.01%) | 1,024,159 | |||||||||
| Total Short-Term Investments: 12.8% (Cost: $1,024,159) | 1,024,159 | ||||||||||
Securities Lending Collateral 1.7% | |||||||||||
133,200 | Dreyfus Government Cash Management Fund, Institutional Shares (7 day yield of 0.01%) (d) | 133,200 | |||||||||
| Total Securities Lending Collateral: (Cost: $133,200) | 133,200 | ||||||||||
| Total Investments: 101.2% (Cost: $7,605,548)(e) | 8,099,296 | ||||||||||
| Obligation to Return Collateral for Securities Loaned: (1.7)% | (133,200 | ) | |||||||||
Cash and Other Assets Less Liabilities: 0.5% | 36,941 | ||||||||||
Net Assets: 100.0% | $ | 8,003,037 | |||||||||
See accompanying notes to financial statements.
88
> Notes to Statement of Investments
(a) Non-income producing security.
(b) All or a portion of this security was on loan at June 30, 2013. The total market value of securities on loan at June 30, 2013 was $123,314.
(c) On June 30, 2013, the Fund's total investments were denominated in currencies as follows:
Currency | Value | Percentage of Net Assets | |||||||||
Euro | $ | 2,807,229 | 35.1 | ||||||||
British Pound | 2,398,501 | 29.9 | |||||||||
Swiss Franc | 457,380 | 5.7 | |||||||||
| Other currencies less than 5% of total net assets | 1,278,827 | 16.0 | |||||||||
Total Equities | $ | 6,941,937 | 86.7 | ||||||||
(d) Investment made with cash collateral received from securities lending activity.
(e) At June 30, 2013, for federal income tax purposes, the cost of investments was $7,605,548 and net unrealized appreciation was $493,748 consisting of gross unrealized appreciation of $727,500 and gross unrealized depreciation of $233,752.
Fair Value Measurements
Various inputs are used in determining the value of the Fund's investments, following the input prioritization hierarchy established by accounting principles generally accepted in the United States of America (GAAP). These inputs are summarized in the three broad levels listed below:
• Level 1 – quoted prices in active markets for identical securities
• Level 2 – prices determined using other significant observable inputs (including quoted prices for similar securities, interest rates, prepayment speeds, credit risk and others)
• Level 3 – prices determined using significant unobservable inputs where quoted prices or observable inputs are unavailable or less reliable (including management's own assumptions about the factors market participants would use in pricing an investment)
The inputs or methodology used for valuing securities are not necessarily an indication of the risk associated with investing in those securities.
Examples of the types of securities in which the Fund would typically invest and how they are classified within this hierarchy are as follows. Typical Level 1 securities include exchange traded domestic equities, mutual funds whose NAVs are published each day and exchange traded foreign equities that are not statistically fair valued. Typical Level 2 securities include exchange traded foreign equities that are statistically fair valued, forward foreign currency exchange contracts and short-term investments valued at amortized cost. Additionally, securities fair valued by the Valuation Committee (the Committee) of the Fund's Board of Trustees (the Board) that rely on significant observable inputs are also included in Level 2. Typical Level 3 securities include any security fair valued by the Committee that relies on significant unobservable inputs.
Under the direction of the Board, the Committee is responsible for carrying out the valuation procedures approved by the Board.
The Committee meets as necessary, and no less frequently than quarterly, to determine fair values for securities for which market quotations are not readily available or for which the investment manager believes that available market quotations are unreliable, to review the appropriateness of the Trust's Portfolio Pricing Policy and the pricing procedures of the investment manager (the Policies), and to review the continuing appropriateness of the current value of any security subject to the Policies. The Policies address, among other things: circumstances under which market quotations will be deemed readily available; selection of third party pricing vendors; appropriate pricing methodologies; events that require fair valuation and fair value techniques; and circumstances under which securities will be deemed to pose a potential for stale pricing, including when securities are illiquid, restricted, or in default. The Committee may also meet to discuss additional valuation matters, which may include review of back-testing results, review of time-sensitive information or approval of other valuation related actions, and to review the appropriateness of the Policies.
For investments categorized as Level 3, the significant unobservable inputs used in the fair value measurement of the Funds' securities may include: (i) data specific to the issuer or comparable issuers, (ii) general market or specific sector news and (iii) quoted prices and specific or similar security transactions. The Committee considers this data and any changes from prior periods in order to assess the reasonableness of observable and unobservable inputs, any assumptions or internal models used to value those securities and changes in fair value. Significant changes in any of these factors could result in lower or higher fair value measurements. Various factors impact the frequency of monitoring (which may occur as often as daily), however the Committee may determine that changes to inputs, assumptions and models are not required with the same frequency.
See accompanying notes to financial statements.
89
Columbia Acorn European Fund
Statement of Investments (Unaudited), continued
> Notes to Statement of Investments
The following table summarizes the inputs used, as of June 30, 2013, in valuing the Fund's assets:
Investment Type | Quoted Prices (Level 1) | Other Significant Observable Inputs (Level 2) | Significant Unobservable Inputs (Level 3) | Total | |||||||||||||||
Equities | |||||||||||||||||||
Europe | $ | 278,150 | $ | 6,280,094 | $ | - | $ | 6,558,244 | |||||||||||
Other Countries | 194,793 | - | - | 194,793 | |||||||||||||||
Asia | - | 188,900 | - | 188,900 | |||||||||||||||
Total Equities | 472,943 | 6,468,994 | - | 6,941,937 | |||||||||||||||
Total Short-Term Investments | 1,024,159 | - | - | 1,024,159 | |||||||||||||||
Total Securities Lending Collateral | 133,200 | - | - | 133,200 | |||||||||||||||
Total Investments | $ | 1,630,302 | $ | 6,468,994 | $ | - | $ | 8,099,296 | |||||||||||
The Fund's assets assigned to the Level 2 input category are generally valued using a market approach, in which a security's value is determined through its correlation to prices and information from observable market transactions for similar or identical assets. Foreign equities are generally valued at the last sale price on the foreign exchange or market on which they trade. The Fund may use a statistical fair valuation model, in accordance with the policy adopted by the Board, provided by an independent third party to value securities principally traded in foreign markets in order to adjust for possible stale pricing that may occur between the close of the foreign exchanges and the time for valuation. These models take into account available market data including intraday index, ADR, and ETF movements.
There were no transfers of financial assets between levels 1 and 2 during the period.
See accompanying notes to financial statements.
90
Columbia Acorn European Fund
Portfolio Diversification (Unaudited)
At June 30, 2013, the Fund's portfolio investments as a percentage of net assets were diversified as follows:
Value | Percentage of Net Assets | ||||||||||
| > Industrial Goods & Services | |||||||||||
Other Industrial Services | $ | 667,640 | 8.3 | ||||||||
Machinery | 524,478 | 6.5 | |||||||||
| Industrial Materials & Specialty Chemicals | 398,637 | 5.0 | |||||||||
Conglomerates | 339,407 | 4.2 | |||||||||
Electrical Components | 200,683 | 2.5 | |||||||||
Construction | 108,999 | 1.4 | |||||||||
Outsourcing Services | 84,852 | 1.1 | |||||||||
2,324,696 | 29.0 | ||||||||||
| > Information | |||||||||||
Business Software | 298,880 | 3.7 | |||||||||
Computer Services | 259,698 | 3.2 | |||||||||
Internet Related | 212,742 | 2.7 | |||||||||
| Computer Hardware & Related Equipment | 204,623 | 2.6 | |||||||||
Financial Processors | 189,077 | 2.4 | |||||||||
| Business Information & Marketing Services | 178,352 | 2.2 | |||||||||
Telephone & Data Services | 73,934 | 0.9 | |||||||||
Advertising | 67,925 | 0.9 | |||||||||
1,485,231 | 18.6 | ||||||||||
| > Consumer Goods & Services | |||||||||||
Retail | 554,957 | 6.9 | |||||||||
Restaurants | 293,118 | 3.7 | |||||||||
Other Durable Goods | 88,782 | 1.1 | |||||||||
Nondurables | 88,622 | 1.1 | |||||||||
Casinos & Gaming | 85,031 | 1.1 | |||||||||
Apparel | 69,349 | 0.9 | |||||||||
Consumer Goods Distribution | 67,702 | 0.8 | |||||||||
1,247,561 | 15.6 | ||||||||||
| > Finance | |||||||||||
Insurance | 379,137 | 4.8 | |||||||||
Brokerage & Money Management | 167,821 | 2.1 | |||||||||
Credit Cards | 74,852 | 0.9 | |||||||||
621,810 | 7.8 | ||||||||||
| > Other Industries | |||||||||||
Real Estate | 347,029 | 4.3 | |||||||||
Transportation | 97,624 | 1.2 | |||||||||
Regulated Utilities | 78,335 | 1.0 | |||||||||
522,988 | 6.5 | ||||||||||
| > Energy & Minerals | |||||||||||
Oil Services | 232,927 | 2.9 | |||||||||
Mining | 183,692 | 2.3 | |||||||||
Agricultural Commodities | 104,613 | 1.3 | |||||||||
521,232 | 6.5 | ||||||||||
Value | Percentage of Net Assets | ||||||||||
| > Health Care | |||||||||||
Medical Equipment & Devices | $ | 138,546 | 1.7 | ||||||||
Medical Supplies | 79,873 | 1.0 | |||||||||
218,419 | 2.7 | ||||||||||
Total Equities: | 6,941,937 | 86.7 | |||||||||
Short-Term Investments: | 1,024,159 | 12.8 | |||||||||
Securities Lending Collateral: | 133,200 | 1.7 | |||||||||
Total Investments: | 8,099,296 | 101.2 | |||||||||
| Obligation to Return Collateral for Securities Loaned: | (133,200 | ) | (1.7 | ) | |||||||
| Cash and Other Assets Less Liabilities: | 36,941 | 0.5 | |||||||||
Net Assets: | $ | 8,003,037 | 100.0 | ||||||||
See accompanying notes to financial statements.
91
Columbia Acorn Family of Funds
Statements of Assets and Liabilities (Unaudited)
June 30, 2013 | Columbia Acorn Fund | Columbia Acorn International | Columbia Acorn USA | Columbia Acorn International Select | |||||||||||||||
Assets: | |||||||||||||||||||
Unaffiliated investments, at cost | $ | 9,041,844,734 | $ | 5,700,648,427 | $ | 991,893,237 | $ | 297,995,188 | |||||||||||
Affiliated investments, at cost (See Note 4) | 2,405,816,179 | 208,516,589 | — | — | |||||||||||||||
| Unaffiliated investments, at value (including securities on loan: Columbia Acorn Fund $447,311,479; Columbia Acorn International $122,061,343; Columbia Acorn USA $63,089,988; Columbia Acorn International Select $4,098,939; Columbia Acorn Select $25,615,118; Columbia Thermostat Fund $—; Columbia Acorn Emerging Markets Fund $1,581,515; Columbia Acorn European Fund $123,314) | $ | 15,175,315,623 | $ | 7,204,546,171 | $ | 1,631,811,777 | $ | 341,529,180 | |||||||||||
Affiliated investments, at value (See Note 4) | 4,116,308,887 | 224,422,025 | — | — | |||||||||||||||
Cash | — | — | — | — | |||||||||||||||
| Foreign currency (cost: Columbia Acorn Fund $—; Columbia Acorn International $8,176,952; Columbia Acorn USA $—; Columbia Acorn International Select $192; Columbia Acorn Select $—; Columbia Thermostat Fund $—; Columbia Acorn Emerging Markets Fund $483,834; Columbia Acorn European Fund $—) | — | 7,995,416 | — | 189 | |||||||||||||||
Receivable for: | |||||||||||||||||||
Investments sold | 21,419,308 | 33,262,973 | 590,521 | 3,125,574 | |||||||||||||||
Fund shares sold | 26,315,769 | 41,869,026 | 1,169,976 | 271,528 | |||||||||||||||
Dividends and interest | 9,502,591 | 7,936,984 | 768,335 | 77,174 | |||||||||||||||
Securities lending income | 467,983 | 200,324 | 55,849 | 21,349 | |||||||||||||||
Foreign tax reclaims | 457,439 | 5,473,379 | — | 186,327 | |||||||||||||||
Expense reimbursement due from Investment Manager | — | 1,314 | — | — | |||||||||||||||
Trustees' deferred compensation plan | 3,016,371 | 900,370 | 258,359 | — | |||||||||||||||
Other assets | 68,960 | 15,228 | 6,330 | 1,104 | |||||||||||||||
Total Assets | 19,352,872,931 | 7,526,623,210 | 1,634,661,147 | 345,212,425 | |||||||||||||||
Liabilities: | |||||||||||||||||||
Payable to custodian bank | 44,103 | — | — | 108 | |||||||||||||||
Collateral on securities loaned | 454,607,005 | 128,096,564 | 63,738,529 | 4,332,824 | |||||||||||||||
Unrealized depreciation on forward foreign currency exchange contracts | — | — | — | 52,114 | |||||||||||||||
Payable for: | |||||||||||||||||||
Investments purchased | 28,633,202 | 30,334,458 | 1,055,333 | 655,953 | |||||||||||||||
Fund shares redeemed | 45,021,671 | 35,293,335 | 748,622 | 347,544 | |||||||||||||||
Investment advisory fee | 331,131 | 151,054 | 37,122 | 8,647 | |||||||||||||||
Administration fee | 19,603 | 7,562 | 1,632 | 349 | |||||||||||||||
12b-1 Service and Distribution fees | 46,514 | 10,788 | 2,142 | 771 | |||||||||||||||
Reports to shareholders | 924,894 | 372,757 | 214,600 | 35,087 | |||||||||||||||
Trustees' deferred compensation plan | 3,016,371 | 900,370 | 258,359 | — | |||||||||||||||
Transfer agent fees | 2,704,447 | 582,534 | 339,591 | 29,312 | |||||||||||||||
Trustees' fees | 23,798 | 12,843 | 4,242 | 44,367 | |||||||||||||||
Custody fees | 49,872 | 218,898 | — | 25,878 | |||||||||||||||
Professional fee | 373,114 | 142,258 | 62,040 | 34,869 | |||||||||||||||
Chief compliance officer expenses | — | — | — | — | |||||||||||||||
Deferred foreign capital gains tax payable | — | — | — | — | |||||||||||||||
Other liabilities | 80,277 | 108,331 | 22,919 | 25,154 | |||||||||||||||
Total Liabilities | 535,876,002 | 196,231,752 | 66,485,131 | 5,592,977 | |||||||||||||||
Net Assets | $ | 18,816,996,929 | $ | 7,330,391,458 | $ | 1,568,176,016 | $ | 339,619,448 | |||||||||||
Composition of Net Assets: | |||||||||||||||||||
Paid-in capital | $ | 10,430,737,199 | $ | 5,678,519,970 | $ | 851,415,665 | $ | 297,617,070 | |||||||||||
Undistributed (Overdistributed) net investment income (loss) | (31,763,902 | ) | (99,842,231 | ) | (5,320,184 | ) | (21,121,073 | ) | |||||||||||
Accumulated net realized gain (loss) | 574,072,201 | 232,232,024 | 82,161,995 | 19,653,349 | |||||||||||||||
Net unrealized appreciation (depreciation) on: | |||||||||||||||||||
Unaffiliated investments | 6,133,470,889 | 1,503,897,744 | 639,918,540 | 43,533,992 | |||||||||||||||
Affiliated investments (See Note 4) | 1,710,492,708 | 15,905,436 | — | — | |||||||||||||||
Foreign currency translations | (12,166 | ) | (321,485 | ) | — | (11,776 | ) | ||||||||||||
Forward foreign currency exchange contracts | — | — | — | (52,114 | ) | ||||||||||||||
Foreign capital gains tax | — | — | — | — | |||||||||||||||
Net Assets | $ | 18,816,996,929 | $ | 7,330,391,458 | $ | 1,568,176,016 | $ | 339,619,448 | |||||||||||
Net asset value per share – Class A (a) | $ | 31.98 | $ | 42.65 | $ | 31.36 | $ | 25.53 | |||||||||||
(Net assets/shares) | ($ | 3,443,356,675/ 107,683,822) | ($ | 1,148,090,184/ 26,921,675) | ($ | 172,413,061/ 5,498,715) | ($ | 72,008,368/ 2,820,719) | |||||||||||
Maximum offering price per share – Class A (b) | $ | 33.93 | $ | 45.25 | $ | 33.27 | $ | 27.09 | |||||||||||
(Net asset value per share/front-end sales charge) | ($31.98/0.9425) | ($42.65/0.9425) | ($31.36/0.9425) | ($25.53/0.9425) | |||||||||||||||
Net asset value and offering price per share – Class B (a) | $ | 29.09 | $ | 41.31 | $ | 28.57 | $ | 24.21 | |||||||||||
(Net assets/shares) | ($ | 23,513,499/ 808,304) | ($ | 14,986,049/ 362,743) | ($ | 693,162/ 24,260) | ($ | 959,371/ 39,619) | |||||||||||
Net asset value and offering price per share – Class C (a) | $ | 28.58 | $ | 41.13 | $ | 28.23 | $ | 24.08 | |||||||||||
(Net assets/shares) | ($ | 815,710,630/ 28,542,864) | ($ | 96,033,820/ 2,335,022) | ($ | 34,331,110/ 1,215,923) | ($ | 9,791,574/ 406,659) | |||||||||||
Net asset value and offering price per share – Class I (c) | $ | 33.26 | $ | 42.79 | $ | 32.83 | (d) | $ | 25.81 | (d) | |||||||||
(Net assets/shares) | ($ | 56,048,756/ 1,685,326) | ($ | 94,955,046/ 2,218,968) | ($3,386/103) | ($2,472/96) | |||||||||||||
Net asset value and offering price per share – Class R (c) | $ | — | $ | 42.57 | $ | — | $ | — | |||||||||||
(Net assets/shares) | ($ | —/— | ) | ($4,226,643/99,288) | ($ | —/— | ) | ($ | —/— | ) | |||||||||
Net asset value and offering price per share – Class R4 (c) | $ | 33.71 | $ | 43.01 | $ | 33.31 | $ | 25.95 | |||||||||||
(Net assets/shares) | ($31,656,878/939,094) | ($29,628,571/688,938) | ($2,202,452/66,117) | ($108,335/4,175) | |||||||||||||||
Net asset value and offering price per share – Class R5 (c) | $ | 33.71 | $ | 42.74 | $ | 33.30 | $ | 25.94 | |||||||||||
(Net assets/shares) | ($132,811,075/3,939,716) | ($212,769,489/4,978,674) | ($770,860/23,151) | ($591,666/22,805) | |||||||||||||||
Net asset value and offering price per share – Class Y (c) | $ | 33.74 | $ | 43.03 | $ | 33.34 | $ | 25.94 | (d) | ||||||||||
(Net assets/shares) | ($885,901,905/26,260,503) | ($108,064,684/2,511,320) | ($2,877,238/86,295) | ($2,163/83) | |||||||||||||||
Net asset value and offering price per share – Class Z (c) | $ | 33.23 | $ | 42.76 | $ | 32.78 | $ | 25.81 | |||||||||||
(Net assets/shares) | ($ | 13,427,997,511/ 404,114,645) | ($ | 5,621,636,972/ 131,484,871) | ($ | 1,354,884,747/ 41,332,591) | ($ | 256,155,499/ 9,923,251) | |||||||||||
(a) Redemption price per share is equal to net asset value less any applicable contingent deferred sales charge.
(b) On sales of $50,000 or more the offering price is reduced.
(c) Redemption price per share is equal to net asset value.
(d) Net asset value per share rounds to this amount due to fractional shares outstanding.
See accompanying notes to financial statements.
92
June 30, 2013 | Columbia Acorn Select | Columbia Thermostat Fund | Columbia Acorn Emerging Markets Fund | Columbia Acorn European Fund | |||||||||||||||
Assets: | |||||||||||||||||||
Unaffiliated investments, at cost | $ | 566,081,039 | $ | 6,705,042 | $ | 181,442,994 | $ | 7,605,548 | |||||||||||
Affiliated investments, at cost (See Note 4) | 36,232,543 | 1,199,603,885 | — | — | |||||||||||||||
| Unaffiliated investments, at value (including securities on loan: Columbia Acorn Fund $447,311,479; Columbia Acorn International $122,061,343; Columbia Acorn USA $63,089,988; Columbia Acorn International Select $4,098,939; Columbia Acorn Select $25,615,118; Columbia Thermostat Fund $—; Columbia Acorn Emerging Markets Fund $1,581,515; Columbia Acorn European Fund $123,314) | $ | 875,006,068 | $ | 6,705,042 | $ | 174,308,037 | $ | 8,099,296 | |||||||||||
Affiliated investments, at value (See Note 4) | 8,614,616 | 1,235,231,400 | — | — | |||||||||||||||
Cash | 51,376 | — | — | — | |||||||||||||||
| Foreign currency (cost: Columbia Acorn Fund $—; Columbia Acorn International $8,176,952; Columbia Acorn USA $—; Columbia Acorn International Select $192; Columbia Acorn Select $—; Columbia Thermostat Fund $—; Columbia Acorn Emerging Markets Fund $483,834; Columbia Acorn European Fund $—) | — | — | 481,198 | — | |||||||||||||||
Receivable for: | |||||||||||||||||||
Investments sold | 3,650,416 | — | — | 20,476 | |||||||||||||||
Fund shares sold | 266,871 | 16,200,372 | 6,332,406 | 95,462 | |||||||||||||||
Dividends and interest | 677,706 | 2,086,646 | 108,377 | 11,595 | |||||||||||||||
Securities lending income | 17,881 | — | 308 | 381 | |||||||||||||||
Foreign tax reclaims | 11,385 | — | 7,102 | 5,824 | |||||||||||||||
Expense reimbursement due from Investment Manager | 8 | — | 36,974 | 548 | |||||||||||||||
Trustees' deferred compensation plan | 296,255 | — | — | — | |||||||||||||||
Other assets | 4,143 | 8,416 | 26,336 | 9 | |||||||||||||||
Total Assets | 888,596,725 | 1,260,231,876 | 181,300,738 | 8,233,591 | |||||||||||||||
Liabilities: | |||||||||||||||||||
Payable to custodian bank | — | — | — | — | |||||||||||||||
Collateral on securities loaned | 25,736,169 | — | 1,624,977 | 133,200 | |||||||||||||||
Unrealized depreciation on forward foreign currency exchange contracts | — | — | — | — | |||||||||||||||
Payable for: | |||||||||||||||||||
Investments purchased | — | 2,527,751 | 1,109,947 | 33,304 | |||||||||||||||
Fund shares redeemed | 4,680,219 | 1,440,042 | 1,016,818 | 24,842 | |||||||||||||||
Investment advisory fee | 19,895 | 3,412 | 5,380 | 259 | |||||||||||||||
Administration fee | 897 | 1,293 | 178 | 8 | |||||||||||||||
12b-1 Service and Distribution fees | 3,733 | 13,886 | 708 | 31 | |||||||||||||||
Reports to shareholders | 171,061 | 2,287 | 10,415 | 10,448 | |||||||||||||||
Trustees' deferred compensation plan | 296,255 | — | — | — | |||||||||||||||
Transfer agent fees | 131,059 | 47,055 | 21,877 | — | |||||||||||||||
Trustees' fees | 4,622 | 28,468 | 886 | 490 | |||||||||||||||
Custody fees | 2,938 | 438 | 5,420 | — | |||||||||||||||
Professional fee | 50,354 | 20,483 | 24,273 | 25,997 | |||||||||||||||
Chief compliance officer expenses | 218 | — | — | — | |||||||||||||||
Deferred foreign capital gains tax payable | — | — | 19 | — | |||||||||||||||
Other liabilities | 22,382 | 6,439 | — | 1,975 | |||||||||||||||
Total Liabilities | 31,119,802 | 4,091,554 | 3,820,898 | 230,554 | |||||||||||||||
Net Assets | $ | 857,476,923 | $ | 1,256,140,322 | $ | 177,479,840 | $ | 8,003,037 | |||||||||||
Composition of Net Assets: | |||||||||||||||||||
Paid-in capital | $ | 487,376,181 | $ | 1,189,275,655 | $ | 184,301,165 | $ | 7,375,236 | |||||||||||
Undistributed (Overdistributed) net investment income (loss) | (2,035,102 | ) | 8,279,446 | 319,703 | 45,639 | ||||||||||||||
Accumulated net realized gain (loss) | 90,828,700 | 22,957,706 | (5,384 | ) | 88,486 | ||||||||||||||
Net unrealized appreciation (depreciation) on: | |||||||||||||||||||
Unaffiliated investments | 308,925,029 | — | (7,134,957 | ) | 493,748 | ||||||||||||||
Affiliated investments (See Note 4) | (27,617,927 | ) | 35,627,515 | — | — | ||||||||||||||
Foreign currency translations | 42 | — | (668 | ) | (72 | ) | |||||||||||||
Forward foreign currency exchange contracts | — | — | — | — | |||||||||||||||
Foreign capital gains tax | — | — | (19 | ) | — | ||||||||||||||
Net Assets | $ | 857,476,923 | $ | 1,256,140,322 | $ | 177,479,840 | $ | 8,003,037 | |||||||||||
Net asset value per share – Class A (a) | $ | 26.26 | $ | 14.86 | $ | 11.99 | $ | 12.63 | |||||||||||
(Net assets/shares) | ($ | 303,380,356/ 11,551,098) | ($ | 467,173,129/ 31,427,794) | ($ | 57,830,140/ 4,823,283) | ($ | 4,035,631/ 319,607) | |||||||||||
Maximum offering price per share – Class A (b) | $ | 27.86 | $ | 15.77 | $ | 12.72 | $ | 13.40 | |||||||||||
(Net asset value per share/front-end sales charge) | ($26.26/0.9425) | ($14.86/0.9425) | ($11.99/0.9425) | ($12.63/0.9425) | |||||||||||||||
Net asset value and offering price per share – Class B (a) | $ | 24.05 | $ | 14.93 | $ | — | $ | — | |||||||||||
(Net assets/shares) | ($ | 4,085,867/ 169,904) | ($ | 3,029,824/ 202,924) | ($ | —/— | ) | ($ | —/— | ) | |||||||||
Net asset value and offering price per share – Class C (a) | $ | 23.74 | $ | 14.91 | $ | 11.92 | $ | 12.55 | |||||||||||
(Net assets/shares) | ($ | 56,957,493/ 2,399,055) | ($ | 391,264,877/ 26,242,550) | ($ | 11,841,471/ 993,732) | ($ | 101,218/ 8,066) | |||||||||||
Net asset value and offering price per share – Class I (c) | $ | 27.25 | $ | — | $ | 12.04 | $ | 12.64 | |||||||||||
(Net assets/shares) | ($ | 37,440,937/ 1,374,180) | ($ | —/— | ) | ($6,082/505) | ($6,436/509) | ||||||||||||
Net asset value and offering price per share – Class R (c) | $ | — | $ | — | $ | — | $ | — | |||||||||||
(Net assets/shares) | ($ | —/— | ) | ($ | —/— | ) | ($ | —/— | ) | ($ | —/— | ) | |||||||
Net asset value and offering price per share – Class R4 (c) | $ | 27.59 | $ | 14.77 | $ | 12.11 | $ | — | |||||||||||
(Net assets/shares) | ($75,850/2,749) | ($7,885,980/533,788) | ($5,560,961/459,275) | ($ | —/— | ) | |||||||||||||
Net asset value and offering price per share – Class R5 (c) | $ | 27.58 | $ | 14.78 | $ | 12.10 | $ | 12.75 | |||||||||||
(Net assets/shares) | ($9,374,864/339,917) | ($331,435/22,420) | ($6,731,346/556,343) | ($630,103/49,419) | |||||||||||||||
Net asset value and offering price per share – Class Y (c) | $ | 27.63 | $ | 14.78 | (d) | $ | 12.00 | (d) | $ | �� | |||||||||
(Net assets/shares) | ($4,322,760/156,448) | ($2,624/178) | ($2,455/205) | ($ | —/— | ) | |||||||||||||
Net asset value and offering price per share – Class Z (c) | $ | 27.19 | $ | 14.71 | $ | 12.02 | $ | 12.64 | |||||||||||
(Net assets/shares) | ($ | 441,838,796/ 16,252,701) | ($ | 386,452,453/ 26,269,552) | ($ | 95,507,385/ 7,944,005) | ($ | 3,229,649/ 255,421) | |||||||||||
See accompanying notes to financial statements.
93
Columbia Acorn Family of Funds
Statements of Operations (Unaudited) For the Six Months Ended June 30, 2013
| Columbia Acorn Fund | Columbia Acorn International | Columbia Acorn USA | Columbia Acorn International Select | ||||||||||||||||
Investment Income: | |||||||||||||||||||
Dividends | $ | 76,862,407 | $ | 94,227,582 | $ | 6,706,282 | $ | 4,116,648 | |||||||||||
Dividends from affiliates (See Note 4) | 18,335,053 | 4,237,791 | — | — | |||||||||||||||
Dividends from affiliated investment company shares (See Note 4) | — | — | — | — | |||||||||||||||
Interest | — | — | — | 114 | |||||||||||||||
Securities lending income, net | 5,480,688 | 1,637,836 | 627,302 | 97,653 | |||||||||||||||
100,678,148 | 100,103,209 | 7,333,584 | 4,214,415 | ||||||||||||||||
Foreign taxes withheld | (1,817,590 | ) | (9,370,498 | ) | (6,720 | ) | (404,528 | ) | |||||||||||
Total Investment Income | 98,860,558 | 90,732,711 | 7,326,864 | 3,809,887 | |||||||||||||||
Expenses: | |||||||||||||||||||
Investment advisory fee | 59,271,120 | 27,192,916 | 6,608,433 | 1,721,756 | |||||||||||||||
Administration fee | 3,512,609 | 1,362,953 | 290,816 | 69,516 | |||||||||||||||
12b-1 Service and Distribution fees: | |||||||||||||||||||
Class A | 4,224,551 | 1,363,359 | 203,523 | 92,503 | |||||||||||||||
Class B | 107,446 | 62,391 | 3,316 | 4,090 | |||||||||||||||
Class C | 3,974,029 | 480,341 | 165,768 | 49,882 | |||||||||||||||
Class R | — | 8,934 | — | — | |||||||||||||||
Transfer agent fees: | |||||||||||||||||||
Class A | 1,827,298 | 867,360 | 101,217 | 41,576 | |||||||||||||||
Class B | 37,011 | 31,656 | 1,853 | 1,520 | |||||||||||||||
Class C | 315,102 | 73,723 | 11,798 | 7,562 | |||||||||||||||
Class R | — | 3,646 | — | — | |||||||||||||||
Class R4 | 3,679 | 2,830 | 242 | 17 | |||||||||||||||
Class R5 | 2,820 | 18,424 | 77 | 24 | |||||||||||||||
Class Z | 5,303,833 | 1,856,907 | 793,755 | 128,445 | |||||||||||||||
Trustees' fees | 350,036 | 131,852 | 31,378 | 12,194 | |||||||||||||||
Custody fees | 172,994 | 783,612 | 9,053 | 80,416 | |||||||||||||||
Registration and blue sky fees | 84,096 | 69,942 | 38,870 | 50,841 | |||||||||||||||
Reports to shareholders | 949,293 | 578,701 | 192,165 | 64,357 | |||||||||||||||
Audit fees | 43,343 | 51,614 | 21,767 | 22,757 | |||||||||||||||
Legal fees | 516,528 | 193,564 | 48,022 | 11,419 | |||||||||||||||
Interest expense (See Note 5) | — | — | — | — | |||||||||||||||
Chief compliance officer expenses (See Note 4) | 252,059 | 95,392 | 22,352 | 5,549 | |||||||||||||||
Other expenses | 306,829 | 230,292 | 27,683 | 9,927 | |||||||||||||||
Total Expenses | 81,254,676 | 35,460,409 | 8,572,088 | 2,374,351 | |||||||||||||||
Less reimbursement of expenses by Investment Manager (See Note 4) | — | (230,240 | ) | — | (13 | ) | |||||||||||||
Net Expenses | 81,254,676 | 35,230,169 | 8,572,088 | 2,374,338 | |||||||||||||||
Net Investment Income (Loss) | 17,605,882 | 55,502,542 | (1,245,224 | ) | 1,435,549 | ||||||||||||||
Net Realized and Unrealized Gain (Loss) on Investments: | |||||||||||||||||||
Net realized gain (loss) on: | |||||||||||||||||||
Unaffiliated investments | 568,055,097 | 395,659,116 | 82,477,187 | 18,411,739 | |||||||||||||||
Affiliated investments (See Note 4) | 31,736,837 | 26,176,925 | — | — | |||||||||||||||
Foreign currency translations | (118,572 | ) | (2,537,078 | ) | — | 24,424 | |||||||||||||
Forward foreign currency exchange contracts | — | — | — | 1,340,145 | |||||||||||||||
Distributions from affiliated investment company shares | — | — | — | — | |||||||||||||||
Net realized gain | 599,673,362 | 419,298,963 | 82,477,187 | 19,776,308 | |||||||||||||||
Net change in net unrealized appreciation (depreciation) on: | |||||||||||||||||||
Unaffiliated investments | 992,243,574 | (22,092,382 | ) | 87,793,751 | (14,765,299 | ) | |||||||||||||
Affiliated investments (See Note 4) | 224,060,431 | (55,315,069 | ) | 392,095 | — | ||||||||||||||
Foreign currency translations | (18,159 | ) | (169,761 | ) | — | (2,902 | ) | ||||||||||||
Forward foreign currency exchange contracts | — | — | — | 359,639 | |||||||||||||||
Foreign capital gains tax | — | 779,466 | — | — | |||||||||||||||
Net change in unrealized appreciation (depreciation) | 1,216,285,846 | (76,797,746 | ) | 88,185,846 | (14,408,562 | ) | |||||||||||||
Net realized and unrealized gain (loss) | 1,815,959,208 | 342,501,217 | 170,663,033 | 5,367,746 | |||||||||||||||
Net Increase (Decrease) in Net Assets from Operations | $ | 1,833,565,090 | $ | 398,003,759 | $ | 169,417,809 | $ | 6,803,295 | |||||||||||
See accompanying notes to financial statements.
94
| Columbia Acorn Select | Columbia Thermostat Fund | Columbia Acorn Emerging Markets Fund | Columbia Acorn European Fund | ||||||||||||||||
Investment Income: | |||||||||||||||||||
Dividends | $ | 3,610,106 | $ | 370 | $ | 871,061 | $ | 100,195 | |||||||||||
Dividends from affiliates (See Note 4) | — | — | — | — | |||||||||||||||
Dividends from affiliated investment company shares (See Note 4) | — | 11,862,143 | — | — | |||||||||||||||
Interest | — | — | — | 1 | |||||||||||||||
Securities lending income, net | 155,098 | — | 786 | 948 | |||||||||||||||
3,765,204 | 11,862,513 | 871,847 | 101,144 | ||||||||||||||||
Foreign taxes withheld | (28,463 | ) | — | (54,364 | ) | (10,799 | ) | ||||||||||||
Total Investment Income | 3,736,741 | 11,862,513 | 817,483 | 90,345 | |||||||||||||||
Expenses: | |||||||||||||||||||
Investment advisory fee | 3,720,369 | 538,343 | 336,343 | 28,328 | |||||||||||||||
Administration fee | 168,368 | 204,217 | 10,620 | 902 | |||||||||||||||
12b-1 Service and Distribution fees: | |||||||||||||||||||
Class A | 361,070 | 492,559 | 24,061 | 2,129 | |||||||||||||||
Class B | 25,927 | 13,706 | — | — | |||||||||||||||
Class C | 291,053 | 1,642,595 | 18,220 | 409 | |||||||||||||||
Class R | — | — | — | — | |||||||||||||||
Transfer agent fees: | |||||||||||||||||||
Class A | 170,911 | 146,299 | 13,052 | 636 | |||||||||||||||
Class B | 10,733 | 3,871 | — | — | |||||||||||||||
Class C | 33,607 | 126,312 | 2,834 | 129 | |||||||||||||||
Class R | — | — | — | — | |||||||||||||||
Class R4 | 26 | 668 | 471 | — | |||||||||||||||
Class R5 | 137 | 26 | 245 | 2 | |||||||||||||||
Class Z | 244,998 | 113,074 | 30,871 | 546 | |||||||||||||||
Trustees' fees | 21,376 | 16,452 | 553 | 186 | |||||||||||||||
Custody fees | 9,091 | 2,057 | 67,510 | 27,459 | |||||||||||||||
Registration and blue sky fees | 38,745 | 71,995 | 28,589 | 23,780 | |||||||||||||||
Reports to shareholders | 154,698 | 102,666 | 21,197 | 19,210 | |||||||||||||||
Audit fees | 21,767 | 14,031 | 22,914 | 21,990 | |||||||||||||||
Legal fees | 30,462 | 22,322 | 267 | 84 | |||||||||||||||
Interest expense (See Note 5) | 345 | — | — | — | |||||||||||||||
Chief compliance officer expenses (See Note 4) | 14,708 | 10,553 | 140 | 43 | |||||||||||||||
Other expenses | 48,404 | 9,319 | 9,816 | 1,615 | |||||||||||||||
Total Expenses | 5,366,795 | 3,531,065 | 587,703 | 127,448 | |||||||||||||||
Less reimbursement of expenses by Investment Manager (See Note 4) | (356 | ) | (42,868 | ) | (107,090 | ) | (91,001 | ) | |||||||||||
Net Expenses | 5,366,439 | 3,488,197 | 480,613 | 36,447 | |||||||||||||||
Net Investment Income (Loss) | (1,629,698 | ) | 8,374,316 | 336,870 | 53,898 | ||||||||||||||
Net Realized and Unrealized Gain (Loss) on Investments: | |||||||||||||||||||
Net realized gain (loss) on: | |||||||||||||||||||
Unaffiliated investments | 103,418,238 | — | 104,475 | 89,392 | |||||||||||||||
Affiliated investments (See Note 4) | (2,748,766 | ) | 35,148,294 | — | — | ||||||||||||||
Foreign currency translations | (2,739 | ) | — | 4,957 | 1,157 | ||||||||||||||
Forward foreign currency exchange contracts | — | — | — | — | |||||||||||||||
Distributions from affiliated investment company shares | — | 1,525,699 | — | — | |||||||||||||||
Net realized gain | 100,666,733 | 36,673,993 | 109,432 | 90,549 | |||||||||||||||
Net change in net unrealized appreciation (depreciation) on: | |||||||||||||||||||
Unaffiliated investments | 7,125,498 | — | (8,590,063 | ) | 101,023 | ||||||||||||||
Affiliated investments (See Note 4) | 1,756,058 | (8,428,328 | ) | — | — | ||||||||||||||
Foreign currency translations | 196 | — | (507 | ) | (141 | ) | |||||||||||||
Forward foreign currency exchange contracts | — | — | — | — | |||||||||||||||
Foreign capital gains tax | — | — | 12,840 | — | |||||||||||||||
Net change in unrealized appreciation (depreciation) | 8,881,752 | (8,428,328 | ) | (8,577,730 | ) | 100,882 | |||||||||||||
Net realized and unrealized gain (loss) | 109,548,485 | 28,245,665 | (8,468,298 | ) | 191,431 | ||||||||||||||
Net Increase (Decrease) in Net Assets from Operations | $ | 107,918,787 | $ | 36,619,981 | $ | (8,131,428 | ) | $ | 245,329 | ||||||||||
See accompanying notes to financial statements.
95
Columbia Acorn Family of Funds
Statements of Changes in Net Assets
| Columbia Acorn Fund | Columbia Acorn International | Columbia Acorn USA | Columbia Acorn International Select | ||||||||||||||||||||||||||||||||
Increase (Decrease) in Net Assets | (Unaudited) Six months ended June 30, | Year ended December 31, | (Unaudited) Six months ended June 30, | Year ended December 31, | (Unaudited) Six months ended June 30, | Year ended December 31, | (Unaudited) Six months ended June 30, | Year ended December 31, | |||||||||||||||||||||||||||
2013 | 2012 (a)(b)(c) | 2013 | 2012 (a)(b)(c) | 2013 | 2012 (a)(b)(c) | 2013 | 2012 (a)(b)(c) | ||||||||||||||||||||||||||||
Operations: | |||||||||||||||||||||||||||||||||||
Net investment income (loss) | $ | 17,605,882 | $ | 81,811,247 | $ | 55,502,542 | $ | 90,750,742 | $ | (1,245,224 | ) | $ | 5,000,823 | $ | 1,435,549 | $ | 6,089,719 | ||||||||||||||||||
| Net realized gain (loss) on investments, foreign currency translations, forward foreign currency exchange contracts and foreign capital gains tax | 567,936,525 | 1,113,274,791 | 393,122,038 | 143,980,673 | 82,477,187 | 120,638,007 | 19,776,308 | 37,404,262 | |||||||||||||||||||||||||||
| Net realized gain (loss) on affiliated investments and distributions from affiliated investment company shares | 31,736,837 | 4,469,667 | 26,176,925 | (103,501 | ) | — | — | — | — | ||||||||||||||||||||||||||
| Net change in net unrealized appreciation (depreciation) on investments, foreign currency translations, forward foreign currency exchange contracts and foreign capital gains tax | 992,225,415 | 1,224,627,488 | (21,482,677 | ) | 920,564,584 | 87,793,751 | 149,564,276 | (14,408,562 | ) | 27,009,907 | |||||||||||||||||||||||||
| Net change in net unrealized appreciation (depreciation) on affiliated investments and affiliated investment company shares | 224,060,431 | 408,220,687 | (55,315,069 | ) | 31,907,664 | 392,095 | (83,200 | ) | — | — | |||||||||||||||||||||||||
Net Increase (Decrease) in Net Assets from Operations | 1,833,565,090 | 2,832,403,880 | 398,003,759 | 1,187,100,162 | 169,417,809 | 275,119,906 | 6,803,295 | 70,503,888 | |||||||||||||||||||||||||||
Distributions to Shareholders From: | |||||||||||||||||||||||||||||||||||
Net investment income – Class A | (4,469,018 | ) | (6,663,987 | ) | (12,802,648 | ) | (14,411,473 | ) | — | (599,485 | ) | — | (4,362,966 | ) | |||||||||||||||||||||
Net realized gain – Class A | (40,964,839 | ) | (197,512,972 | ) | — | — | (242,181 | ) | (11,879,641 | ) | (1,517,809 | ) | (5,497,945 | ) | |||||||||||||||||||||
Net investment income – Class B | — | — | (178,287 | ) | (110,407 | ) | — | — | — | (72,287 | ) | ||||||||||||||||||||||||
Net realized gain – Class B | (326,592 | ) | (2,528,156 | ) | — | — | (1,102 | ) | (115,000 | ) | (21,079 | ) | (103,484 | ) | |||||||||||||||||||||
Net investment income – Class C | — | — | (1,105,201 | ) | (564,735 | ) | — | — | — | (545,569 | ) | ||||||||||||||||||||||||
Net realized gain – Class C | (10,801,205 | ) | (50,561,092 | ) | — | — | (53,759 | ) | (2,747,308 | ) | (211,816 | ) | (788,458 | ) | |||||||||||||||||||||
Net investment income – Class I | (44,508 | ) | (314,994 | ) | (746,333 | ) | (2,000,370 | ) | — | (23 | ) | — | (176 | ) | |||||||||||||||||||||
Net realized gain – Class I | (407,590 | ) | (3,228,769 | ) | — | — | (5 | ) | (1,468 | ) | (51 | ) | (212 | ) | |||||||||||||||||||||
Net investment income – Class R | — | — | (42,157 | ) | (25,256 | ) | — | — | — | — | |||||||||||||||||||||||||
Net investment income – Class R4 | (39,853 | ) | (56 | ) | (323,576 | ) | (223 | ) | — | (79 | ) | — | (894 | ) | |||||||||||||||||||||
Net realized gain – Class R4 | (300,265 | ) | (717 | ) | — | — | (2,492 | ) | (1,157 | ) | (1,031 | ) | (1,048 | ) | |||||||||||||||||||||
Net investment income – Class R5 | (132,214 | ) | (11 | ) | (2,099,911 | ) | (16,524 | ) | — | (15 | ) | — | (150 | ) | |||||||||||||||||||||
Net realized gain – Class R5 | (1,212,896 | ) | (119 | ) | — | — | (1,007 | ) | (193 | ) | (4,308 | ) | (175 | ) | |||||||||||||||||||||
Net investment income – Class Y | (1,014,881 | ) | (88,761 | ) | (676,169 | ) | (19,488 | ) | — | (16 | ) | — | (151 | ) | |||||||||||||||||||||
Net realized gain – Class Y | (8,671,771 | ) | (850,641 | ) | — | — | (3,814 | ) | (193 | ) | (44 | ) | (174 | ) | |||||||||||||||||||||
Net investment income – Class Z | (15,876,887 | ) | (63,442,374 | ) | (63,067,133 | ) | (111,633,313 | ) | — | (8,664,877 | ) | — | (19,872,784 | ) | |||||||||||||||||||||
Net realized gain – Class Z | (156,684,393 | ) | (774,147,758 | ) | — | — | (1,834,199 | ) | (105,839,468 | ) | (5,355,857 | ) | (23,989,252 | ) | |||||||||||||||||||||
Total Distributions to Shareholders | (240,946,912 | ) | (1,099,340,407 | ) | (81,041,415 | ) | (128,781,789 | ) | (2,138,559 | ) | (129,848,923 | ) | (7,111,995 | ) | (55,235,725 | ) | |||||||||||||||||||
Share Transactions: | |||||||||||||||||||||||||||||||||||
Subscriptions – Class A | 270,637,532 | 504,132,337 | 216,271,864 | 192,174,434 | 21,543,081 | 23,184,962 | 15,747,427 | 28,487,144 | |||||||||||||||||||||||||||
Distributions reinvested – Class A | 42,926,712 | 192,504,936 | 12,376,645 | 13,849,288 | 223,746 | 11,472,496 | 1,487,801 | 9,540,300 | |||||||||||||||||||||||||||
Redemptions – Class A | (390,571,227 | ) | (1,043,161,042 | ) | (130,386,400 | ) | (288,655,100 | ) | (18,479,061 | ) | (65,386,017 | ) | (19,178,214 | ) | (22,115,770 | ) | |||||||||||||||||||
Net Increase (Decrease) – Class A | (77,006,983 | ) | (346,523,769 | ) | 98,262,109 | (82,631,378 | ) | 3,287,766 | (30,728,559 | ) | (1,942,986 | ) | 15,911,674 | ||||||||||||||||||||||
Distributions reinvested – Class B | 327,899 | 2,488,680 | 187,191 | 109,244 | 1,097 | 112,821 | 20,971 | 171,043 | |||||||||||||||||||||||||||
Redemptions – Class B | (13,222,201 | ) | (42,408,789 | ) | (3,892,270 | ) | (10,614,723 | ) | (465,938 | ) | (1,506,892 | ) | (309,095 | ) | (821,529 | ) | |||||||||||||||||||
Net Increase (Decrease) – Class B | (12,894,302 | ) | (39,920,109 | ) | (3,705,079 | ) | (10,505,479 | ) | (464,841 | ) | (1,394,071 | ) | (288,124 | ) | (650,486 | ) | |||||||||||||||||||
Subscriptions – Class C | 46,172,793 | 75,456,034 | 8,484,901 | 9,589,255 | 1,813,067 | 1,894,599 | 1,570,827 | 1,909,549 | |||||||||||||||||||||||||||
Distributions reinvested – Class C | 8,852,591 | 41,007,235 | 951,320 | 462,763 | 50,044 | 2,504,682 | 192,611 | 1,184,774 | |||||||||||||||||||||||||||
Redemptions – Class C | (60,283,360 | ) | (147,063,884 | ) | (10,034,663 | ) | (31,713,431 | ) | (2,319,790 | ) | (6,051,022 | ) | (1,683,528 | ) | (2,386,931 | ) | |||||||||||||||||||
Net Increase (Decrease) – Class C | (5,257,976 | ) | (30,600,615 | ) | (598,442 | ) | (21,661,413 | ) | (456,679 | ) | (1,651,741 | ) | 79,910 | 707,392 | |||||||||||||||||||||
Subscriptions – Class I | 41,390,135 | 67,198,938 | 54,489,596 | 89,544,891 | — | 2,149,882 | — | — | |||||||||||||||||||||||||||
Distributions reinvested – Class I | 452,059 | 3,543,577 | 746,086 | 1,999,919 | — | 1,223 | — | — | |||||||||||||||||||||||||||
Redemptions – Class I | (51,441,901 | ) | (30,814,450 | ) | (64,801,856 | ) | (56,555,211 | ) | — | (4,920,409 | ) | — | — | ||||||||||||||||||||||
Net Increase (Decrease) – Class I | (9,599,707 | ) | 39,928,065 | (9,566,174 | ) | 34,989,599 | — | (2,769,304 | ) | — | — | ||||||||||||||||||||||||
(a) Class R4 shares reflect activity for the period from November 8, 2012 (commencement of operations) through December 31, 2012.
(b) Class R5 shares reflect activity for the period from November 8, 2012 (commencement of operations) through December 31, 2012.
(c) Class Y shares reflect activity for the period from November 8, 2012 (commencement of operations) through December 31, 2012.
(d) Class Y shares reflect activity for the period from June 13, 2013 (commencement of operations) through June 30, 2013.
See accompanying notes to financial statements.
96
| Columbia Acorn Select | Columbia Thermostat Fund | Columbia Acorn Emerging Markets Fund | Columbia Acorn European Fund | ||||||||||||||||||||||||||||||||
Increase (Decrease) in Net Assets | (Unaudited) Six months ended June 30, | Year ended December 31, | (Unaudited) Six months ended June 30, | Year ended December 31, | (Unaudited) Six months ended June 30, | Year ended December 31, | (Unaudited) Six months ended June 30, | Year ended December 31, | |||||||||||||||||||||||||||
2013 | 2012 (a)(b)(c) | 2013 | 2012 (a)(b)(c) | 2013 (d) | 2012 (a)(b) | 2013 | 2012 (b) | ||||||||||||||||||||||||||||
Operations: | |||||||||||||||||||||||||||||||||||
Net investment income (loss) | $ | (1,629,698 | ) | $ | 3,199,752 | $ | 8,374,316 | $ | 10,380,505 | $ | 336,870 | $ | 59,454 | $ | 53,898 | $ | 15,258 | ||||||||||||||||||
| Net realized gain (loss) on investments, foreign currency translations, forward foreign currency exchange contracts and foreign capital gains tax | 103,415,499 | 146,041,340 | — | — | 109,432 | (61,273 | ) | 90,549 | 8,711 | ||||||||||||||||||||||||||
| Net realized gain (loss) on affiliated investments and distributions from affiliated investment company shares | (2,748,766 | ) | (32,861,769 | ) | 36,673,993 | 9,964,937 | — | — | — | — | |||||||||||||||||||||||||
| Net change in net unrealized appreciation (depreciation) on investments, foreign currency translations, forward foreign currency exchange contracts and foreign capital gains tax | 7,125,694 | 9,006,880 | — | — | (8,577,730 | ) | 1,577,275 | 100,882 | 478,648 | ||||||||||||||||||||||||||
| Net change in net unrealized appreciation (depreciation) on affiliated investments and affiliated investment company shares | 1,756,058 | 76,071,172 | (8,428,328 | ) | 30,128,824 | — | — | — | — | ||||||||||||||||||||||||||
Net Increase (Decrease) in Net Assets from Operations | 107,918,787 | 201,457,375 | 36,619,981 | 50,474,266 | (8,131,428 | ) | 1,575,456 | 245,329 | 502,617 | ||||||||||||||||||||||||||
Distributions to Shareholders From: | |||||||||||||||||||||||||||||||||||
Net investment income – Class A | (779,075 | ) | — | (272,522 | ) | (5,054,209 | ) | — | (15,490 | ) | — | (1,646 | ) | ||||||||||||||||||||||
Net realized gain – Class A | (14,966,587 | ) | (22,932,516 | ) | — | — | — | — | — | (87 | ) | ||||||||||||||||||||||||
Net investment income – Class B | — | — | (1,924 | ) | (54,808 | ) | — | — | — | — | |||||||||||||||||||||||||
Net realized gain – Class B | (256,208 | ) | (1,087,328 | ) | — | — | — | — | — | — | |||||||||||||||||||||||||
Net investment income – Class C | — | — | (232,365 | ) | (2,121,887 | ) | — | — | — | (20 | ) | ||||||||||||||||||||||||
Net realized gain – Class C | (3,121,557 | ) | (5,136,384 | ) | — | — | — | — | — | (8 | ) | ||||||||||||||||||||||||
Net investment income – Class I | (134,582 | ) | — | — | — | — | (61 | ) | — | (48 | ) | ||||||||||||||||||||||||
Net realized gain – Class I | (1,118,281 | ) | (2,740,487 | ) | — | — | — | — | — | (2 | ) | ||||||||||||||||||||||||
Net investment income – Class R | — | — | — | — | — | — | — | — | |||||||||||||||||||||||||||
Net investment income – Class R4 | (360 | ) | — | (3,837 | ) | (272 | ) | — | (135 | ) | — | — | |||||||||||||||||||||||
Net realized gain – Class R4 | (3,624 | ) | (872 | ) | — | — | — | — | — | — | |||||||||||||||||||||||||
Net investment income – Class R5 | (2,205 | ) | — | (200 | ) | (45 | ) | — | (24 | ) | — | (17 | ) | ||||||||||||||||||||||
Net realized gain – Class R5 | (19,547 | ) | (145 | ) | — | — | — | — | — | — | |||||||||||||||||||||||||
Net investment income – Class Y | (184 | ) | — | (2 | ) | (46 | ) | — | — | — | — | ||||||||||||||||||||||||
Net realized gain – Class Y | (1,461 | ) | (145 | ) | — | — | — | — | — | — | |||||||||||||||||||||||||
Net investment income – Class Z | (2,355,272 | ) | — | (234,747 | ) | (5,300,668 | ) | — | (60,520 | ) | — | (20,402 | ) | ||||||||||||||||||||||
Net realized gain – Class Z | (22,396,704 | ) | (51,934,084 | ) | — | — | — | — | — | (815 | ) | ||||||||||||||||||||||||
Total Distributions to Shareholders | (45,155,647 | ) | (83,831,961 | ) | (745,597 | ) | (12,531,935 | ) | — | (76,230 | ) | — | (23,045 | ) | |||||||||||||||||||||
Share Transactions: | |||||||||||||||||||||||||||||||||||
Subscriptions – Class A | 50,888,589 | 40,027,597 | 171,408,845 | 273,105,947 | 62,047,959 | 2,701,324 | 3,890,585 | 295,687 | |||||||||||||||||||||||||||
Distributions reinvested – Class A | 14,833,712 | 21,373,765 | 248,147 | 4,549,410 | 5 | 15,419 | — | 1,697 | |||||||||||||||||||||||||||
Redemptions – Class A | (50,383,729 | ) | (159,108,074 | ) | (41,610,462 | ) | (48,212,223 | ) | (4,707,605 | ) | (234,401 | ) | (335,672 | ) | (46,529 | ) | |||||||||||||||||||
Net Increase (Decrease) – Class A | 15,338,572 | (97,706,712 | ) | 130,046,530 | 229,443,134 | 57,340,359 | 2,482,342 | 3,554,913 | 250,855 | ||||||||||||||||||||||||||
Distributions reinvested – Class B | 252,212 | 1,050,259 | 1,899 | 52,935 | — | — | — | — | |||||||||||||||||||||||||||
Redemptions – Class B | (6,831,103 | ) | (19,619,654 | ) | (1,617,013 | ) | (7,803,976 | ) | — | — | — | — | |||||||||||||||||||||||
Net Increase (Decrease) – Class B | (6,578,891 | ) | (18,569,395 | ) | (1,615,114 | ) | (7,751,041 | ) | — | — | — | — | |||||||||||||||||||||||
Subscriptions – Class C | 1,518,744 | 3,033,655 | 145,986,597 | 220,660,384 | 11,970,563 | 479,073 | 48,761 | 102,697 | |||||||||||||||||||||||||||
Distributions reinvested – Class C | 2,544,014 | 4,111,417 | 173,596 | 1,498,365 | — | — | — | 28 | |||||||||||||||||||||||||||
Redemptions – Class C | (7,798,710 | ) | (17,080,513 | ) | (18,046,348 | ) | (11,490,278 | ) | (195,994 | ) | (62,650 | ) | (42,319 | ) | (23,910 | ) | |||||||||||||||||||
Net Increase (Decrease) – Class C | (3,735,952 | ) | (9,935,441 | ) | 128,113,845 | 210,668,471 | 11,774,569 | 416,423 | 6,442 | 78,815 | |||||||||||||||||||||||||
Subscriptions – Class I | 27,542,294 | 45,199,109 | — | — | — | — | — | — | |||||||||||||||||||||||||||
Distributions reinvested – Class I | 1,252,711 | 2,740,281 | — | — | — | 61 | — | 50 | |||||||||||||||||||||||||||
Redemptions – Class I | (34,811,057 | ) | (20,749,765 | ) | — | — | — | — | — | — | |||||||||||||||||||||||||
Net Increase (Decrease) – Class I | (6,016,052 | ) | 27,189,625 | — | — | — | 61 | — | 50 | ||||||||||||||||||||||||||
See accompanying notes to financial statements.
97
Columbia Acorn Family of Funds
Statements of Changes in Net Assets, continued
| Columbia Acorn Fund | Columbia Acorn International | Columbia Acorn USA | Columbia Acorn International Select | ||||||||||||||||||||||||||||||||
Increase (Decrease) in Net Assets | (Unaudited) Six months ended June 30, | Year ended December 31, | (Unaudited) Six months ended June 30, | Year ended December 31, | (Unaudited) Six months ended June 30, | Year ended December 31, | (Unaudited) Six months ended June 30, | Year ended December 31, | |||||||||||||||||||||||||||
2013 | 2012 (a)(b)(c) | 2013 | 2012 (a)(b)(c) | 2013 | 2012 (a)(b)(c) | 2013 | 2012 (a)(b)(c) | ||||||||||||||||||||||||||||
Subscriptions – Class R | — | — | 1,978,842 | 4,849,766 | — | — | — | — | |||||||||||||||||||||||||||
Distributions reinvested – Class R | — | — | 34,300 | 20,880 | — | — | — | — | |||||||||||||||||||||||||||
Redemptions – Class R | — | — | (707,741 | ) | (4,484,989 | ) | — | — | — | — | |||||||||||||||||||||||||
Net Increase – Class R | — | — | 1,305,401 | 385,657 | — | — | — | — | |||||||||||||||||||||||||||
Subscriptions – Class R4 | 31,858,484 | 16,900 | 30,001,722 | 15,000 | 2,456,088 | 15,000 | 95,774 | 15,000 | |||||||||||||||||||||||||||
Distributions reinvested – Class R4 | 339,905 | — | 323,396 | — | 2,470 | — | 766 | — | |||||||||||||||||||||||||||
Redemptions – Class R4 | (407,825 | ) | — | (484,985 | ) | — | (298,765 | ) | — | — | — | ||||||||||||||||||||||||
Net Increase – Class R4 | 31,790,564 | 16,900 | 29,840,133 | 15,000 | 2,159,793 | 15,000 | 96,540 | 15,000 | |||||||||||||||||||||||||||
Subscriptions – Class R5 | 137,521,736 | 2,500 | 218,820,711 | 445 | 745,344 | 2,500 | 599,786 | 2,500 | |||||||||||||||||||||||||||
Distributions reinvested – Class R5 | 1,282,817 | — | 2,099,541 | 5,613 | 1,003 | — | 4,263 | — | |||||||||||||||||||||||||||
Redemptions – Class R5 | (7,594,112 | ) | — | (6,468,599 | ) | (2,089,711 | ) | (722 | ) | — | (2,957 | ) | — | ||||||||||||||||||||||
Net Increase (Decrease) – Class R5 | 131,210,441 | 2,500 | 214,451,653 | (2,083,653 | ) | 745,625 | 2,500 | 601,092 | 2,500 | ||||||||||||||||||||||||||
Subscriptions – Class Y | 831,800,157 | 66,583,143 | 83,090,361 | 30,626,355 | 2,700,000 | 2,500 | — | 2,500 | |||||||||||||||||||||||||||
Distributions reinvested – Class Y | 9,686,617 | 939,270 | 676,139 | 19,448 | 3,811 | — | — | — | |||||||||||||||||||||||||||
Redemptions – Class Y | (26,561,833 | ) | (326,942 | ) | (8,171,494 | ) | — | — | — | — | — | ||||||||||||||||||||||||
Net Increase – Class Y | 814,924,941 | 67,195,471 | 75,595,006 | 30,645,803 | 2,703,811 | 2,500 | — | 2,500 | |||||||||||||||||||||||||||
Subscriptions – Class Z | 793,828,705 | 1,687,350,294 | 585,768,752 | 1,168,999,243 | 104,141,073 | 222,245,731 | 41,140,066 | 86,732,266 | |||||||||||||||||||||||||||
Distributions reinvested – Class Z | 150,554,039 | 734,024,683 | 49,236,799 | 86,747,474 | 1,602,536 | 102,214,147 | 3,006,273 | 21,542,287 | |||||||||||||||||||||||||||
Redemptions – Class Z | (2,117,036,882 | ) | (2,657,246,336 | ) | (770,958,650 | ) | (936,482,410 | ) | (312,916,991 | ) | (391,557,641 | ) | (83,218,677 | ) | (85,460,095 | ) | |||||||||||||||||||
Net Increase (Decrease) – Class Z | (1,172,654,138 | ) | (235,871,359 | ) | (135,953,099 | ) | 319,264,307 | (207,173,382 | ) | (67,097,763 | ) | (39,072,338 | ) | 22,814,458 | |||||||||||||||||||||
Net Increase (Decrease) from Share Transactions | (299,487,160 | ) | (545,772,916 | ) | 269,631,508 | 268,418,443 | (199,197,907 | ) | (103,621,438 | ) | (40,525,906 | ) | 38,803,038 | ||||||||||||||||||||||
Increase from regulatory settlements (See Note 7) | — | — | — | 107,802 | — | — | — | — | |||||||||||||||||||||||||||
Total Increase (Decrease) in Net Assets | 1,293,131,018 | 1,187,290,557 | 586,593,852 | 1,326,844,618 | (31,918,657 | ) | 41,649,545 | (40,834,606 | ) | 54,071,201 | |||||||||||||||||||||||||
Net Assets: | |||||||||||||||||||||||||||||||||||
Beginning of period | 17,523,865,911 | 16,336,575,354 | 6,743,797,606 | 5,416,952,988 | 1,600,094,673 | 1,558,445,128 | 380,454,054 | 326,382,853 | |||||||||||||||||||||||||||
End of period | $ | 18,816,996,929 | $ | 17,523,865,911 | $ | 7,330,391,458 | $ | 6,743,797,606 | $ | 1,568,176,016 | $ | 1,600,094,673 | $ | 339,619,448 | $ | 380,454,054 | |||||||||||||||||||
Undistributed (Overdistributed) net investment income (loss) | $ | (31,763,902 | ) | $ | (27,792,423 | ) | $ | (99,842,231 | ) | $ | (74,303,358 | ) | $ | (5,320,184 | ) | $ | (4,074,947 | ) | $ | (21,121,073 | ) | $ | (22,556,622 | ) | |||||||||||
(a) Class R4 shares reflect activity for the period from November 8, 2012 (commencement of operations) through December 31, 2012.
(b) Class R5 shares reflect activity for the period from November 8, 2012 (commencement of operations) through December 31, 2012.
(c) Class Y shares reflect activity for the period from November 8, 2012 (commencement of operations) through December 31, 2012.
(d) Class Y shares reflect activity for the period from June 13, 2013 (commencement of operations) through June 30, 2013.
See accompanying notes to financial statements.
98
| Columbia Acorn Select | Columbia Thermostat Fund | Columbia Acorn Emerging Markets Fund | Columbia Acorn European Fund | ||||||||||||||||||||||||||||||||
Increase (Decrease) in Net Assets | (Unaudited) Six months ended June 30, | Year ended December 31, | (Unaudited) Six months ended June 30, | Year ended December 31, | (Unaudited) Six months ended June 30, | Year ended December 31, | (Unaudited) Six months ended June 30, | Year ended December 31, | |||||||||||||||||||||||||||
2013 | 2012 (a)(b)(c) | 2013 | 2012 (a)(b)(c) | 2013 (d) | 2012 (a)(b) | 2013 | 2012 (b) | ||||||||||||||||||||||||||||
Subscriptions – Class R | — | — | — | — | — | — | — | — | |||||||||||||||||||||||||||
Distributions reinvested – Class R | — | — | — | — | — | — | — | — | |||||||||||||||||||||||||||
Redemptions – Class R | — | — | — | — | — | — | — | — | |||||||||||||||||||||||||||
Net Increase – Class R | — | — | — | — | — | — | — | — | |||||||||||||||||||||||||||
Subscriptions – Class R4 | 59,890 | 15,000 | 8,715,992 | 15,000 | 5,918,827 | 15,000 | — | — | |||||||||||||||||||||||||||
Distributions reinvested – Class R4 | 3,124 | — | 3,827 | — | — | — | — | — | |||||||||||||||||||||||||||
Redemptions – Class R4 | (1,249 | ) | — | (787,839 | ) | — | (12,963 | ) | — | — | — | ||||||||||||||||||||||||
Net Increase – Class R4 | 61,765 | 15,000 | 7,931,980 | 15,000 | 5,905,864 | 15,000 | — | — | |||||||||||||||||||||||||||
Subscriptions – Class R5 | 9,849,828 | 2,500 | 343,406 | 2,500 | 7,046,303 | 2,500 | 623,426 | 2,500 | |||||||||||||||||||||||||||
Distributions reinvested – Class R5 | 21,606 | — | 198 | — | — | — | — | — | |||||||||||||||||||||||||||
Redemptions – Class R5 | (400,931 | ) | — | (9,881 | ) | — | — | — | — | — | |||||||||||||||||||||||||
Net Increase (Decrease) – Class R5 | 9,470,503 | 2,500 | 333,723 | 2,500 | 7,046,303 | 2,500 | 623,426 | 2,500 | |||||||||||||||||||||||||||
Subscriptions – Class Y | 4,407,400 | 2,500 | — | 2,500 | 2,500 | — | — | — | |||||||||||||||||||||||||||
Distributions reinvested – Class Y | 1,498 | — | — | — | — | — | — | — | |||||||||||||||||||||||||||
Redemptions – Class Y | (3,379 | ) | — | — | — | — | — | — | — | ||||||||||||||||||||||||||
Net Increase – Class Y | 4,405,519 | 2,500 | — | 2,500 | 2,500 | — | — | — | |||||||||||||||||||||||||||
Subscriptions – Class Z | 28,113,059 | 92,416,113 | 149,903,184 | 280,471,623 | 96,335,832 | 3,279,578 | 314,854 | 774,240 | |||||||||||||||||||||||||||
Distributions reinvested – Class Z | 17,236,709 | 40,196,957 | 151,076 | 3,443,888 | — | 58,786 | — | 20,822 | |||||||||||||||||||||||||||
Redemptions – Class Z | (229,208,363 | ) | (476,230,534 | ) | (69,221,983 | ) | (69,222,297 | ) | (3,383,970 | ) | (392,871 | ) | (19,962 | ) | (7,954 | ) | |||||||||||||||||||
Net Increase (Decrease) – Class Z | (183,858,595 | ) | (343,617,464 | ) | 80,832,277 | 214,693,214 | 92,951,862 | 2,945,493 | 294,892 | 787,108 | |||||||||||||||||||||||||
Net Increase (Decrease) from Share Transactions | (170,913,131 | ) | (442,619,387 | ) | 345,643,241 | 647,073,778 | 175,021,457 | 5,861,819 | 4,479,673 | 1,119,328 | |||||||||||||||||||||||||
Increase from regulatory settlements (See Note 7) | — | — | — | — | — | — | — | — | |||||||||||||||||||||||||||
Total Increase (Decrease) in Net Assets | (108,149,991 | ) | (324,993,973 | ) | 381,517,625 | 685,016,109 | 166,890,029 | 7,361,045 | 4,725,002 | 1,598,900 | |||||||||||||||||||||||||
Net Assets: | |||||||||||||||||||||||||||||||||||
Beginning of period | 965,626,914 | 1,290,620,887 | 874,622,697 | 189,606,588 | 10,589,811 | 3,228,766 | 3,278,035 | 1,679,135 | |||||||||||||||||||||||||||
End of period | $ | 857,476,923 | $ | 965,626,914 | $ | 1,256,140,322 | $ | 874,622,697 | $ | 177,479,840 | $ | 10,589,811 | $ | 8,003,037 | $ | 3,278,035 | |||||||||||||||||||
Undistributed (Overdistributed) net investment income (loss) | $ | (2,035,102 | ) | $ | 2,866,367 | $ | 8,279,446 | $ | 650,727 | $ | 319,703 | $ | (17,167 | ) | $ | 45,639 | $ | (8,259 | ) | ||||||||||||||||
See accompanying notes to financial statements.
99
Columbia Acorn Family of Funds
Statements of Changes in Net Assets, continued
| Columbia Acorn Fund | Columbia Acorn International | Columbia Acorn USA | Columbia Acorn International Select | ||||||||||||||||||||||||||||||||
Changes in Shares of Beneficial Interest: | (Unaudited) Six months ended June 30, | Year ended December 31, | (Unaudited) Six months ended June 30, | Year ended December 31, | (Unaudited) Six months ended June 30, | Year ended December 31, | (Unaudited) Six months ended June 30, | Year ended December 31, | |||||||||||||||||||||||||||
2013 | 2012 (a)(b)(c) | 2013 | 2012 (a)(b)(c) | 2013 | 2012 (a)(b)(c) | 2013 | 2012 (a)(b)(c) | ||||||||||||||||||||||||||||
Subscriptions – Class A | 8,542,904 | 17,231,624 | 4,973,222 | 5,036,565 | 703,648 | 809,060 | 603,411 | 1,023,664 | |||||||||||||||||||||||||||
Shares issued in reinvestment and capital gains – Class A | 1,344,401 | 6,767,946 | 285,242 | 349,670 | 7,194 | 419,501 | 57,756 | 374,787 | |||||||||||||||||||||||||||
Less shares redeemed – Class A | (12,318,843 | ) | (35,802,801 | ) | (3,028,384 | ) | (7,580,692 | ) | (606,585 | ) | (2,274,459 | ) | (736,118 | ) | (825,702 | ) | |||||||||||||||||||
Net Increase (Decrease) – Class A | (2,431,538 | ) | (11,803,231 | ) | 2,230,080 | (2,194,457 | ) | 104,257 | (1,045,898 | ) | (74,951 | ) | 572,749 | ||||||||||||||||||||||
Shares issued in reinvestment and capital gains – Class B | 11,290 | 95,443 | 4,448 | 2,774 | 39 | 4,518 | 858 | 7,046 | |||||||||||||||||||||||||||
Less shares redeemed – Class B | (457,657 | ) | (1,578,470 | ) | (93,128 | ) | (290,213 | ) | (16,687 | ) | (57,586 | ) | (12,482 | ) | (32,062 | ) | |||||||||||||||||||
Net Increase (Decrease) – Class B | (446,367 | ) | (1,483,027 | ) | (88,680 | ) | (287,439 | ) | (16,648 | ) | (53,068 | ) | (11,624 | ) | (25,016 | ) | |||||||||||||||||||
Subscriptions – Class C | 1,624,027 | 2,852,549 | 203,676 | 259,798 | 65,604 | 72,817 | 64,025 | 71,372 | |||||||||||||||||||||||||||
Shares issued in reinvestment and capital gains – Class C | 310,073 | 1,604,270 | 22,721 | 11,902 | 1,786 | 101,628 | 7,923 | 49,061 | |||||||||||||||||||||||||||
Less shares redeemed – Class C | (2,119,906 | ) | (5,562,067 | ) | (239,189 | ) | (870,089 | ) | (83,677 | ) | (231,588 | ) | (68,314 | ) | (93,117 | ) | |||||||||||||||||||
Net Increase (Decrease) – Class C | (185,806 | ) | (1,105,248 | ) | (12,792 | ) | (598,389 | ) | (16,287 | ) | (57,143 | ) | 3,634 | 27,316 | |||||||||||||||||||||
Subscriptions – Class I | 1,270,898 | 2,226,501 | 1,279,094 | 2,338,136 | — | 69,785 | — | — | |||||||||||||||||||||||||||
Shares issued in reinvestment and capital gains – Class I | 13,616 | 119,925 | 17,140 | 50,947 | — | 42 | — | — | |||||||||||||||||||||||||||
Less shares redeemed – Class I | (1,523,905 | ) | (1,016,424 | ) | (1,463,265 | ) | (1,469,126 | ) | — | (167,312 | ) | — | — | ||||||||||||||||||||||
Net Increase (Decrease) – Class I | (239,391 | ) | 1,330,002 | (167,031 | ) | 919,957 | — | (97,485 | ) | — | — | ||||||||||||||||||||||||
Subscriptions – Class R | — | — | 46,221 | 123,992 | — | — | — | — | |||||||||||||||||||||||||||
Shares issued in reinvestment and capital gains – Class R | — | — | 792 | 521 | — | — | — | — | |||||||||||||||||||||||||||
Less shares redeemed – Class R | — | — | (16,360 | ) | (118,346 | ) | — | — | — | — | |||||||||||||||||||||||||
Net Increase – Class R | — | — | 30,653 | 6,167 | — | — | — | — | |||||||||||||||||||||||||||
Subscriptions – Class R4 | 940,539 | 553 | 692,063 | 376 | 74,469 | 499 | 3,646 | 500 | |||||||||||||||||||||||||||
Shares issued in reinvestment and capital gains – Class R4 | 10,101 | — | 7,392 | — | 75 | — | 29 | — | |||||||||||||||||||||||||||
Less shares redeemed – Class R4 | (12,099 | ) | — | (10,893 | ) | — | (8,926 | ) | — | — | — | ||||||||||||||||||||||||
Net Increase – Class R4 | 938,541 | 553 | 688,562 | 376 | 65,618 | 499 | 3,675 | 500 | |||||||||||||||||||||||||||
Subscriptions – Class R5 | 4,125,297 | 82 | 5,071,987 | 8 | 23,060 | 83 | 22,672 | 83 | |||||||||||||||||||||||||||
Shares issued in reinvestment and capital gains – Class R5 | 38,122 | — | 48,288 | 145 | 30 | — | 163 | — | |||||||||||||||||||||||||||
Less shares redeemed – Class R5 | (223,785 | ) | — | (147,543 | ) | (53,601 | ) | (22 | ) | — | (113 | ) | — | ||||||||||||||||||||||
Net Increase (Decrease) – Class R5 | 3,939,634 | 82 | 4,972,732 | (53,448 | ) | 23,068 | 83 | 22,722 | 83 | ||||||||||||||||||||||||||
Subscriptions – Class Y | 24,585,710 | 2,148,017 | 1,929,352 | 750,647 | 86,097 | 83 | — | 83 | |||||||||||||||||||||||||||
Shares issued in reinvestment and capital gains – Class Y | 287,693 | 31,278 | 15,448 | 476 | 115 | — | — | — | |||||||||||||||||||||||||||
Less shares redeemed – Class Y | (781,503 | ) | (10,692 | ) | (184,603 | ) | — | — | — | — | — | ||||||||||||||||||||||||
Net Increase – Class Y | 24,091,900 | 2,168,603 | 1,760,197 | 751,123 | 86,212 | 83 | — | 83 | |||||||||||||||||||||||||||
Subscriptions – Class Z | 24,252,068 | 55,847,077 | 13,585,747 | 30,630,548 | 3,293,147 | 7,413,473 | 1,573,989 | 3,087,336 | |||||||||||||||||||||||||||
Shares issued in reinvestment and capital gains – Class Z | 4,538,857 | 24,884,327 | 1,131,880 | 2,218,261 | 49,294 | 3,580,586 | 115,448 | 838,401 | |||||||||||||||||||||||||||
Less shares redeemed – Class Z | (63,833,724 | ) | (87,379,864 | ) | (17,784,792 | ) | (24,297,024 | ) | (10,071,616 | ) | (13,185,688 | ) | (3,183,219 | ) | (3,121,838 | ) | |||||||||||||||||||
Net Increase (Decrease) – Class Z | (35,042,799 | ) | (6,648,460 | ) | (3,067,165 | ) | 8,551,785 | (6,729,175 | ) | (2,191,629 | ) | (1,493,782 | ) | 803,899 | |||||||||||||||||||||
Net Increase (Decrease) in Shares of Beneficial Interest | (9,375,826 | ) | (17,540,726 | ) | 6,346,556 | 7,095,675 | (6,482,955 | ) | (3,444,558 | ) | (1,550,326 | ) | 1,379,614 | ||||||||||||||||||||||
(a) Class R4 shares reflect activity for the period from November 8, 2012 (commencement of operations) through December 31, 2012.
(b) Class R5 shares reflect activity for the period from November 8, 2012 (commencement of operations) through December 31, 2012.
(c) Class Y shares reflect activity for the period from November 8, 2012 (commencement of operations) through December 31, 2012.
(d) Class Y shares reflect activity for the period from June 13, 2013 (commencement of operations) through June 30, 2013.
See accompanying notes to financial statements.
100
| Columbia Acorn Select | Columbia Thermostat Fund | Columbia Acorn Emerging Markets Fund | Columbia Acorn European Fund | ||||||||||||||||||||||||||||||||
Changes in Shares of Beneficial Interest: | (Unaudited) Six months ended June 30, | Year ended December 31, | (Unaudited) Six months ended June 30, | Year ended December 31, | (Unaudited) Six months ended June 30, | Year ended December 31, | (Unaudited) Six months ended June 30, | Year ended December 31, | |||||||||||||||||||||||||||
2013 | 2012 (a)(b)(c) | 2013 | 2012 (a)(b)(c) | 2013 (d) | 2012 (a)(b) | 2013 | 2012 (b) | ||||||||||||||||||||||||||||
Subscriptions – Class A | 1,876,439 | 1,572,755 | 11,551,293 | 19,574,784 | 4,948,642 | 242,160 | 307,926 | 26,410 | |||||||||||||||||||||||||||
Shares issued in reinvestment and capital gains – Class A | 565,093 | 878,414 | 16,554 | 319,205 | — | 1,308 | — | 152 | |||||||||||||||||||||||||||
Less shares redeemed – Class A | (1,880,104 | ) | (6,287,849 | ) | (2,792,092 | ) | (3,461,158 | ) | (383,019 | ) | (21,619 | ) | (26,879 | ) | (4,331 | ) | |||||||||||||||||||
Net Increase (Decrease) – Class A | 561,428 | (3,836,680 | ) | 8,775,755 | 16,432,831 | 4,565,623 | 221,849 | 281,047 | 22,231 | ||||||||||||||||||||||||||
Shares issued in reinvestment and capital gains – Class B | 10,485 | 46,775 | 126 | 3,716 | — | — | — | — | |||||||||||||||||||||||||||
Less shares redeemed – Class B | (277,327 | ) | (830,866 | ) | (108,496 | ) | (568,981 | ) | — | — | — | — | |||||||||||||||||||||||
Net Increase (Decrease) – Class B | (266,842 | ) | (784,091 | ) | (108,370 | ) | (565,265 | ) | — | — | — | — | |||||||||||||||||||||||
Subscriptions – Class C | 63,392 | 130,998 | 9,809,029 | 15,757,125 | 958,554 | 43,007 | 3,967 | 9,113 | |||||||||||||||||||||||||||
Shares issued in reinvestment and capital gains – Class C | 107,161 | 185,145 | 11,543 | 104,556 | — | — | — | 3 | |||||||||||||||||||||||||||
Less shares redeemed – Class C | (320,452 | ) | (733,680 | ) | (1,206,898 | ) | (818,151 | ) | (16,056 | ) | (5,549 | ) | (3,483 | ) | (2,036 | ) | |||||||||||||||||||
Net Increase (Decrease) – Class C | (149,899 | ) | (417,537 | ) | 8,613,674 | 15,043,530 | 942,498 | 37,458 | 484 | 7,080 | |||||||||||||||||||||||||
Subscriptions – Class I | 1,014,946 | 1,751,104 | — | — | — | — | — | — | |||||||||||||||||||||||||||
Shares issued in reinvestment and capital gains – Class I | 46,022 | 108,517 | — | — | — | 5 | — | 4 | |||||||||||||||||||||||||||
Less shares redeemed – Class I | (1,210,627 | ) | (798,545 | ) | — | — | — | — | — | — | |||||||||||||||||||||||||
Net Increase (Decrease) – Class I | (149,659 | ) | 1,061,076 | — | — | — | 5 | — | 4 | ||||||||||||||||||||||||||
Subscriptions – Class R | — | — | — | — | — | — | — | — | |||||||||||||||||||||||||||
Shares issued in reinvestment and capital gains – Class R | — | — | — | — | — | — | — | — | |||||||||||||||||||||||||||
Less shares redeemed – Class R | — | — | — | — | — | — | — | — | |||||||||||||||||||||||||||
Net Increase – Class R | — | — | — | — | — | — | — | — | |||||||||||||||||||||||||||
Subscriptions – Class R4 | 2,102 | 579 | 585,352 | 1,065 | 458,992 | 1,311 | — | — | |||||||||||||||||||||||||||
Shares issued in reinvestment and capital gains – Class R4 | 113 | — | 257 | — | — | — | — | — | |||||||||||||||||||||||||||
Less shares redeemed – Class R4 | (45 | ) | — | (52,886 | ) | — | (1,028 | ) | — | — | — | ||||||||||||||||||||||||
Net Increase – Class R4 | 2,170 | 579 | 532,723 | 1,065 | 457,964 | 1,311 | — | — | |||||||||||||||||||||||||||
Subscriptions – Class R5 | 353,501 | 96 | 22,889 | 178 | 556,124 | 219 | 49,196 | 223 | |||||||||||||||||||||||||||
Shares issued in reinvestment and capital gains – Class R5 | 784 | — | 13 | — | — | — | — | — | |||||||||||||||||||||||||||
Less shares redeemed – Class R5 | (14,464 | ) | — | (660 | ) | — | — | — | — | — | |||||||||||||||||||||||||
Net Increase (Decrease) – Class R5 | 339,821 | 96 | 22,242 | 178 | 556,124 | 219 | 49,196 | 223 | |||||||||||||||||||||||||||
Subscriptions – Class Y | 156,417 | 96 | — | 178 | 205 | — | — | — | |||||||||||||||||||||||||||
Shares issued in reinvestment and capital gains – Class Y | 54 | — | — | — | — | — | — | — | |||||||||||||||||||||||||||
Less shares redeemed – Class Y | (119 | ) | — | — | — | — | — | — | — | ||||||||||||||||||||||||||
Net Increase – Class Y | 156,352 | 96 | — | 178 | 205 | — | — | — | |||||||||||||||||||||||||||
Subscriptions – Class Z | 1,025,621 | 3,534,761 | 10,246,924 | 20,385,294 | 7,652,950 | 299,290 | 25,082 | 70,205 | |||||||||||||||||||||||||||
Shares issued in reinvestment and capital gains – Class Z | 634,400 | 1,598,571 | 10,187 | 244,437 | — | 5,008 | — | 1,859 | |||||||||||||||||||||||||||
Less shares redeemed – Class Z | (8,390,620 | ) | (18,152,892 | ) | (4,709,302 | ) | (5,049,709 | ) | (276,299 | ) | (34,993 | ) | (1,583 | ) | (754 | ) | |||||||||||||||||||
Net Increase (Decrease) – Class Z | (6,730,599 | ) | (13,019,560 | ) | 5,547,809 | 15,580,022 | 7,376,651 | 269,305 | 23,499 | 71,310 | |||||||||||||||||||||||||
Net Increase (Decrease) in Shares of Beneficial Interest | (6,237,228 | ) | (16,996,021 | ) | 23,383,833 | 46,492,539 | 13,899,065 | 530,147 | 354,226 | 100,848 | |||||||||||||||||||||||||
See accompanying notes to financial statements.
101
Columbia Acorn Family of Funds
Financial Highlights
The following tables are intended to help you understand the Fund's financial performance. Certain information reflects financial results for a single share of a class held for the periods shown. Per share net investment income (loss) amounts are calculated based on average shares outstanding during the period. Total return assumes reinvestment of all dividends and distributions, if any. Total return does not reflect payment of sales charges, if any, and is not annualized for periods of less than one year.
Columbia Acorn Fund
Income from Investment Operations | Less Distributions to Shareholders | ||||||||||||||||||||||||||||||||||
| (Selected data for a share outstanding throughout each period) | Net Asset Value, Beginning of Period | Net investment income (loss) | Net realized and unrealized gain (loss) | Total from investment operations | Net investment income | Net realized gains | Total Distributions to Shareholders | Increase from regulatory settlements | |||||||||||||||||||||||||||
Class A | |||||||||||||||||||||||||||||||||||
| Six Months Ended June 30, 2013 (Unaudited) | $ | 29.36 | 0.00 | (b) | 3.04 | 3.04 | (0.04 | ) | (0.38 | ) | (0.42 | ) | — | ||||||||||||||||||||||
Year Ended December 31, 2012 | $ | 26.63 | 0.08 | 4.53 | 4.61 | (0.06 | ) | (1.82 | ) | (1.88 | ) | — | |||||||||||||||||||||||
Year Ended December 31, 2011 | $ | 29.24 | (0.10 | ) | (1.30 | ) | (1.40 | ) | (0.02 | ) | (1.19 | ) | (1.21 | ) | — | ||||||||||||||||||||
Year Ended December 31, 2010 | $ | 23.98 | (0.06 | ) | 6.18 | 6.12 | (0.02 | ) | (0.84 | ) | (0.86 | ) | 0.00 | (b) | |||||||||||||||||||||
Year Ended December 31, 2009 | $ | 17.22 | (0.02 | ) | 6.78 | 6.76 | — | — | — | 0.00 | (b) | ||||||||||||||||||||||||
Year Ended December 31, 2008 | $ | 28.87 | (0.01 | ) | (10.98 | ) | (10.99 | ) | — | (0.66 | ) | (0.66 | ) | — | |||||||||||||||||||||
Class B | |||||||||||||||||||||||||||||||||||
| Six Months Ended June 30, 2013 (Unaudited) | $ | 26.80 | (0.10 | ) | 2.77 | 2.67 | — | (0.38 | ) | (0.38 | ) | �� | — | ||||||||||||||||||||||
Year Ended December 31, 2012 | $ | 24.53 | (0.11 | ) | 4.20 | 4.09 | — | (1.82 | ) | (1.82 | ) | — | |||||||||||||||||||||||
Year Ended December 31, 2011 | $ | 27.14 | (0.27 | ) | (1.15 | ) | (1.42 | ) | — | (1.19 | ) | (1.19 | ) | — | |||||||||||||||||||||
Year Ended December 31, 2010 | $ | 22.43 | (0.21 | ) | 5.76 | 5.55 | — | (0.84 | ) | (0.84 | ) | 0.00 | (b) | ||||||||||||||||||||||
Year Ended December 31, 2009 | $ | 16.21 | (0.14 | ) | 6.36 | 6.22 | — | — | — | 0.00 | (b) | ||||||||||||||||||||||||
Year Ended December 31, 2008 | $ | 27.39 | (0.15 | ) | (10.37 | ) | (10.52 | ) | — | (0.66 | ) | (0.66 | ) | — | |||||||||||||||||||||
Class C | |||||||||||||||||||||||||||||||||||
| Six Months Ended June 30, 2013 (Unaudited) | $ | 26.34 | (0.10 | ) | 2.72 | 2.62 | — | (0.38 | ) | (0.38 | ) | — | |||||||||||||||||||||||
Year Ended December 31, 2012 | $ | 24.18 | (0.12 | ) | 4.10 | 3.98 | — | (1.82 | ) | (1.82 | ) | — | |||||||||||||||||||||||
Year Ended December 31, 2011 | $ | 26.85 | (0.29 | ) | (1.19 | ) | (1.48 | ) | — | (1.19 | ) | (1.19 | ) | — | |||||||||||||||||||||
Year Ended December 31, 2010 | $ | 22.23 | (0.24 | ) | 5.70 | 5.46 | — | (0.84 | ) | (0.84 | ) | 0.00 | (b) | ||||||||||||||||||||||
Year Ended December 31, 2009 | $ | 16.09 | (0.17 | ) | 6.31 | 6.14 | — | — | — | 0.00 | (b) | ||||||||||||||||||||||||
Year Ended December 31, 2008 | $ | 27.25 | (0.19 | ) | (10.31 | ) | (10.50 | ) | — | (0.66 | ) | (0.66 | ) | — | |||||||||||||||||||||
Class I | |||||||||||||||||||||||||||||||||||
| Six Months Ended June 30, 2013 (Unaudited) | $ | 30.47 | 0.05 | 3.16 | 3.21 | (0.04 | ) | (0.38 | ) | (0.42 | ) | — | |||||||||||||||||||||||
Year Ended December 31, 2012 | $ | 27.57 | 0.26 | 4.62 | 4.88 | (0.16 | ) | (1.82 | ) | (1.98 | ) | — | |||||||||||||||||||||||
Year Ended December 31, 2011 | $ | 30.19 | 0.01 | (1.35 | ) | (1.34 | ) | (0.09 | ) | (1.19 | ) | (1.28 | ) | — | |||||||||||||||||||||
Year Ended December 31, 2010 (e) | $ | 26.80 | (0.01 | ) | 4.26 | 4.25 | (0.02 | ) | (0.84 | ) | (0.86 | ) | — | ||||||||||||||||||||||
Class R4 | |||||||||||||||||||||||||||||||||||
| Six Months Ended June 30, 2013 (Unaudited) | $ | 30.90 | 0.10 | 3.14 | 3.24 | (0.05 | ) | (0.38 | ) | (0.43 | ) | — | |||||||||||||||||||||||
Year Ended December 31, 2012 (f) | $ | 30.59 | 0.05 | 1.84 | 1.89 | (0.12 | ) | (1.46 | ) | (1.58 | ) | — | |||||||||||||||||||||||
Class R5 | |||||||||||||||||||||||||||||||||||
| Six Months Ended June 30, 2013 (Unaudited) | $ | 30.88 | 0.12 | 3.13 | 3.25 | (0.04 | ) | (0.38 | ) | (0.42 | ) | — | |||||||||||||||||||||||
Year Ended December 31, 2012 (g) | $ | 30.59 | 0.06 | 1.83 | 1.89 | (0.14 | ) | (1.46 | ) | (1.60 | ) | — | |||||||||||||||||||||||
Class Y | |||||||||||||||||||||||||||||||||||
| Six Months Ended June 30, 2013 (Unaudited) | $ | 30.90 | 0.10 | 3.17 | 3.27 | (0.05 | ) | (0.38 | ) | (0.43 | ) | — | |||||||||||||||||||||||
Year Ended December 31, 2012 (h) | $ | 30.62 | 0.09 | 1.80 | 1.89 | (0.15 | ) | (1.46 | ) | (1.61 | ) | — | |||||||||||||||||||||||
Class Z | |||||||||||||||||||||||||||||||||||
| Six Months Ended June 30, 2013 (Unaudited) | $ | 30.45 | 0.04 | 3.16 | 3.20 | (0.04 | ) | (0.38 | ) | (0.42 | ) | — | |||||||||||||||||||||||
Year Ended December 31, 2012 | $ | 27.56 | 0.17 | 4.69 | 4.86 | (0.15 | ) | (1.82 | ) | (1.97 | ) | — | |||||||||||||||||||||||
Year Ended December 31, 2011 | $ | 30.19 | (0.01 | ) | (1.34 | ) | (1.35 | ) | (0.09 | ) | (1.19 | ) | (1.28 | ) | — | ||||||||||||||||||||
Year Ended December 31, 2010 | $ | 24.68 | 0.02 | 6.37 | 6.39 | (0.04 | ) | (0.84 | ) | (0.88 | ) | 0.00 | (b) | ||||||||||||||||||||||
Year Ended December 31, 2009 | $ | 17.71 | 0.04 | 6.98 | 7.02 | (0.05 | ) | — | (0.05 | ) | 0.00 | (b) | |||||||||||||||||||||||
Year Ended December 31, 2008 | $ | 29.61 | 0.06 | (11.29 | ) | (11.23 | ) | (0.01 | ) | (0.66 | ) | (0.67 | ) | — | |||||||||||||||||||||
(a) In addition to the fees and expenses which the Fund bears directly, the Fund indirectly bears a pro rata share of the fees and expenses of the underlying funds in which it invests. Such indirect expenses are not included in the reported expense ratios.
(b) Rounds to zero.
(c) Annualized.
(d) The benefits derived from custody fees paid indirectly had an impact of less than 0.01%.
(e) Class I shares commenced operations on September 27, 2010. Per share data and total return reflect activity from that date.
(f) Class R4 shares commenced operations on November 8, 2012. Per share data and total return reflect activity from that date.
(g) Class R5 shares commenced operations on November 8, 2012. Per share data and total return reflect activity from that date.
(h) Class Y shares commenced operations on November 8, 2012. Per share data and total return reflect activity from that date.
See accompanying notes to financial statements.
102
Ratio to Average Net Assets | Supplemental Data | ||||||||||||||||||||||||||||||
| (Selected data for a share outstanding throughout each period) | Net Asset Value, End of Period | Total Return | Total gross expenses (a) | Total net expenses (a) | Net investment income (loss) | Portfolio turnover rate | Net assets, end of period (000s) | ||||||||||||||||||||||||
Class A | |||||||||||||||||||||||||||||||
| Six Months Ended June 30, 2013 (Unaudited) | $ | 31.98 | 10.37 | % | 1.07 | %(c) | 1.07 | %(c) | 0.00 | %(b)(c) | 9 | % | $ | 3,443,357 | |||||||||||||||||
Year Ended December 31, 2012 | $ | 29.36 | 17.62 | % | 1.06 | % | 1.06 | %(d) | 0.27 | % | 16 | % | $ | 3,233,494 | |||||||||||||||||
Year Ended December 31, 2011 | $ | 26.63 | (4.91 | )% | 1.06 | % | 1.06 | %(d) | (0.33 | )% | 18 | % | $ | 3,246,833 | |||||||||||||||||
Year Ended December 31, 2010 | $ | 29.24 | 25.61 | % | 1.07 | % | 1.07 | %(d) | (0.22 | )% | 28 | % | $ | 3,639,788 | |||||||||||||||||
Year Ended December 31, 2009 | $ | 23.98 | 39.26 | % | 1.07 | % | 1.07 | %(d) | (0.12 | )% | 27 | % | $ | 2,937,761 | |||||||||||||||||
Year Ended December 31, 2008 | $ | 17.22 | (38.72 | )% | 1.05 | % | 1.05 | %(d) | (0.04 | )% | 21 | % | $ | 2,221,100 | |||||||||||||||||
Class B | |||||||||||||||||||||||||||||||
| Six Months Ended June 30, 2013 (Unaudited) | $ | 29.09 | 9.98 | % | 1.71 | %(c) | 1.71 | %(c) | (0.69 | )%(c) | 9 | % | $ | 23,513 | |||||||||||||||||
Year Ended December 31, 2012 | $ | 26.80 | 16.98 | % | 1.65 | % | 1.64 | %(d) | (0.42 | )% | 16 | % | $ | 33,623 | |||||||||||||||||
Year Ended December 31, 2011 | $ | 24.53 | (5.34 | )% | 1.67 | % | 1.67 | %(d) | (0.98 | )% | 18 | % | $ | 67,153 | |||||||||||||||||
Year Ended December 31, 2010 | $ | 27.14 | 24.81 | % | 1.69 | % | 1.69 | %(d) | (0.88 | )% | 28 | % | $ | 287,650 | |||||||||||||||||
Year Ended December 31, 2009 | $ | 22.43 | 38.37 | % | 1.74 | % | 1.74 | %(d) | (0.77 | )% | 27 | % | $ | 525,072 | |||||||||||||||||
Year Ended December 31, 2008 | $ | 16.21 | (39.11 | )% | 1.65 | % | 1.65 | %(d) | (0.64 | )% | 21 | % | $ | 581,587 | |||||||||||||||||
Class C | |||||||||||||||||||||||||||||||
| Six Months Ended June 30, 2013 (Unaudited) | $ | 28.58 | 9.96 | % | 1.79 | %(c) | 1.79 | %(c) | (0.72 | )%(c) | 9 | % | $ | 815,711 | |||||||||||||||||
Year Ended December 31, 2012 | $ | 26.34 | 16.77 | % | 1.80 | % | 1.80 | %(d) | (0.46 | )% | 16 | % | $ | 756,709 | |||||||||||||||||
Year Ended December 31, 2011 | $ | 24.18 | (5.63 | )% | 1.82 | % | 1.82 | %(d) | (1.10 | )% | 18 | % | $ | 721,446 | |||||||||||||||||
Year Ended December 31, 2010 | $ | 26.85 | 24.63 | % | 1.85 | % | 1.85 | %(d) | (1.00 | )% | 28 | % | $ | 829,181 | |||||||||||||||||
Year Ended December 31, 2009 | $ | 22.23 | 38.16 | % | 1.89 | % | 1.89 | %(d) | (0.93 | )% | 27 | % | $ | 736,818 | |||||||||||||||||
Year Ended December 31, 2008 | $ | 16.09 | (39.23 | )% | 1.83 | % | 1.83 | %(d) | (0.82 | )% | 21 | % | $ | 622,665 | |||||||||||||||||
Class I | |||||||||||||||||||||||||||||||
| Six Months Ended June 30, 2013 (Unaudited) | $ | 33.26 | 10.55 | % | 0.71 | %(c) | 0.71 | %(c) | 0.30 | %(c) | 9 | % | $ | 56,049 | |||||||||||||||||
Year Ended December 31, 2012 | $ | 30.47 | 18.02 | % | 0.72 | % | 0.72 | %(d) | 0.86 | % | 16 | % | $ | 58,652 | |||||||||||||||||
Year Ended December 31, 2011 | $ | 27.57 | (4.57 | )% | 0.72 | % | 0.72 | %(d) | 0.02 | % | 18 | % | $ | 16,397 | |||||||||||||||||
Year Ended December 31, 2010 (e) | $ | 30.19 | 15.94 | % | 0.71 | %(c) | 0.71 | %(c)(d) | (0.13 | )%(c) | 28 | % | $ | 11,627 | |||||||||||||||||
Class R4 | |||||||||||||||||||||||||||||||
| Six Months Ended June 30, 2013 (Unaudited) | $ | 33.71 | 10.50 | % | 0.77 | %(c) | 0.77 | %(c) | 0.59 | %(c) | 9 | % | $ | 31,657 | |||||||||||||||||
Year Ended December 31, 2012 (f) | $ | 30.90 | 6.31 | % | 0.87 | %(c) | 0.86 | %(c)(d) | 1.24 | %(c) | 16 | % | $ | 17 | |||||||||||||||||
Class R5 | |||||||||||||||||||||||||||||||
| Six Months Ended June 30, 2013 (Unaudited) | $ | 33.71 | 10.54 | % | 0.73 | %(c) | 0.73 | %(c) | 0.72 | %(c) | 9 | % | $ | 132,811 | |||||||||||||||||
Year Ended December 31, 2012 (g) | $ | 30.88 | 6.33 | % | 0.82 | %(c) | 0.81 | %(c)(d) | 1.29 | %(c) | 16 | % | $ | 3 | |||||||||||||||||
Class Y | |||||||||||||||||||||||||||||||
| Six Months Ended June 30, 2013 (Unaudited) | $ | 33.74 | 10.58 | % | 0.72 | %(c) | 0.72 | %(c) | 0.63 | %(c) | 9 | % | $ | 885,902 | |||||||||||||||||
Year Ended December 31, 2012 (h) | $ | 30.90 | 6.34 | % | 0.75 | %(c) | 0.75 | %(c)(d) | 2.21 | %(c) | 16 | % | $ | 67,012 | |||||||||||||||||
Class Z | |||||||||||||||||||||||||||||||
| Six Months Ended June 30, 2013 (Unaudited) | $ | 33.23 | 10.52 | % | 0.78 | %(c) | 0.78 | %(c) | 0.27 | %(c) | 9 | % | $ | 13,427,998 | |||||||||||||||||
Year Ended December 31, 2012 | $ | 30.45 | 17.93 | % | 0.78 | % | 0.78 | %(d) | 0.57 | % | 16 | % | $ | 13,374,355 | |||||||||||||||||
Year Ended December 31, 2011 | $ | 27.56 | (4.61 | )% | 0.76 | % | 0.76 | %(d) | (0.03 | )% | 18 | % | $ | 12,284,748 | |||||||||||||||||
Year Ended December 31, 2010 | $ | 30.19 | 26.00 | % | 0.76 | % | 0.76 | %(d) | 0.09 | % | 28 | % | $ | 13,330,466 | |||||||||||||||||
Year Ended December 31, 2009 | $ | 24.68 | 39.65 | % | 0.77 | % | 0.77 | %(d) | 0.18 | % | 27 | % | $ | 10,527,500 | |||||||||||||||||
Year Ended December 31, 2008 | $ | 17.71 | (38.55 | )% | 0.76 | % | 0.76 | %(d) | 0.26 | % | 21 | % | $ | 7,445,862 | |||||||||||||||||
See accompanying notes to financial statements.
103
Columbia Acorn Family of Funds
Financial Highlights, continued
Columbia Acorn International
Income from Investment Operations | Less Distributions to Shareholders | ||||||||||||||||||||||||||||||||||||||
| (Selected data for a share outstanding throughout each period) | Net Asset Value, Beginning of Period | Net investment income (loss) | Net realized and unrealized gain (loss) | Reimbursement from affiliate | Total from investment operations | Net investment income | Net realized gains | Total Distributions to Shareholders | Redemption fees added to paid in capital | ||||||||||||||||||||||||||||||
Class A | |||||||||||||||||||||||||||||||||||||||
| Six Months Ended June 30, 2013 (Unaudited) | $ | 40.79 | 0.28 | 2.06 | — | 2.34 | (0.48 | ) | — | (0.48 | ) | — | |||||||||||||||||||||||||||
Year Ended December 31, 2012 | $ | 34.15 | 0.47 | 6.75 | — | 7.22 | (0.58 | ) | — | (0.58 | ) | — | |||||||||||||||||||||||||||
Year Ended December 31, 2011 | $ | 40.87 | 0.32 | (6.02 | ) | 0.00 | (d) | (5.70 | ) | (1.02 | ) | — | (1.02 | ) | — | ||||||||||||||||||||||||
Year Ended December 31, 2010 | $ | 34.13 | 0.22 | 7.21 | — | 7.43 | (0.69 | ) | — | (0.69 | ) | 0.00 | (d) | ||||||||||||||||||||||||||
Year Ended December 31, 2009 | $ | 23.03 | 0.23 | 11.27 | — | 11.50 | (0.41 | ) | — | (0.41 | ) | 0.00 | (d) | ||||||||||||||||||||||||||
Year Ended December 31, 2008 | $ | 43.42 | 0.47 | (20.20 | ) | — | (19.73 | ) | (0.06 | ) | (0.60 | ) | (0.66 | ) | 0.00 | (d) | |||||||||||||||||||||||
Class B | |||||||||||||||||||||||||||||||||||||||
| Six Months Ended June 30, 2013 (Unaudited) | $ | 39.67 | 0.10 | 2.02 | — | 2.12 | (0.48 | ) | — | (0.48 | ) | — | |||||||||||||||||||||||||||
Year Ended December 31, 2012 | $ | 33.17 | 0.19 | 6.55 | — | 6.74 | (0.24 | ) | — | (0.24 | ) | — | |||||||||||||||||||||||||||
Year Ended December 31, 2011 | $ | 39.96 | 0.06 | (5.85 | ) | 0.00 | (d) | (5.79 | ) | (1.00 | ) | — | (1.00 | ) | — | ||||||||||||||||||||||||
Year Ended December 31, 2010 | $ | 33.22 | 0.03 | 7.02 | — | 7.05 | (0.31 | ) | — | (0.31 | ) | 0.00 | (d) | ||||||||||||||||||||||||||
Year Ended December 31, 2009 | $ | 22.41 | 0.08 | 10.92 | — | 11.00 | (0.20 | ) | — | (0.20 | ) | 0.00 | (d) | ||||||||||||||||||||||||||
Year Ended December 31, 2008 | $ | 42.46 | 0.27 | (19.72 | ) | — | (19.45 | ) | — | (0.60 | ) | (0.60 | ) | 0.00 | (d) | ||||||||||||||||||||||||
Class C | |||||||||||||||||||||||||||||||||||||||
| Six Months Ended June 30, 2013 (Unaudited) | $ | 39.50 | 0.11 | 2.00 | — | 2.11 | (0.48 | ) | — | (0.48 | ) | — | |||||||||||||||||||||||||||
Year Ended December 31, 2012 | $ | 33.03 | 0.18 | 6.52 | — | 6.70 | (0.23 | ) | — | (0.23 | ) | — | |||||||||||||||||||||||||||
Year Ended December 31, 2011 | $ | 39.79 | 0.04 | (5.86 | ) | 0.00 | (d) | (5.82 | ) | (0.94 | ) | — | (0.94 | ) | — | ||||||||||||||||||||||||
Year Ended December 31, 2010 | $ | 33.08 | (0.05 | ) | 7.03 | — | 6.98 | (0.27 | ) | — | (0.27 | ) | 0.00 | (d) | |||||||||||||||||||||||||
Year Ended December 31, 2009 | $ | 22.30 | 0.02 | 10.89 | — | 10.91 | (0.14 | ) | — | (0.14 | ) | 0.00 | (d) | ||||||||||||||||||||||||||
Year Ended December 31, 2008 | $ | 42.32 | 0.21 | (19.63 | ) | — | (19.42 | ) | — | (0.60 | ) | (0.60 | ) | 0.00 | (d) | ||||||||||||||||||||||||
Class I | |||||||||||||||||||||||||||||||||||||||
| Six Months Ended June 30, 2013 (Unaudited) | $ | 40.86 | 0.35 | 2.06 | — | 2.41 | (0.48 | ) | — | (0.48 | ) | — | |||||||||||||||||||||||||||
Year Ended December 31, 2012 | $ | 34.33 | 0.57 | 6.83 | — | 7.40 | (0.87 | ) | — | (0.87 | ) | — | |||||||||||||||||||||||||||
Year Ended December 31, 2011 | $ | 40.92 | 0.37 | (5.94 | ) | 0.00 | (d) | (5.57 | ) | (1.02 | ) | — | (1.02 | ) | — | ||||||||||||||||||||||||
Year Ended December 31, 2010 (g) | $ | 37.69 | 0.08 | 3.49 | — | 3.57 | (0.34 | ) | — | (0.34 | ) | 0.00 | (d) | ||||||||||||||||||||||||||
Class R | |||||||||||||||||||||||||||||||||||||||
| Six Months Ended June 30, 2013 (Unaudited) | $ | 40.79 | 0.22 | 2.04 | — | 2.26 | (0.48 | ) | — | (0.48 | ) | — | |||||||||||||||||||||||||||
Year Ended December 31, 2012 | $ | 34.11 | 0.21 | 6.89 | — | �� | 7.10 | (0.42 | ) | — | (0.42 | ) | — | ||||||||||||||||||||||||||
Year Ended December 31, 2011 (h) | $ | 40.11 | (0.00 | )(d) | (6.00 | ) | 0.00 | (d) | (6.00 | ) | — | — | — | — | |||||||||||||||||||||||||
Class R4 | |||||||||||||||||||||||||||||||||||||||
| Six Months Ended June 30, 2013 (Unaudited) | $ | 41.08 | 0.51 | 1.90 | — | 2.41 | (0.48 | ) | — | (0.48 | ) | — | |||||||||||||||||||||||||||
Year Ended December 31, 2012 (i) | $ | 39.86 | (0.00 | )(d) | 1.81 | — | 1.81 | (0.59 | ) | — | (0.59 | ) | — | ||||||||||||||||||||||||||
Class R5 | |||||||||||||||||||||||||||||||||||||||
| Six Months Ended June 30, 2013 (Unaudited) | $ | 40.81 | 0.48 | 1.93 | — | 2.41 | (0.48 | ) | — | (0.48 | ) | — | |||||||||||||||||||||||||||
Year Ended December 31, 2012 | $ | 34.31 | 0.75 | 6.62 | — | 7.37 | (0.87 | ) | — | (0.87 | ) | — | |||||||||||||||||||||||||||
Year Ended December 31, 2011 (j) | $ | 40.24 | 0.09 | (6.02 | ) | 0.00 | (d) | (5.93 | ) | — | — | — | — | ||||||||||||||||||||||||||
Class Y | |||||||||||||||||||||||||||||||||||||||
| Six Months Ended June 30, 2013 (Unaudited) | $ | 41.08 | 0.40 | 2.03 | — | 2.43 | (0.48 | ) | — | (0.48 | ) | — | |||||||||||||||||||||||||||
Year Ended December 31, 2012 (k) | $ | 39.90 | 0.04 | 1.78 | — | 1.82 | (0.64 | ) | — | (0.64 | ) | — | |||||||||||||||||||||||||||
Class Z | |||||||||||||||||||||||||||||||||||||||
| Six Months Ended June 30, 2013 (Unaudited) | $ | 40.84 | 0.34 | 2.06 | — | 2.40 | (0.48 | ) | — | (0.48 | ) | — | |||||||||||||||||||||||||||
Year Ended December 31, 2012 | $ | 34.31 | 0.59 | 6.78 | ��� | 7.37 | (0.84 | ) | — | (0.84 | ) | — | |||||||||||||||||||||||||||
Year Ended December 31, 2011 | $ | 40.92 | 0.48 | (6.07 | ) | 0.00 | (d) | (5.59 | ) | (1.02 | ) | — | (1.02 | ) | — | ||||||||||||||||||||||||
Year Ended December 31, 2010 | $ | 34.26 | 0.35 | 7.23 | — | 7.58 | (0.92 | ) | — | (0.92 | ) | 0.00 | (d) | ||||||||||||||||||||||||||
Year Ended December 31, 2009 | $ | 23.13 | 0.34 | 11.31 | — | 11.65 | (0.53 | ) | — | (0.53 | ) | 0.00 | (d) | ||||||||||||||||||||||||||
Year Ended December 31, 2008 | $ | 43.60 | 0.60 | (20.26 | ) | — | (19.66 | ) | (0.21 | ) | (0.60 | ) | (0.81 | ) | 0.00 | (d) | |||||||||||||||||||||||
(a) Had the Investment Manager and/or Transfer Agent not waived fees and/or reimbursed a portion of expenses, total return would have been reduced.
(b) Annualized.
(c) In addition to the fees and expenses which the Fund bears directly, the Fund indirectly bears a pro rata share of the fees and expenses of the underlying funds in which it invests. Such indirect expenses are not included in the reported expense ratios.
(d) Rounds to zero.
(e) The benefits derived from custody fees paid indirectly had an impact of 0.01%.
(f) During the year ended December 31, 2011, Columbia Management reimbursed the Fund for a loss on a trading error. Had the Fund not received this reimbursement, total return would have been lower by less than 0.01%.
(g) Class I shares commenced operations on September 27, 2010. Per share data and total return reflect activity from that date.
(h) Class R shares commenced operations on August 15, 2011. Per share data and total return reflect activity from that date.
(i) Class R4 shares commenced operations on November 8, 2012. Per share data and total return reflect activity from that date.
(j) Class R5 shares commenced operations on August 15, 2011. Per share data and total return reflect activity from that date.
(k) Class Y shares commenced operations on November 8, 2012. Per share data and total return reflect activity from that date.
See accompanying notes to financial statements.
104
Ratio to Average Net Assets | Supplemental Data | ||||||||||||||||||||||||||||||||||
| (Selected data for a share outstanding throughout each period) | Increase from regulatory settlements | Net Asset Value, End of Period | Total Return | Total gross expenses | Total net expenses | Net investment income (loss) | Portfolio turnover rate | Net assets, end of period (000s) | |||||||||||||||||||||||||||
Class A | |||||||||||||||||||||||||||||||||||
| Six Months Ended June 30, 2013 (Unaudited) | — | $ | 42.65 | 5.71 | %(a) | 1.26 | %(b)(c) | 1.22 | %(b)(c) | 1.32 | %(b) | 23 | % | $ | 1,148,090 | ||||||||||||||||||||
Year Ended December 31, 2012 | 0.00 | (d) | $ | 40.79 | 21.21 | %(a) | 1.28 | %(c) | 1.24 | %(c)(e) | 1.22 | % | 33 | % | $ | 1,007,236 | |||||||||||||||||||
Year Ended December 31, 2011 | 0.00 | (d) | $ | 34.15 | (14.37 | )%(a)(f) | 1.32 | %(c) | 1.30 | %(c)(e) | 0.84 | % | 32 | % | $ | 918,112 | |||||||||||||||||||
Year Ended December 31, 2010 | 0.00 | (d) | $ | 40.87 | 22.23 | % | 1.35 | %(c) | 1.35 | %(c)(e) | 0.62 | % | 25 | % | $ | 810,603 | |||||||||||||||||||
Year Ended December 31, 2009 | 0.01 | $ | 34.13 | 50.40 | % | 1.36 | %(c) | 1.36 | %(c)(e) | 0.85 | % | 31 | % | $ | 578,599 | ||||||||||||||||||||
Year Ended December 31, 2008 | — | $ | 23.03 | (46.09 | )% | 1.31 | % | 1.31 | %(e) | 1.36 | % | 38 | % | $ | 366,820 | ||||||||||||||||||||
Class B | |||||||||||||||||||||||||||||||||||
| Six Months Ended June 30, 2013 (Unaudited) | — | $ | 41.31 | 5.32 | %(a) | 1.98 | %(b)(c) | 1.95 | %(b)(c) | 0.50 | %(b) | 23 | % | $ | 14,986 | ||||||||||||||||||||
Year Ended December 31, 2012 | 0.00 | (d) | $ | 39.67 | 20.33 | %(a) | 2.00 | %(c) | 1.97 | %(c)(e) | 0.51 | % | 33 | % | $ | 17,910 | |||||||||||||||||||
Year Ended December 31, 2011 | 0.00 | (d) | $ | 33.17 | (14.92 | )%(a)(f) | 1.98 | %(c) | 1.96 | %(c)(e) | 0.15 | % | 32 | % | $ | 24,510 | |||||||||||||||||||
Year Ended December 31, 2010 | 0.00 | (d) | $ | 39.96 | 21.49 | % | 1.96 | %(c) | 1.96 | %(c)(e) | 0.08 | % | 25 | % | $ | 29,368 | |||||||||||||||||||
Year Ended December 31, 2009 | 0.01 | $ | 33.22 | 49.36 | % | 2.03 | %(c) | 2.03 | %(c)(e) | 0.29 | % | 31 | % | $ | 38,835 | ||||||||||||||||||||
Year Ended December 31, 2008 | — | $ | 22.41 | (46.41 | )% | 1.90 | % | 1.90 | %(e) | 0.77 | % | 38 | % | $ | 39,153 | ||||||||||||||||||||
Class C | |||||||||||||||||||||||||||||||||||
| Six Months Ended June 30, 2013 (Unaudited) | — | $ | 41.13 | 5.31 | %(a) | 2.01 | %(b)(c) | 1.99 | %(b)(c) | 0.52 | %(b) | 23 | % | $ | 96,034 | ||||||||||||||||||||
Year Ended December 31, 2012 | 0.00 | (d) | $ | 39.50 | 20.31 | %(a) | 2.02 | %(c) | 2.00 | %(c)(e) | 0.48 | % | 33 | % | $ | 92,748 | |||||||||||||||||||
Year Ended December 31, 2011 | 0.00 | (d) | $ | 33.03 | (15.02 | )%(a)(f) | 2.07 | %(c) | 2.06 | %(c)(e) | 0.10 | % | 32 | % | $ | 97,328 | |||||||||||||||||||
Year Ended December 31, 2010 | 0.00 | (d) | $ | 39.79 | 21.34 | % | 2.11 | %(c) | 2.11 | %(c)(e) | (0.13 | )% | 25 | % | $ | 110,931 | |||||||||||||||||||
Year Ended December 31, 2009 | 0.01 | $ | 33.08 | 49.12 | % | 2.17 | %(c) | 2.17 | %(c)(e) | 0.07 | % | 31 | % | $ | 85,625 | ||||||||||||||||||||
Year Ended December 31, 2008 | — | $ | 22.30 | (46.50 | )% | 2.08 | % | 2.08 | %(e) | 0.60 | % | 38 | % | $ | 62,906 | ||||||||||||||||||||
Class I | |||||||||||||||||||||||||||||||||||
| Six Months Ended June 30, 2013 (Unaudited) | — | $ | 42.79 | 5.87 | % | 0.86 | %(b)(c) | 0.86 | %(b)(c) | 1.66 | %(b) | 23 | % | $ | 94,955 | ||||||||||||||||||||
Year Ended December 31, 2012 | 0.00 | (d) | $ | 40.86 | 21.69 | % | 0.88 | %(c) | 0.88 | %(c)(e) | 1.48 | % | 33 | % | $ | 97,484 | |||||||||||||||||||
Year Ended December 31, 2011 | 0.00 | (d) | $ | 34.33 | (14.02 | )%(f) | 0.91 | %(c) | 0.91 | %(c)(e) | 0.99 | % | 32 | % | $ | 50,335 | |||||||||||||||||||
Year Ended December 31, 2010 (g) | — | $ | 40.92 | 9.50 | % | 0.94 | %(b)(c) | 0.94 | %(b)(c)(e) | 0.77 | %(b) | 25 | % | $ | 66,581 | ||||||||||||||||||||
Class R | |||||||||||||||||||||||||||||||||||
| Six Months Ended June 30, 2013 (Unaudited) | — | $ | 42.57 | 5.51 | % | 1.56 | %(b)(c) | 1.56 | %(b)(c) | 1.02 | %(b) | 23 | % | $ | 4,227 | ||||||||||||||||||||
Year Ended December 31, 2012 | 0.00 | (d) | $ | 40.79 | 20.83 | % | 1.52 | %(c) | 1.51 | %(c)(e) | 0.54 | % | 33 | % | $ | 2,799 | |||||||||||||||||||
Year Ended December 31, 2011 (h) | 0.00 | (d) | $ | 34.11 | (14.96 | )% | 1.59 | %(b)(c) | 1.59 | %(b)(c)(e) | (0.02 | )%(b) | 32 | % | $ | 2,130 | |||||||||||||||||||
Class R4 | |||||||||||||||||||||||||||||||||||
| Six Months Ended June 30, 2013 (Unaudited) | — | $ | 43.01 | 5.84 | % | 0.92 | %(b)(c) | 0.92 | %(b)(c) | 2.40 | %(b) | 23 | % | $ | 29,629 | ||||||||||||||||||||
Year Ended December 31, 2012 (i) | — | $ | 41.08 | 4.57 | % | 1.03 | %(b)(c) | 1.02 | %(b)(c)(e) | (0.02 | )%(b) | 33 | % | $ | 15 | ||||||||||||||||||||
Class R5 | |||||||||||||||||||||||||||||||||||
| Six Months Ended June 30, 2013 (Unaudited) | — | $ | 42.74 | 5.88 | % | 0.90 | %(b)(c) | 0.90 | %(b)(c) | 2.25 | %(b) | 23 | % | $ | 212,769 | ||||||||||||||||||||
Year Ended December 31, 2012 | 0.00 | (d) | $ | 40.81 | 21.61 | % | 0.89 | %(c) | 0.89 | %(c)(e) | 1.99 | % | 33 | % | $ | 242 | |||||||||||||||||||
Year Ended December 31, 2011 (j) | 0.00 | (d) | $ | 34.31 | (14.74 | )% | 0.91 | %(b)(c) | 0.91 | %(b)(c)(e) | 0.65 | %(b) | 32 | % | $ | 2,038 | |||||||||||||||||||
Class Y | |||||||||||||||||||||||||||||||||||
| Six Months Ended June 30, 2013 (Unaudited) | — | $ | 43.03 | 5.89 | % | 0.86 | %(b)(c) | 0.86 | %(b)(c) | 1.88 | %(b) | 23 | % | $ | 108,065 | ||||||||||||||||||||
Year Ended December 31, 2012 (k) | — | $ | 41.08 | 4.59 | % | 0.91 | %(b)(c) | 0.90 | %(b)(c)(e) | 0.75 | %(b) | 33 | % | $ | 30,856 | ||||||||||||||||||||
Class Z | |||||||||||||||||||||||||||||||||||
| Six Months Ended June 30, 2013 (Unaudited) | — | $ | 42.76 | 5.85 | % | 0.92 | %(b)(c) | 0.92 | %(b)(c) | 1.59 | %(b) | 23 | % | $ | 5,621,637 | ||||||||||||||||||||
Year Ended December 31, 2012 | 0.00 | (d) | $ | 40.84 | 21.60 | % | 0.93 | %(c) | 0.93 | %(c)(e) | 1.53 | % | 33 | % | $ | 5,494,506 | |||||||||||||||||||
Year Ended December 31, 2011 | 0.00 | (d) | $ | 34.31 | (14.06 | )%(f) | 0.95 | %(c) | 0.95 | %(c)(e) | 1.24 | % | 32 | % | $ | 4,322,500 | |||||||||||||||||||
Year Ended December 31, 2010 | 0.00 | (d) | $ | 40.92 | 22.70 | % | 0.97 | %(c) | 0.97 | %(c)(e) | 0.99 | % | 25 | % | $ | 5,107,580 | |||||||||||||||||||
Year Ended December 31, 2009 | 0.01 | $ | 34.26 | 50.97 | % | 0.99 | %(c) | 0.99 | %(c)(e) | 1.23 | % | 31 | % | $ | 3,727,679 | ||||||||||||||||||||
Year Ended December 31, 2008 | — | $ | 23.13 | (45.89 | )% | 0.96 | % | 0.96 | %(e) | 1.72 | % | 38 | % | $ | 2,371,688 | ||||||||||||||||||||
See accompanying notes to financial statements.
105
Columbia Acorn Family of Funds
Financial Highlights, continued
Columbia Acorn USA
Income from Investment Operations | Less Distributions to Shareholders | ||||||||||||||||||||||||||||||||||
| (Selected data for a share outstanding throughout each period) | Net Asset Value, Beginning of Period | Net investment income (loss) | Net realized and unrealized gain (loss) | Total from investment operations | Net investment income | Net realized gains | Total Distributions to Shareholders | Increase from regulatory settlements | |||||||||||||||||||||||||||
Class A | |||||||||||||||||||||||||||||||||||
| Six Months Ended June 30, 2013 (Unaudited) | $ | 28.21 | (0.05 | ) | 3.24 | 3.19 | — | (0.04 | ) | (0.04 | ) | — | |||||||||||||||||||||||
Year Ended December 31, 2012 | $ | 25.94 | 0.02 | 4.73 | 4.75 | (0.11 | ) | (2.37 | ) | (2.48 | ) | — | |||||||||||||||||||||||
Year Ended December 31, 2011 | $ | 27.54 | (0.22 | ) | (1.21 | ) | (1.43 | ) | — | (0.17 | ) | (0.17 | ) | — | |||||||||||||||||||||
Year Ended December 31, 2010 | $ | 22.43 | (0.15 | ) | 5.26 | 5.11 | — | — | — | — | |||||||||||||||||||||||||
Year Ended December 31, 2009 | $ | 15.90 | (0.11 | ) | 6.64 | 6.53 | — | — | — | 0.00 | (e) | ||||||||||||||||||||||||
Year Ended December 31, 2008 | $ | 27.23 | (0.14 | ) | (10.23 | ) | (10.37 | ) | — | (0.96 | ) | (0.96 | ) | — | |||||||||||||||||||||
Class B | |||||||||||||||||||||||||||||||||||
| Six Months Ended June 30, 2013 (Unaudited) | $ | 25.81 | (0.17 | ) | 2.97 | 2.80 | — | (0.04 | ) | (0.04 | ) | — | |||||||||||||||||||||||
Year Ended December 31, 2012 | $ | 23.98 | (0.19 | ) | 4.39 | 4.20 | — | (2.37 | ) | (2.37 | ) | — | |||||||||||||||||||||||
Year Ended December 31, 2011 | $ | 25.60 | (0.37 | ) | (1.08 | ) | (1.45 | ) | — | (0.17 | ) | (0.17 | ) | — | |||||||||||||||||||||
Year Ended December 31, 2010 | $ | 20.99 | (0.30 | ) | 4.91 | 4.61 | — | — | — | — | |||||||||||||||||||||||||
Year Ended December 31, 2009 | $ | 14.98 | (0.22 | ) | 6.23 | 6.01 | — | — | — | 0.00 | (e) | ||||||||||||||||||||||||
Year Ended December 31, 2008 | $ | 25.87 | (0.27 | ) | (9.66 | ) | (9.93 | ) | — | (0.96 | ) | (0.96 | ) | — | |||||||||||||||||||||
Class C | |||||||||||||||||||||||||||||||||||
| Six Months Ended June 30, 2013 (Unaudited) | $ | 25.49 | (0.14 | ) | 2.92 | 2.78 | — | (0.04 | ) | (0.04 | ) | — | |||||||||||||||||||||||
Year Ended December 31, 2012 | $ | 23.72 | (0.16 | ) | 4.30 | 4.14 | — | (2.37 | ) | (2.37 | ) | — | |||||||||||||||||||||||
Year Ended December 31, 2011 | $ | 25.39 | (0.39 | ) | (1.11 | ) | (1.50 | ) | — | (0.17 | ) | (0.17 | ) | — | |||||||||||||||||||||
Year Ended December 31, 2010 | $ | 20.84 | (0.31 | ) | 4.86 | 4.55 | — | — | — | — | |||||||||||||||||||||||||
Year Ended December 31, 2009 | $ | 14.89 | (0.24 | ) | 6.19 | 5.95 | — | — | — | 0.00 | (e) | ||||||||||||||||||||||||
Year Ended December 31, 2008 | $ | 25.77 | (0.30 | ) | (9.62 | ) | (9.92 | ) | — | (0.96 | ) | (0.96 | ) | — | |||||||||||||||||||||
Class I | |||||||||||||||||||||||||||||||||||
| Six Months Ended June 30, 2013 (Unaudited) | $ | 29.47 | 0.01 | 3.39 | 3.40 | — | (0.04 | ) | (0.04 | ) | — | ||||||||||||||||||||||||
Year Ended December 31, 2012 | $ | 27.00 | (0.10 | ) | 5.16 | 5.06 | (0.22 | ) | (2.37 | ) | (2.59 | ) | — | ||||||||||||||||||||||
Year Ended December 31, 2011 | $ | 28.56 | (0.14 | ) | (1.25 | ) | (1.39 | ) | — | (0.17 | ) | (0.17 | ) | — | |||||||||||||||||||||
Year Ended December 31, 2010 (f) | $ | 24.24 | (0.03 | ) | 4.35 | 4.32 | — | — | — | — | |||||||||||||||||||||||||
Class R4 | |||||||||||||||||||||||||||||||||||
| Six Months Ended June 30, 2013 (Unaudited) | $ | 29.92 | 0.03 | 3.40 | 3.43 | — | (0.04 | ) | (0.04 | ) | — | ||||||||||||||||||||||||
Year Ended December 31, 2012 (g) | $ | 30.06 | 0.06 | 2.28 | 2.34 | (0.16 | ) | (2.32 | ) | (2.48 | ) | — | |||||||||||||||||||||||
Class R5 | |||||||||||||||||||||||||||||||||||
| Six Months Ended June 30, 2013 (Unaudited) | $ | 29.90 | 0.03 | 3.41 | 3.44 | — | (0.04 | ) | (0.04 | ) | — | ||||||||||||||||||||||||
Year Ended December 31, 2012 (h) | $ | 30.06 | 0.07 | 2.27 | 2.34 | (0.18 | ) | (2.32 | ) | (2.50 | ) | — | |||||||||||||||||||||||
Class Y | |||||||||||||||||||||||||||||||||||
| Six Months Ended June 30, 2013 (Unaudited) | $ | 29.93 | 0.01 | 3.44 | 3.45 | — | (0.04 | ) | (0.04 | ) | — | ||||||||||||||||||||||||
Year Ended December 31, 2012 (i) | $ | 30.10 | 0.07 | 2.27 | 2.34 | (0.19 | ) | (2.32 | ) | (2.51 | ) | — | |||||||||||||||||||||||
Class Z | |||||||||||||||||||||||||||||||||||
| Six Months Ended June 30, 2013 (Unaudited) | $ | 29.45 | (0.02 | ) | 3.39 | 3.37 | — | (0.04 | ) | (0.04 | ) | — | |||||||||||||||||||||||
Year Ended December 31, 2012 | $ | 26.98 | 0.11 | 4.92 | 5.03 | (0.19 | ) | (2.37 | ) | (2.56 | ) | — | |||||||||||||||||||||||
Year Ended December 31, 2011 | $ | 28.56 | (0.14 | ) | (1.27 | ) | (1.41 | ) | — | (0.17 | ) | (0.17 | ) | — | |||||||||||||||||||||
Year Ended December 31, 2010 | $ | 23.19 | (0.08 | ) | 5.45 | 5.37 | — | — | — | — | |||||||||||||||||||||||||
Year Ended December 31, 2009 | $ | 16.39 | (0.07 | ) | 6.87 | 6.80 | — | — | — | 0.00 | (e) | ||||||||||||||||||||||||
Year Ended December 31, 2008 | $ | 27.97 | (0.07 | ) | (10.55 | ) | (10.62 | ) | — | (0.96 | ) | (0.96 | ) | — | |||||||||||||||||||||
(a) In addition to the fees and expenses which the Fund bears directly, the Fund indirectly bears a pro rata share of the fees and expenses of the underlying funds in which it invests. Such indirect expenses are not included in the reported expense ratios.
(b) Annualized.
(c) Includes interest expense which rounds to less than 0.01%.
(d) The benefits derived from custody fees paid indirectly had an impact of less than 0.01%.
(e) Rounds to zero.
(f) Class I shares commenced operations on September 27, 2010. Per share data and total return reflect activity from that date.
(g) Class R4 shares commenced operations on November 8, 2012. Per share data and total return reflect activity from that date.
(h) Class R5 shares commenced operations on November 8, 2012. Per share data and total return reflect activity from that date.
(i) Class Y shares commenced operations on November 8, 2012. Per share data and total return reflect activity from that date.
See accompanying notes to financial statements.
106
Ratio to Average Net Assets | Supplemental Data | ||||||||||||||||||||||||||||||
| (Selected data for a share outstanding throughout each period) | Net Asset Value, End of Period | Total Return | Total gross expenses (a) | Total net expenses (a) | Net investment income (loss) | Portfolio turnover rate | Net assets, end of period (000s) | ||||||||||||||||||||||||
Class A | |||||||||||||||||||||||||||||||
| Six Months Ended June 30, 2013 (Unaudited) | $ | 31.36 | 11.32 | % | 1.33 | %(b) | 1.33 | %(b) | (0.36 | )%(b) | 9 | % | $ | 172,413 | |||||||||||||||||
Year Ended December 31, 2012 | $ | 28.21 | 18.67 | % | 1.32 | %(c) | 1.32 | %(c)(d) | 0.08 | % | 14 | % | $ | 152,164 | |||||||||||||||||
Year Ended December 31, 2011 | $ | 25.94 | (5.21 | )% | 1.30 | % | 1.30 | %(d) | (0.78 | )% | 20 | % | $ | 167,038 | |||||||||||||||||
Year Ended December 31, 2010 | $ | 27.54 | 22.78 | % | 1.30 | % | 1.30 | %(d) | (0.64 | )% | 32 | % | $ | 214,097 | |||||||||||||||||
Year Ended December 31, 2009 | $ | 22.43 | 41.07 | % | 1.32 | % | 1.32 | %(d) | (0.64 | )% | 28 | % | $ | 178,605 | |||||||||||||||||
Year Ended December 31, 2008 | $ | 15.90 | (39.38 | )% | 1.29 | % | 1.29 | %(d) | (0.60 | )% | 23 | % | $ | 136,597 | |||||||||||||||||
Class B | |||||||||||||||||||||||||||||||
| Six Months Ended June 30, 2013 (Unaudited) | $ | 28.57 | 10.87 | % | 2.12 | %(b) | 2.12 | %(b) | (1.21 | )%(b) | 9 | % | $ | 693 | |||||||||||||||||
Year Ended December 31, 2012 | $ | 25.81 | 17.87 | % | 1.99 | %(c) | 1.99 | %(c)(d) | (0.71 | )% | 14 | % | $ | 1,056 | |||||||||||||||||
Year Ended December 31, 2011 | $ | 23.98 | (5.68 | )% | 1.92 | % | 1.92 | %(d) | (1.42 | )% | 20 | % | $ | 2,253 | |||||||||||||||||
Year Ended December 31, 2010 | $ | 25.60 | 21.96 | % | 1.98 | % | 1.98 | %(d) | (1.37 | )% | 32 | % | $ | 9,222 | |||||||||||||||||
Year Ended December 31, 2009 | $ | 20.99 | 40.12 | % | 2.02 | % | 2.02 | %(d) | (1.33 | )% | 28 | % | $ | 20,903 | |||||||||||||||||
Year Ended December 31, 2008 | $ | 14.98 | (39.75 | )% | 1.92 | % | 1.92 | %(d) | (1.24 | )% | 23 | % | $ | 23,633 | |||||||||||||||||
Class C | |||||||||||||||||||||||||||||||
| Six Months Ended June 30, 2013 (Unaudited) | $ | 28.23 | 10.92 | % | 2.02 | %(b) | 2.02 | %(b) | (1.07 | )%(b) | 9 | % | $ | 34,331 | |||||||||||||||||
Year Ended December 31, 2012 | $ | 25.49 | 17.82 | % | 2.05 | %(c) | 2.05 | %(c)(d) | (0.61 | )% | 14 | % | $ | 31,410 | |||||||||||||||||
Year Ended December 31, 2011 | $ | 23.72 | (5.92 | )% | 2.05 | % | 2.05 | %(d) | (1.53 | )% | 20 | % | $ | 30,584 | |||||||||||||||||
Year Ended December 31, 2010 | $ | 25.39 | 21.83 | % | 2.08 | % | 2.08 | %(d) | (1.41 | )% | 32 | % | $ | 36,101 | |||||||||||||||||
Year Ended December 31, 2009 | $ | 20.84 | 39.96 | % | 2.13 | % | 2.13 | %(d) | (1.45 | )% | 28 | % | $ | 32,508 | |||||||||||||||||
Year Ended December 31, 2008 | $ | 14.89 | (39.87 | )% | 2.08 | % | 2.08 | %(d) | (1.39 | )% | 23 | % | $ | 25,899 | |||||||||||||||||
Class I | |||||||||||||||||||||||||||||||
| Six Months Ended June 30, 2013 (Unaudited) | $ | 32.83 | 11.55 | % | 0.91 | %(b) | 0.91 | %(b) | 0.06 | %(b) | 9 | % | $ | 3 | |||||||||||||||||
Year Ended December 31, 2012 | $ | 29.47 | 19.10 | % | 0.96 | % | 0.96 | %(d) | (0.33 | )% | 14 | % | $ | 3 | |||||||||||||||||
Year Ended December 31, 2011 | $ | 27.00 | (4.88 | )% | 0.94 | % | 0.94 | %(d) | (0.47 | )% | 20 | % | $ | 2,635 | |||||||||||||||||
Year Ended December 31, 2010 (f) | $ | 28.56 | 17.82 | % | 0.94 | %(b) | 0.94 | %(b)(d) | (0.35 | )%(b) | 32 | % | $ | 28,993 | |||||||||||||||||
Class R4 | |||||||||||||||||||||||||||||||
| Six Months Ended June 30, 2013 (Unaudited) | $ | 33.31 | 11.48 | % | 1.01 | %(b) | 1.01 | %(b) | 0.16 | %(b) | 9 | % | $ | 2,202 | |||||||||||||||||
Year Ended December 31, 2012 (g) | $ | 29.92 | 8.06 | % | 1.14 | %(b)(c) | 1.14 | %(b)(c)(d) | 1.51 | %(b) | 14 | % | $ | 15 | |||||||||||||||||
Class R5 | |||||||||||||||||||||||||||||||
| Six Months Ended June 30, 2013 (Unaudited) | $ | 33.30 | 11.52 | % | 1.00 | %(b) | 1.00 | %(b) | 0.21 | %(b) | 9 | % | $ | 771 | |||||||||||||||||
Year Ended December 31, 2012 (h) | $ | 29.90 | 8.06 | % | 1.12 | %(b) | 1.12 | %(b)(d) | 1.53 | %(b) | 14 | % | $ | 2 | |||||||||||||||||
Class Y | |||||||||||||||||||||||||||||||
| Six Months Ended June 30, 2013 (Unaudited) | $ | 33.34 | 11.54 | % | 0.97 | %(b) | 0.97 | %(b) | 0.05 | %(b) | 9 | % | $ | 2,877 | |||||||||||||||||
Year Ended December 31, 2012 (i) | $ | 29.93 | 8.07 | % | 1.04 | %(b) | 1.04 | %(b)(d) | 1.62 | %(b) | 14 | % | $ | 2 | |||||||||||||||||
Class Z | |||||||||||||||||||||||||||||||
| Six Months Ended June 30, 2013 (Unaudited) | $ | 32.78 | 11.46 | % | 1.07 | %(b) | 1.07 | %(b) | (0.12 | )%(b) | 9 | % | $ | 1,354,885 | |||||||||||||||||
Year Ended December 31, 2012 | $ | 29.45 | 18.98 | % | 1.07 | %(c) | 1.07 | %(c)(d) | 0.36 | % | 14 | % | $ | 1,415,442 | |||||||||||||||||
Year Ended December 31, 2011 | $ | 26.98 | (4.95 | )% | 1.00 | % | 1.00 | %(d) | (0.48 | )% | 20 | % | $ | 1,355,934 | |||||||||||||||||
Year Ended December 31, 2010 | $ | 28.56 | 23.16 | % | 1.01 | % | 1.01 | %(d) | (0.34 | )% | 32 | % | $ | 1,410,133 | |||||||||||||||||
Year Ended December 31, 2009 | $ | 23.19 | 41.49 | % | 1.03 | % | 1.03 | %(d) | (0.36 | )% | 28 | % | $ | 1,157,593 | |||||||||||||||||
Year Ended December 31, 2008 | $ | 16.39 | (39.22 | )% | 1.01 | % | 1.01 | %(d) | (0.32 | )% | 23 | % | $ | 758,267 | |||||||||||||||||
See accompanying notes to financial statements.
107
Columbia Acorn Family of Funds
Financial Highlights, continued
Columbia Acorn International Select
Income from Investment Operations | Less Distributions to Shareholders | ||||||||||||||||||||||||||||||||||
| (Selected data for a share outstanding throughout each period) | Net Asset Value, Beginning of Period | Net investment income (loss) | Net realized and unrealized gain (loss) | Total from investment operations | Net investment income | Net realized gains | Total Distributions to Shareholders | Redemption fees added to paid in capital | |||||||||||||||||||||||||||
Class A | |||||||||||||||||||||||||||||||||||
| Six Months Ended June 30, 2013 (Unaudited) | $ | 25.61 | 0.08 | 0.37 | 0.45 | — | (0.53 | ) | (0.53 | ) | — | ||||||||||||||||||||||||
Year Ended December 31, 2012 | $ | 24.26 | 0.39 | 4.92 | 5.31 | (1.75 | ) | (2.21 | ) | (3.96 | ) | — | |||||||||||||||||||||||
Year Ended December 31, 2011 | $ | 28.01 | 0.18 | (2.95 | ) | (2.77 | ) | (0.59 | ) | (0.39 | ) | (0.98 | ) | — | |||||||||||||||||||||
Year Ended December 31, 2010 | $ | 23.39 | 0.08 | 4.84 | 4.92 | (0.30 | ) | — | (0.30 | ) | 0.00 | (f) | |||||||||||||||||||||||
Year Ended December 31, 2009 | $ | 17.99 | 0.10 | 5.43 | 5.53 | (0.15 | ) | — | (0.15 | ) | 0.00 | (f) | |||||||||||||||||||||||
Year Ended December 31, 2008 | $ | 31.74 | 0.20 | (13.41 | ) | (13.21 | ) | — | (0.54 | ) | (0.54 | ) | 0.00 | (f) | |||||||||||||||||||||
Class B | |||||||||||||||||||||||||||||||||||
| Six Months Ended June 30, 2013 (Unaudited) | $ | 24.40 | (0.01 | ) | 0.35 | 0.34 | — | (0.53 | ) | (0.53 | ) | — | |||||||||||||||||||||||
Year Ended December 31, 2012 | $ | 23.27 | 0.23 | 4.69 | 4.92 | (1.58 | ) | (2.21 | ) | (3.79 | ) | — | |||||||||||||||||||||||
Year Ended December 31, 2011 | $ | 26.72 | 0.01 | (2.82 | ) | (2.81 | ) | (0.25 | ) | (0.39 | ) | (0.64 | ) | — | |||||||||||||||||||||
Year Ended December 31, 2010 | $ | 22.34 | (0.06 | ) | 4.62 | 4.56 | (0.18 | ) | — | (0.18 | ) | 0.00 | (f) | ||||||||||||||||||||||
Year Ended December 31, 2009 | $ | 17.16 | (0.01 | ) | 5.17 | 5.16 | — | — | — | 0.00 | (f) | ||||||||||||||||||||||||
Year Ended December 31, 2008 | $ | 30.50 | 0.04 | (12.84 | ) | (12.80 | ) | — | (0.54 | ) | (0.54 | ) | 0.00 | (f) | |||||||||||||||||||||
Class C | |||||||||||||||||||||||||||||||||||
| Six Months Ended June 30, 2013 (Unaudited) | $ | 24.28 | (0.02 | ) | 0.35 | 0.33 | — | (0.53 | ) | (0.53 | ) | — | |||||||||||||||||||||||
Year Ended December 31, 2012 | $ | 23.17 | 0.18 | 4.67 | 4.85 | (1.53 | ) | (2.21 | ) | (3.74 | ) | — | |||||||||||||||||||||||
Year Ended December 31, 2011 | $ | 26.58 | (0.04 | ) | (2.81 | ) | (2.85 | ) | (0.17 | ) | (0.39 | ) | (0.56 | ) | — | ||||||||||||||||||||
Year Ended December 31, 2010 | $ | 22.21 | (0.10 | ) | 4.60 | 4.50 | (0.13 | ) | — | (0.13 | ) | 0.00 | (f) | ||||||||||||||||||||||
Year Ended December 31, 2009 | $ | 17.08 | (0.06 | ) | 5.17 | 5.11 | — | — | — | 0.00 | (f) | ||||||||||||||||||||||||
Year Ended December 31, 2008 | $ | 30.42 | 0.00 | (f) | (12.80 | ) | (12.80 | ) | — | (0.54 | ) | (0.54 | ) | 0.00 | (f) | ||||||||||||||||||||
Class I | |||||||||||||||||||||||||||||||||||
| Six Months Ended June 30, 2013 (Unaudited) | $ | 25.85 | 0.12 | 0.37 | 0.49 | — | (0.53 | ) | (0.53 | ) | — | ||||||||||||||||||||||||
Year Ended December 31, 2012 | $ | 24.45 | 0.51 | 4.94 | 5.45 | (1.84 | ) | (2.21 | ) | (4.05 | ) | — | |||||||||||||||||||||||
Year Ended December 31, 2011 | $ | 28.33 | 0.31 | (2.97 | ) | (2.66 | ) | (0.83 | ) | (0.39 | ) | (1.22 | ) | — | |||||||||||||||||||||
Year Ended December 31, 2010 (h) | $ | 26.11 | 0.03 | 2.19 | 2.22 | — | — | — | — | ||||||||||||||||||||||||||
Class R4 | |||||||||||||||||||||||||||||||||||
| Six Months Ended June 30, 2013 (Unaudited) | $ | 25.99 | 0.04 | 0.45 | 0.49 | — | (0.53 | ) | (0.53 | ) | — | ||||||||||||||||||||||||
Year Ended December 31, 2012 (i) | $ | 29.98 | (0.02 | ) | (0.09 | )(j) | (0.11 | ) | (1.79 | ) | (2.09 | ) | (3.88 | ) | — | ||||||||||||||||||||
Class R5 | |||||||||||||||||||||||||||||||||||
| Six Months Ended June 30, 2013 (Unaudited) | $ | 25.98 | (0.02 | ) | 0.51 | 0.49 | — | (0.53 | ) | (0.53 | ) | — | |||||||||||||||||||||||
Year Ended December 31, 2012 (k) | $ | 29.98 | (0.02 | ) | (0.09 | )(j) | (0.11 | ) | (1.80 | ) | (2.09 | ) | (3.89 | ) | — | ||||||||||||||||||||
Class Y | |||||||||||||||||||||||||||||||||||
| Six Months Ended June 30, 2013 (Unaudited) | $ | 25.98 | 0.12 | 0.37 | 0.49 | — | (0.53 | ) | (0.53 | ) | — | ||||||||||||||||||||||||
Year Ended December 31, 2012 (l) | $ | 29.99 | (0.02 | ) | (0.09 | )(j) | (0.11 | ) | (1.81 | ) | (2.09 | ) | (3.90 | ) | — | ||||||||||||||||||||
Class Z | |||||||||||||||||||||||||||||||||||
| Six Months Ended June 30, 2013 (Unaudited) | $ | 25.86 | 0.11 | 0.37 | 0.48 | — | (0.53 | ) | (0.53 | ) | — | ||||||||||||||||||||||||
Year Ended December 31, 2012 | $ | 24.46 | 0.49 | 4.95 | 5.44 | (1.83 | ) | (2.21 | ) | (4.04 | ) | — | |||||||||||||||||||||||
Year Ended December 31, 2011 | $ | 28.33 | 0.29 | (2.98 | ) | (2.69 | ) | (0.79 | ) | (0.39 | ) | (1.18 | ) | — | |||||||||||||||||||||
Year Ended December 31, 2010 | $ | 23.64 | 0.18 | 4.89 | 5.07 | (0.38 | ) | — | (0.38 | ) | 0.00 | (f) | |||||||||||||||||||||||
Year Ended December 31, 2009 | $ | 18.19 | 0.17 | 5.50 | 5.67 | (0.24 | ) | — | (0.24 | ) | 0.00 | (f) | |||||||||||||||||||||||
Year Ended December 31, 2008 | $ | 32.02 | 0.28 | (13.53 | ) | (13.25 | ) | (0.04 | ) | (0.54 | ) | (0.58 | ) | 0.00 | (f) | ||||||||||||||||||||
(a) Annualized.
(b) In addition to the fees and expenses which the Fund bears directly, the Fund indirectly bears a pro rata share of the fees and expenses of the underlying funds in which it invests. Such indirect expenses are not included in the reported expense ratios.
(c) Includes interest expense which rounds to less than 0.01%.
(d) The benefits derived from custody fees paid indirectly had an impact of 0.01%.
(e) The benefits derived from custody fees paid indirectly had an impact of less than 0.01%.
(f) Rounds to zero.
(g) Had the Investment Manager and/or Transfer Agent not waived fees and/or reimbursed a portion of expenses, total return would have been reduced.
(h) Class I shares commenced operations on September 27, 2010. Per share data and total return reflect activity from that date.
(i) Class R4 shares commenced operations on November 8, 2012. Per share data and total return reflect activity from that date.
(j) Calculation of the net gain (loss) per share (both realized and unrealized) does not correlate to the aggregate realized and unrealized gain (loss) presented in the Statements of Operations due to the timing of sales and repurchases of Fund shares in relation to fluctuations in the market value of the portfolio.
(k) Class R5 shares commenced operations on November 8, 2012. Per share data and total return reflect activity from that date.
(l) Class Y shares commenced operations on November 8, 2012. Per share data and total return reflect activity from that date.
See accompanying notes to financial statements.
108
Ratio to Average Net Assets | Supplemental Data | ||||||||||||||||||||||||||||||||||
| (Selected data for a share outstanding throughout each period) | Increase from regulatory settlements | Net Asset Value, End of Period | Total Return | Total gross expenses | Total net expenses | Net investment income (loss) | Portfolio turnover rate | Net assets, end of period (000s) | |||||||||||||||||||||||||||
Class A | |||||||||||||||||||||||||||||||||||
| Six Months Ended June 30, 2013 (Unaudited) | — | $ | 25.53 | 1.74 | % | 1.48 | %(a)(b) | 1.48 | %(a)(b) | 0.60 | %(a) | 47 | % | $ | 72,008 | ||||||||||||||||||||
Year Ended December 31, 2012 | — | $ | 25.61 | 22.05 | % | 1.49 | %(b)(c) | 1.49 | %(b)(c)(d) | 1.43 | % | 63 | % | $ | 74,167 | ||||||||||||||||||||
Year Ended December 31, 2011 | — | $ | 24.26 | (10.11 | )% | 1.51 | %(b) | 1.51 | %(b)(e) | 0.66 | % | 44 | % | $ | 56,350 | ||||||||||||||||||||
Year Ended December 31, 2010 | 0.00 | (f) | $ | 28.01 | 21.41 | % | 1.56 | %(b) | 1.56 | %(b)(e) | 0.33 | % | 42 | % | $ | 71,668 | |||||||||||||||||||
Year Ended December 31, 2009 | 0.02 | $ | 23.39 | 31.01 | % | 1.56 | % | 1.56 | %(e) | 0.53 | % | 56 | % | $ | 64,664 | ||||||||||||||||||||
Year Ended December 31, 2008 | — | $ | 17.99 | (42.30 | )% | 1.54 | % | 1.54 | %(e) | 0.78 | % | 68 | % | $ | 46,522 | ||||||||||||||||||||
Class B | |||||||||||||||||||||||||||||||||||
| Six Months Ended June 30, 2013 (Unaudited) | — | $ | 24.21 | 1.37 | %(g) | 2.14 | %(a)(b) | 2.14 | %(a)(b) | (0.05 | )%(a) | 47 | % | $ | 959 | ||||||||||||||||||||
Year Ended December 31, 2012 | — | $ | 24.40 | 21.29 | % | 2.11 | %(b)(c) | 2.10 | %(b)(c)(d) | 0.87 | % | 63 | % | $ | 1,250 | ||||||||||||||||||||
Year Ended December 31, 2011 | — | $ | 23.27 | (10.64 | )% | 2.14 | %(b) | 2.14 | %(b)(e) | 0.04 | % | 44 | % | $ | 1,774 | ||||||||||||||||||||
Year Ended December 31, 2010 | 0.00 | (f) | $ | 26.72 | 20.63 | %(g) | 2.24 | %(b) | 2.20 | %(b)(e) | (0.27 | )% | 42 | % | $ | 3,030 | |||||||||||||||||||
Year Ended December 31, 2009 | 0.02 | $ | 22.34 | 30.19 | %(g) | 2.32 | % | 2.20 | %(e) | (0.05 | )% | 56 | % | $ | 3,887 | ||||||||||||||||||||
Year Ended December 31, 2008 | — | $ | 17.16 | (42.68 | )% | 2.17 | % | 2.17 | %(e) | 0.16 | % | 68 | % | $ | 4,444 | ||||||||||||||||||||
Class C | |||||||||||||||||||||||||||||||||||
| Six Months Ended June 30, 2013 (Unaudited) | — | $ | 24.08 | 1.34 | % | 2.27 | %(a)(b) | 2.27 | %(a)(b) | (0.18 | )%(a) | 47 | % | $ | 9,792 | ||||||||||||||||||||
Year Ended December 31, 2012 | — | $ | 24.28 | 21.10 | % | 2.28 | %(b)(c) | 2.27 | %(b)(c)(d) | 0.67 | % | 63 | % | $ | 9,786 | ||||||||||||||||||||
Year Ended December 31, 2011 | — | $ | 23.17 | (10.81 | )% | 2.31 | %(b) | 2.31 | %(b)(e) | (0.14 | )% | 44 | % | $ | 8,704 | ||||||||||||||||||||
Year Ended December 31, 2010 | 0.00 | (f) | $ | 26.58 | 20.45 | % | 2.36 | %(b) | 2.36 | %(b)(e) | (0.45 | )% | 42 | % | $ | 11,885 | |||||||||||||||||||
Year Ended December 31, 2009 | 0.02 | $ | 22.21 | 30.04 | % | 2.42 | % | 2.42 | %(e) | (0.30 | )% | 56 | % | $ | 11,096 | ||||||||||||||||||||
Year Ended December 31, 2008 | — | $ | 17.08 | (42.79 | )% | 2.34 | % | 2.34 | %(e) | 0.01 | % | 68 | % | $ | 9,747 | ||||||||||||||||||||
Class I | |||||||||||||||||||||||||||||||||||
| Six Months Ended June 30, 2013 (Unaudited) | — | $ | 25.81 | 1.88 | % | 1.16 | %(a)(b) | 1.16 | %(a)(b) | 0.91 | %(a) | 47 | % | $ | 2 | ||||||||||||||||||||
Year Ended December 31, 2012 | — | $ | 25.85 | 22.48 | % | 1.15 | %(b) | 1.14 | %(b)(d) | 1.84 | % | 63 | % | $ | 2 | ||||||||||||||||||||
Year Ended December 31, 2011 | — | $ | 24.45 | (9.68 | )% | 1.04 | %(b) | 1.04 | %(b)(e) | 1.12 | % | 44 | % | $ | 2 | ||||||||||||||||||||
Year Ended December 31, 2010 (h) | — | $ | 28.33 | 8.50 | % | 1.14 | %(a)(b) | 1.14 | %(a)(b)(e) | 0.44 | %(a) | 42 | % | $ | 3 | ||||||||||||||||||||
Class R4 | |||||||||||||||||||||||||||||||||||
| Six Months Ended June 30, 2013 (Unaudited) | — | $ | 25.95 | 1.87 | % | 1.26 | %(a)(b) | 1.26 | %(a)(b) | 0.30 | %(a) | 47 | % | $ | 108 | ||||||||||||||||||||
Year Ended December 31, 2012 (i) | — | $ | 25.99 | (0.27 | )% | 1.30 | %(a)(b)(c) | 1.30 | %(a)(b)(c)(d) | (0.55 | )%(a) | 63 | % | $ | 13 | ||||||||||||||||||||
Class R5 | |||||||||||||||||||||||||||||||||||
| Six Months Ended June 30, 2013 (Unaudited) | — | $ | 25.94 | 1.87 | %(g) | 1.27 | %(a)(b) | 1.26 | %(a)(b) | (0.14 | )%(a) | 47 | % | $ | 592 | ||||||||||||||||||||
Year Ended December 31, 2012 (k) | — | $ | 25.98 | (0.27 | )% | 1.29 | %(a)(b) | 1.28 | %(a)(b)(d) | (0.55 | )%(a) | 63 | % | $ | 2 | ||||||||||||||||||||
Class Y | |||||||||||||||||||||||||||||||||||
| Six Months Ended June 30, 2013 (Unaudited) | — | $ | 25.94 | 1.87 | % | 1.16 | %(a)(b) | 1.16 | %(a)(b) | 0.91 | %(a) | 47 | % | $ | 2 | ||||||||||||||||||||
Year Ended December 31, 2012 (l) | — | $ | 25.98 | (0.25 | )% | 1.21 | %(a)(b) | 1.20 | %(a)(b)(d) | (0.48 | )%(a) | 63 | % | $ | 2 | ||||||||||||||||||||
Class Z | |||||||||||||||||||||||||||||||||||
| Six Months Ended June 30, 2013 (Unaudited) | — | $ | 25.81 | 1.84 | % | 1.21 | %(a)(b) | 1.21 | %(a)(b) | 0.87 | %(a) | 47 | % | $ | 256,155 | ||||||||||||||||||||
Year Ended December 31, 2012 | — | $ | 25.86 | 22.42 | % | 1.20 | %(b)(c) | 1.19 | %(b)(c)(d) | 1.77 | % | 63 | % | $ | 295,231 | ||||||||||||||||||||
Year Ended December 31, 2011 | — | $ | 24.46 | (9.76 | )% | 1.14 | %(b) | 1.14 | %(b)(e) | 1.03 | % | 44 | % | $ | 259,553 | ||||||||||||||||||||
Year Ended December 31, 2010 | 0.00 | (f) | $ | 28.33 | 21.89 | % | 1.16 | %(b) | 1.16 | %(b)(e) | 0.75 | % | 42 | % | $ | 366,081 | |||||||||||||||||||
Year Ended December 31, 2009 | 0.02 | $ | 23.64 | 31.52 | % | 1.20 | % | 1.20 | %(e) | 0.84 | % | 56 | % | $ | 331,027 | ||||||||||||||||||||
Year Ended December 31, 2008 | — | $ | 18.19 | (42.10 | )% | 1.21 | % | 1.21 | %(e) | 1.09 | % | 68 | % | $ | 186,194 | ||||||||||||||||||||
See accompanying notes to financial statements.
109
Columbia Acorn Family of Funds
Financial Highlights, continued
Columbia Acorn Select
Income from Investment Operations | Less Distributions to Shareholders | ||||||||||||||||||||||||||||||||||
| (Selected data for a share outstanding throughout each period) | Net Asset Value, Beginning of Period | Net investment income (loss) | Net realized and unrealized gain (loss) | Reimbursement from affiliate | Total from investment operations | Net investment income | Net realized gains | Total Distributions to Shareholders | |||||||||||||||||||||||||||
Class A | |||||||||||||||||||||||||||||||||||
| Six Months Ended June 30, 2013 (Unaudited) | $ | 24.72 | (0.06 | ) | 3.02 | — | 2.96 | (0.07 | ) | (1.35 | ) | (1.42 | ) | ||||||||||||||||||||||
Year Ended December 31, 2012 | $ | 22.95 | 0.03 | 3.78 | — | 3.81 | — | (2.04 | ) | (2.04 | ) | ||||||||||||||||||||||||
Year Ended December 31, 2011 | $ | 27.94 | (0.15 | ) | (4.46 | ) | — | (4.61 | ) | (0.38 | ) | — | (0.38 | ) | |||||||||||||||||||||
Year Ended December 31, 2010 | $ | 22.81 | (0.18 | ) | 5.31 | — | 5.13 | — | — | — | |||||||||||||||||||||||||
Year Ended December 31, 2009 | $ | 13.77 | (0.14 | ) | 9.18 | — | 9.04 | — | — | — | |||||||||||||||||||||||||
Year Ended December 31, 2008 | $ | 27.89 | (0.18 | ) | (13.25 | ) | — | (13.43 | ) | — | (0.69 | ) | (0.69 | ) | |||||||||||||||||||||
Class B | |||||||||||||||||||||||||||||||||||
| Six Months Ended June 30, 2013 (Unaudited) | $ | 22.75 | (0.15 | ) | 2.80 | — | 2.65 | — | (1.35 | ) | (1.35 | ) | |||||||||||||||||||||||
Year Ended December 31, 2012 | $ | 21.40 | (0.15 | ) | 3.54 | — | 3.39 | — | (2.04 | ) | (2.04 | ) | |||||||||||||||||||||||
Year Ended December 31, 2011 | $ | 26.06 | (0.30 | ) | (4.13 | ) | — | (4.43 | ) | (0.23 | ) | — | (0.23 | ) | |||||||||||||||||||||
Year Ended December 31, 2010 | $ | 21.41 | (0.31 | ) | 4.96 | — | 4.65 | — | — | — | |||||||||||||||||||||||||
Year Ended December 31, 2009 | $ | 13.02 | (0.24 | ) | 8.63 | — | 8.39 | — | — | — | |||||||||||||||||||||||||
Year Ended December 31, 2008 | $ | 26.57 | (0.31 | ) | (12.55 | ) | — | (12.86 | ) | — | (0.69 | ) | (0.69 | ) | |||||||||||||||||||||
Class C | |||||||||||||||||||||||||||||||||||
| Six Months Ended June 30, 2013 (Unaudited) | $ | 22.48 | (0.15 | ) | 2.76 | — | 2.61 | — | (1.35 | ) | (1.35 | ) | |||||||||||||||||||||||
Year Ended December 31, 2012 | $ | 21.20 | (0.14 | ) | 3.46 | — | 3.32 | — | (2.04 | ) | (2.04 | ) | |||||||||||||||||||||||
Year Ended December 31, 2011 | $ | 25.83 | (0.32 | ) | (4.12 | ) | — | (4.44 | ) | (0.19 | ) | — | (0.19 | ) | |||||||||||||||||||||
Year Ended December 31, 2010 | $ | 21.25 | (0.34 | ) | 4.92 | — | 4.58 | — | — | — | |||||||||||||||||||||||||
Year Ended December 31, 2009 | $ | 12.94 | (0.26 | ) | 8.57 | — | 8.31 | — | — | — | |||||||||||||||||||||||||
Year Ended December 31, 2008 | $ | 26.46 | (0.34 | ) | (12.49 | ) | — | (12.83 | ) | — | (0.69 | ) | (0.69 | ) | |||||||||||||||||||||
Class I | |||||||||||||||||||||||||||||||||||
| Six Months Ended June 30, 2013 (Unaudited) | $ | 25.63 | (0.02 | ) | 3.15 | — | 3.13 | (0.16 | ) | (1.35 | ) | (1.51 | ) | ||||||||||||||||||||||
Year Ended December 31, 2012 | $ | 23.65 | 0.23 | 3.79 | — | 4.02 | — | (2.04 | ) | (2.04 | ) | ||||||||||||||||||||||||
Year Ended December 31, 2011 | $ | 28.74 | (0.03 | ) | (4.59 | ) | — | (4.62 | ) | (0.47 | ) | — | (0.47 | ) | |||||||||||||||||||||
Year Ended December 31, 2010 (g) | $ | 24.74 | 0.01 | 3.99 | — | 4.00 | — | — | — | ||||||||||||||||||||||||||
Class R4 | |||||||||||||||||||||||||||||||||||
| Six Months Ended June 30, 2013 (Unaudited) | $ | 25.92 | (0.01 | ) | 3.17 | — | 3.16 | (0.14 | ) | (1.35 | ) | (1.49 | ) | ||||||||||||||||||||||
Year Ended December 31, 2012 (h) | $ | 25.91 | 0.00 | (i) | 1.52 | — | 1.52 | — | (1.51 | ) | (1.51 | ) | |||||||||||||||||||||||
Class R5 | |||||||||||||||||||||||||||||||||||
| Six Months Ended June 30, 2013 (Unaudited) | $ | 25.93 | 0.13 | 3.02 | — | 3.15 | (0.15 | ) | (1.35 | ) | (1.50 | ) | |||||||||||||||||||||||
Year Ended December 31, 2012 (j) | $ | 25.91 | 0.00 | (i) | 1.53 | — | 1.53 | — | (1.51 | ) | (1.51 | ) | |||||||||||||||||||||||
Class Y | |||||||||||||||||||||||||||||||||||
| Six Months Ended June 30, 2013 (Unaudited) | $ | 25.98 | 0.15 | 3.02 | — | 3.17 | (0.17 | ) | (1.35 | ) | (1.52 | ) | |||||||||||||||||||||||
Year Ended December 31, 2012 (k) | $ | 25.96 | 0.01 | 1.52 | — | 1.53 | — | (1.51 | ) | (1.51 | ) | ||||||||||||||||||||||||
Class Z | |||||||||||||||||||||||||||||||||||
| Six Months Ended June 30, 2013 (Unaudited) | $ | 25.57 | (0.03 | ) | 3.14 | — | 3.11 | (0.14 | ) | (1.35 | ) | (1.49 | ) | ||||||||||||||||||||||
Year Ended December 31, 2012 | $ | 23.62 | 0.11 | 3.88 | — | 3.99 | — | (2.04 | ) | (2.04 | ) | ||||||||||||||||||||||||
Year Ended December 31, 2011 | $ | 28.73 | (0.07 | ) | (4.58 | ) | 0.00 | (i) | (4.65 | ) | (0.46 | ) | — | (0.46 | ) | ||||||||||||||||||||
Year Ended December 31, 2010 | $ | 23.38 | (0.10 | ) | 5.45 | — | 5.35 | — | — | — | |||||||||||||||||||||||||
Year Ended December 31, 2009 | $ | 14.07 | (0.08 | ) | 9.39 | — | 9.31 | — | — | — | |||||||||||||||||||||||||
Year Ended December 31, 2008 | $ | 28.41 | (0.12 | ) | (13.53 | ) | — | (13.65 | ) | — | (0.69 | ) | (0.69 | ) | |||||||||||||||||||||
(a) In addition to the fees and expenses which the Fund bears directly, the Fund indirectly bears a pro rata share of the fees and expenses of the underlying funds in which it invests. Such indirect expenses are not included in the reported expense ratios.
(b) Annualized.
(c) Includes interest expense which rounds to less than 0.01%.
(d) The benefits derived from custody fees paid indirectly had an impact of less than 0.01%.
(e) Total return includes a voluntary reimbursement by the Investment Manager for a realized investment loss due to a trading error. This reimbursement increased total return and net asset value per share by less than 0.01% and less than $0.01, respectively.
(f) Had the Investment Manager and/or Transfer Agent not waived fees and/or reimbursed a portion of expenses, total return would have been reduced.
(g) Class I shares commenced operations on September 27, 2010. Per share data and total return reflect activity from that date.
(h) Class R4 shares commenced operations on November 8, 2012. Per share data and total return reflect activity from that date.
(i) Rounds to zero.
(j) Class R5 shares commenced operations on November 8, 2012. Per share data and total return reflect activity from that date.
(k) Class Y shares commenced operations on November 8, 2012. Per share data and total return reflect activity from that date.
(l) During the year ended December 31, 2011, the Fund received a reimbursement by an affiliate. Had the Fund not received this payment, total return would have been lower by 0.01%.
See accompanying notes to financial statements.
110
Ratio to Average Net Assets | Supplemental Data | ||||||||||||||||||||||||||||||
| (Selected data for a share outstanding throughout each period) | Net Asset Value, End of Period | Total Return | Total gross expenses (a) | Total net expenses (a) | Net investment income (loss) | Portfolio turnover rate | Net assets, end of period (000s) | ||||||||||||||||||||||||
Class A | |||||||||||||||||||||||||||||||
| Six Months Ended June 30, 2013 (Unaudited) | $ | 26.26 | 11.98 | % | 1.32 | %(b)(c) | 1.32 | %(b)(c) | (0.47 | )%(b) | 10 | % | $ | 303,380 | |||||||||||||||||
Year Ended December 31, 2012 | $ | 24.72 | 16.87 | % | 1.31 | %(c) | 1.31 | %(c)(d) | 0.13 | % | 15 | % | $ | 271,628 | |||||||||||||||||
Year Ended December 31, 2011 | $ | 22.95 | (16.65 | )% | 1.28 | % | 1.28 | %(d) | (0.57 | )% | 21 | % | $ | 340,325 | |||||||||||||||||
Year Ended December 31, 2010 | $ | 27.94 | 22.49 | % | 1.28 | % | 1.28 | %(d) | (0.73 | )% | 28 | % | $ | 555,263 | |||||||||||||||||
Year Ended December 31, 2009 | $ | 22.81 | 65.65 | % | 1.30 | % | 1.30 | %(d) | (0.78 | )% | 19 | % | $ | 522,443 | |||||||||||||||||
Year Ended December 31, 2008 | $ | 13.77 | (49.31 | )%(e) | 1.24 | % | 1.24 | %(d) | (0.80 | )% | 28 | % | $ | 395,794 | |||||||||||||||||
Class B | |||||||||||||||||||||||||||||||
| Six Months Ended June 30, 2013 (Unaudited) | $ | 24.05 | 11.65 | %(f) | 2.01 | %(b)(c) | 2.00 | %(b)(c) | (1.25 | )%(b) | 10 | % | $ | 4,086 | |||||||||||||||||
Year Ended December 31, 2012 | $ | 22.75 | 16.11 | % | 1.91 | %(c) | 1.90 | %(c)(d) | (0.62 | )% | 15 | % | $ | 9,938 | |||||||||||||||||
Year Ended December 31, 2011 | $ | 21.40 | (17.11 | )% | 1.88 | % | 1.88 | %(d) | (1.21 | )% | 21 | % | $ | 26,126 | |||||||||||||||||
Year Ended December 31, 2010 | $ | 26.06 | 21.72 | % | 1.92 | % | 1.92 | %(d) | (1.39 | )% | 28 | % | $ | 72,203 | |||||||||||||||||
Year Ended December 31, 2009 | $ | 21.41 | 64.44 | % | 2.01 | % | 2.01 | %(d) | (1.49 | )% | 19 | % | $ | 88,004 | |||||||||||||||||
Year Ended December 31, 2008 | $ | 13.02 | (49.62 | )%(e) | 1.87 | % | 1.87 | %(d) | (1.43 | )% | 28 | % | $ | 73,152 | |||||||||||||||||
Class C | |||||||||||||||||||||||||||||||
| Six Months Ended June 30, 2013 (Unaudited) | $ | 23.74 | 11.62 | % | 2.07 | %(b)(c) | 2.07 | %(b)(c) | (1.22 | )%(b) | 10 | % | $ | 56,957 | |||||||||||||||||
Year Ended December 31, 2012 | $ | 22.48 | 15.93 | % | 2.07 | %(c) | 2.06 | %(c)(d) | (0.59 | )% | 15 | % | $ | 57,309 | |||||||||||||||||
Year Ended December 31, 2011 | $ | 21.20 | (17.27 | )% | 2.05 | % | 2.05 | %(d) | (1.34 | )% | 21 | % | $ | 62,887 | |||||||||||||||||
Year Ended December 31, 2010 | $ | 25.83 | 21.55 | % | 2.07 | % | 2.07 | %(d) | (1.52 | )% | 28 | % | $ | 98,445 | |||||||||||||||||
Year Ended December 31, 2009 | $ | 21.25 | 64.22 | % | 2.14 | % | 2.14 | %(d) | (1.62 | )% | 19 | % | $ | 93,121 | |||||||||||||||||
Year Ended December 31, 2008 | $ | 12.94 | (49.71 | )%(e) | 2.04 | % | 2.04 | %(d) | (1.60 | )% | 28 | % | $ | 70,962 | |||||||||||||||||
Class I | |||||||||||||||||||||||||||||||
| Six Months Ended June 30, 2013 (Unaudited) | $ | 27.25 | 12.23 | % | 0.96 | %(b)(c) | 0.96 | %(b)(c) | (0.14 | )%(b) | 10 | % | $ | 37,441 | |||||||||||||||||
Year Ended December 31, 2012 | $ | 25.63 | 17.26 | % | 0.96 | %(c) | 0.95 | %(c)(d) | 0.89 | % | 15 | % | $ | 39,054 | |||||||||||||||||
Year Ended December 31, 2011 | $ | 23.65 | (16.25 | )% | 0.92 | % | 0.92 | %(d) | (0.12 | )% | 21 | % | $ | 10,944 | |||||||||||||||||
Year Ended December 31, 2010 (g) | $ | 28.74 | 16.17 | % | 0.91 | %(b) | 0.91 | %(b)(d) | 0.18 | %(b) | 28 | % | $ | 7,832 | |||||||||||||||||
Class R4 | |||||||||||||||||||||||||||||||
| Six Months Ended June 30, 2013 (Unaudited) | $ | 27.59 | 12.18 | % | 1.08 | %(b)(c) | 1.08 | %(b)(c) | (0.08 | )%(b) | 10 | % | $ | 76 | |||||||||||||||||
Year Ended December 31, 2012 (h) | $ | 25.92 | 5.92 | % | 1.07 | %(b) | 1.06 | %(b)(d) | 0.02 | %(b) | 15 | % | $ | 15 | |||||||||||||||||
Class R5 | |||||||||||||||||||||||||||||||
| Six Months Ended June 30, 2013 (Unaudited) | $ | 27.58 | 12.17 | % | 1.00 | %(b)(c) | 1.00 | %(b)(c) | 0.97 | %(b) | 10 | % | $ | 9,375 | |||||||||||||||||
Year Ended December 31, 2012 (j) | $ | 25.93 | 5.96 | % | 0.99 | %(b) | 0.99 | %(b)(d) | 0.08 | %(b) | 15 | % | $ | 3 | |||||||||||||||||
Class Y | |||||||||||||||||||||||||||||||
| Six Months Ended June 30, 2013 (Unaudited) | $ | 27.63 | 12.21 | % | 1.09 | %(b)(c) | 1.09 | %(b)(c) | 1.27 | %(b) | 10 | % | $ | 4,323 | |||||||||||||||||
Year Ended December 31, 2012 (k) | $ | 25.98 | 5.94 | % | 0.92 | %(b) | 0.92 | %(b)(d) | 0.15 | %(b) | 15 | % | $ | 3 | |||||||||||||||||
Class Z | |||||||||||||||||||||||||||||||
| Six Months Ended June 30, 2013 (Unaudited) | $ | 27.19 | 12.18 | % | 1.05 | %(b)(c) | 1.05 | %(b)(c) | (0.22 | )%(b) | 10 | % | $ | 441,839 | |||||||||||||||||
Year Ended December 31, 2012 | $ | 25.57 | 17.15 | % | 1.03 | %(c) | 1.03 | %(c)(d) | 0.40 | % | 15 | % | $ | 587,678 | |||||||||||||||||
Year Ended December 31, 2011 | $ | 23.62 | (16.37 | )%(l) | 0.97 | % | 0.97 | %(d) | (0.28 | )% | 21 | % | $ | 850,338 | |||||||||||||||||
Year Ended December 31, 2010 | $ | 28.73 | 22.88 | % | 0.97 | % | 0.97 | %(d) | (0.41 | )% | 28 | % | $ | 1,549,112 | |||||||||||||||||
Year Ended December 31, 2009 | $ | 23.38 | 66.17 | % | 0.99 | % | 0.99 | %(d) | (0.47 | )% | 19 | % | $ | 1,241,277 | |||||||||||||||||
Year Ended December 31, 2008 | $ | 14.07 | (49.18 | )%(e) | 0.95 | % | 0.95 | %(d) | (0.51 | )% | 28 | % | $ | 779,892 | |||||||||||||||||
See accompanying notes to financial statements.
111
Columbia Acorn Family of Funds
Financial Highlights, continued
Columbia Thermostat Fund
Income from Investment Operations | Less Distributions to Shareholders | ||||||||||||||||||||||||||||||
| (Selected data for a share outstanding throughout each period) | Net Asset Value, Beginning of Period | Net investment income | Net realized and unrealized gain (loss) | Total from investment operations | Net investment income | Net realized gains | Total Distributions to Shareholders | ||||||||||||||||||||||||
Class A | |||||||||||||||||||||||||||||||
| Six Months Ended June 30, 2013 (Unaudited) | $ | 14.29 | 0.12 | 0.46 | 0.58 | (0.01 | ) | — | (0.01 | ) | |||||||||||||||||||||
Year Ended December 31, 2012 | $ | 12.82 | 0.32 | 1.39 | 1.71 | (0.24 | ) | — | (0.24 | ) | |||||||||||||||||||||
Year Ended December 31, 2011 | $ | 12.58 | 0.28 | 0.30 | 0.58 | (0.34 | ) | — | (0.34 | ) | |||||||||||||||||||||
Year Ended December 31, 2010 | $ | 10.90 | 0.19 | 1.67 | 1.86 | (0.18 | ) | — | (0.18 | ) | |||||||||||||||||||||
Year Ended December 31, 2009 | $ | 8.26 | 0.11 | 2.53 | 2.64 | (0.00 | )(e) | — | (0.00 | )(e) | |||||||||||||||||||||
Year Ended December 31, 2008 | $ | 12.31 | 0.22 | (3.98 | ) | (3.76 | ) | (0.22 | ) | (0.07 | ) | (0.29 | ) | ||||||||||||||||||
Class B | |||||||||||||||||||||||||||||||
| Six Months Ended June 30, 2013 (Unaudited) | $ | 14.39 | 0.08 | 0.47 | 0.55 | (0.01 | ) | — | (0.01 | ) | |||||||||||||||||||||
Year Ended December 31, 2012 | $ | 12.91 | 0.20 | 1.45 | 1.65 | (0.17 | ) | — | (0.17 | ) | |||||||||||||||||||||
Year Ended December 31, 2011 | $ | 12.64 | 0.15 | 0.38 | 0.53 | (0.26 | ) | — | (0.26 | ) | |||||||||||||||||||||
Year Ended December 31, 2010 | $ | 10.93 | 0.13 | 1.67 | 1.80 | (0.09 | ) | — | (0.09 | ) | |||||||||||||||||||||
Year Ended December 31, 2009 | $ | 8.32 | 0.06 | 2.55 | 2.61 | — | — | — | |||||||||||||||||||||||
Year Ended December 31, 2008 | $ | 12.38 | 0.16 | (4.00 | ) | (3.84 | ) | (0.15 | ) | (0.07 | ) | (0.22 | ) | ||||||||||||||||||
Class C | |||||||||||||||||||||||||||||||
| Six Months Ended June 30, 2013 (Unaudited) | $ | 14.39 | 0.07 | 0.46 | 0.53 | (0.01 | ) | — | (0.01 | ) | |||||||||||||||||||||
Year Ended December 31, 2012 | $ | 12.91 | 0.22 | 1.39 | 1.61 | (0.13 | ) | — | (0.13 | ) | |||||||||||||||||||||
Year Ended December 31, 2011 | $ | 12.62 | 0.18 | 0.31 | 0.49 | (0.20 | ) | — | (0.20 | ) | |||||||||||||||||||||
Year Ended December 31, 2010 | $ | 10.91 | 0.10 | 1.68 | 1.78 | (0.07 | ) | — | (0.07 | ) | |||||||||||||||||||||
Year Ended December 31, 2009 | $ | 8.33 | 0.03 | 2.55 | 2.58 | — | — | — | |||||||||||||||||||||||
Year Ended December 31, 2008 | $ | 12.37 | 0.13 | (3.97 | ) | (3.84 | ) | (0.13 | ) | (0.07 | ) | (0.20 | ) | ||||||||||||||||||
Class R4 | |||||||||||||||||||||||||||||||
| Six Months Ended June 30, 2013 (Unaudited) | $ | 14.19 | 0.17 | 0.42 | 0.59 | (0.01 | ) | — | (0.01 | ) | |||||||||||||||||||||
Year Ended December 31, 2012 (f) | $ | 14.08 | 0.09 | 0.28 | 0.37 | (0.26 | ) | — | (0.26 | ) | |||||||||||||||||||||
Class R5 | |||||||||||||||||||||||||||||||
| Six Months Ended June 30, 2013 (Unaudited) | $ | 14.19 | 0.18 | 0.42 | 0.60 | (0.01 | ) | — | (0.01 | ) | |||||||||||||||||||||
Year Ended December 31, 2012 (g) | $ | 14.08 | 0.09 | 0.27 | 0.36 | (0.25 | ) | — | (0.25 | ) | |||||||||||||||||||||
Class Y | |||||||||||||||||||||||||||||||
| Six Months Ended June 30, 2013 (Unaudited) | $ | 14.18 | 0.15 | 0.46 | 0.61 | (0.01 | ) | — | (0.01 | ) | |||||||||||||||||||||
Year Ended December 31, 2012 (h) | $ | 14.08 | 0.09 | 0.27 | 0.36 | (0.26 | ) | — | (0.26 | ) | |||||||||||||||||||||
Class Z | |||||||||||||||||||||||||||||||
| Six Months Ended June 30, 2013 (Unaudited) | $ | 14.13 | 0.14 | 0.45 | 0.59 | (0.01 | ) | — | (0.01 | ) | |||||||||||||||||||||
Year Ended December 31, 2012 | $ | 12.67 | 0.34 | 1.39 | 1.73 | (0.27 | ) | — | (0.27 | ) | |||||||||||||||||||||
Year Ended December 31, 2011 | $ | 12.44 | 0.31 | 0.29 | 0.60 | (0.37 | ) | — | (0.37 | ) | |||||||||||||||||||||
Year Ended December 31, 2010 | $ | 10.80 | 0.21 | 1.66 | 1.87 | (0.23 | ) | — | (0.23 | ) | |||||||||||||||||||||
Year Ended December 31, 2009 | $ | 8.19 | 0.13 | 2.51 | 2.64 | (0.03 | ) | — | (0.03 | ) | |||||||||||||||||||||
Year Ended December 31, 2008 | $ | 12.26 | 0.24 | (3.96 | ) | (3.72 | ) | (0.28 | ) | (0.07 | ) | (0.35 | ) | ||||||||||||||||||
(a) Had the Investment Manager and/or Transfer Agent not waived fees and/or reimbursed a portion of expenses, total return would have been reduced.
(b) In addition to the fees and expenses which the Fund bears directly, the Fund indirectly bears a pro rata share of the fees and expenses of the underlying funds in which it invests. Such indirect expenses are not included in the reported expense ratios.
(c) Annualized.
(d) The benefits derived from custody fees paid indirectly had an impact of less than 0.01%.
(e) Rounds to zero.
(f) Class R4 shares commenced operations on November 8, 2012. Per share data and total return reflect activity from that date.
(g) Class R5 shares commenced operations on November 8, 2012. Per share data and total return reflect activity from that date.
(h) Class Y shares commenced operations on November 8, 2012. Per share data and total return reflect activity from that date.
See accompanying notes to financial statements.
112
Ratio to Average Net Assets | Supplemental Data | ||||||||||||||||||||||||||||||
| (Selected data for a share outstanding throughout each period) | Net Asset Value, End of Period | Total Return (a) | Total gross expenses (b) | Total net expenses (b) | Net investment income | Portfolio turnover rate | Net assets, end of period (000s) | ||||||||||||||||||||||||
Class A | |||||||||||||||||||||||||||||||
| Six Months Ended June 30, 2013 (Unaudited) | $ | 14.86 | 4.05 | % | 0.51 | %(c) | 0.50 | %(c) | 1.70 | %(c) | 48 | % | $ | 467,173 | |||||||||||||||||
Year Ended December 31, 2012 | $ | 14.29 | 13.34 | % | 0.58 | % | 0.50 | %(d) | 2.28 | % | 109 | % | $ | 323,750 | |||||||||||||||||
Year Ended December 31, 2011 | $ | 12.82 | 4.62 | % | 0.67 | % | 0.50 | %(d) | 2.17 | % | 130 | % | $ | 79,744 | |||||||||||||||||
Year Ended December 31, 2010 | $ | 12.58 | 17.28 | % | 0.72 | % | 0.50 | %(d) | 1.64 | % | 118 | % | $ | 44,527 | |||||||||||||||||
Year Ended December 31, 2009 | $ | 10.90 | 31.98 | % | 0.78 | % | 0.50 | %(d) | 1.17 | % | 17 | % | $ | 42,976 | |||||||||||||||||
Year Ended December 31, 2008 | $ | 8.26 | (30.67 | )% | 0.68 | % | 0.50 | %(d) | 1.99 | % | 130 | % | $ | 41,032 | |||||||||||||||||
Class B | |||||||||||||||||||||||||||||||
| Six Months Ended June 30, 2013 (Unaudited) | $ | 14.93 | 3.82 | % | 1.14 | %(c) | 1.00 | %(c) | 1.12 | %(c) | 48 | % | $ | 3,030 | |||||||||||||||||
Year Ended December 31, 2012 | $ | 14.39 | 12.78 | % | 1.16 | % | 1.00 | %(d) | 1.47 | % | 109 | % | $ | 4,480 | |||||||||||||||||
Year Ended December 31, 2011 | $ | 12.91 | 4.19 | % | 1.23 | % | 1.00 | %(d) | 1.18 | % | 130 | % | $ | 11,318 | |||||||||||||||||
Year Ended December 31, 2010 | $ | 12.64 | 16.64 | % | 1.28 | % | 1.00 | %(d) | 1.10 | % | 118 | % | $ | 28,752 | |||||||||||||||||
Year Ended December 31, 2009 | $ | 10.93 | 31.37 | % | 1.32 | % | 1.00 | %(d) | 0.64 | % | 17 | % | $ | 32,758 | |||||||||||||||||
Year Ended December 31, 2008 | $ | 8.32 | (31.10 | )% | 1.20 | % | 1.00 | %(d) | 1.45 | % | 130 | % | $ | 36,673 | |||||||||||||||||
Class C | |||||||||||||||||||||||||||||||
| Six Months Ended June 30, 2013 (Unaudited) | $ | 14.91 | 3.68 | % | 1.26 | %(c) | 1.25 | %(c) | 0.96 | %(c) | 48 | % | $ | 391,265 | |||||||||||||||||
Year Ended December 31, 2012 | $ | 14.39 | 12.52 | % | 1.32 | % | 1.25 | %(d) | 1.56 | % | 109 | % | $ | 253,641 | |||||||||||||||||
Year Ended December 31, 2011 | $ | 12.91 | 3.87 | % | 1.43 | % | 1.25 | %(d) | 1.40 | % | 130 | % | $ | 33,378 | |||||||||||||||||
Year Ended December 31, 2010 | $ | 12.62 | 16.43 | % | 1.49 | % | 1.25 | %(d) | 0.88 | % | 118 | % | $ | 21,866 | |||||||||||||||||
Year Ended December 31, 2009 | $ | 10.91 | 30.97 | % | 1.55 | % | 1.25 | %(d) | 0.39 | % | 17 | % | $ | 21,090 | |||||||||||||||||
Year Ended December 31, 2008 | $ | 8.33 | (31.20 | )% | 1.45 | % | 1.25 | %(d) | 1.23 | % | 130 | % | $ | 24,383 | |||||||||||||||||
Class R4 | |||||||||||||||||||||||||||||||
| Six Months Ended June 30, 2013 (Unaudited) | $ | 14.77 | 4.15 | % | 0.25 | %(c) | 0.22 | %(c) | 2.35 | %(c) | 48 | % | $ | 7,886 | |||||||||||||||||
Year Ended December 31, 2012 (f) | $ | 14.19 | 2.60 | % | 0.42 | %(c) | 0.25 | %(c)(d) | 4.59 | %(c) | 109 | % | $ | 15 | |||||||||||||||||
Class R5 | |||||||||||||||||||||||||||||||
| Six Months Ended June 30, 2013 (Unaudited) | $ | 14.78 | 4.22 | % | 0.24 | %(c) | 0.23 | %(c) | 2.48 | %(c) | 48 | % | $ | 331 | |||||||||||||||||
Year Ended December 31, 2012 (g) | $ | 14.19 | 2.58 | % | 0.35 | %(c) | 0.27 | %(c)(d) | 4.60 | %(c) | 109 | % | $ | 3 | |||||||||||||||||
Class Y | |||||||||||||||||||||||||||||||
| Six Months Ended June 30, 2013 (Unaudited) | $ | 14.78 | 4.30 | % | 0.14 | %(c) | 0.14 | %(c) | 2.02 | %(c) | 48 | % | $ | 3 | |||||||||||||||||
Year Ended December 31, 2012 (h) | $ | 14.18 | 2.55 | % | 0.30 | %(c) | 0.22 | %(c)(d) | 4.63 | %(c) | 109 | % | $ | 3 | |||||||||||||||||
Class Z | |||||||||||||||||||||||||||||||
| Six Months Ended June 30, 2013 (Unaudited) | $ | 14.71 | 4.17 | % | 0.25 | %(c) | 0.25 | %(c) | 1.95 | %(c) | 48 | % | $ | 386,452 | |||||||||||||||||
Year Ended December 31, 2012 | $ | 14.13 | 13.69 | % | 0.30 | % | 0.25 | %(d) | 2.48 | % | 109 | % | $ | 292,732 | |||||||||||||||||
Year Ended December 31, 2011 | $ | 12.67 | 4.85 | % | 0.34 | % | 0.25 | %(d) | 2.43 | % | 130 | % | $ | 65,167 | |||||||||||||||||
Year Ended December 31, 2010 | $ | 12.44 | 17.58 | % | 0.37 | % | 0.25 | %(d) | 1.87 | % | 118 | % | $ | 36,130 | |||||||||||||||||
Year Ended December 31, 2009 | $ | 10.80 | 32.29 | % | 0.39 | % | 0.25 | %(d) | 1.48 | % | 17 | % | $ | 41,765 | |||||||||||||||||
Year Ended December 31, 2008 | $ | 8.19 | (30.53 | )% | 0.33 | % | 0.25 | %(d) | 2.23 | % | 130 | % | $ | 34,985 | |||||||||||||||||
See accompanying notes to financial statements.
113
Columbia Acorn Family of Funds
Financial Highlights, continued
Columbia Acorn Emerging Markets Fund
Income from Investment Operations | Less Distributions to Shareholders | ||||||||||||||||||||||||||||||
| (Selected data for a share outstanding throughout each period) | Net Asset Value, Beginning of Period | Net investment income (loss) | Net realized and unrealized gain (loss) | Total from investment operations | Net investment income | Total Distributions to Shareholders | Net Asset Value, End of Period | ||||||||||||||||||||||||
Class A | |||||||||||||||||||||||||||||||
| Six Months Ended June 30, 2013 (Unaudited) | $ | 12.04 | 0.05 | (0.10 | ) | (0.05 | ) | — | — | $ | 11.99 | ||||||||||||||||||||
Year Ended December 31, 2012 | $ | 9.26 | 0.08 | 2.78 | 2.86 | (0.08 | ) | (0.08 | ) | $ | 12.04 | ||||||||||||||||||||
Year Ended December 31, 2011 (e) | $ | 10.00 | (0.00 | )(f) | (0.74 | ) | (0.74 | ) | — | — | $ | 9.26 | |||||||||||||||||||
Class C | |||||||||||||||||||||||||||||||
| Six Months Ended June 30, 2013 (Unaudited) | $ | 12.01 | 0.01 | (0.10 | ) | (0.09 | ) | — | — | $ | 11.92 | ||||||||||||||||||||
Year Ended December 31, 2012 | $ | 9.24 | (0.02 | ) | 2.79 | 2.77 | — | — | $ | 12.01 | |||||||||||||||||||||
Year Ended December 31, 2011 (h) | $ | 10.00 | (0.02 | ) | (0.74 | ) | (0.76 | ) | — | — | $ | 9.24 | |||||||||||||||||||
Class I | |||||||||||||||||||||||||||||||
| Six Months Ended June 30, 2013 (Unaudited) | $ | 12.08 | 0.01 | (0.05 | ) | (0.04 | ) | — | — | $ | 12.04 | ||||||||||||||||||||
Year Ended December 31, 2012 | $ | 9.29 | 0.11 | 2.80 | 2.91 | (0.12 | ) | (0.12 | ) | $ | 12.08 | ||||||||||||||||||||
Year Ended December 31, 2011 (i) | $ | 10.00 | 0.01 | (0.72 | ) | (0.71 | ) | — | — | $ | 9.29 | ||||||||||||||||||||
Class R4 | |||||||||||||||||||||||||||||||
| Six Months Ended June 30, 2013 (Unaudited) | $ | 12.14 | 0.09 | (0.12 | ) | (0.03 | ) | — | — | $ | 12.11 | ||||||||||||||||||||
Year Ended December 31, 2012 (j) | $ | 11.44 | (0.01 | ) | 0.81 | 0.80 | (0.10 | ) | (0.10 | ) | $ | 12.14 | |||||||||||||||||||
Class R5 | |||||||||||||||||||||||||||||||
| Six Months Ended June 30, 2013 (Unaudited) | $ | 12.14 | 0.11 | (0.15 | ) | (0.04 | ) | — | — | $ | 12.10 | ||||||||||||||||||||
Year Ended December 31, 2012 (k) | $ | 11.44 | (0.00 | )(f) | 0.81 | 0.81 | (0.11 | ) | (0.11 | ) | $ | 12.14 | |||||||||||||||||||
Class Y | |||||||||||||||||||||||||||||||
| Six Months Ended June 30, 2013 (Unaudited) (l) | $ | 12.22 | 0.00 | (f) | (0.22 | ) | (0.22 | ) | — | — | $ | 12.00 | |||||||||||||||||||
Class Z | |||||||||||||||||||||||||||||||
| Six Months Ended June 30, 2013 (Unaudited) | $ | 12.07 | 0.09 | (0.14 | ) | (0.05 | ) | — | — | $ | 12.02 | ||||||||||||||||||||
Year Ended December 31, 2012 | $ | 9.28 | 0.12 | 2.79 | 2.91 | (0.12 | ) | (0.12 | ) | $ | 12.07 | ||||||||||||||||||||
Year Ended December 31, 2011 (m) | $ | 10.00 | 0.01 | (0.73 | ) | (0.72 | ) | — | — | $ | 9.28 | ||||||||||||||||||||
(a) Had the Investment Manager and/or Transfer Agent not waived fees and/or reimbursed a portion of expenses, total return would have been reduced.
(b) Annualized.
(c) In addition to the fees and expenses which the Fund bears directly, the Fund indirectly bears a pro rata share of the fees and expenses of the underlying funds in which it invests. Such indirect expenses are not included in the reported expense ratios.
(d) The benefits derived from custody fees paid indirectly had an impact of 0.01%.
(e) Class A shares commenced operations on August 19, 2011. Per share data and total return reflect activity from that date.
(f) Rounds to zero.
(g) The benefits derived from custody fees paid indirectly had an impact of 0.02%.
(h) Class C shares commenced operations on August 19, 2011. Per share data and total return reflect activity from that date.
(i) Class I shares commenced operations on August 19, 2011. Per share data and total return reflect activity from that date.
(j) Class R4 shares commenced operations on November 8, 2012. Per share data and total return reflect activity from that date.
(k) Class R5 shares commenced operations on November 8, 2012. Per share data and total return reflect activity from that date.
(l) Class Y shares commenced operations on June 13, 2013. Per share data and total return reflect activity from that date.
(m) Class Z shares commenced operations on August 19, 2011. Per share data and total return reflect activity from that date.
See accompanying notes to financial statements.
114
Ratio to Average Net Assets | Supplemental Data | ||||||||||||||||||||||||||
| (Selected data for a share outstanding throughout each period) | Total Return (a) | Total gross expenses | Total net expenses | Net investment income (loss) | Portfolio turnover rate | Net assets, end of period (000s) | |||||||||||||||||||||
Class A | |||||||||||||||||||||||||||
| Six Months Ended June 30, 2013 (Unaudited) | (0.42 | )% | 2.20 | %(b)(c) | 1.82 | %(b)(c) | 0.90 | %(b) | 7 | % | $ | 57,830 | |||||||||||||||
Year Ended December 31, 2012 | 30.86 | % | 6.42 | %(c) | 1.77 | %(c)(d) | 0.77 | % | 30 | % | $ | 3,103 | |||||||||||||||
Year Ended December 31, 2011 (e) | (7.40 | )% | 20.13 | %(b) | 1.85 | %(b)(g) | (0.01 | )%(b) | 9 | % | $ | 332 | |||||||||||||||
Class C | |||||||||||||||||||||||||||
| Six Months Ended June 30, 2013 (Unaudited) | (0.75 | )% | 2.96 | %(b)(c) | 2.59 | %(b)(c) | 0.16 | %(b) | 7 | % | $ | 11,841 | |||||||||||||||
Year Ended December 31, 2012 | 29.98 | % | 7.18 | %(c) | 2.56 | %(c)(d) | (0.15 | )% | 30 | % | $ | 615 | |||||||||||||||
Year Ended December 31, 2011 (h) | (7.60 | )% | 25.06 | %(b) | 2.60 | %(b)(g) | (0.68 | )%(b) | 9 | % | $ | 127 | |||||||||||||||
Class I | |||||||||||||||||||||||||||
| Six Months Ended June 30, 2013 (Unaudited) | (0.33 | )% | 2.16 | %(b)(c) | 1.45 | %(b)(c) | 0.23 | %(b) | 7 | % | $ | 6 | |||||||||||||||
Year Ended December 31, 2012 | 31.39 | % | 6.18 | %(c) | 1.41 | %(c)(d) | 1.05 | % | 30 | % | $ | 6 | |||||||||||||||
Year Ended December 31, 2011 (i) | (7.10 | )% | 19.31 | %(b) | 1.41 | %(b)(g) | 0.17 | %(b) | 9 | % | $ | 5 | |||||||||||||||
Class R4 | |||||||||||||||||||||||||||
| Six Months Ended June 30, 2013 (Unaudited) | (0.25 | )% | 1.74 | %(b)(c) | 1.54 | %(b)(c) | 1.57 | %(b) | 7 | % | $ | 5,561 | |||||||||||||||
Year Ended December 31, 2012 (j) | 7.04 | % | 5.86 | %(b)(c) | 1.54 | %(b)(c)(d) | (0.31 | )%(b) | 30 | % | $ | 16 | |||||||||||||||
Class R5 | |||||||||||||||||||||||||||
| Six Months Ended June 30, 2013 (Unaudited) | (0.33 | )% | 1.66 | %(b)(c) | 1.56 | %(b)(c) | 1.83 | %(b) | 7 | % | $ | 6,731 | |||||||||||||||
Year Ended December 31, 2012 (k) | 7.11 | % | 5.81 | %(b)(c) | 1.46 | %(b)(c)(d) | (0.22 | )%(b) | 30 | % | $ | 3 | |||||||||||||||
Class Y | |||||||||||||||||||||||||||
| Six Months Ended June 30, 2013 (Unaudited) (l) | (1.80 | )% | 1.94 | %(b)(c) | 1.54 | %(b)(c) | 0.01 | %(b) | 7 | % | $ | 2 | |||||||||||||||
Class Z | |||||||||||||||||||||||||||
| Six Months Ended June 30, 2013 (Unaudited) | (0.41 | )% | 1.95 | %(b)(c) | 1.55 | %(b)(c) | 1.47 | %(b) | 7 | % | $ | 95,507 | |||||||||||||||
Year Ended December 31, 2012 | 31.35 | % | 6.15 | %(c) | 1.46 | %(c)(d) | 1.07 | % | 30 | % | $ | 6,846 | |||||||||||||||
Year Ended December 31, 2011 (m) | (7.20 | )% | 19.52 | %(b) | 1.46 | %(b)(g) | 0.15 | %(b) | 9 | % | $ | 2,765 | |||||||||||||||
See accompanying notes to financial statements.
115
Columbia Acorn Family of Funds
Financial Highlights, continued
Columbia Acorn European Fund
Income from Investment Operations | Less Distributions to Shareholders | ||||||||||||||||||||||||||||||
| (Selected data for a share outstanding throughout each period) | Net Asset Value, Beginning of Period | Net investment income (loss) | Net realized and unrealized gain (loss) | Total from investment operations | Net investment income | Net realized gains | Total Distributions to Shareholders | ||||||||||||||||||||||||
Class A | |||||||||||||||||||||||||||||||
| Six Months Ended June 30, 2013 (Unaudited) | $ | 11.76 | 0.16 | 0.71 | 0.87 | — | — | — | |||||||||||||||||||||||
Year Ended December 31, 2012 | $ | 9.43 | 0.03 | 2.37 | 2.40 | (0.07 | ) | (0.00 | )(d) | (0.07 | ) | ||||||||||||||||||||
Year Ended December 31, 2011 (f) | $ | 10.00 | (0.03 | ) | (0.46 | ) | (0.49 | ) | (0.06 | ) | (0.02 | ) | (0.08 | ) | |||||||||||||||||
Class C | |||||||||||||||||||||||||||||||
| Six Months Ended June 30, 2013 (Unaudited) | $ | 11.73 | 0.06 | 0.76 | 0.82 | — | — | — | |||||||||||||||||||||||
Year Ended December 31, 2012 | $ | 9.44 | (0.15 | ) | 2.46 | 2.31 | (0.02 | ) | (0.00 | )(d) | (0.02 | ) | |||||||||||||||||||
Year Ended December 31, 2011 (h) | $ | 10.00 | (0.06 | ) | (0.45 | ) | (0.51 | ) | (0.03 | ) | (0.02 | ) | (0.05 | ) | |||||||||||||||||
Class I | |||||||||||||||||||||||||||||||
| Six Months Ended June 30, 2013 (Unaudited) | $ | 11.75 | 0.13 | 0.76 | 0.89 | — | — | — | |||||||||||||||||||||||
Year Ended December 31, 2012 | $ | 9.43 | 0.10 | 2.32 | 2.42 | (0.10 | ) | (0.00 | )(d) | (0.10 | ) | ||||||||||||||||||||
Year Ended December 31, 2011 (i) | $ | 10.00 | (0.02 | ) | (0.46 | ) | (0.48 | ) | (0.07 | ) | (0.02 | ) | (0.09 | ) | |||||||||||||||||
Class R5 | |||||||||||||||||||||||||||||||
| Six Months Ended June 30, 2013 (Unaudited) | $ | 11.86 | 0.19 | 0.70 | 0.89 | — | — | — | |||||||||||||||||||||||
Year Ended December 31, 2012 (j) | $ | 11.19 | (0.02 | ) | 0.77 | 0.75 | (0.08 | ) | — | (0.08 | ) | ||||||||||||||||||||
Class Z | |||||||||||||||||||||||||||||||
| Six Months Ended June 30, 2013 (Unaudited) | $ | 11.76 | 0.13 | 0.75 | 0.88 | — | — | — | |||||||||||||||||||||||
Year Ended December 31, 2012 | $ | 9.44 | 0.08 | 2.34 | 2.42 | (0.10 | ) | (0.00 | )(d) | (0.10 | ) | ||||||||||||||||||||
Year Ended December 31, 2011 (k) | $ | 10.00 | (0.02 | ) | (0.46 | ) | (0.48 | ) | (0.06 | ) | (0.02 | ) | (0.08 | ) | |||||||||||||||||
(a) Had the Investment Manager and/or Transfer Agent not waived fees and/or reimbursed a portion of expenses, total return would have been reduced.
(b) Annualized.
(c) In addition to the fees and expenses which the Fund bears directly, the Fund indirectly bears a pro rata share of the fees and expenses of the underlying funds in which it invests. Such indirect expenses are not included in the reported expense ratios.
(d) Rounds to zero.
(e) The benefits derived from custody fees paid indirectly had an impact of 0.01%.
(f) Class A shares commenced operations on August 19, 2011. Per share data and total return reflect activity from that date.
(g) The benefits derived from custody fees paid indirectly had an impact of 0.02%.
(h) Class C shares commenced operations on August 19, 2011. Per share data and total return reflect activity from that date.
(i) Class I shares commenced operations on August 19, 2011. Per share data and total return reflect activity from that date.
(j) Class R5 shares commenced operations on November 8, 2012. Per share data and total return reflect activity from that date.
(k) Class Z shares commenced operations on August 19, 2011. Per share data and total return reflect activity from that date.
See accompanying notes to financial statements.
116
Ratio to Average Net Assets | Supplemental Data | ||||||||||||||||||||||||||||||
| (Selected data for a share outstanding throughout each period) | Net Asset Value, End of Period | Total Return (a) | Total gross expenses | Total net expenses | Net investment income (loss) | Portfolio turnover rate | Net assets, end of period (000s) | ||||||||||||||||||||||||
Class A | |||||||||||||||||||||||||||||||
| Six Months Ended June 30, 2013 (Unaudited) | $ | 12.63 | 7.40 | % | 5.26 | %(b)(c) | 1.71 | %(b)(c) | 2.67 | %(b) | 22 | % | $ | 4,036 | |||||||||||||||||
Year Ended December 31, 2012 | $ | 11.76 | 25.46 | % | 12.35 | %(c) | 1.61 | %(c)(e) | 0.23 | % | 37 | % | $ | 453 | |||||||||||||||||
Year Ended December 31, 2011 (f) | $ | 9.43 | (4.97 | )% | 33.59 | %(b) | 1.75 | %(b)(g) | (0.84 | )%(b) | 17 | % | $ | 154 | |||||||||||||||||
Class C | |||||||||||||||||||||||||||||||
| Six Months Ended June 30, 2013 (Unaudited) | $ | 12.55 | 6.99 | % | 6.59 | %(b)(c) | 2.50 | %(b)(c) | 0.93 | %(b) | 22 | % | $ | 101 | |||||||||||||||||
Year Ended December 31, 2012 | $ | 11.73 | 24.46 | % | 12.83 | %(c) | 2.32 | %(c)(e) | (1.33 | )% | 37 | % | $ | 89 | |||||||||||||||||
Year Ended December 31, 2011 (h) | $ | 9.44 | (5.14 | )% | 35.79 | %(b) | 2.50 | %(b)(g) | (1.66 | )%(b) | 17 | % | $ | 5 | |||||||||||||||||
Class I | |||||||||||||||||||||||||||||||
| Six Months Ended June 30, 2013 (Unaudited) | $ | 12.64 | 7.57 | % | 5.35 | %(b)(c) | 1.36 | %(b)(c) | 2.07 | %(b) | 22 | % | $ | 6 | |||||||||||||||||
Year Ended December 31, 2012 | $ | 11.75 | 25.71 | % | 12.05 | %(c) | 1.31 | %(c)(e) | 0.94 | % | 37 | % | $ | 6 | |||||||||||||||||
Year Ended December 31, 2011 (i) | $ | 9.43 | (4.81 | )% | 30.00 | %(b) | 1.31 | %(b)(g) | (0.47 | )%(b) | 17 | % | $ | 5 | |||||||||||||||||
Class R5 | |||||||||||||||||||||||||||||||
| Six Months Ended June 30, 2013 (Unaudited) | $ | 12.75 | 7.50 | % | 6.77 | %(b)(c) | 1.47 | %(b)(c) | 4.65 | %(b) | 22 | % | $ | 630 | |||||||||||||||||
Year Ended December 31, 2012 (j) | $ | 11.86 | 6.70 | % | 14.07 | %(b)(c) | 1.36 | %(b)(c)(e) | (1.07 | )%(b) | 37 | % | $ | 3 | |||||||||||||||||
Class Z | |||||||||||||||||||||||||||||||
| Six Months Ended June 30, 2013 (Unaudited) | $ | 12.64 | 7.48 | % | 5.37 | %(b)(c) | 1.40 | %(b)(c) | 2.06 | %(b) | 22 | % | $ | 3,230 | |||||||||||||||||
Year Ended December 31, 2012 | $ | 11.76 | 25.66 | % | 12.07 | %(c) | 1.33 | %(c)(e) | 0.76 | % | 37 | % | $ | 2,727 | |||||||||||||||||
Year Ended December 31, 2011 (k) | $ | 9.44 | (4.78 | )% | 30.26 | %(b) | 1.37 | %(b)(g) | (0.52 | )%(b) | 17 | % | $ | 1,516 | |||||||||||||||||
See accompanying notes to financial statements.
117
Columbia Acorn Family of Funds
Notes to Financial Statements
1. Nature of Operations
Columbia Acorn Fund, Columbia Acorn International, Columbia Acorn USA, Columbia Acorn International Select, Columbia Acorn Select, Columbia Thermostat Fund, Columbia Acorn Emerging Markets Fund and Columbia Acorn European Fund (the Funds) are each a series of Columbia Acorn Trust (the Trust). The Trust is registered under the Investment Company Act of 1940, as amended (the 1940 Act), as an open-end management investment company organized as a Massachusetts business trust. The investment objective of each Fund is to seek long-term capital appreciation.
Columbia Thermostat Fund pursues its investment objective by investing in shares of other mutual funds. As a "fund of funds" under normal circumstances, the Fund allocates at least 95% of its net assets among a selected group of affiliated stock and bond mutual funds (underlying portfolio funds) according to the current level of the Standard & Poor's (S&P) 500 Index in relation to predetermined ranges set by Columbia Wanger Asset Management, LLC (the Investment Manager). The Fund may invest up to 5% of its net assets plus any cash received that day in cash, repurchase agreements, high quality short-term paper and government securities.
Each Fund may issue an unlimited number of shares. Columbia Acorn Fund, Columbia Acorn USA, Columbia Acorn International Select and Columbia Acorn Select each currently offers Class A, Class B, Class C, Class I, Class R4, Class R5, Class Y and Class Z shares. Columbia Acorn International currently offers Class A, Class B, Class C, Class I, Class R, Class R4, Class R5, Class Y and Class Z shares. Columbia Thermostat Fund currently offers Class A, Class B, Class C, Class R4, Class R5, Class Y and Class Z shares. Columbia Acorn Emerging Markets Fund currently offers Class A, Class C, Class I, Class R4, Class R5, Class Y and Class Z shares. Columbia Acorn European Fund currently offers Class A, Class C, Class I, Class R5 and Class Z shares. Effective February 29, 2008, the Funds generally no longer accept investments by new or existing investors in the Funds' Class B shares, except in connection with the reinvestment of any dividend and/or capital gain distributions in Class B shares of the Funds and exchanges by existing Class B shareholders of certain other funds within the Columbia Family of Funds.
Class A shares are sold with a front-end sales charge. Class A shares bought without an initial sales charge in accounts aggregating $1 million to $50 million at the time of purchase are subject to a 1.00% contingent deferred sales charge (CDSC) if the shares are redeemed within 12 months of purchase, and a 0.50% CDSC if the shares are redeemed
more than 12, but less than 18, months after purchase, with certain limited exceptions.
Class B shares are subject to CDSC if redeemed within six years of purchase. Class B shares will convert to Class A shares automatically eight years after purchase.
Class C shares are offered at net asset value but are subject to a CDSC on redemptions made within one year after purchase.
Class I, Class R, Class R4, Class R5 and Class Y shares are offered at net asset value. There are certain restrictions on who may purchase these share classes. Class Y shares commenced operations on June 13, 2013 for Columbia Acorn Emerging Markets Fund.
Class Z shares are offered at net asset value. There are certain restrictions on who may purchase Class Z shares. Generally, Class Z shares of a Fund may be exchanged for shares of another fund distributed by Columbia Management Investment Distributors, Inc. (CMID) at no additional charge.
Investment income, realized and unrealized gains and losses, and certain fund-level expenses are allocated pro rata on the basis of the relative net assets of all classes, except that each class bears certain expenses specific to that class such as distribution services, transfer agent fees, and certain other class specific expenses. Differences in class expenses may result in payment of different dividend distributions for each class. All of the Funds' share classes have equal rights with respect to voting, subject to Fund or class specific matters.
2. Significant Accounting Policies
The preparation of financial statements in accordance with accounting principles generally accepted in the United States of America (GAAP) requires management to make certain estimates and assumptions that affect the reported amounts of assets and liabilities, the disclosure of contingent assets and liabilities at the date of the financial statements and the reported amounts of revenue and expenses during the reporting period. Actual results could differ from those estimates.
>Security valuation
Securities of the Funds are valued at market value or, if a market quotation for a security is not readily available or is deemed not to be reliable because of events or circumstances that have occurred between the market quotation and the time as of which the security is to be valued, the security is valued at a fair value determined in good faith under consistently applied procedures established by the Board of Trustees (the Board). With respect to Columbia Thermostat Fund, investments in portfolio funds are valued at their net asset values as
118
reported by the portfolio funds. A security traded on a securities exchange or in an over-the-counter market in which transaction prices are reported is valued at the last sales price at the time of valuation. A security traded principally on NASDAQ is valued at the NASDAQ official closing price. Mutual funds and exchange traded funds are valued at their closing net asset value as reported to the applicable exchange.
Short-term investments maturing in 60 days or less are valued at amortized cost, which approximates market value.
Forward foreign currency exchange contracts are marked-to-market based upon foreign currency exchange rates provided by a pricing service.
A security for which a market quotation is not readily available and any other assets are valued at their fair value determined in good faith under consistently applied procedures established by the Board. The Trust has retained an independent statistical fair value pricing service that employs a systematic methodology to assist in the fair valuation process for securities principally traded in a foreign market in order to adjust for possible changes in value that may occur between the close of the foreign exchange and the time as of which the securities are to be valued. If a security is valued at fair value, that value may be different from the last quoted market price for the security. A security for which there is no reported sale on the valuation date is valued at the mean of the latest bid and ask quotations.
>Foreign currency translations
Values of investments denominated in foreign currencies are converted into U.S. dollars using the New York spot market rate of exchange at the time of valuation. Purchases and sales of investments and dividend and interest income are translated into U.S. dollars using the spot market rate of exchange prevailing on the respective dates of such transactions. The gain or loss resulting from changes in foreign exchange rates is included with net realized and unrealized gain or loss from investments, as appropriate.
>Restricted securities
Restricted securities are securities that may only be resold upon registration under federal securities laws or in transactions exempt from registration. In some cases, the issuer of restricted securities has agreed to register such securities for resale at the issuer's expense either upon demand by the Fund or in connection with another registered offering of the securi-
ties. Many restricted securities may be resold in the secondary market in transactions exempt from registration. Such restricted securities may be determined to be liquid under criteria established by the Board.
>Derivative Instruments
Columbia Acorn International Select invests in forward foreign currency exchange contracts, on a very limited basis, as detailed below, to hedge the currency exposure associated with some of the Fund's securities. Forward foreign currency exchange contracts are derivative instruments whose values depend on, or are derived from, in whole or in part, the value of one or more other assets, in this case, currencies. Derivatives may involve various risks, including the potential inability of the counterparty to fulfill its obligation under the terms of the contract and the potential for market movements, which may expose the Fund to gains or losses in excess of the amount shown in the Statements of Assets and Liabilities.
For financial reporting purposes, Columbia Acorn International Select does not offset derivative assets and derivative liabilities that are subject to netting arrangements in the Statements of Assets and Liabilities.
>Forward Foreign Currency Exchange Contracts
Forward foreign currency exchange contracts are agreements between two parties to buy and sell a currency at a set price on a future date. Columbia Acorn International Select utilized forward foreign currency exchange contracts to hedge the currency exposure associated with some of the Fund's securities. The Fund's use of forward foreign currency exchange contracts was not material to the net assets of the Fund.
The values of forward foreign currency exchange contracts fluctuate with changes in foreign currency exchange rates. The Fund will record a realized gain or loss when the forward foreign currency exchange contract expires or is closed.
The use of forward foreign currency exchange contracts does not eliminate fluctuations in the prices of the Fund's portfolio securities. The risks of forward foreign currency exchange contracts include movement in the values of the foreign currencies relative to the U.S. dollar (or other foreign currencies) and the possibility that counterparties will not complete their contractual obligations, which may be in excess of the amount reflected, if any, in the Statements of Assets and Liabilities.
119
Columbia Acorn Family of Funds
Notes to Financial Statements, continued
>Offsetting of Derivative Assets and Derivative Liabilities
The following tables present the gross and net amount of assets and liabilities of Columbia Acorn International Select available for offset under netting arrangements as well as any related collateral received or pledged by the Fund as of June 30, 2013:
| Gross Amounts Not Offset in the Statements of Assets and Liabilities | |||||||||||||||||||||||||||||||
| Gross Amounts of Recognized Liabilities | Gross Amounts Offset in the Statements of Assets and Liabilities | Net Amounts of Liabilities Presented in the Statements of Assets and Liabilities | Financial Instruments(a) | Cash Collateral Pledged | Securities Collateral Pledged | Net Amount(b) | |||||||||||||||||||||||||
| Forward foreign currency exchange contracts | $ | 52,114 | $ | — | $ | 52,114 | $ | — | $ | — | $ | — | $ | 52,114 | |||||||||||||||||
(a) Represents the amount of liabilities that could be offset by assets with the same counterparty under master netting or similar agreements that management elects not to offset on the Statements of Assets and Liabilities.
(b) Represents the net amount due to counterparties in the event of default.
>Effects of derivative transactions in the financial statements
The following tables are intended to provide additional information about the effect of derivatives on the financial statements of Columbia Acorn International Select including: the fair value of derivatives by risk category and the location of those fair values in the Statements of Assets and Liabilities; the impact of derivative transactions on the Fund's operations over the period including realized gains or losses and unrealized gains or losses. The derivative schedule following the Statement of Investments presents additional information regarding derivative instruments outstanding at the end of the period, if any.
The following table is a summary of the fair value of derivative instruments of Columbia Acorn International Select at June 30, 2013:
Liability Derivatives | |||||||||||
| Risk Exposure Category | Statements of Assets and Liabilities Location | Fair Value | |||||||||
| Foreign exchange risk | Unrealized depreciation on forward foreign currency exchange contracts | $ | (52,114 | ) | |||||||
The following table indicates the effect of derivative instruments in the Statements of Operations of Columbia Acorn International Select for the six months ended June 30, 2013:
Amount of Realized Gain (Loss) on
Derivatives Recognized in Income
Risk Exposure Category | Forward Foreign Currency Exchange Contracts | ||||||
Foreign exchange risk | $ | 1,340,145 | |||||
Change in Unrealized Appreciation (Depreciation)
on Derivatives Recognized in Income
Risk Exposure Category | Forward Foreign Currency Exchange Contracts | ||||||
Foreign exchange risk | $ | 359,639 | |||||
The following table is a summary of the volume of derivative instruments of Columbia Acorn International Select for the six months ended June 30, 2013:
Derivative Instrument | Contracts Opened | ||||||
Forward foreign currency exchange contracts | 8 | ||||||
>Security transactions and investment income
Security transactions, investment income and shareholder fund transactions are accounted for on the trade date (date the order to buy or sell is executed) and dividend income and realized gain distributions from other funds are recorded on the ex-dividend date, except that certain dividends from foreign securities are recorded as soon as the information is available to the Funds. Interest income is recorded on the accrual basis and includes amortization of discounts on debt obligations when required for federal income tax purposes. Realized gains and losses from security transactions are recorded on an identified cost basis.
Awards, if any, from class action litigation related to securities owned may be recorded as a reduction of cost of those securities. If the applicable securities are no longer owned, the proceeds are recorded as realized gains.
The Funds estimate the tax character of distributions from real estate investment trusts (REITs). Distributions received in excess of income are recorded as a reduction of the cost of the related investments. If the applicable securities are no longer owned, any distributions received in excess of income are recorded as realized gains.
>Fund share valuation
Fund shares are sold and redeemed on a daily basis at net asset value, subject to any applicable sales charge. Net asset value per share is determined daily as of the close of trading on the New York Stock Exchange (NYSE) on each day the NYSE is
120
open for trading. Generally, income, expenses and realized and unrealized gain/(losses) of a Fund are allocated to each class proportionately on a daily basis for purposes of determining the net asset value of each class. The Rule 12b-1 distribution and service fees and transfer agent fees are charged to each specific class as expenses are incurred. Redemption fees are accounted for as an addition to paid in capital for purposes of determining the net asset value of each class.
>Securities lending
Each Fund, except Columbia Thermostat Fund, may lend securities up to one-third of the value of its total assets to certain approved brokers, dealers and other financial institutions to earn additional income. The Funds retain the benefits of owning the securities, including receipt of dividends or interest generated by the security. The Funds also receive a fee for the loan. The Funds have the ability to recall the loans at any time and could do so in order to vote proxies or to sell the loaned securities. Each loan is collateralized by cash that exceeds the
value of the securities on loan. The market value of the loaned securities is determined daily at the close of business of a Fund and any additional required collateral is delivered to the Fund on the next business day. The Funds have elected to invest the cash collateral in the Dreyfus Government Cash Management Fund, and the income earned is paid to each Fund, net of any fees remitted to Goldman Sachs Agency Lending, the lending agent, and net of any borrower rebates. The Investment Manager does not retain any fees earned by the lending program. Generally, in the event of borrower default, a Fund has the right to use the collateral to offset any losses incurred. In the event a Fund is delayed or prevented from exercising its right to dispose of the collateral, there may be a potential loss to the Fund. Some of these losses may be indemnified by the lending agent. The Funds bear the risk of loss with respect to the investment of collateral.
The net securities lending income earned as of June 30, 2013 by each Fund is included in the Statements of Operations.
The following table presents the Funds' gross and net amount of assets available for offset under a securities lending agreement as well as the related collateral received by the Fund as of June 30, 2013:
| Gross Amounts Not Offset in the Statements of Assets and Liabilities | |||||||||||||||||||||||||||||||
| Gross Amounts of Recognized Assets | Gross Amounts Offset in the Statements of Assets and Liabilities | Net Amounts of Assets Presented in the Statements of Assets and Liabilities | Financial Instruments(a) | Cash Collateral Received | Securities Collateral Received | Net Amount(b) | |||||||||||||||||||||||||
Securities loaned | |||||||||||||||||||||||||||||||
Columbia Acorn Fund | $ | 447,311,479 | $ | — | $ | 447,311,479 | $ | — | $ | 447,311,479 | $ | — | $ | — | |||||||||||||||||
| Columbia Acorn International | 122,061,343 | — | 122,061,343 | — | 122,061,343 | — | — | ||||||||||||||||||||||||
Columbia Acorn USA | 63,089,988 | — | 63,089,988 | — | 63,089,988 | — | — | ||||||||||||||||||||||||
| Columbia Acorn International Select | 4,098,939 | — | 4,098,939 | — | 4,098,939 | — | — | ||||||||||||||||||||||||
Columbia Acorn Select | 25,615,118 | — | 25,615,118 | — | 25,615,118 | — | — | ||||||||||||||||||||||||
| Columbia Acorn Emerging Markets Fund | 1,581,515 | — | 1,581,515 | — | 1,581,515 | — | — | ||||||||||||||||||||||||
| Columbia Acorn European Fund | 123,314 | — | 123,314 | — | 123,314 | — | — | ||||||||||||||||||||||||
(a) Represents the amount of assets that could be offset by liabilities with the same counterparty under master netting or similar agreements that management elects not to offset on the Statements of Assets and Liabilities.
(b) Represents the net amount due from counterparties in the event of default.
>Federal income taxes
It is each Fund's policy to comply with the provisions of the Internal Revenue Code available to regulated investment companies and, in the manner provided therein, distribute substantially all their taxable income, as well as any net realized gain on sales of investments and foreign currency transactions reportable for federal income tax purposes. Columbia Thermostat Fund distributes all of its taxable income, as well as any net realized gain on sales of portfolio fund shares and any distributions of net realized gains received by
the Fund from its portfolio funds, reportable for federal income tax purposes. Accordingly, the Funds paid no federal income taxes and no federal income tax provision was required.
>Foreign capital gains taxes
Realized gains in certain countries may be subject to foreign taxes at the fund level. The Funds accrue for such foreign taxes on realized and unrealized gains at the appropriate rate for each jurisdiction. The amount, if any, is disclosed as a liability on the Statements of Assets and Liabilities.
121
Columbia Acorn Family of Funds
Notes to Financial Statements, continued
>Distributions to shareholders
Distributions to shareholders are recorded on the ex-dividend date.
>Indemnification
In the normal course of business, the Trust on behalf of the Funds enters into contracts that contain a variety of representations and warranties and that provide general indemnities. A Fund's maximum exposure under these arrangements is unknown, as this would involve future claims against the Fund. Also, under the Trust's organizational documents, the trustees and officers of the Trust are indemnified against certain
liabilities that may arise out of their duties to the Trust. However, based on experience, the Funds expect the risk of loss due to these warranties and indemnities to be remote.
3. Federal Tax Information
The timing and character of income and capital gain distributions are determined in accordance with income tax regulations, which may differ from GAAP. Reclassifications are made to the Funds' capital accounts for permanent tax differences to reflect income and gains available for distribution (or available capital loss carryforwards) under income tax regulations.
The following capital loss carryforward, determined as of December 31, 2012, may be available to reduce taxable income arising from future net realized gains on investments, if any, to the extent permitted by the Internal Revenue Code:
Year of Expiration | |||||||||||||||||||||||||||
2015 | 2016 | 2017 | 2018 | Unlimited Short-Term | Total | ||||||||||||||||||||||
Columbia Acorn International | $ | 11,884,052 | $ | 62,714,662 | $ | 102,948,489 | $ | — | $ | — | $ | 177,547,203 | |||||||||||||||
Columbia Thermostat Fund | — | — | 5,983,674 | 2,954,489 | — | 8,938,163 | |||||||||||||||||||||
Columbia Acorn Emerging Markets Fund | — | — | — | — | 86,920 | 86,920 | |||||||||||||||||||||
Unlimited capital loss carryforwards are required to be utilized prior to any capital losses which carry an expiration date. As a result of this ordering rule, capital loss carryforwards which carry an expiration date may be more likely to expire unused.
Under current tax rules, Regulated Investment Companies can elect to treat certain late-year ordinary losses incurred and post-October capital losses (capital losses realized after October 31) as arising on the first day of the following taxable year. The Funds have elected to treat the following late-year ordinary losses and post-October capital losses at December 31, 2012, as arising on January 1, 2013:
Fund | Late-Year Ordinary Losses | Post-October Capital Losses | |||||||||
Columbia Acorn Fund | $ | — | $ | 8,243,176 | |||||||
Columbia Acorn International | — | 422,226 | |||||||||
| Columbia Acorn International Select | 3,455,583 | — | |||||||||
| Columbia Acorn Emerging Markets Fund | — | 19,116 | |||||||||
Columbia Acorn European Fund | — | 1,940 | |||||||||
Management of the Funds has concluded that there are no significant uncertain tax positions that would require recognition in the financial statements. However, management's conclusion may be subject to review and adjustment at a later date based on factors including, but not limited to, new tax laws, regulations, and administrative interpretations (including relevant court decisions). Generally, the Funds' federal tax returns for the prior three fiscal years remain subject to examination by the Internal Revenue Service.
4. Transactions with Affiliates
Columbia Wanger Asset Management, LLC (CWAM) is a wholly-owned subsidiary of Columbia Management Investment Advisers, LLC (Columbia Management), which is a wholly-owned subsidiary of Ameriprise Financial, Inc. (Ameriprise Financial). CWAM furnishes continuing investment supervision to the Funds and is responsible for the overall management of the Funds' business affairs.
CWAM receives a monthly advisory fee based on each Fund's average daily net assets at the following annual rates:
Columbia Acorn Fund
Average Daily Net Assets | Annual Fee Rate | ||||||
Up to $700 million | 0.74 | % | |||||
$700 million to $2 billion | 0.69 | % | |||||
$2 billion to $6 billion | 0.64 | % | |||||
| $6 billion and over | 0.63 | % | |||||
Columbia Acorn International
Average Daily Net Assets | Annual Fee Rate | ||||||
Up to $100 million | 1.19 | % | |||||
$100 million to $500 million | 0.94 | % | |||||
| $500 million and over | 0.74 | % | |||||
Columbia Acorn USA
Average Daily Net Assets | Annual Fee Rate | ||||||
Up to $200 million | 0.94 | % | |||||
$200 million to $500 million | 0.89 | % | |||||
$500 million to $2 billion | 0.84 | % | |||||
$2 billion to $3 billion | 0.80 | % | |||||
| $3 billion and over | 0.70 | % | |||||
122
Columbia Acorn International Select
Average Daily Net Assets | Annual Fee Rate | ||||||
Up to $500 million | 0.94 | % | |||||
| $500 million and over | 0.90 | % | |||||
Columbia Acorn Select
Average Daily Net Assets | Annual Fee Rate | ||||||
Up to $700 million | 0.85 | % | |||||
$700 million to $2 billion | 0.80 | % | |||||
$2 billion to $3 billion | 0.75 | % | |||||
| $3 billion and over | 0.70 | % | |||||
Columbia Thermostat Fund
| Annual Fee Rate | |||||||
All Average Daily Net Assets | 0.10 | % | |||||
Columbia Acorn Emerging Markets Fund
Average Daily Net Assets | Annual Fee Rate | ||||||
Up to $100 million | 1.25 | % | |||||
$100 million to $500 million | 1.00 | % | |||||
| $500 million and over | 0.80 | % | |||||
Columbia Acorn European Fund
Average Daily Net Assets | Annual Fee Rate | ||||||
Up to $100 million | 1.19 | % | |||||
$100 million to $500 million | 0.94 | % | |||||
| $500 million and over | 0.74 | % | |||||
For the six months ended June 30, 2013, the annualized effective investment advisory fee rates were as follows:
Fund | |||||||
Columbia Acorn Fund | 0.64 | % | |||||
Columbia Acorn International | 0.76 | % | |||||
Columbia Acorn USA | 0.86 | % | |||||
Columbia Acorn International Select | 0.94 | % | |||||
Columbia Acorn Select | 0.84 | % | |||||
Columbia Thermostat Fund | 0.10 | % | |||||
Columbia Acorn Emerging Markets Fund | 1.20 | % | |||||
Columbia Acorn European Fund | 1.19 | % | |||||
>Expense limit
Effective May 1, 2013, CWAM has voluntarily agreed to reimburse expenses so that the Funds' ordinary operating expenses (exclusive of transaction costs and certain other investment-related expenses, interest and fees on borrowings and expenses associated with each Fund's investments in other investment companies, if any), after giving effect to any balance credits or overdraft charges from the Funds' custodian, do not exceed annually the average daily net assets of each class as follows:
Fund | Class A | Class B | Class C | Class I | Class R4 | Class R5 | Class Y | Class Z | |||||||||||||||||||||||||||
Columbia Acorn International Select | 1.70 | % | 2.20 | % | 2.45 | % | 1.31 | % | 1.45 | % | 1.36 | % | 1.31 | % | 1.45 | % | |||||||||||||||||||
Columbia Acorn Select | 1.60 | % | 2.10 | % | 2.35 | % | 1.23 | % | 1.35 | % | 1.28 | % | 1.23 | % | 1.35 | % | |||||||||||||||||||
This arrangement may be modified or terminated by either the Funds or CWAM on 30 days notice.
Through April 30, 2013, CWAM voluntarily agreed to reimburse expenses so that the Funds' ordinary operating expenses (exclusive of taxes, brokerage commissions, interest and extraordinary expenses), after giving effect to any balance credits or overdraft charges from the Funds' custodian, do not exceed annually the average daily net assets of each class as follows:
Fund | Class A | Class B | Class C | Class I | Class R4 | Class R5 | Class Y | Class Z | |||||||||||||||||||||||||||
Columbia Acorn International Select | 1.70 | % | 2.20 | % | 2.45 | % | 1.28 | % | 1.45 | % | 1.33 | % | 1.28 | % | 1.45 | % | |||||||||||||||||||
Columbia Acorn Select | 1.60 | % | 2.10 | % | 2.35 | % | 1.25 | % | 1.35 | % | 1.30 | % | 1.25 | % | 1.35 | % | |||||||||||||||||||
Effective May 1, 2013, CWAM has contractually agreed to waive fees and/or reimburse expenses through April 30, 2014, so that the Funds' ordinary operating expenses (exclusive of transaction costs and certain other investment-related expenses, interest and fees on borrowings and expenses associated with each Fund's investments in other investment companies, if any), do not exceed annually the average daily net assets of each class as follows:
Fund | Class A | Class B | Class C | Class I | Class R4 | Class R5 | Class Y | Class Z | |||||||||||||||||||||||||||
Columbia Thermostat Fund | 0.50 | % | 1.00 | % | 1.25 | % | — | % | 0.25 | % | 0.23 | % | 0.18 | % | 0.25 | % | |||||||||||||||||||
Columbia Acorn Emerging Markets Fund | 1.85 | % | — | % | 2.60 | % | 1.54 | % | 1.60 | % | 1.59 | % | 1.54 | %* | 1.60 | % | |||||||||||||||||||
Columbia Acorn European Fund | 1.75 | % | — | % | 2.50 | % | 1.46 | % | — | % | 1.51 | % | — | % | 1.50 | % | |||||||||||||||||||
* Effective June 13, 2013 (the commencement of operations of Columbia Acorn Emerging Markets Fund Class Y shares) through April 30, 2014.
123
Columbia Acorn Family of Funds
Notes to Financial Statements, continued
There is no guarantee that these agreements will continue thereafter.
Through April 30, 2013, CWAM contractually agreed to waive fees and/or reimburse expenses so that the Funds' ordinary operating expenses (exclusive of interest and fees on borrowings and expenses associated with each Fund's investment in other investment companies if any), do not exceed annually the average daily net assets of each class as follows:
Fund | Class A | Class B | Class C | Class I | Class R4 | Class R5 | Class Y | Class Z | |||||||||||||||||||||||||||
Columbia Thermostat Fund | 0.50 | % | 1.00 | % | 1.25 | % | — | % | 0.25 | % | 0.27 | % | 0.22 | % | 0.25 | % | |||||||||||||||||||
Columbia Acorn Emerging Markets Fund | 1.85 | % | — | % | 2.60 | % | 1.41 | % | 1.60 | % | 1.46 | % | — | % | 1.60 | % | |||||||||||||||||||
Columbia Acorn European Fund | 1.75 | % | — | % | 2.50 | % | 1.31 | % | — | % | 1.36 | % | — | % | 1.50 | % | |||||||||||||||||||
CWAM and its affiliates have contractually agreed to waive a portion of total annual Fund operating expenses incurred by Class A shares, Class B shares and Class C shares of Columbia Acorn International such that the Fund's total annual Fund operating expenses will be reduced by 0.04%, 0.03% and 0.02% for Class A, Class B and Class C shares of the Fund, respectively, through August 14, 2013. There is no guarantee that this agreement will continue thereafter.
Expenses reimbursed by CWAM and its affiliates for the six months ended June 30, 2013, were as follows:
Fund | Expenses Reimbursed | ||||||
Columbia Acorn International | $ | 230,240 | |||||
Columbia Acorn International Select | 13 | ||||||
Columbia Acorn Select | 356 | ||||||
Columbia Thermostat Fund | 42,868 | ||||||
Columbia Acorn Emerging Markets Fund | 107,090 | ||||||
Columbia Acorn European Fund | 91,001 | ||||||
CWAM provides administrative services and receives an administration fee from the Funds at the following annual rates:
Columbia Acorn Trust
| Aggregate Average Daily Net Assets of the Trust: | Annual Fee Rate | ||||||
Up to $8 billion | 0.050 | % | |||||
$8 billion to $16 billion | 0.040 | % | |||||
$16 billion to $35 billion | 0.030 | % | |||||
$35 billion to $45 billion | 0.025 | % | |||||
| $45 billion and over | 0.015 | % | |||||
For the six months ended June 30, 2013, the annualized effective administration fee rate was 0.04% of each Fund's average daily net assets. CWAM has delegated to Columbia Management responsibility to provide certain sub-administrative services to the Funds.
CMID, a wholly owned subsidiary of Ameriprise Financial, is the distributor of the Funds.
Sales charges, including front-end and CDSCs, received by the Distributor for distributing each Fund's shares for the six months ended June 30, 2013 are as follows:
| Underwriting Discounts | CDSCs | ||||||||||||||||||
Class A | Class A | Class B | Class C | ||||||||||||||||
Columbia Acorn Fund | $ | 1,080,258 | $ | 2,201 | $ | 1,605 | $ | 16,728 | |||||||||||
| Columbia Acorn International | 258,505 | 161 | 2,795 | 3,618 | |||||||||||||||
Columbia Acorn USA | 46,575 | — | 30 | (142 | ) | ||||||||||||||
| Columbia Acorn International Select | 26,429 | — | 196 | 865 | |||||||||||||||
Columbia Acorn Select | 37,589 | 44 | 121 | 477 | |||||||||||||||
| Columbia Thermostat Fund | 2,907,718 | 7,200 | 262 | 34,623 | |||||||||||||||
| Columbia Acorn Emerging Markets Fund | 232,713 | — | — | 3 | |||||||||||||||
| Columbia Acorn European Fund | 4,749 | — | — | — | |||||||||||||||
Each Fund has adopted a Rule 12b-1 (distribution and service) plan which requires it to pay CMID a monthly service fee equal to 0.25% annually of the average daily net assets attributable to Class A, Class B and Class C shares and a monthly distribution fee equal to 0.50%, 0.75% and 0.50%, annually, of the average daily net assets attributable to Class B, Class C and Class R shares, respectively. CMID receives no compensation with respect to Class R4, Class R5, Class Y and Class Z shares.
Columbia Management Investment Services Corp. (CMIS), a wholly owned subsidiary of Ameriprise Financial, is the transfer agent of the Funds. CMIS receives monthly account-based service fees based on the number of open Fund accounts. Effective May 1, 2013, each Fund pays CMIS a monthly fee at the annual rate of $20.00 per open account. Prior to May 1, 2013, the annual rate was $18.50 per open
124
account. Subject to certain limitations, the Fund reimburses payments made by CMIS to financial intermediaries for the shareholder services that the intermediaries provide, in amounts that vary by share class and with the type of intermediary and type of shareholder services provided.
The Transfer Agent also receives compensation from fees for various shareholder services and reimbursements for
certain out-of-pocket fees. Class I shares do not pay transfer agent fees. Total transfer agent fees for Class R5 shares are subject to an annual limitation of not more than 0.05% of the average daily net assets attributable to Class R5 shares. Effective November 8, 2012, Class Y shares are not liable to pay transfer agent fees for at least twelve months.
For the six months ended June 30, 2013, the Funds' annualized effective transfer agent fee rates as a percentage of average daily net assets of each class were as follows:
Fund | Class A | Class B | Class C | Class R | Class R4 | Class R5 | Class Z | ||||||||||||||||||||||||
Columbia Acorn Fund | 0.11 | % | 0.26 | % | 0.08 | % | — | % | 0.06 | % | 0.01 | % | 0.08 | % | |||||||||||||||||
Columbia Acorn International | 0.16 | % | 0.38 | % | 0.15 | % | 0.20 | % | 0.05 | % | 0.03 | % | 0.06 | % | |||||||||||||||||
Columbia Acorn USA | 0.12 | % | 0.42 | % | 0.07 | % | — | % | 0.05 | % | 0.04 | % | 0.12 | % | |||||||||||||||||
Columbia Acorn International Select | 0.11 | % | 0.28 | % | 0.15 | % | — | % | 0.11 | % | 0.05 | % | 0.09 | % | |||||||||||||||||
Columbia Acorn Select | 0.12 | % | 0.31 | % | 0.12 | % | — | % | 0.12 | % | 0.02 | % | 0.10 | % | |||||||||||||||||
Columbia Thermostat Fund | 0.07 | % | 0.21 | % | 0.08 | % | — | % | 0.06 | % | 0.05 | % | 0.06 | % | |||||||||||||||||
Columbia Acorn Emerging Markets Fund | 0.14 | % | — | % | 0.16 | % | — | % | 0.09 | % | 0.05 | % | 0.20 | % | |||||||||||||||||
Columbia Acorn European Fund | 0.07 | % | — | % | 0.32 | % | — | % | — | % | 0.05 | % | 0.04 | % | |||||||||||||||||
Columbia Acorn International and certain other associated investment companies, have severally, but not jointly, guaranteed the performance and observance of all the terms and conditions of a lease entered into by Seligman Data Corp. (SDC), the former transfer agent to certain associated investment companies, including the payment of rent by SDC (the Guaranty). The lease and the Guaranty expire in January 2019. At June 30, 2013, Columbia Acorn International's total potential future obligation over the life of the Guaranty is $113,984. The liability remaining at June 30, 2013 for non-recurring charges associated with the lease amounted to $63,739 and is included within payable for other liabilities in the Statements of Assets and Liabilities.
Certain officers and trustees of the Trust are also officers of CWAM. The Trust makes no direct payments to its officers and trustees who are affiliated with CWAM.
The Board has appointed a Chief Compliance Officer of the Trust in accordance with federal securities regulations. The Funds, along with other affiliated funds, pay their pro-rata share of the expenses associated with the Office of the Chief Compliance Officer. These expenses are disclosed separately as "Chief compliance officer expenses" in the Statements of Operations.
The Trust offers a deferred compensation plan for its independent trustees. Under that plan, a trustee may elect to defer all or a portion of his or her compensation. Amounts deferred
are retained by the Trust and may represent an unfunded obligation of the Trust. The value of amounts deferred is determined by reference to the change in value of Class Z shares of one or more series of the Trust or a money market fund as specified by the trustee. Benefits under the deferred compensation plan are payable in accordance with the plan.
An affiliated person of a Fund may include any company in which a Fund owns five percent or more of its outstanding voting shares during the year. On June 30, 2013, Columbia Acorn Fund, Columbia Acorn International, Columbia Acorn Select and Columbia Thermostat Fund each held five percent or more of the outstanding voting securities of one or more companies or a company which is under common ownership or control with the Fund. Details of investments in those affiliated companies are presented on pages 38, 39, 52, 73 and 76, respectively.
For the six months ended June 30, 2013, the Funds engaged in purchase and sales transactions with funds that have a common investment manager (or affiliated investment managers), common directors/trustees, and/or common officers. Those transactions complied with Rule 17a-7 under the Investment Company Act of 1940 and were as follows:
Purchases | Sales | ||||||||||
Columbia Acorn Fund | $ | 11,567,570 | $ | — | |||||||
Columbia Acorn International | — | 1,267,105 | |||||||||
Columbia Acorn USA | — | 846,750 | |||||||||
Columbia Acorn Select | 1,112,321 | 10,497,193 | |||||||||
125
Columbia Acorn Family of Funds
Notes to Financial Statements, continued
5. Borrowing Arrangements
During the six months ended June 30, 2013, the Trust participated in a credit facility with JPMorgan Chase Bank, N.A., along with Wanger Advisors Trust, another trust managed by CWAM, in the amount of $150 million prior to January 11, 2013, and in the amount of $200 million thereafter. The credit facility was entered into to facilitate portfolio liquidity. Under the facility, interest is charged to each participating fund based on its borrowings at a rate per annum equal to the Federal Funds Rate plus 1.00%. In addition, a commitment fee of 0.08% per annum of the unutilized line of credit is accrued and apportioned among the participating funds based on their relative net assets. The commitment fee is disclosed as a part of "Other expenses" in the Statements of Operations. The Trust renewed its line of credit in July in the amount of $150 million, and will continue to do so each year at then current market rates and terms.
Other than as noted below, no Fund had borrowings during the six months ended June 30, 2013:
Fund Name | Average Daily Loan Balance Outstanding | Weighted Average Interest Rate | |||||||||
Columbia Acorn Select | $ | 11,400,000 | 1.18 | % | |||||||
6. Investment Transactions
The aggregate cost of purchases and proceeds from sales, other than short-term obligations, for the six months ended June 30, 2013, were:
Purchases | Proceeds from Sales | ||||||||||
Columbia Acorn Fund | $ | 1,561,616,555 | $ | 2,220,008,548 | |||||||
| Columbia Acorn International | 1,919,632,378 | 1,639,948,304 | |||||||||
Columbia Acorn USA | 133,153,095 | 351,689,508 | |||||||||
| Columbia Acorn International Select | 159,496,921 | 206,755,024 | |||||||||
Columbia Acorn Select | 89,777,649 | 288,982,192 | |||||||||
| Columbia Thermostat Fund | 862,551,828 | 516,526,151 | |||||||||
| Columbia Acorn Emerging Markets Fund | 165,470,628 | 3,792,326 | |||||||||
| Columbia Acorn European Fund | 4,709,683 | 1,030,496 | |||||||||
7. Regulatory Settlements with Third Parties
During the year ended December 31, 2012, Columbia Acorn International received a payment of $107,802 resulting from regulatory settlements with third parties in which the Fund had participated. The payment has been included in "Increase from regulatory settlements" in the Statements of Changes in Net Assets.
8. Shareholder Concentration
At June 30, 2013, the table below details the affiliated and significant unaffiliated shareholder account ownership of outstanding shares of each Fund. The Funds have no knowledge about whether any portion of these unaffiliated shares were owned beneficially. Subscription and redemption activity of these accounts may have a significant effect on the operations of the Funds.
| Number of unaffiliated accounts | Percentage of shares outstanding held – unaffiliated | Percentage of shares outstanding held – affiliated | |||||||||||||
Columbia Acorn Fund | 1 | 13.6 | % | 3.5 | % | ||||||||||
Columbia Acorn International | 3 | 35.7 | % | 4.5 | % | ||||||||||
Columbia Acorn USA | 3 | 43.4 | % | — | % | ||||||||||
| Columbia Acorn International Select | 1 | 30.4 | % | — | % | ||||||||||
Columbia Acorn Select | 2 | 30.2 | % | 12.9 | % | ||||||||||
Columbia Thermostat Fund | 2 | 33.5 | % | 18.8 | % | ||||||||||
| Columbia Acorn Emerging Markets Fund | 3 | 56.0 | % | 15.7 | % | ||||||||||
Columbia Acorn European Fund | 1 | 39.5 | % | 37.6 | % | ||||||||||
9. Subsequent Events
Management has evaluated the events and transactions that have occurred through the date the financial statements were issued and noted no items requiring adjustment of the financial statements or additional disclosure.
10. Information Regarding Pending and Settled Legal Proceedings
Ameriprise Financial and certain of its affiliates have historically been involved in a number of legal, arbitration and regulatory proceedings, including routine litigation, class actions, and governmental actions, concerning matters arising in connection with the conduct of their business activities. Ameriprise Financial believes that the Funds are not currently the subject of, and that neither Ameriprise Financial nor any of its affiliates are the subject of, any pending legal, arbitration or regulatory proceedings that are likely to have a material adverse effect on the Funds or the ability of Ameriprise Financial or its affiliates to perform under their contracts with the Funds. Ameriprise Financial is required to make 10-Q, 10-K and, as necessary, 8-K filings with the Securities and Exchange Commission on legal and regulatory matters that relate to Ameriprise Financial and its affiliates. Copies of these filings may be obtained by accessing the SEC website at www.sec.gov.
There can be no assurance that these matters, or the adverse publicity associated with them, will not result in increased fund redemptions, reduced sale of fund shares or other adverse consequences to the Funds. Further, although we believe proceedings are not likely to have a material adverse
126
effect on the Funds or the ability of Ameriprise Financial or its affiliates to perform under their contracts with the Funds, these proceedings are subject to uncertainties and, as such, we are unable to estimate the possible loss or range of loss that may result. An adverse outcome in one or more of these proceedings could result in adverse judgments, settlements, fines, penalties or other relief that could have a material adverse effect on the consolidated financial condition or results of operations of Ameriprise Financial.
127
Board Approval of the Advisory Agreement
Columbia Acorn Trust (the "Trust") has an investment advisory agreement (the "Advisory Agreement") with Columbia Wanger Asset Management, LLC ("Columbia WAM") under which Columbia WAM manages the Columbia Acorn Funds (each, a "Fund," and together, the "Funds"). More than 75% of the trustees of the Trust (the "Trustees") are persons who have no direct or indirect interest in the Advisory Agreement and are not "interested persons" (as defined in the Investment Company Act of 1940, as amended (the "1940 Act")) of the Trust (the "Independent Trustees"). The Trustees oversee the management of each Fund and, as required by law, determine at least annually whether to continue the Advisory Agreement for each Fund.
The Contract Committee (the "Committee") of the Board of Trustees (the "Board"), which is comprised solely of Independent Trustees, makes recommendations to the Board regarding any proposed continuation of the Advisory Agreement. After the Committee has made its recommendations, the full Board determines whether to approve continuation of the Advisory Agreement. The Board also considers matters bearing on the Advisory Agreement at its various meetings throughout the year, meets at least quarterly with Columbia WAM's portfolio managers (the Board's Investment Performance Analysis Committee meets frequently with them as well), and receives monthly reports from Columbia WAM on the performance of the Funds.
In connection with their most recent consideration of the Advisory Agreement for each Fund, the Committee and all Trustees received and reviewed a substantial amount of information provided by Columbia WAM, Columbia Management Investment Advisers, LLC ("Columbia Management") and Ameriprise Financial, Inc. ("Ameriprise") in response to written requests from the Independent Trustees and their independent legal counsel. In addition, the Trustees reviewed the Management Fee Evaluation dated June 2013 (the "Fee Evaluation") prepared by the Trust's chief compliance officer, senior vice president and general counsel, at the request of the Board. Throughout the process, the Trustees had numerous opportunities to ask questions of and request additional materials from Columbia WAM, Columbia Management and Ameriprise.
During each meeting at which the Committee or the Independent Trustees considered the Advisory Agreement, they met in executive session with their independent legal
counsel. The Committee also met with representatives of Columbia WAM, Columbia Management and Ameriprise on several occasions. In all, the Committee convened formally on four separate occasions to consider the continuation of the Advisory Agreement. The Board and/or some or all of the Independent Trustees met on other occasions to receive the Committee's status reports, receive presentations from Columbia WAM, Columbia Management and Ameriprise representatives, and to discuss outstanding issues. In addition, the Investment Performance Analysis Committee of the Board, also comprised exclusively of Independent Trustees, reviewed the performance of the Funds, met in a joint meeting with the Committee, and presented its findings to the Board and the Committee throughout the year. The Compliance Committee of the Board also provided information to the Committee with respect to relevant matters.
The materials reviewed by the Committee and the Trustees included, among other items, (i) information on the investment performance of each Fund and of independently selected peer groups of funds and of the Funds' performance benchmarks over various time periods, (ii) information on each Fund's advisory fees and other expenses, including information comparing the Fund's fees and expenses to those of peer groups of funds and information about any applicable expense limitations and fee breakpoints, (iii) data on sales and redemptions of Fund shares, and (iv) information on the profitability to Columbia WAM and Ameriprise, as well as potential "fall-out" or ancillary benefits that Columbia WAM and its affiliates may receive as a result of their relationships with the Funds. The Trustees also considered other information such as (i) Columbia WAM's financial condition, (ii) each Fund's investment objective and strategy, (iii) the size, education and experience of Columbia WAM's investment staff and its use of technology, external research and trading cost measurement tools, (iv) the portfolio manager compensation framework, (v) the allocation of the Funds' brokerage, and the use of "soft" commission dollars to pay for research products and services, (vi) Columbia WAM's risk management program, (vii) the resources devoted to, and the record of compliance with, the Funds' investment policies and restrictions, policies on personal securities transactions and other compliance policies, and (viii) capacity restraints as a result of increasing size of certain of the Funds.
128
At a meeting held on June 5, 2013, upon the recommendation of the Committee, the Board unanimously approved the continuation of the Advisory Agreement.
In considering the continuation of the Advisory Agreement, the Trustees reviewed and analyzed various factors that they determined were relevant, none of which by itself was considered dispositive. The material factors and conclusions that formed the basis for the Trustees' determination to approve the continuation of the Advisory Agreement are discussed below.
Nature, quality and extent of services. The Trustees reviewed the nature, quality and extent of the services provided by Columbia WAM and its affiliates to the Funds under the Advisory Agreement, taking into account the investment objective and strategy of each Fund and knowledge gained from meetings with management, which were held on at least a quarterly basis. In addition, the Trustees reviewed the available resources and key personnel of Columbia WAM and its affiliates, especially those providing investment management services to the Funds. The Trustees also considered other services provided to the Funds by Columbia WAM and its affiliates, including: managing the execution of portfolio transactions and selecting broker-dealers for those transactions; monitoring adherence to the Funds' investment restrictions; producing shareholder reports; providing support services for the Board and committees of the Board; managing the Funds' securities lending program; communicating with shareholders; serving as the Funds' administrator; and overseeing the activities of the Funds' other service providers, including monitoring for compliance with various policies and procedures as well as applicable securities laws and regulations.
The Trustees concluded that the nature, quality and extent of the services provided by Columbia WAM and its affiliates to each Fund under the Advisory Agreement were appropriate for the Funds and that the Funds were likely to benefit from the continued provision of those services by Columbia WAM. They also concluded that Columbia WAM currently had sufficient personnel, with appropriate education and experience, to serve the Funds effectively, and that the firm had demonstrated its continuing ability to attract and retain well-qualified personnel. In addition, they considered the quality of Columbia WAM's compliance record.
Performance of the Funds. The Trustees received and considered detailed performance information at various
meetings of the Board, the Committee and the Investment Performance Analysis Committee of the Board throughout the year. They reviewed information comparing each Fund's performance with that of its benchmark(s) and with the performance of comparable funds and peer groups as identified by Lipper Inc. ("Lipper") and Morningstar, Inc. ("Morningstar"). The Trustees evaluated the performance of the Funds over various time periods, including over the one-, three- and five-year periods ending December 31, 2012 as well as longer periods in some cases. The Trustees also considered peer performance rankings for similar time periods although they generally focused more on the five-year period, or the since inception periods in the case of the two newer Funds, Columbia Acorn Emerging Markets Fund and Columbia Acorn European Fund.
The Trustees noted that Columbia Acorn International had delivered excellent results over the past five years, and had done so while exposing investors to less risk than competing funds, according to Morningstar, but had performed less well against its peers in the one- and three-year periods, although benchmark performance was satisfactory for the same periods. The Trustees noted that the decline in performance was being monitored closely by the Board and the Investment Performance Analysis Committee.
The Trustees considered that Columbia Acorn International Select's performance was at or just above the median in the Lipper and Morningstar rankings, respectively, for the five-year period. The Fund outperformed its benchmark in the one- and three-year periods and performed well against its Morningstar peers but not against its Lipper peers during those periods.
The Trustees reviewed the performance for Columbia Acorn Emerging Markets Fund and Columbia Acorn European Fund and determined that these Funds had delivered excellent returns for the one-year period versus their respective Morningstar and Lipper peers. They also believed that Columbia Acorn Emerging Markets Fund's performance versus its benchmark was excellent, while Columbia Acorn European Fund's performance lagged its benchmark.
The Trustees considered that the domestic Funds have had mixed results. Columbia Acorn Fund outperformed its peers over the five-year period, ending December 31, 2012, but the Fund underperformed its benchmark during the same period. Columbia Acorn Fund also generally performed
129
Board Approval of the Advisory Agreement,
continued
well versus its peer groups and was even with its benchmark for the one-year period, but underperformed its peers and benchmark in the three-year period. The Trustees considered, however, that Lipper ranked Columbia Acorn Fund as the best-performing fund over the past ten years, with Morningstar rating it second over ten years. The Trustees also noted that the Fund exposed investors to less risk in declining markets according to Morningstar.
The Trustees considered that Columbia Acorn Select underperformed its peers and benchmark over the three- and five-year periods ending December 31, 2012 and exposed investors to more risk versus its peers. The Trustees considered, however, that Columbia Acorn Select had performed better over the one-year period against both its peers and benchmark, and that Columbia WAM had instituted a performance remediation plan during the year to correct underperformance. In addition, the Trustees noted that there had been a portfolio manager change during the past quarter. The Trustees believed that Columbia WAM was devoting appropriate resources to addressing Columbia Acorn Select's underperformance.
The Trustees considered that Columbia Acorn USA's returns were more mixed versus its peer group over the five-year period ending December 31, 2012, with Morningstar ranking the Fund above the median and Lipper ranking it below the median. The Trustees also took into account that the Fund outperformed its benchmark for the same period. The Trustees noted that Columbia Acorn USA had outperformed its peers and benchmark for the one- year period, demonstrating a positive trend of improvement for the Fund. They also considered that Columbia Acorn USA exposed shareholders to more risk than its peers.
Columbia Thermostat Fund outperformed its stated benchmark, a 50/50 blend of the Fund's primary equity and debt benchmarks, over the one-, three- and five-year periods ending December 31, 2012, and enjoyed strong rankings from Morningstar and Lipper versus its peer groups over the period. The Trustees noted that Morningstar ranked this Fund the best of 21 peers, while Lipper ranked it in the first quartile.
The Trustees concluded that Columbia WAM had taken and continued to take a number of corrective steps to improve performance of the underperforming Funds, that Columbia WAM had reported that these steps were being successfully implemented, and that the Investment
Performance Analysis Committee of the Board was monitoring the underperforming Funds' performance closely. In addition the Trustees considered that the Chief Investment Officer (the "CIO") of Columbia WAM had reported to them at numerous committee and Board meetings on the corrective steps being taken to improve performance, and committee representatives met separately with the CIO on multiple occasions to discuss the underperforming Funds.
Costs of Services and Profits Realized by Columbia WAM. At various Committee and Board meetings, the Trustees examined detailed information on the fees and expenses of each Fund in comparison to information for comparable funds provided by Lipper and Morningstar. The Trustees reviewed data from Lipper and Morningstar and noted that in general the Funds' total net operating expenses were competitive with peers for Columbia Acorn Fund, Columbia Acorn International, Columbia Acorn International Select and Columbia Thermostat Fund and that the remainder of the Funds had total net expenses that were less competitive with their peer groups, although it was noted that the two newer Funds, Columbia Acorn European Fund and Columbia Acorn Emerging Markets Fund, had not yet reached scale in terms of assets.
The Trustees also took into account that: the actual advisory fees paid by Columbia Acorn International and Columbia Acorn International Select were lower than both their Morningstar and Lipper peer groups; the actual advisory fees paid by Columbia Acorn Select and Columbia Thermostat Fund were higher than the median advisory fee of the Funds' Lipper and Morningstar peer groups; the actual advisory fees paid by Columbia Acorn USA, Columbia Acorn Emerging Markets Fund and Columbia Acorn European Fund were higher than the median advisory fees paid by the Funds' Morningstar peer groups but not their Lipper peer groups; and the actual advisory fee paid by Columbia Acorn Fund was at the median of the Fund's Lipper peer group, but below the Morningstar peer groups.
The Trustees also reviewed the advisory fee rates charged by Columbia WAM for managing other investment companies, sub-advised funds and other institutional separate accounts, as detailed in materials provided to the Committee by Columbia WAM and in the Fee Evaluation. The Trustees noted that the Funds' advisory fees were generally comparable to the Columbia Wanger Funds' advisory fees at the same asset levels. The Trustees also examined
130
Columbia WAM's institutional separate account fees for various investment strategies and determined that many of the institutional account advisory fees tended to be lower than the Funds with parallel investment strategies. The Trustees noted that Columbia WAM performs significant additional services for the Funds that it does not provide to sub-advised funds or non-mutual fund clients, including administrative services, oversight of the Funds' other service providers, Trustee support, regulatory compliance and numerous other services, and that, in servicing the Funds, Columbia WAM assumes many legal and business risks that it does not assume in servicing many of its non-fund clients.
The Trustees concluded that the rates of advisory fees payable to Columbia WAM were reasonable in relation to the nature and quality of the services to be provided. The Trustees also concluded that the Funds' overall expense ratios were reasonable, considering the quality of the services provided by Columbia WAM and its affiliates and the investment performance of the Funds, taking into account Columbia WAM's continuing steps to improve performance of the underperforming domestic Funds.
The Trustees reviewed the analysis of the historic profitability of Columbia WAM in serving as each Fund's investment manager and of Columbia WAM and its affiliates in their relationships with each Fund. The Committee and Trustees met with representatives from Ameriprise to discuss its methodologies for calculating profitability and allocating costs. They considered that Ameriprise calculated profitability and allocated costs on a contract-by-contract and Fund-by-Fund basis. The Trustees also considered the methodology used by Columbia WAM and Ameriprise in determining compensation payable to portfolio managers and the competitive market for investment management talent. The Trustees were also provided with profitability information from Lipper, which compared Columbia WAM's profitability to other similar investment managers in the mutual fund industry. The Trustees concluded that Columbia WAM's and its affiliates' profits were within a reasonable range of those of competitors with similar business models. The Trustees discussed, however, that profitability comparisons among fund managers may not always be meaningful due to the lack of consistency in data, small number of publicly-owned managers, and the fact that profitability of any investment manager is affected by numerous factors,
including its particular organizational structure, the types of funds and other accounts managed, other lines of business, expense allocation methodology, capital structure and other factors.
Economies of Scale. At various Committee and Board meetings and other informal meetings, the Trustees considered information about the extent to which Columbia WAM realizes economies of scale in connection with an increase in Fund assets. The Trustees noted that the advisory fee schedule for each Fund, other than Columbia Thermostat Fund, includes breakpoints in the rate of fees at various asset levels. The Trustees concluded that the fee structure of each Fund was reflective of a sharing of economies of scale between Columbia WAM and the Funds.
Other Benefits to Columbia WAM. The Trustees also reviewed benefits that accrue to Columbia WAM and its affiliates from their relationships with the Funds, based upon information provided to them by Ameriprise and as outlined in the Fee Evaluation. They noted that the Funds' transfer agency services are performed by Columbia Management Investment Services Corp., an affiliate of Ameriprise, which receives compensation from the Funds for its services provided. They considered that an affiliate of Ameriprise, Columbia Management Investment Distributors, Inc. ("CMID"), serves as the Funds' distributor under a distribution agreement, and that it receives fees under the Columbia Acorn Trust's Rule 12b-1 Plan, most of which CMID pays to broker-dealers, but no fees for its services to the Columbia Wanger Funds. In addition, Columbia Management provides sub-administration services to the Funds. The Committee received information regarding the profitability of each Fund agreement with Columbia WAM affiliates. The Committee and the Board also reviewed information about and discussed the capabilities of each affiliated entity in performing its duties.
The Trustees considered other ways that the Funds and Columbia WAM may potentially benefit from their relationship with each other. For example, the Trustees considered Columbia WAM's use of commissions paid by each Fund on its portfolio brokerage transactions to obtain research products and services benefiting the Funds and/or other clients of Columbia WAM. The Committee reviewed Columbia WAM's annual "soft dollar" report and met with representatives from Columbia WAM to review Columbia WAM's soft dollar spending. The Committee also considered that the
131
Board Approval of the Advisory Agreement,
continued
Compliance Committee of the Board regularly reviewed third-party prepared reports that evaluated the quality of Columbia WAM's execution of the Funds' portfolio transactions. The Trustees noted that these reports showed that Columbia WAM's execution capabilities were generally better than industry peers. The Trustees determined that Columbia WAM's use of the Funds' "soft" commission dollars to obtain research products and services was consistent with current regulatory requirements and guidance. They also concluded that Columbia WAM benefits from the receipt of proprietary research products and services acquired through commissions paid on portfolio transactions of the Funds, and that the Funds benefitted from Columbia WAM's receipt of those products and services as well as research products and services acquired through commissions paid by other clients of Columbia WAM. Finally, the Trustees considered that Columbia WAM's affiliates benefit from management fees received from Columbia Thermostat Fund's investment in other Columbia mutual funds.
After full consideration of the above factors, as well as other factors that were instructive in evaluating the Advisory Agreement, the Trustees, including the Independent Trustees by separate vote, concluded that the continuation of the Advisory Agreement was in the best interest of each Fund. On June 5, 2013, the Trustees approved continuation of the Advisory Agreement through July 31, 2014.
132
Columbia Acorn Family of Funds Expense Information (Unaudited)
as of 6/30/13
Columbia Acorn Fund | Class A | Class B* | Class C | Class I | Class R | Class R4† | Class R5† | Class Y† | Class Z | ||||||||||||||||||||||||||||||
Management Fees | 0.64 | % | 0.64 | % | 0.64 | % | 0.64 | % | 0.64 | % | 0.64 | % | 0.64 | % | 0.64 | % | |||||||||||||||||||||||
Distribution and Service (12b-1) Fees | 0.25 | % | 0.75 | % | 1.00 | % | 0.00 | % | 0.00 | % | 0.00 | % | 0.00 | % | 0.00 | % | |||||||||||||||||||||||
Other Expenses | 0.18 | % | 0.32 | % | 0.15 | % | 0.07 | % | 0.13 | % | 0.09 | % | 0.08 | % | 0.14 | % | |||||||||||||||||||||||
Net Expense Ratio | 1.07 | % | 1.71 | % | 1.79 | % | 0.71 | % | 0.77 | % | 0.73 | % | 0.72 | % | 0.78 | % | |||||||||||||||||||||||
Columbia Acorn International | |||||||||||||||||||||||||||||||||||||||
Management Fees | 0.76 | % | 0.76 | % | 0.76 | % | 0.76 | % | 0.76 | % | 0.76 | % | 0.76 | % | 0.76 | % | 0.76 | % | |||||||||||||||||||||
Distribution and Service (12b-1) Fees | 0.25 | % | 0.75 | % | 1.00 | % | 0.00 | % | 0.50 | % | 0.00 | % | 0.00 | % | 0.00 | % | 0.00 | % | |||||||||||||||||||||
Other Expenses | 0.21 | % | 0.44 | % | 0.23 | % | 0.10 | % | 0.30 | % | 0.16 | % | 0.14 | % | 0.10 | % | 0.16 | % | |||||||||||||||||||||
Net Expense Ratio | 1.22 | % | 1.95 | % | 1.99 | % | 0.86 | % | 1.56 | % | 0.92 | % | 0.90 | % | 0.86 | % | 0.92 | % | |||||||||||||||||||||
Columbia Acorn USA | |||||||||||||||||||||||||||||||||||||||
Management Fees | 0.86 | % | 0.86 | % | 0.86 | % | 0.86 | % | 0.86 | % | 0.86 | % | 0.86 | % | 0.86 | % | |||||||||||||||||||||||
Distribution and Service (12b-1) Fees | 0.25 | % | 0.75 | % | 1.00 | % | 0.00 | % | 0.00 | % | 0.00 | % | 0.00 | % | 0.00 | % | |||||||||||||||||||||||
Other Expenses | 0.22 | % | 0.51 | % | 0.16 | % | 0.05 | % | 0.15 | % | 0.14 | % | 0.11 | % | 0.21 | % | |||||||||||||||||||||||
Net Expense Ratio | 1.33 | % | 2.12 | % | 2.02 | % | 0.91 | % | 1.01 | % | 1.00 | % | 0.97 | % | 1.07 | % | |||||||||||||||||||||||
Columbia Acorn International Select | |||||||||||||||||||||||||||||||||||||||
Management Fees | 0.94 | % | 0.94 | % | 0.94 | % | 0.94 | % | 0.94 | % | 0.94 | % | 0.94 | % | 0.94 | % | |||||||||||||||||||||||
Distribution and Service (12b-1) Fees | 0.25 | % | 0.75 | % | 1.00 | % | 0.00 | % | 0.00 | % | 0.00 | % | 0.00 | % | 0.00 | % | |||||||||||||||||||||||
Other Expenses | 0.29 | % | 0.45 | % | 0.33 | % | 0.22 | % | 0.32 | % | 0.32 | % | 0.22 | % | 0.27 | % | |||||||||||||||||||||||
Net Expense Ratio | 1.48 | % | 2.14 | % | 2.27 | % | 1.16 | % | 1.26 | % | 1.26 | % | 1.16 | % | 1.21 | % | |||||||||||||||||||||||
Columbia Acorn Select | |||||||||||||||||||||||||||||||||||||||
Management Fees | 0.84 | % | 0.84 | % | 0.84 | % | 0.84 | % | 0.84 | % | 0.84 | % | 0.84 | % | 0.84 | % | |||||||||||||||||||||||
Distribution and Service (12b-1) Fees | 0.25 | % | 0.75 | % | 1.00 | % | 0.00 | % | 0.00 | % | 0.00 | % | 0.00 | % | 0.00 | % | |||||||||||||||||||||||
Other Expenses | 0.23 | % | 0.41 | % | 0.23 | % | 0.12 | % | 0.24 | % | 0.16 | % | 0.25 | % | 0.21 | % | |||||||||||||||||||||||
Net Expense Ratio | 1.32 | % | 2.00 | % | 2.07 | % | 0.96 | % | 1.08 | % | 1.00 | % | 1.09 | % | 1.05 | % | |||||||||||||||||||||||
Columbia Thermostat Fund | |||||||||||||||||||||||||||||||||||||||
Management Fees | 0.10 | % | 0.10 | % | 0.10 | % | 0.10 | % | 0.10 | % | 0.10 | % | 0.10 | % | |||||||||||||||||||||||||
Distribution and Service (12b-1) Fees | 0.25 | % | 0.75 | % | 1.00 | % | 0.00 | % | 0.00 | % | 0.00 | % | 0.00 | % | |||||||||||||||||||||||||
Other Expenses | 0.15 | % | 0.15 | % | 0.15 | % | 0.12 | % | 0.13 | % | 0.04 | % | 0.15 | % | |||||||||||||||||||||||||
Net Expense Ratio** | 0.50 | % | 1.00 | % | 1.25 | % | 0.22 | % | 0.23 | % | 0.14 | % | 0.25 | % | |||||||||||||||||||||||||
Columbia Acorn Emerging Markets Fund | |||||||||||||||||||||||||||||||||||||||
Management Fees | 1.20 | % | 1.20 | % | 1.20 | % | 1.20 | % | 1.20 | % | 1.20 | % | 1.20 | % | |||||||||||||||||||||||||
Distribution and Service (12b-1) Fees | 0.25 | % | 1.00 | % | 0.00 | % | 0.00 | % | 0.00 | % | 0.00 | % | 0.00 | % | |||||||||||||||||||||||||
Other Expenses | 0.37 | % | 0.39 | % | 0.25 | % | 0.34 | % | 0.36 | % | 0.34 | % | 0.35 | % | |||||||||||||||||||||||||
Net Expense Ratio | 1.82 | % | 2.59 | % | 1.45 | % | 1.54 | % | 1.56 | % | 1.54 | % | 1.55 | % | |||||||||||||||||||||||||
Columbia Acorn European Fund | |||||||||||||||||||||||||||||||||||||||
Management Fees | 1.19 | % | 1.19 | % | 1.19 | % | 1.19 | % | 1.19 | % | |||||||||||||||||||||||||||||
Distribution and Service (12b-1) Fees | 0.25 | % | 1.00 | % | 0.00 | % | 0.00 | % | 0.00 | % | |||||||||||||||||||||||||||||
Other Expenses | 0.27 | % | 0.31 | % | 0.17 | % | 0.28 | % | 0.21 | % | |||||||||||||||||||||||||||||
Net Expense Ratio | 1.71 | % | 2.50 | % | 1.36 | % | 1.47 | % | 1.40 | % | |||||||||||||||||||||||||||||
See the Funds' prospectuses for information on minimum initial investment amounts and other details of buying, selling and exchanging shares of the Funds.
Fees and expenses are for the six months ended June 30, 2013. The fees and expenses of Columbia Acorn International Select and Columbia Acorn Select include the effect of the voluntary undertaking by Columbia Wanger Asset Management, LLC (CWAM) to reimburse each Fund for the ordinary operating expenses (exclusive of transaction costs and certain other investment-related expenses, interest and fees on borrowings and expenses associated with the Fund's investment in other investment companies, if any), exceeding annually each class' average daily net assets as follows:
Fund | Class A | Class B | Class C | Class I | Class R4 | Class R5 | Class Y | Class Z | |||||||||||||||||||||||||||
Columbia Acorn International Select | 1.70 | % | 2.20 | % | 2.45 | % | 1.31 | % | 1.45 | % | 1.36 | % | 1.31 | % | 1.45 | % | |||||||||||||||||||
Columbia Acorn Select | 1.60 | % | 2.10 | % | 2.35 | % | 1.23 | % | 1.35 | % | 1.28 | % | 1.23 | % | 1.35 | % | |||||||||||||||||||
This arrangement may be modified or terminated by either the Funds or CWAM on 30 days notice.
The fees and expenses of Columbia Thermostat Fund include the effect of CWAM's contractual undertaking to waive fees and/or reimburse expenses of the Fund so that the ordinary operating expenses (exclusive of transaction costs and certain other investment-related expenses, interest and fees on borrowings and expenses associated with the Fund's investment in other investment companies, if any), do not exceed annually the rates of 0.50%, 1.00%, 1.25%, 0.25%, 0.23%, 0.18% and 0.25% of the Fund's average daily net assets attributable to Class A, Class B, Class C, Class R4, Class R5, Class Y and Class Z shares, respectively, through April 30, 2014. There is no guarantee that this agreement will continue thereafter.
The fees and expenses of Columbia Acorn Emerging Markets Fund and Columbia Acorn European Fund include the effect of CWAM's contractual undertaking to waive fees and/or reimburse expenses of each Fund so that the ordinary operating expenses (exclusive of transaction costs and certain other investment-related expenses, interest and fees on borrowings and expenses associated with the Fund's investment in other investment companies, if any), of each Fund's Class A, Class B, Class C, Class R4 (if offered), Class R5, Class Y (if offered) and Class Z shares through April 30, 2014, do not exceed annually each class' average daily net assets as follows:
Fund | Class A | Class C | Class I | Class R4 | Class R5 | Class Y | Class Z | ||||||||||||||||||||||||
Columbia Acorn Emerging Markets Fund | 1.85 | % | 2.60 | % | 1.54 | % | 1.60 | % | 1.59 | % | 1.54 | % | 1.60 | % | |||||||||||||||||
Columbia Acorn European Fund | 1.75 | % | 2.50 | % | 1.46 | % | — | % | 1.51 | % | — | % | 1.50 | % | |||||||||||||||||
There is no guarantee that this agreement will continue thereafter.
The fees and expenses of Columbia Acorn International include the effect of the contractual undertaking by CWAM and its affiliates, effective August 15, 2011, to waive a portion of total annual Fund operating expenses incurred by Class A, Class B and Class C shares of Columbia Acorn International such that the Fund's total annual Fund operating expenses will be reduced by 0.04%, 0.03% and 0.02% for Class A, Class B and Class C shares of the Fund, respectively, through August 14, 2013. There is no guarantee that this agreement will continue thereafter.
* The Funds generally no longer accept investments by new or existing investors in Class B shares, except in connection with the reinvestment of any dividend and/or capital gain distributions in Class B shares of the Funds and exchanges by existing Class B shareholders of certain other funds within the Columbia Family of Funds.
** Does not include estimated fees and expenses of 0.57% incurred by the Fund from the underlying portfolio funds in which it invests.
† With the exception of Class R5 shares of Columbia Acorn International (which commenced operations on August 15, 2011) and Class Y shares of Columbia Acorn Emerging Markets Fund (which commenced operations on June 13, 2013), noted share classes commenced operations on November 8, 2012, and have limited eligibility. Please see the Funds' prospectuses for details.
133
Columbia Acorn Family of Funds
Trustees
Laura M. Born
Chair of the Board
Steven N. Kaplan
Vice Chair of the Board
Michelle L. Collins
Maureen M. Culhane
Margaret M. Eisen
John C. Heaton
Charles P. McQuaid
David J. Rudis
David B. Small
Ralph Wanger (Trustee Emeritus)
Officers
Charles P. McQuaid
President
Robert A. Chalupnik
Vice President
Michael G. Clarke
Assistant Treasurer
Joseph F. DiMaria
Assistant Treasurer
P. Zachary Egan
Vice President
Fritz Kaegi
Vice President
John M. Kunka
Assistant Treasurer
Stephen Kusmierczak
Vice President
Joseph C. LaPalm
Vice President
Bruce H. Lauer
Vice President, Secretary and Treasurer
Louis J. Mendes III
Vice President
Robert A. Mohn
Vice President
Christopher J. Olson
Vice President
Christopher O. Petersen
Assistant Secretary
Scott R. Plummer
Assistant Secretary
Andreas Waldburg-Wolfegg
Vice President
Linda K. Roth-Wiszowaty
Assistant Secretary
Robert P. Scales
Chief Compliance Officer, Chief Legal Officer,
Senior Vice President and General Counsel
Investment Manager
Columbia Wanger Asset Management, LLC
227 West Monroe Street, Suite 3000
Chicago, Illinois 60606
1-800-922-6769
Distributor
Columbia Management Investment Distributors, Inc.
225 Franklin Street
Boston, Massachusetts 02110
Transfer Agent, Dividend Disbursing Agent
Columbia Management Investment Services Corp.
P. O. Box 8081
Boston, Massachusetts 02266-8081
1-800-345-6611
Legal Counsel to the Funds
Perkins Coie LLP
Washington, DC
Legal Counsel to the Independent Trustees
Drinker Biddle & Reath LLP
Philadelphia, Pennsylvania
Independent Registered Public Accounting Firm
PricewaterhouseCoopers LLP
Chicago, Illinois
This report, including the schedules of investments, is submitted for the general information of the shareholders of Columbia Acorn Trust.
A description of the policies and procedures that the Funds use to determine how to vote proxies and a copy of the Funds' voting record are available (i) without charge, upon request, by calling 800-922-6769 and (ii) on the Securities and Exchange Commission's website at www.sec.gov. Information regarding how the Funds voted proxies relating to portfolio securities during the 12-month period ended June 30, is available from the SEC's website. Information regarding how the Funds voted proxies relating to portfolio securities is also available at www.columbiamanagement.com under "About Us." From there, click on "Disclosures."
The Funds file a complete schedule of portfolio holdings with the SEC for the first and third quarters of each fiscal year on Form N-Q. The Funds' Form N-Q is available on the SEC's website at www.sec.gov and may be reviewed and copied at the SEC's Public Reference Room in Washington, D.C. Information on the operation of the Public Reference Room may be obtained by calling 1-800-SEC-0330. The Funds' complete portfolio holdings are disclosed at www.columbiamanagement.com approximately 30 to 40 days after each month-end.
Investors should consider the investment objectives, risks, charges and expenses of a mutual fund carefully before investing. For a free prospectus, which contains this and other important information about the funds, visit www.columbiamanagement.com. Read the prospectus carefully before investing.
Columbia Acorn Family of Funds are distributed by Columbia Management Investment Distributors, Inc., member FINRA and managed by Columbia Wanger Asset Management, LLC.
Find out what's new – visit our web site at:
www.columbiamanagement.com
Our e-mail address is:
ServiceInquiries@ColumbiaManagement.com
Shareholders should not include personal information such as account numbers, Social Security numbers or taxpayer identification numbers in e-mail. We are unable to accept account transactions sent via e-mail.
134
This document contains Global Industry Classification Standard data. The Global Industry Classification Standard ("GICS") was developed by and is the exclusive property and a service mark of MSCI Inc. ("MSCI") and Standard & Poor's Financial Services LLC ("S&P") and is licensed for use by Columbia Wanger Asset Management, LLC. Neither MSCI, S&P, nor any other party involved in making or compiling the GICS or any GICS classifications makes any express or implied warranties or representations with respect to such standard or classification (or the results to be obtained by the use thereof), and all such parties hereby expressly disclaim all warranties of originality, accuracy, completeness, merchantability and fitness for a particular purpose with respect to any of such standard or classification. Without limiting any of the foregoing, in no event shall MSCI, S&P, any of their affiliates or any third party involved in making or compiling the GICS or any GICS classifications have any liability for any direct, indirect, special, punitive, consequential or any other damages (including lost profits) even if notified of the possibility of such damages.
PRESORTED
FIRST-CLASS MAIL
U.S. POSTAGE PAID
HOLLISTON, MA
PERMIT NO. 20
Columbia Management®
Columbia Acorn Family of Funds
Class A, B, C, I, R, R4, R5, Y and Z Shares
Semiannual Report, June 30, 2013
For More Information
You'll find more information about the Columbia Acorn Family of Funds in the documents described below. Contact Columbia Funds as follows to obtain these documents free of charge:
By Mail: Columbia Funds
c/o Columbia Management Investment Services Corp.
P.O. Box 8081
Boston, MA 02266-8081
By Telephone: 800.345.6611
Online: www.columbiamanagement.com
Shareholder Communications with the Board
The Funds' Board of Trustees has adopted procedures by which shareholders may communicate with the Board. Shareholders who wish to communicate with the Board should send their written communications to the Board by mail, c/o Columbia Wanger Asset Management, LLC, 227 West Monroe Street, Suite 3000, Chicago, Illinois 60606, Attention: Secretary. Shareholder communications must (i) be in writing, (ii) identify the Columbia Acorn Fund to which the communication relates and (iii) state the particular class of shares and number of shares held by the communicating shareholder.
Prospectuses and the Statement of Additional Information (SAI)
The prospectuses and the SAI provide more detailed information about the Funds and their policies. The SAI is legally part of each prospectus (it's incorporated by reference). A copy of each has been filed with the SEC.
Information Provided by the SEC
You can review and copy information about the Funds (including their prospectuses, the SAI and shareholder reports) at the SEC's Public Reference Room in Washington, DC. To find out more about the operation of the Public Reference Room, call the SEC at 202.551.8090. Reports and other information about the Fund are also available in the EDGAR Database on the SEC's website at http://www.sec.gov, or you can receive copies of this information, for a fee, by electronic request at the following e-mail address: publicinfo@sec.gov. You can also obtain copies of this information by writing the Public Reference Section, Securities and Exchange Commission, Washington, DC 20549-0102.
The investment company registration number of Columbia Acorn Trust, of which each of these Funds is a series, is 811-01829.
© 2013 Columbia Management Investment Advisers, LLC. All rights reserved.
225 Franklin Street, Boston, MA 02110
800.345.6611 www.columbiamanagement.com
SAR110_12_CO1_(08/13) 712362
Columbia Management®
Columbia Acorn Family of Funds
Class A, B, C, I, R, R4, R5, Y and Z Shares
Semiannual Report, June 30, 2013
For More Information
You'll find more information about the Columbia Acorn Family of Funds in the documents described below. Contact Columbia Funds as follows to obtain these documents free of charge:
By Mail: Columbia Funds
c/o Columbia Management Investment Services Corp.
P.O. Box 8081
Boston, MA 02266-8081
By Telephone: 800.345.6611
Online: www.columbiamanagement.com
Shareholder Communications with the Board
The Funds' Board of Trustees has adopted procedures by which shareholders may communicate with the Board. Shareholders who wish to communicate with the Board should send their written communications to the Board by mail, c/o Columbia Wanger Asset Management, LLC, 227 West Monroe Street, Suite 3000, Chicago, Illinois 60606, Attention: Secretary. Shareholder communications must (i) be in writing, (ii) identify the Columbia Acorn Fund to which the communication relates and (iii) state the particular class of shares and number of shares held by the communicating shareholder.
Prospectuses and the Statement of Additional Information (SAI)
The prospectuses and the SAI provide more detailed information about the Funds and their policies. The SAI is legally part of each prospectus (it's incorporated by reference). A copy of each has been filed with the SEC.
Information Provided by the SEC
You can review and copy information about the Funds (including their prospectuses, the SAI and shareholder reports) at the SEC's Public Reference Room in Washington, DC. To find out more about the operation of the Public Reference Room, call the SEC at 202.551.8090. Reports and other information about the Fund are also available in the EDGAR Database on the SEC's website at http://www.sec.gov, or you can receive copies of this information, for a fee, by electronic request at the following e-mail address: publicinfo@sec.gov. You can also obtain copies of this information by writing the Public Reference Section, Securities and Exchange Commission, Washington, DC 20549-0102.
The investment company registration number of Columbia Acorn Trust, of which each of these Funds is a series, is 811-01829.
© 2013 Columbia Management Investment Advisers, LLC. All rights reserved.
SAR110_12_CO1_(08/13) 712362
Item 2. Code of Ethics.
Not applicable for semiannual reports.
Item 3. Audit Committee Financial Expert.
Not applicable for semiannual reports.
Item 4. Principal Accountant Fees and Services.
Not applicable for semiannual reports.
Item 5. Audit Committee of Listed Registrants.
Not applicable.
Item 6. Investments
(a) The registrant’s “Schedule I – Investments in securities of unaffiliated issuers” (as set forth in 17 CFR 210.12-12) is included in Item 1 of this Form N-CSR.
(b) Not applicable.
Item 7. Disclosure of Proxy Voting Policies and Procedures for Closed-End Management Investment Companies.
Not applicable.
Item 8. Portfolio Managers of Closed-End Management Investment Companies.
Not applicable.
Item 9. Purchases of Equity Securities by Closed-End Management Investment Company and Affiliated Purchasers.
Not applicable.
Item 10. Submission of Matters to a Vote of Security Holders.
There were no material changes to the procedures by which shareholders may recommend nominees to the registrant’s board of directors.
Item 11. Controls and Procedures.
(a) The registrant’s principal executive officer and principal financial officers, based on their evaluation of the registrant’s disclosure controls and procedures as of a date within 90 days of the filing of this report, have concluded that such controls and procedures are adequately designed to ensure that material information required to be disclosed by the registrant in Form N-CSR is accumulated and communicated to the registrant’s management, including the principal executive officer and principal financial officer, or persons performing similar functions, as appropriate to allow timely decisions regarding required disclosure.
(b) There was no change in the registrant’s internal control over financial reporting that occurred during the registrant’s second fiscal quarter of the period covered by this report that has materially affected, or is reasonably likely to materially affect, the registrant’s internal control over financial reporting.
Item 12. Exhibits.
(a)(1) Code of ethics required to be disclosed under Item 2 of Form N-CSR: Not applicable for semiannual reports.
(a)(2) Certifications pursuant to Rule 30a-2(a) under the Investment Company Act of 1940 (17 CFR 270.30a-2(a)) attached hereto as Exhibit 99.CERT.
(a)(3) Not applicable.
(b) Certification pursuant to Rule 30a-2(b) under the Investment Company Act of 1940 (17 CFR 270.30a-2(b)) attached hereto as Exhibit 99.906CERT.
SIGNATURES
Pursuant to the requirements of the Securities Exchange Act of 1934 and the Investment Company Act of 1940, the registrant has duly caused this report to be signed on its behalf by the undersigned, thereunto duly authorized.
(registrant) |
| Columbia Acorn Trust |
| ||||
|
|
|
| ||||
|
|
|
| ||||
By (Signature and Title) |
| /s/ Charles P. McQuaid |
| ||||
|
| Charles P. McQuaid, President | |||||
|
|
|
| ||||
|
|
|
| ||||
Date |
| August 15, 2013 |
| ||||
| |||||||
| |||||||
Pursuant to the requirements of the Securities Exchange Act of 1934 and the Investment Company Act of 1940, this report has been signed below by the following persons on behalf of the registrant and in the capacities and on the dates indicated. | |||||||
| |||||||
| |||||||
By (Signature and Title) |
| /s/ Charles P. McQuaid |
| ||||
|
| Charles P. McQuaid, President | |||||
|
|
|
| ||||
|
|
|
| ||||
Date |
| August 15, 2013 |
| ||||
|
|
|
| ||||
|
|
|
| ||||
By (Signature and Title) |
| /s/ Bruce H. Lauer |
| ||||
|
| Bruce H. Lauer, Treasurer |
| ||||
|
|
|
| ||||
|
|
|
| ||||
Date |
| August 15, 2013 |
| ||||