UNITED STATES
SECURITIES AND EXCHANGE COMMISSION
Washington, D.C. 20549
FORM N-CSR
CERTIFIED SHAREHOLDER REPORT OF REGISTERED
MANAGEMENT INVESTMENT COMPANIES
Investment Company Act file number | 811-01829 |
|
Columbia Acorn Trust |
(Exact name of registrant as specified in charter) |
|
225 Franklin Street, Boston, Massachusetts | | 02110 |
(Address of principal executive offices) | | (Zip code) |
|
Scott R. Plummer 5228 Ameriprise Financial Center Minneapolis, MN 55474 |
(Name and address of agent for service) |
|
Registrant’s telephone number, including area code: | 1-612-671-1947 | |
|
Date of fiscal year end: | December 31 | |
|
Date of reporting period: | June 30, 2012 | |
| | | | | | | | |
Form N-CSR is to be used by management investment companies to file reports with the Commission not later than 10 days after the transmission to stockholders of any report that is required to be transmitted to stockholders under Rule 30e-1 under the Investment Company Act of 1940 (17 CFR 270.30e-1). The Commission may use the information provided on Form N-CSR in its regulatory, disclosure review, inspection, and policymaking roles.
A registrant is required to disclose the information specified by Form N-CSR, and the Commission will make this information public. A registrant is not required to respond to the collection of information contained in Form N-CSR unless the Form displays a currently valid Office of Management and Budget ("OMB") control number. Please direct comments concerning the accuracy of the information collection burden estimate and any suggestions for reducing the burden to Secretary, Securities and Exchange Commission, 450 Fifth Street, NW, Washington, DC 20549-0609. The OMB has reviewed this collection of information under the clearance requirements of 44 U.S.C. § 3507.
Item 1. Reports to Stockholders.
Q2 2012
Columbia Acorn Family of Funds
Class Z Shares
Managed by Columbia Wanger Asset Management, LLC


Semiannual Report
June 30, 2012
n Columbia
Acorn® Fund
n Columbia
Acorn International®
n Columbia
Acorn USA®
n Columbia
Acorn International SelectSM
n Columbia
Acorn SelectSM
n Columbia
Thermostat FundSM
n Columbia
Acorn Emerging Markets FundSM
n Columbia
Acorn European FundSM
Not FDIC insured • No bank guarantee • May lose value
Columbia Acorn Family of Funds
Descriptions of Indexes Included in this Report
• 50/50 Blended Benchmark, established by the Fund's investment manager, is an equally weighted custom composite of Columbia Thermostat Fund's primary equity and primary debt benchmarks, the S&P 500 Index and the Barclays Capital U.S. Aggregate Bond Index, respectively. The percentage of the Fund's assets allocated to underlying stock and bond portfolio funds will vary, and accordingly the composition of the Fund's portfolio will not always reflect the composition of the 50/50 Blended Benchmark.
• Barclays U.S. Aggregate Bond Index is a market value-weighted index that tracks the daily price, coupon, pay-downs and total return performance of fixed-rate, publicly placed, dollar-denominated and non-convertible investment grade debt issues with at least $250 million par amount outstanding and with at least one year to final maturity.
• HSBC Smaller European Companies (inc UK) Index is a weighted combination of two indexes: the HSBC Smaller Europe (ex UK) Index and the HSBC Smaller UK Index. The index is rebalanced on a quarterly basis.
• Lipper Indexes include the largest funds tracked by Lipper, Inc. in the named category. Lipper Mid-Cap Growth Funds Index, 30 largest mid-cap growth funds, including Columbia Acorn Fund and Columbia Acorn Select; Lipper International Small/Mid Growth Funds Index, 10 largest non-U.S. small/mid growth funds, including Columbia Acorn International; Lipper Small-Cap Growth Funds Index, 30 largest small-cap growth funds, including Columbia Acorn USA; Lipper Flexible Portfolio Funds Index, an equal-weighted index of the 30 largest mutual funds within the Flexible Portfolio fund classification, as defined by Lipper. Lipper Emerging Markets Index, 30 largest emerging markets funds; Lipper European Region Index, 10 largest European funds.
• MSCI Europe, Australasia, Far East (EAFE) Index (Net) is a capitalization-weighted index that tracks the total return of common stocks in 22 developed-market countries within Europe, Australasia and the Far East. The returns of the MSCI EAFE Index (Net) are presented net of the withholding tax rate applicable to foreign non-resident institutional investors in the foreign companies included in the index who do not benefit from double taxation treaties.
• MSCI Emerging Markets Small Cap Index, a widely recognized international benchmark, is a free float-adjusted market capitalization index that is designed to measure small-cap emerging market equity performance. The MSCI Emerging Markets Small Cap Index currently consists of the following 21 emerging market country indexes: Brazil, Chile, China, Colombia, Czech Republic, Egypt, Hungary, India, Indonesia, Korea, Malaysia, Mexico, Morocco, Peru, Philippines, Poland, Russia, South Africa, Taiwan, Thailand and Turkey.
• Russell 2000 Index measures the performance of the 2,000 smallest companies in the Russell 3000 Index, which represents approximately 10% of the total market capitalization of the Russell 3000 Index.
• Russell 2500 Index measures the performance of the 2,500 smallest companies in the Russell 3000 Index, which represents approximately 17% of the total market capitalization of the Russell 3000 Index.
• Standard & Poor's (S&P) 500 Index tracks the performance of 500 widely held, large-capitalization U.S. stocks.
• Standard & Poor's (S&P) MidCap 400 Index is a market value-weighted index that tracks the performance of 400 mid-cap U.S. companies.
• S&P Developed Ex-U.S. Between $2B and $10B Index is a subset of the broad market selected by the index sponsor representing the mid-cap developed market, excluding the United States.
• S&P Emerging Markets Between $500M and $5B Index represents the institutionally investable capital of emerging market countries with market caps ranging between $500 million to $5 billion, as selected by S&P. The index currently consists of the following 21 emerging market country indexes: Brazil, Chile, China, Colombia, Czech Republic, Egypt, Hungary, India, Indonesia, Korea, Malaysia, Mexico, Morocco, Peru, Philippines, Poland, Russia, South Africa, Taiwan, Thailand and Turkey.
• S&P Europe Between $500M and $5B Index represents the institutionally investable capital of European countries with market caps ranging between $500 million to $5 billion, as selected by S&P. The index currently consists of the following 17 developed market country indexes: Austria, Belgium, Denmark, Finland, France, Germany, Greece, Ireland, Italy, Luxembourg, the Netherlands, Norway, Portugal, Spain, Sweden, Switzerland and the United Kingdom.
• S&P Global Ex-U.S. SmallCap Index consists of the bottom 20% of institutionally investable capital of developed and emerging countries, excluding the United States.
• S&P Global Ex-U.S. Between $500M and $5B Index is a subset of the broad market selected by the index sponsor representing the mid- and small-cap developed and emerging markets, excluding the United States.
Unlike mutual funds, indexes are not managed and do not incur fees or expenses. It is not possible to invest directly in an index.
The views expressed in the "Chattering Squirrels" and "In a Nutshell" commentaries reflect the current views of the respective authors. These views are not guarantees of future performance and involve certain risks, uncertainties and assumptions that are difficult to predict so actual outcomes and results may differ significantly from the views expressed. These views are subject to change at any time based upon economic, market or other conditions and the respective authors disclaim any responsibility to update such views. These views may not be relied upon as investment advice and, because investment decisions for a Columbia Acorn Fund are based on numerous factors, may not be relied upon as an indication of trading intent on behalf of any particular Columbia Acorn Fund. References to specific company's securities should not be construed as a recommendation or investment advice and there can be no assurance that as of the date of publication of this report, the securities mentioned in each Fund's portfolio are still held or that the securities sold have not been repurchased.
Acorn®, Acorn USA® and Acorn International® are service marks owned and registered by Columbia Acorn Trust. ColumbiaSM, Columbia Management®, and the Columbia Management Logo® are service marks owned and/or registered by Ameriprise Financial, Inc.
You are invited to the 2012 Columbia Acorn Funds Shareholder Information Meeting
Join us to hear presentations by Columbia Acorn Fund's lead portfolio manager Chuck McQuaid and other members of the Columbia Wanger Asset Management investment team.
Where: Drinker Biddle & Reath LLP
191 North Wacker Drive, Suite 3700
Chicago, IL
When: Wednesday, September 19, 2012
12 p.m. CST
A buffet lunch will be served beginning at 11:30.
RSVP: 800.922.6769 by September 14, 2012
Webcast Replay: Available at columbiamanagement.com in October.
 Public Transportation
For directions using public transportation, call 312.836.7000 or visit the Chicago Transit Authority website at transitchicago.com. Metra information is also available by calling this number or can be found at metrarail.com.
 Parking Information
Two parking options are located on Lake Street in the same block as the meeting location, which is between N. Wacker Drive and N. Franklin Street. Lake Street runs one way east after crossing N. Wacker Drive. Hourly parking rates apply at both locations. The first, with signage stating "Public Parking" (phone: 312.267.6867), provides direct access to the building in which the meeting will be held. The second option is a "Self Park" garage (phone: 312.201.1795) located next to the first but without direct access to the building.
 Driving Directions
From the south:
Take 1-57 to the Dan Ryan Expressway. Follow the signs for the Kennedy Expressway West. Travel on the Kennedy and exit using the Washington exit (Exit 51C). Turn right onto W. Washington. Proceed east on Washington until you reach Canal Street. Turn left on Canal Street. Travel on Canal to Lake Street. Turn right on Lake Street. Take Lake Street across N. Wacker Drive to the southeast corner of Lake Street and N. Wacker Drive.
From the north:
Take the Kennedy Expressway (I-90/94) south to Chicago. Exit in the city using the W. Randolph Street exit (Exit 51B). Turn right onto W. Randolph Street. Proceed west on Randolph Street until you reach N. Halsted Street. Turn right onto N. Halsted Street. Travel on Halsted to W. Lake Street. Turn right on Lake Street. Take Lake Street across N. Wacker Drive to the southeast corner of Lake Street and N. Wacker Drive.
From the west:
Take the Eisenhower Expressway (I-290) from the west. Follow the signs for the Kennedy Expressway West. Travel on the Kennedy and exit using the Washington exit (Exit 51C). Turn right onto W. Washington. Proceed east on Washington until you reach Canal Street. Turn left on Canal Street. Travel on Canal to Lake Street. Turn right on Lake Street. Take Lake Street across N. Wacker Drive to the southeast corner of Lake Street and N. Wacker Drive.
From the southwest:
Take the Stevenson Expressway (I-55). Exit to the Kennedy Expressway (North-Wisconsin). Travel on the Kennedy and exit using the Washington exit (Exit 51C). Turn right onto W. Washington. Proceed east on Washington until you reach Canal Street. Turn left on Canal Street. Travel on Canal to Lake Street. Turn right on Lake Street. Take Lake Street across N. Wacker Drive to the southeast corner of Lake Street and N. Wacker Drive.
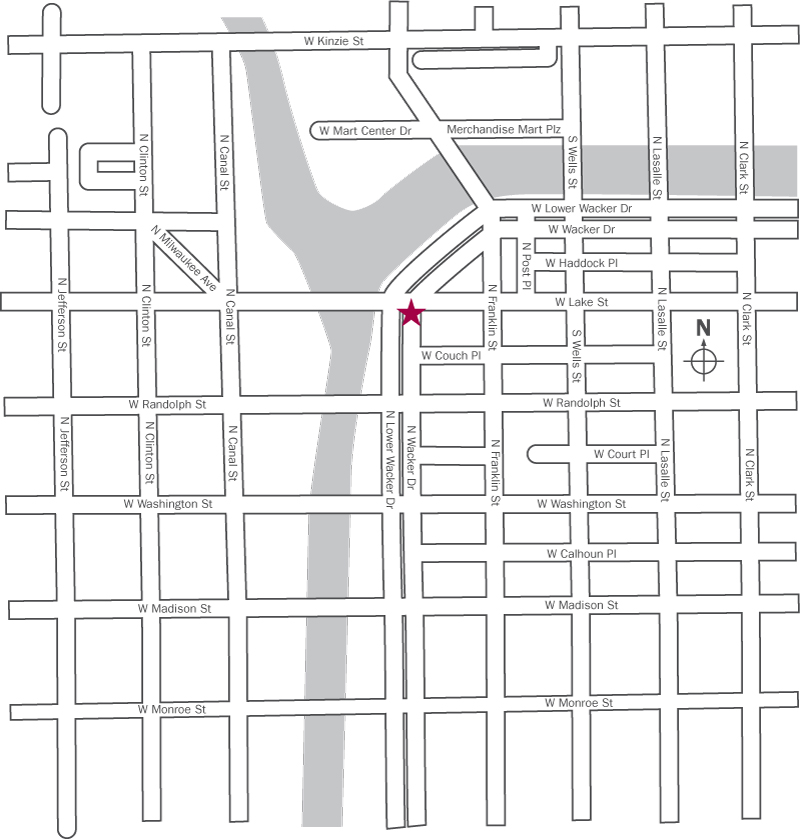
Wacker Drive Construction
Please keep Chicago's Wacker Drive construction project in mind when planning your route. Current information on the project can be found at wackerdrive.org.
Columbia Acorn Family of Funds
Table of Contents
| Performance At A Glance | | | 1 | | |
Chattering Squirrels: Columbia Thermostat
Fund Turns 10 | | | 2 | | |
| Understanding Your Expenses | | | 6 | | |
| Columbia Acorn Fund | |
| In a Nutshell | | | 8 | | |
| At a Glance | | | 9 | | |
| Major Portfolio Changes | | | 24 | | |
| Statement of Investments | | | 26 | | |
| Columbia Acorn International | |
| In a Nutshell | | | 10 | | |
| At a Glance | | | 11 | | |
| Major Portfolio Changes | | | 39 | | |
| Statement of Investments | | | 41 | | |
| Portfolio Diversification | | | 50 | | |
| Columbia Acorn USA | |
| In a Nutshell | | | 12 | | |
| At a Glance | | | 13 | | |
| Major Portfolio Changes | | | 51 | | |
| Statement of Investments | | | 52 | | |
| Columbia Acorn International Select | |
| In a Nutshell | | | 14 | | |
| At a Glance | | | 15 | | |
| Major Portfolio Changes | | | 59 | | |
| Statement of Investments | | | 60 | | |
| Portfolio Diversification | | | 64 | | |
| Columbia Acorn Select | |
| In a Nutshell | | | 16 | | |
| At a Glance | | | 17 | | |
| Major Portfolio Changes | | | 65 | | |
| Statement of Investments | | | 66 | | |
| Columbia Thermostat Fund | |
| In a Nutshell | | | 18 | | |
| At a Glance | | | 19 | | |
| Statement of Investments | | | 72 | | |
| Columbia Acorn Emerging Markets Fund | |
| In a Nutshell | | | 20 | | |
| At a Glance | | | 21 | | |
| Major Portfolio Changes | | | 73 | | |
| Statement of Investments | | | 75 | | |
| Portfolio Diversification | | | 79 | | |
| Columbia Acorn European Fund | |
| In a Nutshell | | | 22 | | |
| At a Glance | | | 23 | | |
| Major Portfolio Changes | | | 80 | | |
| Statement of Investments | | | 81 | | |
| Portfolio Diversification | | | 85 | | |
| Columbia Acorn Family of Funds | |
| Statements of Assets and Liabilities | | | 86 | | |
| Statements of Operations | | | 88 | | |
| Statements of Changes in Net Assets | | | 90 | | |
| Financial Highlights | | | 96 | | |
| Notes to Financial Statements | | | 100 | | |
| Board Approval of the Advisory Agreement | | | 109 | | |
| Columbia Acorn Family of Funds Information | | | 113 | | |
2012 Mid-Year Distributions
The following table lists the mid-year distributions for the Columbia Acorn Funds. The record date was June 5, 2012, and the ex-dividend date and the payable date was June 6, 2012.
| | | Short-term
Capital
Gains | | Long-term
Capital
Gains | | Ordinary
Income | | Reinvestment
Price | |
| Columbia Acorn Fund | | | None | | | $ | 0.35688 | | | | None | | | $ | 29.09 | | |
| Columbia Acorn International | | | None | | | | None | | | $ | 0.19568 | | | $ | 35.88 | | |
| Columbia Acorn USA | | | None | | | $ | 0.05114 | | | | None | | | $ | 28.96 | | |
| Columbia Acorn International Select | | | None | | | $ | 0.11963 | | | | None | | | $ | 26.29 | | |
| Columbia Acorn Select | | | None | | | $ | 0.53050 | | | | None | | | $ | 24.82 | | |
| Columbia Thermostat Fund | | | None | | | | None | | | $ | 0.01739 | | | $ | 13.26 | | |
| Columbia Acorn Emerging Markets Fund | | | None | | | | None | | | $ | 0.00432 | | | $ | 9.83 | | |
| Columbia Acorn European Fund | | $ | 0.00458 | | | | None | | | $ | 0.01203 | | | $ | 10.15 | | |
Columbia Acorn Family of Funds
Performance At A Glance Class Z Average Annual Total Returns through 6/30/12
| | | NAV on
6/30/12 | | 2nd
quarter* | | Year
to date* | | 1 year | | 5 years | | 10 years | | Life
of Fund | |
| Columbia Acorn Fund (ACRNX) (6/10/70) | | $ | 29.74 | | | | -5.42 | % | | | 9.23 | % | | | -2.78 | % | | | 1.70 | % | | | 9.59 | % | | | 14.55 | % | |
| Russell 2500 Index | | | | | -4.14 | % | | | 8.31 | % | | | -2.29 | % | | | 1.18 | % | | | 8.01 | % | | | NA | | |
| S&P 500 Index** | | | | | -2.75 | % | | | 9.49 | % | | | 5.45 | % | | | 0.22 | % | | | 5.33 | % | | | 10.54 | % | |
| Russell 2000 Index | | | | | -3.47 | % | | | 8.53 | % | | | -2.08 | % | | | 0.54 | % | | | 7.00 | % | | | NA | | |
| Lipper Mid-Cap Growth Funds Index | | | | | -6.32 | % | | | 7.72 | % | | | -5.16 | % | | | 1.61 | % | | | 7.29 | % | | | NA | | |
| Columbia Acorn International (ACINX) (9/23/92) | | $ | 37.10 | | | | -5.52 | % | | | 8.72 | % | | | -9.31 | % | | | -0.84 | % | | | 11.07 | % | | | 10.81 | % | |
| S&P Global Ex-U.S. Between $500M and $5B Index | | | | | -8.03 | % | | | 4.82 | % | | | -15.17 | % | | | -2.48 | % | | | 10.95 | % | | | 7.95 | % | |
| S&P Global Ex-U.S. SmallCap Index | | | | | -8.62 | % | | | 4.96 | % | | | -16.34 | % | | | -3.88 | % | | | 10.06 | % | | | 7.18 | % | |
| MSCI EAFE Index | | | | | -7.13 | % | | | 2.96 | % | | | -13.83 | % | | | -6.10 | % | | | 5.14 | % | | | 5.22 | % | |
| Lipper International Small/Mid Growth Funds Index | | | | | -6.03 | % | | | 7.68 | % | | | -10.22 | % | | | -2.99 | % | | | 9.65 | % | | | NA | | |
| Columbia Acorn USA (AUSAX) (9/4/96) | | $ | 29.72 | | | | -5.18 | % | | | 10.35 | % | | | -3.90 | % | | | 0.97 | % | | | 7.85 | % | | | 9.86 | % | |
| Russell 2000 Index | | | | | -3.47 | % | | | 8.53 | % | | | -2.08 | % | | | 0.54 | % | | | 7.00 | % | | | 7.08 | % | |
| Lipper Small-Cap Growth Funds Index | | | | | -4.56 | % | | | 8.95 | % | | | -3.50 | % | | | 0.76 | % | | | 6.23 | % | | | 5.61 | % | |
| Columbia Acorn Int'l Select (ACFFX) (11/23/98) | | $ | 26.88 | | | | -0.87 | % | | | 10.39 | % | | | -3.98 | % | | | 0.16 | % | | | 10.52 | % | | | 9.12 | % | |
| S&P Developed Ex-U.S. Between $2B and $10B Index | | | | | -7.60 | % | | | 3.47 | % | | | -14.48 | % | | | -4.59 | % | | | 8.19 | % | | | 6.49 | % | |
| MSCI EAFE Index | | | | | -7.13 | % | | | 2.96 | % | | | -13.83 | % | | | -6.10 | % | | | 5.14 | % | | | 2.76 | % | |
| Lipper International Small/Mid Growth Funds Index | | | | | -6.03 | % | | | 7.68 | % | | | -10.22 | % | | | -2.99 | % | | | 9.65 | % | | | 9.40 | % | |
| Columbia Acorn Select (ACTWX) (11/23/98) | | $ | 24.92 | | | | -8.44 | % | | | 7.76 | % | | | -9.90 | % | | | -2.64 | % | | | 7.39 | % | | | 9.02 | % | |
| S&P MidCap 400 Index | | | | | -4.93 | % | | | 7.90 | % | | | -2.33 | % | | | 2.55 | % | | | 8.21 | % | | | 8.85 | % | |
| S&P 500 Index** | | | | | -2.75 | % | | | 9.49 | % | | | 5.45 | % | | | 0.22 | % | | | 5.33 | % | | | 3.01 | % | |
| Lipper Mid-Cap Growth Funds Index | | | | | -6.32 | % | | | 7.72 | % | | | -5.16 | % | | | 1.61 | % | | | 7.29 | % | | | 5.92 | % | |
| Columbia Thermostat Fund (COTZX) (9/25/02)† | | $ | 13.51 | | | | -1.40 | % | | | 6.77 | % | | | 6.97 | % | | | 4.68 | % | | | — | | | | 7.84 | % | |
| S&P 500 Index | | | | | -2.75 | % | | | 9.49 | % | | | 5.45 | % | | | 0.22 | % | | | — | | | | 7.48 | % | |
| Barclays U.S. Aggregate Bond Index | | | | | 2.06 | % | | | 2.37 | % | | | 7.47 | % | | | 6.79 | % | | | — | | | | 5.31 | % | |
| Lipper Flexible Portfolio Funds Index | | | | | -2.89 | % | | | 5.75 | % | | | -0.55 | % | | | 1.82 | % | | | — | | | | 7.34 | % | |
| 50/50 Blended Benchmark | | | | | -0.29 | % | | | 6.02 | % | | | 6.92 | % | | | 3.94 | % | | | — | | | | 6.73 | % | |
Columbia Acorn Emerging Markets Fund
(CEFZX) (8/19/11) | | $ | 10.19 | | | | -6.90 | % | | | 9.85 | % | | | — | | | | — | | | | — | | | | 1.94 | %* | |
| S&P Emerging Markets Between $500M and $5B Index | | | | | -8.09 | % | | | 8.88 | % | | | — | | | | — | | | | — | | | | -5.77 | %* | |
| MSCI Emering Markets Small Cap Index | | | | | -8.02 | % | | | 7.27 | % | | | — | | | | — | | | | — | | | | -10.59 | %* | |
| Lipper Emerging Markets Index | | | | | -7.84 | % | | | 5.57 | % | | | — | | | | — | | | | — | | | | -1.62 | %* | |
| Columbia Acorn European Fund (CAEZX) (8/19/11) | | $ | 10.52 | | | | -5.16 | % | | | 11.62 | % | | | — | | | | — | | | | — | | | | 6.29 | %* | |
| S&P Europe Between $500M and $5B Index | | | | | -8.62 | % | | | 7.65 | % | | | — | | | | — | | | | — | | | | -0.07 | %* | |
| HSBC Smaller European Companies Index | | | | | -10.14 | % | | | 5.53 | % | | | — | | | | — | | | | — | | | | -4.53 | %* | |
| Lipper European Region Index | | | | | -7.82 | % | | | 5.05 | % | | | — | | | | — | | | | — | | | | 3.75 | %* | |
*Not annualized.
**Although the Fund typically invests in small- and mid-sized companies, the comparison to the S&P 500 Index is presented to show performance against a widely recognized market index over the life of the Fund.
Performance data shown represents past performance and is not a guarantee of future results. The investment return and principal value of an investment will fluctuate so that shares, when redeemed, may be worth more or less than their original cost. Performance results reflect any fee waivers or reimbursements of Fund expenses by the investment manager (Columbia Wanger Asset Management, LLC ("CWAM")) and/or any of its affiliates. Absent these fee waivers or expense reimbursement arrangements, performance results would have been lower. Current performance may be lower or higher than the performance data shown. Please visit columbiamanagement.com for daily and most recent month-end updates.
Net asset value (NAV) returns do not include sales charges or contingent deferred sales charges (CDSC). If they were included, returns would have been lower. Class Z shares are sold only at NAV with no distribution and service (Rule 12b-1) fees. Only eligible investors may purchase Class Z shares of the Funds, directly or by exchange. Please see each Fund's prospectus for eligibility and other details. Class Z shares have limited eligibility and the investment minimum requirement may vary.
Annual operating expense ratios are stated as of each Fund's prospectus dated May 1, 2012, and differences in expense ratios disclosed elsewhere in this report may result from including fee waivers and expense reimbursements as well as different time periods used in calculating the ratios for Class Z shares. Columbia Acorn Fund: 0.77%. Columbia Acorn International: 0.98%. Columbia Acorn USA: 1.05%. Columbia Acorn International Select: 1.25%. Columbia Acorn Select: 1.00%. Columbia Thermostat Fund has a contractual fee waiver and expense reimbursement agreement with CWAM that expires April 30, 2013; expense ratios without and with the contractual waiver/reimbursement, including fees and expenses associated with the Fund's investments in other investment companies (underlying funds), are 1.03% and 0.90%, respectively. Columbia Acorn Emerging Markets Fund has a contractual fee waiver and expense reimbursement agreement with CWAM that expires April 30, 2013; expense ratios without and with the contractual waiver/reimbursement are 13.35% and 1.60%, respectively. Columbia Acorn European Fund has a contractual fee waiver and expense reimbursement agreement with CWAM that expires April 30, 2013; expense ratios without and with the contractual waiver/reimbursement are 19.02% and 1.50%, respectively. See Page 113 for more information about the Funds' fees and expenses.
†A "fund of funds" bears its allocable share of the costs and expenses of the underlying funds in which it invests. Such funds are thus subject to two levels of fees and potentially higher expense ratios than would be associated with an investment in a fund that invests and trades directly in financial instruments under the direction of a single manager.
All results shown assume reinvestment of distributions and do not reflect the deduction of taxes that a shareholder would pay on fund distributions or on the redemption of fund shares. Unlike mutual funds, indexes are not actively managed and do not incur fees or expenses. It is not possible to invest directly in an index.
1
Chattering Squirrels: Columbia Thermostat Fund Turns 10

 On September 25, 2002, Columbia Wanger Asset Management, LLC (CWAM) launched Columbia Thermostat Fund. To mark the Fund's 10-year anniversary, CWAM's founder, Ralph Wanger, who now serves as a trustee emeritus on the Columbia Acorn Funds board of trustees, and CWAM's chief investment officer and Columbia Thermostat Fund's current lead portfolio manager, Chuck McQuaid, got together to talk about the Fund. Ralph came up with the idea for the Columbia Thermostat Fund and was a portfolio manager of the Fund until 2005. Chuck has been a portfolio manager of the Fund since its inception.
Q: What drove you to launch the Columbia Thermostat Fund in 2002?
Ralph: In 2001, I started to give some thought to what the market was likely to do next. The bull market had died following the tech/media/telecom collapse. Could it be that the days of successfully investing using a buy-and-hold strategy were behind us? I studied the major tops in the stock market, especially 1929, 1968 and the Japanese market in 1989. All of these bull markets were followed by periods in which the market fluctuated wildly with no uptrend for an average of 25 years.
Dow Jones Industrial Average (1925 – 2012)

Source: Columbia Management Investment Advisers, LLC
While the Columbia Acorn Funds have always believed that good stock selection will do well in all market environments, if the market was going to be in a frustrating trading pattern for a long time, I figured a mutual fund that could take advantage of this pattern might be a worthwhile product.
I defined the bull market as the exponential state. A prime example of this type of market was the period from 1982 to 1999. I defined the second state as a sine wave market or a prolonged period during which the market moves up and down in a very quick and volatile fashion and equity investors make no forward progress. Previous periods of sine-wave movement occurred from 1930 to 1954 and from 1969 to 1981.
Exponential Market
Dow Jones Industrial Average 1982 – 1999
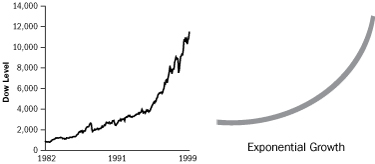
Source: Columbia Management Investment Advisers, LLC
Sine Wave Market
Dow Jones Industrial Average 1969 – 1981
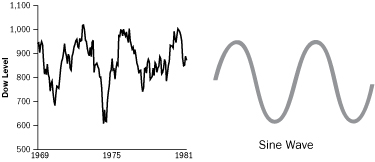
Source: Columbia Management Investment Advisers, LLC
Chuck: I think it is fair to say that Columbia Thermostat Fund came about because Ralph is a student of market history. In a memo Ralph distributed within CWAM in May of 2002 titled, "How to Survive the Next Ten Years," he made the case for a Thermostat-type fund. He noted that the March 2000 peak was a three-way peak: a business cycle peak, a valuation peak and a psychological peak.
After such peaks a sine wave market can start. I believe this is because the stock market has a feedback loop into the economy itself and if the market goes up a lot companies raise a lot of capital and then put that capital to work. During the tech/media/telecom boom, companies raised enormous amounts of money that led to huge overcapacity. For example, loads of fiber optic cable was put in the ground and to this day the price just keeps going down for high-capacity internet connections. When you have a long capital cycle with too much capital invested, it increases competition and hurts profits. During sine wave periods, excess capital in the economy gets burned off and valuations in the
2
market drop from too high to too low. Sine wave markets also have the volatility we're experiencing now.
Q: So how does Columbia Thermostat Fund take advantage of these volatile conditions?
Ralph: The Fund is made up of a mix of stock and bond mutual funds. When the Standard & Poor's (S&P)® 500 Index goes up, the Fund sells a portion of its stock funds and invests more in its bond funds. When the S&P 500 Index goes down, the Fund increases its investment in stock funds and sells shares from the bond funds. It's as simple as that. I consider this rebalancing the real secret of the Fund. By doing this, we are essentially trying to use the market tides to pump energy into the Fund.
S&P Price Range & Columbia Thermostat's Equity Allocation

Source: Columbia Wanger Asset Management, LLC
There are other asset allocation funds that move assets from stocks to bonds based on market moves. Most asset allocation funds, however, are run by sophisticated investment professionals who make subjective decisions based on economic and financial data and complex graphs of market behavior. By contrast, the day-to-day investment decisions for the Columbia Thermostat Fund are made according to predetermined rules based on the current level of the S&P 500 Index. Because the Fund invests according to a pre-set program, there is no need for subjective day-to-day management.
Chuck: The Fund is designed for those who doubt the wisdom of trying to "time" the market. It simply buys stocks when they go down and sells them when they go up. The Fund takes psychology out of investing; it avoids the temptation to buy more stocks because the stock market is currently going up or to sell stocks because the market is declining. The Fund operates by investing its stock and bond assets according to a predetermined asset allocation table based on S&P 500 Index trading ranges described in the prospectus. For example, at June 30, 2012, the Fund had a 50% stock and 50% bond allocation because the S&P 500 Index fell into the 1350 to 1400 price level band. A 5% rebalance in one direction or the other will be triggered when the S&P 500 Index moves out of that range. The only exception is the result of our "31-day Rule." In order to reduce taxable events, after the Fund has increased its percentage allocation to either stock funds or bond funds, it will not decrease that allocation for at least 31 days. The 31-day Rule can also prevent the Fund from buying stock funds too soon during a sudden steep downward reversal in the market.
Stock/Bond Allocation Table
How the Fund will invest the stock/bond assets
| Level of the S&P 500® Index | | Stock
Percentage | | Bond
Percentage | |
| over 1750 | | | 10 | % | | | 90 | % | |
| over 1700-1750 | | | 15 | % | | | 85 | % | |
| over 1650-1700 | | | 20 | % | | | 80 | % | |
| over 1600-1650 | | | 25 | % | | | 75 | % | |
| over 1550-1600 | | | 30 | % | | | 70 | % | |
| over 1500-1550 | | | 35 | % | | | 65 | % | |
| over 1450-1500 | | | 40 | % | | | 60 | % | |
| over 1400-1450 | | | 45 | % | | | 55 | % | |
| over 1350-1400 | | | 50 | % | | | 50 | % | |
| over 1300-1350 | | | 55 | % | | | 45 | % | |
| over 1250-1300 | | | 60 | % | | | 40 | % | |
| over 1200-1250 | | | 65 | % | | | 35 | % | |
| over 1150-1200 | | | 70 | % | | | 30 | % | |
| over 1100-1150 | | | 75 | % | | | 25 | % | |
| over 1050-1100 | | | 80 | % | | | 20 | % | |
| over 1000-1050 | | | 85 | % | | | 15 | % | |
| 1000 and under | | | 90 | % | | | 10 | % | |
Q: The name is a bit unusual. How did you come up with it?
Ralph: With this Fund, I wanted to create a very simple investment option, something that was easy to understand for investors at every level. I thought about my stepmother Elaine. She was very sweet and very sensible but she had no knowledge of finance. I wanted this fund to make sense to people like her. When thinking about what to name the Fund, I thought about familiar things, items we all have in our houses. The thermostat was an obvious choice: it keeps your house cool when it's hot and hot when it's cool. Columbia Thermostat Fund attempts to adjust the temperature of your investments in the same way.
Q: How has Columbia Thermostat Fund performed?
Chuck: Better than expected, actually. With this type of Fund, our hope was to provide Fund shareholders with returns that fell between the bond market and the S&P 500 Index, but to offer these returns with less volatility than the stock market. From inception through June 30, 2012, the Fund's Class Z shares, the oldest share class, had an annualized return of 7.84% and topped both the S&P 500 Index, which was up 7.48% for the period, and the Barclays U.S. Aggregate Bond Index, which was up 5.31%.1 The Fund has a five-star overall Morningstar rating and is ranked in the top decile of the Morningstar aggressive allocation category for the one-, three- and five-year periods ended June 30, 2012.2
3
Q: What about the underlying investments? How do you choose the funds you use within this fund-of-funds?
Ralph: We want to have Columbia Thermostat Fund invested broadly across the stock and bond universes, while being biased toward segments and funds that we think are relatively attractive. We initially selected from among the Columbia Acorn Funds managed by CWAM, which provided fine opportunities in the small- and mid-cap equity segments. We also added mid-cap and large-cap stock funds and bond funds managed by Columbia Management Investment Advisers, LLC (CMIA). When the Fund launched in 2002, we had a bias toward small- and mid-caps in our weighting because they appeared relatively cheap.
Allocation of Stock/Bond Assets Within Asset Classes
As of June 30, 2012
| Columbia Stock Funds | | Type of Fund | | Allocation | |
| Acorn Fund | | Small/Mid-cap growth | | | 15 | % | |
| Acorn Select | | Mid-cap growth | | | 10 | % | |
| Acorn International | | Small/Mid-cap
international growth | | | 20 | % | |
| Dividend Income Fund | | Large-cap value | | | 20 | % | |
Large Cap Enhanced
Core Fund | | Large-cap blend | | | 10 | % | |
| Contrarian Core Fund | | Large-cap blend | | | 15 | % | |
Select Large Cap
Growth Fund | | Large-cap growth | | | 10 | % | |
| Columbia Bond Funds | | Type of Fund | | Allocation | |
| Intermediate Bond Fund | | Intermediate-term bonds | | | 50 | % | |
| Income Opportunities Fund | | High-yield bonds | | | 30 | % | |
| U.S. Treasury Index Fund | | U.S. Treasury notes/bonds | | | 20 | % | |
Chuck: CMIA and CWAM combined manage 56 mutual funds rated four or five stars overall by Morningstar. As of June 30, 2012, Columbia Thermostat Fund was invested in 10 funds, nine of which had overall Morningstar ratings of four or five stars. We certainly have lots of highly rated funds to choose from.3
Q: Since Columbia Thermostat Fund was designed largely to buy stocks low and sell them high, why does the Fund own bond funds instead of money market funds?
Ralph: Bond funds usually yield more than money market funds, tend to have much lower volatility than stock funds, and their short-term returns are generally not correlated much with stock funds. I also thought that in a sine wave scenario, bond funds would have returns not far from stock funds. We choose bond funds with relatively short durations to reduce risk from rising interest rates, though interest rates have instead fallen for much of Columbia Thermostat Fund's history.
Q: How has the Fund changed over time?
Chuck: We do a review of the allocation table and underlying funds held in the portfolio at least annually. We take a long-term perspective on what the trading range of the stock market might be and, as Ralph mentioned, which market segments and funds appear relatively attractive.
Our first adjustments to the portfolio were made in September 2005. At that time, we changed the stock allocation table to allow for more equities within the new ranges. We also changed the equity fund line-up to reduce domestic small- and mid-cap exposure from 50% to 25% because smaller cap stock valuations seemed to be getting high. Equity large-cap exposure was increased from 50% to 60% and, with the addition of Columbia Acorn International, we invested in an international component for the first time. International stocks looked relatively attractive, international investing tends to provide excellent diversification and Columbia Acorn International's performance was gaining traction.
During the Fund's 10-year history, we've adjusted the allocation table three times to hike the stock weighting and one time to cut it, each time in response to what we perceived as changes in stock trading ranges. Additional adjustments have also been made to the underlying funds. Most recently, in December 2011, we rebalanced the Fund's bond exposure after looking at interest rate spreads. Treasury rates looked pretty low and corporate bond rates looked more attractive so we did some swapping. We also fine-tuned the investment mix of the Fund's large-cap equity portion.
One other thing we consider is expenses. When debating between similar investments, the lower-cost funds have an edge. In 2011 we exchanged from the Class Z shares of each underlying fund to the newly introduced Class I shares, which is a lower-cost Columbia share class available only to fund-of-funds, such as Columbia Thermostat Fund.
Q: Have there been any times during the past 10 years when the Fund didn't work as you'd expected?
Ralph: Well, there was one law of economics that we forgot about when we launched the Fund: Murphy's Law. In September 2002, the market was at a low and then in 2003, there was a roaring upswing, which dampened interest in an asset allocation fund. As it turned out, the mini bull market of 2003 was just the upside of the sine.
Chuck: Also, Columbia Thermostat Fund was never set up to be a doomsday fund for the ultra bears who thought the market was going to go to zero. It was always meant for a market that was trading within a range and so we set the allocation table based on our expectations for the market. The real estate collapse in 2008 and the subsequent market turmoil was not something we anticipated so we were 100% invested in stocks for nine months from October 2008 through June 2009. We had raised the allocation table in January of 2008 because we felt price-to-earnings ratios had compressed enough and because we didn't want to go to a zero percentage weight in stocks. Well, that didn't happen! In effect, we had over-estimated earnings but the important thing was not to compound the impact in a knee-jerk reaction and sell stocks at or near the bottom. As it turned out, we
4
rode out the storm and caught every bit of the initial upside when the wave turned, starting in March 2009.
Q: Do you dare speculate on how long you think this sine wave will last?
Ralph: That is the question, isn't it? Let's say it's July and it's 97 degrees. What do you wear to work? Likely very light-weight clothing. In February in Chicago when it's 10 below zero, we dress entirely differently with coats, hats and gloves on top of wool suits. If you dress for the weather, you ought to invest for the weather. Investing in a long-only fund is basically a summer idea, best followed when things are optimistic and warm and beautiful. Columbia Thermostat Fund is a winter-time fund that is designed to be variable and that seeks to help you weather stormy and cold days. I believe a long-only fund and an asset allocation fund ought to both be owned within a long-term investment strategy. The tricky part is knowing when to switch from one to the other. The good news is that the failure consequence is different. If you own a long-only fund and you hold it too long and the market goes down dramatically, you lose money and feel lousy. With Columbia Thermostat Fund, if the next exponential market starts, the Fund is designed to turn into more of a bond fund that seeks to preserve your capital and go up a little bit.
If we look to history for the answer, we see that the sine wave markets have lasted quite a while. As I mentioned earlier, after 1929 it took 25 years to reach the old high. After 1968, it also took 25 years, adjusted for inflation. In Japan, their market peaked in late 1989 at 38,000 and it's now about 9,000 after 22 years. It's certainly going to take more than 25 years for that country to get back to the old high. After more than 20 years of a sine wave market, you can be assured of one thing: almost everyone will be disgusted with stocks.
Japanese Great Recession

Source: Columbia Management Investment Advisers, LLC
Chuck: I can attest to that from my own experience. I began my career in the investment industry in 1976 and friends I had in my MBA program thought I was nuts for choosing this sector. They didn't think anyone could make money in stocks because stocks had been flat or down for a very long time. As it turned out, it was a great time to launch a career in this industry. The term I use is stocks were "in the wilderness." No one cared about stocks and no one wanted to talk about them. People weren't bragging about their portfolios but were taking cover in other investment options. While I still believe that investing in stocks with good fundamentals and growth potential can yield good results in the market, stocks generally seem to be somewhat in the wilderness now.
Ralph: Yes, I suppose we could get to the point where the word "stock" will first bring to mind cattle or a task assigned to supermarket employees. When that happens, go long!

Charles P. McQuaid
President and Chief Investment Officer
Columbia Wanger Asset Management, LLC
Trustee, Columbia Acorn Trust and Wanger Advisors Trust
Current Portfolio Manager, Columbia Thermostat Fund

Ralph Wanger
Retired Founder, Columbia Wanger Asset Management, LLC
Trustee Emeritus, Columbia Acorn Trust and Wanger Advisors Trust
Former Portfolio Manager, Columbia Thermostat Fund
The information and data provided in this analysis are derived from sources that we deem to be reliable and accurate. These views are not guarantees of future performance and involve certain risks, uncertainties and assumptions that are difficult to predict so actual outcomes and results may differ significantly from the views expressed. The views/opinions expressed in "Chattering Squirrels" are those of the authors and not of the Columbia Acorn Trust Board, are subject to change at any time based upon economic, market or other conditions, may differ from views expressed by other Columbia Management associates and the respective parties disclaim any responsibility to update such views. These views may not be relied on as investment advice and, because investment decisions for a Columbia Acorn Fund are based on numerous factors, may not be relied on as an indication of trading intent on behalf of any particular Columbia Acorn Fund.
1 Please see Page 1 of this report for additional performance data for Columbia Thermostat Fund and its benchmarks.
2 Overall ratings among 371 Aggressive Allocation funds. The Fund received a Morningstar Rating of 5 stars among 371 funds and 5 stars among 345 funds for the 3- and 5-year periods, respectively.
3 All ratings are for Class Z shares as of 06/30/12. Other classes may have different performance characteristics and may have different ratings. Out of 118 Z-share Columbia funds rated by Morningstar, eight funds received a 5-star Overall Rating and 48 funds received a 4-star Overall Rating. The Overall Morningstar RatingTM for a fund is derived from a weighted average of the performance figures associated with its 3-, 5- and 10-year Morningstar Rating metrics.
For each fund with at least a 3-year history, Morningstar calculates a Morningstar Rating based on a Morningstar Risk-Adjusted Return measure that accounts for variation in a fund's monthly performance (including the effects of sales charges, loads and redemption fees), placing more emphasis on downward variations and rewarding consistent performance. The top 10% of funds in each category receive 5 stars, the next 22.5% receive 4 stars, the next 35% receive 3 stars, the next 22.5% receive 2 stars and the bottom 10% receive 1 star. (Each share class is counted as a fraction of one fund within this scale and rated separately, which may cause slight variations in the distribution percentages.)
© 2012 Morningstar, Inc. All rights reserved. The Morningstar information contained herein: (1) is proprietary to Morningstar and/or its content providers; (2) may not be copied or distributed; and (3) is not warranted to be accurate, complete or timely. Neither Morningstar nor its content providers are responsible for any damages or losses arising from any use of this information.
5
Understanding Your Expenses
As a shareholder, you incur two types of costs. There are transaction costs, which generally include sales charges on purchases and may include redemption fees. There are also ongoing costs, which generally include management fees, distribution and service (Rule 12b-1) fees, and other Fund expenses. The following information is intended to help you understand your ongoing costs (in dollars) of investing in the Fund and to help you compare these costs with the ongoing costs of investing in other mutual funds.
Analyzing Your Fund's Expenses
To illustrate these ongoing costs, we have provided examples and calculated the expenses paid by investors in Class Z shares of the Funds during the period. The actual and hypothetical information in the tables is based on an initial investment of $1,000 at the beginning of the period indicated and held for the entire period. Expense information is calculated two ways and each method provides you with different information. The amount listed in the "Actual" column is calculated using the Funds' actual operating expenses and total return for the period. You may use the Actual information, together with the amount invested, to estimate the expenses that you paid over the period. Simply divide your account value by $1,000 (for example, an $8,600 account value divided by $1,000 = 8.6), then multiply the results by the expenses paid during the period under the Actual column. The amount listed in the "Hypothetical" column assumes a 5% annual rate of return before expenses (which is not the Funds' actual return) and then applies the Funds' actual expense ratio for the period to the hypothetical return. You should not use the hypothetical account values and expenses to estimate either your actual account balance at the end of the period or the expenses you paid during the period. See "Compare With Other Funds" below for details on how to use the hypothetical data.
In addition to the ongoing expenses which the Funds bear directly, Columbia Thermostat Fund's shareholders indirectly bear the Fund's allocable share of the costs and expenses of each underlying fund in which the Fund invests. You can also estimate the effective expenses paid during the period, which includes the indirect fees associated with investing in the underlying funds, by using the amounts listed in the effective expenses paid during the period column in the "Fund of Funds" table below.
Compare With Other Funds
Since all mutual funds are required to include the same hypothetical calculations about expenses in shareholder reports, you can use this information to compare the ongoing cost of investing in the Funds with other funds. To do so, compare the hypothetical example with the 5% hypothetical examples that appear in the shareholder reports of other funds. As you compare hypothetical examples of other funds, it is important to note that hypothetical examples are meant to highlight the ongoing costs of investing in a fund only and do not reflect any transaction costs, such as sales charges, or redemption or exchange fees. Therefore, the hypothetical calculations are useful in comparing ongoing costs only, and will not help you determine the relative total costs of owning different funds. If transaction costs were included in these calculations, your costs would be higher.
6
January 1, 2012 – June 30, 2012
| | | Account value at
the beginning of
the period ($) | | Account value at
the end of
the period ($) | | Expenses paid
during period ($) | | Fund's
annualized
expense
ratio (%) | |
| | | Actual | | Hypothetical | | Actual | | Hypothetical | | Actual | | Hypothetical | | Actual | |
| Class Z Shares | |
| Columbia Acorn Fund | | | 1,000.00 | | | | 1,000.00 | | | | 1,092.30 | | | | 1,021.08 | | | | 3.95 | | | | 3.82 | | | | 0.76 | | |
| Columbia Acorn International | | | 1,000.00 | | | | 1,000.00 | | | | 1,087.20 | | | | 1,020.34 | | | | 4.72 | | | | 4.57 | | | | 0.91 | | |
| Columbia Acorn USA | | | 1,000.00 | | | | 1,000.00 | | | | 1,103.50 | | | | 1,019.69 | | | | 5.44 | | | | 5.22 | | | | 1.04 | | |
| Columbia Acorn International Select | | | 1,000.00 | | | | 1,000.00 | | | | 1,103.90 | | | | 1,019.00 | | | | 6.17 | | | | 5.92 | | | | 1.18 | | |
| Columbia Acorn Select | | | 1,000.00 | | | | 1,000.00 | | | | 1,077.60 | | | | 1,019.79 | | | | 5.27 | | | | 5.12 | | | | 1.02 | | |
| Columbia Acorn Emerging Markets Fund | | | 1,000.00 | | | | 1,000.00 | | | | 1,098.50 | | | | 1,017.70 | | | | 7.51 | | | | 7.22 | | | | 1.44 | | |
| Columbia Acorn European Fund | | | 1,000.00 | | | | 1,000.00 | | | | 1,116.20 | | | | 1,018.25 | | | | 7.00 | | | | 6.67 | | | | 1.33 | | |
Fund of Funds—Columbia Thermostat Fund
January 1, 2012 – June 30, 2012
| | | Account value at
the beginning of
the period ($) | | Account value at
the end of
the period ($) | | Expenses paid
during period ($) | | Fund's
annualized
expense
ratio (%) | | Effective
expenses
paid during
the period | | Fund's
effective
annualized
expense
ratio (%) | |
| | | Actual | | Hypothetical | | Actual | | Hypothetical | | Actual | | Hypothetical | | Actual | | Actual | | Hypothetical | | Actual | |
| Class Z Shares | |
Columbia
Thermostat Fund | | | 1,000.00 | | | | 1,000.00 | | | | 1,067.70 | | | | 1,023.62 | | | | 1.29 | | | | 1.26 | | | | 0.25 | | | | 4.42 | | | | 4.33 | | | | 0.25 | | |
Expenses paid during the period are equal to the annualized expense ratio, multiplied by the average account value over the period and then multiplied by the number of days in the Fund's most recent fiscal half year and divided by 366.
Expenses do not include fees and expenses incurred indirectly by the Fund from the underlying funds in which the Fund may invest (also referred to as "acquired funds"), including affiliated and non-affiliated pooled investments vehicles (including mutual funds and exchange traded funds).
In the case of Columbia Thermostat Fund, effective expenses paid during the period and the Fund's effective annualized expense ratio include expenses borne directly to the class plus the Fund's pro rata portion of the ongoing expenses charged by the underlying funds using the expense ratio of each class of the underlying funds as of the underlying fund's most recent shareholder report.
Had the investment manager and/or certain of its affiliates not waived/reimbursed certain fees and expenses, account value at the end of the period would have been reduced.
7
Columbia Acorn Fund
In a Nutshell
 | |  | |
|
| Charles P. McQuaid | | Robert A. Mohn | |
|
| Lead Portfolio Manager | | Co-Portfolio Manager | |
|
Performance data shown represents past performance and is not a guarantee of future results. The investment return and principal value will fluctuate so that shares, when redeemed, may be worth more or less than the original cost. Current performance may be lower or higher than the performance data shown. Please visit columbiamanagement.com for daily and most recent month-end performance updates.
Fund Positions
in Mentioned Holdings
As a percentage of net assets, as of 6/30/12
| lululemon athletica | | | 1.6 | % | |
| Crown Castle International | | | 1.5 | % | |
| tw telecom | | | 1.4 | % | |
| FMC Technologies | | | 1.2 | % | |
| SBA Communications | | | 1.1 | % | |
| Biomarin Pharmaceuticals | | | 1.0 | % | |
| Seattle Genetics | | | 0.9 | % | |
| Alexion Pharmaceuticals | | | 0.9 | % | |
| Coach | | | 0.7 | % | |
| Auxilium Pharmaceuticals | | | 0.5 | % | |
| Pacific Rubiales Energy | | | 0.5 | % | |
| Onyx Pharmaceuticals | | | 0.3 | % | |
| Fossil | | | 0.2 | % | |
Columbia Acorn Fund fell 5.42% in the second quarter, offsetting some of the first quarter gains to end up 9.23% for the first half of 2012. The Fund's primary benchmark, the Russell 2500 Index, dropped 4.14% in the quarter and rose 8.31% during the half year. In both periods, Columbia Acorn Fund beat the Lipper Mid-Cap Growth Index, which fell 6.32% in the quarter and gained 7.72% in the half.
Driven by explosive growth in data transmission, telecom stocks helped performance during both the quarter and the half. Cell tower companies Crown Castle International and SBA Communications rose 10% and 12%, respectively, in the quarter and 31% and 33%, respectively, in the half. tw telecom, which provides fiber optic connections to over 15,000 buildings, grew 16% in the second quarter and 32% in the half.
Pharmaceutical and biotech stocks bolstered performance in the second quarter. Onyx Pharmaceuticals, Auxilium Pharmaceuticals, Seattle Genetics and Biomarin Pharmaceuticals all reported good news about drugs either recently approved and/or in development pipelines. The stocks' gains in the quarter ranged from 16% to 77%. Alexion Pharmaceuticals rose 7% in the quarter, resulting in a 39% gain in the half and making it the Fund's second largest dollar winner year to date through June 30.
Consumer durable and apparel stocks helped performance in the first quarter but hurt in the second. The Fund's largest dollar loser in the second quarter was premium active apparel retailer lululemon athletica, down 20% on disappointing earnings guidance. Last year investors were wrongly concerned that inventories were too high but, in the second quarter of 2012, low inventories reduced near-term earnings upside. Due to fine first quarter performance, lululemon was still the Fund's largest dollar winner for the half, up 28%. Other consumer stocks fell in the second quarter due to concerns about sales overseas; handbag maker Coach dropped 24% and watch designer and retailer Fossil fell 42%.
Energy stocks were also disappointing in the second quarter, largely due to declining oil prices and low natural gas prices. In addition, offshore oil equipment maker FMC Technologies had problems ramping up production. Its stock fell 22% in the quarter and was down 25% in the half, making it the Fund's second largest dollar loser in the quarter and the largest loser in the half. Colombian oil producer Pacific Rubiales Energy continued to be volatile; after surging 59% in the first quarter, it fell 27% in the second. The company suffered from delays in receiving drilling permits and lacked new oil discoveries. We cut the Fund's weighting in energy stocks during the second quarter to 6.2%, about matching the benchmark.
Columbia Acorn Fund's international stocks were off 12.74% in the quarter and up just 2.31% in the half.* While we see lots of foreign companies with good business models and attractively valued stocks, we fear macroeconomic concerns could keep their stocks depressed. Foreign holdings accounted for 8.3% of assets at the end of the half, down from 9.2% at the end of the first quarter and 9.3% at the end of 2011. Investors that desire greater exposure to foreign stocks may wish to consider one or more of the Columbia Acorn international funds.
As of press time, a majority of companies in Columbia Acorn Fund seem to be achieving their earnings targets, though many are cutting their outlooks somewhat. Corporations and consumers have generally improved their balance sheets since the Great Recession. As a percentage of income, minimum required payments on consumer mortgages and consumer credit are near 20-year lows. However, federal government deficit, tax and regulatory issues appear to be hindering economic growth and causing uncertainty in the markets. We can't predict when uncertainty will lessen, but when it does, stock prices may be a lot higher. We continue to pursue investments in good businesses at reasonable prices.
*These returns are not comparable to mutual fund returns, as they are gross of fees and other expenses and do not portray the cash effects incurred by actual mutual funds. Columbia Acorn Fund's foreign stockholdings were not purchased as a balanced, stand-alone portfolio.
Stocks of small- and mid-cap companies pose special risks, including possible illiquidity and greater price volatility than stocks of larger, more established companies. International investing involves special risks, including foreign taxation, currency risks, risks associated with possible differences in financial standards and other risks associated with future political and economic developments.
Portfolio holdings are subject to change periodically and may not be representative of current holdings.
8
Columbia Acorn Fund (ACRNX)
At a Glance
Performance data shown represents past performance and is not a guarantee of future results. The investment return and principal value of an investment will fluctuate so that shares, when redeemed, may be worth more or less than their original cost. Current performance may be lower or higher than the performance data shown. Performance results reflect any fee waivers or reimbursements of Fund expenses by the investment manager and/or any of its affiliates. Absent these fee waivers and/or expense reimbursement arrangements, performance results would have been lower. Please visit columbiamanagement.com for daily and most recent month-end updates.
Pretax and After-tax Average Annual Total Returns (Class Z)
through June 30, 2012
| Inception 6/10/70 | | Year
to date* | | 1 year | | 5 years | | 10 years | |
| Returns before taxes | | | 9.23 | % | | | -2.78 | % | | | 1.70 | % | | | 9.59 | % | |
| Returns after taxes on distributions | | | 9.04 | | | | -3.40 | | | | 1.15 | | | | 8.99 | | |
Returns after taxes on distributions
and sale of fund shares | | | 6.26 | | | | -1.04 | | | | 1.40 | | | | 8.45 | | |
| Russell 2500 Index (pretax)** | | | 8.31 | | | | -2.29 | | | | 1.18 | | | | 8.01 | | |
All results shown assume reinvestment of distributions.
*Year to date data is not annualized.
**The Fund's primary benchmark.
After-tax returns are calculated using the highest historical individual federal marginal income tax rates, and do not reflect the impact of state and local taxes. Returns after taxes on distributions and sale of Fund shares reflect the additional tax impact of long-term gains or losses realized when Fund shares are sold. The returns are taxed at the maximum rate and assume shares were purchased at the beginning of the period. Actual after-tax returns depend on the investor's tax situation and may differ from those shown. After-tax returns are not relevant to investors who hold their Fund shares through tax-deferred arrangements such as 401(k) plans or individual retirement accounts. After-tax returns are shown for Class Z shares only; after-tax returns for other share classes will vary. Indexes do not reflect any deduction for fees, expenses or taxes.
The Fund's Class Z annual operating expense ratio, as stated in the May 1, 2012, prospectus, is 0.77%.
Columbia Acorn Fund Portfolio Diversification
as a percentage of net assets, as of 6/30/12

Columbia Acorn Fund Top 10 Holdings
as a percentage of net assets, as of 6/30/12
| 1. | | Ametek
Aerospace/Industrial Instruments | | | 2.0
| % | |
| 2. | | Donaldson
Industrial Air Filtration | | | 1.6
| % | |
| 3. | | lululemon athletica
Premium Active Apparel Retailer | | | 1.6
| % | |
| 4. | | Crown Castle International
Communications Towers | | | 1.5
| % | |
| 5. | | Mettler-Toledo International
Laboratory Equipment | | | 1.5
| % | |
| 6. | | tw telecom
Fiber Optic Telephone/Data Services | | | 1.4
| % | |
| 7. | | Informatica
Enterprise Data Integration Software | | | 1.2
| % | |
| 8. | | Cepheid
Molecular Diagnostics | | | 1.2
| % | |
| 9. | | FMC Technologies
Oil & Gas Well Head Manufacturer | | | 1.2
| % | |
| 10. | | SBA Communications
Communications Towers | | | 1.1
| % | |
The Fund's top 10 holdings and portfolio diversification vary with changes in portfolio investments. See the Statement of Investments for a complete list of the Fund's holdings.
The Growth of a $10,000 Investment in Columbia Acorn Fund (Class Z)
June 10, 1970 through June 30, 2012
This graph compares the results of $10,000 invested in Columbia Acorn Fund at inception on June 10, 1970 to the S&P 500 Index and to an initial $31,777 investment in the Russell 2500 Index on the index's December 31, 1978 inception date. Although the indexes are provided for use in assessing the Fund's performance, the Fund's holdings may differ significantly from those in the indexes. The indexes are unmanaged and returns for both the indexes and the Fund include reinvested dividends and capital gains. It is not possible to invest directly in an index. The graph does not reflect taxes that a shareholder would pay on Fund distributions or on a sale of Fund shares.
Total Net Assets of the Fund: $17.2 billion
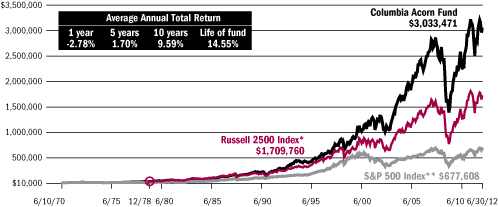
* A $10,000 investment in Columbia Acorn Fund at inception appreciated to $31,777 on December 31, 1978, the inception date of the Russell 2500 Index. For comparison with the Russell 2500 Index, we assigned the index the same value as the Fund at index inception.
**Although the Fund typically invests in small- and mid-sized companies, the comparison to the S&P 500 Index is presented to show performance against a widely recognized market index over the life of the Fund.
9
Columbia Acorn International
In a Nutshell
 | |  | |
|
| P. Zachary Egan | | Louis J. Mendes III | |
|
| Co-Portfolio Manager | | Co-Portfolio Manager | |
|
Performance data shown represents past performance and is not a guarantee of future results. The investment return and principal value will fluctuate so that shares, when redeemed, may be worth more or less than the original cost. Current performance may be lower or higher than the performance data shown. Please visit columbiamanagement.com for daily and most recent month-end performance updates.
Fund's Positions
in Mentioned Holdings
As a percentage of net assets, as of 6/30/12
| Eurofins Scientific | | | 1.1 | % | |
| Gemalto | | | 0.9 | % | |
| Mongolian Mining | | | 0.6 | % | |
| Nagacorp | | | 0.4 | % | |
| Northam Platinum | | | 0.4 | % | |
| Archipelago Resources | | | 0.4 | % | |
| FMC Technologies | | | 0.3 | % | |
| Celtic Exploration | | | 0.1 | % | |
Columbia Acorn International fell 5.52% in the second quarter of 2012, which was 2.51% better than its primary benchmark, the S&P Global Ex-U.S. between $500M and $5B Index. This comes on the heels of a strong first quarter, during which the Fund was up 15.07%. The Fund's return for the first half of the year was 8.72%, 3.90% ahead of the benchmark. For comparison, the large-cap, developed-market MSCI EAFE Index rose 2.96% during the six month period.
This reversal of fortune in the markets in the second quarter occurred in a context of high anxiety regarding the financial stability of peripheral eurozone states and the worsening outlook for Chinese growth. Markets do not like uncertainty and the lack of a resolution to European budget crises continues to rattle the confidence of long-term investors in the region. As confidence falls, sovereign borrowing costs rise, which further deteriorates the long-term financial outlook. Aside from this unhelpful, self-reinforcing mechanism, signs of a slowing Chinese economy further fueled market volatility. Despite the ebb and flow of sentiment, however, many of the Fund's holdings have continued to post a pleasing growth in earnings.
Most notable about the Fund's first-half results is the relatively strong performance of classic "Acorn-style" companies. By this we refer to companies that are taking advantage of structural changes within the market for their products or services—whether related to regulation, technology, energy efficiency, social change or otherwise. These can be contrasted with companies that primarily depend on macroeconomic factors to drive earnings. Top performers for the half year included Nagacorp (+85%), a Cambodian-based casino operator catering to the growing needs of Indochina's emerging middle class for quality entertainment facilities. Two French companies, Eurofins Scientific (+72%) and Gemalto (+47%) performed well despite eurozone concerns. Eurofins Scientific provides laboratory analysis of food, pharmaceuticals and cosmetics products globally and, after a long period of consolidation, looms as a one-stop solution for multinational companies and others increasingly concerned with the safety and purity of traded goods. Gemalto is a leader in developing smart-chip technology for use in credit cards and mobile handsets. These mobile devices are finding increasingly valuable applications in secure payment systems.
Macroeconomic worries did hurt the Fund in commodity-related holdings. Fears of slower global growth drove down a number of energy and basic material stocks. Indonesian gold miner Archipelago Resources (-26%), Mongolian coal miner Mongolian Mining (-24%) and South African platinum miner Northam Platinum (-23%) all fell during the half year on weakened outlook for demand. Similarly, oil exploration-related companies Celtic Exploration (-41%) and FMC Technologies (-25%) declined on expectations that oil prices would soften.
We expect continued volatility in the second half of the year. The euro debt crisis does not lend itself to a tidy resolution in the short- or even mid-term. The most likely outcome in our view is piecemeal structural reform within uncompetitive states, incented by explicit and tacit German support and the fact that the alternatives entail a lower standard of living for these states on a long-term basis. We believe that will be a political process fraught with complexity and made more complicated by the way Europe is organized. In the fall, the presidential election in the United States and the transition of leadership in China will also likely become a focus for continued sentiment shifts in the marketplace. As always, we will strive to work through the noise to identify companies where reasonable valuations are supported by good or improving fundamentals. Thank you for your continued investment in the Fund.
International investing involves special risks, including foreign taxation, currency risks, risks associated with possible differences in financial standards and other risks associated with future political and economic developments. Stocks of small- and mid-cap companies pose special risks, including possible illiquidity and greater price volatility than stocks of larger, more established companies. Investing in emerging markets may involve greater risks than investing in more developed countries. In addition, concentration of investments in a single region may result in greater volatility.
Portfolio holdings are subject to change periodically and may not be representative of current holdings.
10
Columbia Acorn International (ACINX)
At a Glance
Performance data shown represents past performance and is not a guarantee of future results. The investment return and principal value of an investment will fluctuate so that shares, when redeemed, may be worth more or less than their original cost. Current performance may be lower or higher than the performance data shown. Performance results reflect any fee waivers or reimbursements of Fund expenses by the investment manager and/or any of its affiliates. Absent these fee waivers and/or expense reimbursement arrangements, performance results would have been lower. Please visit columbiamanagement.com for daily and most recent month-end updates.
Pretax and After-tax Average Annual Total Returns (Class Z)
through June 30, 2012
| Inception 9/23/92 | | Year
to date* | | 1 year | | 5 years | | 10 years | |
| Returns before taxes | | | 8.72 | % | | | -9.31 | % | | | -0.84 | % | | | 11.07 | % | |
| Returns after taxes on distributions | | | 8.52 | | | | -9.37 | | | | -1.38 | | | | 10.51 | | |
Returns after taxes on distributions
and sale of fund shares | | | 5.66 | | | | -5.94 | | | | -0.76 | | | | 9.89 | | |
S&P Global Ex-U.S. Between
$500M and $5B Index** | | | 4.82 | | | | -15.17 | | | | -2.48 | | | | 10.95 | | |
All results shown assume reinvestment of distributions.
*Year to date data is not annualized.
**The Fund's primary benchmark.
After-tax returns are calculated using the highest historical individual federal marginal income tax rates, and do not reflect the impact of state and local taxes. Returns after taxes on distributions and sale of Fund shares reflect the additional tax impact of long-term gains or losses realized when Fund shares are sold. The returns are taxed at the maximum rate and assume shares were purchased at the beginning of the period. Actual after-tax returns depend on the investor's tax situation and may differ from those shown. After-tax returns are not relevant to investors who hold their Fund shares through tax-deferred arrangements such as 401(k) plans or individual retirement accounts. After-tax returns are shown for Class Z shares only; after-tax returns for other share classes will vary. Indexes do not reflect any deduction for fees, expenses or taxes.
The Fund's Class Z shares annual operating expense ratio, as stated in the May 1, 2012, prospectus, is 0.98%.
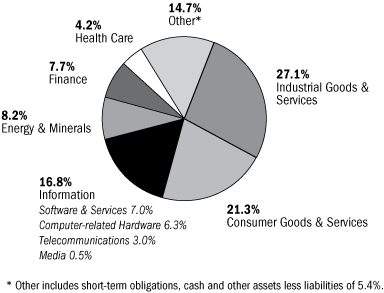
Columbia Acorn International Portfolio Diversification
as a percentage of net assets, as of 6/30/12
Columbia Acorn International Top 10 Holdings
as a percentage of net assets, as of 6/30/12
| 1. | | Far EasTone Telecom (Taiwan)
Taiwan's Third Largest Mobile Operator | | | 1.3
| % | |
| 2. | | Melco Crown Entertainment (Hong Kong)
Macau Casino Operator | | | 1.2
| % | |
| 3. | | Hexagon (Sweden)
Design, Measurement & Visualization Software & Equipment | | | 1.2
| % | |
| 4. | | Eurofins Scientific (France)
Food, Pharmaceuticals & Materials Screening & Testing | | | 1.1
| % | |
| 5. | | Naspers (South Africa)
Media in Africa, China, Russia & Other Emerging Markets | | | 1.0
| % | |
| 6. | | Kansai Paint (Japan)
Paint Producer in Japan, India, China & Southeast Asia | | | 1.0
| % | |
| 7. | | Localiza Rent A Car (Brazil)
Car Rental | | | 0.9
| % | |
| 8. | | Partners Group (Switzerland)
Private Markets Asset Management | | | 0.9
| % | |
| 9. | | Taiwan Mobile (Taiwan)
Taiwan's Second Largest Mobile Operator | | | 0.9
| % | |
| 10. | | Gemalto (France)
Digital Security Solutions | | | 0.9
| % | |
The Fund's top 10 holdings and portfolio diversification vary with changes in portfolio investments. See the Statement of Investments for a complete list of the Fund's holdings.
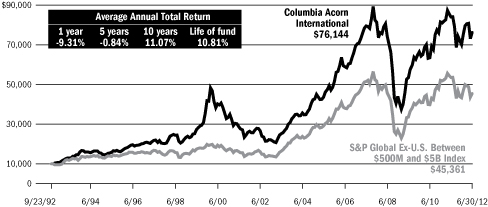
The Growth of a $10,000 Investment in Columbia Acorn International (Class Z)
September 23, 1992 through June 30, 2012
This graph compares the results of $10,000 invested in Columbia Acorn International at inception on September 23, 1992 to the S&P Global Ex-U.S. Between $500M and $5B Index. Although the index is provided for use in assessing the Fund's performance, the Fund's holdings may differ significantly from those in the index. The index is unmanaged and returns for both the index and Fund include reinvested dividends and capital gains. It is not possible to invest directly in an index. The graph does not reflect taxes that a shareholder would pay on Fund distributions or on a sale of Fund shares.
Total Net Assets of the Fund: $6.0 billion
11
Columbia Acorn USA
In a Nutshell
 | | | |
|
| Robert A. Mohn | | | |
|
| Lead Portfolio Manager | | | |
|
Performance data shown represents past performance and is not a guarantee of future results. The investment return and principal value will fluctuate so that shares, when redeemed, may be worth more or less than the original cost. Current performance may be lower or higher than the performance data shown. Please visit columbiamanagement.com for daily and most recent month-end performance updates.
Fund's Positions
in Mentioned Holdings
As a percentage of net assets, as of 6/30/12
| Informatica | | | 2.4 | % | |
| tw telecom | | | 2.4 | % | |
| lululemon athletica | | | 2.2 | % | |
| Gaylord Entertainment | | | 2.1 | % | |
| SBA Communications | | | 1.9 | % | |
| Abercrombie & Fitch | | | 1.0 | % | |
| Atmel | | | 0.8 | % | |
| Auxilium Pharmaceuticals | | | 0.7 | % | |
| Finisar | | | 0.7 | % | |
| Akorn | | | 0.6 | % | |
| Onyx Pharmaceuticals | | | 0.4 | % | |
| SM Energy | | | 0.4 | % | |
| Houston American Energy | | | 0.0 | %* | |
*Rounds to less than 0.1%.
Columbia Acorn USA ended the second quarter of 2012 down 5.18%, underperforming the 3.47% drop of its primary benchmark, the Russell 2000 Index. For the half year ended June 30, 2012, the Fund was up 10.35%, outpacing the 8.53% gain of its benchmark. It was a rough quarter for the markets in general, but lagging performance in Fund retail and technology stocks further dampened returns relative to the benchmark.
On the positive side, two deal announcements positively impacted results. Cost management software company Ariba is to be taken over by SAP. Ariba's stock rose 37% in the quarter on the news and ended the half year up 60%. Convention hotel operator Gaylord Entertainment announced it would convert to a real estate investment trust, news that sent its stock up 25% for the quarter and 60% for the half year.
The Fund's two large investments in the telecom sector, tw telecom, a provider of fiber optic telephone and data services, and SBA Communications, a mobile communications tower company, both benefited from a surge in data usage and reported solid growth in cash flow year-over-year. Their stocks responded favorably, with tw telecom ending the quarter up 16% and the half year up 32%. SBA Communications had a 12% gain in the quarter and was up 33% year-to-date through June.
Several Fund biopharmaceutical stocks were strong in the second quarter. Auxilium Pharmaceuticals gained 45% on news of a successful phase three drug trial. Onyx Pharmaceuticals gained 77% upon receiving approval from an FDA advisory panel for one of its medications. Generic drug manufacturer Akorn rose 34% in the quarter as sales of its generic injectable drugs tripled versus the prior year.
Laggards for the second quarter included several tech stocks. Informatica, an enterprise data integration software company, fell 20% in the quarter (but was up 15% year to date) on concerns over slowing sales activity. Those concerns were confirmed after quarter end as the company pre-announced a drop in software license revenue. The economic turmoil overseas is impacting Informatica's near-term results, as 25% of the company's revenues are generated in Europe. Semiconductor manufacturer Atmel fell 32% in the quarter and ended the half year down 17%. Atmel's revenues dropped 22% versus the prior year due to the loss of an anticipated touchscreen microcontroller contract. Optical components manufacturer Finisar fell 26% in the quarter and was down 11% for the half year as its business suffered from weakening global demand.
Several Fund retail stocks also struggled during the period ended June 30. Premium active apparel retailer lululemon athletica announced a fantastic first quarter, with same-store sales up 25% over the prior year, but company guidance of slower growth in the second quarter sent the stock down 21%. For the half year lululemon gained 27%. Teen apparel retailer Abercrombie & Fitch experienced a sales shortfall on woeful sales in woebegone Europe. Its stock was down roughly 30% for the quarter and for the half year.
Our energy investments were also weak. Oil and gas producer SM Energy fell more than 30% for both the second quarter and the half year as prices of natural gas liquids fell more than crude oil during the second quarter. Houston American Energy was down 79% for the quarter and 91% for the half year on disappointing drilling results in Colombia.
These days the financial press seems to enjoy obsessing over existential economic issues. Certainly, talk of euro woes and fiscal cliffs can be as riveting and entertaining as a good horror flick. "Experts" claim that investing is all about getting the macro right, given the current uncertain economic environment (truthfully, when has the economic outlook ever been certain?). But when the investment community is so overly focused on the big picture, we believe it pays to go small. We'll leave the macro anguish to others who can't see the trees for the forest, and instead dig for what we believe are well-run companies able to grow faster than their peers and that thrive in our current much-maligned, but still growing, economy.
Stocks of small- and mid-cap companies pose special risks, including possible illiquidity and greater price volatility than stocks of larger, more established companies.
Portfolio holdings are subject to change periodically and may not be representative of current holdings.
12
Columbia Acorn USA (AUSAX)
At a Glance
Performance data shown represents past performance and is not a guarantee of future results. The investment return and principal value of an investment will fluctuate so that shares, when redeemed, may be worth more or less than their original cost. Current performance may be lower or higher than the performance data shown. Performance results reflect any fee waivers or reimbursements of Fund expenses by the investment manager and/or any of its affiliates. Absent these fee waivers and/or expense reimbursement arrangements, performance results would have been lower. Please visit columbiamanagement.com for daily and most recent month-end updates.
Pretax and After-tax Average Annual Total Returns (Class Z)
through June 30, 2012
| Inception 9/4/96 | | Year
to date* | | 1 year | | 5 years | | 10 years | |
| Returns before taxes | | | 10.35 | % | | | -3.90 | % | | | 0.97 | % | | | 7.85 | % | |
| Returns after taxes on distributions | | | 10.32 | | | | -4.01 | | | | 0.69 | | | | 7.56 | | |
Returns after taxes on distributions
and sale of fund shares | | | 6.77 | | | | -2.40 | | | | 0.80 | | | | 6.92 | | |
| Russell 2000 Index (pretax)** | | | 8.53 | | | | -2.08 | | | | 0.54 | | | | 7.00 | | |
All results shown assume reinvestment of distributions.
*Year to date data is not annualized.
**The Fund's primary benchmark.
After-tax returns are calculated using the highest historical individual federal marginal income tax rates, and do not reflect the impact of state and local taxes. Returns after taxes on distributions and sale of Fund shares reflect the additional tax impact of long-term gains or losses realized when Fund shares are sold. The returns are taxed at the maximum rate and assume shares were purchased at the beginning of the period. Actual after-tax returns depend on the investor's tax situation and may differ from those shown. After-tax returns are not relevant to investors who hold their Fund shares through tax-deferred arrangements such as 401(k) plans or individual retirement accounts. After-tax returns are shown for Class Z shares only; after-tax returns for other share classes will vary. Indexes do not reflect any deduction for fees, expenses or taxes.
The Fund's Class Z shares annual operating expense ratio, as stated in the May 1, 2012, prospectus, is 1.05%.
Columbia Acorn USA Portfolio Diversification
as a percentage of net assets, as of 6/30/12

Columbia Acorn USA Top 10 Holdings
as a percentage of net assets, as of 6/30/12
| 1. | | Ametek
Aerospace/Industrial Instruments | | | 2.8
| % | |
| 2. | | Informatica
Enterprise Data Integration Software | | | 2.4
| % | |
| 3. | | Nordson
Dispensing Systems for Adhesives & Coatings | | | 2.4
| % | |
| 4. | | tw telecom
Fiber Optic Telephone/Data Services | | | 2.4
| % | |
| 5. | | Micros Systems
Information Systems for Hotels, Restaurants & Retailers | | | 2.3
| % | |
| 6. | | lululemon athletica
Premium Active Apparel Retailer | | | 2.2
| % | |
| 7. | | Gaylord Entertainment
Convention Hotels | | | 2.1
| % | |
| 8. | | Bally Technologies
Slot Machines & Software | | | 1.9
| % | |
| 9. | | ESCO Technologies
Automatic Electric Meter Readers | | | 1.9
| % | |
| 10. | | SBA Communications
Communications Towers | | | 1.9
| % | |
The Fund's top 10 holdings and portfolio diversification vary with changes in portfolio investments. See the Statement of Investments for a complete list of the Fund's holdings.
The Growth of a $10,000 Investment in Columbia Acorn USA (Class Z)
September 4, 1996 through June 30, 2012
This graph compares the results of $10,000 invested in Columbia Acorn USA at inception on September 4, 1996 to the Russell 2000 Index. Although the index is provided for use in assessing the Fund's performance, the Fund's holdings may differ significantly from those in the index. The index is unmanaged and returns for both the index and the Fund include reinvested dividends and capital gains. It is not possible to invest directly in an index. The graph does not reflect taxes that a shareholder would pay on Fund distributions or on a sale of Fund shares.
Total Net Assets of the Fund: $1.6 billion
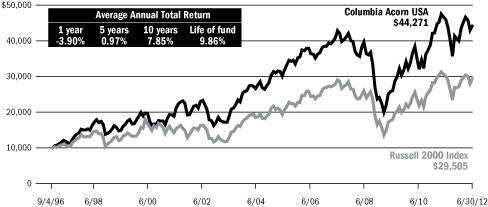
13
Columbia Acorn International Select
In a Nutshell

Christopher J. Olson
Lead Portfolio Manager
Performance data shown represents past performance and is not a guarantee of future results. The investment return and principal value will fluctuate so that shares, when redeemed, may be worth more or less than the original cost. Current performance may be lower or higher than the performance data shown. Please visit columbiamanagement.com for daily and most recent month-end performance updates.
Fund's Positions
in Mentioned Holdings
As a percentage of net assets, as of 6/30/12
| Far EasTone Telecom | | | 7.1 | % | |
| Ascendas REIT | | | 6.6 | % | |
| Mapletree Industrial Trust | | | 5.8 | % | |
| Seven Bank | | | 4.4 | % | |
| Rand Merchant Insurance | | | 4.1 | % | |
| Taiwan Mobile | | | 3.1 | % | |
| Mapletree Logistics Trust | | | 2.6 | % | |
| Archipelago Resources | | | 2.2 | % | |
| Zhaojin Mining Industry | | | 1.6 | % | |
Columbia Acorn International Select ended the second quarter of 2012 down 0.87%, holding up much better than the 7.60% drop of its primary benchmark, the S&P Developed Ex-U.S. Between $2B and $10B Index. Year to date through June 30, 2012, the Fund was up 10.39%, strongly outperforming the 3.47% gain of its benchmark.
Financial stocks provided the biggest boost to Fund gains relative to the benchmark for both the second quarter and the half year. Singapore's Ascendas REIT, Mapletree Industrial Trust and Mapletree Logistics Trust had gains ranging from 4% to 12% in the quarter and each was up 20% or more year to date. These industrial property landlords continue to benefit from a resilient Singaporean economic outlook and investor interest in their strong dividend yields. Japan's Seven Bank, a provider of ATM processing services, rose 17% in the quarter and was up 34% for the half year as its ATM expansion within Japan continued to benefit the company's stock. Rand Merchant Insurance, a South African insurance company, led gains in the first quarter but cooled in the second quarter, falling 4.93%. Despite the drop in the second quarter, Rand Merchant was still up 31% for the half year.
Fund holdings in the telecom services sector also performed strongly for both the second quarter and half year. Far EasTone Telecom, Taiwan's third largest mobile operator, gained 6% in the second quarter and ended the half year up 16%. The company benefited from accelerated smartphone sales that are driving increased data usage. Taiwan Mobile, the second largest mobile operator in Taiwan, saw its stock rise 8% in the second quarter, leading to a 6% gain for the half year. Taiwan Mobile's stock fell in the first quarter, despite an improving earnings outlook, but investors returned in the second quarter after their brief flight to more cyclical names.
Mining companies did not fare well in the first half of 2012 as fears of slower global growth decreased demand. The biggest detractor to Fund performance in the second quarter was Indonesian gold miner Archipelago Resources, which fell 23% in the quarter and was down 26% for the half year. In China, Zhaojin Mining Industry fell 20% in the second quarter and ended the half year off 15%. Northam Platinum, a South African platinum miner, was off 26% in the quarter and down 22% year to date. We opted to sell the Fund's position in Northam Platinum and invested the proceeds elsewhere.
While fears of a global recession eased in the first quarter, the second quarter saw renewed uncertainty regarding the financial stability of Europe and signs of slowing economic growth in China. We are also concerned and have maintained a focus on defensive, secular growth companies with good dividend yields and strong balance sheets. As we mentioned last quarter, the Fund remains underweight in areas such as Europe, the United Kingdom and Japan, where the concerns about global debt are greatest, and is overweight in Asia ex-Japan and emerging markets.
International investing involves special risks, including foreign taxation, currency risks, risks associated with possible differences in financial standards and other risks associated with future political and economic developments. Stocks of small- and mid-cap companies pose special risks, including possible illiquidity and greater price volatility than stocks of larger, more established companies. Investing in emerging markets may involve greater risks than investing in more developed countries.
Portfolio holdings are subject to change periodically and may not be representative of current holdings.
14
Columbia Acorn International Select (ACFFX)
At a Glance
Performance data shown represents past performance and is not a guarantee of future results. The investment return and principal value of an investment will fluctuate so that shares, when redeemed, may be worth more or less than their original cost. Current performance may be lower or higher than the performance data shown. Performance results reflect any fee waivers or reimbursements of Fund expenses by the investment manager and/or any of its affiliates. Absent these fee waivers and/or expense reimbursement arrangements, performance results would have been lower. Please visit columbiamanagement.com for daily and most recent month-end updates.
Pretax and After-tax Average Annual Total Returns (Class Z)
through June 30, 2012
| Inception 11/23/98 | | Year
to date* | | 1 year | | 5 years | | 10 years | |
| Returns before taxes | | | 10.39 | % | | | -3.98 | % | | | 0.16 | % | | | 10.52 | % | |
| Returns after taxes on distributions | | | 10.32 | | | | -4.35 | | | | -0.24 | | | | 10.30 | | |
Returns after taxes on distributions
and sale of fund shares | | | 6.85 | | | | -1.87 | | | | 0.18 | | | | 9.48 | | |
S&P Developed Ex-U.S. Between
$2B and $10B Index (pretax)** | | | 3.47 | | | | -14.48 | | | | -4.59 | | | | 8.19 | | |
All results shown assume reinvestment of distributions.
*Year to date data is not annualized.
**The Fund's primary benchmark.
After-tax returns are calculated using the highest historical individual federal marginal income tax rates, and do not reflect the impact of state and local taxes. Returns after taxes on distributions and sale of Fund shares reflect the additional tax impact of long-term gains or losses realized when Fund shares are sold. The returns are taxed at the maximum rate and assume shares were purchased at the beginning of the period. Actual after-tax returns depend on the investor's tax situation and may differ from those shown. After-tax returns are not relevant to investors who hold their Fund shares through tax-deferred arrangements such as 401(k) plans or individual retirement accounts. After-tax returns are shown for Class Z shares only; after-tax returns for other share classes will vary. Indexes do not reflect any deduction for fees, expenses or taxes.
The Fund's Class Z shares annual operating expense ratio, as stated in the May 1, 2012, prospectus, is 1.25%.
Columbia Acorn International Select Portfolio Diversification
as a percentage of net assets, as of 6/30/12
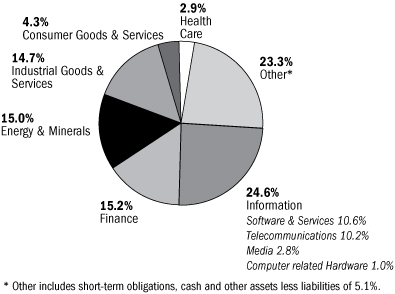
Columbia Acorn International Select
Top 10 Holdings
as a percentage of net assets, as of 6/30/12
| 1. | | Far EasTone Telecom (Taiwan)
Taiwan's Third Largest Mobile Operator | | | 7.1
| % | |
| 2. | | Ascendas REIT (Singapore)
Industrial Property Landlord | | | 6.6
| % | |
| 3. | | Mapletree Industrial Trust (Singapore)
Industrial Property Landlord | | | 5.8
| % | |
| 4. | | Seven Bank (Japan)
ATM Processing Services | | | 4.4
| % | |
| 5. | | Rand Merchant Insurance (South Africa)
Directly Sold Property & Casualty Insurance; Holdings in
Other Insurers | | | 4.1
| % | |
| 6. | | Fresnillo (Mexico)
Silver & Metal Byproduct Mining in Mexico | | | 4.0
| % | |
| 7. | | Goldcorp (Canada)
Gold Mining | | | 3.8
| % | |
| 8. | | UGL (Australia)
Engineering & Facilities Management | | | 3.8
| % | |
| 9. | | Wirecard (Germany)
Online Payment Processing & Risk Management | | | 3.6
| % | |
| 10. | | Commonwealth Property Office Fund (Australia)
Australia Prime Office REIT | | | 3.2
| % | |
The Fund's top 10 holdings and portfolio diversification vary with changes in portfolio investments. See the Statement of Investments for a complete list of the Fund's holdings.
The Growth of a $10,000 Investment in Columbia Acorn International Select (Class Z)
November 23, 1998 through June 30, 2012
This graph compares the results of $10,000 invested in Columbia Acorn International Select at inception on November 23, 1998 to the S&P Developed Ex-U.S. Between $2B and $10B Index. Although the index is provided for use in assessing the Fund's performance, the Fund's holdings may differ significantly from those in the index. The index and Fund returns include reinvested dividends and capital gains. It is not possible to invest directly in an index. The graph does not reflect taxes that a shareholder would pay on Fund distributions or on a sale of Fund shares.
Total Net Assets of the Fund: $338.1 million
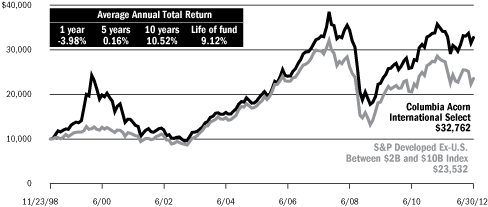
15
Columbia Acorn Select
In a Nutshell
 | |  | |
|
| Ben Andrews | | Robert A. Chalupnik | |
|
| Lead Portfolio Manager | | Co-Portfolio Manager | |
|
Performance data shown represents past performance and is not a guarantee of future results. The investment return and principal value will fluctuate so that shares, when redeemed, may be worth more or less than the original cost. Current performance may be lower or higher than the performance data shown. Please visit columbiamanagement.com for daily and most recent month-end performance updates.
Fund's Positions
in Mentioned Holdings
As a percentage of net assets, as of 6/30/12
| Discover Financial Services | | | 6.1 | % | |
| Hertz | | | 5.2 | % | |
| CNO Financial Group | | | 5.1 | % | |
| SBA Communications | | | 3.8 | % | |
| Gaylord Entertainment | | | 3.3 | % | |
| Coach | | | 3.0 | % | |
| Sanmina-SCI | | | 2.3 | % | |
| Akorn | | | 1.9 | % | |
| Abercrombie & Fitch | | | 1.4 | % | |
| Canacol | | | 1.2 | % | |
| Vail Resorts | | | 1.1 | % | |
| Houston American Energy | | | 0.1 | % | |
Columbia Acorn Select fell 8.44% in the second quarter of 2012, but year to date through June 30, 2012 was up 7.76%. The Fund's primary benchmark, the S&P MidCap 400 Index was down 4.93% in the second quarter and was up 7.90% year to date. The S&P 500 Index, a general barometer of U.S. market large-cap performance, was down 2.75% in the quarter and year to date was up 9.49%.
In our first quarter report, we noted that we were seeing some strengthening in U.S. economic indicators and speculated that improvements might continue for a little while. Unfortunately, they didn't. U.S., European and Asian economic indicators turned down in the second quarter. Many of the stocks that added to the Fund's outperformance in the first quarter took it away this quarter.
On the downside, Sanmina-SCI, Hertz and Coach each cost the Fund close to one percent of portfolio performance in the second quarter. On the upside, we saw Gaylord Entertainment, Akorn and SBA Communications each add between 40 and 65 basis points to the Fund's performance in the quarter. For the first six months of the year, Discover Financial Services added two percent to the Fund's performance, while Gaylord Entertainment, CNO Financial Group and SBA Communications each added a little more than one percent. The larger detractors to the Fund's six-month performance were Houston American Energy, Abercrombie & Fitch and Canacol, which each cost the portfolio between 60 and 75 basis points.
When an economy is over leveraged, we believe a country has a choice to either grow, collapse, or inflate its way out of the problem. In our opinion, the western world has been doing a pretty good job of inflating but political leadership has done a poor job of providing a path to growth. The United States' path has been fraught with consistently changing regulation, controversial interpretations of legislation and court rulings, and concerns that new anti-business legislation will be passed. Each has helped cause businesses to sit back and wait. The western economies have been driven by huge government deficit spending and have bumped along with growth rates in the low single digits, prompting continuous investor concerns of possible recession.
We have struggled to outperform the Fund's primary benchmark. As we've mentioned in previous "Nutshells," we have been slowly changing the mix of the Fund's core growth holdings and the Fund's opportunistic holdings. In an environment in which the economy is struggling to deliver consecutive quarters of increasing growth, we believe core growth stocks should perform better than companies trying to turn around their operations in a weak economic environment (which is the case with many of the Fund's opportunistic holdings). Though the Fund's performance was disappointing this quarter, we feel strongly that we are on the right path as we near the end of this transition within the Fund's portfolio.
During the second quarter, we added one new stock to the portfolio and exited from one position. Our new position is Vail Resorts, a ski resort operator that we believe we picked up cheaply due to the warm winter. On the sell side, we exited from Safeway as we believe the supermarket industry's gross margin pressure is not going to subside.
As investors along with you in the Fund, we are anxious to see performance improve. We believe we are making adjustments to help our Fund seek to outperform its benchmark. Thank you for your investment in the Fund.
Risks include stock market fluctuations due to economic and business developments. The Fund also has potentially greater price volatility due to the Fund's concentration in a limited number of stocks of mid-size companies. International investments involve greater potential risks, including less regulation, currency fluctuations, economic instability and political developments.
Portfolio holdings are subject to change periodically and may not be representative of current holdings.
16
Columbia Acorn Select (ACTWX)
At a Glance
Performance data shown represents past performance and is not a guarantee of future results. The investment return and principal value of an investment will fluctuate so that shares, when redeemed, may be worth more or less than their original cost. Current performance may be lower or higher than the performance data shown. Performance results reflect any fee waivers or reimbursements of Fund expenses by the investment manager and/or any of its affiliates. Absent these fee waivers and/or expense reimbursement arrangements, performance results would have been lower. Please visit columbiamanagement.com for daily and most recent month-end updates.
Pretax and After-tax Average Annual Total Returns (Class Z)
through June 30, 2012
| Inception 11/23/98 | | Year
to date* | | 1 year | | 5 years | | 10 years | |
| Returns before taxes | | | 7.76 | % | | | -9.90 | % | | | -2.64 | % | | | 7.39 | % | |
| Returns after taxes on distributions | | | 7.42 | | | | -10.18 | | | | -2.94 | | | | 7.08 | | |
Returns after taxes on distributions
and sale of fund shares | | | 5.49 | | | | -6.06 | | | | -2.29 | | | | 6.48 | | |
| S&P MidCap 400 Index (pretax)** | | | 7.90 | | | | -2.33 | | | | 2.55 | | | | 8.21 | | |
All results shown assume reinvestment of distributions.
*Year to date data is not annualized.
**The Fund's primary benchmark.
After-tax returns are calculated using the highest historical individual federal marginal income tax rates, and do not reflect the impact of state and local taxes. Returns after taxes on distributions and sale of Fund shares reflect the additional tax impact of long-term gains or losses realized when Fund shares are sold. The returns are taxed at the maximum rate and assume shares were purchased at the beginning of the period. Actual after-tax returns depend on the investor's tax situation and may differ from those shown. After-tax returns are not relevant to investors who hold their Fund shares through tax-deferred arrangements such as 401(k) plans or individual retirement accounts. After-tax returns are shown for Class Z shares only; after-tax returns for other share classes will vary. Indexes do not reflect any deduction for fees, expenses or taxes.
The Fund's Class Z shares annual operating expense ratio, as stated in the May 1, 2012, prospectus, is 1.00%.
Columbia Acorn Select Portfolio Diversification
as a percentage of net assets, as of 6/30/12
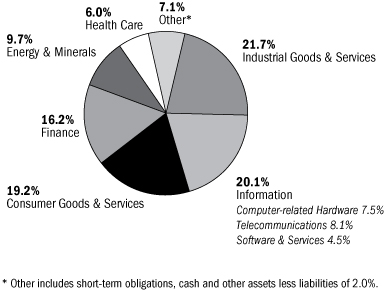
Columbia Acorn Select Top 10 Holdings
as a percentage of net assets, as of 6/30/12
| 1. | | Ametek
Aerospace/Industrial Instruments | | | 6.2
| % | |
| 2. | | Discover Financial Services
Credit Card Company | | | 6.1
| % | |
| 3. | | Hertz
Largest U.S. Rental Car Operator | | | 5.2
| % | |
| 4. | | CNO Financial Group
Life, Long-term Care & Medical Supplement Insurance | | | 5.1
| % | |
| 5. | | SBA Communications
Communications Towers | | | 3.8
| % | |
| 6. | | Crown Castle International
Communications Towers | | | 3.7
| % | |
| 7. | | Donaldson
Industrial Air Filtration | | | 3.5
| % | |
| 8. | | Gaylord Entertainment
Convention Hotels | | | 3.3
| % | |
| 9. | | Pall
Filtration & Fluids Clarification | | | 3.1
| % | |
| 10. | | WNS (India)
Offshore BPO (Business Process Outsourcing) Services | | | 3.0
| % | |
The Fund's top 10 holdings and portfolio diversification vary with changes in portfolio investments. See the Statement of Investments for a complete list of the Fund's holdings.
The Growth of a $10,000 Investment in Columbia Acorn Select (Class Z)
November 23, 1998 through June 30, 2012
This graph compares the results of $10,000 invested in Columbia Acorn Select at inception on November 23, 1998 to the S&P MidCap 400 Index. Although the index is provided for use in assessing the Fund's performance, the Fund's holdings differ significantly from those in the index. The index is unmanaged and returns for both the index and the Fund include reinvested dividends and capital gains. It is not possible to invest directly in an index. The graph does not reflect taxes that a shareholder would pay on Fund distributions or on a sale of Fund shares.
Total Net Assets of the Fund: $1.1 billion

17
Columbia Thermostat Fund
In a Nutshell

Lead Portfolio Manager
Performance data shown represents past performance and is not a guarantee of future results. The investment return and principal value will fluctuate so that shares, when redeemed, may be worth more or less than the original cost. Current performance may be lower or higher than the performance data shown. Please visit columbiamanagement.com for daily and most recent month-end performance updates.
A "fund of fund" bears its allocable share of the costs and expenses of the underlying funds in which it invests. Such funds are thus subject to two levels of fees and potentially higher expense ratios than would be associated with a fund that invests and trades directly in financial instruments under the direction of a single manager.
Columbia Thermostat Fund ended the second quarter of 2012 off 1.40%, above the 2.75% drop of its primary equity benchmark, the S&P 500 Index, and below the 2.06% gain of its primary debt benchmark, the Barclays U.S. Aggregate Bond Index. Year to date through June 30, 2012, the Fund was up 6.77%, falling below the 9.49% S&P 500 Index return and above the 2.37% gain of the Barclays U.S. Aggregate Bond Index.
The Fund hit four reallocation triggers in the second quarter, increasing stock exposure in April and twice in May as the markets cooled, then reducing stocks in June as the equity markets turned. At quarter end, the Fund had an even weighting in its underlying stock and bond investments.
For the quarter, the equity portion of the Fund had a weighted average loss of 4.96%, while the bond portion provided a 2.11% gain. Columbia U.S. Treasury Index Fund led performance among both groups with a 2.76% return for the three months.
Year to date through the end of June, the equity portion of the Fund had an 8.66% return, while the income portion posted a 4.01% gain. Top contributors for the half year were Columbia LargeCap Enhanced Core Fund, up 10.05%, and Columbia Contrarian Core Fund, up 9.67%.
On September 25, Columbia Thermostat Fund will reach its 10-year anniversary. The "Chattering Squirrels" essay at the front of this report looks back at how a fund called "Thermostat" came to be and how it is managed. As always, we thank you for your investment in the Fund. We are pleased to report that, since inception through the end of June, the Fund has, once again, exceeded our expectations by besting both its stock and bond benchmarks.
Results of the Funds Owned in Columbia Thermostat Fund as of June 30, 2012
| Stock Funds | | Weightings | | 2nd | | Year to | |
| Fund | | in category | | quarter | | date | |
Columbia Acorn
International, Class I | | | 20 | % | | | -5.49 | % | | | 8.79 | % | |
Columbia Dividend
Income Fund, Class I | | | 20 | % | | | -0.45 | % | | | 7.79 | % | |
Columbia Acorn Fund,
Class I | | | 15 | % | | | -5.42 | % | | | 9.27 | % | |
Columbia Contrarian
Core Fund, Class I | | | 15 | % | | | -4.37 | % | | | 9.67 | % | |
Columbia Select Large
Cap Growth Fund,
Class I | | | 10 | % | | | -11.47 | % | | | 6.22 | % | |
Columbia Acorn Select,
Class I | | | 10 | % | | | -8.46 | % | | | 7.79 | % | |
Columbia Large Cap
Enhanced Core Fund,
Class I | | | 10 | % | | | -2.98 | % | | | 10.05 | % | |
Weighted Average
Equity Gain/Loss | | | 100 | % | | | -4.96 | % | | | 8.66 | % | |
| Bond Funds | | Weightings | | 2nd | | Year to | |
| Fund | | in category | | quarter | | date | |
Columbia Intermediate
Bond Fund, Class I | | | 50 | % | | | 1.87 | % | | | 3.62 | % | |
Columbia Income
Opportunities Fund,
Class I | | | 30 | % | | | 2.02 | % | | | 6.33 | % | |
Columbia U.S. Treasury
Index Fund, Class I | | | 20 | % | | | 2.76 | % | | | 1.41 | % | |
Weighted Average
Income Gain | | | 100 | % | | | 2.11 | % | | | 4.01 | % | |
Columbia Thermostat Fund
Rebalancing in the Second Quarter
| April 16, 2012 | | 50% stocks, 50% bonds | |
| May 15, 2012 | | 55% stocks, 45% bonds | |
| May 21, 2012 | | 60% stocks, 40% bonds | |
| June 21, 2012 | | 50% stocks, 50% bonds | |
The value of an investment in the Fund is based primarily on the performance of the underlying portfolio funds and the allocation of the Fund's assets among them. An investment in the underlying portfolio funds may present certain risks, including stock market fluctuations that occur in response to economic and business developments; and a greater degree of social, political and economic volatility associated with international investing. Stocks of small- and mid-cap companies pose special risks, including possible illiquidity and greater price volatility than stocks of larger, more established companies. Value stocks may also be subject to specific business risks that have caused the stocks to be out of favor. Lower-rated and medium quality debt securities are more speculative and incur more risk. International investing involves special risks, including foreign taxation, currency risks, risks associated with possible differences in financial standards and other risks associated with future political and economic developments. Changes in interest rates and changes in the financial strength of issuers of lower-rated bonds may also affect underlying fund performance. The Fund is also subject to the risk that the investment advisor's decisions regarding asset classes and underlying portfolio funds will not anticipate market trends successfully, resulting in a failure to preserve capital or lower total return. In addition, the Fund may buy and sell shares of the portfolio funds frequently. This may result in higher transaction costs and additional tax liability. This is not an offer of the shares of any other mutual fund mentioned herein.
18
Columbia Thermostat Fund (COTZX)
At a Glance
Performance data shown represents past performance and is not a guarantee of future results. The investment return and principal value of an investment will fluctuate so that shares, when redeemed, may be worth more or less than their original cost. Current performance may be lower or higher than the performance data shown. Performance results reflect any fee waivers or reimbursements of Fund expenses by the investment manager and/or any of its affiliates. Absent these fee waivers and/or expense reimbursement arrangements, performance results would have been lower. Please visit columbiamanagement.com for daily and most recent month-end updates.
Pretax and After-tax Average Annual Total Returns (Class Z)
through June 30, 2012
| Inception 9/25/02 | | Year
to date* | | 1 year | | 5 years | | Life
of fund | |
| Returns before taxes | | | 6.77 | % | | | 6.97 | % | | | 4.68 | % | | | 7.84 | % | |
| Returns after taxes on distributions | | | 6.72 | | | | 6.46 | | | | 3.73 | | | | 6.67 | | |
Returns after taxes on distributions
and sale of fund shares | | | 4.40 | | | | 4.66 | | | | 3.52 | | | | 6.31 | | |
| S&P 500 Index (pretax)** | | | 9.49 | | | | 5.45 | | | | 0.22 | | | | 7.48 | | |
Barclays U.S. Aggregate Bond Index
(pretax)** | | | 2.37 | | | | 7.47 | | | | 6.79 | | | | 5.31 | | |
Lipper Flexible Portfolio Funds Index
(pretax) | | | 5.75 | | | | -0.55 | | | | 1.82 | | | | 7.34 | | |
All results shown assume reinvestment of distributions.
*Year to date data is not annualized.
**The Fund's primary stock and bond benchmarks, respectively.
After-tax returns are calculated using the highest historical individual federal marginal income tax rates, and do not reflect the impact of state and local taxes. Returns after taxes on distributions and sale of Fund shares reflect the additional tax impact of long-term gains or losses realized when Fund shares are sold. The returns are taxed at the maximum rate and assume shares were purchased at the beginning of the period. Actual after-tax returns depend on the investor's tax situation and may differ from those shown. After-tax returns are not relevant to investors who hold their Fund shares through tax-deferred arrangements such as 401(k) plans or individual retirement accounts. After-tax returns are shown for Class Z shares only; after-tax returns for other share classes will vary. Indexes do not reflect any deduction for fees, expenses or taxes.
The Fund's Class Z annual operating expense ratio, as stated in the May 1, 2012, prospectus, is 0.90%. Columbia Thermostat Fund has a contractual fee waiver and expense reimbursement with CWAM that expires April 30, 2013; expense ratios without and with the contractual waiver/reimbursement, including fees and expenses associated with the Fund's investment in other investment companies (underlying funds), are 1.03% and 0.90%, respectively. Absent the waiver or reimbursement, performance results would have been lower.
Columbia Thermostat Fund Asset Allocation
as a percentage of net assets, as of 6/30/12

Columbia Thermostat Fund Portfolio Weightings
as a percentage of assets in each investment category, as of 6/30/12
Stock Mutual Funds
| Columbia Acorn International, Class I | | | 20 | % | |
| Columbia Dividend Income Fund, Class I | | | 20 | % | |
| Columbia Acorn Fund, Class I | | | 15 | % | |
| Columbia Contrarian Core Fund, Class I | | | 15 | % | |
| Columbia Select Large Cap Growth Fund, Class I | | | 10 | % | |
| Columbia Acorn Select, Class I | | | 10 | % | |
| Columbia Large Cap Enhanced Core Fund, Class I | | | 10 | % | |
Bond Mutual Funds
| Columbia Intermediate Bond Fund, Class I | | | 50 | % | |
| Columbia Income Opportunities Fund, Class I | | | 30 | % | |
| Columbia U.S. Treasury Index Fund, Class I | | | 20 | % | |
The Growth of a $10,000 Investment in Columbia Thermostat Fund (Class Z)
September 25, 2002 through June 30, 2012
This graph compares the results of $10,000 invested in Columbia Thermostat Fund at inception on September 25, 2002 to the S&P 500 Index, the Barclays U.S. Aggregate Bond Index and the Lipper Flexible Portfolio Funds Index. Although the indexes are provided for use in assessing the Fund's performance, the Fund's holdings differ significantly from those in the indexes. The Indexes are unmanaged and returns for the indexes and the Fund include reinvested dividends and capital gains. It is not possible to invest directly in an index. The graph does not reflect taxes that a shareholder would pay on Fund distributions or on a sale of Fund shares.
Total Net Assets of the Fund: $440.1 million
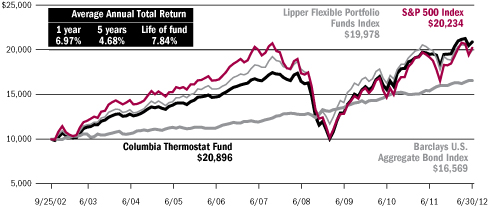
19
Columbia Acorn Emerging Markets Fund
In a Nutshell
 | |  | |
|
| Fritz Kaegi | | Stephen Kusmierczak | |
|
| Lead Portfolio Manager | | Lead Portfolio Manager | |
|
 | |  | |
|
| P. Zachary Egan | | Louis J. Mendes | |
|
| Co-Portfolio Manager | | Co-Portfolio Manager | |
|
Performance data shown represents past performance and is not a guarantee of future results. The investment return and principal value will fluctuate so that shares, when redeemed, may be worth more or less than the original cost. Current performance may be lower or higher than the performance data shown. Please visit columbiamanagement.com for daily and most recent month-end performance updates.
Fund's Positions
in Mentioned Holdings
As a percentage of net assets, as of 6/30/12
| Grupo Aeroportuario del Sureste | | | 2.4 | % | |
| Surya Citra Media | | | 1.8 | % | |
| Multiplus | | | 1.4 | % | |
| Mongolian Mining | | | 1.4 | % | |
| Mayora Indah | | | 0.6 | % | |
| Americas Petrogas | | | 0.6 | % | |
| Northam Platinum | | | 0.5 | % | |
| Madalena Ventures | | | 0.2 | % | |
Columbia Acorn Emerging Markets Fund fell 6.90% in the second quarter of 2012 versus the 8.09% decline in the Fund's primary benchmark, the S&P Emerging Markets Between $500M and $5B Index. The Fund's more conservative positioning in very volatile markets has helped it outperform the benchmark since inception. Since the Fund's launch on August 19, 2011, it has returned a positive 1.94%, outperforming the benchmark's 5.77% decline. For the half year ended June 30, the Fund was up 9.85%, outpacing the 8.88% gain of its benchmark.
In the second quarter, the Fund benefited from its continued overweight in companies that we believe should benefit from rising incomes in emerging markets. Mayora Indah, an Indonesian maker of biscuits and chocolates, was added to the Fund during the quarter and gained nearly 29%. Grupo Aeroportuario del Sureste operates airports in Mexico, where air travel for tourism is growing strongly. Its stock gained over 18% following positive news about possible expansion into Puerto Rico. Surya Citra Media is Indonesia's most profitable private free-to-air broadcaster and gained 17% to reach a new record since its listing in 2002. Multiplus is Brazil's largest operator of loyalty programs and is a beneficiary of secular growth in credit and travel. Despite somewhat disappointing results due to higher airline ticket prices used in rewards, Multiplus gained over 15%.
The largest performance detractors in the second quarter were the Fund's energy and basic materials stocks. Two Canadian-listed oil and gas exploration companies with substantial assets in Argentina dropped sharply in the quarter following government moves to nationalize a large energy company. While we see no evidence of specific government action against our holdings, Madalena Ventures dropped nearly 63% and Americas Petrogas declined 48% as the risk premium for Argentina jumped substantially. Mongolian Mining is a world-class coking coal deposit in Southern Mongolia near the Chinese border. The stock fell 40% to a record low on concerns about tightening investment rules following recent elections. Northam Platinum owns one of the world's best undeveloped deposits of platinum, a precious metal used in important industrial applications like catalytic converters. Northam fell 35% in the wake of weak platinum prices and a leak at its smelter.
An important element of the Fund's relatively conservative positioning is its focus on investing in companies that pay dividends. We believe that a meaningful and growing dividend is the ultimate proof that a company is generating free cash flow, and that reinvested dividends represent the largest component of total shareholder returns over time. The current dividend yield of the Fund's portfolio is slightly below the benchmark's, yet the Fund's more concentrated portfolio is a higher quality one as measured by return on shareholder equity. We think companies that earn higher returns on capital should grow faster than their peers. We do not believe we have to sacrifice growth for higher dividends, and we have tried to identify companies with defensible business models and above-average returns that are exposed to durable growth trends in the emerging markets.
International investing involves special risks, including foreign taxation, currency risks, risks associated with possible differences in financial standards and other risks associated with future political and economic developments. Stocks of small- and mid-cap companies pose special risks, including possible illiquidity and greater price volatility than stocks of larger, more established companies. Investing in emerging markets may involve greater risks than investing in more developed countries.
Portfolio holdings are subject to change periodically and may not be representative of current holdings.
20
Columbia Acorn Emerging
Markets Fund (CEFZX)
At a Glance
Performance data shown represents past performance and is not a guarantee of future results. The investment return and principal value of an investment will fluctuate so that shares, when redeemed, may be worth more or less than their original cost. Current performance may be lower or higher than the performance data shown. Performance results reflect any fee waivers or reimbursements of Fund expenses by the investment manager and/or any of its affiliates. Absent these fee waivers and/or expense reimbursement arrangements, performance results would have been lower. Please visit columbiamanagement.com for daily and most recent month-end updates.
Pretax and After-tax Total Returns (Class Z)
through June 30, 2012
| Inception 8/19/11 | | Year to date* | | Life of fund*† | |
| Returns before taxes | | | 9.85 | % | | | 1.94 | % | |
| Returns after taxes on distributions | | | 9.84 | | | | 1.94 | | |
Returns after taxes on distributions and sale of
fund shares | | | 6.40 | | | | 1.27 | | |
S&P Emerging Markets Between $500M and
$5B Index (pretax)*** | | | 8.88 | | | | -5.77 | | |
All results shown assume reinvestment of distributions.
*Year to date and life of fund data is not annualized.
†Reflects performance from Fund inception on 8/19/11 through 6/30/12.
***The Fund's primary benchmark.
After-tax returns are calculated using the highest historical individual federal marginal income tax rates, and do not reflect the impact of state and local taxes. Returns after taxes on distributions and sale of Fund shares reflect the additional tax impact of long-term gains or losses realized when Fund shares are sold. The returns are taxed at the maximum rate and assume shares were purchased at the beginning of the period. Actual after-tax returns depend on the investor's tax situation and may differ from those shown. After-tax returns are not relevant to investors who hold their Fund shares through tax-deferred arrangements such as 401(k) plans or individual retirement accounts. After-tax returns are shown for Class Z shares only; after-tax returns for other share classes will vary. Indexes do not reflect any deduction for fees, expenses or taxes.
The Fund's Class Z annual operating expense ratio, as stated in the May 1, 2012 prospectus, is 1.60%. Columbia Acorn Emerging Markets Fund has a contractual fee waiver and expense reimbursement agreement with CWAM that expires April 30, 2013; expense ratios without and with the contractual waiver/reimbursement are 13.35% and 1.60%, respectively. Absent the waiver or reimbursement, performance results would have been lower.
Columbia Acorn Emerging Markets Fund Portfolio Diversification
as a percentage of net assets, as of 6/30/12
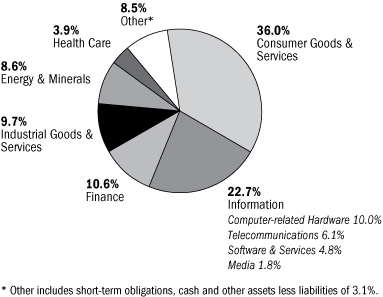
Columbia Acorn Emerging Markets Fund
Top 10 Holdings
as a percentage of net assets, as of 6/30/12
| 1. | | Ace Indonesia (Indonesia)
Home Improvement Retailer | | | 3.5
| % | |
| 2. | | Tower Bersama Infrastructure (Indonesia)
Communications Towers | | | 3.3
| % | |
| 3. | | Nagacorp (Cambodia)
Casino/Entertainment Complex in Cambodia | | | 3.3
| % | |
| 4. | | Far EasTone Telecom (Taiwan)
Taiwan's Third Largest Mobile Operator | | | 2.8
| % | |
| 5. | | Rand Merchant Insurance (South Africa)
Directly Sold Property & Casualty Insurance;
Holdings in Other Insurers | | | 2.8
| % | |
| 6. | | Coronation Fund Managers (South Africa)
South African Fund Manager | | | 2.7
| % | |
| 7. | | Dufry Group (Switzerland)
Operators Airport Duty Free & Duty Paid Shops | | | 2.5
| % | |
| 8. | | CTCI Corp (Taiwan)
International Engineering Firm | | | 2.4
| % | |
| 9. | | Grupo Aeroportuario del Sureste (Mexico)
Mexican Airport Operator | | | 2.4
| % | |
| 10. | | Hexagon (Sweden)
Design, Measurement & Visualization Software & Equipment | | | 2.1
| % | |
The Fund's top 10 holdings and portfolio diversification vary with changes in portfolio investments. See the Statement of Investments for a complete list of the Fund's holdings.
The Growth of a $10,000 Investment in Columbia Acorn Emerging Markets Fund (Class Z)
August 19, 2011 through June 30, 2012
This graph compares the results of $10,000 invested in Columbia Acorn Emerging Markets Fund at inception on August 19, 2011 to the S&P Emerging Markets Between $500M and $5B Index. Although the index is provided for use in assessing the Fund's performance, the Fund's holdings may differ significantly from those in the index. The index and Fund returns include reinvested dividends and capital gains. It is not possible to invest directly in an index. The graph does not reflect taxes that a shareholder would pay on Fund distributions or on a sale of Fund shares.
Total Net Assets of the Fund:
$5.8 million
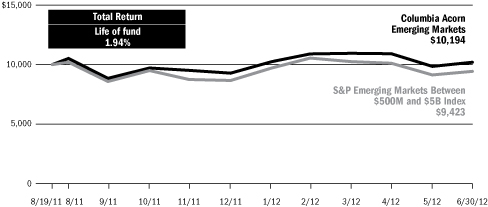
21
Columbia Acorn European Fund
In a Nutshell
 | |  | |
|
Andreas
Waldburg-Wolfegg | | Stephen
Kusmierczak | |
|
| Lead Portfolio Manager | | Co-Portfolio Manager | |
|
Performance data shown represents past performance and is not a guarantee of future results. The investment return and principal value will fluctuate so that shares, when redeemed, may be worth more or less than the original cost. Current performance may be lower or higher than the performance data shown. Please visit columbiamanagement.com for daily and most recent month-end performance updates.
Fund's Positions
in Mentioned Holdings
As a percentage of net assets, as of 6/30/12
| Eurofins Scientific | | | 3.6 | % | |
| Gemalto | | | 3.4 | % | |
| Aalberts Industries | | | 2.0 | % | |
| Domino's Pizza UK & Ireland | | | 1.9 | % | |
| Geox | | | 1.1 | % | |
Columbia Acorn European Fund was up 11.62% for the six months ended June 30, 2012, outperforming the 7.65% return of its primary benchmark, the S&P Europe Between $500M and $5B Index. In absolute numbers, the Fund had a very strong first quarter, up 17.69%, followed by a lackluster second quarter, in which the Fund was down 5.16%. But the real story was in the relative numbers. Whereas the Fund closely matched the 17.80% gain in the first quarter of its benchmark, it contained the losses from the general downdraft in the second quarter better than the benchmark, which fell 8.62%.
French Fund holdings continued to perform strongly in the second quarter. Smart card products and solutions company Gemalto was up 9%, and food, drug and materials testing provider Eurofins Scientific gained 15%. Gemalto released a very positive first quarter sales report that showed sales in the mobile phone division up 11%, the first such growth in a few quarters. This turn confirmed our thesis that the change to fourth-generation wireless technology should increasingly feed through the company's top line. Eurofins Scientific announced a near doubling of its net profit in the first quarter of 2012, which, in itself, is not very significant because the bulk of the business's sales happen in the second half. What we were more interested to see was that Eurofins Scientific's business grew 10% organically in Europe, proof that when you're in the right business, macro issues can take second place. We shaved some off our position in Gemalto and added some in Eurofins Scientific to reflect short-term performance. Both continue to be in the Fund's top-five stocks by size.
Retailers like to complain about the weather: it's never right. Not so for Domino's Pizza UK & Ireland, the U.S. pizza maker's British, Irish and German franchise. The rainiest April on record in the United Kingdom caused people to stay home and order in. Domino's was only too happy to deliver, and so did the stock, up 17% in the quarter and 29% for the half year.
There were few strong detractors in the portfolio, largely because the largest slides came from small positions. Geox, the Italian maker of casual shoes, saw its stock decline 26% in the second quarter following a profit warning that accompanied the release of first quarter figures. Start-up costs related to expansion in Asia, Russia and Eastern Europe have negatively impacted Geox's margins. We believe that the strength of the company's patents, brand and balance sheet will help it gain market share over competitors, especially now that franchisees will be willing to ally themselves closer to a strong operator.
Another detractor to performance in the second quarter was Aalberts Industries, a manufacturer of flow control and heat treatment equipment based in the Netherlands, down almost 23%. An update on quarterly sales and management's outlook at the beginning of May were cautious, which hurt the stock. This diversified industrial company has strong market positions in most European countries and is suffering from lower capacity utilization in its industrial services division. For 2012, we believe the company is likely to show flat growth. On the other hand, we believe Aalberts's strong market positions, outstanding margins and excellent management are unlikely to go away, even during this time of weak demand. We believe its competitive position is bound to improve.
International investing involves special risks, including foreign taxation, currency risks, risks associated with possible differences in financial standards and other risks associated with future political and economic developments. Stocks of small- and mid-cap companies pose special risks, including possible illiquidity and greater price volatility than stocks of larger, more established companies. Investing in emerging markets may involve greater risks than investing in more developed countries.
Portfolio holdings are subject to change periodically and may not be representative of current holdings.
22
Columbia Acorn
European Fund (CAEZX)
At a Glance
Performance data shown represents past performance and is not a guarantee of future results. The investment return and principal value of an investment will fluctuate so that shares, when redeemed, may be worth more or less than their original cost. Current performance may be lower or higher than the performance data shown. Performance results reflect any fee waivers or reimbursements of Fund expenses by the investment manager and/or any of its affiliates. Absent these fee waivers and/or expense reimbursement arrangements, performance results would have been lower. Please visit columbiamanagement.com for daily and most recent month-end updates.
Pretax and After-tax Total Returns (Class Z)
through June 30, 2012
| Inception 8/19/11 | | Year to date* | | Life of fund*† | |
| Returns before taxes | | | 11.62 | % | | | 6.29 | % | |
| Returns after taxes on distributions | | | 11.56 | | | | 5.99 | | |
| Returns after taxes on distributions and sale of fund shares | | | 7.55 | | | | 4.15 | | |
| S&P Europe Between $500M and $5B Index (pretax)*** | | | 7.65 | | | | -0.07 | | |
All results shown assume reinvestment of distributions.
*Year to date and life of fund data is not annualized.
†Reflects performance from Fund inception on 8/19/11 through 6/30/12.
***The Fund's primary benchmark.
After-tax returns are calculated using the highest historical individual federal marginal income tax rates, and do not reflect the impact of state and local taxes. Returns after taxes on distributions and sale of Fund shares reflect the additional tax impact of long-term gains or losses realized when Fund shares are sold. The returns are taxed at the maximum rate and assume shares were purchased at the beginning of the period. Actual after-tax returns depend on the investor's tax situation and may differ from those shown. After-tax returns are not relevant to investors who hold their Fund shares through tax-deferred arrangements such as 401(k) plans or individual retirement accounts. After-tax returns are shown for Class Z shares only; after-tax returns for other share classes will vary. Indexes do not reflect any deduction for fees, expenses or taxes.
The Fund's Class Z annual operating expense ratio, as stated in the May 1, 2012 prospectus, is 1.50%. Columbia Acorn European Fund has a contractual fee waiver and expense reimbursement agreement with CWAM that expires April 30, 2013; expense ratios without and with the contractual waiver/reimbursement are 19.02% and 1.50%, respectively. Absent the waiver or reimbursement, performance results would have been lower.
Columbia Acorn European Fund Portfolio Diversification
as a percentage of net assets, as of 6/30/12

Columbia Acorn European Fund Top 10 Holdings
as a percentage of net assets, as of 6/30/12
| 1. | | Eurofins Scientific (France)
Food, Pharmaceuticals & Materials Screening & Testing | | | 3.6
| % | |
| 2. | | Gemalto (France)
Digital Security Solutions | | | 3.4
| % | |
| 3. | | Wirecard (Germany)
Online Payment Processing & Risk Management | | | 3.0
| % | |
| 4. | | Geberit (Switzerland)
Plumbing Supplies | | | 2.8
| % | |
| 5. | | Charles Taylor (United Kingdom)
Insurance Services | | | 2.7
| % | |
| 6. | | 1000 mercis (France)
Interactive Advertising and Marketing | | | 2.6
| % | |
| 7. | | Marel (Iceland)
Largest Manufacturer of Poultry & Fish Processing Equipment | | | 2.5
| % | |
| 8. | | Hexagon (Sweden)
Design, Measurement & Visualization Software & Equipment | | | 2.5
| % | |
| 9. | | Partners Group (Switzerland)
Private Markets Asset Management | | | 2.5
| % | |
| 10. | | Sweco (Sweden)
Engineering Consultants | | | 2.3
| % | |
The Fund's top 10 holdings and portfolio diversification vary with changes in portfolio investments. See the Statement of Investments for a complete list of the Fund's holdings.
The Growth of a $10,000 Investment in Columbia Acorn European Fund (Class Z)
August 19, 2011 through June 30, 2012
This graph compares the results of $10,000 invested in Columbia Acorn European Fund at inception on August 19, 2011 to the S&P Europe Between $500M and $5B Index. Although the index is provided for use in assessing the Fund's performance, the Fund's holdings may differ significantly from those in the index. The index and Fund returns include reinvested dividends and capital gains. It is not possible to invest directly in an index. The graph does not reflect taxes that a shareholder would pay on Fund distributions or on a sale of Fund shares.
Total Net Assets of the Fund:
$2.1 million
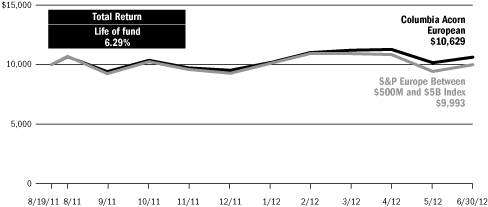
23
Columbia Acorn Fund
Major Portfolio Changes in the Second Quarter (Unaudited)
| | | Number of Shares | |
| | | 3/31/12 | | 6/30/12 | |
| Purchases | |
| Information | |
| Angies list | | | 0 | | | | 231,700 | | |
| Cree | | | 380,000 | | | | 560,000 | | |
| Genpact | | | 1,575,000 | | | | 1,705,000 | | |
| Hexagon (Sweden) | | | 5,164,999 | | | | 5,450,000 | | |
| Lamar Advertising | | | 0 | | | | 1,725,000 | | |
| SABA | | | 0 | | | | 2,000,000 | | |
| Velti | | | 2,500,000 | | | | 2,700,000 | | |
| Yandex (Russia) | | | 0 | | | | 700,100 | | |
| Industrial Goods & Services | |
Aalberts Industries
(Netherlands) | | | 2,263,654 | | | | 2,324,833 | | |
| Ashland | | | 0 | | | | 800,000 | | |
| Chicago Bridge & Iron | | | 1,725,000 | | | | 2,850,000 | | |
| Forward Air | | | 1,300,000 | | | | 1,400,000 | | |
| Generac | | | 1,776,000 | | | | 2,350,000 | | |
| Moog | | | 2,775,000 | | | | 3,000,000 | | |
| Neopost (France) | | | 210,000 | | | | 350,000 | | |
| Polypore International | | | 900,000 | | | | 1,325,000 | | |
| Consumer Goods & Services | |
| American Eagle Outfitters | | | 300,000 | | | | 1,075,000 | | |
| Arcos Dorados (Brazil) | | | 0 | | | | 1,800,000 | | |
| Avis Budget Group | | | 3,800,000 | | | | 4,400,000 | | |
| Deckers Outdoor | | | 1,140,000 | | | | 1,310,000 | | |
| Fossil | | | 392,500 | | | | 527,845 | | |
| GNC Holdings | | | 1,528,500 | | | | 2,305,000 | | |
| Interface | | | 1,750,000 | | | | 2,038,555 | | |
Lifestyle International
(Hong Kong) | | | 13,500,000 | | | | 16,857,500 | | |
| Pier 1 Imports | | | 5,600,000 | | | | 6,600,000 | | |
| Finance | |
| Associated Banc-Corp | | | 6,287,800 | | | | 6,956,800 | | |
| City National | | | 1,175,000 | | | | 1,348,000 | | |
| Eaton Vance | | | 3,700,000 | | | | 4,036,000 | | |
| First Commonwealth | | | 1,000,000 | | | | 2,500,000 | | |
| FX Alliance | | | 0 | | | | 300,000 | | |
| Onex Capital (Canada) | | | 0 | | | | 450,000 | | |
| SEI Investments | | | 6,198,000 | | | | 6,654,000 | | |
| SVB Financial Group | | | 810,000 | | | | 985,000 | | |
| Health Care | |
| ARIAD Pharmaceuticals | | | 0 | | | | 2,568,248 | | |
| Cepheid | | | 3,900,000 | | | | 4,600,000 | | |
| DENTSPLY International | | | 1,136,500 | | | | 1,550,000 | | |
| InterMune | | | 2,950,000 | | | | 3,850,000 | | |
| Synageva Biopharma | | | 180,167 | | | | 569,898 | | |
| | | Number of Shares | |
| | | 3/31/12 | | 6/30/12 | |
| Energy & Minerals | |
| Gulf United (Colombia) | | | 0 | | | | 50,000,000 | | |
| Kirkland Lake Gold (Canada) | | | 920,000 | | | | 1,400,000 | | |
| Laredo Petroleum | | | 0 | | | | 1,159,000 | | |
| Mongolian Mining (Mongolia) | | | 12,000,000 | | | | 16,000,000 | | |
| Other Industries | |
| Rush Enterprises, Class A | | | 2,800,000 | | | | 2,937,175 | | |
See accompanying notes to financial statements.
24
| | | Number of Shares | |
| | | 3/31/12 | | 6/30/12 | |
| Sales | |
| Information | |
| Akamai | | | 250,000 | | | | 0 | | |
| Amphenol | | | 3,495,000 | | | | 3,415,000 | | |
| Ariba | | | 2,850,000 | | | | 900,000 | | |
| Atmel | | | 12,300,000 | | | | 11,562,000 | | |
| Blackbaud | | | 1,650,000 | | | | 960,329 | | |
| Concur Technologies | | | 1,830,000 | | | | 1,400,000 | | |
| Constant Contact | | | 2,350,000 | | | | 2,000,000 | | |
| Discovery Series C | | | 1,595,000 | | | | 900,000 | | |
| Equinix | | | 585,000 | | | | 450,000 | | |
| F5 Networks | | | 685,000 | | | | 640,000 | | |
| Finisar | | | 1,695,000 | | | | 1,345,000 | | |
| FTI Consulting | | | 868,516 | | | | 234,615 | | |
| Global Payments | | | 2,299,000 | | | | 1,700,000 | | |
| Ixia | | | 2,330,000 | | | | 1,730,000 | | |
| Kenexa | | | 1,700,000 | | | | 1,173,100 | | |
| Liberty Global Series A | | | 1,250,000 | | | | 900,000 | | |
| Littelfuse | | | 500,000 | | | | 420,000 | | |
| Mail.ru - GDR (Russia) | | | 400,000 | | | | 234,168 | | |
| NetSuite | | | 1,150,000 | | | | 800,000 | | |
| Plexus | | | 1,100,000 | | | | 960,000 | | |
| Red Hat | | | 750,000 | | | | 700,000 | | |
| Saga Communications | | | 164,991 | | | | 145,271 | | |
| SBA Communications | | | 3,700,000 | | | | 3,400,000 | | |
| TIBCO | | | 2,150,000 | | | | 1,450,000 | | |
| Tyler Technologies | | | 1,700,000 | | | | 900,000 | | |
| Zebra Technologies | | | 1,605,000 | | | | 1,365,000 | | |
| Industrial Goods & Services | |
| Albany International | | | 900,000 | | | | 600,000 | | |
| GrafTech International | | | 3,750,000 | | | | 2,800,000 | | |
| Imtech (Netherlands) | | | 1,601,465 | | | | 1,491,313 | | |
| Interline Brands | | | 2,399,751 | | | | 1,400,000 | | |
| Jain Irrigation Systems (India) | | | 3,450,000 | | | | 0 | | |
Jain Irrigation Systems - DVR
(India) | | | 172,500 | | | | 0 | | |
| Kaydon | | | 501,000 | | | | 0 | | |
| Mersen (France) | | | 260,000 | | | | 92,046 | | |
| Pentair | | | 3,100,000 | | | | 1,890,000 | | |
| Waste Connections | | | 2,400,000 | | | | 2,050,000 | | |
| Consumer Goods & Services | |
| Abercrombie & Fitch | | | 3,460,000 | | | | 3,040,000 | | |
| GLG Life Tech (Canada) | | | 1,678,125 | | | | 1,665,270 | | |
| lululemon athletica | | | 4,922,800 | | | | 4,505,000 | | |
| Monster Beverage | | | 2,340,000 | | | | 1,700,000 | | |
| Saks | | | 5,225,000 | | | | 4,425,000 | | |
| Snyder's-Lance | | | 240,000 | | | | 0 | | |
| True Religion Apparel | | | 393,452 | | | | 231,452 | | |
| Universal Technical Institute | | | 612,205 | | | | 0 | | |
| Warnaco Group | | | 2,190,000 | | | | 1,460,000 | | |
| | | Number of Shares | |
| | | 3/31/12 | | 6/30/12 | |
| Finance | |
| Assured Guaranty | | | 500,000 | | | | 0 | | |
| BOK Financial | | | 2,691,414 | | | | 2,638,000 | | |
| CVB Financial | | | 3,400,000 | | | | 3,000,000 | | |
| Green Bankshares | | | 152,569 | | | | 79,800 | | |
| Oriental Financial Group | | | 500,000 | | | | 0 | | |
| World Acceptance | | | 1,459,555 | | | | 1,425,202 | | |
| Health Care | |
| Alexion Pharmaceuticals | | | 2,290,000 | | | | 1,476,000 | | |
| Allscripts Healthcare Solutions | | | 1,200,000 | | | | 0 | | |
| Gen-Probe | | | 760,000 | | | | 0 | | |
| Hill-Rom Holdings | | | 1,873,800 | | | | 1,275,000 | | |
| Onyx Pharmaceuticals | | | 1,000,000 | | | | 750,000 | | |
| Pacific Biosciences of California | | | 2,525,000 | | | | 0 | | |
| Raptor Pharmaceutical | | | 4,200,000 | | | | 3,609,594 | | |
| Energy & Minerals | |
| Alexco Resource | | | 2,800,000 | | | | 2,050,000 | | |
| Athabasca Oil Sands (Canada) | | | 2,160,000 | | | | 750,000 | | |
| Baytex (Canada) | | | 650,000 | | | | 361,000 | | |
| Black Diamond Group (Canada) | | | 1,056,600 | | | | 893,600 | | |
| Canacol (Colombia) | | | 5,917,100 | | | | 5,116,000 | | |
| Celtic Exploration (Canada) | | | 1,140,000 | | | | 718,000 | | |
| Core Laboratories (Netherlands) | | | 442,000 | | | | 387,000 | | |
| Crew Energy (Canada) | | | 1,547,000 | | | | 493,000 | | |
| FMC Technologies | | | 5,298,000 | | | | 5,150,000 | | |
| Fugro (Netherlands) | | | 1,988,054 | | | | 1,289,106 | | |
| Oil States International | | | 743,000 | | | | 513,000 | | |
Pacific Rubiales Energy
(Colombia) | | | 4,250,000 | | | | 3,700,000 | | |
| Silver Wheaton (Canada) | | | 1,600,000 | | | | 550,000 | | |
| SM Energy | | | 900,000 | | | | 703,000 | | |
| Tullow Oil (United Kingdom) | | | 1,697,000 | | | | 1,050,000 | | |
Tuscany International Drilling
(Colombia) | | | 4,435,000 | | | | 4,415,000 | | |
| Vopak (Netherlands) | | | 300,000 | | | | 218,000 | | |
| Other Industries | |
| Genesee & Wyoming | | | 400,000 | | | | 300,000 | | |
See accompanying notes to financial statements.
25
Columbia Acorn Fund
Statement of Investments (Unaudited), June 30, 2012
| Number of Shares | | | | Value (000) | |
| | | | | | | Equities: 95.8% | |
| Information 27.2% | | | |
| | | > Business Software 6.9% | |
| | 5,000,000 | | | Informatica (a) | | $ | 211,800 | | |
| | | | | Enterprise Data Integration Software | | | | | |
| | 2,550,000 | | | Ansys (a) | | | 160,930 | | |
| | | | | Simulation Software for
Engineers & Designers | | | | | |
| | 2,700,000 | | | Micros Systems (a) | | | 138,240 | | |
| | | | | Information Systems for Hotels,
Restaurants & Retailers | | | | | |
| | 1,400,000 | | | Concur Technologies (a) | | | 95,340 | | |
| | | | | Web Enabled Cost & Expense
Management Software | | | | | |
| | 5,450,000 | | | Hexagon (Sweden) | | | 93,549 | | |
| | | | | Design, Measurement & Visualization
Software & Equipment | | | | | |
| | 2,350,000 | | | Quality Systems | | | 64,649 | | |
| | | | | IT Systems for Medical Groups &
Ambulatory Care Centers | | | | | |
| | 800,000 | | | NetSuite (a) | | | 43,816 | | |
| | | | | End-to-end IT Systems Solutions Delivered
Over the Web | | | | | |
| | 1,450,000 | | | TIBCO (a) | | | 43,384 | | |
| | | | | Datacenter Software | | | | | |
| | 900,000 | | | Ariba (a) | | | 40,284 | | |
| | | | | Cost Management Software | | | | | |
| | 700,000 | | | Red Hat (a) | | | 39,536 | | |
| | | | | Maintenance & Support for Opensource
Operating Systems & Middleware | | | | | |
| | 900,000 | | | Tyler Technologies (a) | | | 36,315 | | |
| | | | | Financial, Tax, Court & Document
Management Systems for Local Governments | | | | | |
| | 2,000,000 | | | Constant Contact (a)(b)(c) | | | 35,760 | | |
| | | | | Email & Other Marketing Campaign
Management Systems Delivered Over the Web | | | | | |
| | 1,173,100 | | | Kenexa (a) | | | 34,055 | | |
| | | | | Recruiting & Workforce Management Solutions | | | | | |
| | 900,000 | | | SPS Commerce (a)(b) | | | 27,342 | | |
| | | | | Supply Chain Management Software
Delivered via the Web | | | | | |
| | 750,000 | | | Jack Henry & Associates | | | 25,890 | | |
| | | | | IT Systems & Outsourced IT Solutions for
Financial Institutions | | | | | |
| | 960,329 | | | Blackbaud | | | 24,652 | | |
| | | | | Software & Services for Non-profits | | | | | |
| | 690,000 | | | Advent Software (a) | | | 18,706 | | |
| | | | | Asset Management & Trading Systems | | | | | |
| | 2,000,000 | | | SABA (a)(b) | | | 18,560 | | |
| | | | | Learning Management Systems | | | | | |
| | 2,700,000 | | | Velti (a)(c) | | | 17,550 | | |
| | | | | Mobile Marketing Software Platform | | | | | |
| | 900,000 | | | Active Network (a) | | | 13,851 | | |
| | | | | Web Delivered Software Solution for
Managing Events & Activities | | | | | |
| | 1,000,000 | | | InContact (a) | | | 5,010 | | |
| | | | | Call Center Systems Delivered Via the
Web & Telco Services | | | | | |
| | 55,000 | | | Solera Holdings | | | 2,298 | | |
| | | | | Software for Automotive Insurance
Claims Processing | | | | | |
| | | | 1,191,517 | | |
| Number of Shares | | | | Value (000) | |
| | | > Instrumentation 2.7% | |
| | 1,600,000 | | | Mettler-Toledo International (a)(b) | | $ | 249,360 | | |
| | | | | Laboratory Equipment | | | | | |
| | 2,780,000 | | | IPG Photonics (a)(b) | | | 121,180 | | |
| | | | | Fiber Lasers | | | | | |
| | 2,035,000 | | | Trimble Navigation (a) | | | 93,631 | | |
| | | | | GPS-based Instruments | | | | | |
| | | | 464,171 | | |
| | | > Mobile Communications 2.7% | |
| | 4,465,000 | | | Crown Castle International (a) | | | 261,917 | | |
| | | | | Communications Towers | | | | | |
| | 3,400,000 | | | SBA Communications (a) | | | 193,970 | | |
| | | | | Communications Towers | | | | | |
| | 1,500,000 | | | Globalstar (a) | | | 480 | | |
| | | | | Satellite Mobile Voice & Data Carrier | | | | | |
| | | | 456,367 | | |
| | | > Telephone & Data Services 2.6% | |
| | 9,500,000 | | | tw telecom (a)(b) | | | 243,770 | | |
| | | | | Fiber Optic Telephone/Data Services | | | | | |
| | 1,400,000 | | | AboveNet (b) | | | 117,600 | | |
| | | | | Metropolitan Fiber Communications Services | | | | | |
| | 2,200,000 | | | Cogent Communications (a) | | | 42,350 | | |
| | | | | Internet Data Pipelines | | | | | |
| | 1,650,000 | | | Boingo Wireless (a) | | | 19,173 | | |
| | | | | Wholesale & Retail WiFi Networks | | | | | |
| | 2,000,000 | | | General Communications (a)(b) | | | 16,620 | | |
| | | | | Commercial Communication & Consumer
CATV, Web & Phone in Alaska | | | | | |
| | | | 439,513 | | |
| | | > Computer Hardware & Related
Equipment 2.4% | |
| | 3,415,000 | | | Amphenol | | | 187,552 | | |
| | | | | Electronic Connectors | | | | | |
| | 4,550,000 | | | II-VI (a)(b) | | | 75,849 | | |
| | | | | Laser Optics & Specialty Materials | | | | | |
| | 1,365,000 | | | Zebra Technologies (a) | | | 46,901 | | |
| | | | | Bar Code Printers | | | | | |
| | 900,000 | | | Netgear (a) | | | 31,059 | | |
| | | | | Networking Products for Small Business & Home | | | | | |
| | 605,000 | | | Stratasys (a)(c) | | | 29,978 | | |
| | | | | Rapid Prototyping Systems | | | | | |
| | 800,000 | | | Nice Systems - ADR (Israel) (a) | | | 29,280 | | |
| | | | | Audio & Video Recording Solutions | | | | | |
| | 207,000 | | | Gemalto (France) | | | 14,867 | | |
| | | | | Digital Security Solutions | | | | | |
| | | | 415,486 | | |
| | | > Semiconductors & Related
Equipment 2.1% | |
| | 11,562,000 | | | Atmel (a) | | | 77,465 | | |
| | | | | Microcontrollers, Radio Frequency &
Memory Semiconductors | | | | | |
| | 7,932,000 | | | ON Semiconductor (a) | | | 56,317 | | |
| | | | | Mixed Signal & Power Management
Semiconductors | | | | | |
| | 5,000,000 | | | Entegris (a) | | | 42,700 | | |
| | | | | Semiconductor Materials Management Products | | | | | |
| | 2,160,000 | | | Microsemi (a) | | | 39,938 | | |
| | | | | Analog/Mixed Signal Semiconductors | | | | | |
See accompanying notes to financial statements.
26
| Number of Shares | | | | Value (000) | |
| | | > Semiconductors & Related
Equipment—continued | |
| | 420,000 | | | Littelfuse | | $ | 23,894 | | |
| | | | | Little Fuses | | | | | |
| | 1,165,000 | | | Monolithic Power Systems (a) | | | 23,149 | | |
| | | | | High Performance Analog & Mixed Signal
Integrated Circuits | | | | | |
| | 1,900,000 | | | IXYS (a)(b) | | | 21,223 | | |
| | | | | Power Semiconductors | | | | | |
| | 400,000 | | | Hittite Microwave (a) | | | 20,448 | | |
| | | | | Radio Frequency, Microwave &
Millimeterwave Semiconductors | | | | | |
| | 615,000 | | | Ultratech (a) | | | 19,373 | | |
| | | | | Semiconductor Equipment | | | | | |
| | 1,765,000 | | | Pericom Semiconductor (a)(b) | | | 15,885 | | |
| | | | | Interface Integrated Circuits & Frequency Control Products | | | | | |
| | 560,000 | | | Cree (a)(c) | | | 14,375 | | |
| | | | | LED Lighting, Components & Chips | | | | | |
| | 2,290,000 | | | TriQuint Semiconductor (a) | | | 12,595 | | |
| | | | | Radio Frequency Semiconductors | | | | | |
| | | | 367,362 | | |
| | | > Computer Services 1.3% | |
| | 3,400,000 | | | iGATE (a)(b) | | | 57,868 | | |
| | | | | IT & Business Process Outsourcing Services | | | | | |
| | 680,000 | | | Syntel | | | 41,275 | | |
| | | | | Offshore IT Services | | | | | |
| | 1,618,000 | | | ExlService Holdings (a)(b) | | | 39,868 | | |
| | | | | Business Process Outsourcing | | | | | |
| | 2,125,000 | | | Virtusa (a)(b) | | | 28,369 | | |
| | | | | Offshore IT Outsourcing | | | | | |
| | 1,705,000 | | | Genpact (a) | | | 28,354 | | |
| | | | | Business Process Outsourcing | | | | | |
| | 3,849,207 | | | Hackett Group (a)(b) | | | 21,440 | | |
| | | | | IT Integration & Best Practice Research | | | | | |
| | 1,091,353 | | | WNS - ADR (India) (a) | | | 10,619 | | |
| | | | | Offshore BPO (Business Process Outsourcing)
Services | | | | | |
| | | | 227,793 | | |
| | | > Gaming Equipment & Services 1.2% | |
| | 3,725,000 | | | Bally Technologies (a)(b) | | | 173,809 | | |
| | | | | Slot Machines & Software | | | | | |
| | 1,530,000 | | | WMS Industries (a) | | | 30,523 | | |
| | | | | Slot Machine Provider | | | | | |
| | | | 204,332 | | |
| | | > Internet Related 1.1% | |
| | 450,000 | | | Equinix (a) | | | 79,042 | | |
| | | | | Network Neutral Data Centers | | | | | |
| | 1,450,000 | | | TripAdvisor | | | 64,801 | | |
| | | | | Online Travel Research | | | | | |
| | 304,000 | | | NetEase.com - ADR (China) (a) | | | 17,890 | | |
| | | | | Chinese Online Gaming Services | | | | | |
| | 700,100 | | | Yandex (Russia) (a) | | | 13,337 | | |
| | | | | Search Engine for Russian & Turkish Languages | | | | | |
| | 234,168 | | | Mail.ru - GDR (Russia) (a)(d) | | | 7,975 | | |
| | | | | Internet Social Networking & Games for
Russian Speakers | | | | | |
| | 231,700 | | | Angies list (a) | | | 3,670 | | |
| | | | | Consumer Subscription & Internet Advertising | | | | | |
| | | | 186,715 | | |
| Number of Shares | | | | Value (000) | |
| | | > Business Information & Marketing
Services 0.9% | |
| | 1,900,000 | | | Verisk Analytics (a) | | $ | 93,594 | | |
| | | | | Risk & Decision Analytics | | | | | |
| | 3,027,016 | | | Navigant Consulting (a)(b) | | | 38,261 | | |
| | | | | Financial Consulting Firm | | | | | |
| | 505,000 | | | RPX (a) | | | 7,247 | | |
| | | | | Patent Aggregation & Defensive Patent
Consulting | | | | | |
| | 234,615 | | | FTI Consulting (a) | | | 6,745 | | |
| | | | | Financial Consulting Firm | | | | | |
| | | | 145,847 | | |
| | | > Telecommunications Equipment 0.7% | |
| | 640,000 | | | F5 Networks (a) | | | 63,718 | | |
| | | | | Internet Traffic Management Equipment | | | | | |
| | 1,730,000 | | | Ixia (a) | | | 20,795 | | |
| | | | | Telecom Network Test Equipment | | | | | |
| | 1,345,000 | | | Finisar (a) | | | 20,121 | | |
| | | | | Optical Subsystems & Components | | | | | |
| | 1,925,000 | | | Infinera (a) | | | 13,167 | | |
| | | | | Optical Networking Equipment | | | | | |
| | | | 117,801 | | |
| | | > CATV 0.6% | |
| | 900,000 | | | Discovery Series C (a) | | | 45,081 | | |
| | | | | Cable TV Programming | | | | | |
| | 900,000 | | | Liberty Global Series A (a) | | | 44,667 | | |
| | | | | Cable TV Franchises Outside the USA | | | | | |
| | 15,770 | | | Jupiter Telecommunications (Japan) | | | 16,079 | | |
| | | | | Largest Cable Service Provider in Japan | | | | | |
| | | | 105,827 | | |
| | | > Financial Processors 0.6% | |
| | 1,700,000 | | | Global Payments | | | 73,491 | | |
| | | | | Credit Card Processor | | | | | |
| | 5,000,000 | | | Singapore Exchange (Singapore) | | | 25,119 | | |
| | | | | Singapore Equity & Derivatives Market
Operator | | | | | |
| | | | 98,610 | | |
| | | > Electronics Distribution 0.6% | |
| | 3,125,000 | | | Avnet (a) | | | 96,438 | | |
| | | | | Electronic Components Distribution | | | | | |
| | | | 96,438 | | |
| | | > Contract Manufacturing 0.3% | |
| | 3,800,000 | | | Sanmina-SCI (a) | | | 31,122 | | |
| | | | | Electronic Manufacturing Services | | | | | |
| | 960,000 | | | Plexus (a) | | | 27,072 | | |
| | | | | Electronic Manufacturing Services | | | | | |
| | | | 58,194 | | |
| | | > Advertising 0.3% | |
| | 1,725,000 | | | Lamar Advertising (a) | | | 49,335 | | |
| | | | | Outdoor Advertising | | | | | |
| | 1,500,000 | | | VisionChina Media - ADR (China) (a) | | | 1,395 | | |
| | | | | Advertising on Digital Screens in China's
Mass Transit System | | | | | |
| | | | 50,730 | | |
See accompanying notes to financial statements.
27
Columbia Acorn Fund
Statement of Investments (Unaudited), continued
| Number of Shares | | | | Value (000) | |
| | | > Entertainment Programming 0.2% | |
| | 1,100,000 | | | IMAX (Canada) (a)(c) | | $ | 26,433 | | |
| | | | | IMAX Movies, Theatre Equipment &
Theatre Joint Ventures | | | | | |
| | | | 26,433 | | |
| | | > TV Broadcasting —% | |
| | 2,500,000 | | | Entravision Communications | | | 3,025 | | |
| | | | | Spanish Language TV & Radio Stations | | | | | |
| | 1,750,000 | | | Gray Television (a)(c) | | | 2,573 | | |
| | | | | Mid-market Affiliated TV Stations | | | | | |
| | | | 5,598 | | |
| | | > Radio —% | |
| | 145,271 | | | Saga Communications (a) | | | 5,391 | | |
| | | | | Radio Stations in Small & Mid-sized Cities | | | | | |
| | | | 5,391 | | |
| | | > Consumer Software —% | |
| | 273,500 | | | Carbonite (a)(c) | | | 2,445 | | |
| | | | | Online Data Storage | | | | | |
| | | | 2,445 | | |
| Information: Total | | | 4,666,570 | | |
| Industrial Goods & Services 19.0% | | | |
| | | > Machinery 11.1% | |
| | 6,750,000 | | | Ametek | | | 336,893 | | |
| | | | | Aerospace/Industrial Instruments | | | | | |
| | 8,400,000 | | | Donaldson (b) | | | 280,308 | | |
| | | | | Industrial Air Filtration | | | | | |
| | 3,125,000 | | | Nordson | | | 160,281 | | |
| | | | | Dispensing Systems for Adhesives & Coatings | | | | | |
| | 3,000,000 | | | Moog (a)(b) | | | 124,050 | | |
| | | | | Motion Control Products for Aerospace,
Defense & Industrial Markets | | | | | |
| | 3,725,000 | | | Kennametal | | | 123,484 | | |
| | | | | Consumable Cutting Tools | | | | | |
| | 2,325,000 | | | Clarcor | | | 111,972 | | |
| | | | | Mobile & Industrial Filters | | | | | |
| | 3,063,000 | | | HEICO (b) | | | 98,812 | | |
| | | | | FAA Approved Aircraft Replacement Parts | | | | | |
| | 1,800,000 | | | Pall | | | 98,658 | | |
| | | | | Filtration & Fluids Clarification | | | | | |
| | 2,200,000 | | | ESCO Technologies (b) | | | 80,168 | | |
| | | | | Automatic Electric Meter Readers | | | | | |
| | 1,890,000 | | | Pentair | | | 72,349 | | |
| | | | | Pumps & Water Treatment | | | | | |
| | 805,000 | | | Toro | | | 58,998 | | |
| | | | | Turf Maintenance Equipment | | | | | |
| | 2,350,000 | | | Generac | | | 56,541 | | |
| | | | | Standby Power Generators | | | | | |
| | 2,675,000 | | | Oshkosh Corporation (a) | | | 56,041 | | |
| | | | | Specialty Truck Manufacturer | | | | | |
| | 1,325,000 | | | Polypore International (a)(c) | | | 53,517 | | |
| | | | | Battery Separators & Filtration Media | | | | | |
| | 435,000 | | | Valmont Industries | | | 52,622 | | |
| | | | | Center Pivot Irrigation Systems & Utility Poles | | | | | |
| | 950,000 | | | WABCO Holdings (a) | | | 50,284 | | |
| | | | | Truck & Bus Component Supplier | | | | | |
| Number of Shares | | | | Value (000) | |
| | 600,000 | | | Wabtec | | $ | 46,806 | | |
| | | | | Freight & Transit Component Supplier | | | | | |
| | 350,000 | | | Neopost (France) | | | 18,678 | | |
| | | | | Postage Meter Machines | | | | | |
| | 170,000 | | | Middleby Corp (a) | | | 16,934 | | |
| | | | | Manufacturer of Cooking Equipment | | | | | |
| | 10,000,000 | | | Marel (Iceland) | | | 12,162 | | |
| | | | | Largest Manufacturer of Poultry & Fish
Processing Equipment | | | | | |
| | 1,000,000 | | | Spartan Motors | | | 5,240 | | |
| | | | | Specialty Truck & Chassis Manufacturer | | | | | |
| | | | 1,914,798 | | |
| | | > Industrial Materials & Specialty
Chemicals 2.4% | |
| | 1,750,000 | | | Albemarle | | | 104,370 | | |
| | | | | Refinery Catalysts & Other Specialty
Chemicals | | | | | |
| | 1,520,000 | | | FMC Corporation | | | 81,290 | | |
| | | | | Niche Specialty Chemicals | | | | | |
| | 800,000 | | | Ashland | | | 55,448 | | |
| | | | | Diversified Chemicals Company | | | | | |
| | 1,880,000 | | | Drew Industries (a)(b) | | | 52,358 | | |
| | | | | RV & Manufactured Home Components | | | | | |
| | 1,525,000 | | | Novozymes (Denmark) | | | 39,545 | | |
| | | | | Industrial Enzymes | | | | | |
| | 673,000 | | | Sociedad Quimica y Minera de
Chile - ADR (Chile) (c) | | | 37,466 | | |
| | | | | Producer of Specialty Fertilizers,
Lithium & Iodine | | | | | |
| | 2,218,700 | | | Kansai Paint (Japan) | | | 23,775 | | |
| | | | | Paint Producer in Japan, India, China &
Southeast Asia | | | | | |
| | 600,000 | | | Albany International | | | 11,226 | | |
| | | | | Paper Machine Clothing & Composites
for Aerospace | | | | | |
| | 200,000 | | | Silgan Holdings | | | 8,538 | | |
| | | | | Metal & Plastic Packaging | | | | | |
| | 92,046 | | | Mersen (France) | | | 2,306 | | |
| | | | | Advanced Industrial Materials | | | | | |
| | | | 416,322 | | |
| | | > Other Industrial Services 1.7% | |
| | 3,050,000 | | | Expeditors International of
Washington | | | 118,187 | | |
| | | | | International Freight Forwarder | | | | | |
| | 1,400,000 | | | Forward Air | | | 45,178 | | |
| | | | | Freight Transportation Between Airports | | | | | |
| | 1,350,000 | | | LKQ (a) | | | 45,090 | | |
| | | | | Alternative Auto Parts Distribution | | | | | |
| | 1,491,313 | | | Imtech (Netherlands) | | | 35,610 | | |
| | | | | Electromechanical & Information & Communications
Technology Installation & Maintenance | | | | | |
| | 1,600,000 | | | Mobile Mini (a) | | | 23,040 | | |
| | | | | Portable Storage Units Leasing | | | | | |
| | 1,500,000 | | | Acorn Energy (b)(c) | | | 12,480 | | |
| | | | | Frac Well Exploration/Monitoring Device,
Sonar Security, Electric Grid Monitoring | | | | | |
| | 750,000 | | | UTI Worldwide | | | 10,958 | | |
| | | | | Freight Forwarding & Logistics | | | | | |
| | | | 290,543 | | |
See accompanying notes to financial statements.
28
| Number of Shares | | | | Value (000) | |
| | | > Construction 1.3% | |
| | 2,850,000 | | | Chicago Bridge & Iron | | $ | 108,186 | | |
| | | | | Engineering & Construction for Liquefied
Natural Gas & Petrochemicals | | | | | |
| | 66,000 | | | NVR (a) | | | 56,100 | | |
| | | | | DC Homebuilder | | | | | |
| | 1,350,000 | | | Fortune Brands Home & Security (a) | | | 30,065 | | |
| | | | | Home Building Supplies & Small Locks | | | | | |
| | 1,800,000 | | | Mills Estruturas e Servicos de
Engenharia (Brazil) | | | 24,197 | | |
| | | | | Civil Engineering & Construction | | | | | |
| | | | 218,548 | | |
| | | > Electrical Components 0.7% | |
| | 1,765,000 | | | Acuity Brands | | | 89,856 | | |
| | | | | Commercial Lighting Fixtures | | | | | |
| | 1,500,000 | | | Ushio (Japan) | | | 18,592 | | |
| | | | | Industrial Light Sources | | | | | |
| | 351,000 | | | Saft (France) | | | 8,421 | | |
| | | | | Niche Battery Manufacturer | | | | | |
| | | | 116,869 | | |
| | | > Outsourcing Services 0.7% | |
| | 2,800,000 | | | Quanta Services (a) | | | 67,396 | | |
| | | | | Electrical & Telecom Construction Services | | | | | |
| | 1,359,200 | | | Insperity (b) | | | 36,766 | | |
| | | | | Professional Employer Organization | | | | | |
| | 600,000 | | | GP Strategies (a) | | | 11,082 | | |
| | | | | Training Programs | | | | | |
| | | | 115,244 | | |
| | | > Waste Management 0.5% | |
| | 2,050,000 | | | Waste Connections | | | 61,336 | | |
| | | | | Solid Waste Management | | | | | |
| | 560,000 | | | Clean Harbors (a) | | | 31,595 | | |
| | | | | Hazardous Waste Services & Disposal | | | | | |
| | | | 92,931 | | |
| | | > Conglomerates 0.2% | |
| | 2,324,833 | | | Aalberts Industries (Netherlands) | | | 36,200 | | |
| | | | | Flow Control & Heat Treatment | | | | | |
| | | | 36,200 | | |
| | | > Industrial Distribution 0.2% | |
| | 1,400,000 | | | Interline Brands (a) | | | 35,098 | | |
| | | | | Industrial Distribution | | | | | |
| | | | 35,098 | | |
| | | > Steel 0.2% | |
| | 2,800,000 | | | GrafTech International (a) | | | 27,020 | | |
| | | | | Industrial Graphite Materials Producer | | | | | |
| | | | 27,020 | | |
| Industrial Goods & Services: Total | | | 3,263,573 | | |
| Consumer Goods & Services 15.9% | | | |
| | | > Retail 4.3% | |
| | 4,505,000 | | | lululemon athletica (a) | | | 268,633 | | |
| | | | | Premium Active Apparel Retailer | | | | | |
| | 6,600,000 | | | Pier 1 Imports (b) | | | 108,438 | | |
| | | | | Home Furnishing Retailer | | | | | |
| | 3,040,000 | | | Abercrombie & Fitch | | | 103,786 | | |
| | | | | Teen Apparel Retailer | | | | | |
| Number of Shares | | | | Value (000) | |
| | 3,370,000 | | | Shutterfly (a)(b) | | $ | 103,425 | | |
| | | | | Internet Photo-centric Retailer | | | | | |
| | 4,425,000 | | | Saks (a)(c) | | | 47,126 | | |
| | | | | Luxury Department Store Retailer | | | | | |
| | 527,845 | | | Fossil (a) | | | 40,401 | | |
| | | | | Watch Designer & Retailer | | | | | |
| | 525,000 | | | DSW | | | 28,560 | | |
| | | | | Branded Footwear Retailer | | | | | |
| | 1,075,000 | | | American Eagle Outfitters | | | 21,210 | | |
| | | | | Teen Apparel Retailer | | | | | |
| | 971,500 | | | Teavana (a)(c) | | | 13,145 | | |
| | | | | Specialty Tea Retailer | | | | | |
| | 1,371,366 | | | Gaiam (a)(b) | | | 5,348 | | |
| | | | | Healthy Living Catalogs & E-Commerce | | | | | |
| | 66,000 | | | The Fresh Market (a) | | | 3,540 | | |
| | | | | Specialty Food Retailer | | | | | |
| | | | 743,612 | | |
| | | > Travel 3.0% | |
| | 3,850,000 | | | Gaylord Entertainment (a)(b) | | | 148,456 | | |
| | | | | Convention Hotels | | | | | |
| | 1,430,000 | | | Vail Resorts | | | 71,614 | | |
| | | | | Ski Resort Operator & Developer | | | | | |
| | 1,450,000 | | | Expedia | | | 69,702 | | |
| | | | | Online Travel Services Company | | | | | |
| | 4,400,000 | | | Avis Budget Group (a) | | | 66,880 | | |
| | | | | Second Largest Car Rental Company | | | | | |
| | 3,750,000 | | | Hertz (a) | | | 48,000 | | |
| | | | | Largest U.S. Rental Car Operator | | | | | |
| | 970,000 | | | Choice Hotels | | | 38,732 | | |
| | | | | Franchisor of Budget Hotel Brands | | | | | |
| | 1,600,000 | | | HomeAway (a)(c) | | | 34,784 | | |
| | | | | Vacation Rental Online Marketplace | | | | | |
| | 2,000,000 | | | Localiza Rent A Car (Brazil) | | | 30,082 | | |
| | | | | Car Rental | | | | | |
| | | | 508,250 | | |
| | | > Apparel 2.3% | |
| | 1,660,000 | | | PVH | | | 129,131 | | |
| | | | | Apparel Wholesaler & Retailer | | | | | |
| | 2,100,000 | | | Coach | | | 122,808 | | |
| | | | | Designer & Retailer of Branded Leather
Accessories | | | | | |
| | 1,460,000 | | | Warnaco Group (a) | | | 62,167 | | |
| | | | | Global Branded Apparel Manufacturer | | | | | |
| | 1,310,000 | | | Deckers Outdoor (a)(c) | | | 57,653 | | |
| | | | | Fashion Footwear Wholesaler | | | | | |
| | 600,000 | | | Steven Madden (a) | | | 19,050 | | |
| | | | | Wholesaler/Retailer of Fashion Footwear | | | | | |
| | 231,452 | | | True Religion Apparel | | | 6,708 | | |
| | | | | Premium Denim | | | | | |
| | | | 397,517 | | |
| | | > Food & Beverage 1.1% | |
| | 1,700,000 | | | Monster Beverage (a) | | | 121,040 | | |
| | | | | Alternative Beverages | | | | | |
| | 32,000,000 | | | Olam International (Singapore) | | | 46,347 | | |
| | | | | Agriculture Supply Chain Manager | | | | | |
| | 1,800,000 | | | Arcos Dorados (Brazil) | | | 26,604 | | |
| | | | | McDonald's Master Franchise for
Latin America | | | | | |
See accompanying notes to financial statements.
29
Columbia Acorn Fund
Statement of Investments (Unaudited), continued
| Number of Shares | | | | Value (000) | |
| | | > Food & Beverage—continued | |
| | 45,500 | | | Annie's (a)(c) | | $ | 1,905 | | |
| | | | | Developer & Marketer of Natural & Organic Food | | | | | |
| | 1,665,270 | | | GLG Life Tech (Canada) (a)(b)(e) | | | 689 | | |
| | | | | All-natural Sweetener Extracted from the
Stevia Plant | | | | | |
| | | | 196,585 | | |
| | | > Consumer Goods Distribution 1.1% | |
| | 2,305,000 | | | GNC Holdings | | | 90,356 | | |
| | | | | Specialty Retailer of Health & Wellness Products | | | | | |
| | 2,015,000 | | | Pool | | | 81,527 | | |
| | | | | Distributor of Swimming Pool Supplies &
Equipment | | | | | |
| | 625,000 | | | United Stationers | | | 16,844 | | |
| | | | | Wholesale Distributor of Business Products | | | | | |
| | | | 188,727 | | |
| | | > Other Consumer Services 0.9% | |
| | 2,190,000 | | | Lifetime Fitness (a)(b) | | | 101,857 | | |
| | | | | Sport & Fitness Club Operator | | | | | |
| | 16,857,500 | | | Lifestyle International (Hong Kong) | | | 37,146 | | |
| | | | | Mid to High-end Department Store
Operator in Hong Kong & China | | | | | |
| | 1,062,500 | | | Move (a) | | | 9,679 | | |
| | | | | Real Estate Internet Websites | | | | | |
| | 441,666 | | | IFM Investments (Century 21
China RE) - ADR (China) (a) | | | 481 | | |
| | | | | Provide Real Estate Services in China | | | | | |
| | | | 149,163 | | |
| | | > Casinos & Gaming 0.8% | |
| | 3,950,000 | | | Pinnacle Entertainment (a)(b) | | | 37,999 | | |
| | | | | Regional Casino Operator | | | | | |
| | 850,000 | | | Penn National Gaming (a) | | | 37,902 | | |
| | | | | Regional Casino Operator | | | | | |
| | 3,000,000 | | | Melco Crown Entertainment - ADR
(Hong Kong) (a) | | | 34,560 | | |
| | | | | Macau Casino Operator | | | | | |
| | 12,000,000 | | | MGM China Holdings (Hong Kong) | | | 18,400 | | |
| | | | | Macau Casino Operator | | | | | |
| | | | 128,861 | | |
| | | > Furniture & Textiles 0.8% | |
| | 4,200,000 | | | Knoll (b) | | | 56,364 | | |
| | | | | Office Furniture | | | | | |
| | 2,250,000 | | | Herman Miller | | | 41,670 | | |
| | | | | Office Furniture | | | | | |
| | 2,038,555 | | | Interface | | | 27,785 | | |
| | | | | Modular & Broadloom Carpet | | | | | |
| | 215,000 | | | Caesarstone (Israel) (a) | | | 2,604 | | |
| | | | | Quartz Countertops | | | | | |
| | | | 128,423 | | |
| | | > Other Durable Goods 0.6% | |
| | 1,500,000 | | | Jarden | | | 63,030 | | |
| | | | | Branded Household Products | | | | | |
| | 460,000 | | | Cavco Industries (a)(b) | | | 23,589 | | |
| | | | | Manufactured Homes | | | | | |
| | 400,000 | | | Tesla Motors (a)(c) | | | 12,516 | | |
| | | | | Design, Manufacture & Sell High Performance
Electric Vehicles | | | | | |
| | | | 99,135 | | |
| Number of Shares | | | | Value (000) | |
| | | > Restaurants 0.4% | |
| | 2,000,000 | | | AFC Enterprises (a)(b) | | $ | 46,280 | | |
| | | | | Popeye's Restaurants | | | | | |
| | 450,000 | | | Cheesecake Factory (a) | | | 14,382 | | |
| | | | | Casual Dining Restaurants | | | | | |
| | 675,000 | | | Bravo Brio Restaurant Group (a) | | | 12,035 | | |
| | | | | Upscale Casual Italian Restaurants | | | | | |
| | | | 72,697 | | |
| | | > Nondurables 0.3% | |
| | 1,600,000 | | | Helen of Troy (a)(b) | | | 54,224 | | |
| | | | | Personal Care, Housewares, Healthcare &
Home Environment Products | | | | | |
| | | | 54,224 | | |
| | | > Educational Services 0.2% | |
| | 800,000 | | | New Oriental Education &
Technology - ADR (China) (a) | | | 19,600 | | |
| | | | | Education Service Provider | | | | | |
| | 300,000 | | | ITT Educational Services (a)(c) | | | 18,225 | | |
| | | | | Postsecondary Degree Services | | | | | |
| | 2,000,000 | | | Voyager Learning - Contingent Value
Rights (e)(f) | | | 220 | | |
| | | | | Education Services for the K-12 Market | | | | | |
| | | | 38,045 | | |
| | | > Leisure Products 0.1% | |
| | 1,290,000 | | | Skullcandy (a)(c) | | | 18,253 | | |
| | | | | Lifestyle Branded Headphones | | | | | |
| | | | 18,253 | | |
| | | > Other Entertainment —% | |
| | 265,000 | | | CTS Eventim (Germany) | | | 7,974 | | |
| | | | | Event Ticket Sales | | | | | |
| | | | 7,974 | | |
| Consumer Goods & Services: Total | | | 2,731,466 | | |
| Finance 11.0% | | | |
| | | > Banks 4.4% | |
| | 2,638,000 | | | BOK Financial | | | 153,532 | | |
| | | | | Tulsa-based Southwest Bank | | | | | |
| | 6,956,800 | | | Associated Banc-Corp | | | 91,760 | | |
| | | | | Midwest Bank | | | | | |
| | 2,337,313 | | | Hancock Holding | | | 71,148 | | |
| | | | | Gulf Coast Bank | | | | | |
| | 1,348,000 | | | City National | | | 65,486 | | |
| | | | | Bank & Asset Manager | | | | | |
| | 2,860,000 | | | MB Financial (b) | | | 61,604 | | |
| | | | | Chicago Bank | | | | | |
| | 985,000 | | | SVB Financial Group (a) | | | 57,839 | | |
| | | | | Bank to Venture Capitalists | | | | | |
| | 5,323,500 | | | Valley National Bancorp | | | 56,429 | | |
| | | | | New Jersey/New York Bank | | | | | |
| | 3,000,000 | | | CVB Financial | | | 34,950 | | |
| | | | | Inland Empire Business Bank | | | | | |
| | 2,200,000 | | | TCF Financial | | | 25,256 | | |
| | | | | Great Lakes Bank | | | | | |
| | 700,000 | | | Wintrust Financial | | | 24,850 | | |
| | | | | Chicago & Milwaukee Full Service Bank | | | | | |
| | 1,350,000 | | | TriCo Bancshares (b) | | | 20,790 | | |
| | | | | California Central Valley Bank | | | | | |
See accompanying notes to financial statements.
30
| Number of Shares | | | | Value (000) | |
| | | > Banks—continued | |
| | 4,299,507 | | | First Busey | | $ | 20,767 | | |
| | | | | Illinois Bank | | | | | |
| | 1,121,188 | | | Sandy Spring Bancorp | | | 20,181 | | |
| | | | | Baltimore, D.C. Bank | | | | | |
| | 2,500,000 | | | First Commonwealth | | | 16,825 | | |
| | | | | Western Pennsylvania Bank | | | | | |
| | 811,295 | | | Hudson Valley | | | 14,685 | | |
| | | | | Metro New York City Bank | | | | | |
| | 2,136,500 | | | TrustCo Bank | | | 11,665 | | |
| | | | | New York State Bank | | | | | |
| | 706,559 | | | Eagle Bancorp (a) | | | 11,128 | | |
| | | | | Metro D.C. Bank | | | | | |
| | 241,405 | | | Pacific Continental Bank | | | 2,141 | | |
| | | | | Pacific Northwest Bank | | | | | |
| | 79,800 | | | Green Bankshares (a) | | | 133 | | |
| | | | | Tennessee Bank | | | | | |
| | | | 761,169 | | |
| | | > Insurance 2.4% | |
| | 8,900,000 | | | CNO Financial Group | | | 69,420 | | |
| | | | | Life, Long-term Care & Medical Supplement
Insurance | | | | | |
| | 833,000 | | | Allied World Holdings | | | 66,198 | | |
| | | | | Commerical Lines Insurance/Reinsurance | | | | | |
| | 2,764,000 | | | Tower Group (b) | | | 57,685 | | |
| | | | | Commercial & Personal Lines Insurance | | | | | |
| | 1,120,000 | | | The Hanover Insurance Group | | | 43,826 | | |
| | | | | Commercial & Personal Lines Insurance | | | | | |
| | 2,050,000 | | | Selective Insurance Group | | | 35,690 | | |
| | | | | Commercial & Personal Lines Insurance | | | | | |
| | 1,100,000 | | | HCC Insurance Holdings | | | 34,540 | | |
| | | | | Specialty Insurance | | | | | |
| | 832,000 | | | Willis Group (Ireland) | | | 30,360 | | |
| | | | | Insurance Broker | | | | | |
| | 925,000 | | | Kemper | | | 28,444 | | |
| | | | | Multi-line Insurance | | | | | |
| | 250,000 | | | Enstar Group (a) | | | 24,735 | | |
| | | | | Insurance/Reinsurance & Related Services | | | | | |
| | 900,000 | | | Brown & Brown | | | 24,543 | | |
| | | | | Insurance Broker | | | | | |
| | | | 415,441 | | |
| | | > Finance Companies 1.6% | |
| | 1,425,202 | | | World Acceptance (a)(b) | | | 93,778 | | |
| | | | | Personal Loans | | | | | |
| | 2,150,000 | | | McGrath Rentcorp (b) | | | 56,975 | | |
| | | | | Temporary Space & IT Rentals | | | | | |
| | 3,400,000 | | | H & E Equipment Services (a)(b) | | | 51,102 | | |
| | | | | Heavy Equipment Leasing | | | | | |
| | 1,123,400 | | | CAI International (a)(b) | | | 22,333 | | |
| | | | | International Container Leasing | | | | | |
| | 1,091,000 | | | Marlin Business Services (b) | | | 17,882 | | |
| | | | | Small Equipment Leasing | | | | | |
| | 450,000 | | | Onex Capital (Canada) | | | 17,472 | | |
| | | | | Private Equity | | | | | |
| | 422,500 | | | Regional Management (a) | | | 6,950 | | |
| | | | | Consumer Loans | | | | | |
| | 78,500 | | | Textainer Group Holdings | | | 2,897 | | |
| | | | | Top International Container Leasor | | | | | |
| | | | 269,389 | | |
| Number of Shares | | | | Value (000) | |
| | | > Brokerage & Money Management 1.5% | |
| | 6,654,000 | | | SEI Investments | | $ | 132,348 | | |
| | | | | Mutual Fund Administration &
Investment Management | | | | | |
| | 4,036,000 | | | Eaton Vance | | | 108,770 | | |
| | | | | Specialty Mutual Funds | | | | | |
| | 300,000 | | | FX Alliance (a) | | | 4,713 | | |
| | | | | FX Trading Software & Services | | | | | |
| | 1,000,000 | | | Artio Global Investors (c) | | | 3,500 | | |
| | | | | International Asset Manager | | | | | |
| | | | 249,331 | | |
| | | > Credit Cards 0.5% | |
| | 550,000 | | | Alliance Data Systems (a) | | | 74,250 | | |
| | | | | Diversified Credit Card Provider | | | | | |
| | 275,000 | | | Wright Express (a) | | | 16,973 | | |
| | | | | Pay Card Processor | | | | | |
| | | | 91,223 | | |
| | | > Diversified Financial Companies 0.4% | |
| | 2,820,000 | | | Leucadia National | | | 59,981 | | |
| | | | | Holding Company | | | | | |
| | | | 59,981 | | |
| | | > Savings & Loans 0.2% | |
| | 400,000 | | | Financial Engines (a) | | | 8,580 | | |
| | | | | Asset Management for 401k Plans | | | | | |
| | 1,010,000 | | | Provident New York Bancorp | | | 7,666 | | |
| | | | | New York State Thrift | | | | | |
| | 470,000 | | | ViewPoint Financial | | | 7,351 | | |
| | | | | Texas Thrift | | | | | |
| | 452,146 | | | Kaiser Federal | | | 6,682 | | |
| | | | | Los Angeles Savings & Loan | | | | | |
| | 65,991 | | | Berkshire Hills Bancorp | | | 1,452 | | |
| | | | | Northeast Thrift | | | | | |
| | | | 31,731 | | |
| Finance: Total | | | 1,878,265 | | |
| Health Care 9.7% | | | |
| | | > Biotechnology & Drug Delivery 4.9% | |
| | 4,315,000 | | | BioMarin Pharmaceutical (a) | | | 170,787 | | |
| | | | | Biotech Focused on Orphan Diseases | | | | | |
| | 6,153,000 | | | Seattle Genetics (a)(b)(c) | | | 156,225 | | |
| | | | | Antibody-based Therapies for Cancer | | | | | |
| | 1,476,000 | | | Alexion Pharmaceuticals (a) | | | 146,567 | | |
| | | | | Biotech Focused on Orphan Diseases | | | | | |
| | 3,250,000 | | | Auxilium Pharmaceuticals (a)(b) | | | 87,393 | | |
| | | | | Biotech Focused on Niche Disease Areas | | | | | |
| | 6,000,000 | | | NPS Pharmaceuticals (a)(b) | | | 51,660 | | |
| | | | | Orphan Drugs & Healthy Royalties | | | | | |
| | 750,000 | | | Onyx Pharmaceuticals (a) | | | 49,837 | | |
| | | | | Commercial-stage Biotech Focused on Cancer | | | | | |
| | 3,850,000 | | | InterMune (a)(b) | | | 46,007 | | |
| | | | | Drugs for Pulmonary Fibrosis & Hepatitis C | | | | | |
| | 2,568,248 | | | ARIAD Pharmaceuticals (a) | | | 44,200 | | |
| | | | | Biotech Focused on Cancer | | | | | |
| | 3,430,000 | | | Isis Pharmaceuticals (a) | | | 41,160 | | |
| | | | | Biotech Pioneer in Antisense Drugs | | | | | |
| | 569,898 | | | Synageva Biopharma (a)(c) | | | 23,115 | | |
| | | | | Biotech Focused on Orphan Diseases | | | | | |
See accompanying notes to financial statements.
31
Columbia Acorn Fund
Statement of Investments (Unaudited), continued
| Number of Shares | | | | Value (000) | |
| | | > Biotechnology & Drug Delivery—continued | |
| | 3,609,594 | | | Raptor Pharmaceutical (a)(b)(c) | | $ | 20,178 | | |
| | | | | Orphan Drug Company | | | | | |
| | 5,750,000 | | | Chelsea Therapeutics
International (a)(b)(c) | | | 8,510 | | |
| | | | | Biotech Focused on Rare Diseases | | | | | |
| | 2,990,000 | | | Anthera Pharmaceuticals (a)(b) | | | 2,022 | | |
| | | | | Biotech Focused on Cardiovascular, Cancer &
Immunology | | | | | |
| | 359,944 | | | MicroDose Therapeutx (e)(f) | | | 252 | | |
| | | | | Drug Inhaler Development | | | | | |
| | | | 847,913 | | |
| | | > Medical Supplies 2.6% | |
| | 4,600,000 | | | Cepheid (a)(b) | | | 205,850 | | |
| | | | | Molecular Diagnostics | | | | | |
| | 950,000 | | | Henry Schein (a) | | | 74,565 | | |
| | | | | Largest Distributor of Healthcare Products | | | | | |
| | 2,126,000 | | | Patterson Companies | | | 73,283 | | |
| | | | | Dental/Vet/Med Distributor | | | | | |
| | 1,550,000 | | | DENTSPLY International | | | 58,606 | | |
| | | | | Leading Dental Supplies Manufacturer | | | | | |
| | 375,000 | | | Techne | | | 27,825 | | |
| | | | | Cytokines, Antibodies & Other Reagents for
Life Science | | | | | |
| | | | 440,129 | | |
| | | > Medical Equipment & Devices 0.9% | |
| | 550,000 | | | Haemonetics (a) | | | 40,760 | | |
| | | | | Blood & Plasma Collection Equipment | | | | | |
| | 1,275,000 | | | Hill-Rom Holdings | | | 39,334 | | |
| | | | | Hospital Beds/Patient Handling | | | | | |
| | 675,000 | | | Sirona Dental Systems (a) | | | 30,382 | | |
| | | | | Manufacturer of Dental Equipment | | | | | |
| | 950,000 | | | PerkinElmer Inc. | | | 24,510 | | |
| | | | | Analytical Instruments for Life Sciences | | | | | |
| | 570,000 | | | Orthofix International (a) | | | 23,513 | | |
| | | | | Bone Fixation & Stimulation Devices | | | | | |
| | | | 158,499 | | |
| | | > Health Care Services 0.7% | |
| | 665,000 | | | Mednax (a) | | | 45,579 | | |
| | | | | Physician Management for Pediatric &
Anesthesia Practices | | | | | |
| | 4,900,000 | | | eResearch Technology (a)(b) | | | 39,151 | | |
| | | | | Clinical Research Services | | | | | |
| | 825,000 | | | HealthSouth (a) | | | 19,189 | | |
| | | | | Inpatient Rehabalitation Facilities | | | | | |
| | 1,875,000 | | | Health Management Associates (a) | | | 14,719 | | |
| | | | | Non-urban Hospitals | | | | | |
| | | | 118,638 | | |
| | | > Pharmaceuticals 0.6% | |
| | 4,000,000 | | | Akorn (a) | | | 63,080 | | |
| | | | | Develops, Manufactures & Sells Specialty
Generic Drugs | | | | | |
| | 3,388,000 | | | Adcock Ingram Holdings
(South Africa) | | | 24,904 | | |
| | | | | Manufacturer of Pharmaceuticals &
Medical Supplies | | | | | |
| | 1,095,000 | | | Horizon Pharma (a)(c) | | | 7,807 | | |
| | | | | Specialty Pharma Company | | | | | |
| Number of Shares | | | | Value (000) | |
| | 2,040,000 | | | Alimera Sciences (a)(b)(c) | | $ | 6,100 | | |
| | | | | Ophthalmology-focused Pharmaceutical Company | | | | | |
| | | | 101,891 | | |
| Health Care: Total | | | 1,667,070 | | |
| Energy & Minerals 6.7% | | | |
| | | > Oil Services 3.2% | |
| | 5,150,000 | | | FMC Technologies (a) | | | 202,034 | | |
| | | | | Oil & Gas Well Head Manufacturer | | | | | |
| | 2,114,000 | | | Atwood Oceanics (a) | | | 79,994 | | |
| | | | | Offshore Drilling Contractor | | | | | |
| | 1,289,106 | | | Fugro (Netherlands) | | | 78,196 | | |
| | | | | Subsea Oilfield Services | | | | | |
| | 1,670,000 | | | ShawCor (Canada) | | | 60,445 | | |
| | | | | Oil & Gas Pipeline Products | | | | | |
| | 1,000,000 | | | Hornbeck Offshore (a) | | | 38,780 | | |
| | | | | Supply Vessel Operator in U.S. Gulf of Mexico | | | | | |
| | 513,000 | | | Oil States International (a) | | | 33,961 | | |
| | | | | Diversified North American Oil Service Provider | | | | | |
| | 893,600 | | | Black Diamond Group (Canada) | | | 20,021 | | |
| | | | | Provides Accommodations/Equipment for
Oil Sands Development | | | | | |
| | 585,000 | | | Rowan (a) | | | 18,913 | | |
| | | | | Contract Offshore Driller | | | | | |
| | 2,890,900 | | | Horizon North Logistics (Canada) | | | 16,497 | | |
| | | | | Provides Diversified Oil Service Offering in
Northern Canada | | | | | |
| | 4,415,000 | | | Tuscany International Drilling
(Colombia) (a) | | | 1,713 | | |
| | | | | South America-based Drilling Rig Contractor | | | | | |
| | | | 550,554 | | |
| | | > Oil & Gas Producers 2.4% | |
| | 3,700,000 | | | Pacific Rubiales Energy (Colombia) | | | 78,354 | | |
| | | | | Oil Production & Exploration in Colombia | | | | | |
| | 695,000 | | | Range Resources | | | 43,000 | | |
| | | | | Oil & Gas Producer | | | | | |
| | 2,700,000 | | | Denbury Resources (a) | | | 40,797 | | |
| | | | | Oil Producer Using CO2 Injection | | | | | |
| | 974,000 | | | Rosetta Resources (a) | | | 35,687 | | |
| | | | | Oil & Gas Producer Exploring in
South Texas & Montana | | | | | |
| | 703,000 | | | SM Energy | | | 34,524 | | |
| | | | | Oil & Gas Producer | | | | | |
| | 1,050,000 | | | Tullow Oil (United Kingdom) | | | 24,268 | | |
| | | | | Oil & Gas Producer | | | | | |
| | 1,159,000 | | | Laredo Petroleum (a) | | | 24,107 | | |
| | | | | Permian Basin Oil Producer | | | | | |
| | 500,000 | | | Cabot Oil and Gas | | | 19,700 | | |
| | | | | Large Natural Gas Producer in Appalachia &
Gulf Coast | | | | | |
| | 361,000 | | | Baytex (Canada) (c) | | | 15,208 | | |
| | | | | Oil & Gas Producer in Canada | | | | | |
| | 7,582,928 | | | PetroMagdalena Energy
(Colombia) (a)(b) | | | 11,768 | | |
| | | | | Oil & Gas Exploration/Production in Colombia | | | | | |
| | 550,000 | | | Swift Energy (a) | | | 10,236 | | |
| | | | | Oil & Gas Exploration & Production | | | | | |
| | 718,000 | | | Celtic Exploration (Canada) (a) | | | 9,711 | | |
| | | | | Canadian Oil & Gas Producer | | | | | |
See accompanying notes to financial statements.
32
| Number of Shares | | | | Value (000) | |
| | | > Oil & Gas Producers—continued | |
| | 1,100,000 | | | Kodiak Oil and Gas (a) | | $ | 9,031 | | |
| | | | | Bakken Oil & Gas Producer | | | | | |
| | 340,000 | | | Petroleum Development
Corporation (a) | | | 8,337 | | |
| | | | | Oil & Gas Producer in U.S. | | | | | |
| | 750,000 | | | Athabasca Oil Sands (Canada) (a) | | | 8,251 | | |
| | | | | Oil Sands & Unconventional Oil Development | | | | | |
| | 37,500,000 | | | Petromanas (Canada) (a)(b) | | | 7,919 | | |
| | | | | Exploring for Oil in Albania | | | | | |
| | 200,000 | | | Approach Resource (a) | | | 5,108 | | |
| | | | | Oil & Gas Producer in West Texas Permian | | | | | |
| | 27,000,000 | | | Shamaran Petroleum (Iraq) (a) | | | 4,509 | | |
| | | | | Oil Exploration in Kurdistan | | | | | |
| | 26,000,000 | | | Petrodorado (Colombia) (a)(b) | | | 4,086 | | |
| | 24,000,000 | | | Petrodorado - Warrants (Colombia) (a)(f) | | | 340 | | |
| | | | | Oil & Gas Exploration & Production in
Colombia, Peru & Paraguay | | | | | |
| | 1,198,100 | | | Pan Orient (Canada) (a) | | | 4,413 | | |
| | | | | Asian Oil & Gas Explorer | | | | | |
| | 25,000,000 | | | Petroamerica (Colombia) (a)(c) | | | 3,192 | | |
| | | | | Oil Exploration & Production in Colombia | | | | | |
| | 493,000 | | | Crew Energy (Canada) (a) | | | 2,784 | | |
| | | | | Canadian Oil & Gas Producer | | | | | |
| | 50,000,000 | | | Gulf United (Colombia) (a)(e)(f) | | | 2,640 | | |
| | | | | Prospecting for Oil Alongside Large
Producers in Colombia | | | | | |
| | 5,116,000 | | | Canacol (Colombia) (a) | | | 2,286 | | |
| | | | | Oil Producer in South America | | | | | |
| | 8,400,000 | | | Canadian Overseas Petroleum
(United Kingdom) (a)(f) | | | 1,465 | | |
| | 4,200,000 | | | Canadian Overseas Petroleum - Warrants (United Kingdom) (a)(e)(f) | | | 81 | | |
| | | | | Oil & Gas Exploration/Production in the
North Sea | | | | | |
| | 4,110,000 | | | Santa Maria Petroleum
(Colombia) (a)(f) | | | 1,240 | | |
| | 890,000 | | | Santa Maria Petroleum (Colombia) (a) | | | 280 | | |
| | | | | Explores for Oil & Gas in Latin America | | | | | |
| | 393,600 | | | Houston American Energy (a) | | | 441 | | |
| | | | | Oil & Gas Exploration/Production in Colombia | | | | | |
| | | | 413,763 | | |
| | | > Mining 0.8% | |
| | 387,000 | | | Core Laboratories (Netherlands) | | | 44,853 | | |
| | | | | Oil & Gas Reservoir Consulting | | | | | |
| | 15,000,000 | | | Zhaojin Mining Industry (China) | | | 19,723 | | |
| | | | | Gold Mining & Refining in China | | | | | |
| | 1,400,000 | | | Kirkland Lake Gold (Canada) (a) | | | 15,071 | | |
| | | | | Gold Mining | | | | | |
| | 550,000 | | | Silver Wheaton (Canada) | | | 14,762 | | |
| | | | | Silver Mining Royalty Company | | | | | |
| | 4,432,000 | | | Northam Platinum (South Africa) | | | 12,677 | | |
| | | | | Platinum Mining in South Africa | | | | | |
| | 1,150,000 | | | Ivanhoe Mines (Mongolia) (a)(c) | | | 11,341 | | |
| | | | | Copper Mine Project in Mongolia | | | | | |
| | 7,500,000 | | | Duluth Metals (Canada) (a)(b) | | | 10,976 | | |
| Number of Shares | | | | Value (000) | |
| | 500,000 | | | Duluth Exploration - Special Warrants
(Canada) (a)(e)(f) | | $ | 39 | | |
| | | | | Copper & Nickel Miner | | | | | |
| | 16,000,000 | | | Mongolian Mining (Mongolia) (a) | | | 9,079 | | |
| | | | | Coking Coal Mining in Mongolia | | | | | |
| | 2,050,000 | | | Alexco Resource (a) | | | 9,041 | | |
| | | | | Mining, Exploration & Environmental Services | | | | | |
| | 800,000 | | | Augusta Resource (a) | | | 1,328 | | |
| | | | | US Copper/Moly Mine | | | | | |
| | 4,000,000 | | | Wolverine Minerals (Canada) (a)(b)(f) | | | 377 | | |
| | 2,000,000 | | | Wolverine Minerals - Warrants
(Canada) (a)(e)(f) | | | 3 | | |
| | | | | Gold Mining | | | | | |
| | | | 149,270 | | |
| | | > Oil Refining, Marketing & Distribution 0.1% | |
| | 218,000 | | | Vopak (Netherlands) | | | 13,983 | | |
| | | | | World's Largest Operator of Petroleum &
Chemical Storage Terminals | | | | | |
| | | | 13,983 | | |
| | | > Agricultural Commodities 0.1% | |
| | 1,306,818 | | | Union Agriculture Group
(Uruguay) (a)(e)(f) | | | 12,794 | | |
| | | | | Farmland Operator in Uruguay | | | | | |
| | | | 12,794 | | |
| | | > Alternative Energy 0.1% | |
| | 2,000,000 | | | GT Advanced Technologies (a) | | | 10,560 | | |
| | | | | Largest Manufacturer of Furnaces &
Reactors to Produce & Cast Polysilicon | | | | | |
| | 1,210,300 | | | Synthesis Energy Systems (China) (a) | | | 1,477 | | |
| | | | | Owner/Operator of Gasification Plants | | | | | |
| | | | 12,037 | | |
| Energy & Minerals: Total | | | 1,152,401 | | |
| Other Industries 6.3% | | | |
| | | > Real Estate 4.0% | |
| | 3,700,000 | | | DuPont Fabros Technology (b) | | | 105,672 | | |
| | | | | Technology-focused Office Buildings | | | | | |
| | 750,000 | | | Federal Realty Investment Trust | | | 78,068 | | |
| | | | | Shopping Centers | | | | | |
| | 1,850,000 | | | Extra Space Storage | | | 56,610 | | |
| | | | | Self Storage Facilities | | | | | |
| | 3,700,000 | | | Associated Estates Realty (b) | | | 55,315 | | |
| | | | | Multi-family Properties | | | | | |
| | 720,000 | | | Digital Realty Trust | | | 54,051 | | |
| | | | | Technology-focused Office Buildings | | | | | |
| | 975,000 | | | Post Properties | | | 47,726 | | |
| | | | | Multi-family Properties | | | | | |
| | 2,450,000 | | | Biomed Realty Trust | | | 45,766 | | |
| | | | | Life Science-focused Office Buildings | | | | | |
| | 770,000 | | | Kilroy Realty | | | 37,276 | | |
| | | | | West Coast Office & Industrial Properties | | | | | |
| | 43,000,000 | | | Mapletree Logistics Trust (Singapore) | | | 33,434 | | |
| | | | | Industrial Property Landlord | | | | | |
| | 3,000,000 | | | Education Realty Trust | | | 33,240 | | |
| | | | | Student Housing | | | | | |
| | 15,000,000 | | | Ascendas REIT (Singapore) | | | 25,589 | | |
| | | | | Industrial Property Landlord | | | | | |
See accompanying notes to financial statements.
33
Columbia Acorn Fund
Statement of Investments (Unaudited), continued
| Number of Shares | | | | Value (000) | |
| | | > Real Estate—continued | |
| | 3,750,000 | | | DCT Industrial Trust | | $ | 23,625 | | |
| | | | | Industrial Properties | | | | | |
| | 325,000 | | | Jones Lang LaSalle | | | 22,870 | | |
| | | | | Real Estate Services | | | | | |
| | 1,300,000 | | | St. Joe (a)(c) | | | 20,553 | | |
| | | | | Florida Panhandle Landowner | | | | | |
| | 3,500,000 | | | Kite Realty Group (b) | | | 17,465 | | |
| | | | | Community Shopping Centers | | | | | |
| | 2,000,031 | | | Summit Hotel Properties (b) | | | 16,740 | | |
| | | | | Owner of Select Service Hotels | | | | | |
| | 2,800 | | | Orix JREIT (Japan) | | | 12,586 | | |
| | | | | Diversified REIT | | | | | |
| | | | 686,586 | | |
| | | > Transportation 1.3% | |
| | 1,155,000 | | | JB Hunt Transport Services | | | 68,838 | | |
| | | | | Truck & Intermodal Carrier | | | | | |
| | 2,937,175 | | | Rush Enterprises, Class A (a)(b) | | | 48,023 | | |
| | 550,000 | | | Rush Enterprises, Class B (a)(b) | | | 7,381 | | |
| | | | | Truck Sales & Service | | | | | |
| | 1,260,000 | | | World Fuel Services | | | 47,918 | | |
| | | | | Global Fuel Broker | | | | | |
| | 2,400,000 | | | Heartland Express | | | 34,344 | | |
| | | | | Regional Trucker | | | | | |
| | 300,000 | | | Genesee & Wyoming (a) | | | 15,852 | | |
| | | | | Short-line Operator | | | | | |
| | | | 222,356 | | |
| | | > Regulated Utilities 1.0% | |
| | 2,000,000 | | | Northeast Utilities | | | 77,620 | | |
| | | | | Regulated Electric Utility | | | | | |
| | 1,660,000 | | | Wisconsin Energy | | | 65,686 | | |
| | | | | Wisconsin Utility | | | | | |
| | 500,000 | | | Allete | | | 20,900 | | |
| | | | | Regulated Electric Utility in Minnesota | | | | | |
| | 200,000 | | | Red Eléctrica de España (Spain) | | | 8,729 | | |
| | | | | Spanish Power Transmission | | | | | |
| | | | 172,935 | | |
| Other Industries: Total | | | 1,081,877 | | |
Total Equities: 95.8%
(Cost: $10,608,838) | | | 16,441,222 | | |
| Number of Shares | | | | Value (000) | |
| Securities Lending Collateral 1.8% | |
| | 303,633,050 | | | Dreyfus Government Cash
Management Fund
(7 day yield of 0.01%) (g) | | $ | 303,633 | | |
Total Securities Lending Collateral:
(Cost: $303,633) | | | 303,633 | | |
Total Investments: 97.6%
(Cost: $10,912,471)(h)(i) | | | 16,744,855 | | |
Obligation to Return Collateral for
Securities Loaned: (1.8)% | | | (303,633 | ) | |
| Cash and Other Assets Less Liabilities: 4.2% | | | 723,250 | | |
| Total Net Assets: 100.0% | | $ | 17,164,472 | | |
ADR - American Depositary Receipts
GDR - Global Depositary Receipts
REIT - Real Estate Investment Trust
See accompanying notes to financial statements.
34
> Notes to Statement of Investments (dollar values in thousands)
(a) Non-income producing security.
(b) An affiliated person of the Fund may include any company in which the Fund owns five percent or more of its outstanding voting shares. Holdings and transactions in these affiliated companies during the six months ended June 30, 2012, are as follows:
| Security | | Balance of
Shares Held
12/31/11 | | Purchases/
Additions | | Sales/
Reductions | | Balance of
Shares Held
6/30/12 | | Value | | Dividend | |
| AboveNet | | | 1,400,000 | | | | - | | | | - | | | | 1,400,000 | | | $ | 117,600 | | | $ | - | | |
| Acorn Energy | | | 1,500,000 | | | | - | | | | - | | | | 1,500,000 | | | | 12,480 | | | | 180 | | |
| AFC Enterprises | | | 2,000,000 | | | | - | | | | - | | | | 2,000,000 | | | | 46,280 | | | | - | | |
| Alimera Sciences | | | 2,040,000 | | | | - | | | | - | | | | 2,040,000 | | | | 6,100 | | | | - | | |
| Anthera Pharmaceuticals | | | 1,740,000 | | | | 1,250,000 | | | | - | | | | 2,990,000 | | | | 2,022 | | | | - | | |
| Associated Estates Realty | | | 3,700,000 | | | | - | | | | - | | | | 3,700,000 | | | | 55,315 | | | | - | | |
| Auxilium Pharmaceuticals | | | 3,033,715 | | | | 216,285 | | | | - | | | | 3,250,000 | | | | 87,393 | | | | 1,295 | | |
| Bally Technologies | | | 3,725,000 | | | | - | | | | - | | | | 3,725,000 | | | | 173,809 | | | | - | | |
| CAI International | | | 1,123,400 | | | | - | | | | - | | | | 1,123,400 | | | | 22,333 | | | | - | | |
| Cavco Industries | | | 460,000 | | | | - | | | | - | | | | 460,000 | | | | 23,589 | | | | - | | |
| Cepheid | | | 3,200,000 | | | | 1,400,000 | | | | - | | | | 4,600,000 | | | | 205,850 | | | | - | | |
| Chelsea Therapeutics International | | | 4,550,000 | | | | 1,200,000 | | | | - | | | | 5,750,000 | | | | 8,510 | | | | - | | |
| Cogent Communications* | | | 2,520,000 | | | | - | | | | 320,000 | | | | 2,200,000 | | | | 42,350 | | | | - | | |
| Constant Contact | | | 2,350,000 | | | | - | | | | 350,000 | | | | 2,000,000 | | | | 35,760 | | | | - | | |
| Donaldson** | | | 4,200,000 | | | | 4,200,000 | | | | - | | | | 8,400,000 | | | | 280,308 | | | | 1,428 | | |
| Drew Industries | | | 1,500,000 | | | | 380,000 | | | | - | | | | 1,880,000 | | | | 52,358 | | | | - | | |
| Duluth Metals | | | 7,500,000 | | | | - | | | | - | | | | 7,500,000 | | | | 10,976 | | | | - | | |
| DuPont Fabros Technology | | | 3,350,000 | | | | 350,000 | | | | - | | | | 3,700,000 | | | | 105,672 | | | | 822 | | |
| eResearch Technology | | | 4,900,000 | | | | - | | | | - | | | | 4,900,000 | | | | 39,151 | | | | - | | |
| ESCO Technologies | | | 2,200,000 | | | | - | | | | - | | | | 2,200,000 | | | | 80,168 | | | | 352 | | |
| ExlService Holdings | | | 1,145,000 | | | | 473,000 | | | | - | | | | 1,618,000 | | | | 39,868 | | | | - | | |
| Gaiam | | | 1,371,366 | | | | - | | | | - | | | | 1,371,366 | | | | 5,348 | | | | - | | |
| Gaylord Entertainment | | | 3,850,000 | | | | - | | | | - | | | | 3,850,000 | | | | 148,456 | | | | - | | |
| General Communications | | | 2,000,000 | | | | - | | | | - | | | | 2,000,000 | | | | 16,620 | | | | - | | |
| GLG Life Tech | | | 1,750,000 | | | | - | | | | 84,730 | | | | 1,665,270 | | | | 689 | | | | - | | |
| H & E Equipment Services | | | 3,400,000 | | | | - | | | | - | | | | 3,400,000 | | | | 51,102 | | | | - | | |
| Hackett Group+ | | | 4,500,000 | | | | - | | | | 650,793 | | | | 3,849,207 | | | | 21,440 | | | | - | | |
| HEICO*** | | | 2,250,000 | | | | 813,000 | | | | - | | | | 3,063,000 | | | | 98,812 | | | | 135 | | |
| Helen of Troy | | | 1,600,000 | | | | - | | | | - | | | | 1,600,000 | | | | 54,224 | | | | - | | |
| Horizon Pharma* | | | 1,095,000 | | | | - | | | | - | | | | 1,095,000 | | | | 7,807 | | | | - | | |
| iGATE | | | 3,400,000 | | | | - | | | | - | | | | 3,400,000 | | | | 57,868 | | | | - | | |
| II-VI | | | 4,550,000 | | | | - | | | | - | | | | 4,550,000 | | | | 75,849 | | | | - | | |
| Insperity | | | 1,210,000 | | | | 149,200 | | | | - | | | | 1,359,200 | | | | 36,766 | | | | 387 | | |
| Interline Brands* | | | 2,600,000 | | | | - | | | | 1,200,000 | | | | 1,400,000 | | | | 35,098 | | | | - | | |
| InterMune | | | 2,950,000 | | | | 900,000 | | | | - | | | | 3,850,000 | | | | 46,007 | | | | - | | |
| IPG Photonics | | | 2,780,000 | | | | - | | | | - | | | | 2,780,000 | | | | 121,180 | | | | - | | |
| IXYS | | | 1,900,000 | | | | - | | | | - | | | | 1,900,000 | | | | 21,223 | | | | - | | |
| Kenexa* | | | 1,700,000 | | | | - | | | | 526,900 | | | | 1,173,100 | | | | 34,055 | | | | - | | |
| Kite Realty Group | | | 3,500,000 | | | | - | | | | - | | | | 3,500,000 | | | | 17,465 | | | | 420 | | |
| Knoll | | | 4,200,000 | | | | - | | | | - | | | | 4,200,000 | | | | 56,364 | | | | 1,260 | | |
| Lifetime Fitness | | | 2,190,000 | | | | - | | | | - | | | | 2,190,000 | | | | 101,857 | | | | - | | |
| lululemon athletica* | | | 5,740,000 | | | | - | | | | 1,235,000 | | | | 4,505,000 | | | | 268,633 | | | | - | | |
| Marlin Business Services | | | 1,091,000 | | | | - | | | | - | | | | 1,091,000 | | | | 17,882 | | | | 131 | | |
| MB Financial | | | 2,360,000 | | | | 500,000 | | | | - | | | | 2,860,000 | | | | 61,604 | | | | 55 | | |
| McGrath Rentcorp | | | 2,150,000 | | | | - | | | | - | | | | 2,150,000 | | | | 56,975 | | | | 1,000 | | |
| Mettler-Toledo International | | | 1,600,000 | | | | - | | | | - | | | | 1,600,000 | | | | 249,360 | | | | - | | |
| Micromet* | | | 6,702,347 | | | | 137,138 | | | | 6,766,894 | | | | 72,591 | | | | - | | | | - | | |
| Moog | | | 2,775,000 | | | | 225,000 | | | | - | | | | 3,000,000 | | | | 124,050 | | | | - | | |
| Navigant Consulting | | | 2,800,000 | | | | 227,016 | | | | - | | | | 3,027,016 | | | | 38,261 | | | | - | | |
| NPS Pharmaceuticals | | | 6,000,000 | | | | - | | | | - | | | | 6,000,000 | | | | 51,660 | | | | - | | |
| Pericom Semiconductor | | | 1,765,000 | | | | - | | | | - | | | | 1,765,000 | | | | 15,885 | | | | - | | |
| Petroamerica* | | | 30,275,000 | | | | - | | | | 5,275,000 | | | | 25,000,000 | | | | 3,192 | | | | - | | |
| Petrodorado | | | 26,000,000 | | | | - | | | | - | | | | 26,000,000 | | | | 4,086 | | | | - | | |
| PetroMagdalena Energy | | | 7,582,928 | | | | - | | | | - | | | | 7,582,928 | | | | 11,768 | | | | - | | |
| Petromanas | | | 37,500,000 | | | | - | | | | - | | | | 37,500,000 | | | | 7,919 | | | | - | | |
| Pier 1 Imports | | | 5,600,000 | | | | 1,000,000 | | | | - | | | | 6,600,000 | | | | 108,438 | | | | 224 | | |
| Pinnacle Entertainment | | | 3,950,000 | | | | - | | | | - | | | | 3,950,000 | | | | 37,999 | | | | - | | |
| Raptor Pharmaceutical | | | 3,455,000 | | | | 745,000 | | | | 590,406 | | | | 3,609,594 | | | | 20,178 | | | | - | | |
See accompanying notes to financial statements.
35
Columbia Acorn Fund
Statement of Investments (Unaudited), continued
> Notes to Statement of Investments (dollar values in thousands)
| Security | | Balance of
Shares Held
12/31/11 | | Purchases/
Additions | | Sales/
Reductions | | Balance of
Shares Held
6/30/12 | | Value | | Dividend | |
| Rush Enterprises | | | 3,350,000 | | | | 137,175 | | | | - | | | | 3,487,175 | | | $ | 55,404 | | | $ | - | | |
| SABA | | | - | | | | 2,000,000 | | | | - | | | | 2,000,000 | | | | 18,560 | | | | - | | |
| Salem Communications* | | | 1,527,700 | | | | - | | | | 1,527,700 | | | | - | | | | - | | | | - | | |
| Santa Maria Petroleum*,**** | | | 50,000,000 | | | | - | | | | 45,000,000 | | | | 5,000,000 | | | | 1,520 | | | | - | | |
| Seattle Genetics | | | 6,153,000 | | | | - | | | | - | | | | 6,153,000 | | | | 156,225 | | | | - | | |
| Shutterfly | | | 3,070,000 | | | | 300,000 | | | | - | | | | 3,370,000 | | | | 103,425 | | | | - | | |
| SPS Commerce | | | 900,000 | | | | - | | | | - | | | | 900,000 | | | | 27,342 | | | | - | | |
| Summit Hotel Properties | | | 1,500,000 | | | | 500,031 | | | | - | | | | 2,000,031 | | | | 16,740 | | | | 413 | | |
| Tower Group | | | 1,675,000 | | | | 1,089,000 | | | | - | | | | 2,764,000 | | | | 57,685 | | | | 1,038 | | |
| TriCo Bancshares | | | 1,350,000 | | | | - | | | | - | | | | 1,350,000 | | | | 20,790 | | | | 364 | | |
| True Religion Apparel* | | | 1,507,000 | | | | - | | | | 1,275,548 | | | | 231,452 | | | | 6,708 | | | | 46 | | |
| tw telecom | | | 9,500,000 | | | | - | | | | - | | | | 9,500,000 | | | | 243,770 | | | | - | | |
| Tyler Technologies* | | | 1,700,000 | | | | - | | | | 800,000 | | | | 900,000 | | | | 36,315 | | | | - | | |
| Virtusa | | | 2,125,000 | | | | - | | | | - | | | | 2,125,000 | | | | 28,369 | | | | - | | |
| Warnaco Group* | | | 2,190,000 | | | | - | | | | 730,000 | | | | 1,460,000 | | | | 62,167 | | | | - | | |
| Wolverine Minerals | | | 4,000,000 | | | | - | | | | - | | | | 4,000,000 | | | | 377 | | | | - | | |
| World Acceptance | | | 1,505,202 | | | | - | | | | 80,000 | | | | 1,425,202 | | | | 93,778 | | | | - | | |
| Total of Affiliated Transactions | | | 350,332,658 | | | | 18,191,845 | | | | 66,412,971 | | | | 302,111,532 | | | $ | 4,463,187 | | | $ | 9,550 | | |
* At June 30, 2012, the Fund owned less than five percent of the company's outstanding voting shares.
** Includes the effects of a 2:1 stock split.
*** Includes the effects of a 5:4 stock split.
**** Includes the effects of a 1:10 reverse stock split.
+ Includes the effects of a corporate action.
The aggregate cost and value of these companies at June 30, 2012, were $2,717,367 and $3,965,342, respectively. Investments in affiliated companies represented 23.10% of the Fund's total net assets at June 30, 2012.
(c) All or a portion of this security was on loan at June 30, 2012. The total market value of securities on loan at June 30, 2012 was $302,684.
(d) Security exempt from registration under Section 4(2) of the Securities Act of 1933. This security may only be resold in exempt transactions to qualified buyers. Private resales of this security to qualified institutional buyers are also exempt from registration pursuant to Rule 144A under the Securities Act of 1933. At June 30, 2012, this security had an aggregate value of $7,975, which represented 0.05% of total net assets.
(e) Illiquid security.
(f) Denotes a restricted security, which is subject to restrictions on resale under federal securities laws. These securities are valued at fair value determined in good faith under consistently applied procedures established by the Board of Trustees. At June 30, 2012, the market value of these securities amounted to $19,451, which represented 0.11% of total net assets.
Additional information on these securities is as follows:
| Security | | Acquisition
Dates | | Shares | | Cost | | Value | |
| Union Agriculture Group | | 12/8/10-6/27/12 | | | 1,306,818 | | | $ | 15,000 | | | $ | 12,794 | | |
| Gulf United | | 4/18/12 | | | 50,000,000 | | | | 4,000 | | | | 2,640 | | |
| Canadian Overseas Petroleum | | 11/24/10 | | | 8,400,000 | | | | 3,591 | | | | 1,465 | | |
| Santa Maria Petroleum | | 1/14/11 | | | 4,110,000 | | | | 5,193 | | | | 1,240 | | |
| Wolverine Minerals | | 6/3/11 | | | 4,000,000 | | | | 2,005 | | | | 377 | | |
| Petrodorado - Warrants | | 11/20/09 | | | 24,000,000 | | | | 2,965 | | | | 340 | | |
| MicroDose Therapeutx | | 11/24/00 | | | 359,944 | | | | 2,005 | | | | 252 | | |
| Voyager Learning - Contingent Value Rights | | 12/24/09 | | | 2,000,000 | | | | - | | | | 220 | | |
| Canadian Overseas Petroleum - Warrants | | 11/24/10 | | | 4,200,000 | | | | 526 | | | | 81 | | |
| Duluth Exploration - Special Warrants | | 8/19/11 | | | 500,000 | | | | - | | | | 39 | | |
| Wolverine Minerals - Warrants | | 6/3/11 | | | 2,000,000 | | | | 243 | | | | 3 | | |
| | | | | | | $ | 35,528 | | | $ | 19,451 | | |
(g) Investment made with cash collateral received from securities lending activity.
(h) At June 30, 2012 for federal income tax purposes, the cost of investments was $10,912,471 and net unrealized appreciation was $5,832,384 consisting of gross unrealized appreciation of $6,608,143 and gross unrealized depreciation of $775,759.
See accompanying notes to financial statements.
36
> Notes to Statement of Investments (dollar values in thousands)
(i) On June 30, 2012, the market value of foreign securities represented 8.26% of total net assets. The Fund's foreign portfolio was diversified as follows:
| Country | | Value | | Percentage
of Net Assets | |
| Canada | | $ | 231,071 | | | | 1.34 | | |
| Netherlands | | | 208,842 | | | | 1.22 | | |
| Singapore | | | 130,489 | | | | 0.76 | | |
| Colombia | | | 105,899 | | | | 0.62 | | |
| Sweden | | | 93,549 | | | | 0.55 | | |
| Hong Kong | | | 90,106 | | | | 0.52 | | |
| Brazil | | | 80,883 | | | | 0.47 | | |
| Japan | | | 71,032 | | | | 0.41 | | |
| China | | | 60,566 | | | | 0.35 | | |
| France | | | 44,272 | | | | 0.26 | | |
| Denmark | | | 39,545 | | | | 0.23 | | |
| South Africa | | | 37,581 | | | | 0.22 | | |
| Chile | | | 37,466 | | | | 0.22 | | |
| Country | | Value | | Percentage
of Net Assets | |
| Israel | | $ | 31,884 | | | | 0.19 | | |
| Ireland | | | 30,360 | | | | 0.18 | | |
| United Kingdom | | | 25,814 | | | | 0.15 | | |
| Russia | | | 21,312 | | | | 0.12 | | |
| Mongolia | | | 20,420 | | | | 0.12 | | |
| Uruguay | | | 12,794 | | | | 0.07 | | |
| Iceland | | | 12,162 | | | | 0.07 | | |
| India | | | 10,619 | | | | 0.06 | | |
| Spain | | | 8,729 | | | | 0.05 | | |
| Germany | | | 7,974 | | | | 0.05 | | |
| Iraq | | | 4,509 | | | | 0.03 | | |
| Total Foreign Portfolio | | $ | 1,417,878 | | | | 8.26 | | |
Fair Value Measurements
Various inputs are used in determining the value of the Fund's investments, following the input prioritization hierarchy established by GAAP. These inputs are summarized in the three broad levels listed below:
• Level 1 – quoted prices in active markets for identical securities
• Level 2 – prices determined using other significant observable inputs (including quoted prices for similar securities, interest rates, prepayment speeds, credit risk and others)
• Level 3 – prices determined using significant unobservable inputs where quoted prices or observable inputs are unavailable or less reliable (including management's own assumptions about the factors market participants would use in pricing an investment)
The inputs or methodology used for valuing securities are not necessarily an indication of the risk associated with investing in those securities.
Examples of the types of securities in which the Fund would typically invest and how they are classified within this hierarchy are as follows. Typical Level 1 securities include exchange traded domestic equities, mutual funds whose NAVs are published each day and exchange traded foreign equities that are not statistically fair valued. Typical Level 2 securities include exchange traded foreign equities that are statistically fair valued and short-term investments valued at amortized cost. Additionally, securities fair valued by the Valuation Committee (the Committee) of the Fund's Board of Trustees (the Board) that rely on significant observable inputs are also included in Level 2. Typical Level 3 securities include any security fair valued by the Committee that relies on significant unobservable inputs.
Under the direction of the Board, the Committee is responsible for carrying out the valuation procedures approved by the Board.
The Committee meets as necessary, and no less frequently than quarterly, to determine fair values for securities for which market quotations are not readily available or for which the investment manager believes that available market quotations are unreliable, and to review the continuing appropriateness of the current value of any security subject to the Trust's Portfolio Pricing Policy and the pricing procedures of the investment manager (the Policies). The Policies address, among other things: circumstances under which market quotations will be deemed readily available; selection of third party pricing vendors; appropriate pricing methodologies; events that require fair valuation and fair value techniques; and circumstances under which securities will be deemed to pose a potential for stale pricing, including when securities are illiquid, restricted, or in default. The Committee may also meet to discuss additional valuation matters, which may include review of back-testing results, review of time-sensitive information or approval of other valuation related actions, and to review the appropriateness of the Policies.
For investments categorized as Level 3, the significant unobservable inputs used in the fair value measurement of the Funds' securities may include: (i) data specific to the issuer or comparable issuers, (ii) general market or specific sector news and (iii) quoted prices and specific or similar security transactions. The Committee considers this data and any changes from prior periods in order to assess the reasonableness of observable and unobservable inputs, any assumptions or internal models used to value those securities and changes in fair value. Significant changes in any of these factors could result in lower or higher fair value measurements. Various factors impact the frequency of monitoring (which may occur as often as daily), however the Committee may determine that changes to inputs, assumptions and models are not required with the same frequency.
See accompanying notes to financial statements.
37
Columbia Acorn Fund
Statement of Investments (Unaudited), continued
> Notes to Statement of Investments (dollar values in thousands)
The following table summarizes the inputs used, as of June 30, 2012, in valuing the Fund's assets:
| Investment Type | | Quoted Prices
(Level 1) | | Other
Significant
Observable
Inputs
(Level 2) | | Significant
Unobservable
Inputs
(Level 3) | | Total | |
| Equities | |
| Information | | $ | 4,508,981 | | | $ | 157,589 | | | $ | - | | | $ | 4,666,570 | | |
| Industrial Goods & Services | | | 3,068,284 | | | | 195,289 | | | | - | | | | 3,263,573 | | |
| Consumer Goods & Services | | | 2,620,690 | | | | 110,556 | | | | 220 | | | | 2,731,466 | | |
| Finance | | | 1,878,265 | | | | - | | | | - | | | | 1,878,265 | | |
| Health Care | | | 1,641,914 | | | | 24,904 | | | | 252 | | | | 1,667,070 | | |
| Energy & Minerals | | | 975,496 | | | | 164,072 | | | | 12,833 | | | | 1,152,401 | | |
| Other Industries | | | 1,001,539 | | | | 80,338 | | | | - | | | | 1,081,877 | | |
| Total Equities | | | 15,695,169 | | | | 732,748 | | | | 13,305 | | | | 16,441,222 | | |
| Total Securities Lending Collateral | | | 303,633 | | | | - | | | | - | | | | 303,633 | | |
| Total Investments | | $ | 15,998,802 | | | $ | 732,748 | | | $ | 13,305 | | | $ | 16,744,855 | | |
The Fund's assets assigned to the Level 2 input category are generally valued using a market approach, in which a security's value is determined through its correlation to prices and information from observable market transactions for similar or identical assets. Foreign equities are generally valued at the last sale price on the foreign exchange or market on which they trade. The Fund may use a statistical fair valuation model, in accordance with the policy adopted by the Board, provided by an independent third party to value securities principally traded in foreign markets in order to adjust for possible stale pricing that may occur between the close of the foreign exchanges and the time for valuation. These models take into account available market data including intraday index, ADR, and ETF movements. Securities acquired via private placement that have a holding period or an extended settlement period are valued at a discount to the same shares that are trading freely on the market. These discounts are determined by the investment manager's experience with similar securities or situations. Factors may include, but are not limited to, trade volume, shares outstanding and stock price. Warrants which do not trade are valued as a percentage of the actively trading common stock using a model, based on Black Scholes. Securities which have halted or temporarily stopped trading are valued at the last sale and adjusted by a premium or a discount to account for the anticipated re-opening price. These adjustments are determined by the investment manager's experience with similar securities or situations.
The following table shows transfers between Level 1 and Level 2 of the fair value hierarchy:
| Transfers In | | Transfers Out | |
| Level 1 | | Level 2 | | Level 1 | | Level 2 | |
| $ | - | | | $ | 1,575 | | | $ | 1,575 | | | $ | - | | |
Financial assets were transferred from Level 1 to Level 2 as trading halted during the period.
The following table reconciles asset balances for the period ending June 30, 2012, in which significant observable and/or unobservable inputs (Level 3) were used in determining value:
Investments
in Securities | | Balance
as of
December 31,
2011 | | Realized
Gain/(Loss) | | Change in
Unrealized
Appreciation
(Depreciation) | | Purchases | | Sales | | Transfers
into
Level 3 | | Transfers
out of
Level 3 | | Balance
as of
June 30,
2012 | |
| Equities | |
| Consumer Goods & Services | | $ | 180 | | | $ | - | | | $ | 40 | | | $ | - | | | $ | - | | | $ | - | | | $ | - | | | $ | 220 | | |
| Health Care | | | 270 | | | | - | | | | (18 | ) | | | - | | | | - | | | | - | | | | - | | | | 252 | | |
| Energy & Minerals | | | 12,507 | | | | - | | | | 326 | | | | - | | | | - | | | | - | | | | - | | | | 12,833 | | |
| | | $ | 12,957 | | | $ | - | | | $ | 348 | | | $ | - | | | $ | - | | | $ | - | | | $ | - | | | $ | 13,305 | | |
The information in the above reconciliation table represents fiscal year to date activity for any securities identified as using Level 3 inputs at either the beginning or the end of the current fiscal period.
The change in unrealized appreciation attributed to securities owned at June 30, 2012, which were valued using significant unobservable inputs (Level 3), amounted to $348.
The Fund does not hold any significant investments categorized as Level 3.
Certain common stock classified as Level 3 are valued at fair value, using a market approach, as determined in good faith under consistently applied procedures established by and under the general supervision of the Board. To determine fair value for these securities, for which no market exists, the Committee utilizes the valuation technique it deems most appropriate in the circumstances, using some unobservable inputs, which may include but are not limited to trades of similar securities, estimated earnings of the company, market multiples derived from a set of comparable companies, and the position of the security within the company's capital structure. Significant increases or decreases to any of these inputs could result in a significantly lower or higher fair value measurement. Generally, a change in estimated earnings of a company may result in a change to the comparable companies and market multiples utilized.
See accompanying notes to financial statements.
38
Columbia Acorn International
Major Portfolio Changes in the Second Quarter (Unaudited)
| | | Number of Shares | |
| | | 3/31/12 | | 6/30/12 | |
| Purchases | |
| Asia | |
| > Japan | |
| Daiseki | | | 1,427,129 | | | | 1,613,429 | | |
| Doshisha | | | 750,600 | | | | 828,000 | | |
| Horiba | | | 257,800 | | | | 424,000 | | |
| Miraca Holdings | | | 0 | | | | 659,500 | | |
| NGK Insulators | | | 2,400,000 | | | | 2,552,000 | | |
| Nihon Parkerizing | | | 145,700 | | | | 756,900 | | |
| Sanrio | | | 500,000 | | | | 865,800 | | |
| Start Today | | | 1,718,724 | | | | 2,572,724 | | |
| > Taiwan | |
| Chroma Ate | | | 10,277,000 | | | | 10,677,000 | | |
| CTCI Corp | | | 18,571,200 | | | | 20,120,000 | | |
| MStar Semiconductor | | | 2,930,000 | | | | 3,661,100 | | |
| Taiwan Mobile | | | 10,329,000 | | | | 16,405,300 | | |
| > Hong Kong | |
| Lifestyle International | | | 18,000,000 | | | | 21,845,000 | | |
| Vitasoy International | | | 0 | | | | 4,495,200 | | |
| > Singapore | |
| Petra Foods | | | 0 | | | | 3,071,300 | | |
| > China | |
| AMVIG Holdings | | | 28,763,700 | | | | 30,000,000 | | |
| Digital China | | | 13,570,200 | | | | 18,000,300 | | |
| > India | |
| Colgate-Palmolive India | | | 0 | | | | 545,000 | | |
| Redington India | | | 1,477,269 | | | | 13,195,000 | | |
| Titan Industries | | | 791,352 | | | | 1,600,000 | | |
| > Korea | |
| Hyundai Home Shopping | | | 10,090 | | | | 55,000 | | |
Kepco Plant Service &
Engineering | | | 0 | | | | 244,530 | | |
| > Indonesia | |
| Ace Indonesia | | | 10,000,000 | | | | 15,000,000 | | |
| Mayora Indah | | | 0 | | | | 2,176,600 | | |
| Mitra Adiperkasa | | | 0 | | | | 12,488,000 | | |
| MNC Skyvision | | | 0 | | | | 32,766,000 | | |
| Tower Bersama Infrastructure | | | 48,560,000 | | | | 51,767,300 | | |
| > Mongolia | |
| Mongolian Mining | | | 42,636,400 | | | | 60,037,500 | | |
| > Cambodia | |
| Nagacorp | | | 50,000,000 | | | | 60,000,000 | | |
| Europe | |
| > United Kingdom | |
| Aggreko | | | 0 | | | | 596,100 | | |
| BBA Aviation | | | 3,167,139 | | | | 8,785,000 | | |
Domino's Pizza United
Kingdom & Ireland | | | 2,497,000 | | | | 3,107,000 | | |
| | | Number of Shares | |
| | | 3/31/12 | | 6/30/12 | |
| Greggs | | | 1,060,885 | | | | 2,300,000 | | |
| Rightmove | | | 548,000 | | | | 822,000 | | |
| Spirax Sarco | | | 0 | | | | 256,202 | | |
| WH Smith | | | 0 | | | | 1,555,000 | | |
| > Netherlands | |
| TKH Group | | | 403,800 | | | | 850,468 | | |
| > France | |
Compagnie Française de
l'Afrique Occidentale | | | 0 | | | | 134,254 | | |
| Eurofins Scientific | | | 418,000 | | | | 553,000 | | |
| Neopost | | | 430,000 | | | | 675,000 | | |
| > Germany | |
| NORMA Group | | | 0 | | | | 690,000 | | |
| > Denmark | |
| Solar A/S | | | 130,651 | | | | 166,013 | | |
| > Italy | |
| Geox | | | 5,800,000 | | | | 7,000,000 | | |
| > Russia | |
| Yandex | | | 0 | | | | 1,123,695 | | |
| > Portugal | |
| Redes Energéticas Nacionais | | | 8,531,175 | | | | 8,635,000 | | |
| Other Countries | |
| > Australia | |
| Challenger Financial | | | 4,546,885 | | | | 11,936,400 | | |
Commonwealth Property
Office Fund | | | 17,451,906 | | | | 48,533,075 | | |
| Domino's Pizza Enterprises | | | 0 | | | | 1,576,290 | | |
| IAG | | | 0 | | | | 7,595,003 | | |
| UGL | | | 2,653,389 | | | | 3,973,200 | | |
| > United States | |
| Rowan | | | 0 | | | | 548,900 | | |
| > Israel | |
| Caesarstone | | | 125,000 | | | | 625,000 | | |
| Latin America | |
| > Brazil | |
| Arcos Dorados | | | 0 | | | | 1,300,000 | | �� |
| MRV Engenharia | | | 2,917,000 | | | | 3,577,000 | | |
| > Chile | |
| Viña Concha y Toro | | | 4,016,878 | | | | 5,640,000 | | |
See accompanying notes to financial statements.
39
Columbia Acorn International
Major Portfolio Changes in the Second Quarter (Unaudited), continued
| | | Number of Shares | |
| | | 3/31/12 | | 6/30/12 | |
| Sales | |
| Asia | |
| > Japan | |
| Aeon Delight | | | 1,860,438 | | | | 1,417,438 | | |
| Ain Pharmaciez | | | 589,792 | | | | 349,792 | | |
| Gree | | | 246,300 | | | | 0 | | |
| Miura | | | 511,450 | | | | 407,050 | | |
| Seven Bank | | | 22,694,000 | | | | 20,227,000 | | |
| Shinsei Bank | | | 18,673,649 | | | | 15,024,649 | | |
| Tsumura | | | 855,604 | | | | 0 | | |
| > Taiwan | |
| Simplo Technology | | | 5,614,530 | | | | 5,058,830 | | |
| > Hong Kong | |
Melco Crown
Entertainment - ADR | | | 7,000,000 | | | | 6,500,000 | | |
| MGM China Holdings | | | 12,500,000 | | | | 10,000,000 | | |
| Sasa International | | | 38,000,000 | | | | 30,000,000 | | |
| > Singapore | |
| Olam International | | | 27,000,000 | | | | 25,000,000 | | |
| > China | |
| NetEase.com - ADR | | | 644,000 | | | | 381,300 | | |
| > Indonesia | |
| Jasa Marga | | | 6,937,300 | | | | 0 | | |
| > Thailand | |
| Home Product Center | | | 118,000,000 | | | | 110,000,000 | | |
| Europe | |
| > United Kingdom | |
| Abcam | | | 2,950,000 | | | | 2,855,000 | | |
| Chemring | | | 5,654,735 | | | | 2,303,000 | | |
| Intertek Group | | | 1,460,000 | | | | 1,004,500 | | |
| JLT Group | | | 3,000,000 | | | | 2,579,333 | | |
| Premier Oil | | | 2,636,932 | | | | 2,027,932 | | |
| Rotork | | | 730,000 | | | | 517,000 | | |
| Tullow Oil | | | 740,581 | | | | 382,581 | | |
| Workspace Group | | | 7,500,000 | | | | 0 | | |
| > Netherlands | |
| Core Laboratories | | | 177,395 | | | | 143,395 | | |
| Fugro | | | 687,967 | | | | 460,000 | | |
| Imtech | | | 1,763,611 | | | | 1,680,623 | | |
| > Switzerland | |
| Dufry Group | | | 360,000 | | | | 330,000 | | |
| Kuehne & Nagel | | | 245,000 | | | | 170,000 | | |
| > France | |
| Gemalto | | | 1,073,700 | | | | 729,700 | | |
| Mersen | | | 460,000 | | | | 162,844 | | |
| Rubis | | | 353,648 | | | | 0 | | |
| | | Number of Shares | |
| | | 3/31/12 | | 6/30/12 | |
| > Germany | |
| Elringklinger | | | 555,700 | | | | 333,000 | | |
| Rheinmetall | | | 679,600 | | | | 405,000 | | |
| Rhoen-Klinikum | | | 1,600,000 | | | | 0 | | |
| > Sweden | |
| East Capital Explorer | | | 905,452 | | | | 419,877 | | |
| > Italy | |
| Ansaldo STS | | | 2,621,149 | | | | 0 | | |
| CIR | | | 12,503,754 | | | | 8,951,757 | | |
| > Russia | |
| Mail.ru - GDR | | | 629,642 | | | | 368,493 | | |
| > Ireland | |
| Paddy Power | | | 289,400 | | | | 263,400 | | |
| United Drug | | | 6,750,000 | | | | 4,237,000 | | |
| > Greece | |
| Intralot | | | 6,954,400 | | | | 4,384,185 | | |
| Other Countries | |
| > Canada | |
| Athabasca Oil Sands | | | 731,000 | | | | 450,000 | | |
| Baytex | | | 615,857 | | | | 263,857 | | |
| Black Diamond Group | | | 1,049,576 | | | | 770,576 | | |
| Celtic Exploration | | | 721,000 | | | | 454,000 | | |
| Crew Energy | | | 1,043,000 | | | | 332,700 | | |
| Horizon North Logistics | | | 2,411,514 | | | | 2,096,514 | | |
| > United States | |
| Alexion Pharmaceuticals | | | 627,431 | | | | 0 | | |
| FMC Technologies | | | 461,213 | | | | 407,213 | | |
| Oil States International | | | 270,000 | | | | 0 | | |
| World Fuel Services | | | 987,228 | | | | 763,228 | | |
| Latin America | |
| > Colombia | |
| Canacol | | | 8,353,169 | | | | 7,850,769 | | |
See accompanying notes to financial statements.
40
Columbia Acorn International
Statement of Investments (Unaudited), June 30, 2012
| Number of Shares | | | | Value (000) | |
| | | | | | | Equities: 94.6% | |
| Asia 43.8% | | | |
| | | > Japan 17.6% | |
| | 5,582,600 | | | Kansai Paint | | $ | 59,822 | | |
| | | | | Paint Producer in Japan, India, China &
Southeast Asia | | | | | |
| | 20,227,000 | | | Seven Bank | | | 51,943 | | |
| | | | | ATM Processing Services | | | | | |
| | 20,096 | | | Wacom | | | 45,009 | | |
| | | | | Computer Graphic Illustration Devices | | | | | |
| | 3,029,900 | | | Park24 | | | 44,746 | | |
| | | | | Parking Lot Operator | | | | | |
| | 1,582,200 | | | Hoshizaki Electric | | | 40,047 | | |
| | | | | Commercial Kitchen Equipment | | | | | |
| | 2,981,100 | | | Kuraray | | | 38,633 | | |
| | | | | Special Resin, Fine Chemical, Fibers & Textures | | | | | |
| | 2,572,724 | | | Start Today (a) | | | 35,952 | | |
| | | | | Online Japanese Apparel Retailer | | | | | |
| | 1,694,562 | | | Glory | | | 35,351 | | |
| | | | | Currency Handling Systems & Related Equipment | | | | | |
| | 7,780 | | | Orix JREIT | | | 34,971 | | |
| | | | | Diversified REIT | | | | | |
| | 1,417,438 | | | Aeon Delight | | | 32,546 | | |
| | | | | Facility Maintenance & Management | | | | | |
| | 865,800 | | | Sanrio (a) | | | 31,566 | | |
| | | | | Character Goods & Licensing | | | | | |
| | 295,762 | | | Nakanishi | | | 30,061 | | |
| | | | | Dental Tools & Machinery | | | | | |
| | 937,651 | | | Kintetsu World Express | | | 30,011 | | |
| | | | | Airfreight Logistics | | | | | |
| | 15,116 | | | Advance Residence Investment | | | 29,385 | | |
| | | | | Residential REIT | | | | | |
| | 2,552,000 | | | NGK Insulators | | | 28,260 | | |
| | | | | Ceramic Products for Auto, Power & Electronics | | | | | |
| | 1,613,429 | | | Daiseki | | | 28,052 | | |
| | | | | Waste Disposal & Recycling | | | | | |
| | 659,500 | | | Miraca Holdings | | | 27,381 | | |
| | | | | Outsourced Lab Testing, Diagnostic
Equipment & Reagents | | | | | |
| | 480,000 | | | Disco | | | 27,184 | | |
| | | | | Semiconductor Dicing & Grinding Equipment | | | | | |
| | 25,979 | | | Jupiter Telecommunications | | | 26,488 | | |
| | | | | Largest Cable Service Provider in Japan | | | | | |
| | 2,137,272 | | | Japan Airport Terminal | | | 26,068 | | |
| | | | | Airport Terminal Operator at Haneda | | | | | |
| | 5,540 | | | Mori Hills REIT Investment | | | 23,942 | | |
| | | | | Tokyo-centric Diversified REIT | | | | | |
| | 828,000 | | | Doshisha | | | 22,937 | | |
| | | | | Wholesaler | | | | | |
| | 2,600,000 | | | Shimadzu | | | 22,498 | | |
| | | | | Analytical Instrument, Medical &
Industrial Equipment | | | | | |
| | 1,885,600 | | | Asahi Diamond Industrial | | | 21,652 | | |
| | | | | Consumable Diamond Tools | | | | | |
| | 349,792 | | | Ain Pharmaciez | | | 21,101 | | |
| | | | | Dispensing Pharmacy/Drugstore Operator | | | | | |
| | 339,000 | | | FP Corporation | | | 21,028 | | |
| | | | | Disposable Food Trays & Containers | | | | | |
| | 6,140 | | | Kenedix Realty Investment | | | 19,852 | | |
| | | | | Tokyo Mid-size Office REIT | | | | | |
| Number of Shares | | | | Value (000) | |
| | 1,940,200 | | | Sintokogio | | $ | 19,450 | | |
| | | | | Automated Casting Machines, Surface
Treatment System & Consumables | | | | | |
| | 880,474 | | | Aeon Mall | | | 18,762 | | |
| | | | | Suburban Shopping Mall Developer, Owner & Operator | | | | | |
| | 15,024,649 | | | Shinsei Bank | | | 18,279 | | |
| | | | | Commercial Bank | | | | | |
| | 772,000 | | | Misumi Group | | | 18,192 | | |
| | | | | Industrial Components Distributor | | | | | |
| | 732,108 | | | Icom | | | 17,976 | | |
| | | | | Two Way Radio Communication Equipment | | | | | |
| | 1,405,739 | | | Ushio | | | 17,424 | | |
| | | | | Industrial Light Sources | | | | | |
| | 857,144 | | | Ibiden | | | 15,527 | | |
| | | | | Electronic Parts & Ceramics | | | | | |
| | 424,000 | | | Horiba | | | 14,891 | | |
| | | | | Measuring Instruments & Analyzers | | | | | |
| | 1,346,963 | | | Torishima Pump Manufacturing | | | 13,541 | | |
| | | | | Industrial Pump for Power Generation &
Water Supply Systems | | | | | |
| | 1,400 | | | Japan Real Estate Investment | | | 12,836 | | |
| | | | | Office REIT in Tokyo | | | | | |
| | 1,821 | | | Fukuoka REIT | | | 12,539 | | |
| | | | | Diversified REIT in Fukuoka | | | | | |
| | 756,900 | | | Nihon Parkerizing | | | 11,723 | | |
| | | | | Metal Surface Treatment Agents & Processing | | | | | |
| | 407,050 | | | Miura | | | 10,838 | | |
| | | | | Industrial Boiler | | | | | |
| | | | 1,058,464 | | |
| | | > Taiwan 7.2% | |
| | 36,606,000 | | | Far EasTone Telecom | | | 79,642 | | |
| | | | | Taiwan's Third Largest Mobile Operator | | | | | |
| | 16,405,300 | | | Taiwan Mobile | | | 54,252 | | |
| | | | | Taiwan's Second Largest Mobile Operator | | | | | |
| | 20,120,000 | | | CTCI Corp | | | 37,671 | | |
| | | | | International Engineering Firm | | | | | |
| | 5,058,830 | | | Simplo Technology | | | 34,938 | | |
| | | | | Battery Packs for Notebook & Tablet PCs | | | | | |
| | 12,218,270 | | | Tripod Technologies | | | 34,730 | | |
| | | | | Printed Circuit Boards (PCB) | | | | | |
| | 5,910,000 | | | Radiant Opto-Electronics (b) | | | 30,036 | | |
| | | | | LCD Back Light Units & Modules | | | | | |
| | 2,492,300 | | | St. Shine Optical | | | 27,893 | | |
| | | | | World's Leading Disposable Contact Lens OEM | | | | | |
| | 11,200,000 | | | Taiwan Hon Chuan | | | 25,229 | | |
| | | | | Beverage Packaging (Bottles, Caps, Labels)
Manufacturer | | | | | |
| | 3,661,100 | | | MStar Semiconductor | | | 24,695 | | |
| | | | | Integrated Circuits for TV, Digital Set-top-box & Handset | | | | | |
| | 10,677,000 | | | Chroma Ate | | | 24,374 | | |
| | | | | Automatic Test Systems, Testing &
Measurement Instruments | | | | | |
| | 6,603,000 | | | Advantech | | | 21,959 | | |
| | | | | Industrial PC & Components | | | | | |
| | 3,181,000 | | | President Chain Store | | | 16,973 | | |
| | | | | Taiwan's Number One Convenience Chain
Store Operator | | | | | |
| | 2,595,000 | | | PC Home | | | 14,711 | | |
| | | | | Taiwanese Internet Retail Company | | | | | |
| | 2,469,000 | | | Lung Yen | | | 7,138 | | |
| | | | | Funeral Services & Columbaria | | | | | |
| | | | 434,241 | | |
See accompanying notes to financial statements.
41
Columbia Acorn International
Statement of Investments (Unaudited), continued
| Number of Shares | | | | Value (000) | |
| | | > Hong Kong 3.9% | |
| | 6,500,000 | | | Melco Crown
Entertainment - ADR (b) | | $ | 74,880 | | |
| | | | | Macau Casino Operator | | | | | |
| | 21,845,000 | | | Lifestyle International | | | 48,136 | | |
| | | | | Mid to High-end Department Store Operator
in Hong Kong & China | | | | | |
| | 15,625,000 | | | L'Occitane International | | | 43,364 | | |
| | | | | Skin Care & Cosmetics Producer | | | | | |
| | 8,475,000 | | | AAC Technologies | | | 24,664 | | |
| | | | | Miniature Acoustic Components | | | | | |
| | 30,000,000 | | | Sasa International | | | 19,007 | | |
| | | | | Cosmetics Retailer | | | | | |
| | 10,000,000 | | | MGM China Holdings | | | 15,333 | | |
| | | | | Macau Casino Operator | | | | | |
| | 8,000,000 | | | Melco International | | | 6,472 | | |
| | | | | Macau Casino Operator | | | | | |
| | 4,495,200 | | | Vitasoy International | | | 3,778 | | |
| | | | | Hong Kong Soy Food Brand | | | | | |
| | | | 235,634 | | |
| | | > Singapore 3.8% | |
| | 25,000,000 | | | Olam International | | | 36,209 | | |
| | | | | Agriculture Supply Chain Manager | | | | | |
| | 20,000,000 | | | Ascendas REIT | | | 34,119 | | |
| | | | | Industrial Property Landlord | | | | | |
| | 20,000,000 | | | CDL Hospitality Trust | | | 30,934 | | |
| | | | | Hotel Owner/Operator | | | | | |
| | 35,000,000 | | | Mapletree Logistics Trust | | | 27,214 | | |
| | | | | Industrial Property Landlord | | | | | |
| | 35,000,000 | | | Mapletree Commercial Trust | | | 27,176 | | |
| | | | | Retail & Office Property Landlord | | | | | |
| | 28,000,000 | | | Mapletree Industrial Trust | | | 26,822 | | |
| | | | | Industrial Property Landlord | | | | | |
| | 15,000,000 | | | Goodpack Limited | | | 20,546 | | |
| | | | | International Bulk Container Leasing | | | | | |
| | 3,500,000 | | | Singapore Exchange | | | 17,584 | | |
| | | | | Singapore Equity & Derivatives Market Operator | | | | | |
| | 3,071,300 | | | Petra Foods | | | 6,061 | | |
| | | | | Cocoa Processor & Chocolate Manufacturer | | | | | |
| | | | 226,665 | | |
| | | > China 3.1% | |
| | 26,565,000 | | | Want Want | | | 32,851 | | |
| | | | | Chinese Branded Consumer Food Company | | | | | |
| | 18,000,300 | | | Digital China | | | 31,721 | | |
| | | | | IT Distribution & Systems Integration Services | | | | | |
| | 1,100,000 | | | New Oriental Education &
Technology - ADR (b) | | | 26,950 | | |
| | | | | Education Service Provider | | | | | |
| | 18,920,554 | | | Zhaojin Mining Industry | | | 24,878 | | |
| | | | | Gold Mining & Refining in China | | | | | |
| | 381,300 | | | NetEase.com - ADR (b) | | | 22,440 | | |
| | | | | Chinese Online Gaming Services | | | | | |
| | 260,000,000 | | | RexLot Holdings | | | 18,625 | | |
| | | | | Lottery Equipment Supplier in China | | | | | |
| | 326,700 | | | 51job - ADR (a)(b) | | | 14,881 | | |
| | | | | Integrated Human Resource Services | | | | | |
| | 30,000,000 | | | AMVIG Holdings | | | 13,284 | | |
| | | | | Chinese Tobacco Packaging Material Supplier | | | | | |
| | | | 185,630 | | |
| Number of Shares | | | | Value (000) | |
| | | > India 2.4% | |
| | 341,652 | | | Asian Paints | | $ | 23,850 | | |
| | | | | India's Largest Paint Company | | | | | |
| | 2,262,300 | | | United Breweries | | | 22,126 | | |
| | | | | India's Largest Brewer | | | | | |
| | 13,195,000 | | | Redington India | | | 18,222 | | |
| | | | | Supply Chain Solutions for IT & Mobile
Handsets in Emerging Markets | | | | | |
| | 8,052,053 | | | Adani Ports & Special
Economic Zone | | | 17,581 | | |
| | | | | Indian West Coast Shipping Port | | | | | |
| | 11,163,303 | | | Jain Irrigation Systems | | | 16,751 | | |
| | 558,165 | | | Jain Irrigation Systems - DVR (b) | | | 395 | | |
| | | | | Agricultural Micro-irrigation Systems &
Food Processing | | | | | |
| | 1,550,000 | | | Shriram Transport Finance | | | 14,786 | | |
| | | | | Used Truck Finance | | | | | |
| | 545,000 | | | Colgate-Palmolive India | | | 11,762 | | |
| | | | | Consumer Products in Oral Care | | | | | |
| | 1,600,000 | | | Titan Industries | | | 6,443 | | |
| | | | | Jewlery, Watches & Eyeglasses | | | | | |
| | 10,249,300 | | | S. Kumars Nationwide | | | 6,361 | | |
| | | | | Textiles, Clothing & Retail | | | | | |
| | 32,642,905 | | | REI Agro | | | 5,466 | | |
| | | | | Basmati Rice Processing | | | | | |
| | 1,650,000 | | | SKIL Ports and Logistics (b) | | | 2,920 | | |
| | | | | Indian Container Port Project | | | | | |
| | | | 146,663 | | |
| | | > Korea 1.8% | |
| | 1,134,000 | | | Grand Korea Leisure | | | 23,541 | | |
| | | | | Largest 'Foreigner Only' Casino Group in Korea | | | | | |
| | 101,150 | | | NHN | | | 22,186 | | |
| | | | | Korean Online Search Services | | | | | |
| | 623,120 | | | Woongjin Coway | | | 19,457 | | |
| | | | | Korean Household Appliance Rental Service Provider | | | | | |
| | 580,000 | | | iMarketKorea | | | 10,751 | | |
| | | | | Procurement, Distribution of MRO
(Maintenance, Repair, Operations) Goods | | | | | |
| | 474,441 | | | Handsome | | | 10,683 | | |
| | | | | Korea's Leading High-end Apparel Company | | | | | |
| | 244,530 | | | Kepco Plant Service & Engineering | | | 10,314 | | |
| | | | | Power Plant & Grid Maintenance | | | | | |
| | 182,000 | | | Hana Tour Service | | | 7,146 | | |
| | | | | Korea's Largest Wholesale Tour Provider | | | | | |
| | 55,000 | | | Hyundai Home Shopping | | | 5,382 | | |
| | | | | TV Home Shopping Company | | | | | |
| | | | 109,460 | | |
| | | > Indonesia 1.2% | |
| | 29,063,787 | | | Archipelago Resources (b)(c) | | | 23,214 | | |
| | | | | Gold Mining Projects in Indonesia,
Vietnam & the Philippines | | | | | |
| | 51,767,300 | | | Tower Bersama Infrastructure (b) | | | 18,135 | | |
| | | | | Communications Towers | | | | | |
| | 12,488,000 | | | Mitra Adiperkasa | | | 9,588 | | |
| | | | | Operator of Department Store & Specialty Retail Stores | | | | | |
| | 15,000,000 | | | Ace Indonesia | | | 8,128 | | |
| | | | | Home Improvement Retailer | | | | | |
| | 2,176,600 | | | Mayora Indah | | | 5,907 | | |
| | | | | Consumer Branded Food Manufacturer | | | | | |
See accompanying notes to financial statements.
42
| Number of Shares | | | | Value (000) | |
| | | > Indonesia—continued | |
| | 32,766,000 | | | MNC Skyvision (b) | | $ | 5,486 | | |
| | | | | Largest Satellite Pay TV Operator in Indonesia | | | | | |
| | 6,217,500 | | | Southern Arc Minerals (b)(c) | | | 1,710 | | |
| | | | | Gold & Copper Exploration in Indonesia | | | | | |
| | | | 72,168 | | |
| | | > Mongolia 0.9% | |
| | 60,037,500 | | | Mongolian Mining (b) | | | 34,069 | | |
| | | | | Coking Coal Mining in Mongolia | | | | | |
| | 1,049,943 | | | Ivanhoe Mines (a)(b) | | | 10,354 | | |
| | 914,678 | | | Ivanhoe Mines (a)(b)(d) | | | 8,854 | | |
| | | | | Copper Mine Project in Mongolia | | | | | |
| | | | 53,277 | | |
| | | > Philippines 0.8% | |
| | 73,221,250 | | | SM Prime Holdings | | | 22,696 | | |
| | | | | Shopping Mall Operator | | | | | |
| | 7,931,700 | | | Int'l Container Terminal | | | 13,923 | | |
| | | | | Container Handling Terminals & Port Management | | | | | |
| | 19,454,700 | | | Manila Water Company | | | 11,331 | | |
| | | | | Water Utility Company in the Philippines | | | | | |
| | | | 47,950 | | |
| | | > Thailand 0.7% | |
| | 110,000,000 | | | Home Product Center | | | 43,930 | | |
| | | | | Home Improvement Retailer | | | | | |
| | | | 43,930 | | |
| | | > Cambodia 0.4% | |
| | 60,000,000 | | | Nagacorp | | | 26,831 | | |
| | | | | Casino/Entertainment Complex in Cambodia | | | | | |
| | | | 26,831 | | |
| Asia: Total | | | 2,640,913 | | |
| Europe 29.9% | | | |
| | | > United Kingdom 5.9% | |
| | 1,004,500 | | | Intertek Group | | | 42,084 | | |
| | | | | Testing, Inspection, Certification Services | | | | | |
| | 3,375,000 | | | Serco | | | 28,343 | | |
| | | | | Facilities Management | | | | | |
| | 2,579,333 | | | JLT Group | | | 28,341 | | |
| | | | | International Business Insurance Broker | | | | | |
| | 8,785,000 | | | BBA Aviation | | | 28,124 | | |
| | | | | Aviation Support Services | | | | | |
| | 3,107,000 | | | Domino's Pizza United
Kingdom & Ireland | | | 25,053 | | |
| | | | | Pizza Delivery in the UK, Ireland & Germany | | | | | |
| | 822,000 | | | Rightmove | | | 20,540 | | |
| | | | | Internet Real Estate Listings | | | | | |
| | 596,100 | | | Aggreko | | | 19,386 | | |
| | | | | Temporary Power & Temperature Control Services | | | | | |
| | 2,855,000 | | | Abcam | | | 18,643 | | |
| | | | | Online Sales of Antibodies | | | | | |
| | 2,300,000 | | | Greggs | | | 18,169 | | |
| | | | | Bakery | | | | | |
| | 1,761,742 | | | Smith and Nephew | | | 17,622 | | |
| | | | | Medical Equipment & Supplies | | | | | |
| | 517,000 | | | Rotork | | | 15,990 | | |
| | | | | Valve Actuators for Oil & Water Pipelines | | | | | |
| | 1,773,408 | | | Shaftesbury | | | 14,317 | | |
| | | | | London Prime Retail REIT | | | | | |
| Number of Shares | | | | Value (000) | |
| | 1,555,000 | | | WH Smith | | $ | 13,276 | | |
| | | | | Newsprint, Book & General Stationery Retailer | | | | | |
| | 262,300 | | | Next | | | 13,171 | | |
| | | | | Clothes & Home Retailer in the UK | | | | | |
| | 2,027,932 | | | Premier Oil (b) | | | 10,775 | | |
| | | | | Oil & Gas Producer in Europe, Pakistan & Asia | | | | | |
| | 2,303,000 | | | Chemring | | | 9,915 | | |
| | | | | Defense Manufacturer of
Countermeasures & Energetics | | | | | |
| | 4,163,948 | | | PureCircle (a)(b) | | | 9,360 | | |
| | | | | Natural Sweeteners | | | | | |
| | 382,581 | | | Tullow Oil | | | 8,842 | | |
| | | | | Oil & Gas Producer | | | | | |
| | 256,202 | | | Spirax Sarco | | | 7,985 | | |
| | | | | Steam Systems for Manufacturing & Process Industries | | | | | |
| | 2,840,000 | | | Sterling Resources (a)(b) | | | 2,845 | | |
| | | | | Oil & Gas Exploration - Europe | | | | | |
| | | | 352,781 | | |
| | | > Netherlands 4.4% | |
| | 1,591,702 | | | UNIT4 (c) | | | 40,567 | | |
| | | | | Business Software Development | | | | | |
| | 1,680,623 | | | Imtech | | | 40,130 | | |
| | | | | Electromechanical & Information & Communications
Technology Installation & Maintenance | | | | | |
| | 2,546,126 | | | Aalberts Industries | | | 39,645 | | |
| | | | | Flow Control & Heat Treatment | | | | | |
| | 1,234,758 | | | Koninklijke TenCate | | | 32,962 | | |
| | | | | Advanced Textiles & Industrial Fabrics | | | | | |
| | 460,000 | | | Fugro | | | 27,903 | | |
| | | | | Subsea Oilfield Services | | | | | |
| | 1,252,514 | | | Arcadis (a) | | | 27,394 | | |
| | | | | Engineering Consultants | | | | | |
| | 317,424 | | | Vopak | | | 20,360 | | |
| | | | | World's Largest Operator of Petroleum &
Chemical Storage Terminals | | | | | |
| | 850,468 | | | TKH Group | | | 18,269 | | |
| | | | | Dutch Industrial Conglomerate | | | | | |
| | 143,395 | | | Core Laboratories | | | 16,620 | | |
| | | | | Oil & Gas Reservoir Consulting | | | | | |
| | | | 263,850 | | |
| | | > Switzerland 3.8% | |
| | 310,000 | | | Partners Group | | | 55,134 | | |
| | | | | Private Markets Asset Management | | | | | |
| | 255,000 | | | Geberit | | | 50,306 | | |
| | | | | Plumbing Supplies | | | | | |
| | 330,000 | | | Dufry Group (b) | | | 39,999 | | |
| | | | | Operates Airport Duty Free & Duty Paid Shops | | | | | |
| | 15,500 | | | Sika | | | 29,931 | | |
| | | | | Chemicals for Construction & Industrial Applications | | | | | |
| | 170,000 | | | Kuehne & Nagel | | | 18,010 | | |
| | | | | Freight Forwarding/Logistics | | | | | |
| | 280,000 | | | Zehnder | | | 16,736 | | |
| | | | | Radiators & Ventilation Systems | | | | | |
| | 580,000 | | | Bank Sarasin & Cie (b) | | | 16,342 | | |
| | | | | Private Banking | | | | | |
| | | | 226,458 | | |
| | | > France 3.5% | |
| | 553,000 | | | Eurofins Scientific | | | 68,673 | | |
| | | | | Food, Pharmaceuticals & Materials
Screening & Testing | | | | | |
See accompanying notes to financial statements.
43
Columbia Acorn International
Statement of Investments (Unaudited), continued
| Number of Shares | | | | Value (000) | |
| | | > France—continued | |
| | 729,700 | | | Gemalto | | $ | 52,410 | | |
| | | | | Digital Security Solutions | | | | | |
| | 675,000 | | | Neopost | | | 36,023 | | |
| | | | | Postage Meter Machines | | | | | |
| | 971,800 | | | Saft | | | 23,315 | | |
| | | | | Niche Battery Manufacturer | | | | | |
| | 232,400 | | | Norbert Dentressangle | | | 14,744 | | |
| | | | | Leading European Logistics & Transport Group | | | | | |
| | 134,254 | | | Compagnie Française de
l'Afrique Occidentale | | | 6,355 | | |
| | | | | African Wholesaler & Distributor | | | | | |
| | 1,831,204 | | | Hi-Media (a)(b) | | | 4,668 | | |
| | | | | Online Advertiser in Europe | | | | | |
| | 162,844 | | | Mersen | | | 4,080 | | |
| | | | | Advanced Industrial Materials | | | | | |
| | | | 210,268 | | |
| | | > Germany 3.2% | |
| | 2,500,000 | | | Wirecard | | | 48,476 | | |
| | | | | Online Payment Processing & Risk Management | | | | | |
| | 148,295 | | | Rational | | | 35,347 | | |
| | | | | Commercial Ovens | | | | | |
| | 500,000 | | | Dürr | | | 30,851 | | |
| | | | | Automotive Plant Engineering & Associated
Capital Equipment | | | | | |
| | 405,000 | | | Rheinmetall | | | 19,909 | | |
| | | | | Defense & Automotive | | | | | |
| | 625,000 | | | CTS Eventim | | | 18,808 | | |
| | | | | Event Ticket Sales | | | | | |
| | 690,000 | | | NORMA Group | | | 15,161 | | |
| | | | | Clamps for Automotive & Industrial Applications | | | | | |
| | 165,400 | | | Bertrandt | | | 12,390 | | |
| | | | | Outsourced Engineering | | | | | |
| | 333,000 | | | Elringklinger | | | 7,946 | | |
| | | | | Automobile Components | | | | | |
| | 338,886 | | | Deutsche Beteiligungs | | | 6,691 | | |
| | | | | Private Equity Investment Management | | | | | |
| | | | 195,579 | | |
| | | > Sweden 2.2% | |
| | 4,056,007 | | | Hexagon | | | 69,621 | | |
| | | | | Design, Measurement & Visualization
Software & Equipment | | | | | |
| | 4,150,024 | | | Sweco (c) | | | 43,732 | | |
| | | | | Engineering Consultants | | | | | |
| | 658,700 | | | Unibet | | | 16,700 | | |
| | | | | European Online Gaming Operator | | | | | |
| | 419,877 | | | East Capital Explorer | | | 2,892 | | |
| | | | | Sweden-based Russia & Central Eastern Europe
Investment Fund | | | | | |
| | | | 132,945 | | |
| | | > Denmark 1.3% | |
| | 1,648,800 | | | Novozymes | | | 42,755 | | |
| | | | | Industrial Enzymes | | | | | |
| | 168,042 | | | SimCorp | | | 28,969 | | |
| | | | | Software for Investment Managers | | | | | |
| | 166,013 | | | Solar A/S | | | 9,002 | | |
| | | | | Technical Wholesaler of Electrical,
Plumbing & HVAC Equipment | | | | | |
| | | | 80,726 | | |
| Number of Shares | | | | Value (000) | |
| | | > Italy 1.1% | |
| | 2,661,000 | | | Pirelli (a) | | $ | 28,065 | | |
| | | | | Global Tire Supplier | | | | | |
| | 166,200 | | | Tod's (a) | | | 16,671 | | |
| | | | | Leather Shoes & Bags | | | | | |
| | 7,000,000 | | | Geox (a) | | | 15,486 | | |
| | | | | Apparel & Shoe Maker | | | | | |
| | 8,951,757 | | | CIR | | | 8,829 | | |
| | | | | Italian Holding Company | | | | | |
| | | | 69,051 | | |
| | | > Russia 0.8% | |
| | 1,123,695 | | | Yandex (b) | | | 21,406 | | |
| | | | | Search Engine for Russian & Turkish Languages | | | | | |
| | 2,109,700 | | | Petropavlovsk | | | 15,114 | | |
| | | | | Gold & Iron Ore Mining in Russia | | | | | |
| | 368,493 | | | Mail.ru - GDR (b)(e) | | | 12,550 | | |
| | | | | Internet Social Networking & Games for
Russian Speakers | | | | | |
| | | | 49,070 | | |
| | | > Iceland 0.6% | |
| | 35,982,499 | | | Marel | | | 36,188 | | |
| | | | | Largest Manufacturer of Poultry & Fish
Processing Equipment | | | | | |
| | | | 36,188 | | |
| | | > Ireland 0.5% | |
| | 263,400 | | | Paddy Power | | | 17,195 | | |
| | | | | Irish Betting Services | | | | | |
| | 4,237,000 | | | United Drug | | | 11,118 | | |
| | | | | Irish Pharmaceutical Wholesaler & Outsourcer | | | | | |
| | | | 28,313 | | |
| | | > Spain 0.4% | |
| | 618,320 | | | Red Eléctrica de España | | | 26,987 | | |
| | | | | Spanish Power Transmission | | | | | |
| | | | 26,987 | | |
| | | > Portugal 0.4% | |
| | 8,635,000 | | | Redes Energéticas Nacionais | | | 22,858 | | |
| | | | | Portuguese Power Transmission & Gas Transportation | | | | | |
| | | | 22,858 | | |
| | | > Czech Republic 0.4% | |
| | 130,682 | | | Komercni Banka | | | 22,798 | | |
| | | | | Leading Czech Universal Bank | | | | | |
| | | | 22,798 | | |
| | | > Norway 0.4% | |
| | 2,403,664 | | | Atea | | | 21,165 | | |
| | | | | Leading Nordic IT Hardware/Software
Reseller & Installation Company | | | | | |
| | | | 21,165 | | |
| | | > Finland 0.3% | |
| | 1,039,429 | | | Stockmann (a) | | | 21,015 | | |
| | | | | Department Store & Fashion Retailer in
Scandinavia & Russia | | | | | |
| | | | 21,015 | | |
| | | > Belgium 0.3% | |
| | 438,880 | | | EVS Broadcast Equipment | | | 20,704 | | |
| | | | | Digital Live Mobile Production Software & Systems | | | | | |
| | | | 20,704 | | |
See accompanying notes to financial statements.
44
| Number of Shares | | | | Value (000) | |
| | | > Kazakhstan 0.3% | |
| | 3,319,000 | | | Halyk Savings Bank of
Kazakhstan - GDR (b) | | $ | 16,554 | | |
| | | | | Largest Retail Bank & Insurer in Kazakhstan | | | | | |
| | | | 16,554 | | |
| | | > Greece 0.1% | |
| | 4,384,185 | | | Intralot | | | 4,949 | | |
| | | | | Lottery & Gaming Systems & Services | | | | | |
| | | | 4,949 | | |
| Europe: Total | | | 1,802,259 | | |
| Other Countries 16.5% | | | |
| | | > South Africa 4.5% | |
| | 1,170,188 | | | Naspers | | | 62,503 | | |
| | | | | Media in Africa, China, Russia & Other
Emerging Markets | | | | | |
| | 3,175,083 | | | Mr. Price | | | 43,531 | | |
| | | | | South African Retailer of Apparel,
Household & Sporting Goods | | | | | |
| | 19,098,300 | | | Rand Merchant Insurance | | | 40,676 | | |
| | | | | Directly Sold Property & Casualty
Insurance; Holdings in Other Insurers | | | | | |
| | 11,763,907 | | | Coronation Fund Managers | | | 39,830 | | |
| | | | | South African Fund Manager | | | | | |
| | 4,992,200 | | | Adcock Ingram Holdings | | | 36,696 | | |
| | | | | Manufacturer of Pharmaceuticals & Medical Supplies | | | | | |
| | 8,679,940 | | | Northam Platinum | | | 24,827 | | |
| | | | | Platinum Mining in South Africa | | | | | |
| | 1,025,504 | | | Massmart Holdings | | | 21,233 | | |
| | | | | General Merchandise, Food & Home
Improvement Stores; Wal-Mart Subsidiary | | | | | |
| | | | 269,296 | | |
| | | > Canada 3.8% | |
| | 1,403,772 | | | CCL Industries | | | 51,499 | | |
| | | | | Leading Global Label Manufacturer | | | | | |
| | 1,212,597 | | | ShawCor | | | 43,890 | | |
| | | | | Oil & Gas Pipeline Products | | | | | |
| | 653,200 | | | Onex Capital | | | 25,362 | | |
| | | | | Private Equity | | | | | |
| | 582,942 | | | AG Growth (a) | | | 21,008 | | |
| | | | | Leading Manufacturer of Augers &
Grain Handling Equipment | | | | | |
| | 770,576 | | | Black Diamond Group | | | 17,264 | | |
| | | | | Provides Accommodations/Equipment for
Oil Sands Development | | | | | |
| | 984,500 | | | Alliance Grain Traders | | | 13,209 | | |
| | | | | Global Leader in Pulse Processing & Distribution | | | | | |
| | 2,919,000 | | | DeeThree Exploration (b)(c)(f) | | | 9,272 | | |
| | 1,142,377 | | | DeeThree Exploration (b)(c) | | | 3,703 | | |
| | | | | Canadian Oil & Gas Producer | | | | | |
| | 2,096,514 | | | Horizon North Logistics | | | 11,964 | | |
| | | | | Provides Diversified Oil Service Offering in
Northern Canada | | | | | |
| | 263,857 | | | Baytex (a) | | | 11,116 | | |
| | | | | Oil & Gas Producer in Canada | | | | | |
| | 454,000 | | | Celtic Exploration (b) | | | 6,141 | | |
| | | | | Canadian Oil & Gas Producer | | | | | |
| | 1,607,306 | | | Pan Orient (b) | | | 5,920 | | |
| | | | | Asian Oil & Gas Explorer | | | | | |
| Number of Shares | | | | Value (000) | |
| | 450,000 | | | Athabasca Oil Sands (b) | | $ | 4,950 | | |
| | | | | Oil Sands & Unconventional Oil Development | | | | | |
| | 1,611,000 | | | Americas Petrogas (a)(b) | | | 2,991 | | |
| | | | | Oil & Gas Exploration in Argentina, Potash in Peru | | | | | |
| | 332,700 | | | Crew Energy (b) | | | 1,879 | | |
| | | | | Canadian Oil & Gas Producer | | | | | |
| | | | 230,168 | | |
| | | > Australia 3.6% | |
| | 3,973,200 | | | UGL (a) | | | 50,875 | | |
| | | | | Engineering & Facilities Management | | | | | |
| | 48,533,075 | | | Commonwealth Property Office Fund | | | 50,591 | | |
| | | | | Australia Prime Office REIT | | | | | |
| | 11,936,400 | | | Challenger Financial | | | 40,091 | | |
| | | | | Largest Annuity Provider | | | | | |
| | 498,560 | | | Cochlear | | | 33,859 | | |
| | | | | Cochlear Implants | | | | | |
| | 7,595,003 | | | IAG | | | 27,240 | | |
| | | | | General Insurance Provider | | | | | |
| | 1,576,290 | | | Domino's Pizza Enterprises | | | 16,294 | | |
| | | | | Domino's Pizza Operator in Australia/New
Zealand & France/Benelux | | | | | |
| | | | 218,950 | | |
| | | > United States 3.4% | |
| | 1,229,871 | | | BioMarin Pharmaceutical (b) | | | 48,678 | | |
| | | | | Biotech Focused on Orphan Diseases | | | | | |
| | 952,080 | | | Atwood Oceanics (b) | | | 36,027 | | |
| | | | | Offshore Drilling Contractor | | | | | |
| | 965,297 | | | Textainer Group Holdings (a) | | | 35,619 | | |
| | | | | Top International Container Leasor | | | | | |
| | 763,228 | | | World Fuel Services | | | 29,026 | | |
| | | | | Global Fuel Broker | | | | | |
| | 555,500 | | | Hornbeck Offshore (b) | | | 21,542 | | |
| | | | | Supply Vessel Operator in U.S. Gulf of Mexico | | | | | |
| | 548,900 | | | Rowan (b) | | | 17,746 | | |
| | | | | Contract Offshore Driller | | | | | |
| | 407,213 | | | FMC Technologies (b) | | | 15,975 | | |
| | | | | Oil & Gas Well Head Manufacturer | | | | | |
| | | | 204,613 | | |
| | | > Israel 1.0% | |
| | 4,706,527 | | | Israel Chemicals | | | 52,074 | | |
| | | | | Producer of Potash, Phosphates, Bromine &
Specialty Chemicals | | | | | |
| | 625,000 | | | Caesarstone (b) | | | 7,569 | | |
| | | | | Quartz Countertops | | | | | |
| | | | 59,643 | | |
| | | > Senegal 0.2% | |
| | 42,360 | | | Sonatel | | | 9,316 | | |
| | | | | Leading Telecoms Operator in Western Africa | | | | | |
| | | | 9,316 | | |
| Other Countries: Total | | | 991,986 | | |
| Latin America 4.4% | | | |
| | | > Brazil 2.8% | |
| | 3,700,000 | | | Localiza Rent A Car | | | 55,652 | | |
| | | | | Car Rental | | | | | |
| | 1,200,000 | | | Multiplus | | | 28,618 | | |
| | | | | Loyalty Program Operator in Brazil | | | | | |
See accompanying notes to financial statements.
45
Columbia Acorn International
Statement of Investments (Unaudited), continued
| Number of Shares | | | | Value (000) | |
| | | > Brazil—continued | |
| | 1,880,200 | | | Mills Estruturas e Servicos
de Engenharia | | $ | 25,275 | | |
| | | | | Civil Engineering & Construction | | | | | |
| | 4,500,000 | | | Odontoprev | | | 22,696 | | |
| | | | | Dental Insurance | | | | | |
| | 1,300,000 | | | Arcos Dorados (a) | | | 19,214 | | |
| | | | | McDonald's Master Franchise for Latin America | | | | | |
| | 3,577,000 | | | MRV Engenharia | | | 16,474 | | |
| | | | | Brazilan Property Developer | | | | | |
| | | | 167,929 | | |
| | | > Mexico 0.8% | |
| | 600,000 | | | Grupo Aeroportuario del
Sureste - ADR | | | 46,842 | | |
| | | | | Mexican Airport Operator | | | | | |
| | | | 46,842 | | |
| | | > Guatemala 0.3% | |
| | 1,403,049 | | | Tahoe Resources (b) | | | 19,390 | | |
| | | | | Silver Project in Guatemala | | | | | |
| | | | 19,390 | | |
| | | > Uruguay 0.2% | |
| | 1,306,818 | | | Union Agriculture Group (b)(f)(g) | | | 12,794 | | |
| | | | | Farmland Operator in Uruguay | | | | | |
| | | | 12,794 | | |
| | | > Chile 0.2% | |
| | 5,640,000 | | | Viña Concha y Toro | | | 11,038 | | |
| | | | | Global Branded Wine Manufacturer | | | | | |
| | | | 11,038 | | |
| | | > Colombia 0.1% | |
| | 7,850,769 | | | Canacol (b) | | | 3,509 | | |
| | | | | Oil Producer in South America | | | | | |
| | 22,525,000 | | | Gulf United (b) | | | 1,351 | | |
| | | | | Prospecting for Oil Alongside Large
Producers in Colombia | | | | | |
| | | | 4,860 | | |
| | | > Argentina —% | |
| | 4,950,000 | | | Madalena Ventures (b)(f) | | | 1,634 | | |
| | 2,475,000 | | | Madalena Ventures (b) | | | 851 | | |
| | | | | Oil & Gas Exploration in Argentina | | | | | |
| | | | 2,485 | | |
| Latin America: Total | | | 265,338 | | |
Total Equities: 94.6%
(Cost: $4,751,710) | | | 5,700,496 | | |
| Number of Shares | | | | Value (000) | |
| Securities Lending Collateral 1.8% | |
| | 111,196,657 | | | Dreyfus Government Cash
Management Fund
(7 day yield of 0.01%) (h) | | $ | 111,197 | | |
Total Securities Lending Collateral:
(Cost: $111,197) | | | 111,197 | | |
Total Investments: 96.4%
(Cost: $4,862,907)(i)(j) | | | 5,811,693 | | |
Obligation to Return Collateral for
Securities Loaned: (1.8)% | | | (111,197 | ) | |
| Cash and Other Assets Less Liabilities: 5.4% | | | 326,071 | | |
| Total Net Assets: 100.0% | | $ | 6,026,567 | | |
ADR - American Depositary Receipts
DVR - Differential Voting Right Equity Shares
GDR - Global Depositary Receipts
REIT - Real Estate Investment Trust
See accompanying notes to financial statements.
46
> Notes to Statement of Investments (dollar values in thousands)
(a) All or a portion of this security was on loan at June 30, 2012. The total market value of securities on loan at June 30, 2012 was $110,353.
(b) Non-income producing security.
(c) An affiliated person of the Fund may include any company in which the Fund owns five percent or more of its outstanding voting shares. Holdings and transactions in these affiliated companies during the period ended June 30, 2012, are as follows:
| Security | | Balance of
Shares Held
12/31/11 | | Purchases/
Additions | | Sales/
Reductions | | Balance of
Shares Held
6/30/12 | | Value | | Dividend | |
| Archipelago Resources | | | 29,063,787 | | | | - | | | | - | | | | 29,063,787 | | | $ | 23,214 | | | $ | - | | |
| DeeThree Exploration | | | 4,061,377 | | | | - | | | | - | | | | 4,061,377 | | | | 12,975 | | | | - | | |
| Koninklijke TenCate* | | | 1,371,573 | | | | 53,685 | | | | 190,500 | | | | 1,234,758 | | | | 32,962 | | | | - | ** | |
| Southern Arc Minerals | | | 6,217,500 | | | | - | | | | - | | | | 6,217,500 | | | | 1,710 | | | | - | | |
| Sweco | | | 4,150,024 | | | | - | | | | - | | | | 4,150,024 | | | | 43,732 | | | | 1,574 | | |
| UNIT4 | | | 1,591,702 | | | | - | | | | - | | | | 1,591,702 | | | | 40,567 | | | | 677 | | |
| Wacom* | | | 23,790 | | | | - | | | | 3,694 | | | | 20,096 | | | | 45,009 | | | | 794 | | |
| Workspace Group* | | | 8,000,000 | | | | - | | | | 8,000,000 | | | | - | | | | - | | | | 298 | | |
| Total of Affiliated Transactions | | | 54,479,753 | | | | 53,685 | | | | 8,194,194 | | | | 46,339,244 | | | $ | 200,169 | | | $ | 3,343 | | |
* At June 30, 2012, the Fund owned less than five percent of the company's outstanding voting shares.
** Rounds to less than $500.
The aggregate cost and value of these companies at June 30, 2012 were $93,271 and $122,198 respectively. Investments in affiliated companies represented 2.03% of the Fund's total net assets at June 30, 2012.
(d) Security is traded on a U.S. exchange.
(e) Security exempt from registration under Section 4(2) of the Securities Act of 1933. This security may only be resold in exempt transactions to qualified buyers. Private resales of this security to qualified institutional buyers are also exempt from registration pursuant to Rule 144A under the Securities Act of 1933. At June 30, 2012, this security had an aggregate value of $12,550, which represented 0.21% of total net assets.
(f) Denotes a restricted security, which is subject to restrictions on resale under federal securities laws. These securities are valued at fair value determined in good faith under consistently applied procedures established by the Board of Trustees. At June 30, 2012, the market value of these securities amounted to $23,700, which represented 0.39% of total net assets.
Additional information on these securities is as follows:
| Security | | Acquisition
Dates | | Shares | | Cost | | Value | |
| Union Agriculture Group | | 12/8/10-6/27/12 | | | 1,306,818 | | | $ | 15,000 | | | $ | 12,794 | | |
| DeeThree Exploration | | 9/7/10-3/8/11 | | | 2,919,000 | | | | 10,228 | | | | 9,272 | | |
| Madalena Ventures | | 10/21/10 | | | 4,950,000 | | | | 3,136 | | | | 1,634 | | |
| | | | | | | $ | 28,364 | | | $ | 23,700 | | |
(g) Illiquid security.
(h) Investment made with cash collateral received from securities lending activity.
(i) At June 30, 2012, for federal income tax purposes, the cost of investments was $4,862,907 and net unrealized appreciation was $948,786 consisting of gross unrealized appreciation of $1,372,957 and gross unrealized depreciation of $424,171.
(j) On June 30, 2012, the Fund's total investments were denominated in currencies as follows:
| Currency | | Value | | Percentage
of Net Assets | |
| Japanese Yen | | $ | 1,058,464 | | | | 17.5 | | |
| Euro | | | 846,954 | | | | 14.1 | | |
| United States Dollar | | | 507,517 | | | | 8.4 | | |
| Taiwan Dollar | | | 434,241 | | | | 7.2 | | |
| British Pound | | | 391,184 | | | | 6.5 | | |
| Hong Kong Dollar | | | 343,012 | | | | 5.7 | | |
| Australian Dollar | | | 330,146 | | | | 5.5 | | |
Other currencies less than
5% of total net assets | | | 1,900,175 | | | | 31.5 | | |
| Total Portfolio | | $ | 5,811,693 | | | | 96.4 | | |
See accompanying notes to financial statements.
47
Columbia Acorn International
Statement of Investments (Unaudited), continued
> Notes to Statement of Investments (dollar values in thousands)
Fair Value Measurements
Various inputs are used in determining the value of the Fund's investments, following the input prioritization hierarchy established by GAAP. These inputs are summarized in the three broad levels listed below:
• Level 1 – quoted prices in active markets for identical securities
• Level 2 – prices determined using other significant observable inputs (including quoted prices for similar securities, interest rates, prepayment speeds, credit risk and others)
• Level 3 – prices determined using significant unobservable inputs where quoted prices or observable inputs are unavailable or less reliable (including management's own assumptions about the factors market participants would use in pricing an investment)
The inputs or methodology used for valuing securities are not necessarily an indication of the risk associated with investing in those securities.
Examples of the types of securities in which the Fund would typically invest and how they are classified within this hierarchy are as follows. Typical Level 1 securities include exchange traded domestic equities, mutual funds whose NAVs are published each day and exchange traded foreign equities that are not statistically fair valued. Typical Level 2 securities include exchange traded foreign equities that are statistically fair valued, forward foreign currency exchange contracts and short-term investments valued at amortized cost. Additionally, securities fair valued by the Valuation Committee (the Committee) of the Fund's Board of Trustees (the Board) that rely on significant observable inputs are also included in Level 2. Typical Level 3 securities include any security fair valued by the Committee that relies on significant unobservable inputs.
Under the direction of the Board, the Committee is responsible for carrying out the valuation procedures approved by the Board.
The Committee meets as necessary, and no less frequently than quarterly, to determine fair values for securities for which market quotations are not readily available or for which the investment manager believes that available market quotations are unreliable, and to review the continuing appropriateness of the current value of any security subject to the Trust's Portfolio Pricing Policy and the pricing procedures of the investment manager (the Policies). The Policies address, among other things: circumstances under which market quotations will be deemed readily available; selection of third party pricing vendors; appropriate pricing methodologies; events that require fair valuation and fair value techniques; and circumstances under which securities will be deemed to pose a potential for stale pricing, including when securities are illiquid, restricted, or in default. The Committee may also meet to discuss additional valuation matters, which may include review of back-testing results, review of time-sensitive information or approval of other valuation related actions, and to review the appropriateness of the Policies.
For investments categorized as Level 3, the significant unobservable inputs used in the fair value measurement of the Funds' securities may include: (i) data specific to the issuer or comparable issuers, (ii) general market or specific sector news and (iii) quoted prices and specific or similar security transactions. The Committee considers this data and any changes from prior periods in order to assess the reasonableness of observable and unobservable inputs, any assumptions or internal models used to value those securities and changes in fair value. Significant changes in any of these factors could result in lower or higher fair value measurements. Various factors impact the frequency of monitoring (which may occur as often as daily), however the Committee may determine that changes to inputs, assumptions and models are not required with the same frequency.
The following table summarizes the inputs used, as of June 30, 2012, in valuing the Fund's assets:
| Investment Type | | Quoted Prices
(Level 1) | | Other
Significant
Observable
Inputs
(Level 2) | | Significant
Unobservable
Inputs
(Level 3) | | Total | |
| Equities | |
| Asia | | $ | 160,069 | | | $ | 2,480,844 | | | $ | - | | | $ | 2,640,913 | | |
| Europe | | | 40,871 | | | | 1,761,388 | | | | - | | | | 1,802,259 | | |
| Other Countries | | | 433,078 | | | | 558,908 | | | | - | | | | 991,986 | | |
| Latin America | | | 250,910 | | | | 1,634 | | | | 12,794 | | | | 265,338 | | |
| Total Equities | | | 884,928 | | | | 4,802,774 | | | | 12,794 | | | | 5,700,496 | | |
| Total Securities Lending Collateral | | | 111,197 | | | | - | | | | - | | | | 111,197 | | |
| Total Investments | | $ | 996,125 | | | $ | 4,802,774 | | | $ | 12,794 | | | $ | 5,811,693 | | |
The Fund's assets assigned to the Level 2 input category are generally valued using a market approach, in which a security's value is determined through its correlation to prices and information from observable market transactions for similar or identical assets. Foreign equities are generally valued at the last sale price on the foreign exchange or market on which they trade. The Fund may use a statistical fair valuation model, in accordance with the policy adopted by the Board, provided by an independent third party to value securities principally traded in foreign markets in order to adjust for possible stale pricing that may occur between the close of the foreign exchanges and the time for valuation. These models take into account available market data including intraday index, ADR, and ETF movements. Securities acquired via private placement that have a holding period or an extended settlement period are valued at a discount to the same shares that are trading freely on the market. These discounts are determined by the investment manager's experience with similar securities or situations. Factors may include, but are not limited to, trade volume, shares outstanding and stock price.
The following table shows transfers between Level 1 and Level 2 of the fair value hierarchy:
| Transfers In | | Transfers Out | |
| Level 1 | | Level 2 | | Level 1 | | Level 2 | |
| $ | 10,584 | | | $ | - | | | $ | - | | | $ | 10,584 | | |
Financial assets were transferred from Level 2 to Level 1 as resale restrictions no longer apply.
See accompanying notes to financial statements.
48
> Notes to Statement of Investments (dollar values in thousands)
The following table reconciles asset balances for the period ending June 30, 2012, in which significant observable and/or unobservable inputs (Level 3) were used in determining value:
Investments
in Securities | | Balance
as of
December 31,
2011 | | Realized
Gain/(Loss) | | Change in
Unrealized
Appreciation
(Depreciation) | | Purchases | | Sales | | Transfers
into
Level 3 | | Transfers
out of
Level 3 | | Balance
as of
June 30,
2012 | |
| Equities | |
| Latin America | | $ | 12,462 | | | $ | - | | | $ | 332 | | | $ | - | | | $ | - | | | $ | - | | | $ | - | | | $ | 12,794 | | |
| | | $ | 12,462 | | | $ | - | | | $ | 332 | | | $ | - | | | $ | - | | | $ | - | | | $ | - | | | $ | 12,794 | | |
The information in the above reconciliation table represents fiscal year to date activity for any securities identified as using Level 3 inputs at either the beginning or the end of the current fiscal period.
The change in unrealized appreciation attributed to securities owned at June 30, 2012, which were valued using significant unobservable inputs (Level 3), amounted to $332.
The Fund does not hold any significant investments categorized as Level 3.
Certain common stock classified as Level 3 are valued at fair value, using a market approach, as determined in good faith under consistently applied procedures established by and under the general supervision of the Board. To determine fair value for these securities, for which no market exists, the Committee utilizes the valuation technique it deems most appropriate in the circumstances, using some unobservable inputs, which may include but are not limited to trades of similar securities, estimated earnings of the company, market multiples derived from a set of comparable companies, and the position of the security within the company's capital structure. Significant increases or decreases to any of these inputs could result in a significantly lower or higher fair value measurement. Generally, a change in estimated earnings of a company may result in a change to the comparable companies and market multiples utilized.
See accompanying notes to financial statements.
49
Columbia Acorn International
Portfolio Diversification (Unaudited)
At June 30, 2012, the Fund's portfolio investments as a percentage of net assets were diversified as follows:
| | | Value (000) | | Percentage
of Net Assets | |
| > Industrial Goods & Services | |
| Other Industrial Services | | $ | 498,256 | | | | 8.3 | | |
| Machinery | | | 376,487 | | | | 6.2 | | |
Industrial Materials &
Specialty Chemicals | | | 363,320 | | | | 6.0 | | |
| Construction | | | 113,252 | | | | 1.9 | | |
| Conglomerates | | | 82,269 | | | | 1.4 | | |
| Outsourcing Services | | | 79,172 | | | | 1.3 | | |
| Electrical Components | | | 78,914 | | | | 1.3 | | |
| Industrial Distribution | | | 40,299 | | | | 0.7 | | |
| | | | 1,631,969 | | | | 27.1 | | |
| > Consumer Goods & Services | |
| Retail | | | 362,751 | | | | 6.0 | | |
| Food & Beverage | | | 205,154 | | | | 3.4 | | |
| Casinos & Gaming | | | 204,526 | | | | 3.4 | | |
| Nondurables | | | 111,534 | | | | 1.9 | | |
| Other Consumer Services | | | 89,612 | | | | 1.5 | | |
| Travel | | | 62,798 | | | | 1.0 | | |
| Apparel | | | 53,546 | | | | 0.9 | | |
| Consumer Goods Distribution | | | 52,921 | | | | 0.9 | | |
| Other Durable Goods | | | 44,802 | | | | 0.7 | | |
| Restaurants | | | 41,347 | | | | 0.7 | | |
| Educational Services | | | 26,950 | | | | 0.5 | | |
| Other Entertainment | | | 18,807 | | | | 0.3 | | |
| Furniture & Textiles | | | 7,569 | | | | 0.1 | | |
| | | | 1,282,317 | | | | 21.3 | | |
| > Information | |
Computer Hardware &
Related Equipment | | | 264,450 | | | | 4.4 | | |
| Mobile Communications | | | 170,006 | | | | 2.8 | | |
| Internet Related | | | 161,623 | | | | 2.7 | | |
| Business Software | | | 139,157 | | | | 2.3 | | |
| Financial Processors | | | 66,059 | | | | 1.1 | | |
| Instrumentation | | | 61,762 | | | | 1.0 | | |
Semiconductors & Related
Equipment | | | 51,879 | | | | 0.9 | | |
| Electronics Distribution | | | 31,721 | | | | 0.5 | | |
| CATV | | | 26,488 | | | | 0.4 | | |
| Computer Services | | | 21,165 | | | | 0.3 | | |
| Telephone & Data Services | | | 9,316 | | | | 0.2 | | |
| Satellite Broadcasting & Services | | | 5,486 | | | | 0.1 | | |
| Advertising | | | 4,669 | | | | 0.1 | | |
| | | | 1,013,781 | | | | 16.8 | | |
| > Other Industries | |
| Real Estate | | | 383,867 | | �� | | 6.4 | | |
| Transportation | | | 116,680 | | | | 1.9 | | |
| Regulated Utilities | | | 61,175 | | | | 1.0 | | |
| | | | 561,722 | | | | 9.3 | | |
| | | Value (000) | | Percentage
of Net Assets | |
| > Energy & Minerals | |
| Oil Services | | $ | 192,311 | | | | 3.2 | | |
| Mining | | | 179,030 | | | | 3.0 | | |
| Oil & Gas Producers | | | 75,778 | | | | 1.3 | | |
| Agricultural Commodities | | | 26,003 | | | | 0.4 | | |
Oil Refining, Marketing &
Distribution | | | 20,360 | | | | 0.3 | | |
| | | | 493,482 | | | | 8.2 | | |
| > Finance | |
| Insurance | | | 159,044 | | | | 2.6 | | |
| Brokerage & Money Management | | | 120,890 | | | | 2.0 | | |
| Banks | | | 109,573 | | | | 1.8 | | |
| Finance Companies | | | 75,767 | | | | 1.3 | | |
| | | | 465,274 | | | | 7.7 | | |
| > Health Care | |
| Medical Equipment & Devices | | | 81,542 | | | | 1.3 | | |
| Biotechnology & Drug Delivery | | | 48,678 | | | | 0.8 | | |
| Pharmaceuticals | | | 47,814 | | | | 0.8 | | |
| Medical Supplies | | | 46,536 | | | | 0.8 | | |
| Health Care Services | | | 27,381 | | | | 0.5 | | |
| | | | 251,951 | | | | 4.2 | | |
| Total Equities: | | | 5,700,496 | | | | 94.6 | | |
| Security Lending Collateral: | | | 111,197 | | | | 1.8 | | |
| Total Investments: | | | 5,811,693 | | | | 96.4 | | |
Obligation to Return
Collateral for Securities
Loaned: | | | (111,197 | ) | | | (1.8 | ) | |
Cash and Other Assets
Less Liabilities: | | | 326,071 | | | | 5.4 | | |
| Net Assets: | | $ | 6,026,567 | | | | 100.0 | | |
See accompanying notes to financial statements.
50
Columbia Acorn USA
Major Portfolio Changes in the Second Quarter (Unaudited)
| | | Number of Shares | |
| | | 3/31/12 | | 6/30/12 | |
| Purchases | |
| Information | |
| SABA | | | 0 | | | | 337,000 | | |
| Industrial Goods & Services | |
| Moog | | | 355,000 | | | | 436,000 | | |
| Polypore International | | | 100,000 | | | | 200,000 | | |
| Consumer Goods & Services | |
| Caesarstone (Israel) | | | 20,000 | | | | 200,000 | | |
| Helen of Troy | | | 106,000 | | | | 262,000 | | |
| Finance | |
| CAI International | | | 330,000 | | | | 376,000 | | |
| First Commonwealth | | | 556,000 | | | | 834,000 | | |
| Health Care | |
| ARIAD Pharmaceuticals | | | 0 | | | | 379,040 | | |
| Cepheid | | | 488,600 | | | | 551,600 | | |
| NPS Pharmaceuticals | | | 1,055,000 | | | | 1,163,600 | | |
| Synageva Biopharma | | | 29,671 | | | | 129,002 | | |
| Other Industries | |
| DuPont Fabros Technology | | | 519,000 | | | | 625,000 | | |
| Energy & Minerals | |
| Approach Resource | | | 100,000 | | | | 244,000 | | |
| Hornbeck Offshore | | | 83,000 | | | | 125,000 | | |
| | | Number of Shares | |
| | | 3/31/12 | | 6/30/12 | |
| Sales | |
| Information | |
| AboveNet | | | 148,000 | | | | 0 | | |
| Ariba | | | 408,000 | | | | 0 | | |
| Blackbaud | | | 300,000 | | | | 67,869 | | |
| Global Payments | | | 170,000 | | | | 153,000 | | |
| Ixia | | | 903,000 | | | | 813,000 | | |
| NetSuite | | | 281,000 | | | | 211,000 | | |
| Nice Systems - ADR (Israel) | | | 177,000 | | | | 160,000 | | |
| ON Semiconductor | | | 1,061,750 | | | | 961,000 | | |
| Polycom | | | 165,000 | | | | 0 | | |
| SBA Communications | | | 560,000 | | | | 529,000 | | |
| Trimble Navigation | | | 168,000 | | | | 151,000 | | |
| Industrial Goods & Services | |
| GrafTech International | | | 686,000 | | | | 616,000 | | |
| Interline Brands | | | 233,400 | | | | 0 | | |
| Kennametal | | | 226,000 | | | | 204,000 | | |
| Pentair | | | 585,000 | | | | 0 | | |
| Waste Connections | | | 176,000 | | | | 90,000 | | |
| Consumer Goods & Services | |
| Hertz | | | 750,000 | | | | 675,000 | | |
| Lifetime Fitness | | | 259,000 | | | | 233,000 | | |
| lululemon athletica | | | 730,000 | | | | 583,000 | | |
| Pinnacle Entertainment | | | 775,000 | | | | 698,000 | | |
| Saks | | | 790,000 | | | | 715,000 | | |
| True Religion Apparel | | | 82,300 | | | | 0 | | |
| Finance | |
| Eaton Vance | | | 340,500 | | | | 306,500 | | |
| Hancock Holding | | | 278,678 | | | | 251,000 | | |
| Valley National Bancorp | | | 675,000 | | | | 641,750 | | |
| Health Care | |
| Akorn | | | 733,000 | | | | 642,000 | | |
| Alexion Pharmaceuticals | | | 251,000 | | | | 83,000 | | |
| Gen-Probe | | | 72,000 | | | | 0 | | |
| Pacific Biosciences of California | | | 385,000 | | | | 0 | | |
| Seattle Genetics | | | 682,000 | | | | 614,000 | | |
| Sirona Dental Systems | | | 224,000 | | | | 202,000 | | |
| Other Industries | |
| Associated Estates Realty | | | 600,000 | | | | 540,000 | | |
| World Fuel Services | | | 256,000 | | | | 230,000 | | |
| Energy & Minerals | |
| FMC Technologies | | | 167,000 | | | | 0 | | |
| Rosetta Resources | | | 143,000 | | | | 129,000 | | |
See accompanying notes to financial statements.
51
Columbia Acorn USA
Statement of Investments (Unaudited), June 30, 2012
| Number of Shares | | | | Value (000) | |
| | | | | | | Equities: 99.6% | |
| Information 30.7% | | | |
| | | > Business Software 9.3% | |
| | 910,000 | | | Informatica (a) | | $ | 38,548 | | |
| | | | | Enterprise Data Integration Software | | | | | |
| | 698,000 | | | Micros Systems (a) | | | 35,738 | | |
| | | | | Information Systems for Hotels,
Restaurants & Retailers | | | | | |
| | 375,000 | | | Ansys (a) | | | 23,666 | | |
| | | | | Simulation Software for Engineers & Designers | | | | | |
| | 243,000 | | | Concur Technologies (a) | | | 16,548 | | |
| | | | | Web Enabled Cost & Expense
Management Software | | | | | |
| | 211,000 | | | NetSuite (a) | | | 11,557 | | |
| | | | | End-to-end IT Systems Solutions Delivered
Over the Web | | | | | |
| | 290,000 | | | SPS Commerce (a) | | | 8,810 | | |
| | | | | Supply Chain Management Software
Delivered via the Web | | | | | |
| | 198,000 | | | Advent Software (a) | | | 5,368 | | |
| | | | | Asset Management & Trading Systems | | | | | |
| | 337,000 | | | SABA (a) | | | 3,127 | | |
| | | | | Learning Management Systems | | | | | |
| | 400,000 | | | Velti (a)(b) | | | 2,600 | | |
| | | | | Mobile Marketing Software Platform | | | | | |
| | 67,869 | | | Blackbaud | | | 1,742 | | |
| | | | | Software & Services for Non-profits | | | | | |
| | | | 147,704 | | |
| | | > Semiconductors & Related
Equipment 3.9% | |
| | 1,958,000 | | | Atmel (a) | | | 13,119 | | |
| | | | | Microcontrollers, Radio Frequency & Memory
Semiconductors | | | | | |
| | 690,000 | | | Microsemi (a) | | | 12,758 | | |
| | | | | Analog/Mixed Signal Semiconductors | | | | | |
| | 426,000 | | | Monolithic Power Systems (a) | | | 8,465 | | |
| | | | | High Performance Analog & Mixed Signal
Integrated Circuits | | | | | |
| | 262,000 | | | Ultratech (a) | | | 8,253 | | |
| | | | | Semiconductor Equipment | | | | | |
| | 961,000 | | | ON Semiconductor (a) | | | 6,823 | | |
| | | | | Mixed Signal & Power
Management Semiconductors | | | | | |
| | 1,075,000 | | | TriQuint Semiconductor (a) | | | 5,912 | | |
| | | | | Radio Frequency Semiconductors | | | | | |
| | 390,000 | | | Pericom Semiconductor (a) | | | 3,510 | | |
| | | | | Interface Integrated Circuits & Frequency Control Products | | | | | |
| | 50,000 | | | Hittite Microwave (a) | | | 2,556 | | |
| | | | | Radio Frequency, Microwave &
Millimeterwave Semiconductors | | | | | |
| | | | 61,396 | | |
| | | > Instrumentation 3.6% | |
| | 180,000 | | | Mettler-Toledo International (a) | | | 28,053 | | |
| | | | | Laboratory Equipment | | | | | |
| | 525,000 | | | IPG Photonics (a) | | | 22,885 | | |
| | | | | Fiber Lasers | | | | | |
| | 151,000 | | | Trimble Navigation (a) | | | 6,947 | | |
| | | | | GPS-based Instruments | | | | | |
| | | | 57,885 | | |
| Number of Shares | | | | Value (000) | |
| | | > Telephone & Data Services 2.7% | |
| | 1,457,000 | | | tw telecom (a) | | $ | 37,387 | | |
| | | | | Fiber Optic Telephone/Data Services | | | | | |
| | 400,000 | | | Boingo Wireless (a)(b) | | | 4,648 | | |
| | | | | Wholesale & Retail WiFi Networks | | | | | |
| | | | 42,035 | | |
| | | > Computer Hardware & Related
Equipment 2.6% | |
| | 1,317,000 | | | II-VI (a) | | | 21,954 | | |
| | | | | Laser Optics & Specialty Materials | | | | | |
| | 292,000 | | | Zebra Technologies (a) | | | 10,033 | | |
| | | | | Bar Code Printers | | | | | |
| | 160,000 | | | Nice Systems - ADR (Israel) (a) | | | 5,856 | | |
| | | | | Audio & Video Recording Solutions | | | | | |
| | 97,000 | | | Netgear (a) | | | 3,348 | | |
| | | | | Networking Products for Small Business & Home | | | | | |
| | | | 41,191 | | |
| | | > Gaming Equipment & Services 2.2% | |
| | 660,000 | | | Bally Technologies (a) | | | 30,796 | | |
| | | | | Slot Machines & Software | | | | | |
| | 235,000 | | | WMS Industries (a) | | | 4,688 | | |
| | | | | Slot Machine Provider | | | | | |
| | | | 35,484 | | |
| | | > Computer Services 2.0% | |
| | 556,000 | | | ExlService Holdings (a) | | | 13,700 | | |
| | | | | Business Process Outsourcing | | | | | |
| | 97,000 | | | Syntel | | | 5,888 | | |
| | | | | Offshore IT Services | | | | | |
| | 776,766 | | | Hackett Group (a) | | | 4,326 | | |
| | | | | IT Integration & Best Practice Research | | | | | |
| | 640,000 | | | RCM Technologies (a)(c) | | | 3,546 | | |
| | | | | Technology & Engineering Services | | | | | |
| | 359,000 | | | WNS - ADR (India) (a) | | | 3,493 | | |
| | | | | Offshore BPO (Business Process
Outsourcing) Services | | | | | |
| | | | 30,953 | | |
| | | > Mobile Communications 1.9% | |
| | 529,000 | | | SBA Communications (a) | | | 30,179 | | |
| | | | | Communications Towers | | | | | |
| | | | 30,179 | | |
| | | > Telecommunications Equipment 1.6% | |
| | 732,000 | | | Finisar (a) | | | 10,951 | | |
| | | | | Optical Subsystems & Components | | | | | |
| | 813,000 | | | Ixia (a) | | | 9,772 | | |
| | | | | Telecom Network Test Equipment | | | | | |
| | 752,000 | | | Infinera (a) | | | 5,144 | | |
| | | | | Optical Networking Equipment | | | | | |
| | | | 25,867 | | |
| | | > Contract Manufacturing 0.4% | |
| | 236,000 | | | Plexus (a) | | | 6,655 | | |
| | | | | Electronic Manufacturing Services | | | | | |
| | | | 6,655 | | |
| | | > Financial Processors 0.4% | |
| | 153,000 | | | Global Payments | | | 6,614 | | |
| | | | | Credit Card Processor | | | | | |
| | | | 6,614 | | |
See accompanying notes to financial statements.
52
| Number of Shares | | | | Value (000) | |
| | | > TV Broadcasting 0.1% | |
| | 875,000 | | | Entravision Communications | | $ | 1,059 | | |
| | | | | Spanish Language TV & Radio Stations | | | | | |
| | | | 1,059 | | |
| Information: Total | | | 487,022 | | |
| Industrial Goods & Services 17.2% | | | |
| | | > Machinery 13.3% | |
| | 876,300 | | | Ametek | | | 43,736 | | |
| | | | | Aerospace/Industrial Instruments | | | | | |
| | 747,200 | | | Nordson | | | 38,324 | | |
| | | | | Dispensing Systems for Adhesives & Coatings | | | | | |
| | 835,000 | | | ESCO Technologies | | | 30,427 | | |
| | | | | Automatic Electric Meter Readers | | | | | |
| | 890,000 | | | Donaldson | | | 29,699 | | |
| | | | | Industrial Air Filtration | | | | | |
| | 631,000 | | | HEICO | | | 20,356 | | |
| | | | | FAA Approved Aircraft Replacement Parts | | | | | |
| | 436,000 | | | Moog (a) | | | 18,029 | | |
| | | | | Motion Control Products for Aerospace,
Defense & Industrial Markets | | | | | |
| | 150,000 | | | Toro | | | 10,993 | | |
| | | | | Turf Maintenance Equipment | | | | | |
| | 200,000 | | | Polypore International (a)(b) | | | 8,078 | | |
| | | | | Battery Separators & Filtration Media | | | | | |
| | 204,000 | | | Kennametal | | | 6,763 | | |
| | | | | Consumable Cutting Tools | | | | | |
| | 146,000 | | | Oshkosh Corporation (a) | | | 3,059 | | |
| | | | | Specialty Truck Manufacturer | | | | | |
| | 26,000 | | | Middleby Corp (a) | | | 2,590 | | |
| | | | | Manufacturer of Cooking Equipment | | | | | |
| | | | 212,054 | | |
| | | > Industrial Materials & Specialty
Chemicals 1.1% | |
| | 496,000 | | | Drew Industries (a) | | | 13,813 | | |
| | | | | RV & Manufactured Home Components | | | | | |
| | 170,000 | | | Albany International | | | 3,181 | | |
| | | | | Paper Machine Clothing & Composites
for Aerospace | | | | | |
| | | | 16,994 | | |
| | | > Electrical Components 0.9% | |
| | 280,000 | | | Acuity Brands | | | 14,255 | | |
| | | | | Commercial Lighting Fixtures | | | | | |
| | | | 14,255 | | |
| | | > Other Industrial Services 0.8% | |
| | 600,000 | | | Acorn Energy (b) | | | 4,992 | | |
| | | | | Frac Well Exploration/Monitoring Device,
Sonar Security, Electric Grid Monitoring | | | | | |
| | 240,000 | | | TrueBlue (a) | | | 3,715 | | |
| | | | | Temporary Manual Labor | | | | | |
| | 109,000 | | | Forward Air | | | 3,518 | | |
| | | | | Freight Transportation Between Airports | | | | | |
| | | | 12,225 | | |
| | | > Waste Management 0.4% | |
| | 65,000 | | | Clean Harbors (a) | | | 3,667 | | |
| | | | | Hazardous Waste Services & Disposal | | | | | |
| Number of Shares | | | | Value (000) | |
| | 90,000 | | | Waste Connections | | $ | 2,693 | | |
| | | | | Solid Waste Management | | | | | |
| | | | 6,360 | | |
| | | > Steel 0.4% | |
| | 616,000 | | | GrafTech International (a) | | | 5,944 | | |
| | | | | Industrial Graphite Materials Producer | | | | | |
| | | | 5,944 | | |
| | | > Construction 0.3% | |
| | 200,000 | | | Fortune Brands Home & Security (a) | | | 4,454 | | |
| | | | | Home Building Supplies & Small Locks | | | | | |
| | | | 4,454 | | |
| Industrial Goods & Services: Total | | | 272,286 | | |
| Consumer Goods & Services 16.2% | | | |
| | | > Retail 5.4% | |
| | 583,000 | | | lululemon athletica (a) | | | 34,764 | | |
| | | | | Premium Active Apparel Retailer | | | | | |
| | 468,500 | | | Abercrombie & Fitch | | | 15,994 | | |
| | | | | Teen Apparel Retailer | | | | | |
| | 805,000 | | | Pier 1 Imports | | | 13,226 | | |
| | | | | Home Furnishing Retailer | | | | | |
| | 356,000 | | | Shutterfly (b) | | | 10,926 | | |
| | | | | Internet Photo-centric Retailer | | | | | |
| | 715,000 | | | Saks (a)(b) | | | 7,615 | | |
| | | | | Luxury Department Store Retailer | | | | | |
| | 161,500 | | | Teavana (a)(b) | | | 2,185 | | |
| | | | | Specialty Tea Retailer | | | | | |
| | 9,000 | | | The Fresh Market (a) | | | 483 | | |
| | | | | Specialty Food Retailer | | | | | |
| | | | 85,193 | | |
| | | > Travel 4.2% | |
| | 849,700 | | | Gaylord Entertainment (a) | | | 32,764 | | |
| | | | | Convention Hotels | | | | | |
| | 1,300,950 | | | Avis Budget Group (a) | | | 19,775 | | |
| | | | | Second Largest Car Rental Company | | | | | |
| | 675,000 | | | Hertz (a) | | | 8,640 | | |
| | | | | Largest U.S. Rental Car Operator | | | | | |
| | 64,000 | | | Vail Resorts | | | 3,205 | | |
| | | | | Ski Resort Operator & Developer | | | | | |
| | 140,000 | | | HomeAway (a)(b) | | | 3,044 | | |
| | | | | Vacation Rental Online Marketplace | | | | | |
| | | | 67,428 | | |
| | | > Furniture & Textiles 1.6% | |
| | 880,000 | | | Knoll | | | 11,810 | | |
| | | | | Office Furniture | | | | | |
| | 621,500 | | | Interface | | | 8,471 | | |
| | | | | Modular & Broadloom Carpet | | | | | |
| | 148,000 | | | Herman Miller | | | 2,741 | | |
| | | | | Office Furniture | | | | | |
| | 200,000 | | | Caesarstone (Israel) (a) | | | 2,422 | | |
| | | | | Quartz Countertops | | | | | |
| | | | 25,444 | | |
| | | > Consumer Goods Distribution 1.2% | |
| | 472,000 | | | Pool | | | 19,097 | | |
| | | | | Distributor of Swimming Pool
Supplies & Equipment | | | | | |
| | | | 19,097 | | |
See accompanying notes to financial statements.
53
Columbia Acorn USA
Statement of Investments (Unaudited), continued
| Number of Shares | | | | Value (000) | |
| | | > Other Durable Goods 1.0% | |
| | 206,000 | | | Cavco Industries (a) | | $ | 10,564 | | |
| | | | | Manufactured Homes | | | | | |
| | 126,000 | | | Jarden | | | 5,294 | | |
| | | | | Branded Household Products | | | | | |
| | | | 15,858 | | |
| | | > Apparel 0.8% | |
| | 222,000 | | | Warnaco Group (a) | | | 9,453 | | |
| | | | | Global Branded Apparel Manufacturer | | | | | |
| | 73,000 | | | Deckers Outdoor (a)(b) | | | 3,212 | | |
| | | | | Fashion Footwear Wholesaler | | | | | |
| | | | 12,665 | | |
| | | > Other Consumer Services 0.7% | |
| | 233,000 | | | Lifetime Fitness (a) | | | 10,837 | | |
| | | | | Sport & Fitness Club Operator | | | | | |
| | | | 10,837 | | |
| | | > Nondurables 0.6% | |
| | 262,000 | | | Helen of Troy (a) | | | 8,879 | | |
| | | | | Personal Care, Housewares, Healthcare &
Home Environment Products | | | | | |
| | | | 8,879 | | |
| | | > Casinos & Gaming 0.4% | |
| | 698,000 | | | Pinnacle Entertainment (a) | | | 6,715 | | |
| | | | | Regional Casino Operator | | | | | |
| | | | 6,715 | | |
| | | > Leisure Products 0.2% | |
| | 230,000 | | | Skullcandy (a)(b) | | | 3,255 | | |
| | | | | Lifestyle Branded Headphones | | | | | |
| | | | 3,255 | | |
| | | > Educational Services 0.1% | |
| | 37,350 | | | ITT Educational Services (a)(b) | | | 2,269 | | |
| | | | | Postsecondary Degree Services | | | | | |
| | | | 2,269 | | |
| | | > Food & Beverage —% | |
| | 4,900 | | | Annie's (a)(b) | | | 205 | | |
| | | | | Developer & Marketer of Natural &
Organic Food | | | | | |
| | | | 205 | | |
| Consumer Goods & Services: Total | | | 257,845 | | |
| Finance 13.4% | | | |
| | | > Banks 7.6% | |
| | 833,000 | | | MB Financial | | | 17,943 | | |
| | | | | Chicago Bank | | | | | |
| | 1,053,000 | | | Associated Banc-Corp | | | 13,889 | | |
| | | | | Midwest Bank | | | | | |
| | 431,597 | | | Lakeland Financial | | | 11,580 | | |
| | | | | Indiana Bank | | | | | |
| | 211,000 | | | City National | | | 10,250 | | |
| | | | | Bank & Asset Manager | | | | | |
| | 170,000 | | | SVB Financial Group (a) | | | 9,982 | | |
| | | | | Bank to Venture Capitalists | | | | | |
| | 251,000 | | | Hancock Holding | | | 7,640 | | |
| | | | | Gulf Coast Bank | | | | | |
| | 1,478,200 | | | First Busey | | | 7,140 | | |
| | | | | Illinois Bank | | | | | |
| Number of Shares | | | | Value (000) | |
| | 641,750 | | | Valley National Bancorp | | $ | 6,803 | | |
| | | | | New Jersey/New York Bank | | | | | |
| | 535,000 | | | TCF Financial | | | 6,142 | | |
| | | | | Great Lakes Bank | | | | | |
| | 834,000 | | | First Commonwealth | | | 5,613 | | |
| | | | | Western Pennsylvania Bank | | | | | |
| | 844,000 | | | TrustCo Bank | | | 4,608 | | |
| | | | | New York State Bank | | | | | |
| | 503,426 | | | Pacific Continental Bank | | | 4,465 | | |
| | | | | Pacific Northwest Bank | | | | | |
| | 269,600 | | | Eagle Bancorp (a) | | | 4,246 | | |
| | | | | Metro D.C. Bank | | | | | |
| | 178,826 | | | Sandy Spring Bancorp | | | 3,219 | | |
| | | | | Baltimore, D.C. Bank | | | | | |
| | 210,000 | | | CVB Financial | | | 2,447 | | |
| | | | | Inland Empire Business Bank | | | | | |
| | 105,700 | | | Hudson Valley | | | 1,913 | | |
| | | | | Metro New York City Bank | | | | | |
| | 851,247 | | | Guaranty Bancorp (a) | | | 1,796 | | |
| | | | | Colorado Bank | | | | | |
| | 90,000 | | | TriCo Bancshares | | | 1,386 | | |
| | | | | California Central Valley Bank | | | | | |
| | | | 121,062 | | |
| | | > Finance Companies 3.8% | |
| | 345,000 | | | World Acceptance (a) | | | 22,701 | | |
| | | | | Personal Loans | | | | | |
| | 310,000 | | | Textainer Group Holdings (b) | | | 11,439 | | |
| | | | | Top International Container Leasor | | | | | |
| | 346,000 | | | McGrath Rentcorp | | | 9,169 | | |
| | | | | Temporary Space & IT Rentals | | | | | |
| | 376,000 | | | CAI International (a) | | | 7,475 | | |
| | | | | International Container Leasing | | | | | |
| | 397,172 | | | H & E Equipment Services (a) | | | 5,970 | | |
| | | | | Heavy Equipment Leasing | | | | | |
| | 100,000 | | | Marlin Business Services | | | 1,639 | | |
| | | | | Small Equipment Leasing | | | | | |
| | 45,500 | | | Regional Management (a) | | | 748 | | |
| | | | | Consumer Loans | | | | | |
| | | | 59,141 | | |
| | | > Savings & Loans 1.0% | |
| | 602,487 | | | ViewPoint Financial | | | 9,423 | | |
| | | | | Texas Thrift | | | | | |
| | 194,000 | | | Berkshire Hills Bancorp | | | 4,268 | | |
| | | | | Northeast Thrift | | | | | |
| | 173,073 | | | Kaiser Federal | | | 2,558 | | |
| | | | | Los Angeles Savings & Loan | | | | | |
| | | | 16,249 | | |
| | | > Brokerage & Money
Management 0.5% | |
| | 306,500 | | | Eaton Vance (b) | | | 8,260 | | |
| | | | | Specialty Mutual Funds | | | | | |
| | | | 8,260 | | |
| | | > Insurance 0.5% | |
| | 55,000 | | | Allied World Holdings | | | 4,371 | | |
| | | | | Commerical Lines Insurance/Reinsurance | | | | | |
See accompanying notes to financial statements.
54
| Number of Shares | | | | Value (000) | |
| | | > Insurance—continued | |
| | 39,000 | | | Enstar Group (a) | | $ | 3,859 | | |
| | | | | Insurance/Reinsurance & Related Services | | | | | |
| | | | 8,230 | | |
| Finance: Total | | | 212,942 | | |
| Health Care 10.3% | | | |
| | | > Biotechnology & Drug Delivery 6.3% | |
| | 520,000 | | | BioMarin Pharmaceutical (a) | | | 20,582 | | |
| | | | | Biotech Focused on Orphan Diseases | | | | | |
| | 614,000 | | | Seattle Genetics (a)(b) | | | 15,589 | | |
| | | | | Antibody-based Therapies for Cancer | | | | | |
| | 421,000 | | | Auxilium Pharmaceuticals (a) | | | 11,321 | | |
| | | | | Biotech Focused on Niche Disease Areas | | | | | |
| | 1,163,600 | | | NPS Pharmaceuticals (a) | | | 10,019 | | |
| | | | | Orphan Drugs & Healthy Royalties | | | | | |
| | 83,000 | | | Alexion Pharmaceuticals (a) | | | 8,242 | | |
| | | | | Biotech Focused on Orphan Diseases | | | | | |
| | 643,000 | | | Isis Pharmaceuticals (a) | | | 7,716 | | |
| | | | | Biotech Pioneer in Antisense Drugs | | | | | |
| | 100,000 | | | Onyx Pharmaceuticals (a) | | | 6,645 | | |
| | | | | Commercial-stage Biotech Focused on Cancer | | | | | |
| | 379,040 | | | ARIAD Pharmaceuticals (a) | | | 6,523 | | |
| | | | | Biotech Focused on Cancer | | | | | |
| | 129,002 | | | Synageva Biopharma (a)(b) | | | 5,232 | | |
| | | | | Biotech Focused on Orphan Diseases | | | | | |
| | 400,000 | | | InterMune (a) | | | 4,780 | | |
| | | | | Drugs for Pulmonary Fibrosis & Hepatitis C | | | | | |
| | 317,506 | | | Raptor Pharmaceutical (a)(b) | | | 1,775 | | |
| | | | | Orphan Drug Company | | | | | |
| | 948,000 | | | Chelsea Therapeutics International (a)(b) | | | 1,403 | | |
| | | | | Biotech Focused on Rare Diseases | | | | | |
| | 530,000 | | | Anthera Pharmaceuticals (a) | | | 358 | | |
| | | | | Biotech Focused on Cardiovascular,
Cancer & Immunology | | | | | |
| | 18,181 | | | Metabolex, Series A-1 (d)(e) | | | 10 | | |
| | | | | Diabetes Drug Development | | | | | |
| | | | 100,195 | | |
| | | > Medical Supplies 1.8% | |
| | 551,600 | | | Cepheid (a) | | | 24,684 | | |
| | | | | Molecular Diagnostics | | | | | |
| | 53,000 | | | Techne | | | 3,933 | | |
| | | | | Cytokines, Antibodies & Other Reagents for
Life Science | | | | | |
| | | | 28,617 | | |
| | | > Medical Equipment & Devices 1.1% | |
| | 202,000 | | | Sirona Dental Systems (a) | | | 9,092 | | |
| | | | | Manufacturer of Dental Equipment | | | | | |
| | 268,000 | | | Hill-Rom Holdings | | | 8,268 | | |
| | | | | Hospital Beds/Patient Handling | | | | | |
| | | | 17,360 | | |
| | | > Pharmaceuticals 0.8% | |
| | 642,000 | | | Akorn (a) | | | 10,124 | | |
| | | | | Develops, Manufactures & Sells Specialty
Generic Drugs | | | | | |
| | 150,000 | | | Horizon Pharma (a)(b) | | | 1,070 | | |
| | | | | Specialty Pharma Company | | | | | |
| Number of Shares | | | | Value (000) | |
| | 133,180 | | | Alimera Sciences (a)(b) | | $ | 398 | | |
| | | | | Ophthalmology-focused Pharmaceutical Company | | | | | |
| | | | 11,592 | | |
| | | > Health Care Services 0.3% | |
| | 664,900 | | | Health Management Associates (a) | | | 5,219 | | |
| | | | | Non-urban Hospitals | | | | | |
| | | | 5,219 | | |
| Health Care: Total | | | 162,983 | | |
| Other Industries 7.3% | | | |
| | | > Real Estate 6.1% | |
| | 915,000 | | | Extra Space Storage | | | 27,999 | | |
| | | | | Self Storage Facilities | | | | | |
| | 625,000 | | | DuPont Fabros Technology | | | 17,850 | | |
| | | | | Technology-focused Office Buildings | | | | | |
| | 561,200 | | | Biomed Realty Trust | | | 10,483 | | |
| | | | | Life Science-focused Office Buildings | | | | | |
| | 783,000 | | | Education Realty Trust | | | 8,676 | | |
| | | | | Student Housing | | | | | |
| | 540,000 | | | Associated Estates Realty | | | 8,073 | | |
| | | | | Multi-family Properties | | | | | |
| | 1,380,000 | | | Kite Realty Group | | | 6,886 | | |
| | | | | Community Shopping Centers | | | | | |
| | 958,000 | | | DCT Industrial Trust | | | 6,035 | | |
| | | | | Industrial Properties | | | | | |
| | 100,000 | | | Post Properties | | | 4,895 | | |
| | | | | Multi-family Properties | | | | | |
| | 77,000 | | | Kilroy Realty | | | 3,728 | | |
| | | | | West Coast Office & Industrial Properties | | | | | |
| | 200,000 | | | St. Joe (a)(b) | | | 3,162 | | |
| | | | | Florida Panhandle Landowner | | | | | |
| | | | 97,787 | | |
| | | > Transportation 1.2% | |
| | 230,000 | | | World Fuel Services | | | 8,747 | | |
| | | | | Global Fuel Broker | | | | | |
| | 515,091 | | | Rush Enterprises, Class A (a) | | | 8,422 | | |
| | 115,000 | | | Rush Enterprises, Class B (a) | | | 1,543 | | |
| | | | | Truck Sales & Service | | | | | |
| | | | 18,712 | | |
| Other Industries: Total | | | 116,499 | | |
| Energy & Minerals 4.5% | | | |
| | | > Oil Services 2.0% | |
| | 725,000 | | | Atwood Oceanics (a) | | | 27,434 | | |
| | | | | Offshore Drilling Contractor | | | | | |
| | 125,000 | | | Hornbeck Offshore (a) | | | 4,847 | | |
| | | | | Supply Vessel Operator in U.S. Gulf of Mexico | | | | | |
| | | | 32,281 | | |
| | | > Oil & Gas Producers 1.8% | |
| | 133,000 | | | SM Energy | | | 6,532 | | |
| | | | | Oil & Gas Producer | | | | | |
| | 244,000 | | | Approach Resource (a) | | | 6,232 | | |
| | | | | Oil & Gas Producer in West Texas Permian | | | | | |
| | 129,000 | | | Rosetta Resources (a) | | | 4,727 | | |
| | | | | Oil & Gas Producer Exploring in
South Texas & Montana | | | | | |
See accompanying notes to financial statements.
55
Columbia Acorn USA
Statement of Investments (Unaudited), continued
| Number of Shares | | | | Value (000) | |
| | | > Oil & Gas Producers—continued | |
| | 170,000 | | | Petroleum Development Corporation (a) | | $ | 4,168 | | |
| | | | | Oil & Gas Producer in U.S. | | | | | |
| | 168,000 | | | Swift Energy (a) | | | 3,126 | | |
| | | | | Oil & Gas Exploration & Production | | | | | |
| | 510,000 | | | Quicksilver Resources (a)(b) | | | 2,764 | | |
| | | | | Natural Gas & Coal Seam Gas Producer | | | | | |
| | 262,200 | | | Houston American Energy (a)(b) | | | 294 | | |
| | | | | Oil & Gas Exploration/Production in Colombia | | | | | |
| | | | 27,843 | | |
| | | > Mining 0.7% | |
| | 77,000 | | | Core Laboratories (Netherlands) | | | 8,924 | | |
| | | | | Oil & Gas Reservoir Consulting | | | | | |
| | 600,000 | | | Alexco Resource (a) | | | 2,646 | | |
| | | | | Mining, Exploration & Environmental Services | | | | | |
| | 180,000 | | | Augusta Resource (a) | | | 299 | | |
| | | | | US Copper/Moly Mine | | | | | |
| | | | 11,869 | | |
| Energy & Minerals: Total | | | 71,993 | | |
Total Equities: 99.6%
(Cost: $1,126,154) | | | 1,581,570 | | |
| Number of Shares | | | | Value (000) | |
| Securities Lending Collateral 3.4% | |
| | 53,351,300 | | | Dreyfus Government Cash
Management Fund
(7 day yield of 0.01%) (f) | | $ | 53,351 | | |
Total Securities Lending Collateral:
(Cost: $53,351) | | | 53,351 | | |
Total Investments: 103.0%
(Cost: $1,179,505)(g)(h) | | | 1,634,921 | | |
Obligation to Return Collateral for
Securities Loaned: (3.4)% | | | (53,351 | ) | |
| Cash and Other Assets Less Liabilities: 0.4% | | | 6,291 | | |
| Total Net Assets: 100.0% | | $ | 1,587,861 | | |
ADR - American Depositary Receipts
> Notes to Statement of Investments (dollar values in thousands)
(a) Non-income producing security.
(b) All or a portion of this security was on loan at June 30, 2012. The total market value of securities on loan at June 30, 2012 was $52,943.
(c) An affiliated person of the Fund may include any company in which the Fund owns five percent or more of its outstanding voting shares. Holdings and transactions in these affiliated companies during the period ended June 30, 2012, are as follows:
| Security | | Balance of
Shares Held
12/31/11 | | Purchases/
Additions | | Sales/
Reductions | | Balance of
Shares Held
6/30/12 | | Value | | Dividend | |
| RCM Technologies | | | 640,000 | | | | - | | | | - | | | | 640,000 | | | $ | 3,546 | | | $ | - | | |
| Total of Affiliated Transactions | | | 640,000 | | | | - | | | | - | | | | 640,000 | | | $ | 3,546 | | | $ | - | | |
The aggregate cost and value of this company at June 30, 2012, were $3,624 and $3,546, respectively. Investments in affiliated companies represented 0.22% of the Fund's total net assets at June 30, 2012.
(d) Denotes a restricted security, which is subject to restrictions on resale under federal securities laws. These securities are valued at fair value determined in good faith under consistently applied procedures established by the Board of Trustees. At June 30, 2012, the market value of these securities amounted to $10, which represented less than 0.01% of total net assets.
Additional information on these securities is as follows:
| Security | | Acquisition
Dates | | Shares | | Cost | | Value | |
| Metabolex, Series A-1 | | 2/11/00 | | | 18,181 | | | $ | 2,000 | | | $ | 10 | | |
| | | | | | | $ | 2,000 | | | $ | 10 | | |
(e) Illiquid security.
(f) Investment made with cash collateral received from securities lending activity.
(g) At June 30, 2012, for federal income tax purposes, the cost of investments was $1,179,505 and net unrealized appreciation was $455,416 consisting of gross unrealized appreciation of $563,241 and gross unrealized depreciation of $107,825.
See accompanying notes to financial statements.
56
> Notes to Statement of Investments (dollar values in thousands)
(h) On June 30, 2012, the market value of foreign securities represented 1.30% of total net assets. The Fund's foreign portfolio was diversified as follows:
| Country | | Value | | Percentage
of Net Assets | |
| Netherlands | | $ | 8,924 | | | | 0.56 | | |
| Israel | | | 8,278 | | | | 0.52 | | |
| India | | | 3,493 | | | | 0.22 | | |
| Total Foreign Portfolio | | $ | 20,695 | | | | 1.30 | | |
Fair Value Measurements
Various inputs are used in determining the value of the Fund's investments, following the input prioritization hierarchy established by GAAP. These inputs are summarized in the three broad levels listed below:
• Level 1 – quoted prices in active markets for identical securities
• Level 2 – prices determined using other significant observable inputs (including quoted prices for similar securities, interest rates, prepayment speeds, credit risk and others)
• Level 3 – prices determined using significant unobservable inputs where quoted prices or observable inputs are unavailable or less reliable (including management's own assumptions about the factors market participants would use in pricing an investment)
The inputs or methodology used for valuing securities are not necessarily an indication of the risk associated with investing in those securities.
Examples of the types of securities in which the Fund would typically invest and how they are classified within this hierarchy are as follows. Typical Level 1 securities include exchange traded domestic equities, mutual funds whose NAVs are published each day and exchange traded foreign equities that are not statistically fair valued. Typical Level 2 securities include exchange traded foreign equities that are statistically fair valued and short-term investments valued at amortized cost. Additionally, securities fair valued by the Valuation Committee (the Committee) of the Fund's Board of Trustees (the Board) that rely on significant observable inputs are also included in Level 2. Typical Level 3 securities include any security fair valued by the Committee that relies on significant unobservable inputs.
Under the direction of the Board, the Committee is responsible for carrying out the valuation procedures approved by the Board.
The Committee meets as necessary, and no less frequently than quarterly, to determine fair values for securities for which market quotations are not readily available or for which the investment manager believes that available market quotations are unreliable, and to review the continuing appropriateness of the current value of any security subject to the Trust's Portfolio Pricing Policy and the pricing procedures of the investment manager (the Policies). The Policies address, among other things: circumstances under which market quotations will be deemed readily available; selection of third party pricing vendors; appropriate pricing methodologies; events that require fair valuation and fair value techniques; and circumstances under which securities will be deemed to pose a potential for stale pricing, including when securities are illiquid, restricted, or in default. The Committee may also meet to discuss additional valuation matters, which may include review of back-testing results, review of time-sensitive information or approval of other valuation related actions, and to review the appropriateness of the Policies.
For investments categorized as Level 3, the significant unobservable inputs used in the fair value measurement of the Funds' securities may include: (i) data specific to the issuer or comparable issuers, (ii) general market or specific sector news and (iii) quoted prices and specific or similar security transactions. The Committee considers this data and any changes from prior periods in order to assess the reasonableness of observable and unobservable inputs, any assumptions or internal models used to value those securities and changes in fair value. Significant changes in any of these factors could result in lower or higher fair value measurements. Various factors impact the frequency of monitoring (which may occur as often as daily), however the Committee may determine that changes to inputs, assumptions and models are not required with the same frequency.
The following table summarizes the inputs used, as of June 30, 2012, in valuing the Fund's assets:
| Investment Type | | Quoted Prices
(Level 1) | | Other
Significant
Observable
Inputs
(Level 2) | | Significant
Unobservable
Inputs
(Level 3) | | Total | |
| Equities | |
| Information | | $ | 487,022 | | | $ | - | | | $ | - | | | $ | 487,022 | | |
| Industrial Goods & Services | | | 272,286 | | | | - | | | | - | | | | 272,286 | | |
| Consumer Goods & Services | | | 257,845 | | | | - | | | | - | | | | 257,845 | | |
| Finance | | | 212,942 | | | | - | | | | - | | | | 212,942 | | |
| Health Care | | | 162,973 | | | | - | | | | 10 | | | | 162,983 | | |
| Other Industries | | | 116,499 | | | | - | | | | - | | | | 116,499 | | |
| Energy & Minerals | | | 71,993 | | | | - | | | | - | | | | 71,993 | | |
| Total Equities | | | 1,581,560 | | | | - | | | | 10 | | | | 1,581,570 | | |
| Total Securities Lending Collateral | | | 53,351 | | | | - | | | | - | | | | 53,351 | | |
| Total Investments | | $ | 1,634,911 | | | $ | - | | | $ | 10 | | | $ | 1,634,921 | | |
See accompanying notes to financial statements.
57
Columbia Acorn USA
Statement of Investments (Unaudited), continued
> Notes to Statement of Investments (dollar values in thousands)
There were no transfers of financial assets between levels 1 and 2 during the period.
The following table reconciles asset balances for the period ending June 30, 2012, in which significant observable and/or unobservable inputs (Level 3) were used in determining value:
Investments
in Securities | | Balance
as of
December 31,
2011 | | Realized
Gain/(Loss) | | Change in
Unrealized
Appreciation
(Depreciation) | | Purchases | | Sales | | Transfers
into
Level 3 | | Transfers
out of
Level 3 | | Balance
as of
June 30,
2012 | |
| Equities | |
| Health Care | | $ | 27 | | | $ | - | | | $ | (17 | ) | | $ | - | | | $ | - | | | $ | - | | | $ | - | | | $ | 10 | | |
| | | $ | 27 | | | $ | - | | | $ | (17 | ) | | $ | - | | | $ | - | | | $ | - | | | $ | - | | | $ | 10 | | |
The information in the above reconciliation table represents fiscal year to date activity for any securities identified as using Level 3 inputs at either the beginning or the end of the current fiscal period.
The change in unrealized depreciation attributed to securities owned at June 30, 2012, which were valued using significant unobservable inputs (Level 3), amounted to $17.
The Fund does not hold any significant investments categorized as Level 3.
Certain common stock classified as Level 3 are valued at fair value, using a market approach, as determined in good faith under consistently applied procedures established by and under the general supervision of the Board. To determine fair value for these securities, for which no market exists, the Committee utilizes the valuation technique it deems most appropriate in the circumstances, using some unobservable inputs, which may include but are not limited to trades of similar securities, estimated earnings of the company, market multiples derived from a set of comparable companies, and the position of the security within the company's capital structure. Significant increases or decreases to any of these inputs could result in a significantly lower or higher fair value measurement. Generally, a change in estimated earnings of a company may result in a change to the comparable companies and market multiples utilized.
See accompanying notes to financial statements.
58
Columbia Acorn International Select
Major Portfolio Changes in the Second Quarter (Unaudited)
| | | Number of Shares | |
| | | 3/31/12 | | 6/30/12 | |
| Purchases | |
| Asia | |
| > Taiwan | |
| CTCI Corp | | | 2,789,400 | | | | 3,508,400 | | |
| Taiwan Mobile | | | 1,179,000 | | | | 3,133,800 | | |
| > Japan | |
| Start Today | | | 0 | | | | 496,000 | | |
| Other Countries | |
| > Australia | |
| Challenger Financial | | | 826,355 | | | | 2,809,800 | | |
Commonwealth Property
Office Fund | | | 3,170,358 | | | | 10,466,968 | | |
| IAG | | | 0 | | | | 1,652,046 | | |
| UGL | | | 0 | | | | 1,000,050 | | |
| > Canada | |
| Goldcorp | | | 0 | | | | 344,400 | | |
| Latin America | |
| > Mexico | |
| Fresnillo | | | 0 | | | | 597,400 | | |
| > Guatemala | |
| Tahoe Resources | | | 0 | | | | 196,800 | | |
| | | Number of Shares | |
| | | 3/31/12 | | 6/30/12 | |
| Sales | |
| Asia | |
| > Japan | |
| Ain Pharmaciez | | | 74,000 | | | | 0 | | |
| Asahi Diamond Industrial | | | 528,000 | | | | 1,000 | | |
| Gree | | | 59,400 | | | | 0 | | |
| Kansai Paint | | | 1,911,000 | | | | 319,000 | | |
| > China | |
| NetEase.com - ADR | | | 84,000 | | | | 1,000 | | |
| > Korea | |
| NHN | | | 49,830 | | | | 32,830 | | |
| Other Countries | |
| > South Africa | |
| Northam Platinum | | | 1,146,000 | | | | 0 | | |
| Rand Merchant Insurance | | | 7,601,015 | | | | 6,483,015 | | |
| > Canada | |
| AG Growth | | | 89,000 | | | | 0 | | |
| Europe | |
| > Germany | |
| Rheinmetall | | | 109,500 | | | | 0 | | |
| Rhoen-Klinikum | | | 175,000 | | | | 0 | | |
| > United Kingdom | |
| Chemring | | | 772,800 | | | | 0 | | |
| Intertek Group | | | 178,000 | | | | 79,000 | | |
| JLT Group | | | 314,000 | | | | 296,400 | | |
| Serco | | | 659,000 | | | | 583,000 | | |
| > Netherlands | |
| Core Laboratories | | | 28,100 | | | | 0 | | |
| Imtech | | | 239,919 | | | | 190,916 | | |
| > Switzerland | |
| Kuehne & Nagel | | | 28,000 | | | | 0 | | |
| > Denmark | |
| Novozymes | | | 145,000 | | | | 125,000 | | |
See accompanying notes to financial statements.
59
Columbia Acorn International Select
Statement of Investments (Unaudited), June 30, 2012
| Number of Shares | | | | Value (000) | |
| | | | | | | Equities: 94.9% | |
| Asia 44.4% | | | |
| | | > Singapore 15.0% | |
| | 13,130,000 | | | Ascendas REIT | | $ | 22,399 | | |
| | | | | Industrial Property Landlord | | | | | |
| | 20,395,000 | | | Mapletree Industrial Trust | | | 19,537 | | |
| | | | | Industrial Property Landlord | | | | | |
| | 11,142,000 | | | Mapletree Logistics Trust | | | 8,664 | | |
| | | | | Industrial Property Landlord | | | | | |
| | | | 50,600 | | |
| | | > Taiwan 12.2% | |
| | 11,103,000 | | | Far EasTone Telecom | | | 24,156 | | |
| | | | | Taiwan's Third Largest Mobile Operator | | | | | |
| | 3,133,800 | | | Taiwan Mobile | | | 10,363 | | |
| | | | | Taiwan's Second Largest Mobile Operator | | | | | |
| | 3,508,400 | | | CTCI Corp | | | 6,569 | | |
| | | | | International Engineering Firm | | | | | |
| | | | 41,088 | | |
| | | > Japan 10.1% | |
| | 5,753,734 | | | Seven Bank | | | 14,776 | | |
| | | | | ATM Processing Services | | | | | |
| | 8,970 | | | Jupiter Telecommunications | | | 9,146 | | |
| | | | | Largest Cable Service Provider in Japan | | | | | |
| | 496,000 | | | Start Today | | | 6,931 | | |
| | | | | Online Japanese Apparel Retailer | | | | | |
| | 319,000 | | | Kansai Paint | | | 3,418 | | |
| | | | | Paint Producer in Japan, India, China &
Southeast Asia | | | | | |
| | 1,000 | | | Asahi Diamond Industrial | | | 11 | | |
| | | | | Consumable Diamond Tools | | | | | |
| | | | 34,282 | | |
| | | > China 2.7% | |
| | 4,146,000 | | | Zhaojin Mining Industry | | | 5,452 | | |
| | | | | Gold Mining & Refining in China | | | | �� | |
| | 3,044,000 | | | Want Want | | | 3,764 | | |
| | | | | Chinese Branded Consumer Food Company | | | | | |
| | 1,000 | | | NetEase.com - ADR (a) | | | 59 | | |
| | | | | Chinese Online Gaming Services | | | | | |
| | | | 9,275 | | |
| | | > Indonesia 2.3% | |
| | 9,272,000 | | | Archipelago Resources (a) | | | 7,406 | | |
| | | | | Gold Mining Projects in Indonesia, Vietnam &
the Philippines | | | | | |
| | 1,404,000 | | | MNC Skyvision (a) | | | 235 | | |
| | | | | Largest Satellite Pay TV Operator in Indonesia | | | | | |
| | | | 7,641 | | |
| | | > Korea 2.1% | |
| | 32,830 | | | NHN | | | 7,201 | | |
| | | | | Korean Online Search Services | | | | | |
| | | | 7,201 | | |
| Asia: Total | | | 150,087 | | |
| Other Countries 28.6% | | | |
| | | > Australia 11.6% | |
| | 1,000,050 | | | UGL | | | 12,805 | | |
| | | | | Engineering & Facilities Management | | | | | |
| Number of Shares | | | | Value (000) | |
| | 10,466,968 | | | Commonwealth Property Office Fund | | $ | 10,911 | | |
| | | | | Australia Prime Office REIT | | | | | |
| | 2,809,800 | | | Challenger Financial | | | 9,437 | | |
| | | | | Largest Annuity Provider | | | | | |
| | 1,652,046 | | | IAG | | | 5,925 | | |
| | | | | General Insurance Provider | | | | | |
| | | | 39,078 | | |
| | | > South Africa 8.7% | |
| | 6,483,015 | | | Rand Merchant Insurance | | | 13,808 | | |
| | | | | Directly Sold Property & Casualty Insurance;
Holdings in Other Insurers | | | | | |
| | 1,317,200 | | | Adcock Ingram Holdings | | | 9,682 | | |
| | | | | Manufacturer of Pharmaceuticals &
Medical Supplies | | | | | |
| | 112,700 | | | Naspers | | | 6,020 | | |
| | | | | Media in Africa, China, Russia & Other
Emerging Markets | | | | | |
| | | | 29,510 | | |
| | | > Canada 5.0% | |
| | 344,400 | | | Goldcorp | | | 12,943 | | |
| | | | | Gold Mining | | | | | |
| | 106,400 | | | CCL Industries | | | 3,903 | | |
| | | | | Leading Global Label Manufacturer | | | | | |
| | | | 16,846 | | |
| | | > United States 1.8% | |
| | 94,000 | | | Atwood Oceanics (a) | | | 3,557 | | |
| | | | | Offshore Drilling Contractor | | | | | |
| | 52,000 | | | SM Energy | | | 2,554 | | |
| | | | | Oil & Gas Producer | | | | | |
| | | | 6,111 | | |
| | | > Israel 1.5% | |
| | 460,000 | | | Israel Chemicals | | | 5,090 | | |
| | | | | Producer of Potash, Phosphates, Bromine &
Specialty Chemicals | | | | | |
| | | | 5,090 | | |
| Other Countries: Total | | | 96,635 | | |
| Europe 16.4% | | | |
| | | > Germany 3.6% | |
| | 630,000 | | | Wirecard | | | 12,216 | | |
| | | | | Online Payment Processing &
Risk Management | | | | | |
| | | | 12,216 | | |
| | | > United Kingdom 3.4% | |
| | 583,000 | | | Serco | | | 4,896 | | |
| | | | | Facilities Management | | | | | |
| | 79,000 | | | Intertek Group | | | 3,310 | | |
| | | | | Testing, Inspection, Certification Services | | | | | |
| | 296,400 | | | JLT Group | | | 3,256 | | |
| | | | | International Business Insurance Broker | | | | | |
| | | | 11,462 | | |
| | | > Sweden 3.0% | |
| | 595,666 | | | Hexagon | | | 10,225 | | |
| | | | | Design, Measurement & Visualization
Software & Equipment | | | | | |
| | | | 10,225 | | |
See accompanying notes to financial statements.
60
| Number of Shares | | | | Value (000) | |
| | | > Iceland 1.7% | |
| | 4,800,000 | | | Marel | | $ | 5,838 | | |
| | | | | Largest Manufacturer of Poultry & Fish
Processing Equipment | | | | | |
| | | | 5,838 | | |
| | | > Netherlands 1.4% | |
| | 190,916 | | | Imtech | | | 4,559 | | |
| | | | | Electromechanical & Information & Communications
Technology Installation & Maintenance | | | | | |
| | | | 4,559 | | |
| | | > Switzerland 1.3% | |
| | 24,000 | | | Partners Group | | | 4,268 | | |
| | | | | Private Markets Asset Management | | | | | |
| | | | 4,268 | | |
| | | > Belgium 1.0% | |
| | 74,000 | | | EVS Broadcast Equipment | | | 3,491 | | |
| | | | | Digital Live Mobile Production
Software & Systems | | | | | |
| | | | 3,491 | | |
| | | > Denmark 1.0% | |
| | 125,000 | | | Novozymes | | | 3,241 | | |
| | | | | Industrial Enzymes | | | | | |
| | | | 3,241 | | |
| Europe: Total | | | 55,300 | | |
| Latin America 5.5% | | | |
| | | > Mexico 4.0% | |
| | 597,400 | | | Fresnillo | | | 13,684 | | |
| | | | | Silver & Metal Byproduct Mining in Mexico | | | | | |
| | | | 13,684 | | |
| Number of Shares | | | | Value (000) | |
| | | > Guatemala 0.8% | |
| | 196,800 | | | Tahoe Resources (a) | | $ | 2,720 | | |
| | | | | Silver Project in Guatemala | | | | | |
| | | | 2,720 | | |
| | | > Uruguay 0.5% | |
| | 191,666 | | | Union Agriculture Group (a)(b)(c) | | | 1,876 | | |
| | | | | Farmland Operator in Uruguay | | | | | |
| | | | 1,876 | | |
| | | > Colombia 0.2% | |
| | 1,880,000 | | | Santa Maria Petroleum (a)(b) | | | 567 | | |
| | | | | Explores for Oil & Gas in Latin America | | | | | |
| | | | 567 | | |
| Latin America: Total | | | 18,847 | | |
Total Equities: 94.9%
(Cost: $273,433) | | | 320,869 | | |
Total Investments: 94.9%
(Cost: $273,433)(d)(e) | | | 320,869 | | |
| Cash and Other Assets Less Liabilities: 5.1% | | | 17,265 | | |
| Total Net Assets: 100.0% | | $ | 338,134 | | |
ADR - American Depositary Receipts
REIT - Real Estate Investment Trust
> Notes to Statement of Investments (dollar values in thousands)
(a) Non-income producing security.
(b) Denotes a restricted security, which is subject to restrictions on resale under federal securities laws. These securities are valued at fair value determined in good faith under consistently applied procedures established by the Board of Trustees. At June 30, 2012, the market value of these securities amounted to $2,443, which represented 0.72% of total net assets.
Additional information on these securities is as follows:
| Security | | Acquisition
Dates | | Shares | | Cost | | Value | |
| Union Agriculture Group | | 12/8/10-6/27/12 | | | 191,666 | | | $ | 2,200 | | | $ | 1,876 | | |
| Santa Maria Petroleum | | 1/14/11 | | | 1,880,000 | | | | 2,376 | | | | 567 | | |
| | | | | | | $ | 4,576 | | | $ | 2,443 | | |
(c) Illiquid security.
(d) At June 30, 2012, for federal income tax purposes, the cost of investments was $273,433 and net unrealized appreciation was $47,436 consisting of gross unrealized appreciation of $56,811 and gross unrealized depreciation of $9,375.
See accompanying notes to financial statements.
61
Columbia Acorn International Select
Statement of Investments (Unaudited), continued
> Notes to Statement of Investments (dollar values in thousands)
(e) On June 30, 2012, the Fund's total investments were denominated in currencies as follows:
| Currency | | Value | | Percentage
of Net Assets | |
| Singapore Dollar | | $ | 50,600 | | | | 15.0 | | |
| Taiwan Dollar | | | 41,089 | | | | 12.2 | | |
| Austrailian Dollar | | | 39,078 | | | | 11.6 | | |
| Japanese Yen | | | 34,282 | | | | 10.1 | | |
| British Pound | | | 32,552 | | | | 9.6 | | |
| South African Rand | | | 29,510 | | | | 8.7 | | |
| United States Dollar | | | 20,988 | | | | 6.2 | | |
| Euro | | | 20,266 | | | | 6.0 | | |
Other currencies less
than 5% of total net assets | | | 52,504 | | | | 15.5 | | |
| Total Portfolio | | $ | 320,869 | | | | 94.9 | | |
At June 30, 2012, the Fund had entered into the following forward foreign currency exchange contracts:
Forward Foreign Currency
Exchange Contracts to Buy | |
Forward Foreign Currency
Exchange Contracts to Sell | |
Principal Amount in
Foreign Currency | |
Principal
Amount in U.S. Dollar | |
Settlement Date | | Unrealized
Appreciation/
(Depreciation) | |
| USD | | | | ZAR | | | | | 236,888 | | | $ | 28,000 | | | 7/13/12 | | $ | (932 | ) | |
The counterparty for all forward foreign currency exchange contracts is State Street Bank and Trust Company.
USD = United States Dollar
ZAR = South African Rand
Fair Value Measurements
Various inputs are used in determining the value of the Fund's investments, following the input prioritization hierarchy established by GAAP. These inputs are summarized in the three broad levels listed below:
• Level 1 – quoted prices in active markets for identical securities
• Level 2 – prices determined using other significant observable inputs (including quoted prices for similar securities, interest rates, prepayment speeds, credit risk and others)
• Level 3 – prices determined using significant unobservable inputs where quoted prices or observable inputs are unavailable or less reliable (including management's own assumptions about the factors market participants would use in pricing an investment)
The inputs or methodology used for valuing securities are not necessarily an indication of the risk associated with investing in those securities.
Examples of the types of securities in which the Fund would typically invest and how they are classified within this hierarchy are as follows. Typical Level 1 securities include exchange traded domestic equities, mutual funds whose NAVs are published each day and exchange traded foreign equities that are not statistically fair valued. Typical Level 2 securities include exchange traded foreign equities that are statistically fair valued, forward foreign currency exchange contracts and short-term investments valued at amortized cost. Additionally, securities fair valued by the Valuation Committee (the Committee) of the Fund's Board of Trustees (the Board) that rely on significant observable inputs are also included in Level 2. Typical Level 3 securities include any security fair valued by the Committee that relies on significant unobservable inputs.
Under the direction of the Board, the Committee is responsible for carrying out the valuation procedures approved by the Board.
The Committee meets as necessary, and no less frequently than quarterly, to determine fair values for securities for which market quotations are not readily available or for which the investment manager believes that available market quotations are unreliable, and to review the continuing appropriateness of the current value of any security subject to the Trust's Portfolio Pricing Policy and the pricing procedures of the investment manager (the Policies). The Policies address, among other things: circumstances under which market quotations will be deemed readily available; selection of third party pricing vendors; appropriate pricing methodologies; events that require fair valuation and fair value techniques; and circumstances under which securities will be deemed to pose a potential for stale pricing, including when securities are illiquid, restricted, or in default. The Committee may also meet to discuss additional valuation matters, which may include review of back-testing results, review of time-sensitive information or approval of other valuation related actions, and to review the appropriateness of the Policies.
For investments categorized as Level 3, the significant unobservable inputs used in the fair value measurement of the Funds' securities may include: (i) data specific to the issuer or comparable issuers, (ii) general market or specific sector news and (iii) quoted prices and specific or similar security transactions. The Committee considers this data and any changes from prior periods in order to assess the reasonableness of observable and unobservable inputs, any assumptions or internal models used to value those securities and changes in fair value. Significant changes in any of these factors could result in lower or higher fair value measurements. Various factors impact the frequency of monitoring (which may occur as often as daily), however the Committee may determine that changes to inputs, assumptions and models are not required with the same frequency.
See accompanying notes to financial statements.
62
> Notes to Statement of Investments (dollar values in thousands)
The following table summarizes the inputs used, as of June 30, 2012, in valuing the Fund's assets:
| Investment Type | | Quoted Prices
(Level 1) | | Other
Significant
Observable
Inputs
(Level 2) | | Significant
Unobservable
Inputs
(Level 3) | | Total | |
| Equities | |
| Asia | | $ | 59 | | | $ | 150,028 | | | $ | - | | | $ | 150,087 | | |
| Other Countries | | | 22,957 | | | | 73,678 | | | | - | | | | 96,635 | | |
| Europe | | | - | | | | 55,300 | | | | - | | | | 55,300 | | |
| Latin America | | | 2,720 | | | | 14,251 | | | | 1,876 | | | | 18,847 | | |
| Total Equities | | | 25,736 | | | | 293,257 | | | | 1,876 | | | | 320,869 | | |
| Total Investments | | $ | 25,736 | | | $ | 293,257 | | | $ | 1,876 | | | $ | 320,869 | | |
Unrealized Depreciation on Forward Foreign
Currency Exchange Contracts | | | - | | | | (932 | ) | | | - | | | | (932 | ) | |
| Total Investments | | $ | 25,736 | | | $ | 292,325 | | | $ | 1,876 | | | $ | 319,937 | | |
The Fund's assets assigned to the Level 2 input category are generally valued using a market approach, in which a security's value is determined through its correlation to prices and information from observable market transactions for similar or identical assets. Foreign equities are generally valued at the last sale price on the foreign exchange or market on which they trade. The Fund may use a statistical fair valuation model, in accordance with the policy adopted by the Board, provided by an independent third party to value securities principally traded in foreign markets in order to adjust for possible stale pricing that may occur between the close of the foreign exchanges and the time for valuation. These models take into account available market data including intraday index, ADR, and ETF movements. Forward foreign currency exchange contracts are valued at the prevailing forward exchange rate of the underlying currencies. Securities acquired via private placement that have a holding period or an extended settlement period are valued at a discount to the same shares that are trading freely on the market. These discounts are determined by the Investment manager's experience with similar securities or situations. Factors may include, but are not limited to, trade volume, shares outstanding and stock price.
There were no transfers of financial assets between levels 1 and 2 during the period.
The following table reconciles asset balances for the period ending June 30, 2012, in which significant observable and/or unobservable inputs (Level 3) were used in determining value:
Investments
in Securities | | Balance
as of
December 31,
2011 | | Realized
Gain/(Loss) | | Change in
Unrealized
Appreciation
(Depreciation) | | Purchases | | Sales | | Transfers
into
Level 3 | | Transfers
out of
Level 3 | | Balance
as of
June 30,
2012 | |
| Equities | |
| Latin America | | $ | 1,828 | | | $ | - | | | $ | 48 | | | $ | - | | | $ | - | | | $ | - | | | $ | - | | | $ | 1,876 | | |
| | | $ | 1,828 | | | $ | - | | | $ | 48 | | | $ | - | | | $ | - | | | $ | - | | | $ | - | | | $ | 1,876 | | |
The information in the above reconciliation table represents fiscal year to date activity for any securities identified as using Level 3 inputs at either the beginning or the end of the current fiscal period.
The change in unrealized appreciation attributed to securities owned at June 30, 2012, which were valued using significant unobservable inputs (Level 3), amounted to $48.
The Fund does not hold any significant investments categorized as Level 3.
Certain common stock classified as Level 3 are valued at fair value, using a market approach, as determined in good faith under consistently applied procedures established by and under the general supervision of the Board. To determine fair value for these securities, for which no market exists, the Committee utilizes the valuation technique it deems most appropriate in the circumstances, using some unobservable inputs, which may include but are not limited to trades of similar securities, estimated earnings of the company, market multiples derived from a set of comparable companies, and the position of the security within the company's capital structure. Significant increases or decreases to any of these inputs could result in a significantly lower or higher fair value measurement. Generally, a change in estimated earnings of a company may result in a change to the comparable companies and market multiples utilized.
See accompanying notes to financial statements.
63
Columbia Acorn International Select
Portfolio Diversification (Unaudited)
At June 30, 2012, the Fund's portfolio investments as a percentage of net assets were diversified as follows:
| | | Value (000) | | Percentage
of Net Assets | |
| > Information | |
| Mobile Communications | | $ | 34,520 | | | | 10.2 | | |
| Internet Related | | | 13,279 | | | | 4.0 | | |
| Financial Processors | | | 12,216 | | | | 3.6 | | |
| Business Software | | | 10,224 | | | | 3.0 | | |
| CATV | | | 9,146 | | | | 2.7 | | |
Computer Hardware & Related
Equipment | | | 3,491 | | | | 1.0 | | |
| Satellite Broadcasting & Services | | | 235 | | | | 0.1 | | |
| | | | 83,111 | | | | 24.6 | | |
| > Other Industries | |
| Real Estate | | | 61,511 | | | | 18.2 | | |
| > Finance | |
| Insurance | | | 32,427 | | | | 9.6 | | |
| Banks | | | 14,776 | | | | 4.4 | | |
| Brokerage & Money Management | | | 4,268 | | | | 1.2 | | |
| | | | 51,471 | | | | 15.2 | | |
| > Energy & Minerals | |
| Mining | | | 42,204 | | | | 12.5 | | |
| Oil Services | | | 3,557 | | | | 1.0 | | |
| Oil & Gas Producers | | | 3,121 | | | | 0.9 | | |
| Agricultural Commodities | | | 1,876 | | | | 0.6 | | |
| | | | 50,758 | | | | 15.0 | | |
| > Industrial Goods & Services | |
| Other Industrial Services | | | 20,674 | | | | 6.1 | | |
Industrial Materials & Specialty
Chemicals | | | 11,749 | | | | 3.5 | | |
| Construction | | | 6,569 | | | | 1.9 | | |
| Machinery | | | 5,849 | | | | 1.7 | | |
| Outsourcing Services | | | 4,896 | | | | 1.5 | | |
| | | | 49,737 | | | | 14.7 | | |
| | | Value (000) | | Percentage
of Net Assets | |
| > Consumer Goods & Services | |
| Retail | | $ | 6,931 | | | | 2.0 | | |
| Nondurables | | | 3,904 | | | | 1.2 | | |
| Food & Beverage | | | 3,764 | | | | 1.1 | | |
| | | | 14,599 | | | | 4.3 | | |
| > Health Care | |
| Pharmaceuticals | | | 9,682 | | | | 2.9 | | |
| Total Equities: | | | 320,869 | | | | 94.9 | | |
| Total Investments: | | | 320,869 | | | | 94.9 | | |
Cash and Other Assets
Less Liabilities: | | | 17,265 | | | | 5.1 | | |
| Net Assets: | | $ | 338,134 | | | | 100.0 | | |
See accompanying notes to financial statements.
64
Columbia Acorn Select
Major Portfolio Changes in the Second Quarter (Unaudited)
| | | Number of Shares | |
| | | 3/31/12 | | 6/30/12 | |
| Purchases | |
| Industrial Goods & Services | |
| Nordson | | | 160,000 | | | | 220,000 | | |
| Information | |
| Globalstar | | | 15,000,000 | | | | 16,721,800 | | |
| Consumer Goods & Services | |
| Vail Resorts | | | 0 | | | | 235,000 | | |
| Energy & Minerals | |
| Canadian Solar (China) | | | 2,700,000 | | | | 3,301,200 | | |
| Houston American Energy | | | 826,400 | | | | 1,455,000 | | |
Tuscany International Drilling
(Colombia) | | | 12,700,000 | | | | 13,613,200 | | |
| | | Number of Shares | |
| | | 3/31/12 | | 6/30/12 | |
| Sales | |
| Industrial Goods & Services | |
| Ametek | | | 1,490,000 | | | | 1,358,000 | | |
| Donaldson | | | 1,260,000 | | | | 1,140,000 | | |
Expeditors International of
Washington | | | 600,000 | | | | 475,000 | | |
| Kennametal | | | 975,000 | | | | 865,000 | | |
| Pall | | | 690,000 | | | | 625,000 | | |
| Quanta Services | | | 1,420,000 | | | | 1,000,000 | | |
| Information | |
| Amphenol | | | 645,000 | | | | 560,000 | | |
| Atmel | | | 1,175,000 | | | | 1,140,000 | | |
| Sanmina-SCI | | | 4,375,000 | | | | 3,026,600 | | |
| SBA Communications | | | 1,010,000 | | | | 735,000 | | |
| VisionChina Media - ADR (China) | | | 6,108,437 | | | | 5,427,200 | | |
| WNS - ADR (India) | | | 3,940,000 | | | | 3,405,000 | | |
| Consumer Goods & Services | |
| Abercrombie & Fitch | | | 555,000 | | | | 455,000 | | |
| Coach | | | 615,000 | | | | 555,000 | | |
| Gaylord Entertainment | | | 1,020,000 | | | | 930,000 | | |
| Hertz | | | 5,225,000 | | | | 4,495,000 | | |
IFM Investments (Century 21
China RE) - ADR (China) | | | 1,143,333 | | | | 998,000 | | |
| ITT Educational Services | | | 270,000 | | | | 223,000 | | |
| lululemon athletica | | | 390,000 | | | | 305,000 | | |
| RexLot Holdings (China) | | | 260,000,000 | | | | 208,000,000 | | |
| Safeway | | | 1,100,000 | | | | 0 | | |
| Tiffany & Co. | | | 200,000 | | | | 184,000 | | |
| Finance | |
| City National | | | 630,000 | | | | 540,000 | | |
| CNO Financial Group | | | 8,325,000 | | | | 7,140,000 | | |
| Discover Financial Services | | | 2,115,000 | | | | 1,935,000 | | |
| Regional Management | | | 84,500 | | | | 0 | | |
| SEI Investments | | | 965,000 | | | | 775,000 | | |
| Energy & Minerals | |
| Canacol (Colombia) | | | 30,872,300 | | | | 29,187,400 | | |
| Eacom Timber (Canada) | | | 33,572,000 | | | | 8,440,000 | | |
| Kirkland Lake Gold (Canada) | | | 870,000 | | | | 835,000 | | |
Pacific Rubiales Energy
(Colombia) | | | 1,480,000 | | | | 1,170,000 | | |
| Petrodorado (Colombia) | | | 34,700,000 | | | | 33,700,000 | | |
| Shamaran Petroleum (Iraq) | | | 36,500,000 | | | | 30,473,500 | | |
| Health Care | |
| Akorn | | | 1,400,000 | | | | 1,310,000 | | |
| NPS Pharmaceuticals | | | 2,510,000 | | | | 2,340,000 | | |
| Seattle Genetics | | | 395,000 | | | | 383,000 | | |
| Other Industries | |
| Biomed Realty Trust | | | 1,660,000 | | | | 1,435,000 | | |
See accompanying notes to financial statements.
65
Columbia Acorn Select
Statement of Investments (Unaudited), June 30, 2012
| Number of Shares | | | | Value (000) | |
| | | | | | | Equities: 98.0% | |
| Industrial Goods & Services 21.7% | | | |
| | | > Machinery 16.4% | |
| | 1,358,000 | | | Ametek | | $ | 67,778 | | |
| | | | | Aerospace/Industrial Instruments | | | | | |
| | 1,140,000 | | | Donaldson | | | 38,042 | | |
| | | | | Industrial Air Filtration | | | | | |
| | 625,000 | | | Pall | | | 34,256 | | |
| | | | | Filtration & Fluids Clarification | | | | | |
| | 865,000 | | | Kennametal | | | 28,675 | | |
| | | | | Consumable Cutting Tools | | | | | |
| | 220,000 | | | Nordson | | | 11,284 | | |
| | | | | Dispensing Systems for Adhesives & Coatings | | | | | |
| | | | 180,035 | | |
| | | > Outsourcing Services 2.2% | |
| | 1,000,000 | | | Quanta Services (a) | | | 24,070 | | |
| | | | | Electrical & Telecom Construction Services | | | | | |
| | | | 24,070 | | |
| | | > Other Industrial Services 1.7% | |
| | 475,000 | | | Expeditors International of Washington | | | 18,406 | | |
| | | | | International Freight Forwarder | | | | | |
| | | | 18,406 | | |
| | | > Industrial Materials & Specialty
Chemicals 1.4% | |
| | 300,000 | | | FMC Corporation | | | 16,044 | | |
| | | | | Niche Specialty Chemicals | | | | | |
| | | | 16,044 | | |
| Industrial Goods & Services: Total | | | 238,555 | | |
| Information 20.1% | | | |
| | | > Mobile Communications 8.0% | |
| | 735,000 | | | SBA Communications (a) | | | 41,932 | | |
| | | | | Communications Towers | | | | | |
| | 700,000 | | | Crown Castle International (a) | | | 41,062 | | |
| | | | | Communications Towers | | | | | |
| | 16,721,800 | | | Globalstar (a)(b)(c) | | | 5,351 | | |
| | | | | Satellite Mobile Voice & Data Carrier | | | | | |
| | | | 88,345 | | |
| | | > Computer Services 3.0% | |
| | 3,405,000 | | | WNS - ADR (India) (a)(b) | | | 33,131 | | |
| | | | | Offshore BPO (Business Process Outsourcing) Services | | | | | |
| | | | 33,131 | | |
| | | > Computer Hardware &
Related Equipment 2.8% | |
| | 560,000 | | | Amphenol | | | 30,755 | | |
| | | | | Electronic Connectors | | | | | |
| | | | 30,755 | | |
| | | > Contract Manufacturing 2.3% | |
| | 3,026,600 | | | Sanmina-SCI (a) | | | 24,788 | | |
| | | | | Electronic Manufacturing Services | | | | | |
| | | | 24,788 | | |
| | | > Instrumentation 1.8% | |
| | 126,000 | | | Mettler-Toledo International (a) | | | 19,637 | | |
| | | | | Laboratory Equipment | | | | | |
| | | | 19,637 | | |
| Number of Shares | | | | Value (000) | |
| | | > Business Software 1.0% | |
| | 167,000 | | | Concur Technologies (a) | | $ | 11,373 | | |
| | | | | Web Enabled Cost & Expense Management
Software | | | | | |
| | | | 11,373 | | |
| | | > Semiconductors & Related
Equipment 0.7% | |
| | 1,140,000 | | | Atmel (a) | | | 7,638 | | |
| | | | | Microcontrollers, Radio Frequency & Memory
Semiconductors | | | | | |
| | | | 7,638 | | |
| | | > Advertising 0.5% | |
| | 5,427,200 | | | VisionChina Media - ADR
(China) (a)(b)(c) | | | 5,047 | | |
| | | | | Advertising on Digital Screens in China's Mass
Transit System | | | | | |
| | | | 5,047 | | |
| Information: Total | | | 220,714 | | |
| Consumer Goods & Services 19.2% | | | |
| | | > Travel 9.6% | |
| | 4,495,000 | | | Hertz (a) | | | 57,536 | | |
| | | | | Largest U.S. Rental Car Operator | | | | | |
| | 930,000 | | | Gaylord Entertainment (a) | | | 35,861 | | |
| | | | | Convention Hotels | | | | | |
| | 235,000 | | | Vail Resorts | | | 11,769 | | |
| | | | | Ski Resort Operator & Developer | | | | | |
| | | | 105,166 | | |
| | | > Retail 3.9% | |
| | 305,000 | | | lululemon athletica (a) | | | 18,187 | | |
| | | | | Premium Active Apparel Retailer | | | | | |
| | 455,000 | | | Abercrombie & Fitch | | | 15,534 | | |
| | | | | Teen Apparel Retailer | | | | | |
| | 184,000 | | | Tiffany & Co. | | | 9,743 | | |
| | | | | Luxury Good Retailer | | | | | |
| | | | 43,464 | | |
| | | > Apparel 2.9% | |
| | 555,000 | | | Coach | | | 32,456 | | |
| | | | | Designer & Retailer of Branded Leather Accessories | | | | | |
| | | | 32,456 | | |
| | | > Casinos & Gaming 1.4% | |
| | 208,000,000 | | | RexLot Holdings (China) | | | 14,900 | | |
| | | | | Lottery Equipment Supplier in China | | | | | |
| | | | 14,900 | | |
| | | > Educational Services 1.2% | |
| | 223,000 | | | ITT Educational Services (a)(c) | | | 13,547 | | |
| | | | | Postsecondary Degree Services | | | | | |
| | | | 13,547 | | |
| | | > Other Consumer Services 0.1% | |
| | 998,000 | | | IFM Investments (Century 21
China RE) - ADR (China) (a)(b) | | | 1,088 | | |
| | | | | Provide Real Estate Services in China | | | | | |
| | | | 1,088 | | |
See accompanying notes to financial statements.
66
| Number of Shares | | | | Value (000) | |
| | | > Food & Beverage 0.1% | |
| | 1,500,000 | | | GLG Life Tech (Canada) (a)(c)(d) | | $ | 621 | | |
| | | | | All-natural Sweetener Extracted from the
Stevia Plant | | | | | |
| | | | 621 | | |
| Consumer Goods & Services: Total | | | 211,242 | | |
| Finance 16.2% | | | |
| | | > Credit Cards 6.1% | |
| | 1,935,000 | | | Discover Financial Services | | | 66,912 | | |
| | | | | Credit Card Company | | | | | |
| | | | 66,912 | | |
| | | > Insurance 5.0% | |
| | 7,140,000 | | | CNO Financial Group | | | 55,692 | | |
| | | | | Life, Long-term Care & Medical Supplement
Insurance | | | | | |
| | | | 55,692 | | |
| | | > Banks 3.7% | |
| | 540,000 | | | City National | | | 26,233 | | |
| | | | | Bank & Asset Manager | | | | | |
| | 1,075,000 | | | Associated Banc-Corp | | | 14,179 | | |
| | | | | Midwest Bank | | | | | |
| | | | 40,412 | | |
| | | > Brokerage & Money Management 1.4% | |
| | 775,000 | | | SEI Investments | | | 15,415 | | |
| | | | | Mutual Fund Administration & Investment
Management | | | | | |
| | | | 15,415 | | |
| Finance: Total | | | 178,431 | | |
| Energy & Minerals 9.7% | | | |
| | | > Oil & Gas Producers 5.3% | |
| | 1,170,000 | | | Pacific Rubiales Energy (Colombia) | | | 24,777 | | |
| | | | | Oil Production & Exploration in Colombia | | | | | |
| | 29,187,400 | | | Canacol (Colombia) (a) | | | 13,044 | | |
| | | | | Oil Producer in South America | | | | | |
| | 33,700,000 | | | Petrodorado (Colombia) (a)(b) | | | 5,296 | | |
| | 17,144,000 | | | Petrodorado - Warrants (Colombia) (a)(e) | | | 243 | | |
| | | | | Oil & Gas Exploration & Production in
Colombia, Peru & Paraguay | | | | | |
| | 30,473,500 | | | Shamaran Petroleum (Iraq) (a) | | | 5,088 | | |
| | | | | Oil Exploration in Kurdistan | | | | | |
| | 24,000,000 | | | Canadian Overseas Petroleum
(United Kingdom) (a)(b)(e) | | | 4,187 | | |
| | 12,000,000 | | | Canadian Overseas Petroleum - Warrants (United Kingdom) (a)(d)(e) | | | 232 | | |
| | | | | Oil & Gas Exploration/Production in the
North Sea | | | | | |
| | 17,575,000 | | | Petromanas (Canada) (a) | | | 3,711 | | |
| | | | | Exploring for Oil in Albania | | | | | |
| | 1,455,000 | | | Houston American Energy (a)(c) | | | 1,630 | | |
| | | | | Oil & Gas Exploration/Production in Colombia | | | | | |
| | | | 58,208 | | |
| Number of Shares | | | | Value (000) | |
| | | > Agricultural Commodities 1.6% | |
| | 1,742,424 | | | Union Agriculture Group
(Uruguay) (a)(d)(e) | | $ | 17,058 | | |
| | | | | Farmland Operator in Uruguay | | | | | |
| | 8,440,000 | | | Eacom Timber (Canada) (a) | | | 829 | | |
| | | | | Canadian Lumber Producer | | | | | |
| | | | 17,887 | | |
| | | > Alternative Energy 1.5% | |
| | 3,301,200 | | | Canadian Solar (China) (a)(b)(c) | | | 11,884 | | |
| | | | | Solar Cell & Module Manufacturer | | | | | |
| | 2,425,000 | | | Synthesis Energy Systems (China) (a) | | | 2,959 | | |
| | | | | Owner/Operator of Gasification Plants | | | | | |
| | 1,165,000 | | | Real Goods Solar (a) | | | 1,316 | | |
| | | | | Residential Solar Energy Installer | | | | | |
| | | | 16,159 | | |
| | | > Mining 0.8% | |
| | 835,000 | | | Kirkland Lake Gold (Canada) (a) | | | 8,989 | | |
| | | | | Gold Mining | | | | | |
| | | | 8,989 | | |
| | | > Oil Services 0.5% | |
| | 13,613,200 | | | Tuscany International Drilling
(Colombia) (a) | | | 5,282 | | |
| | | | | South America-based Drilling Rig Contractor | | | | | |
| | | | 5,282 | | |
| Energy & Minerals: Total | | | 106,525 | | |
| Health Care 6.0% | | | |
| | | > Biotechnology & Drug Delivery 2.7% | |
| | 2,340,000 | | | NPS Pharmaceuticals (a) | | | 20,148 | | |
| | | | | Orphan Drugs & Healthy Royalties | | | | | |
| | 383,000 | | | Seattle Genetics (a)(c) | | | 9,724 | | |
| | | | | Antibody-based Therapies for Cancer | | | | | |
| | | | 29,872 | | |
| | | > Pharmaceuticals 1.9% | |
| | 1,310,000 | | | Akorn (a) | | | 20,659 | | |
| | | | | Develops, Manufactures & Sells Specialty
Generic Drugs | | | | | |
| | | | 20,659 | | |
| | | > Medical Supplies 1.4% | |
| | 190,000 | | | Henry Schein (a) | | | 14,913 | | |
| | | | | Largest Distributor of Healthcare Products | | | | | |
| | | | 14,913 | | |
| Health Care: Total | | | 65,444 | | |
| Other Industries 5.1% | | | |
| | | > Real Estate 3.7% | |
| | 1,435,000 | | | Biomed Realty Trust | | | 26,806 | | |
| | | | | Life Science-focused Office Buildings | | | | | |
| | 475,000 | | | DuPont Fabros Technology | | | 13,566 | | |
| | | | | Technology-focused Office Buildings | | | | | |
| | | | 40,372 | | |
See accompanying notes to financial statements.
67
Columbia Acorn Select
Statement of Investments (Unaudited), continued
| Number of Shares | | | | Value (000) | |
| | | > Regulated Utilities 1.4% | |
| | 403,000 | | | Wisconsin Energy | | $ | 15,946 | | |
| | | Wisconsin Utility | | | | | |
| | | | 15,946 | | |
| Other Industries: Total | | | 56,318 | | |
Total Equities: 98.0%
(Cost: $835,953) | | | 1,077,229 | | |
| Securities Lending Collateral 2.4% | |
| | 26,067,257 | | | Dreyfus Government Cash
Management Fund
(7 day yield of 0.01%) (f) | | | 26,067 | | |
Total Securities Lending Collateral:
(Cost: $26,067) | | | 26,067 | | |
Total Investments: 100.4%
(Cost: $862,020)(g)(h) | | | 1,103,296 | | |
Obligation to Return Collateral for
Securities Loaned: (2.4)% | | | (26,067 | ) | |
| Cash and Other Assets Less Liabilities: 2.0% | | | 21,891 | | |
| Total Net Assets: 100.0% | | $ | 1,099,120 | | |
ADR - American Depositary Receipts
> Notes to Statement of Investments (dollar values in thousands)
(a) Non-income producing security.
(b) An affiliated person of the Fund may include any company in which the Fund owns five percent or more of its outstanding voting shares. Holdings and transactions in these affiliated companies during the period ended June 30, 2012, are as follows:
| Security | | Balance of
Shares Held
12/31/11 | | Purchases/
Additions | | Sales/
Reductions | | Balance of
Shares Held
6/30/12 | | Value | | Dividend | |
| Canacol* | | | 31,372,300 | | | | - | | | | 2,184,900 | | | | 29,187,400 | | | $ | 13,044 | | | $ | - | | |
| Canadian Overseas Petroleum | | | 24,000,000 | | | | - | | | | - | | | | 24,000,000 | | | | 4,187 | | | | - | | |
| Canadian Solar | | | 2,700,000 | | | | 601,200 | | | | - | | | | 3,301,200 | | | | 11,884 | | | | - | | |
| Eacom Timber* | | | 36,000,000 | | | | - | | | | 27,560,000 | | | | 8,440,000 | | | | 829 | | | | - | | |
| GLG Life Tech* | | | 1,850,000 | | | | - | | | | 350,000 | | | | 1,500,000 | | | | 621 | | | | - | | |
| Globalstar | | | 13,184,322 | | | | 3,815,678 | | | | 278,200 | | | | 16,721,800 | | | | 5,351 | | | | - | | |
| IFM Investments (Century 21 China RE) - ADR** | | | 3,430,000 | | | | - | | | | 2,432,000 | | | | 998,000 | | | | 1,088 | | | | - | | |
| Petrodorado | | | 34,700,000 | | | | - | | | | 1,000,000 | | | | 33,700,000 | | | | 5,296 | | | | - | | |
| Real Goods Solar* | | | 1,500,000 | | | | - | | | | 335,000 | | | | 1,165,000 | | | | 1,316 | | | | - | | |
| Sanmina-SCI* | | | 6,100,000 | | | | - | | | | 3,073,400 | | | | 3,026,600 | | | | 24,788 | | | | - | | |
| Synthesis Energy Systems* | | | 2,950,372 | | | | - | | | | 525,372 | | | | 2,425,000 | | | | 2,959 | | | | - | | |
| VisionChina Media - ADR | | | 7,000,000 | | | | - | | | | 1,572,800 | | | | 5,427,200 | | | | 5,047 | | | | - | | |
| WNS - ADR | | | 4,254,230 | | | | - | | | | 849,230 | | | | 3,405,000 | | | | 33,131 | | | | - | | |
| Total of Affiliated Transactions | | | 169,041,224 | | | | 4,416,878 | | | | 40,160,902 | | | | 133,297,200 | | | $ | 109,541 | | | $ | - | | |
* At June 30, 2012, the Fund owned less than five percent of the company's outstanding voting shares.
** Includes the effects of a 1:3 stock split.
See accompanying notes to financial statements.
68
> Notes to Statement of Investments (dollar values in thousands)
The aggregate cost and value of these companies at June 30, 2012, were $152,247 and $65,984, respectively. Investments in affiliated companies represented 6.00% of the Fund's total net assets at June 30, 2012.
(c) All or a portion of this security was on loan at June 30, 2012. The total market value of securities on loan at June 30, 2012 was $25,542.
(d) Illiquid security.
(e) Denotes a restricted security, which is subject to restrictions on resale under federal securities laws. These securities are valued at fair value determined in good faith under consistently applied procedures established by the Board of Trustees. At June 30, 2012, the market value of these securities amounted to $21,720, which represented 1.98% of total net assets.
Additional information on these securities is as follows:
| Security | | Acquisition
Dates | | Shares | | Cost | | Value | |
| Union Agriculuture Group | | 12/8/10-6/27/12 | | | 1,742,424 | | | $ | 20,000 | | | $ | 17,058 | | |
| Canadian Overseas Petroleum | | 11/24/10 | | | 24,000,000 | | | | 10,260 | | | | 4,187 | | |
| Petrodorado - Warrants | | 11/20/09 | | | 17,144,000 | | | | 2,118 | | | | 243 | | |
| Canadian Overseas Petroleum - Warrants | | 11/24/10 | | | 12,000,000 | | | | 1,502 | | | | 232 | | |
| | | | | | | $ | 33,880 | | | $ | 21,720 | | |
(f) Investment made with cash collateral received from securities lending activity.
(g) At June 30, 2012, for federal income tax purposes, the cost of investments was $862,020 and net unrealized appreciation was $241,276 consisting of gross unrealized appreciation of $390,213 and gross unrealized depreciation of $148,937.
(h) On June 30, 2012, the market value of foreign securities represented 14.41% of total net assets. The Fund's foreign portfolio was diversified as follows:
| Country | | Value | | Percentage
of Net Assets | |
| Colombia | | $ | 48,642 | | | | 4.43 | | |
| China | | | 35,878 | | | | 3.27 | | |
| India | | | 33,131 | | | | 3.01 | | |
| Uruguay | | | 17,058 | | | | 1.55 | | |
| Canada | | | 14,150 | | | | 1.29 | | |
| Iraq | | | 5,088 | | | | 0.46 | | |
| United Kingdom | | | 4,419 | | | | 0.40 | | |
| Total Foreign Portfolio | | $ | 158,366 | | | | 14.41 | | |
Fair Value Measurements
Various inputs are used in determining the value of the Fund's investments, following the input prioritization hierarchy established by GAAP. These inputs are summarized in the three broad levels listed below:
• Level 1 – quoted prices in active markets for identical securities
• Level 2 – prices determined using other significant observable inputs (including quoted prices for similar securities, interest rates, prepayment speeds, credit risk and others)
• Level 3 – prices determined using significant unobservable inputs where quoted prices or observable inputs are unavailable or less reliable (including management's own assumptions about the factors market participants would use in pricing an investment)
The inputs or methodology used for valuing securities are not necessarily an indication of the risk associated with investing in those securities.
Examples of the types of securities in which the Fund would typically invest and how they are classified within this hierarchy are as follows. Typical Level 1 securities include exchange traded domestic equities, mutual funds whose NAVs are published each day and exchange traded foreign equities that are not statistically fair valued. Typical Level 2 securities include exchange traded foreign equities that are statistically fair valued and short-term investments valued at amortized cost. Additionally, securities fair valued by the Valuation Committee (the Committee) of the Fund's Board of Trustees (the Board) that rely on significant observable inputs are also included in Level 2. Typical Level 3 securities include any security fair valued by the Committee that relies on significant unobservable inputs.
Under the direction of the Board, the Committee is responsible for carrying out the valuation procedures approved by the Board.
The Committee meets as necessary, and no less frequently than quarterly, to determine fair values for securities for which market quotations are not readily available or for which the investment manager believes that available market quotations are unreliable, and to review the continuing appropriateness of the current value of any security subject to the Trust's Portfolio Pricing Policy and the pricing procedures of the investment manager (the Policies). The Policies address, among other things: circumstances under which market quotations will be deemed readily available; selection of third party pricing vendors; appropriate pricing methodologies; events that require fair valuation and fair value techniques; and circumstances under which securities will be deemed to pose a potential for stale pricing, including when securities are illiquid, restricted, or in default. The Committee may also meet to discuss additional valuation matters, which may include review of back-testing results, review of time-sensitive information or approval of other valuation related actions, and to review the appropriateness of the Policies.
See accompanying notes to financial statements.
69
Columbia Acorn Select
Statement of Investments (Unaudited), continued
> Notes to Statement of Investments (dollar values in thousands)
For investments categorized as Level 3, the significant unobservable inputs used in the fair value measurement of the Funds' securities may include: (i) data specific to the issuer or comparable issuers, (ii) general market or specific sector news and (iii) quoted prices and specific or similar security transactions. The Committee considers this data and any changes from prior periods in order to assess the reasonableness of observable and unobservable inputs, any assumptions or internal models used to value those securities and changes in fair value. Significant changes in any of these factors could result in lower or higher fair value measurements. Various factors impact the frequency of monitoring (which may occur as often as daily), however the Committee may determine that changes to inputs, assumptions and models are not required with the same frequency.
The following table summarizes the inputs used, as of June 30, 2012, in valuing the Fund's assets:
| Investment Type | | Quoted Prices
(Level 1) | | Other
Significant
Observable
Inputs
(Level 2) | | Significant
Unobservable
Inputs
(Level 3) | | Total | |
| Equities | |
| Industrial Goods & Services | | $ | 238,555 | | | $ | - | | | $ | - | | | $ | 238,555 | | |
| Information | | | 220,714 | | | | - | | | | - | | | | 220,714 | | |
| Consumer Goods & Services | | | 195,721 | | | | 15,521 | | | | - | | | | 211,242 | | |
| Finance | | | 178,431 | | | | - | | | | - | | | | 178,431 | | |
| Energy & Minerals | | | 84,805 | | | | 4,662 | | | | 17,058 | | | | 106,525 | | |
| Health Care | | | 65,444 | | | | - | | | | - | | | | 65,444 | | |
| Other Industries | | | 56,318 | | | | - | | | | - | | | | 56,318 | | |
| Total Equities | | | 1,039,988 | | | | 20,183 | | | | 17,058 | | | | 1,077,229 | | |
| Total Securities Lending Collateral | | | 26,067 | | | | - | | | | - | | | | 26,067 | | |
| Total Investments | | $ | 1,066,055 | | | $ | 20,183 | | | $ | 17,058 | | | $ | 1,103,296 | | |
The Fund's assets assigned to the Level 2 input category are generally valued using a market approach, in which a security's value is determined through its correlation to prices and information from observable market transactions for similar or identical assets. Foreign equities are generally valued at the last sale price on the foreign exchange or market on which they trade. The Fund may use a statistical fair valuation model, in accordance with the policy adopted by the Board, provided by an independent third party to value securities principally traded in foreign markets in order to adjust for possible stale pricing that may occur between the close of the foreign exchanges and the time for valuation. These models take into account available market data including intraday index, ADR, and ETF movements. Securities acquired via private placement that have a holding period or an extended settlement period are valued at a discount to the same shares that are trading freely on the market. These discounts are determined by the investment manager's experience with similar securities or situations. Factors may include, but are not limited to, trade volume, shares outstanding and stock price. Warrants which do not trade are valued as a percentage of the actively trading common stock using a model, based on Black Scholes. Securities which have halted or temporarily stopped trading are valued at the last sale and adjusted by a premium or a discount to account for the anticipated re-opening price. These adjustments are determined by the investment manager's experience with similar securities or situations.
The following table shows transfers between Level 1 and Level 2 of the fair value hierarchy:
| Transfers In | | Transfers Out | |
| Level 1 | | Level 2 | | Level 1 | | Level 2 | |
| $ | - | | | $ | 1,665 | | | $ | 1,665 | | | $ | - | | |
Financial assets were transferred from Level 1 to Level 2 as trading halted during the period.
The following table reconciles asset balances for the period ending June 30, 2012, in which significant observable and/or unobservable inputs (Level 3) were used in determining value:
Investments
in Securities | | Balance
as of
December 31,
2011 | | Realized
Gain/(Loss) | | Change in
Unrealized
Appreciation
(Depreciation) | | Purchases | | Sales | | Transfers
into
Level 3 | | Transfers
out of
Level 3 | | Balance
as of
June 30,
2012 | |
| Equities | |
| Energy & Minerals | | $ | 16,617 | | | $ | - | | | $ | 441 | | | $ | - | | | $ | - | | | $ | - | | | $ | - | | | $ | 17,058 | | |
| | | $ | 16,617 | | | $ | - | | | $ | 441 | | | $ | - | | | $ | - | | | $ | - | | | $ | - | | | $ | 17,058 | | |
The information in the above reconciliation table represents fiscal year to date activity for any securities identified as using Level 3 inputs at either the beginning or the end of the current fiscal period.
The change in unrealized appreciation attributed to securities owned at June 30, 2012, which were valued using significant unobservable inputs (Level 3), amounted to $441.
Quantitative information pertaining to Level 3 unobservable fair value measurements
| | | Fair Value at
6/30/12 | |
Valuation Technique(s) | |
Unobservable Input (s) | | Range (Weighted
Average) | |
| Equities | | | 17,058 | | | Market comparable companies | | Discount for lack of marketability | | -2% to -28% (-12%) | |
See accompanying notes to financial statements.
70
> Notes to Statement of Investments (dollar values in thousands)
Certain common stock classified as Level 3 are valued at fair value, using a market approach, as determined in good faith under consistently applied procedures established by and under the general supervision of the Board. To determine fair value for these securities, for which no market exists, the Committee utilizes the valuation technique it deems most appropriate in the circumstances, using some unobservable inputs which may include, but not limited to trades of similar securities, estimated earnings of the company, market multiples derived from a set of comparable companies, and the position of the security within the company's capital structure. Significant increases or decreases to any of these inputs could result in a significantly lower or higher fair value measurement. Generally, a change in estimated earnings of a company may result in a change to the comparable companies and market multiples utilized.
See accompanying notes to financial statements.
71
Columbia Thermostat Fund
Statement of Investments (Unaudited), June 30, 2012
| Number of Shares | | | | Value (000) | |
| | | > Affiliated Stock Funds: 49.4% | |
| | 1,176,526 | | | Columbia Acorn International
Fund, Class I | | $ | 43,684 | | |
| | 2,984,136 | | | Columbia Dividend Income Fund,
Class I | | | 43,240 | | |
| | 1,097,965 | | | Columbia Acorn Fund, Class I | | | 32,675 | | |
| | 2,152,889 | | | Columbia Contrarian Core
Fund, Class I | | | 32,487 | | |
| | 1,706,619 | | | Columbia Select Large Cap
Growth Fund, Class I (a) | | | 21,862 | | |
| | 872,274 | | | Columbia Acorn Select Fund,
Class I | | | 21,772 | | |
| | 1,599,099 | | | Columbia Large Cap Enhanced
Core Fund, Class I | | | 21,684 | | |
| Total Stock Funds: (Cost: $196,004) | | | 217,404 | | |
| Number of Shares | | | | Value (000) | |
| | | > Affiliated Bond Funds: 48.2% | |
| | 11,245,529 | | | Columbia Intermediate Bond
Fund, Class I | | $ | 105,933 | | |
| | 6,646,182 | | | Columbia Income Opportunities
Fund, Class I | | | 63,936 | | |
| | 3,616,501 | | | Columbia U.S. Treasury Index
Fund, Class I | | | 42,205 | | |
| Total Bond Funds: (Cost: $208,564) | | | 212,074 | | |
Total Investments: 97.6%
(Cost: $404,568)(b) | | | 429,478 | | |
| Cash and Other Assets Less Liabilities: 2.4% | | | 10,573 | | |
| Total Net Assets: 100.0% | | $ | 440,051 | | |
> Notes to Statement of Investments (dollar values in thousands)
(a) Non-income producing security.
(b) At June 30, 2012 for federal income tax purposes, the cost of investments was $404,568 and net unrealized gain was $24,910 consisting of gross unrealized appreciation of $24,910 and gross unrealized depreciation of $0.
Fair Value Measurements
Various inputs are used in determining the value of the Fund's investments, following the input prioritization hierarchy established by GAAP. These inputs are summarized in the three broad levels listed below:
• Level 1 – quoted prices in active markets for identical securities
• Level 2 – prices determined using other significant observable inputs (including quoted prices for similar securities, interest rates, prepayment speeds, credit risk and others)
• Level 3 – prices determined using significant unobservable inputs where quoted prices or observable inputs are unavailable or less reliable (including management's own assumptions about the factors market participants would use in pricing an investment)
The inputs or methodology used for valuing securities are not necessarily an indication of the risk associated with investing in those securities.
Examples of the types of securities in which the Fund would typically invest and how they are classified within this hierarchy are as follows. Typical Level 1 securities include mutual funds whose NAVs are published each day. Typical Level 2 securities include short-term investments valued at amortized cost.
Under the direction of the Board of Trustees (the Board), the Valuation Committee (the Committee) is responsible for carrying out the valuation procedures approved by the Board.
The Committee meets as necessary, and no less frequently than quarterly, to determine fair values for securities for which market quotations are not readily available or for which the investment manager believes that available market quotations are unreliable, and to review the continuing appropriateness of the current value of any security subject to the Trust's Portfolio Pricing Policy and the pricing procedures of the investment manager (the Policies). The Policies address, among other things: circumstances under which market quotations will be deemed readily available; selection of third party pricing vendors; appropriate pricing methodologies; events that require fair valuation and fair value techniques; and circumstances under which securities will be deemed to pose a potential for stale pricing, including when securities are illiquid, restricted, or in default. The Committee may also meet to discuss additional valuation matters, which may include review of back-testing results, review of time-sensitive information or approval of other valuation related actions, and to review the appropriateness of the Policies.
For investments categorized as Level 3, the significant unobservable inputs used in the fair value measurement of the Funds' securities may include: (i) data specific to the issuer or comparable issuers, (ii) general market or specific sector news and (iii) quoted prices and specific or similar security transactions. The Committee considers this data and any changes from prior periods in order to assess the reasonableness of observable and unobservable inputs, any assumptions or internal models used to value those securities and changes in fair value. Significant changes in any of these factors could result in lower or higher fair value measurements. Various factors impact the frequency of monitoring (which may occur as often as daily), however the Committee may determine that changes to inputs, assumptions and models are not required with the same frequency.
The following table summarizes the inputs used, as of June 30, 2012, in valuing the Fund's assets:
| Investment Type | | Quoted Prices
(Level 1) | | Other
Significant
Observable
Inputs
(Level 2) | | Significant
Unobservable
Inputs
(Level 3) | | Total | |
| Total Stock Funds | | $ | 217,404 | | | $ | - | | | $ | - | | | $ | 217,404 | | |
| Total Bond Funds | | | 212,074 | | | | - | | | | - | | | | 212,074 | | |
| Total Investments | | $ | 429,478 | | | $ | - | | | $ | - | | | $ | 429,478 | | |
There were no transfers of financial assets between levels 1 and 2 during the period.
See accompanying notes to financial statements.
72
Columbia Acorn Emerging Markets Fund
Major Portfolio Changes in the Second Quarter (Unaudited)
| | | Number of Shares | |
| | | 3/31/12 | | 6/30/12 | |
| Purchases | |
| Asia | |
| > Taiwan | |
| CTCI Corp | | | 64,762 | | | | 73,762 | | |
| Far EasTone Telecom | | | 58,126 | | | | 74,126 | | |
| MStar Semiconductor | | | 9,800 | | | | 13,500 | | |
| PC Home | | | 13,700 | | | | 15,700 | | |
| > Indonesia | |
| Archipelago Resources | | | 137,500 | | | | 150,100 | | |
| Mayora Indah | | | 0 | | | | 13,600 | | |
| Surya Citra Media | | | 93,264 | | | | 102,764 | | |
| Tower Bersama Infrastructure | | | 535,709 | | | | 537,609 | | |
| > Hong Kong | |
| AAC Technologies | | | 18,027 | | | | 21,027 | | |
| Lifestyle International | | | 28,089 | | | | 52,089 | | |
| Sasa International | | | 89,999 | | | | 99,799 | | |
| > China | |
| RexLot Holdings | | | 823,246 | | | | 1,196,000 | | |
| > India | |
| Redington India | | | 7,562 | | | | 37,794 | | |
| > Philippines | |
| Int'l Container Terminal | | | 40,787 | | | | 44,487 | | |
| > Cambodia | |
| Nagacorp | | | 340,000 | | | | 420,000 | | |
| > Mongolia | |
| Mongolian Mining | | | 98,500 | | | | 140,500 | | |
| > Singapore | |
| Petra Foods | | | 0 | | | | 19,900 | | |
| Other Countries | |
| > South Africa | |
| Mr. Price | | | 6,597 | | | | 6,797 | | |
| > United States | |
| Textainer Group Holdings | | | 2,204 | | | | 2,404 | | |
| > Canada | |
| Americas Petrogas | | | 17,500 | | | | 19,000 | | |
| Europe | |
| > Kazakhstan | |
Halyk Savings Bank of
Kazakhstan - GDR | | | 17,800 | | | | 19,400 | | |
| > France | |
Compagnie Française de
l'Afrique Occidentale | | | 0 | | | | 325 | | |
| | | Number of Shares | |
| | | 3/31/12 | | 6/30/12 | |
| Latin America | |
| > Brazil | |
| Arcos Dorados | | | 0 | | | | 4,000 | | |
| MRV Engenharia | | | 11,325 | | | | 12,425 | | |
| Multiplus | | | 3,144 | | | | 3,444 | | |
| > Mexico | |
Grupo Aeroportuario del
Sureste - ADR | | | 1,647 | | | | 1,747 | | |
See accompanying notes to financial statements.
73
Columbia Acorn Emerging Markets Fund
Major Portfolio Changes in the Second Quarter (Unaudited), continued
| | | Number of Shares | |
| | | 3/31/12 | | 6/30/12 | |
| Sales | |
| Asia | |
| > Indonesia | |
| Jasa Marga | | | 109,911 | | | | 0 | | |
| > China | |
| NetEase.com - ADR | | | 1,277 | | | | 977 | | |
| Other Countries | |
| > South Africa | |
| Northam Platinum | | | 15,354 | | | | 10,854 | | |
| > Canada | |
| Alliance Grain Traders | | | 10,801 | | | | 8,801 | | |
| Crew Energy | | | 4,172 | | | | 0 | | |
| Europe | |
| > Sweden | |
| East Capital Explorer | | | 8,806 | | | | 4,006 | | |
| > Germany | |
| Dürr | | | 1,229 | | | | 1,060 | | |
| > France | |
| Rubis | | | 965 | | | | 0 | | |
| Latin America | |
| > Brazil | |
Mills Estruturas e Servicos
de Engenharia | | | 3,361 | | | | 0 | | |
See accompanying notes to financial statements.
74
Columbia Acorn Emerging Markets Fund
Statement of Investments (Unaudited), June 30, 2012
| Number of Shares | | | | Value (000) | |
| | | | | | | Equities: 96.9% | |
| Asia 60.7% | | | |
| | | > Taiwan 19.3% | |
| | 74,126 | | | Far EasTone Telecom | | $ | 161 | | |
| | | | | Taiwan's Third Largest Mobile Operator | | | | | |
| | 73,762 | | | CTCI Corp | | | 138 | | |
| | | | | International Engineering Firm | | | | | |
| | 9,200 | | | St. Shine Optical | | | 103 | | |
| | | | | World's Leading Disposable Contact Lens OEM | | | | | |
| | 42,990 | | | Chroma Ate | | | 98 | | |
| | | | | Automatic Test Systems, Testing & Measurement
Instruments | | | | | |
| | 33,000 | | | Tripod Technologies | | | 94 | | |
| | | | | Printed Circuit Boards (PCB) | | | | | |
| | 13,500 | | | MStar Semiconductor | | | 91 | | |
| | | | | Integrated Circuits for TV, Digital Set-top-box & Handset | | | | | |
| | 15,700 | | | PC Home | | | 89 | | |
| | | | | Taiwanese Internet Retail Company | | | | | |
| | 12,342 | | | Simplo Technology | | | 85 | | |
| | | | | Battery Packs for Notebook & Tablet PCs | | | | | |
| | 15,277 | | | Radiant Opto-Electronics (a) | | | 78 | | |
| | | | | LCD Back Light Units & Modules | | | | | |
| | 21,169 | | | Advantech | | | 70 | | |
| | | | | Industrial PC & Components | | | | | |
| | 18,500 | | | Lung Yen | | | 54 | | |
| | | | | Funeral Services & Columbaria | | | | | |
| | 23,689 | | | Taiwan Hon Chuan | | | 53 | | |
| | | | | Beverage Packaging (Bottles, Caps, Labels)
Manufacturer | | | | | |
| | | | 1,114 | | |
| | | > Indonesia 11.2% | |
| | 369,019 | | | Ace Indonesia | | | 200 | | |
| | | | | Home Improvement Retailer | | | | | |
| | 537,609 | | | Tower Bersama Infrastructure (a) | | | 188 | | |
| | | | | Communications Towers | | | | | |
| | 150,100 | | | Archipelago Resources (a) | | | 120 | | |
| | | | | Gold Mining Projects in Indonesia, Vietnam &
the Philippines | | | | | |
| | 102,764 | | | Surya Citra Media | | | 105 | | |
| | | | | Free to Air TV in Indonesia | | | | | |
| | 13,600 | | | Mayora Indah | | | 37 | | |
| | | | | Consumer Branded Food Manufacturer | | | | | |
| | | | 650 | | |
| | | > Hong Kong 7.1% | |
| | 52,089 | | | Lifestyle International | | | 115 | | |
| | | | | Mid to High-end Department Store Operator in
Hong Kong & China | | | | | |
| | 128,862 | | | Melco International | | | 105 | | |
| | | | | Macau Casino Operator | | | | | |
| | 5,650 | | | Melco Crown Entertainment - ADR (a) | | | 65 | | |
| | | | | Macau Casino Operator | | | | | |
| | 99,799 | | | Sasa International | | | 63 | | |
| | | | | Cosmetics Retailer | | | | | |
| | 21,027 | | | AAC Technologies | | | 61 | | |
| | | | | Miniature Acoustic Components | | | | | |
| | | | 409 | | |
| Number of Shares | | | | Value (000) | |
| | | > China 6.0% | |
| | 54,951 | | | Digital China | | $ | 97 | | |
| | | | | IT Distribution & Systems Integration Services | | | | | |
| | 1,196,000 | | | RexLot Holdings | | | 86 | | |
| | | | | Lottery Equipment Supplier in China | | | | | |
| | 977 | | | NetEase.com - ADR (a) | | | 57 | | |
| | | | | Chinese Online Gaming Services | | | | | |
| | 1,254 | | | 51job - ADR (a)(b) | | | 57 | | |
| | | | | Integrated Human Resource Services | | | | | |
| | 111,475 | | | AMVIG Holdings | | | 49 | | |
| | | | | Chinese Tobacco Packaging Material Supplier | | | | | |
| | | | 346 | | |
| | | > India 5.2% | |
| | 8,635 | | | United Breweries | | | 85 | | |
| | | | | India's Largest Brewer | | | | | |
| | 14,240 | | | Titan Industries | | | 57 | | |
| | | | | Jewlery, Watches & Eyeglasses | | | | | |
| | 24,700 | | | Adani Ports & Special Economic Zone | | | 54 | | |
| | | | | Indian West Coast Shipping Port | | | | | |
| | 37,794 | | | Redington India | | | 52 | | |
| | | | | Supply Chain Solutions for IT & Mobile Handsets
in Emerging Markets | | | | | |
| | 33,749 | | | Jain Irrigation Systems | | | 51 | | |
| | | | | Agricultural Micro-irrigation Systems &
Food Processing | | | | | |
| | | | 299 | | |
| | | > Philippines 3.4% | |
| | 44,487 | | | Int'l Container Terminal | | | 78 | | |
| | | | | Container Handling Terminals & Port Management | | | | | |
| | 109,465 | | | Manila Water Company | | | 64 | | |
| | | | | Water Utility Company in the Philippines | | | | | |
| | 176,818 | | | SM Prime Holdings | | | 55 | | |
| | | | | Shopping Mall Operator | | | | | |
| | | | 197 | | |
| | | > Cambodia 3.3% | |
| | 420,000 | | | Nagacorp | | | 188 | | |
| | | | �� | Casino/Entertainment Complex in Cambodia | | | | | |
| | | | 188 | | |
| | | > Thailand 1.9% | |
| | 272,518 | | | Home Product Center | | | 109 | | |
| | | | | Home Improvement Retailer | | | | | |
| | | | 109 | | |
| | | > Mongolia 1.4% | |
| | 140,500 | | | Mongolian Mining (a) | | | 80 | | |
| | | | | Coking Coal Mining in Mongolia | | | | | |
| | | | 80 | | |
| | | > Japan 1.2% | |
| | 6,760 | | | Kansai Paint | | | 72 | | |
| | | | | Paint Producer in Japan, India, China &
Southeast Asia | | | | | |
| | | | 72 | | |
| | | > Singapore 0.7% | |
| | 19,900 | | | Petra Foods | | | 39 | | |
| | | | | Cocoa Processor & Chocolate Manufacturer | | | | | |
| | | | 39 | | |
| Asia: Total | | | 3,503 | | |
See accompanying notes to financial statements.
75
Columbia Acorn Emerging Markets Fund
Statement of Investments (Unaudited), continued
| Number of Shares | | | | Value (000) | |
| Other Countries 16.9% | | | |
| | | > South Africa 10.9% | |
| | 75,000 | | | Rand Merchant Insurance | | $ | 160 | | |
| | | | | Directly Sold Property & Casualty Insurance;
Holdings in Other Insurers | | | | | |
| | 45,226 | | | Coronation Fund Managers | | | 153 | | |
| | | | | South African Fund Manager | | | | | |
| | 16,350 | | | Adcock Ingram Holdings | | | 120 | | |
| | | | | Manufacturer of Pharmaceuticals & Medical
Supplies | | | | | |
| | 6,797 | | | Mr. Price | | | 93 | | |
| | | | | South African Retailer of Apparel, Household &
Sporting Goods | | | | | |
| | 3,497 | | | Massmart Holdings | | | 73 | | |
| | | | | General Merchandise, Food & Home Improvement
Stores; Wal-Mart Subsidiary | | | | | |
| | 10,854 | | | Northam Platinum | | | 31 | | |
| | | | | Platinum Mining in South Africa | | | | | |
| | | | 630 | | |
| | | > United States 3.3% | |
| | 2,404 | | | Textainer Group Holdings (b) | | | 89 | | |
| | | | | Top International Container Leasor | | | | | |
| | 1,709 | | | Hornbeck Offshore (a) | | | 66 | | |
| | | | | Supply Vessel Operator in U.S. Gulf of Mexico | | | | | |
| | 952 | | | Atwood Oceanics (a) | | | 36 | | |
| | | | | Offshore Drilling Contractor | | | | | |
| | | | 191 | | |
| | | > Canada 2.7% | |
| | 8,801 | | | Alliance Grain Traders | | | 118 | | |
| | | | | Global Leader in Pulse Processing & Distribution | | | | | |
| | 19,000 | | | Americas Petrogas (a) | | | 35 | | |
| | | | | Oil & Gas Exploration in Argentina, Potash in Peru | | | | | |
| | | | 153 | | |
| Other Countries: Total | | | 974 | | |
| Europe 11.0% | | | |
| | | > Sweden 2.6% | |
| | 7,231 | | | Hexagon | | | 124 | | |
| | | | | Design, Measurement & Visualization
Software & Equipment | | | | | |
| | 4,006 | | | East Capital Explorer | | | 28 | | |
| | | | | Sweden-based Russia & Central Eastern Europe
Investment Fund | | | | | |
| | | | 152 | | |
| | | > Switzerland 2.5% | |
| | 1,178 | | | Dufry Group (a) | | | 143 | | |
| | | | | Operates Airport Duty Free & Duty Paid Shops | | | | | |
| | | | 143 | | |
| | | > Kazakhstan 1.7% | |
| | 19,400 | | | Halyk Savings Bank of
Kazakhstan - GDR (a) | | | 97 | | |
| | | | | Largest Retail Bank & Insurer in Kazakhstan | | | | | |
| | | | 97 | | |
| Number of Shares | | | | Value (000) | |
| | | > Czech Republic 1.4% | |
| | 474 | | | Komercni Banka | | $ | 83 | | |
| | | | | Leading Czech Universal Bank | | | | | |
| | | | 83 | | |
| | | > Italy 1.4% | |
| | 7,631 | | | Pirelli | | | 80 | | |
| | | | | Global Tire Supplier | | | | | |
| | | | 80 | | |
| | | > Germany 1.1% | |
| | 1,060 | | | Dürr | | | 65 | | |
| | | | | Automotive Plant Engineering & Associated
Capital Equipment | | | | | |
| | | | 65 | | |
| | | > France 0.3% | |
| | 325 | | | Compagnie Française de l'Afrique Occidentale | | | 15 | | |
| | | | | African Wholesaler & Distributor | | | | | |
| | | | 15 | | |
| Europe: Total | | | 635 | | |
| Latin America 8.3% | | | |
| | | > Brazil 5.0% | |
| | 6,090 | | | Localiza Rent A Car | | | 92 | | |
| | | | | Car Rental | | | | | |
| | 3,444 | | | Multiplus | | | 82 | | |
| | | | | Loyalty Program Operator in Brazil | | | | | |
| | 4,000 | | | Arcos Dorados (b) | | | 59 | | |
| | | | | McDonald's Master Franchise for Latin America | | | | | |
| | 12,425 | | | MRV Engenharia | | | 57 | | |
| | | | | Brazilan Property Developer | | | | | |
| | | | 290 | | |
| | | > Mexico 2.4% | |
| | 1,747 | | | Grupo Aeroportuario del Sureste - ADR | | | 136 | | |
| | | | | Mexican Airport Operator | | | | | |
| | | | 136 | | |
| | | > Chile 0.7% | |
| | 18,900 | | | Viña Concha y Toro | | | 37 | | |
| | | | | Global Branded Wine Manufacturer | | | | | |
| | | | 37 | | |
| | | > Argentina 0.2% | |
| | 40,200 | | | Madalena Ventures (a) | | | 14 | | |
| | | | | Oil & Gas Exploration in Argentina | | | | | |
| | | | 14 | | |
| Latin America: Total | | | 477 | | |
Total Equities: 96.9%
(Cost: $5,503) | | | 5,589 | | |
See accompanying notes to financial statements.
76
| Number of Shares | | | | Value (000) | |
| Securities Lending Collateral 1.8% | |
| | 104,775 | | | Dreyfus Government Cash
Management Fund
(7 day yield of 0.01%) (c) | | $ | 105 | | |
Total Securities Lending Collateral:
(Cost: $105) | | | 105 | | |
Total Investments: 98.7%
(Cost: $5,608)(d)(e) | | | 5,694 | | |
Obligation to Return Collateral for
Securities Loaned: (1.8)% | | | (105 | ) | |
| Cash and Other Assets Less Liabilities: 3.1% | | | 183 | | |
| Total Net Assets: 100.0% | | $ | 5,772 | | |
ADR - American Depositary Receipts
GDR - Global Depositary Receipts
> Notes to Statement of Investments (dollar values in thousands)
(a) Non-income producing security.
(b) All or a portion of this security was on loan at June 30, 2012. The total market value of securities on loan at June 30, 2012 was $105.
(c) Investment made with cash collateral received from securities lending activity.
(d) At June 30, 2012, for federal income tax purposes, the cost of investments was $5,608 and net unrealized appreciation was $86 consisting of gross unrealized appreciation of $549 and gross unrealized depreciation of $463.
(e) On June 30, 2012, the Fund's total investments were denominated in currencies as follows:
| Currency | | Value | | Percentage
of Net Assets | |
| Taiwan Dollar | | $ | 1,114 | | | | 19.3 | | |
| Hong Kong Dollar | | | 843 | | | | 14.6 | | |
| United States Dollar | | | 663 | | | | 11.5 | | |
| South African Rand | | | 630 | | | | 10.9 | | |
| Indonesian Rupiah | | | 530 | | | | 9.2 | | |
| Indian Rupee | | | 298 | | | | 5.2 | | |
Other currencies less
than 5% of total net assets | | | 1,511 | | | | 26.2 | | |
| Total Portfolio | | $ | 5,589 | | | | 96.9 | | |
Fair Value Measurements
Various inputs are used in determining the value of the Fund's investments, following the input prioritization hierarchy established by GAAP. These inputs are summarized in the three broad levels listed below:
• Level 1 – quoted prices in active markets for identical securities
• Level 2 – prices determined using other significant observable inputs (including quoted prices for similar securities, interest rates, prepayment speeds, credit risk and others)
• Level 3 – prices determined using significant unobservable inputs where quoted prices or observable inputs are unavailable or less reliable (including management's own assumptions about the factors market participants would use in pricing an investment)
The inputs or methodology used for valuing securities are not necessarily an indication of the risk associated with investing in those securities.
Examples of the types of securities in which the Fund would typically invest and how they are classified within this hierarchy are as follows. Typical Level 1 securities include exchange traded domestic equities, mutual funds whose NAVs are published each day and exchange traded foreign equities that are not statistically fair valued. Typical Level 2 securities include exchange traded foreign equities that are statistically fair valued and short-term investments valued at amortized cost. Additionally, securities fair valued by the Valuation Committee (the Committee) of the Fund's Board of Trustees (the Board) that rely on significant observable inputs are also included in Level 2. Typical Level 3 securities include any security fair valued by the Committee that relies on significant unobservable inputs.
See accompanying notes to financial statements.
77
Columbia Acorn Emerging Markets Fund
Statement of Investments (Unaudited), continued
> Notes to Statement of Investments (dollar values in thousands)
Under the direction of the Board, the Committee is responsible for carrying out the valuation procedures approved by the Board.
The Committee meets as necessary, and no less frequently than quarterly, to determine fair values for securities for which market quotations are not readily available or for which the investment manager believes that available market quotations are unreliable, and to review the continuing appropriateness of the current value of any security subject to the Trust's Portfolio Pricing Policy and the pricing procedures of the investment manager (the Policies). The Policies address, among other things: circumstances under which market quotations will be deemed readily available; selection of third party pricing vendors; appropriate pricing methodologies; events that require fair valuation and fair value techniques; and circumstances under which securities will be deemed to pose a potential for stale pricing, including when securities are illiquid, restricted, or in default. The Committee may also meet to discuss additional valuation matters, which may include review of back-testing results, review of time-sensitive information or approval of other valuation related actions, and to review the appropriateness of the Policies.
For investments categorized as Level 3, the significant unobservable inputs used in the fair value measurement of the Funds' securities may include: (i) data specific to the issuer or comparable issuers, (ii) general market or specific sector news and (iii) quoted prices and specific or similar security transactions. The Committee considers this data and any changes from prior periods in order to assess the reasonableness of observable and unobservable inputs, any assumptions or internal models used to value those securities and changes in fair value. Significant changes in any of these factors could result in lower or higher fair value measurements. Various factors impact the frequency of monitoring (which may occur as often as daily), however the Committee may determine that changes to inputs, assumptions and models are not required with the same frequency.
The following table summarizes the inputs used, as of June 30, 2012, in valuing the Fund's assets:
| Investment Type | | Quoted Prices
(Level 1) | | Other
Significant
Observable
Inputs
(Level 2) | | Significant
Unobservable
Inputs
(Level 3) | | Total | |
| Equities | |
| Asia | | $ | 179 | | | $ | 3,324 | | | $ | - | | | $ | 3,503 | | |
| Other Countries | | | 344 | | | | 630 | | | | - | | | | 974 | | |
| Europe | | | - | | | | 635 | | | | - | | | | 635 | | |
| Latin America | | | 477 | | | | - | | | | - | | | | 477 | | |
| Total Equities | | | 1,000 | | | | 4,589 | | | | - | | | | 5,589 | | |
| Total Securities Lending Collateral | | | 105 | | | | - | | | | - | | | | 105 | | |
| Total Investments | | $ | 1,105 | | | $ | 4,589 | | | $ | - | | | $ | 5,694 | | |
The Fund's assets assigned to the Level 2 input category are generally valued using a market approach, in which a security's value is determined through its correlation to prices and information from observable market transactions for similar or identical assets. Foreign equities are generally valued at the last sale price on the foreign exchange or market on which they trade. The Fund may use a statistical fair valuation model, in accordance with the policy adopted by the Board, provided by an independent third party to value securities principally traded in foreign markets in order to adjust for possible stale pricing that may occur between the close of the foreign exchanges and the time for valuation. These models take into account available market data including intraday index, ADR, and ETF movements.
There were no transfers of financial assets between levels 1 and 2 during the period.
See accompanying notes to financial statements.
78
Columbia Acorn Emerging Markets Fund
Portfolio Diversification (Unaudited)
At June 30, 2012, the Fund's portfolio investments as a percentage of net assets were diversified as follows:
| | | Value (000) | | Percentage
of Net Assets | |
| > Consumer Goods & Services | |
| Retail | | $ | 827 | | | | 14.4 | | |
| Casinos & Gaming | | | 443 | | | | 7.7 | | |
| Food & Beverage | | | 354 | | | | 6.1 | | |
| Other Consumer Services | | | 225 | | | | 3.9 | | |
| Travel | | | 92 | | | | 1.6 | | |
| Other Durable Goods | | | 80 | | | | 1.4 | | |
| Consumer Goods Distribution | | | 52 | | | | 0.9 | | |
| | | | 2,073 | | | | 36.0 | | |
| > Information | |
Computer Hardware &
Related Equipment | | | 388 | | | | 6.7 | | |
| Mobile Communications | | | 350 | | | | 6.1 | | |
| Business Software | | | 124 | | | | 2.1 | | |
| TV Broadcasting | | | 104 | | | | 1.8 | | |
| Instrumentation | | | 98 | | | | 1.7 | | |
| Electronics Distribution | | | 97 | | | | 1.7 | | |
Semiconductors &
Related Equipment | | | 91 | | | | 1.6 | | |
| Internet Related | | | 58 | | | | 1.0 | | |
| | | | 1,310 | | | | 22.7 | | |
| > Finance | |
| Brokerage & Money Management | | | 181 | | | | 3.2 | | |
| Banks | | | 180 | | | | 3.1 | | |
| Insurance | | | 160 | | | | 2.8 | | |
| Finance Companies | | | 89 | | | | 1.5 | | |
| | | | 610 | | | | 10.6 | | |
| > Industrial Goods & Services | |
Industrial Materials &
Specialty Chemicals | | | 175 | | | | 3.0 | | |
| Construction | | | 138 | | | | 2.4 | | |
| Other Industrial Services | | | 132 | | | | 2.3 | | |
| Machinery | | | 116 | | | | 2.0 | | |
| | | | 561 | | | | 9.7 | | |
| > Energy & Minerals | |
| Mining | | | 231 | | | | 4.0 | | |
| Agricultural Commodities | | | 118 | | | | 2.0 | | |
| Oil Services | | | 102 | | | | 1.8 | | |
| Oil & Gas Producers | | | 49 | | | | 0.8 | | |
| | | | 500 | | | | 8.6 | | |
| > Other Industries | |
| Transportation | | | 136 | | | | 2.4 | | |
| Real Estate | | | 112 | | | | 1.9 | | |
| Regulated Utilities | | | 64 | | | | 1.1 | | |
| | | | 312 | | | | 5.4 | | |
| | | Value (000) | | Percentage
of Net Assets | |
| > Health Care | |
| Pharmaceuticals | | $ | 120 | | | | 2.1 | | |
| Medical Supplies | | | 103 | | | | 1.8 | | |
| | | | 223 | | | | 3.9 | | |
| Total Equities: | | | 5,589 | | | | 96.9 | | |
| Security Lending Collateral: | | | 105 | | | | 1.8 | | |
| Total Investments: | | | 5,694 | | | | 98.7 | | |
Obligation to Return
Collateral for Securities
Loaned: | | | (105 | ) | | | (1.8 | ) | |
Cash and Other Assets
Less Liabilities: | | | 183 | | | | 3.1 | | |
| Net Assets: | | $ | 5,772 | | | | 100.0 | | |
See accompanying notes to financial statements.
79
Columbia Acorn European Fund
Major Portfolio Changes in the Second Quarter (Unaudited)
| | | Number of Shares | |
| | | 3/31/12 | | 6/30/12 | |
| Purchases | |
| Europe | |
| > United Kingdom | |
| Aggreko | | | 0 | | | | 700 | | |
| BBA Aviation | | | 0 | | | | 7,480 | | |
| Charles Taylor | | | 15,220 | | | | 22,220 | | |
Domino's Pizza United Kingdom &
Ireland | | | 3,610 | | | | 5,090 | | |
| Greggs | | | 999 | | | | 3,200 | | |
| Rightmove | | | 1,000 | | | | 1,400 | | |
| WH Smith | | | 0 | | | | 2,000 | | |
| > Netherlands | |
| Vopak | | | 0 | | | | 300 | | |
| > Switzerland | |
| Dufry Group | | | 170 | | | | 310 | | |
| Partners Group | | | 160 | | | | 295 | | |
| > Russia | |
| Yandex | | | 0 | | | | 1,900 | | |
| | | Number of Shares | |
| | | 3/31/12 | | 6/30/12 | |
| Sales | |
| Europe | |
| > United Kingdom | |
| Chemring | | | 4,900 | | | | 0 | | |
| Intertek Group | | | 1,100 | | | | 500 | | |
| Workspace Group | | | 5,800 | | | | 0 | | |
| > France | |
| Mersen | | | 600 | | | | 213 | | |
| Rubis | | | 310 | | | | 0 | | |
| > Netherlands | |
| Core Laboratories | | | 330 | | | | 230 | | |
| Fugro | | | 410 | | | | 0 | | |
| > Germany | |
| Rheinmetall | | | 560 | | | | 360 | | |
| > Russia | |
| Mail.ru - GDR | | | 1,000 | | | | 600 | | |
See accompanying notes to financial statements.
80
Columbia Acorn European Fund
Statement of Investments (Unaudited), June 30, 2012
| Number of Shares | | | | Value (000) | |
| | | | | | | Equities: 92.9% | |
| Europe 89.8% | | | |
| | | > United Kingdom 18.3% | |
| | 22,220 | | | Charles Taylor | | $ | 56 | | |
| | | | | Insurance Services | | | | | |
| | 5,090 | | | Domino's Pizza United Kingdom & Ireland | | | 41 | | |
| | | | | Pizza Delivery in the UK, Ireland & Germany | | | | | |
| | 1,400 | | | Rightmove | | | 35 | | |
| | | | | Internet Real Estate Listings | | | | | |
| | 2,827 | | | JLT Group | | | 31 | | |
| | | | | International Business Insurance Broker | | | | | |
| | 3,480 | | | Serco | | | 29 | | |
| | | | | Facilities Management | | | | | |
| | 3,180 | | | Shaftesbury | | | 26 | | |
| | | | | London Prime Retail REIT | | | | | |
| | 3,200 | | | Greggs | | | 25 | | |
| | | | | Bakery | | | | | |
| | 7,480 | | | BBA Aviation | | | 24 | | |
| | | | | Aviation Support Services | | | | | |
| | 700 | | | Aggreko | | | 23 | | |
| | | | | Temporary Power & Temperature Control Services | | | | | |
| | 500 | | | Intertek Group | | | 21 | | |
| | | | | Testing, Inspection, Certification Services | | | | | |
| | 3,190 | | | Abcam | | | 21 | | |
| | | | | Online Sales of Antibodies | | | | | |
| | 660 | | | Rotork | | | 20 | | |
| | | | | Valve Actuators for Oil & Water Pipelines | | | | | |
| | 2,000 | | | WH Smith | | | 17 | | |
| | | | | Newsprint, Book & General Stationery Retailer | | | | | |
| | 2,870 | | | Premier Oil (a) | | | 15 | | |
| | | | | Oil & Gas Producer in Europe, Pakistan & Asia | | | | | |
| | 71 | | | Spirax Sarco | | | 2 | | |
| | | | | Steam Systems for Manufacturing & Process Industries | | | | | |
| | | | 386 | | |
| | | > France 14.2% | |
| | 600 | | | Eurofins Scientific | | | 75 | | |
| | | | | Food, Pharmaceuticals & Materials Screening &
Testing | | | | | |
| | 1,000 | | | Gemalto | | | 72 | | |
| | | | | Digital Security Solutions | | | | | |
| | 1,200 | | | 1000 mercis | | | 55 | | |
| | | | | Interactive Advertising & Marketing | | | | | |
| | 1,300 | | | Saft | | | 31 | | |
| | | | | Niche Battery Manufacturer | | | | | |
| | 360 | | | Norbert Dentressangle | | | 23 | | |
| | | | | Leading European Logistics & Transport Group | | | | | |
| | 400 | | | Neopost | | | 21 | | |
| | | | | Postage Meter Machines | | | | | |
| | 7,100 | | | Hi-Media (a) | | | 18 | | |
| | | | | Online Advertiser in Europe | | | | | |
| | 213 | | | Mersen | | | 5 | | |
| | | | | Advanced Industrial Materials | | | | | |
| | | | 300 | | |
| | | > Netherlands 12.3% | |
| | 1,730 | | | UNIT4 | | | 44 | | |
| | | | | Business Software Development | | | | | |
| Number of Shares | | | | Value (000) | |
| | 2,785 | | | Aalberts Industries | | $ | 43 | | |
| | | | | Flow Control & Heat Treatment | | | | | |
| | 1,412 | | | Koninklijke TenCate | | | 38 | | |
| | | | | Advanced Textiles & Industrial Fabrics | | | | | |
| | 1,499 | | | Imtech | | | 36 | | |
| | | | | Electromechanical & Information & Communications
Technology Installation & Maintenance | | | | | |
| | 1,480 | | | Arcadis | | | 32 | | |
| | | | | Engineering Consultants | | | | | |
| | 230 | | | Core Laboratories | | | 27 | | |
| | | | | Oil & Gas Reservoir Consulting | | | | | |
| | 917 | | | TKH Group | | | 20 | | |
| | | | | Dutch Industrial Conglomerate | | | | | |
| | 300 | | | Vopak | | | 19 | | |
| | | | | World's Largest Operator of Petroleum &
Chemical Storage Terminals | | | | | |
| | | | 259 | | |
| | | > Germany 10.1% | |
| | 3,250 | | | Wirecard | | | 63 | | |
| | | | | Online Payment Processing & Risk Management | | | | | |
| | 520 | | | Dürr | | | 32 | | |
| | | | | Automotive Plant Engineering & Associated Capital Equipment | | | | | |
| | 130 | | | Rational | | | 31 | | |
| | | | | Commercial Ovens | | | | | |
| | 375 | | | Bertrandt | | | 28 | | |
| | | | | Outsourced Engineering | | | | | |
| | 500 | | | Stratec Biomedical Systems | | | 22 | | |
| | | | | Diagnostic Instrumentation | | | | | |
| | 590 | | | CTS Eventim | | | 18 | | |
| | | | | Event Ticket Sales | | | | | |
| | 360 | | | Rheinmetall | | | 18 | | |
| | | | | Defense & Automotive | | | | | |
| | | | 212 | | |
| | | > Switzerland 9.9% | |
| | 300 | | | Geberit | | | 59 | | |
| | | | | Plumbing Supplies | | | | | |
| | 295 | | | Partners Group | | | 52 | | |
| | | | | Private Markets Asset Management | | | | | |
| | 21 | | | Sika | | | 41 | | |
| | | | | Chemicals for Construction & Industrial Applications | | | | | |
| | 310 | | | Dufry Group (a) | | | 38 | | |
| | | | | Operates Airport Duty Free & Duty Paid Shops | | | | | |
| | 320 | | | Zehnder | | | 19 | | |
| | | | | Radiators & Ventilation Systems | | | | | |
| | | | 209 | | |
| | | > Sweden 6.0% | |
| | 3,070 | | | Hexagon | | | 53 | | |
| | | | | Design, Measurement & Visualization Software &
Equipment | | | | | |
| | 4,570 | | | Sweco | | | 48 | | |
| | | | | Engineering Consultants | | | | | |
| | 1,000 | | | Unibet | | | 25 | | |
| | | | | European Online Gaming Operator | | | | | |
| | | | 126 | | |
| | | > Italy 3.7% | |
| | 11,000 | | | Geox | | | 24 | | |
| | | | | Apparel & Shoe Maker | | | | | |
See accompanying notes to financial statements.
81
Columbia Acorn European Fund
Statement of Investments (Unaudited), continued
| Number of Shares | | | | Value (000) | |
| | | > Italy—continued | |
| | 230 | | | Tod's | | $ | 23 | | |
| | | | | Leather Shoes & Bags | | | | | |
| | 2,000 | | | Pirelli | | | 21 | | |
| | | | | Global Tire Supplier | | | | | |
| | 9,960 | | | CIR | | | 10 | | |
| | | | | Italian Holding Company | | | | | |
| | | | 78 | | |
| | | > Russia 2.7% | |
| | 1,900 | | | Yandex (a) | | | 36 | | |
| | | | | Search Engine for Russian & Turkish Languages | | | | | |
| | 600 | | | Mail.ru - GDR (a)(b) | | | 21 | | |
| | | | | Internet Social Networking & Games for Russian Speakers | | | | | |
| | | | 57 | | |
| | | > Iceland 2.5% | |
| | 43,750 | | | Marel | | | 53 | | |
| | | | | Largest Manufacturer of Poultry & Fish Processing
Equipment | | | | | |
| | | | 53 | | |
| | | > Ireland 1.9% | |
| | 300 | | | Paddy Power | | | 20 | | |
| | | | | Irish Betting Services | | | | | |
| | 7,300 | | | United Drug | | | 19 | | |
| | | | | Irish Pharmaceutical Wholesaler & Outsourcer | | | | | |
| | | | 39 | | |
| | | > Portugal 1.7% | |
| | 13,480 | | | Redes Energéticas Nacionais | | | 36 | | |
| | | | | Portuguese Power Transmission &
Gas Transportation | | | | | |
| | | | 36 | | |
| | | > Norway 1.6% | |
| | 3,710 | | | Atea | | | 33 | | |
| | | | | Leading Nordic IT Hardware/Software Reseller &
Installation Company | | | | | |
| | | | 33 | | |
| | | > Belgium 1.2% | |
| | 530 | | | EVS Broadcast Equipment | | | 25 | | |
| | | | | Digital Live Mobile Production Software & Systems | | | | | |
| | | | 25 | | |
| | | > Czech Republic 1.1% | |
| | 140 | | | Komercni Banka | | | 24 | | |
| | | | | Leading Czech Universal Bank | | | | | |
| | | | 24 | | |
| | | > Poland 1.1% | |
| | 4,000 | | | FX Energy (a) | | | 24 | | |
| | | | | Oil & Gas Producer in Poland | | | | | |
| | | | 24 | | |
| | | > Denmark 0.8% | |
| | 300 | | | Solar A/S | | | 16 | | |
| | | | | Technical Wholesaler of Electrical, Plumbing &
HVAC Equipment | | | | | |
| | | | 16 | | |
| Number of Shares | | | | Value (000) | |
| | | > Greece 0.7% | |
| | 13,330 | | | Intralot | | $ | 15 | | |
| | | | | Lottery & Gaming Systems & Services | | | | | |
| | | | 15 | | |
| Europe: Total | | | 1,892 | | |
| Other Countries 1.7% | | | |
| | | > Canada 1.3% | |
| | 1,970 | | | Alliance Grain Traders | | | 26 | | |
| | | | | Global Leader in Pulse Processing & Distribution | | | | | |
| | | | 26 | | |
| | | > United States 0.4% | |
| | 1,300 | | | Velti (a)(c) | | | 9 | | |
| | | | | Mobile Marketing Software Platform | | | | | |
| | | | 9 | | |
| Other Countries: Total | | | 35 | | |
| Asia 1.4% | | | |
| | | > Hong Kong 1.4% | |
| | 11,000 | | | L'Occitane International | | | 30 | | |
| | | | | Skin Care & Cosmetics Producer | | | | | |
| | | | 30 | | |
| Asia: Total | | | 30 | | |
Total Equities: 92.9%
(Cost: $1,874) | | | 1,957 | | |
| Securities Lending Collateral 0.3% | | | |
| | 5,850 | | | Dreyfus Government Cash
Management Fund
(7 day yield of 0.01%) (d) | | | 6 | | |
Total Securities Lending Collateral:
(Cost: $6) | | | 6 | | |
Total Investments: 93.2%
(Cost: $1,880)(e)(f) | | | 1,963 | | |
Obligation to Return Collateral for
Securities Loaned: (0.3)% | | | (6 | ) | |
| Cash and Other Assets Less Liabilities: 7.1% | | | 149 | | |
| Total Net Assets: 100.0% | | $ | 2,106 | | |
GDR - Global Depositary Receipts
REIT - Real Estate Investment Trust
See accompanying notes to financial statements.
82
> Notes to Statement of Investments (dollar values in thousands)
(a) Non-income producing security.
(b) Security exempt from registration under Section 4(2) of the Securities Act of 1933. This security may only be resold in exempt transactions to qualified buyers. Private resales of this security to qualified institutional buyers are also exempt from registration pursuant to Rule 144A under the Securities Act of 1933. At June 30, 2012, this security had an aggregate value of $21, which represented 1.00% of total net assets.
(c) All or a portion of this security was on loan at June 30, 2012. The total market value of securities on loan at June 30, 2012 was $6.
(d) Investment made with cash collateral received from securities lending activity.
(e) At June 30, 2012, for federal income tax purposes, the cost of investments was $1,880 and net unrealized appreciation was $83 consisting of gross unrealized appreciation of $191 and gross unrealized depreciation of $108.
(f) On June 30, 2012, the Fund's total investments were denominated in currencies as follows:
| Currency | | Value | | Percentage
of Net Assets | |
| Euro | | $ | 937 | | | | 44.5 | | |
| British Pound | | | 386 | | | | 18.3 | | |
| Swiss Franc | | | 209 | | | | 9.9 | | |
| Swedish Krona | | | 126 | | | | 6.0 | | |
| United States Dollar | | | 116 | | | | 5.5 | | |
Other currencies less
than 5% of total net assets | | | 183 | | | | 8.7 | | |
| Total Portfolio | | $ | 1,957 | | | | 92.9 | | |
Fair Value Measurements
Various inputs are used in determining the value of the Fund's investments, following the input prioritization hierarchy established by GAAP. These inputs are summarized in the three broad levels listed below:
• Level 1 – quoted prices in active markets for identical securities
• Level 2 – prices determined using other significant observable inputs (including quoted prices for similar securities, interest rates, prepayment speeds, credit risk and others)
• Level 3 – prices determined using significant unobservable inputs where quoted prices or observable inputs are unavailable or less reliable (including management's own assumptions about the factors market participants would use in pricing an investment)
The inputs or methodology used for valuing securities are not necessarily an indication of the risk associated with investing in those securities.
Examples of the types of securities in which the Fund would typically invest and how they are classified within this hierarchy are as follows. Typical Level 1 securities include exchange traded domestic equities, mutual funds whose NAVs are published each day and exchange traded foreign equities that are not statistically fair valued. Typical Level 2 securities include exchange traded foreign equities that are statistically fair valued and short-term investments valued at amortized cost. Additionally, securities fair valued by the Valuation Committee (the Committee) of the Fund's Board of Trustees (the Board) that rely on significant observable inputs are also included in Level 2. Typical Level 3 securities include any security fair valued by the Committee that relies on significant unobservable inputs.
Under the direction of the Board, the Committee is responsible for carrying out the valuation procedures approved by the Board.
The Committee meets as necessary, and no less frequently than quarterly, to determine fair values for securities for which market quotations are not readily available or for which the investment manager believes that available market quotations are unreliable, and to review the continuing appropriateness of the current value of any security subject to the Trust's Portfolio Pricing Policy and the pricing procedures of the investment manager (the Policies). The Policies address, among other things: circumstances under which market quotations will be deemed readily available; selection of third party pricing vendors; appropriate pricing methodologies; events that require fair valuation and fair value techniques; and circumstances under which securities will be deemed to pose a potential for stale pricing, including when securities are illiquid, restricted, or in default. The Committee may also meet to discuss additional valuation matters, which may include review of back-testing results, review of time-sensitive information or approval of other valuation related actions, and to review the appropriateness of the Policies.
For investments categorized as Level 3, the significant unobservable inputs used in the fair value measurement of the Funds' securities may include: (i) data specific to the issuer or comparable issuers, (ii) general market or specific sector news and (iii) quoted prices and specific or similar security transactions. The Committee considers this data and any changes from prior periods in order to assess the reasonableness of observable and unobservable inputs, any assumptions or internal models used to value those securities and changes in fair value. Significant changes in any of these factors could result in lower or higher fair value measurements. Various factors impact the frequency of monitoring (which may occur as often as daily), however the Committee may determine that changes to inputs, assumptions and models are not required with the same frequency.
See accompanying notes to financial statements.
83
Columbia Acorn European Fund
Statement of Investments (Unaudited), continued
> Notes to Statement of Investments (dollar values in thousands)
The following table summarizes the inputs used, as of June 30, 2012, in valuing the Fund's assets:
| Investment Type | | Quoted Prices
(Level 1) | | Other
Significant
Observable
Inputs
(Level 2) | | Significant
Unobservable
Inputs
(Level 3) | | Total | |
| Equities | |
| Europe | | $ | 87 | | | $ | 1,805 | | | $ | - | | | $ | 1,892 | | |
| Other Countries | | | 35 | | | | - | | | | - | | | | 35 | | |
| Asia | | | - | | | | 30 | | | | - | | | | 30 | | |
| Total Equities | | | 122 | | | | 1,835 | | | | - | | | | 1,957 | | |
| Total Securities Lending Collateral | | | 6 | | | | - | | | | - | | | | 6 | | |
| Total Investments | | $ | 128 | | | $ | 1,835 | | | $ | - | | | $ | 1,963 | | |
The Fund's assets assigned to the Level 2 input category are generally valued using a market approach, in which a security's value is determined through its correlation to prices and information from observable market transactions for similar or identical assets. Foreign equities are generally valued at the last sale price on the foreign exchange or market on which they trade. The Fund may use a statistical fair valuation model, in accordance with the policy adopted by the Board, provided by an independent third party to value securities principally traded in foreign markets in order to adjust for possible stale pricing that may occur between the close of the foreign exchanges and the time for valuation. These models take into account available market data including intraday index, ADR, and ETF movements.
There were no transfers of financial assets between levels 1 and 2 during the period.
See accompanying notes to financial statements.
84
Columbia Acorn European Fund
Portfolio Diversification (Unaudited)
At June 30, 2012, the Fund's portfolio investments as a percentage of net assets were diversified as follows:
| | | Value (000) | | Percentage
of Net Assets | |
| > Industrial Goods & Services | |
| Other Industrial Services | | $ | 235 | | | | 11.2 | | |
| Machinery | | | 178 | | | | 8.4 | | |
Industrial Materials &
Specialty Chemicals | | | 84 | | | | 4.0 | | |
| Outsourcing Services | | | 81 | | | | 3.8 | | |
| Conglomerates | | | 73 | | | | 3.4 | | |
| Construction | | | 59 | | | | 2.8 | | |
| Electrical Components | | | 31 | | | | 1.5 | | |
| Industrial Distribution | | | 16 | | | | 0.8 | | |
| | | | 757 | | | | 35.9 | | |
| > Information | |
| Business Software | | | 105 | | | | 5.0 | | |
Computer Hardware &
Related Equipment | | | 97 | | | | 4.6 | | |
| Internet Related | | | 92 | | | | 4.4 | | |
| Financial Processors | | | 63 | | | | 3.0 | | |
Business Information &
Marketing Services | | | 55 | | | | 2.6 | | |
| Computer Services | | | 32 | | | | 1.5 | | |
| Advertising | | | 18 | | | | 0.8 | | |
| | | | 462 | | | | 21.9 | | |
| > Consumer Goods & Services | |
| Casinos & Gaming | | | 60 | | | | 2.9 | | |
| Retail | | | 55 | | | | 2.6 | | |
| Nondurables | | | 54 | | | | 2.6 | | |
| Restaurants | | | 41 | | | | 1.9 | | |
| Other Durable Goods | | | 40 | | | | 1.9 | | |
| Food & Beverage | | | 25 | | | | 1.2 | | |
| Apparel | | | 24 | | | | 1.1 | | |
| Other Entertainment | | | 18 | | | | 0.9 | | |
| | | | 317 | | | | 15.1 | | |
| > Finance | |
| Insurance | | | 87 | | | | 4.1 | | |
| Brokerage & Money Management | | | 53 | | | | 2.5 | | |
| Banks | | | 24 | | | | 1.2 | | |
| | | | 164 | | | | 7.8 | | |
| > Energy & Minerals | |
| Oil & Gas Producers | | | 39 | | | | 1.9 | | |
| Mining | | | 27 | | | | 1.3 | | |
| Agricultural Commodities | | | 26 | | | | 1.2 | | |
| Oil Refining, Marketing & Distribution | | | 19 | | | | 0.9 | | |
| | | | 111 | | | | 5.3 | | |
| > Other Industries | |
| Regulated Utilities | | | 36 | | | | 1.7 | | |
| Real Estate | | | 25 | | | | 1.2 | | |
| Transportation | | | 23 | | | | 1.1 | | |
| | | | 84 | | | | 4.0 | | |
| | | Value (000) | | Percentage
of Net Assets | |
| > Health Care | |
| Medical Equipment & Devices | | $ | 22 | | | | 1.0 | | |
| Medical Supplies | | | 21 | | | | 1.0 | | |
| Pharmaceuticals | | | 19 | | | | 0.9 | | |
| | | | 62 | | | | 2.9 | | |
| Total Equities: | | | 1,957 | | | | 92.9 | | |
| Security Lending Collateral: | | | 6 | | | | 0.3 | | |
| Total Investments: | | | 1,963 | | | | 93.2 | | |
Obligation to Return
Collateral for Securities
Loaned: | | | (6 | ) | | | (0.3 | ) | |
Cash and Other Assets
Less Liabilities: | | | 149 | | | | 7.1 | | |
| Net Assets: | | $ | 2,106 | | | | 100.0 | | |
See accompanying notes to financial statements.
85
Columbia Acorn Family of Funds
Statements of Assets and Liabilities (Unaudited)
| June 30, 2012 | | Columbia
Acorn
Fund | | Columbia
Acorn
International | | Columbia
Acorn
USA | | Columbia
Acorn
International
Select | |
| (in thousands) | |
| Assets: | |
| Unaffiliated investments, at cost | | $ | 8,195,104 | | | $ | 4,769,636 | | | $ | 1,175,881 | | | $ | 273,433 | | |
| Affiliated investments, at cost (See Note 4) | | | 2,717,367 | | | | 93,271 | | | | 3,624 | | | | — | | |
Unaffiliated investments, at value (including securities on loan: Columbia Acorn Fund $302,684;
Columbia Acorn International $110,353; Columbia Acorn USA $52,943; Columbia Acorn
International Select $—; Columbia Acorn Select $25,542; Columbia Thermostat Fund $—;
Columbia Acorn Emerging Markets Fund $105; Columbia Acorn European Fund $6) | | $ | 12,779,513 | | | $ | 5,689,495 | | | $ | 1,631,375 | | | $ | 320,869 | | |
| Affiliated investments, at value (See Note 4) | | | 3,965,342 | | | | 122,198 | | | | 3,546 | | | | — | | |
| Cash | | | 723,080 | | | | 234,386 | | | | 5,316 | | | | 17,891 | | |
Foreign currency (cost: Columbia Acorn Fund $—; Columbia Acorn International $978; Columbia Acorn
USA $—; Columbia Acorn International Select $183; Columbia Acorn Select $—; Columbia Thermostat
Fund $—; Columbia Acorn Emerging Markets Fund $1; Columbia Acorn European Fund $—) | | | 1,468 | | | | 980 | | | | — | | | | 184 | | |
| Receivable for: | |
| Investments sold | | | 14,479 | | | | 26,099 | | | | 1,960 | | | | 4,811 | | |
| Fund shares sold | | | 13,853 | | | | 101,107 | | | | 1,798 | | | | 719 | | |
| Dividends and interest | | | 6,953 | | | | 5,681 | | | | 386 | | | | 387 | | |
| Securities lending income | | | 764 | | | | 147 | | | | 111 | | | | 3 | | |
| Foreign tax reclaims | | | 309 | | | | 4,004 | | | | — | | | | 211 | | |
| Expense reimbursement due from Advisor | | | — | | | | 1 | | | | — | | | | — | | |
| Trustees' Deferred Compensation Investments | | | 2,374 | | | | 659 | | | | 195 | | | | — | | |
| Other assets | | | 228 | | | | 20 | | | | 10 | | | | 1 | | |
| Total Assets | | | 17,508,363 | | | | 6,184,777 | | | | 1,644,697 | | | | 345,076 | | |
| Liabilities: | |
| Collateral on securities loaned | | | 303,633 | | | | 111,197 | | | | 53,351 | | | | — | | |
| Unrealized depreciation on forward foreign currency exchange contracts | | | — | | | | — | | | | — | | | | 933 | �� | |
| Payable to advisor | | | — | | | | — | | | | — | | | | — | | |
| Payable for: | |
| Investments purchased | | | 9,292 | | | | 35,885 | | | | 871 | | | | 5,304 | | |
| Fund shares redeemed | | | 26,065 | | | | 5,369 | | | | 2,043 | | | | 540 | | |
| Management fee | | | 292 | | | | 120 | | | | 36 | | | | 8 | | |
| Administration fee | | | 18 | | | | 6 | | | | 2 | | | | — | (a) | |
| 12b-1 Service and Distribution fees | | | 43 | | | | 9 | | | | 2 | | | | 1 | | |
| Reports to shareholders | | | 565 | | | | 263 | | | | 50 | | | | 39 | | |
| Deferred Trustees' fees | | | 2,374 | | | | 659 | | | | 195 | | | | — | | |
| Transfer agent fees | | | 1,403 | | | | 374 | | | | 241 | | | | 25 | | |
| Trustees' fees | | | — | | | | 1 | | | | — | | | | 40 | | |
| Custody fees | | | 75 | | | | 185 | | | | 2 | | | | 16 | | |
| Professional fee | | | 88 | | | | 48 | | | | 39 | | | | 25 | | |
| Chief compliance officer expenses | | | 43 | | | | 13 | | | | 4 | | | | 2 | | |
| Deferred foreign capital gains tax payable | | | — | | | | 4,024 | | | | — | | | | — | | |
| Other liabilities | | | — | | | | 57 | | | | — | | | | 9 | | |
| Total Liabilities | | | 343,891 | | | | 158,210 | | | | 56,836 | | | | 6,942 | | |
| Net Assets | | $ | 17,164,472 | | | $ | 6,026,567 | | | $ | 1,587,861 | | | $ | 338,134 | | |
| Composition of Net Assets: | |
| Paid-in capital | | $ | 10,721,070 | | | $ | 5,301,264 | | | $ | 1,029,599 | | | $ | 279,482 | | |
| Undistributed (overdistributed) net investment income | | | (28,080 | ) | | | (36,596 | ) | | | (3,403 | ) | | | (2,516 | ) | |
| Accumulated net realized gain (loss) | | | 639,075 | | | | (182,854 | ) | | | 106,249 | | | | 14,670 | | |
| Net unrealized appreciation (depreciation) on: | |
| Unaffiliated investments | | | 4,584,409 | | | | 919,859 | | | | 455,494 | | | | 47,436 | | |
| Affiliated investments | | | 1,247,975 | | | | 28,927 | | | | (78 | ) | | | — | | |
| Foreign currency translations | | | 23 | | | | (9 | ) | | | — | | | | (6 | ) | |
| Forward foreign currency exchange contracts | | | — | | | | — | | | | — | | | | (932 | ) | |
| Foreign capital gains tax | | | — | | | | (4,024 | ) | | | — | | | | — | | |
| Net Assets | | $ | 17,164,472 | | | $ | 6,026,567 | | | $ | 1,587,861 | | | $ | 338,134 | | |
| Net asset value per share – Class A (b) | | $ | 28.69 | | | $ | 37.01 | | | $ | 28.52 | | | $ | 26.62 | | |
| (Net assets/shares) | | | ($3,289,689/114,676) | | | | ($926,998/25,045) | | | | ($157,525/5,523) | | | | ($57,282/2,152) | | |
| Maximum offering price per share – Class A (c) | | $ | 30.44 | | | $ | 39.27 | | | $ | 30.26 | | | $ | 28.24 | | |
| (Net asset value per share/front-end sales charge) | | | ($28.69/0.9425) | | | | ($37.01/0.9425) | | | | ($28.52/0.9425) | | | | ($26.62/0.9425) | | |
| Net asset value and offering price per share – Class B (b) | | $ | 26.32 | | | $ | 35.88 | | | $ | 26.27 | | | $ | 25.45 | | |
| (Net assets/shares) | | | ($45,604/1,733) | | | | ($21,112/588) | | | | ($1,627/62) | | | | ($1,364/53) | | |
| Net asset value and offering price per share – Class C (b) | | $ | 25.92 | | | $ | 35.73 | | | $ | 25.99 | | | $ | 25.32 | | |
| (Net assets/shares) | | | ($749,753/28,929) | | | | ($92,746/2,596) | | | | ($31,666/1,218) | | | | ($8,585/339) | | |
| Net asset value and offering price per share – Class I (d) | | $ | 29.76 | | | $ | 37.13 | | | $ | 29.75 | | | $ | 26.88 | | |
| (Net assets/shares) | | | ($32,680/1,098) | | | | ($62,855/1,693) | | | | ($618/21) | | | ($ | 3/— | (e)) | |
| Net asset value and offering price per share – Class R | | $ | — | | | $ | 36.97 | | | $ | — | | | $ | — | | |
| (Net assets/shares) | | ($ | —/— | ) | | | ($961/26) | | | ($ | —/— | ) | | ($ | —/— | ) | |
| Net asset value and offering price per share – Class R5 | | $ | — | | | $ | 37.10 | | | $ | — | | | $ | — | | |
| (Net assets/shares) | | ($ | —/— | ) | | | ($2,179/59) | | | ($ | —/— | ) | | ($ | —/— | ) | |
| Net asset value and offering price per share – Class Z (d) | | $ | 29.74 | | | $ | 37.10 | | | $ | 29.72 | | | $ | 26.88 | | |
| (Net assets/shares) | | | ($13,046,746/438,699) | | | | ($4,919,716/132,598) | | | | ($1,396,425/46,989) | | | | ($270,900/10,078) | | |
(a) Rounds to less than $500.
(b) Redemption price per share is equal to net asset value less any applicable contingent deferred sales charge.
(c) On sales of $50,000 or more the offering price is reduced.
(d) Redemption price per share is equal to net asset value.
(e) Rounds to less than 500 shares.
See accompanying notes to financial statements.
86
| June 30, 2012 | | Columbia
Acorn
Select | | Columbia
Thermostat
Fund | | Columbia
Acorn
Emerging
Markets
Fund | | Columbia
Acorn
European
Fund | |
| (in thousands) | |
| Assets: | |
| Unaffiliated investments, at cost | | $ | 709,773 | | | $ | — | | | $ | 5,608 | | | $ | 1,880 | | |
| Affiliated investments, at cost (See Note 4) | | | 152,247 | | | | 404,568 | | | | — | | | | — | | |
Unaffiliated investments, at value (including securities on loan: Columbia Acorn Fund $302,684;
Columbia Acorn International $110,353; Columbia Acorn USA $52,943; Columbia Acorn
International Select $—; Columbia Acorn Select $25,542; Columbia Thermostat Fund $—;
Columbia Acorn Emerging Markets Fund $105; Columbia Acorn European Fund $6) | | $ | 1,037,312 | | | $ | — | | | $ | 5,694 | | | $ | 1,963 | | |
| Affiliated investments, at value (See Note 4) | | | 65,984 | | | | 429,478 | | | | — | | | | — | | |
| Cash | | | 19,892 | | | | 4,565 | | | | 219 | | | | 153 | | |
Foreign currency (cost: Columbia Acorn Fund $—; Columbia Acorn International $978; Columbia Acorn
USA $—; Columbia Acorn International Select $183; Columbia Acorn Select $—; Columbia Thermostat
Fund $—; Columbia Acorn Emerging Markets Fund $1; Columbia Acorn European Fund $—) | | | — | | | | — | | | | 1 | | | | — | | |
| Receivable for: | |
| Investments sold | | | 1,867 | | | | — | | | | 2 | | | | 38 | | |
| Fund shares sold | | | 677 | | | | 9,061 | | | | 10 | | | | — | | |
| Dividends and interest | | | 670 | | | | 1,251 | | | | 9 | | | | 1 | | |
| Securities lending income | | | 290 | | | | — | | | | — | (a) | | | — | (a) | |
| Foreign tax reclaims | | | — | | | | — | | | | 1 | | | | 2 | | |
| Expense reimbursement due from Advisor | | | — | | | | — | (a) | | | — | | | | — | | |
| Trustees' Deferred Compensation Investments | | | 237 | | | | — | | | | — | | | | — | | |
| Other assets | | | 6 | | | | — | (a) | | | 8 | | | | 8 | | |
| Total Assets | | | 1,126,935 | | | | 444,355 | | | | 5,944 | | | | 2,165 | | |
| Liabilities: | |
| Collateral on securities loaned | | | 26,067 | | | | — | | | | 105 | | | | 6 | | |
| Unrealized depreciation on forward foreign currency exchange contracts | | | — | | | | — | | | | — | | | | — | | |
| Payable to advisor | | | — | | | | — | | | | 8 | | | | 7 | | |
| Payable for: | |
| Investments purchased | | | — | | | | 3,645 | | | | 18 | | | | 11 | | |
| Fund shares redeemed | | | 1,180 | | | | 591 | | | | — | | | | — | | |
| Management fee | | | 24 | | | | 1 | | | | — | (a) | | | — | (a) | |
| Administration fee | | | 1 | | | | 1 | | | | — | (a) | | | — | (a) | |
| 12b-1 Service and Distribution fees | | | 4 | | | | 4 | | | | — | (a) | | | — | (a) | |
| Reports to shareholders | | | 122 | | | | 8 | | | | 10 | | | | 10 | | |
| Deferred Trustees' fees | | | 237 | | | | — | | | | — | | | | — | | |
| Transfer agent fees | | | 124 | | | | 23 | | | | — | (a) | | | — | (a) | |
| Trustees' fees | | | 1 | | | | 23 | | | | — | (a) | | | — | (a) | |
| Custody fees | | | 2 | | | | — | (a) | | | 11 | | | | 5 | | |
| Professional fee | | | 38 | | | | 8 | | | | 12 | | | | 15 | | |
| Chief compliance officer expenses | | | 6 | | | | — | | | | — | (a) | | | — | (a) | |
| Deferred foreign capital gains tax payable | | | — | | | | — | | | | 4 | | | | — | | |
| Other liabilities | | | 9 | | | | — | | | | 4 | | | | 5 | | |
| Total Liabilities | | | 27,815 | | | | 4,304 | | | | 172 | | | | 59 | | |
| Net Assets | | $ | 1,099,120 | | | $ | 440,051 | | | $ | 5,772 | | | $ | 2,106 | | |
| Composition of Net Assets: | |
| Paid-in capital | | $ | 820,730 | | | $ | 434,121 | | | $ | 5,754 | | | $ | 2,021 | | |
| Undistributed (overdistributed) net investment income | | | (2,288 | ) | | | 2,831 | | | | 10 | | | | 23 | | |
| Accumulated net realized gain (loss) | | | 39,399 | | | | (21,811 | ) | | | (74 | ) | | | (21 | ) | |
| Net unrealized appreciation (depreciation) on: | |
| Unaffiliated investments | | | 327,539 | | | | — | | | | 86 | | | | 83 | | |
| Affiliated investments | | | (86,263 | ) | | | 24,910 | | | | — | | | | — | | |
| Foreign currency translations | | | 3 | | | | — | | | | — | (a) | | | — | (a) | |
| Forward foreign currency exchange contracts | | | — | | | | — | | | | — | | | | — | | |
| Foreign capital gains tax | | | — | | | | — | | | | (4 | ) | | | — | | |
| Net Assets | | $ | 1,099,120 | | | $ | 440,051 | | | $ | 5,772 | | | $ | 2,106 | | |
| Net asset value per share – Class A (b) | | $ | 24.17 | | | $ | 13.65 | | | $ | 10.15 | | | $ | 10.50 | | |
| (Net assets/shares) | | | ($303,485/12,557) | | | | ($171,091/12,535) | | | | ($1,274/125) | | | | ($203/19) | | |
| Maximum offering price per share – Class A (c) | | $ | 25.64 | | | $ | 14.48 | | | $ | 10.77 | | | $ | 11.14 | | |
| (Net asset value per share/front-end sales charge) | | | ($24.17/0.9425) | | | | ($13.65/0.9425) | | | | ($10.15/0.9425) | | | | ($10.50/0.9425) | | |
| Net asset value and offering price per share – Class B (b) | | $ | 22.43 | | | $ | 13.71 | | | $ | — | | | $ | — | | |
| (Net assets/shares) | | | ($15,343/684) | | | | ($5,833/425) | | | ($ | —/— | ) | | ($ | —/— | ) | |
| Net asset value and offering price per share – Class C (b) | | $ | 22.20 | | | $ | 13.69 | | | $ | 10.10 | | | $ | 10.46 | | |
| (Net assets/shares) | | | ($60,556/2,728) | | | | ($111,865/8,170) | | | | ($216/21) | | | | ($18/2) | | |
| Net asset value and offering price per share – Class I (d) | | $ | 24.96 | | | $ | — | | | $ | 10.19 | | | $ | 10.51 | | |
| (Net assets/shares) | | | ($21,778/872) | | | ($ | —/— | ) | | | ($5/1) | | | | ($5/1) | | |
| Net asset value and offering price per share – Class R | | $ | — | | | $ | — | | | $ | — | | | $ | — | | |
| (Net assets/shares) | | ($ | —/— | ) | | ($ | —/— | ) | | ($ | —/— | ) | | ($ | —/— | ) | |
| Net asset value and offering price per share – Class R5 | | $ | — | | | $ | — | | | $ | — | | | $ | — | | |
| (Net assets/shares) | | ($ | —/— | ) | | ($ | —/— | ) | | ($ | —/— | ) | | ($ | —/— | ) | |
| Net asset value and offering price per share – Class Z (d) | | $ | 24.92 | | | $ | 13.51 | | | $ | 10.19 | | | $ | 10.52 | | |
| (Net assets/shares) | | | ($697,958/28,005) | | | | ($151,262/11,198) | | | | ($4,277/420) | | | | ($1,880/178) | | |
See accompanying notes to financial statements.
87
Columbia Acorn Family of Funds
Statements of Operations (Unaudited) For the Six Months Ended June 30, 2012
| (in thousands) | | Columbia
Acorn
Fund | | Columbia
Acorn
International | | Columbia
Acorn
USA | | Columbia
Acorn
International
Select | |
| Investment Income: | |
| Dividend income | | $ | 68,183 | | | $ | 86,067 | | | $ | 5,295 | | | $ | 5,357 | | |
| Dividend income from affiliates (See Note 4) | | | 9,504 | | | | 2,251 | | | | — | | | | — | | |
| Interest income | | | — | (a) | | | — | (a) | | | — | | | | 3 | | |
| Securities lending income, net | | | 4,039 | | | | 707 | | | | 536 | | | | 15 | | |
| Dividends from affiliated investment company shares | | | — | | | | — | | | | — | | | | — | | |
| | | | 81,726 | | | | 89,025 | | | | 5,831 | | | | 5,375 | | |
| Foreign taxes withheld | | | (1,840 | ) | | | (8,503 | ) | | | (7 | ) | | | (469 | ) | |
| Total Investment Income | | | 79,886 | | | | 80,522 | | | | 5,824 | | | | 4,906 | | |
| Expenses: | |
| Management fee | | | 56,115 | | | | 22,639 | | | | 7,167 | | | | 1,578 | | |
| Administration fee | | | 3,398 | | | | 1,155 | | | | 323 | | | | 65 | | |
| 12b-1 Service and Distribution fees: | |
| Class A | | | 4,288 | | | | 1,203 | | | | 214 | | | | 72 | | |
| Class B | | | 219 | | | | 89 | | | | 7 | | | | 6 | | |
| Class C | | | 3,851 | | | | 491 | | | | 162 | | | | 44 | | |
| Class R | | | — | | | | 2 | | | | — | | | | — | | |
| Transfer agent fees: | |
| Class A | | | 1,487 | | | | 758 | | | | 84 | | | | 38 | | |
| Class B | | | 53 | | | | 48 | | | | 3 | | | | 2 | | |
| Class C | | | 339 | | | | 71 | | | | 15 | | | | 7 | | |
| Class R | | | — | | | | 1 | | | | — | | | | — | | |
| Class R5 | | | — | | | | — | (a) | | | — | | | | — | | |
| Class Z | | | 2,916 | | | | 1,058 | | | | 560 | | | | 74 | | |
| Custody fees | | | — | | | | 547 | | | | 7 | | | | 42 | | |
| Trustees' fees | | | 496 | | | | 171 | | | | 49 | | | | 10 | | |
| Registration and blue sky fees | | | 109 | | | | 89 | | | | 55 | | | | 41 | | |
| Reports to shareholders | | | 1,207 | | | | 692 | | | | 249 | | | | 93 | | |
| Audit fees | | | 39 | | | | 62 | | | | 19 | | | | 20 | | |
| Legal fees | | | 773 | | | | 291 | | | | 87 | | | | 18 | | |
| Interest expense (See Note 5) | | | — | | | | — | | | | — | | | | — | | |
| Chief compliance officer expenses (See Note 4) | | | 247 | | | | 83 | | | | 23 | | | | 5 | | |
| Organizational expenses (See Note 4) | | | — | | | | — | | | | — | | | | — | | |
| Other expenses | | | 355 | | | | 133 | | | | 36 | | | | 13 | | |
| Total Expenses | | | 75,892 | | | | 29,583 | | | | 9,060 | | | | 2,128 | | |
| Less reimbursement of expenses by Investment Advisor (See Note 4) | | | — | | | | (206 | ) | | | — | | | | — | | |
| Net Expenses | | | 75,892 | | | | 29,377 | | | | 9,060 | | | | 2,128 | | |
| Net Investment Income/(Loss) | | | 3,994 | | | | 51,145 | | | | (3,236 | ) | | | 2,778 | | |
Net Realized and Unrealized Gain/(Loss)
on Portfolio Positions: | |
| Net Realized Gain/(Loss) on: | |
| Unaffiliated investments | | | 669,444 | | | | 118,555 | | | | 106,876 | | | | 14,604 | | |
| Affiliated investments (See Note 4) | | | 560 | | | | — | | | | — | | | | — | | |
| Foreign currency translations | | | (99 | ) | | | (1,108 | ) | | | — | | | | (108 | ) | |
| Forward foreign currency exchange contracts | | | — | | | | 5,423 | | | | — | | | | 210 | | |
| Distributions from affiliated investment company shares | | | — | | | | — | | | | — | | | | — | | |
| Net realized gain/(loss) | | | 669,905 | | | | 122,870 | | | | 106,876 | | | | 14,706 | | |
| Net change in net unrealized appreciation/(depreciation) on: | |
| Unaffiliated investments | | | 667,791 | | | | 317,503 | | | | 52,933 | | | | 15,607 | | |
| Affiliated investments (See Note 4) | | | 169,764 | | | | (10,385 | ) | | | 231 | | | | — | | |
| Foreign currency translations | | | 35 | | | | 70 | | | | — | | | | 6 | | |
| Forward foreign currency exchange contracts | | | — | | | | (4,539 | ) | | | — | | | | 16 | | |
| Foreign capital gains tax | | | — | | | | (1,703 | ) | | | — | | | | — | | |
| Net change in unrealized appreciation/(depreciation) | | | 837,590 | | | | 300,946 | | | | 53,164 | | | | 15,629 | | |
| Net realized and unrealized gain | | | 1,507,495 | | | | 423,816 | | | | 160,040 | | | | 30,335 | | |
| Net Increase in Net Assets resulting from Operations | | $ | 1,511,489 | | | $ | 474,961 | | | $ | 156,804 | | | $ | 33,113 | | |
(a) Rounds to less than $500.
See accompanying notes to financial statements.
88
| (in thousands) | | Columbia
Acorn
Select | | Columbia
Thermostat
Fund | | Columbia
Acorn
Emerging
Markets
Fund | | Columbia
Acorn
European
Fund | |
| Investment Income: | |
| Dividend income | | $ | 4,297 | | | $ | — | | | $ | 55 | | | $ | 44 | | |
| Dividend income from affiliates (See Note 4) | | | — | | | | — | | | | — | | | | — | | |
| Interest income | | | — | | | | — | | | | — | | | | — | (a) | |
| Securities lending income, net | | | 1,292 | | | | — | | | | — | (a) | | | — | (a) | |
| Dividends from affiliated investment company shares | | | — | | | | 3,776 | | | | — | | | | — | | |
| | | | 5,589 | | | | 3,776 | | | | 55 | | | | 44 | | |
| Foreign taxes withheld | | | (47 | ) | | | — | | | | (3 | ) | | | (5 | ) | |
| Total Investment Income | | | 5,542 | | | | 3,776 | | | | 52 | | | | 39 | | |
| Expenses: | |
| Management fee | | | 5,314 | | | | 154 | | | | 31 | | | | 12 | | |
| Administration fee | | | 249 | | | | 60 | | | | 1 | | | | — | (a) | |
| 12b-1 Service and Distribution fees: | |
| Class A | | | 428 | | | | 153 | | | | 1 | | | | — | (a) | |
| Class B | | | 81 | | | | 31 | | | | — | | | | — | | |
| Class C | | | 331 | | | | 330 | | | | 1 | | | | — | (a) | |
| Class R | | | — | | | | — | | | | — | | | | — | | |
| Transfer agent fees: | |
| Class A | | | 193 | | | | 58 | | | | 1 | | | | — | (a) | |
| Class B | | | 22 | | | | 7 | | | | — | | | | — | | |
| Class C | | | 35 | | | | 30 | | | | — | (a) | | | — | (a) | |
| Class R | | | — | | | | — | | | | — | | | | — | | |
| Class R5 | | | — | | | | — | | | | — | | | | — | | |
| Class Z | | | 264 | | | | 31 | | | | 1 | | | | — | (a) | |
| Custody fees | | | — | | | | 3 | | | | 30 | | | | 2 | | |
| Trustees' fees | | | 44 | | | | 7 | | | | — | (a) | | | — | (a) | |
| Registration and blue sky fees | | | 52 | | | | 65 | | | | 56 | | | | 57 | | |
| Reports to shareholders | | | 226 | | | | 65 | | | | 14 | | | | 14 | | |
| Audit fees | | | 20 | | | | 10 | | | | 27 | | | | 23 | | |
| Legal fees | | | 66 | | | | 9 | | | | — | (a) | | | — | (a) | |
| Interest expense (See Note 5) | | | 1 | | | | — | | | | — | | | | — | | |
| Chief compliance officer expenses (See Note 4) | | | 18 | | | | 4 | | | | — | (a) | | | — | (a) | |
| Organizational expenses (See Note 4) | | | — | | | | — | | | | 23 | | | | 21 | | |
| Other expenses | | | 162 | | | | 10 | | | | 2 | | | | 3 | | |
| Total Expenses | | | 7,506 | | | | 1,027 | | | | 188 | | | | 132 | | |
| Less reimbursement of expenses by Investment Advisor (See Note 4) | | | — | | | | (127 | ) | | | (149 | ) | | | (118 | ) | |
| Net Expenses | | | 7,506 | | | | 900 | | | | 39 | | | | 14 | | |
| Net Investment Income/(Loss) | | | (1,964 | ) | | | 2,876 | | | | 13 | | | | 25 | | |
Net Realized and Unrealized Gain/(Loss)
on Portfolio Positions: | |
| Net Realized Gain/(Loss) on: | |
| Unaffiliated investments | | | 73,373 | | | | — | | | | (19 | ) | | | (8 | ) | |
| Affiliated investments (See Note 4) | | | (12,823 | ) | | | (2,082 | ) | | | — | | | | — | | |
| Foreign currency translations | | | (8 | ) | | | — | | | | (1 | ) | | | (1 | ) | |
| Forward foreign currency exchange contracts | | | — | | | | — | | | | — | | | | — | | |
| Distributions from affiliated investment company shares | | | — | | | | 1,621 | | | | — | | | | — | | |
| Net realized gain/(loss) | | | 60,542 | | | | (461 | ) | | | (20 | ) | | | (9 | ) | |
| Net change in net unrealized appreciation/(depreciation) on: | |
| Unaffiliated investments | | | 34,747 | | | | — | | | | 220 | | | | 169 | | |
| Affiliated investments (See Note 4) | | | 19,182 | | | | 10,983 | | | | — | | | | — | | |
| Foreign currency translations | | | 3 | | | | — | | | | — | (a) | | | — | (a) | |
| Forward foreign currency exchange contracts | | | — | | | | — | | | | — | | | | — | | |
| Foreign capital gains tax | | | — | | | | — | | | | (3 | ) | | | — | | |
| Net change in unrealized appreciation/(depreciation) | | | 53,932 | | | | 10,983 | | | | 217 | | | | 169 | | |
| Net realized and unrealized gain | | | 114,474 | | | | 10,522 | | | | 197 | | | | 160 | | |
| Net Increase in Net Assets resulting from Operations | | $ | 112,510 | | | $ | 13,398 | | | $ | 210 | | | $ | 185 | | |
See accompanying notes to financial statements.
89
Columbia Acorn Family of Funds
Statements of Changes in Net Assets
| | | Columbia
Acorn Fund | | Columbia Acorn
International | | Columbia
Acorn USA | | Columbia Acorn
International Select | |
| Increase (Decrease) in Net Assets | | (Unaudited)
Six months
ended
June 30, | | Year ended
December 31, | | (Unaudited)
Six months
ended
June 30, | | Year ended
December 31, | | (Unaudited)
Six months
ended
June 30, | | Year ended
December 31, | | (Unaudited)
Six months
ended
June 30, | | Year ended
December 31, | |
| (in thousands) | | 2012 | | 2011 | | 2012 | | 2011 (a) | | 2012 | | 2011 | | 2012 | | 2011 | |
| Operations: | |
| Net investment income/(loss) | | $ | 3,994 | | | $ | (26,858 | ) | | $ | 51,145 | | | $ | 70,394 | | | $ | (3,236 | ) | | $ | (9,383 | ) | | $ | 2,778 | | | $ | 3,857 | | |
Net realized gain/(loss) on investments, foreign
currency transactions, forward foreign currency
exchange contracts and foreign capital gains tax | | | 669,345 | | | | 756,714 | | | | 122,870 | | | | 226,124 | | | | 106,876 | | | | 41,208 | | | | 14,706 | | | | 45,952 | | |
Net realized gain/(loss) on affiliated investments and
distributions from affiliated investment companies and
affiliated investment company shares | | | 560 | | | | (10,817 | ) | | | — | | | | (3,603 | ) | | | — | | | | (512 | ) | | | — | | | | — | | |
| Reimbursement from affiliate (See Note 4) | | | — | | | | — | | | | — | | | | 174 | | | | — | | | | — | | | | — | | | | — | | |
Net change in net unrealized appreciation/(depreciation)
on investments, foreign currency translations,
forward foreign currency exchange contracts and
foreign capital gains tax | | | 667,826 | | | | (1,530,794 | ) | | | 311,331 | | | | (1,230,965 | ) | | | 52,933 | | | | (112,790 | ) | | | 15,629 | | | | (89,001 | ) | |
Net change in net unrealized appreciation/(depreciation)
on affiliated investment companies and affiliated
investment company shares | | | 169,764 | | | | (43,544 | ) | | | (10,385 | ) | | | 22,440 | | | | 231 | | | | 876 | | | | — | | | | — | | |
| Net Increase/(Decrease) from Operations | | | 1,511,489 | | | | (855,299 | ) | | | 474,961 | | | | (915,436 | ) | | | 156,804 | | | | (80,601 | ) | | | 33,113 | | | | (39,192 | ) | |
| Distributions to Shareholders From: | |
| Net investment income – Class A | | | — | | | | (2,049 | ) | | | (1,509 | ) | | | (21,972 | ) | | | — | | | | — | | | | — | | | | (1,392 | ) | |
| Net realized gain – Class A | | | (41,199 | ) | | | (144,445 | ) | | | — | | | | — | | | | (285 | ) | | | (1,096 | ) | | | (256 | ) | | | (901 | ) | |
| Net investment income – Class B | | | — | | | | — | | | | — | | | | (600 | ) | | | — | | | | — | | | | — | | | | (23 | ) | |
| Net realized gain – Class B | | | (649 | ) | | | (4,964 | ) | | | — | | | | — | | | | (3 | ) | | | (21 | ) | | | (7 | ) | | | (31 | ) | |
| Net investment income – Class C | | | — | | | | — | | | | — | | | | (2,369 | ) | | | — | | | | — | | | | — | | | | (70 | ) | |
| Net realized gain – Class C | | | (10,281 | ) | | | (35,291 | ) | | | — | | | | — | | | | (62 | ) | | | (217 | ) | | | (40 | ) | | | (150 | ) | |
| Net investment income – Class I | | | — | | | | (34 | ) | | | (385 | ) | | | (676 | ) | | | — | | | | — | | | | — | | | | — | (c) | |
| Net realized gain – Class I | | | (431 | ) | | | (670 | ) | | | — | | | | — | | | | (1 | ) | | | (16 | ) | | | — | (c) | | | — | (c) | |
| Net investment income – Class R5 | | | — | | | | — | | | | (13 | ) | | | — | | | | — | | | | — | | | | — | | | | — | | |
| Net investment income – Class Z | | | — | | | | (36,823 | ) | | | (25,320 | ) | | | (131,455 | ) | | | — | | | | — | | | | — | | | | (9,039 | ) | |
| Net realized gain – Class Z | | | (154,079 | ) | | | (521,915 | ) | | | — | | | | — | | | | (2,401 | ) | | | (8,481 | ) | | | (1,201 | ) | | | (4,186 | ) | |
| Total Distributions to Shareholders | | | (206,639 | ) | | | (746,191 | ) | | | (27,227 | ) | | | (157,072 | ) | | | (2,752 | ) | | | (9,831 | ) | | | (1,504 | ) | | | (15,792 | ) | |
| Share Transactions: | |
| Subscriptions – Class A | | | 281,631 | | | | 881,347 | | | | 99,830 | | | | 302,659 | | | | 11,204 | | | | 41,839 | | | | 7,107 | | | | 18,154 | | |
| Distributions reinvested – Class A | | | 38,957 | | | | 134,125 | | | | 1,446 | | | | 18,983 | | | | 262 | | | | 993 | | | | 248 | | | | 2,039 | | |
Net assets of shares issued in connection with
Merger – Class A | | | — | | | | — | | | | — | | | | 204,930 | | | | — | | | | — | | | | — | | | | — | | |
| Redemptions – Class A | | | (528,484 | ) | | | (1,072,697 | ) | | | (170,050 | ) | | | (251,677 | ) | | | (37,979 | ) | | | (80,479 | ) | | | (11,843 | ) | | | (26,422 | ) | |
| Net Increase/(Decrease) – Class A | | | (207,896 | ) | | | (57,225 | ) | | | (68,774 | ) | | | 274,895 | | | | (26,513 | ) | | | (37,647 | ) | | | (4,488 | ) | | | (6,229 | ) | |
| Distributions reinvested – Class B (d) | | | 639 | | | | 4,777 | | | | — | (c) | | | 558 | | | | 3 | | | | 27 | | | | 8 | | | | 51 | | |
Net assets of shares issued in connection with
Merger – Class B | | | — | | | | — | | | | — | | | | 12,517 | | | | — | | | | — | | | | — | | | | — | | |
| Redemptions – Class B | | | (27,729 | ) | | | (215,636 | ) | | | (5,444 | ) | | | (13,183 | ) | | | (847 | ) | | | (6,779 | ) | | | (579 | ) | | | (1,017 | ) | |
| Net Decrease – Class B | | | (27,090 | ) | | | (210,859 | ) | | | (5,444 | ) | | | (108 | ) | | | (844 | ) | | | (6,752 | ) | | | (571 | ) | | | (966 | ) | |
| Subscriptions – Class C | | | 40,316 | | | | 101,181 | | | | 4,825 | | | | 19,819 | | | | 896 | | | | 2,255 | | | | 363 | | | | 966 | | |
| Distributions reinvested – Class C | | | 8,259 | | | | 27,313 | | | | — | | | | 1,845 | | | | 56 | | | | 193 | | | | 36 | | | | 188 | | |
Net assets of shares issued in connection with
Merger – Class C | | | — | | | | — | | | | — | | | | 25,563 | | | | — | | | | — | | | | — | | | | — | | |
| Redemptions – Class C | | | (72,750 | ) | | | (154,450 | ) | | | (17,087 | ) | | | (42,187 | ) | | | (2,816 | ) | | | (5,937 | ) | | | (1,317 | ) | | | (2,975 | ) | |
| Net Increase/(Decrease) – Class C | | | (24,175 | ) | | | (25,956 | ) | | | (12,262 | ) | | | 5,040 | | | | (1,864 | ) | | | (3,489 | ) | | | (918 | ) | | | (1,821 | ) | |
| Subscriptions – Class I | | | 27,185 | | | | 17,610 | | | | 37,921 | | | | 27,930 | | | | 2,148 | | | | 11,070 | | | | — | | | | — | | |
| Distributions reinvested – Class I | | | 431 | | | | 704 | | | | 385 | | | | 676 | | | | 1 | | | | 16 | | | | — | | | | — | | |
Net assets of shares issued in connection with
Merger – Class I | | | — | | | | — | | | | — | | | | 152,987 | | | | — | | | | — | | | | — | | | | — | | |
| Redemptions – Class I | | | (12,325 | ) | | | (13,595 | ) | | | (30,100 | ) | | | (184,760 | ) | | | (4,296 | ) | | | (38,709 | ) | | | — | | | | — | | |
| Net Increase/(Decrease) – Class I | | | 15,291 | | | | 4,719 | | | | 8,206 | | | | (3,167 | ) | | | (2,147 | ) | | | (27,623 | ) | | | — | | | | — | | |
(a) Class R and Class R5 shares reflect activity for the period August 15, 2011 (commencement of operations) through December 31, 2011.
(b) For the period from August 19, 2011 (commencement of operations) to December 31, 2011.
(c) Rounds to less than $500.
(d) Presentation for fiscal year 2011 has been changed to conform to that of the current year.
See accompanying notes to financial statements.
90
| | | Columbia
Acorn Select | | Columbia
Thermostat Fund | | Columbia Acorn
Emerging Markets Fund | | Columbia Acorn
European Fund | |
| Increase (Decrease) in Net Assets | | (Unaudited)
Six months
ended
June 30, | | Year ended
December 31, | | (Unaudited)
Six months
ended
June 30, | | Year ended
December 31, | | (Unaudited)
Six months
ended
June 30, | | Year ended
December 31, | | (Unaudited)
Six months
ended
June 30, | | Year ended
December 31, | |
| (in thousands) | | 2012 | | 2011 | | 2012 | | 2011 | | 2012 | | 2011 (b) | | 2012 | | 2011 (b) | |
| Operations: | |
| Net investment income/(loss) | | $ | (1,964 | ) | | $ | (7,972 | ) | | $ | 2,876 | | | $ | 2,784 | | | $ | 13 | | | $ | 1 | | | $ | 25 | | | $ | (3 | ) | |
Net realized gain/(loss) on investments, foreign
currency transactions, forward foreign currency
exchange contracts and foreign capital gains tax | | | 73,365 | | | | 209,796 | | | | — | | | | — | | | | (20 | ) | | | (57 | ) | | | (9 | ) | | | 6 | | |
Net realized gain/(loss) on affiliated investments and
distributions from affiliated investment companies and
affiliated investment company shares | | | (12,823 | ) | | | (66,391 | ) | | | (461 | ) | | | 8,878 | | | | — | | | | — | | | | — | | | | — | | |
| Reimbursement from affiliate (See Note 4) | | | — | | | | — | | | | — | | | | — | | | | — | | | | — | | | | — | | | | — | | |
Net change in net unrealized appreciation/(depreciation)
on investments, foreign currency translations,
forward foreign currency exchange contracts and
foreign capital gains tax | | | 34,750 | | | | (347,748 | ) | | | — | | | | — | | | | 217 | | | | (135 | ) | | | 169 | | | | (86 | ) | |
Net change in net unrealized appreciation/(depreciation)
on affiliated investment companies and affiliated
investment company shares | | | 19,182 | | | | (112,603 | ) | | | 10,983 | | | | (4,866 | ) | | | — | | | | — | | | | — | | | | — | | |
| Net Increase/(Decrease) from Operations | | | 112,510 | | | | (324,918 | ) | | | 13,398 | | | | 6,796 | | | | 210 | | | | (191 | ) | | | 185 | | | | (83 | ) | |
| Distributions to Shareholders From: | |
| Net investment income – Class A | | | — | | | | (7,162 | ) | | | (201 | ) | | | (1,706 | ) | | | — | | | | — | | | | — | (c) | | | (1 | ) | |
| Net realized gain – Class A | | | (6,620 | ) | | | — | | | | — | | | | — | | | | — | | | | — | | | | — | (c) | | | — | (c) | |
| Net investment income – Class B | | | — | | | | (500 | ) | | | (8 | ) | | | (351 | ) | | | — | | | | — | | | | — | | | | — | | |
| Net realized gain – Class B | | | (386 | ) | | | — | | | | — | | | | — | | | | — | | | | — | | | | — | | | | — | | |
| Net investment income – Class C | | | — | | | | (672 | ) | | | (125 | ) | | | (405 | ) | | | — | | | | — | | | | — | (c) | | | — | (c) | |
| Net realized gain – Class C | | | (1,438 | ) | | | — | | | | — | | | | — | | | | — | | | | — | | | | — | (c) | | | — | (c) | |
| Net investment income – Class I | | | — | | | | (141 | ) | | | — | | | | — | | | | — | (c) | | | — | | | | — | (c) | | | — | (c) | |
| Net realized gain – Class I | | | (494 | ) | | | — | | | | — | | | | — | | | | — | | | | — | | | | — | (c) | | | — | (c) | |
| Net investment income – Class R5 | | | — | | | | — | | | | — | | | | — | | | | — | | | | — | | | | — | | | | — | | |
| Net investment income – Class Z | | | — | | | | (22,715 | ) | | | (182 | ) | | | (1,460 | ) | | | (2 | ) | | | — | | | | (2 | ) | | | (11 | ) | |
| Net realized gain – Class Z | | | (14,894 | ) | | | — | | | | — | | | | — | | | | — | | | | — | | | | (1 | ) | | | (3 | ) | |
| Total Distributions to Shareholders | | | (23,832 | ) | | | (31,190 | ) | | | (516 | ) | | | (3,922 | ) | | | (2 | ) | | | — | | | | (3 | ) | | | (15 | ) | |
| Share Transactions: | |
| Subscriptions – Class A | | | 27,104 | | | | 72,441 | | | | 102,772 | | | | 44,385 | | | | 1,051 | | | | 351 | | | | 63 | | | | 164 | | |
| Distributions reinvested – Class A | | | 6,159 | | | | 6,307 | | | | 180 | | | | 1,391 | | | | — | | | | — | | | | ��� | (c) | | | 1 | | |
Net assets of shares issued in connection with
Merger – Class A | | | — | | | | — | | | | — | | | | — | | | | — | | | | — | | | | — | | | | — | | |
| Redemptions – Class A | | | (91,503 | ) | | | (203,499 | ) | | | (17,032 | ) | | | (11,539 | ) | | | (86 | ) | | | (13 | ) | | | (29 | ) | | | — | | |
| Net Increase/(Decrease) – Class A | | | (58,240 | ) | | | (124,751 | ) | | | 85,920 | | | | 34,237 | | | | 965 | | | | 338 | | | | 34 | | | | 165 | | |
| Distributions reinvested – Class B (d) | | | 325 | | | | 464 | | | | 18 | | | | 381 | | | | — | | | | — | | | | — | | | | — | | |
Net assets of shares issued in connection with
Merger – Class B | | | — | | | | — | | | | — | | | | — | | | | — | | | | — | | | | — | | | | — | | |
| Redemptions – Class B | | | (13,176 | ) | | | (37,412 | ) | | | (6,155 | ) | | | (18,369 | ) | | | — | | | | — | | | | — | | | | — | | |
| Net Decrease – Class B | | | (12,851 | ) | | | (36,948 | ) | | | (6,137 | ) | | | (17,988 | ) | | | — | | | | — | | | | — | | | | — | | |
| Subscriptions – Class C | | | 1,768 | | | | 3,603 | | | | 79,175 | | | | 15,268 | | | | 79 | | | | 138 | | | | 13 | | | | 5 | | |
| Distributions reinvested – Class C | | | 1,143 | | | | 494 | | | | 89 | | | | 313 | | | | — | | | | — | | | | — | (c) | | | — | (c) | |
Net assets of shares issued in connection with
Merger – Class C | | | — | | | | — | | | | — | | | | — | | | | — | | | | — | | | | — | | | | — | | |
| Redemptions – Class C | | | (8,647 | ) | | | (23,948 | ) | | | (2,845 | ) | | | (4,725 | ) | | | — | | | | (10 | ) | | | — | | | | — | | |
| Net Increase/(Decrease) – Class C | | | (5,736 | ) | | | (19,851 | ) | | | 76,419 | | | | 10,856 | | | | 79 | | | | 128 | | | | 13 | | | | 5 | | |
| Subscriptions – Class I | | | 18,526 | | | | 12,447 | | | | — | | | | — | | | | — | | | | 5 | | | | — | | | | 5 | | |
| Distributions reinvested – Class I | | | 494 | | | | 141 | | | | — | | | | — | | | | — | (c) | | | — | | | | — | (c) | | | — | (c) | |
Net assets of shares issued in connection with
Merger – Class I | | | — | | | | — | | | | — | | | | — | | | | — | | | | — | | | | — | | | | — | | |
| Redemptions – Class I | | | (8,175 | ) | | | (8,782 | ) | | | — | | | | — | | | | — | | | | — | | | | — | | | | — | | |
| Net Increase/(Decrease) – Class I | | | 10,845 | | | | 3,806 | | | | — | | | | — | | | | — | (c) | | | 5 | | | | — | (c) | | | 5 | | |
See accompanying notes to financial statements.
91
Columbia Acorn Family of Funds
Statements of Changes in Net Assets, continued
| | | Columbia
Acorn Fund | | Columbia Acorn
International | | Columbia
Acorn USA | | Columbia Acorn
International Select | |
| Increase (Decrease) in Net Assets | | (Unaudited)
Six months
ended
June 30, | | Year ended
December 31, | | (Unaudited)
Six months
ended
June 30, | | Year ended
December 31, | | (Unaudited)
Six months
ended
June 30, | | Year ended
December 31, | | (Unaudited)
Six months
ended
June 30, | | Year ended
December 31, | |
| (in thousands) | | 2012 | | 2011 | | 2012 | | 2011 (a) | | 2012 | | 2011 | | 2012 | | 2011 | |
| Subscriptions – Class R | | | — | | | | — | | | | 356 | | | | 370 | | | | — | | | | — | | | | — | | | | — | | |
Net assets of shares issued in connection with
Merger – Class R | | | — | | | | — | | | | — | | | | 2,027 | | | | — | | | | — | | | | — | | | | — | | |
| Redemptions – Class R | | | — | | | | — | | | | (1,617 | ) | | | (77 | ) | | | — | | | | — | | | | — | | | | — | | |
| Net Increase/(Decrease) – Class R | | | — | | | | — | | | | (1,261 | ) | | | 2,320 | | | | — | | | | — | | | | — | | | | — | | |
| Subscriptions – Class R5 | | | — | | | | — | | | | — | (c) | | | 3 | | | | — | | | | — | | | | — | | | | — | | |
| Distributions reinvested – Class R5 | | | — | | | | — | | | | 2 | | | | — | | | | — | | | | — | | | | — | | | | — | | |
Net assets of shares issued in connection with
Merger – Class R5 | | | — | | | | — | | | | — | | | | 2,232 | | | | — | | | | — | | | | — | | | | — | | |
| Redemptions – Class R5 | | | — | | | | — | | | | (27 | ) | | | — | (c) | | | — | | | | — | | | | — | | | | — | | |
| Net Increase/(Decrease) – Class R5 | | | — | | | | — | | | | (25 | ) | | | 2,235 | | | | — | | | | — | | | | — | | | | — | | |
| Subscriptions – Class Z | | | 958,888 | | | | 2,172,346 | | | | 681,137 | | | | 965,616 | | | | 109,255 | | | | 349,841 | | | | 19,696 | | | | 45,936 | | |
| Distributions reinvested – Class Z | | | 133,961 | | | | 471,639 | | | | 19,181 | | | | 91,324 | | | | 2,158 | | | | 7,534 | | | | 524 | | | | 5,069 | | |
| Redemptions – Class Z | | | (1,325,932 | ) | | | (2,515,311 | ) | | | (458,986 | ) | | | (973,865 | ) | | | (204,681 | ) | | | (331,533 | ) | | | (34,101 | ) | | | (113,289 | ) | |
| Net Increase/(Decrease) – Class Z | | | (233,083 | ) | | | 128,674 | | | | 241,332 | | | | 83,075 | | | | (93,268 | ) | | | 25,842 | | | | (13,881 | ) | | | (62,284 | ) | |
| Net Increase/(Decrease) from Share Transactions | | | (476,953 | ) | | | (160,647 | ) | | | 161,772 | | | | 364,290 | | | | (124,636 | ) | | | (49,669 | ) | | | (19,858 | ) | | | (71,300 | ) | |
| Increase from regulatory settlements (See Note 7) | | | — | | | | — | | | | 108 | | | | 108 | | | | — | | | | — | | | | — | | | | — | | |
| Increase from contribution from affiliate (See Note 4) | | | — | | | | — | | | | — | | | | — | | | | — | | | | — | | | | — | | | | — | | |
| Total Increase/(Decrease) in Net Assets | | | 827,897 | | | | (1,762,137 | ) | | | 609,614 | | | | (708,110 | ) | | | 29,416 | | | | (140,101 | ) | | | 11,751 | | | | (126,284 | ) | |
| Net Assets: | |
| Beginning of period | | | 16,336,575 | | | | 18,098,712 | | | | 5,416,953 | | | | 6,125,063 | | | | 1,558,445 | | | | 1,698,546 | | | | 326,383 | | | | 452,667 | | |
| End of period | | $ | 17,164,472 | | | $ | 16,336,575 | | | $ | 6,026,567 | | | $ | 5,416,953 | | | $ | 1,587,861 | | | $ | 1,558,445 | | | $ | 338,134 | | | $ | 326,383 | | |
Undistributed (Overdistributed) Net
Investment Income | | $ | (28,080 | ) | | $ | (32,074 | ) | | $ | (36,596 | ) | | $ | (60,514 | ) | | $ | (3,403 | ) | | $ | (167 | ) | | $ | (2,516 | ) | | $ | (5,294 | ) | |
(a) Class R and Class R5 shares reflect activity for the period August 15, 2011 (commencement of operations) through December 31, 2011.
(b) For the period from August 19, 2011 (commencement of operations) to December 31, 2011.
(c) Rounds to less than $500.
See accompanying notes to financial statements.
92
| | | Columbia
Acorn Select | | Columbia
Thermostat Fund | | Columbia Acorn
Emerging Markets Fund | | Columbia Acorn
European Fund | |
| Increase (Decrease) in Net Assets | | (Unaudited)
Six months
ended
June 30, | | Year ended
December 31, | | (Unaudited)
Six months
ended
June 30, | | Year ended
December 31, | | (Unaudited)
Six months
ended
June 30, | | Year ended
December 31, | | (Unaudited)
Six months
ended
June 30, | | Year ended
December 31, | |
| (in thousands) | | 2012 | | 2011 | | 2012 | | 2011 | | 2012 | | 2011 (b) | | 2012 | | 2011 (b) | |
| Subscriptions – Class R | | | — | | | | — | | | | — | | | | — | | | | — | | | | — | | | | — | | | | — | | |
Net assets of shares issued in connection with
Merger – Class R | | | — | | | | — | | | | — | | | | — | | | | — | | | | — | | | | — | | | | — | | |
| Redemptions – Class R | | | — | | | | — | | | | — | | | | — | | | | — | | | | — | | | | — | | | | — | | |
| Net Increase/(Decrease) – Class R | | | — | | | | — | | | | — | | | | — | | | | — | | | | — | | | | — | | | | — | | |
| Subscriptions – Class R5 | | | — | | | | — | | | | — | | | | — | | | | — | | | | — | | | | — | | | | — | | |
| Distributions reinvested – Class R5 | | | — | | | | — | | | | — | | | | — | | | | — | | | | — | | | | — | | | | — | | |
Net assets of shares issued in connection with
Merger – Class R5 | | | — | | | | — | | | | — | | | | — | | | | — | | | | — | | | | — | | | | — | | |
| Redemptions – Class R5 | | | — | | | | — | | | | — | | | | — | | | | — | | | | — | | | | — | | | | — | | |
| Net Increase/(Decrease) – Class R5 | | | — | | | | — | | | | — | | | | — | | | | — | | | | — | | | | — | | | | — | | |
| Subscriptions – Class Z | | | 57,480 | | | | 177,362 | | | | 120,997 | | | | 42,102 | | | | 1,290 | | | | 2,949 | | | | 195 | | | | 1,589 | | |
| Distributions reinvested – Class Z | | | 11,596 | | | | 17,488 | | | | 116 | | | | 1,165 | | | | 2 | | | | — | | | | 3 | | | | 13 | | |
| Redemptions – Class Z | | | (283,273 | ) | | | (653,289 | ) | | | (39,753 | ) | | | (14,914 | ) | | | (1 | ) | | | — | (c) | | | — | (c) | | | — | (c) | |
| Net Increase/(Decrease) – Class Z | | | (214,197 | ) | | | (458,439 | ) | | | 81,360 | | | | 28,353 | | | | 1,291 | | | | 2,949 | | | | 198 | | | | 1,602 | | |
| Net Increase/(Decrease) from Share Transactions | | | (280,179 | ) | | | (636,183 | ) | | | 237,562 | | | | 55,458 | | | | 2,335 | | | | 3,420 | | | | 245 | | | | 1,777 | | |
| Increase from regulatory settlements (See Note 7) | | | — | | | | — | | | | — | | | | — | | | | — | | | | — | | | | — | | | | — | | |
| Increase from contribution from affiliate (See Note 4) | | | — | | | | 57 | | | | — | | | | — | | | | — | | | | — | | | | — | | | | — | | |
| Total Increase/(Decrease) in Net Assets | | | (191,501 | ) | | | (992,234 | ) | | | 250,444 | | | | 58,332 | | | | 2,543 | | | | 3,229 | | | | 427 | | | | 1,679 | | |
| Net Assets: | |
| Beginning of period | | | 1,290,621 | | | | 2,282,855 | | | | 189,607 | | | | 131,275 | | | | 3,229 | | | | — | | | | 1,679 | | | | — | | |
| End of period | | $ | 1,099,120 | | | $ | 1,290,621 | | | $ | 440,051 | | | $ | 189,607 | | | $ | 5,772 | | | $ | 3,229 | | | $ | 2,106 | | | $ | 1,679 | | |
Undistributed (Overdistributed) Net
Investment Income | | $ | (2,288 | ) | | $ | (324 | ) | | $ | 2,831 | | | $ | 471 | | | $ | 10 | | | $ | (1 | ) | | $ | 23 | | | $ | — | (c) | |
See accompanying notes to financial statements.
93
Columbia Acorn Family of Funds
Statements of Changes in Net Assets, continued
| | | Columbia
Acorn Fund | | Columbia Acorn
International | | Columbia
Acorn USA | | Columbia Acorn
International Select | |
| Changes in Shares of Beneficial Interest: | | (Unaudited)
Six months
ended
June 30, | | Year ended
December 31, | | (Unaudited)
Six months
ended
June 30, | | Year ended
December 31, | | (Unaudited)
Six months
ended
June 30, | | Year ended
December 31, | | (Unaudited)
Six months
ended
June 30, | | Year ended
December 31, | |
| (in thousands) | | 2012 | | 2011 | | 2012 | | 2011 (a) | | 2012 | | 2011 | | 2012 | | 2011 | |
| Subscriptions – Class A | | | 9,628 | | | | 30,309 | | | | 2,671 | | | | 7,713 | | | | 391 | | | | 1,507 | | | | 274 | | | | 666 | | |
Shares issued in reinvestment and capital
gains – Class A | | | 1,388 | | | | 4,849 | | | | 40 | | | | 463 | | | | 9 | | | | 38 | | | | 9 | | | | 78 | | |
| Shares issued in connection with merger – Class A | | | — | | | | — | | | | — | | | | 5,467 | | | | — | | | | — | | | | — | | | | — | | |
| Less shares redeemed – Class A | | | (18,258 | ) | | | (37,725 | ) | | | (4,553 | ) | | | (6,592 | ) | | | (1,318 | ) | | | (2,879 | ) | | | (454 | ) | | | (980 | ) | |
| Net Increase/(Decrease) – Class A | | | (7,242 | ) | | | (2,567 | ) | | | (1,842 | ) | | | 7,051 | | | | (918 | ) | | | (1,334 | ) | | | (171 | ) | | | (236 | ) | |
Shares issued in reinvestment and capital
gains – Class B (d) | | | 25 | | | | 185 | | | | — | | | | 14 | | | | — | (c) | | | 1 | | | | — | (c) | | | 2 | | |
| Shares issued in connection with merger – Class B | | | — | | | | — | | | | — | | | | 343 | | | | — | | | | — | | | | — | | | | — | | |
| Less shares redeemed – Class B | | | (1,030 | ) | | | (8,046 | ) | | | (151 | ) | | | (353 | ) | | | (32 | ) | | | (267 | ) | | | (23 | ) | | | (39 | ) | |
| Net Increase/(Decrease) – Class B | | | (1,005 | ) | | | (7,861 | ) | | | (151 | ) | | | 4 | | | | (32 | ) | | | (266 | ) | | | (23 | ) | | | (37 | ) | |
| Subscriptions – Class C | | | 1,516 | | | | 3,779 | | | | 134 | | | | 519 | | | | 34 | | | | 90 | | | | 14 | | | | 36 | | |
Shares issued in reinvestment and capital
gains – Class C | | | 325 | | | | 1,086 | | | | — | | | | 46 | | | | 2 | | | | 8 | | | | 1 | | | | 8 | | |
| Shares issued in connection with merger – Class C | | | — | | | | — | | | | — | | | | 703 | | | | — | | | | — | | | | — | | | | — | | |
| Less shares redeemed – Class C | | | (2,746 | ) | | | (5,913 | ) | | | (484 | ) | | | (1,110 | ) | | | (107 | ) | | | (231 | ) | | | (52 | ) | | | (115 | ) | |
| Net Increase/(Decrease) – Class C | | | (905 | ) | | | (1,048 | ) | | | (350 | ) | | | 158 | | | | (71 | ) | | | (133 | ) | | | (37 | ) | | | (71 | ) | |
| Subscriptions – Class I | | | 901 | | | | 639 | | | | 1,013 | | | | 764 | | | | 70 | | | | 371 | | | | — | | | | — | | |
Shares issued in reinvestment and capital
gains – Class I | | | 15 | | | | 25 | | | | 11 | | | | 17 | | | | — | (c) | | | 1 | | | | — | | | | — | | |
| Shares issued in connection with merger – Class I | | | — | | | | — | | | | — | | | | 4,062 | | | | — | | | | — | | | | — | | | | — | | |
| Less shares redeemed – Class I | | | (413 | ) | | | (454 | ) | | | (797 | ) | | | (5,004 | ) | | | (147 | ) | | | (1,289 | ) | | | — | | | | — | | |
| Net Increase/(Decrease) – Class I | | | 503 | | | | 210 | | | | 227 | | | | (161 | ) | | | (77 | ) | | | (917 | ) | | | — | | | | — | | |
| Subscriptions – Class R | | | — | | | | — | | | | 10 | | | | 10 | | | | — | | | | — | | | | — | | | | — | | |
| Shares issued in connection with merger – Class R | | | — | | | | — | | | | — | | | | 54 | | | | — | | | | — | | | | — | | | | — | | |
| Less shares redeemed – Class R | | | — | | | | — | | | | (46 | ) | | | (2 | ) | | | — | | | | — | | | | — | | | | — | | |
| Net Increase/(Decrease) – Class R | | | — | | | | — | | | | (36 | ) | | | 62 | | | | — | | | | — | | | | — | | | | — | | |
| Subscriptions – Class R5 | | | — | | | | — | | | | — | (c) | | | — | (c) | | | — | | | | — | | | | — | | | | — | | |
Shares issued in reinvestment and capital
gains – Class R5 | | | — | | | | — | | | | — | (c) | | | — | | | | — | | | | — | | | | — | | | | — | | |
| Shares issued in connection with merger – Class R5 | | | — | | | | — | | | | — | | | | 59 | | | | — | | | | — | | | | — | | | | — | | |
| Less shares redeemed – Class R5 | | | — | | | | — | | | | — | (c) | | | — | | | | — | | | | — | | | | — | | | | — | | |
| Net Increase – Class R5 | | | — | | | | — | | | | — | (c) | | | 59 | | | | — | | | | — | | | | — | | | | — | | |
| Subscriptions – Class Z | | | 31,901 | | | | 72,817 | | | | 18,269 | | | | 24,482 | | | | 3,627 | | | | 12,164 | | | | 743 | | | | 1,655 | | |
Shares issued in reinvestment and capital
gains – Class Z | | | 4,605 | | | | 16,442 | | | | 535 | | | | 2,222 | | | | 75 | | | | 274 | | | | 20 | | | | 192 | | |
| Less shares redeemed – Class Z | | | (43,613 | ) | | | (85,040 | ) | | | (12,206 | ) | | | (25,537 | ) | | | (6,966 | ) | | | (11,564 | ) | | | (1,298 | ) | | | (4,157 | ) | |
| Net Increase/(Decrease) – Class Z | | | (7,107 | ) | | | 4,219 | | | | 6,598 | | | | 1,167 | | | | (3,264 | ) | | | 874 | | | | (535 | ) | | | (2,310 | ) | |
| Net Increase/(Decrease) in Shares of Beneficial Interest | | | (15,756 | ) | | | (7,047 | ) | | | 4,446 | | | | 8,340 | | | | (4,362 | ) | | | (1,776 | ) | | | (766 | ) | | | (2,654 | ) | |
(a) Class R and Class R5 shares reflect activity for the period August 15, 2011 (commencement of operations) through December 31, 2011.
(b) For the period from August 19, 2011 (commencement of operations) to December 31, 2011.
(c) Rounds to less than 500 shares.
(d) Presentation for fiscal year 2011 has been changed to conform to that of the current year.
See accompanying notes to financial statements.
94
| | | Columbia
Acorn Select | | Columbia
Thermostat Fund | | Columbia Acorn
Emerging Markets Fund | | Columbia Acorn
European Fund | |
| Changes in Shares of Beneficial Interest: | | (Unaudited)
Six months
ended
June 30, | | Year ended
December 31, | | (Unaudited)
Six months
ended
June 30, | | Year ended
December 31, | | (Unaudited)
Six months
ended
June 30, | | Year ended
December 31, | | (Unaudited)
Six months
ended
June 30, | | Year ended
December 31, | |
| (in thousands) | | 2012 | | 2011 | | 2012 | | 2011 | | 2012 | | 2011 (b) | | 2012 | | 2011 (b) | |
| Subscriptions – Class A | | | 1,056 | | | | 2,804 | | | | 7,563 | | | | 3,467 | | | | 97 | | | | 37 | | | | 6 | | | | 16 | | |
Shares issued in reinvestment and capital
gains – Class A | | | 256 | | | | 242 | | | | 13 | | | | 109 | | | | — | | | | — | | | | — | (c) | | | — | (c) | |
| Shares issued in connection with merger – Class A | | | — | | | | — | | | | — | | | | — | | | | — | | | | — | | | | — | | | | — | | |
| Less shares redeemed – Class A | | | (3,581 | ) | | | (8,092 | ) | | | (1,260 | ) | | | (898 | ) | | | (8 | ) | | | (1 | ) | | | (3 | ) | | | — | | |
| Net Increase/(Decrease) – Class A | | | (2,269 | ) | | | (5,046 | ) | | | 6,316 | | | | 2,678 | | | | 89 | | | | 36 | | | | 3 | | | | 16 | | |
Shares issued in reinvestment and capital
gains – Class B (d) | | | 14 | | | | 19 | | | | 1 | | | | 30 | | | | — | | | | — | | | | — | | | | — | | |
| Shares issued in connection with merger – Class B | | | — | | | | — | | | | — | | | | — | | | | — | | | | — | | | | — | | | | — | | |
| Less shares redeemed – Class B | | | (551 | ) | | | (1,569 | ) | | | (453 | ) | | | (1,427 | ) | | | — | | | | — | | | | — | | | | — | | |
| Net Increase/(Decrease) – Class B | | | (537 | ) | | | (1,550 | ) | | | (452 | ) | | | (1,397 | ) | | | — | | | | — | | | | — | | | | — | | |
| Subscriptions – Class C | | | 75 | | | | 145 | | | | 5,788 | | | | 1,196 | | | | 7 | | | | 15 | | | | 1 | | | | 1 | | |
Shares issued in reinvestment and capital
gains – Class C | | | 52 | | | | 21 | | | | 7 | | | | 24 | | | | — | | | | — | | | | — | (c) | | | — | (c) | |
| Shares issued in connection with merger – Class C | | | — | | | | — | | | | — | | | | — | | | | — | | | | — | | | | — | | | | — | | |
| Less shares redeemed – Class C | | | (365 | ) | | | (1,011 | ) | | | (210 | ) | | | (368 | ) | | | — | | | | (1 | ) | | | — | | | | — | | |
| Net Increase/(Decrease) – Class C | | | (238 | ) | | | (845 | ) | | | 5,585 | | | | 852 | | | | 7 | | | | 14 | | | | 1 | | | | 1 | | |
| Subscriptions – Class I | | | 708 | | | | 520 | | | | — | | | | — | | | | — | | | | 1 | | | | — | | | | 1 | | |
Shares issued in reinvestment and capital
gains – Class I | | | 20 | | | | 5 | | | | — | | | | — | | | | — | | | | — | | | | — | (c) | | | — | (c) | |
| Shares issued in connection with merger – Class I | | | — | | | | — | | | | — | | | | — | | | | — | | | | — | | | | — | | | | — | | |
| Less shares redeemed – Class I | | | (319 | ) | | | (335 | ) | | | — | | | | — | | | | — | | | | — | | | | — | | | | — | | |
| Net Increase/(Decrease) – Class I | | | 409 | | | | 190 | | | | — | | | | — | | | | — | | | | 1 | | | | — | (c) | | | 1 | | |
| Subscriptions – Class R | | | — | | | | — | | | | — | | | | — | | | | — | | | | — | | | | — | | | | — | | |
| Shares issued in connection with merger – Class R | | | — | | | | — | | | | — | | | | — | | | | — | | | | — | | | | — | | | | — | | |
| Less shares redeemed – Class R | | | — | | | | — | | | | — | | | | — | | | | — | | | | — | | | | — | | | | — | | |
| Net Increase/(Decrease) – Class R | | | — | | | | — | | | | — | | | | — | | | | — | | | | — | | | | — | | | | — | | |
| Subscriptions – Class R5 | | | — | | | | — | | | | — | | | | — | | | | — | | | | — | | | | — | | | | — | | |
Shares issued in reinvestment and capital
gains – Class R5 | | | — | | | | — | | | | — | | | | — | | | | — | | | | — | | | | — | | | | — | | |
| Shares issued in connection with merger – Class R5 | | | — | | | | — | | | | — | | | | — | | | | — | | | | — | | | | — | | | | — | | |
| Less shares redeemed – Class R5 | | | — | | | | — | | | | — | | | | — | | | | — | | | | — | | | | — | | | | — | | |
| Net Increase – Class R5 | | | — | | | | — | | | | — | | | | — | | | | — | | | | — | | | | — | | | | — | | |
| Subscriptions – Class Z | | | 2,182 | | | | 6,576 | | | | 8,991 | | | | 3,338 | | | | 122 | | | | 298 | | | | 17 | | | | 159 | | |
Shares issued in reinvestment and capital
gains – Class Z | | | 467 | | | | 654 | | | | 9 | | | | 92 | | | | — | (c) | | | — | | | | — | (c) | | | 2 | | |
| Less shares redeemed – Class Z | | | (10,647 | ) | | | (25,141 | ) | | | (2,944 | ) | | | (1,192 | ) | | | — | (c) | | | — | (c) | | | — | (c) | | | — | (c) | |
| Net Increase/(Decrease) – Class Z | | | (7,998 | ) | | | (17,911 | ) | | | 6,056 | | | | 2,238 | | | | 122 | | | | 298 | | | | 17 | | | | 161 | | |
| Net Increase/(Decrease) in Shares of Beneficial Interest | | | (10,633 | ) | | | (25,162 | ) | | | 17,505 | | | | 4,371 | | | | 218 | | | | 349 | | | | 21 | | | | 179 | | |
See accompanying notes to financial statements.
95
Columbia Acorn Family of Funds
Financial Highlights
Columbia Acorn Fund
| Class Z Shares | | (Unaudited)
Six months
ended June 30, | | Year ended December 31, | |
| Selected data for a share outstanding throughout each period | | 2012 | | 2011 | | 2010 | | 2009 | | 2008 | | 2007 | |
| Net Asset Value, Beginning of Period | | $ | 27.56 | | | $ | 30.19 | | | $ | 24.68 | | | $ | 17.71 | | | $ | 29.61 | | | $ | 29.71 | | |
| Income from Investment Operations | |
| Net investment income/(loss) (a) | | | 0.02 | | | | (0.01 | ) | | | 0.02 | | | | 0.04 | | | | 0.06 | | | | 0.15 | (b) | |
| Net realized and unrealized gain/(loss) | | | 2.52 | | | | (1.34 | ) | | | 6.37 | | | | 6.98 | | | | (11.29 | ) | | | 2.17 | | |
| Total from Investment Operations | | | 2.54 | | | | (1.35 | ) | | | 6.39 | | | | 7.02 | | | | (11.23 | ) | | | 2.32 | | |
| Less Distributions to Shareholders | |
| From net investment income | | | — | | | | (0.09 | ) | | | (0.04 | ) | | | (0.05 | ) | | | (0.01 | ) | | | (0.12 | ) | |
| From net realized gains | | | (0.36 | ) | | | (1.19 | ) | | | (0.84 | ) | | | — | | | | (0.66 | ) | | | (2.30 | ) | |
| Total Distributions to Shareholders | | | (0.36 | ) | | | (1.28 | ) | | | (0.88 | ) | | | (0.05 | ) | | | (0.67 | ) | | | (2.42 | ) | |
| Increase from regulatory settlements | | | — | | | | — | | | | 0.00 | (c) | | | 0.00 | (c) | | | — | | | | — | | |
| Net Asset Value, End of Period | | $ | 29.74 | | | $ | 27.56 | | | $ | 30.19 | | | $ | 24.68 | | | $ | 17.71 | | | $ | 29.61 | | |
| Total Return (d) | | | 9.23 | %(e) | | | (4.61 | )% | | | 26.00 | % | | | 39.65 | % | | | (38.55 | )% | | | 7.69 | %(f)(g) | |
| Ratios to Average Net Assets/Supplemental Data | |
| Net expenses | | | 0.76 | %(h) | | | 0.76 | %(i) | | | 0.76 | %(i) | | | 0.77 | %(i) | | | 0.76 | %(i) | | | 0.74 | %(i) | |
| Net investment income/(loss) | | | 0.15 | %(h) | | | (0.03 | )%(i) | | | 0.09 | %(i) | | | 0.18 | %(i) | | | 0.26 | %(i) | | | 0.46 | %(i) | |
| Waiver/Reimbursement | | | — | | | | — | | | | — | | | | — | | | | — | | | | 0.00 | %(j) | |
| Portfolio turnover rate | | | 8 | %(e) | | | 18 | % | | | 28 | % | | | 27 | % | | | 21 | % | | | 20 | % | |
| Net assets at end of period (in millions) | | $ | 13,047 | | | $ | 12,285 | | | $ | 13,330 | | | $ | 10,527 | | | $ | 7,446 | | | $ | 13,038 | | |
(a) Per share data was calculated using the average shares outstanding during the period.
(b) Net investment income per share includes special dividends. The effect of these dividends amounted to $0.03 per share.
(c) Rounds to less than $0.01 per share.
(d) Total return at net asset value assuming all distributions reinvested.
(e) Not annualized.
(f) Had the Investment Manager and/or Transfer Agent not waived fees and/or reimbursed a portion of expenses, total return would have been reduced.
(g) Total return includes a voluntary reimbursement by the Investment Manager for a realized investment loss due to a trading error. This reimbursement increased total return and net asset value per share by less than 0.01% and less than $0.01, respectively.
(h) Annualized.
(i) The benefits derived from custody fees paid indirectly had an impact of less than 0.01%.
(j) Rounds to less than 0.01%.
See accompanying notes to financial statements.
Columbia Acorn International
| Class Z Shares | | (Unaudited)
Six months
ended June 30, | | Year ended December 31, | |
| Selected data for a share outstanding throughout each period | | 2012 | | 2011 | | 2010 | | 2009 | | 2008 | | 2007 | |
| Net Asset Value, Beginning of Period | | $ | 34.31 | | | $ | 40.92 | | | $ | 34.26 | | | $ | 23.13 | | | $ | 43.60 | | | $ | 40.31 | | |
| Income from Investment Operations | |
| Net investment income (a) | | | 0.34 | | | | 0.48 | | | | 0.35 | | | | 0.34 | | | | 0.60 | | | | 0.43 | | |
| Net realized and unrealized gain/(loss) | | | 2.65 | | | | (6.07 | ) | | | 7.23 | | | | 11.31 | | | | (20.26 | ) | | | 6.56 | | |
| Reimbursement from affiliate | | | — | | | | 0.00 | (b) | | | — | | | | — | | | | — | | | | — | | |
| Total from Investment Operations | | | 2.99 | | | | (5.59 | ) | | | 7.58 | | | | 11.65 | | | | (19.66 | ) | | | 6.99 | | |
| Less Distributions to Shareholders | |
| From net investment income | | | (0.20 | ) | | | (1.02 | ) | | | (0.92 | ) | | | (0.53 | ) | | | (0.21 | ) | | | (0.34 | ) | |
| From net realized gains | | | — | | | | — | | | | — | | | | — | | | | (0.60 | ) | | | (3.36 | ) | |
| Total Distributions to Shareholders | | | (0.20 | ) | | | (1.02 | ) | | | (0.92 | ) | | | (0.53 | ) | | | (0.81 | ) | | | (3.70 | ) | |
| Redemption fees added to paid in capital (a) | | | — | | | | — | | | | 0.00 | (b) | | | 0.00 | (b) | | | 0.00 | (b) | | | 0.00 | (b) | |
| Increase from regulatory settlements | | | 0.00 | (b) | | | 0.00 | (b) | | | 0.00 | (b) | | | 0.01 | | | | — | | | | — | | |
| Net Asset Value, End of Period | | $ | 37.10 | | | $ | 34.31 | | | $ | 40.92 | | | $ | 34.26 | | | $ | 23.13 | | | $ | 43.60 | | |
| Total Return (c) | | | 8.72 | %(d) | | | (14.06 | )%(e) | | | 22.70 | % | | | 50.97 | % | | | (45.89 | )% | | | 17.28 | %(f) | |
| Ratios to Average Net Assets/Supplemental Data | |
| Net expenses | | | 0.91 | %(g) | | | 0.95 | %(h) | | | 0.97 | %(h) | | | 0.99 | %(h) | | | 0.96 | %(h) | | | 0.91 | %(h) | |
| Net investment income | | | 1.80 | %(g) | | | 1.24 | %(h) | | | 0.99 | %(h) | | | 1.23 | %(h) | | | 1.72 | %(h) | | | 0.96 | %(h) | |
| Waiver/Reimbursement | | | — | | | | — | | | | — | | | | — | | | | — | | | | 0.00 | %(i) | |
| Portfolio turnover rate | | | 18 | %(d) | | | 32 | % | | | 25 | % | | | 31 | % | | | 38 | % | | | 28 | % | |
| Net assets at end of period (in millions) | | $ | 4,920 | | | $ | 4,323 | | | $ | 5,108 | | | $ | 3,728 | | | $ | 2,372 | | | $ | 4,918 | | |
(a) Per share data was calculated using the average shares outstanding during the period.
(b) Rounds to less than $0.01 per share.
(c) Total return at net asset value assuming all distributions reinvested.
(d) Not annualized.
(e) During the year ended December 31, 2011, Columbia Management reimbursed the Fund for a loss on a trading error. Had the Fund not received this reimbursement total return would have been lower by less than 0.01%.
(f) Had the Investment Manager and/or Transfer Agent not waived fees and/or reimbursed a portion of expenses, total return would have been reduced.
(g) Annualized.
(h) The benefits derived from custody fees paid indirectly had an impact of less than 0.01%.
(i) Rounds to less than 0.01%.
96
Columbia Acorn USA
| Class Z Shares | | (Unaudited)
Six months
ended June 30, | | Year ended December 31, | |
| Selected data for a share outstanding throughout each period | | 2012 | | 2011 | | 2010 | | 2009 | | 2008 | | 2007 | |
| Net Asset Value, Beginning of Period | | $ | 26.98 | | | $ | 28.56 | | | $ | 23.19 | | | $ | 16.39 | | | $ | 27.97 | | | $ | 28.66 | | |
| Income from Investment Operations | |
| Net investment loss (a) | | | (0.05 | ) | | | (0.14 | ) | | | (0.08 | ) | | | (0.07 | ) | | | (0.07 | ) | | | (0.01 | )(b) | |
| Net realized and unrealized gain/(loss) | | | 2.84 | | | | (1.27 | ) | | | 5.45 | | | | 6.87 | | | | (10.55 | ) | | | 1.03 | | |
| Total from Investment Operations | | | 2.79 | | | | (1.41 | ) | | | 5.37 | | | | 6.80 | | | | (10.62 | ) | | | 1.02 | | |
| Less Distributions to Shareholders | |
| From net realized gains | | | (0.05 | ) | | | (0.17 | ) | | | — | | | | — | | | | (0.96 | ) | | | (1.71 | ) | |
| Total Distributions to Shareholders | | | (0.05 | ) | | | (0.17 | ) | | | — | | | | — | | | | (0.96 | ) | | | (1.71 | ) | |
| Increase from regulatory settlements | | | — | | | | — | | | | — | | | | 0.00 | (c) | | | — | | | | — | | |
| Net Asset Value, End of Period | | $ | 29.72 | | | $ | 26.98 | | | $ | 28.56 | | | $ | 23.19 | | | $ | 16.39 | | | $ | 27.97 | | |
| Total Return (d) | | | 10.35 | %(e) | | | (4.95 | )% | | | 23.16 | % | | | 41.49 | % | | | (39.22 | )% | | | 3.46 | %(f)(g) | |
| Ratios to Average Net Assets/Supplemental Data | |
| Net expenses | | | 1.04 | %(h) | | | 1.00 | %(i) | | | 1.01 | %(i) | | | 1.03 | %(i) | | | 1.01 | %(i) | | | 0.98 | %(i) | |
| Net investment loss | | | (0.34 | )%(h) | | | (0.48 | )%(i) | | | (0.34 | )%(i) | | | (0.36 | )%(i) | | | (0.32 | )%(i) | | | (0.03 | )%(i) | |
| Waiver/Reimbursement | | | — | | | | — | | | | — | | | | — | | | | — | | | | 0.00 | %(j) | |
| Portfolio turnover rate | | | 8 | %(e) | | | 20 | % | | | 32 | % | | | 28 | % | | | 23 | % | | | 21 | % | |
| Net assets at end of period (in millions) | | $ | 1,396 | | | $ | 1,356 | | | $ | 1,410 | | | $ | 1,158 | | | $ | 758 | | | $ | 1,214 | | |
(a) Per share data was calculated using the average shares outstanding during the period.
(b) Net investment income per share includes special dividends. The effect of these dividends amounted to $0.09 per share.
(c) Rounds to less than $0.01 per share.
(d) Total return at net asset value assuming all distributions reinvested and no initial sales charge or contingent deferred sales charge.
(e) Not annualized.
(f) Had the Investment Manager and/or Transfer Agent not waived fees and/or reimbursed a portion of expenses, total return would have been reduced.
(g) Total return includes a voluntary reimbursement by the Investment Manager for a realized investment loss due to a trading error. This reimbursement increased total return and net asset value per share by less than 0.01% and less than $0.01, respectively.
(h) Annualized.
(i) The benefits derived from custody fees paid indirectly had an impact of less than 0.01%.
(j) Rounds to less than 0.01%.
Columbia Acorn International Select
| Class Z Shares | | (Unaudited)
Six months
ended June 30, | | Year ended December 31, | |
| Selected data for a share outstanding throughout each period | | 2012 | | 2011 | | 2010 | | 2009 | | 2008 | | 2007 | |
| Net Asset Value, Beginning of Period | | $ | 24.46 | | | $ | 28.33 | | | $ | 23.64 | | | $ | 18.19 | | | $ | 32.02 | | | $ | 27.97 | | |
| Income from Investment Operations | |
| Net investment income (a) | | | 0.23 | | | | 0.29 | | | | 0.18 | | | | 0.17 | | | | 0.28 | | | | 0.14 | (b) | |
| Net realized and unrealized gain/(loss) | | | 2.31 | | | | (2.98 | ) | | | 4.89 | | | | 5.50 | | | | (13.53 | ) | | | 5.96 | | |
| Total from Investment Operations | | | 2.54 | | | | (2.69 | ) | | | 5.07 | | | | 5.67 | | | | (13.25 | ) | | | 6.10 | | |
| Less Distributions to Shareholders | |
| From net investment income | | | — | | | | (0.79 | ) | | | (0.38 | ) | | | (0.24 | ) | | | (0.04 | ) | | | (0.28 | ) | |
| From net realized gains | | | (0.12 | ) | | | (0.39 | ) | | | — | | | | — | | | | (0.54 | ) | | | (1.77 | ) | |
| Total Distributions to Shareholders | | | (0.12 | ) | | | (1.18 | ) | | | (0.38 | ) | | | (0.24 | ) | | | (0.58 | ) | | | (2.05 | ) | |
| Redemption fees added to paid in capital (a) | | | — | | | | — | | | | 0.00 | (c) | | | 0.00 | (c) | | | 0.00 | (c) | | | 0.00 | (c) | |
| Increase from regulatory settlements | | | — | | | | — | | | | 0.00 | (c) | | | 0.02 | | | | — | | | | — | | |
| Net Asset Value, End of Period | | $ | 26.88 | | | $ | 24.46 | | | $ | 28.33 | | | $ | 23.64 | | | $ | 18.19 | | | $ | 32.02 | | |
| Total Return (d) | | | 10.39 | %(e) | | | (9.76 | )% | | | 21.89 | % | | | 31.52 | % | | | (42.10 | )% | | | 21.86 | %(f) | |
| Ratios to Average Net Assets/Supplemental Data | |
| Net expenses | | | 1.18 | %(g) | | | 1.14 | %(h) | | | 1.16 | %(h) | | | 1.20 | %(h) | | | 1.21 | %(h) | | | 1.18 | %(h) | |
| Net investment income | | | 1.75 | %(g) | | | 1.03 | %(h) | | | 0.75 | %(h) | | | 0.84 | %(h) | | | 1.09 | %(h) | | | 0.44 | %(h) | |
| Waiver/Reimbursement | | | — | | | | — | | | | — | | | | — | | | | — | | | | 0.00 | %(i) | |
| Portfolio turnover rate | | | 29 | %(e) | | | 44 | % | | | 42 | % | | | 56 | % | | | 68 | % | | | 57 | % | |
| Net assets at end of period (in millions) | | $ | 271 | | | $ | 260 | | | $ | 366 | | | $ | 331 | | | $ | 186 | | | $ | 204 | | |
(a) Per share data was calculated using the average shares outstanding during the period.
(b) Net investment income per share includes special dividends. The effect of these dividends amounted to $0.07 per share.
(c) Rounds to less than $0.01 per share.
(d) Total return at net asset value assuming all distributions reinvested.
(e) Not annualized.
(f) Had the Investment Manager and/or Transfer Agent not waived fees and/or reimbursed a portion of expenses, total return would have been reduced.
(g) Annualized.
(h) The benefits derived from custody fees paid indirectly had an impact of less than 0.01%.
(i) Rounds to less than 0.01%.
See accompanying notes to financial statements.
97
Columbia Acorn Family of Funds
Financial Highlights, continued
Columbia Acorn Select
| Class Z Shares | | (Unaudited)
Six months
ended June 30, | | Year ended December 31, | |
| Selected data for a share outstanding throughout each period | | 2012 | | 2011 | | 2010 | | 2009 | | 2008 | | 2007 | |
| Net Asset Value, Beginning of Period | | $ | 23.62 | | | $ | 28.73 | | | $ | 23.38 | | | $ | 14.07 | | | $ | 28.41 | | | $ | 26.59 | | |
| Income from Investment Operations | |
| Net investment loss (a) | | | (0.02 | ) | | | (0.07 | ) | | | (0.10 | ) | | | (0.08 | ) | | | (0.12 | ) | | | (0.07 | ) | |
| Net realized and unrealized gain/(loss) | | | 1.85 | | | | (4.58 | ) | | | 5.45 | | | | 9.39 | | | | (13.53 | ) | | | 2.53 | | |
| Reimbursement from affiliate | | | — | | | | 0.00 | (b) | | | — | | | | — | | | | — | | | | — | | |
| Total from Investment Operations | | | 1.83 | | | | (4.65 | ) | | | 5.35 | | | | 9.31 | | | | (13.65 | ) | | | 2.46 | | |
| Less Distributions to Shareholders | |
| From net investment income | | | — | | | | (0.46 | ) | | | — | | | | — | | | | — | | | | — | | |
| From net realized gains | | | (0.53 | ) | | | — | | | | — | | | | — | | | | (0.69 | ) | | | (0.64 | ) | |
| Total Distributions to Shareholders | | | (0.53 | ) | | | (0.46 | ) | | | — | | | | — | | | | (0.69 | ) | | | (0.64 | ) | |
| Net Asset Value, End of Period | | $ | 24.92 | | | $ | 23.62 | | | $ | 28.73 | | | $ | 23.38 | | | $ | 14.07 | | | $ | 28.41 | | |
| Total Return (c) | | | 7.76 | %(d) | | | (16.37 | )%(e) | | | 22.88 | % | | | 66.17 | % | | | (49.18 | )%(f) | | | 9.20 | %(g) | |
| Ratios to Average Net Assets/Supplemental Data | |
| Net expenses before interest expense | | | 1.02 | %(h) | | | 0.97 | %(i) | | | 0.97 | %(i) | | | 0.99 | %(i) | | | 0.95 | %(i) | | | 0.91 | %(i) | |
| Interest expense | | | 0.00 | %(h)(j) | | | — | | | | — | | | | — | | | | — | | | | — | | |
| Net expenses | | | 1.02 | %(h) | | | 0.97 | %(i) | | | 0.97 | %(i) | | | 0.99 | %(i) | | | 0.95 | %(i) | | | 0.91 | %(i) | |
| Net investment loss | | | (0.16 | )%(h) | | | (0.28 | )%(i) | | | (0.41 | )%(i) | | | (0.47 | )%(i) | | | (0.51 | )%(i) | | | (0.24 | )%(i) | |
| Waiver/Reimbursement | | | — | | | | — | | | | — | | | | — | | | | — | | | | 0.00 | %(j) | |
| Portfolio turnover rate | | | 8 | %(d) | | | 21 | % | | | 28 | % | | | 19 | % | | | 28 | % | | | 14 | % | |
| Net assets at end of period (in millions) | | $ | 698 | | | $ | 850 | | | $ | 1,549 | | | $ | 1,241 | | | $ | 780 | | | $ | 1,571 | | |
(a) Per share data was calculated using the average shares outstanding during the period.
(b) Rounds to less than $0.01 per share.
(c) Total return at net asset value assuming all distributions reinvested.
(d) Not annualized.
(e) During the year ended December 31, 2011, the Fund received a reimbursement by an affiliate. Had the Fund not received this payment, the total return would have been lower by 0.01%.
(f) Total return includes a voluntary reimbursement by the Investment Manager for a realized investment loss due to a trading error. This reimbursement increased total return and net asset value per share by less than 0.01% and less than $0.01, respectively.
(g) Had the Investment Manager and/or Transfer Agent not waived fees and/or reimbursed a portion of expenses, total return would have been reduced.
(h) Annualized.
(i) The benefits derived from custody fees paid indirectly had an impact of less than 0.01%.
(j) Rounds to less than 0.01%.
Columbia Thermostat Fund
| Class Z Shares | | (Unaudited)
Six months
ended June 30, | | Year ended December 31, | |
| Selected data for a share outstanding throughout each period | | 2012 | | 2011 | | 2010 | | 2009 | | 2008 | | 2007 | |
| Net Asset Value, Beginning of Period | | $ | 12.67 | | | $ | 12.44 | | | $ | 10.80 | | | $ | 8.19 | | | $ | 12.26 | | | $ | 12.57 | | |
| Income from Investment Operations | |
| Net investment income (a) | | | 0.15 | | | | 0.31 | | | | 0.21 | | | | 0.13 | | | | 0.24 | | | | 0.52 | | |
| Net realized and unrealized gain/(loss) | | | 0.71 | | | | 0.29 | | | | 1.66 | | | | 2.51 | | | | (3.96 | ) | | | 0.53 | | |
| Total from Investment Operations | | | 0.86 | | | | 0.60 | | | | 1.87 | | | | 2.64 | | | | (3.72 | ) | | | 1.05 | | |
| Less Distributions to Shareholders | |
| From net investment income | | | (0.02 | ) | | | (0.37 | ) | | | (0.23 | ) | | | (0.03 | ) | | | (0.28 | ) | | | (0.57 | ) | |
| From net realized gains | | | — | | | | — | | | | — | | | | — | | | | (0.07 | ) | | | (0.79 | ) | |
| Total Distributions to Shareholders | | | (0.02 | ) | | | (0.37 | ) | | | (0.23 | ) | | | (0.03 | ) | | | (0.35 | ) | | | (1.36 | ) | |
| Net Asset Value, End of Period | | $ | 13.51 | | | $ | 12.67 | | | $ | 12.44 | | | $ | 10.80 | | | $ | 8.19 | | | $ | 12.26 | | |
| Total Return (b)(c) | | | 6.77 | %(d) | | | 4.85 | % | | | 17.58 | % | | | 32.29 | % | | | (30.53 | )% | | | 8.49 | % | |
| Ratios to Average Net Assets/Supplemental Data | |
| Net expenses (e) | | | 0.25 | %(f) | | | 0.25 | %(g) | | | 0.25 | %(g) | | | 0.25 | %(g) | | | 0.25 | %(g) | | | 0.25 | %(g) | |
| Net investment income | | | 2.20 | %(f) | | | 2.43 | %(g) | | | 1.87 | %(g) | | | 1.48 | %(g) | | | 2.23 | %(g) | | | 4.05 | %(g) | |
| Waiver/Reimbursement | | | 0.05 | %(f) | | | 0.09 | % | | | 0.12 | % | | | 0.14 | % | | | 0.08 | % | | | 0.15 | % | |
| Portfolio turnover rate | | | 47 | %(d) | | | 130 | % | | | 118 | % | | | 17 | % | | | 130 | % | | | 128 | % | |
| Net assets at end of period (in millions) | | $ | 151 | | | $ | 65 | | | $ | 36 | | | $ | 42 | | | $ | 35 | | | $ | 36 | | |
(a) Per share data was calculated using the average shares outstanding during the period.
(b) Total return at net asset value assuming all distributions reinvested and no initial sales charge or contingent deferred sales charge.
(c) Had the Investment Manager and/or Transfer Agent not waived fees and/or reimbursed a portion of expenses, total return would have been reduced.
(d) Not annualized.
(e) Does not include expenses of the investment companies in which the Fund invests.
(f) Annualized.
(g) The benefits derived from custody fees paid indirectly had an impact of less than 0.01%.
See accompanying notes to financial statements.
98
Columbia Acorn Emerging Markets Fund
| Class Z Shares | | (Unaudited)
Six months
ended June 30, | | Year ended
December 31, | |
| Selected data for a share outstanding throughout each period | | 2012 | | 2011 (a) | |
| Net Asset Value, Beginning of Period | | $ | 9.28 | | | $ | 10.00 | | |
| Income from Investment Operations | |
| Net investment income (b) | | | 0.03 | | | | 0.01 | | |
| Net realized and unrealized gain/(loss) | | | 0.88 | | | | (0.73 | ) | |
| Total from Investment Operations | | | 0.91 | | | | (0.72 | ) | |
| Less Distributions to Shareholders | |
| From net investment income | | | (0.00 | )(c) | | | — | | |
| Total Distributions to Shareholders | | | (0.00 | )(c) | | | — | | |
| Net Asset Value, End of Period | | $ | 10.19 | | | $ | 9.28 | | |
| Total Return (d)(e) | | | 9.85 | % | | | (7.20 | )% | |
| Ratios to Average Net Assets/Supplemental Data | |
| Net expenses (f) | | | 1.44 | % | | | 1.46 | % | |
| Net investment income (f) | | | 0.56 | % | | | 0.15 | % | |
| Waiver/Reimbursement (f) | | | 5.91 | % | | | 18.06 | % | |
| Portfolio turnover rate (e) | | | 15 | % | | | 9 | % | |
| Net assets at end of period (in millions) | | $ | 4 | | | $ | 3 | | |
(a) Class Z shares commenced operations on August 19, 2011. Per share data and total return reflect activity from that date.
(b) Per share data was calculated using the average shares outstanding during the period.
(c) Rounds to less than $0.01 per share.
(d) Total return at net asset value assuming all distributions reinvested and no initial sales charge or contingent deferred sales charge.
(e) Not annualized.
(f) Annualized.
Columbia Acorn European Fund
| Class Z Shares | | (Unaudited)
Six months
ended June 30, | | Year ended
December 31, | |
| Selected data for a share outstanding throughout each period | | 2012 | | 2011 (a) | |
| Net Asset Value, Beginning of Period | | $ | 9.44 | | | $ | 10.00 | | |
| Income from Investment Operations | |
| Net investment income/(loss) (b) | | | 0.14 | | | | (0.02 | ) | |
| Net realized and unrealized gain/(loss) | | | 0.96 | | | | (0.46 | ) | |
| Total from Investment Operations | | | 1.10 | | | | (0.48 | ) | |
| Less Distributions to Shareholders | |
| From net investment income | | | (0.01 | ) | | | (0.06 | ) | |
| From net realized gains | | | (0.01 | ) | | | (0.02 | ) | |
| Total Distributions to Shareholders | | | (0.02 | ) | | | (0.08 | ) | |
| Net Asset Value, End of Period | | $ | 10.52 | | | $ | 9.44 | | |
| Total Return (d)(e) | | | 11.62 | % | | | (4.78 | )% | |
| Ratios to Average Net Assets/Supplemental Data | |
| Net expenses (f) | | | 1.33 | % | | | 1.37 | % | |
| Net investment income/(loss) (f) | | | 2.67 | % | | | (0.52 | )% | |
| Waiver/Reimbursement (f) | | | 12.21 | % | | | 28.89 | % | |
| Portfolio turnover rate (e) | | | 18 | % | | | 17 | % | |
| Net assets at end of period (in millions) | | $ | 2 | | | $ | 2 | | |
(a) Class Z shares commenced operations on August 19, 2011. Per share data and total return reflect activity from that date.
(b) Per share data was calculated using the average shares outstanding during the period.
(c) Rounds to less than $0.01 per share.
(d) Total return at net asset value assuming all distributions reinvested.
(e) Not annualized.
(f) Annualized.
See accompanying notes to financial statements.
99
Columbia Acorn Family of Funds
Notes to Financial Statements (Unaudited)
1. Nature of Operations
Columbia Acorn Fund, Columbia Acorn International, Columbia Acorn USA, Columbia Acorn International Select, Columbia Acorn Select, Columbia Thermostat Fund, Columbia Acorn Emerging Markets Fund and Columbia Acorn European Fund (the Funds) are each a series of Columbia Acorn Trust (the Trust). The Trust is registered under The Investment Company Act of 1940, as amended (the 1940 Act), as an open-end management investment company organized as a Massachusetts business trust. The investment objective of each Fund is to seek long-term capital appreciation.
Columbia Thermostat Fund pursues its investment objective by investing in shares of other mutual funds. As a "fund of funds" under normal circumstances, the Fund allocates at least 95% of its net assets among a selected group of affiliated stock and bond mutual funds (underlying portfolio funds) according to the current level of the Standard & Poor's (S&P) 500 Index in relation to predetermined ranges set by Columbia Wanger Asset Management, LLC (the Investment Manager). The Fund may invest up to 5% of its net assets plus any cash received that day in cash, repurchase agreements, high quality short-term paper and government securities.
Each Fund may issue an unlimited number of shares. Columbia Acorn Fund, Columbia Acorn USA, Columbia Acorn International Select and Columbia Acorn Select each currently offers Class A, Class B, Class C, Class I and Class Z shares. Columbia Acorn International currently offers Class A, Class B, Class C, Class I, Class R, Class R5 and Class Z shares. Columbia Acorn Emerging Markets Fund and Columbia Acorn European Fund each currently offers Class A, Class C, Class I and Class Z shares. Columbia Thermostat Fund currently offers Class A, Class B, Class C and Class Z shares. Effective February 29, 2008, the Funds generally no longer accept investments by new or existing investors in the Fund's Class B shares, except in connection with the reinvestment of any dividend and/or capital gain distributions in Class B shares of the Funds and exchanges by existing Class B shareholders of certain other funds within the Columbia Family of Funds.
Class A shares are sold with a front-end sales charge. Class A shares bought without an initial sales charge in accounts aggregating $1 million to $50 million at the time of purchase are subject to a 1.00% contingent deferred sales charge (CDSC) if the shares are redeemed within 18 months of purchase.
Class B shares are subject to CDSC if redeemed within six years of purchase. Class B shares will convert to Class A shares automatically eight years after purchase.
Class C shares are offered at net asset value but are subject to a CDSC on redemptions made within one year after purchase.
Class I, Class R and Class R5 shares are offered at net asset value. There are certain restrictions on who may purchase Class I, Class R and Class R5 shares.
Class Z shares are offered at net asset value. There are certain restrictions on who may purchase Class Z shares. Generally, Class Z shares of a Fund may be exchanged for shares of another fund distributed by Columbia Management Distributors, Inc. at no additional charge.
The financial highlights for the Fund's Class A, Class B, Class C, Class I, Class R and Class R5 shares are presented in a separate semiannual report.
Investment income, realized and unrealized gains and losses, and certain fund-level expenses are allocated pro rata on the basis of the relative net assets of all classes, except that each class bears certain expenses specific to that class such as distribution services, transfer agent fees, and certain other class specific expenses. Differences in class expenses may result in payment of different dividend distributions for each class. All of the Funds' share classes have equal rights with respect to voting, subject to Fund or class specific matters.
2. Significant Accounting Policies
The preparation of financial statements in accordance with accounting principles generally accepted in the United States of America (GAAP) requires management to make certain estimates and assumptions that affect the reported amounts of assets and liabilities, the disclosure of contingent assets and liabilities at the date of the financial statements and the reported amounts of revenue and expenses during the reporting period. Actual results could differ from those estimates.
>Security valuation
Securities of the Funds are valued at market value or, if a market quotation for a security is not readily available or is deemed not to be reliable because of events or circumstances that have occurred between the market quotation and the time as of which the security is to be valued, the security is valued at a fair value determined in good faith under consistently applied procedures established by the Board of Trustees. With respect to Columbia Thermostat Fund, investments in portfolio funds are valued at their net asset values as reported by the portfolio funds. A security traded on a securities exchange or in an over-the-counter market in which transaction prices are reported is valued at the last sales price at the time of valuation. A security traded principally on NASDAQ is valued at the
100
NASDAQ official closing price. Mutual Funds and Exchange Traded Funds are valued at their closing net asset value as reported to NASDAQ.
Short-term investments maturing in 60 days or less are valued at amortized cost, which approximates market value.
Forward foreign currency exchange contracts are marked-to-market based upon foreign currency exchange rates provided by a pricing service.
A security for which a market quotation is not readily available and any other assets are valued at their fair value determined in good faith under consistently applied procedures established by the Board of Trustees. The Trust has retained an independent statistical fair value pricing service that employs a systematic methodology to assist in the fair valuation process for securities principally traded in a foreign market in order to adjust for possible changes in value that may occur between the close of the foreign exchange and the time as of which the securities are to be valued. If a security is valued at fair value, that value may be different from the last quoted market price for the security. A security for which there is no reported sale on the valuation date is valued at the mean of the latest bid and ask quotations.
>Foreign currency translations
Values of investments denominated in foreign currencies are converted into U.S. dollars using the New York spot market rate of exchange at the time of valuation. Purchases and sales of investments and dividend and interest income are translated into U.S. dollars using the spot market rate of exchange prevailing on the respective dates of such transactions. The gain or loss resulting from changes in foreign exchange rates is included with net realized and unrealized gain or loss from investments, as appropriate.
>Repurchase agreements
Each Fund may engage in repurchase agreement transactions. Each Fund, through its custodian, receives delivery of underlying securities collateralizing repurchase agreements. The counterparty is required to maintain collateral that is at all times at least equal to the repurchase price including interest. In the event of default or bankruptcy by the counterparty to the agreement, realization and/or retention of the collateral may be subject to legal proceedings.
>Restricted securities
Restricted securities are securities that may only be resold upon registration under federal securities laws or in transactions exempt from registration. In some cases, the issuer of restricted securities has agreed to register such securities for resale at the issuer's expense either upon demand by the Fund or in connection with another registered offering of the securities. Many restricted securities may be resold in the secondary market in transactions exempt from registration. Such restricted securities may be determined to be liquid under criteria established by the Board of Trustees.
>Derivative instruments
Columbia Acorn International and Columbia Acorn International Select invest in certain derivative instruments as detailed below to meet their investment objectives. Derivatives are instruments whose values depend on, or are derived from, in whole or in part, the value of one or more other assets, such as securities, currencies, commodities or indices. Derivative instruments may be used to maintain cash reserves while maintaining exposure to certain other assets, to offset anticipated declines in values of investments, to facilitate trading, to reduce transaction costs and to pursue higher investment returns. The Funds may also use derivative instruments to mitigate certain investment risks, such as foreign currency exchange rate risk, interest rate risk and credit risk. Derivatives may involve various risks, including the potential inability of the counterparty to fulfill its obligation under the terms of the contract, the potential for an illiquid secondary market and the potential for market movements which may expose the Funds to gains or losses in excess of the amount shown in the Statements of Assets and Liabilities.
>Forward foreign currency exchange contracts
Forward foreign currency exchange contracts are agreements between two parties to buy and sell a currency at a set price on a future date. These contracts are intended to be used to minimize the exposure to foreign exchange rate fluctuations during the period between the trade and settlement dates of the contracts. Columbia Acorn International and Columbia International Select utilize forward foreign currency exchange contracts to hedge the currency exposure associated with some or all of the Fund's securities or to hedge out of a currency that is off benchmark.
The values of forward foreign currency exchange contracts fluctuate with changes in foreign currency exchange rates. Each Fund will record a realized gain or loss when the forward foreign currency exchange contract is closed.
The use of forward foreign currency exchange contracts does not eliminate fluctuations in the prices of the Funds' portfolio securities. The risks of forward foreign currency exchange contracts include movement in the values of the foreign currencies relative to the U.S. dollar (or other foreign
101
Columbia Acorn Family of Funds
Notes to Financial Statements (Unaudited), continued
currencies) and the possibility that counterparties will not complete their contractual obligations, which may be in excess of the amount reflected, if any, in the Statements of Assets and Liabilities.
>Effects of Derivative Transactions in the Financial Statements
The following tables are intended to provide additional information about the effect of derivatives on the financial statements of Columbia Acorn International and Columbia Acorn International Select including: the fair value of derivatives by risk category and the location of those fair values in the Statements of Assets and Liabilities; the impact of derivative transactions on the Funds' operations over the period including realized gains or losses and unrealized gains or losses. The derivative schedules following the Statements of Investments present additional information regarding derivative instruments outstanding at the end of the period, if any.
During the six months ended June 30, 2012, Columbia Acorn International entered into three forward foreign currency exchange contracts.
The effect of derivative instruments on Columbia Acorn International's Statement of Operations for the six months ended June 30, 2012 was as follows:
Amount of Realized Gain (Loss) and Change in Unrealized Appreciation (Depreciation)
on Derivatives Recognized in Income
| | | Risk
Exposure
Category | | Realized
Gain (Loss) | | Change
in
Unrealized
Appreciation
(Depreciation) | |
| (in thousands) | |
Forward foreign
currency
exchange
contracts | | Foreign Exchange
Rate Risk | | $ | 5,423 | | | $ | (4,539 | ) | |
During the six months ended June 30, 2012, Columbia Acorn International Select entered into 12 forward foreign currency exchange contracts.
The following table is a summary of the value of Columbia Acorn International Select's derivative instruments as of June 30, 2012.
Liability Derivatives
Risk Exposure
Category | | Statement of Assets
and Liabilities Location | | Fair
Value | |
| (in thousands) | |
| Foreign exchange contracts | | Unrealized depreciation on
forward foreign currency
exchange contracts | | | $(932) | | |
The effect of derivative instruments on Columbia Acorn International Select's Statement of Operations for the six months ended June 30, 2012 was as follows:
Amount of Realized Gain (Loss) and Change in Unrealized Appreciation (Depreciation)
on Derivatives Recognized in Income
| | | Risk
Exposure
Category | | Realized
Gain (Loss) | | Change
in
Unrealized
Appreciation
(Depreciation) | |
| (in thousands) | |
Forward foreign
currency
exchange
contracts | | Foreign Exchange
Rate Risk | | $ | 210 | | | $ | 16 | | |
>Security transactions and investment income
Security transactions, investment income and shareholder fund transactions are accounted for on the trade date (date the order to buy or sell is executed) and dividend income and realized gain distributions from other funds are recorded on the ex-dividend date, except that certain dividends from foreign securities are recorded as soon as the information is available to the Funds. Interest income is recorded on the accrual basis and includes amortization of discounts on debt obligations when required for federal income tax purposes. Realized gains and losses from security transactions are recorded on an identified cost basis.
Awards, if any, from class action litigation related to securities owned may be recorded as a reduction of cost of those securities. If the applicable securities are no longer owned, the proceeds are recorded as realized gains.
The Funds estimate the tax character of distributions from real estate investment trusts (REITs). Distributions received in excess of income are recorded as a reduction of the cost of the related investments. If the applicable securities are no longer owned, any distributions received in excess of income are recorded as realized gains.
>Fund share valuation
Fund shares are sold and redeemed on a daily basis at net asset value, subject to any applicable sales charge. Net asset value per share is determined daily as of the close of trading on the New York Stock Exchange (NYSE) on each day the NYSE is open for trading. Generally, income, expenses and realized and unrealized gain/(losses) of a Fund are allocated to each class proportionately on a daily basis for purposes of determining the net asset value of each class. The Rule 12b-1 distribution and service fees and transfer agent fees are charged to each specific class as expenses are incurred. Redemption fees are accounted for as an addition to paid in capital for purposes of determining the net asset value of each class.
102
>Securities lending
Each Fund, except Columbia Thermostat Fund, may lend securities up to one-third of the value of its total assets to certain approved brokers, dealers and other financial institutions to earn additional income. The Fund retains the benefits of owning the securities, including receipt of dividends or interest generated by the security. Each Fund also receives a fee for the loan. Each Fund has the ability to recall the loans at any time and could do so in order to vote proxies or to sell the loaned securities. Each loan is collateralized by cash that exceeds the value of the securities on loan. The market value of the loaned securities is determined daily at the close of business of each Fund and any additional required collateral is delivered to each Fund on the next business day. Each Fund has elected to invest the cash collateral in the Dreyfus Government Cash Management Fund, and the income earned is paid to each Fund, net of any fees remitted to Goldman Sachs Agency Lending, the lending agent, and net of any borrower rebates. The Investment Manager does not retain any fees earned by the lending program. Generally, in the event of borrower default, a Fund has the right to use the collateral to offset any losses incurred. In the event a Fund is delayed or prevented from exercising its right to dispose of the collateral, there may be a potential loss to the Fund. Some of these losses may be indemnified by the lending agent. Each Fund bears the risk of loss with respect to the investment of collateral.
The net securities lending income earned as of June 30, 2012 by each Fund is included in the Statements of Operations.
>Federal income taxes
It is each Fund's policy to comply with the provisions of the Internal Revenue Code available to regulated investment companies and, in the manner provided therein, distribute substantially all their taxable income, as well as any net realized gain on sales of investments and foreign currency transactions reportable for federal income tax purposes. Columbia Thermostat Fund distributes all of its taxable income, as well as any net realized gain on sales of portfolio fund shares and any distributions of net realized gains received by the Fund from its portfolio funds, reportable for federal income tax purposes. Accordingly, the Funds paid no federal income taxes and no federal income tax provision was required.
>Foreign capital gains taxes
Realized gains in certain countries may be subject to foreign taxes at the fund level. The Funds accrue for such foreign taxes on net realized and unrealized gains at the appropriate rate for each jurisdiction. The amount, if any, is disclosed as a liability on the Statements of Assets and Liabilities.
>Distributions to shareholders
Distributions to shareholders are recorded on the ex-dividend date.
>Indemnification
In the normal course of business, the Trust on behalf of the Funds enters into contracts that contain a variety of representations and warranties and that provide general indemnities. A Fund's maximum exposure under these arrangements is unknown, as this would involve future claims against the Fund. Also, under the Trust's organizational documents, the trustees and officers of the Trust are indemnified against certain liabilities that may arise out of their duties to the Trust. However, based on experience, the Funds expect the risk of loss due to these warranties and indemnities to be remote.
>Recent Accounting Pronouncement
Disclosures about Offsetting Assets and Liabilities
In December 2011, the Financial Accounting Standards Board (FASB) issued ASU No. 2011-11, Disclosures about Offsetting Assets and Liabilities. The objective of the FASB is to enhance current disclosure requirements on offsetting of certain assets and liabilities and to enable financial statement users to compare financial statements prepared under GAAP and International Financial Reporting Standards.
Specifically, ASU No. 2011-11 requires an entity to disclose both gross and net information for derivatives and other financial instruments that are subject to a master netting arrangement or similar agreement. The standard requires disclosure of collateral received in connection with the master netting agreements or similar agreements. The effective date of ASU No. 2011-11 is for interim and annual periods beginning on or after January 1, 2013. At this time, management is evaluating the implications of this guidance and the impact it will have on the financial statement amounts and footnote disclosures, if any.
3. Federal Tax Information
The timing and character of income and capital gain distributions are determined in accordance with income tax regulations, which may differ from GAAP. Reclassifications are made to the Funds' capital accounts for permanent tax differences to reflect income and gains available for distribution (or available capital loss carryforwards) under income tax regulations.
The following capital loss carryforward, determined as of December 31, 2011, may be available to reduce taxable
103
Columbia Acorn Family of Funds
Notes to Financial Statements (Unaudited), continued
income arising from future net realized gains on investments, if any, to the extent permitted by the Internal Revenue Code:
| | | Year of Expiration | | | |
| Fund | | 2015 | | 2016 | | 2017 | | 2018 | | Unlimited | | Total | |
| (in thousands) | |
Columbia
Acorn
International | | $ | 15,640 | | | $ | 82,683 | | | $ | 189,008 | | | $ | — | | | $ | — | | | $ | 287,331 | | |
Columbia
Thermostat
Fund | | | — | | | | — | | | | 17,733 | | | | 2,955 | | | | — | | | | 20,688 | | |
Columbia
Acorn
Emerging
Markets
Fund | | | — | | | | — | | | | — | | | | — | | | | 11 | | | | 11 | | |
Unlimited capital loss carryforwards are required to be utilized prior to any capital losses which carry an expiration date. As a result of this ordering rule, capital loss carryforwards which carry an expiration date may be more likely to expire unused.
Columbia Acorn International acquired capital loss carryforwards in connection with the merger with RiverSource Partners International Select Growth Fund and RiverSource Partners International Small Cap Fund of $121,174,098 and $73,618,287, respectively (Note 8). In addition to the acquired capital loss carryforwards, the Fund also acquired unrealized capital gains as a result of the merger. The yearly utilization of the acquired capital loss carryforwards may be limited by the Internal Revenue Code. Any capital loss carryforwards acquired as part of a merger that are permanently lost due to the provisions under the Internal Revenue Code are included as being expired.
Under current tax rules, regulated investment companies can elect to treat certain late-year ordinary losses incurred and post-October capital losses (capital losses realized after October 31) as arising on the first day of the following taxable year. At December 31, 2011, the Funds elected to treat the following late year ordinary losses and post-October capital losses as arising on January 1, 2012:
| Fund | | Late year
ordinary
losses | | Post-October
capital losses | |
| (in thousands) | |
| Columbia Acorn Fund | | $ | 9,350 | | | $ | 50,163 | | |
| Columbia Acorn International | | | — | | | | 12,775 | | |
| Columbia Acorn USA | | | — | | | | 3,057 | | |
| Columbia Acorn International Select | | | 2,622 | | | | 3,120 | | |
| Columbia Acorn Select | | | 107 | | | | 3,172 | | |
| Columbia Acorn Emerging Markets Fund | | | — | | | | 42 | | |
| Columbia Acorn European Fund | | | 2 | | | | 7 | | |
Management of the Funds has concluded that there are no significant uncertain tax positions that would require recognition in the financial statements. However, management's conclusion may be subject to review and adjustment at a later date based on factors including, but not limited to, new tax laws, regulations, and administrative interpretations (including relevant court decisions). Generally, the Funds' federal tax returns for the prior three fiscal years remain subject to examination by the Internal Revenue Service.
4. Transactions with Affiliates
Columbia Wanger Asset Management, LLC (CWAM) is a wholly-owned subsidiary of Columbia Management Investment Advisers, LLC (Columbia Management), which is a wholly-owned subsidiary of Ameriprise Financial, Inc. (Ameriprise Financial). CWAM furnishes continuing investment supervision to the Funds and is responsible for the overall management of the Funds' business affairs.
CWAM receives a monthly advisory fee based on each Fund's average daily net assets at the following annual rates:
Columbia Acorn Fund
| Average Daily Net Assets | | Annual
Fee Rate | |
| Up to $700 million | | | 0.74 | % | |
| $700 million to $2 billion | | | 0.69 | % | |
| $2 billion to $6 billion | | | 0.64 | % | |
| $6 billion and over | | | 0.63 | % | |
Columbia Acorn International
| Average Daily Net Assets | | Annual
Fee Rate | |
| Up to $100 million | | | 1.19 | % | |
| $100 million to $500 million | | | 0.94 | % | |
| $500 million and over | | | 0.74 | % | |
Columbia Acorn USA
| Average Daily Net Assets | | Annual
Fee Rate | |
| Up to $200 million | | | 0.94 | % | |
| $200 million to $500 million | | | 0.89 | % | |
| $500 million to $2 billion | | | 0.84 | % | |
| $2 billion to $3 billion | | | 0.80 | % | |
| $3 billion and over | | | 0.70 | % | |
Columbia Acorn International Select
| Average Daily Net Assets | | Annual
Fee Rate | |
| Up to $500 million | | | 0.94 | % | |
| $500 million and over | | | 0.90 | % | |
Columbia Acorn Select
| Average Daily Net Assets | | Annual
Fee Rate | |
| Up to $700 million | | | 0.85 | % | |
| $700 million to $2 billion | | | 0.80 | % | |
| $2 billion to $3 billion | | | 0.75 | % | |
| $3 billion and over | | | 0.70 | % | |
Columbia Thermostat Fund
| | | Annual
Fee Rate | |
| All Average Daily Net Assets | | | 0.10 | % | |
104
Columbia Acorn Emerging Markets Fund
| Average Daily Net Assets | | Annual
Fee Rate | |
| Up to $100 million | | | 1.25 | % | |
| $100 million to $500 million | | | 1.00 | % | |
| $500 million and over | | | 0.80 | % | |
Columbia Acorn European Fund
| Average Daily Net Assets | | Annual
Fee Rate | |
| Up to $100 million | | | 1.19 | % | |
| $100 million to $500 million | | | 0.94 | % | |
| $500 million and over | | | 0.74 | % | |
For the six months ended June 30, 2012, the annualized effective investment advisory fee rate were as follows:
| Fund | |
| Columbia Acorn Fund | | | 0.64 | % | |
| Columbia Acorn International | | | 0.76 | % | |
| Columbia Acorn USA | | | 0.86 | % | |
| Columbia Acorn International Select | | | 0.94 | % | |
| Columbia Acorn Select | | | 0.83 | % | |
| Columbia Thermostat Fund | | | 0.10 | % | |
| Columbia Acorn Emerging Markets Fund | | | 1.25 | % | |
| Columbia Acorn European Fund | | | 1.19 | % | |
>Expense Limit
CWAM has voluntarily agreed to reimburse the ordinary operating expenses (exclusive of brokerage commissions, interest, taxes and extraordinary expenses, but inclusive of custodial charges relating to overdrafts, if any) after giving effect to any balance credits from the Funds' custodian, exceeding annually each Fund's average daily net assets attributable to Class Z shares as follows:
| Fund | | Class Z | |
| Columbia Acorn International Select | | | 1.45 | % | |
| Columbia Acorn Select | | | 1.35 | % | |
This arrangement may be modified or terminated by either the Funds or CWAM on 30 days notice.
CWAM has contractually agreed to waive fees and/or reimburse expenses of Columbia Thermostat Fund through April 30, 2013 so that the ordinary operating expenses (exclusive of interest and fees on borrowings, and expenses associated with the Fund's investment in other investment companies, but including custodian charges relating to overdrafts, if any) will not exceed 0.25% annually of the Fund's average daily net assets attributable to Class Z shares. There is no guarantee that this arrangement will continue after April 30, 2013.
CWAM has contractually agreed to waive fees and/or reimburse expenses of Columbia Acorn Emerging Markets Fund and Columbia Acorn European Fund through April 30, 2013, so that the ordinary operating expenses (exclusive of interest and fees on borrowings, and expenses associated with each Fund's investment in other investment companies, but including custodian charges relating to overdrafts, if any), do not exceed the following annual rates based on each Fund's average daily net assets attributable to Class Z shares:
| Fund | | Class Z | |
| Columbia Acorn Emerging Markets Fund | | | 1.60 | % | |
| Columbia Acorn European Fund | | | 1.50 | % | |
There is no guarantee that these arrangements will continue after April 30, 2013.
CWAM may recoup any fees waived and/or expenses reimbursed with respect to any share class of Columbia Acorn Emerging Markets Fund and Columbia Acorn European Fund for a one-year period following the date of such fee waiver and/or reimbursement if such recovery does not cause the Funds' ordinary operating expenses (excluding interest and fees on borrowings and expenses associated with the Funds' investment in other investment companies, if any) to exceed the annual expense limitations above, or to exceed such annual expense limitations as may be in place at the time of the recoupment, whichever is less.
Effective August 15, 2011, CWAM and its affiliates have contractually agreed to waive a portion of total annual Fund operating expenses incurred by Class A shares, Class B shares and Class C shares of Columbia Acorn International such that the Fund's total annual Fund operating expenses will be reduced by 0.04%, 0.03% and 0.02% for Class A, Class B and Class C shares of the Fund, respectively, through August 14, 2013. There is no guarantee that this arrangement will continue thereafter.
Expenses reimbursed by CWAM and its affiliates for the six months ended June 30, 2012, were as follows:
| Fund | | Expenses
Reimbursed | |
| (in thousands) | |
| Columbia Acorn International | | $ | 206 | | |
| Columbia Thermostat Fund | | | 127 | | |
| Columbia Acorn Emerging Markets Fund | | | 149 | | |
| Columbia Acorn European Fund | | | 118 | | |
CWAM provides administrative services and receives an administration fee from the Funds at the following annual rates:
Columbia Acorn Trust
Aggregate Average Daily
Net Assets of the Trust | | Annual
Fee Rate | |
| Up to $8 billion | | | 0.050 | % | |
| $8 billion to $16 billion | | | 0.040 | % | |
| $16 billion to $35 billion | | | 0.030 | % | |
| $35 billion to $45 billion | | | 0.025 | % | |
| $45 billion and over | | | 0.015 | % | |
105
Columbia Acorn Family of Funds
Notes to Financial Statements (Unaudited), continued
For the six months ended June 30, 2012, the annualized effective administration fee rate was 0.04% of each Fund's average daily net assets. CWAM has delegated to Columbia Management responsibility to provide certain sub-administrative services to the Funds.
Columbia Management Investment Distributors, Inc. (CMID), a wholly owned subsidiary of Ameriprise Financial, is the distributor of the Funds.
Each Fund has adopted a Rule 12b-1 (distribution and service) plan which requires it to pay CMID a monthly service fee equal to 0.25% annually of the average daily net assets attributable to Class A, Class B and Class C shares and a monthly distribution fee equal to 0.50%, 0.75% and 0.50%, annually, of the average daily net assets attributable to Class B, Class C and Class R shares, respectively. CMID receives no compensation with respect to Class R5 and Class Z shares.
Columbia Management Investment Services Corp. (CMIS), a wholly owned subsidiary of Ameriprise Financial, is the transfer agent of the Funds. Effective May 1, 2012, CMIS receives monthly account-based service fees based on the number of open Fund accounts. CMIS is also reimbursed by the Funds for the fees and expenses that it pays retirement plan sponsors, defined contribution plans and 529 Plans (the Plans) or other financial intermediaries that maintain omnibus accounts with the Funds and provide record keeping services to shareholders invested through the Plans. Such fees are calculated as a percentage of the average aggregate value of each Fund's shares maintained by a Plan. CMIS is also reimbursed for the fees and expenses that it pays each fund supermarket, broker-dealer firm or other financial intermediary that maintains an omnibus account with a Fund. Such fees are based on the number of sub-accounts comprising the omnibus position. Each Fund paid CMIS a monthly fee at the annual rate of $17.00 per open account prior to May 1, 2012, and $20.00 per open account thereafter.
The Transfer Agent also receives compensation from fees for various shareholder services and reimbursements for certain out-of-pocket fees. Class I shares do not pay transfer agent fees.
For the six months ended June 30, 2012, the Funds' annualized effective transfer agent fee rates as a percentage of average daily net assets of each class were as follows:
| Fund | | Class Z | |
| Columbia Acorn Fund | | | 0.04 | % | |
| Columbia Acorn International | | | 0.04 | % | |
| Columbia Acorn USA | | | 0.08 | % | |
| Columbia Acorn International Select | | | 0.06 | % | |
| Columbia Acorn Select | | | 0.06 | % | |
| Columbia Thermostat | | | 0.06 | % | |
| Columbia Acorn Emerging Markets Fund | | | 0.03 | % | |
| Columbia Acorn European Fund | | | 0.02 | % | |
In connection with the acquisition that closed August 15, 2011, Columbia Acorn International assumed the assets and obligations of RiverSource Partners International Small Cap Fund and RiverSource Partners International Select Growth Fund (See Note 8), which together with certain other associated investment companies, have severally, but not jointly, guaranteed the performance and observance of all the terms and conditions of a lease (including the payment of rent (the Guaranty)) entered into by Seligman Data Corp. (SDC), the former transfer agent of Seligman Global Smaller Companies Fund and Seligman International Growth Fund, which were acquired by RiverSource Partners International Small Cap Fund and RiverSource Partners International Select Growth Fund, respectively, in previous years. The lease and the Guaranty expire in January 2019. At June 30, 2012, Columbia Acorn International's total potential future obligation over the life of the Guaranty is $131,390. The liability remaining at June 30, 2012 for non-recurring charges associated with the lease amounted to $75,951 and is included within payable for other liabilities in the Statements of Assets and Liabilities.
Certain officers and trustees of the Trust are also officers of CWAM. The Trust makes no direct payments to its officers and trustees who are affiliated with CWAM.
The Board of Trustees has appointed a Chief Compliance Officer of the Trust in accordance with federal securities regulations. The Funds, along with other affiliated funds, pay their pro-rata share of the expenses associated with the Office of the Chief Compliance Officer. These expenses are disclosed separately as "Chief compliance officer expenses" in the Statements of Operations.
The Trust offers a deferred compensation plan for its independent trustees. Under that plan, a trustee may elect to defer all or a portion of his or her compensation. Amounts deferred are retained by the Trust and may represent an unfunded obligation of the Trust. The value of amounts deferred is determined by reference to the change in value of Class Z shares of one or more series of the Trust or a money market fund as specified by the trustee. Benefits under the deferred compensation plan are payable in accordance with the plan.
Organizational expenses for Columbia Emerging Markets Fund and Columbia European Fund consist of offering costs which were incurred prior to the initial public offering of shares of the Funds and include, among other things, state registration filing fees and printing costs. The offering costs were paid by CWAM as incurred. The Funds have capitalized these offering costs and are amortizing them to expense over a period of 12 months from the commencement of the initial public offering of
106
shares. The Funds reimburse CWAM during the 12 month period on a monthly basis an amount equal to the offering costs amortized to expense by each Fund during that month.
An affiliated person of a Fund may include any company in which a Fund owns five percent or more of its outstanding voting shares. On June 30, 2012, Columbia Acorn Fund, Columbia Acorn International, Columbia Acorn USA, Columbia Acorn Select and Columbia Thermostat Fund each held five percent or more of the outstanding voting securities of one or more companies. Details of investments in those affiliated companies are presented on pages 35, 47, 56, 68 and 72, respectively.
For the six months ended June 30, 2012, the Funds engaged in purchase and sales transactions with funds that have a common investment adviser (or affiliated investment advisers), common directors/trustees, and/or common officers. Those transactions complied with Rule 17a-7 under the Investment Company Act of 1940 and were as follows:
| | | Purchases | | Sales | |
| (in thousands) | |
| Columbia Acorn Fund | | $ | 800 | | | $ | — | | |
| Columbia Acorn International | | | 1,450 | | | | — | | |
| Columbia Acorn Select | | | — | | | | 1,446 | | |
| Columbia Acorn Emerging Markets Fund | | | 12 | | | | — | | |
During the year ended December 31, 2011, Columbia Management reimbursed Columbia Acorn International $174,055 for a loss on a trading error.
During the year ended December 31, 2011, Columbia Acorn Select Class Z shares received a payment of $56,666 from Columbia Management as a reimbursement for certain shareholder transactions processed at an incorrect price. The payment has been included in "Increase from contribution from affiliate" on the Statements of Changes in Net Assets.
5. Borrowing Arrangements
The Trust participates in a $150 million credit facility, along with another Trust managed by CWAM, which was entered into to facilitate portfolio liquidity. Under the facility, as in effect for the six months ended June 30, 2012, interest is charged to each participating fund based on its borrowings at a rate per annum equal to the higher of Federal Funds Rate or Overnight LIBOR plus 1.25%. In addition, a commitment fee of 0.10% per annum of the unutilized line of credit is accrued and apportioned among the participating funds based on their relative net assets. The commitment fee is included in "Other expenses" in the Statements of Operations. The Trust expects to renew this line of credit for one year durations annually in July at then current market rates and terms.
Except for Columbia Acorn Select, no Fund had borrowings during the six months ended June 30, 2012. For Columbia Acorn Select, the average daily loan balance outstanding on days when borrowing existed was $8,500,000 at a weighted average interest rate of 1.49%.
6. Investment Transactions
The aggregate cost of purchases and proceeds from sales, other than short-term obligations, for the six months ended June 30, 2012, were:
| | | Purchases | | Proceeds from
Sales | |
| (in thousands) | |
| Columbia Acorn Fund | | $ | 1,335,545 | | | $ | 2,296,276 | | |
| Columbia Acorn International | | | 1,052,221 | | | | 1,021,815 | | |
| Columbia Acorn USA | | | 129,533 | | | | 261,587 | | |
| Columbia Acorn International Select | | | 93,008 | | | | 111,597 | | |
| Columbia Acorn Select | | | 99,446 | | | | 423,716 | | |
| Columbia Thermostat Fund | | | 382,471 | | | | 144,148 | | |
Columbia Acorn Emerging Markets
Fund | | | 3,240 | | | | 715 | | |
| Columbia Acorn European Fund | | | 503 | | | | 331 | | |
7. Regulatory Settlements with Third Parties
During the six months ended June 30, 2012, Columbia Acorn International received payments of $107,802 resulting from certain regulatory settlements with third parties in which the Fund had participated. The payments have been included in "Increase from regulatory settlements" in the Statements of Changes in Net Assets.
During the year ended December 31, 2011, Columbia Acorn International received payments of $107,617 resulting from certain regulatory settlements with third parties in which the Fund had participated. The payments have been included in "Increase from regulatory settlements" in the Statements of Changes in Net Assets.
8. Fund Merger
On August 15, 2011, Columbia Acorn International acquired the assets and assumed the identified liabilities of RiverSource Partners International Select Growth Fund and RiverSource Partners International Small Cap Fund, both series of RiverSource International Managers Series, Inc., which were sub-advised by CWAM. The reorganization was completed after shareholders approved the plan on May 11, 2011. The purpose of the transaction was to combine funds managed by CWAM with comparable investment objectives and strategies.
The aggregate net assets of Columbia Acorn International immediately before the acquisitions were $5,887,634,436 and the combined net assets immediately after the acquisitions were $6,287,891,195.
107
Columbia Acorn Family of Funds
Notes to Financial Statements (Unaudited), continued
The merger was accomplished by a tax-free exchange of 48,230,699 shares of RiverSource Partners International Select Growth Fund valued at $311,482,971 (including $29,840,736 of unrealized appreciation) and 15,801,504 shares of RiverSource Partners International Small Cap Fund valued at $88,773,788 (including $6,322,097 of unrealized appreciation).
In exchange for RiverSource Partners International Select Growth Fund and RiverSource Partners International Small Cap Fund shares, Columbia Acorn International issued the following number of shares:
| | | RiverSource
Partners
International
Select Growth
Fund | | RiverSource
Partners
International
Small Cap
Fund | |
| Class A | | | 3,800,227 | | | | 1,666,707 | | |
| Class B | | | 267,259 | | | | 75,499 | | |
| Class C | | | 183,761 | | | | 518,779 | | |
| Class I | | | 4,010,380 | | | | 51,634 | | |
| Class R | | | 35,341 | | | | 48,348 | | |
| Class R5 | | | 5,711 | | | | 23,983 | | |
For financial reporting purposes, net assets received and shares issued by Columbia Acorn International were recorded at fair value; however, RiverSource Partners International Select Growth Fund and RiverSource Partners International Small Cap Fund's cost of investments was carried forward.
The financial statements reflect the operations of Columbia Acorn International for the period prior to the merger and the combined fund for the period subsequent to the merger. Because the combined investment portfolios have been managed as a single integrated portfolio since the merger was completed, it is not practicable to separate the amounts of revenue and earnings of RiverSource Partners International Select Growth Fund and RiverSource Partners International Small Cap Fund that have been included in the combined Fund's Statement of Operations since the merger was completed.
Assuming the merger had been completed on January 1, 2011, Columbia Acorn International's pro-forma net investment income, net gain on investments, net change in unrealized depreciation and net increase in net assets from operations for the year ended December 31, 2011 would have been approximately $76.7 million, $260.0 million, $(1,274.8) million and $(938.1) million, respectively.
9. Shareholder Concentration
At June 30, 2012, the table below details the affiliated and significant unaffiliated shareholder account ownership of outstanding shares of each Fund. The Funds have no knowledge about whether any portion of those shares was owned beneficially. Subscription and redemption activity of these accounts may have a significant effect on the operations of the Funds.
| | | Number of
unaffiliated
accounts | | Percentage of
shares
outstanding
held –
unaffiliated | | Percentage of
shares
outstanding
held –
affiliated | |
| Columbia Acorn Fund | | | 1 | | | | 11.1 | % | | | — | | |
| Columbia Acorn International | | | 3 | | | | 38.7 | % | | | — | | |
| Columbia Acorn USA | | | 3 | | | | 51.7 | % | | | — | | |
Columbia Acorn International
Select | | | 1 | | | | 43.6 | % | | | — | | |
| Columbia Acorn Select | | | 2 | | | | 26.5 | % | | | — | | |
| Columbia Thermostat Fund | | | 2 | | | | 38.2 | % | | | — | | |
Columbia Acorn Emerging
Markets Fund | | | 1 | | | | 17.4 | % | | | 29.7 | % | |
| Columbia Acorn European Fund | | | 1 | | | | 18.0 | % | | | 53.7 | % | |
10. Subsequent Events
Management has evaluated the events and transactions that have occurred through the date the financial statements were issued and noted no items requiring adjustment of the financial statements or additional disclosure.
11. Information Regarding Pending and Settled Legal Proceedings
Ameriprise Financial and certain of its affiliates have historically been involved in a number of legal, arbitration and regulatory proceedings, including routine litigation, class actions, and governmental actions, concerning matters arising in connection with the conduct of their business activities. Ameriprise Financial believes that the Funds are not currently the subject of, and that neither Ameriprise Financial nor any of its affiliates are the subject of, any pending legal, arbitration or regulatory proceedings that are likely to have a material adverse effect on the Funds or the ability of Ameriprise Financial or its affiliates to perform under their contracts with the Funds. Ameriprise Financial is required to make 10-Q, 10-K and, as necessary, 8-K filings with the Securities and Exchange Commission on legal and regulatory matters that relate to Ameriprise Financial and its affiliates. Copies of these filings may be obtained by accessing the SEC website at www.sec.gov.
There can be no assurance that these matters, or the adverse publicity associated with them, will not result in increased fund redemptions, reduced sale of fund shares or other adverse consequences to the Funds. Further, although we believe proceedings are not likely to have a material adverse effect on the Funds or the ability of Ameriprise Financial or its affiliates to perform under their contracts with the Funds, these proceedings are subject to uncertainties and, as such, we are unable to estimate the possible loss or range of loss that may result. An adverse outcome in one or more of these proceedings could result in adverse judgments, settlements, fines, penalties or other relief that could have a material adverse effect on the consolidated financial condition or results of operations of Ameriprise Financial.
108
Board Approval of the Advisory Agreement
Columbia Acorn Trust (the "Trust") has an investment advisory agreement (the "Advisory Agreement") with Columbia Wanger Asset Management, LLC ("Columbia WAM") under which Columbia WAM manages the Columbia Acorn Funds (each, a "Fund", and together, the "Funds"). More than 75% of the trustees of the Trust (the "Trustees") are persons who have no direct or indirect interest in the Advisory Agreement and are not "interested persons" (as defined in the Investment Company Act of 1940, as amended (the "1940 Act")) of the Trust (the "Independent Trustees"). The Trustees oversee the management of each Fund and, as required by law, determine at least annually whether to continue the Advisory Agreement for each Fund.
The Contract Committee (the "Committee") of the Board of Trustees (the "Board"), which is comprised solely of Independent Trustees, makes recommendations to the Board regarding any proposed continuation of the Advisory Agreement. After the Committee has made its recommendations, the full Board determines whether to approve continuation of the Advisory Agreement. The Board also considers matters bearing on the Advisory Agreement at its various meetings throughout the year, meets at least quarterly with Columbia WAM's portfolio managers and receives monthly reports from Columbia WAM on the performance of the Funds.
In connection with their most recent consideration of the Advisory Agreement for each Fund, the Committee and all Trustees received and reviewed a substantial amount of information provided by Columbia WAM, Columbia Management Investment Advisers, LLC ("Columbia Management") and Ameriprise Financial, Inc. ("Ameriprise") in response to written requests from the Independent Trustees and their independent legal counsel. Throughout the process, the Trustees had numerous opportunities to ask questions of and request additional materials from Columbia WAM, Columbia Management and Ameriprise.
During each meeting at which the Committee or the Independent Trustees considered the Advisory Agreement, they met in executive session with their independent legal counsel. The Committee also met with representatives of Columbia WAM, Columbia Management and Ameriprise on several occasions. In all, the Committee convened formally on six separate occasions to consider the continuation of the Advisory Agreement. The Board and/or some or all of the Independent Trustees met on other occasions to receive the Committee's status reports, receive presentations from Columbia WAM, Columbia Management and Ameriprise representatives, and to discuss outstanding issues. In addition, the Investment Performance Analysis Committee of the Board, also comprised exclusively of Independent Trustees, reviewed the performance of the Funds and presented its findings to the Board and the Committee throughout the year. The Compliance Committee of the Board also provided information to the Committee with respect to relevant matters.
The Trustees reviewed the Advisory Agreement, as well as certain information obtained through Columbia WAM's, Columbia Management's and Ameriprise's responses to independent legal counsel's questionnaires. In addition, the Trustees reviewed the Management Fee Evaluation dated June 2012 (the "Fee Evaluation") prepared by the Trust's chief compliance officer, senior vice president and general counsel, at the request of the Board.
The materials reviewed by the Committee and the Trustees included, among other items, (i) information on the investment performance of each Fund and of independently selected peer groups of funds and of the Funds' performance benchmarks over various time periods, (ii) information on each Fund's advisory fees and other expenses, including information comparing the Fund's fees and expenses to those of peer groups of funds and information about any applicable expense limitations and fee breakpoints, (iii) data on sales and redemptions of Fund shares, and (iv) information on the profitability to Columbia WAM and Ameriprise, as well as potential "fall-out" or ancillary benefits that Columbia WAM and its affiliates may receive as a result of their relationships with the Funds. The Trustees also considered other information such as (i) Columbia WAM's financial condition, (ii) each Fund's investment objective and strategy, (iii) the size, education and experience of Columbia WAM's investment staff and its use of technology, external research and trading cost measurement tools, (iv) the portfolio manager compensation framework, (v) the allocation of the Funds' brokerage, and the use of "soft" commission dollars to pay for research products and services, (vi) Columbia WAM's risk management program, and (vii) the resources devoted to, and the record of compliance with, the Funds' investment policies and restrictions, policies on personal securities transactions and other compliance policies.
At a meeting held on June 6, 2012, upon recommendations of the Committee, the Board of Trustees unanimously approved the continuation of the Advisory Agreement.
109
Board Approval of the Advisory Agreement, continued
In considering the continuation of the Advisory Agreement, the Trustees reviewed and analyzed various factors that they determined were relevant, none of which by itself was considered dispositive. The material factors and conclusions that formed the basis for the Trustees' determination to approve the continuation of the Advisory Agreement are discussed below.
Nature, quality and extent of services. The Trustees reviewed the nature, quality and extent of the services provided by Columbia WAM and its affiliates to the Funds under the Advisory Agreement, taking into account the investment objective and strategy of each Fund and knowledge gained from meetings with management, which were held on at least a quarterly basis. In addition, the Trustees reviewed the available resources and key personnel of Columbia WAM and its affiliates, especially those providing investment management services to the Funds. The Trustees also considered other services provided to the Funds by Columbia WAM and its affiliates, including: managing the execution of portfolio transactions and selecting broker-dealers for those transactions; monitoring adherence to the Funds' investment restrictions; producing shareholder reports; providing support services for the Board and committees of the Board; managing the Funds' securities lending program; communicating with shareholders; serving as the Funds' administrator; and overseeing the activities of the Funds' other service providers, including monitoring for compliance with various policies and procedures as well as applicable securities laws and regulations.
The Trustees concluded that the nature, quality and extent of the services provided by Columbia WAM and its affiliates to each Fund under the Advisory Agreement were appropriate for the Funds and that the Funds were likely to benefit from the continued provision of those services by Columbia WAM. They also concluded that Columbia WAM currently had sufficient personnel, with appropriate education and experience, to serve the Funds effectively, and that the firm had demonstrated its continuing ability to attract and retain well-qualified personnel. In addition, they took note of the quality of Columbia WAM's compliance record.
Performance of the Funds. The Trustees received and considered detailed performance information at various meetings of the Board, the Committee and the Investment Performance Analysis Committee of the Board throughout the year. They reviewed information comparing each Fund's performance with that of its benchmark(s) and with the performance of comparable funds and peer groups as identified by Lipper Inc. ("Lipper") and Morningstar, Inc. ("Morningstar"). The Trustees evaluated the performance of the Funds over various time periods, including over the one-, three- and five-year periods ending December 31, 2011. The Trustees also considered peer performance rankings for similar time periods although they focused more on the five-year period, or the since inception periods in the case of the two newer Funds, Columbia Acorn Emerging Markets Fund and Columbia Acorn European Fund.
The Trustees noted that Columbia Acorn International and Columbia Acorn International Select had delivered excellent results over the past five years, and had done so while exposing investors to less risk than competing funds, according to Morningstar. They also considered that Columbia Acorn Emerging Markets Fund and Columbia Acorn European Fund had delivered excellent returns since inception versus their respective Morningstar peer groups, although their returns were below median compared to their respective Lipper peer groups. The Trustees considered that these newer Funds had operated for less than one year and that the Funds had relatively few peers in their peer groups compared to peer groups for other Funds.
The Trustees considered that the domestic Funds have had mixed results. Columbia Acorn Fund underperformed its peers over the five-year period, ending December 31, 2011, but the Fund beat its benchmark during the same period. Columbia Acorn Fund underperformed its peer groups for the one- and three-year periods as well, and outperformed its benchmark for the three-year but not the one-year period. The Trustees considered, however, that Morningstar and Lipper ranked Columbia Acorn Fund as the best-performing fund over the past ten years. Columbia Acorn Select underperformed its peers and benchmark over the five-year period ending December 31, 2011 and exposed investors to more risk versus its peers. The Trustees considered that Columbia Acorn Select had performed better over the three-year period, but that its one-year returns were well below the peer group median and benchmark. Columbia Acorn USA's returns were behind its peer group median over the five-year period ending December 31, 2011, though it outperformed its benchmark for the same period. The Trustees noted that the Fund also had underperformed its peers for the one- and three-year periods but had outperformed its benchmark for the same periods. Over the ten-year period, Columbia Acorn USA ranked above
110
median according to Morningstar and Lipper. The Fund also exposed shareholders to more risk than its peers. Columbia Thermostat Fund outperformed its stated benchmark, a 50/50 blend of the Fund's primary equity and debt benchmarks, over the three- and five-year periods ending December 31, 2011, and enjoyed strong rankings from Morningstar and Lipper versus its peer groups over these periods.
The Trustees concluded that Fund performance was satisfactory with respect to the international Funds and Columbia Thermostat Fund. The Trustees determined that performance with respect to Columbia Acorn Select, in particular, and with respect to Columbia Acorn Fund and Columbia Acorn USA needed to be improved, although performance of these three Funds had been ahead of their benchmarks at the time of the June 6th Board meeting. The Trustees concluded, however, that Columbia WAM had taken and continued to take a number of corrective steps to improve performance of the underperforming domestic Funds, that Columbia WAM had reported that these steps were being successfully implemented, and that the Investment Performance Analysis Committee of the Board was monitoring these Funds' performance closely. In addition the Trustees considered that the Chief Investment Officer (the "CIO") of Columbia WAM had reported to them at numerous committee and Board meetings on the corrective steps being taken to improve performance, and committee representatives met separately with the CIO on multiple occasions to discuss the underperforming Funds.
The Trustees concluded that, although past performance is not necessarily indicative of future results, the strong overall longer-term performance record of the international Funds, Columbia Acorn Fund and Columbia Thermostat Fund, and the steps taken by Columbia WAM to correct performance in the underperforming domestic Funds, were an important factor in their evaluation of the quality of services provided by Columbia WAM under the Advisory Agreement for these Funds.
Costs of Services and Profits Realized by Columbia WAM. At various Committee and Board meetings, the Trustees examined detailed information on the fees and expenses of each Fund in comparison to information for comparable funds provided by Lipper and Morningstar. The Trustees reviewed data from Lipper and Morningstar and noted that in general the Funds' total net operating expenses were equal to or below their Morningstar median peer group rankings, except that Columbia Acorn USA, Columbia Acorn European Fund, and Columbia Acorn Select had total net operating expenses above their Morningstar peer group medians. All of the Funds' total net operating expenses, however, were below their Lipper peer group medians.
The actual advisory fees paid by Columbia Acorn Fund, Columbia Acorn International and Columbia Thermostat Fund were lower than both their Morningstar and Lipper peer groups; the actual advisory fees paid by Columbia Acorn Select and Columbia Acorn USA were higher than the median advisory fee of the Funds' Lipper and Morningstar peer groups; the actual advisory fees paid by Columbia Acorn Emerging Markets Fund and Columbia Acorn European Fund were higher than the median advisory fees paid by the Funds' Morningstar peer groups but not their Lipper peer groups; and the actual advisory fee paid by Columbia Acorn International Select was higher than the median advisory fee of the Fund's Lipper peer group, but not of its Morningstar peer group.
The Trustees also reviewed the advisory fee rates charged by Columbia WAM for managing other investment companies (including the Columbia Wanger Funds), sub-advised funds and other institutional separate accounts, as detailed in materials provided to the Committee by Columbia WAM and in the Fee Evaluation. The Trustees noted that the Funds' advisory fees were generally comparable to the Columbia Wanger Funds' advisory fees at the same asset levels. The Trustees also examined Columbia WAM's institutional separate account fees for various investment strategies; in some cases those fees were higher than the advisory fees charged to the Funds, and in a few instances the fees were lower. The Trustees noted that Columbia WAM performs significant additional services for the Funds that it does not provide to sub-advised funds or non-mutual fund clients, including administrative services, oversight of the Funds' other service providers, Trustee support, regulatory compliance and numerous other services, and that, in servicing the Funds, Columbia WAM assumes many legal and business risks that it does not assume in servicing many of its non-fund clients.
The Trustees concluded that the rates of advisory fees payable to Columbia WAM were reasonable in relation to the nature and quality of the services to be provided. The Trustees also concluded that the Funds' overall expense ratios were reasonable, considering the quality of the services provided by Columbia WAM and its affiliates and the investment performance of the Funds, taking into account Columbia WAM's continuing steps to improve performance of the underperforming domestic Funds.
111
Board Approval of the Advisory Agreement, continued
The Trustees reviewed the analysis of the historic profitability of Columbia WAM in serving as each Fund's investment adviser and of Columbia WAM and its affiliates in their relationships with each Fund. The Committee and Trustees met with representatives from Ameriprise to discuss its methodologies for calculating profitability and allocating costs. They considered that Ameriprise calculated profitability and allocated costs on a contract-by-contract and fund-by-fund basis. The Trustees also considered the methodology used by Columbia WAM and Ameriprise in determining compensation payable to portfolio managers and the competitive market for investment management talent. The Trustees were also provided with profitability information from Lipper, which compared Columbia WAM's profitability to other similar investment advisers in the mutual fund industry. The Trustees concluded that Columbia WAM's and its affiliates' profits were within a reasonable range of those of competitors with similar business models. The Trustees discussed, however, that profitability comparisons among fund managers may not always be meaningful due to the lack of consistency in data, small number of publicly-owned managers, and the fact that profitability of any investment manager is affected by numerous factors, including its particular organizational structure, the types of funds and other accounts managed, other lines of business, expense allocation methodology, capital structure and cost of capital.
Economies of Scale. At various Committee and Board meetings and other informal meetings, the Trustees considered information about the extent to which Columbia WAM realizes economies of scale in connection with an increase in Fund assets. The Trustees also discussed the potential for Fund sales growth. The Trustees noted that the advisory fee schedule for each Fund, other than Columbia Thermostat Fund, includes breakpoints in the rate of fees at various asset levels. The Trustees concluded that the fee structure of each Fund was reflective of a sharing between Columbia WAM and the Funds of economies of scale.
Other Benefits to Columbia WAM. The Trustees also reviewed benefits that accrue to Columbia WAM and its affiliates from their relationships with the Funds, based upon information provided to them by Ameriprise and as outlined in the Fee Evaluation. They noted that the Funds' transfer agency services are performed by Columbia Management Investment Services Corp., an affiliate of Ameriprise, which receives compensation from the Funds for its services provided. They considered that an affiliate of Ameriprise, Columbia Management Investment Distributors, Inc. ("CMID"), serves as the Funds' distributor under a distribution agreement, and that it receives fees under the Trust's Rule 12b-1 Plan, most of which CMID pays to broker-dealers. In addition, Columbia Management provides sub-administration services to the Funds. The Committee received information regarding the profitability of each Fund agreement with Columbia WAM affiliates. The Committee and the Board also reviewed information about and discussed the capabilities of each affiliated entity in performing its duties.
The Trustees considered other ways that the Funds and Columbia WAM may potentially benefit from their relationship with each other. For example, the Trustees considered Columbia WAM's use of commissions paid by each Fund on its portfolio brokerage transactions to obtain research products and services benefiting the Funds and/or other clients of Columbia WAM. The Committee reviewed Columbia WAM's annual "soft dollar" report and met with representatives from Columbia WAM to review Columbia WAM's soft dollar spending. The Committee also considered that the Compliance Committee of the Board regularly reviewed third-party prepared reports that evaluated the quality of Columbia WAM's execution of the Funds' portfolio transactions. The Trustees noted that these reports showed that Columbia WAM's execution capabilities were generally better than industry peers. The Trustees determined that Columbia WAM's use of the Funds' "soft" commission dollars to obtain research products and services was consistent with current regulatory requirements and guidance. They also concluded that Columbia WAM benefits from the receipt of proprietary research products and services acquired through commissions paid on portfolio transactions of the Funds, and that the Funds benefit from Columbia WAM's receipt of those products and services as well as research products and services acquired through commissions paid by other clients of Columbia WAM.
After full consideration of the above factors, as well as other factors that were instructive in evaluating the Advisory Agreement, the Trustees, including the Independent Trustees, concluded that the continuation of the Advisory Agreement was in the best interest of each Fund. On June 6, 2012, the Trustees approved continuation of the Advisory Agreement through July 31, 2013.
112
Columbia Acorn Family of Funds
Second Quarter Class Z Share Information (Unaudited)
Minimum Initial Investment in
all Funds:
| |
$0 to $2,000,
available only to
certain eligible
investors | |
| Exchange Fee: | | None | |
| Columbia Acorn Fund | | ACRNX | |
| Management Fee | | | 0.64 | % | |
| 12b-1 Fee | | | 0.00 | % | |
| Other Expenses | | | 0.12 | % | |
| Net Expense Ratio | | | 0.76 | % | |
| Columbia Acorn International | | ACINX | |
| Management Fee | | | 0.76 | % | |
| 12b-1 Fee | | | 0.00 | % | |
| Other Expenses | | | 0.15 | % | |
| Net Expense Ratio | | | 0.91 | % | |
| Columbia Acorn USA | | AUSAX | |
| Management Fee | | | 0.86 | % | |
| 12b-1 Fee | | | 0.00 | % | |
| Other Expenses | | | 0.18 | % | |
| Net Expense Ratio | | | 1.04 | % | |
| Columbia Acorn International Select | | ACFFX | |
| Management Fee | | | 0.94 | % | |
| 12b-1 Fee | | | 0.00 | % | |
| Other Expenses | | | 0.24 | % | |
| Net Expense Ratio | | | 1.18 | % | |
| Columbia Acorn Select | | ACTWX | |
| Management Fee | | | 0.83 | % | |
| 12b-1 Fee | | | 0.00 | % | |
| Other Expenses | | | 0.19 | % | |
| Net Expense Ratio | | | 1.02 | % | |
| Columbia Thermostat Fund | | COTZX | |
| Management Fee | | | 0.10 | % | |
| 12b-1 Fee | | | 0.00 | % | |
| Other Expenses | | | 0.15 | %* | |
| Net Expense Ratio | | | 0.25 | %* | |
| Columbia Acorn Emerging Markets Fund | | CEFZX | |
| Management Fee | | | 1.25 | % | |
| 12b-1 Fee | | | 0.00 | % | |
| Other Expenses | | | 0.19 | % | |
| Net Expense Ratio | | | 1.44 | % | |
| Columbia Acorn European Fund | | CAEZX | |
| Management Fee | | | 1.19 | % | |
| 12b-1 Fee | | | 0.00 | % | |
| Other Expenses | | | 0.14 | % | |
| Net Expense Ratio | | | 1.33 | % | |
Fees and expenses are for the six months ended June 30, 2012.
The fees and expenses of Columbia Acorn Select and Columbia Acorn International Select include the effect of the voluntary undertaking by Columbia Wanger Asset Management, LLC (CWAM) to waive fees and/or reimburse the Funds for any ordinary operating expenses (exclusive of brokerage commissions, interest, taxes and extraordinary expenses, but inclusive of custodian charges relating to overdrafts, if any), after giving effect to any balance credits from the Funds' custodian, in excess of the following annual rates:
| Fund | | Class Z | |
| Columbia Acorn International Select | | | 1.45 | % | |
| Columbia Acorn Select | | | 1.35 | % | |
These arrangements may be modified or terminated by either the Funds or CWAM upon 30 days notice.
Columbia Thermostat Fund's fees and expenses include the effect of CWAM's contractual undertaking to waive fees and/or reimburse the Fund for any ordinary operating expenses (exclusive of distribution and service fees, interest and fees on borrowings and expenses associated with the Fund's investments in other investment companies, but including custodian charges relating to overdrafts, if any), after giving effect to any balance credits from the Fund's custodian, in excess of the annual rate of 0.25% of the average daily net assets. Columbia Thermostat Fund's waiver/reimbursement arrangement is contractual through April 30, 2013. There is no guarantee that this arrangement will continue thereafter.
The fees and expenses of Columbia Acorn Emerging Markets Fund and Columbia Acorn European Fund also include the effect of fee waivers/reimbursements. CWAM has contractually undertaken to waive fees and/or reimburse Columbia Acorn Emerging Markets Fund so that the Fund's ordinary operating expenses (excluding interest and fees on borrowings and expenses associated with the Fund's investment in other investment companies, if any) do not exceed the annual rate of 1.60% of the Fund's average daily net assets attributable to Class Z shares, through April 30, 2013. There is no guarantee that this arrangement will continue thereafter. CWAM has contractually undertaken to waive fees and/or reimburse Columbia Acorn European Fund so that its ordinary operating expenses (excluding interest and fees on borrowings and expenses associated with the Fund's investment in other investment companies, if any) do not exceed the annual rate of 1.50% of the Fund's average daily net assets attributable to Class Z shares, through April 30, 2013. There is no guarantee that this arrangement will continue thereafter.
* Does not include estimated fees and expenses of 0.61% incurred by the Fund from the underlying portfolio funds in which it invests.
113
Columbia Acorn Family of Funds
Trustees
Laura M. Born
Chair of the Board
Steven N. Kaplan
Vice Chair of the Board
Michelle L. Collins
Maureen M. Culhane
Margaret M. Eisen
John C. Heaton
Charles P. McQuaid
David J. Rudis
David B. Small
Ralph Wanger (Trustee Emeritus)
Officers
Charles P. McQuaid
President
Ben Andrews
Vice President
Robert A. Chalupnik
Vice President
Michael G. Clarke
Assistant Treasurer
Joseph F. DiMaria
Assistant Treasurer
P. Zachary Egan
Vice President
Fritz Kaegi
Vice President
John M. Kunka
Assistant Treasurer
Stephen Kusmierczak
Vice President
Joseph C. LaPalm
Vice President
Bruce H. Lauer
Vice President, Secretary and Treasurer
Louis J. Mendes III
Vice President
Robert A. Mohn
Vice President
Christopher J. Olson
Vice President
Christopher O. Petersen
Assistant Secretary
Scott R. Plummer
Assistant Secretary
Andreas Waldburg-Wolfegg
Vice President
Linda K. Roth-Wiszowaty
Assistant Secretary
Robert P. Scales
Chief Compliance Officer, Chief Legal Officer,
Senior Vice President and General Counsel
Investment Manager
Columbia Wanger Asset Management, LLC
227 West Monroe Street, Suite 3000
Chicago, Illinois 60606
1-800-922-6769
Distributor
Columbia Management Investment Distributors, Inc.
225 Franklin Street
Boston, Massachusetts 02110
Transfer Agent, Dividend Disbursing Agent
Columbia Management Investment Services Corp.
P. O. Box 8081
Boston, Massachusetts 02266-8081
1-800-345-6611
Legal Counsel to the Funds
Perkins Coie LLP
Washington, DC
Legal Counsel to the Independent Trustees
Drinker Biddle & Reath LLP
Philadelphia, Pennsylvania
Independent Registered Public Accounting Firm
PricewaterhouseCoopers LLP
Chicago, Illinois
This report, including the schedules of investments, is submitted for the general information of the shareholders of Columbia Acorn Trust.
A description of the policies and procedures that the Funds use to determine how to vote proxies and a copy of the Funds' voting record are available (i) without charge, upon request, by calling 800-922-6769 and (ii) on the Securities and Exchange Commission's website at www.sec.gov. Information regarding how the Funds voted proxies relating to portfolio securities during the 12-month period ended June 30, is available from the SEC's website. Information regarding how the Funds voted proxies relating to portfolio securities is also available at www.columbiamanagement.com under "About Us." From there, click on "Disclosures."
The Funds file a complete schedule of portfolio holdings with the SEC for the first and third quarters of each fiscal year on Form N-Q. The Funds' Form N-Q is available on the SEC's website at www.sec.gov and may be reviewed and copied at the SEC's Public Reference Room in Washington, D.C. Information on the operation of the Public Reference Room may be obtained by calling 1-800-SEC-0330. The Funds' complete portfolio holdings are disclosed at www.columbiamanagement.com approximately 30 to 40 days after each month-end.
Investors should consider the investment objectives, risks, charges and expenses of a mutual fund carefully before investing. For a free prospectus, which contains this and other important information about the funds, visit www.columbiamanagement.com. Read the prospectus carefully before investing.
Columbia Acorn Funds are distributed by Columbia Management Investment Distributors, Inc., member FINRA and managed by Columbia Wanger Asset Management, LLC.
Find out what's new – visit our web site at:
www.columbiamanagement.com
Our e-mail address is:
ServiceInquiries@ColumbiaManagement.com
Shareholders should not include personal information such as account numbers, Social Security numbers or taxpayer identification numbers in e-mail. We are unable to accept account transactions sent via e-mail.
114
This document contains Global Industry Classification Standard data. The Global Industry Classification Standard ("GICS") was developed by and is the exclusive property and a service mark of MSCI Inc. ("MSCI") and Standard & Poor's Financial Services LLC ("S&P") and is licensed for use by Columbia Wanger Asset Management, LLC. Neither MSCI, S&P, nor any other party involved in making or compiling the GICS or any GICS classifications makes any express or implied warranties or representations with respect to such standard or classification (or the results to be obtained by the use thereof), and all such parties hereby expressly disclaim all warranties of originality, accuracy, completeness, merchantability and fitness for a particular purpose with respect to any of such standard or classification. Without limiting any of the foregoing, in no event shall MSCI, S&P, any of their affiliates or any third party involved in making or compiling the GICS or any GICS classifications have any liability for any direct, indirect, special, punitive, consequential or any other damages (including lost profits) even if notified of the possibility of such damages.
Columbia Management®
Columbia Acorn Family of Funds
Class Z Shares
Semiannual Report, June 30, 2012
For More Information
You'll find more information about the Columbia Acorn Family of Funds in the documents described below. Contact Columbia Funds as follows to obtain these documents free of charge:
By Mail: Columbia Funds
c/o Columbia Management Investment Services Corp.
P. O. Box 8081 Boston, MA 02266-8081
By Telephone: 800.345.6611
Online: www.columbiamanagement.com
Shareholder Communications with the Board
The Funds' Board of Trustees has adopted procedures by which shareholders may communicate with the Board. Shareholders who wish to communicate with the Board should send their written communications to the Board by mail, c/o Columbia Wanger Asset Management, LLC, 227 West Monroe Street, Suite 3000, Chicago, Illinois 60606, Attention: Secretary. Shareholder communications must (i) be in writing, (ii) identify the Columbia Acorn Fund to which the communication relates and (iii) state the particular class of shares and number of shares held by the communicating shareholder.
Prospectuses and the Statement of Additional Information (SAI)
The prospectuses and the SAI provide more detailed information about the Funds and their policies. The SAI is legally part of each prospectus (it's incorporated by reference). A copy of each has been filed with the SEC.
Information Provided by the SEC
You can review and copy information about the Funds (including their prospectuses, the SAI and shareholder reports) at the SEC's Public Reference Room in Washington, DC. To find out more about the operation of the Public Reference Room, call the SEC at 202.551.8090. Reports and other information about the Fund are also available in the EDGAR Database on the SEC's website at http://www.sec.gov, or you can receive copies of this information, for a fee, by electronic request at the following e-mail address: publicinfo@sec.gov. You can also obtain copies of this information by writing the Public Reference Section, Securities and Exchange Commission, Washington, DC 20549-0102.
The investment company registration number of Columbia Acorn Trust, of which each of these Funds is a series, is 811-01829.
© 2012 Columbia Management Investment Advisers, LLC. All rights reserved.
225 Franklin Street, Boston, MA 02110
800.345.6611 www.columbiamanagement.com
C-1565 D (8/12) 142538
Q2 2012
Columbia Acorn Family of Funds
Class A, B, C, I, R and R5 Shares
Managed by Columbia Wanger Asset Management, LLC


Semiannual Report
June 30, 2012
n Columbia
Acorn® Fund
n Columbia
Acorn International®
n Columbia
Acorn USA®
n Columbia
Acorn International SelectSM
n Columbia
Acorn SelectSM
n Columbia
Thermostat FundSM
n Columbia
Acorn Emerging Markets FundSM
n Columbia
Acorn European FundSM
Not FDIC insured • No bank guarantee • May lose value
The views expressed in the "Chattering Squirrels" and "In a Nutshell" commentaries reflect the current views of the respective authors. These views are not guarantees of future performance and involve certain risks, uncertainties and assumptions that are difficult to predict so actual outcomes and results may differ significantly from the views expressed. These views are subject to change at any time based upon economic, market or other conditions and the respective authors disclaim any responsibility to update such views. These views may not be relied upon as investment advice and, because investment decisions for a Columbia Acorn Fund are based on numerous factors, may not be relied upon as an indication of trading intent on behalf of any particular Columbia Acorn Fund. References to specific company's securities should not be construed as a recommendation or investment advice and there can be no assurance that as of the date of publication of this report, the securities mentioned in each Fund's portfolio are still held or that the securities sold have not been repurchased.
Acorn®, Acorn USA® and Acorn International® are service marks owned and registered by Columbia Acorn Trust. ColumbiaSM, Columbia Management®, and the Columbia Management Logo® are service marks owned and/or registered by Ameriprise Financial, Inc.
You are invited to the 2012 Columbia Acorn Funds Shareholder Information Meeting
Join us to hear presentations by Columbia Acorn Fund's lead portfolio manager Chuck McQuaid and other members of the Columbia Wanger Asset Management investment team.
Where: Drinker Biddle & Reath LLP
191 North Wacker Drive, Suite 3700
Chicago, IL
When: Wednesday, September 19, 2012
12 p.m. CST
A buffet lunch will be served beginning at 11:30.
RSVP: 800.922.6769 by September 14, 2012
Webcast Replay: Available at columbiamanagement.com in October.
 Public Transportation
For directions using public transportation, call 312.836.7000 or visit the Chicago Transit Authority website at transitchicago.com. Metra information is also available by calling this number or can be found at metrarail.com.
 Parking Information
Two parking options are located on Lake Street in the same block as the meeting location, which is between N. Wacker Drive and N. Franklin Street. Lake Street runs one way east after crossing N. Wacker Drive. Hourly parking rates apply at both locations. The first, with signage stating "Public Parking" (phone: 312.267.6867), provides direct access to the building in which the meeting will be held. The second option is a "Self Park" garage (phone: 312.201.1795) located next to the first but without direct access to the building.
 Driving Directions
From the south:
Take 1-57 to the Dan Ryan Expressway. Follow the signs for the Kennedy Expressway West. Travel on the Kennedy and exit using the Washington exit (Exit 51C). Turn right onto W. Washington. Proceed east on Washington until you reach Canal Street. Turn left on Canal Street. Travel on Canal to Lake Street. Turn right on Lake Street. Take Lake Street across N. Wacker Drive to the southeast corner of Lake Street and N. Wacker Drive.
From the north:
Take the Kennedy Expressway (I-90/94) south to Chicago. Exit in the city using the W. Randolph Street exit (Exit 51B). Turn right onto W. Randolph Street. Proceed west on Randolph Street until you reach N. Halsted Street. Turn right onto N. Halsted Street. Travel on Halsted to W. Lake Street. Turn right on Lake Street. Take Lake Street across N. Wacker Drive to the southeast corner of Lake Street and N. Wacker Drive.
From the west:
Take the Eisenhower Expressway (I-290) from the west. Follow the signs for the Kennedy Expressway West. Travel on the Kennedy and exit using the Washington exit (Exit 51C). Turn right onto W. Washington. Proceed east on Washington until you reach Canal Street. Turn left on Canal Street. Travel on Canal to Lake Street. Turn right on Lake Street. Take Lake Street across N. Wacker Drive to the southeast corner of Lake Street and N. Wacker Drive.
From the southwest:
Take the Stevenson Expressway (I-55). Exit to the Kennedy Expressway (North-Wisconsin). Travel on the Kennedy and exit using the Washington exit (Exit 51C). Turn right onto W. Washington. Proceed east on Washington until you reach Canal Street. Turn left on Canal Street. Travel on Canal to Lake Street. Turn right on Lake Street. Take Lake Street across N. Wacker Drive to the southeast corner of Lake Street and N. Wacker Drive.

Wacker Drive Construction
Please keep Chicago's Wacker Drive construction project in mind when planning your route. Current information on the project can be found at wackerdrive.org.
Columbia Acorn Family of Funds
Table of Contents
| Share Class Performance | | | 2 | | |
|
| Fund Performance vs. Benchmarks | | | 3 | | |
|
| Descriptions of Indexes | | | 4 | | |
|
Chattering Squirrels: Columbia Thermostat
Fund Turns 10 | | | 5 | | |
|
| Understanding Your Expenses | | | 9 | | |
|
| Columbia Acorn Fund | |
|
| In a Nutshell | | | 12 | | |
|
| At a Glance | | | 13 | | |
|
| Major Portfolio Changes | | | 28 | | |
|
| Statement of Investments | | | 30 | | |
|
| Columbia Acorn International | |
|
| In a Nutshell | | | 14 | | |
|
| At a Glance | | | 15 | | |
|
| Major Portfolio Changes | | | 43 | | |
|
| Statement of Investments | | | 45 | | |
|
| Portfolio Diversification | | | 54 | | |
|
| Columbia Acorn USA | |
|
| In a Nutshell | | | 16 | | |
|
| At a Glance | | | 17 | | |
|
| Major Portfolio Changes | | | 55 | | |
|
| Statement of Investments | | | 56 | | |
|
| Columbia Acorn International Select | |
|
| In a Nutshell | | | 18 | | |
|
| At a Glance | | | 19 | | |
|
| Major Portfolio Changes | | | 63 | | |
|
| Statement of Investments | | | 64 | | |
|
| Portfolio Diversification | | | 68 | | |
|
| Columbia Acorn Select | |
|
| In a Nutshell | | | 20 | | |
|
| At a Glance | | | 21 | | |
|
| Major Portfolio Changes | | | 69 | | |
|
| Statement of Investments | | | 70 | | |
|
| Columbia Thermostat Fund | |
|
| In a Nutshell | | | 22 | | |
|
| At a Glance | | | 23 | | |
|
| Statement of Investments | | | 76 | | |
|
| Columbia Acorn Emerging Markets Fund | |
|
| In a Nutshell | | | 24 | | |
|
| At a Glance | | | 25 | | |
|
| Major Portfolio Changes | | | 77 | | |
|
| Statement of Investments | | | 79 | | |
|
| Portfolio Diversification | | | 83 | | |
|
| Columbia Acorn European Fund | |
|
| In a Nutshell | | | 26 | | |
|
| At a Glance | | | 27 | | |
|
| Major Portfolio Changes | | | 84 | | |
|
| Statement of Investments | | | 85 | | |
|
| Portfolio Diversification | | | 89 | | |
|
| Columbia Acorn Family of Funds | |
|
| Statements of Assets and Liabilities | | | 90 | | |
| Statements of Operations | | | 92 | | |
| Statements of Changes in Net Assets | | | 94 | | |
| Financial Highlights | | | 100 | | |
| Notes to Financial Statements | | | 116 | | |
| Board Approval of the Advisory Agreement | | | 126 | | |
| Columbia Acorn Family of Funds Information | | | 130 | | |
|
Columbia Acorn Family of Funds
2012 Mid-year Distributions
The following table lists the mid-year distributions for the Columbia Acorn Funds. The record date was June 5, 2012, and the ex-dividend date and the payable date was June 6, 2012. Share classes that are not listed did not have any distributions at mid-year.
| | | Short-term
Capital
Gains | | Long-term
Capital
Gains | | Ordinary
Income | | Reinvestment
Price | |
| Columbia Acorn Fund Class A | | | None | | | $ | 0.35688 | | | | None | | | $ | 28.07 | | |
| Columbia Acorn Fund Class B | | | None | | | $ | 0.35688 | | | | None | | | $ | 25.76 | | |
| Columbia Acorn Fund Class C | | | None | | | $ | 0.35688 | | | | None | | | $ | 25.37 | | |
| Columbia Acorn Fund Class I | | | None | | | $ | 0.35688 | | | | None | | | $ | 29.11 | | |
| Columbia Acorn International Class A | | | None | | | | None | | | $ | 0.05961 | | | $ | 35.80 | | |
| Columbia Acorn International Class I | | | None | | | | None | | | $ | 0.21123 | | | $ | 35.90 | | |
| Columbia Acorn International Class R5 | | | None | | | | None | | | $ | 0.21123 | | | $ | 35.87 | | |
| Columbia Acorn USA Class A | | | None | | | $ | 0.05114 | | | | None | | | $ | 27.80 | | |
| Columbia Acorn USA Class B | | | None | | | $ | 0.05114 | | | | None | | | $ | 25.61 | | |
| Columbia Acorn USA Class C | | | None | | | $ | 0.05114 | | | | None | | | $ | 25.34 | | |
| Columbia Acorn USA Class I | | | None | | | $ | 0.05114 | | | | None | | | $ | 28.99 | | |
| Columbia Acorn International Select Class A | | | None | | | $ | 0.11963 | | | | None | | | $ | 26.04 | | |
| Columbia Acorn International Select Class B | | | None | | | $ | 0.11963 | | | | None | | | $ | 24.90 | | |
| Columbia Acorn International Select Class C | | | None | | | $ | 0.11963 | | | | None | | | $ | 24.77 | | |
| Columbia Acorn International Select Class I | | | None | | | $ | 0.11963 | | | | None | | | $ | 26.29 | | |
| Columbia Acorn Select Class A | | | None | | | $ | 0.53050 | | | | None | | | $ | 24.07 | | |
| Columbia Acorn Select Class B | | | None | | | $ | 0.53050 | | | | None | | | $ | 22.35 | | |
| Columbia Acorn Select Class C | | | None | | | $ | 0.53050 | | | | None | | | $ | 22.12 | | |
| Columbia Acorn Select Class I | | | None | | | $ | 0.53050 | | | | None | | | $ | 24.86 | | |
| Columbia Thermostat Fund Class A | | | None | | | | None | | | $ | 0.01739 | | | $ | 13.40 | | |
| Columbia Thermostat Fund Class B | | | None | | | | None | | | $ | 0.01739 | | | $ | 13.46 | | |
| Columbia Thermostat Fund Class C | | | None | | | | None | | | $ | 0.01739 | | | $ | 13.45 | | |
| Columbia Acorn Emerging Markets Fund Class I | | | None | | | | None | | | $ | 0.00610 | | | $ | 9.84 | | |
| Columbia Acorn European Fund Class A | | $ | 0.00458 | | | | None | | | $ | 0.01203 | | | $ | 10.13 | | |
| Columbia Acorn European Fund Class C | | $ | 0.00458 | | | | None | | | $ | 0.01203 | | | $ | 10.10 | | |
| Columbia Acorn European Fund Class I | | $ | 0.00458 | | | | None | | | $ | 0.01203 | | | $ | 10.14 | | |
Net Asset Value Per Share as of 6/30/12
| | | Columbia
Acorn Fund | | Columbia
Acorn
International | | Columbia
Acorn USA | | Columbia
Acorn
International
Select | | Columbia
Acorn
Select | | Columbia
Thermostat
Fund | | Columbia
Acorn
Emerging
Markets
Fund | | Columbia
Acorn
European
Fund | |
| Class A | | $ | 28.69 | | | $ | 37.01 | | | $ | 28.52 | | | $ | 26.62 | | | $ | 24.17 | | | $ | 13.65 | | | $ | 10.15 | | | $ | 10.50 | | |
| Class B | | $ | 26.32 | | | $ | 35.88 | | | $ | 26.27 | | | $ | 25.45 | | | $ | 22.43 | | | $ | 13.71 | | | | NA | | | | NA | | |
| Class C | | $ | 25.92 | | | $ | 35.73 | | | $ | 25.99 | | | $ | 25.32 | | | $ | 22.20 | | | $ | 13.69 | | | $ | 10.10 | | | $ | 10.46 | | |
| Class I | | $ | 29.76 | | | $ | 37.13 | | | $ | 29.75 | | | $ | 26.88 | | | $ | 24.96 | | | | NA | | | $ | 10.19 | | | $ | 10.51 | | |
| Class R | | | NA | | | $ | 36.97 | | | | NA | | | | NA | | | | NA | | | | NA | | | | NA | | | | NA | | |
| Class R5 | | | NA | | | $ | 37.10 | | | | NA | | | | NA | | | | NA | | | | NA | | | | NA | | | | NA | | |
1
Columbia Acorn Family of Funds
Share Class Performance Average Annual Total Returns through 6/30/12
| | | Class A | | Class B* | | Class C | | Class I | | Class R | | Class R5 | |
| | | Without
Sales
Charge | | With
Sales
Charge | | Without
Sales
Charge | | With
Sales
Charge | | Without
Sales
Charge | | With
Sales
Charge | | Without
Sales
Charge | | Without
Sales
Charge | | Without
Sales
Charge | |
| Columbia Acorn Fund | |
| 3 months** | | | -5.48 | % | | | -10.93 | % | | | -5.61 | % | | | -10.26 | % | | | -5.65 | % | | | -6.59 | % | | | -5.42 | % | | | NA | | | | NA | | |
| Year to date** | | | 9.11 | % | | | 2.85 | % | | | 8.78 | % | | | 3.78 | % | | | 8.70 | % | | | 7.70 | % | | | 9.27 | % | | | NA | | | | NA | | |
| 1 year | | | -3.03 | % | | | -8.62 | % | | | -3.42 | % | | | -8.02 | % | | | -3.76 | % | | | -4.67 | % | | | -2.75 | % | | | NA | | | | NA | | |
| 5 years | | | 1.40 | % | | | 0.21 | % | | | 0.81 | % | | | 0.47 | % | | | 0.61 | % | | | 0.61 | % | | | 1.72 | % | | | NA | | | | NA | | |
| 10 years | | | 9.22 | % | | | 8.57 | % | | | 8.53 | % | | | 8.53 | % | | | 8.39 | % | | | 8.39 | % | | | 9.60 | % | | | NA | | | | NA | | |
| Life of Fund | | | 14.18 | % | | | 14.02 | % | | | 13.48 | % | | | 13.48 | % | | | 13.31 | % | | | 13.31 | % | | | 14.56 | % | | | NA | | | | NA | | |
| Columbia Acorn International | |
| 3 months** | | | -5.60 | % | | | -11.04 | % | | | -5.75 | % | | | -10.46 | % | | | -5.75 | % | | | -6.69 | % | | | -5.49 | % | | | -5.66 | % | | | -5.50 | % | |
| Year to date** | | | 8.56 | % | | | 2.32 | % | | | 8.17 | % | | | 3.17 | % | | | 8.17 | % | | | 7.17 | % | | | 8.79 | % | | | 8.38 | % | | | 8.77 | % | |
| 1 year | | | -9.63 | % | | | -14.82 | % | | | -10.23 | % | | | -14.72 | % | | | -10.27 | % | | | -11.17 | % | | | -9.24 | % | | | -9.87 | % | | | -9.27 | % | |
| 5 years | | | -1.20 | % | | | -2.36 | % | | | -1.83 | % | | | -2.18 | % | | | -1.96 | % | | | -1.96 | % | | | -0.81 | % | | | -1.47 | % | | | -0.84 | % | |
| 10 years | | | 10.67 | % | | | 10.01 | % | | | 9.94 | % | | | 9.94 | % | | | 9.84 | % | | | 9.84 | % | | | 11.09 | % | | | 10.38 | % | | | 11.07 | % | |
| Life of Fund | | | 10.38 | % | | | 10.05 | % | | | 9.69 | % | | | 9.69 | % | | | 9.57 | % | | | 9.57 | % | | | 10.82 | % | | | 10.12 | % | | | 10.81 | % | |
| Columbia Acorn USA | |
| 3 months** | | | -5.26 | % | | | -10.71 | % | | | -5.42 | % | | | -10.14 | % | | | -5.40 | % | | | -6.35 | % | | | -5.18 | % | | | NA | | | | NA | | |
| Year to date** | | | 10.15 | % | | | 3.82 | % | | | 9.77 | % | | | 4.77 | % | | | 9.79 | % | | | 8.79 | % | | | 10.38 | % | | | NA | | | | NA | | |
| 1 year | | | -4.18 | % | | | -9.69 | % | | | -4.62 | % | | | -9.35 | % | | | -4.88 | % | | | -5.82 | % | | | -3.83 | % | | | NA | | | | NA | | |
| 5 years | | | 0.68 | % | | | -0.50 | % | | | 0.05 | % | | | -0.31 | % | | | -0.09 | % | | | -0.09 | % | | | 0.99 | % | | | NA | | | | NA | | |
| 10 years | | | 7.48 | % | | | 6.84 | % | | | 6.78 | % | | | 6.78 | % | | | 6.68 | % | | | 6.68 | % | | | 7.86 | % | | | NA | | | | NA | | |
| Life of Fund | | | 9.47 | % | | | 9.06 | % | | | 8.77 | % | | | 8.77 | % | | | 8.67 | % | | | 8.67 | % | | | 9.87 | % | | | NA | | | | NA | | |
| Columbia Acorn International Select | |
| 3 months** | | | -0.95 | % | | | -6.66 | % | | | -1.11 | % | | | -6.03 | % | | | -1.12 | % | | | -2.10 | % | | | -0.87 | % | | | NA | | | | NA | | |
| Year to date** | | | 10.23 | % | | | 3.89 | % | | | 9.89 | % | | | 4.89 | % | | | 9.81 | % | | | 8.81 | % | | | 10.44 | % | | | NA | | | | NA | | |
| 1 year | | | -4.30 | % | | | -9.80 | % | | | -4.85 | % | | | -9.49 | % | | | -5.03 | % | | | -5.96 | % | | | -3.93 | % | | | NA | | | | NA | | |
| 5 years | | | -0.20 | % | | | -1.38 | % | | | -0.83 | % | | | -1.19 | % | | | -0.99 | % | | | -0.99 | % | | | 0.18 | % | | | NA | | | | NA | | |
| 10 years | | | 10.15 | % | | | 9.50 | % | | | 9.43 | % | | | 9.43 | % | | | 9.31 | % | | | 9.31 | % | | | 10.54 | % | | | NA | | | | NA | | |
| Life of Fund | | | 8.75 | % | | | 8.28 | % | | | 8.04 | % | | | 8.04 | % | | | 7.93 | % | | | 7.93 | % | | | 9.13 | % | | | NA | | | | NA | | |
| Columbia Acorn Select | |
| 3 months** | | | -8.51 | % | | | -13.78 | % | | | -8.66 | % | | | -13.12 | % | | | -8.67 | % | | | -9.56 | % | | | -8.46 | % | | | NA | | | | NA | | |
| Year to date** | | | 7.64 | % | | | 1.45 | % | | | 7.30 | % | | | 2.30 | % | | | 7.23 | % | | | 6.23 | % | | | 7.79 | % | | | NA | | | | NA | | |
| 1 year | | | -10.17 | % | | | -15.34 | % | | | -10.65 | % | | | -15.02 | % | | | -10.82 | % | | | -11.69 | % | | | -9.76 | % | | | NA | | | | NA | | |
| 5 years | | | -2.93 | % | | | -4.07 | % | | | -3.55 | % | | | -3.90 | % | | | -3.70 | % | | | -3.70 | % | | | -2.60 | % | | | NA | | | | NA | | |
| 10 years | | | 7.05 | % | | | 6.42 | % | | | 6.34 | % | | | 6.34 | % | | | 6.23 | % | | | 6.23 | % | | | 7.41 | % | | | NA | | | | NA | | |
| Life of Fund | | | 8.67 | % | | | 8.20 | % | | | 7.96 | % | | | 7.96 | % | | | 7.85 | % | | | 7.85 | % | | | 9.04 | % | | | NA | | | | NA | | |
| Columbia Thermostat Fund† | |
| 3 months** | | | -1.46 | % | | | -7.15 | % | | | -1.59 | % | | | -6.51 | % | | | -1.67 | % | | | -2.65 | % | | | NA | | | | NA | | | | NA | | |
| Year to date** | | | 6.61 | % | | | 0.50 | % | | | 6.33 | % | | | 1.33 | % | | | 6.18 | % | | | 5.18 | % | | | NA | | | | NA | | | | NA | | |
| 1 year | | | 6.80 | % | | | 0.67 | % | | | 6.24 | % | | | 1.24 | % | | | 5.98 | % | | | 4.98 | % | | | NA | | | | NA | | | | NA | | |
| 5 years | | | 4.43 | % | | | 3.21 | % | | | 3.90 | % | | | 3.55 | % | | | 3.64 | % | | | 3.64 | % | | | NA | | | | NA | | | | NA | | |
| Life of Fund | | | 7.57 | % | | | 6.92 | % | | | 6.97 | % | | | 6.97 | % | | | 6.77 | % | | | 6.77 | % | | | NA | | | | NA | | | | NA | | |
| Columbia Acorn Emerging Markets Fund | |
| 3 months** | | | -7.05 | % | | | -12.42 | % | | | NA | | | | NA | | | | -7.17 | % | | | -8.10 | % | | | -6.97 | % | | | NA | | | | NA | | |
| Year to date** | | | 9.61 | % | | | 3.36 | % | | | NA | | | | NA | | | | 9.31 | % | | | 8.31 | % | | | 9.76 | % | | | NA | | | | NA | | |
| Life of Fund** | | | 1.50 | % | | | -4.34 | % | | | NA | | | | NA | | | | 1.00 | % | | | 0.00 | % | | | 1.96 | % | | | NA | | | | NA | | |
| Columbia Acorn European Fund | |
| 3 months** | | | -5.25 | % | | | -10.72 | % | | | NA | | | | NA | | | | -5.53 | % | | | -6.47 | % | | | -5.25 | % | | | NA | | | | NA | | |
| Year to date** | | | 11.53 | % | | | 5.07 | % | | | NA | | | | NA | | | | 10.99 | % | | | 9.99 | % | | | 11.64 | % | | | NA | | | | NA | | |
| Life of Fund** | | | 5.99 | % | | | -0.11 | % | | | NA | | | | NA | | | | 5.28 | % | | | 4.28 | % | | | 6.26 | % | | | NA | | | | NA | | |
The inception date for Class A, B and C shares is 10/16/00 for all Funds except Columbia Thermostat Fund, Columbia Acorn Emerging Markets Fund and Columbia Acorn European Fund. The inception date for Class A, B and C shares of Columbia Thermostat Fund is 3/03/03. The inception date for all share classes of Columbia Acorn Emerging Markets Fund and Columbia Acorn European Fund is 8/19/11. The inception date for Class R and R5 shares of Columbia Acorn International is 9/27/10.
The returns shown for "Life of Fund" are calculated from the inception date of the Fund. In cases where the inception date of the Fund is earlier than the inception date of a share class, or where a period shown dates to before the inception date of a share class, the returns shown may append the returns of the Fund's Class Z shares, the Fund's oldest share class. These returns are adjusted to reflect any higher class-related operating expenses of the newer share classes, as applicable. Please visit columbiamanagement.com/mutual-funds/appended-performance for more information.
All results shown assume reinvestment of distributions and do not reflect the deduction of taxes that a shareholder would pay on fund distributions or on the redemption of fund shares.
*The Funds generally no longer accept investments by new or existing investors in Class B shares, except in connection with the reinvestment of any dividend and/or capital gain distributions in Class B shares of the Funds and exchanges by existing Class B shareholders of certain other funds within the Columbia Family of Funds.
**Not annualized.
Performance data shown represents past performance and is not a guarantee of future results. The investment return and principal value of an investment will fluctuate so that shares, when redeemed, may be worth more or less than their original cost.
Performance results reflect any fee waivers or reimbursements of Fund expenses by the investment manager and/or any of its affiliates. Absent these fee waivers and/or expense reimbursement arrangements, performance results would have been lower.
Current performance may be lower or higher than the performance data shown. Please visit columbiamanagement.com for daily and most recent month-end updates.
The "with sales charge" returns include the maximum initial sales charge of 5.75% for Class A shares, the applicable contingent deferred sales charge (CDSC) for Class B shares (5%, 4%, 3%, 3%, 2%, 1%, 0% for the first through seventh years after purchase, respectively), and the maximum CDSC of 1.00% of Class C shares during the first year after purchase.
Please see Page 130 of this report for each Fund's operating expense ratio as of the end of the second quarter. On this page, you will find information on fee waiver/expense reimbursement arrangements in place for Columbia Acorn International, Columbia Thermostat Fund, Columbia Acorn Emerging Markets Fund and Columbia Acorn European Fund.
†A "fund of funds" bears its allocable share of the costs and expenses of the underlying funds in which it invests. Such funds are thus subject to two levels of fees and potentially higher expense ratios than would be associated with an investment in a fund that invests and trades directly in financial instruments under the direction of a single manager.
2
Columbia Acorn Family of Funds
Fund Performance vs. Benchmarks Average Annual Total Returns through 6/30/12
| Class A Shares, without sales charge | | 2nd
quarter* | | Year to
date* | | 1 year | | 5 years | | 10 years | | Life of
Fund | |
| Columbia Acorn Fund (LACAX) (10/16/00) | | | -5.48 | % | | | 9.11 | % | | | -3.03 | % | | | 1.40 | % | | | 9.22 | % | | | 14.18 | % | |
| Russell 2500 Index | | | -4.14 | % | | | 8.31 | % | | | -2.29 | % | | | 1.18 | % | | | 8.01 | % | | | NA | | |
| S&P 500 Index** | | | -2.75 | % | | | 9.49 | % | | | 5.45 | % | | | 0.22 | % | | | 5.33 | % | | | 10.54 | % | |
| Russell 2000 Index | | | -3.47 | % | | | 8.53 | % | | | -2.08 | % | | | 0.54 | % | | | 7.00 | % | | | NA | | |
| Lipper Mid-Cap Growth Funds Index | | | -6.32 | % | | | 7.72 | % | | | -5.16 | % | | | 1.61 | % | | | 7.29 | % | | | NA | | |
| Columbia Acorn International (LAIAX) (10/16/00) | | | -5.60 | % | | | 8.56 | % | | | -9.63 | % | | | -1.20 | % | | | 10.67 | % | | | 10.38 | % | |
| S&P Global Ex-U.S. Between $500M and $5B Index | | | -8.03 | % | | | 4.82 | % | | | -15.17 | % | | | -2.48 | % | | | 10.95 | % | | | 7.95 | % | |
| S&P Global Ex-U.S. SmallCap Index | | | -8.62 | % | | | 4.96 | % | | | -16.34 | % | | | -3.88 | % | | | 10.06 | % | | | 7.18 | % | |
| MSCI EAFE Index | | | -7.13 | % | | | 2.96 | % | | | -13.83 | % | | | -6.10 | % | | | 5.14 | % | | | 5.22 | % | |
| Lipper International Small/Mid Growth Funds Index | | | -6.03 | % | | | 7.68 | % | | | -10.22 | % | | | -2.99 | % | | | 9.65 | % | | | NA | | |
| Columbia Acorn USA (LAUAX) (10/16/00) | | | -5.26 | % | | | 10.15 | % | | | -4.18 | % | | | 0.68 | % | | | 7.48 | % | | | 9.47 | % | |
| Russell 2000 Index | | | -3.47 | % | | | 8.53 | % | | | -2.08 | % | | | 0.54 | % | | | 7.00 | % | | | 7.08 | % | |
| Lipper Small-Cap Growth Funds Index | | | -4.56 | % | | | 8.95 | % | | | -3.50 | % | | | 0.76 | % | | | 6.23 | % | | | 5.62 | % | |
| Columbia Acorn Int'l Select (LAFAX) (10/16/00) | | | -0.95 | % | | | 10.23 | % | | | -4.30 | % | | | -0.20 | % | | | 10.15 | % | | | 8.75 | % | |
| S&P Developed Ex-U.S. Between $2B and $10B Index | | | -7.60 | % | | | 3.47 | % | | | -14.48 | % | | | -4.59 | % | | | 8.19 | % | | | 6.49 | % | |
| MSCI EAFE Index | | | -7.13 | % | | | 2.96 | % | | | -13.83 | % | | | -6.10 | % | | | 5.14 | % | | | 2.76 | % | |
| Lipper International Small/Mid Growth Funds Index | | | -6.03 | % | | | 7.68 | % | | | -10.22 | % | | | -2.99 | % | | | 9.65 | % | | | 9.40 | % | |
| Columbia Acorn Select (LTFAX) (10/16/00) | | | -8.51 | % | | | 7.64 | % | | | -10.17 | % | | | -2.93 | % | | | 7.05 | % | | | 8.67 | % | |
| S&P MidCap 400 Index | | | -4.93 | % | | | 7.90 | % | | | -2.33 | % | | | 2.55 | % | | | 8.21 | % | | | 8.85 | % | |
| S&P 500 Index** | | | -2.75 | % | | | 9.49 | % | | | 5.45 | % | | | 0.22 | % | | | 5.33 | % | | | 3.01 | % | |
| Lipper Mid-Cap Growth Funds Index | | | -6.32 | % | | | 7.72 | % | | | -5.16 | % | | | 1.61 | % | | | 7.29 | % | | | 5.92 | % | |
| Columbia Thermostat Fund (CTFAX) (3/3/03)† | | | -1.46 | % | | | 6.61 | % | | | 6.80 | % | | | 4.43 | % | | | — | | | | 7.57 | % | |
| S&P 500 Index | | | -2.75 | % | | | 9.49 | % | | | 5.45 | % | | | 0.22 | % | | | — | | | | 7.48 | % | |
| Barclays U.S. Aggregate Bond Index | | | 2.06 | % | | | 2.37 | % | | | 7.47 | % | | | 6.79 | % | | | — | | | | 5.31 | % | |
| Lipper Flexible Portfolio Funds Index | | | -2.89 | % | | | 5.75 | % | | | -0.55 | % | | | 1.82 | % | | | — | | | | 7.34 | % | |
| 50/50 Blended Benchmark | | | -0.29 | % | | | 6.02 | % | | | 6.92 | % | | | 3.94 | % | | | — | | | | 6.73 | % | |
| Columbia Acorn Emerging Markets Fund (CAGAX) (8/19/11) | | | -7.05 | % | | | 9.61 | % | | | — | | | | — | | | | — | | | | 1.50 | %* | |
| S&P Emerging Markets Between $500M and $5B Index | | | -8.09 | % | | | 8.88 | % | | | — | | | | — | | | | — | | | | -5.77 | %* | |
| MSCI Emering Markets Small Cap Index | | | -8.02 | % | | | 7.27 | % | | | — | | | | — | | | | — | | | | -10.59 | %* | |
| Lipper Emerging Markets Index | | | -7.84 | % | | | 5.57 | % | | | — | | | | — | | | | — | | | | -1.62 | %* | |
| Columbia Acorn European Fund (CAEAX) (8/19/11) | | | -5.25 | % | | | 11.53 | % | | | — | | | | — | | | | — | | | | 5.99 | %* | |
| S&P Europe Between $500M and $5B Index | | | -8.62 | % | | | 7.65 | % | | | — | | | | — | | | | — | | | | -0.07 | %* | |
| HSBC Smaller European Companies Index | | | -10.14 | % | | | 5.53 | % | | | — | | | | — | | | | — | | | | -4.53 | %* | |
| Lipper European Region Index | | | -7.82 | % | | | 5.05 | % | | | — | | | | — | | | | — | | | | 3.75 | %* | |
*Not annualized.
**Although the Fund typically invests in small- and mid-sized companies, the comparison to the S&P 500 Index is presented to show performance against a widely recognized market index over the life of the Fund.
Performance data shown represents past performance and is not a guarantee of future results. The investment return and principal value of an investment will fluctuate so that shares, when redeemed, may be worth more or less than their original cost. Current performance may be lower or higher than the performance data shown. Please visit columbiamanagement.com for daily and most recent month-end updates.
Performance results reflect any fee waivers or reimbursements of Fund expenses by the investment manager and/or its affiliates. Please see Page 130 of this report for information on contractual fee waiver/expense reimbursement arrangements in place for Columbia Acorn International, Columbia Thermostat Fund, Columbia Acorn Emerging Markets Fund and Columbia Acorn European Fund. Absent these fee waivers/expense reimbursement arrangements, performance results would have been lower. Annual operating expense ratios are stated as of each Fund's current prospectus dated May 1, 2012, and differences in expense ratios disclosed elsewhere in this report may result from application of any fee waivers/expense reimbursements as well as different time periods used in calculating the ratios. Columbia Acorn Fund: Class A: 1.11%; Class B: 1.81%; Class C: 1.94%; Class I: 0.71%. Columbia Acorn International: Class A: 1.35%; Class B: 2.08%; Class C: 2.14%; Class I: 0.86%; Class R: 1.42%; Class R5: 0.87%. Columbia Acorn USA: Class A: 1.33%; Class B: 2.10%; Class C: 2.18%; Class I: 0.95%. Columbia Acorn International Select: Class A: 1.62%; Class B: 2.32%; Class C: 2.44%; Class I: 1.08%. Columbia Acorn Select: Class A: 1.35%; Class B: 2.05%; Class C: 2.17%; Class I: 0.91%. Columbia Thermostat Fund: Class A: 1.15%; Class B: 1.65%; Class C: 1.90%. Columbia Acorn Emerging Markets Fund Class A: 1.85%; Class C: 2.60%; Class I: 1.41%. Columbia Acorn European Fund Class A: 1.75%; Class C: 2.50%; Class I: 1.31%.
†A "fund of funds" bears its allocable share of the costs and expenses of the underlying funds in which it invests. Such funds are thus subject to two levels of fees and potentially higher expense ratios than would be associated with an investment in a fund that invests and trades directly in financial instruments under the direction of a single manager.
The returns shown for "Life of Fund" are calculated from the inception date of the Fund. The returns shown for periods prior to inception of a Fund's Class A shares may append the returns of the Fund's Class Z shares, the Fund's oldest share class. These returns are adjusted to reflect any higher class-related operating expenses of the newer share classes, as applicable. Please visit columbiamanagement.com/mutual-funds/appended-performance for more information.
All results shown assume reinvestment of distributions and do not reflect the deduction of taxes that a shareholder would pay on fund distributions or on the redemption of Fund shares. Unlike mutual funds, indexes are not actively managed and do not incur fees or expenses. It is not possible to invest directly in an index.
3
Columbia Acorn Family of Funds
Descriptions of Indexes Included in this Report
• 50/50 Blended Benchmark, established by the Fund's investment manager, is an equally weighted custom composite of Columbia Thermostat Fund's primary equity and primary debt benchmarks, the S&P 500 Index and the Barclays U.S. Aggregate Bond Index, respectively. The percentage of the Fund's assets allocated to underlying stock and bond portfolio funds will vary, and accordingly the composition of the Fund's portfolio will not always reflect the composition of the 50/50 Blended Benchmark.
• Barclays U.S. Aggregate Bond Index is a market value-weighted index that tracks the daily price, coupon, pay-downs and total return performance of fixed-rate, publicly placed, dollar-denominated and non-convertible investment grade debt issues with at least $250 million par amount outstanding and with at least one year to final maturity.
• HSBC Smaller European Companies (inc UK) Index is a weighted combination of two indexes: the HSBC Smaller Europe (ex UK) Index and the HSBC Smaller UK Index. The index is rebalanced on a quarterly basis.
• Lipper Indexes include the largest funds tracked by Lipper, Inc. in the named category. Lipper Mid-Cap Growth Funds Index, 30 largest mid-cap growth funds, including Columbia Acorn Fund and Columbia Acorn Select; Lipper International Small/Mid Growth Funds Index, 10 largest non-U.S. small/mid growth funds, including Columbia Acorn International; Lipper Small-Cap Growth Funds Index, 30 largest small-cap growth funds, including Columbia Acorn USA; Lipper Flexible Portfolio Funds Index, an equal-weighted index of the 30 largest mutual funds within the Flexible Portfolio fund classification, as defined by Lipper. Lipper Emerging Markets Index, 30 largest emerging markets funds; Lipper European Region Index, 10 largest European funds.
• MSCI Europe, Australasia, Far East (EAFE) Index (Net) is a capitalization-weighted index that tracks the total return of common stocks in 22 developed-market countries within Europe, Australasia and the Far East. The returns of the MSCI EAFE Index (Net) are presented net of the withholding tax rate applicable to foreign non-resident institutional investors in the foreign companies included in the index who do not benefit from double taxation treaties.
• MSCI Emerging Markets Small Cap Index, a widely recognized international benchmark, is a free float-adjusted market capitalization index that is designed to measure small-cap emerging market equity performance. The MSCI Emerging Markets Small Cap Index currently consists of the following 21 emerging market country indexes: Brazil, Chile, China, Colombia, Czech Republic, Egypt, Hungary, India, Indonesia, Korea, Malaysia, Mexico, Morocco, Peru, Philippines, Poland, Russia, South Africa, Taiwan, Thailand and Turkey.
• Russell 2000 Index measures the performance of the 2,000 smallest companies in the Russell 3000 Index, which represents approximately 10% of the total market capitalization of the Russell 3000 Index.
• Russell 2500 Index measures the performance of the 2,500 smallest companies in the Russell 3000 Index, which represents approximately 17% of the total market capitalization of the Russell 3000 Index.
• Standard & Poor's (S&P) 500 Index tracks the performance of 500 widely held, large-capitalization U.S. stocks.
• Standard & Poor's (S&P) MidCap 400 Index is a market value-weighted index that tracks the performance of 400 mid-cap U.S. companies.
• S&P Developed Ex-U.S. Between $2B and $10B Index is a subset of the broad market selected by the index sponsor representing the mid-cap developed market, excluding the United States.
• S&P Emerging Markets Between $500M and $5B Index represents the institutionally investable capital of emerging market countries with market caps ranging between $500 million to $5 billion, as selected by S&P. The index currently consists of the following 21 emerging market country indexes: Brazil, Chile, China, Colombia, Czech Republic, Egypt, Hungary, India, Indonesia, Korea, Malaysia, Mexico, Morocco, Peru, Philippines, Poland, Russia, South Africa, Taiwan, Thailand and Turkey.
• S&P Europe Between $500M and $5B Index represents the institutionally investable capital of European countries with market caps ranging between $500 million to $5 billion, as selected by S&P. The index currently consists of the following 17 developed market country indexes: Austria, Belgium, Denmark, Finland, France, Germany, Greece, Ireland, Italy, Luxembourg, the Netherlands, Norway, Portugal, Spain, Sweden, Switzerland and the United Kingdom.
• S&P Global Ex-U.S. SmallCap Index consists of the bottom 20% of institutionally investable capital of developed and emerging countries, excluding the United States.
• S&P Global Ex-U.S. Between $500M and $5B Index is a subset of the broad market selected by the index sponsor representing the mid- and small-cap developed and emerging markets, excluding the United States.
Unlike mutual funds, indexes are not managed and do not incur fees or expenses. It is not possible to invest directly in an index.
4
Chattering Squirrels: Columbia Thermostat Fund Turns 10

 On September 25, 2002, Columbia Wanger Asset Management, LLC (CWAM) launched Columbia Thermostat Fund. To mark the Fund's 10-year anniversary, CWAM's founder, Ralph Wanger, who now serves as a trustee emeritus on the Columbia Acorn Funds board of trustees, and CWAM's chief investment officer and Columbia Thermostat Fund's current lead portfolio manager, Chuck McQuaid, got together to talk about the Fund. Ralph came up with the idea for the Columbia Thermostat Fund and was a portfolio manager of the Fund until 2005. Chuck has been a portfolio manager of the Fund since its inception.
Q: What drove you to launch the Columbia Thermostat Fund in 2002?
Ralph: In 2001, I started to give some thought to what the market was likely to do next. The bull market had died following the tech/media/telecom collapse. Could it be that the days of successfully investing using a buy-and-hold strategy were behind us? I studied the major tops in the stock market, especially 1929, 1968 and the Japanese market in 1989. All of these bull markets were followed by periods in which the market fluctuated wildly with no uptrend for an average of 25 years.
Dow Jones Industrial Average (1925 – 2012)
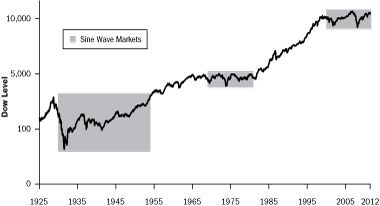
Source: Columbia Management Investment Advisers, LLC
While the Columbia Acorn Funds have always believed that good stock selection will do well in all market environments, if the market was going to be in a frustrating trading pattern for a long time, I figured a mutual fund that could take advantage of this pattern might be a worthwhile product.
I defined the bull market as the exponential state. A prime example of this type of market was the period from 1982 to 1999. I defined the second state as a sine wave market or a prolonged period during which the market moves up and down in a very quick and volatile fashion and equity investors make no forward progress. Previous periods of sine-wave movement occurred from 1930 to 1954 and from 1969 to 1981.
Exponential Market
Dow Jones Industrial Average 1982 – 1999

Source: Columbia Management Investment Advisers, LLC
Sine Wave Market
Dow Jones Industrial Average 1969 – 1981

Source: Columbia Management Investment Advisers, LLC
Chuck: I think it is fair to say that Columbia Thermostat Fund came about because Ralph is a student of market history. In a memo Ralph distributed within CWAM in May of 2002 titled, "How to Survive the Next Ten Years," he made the case for a Thermostat-type fund. He noted that the March 2000 peak was a three-way peak: a business cycle peak, a valuation peak and a psychological peak.
After such peaks a sine wave market can start. I believe this is because the stock market has a feedback loop into the economy itself and if the market goes up a lot companies raise a lot of capital and then put that capital to work. During the tech/media/telecom boom, companies raised enormous amounts of money that led to huge overcapacity. For example, loads of fiber optic cable was put in the ground and to this day the price just keeps going down for high-capacity internet connections. When you have a long capital cycle with too much capital invested, it increases competition and hurts profits. During sine wave periods, excess capital in the economy gets burned off and valuations in the market
5
drop from too high to too low. Sine wave markets also have the volatility we're experiencing now.
Q: So how does Columbia Thermostat Fund take advantage of these volatile conditions?
Ralph: The Fund is made up of a mix of stock and bond mutual funds. When the Standard & Poor's (S&P)® 500 Index goes up, the Fund sells a portion of its stock funds and invests more in its bond funds. When the S&P 500 Index goes down, the Fund increases its investment in stock funds and sells shares from the bond funds. It's as simple as that. I consider this rebalancing the real secret of the Fund. By doing this, we are essentially trying to use the market tides to pump energy into the Fund.
S&P Price Range & Columbia Thermostat's Equity Allocation

Source: Columbia Wanger Asset Management, LLC
There are other asset allocation funds that move assets from stocks to bonds based on market moves. Most asset allocation funds, however, are run by sophisticated investment professionals who make subjective decisions based on economic and financial data and complex graphs of market behavior. By contrast, the day-to-day investment decisions for the Columbia Thermostat Fund are made according to predetermined rules based on the current level of the S&P 500 Index. Because the Fund invests according to a pre-set program, there is no need for subjective day-to-day management.
Chuck: The Fund is designed for those who doubt the wisdom of trying to "time" the market. It simply buys stocks when they go down and sells them when they go up. The Fund takes psychology out of investing; it avoids the temptation to buy more stocks because the stock market is currently going up or to sell stocks because the market is declining. The Fund operates by investing its stock and bond assets according to a predetermined asset allocation table based on S&P 500 Index trading ranges described in the prospectus. For example, at June 30, 2012, the Fund had a 50% stock and 50% bond allocation because the S&P 500 Index fell into the 1350 to 1400 price level band. A 5% rebalance in one direction or the other will be triggered when the S&P 500 Index moves out of that range. The only exception is the result of our "31-day Rule." In order to reduce taxable events, after the Fund has increased its percentage allocation to either stock funds or bond funds, it will not decrease that allocation for at least 31 days. The 31-day Rule can also prevent the Fund from buying stock funds too soon during a sudden steep downward reversal in the market.
Stock/Bond Allocation Table
How the Fund will invest the stock/bond assets
| Level of the S&P 500® Index | | Stock
Percentage | | Bond
Percentage | |
| over 1750 | | | 10 | % | | | 90 | % | |
| over 1700-1750 | | | 15 | % | | | 85 | % | |
| over 1650-1700 | | | 20 | % | | | 80 | % | |
| over 1600-1650 | | | 25 | % | | | 75 | % | |
| over 1550-1600 | | | 30 | % | | | 70 | % | |
| over 1500-1550 | | | 35 | % | | | 65 | % | |
| over 1450-1500 | | | 40 | % | | | 60 | % | |
| over 1400-1450 | | | 45 | % | | | 55 | % | |
| over 1350-1400 | | | 50 | % | | | 50 | % | |
| over 1300-1350 | | | 55 | % | | | 45 | % | |
| over 1250-1300 | | | 60 | % | | | 40 | % | |
| over 1200-1250 | | | 65 | % | | | 35 | % | |
| over 1150-1200 | | | 70 | % | | | 30 | % | |
| over 1100-1150 | | | 75 | % | | | 25 | % | |
| over 1050-1100 | | | 80 | % | | | 20 | % | |
| over 1000-1050 | | | 85 | % | | | 15 | % | |
| 1000 and under | | | 90 | % | | | 10 | % | |
Q: The name is a bit unusual. How did you come up with it?
Ralph: With this Fund, I wanted to create a very simple investment option, something that was easy to understand for investors at every level. I thought about my stepmother Elaine. She was very sweet and very sensible but she had no knowledge of finance. I wanted this fund to make sense to people like her. When thinking about what to name the Fund, I thought about familiar things, items we all have in our houses. The thermostat was an obvious choice: it keeps your house cool when it's hot and hot when it's cool. Columbia Thermostat Fund attempts to adjust the temperature of your investments in the same way.
Q: How has Columbia Thermostat Fund performed?
Chuck: Better than expected, actually. With this type of Fund, our hope was to provide Fund shareholders with returns that fell between the bond market and the S&P 500 Index, but to offer these returns with less volatility than the stock market. From inception through June 30, 2012, the Fund's Class A shares, without sales charge, had an annualized return of 7.57% and topped both the S&P 500 Index, which was up 7.48% for the period, and the Barclays U.S. Aggregate Bond Index, which was up 5.31%.1 The Fund has a five-star overall Morningstar rating and is ranked in the top decile of the Morningstar aggressive allocation category for the one-, three- and five-year periods ended June 30, 2012.2
6
Q: What about the underlying investments? How do you choose the funds you use within this fund-of-funds?
Ralph: We want to have Columbia Thermostat Fund invested broadly across the stock and bond universes, while being biased toward segments and funds that we think are relatively attractive. We initially selected from among the Columbia Acorn Funds managed by CWAM, which provided fine opportunities in the small- and mid-cap equity segments. We also added mid-cap and large-cap stock funds and bond funds managed by Columbia Management Investment Advisers, LLC (CMIA). When the Fund launched in 2002, we had a bias toward small- and mid-caps in our weighting because they appeared relatively cheap.
Allocation of Stock/Bond Assets Within Asset Classes
As of June 30, 2012
| Columbia Stock Funds | | Type of Fund | | Allocation | |
| Acorn Fund | | Small/Mid-cap growth | | | 15 | % | |
| Acorn Select | | Mid-cap growth | | | 10 | % | |
| Acorn International | | Small/Mid-cap
international growth | | | 20 | % | |
| Dividend Income Fund | | Large-cap value | | | 20 | % | |
Large Cap Enhanced
Core Fund | | Large-cap blend | | | 10 | % | |
| Contrarian Core Fund | | Large-cap blend | | | 15 | % | |
Select Large Cap
Growth Fund | | Large-cap growth | | | 10 | % | |
| Columbia Bond Funds | | Type of Fund | | Allocation | |
| Intermediate Bond Fund | | Intermediate-term bonds | | | 50 | % | |
| Income Opportunities Fund | | High-yield bonds | | | 30 | % | |
| U.S. Treasury Index Fund | | U.S. Treasury notes/bonds | | | 20 | % | |
Chuck: CMIA and CWAM combined manage 56 mutual funds rated four or five stars overall by Morningstar. As of June 30, 2012, Columbia Thermostat Fund was invested in 10 funds, nine of which had overall Morningstar ratings of four or five stars. We certainly have lots of highly rated funds to choose from.3 However, past performance does not guarantee future results.
Q: Since Columbia Thermostat Fund was designed largely to buy stocks low and sell them high, why does the Fund own bond funds instead of money market funds?
Ralph: Bond funds usually yield more than money market funds, tend to have much lower volatility than stock funds, and their short-term returns are generally not correlated much with stock funds. I also thought that in a sine wave scenario, bond funds would have returns not far from stock funds. We choose bond funds with relatively short durations to reduce risk from rising interest rates, though interest rates have instead fallen for much of Columbia Thermostat Fund's history.
Q: How has the Fund changed over time?
Chuck: We do a review of the allocation table and underlying funds held in the portfolio at least annually. We take a long-term perspective on what the trading range of the stock market might be and, as Ralph mentioned, which market segments and funds appear relatively attractive.
Our first adjustments to the portfolio were made in September 2005. At that time, we changed the stock allocation table to allow for more equities within the new ranges. We also changed the equity fund line-up to reduce domestic small- and mid-cap exposure from 50% to 25% because smaller cap stock valuations seemed to be getting high. Equity large-cap exposure was increased from 50% to 60% and, with the addition of Columbia Acorn International, we invested in an international component for the first time. International stocks looked relatively attractive, international investing tends to provide excellent diversification and Columbia Acorn International's performance was gaining traction.
During the Fund's 10-year history, we've adjusted the allocation table three times to hike the stock weighting and one time to cut it, each time in response to what we perceived as changes in stock trading ranges. Additional adjustments have also been made to the underlying funds. Most recently, in December 2011, we rebalanced the Fund's bond exposure after looking at interest rate spreads. Treasury rates looked pretty low and corporate bond rates looked more attractive so we did some swapping. We also fine-tuned the investment mix of the Fund's large-cap equity portion.
One other thing we consider is expenses. When debating between similar investments, the lower-cost funds have an edge. In 2011, we exchanged from the Class Z shares of each underlying fund to the newly introduced Class I shares, which is a lower-cost Columbia share class available only to fund-of-funds, such as Columbia Thermostat Fund.
Q: Have there been any times during the past 10 years when the Fund didn't work as you'd expected?
Ralph: Well, there was one law of economics that we forgot about when we launched the Fund: Murphy's Law. In September 2002, the market was at a low and then in 2003, there was a roaring upswing, which dampened interest in an asset allocation fund. As it turned out, the mini bull market of 2003 was just the upside of the sine.
Chuck: Also, Columbia Thermostat Fund was never set up to be a doomsday fund for the ultra bears who thought the market was going to go to zero. It was always meant for a market that was trading within a range and so we set the allocation table based on our expectations for the market. The real estate collapse in 2008 and the subsequent market turmoil was not something we anticipated so we were 100% invested in stocks for nine months from October 2008 through June 2009. We had raised the allocation table in January of 2008 because we felt price-to-earnings ratios had compressed enough and because we didn't want to go to a zero percentage weight in stocks. Well, that didn't happen! In effect, we had over-estimated earnings but the important thing was not to compound the impact in a knee-jerk reaction and sell stocks at or near the bottom. As it turned out, we
7
rode out the storm and caught every bit of the initial upside when the wave turned, starting in March 2009.
Q: Do you dare speculate on how long you think this sine wave will last?
Ralph: That is the question, isn't it? Let's say it's July and it's 97 degrees. What do you wear to work? Likely very light-weight clothing. In February in Chicago when it's 10 below zero, we dress entirely differently with coats, hats and gloves on top of wool suits. If you dress for the weather, you ought to invest for the weather. Investing in a long-only fund is basically a summer idea, best followed when things are optimistic and warm and beautiful. Columbia Thermostat Fund is a winter-time fund that is designed to be variable and that seeks to help you weather stormy and cold days. I believe a long-only fund and an asset allocation fund ought to both be owned within a long-term investment strategy. The tricky part is knowing when to switch from one to the other. The good news is that the failure consequence is different. If you own a long-only fund and you hold it too long and the market goes down dramatically, you lose money and feel lousy. With Columbia Thermostat Fund, if the next exponential market starts, the Fund is designed to turn into more of a bond fund that seeks to preserve your capital and go up a little bit.
If we look to history for the answer, we see that the sine wave markets have lasted quite a while. As I mentioned earlier, after 1929 it took 25 years to reach the old high. After 1968, it also took 25 years, adjusted for inflation. In Japan, their market peaked in late 1989 at 38,000 and it's now about 9,000 after 22 years. It's certainly going to take more than 25 years for that country to get back to the old high. After more than 20 years of a sine wave market, you can be assured of one thing: almost everyone will be disgusted with stocks.
Japanese Great Recession
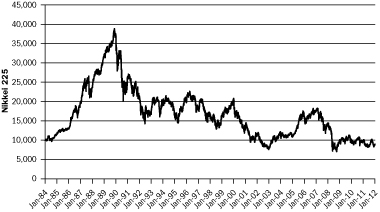
Source: Columbia Management Investment Advisers, LLC
Chuck: I can attest to that from my own experience. I began my career in the investment industry in 1976 and friends I had in my MBA program thought I was nuts for choosing this sector. They didn't think anyone could make money in stocks because stocks had been flat or down for a very long time. As it turned out, it was a great time to launch a career in this industry. The term I use is stocks were "in the wilderness." No one cared about stocks and no one wanted to talk about them. People weren't bragging about their portfolios but were taking cover in other investment options. While I still believe that investing in stocks with good fundamentals and growth potential can yield good results in the market, stocks generally seem to be somewhat in the wilderness now.
Ralph: Yes, I suppose we could get to the point where the word "stock" will first bring to mind cattle or a task assigned to supermarket employees. When that happens, go long!

Charles P. McQuaid
President and Chief Investment Officer
Columbia Wanger Asset Management, LLC
Trustee, Columbia Acorn Trust and Wanger Advisors Trust
Current Portfolio Manager, Columbia Thermostat Fund

Ralph Wanger
Retired Founder, Columbia Wanger Asset Management, LLC
Trustee Emeritus, Columbia Acorn Trust and Wanger Advisors Trust
Former Portfolio Manager, Columbia Thermostat Fund
The information and data provided in this analysis are derived from sources that we deem to be reliable and accurate. These views are not guarantees of future performance and involve certain risks, uncertainties and assumptions that are difficult to predict so actual outcomes and results may differ significantly from the views expressed. The views/opinions expressed in "Chattering Squirrels" are those of the authors and not of the Columbia Acorn Trust Board, are subject to change at any time based upon economic, market or other conditions, may differ from views expressed by other Columbia Management associates and the respective parties disclaim any responsibility to update such views. These views may not be relied on as investment advice and, because investment decisions for a Columbia Acorn Fund are based on numerous factors, may not be relied on as an indication of trading intent on behalf of any particular Columbia Acorn Fund.
1 Please see Page 3 of this report for additional performance data for Columbia Thermostat Fund and its benchmarks.
2 Overall rating among 371 Aggressive Allocation funds. The Fund received a Morningstar Rating of 5 stars among 371 funds and 5 stars among 345 funds for the 3- and 5-year periods, respectively.
3 All ratings are for Class Z shares as of 06/30/12. Other classes may have different performance characteristics and may have different ratings. Out of 118 Z-share Columbia funds rated by Morningstar, eight funds received a 5-star Overall Rating and 48 funds received a 4-star Overall Rating. The Overall Morningstar RatingTM for a fund is derived from a weighted average of the performance figures associated with its 3-, 5- and 10-year Morningstar Rating metrics.
For each fund with at least a 3-year history, Morningstar calculates a Morningstar Rating based on a Morningstar Risk-Adjusted Return measure that accounts for variation in a fund's monthly performance (including the effects of sales charges, loads and redemption fees), placing more emphasis on downward variations and rewarding consistent performance. The top 10% of funds in each category receive 5 stars, the next 22.5% receive 4 stars, the next 35% receive 3 stars, the next 22.5% receive 2 stars and the bottom 10% receive 1 star. (Each share class is counted as a fraction of one fund within this scale and rated separately, which may cause slight variations in the distribution percentages.)
© 2012 Morningstar, Inc. All rights reserved. The Morningstar information contained herein: (1) is proprietary to Morningstar and/or its content providers; (2) may not be copied or distributed; and (3) is not warranted to be accurate, complete or timely. Neither Morningstar nor its content providers are responsible for any damages or losses arising from any use of this information.
8
Understanding Your Expenses
As a shareholder, you incur two types of costs. There are transaction costs, which generally include sales charges on purchases and may include redemption fees. There are also ongoing costs, which generally include management fees, distribution and service (Rule 12b-1) fees, and other Fund expenses. The following information is intended to help you understand your ongoing costs (in dollars) of investing in the Fund and to help you compare these costs with the ongoing costs of investing in other mutual funds.
Analyzing Your Fund's Expenses
To illustrate these ongoing costs, we have provided examples and calculated the expenses paid by investors in Class A, B, C, I, R and R5 shares of the Funds during the period. The actual and hypothetical information in the tables is based on an initial investment of $1,000 at the beginning of the period indicated and held for the entire period. Expense information is calculated two ways and each method provides you with different information. The amount listed in the "Actual" column is calculated using the Funds' actual operating expenses and total return for the period. You may use the Actual information, together with the amount invested, to estimate the expenses that you paid over the period. Simply divide your account value by $1,000 (for example, an $8,600 account value divided by $1,000 = 8.6), then multiply the results by the expenses paid during the period under the Actual column. The amount listed in the "Hypothetical" column assumes a 5% annual rate of return before expenses (which is not the Funds' actual return) and then applies the Funds' actual expense ratio for the period to the hypothetical return. You should not use the hypothetical account values and expenses to estimate either your actual account balance at the end of the period or the expenses you paid during the period. See "Compare With Other Funds" below for details on how to use the hypothetical data.
In addition to the ongoing expenses which the Funds bear directly, Columbia Thermostat Fund's shareholders indirectly bear the Fund's allocable share of the costs and expenses of each underlying fund in which the Fund invests. You can also estimate the effective expenses paid during the period, which includes the indirect fees associated with investing in the underlying funds, by using the amounts listed in the effective expenses paid during the period column in the "Fund of Funds" table on Page 11.
Compare With Other Funds
Since all mutual funds are required to include the same hypothetical calculations about expenses in shareholder reports, you can use this information to compare the ongoing cost of investing in the Funds with other funds. To do so, compare the hypothetical example with the 5% hypothetical examples that appear in the shareholder reports of other funds. As you compare hypothetical examples of other funds, it is important to note that hypothetical examples are meant to highlight the ongoing costs of investing in a fund only and do not reflect any transaction costs, such as sales charges, or redemption or exchange fees. Therefore, the hypothetical calculations are useful in comparing ongoing costs only, and will not help you determine the relative total costs of owning different funds. If transaction costs were included in these calculations, your costs would be higher.
January 1, 2012 – June 30, 2012
| | | Account value at
the beginning of
the period ($) | | Account value at
the end of
the period ($) | | Expenses paid
during the period ($) | | Fund's
annualized
expense
ratio (%) | |
| | | Actual | | Hypothetical | | Actual | | Hypothetical | | Actual | | Hypothetical | | Actual | |
| Columbia Acorn Fund | |
| Class A | | | 1,000.00 | | | | 1,000.00 | | | | 1,091.10 | | | | 1,019.64 | | | | 5.46 | | | | 5.27 | | | | 1.05 | | |
| Class B | | | 1,000.00 | | | | 1,000.00 | | | | 1,087.80 | | | | 1,016.66 | | | | 8.57 | | | | 8.27 | | | | 1.65 | | |
| Class C | | | 1,000.00 | | | | 1,000.00 | | | | 1,087.00 | | | | 1,015.91 | | | | 9.34 | | | | 9.02 | | | | 1.80 | | |
| Class I | | | 1,000.00 | | | | 1,000.00 | | | | 1,092.70 | | | | 1,021.28 | | | | 3.75 | | | | 3.62 | | | | 0.72 | | |
9
Understanding Your Expenses
continued
| | | Account value at
the beginning of
the period ($) | | Account value at
the end of
the period ($) | | Expenses paid
during the period ($) | | Fund's
annualized
expense
ratio (%) | |
| | | Actual | | Hypothetical | | Actual | | Hypothetical | | Actual | | Hypothetical | | Actual | |
| Columbia Acorn International | |
| Class A | | | 1,000.00 | | | | 1,000.00 | | | | 1,085.60 | | | | 1,018.70 | | | | 6.43 | | | | 6.22 | | | | 1.24 | | |
| Class B | | | 1,000.00 | | | | 1,000.00 | | | | 1,081.70 | | | | 1,014.97 | | | | 10.30 | | | | 9.97 | | | | 1.99 | | |
| Class C | | | 1,000.00 | | | | 1,000.00 | | | | 1,081.70 | | | | 1,014.97 | | | | 10.30 | | | | 9.97 | | | | 1.99 | | |
| Class I | | | 1,000.00 | | | | 1,000.00 | | | | 1,087.90 | | | | 1,020.54 | | | | 4.52 | | | | 4.37 | | | | 0.87 | | |
| Class R | | | 1,000.00 | | | | 1,000.00 | | | | 1,083.80 | | | | 1,017.55 | | | | 7.62 | | | | 7.37 | | | | 1.47 | | |
| Class R5 | | | 1,000.00 | | | | 1,000.00 | | | | 1,087.20 | | | | 1,020.34 | | | | 4.57 | | | | 4.42 | | | | 0.88 | | |
| Columbia Acorn USA | |
| Class A | | | 1,000.00 | | | | 1,000.00 | | | | 1,101.50 | | | | 1,018.35 | | | | 6.84 | | | | 6.57 | | | | 1.31 | | |
| Class B | | | 1,000.00 | | | | 1,000.00 | | | | 1,097.70 | | | | 1,014.87 | | | | 10.48 | | | | 10.07 | | | | 2.01 | | |
| Class C | | | 1,000.00 | | | | 1,000.00 | | | | 1,097.90 | | | | 1,014.67 | | | | 10.69 | | | | 10.27 | | | | 2.05 | | |
| Class I | | | 1,000.00 | | | | 1,000.00 | | | | 1,103.80 | | | | 1,020.09 | | | | 5.02 | | | | 4.82 | | | | 0.96 | | |
| Columbia Acorn International Select | |
| Class A | | | 1,000.00 | | | | 1,000.00 | | | | 1,102.30 | | | | 1,017.40 | | | | 7.84 | | | | 7.52 | | | | 1.50 | | |
| Class B | | | 1,000.00 | | | | 1,000.00 | | | | 1,098.90 | | | | 1,014.37 | | | | 11.01 | | | | 10.57 | | | | 2.11 | | |
| Class C | | | 1,000.00 | | | | 1,000.00 | | | | 1,098.10 | | | | 1,013.48 | | | | 11.95 | | | | 11.46 | | | | 2.29 | | |
| Class I | | | 1,000.00 | | | | 1,000.00 | | | | 1,104.40 | | | | 1,019.19 | | | | 5.96 | | | | 5.72 | | | | 1.14 | | |
| Columbia Acorn Select | |
| Class A | | | 1,000.00 | | | | 1,000.00 | | | | 1,076.40 | | | | 1,018.30 | | | | 6.81 | | | | 6.62 | | | | 1.32 | | |
| Class B | | | 1,000.00 | | | | 1,000.00 | | | | 1,073.00 | | | | 1,015.42 | | | | 9.79 | | | | 9.52 | | | | 1.90 | | |
| Class C | | | 1,000.00 | | | | 1,000.00 | | | | 1,072.30 | | | | 1,014.57 | | | | 10.67 | | | | 10.37 | | | | 2.07 | | |
| Class I | | | 1,000.00 | | | | 1,000.00 | | | | 1,077.90 | | | | 1,020.04 | | | | 5.01 | | | | 4.87 | | | | 0.97 | | |
| Columbia Acorn Emerging Markets Fund | |
| Class A | | | 1,000.00 | | | | 1,000.00 | | | | 1,096.10 | | | | 1,015.96 | | | | 9.33 | | | | 8.97 | | | | 1.79 | | |
| Class C | | | 1,000.00 | | | | 1,000.00 | | | | 1,093.10 | | | | 1,012.18 | | | | 13.27 | | | | 12.76 | | | | 2.55 | | |
| Class I | | | 1,000.00 | | | | 1,000.00 | | | | 1,097.60 | | | | 1,017.85 | | | | 7.35 | | | | 7.07 | | | | 1.41 | | |
| Columbia Acorn European Fund | |
| Class A | | | 1,000.00 | | | | 1,000.00 | | | | 1,115.30 | | | | 1,016.91 | | | | 8.41 | | | | 8.02 | | | | 1.60 | | |
| Class C | | | 1,000.00 | | | | 1,000.00 | | | | 1,109.90 | | | | 1,012.98 | | | | 12.54 | | | | 11.96 | | | | 2.39 | | |
| Class I | | | 1,000.00 | | | | 1,000.00 | | | | 1,116.40 | | | | 1,018.35 | | | | 6.89 | | | | 6.57 | | | | 1.31 | | |
10
Fund of Funds—Columbia Thermostat Fund
January 1, 2012 – June 30, 2012
| | | Account value at
the beginning of
the period ($) | | Account value at
the end of
the period ($) | | Expenses paid
during period ($) | | Fund's
annualized
expense
ratio (%) | | Effective
expenses
paid during
the period | | Fund's
effective
annualized
expense
ratio (%) | |
| | | Actual | | Hypothetical | | Actual | | Hypothetical | | Actual | | Hypothetical | | Actual | | Actual | | Hypothetical | | Actual | |
| Columbia Thermostat Fund | |
| Class A | | | 1,000.00 | | | | 1,000.00 | | | | 1,066.10 | | | | 1,022.38 | | | | 2.57 | | | | 2.51 | | | | 0.50 | | | | 5.70 | | | | 5.58 | | | | 1.11 | | |
| Class B | | | 1,000.00 | | | | 1,000.00 | | | | 1,063.30 | | | | 1,019.89 | | | | 5.13 | | | | 5.02 | | | | 1.00 | | | | 8.26 | | | | 8.09 | | | | 1.61 | | |
| Class C | | | 1,000.00 | | | | 1,000.00 | | | | 1,061.80 | | | | 1,018.65 | | | | 6.41 | | | | 6.27 | | | | 1.25 | | | | 9.53 | | | | 9.34 | | | | 1.86 | | |
Expenses paid during the period are equal to the annualized expense ratio, multiplied by the average account value over the period and then multiplied by the number of days in the Fund's most recent fiscal half year and divided by 366.
Expenses do not include fees and expenses incurred indirectly by the Fund from the underlying funds in which the Fund may invest (also referred to as "acquired funds"), including affiliated and non-affiliated pooled investments vehicles (including mutual funds and exchange traded funds).
In the case of Columbia Thermostat Fund, effective expenses paid during the period and the Fund's effective annualized expense ratio include expenses borne directly by the class plus the Fund's pro rata portion of the ongoing expenses charged by the underlying funds using the expense ratio of each class of the underlying funds as of the underlying fund's most recent shareholder report.
Had the investment adviser and/or certain of its affiliates not waived/reimbursed certain fees and expenses, account value at the end of the period would have been reduced.
11
Columbia Acorn Fund
In a Nutshell
 | |  | |
|
| Charles P. McQuaid | | Robert A. Mohn | |
|
| Lead Portfolio Manager | | Co-Portfolio Manager | |
|
Performance data shown represents past performance and is not a guarantee of future results. The investment return and principal value will fluctuate so that shares, when redeemed, may be worth more or less than the original cost. Current performance may be lower or higher than the performance data shown. Please visit columbiamanagement.com for daily and most recent month-end performance updates.
Fund Positions
in Mentioned Holdings
As a percentage of net assets, as of 6/30/12
| lululemon athletica | | | 1.6 | % | |
| Crown Castle International | | | 1.5 | % | |
| tw telecom | | | 1.4 | % | |
| FMC Technologies | | | 1.2 | % | |
| SBA Communications | | | 1.1 | % | |
| Biomarin Pharmaceuticals | | | 1.0 | % | |
| Seattle Genetics | | | 0.9 | % | |
| Alexion Pharmaceuticals | | | 0.9 | % | |
| Coach | | | 0.7 | % | |
| Auxilium Pharmaceuticals | | | 0.5 | % | |
| Pacific Rubiales Energy | | | 0.5 | % | |
| Onyx Pharmaceuticals | | | 0.3 | % | |
| Fossil | | | 0.2 | % | |
Columbia Acorn Fund fell 5.48% (Class A shares, without sales charge) in the second quarter, offsetting some of the first quarter gains to end up 9.11% for the first half of 2012. The Fund's primary benchmark, the Russell 2500 Index, dropped 4.14% in the quarter and rose 8.31% during the half year. In both periods, Columbia Acorn Fund beat the Lipper Mid-Cap Growth Index, which fell 6.32% in the quarter and gained 7.72% in the half.
Driven by explosive growth in data transmission, telecom stocks helped performance during both the quarter and the half. Cell tower companies Crown Castle International and SBA Communications rose 10% and 12%, respectively, in the quarter and 31% and 33%, respectively, in the half. tw telecom, which provides fiber optic connections to over 15,000 buildings, grew 16% in the second quarter and 32% in the half.
Pharmaceutical and biotech stocks bolstered performance in the second quarter. Onyx Pharmaceuticals, Auxilium Pharmaceuticals, Seattle Genetics and Biomarin Pharmaceuticals all reported good news about drugs either recently approved and/or in development pipelines. The stocks' gains in the quarter ranged from 16% to 77%. Alexion Pharmaceuticals rose 7% in the quarter, resulting in a 39% gain in the half and making it the Fund's second largest dollar winner year to date through June 30.
Consumer durable and apparel stocks helped performance in the first quarter but hurt in the second. The Fund's largest dollar loser in the second quarter was premium active apparel retailer lululemon athletica, down 20% on disappointing earnings guidance. Last year investors were wrongly concerned that inventories were too high but, in the second quarter of 2012, low inventories reduced near-term earnings upside. Due to fine first quarter performance, lululemon was still the Fund's largest dollar winner for the half, up 28%. Other consumer stocks fell in the second quarter due to concerns about sales overseas; handbag maker Coach dropped 24% and watch designer and retailer Fossil fell 42%.
Energy stocks were also disappointing in the second quarter, largely due to declining oil prices and low natural gas prices. In addition, offshore oil equipment maker FMC Technologies had problems ramping up production. Its stock fell 22% in the quarter and was down 25% in the half, making it the Fund's second largest dollar loser in the quarter and the largest loser in the half. Colombian oil producer Pacific Rubiales Energy continued to be volatile; after surging 59% in the first quarter, it fell 27% in the second. The company suffered from delays in receiving drilling permits and lacked new oil discoveries. We cut the Fund's weighting in energy stocks during the second quarter to 6.2%, about matching the benchmark.
Columbia Acorn Fund's international stocks were off 12.74% in the quarter and up just 2.31% in the half.* While we see lots of foreign companies with good business models and attractively valued stocks, we fear macroeconomic concerns could keep their stocks depressed. Foreign holdings accounted for 8.3% of assets at the end of the half, down from 9.2% at the end of the first quarter and 9.3% at the end of 2011. Investors that desire greater exposure to foreign stocks may wish to consider one or more of the Columbia Acorn international funds.
As of press time, a majority of companies in Columbia Acorn Fund seem to be achieving their earnings targets, though many are cutting their outlooks somewhat. Corporations and consumers have generally improved their balance sheets since the Great Recession. As a percentage of income, minimum required payments on consumer mortgages and consumer credit are near 20-year lows. However, federal government deficit, tax and regulatory issues appear to be hindering economic growth and causing uncertainty in the markets. We can't predict when uncertainty will lessen, but when it does, stock prices may be a lot higher. We continue to pursue investments in good businesses at reasonable prices.
*These returns are not comparable to mutual fund returns, as they are gross of fees and other expenses and do not portray the cash effects incurred by actual mutual funds. Columbia Acorn Fund's foreign stockholdings were not purchased as a balanced, stand-alone portfolio.
Stocks of small- and mid-cap companies pose special risks, including possible illiquidity and greater price volatility than stocks of larger, more established companies. International investing involves special risks, including foreign taxation, currency risks, risks associated with possible differences in financial standards and other risks associated with future political and economic developments.
Portfolio holdings are subject to change periodically and may not be representative of current holdings.
12
Columbia Acorn Fund
At a Glance (Class A Shares - LACAX)
Performance data shown represents past performance and is not a guarantee of future results. The investment return and principal value of an investment will fluctuate so that shares, when redeemed, may be worth more or less than their original cost. Current performance may be lower or higher than the performance data shown. Performance results reflect any fee waivers or reimbursements of Fund expenses by the investment manager and/or any of its affiliates. Absent these fee waivers and/or expense reimbursement arrangements, performance results would have been lower. Please visit columbiamanagement.com for daily and most recent month-end updates.
Pretax and After-tax Average Annual Total Returns (Based on Class A Share Returns, inception 10/16/00)
through June 30, 2012
| | | | | Year
to date* | | 1 year | | 5 years | | 10 years | |
Returns before taxes
| | NAV
POP | | | 9.11
2.85 | % | | | -3.03
-8.62 | % | | | 1.40
0.21 | % | | | 9.22
8.57 | % | |
Returns after taxes
on distributions | | NAV
POP | | | 8.90
2.66 | | | | -3.68
-9.22 | | | | 0.88
-0.31 | | | | 8.63
7.99 | | |
Returns after taxes
on distributions and
sale of fund shares | | NAV
POP
| | | 6.18
2.10
| | | | -1.18
-4.86
| | | | 1.16
0.14
| | | | 8.12
7.53
| | |
| Russell 2500 Index** (pretax) | | | | | | | 8.31 | | | | -2.29 | | | | 1.18 | | | | 8.01 | | |
All results shown assume reinvestment of distributions.
*Year to date data is not annualized.
**The Fund's primary benchmark.
After-tax returns are calculated using the highest historical individual federal marginal income tax rates, and do not reflect the impact of state and local taxes. Returns after taxes on distributions and sale of Fund shares reflect the additional tax impact of long-term gains or losses realized when Fund shares are sold. The returns are taxed at the maximum rate and assume shares were purchased at the beginning of the period. Actual after-tax returns depend on the investor's tax situation and may differ from those shown. After-tax returns are not relevant to investors who hold their Fund shares through tax-deferred arrangements such as 401(k) plans or individual retirement accounts. After-tax returns are shown for Class A shares only; after-tax returns for other share classes will vary. Indexes do not reflect any deduction for fees, expenses or taxes.
Public offering price (POP) returns include the maximum sales charge of 5.75% for Class A shares. Net asset value (NAV) returns do not include sales charges or contingent deferred sales charges (CDSC).
The Fund's Class A shares annual operating expense ratio, as stated in the May 1, 2012, prospectus, is 1.11%.
Columbia Acorn Fund Portfolio Diversification
as a percentage of net assets, as of 6/30/12
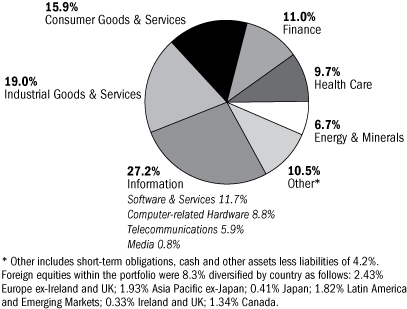
Columbia Acorn Fund Top 10 Holdings
as a percentage of net assets, as of 6/30/12
| 1. | | Ametek
Aerospace/Industrial Instruments | | | 2.0
| % | |
| 2. | | Donaldson
Industrial Air Filtration | | | 1.6
| % | |
| 3. | | lululemon athletica
Premium Active Apparel Retailer | | | 1.6
| % | |
| 4. | | Crown Castle International
Communications Towers | | | 1.5
| % | |
| 5. | | Mettler-Toledo International
Laboratory Equipment | | | 1.5
| % | |
| 6. | | tw telecom
Fiber Optic Telephone/Data Services | | | 1.4
| % | |
| 7. | | Informatica
Enterprise Data Integration Software | | | 1.2
| % | |
| 8. | | Cepheid
Molecular Diagnostics | | | 1.2
| % | |
| 9. | | FMC Technologies
Oil & Gas Well Head Manufacturer | | | 1.2
| % | |
| 10. | | SBA Communications
Communications Towers | | | 1.1
| % | |
The Fund's top 10 holdings and portfolio diversification vary with changes in portfolio investments. See the Statement of Investments for a complete list of the Fund's holdings.
The Growth of a $10,000 Investment in Columbia Acorn Fund (Class A)
June 10, 1970 (Fund inception) through June 30, 2012
The chart shows the change in value of a hypothetical $10,000 investment in Class A shares of the Fund during the stated time period. Although the indexes are provided for use in assessing the Fund's performance, the Fund's holdings may differ significantly from those in the index. It is not possible to invest directly in an index. The graph does not reflect taxes that a shareholder may pay on Fund distributions or on a sale of Fund shares.
The returns shown for periods prior to the inception date of the Fund's Class A shares are calculated from the inception date of the Fund and append the returns of the Fund's Class Z shares, the Fund's oldest share class. These returns are adjusted to reflect any higher class-related operating expenses of the newer share classes, as applicable. Please visit columbiamanagement.com/mutual-funds/appended-performance for more information.
Total Net Assets of the Fund: $17.2 billion
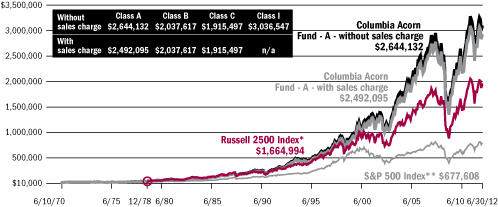
* A $10,000 investment in Columbia Acorn Fund at inception appreciated to $30,945 on December 31, 1978, the inception date of the Russell 2500 Index. For comparison with the Russell 2500 Index, we assigned the index the same value as the Fund at index inception.
**Although the Fund typically invests in small- and mid-sized companies, the comparison to the S&P 500 Index is presented to show performance against a widely recognized market index over the life of the Fund.
13
Columbia Acorn International
In a Nutshell
 | |  | |
|
| P. Zachary Egan | | Louis J. Mendes III | |
|
| Co-Portfolio Manager | | Co-Portfolio Manager | |
|
Performance data shown represents past performance and is not a guarantee of future results. The investment return and principal value will fluctuate so that shares, when redeemed, may be worth more or less than the original cost. Current performance may be lower or higher than the performance data shown. Please visit columbiamanagement.com for daily and most recent month-end performance updates.
Fund's Positions
in Mentioned Holdings
As a percentage of net assets, as of 6/30/12
| Eurofins Scientific | | | 1.1 | % | |
| Gemalto | | | 0.9 | % | |
| Mongolian Mining | | | 0.6 | % | |
| Nagacorp | | | 0.4 | % | |
| Northam Platinum | | | 0.4 | % | |
| Archipelago Resources | | | 0.4 | % | |
| FMC Technologies | | | 0.3 | % | |
| Celtic Exploration | | | 0.1 | % | |
Columbia Acorn International fell 5.60% (Class A shares, without sales charge) in the second quarter of 2012, which was 2.43% better than its primary benchmark, the S&P Global Ex-U.S. between $500M and $5B Index. This comes on the heels of a strong first quarter, during which the Fund was up 14.99%. The Fund's return for the first half of the year was 8.56%, 3.74% ahead of the benchmark. For comparison, the large-cap, developed-market MSCI EAFE Index rose 2.96% during the six month period.
This reversal of fortune in the markets in the second quarter occurred in a context of high anxiety regarding the financial stability of peripheral eurozone states and the worsening outlook for Chinese growth. Markets do not like uncertainty and the lack of a resolution to European budget crises continues to rattle the confidence of long-term investors in the region. As confidence falls, sovereign borrowing costs rise, which further deteriorates the long-term financial outlook. Aside from this unhelpful, self-reinforcing mechanism, signs of a slowing Chinese economy further fueled market volatility. Despite the ebb and flow of sentiment, however, many of the Fund's holdings have continued to post a pleasing growth in earnings.
Most notable about the Fund's first-half results is the relatively strong performance of classic "Acorn-style" companies. By this we refer to companies that are taking advantage of structural changes within the market for their products or services—whether related to regulation, technology, energy efficiency, social change or otherwise. These can be contrasted with companies that primarily depend on macroeconomic factors to drive earnings. Top performers for the half year included Nagacorp (+85%), a Cambodian-based casino operator catering to the growing needs of Indochina's emerging middle class for quality entertainment facilities. Two French companies, Eurofins Scientific (+72%) and Gemalto (+47%) performed well despite eurozone concerns. Eurofins Scientific provides laboratory analysis of food, pharmaceuticals and cosmetics products globally and, after a long period of consolidation, looms as a one-stop solution for multinational companies and others increasingly concerned with the safety and purity of traded goods. Gemalto is a leader in developing smart-chip technology for use in credit cards and mobile handsets. These mobile devices are finding increasingly valuable applications in secure payment systems.
Macroeconomic worries did hurt the Fund in commodity-related holdings. Fears of slower global growth drove down a number of energy and basic material stocks. Indonesian gold miner Archipelago Resources (-26%), Mongolian coal miner Mongolian Mining (-24%) and South African platinum miner Northam Platinum (-23%) all fell during the half year on weakened outlook for demand. Similarly, oil exploration-related companies Celtic Exploration (-41%) and FMC Technologies (-25%) declined on expectations that oil prices would soften.
We expect continued volatility in the second half of the year. The euro debt crisis does not lend itself to a tidy resolution in the short- or even mid-term. The most likely outcome in our view is piecemeal structural reform within uncompetitive states, incented by explicit and tacit German support and the fact that the alternatives entail a lower standard of living for these states on a long-term basis. We believe that will be a political process fraught with complexity and made more complicated by the way Europe is organized. In the fall, the presidential election in the United States and the transition of leadership in China will also likely become a focus for continued sentiment shifts in the marketplace. As always, we will strive to work through the noise to identify companies where reasonable valuations are supported by good or improving fundamentals. Thank you for your continued investment in the Fund.
International investing involves special risks, including foreign taxation, currency risks, risks associated with possible differences in financial standards and other risks associated with future political and economic developments. Stocks of small- and mid-cap companies pose special risks, including possible illiquidity and greater price volatility than stocks of larger, more established companies. Investing in emerging markets may involve greater risks than investing in more developed countries. In addition, concentration of investments in a single region may result in greater volatility.
Portfolio holdings are subject to change periodically and may not be representative of current holdings.
14
Columbia Acorn International
At a Glance (Class A Shares - LAIAX)
Performance data shown represents past performance and is not a guarantee of future results. The investment return and principal value of an investment will fluctuate so that shares, when redeemed, may be worth more or less than their original cost. Current performance may be lower or higher than the performance data shown. Performance results reflect any fee waivers or reimbursements of Fund expenses by the investment manager and/or any of its affiliates. Absent these fee waivers and/or expense reimbursement arrangements, performance results would have been lower. Please visit columbiamanagement.com for daily and most recent month-end updates.
Pretax and After-tax Average Annual Total Returns (Based on Class A Share Returns, inception 10/16/00)
through June 30, 2012
| | | | | Year
to date* | | 1 year | | 5 years | | 10 years | |
Returns before taxes
| | NAV
POP | | | 8.56
2.32 | % | | | -9.63
-14.82 | % | | | -1.20
-2.36 | % | | | 10.67
10.01 | % | |
Returns after taxes
on distributions | | NAV
POP | | | 8.49
2.26 | | | | -9.57
-14.76 | | | | -1.66
-2.81 | | | | 10.19
9.54 | | |
Returns after taxes
on distributions and
sale of fund shares | | NAV
POP
| | | 5.56
1.51
| | | | -6.15
-9.53
| | | | -1.04
-2.01
| | | | 9.55
8.94
| | |
S&P Global Ex-US
Between $500M and
$5B Index** (pretax) | | | | | | | 4.82 | | | | -15.17 | | | | -2.48 | | | | 10.95 | | |
All results shown assume reinvestment of distributions.
*Year to date data is not annualized.
**The Fund's primary benchmark.
After-tax returns are calculated using the highest historical individual federal marginal income tax rates, and do not reflect the impact of state and local taxes. Returns after taxes on distributions and sale of Fund shares reflect the additional tax impact of long-term gains or losses realized when Fund shares are sold. The returns are taxed at the maximum rate and assume shares were purchased at the beginning of the period. Actual after-tax returns depend on the investor's tax situation and may differ from those shown. After-tax returns are not relevant to investors who hold their Fund shares through tax-deferred arrangements such as 401(k) plans or individual retirement accounts. After-tax returns are shown for Class A shares only; after-tax returns for other share classes will vary. Indexes do not reflect any deduction for fees, expenses or taxes.
Public offering price (POP) returns include the maximum sales charge of 5.75% for Class A shares. Net asset value (NAV) returns do not include sales charges or contingent deferred sales charges (CDSC).
The Fund's Class A shares annual operating expense ratio, as stated in the May 1, 2012, prospectus, is 1.35%.
Columbia Acorn International Portfolio Diversification
as a percentage of net assets, as of 6/30/12

Columbia Acorn International Top 10 Holdings
as a percentage of net assets, as of 6/30/12
| 1. | | Far EasTone Telecom (Taiwan)
Taiwan's Third Largest Mobile Operator | | | 1.3
| % | |
| 2. | | Melco Crown Entertainment (Hong Kong)
Macau Casino Operator | | | 1.2
| % | |
| 3. | | Hexagon (Sweden)
Design, Measurement & Visualization Software & Equipment | | | 1.2
| % | |
| 4. | | Eurofins Scientific (France)
Food, Pharmaceuticals & Materials Screening & Testing | | | 1.1
| % | |
| 5. | | Naspers (South Africa)
Media in Africa, China, Russia & Other Emerging Markets | | | 1.0
| % | |
| 6. | | Kansai Paint (Japan)
Paint Producer in Japan, India, China & Southeast Asia | | | 1.0
| % | |
| 7. | | Localiza Rent A Car (Brazil)
Car Rental | | | 0.9
| % | |
| 8. | | Partners Group (Switzerland)
Private Markets Asset Management | | | 0.9
| % | |
| 9. | | Taiwan Mobile (Taiwan)
Taiwan's Second Largest Mobile Operator | | | 0.9
| % | |
| 10. | | Gemalto (France)
Digital Security Solutions | | | 0.9
| % | |
The Fund's top 10 holdings and portfolio diversification vary with changes in portfolio investments. See the Statement of Investments for a complete list of the Fund's holdings.
The Growth of a $10,000 Investment in Columbia Acorn International (Class A)
September 23, 1992 (Fund inception) through June 30, 2012
The chart shows the change in value of a hypothetical $10,000 investment in Class A shares of the Fund during the stated time period. Although the index is provided for use in assessing the Fund's performance, the Fund's holdings may differ significantly from those in the index. It is not possible to invest directly in an index. The graph does not reflect taxes that a shareholder may pay on Fund distributions or on a sale of Fund shares.
The returns shown for periods prior to the inception date of the Fund's Class A shares are calculated from the inception date of the Fund and append the returns of the Fund's Class Z shares, the Fund's oldest share class. These returns are adjusted to reflect any higher class-related operating expenses of the newer share classes, as applicable. Please visit columbiamanagement.com/mutual-funds/appended-performance for more information.
Total Net Assets of the Fund: $6.0 billion
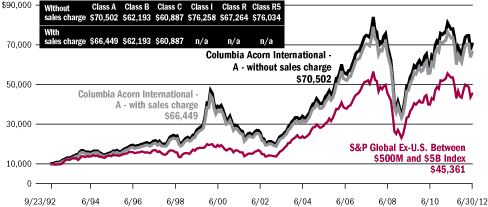
15
Columbia Acorn USA
In a Nutshell
 | | | |
|
| Robert A. Mohn | | | |
|
| Lead Portfolio Manager | | | |
|
Performance data shown represents past performance and is not a guarantee of future results. The investment return and principal value will fluctuate so that shares, when redeemed, may be worth more or less than the original cost. Current performance may be lower or higher than the performance data shown. Please visit columbiamanagement.com for daily and most recent month-end performance updates.
Fund's Positions
in Mentioned Holdings
As a percentage of net assets, as of 6/30/12
| Informatica | | | 2.4 | % | |
| tw telecom | | | 2.4 | % | |
| lululemon athletica | | | 2.2 | % | |
| Gaylord Entertainment | | | 2.1 | % | |
| SBA Communications | | | 1.9 | % | |
| Abercrombie & Fitch | | | 1.0 | % | |
| Atmel | | | 0.8 | % | |
| Auxilium Pharmaceuticals | | | 0.7 | % | |
| Finisar | | | 0.7 | % | |
| Akorn | | | 0.6 | % | |
| Onyx Pharmaceuticals | | | 0.4 | % | |
| SM Energy | | | 0.4 | % | |
| Houston American Energy | | | 0.0 | %* | |
*Rounds to less than 0.1%.
Columbia Acorn USA ended the second quarter of 2012 down 5.26% (Class A shares, without sales charge), underperforming the 3.47% drop of its primary benchmark, the Russell 2000 Index. For the half year ended June 30, 2012, the Fund was up 10.15%, outpacing the 8.53% gain of its benchmark. It was a rough quarter for the markets in general, but lagging performance in Fund retail and technology stocks further dampened returns relative to the benchmark.
On the positive side, two deal announcements positively impacted results. Cost management software company Ariba is to be taken over by SAP. Ariba's stock rose 37% in the quarter on the news and ended the half year up 60%. Convention hotel operator Gaylord Entertainment announced it would convert to a real estate investment trust, news that sent its stock up 25% for the quarter and 60% for the half year.
The Fund's two large investments in the telecom sector, tw telecom, a provider of fiber optic telephone and data services, and SBA Communications, a mobile communications tower company, both benefited from a surge in data usage and reported solid growth in cash flow year-over-year. Their stocks responded favorably, with tw telecom ending the quarter up 16% and the half year up 32%. SBA Communications had a 12% gain in the quarter and was up 33% year-to-date through June.
Several Fund biopharmaceutical stocks were strong in the second quarter. Auxilium Pharmaceuticals gained 45% on news of a successful phase three drug trial. Onyx Pharmaceuticals gained 77% upon receiving approval from an FDA advisory panel for one of its medications. Generic drug manufacturer Akorn rose 34% in the quarter as sales of its generic injectable drugs tripled versus the prior year.
Laggards for the second quarter included several tech stocks. Informatica, an enterprise data integration software company, fell 20% in the quarter (but was up 15% year to date) on concerns over slowing sales activity. Those concerns were confirmed after quarter end as the company pre-announced a drop in software license revenue. The economic turmoil overseas is impacting Informatica's near-term results, as 25% of the company's revenues are generated in Europe. Semiconductor manufacturer Atmel fell 32% in the quarter and ended the half year down 17%. Atmel's revenues dropped 22% versus the prior year due to the loss of an anticipated touchscreen microcontroller contract. Optical components manufacturer Finisar fell 26% in the quarter and was down 11% for the half year as its business suffered from weakening global demand.
Several Fund retail stocks also struggled during the period ended June 30. Premium active apparel retailer lululemon athletica announced a fantastic first quarter, with same-store sales up 25% over the prior year, but company guidance of slower growth in the second quarter sent the stock down 21%. For the half year lululemon gained 27%. Teen apparel retailer Abercrombie & Fitch experienced a sales shortfall on woeful sales in woebegone Europe. Its stock was down roughly 30% for the quarter and for the half year.
Our energy investments were also weak. Oil and gas producer SM Energy fell more than 30% for both the second quarter and the half year as prices of natural gas liquids fell more than crude oil during the second quarter. Houston American Energy was down 79% for the quarter and 91% for the half year on disappointing drilling results in Colombia.
These days the financial press seems to enjoy obsessing over existential economic issues. Certainly, talk of euro woes and fiscal cliffs can be as riveting and entertaining as a good horror flick. "Experts" claim that investing is all about getting the macro right, given the current uncertain economic environment (truthfully, when has the economic outlook ever been certain?). But when the investment community is so overly focused on the big picture, we believe it pays to go small. We'll leave the macro anguish to others who can't see the trees for the forest, and instead dig for what we believe are well-run companies able to grow faster than their peers and that thrive in our current much-maligned, but still growing, economy.
Stocks of small- and mid-cap companies pose special risks, including possible illiquidity and greater price volatility than stocks of larger, more established companies.
Portfolio holdings are subject to change periodically and may not be representative of current holdings.
16
Columbia Acorn USA
At a Glance (Class A Shares - LAUAX)
Performance data shown represents past performance and is not a guarantee of future results. The investment return and principal value of an investment will fluctuate so that shares, when redeemed, may be worth more or less than their original cost. Current performance may be lower or higher than the performance data shown. Performance results reflect any fee waivers or reimbursements of Fund expenses by the investment manager and/or any of its affiliates. Absent these fee waivers and/or expense reimbursement arrangements, performance results would have been lower. Please visit columbiamanagement.com for daily and most recent month-end updates.
Pretax and After-tax Average Annual Total Returns (Based on Class A Share Returns, inception 10/16/00)
through June 30, 2012
| | | | | Year
to date* | | 1 year | | 5 years | | 10 years | |
Returns before taxes
| | NAV
POP | | | 10.15
3.82 | % | | | -4.18
-9.69 | % | | | 0.68
-0.50 | % | | | 7.48
6.84 | % | |
Returns after
taxes on distributions | | NAV
POP | | | 10.12
3.80 | | | | -4.30
-9.80 | | | | 0.39
-0.79 | | | | 7.18
6.55 | | |
Returns after taxes
on distributions and
sale of fund shares | | NAV
POP
| | | 6.64
2.52
| | | | -2.58
-6.16
| | | | 0.55
-0.45
| | | | 6.58
6.00
| | |
| Russell 2000 Index**(pretax) | | | | | | | 8.53 | | | | -2.08 | | | | 0.54 | | | | 7.00 | | |
All results shown assume reinvestment of distributions.
*Year to date data is not annualized.
**The Fund's primary benchmark.
After-tax returns are calculated using the highest historical individual federal marginal income tax rates, and do not reflect the impact of state and local taxes. Returns after taxes on distributions and sale of Fund shares reflect the additional tax impact of long-term gains or losses realized when Fund shares are sold. The returns are taxed at the maximum rate and assume shares were purchased at the beginning of the period. Actual after-tax returns depend on the investor's tax situation and may differ from those shown. After-tax returns are not relevant to investors who hold their Fund shares through tax-deferred arrangements such as 401(k) plans or individual retirement accounts. After-tax returns are shown for Class A shares only; after-tax returns for other share classes will vary. Indexes do not reflect any deduction for fees, expenses or taxes.
Public offering price (POP) returns include the maximum sales charge of 5.75% for Class A shares. Net asset value (NAV) returns do not include sales charges or contingent deferred sales charges (CDSC).
The Fund's Class A shares annual operating expense ratio, as stated in the May 1, 2012, prospectus, is 1.33%.
Columbia Acorn USA Portfolio Diversification
as a percentage of net assets, as of 6/30/12
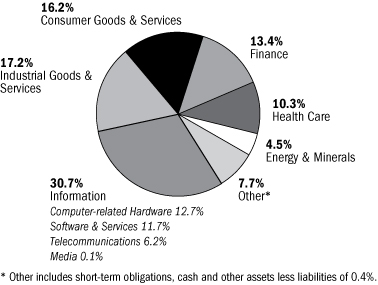
Columbia Acorn USA Top 10 Holdings
as a percentage of net assets, as of 6/30/12
| 1. | | Ametek
Aerospace/Industrial Instruments | | | 2.8
| % | |
| 2. | | Informatica
Enterprise Data Integration Software | | | 2.4
| % | |
| 3. | | Nordson
Dispensing Systems for Adhesives & Coatings | | | 2.4
| % | |
| 4. | | tw telecom
Fiber Optic Telephone/Data Services | | | 2.4
| % | |
| 5. | | Micros Systems
Information Systems for Hotels, Restaurants & Retailers | | | 2.3
| % | |
| 6. | | lululemon athletica
Premium Active Apparel Retailer | | | 2.2
| % | |
| 7. | | Gaylord Entertainment
Convention Hotels | | | 2.1
| % | |
| 8. | | Bally Technologies
Slot Machines & Software | | | 1.9
| % | |
| 9. | | ESCO Technologies
Automatic Electric Meter Readers | | | 1.9
| % | |
| 10. | | SBA Communications
Communications Towers | | | 1.9
| % | |
The Fund's top 10 holdings and portfolio diversification vary with changes in portfolio investments. See the Statement of Investments for a complete list of the Fund's holdings.
The Growth of a $10,000 Investment in Columbia Acorn USA (Class A)
September 4, 1996 (Fund inception) through June 30, 2012
The chart shows the change in value of a hypothetical $10,000 investment in Class A shares of the Fund during the stated time period. Although the index is provided for use in assessing the Fund's performance, the Fund's holdings may differ significantly from those in the index. It is not possible to invest directly in an index. The graph does not reflect taxes that a shareholder may pay on Fund distributions or on a sale of Fund shares.
The returns shown for periods prior to the inception date of the Fund's Class A shares are calculated from the inception date of the Fund and append the returns of the Fund's Class Z shares, the Fund's oldest share class. These returns are adjusted to reflect any higher class-related operating expenses of the newer share classes, as applicable. Please visit columbiamanagement.com/mutual-funds/appended-performance for more information.
Total Net Assets of the Fund: $1.6 billion
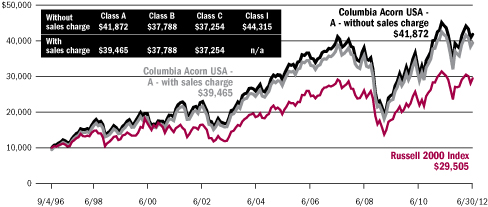
17
Columbia Acorn International Select
In a Nutshell

Christopher J. Olson
Lead Portfolio Manager
Performance data shown represents past performance and is not a guarantee of future results. The investment return and principal value will fluctuate so that shares, when redeemed, may be worth more or less than the original cost. Current performance may be lower or higher than the performance data shown. Please visit columbiamanagement.com for daily and most recent month-end performance updates.
Fund's Positions
in Mentioned Holdings
As a percentage of net assets, as of 6/30/12
| Far EasTone Telecom | | | 7.1 | % | |
| Ascendas REIT | | | 6.6 | % | |
| Mapletree Industrial Trust | | | 5.8 | % | |
| Seven Bank | | | 4.4 | % | |
| Rand Merchant Insurance | | | 4.1 | % | |
| Taiwan Mobile | | | 3.1 | % | |
| Mapletree Logistics Trust | | | 2.6 | % | |
| Archipelago Resources | | | 2.2 | % | |
| Zhaojin Mining Industry | | | 1.6 | % | |
Columbia Acorn International Select ended the second quarter of 2012 down 0.95% (Class A shares, without sales charge), holding up much better than the 7.60% drop of its primary benchmark, the S&P Developed Ex-U.S. Between $2B and $10B Index. Year to date through June 30, 2012, the Fund was up 10.23%, strongly outperforming the 3.47% gain of its benchmark.
Financial stocks provided the biggest boost to Fund gains relative to the benchmark for both the second quarter and the half year. Singapore's Ascendas REIT, Mapletree Industrial Trust and Mapletree Logistics Trust had gains ranging from 4% to 12% in the quarter and each was up 20% or more year to date. These industrial property landlords continue to benefit from a resilient Singaporean economic outlook and investor interest in their strong dividend yields. Japan's Seven Bank, a provider of ATM processing services, rose 17% in the quarter and was up 34% for the half year as its ATM expansion within Japan continued to benefit the company's stock. Rand Merchant Insurance, a South African insurance company, led gains in the first quarter but cooled in the second quarter, falling 4.93%. Despite the drop in the second quarter, Rand Merchant was still up 31% for the half year.
Fund holdings in the telecom services sector also performed strongly for both the second quarter and half year. Far EasTone Telecom, Taiwan's third largest mobile operator, gained 6% in the second quarter and ended the half year up 16%. The company benefited from accelerated smartphone sales that are driving increased data usage. Taiwan Mobile, the second largest mobile operator in Taiwan, saw its stock rise 8% in the second quarter, leading to a 6% gain for the half year. Taiwan Mobile's stock fell in the first quarter, despite an improving earnings outlook, but investors returned in the second quarter after their brief flight to more cyclical names.
Mining companies did not fare well in the first half of 2012 as fears of slower global growth decreased demand. The biggest detractor to Fund performance in the second quarter was Indonesian gold miner Archipelago Resources, which fell 23% in the quarter and was down 26% for the half year. In China, Zhaojin Mining Industry fell 20% in the second quarter and ended the half year off 15%. Northam Platinum, a South African platinum miner, was off 26% in the quarter and down 22% year to date. We opted to sell the Fund's position in Northam Platinum and invested the proceeds elsewhere.
While fears of a global recession eased in the first quarter, the second quarter saw renewed uncertainty regarding the financial stability of Europe and signs of slowing economic growth in China. We are also concerned and have maintained a focus on defensive, secular growth companies with good dividend yields and strong balance sheets. As we mentioned last quarter, the Fund remains underweight in areas such as Europe, the United Kingdom and Japan, where the concerns about global debt are greatest, and is overweight in Asia ex-Japan and emerging markets.
International investing involves special risks, including foreign taxation, currency risks, risks associated with possible differences in financial standards and other risks associated with future political and economic developments. Stocks of small- and mid-cap companies pose special risks, including possible illiquidity and greater price volatility than stocks of larger, more established companies. Investing in emerging markets may involve greater risks than investing in more developed countries.
Portfolio holdings are subject to change periodically and may not be representative of current holdings.
18
Columbia Acorn International Select
At a Glance (Class A Shares - LAFAX)
Performance data shown represents past performance and is not a guarantee of future results. The investment return and principal value of an investment will fluctuate so that shares, when redeemed, may be worth more or less than their original cost. Current performance may be lower or higher than the performance data shown. Performance results reflect any fee waivers or reimbursements of Fund expenses by the investment manager and/or any of its affiliates. Absent these fee waivers and/or expense reimbursement arrangements, performance results would have been lower. Please visit columbiamanagement.com for daily and most recent month-end updates.
Pretax and After-tax Average Annual Total Returns (Based on Class A Share Returns, inception 10/16/00)
through June 30, 2012
| | | | | Year
to date* | | 1 year | | 5 years | | 10 years | |
Returns before taxes
| | NAV
POP | | | 10.23
3.89 | % | | | -4.30
-9.80 | % | | | -0.20
-1.38 | % | | | 10.15
9.50 | % | |
Returns after taxes
on distributions | | NAV
POP | | | 10.16
3.82 | | | | -4.62
-10.10 | | | | -0.55
-1.72 | | | | 9.98
9.33 | | |
Returns after taxes
on distributions and
sale of fund shares | | NAV
POP
| | | 6.75
2.62
| | | | -2.15
-5.76
| | | | -0.12
-1.11
| | | | 9.15
8.55
| | |
S&P Developed Ex-US
Between $2B and
$10B Index** (pretax) | | | | | | | 3.47 | | | | -14.48 | | | | -4.59 | | | | 8.19 | | |
All results shown assume reinvestment of distributions.
*Year to date data is not annualized.
**The Fund's primary benchmark.
After-tax returns are calculated using the highest historical individual federal marginal income tax rates, and do not reflect the impact of state and local taxes. Returns after taxes on distributions and sale of Fund shares reflect the additional tax impact of long-term gains or losses realized when Fund shares are sold. The returns are taxed at the maximum rate and assume shares were purchased at the beginning of the period. Actual after-tax returns depend on the investor's tax situation and may differ from those shown. After-tax returns are not relevant to investors who hold their Fund shares through tax-deferred arrangements such as 401(k) plans or individual retirement accounts. After-tax returns are shown for Class A shares only; after-tax returns for other share classes will vary. Indexes do not reflect any deduction for fees, expenses or taxes.
Public offering price (POP) returns include the maximum sales charge of 5.75% for Class A shares. Net asset value (NAV) returns do not include sales charges or contingent deferred sales charges (CDSC).
The Fund's Class A shares annual operating expense ratio, as stated in the May 1, 2012, prospectus, is 1.62%.
Columbia Acorn International Select Portfolio Diversification
as a percentage of net assets, as of 6/30/12

The Growth of a $10,000 Investment in Columbia Acorn International Select (Class A)
November 23, 1998 (Fund inception) through June 30, 2012
Columbia Acorn International Select
Top 10 Holdings
as a percentage of net assets, as of 6/30/12
| 1. | | Far EasTone Telecom (Taiwan)
Taiwan's Third Largest Mobile Operator | | | 7.1
| % | |
| 2. | | Ascendas REIT (Singapore)
Industrial Property Landlord | | | 6.6
| % | |
| 3. | | Mapletree Industrial Trust (Singapore)
Industrial Property Landlord | | | 5.8
| % | |
| 4. | | Seven Bank (Japan)
ATM Processing Services | | | 4.4
| % | |
| 5. | | Rand Merchant Insurance (South Africa)
Directly Sold Property & Casualty Insurance; Holdings in
Other Insurers | | | 4.1
| % | |
| 6. | | Fresnillo (Mexico)
Silver & Metal Byproduct Mining in Mexico | | | 4.0
| % | |
| 7. | | Goldcorp (Canada)
Gold Mining | | | 3.8
| % | |
| 8. | | UGL (Australia)
Engineering & Facilities Management | | | 3.8
| % | |
| 9. | | Wirecard (Germany)
Online Payment Processing & Risk Management | | | 3.6
| % | |
| 10. | | Commonwealth Property Office Fund (Australia)
Australia Prime Office REIT | | | 3.2
| % | |
The Fund's top 10 holdings and portfolio diversification vary with changes in portfolio investments. See the Statement of Investments for a complete list of the Fund's holdings.
The chart shows the change in value of a hypothetical $10,000 investment in Class A shares of the Fund during the stated time period. Although the index is provided for use in assessing the Fund's performance, the Fund's holdings may differ significantly from those in the index. It is not possible to invest directly in an index. The graph does not reflect taxes that a shareholder may pay on Fund distributions or on a sale of Fund shares.
The returns shown for periods prior to the inception date of the Fund's Class A shares are calculated from the inception date of the Fund and append the returns of the Fund's Class Z shares, the Fund's oldest share class. These returns are adjusted to reflect any higher class-related operating expenses of the newer share classes, as applicable. Please visit columbiamanagement.com/mutual-funds/appended-performance for more information.
Total Net Assets of the Fund: $338.1 million
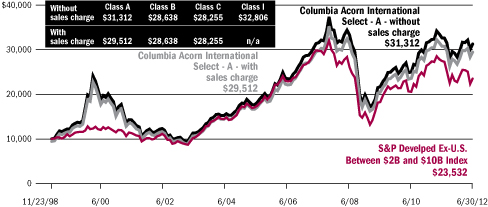
19
Columbia Acorn Select
In a Nutshell
 | |  | |
|
| Ben Andrews | | Robert A. Chalupnik | |
|
| Lead Portfolio Manager | | Co-Portfolio Manager | |
|
Performance data shown represents past performance and is not a guarantee of future results. The investment return and principal value will fluctuate so that shares, when redeemed, may be worth more or less than the original cost. Current performance may be lower or higher than the performance data shown. Please visit columbiamanagement.com for daily and most recent month-end performance updates.
Fund's Positions
in Mentioned Holdings
As a percentage of net assets, as of 6/30/12
| Discover Financial Services | | | 6.1 | % | |
| Hertz | | | 5.2 | % | |
| CNO Financial Group | | | 5.1 | % | |
| SBA Communications | | | 3.8 | % | |
| Gaylord Entertainment | | | 3.3 | % | |
| Coach | | | 3.0 | % | |
| Sanmina-SCI | | | 2.3 | % | |
| Akorn | | | 1.9 | % | |
| Abercrombie & Fitch | | | 1.4 | % | |
| Canacol | | | 1.2 | % | |
| Vail Resorts | | | 1.1 | % | |
| Houston American Energy | | | 0.1 | % | |
Columbia Acorn Select fell 8.51% (Class A shares, without sales charge) in the second quarter, but year to date through June 30, 2012, was up 7.64%. The Fund's primary benchmark, the S&P MidCap 400 Index was down 4.93% in the second quarter and was up 7.90% year to date. The S&P 500 Index, a general barometer of U.S. market large-cap performance, was down 2.75% in the quarter and year to date was up 9.49%.
In our first quarter report, we noted that we were seeing some strengthening in U.S. economic indicators and speculated that improvements might continue for a little while. Unfortunately, they didn't. U.S., European and Asian economic indicators turned down in the second quarter. Many of the stocks that added to the Fund's outperformance in the first quarter took it away this quarter.
On the downside, Sanmina-SCI, Hertz and Coach each cost the Fund close to one percent of portfolio performance in the second quarter. On the upside, we saw Gaylord Entertainment, Akorn and SBA Communications each add between 40 and 65 basis points to the Fund's performance in the quarter. For the first six months of the year, Discover Financial Services added two percent to the Fund's performance, while Gaylord Entertainment, CNO Financial Group and SBA Communications each added a little more than one percent. The larger detractors to the Fund's six-month performance were Houston American Energy, Abercrombie & Fitch and Canacol, which each cost the portfolio between 60 and 75 basis points.
When an economy is over leveraged, we believe a country has a choice to either grow, collapse, or inflate its way out of the problem. In our opinion, the western world has been doing a pretty good job of inflating but political leadership has done a poor job of providing a path to growth. The United States' path has been fraught with consistently changing regulation, controversial interpretations of legislation and court rulings, and concerns that new anti-business legislation will be passed. Each has helped cause businesses to sit back and wait. The western economies have been driven by huge government deficit spending and have bumped along with growth rates in the low single digits, prompting continuous investor concerns of possible recession.
We have struggled to outperform the Fund's primary benchmark. As we've mentioned in previous "Nutshells," we have been slowly changing the mix of the Fund's core growth holdings and the Fund's opportunistic holdings. In an environment in which the economy is struggling to deliver consecutive quarters of increasing growth, we believe core growth stocks should perform better than companies trying to turn around their operations in a weak economic environment (which is the case with many of the Fund's opportunistic holdings). Though the Fund's performance was disappointing this quarter, we feel strongly that we are on the right path as we near the end of this transition within the Fund's portfolio.
During the second quarter, we added one new stock to the portfolio and exited from one position. Our new position is Vail Resorts, a ski resort operator that we believe we picked up cheaply due to the warm winter. On the sell side, we exited from Safeway as we believe the supermarket industry's gross margin pressure is not going to subside.
As investors along with you in the Fund, we are anxious to see performance improve. We believe we are making adjustments to help our Fund seek to outperform its benchmark. Thank you for your investment in the Fund.
Risks include stock market fluctuations due to economic and business developments. The Fund also has potentially greater price volatility due to the Fund's concentration in a limited number of stocks of mid-size companies. International investments involve greater potential risks, including less regulation, currency fluctuations, economic instability and political developments.
Portfolio holdings are subject to change periodically and may not be representative of current holdings.
20
Columbia Acorn Select
At a Glance (Class A Shares - LTFAX)
Performance data shown represents past performance and is not a guarantee of future results. The investment return and principal value of an investment will fluctuate so that shares, when redeemed, may be worth more or less than their original cost. Current performance may be lower or higher than the performance data shown. Performance results reflect any fee waivers or reimbursements of Fund expenses by the investment manager and/or any of its affiliates. Absent these fee waivers and/or expense reimbursement arrangements, performance results would have been lower. Please visit columbiamanagement.com for daily and most recent month-end updates.
Pretax and After-tax Average Annual Total Returns (Based on Class A Share Returns, inception 10/16/00)
through June 30, 2012
| | | | | Year
to date* | | 1 year | | 5 years | | 10 years | |
Returns before taxes
| | NAV
POP | | | 7.64
1.45 | % | | | -10.17
-15.34 | % | | | -2.93
-4.07 | % | | | 7.05
6.42 | % | |
Returns after
taxes on distributions | | NAV
POP | | | 7.29
1.12 | | | | -10.46
-15.62 | | | | -3.22
-4.35 | | | | 6.76
6.12 | | |
Returns after taxes
on distributions and
sale of fund shares | | NAV
POP
| | | 5.43
1.38
| | | | -6.23
-9.61
| | | | -2.52
-3.46
| | | | 6.18
5.60
| | |
| S&P MidCap 400 Index** (pretax) | | | | | | | 7.90 | | | | -2.33 | | | | 2.55 | | | | 8.21 | | |
All results shown assume reinvestment of distributions.
*Year to date data is not annualized.
**The Fund's primary benchmark.
After-tax returns are calculated using the highest historical individual federal marginal income tax rates, and do not reflect the impact of state and local taxes. Returns after taxes on distributions and sale of Fund shares reflect the additional tax impact of long-term gains or losses realized when Fund shares are sold. The returns are taxed at the maximum rate and assume shares were purchased at the beginning of the period. Actual after-tax returns depend on the investor's tax situation and may differ from those shown. After-tax returns are not relevant to investors who hold their Fund shares through tax-deferred arrangements such as 401(k) plans or individual retirement accounts. After-tax returns are shown for Class A shares only; after-tax returns for other share classes will vary. Indexes do not reflect any deduction for fees, expenses or taxes.
Public offering price (POP) returns include the maximum sales charge of 5.75% for Class A shares. Net asset value (NAV) returns do not include sales charges or contingent deferred sales charges (CDSC).
The Fund's Class A shares annual operating expense ratio, as stated in the May 1, 2012, prospectus, is 1.35%.
Columbia Acorn Select Portfolio Diversification
as a percentage of net assets, as of 6/30/12

Columbia Acorn Select Top 10 Holdings
as a percentage of net assets, as of 6/30/12
| 1. | | Ametek
Aerospace/Industrial Instruments | | | 6.2
| % | |
| 2. | | Discover Financial Services
Credit Card Company | | | 6.1
| % | |
| 3. | | Hertz
Largest U.S. Rental Car Operator | | | 5.2
| % | |
| 4. | | CNO Financial Group
Life, Long-term Care & Medical Supplement Insurance | | | 5.1
| % | |
| 5. | | SBA Communications
Communications Towers | | | 3.8
| % | |
| 6. | | Crown Castle International
Communications Towers | | | 3.7
| % | |
| 7. | | Donaldson
Industrial Air Filtration | | | 3.5
| % | |
| 8. | | Gaylord Entertainment
Convention Hotels | | | 3.3
| % | |
| 9. | | Pall
Filtration & Fluids Clarification | | | 3.1
| % | |
| 10. | | WNS (India)
Offshore BPO (Business Process Outsourcing) Services | | | 3.0
| % | |
The Fund's top 10 holdings and portfolio diversification vary with changes in portfolio investments. See the Statement of Investments for a complete list of the Fund's holdings.
The Growth of a $10,000 Investment in Columbia Acorn Select (Class A)
November 23, 1998 (Fund inception) through June 30, 2012
The chart shows the change in value of a hypothetical $10,000 investment in Class A shares of the Fund during the stated time period. Although the index is provided for use in assessing the Fund's performance, the Fund's holdings may differ significantly from those in the index. It is not possible to invest directly in an index. The graph does not reflect taxes that a shareholder may pay on Fund distributions or on a sale of Fund shares.
The returns shown for periods prior to the inception date of the Fund's Class A shares are calculated from the inception date of the Fund and append the returns of the Fund's Class Z shares, the Fund's oldest share class. These returns are adjusted to reflect any higher class-related operating expenses of the newer share classes, as applicable. Please visit columbiamanagement.com/mutual-funds/appended-performance for more information.
Total Net Assets of the Fund: $1.1 billion
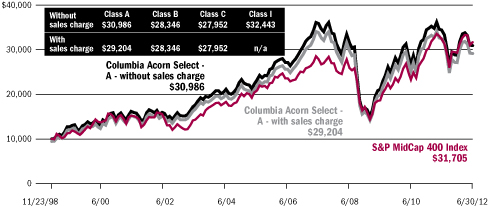
21
Columbia Thermostat Fund
In a Nutshell

Lead Portfolio Manager
Performance data shown represents past performance and is not a guarantee of future results. The investment return and principal value will fluctuate so that shares, when redeemed, may be worth more or less than the original cost. Current performance may be lower or higher than the performance data shown. Please visit columbiamanagement.com for daily and most recent month-end performance updates.
A "fund of fund" bears its allocable share of the costs and expenses of the underlying funds in which it invests. Such funds are thus subject to two levels of fees and potentially higher expense ratios than would be associated with a fund that invests and trades directly in financial instruments under the direction of a single manager.
Columbia Thermostat Fund ended the second quarter of 2012 off 1.46% (Class A shares, without sales charge), above the 2.75% drop of its primary equity benchmark, the S&P 500 Index, and below the 2.06% gain of its primary debt benchmark, the Barclays U.S. Aggregate Bond Index. Year to date through June 30, 2012, the Fund was up 6.61%, falling below the 9.49% S&P 500 Index return and above the 2.37% gain of the Barclays U.S. Aggregate Bond Index.
The Fund hit four reallocation triggers in the second quarter, increasing stock exposure in April and twice in May as the markets cooled, then reducing stocks in June as the equity markets turned. At quarter end, the Fund had an even weighting in its underlying stock and bond investments.
For the quarter, the equity portion of the Fund had a weighted average loss of 4.96%, while the bond portion provided a 2.11% gain. Columbia U.S. Treasury Index Fund led performance among both groups with a 2.76% return for the three months.
Year to date through the end of June, the equity portion of the Fund had an 8.66% return, while the income portion posted a 4.01% gain. Top contributors for the half year were Columbia LargeCap Enhanced Core Fund, up 10.05%, and Columbia Contrarian Core Fund, up 9.67%.
On September 25, Columbia Thermostat Fund will reach its 10-year anniversary. The "Chattering Squirrels" essay at the front of this report looks back at how a fund called "Thermostat" came to be and how it is managed. As always, we thank you for your investment in the Fund. We are pleased to report that, since inception through the end of June, the Fund has, once again, exceeded our expectations by besting both its stock and bond benchmarks.
Results of the Funds Owned in Columbia Thermostat Fund as of June 30, 2012
| Stock Funds | | Weightings | | 2nd | | Year to | |
| Fund | | in category | | quarter | | date | |
Columbia Acorn
International, Class I | | | 20 | % | | | -5.49 | % | | | 8.79 | % | |
Columbia Dividend
Income Fund, Class I | | | 20 | % | | | -0.45 | % | | | 7.79 | % | |
Columbia Acorn Fund,
Class I | | | 15 | % | | | -5.42 | % | | | 9.27 | % | |
Columbia Contrarian
Core Fund, Class I | | | 15 | % | | | -4.37 | % | | | 9.67 | % | |
Columbia Select Large
Cap Growth Fund,
Class I | | | 10 | % | | | -11.47 | % | | | 6.22 | % | |
Columbia Acorn Select,
Class I | | | 10 | % | | | -8.46 | % | | | 7.79 | % | |
Columbia Large Cap
Enhanced Core Fund,
Class I | | | 10 | % | | | -2.98 | % | | | 10.05 | % | |
Weighted Average
Equity Gain/Loss | | | 100 | % | | | -4.96 | % | | | 8.66 | % | |
| Bond Funds | | Weightings | | 2nd | | Year to | |
| Fund | | in category | | quarter | | date | |
Columbia Intermediate
Bond Fund, Class I | | | 50 | % | | | 1.87 | % | | | 3.62 | % | |
Columbia Income
Opportunities Fund,
Class I | | | 30 | % | | | 2.02 | % | | | 6.33 | % | |
Columbia U.S. Treasury
Index Fund, Class I | | | 20 | % | | | 2.76 | % | | | 1.41 | % | |
Weighted Average
Income Gain | | | 100 | % | | | 2.11 | % | | | 4.01 | % | |
Columbia Thermostat Fund
Rebalancing in the Second Quarter
| April 16, 2012 | | 50% stocks, 50% bonds | |
| May 15, 2012 | | 55% stocks, 45% bonds | |
| May 21, 2012 | | 60% stocks, 40% bonds | |
| June 21, 2012 | | 50% stocks, 50% bonds | |
The value of an investment in the Fund is based primarily on the performance of the underlying portfolio funds and the allocation of the Fund's assets among them. An investment in the underlying portfolio funds may present certain risks, including stock market fluctuations that occur in response to economic and business developments; and a greater degree of social, political and economic volatility associated with international investing. Stocks of small- and mid-cap companies pose special risks, including possible illiquidity and greater price volatility than stocks of larger, more established companies. Value stocks may also be subject to specific business risks that have caused the stocks to be out of favor. Lower-rated and medium quality debt securities are more speculative and incur more risk. International investing involves special risks, including foreign taxation, currency risks, risks associated with possible differences in financial standards and other risks associated with future political and economic developments. Changes in interest rates and changes in the financial strength of issuers of lower-rated bonds may also affect underlying fund performance. The Fund is also subject to the risk that the investment advisor's decisions regarding asset classes and underlying portfolio funds will not anticipate market trends successfully, resulting in a failure to preserve capital or lower total return. In addition, the Fund may buy and sell shares of the portfolio funds frequently. This may result in higher transaction costs and additional tax liability. This is not an offer of the shares of any other mutual fund mentioned herein.
22
Columbia Thermostat Fund
At a Glance (Class A Shares - CTFAX)
Performance data shown represents past performance and is not a guarantee of future results. The investment return and principal value of an investment will fluctuate so that shares, when redeemed, may be worth more or less than their original cost. Current performance may be lower or higher than the performance data shown. Performance results reflect any fee waivers or reimbursements of Fund expenses by the investment manager and/or any of its affiliates. Absent these fee waivers and/or expense reimbursement arrangements, performance results would have been lower. Please visit columbiamanagement.com for daily and most recent month-end updates.
Pretax and After-tax Average Annual Total Returns (Based on Class A Share Returns, inception 3/3/03)
through June 30, 2012
| | | | | Year
to date* | | 1 year | | 5 years | | Life of
fund | |
Returns before taxes
| | NAV
POP | | | 6.61
0.50 | % | | | 6.80
0.67 | % | | | 4.43
3.21 | % | | | 7.57
6.92 | % | |
Returns after taxes
on distributions | | NAV
POP | | | 6.56
0.45 | | | | 6.36
0.26 | | | | 3.58
2.36 | | | | 6.50
5.85 | | |
Returns after taxes
on distributions and
sale of fund shares | | NAV
POP
| | | 4.30
0.32
| | | | 4.53
0.54
| | | | 3.35
2.29
| | | | 6.12
5.54
| | |
| S&P 500 Index** (pretax) | | | | | | | 9.49 | | | | 5.45 | | | | 0.22 | | | | 7.48 | | |
Barclays U.S. Aggregate
Bond Index** (pretax) | | | | | 2.37 | | | | 7.47 | | | | 6.79 | | | | 5.31 | | |
Lipper Flexible Portfolio
Funds Index (pretax) | | | | | 5.75 | | | | -0.55 | | | | 1.82 | | | | 7.34 | | |
All results shown assume reinvestment of distributions.
*Year to date data is not annualized.
**The Fund's primary stock and bond benchmarks.
After-tax returns are calculated using the highest historical individual federal marginal income tax rates, and do not reflect the impact of state and local taxes. Returns after taxes on distributions and sale of Fund shares reflect the additional tax impact of long-term gains or losses realized when Fund shares are sold. The returns are taxed at the maximum rate and assume shares were purchased at the beginning of the period. Actual after-tax returns depend on the investor's tax situation and may differ from those shown. After-tax returns are not relevant to investors who hold their Fund shares through tax-deferred arrangements such as 401(k) plans or individual retirement accounts. After-tax returns are shown for Class A shares only; after-tax returns for other share classes will vary. Indexes do not reflect any deduction for fees, expenses or taxes.
Public offering price (POP) returns include the maximum sales charge of 5.75% for Class A shares. Net asset value (NAV) returns do not include sales charges or contingent deferred sales charges (CDSC).
The Fund's annual operating expense ratio, as stated in the May 1, 2012, prospectus, reflects a contractual fee waiver and expense reimbursement with CWAM that expires April 30, 2013. Class A expense ratios without and with the contractual waiver/reimbursement, including fees and expenses associated with the Fund's investment in other investment companies, are 1.46% and 1.15%, respectively. Absent the waiver or reimbursement, performance results would have been lower.
Columbia Thermostat Fund Asset Allocation
as a percentage of net assets, as of 6/30/12
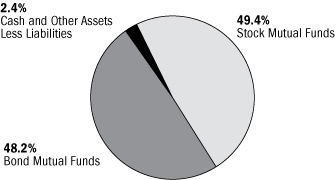
Columbia Thermostat Fund Portfolio Weightings
as a percentage of assets in each investment category, as of 6/30/12
Stock Mutual Funds
| Columbia Acorn International, Class I | | | 20 | % | |
| Columbia Dividend Income Fund, Class I | | | 20 | % | |
| Columbia Acorn Fund, Class I | | | 15 | % | |
| Columbia Contrarian Core Fund, Class I | | | 15 | % | |
| Columbia Select Large Cap Growth Fund, Class I | | | 10 | % | |
| Columbia Acorn Select, Class I | | | 10 | % | |
| Columbia Large Cap Enhanced Core Fund, Class I | | | 10 | % | |
Bond Mutual Funds
| Columbia Intermediate Bond Fund, Class I | | | 50 | % | |
| Columbia Income Opportunities Fund, Class I | | | 30 | % | |
| Columbia U.S. Treasury Index Fund, Class I | | | 20 | % | |
The Growth of a $10,000 Investment in Columbia Thermostat Fund (Class A)
September 25, 2002 (Fund inception) through June 30, 2012
The chart shows the change in value of a hypothetical $10,000 investment in Class A shares of the Fund during the stated time period. Although the indexes are provided for use in assessing the Fund's performance, the Fund's holdings may differ significantly from those in the index. It is not possible to invest directly in an index. The graph does not reflect taxes that a shareholder may pay on Fund distributions or on a sale of Fund shares.
The returns shown for periods prior to the inception date of the Fund's Class A shares are calculated from the inception date of the Fund and append the returns of the Fund's Class Z shares, the Fund's oldest share class. These returns are adjusted to reflect any higher class-related operating expenses of the newer share classes, as applicable. Please visit columbiamanagement.com/mutual-funds/appended-performance for more information.
Total Net Assets of the Fund: $440.1 million
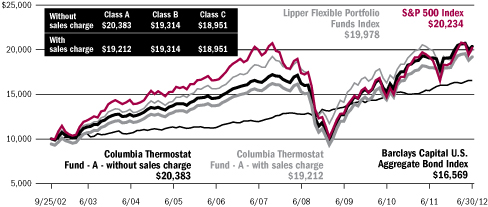
23
Columbia Acorn Emerging Markets Fund
In a Nutshell
|  | | | |  | | |
|
| Fritz Kaegi | | Stephen Kusmierczak | |
|
| Lead Portfolio Manager | | Lead Portfolio Manager | |
|
|  | | | |  | | |
|
| P. Zachary Egan | | Louis J. Mendes | |
|
| Co-Portfolio Manager | | Co-Portfolio Manager | |
|
Performance data shown represents past performance and is not a guarantee of future results. The investment return and principal value will fluctuate so that shares, when redeemed, may be worth more or less than the original cost. Current performance may be lower or higher than the performance data shown. Please visit columbiamanagement.com for daily and most recent month-end performance updates.
Fund's Positions
in Mentioned Holdings
As a percentage of net assets, as of 6/30/12
| Grupo Aeroportuario del Sureste | | | 2.4 | % | |
| Surya Citra Media | | | 1.8 | % | |
| Multiplus | | | 1.4 | % | |
| Mongolian Mining | | | 1.4 | % | |
| Mayora Indah | | | 0.6 | % | |
| Americas Petrogas | | | 0.6 | % | |
| Northam Platinum | | | 0.5 | % | |
| Madalena Ventures | | | 0.2 | % | |
Columbia Acorn Emerging Markets Fund fell 7.05% (Class A shares, without sales charge) in the second quarter of 2012 versus the 8.09% decline in the Fund's primary benchmark, the S&P Emerging Markets Between $500M and $5B Index. The Fund's more conservative positioning in very volatile markets has helped it outperform the benchmark since inception. Since the Fund's launch on August 19, 2011, it has returned a positive 1.50%, outperforming the benchmark's 5.77% decline. For the half year ended June 30, the Fund was up 9.61%, outpacing the 8.88% gain of its benchmark.
In the second quarter, the Fund benefited from its continued overweight in companies that we believe should benefit from rising incomes in emerging markets. Mayora Indah, an Indonesian maker of biscuits and chocolates, was added to the Fund during the quarter and gained nearly 29%. Grupo Aeroportuario del Sureste operates airports in Mexico, where air travel for tourism is growing strongly. Its stock gained over 18% following positive news about possible expansion into Puerto Rico. Surya Citra Media is Indonesia's most profitable private free-to-air broadcaster and gained 17% to reach a new record since its listing in 2002. Multiplus is Brazil's largest operator of loyalty programs and is a beneficiary of secular growth in credit and travel. Despite somewhat disappointing results due to higher airline ticket prices used in rewards, Multiplus gained over 15%.
The largest performance detractors in the second quarter were the Fund's energy and basic materials stocks. Two Canadian-listed oil and gas exploration companies with substantial assets in Argentina dropped sharply in the quarter following government moves to nationalize a large energy company. While we see no evidence of specific government action against our holdings, Madalena Ventures dropped nearly 63% and Americas Petrogas declined 48% as the risk premium for Argentina jumped substantially. Mongolian Mining is a world-class coking coal deposit in Southern Mongolia near the Chinese border. The stock fell 40% to a record low on concerns about tightening investment rules following recent elections. Northam Platinum owns one of the world's best undeveloped deposits of platinum, a precious metal used in important industrial applications like catalytic converters. Northam fell 35% in the wake of weak platinum prices and a leak at its smelter.
An important element of the Fund's relatively conservative positioning is its focus on investing in companies that pay dividends. We believe that a meaningful and growing dividend is the ultimate proof that a company is generating free cash flow, and that reinvested dividends represent the largest component of total shareholder returns over time. The current dividend yield of the Fund's portfolio is slightly below the benchmark's, yet the Fund's more concentrated portfolio is a higher quality one as measured by return on shareholder equity. We think companies that earn higher returns on capital should grow faster than their peers. We do not believe we have to sacrifice growth for higher dividends, and we have tried to identify companies with defensible business models and above-average returns that are exposed to durable growth trends in the emerging markets.
International investing involves special risks, including foreign taxation, currency risks, risks associated with possible differences in financial standards and other risks associated with future political and economic developments. Stocks of small- and mid-cap companies pose special risks, including possible illiquidity and greater price volatility than stocks of larger, more established companies. Investing in emerging markets may involve greater risks than investing in more developed countries.
Portfolio holdings are subject to change periodically and may not be representative of current holdings.
24
Columbia Acorn Emerging
Markets Fund
At a Glance (Class A Shares - CAGAX)
Performance data shown represents past performance and is not a guarantee of future results. The investment return and principal value of an investment will fluctuate so that shares, when redeemed, may be worth more or less than their original cost. Current performance may be lower or higher than the performance data shown. Performance results reflect any fee waivers or reimbursements of Fund expenses by the investment manager and/or any of its affiliates. Absent these fee waivers and/or expense reimbursement arrangements, performance results would have been lower. Please visit columbiamanagement.com for daily and most recent month-end updates.
Pretax and After-tax Average Annual Total Returns (Based on Class A Share Returns, inception 8/19/11)
through June 30, 2012
| | | | | Year to date* | | Life of fund†* | |
| Returns before taxes | | NAV
POP | | | 9.61
3.36 | % | | | 1.50
-4.34 | % | |
| Returns after taxes on distributions | | NAV
POP | | | 9.61
3.36 | | | | 1.51
-4.33 | | |
Returns after taxes on distributions and
sale of fund shares | | NAV
POP | | | 6.25
2.18 | | | | 0.98
-2.81 | | |
S&P Emerging Markets Between $500M and
$5B Index (pretax)** | | | | | 8.88 | | | | -5.77 | | |
All results shown assume reinvestment of distributions.
*Not annualized.
†Reflects performance from Fund inception on 8/19/11 through 6/30/12.
**The Fund's primary benchmark.
After-tax returns are calculated using the highest historical individual federal marginal income tax rates, and do not reflect the impact of state and local taxes. Returns after taxes on distributions and sale of Fund shares reflect the additional tax impact of long-term gains or losses realized when Fund shares are sold. The returns are taxed at the maximum rate and assume shares were purchased at the beginning of the period. Actual after-tax returns depend on the investor's tax situation and may differ from those shown. After-tax returns are not relevant to investors who hold their Fund shares through tax-deferred arrangements such as 401(k) plans or individual retirement accounts. After-tax returns are shown for Class A shares only; after-tax returns for other share classes will vary. Indexes do not reflect any deduction for fees, expenses or taxes.
Public offering price (POP) returns include the maximum sales charge of 5.75% for Class A shares. Net asset value (NAV) returns do not include sales charges or contingent deferred sales charges (CDSC).
The Fund's annual operating expense ratio, as stated in the May 1, 2012, prospectus, reflects a contractual fee waiver and expense reimbursement agreement with CWAM that expires April 30, 2013; Class A share expense ratios without and with the contractual fee waiver/reimbursement are 14.22% and 1.85%, respectively.
Columbia Acorn Emerging Markets Fund Portfolio Diversification
as a percentage of net assets, as of 6/30/12

Columbia Acorn Emerging Markets Fund
Top 10 Holdings
as a percentage of net assets, as of 6/30/12
| 1. | | Ace Indonesia (Indonesia)
Home Improvement Retailer | | | 3.5
| % | |
| 2. | | Tower Bersama Infrastructure (Indonesia)
Communications Towers | | | 3.3
| % | |
| 3. | | Nagacorp (Cambodia)
Casino/Entertainment Complex in Cambodia | | | 3.3
| % | |
| 4. | | Far EasTone Telecom (Taiwan)
Taiwan's Third Largest Mobile Operator | | | 2.8
| % | |
| 5. | | Rand Merchant Insurance (South Africa)
Directly Sold Property & Casualty Insurance;
Holdings in Other Insurers | | | 2.8
| % | |
| 6. | | Coronation Fund Managers (South Africa)
South African Fund Manager | | | 2.7
| % | |
| 7. | | Dufry Group (Switzerland)
Operators Airport Duty Free & Duty Paid Shops | | | 2.5
| % | |
| 8. | | CTCI Corp (Taiwan)
International Engineering Firm | | | 2.4
| % | |
| 9. | | Grupo Aeroportuario del Sureste (Mexico)
Mexican Airport Operator | | | 2.4
| % | |
| 10. | | Hexagon (Sweden)
Design, Measurement & Visualization Software & Equipment | | | 2.1
| % | |
The Fund's top 10 holdings and portfolio diversification vary with changes in portfolio investments. See the Statement of Investments for a complete list of the Fund's holdings.
The Growth of a $10,000 Investment in Columbia Acorn Emerging Markets Fund (Class A)
August 19, 2011 (Fund inception) through June 30, 2012
The chart shows the change in value of a hypothetical $10,000 investment in Class A shares of the Fund during the stated time period. Although the index is provided for use in assessing the Fund's performance, the Fund's holdings may differ significantly from those in the index. It is not possible to invest directly in an index. The graph does not reflect taxes that a shareholder may pay on Fund distributions or on a sale of Fund shares.
Total Net Assets of the Fund:
$5.8 million
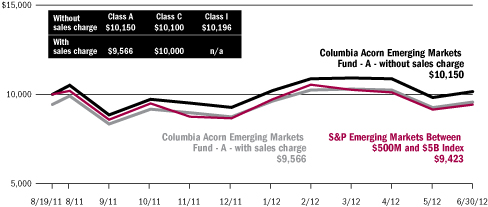
25
Columbia Acorn European Fund
In a Nutshell
 | |  | |
|
Andreas
Waldburg-Wolfegg | | Stephen
Kusmierczak | |
|
| Lead Portfolio Manager | | Co-Portfolio Manager | |
|
Performance data shown represents past performance and is not a guarantee of future results. The investment return and principal value will fluctuate so that shares, when redeemed, may be worth more or less than the original cost. Current performance may be lower or higher than the performance data shown. Please visit columbiamanagement.com for daily and most recent month-end performance updates.
Fund's Positions
in Mentioned Holdings
As a percentage of net assets, as of 6/30/12
| Eurofins Scientific | | | 3.6 | % | |
| Gemalto | | | 3.4 | % | |
| Aalberts Industries | | | 2.0 | % | |
| Domino's Pizza UK & Ireland | | | 1.9 | % | |
| Geox | | | 1.1 | % | |
Columbia Acorn European Fund was up 11.53% (Class A shares, without sales charge) for the six months ended June 30, 2012, outperforming the 7.65% return of its primary benchmark, the S&P Europe Between $500M and $5B Index. In absolute numbers, the Fund had a very strong first quarter, up 17.71%, followed by a lackluster second quarter, in which the Fund was down 5.25%. But the real story was in the relative numbers. Whereas the Fund closely matched the 17.80% gain in the first quarter of its benchmark, it contained the losses from the general downdraft in the second quarter better than the benchmark, which fell 8.62%.
French Fund holdings continued to perform strongly in the second quarter. Smart card products and solutions company Gemalto was up 9%, and food, drug and materials testing provider Eurofins Scientific gained 15%. Gemalto released a very positive first quarter sales report that showed sales in the mobile phone division up 11%, the first such growth in a few quarters. This turn confirmed our thesis that the change to fourth-generation wireless technology should increasingly feed through the company's top line. Eurofins Scientific announced a near doubling of its net profit in the first quarter of 2012, which, in itself, is not very significant because the bulk of the business's sales happen in the second half. What we were more interested to see was that Eurofins Scientific's business grew 10% organically in Europe, proof that when you're in the right business, macro issues can take second place. We shaved some off our position in Gemalto and added some in Eurofins Scientific to reflect short-term performance. Both continue to be in the Fund's top-five stocks by size.
Retailers like to complain about the weather: it's never right. Not so for Domino's Pizza UK & Ireland, the U.S. pizza maker's British, Irish and German franchise. The rainiest April on record in the United Kingdom caused people to stay home and order in. Domino's was only too happy to deliver, and so did the stock, up 17% in the quarter and 29% for the half year.
There were few strong detractors in the portfolio, largely because the largest slides came from small positions. Geox, the Italian maker of casual shoes, saw its stock decline 26% in the second quarter following a profit warning that accompanied the release of first quarter figures. Start-up costs related to expansion in Asia, Russia and Eastern Europe have negatively impacted Geox's margins. We believe that the strength of the company's patents, brand and balance sheet will help it gain market share over competitors, especially now that franchisees will be willing to ally themselves closer to a strong operator.
Another detractor to performance in the second quarter was Aalberts Industries, a manufacturer of flow control and heat treatment equipment based in the Netherlands, down almost 23%. An update on quarterly sales and management's outlook at the beginning of May were cautious, which hurt the stock. This diversified industrial company has strong market positions in most European countries and is suffering from lower capacity utilization in its industrial services division. For 2012, we believe the company is likely to show flat growth. On the other hand, we believe Aalberts's strong market positions, outstanding margins and excellent management are unlikely to go away, even during this time of weak demand. We believe its competitive position is bound to improve.
International investing involves special risks, including foreign taxation, currency risks, risks associated with possible differences in financial standards and other risks associated with future political and economic developments. Stocks of small- and mid-cap companies pose special risks, including possible illiquidity and greater price volatility than stocks of larger, more established companies. Investing in emerging markets may involve greater risks than investing in more developed countries.
Portfolio holdings are subject to change periodically and may not be representative of current holdings.
26
Columbia Acorn
European Fund
At a Glance (Class A Shares - CAEAX)
Performance data shown represents past performance and is not a guarantee of future results. The investment return and principal value of an investment will fluctuate so that shares, when redeemed, may be worth more or less than their original cost. Current performance may be lower or higher than the performance data shown. Performance results reflect any fee waivers or reimbursements of Fund expenses by the investment manager and/or any of its affiliates. Absent these fee waivers and/or expense reimbursement arrangements, performance results would have been lower. Please visit columbiamanagement.com for daily and most recent month-end updates.
Pretax and After-tax Average Annual Total Returns (Based on Class A Share Returns, inception 8/19/11)
through June 30, 2012
| | | | | Year to date* | | Life of fund†* | |
| Returns before taxes | | NAV
POP | | | 11.53
5.07 | % | | | 5.99
-0.11 | % | |
| Returns after taxes on distributions | | NAV
POP | | | 11.47
5.01 | | | | 5.71
-0.36 | | |
Returns after taxes on distributions and
sale of fund shares | | NAV
POP | | | 7.49
3.29 | | | | 3.95
-0.02 | | |
S&P Europe Between $500M and
$5B Index (pretax)** | | | | | 7.65 | | | | -0.07 | | |
All results shown assume reinvestment of distributions.
*Not annualized.
†Reflects performance from Fund inception on 8/19/11 through 6/30/12.
**The Fund's primary benchmark.
After-tax returns are calculated using the highest historical individual federal marginal income tax rates, and do not reflect the impact of state and local taxes. Returns after taxes on distributions and sale of Fund shares reflect the additional tax impact of long-term gains or losses realized when Fund shares are sold. The returns are taxed at the maximum rate and assume shares were purchased at the beginning of the period. Actual after-tax returns depend on the investor's tax situation and may differ from those shown. After-tax returns are not relevant to investors who hold their Fund shares through tax-deferred arrangements such as 401(k) plans or individual retirement accounts. After-tax returns are shown for Class A shares only; after-tax returns for other share classes will vary. Indexes do not reflect any deduction for fees, expenses or taxes.
Public offering price (POP) returns include the maximum sales charge of 5.75% for Class A shares. Net asset value (NAV) returns do not include sales charges or contingent deferred sales charges (CDSC).
The Fund's annual operating expense ratio, as stated in the May 1, 2012, prospectus, reflects a contractual fee waiver and expense reimbursement agreement with CWAM that expires April 30, 2013; Class A share expense ratios without and with the contractual fee waiver/reimbursement are 19.73% and 1.75%, respectively.
Columbia Acorn European Fund Portfolio Diversification
as a percentage of net assets, as of 6/30/12
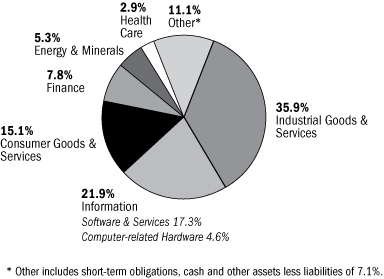
Columbia Acorn European Fund Top 10 Holdings
as a percentage of net assets, as of 6/30/12
| 1. | | Eurofins Scientific (France)
Food, Pharmaceuticals & Materials Screening & Testing | | | 3.6
| % | |
| 2. | | Gemalto (France)
Digital Security Solutions | | | 3.4
| % | |
| 3. | | Wirecard (Germany)
Online Payment Processing & Risk Management | | | 3.0
| % | |
| 4. | | Geberit (Switzerland)
Plumbing Supplies | | | 2.8
| % | |
| 5. | | Charles Taylor (United Kingdom)
Insurance Services | | | 2.7
| % | |
| 6. | | | 1000 mercis (France)
Interactive Advertising and Marketing | | | | 2.6
| % | |
| 7. | | Marel (Iceland)
Largest Manufacturer of Poultry & Fish Processing Equipment | | | 2.5
| % | |
| 8. | | Hexagon (Sweden)
Design, Measurement & Visualization Software & Equipment | | | 2.5
| % | |
| 9. | | Partners Group (Switzerland)
Private Markets Asset Management | | | 2.5
| % | |
| 10. | | Sweco (Sweden)
Engineering Consultants | | | 2.3
| % | |
The Fund's top 10 holdings and portfolio diversification vary with changes in portfolio investments. See the Statement of Investments for a complete list of the Fund's holdings.
The Growth of a $10,000 Investment in Columbia Acorn European Fund (Class A)
August 19, 2011 (Fund inception) through June 30, 2012
The chart shows the change in value of a hypothetical $10,000 investment in Class A shares of the Fund during the stated time period. Although the index is provided for use in assessing the Fund's performance, the Fund's holdings may differ significantly from those in the index. It is not possible to invest directly in an index. The graph does not reflect taxes that a shareholder may pay on Fund distributions or on a sale of Fund shares.
Total Net Assets of the Fund:
$2.1 million
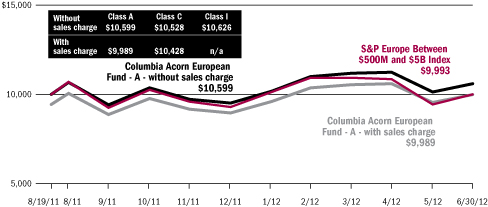
27
Columbia Acorn Fund
Major Portfolio Changes in the Second Quarter (Unaudited)
| | | Number of Shares | |
| | | 3/31/12 | | 6/30/12 | |
| Purchases | |
| Information | |
| Angies list | | | 0 | | | | 231,700 | | |
| Cree | | | 380,000 | | | | 560,000 | | |
| Genpact | | | 1,575,000 | | | | 1,705,000 | | |
| Hexagon (Sweden) | | | 5,164,999 | | | | 5,450,000 | | |
| Lamar Advertising | | | 0 | | | | 1,725,000 | | |
| SABA | | | 0 | | | | 2,000,000 | | |
| Velti | | | 2,500,000 | | | | 2,700,000 | | |
| Yandex (Russia) | | | 0 | | | | 700,100 | | |
| Industrial Goods & Services | |
Aalberts Industries
(Netherlands) | | | 2,263,654 | | | | 2,324,833 | | |
| Ashland | | | 0 | | | | 800,000 | | |
| Chicago Bridge & Iron | | | 1,725,000 | | | | 2,850,000 | | |
| Forward Air | | | 1,300,000 | | | | 1,400,000 | | |
| Generac | | | 1,776,000 | | | | 2,350,000 | | |
| Moog | | | 2,775,000 | | | | 3,000,000 | | |
| Neopost (France) | | | 210,000 | | | | 350,000 | | |
| Polypore International | | | 900,000 | | | | 1,325,000 | | |
| Consumer Goods & Services | |
| American Eagle Outfitters | | | 300,000 | | | | 1,075,000 | | |
| Arcos Dorados (Brazil) | | | 0 | | | | 1,800,000 | | |
| Avis Budget Group | | | 3,800,000 | | | | 4,400,000 | | |
| Deckers Outdoor | | | 1,140,000 | | | | 1,310,000 | | |
| Fossil | | | 392,500 | | | | 527,845 | | |
| GNC Holdings | | | 1,528,500 | | | | 2,305,000 | | |
| Interface | | | 1,750,000 | | | | 2,038,555 | | |
Lifestyle International
(Hong Kong) | | | 13,500,000 | | | | 16,857,500 | | |
| Pier 1 Imports | | | 5,600,000 | | | | 6,600,000 | | |
| Finance | |
| Associated Banc-Corp | | | 6,287,800 | | | | 6,956,800 | | |
| City National | | | 1,175,000 | | | | 1,348,000 | | |
| Eaton Vance | | | 3,700,000 | | | | 4,036,000 | | |
| First Commonwealth | | | 1,000,000 | | | | 2,500,000 | | |
| FX Alliance | | | 0 | | | | 300,000 | | |
| Onex Capital (Canada) | | | 0 | | | | 450,000 | | |
| SEI Investments | | | 6,198,000 | | | | 6,654,000 | | |
| SVB Financial Group | | | 810,000 | | | | 985,000 | | |
| Health Care | |
| ARIAD Pharmaceuticals | | | 0 | | | | 2,568,248 | | |
| Cepheid | | | 3,900,000 | | | | 4,600,000 | | |
| DENTSPLY International | | | 1,136,500 | | | | 1,550,000 | | |
| InterMune | | | 2,950,000 | | | | 3,850,000 | | |
| Synageva Biopharma | | | 180,167 | | | | 569,898 | | |
| | | Number of Shares | |
| | | 3/31/12 | | 6/30/12 | |
| Energy & Minerals | |
| Gulf United (Colombia) | | | 0 | | | | 50,000,000 | | |
| Kirkland Lake Gold (Canada) | | | 920,000 | | | | 1,400,000 | | |
| Laredo Petroleum | | | 0 | | | | 1,159,000 | | |
| Mongolian Mining (Mongolia) | | | 12,000,000 | | | | 16,000,000 | | |
| Other Industries | |
| Rush Enterprises, Class A | | | 2,800,000 | | | | 2,937,175 | | |
See accompanying notes to financial statements.
28
| | | Number of Shares | |
| | | 3/31/12 | | 6/30/12 | |
| Sales | |
| Information | |
| Akamai | | | 250,000 | | | | 0 | | |
| Amphenol | | | 3,495,000 | | | | 3,415,000 | | |
| Ariba | | | 2,850,000 | | | | 900,000 | | |
| Atmel | | | 12,300,000 | | | | 11,562,000 | | |
| Blackbaud | | | 1,650,000 | | | | 960,329 | | |
| Concur Technologies | | | 1,830,000 | | | | 1,400,000 | | |
| Constant Contact | | | 2,350,000 | | | | 2,000,000 | | |
| Discovery Series C | | | 1,595,000 | | | | 900,000 | | |
| Equinix | | | 585,000 | | | | 450,000 | | |
| F5 Networks | | | 685,000 | | | | 640,000 | | |
| Finisar | | | 1,695,000 | | | | 1,345,000 | | |
| FTI Consulting | | | 868,516 | | | | 234,615 | | |
| Global Payments | | | 2,299,000 | | | | 1,700,000 | | |
| Ixia | | | 2,330,000 | | | | 1,730,000 | | |
| Kenexa | | | 1,700,000 | | | | 1,173,100 | | |
| Liberty Global Series A | | | 1,250,000 | | | | 900,000 | | |
| Littelfuse | | | 500,000 | | | | 420,000 | | |
| Mail.ru - GDR (Russia) | | | 400,000 | | | | 234,168 | | |
| NetSuite | | | 1,150,000 | | | | 800,000 | | |
| Plexus | | | 1,100,000 | | | | 960,000 | | |
| Red Hat | | | 750,000 | | | | 700,000 | | |
| Saga Communications | | | 164,991 | | | | 145,271 | | |
| SBA Communications | | | 3,700,000 | | | | 3,400,000 | | |
| TIBCO | | | 2,150,000 | | | | 1,450,000 | | |
| Tyler Technologies | | | 1,700,000 | | | | 900,000 | | |
| Zebra Technologies | | | 1,605,000 | | | | 1,365,000 | | |
| Industrial Goods & Services | |
| Albany International | | | 900,000 | | | | 600,000 | | |
| GrafTech International | | | 3,750,000 | | | | 2,800,000 | | |
| Imtech (Netherlands) | | | 1,601,465 | | | | 1,491,313 | | |
| Interline Brands | | | 2,399,751 | | | | 1,400,000 | | |
| Jain Irrigation Systems (India) | | | 3,450,000 | | | | 0 | | |
Jain Irrigation Systems - DVR
(India) | | | 172,500 | | | | 0 | | |
| Kaydon | | | 501,000 | | | | 0 | | |
| Mersen (France) | | | 260,000 | | | | 92,046 | | |
| Pentair | | | 3,100,000 | | | | 1,890,000 | | |
| Waste Connections | | | 2,400,000 | | | | 2,050,000 | | |
| Consumer Goods & Services | |
| Abercrombie & Fitch | | | 3,460,000 | | | | 3,040,000 | | |
| GLG Life Tech (Canada) | | | 1,678,125 | | | | 1,665,270 | | |
| lululemon athletica | | | 4,922,800 | | | | 4,505,000 | | |
| Monster Beverage | | | 2,340,000 | | | | 1,700,000 | | |
| Saks | | | 5,225,000 | | | | 4,425,000 | | |
| Snyder's-Lance | | | 240,000 | | | | 0 | | |
| True Religion Apparel | | | 393,452 | | | | 231,452 | | |
| Universal Technical Institute | | | 612,205 | | | | 0 | | |
| Warnaco Group | | | 2,190,000 | | | | 1,460,000 | | |
| | | Number of Shares | |
| | | 3/31/12 | | 6/30/12 | |
| Finance | |
| Assured Guaranty | | | 500,000 | | | | 0 | | |
| BOK Financial | | | 2,691,414 | | | | 2,638,000 | | |
| CVB Financial | | | 3,400,000 | | | | 3,000,000 | | |
| Green Bankshares | | | 152,569 | | | | 79,800 | | |
| Oriental Financial Group | | | 500,000 | | | | 0 | | |
| World Acceptance | | | 1,459,555 | | | | 1,425,202 | | |
| Health Care | |
| Alexion Pharmaceuticals | | | 2,290,000 | | | | 1,476,000 | | |
| Allscripts Healthcare Solutions | | | 1,200,000 | | | | 0 | | |
| Gen-Probe | | | 760,000 | | | | 0 | | |
| Hill-Rom Holdings | | | 1,873,800 | | | | 1,275,000 | | |
| Onyx Pharmaceuticals | | | 1,000,000 | | | | 750,000 | | |
| Pacific Biosciences of California | | | 2,525,000 | | | | 0 | | |
| Raptor Pharmaceutical | | | 4,200,000 | | | | 3,609,594 | | |
| Energy & Minerals | |
| Alexco Resource | | | 2,800,000 | | | | 2,050,000 | | |
| Athabasca Oil Sands (Canada) | | | 2,160,000 | | | | 750,000 | | |
| Baytex (Canada) | | | 650,000 | | | | 361,000 | | |
| Black Diamond Group (Canada) | | | 1,056,600 | | | | 893,600 | | |
| Canacol (Colombia) | | | 5,917,100 | | | | 5,116,000 | | |
| Celtic Exploration (Canada) | | | 1,140,000 | | | | 718,000 | | |
| Core Laboratories (Netherlands) | | | 442,000 | | | | 387,000 | | |
| Crew Energy (Canada) | | | 1,547,000 | | | | 493,000 | | |
| FMC Technologies | | | 5,298,000 | | | | 5,150,000 | | |
| Fugro (Netherlands) | | | 1,988,054 | | | | 1,289,106 | | |
| Oil States International | | | 743,000 | | | | 513,000 | | |
Pacific Rubiales Energy
(Colombia) | | | 4,250,000 | | | | 3,700,000 | | |
| Silver Wheaton (Canada) | | | 1,600,000 | | | | 550,000 | | |
| SM Energy | | | 900,000 | | | | 703,000 | | |
| Tullow Oil (United Kingdom) | | | 1,697,000 | | | | 1,050,000 | | |
Tuscany International Drilling
(Colombia) | | | 4,435,000 | | | | 4,415,000 | | |
| Vopak (Netherlands) | | | 300,000 | | | | 218,000 | | |
| Other Industries | |
| Genesee & Wyoming | | | 400,000 | | | | 300,000 | | |
See accompanying notes to financial statements.
29
Columbia Acorn Fund
Statement of Investments (Unaudited), June 30, 2012
| Number of Shares | | | | Value (000) | |
| | | | | | | Equities: 95.8% | |
| Information 27.2% | | | |
| | | > Business Software 6.9% | |
| | 5,000,000 | | | Informatica (a) | | $ | 211,800 | | |
| | | | | Enterprise Data Integration Software | | | | | |
| | 2,550,000 | | | Ansys (a) | | | 160,930 | | |
| | | | | Simulation Software for
Engineers & Designers | | | | | |
| | 2,700,000 | | | Micros Systems (a) | | | 138,240 | | |
| | | | | Information Systems for Hotels,
Restaurants & Retailers | | | | | |
| | 1,400,000 | | | Concur Technologies (a) | | | 95,340 | | |
| | | | | Web Enabled Cost & Expense
Management Software | | | | | |
| | 5,450,000 | | | Hexagon (Sweden) | | | 93,549 | | |
| | | | | Design, Measurement & Visualization
Software & Equipment | | | | | |
| | 2,350,000 | | | Quality Systems | | | 64,649 | | |
| | | | | IT Systems for Medical Groups &
Ambulatory Care Centers | | | | | |
| | 800,000 | | | NetSuite (a) | | | 43,816 | | |
| | | | | End-to-end IT Systems Solutions Delivered
Over the Web | | | | | |
| | 1,450,000 | | | TIBCO (a) | | | 43,384 | | |
| | | | | Datacenter Software | | | | | |
| | 900,000 | | | Ariba (a) | | | 40,284 | | |
| | | | | Cost Management Software | | | | | |
| | 700,000 | | | Red Hat (a) | | | 39,536 | | |
| | | | | Maintenance & Support for Opensource
Operating Systems & Middleware | | | | | |
| | 900,000 | | | Tyler Technologies (a) | | | 36,315 | | |
| | | | | Financial, Tax, Court & Document
Management Systems for Local Governments | | | | | |
| | 2,000,000 | | | Constant Contact (a)(b)(c) | | | 35,760 | | |
| | | | | Email & Other Marketing Campaign
Management Systems Delivered Over the Web | | | | | |
| | 1,173,100 | | | Kenexa (a) | | | 34,055 | | |
| | | | | Recruiting & Workforce Management Solutions | | | | | |
| | 900,000 | | | SPS Commerce (a)(b) | | | 27,342 | | |
| | | | | Supply Chain Management Software
Delivered via the Web | | | | | |
| | 750,000 | | | Jack Henry & Associates | | | 25,890 | | |
| | | | | IT Systems & Outsourced IT Solutions for
Financial Institutions | | | | | |
| | 960,329 | | | Blackbaud | | | 24,652 | | |
| | | | | Software & Services for Non-profits | | | | | |
| | 690,000 | | | Advent Software (a) | | | 18,706 | | |
| | | | | Asset Management & Trading Systems | | | | | |
| | 2,000,000 | | | SABA (a)(b) | | | 18,560 | | |
| | | | | Learning Management Systems | | | | | |
| | 2,700,000 | | | Velti (a)(c) | | | 17,550 | | |
| | | | | Mobile Marketing Software Platform | | | | | |
| | 900,000 | | | Active Network (a) | | | 13,851 | | |
| | | | | Web Delivered Software Solution for
Managing Events & Activities | | | | | |
| | 1,000,000 | | | InContact (a) | | | 5,010 | | |
| | | | | Call Center Systems Delivered Via the
Web & Telco Services | | | | | |
| | 55,000 | | | Solera Holdings | | | 2,298 | | |
| | | | | Software for Automotive Insurance
Claims Processing | | | | | |
| | | | 1,191,517 | | |
| Number of Shares | | | | Value (000) | |
| | | > Instrumentation 2.7% | |
| | 1,600,000 | | | Mettler-Toledo International (a)(b) | | $ | 249,360 | | |
| | | | | Laboratory Equipment | | | | | |
| | 2,780,000 | | | IPG Photonics (a)(b) | | | 121,180 | | |
| | | | | Fiber Lasers | | | | | |
| | 2,035,000 | | | Trimble Navigation (a) | | | 93,631 | | |
| | | | | GPS-based Instruments | | | | | |
| | | | 464,171 | | |
| | | > Mobile Communications 2.7% | |
| | 4,465,000 | | | Crown Castle International (a) | | | 261,917 | | |
| | | | | Communications Towers | | | | | |
| | 3,400,000 | | | SBA Communications (a) | | | 193,970 | | |
| | | | | Communications Towers | | | | | |
| | 1,500,000 | | | Globalstar (a) | | | 480 | | |
| | | | | Satellite Mobile Voice & Data Carrier | | | | | |
| | | | 456,367 | | |
| | | > Telephone & Data Services 2.6% | |
| | 9,500,000 | | | tw telecom (a)(b) | | | 243,770 | | |
| | | | | Fiber Optic Telephone/Data Services | | | | | |
| | 1,400,000 | | | AboveNet (b) | | | 117,600 | | |
| | | | | Metropolitan Fiber Communications Services | | | | | |
| | 2,200,000 | | | Cogent Communications (a) | | | 42,350 | | |
| | | | | Internet Data Pipelines | | | | | |
| | 1,650,000 | | | Boingo Wireless (a) | | | 19,173 | | |
| | | | | Wholesale & Retail WiFi Networks | | | | | |
| | 2,000,000 | | | General Communications (a)(b) | | | 16,620 | | |
| | | | | Commercial Communication & Consumer
CATV, Web & Phone in Alaska | | | | | |
| | | | 439,513 | | |
| | | > Computer Hardware & Related
Equipment 2.4% | |
| | 3,415,000 | | | Amphenol | | | 187,552 | | |
| | | | | Electronic Connectors | | | | | |
| | 4,550,000 | | | II-VI (a)(b) | | | 75,849 | | |
| | | | | Laser Optics & Specialty Materials | | | | | |
| | 1,365,000 | | | Zebra Technologies (a) | | | 46,901 | | |
| | | | | Bar Code Printers | | | | | |
| | 900,000 | | | Netgear (a) | | | 31,059 | | |
| | | | | Networking Products for Small Business & Home | | | | | |
| | 605,000 | | | Stratasys (a)(c) | | | 29,978 | | |
| | | | | Rapid Prototyping Systems | | | | | |
| | 800,000 | | | Nice Systems - ADR (Israel) (a) | | | 29,280 | | |
| | | | | Audio & Video Recording Solutions | | | | | |
| | 207,000 | | | Gemalto (France) | | | 14,867 | | |
| | | | | Digital Security Solutions | | | | | |
| | | | 415,486 | | |
| | | > Semiconductors & Related
Equipment 2.1% | |
| | 11,562,000 | | | Atmel (a) | | | 77,465 | | |
| | | | | Microcontrollers, Radio Frequency &
Memory Semiconductors | | | | | |
| | 7,932,000 | | | ON Semiconductor (a) | | | 56,317 | | |
| | | | | Mixed Signal & Power Management
Semiconductors | | | | | |
| | 5,000,000 | | | Entegris (a) | | | 42,700 | | |
| | | | | Semiconductor Materials Management Products | | | | | |
| | 2,160,000 | | | Microsemi (a) | | | 39,938 | | |
| | | | | Analog/Mixed Signal Semiconductors | | | | | |
See accompanying notes to financial statements.
30
| Number of Shares | | | | Value (000) | |
| | | > Semiconductors & Related
Equipment—continued | |
| | 420,000 | | | Littelfuse | | $ | 23,894 | | |
| | | | | Little Fuses | | | | | |
| | 1,165,000 | | | Monolithic Power Systems (a) | | | 23,149 | | |
| | | | | High Performance Analog & Mixed Signal
Integrated Circuits | | | | | |
| | 1,900,000 | | | IXYS (a)(b) | | | 21,223 | | |
| | | | | Power Semiconductors | | | | | |
| | 400,000 | | | Hittite Microwave (a) | | | 20,448 | | |
| | | | | Radio Frequency, Microwave &
Millimeterwave Semiconductors | | | | | |
| | 615,000 | | | Ultratech (a) | | | 19,373 | | |
| | | | | Semiconductor Equipment | | | | | |
| | 1,765,000 | | | Pericom Semiconductor (a)(b) | | | 15,885 | | |
| | | | | Interface Integrated Circuits & Frequency Control Products | | | | | |
| | 560,000 | | | Cree (a)(c) | | | 14,375 | | |
| | | | | LED Lighting, Components & Chips | | | | | |
| | 2,290,000 | | | TriQuint Semiconductor (a) | | | 12,595 | �� | |
| | | | | Radio Frequency Semiconductors | | | | | |
| | | | 367,362 | | |
| | | > Computer Services 1.3% | |
| | 3,400,000 | | | iGATE (a)(b) | | | 57,868 | | |
| | | | | IT & Business Process Outsourcing Services | | | | | |
| | 680,000 | | | Syntel | | | 41,275 | | |
| | | | | Offshore IT Services | | | | | |
| | 1,618,000 | | | ExlService Holdings (a)(b) | | | 39,868 | | |
| | | | | Business Process Outsourcing | | | | | |
| | 2,125,000 | | | Virtusa (a)(b) | | | 28,369 | | |
| | | | | Offshore IT Outsourcing | | | | | |
| | 1,705,000 | | | Genpact (a) | | | 28,354 | | |
| | | | | Business Process Outsourcing | | | | | |
| | 3,849,207 | | | Hackett Group (a)(b) | | | 21,440 | | |
| | | | | IT Integration & Best Practice Research | | | | | |
| | 1,091,353 | | | WNS - ADR (India) (a) | | | 10,619 | | |
| | | | | Offshore BPO (Business Process Outsourcing)
Services | | | | | |
| | | | 227,793 | | |
| | | > Gaming Equipment & Services 1.2% | |
| | 3,725,000 | | | Bally Technologies (a)(b) | | | 173,809 | | |
| | | | | Slot Machines & Software | | | | | |
| | 1,530,000 | | | WMS Industries (a) | | | 30,523 | | |
| | | | | Slot Machine Provider | | | | | |
| | | | 204,332 | | |
| | | > Internet Related 1.1% | |
| | 450,000 | | | Equinix (a) | | | 79,042 | | |
| | | | | Network Neutral Data Centers | | | | | |
| | 1,450,000 | | | TripAdvisor | | | 64,801 | | |
| | | | | Online Travel Research | | | | | |
| | 304,000 | | | NetEase.com - ADR (China) (a) | | | 17,890 | | |
| | | | | Chinese Online Gaming Services | | | | | |
| | 700,100 | | | Yandex (Russia) (a) | | | 13,337 | | |
| | | | | Search Engine for Russian & Turkish Languages | | | | | |
| | 234,168 | | | Mail.ru - GDR (Russia) (a)(d) | | | 7,975 | | |
| | | | | Internet Social Networking & Games for
Russian Speakers | | | | | |
| | 231,700 | | | Angies list (a) | | | 3,670 | | |
| | | | | Consumer Subscription & Internet Advertising | | | | | |
| | | | 186,715 | | |
| Number of Shares | | | | Value (000) | |
| | | > Business Information & Marketing
Services 0.9% | |
| | 1,900,000 | | | Verisk Analytics (a) | | $ | 93,594 | | |
| | | | | Risk & Decision Analytics | | | | | |
| | 3,027,016 | | | Navigant Consulting (a)(b) | | | 38,261 | | |
| | | | | Financial Consulting Firm | | | | | |
| | 505,000 | | | RPX (a) | | | 7,247 | | |
| | | | | Patent Aggregation & Defensive Patent
Consulting | | | | | |
| | 234,615 | | | FTI Consulting (a) | | | 6,745 | | |
| | | | | Financial Consulting Firm | | | | | |
| | | | 145,847 | | |
| | | > Telecommunications Equipment 0.7% | |
| | 640,000 | | | F5 Networks (a) | | | 63,718 | | |
| | | | | Internet Traffic Management Equipment | | | | | |
| | 1,730,000 | | | Ixia (a) | | | 20,795 | | |
| | | | | Telecom Network Test Equipment | | | | | |
| | 1,345,000 | | | Finisar (a) | | | 20,121 | | |
| | | | | Optical Subsystems & Components | | | | | |
| | 1,925,000 | | | Infinera (a) | | | 13,167 | | |
| | | | | Optical Networking Equipment | | | | | |
| | | | 117,801 | | |
| | | > CATV 0.6% | |
| | 900,000 | | | Discovery Series C (a) | | | 45,081 | | |
| | | | | Cable TV Programming | | | | | |
| | 900,000 | | | Liberty Global Series A (a) | | | 44,667 | | |
| | | | | Cable TV Franchises Outside the USA | | | | | |
| | 15,770 | | | Jupiter Telecommunications (Japan) | | | 16,079 | | |
| | | | | Largest Cable Service Provider in Japan | | | | | |
| | | | 105,827 | | |
| | | > Financial Processors 0.6% | |
| | 1,700,000 | | | Global Payments | | | 73,491 | | |
| | | | | Credit Card Processor | | | | | |
| | 5,000,000 | | | Singapore Exchange (Singapore) | | | 25,119 | | |
| | | | | Singapore Equity & Derivatives Market
Operator | | | | | |
| | | | 98,610 | | |
| | | > Electronics Distribution 0.6% | |
| | 3,125,000 | | | Avnet (a) | | | 96,438 | | |
| | | | | Electronic Components Distribution | | | | | |
| | | | 96,438 | | |
| | | > Contract Manufacturing 0.3% | |
| | 3,800,000 | | | Sanmina-SCI (a) | | | 31,122 | | |
| | | | | Electronic Manufacturing Services | | | | | |
| | 960,000 | | | Plexus (a) | | | 27,072 | | |
| | | | | Electronic Manufacturing Services | | | | | |
| | | | 58,194 | | |
| | | > Advertising 0.3% | |
| | 1,725,000 | | | Lamar Advertising (a) | | | 49,335 | | |
| | | | | Outdoor Advertising | | | | | |
| | 1,500,000 | | | VisionChina Media - ADR (China) (a) | | | 1,395 | | |
| | | | | Advertising on Digital Screens in China's
Mass Transit System | | | | | |
| | | | 50,730 | | |
See accompanying notes to financial statements.
31
Columbia Acorn Fund
Statement of Investments (Unaudited), continued
| Number of Shares | | | | Value (000) | |
| | | > Entertainment Programming 0.2% | |
| | 1,100,000 | | | IMAX (Canada) (a)(c) | | $ | 26,433 | | |
| | | | | IMAX Movies, Theatre Equipment &
Theatre Joint Ventures | | | | | |
| | | | 26,433 | | |
| | | > TV Broadcasting —% | |
| | 2,500,000 | | | Entravision Communications | | | 3,025 | | |
| | | | | Spanish Language TV & Radio Stations | | | | | |
| | 1,750,000 | | | Gray Television (a)(c) | | | 2,573 | | |
| | | | | Mid-market Affiliated TV Stations | | | | | |
| | | | 5,598 | | |
| | | > Radio —% | |
| | 145,271 | | | Saga Communications (a) | | | 5,391 | | |
| | | | | Radio Stations in Small & Mid-sized Cities | | | | | |
| | | | 5,391 | | |
| | | > Consumer Software —% | |
| | 273,500 | | | Carbonite (a)(c) | | | 2,445 | | |
| | | | | Online Data Storage | | | | | |
| | | | 2,445 | | |
| Information: Total | | | 4,666,570 | | |
| Industrial Goods & Services 19.0% | | | |
| | | > Machinery 11.1% | |
| | 6,750,000 | | | Ametek | | | 336,893 | | |
| | | | | Aerospace/Industrial Instruments | | | | | |
| | 8,400,000 | | | Donaldson (b) | | | 280,308 | | |
| | | | | Industrial Air Filtration | | | | | |
| | 3,125,000 | | | Nordson | | | 160,281 | | |
| | | | | Dispensing Systems for Adhesives & Coatings | | | | | |
| | 3,000,000 | | | Moog (a)(b) | | | 124,050 | | |
| | | | | Motion Control Products for Aerospace,
Defense & Industrial Markets | | | | | |
| | 3,725,000 | | | Kennametal | | | 123,484 | | |
| | | | | Consumable Cutting Tools | | | | | |
| | 2,325,000 | | | Clarcor | | | 111,972 | | |
| | | | | Mobile & Industrial Filters | | | | | |
| | 3,063,000 | | | HEICO (b) | | | 98,812 | | |
| | | | | FAA Approved Aircraft Replacement Parts | | | | | |
| | 1,800,000 | | | Pall | | | 98,658 | | |
| | | | | Filtration & Fluids Clarification | | | | | |
| | 2,200,000 | | | ESCO Technologies (b) | | | 80,168 | | |
| | | | | Automatic Electric Meter Readers | | | | | |
| | 1,890,000 | | | Pentair | | | 72,349 | | |
| | | | | Pumps & Water Treatment | | | | | |
| | 805,000 | | | Toro | | | 58,998 | | |
| | | | | Turf Maintenance Equipment | | | | | |
| | 2,350,000 | | | Generac | | | 56,541 | | |
| | | | | Standby Power Generators | | | | | |
| | 2,675,000 | | | Oshkosh Corporation (a) | | | 56,041 | | |
| | | | | Specialty Truck Manufacturer | | | | | |
| | 1,325,000 | | | Polypore International (a)(c) | | | 53,517 | | |
| | | | | Battery Separators & Filtration Media | | | | | |
| | 435,000 | | | Valmont Industries | | | 52,622 | | |
| | | | | Center Pivot Irrigation Systems & Utility Poles | | | | | |
| | 950,000 | | | WABCO Holdings (a) | | | 50,284 | | |
| | | | | Truck & Bus Component Supplier | | | | | |
| Number of Shares | | | | Value (000) | |
| | 600,000 | | | Wabtec | | $ | 46,806 | | |
| | | | | Freight & Transit Component Supplier | | | | | |
| | 350,000 | | | Neopost (France) | | | 18,678 | | |
| | | | | Postage Meter Machines | | | | | |
| | 170,000 | | | Middleby Corp (a) | | | 16,934 | | |
| | | | | Manufacturer of Cooking Equipment | | | | | |
| | 10,000,000 | | | Marel (Iceland) | | | 12,162 | | |
| | | | | Largest Manufacturer of Poultry & Fish
Processing Equipment | | | | | |
| | 1,000,000 | | | Spartan Motors | | | 5,240 | | |
| | | | | Specialty Truck & Chassis Manufacturer | | | | | |
| | | | 1,914,798 | | |
| | | > Industrial Materials & Specialty
Chemicals 2.4% | |
| | 1,750,000 | | | Albemarle | | | 104,370 | | |
| | | | | Refinery Catalysts & Other Specialty
Chemicals | | | | | |
| | 1,520,000 | | | FMC Corporation | | | 81,290 | | |
| | | | | Niche Specialty Chemicals | | | | | |
| | 800,000 | | | Ashland | | | 55,448 | | |
| | | | | Diversified Chemicals Company | | | | | |
| | 1,880,000 | | | Drew Industries (a)(b) | | | 52,358 | | |
| | | | | RV & Manufactured Home Components | | | | | |
| | 1,525,000 | | | Novozymes (Denmark) | | | 39,545 | | |
| | | | | Industrial Enzymes | | | | | |
| | 673,000 | | | Sociedad Quimica y Minera de
Chile - ADR (Chile) (c) | | | 37,466 | | |
| | | | | Producer of Specialty Fertilizers,
Lithium & Iodine | | | | | |
| | 2,218,700 | | | Kansai Paint (Japan) | | | 23,775 | | |
| | | | | Paint Producer in Japan, India, China &
Southeast Asia | | | | | |
| | 600,000 | | | Albany International | | | 11,226 | | |
| | | | | Paper Machine Clothing & Composites
for Aerospace | | | | | |
| | 200,000 | | | Silgan Holdings | | | 8,538 | | |
| | | | | Metal & Plastic Packaging | | | | | |
| | 92,046 | | | Mersen (France) | | | 2,306 | | |
| | | | | Advanced Industrial Materials | | | | | |
| | | | 416,322 | | |
| | | > Other Industrial Services 1.7% | |
| | 3,050,000 | | | Expeditors International of
Washington | | | 118,187 | | |
| | | | | International Freight Forwarder | | | | | |
| | 1,400,000 | | | Forward Air | | | 45,178 | | |
| | | | | Freight Transportation Between Airports | | | | | |
| | 1,350,000 | | | LKQ (a) | | | 45,090 | | |
| | | | | Alternative Auto Parts Distribution | | | | | |
| | 1,491,313 | | | Imtech (Netherlands) | | | 35,610 | | |
| | | | | Electromechanical & Information & Communications
Technology Installation & Maintenance | | | | | |
| | 1,600,000 | | | Mobile Mini (a) | | | 23,040 | | |
| | | | | Portable Storage Units Leasing | | | | | |
| | 1,500,000 | | | Acorn Energy (b)(c) | | | 12,480 | | |
| | | | | Frac Well Exploration/Monitoring Device,
Sonar Security, Electric Grid Monitoring | | | | | |
| | 750,000 | | | UTI Worldwide | | | 10,958 | | |
| | | | | Freight Forwarding & Logistics | | | | | |
| | | | 290,543 | | |
See accompanying notes to financial statements.
32
| Number of Shares | | | | Value (000) | |
| | | > Construction 1.3% | |
| | 2,850,000 | | | Chicago Bridge & Iron | | $ | 108,186 | | |
| | | | | Engineering & Construction for Liquefied
Natural Gas & Petrochemicals | | | | | |
| | 66,000 | | | NVR (a) | | | 56,100 | | |
| | | | | DC Homebuilder | | | | | |
| | 1,350,000 | | | Fortune Brands Home & Security (a) | | | 30,065 | | |
| | | | | Home Building Supplies & Small Locks | | | | | |
| | 1,800,000 | | | Mills Estruturas e Servicos de
Engenharia (Brazil) | | | 24,197 | | |
| | | | | Civil Engineering & Construction | | | | | |
| | | | 218,548 | | |
| | | > Electrical Components 0.7% | |
| | 1,765,000 | | | Acuity Brands | | | 89,856 | | |
| | | | | Commercial Lighting Fixtures | | | | | |
| | 1,500,000 | | | Ushio (Japan) | | | 18,592 | | |
| | | | | Industrial Light Sources | | | | | |
| | 351,000 | | | Saft (France) | | | 8,421 | | |
| | | | | Niche Battery Manufacturer | | | | | |
| | | | 116,869 | | |
| | | > Outsourcing Services 0.7% | |
| | 2,800,000 | | | Quanta Services (a) | | | 67,396 | | |
| | | | | Electrical & Telecom Construction Services | | | | | |
| | 1,359,200 | | | Insperity (b) | | | 36,766 | | |
| | | | | Professional Employer Organization | | | | | |
| | 600,000 | | | GP Strategies (a) | | | 11,082 | | |
| | | | | Training Programs | | | | | |
| | | | 115,244 | | |
| | | > Waste Management 0.5% | |
| | 2,050,000 | | | Waste Connections | | | 61,336 | | |
| | | | | Solid Waste Management | | | | | |
| | 560,000 | | | Clean Harbors (a) | | | 31,595 | | |
| | | | | Hazardous Waste Services & Disposal | | | | | |
| | | | 92,931 | | |
| | | > Conglomerates 0.2% | |
| | 2,324,833 | | | Aalberts Industries (Netherlands) | | | 36,200 | | |
| | | | | Flow Control & Heat Treatment | | | | | |
| | | | 36,200 | | |
| | | > Industrial Distribution 0.2% | |
| | 1,400,000 | | | Interline Brands (a) | | | 35,098 | | |
| | | | | Industrial Distribution | | | | | |
| | | | 35,098 | | |
| | | > Steel 0.2% | |
| | 2,800,000 | | | GrafTech International (a) | | | 27,020 | | |
| | | | | Industrial Graphite Materials Producer | | | | | |
| | | | 27,020 | | |
| Industrial Goods & Services: Total | | | 3,263,573 | | |
| Consumer Goods & Services 15.9% | | | |
| | | > Retail 4.3% | |
| | 4,505,000 | | | lululemon athletica (a) | | | 268,633 | | |
| | | | | Premium Active Apparel Retailer | | | | | |
| | 6,600,000 | | | Pier 1 Imports (b) | | | 108,438 | | |
| | | | | Home Furnishing Retailer | | | | | |
| | 3,040,000 | | | Abercrombie & Fitch | | | 103,786 | | |
| | | | | Teen Apparel Retailer | | | | | |
| Number of Shares | | | | Value (000) | |
| | 3,370,000 | | | Shutterfly (a)(b) | | $ | 103,425 | | |
| | | | | Internet Photo-centric Retailer | | | | | |
| | 4,425,000 | | | Saks (a)(c) | | | 47,126 | | |
| | | | | Luxury Department Store Retailer | | | | | |
| | 527,845 | | | Fossil (a) | | | 40,401 | | |
| | | | | Watch Designer & Retailer | | | | | |
| | 525,000 | | | DSW | | | 28,560 | | |
| | | | | Branded Footwear Retailer | | | | | |
| | 1,075,000 | | | American Eagle Outfitters | | | 21,210 | | |
| | | | | Teen Apparel Retailer | | | | | |
| | 971,500 | | | Teavana (a)(c) | | | 13,145 | | |
| | | | | Specialty Tea Retailer | | | | | |
| | 1,371,366 | | | Gaiam (a)(b) | | | 5,348 | | |
| | | | | Healthy Living Catalogs & E-Commerce | | | | | |
| | 66,000 | | | The Fresh Market (a) | | | 3,540 | | |
| | | | | Specialty Food Retailer | | | | | |
| | | | 743,612 | | |
| | | > Travel 3.0% | |
| | 3,850,000 | | | Gaylord Entertainment (a)(b) | | | 148,456 | | |
| | | | | Convention Hotels | | | | | |
| | 1,430,000 | | | Vail Resorts | | | 71,614 | | |
| | | | | Ski Resort Operator & Developer | | | | | |
| | 1,450,000 | | | Expedia | | | 69,702 | | |
| | | | | Online Travel Services Company | | | | | |
| | 4,400,000 | | | Avis Budget Group (a) | | | 66,880 | | |
| | | | | Second Largest Car Rental Company | | | | | |
| | 3,750,000 | | | Hertz (a) | | | 48,000 | | |
| | | | | Largest U.S. Rental Car Operator | | | | | |
| | 970,000 | | | Choice Hotels | | | 38,732 | | |
| | | | | Franchisor of Budget Hotel Brands | | | | | |
| | 1,600,000 | | | HomeAway (a)(c) | | | 34,784 | | |
| | | | | Vacation Rental Online Marketplace | | | | | |
| | 2,000,000 | | | Localiza Rent A Car (Brazil) | | | 30,082 | | |
| | | | | Car Rental | | | | | |
| | | | 508,250 | | |
| | | > Apparel 2.3% | |
| | 1,660,000 | | | PVH | | | 129,131 | | |
| | | | | Apparel Wholesaler & Retailer | | | | | |
| | 2,100,000 | | | Coach | | | 122,808 | | |
| | | | | Designer & Retailer of Branded Leather
Accessories | | | | | |
| | 1,460,000 | | | Warnaco Group (a) | | | 62,167 | | |
| | | | | Global Branded Apparel Manufacturer | | | | | |
| | 1,310,000 | | | Deckers Outdoor (a)(c) | | | 57,653 | | |
| | | | | Fashion Footwear Wholesaler | | | | | |
| | 600,000 | | | Steven Madden (a) | | | 19,050 | | |
| | | | | Wholesaler/Retailer of Fashion Footwear | | | | | |
| | 231,452 | | | True Religion Apparel | | | 6,708 | | |
| | | | | Premium Denim | | | | | |
| | | | 397,517 | | |
| | | > Food & Beverage 1.1% | |
| | 1,700,000 | | | Monster Beverage (a) | | | 121,040 | | |
| | | | | Alternative Beverages | | | | | |
| | 32,000,000 | | | Olam International (Singapore) | | | 46,347 | | |
| | | | | Agriculture Supply Chain Manager | | | | | |
| | 1,800,000 | | | Arcos Dorados (Brazil) | | | 26,604 | | |
| | | | | McDonald's Master Franchise for
Latin America | | | | | |
See accompanying notes to financial statements.
33
Columbia Acorn Fund
Statement of Investments (Unaudited), continued
| Number of Shares | | | | Value (000) | |
| | | > Food & Beverage—continued | |
| | 45,500 | | | Annie's (a)(c) | | $ | 1,905 | | |
| | | | | Developer & Marketer of Natural & Organic Food | | | | | |
| | 1,665,270 | | | GLG Life Tech (Canada) (a)(b)(e) | | | 689 | | |
| | | | | All-natural Sweetener Extracted from the
Stevia Plant | | | | | |
| | | | 196,585 | | |
| | | > Consumer Goods Distribution 1.1% | |
| | 2,305,000 | | | GNC Holdings | | | 90,356 | | |
| | | | | Specialty Retailer of Health & Wellness Products | | | | | |
| | 2,015,000 | | | Pool | | | 81,527 | | |
| | | | | Distributor of Swimming Pool Supplies &
Equipment | | | | | |
| | 625,000 | | | United Stationers | | | 16,844 | | |
| | | | | Wholesale Distributor of Business Products | | | | | |
| | | | 188,727 | | |
| | | > Other Consumer Services 0.9% | |
| | 2,190,000 | | | Lifetime Fitness (a)(b) | | | 101,857 | | |
| | | | | Sport & Fitness Club Operator | | | | | |
| | 16,857,500 | | | Lifestyle International (Hong Kong) | | | 37,146 | | |
| | | | | Mid to High-end Department Store
Operator in Hong Kong & China | | | | | |
| | 1,062,500 | | | Move (a) | | | 9,679 | | |
| | | | | Real Estate Internet Websites | | | | | |
| | 441,666 | | | IFM Investments (Century 21
China RE) - ADR (China) (a) | | | 481 | | |
| | | | | Provide Real Estate Services in China | | | | | |
| | | | 149,163 | | |
| | | > Casinos & Gaming 0.8% | |
| | 3,950,000 | | | Pinnacle Entertainment (a)(b) | | | 37,999 | | |
| | | | | Regional Casino Operator | | | | | |
| | 850,000 | | | Penn National Gaming (a) | | | 37,902 | | |
| | | | | Regional Casino Operator | | | | | |
| | 3,000,000 | | | Melco Crown Entertainment - ADR
(Hong Kong) (a) | | | 34,560 | | |
| | | | | Macau Casino Operator | | | | | |
| | 12,000,000 | | | MGM China Holdings (Hong Kong) | | | 18,400 | | |
| | | | | Macau Casino Operator | | | | | |
| | | | 128,861 | | |
| | | > Furniture & Textiles 0.8% | |
| | 4,200,000 | | | Knoll (b) | | | 56,364 | | |
| | | | | Office Furniture | | | | | |
| | 2,250,000 | | | Herman Miller | | | 41,670 | | |
| | | | | Office Furniture | | | | | |
| | 2,038,555 | | | Interface | | | 27,785 | | |
| | | | | Modular & Broadloom Carpet | | | | | |
| | 215,000 | | | Caesarstone (Israel) (a) | | | 2,604 | | |
| | | | | Quartz Countertops | | | | | |
| | | | 128,423 | | |
| | | > Other Durable Goods 0.6% | |
| | 1,500,000 | | | Jarden | | | 63,030 | | |
| | | | | Branded Household Products | | | | | |
| | 460,000 | | | Cavco Industries (a)(b) | | | 23,589 | | |
| | | | | Manufactured Homes | | | | | |
| | 400,000 | | | Tesla Motors (a)(c) | | | 12,516 | | |
| | | | | Design, Manufacture & Sell High Performance
Electric Vehicles | | | | | |
| | | | 99,135 | | |
| Number of Shares | | | | Value (000) | |
| | | > Restaurants 0.4% | |
| | 2,000,000 | | | AFC Enterprises (a)(b) | | $ | 46,280 | | |
| | | | | Popeye's Restaurants | | | | | |
| | 450,000 | | | Cheesecake Factory (a) | | | 14,382 | | |
| | | | | Casual Dining Restaurants | | | | | |
| | 675,000 | | | Bravo Brio Restaurant Group (a) | | | 12,035 | | |
| | | | | Upscale Casual Italian Restaurants | | | | | |
| | | | 72,697 | | |
| | | > Nondurables 0.3% | |
| | 1,600,000 | | | Helen of Troy (a)(b) | | | 54,224 | | |
| | | | | Personal Care, Housewares, Healthcare &
Home Environment Products | | | | | |
| | | | 54,224 | | |
| | | > Educational Services 0.2% | |
| | 800,000 | | | New Oriental Education &
Technology - ADR (China) (a) | | | 19,600 | | |
| | | | | Education Service Provider | | | | | |
| | 300,000 | | | ITT Educational Services (a)(c) | | | 18,225 | | |
| | | | | Postsecondary Degree Services | | | | | |
| | 2,000,000 | | | Voyager Learning - Contingent Value
Rights (e)(f) | | | 220 | | |
| | | | | Education Services for the K-12 Market | | | | | |
| | | | 38,045 | | |
| | | > Leisure Products 0.1% | |
| | 1,290,000 | | | Skullcandy (a)(c) | | | 18,253 | | |
| | | | | Lifestyle Branded Headphones | | | | | |
| | | | 18,253 | | |
| | | > Other Entertainment —% | |
| | 265,000 | | | CTS Eventim (Germany) | | | 7,974 | | |
| | | | | Event Ticket Sales | | | | | |
| | | | 7,974 | | |
| Consumer Goods & Services: Total | | | 2,731,466 | | |
| Finance 11.0% | | | |
| | | > Banks 4.4% | |
| | 2,638,000 | | | BOK Financial | | | 153,532 | | |
| | | | | Tulsa-based Southwest Bank | | | | | |
| | 6,956,800 | | | Associated Banc-Corp | | | 91,760 | | |
| | | | | Midwest Bank | | | | | |
| | 2,337,313 | | | Hancock Holding | | | 71,148 | | |
| | | | | Gulf Coast Bank | | | | | |
| | 1,348,000 | | | City National | | | 65,486 | | |
| | | | | Bank & Asset Manager | | | | | |
| | 2,860,000 | | | MB Financial (b) | | | 61,604 | | |
| | | | | Chicago Bank | | | | | |
| | 985,000 | | | SVB Financial Group (a) | | | 57,839 | | |
| | | | | Bank to Venture Capitalists | | | | | |
| | 5,323,500 | | | Valley National Bancorp | | | 56,429 | | |
| | | | | New Jersey/New York Bank | | | | | |
| | 3,000,000 | | | CVB Financial | | | 34,950 | | |
| | | | | Inland Empire Business Bank | | | | | |
| | 2,200,000 | | | TCF Financial | | | 25,256 | | |
| | | | | Great Lakes Bank | | | | | |
| | 700,000 | | | Wintrust Financial | | | 24,850 | | |
| | | | | Chicago & Milwaukee Full Service Bank | | | | | |
| | 1,350,000 | | | TriCo Bancshares (b) | | | 20,790 | | |
| | | | | California Central Valley Bank | | | | | |
See accompanying notes to financial statements.
34
| Number of Shares | | | | Value (000) | |
| | | > Banks—continued | |
| | 4,299,507 | | | First Busey | | $ | 20,767 | | |
| | | | | Illinois Bank | | | | | |
| | 1,121,188 | | | Sandy Spring Bancorp | | | 20,181 | | |
| | | | | Baltimore, D.C. Bank | | | | | |
| | 2,500,000 | | | First Commonwealth | | | 16,825 | | |
| | | | | Western Pennsylvania Bank | | | | | |
| | 811,295 | | | Hudson Valley | | | 14,685 | | |
| | | | | Metro New York City Bank | | | | | |
| | 2,136,500 | | | TrustCo Bank | | | 11,665 | | |
| | | | | New York State Bank | | | | | |
| | 706,559 | | | Eagle Bancorp (a) | | | 11,128 | | |
| | | | | Metro D.C. Bank | | | | | |
| | 241,405 | | | Pacific Continental Bank | | | 2,141 | | |
| | | | | Pacific Northwest Bank | | | | | |
| | 79,800 | | | Green Bankshares (a) | | | 133 | | |
| | | | | Tennessee Bank | | | | | |
| | | | 761,169 | | |
| | | > Insurance 2.4% | |
| | 8,900,000 | | | CNO Financial Group | | | 69,420 | | |
| | | | | Life, Long-term Care & Medical Supplement
Insurance | | | | | |
| | 833,000 | | | Allied World Holdings | | | 66,198 | | |
| | | | | Commerical Lines Insurance/Reinsurance | | | | | |
| | 2,764,000 | | | Tower Group (b) | | | 57,685 | | |
| | | | | Commercial & Personal Lines Insurance | | | | | |
| | 1,120,000 | | | The Hanover Insurance Group | | | 43,826 | | |
| | | | | Commercial & Personal Lines Insurance | | | | | |
| | 2,050,000 | | | Selective Insurance Group | | | 35,690 | | |
| | | | | Commercial & Personal Lines Insurance | | | | | |
| | 1,100,000 | | | HCC Insurance Holdings | | | 34,540 | | |
| | | | | Specialty Insurance | | | | | |
| | 832,000 | | | Willis Group (Ireland) | | | 30,360 | | |
| | | | | Insurance Broker | | | | | |
| | 925,000 | | | Kemper | | | 28,444 | | |
| | | | | Multi-line Insurance | | | | | |
| | 250,000 | | | Enstar Group (a) | | | 24,735 | | |
| | | | | Insurance/Reinsurance & Related Services | | | | | |
| | 900,000 | | | Brown & Brown | | | 24,543 | | |
| | | | | Insurance Broker | | | | | |
| | | | 415,441 | | |
| | | > Finance Companies 1.6% | |
| | 1,425,202 | | | World Acceptance (a)(b) | | | 93,778 | | |
| | | | | Personal Loans | | | | | |
| | 2,150,000 | | | McGrath Rentcorp (b) | | | 56,975 | | |
| | | | | Temporary Space & IT Rentals | | | | | |
| | 3,400,000 | | | H & E Equipment Services (a)(b) | | | 51,102 | | |
| | | | | Heavy Equipment Leasing | | | | | |
| | 1,123,400 | | | CAI International (a)(b) | | | 22,333 | | |
| | | | | International Container Leasing | | | | | |
| | 1,091,000 | | | Marlin Business Services (b) | | | 17,882 | | |
| | | | | Small Equipment Leasing | | | | | |
| | 450,000 | | | Onex Capital (Canada) | | | 17,472 | | |
| | | | | Private Equity | | | | | |
| | 422,500 | | | Regional Management (a) | | | 6,950 | | |
| | | | | Consumer Loans | | | | | |
| | 78,500 | | | Textainer Group Holdings | | | 2,897 | | |
| | | | | Top International Container Leasor | | | | | |
| | | | 269,389 | | |
| Number of Shares | | | | Value (000) | |
| | | > Brokerage & Money Management 1.5% | |
| | 6,654,000 | | | SEI Investments | | $ | 132,348 | | |
| | | | | Mutual Fund Administration &
Investment Management | | | | | |
| | 4,036,000 | | | Eaton Vance | | | 108,770 | | |
| | | | | Specialty Mutual Funds | | | | | |
| | 300,000 | | | FX Alliance (a) | | | 4,713 | | |
| | | | | FX Trading Software & Services | | | | | |
| | 1,000,000 | | | Artio Global Investors (c) | | | 3,500 | | |
| | | | | International Asset Manager | | | | | |
| | | | 249,331 | | |
| | | > Credit Cards 0.5% | |
| | 550,000 | | | Alliance Data Systems (a) | | | 74,250 | | |
| | | | | Diversified Credit Card Provider | | | | | |
| | 275,000 | | | Wright Express (a) | | | 16,973 | | |
| | | | | Pay Card Processor | | | | | |
| | | | 91,223 | | |
| | | > Diversified Financial Companies 0.4% | |
| | 2,820,000 | | | Leucadia National | | | 59,981 | | |
| | | | | Holding Company | | | | | |
| | | | 59,981 | | |
| | | > Savings & Loans 0.2% | |
| | 400,000 | | | Financial Engines (a) | | | 8,580 | | |
| | | | | Asset Management for 401k Plans | | | | | |
| | 1,010,000 | | | Provident New York Bancorp | | | 7,666 | | |
| | | | | New York State Thrift | | | | | |
| | 470,000 | | | ViewPoint Financial | | | 7,351 | | |
| | | | | Texas Thrift | | | | | |
| | 452,146 | | | Kaiser Federal | | | 6,682 | | |
| | | | | Los Angeles Savings & Loan | | | | | |
| | 65,991 | | | Berkshire Hills Bancorp | | | 1,452 | | |
| | | | | Northeast Thrift | | | | | |
| | | | 31,731 | | |
| Finance: Total | | | 1,878,265 | | |
| Health Care 9.7% | | | |
| | | > Biotechnology & Drug Delivery 4.9% | |
| | 4,315,000 | | | BioMarin Pharmaceutical (a) | | | 170,787 | | |
| | | | | Biotech Focused on Orphan Diseases | | | | | |
| | 6,153,000 | | | Seattle Genetics (a)(b)(c) | | | 156,225 | | |
| | | | | Antibody-based Therapies for Cancer | | | | | |
| | 1,476,000 | | | Alexion Pharmaceuticals (a) | | | 146,567 | | |
| | | | | Biotech Focused on Orphan Diseases | | | | | |
| | 3,250,000 | | | Auxilium Pharmaceuticals (a)(b) | | | 87,393 | | |
| | | | | Biotech Focused on Niche Disease Areas | | | | | |
| | 6,000,000 | | | NPS Pharmaceuticals (a)(b) | | | 51,660 | | |
| | | | | Orphan Drugs & Healthy Royalties | | | | | |
| | 750,000 | | | Onyx Pharmaceuticals (a) | | | 49,837 | | |
| | | | | Commercial-stage Biotech Focused on Cancer | | | | | |
| | 3,850,000 | | | InterMune (a)(b) | | | 46,007 | | |
| | | | | Drugs for Pulmonary Fibrosis & Hepatitis C | | | | | |
| | 2,568,248 | | | ARIAD Pharmaceuticals (a) | | | 44,200 | | |
| | | | | Biotech Focused on Cancer | | | | | |
| | 3,430,000 | | | Isis Pharmaceuticals (a) | | | 41,160 | | |
| | | | | Biotech Pioneer in Antisense Drugs | | | | | |
| | 569,898 | | | Synageva Biopharma (a)(c) | | | 23,115 | | |
| | | | | Biotech Focused on Orphan Diseases | | | | | |
See accompanying notes to financial statements.
35
Columbia Acorn Fund
Statement of Investments (Unaudited), continued
| Number of Shares | | | | Value (000) | |
| | | > Biotechnology & Drug Delivery—continued | |
| | 3,609,594 | | | Raptor Pharmaceutical (a)(b)(c) | | $ | 20,178 | | |
| | | | | Orphan Drug Company | | | | | |
| | 5,750,000 | | | Chelsea Therapeutics
International (a)(b)(c) | | | 8,510 | | |
| | | | | Biotech Focused on Rare Diseases | | | | | |
| | 2,990,000 | | | Anthera Pharmaceuticals (a)(b) | | | 2,022 | | |
| | | | | Biotech Focused on Cardiovascular, Cancer &
Immunology | | | | | |
| | 359,944 | | | MicroDose Therapeutx (e)(f) | | | 252 | | |
| | | | | Drug Inhaler Development | | | | | |
| | | | 847,913 | | |
| | | > Medical Supplies 2.6% | |
| | 4,600,000 | | | Cepheid (a)(b) | | | 205,850 | | |
| | | | | Molecular Diagnostics | | | | | |
| | 950,000 | | | Henry Schein (a) | | | 74,565 | | |
| | | | | Largest Distributor of Healthcare Products | | | | | |
| | 2,126,000 | | | Patterson Companies | | | 73,283 | | |
| | | | | Dental/Vet/Med Distributor | | | | | |
| | 1,550,000 | | | DENTSPLY International | | | 58,606 | | |
| | | | | Leading Dental Supplies Manufacturer | | | | | |
| | 375,000 | | | Techne | | | 27,825 | | |
| | | | | Cytokines, Antibodies & Other Reagents for
Life Science | | | | | |
| | | | 440,129 | | |
| | | > Medical Equipment & Devices 0.9% | |
| | 550,000 | | | Haemonetics (a) | | | 40,760 | | |
| | | | | Blood & Plasma Collection Equipment | | | | | |
| | 1,275,000 | | | Hill-Rom Holdings | | | 39,334 | | |
| | | | | Hospital Beds/Patient Handling | | | | | |
| | 675,000 | | | Sirona Dental Systems (a) | | | 30,382 | | |
| | | | | Manufacturer of Dental Equipment | | | | | |
| | 950,000 | | | PerkinElmer Inc. | | | 24,510 | | |
| | | | | Analytical Instruments for Life Sciences | | | | | |
| | 570,000 | | | Orthofix International (a) | | | 23,513 | | |
| | | | | Bone Fixation & Stimulation Devices | | | | | |
| | | | 158,499 | | |
| | | > Health Care Services 0.7% | |
| | 665,000 | | | Mednax (a) | | | 45,579 | | |
| | | | | Physician Management for Pediatric &
Anesthesia Practices | | | | | |
| | 4,900,000 | | | eResearch Technology (a)(b) | | | 39,151 | | |
| | | | | Clinical Research Services | | | | | |
| | 825,000 | | | HealthSouth (a) | | | 19,189 | | |
| | | | | Inpatient Rehabalitation Facilities | | | | | |
| | 1,875,000 | | | Health Management Associates (a) | | | 14,719 | | |
| | | | | Non-urban Hospitals | | | | | |
| | | | 118,638 | | |
| | | > Pharmaceuticals 0.6% | |
| | 4,000,000 | | | Akorn (a) | | | 63,080 | | |
| | | | | Develops, Manufactures & Sells Specialty
Generic Drugs | | | | | |
| | 3,388,000 | | | Adcock Ingram Holdings
(South Africa) | | | 24,904 | | |
| | | | | Manufacturer of Pharmaceuticals &
Medical Supplies | | | | | |
| | 1,095,000 | | | Horizon Pharma (a)(c) | | | 7,807 | | |
| | | | | Specialty Pharma Company | | | | | |
| Number of Shares | | | | Value (000) | |
| | 2,040,000 | | | Alimera Sciences (a)(b)(c) | | $ | 6,100 | | |
| | | | | Ophthalmology-focused Pharmaceutical Company | | | | | |
| | | | 101,891 | | |
| Health Care: Total | | | 1,667,070 | | |
| Energy & Minerals 6.7% | | | |
| | | > Oil Services 3.2% | |
| | 5,150,000 | | | FMC Technologies (a) | | | 202,034 | | |
| | | | | Oil & Gas Well Head Manufacturer | | | | | |
| | 2,114,000 | | | Atwood Oceanics (a) | | | 79,994 | | |
| | | | | Offshore Drilling Contractor | | | | | |
| | 1,289,106 | | | Fugro (Netherlands) | | | 78,196 | | |
| | | | | Subsea Oilfield Services | | | | | |
| | 1,670,000 | | | ShawCor (Canada) | | | 60,445 | | |
| | | | | Oil & Gas Pipeline Products | | | | | |
| | 1,000,000 | | | Hornbeck Offshore (a) | | | 38,780 | | |
| | | | | Supply Vessel Operator in U.S. Gulf of Mexico | | | | | |
| | 513,000 | | | Oil States International (a) | | | 33,961 | | |
| | | | | Diversified North American Oil Service Provider | | | | | |
| | 893,600 | | | Black Diamond Group (Canada) | | | 20,021 | | |
| | | | | Provides Accommodations/Equipment for
Oil Sands Development | | | | | |
| | 585,000 | | | Rowan (a) | | | 18,913 | | |
| | | | | Contract Offshore Driller | | | | | |
| | 2,890,900 | | | Horizon North Logistics (Canada) | | | 16,497 | | |
| | | | | Provides Diversified Oil Service Offering in
Northern Canada | | | | | |
| | 4,415,000 | | | Tuscany International Drilling
(Colombia) (a) | | | 1,713 | | |
| | | | | South America-based Drilling Rig Contractor | | | | | |
| | | | 550,554 | | |
| | | > Oil & Gas Producers 2.4% | |
| | 3,700,000 | | | Pacific Rubiales Energy (Colombia) | | | 78,354 | | |
| | | | | Oil Production & Exploration in Colombia | | | | | |
| | 695,000 | | | Range Resources | | | 43,000 | | |
| | | | | Oil & Gas Producer | | | | | |
| | 2,700,000 | | | Denbury Resources (a) | | | 40,797 | | |
| | | | | Oil Producer Using CO2 Injection | | | | | |
| | 974,000 | | | Rosetta Resources (a) | | | 35,687 | | |
| | | | | Oil & Gas Producer Exploring in
South Texas & Montana | | | | | |
| | 703,000 | | | SM Energy | | | 34,524 | | |
| | | | | Oil & Gas Producer | | | | | |
| | 1,050,000 | | | Tullow Oil (United Kingdom) | | | 24,268 | | |
| | | | | Oil & Gas Producer | | | | | |
| | 1,159,000 | | | Laredo Petroleum (a) | | | 24,107 | | |
| | | | | Permian Basin Oil Producer | | | | | |
| | 500,000 | | | Cabot Oil and Gas | | | 19,700 | | |
| | | | | Large Natural Gas Producer in Appalachia &
Gulf Coast | | | | | |
| | 361,000 | | | Baytex (Canada) (c) | | | 15,208 | | |
| | | | | Oil & Gas Producer in Canada | | | | | |
| | 7,582,928 | | | PetroMagdalena Energy
(Colombia) (a)(b) | | | 11,768 | | |
| | | | | Oil & Gas Exploration/Production in Colombia | | | | | |
| | 550,000 | | | Swift Energy (a) | | | 10,236 | | |
| | | | | Oil & Gas Exploration & Production | | | | | |
| | 718,000 | | | Celtic Exploration (Canada) (a) | | | 9,711 | | |
| | | | | Canadian Oil & Gas Producer | | | | | |
See accompanying notes to financial statements.
36
| Number of Shares | | | | Value (000) | |
| | | > Oil & Gas Producers—continued | |
| | 1,100,000 | | | Kodiak Oil and Gas (a) | | $ | 9,031 | | |
| | | | | Bakken Oil & Gas Producer | | | | | |
| | 340,000 | | | Petroleum Development
Corporation (a) | | | 8,337 | | |
| | | | | Oil & Gas Producer in U.S. | | | | | |
| | 750,000 | | | Athabasca Oil Sands (Canada) (a) | | | 8,251 | | |
| | | | | Oil Sands & Unconventional Oil Development | | | | | |
| | 37,500,000 | | | Petromanas (Canada) (a)(b) | | | 7,919 | | |
| | | | | Exploring for Oil in Albania | | | | | |
| | 200,000 | | | Approach Resource (a) | | | 5,108 | | |
| | | | | Oil & Gas Producer in West Texas Permian | | | | | |
| | 27,000,000 | | | Shamaran Petroleum (Iraq) (a) | | | 4,509 | | |
| | | | | Oil Exploration in Kurdistan | | | | | |
| | 26,000,000 | | | Petrodorado (Colombia) (a)(b) | | | 4,086 | | |
| | 24,000,000 | | | Petrodorado - Warrants (Colombia) (a)(f) | | | 340 | | |
| | | | | Oil & Gas Exploration & Production in
Colombia, Peru & Paraguay | | | | | |
| | 1,198,100 | | | Pan Orient (Canada) (a) | | | 4,413 | | |
| | | | | Asian Oil & Gas Explorer | | | | | |
| | 25,000,000 | | | Petroamerica (Colombia) (a)(c) | | | 3,192 | | |
| | | | | Oil Exploration & Production in Colombia | | | | | |
| | 493,000 | | | Crew Energy (Canada) (a) | | | 2,784 | | |
| | | | | Canadian Oil & Gas Producer | | | | | |
| | 50,000,000 | | | Gulf United (Colombia) (a)(e)(f) | | | 2,640 | | |
| | | | | Prospecting for Oil Alongside Large
Producers in Colombia | | | | | |
| | 5,116,000 | | | Canacol (Colombia) (a) | | | 2,286 | | |
| | | | | Oil Producer in South America | | | | | |
| | 8,400,000 | | | Canadian Overseas Petroleum
(United Kingdom) (a)(f) | | | 1,465 | | |
| | 4,200,000 | | | Canadian Overseas Petroleum - Warrants (United Kingdom) (a)(e)(f) | | | 81 | | |
| | | | | Oil & Gas Exploration/Production in the
North Sea | | | | | |
| | 4,110,000 | | | Santa Maria Petroleum
(Colombia) (a)(f) | | | 1,240 | | |
| | 890,000 | | | Santa Maria Petroleum (Colombia) (a) | | | 280 | | |
| | | | | Explores for Oil & Gas in Latin America | | | | | |
| | 393,600 | | | Houston American Energy (a) | | | 441 | | |
| | | | | Oil & Gas Exploration/Production in Colombia | | | | | |
| | | | 413,763 | | |
| | | > Mining 0.8% | |
| | 387,000 | | | Core Laboratories (Netherlands) | | | 44,853 | | |
| | | | | Oil & Gas Reservoir Consulting | | | | | |
| | 15,000,000 | | | Zhaojin Mining Industry (China) | | | 19,723 | | |
| | | | | Gold Mining & Refining in China | | | | | |
| | 1,400,000 | | | Kirkland Lake Gold (Canada) (a) | | | 15,071 | | |
| | | | | Gold Mining | | | | | |
| | 550,000 | | | Silver Wheaton (Canada) | | | 14,762 | | |
| | | | | Silver Mining Royalty Company | | | | | |
| | 4,432,000 | | | Northam Platinum (South Africa) | | | 12,677 | | |
| | | | | Platinum Mining in South Africa | | | | | |
| | 1,150,000 | | | Ivanhoe Mines (Mongolia) (a)(c) | | | 11,341 | | |
| | | | | Copper Mine Project in Mongolia | | | | | |
| | 7,500,000 | | | Duluth Metals (Canada) (a)(b) | | | 10,976 | | |
| Number of Shares | | | | Value (000) | |
| | 500,000 | | | Duluth Exploration - Special Warrants
(Canada) (a)(e)(f) | | $ | 39 | | |
| | | | | Copper & Nickel Miner | | | | | |
| | 16,000,000 | | | Mongolian Mining (Mongolia) (a) | | | 9,079 | | |
| | | | | Coking Coal Mining in Mongolia | | | | | |
| | 2,050,000 | | | Alexco Resource (a) | | | 9,041 | | |
| | | | | Mining, Exploration & Environmental Services | | | | | |
| | 800,000 | | | Augusta Resource (a) | | | 1,328 | | |
| | | | | US Copper/Moly Mine | | | | | |
| | 4,000,000 | | | Wolverine Minerals (Canada) (a)(b)(f) | | | 377 | | |
| | 2,000,000 | | | Wolverine Minerals - Warrants
(Canada) (a)(e)(f) | | | 3 | | |
| | | | | Gold Mining | | | | | |
| | | | 149,270 | | |
| | | > Oil Refining, Marketing & Distribution 0.1% | |
| | 218,000 | | | Vopak (Netherlands) | | | 13,983 | | |
| | | | | World's Largest Operator of Petroleum &
Chemical Storage Terminals | | | | | |
| | | | 13,983 | | |
| | | > Agricultural Commodities 0.1% | |
| | 1,306,818 | | | Union Agriculture Group
(Uruguay) (a)(e)(f) | | | 12,794 | | |
| | | | | Farmland Operator in Uruguay | | | | | |
| | | | 12,794 | | |
| | | > Alternative Energy 0.1% | |
| | 2,000,000 | | | GT Advanced Technologies (a) | | | 10,560 | | |
| | | | | Largest Manufacturer of Furnaces &
Reactors to Produce & Cast Polysilicon | | | | | |
| | 1,210,300 | | | Synthesis Energy Systems (China) (a) | | | 1,477 | | |
| | | | | Owner/Operator of Gasification Plants | | | | | |
| | | | 12,037 | | |
| Energy & Minerals: Total | | | 1,152,401 | | |
| Other Industries 6.3% | | | |
| | | > Real Estate 4.0% | |
| | 3,700,000 | | | DuPont Fabros Technology (b) | | | 105,672 | | |
| | | | | Technology-focused Office Buildings | | | | | |
| | 750,000 | | | Federal Realty Investment Trust | | | 78,068 | | |
| | | | | Shopping Centers | | | | | |
| | 1,850,000 | | | Extra Space Storage | | | 56,610 | | |
| | | | | Self Storage Facilities | | | | | |
| | 3,700,000 | | | Associated Estates Realty (b) | | | 55,315 | | |
| | | | | Multi-family Properties | | | | | |
| | 720,000 | | | Digital Realty Trust | | | 54,051 | | |
| | | | | Technology-focused Office Buildings | | | | | |
| | 975,000 | | | Post Properties | | | 47,726 | | |
| | | | | Multi-family Properties | | | | | |
| | 2,450,000 | | | Biomed Realty Trust | | | 45,766 | | |
| | | | | Life Science-focused Office Buildings | | | | | |
| | 770,000 | | | Kilroy Realty | | | 37,276 | | |
| | | | | West Coast Office & Industrial Properties | | | | | |
| | 43,000,000 | | | Mapletree Logistics Trust (Singapore) | | | 33,434 | | |
| | | | | Industrial Property Landlord | | | | | |
| | 3,000,000 | | | Education Realty Trust | | | 33,240 | | |
| | | | | Student Housing | | | | | |
| | 15,000,000 | | | Ascendas REIT (Singapore) | | | 25,589 | | |
| | | | | Industrial Property Landlord | | | | | |
See accompanying notes to financial statements.
37
Columbia Acorn Fund
Statement of Investments (Unaudited), continued
| Number of Shares | | | | Value (000) | |
| | | > Real Estate—continued | |
| | 3,750,000 | | | DCT Industrial Trust | | $ | 23,625 | | |
| | | | | Industrial Properties | | | | | |
| | 325,000 | | | Jones Lang LaSalle | | | 22,870 | | |
| | | | | Real Estate Services | | | | | |
| | 1,300,000 | | | St. Joe (a)(c) | | | 20,553 | | |
| | | | | Florida Panhandle Landowner | | | | | |
| | 3,500,000 | | | Kite Realty Group (b) | | | 17,465 | | |
| | | | | Community Shopping Centers | | | | | |
| | 2,000,031 | | | Summit Hotel Properties (b) | | | 16,740 | | |
| | | | | Owner of Select Service Hotels | | | | | |
| | 2,800 | | | Orix JREIT (Japan) | | | 12,586 | | |
| | | | | Diversified REIT | | | | | |
| | | | 686,586 | | |
| | | > Transportation 1.3% | |
| | 1,155,000 | | | JB Hunt Transport Services | | | 68,838 | | |
| | | | | Truck & Intermodal Carrier | | | | | |
| | 2,937,175 | | | Rush Enterprises, Class A (a)(b) | | | 48,023 | | |
| | 550,000 | | | Rush Enterprises, Class B (a)(b) | | | 7,381 | | |
| | | | | Truck Sales & Service | | | | | |
| | 1,260,000 | | | World Fuel Services | | | 47,918 | | |
| | | | | Global Fuel Broker | | | | | |
| | 2,400,000 | | | Heartland Express | | | 34,344 | | |
| | | | | Regional Trucker | | | | | |
| | 300,000 | | | Genesee & Wyoming (a) | | | 15,852 | | |
| | | | | Short-line Operator | | | | | |
| | | | 222,356 | | |
| | | > Regulated Utilities 1.0% | |
| | 2,000,000 | | | Northeast Utilities | | | 77,620 | | |
| | | | | Regulated Electric Utility | | | | | |
| | 1,660,000 | | | Wisconsin Energy | | | 65,686 | | |
| | | | | Wisconsin Utility | | | | | |
| | 500,000 | | | Allete | | | 20,900 | | |
| | | | | Regulated Electric Utility in Minnesota | | | | | |
| | 200,000 | | | Red Eléctrica de España (Spain) | | | 8,729 | | |
| | | | | Spanish Power Transmission | | | | | |
| | | | 172,935 | | |
| Other Industries: Total | | | 1,081,877 | | |
Total Equities: 95.8%
(Cost: $10,608,838) | | | 16,441,222 | | |
| Number of Shares | | | | Value (000) | |
| Securities Lending Collateral 1.8% | |
| | 303,633,050 | | | Dreyfus Government Cash
Management Fund
(7 day yield of 0.01%) (g) | | $ | 303,633 | | |
Total Securities Lending Collateral:
(Cost: $303,633) | | | 303,633 | | |
Total Investments: 97.6%
(Cost: $10,912,471)(h)(i) | | | 16,744,855 | | |
Obligation to Return Collateral for
Securities Loaned: (1.8)% | | | (303,633 | ) | |
| Cash and Other Assets Less Liabilities: 4.2% | | | 723,250 | | |
| Total Net Assets: 100.0% | | $ | 17,164,472 | | |
ADR - American Depositary Receipts
GDR - Global Depositary Receipts
REIT - Real Estate Investment Trust
See accompanying notes to financial statements.
38
> Notes to Statement of Investments (dollar values in thousands)
(a) Non-income producing security.
(b) An affiliated person of the Fund may include any company in which the Fund owns five percent or more of its outstanding voting shares. Holdings and transactions in these affiliated companies during the six months ended June 30, 2012, are as follows:
| Security | | Balance of
Shares Held
12/31/11 | | Purchases/
Additions | | Sales/
Reductions | | Balance of
Shares Held
6/30/12 | | Value | | Dividend | |
| AboveNet | | | 1,400,000 | | | | - | | | | - | | | | 1,400,000 | | | $ | 117,600 | | | $ | - | | |
| Acorn Energy | | | 1,500,000 | | | | - | | | | - | | | | 1,500,000 | | | | 12,480 | | | | 180 | | |
| AFC Enterprises | | | 2,000,000 | | | | - | | | | - | | | | 2,000,000 | | | | 46,280 | | | | - | | |
| Alimera Sciences | | | 2,040,000 | | | | - | | | | - | | | | 2,040,000 | | | | 6,100 | | | | - | | |
| Anthera Pharmaceuticals | | | 1,740,000 | | | | 1,250,000 | | | | - | | | | 2,990,000 | | | | 2,022 | | | | - | | |
| Associated Estates Realty | | | 3,700,000 | | | | - | | | | - | | | | 3,700,000 | | | | 55,315 | | | | - | | |
| Auxilium Pharmaceuticals | | | 3,033,715 | | | | 216,285 | | | | - | | | | 3,250,000 | | | | 87,393 | | | | 1,295 | | |
| Bally Technologies | | | 3,725,000 | | | | - | | | | - | | | | 3,725,000 | | | | 173,809 | | | | - | | |
| CAI International | | | 1,123,400 | | | | - | | | | - | | | | 1,123,400 | | | | 22,333 | | | | - | | |
| Cavco Industries | | | 460,000 | | | | - | | | | - | | | | 460,000 | | | | 23,589 | | | | - | | |
| Cepheid | | | 3,200,000 | | | | 1,400,000 | | | | - | | | | 4,600,000 | | | | 205,850 | | | | - | | |
| Chelsea Therapeutics International | | | 4,550,000 | | | | 1,200,000 | | | | - | | | | 5,750,000 | | | | 8,510 | | | | - | | |
| Cogent Communications* | | | 2,520,000 | | | | - | | | | 320,000 | | | | 2,200,000 | | | | 42,350 | | | | - | | |
| Constant Contact | | | 2,350,000 | | | | - | | | | 350,000 | | | | 2,000,000 | | | | 35,760 | | | | - | | |
| Donaldson** | | | 4,200,000 | | | | 4,200,000 | | | | - | | | | 8,400,000 | | | | 280,308 | | | | 1,428 | | |
| Drew Industries | | | 1,500,000 | | | | 380,000 | | | | - | | | | 1,880,000 | | | | 52,358 | | | | - | | |
| Duluth Metals | | | 7,500,000 | | | | - | | | | - | | | | 7,500,000 | | | | 10,976 | | | | - | | |
| DuPont Fabros Technology | | | 3,350,000 | | | | 350,000 | | | | - | | | | 3,700,000 | | | | 105,672 | | | | 822 | | |
| eResearch Technology | | | 4,900,000 | | | | - | | | | - | | | | 4,900,000 | | | | 39,151 | | | | - | | |
| ESCO Technologies | | | 2,200,000 | | | | - | | | | - | | | | 2,200,000 | | | | 80,168 | | | | 352 | | |
| ExlService Holdings | | | 1,145,000 | | | | 473,000 | | | | - | | | | 1,618,000 | | | | 39,868 | | | | - | | |
| Gaiam | | | 1,371,366 | | | | - | | | | - | | | | 1,371,366 | | | | 5,348 | | | | - | | |
| Gaylord Entertainment | | | 3,850,000 | | | | - | | | | - | | | | 3,850,000 | | | | 148,456 | | | | - | | |
| General Communications | | | 2,000,000 | | | | - | | | | - | | | | 2,000,000 | | | | 16,620 | | | | - | | |
| GLG Life Tech | | | 1,750,000 | | | | - | | | | 84,730 | | | | 1,665,270 | | | | 689 | | | | - | | |
| H & E Equipment Services | | | 3,400,000 | | | | - | | | | - | | | | 3,400,000 | | | | 51,102 | | | | - | | |
| Hackett Group+ | | | 4,500,000 | | | | - | | | | 650,793 | | | | 3,849,207 | | | | 21,440 | | | | - | | |
| HEICO*** | | | 2,250,000 | | | | 813,000 | | | | - | | | | 3,063,000 | | | | 98,812 | | | | 135 | | |
| Helen of Troy | | | 1,600,000 | | | | - | | | | - | | | | 1,600,000 | | | | 54,224 | | | | - | | |
| Horizon Pharma* | | | 1,095,000 | | | | - | | | | - | | | | 1,095,000 | | | | 7,807 | | | | - | | |
| iGATE | | | 3,400,000 | | | | - | | | | - | | | | 3,400,000 | | | | 57,868 | | | | - | | |
| II-VI | | | 4,550,000 | | | | - | | | | - | | | | 4,550,000 | | | | 75,849 | | | | - | | |
| Insperity | | | 1,210,000 | | | | 149,200 | | | | - | | | | 1,359,200 | | | | 36,766 | | | | 387 | | |
| Interline Brands* | | | 2,600,000 | | | | - | | | | 1,200,000 | | | | 1,400,000 | | | | 35,098 | | | | - | | |
| InterMune | | | 2,950,000 | | | | 900,000 | | | | - | | | | 3,850,000 | | | | 46,007 | | | | - | | |
| IPG Photonics | | | 2,780,000 | | | | - | | | | - | | | | 2,780,000 | | | | 121,180 | | | | - | | |
| IXYS | | | 1,900,000 | | | | - | | | | - | | | | 1,900,000 | | | | 21,223 | | | | - | | |
| Kenexa* | | | 1,700,000 | | | | - | | | | 526,900 | | | | 1,173,100 | | | | 34,055 | | | | - | | |
| Kite Realty Group | | | 3,500,000 | | | | - | | | | - | | | | 3,500,000 | | | | 17,465 | | | | 420 | | |
| Knoll | | | 4,200,000 | | | | - | | | | - | | | | 4,200,000 | | | | 56,364 | | | | 1,260 | | |
| Lifetime Fitness | | | 2,190,000 | | | | - | | | | - | | | | 2,190,000 | | | | 101,857 | | | | - | | |
| lululemon athletica* | | | 5,740,000 | | | | - | | | | 1,235,000 | | | | 4,505,000 | | | | 268,633 | | | | - | | |
| Marlin Business Services | | | 1,091,000 | | | | - | | | | - | | | | 1,091,000 | | | | 17,882 | | | | 131 | | |
| MB Financial | | | 2,360,000 | | | | 500,000 | | | | - | | | | 2,860,000 | | | | 61,604 | | | | 55 | | |
| McGrath Rentcorp | | | 2,150,000 | | | | - | | | | - | | | | 2,150,000 | | | | 56,975 | | | | 1,000 | | |
| Mettler-Toledo International | | | 1,600,000 | | | | - | | | | - | | | | 1,600,000 | | | | 249,360 | | | | - | | |
| Micromet* | | | 6,702,347 | | | | 137,138 | | | | 6,766,894 | | | | 72,591 | | | | - | | | | - | | |
| Moog | | | 2,775,000 | | | | 225,000 | | | | - | | | | 3,000,000 | | | | 124,050 | | | | - | | |
| Navigant Consulting | | | 2,800,000 | | | | 227,016 | | | | - | | | | 3,027,016 | | | | 38,261 | | | | - | | |
| NPS Pharmaceuticals | | | 6,000,000 | | | | - | | | | - | | | | 6,000,000 | | | | 51,660 | | | | - | | |
| Pericom Semiconductor | | | 1,765,000 | | | | - | | | | - | | | | 1,765,000 | | | | 15,885 | | | | - | | |
| Petroamerica* | | | 30,275,000 | | | | - | | | | 5,275,000 | | | | 25,000,000 | | | | 3,192 | | | | - | | |
| Petrodorado | | | 26,000,000 | | | | - | | | | - | | | | 26,000,000 | | | | 4,086 | | | | - | | |
| PetroMagdalena Energy | | | 7,582,928 | | | | - | | | | - | | | | 7,582,928 | | | | 11,768 | | | | - | | |
| Petromanas | | | 37,500,000 | | | | - | | | | - | | | | 37,500,000 | | | | 7,919 | | | | - | | |
| Pier 1 Imports | | | 5,600,000 | | | | 1,000,000 | | | | - | | | | 6,600,000 | | | | 108,438 | | | | 224 | | |
| Pinnacle Entertainment | | | 3,950,000 | | | | - | | | | - | | | | 3,950,000 | | | | 37,999 | | | | - | | |
| Raptor Pharmaceutical | | | 3,455,000 | | | | 745,000 | | | | 590,406 | | | | 3,609,594 | | | | 20,178 | | | | - | | |
See accompanying notes to financial statements.
39
Columbia Acorn Fund
Statement of Investments (Unaudited), continued
> Notes to Statement of Investments (dollar values in thousands)
| Security | | Balance of
Shares Held
12/31/11 | | Purchases/
Additions | | Sales/
Reductions | | Balance of
Shares Held
6/30/12 | | Value | | Dividend | |
| Rush Enterprises | | | 3,350,000 | | | | 137,175 | | | | - | | | | 3,487,175 | | | $ | 55,404 | | | $ | - | | |
| SABA | | | - | | | | 2,000,000 | | | | - | | | | 2,000,000 | | | | 18,560 | | | | - | | |
| Salem Communications* | | | 1,527,700 | | | | - | | | | 1,527,700 | | | | - | | | | - | | | | - | | |
| Santa Maria Petroleum*,**** | | | 50,000,000 | | | | - | | | | 45,000,000 | | | | 5,000,000 | | | | 1,520 | | | | - | | |
| Seattle Genetics | | | 6,153,000 | | | | - | | | | - | | | | 6,153,000 | | | | 156,225 | | | | - | | |
| Shutterfly | | | 3,070,000 | | | | 300,000 | | | | - | | | | 3,370,000 | | | | 103,425 | | | | - | | |
| SPS Commerce | | | 900,000 | | | | - | | | | - | | | | 900,000 | | | | 27,342 | | | | - | | |
| Summit Hotel Properties | | | 1,500,000 | | | | 500,031 | | | | - | | | | 2,000,031 | | | | 16,740 | | | | 413 | | |
| Tower Group | | | 1,675,000 | | | | 1,089,000 | | | | - | | | | 2,764,000 | | | | 57,685 | | | | 1,038 | | |
| TriCo Bancshares | | | 1,350,000 | | | | - | | | | - | | | | 1,350,000 | | | | 20,790 | | | | 364 | | |
| True Religion Apparel* | | | 1,507,000 | | | | - | | | | 1,275,548 | | | | 231,452 | | | | 6,708 | | | | 46 | | |
| tw telecom | | | 9,500,000 | | | | - | | | | - | | | | 9,500,000 | | | | 243,770 | | | | - | | |
| Tyler Technologies* | | | 1,700,000 | | | | - | | | | 800,000 | | | | 900,000 | | | | 36,315 | | | | - | | |
| Virtusa | | | 2,125,000 | | | | - | | | | - | | | | 2,125,000 | | | | 28,369 | | | | - | | |
| Warnaco Group* | | | 2,190,000 | | | | - | | | | 730,000 | | | | 1,460,000 | | | | 62,167 | | | | - | | |
| Wolverine Minerals | | | 4,000,000 | | | | - | | | | - | | | | 4,000,000 | | | | 377 | | | | - | | |
| World Acceptance | | | 1,505,202 | | | | - | | | | 80,000 | | | | 1,425,202 | | | | 93,778 | | | | - | | |
| Total of Affiliated Transactions | | | 350,332,658 | | | | 18,191,845 | | | | 66,412,971 | | | | 302,111,532 | | | $ | 4,463,187 | | | $ | 9,550 | | |
* At June 30, 2012, the Fund owned less than five percent of the company's outstanding voting shares.
** Includes the effects of a 2:1 stock split.
*** Includes the effects of a 5:4 stock split.
**** Includes the effects of a 1:10 reverse stock split.
+ Includes the effects of a corporate action.
The aggregate cost and value of these companies at June 30, 2012, were $2,717,367 and $3,965,342, respectively. Investments in affiliated companies represented 23.10% of the Fund's total net assets at June 30, 2012.
(c) All or a portion of this security was on loan at June 30, 2012. The total market value of securities on loan at June 30, 2012 was $302,684.
(d) Security exempt from registration under Section 4(2) of the Securities Act of 1933. This security may only be resold in exempt transactions to qualified buyers. Private resales of this security to qualified institutional buyers are also exempt from registration pursuant to Rule 144A under the Securities Act of 1933. At June 30, 2012, this security had an aggregate value of $7,975, which represented 0.05% of total net assets.
(e) Illiquid security.
(f) Denotes a restricted security, which is subject to restrictions on resale under federal securities laws. These securities are valued at fair value determined in good faith under consistently applied procedures established by the Board of Trustees. At June 30, 2012, the market value of these securities amounted to $19,451, which represented 0.11% of total net assets.
Additional information on these securities is as follows:
| Security | | Acquisition
Dates | | Shares | | Cost | | Value | |
| Union Agriculture Group | | 12/8/10-6/27/12 | | | 1,306,818 | | | $ | 15,000 | | | $ | 12,794 | | |
| Gulf United | | 4/18/12 | | | 50,000,000 | | | | 4,000 | | | | 2,640 | | |
| Canadian Overseas Petroleum | | 11/24/10 | | | 8,400,000 | | | | 3,591 | | | | 1,465 | | |
| Santa Maria Petroleum | | 1/14/11 | | | 4,110,000 | | | | 5,193 | | | | 1,240 | | |
| Wolverine Minerals | | 6/3/11 | | | 4,000,000 | | | | 2,005 | | | | 377 | | |
| Petrodorado - Warrants | | 11/20/09 | | | 24,000,000 | | | | 2,965 | | | | 340 | | |
| MicroDose Therapeutx | | 11/24/00 | | | 359,944 | | | | 2,005 | | | | 252 | | |
| Voyager Learning - Contingent Value Rights | | 12/24/09 | | | 2,000,000 | | | | - | | | | 220 | | |
| Canadian Overseas Petroleum - Warrants | | 11/24/10 | | | 4,200,000 | | | | 526 | | | | 81 | | |
| Duluth Exploration - Special Warrants | | 8/19/11 | | | 500,000 | | | | - | | | | 39 | | |
| Wolverine Minerals - Warrants | | 6/3/11 | | | 2,000,000 | | | | 243 | | | | 3 | | |
| | | | | | | $ | 35,528 | | | $ | 19,451 | | |
(g) Investment made with cash collateral received from securities lending activity.
(h) At June 30, 2012 for federal income tax purposes, the cost of investments was $10,912,471 and net unrealized appreciation was $5,832,384 consisting of gross unrealized appreciation of $6,608,143 and gross unrealized depreciation of $775,759.
See accompanying notes to financial statements.
40
> Notes to Statement of Investments (dollar values in thousands)
(i) On June 30, 2012, the market value of foreign securities represented 8.26% of total net assets. The Fund's foreign portfolio was diversified as follows:
| Country | | Value | | Percentage
of Net Assets | |
| Canada | | $ | 231,071 | | | | 1.34 | | |
| Netherlands | | | 208,842 | | | | 1.22 | | |
| Singapore | | | 130,489 | | | | 0.76 | | |
| Colombia | | | 105,899 | | | | 0.62 | | |
| Sweden | | | 93,549 | | | | 0.55 | | |
| Hong Kong | | | 90,106 | | | | 0.52 | | |
| Brazil | | | 80,883 | | | | 0.47 | | |
| Japan | | | 71,032 | | | | 0.41 | | |
| China | | | 60,566 | | | | 0.35 | | |
| France | | | 44,272 | | | | 0.26 | | |
| Denmark | | | 39,545 | | | | 0.23 | | |
| South Africa | | | 37,581 | | | | 0.22 | | |
| Chile | | | 37,466 | | | | 0.22 | | |
| Country | | Value | | Percentage
of Net Assets | |
| Israel | | $ | 31,884 | | | | 0.19 | | |
| Ireland | | | 30,360 | | | | 0.18 | | |
| United Kingdom | | | 25,814 | | | | 0.15 | | |
| Russia | | | 21,312 | | | | 0.12 | | |
| Mongolia | | | 20,420 | | | | 0.12 | | |
| Uruguay | | | 12,794 | | | | 0.07 | | |
| Iceland | | | 12,162 | | | | 0.07 | | |
| India | | | 10,619 | | | | 0.06 | | |
| Spain | | | 8,729 | | | | 0.05 | | |
| Germany | | | 7,974 | | | | 0.05 | | |
| Iraq | | | 4,509 | | | | 0.03 | | |
| Total Foreign Portfolio | | $ | 1,417,878 | | | | 8.26 | | |
Fair Value Measurements
Various inputs are used in determining the value of the Fund's investments, following the input prioritization hierarchy established by GAAP. These inputs are summarized in the three broad levels listed below:
• Level 1 – quoted prices in active markets for identical securities
• Level 2 – prices determined using other significant observable inputs (including quoted prices for similar securities, interest rates, prepayment speeds, credit risk and others)
• Level 3 – prices determined using significant unobservable inputs where quoted prices or observable inputs are unavailable or less reliable (including management's own assumptions about the factors market participants would use in pricing an investment)
The inputs or methodology used for valuing securities are not necessarily an indication of the risk associated with investing in those securities.
Examples of the types of securities in which the Fund would typically invest and how they are classified within this hierarchy are as follows. Typical Level 1 securities include exchange traded domestic equities, mutual funds whose NAVs are published each day and exchange traded foreign equities that are not statistically fair valued. Typical Level 2 securities include exchange traded foreign equities that are statistically fair valued and short-term investments valued at amortized cost. Additionally, securities fair valued by the Valuation Committee (the Committee) of the Fund's Board of Trustees (the Board) that rely on significant observable inputs are also included in Level 2. Typical Level 3 securities include any security fair valued by the Committee that relies on significant unobservable inputs.
Under the direction of the Board, the Committee is responsible for carrying out the valuation procedures approved by the Board.
The Committee meets as necessary, and no less frequently than quarterly, to determine fair values for securities for which market quotations are not readily available or for which the investment manager believes that available market quotations are unreliable, and to review the continuing appropriateness of the current value of any security subject to the Trust's Portfolio Pricing Policy and the pricing procedures of the investment manager (the Policies). The Policies address, among other things: circumstances under which market quotations will be deemed readily available; selection of third party pricing vendors; appropriate pricing methodologies; events that require fair valuation and fair value techniques; and circumstances under which securities will be deemed to pose a potential for stale pricing, including when securities are illiquid, restricted, or in default. The Committee may also meet to discuss additional valuation matters, which may include review of back-testing results, review of time-sensitive information or approval of other valuation related actions, and to review the appropriateness of the Policies.
For investments categorized as Level 3, the significant unobservable inputs used in the fair value measurement of the Funds' securities may include: (i) data specific to the issuer or comparable issuers, (ii) general market or specific sector news and (iii) quoted prices and specific or similar security transactions. The Committee considers this data and any changes from prior periods in order to assess the reasonableness of observable and unobservable inputs, any assumptions or internal models used to value those securities and changes in fair value. Significant changes in any of these factors could result in lower or higher fair value measurements. Various factors impact the frequency of monitoring (which may occur as often as daily), however the Committee may determine that changes to inputs, assumptions and models are not required with the same frequency.
See accompanying notes to financial statements.
41
Columbia Acorn Fund
Statement of Investments (Unaudited), continued
> Notes to Statement of Investments (dollar values in thousands)
The following table summarizes the inputs used, as of June 30, 2012, in valuing the Fund's assets:
| Investment Type | | Quoted Prices
(Level 1) | | Other
Significant
Observable
Inputs
(Level 2) | | Significant
Unobservable
Inputs
(Level 3) | | Total | |
| Equities | |
| Information | | $ | 4,508,981 | | | $ | 157,589 | | | $ | - | | | $ | 4,666,570 | | |
| Industrial Goods & Services | | | 3,068,284 | | | | 195,289 | | | | - | | | | 3,263,573 | | |
| Consumer Goods & Services | | | 2,620,690 | | | | 110,556 | | | | 220 | | | | 2,731,466 | | |
| Finance | | | 1,878,265 | | | | - | | | | - | | | | 1,878,265 | | |
| Health Care | | | 1,641,914 | | | | 24,904 | | | | 252 | | | | 1,667,070 | | |
| Energy & Minerals | | | 975,496 | | | | 164,072 | | | | 12,833 | | | | 1,152,401 | | |
| Other Industries | | | 1,001,539 | | | | 80,338 | | | | - | | | | 1,081,877 | | |
| Total Equities | | | 15,695,169 | | | | 732,748 | | | | 13,305 | | | | 16,441,222 | | |
| Total Securities Lending Collateral | | | 303,633 | | | | - | | | | - | | | | 303,633 | | |
| Total Investments | | $ | 15,998,802 | | | $ | 732,748 | | | $ | 13,305 | | | $ | 16,744,855 | | |
The Fund's assets assigned to the Level 2 input category are generally valued using a market approach, in which a security's value is determined through its correlation to prices and information from observable market transactions for similar or identical assets. Foreign equities are generally valued at the last sale price on the foreign exchange or market on which they trade. The Fund may use a statistical fair valuation model, in accordance with the policy adopted by the Board, provided by an independent third party to value securities principally traded in foreign markets in order to adjust for possible stale pricing that may occur between the close of the foreign exchanges and the time for valuation. These models take into account available market data including intraday index, ADR, and ETF movements. Securities acquired via private placement that have a holding period or an extended settlement period are valued at a discount to the same shares that are trading freely on the market. These discounts are determined by the investment manager's experience with similar securities or situations. Factors may include, but are not limited to, trade volume, shares outstanding and stock price. Warrants which do not trade are valued as a percentage of the actively trading common stock using a model, based on Black Scholes. Securities which have halted or temporarily stopped trading are valued at the last sale and adjusted by a premium or a discount to account for the anticipated re-opening price. These adjustments are determined by the investment manager's experience with similar securities or situations.
The following table shows transfers between Level 1 and Level 2 of the fair value hierarchy:
| Transfers In | | Transfers Out | |
| Level 1 | | Level 2 | | Level 1 | | Level 2 | |
| $ | - | | | $ | 1,575 | | | $ | 1,575 | | | $ | - | | |
Financial assets were transferred from Level 1 to Level 2 as trading halted during the period.
The following table reconciles asset balances for the period ending June 30, 2012, in which significant observable and/or unobservable inputs (Level 3) were used in determining value:
Investments
in Securities | | Balance
as of
December 31,
2011 | | Realized
Gain/(Loss) | | Change in
Unrealized
Appreciation
(Depreciation) | | Purchases | | Sales | | Transfers
into
Level 3 | | Transfers
out of
Level 3 | | Balance
as of
June 30,
2012 | |
| Equities | |
| Consumer Goods & Services | | $ | 180 | | | $ | - | | | $ | 40 | | | $ | - | | | $ | - | | | $ | - | | | $ | - | | | $ | 220 | | |
| Health Care | | | 270 | | | | - | | | | (18 | ) | | | - | | | | - | | | | - | | | | - | | | | 252 | | |
| Energy & Minerals | | | 12,507 | | | | - | | | | 326 | | | | - | | | | - | | | | - | | | | - | | | | 12,833 | | |
| | | $ | 12,957 | | | $ | - | | | $ | 348 | | | $ | - | | | $ | - | | | $ | - | | | $ | - | | | $ | 13,305 | | |
The information in the above reconciliation table represents fiscal year to date activity for any securities identified as using Level 3 inputs at either the beginning or the end of the current fiscal period.
The change in unrealized appreciation attributed to securities owned at June 30, 2012, which were valued using significant unobservable inputs (Level 3), amounted to $348.
The Fund does not hold any significant investments categorized as Level 3.
Certain common stock classified as Level 3 are valued at fair value, using a market approach, as determined in good faith under consistently applied procedures established by and under the general supervision of the Board. To determine fair value for these securities, for which no market exists, the Committee utilizes the valuation technique it deems most appropriate in the circumstances, using some unobservable inputs, which may include but are not limited to trades of similar securities, estimated earnings of the company, market multiples derived from a set of comparable companies, and the position of the security within the company's capital structure. Significant increases or decreases to any of these inputs could result in a significantly lower or higher fair value measurement. Generally, a change in estimated earnings of a company may result in a change to the comparable companies and market multiples utilized.
See accompanying notes to financial statements.
42
Columbia Acorn International
Major Portfolio Changes in the Second Quarter (Unaudited)
| | | Number of Shares | |
| | | 3/31/12 | | 6/30/12 | |
| Purchases | |
| Asia | |
| > Japan | |
| Daiseki | | | 1,427,129 | | | | 1,613,429 | | |
| Doshisha | | | 750,600 | | | | 828,000 | | |
| Horiba | | | 257,800 | | | | 424,000 | | |
| Miraca Holdings | | | 0 | | | | 659,500 | | |
| NGK Insulators | | | 2,400,000 | | | | 2,552,000 | | |
| Nihon Parkerizing | | | 145,700 | | | | 756,900 | | |
| Sanrio | | | 500,000 | | | | 865,800 | | |
| Start Today | | | 1,718,724 | | | | 2,572,724 | | |
| > Taiwan | |
| Chroma Ate | | | 10,277,000 | | | | 10,677,000 | | |
| CTCI Corp | | | 18,571,200 | | | | 20,120,000 | | |
| MStar Semiconductor | | | 2,930,000 | | | | 3,661,100 | | |
| Taiwan Mobile | | | 10,329,000 | | | | 16,405,300 | | |
| > Hong Kong | |
| Lifestyle International | | | 18,000,000 | | | | 21,845,000 | | |
| Vitasoy International | | | 0 | | | | 4,495,200 | | |
| > Singapore | |
| Petra Foods | | | 0 | | | | 3,071,300 | | |
| > China | |
| AMVIG Holdings | | | 28,763,700 | | | | 30,000,000 | | |
| Digital China | | | 13,570,200 | | | | 18,000,300 | | |
| > India | |
| Colgate-Palmolive India | | | 0 | | | | 545,000 | | |
| Redington India | | | 1,477,269 | | | | 13,195,000 | | |
| Titan Industries | | | 791,352 | | | | 1,600,000 | | |
| > Korea | |
| Hyundai Home Shopping | | | 10,090 | | | | 55,000 | | |
Kepco Plant Service &
Engineering | | | 0 | | | | 244,530 | | |
| > Indonesia | |
| Ace Indonesia | | | 10,000,000 | | | | 15,000,000 | | |
| Mayora Indah | | | 0 | | | | 2,176,600 | | |
| Mitra Adiperkasa | | | 0 | | | | 12,488,000 | | |
| MNC Skyvision | | | 0 | | | | 32,766,000 | | |
| Tower Bersama Infrastructure | | | 48,560,000 | | | | 51,767,300 | | |
| > Mongolia | |
| Mongolian Mining | | | 42,636,400 | | | | 60,037,500 | | |
| > Cambodia | |
| Nagacorp | | | 50,000,000 | | | | 60,000,000 | | |
| Europe | |
| > United Kingdom | |
| Aggreko | | | 0 | | | | 596,100 | | |
| BBA Aviation | | | 3,167,139 | | | | 8,785,000 | | |
Domino's Pizza United
Kingdom & Ireland | | | 2,497,000 | | | | 3,107,000 | | |
| | | Number of Shares | |
| | | 3/31/12 | | 6/30/12 | |
| Greggs | | | 1,060,885 | | | | 2,300,000 | | |
| Rightmove | | | 548,000 | | | | 822,000 | | |
| Spirax Sarco | | | 0 | | | | 256,202 | | |
| WH Smith | | | 0 | | | | 1,555,000 | | |
| > Netherlands | |
| TKH Group | | | 403,800 | | | | 850,468 | | |
| > France | |
Compagnie Française de
l'Afrique Occidentale | | | 0 | | | | 134,254 | | |
| Eurofins Scientific | | | 418,000 | | | | 553,000 | | |
| Neopost | | | 430,000 | | | | 675,000 | | |
| > Germany | |
| NORMA Group | | | 0 | | | | 690,000 | | |
| > Denmark | |
| Solar A/S | | | 130,651 | | | | 166,013 | | |
| > Italy | |
| Geox | | | 5,800,000 | | | | 7,000,000 | | |
| > Russia | |
| Yandex | | | 0 | | | | 1,123,695 | | |
| > Portugal | |
| Redes Energéticas Nacionais | | | 8,531,175 | | | | 8,635,000 | | |
| Other Countries | |
| > Australia | |
| Challenger Financial | | | 4,546,885 | | | | 11,936,400 | | |
Commonwealth Property
Office Fund | | | 17,451,906 | | | | 48,533,075 | | |
| Domino's Pizza Enterprises | | | 0 | | | | 1,576,290 | | |
| IAG | | | 0 | | | | 7,595,003 | | |
| UGL | | | 2,653,389 | | | | 3,973,200 | | |
| > United States | |
| Rowan | | | 0 | | | | 548,900 | | |
| > Israel | |
| Caesarstone | | | 125,000 | | | | 625,000 | | |
| Latin America | |
| > Brazil | |
| Arcos Dorados | | | 0 | | | | 1,300,000 | | |
| MRV Engenharia | | | 2,917,000 | | | | 3,577,000 | | |
| > Chile | |
| Viña Concha y Toro | | | 4,016,878 | | | | 5,640,000 | | |
See accompanying notes to financial statements.
43
Columbia Acorn International
Major Portfolio Changes in the Second Quarter (Unaudited), continued
| | | Number of Shares | |
| | | 3/31/12 | | 6/30/12 | |
| Sales | |
| Asia | |
| > Japan | |
| Aeon Delight | | | 1,860,438 | | | | 1,417,438 | | |
| Ain Pharmaciez | | | 589,792 | | | | 349,792 | | |
| Gree | | | 246,300 | | | | 0 | | |
| Miura | | | 511,450 | | | | 407,050 | | |
| Seven Bank | | | 22,694,000 | | | | 20,227,000 | | |
| Shinsei Bank | | | 18,673,649 | | | | 15,024,649 | | |
| Tsumura | | | 855,604 | | | | 0 | | |
| > Taiwan | |
| Simplo Technology | | | 5,614,530 | | | | 5,058,830 | | |
| > Hong Kong | |
Melco Crown
Entertainment - ADR | | | 7,000,000 | | | | 6,500,000 | | |
| MGM China Holdings | | | 12,500,000 | | | | 10,000,000 | | |
| Sasa International | | | 38,000,000 | | | | 30,000,000 | | |
| > Singapore | |
| Olam International | | | 27,000,000 | | | | 25,000,000 | | |
| > China | |
| NetEase.com - ADR | | | 644,000 | | | | 381,300 | | |
| > Indonesia | |
| Jasa Marga | | | 6,937,300 | | | | 0 | | |
| > Thailand | |
| Home Product Center | | | 118,000,000 | | | | 110,000,000 | | |
| Europe | |
| > United Kingdom | |
| Abcam | | | 2,950,000 | | | | 2,855,000 | | |
| Chemring | | | 5,654,735 | | | | 2,303,000 | | |
| Intertek Group | | | 1,460,000 | | | | 1,004,500 | | |
| JLT Group | | | 3,000,000 | | | | 2,579,333 | | |
| Premier Oil | | | 2,636,932 | | | | 2,027,932 | | |
| Rotork | | | 730,000 | | | | 517,000 | | |
| Tullow Oil | | | 740,581 | | | | 382,581 | | |
| Workspace Group | | | 7,500,000 | | | | 0 | | |
| > Netherlands | |
| Core Laboratories | | | 177,395 | | | | 143,395 | | |
| Fugro | | | 687,967 | | | | 460,000 | | |
| Imtech | | | 1,763,611 | | | | 1,680,623 | | |
| > Switzerland | |
| Dufry Group | | | 360,000 | | | | 330,000 | | |
| Kuehne & Nagel | | | 245,000 | | | | 170,000 | | |
| > France | |
| Gemalto | | | 1,073,700 | | | | 729,700 | | |
| Mersen | | | 460,000 | | | | 162,844 | | |
| Rubis | | | 353,648 | | | | 0 | | |
| | | Number of Shares | |
| | | 3/31/12 | | 6/30/12 | |
| > Germany | |
| Elringklinger | | | 555,700 | | | | 333,000 | | |
| Rheinmetall | | | 679,600 | | | | 405,000 | | |
| Rhoen-Klinikum | | | 1,600,000 | | | | 0 | | |
| > Sweden | |
| East Capital Explorer | | | 905,452 | | | | 419,877 | | |
| > Italy | |
| Ansaldo STS | | | 2,621,149 | | | | 0 | | |
| CIR | | | 12,503,754 | | | | 8,951,757 | | |
| > Russia | |
| Mail.ru - GDR | | | 629,642 | | | | 368,493 | | |
| > Ireland | |
| Paddy Power | | | 289,400 | | | | 263,400 | | |
| United Drug | | | 6,750,000 | | | | 4,237,000 | | |
| > Greece | |
| Intralot | | | 6,954,400 | | | | 4,384,185 | | |
| Other Countries | |
| > Canada | |
| Athabasca Oil Sands | | | 731,000 | | | | 450,000 | | |
| Baytex | | | 615,857 | | | | 263,857 | | |
| Black Diamond Group | | | 1,049,576 | | | | 770,576 | | |
| Celtic Exploration | | | 721,000 | | | | 454,000 | | |
| Crew Energy | | | 1,043,000 | | | | 332,700 | | |
| Horizon North Logistics | | | 2,411,514 | | | | 2,096,514 | | |
| > United States | |
| Alexion Pharmaceuticals | | | 627,431 | | | | 0 | | |
| FMC Technologies | | | 461,213 | | | | 407,213 | | |
| Oil States International | | | 270,000 | | | | 0 | | |
| World Fuel Services | | | 987,228 | | | | 763,228 | | |
| Latin America | |
| > Colombia | |
| Canacol | | | 8,353,169 | | | | 7,850,769 | | |
See accompanying notes to financial statements.
44
Columbia Acorn International
Statement of Investments (Unaudited), June 30, 2012
| Number of Shares | | | | Value (000) | |
| | | | | | | Equities: 94.6% | |
| Asia 43.8% | | | |
| | | > Japan 17.6% | |
| | 5,582,600 | | | Kansai Paint | | $ | 59,822 | | |
| | | | | Paint Producer in Japan, India, China &
Southeast Asia | | | | | |
| | 20,227,000 | | | Seven Bank | | | 51,943 | | |
| | | | | ATM Processing Services | | | | | |
| | 20,096 | | | Wacom | | | 45,009 | | |
| | | | | Computer Graphic Illustration Devices | | | | | |
| | 3,029,900 | | | Park24 | | | 44,746 | | |
| | | | | Parking Lot Operator | | | | | |
| | 1,582,200 | | | Hoshizaki Electric | | | 40,047 | | |
| | | | | Commercial Kitchen Equipment | | | | | |
| | 2,981,100 | | | Kuraray | | | 38,633 | | |
| | | | | Special Resin, Fine Chemical, Fibers & Textures | | | | | |
| | 2,572,724 | | | Start Today (a) | | | 35,952 | | |
| | | | | Online Japanese Apparel Retailer | | | | | |
| | 1,694,562 | | | Glory | | | 35,351 | | |
| | | | | Currency Handling Systems & Related Equipment | | | | | |
| | 7,780 | | | Orix JREIT | | | 34,971 | | |
| | | | | Diversified REIT | | | | | |
| | 1,417,438 | | | Aeon Delight | | | 32,546 | | |
| | | | | Facility Maintenance & Management | | | | | |
| | 865,800 | | | Sanrio (a) | | | 31,566 | | |
| | | | | Character Goods & Licensing | | | | | |
| | 295,762 | | | Nakanishi | | | 30,061 | | |
| | | | | Dental Tools & Machinery | | | | | |
| | 937,651 | | | Kintetsu World Express | | | 30,011 | | |
| | | | | Airfreight Logistics | | | | | |
| | 15,116 | | | Advance Residence Investment | | | 29,385 | | |
| | | | | Residential REIT | | | | | |
| | 2,552,000 | | | NGK Insulators | | | 28,260 | | |
| | | | | Ceramic Products for Auto, Power & Electronics | | | | | |
| | 1,613,429 | | | Daiseki | | | 28,052 | | |
| | | | | Waste Disposal & Recycling | | | | | |
| | 659,500 | | | Miraca Holdings | | | 27,381 | | |
| | | | | Outsourced Lab Testing, Diagnostic
Equipment & Reagents | | | | | |
| | 480,000 | | | Disco | | | 27,184 | | |
| | | | | Semiconductor Dicing & Grinding Equipment | | | | | |
| | 25,979 | | | Jupiter Telecommunications | | | 26,488 | | |
| | | | | Largest Cable Service Provider in Japan | | | | | |
| | 2,137,272 | | | Japan Airport Terminal | | | 26,068 | | |
| | | | | Airport Terminal Operator at Haneda | | | | | |
| | 5,540 | | | Mori Hills REIT Investment | | | 23,942 | | |
| | | | | Tokyo-centric Diversified REIT | | | | | |
| | 828,000 | | | Doshisha | | | 22,937 | | |
| | | | | Wholesaler | | | | | |
| | 2,600,000 | | | Shimadzu | | | 22,498 | | |
| | | | | Analytical Instrument, Medical &
Industrial Equipment | | | | | |
| | 1,885,600 | | | Asahi Diamond Industrial | | | 21,652 | | |
| | | | | Consumable Diamond Tools | | | | | |
| | 349,792 | | | Ain Pharmaciez | | | 21,101 | | |
| | | | | Dispensing Pharmacy/Drugstore Operator | | | | | |
| | 339,000 | | | FP Corporation | | | 21,028 | | |
| | | | | Disposable Food Trays & Containers | | | | | |
| | 6,140 | | | Kenedix Realty Investment | | | 19,852 | | |
| | | | | Tokyo Mid-size Office REIT | | | | | |
| Number of Shares | | | | Value (000) | |
| | 1,940,200 | | | Sintokogio | | $ | 19,450 | | |
| | | | | Automated Casting Machines, Surface
Treatment System & Consumables | | | | | |
| | 880,474 | | | Aeon Mall | | | 18,762 | | |
| | | | | Suburban Shopping Mall Developer, Owner & Operator | | | | | |
| | 15,024,649 | | | Shinsei Bank | | | 18,279 | | |
| | | | | Commercial Bank | | | | | |
| | 772,000 | | | Misumi Group | | | 18,192 | | |
| | | | | Industrial Components Distributor | | | | | |
| | 732,108 | | | Icom | | | 17,976 | | |
| | | | | Two Way Radio Communication Equipment | | | | | |
| | 1,405,739 | | | Ushio | | | 17,424 | | |
| | | | | Industrial Light Sources | | | | | |
| | 857,144 | | | Ibiden | | | 15,527 | | |
| | | | | Electronic Parts & Ceramics | | | | | |
| | 424,000 | | | Horiba | | | 14,891 | | |
| | | | | Measuring Instruments & Analyzers | | | | | |
| | 1,346,963 | | | Torishima Pump Manufacturing | | | 13,541 | | |
| | | | | Industrial Pump for Power Generation &
Water Supply Systems | | | | | |
| | 1,400 | | | Japan Real Estate Investment | | | 12,836 | | |
| | | | | Office REIT in Tokyo | | | | | |
| | 1,821 | | | Fukuoka REIT | | | 12,539 | | |
| | | | | Diversified REIT in Fukuoka | | | | | |
| | 756,900 | | | Nihon Parkerizing | | | 11,723 | | |
| | | | | Metal Surface Treatment Agents & Processing | | | | | |
| | 407,050 | | | Miura | | | 10,838 | | |
| | | | | Industrial Boiler | | | | | |
| | | | 1,058,464 | | |
| | | > Taiwan 7.2% | |
| | 36,606,000 | | | Far EasTone Telecom | | | 79,642 | | |
| | | | | Taiwan's Third Largest Mobile Operator | | | | | |
| | 16,405,300 | | | Taiwan Mobile | | | 54,252 | | |
| | | | | Taiwan's Second Largest Mobile Operator | | | | | |
| | 20,120,000 | | | CTCI Corp | | | 37,671 | | |
| | | | | International Engineering Firm | | | | | |
| | 5,058,830 | | | Simplo Technology | | | 34,938 | | |
| | | | | Battery Packs for Notebook & Tablet PCs | | | | | |
| | 12,218,270 | | | Tripod Technologies | | | 34,730 | | |
| | | | | Printed Circuit Boards (PCB) | | | | | |
| | 5,910,000 | | | Radiant Opto-Electronics (b) | | | 30,036 | | |
| | | | | LCD Back Light Units & Modules | | | | | |
| | 2,492,300 | | | St. Shine Optical | | | 27,893 | | |
| | | | | World's Leading Disposable Contact Lens OEM | | | | | |
| | 11,200,000 | | | Taiwan Hon Chuan | | | 25,229 | | |
| | | | | Beverage Packaging (Bottles, Caps, Labels)
Manufacturer | | | | | |
| | 3,661,100 | | | MStar Semiconductor | | | 24,695 | | |
| | | | | Integrated Circuits for TV, Digital Set-top-box & Handset | | | | | |
| | 10,677,000 | | | Chroma Ate | | | 24,374 | | |
| | | | | Automatic Test Systems, Testing &
Measurement Instruments | | | | | |
| | 6,603,000 | | | Advantech | | | 21,959 | | |
| | | | | Industrial PC & Components | | | | | |
| | 3,181,000 | | | President Chain Store | | | 16,973 | | |
| | | | | Taiwan's Number One Convenience Chain
Store Operator | | | | | |
| | 2,595,000 | | | PC Home | | | 14,711 | | |
| | | | | Taiwanese Internet Retail Company | | | | | |
| | 2,469,000 | | | Lung Yen | | | 7,138 | | |
| | | | | Funeral Services & Columbaria | | | | | |
| | | | 434,241 | | |
See accompanying notes to financial statements.
45
Columbia Acorn International
Statement of Investments (Unaudited), continued
| Number of Shares | | | | Value (000) | |
| | | > Hong Kong 3.9% | |
| | 6,500,000 | | | Melco Crown
Entertainment - ADR (b) | | $ | 74,880 | | |
| | | | | Macau Casino Operator | | | | | |
| | 21,845,000 | | | Lifestyle International | | | 48,136 | | |
| | | | | Mid to High-end Department Store Operator
in Hong Kong & China | | | | | |
| | 15,625,000 | | | L'Occitane International | | | 43,364 | | |
| | | | | Skin Care & Cosmetics Producer | | | | | |
| | 8,475,000 | | | AAC Technologies | | | 24,664 | | |
| | | | | Miniature Acoustic Components | | | | | |
| | 30,000,000 | | | Sasa International | | | 19,007 | | |
| | | | | Cosmetics Retailer | | | | | |
| | 10,000,000 | | | MGM China Holdings | | | 15,333 | | |
| | | | | Macau Casino Operator | | | | | |
| | 8,000,000 | | | Melco International | | | 6,472 | | |
| | | | | Macau Casino Operator | | | | | |
| | 4,495,200 | | | Vitasoy International | | | 3,778 | | |
| | | | | Hong Kong Soy Food Brand | | | | | |
| | | | 235,634 | | |
| | | > Singapore 3.8% | |
| | 25,000,000 | | | Olam International | | | 36,209 | | |
| | | | | Agriculture Supply Chain Manager | | | | | |
| | 20,000,000 | | | Ascendas REIT | | | 34,119 | | |
| | | | | Industrial Property Landlord | | | | | |
| | 20,000,000 | | | CDL Hospitality Trust | | | 30,934 | | |
| | | | | Hotel Owner/Operator | | | | | |
| | 35,000,000 | | | Mapletree Logistics Trust | | | 27,214 | | |
| | | | | Industrial Property Landlord | | | | | |
| | 35,000,000 | | | Mapletree Commercial Trust | | | 27,176 | | |
| | | | | Retail & Office Property Landlord | | | | | |
| | 28,000,000 | | | Mapletree Industrial Trust | | | 26,822 | | |
| | | | | Industrial Property Landlord | | | | | |
| | 15,000,000 | | | Goodpack Limited | | | 20,546 | | |
| | | | | International Bulk Container Leasing | | | | | |
| | 3,500,000 | | | Singapore Exchange | | | 17,584 | | |
| | | | | Singapore Equity & Derivatives Market Operator | | | | | |
| | 3,071,300 | | | Petra Foods | | | 6,061 | | |
| | | | | Cocoa Processor & Chocolate Manufacturer | | | | | |
| | | | 226,665 | | |
| | | > China 3.1% | |
| | 26,565,000 | | | Want Want | | | 32,851 | | |
| | | | | Chinese Branded Consumer Food Company | | | | | |
| | 18,000,300 | | | Digital China | | | 31,721 | | |
| | | | | IT Distribution & Systems Integration Services | | | | | |
| | 1,100,000 | | | New Oriental Education &
Technology - ADR (b) | | | 26,950 | | |
| | | | | Education Service Provider | | | | | |
| | 18,920,554 | | | Zhaojin Mining Industry | | | 24,878 | | |
| | | | | Gold Mining & Refining in China | | | | | |
| | 381,300 | | | NetEase.com - ADR (b) | | | 22,440 | | |
| | | | | Chinese Online Gaming Services | | | | | |
| | 260,000,000 | | | RexLot Holdings | | | 18,625 | | |
| | | | | Lottery Equipment Supplier in China | | | | | |
| | 326,700 | | | 51job - ADR (a)(b) | | | 14,881 | | |
| | | | | Integrated Human Resource Services | | | | | |
| | 30,000,000 | | | AMVIG Holdings | | | 13,284 | | |
| | | | | Chinese Tobacco Packaging Material Supplier | | | | | |
| | | | 185,630 | | |
| Number of Shares | | | | Value (000) | |
| | | > India 2.4% | |
| | 341,652 | | | Asian Paints | | $ | 23,850 | | |
| | | | | India's Largest Paint Company | | | | | |
| | 2,262,300 | | | United Breweries | | | 22,126 | | |
| | | | | India's Largest Brewer | | | | | |
| | 13,195,000 | | | Redington India | | | 18,222 | | |
| | | | | Supply Chain Solutions for IT & Mobile
Handsets in Emerging Markets | | | | | |
| | 8,052,053 | | | Adani Ports & Special
Economic Zone | | | 17,581 | | |
| | | | | Indian West Coast Shipping Port | | | | | |
| | 11,163,303 | | | Jain Irrigation Systems | | | 16,751 | | |
| | 558,165 | | | Jain Irrigation Systems - DVR (b) | | | 395 | | |
| | | | | Agricultural Micro-irrigation Systems &
Food Processing | | | | | |
| | 1,550,000 | | | Shriram Transport Finance | | | 14,786 | | |
| | | | | Used Truck Finance | | | | | |
| | 545,000 | | | Colgate-Palmolive India | | | 11,762 | | |
| | | | | Consumer Products in Oral Care | | | | | |
| | 1,600,000 | | | Titan Industries | | | 6,443 | | |
| | | | | Jewlery, Watches & Eyeglasses | | | | | |
| | 10,249,300 | | | S. Kumars Nationwide | | | 6,361 | | |
| | | | | Textiles, Clothing & Retail | | | | | |
| | 32,642,905 | | | REI Agro | | | 5,466 | | |
| | | | | Basmati Rice Processing | | | | | |
| | 1,650,000 | | | SKIL Ports and Logistics (b) | | | 2,920 | | |
| | | | | Indian Container Port Project | | | | | |
| | | | 146,663 | | |
| | | > Korea 1.8% | |
| | 1,134,000 | | | Grand Korea Leisure | | | 23,541 | | |
| | | | | Largest 'Foreigner Only' Casino Group in Korea | | | | | |
| | 101,150 | | | NHN | | | 22,186 | | |
| | | | | Korean Online Search Services | | | | | |
| | 623,120 | | | Woongjin Coway | | | 19,457 | | |
| | | | | Korean Household Appliance Rental Service Provider | | | | | |
| | 580,000 | | | iMarketKorea | | | 10,751 | | |
| | | | | Procurement, Distribution of MRO
(Maintenance, Repair, Operations) Goods | | | | | |
| | 474,441 | | | Handsome | | | 10,683 | | |
| | | | | Korea's Leading High-end Apparel Company | | | | | |
| | 244,530 | | | Kepco Plant Service & Engineering | | | 10,314 | | |
| | | | | Power Plant & Grid Maintenance | | | | | |
| | 182,000 | | | Hana Tour Service | | | 7,146 | | |
| | | | | Korea's Largest Wholesale Tour Provider | | | | | |
| | 55,000 | | | Hyundai Home Shopping | | | 5,382 | | |
| | | | | TV Home Shopping Company | | | | | |
| | | | 109,460 | | |
| | | > Indonesia 1.2% | |
| | 29,063,787 | | | Archipelago Resources (b)(c) | | | 23,214 | | |
| | | | | Gold Mining Projects in Indonesia,
Vietnam & the Philippines | | | | | |
| | 51,767,300 | | | Tower Bersama Infrastructure (b) | | | 18,135 | | |
| | | | | Communications Towers | | | | | |
| | 12,488,000 | | | Mitra Adiperkasa | | | 9,588 | | |
| | | | | Operator of Department Store & Specialty Retail Stores | | | | | |
| | 15,000,000 | | | Ace Indonesia | | | 8,128 | | |
| | | | | Home Improvement Retailer | | | | | |
| | 2,176,600 | | | Mayora Indah | | | 5,907 | | |
| | | | | Consumer Branded Food Manufacturer | | | | | |
See accompanying notes to financial statements.
46
| Number of Shares | | | | Value (000) | |
| | | > Indonesia—continued | |
| | 32,766,000 | | | MNC Skyvision (b) | | $ | 5,486 | | |
| | | | | Largest Satellite Pay TV Operator in Indonesia | | | | | |
| | 6,217,500 | | | Southern Arc Minerals (b)(c) | | | 1,710 | | |
| | | | | Gold & Copper Exploration in Indonesia | | | | | |
| | | | 72,168 | | |
| | | > Mongolia 0.9% | |
| | 60,037,500 | | | Mongolian Mining (b) | | | 34,069 | | |
| | | | | Coking Coal Mining in Mongolia | | | | | |
| | 1,049,943 | | | Ivanhoe Mines (a)(b) | | | 10,354 | | |
| | 914,678 | | | Ivanhoe Mines (a)(b)(d) | | | 8,854 | | |
| | | | | Copper Mine Project in Mongolia | | | | | |
| | | | 53,277 | | |
| | | > Philippines 0.8% | |
| | 73,221,250 | | | SM Prime Holdings | | | 22,696 | | |
| | | | | Shopping Mall Operator | | | | | |
| | 7,931,700 | | | Int'l Container Terminal | | | 13,923 | | |
| | | | | Container Handling Terminals & Port Management | | | | | |
| | 19,454,700 | | | Manila Water Company | | | 11,331 | | |
| | | | | Water Utility Company in the Philippines | | | | | |
| | | | 47,950 | | |
| | | > Thailand 0.7% | |
| | 110,000,000 | | | Home Product Center | | | 43,930 | | |
| | | | | Home Improvement Retailer | | | | | |
| | | | 43,930 | | |
| | | > Cambodia 0.4% | |
| | 60,000,000 | | | Nagacorp | | | 26,831 | | |
| | | | | Casino/Entertainment Complex in Cambodia | | | | | |
| | | | 26,831 | | |
| Asia: Total | | | 2,640,913 | | |
| Europe 29.9% | | | |
| | | > United Kingdom 5.9% | |
| | 1,004,500 | | | Intertek Group | | | 42,084 | | |
| | | | | Testing, Inspection, Certification Services | | | | | |
| | 3,375,000 | | | Serco | | | 28,343 | | |
| | | | | Facilities Management | | | | | |
| | 2,579,333 | | | JLT Group | | | 28,341 | | |
| | | | | International Business Insurance Broker | | | | | |
| | 8,785,000 | | | BBA Aviation | | | 28,124 | | |
| | | | | Aviation Support Services | | | | | |
| | 3,107,000 | | | Domino's Pizza United
Kingdom & Ireland | | | 25,053 | | |
| | | | | Pizza Delivery in the UK, Ireland & Germany | | | | | |
| | 822,000 | | | Rightmove | | | 20,540 | | |
| | | | | Internet Real Estate Listings | | | | | |
| | 596,100 | | | Aggreko | | | 19,386 | | |
| | | | | Temporary Power & Temperature Control Services | | | | | |
| | 2,855,000 | | | Abcam | | | 18,643 | | |
| | | | | Online Sales of Antibodies | | | | | |
| | 2,300,000 | | | Greggs | | | 18,169 | | |
| | | | | Bakery | | | | | |
| | 1,761,742 | | | Smith and Nephew | | | 17,622 | | |
| | | | | Medical Equipment & Supplies | | | | | |
| | 517,000 | | | Rotork | | | 15,990 | | |
| | | | | Valve Actuators for Oil & Water Pipelines | | | | | |
| | 1,773,408 | | | Shaftesbury | | | 14,317 | | |
| | | | | London Prime Retail REIT | | | | | |
| Number of Shares | | | | Value (000) | |
| | 1,555,000 | | | WH Smith | | $ | 13,276 | | |
| | | | | Newsprint, Book & General Stationery Retailer | | | | | |
| | 262,300 | | | Next | | | 13,171 | | |
| | | | | Clothes & Home Retailer in the UK | | | | | |
| | 2,027,932 | | | Premier Oil (b) | | | 10,775 | | |
| | | | | Oil & Gas Producer in Europe, Pakistan & Asia | | | | | |
| | 2,303,000 | | | Chemring | | | 9,915 | | |
| | | | | Defense Manufacturer of
Countermeasures & Energetics | | | | | |
| | 4,163,948 | | | PureCircle (a)(b) | | | 9,360 | | |
| | | | | Natural Sweeteners | | | | | |
| | 382,581 | | | Tullow Oil | | | 8,842 | | |
| | | | | Oil & Gas Producer | | | | | |
| | 256,202 | | | Spirax Sarco | | | 7,985 | | |
| | | | | Steam Systems for Manufacturing & Process Industries | | | | | |
| | 2,840,000 | | | Sterling Resources (a)(b) | | | 2,845 | | |
| | | | | Oil & Gas Exploration - Europe | | | | | |
| | | | 352,781 | | |
| | | > Netherlands 4.4% | |
| | 1,591,702 | | | UNIT4 (c) | | | 40,567 | | |
| | | | | Business Software Development | | | | | |
| | 1,680,623 | | | Imtech | | | 40,130 | | |
| | | | | Electromechanical & Information & Communications
Technology Installation & Maintenance | | | | | |
| | 2,546,126 | | | Aalberts Industries | | | 39,645 | | |
| | | | | Flow Control & Heat Treatment | | | | | |
| | 1,234,758 | | | Koninklijke TenCate | | | 32,962 | | |
| | | | | Advanced Textiles & Industrial Fabrics | | | | | |
| | 460,000 | | | Fugro | | | 27,903 | | |
| | | | | Subsea Oilfield Services | | | | | |
| | 1,252,514 | | | Arcadis (a) | | | 27,394 | | |
| | | | | Engineering Consultants | | | | | |
| | 317,424 | | | Vopak | | | 20,360 | | |
| | | | | World's Largest Operator of Petroleum &
Chemical Storage Terminals | | | | | |
| | 850,468 | | | TKH Group | | | 18,269 | | |
| | | | | Dutch Industrial Conglomerate | | | | | |
| | 143,395 | | | Core Laboratories | | | 16,620 | | |
| | | | | Oil & Gas Reservoir Consulting | | | | | |
| | | | 263,850 | | |
| | | > Switzerland 3.8% | |
| | 310,000 | | | Partners Group | | | 55,134 | | |
| | | | | Private Markets Asset Management | | | | | |
| | 255,000 | | | Geberit | | | 50,306 | | |
| | | | | Plumbing Supplies | | | | | |
| | 330,000 | | | Dufry Group (b) | | | 39,999 | | |
| | | | | Operates Airport Duty Free & Duty Paid Shops | | | | | |
| | 15,500 | | | Sika | | | 29,931 | | |
| | | | | Chemicals for Construction & Industrial Applications | | | | | |
| | 170,000 | | | Kuehne & Nagel | | | 18,010 | | |
| | | | | Freight Forwarding/Logistics | | | | | |
| | 280,000 | | | Zehnder | | | 16,736 | | |
| | | | | Radiators & Ventilation Systems | | | | | |
| | 580,000 | | | Bank Sarasin & Cie (b) | | | 16,342 | | |
| | | | | Private Banking | | | | | |
| | | | 226,458 | | |
| | | > France 3.5% | |
| | 553,000 | | | Eurofins Scientific | | | 68,673 | | |
| | | | | Food, Pharmaceuticals & Materials
Screening & Testing | | | | | |
See accompanying notes to financial statements.
47
Columbia Acorn International
Statement of Investments (Unaudited), continued
| Number of Shares | | | | Value (000) | |
| | | > France—continued | |
| | 729,700 | | | Gemalto | | $ | 52,410 | | |
| | | | | Digital Security Solutions | | | | | |
| | 675,000 | | | Neopost | | | 36,023 | | |
| | | | | Postage Meter Machines | | | | | |
| | 971,800 | | | Saft | | | 23,315 | | |
| | | | | Niche Battery Manufacturer | | | | | |
| | 232,400 | | | Norbert Dentressangle | | | 14,744 | | |
| | | | | Leading European Logistics & Transport Group | | | | | |
| | 134,254 | | | Compagnie Française de
l'Afrique Occidentale | | | 6,355 | | |
| | | | | African Wholesaler & Distributor | | | | | |
| | 1,831,204 | | | Hi-Media (a)(b) | | | 4,668 | | |
| | | | | Online Advertiser in Europe | | | | | |
| | 162,844 | | | Mersen | | | 4,080 | | |
| | | | | Advanced Industrial Materials | | | | | |
| | | | 210,268 | | |
| | | > Germany 3.2% | |
| | 2,500,000 | | | Wirecard | | | 48,476 | | |
| | | | | Online Payment Processing & Risk Management | | | | | |
| | 148,295 | | | Rational | | | 35,347 | | |
| | | | | Commercial Ovens | | | | | |
| | 500,000 | | | Dürr | | | 30,851 | | |
| | | | | Automotive Plant Engineering & Associated
Capital Equipment | | | | | |
| | 405,000 | | | Rheinmetall | | | 19,909 | | |
| | | | | Defense & Automotive | | | | | |
| | 625,000 | | | CTS Eventim | | | 18,808 | | |
| | | | | Event Ticket Sales | | | | | |
| | 690,000 | | | NORMA Group | | | 15,161 | | |
| | | | | Clamps for Automotive & Industrial Applications | | | | | |
| | 165,400 | | | Bertrandt | | | 12,390 | | |
| | | | | Outsourced Engineering | | | | | |
| | 333,000 | | | Elringklinger | | | 7,946 | | |
| | | | | Automobile Components | | | | | |
| | 338,886 | | | Deutsche Beteiligungs | | | 6,691 | | |
| | | | | Private Equity Investment Management | | | | | |
| | | | 195,579 | | |
| | | > Sweden 2.2% | |
| | 4,056,007 | | | Hexagon | | | 69,621 | | |
| | | | | Design, Measurement & Visualization
Software & Equipment | | | | | |
| | 4,150,024 | | | Sweco (c) | | | 43,732 | | |
| | | | | Engineering Consultants | | | | | |
| | 658,700 | | | Unibet | | | 16,700 | | |
| | | | | European Online Gaming Operator | | | | | |
| | 419,877 | | | East Capital Explorer | | | 2,892 | | |
| | | | | Sweden-based Russia & Central Eastern Europe
Investment Fund | | | | | |
| | | | 132,945 | | |
| | | > Denmark 1.3% | |
| | 1,648,800 | | | Novozymes | | | 42,755 | | |
| | | | | Industrial Enzymes | | | | | |
| | 168,042 | | | SimCorp | | | 28,969 | | |
| | | | | Software for Investment Managers | | | | | |
| | 166,013 | | | Solar A/S | | | 9,002 | | |
| | | | | Technical Wholesaler of Electrical,
Plumbing & HVAC Equipment | | | | | |
| | | | 80,726 | | |
| Number of Shares | | | | Value (000) | |
| | | > Italy 1.1% | |
| | 2,661,000 | | | Pirelli (a) | | $ | 28,065 | | |
| | | | | Global Tire Supplier | | | | | |
| | 166,200 | | | Tod's (a) | | | 16,671 | | |
| | | | | Leather Shoes & Bags | | | | | |
| | 7,000,000 | | | Geox (a) | | | 15,486 | | |
| | | | | Apparel & Shoe Maker | | | | | |
| | 8,951,757 | | | CIR | | | 8,829 | | |
| | | | | Italian Holding Company | | | | | |
| | | | 69,051 | | |
| | | > Russia 0.8% | |
| | 1,123,695 | | | Yandex (b) | | | 21,406 | | |
| | | | | Search Engine for Russian & Turkish Languages | | | | | |
| | 2,109,700 | | | Petropavlovsk | | | 15,114 | | |
| | | | | Gold & Iron Ore Mining in Russia | | | | | |
| | 368,493 | | | Mail.ru - GDR (b)(e) | | | 12,550 | | |
| | | | | Internet Social Networking & Games for
Russian Speakers | | | | | |
| | | | 49,070 | | |
| | | > Iceland 0.6% | |
| | 35,982,499 | | | Marel | | | 36,188 | | |
| | | | | Largest Manufacturer of Poultry & Fish
Processing Equipment | | | | | |
| | | | 36,188 | | |
| | | > Ireland 0.5% | |
| | 263,400 | | | Paddy Power | | | 17,195 | | |
| | | | | Irish Betting Services | | | | | |
| | 4,237,000 | | | United Drug | | | 11,118 | | |
| | | | | Irish Pharmaceutical Wholesaler & Outsourcer | | | | | |
| | | | 28,313 | | |
| | | > Spain 0.4% | |
| | 618,320 | | | Red Eléctrica de España | | | 26,987 | | |
| | | | | Spanish Power Transmission | | | | | |
| | | | 26,987 | | |
| | | > Portugal 0.4% | |
| | 8,635,000 | | | Redes Energéticas Nacionais | | | 22,858 | | |
| | | | | Portuguese Power Transmission & Gas Transportation | | | | | |
| | | | 22,858 | | |
| | | > Czech Republic 0.4% | |
| | 130,682 | | | Komercni Banka | | | 22,798 | | |
| | | | | Leading Czech Universal Bank | | | | | |
| | | | 22,798 | | |
| | | > Norway 0.4% | |
| | 2,403,664 | | | Atea | | | 21,165 | | |
| | | | | Leading Nordic IT Hardware/Software
Reseller & Installation Company | | | | | |
| | | | 21,165 | | |
| | | > Finland 0.3% | |
| | 1,039,429 | | | Stockmann (a) | | | 21,015 | | |
| | | | | Department Store & Fashion Retailer in
Scandinavia & Russia | | | | | |
| | | | 21,015 | | |
| | | > Belgium 0.3% | |
| | 438,880 | | | EVS Broadcast Equipment | | | 20,704 | | |
| | | | | Digital Live Mobile Production Software & Systems | | | | | |
| | | | 20,704 | | |
See accompanying notes to financial statements.
48
| Number of Shares | | | | Value (000) | |
| | | > Kazakhstan 0.3% | |
| | 3,319,000 | | | Halyk Savings Bank of
Kazakhstan - GDR (b) | | $ | 16,554 | | |
| | | | | Largest Retail Bank & Insurer in Kazakhstan | | | | | |
| | | | 16,554 | | |
| | | > Greece 0.1% | |
| | 4,384,185 | | | Intralot | | | 4,949 | | |
| | | | | Lottery & Gaming Systems & Services | | | | | |
| | | | 4,949 | | |
| Europe: Total | | | 1,802,259 | | |
| Other Countries 16.5% | | | |
| | | > South Africa 4.5% | |
| | 1,170,188 | | | Naspers | | | 62,503 | | |
| | | | | Media in Africa, China, Russia & Other
Emerging Markets | | | | | |
| | 3,175,083 | | | Mr. Price | | | 43,531 | | |
| | | | | South African Retailer of Apparel,
Household & Sporting Goods | | | | | |
| | 19,098,300 | | | Rand Merchant Insurance | | | 40,676 | | |
| | | | | Directly Sold Property & Casualty
Insurance; Holdings in Other Insurers | | | | | |
| | 11,763,907 | | | Coronation Fund Managers | | | 39,830 | | |
| | | | | South African Fund Manager | | | | | |
| | 4,992,200 | | | Adcock Ingram Holdings | | | 36,696 | | |
| | | | | Manufacturer of Pharmaceuticals & Medical Supplies | | | | | |
| | 8,679,940 | | | Northam Platinum | | | 24,827 | | |
| | | | | Platinum Mining in South Africa | | | | | |
| | 1,025,504 | | | Massmart Holdings | | | 21,233 | | |
| | | | | General Merchandise, Food & Home
Improvement Stores; Wal-Mart Subsidiary | | | | | |
| | | | 269,296 | | |
| | | > Canada 3.8% | |
| | 1,403,772 | | | CCL Industries | | | 51,499 | | |
| | | | | Leading Global Label Manufacturer | | | | | |
| | 1,212,597 | | | ShawCor | | | 43,890 | | |
| | | | | Oil & Gas Pipeline Products | | | | | |
| | 653,200 | | | Onex Capital | | | 25,362 | | |
| | | | | Private Equity | | | | | |
| | 582,942 | | | AG Growth (a) | | | 21,008 | | |
| | | | | Leading Manufacturer of Augers &
Grain Handling Equipment | | | | | |
| | 770,576 | | | Black Diamond Group | | | 17,264 | | |
| | | | | Provides Accommodations/Equipment for
Oil Sands Development | | | | | |
| | 984,500 | | | Alliance Grain Traders | | | 13,209 | | |
| | | | | Global Leader in Pulse Processing & Distribution | | | | | |
| | 2,919,000 | | | DeeThree Exploration (b)(c)(f) | | | 9,272 | | |
| | 1,142,377 | | | DeeThree Exploration (b)(c) | | | 3,703 | | |
| | | | | Canadian Oil & Gas Producer | | | | | |
| | 2,096,514 | | | Horizon North Logistics | | | 11,964 | | |
| | | | | Provides Diversified Oil Service Offering in
Northern Canada | | | | | |
| | 263,857 | | | Baytex (a) | | | 11,116 | | |
| | | | | Oil & Gas Producer in Canada | | | | | |
| | 454,000 | | | Celtic Exploration (b) | | | 6,141 | | |
| | | | | Canadian Oil & Gas Producer | | | | | |
| | 1,607,306 | | | Pan Orient (b) | | | 5,920 | | |
| | | | | Asian Oil & Gas Explorer | | | | | |
| Number of Shares | | | | Value (000) | |
| | 450,000 | | | Athabasca Oil Sands (b) | | $ | 4,950 | | |
| | | | | Oil Sands & Unconventional Oil Development | | | | | |
| | 1,611,000 | | | Americas Petrogas (a)(b) | | | 2,991 | | |
| | | | | Oil & Gas Exploration in Argentina, Potash in Peru | | | | | |
| | 332,700 | | | Crew Energy (b) | | | 1,879 | | |
| | | | | Canadian Oil & Gas Producer | | | | | |
| | | | 230,168 | | |
| | | > Australia 3.6% | |
| | 3,973,200 | | | UGL (a) | | | 50,875 | | |
| | | | | Engineering & Facilities Management | | | | | |
| | 48,533,075 | | | Commonwealth Property Office Fund | | | 50,591 | | |
| | | | | Australia Prime Office REIT | | | | | |
| | 11,936,400 | | | Challenger Financial | | | 40,091 | | |
| | | | | Largest Annuity Provider | | | | | |
| | 498,560 | | | Cochlear | | | 33,859 | | |
| | | | | Cochlear Implants | | | | | |
| | 7,595,003 | | | IAG | | | 27,240 | | |
| | | | | General Insurance Provider | | | | | |
| | 1,576,290 | | | Domino's Pizza Enterprises | | | 16,294 | | |
| | | | | Domino's Pizza Operator in Australia/New
Zealand & France/Benelux | | | | | |
| | | | 218,950 | | |
| | | > United States 3.4% | |
| | 1,229,871 | | | BioMarin Pharmaceutical (b) | | | 48,678 | | |
| | | | | Biotech Focused on Orphan Diseases | | | | | |
| | 952,080 | | | Atwood Oceanics (b) | | | 36,027 | | |
| | | | | Offshore Drilling Contractor | | | | | |
| | 965,297 | | | Textainer Group Holdings (a) | | | 35,619 | | |
| | | | | Top International Container Leasor | | | | | |
| | 763,228 | | | World Fuel Services | | | 29,026 | | |
| | | | | Global Fuel Broker | | | | | |
| | 555,500 | | | Hornbeck Offshore (b) | | | 21,542 | | |
| | | | | Supply Vessel Operator in U.S. Gulf of Mexico | | | | | |
| | 548,900 | | | Rowan (b) | | | 17,746 | | |
| | | | | Contract Offshore Driller | | | | | |
| | 407,213 | | | FMC Technologies (b) | | | 15,975 | | |
| | | | | Oil & Gas Well Head Manufacturer | | | | | |
| | | | 204,613 | | |
| | | > Israel 1.0% | |
| | 4,706,527 | | | Israel Chemicals | | | 52,074 | | |
| | | | | Producer of Potash, Phosphates, Bromine &
Specialty Chemicals | | | | | |
| | 625,000 | | | Caesarstone (b) | | | 7,569 | | |
| | | | | Quartz Countertops | | | | | |
| | | | 59,643 | | |
| | | > Senegal 0.2% | |
| | 42,360 | | | Sonatel | | | 9,316 | | |
| | | | | Leading Telecoms Operator in Western Africa | | | | | |
| | | | 9,316 | | |
| Other Countries: Total | | | 991,986 | | |
| Latin America 4.4% | | | |
| | | > Brazil 2.8% | |
| | 3,700,000 | | | Localiza Rent A Car | | | 55,652 | | |
| | | | | Car Rental | | | | | |
| | 1,200,000 | | | Multiplus | | | 28,618 | | |
| | | | | Loyalty Program Operator in Brazil | | | | | |
See accompanying notes to financial statements.
49
Columbia Acorn International
Statement of Investments (Unaudited), continued
| Number of Shares | | | | Value (000) | |
| | | > Brazil—continued | |
| | 1,880,200 | | | Mills Estruturas e Servicos
de Engenharia | | $ | 25,275 | | |
| | | | | Civil Engineering & Construction | | | | | |
| | 4,500,000 | | | Odontoprev | | | 22,696 | | |
| | | | | Dental Insurance | | | | | |
| | 1,300,000 | | | Arcos Dorados (a) | | | 19,214 | | |
| | | | | McDonald's Master Franchise for Latin America | | | | | |
| | 3,577,000 | | | MRV Engenharia | | | 16,474 | | |
| | | | | Brazilan Property Developer | | | | | |
| | | | 167,929 | | |
| | | > Mexico 0.8% | |
| | 600,000 | | | Grupo Aeroportuario del
Sureste - ADR | | | 46,842 | | |
| | | | | Mexican Airport Operator | | | | | |
| | | | 46,842 | | |
| | | > Guatemala 0.3% | |
| | 1,403,049 | | | Tahoe Resources (b) | | | 19,390 | | |
| | | | | Silver Project in Guatemala | | | | | |
| | | | 19,390 | | |
| | | > Uruguay 0.2% | |
| | 1,306,818 | | | Union Agriculture Group (b)(f)(g) | | | 12,794 | | |
| | | | | Farmland Operator in Uruguay | | | | | |
| | | | 12,794 | | |
| | | > Chile 0.2% | |
| | 5,640,000 | | | Viña Concha y Toro | | | 11,038 | | |
| | | | | Global Branded Wine Manufacturer | | | | | |
| | | | 11,038 | | |
| | | > Colombia 0.1% | |
| | 7,850,769 | | | Canacol (b) | | | 3,509 | | |
| | | | | Oil Producer in South America | | | | | |
| | 22,525,000 | | | Gulf United (b) | | | 1,351 | | |
| | | | | Prospecting for Oil Alongside Large
Producers in Colombia | | | | | |
| | | | 4,860 | | |
| | | > Argentina —% | |
| | 4,950,000 | | | Madalena Ventures (b)(f) | | | 1,634 | | |
| | 2,475,000 | | | Madalena Ventures (b) | | | 851 | | |
| | | | | Oil & Gas Exploration in Argentina | | | | | |
| | | | 2,485 | | |
| Latin America: Total | | | 265,338 | | |
Total Equities: 94.6%
(Cost: $4,751,710) | | | 5,700,496 | | |
| Number of Shares | | | | Value (000) | |
| Securities Lending Collateral 1.8% | |
| | 111,196,657 | | | Dreyfus Government Cash
Management Fund
(7 day yield of 0.01%) (h) | | $ | 111,197 | | |
Total Securities Lending Collateral:
(Cost: $111,197) | | | 111,197 | | |
Total Investments: 96.4%
(Cost: $4,862,907)(i)(j) | | | 5,811,693 | | |
Obligation to Return Collateral for
Securities Loaned: (1.8)% | | | (111,197 | ) | |
| Cash and Other Assets Less Liabilities: 5.4% | | | 326,071 | | |
| Total Net Assets: 100.0% | | $ | 6,026,567 | | |
ADR - American Depositary Receipts
DVR - Differential Voting Right Equity Shares
GDR - Global Depositary Receipts
REIT - Real Estate Investment Trust
See accompanying notes to financial statements.
50
> Notes to Statement of Investments (dollar values in thousands)
(a) All or a portion of this security was on loan at June 30, 2012. The total market value of securities on loan at June 30, 2012 was $110,353.
(b) Non-income producing security.
(c) An affiliated person of the Fund may include any company in which the Fund owns five percent or more of its outstanding voting shares. Holdings and transactions in these affiliated companies during the period ended June 30, 2012, are as follows:
| Security | | Balance of
Shares Held
12/31/11 | | Purchases/
Additions | | Sales/
Reductions | | Balance of
Shares Held
6/30/12 | | Value | | Dividend | |
| Archipelago Resources | | | 29,063,787 | | | | - | | | | - | | | | 29,063,787 | | | $ | 23,214 | | | $ | - | | |
| DeeThree Exploration | | | 4,061,377 | | | | - | | | | - | | | | 4,061,377 | | | | 12,975 | | | | - | | |
| Koninklijke TenCate* | | | 1,371,573 | | | | 53,685 | | | | 190,500 | | | | 1,234,758 | | | | 32,962 | | | | - | ** | |
| Southern Arc Minerals | | | 6,217,500 | | | | - | | | | - | | | | 6,217,500 | | | | 1,710 | | | | - | | |
| Sweco | | | 4,150,024 | | | | - | | | | - | | | | 4,150,024 | | | | 43,732 | | | | 1,574 | | |
| UNIT4 | | | 1,591,702 | | | | - | | | | - | | | | 1,591,702 | | | | 40,567 | | | | 677 | | |
| Wacom* | | | 23,790 | | | | - | | | | 3,694 | | | | 20,096 | | | | 45,009 | | | | 794 | | |
| Workspace Group* | | | 8,000,000 | | | | - | | | | 8,000,000 | | | | - | | | | - | | | | 298 | | |
| Total of Affiliated Transactions | | | 54,479,753 | | | | 53,685 | | | | 8,194,194 | | | | 46,339,244 | | | $ | 200,169 | | | $ | 3,343 | | |
* At June 30, 2012, the Fund owned less than five percent of the company's outstanding voting shares.
** Rounds to less than $500.
The aggregate cost and value of these companies at June 30, 2012 were $93,271 and $122,198 respectively. Investments in affiliated companies represented 2.03% of the Fund's total net assets at June 30, 2012.
(d) Security is traded on a U.S. exchange.
(e) Security exempt from registration under Section 4(2) of the Securities Act of 1933. This security may only be resold in exempt transactions to qualified buyers. Private resales of this security to qualified institutional buyers are also exempt from registration pursuant to Rule 144A under the Securities Act of 1933. At June 30, 2012, this security had an aggregate value of $12,550, which represented 0.21% of total net assets.
(f) Denotes a restricted security, which is subject to restrictions on resale under federal securities laws. These securities are valued at fair value determined in good faith under consistently applied procedures established by the Board of Trustees. At June 30, 2012, the market value of these securities amounted to $23,700, which represented 0.39% of total net assets.
Additional information on these securities is as follows:
| Security | | Acquisition
Dates | | Shares | | Cost | | Value | |
| Union Agriculture Group | | 12/8/10-6/27/12 | | | 1,306,818 | | | $ | 15,000 | | | $ | 12,794 | | |
| DeeThree Exploration | | 9/7/10-3/8/11 | | | 2,919,000 | | | | 10,228 | | | | 9,272 | | |
| Madalena Ventures | | 10/21/10 | | | 4,950,000 | | | | 3,136 | | | | 1,634 | | |
| | | | | | | $ | 28,364 | | | $ | 23,700 | | |
(g) Illiquid security.
(h) Investment made with cash collateral received from securities lending activity.
(i) At June 30, 2012, for federal income tax purposes, the cost of investments was $4,862,907 and net unrealized appreciation was $948,786 consisting of gross unrealized appreciation of $1,372,957 and gross unrealized depreciation of $424,171.
(j) On June 30, 2012, the Fund's total investments were denominated in currencies as follows:
| Currency | | Value | | Percentage
of Net Assets | |
| Japanese Yen | | $ | 1,058,464 | | | | 17.5 | | |
| Euro | | | 846,954 | | | | 14.1 | | |
| United States Dollar | | | 507,517 | | | | 8.4 | | |
| Taiwan Dollar | | | 434,241 | | | | 7.2 | | |
| British Pound | | | 391,184 | | | | 6.5 | | |
| Hong Kong Dollar | | | 343,012 | | | | 5.7 | | |
| Australian Dollar | | | 330,146 | | | | 5.5 | | |
Other currencies less than
5% of total net assets | | | 1,900,175 | | | | 31.5 | | |
| Total Portfolio | | $ | 5,811,693 | | | | 96.4 | | |
See accompanying notes to financial statements.
51
Columbia Acorn International
Statement of Investments (Unaudited), continued
> Notes to Statement of Investments (dollar values in thousands)
Fair Value Measurements
Various inputs are used in determining the value of the Fund's investments, following the input prioritization hierarchy established by GAAP. These inputs are summarized in the three broad levels listed below:
• Level 1 – quoted prices in active markets for identical securities
• Level 2 – prices determined using other significant observable inputs (including quoted prices for similar securities, interest rates, prepayment speeds, credit risk and others)
• Level 3 – prices determined using significant unobservable inputs where quoted prices or observable inputs are unavailable or less reliable (including management's own assumptions about the factors market participants would use in pricing an investment)
The inputs or methodology used for valuing securities are not necessarily an indication of the risk associated with investing in those securities.
Examples of the types of securities in which the Fund would typically invest and how they are classified within this hierarchy are as follows. Typical Level 1 securities include exchange traded domestic equities, mutual funds whose NAVs are published each day and exchange traded foreign equities that are not statistically fair valued. Typical Level 2 securities include exchange traded foreign equities that are statistically fair valued, forward foreign currency exchange contracts and short-term investments valued at amortized cost. Additionally, securities fair valued by the Valuation Committee (the Committee) of the Fund's Board of Trustees (the Board) that rely on significant observable inputs are also included in Level 2. Typical Level 3 securities include any security fair valued by the Committee that relies on significant unobservable inputs.
Under the direction of the Board, the Committee is responsible for carrying out the valuation procedures approved by the Board.
The Committee meets as necessary, and no less frequently than quarterly, to determine fair values for securities for which market quotations are not readily available or for which the investment manager believes that available market quotations are unreliable, and to review the continuing appropriateness of the current value of any security subject to the Trust's Portfolio Pricing Policy and the pricing procedures of the investment manager (the Policies). The Policies address, among other things: circumstances under which market quotations will be deemed readily available; selection of third party pricing vendors; appropriate pricing methodologies; events that require fair valuation and fair value techniques; and circumstances under which securities will be deemed to pose a potential for stale pricing, including when securities are illiquid, restricted, or in default. The Committee may also meet to discuss additional valuation matters, which may include review of back-testing results, review of time-sensitive information or approval of other valuation related actions, and to review the appropriateness of the Policies.
For investments categorized as Level 3, the significant unobservable inputs used in the fair value measurement of the Funds' securities may include: (i) data specific to the issuer or comparable issuers, (ii) general market or specific sector news and (iii) quoted prices and specific or similar security transactions. The Committee considers this data and any changes from prior periods in order to assess the reasonableness of observable and unobservable inputs, any assumptions or internal models used to value those securities and changes in fair value. Significant changes in any of these factors could result in lower or higher fair value measurements. Various factors impact the frequency of monitoring (which may occur as often as daily), however the Committee may determine that changes to inputs, assumptions and models are not required with the same frequency.
The following table summarizes the inputs used, as of June 30, 2012, in valuing the Fund's assets:
| Investment Type | | Quoted Prices
(Level 1) | | Other
Significant
Observable
Inputs
(Level 2) | | Significant
Unobservable
Inputs
(Level 3) | | Total | |
| Equities | |
| Asia | | $ | 160,069 | | | $ | 2,480,844 | | | $ | - | | | $ | 2,640,913 | | |
| Europe | | | 40,871 | | | | 1,761,388 | | | | - | | | | 1,802,259 | | |
| Other Countries | | | 433,078 | | | | 558,908 | | | | - | | | | 991,986 | | |
| Latin America | | | 250,910 | | | | 1,634 | | | | 12,794 | | | | 265,338 | | |
| Total Equities | | | 884,928 | | | | 4,802,774 | | | | 12,794 | | | | 5,700,496 | | |
| Total Securities Lending Collateral | | | 111,197 | | | | - | | | | - | | | | 111,197 | | |
| Total Investments | | $ | 996,125 | | | $ | 4,802,774 | | | $ | 12,794 | | | $ | 5,811,693 | | |
The Fund's assets assigned to the Level 2 input category are generally valued using a market approach, in which a security's value is determined through its correlation to prices and information from observable market transactions for similar or identical assets. Foreign equities are generally valued at the last sale price on the foreign exchange or market on which they trade. The Fund may use a statistical fair valuation model, in accordance with the policy adopted by the Board, provided by an independent third party to value securities principally traded in foreign markets in order to adjust for possible stale pricing that may occur between the close of the foreign exchanges and the time for valuation. These models take into account available market data including intraday index, ADR, and ETF movements. Securities acquired via private placement that have a holding period or an extended settlement period are valued at a discount to the same shares that are trading freely on the market. These discounts are determined by the investment manager's experience with similar securities or situations. Factors may include, but are not limited to, trade volume, shares outstanding and stock price.
The following table shows transfers between Level 1 and Level 2 of the fair value hierarchy:
| Transfers In | | Transfers Out | |
| Level 1 | | Level 2 | | Level 1 | | Level 2 | |
| $ | 10,584 | | | $ | - | | | $ | - | | | $ | 10,584 | | |
Financial assets were transferred from Level 2 to Level 1 as resale restrictions no longer apply.
See accompanying notes to financial statements.
52
> Notes to Statement of Investments (dollar values in thousands)
The following table reconciles asset balances for the period ending June 30, 2012, in which significant observable and/or unobservable inputs (Level 3) were used in determining value:
Investments
in Securities | | Balance
as of
December 31,
2011 | | Realized
Gain/(Loss) | | Change in
Unrealized
Appreciation
(Depreciation) | | Purchases | | Sales | | Transfers
into
Level 3 | | Transfers
out of
Level 3 | | Balance
as of
June 30,
2012 | |
| Equities | |
| Latin America | | $ | 12,462 | | | $ | - | | | $ | 332 | | | $ | - | | | $ | - | | | $ | - | | | $ | - | | | $ | 12,794 | | |
| | | $ | 12,462 | | | $ | - | | | $ | 332 | | | $ | - | | | $ | - | | | $ | - | | | $ | - | | | $ | 12,794 | | |
The information in the above reconciliation table represents fiscal year to date activity for any securities identified as using Level 3 inputs at either the beginning or the end of the current fiscal period.
The change in unrealized appreciation attributed to securities owned at June 30, 2012, which were valued using significant unobservable inputs (Level 3), amounted to $332.
The Fund does not hold any significant investments categorized as Level 3.
Certain common stock classified as Level 3 are valued at fair value, using a market approach, as determined in good faith under consistently applied procedures established by and under the general supervision of the Board. To determine fair value for these securities, for which no market exists, the Committee utilizes the valuation technique it deems most appropriate in the circumstances, using some unobservable inputs, which may include but are not limited to trades of similar securities, estimated earnings of the company, market multiples derived from a set of comparable companies, and the position of the security within the company's capital structure. Significant increases or decreases to any of these inputs could result in a significantly lower or higher fair value measurement. Generally, a change in estimated earnings of a company may result in a change to the comparable companies and market multiples utilized.
See accompanying notes to financial statements.
53
Columbia Acorn International
Portfolio Diversification (Unaudited)
At June 30, 2012, the Fund's portfolio investments as a percentage of net assets were diversified as follows:
| | | Value (000) | | Percentage
of Net Assets | |
| > Industrial Goods & Services | |
| Other Industrial Services | | $ | 498,256 | | | | 8.3 | | |
| Machinery | | | 376,487 | | | | 6.2 | | |
Industrial Materials &
Specialty Chemicals | | | 363,320 | | | | 6.0 | | |
| Construction | | | 113,252 | | | | 1.9 | | |
| Conglomerates | | | 82,269 | | | | 1.4 | | |
| Outsourcing Services | | | 79,172 | | | | 1.3 | | |
| Electrical Components | | | 78,914 | | | | 1.3 | | |
| Industrial Distribution | | | 40,299 | | | | 0.7 | | |
| | | | 1,631,969 | | | | 27.1 | | |
| > Consumer Goods & Services | |
| Retail | | | 362,751 | | | | 6.0 | | |
| Food & Beverage | | | 205,154 | | | | 3.4 | | |
| Casinos & Gaming | | | 204,526 | | | | 3.4 | | |
| Nondurables | | | 111,534 | | | | 1.9 | | |
| Other Consumer Services | | | 89,612 | | | | 1.5 | | |
| Travel | | | 62,798 | | | | 1.0 | | |
| Apparel | | | 53,546 | | | | 0.9 | | |
| Consumer Goods Distribution | | | 52,921 | | | | 0.9 | | |
| Other Durable Goods | | | 44,802 | | | | 0.7 | | |
| Restaurants | | | 41,347 | | | | 0.7 | | |
| Educational Services | | | 26,950 | | | | 0.5 | | |
| Other Entertainment | | | 18,807 | | | | 0.3 | | |
| Furniture & Textiles | | | 7,569 | | | | 0.1 | | |
| | | | 1,282,317 | | | | 21.3 | | |
| > Information | |
Computer Hardware &
Related Equipment | | | 264,450 | | | | 4.4 | | |
| Mobile Communications | | | 170,006 | | | | 2.8 | | |
| Internet Related | | | 161,623 | | | | 2.7 | | |
| Business Software | | | 139,157 | | | | 2.3 | | |
| Financial Processors | | | 66,059 | | | | 1.1 | | |
| Instrumentation | | | 61,762 | | | | 1.0 | | |
Semiconductors & Related
Equipment | | | 51,879 | | | | 0.9 | | |
| Electronics Distribution | | | 31,721 | | | | 0.5 | | |
| CATV | | | 26,488 | | | | 0.4 | | |
| Computer Services | | | 21,165 | | | | 0.3 | | |
| Telephone & Data Services | | | 9,316 | | | | 0.2 | | |
| Satellite Broadcasting & Services | | | 5,486 | | | | 0.1 | | |
| Advertising | | | 4,669 | | | | 0.1 | | |
| | | | 1,013,781 | | | | 16.8 | | |
| > Other Industries | |
| Real Estate | | | 383,867 | | | | 6.4 | | |
| Transportation | | | 116,680 | | | | 1.9 | | |
| Regulated Utilities | | | 61,175 | | | | 1.0 | | |
| | | | 561,722 | | | | 9.3 | | |
| | | Value (000) | | Percentage
of Net Assets | |
| > Energy & Minerals | |
| Oil Services | | $ | 192,311 | | | | 3.2 | | |
| Mining | | | 179,030 | | | | 3.0 | | |
| Oil & Gas Producers | | | 75,778 | | | | 1.3 | | |
| Agricultural Commodities | | | 26,003 | | | | 0.4 | | |
Oil Refining, Marketing &
Distribution | | | 20,360 | | | | 0.3 | | |
| | | | 493,482 | | | | 8.2 | | |
| > Finance | |
| Insurance | | | 159,044 | | | | 2.6 | | |
| Brokerage & Money Management | | | 120,890 | | | | 2.0 | | |
| Banks | | | 109,573 | | | | 1.8 | | |
| Finance Companies | | | 75,767 | | | | 1.3 | | |
| | | | 465,274 | | | | 7.7 | | |
| > Health Care | |
| Medical Equipment & Devices | | | 81,542 | | | | 1.3 | | |
| Biotechnology & Drug Delivery | | | 48,678 | | | | 0.8 | | |
| Pharmaceuticals | | | 47,814 | | | | 0.8 | | |
| Medical Supplies | | | 46,536 | | | | 0.8 | | |
| Health Care Services | | | 27,381 | | | | 0.5 | | |
| | | | 251,951 | | | | 4.2 | | |
| Total Equities: | | | 5,700,496 | | | | 94.6 | | |
| Security Lending Collateral: | | | 111,197 | | | | 1.8 | | |
| Total Investments: | | | 5,811,693 | | | | 96.4 | | |
Obligation to Return
Collateral for Securities
Loaned: | | | (111,197 | ) | | | (1.8 | ) | |
Cash and Other Assets
Less Liabilities: | | | 326,071 | | | | 5.4 | | |
| Net Assets: | | $ | 6,026,567 | | | | 100.0 | | |
See accompanying notes to financial statements.
54
Columbia Acorn USA
Major Portfolio Changes in the Second Quarter (Unaudited)
| | | Number of Shares | |
| | | 3/31/12 | | 6/30/12 | |
| Purchases | |
| Information | |
| SABA | | | 0 | | | | 337,000 | | |
| Industrial Goods & Services | |
| Moog | | | 355,000 | | | | 436,000 | | |
| Polypore International | | | 100,000 | | | | 200,000 | | |
| Consumer Goods & Services | |
| Caesarstone (Israel) | | | 20,000 | | | | 200,000 | | |
| Helen of Troy | | | 106,000 | | | | 262,000 | | |
| Finance | |
| CAI International | | | 330,000 | | | | 376,000 | | |
| First Commonwealth | | | 556,000 | | | | 834,000 | | |
| Health Care | |
| ARIAD Pharmaceuticals | | | 0 | | | | 379,040 | | |
| Cepheid | | | 488,600 | | | | 551,600 | | |
| NPS Pharmaceuticals | | | 1,055,000 | | | | 1,163,600 | | |
| Synageva Biopharma | | | 29,671 | | | | 129,002 | | |
| Other Industries | |
| DuPont Fabros Technology | | | 519,000 | | | | 625,000 | | |
| Energy & Minerals | |
| Approach Resource | | | 100,000 | | | | 244,000 | | |
| Hornbeck Offshore | | | 83,000 | | | | 125,000 | | |
| | | Number of Shares | |
| | | 3/31/12 | | 6/30/12 | |
| Sales | |
| Information | |
| AboveNet | | | 148,000 | | | | 0 | | |
| Ariba | | | 408,000 | | | | 0 | | |
| Blackbaud | | | 300,000 | | | | 67,869 | | |
| Global Payments | | | 170,000 | | | | 153,000 | | |
| Ixia | | | 903,000 | | | | 813,000 | | |
| NetSuite | | | 281,000 | | | | 211,000 | | |
| Nice Systems - ADR (Israel) | | | 177,000 | | | | 160,000 | | |
| ON Semiconductor | | | 1,061,750 | | | | 961,000 | | |
| Polycom | | | 165,000 | | | | 0 | | |
| SBA Communications | | | 560,000 | | | | 529,000 | | |
| Trimble Navigation | | | 168,000 | | | | 151,000 | | |
| Industrial Goods & Services | |
| GrafTech International | | | 686,000 | | | | 616,000 | | |
| Interline Brands | | | 233,400 | | | | 0 | | |
| Kennametal | | | 226,000 | | | | 204,000 | | |
| Pentair | | | 585,000 | | | | 0 | | |
| Waste Connections | | | 176,000 | | | | 90,000 | | |
| Consumer Goods & Services | |
| Hertz | | | 750,000 | | | | 675,000 | | |
| Lifetime Fitness | | | 259,000 | | | | 233,000 | | |
| lululemon athletica | | | 730,000 | | | | 583,000 | | |
| Pinnacle Entertainment | | | 775,000 | | | | 698,000 | | |
| Saks | | | 790,000 | | | | 715,000 | | |
| True Religion Apparel | | | 82,300 | | | | 0 | | |
| Finance | |
| Eaton Vance | | | 340,500 | | | | 306,500 | | |
| Hancock Holding | | | 278,678 | | | | 251,000 | | |
| Valley National Bancorp | | | 675,000 | | | | 641,750 | | |
| Health Care | |
| Akorn | | | 733,000 | | | | 642,000 | | |
| Alexion Pharmaceuticals | | | 251,000 | | | | 83,000 | | |
| Gen-Probe | | | 72,000 | | | | 0 | | |
| Pacific Biosciences of California | | | 385,000 | | | | 0 | | |
| Seattle Genetics | | | 682,000 | | | | 614,000 | | |
| Sirona Dental Systems | | | 224,000 | | | | 202,000 | | |
| Other Industries | |
| Associated Estates Realty | | | 600,000 | | | | 540,000 | | |
| World Fuel Services | | | 256,000 | | | | 230,000 | | |
| Energy & Minerals | |
| FMC Technologies | | | 167,000 | | | | 0 | | |
| Rosetta Resources | | | 143,000 | | | | 129,000 | | |
See accompanying notes to financial statements.
55
Columbia Acorn USA
Statement of Investments (Unaudited), June 30, 2012
| Number of Shares | | | | Value (000) | |
| | | | | | | Equities: 99.6% | |
| Information 30.7% | | | |
| | | > Business Software 9.3% | |
| | 910,000 | | | Informatica (a) | | $ | 38,548 | | |
| | | | | Enterprise Data Integration Software | | | | | |
| | 698,000 | | | Micros Systems (a) | | | 35,738 | | |
| | | | | Information Systems for Hotels,
Restaurants & Retailers | | | | | |
| | 375,000 | | | Ansys (a) | | | 23,666 | | |
| | | | | Simulation Software for Engineers & Designers | | | | | |
| | 243,000 | | | Concur Technologies (a) | | | 16,548 | | |
| | | | | Web Enabled Cost & Expense
Management Software | | | | | |
| | 211,000 | | | NetSuite (a) | | | 11,557 | | |
| | | | | End-to-end IT Systems Solutions Delivered
Over the Web | | | | | |
| | 290,000 | | | SPS Commerce (a) | | | 8,810 | | |
| | | | | Supply Chain Management Software
Delivered via the Web | | | | | |
| | 198,000 | | | Advent Software (a) | | | 5,368 | | |
| | | | | Asset Management & Trading Systems | | | | | |
| | 337,000 | | | SABA (a) | | | 3,127 | | |
| | | | | Learning Management Systems | | | | | |
| | 400,000 | | | Velti (a)(b) | | | 2,600 | | |
| | | | | Mobile Marketing Software Platform | | | | | |
| | 67,869 | | | Blackbaud | | | 1,742 | | |
| | | | | Software & Services for Non-profits | | | | | |
| | | | 147,704 | | |
| | | > Semiconductors & Related
Equipment 3.9% | |
| | 1,958,000 | | | Atmel (a) | | | 13,119 | | |
| | | | | Microcontrollers, Radio Frequency & Memory
Semiconductors | | | | | |
| | 690,000 | | | Microsemi (a) | | | 12,758 | | |
| | | | | Analog/Mixed Signal Semiconductors | | | | | |
| | 426,000 | | | Monolithic Power Systems (a) | | | 8,465 | | |
| | | | | High Performance Analog & Mixed Signal
Integrated Circuits | | | | | |
| | 262,000 | | | Ultratech (a) | | | 8,253 | | |
| | | | | Semiconductor Equipment | | | | | |
| | 961,000 | | | ON Semiconductor (a) | | | 6,823 | | |
| | | | | Mixed Signal & Power
Management Semiconductors | | | | | |
| | 1,075,000 | | | TriQuint Semiconductor (a) | | | 5,912 | | |
| | | | | Radio Frequency Semiconductors | | | | | |
| | 390,000 | | | Pericom Semiconductor (a) | | | 3,510 | | |
| | | | | Interface Integrated Circuits & Frequency Control Products | | | | | |
| | 50,000 | | | Hittite Microwave (a) | | | 2,556 | | |
| | | | | Radio Frequency, Microwave &
Millimeterwave Semiconductors | | | | | |
| | | | 61,396 | | |
| | | > Instrumentation 3.6% | |
| | 180,000 | | | Mettler-Toledo International (a) | | | 28,053 | | |
| | | | | Laboratory Equipment | | | | | |
| | 525,000 | | | IPG Photonics (a) | | | 22,885 | | |
| | | | | Fiber Lasers | | | | | |
| | 151,000 | | | Trimble Navigation (a) | | | 6,947 | | |
| | | | | GPS-based Instruments | | | | | |
| | | | 57,885 | | |
| Number of Shares | | | | Value (000) | |
| | | > Telephone & Data Services 2.7% | |
| | 1,457,000 | | | tw telecom (a) | | $ | 37,387 | | |
| | | | | Fiber Optic Telephone/Data Services | | | | | |
| | 400,000 | | | Boingo Wireless (a)(b) | | | 4,648 | | |
| | | | | Wholesale & Retail WiFi Networks | | | | | |
| | | | 42,035 | | |
| | | > Computer Hardware & Related
Equipment 2.6% | |
| | 1,317,000 | | | II-VI (a) | | | 21,954 | | |
| | | | | Laser Optics & Specialty Materials | | | | | |
| | 292,000 | | | Zebra Technologies (a) | | | 10,033 | | |
| | | | | Bar Code Printers | | | | | |
| | 160,000 | | | Nice Systems - ADR (Israel) (a) | | | 5,856 | | |
| | | | | Audio & Video Recording Solutions | | | | | |
| | 97,000 | | | Netgear (a) | | | 3,348 | | |
| | | | | Networking Products for Small Business & Home | | | | | |
| | | | 41,191 | | |
| | | > Gaming Equipment & Services 2.2% | |
| | 660,000 | | | Bally Technologies (a) | | | 30,796 | | |
| | | | | Slot Machines & Software | | | | | |
| | 235,000 | | | WMS Industries (a) | | | 4,688 | | |
| | | | | Slot Machine Provider | | | | | |
| | | | 35,484 | | |
| | | > Computer Services 2.0% | |
| | 556,000 | | | ExlService Holdings (a) | | | 13,700 | | |
| | | | | Business Process Outsourcing | | | | | |
| | 97,000 | | | Syntel | | | 5,888 | | |
| | | | | Offshore IT Services | | | | | |
| | 776,766 | | | Hackett Group (a) | | | 4,326 | | |
| | | | | IT Integration & Best Practice Research | | | | | |
| | 640,000 | | | RCM Technologies (a)(c) | | | 3,546 | | |
| | | | | Technology & Engineering Services | | | | | |
| | 359,000 | | | WNS - ADR (India) (a) | | | 3,493 | | |
| | | | | Offshore BPO (Business Process
Outsourcing) Services | | | | | |
| | | | 30,953 | | |
| | | > Mobile Communications 1.9% | |
| | 529,000 | | | SBA Communications (a) | | | 30,179 | | |
| | | | | Communications Towers | | | | | |
| | | | 30,179 | | |
| | | > Telecommunications Equipment 1.6% | |
| | 732,000 | | | Finisar (a) | | | 10,951 | | |
| | | | | Optical Subsystems & Components | | | | | |
| | 813,000 | | | Ixia (a) | | | 9,772 | | |
| | | | | Telecom Network Test Equipment | | | | | |
| | 752,000 | | | Infinera (a) | | | 5,144 | | |
| | | | | Optical Networking Equipment | | | | | |
| | | | 25,867 | | |
| | | > Contract Manufacturing 0.4% | |
| | 236,000 | | | Plexus (a) | | | 6,655 | | |
| | | | | Electronic Manufacturing Services | | | | | |
| | | | 6,655 | | |
| | | > Financial Processors 0.4% | |
| | 153,000 | | | Global Payments | | | 6,614 | | |
| | | | | Credit Card Processor | | | | | |
| | | | 6,614 | | |
See accompanying notes to financial statements.
56
| Number of Shares | | | | Value (000) | |
| | | > TV Broadcasting 0.1% | |
| | 875,000 | | | Entravision Communications | | $ | 1,059 | | |
| | | | | Spanish Language TV & Radio Stations | | | | | |
| | | | 1,059 | | |
| Information: Total | | | 487,022 | | |
| Industrial Goods & Services 17.2% | | | |
| | | > Machinery 13.3% | |
| | 876,300 | | | Ametek | | | 43,736 | | |
| | | | | Aerospace/Industrial Instruments | | | | | |
| | 747,200 | | | Nordson | | | 38,324 | | |
| | | | | Dispensing Systems for Adhesives & Coatings | | | | | |
| | 835,000 | | | ESCO Technologies | | | 30,427 | | |
| | | | | Automatic Electric Meter Readers | | | | | |
| | 890,000 | | | Donaldson | | | 29,699 | | |
| | | | | Industrial Air Filtration | | | | | |
| | 631,000 | | | HEICO | | | 20,356 | | |
| | | | | FAA Approved Aircraft Replacement Parts | | | | | |
| | 436,000 | | | Moog (a) | | | 18,029 | | |
| | | | | Motion Control Products for Aerospace,
Defense & Industrial Markets | | | | | |
| | 150,000 | | | Toro | | | 10,993 | | |
| | | | | Turf Maintenance Equipment | | | | | |
| | 200,000 | | | Polypore International (a)(b) | | | 8,078 | | |
| | | | | Battery Separators & Filtration Media | | | | | |
| | 204,000 | | | Kennametal | | | 6,763 | | |
| | | | | Consumable Cutting Tools | | | | | |
| | 146,000 | | | Oshkosh Corporation (a) | | | 3,059 | | |
| | | | | Specialty Truck Manufacturer | | | | | |
| | 26,000 | | | Middleby Corp (a) | | | 2,590 | | |
| | | | | Manufacturer of Cooking Equipment | | | | | |
| | | | 212,054 | | |
| | | > Industrial Materials & Specialty
Chemicals 1.1% | |
| | 496,000 | | | Drew Industries (a) | | | 13,813 | | |
| | | | | RV & Manufactured Home Components | | | | | |
| | 170,000 | | | Albany International | | | 3,181 | | |
| | | | | Paper Machine Clothing & Composites
for Aerospace | | | | | |
| | | | 16,994 | | |
| | | > Electrical Components 0.9% | |
| | 280,000 | | | Acuity Brands | | | 14,255 | | |
| | | | | Commercial Lighting Fixtures | | | | | |
| | | | 14,255 | | |
| | | > Other Industrial Services 0.8% | |
| | 600,000 | | | Acorn Energy (b) | | | 4,992 | | |
| | | | | Frac Well Exploration/Monitoring Device,
Sonar Security, Electric Grid Monitoring | | | | | |
| | 240,000 | | | TrueBlue (a) | | | 3,715 | | |
| | | | | Temporary Manual Labor | | | | | |
| | 109,000 | | | Forward Air | | | 3,518 | | |
| | | | | Freight Transportation Between Airports | | | | | |
| | | | 12,225 | | |
| | | > Waste Management 0.4% | |
| | 65,000 | | | Clean Harbors (a) | | | 3,667 | | |
| | | | | Hazardous Waste Services & Disposal | | | | | |
| Number of Shares | | | | Value (000) | |
| | 90,000 | | | Waste Connections | | $ | 2,693 | | |
| | | | | Solid Waste Management | | | | | |
| | | | 6,360 | | |
| | | > Steel 0.4% | |
| | 616,000 | | | GrafTech International (a) | | | 5,944 | | |
| | | | | Industrial Graphite Materials Producer | | | | | |
| | | | 5,944 | | |
| | | > Construction 0.3% | |
| | 200,000 | | | Fortune Brands Home & Security (a) | | | 4,454 | | |
| | | | | Home Building Supplies & Small Locks | | | | | |
| | | | 4,454 | | |
| Industrial Goods & Services: Total | | | 272,286 | | |
| Consumer Goods & Services 16.2% | | | |
| | | > Retail 5.4% | |
| | 583,000 | | | lululemon athletica (a) | | | 34,764 | | |
| | | | | Premium Active Apparel Retailer | | | | | |
| | 468,500 | | | Abercrombie & Fitch | | | 15,994 | | |
| | | | | Teen Apparel Retailer | | | | | |
| | 805,000 | | | Pier 1 Imports | | | 13,226 | | |
| | | | | Home Furnishing Retailer | | | | | |
| | 356,000 | | | Shutterfly (b) | | | 10,926 | | |
| | | | | Internet Photo-centric Retailer | | | | | |
| | 715,000 | | | Saks (a)(b) | | | 7,615 | | |
| | | | | Luxury Department Store Retailer | | | | | |
| | 161,500 | | | Teavana (a)(b) | | | 2,185 | | |
| | | | | Specialty Tea Retailer | | | | | |
| | 9,000 | | | The Fresh Market (a) | | | 483 | | |
| | | | | Specialty Food Retailer | | | | | |
| | | | 85,193 | | |
| | | > Travel 4.2% | |
| | 849,700 | | | Gaylord Entertainment (a) | | | 32,764 | | |
| | | | | Convention Hotels | | | | | |
| | 1,300,950 | | | Avis Budget Group (a) | | | 19,775 | | |
| | | | | Second Largest Car Rental Company | | | | | |
| | 675,000 | | | Hertz (a) | | | 8,640 | | |
| | | | | Largest U.S. Rental Car Operator | | | | | |
| | 64,000 | | | Vail Resorts | | | 3,205 | | |
| | | | | Ski Resort Operator & Developer | | | | | |
| | 140,000 | | | HomeAway (a)(b) | | | 3,044 | | |
| | | | | Vacation Rental Online Marketplace | | | | | |
| | | | 67,428 | | |
| | | > Furniture & Textiles 1.6% | |
| | 880,000 | | | Knoll | | | 11,810 | | |
| | | | | Office Furniture | | | | | |
| | 621,500 | | | Interface | | | 8,471 | | |
| | | | | Modular & Broadloom Carpet | | | | | |
| | 148,000 | | | Herman Miller | | | 2,741 | | |
| | | | | Office Furniture | | | | | |
| | 200,000 | | | Caesarstone (Israel) (a) | | | 2,422 | | |
| | | | | Quartz Countertops | | | | | |
| | | | 25,444 | | |
| | | > Consumer Goods Distribution 1.2% | |
| | 472,000 | | | Pool | | | 19,097 | | |
| | | | | Distributor of Swimming Pool
Supplies & Equipment | | | | | |
| | | | 19,097 | | |
See accompanying notes to financial statements.
57
Columbia Acorn USA
Statement of Investments (Unaudited), continued
| Number of Shares | | | | Value (000) | |
| | | > Other Durable Goods 1.0% | |
| | 206,000 | | | Cavco Industries (a) | | $ | 10,564 | | |
| | | | | Manufactured Homes | | | | | |
| | 126,000 | | | Jarden | | | 5,294 | | |
| | | | | Branded Household Products | | | | | |
| | | | 15,858 | | |
| | | > Apparel 0.8% | |
| | 222,000 | | | Warnaco Group (a) | | | 9,453 | | |
| | | | | Global Branded Apparel Manufacturer | | | | | |
| | 73,000 | | | Deckers Outdoor (a)(b) | | | 3,212 | | |
| | | | | Fashion Footwear Wholesaler | | | | | |
| | | | 12,665 | | |
| | | > Other Consumer Services 0.7% | |
| | 233,000 | | | Lifetime Fitness (a) | | | 10,837 | | |
| | | | | Sport & Fitness Club Operator | | | | | |
| | | | 10,837 | | |
| | | > Nondurables 0.6% | |
| | 262,000 | | | Helen of Troy (a) | | | 8,879 | | |
| | | | | Personal Care, Housewares, Healthcare &
Home Environment Products | | | | | |
| | | | 8,879 | | |
| | | > Casinos & Gaming 0.4% | |
| | 698,000 | | | Pinnacle Entertainment (a) | | | 6,715 | | |
| | | | | Regional Casino Operator | | | | | |
| | | | 6,715 | | |
| | | > Leisure Products 0.2% | |
| | 230,000 | | | Skullcandy (a)(b) | | | 3,255 | | |
| | | | | Lifestyle Branded Headphones | | | | | |
| | | | 3,255 | | |
| | | > Educational Services 0.1% | |
| | 37,350 | | | ITT Educational Services (a)(b) | | | 2,269 | | |
| | | | | Postsecondary Degree Services | | | | | |
| | | | 2,269 | | |
| | | > Food & Beverage —% | |
| | 4,900 | | | Annie's (a)(b) | | | 205 | | |
| | | | | Developer & Marketer of Natural &
Organic Food | | | | | |
| | | | 205 | | |
| Consumer Goods & Services: Total | | | 257,845 | | |
| Finance 13.4% | | | |
| | | > Banks 7.6% | |
| | 833,000 | | | MB Financial | | | 17,943 | | |
| | | | | Chicago Bank | | | | | |
| | 1,053,000 | | | Associated Banc-Corp | | | 13,889 | | |
| | | | | Midwest Bank | | | | | |
| | 431,597 | | | Lakeland Financial | | | 11,580 | | |
| | | | | Indiana Bank | | | | | |
| | 211,000 | | | City National | | | 10,250 | | |
| | | | | Bank & Asset Manager | | | | | |
| | 170,000 | | | SVB Financial Group (a) | | | 9,982 | | |
| | | | | Bank to Venture Capitalists | | | | | |
| | 251,000 | | | Hancock Holding | | | 7,640 | | |
| | | | | Gulf Coast Bank | | | | | |
| | 1,478,200 | | | First Busey | | | 7,140 | | |
| | | | | Illinois Bank | | | | | |
| Number of Shares | | | | Value (000) | |
| | 641,750 | | | Valley National Bancorp | | $ | 6,803 | | |
| | | | | New Jersey/New York Bank | | | | | |
| | 535,000 | | | TCF Financial | | | 6,142 | | |
| | | | | Great Lakes Bank | | | | | |
| | 834,000 | | | First Commonwealth | | | 5,613 | | |
| | | | | Western Pennsylvania Bank | | | | | |
| | 844,000 | | | TrustCo Bank | | | 4,608 | | |
| | | | | New York State Bank | | | | | |
| | 503,426 | | | Pacific Continental Bank | | | 4,465 | | |
| | | | | Pacific Northwest Bank | | | | | |
| | 269,600 | | | Eagle Bancorp (a) | | | 4,246 | | |
| | | | | Metro D.C. Bank | | | | | |
| | 178,826 | | | Sandy Spring Bancorp | | | 3,219 | | |
| | | | | Baltimore, D.C. Bank | | | | | |
| | 210,000 | | | CVB Financial | | | 2,447 | | |
| | | | | Inland Empire Business Bank | | | | | |
| | 105,700 | | | Hudson Valley | | | 1,913 | | |
| | | | | Metro New York City Bank | | | | | |
| | 851,247 | | | Guaranty Bancorp (a) | | | 1,796 | | |
| | | | | Colorado Bank | | | | | |
| | 90,000 | | | TriCo Bancshares | | | 1,386 | | |
| | | | | California Central Valley Bank | | | | | |
| | | | 121,062 | | |
| | | > Finance Companies 3.8% | |
| | 345,000 | | | World Acceptance (a) | | | 22,701 | | |
| | | | | Personal Loans | | | | | |
| | 310,000 | | | Textainer Group Holdings (b) | | | 11,439 | | |
| | | | | Top International Container Leasor | | | | | |
| | 346,000 | | | McGrath Rentcorp | | | 9,169 | | |
| | | | | Temporary Space & IT Rentals | | | | | |
| | 376,000 | | | CAI International (a) | | | 7,475 | | |
| | | | | International Container Leasing | | | | | |
| | 397,172 | | | H & E Equipment Services (a) | | | 5,970 | | |
| | | | | Heavy Equipment Leasing | | | | | |
| | 100,000 | | | Marlin Business Services | | | 1,639 | | |
| | | | | Small Equipment Leasing | | | | | |
| | 45,500 | | | Regional Management (a) | | | 748 | | |
| | | | | Consumer Loans | | | | | |
| | | | 59,141 | | |
| | | > Savings & Loans 1.0% | |
| | 602,487 | | | ViewPoint Financial | | | 9,423 | | |
| | | | | Texas Thrift | | | | | |
| | 194,000 | | | Berkshire Hills Bancorp | | | 4,268 | | |
| | | | | Northeast Thrift | | | | | |
| | 173,073 | | | Kaiser Federal | | | 2,558 | | |
| | | | | Los Angeles Savings & Loan | | | | | |
| | | | 16,249 | | |
| | | > Brokerage & Money
Management 0.5% | |
| | 306,500 | | | Eaton Vance (b) | | | 8,260 | | |
| | | | | Specialty Mutual Funds | | | | | |
| | | | 8,260 | | |
| | | > Insurance 0.5% | |
| | 55,000 | | | Allied World Holdings | | | 4,371 | | |
| | | | | Commerical Lines Insurance/Reinsurance | | | | | |
See accompanying notes to financial statements.
58
| Number of Shares | | | | Value (000) | |
| | | > Insurance—continued | |
| | 39,000 | | | Enstar Group (a) | | $ | 3,859 | | |
| | | | | Insurance/Reinsurance & Related Services | | | | | |
| | | | 8,230 | | |
| Finance: Total | | | 212,942 | | |
| Health Care 10.3% | | | |
| | | > Biotechnology & Drug Delivery 6.3% | |
| | 520,000 | | | BioMarin Pharmaceutical (a) | | | 20,582 | | |
| | | | | Biotech Focused on Orphan Diseases | | | | | |
| | 614,000 | | | Seattle Genetics (a)(b) | | | 15,589 | | |
| | | | | Antibody-based Therapies for Cancer | | | | | |
| | 421,000 | | | Auxilium Pharmaceuticals (a) | | | 11,321 | | |
| | | | | Biotech Focused on Niche Disease Areas | | | | | |
| | 1,163,600 | | | NPS Pharmaceuticals (a) | | | 10,019 | | |
| | | | | Orphan Drugs & Healthy Royalties | | | | | |
| | 83,000 | | | Alexion Pharmaceuticals (a) | | | 8,242 | | |
| | | | | Biotech Focused on Orphan Diseases | | | | | |
| | 643,000 | | | Isis Pharmaceuticals (a) | | | 7,716 | | |
| | | | | Biotech Pioneer in Antisense Drugs | | | | | |
| | 100,000 | | | Onyx Pharmaceuticals (a) | | | 6,645 | | |
| | | | | Commercial-stage Biotech Focused on Cancer | | | | | |
| | 379,040 | | | ARIAD Pharmaceuticals (a) | | | 6,523 | | |
| | | | | Biotech Focused on Cancer | | | | | |
| | 129,002 | | | Synageva Biopharma (a)(b) | | | 5,232 | | |
| | | | | Biotech Focused on Orphan Diseases | | | | | |
| | 400,000 | | | InterMune (a) | | | 4,780 | | |
| | | | | Drugs for Pulmonary Fibrosis & Hepatitis C | | | | | |
| | 317,506 | | | Raptor Pharmaceutical (a)(b) | | | 1,775 | | |
| | | | | Orphan Drug Company | | | | | |
| | 948,000 | | | Chelsea Therapeutics International (a)(b) | | | 1,403 | | |
| | | | | Biotech Focused on Rare Diseases | | | | | |
| | 530,000 | | | Anthera Pharmaceuticals (a) | | | 358 | | |
| | | | | Biotech Focused on Cardiovascular,
Cancer & Immunology | | | | | |
| | 18,181 | | | Metabolex, Series A-1 (d)(e) | | | 10 | | |
| | | | | Diabetes Drug Development | | | | | |
| | | | 100,195 | | |
| | | > Medical Supplies 1.8% | |
| | 551,600 | | | Cepheid (a) | | | 24,684 | | |
| | | | | Molecular Diagnostics | | | | | |
| | 53,000 | | | Techne | | | 3,933 | | |
| | | | | Cytokines, Antibodies & Other Reagents for
Life Science | | | | | |
| | | | 28,617 | | |
| | | > Medical Equipment & Devices 1.1% | |
| | 202,000 | | | Sirona Dental Systems (a) | | | 9,092 | | |
| | | | | Manufacturer of Dental Equipment | | | | | |
| | 268,000 | | | Hill-Rom Holdings | | | 8,268 | | |
| | | | | Hospital Beds/Patient Handling | | | | | |
| | | | 17,360 | | |
| | | > Pharmaceuticals 0.8% | |
| | 642,000 | | | Akorn (a) | | | 10,124 | | |
| | | | | Develops, Manufactures & Sells Specialty
Generic Drugs | | | | | |
| | 150,000 | | | Horizon Pharma (a)(b) | | | 1,070 | | |
| | | | | Specialty Pharma Company | | | | | |
| Number of Shares | | | | Value (000) | |
| | 133,180 | | | Alimera Sciences (a)(b) | | $ | 398 | | |
| | | | | Ophthalmology-focused Pharmaceutical Company | | | | | |
| | | | 11,592 | | |
| | | > Health Care Services 0.3% | |
| | 664,900 | | | Health Management Associates (a) | | | 5,219 | | |
| | | | | Non-urban Hospitals | | | | | |
| | | | 5,219 | | |
| Health Care: Total | | | 162,983 | | |
| Other Industries 7.3% | | | |
| | | > Real Estate 6.1% | |
| | 915,000 | | | Extra Space Storage | | | 27,999 | | |
| | | | | Self Storage Facilities | | | | | |
| | 625,000 | | | DuPont Fabros Technology | | | 17,850 | | |
| | | | | Technology-focused Office Buildings | | | | | |
| | 561,200 | | | Biomed Realty Trust | | | 10,483 | | |
| | | | | Life Science-focused Office Buildings | | | | | |
| | 783,000 | | | Education Realty Trust | | | 8,676 | | |
| | | | | Student Housing | | | | | |
| | 540,000 | | | Associated Estates Realty | | | 8,073 | | |
| | | | | Multi-family Properties | | | | | |
| | 1,380,000 | | | Kite Realty Group | | | 6,886 | | |
| | | | | Community Shopping Centers | | | | | |
| | 958,000 | | | DCT Industrial Trust | | | 6,035 | | |
| | | | | Industrial Properties | | | | | |
| | 100,000 | | | Post Properties | | | 4,895 | | |
| | | | | Multi-family Properties | | | | | |
| | 77,000 | | | Kilroy Realty | | | 3,728 | | |
| | | | | West Coast Office & Industrial Properties | | | | | |
| | 200,000 | | | St. Joe (a)(b) | | | 3,162 | | |
| | | | | Florida Panhandle Landowner | | | | | |
| | | | 97,787 | | |
| | | > Transportation 1.2% | |
| | 230,000 | | | World Fuel Services | | | 8,747 | | |
| | | | | Global Fuel Broker | | | | | |
| | 515,091 | | | Rush Enterprises, Class A (a) | | | 8,422 | | |
| | 115,000 | | | Rush Enterprises, Class B (a) | | | 1,543 | | |
| | | | | Truck Sales & Service | | | | | |
| | | | 18,712 | | |
| Other Industries: Total | | | 116,499 | | |
| Energy & Minerals 4.5% | | | |
| | | > Oil Services 2.0% | |
| | 725,000 | | | Atwood Oceanics (a) | | | 27,434 | | |
| | | | | Offshore Drilling Contractor | | | | | |
| | 125,000 | | | Hornbeck Offshore (a) | | | 4,847 | | |
| | | | | Supply Vessel Operator in U.S. Gulf of Mexico | | | | | |
| | | | 32,281 | | |
| | | > Oil & Gas Producers 1.8% | |
| | 133,000 | | | SM Energy | | | 6,532 | | |
| | | | | Oil & Gas Producer | | | | | |
| | 244,000 | | | Approach Resource (a) | | | 6,232 | | |
| | | | | Oil & Gas Producer in West Texas Permian | | | | | |
| | 129,000 | | | Rosetta Resources (a) | | | 4,727 | | |
| | | | | Oil & Gas Producer Exploring in
South Texas & Montana | | | | | |
See accompanying notes to financial statements.
59
Columbia Acorn USA
Statement of Investments (Unaudited), continued
| Number of Shares | | | | Value (000) | |
| | | > Oil & Gas Producers—continued | |
| | 170,000 | | | Petroleum Development Corporation (a) | | $ | 4,168 | | |
| | | | | Oil & Gas Producer in U.S. | | | | | |
| | 168,000 | | | Swift Energy (a) | | | 3,126 | | |
| | | | | Oil & Gas Exploration & Production | | | | | |
| | 510,000 | | | Quicksilver Resources (a)(b) | | | 2,764 | | |
| | | | | Natural Gas & Coal Seam Gas Producer | | | | | |
| | 262,200 | | | Houston American Energy (a)(b) | | | 294 | | |
| | | | | Oil & Gas Exploration/Production in Colombia | | | | | |
| | | | 27,843 | | |
| | | > Mining 0.7% | |
| | 77,000 | | | Core Laboratories (Netherlands) | | | 8,924 | | |
| | | | | Oil & Gas Reservoir Consulting | | | | | |
| | 600,000 | | | Alexco Resource (a) | | | 2,646 | | |
| | | | | Mining, Exploration & Environmental Services | | | | | |
| | 180,000 | | | Augusta Resource (a) | | | 299 | | |
| | | | | US Copper/Moly Mine | | | | | |
| | | | 11,869 | | |
| Energy & Minerals: Total | | | 71,993 | | |
Total Equities: 99.6%
(Cost: $1,126,154) | | | 1,581,570 | | |
| Number of Shares | | | | Value (000) | |
| Securities Lending Collateral 3.4% | |
| | 53,351,300 | | | Dreyfus Government Cash
Management Fund
(7 day yield of 0.01%) (f) | | $ | 53,351 | | |
Total Securities Lending Collateral:
(Cost: $53,351) | | | 53,351 | | |
Total Investments: 103.0%
(Cost: $1,179,505)(g)(h) | | | 1,634,921 | | |
Obligation to Return Collateral for
Securities Loaned: (3.4)% | | | (53,351 | ) | |
| Cash and Other Assets Less Liabilities: 0.4% | | | 6,291 | | |
| Total Net Assets: 100.0% | | $ | 1,587,861 | | |
ADR - American Depositary Receipts
> Notes to Statement of Investments (dollar values in thousands)
(a) Non-income producing security.
(b) All or a portion of this security was on loan at June 30, 2012. The total market value of securities on loan at June 30, 2012 was $52,943.
(c) An affiliated person of the Fund may include any company in which the Fund owns five percent or more of its outstanding voting shares. Holdings and transactions in these affiliated companies during the period ended June 30, 2012, are as follows:
| Security | | Balance of
Shares Held
12/31/11 | | Purchases/
Additions | | Sales/
Reductions | | Balance of
Shares Held
6/30/12 | | Value | | Dividend | |
| RCM Technologies | | | 640,000 | | | | - | | | | - | | | | 640,000 | | | $ | 3,546 | | | $ | - | | |
| Total of Affiliated Transactions | | | 640,000 | | | | - | | | | - | | | | 640,000 | | | $ | 3,546 | | | $ | - | | |
The aggregate cost and value of this company at June 30, 2012, were $3,624 and $3,546, respectively. Investments in affiliated companies represented 0.22% of the Fund's total net assets at June 30, 2012.
(d) Denotes a restricted security, which is subject to restrictions on resale under federal securities laws. These securities are valued at fair value determined in good faith under consistently applied procedures established by the Board of Trustees. At June 30, 2012, the market value of these securities amounted to $10, which represented less than 0.01% of total net assets.
Additional information on these securities is as follows:
| Security | | Acquisition
Dates | | Shares | | Cost | | Value | |
| Metabolex, Series A-1 | | 2/11/00 | | | 18,181 | | | $ | 2,000 | | | $ | 10 | | |
| | | | | | | $ | 2,000 | | | $ | 10 | | |
(e) Illiquid security.
(f) Investment made with cash collateral received from securities lending activity.
(g) At June 30, 2012, for federal income tax purposes, the cost of investments was $1,179,505 and net unrealized appreciation was $455,416 consisting of gross unrealized appreciation of $563,241 and gross unrealized depreciation of $107,825.
See accompanying notes to financial statements.
60
> Notes to Statement of Investments (dollar values in thousands)
(h) On June 30, 2012, the market value of foreign securities represented 1.30% of total net assets. The Fund's foreign portfolio was diversified as follows:
| Country | | Value | | Percentage
of Net Assets | |
| Netherlands | | $ | 8,924 | | | | 0.56 | | |
| Israel | | | 8,278 | | | | 0.52 | | |
| India | | | 3,493 | | | | 0.22 | | |
| Total Foreign Portfolio | | $ | 20,695 | | | | 1.30 | | |
Fair Value Measurements
Various inputs are used in determining the value of the Fund's investments, following the input prioritization hierarchy established by GAAP. These inputs are summarized in the three broad levels listed below:
• Level 1 – quoted prices in active markets for identical securities
• Level 2 – prices determined using other significant observable inputs (including quoted prices for similar securities, interest rates, prepayment speeds, credit risk and others)
• Level 3 – prices determined using significant unobservable inputs where quoted prices or observable inputs are unavailable or less reliable (including management's own assumptions about the factors market participants would use in pricing an investment)
The inputs or methodology used for valuing securities are not necessarily an indication of the risk associated with investing in those securities.
Examples of the types of securities in which the Fund would typically invest and how they are classified within this hierarchy are as follows. Typical Level 1 securities include exchange traded domestic equities, mutual funds whose NAVs are published each day and exchange traded foreign equities that are not statistically fair valued. Typical Level 2 securities include exchange traded foreign equities that are statistically fair valued and short-term investments valued at amortized cost. Additionally, securities fair valued by the Valuation Committee (the Committee) of the Fund's Board of Trustees (the Board) that rely on significant observable inputs are also included in Level 2. Typical Level 3 securities include any security fair valued by the Committee that relies on significant unobservable inputs.
Under the direction of the Board, the Committee is responsible for carrying out the valuation procedures approved by the Board.
The Committee meets as necessary, and no less frequently than quarterly, to determine fair values for securities for which market quotations are not readily available or for which the investment manager believes that available market quotations are unreliable, and to review the continuing appropriateness of the current value of any security subject to the Trust's Portfolio Pricing Policy and the pricing procedures of the investment manager (the Policies). The Policies address, among other things: circumstances under which market quotations will be deemed readily available; selection of third party pricing vendors; appropriate pricing methodologies; events that require fair valuation and fair value techniques; and circumstances under which securities will be deemed to pose a potential for stale pricing, including when securities are illiquid, restricted, or in default. The Committee may also meet to discuss additional valuation matters, which may include review of back-testing results, review of time-sensitive information or approval of other valuation related actions, and to review the appropriateness of the Policies.
For investments categorized as Level 3, the significant unobservable inputs used in the fair value measurement of the Funds' securities may include: (i) data specific to the issuer or comparable issuers, (ii) general market or specific sector news and (iii) quoted prices and specific or similar security transactions. The Committee considers this data and any changes from prior periods in order to assess the reasonableness of observable and unobservable inputs, any assumptions or internal models used to value those securities and changes in fair value. Significant changes in any of these factors could result in lower or higher fair value measurements. Various factors impact the frequency of monitoring (which may occur as often as daily), however the Committee may determine that changes to inputs, assumptions and models are not required with the same frequency.
The following table summarizes the inputs used, as of June 30, 2012, in valuing the Fund's assets:
| Investment Type | | Quoted Prices
(Level 1) | | Other
Significant
Observable
Inputs
(Level 2) | | Significant
Unobservable
Inputs
(Level 3) | | Total | |
| Equities | |
| Information | | $ | 487,022 | | | $ | - | | | $ | - | | | $ | 487,022 | | |
| Industrial Goods & Services | | | 272,286 | | | | - | | | | - | | | | 272,286 | | |
| Consumer Goods & Services | | | 257,845 | | | | - | | | | - | | | | 257,845 | | |
| Finance | | | 212,942 | | | | - | | | | - | | | | 212,942 | | |
| Health Care | | | 162,973 | | | | - | | | | 10 | | | | 162,983 | | |
| Other Industries | | | 116,499 | | | | - | | | | - | | | | 116,499 | | |
| Energy & Minerals | | | 71,993 | | | | - | | | | - | | | | 71,993 | | |
| Total Equities | | | 1,581,560 | | | | - | | | | 10 | | | | 1,581,570 | | |
| Total Securities Lending Collateral | | | 53,351 | | | | - | | | | - | | | | 53,351 | | |
| Total Investments | | $ | 1,634,911 | | | $ | - | | | $ | 10 | | | $ | 1,634,921 | | |
See accompanying notes to financial statements.
61
Columbia Acorn USA
Statement of Investments (Unaudited), continued
> Notes to Statement of Investments (dollar values in thousands)
There were no transfers of financial assets between levels 1 and 2 during the period.
The following table reconciles asset balances for the period ending June 30, 2012, in which significant observable and/or unobservable inputs (Level 3) were used in determining value:
Investments
in Securities | | Balance
as of
December 31,
2011 | | Realized
Gain/(Loss) | | Change in
Unrealized
Appreciation
(Depreciation) | | Purchases | | Sales | | Transfers
into
Level 3 | | Transfers
out of
Level 3 | | Balance
as of
June 30,
2012 | |
| Equities | |
| Health Care | | $ | 27 | | | $ | - | | | $ | (17 | ) | | $ | - | | | $ | - | | | $ | - | | | $ | - | | | $ | 10 | | |
| | | $ | 27 | | | $ | - | | | $ | (17 | ) | | $ | - | | | $ | - | | | $ | - | | | $ | - | | | $ | 10 | | |
The information in the above reconciliation table represents fiscal year to date activity for any securities identified as using Level 3 inputs at either the beginning or the end of the current fiscal period.
The change in unrealized depreciation attributed to securities owned at June 30, 2012, which were valued using significant unobservable inputs (Level 3), amounted to $17.
The Fund does not hold any significant investments categorized as Level 3.
Certain common stock classified as Level 3 are valued at fair value, using a market approach, as determined in good faith under consistently applied procedures established by and under the general supervision of the Board. To determine fair value for these securities, for which no market exists, the Committee utilizes the valuation technique it deems most appropriate in the circumstances, using some unobservable inputs, which may include but are not limited to trades of similar securities, estimated earnings of the company, market multiples derived from a set of comparable companies, and the position of the security within the company's capital structure. Significant increases or decreases to any of these inputs could result in a significantly lower or higher fair value measurement. Generally, a change in estimated earnings of a company may result in a change to the comparable companies and market multiples utilized.
See accompanying notes to financial statements.
62
Columbia Acorn International Select
Major Portfolio Changes in the Second Quarter (Unaudited)
| | | Number of Shares | |
| | | 3/31/12 | | 6/30/12 | |
| Purchases | |
| Asia | |
| > Taiwan | |
| CTCI Corp | | | 2,789,400 | | | | 3,508,400 | | |
| Taiwan Mobile | | | 1,179,000 | | | | 3,133,800 | | |
| > Japan | |
| Start Today | | | 0 | | | | 496,000 | | |
| Other Countries | |
| > Australia | |
| Challenger Financial | | | 826,355 | | | | 2,809,800 | | |
Commonwealth Property
Office Fund | | | 3,170,358 | | | | 10,466,968 | | |
| IAG | | | 0 | | | | 1,652,046 | | |
| UGL | | | 0 | | | | 1,000,050 | | |
| > Canada | |
| Goldcorp | | | 0 | | | | 344,400 | | |
| Latin America | |
| > Mexico | |
| Fresnillo | | | 0 | | | | 597,400 | | |
| > Guatemala | |
| Tahoe Resources | | | 0 | | | | 196,800 | | |
| | | Number of Shares | |
| | | 3/31/12 | | 6/30/12 | |
| Sales | |
| Asia | |
| > Japan | |
| Ain Pharmaciez | | | 74,000 | | | | 0 | | |
| Asahi Diamond Industrial | | | 528,000 | | | | 1,000 | | |
| Gree | | | 59,400 | | | | 0 | | |
| Kansai Paint | | | 1,911,000 | | | | 319,000 | | |
| > China | |
| NetEase.com - ADR | | | 84,000 | | | | 1,000 | | |
| > Korea | |
| NHN | | | 49,830 | | | | 32,830 | | |
| Other Countries | |
| > South Africa | |
| Northam Platinum | | | 1,146,000 | | | | 0 | | |
| Rand Merchant Insurance | | | 7,601,015 | | | | 6,483,015 | | |
| > Canada | |
| AG Growth | | | 89,000 | | | | 0 | | |
| Europe | |
| > Germany | |
| Rheinmetall | | | 109,500 | | | | 0 | | |
| Rhoen-Klinikum | | | 175,000 | | | | 0 | | |
| > United Kingdom | |
| Chemring | | | 772,800 | | | | 0 | | |
| Intertek Group | | | 178,000 | | | | 79,000 | | |
| JLT Group | | | 314,000 | | | | 296,400 | | |
| Serco | | | 659,000 | | | | 583,000 | | |
| > Netherlands | |
| Core Laboratories | | | 28,100 | | | | 0 | | |
| Imtech | | | 239,919 | | | | 190,916 | | |
| > Switzerland | |
| Kuehne & Nagel | | | 28,000 | | | | 0 | | |
| > Denmark | |
| Novozymes | | | 145,000 | | | | 125,000 | | |
See accompanying notes to financial statements.
63
Columbia Acorn International Select
Statement of Investments (Unaudited), June 30, 2012
| Number of Shares | | | | Value (000) | |
| | | | | | | Equities: 94.9% | |
| Asia 44.4% | | | |
| | | > Singapore 15.0% | |
| | 13,130,000 | | | Ascendas REIT | | $ | 22,399 | | |
| | | | | Industrial Property Landlord | | | | | |
| | 20,395,000 | | | Mapletree Industrial Trust | | | 19,537 | | |
| | | | | Industrial Property Landlord | | | | | |
| | 11,142,000 | | | Mapletree Logistics Trust | | | 8,664 | | |
| | | | | Industrial Property Landlord | | | | | |
| | | | 50,600 | | |
| | | > Taiwan 12.2% | |
| | 11,103,000 | | | Far EasTone Telecom | | | 24,156 | | |
| | | | | Taiwan's Third Largest Mobile Operator | | | | | |
| | 3,133,800 | | | Taiwan Mobile | | | 10,363 | | |
| | | | | Taiwan's Second Largest Mobile Operator | | | | | |
| | 3,508,400 | | | CTCI Corp | | | 6,569 | | |
| | | | | International Engineering Firm | | | | | |
| | | | 41,088 | | |
| | | > Japan 10.1% | |
| | 5,753,734 | | | Seven Bank | | | 14,776 | | |
| | | | | ATM Processing Services | | | | | |
| | 8,970 | | | Jupiter Telecommunications | | | 9,146 | | |
| | | | | Largest Cable Service Provider in Japan | | | | | |
| | 496,000 | | | Start Today | | | 6,931 | | |
| | | | | Online Japanese Apparel Retailer | | | | | |
| | 319,000 | | | Kansai Paint | | | 3,418 | | |
| | | | | Paint Producer in Japan, India, China &
Southeast Asia | | | | | |
| | 1,000 | | | Asahi Diamond Industrial | | | 11 | | |
| | | | | Consumable Diamond Tools | | | | | |
| | | | 34,282 | | |
| | | > China 2.7% | |
| | 4,146,000 | | | Zhaojin Mining Industry | | | 5,452 | | |
| | | | | Gold Mining & Refining in China | | | | | |
| | 3,044,000 | | | Want Want | | | 3,764 | | |
| | | | | Chinese Branded Consumer Food Company | | | | | |
| | 1,000 | | | NetEase.com - ADR (a) | | | 59 | | |
| | | | | Chinese Online Gaming Services | | | | | |
| | | | 9,275 | | |
| | | > Indonesia 2.3% | |
| | 9,272,000 | | | Archipelago Resources (a) | | | 7,406 | | |
| | | | | Gold Mining Projects in Indonesia, Vietnam &
the Philippines | | | | | |
| | 1,404,000 | | | MNC Skyvision (a) | | | 235 | | |
| | | | | Largest Satellite Pay TV Operator in Indonesia | | | | | |
| | | | 7,641 | | |
| | | > Korea 2.1% | |
| | 32,830 | | | NHN | | | 7,201 | | |
| | | | | Korean Online Search Services | | | | | |
| | | | 7,201 | | |
| Asia: Total | | | 150,087 | | |
| Other Countries 28.6% | | | |
| | | > Australia 11.6% | |
| | 1,000,050 | | | UGL | | | 12,805 | | |
| | | | | Engineering & Facilities Management | | | | | |
| Number of Shares | | | | Value (000) | |
| | 10,466,968 | | | Commonwealth Property Office Fund | | $ | 10,911 | | |
| | | | | Australia Prime Office REIT | | | | | |
| | 2,809,800 | | | Challenger Financial | | | 9,437 | | |
| | | | | Largest Annuity Provider | | | | | |
| | 1,652,046 | | | IAG | | | 5,925 | | |
| | | | | General Insurance Provider | | | | | |
| | | | 39,078 | | |
| | | > South Africa 8.7% | |
| | 6,483,015 | | | Rand Merchant Insurance | | | 13,808 | | |
| | | | | Directly Sold Property & Casualty Insurance;
Holdings in Other Insurers | | | | | |
| | 1,317,200 | | | Adcock Ingram Holdings | | | 9,682 | | |
| | | | | Manufacturer of Pharmaceuticals &
Medical Supplies | | | | | |
| | 112,700 | | | Naspers | | | 6,020 | | |
| | | | | Media in Africa, China, Russia & Other
Emerging Markets | | | | | |
| | | | 29,510 | | |
| | | > Canada 5.0% | |
| | 344,400 | | | Goldcorp | | | 12,943 | | |
| | | | | Gold Mining | | | | | |
| | 106,400 | | | CCL Industries | | | 3,903 | | |
| | | | | Leading Global Label Manufacturer | | | | | |
| | | | 16,846 | | |
| | | > United States 1.8% | |
| | 94,000 | | | Atwood Oceanics (a) | | | 3,557 | | |
| | | | | Offshore Drilling Contractor | | | | | |
| | 52,000 | | | SM Energy | | | 2,554 | | |
| | | | | Oil & Gas Producer | | | | | |
| | | | 6,111 | | |
| | | > Israel 1.5% | |
| | 460,000 | | | Israel Chemicals | | | 5,090 | | |
| | | | | Producer of Potash, Phosphates, Bromine &
Specialty Chemicals | | | | | |
| | | | 5,090 | | |
| Other Countries: Total | | | 96,635 | | |
| Europe 16.4% | | | |
| | | > Germany 3.6% | |
| | 630,000 | | | Wirecard | | | 12,216 | | |
| | | | | Online Payment Processing &
Risk Management | | | | | |
| | | | 12,216 | | |
| | | > United Kingdom 3.4% | |
| | 583,000 | | | Serco | | | 4,896 | | |
| | | | | Facilities Management | | | | | |
| | 79,000 | | | Intertek Group | | | 3,310 | | |
| | | | | Testing, Inspection, Certification Services | | | | | |
| | 296,400 | | | JLT Group | | | 3,256 | | |
| | | | | International Business Insurance Broker | | | | | |
| | | | 11,462 | | |
| | | > Sweden 3.0% | |
| | 595,666 | | | Hexagon | | | 10,225 | | |
| | | | | Design, Measurement & Visualization
Software & Equipment | | | | | |
| | | | 10,225 | | |
See accompanying notes to financial statements.
64
| Number of Shares | | | | Value (000) | |
| | | > Iceland 1.7% | |
| | 4,800,000 | | | Marel | | $ | 5,838 | | |
| | | | | Largest Manufacturer of Poultry & Fish
Processing Equipment | | | | | |
| | | | 5,838 | | |
| | | > Netherlands 1.4% | |
| | 190,916 | | | Imtech | | | 4,559 | | |
| | | | | Electromechanical & Information & Communications
Technology Installation & Maintenance | | | | | |
| | | | 4,559 | | |
| | | > Switzerland 1.3% | |
| | 24,000 | | | Partners Group | | | 4,268 | | |
| | | | | Private Markets Asset Management | | | | | |
| | | | 4,268 | | |
| | | > Belgium 1.0% | |
| | 74,000 | | | EVS Broadcast Equipment | | | 3,491 | | |
| | | | | Digital Live Mobile Production
Software & Systems | | | | | |
| | | | 3,491 | | |
| | | > Denmark 1.0% | |
| | 125,000 | | | Novozymes | | | 3,241 | | |
| | | | | Industrial Enzymes | | | | | |
| | | | 3,241 | | |
| Europe: Total | | | 55,300 | | |
| Latin America 5.5% | | | |
| | | > Mexico 4.0% | |
| | 597,400 | | | Fresnillo | | | 13,684 | | |
| | | | | Silver & Metal Byproduct Mining in Mexico | | | | | |
| | | | 13,684 | | |
| Number of Shares | | | | Value (000) | |
| | | > Guatemala 0.8% | |
| | 196,800 | | | Tahoe Resources (a) | | $ | 2,720 | | |
| | | | | Silver Project in Guatemala | | | | | |
| | | | 2,720 | | |
| | | > Uruguay 0.5% | |
| | 191,666 | | | Union Agriculture Group (a)(b)(c) | | | 1,876 | | |
| | | | | Farmland Operator in Uruguay | | | | | |
| | | | 1,876 | | |
| | | > Colombia 0.2% | |
| | 1,880,000 | | | Santa Maria Petroleum (a)(b) | | | 567 | | |
| | | | | Explores for Oil & Gas in Latin America | | | | | |
| | | | 567 | | |
| Latin America: Total | | | 18,847 | | |
Total Equities: 94.9%
(Cost: $273,433) | | | 320,869 | | |
Total Investments: 94.9%
(Cost: $273,433)(d)(e) | | | 320,869 | | |
| Cash and Other Assets Less Liabilities: 5.1% | | | 17,265 | | |
| Total Net Assets: 100.0% | | $ | 338,134 | | |
ADR - American Depositary Receipts
REIT - Real Estate Investment Trust
> Notes to Statement of Investments (dollar values in thousands)
(a) Non-income producing security.
(b) Denotes a restricted security, which is subject to restrictions on resale under federal securities laws. These securities are valued at fair value determined in good faith under consistently applied procedures established by the Board of Trustees. At June 30, 2012, the market value of these securities amounted to $2,443, which represented 0.72% of total net assets.
Additional information on these securities is as follows:
| Security | | Acquisition
Dates | | Shares | | Cost | | Value | |
| Union Agriculture Group | | 12/8/10-6/27/12 | | | 191,666 | | | $ | 2,200 | | | $ | 1,876 | | |
| Santa Maria Petroleum | | 1/14/11 | | | 1,880,000 | | | | 2,376 | | | | 567 | | |
| | | | | | | $ | 4,576 | | | $ | 2,443 | | |
(c) Illiquid security.
(d) At June 30, 2012, for federal income tax purposes, the cost of investments was $273,433 and net unrealized appreciation was $47,436 consisting of gross unrealized appreciation of $56,811 and gross unrealized depreciation of $9,375.
See accompanying notes to financial statements.
65
Columbia Acorn International Select
Statement of Investments (Unaudited), continued
> Notes to Statement of Investments (dollar values in thousands)
(e) On June 30, 2012, the Fund's total investments were denominated in currencies as follows:
| Currency | | Value | | Percentage
of Net Assets | |
| Singapore Dollar | | $ | 50,600 | | | | 15.0 | | |
| Taiwan Dollar | | | 41,089 | | | | 12.2 | | |
| Austrailian Dollar | | | 39,078 | | | | 11.6 | | |
| Japanese Yen | | | 34,282 | | | | 10.1 | | |
| British Pound | | | 32,552 | | | | 9.6 | | |
| South African Rand | | | 29,510 | | | | 8.7 | | |
| United States Dollar | | | 20,988 | | | | 6.2 | | |
| Euro | | | 20,266 | | | | 6.0 | | |
Other currencies less
than 5% of total net assets | | | 52,504 | | | | 15.5 | | |
| Total Portfolio | | $ | 320,869 | | | | 94.9 | | |
At June 30, 2012, the Fund had entered into the following forward foreign currency exchange contracts:
Forward Foreign Currency
Exchange Contracts to Buy | | Forward Foreign Currency
Exchange Contracts to Sell | | Principal Amount in
Foreign Currency | | Principal
Amount in U.S. Dollar | | Settlement Date | | Unrealized
Appreciation/
(Depreciation) | |
| USD | | | | ZAR | | | | | 236,888 | | | $ | 28,000 | | | 7/13/12 | | $ | (932 | ) | |
The counterparty for all forward foreign currency exchange contracts is State Street Bank and Trust Company.
USD = United States Dollar
ZAR = South African Rand
Fair Value Measurements
Various inputs are used in determining the value of the Fund's investments, following the input prioritization hierarchy established by GAAP. These inputs are summarized in the three broad levels listed below:
• Level 1 – quoted prices in active markets for identical securities
• Level 2 – prices determined using other significant observable inputs (including quoted prices for similar securities, interest rates, prepayment speeds, credit risk and others)
• Level 3 – prices determined using significant unobservable inputs where quoted prices or observable inputs are unavailable or less reliable (including management's own assumptions about the factors market participants would use in pricing an investment)
The inputs or methodology used for valuing securities are not necessarily an indication of the risk associated with investing in those securities.
Examples of the types of securities in which the Fund would typically invest and how they are classified within this hierarchy are as follows. Typical Level 1 securities include exchange traded domestic equities, mutual funds whose NAVs are published each day and exchange traded foreign equities that are not statistically fair valued. Typical Level 2 securities include exchange traded foreign equities that are statistically fair valued, forward foreign currency exchange contracts and short-term investments valued at amortized cost. Additionally, securities fair valued by the Valuation Committee (the Committee) of the Fund's Board of Trustees (the Board) that rely on significant observable inputs are also included in Level 2. Typical Level 3 securities include any security fair valued by the Committee that relies on significant unobservable inputs.
Under the direction of the Board, the Committee is responsible for carrying out the valuation procedures approved by the Board.
The Committee meets as necessary, and no less frequently than quarterly, to determine fair values for securities for which market quotations are not readily available or for which the investment manager believes that available market quotations are unreliable, and to review the continuing appropriateness of the current value of any security subject to the Trust's Portfolio Pricing Policy and the pricing procedures of the investment manager (the Policies). The Policies address, among other things: circumstances under which market quotations will be deemed readily available; selection of third party pricing vendors; appropriate pricing methodologies; events that require fair valuation and fair value techniques; and circumstances under which securities will be deemed to pose a potential for stale pricing, including when securities are illiquid, restricted, or in default. The Committee may also meet to discuss additional valuation matters, which may include review of back-testing results, review of time-sensitive information or approval of other valuation related actions, and to review the appropriateness of the Policies.
For investments categorized as Level 3, the significant unobservable inputs used in the fair value measurement of the Funds' securities may include: (i) data specific to the issuer or comparable issuers, (ii) general market or specific sector news and (iii) quoted prices and specific or similar security transactions. The Committee considers this data and any changes from prior periods in order to assess the reasonableness of observable and unobservable inputs, any assumptions or internal models used to value those securities and changes in fair value. Significant changes in any of these factors could result in lower or higher fair value measurements. Various factors impact the frequency of monitoring (which may occur as often as daily), however the Committee may determine that changes to inputs, assumptions and models are not required with the same frequency.
See accompanying notes to financial statements.
66
> Notes to Statement of Investments (dollar values in thousands)
The following table summarizes the inputs used, as of June 30, 2012, in valuing the Fund's assets:
| Investment Type | | Quoted Prices
(Level 1) | | Other
Significant
Observable
Inputs
(Level 2) | | Significant
Unobservable
Inputs
(Level 3) | | Total | |
| Equities | |
| Asia | | $ | 59 | | | $ | 150,028 | | | $ | - | | | $ | 150,087 | | |
| Other Countries | | | 22,957 | | | | 73,678 | | | | - | | | | 96,635 | | |
| Europe | | | - | | | | 55,300 | | | | - | | | | 55,300 | | |
| Latin America | | | 2,720 | | | | 14,251 | | | | 1,876 | | | | 18,847 | | |
| Total Equities | | | 25,736 | | | | 293,257 | | | | 1,876 | | | | 320,869 | | |
| Total Investments | | $ | 25,736 | | | $ | 293,257 | | | $ | 1,876 | | | $ | 320,869 | | |
Unrealized Depreciation on Forward Foreign
Currency Exchange Contracts | | | - | | | | (932 | ) | | | - | | | | (932 | ) | |
| Total Investments | | $ | 25,736 | | | $ | 292,325 | | | $ | 1,876 | | | $ | 319,937 | | |
The Fund's assets assigned to the Level 2 input category are generally valued using a market approach, in which a security's value is determined through its correlation to prices and information from observable market transactions for similar or identical assets. Foreign equities are generally valued at the last sale price on the foreign exchange or market on which they trade. The Fund may use a statistical fair valuation model, in accordance with the policy adopted by the Board, provided by an independent third party to value securities principally traded in foreign markets in order to adjust for possible stale pricing that may occur between the close of the foreign exchanges and the time for valuation. These models take into account available market data including intraday index, ADR, and ETF movements. Forward foreign currency exchange contracts are valued at the prevailing forward exchange rate of the underlying currencies. Securities acquired via private placement that have a holding period or an extended settlement period are valued at a discount to the same shares that are trading freely on the market. These discounts are determined by the Investment manager's experience with similar securities or situations. Factors may include, but are not limited to, trade volume, shares outstanding and stock price.
There were no transfers of financial assets between levels 1 and 2 during the period.
The following table reconciles asset balances for the period ending June 30, 2012, in which significant observable and/or unobservable inputs (Level 3) were used in determining value:
Investments
in Securities | | Balance
as of
December 31,
2011 | | Realized
Gain/(Loss) | | Change in
Unrealized
Appreciation
(Depreciation) | | Purchases | | Sales | | Transfers
into
Level 3 | | Transfers
out of
Level 3 | | Balance
as of
June 30,
2012 | |
| Equities | |
| Latin America | | $ | 1,828 | | | $ | - | | | $ | 48 | | | $ | - | | | $ | - | | | $ | - | | | $ | - | | | $ | 1,876 | | |
| | | $ | 1,828 | | | $ | - | | | $ | 48 | | | $ | - | | | $ | - | | | $ | - | | | $ | - | | | $ | 1,876 | | |
The information in the above reconciliation table represents fiscal year to date activity for any securities identified as using Level 3 inputs at either the beginning or the end of the current fiscal period.
The change in unrealized appreciation attributed to securities owned at June 30, 2012, which were valued using significant unobservable inputs (Level 3), amounted to $48.
The Fund does not hold any significant investments categorized as Level 3.
Certain common stock classified as Level 3 are valued at fair value, using a market approach, as determined in good faith under consistently applied procedures established by and under the general supervision of the Board. To determine fair value for these securities, for which no market exists, the Committee utilizes the valuation technique it deems most appropriate in the circumstances, using some unobservable inputs, which may include but are not limited to trades of similar securities, estimated earnings of the company, market multiples derived from a set of comparable companies, and the position of the security within the company's capital structure. Significant increases or decreases to any of these inputs could result in a significantly lower or higher fair value measurement. Generally, a change in estimated earnings of a company may result in a change to the comparable companies and market multiples utilized.
See accompanying notes to financial statements.
67
Columbia Acorn International Select
Portfolio Diversification (Unaudited)
At June 30, 2012, the Fund's portfolio investments as a percentage of net assets were diversified as follows:
| | | Value (000) | | Percentage
of Net Assets | |
| > Information | |
| Mobile Communications | | $ | 34,520 | | | | 10.2 | | |
| Internet Related | | | 13,279 | | | | 4.0 | | |
| Financial Processors | | | 12,216 | | | | 3.6 | | |
| Business Software | | | 10,224 | | | | 3.0 | | |
| CATV | | | 9,146 | | | | 2.7 | | |
Computer Hardware & Related
Equipment | | | 3,491 | | | | 1.0 | | |
| Satellite Broadcasting & Services | | | 235 | | | | 0.1 | | |
| | | | 83,111 | | | | 24.6 | | |
| > Other Industries | |
| Real Estate | | | 61,511 | | | | 18.2 | | |
| > Finance | |
| Insurance | | | 32,427 | | | | 9.6 | | |
| Banks | | | 14,776 | | | | 4.4 | | |
| Brokerage & Money Management | | | 4,268 | | | | 1.2 | | |
| | | | 51,471 | | | | 15.2 | | |
| > Energy & Minerals | |
| Mining | | | 42,204 | | | | 12.5 | | |
| Oil Services | | | 3,557 | | | | 1.0 | | |
| Oil & Gas Producers | | | 3,121 | | | | 0.9 | | |
| Agricultural Commodities | | | 1,876 | | | | 0.6 | | |
| | | | 50,758 | | | | 15.0 | | |
| > Industrial Goods & Services | |
| Other Industrial Services | | | 20,674 | | | | 6.1 | | |
Industrial Materials & Specialty
Chemicals | | | 11,749 | | | | 3.5 | | |
| Construction | | | 6,569 | | | | 1.9 | | |
| Machinery | | | 5,849 | | | | 1.7 | | |
| Outsourcing Services | | | 4,896 | | | | 1.5 | | |
| | | | 49,737 | | | | 14.7 | | |
| | | Value (000) | | Percentage
of Net Assets | |
| > Consumer Goods & Services | |
| Retail | | $ | 6,931 | | | | 2.0 | | |
| Nondurables | | | 3,904 | | | | 1.2 | | |
| Food & Beverage | | | 3,764 | | | | 1.1 | | |
| | | | 14,599 | | | | 4.3 | | |
| > Health Care | |
| Pharmaceuticals | | | 9,682 | | | | 2.9 | | |
| Total Equities: | | | 320,869 | | | | 94.9 | | |
| Total Investments: | | | 320,869 | | | | 94.9 | | |
Cash and Other Assets
Less Liabilities: | | | 17,265 | | | | 5.1 | | |
| Net Assets: | | $ | 338,134 | | | | 100.0 | | |
See accompanying notes to financial statements.
68
Columbia Acorn Select
Major Portfolio Changes in the Second Quarter (Unaudited)
| | | Number of Shares | |
| | | 3/31/12 | | 6/30/12 | |
| Purchases | |
| Industrial Goods & Services | |
| Nordson | | | 160,000 | | | | 220,000 | | |
| Information | |
| Globalstar | | | 15,000,000 | | | | 16,721,800 | | |
| Consumer Goods & Services | |
| Vail Resorts | | | 0 | | | | 235,000 | | |
| Energy & Minerals | |
| Canadian Solar (China) | | | 2,700,000 | | | | 3,301,200 | | |
| Houston American Energy | | | 826,400 | | | | 1,455,000 | | |
Tuscany International Drilling
(Colombia) | | | 12,700,000 | | | | 13,613,200 | | |
| | | Number of Shares | |
| | | 3/31/12 | | 6/30/12 | |
| Sales | |
| Industrial Goods & Services | |
| Ametek | | | 1,490,000 | | | | 1,358,000 | | |
| Donaldson | | | 1,260,000 | | | | 1,140,000 | | |
Expeditors International of
Washington | | | 600,000 | | | | 475,000 | | |
| Kennametal | | | 975,000 | | | | 865,000 | | |
| Pall | | | 690,000 | | | | 625,000 | | |
| Quanta Services | | | 1,420,000 | | | | 1,000,000 | | |
| Information | |
| Amphenol | | | 645,000 | | | | 560,000 | | |
| Atmel | | | 1,175,000 | | | | 1,140,000 | | |
| Sanmina-SCI | | | 4,375,000 | | | | 3,026,600 | | |
| SBA Communications | | | 1,010,000 | | | | 735,000 | | |
| VisionChina Media - ADR (China) | | | 6,108,437 | | | | 5,427,200 | | |
| WNS - ADR (India) | | | 3,940,000 | | | | 3,405,000 | | |
| Consumer Goods & Services | |
| Abercrombie & Fitch | | | 555,000 | | | | 455,000 | | |
| Coach | | | 615,000 | | | | 555,000 | | |
| Gaylord Entertainment | | | 1,020,000 | | | | 930,000 | | |
| Hertz | | | 5,225,000 | | | | 4,495,000 | | |
IFM Investments (Century 21
China RE) - ADR (China) | | | 1,143,333 | | | | 998,000 | | |
| ITT Educational Services | | | 270,000 | | | | 223,000 | | |
| lululemon athletica | | | 390,000 | | | | 305,000 | | |
| RexLot Holdings (China) | | | 260,000,000 | | | | 208,000,000 | | |
| Safeway | | | 1,100,000 | | | | 0 | | |
| Tiffany & Co. | | | 200,000 | | | | 184,000 | | |
| Finance | |
| City National | | | 630,000 | | | | 540,000 | | |
| CNO Financial Group | | | 8,325,000 | | | | 7,140,000 | | |
| Discover Financial Services | | | 2,115,000 | | | | 1,935,000 | | |
| Regional Management | | | 84,500 | | | | 0 | | |
| SEI Investments | | | 965,000 | | | | 775,000 | | |
| Energy & Minerals | |
| Canacol (Colombia) | | | 30,872,300 | | | | 29,187,400 | | |
| Eacom Timber (Canada) | | | 33,572,000 | | | | 8,440,000 | | |
| Kirkland Lake Gold (Canada) | | | 870,000 | | | | 835,000 | | |
Pacific Rubiales Energy
(Colombia) | | | 1,480,000 | | | | 1,170,000 | | |
| Petrodorado (Colombia) | | | 34,700,000 | | | | 33,700,000 | | |
| Shamaran Petroleum (Iraq) | | | 36,500,000 | | | | 30,473,500 | | |
| Health Care | |
| Akorn | | | 1,400,000 | | | | 1,310,000 | | |
| NPS Pharmaceuticals | | | 2,510,000 | | | | 2,340,000 | | |
| Seattle Genetics | | | 395,000 | | | | 383,000 | | |
| Other Industries | |
| Biomed Realty Trust | | | 1,660,000 | | | | 1,435,000 | | |
See accompanying notes to financial statements.
69
Columbia Acorn Select
Statement of Investments (Unaudited), June 30, 2012
| Number of Shares | | | | Value (000) | |
| | | | | | | Equities: 98.0% | |
| Industrial Goods & Services 21.7% | | | |
| | | > Machinery 16.4% | |
| | 1,358,000 | | | Ametek | | $ | 67,778 | | |
| | | | | Aerospace/Industrial Instruments | | | | | |
| | 1,140,000 | | | Donaldson | | | 38,042 | | |
| | | | | Industrial Air Filtration | | | | | |
| | 625,000 | | | Pall | | | 34,256 | | |
| | | | | Filtration & Fluids Clarification | | | | | |
| | 865,000 | | | Kennametal | | | 28,675 | | |
| | | | | Consumable Cutting Tools | | | | | |
| | 220,000 | | | Nordson | | | 11,284 | | |
| | | | | Dispensing Systems for Adhesives & Coatings | | | | | |
| | | | 180,035 | | |
| | | > Outsourcing Services 2.2% | |
| | 1,000,000 | | | Quanta Services (a) | | | 24,070 | | |
| | | | | Electrical & Telecom Construction Services | | | | | |
| | | | 24,070 | | |
| | | > Other Industrial Services 1.7% | |
| | 475,000 | | | Expeditors International of Washington | | | 18,406 | | |
| | | | | International Freight Forwarder | | | | | |
| | | | 18,406 | | |
| | | > Industrial Materials & Specialty
Chemicals 1.4% | |
| | 300,000 | | | FMC Corporation | | | 16,044 | | |
| | | | | Niche Specialty Chemicals | | | | | |
| | | | 16,044 | | |
| Industrial Goods & Services: Total | | | 238,555 | | |
| Information 20.1% | | | |
| | | > Mobile Communications 8.0% | |
| | 735,000 | | | SBA Communications (a) | | | 41,932 | | |
| | | | | Communications Towers | | | | | |
| | 700,000 | | | Crown Castle International (a) | | | 41,062 | | |
| | | | | Communications Towers | | | | | |
| | 16,721,800 | | | Globalstar (a)(b)(c) | | | 5,351 | | |
| | | | | Satellite Mobile Voice & Data Carrier | | | | | |
| | | | 88,345 | | |
| | | > Computer Services 3.0% | |
| | 3,405,000 | | | WNS - ADR (India) (a)(b) | | | 33,131 | | |
| | | | | Offshore BPO (Business Process Outsourcing) Services | | | | | |
| | | | 33,131 | | |
| | | > Computer Hardware &
Related Equipment 2.8% | |
| | 560,000 | | | Amphenol | | | 30,755 | | |
| | | | | Electronic Connectors | | | | | |
| | | | 30,755 | | |
| | | > Contract Manufacturing 2.3% | |
| | 3,026,600 | | | Sanmina-SCI (a) | | | 24,788 | | |
| | | | | Electronic Manufacturing Services | | | | | |
| | | | 24,788 | | |
| | | > Instrumentation 1.8% | |
| | 126,000 | | | Mettler-Toledo International (a) | | | 19,637 | | |
| | | | | Laboratory Equipment | | | | | |
| | | | 19,637 | | |
| Number of Shares | | | | Value (000) | |
| | | > Business Software 1.0% | |
| | 167,000 | | | Concur Technologies (a) | | $ | 11,373 | | |
| | | | | Web Enabled Cost & Expense Management
Software | | | | | |
| | | | 11,373 | | |
| | | > Semiconductors & Related
Equipment 0.7% | |
| | 1,140,000 | | | Atmel (a) | | | 7,638 | | |
| | | | | Microcontrollers, Radio Frequency & Memory
Semiconductors | | | | | |
| | | | 7,638 | | |
| | | > Advertising 0.5% | |
| | 5,427,200 | | | VisionChina Media - ADR
(China) (a)(b)(c) | | | 5,047 | | |
| | | | | Advertising on Digital Screens in China's Mass
Transit System | | | | | |
| | | | 5,047 | | |
| Information: Total | | | 220,714 | | |
| Consumer Goods & Services 19.2% | | | |
| | | > Travel 9.6% | |
| | 4,495,000 | | | Hertz (a) | | | 57,536 | | |
| | | | | Largest U.S. Rental Car Operator | | | | | |
| | 930,000 | | | Gaylord Entertainment (a) | | | 35,861 | | |
| | | | | Convention Hotels | | | | | |
| | 235,000 | | | Vail Resorts | | | 11,769 | | |
| | | | | Ski Resort Operator & Developer | | | | | |
| | | | 105,166 | | |
| | | > Retail 3.9% | |
| | 305,000 | | | lululemon athletica (a) | | | 18,187 | | |
| | | | | Premium Active Apparel Retailer | | | | | |
| | 455,000 | | | Abercrombie & Fitch | | | 15,534 | | |
| | | | | Teen Apparel Retailer | | | | | |
| | 184,000 | | | Tiffany & Co. | | | 9,743 | | |
| | | | | Luxury Good Retailer | | | | | |
| | | | 43,464 | | |
| | | > Apparel 2.9% | |
| | 555,000 | | | Coach | | | 32,456 | | |
| | | | | Designer & Retailer of Branded Leather Accessories | | | | | |
| | | | 32,456 | | |
| | | > Casinos & Gaming 1.4% | |
| | 208,000,000 | | | RexLot Holdings (China) | | | 14,900 | | |
| | | | | Lottery Equipment Supplier in China | | | | | |
| | | | 14,900 | | |
| | | > Educational Services 1.2% | |
| | 223,000 | | | ITT Educational Services (a)(c) | | | 13,547 | | |
| | | | | Postsecondary Degree Services | | | | | |
| | | | 13,547 | | |
| | | > Other Consumer Services 0.1% | |
| | 998,000 | | | IFM Investments (Century 21
China RE) - ADR (China) (a)(b) | | | 1,088 | | |
| | | | | Provide Real Estate Services in China | | | | | |
| | | | 1,088 | | |
See accompanying notes to financial statements.
70
| Number of Shares | | | | Value (000) | |
| | | > Food & Beverage 0.1% | |
| | 1,500,000 | | | GLG Life Tech (Canada) (a)(c)(d) | | $ | 621 | | |
| | | | | All-natural Sweetener Extracted from the
Stevia Plant | | | | | |
| | | | 621 | | |
| Consumer Goods & Services: Total | | | 211,242 | | |
| Finance 16.2% | | | |
| | | > Credit Cards 6.1% | |
| | 1,935,000 | | | Discover Financial Services | | | 66,912 | | |
| | | | | Credit Card Company | | | | | |
| | | | 66,912 | | |
| | | > Insurance 5.0% | |
| | 7,140,000 | | | CNO Financial Group | | | 55,692 | | |
| | | | | Life, Long-term Care & Medical Supplement
Insurance | | | | | |
| | | | 55,692 | | |
| | | > Banks 3.7% | |
| | 540,000 | | | City National | | | 26,233 | | |
| | | | | Bank & Asset Manager | | | | | |
| | 1,075,000 | | | Associated Banc-Corp | | | 14,179 | | |
| | | | | Midwest Bank | | | | | |
| | | | 40,412 | | |
| | | > Brokerage & Money Management 1.4% | |
| | 775,000 | | | SEI Investments | | | 15,415 | | |
| | | | | Mutual Fund Administration & Investment
Management | | | | | |
| | | | 15,415 | | |
| Finance: Total | | | 178,431 | | |
| Energy & Minerals 9.7% | | | |
| | | > Oil & Gas Producers 5.3% | |
| | 1,170,000 | | | Pacific Rubiales Energy (Colombia) | | | 24,777 | | |
| | | | | Oil Production & Exploration in Colombia | | | | | |
| | 29,187,400 | | | Canacol (Colombia) (a) | | | 13,044 | | |
| | | | | Oil Producer in South America | | | | | |
| | 33,700,000 | | | Petrodorado (Colombia) (a)(b) | | | 5,296 | | |
| | 17,144,000 | | | Petrodorado - Warrants (Colombia) (a)(e) | | | 243 | | |
| | | | | Oil & Gas Exploration & Production in
Colombia, Peru & Paraguay | | | | | |
| | 30,473,500 | | | Shamaran Petroleum (Iraq) (a) | | | 5,088 | | |
| | | | | Oil Exploration in Kurdistan | | | | | |
| | 24,000,000 | | | Canadian Overseas Petroleum
(United Kingdom) (a)(b)(e) | | | 4,187 | | |
| | 12,000,000 | | | Canadian Overseas Petroleum - Warrants (United Kingdom) (a)(d)(e) | | | 232 | | |
| | | | | Oil & Gas Exploration/Production in the
North Sea | | | | | |
| | 17,575,000 | | | Petromanas (Canada) (a) | | | 3,711 | | |
| | | | | Exploring for Oil in Albania | | | | | |
| | 1,455,000 | | | Houston American Energy (a)(c) | | | 1,630 | | |
| | | | | Oil & Gas Exploration/Production in Colombia | | | | | |
| | | | 58,208 | | |
| Number of Shares | | | | Value (000) | |
| | | > Agricultural Commodities 1.6% | |
| | 1,742,424 | | | Union Agriculture Group
(Uruguay) (a)(d)(e) | | $ | 17,058 | | |
| | | | | Farmland Operator in Uruguay | | | | | |
| | 8,440,000 | | | Eacom Timber (Canada) (a) | | | 829 | | |
| | | | | Canadian Lumber Producer | | | | | |
| | | | 17,887 | | |
| | | > Alternative Energy 1.5% | |
| | 3,301,200 | | | Canadian Solar (China) (a)(b)(c) | | | 11,884 | | |
| | | | | Solar Cell & Module Manufacturer | | | | | |
| | 2,425,000 | | | Synthesis Energy Systems (China) (a) | | | 2,959 | | |
| | | | | Owner/Operator of Gasification Plants | | | | | |
| | 1,165,000 | | | Real Goods Solar (a) | | | 1,316 | | |
| | | | | Residential Solar Energy Installer | | | | | |
| | | | 16,159 | | |
| | | > Mining 0.8% | |
| | 835,000 | | | Kirkland Lake Gold (Canada) (a) | | | 8,989 | | |
| | | | | Gold Mining | | | | | |
| | | | 8,989 | | |
| | | > Oil Services 0.5% | |
| | 13,613,200 | | | Tuscany International Drilling
(Colombia) (a) | | | 5,282 | | |
| | | | | South America-based Drilling Rig Contractor | | | | | |
| | | | 5,282 | | |
| Energy & Minerals: Total | | | 106,525 | | |
| Health Care 6.0% | | | |
| | | > Biotechnology & Drug Delivery 2.7% | |
| | 2,340,000 | | | NPS Pharmaceuticals (a) | | | 20,148 | | |
| | | | | Orphan Drugs & Healthy Royalties | | | | | |
| | 383,000 | | | Seattle Genetics (a)(c) | | | 9,724 | | |
| | | | | Antibody-based Therapies for Cancer | | | | | |
| | | | 29,872 | | |
| | | > Pharmaceuticals 1.9% | |
| | 1,310,000 | | | Akorn (a) | | | 20,659 | | |
| | | | | Develops, Manufactures & Sells Specialty
Generic Drugs | | | | | |
| | | | 20,659 | | |
| | | > Medical Supplies 1.4% | |
| | 190,000 | | | Henry Schein (a) | | | 14,913 | | |
| | | | | Largest Distributor of Healthcare Products | | | | | |
| | | | 14,913 | | |
| Health Care: Total | | | 65,444 | | |
| Other Industries 5.1% | | | |
| | | > Real Estate 3.7% | |
| | 1,435,000 | | | Biomed Realty Trust | | | 26,806 | | |
| | | | | Life Science-focused Office Buildings | | | | | |
| | 475,000 | | | DuPont Fabros Technology | | | 13,566 | | |
| | | | | Technology-focused Office Buildings | | | | | |
| | | | 40,372 | | |
See accompanying notes to financial statements.
71
Columbia Acorn Select
Statement of Investments (Unaudited), continued
| Number of Shares | | | | Value (000) | |
| | | > Regulated Utilities 1.4% | |
| | 403,000 | | | Wisconsin Energy | | $ | 15,946 | | |
| | | Wisconsin Utility | | | | | |
| | | | 15,946 | | |
| Other Industries: Total | | | 56,318 | | |
Total Equities: 98.0%
(Cost: $835,953) | | | 1,077,229 | | |
| Securities Lending Collateral 2.4% | |
| | 26,067,257 | | | Dreyfus Government Cash
Management Fund
(7 day yield of 0.01%) (f) | | | 26,067 | | |
Total Securities Lending Collateral:
(Cost: $26,067) | | | 26,067 | | |
Total Investments: 100.4%
(Cost: $862,020)(g)(h) | | | 1,103,296 | | |
Obligation to Return Collateral for
Securities Loaned: (2.4)% | | | (26,067 | ) | |
| Cash and Other Assets Less Liabilities: 2.0% | | | 21,891 | | |
| Total Net Assets: 100.0% | | $ | 1,099,120 | | |
ADR - American Depositary Receipts
> Notes to Statement of Investments (dollar values in thousands)
(a) Non-income producing security.
(b) An affiliated person of the Fund may include any company in which the Fund owns five percent or more of its outstanding voting shares. Holdings and transactions in these affiliated companies during the period ended June 30, 2012, are as follows:
| Security | | Balance of
Shares Held
12/31/11 | | Purchases/
Additions | | Sales/
Reductions | | Balance of
Shares Held
6/30/12 | | Value | | Dividend | |
| Canacol* | | | 31,372,300 | | | | - | | | | 2,184,900 | | | | 29,187,400 | | | $ | 13,044 | | | $ | - | | |
| Canadian Overseas Petroleum | | | 24,000,000 | | | | - | | | | - | | | | 24,000,000 | | | | 4,187 | | | | - | | |
| Canadian Solar | | | 2,700,000 | | | | 601,200 | | | | - | | | | 3,301,200 | | | | 11,884 | | | | - | | |
| Eacom Timber* | | | 36,000,000 | | | | - | | | | 27,560,000 | | | | 8,440,000 | | | | 829 | | | | - | | |
| GLG Life Tech* | | | 1,850,000 | | | | - | | | | 350,000 | | | | 1,500,000 | | | | 621 | | | | - | | |
| Globalstar | | | 13,184,322 | | | | 3,815,678 | | | | 278,200 | | | | 16,721,800 | | | | 5,351 | | | | - | | |
| IFM Investments (Century 21 China RE) - ADR** | | | 3,430,000 | | | | - | | | | 2,432,000 | | | | 998,000 | | | | 1,088 | | | | - | | |
| Petrodorado | | | 34,700,000 | | | | - | | | | 1,000,000 | | | | 33,700,000 | | | | 5,296 | | | | - | | |
| Real Goods Solar* | | | 1,500,000 | | | | - | | | | 335,000 | | | | 1,165,000 | | | | 1,316 | | | | - | | |
| Sanmina-SCI* | | | 6,100,000 | | | | - | | | | 3,073,400 | | | | 3,026,600 | | | | 24,788 | | | | - | | |
| Synthesis Energy Systems* | | | 2,950,372 | | | | - | | | | 525,372 | | | | 2,425,000 | | | | 2,959 | | | | - | | |
| VisionChina Media - ADR | | | 7,000,000 | | | | - | | | | 1,572,800 | | | | 5,427,200 | | | | 5,047 | | | | - | | |
| WNS - ADR | | | 4,254,230 | | | | - | | | | 849,230 | | | | 3,405,000 | | | | 33,131 | | | | - | | |
| Total of Affiliated Transactions | | | 169,041,224 | | | | 4,416,878 | | | | 40,160,902 | | | | 133,297,200 | | | $ | 109,541 | | | $ | - | | |
* At June 30, 2012, the Fund owned less than five percent of the company's outstanding voting shares.
** Includes the effects of a 1:3 stock split.
See accompanying notes to financial statements.
72
> Notes to Statement of Investments (dollar values in thousands)
The aggregate cost and value of these companies at June 30, 2012, were $152,247 and $65,984, respectively. Investments in affiliated companies represented 6.00% of the Fund's total net assets at June 30, 2012.
(c) All or a portion of this security was on loan at June 30, 2012. The total market value of securities on loan at June 30, 2012 was $25,542.
(d) Illiquid security.
(e) Denotes a restricted security, which is subject to restrictions on resale under federal securities laws. These securities are valued at fair value determined in good faith under consistently applied procedures established by the Board of Trustees. At June 30, 2012, the market value of these securities amounted to $21,720, which represented 1.98% of total net assets.
Additional information on these securities is as follows:
| Security | | Acquisition
Dates | | Shares | | Cost | | Value | |
| Union Agriculuture Group | | 12/8/10-6/27/12 | | | 1,742,424 | | | $ | 20,000 | | | $ | 17,058 | | |
| Canadian Overseas Petroleum | | 11/24/10 | | | 24,000,000 | | | | 10,260 | | | | 4,187 | | |
| Petrodorado - Warrants | | 11/20/09 | | | 17,144,000 | | | | 2,118 | | | | 243 | | |
| Canadian Overseas Petroleum - Warrants | | 11/24/10 | | | 12,000,000 | | | | 1,502 | | | | 232 | | |
| | | | | | | $ | 33,880 | | | $ | 21,720 | | |
(f) Investment made with cash collateral received from securities lending activity.
(g) At June 30, 2012, for federal income tax purposes, the cost of investments was $862,020 and net unrealized appreciation was $241,276 consisting of gross unrealized appreciation of $390,213 and gross unrealized depreciation of $148,937.
(h) On June 30, 2012, the market value of foreign securities represented 14.41% of total net assets. The Fund's foreign portfolio was diversified as follows:
| Country | | Value | | Percentage
of Net Assets | |
| Colombia | | $ | 48,642 | | | | 4.43 | | |
| China | | | 35,878 | | | | 3.27 | | |
| India | | | 33,131 | | | | 3.01 | | |
| Uruguay | | | 17,058 | | | | 1.55 | | |
| Canada | | | 14,150 | | | | 1.29 | | |
| Iraq | | | 5,088 | | | | 0.46 | | |
| United Kingdom | | | 4,419 | | | | 0.40 | | |
| Total Foreign Portfolio | | $ | 158,366 | | | | 14.41 | | |
Fair Value Measurements
Various inputs are used in determining the value of the Fund's investments, following the input prioritization hierarchy established by GAAP. These inputs are summarized in the three broad levels listed below:
• Level 1 – quoted prices in active markets for identical securities
• Level 2 – prices determined using other significant observable inputs (including quoted prices for similar securities, interest rates, prepayment speeds, credit risk and others)
• Level 3 – prices determined using significant unobservable inputs where quoted prices or observable inputs are unavailable or less reliable (including management's own assumptions about the factors market participants would use in pricing an investment)
The inputs or methodology used for valuing securities are not necessarily an indication of the risk associated with investing in those securities.
Examples of the types of securities in which the Fund would typically invest and how they are classified within this hierarchy are as follows. Typical Level 1 securities include exchange traded domestic equities, mutual funds whose NAVs are published each day and exchange traded foreign equities that are not statistically fair valued. Typical Level 2 securities include exchange traded foreign equities that are statistically fair valued and short-term investments valued at amortized cost. Additionally, securities fair valued by the Valuation Committee (the Committee) of the Fund's Board of Trustees (the Board) that rely on significant observable inputs are also included in Level 2. Typical Level 3 securities include any security fair valued by the Committee that relies on significant unobservable inputs.
Under the direction of the Board, the Committee is responsible for carrying out the valuation procedures approved by the Board.
The Committee meets as necessary, and no less frequently than quarterly, to determine fair values for securities for which market quotations are not readily available or for which the investment manager believes that available market quotations are unreliable, and to review the continuing appropriateness of the current value of any security subject to the Trust's Portfolio Pricing Policy and the pricing procedures of the investment manager (the Policies). The Policies address, among other things: circumstances under which market quotations will be deemed readily available; selection of third party pricing vendors; appropriate pricing methodologies; events that require fair valuation and fair value techniques; and circumstances under which securities will be deemed to pose a potential for stale pricing, including when securities are illiquid, restricted, or in default. The Committee may also meet to discuss additional valuation matters, which may include review of back-testing results, review of time-sensitive information or approval of other valuation related actions, and to review the appropriateness of the Policies.
See accompanying notes to financial statements.
73
Columbia Acorn Select
Statement of Investments (Unaudited), continued
> Notes to Statement of Investments (dollar values in thousands)
For investments categorized as Level 3, the significant unobservable inputs used in the fair value measurement of the Funds' securities may include: (i) data specific to the issuer or comparable issuers, (ii) general market or specific sector news and (iii) quoted prices and specific or similar security transactions. The Committee considers this data and any changes from prior periods in order to assess the reasonableness of observable and unobservable inputs, any assumptions or internal models used to value those securities and changes in fair value. Significant changes in any of these factors could result in lower or higher fair value measurements. Various factors impact the frequency of monitoring (which may occur as often as daily), however the Committee may determine that changes to inputs, assumptions and models are not required with the same frequency.
The following table summarizes the inputs used, as of June 30, 2012, in valuing the Fund's assets:
| Investment Type | | Quoted Prices
(Level 1) | | Other
Significant
Observable
Inputs
(Level 2) | | Significant
Unobservable
Inputs
(Level 3) | | Total | |
| Equities | |
| Industrial Goods & Services | | $ | 238,555 | | | $ | - | | | $ | - | | | $ | 238,555 | | |
| Information | | | 220,714 | | | | - | | | | - | | | | 220,714 | | |
| Consumer Goods & Services | | | 195,721 | | | | 15,521 | | | | - | | | | 211,242 | | |
| Finance | | | 178,431 | | | | - | | | | - | | | | 178,431 | | |
| Energy & Minerals | | | 84,805 | | | | 4,662 | | | | 17,058 | | | | 106,525 | | |
| Health Care | | | 65,444 | | | | - | | | | - | | | | 65,444 | | |
| Other Industries | | | 56,318 | | | | - | | | | - | | | | 56,318 | | |
| Total Equities | | | 1,039,988 | | | | 20,183 | | | | 17,058 | | | | 1,077,229 | | |
| Total Securities Lending Collateral | | | 26,067 | | | | - | | | | - | | | | 26,067 | | |
| Total Investments | | $ | 1,066,055 | | | $ | 20,183 | | | $ | 17,058 | | | $ | 1,103,296 | | |
The Fund's assets assigned to the Level 2 input category are generally valued using a market approach, in which a security's value is determined through its correlation to prices and information from observable market transactions for similar or identical assets. Foreign equities are generally valued at the last sale price on the foreign exchange or market on which they trade. The Fund may use a statistical fair valuation model, in accordance with the policy adopted by the Board, provided by an independent third party to value securities principally traded in foreign markets in order to adjust for possible stale pricing that may occur between the close of the foreign exchanges and the time for valuation. These models take into account available market data including intraday index, ADR, and ETF movements. Securities acquired via private placement that have a holding period or an extended settlement period are valued at a discount to the same shares that are trading freely on the market. These discounts are determined by the investment manager's experience with similar securities or situations. Factors may include, but are not limited to, trade volume, shares outstanding and stock price. Warrants which do not trade are valued as a percentage of the actively trading common stock using a model, based on Black Scholes. Securities which have halted or temporarily stopped trading are valued at the last sale and adjusted by a premium or a discount to account for the anticipated re-opening price. These adjustments are determined by the investment manager's experience with similar securities or situations.
The following table shows transfers between Level 1 and Level 2 of the fair value hierarchy:
| Transfers In | | Transfers Out | |
| Level 1 | | Level 2 | | Level 1 | | Level 2 | |
| $ | - | | | $ | 1,665 | | | $ | 1,665 | | | $ | - | | |
Financial assets were transferred from Level 1 to Level 2 as trading halted during the period.
The following table reconciles asset balances for the period ending June 30, 2012, in which significant observable and/or unobservable inputs (Level 3) were used in determining value:
Investments
in Securities | | Balance
as of
December 31,
2011 | | Realized
Gain/(Loss) | | Change in
Unrealized
Appreciation
(Depreciation) | | Purchases | | Sales | | Transfers
into
Level 3 | | Transfers
out of
Level 3 | | Balance
as of
June 30,
2012 | |
| Equities | |
| Energy & Minerals | | $ | 16,617 | | | $ | - | | | $ | 441 | | | $ | - | | | $ | - | | | $ | - | | | $ | - | | | $ | 17,058 | | |
| | | $ | 16,617 | | | $ | - | | | $ | 441 | | | $ | - | | | $ | - | | | $ | - | | | $ | - | | | $ | 17,058 | | |
The information in the above reconciliation table represents fiscal year to date activity for any securities identified as using Level 3 inputs at either the beginning or the end of the current fiscal period.
The change in unrealized appreciation attributed to securities owned at June 30, 2012, which were valued using significant unobservable inputs (Level 3), amounted to $441.
Quantitative information pertaining to Level 3 unobservable fair value measurements
| | | Fair Value at
6/30/12 | |
Valuation Technique(s) | |
Unobservable Input (s) | | Range (Weighted
Average) | |
| Equities | | | 17,058 | | | Market comparable companies | | Discount for lack of marketability | | -2% to -28% (-12%) | |
See accompanying notes to financial statements.
74
> Notes to Statement of Investments (dollar values in thousands)
Certain common stock classified as Level 3 are valued at fair value, using a market approach, as determined in good faith under consistently applied procedures established by and under the general supervision of the Board. To determine fair value for these securities, for which no market exists, the Committee utilizes the valuation technique it deems most appropriate in the circumstances, using some unobservable inputs which may include, but are not limited to trades of similar securities, estimated earnings of the company, market multiples derived from a set of comparable companies, and the position of the security within the company's capital structure. Significant increases or decreases to any of these inputs could result in a significantly lower or higher fair value measurement. Generally, a change in estimated earnings of a company may result in a change to the comparable companies and market multiples utilized.
See accompanying notes to financial statements.
75
Columbia Thermostat Fund
Statement of Investments (Unaudited), June 30, 2012
| Number of Shares | | | | Value (000) | |
| | | > Affiliated Stock Funds: 49.4% | |
| | 1,176,526 | | | Columbia Acorn International
Fund, Class I | | $ | 43,684 | | |
| | 2,984,136 | | | Columbia Dividend Income Fund,
Class I | | | 43,240 | | |
| | 1,097,965 | | | Columbia Acorn Fund, Class I | | | 32,675 | | |
| | 2,152,889 | | | Columbia Contrarian Core
Fund, Class I | | | 32,487 | | |
| | 1,706,619 | | | Columbia Select Large Cap
Growth Fund, Class I (a) | | | 21,862 | | |
| | 872,274 | | | Columbia Acorn Select Fund,
Class I | | | 21,772 | | |
| | 1,599,099 | | | Columbia Large Cap Enhanced
Core Fund, Class I | | | 21,684 | | |
| Total Stock Funds: (Cost: $196,004) | | | 217,404 | | |
| Number of Shares | | | | Value (000) | |
| | | > Affiliated Bond Funds: 48.2% | |
| | 11,245,529 | | | Columbia Intermediate Bond
Fund, Class I | | $ | 105,933 | | |
| | 6,646,182 | | | Columbia Income Opportunities
Fund, Class I | | | 63,936 | | |
| | 3,616,501 | | | Columbia U.S. Treasury Index
Fund, Class I | | | 42,205 | | |
| Total Bond Funds: (Cost: $208,564) | | | 212,074 | | |
Total Investments: 97.6%
(Cost: $404,568)(b) | | | 429,478 | | |
| Cash and Other Assets Less Liabilities: 2.4% | | | 10,573 | | |
| Total Net Assets: 100.0% | | $ | 440,051 | | |
> Notes to Statement of Investments (dollar values in thousands)
(a) Non-income producing security.
(b) At June 30, 2012 for federal income tax purposes, the cost of investments was $404,568 and net unrealized gain was $24,910 consisting of gross unrealized appreciation of $24,910 and gross unrealized depreciation of $0.
Fair Value Measurements
Various inputs are used in determining the value of the Fund's investments, following the input prioritization hierarchy established by GAAP. These inputs are summarized in the three broad levels listed below:
• Level 1 – quoted prices in active markets for identical securities
• Level 2 – prices determined using other significant observable inputs (including quoted prices for similar securities, interest rates, prepayment speeds, credit risk and others)
• Level 3 – prices determined using significant unobservable inputs where quoted prices or observable inputs are unavailable or less reliable (including management's own assumptions about the factors market participants would use in pricing an investment)
The inputs or methodology used for valuing securities are not necessarily an indication of the risk associated with investing in those securities.
Examples of the types of securities in which the Fund would typically invest and how they are classified within this hierarchy are as follows. Typical Level 1 securities include mutual funds whose NAVs are published each day. Typical Level 2 securities include short-term investments valued at amortized cost.
Under the direction of the Board of Trustees (the Board), the Valuation Committee (the Committee) is responsible for carrying out the valuation procedures approved by the Board.
The Committee meets as necessary, and no less frequently than quarterly, to determine fair values for securities for which market quotations are not readily available or for which the investment manager believes that available market quotations are unreliable, and to review the continuing appropriateness of the current value of any security subject to the Trust's Portfolio Pricing Policy and the pricing procedures of the investment manager (the Policies). The Policies address, among other things: circumstances under which market quotations will be deemed readily available; selection of third party pricing vendors; appropriate pricing methodologies; events that require fair valuation and fair value techniques; and circumstances under which securities will be deemed to pose a potential for stale pricing, including when securities are illiquid, restricted, or in default. The Committee may also meet to discuss additional valuation matters, which may include review of back-testing results, review of time-sensitive information or approval of other valuation related actions, and to review the appropriateness of the Policies.
For investments categorized as Level 3, the significant unobservable inputs used in the fair value measurement of the Funds' securities may include: (i) data specific to the issuer or comparable issuers, (ii) general market or specific sector news and (iii) quoted prices and specific or similar security transactions. The Committee considers this data and any changes from prior periods in order to assess the reasonableness of observable and unobservable inputs, any assumptions or internal models used to value those securities and changes in fair value. Significant changes in any of these factors could result in lower or higher fair value measurements. Various factors impact the frequency of monitoring (which may occur as often as daily), however the Committee may determine that changes to inputs, assumptions and models are not required with the same frequency.
The following table summarizes the inputs used, as of June 30, 2012, in valuing the Fund's assets:
| Investment Type | | Quoted Prices
(Level 1) | | Other
Significant
Observable
Inputs
(Level 2) | | Significant
Unobservable
Inputs
(Level 3) | | Total | |
| Total Stock Funds | | $ | 217,404 | | | $ | - | | | $ | - | | | $ | 217,404 | | |
| Total Bond Funds | | | 212,074 | | | | - | | | | - | | | | 212,074 | | |
| Total Investments | | $ | 429,478 | | | $ | - | | | $ | - | | | $ | 429,478 | | |
There were no transfers of financial assets between levels 1 and 2 during the period.
See accompanying notes to financial statements.
76
Columbia Acorn Emerging Markets Fund
Major Portfolio Changes in the Second Quarter (Unaudited)
| | | Number of Shares | |
| | | 3/31/12 | | 6/30/12 | |
| Purchases | |
| Asia | |
| > Taiwan | |
| CTCI Corp | | | 64,762 | | | | 73,762 | | |
| Far EasTone Telecom | | | 58,126 | | | | 74,126 | | |
| MStar Semiconductor | | | 9,800 | | | | 13,500 | | |
| PC Home | | | 13,700 | | | | 15,700 | | |
| > Indonesia | |
| Archipelago Resources | | | 137,500 | | | | 150,100 | | |
| Mayora Indah | | | 0 | | | | 13,600 | | |
| Surya Citra Media | | | 93,264 | | | | 102,764 | | |
| Tower Bersama Infrastructure | | | 535,709 | | | | 537,609 | | |
| > Hong Kong | |
| AAC Technologies | | | 18,027 | | | | 21,027 | | |
| Lifestyle International | | | 28,089 | | | | 52,089 | | |
| Sasa International | | | 89,999 | | | | 99,799 | | |
| > China | |
| RexLot Holdings | | | 823,246 | | | | 1,196,000 | | |
| > India | |
| Redington India | | | 7,562 | | | | 37,794 | | |
| > Philippines | |
| Int'l Container Terminal | | | 40,787 | | | | 44,487 | | |
| > Cambodia | |
| Nagacorp | | | 340,000 | | | | 420,000 | | |
| > Mongolia | |
| Mongolian Mining | | | 98,500 | | | | 140,500 | | |
| > Singapore | |
| Petra Foods | | | 0 | | | | 19,900 | | |
| Other Countries | |
| > South Africa | |
| Mr. Price | | | 6,597 | | | | 6,797 | | |
| > United States | |
| Textainer Group Holdings | | | 2,204 | | | | 2,404 | | |
| > Canada | |
| Americas Petrogas | | | 17,500 | | | | 19,000 | | |
| Europe | |
| > Kazakhstan | |
Halyk Savings Bank of
Kazakhstan - GDR | | | 17,800 | | | | 19,400 | | |
| > France | |
Compagnie Française de
l'Afrique Occidentale | | | 0 | | | | 325 | | |
| | | Number of Shares | |
| | | 3/31/12 | | 6/30/12 | |
| Latin America | |
| > Brazil | |
| Arcos Dorados | | | 0 | | | | 4,000 | | |
| MRV Engenharia | | | 11,325 | | | | 12,425 | | |
| Multiplus | | | 3,144 | | | | 3,444 | | |
| > Mexico | |
Grupo Aeroportuario del
Sureste - ADR | | | 1,647 | | | | 1,747 | | |
See accompanying notes to financial statements.
77
Columbia Acorn Emerging Markets Fund
Major Portfolio Changes in the Second Quarter (Unaudited), continued
| | | Number of Shares | |
| | | 3/31/12 | | 6/30/12 | |
| Sales | |
| Asia | |
| > Indonesia | |
| Jasa Marga | | | 109,911 | | | | 0 | | |
| > China | |
| NetEase.com - ADR | | | 1,277 | | | | 977 | | |
| Other Countries | |
| > South Africa | |
| Northam Platinum | | | 15,354 | | | | 10,854 | | |
| > Canada | |
| Alliance Grain Traders | | | 10,801 | | | | 8,801 | | |
| Crew Energy | | | 4,172 | | | | 0 | | |
| Europe | |
| > Sweden | |
| East Capital Explorer | | | 8,806 | | | | 4,006 | | |
| > Germany | |
| Dürr | | | 1,229 | | | | 1,060 | | |
| > France | |
| Rubis | | | 965 | | | | 0 | | |
| Latin America | |
| > Brazil | |
Mills Estruturas e Servicos
de Engenharia | | | 3,361 | | | | 0 | | |
See accompanying notes to financial statements.
78
Columbia Acorn Emerging Markets Fund
Statement of Investments (Unaudited), June 30, 2012
| Number of Shares | | | | Value (000) | |
| | | | | | | Equities: 96.9% | |
| Asia 60.7% | | | |
| | | > Taiwan 19.3% | |
| | 74,126 | | | Far EasTone Telecom | | $ | 161 | | |
| | | | | Taiwan's Third Largest Mobile Operator | | | | | |
| | 73,762 | | | CTCI Corp | | | 138 | | |
| | | | | International Engineering Firm | | | | | |
| | 9,200 | | | St. Shine Optical | | | 103 | | |
| | | | | World's Leading Disposable Contact Lens OEM | | | | | |
| | 42,990 | | | Chroma Ate | | | 98 | | |
| | | | | Automatic Test Systems, Testing & Measurement
Instruments | | | | | |
| | 33,000 | | | Tripod Technologies | | | 94 | | |
| | | | | Printed Circuit Boards (PCB) | | | | | |
| | 13,500 | | | MStar Semiconductor | | | 91 | | |
| | | | | Integrated Circuits for TV, Digital Set-top-box & Handset | | | | | |
| | 15,700 | | | PC Home | | | 89 | | |
| | | | | Taiwanese Internet Retail Company | | | | | |
| | 12,342 | | | Simplo Technology | | | 85 | | |
| | | | | Battery Packs for Notebook & Tablet PCs | | | | | |
| | 15,277 | | | Radiant Opto-Electronics (a) | | | 78 | | |
| | | | | LCD Back Light Units & Modules | | | | | |
| | 21,169 | | | Advantech | | | 70 | | |
| | | | | Industrial PC & Components | | | | | |
| | 18,500 | | | Lung Yen | | | 54 | | |
| | | | | Funeral Services & Columbaria | | | | | |
| | 23,689 | | | Taiwan Hon Chuan | | | 53 | | |
| | | | | Beverage Packaging (Bottles, Caps, Labels)
Manufacturer | | | | | |
| | | | 1,114 | | |
| | | > Indonesia 11.2% | |
| | 369,019 | | | Ace Indonesia | | | 200 | | |
| | | | | Home Improvement Retailer | | | | | |
| | 537,609 | | | Tower Bersama Infrastructure (a) | | | 188 | | |
| | | | | Communications Towers | | | | | |
| | 150,100 | | | Archipelago Resources (a) | | | 120 | | |
| | | | | Gold Mining Projects in Indonesia, Vietnam &
the Philippines | | | | | |
| | 102,764 | | | Surya Citra Media | | | 105 | | |
| | | | | Free to Air TV in Indonesia | | | | | |
| | 13,600 | | | Mayora Indah | | | 37 | | |
| | | | | Consumer Branded Food Manufacturer | | | | | |
| | | | 650 | | |
| | | > Hong Kong 7.1% | |
| | 52,089 | | | Lifestyle International | | | 115 | | |
| | | | | Mid to High-end Department Store Operator in
Hong Kong & China | | | | | |
| | 128,862 | | | Melco International | | | 105 | | |
| | | | | Macau Casino Operator | | | | | |
| | 5,650 | | | Melco Crown Entertainment - ADR (a) | | | 65 | | |
| | | | | Macau Casino Operator | | | | | |
| | 99,799 | | | Sasa International | | | 63 | | |
| | | | | Cosmetics Retailer | | | | | |
| | 21,027 | | | AAC Technologies | | | 61 | | |
| | | | | Miniature Acoustic Components | | | | | |
| | | | 409 | | |
| Number of Shares | | | | Value (000) | |
| | | > China 6.0% | |
| | 54,951 | | | Digital China | | $ | 97 | | |
| | | | | IT Distribution & Systems Integration Services | | | | | |
| | 1,196,000 | | | RexLot Holdings | | | 86 | | |
| | | | | Lottery Equipment Supplier in China | | | | | |
| | 977 | | | NetEase.com - ADR (a) | | | 57 | | |
| | | | | Chinese Online Gaming Services | | | | | |
| | 1,254 | | | 51job - ADR (a)(b) | | | 57 | | |
| | | | | Integrated Human Resource Services | | | | | |
| | 111,475 | | | AMVIG Holdings | | | 49 | | |
| | | | | Chinese Tobacco Packaging Material Supplier | | | | | |
| | | | 346 | | |
| | | > India 5.2% | |
| | 8,635 | | | United Breweries | | | 85 | | |
| | | | | India's Largest Brewer | | | | | |
| | 14,240 | | | Titan Industries | | | 57 | | |
| | | | | Jewlery, Watches & Eyeglasses | | | | | |
| | 24,700 | | | Adani Ports & Special Economic Zone | | | 54 | | |
| | | | | Indian West Coast Shipping Port | | | | | |
| | 37,794 | | | Redington India | | | 52 | | |
| | | | | Supply Chain Solutions for IT & Mobile Handsets
in Emerging Markets | | | | | |
| | 33,749 | | | Jain Irrigation Systems | | | 51 | | |
| | | | | Agricultural Micro-irrigation Systems &
Food Processing | | | | | |
| | | | 299 | | |
| | | > Philippines 3.4% | |
| | 44,487 | | | Int'l Container Terminal | | | 78 | | |
| | | | | Container Handling Terminals & Port Management | | | | | |
| | 109,465 | | | Manila Water Company | | | 64 | | |
| | | | | Water Utility Company in the Philippines | | | | | |
| | 176,818 | | | SM Prime Holdings | | | 55 | | |
| | | | | Shopping Mall Operator | | | | | |
| | | | 197 | | |
| | | > Cambodia 3.3% | |
| | 420,000 | | | Nagacorp | | | 188 | | |
| | | | | Casino/Entertainment Complex in Cambodia | | | | | |
| | | | 188 | | |
| | | > Thailand 1.9% | |
| | 272,518 | | | Home Product Center | | | 109 | | |
| | | | | Home Improvement Retailer | | | | | |
| | | | 109 | | |
| | | > Mongolia 1.4% | |
| | 140,500 | | | Mongolian Mining (a) | | | 80 | | |
| | | | | Coking Coal Mining in Mongolia | | | | | |
| | | | 80 | | |
| | | > Japan 1.2% | |
| | 6,760 | | | Kansai Paint | | | 72 | | |
| | | | | Paint Producer in Japan, India, China &
Southeast Asia | | | | | |
| | | | 72 | | |
| | | > Singapore 0.7% | |
| | 19,900 | | | Petra Foods | | | 39 | | |
| | | | | Cocoa Processor & Chocolate Manufacturer | | | | | |
| | | | 39 | | |
| Asia: Total | | | 3,503 | | |
See accompanying notes to financial statements.
79
Columbia Acorn Emerging Markets Fund
Statement of Investments (Unaudited), continued
| Number of Shares | | | | Value (000) | |
| Other Countries 16.9% | | | |
| | | > South Africa 10.9% | |
| | 75,000 | | | Rand Merchant Insurance | | $ | 160 | | |
| | | | | Directly Sold Property & Casualty Insurance;
Holdings in Other Insurers | | | | | |
| | 45,226 | | | Coronation Fund Managers | | | 153 | | |
| | | | | South African Fund Manager | | | | | |
| | 16,350 | | | Adcock Ingram Holdings | | | 120 | | |
| | | | | Manufacturer of Pharmaceuticals & Medical
Supplies | | | | | |
| | 6,797 | | | Mr. Price | | | 93 | | |
| | | | | South African Retailer of Apparel, Household &
Sporting Goods | | | | | |
| | 3,497 | | | Massmart Holdings | | | 73 | | |
| | | | | General Merchandise, Food & Home Improvement
Stores; Wal-Mart Subsidiary | | | | | |
| | 10,854 | | | Northam Platinum | | | 31 | | |
| | | | | Platinum Mining in South Africa | | | | | |
| | | | 630 | | |
| | | > United States 3.3% | |
| | 2,404 | | | Textainer Group Holdings (b) | | | 89 | | |
| | | | | Top International Container Leasor | | | | | |
| | 1,709 | | | Hornbeck Offshore (a) | | | 66 | | |
| | | | | Supply Vessel Operator in U.S. Gulf of Mexico | | | | | |
| | 952 | | | Atwood Oceanics (a) | | | 36 | | |
| | | | | Offshore Drilling Contractor | | | | | |
| | | | 191 | | |
| | | > Canada 2.7% | |
| | 8,801 | | | Alliance Grain Traders | | | 118 | | |
| | | | | Global Leader in Pulse Processing & Distribution | | | | | |
| | 19,000 | | | Americas Petrogas (a) | | | 35 | | |
| | | | | Oil & Gas Exploration in Argentina, Potash in Peru | | | | | |
| | | | 153 | | |
| Other Countries: Total | | | 974 | | |
| Europe 11.0% | | | |
| | | > Sweden 2.6% | |
| | 7,231 | | | Hexagon | | | 124 | | |
| | | | | Design, Measurement & Visualization
Software & Equipment | | | | | |
| | 4,006 | | | East Capital Explorer | | | 28 | | |
| | | | | Sweden-based Russia & Central Eastern Europe
Investment Fund | | | | | |
| | | | 152 | | |
| | | > Switzerland 2.5% | |
| | 1,178 | | | Dufry Group (a) | | | 143 | | |
| | | | | Operates Airport Duty Free & Duty Paid Shops | | | | | |
| | | | 143 | | |
| | | > Kazakhstan 1.7% | |
| | 19,400 | | | Halyk Savings Bank of
Kazakhstan - GDR (a) | | | 97 | | |
| | | | | Largest Retail Bank & Insurer in Kazakhstan | | | | | |
| | | | 97 | | |
| Number of Shares | | | | Value (000) | |
| | | > Czech Republic 1.4% | |
| | 474 | | | Komercni Banka | | $ | 83 | | |
| | | | | Leading Czech Universal Bank | | | | | |
| | | | 83 | | |
| | | > Italy 1.4% | |
| | 7,631 | | | Pirelli | | | 80 | | |
| | | | | Global Tire Supplier | | | | | |
| | | | 80 | | |
| | | > Germany 1.1% | |
| | 1,060 | | | Dürr | | | 65 | | |
| | | | | Automotive Plant Engineering & Associated
Capital Equipment | | | | | |
| | | | 65 | | |
| | | > France 0.3% | |
| | 325 | | | Compagnie Française de l'Afrique Occidentale | | | 15 | | |
| | | | | African Wholesaler & Distributor | | | | | |
| | | | 15 | | |
| Europe: Total | | | 635 | | |
| Latin America 8.3% | | | |
| | | > Brazil 5.0% | |
| | 6,090 | | | Localiza Rent A Car | | | 92 | | |
| | | | | Car Rental | | | | | |
| | 3,444 | | | Multiplus | | | 82 | | |
| | | | | Loyalty Program Operator in Brazil | | | | | |
| | 4,000 | | | Arcos Dorados (b) | | | 59 | | |
| | | | | McDonald's Master Franchise for Latin America | | | | | |
| | 12,425 | | | MRV Engenharia | | | 57 | | |
| | | | | Brazilan Property Developer | | | | | |
| | | | 290 | | |
| | | > Mexico 2.4% | |
| | 1,747 | | | Grupo Aeroportuario del Sureste - ADR | | | 136 | | |
| | | | | Mexican Airport Operator | | | | | |
| | | | 136 | | |
| | | > Chile 0.7% | |
| | 18,900 | | | Viña Concha y Toro | | | 37 | | |
| | | | | Global Branded Wine Manufacturer | | | | | |
| | | | 37 | | |
| | | > Argentina 0.2% | |
| | 40,200 | | | Madalena Ventures (a) | | | 14 | | |
| | | | | Oil & Gas Exploration in Argentina | | | | | |
| | | | 14 | | |
| Latin America: Total | | | 477 | | |
Total Equities: 96.9%
(Cost: $5,503) | | | 5,589 | | |
See accompanying notes to financial statements.
80
| Number of Shares | | | | Value (000) | |
| Securities Lending Collateral 1.8% | |
| | 104,775 | | | Dreyfus Government Cash
Management Fund
(7 day yield of 0.01%) (c) | | $ | 105 | | |
Total Securities Lending Collateral:
(Cost: $105) | | | 105 | | |
Total Investments: 98.7%
(Cost: $5,608)(d)(e) | | | 5,694 | | |
Obligation to Return Collateral for
Securities Loaned: (1.8)% | | | (105 | ) | |
| Cash and Other Assets Less Liabilities: 3.1% | | | 183 | | |
| Total Net Assets: 100.0% | | $ | 5,772 | | |
ADR - American Depositary Receipts
GDR - Global Depositary Receipts
> Notes to Statement of Investments (dollar values in thousands)
(a) Non-income producing security.
(b) All or a portion of this security was on loan at June 30, 2012. The total market value of securities on loan at June 30, 2012 was $105.
(c) Investment made with cash collateral received from securities lending activity.
(d) At June 30, 2012, for federal income tax purposes, the cost of investments was $5,608 and net unrealized appreciation was $86 consisting of gross unrealized appreciation of $549 and gross unrealized depreciation of $463.
(e) On June 30, 2012, the Fund's total investments were denominated in currencies as follows:
| Currency | | Value | | Percentage
of Net Assets | |
| Taiwan Dollar | | $ | 1,114 | | | | 19.3 | | |
| Hong Kong Dollar | | | 843 | | | | 14.6 | | |
| United States Dollar | | | 663 | | | | 11.5 | | |
| South African Rand | | | 630 | | | | 10.9 | | |
| Indonesian Rupiah | | | 530 | | | | 9.2 | | |
| Indian Rupee | | | 298 | | | | 5.2 | | |
Other currencies less
than 5% of total net assets | | | 1,511 | | | | 26.2 | | |
| Total Portfolio | | $ | 5,589 | | | | 96.9 | | |
Fair Value Measurements
Various inputs are used in determining the value of the Fund's investments, following the input prioritization hierarchy established by GAAP. These inputs are summarized in the three broad levels listed below:
• Level 1 – quoted prices in active markets for identical securities
• Level 2 – prices determined using other significant observable inputs (including quoted prices for similar securities, interest rates, prepayment speeds, credit risk and others)
• Level 3 – prices determined using significant unobservable inputs where quoted prices or observable inputs are unavailable or less reliable (including management's own assumptions about the factors market participants would use in pricing an investment)
The inputs or methodology used for valuing securities are not necessarily an indication of the risk associated with investing in those securities.
Examples of the types of securities in which the Fund would typically invest and how they are classified within this hierarchy are as follows. Typical Level 1 securities include exchange traded domestic equities, mutual funds whose NAVs are published each day and exchange traded foreign equities that are not statistically fair valued. Typical Level 2 securities include exchange traded foreign equities that are statistically fair valued and short-term investments valued at amortized cost. Additionally, securities fair valued by the Valuation Committee (the Committee) of the Fund's Board of Trustees (the Board) that rely on significant observable inputs are also included in Level 2. Typical Level 3 securities include any security fair valued by the Committee that relies on significant unobservable inputs.
See accompanying notes to financial statements.
81
Columbia Acorn Emerging Markets Fund
Statement of Investments (Unaudited), continued
> Notes to Statement of Investments (dollar values in thousands)
Under the direction of the Board, the Committee is responsible for carrying out the valuation procedures approved by the Board.
The Committee meets as necessary, and no less frequently than quarterly, to determine fair values for securities for which market quotations are not readily available or for which the investment manager believes that available market quotations are unreliable, and to review the continuing appropriateness of the current value of any security subject to the Trust's Portfolio Pricing Policy and the pricing procedures of the investment manager (the Policies). The Policies address, among other things: circumstances under which market quotations will be deemed readily available; selection of third party pricing vendors; appropriate pricing methodologies; events that require fair valuation and fair value techniques; and circumstances under which securities will be deemed to pose a potential for stale pricing, including when securities are illiquid, restricted, or in default. The Committee may also meet to discuss additional valuation matters, which may include review of back-testing results, review of time-sensitive information or approval of other valuation related actions, and to review the appropriateness of the Policies.
For investments categorized as Level 3, the significant unobservable inputs used in the fair value measurement of the Funds' securities may include: (i) data specific to the issuer or comparable issuers, (ii) general market or specific sector news and (iii) quoted prices and specific or similar security transactions. The Committee considers this data and any changes from prior periods in order to assess the reasonableness of observable and unobservable inputs, any assumptions or internal models used to value those securities and changes in fair value. Significant changes in any of these factors could result in lower or higher fair value measurements. Various factors impact the frequency of monitoring (which may occur as often as daily), however the Committee may determine that changes to inputs, assumptions and models are not required with the same frequency.
The following table summarizes the inputs used, as of June 30, 2012, in valuing the Fund's assets:
| Investment Type | | Quoted Prices
(Level 1) | | Other
Significant
Observable
Inputs
(Level 2) | | Significant
Unobservable
Inputs
(Level 3) | | Total | |
| Equities | |
| Asia | | $ | 179 | | | $ | 3,324 | | | $ | - | | | $ | 3,503 | | |
| Other Countries | | | 344 | | | | 630 | | | | - | | | | 974 | | |
| Europe | | | - | | | | 635 | | | | - | | | | 635 | | |
| Latin America | | | 477 | | | | - | | | | - | | | | 477 | | |
| Total Equities | | | 1,000 | | | | 4,589 | | | | - | | | | 5,589 | | |
| Total Securities Lending Collateral | | | 105 | | | | - | | | | - | | | | 105 | | |
| Total Investments | | $ | 1,105 | | | $ | 4,589 | | | $ | - | | | $ | 5,694 | | |
The Fund's assets assigned to the Level 2 input category are generally valued using a market approach, in which a security's value is determined through its correlation to prices and information from observable market transactions for similar or identical assets. Foreign equities are generally valued at the last sale price on the foreign exchange or market on which they trade. The Fund may use a statistical fair valuation model, in accordance with the policy adopted by the Board, provided by an independent third party to value securities principally traded in foreign markets in order to adjust for possible stale pricing that may occur between the close of the foreign exchanges and the time for valuation. These models take into account available market data including intraday index, ADR, and ETF movements.
There were no transfers of financial assets between levels 1 and 2 during the period.
See accompanying notes to financial statements.
82
Columbia Acorn Emerging Markets Fund
Portfolio Diversification (Unaudited)
At June 30, 2012, the Fund's portfolio investments as a percentage of net assets were diversified as follows:
| | | Value (000) | | Percentage
of Net Assets | |
| > Consumer Goods & Services | |
| Retail | | $ | 827 | | | | 14.4 | | |
| Casinos & Gaming | | | 443 | | | | 7.7 | | |
| Food & Beverage | | | 354 | | | | 6.1 | | |
| Other Consumer Services | | | 225 | | | | 3.9 | | |
| Travel | | | 92 | | | | 1.6 | | |
| Other Durable Goods | | | 80 | | | | 1.4 | | |
| Consumer Goods Distribution | | | 52 | | | | 0.9 | | |
| | | | 2,073 | | | | 36.0 | | |
| > Information | |
Computer Hardware &
Related Equipment | | | 388 | | | | 6.7 | | |
| Mobile Communications | | | 350 | | | | 6.1 | | |
| Business Software | | | 124 | | | | 2.1 | | |
| TV Broadcasting | | | 104 | | | | 1.8 | | |
| Instrumentation | | | 98 | | | | 1.7 | | |
| Electronics Distribution | | | 97 | | | | 1.7 | | |
Semiconductors &
Related Equipment | | | 91 | | | | 1.6 | | |
| Internet Related | | | 58 | | | | 1.0 | | |
| | | | 1,310 | | | | 22.7 | | |
| > Finance | |
| Brokerage & Money Management | | | 181 | | | | 3.2 | | |
| Banks | | | 180 | | | | 3.1 | | |
| Insurance | | | 160 | | | | 2.8 | | |
| Finance Companies | | | 89 | | | | 1.5 | | |
| | | | 610 | | | | 10.6 | | |
| > Industrial Goods & Services | |
Industrial Materials &
Specialty Chemicals | | | 175 | | | | 3.0 | | |
| Construction | | | 138 | | | | 2.4 | | |
| Other Industrial Services | | | 132 | | | | 2.3 | | |
| Machinery | | | 116 | | | | 2.0 | | |
| | | | 561 | | | | 9.7 | | |
| > Energy & Minerals | |
| Mining | | | 231 | | | | 4.0 | | |
| Agricultural Commodities | | | 118 | | | | 2.0 | | |
| Oil Services | | | 102 | | | | 1.8 | | |
| Oil & Gas Producers | | | 49 | | | | 0.8 | | |
| | | | 500 | | | | 8.6 | | |
| > Other Industries | |
| Transportation | | | 136 | | | | 2.4 | | |
| Real Estate | | | 112 | | | | 1.9 | | |
| Regulated Utilities | | | 64 | | | | 1.1 | | |
| | | | 312 | | | | 5.4 | | |
| | | Value (000) | | Percentage
of Net Assets | |
| > Health Care | |
| Pharmaceuticals | | $ | 120 | | | | 2.1 | | |
| Medical Supplies | | | 103 | | | | 1.8 | | |
| | | | 223 | | | | 3.9 | | |
| Total Equities: | | | 5,589 | | | | 96.9 | | |
| Security Lending Collateral: | | | 105 | | | | 1.8 | | |
| Total Investments: | | | 5,694 | | | | 98.7 | | |
Obligation to Return
Collateral for Securities
Loaned: | | | (105 | ) | | | (1.8 | ) | |
Cash and Other Assets
Less Liabilities: | | | 183 | | | | 3.1 | | |
| Net Assets: | | $ | 5,772 | | | | 100.0 | | |
See accompanying notes to financial statements.
83
Columbia Acorn European Fund
Major Portfolio Changes in the Second Quarter (Unaudited)
| | | Number of Shares | |
| | | 3/31/12 | | 6/30/12 | |
| Purchases | |
| Europe | |
| > United Kingdom | |
| Aggreko | | | 0 | | | | 700 | | |
| BBA Aviation | | | 0 | | | | 7,480 | | |
| Charles Taylor | | | 15,220 | | | | 22,220 | | |
Domino's Pizza United Kingdom &
Ireland | | | 3,610 | | | | 5,090 | | |
| Greggs | | | 999 | | | | 3,200 | | |
| Rightmove | | | 1,000 | | | | 1,400 | | |
| WH Smith | | | 0 | | | | 2,000 | | |
| > Netherlands | |
| Vopak | | | 0 | | | | 300 | | |
| > Switzerland | |
| Dufry Group | | | 170 | | | | 310 | | |
| Partners Group | | | 160 | | | | 295 | | |
| > Russia | |
| Yandex | | | 0 | | | | 1,900 | | |
| | | Number of Shares | |
| | | 3/31/12 | | 6/30/12 | |
| Sales | |
| Europe | |
| > United Kingdom | |
| Chemring | | | 4,900 | | | | 0 | | |
| Intertek Group | | | 1,100 | | | | 500 | | |
| Workspace Group | | | 5,800 | | | | 0 | | |
| > France | |
| Mersen | | | 600 | | | | 213 | | |
| Rubis | | | 310 | | | | 0 | | |
| > Netherlands | |
| Core Laboratories | | | 330 | | | | 230 | | |
| Fugro | | | 410 | | | | 0 | | |
| > Germany | |
| Rheinmetall | | | 560 | | | | 360 | | |
| > Russia | |
| Mail.ru - GDR | | | 1,000 | | | | 600 | | |
See accompanying notes to financial statements.
84
Columbia Acorn European Fund
Statement of Investments (Unaudited), June 30, 2012
| Number of Shares | | | | Value (000) | |
| | | | | | | Equities: 92.9% | |
| Europe 89.8% | | | |
| | | > United Kingdom 18.3% | |
| | 22,220 | | | Charles Taylor | | $ | 56 | | |
| | | | | Insurance Services | | | | | |
| | 5,090 | | | Domino's Pizza United Kingdom & Ireland | | | 41 | | |
| | | | | Pizza Delivery in the UK, Ireland & Germany | | | | | |
| | 1,400 | | | Rightmove | | | 35 | | |
| | | | | Internet Real Estate Listings | | | | | |
| | 2,827 | | | JLT Group | | | 31 | | |
| | | | | International Business Insurance Broker | | | | | |
| | 3,480 | | | Serco | | | 29 | | |
| | | | | Facilities Management | | | | | |
| | 3,180 | | | Shaftesbury | | | 26 | | |
| | | | | London Prime Retail REIT | | | | | |
| | 3,200 | | | Greggs | | | 25 | | |
| | | | | Bakery | | | | | |
| | 7,480 | | | BBA Aviation | | | 24 | | |
| | | | | Aviation Support Services | | | | | |
| | 700 | | | Aggreko | | | 23 | | |
| | | | | Temporary Power & Temperature Control Services | | | | | |
| | 500 | | | Intertek Group | | | 21 | | |
| | | | | Testing, Inspection, Certification Services | | | | | |
| | 3,190 | | | Abcam | | | 21 | | |
| | | | | Online Sales of Antibodies | | | | | |
| | 660 | | | Rotork | | | 20 | | |
| | | | | Valve Actuators for Oil & Water Pipelines | | | | | |
| | 2,000 | | | WH Smith | | | 17 | | |
| | | | | Newsprint, Book & General Stationery Retailer | | | | | |
| | 2,870 | | | Premier Oil (a) | | | 15 | | |
| | | | | Oil & Gas Producer in Europe, Pakistan & Asia | | | | | |
| | 71 | | | Spirax Sarco | | | 2 | | |
| | | | | Steam Systems for Manufacturing & Process Industries | | | | | |
| | | | 386 | | |
| | | > France 14.2% | |
| | 600 | | | Eurofins Scientific | | | 75 | | |
| | | | | Food, Pharmaceuticals & Materials Screening &
Testing | | | | | |
| | 1,000 | | | Gemalto | | | 72 | | |
| | | | | Digital Security Solutions | | | | | |
| | 1,200 | | | 1000 mercis | | | 55 | | |
| | | | | Interactive Advertising & Marketing | | | | | |
| | 1,300 | | | Saft | | | 31 | | |
| | | | | Niche Battery Manufacturer | | | | | |
| | 360 | | | Norbert Dentressangle | | | 23 | | |
| | | | | Leading European Logistics & Transport Group | | | | | |
| | 400 | | | Neopost | | | 21 | | |
| | | | | Postage Meter Machines | | | | | |
| | 7,100 | | | Hi-Media (a) | | | 18 | | |
| | | | | Online Advertiser in Europe | | | | | |
| | 213 | | | Mersen | | | 5 | | |
| | | | | Advanced Industrial Materials | | | | | |
| | | | 300 | | |
| | | > Netherlands 12.3% | |
| | 1,730 | | | UNIT4 | | | 44 | | |
| | | | | Business Software Development | | | | | |
| Number of Shares | | | | Value (000) | |
| | 2,785 | | | Aalberts Industries | | $ | 43 | | |
| | | | | Flow Control & Heat Treatment | | | | | |
| | 1,412 | | | Koninklijke TenCate | | | 38 | | |
| | | | | Advanced Textiles & Industrial Fabrics | | | | | |
| | 1,499 | | | Imtech | | | 36 | | |
| | | | | Electromechanical & Information & Communications
Technology Installation & Maintenance | | | | | |
| | 1,480 | | | Arcadis | | | 32 | | |
| | | | | Engineering Consultants | | | | | |
| | 230 | | | Core Laboratories | | | 27 | | |
| | | | | Oil & Gas Reservoir Consulting | | | | | |
| | 917 | | | TKH Group | | | 20 | | |
| | | | | Dutch Industrial Conglomerate | | | | | |
| | 300 | | | Vopak | | | 19 | | |
| | | | | World's Largest Operator of Petroleum &
Chemical Storage Terminals | | | | | |
| | | | 259 | | |
| | | > Germany 10.1% | |
| | 3,250 | | | Wirecard | | | 63 | | |
| | | | | Online Payment Processing & Risk Management | | | | | |
| | 520 | | | Dürr | | | 32 | | |
| | | | | Automotive Plant Engineering & Associated Capital Equipment | | | | | |
| | 130 | | | Rational | | | 31 | | |
| | | | | Commercial Ovens | | | | | |
| | 375 | | | Bertrandt | | | 28 | | |
| | | | | Outsourced Engineering | | | | | |
| | 500 | | | Stratec Biomedical Systems | | | 22 | | |
| | | | | Diagnostic Instrumentation | | | | | |
| | 590 | | | CTS Eventim | | | 18 | | |
| | | | | Event Ticket Sales | | | | | |
| | 360 | | | Rheinmetall | | | 18 | | |
| | | | | Defense & Automotive | | | | | |
| | | | 212 | | |
| | | > Switzerland 9.9% | |
| | 300 | | | Geberit | | | 59 | | |
| | | | | Plumbing Supplies | | | | | |
| | 295 | | | Partners Group | | | 52 | | |
| | | | | Private Markets Asset Management | | | | | |
| | 21 | | | Sika | | | 41 | | |
| | | | | Chemicals for Construction & Industrial Applications | | | | | |
| | 310 | | | Dufry Group (a) | | | 38 | | |
| | | | | Operates Airport Duty Free & Duty Paid Shops | | | | | |
| | 320 | | | Zehnder | | | 19 | | |
| | | | | Radiators & Ventilation Systems | | | | | |
| | | | 209 | | |
| | | > Sweden 6.0% | |
| | 3,070 | | | Hexagon | | | 53 | | |
| | | | | Design, Measurement & Visualization Software &
Equipment | | | | | |
| | 4,570 | | | Sweco | | | 48 | | |
| | | | | Engineering Consultants | | | | | |
| | 1,000 | | | Unibet | | | 25 | | |
| | | | | European Online Gaming Operator | | | | | |
| | | | 126 | | |
| | | > Italy 3.7% | |
| | 11,000 | | | Geox | | | 24 | | |
| | | | | Apparel & Shoe Maker | | | | | |
See accompanying notes to financial statements.
85
Columbia Acorn European Fund
Statement of Investments (Unaudited), continued
| Number of Shares | | | | Value (000) | |
| | | > Italy—continued | |
| | 230 | | | Tod's | | $ | 23 | | |
| | | | | Leather Shoes & Bags | | | | | |
| | 2,000 | | | Pirelli | | | 21 | | |
| | | | | Global Tire Supplier | | | | | |
| | 9,960 | | | CIR | | | 10 | | |
| | | | | Italian Holding Company | | | | | |
| | | | 78 | | |
| | | > Russia 2.7% | |
| | 1,900 | | | Yandex (a) | | | 36 | | |
| | | | | Search Engine for Russian & Turkish Languages | | | | | |
| | 600 | | | Mail.ru - GDR (a)(b) | | | 21 | | |
| | | | | Internet Social Networking & Games for Russian Speakers | | | | | |
| | | | 57 | | |
| | | > Iceland 2.5% | |
| | 43,750 | | | Marel | | | 53 | | |
| | | | | Largest Manufacturer of Poultry & Fish Processing
Equipment | | | | | |
| | | | 53 | | |
| | | > Ireland 1.9% | |
| | 300 | | | Paddy Power | | | 20 | | |
| | | | | Irish Betting Services | | | | | |
| | 7,300 | | | United Drug | | | 19 | | |
| | | | | Irish Pharmaceutical Wholesaler & Outsourcer | | | | | |
| | | | 39 | | |
| | | > Portugal 1.7% | |
| | 13,480 | | | Redes Energéticas Nacionais | | | 36 | | |
| | | | | Portuguese Power Transmission &
Gas Transportation | | | | | |
| | | | 36 | | |
| | | > Norway 1.6% | |
| | 3,710 | | | Atea | | | 33 | | |
| | | | | Leading Nordic IT Hardware/Software Reseller &
Installation Company | | | | | |
| | | | 33 | | |
| | | > Belgium 1.2% | |
| | 530 | | | EVS Broadcast Equipment | | | 25 | | |
| | | | | Digital Live Mobile Production Software & Systems | | | | | |
| | | | 25 | | |
| | | > Czech Republic 1.1% | |
| | 140 | | | Komercni Banka | | | 24 | | |
| | | | | Leading Czech Universal Bank | | | | | |
| | | | 24 | | |
| | | > Poland 1.1% | |
| | 4,000 | | | FX Energy (a) | | | 24 | | |
| | | | | Oil & Gas Producer in Poland | | | | | |
| | | | 24 | | |
| | | > Denmark 0.8% | |
| | 300 | | | Solar A/S | | | 16 | | |
| | | | | Technical Wholesaler of Electrical, Plumbing &
HVAC Equipment | | | | | |
| | | | 16 | | |
| Number of Shares | | | | Value (000) | |
| | | > Greece 0.7% | |
| | 13,330 | | | Intralot | | $ | 15 | | |
| | | | | Lottery & Gaming Systems & Services | | | | | |
| | | | 15 | | |
| Europe: Total | | | 1,892 | | |
| Other Countries 1.7% | | | |
| | | > Canada 1.3% | |
| | 1,970 | | | Alliance Grain Traders | | | 26 | | |
| | | | | Global Leader in Pulse Processing & Distribution | | | | | |
| | | | 26 | | |
| | | > United States 0.4% | |
| | 1,300 | | | Velti (a)(c) | | | 9 | | |
| | | | | Mobile Marketing Software Platform | | | | | |
| | | | 9 | | |
| Other Countries: Total | | | 35 | | |
| Asia 1.4% | | | |
| | | > Hong Kong 1.4% | |
| | 11,000 | | | L'Occitane International | | | 30 | | |
| | | | | Skin Care & Cosmetics Producer | | | | | |
| | | | 30 | | |
| Asia: Total | | | 30 | | |
Total Equities: 92.9%
(Cost: $1,874) | | | 1,957 | | |
| Securities Lending Collateral 0.3% | | | |
| | 5,850 | | | Dreyfus Government Cash
Management Fund
(7 day yield of 0.01%) (d) | | | 6 | | |
Total Securities Lending Collateral:
(Cost: $6) | | | 6 | | |
Total Investments: 93.2%
(Cost: $1,880)(e)(f) | | | 1,963 | | |
Obligation to Return Collateral for
Securities Loaned: (0.3)% | | | (6 | ) | |
| Cash and Other Assets Less Liabilities: 7.1% | | | 149 | | |
| Total Net Assets: 100.0% | | $ | 2,106 | | |
GDR - Global Depositary Receipts
REIT - Real Estate Investment Trust
See accompanying notes to financial statements.
86
> Notes to Statement of Investments (dollar values in thousands)
(a) Non-income producing security.
(b) Security exempt from registration under Section 4(2) of the Securities Act of 1933. This security may only be resold in exempt transactions to qualified buyers. Private resales of this security to qualified institutional buyers are also exempt from registration pursuant to Rule 144A under the Securities Act of 1933. At June 30, 2012, this security had an aggregate value of $21, which represented 1.00% of total net assets.
(c) All or a portion of this security was on loan at June 30, 2012. The total market value of securities on loan at June 30, 2012 was $6.
(d) Investment made with cash collateral received from securities lending activity.
(e) At June 30, 2012, for federal income tax purposes, the cost of investments was $1,880 and net unrealized appreciation was $83 consisting of gross unrealized appreciation of $191 and gross unrealized depreciation of $108.
(f) On June 30, 2012, the Fund's total investments were denominated in currencies as follows:
| Currency | | Value | | Percentage
of Net Assets | |
| Euro | | $ | 937 | | | | 44.5 | | |
| British Pound | | | 386 | | | | 18.3 | | |
| Swiss Franc | | | 209 | | | | 9.9 | | |
| Swedish Krona | | | 126 | | | | 6.0 | | |
| United States Dollar | | | 116 | | | | 5.5 | | |
Other currencies less
than 5% of total net assets | | | 183 | | | | 8.7 | | |
| Total Portfolio | | $ | 1,957 | | | | 92.9 | | |
Fair Value Measurements
Various inputs are used in determining the value of the Fund's investments, following the input prioritization hierarchy established by GAAP. These inputs are summarized in the three broad levels listed below:
• Level 1 – quoted prices in active markets for identical securities
• Level 2 – prices determined using other significant observable inputs (including quoted prices for similar securities, interest rates, prepayment speeds, credit risk and others)
• Level 3 – prices determined using significant unobservable inputs where quoted prices or observable inputs are unavailable or less reliable (including management's own assumptions about the factors market participants would use in pricing an investment)
The inputs or methodology used for valuing securities are not necessarily an indication of the risk associated with investing in those securities.
Examples of the types of securities in which the Fund would typically invest and how they are classified within this hierarchy are as follows. Typical Level 1 securities include exchange traded domestic equities, mutual funds whose NAVs are published each day and exchange traded foreign equities that are not statistically fair valued. Typical Level 2 securities include exchange traded foreign equities that are statistically fair valued and short-term investments valued at amortized cost. Additionally, securities fair valued by the Valuation Committee (the Committee) of the Fund's Board of Trustees (the Board) that rely on significant observable inputs are also included in Level 2. Typical Level 3 securities include any security fair valued by the Committee that relies on significant unobservable inputs.
Under the direction of the Board, the Committee is responsible for carrying out the valuation procedures approved by the Board.
The Committee meets as necessary, and no less frequently than quarterly, to determine fair values for securities for which market quotations are not readily available or for which the investment manager believes that available market quotations are unreliable, and to review the continuing appropriateness of the current value of any security subject to the Trust's Portfolio Pricing Policy and the pricing procedures of the investment manager (the Policies). The Policies address, among other things: circumstances under which market quotations will be deemed readily available; selection of third party pricing vendors; appropriate pricing methodologies; events that require fair valuation and fair value techniques; and circumstances under which securities will be deemed to pose a potential for stale pricing, including when securities are illiquid, restricted, or in default. The Committee may also meet to discuss additional valuation matters, which may include review of back-testing results, review of time-sensitive information or approval of other valuation related actions, and to review the appropriateness of the Policies.
For investments categorized as Level 3, the significant unobservable inputs used in the fair value measurement of the Funds' securities may include: (i) data specific to the issuer or comparable issuers, (ii) general market or specific sector news and (iii) quoted prices and specific or similar security transactions. The Committee considers this data and any changes from prior periods in order to assess the reasonableness of observable and unobservable inputs, any assumptions or internal models used to value those securities and changes in fair value. Significant changes in any of these factors could result in lower or higher fair value measurements. Various factors impact the frequency of monitoring (which may occur as often as daily), however the Committee may determine that changes to inputs, assumptions and models are not required with the same frequency.
See accompanying notes to financial statements.
87
Columbia Acorn European Fund
Statement of Investments (Unaudited), continued
> Notes to Statement of Investments (dollar values in thousands)
The following table summarizes the inputs used, as of June 30, 2012, in valuing the Fund's assets:
| Investment Type | | Quoted Prices
(Level 1) | | Other
Significant
Observable
Inputs
(Level 2) | | Significant
Unobservable
Inputs
(Level 3) | | Total | |
| Equities | |
| Europe | | $ | 87 | | | $ | 1,805 | | | $ | - | | | $ | 1,892 | | |
| Other Countries | | | 35 | | | | - | | | | - | | | | 35 | | |
| Asia | | | - | | | | 30 | | | | - | | | | 30 | | |
| Total Equities | | | 122 | | | | 1,835 | | | | - | | | | 1,957 | | |
| Total Securities Lending Collateral | | | 6 | | | | - | | | | - | | | | 6 | | |
| Total Investments | | $ | 128 | | | $ | 1,835 | | | $ | - | | | $ | 1,963 | | |
The Fund's assets assigned to the Level 2 input category are generally valued using a market approach, in which a security's value is determined through its correlation to prices and information from observable market transactions for similar or identical assets. Foreign equities are generally valued at the last sale price on the foreign exchange or market on which they trade. The Fund may use a statistical fair valuation model, in accordance with the policy adopted by the Board, provided by an independent third party to value securities principally traded in foreign markets in order to adjust for possible stale pricing that may occur between the close of the foreign exchanges and the time for valuation. These models take into account available market data including intraday index, ADR, and ETF movements.
There were no transfers of financial assets between levels 1 and 2 during the period.
See accompanying notes to financial statements.
88
Columbia Acorn European Fund
Portfolio Diversification (Unaudited)
At June 30, 2012, the Fund's portfolio investments as a percentage of net assets were diversified as follows:
| | | Value (000) | | Percentage
of Net Assets | |
| > Industrial Goods & Services | |
| Other Industrial Services | | $ | 235 | | | | 11.2 | | |
| Machinery | | | 178 | | | | 8.4 | | |
Industrial Materials &
Specialty Chemicals | | | 84 | | | | 4.0 | | |
| Outsourcing Services | | | 81 | | | | 3.8 | | |
| Conglomerates | | | 73 | | | | 3.4 | | |
| Construction | | | 59 | | | | 2.8 | | |
| Electrical Components | | | 31 | | | | 1.5 | | |
| Industrial Distribution | | | 16 | | | | 0.8 | | |
| | | | 757 | | | | 35.9 | | |
| > Information | |
| Business Software | | | 105 | | | | 5.0 | | |
Computer Hardware &
Related Equipment | | | 97 | | | | 4.6 | | |
| Internet Related | | | 92 | | | | 4.4 | | |
| Financial Processors | | | 63 | | | | 3.0 | | |
Business Information &
Marketing Services | | | 55 | | | | 2.6 | | |
| Computer Services | | | 32 | | | | 1.5 | | |
| Advertising | | | 18 | | | | 0.8 | | |
| | | | 462 | | | | 21.9 | | |
| > Consumer Goods & Services | |
| Casinos & Gaming | | | 60 | | | | 2.9 | | |
| Retail | | | 55 | | | | 2.6 | | |
| Nondurables | | | 54 | | | | 2.6 | | |
| Restaurants | | | 41 | | | | 1.9 | | |
| Other Durable Goods | | | 40 | | | | 1.9 | | |
| Food & Beverage | | | 25 | | | | 1.2 | | |
| Apparel | | | 24 | | | | 1.1 | | |
| Other Entertainment | | | 18 | | | | 0.9 | | |
| | | | 317 | | | | 15.1 | | |
| > Finance | |
| Insurance | | | 87 | | | | 4.1 | | |
| Brokerage & Money Management | | | 53 | | | | 2.5 | | |
| Banks | | | 24 | | | | 1.2 | | |
| | | | 164 | | | | 7.8 | | |
| > Energy & Minerals | |
| Oil & Gas Producers | | | 39 | | | | 1.9 | | |
| Mining | | | 27 | | | | 1.3 | | |
| Agricultural Commodities | | | 26 | | | | 1.2 | | |
| Oil Refining, Marketing & Distribution | | | 19 | | | | 0.9 | | |
| | | | 111 | | | | 5.3 | | |
| > Other Industries | |
| Regulated Utilities | | | 36 | | | | 1.7 | | |
| Real Estate | | | 25 | | | | 1.2 | | |
| Transportation | | | 23 | | | | 1.1 | | |
| | | | 84 | | | | 4.0 | | |
| | | Value (000) | | Percentage
of Net Assets | |
| > Health Care | |
| Medical Equipment & Devices | | $ | 22 | | | | 1.0 | | |
| Medical Supplies | | | 21 | | | | 1.0 | | |
| Pharmaceuticals | | | 19 | | | | 0.9 | | |
| | | | 62 | | | | 2.9 | | |
| Total Equities: | | | 1,957 | | | | 92.9 | | |
| Security Lending Collateral: | | | 6 | | | | 0.3 | | |
| Total Investments: | | | 1,963 | | | | 93.2 | | |
Obligation to Return
Collateral for Securities
Loaned: | | | (6 | ) | | | (0.3 | ) | |
Cash and Other Assets
Less Liabilities: | | | 149 | | | | 7.1 | | |
| Net Assets: | | $ | 2,106 | | | | 100.0 | | |
See accompanying notes to financial statements.
89
Columbia Acorn Family of Funds
Statements of Assets and Liabilities (Unaudited)
| June 30, 2012 | | Columbia
Acorn
Fund | | Columbia
Acorn
International | | Columbia
Acorn
USA | | Columbia
Acorn
International
Select | |
| (in thousands) | |
| Assets: | |
| Unaffiliated investments, at cost | | $ | 8,195,104 | | | $ | 4,769,636 | | | $ | 1,175,881 | | | $ | 273,433 | | |
| Affiliated investments, at cost (See Note 4) | | | 2,717,367 | | | | 93,271 | | | | 3,624 | | | | — | | |
Unaffiliated investments, at value (including securities on loan: Columbia Acorn Fund $302,684;
Columbia Acorn International $110,353; Columbia Acorn USA $52,943; Columbia Acorn
International Select $—; Columbia Acorn Select $25,542; Columbia Thermostat Fund $—;
Columbia Acorn Emerging Markets Fund $105; Columbia Acorn European Fund $6) | | $ | 12,779,513 | | | $ | 5,689,495 | | | $ | 1,631,375 | | | $ | 320,869 | | |
| Affiliated investments, at value (See Note 4) | | | 3,965,342 | | | | 122,198 | | | | 3,546 | | | | — | | |
| Cash | | | 723,080 | | | | 234,386 | | | | 5,316 | | | | 17,891 | | |
Foreign currency (cost: Columbia Acorn Fund $—; Columbia Acorn International $978; Columbia Acorn
USA $—; Columbia Acorn International Select $183; Columbia Acorn Select $—; Columbia Thermostat
Fund $—; Columbia Acorn Emerging Markets Fund $1; Columbia Acorn European Fund $—) | | | 1,468 | | | | 980 | | | | — | | | | 184 | | |
| Receivable for: | |
| Investments sold | | | 14,479 | | | | 26,099 | | | | 1,960 | | | | 4,811 | | |
| Fund shares sold | | | 13,853 | | | | 101,107 | | | | 1,798 | | | | 719 | | |
| Dividends and interest | | | 6,953 | | | | 5,681 | | | | 386 | | | | 387 | | |
| Securities lending income | | | 764 | | | | 147 | | | | 111 | | | | 3 | | |
| Foreign tax reclaims | | | 309 | | | | 4,004 | | | | — | | | | 211 | | |
| Expense reimbursement due from Advisor | | | — | | | | 1 | | | | — | | | | — | | |
| Trustees' Deferred Compensation Investments | | | 2,374 | | | | 659 | | | | 195 | | | | — | | |
| Other assets | | | 228 | | | | 20 | | | | 10 | | | | 1 | | |
| Total Assets | | | 17,508,363 | | | | 6,184,777 | | | | 1,644,697 | | | | 345,076 | | |
| Liabilities: | |
| Collateral on securities loaned | | | 303,633 | | | | 111,197 | | | | 53,351 | | | | — | | |
| Unrealized depreciation on forward foreign currency exchange contracts | | | — | | | | — | | | | — | | | | 933 | | |
| Payable to advisor | | | — | | | | — | | | | — | | | | — | | |
| Payable for: | |
| Investments purchased | | | 9,292 | | | | 35,885 | | | | 871 | | | | 5,304 | | |
| Fund shares redeemed | | | 26,065 | | | | 5,369 | | | | 2,043 | | | | 540 | | |
| Management fee | | | 292 | | | | 120 | | | | 36 | | | | 8 | | |
| Administration fee | | | 18 | | | | 6 | | | | 2 | | | | — | (a) | |
| 12b-1 Service and Distribution fees | | | 43 | | | | 9 | | | | 2 | | | | 1 | | |
| Reports to shareholders | | | 565 | | | | 263 | | | | 50 | | | | 39 | | |
| Deferred Trustees' fees | | | 2,374 | | | | 659 | | | | 195 | | | | — | | |
| Transfer agent fees | | | 1,403 | | | | 374 | | | | 241 | | | | 25 | | |
| Trustees' fees | | | — | | | | 1 | | | | — | | | | 40 | | |
| Custody fees | | | 75 | | | | 185 | | | | 2 | | | | 16 | | |
| Professional fee | | | 88 | | | | 48 | | | | 39 | | | | 25 | | |
| Chief compliance officer expenses | | | 43 | | | | 13 | | | | 4 | | | | 2 | | |
| Deferred foreign capital gains tax payable | | | — | | | | 4,024 | | | | — | | | | — | | |
| Other liabilities | | | — | | | | 57 | | | | — | | | | 9 | | |
| Total Liabilities | | | 343,891 | | | | 158,210 | | | | 56,836 | | | | 6,942 | | |
| Net Assets | | $ | 17,164,472 | | | $ | 6,026,567 | | | $ | 1,587,861 | | | $ | 338,134 | | |
| Composition of Net Assets: | |
| Paid-in capital | | $ | 10,721,070 | | | $ | 5,301,264 | | | $ | 1,029,599 | | | $ | 279,482 | | |
| Undistributed (overdistributed) net investment income | | | (28,080 | ) | | | (36,596 | ) | | | (3,403 | ) | | | (2,516 | ) | |
| Accumulated net realized gain (loss) | | | 639,075 | | | | (182,854 | ) | | | 106,249 | | | | 14,670 | | |
| Net unrealized appreciation (depreciation) on: | |
| Unaffiliated investments | | | 4,584,409 | | | | 919,859 | | | | 455,494 | | | | 47,436 | | |
| Affiliated investments | | | 1,247,975 | | | | 28,927 | | | | (78 | ) | | | — | | |
| Foreign currency translations | | | 23 | | | | (9 | ) | | | — | | | | (6 | ) | |
| Forward foreign currency exchange contracts | | | — | | | | — | | | | — | | | | (932 | ) | |
| Foreign capital gains tax | | | — | | | | (4,024 | ) | | | — | | | | — | | |
| Net Assets | | $ | 17,164,472 | | | $ | 6,026,567 | | | $ | 1,587,861 | | | $ | 338,134 | | |
| Net asset value per share – Class A (b) | | $ | 28.69 | | | $ | 37.01 | | | $ | 28.52 | | | $ | 26.62 | | |
| (Net assets/shares) | | | ($3,289,689/114,676) | | | | ($926,998/25,045) | | | | ($157,525/5,523) | | | | ($57,282/2,152) | | |
| Maximum offering price per share – Class A (c) | | $ | 30.44 | | | $ | 39.27 | | | $ | 30.26 | | | $ | 28.24 | | |
| (Net asset value per share/front-end sales charge) | | | ($28.69/0.9425) | | | | ($37.01/0.9425) | | | | ($28.52/0.9425) | | | | ($26.62/0.9425) | | |
| Net asset value and offering price per share – Class B (b) | | $ | 26.32 | | | $ | 35.88 | | | $ | 26.27 | | | $ | 25.45 | | |
| (Net assets/shares) | | | ($45,604/1,733) | | | | ($21,112/588) | | | | ($1,627/62) | | | | ($1,364/53) | | |
| Net asset value and offering price per share – Class C (b) | | $ | 25.92 | | | $ | 35.73 | | | $ | 25.99 | | | $ | 25.32 | | |
| (Net assets/shares) | | | ($749,753/28,929) | | | | ($92,746/2,596) | | | | ($31,666/1,218) | | | | ($8,585/339) | | |
| Net asset value and offering price per share – Class I (d) | | $ | 29.76 | | | $ | 37.13 | | | $ | 29.75 | | | $ | 26.88 | | |
| (Net assets/shares) | | | ($32,680/1,098) | | | | ($62,855/1,693) | | | | ($618/21) | | | ($ | 3/— | (e)) | |
| Net asset value and offering price per share – Class R | | $ | — | | | $ | 36.97 | | | $ | — | | | $ | — | | |
| (Net assets/shares) | | ($ | —/— | ) | | | ($961/26) | | | ($ | —/— | ) | | ($ | —/— | ) | |
| Net asset value and offering price per share – Class R5 | | $ | — | | | $ | 37.10 | | | $ | — | | | $ | — | | |
| (Net assets/shares) | | ($ | —/— | ) | | | ($2,179/59) | | | ($ | —/— | ) | | ($ | —/— | ) | |
| Net asset value and offering price per share – Class Z (d) | | $ | 29.74 | | | $ | 37.10 | | | $ | 29.72 | | | $ | 26.88 | | |
| (Net assets/shares) | | | ($13,046,746/438,699) | | | | ($4,919,716/132,598) | | | | ($1,396,425/46,989) | | | | ($270,900/10,078) | | |
(a) Rounds to less than $500.
(b) Redemption price per share is equal to net asset value less any applicable contingent deferred sales charge.
(c) On sales of $50,000 or more the offering price is reduced.
(d) Redemption price per share is equal to net asset value.
(e) Rounds to less than 500 shares.
See accompanying notes to financial statements.
90
| June 30, 2012 | | Columbia
Acorn
Select | | Columbia
Thermostat
Fund | | Columbia
Acorn
Emerging
Markets
Fund | | Columbia
Acorn
European
Fund | |
| (in thousands) | |
| Assets: | |
| Unaffiliated investments, at cost | | $ | 709,773 | | | $ | — | | | $ | 5,608 | | | $ | 1,880 | | |
| Affiliated investments, at cost (See Note 4) | | | 152,247 | | | | 404,568 | | | | — | | | | — | | |
Unaffiliated investments, at value (including securities on loan: Columbia Acorn Fund $302,684;
Columbia Acorn International $110,353; Columbia Acorn USA $52,943; Columbia Acorn
International Select $—; Columbia Acorn Select $25,542; Columbia Thermostat Fund $—;
Columbia Acorn Emerging Markets Fund $105; Columbia Acorn European Fund $6) | | $ | 1,037,312 | | | $ | — | | | $ | 5,694 | | | $ | 1,963 | | |
| Affiliated investments, at value (See Note 4) | | | 65,984 | | | | 429,478 | | | | — | | | | — | | |
| Cash | | | 19,892 | | | | 4,565 | | | | 219 | | | | 153 | | |
Foreign currency (cost: Columbia Acorn Fund $—; Columbia Acorn International $978; Columbia Acorn
USA $—; Columbia Acorn International Select $183; Columbia Acorn Select $—; Columbia Thermostat
Fund $—; Columbia Acorn Emerging Markets Fund $1; Columbia Acorn European Fund $—) | | | — | | | | — | | | | 1 | | | | — | | |
| Receivable for: | |
| Investments sold | | | 1,867 | | | | — | | | | 2 | | | | 38 | | |
| Fund shares sold | | | 677 | | | | 9,061 | | | | 10 | | | | — | | |
| Dividends and interest | | | 670 | | | | 1,251 | | | | 9 | | | | 1 | | |
| Securities lending income | | | 290 | | | | — | | | | — | (a) | | | — | (a) | |
| Foreign tax reclaims | | | — | | | | — | | | | 1 | | | | 2 | | |
| Expense reimbursement due from Advisor | | | — | | | | — | (a) | | | — | | | | — | | |
| Trustees' Deferred Compensation Investments | | | 237 | | | | — | | | | — | | | | — | | |
| Other assets | | | 6 | | | | — | (a) | | | 8 | | | | 8 | | |
| Total Assets | | | 1,126,935 | | | | 444,355 | | | | 5,944 | | | | 2,165 | | |
| Liabilities: | |
| Collateral on securities loaned | | | 26,067 | | | | — | | | | 105 | | | | 6 | | |
| Unrealized depreciation on forward foreign currency exchange contracts | | | — | | | | — | | | | — | | | | — | | |
| Payable to advisor | | | — | | | | — | | | | 8 | | | | 7 | | |
| Payable for: | |
| Investments purchased | | | — | | | | 3,645 | | | | 18 | | | | 11 | | |
| Fund shares redeemed | | | 1,180 | | | | 591 | | | | — | | | | — | | |
| Management fee | | | 24 | | | | 1 | | | | — | (a) | | | — | (a) | |
| Administration fee | | | 1 | | | | 1 | | | | — | (a) | | | — | (a) | |
| 12b-1 Service and Distribution fees | | | 4 | | | | 4 | | | | — | (a) | | | — | (a) | |
| Reports to shareholders | | | 122 | | | | 8 | | | | 10 | | | | 10 | | |
| Deferred Trustees' fees | | | 237 | | | | — | | | | — | | | | — | | |
| Transfer agent fees | | | 124 | | | | 23 | | | | — | (a) | | | — | (a) | |
| Trustees' fees | | | 1 | | | | 23 | | | | — | (a) | | | — | (a) | |
| Custody fees | | | 2 | | | | — | (a) | | | 11 | | | | 5 | | |
| Professional fee | | | 38 | | | | 8 | | | | 12 | | | | 15 | | |
| Chief compliance officer expenses | | | 6 | | | | — | | | | — | (a) | | | — | (a) | |
| Deferred foreign capital gains tax payable | | | — | | | | — | | | | 4 | | | | — | | |
| Other liabilities | | | 9 | | | | — | | | | 4 | | | | 5 | | |
| Total Liabilities | | | 27,815 | | | | 4,304 | | | | 172 | | | | 59 | | |
| Net Assets | | $ | 1,099,120 | | | $ | 440,051 | | | $ | 5,772 | | | $ | 2,106 | | |
| Composition of Net Assets: | |
| Paid-in capital | | $ | 820,730 | | | $ | 434,121 | | | $ | 5,754 | | | $ | 2,021 | | |
| Undistributed (overdistributed) net investment income | | | (2,288 | ) | | | 2,831 | | | | 10 | | | | 23 | | |
| Accumulated net realized gain (loss) | | | 39,399 | | | | (21,811 | ) | | | (74 | ) | | | (21 | ) | |
| Net unrealized appreciation (depreciation) on: | |
| Unaffiliated investments | | | 327,539 | | | | — | | | | 86 | | | | 83 | | |
| Affiliated investments | | | (86,263 | ) | | | 24,910 | | | | — | | | | — | | |
| Foreign currency translations | | | 3 | | | | — | | | | — | (a) | | | — | (a) | |
| Forward foreign currency exchange contracts | | | — | | | | — | | | | — | | | | — | | |
| Foreign capital gains tax | | | — | | | | — | | | | (4 | ) | | | — | | |
| Net Assets | | $ | 1,099,120 | | | $ | 440,051 | | | $ | 5,772 | | | $ | 2,106 | | |
| Net asset value per share – Class A (b) | | $ | 24.17 | | | $ | 13.65 | | | $ | 10.15 | | | $ | 10.50 | | |
| (Net assets/shares) | | | ($303,485/12,557) | | | | ($171,091/12,535) | | | | ($1,274/125) | | | | ($203/19) | | |
| Maximum offering price per share – Class A (c) | | $ | 25.64 | | | $ | 14.48 | | | $ | 10.77 | | | $ | 11.14 | | |
| (Net asset value per share/front-end sales charge) | | | ($24.17/0.9425) | | | | ($13.65/0.9425) | | | | ($10.15/0.9425) | | | | ($10.50/0.9425) | | |
| Net asset value and offering price per share – Class B (b) | | $ | 22.43 | | | $ | 13.71 | | | $ | — | | | $ | — | | |
| (Net assets/shares) | | | ($15,343/684) | | | | ($5,833/425) | | | ($ | —/— | ) | | ($ | —/— | ) | |
| Net asset value and offering price per share – Class C (b) | | $ | 22.20 | | | $ | 13.69 | | | $ | 10.10 | | | $ | 10.46 | | |
| (Net assets/shares) | | | ($60,556/2,728) | | | | ($111,865/8,170) | | | | ($216/21) | | | | ($18/2) | | |
| Net asset value and offering price per share – Class I (d) | | $ | 24.96 | | | $ | — | | | $ | 10.19 | | | $ | 10.51 | | |
| (Net assets/shares) | | | ($21,778/872) | | | ($ | —/— | ) | | | ($5/1) | | | | ($5/1) | | |
| Net asset value and offering price per share – Class R | | $ | — | | | $ | — | | | $ | — | | | $ | — | | |
| (Net assets/shares) | | ($ | —/— | ) | | ($ | —/— | ) | | ($ | —/— | ) | | ($ | —/— | ) | |
| Net asset value and offering price per share – Class R5 | | $ | — | | | $ | — | | | $ | — | | | $ | — | | |
| (Net assets/shares) | | ($ | —/— | ) | | ($ | —/— | ) | | ($ | —/— | ) | | ($ | —/— | ) | |
| Net asset value and offering price per share – Class Z (d) | | $ | 24.92 | | | $ | 13.51 | | | $ | 10.19 | | | $ | 10.52 | | |
| (Net assets/shares) | | | ($697,958/28,005) | | | | ($151,262/11,198) | | | | ($4,277/420) | | | | ($1,880/178) | | |
See accompanying notes to financial statements.
91
Columbia Acorn Family of Funds
Statements of Operations (Unaudited) For the Six Months Ended June 30, 2012
| (in thousands) | | Columbia
Acorn
Fund | | Columbia
Acorn
International | | Columbia
Acorn
USA | | Columbia
Acorn
International
Select | |
| Investment Income: | |
| Dividend income | | $ | 68,183 | | | $ | 86,067 | | | $ | 5,295 | | | $ | 5,357 | | |
| Dividend income from affiliates (See Note 4) | | | 9,504 | | | | 2,251 | | | | — | | | | — | | |
| Interest income | | | — | (a) | | | — | (a) | | | — | | | | 3 | | |
| Securities lending income, net | | | 4,039 | | | | 707 | | | | 536 | | | | 15 | | |
| Dividends from affiliated investment company shares | | | — | | | | — | | | | — | | | | — | | |
| | | | 81,726 | | | | 89,025 | | | | 5,831 | | | | 5,375 | | |
| Foreign taxes withheld | | | (1,840 | ) | | | (8,503 | ) | | | (7 | ) | | | (469 | ) | |
| Total Investment Income | | | 79,886 | | | | 80,522 | | | | 5,824 | | | | 4,906 | | |
| Expenses: | |
| Management fee | | | 56,115 | | | | 22,639 | | | | 7,167 | | | | 1,578 | | |
| Administration fee | | | 3,398 | | | | 1,155 | | | | 323 | | | | 65 | | |
| 12b-1 Service and Distribution fees: | |
| Class A | | | 4,288 | | | | 1,203 | | | | 214 | | | | 72 | | |
| Class B | | | 219 | | | | 89 | | | | 7 | | | | 6 | | |
| Class C | | | 3,851 | | | | 491 | | | | 162 | | | | 44 | | |
| Class R | | | — | | | | 2 | | | | — | | | | — | | |
| Transfer agent fees: | |
| Class A | | | 1,487 | | | | 758 | | | | 84 | | | | 38 | | |
| Class B | | | 53 | | | | 48 | | | | 3 | | | | 2 | | |
| Class C | | | 339 | | | | 71 | | | | 15 | | | | 7 | | |
| Class R | | | — | | | | 1 | | | | — | | | | — | | |
| Class R5 | | | — | | | | — | (a) | | | — | | | | — | | |
| Class Z | | | 2,916 | | | | 1,058 | | | | 560 | | | | 74 | | |
| Custody fees | | | — | | | | 547 | | | | 7 | | | | 42 | | |
| Trustees' fees | | | 496 | | | | 171 | | | | 49 | | | | 10 | | |
| Registration and blue sky fees | | | 109 | | | | 89 | | | | 55 | | | | 41 | | |
| Reports to shareholders | | | 1,207 | | | | 692 | | | | 249 | | | | 93 | | |
| Audit fees | | | 39 | | | | 62 | | | | 19 | | | | 20 | | |
| Legal fees | | | 773 | | | | 291 | | | | 87 | | | | 18 | | |
| Interest expense (See Note 5) | | | — | | | | — | | | | — | | | | — | | |
| Chief compliance officer expenses (See Note 4) | | | 247 | | | | 83 | | | | 23 | | | | 5 | | |
| Organizational expenses (See Note 4) | | | — | | | | — | | | | — | | | | — | | |
| Other expenses | | | 355 | | | | 133 | | | | 36 | | | | 13 | | |
| Total Expenses | | | 75,892 | | | | 29,583 | | | | 9,060 | | | | 2,128 | | |
| Less reimbursement of expenses by Investment Advisor (See Note 4) | | | — | | | | (206 | ) | | | — | | | | — | | |
| Net Expenses | | | 75,892 | | | | 29,377 | | | | 9,060 | | | | 2,128 | | |
| Net Investment Income/(Loss) | | | 3,994 | | | | 51,145 | | | | (3,236 | ) | | | 2,778 | | |
Net Realized and Unrealized Gain/(Loss)
on Portfolio Positions: | |
| Net Realized Gain/(Loss) on: | |
| Unaffiliated investments | | | 669,444 | | | | 118,555 | | | | 106,876 | | | | 14,604 | | |
| Affiliated investments (See Note 4) | | | 560 | | | | — | | | | — | | | | — | | |
| Foreign currency translations | | | (99 | ) | | | (1,108 | ) | | | — | | | | (108 | ) | |
| Forward foreign currency exchange contracts | | | — | | | | 5,423 | | | | — | | | | 210 | | |
| Distributions from affiliated investment company shares | | | — | | | | — | | | | — | | | | — | | |
| Net realized gain/(loss) | | | 669,905 | | | | 122,870 | | | | 106,876 | | | | 14,706 | | |
| Net change in net unrealized appreciation/(depreciation) on: | |
| Unaffiliated investments | | | 667,791 | | | | 317,503 | | | | 52,933 | | | | 15,607 | | |
| Affiliated investments (See Note 4) | | | 169,764 | | | | (10,385 | ) | | | 231 | | | | — | | |
| Foreign currency translations | | | 35 | | | | 70 | | | | — | | | | 6 | | |
| Forward foreign currency exchange contracts | | | — | | | | (4,539 | ) | | | — | | | | 16 | | |
| Foreign capital gains tax | | | — | | | | (1,703 | ) | | | — | | | | — | | |
| Net change in unrealized appreciation/(depreciation) | | | 837,590 | | | | 300,946 | | | | 53,164 | | | | 15,629 | | |
| Net realized and unrealized gain | | | 1,507,495 | | | | 423,816 | | | | 160,040 | | | | 30,335 | | |
| Net Increase in Net Assets resulting from Operations | | $ | 1,511,489 | | | $ | 474,961 | | | $ | 156,804 | | | $ | 33,113 | | |
(a) Rounds to less than $500.
See accompanying notes to financial statements.
92
| (in thousands) | | Columbia
Acorn
Select | | Columbia
Thermostat
Fund | | Columbia
Acorn
Emerging
Markets
Fund | | Columbia
Acorn
European
Fund | |
| Investment Income: | |
| Dividend income | | $ | 4,297 | | | $ | — | | | $ | 55 | | | $ | 44 | | |
| Dividend income from affiliates (See Note 4) | | | — | | | | — | | | | — | | | | — | | |
| Interest income | | | — | | | | — | | | | — | | | | — | (a) | |
| Securities lending income, net | | | 1,292 | | | | — | | | | — | (a) | | | — | (a) | |
| Dividends from affiliated investment company shares | | | — | | | | 3,776 | | | | — | | | | — | | |
| | | | 5,589 | | | | 3,776 | | | | 55 | | | | 44 | | |
| Foreign taxes withheld | | | (47 | ) | | | — | | | | (3 | ) | | | (5 | ) | |
| Total Investment Income | | | 5,542 | | | | 3,776 | | | | 52 | | | | 39 | | |
| Expenses: | |
| Management fee | | | 5,314 | | | | 154 | | | | 31 | | | | 12 | | |
| Administration fee | | | 249 | | | | 60 | | | | 1 | | | | — | (a) | |
| 12b-1 Service and Distribution fees: | |
| Class A | | | 428 | | | | 153 | | | | 1 | | | | — | (a) | |
| Class B | | | 81 | | | | 31 | | | | — | | | | — | | |
| Class C | | | 331 | | | | 330 | | | | 1 | | | | — | (a) | |
| Class R | | | — | | | | — | | | | — | | | | — | | |
| Transfer agent fees: | |
| Class A | | | 193 | | | | 58 | | | | 1 | | | | — | (a) | |
| Class B | | | 22 | | | | 7 | | | | — | | | | — | | |
| Class C | | | 35 | | | | 30 | | | | — | (a) | | | — | (a) | |
| Class R | | | — | | | | — | | | | — | | | | — | | |
| Class R5 | | | — | | | | — | | | | — | | | | — | | |
| Class Z | | | 264 | | | | 31 | | | | 1 | | | | — | (a) | |
| Custody fees | | | — | | | | 3 | | | | 30 | | | | 2 | | |
| Trustees' fees | | | 44 | | | | 7 | | | | — | (a) | | | — | (a) | |
| Registration and blue sky fees | | | 52 | | | | 65 | | | | 56 | | | | 57 | | |
| Reports to shareholders | | | 226 | | | | 65 | | | | 14 | | | | 14 | | |
| Audit fees | | | 20 | | | | 10 | | | | 27 | | | | 23 | | |
| Legal fees | | | 66 | | | | 9 | | | | — | (a) | | | — | (a) | |
| Interest expense (See Note 5) | | | 1 | | | | — | | | | — | | | | — | | |
| Chief compliance officer expenses (See Note 4) | | | 18 | | | | 4 | | | | — | (a) | | | — | (a) | |
| Organizational expenses (See Note 4) | | | — | | | | — | | | | 23 | | | | 21 | | |
| Other expenses | | | 162 | | | | 10 | | | | 2 | | | | 3 | | |
| Total Expenses | | | 7,506 | | | | 1,027 | | | | 188 | | | | 132 | | |
| Less reimbursement of expenses by Investment Advisor (See Note 4) | | | — | | | | (127 | ) | | | (149 | ) | | | (118 | ) | |
| Net Expenses | | | 7,506 | | | | 900 | | | | 39 | | | | 14 | | |
| Net Investment Income/(Loss) | | | (1,964 | ) | | | 2,876 | | | | 13 | | | | 25 | | |
Net Realized and Unrealized Gain/(Loss)
on Portfolio Positions: | |
| Net Realized Gain/(Loss) on: | |
| Unaffiliated investments | | | 73,373 | | | | — | | | | (19 | ) | | | (8 | ) | |
| Affiliated investments (See Note 4) | | | (12,823 | ) | | | (2,082 | ) | | | — | | | | — | | |
| Foreign currency translations | | | (8 | ) | | | — | | | | (1 | ) | | | (1 | ) | |
| Forward foreign currency exchange contracts | | | — | | | | — | | | | — | | | | — | | |
| Distributions from affiliated investment company shares | | | — | | | | 1,621 | | | | — | | | | — | | |
| Net realized gain/(loss) | | | 60,542 | | | | (461 | ) | | | (20 | ) | | | (9 | ) | |
| Net change in net unrealized appreciation/(depreciation) on: | |
| Unaffiliated investments | | | 34,747 | | | | — | | | | 220 | | | | 169 | | |
| Affiliated investments (See Note 4) | | | 19,182 | | | | 10,983 | | | | — | | | | — | | |
| Foreign currency translations | | | 3 | | | | — | | | | — | (a) | | | — | (a) | |
| Forward foreign currency exchange contracts | | | — | | | | — | | | | — | | | | — | | |
| Foreign capital gains tax | | | — | | | | — | | | | (3 | ) | | | — | | |
| Net change in unrealized appreciation/(depreciation) | | | 53,932 | | | | 10,983 | | | | 217 | | | | 169 | | |
| Net realized and unrealized gain | | | 114,474 | | | | 10,522 | | | | 197 | | | | 160 | | |
| Net Increase in Net Assets resulting from Operations | | $ | 112,510 | | | $ | 13,398 | | | $ | 210 | | | $ | 185 | | |
See accompanying notes to financial statements.
93
Columbia Acorn Family of Funds
Statements of Changes in Net Assets
| | | Columbia
Acorn Fund | | Columbia Acorn
International | | Columbia
Acorn USA | | Columbia Acorn
International Select | |
| Increase (Decrease) in Net Assets | | (Unaudited)
Six months
ended
June 30, | | Year ended
December 31, | | (Unaudited)
Six months
ended
June 30, | | Year ended
December 31, | | (Unaudited)
Six months
ended
June 30, | | Year ended
December 31, | | (Unaudited)
Six months
ended
June 30, | | Year ended
December 31, | |
| (in thousands) | | 2012 | | 2011 | | 2012 | | 2011 (a) | | 2012 | | 2011 | | 2012 | | 2011 | |
| Operations: | |
| Net investment income/(loss) | | $ | 3,994 | | | $ | (26,858 | ) | | $ | 51,145 | | | $ | 70,394 | | | $ | (3,236 | ) | | $ | (9,383 | ) | | $ | 2,778 | | | $ | 3,857 | | |
Net realized gain/(loss) on investments, foreign
currency transactions, forward foreign currency
exchange contracts and foreign capital gains tax | | | 669,345 | | | | 756,714 | | | | 122,870 | | | | 226,124 | | | | 106,876 | | | | 41,208 | | | | 14,706 | | | | 45,952 | | |
Net realized gain/(loss) on affiliated investments and
distributions from affiliated investment companies and
affiliated investment company shares | | | 560 | | | | (10,817 | ) | | | — | | | | (3,603 | ) | | | — | | | | (512 | ) | | | — | | | | — | | |
| Reimbursement from affiliate (See Note 4) | | | — | | | | — | | | | — | | | | 174 | | | | — | | | | — | | | | — | | | | — | | |
Net change in net unrealized appreciation/(depreciation)
on investments, foreign currency translations,
forward foreign currency exchange contracts and
foreign capital gains tax | | | 667,826 | | | | (1,530,794 | ) | | | 311,331 | | | | (1,230,965 | ) | | | 52,933 | | | | (112,790 | ) | | | 15,629 | | | | (89,001 | ) | |
Net change in net unrealized appreciation/(depreciation)
on affiliated investment companies and affiliated
investment company shares | | | 169,764 | | | | (43,544 | ) | | | (10,385 | ) | | | 22,440 | | | | 231 | | | | 876 | | | | — | | | | — | | |
| Net Increase/(Decrease) from Operations | | | 1,511,489 | | | | (855,299 | ) | | | 474,961 | | | | (915,436 | ) | | | 156,804 | | | | (80,601 | ) | | | 33,113 | | | | (39,192 | ) | |
| Distributions to Shareholders From: | |
| Net investment income – Class A | | | — | | | | (2,049 | ) | | | (1,509 | ) | | | (21,972 | ) | | | — | | | | — | | | | — | | | | (1,392 | ) | |
| Net realized gain – Class A | | | (41,199 | ) | | | (144,445 | ) | | | — | | | | — | | | | (285 | ) | | | (1,096 | ) | | | (256 | ) | | | (901 | ) | |
| Net investment income – Class B | | | — | | | | — | | | | — | | | | (600 | ) | | | — | | | | — | | | | — | | | | (23 | ) | |
| Net realized gain – Class B | | | (649 | ) | | | (4,964 | ) | | | — | | | | — | | | | (3 | ) | | | (21 | ) | | | (7 | ) | | | (31 | ) | |
| Net investment income – Class C | | | — | | | | — | | | | — | | | | (2,369 | ) | | | — | | | | — | | | | — | | | | (70 | ) | |
| Net realized gain – Class C | | | (10,281 | ) | | | (35,291 | ) | | | — | | | | — | | | | (62 | ) | | | (217 | ) | | | (40 | ) | | | (150 | ) | |
| Net investment income – Class I | | | — | | | | (34 | ) | | | (385 | ) | | | (676 | ) | | | — | | | | — | | | | — | | | | — | (c) | |
| Net realized gain – Class I | | | (431 | ) | | | (670 | ) | | | — | | | | — | | | | (1 | ) | | | (16 | ) | | | — | (c) | | | — | (c) | |
| Net investment income – Class R5 | | | — | | | | — | | | | (13 | ) | | | — | | | | — | | | | — | | | | — | | | | — | | |
| Net investment income – Class Z | | | — | | | | (36,823 | ) | | | (25,320 | ) | | | (131,455 | ) | | | — | | | | — | | | | — | | | | (9,039 | ) | |
| Net realized gain – Class Z | | | (154,079 | ) | | | (521,915 | ) | | | — | | | | — | | | | (2,401 | ) | | | (8,481 | ) | | | (1,201 | ) | | | (4,186 | ) | |
| Total Distributions to Shareholders | | | (206,639 | ) | | | (746,191 | ) | | | (27,227 | ) | | | (157,072 | ) | | | (2,752 | ) | | | (9,831 | ) | | | (1,504 | ) | | | (15,792 | ) | |
| Share Transactions: | |
| Subscriptions – Class A | | | 281,631 | | | | 881,347 | | | | 99,830 | | | | 302,659 | | | | 11,204 | | | | 41,839 | | | | 7,107 | | | | 18,154 | | |
| Distributions reinvested – Class A | | | 38,957 | | | | 134,125 | | | | 1,446 | | | | 18,983 | | | | 262 | | | | 993 | | | | 248 | | | | 2,039 | | |
Net assets of shares issued in connection with
Merger – Class A | | | — | | | | — | | | | — | | | | 204,930 | | | | — | | | | — | | | | — | | | | — | | |
| Redemptions – Class A | | | (528,484 | ) | | | (1,072,697 | ) | | | (170,050 | ) | | | (251,677 | ) | | | (37,979 | ) | | | (80,479 | ) | | | (11,843 | ) | | | (26,422 | ) | |
| Net Increase/(Decrease) – Class A | | | (207,896 | ) | | | (57,225 | ) | | | (68,774 | ) | | | 274,895 | | | | (26,513 | ) | | | (37,647 | ) | | | (4,488 | ) | | | (6,229 | ) | |
| Distributions reinvested – Class B (d) | | | 639 | | | | 4,777 | | | | — | (c) | | | 558 | | | | 3 | | | | 27 | | | | 8 | | | | 51 | | |
Net assets of shares issued in connection with
Merger – Class B | | | — | | | | — | | | | — | | | | 12,517 | | | | — | | | | — | | | | — | | | | — | | |
| Redemptions – Class B | | | (27,729 | ) | | | (215,636 | ) | | | (5,444 | ) | | | (13,183 | ) | | | (847 | ) | | | (6,779 | ) | | | (579 | ) | | | (1,017 | ) | |
| Net Decrease – Class B | | | (27,090 | ) | | | (210,859 | ) | | | (5,444 | ) | | | (108 | ) | | | (844 | ) | | | (6,752 | ) | | | (571 | ) | | | (966 | ) | |
| Subscriptions – Class C | | | 40,316 | | | | 101,181 | | | | 4,825 | | | | 19,819 | | | | 896 | | | | 2,255 | | | | 363 | | | | 966 | | |
| Distributions reinvested – Class C | | | 8,259 | | | | 27,313 | | | | — | | | | 1,845 | | | | 56 | | | | 193 | | | | 36 | | | | 188 | | |
Net assets of shares issued in connection with
Merger – Class C | | | — | | | | — | | | | — | | | | 25,563 | | | | — | | | | — | | | | — | | | | — | | |
| Redemptions – Class C | | | (72,750 | ) | | | (154,450 | ) | | | (17,087 | ) | | | (42,187 | ) | | | (2,816 | ) | | | (5,937 | ) | | | (1,317 | ) | | | (2,975 | ) | |
| Net Increase/(Decrease) – Class C | | | (24,175 | ) | | | (25,956 | ) | | | (12,262 | ) | | | 5,040 | | | | (1,864 | ) | | | (3,489 | ) | | | (918 | ) | | | (1,821 | ) | |
| Subscriptions – Class I | | | 27,185 | | | | 17,610 | | | | 37,921 | | | | 27,930 | | | | 2,148 | | | | 11,070 | | | | — | | | | — | | |
| Distributions reinvested – Class I | | | 431 | | | | 704 | | | | 385 | | | | 676 | | | | 1 | | | | 16 | | | | — | | | | — | | |
Net assets of shares issued in connection with
Merger – Class I | | | — | | | | — | | | | — | | | | 152,987 | | | | — | | | | — | | | | — | | | | — | | |
| Redemptions – Class I | | | (12,325 | ) | | | (13,595 | ) | | | (30,100 | ) | | | (184,760 | ) | | | (4,296 | ) | | | (38,709 | ) | | | — | | | | — | | |
| Net Increase/(Decrease) – Class I | | | 15,291 | | | | 4,719 | | | | 8,206 | | | | (3,167 | ) | | | (2,147 | ) | | | (27,623 | ) | | | — | | | | — | | |
(a) Class R and Class R5 shares reflect activity for the period August 15, 2011 (commencement of operations) through December 31, 2011.
(b) For the period from August 19, 2011 (commencement of operations) to December 31, 2011.
(c) Rounds to less than $500.
(d) Presentation for fiscal year 2011 has been changed to conform to that of the current year.
See accompanying notes to financial statements.
94
| | | Columbia
Acorn Select | | Columbia
Thermostat Fund | | Columbia Acorn
Emerging Markets Fund | | Columbia Acorn
European Fund | |
| Increase (Decrease) in Net Assets | | (Unaudited)
Six months
ended
June 30, | | Year ended
December 31, | | (Unaudited)
Six months
ended
June 30, | | Year ended
December 31, | | (Unaudited)
Six months
ended
June 30, | | Year ended
December 31, | | (Unaudited)
Six months
ended
June 30, | | Year ended
December 31, | |
| (in thousands) | | 2012 | | 2011 | | 2012 | | 2011 | | 2012 | | 2011 (b) | | 2012 | | 2011 (b) | |
| Operations: | |
| Net investment income/(loss) | | $ | (1,964 | ) | | $ | (7,972 | ) | | $ | 2,876 | | | $ | 2,784 | | | $ | 13 | | | $ | 1 | | | $ | 25 | | | $ | (3 | ) | |
Net realized gain/(loss) on investments, foreign
currency transactions, forward foreign currency
exchange contracts and foreign capital gains tax | | | 73,365 | | | | 209,796 | | | | — | | | | — | | | | (20 | ) | | | (57 | ) | | | (9 | ) | | | 6 | | |
Net realized gain/(loss) on affiliated investments and
distributions from affiliated investment companies and
affiliated investment company shares | | | (12,823 | ) | | | (66,391 | ) | | | (461 | ) | | | 8,878 | | | | — | | | | — | | | | — | | | | — | | |
| Reimbursement from affiliate (See Note 4) | | | — | | | | — | | | | — | | | | — | | | | — | | | | — | | | | — | | | | — | | |
Net change in net unrealized appreciation/(depreciation)
on investments, foreign currency translations,
forward foreign currency exchange contracts and
foreign capital gains tax | | | 34,750 | | | | (347,748 | ) | | | — | | | | — | | | | 217 | | | | (135 | ) | | | 169 | | | | (86 | ) | |
Net change in net unrealized appreciation/(depreciation)
on affiliated investment companies and affiliated
investment company shares | | | 19,182 | | | | (112,603 | ) | | | 10,983 | | | | (4,866 | ) | | | — | | | | — | | | | — | | | | — | | |
| Net Increase/(Decrease) from Operations | | | 112,510 | | | | (324,918 | ) | | | 13,398 | | | | 6,796 | | | | 210 | | | | (191 | ) | | | 185 | | | | (83 | ) | |
| Distributions to Shareholders From: | |
| Net investment income – Class A | | | — | | | | (7,162 | ) | | | (201 | ) | | | (1,706 | ) | | | — | | | | — | | | | — | (c) | | | (1 | ) | |
| Net realized gain – Class A | | | (6,620 | ) | | | — | | | | — | | | | — | | | | — | | | | — | | | | — | (c) | | | — | (c) | |
| Net investment income – Class B | | | — | | | | (500 | ) | | | (8 | ) | | | (351 | ) | | | — | | | | — | | | | — | | | | — | | |
| Net realized gain – Class B | | | (386 | ) | | | — | | | | — | | | | — | | | | — | | | | — | | | | — | | | | — | | |
| Net investment income – Class C | | | — | | | | (672 | ) | | | (125 | ) | | | (405 | ) | | | — | | | | — | | | | — | (c) | | | — | (c) | |
| Net realized gain – Class C | | | (1,438 | ) | | | — | | | | — | | | | — | | | | — | | | | — | | | | — | (c) | | | — | (c) | |
| Net investment income – Class I | | | — | | | | (141 | ) | | | — | | | | — | | | | — | (c) | | | — | | | | — | (c) | | | — | (c) | |
| Net realized gain – Class I | | | (494 | ) | | | — | | | | — | | | | — | | | | — | | | | — | | | | — | (c) | | | — | (c) | |
| Net investment income – Class R5 | | | — | | | | — | | | | — | | | | — | | | | — | | | | — | | | | — | | | | — | | |
| Net investment income – Class Z | | | — | | | | (22,715 | ) | | | (182 | ) | | | (1,460 | ) | | | (2 | ) | | | — | | | | (2 | ) | | | (11 | ) | |
| Net realized gain – Class Z | | | (14,894 | ) | | | — | | | | — | | | | — | | | | — | | | | — | | | | (1 | ) | | | (3 | ) | |
| Total Distributions to Shareholders | | | (23,832 | ) | | | (31,190 | ) | | | (516 | ) | | | (3,922 | ) | | | (2 | ) | | | — | | | | (3 | ) | | | (15 | ) | |
| Share Transactions: | |
| Subscriptions – Class A | | | 27,104 | | | | 72,441 | | | | 102,772 | | | | 44,385 | | | | 1,051 | | | | 351 | | | | 63 | | | | 164 | | |
| Distributions reinvested – Class A | | | 6,159 | | | | 6,307 | | | | 180 | | | | 1,391 | | | | — | | | | — | | | | — | (c) | | | 1 | | |
Net assets of shares issued in connection with
Merger – Class A | | | — | | | | — | | | | — | | | | — | | | | — | | | | — | | | | — | | | | — | | |
| Redemptions – Class A | | | (91,503 | ) | | | (203,499 | ) | | | (17,032 | ) | | | (11,539 | ) | | | (86 | ) | | | (13 | ) | | | (29 | ) | | | — | | |
| Net Increase/(Decrease) – Class A | | | (58,240 | ) | | | (124,751 | ) | | | 85,920 | | | | 34,237 | | | | 965 | | | | 338 | | | | 34 | | | | 165 | | |
| Distributions reinvested – Class B (d) | | | 325 | | | | 464 | | | | 18 | | | | 381 | | | | — | | | | — | | | | — | | | | — | | |
Net assets of shares issued in connection with
Merger – Class B | | | — | | | | — | | | | — | | | | — | | | | — | | | | — | | | | — | | | | — | | |
| Redemptions – Class B | | | (13,176 | ) | | | (37,412 | ) | | | (6,155 | ) | | | (18,369 | ) | | | — | | | | — | | | | — | | | | — | | |
| Net Decrease – Class B | | | (12,851 | ) | | | (36,948 | ) | | | (6,137 | ) | | | (17,988 | ) | | | — | | | | — | | | | — | | | | — | | |
| Subscriptions – Class C | | | 1,768 | | | | 3,603 | | | | 79,175 | | | | 15,268 | | | | 79 | | | | 138 | | | | 13 | | | | 5 | | |
| Distributions reinvested – Class C | | | 1,143 | | | | 494 | | | | 89 | | | | 313 | | | | — | | | | — | | | | — | (c) | | | — | (c) | |
Net assets of shares issued in connection with
Merger – Class C | | | — | | | | — | | | | — | | | | — | | | | — | | | | — | | | | — | | | | — | | |
| Redemptions – Class C | | | (8,647 | ) | | | (23,948 | ) | | | (2,845 | ) | | | (4,725 | ) | | | — | | | | (10 | ) | | | — | | | | — | | |
| Net Increase/(Decrease) – Class C | | | (5,736 | ) | | | (19,851 | ) | | | 76,419 | | | | 10,856 | | | | 79 | | | | 128 | | | | 13 | | | | 5 | | |
| Subscriptions – Class I | | | 18,526 | | | | 12,447 | | | | — | | | | — | | | | — | | | | 5 | | | | — | | | | 5 | | |
| Distributions reinvested – Class I | | | 494 | | | | 141 | | | | — | | | | — | | | | — | (c) | | | — | | | | — | (c) | | | — | (c) | |
Net assets of shares issued in connection with
Merger – Class I | | | — | | | | — | | | | — | | | | — | | | | — | | | | — | | | | — | | | | — | | |
| Redemptions – Class I | | | (8,175 | ) | | | (8,782 | ) | | | — | | | | — | | | | — | | | | — | | | | — | | | | — | | |
| Net Increase/(Decrease) – Class I | | | 10,845 | | | | 3,806 | | | | — | | | | — | | | | — | (c) | | | 5 | | | | — | (c) | | | 5 | | |
See accompanying notes to financial statements.
95
Columbia Acorn Family of Funds
Statements of Changes in Net Assets, continued
| | | Columbia
Acorn Fund | | Columbia Acorn
International | | Columbia
Acorn USA | | Columbia Acorn
International Select | |
| Increase (Decrease) in Net Assets | | (Unaudited)
Six months
ended
June 30, | | Year ended
December 31, | | (Unaudited)
Six months
ended
June 30, | | Year ended
December 31, | | (Unaudited)
Six months
ended
June 30, | | Year ended
December 31, | | (Unaudited)
Six months
ended
June 30, | | Year ended
December 31, | |
| (in thousands) | | 2012 | | 2011 | | 2012 | | 2011 (a) | | 2012 | | 2011 | | 2012 | | 2011 | |
| Subscriptions – Class R | | | — | | | | — | | | | 356 | | | | 370 | | | | — | | | | — | | | | — | | | | — | | |
Net assets of shares issued in connection with
Merger – Class R | | | — | | | | — | | | | — | | | | 2,027 | | | | — | | | | — | | | | — | | | | — | | |
| Redemptions – Class R | | | — | | | | — | | | | (1,617 | ) | | | (77 | ) | | | — | | | | — | | | | — | | | | — | | |
| Net Increase/(Decrease) – Class R | | | — | | | | — | | | | (1,261 | ) | | | 2,320 | | | | — | | | | — | | | | — | | | | — | | |
| Subscriptions – Class R5 | | | — | | | | — | | | | — | (c) | | | 3 | | | | — | | | | — | | | | — | | | | — | | |
| Distributions reinvested – Class R5 | | | — | | | | — | | | | 2 | | | | — | | | | — | | | | — | | | | — | | | | — | | |
Net assets of shares issued in connection with
Merger – Class R5 | | | — | | | | — | | | | — | | | | 2,232 | | | | — | | | | — | | | | — | | | | — | | |
| Redemptions – Class R5 | | | — | | | | — | | | | (27 | ) | | | — | (c) | | | — | | | | — | | | | — | | | | — | | |
| Net Increase/(Decrease) – Class R5 | | | — | | | | — | | | | (25 | ) | | | 2,235 | | | | — | | | | — | | | | — | | | | — | | |
| Subscriptions – Class Z | | | 958,888 | | | | 2,172,346 | | | | 681,137 | | | | 965,616 | | | | 109,255 | | | | 349,841 | | | | 19,696 | | | | 45,936 | | |
| Distributions reinvested – Class Z | | | 133,961 | | | | 471,639 | | | | 19,181 | | | | 91,324 | | | | 2,158 | | | | 7,534 | | | | 524 | | | | 5,069 | | |
| Redemptions – Class Z | | | (1,325,932 | ) | | | (2,515,311 | ) | | | (458,986 | ) | | | (973,865 | ) | | | (204,681 | ) | | | (331,533 | ) | | | (34,101 | ) | | | (113,289 | ) | |
| Net Increase/(Decrease) – Class Z | | | (233,083 | ) | | | 128,674 | | | | 241,332 | | | | 83,075 | | | | (93,268 | ) | | | 25,842 | | | | (13,881 | ) | | | (62,284 | ) | |
| Net Increase/(Decrease) from Share Transactions | | | (476,953 | ) | | | (160,647 | ) | | | 161,772 | | | | 364,290 | | | | (124,636 | ) | | | (49,669 | ) | | | (19,858 | ) | | | (71,300 | ) | |
| Increase from regulatory settlements (See Note 7) | | | — | | | | — | | | | 108 | | | | 108 | | | | — | | | | — | | | | — | | | | — | | |
| Increase from contribution from affiliate (See Note 4) | | | — | | | | — | | | | — | | | | — | | | | — | | | | — | | | | — | | | | — | | |
| Total Increase/(Decrease) in Net Assets | | | 827,897 | | | | (1,762,137 | ) | | | 609,614 | | | | (708,110 | ) | | | 29,416 | | | | (140,101 | ) | | | 11,751 | | | | (126,284 | ) | |
| Net Assets: | |
| Beginning of period | | | 16,336,575 | | | | 18,098,712 | | | | 5,416,953 | | | | 6,125,063 | | | | 1,558,445 | | | | 1,698,546 | | | | 326,383 | | | | 452,667 | | |
| End of period | | $ | 17,164,472 | | | $ | 16,336,575 | | | $ | 6,026,567 | | | $ | 5,416,953 | | | $ | 1,587,861 | | | $ | 1,558,445 | | | $ | 338,134 | | | $ | 326,383 | | |
Undistributed (Overdistributed) Net
Investment Income | | $ | (28,080 | ) | | $ | (32,074 | ) | | $ | (36,596 | ) | | $ | (60,514 | ) | | $ | (3,403 | ) | | $ | (167 | ) | | $ | (2,516 | ) | | $ | (5,294 | ) | |
(a) Class R and Class R5 shares reflect activity for the period August 15, 2011 (commencement of operations) through December 31, 2011.
(b) For the period from August 19, 2011 (commencement of operations) to December 31, 2011.
(c) Rounds to less than $500.
See accompanying notes to financial statements.
96
| | | Columbia
Acorn Select | | Columbia
Thermostat Fund | | Columbia Acorn
Emerging Markets Fund | | Columbia Acorn
European Fund | |
| Increase (Decrease) in Net Assets | | (Unaudited)
Six months
ended
June 30, | | Year ended
December 31, | | (Unaudited)
Six months
ended
June 30, | | Year ended
December 31, | | (Unaudited)
Six months
ended
June 30, | | Year ended
December 31, | | (Unaudited)
Six months
ended
June 30, | | Year ended
December 31, | |
| (in thousands) | | 2012 | | 2011 | | 2012 | | 2011 | | 2012 | | 2011 (b) | | 2012 | | 2011 (b) | |
| Subscriptions – Class R | | | — | | | | — | | | | — | | | | — | | | | — | | | | — | | | | — | | | | — | | |
Net assets of shares issued in connection with
Merger – Class R | | | — | | | | — | | | | — | | | | — | | | | — | | | | — | | | | — | | | | — | | |
| Redemptions – Class R | | | — | | | | — | | | | — | | | | — | | | | — | | | | — | | | | — | | | | — | | |
| Net Increase/(Decrease) – Class R | | | — | | | | — | | | | — | | | | — | | | | — | | | | — | | | | — | | | | — | | |
| Subscriptions – Class R5 | | | — | | | | — | | | | — | | | | — | | | | — | | | | — | | | | — | | | | — | | |
| Distributions reinvested – Class R5 | | | — | | | | — | | | | — | | | | — | | | | — | | | | — | | | | — | | | | — | | |
Net assets of shares issued in connection with
Merger – Class R5 | | | — | | | | — | | | | — | | | | — | | | | — | | | | — | | | | — | | | | — | | |
| Redemptions – Class R5 | | | — | | | | — | | | | — | | | | — | | | | — | | | | — | | | | — | | | | — | | |
| Net Increase/(Decrease) – Class R5 | | | — | | | | — | | | | — | | | | — | | | | — | | | | — | | | | — | | | | — | | |
| Subscriptions – Class Z | | | 57,480 | | | | 177,362 | | | | 120,997 | | | | 42,102 | | | | 1,290 | | | | 2,949 | | | | 195 | | | | 1,589 | | |
| Distributions reinvested – Class Z | | | 11,596 | | | | 17,488 | | | | 116 | | | | 1,165 | | | | 2 | | | | — | | | | 3 | | | | 13 | | |
| Redemptions – Class Z | | | (283,273 | ) | | | (653,289 | ) | | | (39,753 | ) | | | (14,914 | ) | | | (1 | ) | | | — | (c) | | | — | (c) | | | — | (c) | |
| Net Increase/(Decrease) – Class Z | | | (214,197 | ) | | | (458,439 | ) | | | 81,360 | | | | 28,353 | | | | 1,291 | | | | 2,949 | | | | 198 | | | | 1,602 | | |
| Net Increase/(Decrease) from Share Transactions | | | (280,179 | ) | | | (636,183 | ) | | | 237,562 | | | | 55,458 | | | | 2,335 | | | | 3,420 | | | | 245 | | | | 1,777 | | |
| Increase from regulatory settlements (See Note 7) | | | — | | | | — | | | | — | | | | — | | | | — | | | | — | | | | — | | | | — | | |
| Increase from contribution from affiliate (See Note 4) | | | — | | | | 57 | | | | — | | | | — | | | | — | | | | — | | | | — | | | | — | | |
| Total Increase/(Decrease) in Net Assets | | | (191,501 | ) | | | (992,234 | ) | | | 250,444 | | | | 58,332 | | | | 2,543 | | | | 3,229 | | | | 427 | �� | | | 1,679 | | |
| Net Assets: | |
| Beginning of period | | | 1,290,621 | | | | 2,282,855 | | | | 189,607 | | | | 131,275 | | | | 3,229 | | | | — | | | | 1,679 | | | | — | | |
| End of period | | $ | 1,099,120 | | | $ | 1,290,621 | | | $ | 440,051 | | | $ | 189,607 | | | $ | 5,772 | | | $ | 3,229 | | | $ | 2,106 | | | $ | 1,679 | | |
Undistributed (Overdistributed) Net
Investment Income | | $ | (2,288 | ) | | $ | (324 | ) | | $ | 2,831 | | | $ | 471 | | | $ | 10 | | | $ | (1 | ) | | $ | 23 | | | $ | — | (c) | |
See accompanying notes to financial statements.
97
Columbia Acorn Family of Funds
Statements of Changes in Net Assets, continued
| | | Columbia
Acorn Fund | | Columbia Acorn
International | | Columbia
Acorn USA | | Columbia Acorn
International Select | |
| Changes in Shares of Beneficial Interest: | | (Unaudited)
Six months
ended
June 30, | | Year ended
December 31, | | (Unaudited)
Six months
ended
June 30, | | Year ended
December 31, | | (Unaudited)
Six months
ended
June 30, | | Year ended
December 31, | | (Unaudited)
Six months
ended
June 30, | | Year ended
December 31, | |
| (in thousands) | | 2012 | | 2011 | | 2012 | | 2011 (a) | | 2012 | | 2011 | | 2012 | | 2011 | |
| Subscriptions – Class A | | | 9,628 | | | | 30,309 | | | | 2,671 | | | | 7,713 | | | | 391 | | | | 1,507 | | | | 274 | | | | 666 | | |
Shares issued in reinvestment and capital
gains – Class A | | | 1,388 | | | | 4,849 | | | | 40 | | | | 463 | | | | 9 | | | | 38 | | | | 9 | | | | 78 | | |
| Shares issued in connection with merger – Class A | | | — | | | | — | | | | — | | | | 5,467 | | | | — | | | | — | | | | — | | | | — | | |
| Less shares redeemed – Class A | | | (18,258 | ) | | | (37,725 | ) | | | (4,553 | ) | | | (6,592 | ) | | | (1,318 | ) | | | (2,879 | ) | | | (454 | ) | | | (980 | ) | |
| Net Increase/(Decrease) – Class A | | | (7,242 | ) | | | (2,567 | ) | | | (1,842 | ) | | | 7,051 | | | | (918 | ) | | | (1,334 | ) | | | (171 | ) | | | (236 | ) | |
Shares issued in reinvestment and capital
gains – Class B (d) | | | 25 | | | | 185 | | | | — | | | | 14 | | | | — | (c) | | | 1 | | | | — | (c) | | | 2 | | |
| Shares issued in connection with merger – Class B | | | — | | | | — | | | | — | | | | 343 | | | | — | | | | — | | | | — | | | | — | | |
| Less shares redeemed – Class B | | | (1,030 | ) | | | (8,046 | ) | | | (151 | ) | | | (353 | ) | | | (32 | ) | | | (267 | ) | | | (23 | ) | | | (39 | ) | |
| Net Increase/(Decrease) – Class B | | | (1,005 | ) | | | (7,861 | ) | | | (151 | ) | | | 4 | | | | (32 | ) | | | (266 | ) | | | (23 | ) | | | (37 | ) | |
| Subscriptions – Class C | | | 1,516 | | | | 3,779 | | | | 134 | | | | 519 | | | | 34 | | | | 90 | | | | 14 | | | | 36 | | |
Shares issued in reinvestment and capital
gains – Class C | | | 325 | | | | 1,086 | | | | — | | | | 46 | | | | 2 | | | | 8 | | | | 1 | | | | 8 | | |
| Shares issued in connection with merger – Class C | | | — | | | | — | | | | — | | | | 703 | | | | — | | | | — | | | | — | | | | — | | |
| Less shares redeemed – Class C | | | (2,746 | ) | | | (5,913 | ) | | | (484 | ) | | | (1,110 | ) | | | (107 | ) | | | (231 | ) | | | (52 | ) | | | (115 | ) | |
| Net Increase/(Decrease) – Class C | | | (905 | ) | | | (1,048 | ) | | | (350 | ) | | | 158 | | | | (71 | ) | | | (133 | ) | | | (37 | ) | | | (71 | ) | |
| Subscriptions – Class I | | | 901 | | | | 639 | | | | 1,013 | | | | 764 | | | | 70 | | | | 371 | | | | — | | | | — | | |
Shares issued in reinvestment and capital
gains – Class I | | | 15 | | | | 25 | | | | 11 | | | | 17 | | | | — | (c) | | | 1 | | | | — | | | | — | | |
| Shares issued in connection with merger – Class I | | | — | | | | — | | | | — | | | | 4,062 | | | | — | | | | — | | | | — | | | | — | | |
| Less shares redeemed – Class I | | | (413 | ) | | | (454 | ) | | | (797 | ) | | | (5,004 | ) | | | (147 | ) | | | (1,289 | ) | | | — | | | | — | | |
| Net Increase/(Decrease) – Class I | | | 503 | | | | 210 | | | | 227 | | | | (161 | ) | | | (77 | ) | | | (917 | ) | | | — | | | | — | | |
| Subscriptions – Class R | | | — | | | | — | | | | 10 | | | | 10 | | | | — | | | | — | | | | — | | | | — | | |
| Shares issued in connection with merger – Class R | | | — | | | | — | | | | — | | | | 54 | | | | — | | | | — | | | | — | | | | — | | |
| Less shares redeemed – Class R | | | — | | | | — | | | | (46 | ) | | | (2 | ) | | | — | | | | — | | | | — | | | | — | | |
| Net Increase/(Decrease) – Class R | | | — | | | | — | | | | (36 | ) | | | 62 | | | | — | | | | — | | | | — | | | | — | | |
| Subscriptions – Class R5 | | | — | | | | — | | | | — | (c) | | | — | (c) | | | — | | | | — | | | | — | | | | — | | |
Shares issued in reinvestment and capital
gains – Class R5 | | | — | | | | — | | | | — | (c) | | | — | | | | — | | | | — | | | | — | | | | — | | |
| Shares issued in connection with merger – Class R5 | | | — | | | | — | | | | — | | | | 59 | | | | — | | | | — | | | | — | | | | — | | |
| Less shares redeemed – Class R5 | | | — | | | | — | | | | — | (c) | | | — | | | | — | | | | — | | | | — | | | | — | | |
| Net Increase – Class R5 | | | — | | | | — | | | | — | (c) | | | 59 | | | | — | | | | — | | | | — | | | | — | | |
| Subscriptions – Class Z | | | 31,901 | | | | 72,817 | | | | 18,269 | | | | 24,482 | | | | 3,627 | | | | 12,164 | | | | 743 | | | | 1,655 | | |
Shares issued in reinvestment and capital
gains – Class Z | | | 4,605 | | | | 16,442 | | | | 535 | | | | 2,222 | | | | 75 | | | | 274 | | | | 20 | | | | 192 | | |
| Less shares redeemed – Class Z | | | (43,613 | ) | | | (85,040 | ) | | | (12,206 | ) | | | (25,537 | ) | | | (6,966 | ) | | | (11,564 | ) | | | (1,298 | ) | | | (4,157 | ) | |
| Net Increase/(Decrease) – Class Z | | | (7,107 | ) | | | 4,219 | | | | 6,598 | | | | 1,167 | | | | (3,264 | ) | | | 874 | | | | (535 | ) | | | (2,310 | ) | |
| Net Increase/(Decrease) in Shares of Beneficial Interest | | | (15,756 | ) | | | (7,047 | ) | | | 4,446 | | | | 8,340 | | | | (4,362 | ) | | | (1,776 | ) | | | (766 | ) | | | (2,654 | ) | |
(a) Class R and Class R5 shares reflect activity for the period August 15, 2011 (commencement of operations) through December 31, 2011.
(b) For the period from August 19, 2011 (commencement of operations) to December 31, 2011.
(c) Rounds to less than 500 shares.
(d) Presentation for fiscal year 2011 has been changed to conform to that of the current year.
See accompanying notes to financial statements.
98
| | | Columbia
Acorn Select | | Columbia
Thermostat Fund | | Columbia Acorn
Emerging Markets Fund | | Columbia Acorn
European Fund | |
| Changes in Shares of Beneficial Interest: | | (Unaudited)
Six months
ended
June 30, | | Year ended
December 31, | | (Unaudited)
Six months
ended
June 30, | | Year ended
December 31, | | (Unaudited)
Six months
ended
June 30, | | Year ended
December 31, | | (Unaudited)
Six months
ended
June 30, | | Year ended
December 31, | |
| (in thousands) | | 2012 | | 2011 | | 2012 | | 2011 | | 2012 | | 2011 (b) | | 2012 | | 2011 (b) | |
| Subscriptions – Class A | | | 1,056 | | | | 2,804 | | | | 7,563 | | | | 3,467 | | | | 97 | | | | 37 | | | | 6 | | | | 16 | | |
Shares issued in reinvestment and capital
gains – Class A | | | 256 | | | | 242 | | | | 13 | | | | 109 | | | | — | | | | — | | | | — | (c) | | | — | (c) | |
| Shares issued in connection with merger – Class A | | | — | | | | — | | | | — | | | | — | | | | — | | | | — | | | | — | | | | — | | |
| Less shares redeemed – Class A | | | (3,581 | ) | | | (8,092 | ) | | | (1,260 | ) | | | (898 | ) | | | (8 | ) | | | (1 | ) | | | (3 | ) | | | — | | |
| Net Increase/(Decrease) – Class A | | | (2,269 | ) | | | (5,046 | ) | | | 6,316 | | | | 2,678 | | | | 89 | | | | 36 | | | | 3 | | | | 16 | | |
Shares issued in reinvestment and capital
gains – Class B (d) | | | 14 | | | | 19 | | | | 1 | | | | 30 | | | | — | | | | — | | | | — | | | | — | | |
| Shares issued in connection with merger – Class B | | | — | | | | — | | | | — | | | | — | | | | — | | | | — | | | | — | | | | — | | |
| Less shares redeemed – Class B | | | (551 | ) | | | (1,569 | ) | | | (453 | ) | | | (1,427 | ) | | | — | | | | — | | | | — | | | | — | | |
| Net Increase/(Decrease) – Class B | | | (537 | ) | | | (1,550 | ) | | | (452 | ) | | | (1,397 | ) | | | — | | | | — | | | | — | | | | — | | |
| Subscriptions – Class C | | | 75 | | | | 145 | | | | 5,788 | | | | 1,196 | | | | 7 | | | | 15 | | | | 1 | | | | 1 | | |
Shares issued in reinvestment and capital
gains – Class C | | | 52 | | | | 21 | | | | 7 | | | | 24 | | | | — | | | | — | | | | — | (c) | | | — | (c) | |
| Shares issued in connection with merger – Class C | | | — | | | | — | | | | — | | | | — | | | | — | | | | — | | | | — | | | | — | | |
| Less shares redeemed – Class C | | | (365 | ) | | | (1,011 | ) | | | (210 | ) | | | (368 | ) | | | — | | | | (1 | ) | �� | | — | | | | — | | |
| Net Increase/(Decrease) – Class C | | | (238 | ) | | | (845 | ) | | | 5,585 | | | | 852 | | | | 7 | | | | 14 | | | | 1 | | | | 1 | | |
| Subscriptions – Class I | | | 708 | | | | 520 | | | | — | | | | — | | | | — | | | | 1 | | | | — | | | | 1 | | |
Shares issued in reinvestment and capital
gains – Class I | | | 20 | | | | 5 | | | | — | | | | — | | | | — | | | | — | | | | — | (c) | | | — | (c) | |
| Shares issued in connection with merger – Class I | | | — | | | | — | | | | — | | | | — | | | | — | | | | — | | | | — | | | | — | | |
| Less shares redeemed – Class I | | | (319 | ) | | | (335 | ) | | | — | | | | — | | | | — | | | | — | | | | — | | | | — | | |
| Net Increase/(Decrease) – Class I | | | 409 | | | | 190 | | | | — | | | | — | | | | — | | | | 1 | | | | — | (c) | | | 1 | | |
| Subscriptions – Class R | | | — | | | | — | | | | — | | | | — | | | | — | | | | — | | | | — | | | | — | | |
| Shares issued in connection with merger – Class R | | | — | | | | — | | | | — | | | | — | | | | — | | | | — | | | | — | | | | — | | |
| Less shares redeemed – Class R | | | — | | | | — | | | | — | | | | — | | | | — | | | | — | | | | — | | | | — | | |
| Net Increase/(Decrease) – Class R | | | — | | | | — | | | | — | | | | — | | | | — | | | | — | | | | — | | | | — | | |
| Subscriptions – Class R5 | | | — | | | | — | | | | — | | | | — | | | | — | | | | — | | | | — | | | | — | | |
Shares issued in reinvestment and capital
gains – Class R5 | | | — | | | | — | | | | — | | | | — | | | | — | | | | — | | | | — | | | | — | | |
| Shares issued in connection with merger – Class R5 | | | — | | | | — | | | | — | | | | — | | | | — | | | | — | | | | — | | | | — | | |
| Less shares redeemed – Class R5 | | | — | | | | — | | | | — | | | | — | | | | — | | | | — | | | | — | | | | — | | |
| Net Increase – Class R5 | | | — | | | | — | | | | — | | | | — | | | | — | | | | — | | | | — | | | | — | | |
| Subscriptions – Class Z | | | 2,182 | | | | 6,576 | | | | 8,991 | | | | 3,338 | | | | 122 | | | | 298 | | | | 17 | | | | 159 | | |
Shares issued in reinvestment and capital
gains – Class Z | | | 467 | | | | 654 | | | | 9 | | | | 92 | | | | — | (c) | | | — | | | | — | (c) | | | 2 | | |
| Less shares redeemed – Class Z | | | (10,647 | ) | | | (25,141 | ) | | | (2,944 | ) | | | (1,192 | ) | | | — | (c) | | | — | (c) | | | — | (c) | | | — | (c) | |
| Net Increase/(Decrease) – Class Z | | | (7,998 | ) | | | (17,911 | ) | | | 6,056 | | | | 2,238 | | | | 122 | | | | 298 | | | | 17 | | | | 161 | | |
| Net Increase/(Decrease) in Shares of Beneficial Interest | | | (10,633 | ) | | | (25,162 | ) | | | 17,505 | | | | 4,371 | | | | 218 | | | | 349 | | | | 21 | | | | 179 | | |
See accompanying notes to financial statements.
99
Columbia Acorn Family of Funds
Financial Highlights
Columbia Acorn Fund
| Class A Shares | | (Unaudited)
Six months
ended June 30, | | Year ended December 31, | |
| Selected data for a share outstanding throughout each period | | 2012 | | 2011 | | 2010 | | 2009 | | 2008 | | 2007 | |
| Net Asset Value, Beginning of Period | | $ | 26.63 | | | $ | 29.24 | | | $ | 23.98 | | | $ | 17.22 | | | $ | 28.87 | | | $ | 29.02 | | |
| Income from Investment Operations | |
| Net investment income/(loss) (a) | | | (0.02 | ) | | | (0.10 | ) | | | (0.06 | ) | | | (0.02 | ) | | | (0.01 | ) | | | 0.05 | (b) | |
| Net realized and unrealized gain/(loss) | | | 2.44 | | | | (1.30 | ) | | | 6.18 | | | | 6.78 | | | | (10.98 | ) | | | 2.13 | | |
| Total from Investment Operations | | | 2.42 | | | | (1.40 | ) | | | 6.12 | | | | 6.76 | | | | (10.99 | ) | | | 2.18 | | |
| Less Distributions to Shareholders | |
| From net investment income | | | — | | | | (0.02 | ) | | | (0.02 | ) | | | — | | | | — | | | | (0.03 | ) | |
| From net realized gains | | | (0.36 | ) | | | (1.19 | ) | | | (0.84 | ) | | | — | | | | (0.66 | ) | | | (2.30 | ) | |
| Total Distributions to Shareholders | | | (0.36 | ) | | | (1.21 | ) | | | (0.86 | ) | | | — | | | | (0.66 | ) | | | (2.33 | ) | |
| Increase from regulatory settlements | | | — | | | | — | | | | 0.00 | (c) | | | 0.00 | (c) | | | — | | | | — | | |
| Net Asset Value, End of Period | | $ | 28.69 | | | $ | 26.63 | | | $ | 29.24 | | | $ | 23.98 | | | $ | 17.22 | | | $ | 28.87 | | |
| Total Return (d) | | | 9.11 | %(e) | | | (4.91 | )% | | | 25.61 | % | | | 39.26 | % | | | (38.72 | )% | | | 7.39 | %(f)(g) | |
| Ratios to Average Net Assets/Supplemental Data | |
| Net expenses | | | 1.05 | %(h) | | | 1.06 | %(i) | | | 1.07 | %(i) | | | 1.07 | %(i) | | | 1.05 | %(i) | | | 1.02 | %(i) | |
| Net investment income/(loss) | | | (0.14 | )%(h) | | | (0.33 | )%(i) | | | (0.22 | )%(i) | | | (0.12 | )%(i) | | | (0.04 | )%(i) | | | 0.17 | %(i) | |
| Waiver/Reimbursement | | | — | % | | | — | % | | | — | % | | | — | % | | | — | % | | | 0.01 | % | |
| Portfolio turnover rate | | | 8 | %(e) | | | 18 | % | | | 28 | % | | | 27 | % | | | 21 | % | | | 20 | % | |
| Net assets at end of period (000s) | | $ | 3,289,689 | | | $ | 3,246,833 | | | $ | 3,639,788 | | | $ | 2,937,761 | | | $ | 2,221,100 | | | $ | 4,300,920 | | |
(a) Per share data was calculated using the average shares outstanding during the period.
(b) Net investment income per share includes special dividends. The effect of these dividends amounted to $0.03 per share.
(c) Rounds to less than $0.01 per share.
(d) Total return at net asset value assuming all distributions reinvested and no initial sales charge or contingent deferred sales charge.
(e) Not annualized.
(f) Had the Investment Manager and/or Transfer Agent not waived fees and/or reimbursed a portion of expenses, total return would have been reduced.
(g) Total return includes a voluntary reimbursement by the Advisor for a realized investment loss due to a trading error. This reimbursement increased total return and net asset value per share by less than 0.01% and less than $0.01, respectively.
(h) Annualized.
(i) The benefits derived from custody fees paid indirectly had an impact of less than 0.01%.
Columbia Acorn Fund
| Class B Shares | | (Unaudited)
Six months
ended June 30, | | Year ended December 31, | |
| Selected data for a share outstanding throughout each period | | 2012 | | 2011 | | 2010 | | 2009 | | 2008 | | 2007 | |
| Net Asset Value, Beginning of Period | | $ | 24.53 | | | $ | 27.14 | | | $ | 22.43 | | | $ | 16.21 | | | $ | 27.39 | | | $ | 27.78 | | |
| Income from Investment Operations | |
| Net investment loss (a) | | | (0.10 | ) | | | (0.27 | ) | | | (0.21 | ) | | | (0.14 | ) | | | (0.15 | ) | | | (0.11 | )(b) | |
| Net realized and unrealized gain/(loss) | | | 2.25 | | | | (1.15 | ) | | | 5.76 | | | | 6.36 | | | | (10.37 | ) | | | 2.02 | | |
| Total from Investment Operations | | | 2.15 | | | | (1.42 | ) | | | 5.55 | | | | 6.22 | | | | (10.52 | ) | | | 1.91 | | |
| Less Distributions to Shareholders | |
| From net realized gains | | | (0.36 | ) | | | (1.19 | ) | | | (0.84 | ) | | | — | | | | (0.66 | ) | | | (2.30 | ) | |
| Total Distributions to Shareholders | | | (0.36 | ) | | | (1.19 | ) | | | (0.84 | ) | | | — | | | | (0.66 | ) | | | (2.30 | ) | |
| Increase from regulatory settlements | | | — | | | | — | | | | 0.00 | (c) | | | 0.00 | (c) | | | — | | | | — | | |
| Net Asset Value, End of Period | | $ | 26.32 | | | $ | 24.53 | | | $ | 27.14 | | | $ | 22.43 | | | $ | 16.21 | | | $ | 27.39 | | |
| Total Return (d) | | | 8.78 | %(e) | | | (5.34 | )% | | | 24.81 | % | | | 38.37 | % | | | (39.11 | )% | | | 6.76 | %(f)(g) | |
| Ratios to Average Net Assets/Supplemental Data | |
| Net expenses | | | 1.65 | %(h) | | | 1.67 | %(i) | | | 1.69 | %(i) | | | 1.74 | %(i) | | | 1.65 | %(i) | | | 1.59 | %(i) | |
| Net investment loss | | | (0.76 | )%(h) | | | (0.98 | )%(i) | | | (0.88 | )%(i) | | | (0.77 | )%(i) | | | (0.64 | )%(i) | | | (0.39 | )%(i) | |
| Waiver/Reimbursement | | | — | % | | | — | % | | | — | % | | | — | % | | | — | % | | | 0.01 | % | |
| Portfolio turnover rate | | | 8 | %(e) | | | 18 | % | | | 28 | % | | | 27 | % | | | 21 | % | | | 20 | % | |
| Net assets at end of period (000s) | | $ | 45,604 | | | $ | 67,153 | | | $ | 287,650 | | | $ | 525,072 | | | $ | 581,587 | | | $ | 1,270,292 | | |
(a) Per share data was calculated using the average shares outstanding during the period.
(b) Net investment income per share includes special dividends. The effect of these dividends amounted to $0.03 per share.
(c) Rounds to less than $0.01 per share.
(d) Total return at net asset value assuming all distributions reinvested and no contingent deferred sales charge.
(e) Not annualized.
(f) Had the Investment Manager and/or Transfer Agent not waived fees and/or reimbursed a portion of expenses, total return would have been reduced.
(g) Total return includes a voluntary reimbursement by the Advisor for a realized investment loss due to a trading error. This reimbursement increased total return and net asset value per share by less than 0.01% and less than $0.01, respectively.
(h) Annualized.
(i) The benefits derived from custody fees paid indirectly had an impact of less than 0.01%.
See accompanying notes to financial statements.
100
Columbia Acorn Fund
| Class C Shares | | (Unaudited)
Six months
ended June 30, | | Year ended December 31, | |
| Selected data for a share outstanding throughout each period | | 2012 | | 2011 | | 2010 | | 2009 | | 2008 | | 2007 | |
| Net Asset Value, Beginning of Period | | $ | 24.18 | | | $ | 26.85 | | | $ | 22.23 | | | $ | 16.09 | | | $ | 27.25 | | | $ | 27.70 | | |
| Income from Investment Operations | |
| Net investment loss (a) | | | (0.12 | ) | | | (0.29 | ) | | | (0.24 | ) | | | (0.17 | ) | | | (0.19 | ) | | | (0.18 | )(b) | |
| Net realized and unrealized gain/(loss) | | | 2.22 | | | | (1.19 | ) | | | 5.70 | | | | 6.31 | | | | (10.31 | ) | | | 2.03 | | |
| Total from Investment Operations | | | 2.10 | | | | (1.48 | ) | | | 5.46 | | | | 6.14 | | | | (10.50 | ) | | | 1.85 | | |
| Less Distributions to Shareholders | |
| From net realized gains | | | (0.36 | ) | | | (1.19 | ) | | | (0.84 | ) | | | — | | | | (0.66 | ) | | | (2.30 | ) | |
| Total Distributions to Shareholders | | | (0.36 | ) | | | (1.19 | ) | | | (0.84 | ) | | | — | | | | (0.66 | ) | | | (2.30 | ) | |
| Increase from regulatory settlements | | | — | | | | — | | | | 0.00 | (c) | | | 0.00 | (c) | | | — | | | | — | | |
| Net Asset Value, End of Period | | $ | 25.92 | | | $ | 24.18 | | | $ | 26.85 | | | $ | 22.23 | | | $ | 16.09 | | | $ | 27.25 | | |
| Total Return (d) | | | 8.70 | %(e) | | | (5.63 | )% | | | 24.63 | % | | | 38.16 | % | | | (39.23 | )% | | | 6.56 | %(f)(g) | |
| Ratios to Average Net Assets/Supplemental Data | |
| Net expenses | | | 1.80 | %(h) | | | 1.82 | %(i) | | | 1.85 | %(i) | | | 1.89 | %(i) | | | 1.83 | %(i) | | | 1.79 | %(i) | |
| Net investment loss | | | (0.89 | )%(h) | | | (1.10 | )%(i) | | | (1.00 | )%(i) | | | (0.93 | )%(i) | | | (0.82 | )%(i) | | | (0.60 | )%(i) | |
| Waiver/Reimbursement | | | — | % | | | — | % | | | — | % | | | — | % | | | — | % | | | 0.00 | %(j) | |
| Portfolio turnover rate | | | 8 | %(e) | | | 18 | % | | | 28 | % | | | 27 | % | | | 21 | % | | | 20 | % | |
| Net assets at end of period (000s) | | $ | 749,753 | | | $ | 721,446 | | | $ | 829,181 | | | $ | 736,818 | | | $ | 622,665 | | | $ | 1,312,243 | | |
(a) Per share data was calculated using the average shares outstanding during the period.
(b) Net investment income per share includes special dividends. The effect of these dividends amounted to $0.03 per share.
(c) Rounds to less than $0.01 per share.
(d) Total return at net asset value assuming all distributions reinvested and no contingent deferred sales charge.
(e) Not annualized.
(f) Had the Investment Manager and/or Transfer Agent not waived fees and/or reimbursed a portion of expenses, total return would have been reduced.
(g) Total return includes a voluntary reimbursement by the Advisor for a realized investment loss due to a trading error. This reimbursement increased total return and net asset value per share by less than 0.01% and less than $0.01, respectively.
(h) Annualized.
(i) The benefits derived from custody fees paid indirectly had an impact of less than 0.01%.
(j) Rounds to less than 0.01%.
Columbia Acorn Fund
| Class I Shares | | (Unaudited)
Six months
ended June 30, | | Year ended December 31, | |
| Selected data for a share outstanding throughout each period | | 2012 | | 2011 | | 2010 (a) | |
| Net Asset Value, Beginning of Period | | $ | 27.57 | | | $ | 30.19 | | | $ | 26.80 | | |
| Income from Investment Operations | |
| Net investment income/(loss) (b) | | | 0.04 | | | | 0.01 | | | | (0.01 | ) | |
| Net realized and unrealized gain/(loss) | | | 2.51 | | | | (1.35 | ) | | | 4.26 | | |
| Total from Investment Operations | | | 2.55 | | | | (1.34 | ) | | | 4.25 | | |
| Less Distributions to Shareholders | |
| From net investment income | | | — | | | | (0.09 | ) | | | (0.02 | ) | |
| From net realized gains | | | (0.36 | ) | | | (1.19 | ) | | | (0.84 | ) | |
| Total Distributions to Shareholders | | | (0.36 | ) | | | (1.28 | ) | | | (0.86 | ) | |
| Net Asset Value, End of Period | | $ | 29.76 | | | $ | 27.57 | | | $ | 30.19 | | |
| Total Return (c) | | | 9.27 | %(d) | | | (4.57 | )% | | | 15.94 | %(d) | |
| Ratios to Average Net Assets/Supplemental Data | |
| Net expenses | | | 0.72 | %(e) | | | 0.72 | %(f) | | | 0.71 | %(e)(f) | |
| Net investment income/(loss) | | | 0.24 | %(e) | | | 0.02 | %(f) | | | (0.13 | )%(e)(f) | |
| Portfolio turnover rate | | | 8 | %(d) | | | 18 | % | | | 28 | %(d) | |
| Net assets at end of period (000s) | | $ | 32,680 | | | $ | 16,397 | | | $ | 11,627 | | |
(a) Class I shares commenced operations on September 27, 2010. Per share data and total return reflect activity from that date.
(b) Per share data was calculated using the average shares outstanding during the period.
(c) Total return at net asset value assuming all distributions reinvested.
(d) Not annualized.
(e) Annualized.
(f) The benefits derived from custody fees paid indirectly had an impact of less than 0.01%.
See accompanying notes to financial statements.
101
Columbia Acorn Family of Funds
Financial Highlights, continued
Columbia Acorn International
| Class A Shares | | (Unaudited)
Six months
ended June 30, | | Year ended December 31, | |
| Selected data for a share outstanding throughout each period | | 2012 | | 2011 | | 2010 | | 2009 | | 2008 | | 2007 | |
| Net Asset Value, Beginning of Period | | $ | 34.15 | | | $ | 40.87 | | | $ | 34.13 | | | $ | 23.03 | | | $ | 43.42 | | | $ | 40.07 | | |
| Income from Investment Operations | |
| Net investment income (a) | | | 0.27 | | | | 0.32 | | | | 0.22 | | | | 0.23 | | | | 0.47 | | | | 0.27 | | |
| Net realized and unrealized gain/(loss) | | | 2.65 | | | | (6.02 | ) | | | 7.21 | | | | 11.27 | | | | (20.20 | ) | | | 6.52 | | |
| Reimbursement from affiliate | | | — | | | | 0.00 | (b) | | | — | | | | — | | | | — | | | | — | | |
| Total from Investment Operations | | | 2.92 | | | | (5.70 | ) | | | 7.43 | | | | 11.50 | | | | (19.73 | ) | | | 6.79 | | |
| Less Distributions to Shareholders | |
| From net investment income | | | (0.06 | ) | | | (1.02 | ) | | | (0.69 | ) | | | (0.41 | ) | | | (0.06 | ) | | | (0.08 | ) | |
| From net realized gains | | | — | | | | — | | | | — | | | | — | | | | (0.60 | ) | | | (3.36 | ) | |
| Total Distributions to Shareholders | | | (0.06 | ) | | | (1.02 | ) | | | (0.69 | ) | | | (0.41 | ) | | | (0.66 | ) | | | (3.44 | ) | |
| Redemption fees added to paid in capital (a) | | | — | | | | — | | | | 0.00 | (b) | | | 0.00 | (b) | | | 0.00 | (b) | | | 0.00 | (b) | |
| Increase from regulatory settlements | | | 0.00 | (b) | | | 0.00 | (b) | | | 0.00 | (b) | | | 0.01 | | | | — | | | | — | | |
| Net Asset Value, End of Period | | $ | 37.01 | | | $ | 34.15 | | | $ | 40.87 | | | $ | 34.13 | | | $ | 23.03 | | | $ | 43.42 | | |
| Total Return (c) | | | 8.56 | %(d) | | | (14.37 | )%(e)(f) | | | 22.23 | % | | | 50.40 | % | | | (46.09 | )% | | | 16.90 | %(e) | |
| Ratios to Average Net Assets/Supplemental Data | |
| Net expenses | | | 1.24 | %(g) | | | 1.30 | %(h) | | | 1.35 | %(h) | | | 1.36 | %(h) | | | 1.31 | %(h) | | | 1.23 | %(h) | |
| Net investment income | | | 1.44 | %(g) | | | 0.84 | %(h) | | | 0.62 | %(h) | | | 0.85 | %(h) | | | 1.36 | %(h) | | | 0.60 | %(h) | |
| Waiver/Reimbursement | | | 0.04 | %(g) | | | 0.02 | % | | | — | % | | | — | % | | | — | % | | | 0.00 | %(i) | |
| Portfolio turnover rate | | | 18 | %(d) | | | 32 | % | | | 25 | % | | | 31 | % | | | 38 | % | | | 28 | % | |
| Net assets at end of period (000s) | | $ | 926,998 | | | $ | 918,112 | | | $ | 810,603 | | | $ | 578,599 | | | $ | 366,820 | | | $ | 622,901 | | |
(a) Per share data was calculated using the average shares outstanding during the period.
(b) Rounds to less than $0.01 per share.
(c) Total return at net asset value assuming all distributions reinvested and no initial sales charge or contingent deferred sales charge.
(d) Not annualized.
(e) Had the Investment Manager and/or Transfer Agent not waived fees and/or reimbursed a portion of expenses, total return would have been reduced.
(f) During the year ended December 31, 2011, Columbia Management reimbursed the Fund for a loss on a trading error. Had the Fund not received this reimbursement total return would have been lower by less than 0.01%.
(g) Annualized.
(h) The benefits derived from custody fees paid indirectly had an impact of less than 0.01%.
(i) Rounds to less than 0.01%.
Columbia Acorn International
| Class B Shares | | (Unaudited)
Six months
ended June 30, | | Year ended December 31, | |
| Selected data for a share outstanding throughout each period | | 2012 | | 2011 | | 2010 | | 2009 | | 2008 | | 2007 | |
| Net Asset Value, Beginning of Period | | $ | 33.17 | | | $ | 39.96 | | | $ | 33.22 | | | $ | 22.41 | | | $ | 42.46 | | | $ | 39.39 | | |
| Income from Investment Operations | |
| Net investment income (a) | | | 0.12 | | | | 0.06 | | | | 0.03 | | | | 0.08 | | | | 0.27 | | | | 0.04 | | |
| Net realized and unrealized gain/(loss) | | | 2.59 | | | | (5.85 | ) | | | 7.02 | | | | 10.92 | | | | (19.72 | ) | | | 6.39 | | |
| Increase from payments by affiliate | | | — | | | | 0.00 | (b) | | | — | | | | — | | | | — | | | | — | | |
| Total from Investment Operations | | | 2.71 | | | | (5.79 | ) | | | 7.05 | | | | 11.00 | | | | (19.45 | ) | | | 6.43 | | |
| Less Distributions to Shareholders | |
| From net investment income | | | — | | | | (1.00 | ) | | | (0.31 | ) | | | (0.20 | ) | | | — | | | | (0.00 | )(b) | |
| From net realized gains | | | — | | | | — | | | | — | | | | — | | | | (0.60 | ) | | | (3.36 | ) | |
| Total Distributions to Shareholders | | | — | | | | (1.00 | ) | | | (0.31 | ) | | | (0.20 | ) | | | (0.60 | ) | | | (3.36 | ) | |
| Redemption fees added to paid in capital (a) | | | — | | | | — | | | | 0.00 | (b) | | | 0.00 | (b) | | | 0.00 | (b) | | | 0.00 | (b) | |
| Increase from regulatory settlements | | | 0.00 | (b) | | | 0.00 | (b) | | | 0.00 | (b) | | | 0.01 | | | | — | | | | — | | |
| Net Asset Value, End of Period | | $ | 35.88 | | | $ | 33.17 | | | $ | 39.96 | | | $ | 33.22 | | | $ | 22.41 | | | $ | 42.46 | | |
| Total Return (c) | | | 8.17 | %(d) | | | (14.92 | )%(e)(f) | | | 21.49 | % | | | 49.36 | % | | | (46.41 | )% | | | 16.25 | %(e) | |
| Ratios to Average Net Assets/Supplemental Data | |
| Net expenses | | | 1.99 | %(g) | | | 1.96 | %(h) | | | 1.96 | %(h) | | | 2.03 | %(h) | | | 1.90 | %(h) | | | 1.81 | %(h) | |
| Net investment income | | | 0.64 | %(g) | | | 0.15 | %(h) | | | 0.08 | %(h) | | | 0.29 | %(h) | | | 0.77 | %(h) | | | 0.08 | %(h) | |
| Waiver/Reimbursement | | | 0.03 | %(g) | | | 0.02 | % | | | — | % | | | — | % | | | — | % | | | 0.01 | % | |
| Portfolio turnover rate | | | 18 | %(d) | | | 32 | % | | | 25 | % | | | 31 | % | | | 38 | % | | | 28 | % | |
| Net assets at end of period (000s) | | $ | 21,112 | | | $ | 24,510 | | | $ | 29,368 | | | $ | 38,835 | | | $ | 39,153 | | | $ | 103,631 | | |
(a) Per share data was calculated using the average shares outstanding during the period.
(b) Rounds to less than $0.01 per share.
(c) Total return at net asset value assuming all distributions reinvested and no contingent deferred sales charge.
(d) Not annualized.
(e) Had the Investment Manager and/or Transfer Agent not waived fees and/or reimbursed a portion of expenses, total return would have been reduced.
(f) During the year ended December 31, 2011, Columbia Management reimbursed the Fund for a loss on a trading error. Had the Fund not received this reimbursement total return would have been lower by less than 0.01%.
(g) Annualized.
(h) The benefits derived from custody fees paid indirectly had an impact of less than 0.01%.
See accompanying notes to financial statements.
102
Columbia Acorn International
| Class C Shares | | (Unaudited)
Six months
ended June 30, | | Year ended December 31, | |
| Selected data for a share outstanding throughout each period | | 2012 | | 2011 | | 2010 | | 2009 | | 2008 | | 2007 | |
| Net Asset Value, Beginning of Period | | $ | 33.03 | | | $ | 39.79 | | | $ | 33.08 | | | $ | 22.30 | | | $ | 42.32 | | | $ | 39.35 | | |
| Income from Investment Operations | |
| Net investment income/(loss) (a) | | | 0.12 | | | | 0.04 | | | | (0.05 | ) | | | 0.02 | | | | 0.21 | | | | (0.06 | ) | |
| Net realized and unrealized gain/(loss) | | | 2.58 | | | | (5.86 | ) | | | 7.03 | | | | 10.89 | | | | (19.63 | ) | | | 6.39 | | |
| Increase from payments by affiliate | | | — | | | | 0.00 | (b) | | | — | | | | — | | | | — | | | | — | | |
| Total from Investment Operations | | | 2.70 | | | | (5.82 | ) | | | 6.98 | | | | 10.91 | | | | (19.42 | ) | | | 6.33 | | |
| Less Distributions to Shareholders | |
| From net investment income | | | — | | | | (0.94 | ) | | | (0.27 | ) | | | (0.14 | ) | | | — | | | | (0.00 | )(b) | |
| From net realized gains | | | — | | | | — | | | | — | | | | — | | | | (0.60 | ) | | | (3.36 | ) | |
| Total Distributions to Shareholders | | | — | | | | (0.94 | ) | | | (0.27 | ) | | | (0.14 | ) | | | (0.60 | ) | | | (3.36 | ) | |
| Redemption fees added to paid in capital (a) | | | — | | | | — | | | | 0.00 | (b) | | | 0.00 | (b) | | | 0.00 | (b) | | | 0.00 | (b) | |
| Increase from regulatory settlements | | | 0.00 | (b) | | | 0.00 | (b) | | | 0.00 | (b) | | | 0.01 | | | | — | | | | — | | |
| Net Asset Value, End of Period | | $ | 35.73 | | | $ | 33.03 | | | $ | 39.79 | | | $ | 33.08 | | | $ | 22.30 | | | $ | 42.32 | | |
| Total Return (c) | | | 8.17 | %(d) | | | (15.02 | )%(e)(f) | | | 21.34 | % | | | 49.12 | % | | | (46.50 | )% | | | 16.01 | %(e) | |
| Ratios to Average Net Assets/Supplemental Data | |
| Net expenses | | | 1.99 | %(g) | | | 2.06 | %(h) | | | 2.11 | %(h) | | | 2.17 | %(h) | | | 2.08 | %(h) | | | 1.99 | %(h) | |
| Net investment income/(loss) | | | 0.69 | %(g) | | | 0.10 | %(h) | | | (0.13 | )%(h) | | | 0.07 | %(h) | | | 0.60 | %(h) | | | (0.14 | )%(h) | |
| Waiver/Reimbursement | | | 0.02 | %(g) | | | 0.01 | % | | | — | % | | | — | % | | | — | % | | | 0.00 | %(i) | |
| Portfolio turnover rate | | | 18 | %(d) | | | 32 | % | | | 25 | % | | | 31 | % | | | 38 | % | | | 28 | % | |
| Net assets at end of period (000s) | | $ | 92,746 | | | $ | 97,328 | | | $ | 110,931 | | | $ | 85,625 | | | $ | 62,906 | | | $ | 153,416 | | |
(a) Per share data was calculated using the average shares outstanding during the period.
(b) Rounds to less than $0.01 per share.
(c) Total return at net asset value assuming all distributions reinvested and no contingent deferred sales charge.
(d) Not annualized.
(e) Had the Investment Manager and/or Transfer Agent not waived fees and/or reimbursed a portion of expenses, total return would have been reduced.
(f) During the year ended December 31, 2011, Columbia Management reimbursed the Fund for a loss on a trading error. Had the Fund not received this reimbursement total return would have been lower by less than 0.01%.
(g) Annualized.
(h) The benefits derived from custody fees paid indirectly had an impact of less than 0.01%.
(i) Rounds to less than 0.01%.
Columbia Acorn International
| Class I Shares | | (Unaudited)
Six months
ended June 30, | | Year ended December 31, | |
| Selected data for a share outstanding throughout each period | | 2012 | | 2011 | | 2010 (a) | |
| Net Asset Value, Beginning of Period | | $ | 34.33 | | | $ | 40.92 | | | $ | 37.69 | | |
| Income from Investment Operations | |
| Net investment income (b) | | | 0.34 | | | | 0.37 | | | | 0.08 | | |
| Net realized and unrealized gain/(loss) | | | 2.67 | | | | (5.94 | ) | | | 3.49 | | |
| Increase from payments by affiliate | | | — | | | | 0.00 | (c) | | | — | | |
| Total from Investment Operations | | | 3.01 | | | | (5.57 | ) | | | 3.57 | | |
| Less Distributions to Shareholders | |
| From net investment income | | | (0.21 | ) | | | (1.02 | ) | | | (0.34 | ) | |
| Total Distributions to Shareholders | | | (0.21 | ) | | | (1.02 | ) | | | (0.34 | ) | |
| Redemption fees added to paid in capital (b) | | | — | | | | — | | | | 0.00 | (c) | |
| Increase from regulatory settlements | | | 0.00 | (c) | | | 0.00 | (c) | | | — | | |
| Net Asset Value, End of Period | | $ | 37.13 | | | $ | 34.33 | | | $ | 40.92 | | |
| Total Return (d) | | | 8.79 | %(e) | | | (14.02 | )%(f) | | | 9.50 | %(e) | |
| Ratios to Average Net Assets/Supplemental Data | |
| Net expenses | | | 0.87 | %(g) | | | 0.91 | %(h) | | | 0.94 | %(h) | |
| Net investment income | | | 1.82 | %(g) | | | 0.99 | %(h) | | | 0.77 | %(h) | |
| Portfolio turnover rate | | | 18 | %(e) | | | 32 | % | | | 25 | %(e) | |
| Net assets at end of period (000s) | | $ | 62,855 | | | $ | 50,335 | | | $ | 66,581 | | |
(a) Class I shares commenced operations on September 27, 2010. Per share data and total return reflect activity from that date.
(b) Per share data was calculated using the average shares outstanding during the period.
(c) Rounds to less than $0.01 per share.
(d) Total return at net asset value assuming all distributions reinvested.
(e) Not annualized.
(f) During the year ended December 31, 2011, Columbia Management reimbursed the Fund for a loss on a trading error. Had the Fund not received this reimbursement total return would have been lower by less than 0.01%.
(g) Annualized.
(h) The benefits derived from custody fees paid indirectly had an impact of less than 0.01%.
See accompanying notes to financial statements.
103
Columbia Acorn Family of Funds
Financial Highlights, continued
Columbia Acorn International
| Class R Shares | | (Unaudited)
Six months
ended June 30, | | Year ended
December 31, | |
| Selected data for a share outstanding throughout each period | | 2012 | | 2011 (a) | |
| Net Asset Value, Beginning of Period | | $ | 34.11 | | | $ | 40.11 | | |
| Income from Investment Operations | |
| Net investment income (b) | | | 0.19 | | | | (0.00 | )(c) | |
| Net realized and unrealized gain (loss) | | | 2.67 | | | | (6.00 | ) | |
| Increase from payments by affiliate | | | — | | | | 0.00 | (c) | |
| Total from Investment Operations | | | 2.86 | | | | (6.00 | ) | |
| Increase from regulatory settlements | | | 0.00 | (c) | | | 0.00 | (c) | |
| Net Asset Value, End of Period | | $ | 36.97 | | | $ | 34.11 | | |
| Total Return (d)(e) | | | 8.38 | % | | | (14.96 | )% | |
| Ratios to Average Net Assets/Supplemental Data | |
| Net expenses (f) | | | 1.47 | % | | | 1.59 | %(g) | |
| Net investment income/(loss) (f) | | | 1.01 | % | | | (0.02 | )%(g) | |
| Portfolio turnover rate (e) | | | 18 | % | | | 32 | % | |
| Net assets at end of period (000s) | | $ | 961 | | | $ | 2,130 | | |
(a) Class R shares commenced operations on August 15, 2011. Per share data and total return reflect activity from that date.
(b) Per share data was calculated using the average shares outstanding during the period.
(c) Rounds to less than $0.01 per share.
(d) Total return at net asset value assuming all distributions reinvested and no initial sales charge or contingent deferred sales charge.
(e) Not annualized.
(f) Annualized.
(g) The benefits derived from custody fees paid indirectly had an impact of less than 0.01%.
Columbia Acorn International
| Class R5 Shares | | (Unaudited)
Six months
ended June 30, | | Year ended
December 31, | |
| Selected data for a share outstanding throughout each period | | 2012 | | 2011 (a) | |
| Net Asset Value, Beginning of Period | | $ | 34.31 | | | $ | 40.24 | | |
| Income from Investment Operations | |
| Net investment income (b) | | | 0.34 | | | | 0.09 | | |
| Net realized and unrealized gain/(loss) | | | 2.66 | | | | (6.02 | ) | |
| Increase from payments by affiliate | | | — | | | | 0.00 | (c) | |
| Total from Investment Operations | | | 3.00 | | | | (5.93 | ) | |
| Less Distributions to Shareholders | |
| From net investment income | | | (0.21 | ) | | | — | | |
| Total Distributions to Shareholders | | | (0.21 | ) | | | — | | |
| Increase from regulatory settlements | | | 0.00 | (c) | | | 0.00 | (c) | |
| Net Asset Value, End of Period | | $ | 37.10 | | | $ | 34.31 | | |
| Total Return (d)(e) | | | 8.77 | % | | | (14.74 | )% | |
| Ratios to Average Net Assets/Supplemental Data | |
| Net expenses (f) | | | 0.88 | % | | | 0.91 | %(g) | |
| Net investment income (f) | | | 1.82 | % | | | 0.65 | %(g) | |
| Portfolio turnover rate (e) | | | 18 | % | | | 32 | % | |
| Net assets at end of period (000s) | | $ | 2,179 | | | $ | 2,038 | | |
(a) Class R5 shares commenced operations on August 15, 2011. Per share data and total return reflect activity from that date.
(b) Per share data was calculated using the average shares outstanding during the period.
(c) Rounds to less than $0.01 per share.
(d) Total return at net asset value assuming all distributions reinvested and no initial sales charge or contingent deferred sales charge.
(e) Not annualized.
(f) Annualized.
(g) The benefits derived from custody fees paid indirectly had an impact of less than 0.01%.
See accompanying notes to financial statements.
104
Columbia Acorn USA
| Class A Shares | | (Unaudited)
Six months
ended June 30, | | Year ended December 31, | |
| Selected data for a share outstanding throughout each period | | 2012 | | 2011 | | 2010 | | 2009 | | 2008 | | 2007 | |
| Net Asset Value, Beginning of Period | | $ | 25.94 | | | $ | 27.54 | | | $ | 22.43 | | | $ | 15.90 | | | $ | 27.23 | | | $ | 28.02 | | |
| Income from Investment Operations | |
| Net investment loss (a) | | | (0.09 | ) | | | (0.22 | ) | | | (0.15 | ) | | | (0.11 | ) | | | (0.14 | ) | | | (0.09 | )(b) | |
| Net realized and unrealized gain/(loss) | | | 2.72 | | | | (1.21 | ) | | | 5.26 | | | | 6.64 | | | | (10.23 | ) | | | 1.01 | | |
| Total from Investment Operations | | | 2.63 | | | | (1.43 | ) | | | 5.11 | | | | 6.53 | | | | (10.37 | ) | | | 0.92 | | |
| Less Distributions to Shareholders | |
| From net realized gains | | | (0.05 | ) | | | (0.17 | ) | | | — | | | | — | | | | (0.96 | ) | | | (1.71 | ) | |
| Total Distributions to Shareholders | | | (0.05 | ) | | | (0.17 | ) | | | — | | | | — | | | | (0.96 | ) | | | (1.71 | ) | |
| Increase from regulatory settlements | | | — | | | | — | | | | — | | | | 0.00 | (c) | | | — | | | | — | | |
| Net Asset Value, End of Period | | $ | 28.52 | | | $ | 25.94 | | | $ | 27.54 | | | $ | 22.43 | | | $ | 15.90 | | | $ | 27.23 | | |
| Total Return (d) | | | 10.15 | %(e) | | | (5.21 | )% | | | 22.78 | % | | | 41.07 | % | | | (39.38 | )% | | | 3.18 | %(f)(g) | |
| Ratios to Average Net Assets/Supplemental Data | |
| Net expenses | | | 1.31 | %(h) | | | 1.30 | %(i) | | | 1.30 | %(i) | | | 1.32 | %(i) | | | 1.29 | %(i) | | | 1.25 | %(i) | |
| Net investment loss | | | (0.61 | )%(h) | | | (0.78 | )%(i) | | | (0.64 | )%(i) | | | (0.64 | )%(i) | | | (0.60 | )%(i) | | | (0.29 | )%(i) | |
| Waiver/Reimbursement | | | — | % | | | — | % | | | — | % | | | — | % | | | — | % | | | 0.00 | %(j) | |
| Portfolio turnover rate | | | 8 | %(e) | | | 20 | % | | | 32 | % | | | 28 | % | | | 23 | % | | | 21 | % | |
| Net assets at end of period (000s) | | $ | 157,525 | | | $ | 167,038 | | | $ | 214,097 | | | $ | 178,605 | | | $ | 136,597 | | | $ | 245,085 | | |
(a) Per share data was calculated using the average shares outstanding during the period.
(b) Net investment income per share includes special dividends. The effect of these dividends amounted to $0.09 per share.
(c) Rounds to less than $0.01 per share.
(d) Total return at net asset value assuming all distributions reinvested and no initial sales charge or contingent deferred sales charge.
(e) Not annualized.
(f) Had the Investment Manager and/or Transfer Agent not waived fees and/or reimbursed a portion of expenses, total return would have been reduced.
(g) Total return includes a voluntary reimbursement by the Advisor for a realized investment loss due to a trading error. This reimbursement increased total return and net asset value per share by less than 0.01% and less than $0.01, respectively.
(h) Annualized.
(i) The benefits derived from custody fees paid indirectly had an impact of less than 0.01%.
(j) Rounds to less than 0.01%.
Columbia Acorn USA
| Class B Shares | | (Unaudited)
Six months
ended June 30, | | Year ended December 31, | |
| Selected data for a share outstanding throughout each period | | 2012 | | 2011 | | 2010 | | 2009 | | 2008 | | 2007 | |
| Net Asset Value, Beginning of Period | | $ | 23.98 | | | $ | 25.60 | | | $ | 20.99 | | | $ | 14.98 | | | $ | 25.87 | | | $ | 26.87 | | |
| Income from Investment Operations | |
| Net investment loss (a) | | | (0.17 | ) | | | (0.37 | ) | | | (0.30 | ) | | | (0.22 | ) | | | (0.27 | ) | | | (0.25 | )(b) | |
| Net realized and unrealized gain/(loss) | | | 2.51 | | | | (1.08 | ) | | | 4.91 | | | | 6.23 | | | | (9.66 | ) | | | 0.96 | | |
| Total from Investment Operations | | | 2.34 | | | | (1.45 | ) | | | 4.61 | | | | 6.01 | | | | (9.93 | ) | | | 0.71 | | |
| Less Distributions to Shareholders | |
| From net realized gains | | | (0.05 | ) | | | (0.17 | ) | | | — | | | | — | | | | (0.96 | ) | | | (1.71 | ) | |
| Total Distributions to Shareholders | | | (0.05 | ) | | | (0.17 | ) | | | — | | | | — | | | | (0.96 | ) | | | (1.71 | ) | |
| Increase from regulatory settlements | | | — | | | | — | | | | — | | | | 0.00 | (c) | | | — | | | | — | | |
| Net Asset Value, End of Period | | $ | 26.27 | | | $ | 23.98 | | | $ | 25.60 | | | $ | 20.99 | | | $ | 14.98 | | | $ | 25.87 | | |
| Total Return (d) | | | 9.77 | %(e) | | | (5.68 | )% | | | 21.96 | % | | | 40.12 | % | | | (39.75 | )% | | | 2.53 | %(f)(g) | |
| Ratios to Average Net Assets/Supplemental Data | |
| Net expenses | | | 2.01 | %(h) | | | 1.92 | %(i) | | | 1.98 | %(i) | | | 2.02 | %(i) | | | 1.92 | %(i) | | | 1.85 | %(i) | |
| Net investment loss | | | (1.32 | )%(h) | | | (1.42 | )%(i) | | | (1.37 | )%(i) | | | (1.33 | )%(i) | | | (1.24 | )%(i) | | | (0.87 | )%(i) | |
| Waiver/Reimbursement | | | — | % | | | — | % | | | — | % | | | — | % | | | — | % | | | 0.01 | % | |
| Portfolio turnover rate | | | 8 | %(e) | | | 20 | % | | | 32 | % | | | 28 | % | | | 23 | % | | | 21 | % | |
| Net assets at end of period (000s) | | $ | 1,627 | | | $ | 2,253 | | | $ | 9,222 | | | $ | 20,903 | | | $ | 23,633 | | | $ | 53,820 | | |
(a) Per share data was calculated using the average shares outstanding during the period.
(b) Net investment income per share includes special dividends. The effect of these dividends amounted to $0.09 per share.
(c) Rounds to less than $0.01 per share.
(d) Total return at net asset value assuming all distributions reinvested and no contingent deferred sales charge.
(e) Not annualized.
(f) Had the Investment Manager and/or Transfer Agent not waived fees and/or reimbursed a portion of expenses, total return would have been reduced.
(g) Total return includes a voluntary reimbursement by the Advisor for a realized investment loss due to a trading error. This reimbursement increased total return and net asset value per share by less than 0.01% and less than $0.01, respectively.
(h) Annualized.
(i) The benefits derived from custody fees paid indirectly had an impact of less than 0.01%.
See accompanying notes to financial statements.
105
Columbia Acorn Family of Funds
Financial Highlights, continued
Columbia Acorn USA
| Class C Shares | | (Unaudited)
Six months
ended June 30, | | Year ended December 31, | |
| Selected data for a share outstanding throughout each period | | 2012 | | 2011 | | 2010 | | 2009 | | 2008 | | 2007 | |
| Net Asset Value, Beginning of Period | | $ | 23.72 | | | $ | 25.39 | | | $ | 20.84 | | | $ | 14.89 | | | $ | 25.77 | | | $ | 26.81 | | |
| Income from Investment Operations | |
| Net investment loss (a) | | | (0.18 | ) | | | (0.39 | ) | | | (0.31 | ) | | | (0.24 | ) | | | (0.30 | ) | | | (0.30 | )(b) | |
| Net realized and unrealized gain/(loss) | | | 2.50 | | | | (1.11 | ) | | | 4.86 | | | | 6.19 | | | | (9.62 | ) | | | 0.97 | | |
| Total from Investment Operations | | | 2.32 | | | | (1.50 | ) | | | 4.55 | | | | 5.95 | | | | (9.92 | ) | | | 0.67 | | |
| Less Distributions to Shareholders | |
| From net realized gains | | | (0.05 | ) | | | (0.17 | ) | | | — | | | | — | | | | (0.96 | ) | | | (1.71 | ) | |
| Total Distributions to Shareholders | | | (0.05 | ) | | | (0.17 | ) | | | — | | | | — | | | | (0.96 | ) | | | (1.71 | ) | |
| Increase from regulatory settlements | | | — | | | | — | | | | — | | | | 0.00 | (c) | | | — | | | | — | | |
| Net Asset Value, End of Period | | $ | 25.99 | | | $ | 23.72 | | | $ | 25.39 | | | $ | 20.84 | | | $ | 14.89 | | | $ | 25.77 | | |
| Total Return (d) | | | 9.79 | %(e) | | | (5.92 | )% | | | 21.83 | % | | | 39.96 | % | | | (39.87 | )% | | | 2.39 | %(f)(g) | |
| Ratios to Average Net Assets/Supplemental Data | |
| Net expenses | | | 2.05 | %(h) | | | 2.05 | %(i) | | | 2.08 | %(i) | | | 2.13 | %(i) | | | 2.08 | %(i) | | | 2.03 | %(i) | |
| Net investment loss | | | (1.35 | )%(h) | | | (1.53 | )%(i) | | | (1.41 | )%(i) | | | (1.45 | )%(i) | | | (1.39 | )%(i) | | | (1.07 | )%(i) | |
| Waiver/Reimbursement | | | — | % | | | — | % | | | — | % | | | — | % | | | — | % | | | 0.00 | %(j) | |
| Portfolio turnover rate | | | 8 | %(e) | | | 20 | % | | | 32 | % | | | 28 | % | | | 23 | % | | | 21 | % | |
| Net assets at end of period (000s) | | $ | 31,666 | | | $ | 30,584 | | | $ | 36,101 | | | $ | 32,508 | | | $ | 25,899 | | | $ | 50,743 | | |
(a) Per share data was calculated using the average shares outstanding during the period.
(b) Net investment income per share includes special dividends. The effect of these dividends amounted to $0.09 per share.
(c) Rounds to less than $0.01 per share.
(d) Total return at net asset value assuming all distributions reinvested and no contingent deferred sales charge.
(e) Not annualized.
(f) Had the Investment Manager and/or Transfer Agent not waived fees and/or reimbursed a portion of expenses, total return would have been reduced.
(g) Total return includes a voluntary reimbursement by the Advisor for a realized investment loss due to a trading error. This reimbursement increased total return and net asset value per share by less than 0.01% and less than $0.01, respectively.
(h) Annualized.
(i) The benefits derived from custody fees paid indirectly had an impact of less than 0.01%.
(j) Rounds to less than 0.01%.
Columbia Acorn USA
| Class I Shares | | (Unaudited)
Six months
ended June 30, | | Year ended December 31, | |
| Selected data for a share outstanding throughout each period | | 2012 | | 2011 | | 2010 (a) | |
| Net Asset Value, Beginning of Period | | $ | 27.00 | | | $ | 28.56 | | | $ | 24.24 | | |
| Income from Investment Operations | |
| Net investment loss (b) | | | (0.04 | ) | | | (0.14 | ) | | | (0.03 | ) | |
| Net realized and unrealized gain/(loss) | | | 2.84 | | | | (1.25 | ) | | | 4.35 | | |
| Total from Investment Operations | | | 2.80 | | | | (1.39 | ) | | | 4.32 | | |
| Less Distributions to Shareholders | |
| From net realized gains | | | (0.05 | ) | | | (0.17 | ) | | | — | | |
| Total Distributions to Shareholders | | | (0.05 | ) | | | (0.17 | ) | | | — | | |
| Net Asset Value, End of Period | | $ | 29.75 | | | $ | 27.00 | | | $ | 28.56 | | |
| Total Return (c) | | | 10.38 | %(d) | | | (4.88 | )% | | | 17.82 | %(d) | |
| Ratios to Average Net Assets/Supplemental Data | |
| Net expenses | | | 0.96 | %(e) | | | 0.94 | %(f) | | | 0.94 | %(e)(f) | |
| Net investment loss | | | (0.28 | )%(e) | | | (0.47 | )%(f) | | | (0.35 | )%(e)(f) | |
| Portfolio turnover rate | | | 8 | %(d) | | | 20 | % | | | 32 | %(d) | |
| Net assets at end of period (000s) | | $ | 618 | | | $ | 2,635 | | | $ | 28,993 | | |
(a) Class I shares commenced operations on September 27, 2010. Per share data and total return reflect activity from that date.
(b) Per share data was calculated using the average shares outstanding during the period.
(c) Total return at net asset value assuming all distributions reinvested.
(d) Not annualized.
(e) Annualized.
(f) The benefits derived from custody fees paid indirectly had an impact of less than 0.01%.
See accompanying notes to financial statements.
106
Columbia Acorn International Select
| Class A Shares | | (Unaudited)
Six months
ended June 30, | | Year ended December 31, | |
| Selected data for a share outstanding throughout each period | | 2012 | | 2011 | | 2010 | | 2009 | | 2008 | | 2007 | |
| Net Asset Value, Beginning of Period | | $ | 24.26 | | | $ | 28.01 | | | $ | 23.39 | | | $ | 17.99 | | | $ | 31.74 | | | $ | 27.68 | | |
| Income from Investment Operations | |
| Net investment income (a) | | | 0.18 | | | | 0.18 | | | | 0.08 | | | | 0.10 | | | | 0.20 | | | | 0.04 | (b) | |
| Net realized and unrealized gain/(loss) | | | 2.30 | | | | (2.95 | ) | | | 4.84 | | | | 5.43 | | | | (13.41 | ) | | | 5.91 | | |
| Total from Investment Operations | | | 2.48 | | | | (2.77 | ) | | | 4.92 | | | | 5.53 | | | | (13.21 | ) | | | 5.95 | | |
| Less Distributions to Shareholders | |
| From net investment income | | | — | | | | (0.59 | ) | | | (0.30 | ) | | | (0.15 | ) | | | — | | | | (0.12 | ) | |
| From net realized gains | | | (0.12 | ) | | | (0.39 | ) | | | — | | | | — | | | | (0.54 | ) | | | (1.77 | ) | |
| Total Distributions to Shareholders | | | (0.12 | ) | | | (0.98 | ) | | | (0.30 | ) | | | (0.15 | ) | | | (0.54 | ) | | | (1.89 | ) | |
| Redemption fees added to paid in capital (a) | | | — | | | | — | | | | 0.00 | (c) | | | 0.00 | (c) | | | 0.00 | (c) | | | 0.00 | (c) | |
| Increase from regulatory settlements | | | — | | | | — | | | | 0.00 | (c) | | | 0.02 | | | | — | | | | — | | |
| Net Asset Value, End of Period | | $ | 26.62 | | | $ | 24.26 | | | $ | 28.01 | | | $ | 23.39 | | | $ | 17.99 | | | $ | 31.74 | | |
| Total Return (d) | | | 10.23 | %(e) | | | (10.11 | )% | | | 21.41 | % | | | 31.01 | % | | | (42.30 | )% | | | 21.50 | %(f) | |
| Ratios to Average Net Assets/Supplemental Data | |
| Net expenses | | | 1.50 | %(g) | | | 1.51 | %(h) | | | 1.56 | %(h) | | | 1.56 | %(h) | | | 1.54 | %(h) | | | 1.49 | %(h) | |
| Net investment income | | | 1.42 | %(g) | | | 0.66 | %(h) | | | 0.33 | %(h) | | | 0.53 | %(h) | | | 0.78 | %(h) | | | 0.11 | %(h) | |
| Waiver/Reimbursement | | | — | % | | | — | % | | | — | % | | | — | % | | | — | % | | | 0.00 | %(i) | |
| Portfolio turnover rate | | | 29 | %(e) | | | 44 | % | | | 42 | % | | | 56 | % | | | 68 | % | | | 57 | % | |
| Net assets at end of period (000s) | | $ | 57,282 | | | $ | 56,350 | | | $ | 71,668 | | | $ | 64,664 | | | $ | 46,522 | | | $ | 48,538 | | |
(a) Per share data was calculated using the average shares outstanding during the period.
(b) Net investment income per share includes special dividends. The effect of these dividends amounted to $0.07 per share.
(c) Rounds to less than $0.01 per share.
(d) Total return at net asset value assuming all distributions reinvested and no initial sales charge or contingent deferred sales charge.
(e) Not annualized.
(f) Had the Investment Manager and/or Transfer Agent not waived fees and/or reimbursed a portion of expenses, total return would have been reduced.
(g) Annualized.
(h) The benefits derived from custody fees paid indirectly had an impact of less than 0.01%.
(i) Rounds to less than 0.01%.
Columbia Acorn International Select
| Class B Shares | | (Unaudited)
Six months
ended June 30, | | Year ended December 31, | |
| Selected data for a share outstanding throughout each period | | 2012 | | 2011 | | 2010 | | 2009 | | 2008 | | 2007 | |
| Net Asset Value, Beginning of Period | | $ | 23.27 | | | $ | 26.72 | | | $ | 22.34 | | | $ | 17.16 | | | $ | 30.50 | | | $ | 26.73 | | |
| Income from Investment Operations | |
| Net investment income/(loss) (a) | | | 0.10 | | | | 0.01 | | | | (0.06 | ) | | | (0.01 | ) | | | 0.04 | | | | (0.13 | )(b) | |
| Net realized and unrealized gain/(loss) | | | 2.20 | | | | (2.82 | ) | | | 4.62 | | | | 5.17 | | | | (12.84 | ) | | | 5.67 | | |
| Total from Investment Operations | | | 2.30 | | | | (2.81 | ) | | | 4.56 | | | | 5.16 | | | | (12.80 | ) | | | 5.54 | | |
| Less Distributions to Shareholders | |
| From net investment income | | | — | | | | (0.25 | ) | | | (0.18 | ) | | | — | | | | — | | | | — | | |
| From net realized gains | | | (0.12 | ) | | | (0.39 | ) | | | — | | | | — | | | | (0.54 | ) | | | (1.77 | ) | |
| Total Distributions to Shareholders | | | (0.12 | ) | | | (0.64 | ) | | | (0.18 | ) | | | — | | | | (0.54 | ) | | | (1.77 | ) | |
| Redemption fees added to paid in capital (a) | | | — | | | | — | | | | 0.00 | (c) | | | 0.00 | (c) | | | 0.00 | (c) | | | 0.00 | (c) | |
| Increase from regulatory settlements | | | — | | | | — | | | | 0.00 | (c) | | | 0.02 | | | | — | | | | — | | |
| Net Asset Value, End of Period | | $ | 25.45 | | | $ | 23.27 | | | $ | 26.72 | | | $ | 22.34 | | | $ | 17.16 | | | $ | 30.50 | | |
| Total Return (d) | | | 9.89 | %(e) | | | (10.64 | )% | | | 20.63 | %(f) | | | 30.19 | %(f) | | | (42.68 | )% | | | 20.69 | %(f) | |
| Ratios to Average Net Assets/Supplemental Data | |
| Net expenses | | | 2.11 | %(g) | | | 2.14 | %(h) | | | 2.20 | %(h) | | | 2.20 | %(h) | | | 2.17 | %(h) | | | 2.10 | %(h) | |
| Net investment income/(loss) | | | 0.77 | %(g) | | | 0.04 | %(h) | | | (0.27 | )%(h) | | | (0.05 | )%(h) | | | 0.16 | %(h) | | | (0.45 | )%(h) | |
| Waiver/Reimbursement | | | — | % | | | — | % | | | 0.04 | % | | | 0.12 | % | | | — | % | | | 0.01 | % | |
| Portfolio turnover rate | | | 29 | %(e) | | | 44 | % | | | 42 | % | | | 56 | % | | | 68 | % | | | 57 | % | |
| Net assets at end of period (000s) | | $ | 1,364 | | | $ | 1,774 | | | $ | 3,030 | | | $ | 3,887 | | | $ | 4,444 | | | $ | 11,941 | | |
(a) Per share data was calculated using the average shares outstanding during the period.
(b) Net investment income per share includes special dividends. The effect of these dividends amounted to $0.07 per share.
(c) Rounds to less than $0.01 per share.
(d) Total return at net asset value assuming all distributions reinvested and no contingent deferred sales charge.
(e) Not annualized.
(f) Had the Investment Manager and/or Transfer Agent not waived fees and/or reimbursed a portion of expenses, total return would have been reduced.
(g) Annualized.
(h) The benefits derived from custody fees paid indirectly had an impact of less than 0.01%.
See accompanying notes to financial statements.
107
Columbia Acorn Family of Funds
Financial Highlights, continued
Columbia Acorn International Select
| Class C Shares | | (Unaudited)
Six months
ended June 30, | | Year ended December 31, | |
| Selected data for a share outstanding throughout each period | | 2012 | | 2011 | | 2010 | | 2009 | | 2008 | | 2007 | |
| Net Asset Value, Beginning of Period | | $ | 23.17 | | | $ | 26.58 | | | $ | 22.21 | | | $ | 17.08 | | | $ | 30.42 | | | $ | 26.70 | | |
| Income from Investment Operations | |
| Net investment income/(loss) (a) | | | 0.08 | | | | (0.04 | ) | | | (0.10 | ) | | | (0.06 | ) | | | 0.00 | (b) | | | (0.20 | )(c) | |
| Net realized and unrealized gain/(loss) | | | 2.19 | | | | (2.81 | ) | | | 4.60 | | | | 5.17 | | | | (12.80 | ) | | | 5.69 | | |
| Total from Investment Operations | | | 2.27 | | | | (2.85 | ) | | | 4.50 | | | | 5.11 | | | | (12.80 | ) | | | 5.49 | | |
| Less Distributions to Shareholders | |
| From net investment income | | | — | | | | (0.17 | ) | | | (0.13 | ) | | | — | | | | — | | | | — | | |
| From net realized gains | | | (0.12 | ) | | | (0.39 | ) | | | — | | | | — | | | | (0.54 | ) | | | (1.77 | ) | |
| Total Distributions to Shareholders | | | (0.12 | ) | | | (0.56 | ) | | | (0.13 | ) | | | — | | | | (0.54 | ) | | | (1.77 | ) | |
| Redemption fees added to paid in capital (a) | | | — | | | | — | | | | 0.00 | (b) | | | 0.00 | (b) | | | 0.00 | (b) | | | 0.00 | (b) | |
| Increase from regulatory settlements | | | — | | | | — | | | | 0.00 | (b) | | | 0.02 | | | | — | | | | — | | |
| Net Asset Value, End of Period | | $ | 25.32 | | | $ | 23.17 | | | $ | 26.58 | | | $ | 22.21 | | | $ | 17.08 | | | $ | 30.42 | | |
| Total Return (d) | | | 9.81 | %(e) | | | (10.81 | )% | | | 20.45 | % | | | 30.04 | % | | | (42.79 | )% | | | 20.53 | %(f) | |
| Ratios to Average Net Assets/Supplemental Data | |
| Net expenses | | | 2.29 | %(g) | | | 2.31 | %(h) | | | 2.36 | %(h) | | | 2.42 | %(h) | | | 2.34 | %(h) | | | 2.29 | %(h) | |
| Net investment income/(loss) | | | 0.62 | %(g) | | | (0.14 | )%(h) | | | (0.45 | )%(h) | | | (0.30 | )%(h) | | | 0.01 | %(h) | | | (0.68 | )%(h) | |
| Waiver/Reimbursement | | | — | % | | | — | % | | | — | % | | | — | % | | | — | % | | | 0.01 | % | |
| Portfolio turnover rate | | | 29 | %(e) | | | 44 | % | | | 42 | % | | | 56 | % | | | 68 | % | | | 57 | % | |
| Net assets at end of period (000s) | | $ | 8,585 | | | $ | 8,704 | | | $ | 11,885 | | | $ | 11,096 | | | $ | 9,747 | | | $ | 13,023 | | |
(a) Per share data was calculated using the average shares outstanding during the period.
(b) Rounds to less than $0.01 per share.
(c) Net investment income per share includes special dividends. The effect of these dividends amounted to $0.07 per share.
(d) Total return at net asset value assuming all distributions reinvested and no contingent deferred sales charge.
(e) Not annualized.
(f) Had the Investment Manager and/or Transfer Agent not waived fees and/or reimbursed a portion of expenses, total return would have been reduced.
(g) Annualized.
(h) The benefits derived from custody fees paid indirectly had an impact of less than 0.01%.
Columbia Acorn International Select
| Class I Shares | | (Unaudited)
Six months
ended June 30, | | Year ended December 31, | |
| Selected data for a share outstanding throughout each period | | 2012 | | 2011 | | 2010 (a) | |
| Net Asset Value, Beginning of Period | | $ | 24.45 | | | $ | 28.33 | | | $ | 26.11 | | |
| Income from Investment Operations | |
| Net investment income (b) | | | 0.23 | | | | 0.31 | | | | 0.03 | | |
| Net realized and unrealized gain/(loss) | | | 2.32 | | | | (2.97 | ) | | | 2.19 | | |
| Total from Investment Operations | | | 2.55 | | | | (2.66 | ) | | | 2.22 | | |
| Less Distributions to Shareholders | |
| From net investment income | | | — | | | | (0.83 | ) | | | — | | |
| From net realized gains | | | (0.12 | ) | | | (0.39 | ) | | | — | | |
| Total Distributions to Shareholders | | | (0.12 | ) | | | (1.22 | ) | | | — | | |
| Net Asset Value, End of Period | | $ | 26.88 | | | $ | 24.45 | | | $ | 28.33 | | |
| Total Return (c) | | | 10.44 | %(d) | | | (9.68 | )% | | | 8.50 | %(d) | |
| Ratios to Average Net Assets/Supplemental Data | |
| Net expenses | | | 1.14 | %(e) | | | 1.04 | %(f) | | | 1.14 | %(e)(f) | |
| Net investment income | | | 1.78 | %(e) | | | 1.12 | %(f) | | | 0.44 | %(e)(f) | |
| Portfolio turnover rate | | | 29 | %(d) | | | 44 | % | | | 42 | %(d) | |
| Net assets at end of period (000s) | | $ | 3 | | | $ | 2 | | | $ | 3 | | |
(a) Class I shares commenced operations on September 27, 2010. Per share data and total return reflect activity from that date.
(b) Per share data was calculated using the average shares outstanding during the period.
(c) Total return at net asset value assuming all distributions reinvested and no contingent deferred sales charge.
(d) Not annualized.
(e) Annualized.
(f) The benefits derived from custody fees paid indirectly had an impact of less than 0.01%.
See accompanying notes to financial statements.
108
Columbia Acorn Select
| Class A Shares | | (Unaudited)
Six months
ended June 30, | | Year ended December 31, | |
| Selected data for a share outstanding throughout each period | | 2012 | | 2011 | | 2010 | | 2009 | | 2008 | | 2007 | |
| Net Asset Value, Beginning of Period | | $ | 22.95 | | | $ | 27.94 | | | $ | 22.81 | | | $ | 13.77 | | | $ | 27.89 | | | $ | 26.18 | | |
| Income from Investment Operations | |
| Net investment loss (a) | | | (0.06 | ) | | | (0.15 | ) | | | (0.18 | ) | | | (0.14 | ) | | | (0.18 | ) | | | (0.15 | ) | |
| Net realized and unrealized gain/(loss) | | | 1.81 | | | | (4.46 | ) | | | 5.31 | | | | 9.18 | | | | (13.25 | ) | | | 2.50 | | |
| Total from Investment Operations | | | 1.75 | | | | (4.61 | ) | | | 5.13 | | | | 9.04 | | | | (13.43 | ) | | | 2.35 | | |
| Less Distributions to Shareholders | |
| From net investment income | | | — | | | | (0.38 | ) | | | — | | | | — | | | | — | | | | — | | |
| From net realized gains | | | (0.53 | ) | | | — | | | | — | | | | — | | | | (0.69 | ) | | | (0.64 | ) | |
| Total Distributions to Shareholders | | | (0.53 | ) | | | (0.38 | ) | | | — | | | | — | | | | (0.69 | ) | | | (0.64 | ) | |
| Net Asset Value, End of Period | | $ | 24.17 | | | $ | 22.95 | | | $ | 27.94 | | | $ | 22.81 | | | $ | 13.77 | | | $ | 27.89 | | |
| Total Return (b) | | | 7.64 | %(c) | | | (16.65 | )% | | | 22.49 | % | | | 65.65 | % | | | (49.31 | )%(d) | | | 8.92 | %(e) | |
| Ratios to Average Net Assets/Supplemental Data | |
| Net expenses before interest expense | | | 1.32 | %(f) | | | 1.28 | %(g) | | | 1.28 | %(g) | | | 1.30 | %(g) | | | 1.24 | %(g) | | | 1.19 | %(g) | |
| Interest expense | | | 0.00 | %(f)(h) | | | — | % | | | — | % | | | — | % | | | — | % | | | — | % | |
| Net expenses | | | 1.32 | %(f) | | | 1.28 | %(g) | | | 1.28 | %(g) | | | 1.30 | %(g) | | | 1.24 | %(g) | | | 1.19 | %(g) | |
| Net investment loss | | | (0.45 | )%(f) | | | (0.57 | )%(g) | | | (0.73 | )%(g) | | | (0.78 | )%(g) | | | (0.80 | )%(g) | | | (0.52 | )%(g) | |
| Waiver/Reimbursement | | | — | % | | | — | % | | | — | % | | | — | % | | | — | % | | | 0.00 | %(h) | |
| Portfolio turnover rate | | | 8 | %(c) | | | 21 | % | | | 28 | % | | | 19 | % | | | 28 | % | | | 14 | % | |
| Net assets at end of period (000s) | | $ | 303,485 | | | $ | 340,325 | | | $ | 555,263 | | | $ | 522,443 | | | $ | 395,794 | | | $ | 1,117,941 | | |
(a) Per share data was calculated using the average shares outstanding during the period.
(b) Total return at net asset value assuming all distributions reinvested and no initial sales charge or contingent deferred sales charge.
(c) Not annualized.
(d) Total return includes a voluntary reimbursement by the Advisor for a realized investment loss due to a trading error. This reimbursement increased total return and net asset value per share by less than 0.01% and less than $0.01, respectively.
(e) Had the Investment Manager and/or Transfer Agent not waived fees and/or reimbursed a portion of expenses, total return would have been reduced.
(f) Annualized.
(g) The benefits derived from custody fees paid indirectly had an impact of less than 0.01%.
(h) Rounds to less than 0.01%.
Columbia Acorn Select
| Class B Shares | | (Unaudited)
Six months
ended June 30, | | Year ended December 31, | |
| Selected data for a share outstanding throughout each period | | 2012 | | 2011 | | 2010 | | 2009 | | 2008 | | 2007 | |
| Net Asset Value, Beginning of Period | | $ | 21.40 | | | $ | 26.06 | | | $ | 21.41 | | | $ | 13.02 | | | $ | 26.57 | | | $ | 25.13 | | |
| Income from Investment Operations | |
| Net investment loss (a) | | | (0.13 | ) | | | (0.30 | ) | | | (0.31 | ) | | | (0.24 | ) | | | (0.31 | ) | | | (0.31 | ) | |
| Net realized and unrealized gain/(loss) | | | 1.69 | | | | (4.13 | ) | | | 4.96 | | | | 8.63 | | | | (12.55 | ) | | | 2.39 | | |
| Total from Investment Operations | | | 1.56 | | | | (4.43 | ) | | | 4.65 | | | | 8.39 | | | | (12.86 | ) | | | 2.08 | | |
| Less Distributions to Shareholders | |
| From net investment income | | | — | | | | (0.23 | ) | | | — | | | | — | | | | — | | | | — | | |
| From net realized gains | | | (0.53 | ) | | | — | | | | — | | | | — | | | | (0.69 | ) | | | (0.64 | ) | |
| Total Distributions to Shareholders | | | (0.53 | ) | | | (0.23 | ) | | | — | | | | — | | | | (0.69 | ) | | | (0.64 | ) | |
| Net Asset Value, End of Period | | $ | 22.43 | | | $ | 21.40 | | | $ | 26.06 | | | $ | 21.41 | | | $ | 13.02 | | | $ | 26.57 | | |
| Total Return (b) | | | 7.30 | %(c) | | | (17.11 | )% | | | 21.72 | % | | | 64.44 | % | | | (49.62 | )%(d) | | | 8.22 | %(e) | |
| Ratios to Average Net Assets/Supplemental Data | |
| Net expenses before interest expense | | | 1.90 | %(f) | | | 1.88 | %(g) | | | 1.92 | %(g) | | | 2.01 | %(g) | | | 1.87 | %(g) | | | 1.79 | %(g) | |
| Interest expense | | | 0.00 | %(f)(h) | | | — | % | | | — | % | | | — | % | | | — | % | | | — | % | |
| Net expenses | | | 1.90 | %(f) | | | 1.88 | %(g) | | | 1.92 | %(g) | | | 2.01 | %(g) | | | 1.87 | %(g) | | | 1.79 | %(g) | |
| Net investment loss | | | (1.08 | )%(f) | | | (1.21 | )%(g) | | | (1.39 | )%(g) | | | (1.49 | )%(g) | | | (1.43 | )%(g) | | | (1.12 | )%(g) | |
| Waiver/Reimbursement | | | — | % | | | — | % | | | — | % | | | — | % | | | — | % | | | 0.01 | % | |
| Portfolio turnover rate | | | 8 | %(c) | | | 21 | % | | | 28 | % | | | 19 | % | | | 28 | % | | | 14 | % | |
| Net assets at end of period (000s) | | $ | 15,343 | | | $ | 26,126 | | | $ | 72,203 | | | $ | 88,004 | | | $ | 73,152 | | | $ | 199,182 | | |
(a) Per share data was calculated using the average shares outstanding during the period.
(b) Total return at net asset value assuming all distributions reinvested and no contingent deferred sales charge.
(c) Not annualized.
(d) Total return includes a voluntary reimbursement by the Advisor for a realized investment loss due to a trading error. This reimbursement increased total return and net asset value per share by less than 0.01% and less than $0.01, respectively.
(e) Had the Investment Manager and/or Transfer Agent not waived fees and/or reimbursed a portion of expenses, total return would have been reduced.
(f) Annualized.
(g) The benefits derived from custody fees paid indirectly had an impact of less than 0.01%.
(h) Rounds to less than 0.01%.
See accompanying notes to financial statements.
109
Columbia Acorn Family of Funds
Financial Highlights, continued
Columbia Acorn Select
| Class C Shares | | (Unaudited)
Six months
ended June 30, | | Year ended December 31, | |
| Selected data for a share outstanding throughout each period | | 2012 | | 2011 | | 2010 | | 2009 | | 2008 | | 2007 | |
| Net Asset Value, Beginning of Period | | $ | 21.20 | | | $ | 25.83 | | | $ | 21.25 | | | $ | 12.94 | | | $ | 26.46 | | | $ | 25.07 | | |
| Income from Investment Operations | |
| Net investment loss (a) | | | (0.14 | ) | | | (0.32 | ) | | | (0.34 | ) | | | (0.26 | ) | | | (0.34 | ) | | | (0.36 | ) | |
| Net realized and unrealized gain/(loss) | | | 1.67 | | | | (4.12 | ) | | | 4.92 | | | | 8.57 | | | | (12.49 | ) | | | 2.39 | | |
| Total from Investment Operations | | | 1.53 | | | | (4.44 | ) | | | 4.58 | | | | 8.31 | | | | (12.83 | ) | | | 2.03 | | |
| Less Distributions to Shareholders | |
| From net investment income | | | — | | | | (0.19 | ) | | | — | | | | — | | | | — | | | | — | | |
| From net realized gains | | | (0.53 | ) | | | — | | | | — | | | | — | | | | (0.69 | ) | | | (0.64 | ) | |
| Total Distributions to Shareholders | | | (0.53 | ) | | | (0.19 | ) | | | — | | | | — | | | | (0.69 | ) | | | (0.64 | ) | |
| Net Asset Value, End of Period | | $ | 22.20 | | | $ | 21.20 | | | $ | 25.83 | | | $ | 21.25 | | | $ | 12.94 | | | $ | 26.46 | | |
| Total Return (b) | | | 7.23 | %(c) | | | (17.27 | )% | | | 21.55 | % | | | 64.22 | % | | | (49.71 | )%(d) | | | 8.04 | %(e) | |
| Ratios to Average Net Assets/Supplemental Data | |
| Net expenses before interest expense | | | 2.07 | %(f) | | | 2.05 | %(g) | | | 2.07 | %(g) | | | 2.14 | %(g) | | | 2.04 | %(g) | | | 1.98 | %(g) | |
| Interest expense | | | 0.00 | %(f)(h) | | | — | % | | | — | % | | | — | % | | | — | % | | | — | % | |
| Net expenses | | | 2.07 | %(f) | | | 2.05 | %(g) | | | 2.07 | %(g) | | | 2.14 | %(g) | | | 2.04 | %(g) | | | 1.98 | %(g) | |
| Net investment loss | | | (1.19 | )%(f) | | | (1.34 | )%(g) | | | (1.52 | )%(g) | | | (1.62 | )%(g) | | | (1.60 | )%(g) | | | (1.31 | )%(g) | |
| Waiver/Reimbursement | | | — | % | | | — | % | | | — | % | | | — | % | | | — | % | | | 0.00 | %(h) | |
| Portfolio turnover rate | | | 8 | %(c) | | | 21 | % | | | 28 | % | | | 19 | % | | | 28 | % | | | 14 | % | |
| Net assets at end of period (000s) | | $ | 60,556 | | | $ | 62,887 | | | $ | 98,445 | | | $ | 93,121 | | | $ | 70,962 | | | $ | 197,100 | | |
(a) Per share data was calculated using the average shares outstanding during the period.
(b) Total return at net asset value assuming all distributions reinvested and no contingent deferred sales charge.
(c) Not annualized.
(d) Total return includes a voluntary reimbursement by the Advisor for a realized investment loss due to a trading error. This reimbursement increased total return and net asset value per share by less than 0.01% and less than $0.01, respectively.
(e) Had the Investment Manager and/or Transfer Agent not waived fees and/or reimbursed a portion of expenses, total return would have been reduced.
(f) Annualized.
(g) The benefits derived from custody fees paid indirectly had an impact of less than 0.01%.
(h) Rounds to less than 0.01%.
Columbia Acorn Select
| Class I Shares | | (Unaudited)
Six months
ended June 30, | | Year ended December 31, | |
| Selected data for a share outstanding throughout each period | | 2012 | | 2011 | | 2010 (a) | |
| Net Asset Value, Beginning of Period | | $ | 23.65 | | | $ | 28.74 | | | $ | 24.74 | | |
| Income from Investment Operations | |
| Net investment income/(loss) (b) | | | 0.00 | (c) | | | (0.03 | ) | | | 0.01 | | |
| Net realized and unrealized gain/(loss) | | | 1.84 | | | | (4.59 | ) | | | 3.99 | | |
| Total from Investment Operations | | | 1.84 | | | | (4.62 | ) | | | 4.00 | | |
| Less Distributions to Shareholders | |
| From net investment income | | | — | | | | (0.47 | ) | | | — | | |
| From net realized gains | | | (0.53 | ) | | | — | | | | — | | |
| Total Distributions to Shareholders | | | (0.53 | ) | | | (0.47 | ) | | | — | | |
| Net Asset Value, End of Period | | $ | 24.96 | | | $ | 23.65 | | | $ | 28.74 | | |
| Total Return (d) | | | 7.79 | %(e) | | | (16.25 | )% | | | 16.17 | %(e) | |
| Ratios to Average Net Assets/Supplemental Data | |
| Net expenses before interest expense | | | 0.97 | %(f) | | | 0.92 | %(g) | | | 0.91 | %(f)(g) | |
| Interest expense | | | 0.00 | %(f)(h) | | | — | % | | | — | % | |
| Net expenses | | | 0.97 | %(f) | | | 0.92 | %(g) | | | 0.91 | %(f)(g) | |
| Net investment income/(loss) | | | 0.03 | %(f) | | | (0.12 | )%(g) | | | 0.18 | %(f)(g) | |
| Portfolio turnover rate | | | 8 | %(e) | | | 21 | % | | | 28 | %(e) | |
| Net assets at end of period (000s) | | $ | 21,778 | | | $ | 10,944 | | | $ | 7,832 | | |
(a) Class I shares commenced operations on September 27, 2010. Per share data and total return reflect activity from that date.
(b) Per share data was calculated using the average shares outstanding during the period.
(c) Rounds to less than $0.01 per share.
(d) Total return at net asset value assuming all distributions reinvested.
(e) Not annualized.
(f) Annualized.
(g) The benefits derived from custody fees paid indirectly had an impact of less than 0.01%.
(h) Rounds to less than 0.01%.
See accompanying notes to financial statements.
110
Columbia Thermostat Fund
| Class A Shares | | (Unaudited)
Six months
ended June 30, | | Year ended December 31, | |
| Selected data for a share outstanding throughout each period | | 2012 | | 2011 | | 2010 | | 2009 | | 2008 | | 2007 | |
| Net Asset Value, Beginning of Period | | $ | 12.82 | | | $ | 12.58 | | | $ | 10.90 | | | $ | 8.26 | | | $ | 12.31 | | | $ | 12.59 | | |
| Income from Investment Operations | |
| Net investment income (a) | | | 0.13 | | | | 0.28 | | | | 0.19 | | | | 0.11 | | | | 0.22 | | | | 0.49 | | |
| Net realized and unrealized gain/(loss) | | | 0.72 | | | | 0.30 | | | | 1.67 | | | | 2.53 | | | | (3.98 | ) | | | 0.53 | | |
| Total from Investment Operations | | | 0.85 | | | | 0.58 | | | | 1.86 | | | | 2.64 | | | | (3.76 | ) | | | 1.02 | | |
| Less Distributions to Shareholders | |
| From net investment income | | | (0.02 | ) | | | (0.34 | ) | | | (0.18 | ) | | | (0.00 | )(b) | | | (0.22 | ) | | | (0.51 | ) | |
| From net realized gains | | | — | | | | — | | | | — | | | | — | | | | (0.07 | ) | | | (0.79 | ) | |
| Total Distributions to Shareholders | | | (0.02 | ) | | | (0.34 | ) | | | (0.18 | ) | | | (0.00 | )(b) | | | (0.29 | ) | | | (1.30 | ) | |
| Net Asset Value, End of Period | | $ | 13.65 | | | $ | 12.82 | | | $ | 12.58 | | | $ | 10.90 | | | $ | 8.26 | | | $ | 12.31 | | |
| Total Return (c)(d) | | | 6.61 | %(e) | | | 4.62 | % | | | 17.28 | % | | | 31.98 | % | | | (30.67 | )% | | | 8.19 | % | |
| Ratios to Average Net Assets/Supplemental Data | |
| Net expenses (f) | | | 0.50 | %(g) | | | 0.50 | %(h) | | | 0.50 | %(h) | | | 0.50 | %(h) | | | 0.50 | %(h) | | | 0.50 | %(h) | |
| Net investment income | | | 1.94 | %(g) | | | 2.17 | %(h) | | | 1.64 | %(h) | | | 1.17 | %(h) | | | 1.99 | %(h) | | | 3.75 | %(h) | |
| Waiver/Reimbursement | | | 0.09 | %(g) | | | 0.17 | % | | | 0.22 | % | | | 0.28 | % | | | 0.18 | % | | | 0.18 | % | |
| Portfolio turnover rate | | | 47 | %(e) | | | 130 | % | | | 118 | % | | | 17 | % | | | 130 | % | | | 128 | % | |
| Net assets at end of period (000s) | | $ | 171,091 | | | $ | 79,744 | | | $ | 44,527 | | | $ | 42,976 | | | $ | 41,032 | | | $ | 53,246 | | |
(a) Per share data was calculated using the average shares outstanding during the period.
(b) Rounds to less than $0.01 per share.
(c) Total return at net asset value assuming all distributions reinvested and no initial sales charge or contingent deferred sales charge.
(d) Had the Investment Manager and/or Transfer Agent not waived fees and/or reimbursed a portion of expenses, total return would have been reduced.
(e) Not annualized.
(f) In addition to the fees and expenses which the Fund bears directly, the Fund indirectly bears a pro rata share of the fees and expenses of the affiliated funds in which it invests. Such indirect expenses are not included in the reported expense ratios.
(g) Annualized.
(h) The benefits derived from custody fees paid indirectly had an impact of less than 0.01%.
Columbia Thermostat Fund
| Class B Shares | | (Unaudited)
Six months
ended June 30, | | Year ended December 31, | |
| Selected data for a share outstanding throughout each period | | 2012 | | 2011 | | 2010 | | 2009 | | 2008 | | 2007 | |
| Net Asset Value, Beginning of Period | | $ | 12.91 | | | $ | 12.64 | | | $ | 10.93 | | | $ | 8.32 | | | $ | 12.38 | | | $ | 12.62 | | |
| Income from Investment Operations | |
| Net investment income (a) | | | 0.09 | | | | 0.15 | | | | 0.13 | | | | 0.06 | | | | 0.16 | | | | 0.42 | | |
| Net realized and unrealized gain/(loss) | | | 0.73 | | | | 0.38 | | | | 1.67 | | | | 2.55 | | | | (4.00 | ) | | | 0.54 | | |
| Total from Investment Operations | | | 0.82 | | | | 0.53 | | | | 1.80 | | | | 2.61 | | | | (3.84 | ) | | | 0.96 | | |
| Less Distributions to Shareholders | |
| From net investment income | | | (0.02 | ) | | | (0.26 | ) | | | (0.09 | ) | | | — | | | | (0.15 | ) | | | (0.41 | ) | |
| From net realized gains | | | — | | | | — | | | | — | | | | — | | | | (0.07 | ) | | | (0.79 | ) | |
| Total Distributions to Shareholders | | | (0.02 | ) | | | (0.26 | ) | | | (0.09 | ) | | | — | | | | (0.22 | ) | | | (1.20 | ) | |
| Net Asset Value, End of Period | | $ | 13.71 | | | $ | 12.91 | | | $ | 12.64 | | | $ | 10.93 | | | $ | 8.32 | | | $ | 12.38 | | |
| Total Return (b)(c) | | | 6.33 | %(d) | | | 4.19 | % | | | 16.64 | % | | | 31.37 | % | | | (31.10 | )% | | | 7.71 | % | |
| Ratios to Average Net Assets/Supplemental Data | |
| Net expenses (e) | | | 1.00 | %(f) | | | 1.00 | %(g) | | | 1.00 | %(g) | | | 1.00 | %(g) | | | 1.00 | %(g) | | | 1.00 | %(g) | |
| Net investment income | | | 1.31 | %(f) | | | 1.18 | %(g) | | | 1.10 | %(g) | | | 0.64 | %(g) | | | 1.45 | %(g) | | | 3.25 | %(g) | |
| Waiver/Reimbursement | | | 0.17 | %(f) | | | 0.23 | % | | | 0.28 | % | | | 0.32 | % | | | 0.20 | % | | | 0.19 | % | |
| Portfolio turnover rate | | | 47 | %(d) | | | 130 | % | | | 118 | % | | | 17 | % | | | 130 | % | | | 128 | % | |
| Net assets at end of period (000s) | | $ | 5,833 | | | $ | 11,318 | | | $ | 28,752 | | | $ | 32,758 | | | $ | 36,673 | | | $ | 67,709 | | |
(a) Per share data was calculated using the average shares outstanding during the period.
(b) Total return at net asset value assuming all distributions reinvested and no contingent deferred sales charge.
(c) Had the Investment Manager and/or Transfer Agent not waived fees and/or reimbursed a portion of expenses, total return would have been reduced.
(d) Not annualized.
(e) In addition to the fees and expenses which the Fund bears directly, the Fund indirectly bears a pro rata share of the fees and expenses of the affiliated funds in which it invests. Such indirect expenses are not included in the reported expense ratios.
(f) Annualized.
(g) The benefits derived from custody fees paid indirectly had an impact of less than 0.01%.
See accompanying notes to financial statements.
111
Columbia Acorn Family of Funds
Financial Highlights, continued
Columbia Thermostat Fund
| Class C Shares | | (Unaudited)
Six months
ended June 30, | | Year ended December 31, | |
| Selected data for a share outstanding throughout each period | | 2012 | | 2011 | | 2010 | | 2009 | | 2008 | | 2007 | |
| Net Asset Value, Beginning of Period | | $ | 12.91 | | | $ | 12.62 | | | $ | 10.91 | | | $ | 8.33 | | | $ | 12.37 | | | $ | 12.62 | | |
| Income from Investment Operations | |
| Net investment income (a) | | | 0.08 | | | | 0.18 | | | | 0.10 | | | | 0.03 | | | | 0.13 | | | | 0.39 | | |
| Net realized and unrealized gain/(loss) | | | 0.72 | | | | 0.31 | | | | 1.68 | | | | 2.55 | | | | (3.97 | ) | | | 0.53 | | |
| Total from Investment Operations | | | 0.80 | | | | 0.49 | | | | 1.78 | | | | 2.58 | | | | (3.84 | ) | | | 0.92 | | |
| Less Distributions to Shareholders | |
| From net investment income | | | (0.02 | ) | | | (0.20 | ) | | | (0.07 | ) | | | — | | | | (0.13 | ) | | | (0.38 | ) | |
| From net realized gains | | | — | | | | — | | | | — | | | | — | | | | (0.07 | ) | | | (0.79 | ) | |
| Total Distributions to Shareholders | | | (0.02 | ) | | | (0.20 | ) | | | (0.07 | ) | | | — | | | | (0.20 | ) | | | (1.17 | ) | |
| Net Asset Value, End of Period | | $ | 13.69 | | | $ | 12.91 | | | $ | 12.62 | | | $ | 10.91 | | | $ | 8.33 | | | $ | 12.37 | | |
| Total Return (b)(c) | | | 6.18 | %(d) | | | 3.87 | % | | | 16.43 | % | | | 30.97 | % | | | (31.20 | )% | | | 7.36 | % | |
| Ratios to Average Net Assets/Supplemental Data | |
| Net expenses (e) | | | 1.25 | %(f) | | | 1.25 | %(g) | | | 1.25 | %(g) | | | 1.25 | %(g) | | | 1.25 | %(g) | | | 1.25 | %(g) | |
| Net investment income | | | 1.22 | %(f) | | | 1.40 | %(g) | | | 0.88 | %(g) | | | 0.39 | %(g) | | | 1.23 | %(g) | | | 3.02 | %(g) | |
| Waiver/Reimbursement | | | 0.10 | %(f) | | | 0.18 | % | | | 0.24 | % | | | 0.30 | % | | | 0.20 | % | | | 0.19 | % | |
| Portfolio turnover rate | | | 47 | %(d) | | | 130 | % | | | 118 | % | | | 17 | % | | | 130 | % | | | 128 | % | |
| Net assets at end of period (000s) | | $ | 111,865 | | | $ | 33,378 | | | $ | 21,866 | | | $ | 21,090 | | | $ | 24,383 | | | $ | 26,908 | | |
(a) Per share data was calculated using the average shares outstanding during the period.
(b) Total return at net asset value assuming all distributions reinvested and no contingent deferred sales charge.
(c) Had the Investment Manager and/or Transfer Agent not waived fees and/or reimbursed a portion of expenses, total return would have been reduced.
(d) Not annualized.
(e) In addition to the fees and expenses which the Fund bears directly, the Fund indirectly bears a pro rata share of the fees and expenses of the affiliated funds in which it invests. Such indirect expenses are not included in the reported expense ratios.
(f) Annualized.
(g) The benefits derived from custody fees paid indirectly had an impact of less than 0.01%.
Columbia Acorn Emerging Markets Fund
| Class A Shares | | (Unaudited)
Six months
ended June 30, | | Year ended
December 31, | |
| Selected data for a share outstanding throughout each period | | 2012 | | 2011 (a) | |
| Net Asset Value, Beginning of Period | | $ | 9.26 | | | $ | 10.00 | | |
| Income from Investment Operations | |
| Net investment income (b) | | | 0.03 | | | | (0.00 | )(c) | |
| Net realized and unrealized gain/(loss) | | | 0.86 | | | | (0.74 | ) | |
| Total from Investment Operations | | | 0.89 | | | | (0.74 | ) | |
| Net Asset Value, End of Period | | $ | 10.15 | | | $ | 9.26 | | |
| Total Return (d)(e)(f) | | | 9.61 | % | | | (7.40 | )% | |
| Ratios to Average Net Assets/Supplemental Data | |
| Net expenses (g) | | | 1.79 | % | | | 1.85 | % | |
| Net investment income/(loss) (g) | | | 0.53 | % | | | (0.01 | )% | |
| Waiver/Reimbursement (g) | | | 6.25 | % | | | 18.28 | % | |
| Portfolio turnover rate (f) | | | 15 | % | | | 9 | % | |
| Net assets at end of period (000s) | | $ | 1,274 | | | $ | 332 | | |
(a) Class A shares commenced operations on August 19, 2011. Per share data and total return reflect activity from that date.
(b) Per share data was calculated using the average shares outstanding during the period.
(c) Rounds to less than $0.01 per share.
(d) Total return at net asset value assuming all distributions reinvested and no initial sales charge or contingent deferred sales charge.
(e) Had the Investment Manager and/or Transfer Agent not waived fees and/or reimbursed a portion of expenses, total return would have been reduced.
(f) Not annualized.
(g) Annualized.
See accompanying notes to financial statements.
112
Columbia Acorn Emerging Markets Fund
| Class C Shares | | (Unaudited)
Six months
ended June 30, | | Year ended
December 31, | |
| Selected data for a share outstanding throughout each period | | 2012 | | 2011 (a) | |
| Net Asset Value, Beginning of Period | | $ | 9.24 | | | $ | 10.00 | | |
| Income from Investment Operations | |
| Net investment income/(loss) (b) | | | (0.03 | ) | | | (0.02 | ) | |
| Net realized and unrealized gain/(loss) | | | 0.89 | | | | (0.74 | ) | |
| Total from Investment Operations | | | 0.86 | | | | (0.76 | ) | |
| Net Asset Value, End of Period | | $ | 10.10 | | | $ | 9.24 | | |
| Total Return (c)(d)(e) | | | 9.31 | % | | | (7.60 | )% | |
| Ratios to Average Net Assets/Supplemental Data | |
| Net expenses (f) | | | 2.55 | % | | | 2.60 | % | |
| Net investment income/(loss) (f) | | | (0.52 | )% | | | (0.68 | )% | |
| Waiver/Reimbursement (f) | | | 5.95 | % | | | 22.46 | % | |
| Portfolio turnover rate (e) | | | 15 | % | | | 9 | % | |
| Net assets at end of period (000s) | | $ | 216 | | | $ | 127 | | |
(a) Class C shares commenced operations on August 19, 2011. Per share data and total return reflect activity from that date.
(b) Per share data was calculated using the average shares outstanding during the period.
(c) Total return at net asset value assuming all distributions reinvested and no contingent deferred sales charge.
(d) Had the Investment Manager and/or Transfer Agent not waived fees and/or reimbursed a portion of expenses, total return would have been reduced.
(e) Not annualized.
(f) Annualized.
Columbia Acorn Emerging Markets Fund
| Class I Shares | | (Unaudited)
Six months
ended June 30, | | Year ended
December 31, | |
| Selected data for a share outstanding throughout each period | | 2012 | | 2011 (a) | |
| Net Asset Value, Beginning of Period | | $ | 9.29 | | | $ | 10.00 | | |
| Income from Investment Operations | |
| Net investment income (b) | | | 0.02 | | | | 0.01 | | |
| Net realized and unrealized gain/(loss) | | | 0.89 | | | | (0.72 | ) | |
| Total from Investment Operations | | | 0.91 | | | | (0.71 | ) | |
| Less Distributions to Shareholders | |
| From net investment income | | | (0.01 | ) | | | — | | |
| Total Distributions to Shareholders | | | (0.01 | ) | | | — | | |
| Net Asset Value, End of Period | | $ | 10.19 | | | $ | 9.29 | | |
| Total Return (c)(d)(e) | | | 9.76 | % | | | (7.10 | )% | |
| Ratios to Average Net Assets/Supplemental Data | |
| Net expenses (f) | | | 1.41 | % | | | 1.41 | % | |
| Net investment income (f) | | | 0.47 | % | | | 0.17 | % | |
| Waiver/Reimbursement (f) | | | 5.83 | % | | | 17.90 | % | |
| Portfolio turnover rate (e) | | | 15 | % | | | 9 | % | |
| Net assets at end of period (000s) | | $ | 5 | | | $ | 5 | | |
(a) Class I shares commenced operations on August 19, 2011. Per share data and total return reflect activity from that date.
(b) Per share data was calculated using the average shares outstanding during the period.
(c) Total return at net asset value assuming all distributions reinvested and no contingent deferred sales charge.
(d) Had the Investment Manager and/or Transfer Agent not waived fees and/or reimbursed a portion of expenses, total return would have been reduced.
(e) Not annualized.
(f) Annualized.
See accompanying notes to financial statements.
113
Columbia Acorn Family of Funds
Financial Highlights, continued
Columbia Acorn European Fund
| Class A Shares | | (Unaudited)
Six months
ended June 30, | | Year ended
December 31, | |
| Selected data for a share outstanding throughout each period | | 2012 | | 2011 (a) | |
| Net Asset Value, Beginning of Period | | $ | 9.43 | | | $ | 10.00 | | |
| Income from Investment Operations | |
| Net investment income/(loss) (b) | | | 0.12 | | | | (0.03 | ) | |
| Net realized and unrealized gain/(loss) | | | 0.97 | | | | (0.46 | ) | |
| Total from Investment Operations | | | 1.09 | | | | (0.49 | ) | |
| Less Distributions to Shareholders | |
| From net investment income | | | (0.01 | ) | | | (0.06 | ) | |
| From net realized gains | | | (0.01 | ) | | | (0.02 | ) | |
| Total Distributions to Shareholders | | | (0.02 | ) | | | (0.08 | ) | |
| Net Asset Value, End of Period | | $ | 10.50 | | | $ | 9.43 | | |
| Total Return (c)(d)(e) | | | 11.53 | % | | | (4.97 | )% | |
| Ratios to Average Net Assets/Supplemental Data | |
| Net expenses (f) | | | 1.60 | % | | | 1.75 | % | |
| Net investment income/(loss) (f) | | | 2.27 | % | | | (0.84 | )% | |
| Waiver/Reimbursement (f) | | | 12.28 | % | | | 31.84 | % | |
| Portfolio turnover rate (e) | | | 18 | % | | | 17 | % | |
| Net assets at end of period (000s) | | $ | 203 | | | $ | 154 | | |
(a) Class A shares commenced operations on August 19, 2011. Per share data and total return reflect activity from that date.
(b) Per share data was calculated using the average shares outstanding during the period.
(c) Total return at net asset value assuming all distributions reinvested.
(d) Had the Investment Manager and/or Transfer Agent not waived fees and/or reimbursed a portion of expenses, total return would have been reduced.
(e) Not annualized.
(f) Annualized.
Columbia Acorn European Fund
| Class C Shares | | (Unaudited)
Six months
ended June 30, | | Year ended
December 31, | |
| Selected data for a share outstanding throughout each period | | 2012 | | 2011 (a) | |
| Net Asset Value, Beginning of Period | | $ | 9.44 | | | $ | 10.00 | | |
| Income from Investment Operations | |
| Net investment income/(loss) (b) | | | 0.08 | | | | (0.06 | ) | |
| Net realized and unrealized gain/(loss) | | | 0.96 | | | | (0.45 | ) | |
| Total from Investment Operations | | | 1.04 | | | | (0.51 | ) | |
| Less Distributions to Shareholders | |
| From net investment income | | | (0.01 | ) | | | (0.03 | ) | |
| From net realized gains | | | (0.01 | ) | | | (0.02 | ) | |
| Total Distributions to Shareholders | | | (0.02 | ) | | | (0.05 | ) | |
| Net Asset Value, End of Period | | $ | 10.46 | | | $ | 9.44 | | |
| Total Return (c)(d)(e) | | | 10.99 | % | | | (5.14 | )% | |
| Ratios to Average Net Assets/Supplemental Data | |
| Net expenses (f) | | | 2.39 | % | | | 2.50 | % | |
| Net investment income/(loss) (f) | | | 1.48 | % | | | (1.66 | )% | |
| Waiver/Reimbursement (f) | | | 12.53 | % | | | 33.29 | % | |
| Portfolio turnover rate (e) | | | 18 | % | | | 17 | % | |
| Net assets at end of period (000s) | | $ | 18 | | | $ | 5 | | |
(a) Class C shares commenced operations on August 19, 2011. Per share data and total return reflect activity from that date.
(b) Per share data was calculated using the average shares outstanding during the period.
(c) Total return at net asset value assuming all distributions reinvested.
(d) Had the Investment Manager and/or Transfer Agent not waived fees and/or reimbursed a portion of expenses, total return would have been reduced.
(e) Not annualized.
(f) Annualized.
See accompanying notes to financial statements.
114
Columbia Acorn European Fund
| Class I Shares | | (Unaudited)
Six months
ended June 30, | | Year ended
December 31, | |
| Selected data for a share outstanding throughout each period | | 2012 | | 2011 (a) | |
| Net Asset Value, Beginning of Period | | $ | 9.43 | | | $ | 10.00 | | |
| Income from Investment Operations | |
| Net investment income/(loss) (b) | | | 0.14 | | | | (0.02 | ) | |
| Net realized and unrealized gain/(loss) | | | 0.96 | | | | (0.46 | ) | |
| Total from Investment Operations | | | 1.10 | | | | (0.48 | ) | |
| Less Distributions to Shareholders | |
| From net investment income | | | (0.01 | ) | | | (0.07 | ) | |
| From net realized gains | | | (0.01 | ) | | | (0.02 | ) | |
| Total Distributions to Shareholders | | | (0.02 | ) | | | (0.09 | ) | |
| Net Asset Value, End of Period | | $ | 10.51 | | | $ | 9.43 | | |
| Total Return (c)(d)(e) | | | 11.64 | % | | | (4.81 | )% | |
| Ratios to Average Net Assets/Supplemental Data | |
| Net expenses (f) | | | 1.31 | % | | | 1.31 | % | |
| Net investment income/(loss) (f) | | | 2.69 | % | | | (0.47 | )% | |
| Waiver/Reimbursement (f) | | | 12.17 | % | | | 28.69 | % | |
| Portfolio turnover rate (e) | | | 18 | % | | | 17 | % | |
| Net assets at end of period (000s) | | $ | 5 | | | $ | 5 | | |
(a) Class I shares commenced operations on August 19, 2011. Per share data and total return reflect activity from that date.
(b) Per share data was calculated using the average shares outstanding during the period.
(c) Total return at net asset value assuming all distributions reinvested.
(d) Had the Investment Manager and/or Transfer Agent not waived fees and/or reimbursed a portion of expenses, total return would have been reduced.
(e) Not annualized.
(f) Annualized.
See accompanying notes to financial statements.
115
Columbia Acorn Family of Funds
Notes to Financial Statements (Unaudited)
1. Nature of Operations
Columbia Acorn Fund, Columbia Acorn International, Columbia Acorn USA, Columbia Acorn International Select, Columbia Acorn Select, Columbia Thermostat Fund, Columbia Acorn Emerging Markets Fund and Columbia Acorn European Fund (the Funds) are each a series of Columbia Acorn Trust (the Trust). The Trust is registered under the Investment Company Act of 1940, as amended (the 1940 Act), as an open-end management investment company organized as a Massachusetts business trust. The investment objective of each Fund is to seek long-term capital appreciation.
Columbia Thermostat Fund pursues its investment objective by investing in shares of other mutual funds. As a "fund of funds" under normal circumstances, the Fund allocates at least 95% of its net assets among a selected group of affiliated stock and bond mutual funds (underlying portfolio funds) according to the current level of the Standard & Poor's (S&P) 500 Index in relation to predetermined ranges set by Columbia Wanger Asset Management, LLC (the Investment Manager). The Fund may invest up to 5% of its net assets plus any cash received that day in cash, repurchase agreements, high quality short-term paper and government securities.
Each Fund may issue an unlimited number of shares. Columbia Acorn Fund, Columbia Acorn USA, Columbia Acorn International Select and Columbia Acorn Select each currently offers Class A, Class B, Class C, Class I and Class Z shares. Columbia Acorn International currently offers Class A, Class B, Class C, Class I, Class R, Class R5 and Class Z shares. Columbia Acorn Emerging Markets Fund and Columbia Acorn European Fund each currently offers Class A, Class C, Class I and Class Z shares. Columbia Thermostat Fund currently offers Class A, Class B, Class C and Class Z shares. Effective February 29, 2008, the Funds generally no longer accept investments by new or existing investors in the Fund's Class B shares, except in connection with the reinvestment of any dividend and/or capital gain distributions in Class B shares of the Funds and exchanges by existing Class B shareholders of certain other funds within the Columbia Family of Funds.
Class A shares are sold with a front-end sales charge. Class A shares bought without an initial sales charge in accounts aggregating $1 million to $50 million at the time of purchase are subject to a 1.00% contingent deferred sales charge (CDSC) if the shares are redeemed within 18 months of purchase.
Class B shares are subject to CDSC if redeemed within six years of purchase. Class B shares will convert to Class A shares automatically eight years after purchase.
Class C shares are offered at net asset value but are subject to a CDSC on redemptions made within one year after purchase.
Class I, Class R and Class R5 shares are offered at net asset value. There are certain restrictions on who may purchase Class I, Class R and Class R5 shares.
Class Z shares are offered at net asset value. There are certain restrictions on who may purchase Class Z shares. Generally, Class Z shares of a Fund may be exchanged for shares of another fund distributed by Columbia Management Distributors, Inc. at no additional charge.
The financial highlights for the Fund's Class Z shares are presented in a separate semiannual report.
Investment income, realized and unrealized gains and losses, and certain fund-level expenses are allocated pro rata on the basis of the relative net assets of all classes, except that each class bears certain expenses specific to that class such as distribution services, transfer agent fees, and certain other class specific expenses. Differences in class expenses may result in payment of different dividend distributions for each class. All of the Funds' share classes have equal rights with respect to voting, subject to Fund or class specific matters.
2. Significant Accounting Policies
The preparation of financial statements in accordance with accounting principles generally accepted in the United States of America (GAAP) requires management to make certain estimates and assumptions that affect the reported amounts of assets and liabilities, the disclosure of contingent assets and liabilities at the date of the financial statements and the reported amounts of revenue and expenses during the reporting period. Actual results could differ from those estimates.
>Security valuation
Securities of the Funds are valued at market value or, if a market quotation for a security is not readily available or is deemed not to be reliable because of events or circumstances that have occurred between the market quotation and the time as of which the security is to be valued, the security is valued at a fair value determined in good faith under consistently applied procedures established by the Board of Trustees. With respect to Columbia Thermostat Fund, investments in portfolio funds are valued at their net asset values as reported by the portfolio funds. A security traded on a securities exchange or in an over-the-counter market in which transaction prices are reported is valued at the last sales price at the time of valuation. A security traded principally on NASDAQ is valued at the
116
NASDAQ official closing price. Mutual Funds and Exchange Traded Funds are valued at their closing net asset value as reported to NASDAQ.
Short-term investments maturing in 60 days or less are valued at amortized cost, which approximates market value.
Forward foreign currency exchange contracts are marked-to-market based upon foreign currency exchange rates provided by a pricing service.
A security for which a market quotation is not readily available and any other assets are valued at their fair value determined in good faith under consistently applied procedures established by the Board of Trustees. The Trust has retained an independent statistical fair value pricing service that employs a systematic methodology to assist in the fair valuation process for securities principally traded in a foreign market in order to adjust for possible changes in value that may occur between the close of the foreign exchange and the time as of which the securities are to be valued. If a security is valued at fair value, that value may be different from the last quoted market price for the security. A security for which there is no reported sale on the valuation date is valued at the mean of the latest bid and ask quotations.
>Foreign currency translations
Values of investments denominated in foreign currencies are converted into U.S. dollars using the New York spot market rate of exchange at the time of valuation. Purchases and sales of investments and dividend and interest income are translated into U.S. dollars using the spot market rate of exchange prevailing on the respective dates of such transactions. The gain or loss resulting from changes in foreign exchange rates is included with net realized and unrealized gain or loss from investments, as appropriate.
>Repurchase agreements
Each Fund may engage in repurchase agreement transactions. Each Fund, through its custodian, receives delivery of underlying securities collateralizing repurchase agreements. The counterparty is required to maintain collateral that is at all times at least equal to the repurchase price including interest. In the event of default or bankruptcy by the counterparty to the agreement, realization and/or retention of the collateral may be subject to legal proceedings.
>Restricted securities
Restricted securities are securities that may only be resold upon registration under federal securities laws or in transactions exempt from registration. In some cases, the issuer of restricted securities has agreed to register such securities for resale at the issuer's expense either upon demand by the Fund or in connection with another registered offering of the securities. Many restricted securities may be resold in the secondary market in transactions exempt from registration. Such restricted securities may be determined to be liquid under criteria established by the Board of Trustees.
>Derivative instruments
Columbia Acorn International and Columbia Acorn International Select invest in certain derivative instruments as detailed below to meet their investment objectives. Derivatives are instruments whose values depend on, or are derived from, in whole or in part, the value of one or more other assets, such as securities, currencies, commodities or indices. Derivative instruments may be used to maintain cash reserves while maintaining exposure to certain other assets, to offset anticipated declines in values of investments, to facilitate trading, to reduce transaction costs and to pursue higher investment returns. The Funds may also use derivative instruments to mitigate certain investment risks, such as foreign currency exchange rate risk, interest rate risk and credit risk. Derivatives may involve various risks, including the potential inability of the counterparty to fulfill its obligation under the terms of the contract, the potential for an illiquid secondary market and the potential for market movements which may expose the Funds to gains or losses in excess of the amount shown in the Statements of Assets and Liabilities.
>Forward foreign currency exchange contracts
Forward foreign currency exchange contracts are agreements between two parties to buy and sell a currency at a set price on a future date. These contracts are intended to be used to minimize the exposure to foreign exchange rate fluctuations during the period between the trade and settlement dates of the contracts. Columbia Acorn International and Columbia Acorn International Select utilize forward foreign currency exchange contracts to hedge the currency exposure associated with some or all of the Fund's securities or to hedge out of a currency that is off benchmark.
The values of forward foreign currency exchange contracts fluctuate with changes in foreign currency exchange rates. Each Fund will record a realized gain or loss when the forward foreign currency exchange contract is closed.
The use of forward foreign currency exchange contracts does not eliminate fluctuations in the prices of the Funds' portfolio securities. The risks of forward foreign currency exchange contracts include movement in the values of the foreign currencies relative to the U.S. dollar (or other foreign currencies) and
117
Columbia Acorn Family of Funds
Notes to Financial Statements (Unaudited), continued
the possibility that counterparties will not complete their contractual obligations, which may be in excess of the amount reflected, if any, in the Statements of Assets and Liabilities.
>Effects of derivative transactions in the financial statements
The following tables are intended to provide additional information about the effect of derivatives on the financial statements of Columbia Acorn International and Columbia Acorn International Select including: the fair value of derivatives by risk category and the location of those fair values in the Statements of Assets and Liabilities; the impact of derivative transactions on the Funds' operations over the period including realized gains or losses and unrealized gains or losses. The derivative schedules following the Statements of Investments present additional information regarding derivative instruments outstanding at the end of the period, if any.
During the six months ended June 30, 2012, Columbia Acorn International entered into three forward foreign currency exchange contracts.
The effect of derivative instruments on Columbia Acorn International's Statement of Operations for the six months ended June 30, 2012, was as follows:
Amount of Realized Gain (Loss) and Change in Unrealized
Appreciation (Depreciation)
on Derivatives Recognized in Income
| | | Risk
Exposure
Category | | Realized
Gain (Loss) | | Change
in
Unrealized
Appreciation
(Depreciation) | |
| (in thousands) | |
Forward foreign
currency
exchange
contracts | | Foreign Exchange
Rate Risk | | $ | 5,423 | | | $ | (4,539 | ) | |
During the six months ended June 30, 2012, Columbia Acorn International Select entered into 12 forward foreign currency exchange contracts.
The following table is a summary of the value of Columbia Acorn International Select's derivative instruments as of June 30, 2012.
Liability Derivatives
Risk Exposure
Category | | Statement of Assets
and Liabilities Location | | Fair
Value | |
| (in thousands) | |
| Foreign exchange contracts | | Unrealized depreciation on
forward foreign currency
exchange contracts | | | $(932) | | |
The effect of derivative instruments on Columbia Acorn International Select's Statement of Operations for the six months ended June 30, 2012, was as follows:
Amount of Realized Gain (Loss) and Change in Unrealized
Appreciation (Depreciation)
on Derivatives Recognized in Income
| | | Risk
Exposure
Category | | Realized
Gain (Loss) | | Change
in
Unrealized
Appreciation
(Depreciation) | |
| (in thousands) | |
Forward foreign
currency
exchange
contracts | | Foreign Exchange
Rate Risk | | $ | 210 | | | $ | 16 | | |
>Security transactions and investment income
Security transactions, investment income and shareholder fund transactions are accounted for on the trade date (date the order to buy or sell is executed) and dividend income and realized gain distributions from other funds are recorded on the ex-dividend date, except that certain dividends from foreign securities are recorded as soon as the information is available to the Funds. Interest income is recorded on the accrual basis and includes amortization of discounts on debt obligations when required for federal income tax purposes. Realized gains and losses from security transactions are recorded on an identified cost basis.
Awards, if any, from class action litigation related to securities owned may be recorded as a reduction of cost of those securities. If the applicable securities are no longer owned, the proceeds are recorded as realized gains.
The Funds estimate the tax character of distributions from real estate investment trusts (REITs). Distributions received in excess of income are recorded as a reduction of the cost of the related investments. If the applicable securities are no longer owned, any distributions received in excess of income are recorded as realized gains.
>Fund share valuation
Fund shares are sold and redeemed on a daily basis at net asset value, subject to any applicable sales charge. Net asset value per share is determined daily as of the close of trading on the New York Stock Exchange (NYSE) on each day the NYSE is open for trading. Generally, income, expenses and realized and unrealized gain/(losses) of a Fund are allocated to each class proportionately on a daily basis for purposes of determining the net asset value of each class. The Rule 12b-1 distribution and service fees and transfer agent fees are charged to each specific class as expenses are incurred.
118
Redemption fees are accounted for as an addition to paid in capital for purposes of determining the net asset value of each class.
>Securities lending
Each Fund, except Columbia Thermostat Fund, may lend securities up to one-third of the value of its total assets to certain approved brokers, dealers and other financial institutions to earn additional income. The Fund retains the benefits of owning the securities, including receipt of dividends or interest generated by the security. Each Fund also receives a fee for the loan. Each Fund has the ability to recall the loans at any time and could do so in order to vote proxies or to sell the loaned securities. Each loan is collateralized by cash that exceeds the value of the securities on loan. The market value of the loaned securities is determined daily at the close of business of each Fund and any additional required collateral is delivered to each Fund on the next business day. Each Fund has elected to invest the cash collateral in the Dreyfus Government Cash Management Fund, and the income earned is paid to each Fund, net of any fees remitted to Goldman Sachs Agency Lending, the lending agent, and net of any borrower rebates. The Investment Manager does not retain any fees earned by the lending program. Generally, in the event of borrower default, a Fund has the right to use the collateral to offset any losses incurred. In the event a Fund is delayed or prevented from exercising its right to dispose of the collateral, there may be a potential loss to the Fund. Some of these losses may be indemnified by the lending agent. Each Fund bears the risk of loss with respect to the investment of collateral.
The net securities lending income earned as of June 30, 2012, by each Fund is included in the Statements of Operations.
>Federal income taxes
It is each Fund's policy to comply with the provisions of the Internal Revenue Code available to regulated investment companies and, in the manner provided therein, distribute substantially all their taxable income, as well as any net realized gain on sales of investments and foreign currency transactions reportable for federal income tax purposes. Columbia Thermostat Fund distributes all of its taxable income, as well as any net realized gain on sales of portfolio fund shares and any distributions of net realized gains received by the Fund from its portfolio funds, reportable for federal income tax purposes. Accordingly, the Funds paid no federal income taxes and no federal income tax provision was required.
>Foreign capital gains taxes
Realized gains in certain countries may be subject to foreign taxes at the fund level. The Funds accrue for such foreign taxes on net realized and unrealized gains at the appropriate rate for each jurisdiction. The amount, if any, is disclosed as a liability on the Statements of Assets and Liabilities.
>Distributions to shareholders
Distributions to shareholders are recorded on the ex-dividend date.
>Indemnification
In the normal course of business, the Trust on behalf of the Funds enters into contracts that contain a variety of representations and warranties and that provide general indemnities. A Fund's maximum exposure under these arrangements is unknown, as this would involve future claims against the Fund. Also, under the Trust's organizational documents, the trustees and officers of the Trust are indemnified against certain liabilities that may arise out of their duties to the Trust. However, based on experience, the Funds expect the risk of loss due to these warranties and indemnities to be remote.
>Recent Accounting Pronouncement
Disclosures about Offsetting Assets and Liabilities
In December 2011, the Financial Accounting Standards Board (FASB) issued ASU No. 2011-11, Disclosures about Offsetting Assets and Liabilities. The objective of the FASB is to enhance current disclosure requirements on offsetting of certain assets and liabilities and to enable financial statement users to compare financial statements prepared under GAAP and International Financial Reporting Standards.
Specifically, ASU No. 2011-11 requires an entity to disclose both gross and net information for derivatives and other financial instruments that are subject to a master netting arrangement or similar agreement. The standard requires disclosure of collateral received in connection with the master netting agreements or similar agreements. The effective date of ASU No. 2011-11 is for interim and annual periods beginning on or after January 1, 2013. At this time, management is evaluating the implications of this guidance and the impact it will have on the financial statement amounts and footnote disclosures, if any.
3. Federal Tax Information
The timing and character of income and capital gain distributions are determined in accordance with income tax regulations, which may differ from GAAP. Reclassifications are made to the Funds' capital accounts for permanent tax
119
Columbia Acorn Family of Funds
Notes to Financial Statements (Unaudited), continued
differences to reflect income and gains available for distribution (or available capital loss carryforwards) under income tax regulations.
The following capital loss carryforward, determined as of December 31, 2011, may be available to reduce taxable income arising from future net realized gains on investments, if any, to the extent permitted by the Internal Revenue Code:
| | | Year of Expiration | | | |
| Fund | | 2015 | | 2016 | | 2017 | | 2018 | | Unlimited | | Total | |
| ( in thousands) | |
Columbia
Acorn
International | | $ | 15,640 | | | $ | 82,683 | | | $ | 189,008 | | | $ | — | | | $ | — | | | $ | 287,331 | | |
Columbia
Thermostat
Fund | | | — | | | | — | | | | 17,733 | | | | 2,955 | | | | — | | | | 20,688 | | |
Columbia
Acorn
Emerging
Markets
Fund | | | — | | | | — | | | | — | | | | — | | | | 11 | | | | 11 | | |
Unlimited capital loss carryforwards are required to be utilized prior to any capital losses which carry an expiration date. As a result of this ordering rule, capital loss carryforwards which carry an expiration date may be more likely to expire unused.
Columbia Acorn International acquired capital loss carryforwards in connection with the merger with RiverSource Partners International Select Growth Fund and RiverSource Partners International Small Cap Fund of $121,174,098 and $73,618,287, respectively (Note 8). In addition to the acquired capital loss carryforwards, the Fund also acquired unrealized capital gains as a result of the merger. The yearly utilization of the acquired capital loss carryforwards may be limited by the Internal Revenue Code. Any capital loss carryforwards acquired as part of a merger that are permanently lost due to the provisions under the Internal Revenue Code are included as being expired.
Under current tax rules, regulated investment companies can elect to treat certain late-year ordinary losses incurred and post-October capital losses (capital losses realized after October 31) as arising on the first day of the following taxable year. At December 31, 2011, the Funds elected to treat the following late year ordinary losses and post-October capital losses as arising on January 1, 2012:
| Fund | | Late year
ordinary
losses | | Post-October
capital losses | |
| (in thousands) | |
| Columbia Acorn Fund | | $ | 9,350 | | | $ | 50,163 | | |
| Columbia Acorn International | | | — | | | | 12,775 | | |
| Columbia Acorn USA | | | — | | | | 3,057 | | |
| Columbia Acorn International Select | | | 2,622 | | | | 3,120 | | |
| Columbia Acorn Select | | | 107 | | | | 3,172 | | |
| Columbia Acorn Emerging Markets Fund | | | — | | | | 42 | | |
| Columbia Acorn European Fund | | | 2 | | | | 7 | | |
Management of the Funds has concluded that there are no significant uncertain tax positions that would require recognition in the financial statements. However, management's conclusion may be subject to review and adjustment at a later date based on factors including, but not limited to, new tax laws, regulations, and administrative interpretations (including relevant court decisions). Generally, the Funds' federal tax returns for the prior three fiscal years remain subject to examination by the Internal Revenue Service.
4. Transactions With Affiliates
Columbia Wanger Asset Management, LLC (CWAM) is a wholly-owned subsidiary of Columbia Management Investment Advisers, LLC (Columbia Management), which is a wholly-owned subsidiary of Ameriprise Financial, Inc. (Ameriprise Financial). CWAM furnishes continuing investment supervision to the Funds and is responsible for the overall management of the Funds' business affairs.
CWAM receives a monthly advisory fee based on each Fund's average daily net assets at the following annual rates:
Columbia Acorn Fund
| Average Daily Net Assets | | Annual
Fee Rate | |
| Up to $700 million | | | 0.74 | % | |
| $700 million to $2 billion | | | 0.69 | % | |
| $2 billion to $6 billion | | | 0.64 | % | |
| $6 billion and over | | | 0.63 | % | |
Columbia Acorn International
| Average Daily Net Assets | | Annual
Fee Rate | |
| Up to $100 million | | | 1.19 | % | |
| $100 million to $500 million | | | 0.94 | % | |
| $500 million and over | | | 0.74 | % | |
Columbia Acorn USA
| Average Daily Net Assets | | Annual
Fee Rate | |
| Up to $200 million | | | 0.94 | % | |
| $200 million to $500 million | | | 0.89 | % | |
| $500 million to $2 billion | | | 0.84 | % | |
| $2 billion to $3 billion | | | 0.80 | % | |
| $3 billion and over | | | 0.70 | % | |
Columbia Acorn International Select
| Average Daily Net Assets | | Annual
Fee Rate | |
| | Up to $500 million | | | | 0.94 | % | |
| | $500 million and over | | | | 0.90 | % | |
Columbia Acorn Select
| Average Daily Net Assets | | Annual
Fee Rate | |
| Up to $700 million | | | 0.85 | % | |
| $700 million to $2 billion | | | 0.80 | % | |
| $2 billion to $3 billion | | | 0.75 | % | |
| $3 billion and over | | | 0.70 | % | |
120
Columbia Thermostat Fund
| | | Annual
Fee Rate | |
| All Average Daily Net Assets | | | 0.10 | % | |
Columbia Acorn Emerging Markets Fund
| Average Daily Net Assets | | Annual
Fee Rate | |
| Up to $100 million | | | 1.25 | % | |
| $100 million to $500 million | | | 1.00 | % | |
| $500 million and over | | | 0.80 | % | |
Columbia Acorn European Fund
| Average Daily Net Assets | | Annual
Fee Rate | |
| Up to $100 million | | | 1.19 | % | |
| $100 million to $500 million | | | 0.94 | % | |
| $500 million and over | | | 0.74 | % | |
For the six months ended June 30, 2012, the annualized effective investment advisory fee rate were as follows:
| Fund | |
| Columbia Acorn Fund | | | 0.64 | % | |
| Columbia Acorn International | | | 0.76 | % | |
| Columbia Acorn USA | | | 0.86 | % | |
| Columbia Acorn International Select | | | 0.94 | % | |
| Columbia Acorn Select | | | 0.83 | % | |
| Columbia Thermostat Fund | | | 0.10 | % | |
| Columbia Acorn Emerging Markets Fund | | | 1.25 | % | |
| Columbia Acorn European Fund | | | 1.19 | % | |
>Expense Limit
CWAM has voluntarily agreed to reimburse the ordinary operating expenses (exclusive of brokerage commissions, interest, taxes and extraordinary expenses, but inclusive of custodial charges relating to overdrafts, if any) after giving effect to any balance credits from the Funds' custodian, exceeding annually each class' average daily net assets as follows:
| Fund | | Class A | | Class B | | Class C | | Class I | |
Columbia Acorn
International Select | | | 1.70 | % | | | 2.20 | % | | | 2.45 | % | | | 1.28 | % | |
| Columbia Acorn Select | | | 1.60 | % | | | 2.10 | % | | | 2.35 | % | | | 1.25 | % | |
This arrangement may be modified or terminated by either the Funds or CWAM on 30 days notice.
CWAM has contractually agreed to waive fees and/or reimburse expenses of Columbia Thermostat Fund through April 30, 2013 so that the ordinary operating expenses (exclusive of distribution and service fees, interest and fees on borrowings, and expenses associated with the Fund's investment in other investment companies, but including custodian charges relating to overdrafts, if any) do not exceed the annual rate of 0.25% of the Fund's average daily net assets.
There is no guarantee that this arrangement will continue after April 30, 2013.
CWAM has contractually agreed to waive fees and/or reimburse expenses of Columbia Acorn Emerging Markets Fund and Columbia Acorn European Fund through April 30, 2013, so that the ordinary operating expenses (exclusive of interest and fees on borrowings, and expenses associated with each Fund's investment in other investment companies, but including custodian charges relating to overdrafts, if any), do not exceed the following annual rates based on each class' average daily net assets:
| Fund | | Class A | | Class C | | Class I | |
Columbia Acorn Emerging
Markets Fund | | | 1.85 | % | | | 2.60 | % | | | 1.41 | % | |
Columbia Acorn European
Fund | | | 1.75 | % | | | 2.50 | % | | | 1.31 | % | |
There is no guarantee that these arrangements will continue after April 30, 2013.
CWAM may recoup any fees waived and/or expenses reimbursed with respect to any share class of Columbia Acorn Emerging Markets Fund and Columbia Acorn European Fund for a one-year period following the date of such fee waiver and/or reimbursement if such recovery does not cause the Funds' ordinary operating expenses (excluding interest and fees on borrowings and expenses associated with the Funds' investment in other investment companies, if any) to exceed the annual expense limitations above, or to exceed such annual expense limitations as may be in place at the time of the recoupment, whichever is less.
Effective August 15, 2011, CWAM and its affiliates have contractually agreed to waive a portion of total annual Fund operating expenses incurred by Class A shares, Class B shares and Class C shares of Columbia Acorn International such that the Fund's total annual Fund operating expenses will be reduced by 0.04%, 0.03% and 0.02% for Class A, Class B and Class C shares of the Fund, respectively, through August 14, 2013. There is no guarantee that this arrangement will continue thereafter.
121
Columbia Acorn Family of Funds
Notes to Financial Statements (Unaudited), continued
Expenses reimbursed by CWAM and its affiliates for the six months ended June 30, 2012, were as follows:
| Fund | | Expenses
Reimbursed | |
| (in thousands) | |
| Columbia Acorn International Select | | $ | 206 | | |
| Columbia Thermostat Fund | | | 127 | | |
| Columbia Acorn Emerging Markets Fund | | | 149 | | |
| Columbia Acorn European Fund | | | 118 | | |
CWAM provides administrative services and receives an administration fee from the Funds at the following annual rates:
Columbia Acorn Trust
Aggregate Average Daily
Net Assets of the Trust | | Annual
Fee Rate | |
| Up to $8 billion | | | 0.050 | % | |
| $8 billion to $16 billion | | | 0.040 | % | |
| $16 billion to $35 billion | | | 0.030 | % | |
| $35 billion to $45 billion | | | 0.025 | % | |
| $45 billion and over | | | 0.015 | % | |
For the six months ended June 30, 2012, the annualized effective administration fee rate was 0.04% of each Fund's average daily net assets. CWAM has delegated to Columbia Management responsibility to provide certain sub-administrative services to the Funds.
Columbia Management Investment Distributors, Inc. (CMID), a wholly owned subsidiary of Ameriprise Financial, is the distributor of the Funds.
Each Fund has adopted a Rule 12b-1 (distribution and service) plan which requires it to pay CMID a monthly service fee equal to 0.25% annually of the average daily net assets attributable to Class A, Class B and Class C shares and a monthly distribution fee equal to 0.50%, 0.75% and 0.50%, annually, of the average daily net assets attributable to Class B, Class C and Class R shares, respectively. CMID receives no compensation with respect to Class R5 and Class Z shares.
Columbia Management Investment Services Corp. (CMIS), a wholly owned subsidiary of Ameriprise Financial, is the transfer agent of the Funds. Effective May 1, 2012, CMIS receives monthly account-based service fees based on the number of open Fund accounts. CMIS is also reimbursed by the Funds for the fees and expenses that it pays retirement plan sponsors, defined contribution plans and 529 Plans (the Plans) or other financial intermediaries that maintain omnibus accounts with the Funds and provide record keeping services to shareholders invested through the Plans. Such fees are calculated as a percentage of the average aggregate value of each Fund's shares maintained by a Plan. CMIS is also reimbursed for the fees and expenses that it pays each fund supermarket, broker-dealer firm or other financial intermediary that maintains an omnibus accounts with a Fund. Such fees are based on the number of sub-accounts comprising the omnibus position. Each Fund paid CMIS a monthly fee at the annual rate of $17.00 per open account prior to May 1, 2012, and $20.00 per open account thereafter.
The Transfer Agent also receives compensation from fees for various shareholder services and reimbursements for certain out-of-pocket fees. Class I shares do not pay transfer agent fees.
For the six months ended June 30, 2012, the Funds' annualized effective transfer agent fee rates as a percentage of average daily net assets of each class were as follows:
| Fund | | Class A | | Class B | | Class C | | Class R | | Class R5 | |
Columbia
Acorn Fund | | | 0.09 | % | | | 0.18 | % | | | 0.09 | % | | | — | | | | — | | |
Columbia
Acorn
International | | | 0.16 | % | | | 0.40 | % | | | 0.14 | % | | | 0.11 | % | | | 0.02 | % | |
Columbia
Acorn USA | | | 0.10 | % | | �� | 0.30 | % | | | 0.09 | % | | | — | | | | — | | |
Columbia
Acorn
International
Select | | | 0.13 | % | | | 0.24 | % | | | 0.17 | % | | | — | | | | — | | |
Columbia
Acorn Select | | | 0.11 | % | | | 0.20 | % | | | 0.11 | % | | | — | | | | — | | |
Columbia
Thermostat
Fund | | | 0.09 | % | | | 0.18 | % | | | 0.09 | % | | | — | | | | — | | |
Columbia
Acorn
Emerging
Markets Fund | | | 0.13 | % | | | — | | | | 0.14 | % | | | — | | | | — | | |
Columbia
Acorn
European
Fund | | | 0.04 | % | | | — | | | | 0.08 | % | | | — | | | | — | | |
In connection with the acquisition that closed August 15, 2011, Columbia Acorn International assumed the assets and obligations of RiverSource Partners International Small Cap Fund and RiverSource Partners International Select Growth Fund (See Note 8), which together with certain other associated investment companies, have severally, but not jointly, guaranteed the performance and observance of all the terms and conditions of a lease (including the payment of rent (the Guaranty)) entered into by Seligman Data Corp. (SDC), the former transfer agent of Seligman Global Smaller Companies Fund and Seligman International Growth Fund, which were acquired by RiverSource Partners International Small Cap Fund
122
and RiverSource Partners International Select Growth Fund, respectively, in previous years. The lease and the Guaranty expire in January 2019. At June 30, 2012, Columbia Acorn International's total potential future obligation over the life of the Guaranty is $131,390. The liability remaining at June 30, 2012, for non-recurring charges associated with the lease amounted to $75,951 and is included within payable for other liabilities in the Statements of Assets and Liabilities.
Certain officers and trustees of the Trust are also officers of CWAM. The Trust makes no direct payments to its officers and trustees who are affiliated with CWAM.
The Board of Trustees has appointed a Chief Compliance Officer of the Trust in accordance with federal securities regulations. The Funds, along with other affiliated funds, pay their pro-rata share of the expenses associated with the Office of the Chief Compliance Officer. These expenses are disclosed separately as "Chief compliance officer expenses" in the Statements of Operations.
The Trust offers a deferred compensation plan for its independent trustees. Under that plan, a trustee may elect to defer all or a portion of his or her compensation. Amounts deferred are retained by the Trust and may represent an unfunded obligation of the Trust. The value of amounts deferred is determined by reference to the change in value of Class Z shares of one or more series of the Trust or a money market fund as specified by the trustee. Benefits under the deferred compensation plan are payable in accordance with the plan.
Organizational expenses for Columbia Acorn Emerging Markets Fund and Columbia Acorn European Fund consist of offering costs which were incurred prior to the initial public offering of shares of the Funds and include, among other things, state registration filing fees and printing costs. The offering costs were paid by CWAM as incurred. The Funds have capitalized these offering costs and are amortizing them to expense over a period of 12 months from the commencement of the initial public offering of shares. The Funds reimburse CWAM during the 12 month period on a monthly basis an amount equal to the offering amortized to expense by each Fund during that month.
An affiliated person of a Fund may include any company in which a Fund owns five percent or more of its outstanding voting shares. On June 30, 2012, Columbia Acorn Fund, Columbia Acorn International, Columbia Acorn USA, Columbia Acorn Select and Columbia Thermostat Fund each held five percent or more of the outstanding voting securities of one or more companies. Details of investments in those affiliated companies are presented on pages 39, 51, 60, 72 and 76, respectively.
For the six months ended June 30, 2012, the Funds engaged in purchase and sales transactions with funds that have a common investment adviser (or affiliated investment advisers), common directors/trustees, and/or common officers. Those transactions complied with Rule 17a-7 under the Investment Company Act of 1940 and were as follows:
| | | Purchases | | Sales | |
| (in thousands) | |
| Columbia Acorn Fund | | $ | 800 | | | $ | — | | |
| Columbia Acorn International | | | 1,450 | | | | — | | |
| Columbia Acorn Select | | | — | | | | 1,446 | | |
Columbia Acorn Emerging Markets
Fund | | | 12 | | | | — | | |
During the year ended December 31, 2011, Columbia Management reimbursed Columbia Acorn International $174,055 for a loss on a trading error.
During the year ended December 31, 2011, Columbia Acorn Select Class Z shares received a payment of $56,666 from Columbia Management as a reimbursement for certain shareholder transactions processed at an incorrect price. The payment has been included in "Increase from contribution from affiliate" on the Statements of Changes in Net Assets.
5. Borrowing Arrangements
The Trust participates in a $150 million credit facility, along with another Trust managed by CWAM, which was entered into to facilitate portfolio liquidity. Under the facility, as in effect for the six months ended June 30, 2012, interest is charged to each participating fund based on its borrowings at a rate per annum equal to the higher of Federal Funds Rate or Overnight LIBOR plus 1.25%. In addition, a commitment fee of 0.10% per annum of the unutilized line of credit is accrued and apportioned among the participating funds based on their relative net assets. The commitment fee is included in "Other expenses" in the Statements of Operations. The Trust expects to renew this line of credit for one year durations annually in July at then current market rates and terms.
Except for Columbia Acorn Select, no Fund had borrowings during the six months ended June 30, 2012. For Columbia Acorn Select, the average daily loan balance outstanding on days when borrowing existed was $8,500,000 at a weighted average interest rate of 1.49%.
123
Columbia Acorn Family of Funds
Notes to Financial Statements (Unaudited), continued
6. Investment Transactions
The aggregate cost of purchases and proceeds from sales, other than short-term obligations, for the six months ended June 30, 2012, were:
| Fund | | Purchases | | Proceeds from
Sales | |
| (in thousands) | |
| Columbia Acorn Fund | | $ | 1,335,545 | | | $ | 2,296,276 | | |
| Columbia Acorn International | | | 1,052,221 | | | | 1,021,815 | | |
| Columbia Acorn USA | | | 129,533 | | | | 261,587 | | |
| Columbia Acorn International Select | | | 93,008 | | | | 111,597 | | |
| Columbia Acorn Select | | | 99,446 | | | | 423,716 | | |
| Columbia Thermostat Fund | | | 382,471 | | | | 144,148 | | |
Columbia Acorn Emerging Markets
Fund | | | 3,240 | | | | 715 | | |
| Columbia Acorn European Fund | | | 503 | | | | 331 | | |
7. Regulatory Settlements with Third Parties
During the six months ended June 30, 2012, Columbia Acorn International received payments of $107,802 resulting from certain regulatory settlements with third parties in which the Fund had participated. The payments have been included in "Increase from regulatory settlements" in the Statements of Changes in Net Assets.
During the year ended December 31, 2011, Columbia Acorn International received payments of $107,617 resulting from certain regulatory settlements with third parties in which the Fund had participated. The payments have been included in "Increase from regulatory settlements" in the Statements of Changes in Net Assets.
8. Fund Merger
On August 15, 2011, Columbia Acorn International acquired the assets and assumed the identified liabilities of RiverSource Partners International Select Growth Fund and RiverSource Partners International Small Cap Fund, both series of RiverSource International Managers Series, Inc., which were sub-advised by CWAM. The reorganization was completed after shareholders approved the plan on May 11, 2011. The purpose of the transaction was to combine funds managed by CWAM with comparable investment objectives and strategies.
The aggregate net assets of Columbia Acorn International immediately before the acquisitions were $5,887,634,436 and the combined net assets immediately after the acquisitions were $6,287,891,195.
The merger was accomplished by a tax-free exchange of 48,230,699 shares of RiverSource Partners International Select Growth Fund valued at $311,482,971 (including $29,840,736 of unrealized appreciation) and 15,801,504 shares of RiverSource Partners International Small Cap Fund valued at $88,773,788 (including $6,322,097 of unrealized appreciation).
In exchange for RiverSource Partners International Select Growth Fund and RiverSource Partners International Small Cap Fund shares, Columbia Acorn International issued the following number of shares:
| | | RiverSource
Partners
International
Select Growth
Fund | | RiverSource
Partners
International
Small Cap
Fund | |
| Class A | | | 3,800,227 | | | | 1,666,707 | | |
| Class B | | | 267,259 | | | | 75,499 | | |
| Class C | | | 183,761 | | | | 518,779 | | |
| Class I | | | 4,010,380 | | | | 51,634 | | |
| Class R | | | 35,341 | | | | 48,348 | | |
| Class R5 | | | 5,711 | | | | 23,983 | | |
For financial reporting purposes, net assets received and shares issued by Columbia Acorn International were recorded at fair value; however, RiverSource Partners International Select Growth Fund and RiverSource Partners International Small Cap Fund's cost of investments was carried forward.
The financial statements reflect the operations of Columbia Acorn International for the period prior to the merger and the combined fund for the period subsequent to the merger. Because the combined investment portfolios have been managed as a single integrated portfolio since the merger was completed, it is not practicable to separate the amounts of revenue and earnings of RiverSource Partners International Select Growth Fund and RiverSource Partners International Small Cap Fund that have been included in the combined Fund's Statement of Operations since the merger was completed.
Assuming the merger had been completed on January 1, 2011, Columbia Acorn International's pro-forma net investment income, net gain on investments, net change in unrealized depreciation and net increase in net assets from operations for the year ended December 31, 2011, would have been approximately $76.7 million, $260.0 million, $(1,274.8) million and $(938.1) million, respectively.
9. Shareholder Concentration
At June 30, 2012, the table below details the affiliated and significant unaffiliated shareholder account ownership of outstanding shares of each Fund. The Funds have no knowledge about whether any portion of those shares was owned
124
beneficially. Subscription and redemption activity of these accounts may have a significant effect on the operations of the Funds.
| Fund | | Number of
unaffiliated
accounts | | Percentage of
shares
outstanding
held –
unaffiliated | | Percentage of
shares
outstanding
held –
affiliated | |
| Columbia Acorn Fund | | | 1 | | | | 11.1 | % | | | — | | |
| Columbia Acorn International | | | 3 | | | | 38.7 | % | | | — | | |
| Columbia Acorn USA | | | 3 | | | | 51.7 | % | | | — | | |
| Columbia International Select | | | 1 | | | | 43.6 | % | | | — | | |
| Columbia Acorn Select | | | 2 | | | | 26.5 | % | | | — | | |
| Columbia Thermostat Fund | | | 2 | | | | 38.2 | % | | | — | | |
Columbia Acorn Emerging
Markets Fund | | | 1 | | | | 17.4 | % | | | 29.7 | % | |
| Columbia Acorn European Fund | | | 1 | | | | 18.0 | % | | | 53.7 | % | |
10. Subsequent Events
Management has evaluated the events and transactions that have occurred through the date the financial statements were issued and noted no items requiring adjustment of the financial statements or additional disclosure.
11. Information Regarding Pending and Settled Legal Proceedings
Ameriprise Financial and certain of its affiliates have historically been involved in a number of legal, arbitration and regulatory proceedings, including routine litigation, class actions, and governmental actions, concerning matters arising in connection with the conduct of their business activities. Ameriprise Financial believes that the Funds are not currently the subject of, and that neither Ameriprise Financial nor any of its affiliates are the subject of, any pending legal, arbitration or regulatory proceedings that are likely to have a material adverse effect on the Funds or the ability of Ameriprise Financial or its affiliates to perform under their contracts with the Funds. Ameriprise Financial is required to make 10-Q, 10-K and, as necessary, 8-K filings with the Securities and Exchange Commission on legal and regulatory matters that relate to Ameriprise Financial and its affiliates. Copies of these filings may be obtained by accessing the SEC website at www.sec.gov.
There can be no assurance that these matters, or the adverse publicity associated with them, will not result in increased fund redemptions, reduced sale of fund shares or other adverse consequences to the Funds. Further, although we believe proceedings are not likely to have a material adverse effect on the Funds or the ability of Ameriprise Financial or its affiliates to perform under their contracts with the Funds, these proceedings are subject to uncertainties and, as such, we are unable to estimate the possible loss or range of loss that may result. An adverse outcome in one or more of these proceedings could result in adverse judgments, settlements, fines, penalties or other relief that could have a material adverse effect on the consolidated financial condition or results of operations of Ameriprise Financial.
125
Board Approval of the Advisory Agreement
Columbia Acorn Trust (the "Trust") has an investment advisory agreement (the "Advisory Agreement") with Columbia Wanger Asset Management, LLC ("Columbia WAM") under which Columbia WAM manages the Columbia Acorn Funds (each, a "Fund", and together, the "Funds"). More than 75% of the trustees of the Trust (the "Trustees") are persons who have no direct or indirect interest in the Advisory Agreement and are not "interested persons" (as defined in the Investment Company Act of 1940, as amended (the "1940 Act")) of the Trust (the "Independent Trustees"). The Trustees oversee the management of each Fund and, as required by law, determine at least annually whether to continue the Advisory Agreement for each Fund.
The Contract Committee (the "Committee") of the Board of Trustees (the "Board"), which is comprised solely of Independent Trustees, makes recommendations to the Board regarding any proposed continuation of the Advisory Agreement. After the Committee has made its recommendations, the full Board determines whether to approve continuation of the Advisory Agreement. The Board also considers matters bearing on the Advisory Agreement at its various meetings throughout the year, meets at least quarterly with Columbia WAM's portfolio managers and receives monthly reports from Columbia WAM on the performance of the Funds.
In connection with their most recent consideration of the Advisory Agreement for each Fund, the Committee and all Trustees received and reviewed a substantial amount of information provided by Columbia WAM, Columbia Management Investment Advisers, LLC ("Columbia Management") and Ameriprise Financial, Inc. ("Ameriprise") in response to written requests from the Independent Trustees and their independent legal counsel. Throughout the process, the Trustees had numerous opportunities to ask questions of and request additional materials from Columbia WAM, Columbia Management and Ameriprise.
During each meeting at which the Committee or the Independent Trustees considered the Advisory Agreement, they met in executive session with their independent legal counsel. The Committee also met with representatives of Columbia WAM, Columbia Management and Ameriprise on several occasions. In all, the Committee convened formally on six separate occasions to consider the continuation of the Advisory Agreement. The Board and/or some or all of the Independent Trustees met on other occasions to receive the Committee's status reports, receive presentations from Columbia WAM, Columbia Management and Ameriprise representatives, and to discuss outstanding issues. In addition, the Investment Performance Analysis Committee of the Board, also comprised exclusively of Independent Trustees, reviewed the performance of the Funds and presented its findings to the Board and the Committee throughout the year. The Compliance Committee of the Board also provided information to the Committee with respect to relevant matters.
The Trustees reviewed the Advisory Agreement, as well as certain information obtained through Columbia WAM's, Columbia Management's and Ameriprise's responses to independent legal counsel's questionnaires. In addition, the Trustees reviewed the Management Fee Evaluation dated June 2012 (the "Fee Evaluation") prepared by the Trust's chief compliance officer, senior vice president and general counsel, at the request of the Board.
The materials reviewed by the Committee and the Trustees included, among other items, (i) information on the investment performance of each Fund and of independently selected peer groups of funds and of the Funds' performance benchmarks over various time periods, (ii) information on each Fund's advisory fees and other expenses, including information comparing the Fund's fees and expenses to those of peer groups of funds and information about any applicable expense limitations and fee breakpoints, (iii) data on sales and redemptions of Fund shares, and (iv) information on the profitability to Columbia WAM and Ameriprise, as well as potential "fall-out" or ancillary benefits that Columbia WAM and its affiliates may receive as a result of their relationships with the Funds. The Trustees also considered other information such as (i) Columbia WAM's financial condition, (ii) each Fund's investment objective and strategy, (iii) the size, education and experience of Columbia WAM's investment staff and its use of technology, external research and trading cost measurement tools, (iv) the portfolio manager compensation framework, (v) the allocation of the Funds' brokerage, and the use of "soft" commission dollars to pay for research products and services, (vi) Columbia WAM's risk management program, and (vii) the resources devoted to, and the record of compliance with, the Funds' investment policies and restrictions, policies on personal securities transactions and other compliance policies.
At a meeting held on June 6, 2012, upon recommendations of the Committee, the Board of Trustees unanimously approved the continuation of the Advisory Agreement.
126
In considering the continuation of the Advisory Agreement, the Trustees reviewed and analyzed various factors that they determined were relevant, none of which by itself was considered dispositive. The material factors and conclusions that formed the basis for the Trustees' determination to approve the continuation of the Advisory Agreement are discussed below.
Nature, quality and extent of services. The Trustees reviewed the nature, quality and extent of the services provided by Columbia WAM and its affiliates to the Funds under the Advisory Agreement, taking into account the investment objective and strategy of each Fund and knowledge gained from meetings with management, which were held on at least a quarterly basis. In addition, the Trustees reviewed the available resources and key personnel of Columbia WAM and its affiliates, especially those providing investment management services to the Funds. The Trustees also considered other services provided to the Funds by Columbia WAM and its affiliates, including: managing the execution of portfolio transactions and selecting broker-dealers for those transactions; monitoring adherence to the Funds' investment restrictions; producing shareholder reports; providing support services for the Board and committees of the Board; managing the Funds' securities lending program; communicating with shareholders; serving as the Funds' administrator; and overseeing the activities of the Funds' other service providers, including monitoring for compliance with various policies and procedures as well as applicable securities laws and regulations.
The Trustees concluded that the nature, quality and extent of the services provided by Columbia WAM and its affiliates to each Fund under the Advisory Agreement were appropriate for the Funds and that the Funds were likely to benefit from the continued provision of those services by Columbia WAM. They also concluded that Columbia WAM currently had sufficient personnel, with appropriate education and experience, to serve the Funds effectively, and that the firm had demonstrated its continuing ability to attract and retain well-qualified personnel. In addition, they took note of the quality of Columbia WAM's compliance record.
Performance of the Funds. The Trustees received and considered detailed performance information at various meetings of the Board, the Committee and the Investment Performance Analysis Committee of the Board throughout the year. They reviewed information comparing each Fund's performance with that of its benchmark(s) and with the performance of comparable funds and peer groups as identified by Lipper Inc. ("Lipper") and Morningstar, Inc. ("Morningstar"). The Trustees evaluated the performance of the Funds over various time periods, including over the one-, three- and five-year periods ending December 31, 2011. The Trustees also considered peer performance rankings for similar time periods although they focused more on the five-year period, or the since inception periods in the case of the two newer Funds, Columbia Acorn Emerging Markets Fund and Columbia Acorn European Fund.
The Trustees noted that Columbia Acorn International and Columbia Acorn International Select had delivered excellent results over the past five years, and had done so while exposing investors to less risk than competing funds, according to Morningstar. They also considered that Columbia Acorn Emerging Markets Fund and Columbia Acorn European Fund had delivered excellent returns since inception versus their respective Morningstar peer groups, although their returns were below median compared to their respective Lipper peer groups. The Trustees considered that these newer Funds had operated for less than one year and that the Funds had relatively few peers in their peer groups compared to peer groups for other Funds.
The Trustees considered that the domestic Funds have had mixed results. Columbia Acorn Fund underperformed its peers over the five-year period, ending December 31, 2011, but the Fund beat its benchmark during the same period. Columbia Acorn Fund underperformed its peer groups for the one- and three-year periods as well, and outperformed its benchmark for the three-year but not the one-year period. The Trustees considered, however, that Morningstar and Lipper ranked Columbia Acorn Fund as the best-performing fund over the past ten years. Columbia Acorn Select underperformed its peers and benchmark over the five-year period ending December 31, 2011 and exposed investors to more risk versus its peers. The Trustees considered that Columbia Acorn Select had performed better over the three-year period, but that its one-year returns were well below the peer group median and benchmark. Columbia Acorn USA's returns were behind its peer group median over the five-year period ending December 31, 2011, though it outperformed its benchmark for the same period. The Trustees noted that the Fund also had underperformed its peers for the one- and three-year periods but had outperformed its benchmark for the same periods. Over the ten-year period, Columbia Acorn USA ranked above
127
Board Approval of the Advisory Agreement, continued
median according to Morningstar and Lipper. The Fund also exposed shareholders to more risk than its peers. Columbia Thermostat Fund outperformed its stated benchmark, a 50/50 blend of the Fund's primary equity and debt benchmarks, over the three- and five-year periods ending December 31, 2011, and enjoyed strong rankings from Morningstar and Lipper versus its peer groups over these periods.
The Trustees concluded that Fund performance was satisfactory with respect to the international Funds and Columbia Thermostat Fund. The Trustees determined that performance with respect to Columbia Acorn Select, in particular, and with respect to Columbia Acorn Fund and Columbia Acorn USA needed to be improved, although performance of these three Funds had been ahead of their benchmarks at the time of the June 6th Board meeting. The Trustees concluded, however, that Columbia WAM had taken and continued to take a number of corrective steps to improve performance of the underperforming domestic Funds, that Columbia WAM had reported that these steps were being successfully implemented, and that the Investment Performance Analysis Committee of the Board was monitoring these Funds' performance closely. In addition the Trustees considered that the Chief Investment Officer (the "CIO") of Columbia WAM had reported to them at numerous committee and Board meetings on the corrective steps being taken to improve performance, and committee representatives met separately with the CIO on multiple occasions to discuss the underperforming Funds.
The Trustees concluded that, although past performance is not necessarily indicative of future results, the strong overall longer-term performance record of the international Funds, Columbia Acorn Fund and Columbia Thermostat Fund, and the steps taken by Columbia WAM to correct performance in the underperforming domestic Funds, were an important factor in their evaluation of the quality of services provided by Columbia WAM under the Advisory Agreement for these Funds.
Costs of Services and Profits Realized by Columbia WAM. At various Committee and Board meetings, the Trustees examined detailed information on the fees and expenses of each Fund in comparison to information for comparable funds provided by Lipper and Morningstar. The Trustees reviewed data from Lipper and Morningstar and noted that in general the Funds' total net operating expenses were equal to or below their Morningstar median peer group rankings, except that Columbia Acorn USA, Columbia Acorn European Fund, and Columbia Acorn Select had total net operating expenses above their Morningstar peer group medians. All of the Funds' total net operating expenses, however, were below their Lipper peer group medians.
The actual advisory fees paid by Columbia Acorn Fund, Columbia Acorn International and Columbia Thermostat Fund were lower than both their Morningstar and Lipper peer groups; the actual advisory fees paid by Columbia Acorn Select and Columbia Acorn USA were higher than the median advisory fee of the Funds' Lipper and Morningstar peer groups; the actual advisory fees paid by Columbia Acorn Emerging Markets Fund and Columbia Acorn European Fund were higher than the median advisory fees paid by the Funds' Morningstar peer groups but not their Lipper peer groups; and the actual advisory fee paid by Columbia Acorn International Select was higher than the median advisory fee of the Fund's Lipper peer group, but not of its Morningstar peer group.
The Trustees also reviewed the advisory fee rates charged by Columbia WAM for managing other investment companies (including the Columbia Wanger Funds), sub-advised funds and other institutional separate accounts, as detailed in materials provided to the Committee by Columbia WAM and in the Fee Evaluation. The Trustees noted that the Funds' advisory fees were generally comparable to the Columbia Wanger Funds' advisory fees at the same asset levels. The Trustees also examined Columbia WAM's institutional separate account fees for various investment strategies; in some cases those fees were higher than the advisory fees charged to the Funds, and in a few instances the fees were lower. The Trustees noted that Columbia WAM performs significant additional services for the Funds that it does not provide to sub-advised funds or non-mutual fund clients, including administrative services, oversight of the Funds' other service providers, Trustee support, regulatory compliance and numerous other services, and that, in servicing the Funds, Columbia WAM assumes many legal and business risks that it does not assume in servicing many of its non-fund clients.
The Trustees concluded that the rates of advisory fees payable to Columbia WAM were reasonable in relation to the nature and quality of the services to be provided. The Trustees also concluded that the Funds' overall expense ratios were reasonable, considering the quality of the services provided by Columbia WAM and its affiliates and the investment performance of the Funds, taking into account Columbia WAM's continuing steps to improve performance of the underperforming domestic Funds.
128
The Trustees reviewed the analysis of the historic profitability of Columbia WAM in serving as each Fund's investment adviser and of Columbia WAM and its affiliates in their relationships with each Fund. The Committee and Trustees met with representatives from Ameriprise to discuss its methodologies for calculating profitability and allocating costs. They considered that Ameriprise calculated profitability and allocated costs on a contract-by-contract and fund-by-fund basis. The Trustees also considered the methodology used by Columbia WAM and Ameriprise in determining compensation payable to portfolio managers and the competitive market for investment management talent. The Trustees were also provided with profitability information from Lipper, which compared Columbia WAM's profitability to other similar investment advisers in the mutual fund industry. The Trustees concluded that Columbia WAM's and its affiliates' profits were within a reasonable range of those of competitors with similar business models. The Trustees discussed, however, that profitability comparisons among fund managers may not always be meaningful due to the lack of consistency in data, small number of publicly-owned managers, and the fact that profitability of any investment manager is affected by numerous factors, including its particular organizational structure, the types of funds and other accounts managed, other lines of business, expense allocation methodology, capital structure and cost of capital.
Economies of Scale. At various Committee and Board meetings and other informal meetings, the Trustees considered information about the extent to which Columbia WAM realizes economies of scale in connection with an increase in Fund assets. The Trustees also discussed the potential for Fund sales growth. The Trustees noted that the advisory fee schedule for each Fund, other than Columbia Thermostat Fund, includes breakpoints in the rate of fees at various asset levels. The Trustees concluded that the fee structure of each Fund was reflective of a sharing between Columbia WAM and the Funds of economies of scale.
Other Benefits to Columbia WAM. The Trustees also reviewed benefits that accrue to Columbia WAM and its affiliates from their relationships with the Funds, based upon information provided to them by Ameriprise and as outlined in the Fee Evaluation. They noted that the Funds' transfer agency services are performed by Columbia Management Investment Services Corp., an affiliate of Ameriprise, which receives compensation from the Funds for its services provided. They considered that an affiliate of Ameriprise, Columbia Management Investment Distributors, Inc. ("CMID"), serves as the Funds' distributor under a distribution agreement, and that it receives fees under the Trust's Rule 12b-1 Plan, most of which CMID pays to broker-dealers. In addition, Columbia Management provides sub-administration services to the Funds. The Committee received information regarding the profitability of each Fund agreement with Columbia WAM affiliates. The Committee and the Board also reviewed information about and discussed the capabilities of each affiliated entity in performing its duties.
The Trustees considered other ways that the Funds and Columbia WAM may potentially benefit from their relationship with each other. For example, the Trustees considered Columbia WAM's use of commissions paid by each Fund on its portfolio brokerage transactions to obtain research products and services benefiting the Funds and/or other clients of Columbia WAM. The Committee reviewed Columbia WAM's annual "soft dollar" report and met with representatives from Columbia WAM to review Columbia WAM's soft dollar spending. The Committee also considered that the Compliance Committee of the Board regularly reviewed third-party prepared reports that evaluated the quality of Columbia WAM's execution of the Funds' portfolio transactions. The Trustees noted that these reports showed that Columbia WAM's execution capabilities were generally better than industry peers. The Trustees determined that Columbia WAM's use of the Funds' "soft" commission dollars to obtain research products and services was consistent with current regulatory requirements and guidance. They also concluded that Columbia WAM benefits from the receipt of proprietary research products and services acquired through commissions paid on portfolio transactions of the Funds, and that the Funds benefit from Columbia WAM's receipt of those products and services as well as research products and services acquired through commissions paid by other clients of Columbia WAM.
After full consideration of the above factors, as well as other factors that were instructive in evaluating the Advisory Agreement, the Trustees, including the Independent Trustees, concluded that the continuation of the Advisory Agreement was in the best interest of each Fund. On June 6, 2012, the Trustees approved continuation of the Advisory Agreement through July 31, 2013.
129
Columbia Acorn Family of Funds
Second Quarter Class A, B, C, I, R and R5 Expense Information (Unaudited)
| Columbia Acorn Fund | | Class A | | Class B* | | Class C | | Class I | | | | | |
| Management Fees | | | 0.64 | % | | | 0.64 | % | | | 0.64 | % | | | 0.64 | % | | | | | |
| Distribution and Services (12b-1) Fees | | | 0.25 | % | | | 0.75 | % | | | 1.00 | % | | | 0.00 | % | | | | | |
| Other Expenses | | | 0.16 | % | | | 0.26 | % | | | 0.16 | % | | | 0.08 | % | | | | | |
| Net Expense Ratio | | | 1.05 | % | | | 1.65 | % | | | 1.80 | % | | | 0.72 | % | | | | | |
| Columbia Acorn International | | Class A | | Class B* | | Class C | | Class I | | Class R | | Class R5 | |
| Management Fees | | | 0.76 | % | | | 0.76 | % | | | 0.76 | % | | | 0.76 | % | | | 0.76 | % | | | 0.76 | % | |
| Distribution and Services (12b-1) Fees | | | 0.25 | % | | | 0.75 | % | | | 1.00 | % | | | 0.00 | % | | | 0.50 | % | | | 0.00 | % | |
| Other Expenses | | | 0.23 | % | | | 0.48 | % | | | 0.23 | % | | | 0.11 | % | | | 0.21 | % | | | 0.12 | % | |
| Net Expense Ratio | | | 1.24 | % | | | 1.99 | % | | | 1.99 | % | | | 0.87 | % | | | 1.47 | % | | | 0.88 | % | |
| Columbia Acorn USA | | Class A | | Class B* | | Class C | | Class I | | | | | |
| Management Fees | | | 0.86 | % | | | 0.86 | % | | | 0.86 | % | | | 0.86 | % | | | | | |
| Distribution and Services (12b-1) Fees | | | 0.25 | % | | | 0.75 | % | | | 1.00 | % | | | 0.00 | % | | | | | |
| Other Expenses | | | 0.20 | % | | | 0.40 | % | | | 0.19 | % | | | 0.10 | % | | | | | |
| Net Expense Ratio | | | 1.31 | % | | | 2.01 | % | | | 2.05 | % | | | 0.96 | % | | | | | |
| Columbia Acorn International Select | | Class A | | Class B* | | Class C | | Class I | | | | | |
| Management Fees | | | 0.94 | % | | | 0.94 | % | | | 0.94 | % | | | 0.94 | % | | | | | |
| Distribution and Services (12b-1) Fees | | | 0.25 | % | | | 0.75 | % | | | 1.00 | % | | | 0.00 | % | | | | | |
| Other Expenses | | | 0.31 | % | | | 0.42 | % | | | 0.35 | % | | | 0.20 | % | | | | | |
| Net Expense Ratio | | | 1.50 | % | | | 2.11 | % | | | 2.29 | % | | | 1.14 | % | | | | | |
| Columbia Acorn Select | | Class A | | Class B* | | Class C | | Class I | | | | | |
| Management Fees | | | 0.83 | % | | | 0.83 | % | | | 0.83 | % | | | 0.83 | % | | | | | |
| Distribution and Services (12b-1) Fees | | | 0.25 | % | | | 0.75 | % | | | 1.00 | % | | | 0.00 | % | | | | | |
| Other Expenses | | | 0.24 | % | | | 0.32 | % | | | 0.24 | % | | | 0.14 | % | | | | | |
| Net Expense Ratio | | | 1.32 | % | | | 1.90 | % | | | 2.07 | % | | | 0.97 | % | | | | | |
| Columbia Thermostat Fund | | Class A | | Class B* | | Class C | | | | | | | |
| Management Fees | | | 0.10 | % | | | 0.10 | % | | | 0.10 | % | | | | | | | |
| Distribution and Services (12b-1) Fees | | | 0.25 | % | | | 0.75 | % | | | 1.00 | % | | | | | | | |
| Other Expenses** | | | 0.15 | % | | | 0.15 | % | | | 0.15 | % | | | | | | | |
| Net Expense Ratio** | | | 0.50 | % | | | 1.00 | % | | | 1.25 | % | | | | | | | |
| Columbia Acorn Emerging Markets Fund | | Class A | | | | Class C | | Class I | | | | | |
| Management Fees | | | 1.25 | % | | | | | 1.25 | % | | | 1.25 | % | | | | | |
| Distribution and Services (12b-1) Fees | | | 0.25 | % | | | | | 1.00 | % | | | 0.00 | % | | | | | |
| Other Expenses | | | 0.29 | % | | | | | 0.30 | % | | | 0.16 | % | | | | | |
| Net Expense Ratio | | | 1.79 | % | | | | | 2.55 | % | | | 1.41 | % | | | | | |
| Columbia Acorn European Fund | | Class A | | | | Class C | | Class I | | | | | |
| Management Fees | | | 1.19 | % | | | | | 1.19 | % | | | 1.19 | % | | | | | |
| Distribution and Services (12b-1) Fees | | | 0.25 | % | | | | | 1.00 | % | | | 0.00 | % | | | | | |
| Other Expenses | | | 0.16 | % | | | | | 0.20 | % | | | 0.12 | % | | | | | |
| Net Expense Ratio | | | 1.60 | % | | | | | 2.39 | % | | | 1.31 | % | | | | | |
See the Funds' prospectuses for information on minimum initial investment amounts and other details of buying, selling and exchanging shares of the Funds.
Fees and expenses are for the six months ended June 30, 2012. The fees and expenses of Columbia Acorn Select and Columbia Acorn International Select include the effect of the voluntary undertaking by Columbia Wanger Asset Management, LLC (CWAM) to waive fees and/or reimburse the Funds for any ordinary operating expenses (exclusive of brokerage commissions, interest, taxes and extraordinary expenses, but inclusive of custodian charges relating to overdrafts, if any), after giving effect to any balance credits from the Funds' custodian, in excess of the following annual rates:
| Fund | | Class A | | Class B | | Class C | | Class I | |
| Columbia Acorn International Select | | | 1.70 | % | | | 2.20 | % | | | 2.45 | % | | | 1.30 | % | |
| Columbia Acorn Select | | | 1.60 | % | | | 2.10 | % | | | 2.35 | % | | | 1.25 | % | |
These arrangements may be modified or terminated by either the Funds or CWAM upon 30 days notice.
Columbia Thermostat Fund's fees and expenses include the effect of CWAM's contractual undertaking to waive fees and/or reimburse the Fund for any ordinary operating expenses (exclusive of distribution and service fees, interest and fees on borrowings and expenses associated with the Fund's investments in other investment companies, but including custodian charges relating to overdrafts, if any), after giving effect to any balance credits from the Fund's custodian, in excess of the annual rate of 0.25% of the average daily net assets. Columbia Thermostat Fund's waiver/reimbursement arrangement is contractual through April 30, 2013. There is no guarantee that this arrangement will continue thereafter.
The fees and expenses of Columbia Acorn Emerging Markets Fund and Columbia Acorn European Fund also include the effect of fee waivers/reimbursement. CWAM has contractually undertaken to waive fees and/or reimburse Columbia Acorn Emerging Markets Fund so that the Fund's ordinary operating expenses (excluding interest and fees on borrowings and expenses associated with the Fund's investment in other investment companies, if any) do not exceed the annual rates of 1.85%, 2.60% and 1.41% of the Fund's average daily net assets attributable to Class A, Class C and Class I shares, respectively, through April 30, 2013. There is no guarantee that this arrangement will continue thereafter. CWAM has contractually undertaken to waive fees and/or reimburse Columbia Acorn European Fund so that the Fund's ordinary operating expenses (excluding interest and fees on borrowings and expenses associated with the Fund's investment in other investment companies, if any) do not exceed the annual rates of 1.75%, 2.50% and 1.31% of the Fund's average daily net assets attributable to Class A, Class C and Class I shares, respectively, through April 30, 2013. There is no guarantee that this arrangement will continue thereafter.
Columbia Acorn International's fees and expenses include the effect of the contractual undertaking by CWAM and its affiliates, effective August 15, 2011, to waive a portion of total annual Fund operating expenses incurred by Class A, Class B and Class C shares of Columbia Acorn International such that the Fund's total annual Fund operating expenses will be reduced by 0.04%, 0.03% and 0.02% for Class A, Class B and Class C shares of the Fund, respectively, through August 14, 2013. There is no guarantee that this arrangement will continue thereafter.
* The Funds generally no longer accept investments by new or existing investors in Class B shares, except in connection with the reinvestment of any dividend and/or capital gain distributions in Class B shares of the Funds and exchanges by existing Class B shareholders of certain other funds within the Columbia Family of Funds.
** Does not include estimated fees and expenses of 0.61% incurred by the Fund from the underlying portfolio funds in which it invests.
130
This page intentionally left blank.
131
This page intentionally left blank.
132
This page intentionally left blank.
133
Columbia Acorn Family of Funds
Trustees
Laura M. Born
Chair of the Board
Steven N. Kaplan
Vice Chair of the Board
Michelle L. Collins
Maureen M. Culhane
Margaret M. Eisen
John C. Heaton
Charles P. McQuaid
David J. Rudis
David B. Small
Ralph Wanger (Trustee Emeritus)
Officers
Charles P. McQuaid
President
Ben Andrews
Vice President
Robert A. Chalupnik
Vice President
Michael G. Clarke
Assistant Treasurer
Joseph F. DiMaria
Assistant Treasurer
P. Zachary Egan
Vice President
Fritz Kaegi
Vice President
John M. Kunka
Assistant Treasurer
Stephen Kusmierczak
Vice President
Joseph C. LaPalm
Vice President
Bruce H. Lauer
Vice President, Secretary and Treasurer
Louis J. Mendes III
Vice President
Robert A. Mohn
Vice President
Christopher J. Olson
Vice President
Christopher O. Petersen
Assistant Secretary
Scott R. Plummer
Assistant Secretary
Andreas Waldburg-Wolfegg
Vice President
Linda K. Roth-Wiszowaty
Assistant Secretary
Robert P. Scales
Chief Compliance Officer, Chief Legal Officer,
Senior Vice President and General Counsel
Investment Manager
Columbia Wanger Asset Management, LLC
227 West Monroe Street, Suite 3000
Chicago, Illinois 60606
1-800-922-6769
Distributor
Columbia Management Investment Distributors, Inc.
225 Franklin Street
Boston, Massachusetts 02110
Transfer Agent, Dividend Disbursing Agent
Columbia Management Investment Services Corp.
P. O. Box 8081
Boston, Massachusetts 02266-8081
1-800-345-6611
Legal Counsel to the Funds
Perkins Coie LLP
Washington, DC
Legal Counsel to the Independent Trustees
Drinker Biddle & Reath LLP
Philadelphia, Pennsylvania
Independent Registered Public Accounting Firm
PricewaterhouseCoopers LLP
Chicago, Illinois
This report, including the schedules of investments, is submitted for the general information of the shareholders of Columbia Acorn Trust.
A description of the policies and procedures that the Funds use to determine how to vote proxies and a copy of the Funds' voting record are available (i) without charge, upon request, by calling 800-922-6769 and (ii) on the Securities and Exchange Commission's website at www.sec.gov. Information regarding how the Funds voted proxies relating to portfolio securities during the 12-month period ended June 30, is available from the SEC's website. Information regarding how the Funds voted proxies relating to portfolio securities is also available at www.columbiamanagement.com under "About Us." From there, click on "Disclosures."
The Funds file a complete schedule of portfolio holdings with the SEC for the first and third quarters of each fiscal year on Form N-Q. The Funds' Form N-Q is available on the SEC's website at www.sec.gov and may be reviewed and copied at the SEC's Public Reference Room in Washington, D.C. Information on the operation of the Public Reference Room may be obtained by calling 1-800-SEC-0330. The Funds' complete portfolio holdings are disclosed at www.columbiamanagement.com approximately 30 to 40 days after each month-end.
Investors should consider the investment objectives, risks, charges and expenses of a mutual fund carefully before investing. For a free prospectus, which contains this and other important information about the funds, visit www.columbiamanagement.com. Read the prospectus carefully before investing.
Columbia Acorn Funds are distributed by Columbia Management Investment Distributors, Inc., member FINRA and managed by Columbia Wanger Asset Management, LLC.
Find out what's new – visit our web site at:
www.columbiamanagement.com
Our e-mail address is:
ServiceInquiries@ColumbiaManagement.com
Shareholders should not include personal information such as account numbers, Social Security numbers or taxpayer identification numbers in e-mail. We are unable to accept account transactions sent via e-mail.
134
This document contains Global Industry Classification Standard data. The Global Industry Classification Standard ("GICS") was developed by and is the exclusive property and a service mark of MSCI Inc. ("MSCI") and Standard & Poor's Financial Services LLC ("S&P") and is licensed for use by Columbia Wanger Asset Management, LLC. Neither MSCI, S&P, nor any other party involved in making or compiling the GICS or any GICS classifications makes any express or implied warranties or representations with respect to such standard or classification (or the results to be obtained by the use thereof), and all such parties hereby expressly disclaim all warranties of originality, accuracy, completeness, merchantability and fitness for a particular purpose with respect to any of such standard or classification. Without limiting any of the foregoing, in no event shall MSCI, S&P, any of their affiliates or any third party involved in making or compiling the GICS or any GICS classifications have any liability for any direct, indirect, special, punitive, consequential or any other damages (including lost profits) even if notified of the possibility of such damages.
Columbia Management®
Columbia Acorn Family of Funds
Class A, B, C, I, R and R5 Shares
Semiannual Report, June 30, 2012
For More Information
You'll find more information about the Columbia Acorn Family of Funds in the documents described below. Contact Columbia Funds as follows to obtain these documents free of charge:
By Mail: Columbia Funds
c/o Columbia Management Investment Services Corp.
P.O. Box 8081
Boston, MA 02266-8081
By Telephone: 800.345.6611
Online: www.columbiamanagement.com
Shareholder Communications with the Board
The Funds' Board of Trustees has adopted procedures by which shareholders may communicate with the Board. Shareholders who wish to communicate with the Board should send their written communications to the Board by mail, c/o Columbia Wanger Asset Management, LLC, 227 West Monroe Street, Suite 3000, Chicago, Illinois 60606, Attention: Secretary. Shareholder communications must (i) be in writing, (ii) identify the Columbia Acorn Fund to which the communication relates and (iii) state the particular class of shares and number of shares held by the communicating shareholder.
Prospectuses and the Statement of Additional Information (SAI)
The prospectuses and the SAI provide more detailed information about the Funds and their policies. The SAI is legally part of each prospectus (it's incorporated by reference). A copy of each has been filed with the SEC.
Information Provided by the SEC
You can review and copy information about the Funds (including their prospectuses, the SAI and shareholder reports) at the SEC's Public Reference Room in Washington, DC. To find out more about the operation of the Public Reference Room, call the SEC at 202.551.8090. Reports and other information about the Fund are also available in the EDGAR Database on the SEC's website at http://www.sec.gov, or you can receive copies of this information, for a fee, by electronic request at the following e-mail address: publicinfo@sec.gov. You can also obtain copies of this information by writing the Public Reference Section, Securities and Exchange Commission, Washington, DC 20549-0102.
The investment company registration number of Columbia Acorn Trust, of which each of these Funds is a series, is 811-01829.
© 2012 Columbia Management Investment Advisers, LLC. All rights reserved.
225 Franklin Street, Boston, MA 02110
800.345.6611 www.columbiamanagement.com
C-1454 D (8/12) 142923
Item 2. Code of Ethics.
Not applicable for semiannual reports.
Item 3. Audit Committee Financial Expert.
Not applicable for semiannual reports.
Item 4. Principal Accountant Fees and Services.
Not applicable for semiannual reports.
Item 5. Audit Committee of Listed Registrants.
Not applicable.
Item 6. Investments
(a) The registrant’s “Schedule I — Investments in securities of unaffiliated issuers” (as set forth in 17 CFR 210.12-12) is included in Item 1 of this Form N-CSR.
(b) Not applicable.
Item 7. Disclosure of Proxy Voting Policies and Procedures for Closed-End Management Investment Companies.
Not applicable.
Item 8. Portfolio Managers of Closed-End Management Investment Companies.
Not applicable.
Item 9. Purchases of Equity Securities by Closed-End Management Investment Company and Affiliated Purchasers.
Not applicable.
Item 10. Submission of Matters to a Vote of Security Holders.
There were no material changes to the procedures by which shareholders may recommend nominees to the registrant’s board of directors.
Item 11. Controls and Procedures.
(a) The registrant’s principal executive officer and principal financial officers, based on their evaluation of the registrant’s disclosure controls and procedures as of a date within 90 days of the filing of this report, have concluded that such controls and procedures are adequately designed to ensure that material information required to be disclosed by the registrant in Form N-CSR is accumulated and communicated to the registrant’s management, including the principal executive officer and principal financial officer, or persons performing similar functions, as appropriate to allow timely decisions regarding required disclosure.
(b) There was no change in the registrant’s internal control over financial reporting that occurred during the registrant’s second fiscal quarter of the period covered by this report that has materially affected, or is reasonably likely to materially affect, the registrant’s internal control over financial reporting.
Item 12. Exhibits.
(a)(1) Code of ethics required to be disclosed under Item 2 of Form N-CSR: Not applicable for semiannual reports.
(a)(2) Certifications pursuant to Rule 30a-2(a) under the Investment Company Act of 1940 (17 CFR 270.30a-2(a)) attached hereto as Exhibit 99.CERT.
(a)(3) Not applicable.
(b) Certification pursuant to Rule 30a-2(b) under the Investment Company Act of 1940 (17 CFR 270.30a-2(b)) attached hereto as Exhibit 99.906CERT.
SIGNATURES
Pursuant to the requirements of the Securities Exchange Act of 1934 and the Investment Company Act of 1940, the registrant has duly caused this report to be signed on its behalf by the undersigned, thereunto duly authorized.
(registrant) | | Columbia Acorn Trust | |
| | |
| | |
By (Signature and Title) | | /s/ Charles P. McQuaid | |
| Charles P. McQuaid, President | |
| | |
| | |
Date | | August 21, 2012 | |
| | | | | |
Pursuant to the requirements of the Securities Exchange Act of 1934 and the Investment Company Act of 1940, this report has been signed below by the following persons on behalf of the registrant and in the capacities and on the dates indicated.
By (Signature and Title) | | /s/ Charles P. McQuaid | |
| Charles P. McQuaid, President | |
| | |
| | |
Date | | August 21, 2012 | |
| | | |
| | | |
By (Signature and Title) | | /s/ Bruce H. Lauer | |
| Bruce H. Lauer, Treasurer | |
| | |
| | |
Date | | August 21, 2012 | |
| | | | |