UNITED STATES
SECURITIES AND EXCHANGE COMMISSION
Washington, D.C. 20549
FORM N-CSR
CERTIFIED SHAREHOLDER REPORT OF REGISTERED
MANAGEMENT INVESTMENT COMPANIES
Investment Company Act file number | 811-01829 |
|
Columbia Acorn Trust |
(Exact name of registrant as specified in charter) |
|
225 Franklin Street, Boston, Massachusetts | | 02110 |
(Address of principal executive offices) | | (Zip code) |
|
Scott R. Plummer 5228 Ameriprise Financial Center Minneapolis, MN 55474 |
(Name and address of agent for service) |
|
Registrant’s telephone number, including area code: | 1-612-671-1947 | |
|
Date of fiscal year end: | December 31 | |
|
Date of reporting period: | June 30, 2011 | |
| | | | | | | | |
Form N-CSR is to be used by management investment companies to file reports with the Commission not later than 10 days after the transmission to stockholders of any report that is required to be transmitted to stockholders under Rule 30e-1 under the Investment Company Act of 1940 (17 CFR 270.30e-1). The Commission may use the information provided on Form N-CSR in its regulatory, disclosure review, inspection, and policymaking roles.
A registrant is required to disclose the information specified by Form N-CSR, and the Commission will make this information public. A registrant is not required to respond to the collection of information contained in Form N-CSR unless the Form displays a currently valid Office of Management and Budget (“OMB”) control number. Please direct comments concerning the accuracy of the information collection burden estimate and any suggestions for reducing the burden to Secretary, Securities and Exchange Commission, 450 Fifth Street, NW, Washington, DC 20549-0609. The OMB has reviewed this collection of information under the clearance requirements of 44 U.S.C. § 3507.
Item 1. Reports to Stockholders.
Q2 2011

Columbia Acorn Family of Funds
Class Z Shares
Managed by Columbia Wanger Asset Management, LLC

Semiannual Report
June 30, 2011
n ColumbiaSM
Acorn® Fund
n ColumbiaSM
Acorn International®
n ColumbiaSM
Acorn USA®
n ColumbiaSM
Acorn International SelectSM
n ColumbiaSM
Acorn SelectSM
n ColumbiaSM
Thermostat FundSM
Not FDIC insured • No bank guarantee • May lose value
Columbia Acorn Family of Funds
Descriptions of Indexes Included in this Report
• 50/50 Blended Benchmark, established by the Fund's adviser, is an equally weighted custom composite of Columbia Thermostat Fund's primary equity and primary debt benchmarks, the S&P 500 Index and the Barclays Capital U.S. Aggregate Bond Index, respectively. The percentage of the Fund's assets allocated to underlying stock and bond portfolio funds will vary, and accordingly the composition of the Fund's portfolio will not always reflect the composition of the 50/50 Blended Benchmark.
• Barclays Capital U.S. Aggregate Bond Index is a market value-weighted index that tracks the daily price, coupon, pay-downs and total return performance of fixed-rate, publicly placed, dollar-denominated and non-convertible investment grade debt issues with at least $250 million par amount outstanding and with at least one year to final maturity.
• Lipper Indexes include the largest funds tracked by Lipper, Inc. in the named category. Lipper Small-Cap Core Funds Index, 30 largest small-cap core funds; Lipper Mid-Cap Growth Funds Index, 30 largest mid-cap growth funds, including Columbia Acorn Fund and Columbia Acorn Select; Lipper International Small/Mid Growth Funds Index, 10 largest non-U.S. small/mid growth funds, including Columbia Acorn International; Lipper Small-Cap Growth Funds Index, 30 largest small-cap growth funds, including Columbia Acorn USA; Lipper International Funds Index, 30 largest non-U.S. funds, excluding non-U.S. small-cap funds; Lipper Flexible Portfolio Funds Index, an equal-weighted index of the 30 largest mutual funds within the Flexible Portfolio fund classification, as defined by Lipper.
• Morgan Stanley Capital International Europe, Australasia, Far East (MSCI EAFE) Index (Net) is a capitalization-weighted index that tracks the total return of common stocks in 22 developed-market countries within Europe, Australasia and the Far East. The returns of the MSCI EAFE Index (Net) are presented net of the withholding tax rate applicable to foreign non-resident institutional investors in the foreign companies included in the index who do not benefit from double taxation treaties.
• Russell 2000 Index measures the performance of the 2,000 smallest companies in the Russell 3000 Index, which represents approximately 8% of the total market capitalization of the Russell 3000 Index.
• Russell 2500 Index measures the performance of the 2,500 smallest companies in the Russell 3000 Index, which represents approximately 17% of the total market capitalization of the Russell 3000 Index.
• Standard & Poor's (S&P) 500 Index tracks the performance of 500 widely held, large-capitalization U.S. stocks.
• Standard & Poor's (S&P) MidCap 400 Index is a market value-weighted index that tracks the performance of 400 mid-cap U.S. companies.
• S&P Developed Ex-U.S. Between $2B and $10B Index is a subset of the broad market selected by the index sponsor representing the mid-cap developed market, excluding the United States.
• S&P Global Ex-U.S. SmallCap Index consists of the bottom 20% of institutionally investable capital of developed and emerging countries, outside the United States.
• S&P Global Ex-U.S. Between $500M and $5B Index is a subset of the broad market selected by the index sponsor representing the mid- and small-cap developed and emerging markets, excluding the United States.
Unlike mutual funds, indexes are not managed and do not incur fees or expenses. It is not possible to invest directly in an index.
The views expressed in the "Squirrel Chatter II" and "In a Nutshell" commentaries reflect the current views of the respective authors. These views are not guarantees of future performance and involve certain risks, uncertainties and assumptions that are difficult to predict so actual outcomes and results may differ significantly from the views expressed. These views are subject to change at any time based upon economic, market or other conditions and the respective authors disclaim any responsibility to update such views. These views may not be relied upon as investment advice and, because investment decisions for a Columbia Acorn Fund are based on numerous factors, may not be relied upon as an indication of trading intent on behalf of any particular Columbia Acorn Fund. References to specific company's securities should not be construed as a recommendation or investment advice and there can be no assurance that as of the date of publication of this report, the securities mentioned in each Fund's portfolio are still held or that the securities sold have not been repurchased.
Columbia Acorn Funds News
Introducing ColumbiaSM Acorn® Emerging Markets Fund and ColumbiaSM Acorn® European Fund
On August 22, 2011, we launched two new Columbia Acorn Funds: Columbia Acorn Emerging Markets Fund and Columbia Acorn European Fund. These Funds utilize Columbia Wanger Asset Management's time-tested approach to investing, which centers on finding small- to mid-cap stocks in growing businesses with solid long-term prospects. In recent years, our nine international and global analysts have visited over 50 countries in search of investment ideas. These analysts include the portfolio managers running our new Funds, each of whom has exhibited excellent stock-picking skills.
Within the emerging markets, we've noted that most funds invest in large-cap stocks. Their focus is often commodity producers, whose businesses are tied to world macroeconomics, or financial companies, some of which may be quite risky. By focusing on smaller stocks, Columbia Acorn Emerging Markets Fund invests in what we believe to be more innovative, well-run niche businesses, priced at reasonable valuations. We believe that these types of companies should benefit from providing sought-after products and services to growing numbers of local, middle-class consumers, who have increasing spending power. We also believe that many of these companies experience lower levels of competition and better opportunities to internally reinvest profits than larger cap or developed market companies.
Likewise, Columbia Acorn European Fund has a small- to mid-cap stock focus. Because European companies operate in fairly small domestic markets, many are adept at creating niche products that have international appeal. European companies lead the world in machine tool manufacturing, products used to promote energy efficiency, luxury goods items, rail technology and some areas of medical technology. These products are needed, or wanted, in both developed and developing world markets. The integration of the European Union into a single trade zone with a common currency has created greater efficiency and productivity within the region, and opportunities to improve the infrastructure in Central and Eastern Europe are plentiful. Columbia Acorn European Fund's managers have extensive experience investing within the European markets and manage a similar offshore fund, Wanger European Smaller Companies Fund, which is not available to U.S.-domiciled investors.
I am personally investing in both Funds, as are the new Funds' portfolio managers. The Funds entail specific risks that are outlined in their prospectuses, and they may not be suitable for all investors. If interested, please call 1-800-922-6769 or your broker for a prospectus.
New Co-manager Named to Columbia Acorn Select Investment Team
I am pleased to announce that Robert Chalupnik has been named co-manager of Columbia Acorn Select, effective May 1, 2011. Since 2000, Rob has followed industrial stocks as a Columbia Wanger Asset Management analyst. Rob has excelled in finding growing niche businesses selling at reasonable prices. Over his 10 years as an analyst, he has distinguished himself by substantially beating his custom benchmark, which is comprised of most of the industrial stocks included in the Russell 2500 Index. Three of Rob's finds were among the top-10 positions in Columbia Acorn Fund at the end of period. Rob has worked with Columbia Acorn Select lead portfolio manager Ben Andrews since January of this year and together they have added what we believe to be some of Columbia Wanger Asset Management's best ideas into Columbia Acorn Select. Ben remains lead manager of the Fund and welcomes Rob in his new role.

Charles P. McQuaid
President and Chief Investment Officer
Columbia Wanger Asset Management, LLC
Investors should consider the investment objectives, risks, charges and expenses of a mutual fund carefully before investing. For a free prospectus, which contains this and other important information about the fund, visit columbiamanagement.com. The prospectus should be read carefully before investing.
The Russell 2500 Index measures the performance of the 2,500 smallest companies in the Russell 3000 Index, which represents approximately 17% of the total market capitalization of the Russell 3000 Index.
There is no guarantee that any investment strategy will deliver favorable results. The market value of securities and currencies may fall or fail to rise. Market risk may affect a single issuer, sector of the economy, industry or the market as a whole. Investments in foreign securities involve certain risks not associated with investments in U.S. companies, due to political, regulatory, economic, social and other conditions or events occurring in the country, as well as fluctuations in currency and the risks associated with less developed custody and settlement practices. Risks are particularly significant in emerging markets. Investments in small-capitalization companies involve greater risks and volatility than investments in larger, more established companies. See the prospectus for more information on these and other risks associated with the Fund.
Columbia Acorn Family of Funds
Table of Contents
| Performance At A Glance | | | 1 | | |
Squirrel Chatter II: Shale Gas Returns,
Transforming the Energy Outlook | | | 2 | | |
| Understanding Your Expenses | | | 6 | | |
| Columbia Acorn Fund | |
| In a Nutshell | | | 8 | | |
| At a Glance | | | 9 | | |
| Major Portfolio Changes | | | 20 | | |
| Statement of Investments | | | 22 | | |
| Columbia Acorn International | |
| In a Nutshell | | | 10 | | |
| At a Glance | | | 11 | | |
| Major Portfolio Changes | | | 36 | | |
| Statement of Investments | | | 38 | | |
| Portfolio Diversification | | | 47 | | |
| Columbia Acorn USA | |
| In a Nutshell | | | 12 | | |
| At a Glance | | | 13 | | |
| Major Portfolio Changes | | | 48 | | |
| Statement of Investments | | | 49 | | |
| Columbia Acorn International Select | |
| In a Nutshell | | | 14 | | |
| At a Glance | | | 15 | | |
| Major Portfolio Changes | | | 56 | | |
| Statement of Investments | | | 57 | | |
| Portfolio Diversification | | | 61 | | |
| Columbia Acorn Select | |
| In a Nutshell | | | 16 | | |
| At a Glance | | | 17 | | |
| Major Portfolio Changes | | | 62 | | |
| Statement of Investments | | | 63 | | |
| Columbia Thermostat Fund | |
| In a Nutshell | | | 18 | | |
| At a Glance | | | 19 | | |
| Statement of Investments | | | 68 | | |
| Columbia Acorn Family of Funds | |
| Statements of Assets and Liabilities | | | 70 | | |
| Statements of Operations | | | 71 | | |
| Statements of Changes in Net Assets | | | 72 | | |
| Financial Highlights | | | 76 | | |
| Notes to Financial Statements | | | 79 | | |
Management Fee Evaluation of the
Senior Officer | | | 87 | | |
| Board Approval of the Advisory Agreement | | | 93 | | |
| Columbia Acorn Family of Funds Information | | | 96 | | |
2011 Mid-Year Distributions
The following table lists the mid-year distributions for Columbia Acorn Fund, Columbia Acorn International, Columbia Acorn International Select, Columbia Acorn Select and Columbia Thermostat Fund. Columbia Acorn USA did not have mid-year distributions. The record date was June 7, 2011, and the ex-dividend date and the payable date was June 8, 2011.
| | | Short-term
Capital
Gains | | Long-term
Capital
Gains | | Ordinary
Income | | Reinvestment
Price | |
| Columbia Acorn Fund | | | None | | | $ | 0.3037 | | | $ | 0.0830 | | | $ | 30.40 | | |
| Columbia Acorn International | | | None | | | | None | | | $ | 1.0248 | | | $ | 41.10 | | |
| Columbia Acorn International Select | | | None | | | | None | | | $ | 0.4137 | | | $ | 29.19 | | |
| Columbia Acorn Select | | | None | | | | None | | | $ | 0.4600 | | | $ | 26.76 | | |
| Columbia Thermostat Fund | | | None | | | | None | | | $ | 0.1564 | | | $ | 12.64 | | |
Columbia Acorn Family of Funds
Performance At A Glance Class Z Average Annual Total Returns through 6/30/11
| | | NAV on
6/30/11 | | 2nd
quarter* | | Year
to date* | | 1 year | | 3 years | | 5 years | | 10 years | | Life
of Fund | |
Columbia Acorn Fund
(ACRNX) (6/10/70) | | $ | 31.95 | | | | 1.43 | % | | | 7.18 | % | | | 39.46 | % | | | 8.42 | % | | | 6.19 | % | | | 9.21 | % | | | 15.01 | % | |
| Russell 2500 Index | | | | | -0.59 | % | | | 8.06 | % | | | 39.28 | % | | | 8.17 | % | | | 5.20 | % | | | 7.40 | % | | | NA | | |
| S&P 500 Index** | | | | | 0.10 | % | | | 6.02 | % | | | 30.69 | % | | | 3.34 | % | | | 2.94 | % | | | 2.72 | % | | | 10.67 | % | |
| Lipper Small-Cap Core Funds Index | | | | | -1.36 | % | | | 6.18 | % | | | 36.32 | % | | | 7.54 | % | | | 4.74 | % | | | 6.91 | % | | | NA | | |
| Lipper Mid-Cap Growth Funds Index | | | | | -0.04 | % | | | 7.57 | % | | | 39.76 | % | | | 5.63 | % | | | 6.86 | % | | | 4.73 | % | | | NA | | |
Columbia Acorn International
(ACINX) (9/23/92) | | $ | 41.13 | | | | 1.70 | % | | | 3.02 | % | | | 32.28 | % | | | 4.24 | % | | | 7.35 | % | | | 11.31 | % | | | 12.00 | % | |
S&P Global Ex-U.S. Between
$500M and $5B Index | | | | | 0.72 | % | | | 2.63 | % | | | 34.29 | % | | | 5.43 | % | | | 7.09 | % | | | 12.71 | % | | | 9.34 | % | |
| S&P Global Ex-U.S. SmallCap Index | | | | | 0.59 | % | | | 3.62 | % | | | 35.68 | % | | | 4.10 | % | | | 5.91 | % | | | 11.92 | % | | | 8.61 | % | |
| MSCI EAFE Index (Net) | | | | | 1.56 | % | | | 4.98 | % | | | 30.36 | % | | | -1.77 | % | | | 1.48 | % | | | 5.66 | % | | | 6.35 | % | |
Lipper International Small/
Mid Growth Funds Index | | | | | 1.69 | % | | | 2.88 | % | | | 36.54 | % | | | 2.35 | % | | | 4.85 | % | | | 9.71 | % | | | NA | | |
Columbia Acorn USA
(AUSAX) (9/4/96) | | $ | 31.17 | | | | 1.50 | % | | | 9.14 | % | | | 43.38 | % | | | 8.09 | % | | | 4.85 | % | | | 7.19 | % | | | 10.86 | % | |
| Russell 2000 Index | | | | | -1.61 | % | | | 6.21 | % | | | 37.41 | % | | | 7.77 | % | | | 4.08 | % | | | 6.27 | % | | | 7.73 | % | |
| Russell 2500 Index | | | | | -0.59 | % | | | 8.06 | % | | | 39.28 | % | | | 8.17 | % | | | 5.20 | % | | | 7.40 | % | | | 9.40 | % | |
| S&P 500 Index** | | | | | 0.10 | % | | | 6.02 | % | | | 30.69 | % | | | 3.34 | % | | | 2.94 | % | | | 2.72 | % | | | 6.72 | % | |
| Lipper Small-Cap Growth Funds Index | | | | | 0.23 | % | | | 9.07 | % | | | 41.91 | % | | | 7.60 | % | | | 4.77 | % | | | 4.04 | % | | | 6.26 | % | |
Columbia Acorn Int'l Select
(ACFFX) (11/23/98) | | $ | 28.98 | | | | 1.10 | % | | | 3.74 | % | | | 31.33 | % | | | -0.26 | % | | | 7.22 | % | | | 9.50 | % | | | 10.23 | % | |
S&P Developed Ex-U.S. Between
$2B and $10B Index | | | | | 0.90 | % | | | 4.04 | % | | | 33.74 | % | | | 1.73 | % | | | 3.73 | % | | | 9.60 | % | | | 8.36 | % | |
| MSCI EAFE Index (Net) | | | | | 1.56 | % | | | 4.98 | % | | | 30.36 | % | | | -1.77 | % | | | 1.48 | % | | | 5.66 | % | | | 4.20 | % | |
Lipper International Small/
Mid Growth Funds Index | | | | | 1.69 | % | | | 2.88 | % | | | 36.54 | % | | | 2.35 | % | | | 4.85 | % | | | 9.71 | % | | | 11.13 | % | |
Columbia Acorn Select
(ACTWX) (11/23/98) | | $ | 28.25 | | | | -0.95 | % | | | 0.02 | % | | | 29.03 | % | | | 3.29 | % | | | 5.17 | % | | | 8.41 | % | | | 10.68 | % | |
| S&P MidCap 400 Index | | | | | -0.73 | % | | | 8.56 | % | | | 39.38 | % | | | 7.82 | % | | | 6.60 | % | | | 7.94 | % | | | 9.79 | % | |
| S&P 500 Index** | | | | | 0.10 | % | | | 6.02 | % | | | 30.69 | % | | | 3.34 | % | | | 2.94 | % | | | 2.72 | % | | | 2.82 | % | |
| Lipper Mid-Cap Growth Funds Index | | | | | -0.04 | % | | | 7.57 | % | | | 39.76 | % | | | 5.63 | % | | | 6.86 | % | | | 4.73 | % | | | 6.86 | % | |
Columbia Thermostat Fund
(COTZX) (9/25/02)† | | $ | 12.86 | | | | 1.47 | % | | | 4.66 | % | | | 25.39 | % | | | 5.82 | % | | | 5.81 | % | | | — | | | | 7.94 | % | |
| S&P 500 Index | | | | | 0.10 | % | | | 6.02 | % | | | 30.69 | % | | | 3.34 | % | | | 2.94 | % | | | — | | | | 7.72 | % | |
Barclays Capital U.S.
Aggregate Bond Index | | | | | 2.29 | % | | | 2.72 | % | | | 3.90 | % | | | 6.46 | % | | | 6.52 | % | | | — | | | | 5.06 | % | |
| Lipper Flexible Portfolio Funds Index | | | | | 0.46 | % | | | 5.11 | % | | | 23.38 | % | | | 4.00 | % | | | 5.16 | % | | | — | | | | 8.28 | % | |
| 50/50 Blended Benchmark†† | | | | | 1.21 | % | | | 4.40 | % | | | 16.88 | % | | | 5.45 | % | | | 5.14 | % | | | — | | | | 6.71 | % | |
*Not annualized.
**Although the Fund typically invests in small- and mid-sized companies, the comparison to the S&P 500 Index is presented to show performance against a widely recognized market index over the life of the Fund.
Performance data shown represents past performance and is not a guarantee of future results. The investment return and principal value of an investment will fluctuate so that shares, when redeemed, may be worth more or less than their original cost. Current performance may be lower or higher than the performance data shown. Please visit columbiamanagement.com for daily and most recent month-end updates.
Net asset value (NAV) returns do not include sales charges or contingent deferred sales charges (CDSC). If they were included, returns would have been lower. Class Z shares are sold only at NAV with no distribution and service (Rule 12b-1) fees. Only eligible investors may purchase Class Z shares of the Funds, directly or by exchange. Please see each Fund's prospectus for eligibility and other details. Class Z shares have limited eligibility and the investment minimum requirement may vary.
Performance results reflect any fee waivers or reimbursements of Fund expenses by the investment adviser and/or any of its affiliates. Absent these fee waivers or expense reimbursement arrangements, performance results would have been lower. Annual operating expense ratios are stated as of each Fund's current prospectus and differences in expense ratios disclosed elsewhere in this report may result from including fee waivers and expense reimbursements as well as different time periods used in calculating the ratios. Columbia Acorn Fund Class Z: 0.76%. Columbia Acorn International Class Z: 0.98%. Columbia Acorn USA Class Z: 1.01%. Columbia Acorn International Select Class Z: 1.16%. Columbia Acorn Select Class Z: 0.97%. Columbia Thermostat Fund has a contractual expense waiver or reimbursement that expires April 30, 2012. Expense ratios without and with the contractual waiver, including fees and expenses associated with the Fund's investments in other investment companies, for Class Z shares are 1.16% and 1.04%, respectively.
†A "fund of funds" bears its allocable share of the costs and expenses of the underlying funds in which it invests. Such funds are thus subject to two levels of fees and potentially higher expense ratios than would be associated with an investment in a fund that invests and trades directly in financial instruments under the direction of a single manager.
††The 50/50 Blended Benchmark is a custom supplemental benchmark established by the adviser.
All results shown assume reinvestment of distributions and do not reflect the deduction of taxes that a shareholder would pay on fund distributions or on the redemption of fund shares.
Unlike mutual funds, indexes are not actively managed and do not incur fees or expenses. It is not possible to invest directly in an index. For index definitions, see the inside front cover of this report.
1
Squirrel Chatter II: Shale Gas Returns, Transforming the Energy Outlook
 Just five to seven years ago, it was widely believed that North American natural gas resources were being rapidly depleted. Today, the outlook appears to be very much improved thanks to the ingenuity of a few individuals and a process that should provide natural gas for decades to come.
In 1825, some 34 years before Colonel Edwin Drake1 drilled the first oil well in Titusville, Pennsylvania, William Aaron Hart drilled the first natural gas well, in shale located in Fredonia, New York. By August of that year, five structures in the village were illuminated by natural gas and by November there were 36 gas lights in the village. In 1857, Preston Barmore, the superintendent of the Fredonia Natural Gas Co., was not satisfied with the production from a 122 foot well so he exploded crevices of rock in the well, increasing the supply of gas. Within a few years, the village had 150 gas lights.2
Plenty of natural gas was subsequently found in sandstone formations under impermeable rock, in similar formations as oil, or accompanied by oil. Extracting this natural gas was less costly than drilling for gas in shale, so shale exploration all but ended. Over 300,000 miles of gas pipelines were built, and demand for natural gas grew.3 U.S.-marketed production rose to 1 trillion cubic feet (TCF) of natural gas by 1923, and has ranged from 16.9 to 22.6 TCF since 1973.4 Natural gas is used for heating and manufacturing, and is a feedstock for fertilizers, plastics and chemicals.
Recent Natural Gas Shortages
In 2004, Julian Darley wrote High Noon for Natural Gas, The New Energy Crisis. He reviewed Hubbert's Peak, a theory named after the geologist who researched oil finding and production curves and then correctly predicted that U.S. oil production would peak around 1970. Darley applied Hubbert's Peak to natural gas data and concluded that North American gas production had also peaked and was likely to plunge.
Darley wrote, "The United States and Canada are entering a natural gas crisis ...North American supply is simply no longer able to meet desired consumption."5 He added, "...the worst immediate problem confronting the United States (and Canada) is not oil, but natural gas. It is a natural gas shortage that could seriously interrupt the U.S. economy..."6 Darley noted that the U.S. Energy Information Administration (EIA) made enormous upward revisions for production of natural gas from shale, tight sands and coal beds, but he believed such gains would fail to occur. Instead, importing of liquefied natural gas (LNG) would have to be an interim solution. But LNG, Darley stated, had safety and security risks. Geopolitically, relying on imported LNG would also be problematic, as Russia and Iran had the largest reserves of natural gas.
Darley believed that the 300-plus new natural gas-fired electric generating stations, built between 1980 and 2003 at a cost of $100 billion, were huge mistakes. The power companies had apparently reviewed a 1999 National Petroleum Council report that stated North American natural gas supplies would grow. Darley labeled that report as an "example of the kind of cornucopian delusion that characterizes many in government and most in industry, who believe in nothing but economics and the miracle of capitalism with its unlimited ability to find substitutes for everything."7
Darley thought that with worldwide Peak Oil imminent and North American natural gas production plunging, energy was to become scarce, and the industrial revolution would unwind. He advocated that people should be able to obtain their daily needs within walking distance from where they lived. His long-term solution was to depopulate the earth, such that mankind no longer mined the planet and consumed only the energy that the sun regularly provides. At one child per woman, the population of the earth would be back to one billion in about one hundred years.
Domestic natural gas production fell between 2001 and 2005 and prices increased between 2002 and 2008.8 Most major oil companies and analysts agreed that natural gas production in North America was peaking, and that the U.S. would need substantial imports of LNG. I remember going to an energy conference in early 2006 where this
2
view was widespread. Darley's nightmare scenario seemed to be coming true.
Back in the Gas Fields
George Mitchell has been called the Father of the Barnett Natural Gas Field, located in and around Fort Worth, Texas. Over an 18-year period beginning in 1981, his company, Mitchell Energy and Development, experimented with fracturing gas-bearing shale that is located between 6,000 and 14,000 feet below the surface. Geologists knew that shale had lots of pores and the ability to store natural gas, but since pores in shale are rarely interconnected, gas flows poorly through shale. Initial attempts to extract this gas were costly, and production was not economical. Eventually, the company developed a "light sand frac" method that was effective and used less fluid. The combination of reduced costs and rising natural gas prices made such drilling profitable. Mitchell drilled many wells at the Barnett field, producing far more natural gas than most people expected.9
Mitchell needed more funding and sold his company to Devon Energy, a larger, independent producer. Devon had expertise in an additional technology, horizontal drilling, which tilted drill holes at angles or sideways once they hit pay dirt. More gas-bearing shale was consequently exposed to the well. With this added technology, the company drilled 55 wells in the Barnett field in 2003 and the shale gas boom began.10 Some 13,500 gas wells have been drilled in the Barnett field since 199711 and the Barnett field accounted for 6% of total natural gas production in the United States in 2010.12
Drilling at other shale gas formations has also jumped. U.S. shale gas production increased 12-fold in the last decade and currently accounts for about 25% of U.S. natural gas production.13 With greater production, natural gas wellhead prices halved from 2008 to 2010. In its yearly forecast in 2010, the EIA doubled its estimate of U.S. shale gas production for 2035 and predicts shale gas production will hit 46% of U.S. consumption that year.14 Imports will drop from 11% of natural gas consumption in 2009 to 1%.15 With "economics and the miracle of capitalism,"16 we won't need to revert to Darley's dark ages any time soon. The EIA also believes shale gas totaling at least six-times U.S. reserves is recoverable in at least 32 other countries.17
Energy Mix
In 2009, Robert Hefner published The Grand Energy Transition. The book provides perspectives on past and future sources and uses of energy. Hefner believes that energy usage naturally transitions from solids (wood and coal) to liquids (oil) and then to gasses (natural gas, wind and hopefully nuclear fusion). He sees newer fuels as superior to older ones, with each new fuel facilitating new technologies, improvements in the environment and higher living standards.
The transition to coal from wood powered the industrial revolution and allowed millions of acres of forests to regrow. Coal then fell from 80% of the world energy market in 1900 to about 28% currently. Oil ascended to 48% of the world's energy by 1973, displacing much dirty coal and revolutionizing transportation via the introduction of automobiles and airplanes. Oil subsequently dropped to about 36% of world energy consumption. Natural gas has risen from 10% of the world's energy in 1950 to 24% currently.18
Believing in global warming, Hefner notes that the transition from wood to coal to oil to natural gas slashed carbon content and increased hydrogen content of fuels with each transition. Since burning carbon creates carbon dioxide (CO2), the primary greenhouse gas, and burning hydrogen creates water, the natural transitions from solids to liquids to gasses slow global warming. Burning natural gas creates 44% less CO2 than burning coal and 29% less than burning oil. Burning natural gas also emits about 80% less nitrogen oxides, over 90% lower particulates and over 99% less sulfur dioxide than coal or oil.19
Under an earlier belief that the United States was running out of natural gas, the Natural Gas Policy Act (NGPA) and the Fuel Use Act were passed in 1978. The NGPA immediately deregulated prices for gas produced from deep wells and phased out other price controls.20 The Fuel Use Act mandated the phase out of natural gas for electric generation and restricted its industrial uses. Prices for deep gas jumped, but so did drilling. Production grew, and with demand depressed by the Fuel Use Act, prices then collapsed. There was an excess supply of natural gas, known as the "gas bubble," until the year 2000.
Hefner believes that prior price controls and the Fuel Use Act slowed the natural transition from coal and oil to
3
natural gas. As a result of the Fuel Use Act, some 100,000 megawatts of coal-fired electric generating capacity was built in the United States through 1989 that has emitted 15 billion metric tons of CO2 into the atmosphere.21 Hefner believes that the construction of the coal burning plants, not the natural gas burning plants, was the big mistake.
Hefner subscribes to Peak Oil occurring soon, but sees many decades of abundant and relatively cheap natural gas. Hence, he predicts the grand energy transition to natural gas will continue, and he believes natural gas will be a bridge fuel to renewable energy and possibly nuclear fusion. Natural gas complements wind energy quite well, as gas-burning electric plants can quickly power up when the wind slows.
Some 12 million vehicles worldwide are powered by natural gas. Of that number, there are estimated to be 110,000 natural gas-powered vehicles in the United States,22 including thousands of trucks serving the ports of Long Beach and Los Angeles,23 more than 11,000 buses24 and approximately 12,000 Honda Civic GX cars.25 These vehicles burn natural gas currently priced at one-third of the energy equivalent price of oil. Hefner believes that half the autos in the United States should be powered by natural gas, and the dirtiest, coal-burning electric plants should be replaced by natural gas plants. Yearly gas consumption would rise by 13 TCF, but could be met by increased shale gas production.26
Investment Implications
We believe that innovations in producing gas from shale have indeed transformed the U.S. energy outlook. We profitably invested in some of the pioneers of shale gas though, with the current glut of natural gas, the stocks now look less attractive. Supplies of gas may remain high in the short term as some unprofitable drilling persists in order to keep lease rights. Over time, the low prices will likely result in reduced drilling and more constrained supplies. When this happens, natural gas prices should rise to a level where drilling and production are moderately profitable. We continue to look for suppliers and service companies participating in shale gas production. Some shale oil fields are now being developed, including the Bakken field in North Dakota and Canada and the Eagle Ford field in Texas. At this point, we don't think there will be enough shale oil production to revolutionize the oil market, but we do believe we have found some attractive stocks participating in those developments.

Charles P. McQuaid
President and Chief Investment Officer
Columbia Wanger Asset Management, LLC
The information and data provided in this analysis are derived from sources that we deem to be reliable and accurate. These views are not guarantees of future performance and involve certain risks, uncertainties and assumptions that are difficult to predict so actual outcomes and results may differ significantly from the views expressed. The views/opinions expressed in Squirrel Chatter II are those of the author and not of the Columbia Acorn Trust Board, are subject to change at any time based upon economic, market or other conditions, may differ from views expressed by other Columbia Management associates and the respective parties disclaim any responsibility to update such views. These views may not be relied on as investment advice and, because investment decisions for a Columbia Acorn Fund are based on numerous factors, may not be relied on as an indication of trading intent on behalf of any particular Columbia Acorn Fund.
1 Colonel Edwin Drake was an American oil driller, credited with being the first to drill for oil in the United States.
2 Lash, Eileen and Gary, "The Early History of Natural Gas, Kicking Down the Well," The SUNY Fredonia Shale Research Institute, June 3, 2011, http://www.fredonia.edu/shaleinstitute/history.asp.
3 U.S. Energy Information Administration (EIA), http://www.eia.gov/pub/oil_gas/natural_gas/analysis_publications/ngpipeline/index.html.
4 EIA data, including imports primarily from Canada, states the U.S. has been using about 23 trillion cubic feet (TCF) of gas a year, including about 6.6 TCF for industrial purposes. www.eia.gov.
5 Darley, Julian, High Noon for Natural Gas, The New Energy Crisis, (White River Junction, Vermont, Chelsea Green Publishing Company 2004) p. 13.
6 Ibid., p. 2.
7 Ibid., p. 79-80.
8 According to EIA data, domestic natural gas production fell from 20.6 TCF in 2001 to 18.9 TCF in 2005. Average annual wellhead prices rose from $3 to $5 in 2002-2003 to $6 to $8 from 2006-2008. www.eia.gov.
9 Airhart, Marc, "The Father of the Barnett Natural Gas Field," http://geology.com/research/barnett-shale-father.html.
10 Yergin, Daniel, "Stepping on the Gas," Wall Street Journal, April 2, 2011.
11 Presentation for the Organization of Economic Cooperation and Development (OECD), "Shale Gas and the Outlook for U.S. Natural Gas Markets and Global Gas Resources," June 21, 2011, http://www.eia.gov/pressroom/presentations/newell_06212011.pdf.
12 U.S. Department of Energy, Office of Fossil Energy and National Energy Technology Laboratory, "Modern Shale Gas, Development in the United States: A Primer," April 2009, p. ES-1, http://fossil.energy.gov/programs/oilgas/publications/
naturalgas_general/Shale_Gas_Primer_2009.pdf
13 Presentation for the Organization of Economic Cooperation and Development (OECD), "Shale Gas and the Outlook for U.S. Natural Gas Markets and Global Gas Resources," June 21, 2011, http://www.eia.gov/pressroom/presentations/newell_06212011.pdf.
4
14 Lomax, Simon, "Shale-Gas Output May Double by 2035, Reducing Energy Imports, U.S. Says," Bloomberg, December 16, 2010, http://www.bloomberg.com/news/2010-12-16/natural-gas-production-from-shale-may-double-by-35-u-s-agency-forecasts.html.
15 Presentation for the Organization of Economic Cooperation and Development (OECD), "Shale Gas and the Outlook for U.S. Natural Gas Markets and Global Gas Resources," June 21, 2011, http://www.eia.gov/pressroom/presentations/newell_06212011.pdf.
16 Darley, Julian, op. cit., p. 79-80.
17 Presentation for the Organization of Economic Cooperation and Development (OECD), "Shale Gas and the Outlook for U.S. Natural Gas Markets and Global Gas Resources," June 21, 2011, http://www.eia.gov/pressroom/presentations/newell_06212011.pdf.
18 Hefner III, Robert A., The Grand Energy Transition, (Hoboken, New Jersey, John Wiley & Sons, Inc. 2009) p. 27.
19 U.S. Department of Energy, Office of Fossil Energy and National Energy Technology Laboratory, "Modern Shale Gas, Development in the United States: A Primer," April 2009, p. 5, http://fossil.energy.gov/programs/oilgas/publications/naturalgas_general/Shale_
Gas_Primer_2009.pdf
20 Hefner III, Robert A., op. cit., p. 120-121. Having been an independent explorer for natural gas, Hefner was well aware that gas existed in locations independently of oil. (He has been called the "Father of Deep Natural Gas" as his company drilled very deep wells finding only natural gas at very high pressure.) In the 1970s when geologists for major oil companies testified to Congress that the U.S. was running out of natural gas, Hefner dissented, believing that the shortage was caused by price controls in place since 1954. Price controls cause shortages of valuable commodities by boosting demand and restraining supplies.
21 Ibid., p. 122.
22 Natural Gas Vehicles of America, http://www.ngvc.org/mktplace/index.html. Accessed July 20, 2011.
23 Hefner III, Robert A., op. cit., p. 201.
24 Natural Gas Vehicles of America, http://www.ngvc.org/mktplace/index.html. Accessed July 20, 2011.
25 Oberman, Mira, "The Greenest Car You've (Likely) Never Heard Of," Agence France-Presse, April 11, 2011.
26 Hefner III, Robert A., op. cit., p. 203.
5
Understanding Your Expenses
As a Fund shareholder, you incur two types of costs. There are transaction costs, which generally include sales charges on purchases and may include redemption or exchange fees. There are also ongoing costs, which generally include investment advisory fees and other Fund expenses. The following information is intended to help you understand your ongoing costs of investing in the Columbia Acorn Funds and to compare these costs with the ongoing costs of investing in other mutual funds.
Analyzing Your Fund's Expenses
To illustrate these ongoing costs, we have provided examples and calculated the expenses paid by investors in the Class Z shares of the Columbia Acorn Funds for the last six months. The information in the following table is based on an initial investment of $1,000, which is invested at the beginning of the reporting period and held for the entire period. Expense information is calculated two ways and each method provides you with different information. The amount listed in the "Actual" column is calculated using each Fund's actual operating expenses and total return for the period. The amount listed in the "Hypothetical" column assumes that the return each year is 5% before expenses and then applies each Fund's actual expense ratio for the period to the hypothetical return. You should not use the hypothetical account values and expenses to estimate either your actual account balance at the end of the period or the expenses you paid during the reporting period. See the "Compare With Other Funds" information for details on using the hypothetical data.
January 1, 2011 – June 30, 2011
| | | Account value at
the beginning of
the period ($) | | Account value at
the end of
the period ($) | | Expenses paid
during period ($) | | Fund's
annualized
expense
ratio (%)* | |
| Class Z Shares | | Actual | | Hypothetical | | Actual | | Hypothetical | | Actual | | Hypothetical | | Actual | |
| Columbia Acorn Fund | | | 1,000.00 | | | | 1,000.00 | | | | 1,071.80 | | | | 1,021.08 | | | | 3.85 | | | | 3.76 | | | | 0.75 | | |
| Columbia Acorn International | | | 1,000.00 | | | | 1,000.00 | | | | 1,030.20 | | | | 1,020.08 | | | | 4.78 | | | | 4.76 | | | | 0.95 | | |
| Columbia Acorn USA | | | 1,000.00 | | | | 1,000.00 | | | | 1,091.40 | | | | 1,019.89 | | | | 5.13 | | | | 4.96 | | | | 0.99 | | |
| Columbia Acorn International Select | | | 1,000.00 | | | | 1,000.00 | | | | 1,037.40 | | | | 1,019.09 | | | | 5.81 | | | | 5.76 | | | | 1.15 | | |
| Columbia Acorn Select | | | 1,000.00 | | | | 1,000.00 | | | | 1,000.20 | | | | 1,019.98 | | | | 4.81 | | | | 4.86 | | | | 0.97 | | |
| Columbia Thermostat Fund** | | | 1,000.00 | | | | 1,000.00 | | | | 1,046.60 | | | | 1,023.55 | | | | 1.27 | | | | 1.25 | | | | 0.25 | | |
It is important to note that the expense amounts shown in the table are meant to highlight only ongoing costs of investing in the Funds and do not reflect any transaction costs, such as sales charges, redemption or exchange fees. Therefore, the hypothetical examples provided may not help you determine the relative total costs of owning different funds. If these transaction costs were included, your costs would have been higher.
*Expenses paid during the period are equal to each Fund's annualized expense ratio, multiplied by the average account value over the period and then multiplied by the number of days in the Fund's most recent fiscal half-year and divided by 365.
**Columbia Thermostat Fund's expenses do not include fees and expenses incurred by the Fund from the underlying portfolio funds in which it invests. Had the investment adviser and/or any of its affiliates not waived fees or reimbursed a portion of expenses, account value at the end of the period would have been reduced.
Compare With Other Funds
Since all mutual funds are required to include the same hypothetical calculations about expenses in shareholder reports, you can use this information to compare the ongoing cost of investing in the Funds with other funds. To do so, compare the 5% hypothetical example with the 5% hypothetical examples that appear in the shareholder reports of other funds. As you compare hypothetical examples of other funds, it is important to note that hypothetical examples are meant to highlight the continuing costs of investing in a fund and do not reflect any transaction costs, such as sales charges, or redemption or exchange fees.
6
Estimating Your Actual Expenses
To estimate the expenses that you actually paid over the period, first you will need your account balance at the end of the period:
• For shareholders who receive their account statements from Columbia Management Investment Services, Corp., your account balance is available online at columbiamanagement.com or by calling Shareholder Services at (800) 922-6769.
• For shareholders who receive their account statements from their brokerage firm, contact your brokerage firm to obtain your account balance.
1. Divide your ending account balance by $1,000. For example, if an account balance was $8,600 at the end of the period, the result would be 8.6.
2. In the section of the table titled "Expenses paid during the period," locate the amount for your Fund. You will find this number is in the column labeled "Actual." Multiply this number by the result from step 1. Your answer is an estimate of the expenses you paid on your account during the period.
7
Columbia Acorn Fund
In a Nutshell
 | |  | |
|
| Charles P. McQuaid | | Robert A. Mohn | |
|
| Lead Portfolio Manager | | Co-Portfolio Manager | |
|
Performance data shown represents past performance and is not a guarantee of future results. The investment return and principal value will fluctuate so that shares, when redeemed, may be worth more or less than the original cost. Current performance may be lower or higher than the performance data shown. Please visit columbiamanagement.com for daily and most recent month-end performance updates.
Fund Positions
in Mentioned Holdings
As a percentage of net assets, as of 6/30/11
| lululemon athletica | | | 2.3 | % | |
| Informatica | | | 1.4 | % | |
| Abercrombie & Fitch | | | 1.2 | % | |
| IPG Photonics | | | 1.0 | % | |
| Fugro | | | 1.0 | % | |
| Polycom | | | 0.8 | % | |
| Hansen Natural | | | 0.8 | % | |
| Pacific Rubiales Energy | | | 0.7 | % | |
| Oshkosh | | | 0.5 | % | |
| SRA International | | | 0.3 | % | |
Columbia Acorn Fund rose 1.43% in the second quarter of 2011, outperforming the 0.59% drop in its primary benchmark, the Russell 2500 Index, and also beating other indexes shown on Page 1. During the first half of 2011, the Fund was up 7.18%, somewhat less than the Russell 2500's gain of 8.06%, and was mixed versus other indexes.
Consumer stocks were marked up during both the quarter and the half. Premium active apparel retailer lululemon athletica was the Fund's top dollar winner during both periods, up 26% in the quarter and 63% in the half. Alternative beverage producer Hansen Natural also provided large gains, rising 34% in the quarter and 55% in the half. Sales momentum at teen apparel retailer Abercrombie & Fitch accelerated, causing its stock to rack up a 14% gain in the quarter and a 16% gain in the half. All three companies had excellent growth in sales and earnings.
Several technology stocks also boosted results for the Fund. IPG Photonics, a company that is coupling laser and fiber optic technology, was Columbia Acorn Fund's second largest dollar gainer in both the quarter and the half, rising 26% and 130%, respectively. The company's quarterly earnings per share grew over six-fold on revenues that nearly doubled versus the prior year. Data integration software company Informatica rose 12% in the quarter and 33% in the half on fine earnings growth. Video conferencing equipment maker Polycom showed a 24% gain in the quarter and a 65% jump in the half on better than expected earnings.
Performance was boosted by takeovers. In the quarter, device maker American Medical Systems appreciated 39% as it agreed to be taken over by Endo Pharmaceuticals. Government I.T. services company SRA International agreed to sell out to a private equity firm, and its stock was up 51% in the half. GSI Commerce and Terremark were subject to takeover offers in the first quarter and their stocks also helped first half results.
The Fund's largest dollar loser in the quarter was sub-sea oilfield services provider Fugro, off 16% on disappointing earnings caused by customers delaying projects. Oshkosh fell 18% in the quarter, on news of a difficult start to military truck production. The Fund's largest dollar loser in the half was Colombian oil producer Pacific Rubiales Energy, off 21%. The stock gave up a fraction of its 2010 gains on exploration results that disappointed some analysts.
Columbia Acorn Fund's foreign stocks were off 3.59% in the quarter and 2.69% in the half.* Fugro and Pacific Rubiales Energy, mentioned above, were the largest foreign losers. The Fund's international stock weight dropped to 10.8% from 11.6% at the end of the first quarter and from 12.6% at the end of 2010.
The markets have been concerned about sovereign debt issues. While the U.S. debt ceiling was raised after the end of the quarter, the debt deal resulted in no fundamental reforms and large remaining uncertainties. A congressional committee will hopefully provide better solutions on schedule, before the end of 2011. The Greek debt situation seems more intractable, but the size of the debt is relatively small. Meanwhile, most of the companies owned by the Fund have been reporting fine earnings gains, which we believe could lead to higher stock prices should macroeconomic concerns ease.
*These returns are not comparable to mutual fund returns, as they are gross of fees and other expenses and do not portray the cash effects incurred by actual mutual funds. Columbia Acorn Fund's foreign stockholdings were not purchased as a balanced, stand-alone portfolio.
Stocks of small- and mid-cap companies pose special risks, including possible illiquidity and greater price volatility than stocks of larger, more established companies. International investing involves special risks, including foreign taxation, currency risks, risks associated with possible differences in financial standards and other risks associated with future political and economic developments.
Portfolio holdings are subject to change periodically and may not be representative of current holdings.
8
Columbia Acorn Fund (ACRNX)
At a Glance
Performance data shown represents past performance and is not a guarantee of future results. The investment return and principal value of an investment will fluctuate so that shares, when redeemed, may be worth more or less than their original cost. Current performance may be lower or higher than the performance data shown. Performance results reflect any fee waivers or reimbursements of Fund expenses by the investment adviser and/or any of its affiliates. Absent these fee waivers and/or expense reimbursement arrangements, performance results would have been lower. Please visit columbiamanagement.com for daily and most recent month-end updates.
Pretax and After-tax Average Annual Total Returns (Class Z)
through June 30, 2011
Inception 6/10/70
| | Year
to date* | |
1 year | |
5 years | |
10 years | |
| Returns before taxes | | | 7.18 | % | | | 39.46 | % | | | 6.19 | % | | | 9.21 | % | |
| Returns after taxes on distributions | | | 6.92 | | | | 38.52 | | | | 5.49 | | | | 8.66 | | |
Returns after taxes on distributions
and sale of fund shares | | | 4.86 | | | | 26.57 | | | | 5.23 | | | | 8.07 | | |
| Russell 2500 Index (pretax)** | | | 8.06 | | | | 39.28 | | | | 5.20 | | | | 7.40 | | |
All results shown assume reinvestment of distributions.
*Year to date data is not annualized
**The Fund's primary benchmark.
After-tax returns are calculated using the highest historical individual federal marginal income tax rates, and do not reflect the impact of state and local taxes. Returns after taxes on distributions and sale of Fund shares reflect the additional tax impact of long-term gains or losses realized when Fund shares are sold. The returns are taxed at the maximum rate and assume shares were purchased at the beginning of the period. Actual after-tax returns depend on the investor's tax situation and may differ from those shown. After-tax returns are not relevant to investors who hold their Fund shares through tax-deferred arrangements such as 401(k) plans or individual retirement accounts. After-tax returns are shown for Class Z shares only; after-tax returns for other share classes will vary. Indexes do not reflect any deduction for fees, expenses or taxes.
The Fund's Class Z annual operating expense ratio, as stated in the current prospectus, is 0.76%.
Columbia Acorn Fund Portfolio Diversification
as a percentage of net assets, as of 6/30/11
Columbia Acorn Fund Top 10 Holdings
as a percentage of net assets, as of 6/30/11
| 1. | | lululemon athletica
Premium Active Apparel Retailer | | | 2.3
| % | |
| 2. | | Ametek
Aerospace/Industrial Instruments | | | 1.6
| % | |
| 3. | | FMC Technologies
Oil & Gas Wellhead Manufacturer | | | 1.4
| % | |
| 4. | | Informatica
Enterprise Data Integration Software | | | 1.4
| % | |
| 5. | | Mettler Toledo
Laboratory Equipment | | | 1.4
| % | |
| 6. | | Donaldson
Industrial Air Filtration | | | 1.3
| % | |
| 7. | | Crown Castle International
Communications Towers | | | 1.3
| % | |
| 8. | | Abercrombie & Fitch
Teen Apparel Retailer | | | 1.2
| % | |
| 9. | | IPG Photonics
Fiber Lasers | | | 1.1
| % | |
| 10. | | Alexion Pharmaceuticals
Biotech Focused on Orphan Diseases | | | 1.0
| % | |
The Fund's top 10 holdings and portfolio diversification vary with changes in portfolio investments. See the Statement of Investments for a complete list of the Fund's holdings.
The Growth of a $10,000 Investment in Columbia Acorn Fund (Class Z)
June 10, 1970 through June 30, 2011
This graph compares the results of $10,000 invested in Columbia Acorn Fund at inception on June 10, 1970 to the S&P 500 Index and to an initial $31,777 investment in the Russell 2500 Index on the index's December 31, 1978 inception date. Although the indexes are provided for use in assessing the Fund's performance, the Fund's holdings may differ significantly from those in the indexes. The indexes are unmanaged and returns for both the indexes and the Fund include reinvested dividends and capital gains. It is not possible to invest directly in an index. The graph does not reflect taxes that a shareholder would pay on Fund distributions or on a sale of Fund shares.
Total Net Assets of the Fund: $19.3 billion
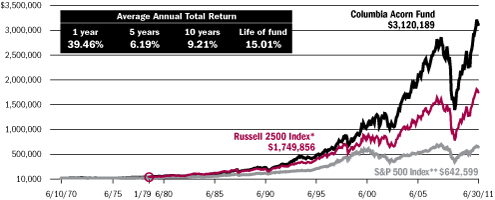
* A $10,000 investment in Columbia Acorn Fund at inception appreciated to $31,777 on December 31, 1978, the inception date of the Russell 2500 Index. For comparison with the Russell 2500 Index, we assigned the index the same value as the Fund at index inception.
**Although the Fund typically invests in small- and mid-sized companies, the comparison to the S&P 500 Index is presented to show performance against a widely recognized market index over the life of the Fund.
9
Columbia Acorn International
In a Nutshell
 | |  | |
|
| P. Zachary Egan | | Louis J. Mendes III | |
|
| Co-Portfolio Manager | | Co-Portfolio Manager | |
|
Performance data shown represents past performance and is not a guarantee of future results. The investment return and principal value will fluctuate so that shares, when redeemed, may be worth more or less than the original cost. Current performance may be lower or higher than the performance data shown. Please visit columbiamanagement.com for daily and most recent month-end performance updates.
Fund's Positions
in Mentioned Holdings
As a percentage of net assets, as of 6/30/11
| Melco Crown Entertainment | | | 1.4 | % | |
| ShawCor | | | 0.8 | % | |
| Simplo Technology | | | 0.7 | % | |
| President Chain Store | | | 0.5 | % | |
| Gree | | | 0.5 | % | |
| Start Today | | | 0.4 | % | |
| Petropavlovsk | | | 0.4 | % | |
Columbia Acorn International was up 1.70% in the second quarter of 2011, 0.98% ahead of its primary benchmark, the S&P Global Ex-U.S. Between $500M and $5B Index. This brought the Fund's return for the six months to 3.02%, slightly ahead of the 2.63% gain of its benchmark.
The Fund's absolute returns in the quarter were highest in Asia, driven by Melco Crown Entertainment, which operates a casino in Macau; Simplo Technology, a Taiwanese manufacturer of battery packs for notebook computers and iPads; and President Chain Store, a Taiwanese convenience store operator with inroads into mainland China. Consistent with the performance of these stocks, consumer discretionary and information technology sector holdings were the Fund's best performing globally. In a somewhat subdued quarter for international small-cap stocks overall, the Fund's Japanese holdings also put up a pleasing 5.9% USD return, led by two of the Fund's internet-related stocks: Gree, a social networking site and game developer, and Start Today, an online apparel retailer. These stocks were up over 30% and 28%, respectively, likely buoyed by high valuations assigned to U.S. internet-related businesses in recent public and private market transactions.
Energy and resource companies were among the most disappointing in the quarter. ShawCor was a big position and down 18% after reporting first quarter results substantially below expectations. This Canadian company makes money by coating pipelines, and the most profitable work tends to be large offshore projects, and those in Asia, the Middle East, and the North Sea. While the company is bidding on many new projects now, in recent quarters they unfortunately ran into a lull in large projects as work lined up two or three years ago came to an end. Petropavlovsk, a U.K.-domiciled gold and iron ore miner with mines in Russia, was off over 26% on investor worries that more delays and capital would be required to complete the company's projects. This came on top of general weakness among gold mining stocks.
Eurozone sovereign risk has recently been leading headlines. Europe, including countries not part of the common euro currency, is home to almost 40% of the Fund's assets. This is an overweight position, with risk mitigated and opportunity enhanced, we believe, by the fact that many of these European holdings have significant revenues and earnings outside of Europe. While we are not economists and do not structure the portfolio according to macroeconomic precepts, we expect the euro to survive the present crisis. We believe the protracted public debate reflects the inevitably messy process of allocating economic and political pain among creditor and debtor countries, and private and public actors. Indeed, creditor countries who seek tighter fiscal coordination among eurozone countries going forward have little to gain in ending the crisis until they have extracted such concessions. Markets, however, do not like uncertainty and continued volatility is likely until a solution is reached.
Thank you for your continued confidence in Columbia Acorn International.
International investing involves special risks, including foreign taxation, currency risks, risks associated with possible differences in financial standards and other risks associated with future political and economic developments. Stocks of small- and mid-cap companies pose special risks, including possible illiquidity and greater price volatility than stocks of larger, more established companies. Investing in emerging markets may involve greater risks than investing in more developed countries. In addition, concentration of investments in a single region may result in greater volatility.
Portfolio holdings are subject to change periodically and may not be representative of current holdings.
10
Columbia Acorn International (ACINX)
At a Glance
Performance data shown represents past performance and is not a guarantee of future results. The investment return and principal value of an investment will fluctuate so that shares, when redeemed, may be worth more or less than their original cost. Current performance may be lower or higher than the performance data shown. Performance results reflect any fee waivers or reimbursements of Fund expenses by the investment adviser and/or any of its affiliates. Absent these fee waivers and/or expense reimbursement arrangements, performance results would have been lower. Please visit columbiamanagement.com for daily and most recent month-end updates.
Pretax and After-tax Average Annual Total Returns (Class Z)
through June 30, 2011
Inception 9/23/92
| | Year
to date* | |
1 year | |
5 years | |
10 years | |
| Returns before taxes | | | 3.02 | % | | | 32.28 | % | | | 7.35 | % | | | 11.31 | % | |
| Returns after taxes on distributions | | | 2.14 | | | | 31.16 | | | | 6.48 | | | | 10.73 | | |
Returns after taxes on distributions
and sale of fund shares | | | 1.96 | | | | 21.34 | | | | 6.23 | | | | 10.05 | | |
S&P Global Ex-U.S. Between
$500M and $5B Index** | | | 2.63 | | | | 34.29 | | | | 7.09 | | | | 12.71 | | |
All results shown assume reinvestment of distributions.
*Year to date data is not annualized
**The Fund's primary benchmark.
After-tax returns are calculated using the highest historical individual federal marginal income tax rates, and do not reflect the impact of state and local taxes. Returns after taxes on distributions and sale of Fund shares reflect the additional tax impact of long-term gains or losses realized when Fund shares are sold. The returns are taxed at the maximum rate and assume shares were purchased at the beginning of the period. Actual after-tax returns depend on the investor's tax situation and may differ from those shown. After-tax returns are not relevant to investors who hold their Fund shares through tax-deferred arrangements such as 401(k) plans or individual retirement accounts. After-tax returns are shown for Class Z shares only; after-tax returns for other share classes will vary. Indexes do not reflect any deduction for fees, expenses or taxes.
The Fund's Class Z shares annual operating expense ratio, as stated in the current prospectus, is 0.98%.
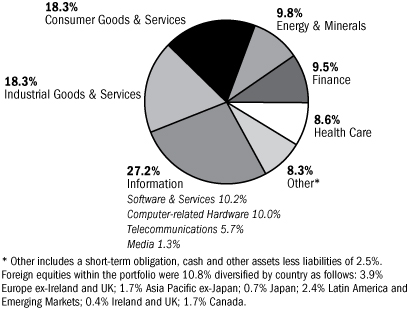
Columbia Acorn International Portfolio Diversification
as a percentage of net assets, as of 6/30/11

Columbia Acorn International Top 10 Holdings
as a percentage of net assets, as of 6/30/11
| 1. | | Hexagon (Sweden)
Measurement Equipment & Software | | | 1.5
| % | |
| 2. | | Melco Crown Entertainment (Hong Kong)
Macau Casino Operator | | | 1.4
| % | |
| 3. | | Olam International (Singapore)
Agriculture Supply Chain Manager | | | 1.2
| % | |
| 4. | | Localiza Rent A Car (Brazil)
Car Rental | | | 1.2
| % | |
| 5. | | Kansai Paint (Japan)
Paint Producer in Japan, India, China & Southeast Asia | | | 1.1
| % | |
| 6. | | Zhaojin Mining Industry (China)
Gold Mining & Refining in China | | | 1.0
| % | |
| 7. | | Imtech (Netherlands)
Electromechanical & Information & Communications
Technologies Installation & Maintenance | | | 1.0
| % | |
| 8. | | Intertek Group (United Kingdom)
Testing, Inspection & Certification Services | | | 1.0
| % | |
| 9. | | Naspers (South Africa)
Media in Africa, China, Russia & Other Emerging Markets | | | 1.0
| % | |
| 10. | | Fugro (Netherlands)
Sub-sea Oilfield Services | | | 0.9
| % | |
The Fund's top 10 holdings and portfolio diversification vary with changes in portfolio investments. See the Statement of Investments for a complete list of the Fund's holdings.
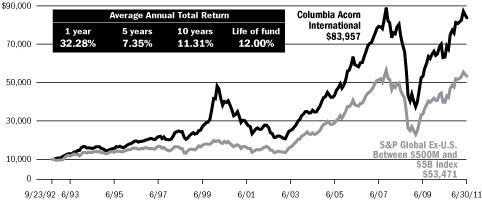
The Growth of a $10,000 Investment in Columbia Acorn International (Class Z)
September 23, 1992 through June 30, 2011
This graph compares the results of $10,000 invested in Columbia Acorn International at inception on September 23, 1992 to the S&P Global Ex-U.S. Between $500M and $5B Index. Although the index is provided for use in assessing the Fund's performance, the Fund's holdings may differ significantly from those in the index. The index is unmanaged and returns for both the index and Fund include reinvested dividends and capital gains. It is not possible to invest directly in an index. The graph does not reflect taxes that a shareholder would pay on Fund distributions or on a sale of Fund shares.
Total Net Assets of the Fund: $6.4 billion
11
Columbia Acorn USA
In a Nutshell
 | | | |
|
| Robert A. Mohn | | | |
|
| Lead Portfolio Manager | | | |
|
Performance data shown represents past performance and is not a guarantee of future results. The investment return and principal value will fluctuate so that shares, when redeemed, may be worth more or less than the original cost. Current performance may be lower or higher than the performance data shown. Please visit columbiamanagement.com for daily and most recent month-end performance updates.
Fund's Positions
in Mentioned Holdings
As a percentage of net assets, as of 6/30/11
| IPG Photonics | | | 2.6 | % | |
| lululemon athletica | | | 2.3 | % | |
| Gaylord Entertainment | | | 1.3 | % | |
| Polycom | | | 1.3 | % | |
| Cepheid | | | 0.8 | % | |
| Diamond Foods | | | 0.8 | % | |
| Finisar | | | 0.7 | % | |
| Ixia | | | 0.6 | % | |
| TriQuint Semiconductor | | | 0.6 | % | |
The equity markets were relatively flat in the second quarter of 2011. Columbia Acorn USA gained 1.50%, outperforming its primary benchmark, the Russell 2000 Index, which dropped 1.61%. Year to date through June 30, 2011, the Fund was up 9.14%, ahead of the 6.21% gain of its benchmark.
Winners for the quarter and half year came from a variety of sectors. IPG Photonics, a fiber laser manufacturer, dominates its market niche and nearly doubled sales versus the prior year. Its stock rose 26% in the quarter and ended the first six-months of 2011 up 130%. Premium active apparel retailer lululemon athletica also had strong revenue growth on ever-increasing awareness of the brand in the United States. The stock rose 26% in the quarter, and was up 63% for the half year. Polycom, a provider of video conferencing equipment, was up 24% in the quarter and finished the half year with a 65% return. The company's business benefited from increased corporate adoption of video conferencing as well as recent stumbles by a close competitor.
Diamond Foods, a provider of nuts and snack foods, announced an agreement to purchase the Pringles brand from Procter & Gamble, a move that will transform Diamond into the second largest snack company in the world, behind Pepsi. The stock rose 37% in the quarter on the news and was up 44% for the half year. Cepheid, a provider of molecular diagnostic equipment, experienced strong sales of its automated genetic testing instruments, which helped drive its stock up 24% in the quarter and 52% for the half year.
On the downside, two names in the optical network equipment business fell due to revenue shortfalls. Finisar, a provider of optical sub-systems and components, was a big winner for the Fund last year but orders have slowed in 2011, leaving Finisar customers with excess inventory. Its stock was off 27% in the quarter and 39% for the six months. Ixia sells telecom test equipment for optical networks and also suffered from a drop in orders. The company's stock fell 19% in the quarter and 22% for the half year.
TriQuint Semiconductor, a manufacturer of radio frequency semiconductors for mobile phones and other wireless devices, disappointed as some handset manufacturers deferred new product launches, sending the company's stock down 21% in the quarter and 17% for the half year. Gaylord Entertainment, an owner of convention hotels, was hurt by a drop in the occupancy rate at its Washington DC hotel, sending the stock down 13% for the quarter and 17% for the half year.
These days, many investors are obsessing over a seeming epidemic of ominous macroeconomic troubles and their potential solutions. Scary stuff like national debt crises, Mediterranean defaults, stubbornly high unemployment, and double-dipping housing prices dominate the news. But we believe that these issues are not as relevant to our philosophy of investing. We don't subscribe to the current fetish of investing based on macroeconomic factors (commonly referred to as "risk-on, risk-off" trading). Even in volatile, uncertain times like today, plenty of individual smaller cap companies are growing faster than their peers and possess bright long-term prospects. We spend our time and effort seeking out these kinds of businesses for your Fund. We'll leave the macro-dancing to the other guys.
Stocks of small- and mid-cap companies pose special risks, including possible illiquidity and greater price volatility than stocks of larger, more established companies.
Portfolio holdings are subject to change periodically and may not be representative of current holdings.
12
Columbia Acorn USA (AUSAX)
At a Glance
Performance data shown represents past performance and is not a guarantee of future results. The investment return and principal value of an investment will fluctuate so that shares, when redeemed, may be worth more or less than their original cost. Current performance may be lower or higher than the performance data shown. Performance results reflect any fee waivers or reimbursements of Fund expenses by the investment adviser and/or any of its affiliates. Absent these fee waivers and/or expense reimbursement arrangements, performance results would have been lower. Please visit columbiamanagement.com for daily and most recent month-end updates.
Pretax and After-tax Average Annual Total Returns (Class Z)
through June 30, 2011
Inception 9/4/96
| | Year
to date* | |
1 year | |
5 years | |
10 years | |
| Returns before taxes | | | 9.14 | % | | | 43.38 | % | | | 4.85 | % | | | 7.19 | % | |
| Returns after taxes on distributions | | | 9.14 | | | | 43.38 | | | | 4.50 | | | | 6.87 | | |
Returns after taxes on distributions
and sale of fund shares | | | 5.94 | | | | 28.19 | | | | 4.13 | | | | 6.28 | | |
| Russell 2000 Index (pretax)** | | | 6.21 | | | | 37.41 | | | | 4.08 | | | | 6.27 | | |
All results shown assume reinvestment of distributions.
*Year to date data is not annualized
**The Fund's primary benchmark.
After-tax returns are calculated using the highest historical individual federal marginal income tax rates, and do not reflect the impact of state and local taxes. Returns after taxes on distributions and sale of Fund shares reflect the additional tax impact of long-term gains or losses realized when Fund shares are sold. The returns are taxed at the maximum rate and assume shares were purchased at the beginning of the period. Actual after-tax returns depend on the investor's tax situation and may differ from those shown. After-tax returns are not relevant to investors who hold their Fund shares through tax-deferred arrangements such as 401(k) plans or individual retirement accounts. After-tax returns are shown for Class Z shares only; after-tax returns for other share classes will vary. Indexes do not reflect any deduction for fees, expenses or taxes.
The Fund's Class Z shares annual operating expense ratio, as stated in the current prospectus, is 1.01%.
Columbia Acorn USA Portfolio Diversification
as a percentage of net assets, as of 6/30/11

Columbia Acorn USA Top 10 Holdings
as a percentage of net assets, as of 6/30/11
| 1. | | Informatica
Enterprise Data Integration Software | | | 3.0
| % | |
| 2. | | IPG Photonics
Fiber Lasers | | | 2.6
| % | |
| 3. | | FMC Technologies
Oil & Gas Wellhead Manufacturer | | | 2.3
| % | |
| 4. | | lululemon athletica
Premium Active Apparel Retailer | | | 2.3
| % | |
| 5. | | Ametek
Aerospace/Industrial Instruments | | | 2.2
| % | |
| 6. | | Nordson
Dispensing Systems for Adhesives & Coatings | | | 2.1
| % | |
| 7. | | Atwood Oceanics
Offshore Drilling Contractor | | | 1.9
| % | |
| 8. | | Micros Systems
Information Systems for Hotels, Restaurants & Retailers | | | 1.8
| % | |
| 9. | | tw telecom
Fiber Optic Telephone/Data Services | | | 1.7
| % | |
| 10. | | II-VI
Laser Optics & Specialty Materials | | | 1.7
| % | |
The Fund's top 10 holdings and portfolio diversification vary with changes in portfolio investments. See the Statement of Investments for a complete list of the Fund's holdings.
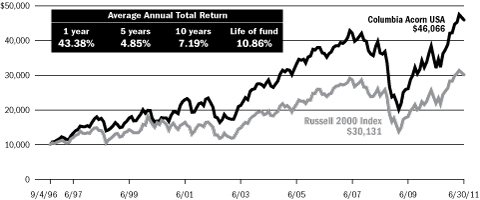
The Growth of a $10,000 Investment in Columbia Acorn USA (Class Z)
September 4, 1996 through June 30, 2011
This graph compares the results of $10,000 invested in Columbia Acorn USA at inception on September 4, 1996 to the Russell 2000 Index. Although the index is provided for use in assessing the Fund's performance, the Fund's holdings may differ significantly from those in the index. The index is unmanaged and returns for both the index and the Fund include reinvested dividends and capital gains. It is not possible to invest directly in an index. The graph does not reflect taxes that a shareholder would pay on Fund distributions or on a sale of Fund shares.
Total Net Assets of the Fund: $1.9 billion
13
Columbia Acorn International Select
In a Nutshell

Christopher J. Olson
Lead Portfolio Manager
Performance data shown represents past performance and is not a guarantee of future results. The investment return and principal value will fluctuate so that shares, when redeemed, may be worth more or less than the original cost. Current performance may be lower or higher than the performance data shown. Please visit columbiamanagement.com for daily and most recent month-end performance updates.
Fund's Positions
in Mentioned Holdings
As a percentage of net assets, as of 6/30/11
| Ascendas REIT | | | 5.0 | % | |
| Hexagon | | | 3.7 | % | |
| Wirecard | | | 2.7 | % | |
| Asahi Diamond Industrial | | | 2.4 | % | |
| Jupiter Telecommunications | | | 2.2 | % | |
| Fugro | | | 1.9 | % | |
| United Drug | | | 1.9 | % | |
| Pacific Rubiales Energy | | | 1.6 | % | |
| Jiangsu Expressway | | | 1.4 | % | |
| Gree | | | 1.4 | % | |
| Workspace Group | | | 1.1 | % | |
| Quetzal Energy | | | 0.3 | % | |
Columbia Acorn International Select ended the second quarter up 1.10%, outperforming the 0.90% gain of its primary benchmark, the S&P Developed Ex-U.S. Between $2B and $10B Index. For the half year, the Fund was up 3.74% versus a 4.04% gain for the benchmark.
The Fund's top three contributors to performance for the quarter were Japanese stocks, as the economic situation in Japan began to stabilize and recover following the March 2011 Tohoku earthquake. Gree, a mobile social networking game developer, was up 32% in the second quarter and 78% for the half year. The company continued to benefit from new product rollouts. Asahi Diamond Industrial, a manufacturer of consumable diamond tools, was up 14% in the quarter and ended the half year with a 16% gain. Its operations were largely unaffected by the earthquake and its revenues remained strong. Jupiter Telecommunications, the largest cable service provider in Japan, had a 15% gain in the quarter on continued subscriber growth. The majority of its operations are in the Tokyo region.
Elsewhere, Ascendas REIT, an industrial property landlord in Singapore, is a large position in the Fund and was up 6% for the quarter and the half year. The company continues to report rental rate increases on strong demand for its properties and its 7% dividend yield has attracted attention in a world of low interest rates. Swedish measurement equipment manufacturer Hexagon continued its strong run, gaining 4% in the quarter and ending the half year up 16%. The company has benefited from continued revenue growth driven mainly by its exposure to emerging markets.
Year to date, German online payment processor and risk manager Wirecard was up 32%. The company is growing revenues at a 20% clip on the back of ongoing growth of e-commerce as well as the introduction of a popular prepaid cash card. Irish pharmaceutical company United Drug rose 21% as investors realized earnings had improved and the stock was very cheap. Workspace Group, a UK real estate company, was up 29% for the half year, benefiting from improving occupancy rates.
Energy stocks dominated the laggards list for the quarter and half. After many quarters of strong performance, Dutch sub-sea oilfield services provider Fugro fell more than 16% in the quarter and was off 11% for the half year. The company reported disappointing earnings, stating that many of its customers opted to delay expected projects. Quetzal Energy, an oil and gas exploration company operating in Latin America, fell 44% in the quarter and was down 37% for the half as a delay in receiving environmental approvals slowed down its drilling program. Pacific Rubiales Energy, a Colombian oil production and exploration company, was off 3% in the quarter and down 21% for the half year on disappointing results from recent explorations.
Outside the energy sector, Petropavlovsk, a UK-listed company operating gold and iron ore mines in Russia, fell 15% in the quarter and was off 24% in Columbia Acorn International Select for the half year. Delays and capital concerns, combined with weakness in gold mining stocks in general, hurt returns. We sold the Fund's position in the stock. Jiangsu Expressway, a Chinese toll road operator, fell 13% in the quarter and was off 15% for the half after the government began to crack down on toll operators who were overcharging. Jiangsu Expressway has kept its charges in line with stated policy but was down nonetheless, as the entire sector was sold off.
International investing involves special risks, including foreign taxation, currency risks, risks associated with possible differences in financial standards and other risks associated with future political and economic developments. Stocks of small- and mid-cap companies pose special risks, including possible illiquidity and greater price volatility than stocks of larger, more established companies. Investing in emerging markets may involve greater risks than investing in more developed countries.
Portfolio holdings are subject to change periodically and may not be representative of current holdings.
14
Columbia Acorn International Select (ACFFX)
At a Glance
Performance data shown represents past performance and is not a guarantee of future results. The investment return and principal value of an investment will fluctuate so that shares, when redeemed, may be worth more or less than their original cost. Current performance may be lower or higher than the performance data shown. Performance results reflect any fee waivers or reimbursements of Fund expenses by the investment adviser and/or any of its affiliates. Absent these fee waivers and/or expense reimbursement arrangements, performance results would have been lower. Please visit columbiamanagement.com for daily and most recent month-end updates.
Pretax and After-tax Average Annual Total Returns (Class Z)
through June 30, 2011
Inception 11/23/98
| | Year
to date* | |
1 year | |
5 years | |
10 years | |
| Returns before taxes | | | 3.74 | % | | | 31.33 | % | | | 7.22 | % | | | 9.50 | % | |
| Returns after taxes on distributions | | | 3.24 | | | | 30.81 | | | | 6.82 | | | | 9.30 | | |
Returns after taxes on distributions
and sale of fund shares | | | 2.44 | | | | 20.49 | | | | 6.23 | | | | 8.49 | | |
S&P Developed Ex-U.S. Between
$2B and $10B Index (pretax)** | | | 4.04 | | | | 33.74 | | | | 3.73 | | | | 9.60 | | |
All results shown assume reinvestment of distributions.
*Year to date data is not annualized
**The Fund's primary benchmark.
After-tax returns are calculated using the highest historical individual federal marginal income tax rates, and do not reflect the impact of state and local taxes. Returns after taxes on distributions and sale of Fund shares reflect the additional tax impact of long-term gains or losses realized when Fund shares are sold. The returns are taxed at the maximum rate and assume shares were purchased at the beginning of the period. Actual after-tax returns depend on the investor's tax situation and may differ from those shown. After-tax returns are not relevant to investors who hold their Fund shares through tax-deferred arrangements such as 401(k) plans or individual retirement accounts. After-tax returns are shown for Class Z shares only; after-tax returns for other share classes will vary. Indexes do not reflect any deduction for fees, expenses or taxes.
The Fund's Class Z shares annual operating expense ratio, as stated in the current prospectus, is 1.16%.
Columbia Acorn International Select Portfolio Diversification
as a percentage of net assets, as of 6/30/11

Columbia Acorn International Select Top 10 Holdings
as a percentage of net assets, as of 6/30/11
| 1. | | Ascendas REIT (Singapore)
Singapore Industrial Property Landlord | | | 5.0
| % | |
| 2. | | Kansai Paint (Japan)
Paint Producer in Japan, India, China & Southeast Asia | | | 4.4
| % | |
| 3. | | Chemring (United Kingdom)
Defense Manufacturer of Countermeasures & Energetics | | | 3.8
| % | |
| 4. | | Hexagon (Sweden)
Measurement Equipment & Software | | | 3.7
| % | |
| 5. | | NHN (South Korea)
South Korea's Largest Online Search Engine | | | 3.2
| % | |
| 6. | | Mapletree Industrial Trust (Singapore)
Industrial Property Landlord | | | 3.2
| % | |
| 7. | | Intertek Group (United Kingdom)
Testing, Inspection & Certification Services | | | 2.9
| % | |
| 8. | | Wirecard (Germany)
Online Payment Processing & Risk Management | | | 2.7
| % | |
| 9. | | Asahi Diamond Industrial (Japan)
Consumable Diamond Tools | | | 2.4
| % | |
| 10. | | AkzoNobel (Netherlands)
Largest Global Supplier of Protective Paints & Coatings | | | 2.4
| % | |
The Fund's top 10 holdings and portfolio diversification vary with changes in portfolio investments. See the Statement of Investments for a complete list of the Fund's holdings.
The Growth of a $10,000 Investment in Columbia Acorn International Select (Class Z)
November 23, 1998 through June 30, 2011
This graph compares the results of $10,000 invested in Columbia Acorn International Select at inception on November 23, 1998 to the S&P Developed Ex-U.S. Between $2B and $10B Index. Although the index is provided for use in assessing the Fund's performance, the Fund's holdings may differ significantly from those in the index. The index and Fund returns include reinvested dividends and capital gains. It is not possible to invest directly in an index. The graph does not reflect taxes that a shareholder would pay on Fund distributions or on a sale of Fund shares.
Total Net Assets of the Fund: $437.3 million
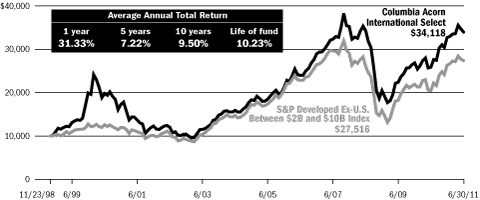
15
Columbia Acorn Select
In a Nutshell
 | |  | |
|
| Ben Andrews | | Robert A. Chalupnik | |
|
| Lead Portfolio Manager | | Co-Portfolio Manager | |
|
Performance data shown represents past performance and is not a guarantee of future results. The investment return and principal value will fluctuate so that shares, when redeemed, may be worth more or less than the original cost. Current performance may be lower or higher than the performance data shown. Please visit columbiamanagement.com for daily and most recent month-end performance updates.
Fund's Positions
in Mentioned Holdings
As a percentage of net assets, as of 6/30/11
| Discover Financial Services | | | 6.6 | % | |
| Abercrombie & Fitch | | | 3.6 | % | |
| Coach | | | 3.2 | % | |
| Canacol Energy | | | 1.9 | % | |
| Quanta Services | | | 1.4 | % | |
| Gaylord Entertainment | | | 1.3 | % | |
| Finisar | | | 0.3 | % | |
Columbia Acorn Select fell 0.95% in the second quarter of 2011 and was nearly flat for the half year, up 0.02%. The Fund's primary benchmark, the S&P MidCap 400 Index, was down 0.73% in the second quarter and up 8.56% for the six months ended June 30, 2011. The large-cap oriented S&P 500 Index was flat in the second quarter (up 0.10%) and was up 6.02% for the half year. Year-to-date performance was hampered by poor performance of Fund energy stocks and the failure of many holdings to participate in the recent market rally.
Looking first at the stocks that drove the portfolio in the second quarter, Discover Financial Services added 0.77% to the portfolio's return as the company's credit card portfolio continued to heal in the improving economy. This improvement caused investors to increase the valuation they were willing to pay for Discover, bidding up the stock price. Retailers Abercrombie & Fitch and Coach each added approximately 0.60% to the portfolio as their products were well received by consumers.
On the downside, Canacol Energy, an oil and gas explorer/producer, cost the portfolio 0.66% as an exploratory well in Guyana came up dry and the general malaise for Colombian oil producers weighed on the stock. Over the six-month period, energy stocks cost the Fund approximately 3.7% of performance, and were the main laggards in the portfolio. We still believe in these names and will watch them closely as we expect several more drilling results by the end of this year.
Though many of the Fund's stocks did not participate in the stock market rally through June 30, 2011, we believe they have potential to add return in the coming quarters as these companies are growing and we believe they are valued inexpensively compared with their peers.
During the quarter, we sold out of four companies and purchased three new companies. The sales were wireless communications and broadcast tower company American Tower, water treatment applications service provider Nalco Holding Company, for-profit, post-secondary education provider Career Education, and recreational vehicle manufacturer Thor Industries. Our purchases were convention hotelier Gaylord Entertainment, fiber optic sub-systems and components provider Finisar, and electrical and telecom construction services provider Quanta Services. Quanta is a company that we owned previously but sold due to uncertainty about its ability to turn contracts/backlog into sales. There is evidence of this backlog becoming revenue, so we added the company back into the portfolio during the quarter.
I would like to welcome Rob Chalupnik as co-portfolio manager of Columbia Acorn Select. Rob has a strong track record as the domestic industrials analyst at Columbia Wanger Asset Management. I have worked closely with Rob over the years and feel strongly that his knowledge and ability will be additive to the performance of this Fund, not only through his stock picks but through his input on portfolio structure as well.
Thank you for your continued investment in Columbia Acorn Select.
Risks include stock market fluctuations due to economic and business developments. The Fund also has potentially greater price volatility due to the Fund's concentration in a limited number of stocks of mid-size companies. The Fund is a non-diversified fund and may, therefore, have a greater risk of loss from a few issuers than a similar fund that invests more broadly. The Fund may not operate as a non-diversified fund at all times. International investments involve greater potential risks, including less regulation, currency fluctuations, economic instability and political developments.
Portfolio holdings are subject to change periodically and may not be representative of current holdings.
16
Columbia Acorn Select (ACTWX)
At a Glance
Performance data shown represents past performance and is not a guarantee of future results. The investment return and principal value of an investment will fluctuate so that shares, when redeemed, may be worth more or less than their original cost. Current performance may be lower or higher than the performance data shown. Performance results reflect any fee waivers or reimbursements of Fund expenses by the investment adviser and/or any of its affiliates. Absent these fee waivers and/or expense reimbursement arrangements, performance results would have been lower. Please visit columbiamanagement.com for daily and most recent month-end updates.
Pretax and After-tax Average Annual Total Returns (Class Z)
through June 30, 2011
Inception 11/23/98
| | Year
to date* | |
1 year | |
5 years | |
10 years | |
| Returns before taxes | | | 0.02 | % | | | 29.03 | % | | | 5.17 | % | | | 8.41 | % | |
| Returns after taxes on distributions | | | -0.57 | | | | 28.27 | | | | 4.84 | | | | 8.13 | | |
Returns after taxes on distributions
and sale of fund shares | | | -0.01 | | | | 18.85 | | | | 4.37 | | | | 7.39 | | |
| S&P MidCap 400 Index (pretax)** | | | 8.56 | | | | 39.38 | | | | 6.60 | | | | 7.94 | | |
All results shown assume reinvestment of distributions.
*Year to date data is not annualized
**The Fund's primary benchmark.
After-tax returns are calculated using the highest historical individual federal marginal income tax rates, and do not reflect the impact of state and local taxes. Returns after taxes on distributions and sale of Fund shares reflect the additional tax impact of long-term gains or losses realized when Fund shares are sold. The returns are taxed at the maximum rate and assume shares were purchased at the beginning of the period. Actual after-tax returns depend on the investor's tax situation and may differ from those shown. After-tax returns are not relevant to investors who hold their Fund shares through tax-deferred arrangements such as 401(k) plans or individual retirement accounts. After-tax returns are shown for Class Z shares only; after-tax returns for other share classes will vary. Indexes do not reflect any deduction for fees, expenses or taxes.
The Fund's Class Z shares annual operating expense ratio, as stated in the current prospectus, is 0.97%.
Columbia Acorn Select Portfolio Diversification
as a percentage of net assets, as of 6/30/11
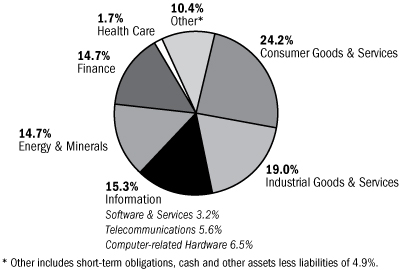
Columbia Acorn Select Top 10 Holdings
as a percentage of net assets, as of 6/30/11
| 1. | | Discover Financial Services
Credit Card Company | | | 6.8
| % | |
| 2. | | Hertz
Largest U.S. Rental Car Operator | | | 6.5
| % | |
| 3. | | CNO Financial Group
Life, Long-term Care & Medical Supplement Insurance | | | 4.8
| % | |
| 4. | | Ametek
Aerospace/Industrial Instruments | | | 4.0
| % | |
| 5. | | Abercrombie & Fitch
Teen Apparel Retailer | | | 3.6
| % | |
| 6. | | Sanmina-SCI
Electronic Manufacturing Services | | | 3.5
| % | |
| 7. | | Safeway
Supermarkets | | | 3.4
| % | |
| 8. | | Pacific Rubiales Energy (Colombia)
Oil Production & Exploration in Colombia | | | 3.3
| % | |
| 9. | | Coach
Designer & Retailer of Branded Leather Accessories | | | 3.2
| % | |
| 10. | | Crown Castle International
Communications Towers | | | 3.0
| % | |
The Fund's top 10 holdings and portfolio diversification vary with changes in portfolio investments. See the Statement of Investments for a complete list of the Fund's holdings.
The Growth of a $10,000 Investment in Columbia Acorn Select (Class Z)
November 23, 1998 through June 30, 2011
This graph compares the results of $10,000 invested in Columbia Acorn Select at inception on November 23, 1998 to the S&P MidCap 400 Index. Although the index is provided for use in assessing the Fund's performance, the Fund's holdings differ significantly from those in the index. The index is unmanaged and returns for both the index and the Fund include reinvested dividends and capital gains. It is not possible to invest directly in an index. The graph does not reflect taxes that a shareholder would pay on Fund distributions or on a sale of Fund shares.
Total Net Assets of the Fund: $2.0 billion
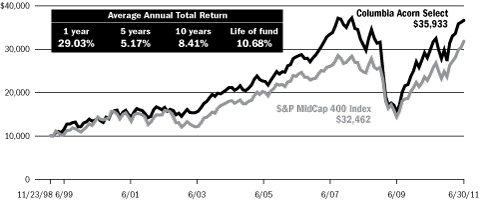
17
Columbia Thermostat Fund
In a Nutshell

Lead Portfolio Manager
Performance data shown represents past performance and is not a guarantee of future results. The investment return and principal value will fluctuate so that shares, when redeemed, may be worth more or less than the original cost. Current performance may be lower or higher than the performance data shown. Please visit columbiamanagement.com for daily and most recent month-end performance updates.
A "fund of fund" bears its allocable share of the costs and expenses of the underlying funds in which it invests. Such funds are thus subject to two levels of fees and potentially higher expense ratios than would be associated with a fund that invests and trades directly in financial instruments under the direction of a single manager.
Columbia Thermostat Fund gained 1.47% in the second quarter of 2011, outperforming the 0.10% gain of its primary equity benchmark, the S&P 500 Index, and underperforming the 2.29% increase of the Fund's primary debt benchmark, the Barclays Capital U.S. Aggregate Bond Index. Year to date through June 30, 2011, the Fund was up 4.66% while the S&P 500 Index had a 6.02% gain and the Barclays index rose 2.72%.
The Fund hit four reallocation triggers during the second quarter. In April, we reduced stock exposure twice on the strength of the equity market and then in May and June returned to stocks as the equity markets declined. The Fund ended the quarter at the same weight it started, with a 60% exposure to its underlying stock funds and 40% exposure to its bond funds.
The bond portion of the portfolio outperformed the equity portion in the quarter with a 1.50% weighted average return versus a 0.93% weighted average gain for equities. Columbia U.S. Treasury Index Fund was the top performing holding for the quarter, up 2.28%. Year to date, Columbia Thermostat's equity portion had a 5.22% weighted average gain versus a 2.83% gain for the income portion. Columbia Large Cap Enhanced Core Fund led performance with a 7.90% gain for the half-year period.
The markets continue to provide the types of ups and downs that Columbia Thermostat Fund was made for. We are pleased to see that the Fund, as expected, provided a return between that of its equity and income benchmarks for the six-month period.
Results of the Funds Owned in Columbia Thermostat Fund as of June 30, 2011
| Stock Funds | | Weightings | | 2nd | | Year to | |
| Fund | | in category | | quarter | | date | |
Columbia Acorn
International, Class I | | | 20 | % | | | 1.69 | % | | | 3.06 | % | |
Columbia Dividend
Income Fund, Class I | | | 20 | % | | | 0.83 | % | | | 6.07 | % | |
Columbia Acorn Fund,
Class I | | | 15 | % | | | 1.47 | % | | | 7.22 | % | |
Columbia Marsico
Growth Fund, Class I | | | 15 | % | | | 0.87 | % | | | 6.29 | % | |
Columbia Acorn Select,
Class I | | | 10 | % | | | -0.93 | % | | | 0.04 | % | |
Columbia Contrarian
Core Fund, Class I | | | 10 | % | | | 0.60 | % | | | 5.66 | % | |
Columbia Large Cap
Enhanced Core Fund,
Class I | | | 10 | % | | | 0.94 | % | | | 7.90 | % | |
Weighted Average
Equity Return | | | 100 | % | | | 0.93 | % | | | 5.22 | % | |
| Bond Funds | | Weightings | | 2nd | | Year | |
| Fund | | in category | | quarter | | to date | |
Columbia Intermediate
Bond Fund, Class I | | | 50 | % | | | 1.29 | % | | | 2.64 | % | |
Columbia U.S. Treasury
Index Fund, Class I | | | 30 | % | | | 2.28 | % | | | 2.03 | % | |
Columbia Income
Opportunities Fund,
Class I | | | 20 | % | | | 0.82 | % | | | 4.39 | % | |
Weighted Average
Income Return | | | 100 | % | | | 1.50 | % | | | 2.83 | % | |
Columbia Thermostat Fund
Rebalancing in the Second Quarter
| April 11, 2011 | | 55% stocks, 45% bonds | |
| April 28, 2011 | | 50% stocks, 50% bonds | |
| May 31, 2011 | | 55% stocks, 45% bonds | |
| June 7, 2011 | | 60% stocks, 40% bonds | |
The value of an investment in the Fund is based primarily on the performance of the underlying portfolio funds and the allocation of the Fund's assets among them. An investment in the underlying portfolio funds may present certain risks, including stock market fluctuations that occur in response to economic and business developments; and a greater degree of social, political and economic volatility associated with international investing. Stocks of small- and mid-cap companies pose special risks, including possible illiquidity and greater price volatility than stocks of larger, more established companies. Value stocks may also be subject to specific business risks that have caused the stocks to be out of favor. Lower-rated and medium quality debt securities are more speculative and incur more risk. International investing involves special risks, including foreign taxation, currency risks, risks associated with possible differences in financial standards and other risks associated with future political and economic developments. Changes in interest rates and changes in the financial strength of issuers of lower-rated bonds may also affect underlying fund performance. The Fund is also subject to the risk that the investment advisor's decisions regarding asset classes and underlying portfolio funds will not anticipate market trends successfully, resulting in a failure to preserve capital or lower total return. In addition, the Fund may buy and sell shares of the portfolio funds frequently. This may result in higher transaction costs and additional tax liability. This is not an offer of the shares of any other mutual fund mentioned herein.
18
Columbia Thermostat Fund (COTZX)
At a Glance
Performance data shown represents past performance and is not a guarantee of future results. The investment return and principal value of an investment will fluctuate so that shares, when redeemed, may be worth more or less than their original cost. Current performance may be lower or higher than the performance data shown. Performance results reflect any fee waivers or reimbursements of Fund expenses by the investment adviser and/or any of its affiliates. Absent these fee waivers and/or expense reimbursement arrangements, performance results would have been lower. Please visit columbiamanagement.com for daily and most recent month-end updates.
Pretax and After-tax Average Annual Total Returns (Class Z)
through June 30, 2011
Inception 9/25/02
| | Year
to date* | |
1 year | |
5 years | |
Life of fund | |
| Returns before taxes | | | 4.66 | % | | | 25.39 | % | | | 5.81 | % | | | 7.94 | % | |
| Returns after taxes on distributions | | | 4.21 | | | | 24.75 | | | | 4.46 | | | | 6.68 | | |
Returns after taxes on distributions
and sale of fund shares | | | 3.02 | | | | 16.62 | | | | 4.34 | | | | 6.35 | | |
| S&P 500 Index (pretax)** | | | 6.02 | | | | 30.69 | | | | 2.94 | | | | 7.72 | | |
Barclays Capital U.S. Aggregate
Bond Index (pretax)** | | | 2.72 | | | | 3.90 | | | | 6.52 | | | | 5.06 | | |
Lipper Flexible Portfolio Funds
Index (pretax) | | | 5.11 | | | | 23.38 | | | | 5.16 | | | | 8.28 | | |
All results shown assume reinvestment of distributions.
*Year to date data is not annualized
**The Fund's primary stock and bond benchmarks, respectively.
After-tax returns are calculated using the highest historical individual federal marginal income tax rates, and do not reflect the impact of state and local taxes. Returns after taxes on distributions and sale of Fund shares reflect the additional tax impact of long-term gains or losses realized when Fund shares are sold. The returns are taxed at the maximum rate and assume shares were purchased at the beginning of the period. Actual after-tax returns depend on the investor's tax situation and may differ from those shown. After-tax returns are not relevant to investors who hold their Fund shares through tax-deferred arrangements such as 401(k) plans or individual retirement accounts. After-tax returns are shown for Class Z shares only; after-tax returns for other share classes will vary. Indexes do not reflect any deduction for fees, expenses or taxes.
The Fund's Class Z annual operating expense ratio, as stated in the current prospectus, reflects a contractual expense waiver or reimbursement that expires April 30, 2012. Expense ratios without and with the contractual waiver, including fees and expenses associated with the Fund's investment in other investment companies, are 1.16% and 1.04%, respectively. Absent the waiver or reimbursement, performance results would have been lower.
Columbia Thermostat Fund Asset Allocation
as a percentage of net assets, as of 6/30/11

Columbia Thermostat Fund Portfolio Weightings
as a percentage of assets in each investment category, as of 6/30/11
Stock Mutual Funds
| Columbia Acorn International, Class I | | | 20 | % | |
| Columbia Dividend Income Fund, Class I | | | 20 | % | |
| Columbia Acorn Fund, Class I | | | 15 | % | |
| Columbia Marsico Growth Fund, Class I | | | 15 | % | |
| Columbia Acorn Select, Class I | | | 10 | % | |
| Columbia Large Cap Enhanced Core Fund, Class I | | | 10 | % | |
| Columbia Contrarian Core Fund, Class I | | | 10 | % | |
Bond Mutual Funds
| Columbia Intermediate Bond Fund, Class I | | | 50 | % | |
| Columbia U.S. Treasury Index Fund, Class I | | | 30 | % | |
| Columbia Conservative High Yield Fund, Class I | | | 20 | % | |
The Growth of a $10,000 Investment in Columbia Thermostat Fund (Class Z)
September 25, 2002 through June 30, 2011
This graph compares the results of $10,000 invested in Columbia Thermostat Fund at inception on September 25, 2002 to the S&P 500 Index, the Barclays Capital U.S. Aggregate Bond Index and the Lipper Flexible Portfolio Funds Index. Although the indexes are provided for use in assessing the Fund's performance, the Fund's holdings differ significantly from those in the indexes. The Indexes are unmanaged and returns for the indexes and the Fund include reinvested dividends and capital gains. It is not possible to invest directly in an index. The graph does not reflect taxes that a shareholder would pay on Fund distributions or on a sale of Fund shares.
Total Net Assets of the Fund: $137.9 million
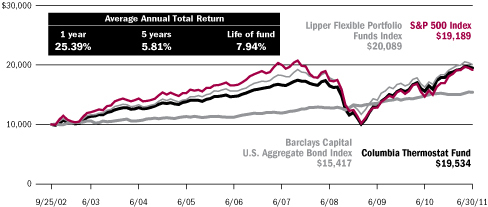
19
Columbia Acorn Fund
Major Portfolio Changes in the Second Quarter (Unaudited)
| | | Number of Shares | |
| | | 03/31/11 | | 06/30/11 | |
| Purchases | |
| Information | |
| ANSYS | | | 2,100,000 | | | | 2,550,000 | | |
| Boingo Wireless | | | 0 | | | | 1,200,000 | | |
| Constant Contact | | | 1,919,615 | | | | 1,950,000 | | |
| ExlService Holdings | | | 1,045,000 | | | | 1,145,000 | | |
| Genpact | | | 0 | | | | 781,635 | | |
| IMAX (Canada) | | | 800,000 | | | | 1,400,000 | | |
| Intralinks | | | 0 | | | | 550,000 | | |
| Ixia | | | 1,720,000 | | | | 2,030,000 | | |
| ON Semiconductor | | | 3,440,000 | | | | 5,117,000 | | |
| Polycom | | | 2,305,000 | | | | 2,455,000 | | |
| Syntel | | | 0 | | | | 580,000 | | |
| TIBCO | | | 0 | | | | 1,381,600 | | |
| Verisk Analytics | | | 450,000 | | | | 900,000 | | |
| Virtusa | | | 2,064,900 | | | | 2,125,000 | | |
| WMS Industries | | | 1,150,000 | | | | 2,100,000 | | |
| WNS - ADR (India) | | | 1,000,000 | | | | 1,027,147 | | |
| Consumer Goods & Services | |
| Cavco Industries | | | 388,907 | | | | 415,000 | | |
| HomeAway | | | 0 | | | | 1,289,880 | | |
| MGM China Holdings (Hong Kong) | | | 0 | | | | 12,000,000 | | |
| P.F. Chang's China Bistro | | | 300,000 | | | | 480,000 | | |
| Phillips-Van Heusen | | | 1,055,000 | | | | 1,410,000 | | |
| Thor Industries | | | 1,190,000 | | | | 1,980,000 | | |
| Industrial Goods & Services | |
| Albemarle | | | 1,575,972 | | | | 1,650,000 | | |
| Imtech (Netherlands) | | | 1,731,432 | | | | 1,767,165 | | |
| Kennametal | | | 2,625,000 | | | | 2,900,000 | | |
| LKQ | | | 450,000 | | | | 900,000 | | |
| Pentair | | | 3,350,000 | | | | 3,535,000 | | |
| Quanta Services | | | 1,950,000 | | | | 2,800,000 | | |
| Ushio (Japan) | | | 1,322,000 | | | | 1,500,000 | | |
| Valmont Industries | | | 0 | | | | 100,000 | | |
| Energy & Minerals | |
| Alexco Resource | | | 2,400,000 | | | | 2,800,000 | | |
| Celtic Exploration (Canada) | | | 0 | | | | 175,400 | | |
| Crew Energy (Canada) | | | 0 | | | | 484,500 | | |
| Fugro (Netherlands) | | | 2,570,626 | | | | 2,641,054 | | |
| Oil States International | | | 463,954 | | | | 743,000 | | |
| Primary Petroleum (Canada) | | | 0 | | | | 2,245,000 | | |
| Silver Standard Resources | | | 800,000 | | | | 900,000 | | |
| Swift Energy | | | 275,000 | | | | 550,000 | | |
| Wolverine Minerals (Canada) | | | 0 | | | | 4,000,000 | | |
| Finance | |
| Alliance Data Systems | | | 275,000 | | | | 400,000 | | |
| Assured Guaranty | | | 0 | | | | 300,000 | | |
| City National | | | 1,045,000 | | | | 1,145,000 | | |
| | | Number of Shares | |
| | | 03/31/11 | | 06/30/11 | |
| Enstar Group | | | 0 | | | | 33,746 | | |
| Financial Engines | | | 0 | | | | 400,000 | | |
| First Busey | | | 3,299,507 | | | | 4,056,427 | | |
| Health Care | |
Adcock Ingram Holdings
(South Africa) | | | 2,259,000 | | | | 2,393,955 | | |
| Akorn | | | 3,733,354 | | | | 4,000,000 | | |
| Alimera Sciences | | | 855,298 | | | | 1,818,154 | | |
| Anthera Pharmaceuticals | | | 1,450,000 | | | | 1,740,000 | | |
| Auxilium Pharmaceuticals | | | 1,200,000 | | | | 2,400,000 | | |
| Community Health Systems | | | 1,380,000 | | | | 1,655,000 | | |
| InterMune | | | 1,731,000 | | | | 2,226,000 | | |
| Kindred Healthcare | | | 0 | | | | 1,450,000 | | |
| Nabi Biopharmaceuticals | | | 2,611,936 | | | | 3,300,000 | | |
| United Therapeutics | | | 510,000 | | | | 780,000 | | |
| Other Industries | |
| Associated Estates Realty | | | 2,200,000 | | | | 2,700,000 | | |
| Genesee & Wyoming | | | 100,000 | | | | 400,000 | | |
| St. Joe | | | 0 | | | | 699,701 | | |
| Summit Hotel Properties | | | 1,092,000 | | | | 1,481,994 | | |
See accompanying notes to financial statements.
20
| | | Number of Shares | |
| | | 03/31/11 | | 06/30/11 | |
| Sales | |
| Information | |
| AboveNet | | | 1,265,000 | | | | 1,199,876 | | |
| Blue Coat Systems | | | 1,260,000 | | | | 313,300 | | |
| Crown Castle International | | | 6,300,000 | | | | 6,000,000 | | |
| Dionex | | | 300,000 | | | | 0 | | |
| Dolby Laboratories | | | 1,140,000 | | | | 815,000 | | |
| Hexagon (Sweden) | | | 5,914,999 | | | | 5,164,999 | | |
| Informatica | | | 5,200,000 | | | | 4,700,000 | | |
| NetSuite | | | 1,800,000 | | | | 1,450,000 | | |
| Plexus | | | 1,490,000 | | | | 1,210,000 | | |
| SRA International | | | 1,655,000 | | | | 1,583,750 | | |
| THQ | | | 3,567,000 | | | | 0 | | |
| Consumer Goods & Services | |
| Blue Nile | | | 180,000 | | | | 62,784 | | |
| Chico's FAS | | | 2,562,000 | | | | 1,933,750 | | |
| CTS Eventim (Germany) | | | 220,000 | | | | 173,436 | | |
| Diamond Foods | | | 1,300,000 | | | | 1,170,000 | | |
| Hansen Natural | | | 2,200,000 | | | | 1,900,000 | | |
| ITT Educational Services | | | 1,080,000 | | | | 350,000 | | |
| lululemon athletica | | | 4,035,000 | | | | 3,991,265 | | |
| Talbots | | | 4,150,000 | | | | 828,500 | | |
| Industrial Goods & Services | |
| American Reprographics | | | 900,000 | | | | 0 | | |
| Lumber Liquidators | | | 700,000 | | | | 0 | | |
| Mersen (France) | | | 753,000 | | | | 524,000 | | |
| Mine Safety Appliances | | | 1,525,000 | | | | 1,300,000 | | |
| Mueller Water Products | | | 1,750,000 | | | | 649,641 | | |
| Nalco | | | 1,800,000 | | | | 831,000 | | |
| Serco (United Kingdom) | | | 2,559,000 | | | | 0 | | |
| Simpson Manufacturing | | | 700,000 | | | | 360,073 | | |
| Energy & Minerals | |
| Atwood Oceanics | | | 3,200,000 | | | | 2,399,000 | | |
| Carrizo Oil & Gas | | | 583,000 | | | | 293,000 | | |
| Gran Tierra Energy (Colombia) | | | 3,131,195 | | | | 0 | | |
| Pan American Silver (Canada) | | | 500,000 | | | | 0 | | |
Synthesis Energy Systems
(China) | | | 1,726,270 | | | | 1,210,300 | | |
| Tesco | | | 1,750,000 | | | | 0 | | |
| Vaalco Energy | | | 750,000 | | | | 0 | | |
| Finance | |
| CAI International | | | 1,450,000 | | | | 1,123,400 | | |
| GATX | | | 1,480,000 | | | | 90,020 | | |
Housing Development Finance
(India) | | | 1,300,000 | | | | 0 | | |
| Investment Technology Group | | | 697,000 | | | | 629,493 | | |
| SVB Financial Group | | | 1,260,000 | | | | 1,160,000 | | |
| TCF Financial | | | 4,150,000 | | | | 3,613,000 | | |
| Wilmington Trust | | | 2,640,000 | | | | 0 | | |
| | | Number of Shares | |
| | | 03/31/11 | | 06/30/11 | |
| Health Care | |
| Allos Therapeutics | | | 2,755,534 | | | | 0 | | |
| American Medical Systems | | | 3,150,000 | | | | 0 | | |
| AthenaHealth | | | 500,000 | | | | 0 | | |
| Gen-Probe | | | 1,065,000 | | | | 700,000 | | |
| Idenix Pharmaceuticals | | | 2,682,497 | | | | 2,300,000 | | |
| Nanosphere | | | 964,499 | | | | 0 | | |
| Nektar Therapeutics | | | 1,091,990 | | | | 0 | | |
| Savient Pharmaceuticals | | | 1,700,000 | | | | 0 | | |
| United Drug (Ireland) | | | 826,526 | | | | 0 | | |
See accompanying notes to financial statements.
21
Columbia Acorn Fund
Statement of Investments (Unaudited), June 30, 2011
| Number of Shares | | | | Value (000) | |
| | | | | | | Equities: 97.5% | |
| Information 27.2% | | | |
| | | > Business Software 6.6% | |
| | 4,700,000 | | | Informatica (a) | | $ | 274,621 | | |
| | | | | Enterprise Data Integration Software | | | | | |
| | 2,550,000 | | | ANSYS (a) | | | 139,408 | | |
| | | | | Simulation Software for
Engineers & Designers | | | | | |
| | 2,700,000 | | | Micros Systems (a) | | | 134,217 | | |
| | | | | Information Systems for Hotels,
Restaurants & Retailers | | | | | |
| | 1,100,000 | | | Quality Systems | | | 96,030 | | |
| | | | | IT Systems for Medical Groups &
Ambulatory Care Centers | | | | | |
| | 1,480,000 | | | Concur Technologies (a) | | | 74,104 | | |
| | | | | Web Enabled Cost & Expense
Management Software | | | | | |
| | 1,700,000 | | | Blackboard (a)(b) | | | 73,763 | | |
| | | | | Education Software | | | | | |
| | 2,250,000 | | | Blackbaud (c) | | | 62,370 | | |
| | | | | Software & Services for Non-profits | | | | | |
| | 1,450,000 | | | NetSuite (a)(b) | | | 56,840 | | |
| | | | | End to End IT Systems Solutions
Delivered Over the Web | | | | | |
| | 2,000,000 | | | Tyler Technologies (a)(c) | | | 53,560 | | |
| | | | | Financial, Tax, Court & Document
Management Systems for Local
Governments | | | | | |
| | 1,950,000 | | | Constant Contact (a)(b)(c) | | | 49,491 | | |
| | | | | E-mail & Other Marketing Campaign
Management Systems Delivered
Over the Web | | | | | |
| | 2,025,000 | | | Kenexa (a)(c) | | | 48,560 | | |
| | | | | Recruiting & Workforce Management
Solutions | | | | | |
| | 1,200,000 | | | Ariba (a) | | | 41,364 | | |
| | | | | Cost Management Software | | | | | |
| | 1,381,600 | | | TIBCO (a) | | | 40,094 | | |
| | | | | Datacenter Software | | | | | |
| | 850,000 | | | Red Hat (a) | | | 39,015 | | |
| | | | | Maintenance & Support for Open
Source & Middleware | | | | | |
| | 920,000 | | | Jack Henry & Associates | | | 27,609 | | |
| | | | | Systems Financial Institutions | | | | | |
| | 690,000 | | | Advent Software (a) | | | 19,437 | | |
| | | | | Asset Management & Trading Systems | | | | | |
| | 900,000 | | | SPS Commerce (a)(c) | | | 16,011 | | |
| | | | | Supply Chain Management Software
Delivered via the Web | | | | | |
| | 550,000 | | | Intralinks (a) | | | 9,504 | | |
| | | | | Collaboration Software | | | | | |
| | 1,500,000 | | | Actuate (a) | | | 8,775 | | |
| | | | | Information Delivery Software & Solutions | | | | | |
| | 1,000,000 | | | InContact (a) | | | 4,750 | | |
| | | | | Call Center Systems Delivered via the
Web & Telecommunications Services | | | | | |
| | | | 1,269,523 | | |
| | | > Instrumentation 3.7% | |
| | 1,600,000 | | | Mettler Toledo (a) | | | 269,872 | | |
| | | | | Laboratory Equipment | | | | | |
| | 2,780,000 | | | IPG Photonics (a)(c) | | | 202,134 | | |
| | | | | Fiber Lasers | | | | | |
| Number of Shares | | | | Value (000) | |
| | 5,164,999 | | | Hexagon (Sweden) | | $ | 127,222 | | |
| | | | | Measurement Equipment & Software | | | | | |
| | 2,035,000 | | | Trimble Navigation (a) | | | 80,667 | | |
| | | | | GPS-based Instruments | | | | | |
| | 600,000 | | | FLIR Systems | | | 20,226 | | |
| | | | | Infrared Cameras | | | | | |
| | 400,000 | | | Hamamatsu Photonics (Japan) | | | 17,295 | | |
| | | | | Optical Sensors for Medical & Industrial
Applications | | | | | |
| | | | 717,416 | | |
| | | > Computer Hardware & Related
Equipment 2.7% | |
| | 3,565,000 | | | Amphenol | | | 192,474 | | |
| | | | | Electronic Connectors | | | | | |
| | 4,550,000 | | | II-VI (a)(c) | | | 116,480 | | |
| | | | | Laser Optics & Specialty Materials | | | | | |
| | 1,605,000 | | | Zebra Technologies (a) | | | 67,683 | | |
| | | | | Bar Code Printers | | | | | |
| | 1,200,000 | | | Netgear (a) | | | 52,464 | | |
| | | | | Networking Products for Small
Business & Home | | | | | |
| | 815,000 | | | Dolby Laboratories (a) | | | 34,605 | | |
| | | | | Audio Technology for Consumer Electronics | | | | | |
| | 800,000 | | | Nice Systems - ADR (Israel) (a) | | | 29,088 | | |
| | | | | Audio & Video Recording Solutions | | | | | |
| | 605,000 | | | Stratasys (a) | | | 20,389 | | |
| | | | | Rapid Prototyping Systems | | | | | |
| | | | 513,183 | | |
| | | > Semiconductors & Related
Equipment 2.1% | |
| | 8,130,000 | | | Atmel (a) | | | 114,389 | | |
| | | | | Microcontrollers, Radio Frequency &
Memory Semiconductors | | | | | |
| | 5,117,000 | | | ON Semiconductor (a) | | | 53,575 | | |
| | | | | Mixed-signal & Power Management
Semiconductors | | | | | |
| | 5,000,000 | | | Entegris (a) | | | 50,600 | | |
| | | | | Semiconductor Materials Management
Products | | | | | |
| | 2,345,000 | | | Microsemi (a) | | | 48,072 | | |
| | | | | Analog/Mixed-signal Semiconductors | | | | | |
| | 500,000 | | | Littelfuse | | | 29,360 | | |
| | | | | Little Fuses | | | | | |
| | 1,900,000 | | | IXYS (a)(c) | | | 28,462 | | |
| | | | | Power Semiconductors | | | | | |
| | 935,000 | | | Supertex (a)(c) | | | 20,944 | | |
| | | | | Analog/Mixed-signal Semiconductors | | | | | |
| | 1,750,000 | | | TriQuint Semiconductor (a) | | | 17,833 | | |
| | | | | Radio Frequency Semiconductors | | | | | |
| | 1,765,000 | | | Pericom Semiconductor (a)(c) | | | 15,779 | | |
| | | | | Interface Integrated Circuits (ICs) &
Frequency Control Products | | | | | |
| | 1,650,000 | | | Applied Micro Circuits (a) | | | 14,619 | | |
| | | | | Communications Semiconductors | | | | | |
| | 800,000 | | | Monolithic Power Systems (a) | | | 12,336 | | |
| | | | | High Performance Analog & Mixed-signal
Integrated Circuits (ICs) | | | | | |
| | | | 405,969 | | |
See accompanying notes to financial statements.
22
| Number of Shares | | | | Value (000) | |
| | | > Telephone and Data Services 2.1% | |
| | 9,500,000 | | | tw telecom (a)(c) | | $ | 195,035 | | |
| | | | | Fiber Optic Telephone/Data Services | | | | | |
| | 1,199,876 | | | AboveNet | | | 84,543 | | |
| | | | | Metropolitan Fiber Communications
Services | | | | | |
| | 9,600,000 | | | PAETEC Holding (a)(c) | | | 45,984 | | |
| | | | | Telephone/Data Services for Business | | | | | |
| | 2,520,000 | | | Cogent Communications (a)(c) | | | 42,865 | | |
| | | | | Internet Data Pipelines | | | | | |
| | 2,000,000 | | | General Communications (a) | | | 24,140 | | |
| | | | | Commercial Communications & Consumer
CATV, Web & Phone in Alaska | | | | | |
| | 1,200,000 | | | Boingo Wireless (a)(b) | | | 10,896 | | |
| | | | | Wholesale & Retail WiFi Networks | | | | | |
| | | | 403,463 | | |
| | | > Mobile Communications 2.0% | |
| | 6,000,000 | | | Crown Castle International (a) | | | 244,740 | | |
| | | | | Communications Towers | | | | | |
| | 3,150,000 | | | SBA Communications (a) | | | 120,298 | | |
| | | | | Communications Towers | | | | | |
| | 1,000,000 | | | MetroPCS Communications (a) | | | 17,210 | | |
| | | | | Discount Cellular Telephone Services | | | | | |
| | 1,500,000 | | | Globalstar (a)(b) | | | 1,845 | | |
| | | | | Satellite Mobile Voice & Data Carrier | | | | | |
| | | | 384,093 | | |
| | | > Telecommunications Equipment 1.6% | |
| | 2,455,000 | | | Polycom (a) | | | 157,856 | | |
| | | | | Video Conferencing Equipment | | | | | |
| | 685,000 | | | F5 Networks (a) | | | 75,521 | | |
| | | | | Internet Traffic Management Equipment | | | | | |
| | 1,725,000 | | | Finisar (a) | | | 31,102 | | |
| | | | | Optical Sub-systems & Components | | | | | |
| | 2,030,000 | | | Ixia (a) | | | 25,984 | | |
| | | | | Telecom Network Test Equipment | | | | | |
| | 1,925,000 | | | Infinera (a) | | | 13,302 | | |
| | | | | Optical Networking Equipment | | | | | |
| | 313,300 | | | Blue Coat Systems (a) | | | 6,849 | | |
| | | | | WAN Acceleration & Network Security | | | | | |
| | | | 310,614 | | |
| | | > Computer Services 1.4% | |
| | 1,583,750 | | | SRA International (a) | | | 48,970 | | |
| | | | | Government IT Services | | | | | |
| | 2,900,000 | | | iGate (b)(c) | | | 47,328 | | |
| | | | | IT & BPO (Business Process Outsourcing)
Services | | | | | |
| | 2,125,000 | | | Virtusa (a)(c) | | | 40,269 | | |
| | | | | Offshore IT Outsourcing | | | | | |
| | 580,000 | | | Syntel | | | 34,290 | | |
| | | | | Offshore I/T Services | | | | | |
| | 1,145,000 | | | ExlService Holdings (a) | | | 26,449 | | |
| | | | | BPO (Business Process Outsourcing) | | | | | |
| | 4,500,000 | | | Hackett Group (a)(c) | | | 22,905 | | |
| | | | | IT Integration & Best Practice Research | | | | | |
| | 1,560,000 | | | Acxiom (a) | | | 20,452 | | |
| | | | | Database Marketing Services | | | | | |
| | 781,635 | | | Genpact (a) | | | 13,475 | | |
| | | | | Business Process Outsourcing | | | | | |
| Number of Shares | | | | Value (000) | |
| | 1,027,147 | | | WNS - ADR (India) (a) | | $ | 9,131 | | |
| | | | | Offshore BPO (Business Process
Outsourcing) Services | | | | | |
| | | | 263,269 | | |
| | | > Gaming Equipment & Services 1.1% | |
| | 3,725,000 | | | Bally Technologies (a)(b)(c) | | | 151,533 | | |
| | | | | Slot Machines & Software | | | | | |
| | 2,100,000 | | | WMS Industries (a) | | | 64,512 | | |
| | | | | Slot Machine Provider | | | | | |
| | | | 216,045 | | |
| | | > CATV 1.0% | |
| | 3,000,000 | | | Discovery Communications,
Series C (a) | | | 109,650 | | |
| | | | | Cable TV Programming | | | | | |
| | 1,250,000 | | | Liberty Global, Series A (a)(b) | | | 56,300 | | |
| | | | | Cable TV Franchises Outside the USA | | | | | |
| | 17,770 | | | Jupiter Telecommunications (Japan) | | | 19,881 | | |
| | | | | Largest Cable Service Provider in Japan | | | | | |
| | | | 185,831 | | |
| | | > Financial Processors 0.9% | |
| | 2,429,000 | | | Global Payments | | | 123,879 | | |
| | | | | Credit Card Processor | | | | | |
| | 5,000,000 | | | Singapore Exchange (Singapore) | | | 30,725 | | |
| | | | | Singapore Equity & Derivatives
Market Operator | | | | | |
| | 750,000 | | | Hong Kong Exchanges and Clearing
(Hong Kong) | | | 15,802 | | |
| | | | | Hong Kong Equity & Derivatives
Market Operator | | | | | |
| | | | 170,406 | | |
| | | > Electronics Distribution 0.5% | |
| | 3,125,000 | | | Avnet (a) | | | 99,625 | | |
| | | | | Electronic Components Distribution | | | | | |
| | | | 99,625 | | |
| | | > Business Information &
Marketing Services 0.5% | |
| | 900,000 | | | FTI Consulting (a)(b) | | | 34,146 | | |
| | | | | Financial Consulting Firm | | | | | |
| | 3,100,000 | | | Navigant Consulting (a)(c) | | | 32,519 | | |
| | | | | Financial Consulting Firm | | | | | |
| | 900,000 | | | Verisk Analytics (a) | | | 31,158 | | |
| | | | | Risk & Decision Analytics | | | | | |
| | | | 97,823 | | |
| | | > Contract Manufacturing 0.4% | |
| | 1,210,000 | | | Plexus (a) | | | 42,120 | | |
| | | | | Electronic Manufacturing Services | | | | | |
| | 2,800,000 | | | Sanmina-SCI (a) | | | 28,924 | | |
| | | | | Electronic Manufacturing Services | | | | | |
| | | | 71,044 | | |
| | | > Internet Related 0.3% | |
| | 435,000 | | | Equinix (a) | | | 43,944 | | |
| | | | | Network Neutral Data Centers | | | | | |
| | 464,305 | | | Mail.ru - GDR (Russia) (a)(d) | | | 15,424 | | |
| | | | | Internet Social Networking & Games
for Russian Speakers | | | | | |
| | 1,000,000 | | | TheStreet.com | | | 3,070 | | |
| | | | | Financial Information Websites | | | | | |
| | | | 62,438 | | |
See accompanying notes to financial statements.
23
Columbia Acorn Fund
Statement of Investments (Unaudited), continued
| Number of Shares | | | | Value (000) | |
| | | > Entertainment Programming 0.2% | |
| | 1,400,000 | | | IMAX (Canada) (a) | | $ | 45,402 | | |
| | | | | IMAX Movies, Theatre Equipment &
Theatre Joint Ventures | | | | | |
| | | | 45,402 | | |
| | | > Radio 0.1% | |
| | 164,991 | | | Saga Communications (a) | | | 6,105 | | |
| | | | | Radio Stations in Small & Mid-sized Cities | | | | | |
| | 1,541,000 | | | Salem Communications (c) | | | 5,532 | | |
| | | | | Radio Stations for Religious Programming | | | | | |
| | 2,400,000 | | | Spanish Broadcasting System (a)(c) | | | 1,680 | | |
| | | | | Spanish Language Radio Stations | | | | | |
| | | | 13,317 | | |
| | | > TV Broadcasting —% | |
| | 2,500,000 | | | Entravision Communications (a) | | | 4,625 | | |
| | | | | Spanish Language TV & Radio Stations | | | | | |
| | 1,750,000 | | | Gray Television (a)(b) | | | 4,620 | | |
| | | | | Mid-market Affiliated TV Stations | | | | | |
| | | | 9,245 | | |
| | | > Advertising —% | |
| | 1,500,000 | | | VisionChina Media - ADR
(China) (a)(b) | | | 4,245 | | |
| | | | | Advertising on Digital Screens in
China's Mass Transit System | | | | | |
| | | | 4,245 | | |
| Information: Total | | | 5,242,951 | | |
| Consumer Goods & Services 18.3% | | | |
| | | > Retail 5.2% | |
| | 3,991,265 | | | lululemon athletica (a)(c) | | | 446,304 | | |
| | | | | Premium Active Apparel Retailer | | | | | |
| | 3,510,000 | | | Abercrombie & Fitch | | | 234,889 | | |
| | | | | Teen Apparel Retailer | | | | | |
| | 2,300,000 | | | Shutterfly (a)(c) | | | 132,066 | | |
| | | | | Internet Photo-centric Retailer | | | | | |
| | 5,600,000 | | | Pier 1 Imports (a) | | | 64,792 | | |
| | | | | Home Furnishing Retailer | | | | | |
| | 5,225,000 | | | Saks (a) | | | 58,363 | | |
| | | | | Luxury Department Store Retailer | | | | | |
| | 1,933,750 | | | Chico's FAS | | | 29,451 | | |
| | | | | Women's Specialty Retailer | | | | | |
| | 525,000 | | | DSW (a) | | | 26,570 | | |
| | | | | Branded Footwear Retailer | | | | | |
| | 1,371,366 | | | Gaiam (c) | | | 6,816 | | |
| | | | | Healthy Living Catalogs & E-Commerce | | | | | |
| | 828,500 | | | Talbots (a)(b) | | | 2,767 | | |
| | | | | Women's Specialty Retailer | | | | | |
| | 62,784 | | | Blue Nile (a)(b) | | | 2,761 | | |
| | | | | Online Jewelry Retailer | | | | | |
| | 66,000 | | | The Fresh Market (a) | | | 2,553 | | |
| | | | | Specialty Food Retailer | | | | | |
| | | | 1,007,332 | | |
| | | > Apparel 3.5% | |
| | 2,100,000 | | | Coach | | | 134,253 | | |
| | | | | Designer & Retailer of Branded
Leather Accessories | | | | | |
| Number of Shares | | | | Value (000) | |
| | 2,190,000 | | | Warnaco Group (a) | | $ | 114,427 | | |
| | | | | Global Branded Apparel Manufacturer | | | | | |
| | 1,120,000 | | | Deckers Outdoor (a) | | | 98,717 | | |
| | | | | Fashion Footwear Wholesaler | | | | | |
| | 1,410,000 | | | Phillips-Van Heusen | | | 92,313 | | |
| | | | | Apparel Wholesaler & Retailer | | | | | |
| | 1,980,000 | | | Guess? | | | 83,279 | | |
| | | | | Branded Apparel, Accessories & Licensor | | | | | |
| | 2,047,000 | | | True Religion Apparel (a)(c) | | | 59,527 | | |
| | | | | Premium Denim | | | | | |
| | 1,400,000 | | | Crocs (a) | | | 36,050 | | |
| | | | | Branded Footwear Wholesaler & Retailer | | | | | |
| | 1,000,000 | | | Hanesbrands (a) | | | 28,550 | | |
| | | | | Apparel Wholesaler | | | | | |
| | 600,000 | | | Steven Madden (a) | | | 22,506 | | |
| | | | | Wholesaler/Retailer of Fashion Footwear | | | | | |
| | 100,197 | | | Zuoan Fashion (China) (a)(b) | | | 560 | | |
| | | | | Men's Apparel Provider in China | | | | | |
| | | | 670,182 | | |
| | | > Travel 2.8% | |
| | 3,850,000 | | | Gaylord Entertainment (a)(c) | | | 115,500 | | |
| | | | | Convention Hotels | | | | | |
| | 3,900,000 | | | Expedia | | | 113,061 | | |
| | | | | Online Travel Services Company | | | | | |
| | 4,600,000 | | | Avis Budget Group (a) | | | 78,614 | | |
| | | | | Second Largest Car Rental Company | | | | | |
| | 1,250,000 | | | Vail Resorts | | | 57,775 | | |
| | | | | Ski Resort Operator & Developer | | | | | |
| | 1,289,880 | | | HomeAway (a) | | | 49,919 | | |
| | | | | Vacation Rental Online Marketplace | | | | | |
| | 3,000,000 | | | Hertz (a) | | | 47,640 | | |
| | | | | Largest U.S. Rental Car Operator | | | | | |
| | 2,000,000 | | | Localiza Rent A Car (Brazil) | | | 35,754 | | |
| | | | | Car Rental | | | | | |
| | 970,000 | | | Choice Hotels | | | 32,359 | | |
| | | | | Franchisor of Budget Hotel Brands | | | | | |
| | | | 530,622 | | |
| | | > Food & Beverage 1.7% | |
| | 1,900,000 | | | Hansen Natural (a) | | | 153,805 | | |
| | | | | Alternative Beverages | | | | | |
| | 1,170,000 | | | Diamond Foods (b)(c) | | | 89,318 | | |
| | | | | Snack Foods & Culinary Ingredients | | | | | |
| | 32,896,000 | | | Olam International (Singapore) | | | 73,128 | | |
| | | | | Agriculture Supply Chain Manager | | | | | |
| | 1,200,000 | | | GLG Life Tech (Canada) (a) | | | 8,064 | | |
| | | | | Produce an All-natural Sweetener
Extracted from the Stevia Plant | | | | | |
| | 240,000 | | | Lance | | | 5,191 | | |
| | | | | Snack Foods | | | | | |
| | | | 329,506 | | |
| | | > Furniture & Textiles 0.9% | |
| | 4,000,000 | | | Knoll (c) | | | 80,280 | | |
| | | | | Office Furniture | | | | | |
| | 2,800,000 | | | Herman Miller | | | 76,216 | | |
| | | | | Office Furniture | | | | | |
| | 1,000,000 | | | Interface | | | 19,370 | | |
| | | | | Modular & Broadloom Carpet | | | | | |
| | | | 175,866 | | |
See accompanying notes to financial statements.
24
| Number of Shares | | | | Value (000) | |
| | | > Casinos & Gaming 0.9% | |
| | 1,590,000 | | | Penn National Gaming (a) | | $ | 64,141 | | |
| | | | | Regional Casino Operator | | | | | |
| | 3,400,000 | | | Pinnacle Entertainment (a)(c) | | | 50,660 | | |
| | | | | Regional Casino Operator | | | | | |
| | 3,000,000 | | | Melco Crown Entertainment - ADR
(Hong Kong) (a) | | | 38,310 | | |
| | | | | Macau Casino Operator | | | | | |
| | 12,000,000 | | | MGM China Holdings (Hong Kong) (a) | | | 22,144 | | |
| | | | | Macau Casino Operator | | | | | |
| | | | 175,255 | | |
| | | > Educational Services 0.7% | |
| | 2,800,000 | | | Career Education (a) | | | 59,220 | | |
| | | | | Post-secondary Education | | | | | |
| | 1,700,000 | | | Universal Technical Institute (c) | | | 33,609 | | |
| | | | | Vocational Training | | | | | |
| | 350,000 | | | ITT Educational Services (a)(b) | | | 27,384 | | |
| | | | | Post-secondary Degree Services | | | | | |
| | 200,000 | | | New Oriental Education &
Technology - ADR (China) (a) | | | 22,344 | | |
| | | | | Education Service Provider | | | | | |
| | 2,000,000 | | | Voyager Learning, Contingent Value
Rights (a)(d) | | | 300 | | |
| | | | | Education Services for the K-12 Market | | | | | |
| | | | 142,857 | | |
| | | > Other Consumer Services 0.7% | |
| | 2,190,000 | | | Lifetime Fitness (a)(c) | | | 87,403 | | |
| | | | | Sport & Fitness Club Operator | | | | | |
| | 14,000,000 | | | Lifestyle International (Hong Kong) | | | 41,319 | | |
| | | | | Mid- to High-end Department Store
Operator in Hong Kong & China | | | | | |
| | 4,250,000 | | | Move (a) | | | 9,307 | | |
| | | | | Real Estate Internet Websites | | | | | |
| | 1,325,000 | | | IFM Investments (Century 21
China RE) - ADR (China) (a) | | | 1,948 | | |
| | | | | Provides Real Estate Services in China | | | | | |
| | | | 139,977 | | |
| | | > Other Durable Goods 0.5% | |
| | 1,720,000 | | | Jarden | | | 59,357 | | |
| | | | | Branded Household Products | | | | | |
| | 415,000 | | | Cavco Industries (a)(c) | | | 18,675 | | |
| | | | | Manufactured Homes | | | | | |
| | 400,000 | | | Tesla Motors (a)(b) | | | 11,652 | | |
| | | | | Design, Manufacture & Sell
High Performance Electric Vehicles | | | | | |
| | | | 89,684 | | |
| | | > Restaurants 0.4% | |
| | 2,000,000 | | | AFC Enterprises (a)(c) | | | 32,900 | | |
| | | | | Popeye's Restaurants | | | | | |
| | 480,000 | | | P.F. Chang's China Bistro | | | 19,315 | | |
| | | | | Mandarin Style Restaurants | | | | | |
| | 675,000 | | | Bravo Brio Restaurant Group (a) | | | 16,490 | | |
| | | | | Upscale Casual Italian Restaurants | | | | | |
| | 450,000 | | | Cheesecake Factory (a) | | | 14,117 | | |
| | | | | Casual Dining Restaurants | | | | | |
| | | | 82,822 | | |
| Number of Shares | | | | Value (000) | |
| | | > Consumer Goods Distribution 0.3% | |
| | 2,100,000 | | | Pool | | $ | 62,601 | | |
| | | | | Distributor of Swimming Pool
Supplies & Equipment | | | | | |
| | | | 62,601 | | |
| | | > Leisure Products 0.3% | |
| | 1,980,000 | | | Thor Industries | | | 57,103 | | |
| | | | | RV & Bus Manufacturer | | | | | |
| | | | 57,103 | | |
| | | > Nondurables 0.3% | |
| | 1,600,000 | | | Helen of Troy (a)(c) | | | 55,248 | | |
| | | | | Hair Dryers & Curling Irons | | | | | |
| | | | 55,248 | | |
| | | > Other Entertainment 0.1% | |
| | 173,436 | | | CTS Eventim (Germany) | | | 11,984 | | |
| | | | | Event Ticket Sales | | | | | |
| | | | 11,984 | | |
| Consumer Goods & Services: Total | | | 3,531,039 | | |
| Industrial Goods & Services 18.3% | | | |
| | | > Machinery 10.1% | |
| | 6,750,000 | | | Ametek | | | 303,075 | | |
| | | | | Aerospace/Industrial Instruments | | | | | |
| | 4,200,000 | | | Donaldson (c) | | | 254,856 | | |
| | | | | Industrial Air Filtration | | | | | |
| | 3,000,000 | | | Nordson | | | 164,550 | | |
| | | | | Dispensing Systems for Adhesives & Coatings | | | | | |
| | 3,535,000 | | | Pentair | | | 142,673 | | |
| | | | | Pumps & Water Treatment | | | | | |
| | 2,900,000 | | | Kennametal | | | 122,409 | | |
| | | | | Consumable Cutting Tools | | | | | |
| | 2,565,000 | | | Clarcor (c) | | | 121,273 | | |
| | | | | Mobile & Industrial Filters | | | | | |
| | 3,650,000 | | | Oshkosh (a) | | | 105,631 | | |
| | | | | Specialty Truck Manufacturer | | | | | |
| | 1,800,000 | | | Pall | | | 101,214 | | |
| | | | | Filtration & Fluids Clarification | | | | | |
| | 2,250,000 | | | HEICO (c) | | | 89,460 | | |
| | | | | FAA Approved Aircraft Replacement Parts | | | | | |
| | 2,050,000 | | | MOOG (a) | | | 89,216 | | |
| | | | | Motion Control Products for Aerospace,
Defense & Industrial Markets | | | | | |
| | 2,200,000 | | | ESCO Technologies (c) | | | 80,960 | | |
| | | | | Automatic Electric Meter Readers | | | | | |
| | 1,150,000 | | | WABCO Holdings (a) | | | 79,419 | | |
| | | | | Truck & Bus Component Supplier | | | | | |
| | 805,000 | | | Toro | | | 48,703 | | |
| | | | | Turf Maintenance Equipment | | | | | |
| | 1,300,000 | | | Mine Safety Appliances | | | 48,542 | | |
| | | | | Safety Equipment | | | | | |
| | 1,300,000 | | | Kaydon | | | 48,516 | | |
| | | | | Specialized Friction & Motion Control Products | | | | | |
| | 600,000 | | | Wabtec | | | 39,432 | | |
| | | | | Freight & Transit Component Supplier | | | | | |
| | 1,600,000 | | | Generac (a) | | | 31,040 | | |
| | | | | Stand-by Power Generators | | | | | |
| | 287,000 | | | Neopost (France) | | | 24,655 | | |
| | | | | Postage Meter Machines | | | | | |
See accompanying notes to financial statements.
25
Columbia Acorn Fund
Statement of Investments (Unaudited), continued
| Number of Shares | | | | Value (000) | |
| | | > Machinery—continued | |
| | 3,500,000 | | | Jain Irrigation Systems (India) | | $ | 13,382 | | |
| | | | | Agricultural Micro-irrigation Systems &
Food Processing | | | | | |
| | 10,000,000 | | | Marel (Iceland) (a) | | | 10,586 | | |
| | | | | Largest Manufacturer of Poultry & Fish
Processing Equipment | | | | | |
| | 100,000 | | | Valmont Industries | | | 9,639 | | |
| | | | | Center Pivot Irrigation Systems & Utility Poles | | | | | |
| | 1,250,000 | | | Spartan Motors | | | 6,750 | | |
| | | | | Specialty Truck & Chassis Manufacturer | | | | | |
| | | | 1,935,981 | | |
| | | > Industrial Materials & Specialty
Chemicals 2.4% | |
| | 1,650,000 | | | Albemarle | | | 114,180 | | |
| | | | | Refinery Catalysts & Other Specialty
Chemicals | | | | | |
| | 650,000 | | | FMC Corp. | | | 55,913 | | |
| | | | | Niche Specialty Chemicals | | | | | |
| | 340,000 | | | Novozymes (Denmark) | | | 55,329 | | |
| | | | | Industrial Enzymes | | | | | |
| | 673,000 | | | Sociedad Quimica y Minera de
Chile - ADR (Chile) | | | 43,557 | | |
| | | | | Producer of Specialty Fertilizers,
Lithium & Iodine | | | | | |
| | 1,260,000 | | | Drew Industries (c) | | | 31,147 | | |
| | | | | RV & Manufactured Home Components | | | | | |
| | 524,000 | | | Mersen (France) | | | 29,559 | | |
| | | | | Advanced Industrial Materials | | | | | |
| | 1,100,000 | | | Albany International | | | 29,029 | | |
| | | | | Paper Machine Clothing & Advanced Textiles | | | | | |
| | 10,000 | | | Sika (Switzerland) | | | 24,109 | | |
| | | | | Chemicals for Construction & Industrial
Applications | | | | | |
| | 831,000 | | | Nalco | | | 23,110 | | |
| | | | | Provider of Water Treatment & Process
Chemicals & Services | | | | | |
| | 350,000 | | | Greif | | | 22,761 | | |
| | | | | Industrial Packaging | | | | | |
| | 2,218,700 | | | Kansai Paint (Japan) | | | 20,215 | | |
| | | | | Paint Producer in Japan, India, China &
Southeast Asia | | | | | |
| | 400,000 | | | Silgan Holdings | | | 16,388 | | |
| | | | | Metal & Plastic Packaging | | | | | |
| | | | 465,297 | | |
| | | > Other Industrial Services 2.0% | |
| | 3,200,000 | | | Expeditors International of Washington | | | 163,808 | | |
| | | | | International Freight Forwarder | | | | | |
| | 1,767,165 | | | Imtech (Netherlands) | | | 62,503 | | |
| | | | | Electromechanical & Information &
Communications Technologies Installation &
Maintenance | | | | | |
| | 1,300,000 | | | Forward Air | | | 43,927 | | |
| | | | | Freight Transportation Between Airports | | | | | |
| | 1,600,000 | | | Mobile Mini (a) | | | 33,904 | | |
| | | | | Portable Storage Units Leasing | | | | | |
| | 900,000 | | | LKQ (a) | | | 23,481 | | |
| | | | | Alternative Auto Parts Distribution | | | | | |
| | 1,000,000 | | | UTI Worldwide | | | 19,690 | | |
| | | | | Freight Forwarding & Logistics | | | | | |
| Number of Shares | | | | Value (000) | |
| | 626,524 | | | Arcadis (Netherlands) | | $ | 15,327 | | |
| | | | | Engineering Consultants | | | | | |
| | 1,050,000 | | | TrueBlue (a) | | | 15,204 | | |
| | | | | Temporary Manual Labor | | | | | |
| | 10,000,000 | | | Hutchison Port Holdings Trust
(Hong Kong) (a) | | | 8,450 | | |
| | | | | Southern China Container Ports | | | | | |
| | | | 386,294 | | |
| | | > Industrial Distribution 1.0% | |
| | 900,000 | | | WW Grainger | | | 138,285 | | |
| | | | | Industrial Distribution | | | | | |
| | 2,600,000 | | | Interline Brands (a)(c) | | | 47,762 | | |
| | | | | Industrial Distribution | | | | | |
| | 100,000 | | | Watsco | | | 6,799 | | |
| | | | | HVAC Distribution | | | | | |
| | | | 192,846 | | |
| | | > Electrical Components 0.6% | |
| | 1,440,000 | | | Acuity Brands | | | 80,323 | | |
| | | | | Commercial Lighting Fixtures | | | | | |
| | 1,500,000 | | | Ushio (Japan) | | | 29,659 | | |
| | | | | Industrial Light Sources | | | | | |
| | 351,000 | | | Saft (France) | | | 12,071 | | |
| | | | | Niche Battery Manufacturer | | | | | |
| | | | 122,053 | | |
| | | > Waste Management 0.6% | |
| | 1,672,500 | | | Waste Connections | | | 53,068 | | |
| | | | | Solid Waste Management | | | | | |
| | 1,000,000 | | | Republic Services | | | 30,850 | | |
| | | | | Solid Waste Management | | | | | |
| | 280,000 | | | Clean Harbors (a) | | | 28,910 | | |
| | | | | Hazardous Waste Services & Disposal | | | | | |
| | | | 112,828 | | |
| | | > Outsourcing Services 0.5% | |
| | 2,800,000 | | | Quanta Services (a) | | | 56,560 | | |
| | | | | Electrical & Telecom Construction Services | | | | | |
| | 1,210,000 | | | Insperity | | | 35,828 | | |
| | | | | Professional Employer Organization | | | | | |
| | 600,000 | | | GP Strategies (a) | | | 8,196 | | |
| | | | | Training Programs | | | | | |
| | | | 100,584 | | |
| | | > Construction 0.4% | |
| | 66,000 | | | NVR (a) | | | 47,882 | | |
| | | | | D.C. Homebuilder | | | | | |
| | 1,800,000 | | | Mills Estruturas e Serviços de
Engenharia (Brazil) | | | 25,951 | | |
| | | | | Civil Engineering & Construction | | | | | |
| | 360,073 | | | Simpson Manufacturing | | | 10,755 | | |
| | | | | Wall Joint Maker | | | | | |
| | | | 84,588 | | |
| | | > Conglomerates 0.4% | |
| | 2,263,654 | | | Aalberts Industries (Netherlands) | | | 52,916 | | |
| | | | | Flow Control & Heat Treatment | | | | | |
| | 600,000 | | | Ibiden (Japan) | | | 18,785 | | |
| | | | | Electronic Parts & Ceramics | | | | | |
| | | | 71,701 | | |
See accompanying notes to financial statements.
26
| Number of Shares | | | | Value (000) | |
| | | > Steel 0.3% | |
| | 2,340,000 | | | GrafTech International (a) | | $ | 47,432 | | |
| | | | | Industrial Graphite Materials Producer | | | | | |
| | | | 47,432 | | |
| | | > Water —% | |
| | 649,641 | | | Mueller Water Products | | | 2,586 | | |
| | | | | Fire Hydrants, Valves & Ductile Iron Pipes | | | | | |
| | | | 2,586 | | |
| Industrial Goods & Services: Total | | | 3,522,190 | | |
| Energy & Minerals 9.8% | | | |
| | | > Oil Services 3.9% | |
| | 6,200,000 | | | FMC Technologies (a) | | | 277,698 | | |
| | | | | Oil & Gas Wellhead Manufacturer | | | | | |
| | 2,641,054 | | | Fugro (Netherlands) | | | 190,424 | | |
| | | | | Sub-sea Oilfield Services | | | | | |
| | 2,399,000 | | | Atwood Oceanics (a) | | | 105,868 | | |
| | | | | Offshore Drilling Contractor | | | | | |
| | 743,000 | | | Oil States International (a) | | | 59,373 | | |
| | | | | Diversified North American Oil Service
Provider | | | | | |
| | 1,670,000 | | | ShawCor (Canada) | | | 51,289 | | |
| | | | | Oil & Gas Pipeline Products | | | | | |
| | 375,000 | | | Bristow | | | 19,132 | | |
| | | | | Largest Provider of Helicopter Services
to Offshore Oil & Gas Producers | | | | | |
| | 528,300 | | | Black Diamond Group (Canada) | | | 17,255 | | |
| | | | | Provides Accommodations/Equipment for
Oil Sands Exploitation | | | | | |
| | 500,000 | | | Hornbeck Offshore (a) | | | 13,750 | | |
| | | | | Supply Vessel Operator in U.S. Gulf of Mexico | | | | | |
| | 2,890,900 | | | Horizon North Logistics (Canada) | | | 13,429 | | |
| | | | | Provides Diversified Oil Service Offering in
Northern Canada | | | | | |
| | 9,519,200 | | | Tuscany International Drilling
(Colombia) (a) | | | 9,080 | | |
| | 1,040,000 | | | Tuscany International Drilling - Warrants
(Colombia) (a) | | | 38 | | |
| | | | | South America-based Drilling Rig Contractor | | | | | |
| | | | 757,336 | | |
| | | > Oil & Gas Producers 3.7% | |
| | 4,810,550 | | | Pacific Rubiales Energy (Colombia) | | | 128,936 | | |
| | | | | Oil Production & Exploration in Colombia | | | | | |
| | 1,650,000 | | | Southwestern Energy (a) | | | 70,752 | | |
| | | | | Oil & Gas Producer | | | | | |
| | 2,700,000 | | | Denbury Resources (a) | | | 54,000 | | |
| | | | | Oil Producer Using Co2 Injection | | | | | |
| | 715,000 | | | SM Energy | | | 52,538 | | |
| | | | | Oil & Gas Producer | | | | | |
| | 974,000 | | | Rosetta Resources (a) | | | 50,200 | | |
| | | | | Oil & Gas Producer Exploring in
South Texas & Montana | | | | | |
| | 2,400,000 | | | Tullow Oil (United Kingdom) | | | 47,763 | | |
| | | | | Oil & Gas Producer | | | | | |
| | 910,000 | | | Ultra Petroleum (a) | | | 41,678 | | |
| | | | | Oil & Gas Producer | | | | | |
| Number of Shares | | | | Value (000) | |
| | 695,000 | | | Range Resources | | $ | 38,572 | | |
| | | | | Oil & Gas Producer | | | | | |
| | 650,000 | | | Baytex (Canada) (b) | | | 35,531 | | |
| | | | | Oil & Gas Producer in Canada | | | | | |
| | 1,200,000 | | | Houston American Energy (b) | | | 21,756 | | |
| | | | | Oil & Gas Exploration & Production
in Colombia | | | | | |
| | 27,063,400 | | | ShaMaran Petroleum (Iraq) (a) | | | 21,326 | | |
| | | | | Oil Exploration in Kurdistan | | | | | |
| | 550,000 | | | Swift Energy (a) | | | 20,499 | | |
| | | | | Oil & Gas Exploration & Production Company | | | | | |
| | 850,000 | | | Northern Oil & Gas (a)(b) | | | 18,828 | | |
| | | | �� | Small E&P Company in North Dakota Bakken | | | | | |
| | 250,000 | | | Cabot Oil & Gas | | | 16,578 | | |
| | | | | Large Natural Gas Producer in Appalachia &
Gulf Coast | | | | | |
| | 293,000 | | | Carrizo Oil & Gas (a) | | | 12,233 | | |
| | | | | Oil & Gas Producer | | | | | |
| | 37,500,000 | | | Petromanas (Canada) (a)(c)(d) | | | 11,050 | | |
| | 18,750,000 | | | Petromanas - Warrants
(Canada) (a)(c)(d) | | | 476 | | |
| | | | | Exploring for Oil in Albania | | | | | |
| | 26,000,000 | | | Petrodorado (Colombia) (a)(c) | | | 8,222 | | |
| | 24,000,000 | | | Petrodorado - Warrants
(Colombia) (a)(c)(d) | | | 2,436 | | |
| | | | | Oil & Gas Exploration & Production in
Colombia, Peru & Paraguay | | | | | |
| | 42,580,500 | | | Alange Energy (Colombia) (a)(b) | | | 9,713 | | |
| | | | | Oil & Gas Exploration & Production
in Colombia | | | | | |
| | 484,500 | | | Crew Energy (Canada) (a) | | | 7,535 | | |
| | | | | Canadian Oil & Gas Producer | | | | | |
| | 575,000 | | | Venoco (a) | | | 7,326 | | |
| | | | | Oil & Gas Producer in California & Texas | | | | | |
| | 6,300,000 | | | Canacol Energy (Colombia) (a)(d) | | | 6,786 | | |
| | | | | Oil Producer in South America | | | | | |
| | 228,200 | | | Oasis Petroleum (a) | | | 6,773 | | |
| | | | | Oil Producer in North Dakota | | | | | |
| | 1,198,100 | | | Pan Orient (Canada) (a) | | | 6,659 | | |
| | | | | Growth Oriented & Return Focused
Asian Explorer | | | | | |
| | 30,275,000 | | | Petroamerica (Colombia) (a)(c) | | | 5,023 | | |
| | | | | Oil Exploration & Production in Colombia | | | | | |
| | 8,400,000 | | | Canadian Overseas Petroleum
(United Kingdom) (a)(d) | | | 3,884 | | |
| | 4,200,000 | | | Canadian Overseas Petroleum -
Warrants (United Kingdom) (a)(d) | | | 572 | | |
| | | | | Oil & Gas Exploration/Production in the
North Sea | | | | | |
| | 41,100,000 | | | Quetzal Energy (Colombia) (a)(c)(d) | | | 3,273 | | |
| | 8,900,000 | | | Quetzal Energy (Colombia) (a)(c) | | | 738 | | |
| | | | | Explores for Oil & Gas in Latin America | | | | | |
| | 175,400 | | | Celtic Exploration (Canada) (a) | | | 3,879 | | |
| | | | | Canadian Oil & Gas Producer | | | | | |
| | 2,245,000 | | | Primary Petroleum (Canada) (a) | | | 1,117 | | |
| | | | | Targeting Oil Deposits in Western Montana | | | | | |
| | | | 716,652 | | |
See accompanying notes to financial statements.
27
Columbia Acorn Fund
Statement of Investments (Unaudited), continued
| Number of Shares | | | | Value (000) | |
| | | > Mining 1.6% | |
| | 641,000 | | | Core Laboratories (Netherlands) (b) | | $ | 71,497 | | |
| | | | | Oil & Gas Reservoir Consulting | | | | | |
| | 1,950,000 | | | Silver Wheaton (Canada) | | | 64,350 | | |
| | | | | Silver Mining Royalty Company | | | | | |
| | 15,000,000 | | | Zhaojin Mining Industry (China) | | | 30,945 | | |
| | | | | Gold Mining & Refining in China | | | | | |
| | 1,150,000 | | | Ivanhoe Mines (Canada) (a) | | | 29,059 | | |
| | | | | Copper Mine Project in Mongolia | | | | | |
| | 4,432,000 | | | Northam Platinum (South Africa) | | | 27,837 | | |
| | | | | Platinum Mining in South Africa | | | | | |
| | 900,000 | | | Silver Standard Resources (a) | | | 24,021 | | |
| | | | | Silver Mining | | | | | |
| | 2,800,000 | | | Alexco Resource (a) | | | 20,188 | | |
| | | | | Mining, Exploration & Environmental Services | | | | | |
| | 5,000,000 | | | Orko Silver (Canada) (a)(b) | | | 14,464 | | |
| | | | | Silver Exploration & Development | | | | | |
| | 3,816,400 | | | Duluth Metals (Canada) (a) | | | 9,418 | | |
| | | | | Copper & Nickel Miner | | | | | |
| | 5,215,500 | | | Mongolian Mining (Hong Kong) (a) | | | 6,449 | | |
| | | | | Coking Coal Mining in Mongolia | | | | | |
| | 236,400 | | | Tahoe Resources (Canada) (a)(d) | | | 4,368 | | |
| | | | | Silver Project in Guatemala | | | | | |
| | 800,000 | | | Augusta Resource (a) | | | 3,704 | | |
| | | | | U.S. Copper/Molybdenum Mine | | | | | |
| | 4,000,000 | | | Wolverine Minerals (Canada) (a)(c)(d) | | | 2,389 | | |
| | 2,000,000 | | | Wolverine Minerals - Warrants
(Canada) (a)(c)(d) | | | 281 | | |
| | | | | Gold Miner | | | | | |
| | | | 308,970 | | |
| | | > Alternative Energy 0.3% | |
| | 3,000,000 | | | GT Solar International (a)(b) | | | 48,600 | | |
| | | | | Largest Manufacturer of Furnaces &
Reactors to Produce & Cast Polysilicon | | | | | |
| | 500,000 | | | STR Holdings (a)(b) | | | 7,460 | | |
| | | | | Makes Encapsulant for Solar Power
Modules/Provides Quality Assurance | | | | | |
| | 1,210,300 | | | Synthesis Energy Systems
(China) (a)(b) | | | 2,263 | | |
| | | | | Owner/Operator of Gasification Plants | | | | | |
| | | | 58,323 | | |
| | | > Oil Refining, Marketing &
Distribution 0.2% | |
| | 600,000 | | | Vopak (Netherlands) | | | 29,400 | | |
| | | | | World's Largest Operator of Petroleum &
Chemical Storage Terminals | | | | | |
| | | | 29,400 | | |
| | | > Agricultural Commodities 0.1% | |
| | 6,818,182 | | | Union Agriculture Group
(Argentina) (a)(d) | | | 15,000 | | |
| | | | | Farmland Operator in Uruguay | | | | | |
| | | | 15,000 | | |
| Energy & Minerals: Total | | | 1,885,681 | | |
| Number of Shares | | | | Value (000) | |
| Finance 9.5% | | | |
| | | > Banks 3.9% | |
| | 2,800,000 | | | BOK Financial | | $ | 153,356 | | |
| | | | | Tulsa-based Southwest Bank | | | | | |
| | 6,304,320 | | | Valley National Bancorp (b) | | | 85,802 | | |
| | | | | New Jersey/New York Bank | | | | | |
| | 5,413,800 | | | Associated Banc-Corp | | | 75,252 | | |
| | | | | Midwest Bank | | | | | |
| | 2,337,313 | | | Hancock Holding (b) | | | 72,410 | | |
| | | | | Gulf Coast Bank | | | | | |
| | 1,160,000 | | | SVB Financial Group (a) | | | 69,264 | | |
| | | | | Bank to Venture Capitalists | | | | | |
| | 1,145,000 | | | City National | | | 62,116 | | |
| | | | | Bank & Asset Manager | | | | | |
| | 2,860,000 | | | MB Financial (c) | | | 55,026 | | |
| | | | | Chicago Bank | | | | | |
| | 3,613,000 | | | TCF Financial | | | 49,859 | | |
| | | | | Great Lakes Bank | | | | | |
| | 4,300,000 | | | CVB Financial (b) | | | 39,775 | | |
| | | | | Inland Empire Business Bank | | | | | |
| | 4,056,427 | | | First Busey | | | 21,458 | | |
| | | | | Illinois Bank | | | | | |
| | 1,121,188 | | | Sandy Spring Bancorp | | | 20,170 | | |
| | | | | Baltimore/D.C. Bank | | | | | |
| | 1,350,000 | | | TriCo Bancshares (c) | | | 19,710 | | |
| | | | | California Central Valley Bank | | | | | |
| | 772,632 | | | Hudson Valley | | | 14,920 | | |
| | | | | Metro New York City Bank | | | | | |
| | 706,559 | | | Eagle Bancorp (a) | | | 9,397 | | |
| | | | | Metro D.C. Bank | | | | | |
| | 3,764,300 | | | Shinsei Bank (Japan) | | | 3,765 | | |
| | | | | Commercial Bank | | | | | |
| | 246,505 | | | Pacific Continental | | | 2,256 | | |
| | | | | Pacific Northwest Bank | | | | | |
| | 583,872 | | | Green Bankshares (a)(b) | | | 1,530 | | |
| | | | | Tennessee Bank | | | | | |
| | | | 756,066 | | |
| | | > Insurance 2.2% | |
| | 2,820,000 | | | Leucadia National | | | 96,162 | | |
| | | | | Insurance Holding Company | | | | | |
| | 9,400,000 | | | CNO Financial Group (a) | | | 74,354 | | |
| | | | | Life, Long-term Care & Medical Supplement
Insurance | | | | | |
| | 1,320,000 | | | Hanover Insurance Group | | | 49,777 | | |
| | | | | Personal & Commercial Lines Insurance | | | | | |
| | 1,200,000 | | | HCC Insurance Holdings | | | 37,800 | | |
| | | | | Specialty Insurance | | | | | |
| | 832,000 | | | Willis Group (Ireland) | | | 34,204 | | |
| | | | | Insurance Broker | | | | | |
| | 1,000,000 | | | Delphi Financial Group | | | 29,210 | | |
| | | | | Workers Compensation & Group Employee
Benefit Products & Services | | | | | |
| | 1,225,000 | | | Tower Group | | | 29,180 | | |
| | | | | Commercial & Personal Lines Insurance | | | | | |
| | 1,420,000 | | | Selective Insurance Group | | | 23,103 | | |
| | | | | Commercial & Personal Lines Insurance | | | | | |
| | 900,000 | | | Brown & Brown | | | 23,094 | | |
| | | | | Insurance Broker | | | | | |
| | 1,600,000 | | | Symetra Financial | | | 21,488 | | |
| | | | | Life Insurance | | | | | |
See accompanying notes to financial statements.
28
| Number of Shares | | | | Value (000) | |
| | | > Insurance—continued | |
| | 300,000 | | | Assured Guaranty | | $ | 4,893 | | |
| | | | | Global Muni Bond Insurance | | | | | |
| | 33,746 | | | Enstar Group (a) | | | 3,526 | | |
| | | | | Insurance/Reinsurance & Related Services | | | | | |
| | | | 426,791 | | |
| | | > Finance Companies 1.6% | |
| | 1,505,202 | | | World Acceptance (a)(c) | | | 98,696 | | |
| | | | | Personal Loans | | | | | |
| | 2,350,000 | | | McGrath Rentcorp (c) | | | 65,988 | | |
| | | | | Temporary Space & IT Rentals | | | | | |
| | 2,300,000 | | | Aaron's | | | 64,998 | | |
| | | | | Rent to Own | | | | | |
| | 3,000,000 | | | H&E Equipment Services (a)(c) | | | 41,970 | | |
| | | | | Heavy Equipment Leasing | | | | | |
| | 1,123,400 | | | CAI International (a)(c) | | | 23,209 | | |
| | | | | International Container Leasing | | | | | |
| | 1,091,000 | | | Marlin Business Services (a)(c) | | | 13,801 | | |
| | | | | Small Equipment Leasing | | | | | |
| | 90,020 | | | GATX | | | 3,342 | | |
| | | | | Rail Car Lessor | | | | | |
| | 78,500 | | | Textainer Group Holdings | | | 2,413 | | |
| | | | | Top International Container Leasor | | | | | |
| | | | 314,417 | | |
| | | > Brokerage & Money Management 1.4% | |
| | 6,198,000 | | | SEI Investments | | | 139,517 | | |
| | | | | Mutual Fund Administration & Investment
Management | | | | | |
| | 3,391,000 | | | Eaton Vance | | | 102,510 | | |
| | | | | Specialty Mutual Funds | | | | | |
| | 400,000 | | | Financial Engines (a) | | | 10,368 | | |
| | | | | Asset management for 401k plans | | | | | |
| | 629,493 | | | Investment Technology Group (a) | | | 8,825 | | |
| | | | | Electronic Trading | | | | | |
| | | | 261,220 | | |
| | | > Credit Cards 0.2% | |
| | 400,000 | | | Alliance Data Systems (a)(b) | | | 37,628 | | |
| | | | | Diversified Credit Card Provider | | | | | |
| | | | 37,628 | | |
| | | > Savings & Loans 0.2% | |
| | 1,024,069 | | | ViewPoint Financial | | | 14,132 | | |
| | | | | Texas Thrift | | | | | |
| | 1,010,000 | | | Provident New York Bancorp | | | 8,444 | | |
| | | | | New York State Thrift | | | | | |
| | 452,146 | | | Kaiser Federal Financial Group | | | 5,570 | | |
| | | | | Los Angeles Savings & Loan | | | | | |
| | 65,991 | | | Berkshire Hills Bancorp | | | 1,478 | | |
| | | | | Northeast Thrift | | | | | |
| | | | 29,624 | | |
| Finance: Total | | | 1,825,746 | | |
| Health Care 8.6% | | | |
| | | > Biotechnology & Drug Delivery 3.2% | |
| | 4,315,000 | | | BioMarin Pharmaceutical (a) | | | 117,411 | | |
| | | | | Biotech Focused on Orphan Diseases | | | | | |
| | 4,181,000 | | | Seattle Genetics (a)(b) | | | 85,794 | | |
| | | | | Antibody-based Therapies for Cancer | | | | | |
| Number of Shares | | | | Value (000) | |
| | 2,226,000 | | | InterMune (a) | | $ | 79,802 | | |
| | | | | Drugs for Pulmonary Fibrosis & Hepatitis C | | | | | |
| | 1,450,000 | | | Onyx Pharmaceuticals (a) | | | 51,185 | | |
| | | | | Commercial-stage Biotech Focused on Cancer | | | | | |
| | 2,400,000 | | | Auxilium Pharmaceuticals (a)(c) | | | 47,040 | | |
| | | | | Biotech Focused on Niche Disease Areas | | | | | |
| | 780,000 | | | United Therapeutics (a) | | | 42,978 | | |
| | | | | Biotech Focused on Rare Diseases | | | | | |
| | 4,500,000 | | | NPS Pharmaceuticals (a)(c) | | | 42,525 | | |
| | | | | Orphan Drugs & Healthy Royalties | | | | | |
| | 4,500,000 | | | Isis Pharmaceuticals (a) | | | 41,220 | | |
| | | | | Biotech Pioneer in Anti-sense Drugs | | | | | |
| | 5,500,000 | | | Micromet (a)(b)(c) | | | 31,570 | | |
| | | | | Next-generation Antibody Technology | | | | | |
| | 4,549,900 | | | Chelsea Therapeutics (a)(b)(c) | | | 23,205 | | |
| | | | | Biotech Focused on Rare Diseases | | | | | |
| | 3,300,000 | | | Nabi Biopharmaceuticals (a)(c) | | | 17,754 | | |
| | | | | Biotech Focused on Vaccines | | | | | |
| | 1,740,000 | | | Anthera Pharmaceuticals (a)(b)(c) | | | 14,216 | | |
| | | | | Biotech Focused on Cardiovascular,
Cancer & Immunology | | | | | |
| | 2,300,000 | | | Idenix Pharmaceuticals (a) | | | 11,500 | | |
| | | | | Developer of Drugs for Infectious Diseases | | | | | |
| | 3,500,000 | | | Array Biopharma (a)(c) | | | 7,840 | | |
| | | | | Drugs for Cancer & Inflammatory Diseases | | | | | |
| | 359,944 | | | MicroDose Technologies (a)(d) | | | 374 | | |
| | | | | Drug Inhaler Development | | | | | |
| | 94,715 | | | Locus Pharmaceuticals (a)(d)(e) | | | — | | |
| | | | | High Throughput Rational Drug Design | | | | | |
| | | | 614,414 | | |
| | | > Medical Equipment & Devices 2.8% | |
| | 4,200,000 | | | Alexion Pharmaceuticals (a)(b) | | | 197,526 | | |
| | | | | Biotech Focused on Orphan Diseases | | | | | |
| | 1,800,000 | | | Sirona Dental Systems (a) | | | 95,580 | | |
| | | | | Manufacturer of Dental Equipment | | | | | |
| | 1,000,000 | | | Edwards Lifesciences (a) | | | 87,180 | | |
| | | | | Heart Valves | | | | | |
| | 700,000 | | | Gen-Probe (a) | | | 48,405 | | |
| | | | | Molecular In-vitro Diagnostics | | | | | |
| | 500,000 | | | Idexx Laboratories (a) | | | 38,780 | | |
| | | | | Diagnostic Equipment & Services for
Veterinarians | | | | | |
| | 550,000 | | | Haemonetics (a) | | | 35,403 | | |
| | | | | Blood & Plasma Collection Equipment | | | | | |
| | 570,000 | | | Orthofix International (a) | | | 24,208 | | |
| | | | | Bone Fixation & Stimulation Devices | | | | | |
| | 1,650,000 | | | Pacific Biosciences of California (a)(b) | | | 19,305 | | |
| | | | | Genome Sequencing | | | | | |
| | | | 546,387 | | |
| | | > Medical Supplies 1.3% | |
| | 3,200,000 | | | Cepheid (a)(c) | | | 110,848 | | |
| | | | | Molecular Diagnostics | | | | | |
| | 2,126,000 | | | Patterson Companies | | | 69,924 | | |
| | | | | Dental, Veterinarian & Medical Distributor | | | | | |
| | 650,000 | | | Henry Schein (a) | | | 46,534 | | |
| | | | | Largest Distributor of Healthcare Products | | | | | |
| | 325,200 | | | Neogen (a) | | | 14,702 | | |
| | | | | Food & Animal Safety Products | | | | | |
See accompanying notes to financial statements.
29
Columbia Acorn Fund
Statement of Investments (Unaudited), continued
| Number of Shares | | | | Value (000) | |
| | | > Medical Supplies—continued | |
| | 200,000 | | | Owens & Minor | | $ | 6,898 | | |
| | | | | Distribution of Medical Supplies | | | | | |
| | | | 248,906 | | |
| | | > Health Care Services 0.8% | |
| | 1,655,000 | | | Community Health Systems (a) | | | 42,500 | | |
| | | | | Non-urban Hospitals | | | | | |
| | 3,800,000 | | | Health Management Associates (a) | | | 40,964 | | |
| | | | | Non-urban Hospitals | | | | | |
| | 400,000 | | | HMS Holdings (a) | | | 30,748 | | |
| | | | | Cost Containment Services | | | | | |
| | 4,250,000 | | | eResearch Technology (a)(c) | | | 27,073 | | |
| | | | | Clinical Research Services | | | | | |
| | 700,000 | | | Allscripts Healthcare Solutions (a) | | | 13,594 | | |
| | | | | IT for Physician Offices & Hospitals | | | | | |
| | | | 154,879 | | |
| | | > Pharmaceuticals 0.3% | |
| | 4,000,000 | | | Akorn (a) | | | 28,000 | | |
| | | | | Develops, Manufactures & Sells Specialty
Generic Drugs | | | | | |
| | 2,393,955 | | | Adcock Ingram Holdings (South Africa) | | | 21,034 | | |
| | | | | Manufacturer of Pharmaceuticals &
Medical Supplies | | | | | |
| | 1,818,154 | | | Alimera Sciences (a)(b)(c) | | | 14,818 | | |
| | | | | Ophthalmogy-focused Pharmaceutical
Company | | | | | |
| | | | 63,852 | | |
| | | > Hospital Management 0.2% | |
| | 1,450,000 | | | Kindred Healthcare (a) | | | 31,131 | | |
| | | | | Post-Acute Healthcare Facilities | | | | | |
| | | | 31,131 | | |
| Health Care: Total | | | 1,659,569 | | |
| Other Industries 5.8% | | | |
| | | > Real Estate 3.5% | |
| | 4,575,000 | | | BioMed Realty Trust | | | 88,023 | | |
| | | | | Life Science-focused Office Buildings | | | | | |
| | 840,000 | | | Federal Realty Investment Trust | | | 71,551 | | |
| | | | | Shopping Centers | | | | | |
| | 2,200,000 | | | Dupont Fabros Technology (b) | | | 55,440 | | |
| | | | | Technology-focused Office Buildings | | | | | |
| | 720,000 | | | Digital Realty Trust (b) | | | 44,481 | | |
| | | | | Technology-focused Office Buildings | | | | | |
| | 1,120,000 | | | Kilroy Realty | | | 44,229 | | |
| | | | | West Coast Office & Industrial Properties | | | | | |
| | 2,700,000 | | | Associated Estates Realty (c) | | | 43,875 | | |
| | | | | Multi-family Properties | | | | | |
| | 975,000 | | | Post Properties | | | 39,741 | | |
| | | | | Multi-family Properties | | | | | |
| | 1,850,000 | | | Extra Space Storage | | | 39,460 | | |
| | | | | Self Storage Facilities | | | | | |
| | 43,000,000 | | | Mapletree Logistics Trust (Singapore) | | | 32,243 | | |
| | | | | Industrial Property Landlord | | | | | |
| | 530,000 | | | Macerich | | | 28,355 | | |
| | | | | Regional Shopping Malls | | | | | |
| | 900,000 | | | Corporate Office Properties | | | 27,999 | | |
| | | | | Office Buildings | | | | | |
| Number of Shares | | | | Value (000) | |
| | 3,000,000 | | | Education Realty Trust | | $ | 25,710 | | |
| | | | | Student Housing | | | | | |
| | 15,000,000 | | | Ascendas REIT (Singapore) | | | 24,949 | | |
| | | | | Industrial Property Landlord | | | | | |
| | 700,000 | | | Washington REIT | | | 22,764 | | |
| | | | | Washington D.C. Diversified Properties | | | | | |
| | 3,750,000 | | | DCT Industrial Trust | | | 19,612 | | |
| | | | | Industrial Properties | | | | | |
| | 1,481,994 | | | Summit Hotel Properties (c) | | | 16,821 | | |
| | | | | Owner of Select Service Hotels | | | | | |
| | 2,800 | | | Orix JREIT (Japan) | | | 15,473 | | |
| | | | | Diversified REIT | | | | | |
| | 3,050,000 | | | Kite Realty Group | | | 15,189 | | |
| | | | | Community Shopping Centers | | | | | |
| | 699,701 | | | St. Joe (a) | | | 14,582 | | |
| | | | | Florida Panhandle Landowner | | | | | |
| | 37,407 | | | Security Capital European Realty
(Luxembourg) (a)(d)(e) | | | — | | |
| | | | | Self Storage Properties | | | | | |
| | | | 670,497 | | |
| | | > Transportation 1.3% | |
| | 1,730,000 | | | JB Hunt Transport Services | | | 81,465 | | |
| | | | | Truck & Intermodal Carrier | | | | | |
| | 2,800,000 | | | Rush Enterprises, Class A (a)(c) | | | 53,284 | | |
| | 550,000 | | | Rush Enterprises, Class B (a)(c) | | | 8,855 | | |
| | | | | Truck Sales & Services | | | | | |
| | 1,260,000 | | | World Fuel Services | | | 45,272 | | |
| | | | | Global Fuel Broker | | | | | |
| | 2,730,000 | | | Heartland Express | | | 45,209 | | |
| | | | | Regional Trucker | | | | | |
| | 400,000 | | | Genesee & Wyoming (a) | | | 23,456 | | |
| | | | | Short-line Operator | | | | | |
| | | | 257,541 | | |
| | | > Regulated Utilities 1.0% | |
| | 2,000,000 | | | Northeast Utilities | | | 70,340 | | |
| | | | | Regulated Electric Utility | | | | | |
| | 1,800,000 | | | Wisconsin Energy | | | 56,430 | | |
| | | | | Wisconsin Utility | | | | | |
| | 500,000 | | | ALLETE | | | 20,520 | | |
| | | | | Regulated Electric Utility in Minnesota | | | | | |
| | 333,000 | | | Red Eléctrica de España (Spain) | | | 20,101 | | |
| | | | | Spanish Power Transmission | | | | | |
| | 3,333,000 | | | Terna (Italy) (b) | | | 15,496 | | |
| | | | | Italian Power Transmission | | | | | |
| | | | 182,887 | | |
| Other Industries: Total | | | 1,110,925 | | |
Total Equities: 97.5%
(Cost: $11,304,342) | | | 18,778,101 | | |
| Securities Lending Collateral – 1.8% | | | |
| | 352,904 | | | Dreyfus Government Cash
Management Fund (f)
(7 day yield of 0.00%) | | | 352,904 | | |
Total Securities Lending Collateral:
(Cost: $352,904) | | | 352,904 | | |
See accompanying notes to financial statements.
30
| Principal Amount | | | | Value (000) | |
| Short-Term Obligation 2.8% | |
| | | > Repurchase Agreement 2.8% | |
| $ | 534,686 | | | Repurchase Agreement with
Fixed Income Clearing Corp.,
dated 6/30/11, due 7/01/11
at 0.01%, collateralized by
U.S. Government Agency
obligations with various
maturities to 12/03/15,
market value $545,385
(repurchase proceeds $534,686) | | $ | 534,686 | | |
| | | | 534,686 | | |
Total Short-Term Obligation:
(Amortized Cost: $534,686) | | | 534,686 | | |
Total Investments: 102.1%
(Cost: $12,191,932)(g)(h) | | | 19,665,691 | | |
Obligation to Return Collateral for
Securities Loaned: (1.8)% | | | (352,904 | ) | |
| Cash and Other Assets Less Liabilities: (0.3)% | | | (60,928 | ) | |
| Total Net Assets: 100.0% | | $ | 19,251,859 | | |
ADR = American Depositary Receipts
GDR = Global Depository Receipts
See accompanying notes to financial statements.
31
Columbia Acorn Fund
Statement of Investments (Unaudited), continued
> Notes to Statement of Investments (dollar values in thousands)
(a) Non-income producing security.
(b) All or a portion of this security was on loan at June 30, 2011. The total market value of Fund securities on loan at June 30, 2011 was $340,090.
(c) An affiliated person of the Fund may include any company in which the Fund owns five percent or more of its outstanding voting shares. Holdings and transactions in these affiliated companies during the six months ended June 30, 2011, are as follows:
| Affiliates | | Balance of
Shares Held
12/31/10 | | Purchases/
Additions | | Sales/
Reductions | | Balance of
Shares Held
6/30/11 | | Value | | Dividend | |
| AFC Enterprises | | | 2,000,000 | | | | - | | | | - | | | | 2,000,000 | | | $ | 32,900 | | | $ | - | | |
| Allos Therapeutics* | | | 7,035,000 | | | | - | | | | 7,035,000 | | | | - | | | | - | | | | - | | |
| Alimera Sciences | | | 361,450 | | | | 1,456,704 | | | | - | | | | 1,818,154 | | | | 14,818 | | | | - | | |
| Anthera Pharmaceuticals | | | 1,450,000 | | | | 290,000 | | | | - | | | | 1,740,000 | | | | 14,216 | | | | - | | |
| Array Biopharma | | | 3,500,000 | | | | - | | | | - | | | | 3,500,000 | | | | 7,840 | | | | - | | |
| Art Technology Group* | | | 9,000,000 | | | | - | | | | 9,000,000 | | | | - | | | | - | | | | - | | |
| Associated Estates Realty | | | 2,200,000 | | | | 500,000 | | | | - | | | | 2,700,000 | | | | 43,875 | | | | 748 | | |
| Auxilium Pharmaceuticals | | | 1,200,000 | | | | 1,200,000 | | | | - | | | | 2,400,000 | | | | 47,040 | | | | - | | |
| Bally Technologies | | | 3,725,000 | | | | - | | | | - | | | | 3,725,000 | | | | 151,533 | | | | - | | |
| Blackbaud | | | 2,250,000 | | | | - | | | | - | | | | 2,250,000 | | | | 62,370 | | | | 540 | | |
| CAI International | | | 1,650,000 | | | | - | | | | 526,600 | | | | 1,123,400 | | | | 23,209 | | | | - | | |
| Cavco Industries | | | 180,000 | | | | 235,000 | | | | - | | | | 415,000 | | | | 18,675 | | | | - | | |
| Cepheid | | | 2,415,000 | | | | 785,000 | | | | - | | | | 3,200,000 | | | | 110,848 | | | | - | | |
| Chelsea Therapeutics | | | 3,449,900 | | | | 1,100,000 | | | | - | | | | 4,549,900 | | | | 23,205 | | | | - | | |
| Clarcor | | | 2,565,000 | | | | - | | | | - | | | | 2,565,000 | | | | 121,273 | | | | 539 | | |
| Cogent Communications | | | 2,800,000 | | | | - | | | | 280,000 | | | | 2,520,000 | | | | 42,865 | | | | - | | |
| Constant Contact | | | 1,400,000 | | | | 550,000 | | | | - | | | | 1,950,000 | | | | 49,491 | | | | - | | |
| Diamond Foods | | | 1,300,000 | | | | - | | | | 130,000 | | | | 1,170,000 | | | | 89,318 | | | | 117 | | |
| Donaldson | | | 4,200,000 | | | | - | | | | - | | | | 4,200,000 | | | | 254,856 | | | | 1,176 | | |
| Drew Industries | | | 1,260,000 | | | | - | | | | - | | | | 1,260,000 | | | | 31,147 | | | | - | | |
| Education Realty Trust* | | | 3,000,000 | | | | - | | | | - | | | | 3,000,000 | | | | 25,710 | | | | 300 | | |
| eResearch Technology | | | 4,250,000 | | | | - | | | | - | | | | 4,250,000 | | | | 27,073 | | | | - | | |
| ESCO Technologies | | | 2,200,000 | | | | - | | | | - | | | | 2,200,000 | | | | 80,960 | | | | 352 | | |
| Gaiam | | | 1,371,366 | | | | - | | | | - | | | | 1,371,366 | | | | 6,816 | | | | - | | |
| Gaylord Entertainment | | | 3,850,000 | | | | - | | | | - | | | | 3,850,000 | | | | 115,500 | | | | - | | |
| H&E Equipment Services | | | 3,000,000 | | | | - | | | | - | | | | 3,000,000 | | | | 41,970 | | | | - | | |
| Hackett Group | | | 4,500,000 | | | | - | | | | - | | | | 4,500,000 | | | | 22,905 | | | | - | | |
| HEICO | | | 1,700,000 | | | | 550,000 | | | | - | | | | 2,250,000 | | | | 89,460 | | | | 102 | | |
| Helen of Troy | | | 1,600,000 | | | | - | | | | - | | | | 1,600,000 | | | | 55,248 | | | | - | | |
| iGate | | | 2,913,065 | | | | - | | | | 13,065 | | | | 2,900,000 | | | | 47,328 | | | | - | | |
| II-VI | | | 2,225,000 | | | | 2,325,000 | | | | - | | | | 4,550,000 | | | | 116,480 | | | | - | | |
| Informatica* | | | 5,200,000 | | | | - | | | | 500,000 | | | | 4,700,000 | | | | 274,621 | | | | - | | |
| Interline Brands | | | 2,600,000 | | | | - | | | | - | | | | 2,600,000 | | | | 47,762 | | | | - | | |
| IPG Photonics | | | 2,710,000 | | | | 70,000 | | | | - | | | | 2,780,000 | | | | 202,134 | | | | - | | |
| IXYS | | | 1,900,000 | | | | - | | | | - | | | | 1,900,000 | | | | 28,462 | | | | - | | |
| Kenexa | | | 2,025,000 | | | | - | | | | - | | | | 2,025,000 | | | | 48,560 | | | | - | | |
| Knoll | | | 4,000,000 | | | | - | | | | - | | | | 4,000,000 | | | | 80,280 | | | | 640 | | |
| Lifetime Fitness | | | 2,190,000 | | | | - | | | | - | | | | 2,190,000 | | | | 87,403 | | | | - | | |
| lululemon athletica | | | 4,035,000 | | | | - | | | | 43,735 | | | | 3,991,265 | | | | 446,304 | | | | - | | |
| Marlin Business Services | | | 1,091,000 | | | | - | | | | - | | | | 1,091,000 | | | | 13,801 | | | | - | | |
| MB Financial | | | 2,860,000 | | | | - | | | | - | | | | 2,860,000 | | | | 55,026 | | | | 57 | | |
| McGrath Rentcorp | | | 2,350,000 | | | | - | | | | - | | | | 2,350,000 | | | | 65,988 | | | | 1,069 | | |
| Micromet | | | 5,500,000 | | | | - | | | | - | | | | 5,500,000 | | | | 31,570 | | | | - | | |
| Nabi Biopharmaceuticals | | | 1,383,454 | | | | 1,916,546 | | | | - | | | | 3,300,000 | | | | 17,754 | | | | - | | |
| Nanosphere* | | | 1,480,056 | | | | - | | | | 1,480,056 | | | | - | | | | - | | | | - | | |
| Navigant Consulting | | | 3,100,000 | | | | - | | | | - | | | | 3,100,000 | | | | 32,519 | | | | - | | |
| NPS Pharmaceuticals | | | 3,200,000 | | | | 1,300,000 | | | | - | | | | 4,500,000 | | | | 42,525 | | | | - | | |
| Orko Silver* | | | 10,000,000 | | | | - | | | | 5,000,000 | | | | 5,000,000 | | | | 14,464 | | | | - | | |
| Orthofix International* | | | 1,150,000 | | | | - | | | | 580,000 | | | | 570,000 | | | | 24,208 | | | | - | | |
| PAETEC Holding | | | 9,600,000 | | | | - | | | | - | | | | 9,600,000 | | | | 45,984 | | | | - | | |
| Pericom Semiconductor | | | 1,765,000 | | | | - | | | | - | | | | 1,765,000 | | | | 15,779 | | | | - | | |
| Petroamerica | | | 30,275,000 | | | | - | | | | - | | | | 30,275,000 | | | | 5,023 | | | | - | | |
| Petrodorado | | | 48,000,000 | | | | 2,000,000 | | | | - | | | | 50,000,000 | | | | 10,658 | | | | - | | |
| Petrolifera Petroleum* | | | 13,950,000 | | | | - | | | | 13,950,000 | | | | - | | | | - | | | | - | | |
| Petromanas | | | 56,250,000 | | | | - | | | | - | | | | 56,250,000 | | | | 11,526 | | | | - | | |
| Pinnacle Entertainment | | | 3,400,000 | | | | - | | | | - | | | | 3,400,000 | | | | 50,660 | | | | - | | |
See accompanying notes to financial statements.
32
> Notes to Statement of Investments (dollar values in thousands)
| Affiliates | | Balance of
Shares Held
12/31/10 | | Purchases/
Additions | | Sales/
Reductions | | Balance of
Shares Held
6/30/11 | | Value | | Dividend | |
| Quetzal Energy | | | - | | | | 50,000,000 | | | | - | | | | 50,000,000 | | | $ | 4,011 | | | $ | - | | |
| Rush Enterprises | | | 3,350,000 | | | | - | | | | - | | | | 3,350,000 | | | | 62,139 | | | | - | | |
| Salem Communications | | | 1,541,000 | | | | - | | | | - | | | | 1,541,000 | | | | 5,532 | | | | - | | |
| Shutterfly | | | 1,700,000 | | | | 600,000 | | | | - | | | | 2,300,000 | | | | 132,066 | | | | - | | |
| Spanish Broadcasting System | | | 2,400,000 | | | | - | | | | - | | | | 2,400,000 | | | | 1,680 | | | | - | | |
| SPS Commerce | | | 856,429 | | | | 43,571 | | | | - | | | | 900,000 | | | | 16,011 | | | | - | | |
| Summit Hotel Properties | | | - | | | | 1,481,994 | | | | - | | | | 1,481,994 | | | | 16,821 | | | | 61 | | |
| Supertex | | | 1,035,000 | | | | - | | | | 100,000 | | | | 935,000 | | | | 20,944 | | | | - | | |
| Talbots* | | | 4,150,000 | | | | - | | | | 3,321,500 | | | | 828,500 | | | | 2,767 | | | | - | | |
| THQ* | | | 3,567,000 | | | | - | | | | 3,567,000 | | | | - | | | | - | | | | - | | |
| TriCo Bancshares | | | 1,350,000 | | | | - | | | | - | | | | 1,350,000 | | | | 19,710 | | | | 243 | | |
| True Religion Apparel | | | 2,047,000 | | | | - | | | | - | | | | 2,047,000 | | | | 59,527 | | | | - | | |
| Tuscany International Drilling*+ | | | 13,319,200 | | | | 4,589,700 | | | | 7,349,700 | | | | 10,559,200 | | | | 9,118 | | | | - | | |
| tw telecom | | | 9,500,000 | | | | - | | | | - | | | | 9,500,000 | | | | 195,035 | | | | - | | |
| Tyler Technologies | | | 2,000,000 | | | | - | | | | - | | | | 2,000,000 | | | | 53,560 | | | | - | | |
| Universal Technical Institute | | | 1,700,000 | | | | - | | | | - | | | | 1,700,000 | | | | 33,609 | | | | - | | |
| Virtusa | | | 2,000,000 | | | | 125,000 | | | | - | | | | 2,125,000 | | | | 40,269 | | | | - | | |
| Warnaco Group* | | | 2,190,000 | | | | - | | | | - | | | | 2,190,000 | | | | 114,427 | | | | - | | |
| Wolverine Minderals | | | - | | | | 6,000,000 | | | | - | | | | 6,000,000 | | | | 2,670 | | | | - | | |
| World Acceptance | | | 1,505,202 | | | | - | | | | - | | | | 1,505,202 | | | | 98,696 | | | | - | | |
| Total of Affiliated Transactions | | | 358,776,122 | | | | 77,118,515 | | | | 52,876,656 | | | | 383,017,981 | | | $ | 4,310,532 | | | $ | 5,944 | | |
* At June 30, 2011, the Fund owned less than five percent of the company's outstanding voting shares.
+ Includes the effects of a corporate action.
The aggregate cost and value of these companies at June 30, 2011, were $2,325,878 and $3,845,216, respectively. Investments in affiliated companies represented 20.0% of the Fund's total net assets at June 30, 2011.
(d) Denotes a restricted security, which is subject to restrictions on resale under federal securities laws. These securities are valued at a fair value determined in good faith under consistently applied procedures established by the Board of Trustees. At June 30, 2011, the market value of these securities amounted to $66,613, which represented 0.35% of total net assets.
Additional information on these securities is as follows:
| Security | | Acquisition
Dates | | Shares | | Cost | | Value | |
| Mail.ru - GDR | | 11/5/10-12/31/10 | | | 464,305 | | | $ | 16,518 | | | $ | 15,424 | | |
| Union Agriculture Group | | 12/08/10 | | | 6,818,182 | | | | 15,000 | | | | 15,000 | | |
| Petromanas | | 5/20/10 | | | 37,500,000 | | | | 13,032 | | | | 11,050 | | |
| Canacol Energy | | 4/15/10 | | | 6,300,000 | | | | 4,667 | | | | 6,786 | | |
| Tahoe Resources | | 5/28/10 | | | 236,400 | | | | 1,350 | | | | 4,368 | | |
| Canadian Overseas Petroleum | | 11/24/10 | | | 8,400,000 | | | | 3,591 | | | | 3,884 | | |
| Quetzal Energy | | 1/14/11 | | | 41,100,000 | | | | 5,193 | | | | 3,273 | | |
| Petrodorado - Warrants | | 11/20/09 | | | 24,000,000 | | | | 2,965 | | | | 2,436 | | |
| Wolverine Minerals | | 6/03/11 | | | 4,000,000 | | | | 2,005 | | | | 2,389 | | |
| Canadian Overseas Petroleum - Warrants | | 11/24/10 | | | 4,200,000 | | | | 526 | | | | 572 | | |
| Petromanas - Warrants | | 5/20/10 | | | 18,750,000 | | | | 1,086 | | | | 476 | | |
| MicroDose Technologies | | 11/24/00 | | | 359,944 | | | | 2,005 | | | | 374 | | |
| Voyager Learning, Contingent Value Rights | | 12/24/09 | | | 2,000,000 | | | | - | | | | 300 | | |
| Wolverine Minerals - Warrants | | 6/03/11 | | | 2,000,000 | | | | 243 | | | | 281 | | |
| Locus Pharmaceuticals | | 9/05/01-2/08/07 | | | 94,715 | | | | 7,780 | | | | - | | |
| Security Capital European Realty | | 8/20/98-7/20/99 | | | 37,407 | | | | 205 | | | | - | | |
| | | | | | | $ | 76,166 | | | $ | 66,613 | | |
(e) Security has no value.
(f) Investment made with cash collateral received from securities lending activity.
(g) At June 30, 2011, for federal income tax purposes, the cost of investments was $12,191,932 and net unrealized appreciation was $7,473,759, consisting of gross unrealized appreciation of $8,160,875 and gross unrealized depreciation of $687,116.
See accompanying notes to financial statements.
33
Columbia Acorn Fund
Statement of Investments (Unaudited), continued
> Notes to Statement of Investments (dollar values in thousands)
(h) On June 30, 2011, the market value of foreign securities represented 10.80% of total net assets. The Fund's foreign portfolio was diversified as follows:
| | | Value | | Percent | |
| Netherlands | | $ | 422,067 | | | | 2.19 | | |
| Canada | | | 326,015 | | | | 1.69 | | |
| Colombia | | | 174,245 | | | | 0.91 | | |
| Singapore | | | 161,045 | | | | 0.84 | | |
| Hong Kong | | | 132,474 | | | | 0.69 | | |
| Sweden | | | 127,222 | | | | 0.66 | | |
| Japan | | | 125,073 | | | | 0.65 | | |
| France | | | 66,285 | | | | 0.34 | | |
| China | | | 62,305 | | | | 0.32 | | |
| Brazil | | | 61,705 | | | | 0.32 | | |
| Denmark | | | 55,329 | | | | 0.29 | | |
| United Kingdon | | | 52,219 | | | | 0.27 | | |
| South Africa | | | 48,871 | | | | 0.25 | | |
| | | Value | | Percent | |
| Chile | | $ | 43,557 | | | | 0.23 | | |
| Ireland | | | 34,204 | | | | 0.18 | | |
| Israel | | | 29,088 | | | | 0.15 | | |
| Switzerland | | | 24,109 | | | | 0.13 | | |
| India | | | 22,513 | | | | 0.12 | | |
| Iraq | | | 21,326 | | | | 0.11 | | |
| Spain | | | 20,101 | | | | 0.10 | | |
| Italy | | | 15,496 | | | | 0.08 | | |
| Russia | | | 15,424 | | | | 0.08 | | |
| Argentina | | | 15,000 | | | | 0.08 | | |
| Germany | | | 11,984 | | | | 0.06 | | |
| Iceland | | | 10,586 | | | | 0.06 | | |
| Luxembourg | | | - | | | | 0.00 | | |
| Total Foreign Portfolio | | $ | 2,078,243 | | | | 10.80 | | |
Various inputs are used in determining the value of the Fund's investments, following the input prioritization hierarchy established by GAAP. These inputs are summarized in the three broad levels listed below:
• Level 1 – quoted prices in active markets for identical securities
• Level 2 – prices determined using other significant observable inputs (including quoted prices for similar securities, interest rates, prepayment speeds, credit risk and others)
• Level 3 – prices determined using significant unobservable inputs where quoted prices or observable inputs are unavailable or less reliable (including management's own assumptions about the factors market participants would use in pricing an investment)
The inputs or methodology used for valuing securities are not necessarily an indication of the risk associated with investing in those securities.
Examples of the types of securities in which the Fund would typically invest and how they are classified within this hierarchy are as follows. Typical Level 1 securities include exchange traded domestic equities, mutual funds whose NAVs are published each day and exchange traded foreign equities that are not statistically fair valued. Typical Level 2 securities include exchange traded foreign equities that are statistically fair valued, forward foreign currency exchange contracts and short-term investments valued at amortized cost. Additionally, securities fair valued by the Valuation Committee of the Fund's Board of Trustees that rely on significant observable inputs are also included in Level 2. Typical Level 3 securities include any security fair valued by the Valuation Committee that relies on significant unobservable inputs.
The following table summarizes the inputs used, as of June 30, 2011, in valuing the Fund's assets:
| Investment Type | | Quoted Prices
(Level 1) | | Other
Significant
Observable
Inputs
(Level 2) | | Significant
Unobservable
Inputs
(Level 3) | | Total | |
| Equities | |
| Information | | $ | 5,032,026 | | | $ | 210,925 | | | $ | - | | | $ | 5,242,951 | | |
| Consumer Goods & Services | | | 3,382,164 | | | | 148,575 | | | | 300 | | | | 3,531,039 | | |
| Industrial Goods & Services | | | 3,153,094 | | | | 369,096 | | | | - | | | | 3,522,190 | | |
| Energy & Minerals | | | 1,502,348 | | | | 368,333 | | | | 15,000 | | | | 1,885,681 | | |
| Finance | | | 1,821,981 | | | | 3,765 | | | | - | | | | 1,825,746 | | |
| Health Care | | | 1,638,161 | | | | 21,034 | | | | 374 | | | | 1,659,569 | | |
| Other Industries | | | 1,002,663 | | | | 108,262 | | | | - | | | | 1,110,925 | | |
| Total Equities | | | 17,532,437 | | | | 1,229,990 | | | | 15,674 | | | | 18,778,101 | | |
| Total Securities Lending Collateral | | | 352,904 | | | | - | | | | - | | | | 352,904 | | |
| Total Short-Term Obligation | | | - | | | | 534,686 | | | | - | | | | 534,686 | | |
| Total Investments | | $ | 17,885,341 | | | $ | 1,764,676 | | | $ | 15,674 | | | $ | 19,665,691 | | |
The Fund's assets assigned to the Level 2 input category are generally valued using a market approach, in which a security's value is determined through its correlation to prices and information from observable market transactions for similar or identical assets. Foreign equities are generally valued at the last sales price on the foreign exchange or market on which they trade. The Fund may use a systematic fair valuation model provided by an independent third party to value securities principally traded in foreign markets in order to adjust for possible stale pricing that may occur between the close of the foreign exchanges and the time for valuation. These models take into account available market data including intraday index, ADR, and ETF movements. Securities acquired via private placement that have a holding period or an extended settlement period are valued at a discount to the same shares that are trading freely on the market. These discounts are determined by the adviser's experience with similar securities or situations. Factors may include, but are not limited to, trade volume, shares outstanding and stock price. Warrants which do not trade are valued as a percentage of the actively trading common stock using a model based on Black Scholes.
See accompanying notes to financial statements.
34
> Notes to Statement of Investments (dollar values in thousands)
Certain short-term obligations may be valued using amortized cost, an income approach which converts future cash flows to a present value based upon the discount or premium at purchase.
The Fund's assets assigned to the Level 3 input category are valued at fair value as determined in good faith under consistently applied procedures established by and under the general supervision of the Board of Trustees. To determine fair value, management will utilize the valuation technique that they deem the most appropriate in the circumstances. Securities acquired via private placement but are not yet trading are valued using the market approach for which management has determined that the original transaction price is the best representation of fair value. The original cost may be adjusted for the market movement in an index, ETF or similar security during the period it does not trade. Securities for which no market exist are valued based upon the market approach using some unobservable inputs which may include, but are not limited to, projected earnings, available cash, line of business, multiples, and consideration of the prioritization of the equity in a company's capital structure.
The following table reconciles asset balances for the six months ending June 30, 2011, in which significant unobservable inputs (Level 3) were used in determining value:
Investments
in Securities | | Balance
as of
December 31,
2010 | | Realized
Gain/(Loss) | | Change in
Unrealized
Appreciation
(Depreciation) | | Purchases | | Sales | | Transfers
into
Level 3 | | Transfers
out of
Level 3 | | Balance
as of
June 30,
2011 | |
| Equities | |
| Consumer Goods & Services | | $ | 262 | | | $ | - | | | $ | 38 | | | $ | - | | | $ | - | | | $ | - | | | $ | - | | | $ | 300 | | |
| Energy & Minerals | | | 15,000 | | | | - | | | | - | | | | - | | | | - | | | | - | | | | - | | | | 15,000 | | |
| Health Care | | | 103 | | | | - | | | | 271 | | | | - | | | | - | | | | - | | | | - | | | | 374 | | |
| | | $ | 15,365 | | | $ | - | | | $ | 309 | | | $ | - | | | $ | - | | | $ | - | | | $ | - | | | $ | 15,674 | | |
The information in the above reconciliation table represents fiscal year to date activity for any securities identified as using Level 3 inputs at either the beginning or the end of the current fiscal period.
The change in unrealized appreciation attributed to securities owned at June 30, 2011, which were valued using significant unobservable inputs (Level 3) amounted to $309. This amount is included in net change in unrealized appreciation (depreciation) on the Statements of Changes in Net Assets.
The following table shows transfers between Level 1 and Level 2 of the fair value hierarchy:
| Transfers In | | Transfers Out | |
| Level 1 | | Level 2 | | Level 1 | | Level 2 | |
| $ | 54,754 | | | $ | - | | | $ | - | | | $ | 54,754 | | |
Financial assets were transferred from Level 2 to Level 1 as they resumed trading during the period.
For more information on valuation inputs, and their aggregation into the levels used in the tables above, please refer to the Security Valuation section in the accompanying Notes to Financial Statements.
See accompanying notes to financial statements.
35
Columbia Acorn International
Major Portfolio Changes in the Second Quarter (Unaudited)
| | | Number of Shares | |
| | | 03/31/11 | | 06/30/11 | |
| Purchases | |
| Europe | |
| > United Kingdom | |
| GlobeOp Financial Services | | | 3,100,000 | | | | 3,758,000 | | |
| JLT Group | | | 2,147,000 | | | | 2,868,800 | | |
| Kesa Electricals | | | 0 | | | | 8,346,000 | | |
| Next | | | 0 | | | | 582,000 | | |
| Smith & Nephew | | | 1,445,775 | | | | 1,630,000 | | |
| > Netherlands | |
| Fugro | | | 763,202 | | | | 784,111 | | |
| Imtech | | | 1,803,729 | | | | 1,841,280 | | |
| USG People | | | 1,079,600 | | | | 1,093,994 | | |
| > France | |
| Gemalto | | | 639,000 | | | | 799,000 | | |
| Teleperformance | | | 670,000 | | | | 1,078,000 | | |
| > Germany | |
| Dürr | | | 0 | | | | 237,511 | | |
| Rhoen-Klinikum | | | 1,110,000 | | | | 1,460,000 | | |
| > Switzerland | |
| Dufry Group | | | 0 | | | | 190,000 | | |
| Partners Group | | | 185,000 | | | | 235,000 | | |
| > Norway | |
| Atea | | | 340,964 | | | | 2,045,964 | | |
| > Belgium | |
| EVS Broadcast Equipment | | | 0 | | | | 145,031 | | |
| Asia | |
| > Japan | |
| Asics | | | 3,008,500 | | | | 3,650,000 | | |
| Hoshizaki Electric | | | 1,532,300 | | | | 1,563,000 | | |
| Ibiden | | | 711,000 | | | | 819,000 | | |
| Japan Airport Terminal | | | 1,250,000 | | | | 1,666,700 | | |
| Kuraray | | | 1,670,000 | | | | 1,974,000 | | |
| Shinsei Bank | | | 13,353,800 | | | | 23,908,800 | | |
| Sintokogio | | | 1,172,500 | | | | 1,794,000 | | |
| Torishima Pump Manufacturing | | | 972,500 | | | | 1,250,500 | | |
| Ushio | | | 1,170,800 | | | | 1,292,500 | | |
| > Singapore | |
| Mapletree Commercial Trust | | | 0 | | | | 30,000,000 | | |
| > Hong Kong | |
| MGM China Holdings | | | 0 | | | | 12,000,000 | | |
| Sa Sa International | | | 33,000,000 | | | | 35,000,000 | | |
| > China | |
| ENN Energy | | | 0 | | | | 6,000,000 | | |
| Noah Holdings - ADR | | | 223,100 | | | | 432,790 | | |
| Want Want | | | 0 | | | | 7,143,600 | | |
| | | Number of Shares | |
| | | 03/31/11 | | 06/30/11 | |
| > Taiwan | |
| China Steel Chemical | | | 2,966,500 | | | | 4,192,000 | | |
| Far Eastone Telecom | | | 4,957,300 | | | | 21,429,000 | | |
| President Chain Store | | | 3,362,500 | | | | 5,665,000 | | |
| St. Shine Optical | | | 1,133,100 | | | | 1,511,000 | | |
| Taiwan Hon Chuan | | | 4,639,400 | | | | 6,911,000 | | |
| > India | |
| Jain Irrigation Systems | | | 7,675,000 | | | | 8,587,418 | | |
Mundra Port & Special
Economic Zone | | | 6,360,300 | | | | 7,496,953 | | |
| United Breweries | | | 0 | | | | 367,138 | | |
| > Thailand | |
| Home Product Center | | | 58,207,800 | | | | 80,000,000 | | |
| > Indonesia | |
| Ace Indonesia | | | 0 | | | | 6,898,100 | | |
| Other Countries | |
| > Canada | |
| Alliance Grain Traders | | | 0 | | | | 501,700 | | |
| Celtic Exploration | | | 0 | | | | 146,200 | | |
| Crew Energy | | | 0 | | | | 367,600 | | |
| > United States | |
| Oil States International | | | 0 | | | | 250,000 | | |
| > South Africa | |
| Coronation Fund Managers | | | 1,788,501 | | | | 8,723,060 | | |
| Rand Merchant Insurance | | | 10,355,359 | | | | 17,625,208 | | |
| Latin America | |
| > Brazil | |
| Multiplus | | | 0 | | | | 1,100,000 | | |
| > Colombia | |
| Canacol Energy | | | 8,058,800 | | | | 8,240,000 | | |
See accompanying notes to financial statements.
36
| | | Number of Shares | |
| | | 03/31/11 | | 06/30/11 | |
| Sales | |
| Europe | |
| > United Kingdom | |
| Cobham | | | 9,259,000 | | | | 5,385,000 | | |
| FlyBe | | | 1,462,658 | | | | 1,376,083 | | |
| Serco | | | 6,700,000 | | | | 3,513,800 | | |
| > France | |
| Eurofins Scientific | | | 600,800 | | | | 489,287 | | |
| Toreador Resources | | | 372,000 | | | | 0 | | |
| > Germany | |
| CTS Eventim | | | 490,000 | | | | 403,286 | | |
| Vossloh | | | 240,000 | | | | 165,000 | | |
| > Sweden | |
| East Capital Explorer | | | 916,662 | | | | 905,452 | | |
| Hexagon | | | 4,382,000 | | | | 3,799,000 | | |
| > Italy | |
| Tod's | | | 452,200 | | | | 257,200 | | |
| > Ireland | |
| United Drug | | | 12,110,000 | | | | 9,669,485 | | |
| > Finland | |
| Poyry | | | 1,706,942 | | | | 410,523 | | |
| Asia | |
| > Japan | |
| Benesse | | | 33,300 | | | | 0 | | |
| Gree | | | 2,226,000 | | | | 1,355,000 | | |
| Start Today | | | 2,421,300 | | | | 1,275,000 | | |
| Suruga Bank | | | 1,750,000 | | | | 0 | | |
| > Singapore | |
| Mapletree Logistics Trust | | | 57,000,000 | | | | 50,000,000 | | |
| > China | |
| China Communication Services | | | 45,000,000 | | | | 41,959,300 | | |
| China Green | | | 10,140,400 | | | | 0 | | |
| China Yurun Food | | | 12,199,600 | | | | 10,764,600 | | |
| Jiangsu Expressway | | | 36,700,000 | | | | 23,146,000 | | |
New Oriental Education &
Technology - ADR | | | 278,315 | | | | 230,000 | | |
| Wasion Group | | | 29,425,300 | | | | 24,244,400 | | |
| Zuoan Fashion | | | 817,360 | | | | 680,503 | | |
| > Taiwan | |
| Formosa International Hotels | | | 1,599,620 | | | | 1,142,620 | | |
| Simplo Technology | | | 7,200,000 | | | | 5,821,000 | | |
| > India | |
| Asian Paints | | | 368,098 | | | | 320,000 | | |
| Housing Development Finance | | | 1,100,000 | | | | 0 | | |
Infrastructure Development
Finance | | | 5,675,000 | | | | 3,550,000 | | |
| Shriram Transport Finance | | | 1,835,000 | | | | 715,000 | | |
| | | Number of Shares | |
| | | 03/31/11 | | 06/30/11 | |
| Other Countries | |
| > Canada | |
| Baytex | | | 735,000 | | | | 574,000 | | |
| Guyana Goldfields | | | 1,355,000 | | | | 1,291,135 | | |
| > United States | |
| Atwood Oceanics | | | 1,340,000 | | | | 1,273,000 | | |
| Tesco | | | 324,000 | | | | 0 | | |
| > Australia | |
| Hastie Group | | | 3,962,289 | | | | 0 | | |
| SAI Global | | | 7,286,896 | | | | 6,281,896 | | |
| Latin America | |
| > Brazil | |
| Localiza Rent A Car | | | 4,700,000 | | | | 4,300,000 | | |
| PDG Realty | | | 5,000,000 | | | | 4,400,000 | | |
See accompanying notes to financial statements.
37
Columbia Acorn International
Statement of Investments (Unaudited), June 30, 2011
| Number of Shares | | | | Value (000) | |
| | | | | | | Equities: 95.6% | |
| Europe 37.4% | | | |
| | | > United Kingdom 7.0% | |
| | 2,000,000 | | | Intertek Group | | $ | 63,331 | | |
| | | | | Testing, Inspection & Certification Services | | | | | |
| | 5,437,000 | | | Chemring | | | 55,847 | | |
| | | | | Defense Manufacturer of
Countermeasures & Energetics | | | | | |
| | 2,868,800 | | | JLT Group | | | 31,355 | | |
| | | | | International Business Insurance Broker | | | | | |
| | 3,513,800 | | | Serco | | | 31,158 | | |
| | | | | Facilities Management | | | | | |
| | 56,093,000 | | | Workspace Group | | | 27,233 | | |
| | | | | United Kingdom Real Estate | | | | | |
| | 26,712,371 | | | Archipelago Resources (a) | | | 26,474 | | |
| | | | | Gold Mining Projects in Indonesia,
Vietnam & the Philippines | | | | | |
| | 3,758,000 | | | GlobeOp Financial Services | | | 23,613 | | |
| | | | | Hedge Fund Administrator | | | | | |
| | 1,976,000 | | | Petropavlovsk | | | 23,151 | | |
| | | | | Gold & Iron Ore Mining in Russia | | | | | |
| | 582,000 | | | Next | | | 21,717 | | |
| | | | | Clothes & Home Retailer in the
United Kingdom | | | | | |
| | 8,346,000 | | | Kesa Electricals | | | 18,445 | | |
| | | | | Europe's Leading Electricals Retailers | | | | | |
| | 2,752,210 | | | Abcam | | | 18,409 | | |
| | | | | Online Sales of Antibodies | | | | | |
| | 680,000 | | | Rotork | | | 18,400 | | |
| | | | | Valve Actuators for Oil & Water Pipelines | | | | | |
| | 5,385,000 | | | Cobham | | | 18,288 | | |
| | | | | Aerospace Components | | | | | |
| | 2,432,000 | | | Premier Oil (a) | | | 17,432 | | |
| | | | | Oil & Gas Producer in Europe, Pakistan &
Asia | | | | | |
| | 1,630,000 | | | Smith & Nephew | | | 17,397 | | |
| | | | | Medical Equipment & Supplies | | | | | |
| | 690,000 | | | Tullow Oil | | | 13,732 | | |
| | | | | Oil & Gas Producer | | | | | |
| | 859,200 | | | Shaftesbury | | | 7,281 | | |
| | | | | London Prime Retail REIT | | | | | |
| | 3,889,000 | | | PureCircle (a)(b) | | | 5,524 | | |
| | | | | Natural Sweeteners | | | | | |
| | 1,650,000 | | | SKIL Ports & Logistics (a) | | | 5,164 | | |
| | | | | Indian Container Port Project | | | | | |
| | 1,549,500 | | | Sterling Resources (a) | | | 2,651 | | |
| | 1,050,500 | | | Sterling Resources (a)(c) | | | 1,761 | | |
| | | | | Oil & Gas Exploration - Europe | | | | | |
| | 1,376,083 | | | FlyBe (a) | | | 4,064 | | |
| | | | | Largest European Regional Airline | | | | | |
| | | | 452,427 | | |
| | | > Netherlands 6.4% | |
| | 1,841,280 | | | Imtech | | | 65,125 | | |
| | | | | Electromechanical & Information &
Communications Technologies
Installation & Maintenance | | | | | |
| | 784,111 | | | Fugro | | | 56,536 | | |
| | | | | Sub-sea Oilfield Services | | | | | |
| Number of Shares | | | | Value (000) | |
| | 1,104,200 | | | Vopak | | $ | 54,106 | | |
| | | | | World's Largest Operator of Petroleum &
Chemical Storage Terminals | | | | | |
| | 2,296,992 | | | Aalberts Industries | | | 53,695 | | |
| | | | | Flow Control & Heat Treatment | | | | | |
| | 1,476,800 | | | Unit 4 Agresso (d) | | | 53,390 | | |
| | | | | Business Software Development | | | | | |
| | 1,272,365 | | | Koninklijke TenCate | | | 51,516 | | |
| | | | | Advanced Textiles & Industrial Fabrics | | | | | |
| | 1,164,669 | | | Arcadis | | | 28,493 | | |
| | | | | Engineering Consultants | | | | | |
| | 249,000 | | | Core Laboratories | | | 27,773 | | |
| | | | | Oil & Gas Reservoir Consulting | | | | | |
| | 1,093,994 | | | USG People | | | 18,918 | | |
| | | | | Temporary Staffing Services | | | | | |
| | | | 409,552 | | |
| | | > France 5.1% | |
| | 610,000 | | | Neopost | | | 52,403 | | |
| | | | | Postage Meter Machines | | | | | |
| | 489,287 | | | Eurofins Scientific | | | 45,070 | | |
| | | | | Food, Pharmaceuticals & Materials
Screening & Testing | | | | | |
| | 799,000 | | | Gemalto | | | 38,207 | | |
| | | | | Smart Card Products & Solutions | | | | | |
| | 274,100 | | | Rubis | | | 34,772 | | |
| | | | | Tank Storage & Liquefied Petroleum Gas
Distribution | | | | | |
| | 1,078,000 | | | Teleperformance | | | 31,680 | | |
| | | | | Call Center Operator | | | | | |
| | 902,900 | | | Saft | | | 31,051 | | |
| | | | | Niche Battery Manufacturer | | | | | |
| | 541,500 | | | Mersen | | | 30,546 | | |
| | | | | Advanced Industrial Materials | | | | | |
| | 322,200 | | | Pierre & Vacances | | | 26,862 | | |
| | | | | Vacation Apartment Lets | | | | | |
| | 213,800 | | | Norbert Dentressangle | | | 25,265 | | |
| | | | | Leading European Logistics & Transport
Group | | | | | |
| | 1,689,100 | | | Hi-Media (a) | | | 10,116 | | |
| | | | | Online Advertiser in Europe | | | | | |
| | | | 325,972 | | |
| | | > Germany 3.9% | |
| | 630,000 | | | Rheinmetall | | | 55,775 | | |
| | | | | Defense & Automotive | | | | | |
| | 2,120,000 | | | Wirecard (b) | | | 37,891 | | |
| | | | | Online Payment Processing & Risk
Management | | | | | |
| | 137,500 | | | Rational | | | 36,240 | | |
| | | | | Commercial Ovens | | | | | |
| | 1,460,000 | | | Rhoen-Klinikum | | | 35,230 | | |
| | | | | Health Care Services | | | | | |
| | 403,286 | | | CTS Eventim | | | 27,867 | | |
| | | | | Event Ticket Sales | | | | | |
| | 165,000 | | | Vossloh | | | 23,157 | | |
| | | | | Rail Infrastructure & Diesel Locomotives | | | | | |
| | 515,000 | | | Elringklinger | | | 18,275 | | |
| | | | | Automobile Components | | | | | |
See accompanying notes to financial statements.
38
| Number of Shares | | | | Value (000) | |
| | | > Germany—continued | |
| | 237,511 | | | Dürr | | $ | 9,644 | | |
| | | | | Automotive Plant Engineering &
Associated Capital Equipment | | | | | |
| | 312,500 | | | Deutsche Beteiligungs | | | 8,814 | | |
| | | | | Private Equity Investment Management | | | | | |
| | | | 252,893 | | |
| | | > Switzerland 3.7% | |
| | 22,300 | | | Sika | | | 53,764 | | |
| | | | | Chemicals for Construction & Industrial
Applications | | | | | |
| | 325,000 | | | Kuehne & Nagel | | | 49,325 | | |
| | | | | Freight Forwarding/Logistics | | | | | |
| | 185,000 | | | Geberit (a) | | | 43,832 | | |
| | | | | Plumbing Supplies | | | | | |
| | 235,000 | | | Partners Group | | | 41,592 | | |
| | | | | Private Markets Asset Management | | | | | |
| | 720,000 | | | Bank Sarasin & Cie | | | 28,517 | | |
| | | | | Private Banking | | | | | |
| | 190,000 | | | Dufry Group (a) | | | 23,932 | | |
| | | | | Operates Airport Duty Free & Duty Paid
Shops | | | | | |
| | | | 240,962 | | |
| | | > Sweden 2.6% | |
| | 3,799,000 | | | Hexagon (b) | | | 93,576 | | |
| | | | | Measurement Equipment & Software | | | | | |
| | 3,887,000 | | | Sweco | | | 38,254 | | |
| | | | | Engineering Consultants | | | | | |
| | 607,000 | | | Unibet (a) | | | 13,171 | | |
| | | | | European Online Gaming Operator | | | | | |
| | 905,452 | | | East Capital Explorer | | | 10,521 | | |
| | | | | Sweden-based RUS/CEE Investment Fund | | | | | |
| | 708,342 | | | Orc Software (b) | | | 9,435 | | |
| | | | | Software for Securities Trading, Analysis &
Risk Management | | | | | |
| | | | 164,957 | | |
| | | > Italy 2.4% | |
| | 257,200 | | | Tod's | | | 34,407 | | |
| | | | | Leather Shoes & Bags | | | | | |
| | 2,083,000 | | | Ansaldo STS | | | 29,195 | | |
| | | | | Railway Systems Integrator | | | | | |
| | 4,311,600 | | | Credito Emiliano | | | 27,273 | | |
| | | | | Italian Regional Bank | | | | | |
| | 9,796,000 | | | CIR | | | 24,533 | | |
| | | | | Italian Holding Company | | | | | |
| | 3,573,000 | | | Geox | | | 21,410 | | |
| | | | | Apparel & Shoe Maker | | | | | |
| | 4,111,000 | | | Terna (b) | | | 19,113 | | |
| | | | | Italian Power Transmission | | | | | |
| | | | 155,931 | | |
| | | > Denmark 1.2% | |
| | 306,000 | | | Novozymes | | | 49,796 | | |
| | | | | Industrial Enzymes | | | | | |
| | 156,000 | | | SimCorp | | | 30,785 | | |
| | | | | Software for Investment Managers | | | | | |
| | | | 80,581 | | |
| Number of Shares | | | | Value (000) | |
| | | > Ireland 1.1% | |
| | 9,669,485 | | | United Drug | | $ | 33,121 | | |
| | | | | Irish Pharmaceutical Wholesaler &
Outsourcer | | | | | |
| | 359,000 | | | Paddy Power | | | 19,517 | | |
| | | | | Irish Betting Services | | | | | |
| | 297,000 | | | Aryzta | | | 15,735 | | |
| | | | | Baked Goods | | | | | |
| | | | 68,373 | | |
| | | > Portugal 0.6% | |
| | 7,278,105 | | | Redes Energéticas Nacionais | | | 26,164 | | |
| | | | | Portuguese Power Transmission & Gas
Transportation | | | | | |
| | 22,568,987 | | | Banco Comercial Português (a) | | | 13,419 | | |
| | | | | Largest Portuguese Banking Franchise | | | | | |
| | | | 39,583 | | |
| | | > Iceland 0.6% | |
| | 35,982,499 | | | Marel (a) | | | 38,090 | | |
| | | | | Largest Manufacturer of Poultry & Fish
Processing Equipment | | | | | |
| | | | 38,090 | | |
| | | > Spain 0.5% | |
| | 579,000 | | | Red Eléctrica de España | | | 34,950 | | |
| | | | | Spanish Power Transmission | | | | | |
| | | | 34,950 | | |
| | | > Finland 0.5% | |
| | 967,777 | | | Stockmann (b) | | | 27,423 | | |
| | | | | Department Store & Fashion Retailer in
Scandinavia & Russia | | | | | |
| | 410,523 | | | Poyry | | | 5,876 | | |
| | | | | Engineering Consultants | | | | | |
| | | | 33,299 | | |
| | | > Czech Republic 0.5% | |
| | 121,268 | | | Komercni Banka (b) | | | 29,574 | | |
| | | | | Leading Czech Republic Universal Bank | | | | | |
| | | | 29,574 | | |
| | | > Russia 0.4% | |
| | 764,506 | | | Mail.ru - GDR (a)(c) | | | 25,397 | | |
| | | | | Internet Social Networking & Games for
Russian Speakers | | | | | |
| | | | 25,397 | | |
| | | > Norway 0.3% | |
| | 2,045,964 | | | Atea | | | 21,521 | | |
| | | | | Leading Nordic IT Hardware/Software
Re-seller & Installation Company | | | | | |
| | | | 21,521 | | |
| | | > Greece 0.2% | |
| | 6,475,300 | | | Intralot | | | 13,803 | | |
| | | | | Lottery & Gaming Systems & Services | | | | | |
| | | | 13,803 | | |
| | | > Poland 0.2% | |
| | 893,900 | | | Central European Distribution (a) | | | 10,012 | | |
| | | | | Largest Spirits Company in Central &
Eastern Europe | | | | | |
| | | | 10,012 | | |
See accompanying notes to financial statements.
39
Columbia Acorn International
Statement of Investments (Unaudited), continued
| Number of Shares | | | | Value (000) | |
| | | > Belgium 0.2% | |
| | 145,031 | | | EVS Broadcast Equipment | | $ | 9,818 | | |
| | | | | Digital Live Mobile Production Software &
Systems | | | | | |
| | | | 9,818 | | |
| Europe: Total | | | 2,407,695 | | |
| Asia 36.8% | | | |
| | | > Japan 16.2% | |
| | 7,568,400 | | | Kansai Paint | | | 68,957 | | |
| | | | | Paint Producer in Japan, India, China &
Southeast Asia | | | | | |
| | 3,650,000 | | | Asics | | | 54,481 | | |
| | | | | Footwear & Apparel | | | | | |
| | 21,000 | | | Seven Bank | | | 41,964 | | |
| | | | | ATM Processing Services | | | | | |
| | 1,846,000 | | | Aeon Delight | | | 37,221 | | |
| | | | | Facility Maintenance & Management | | | | | |
| | 6,400 | | | Orix JREIT | | | 35,367 | | |
| | | | | Diversified REIT | | | | | |
| | 1,563,000 | | | Hoshizaki Electric | | | 34,695 | | |
| | | | | Commercial Kitchen Equipment | | | | | |
| | 15,300 | | | Advance Residence Investment | | | 32,022 | | |
| | | | | Residential REIT | | | | | |
| | 710,000 | | | Hamamatsu Photonics | | | 30,698 | | |
| | | | | Optical Sensors for Medical & Industrial
Applications | | | | | |
| | 3,283,000 | | | Kamigumi | | | 30,682 | | |
| | | | | Port Cargo Handling & Logistics | | | | | |
| | 1,360,000 | | | Asahi Diamond Industrial | | | 29,733 | | |
| | | | | Consumable Diamond Tools | | | | | |
| | 1,355,000 | | | Gree (a) | | | 29,621 | | |
| | | | | Mobile Social Networking Game
Developer/Platform | | | | | |
| | 707,000 | | | Ain Pharmaciez | | | 29,090 | | |
| | | | | Dispensing Pharmacy/Drugstore Operator | | | | | |
| | 1,974,000 | | | Kuraray | | | 28,919 | | |
| | | | | Special Resin, Fine Chemical, Fibers &
Textures | | | | | |
| | 868,000 | | | Kintetsu World Express | | | 28,505 | | |
| | | | | Airfreight Logistics | | | | | |
| | 274,000 | | | Nakanishi | | | 28,232 | | |
| | | | | Dental Tools & Machinery | | | | | |
| | 23,500 | | | Wacom (d) | | | 27,443 | | |
| | | | | Computer Graphic Illustration Devices | | | | | |
| | 24,022 | | | Jupiter Telecommunications | | | 26,875 | | |
| | | | | Largest Cable Service Provider in Japan | | | | | |
| | 819,000 | | | Ibiden | | | 25,641 | | |
| | | | | Electronic Parts & Ceramics | | | | | |
| | 1,292,500 | | | Ushio | | | 25,556 | | |
| | | | | Industrial Light Sources | | | | | |
| | 1,275,000 | | | Start Today | | | 25,461 | | |
| | | | | Online Japanese Apparel Retailer | | | | | |
| | 789,000 | | | Tsumura | | | 25,223 | | |
| | | | | Traditional Chinese/Japanese Herbal Rx
Drugs (Kampo) | | | | | |
| | 23,908,800 | | | Shinsei Bank | | | 23,915 | | |
| | | | | Commercial Bank | | | | | |
| | 1,181,200 | | | Daiseki | | | 23,914 | | |
| | | | | Waste Disposal & Recycling | | | | | |
| Number of Shares | | | | Value (000) | |
| | 509,000 | | | Makita | | $ | 23,719 | | |
| | | | | Power Tools | | | | | |
| | 5,100 | | | Osaka Securities Exchange | | | 22,766 | | |
| | | | | Osaka Securities Exchange | | | | | |
| | 7,174,000 | | | Nippon Sheet Glass | | | 22,306 | | |
| | | | | Sheet Glass for Building & Automotive Use | | | | | |
| | 977,000 | | | Glory | | | 22,006 | | |
| | | | | Currency Handling Systems & Related
Equipment | | | | | |
| | 2,400,000 | | | Shimadzu | | | 21,982 | | |
| | | | | Analytical Instruments, Medical & Industrial
Equipment | | | | | |
| | 906,000 | | | Aeon Mall | | | 21,948 | | |
| | | | | Suburban Shopping Mall Developer,
Owner & Operator | | | | | |
| | 2,850 | | | Fukuoka | | | 21,457 | | |
| | | | | Diversified REIT in Fukuoka | | | | | |
| | 2,870 | | | Kakaku.com | | | 20,181 | | |
| | | | | Online Price Comparison Services for
Consumers | | | | | |
| | 1,250,500 | | | Torishima Pump Manufacturing | | | 20,072 | | |
| | | | | Industrial Pump for Power Generation &
Water Supply Systems | | | | | |
| | 1,666,700 | | | Japan Airport Terminal | | | 19,411 | | |
| | | | | Airport Terminal Operator at Haneda | | | | | |
| | 1,794,000 | | | Sintokogio | | | 18,418 | | |
| | | | | Automated Casting Machines, Surface
Treatment Systems & Consumables | | | | | |
| | 675,780 | | | Icom | | | 17,390 | | |
| | | | | Two Way Radio Communication Equipment | | | | | |
| | 587,800 | | | Miura | | | 17,039 | | |
| | | | | Industrial Boiler Maker, Seller, Distributor &
Manufacturer | | | | | |
| | 4,458 | | | Mori Hills | | | 16,313 | | |
| | | | | Tokyo Centric Diversified REIT | | | | | |
| | 439,800 | | | Pigeon | | | 14,456 | | |
| | | | | Baby Care Products | | | | | |
| | | | 1,043,679 | | |
| | | > Singapore 4.6% | |
| | 35,981,000 | | | Olam International | | | 79,986 | | |
| | | | | Agriculture Supply Chain Manager | | | | | |
| | 23,000,000 | | | CDL Hospitality Trust | | | 38,607 | | |
| | | | | Hotel Owner/Operator | | | | | |
| | 50,000,000 | | | Mapletree Logistics Trust | | | 37,491 | | |
| | | | | Industrial Property Landlord | | | | | |
| | 22,000,000 | | | Ascendas REIT | | | 36,592 | | |
| | | | | Industrial Property Landlord | | | | | |
| | 37,010,000 | | | Mapletree Industrial Trust | | | 35,291 | | |
| | | | | Industrial Property Landlord | | | | | |
| | 4,000,000 | | | Singapore Exchange | | | 24,580 | | |
| | | | | Singapore Equity & Derivatives Market
Operator | | | | | |
| | 30,000,000 | | | Mapletree Commercial Trust (a) | | | 21,127 | | |
| | | | | Retail & Office Property Landlord | | | | | |
| | 13,000,000 | | | Goodpack | | | 19,391 | | |
| | | | | International Bulk Container Leasing | | | | | |
| | | | 293,065 | | |
| | | > Hong Kong 4.3% | |
| | 7,000,000 | | | Melco Crown Entertainment -
ADR (a)(b) | | | 89,390 | | |
| | | | | Macau Casino Operator | | | | | |
See accompanying notes to financial statements.
40
| Number of Shares | | | | Value (000) | |
| | | > Hong Kong—continued | |
| | 18,000,000 | | | Lifestyle International | | $ | 53,125 | | |
| | | | | Mid- to High-end Department Store
Operator in Hong Kong & China | | | | | |
| | 23,335,500 | | | Mongolian Mining (a) | | | 28,855 | | |
| | | | | Coking Coal Mining in Mongolia | | | | | |
| | 30,000,000 | | | Hutchison Port Holdings Trust (a) | | | 25,350 | | |
| | | | | Southern China Container Ports | | | | | |
| | 35,000,000 | | | Sa Sa International | | | 22,487 | | |
| | | | | Cosmetics Retailer | | | | | |
| | 12,000,000 | | | MGM China Holdings (a) | | | 22,144 | | |
| | | | | Macau Casino Operator | | | | | |
| | 8,077,000 | | | L'Occitane International (a) | | | 21,636 | | |
| | | | | Skin Care & Cosmetics Producer | | | | | |
| | 750,000 | | | Hong Kong Exchanges and Clearing | | | 15,802 | | |
| | | | | Hong Kong Equity & Derivatives Market
Operator | | | | | |
| | | | 278,789 | | |
| | | > China 4.2% | |
| | 32,276,000 | | | Zhaojin Mining Industry | | | 66,584 | | |
| | | | | Gold Mining & Refining in China | | | | | |
| | 10,764,600 | | | China Yurun Food | | | 30,437 | | |
| | | | | Meat Processor in China | | | | | |
| | 230,000 | | | New Oriental Education &
Technology - ADR (a) | | | 25,696 | | |
| | | | | Education Service Provider | | | | | |
| | 41,959,300 | | | China Communication Services | | | 24,845 | | |
| | | | | China's Telecom Infrastructure Service
Provider | | | | | |
| | 240,000,000 | | | RexLot Holdings | | | 23,216 | | |
| | | | | Lottery Equipment Supplier in China | | | | | |
| | 23,146,000 | | | Jiangsu Expressway | | | 21,218 | | |
| | | | | Chinese Toll Road Operator | | | | | |
| | 6,000,000 | | | ENN Energy | | | 20,460 | | |
| | | | | China's Largest Private Gas Operator | | | | | |
| | 11,286,200 | | | Shandong Weigao | | | 16,385 | | |
| | | | | Vertically Integrated Hospital
Consumable Manufacturing | | | | | |
| | 247,000 | | | 51job - ADR (a) | | | 13,864 | | |
| | | | | An Integrated Human Resources Service
Provider | | | | | |
| | 24,244,400 | | | Wasion Group | | | 11,413 | | |
| | | | | Electronic Power Meter Total Solution
Provider | | | | | |
| | 7,143,600 | | | Want Want | | | 6,936 | | |
| | | | | Chinese Branded Consumer Food Company | | | | | |
| | 432,790 | | | Noah Holdings - ADR (a)(b) | | | 4,865 | | |
| | | | | Wealth Management Product Distributor
in China | | | | | |
| | 680,503 | | | Zuoan Fashion (a)(b) | | | 3,804 | | |
| | | | | Men's Apparel Provider in China | | | | | |
| | | | 269,723 | | |
| | | > Taiwan 3.5% | |
| | 5,821,000 | | | Simplo Technology | | | 47,049 | | |
| | | | | World's Largest Notebook Battery Pack
Supplier | | | | | |
| | 21,429,000 | | | Far Eastone Telecom | | | 34,202 | | |
| | | | | Taiwan's Third Largest Mobile Operator | | | | | |
| | 5,665,000 | | | President Chain Store | | | 32,821 | | |
| | | | | Taiwan's Number One Convenience Chain
Store Operator | | | | | |
| Number of Shares | | | | Value (000) | |
| | 1,511,000 | | | St. Shine Optical | | $ | 22,957 | | |
| | | | | World's Leading Disposable Contact
Lens OEM | | | | | |
| | 4,192,000 | | | China Steel Chemical | | | 22,456 | | |
| | | | | Sole Coal Chemical Producer in Taiwan | | | | | |
| | 1,142,620 | | | Formosa International Hotels | | | 21,674 | | |
| | | | | Hotel, Food & Beverage Operation &
Hospitality Management Services | | | | | |
| | 6,911,000 | | | Taiwan Hon Chuan | | | 20,837 | | |
| | | | | Beverage Packaging (Bottles, Caps &
Labels) Manufacturer | | | | | |
| | 7,206,000 | | | Everlight Electronics | | | 19,409 | | |
| | | | | LED Packager | | | | | |
| | 2,211,000 | | | Sinyi Realty | | | 4,270 | | |
| | | | | Taiwanese Realty Company | | | | | |
| | | | 225,675 | | |
| | | > India 2.4% | |
| | 8,587,418 | | | Jain Irrigation Systems | | | 32,834 | | |
| | | | | Agricultural Micro-irrigation Systems &
Food Processing | | | | | |
| | 7,496,953 | | | Mundra Port & Special Economic Zone | | | 27,203 | | |
| | | | | Indian West Coast Shipping Port | | | | | |
| | 320,000 | | | Asian Paints | | | 22,666 | | |
| | | | | India's Largest Paint Company | | | | | |
| | 30,574,905 | | | REI Agro | | | 17,444 | | |
| | | | | Basmati Rice Processing | | | | | |
| | 11,814,746 | | | Manappuram General Finance | | | 14,896 | | |
| | | | | Short-term Lending Collateralized by
Household Gold | | | | | |
| | 9,600,000 | | | S. Kumars Nationwide (a) | | | 11,654 | | |
| | | | | Textiles, Clothing & Retail | | | | | |
| | 3,550,000 | | | Infrastructure Development Finance (a) | | | 10,427 | | |
| | | | | Infrastructure Finance in India | | | | | |
| | 715,000 | | | Shriram Transport Finance | | | 9,892 | | |
| | | | | Used Truck Finance | | | | | |
| | 367,138 | | | United Breweries | | | 4,374 | | |
| | | | | India's Largest Brewer | | | | | |
| | | | 151,390 | | |
| | | > South Korea 1.3% | |
| | 1,157,000 | | | Woongjin Coway | | | 41,264 | | |
| | | | | South Korean Household Appliance Rental
Service Provider | | | | | |
| | 150,000 | | | NHN (a) | | | 26,593 | | |
| | | | | South Korea's Largest Online Search Engine | | | | | |
| | 121,132 | | | MegaStudy | | | 16,295 | | |
| | | | | Education Service Provider | | | | | |
| | | | 84,152 | | |
| | | > Thailand 0.3% | |
| | 80,000,000 | | | Home Product Center | | | 21,351 | | |
| | | | | Home Improvement Retailer | | | | | |
| | | | 21,351 | | |
| | | > Indonesia —% | |
| | 6,898,100 | | | Ace Indonesia | | | 2,433 | | |
| | | | | Home Improvement Retailer | | | | | |
| | | | 2,433 | | |
| Asia: Total | | | 2,370,257 | | |
See accompanying notes to financial statements.
41
Columbia Acorn International
Statement of Investments (Unaudited), continued
| Number of Shares | | | | Value (000) | |
| Other Countries 15.8% | | | |
| | | > Canada 5.3% | |
| | 1,710,000 | | | ShawCor | | $ | 52,517 | | |
| | | | | Oil & Gas Pipeline Products | | | | | |
| | 977,500 | | | Ivanhoe Mines (a) | | | 24,700 | | |
| | 855,600 | | | Ivanhoe Mines (a)(e) | | | 21,647 | | |
| | | | | Copper Mine Project in Mongolia | | | | | |
| | 1,301,612 | | | CCL Industries | | | 44,752 | | |
| | | | | Leading Global Label Manufacturer | | | | | |
| | 574,000 | | | Baytex (b) | | | 31,377 | | |
| | | | | Oil & Gas Producer in Canada | | | | | |
| | 540,000 | | | AG Growth | | | 25,644 | | |
| | | | | Leading Manufacturer of Augers & Grain
Handling Equipment | | | | | |
| | 605,000 | | | Onex Capital | | | 23,442 | | |
| | | | | Private Equity Firm | | | | | |
| | 546,500 | | | Black Diamond Group | | | 17,849 | | |
| | | | | Provides Accommodations/Equipment for
Oil Sands Exploitation | | | | | |
| | 872,700 | | | Tahoe Resources (a)(c) | | | 16,125 | | |
| | | | | Silver Project in Guatemala | | | | | |
| | 2,696,000 | | | DeeThree Exploration (a)(c)(d) | | | 9,862 | | |
| | 1,042,877 | | | DeeThree Exploration (a)(d) | | | 3,893 | | |
| | | | | Canadian Oil & Gas Producer | | | | | |
| | 501,700 | | | Alliance Grain Traders | | | 13,421 | | |
| | | | | Global Leader in Pulse Processing &
Distribution | | | | | |
| | 2,214,100 | | | Horizon North Logistics | | | 10,285 | | |
| | | | | Provides Diversified Oil Service Offering
in Northern Canada | | | | | |
| | 5,737,500 | | | Southern Arc Minerals (a)(c)(d) | | | 10,086 | | |
| | | | | Gold & Copper Exploration in Indonesia | | | | | |
| | 1,291,135 | | | Guyana Goldfields (a) | | | 9,170 | | |
| | | | | Gold Mining Projects in Guyana | | | | | |
| | 1,480,610 | | | Pan Orient (a) | | | 8,229 | | |
| | | | | Growth Oriented & Return Focused Asian
Explorer | | | | | |
| | 367,600 | | | Crew Energy (a) | | | 5,717 | | |
| | | | | Canadian Oil & Gas Producer | | | | | |
| | 12,500,000 | | | Eacom Timber (a)(c) | | | 3,937 | | |
| | | | | Canadian Lumber Producer | | | | | |
| | 12,500,000 | | | Petromanas (a)(c) | | | 3,683 | | |
| | 6,250,000 | | | Petromanas - Warrants (a)(c) | | | 159 | | |
| | | | | Exploring for Oil in Albania | | | | | |
| | 146,200 | | | Celtic Exploration (a) | | | 3,233 | | |
| | | | | Canadian Oil & Gas Producer | | | | | |
| | | | 339,728 | | |
| | | > United States 3.8% | |
| | 1,273,000 | | | Atwood Oceanics (a) | | | 56,177 | | |
| | | | | Offshore Drilling Contractor | | | | | |
| | 822,000 | | | Alexion Pharmaceuticals (a) | | | 38,659 | | |
| | | | | Biotech Focused on Orphan Diseases | | | | | |
| | 918,000 | | | World Fuel Services | | | 32,984 | | |
| | | | | Global Fuel Broker | | | | | |
| | 1,145,000 | | | BioMarin Pharmaceutical (a) | | | 31,155 | | |
| | | | | Biotech Focused on Orphan Diseases | | | | | |
| | 658,000 | | | FMC Technologies (a) | | | 29,472 | | |
| | | | | Oil & Gas Wellhead Manufacturer | | | | | |
| Number of Shares | | | | Value (000) | |
| | 250,000 | | | Oil States International (a) | | $ | 19,978 | | |
| | | | | Diversified North American Oil Service
Provider | | | | | |
| | 391,000 | | | Bristow | | | 19,949 | | |
| | | | | Largest Provider of Helicopter Services to
Offshore Oil & Gas Producers | | | | | |
| | 568,000 | | | Textainer Group Holdings | | | 17,460 | | |
| | | | | Top International Container Leasor | | | | | |
| | | | 245,834 | | |
| | | > South Africa 3.8% | |
| | 1,096,000 | | | Naspers | | | 61,909 | | |
| | | | | Media in Africa, China, Russia & Other
Emerging Markets | | | | | |
| | 4,600,000 | | | Mr. Price | | | 46,396 | | |
| | | | | South African Retailer of Apparel,
Household & Sporting Goods | | | | | |
| | 4,625,000 | | | Adcock Ingram Holdings | | | 40,636 | | |
| | | | | Manufacturer of Pharmaceuticals &
Medical Supplies | | | | | |
| | 5,780,900 | | | Northam Platinum | | | 36,309 | | |
| | | | | Platinum Mining in South Africa | | | | | |
| | 17,625,208 | | | Rand Merchant Insurance | | | 32,191 | | |
| | | | | Directly Sold Property & Casualty
Insurance; Holdings in Other Insurers | | | | | |
| | 8,723,060 | | | Coronation Fund Managers | | | 24,898 | | |
| | | | | South African Fund Manager | | | | | |
| | | | 242,339 | | |
| | | > Australia 1.7% | |
| | 2,482,000 | | | UGL | | | 37,092 | | |
| | | | | Engineering & Facilities Management | | | | | |
| | 467,000 | | | Cochlear | | | 36,145 | | |
| | | | | Cochlear Implants | | | | | |
| | 6,281,896 | | | SAI Global | | | 32,009 | | |
| | | | | Publishing, Certification & Compliance Services | | | | | |
| | 1,000,000 | | | Seek | | | 6,936 | | |
| | | | | Online Job Listing & Education | | | | | |
| | | | 112,182 | | |
| | | > Israel 0.7% | |
| | 2,890,000 | | | Israel Chemicals | | | 46,119 | | |
| | | | | Producer of Potash, Phosphates,
Bromine & Specialty Chemicals | | | | | |
| | | | 46,119 | | |
| | | > Kazakhstan 0.3% | |
| | 1,770,000 | | | Halyk Savings Bank of
Kazakhstan - GDR (a) | | | 15,841 | | |
| | | | | Largest Retail Bank & Insurer in Kazakhstan | | | | | |
| | | | 15,841 | | |
| | | > Senegal 0.2% | |
| | 43,000 | | | Sonatel (f) | | | 13,784 | | |
| | | | | Leading Telecoms Operator in
Western Africa | | | | | |
| | | | 13,784 | | |
| | | > Egypt —% | |
| | 235,342 | | | Paints & Chemical Industries (Pachin) | | | 1,509 | | |
| | | | | Paints & Inks in Egypt | | | | | |
| | | | 1,509 | | |
| Other Countries: Total | | | 1,017,336 | | |
See accompanying notes to financial statements.
42
| Number of Shares | | | | Value (000) | |
| Latin America 5.6% | | | |
| | | > Brazil 4.2% | |
| | 4,300,000 | | | Localiza Rent A Car | | $ | 76,872 | | |
| | | | | Car Rental | | | | | |
| | 3,000,000 | | | Mills Estruturas e Serviços de
Engenharia | | | 43,251 | | |
| | | | | Civil Engineering & Construction | | | | | |
| | 5,937,000 | | | Suzano | | | 42,949 | | |
| | | | | Brazilian Pulp & Paper Producer | | | | | |
| | 1,300,000 | | | Natura | | | 32,487 | | |
| | | | | Direct Retailer of Cosmetics | | | | | |
| | 3,400,000 | | | MRV Engenharia | | | 28,234 | | |
| | | | | Brazilian Property Developer | | | | | |
| | 4,400,000 | | | PDG Realty | | | 24,782 | | |
| | | | | Brazilian Property Developer | | | | | |
| | 1,100,000 | | | Multiplus | | | 19,172 | | |
| | | | | Loyalty Program Operator in Brazil | | | | | |
| | | | 267,747 | | |
| | | > Mexico 0.5% | |
| | 580,000 | | | Grupo Aeroportuario del
Sureste - ADR | | | 34,185 | | |
| | | | | Mexican Airport Operator | | | | | |
| | | | 34,185 | | |
| | | > Chile 0.4% | |
| | 340,000 | | | Sociedad Quimica y Minera de
Chile - ADR (b) | | | 22,005 | | |
| | | | | Producer of Specialty Fertilizers,
Lithium & Iodine | | | | | |
| | | | 22,005 | | |
| | | > Argentina 0.3% | |
| | 6,818,182 | | | Union Agriculture Group (a)(c) | | | 15,000 | | |
| | | | | Farmland Operator in Uruguay | | | | | |
| | 5,400,000 | | | Madalena Ventures (a)(c) | | | 3,128 | | |
| | | | | Oil & Gas Exploration in Argentina | | | | | |
| | | | 18,128 | | |
| | | > Colombia 0.2% | |
| | 8,240,000 | | | Canacol Energy (a) | | | 9,056 | | |
| | | | | Oil Producer in South America | | | | | |
| | 20,718,000 | | | Gulf United (a)(c) | | | 6,091 | | |
| | | | | Prospecting for Oil Alongside Large
Producers in Colombia | | | | | |
| | | | 15,147 | | |
| Latin America: Total | | | 357,212 | | |
Total Equities: 95.6%
(Cost: $4,331,138) | | | 6,152,500 | | |
| | | Securities Lending Collateral: 1.4% | |
| | 90,620,846 | | | Dreyfus Government Cash
Management Fund (g)
(7 day yield of 0.00%) | | | 90,621 | | |
Total Securities Lending Collateral:
(Cost: $90,621) | | | 90,621 | | |
| Principal Amount (000) | | | | Value (000) | |
| Short-Term Obligation 3.5% | |
| | | > Repurchase Agreement 3.5% | |
| $ | 226,923 | | | Repurchase Agreement with
Fixed Income Clearing Corp.,
dated 6/30/11, due 7/01/11
at 0.01%, collateralized by
U.S. Government Agency
obligations with various
maturities to 9/08/17,
market value $231,463
(repurchase proceeds $226,923) | | $ | 226,923 | | |
| | | | 226,923 | | |
Total Short-Term Obligation:
(Cost: $226,923) | | | 226,923 | | |
Total Investments: 100.5%
(Cost: $4,648,682)(h)(i) | | | 6,470,044 | | |
Obligation to Return Collateral for
Securities Loaned: (1.4)% | | | (90,621 | ) | |
| Cash and Other Assets Less Liabilities: 0.9% | | | 60,237 | | |
| Total Net Assets: 100.0% | | $ | 6,439,660 | | |
ADR = American Depositary Receipts
GDR = Global Depositary Receipts
See accompanying notes to financial statements.
43
Columbia Acorn International
Statement of Investments (Unaudited), continued
> Notes to Statements of Investments (dollar values in thousands)
(a) Non-income producing security.
(b) All or a portion of this security was on loan at June 30, 2011. The total market value of Fund securities on loan at June 30, 2011 was $88,468.
(c) Denotes a restricted security, which is subject to restrictions on resale under federal securities laws. These securities are valued at a fair value determined in good faith under consistently applied procedures established by the Board of Trustees. At June 30, 2011, the market value of these securities amounted to $95,229, which represented 1.48% of total net assets.
Additional information on these securities is as follows:
| Security | | Acquisition
Dates | | Shares | | Cost | | Value | |
| Mail.ru - GDR | | 11/05/10-12/31/10 | | | 764,506 | | | $ | 26,088 | | | $ | 25,397 | | |
| Tahoe Resources | | 5/28/10 | | | 872,700 | | | | 4,984 | | | | 16,125 | | |
| Union Agriculture Group | | 12/08/10 | | | 6,818,182 | | | | 15,000 | | | | 15,000 | | |
| Southern Arc Minerals | | 2/16/11 | | | 5,737,500 | | | | 9,308 | | | | 10,086 | | |
| DeeThree Exploration | | 9/07/10-3/08/11 | | | 2,696,000 | | | | 9,486 | | | | 9,862 | | |
| Gulf United | | 2/11/11 | | | 20,718,000 | | | | 6,215 | | | | 6,091 | | |
| Eacom Timber | | 3/17/10 | | | 12,500,000 | | | | 6,188 | | | | 3,937 | | |
| Petromanas | | 5/20/10 | | | 12,500,000 | | | | 4,344 | | | | 3,683 | | |
| Madalena Ventures | | 10/21/10 | | | 5,400,000 | | | | 3,422 | | | | 3,128 | | |
| Sterling Resources | | 12/02/10 | | | 1,050,500 | | | | 3,135 | | | | 1,761 | | |
| Petromanas - Warrants | | 5/20/10 | | | 6,250,000 | | | | 362 | | | | 159 | | |
| | | | | | | $ | 88,532 | | | $ | 95,229 | | |
(d) An affiliated person of the Fund may include any company in which the Fund owns five percent or more of its outstanding voting shares. Holdings and transactions in these affiliated companies during the six months ended June 30, 2011, are as follows:
| Affiliates | | Balance of
Shares Held
12/31/10 | |
Purchases/
Additions | |
Sales/
Reductions | | Balance of
Shares Held
6/30/11 | |
Value | |
Dividend | |
| DeeThree Exploration | | | 2,392,877 | | | | 1,346,000 | | | | - | | | | 3,738,877 | | | $ | 13,755 | | | $ | - | | |
| Gulf United* | | | - | | | | 20,718,000 | | | | - | | | | 20,718,000 | | | | 6,091 | | | | - | | |
| Southern Arc Minerals | | | - | | | | 5,737,500 | | | | - | | | | 5,737,500 | | | | 10,086 | | | | - | | |
| Unit 4 Aggresso | | | 1,476,800 | | | | - | | | | - | | | | 1,476,800 | | | | 53,390 | | | | 450 | | |
| United Drug* | | | 12,110,000 | | | | - | | | | 2,440,515 | | | | 9,669,485 | | | | 33,121 | | | | 1,013 | | |
| Wacom | | | 20,900 | | | | 2,600 | | | | - | | | | 23,500 | | | | 27,443 | | | | 721 | | |
| Workspace Group* | | | 60,304,000 | | | | - | | | | 4,211,000 | | | | 56,093,000 | | | | 27,233 | | | | 213 | | |
| Total of Affiliated Transactions | | | 76,304,577 | | | | 27,804,100 | | | | 6,651,515 | | | | 97,457,162 | | | $ | 171,119 | | | $ | 2,397 | | |
* At June 30, 2011, the Fund owned less than five percent of the company's outstanding voting shares.
The aggregate cost and value of these affiliated companies at June 30, 2011, was $85,252 and $104,674, respectively. Investments in affiliated companies represented 1.6% of total net assets at June 30, 2011.
(e) Security is traded on a U.S. exchange.
(f) Illiquid security.
(g) Investment made with cash collateral received from securities lending activity.
(h) At June 30, 2011, for federal income tax purposes, the cost of investments was $4,648,682 and net unrealized apppreciation was $1,821,362, consisting of gross unrealized appreciation of $2,050,001 and gross unrealized depreciation of $228,639.
(i) On June 30, 2011, the Fund's total investments were denominated in currencies as follows:
| Currency | | Value | | Percentage
of Net Assets | |
| Euro | | $ | 1,316,400 | | | | 20.4 | | |
| Japanese Yen | | | 1,043,679 | | | | 16.2 | | |
| U.S. Dollar | | | 904,297 | | | | 14.0 | | |
| British Pound | | | 448,015 | | | | 7.0 | | |
| Hong Kong Dollar | | | 385,544 | | | | 6.0 | | |
| Canadian Dollar | | | 334,678 | | | | 5.2 | | |
Other currencies less
than 5% of total net assets | | | 2,037,431 | | | | 31.7 | | |
| | | $ | 6,470,044 | | | | 100.5 | | |
See accompanying notes to financial statements.
44
> Notes to Statements of Investments (dollar values in thousands)
At June 30, 2011, the Fund had entered into the following forward foreign currency exchange contracts:
Forward Foreign Currency
Exchange Contracts to Buy | | Forward Foreign Currency
Exchange Contracts to Sell | | Principal Amount in
Foreign Currency | | Principal
Amount in U.S. Dollar | | Settlement Date | | Unrealized
Appreciation | |
| AUD | | | | USD | | | | | 40,296 | | | $ | 42,000 | | | 7/15/11 | | $ | 1,165 | | |
| AUD | | | | USD | | | | | 1,408 | | | | 1,500 | | | 7/15/11 | | | 8 | | |
| AUD | | | | USD | | | | | 38,544 | | | | 40,500 | | | 8/15/11 | | | 627 | | |
| AUD | | | | USD | | | | | 1,414 | | | | 1,500 | | | 8/15/11 | | | 8 | | |
| AUD | | | | USD | | | | | 39,736 | | | | 42,000 | | | 9/15/11 | | | 234 | | |
| CAD | | | | USD | | | | | 1,937 | | | | 2,000 | | | 7/15/11 | | | 8 | | |
| CAD | | | | USD | | | | | 3,876 | | | | 4,000 | | | 7/15/11 | | | 18 | | |
| CAD | | | | USD | | | | | 45,558 | | | | 47,000 | | | 8/15/11 | | | 188 | | |
| CAD | | | | USD | | | | | 3,879 | | | | 4,000 | | | 8/15/11 | | | 18 | | |
| CAD | | | | USD | | | | | 49,493 | | | | 51,000 | | | 9/15/11 | | | 226 | | |
| EUR | | | | USD | | | | | 3,877 | | | | 5,500 | | | 7/15/11 | | | 120 | | |
| JPY | | | | USD | | | | | 999,744 | | | | 12,000 | | | 7/15/11 | | | 419 | | |
| JPY | | | | USD | | | | | 484,386 | | | | 6,000 | | | 8/15/11 | | | 18 | | |
| | | | | | | $ | 259,000 | | | | | $ | 3,057 | | |
Forward Foreign Currency
Exchange Contracts to Buy | | Forward Foreign Currency
Exchange Contracts to Sell | | Principal Amount in
Foreign Currency | | Principal
Amount in U.S. Dollar | |
Settlement Date | | Unrealized
Depreciation | |
| USD | AUD | | | | | | | | 1,422 | | | $ | 1,500 | | | 7/15/11 | | $ | (23 | ) | |
| CAD | USD | | | | | | | | 43,344 | | | | 45,000 | | | 7/15/11 | | | (70 | ) | |
| USD | EUR | | | | | | | | 68,493 | | | | 99,000 | | | 7/15/11 | | | (297 | ) | |
| USD | EUR | | | | | | | | 4,150 | | | | 6,000 | | | 7/15/11 | | | (16 | ) | |
| USD | EUR | | | | | | | | 65,972 | | | | 93,500 | | | 8/15/11 | | | (2,060 | ) | |
| USD | EUR | | | | | | | | 4,154 | | | | 6,000 | | | 8/15/11 | | | (17 | ) | |
| USD | EUR | | | | | | | | 68,953 | | | | 99,500 | | | 9/15/11 | | | (290 | ) | |
| USD | JPY | | | | | | | | 484,482 | | | | 6,000 | | | 7/15/11 | | | (18 | ) | |
| JPY | USD | | | | | | | | 40,220 | | | | 500 | | | 7/15/11 | | | - | * | |
| JPY | USD | | | | | | | | 40,214 | | | | 500 | | | 8/15/11 | | | - | * | |
| JPY | USD | | | | | | | | 522,691 | | | | 6,500 | | | 9/15/11 | | | (5 | ) | |
| | | | | | | $ | 364,000 | | | | | $ | (2,796 | ) | |
* Rounds to less than $500.
The counterparty for all forward foreign currency exchange contracts is State Street Bank and Trust Company.
AUD = Australian Dollar
CAD = Canadian Dollar
EUR = Euro
JPY = Japanese Yen
USD = United States Dollar
Various inputs are used in determining the value of the Fund's investments, following the input prioritization hierarchy established by GAAP. These inputs are summarized in the three broad levels listed below:
• Level 1 – quoted prices in active markets for identical securities
• Level 2 – prices determined using other significant observable inputs (including quoted prices for similar securities, interest rates, prepayment speeds, credit risk and others)
• Level 3 – prices determined using significant unobservable inputs where quoted prices or observable inputs are unavailable or less reliable (including management's own assumptions about the factors market participants would use in pricing an investment)
The inputs or methodology used for valuing securities are not necessarily an indication of the risk associated with investing in those securities.
Examples of the types of securities in which the Fund would typically invest and how they are classified within this hierarchy are as follows. Typical Level 1 securities include exchange traded domestic equities, mutual funds whose NAVs are published each day and exchange traded foreign equities that are not statistically fair valued. Typical Level 2 securities include exchange traded foreign equities that are statistically fair valued, forward foreign currency exchange contracts and short-term investments valued at amortized cost. Additionally, securities fair valued by the Valuation Committee of the Fund's Board of Trustees that rely on significant observable inputs are also included in Level 2. Typical Level 3 securities include any security fair valued by the Valuation Committee that relies on significant unobservable inputs.
See accompanying notes to financial statements.
45
Columbia Acorn International
Statement of Investments (Unaudited), continued
> Notes to Statements of Investments (dollar values in thousands)
The following table summarizes the inputs used, as of June 30, 2011, in valuing the Fund's assets:
| Investment Type | |
Quoted Prices
(Level 1) | | Other
Significant
Observable
Inputs
(Level 2) | |
Significant
Unobservable
Inputs
(Level 3) | |
Total | |
| Equities | |
| Europe | | $ | 65,833 | | | $ | 2,341,862 | | | $ | - | | | $ | 2,407,695 | | |
| Asia | | | 162,969 | | | | 2,207,288 | | | | - | | | | 2,370,257 | | |
| Other Countries | | | 541,710 | | | | 475,626 | | | | - | | | | 1,017,336 | | |
| Latin America | | | 332,993 | | | | 9,219 | | | | 15,000 | | | | 357,212 | | |
| Total Equities | | | 1,103,505 | | | | 5,033,995 | | | | 15,000 | | | | 6,152,500 | | |
| Total Securities Lending Collateral | | | 90,621 | | | | - | | | | - | | | | 90,621 | | |
| Total Short-Term Obligation | | | - | | | | 226,923 | | | | - | | | | 226,923 | | |
| Total Investments | | $ | 1,194,126 | | | $ | 5,260,918 | | | $ | 15,000 | | | $ | 6,470,044 | | |
Unrealized Appreciation on Forward Foreign Currency
Exchange Contracts | | | - | | | | 3,057 | | | | - | | | | 3,057 | | |
Unrealized Depreciation on Forward Foreign Currency
Exchange Contracts | | | - | | | | (2,796 | ) | | | - | | | | (2,796 | ) | |
| Total | | $ | 1,194,126 | | | $ | 5,261,179 | | | $ | 15,000 | | | $ | 6,470,305 | | |
The Fund's assets assigned to the Level 2 input category are generally valued using a market approach, in which a security's value is determined through its correlation to prices and information from observable market transactions for similar or identical assets. Foreign equities are generally valued at the last sales price on the foreign exchange or market on which they trade. The Fund may use a systematic fair valuation model provided by an independent third party to value securities principally traded in foreign markets in order to adjust for possible stale pricing that may occur between the close of the foreign exchanges and the time for valuation. These models take into account available market data including intraday index, ADR, and ETF movements. Forward foreign currency exchange contracts are valued at the prevailing forward exchange rate of the underlying currencies. Securities acquired via private placement that have a holding period or an extended settlement period are valued at a discount to the same shares that are trading freely on the market. These discounts are determined by the adviser's experience with similar securities or situations. Factors may include, but are not limited to, trade volume, shares outstanding and stock price.
Certain short-term obligations may be valued using amortized cost, an income approach which converts future cash flows to a present value based upon the discount or premium at purchase.
The Fund's assets assigned to the Level 3 input category are valued at fair value as determined in good faith under consistently applied procedures established by and under the general supervision of the Board of Trustees. To determine fair value, management will utilize the valuation technique that they deem the most appropriate in the circumstances. Securities acquired via private placement that are not yet trading are valued using a market approach for which management has determined that the original transaction price is the best representation of fair value. The original cost may be adjusted for the market movement in an index, ETF or similar security during the period it does not trade.
The following table shows transfers between Level 1 and Level 2 of the fair value hierarchy.
| Transfers In | | Transfers Out | |
| Level 1 | | Level 2 | | Level 1 | | Level 2 | |
| $ | 263,663 | | | $ | 13,490 | | | $ | 13,490 | | | $ | 263,663 | | |
Financial assets were transferred from Level 2 to Level 1 as they resumed trading during the period.
Foreign exchange-traded financial assets were transferred from Level 1 to Level 2.
The following table reconciles asset balances for the six months ending June 30, 2011, in which significant unobservable inputs (Level 3) were used in determining value:
Investments
in Securities | | Balance
as of
December 31,
2010 | | Realized
Gain/(Loss) | | Change in
Unrealized
Appreciation
(Depreciation) | | Purchases | | Sales | | Transfers
into
Level 3 | | Transfers
out of
Level 3 | | Balance
as of
June 30,
2011 | |
| Equities | |
| Asia | | $ | 79 | | | $ | (38,558 | ) | | $ | 38,479 | | | $ | - | | | $ | - | | | $ | - | | | $ | - | | | $ | - | | |
| Latin America | | | 15,000 | | | | - | | | | - | | | | - | | | | - | | | | - | | | | - | | | | 15,000 | | |
| | | $ | 15,079 | | | $ | (38,558 | ) | | $ | 38,479 | | | $ | - | | | $ | - | | | $ | - | | | $ | - | | | $ | 15,000 | | |
The information in the above reconciliation table represents fiscal year to date activity for any securities identified as using Level 3 inputs at either the beginning or the end of the current fiscal period.
The change in unrealized appreciation (depreciation) attributed to securities owned at June 30, 2011, which were valued using significant unobservable inputs (Level 3) amounted to $38,479. This amount is included in net change in unrealized appreciation (depreciation) on the Statements of Changes in Net Assets.
For more information on valuation inputs, and their aggregation into the levels used in the tables above, please refer to the Security Valuation section in the accompanying Notes to Financial Statements.
See accompanying notes to financial statements.
46
Columbia Acorn International
Portfolio Diversification (Unaudited)
At June 30, 2011, the Fund's portfolio investments as a percent of net assets were diversified as follows:
| | | Value (000) | | Percentage
of Net Assets | |
| > Industrial Goods & Services | |
| Other Industrial Services | | $ | 541,127 | | | | 8.4 | | |
| Machinery | | | 469,283 | | | | 7.3 | | |
Industrial Materials & Specialty
Chemicals | | | 459,670 | | | | 7.1 | | |
| Electrical Components | | | 130,742 | | | | 2.0 | | |
| Conglomerates | | | 103,870 | | | | 1.6 | | |
| Construction | | | 87,084 | | | | 1.4 | | |
| Outsourcing Services | | | 50,077 | | | | 0.8 | | |
| Industrial Distribution | | | 19,391 | | | | 0.3 | | |
| | | | 1,861,244 | | | | 28.9 | | |
| > Consumer Goods & Services | |
| Retail | | | 247,635 | | | | 3.9 | | |
| Food & Beverage | | | 189,620 | | | | 2.9 | | |
| Casinos & Gaming | | | 181,242 | | | | 2.8 | | |
| Nondurables | | | 147,738 | | | | 2.3 | | |
| Apparel | | | 118,771 | | | | 1.8 | | |
| Other Consumer Services | | | 112,523 | | | | 1.7 | | |
| Travel | | | 107,797 | | | | 1.7 | | |
| Other Entertainment | | | 49,541 | | | | 0.8 | | |
| Educational Services | | | 41,991 | | | | 0.7 | | |
| Consumer Goods Distribution | | | 18,445 | | | | 0.3 | | |
| | | | 1,215,303 | | | | 18.9 | | |
| > Energy & Minerals | |
| Mining | | | 290,874 | | | | 4.5 | | |
| Oil Services | | | 262,762 | | | | 4.1 | | |
| Oil & Gas Producers | | | 120,004 | | | | 1.8 | | |
Oil Refining, Marketing &
Distribution | | | 88,879 | | | | 1.4 | | |
| Agricultural Commodities | | | 75,308 | | | | 1.2 | | |
| | | | 837,827 | | | | 13.0 | | |
| > Information | |
| Instrumentation | | | 146,256 | | | | 2.3 | | |
| Internet Related | | | 141,016 | | | | 2.2 | | |
Computer Hardware & Related
Equipment | | | 112,699 | | | | 1.8 | | |
| Business Software | | | 93,992 | | | | 1.5 | | |
| Financial Processors | | | 78,273 | | | | 1.2 | | |
| Mobile Communications | | | 51,592 | | | | 0.8 | | |
| Telephone and Data Services | | | 45,463 | | | | 0.7 | | |
| Computer Services | | | 30,956 | | | | 0.5 | | |
| Gaming Equipment & Services | | | 29,621 | | | | 0.5 | | |
| CATV | | | 26,875 | | | | 0.4 | | |
| Telecommunications Equipment | | | 24,845 | | | | 0.4 | | |
Semiconductors & Related
Equipment | | | 19,409 | | | | 0.3 | | |
| Advertising | | | 10,116 | | | | 0.2 | | |
| | | | 811,113 | | | | 12.8 | | |
| | | Value (000) | | Percentage
of Net Assets | |
| > Other Industries | |
| Real Estate | | $ | 361,797 | | | | 5.6 | | |
| Transportation | | | 163,746 | | | | 2.5 | | |
| Regulated Utilities | | | 100,687 | | | | 1.6 | | |
| | | | 626,230 | | | | 9.7 | | |
| > Finance | |
| Banks | | | 162,412 | | | | 2.5 | | |
| Brokerage & Money Management | | | 137,955 | | | | 2.1 | | |
| Finance Companies | | | 93,321 | | | | 1.5 | | |
| Insurance | | | 63,547 | | | | 1.0 | | |
| | | | 457,235 | | | | 7.1 | | |
| > Health Care | |
| Medical Equipment & Devices | | | 136,817 | | | | 2.1 | | |
| Pharmaceuticals | | | 98,980 | | | | 1.5 | | |
| Medical Supplies | | | 41,365 | | | | 0.6 | | |
| Health Care Services | | | 35,231 | | | | 0.5 | | |
| Biotechnology & Drug Delivery | | | 31,155 | | | | 0.5 | | |
| | | | 343,548 | | | | 5.2 | | |
| Total Equities: | | | 6,152,500 | | | | 95.6 | | |
| Securities Lending Collateral: | | | 90,621 | | | | 1.4 | | |
| Short-Term Obligation: | | | 226,923 | | | | 3.5 | | |
| Total Investments: | | | 6,470,044 | | | | 100.5 | | |
Obligation to Return
Collateral for Securities
Loaned: | | | (90,621 | ) | | | (1.4 | ) | |
Cash and Other Assets
Less Liabilities: | | | 60,237 | | | | 0.9 | | |
| Net Assets: | | $ | 6,439,660 | | | | 100.0 | | |
See accompanying notes to financial statements.
47
Columbia Acorn USA
Major Portfolio Changes in the Second Quarter (Unaudited)
| | | Number of Shares | |
| | | 03/31/11 | | 06/30/11 | |
| Purchases | |
| Consumer Goods & Services | |
| HomeAway | | | 0 | | | | 30,000 | | |
| Industrial Goods & Services | |
| Drew Industries | | | 326,000 | | | | 496,000 | | |
| ESCO Technologies | | | 735,000 | | | | 835,000 | | |
| HEICO | | | 403,732 | | | | 504,665 | | |
| Nordson | | | 373,600 | | | | 747,200 | | |
| Finance | |
| Enstar Group | | | 0 | | | | 39,000 | | |
| Hancock Holding | | | 40,000 | | | | 278,678 | | |
| TrustCo Bank | | | 0 | | | | 245,300 | | |
| Health Care | |
| Akorn | | | 676,582 | | | | 725,000 | | |
| Auxilium Pharmaceuticals | | | 205,000 | | | | 375,000 | | |
| Community Health Systems | | | 0 | | | | 151,000 | | |
| Isis Pharmaceuticals | | | 626,000 | | | | 850,000 | | |
| Kindred Healthcare | | | 0 | | | | 150,000 | | |
| United Therapeutics | | | 65,000 | | | | 102,000 | | |
| Energy & Minerals | |
| FMC Technologies | | | 500,000 | | | | 1,000,000 | | |
| Swift Energy | | | 84,000 | | | | 168,000 | | |
| Other Industries | |
| Rush Enterprises, Class A | | | 210,091 | | | | 410,091 | | |
| | | Number of Shares | |
| | | 03/31/11 | | 06/30/11 | |
| Sales | |
| Information | |
| Acxiom | | | 172,000 | | | | 0 | | |
| Blue Coat Systems | | | 197,000 | | | | 0 | | |
| Crown Castle International | | | 150,000 | | | | 0 | | |
| Equinix | | | 44,000 | | | | 0 | | |
| SRA International | | | 261,000 | | | | 0 | | |
| Supertex | | | 177,266 | | | | 0 | | |
| Consumer Goods & Services | |
| Chico's FAS | | | 614,000 | | | | 481,000 | | |
| Express | | | 104,508 | | | | 0 | | |
| ITT Educational Services | | | 153,700 | | | | 37,350 | | |
| Knoll | | | 980,000 | | | | 880,000 | | |
| Vail Resorts | | | 150,000 | | | | 71,000 | | |
| Wet Seal | | | 620,000 | | | | 0 | | |
| Industrial Goods & Services | |
| American Reprographics | | | 396,000 | | | | 0 | | |
| Mueller Water Products | | | 550,000 | | | | 204,200 | | |
| Finance | |
| GATX | | | 240,000 | | | | 42,400 | | |
| Investment Technology Group | | | 139,400 | | | | 0 | | |
| Tower Group | | | 222,000 | | | | 0 | | |
| Valley National Bancorp | | | 981,941 | | | | 931,000 | | |
| Whitney Holding | | | 571,000 | | | | 0 | | |
| Wilmington Trust | | | 245,000 | | | | 0 | | |
| Health Care | |
| Allos Therapeutics | | | 446,532 | | | | 0 | | |
| American Medical Systems | | | 72,000 | | | | 0 | | |
| Idenix Pharmaceuticals | | | 428,965 | | | | 0 | | |
| Nektar Therapeutics | | | 146,710 | | | | 0 | | |
| Energy & Minerals | |
| Atwood Oceanics | | | 845,000 | | | | 803,000 | | |
| Carrizo Oil & Gas | | | 146,000 | | | | 73,000 | | |
| Hornbeck Offshore | | | 101,000 | | | | 0 | | |
| Tesco | | | 53,000 | | | | 0 | | |
See accompanying notes to financial statements.
48
Columbia Acorn USA
Statement of Investments (Unaudited), June 30, 2011
| Number of Shares | | | | Value (000) | |
| | | | | | | Equities: 99.4% | |
| Information 34.1% | | | |
| | | > Business Software 9.7% | |
| | 985,000 | | | Informatica (a) | | $ | 57,554 | | |
| | | | | Enterprise Data Integration Software | | | | | |
| | 698,000 | | | Micros Systems (a) | | | 34,698 | | |
| | | | | Information Systems for Hotels,
Restaurants & Retailers | | | | | |
| | 375,000 | | | ANSYS (a) | | | 20,501 | | |
| | | | | Simulation Software for Engineers &
Designers | | | | | |
| | 408,000 | | | Ariba (a) | | | 14,064 | | |
| | | | | Cost Management Software | | | | | |
| | 243,000 | | | Concur Technologies (a) | | | 12,167 | | |
| | | | | Web Enabled Cost & Expense Management
Software | | | | | |
| | 247,000 | | | Blackboard (a)(b) | | | 10,717 | | |
| | | | | Education Software | | | | | |
| | 333,000 | | | Blackbaud | | | 9,231 | | |
| | | | | Software & Services for Non-profits | | | | | |
| | 220,000 | | | Advent Software (a) | | | 6,197 | | |
| | | | | Asset Management & Trading Systems | | | | | |
| | 322,000 | | | SPS Commerce (a) | | | 5,728 | | |
| | | | | Supply Chain Management Software Delivered
via the Web | | | | | |
| | 129,000 | | | NetSuite (a) | | | 5,057 | | |
| | | | | End to End IT Systems Solutions Delivered
Over the Web | | | | | |
| | 198,000 | | | Constant Contact (a) | | | 5,025 | | |
| | | | | E-mail & Other Marketing Campaign
Management Systems Delivered Over the Web | | | | | |
| | 52,000 | | | Quality Systems | | | 4,540 | | |
| | | | | IT Systems for Medical Groups & Ambulatory
Care Centers | | | | | |
| | | | 185,479 | | |
| | | > Instrumentation 4.7% | |
| | 678,000 | | | IPG Photonics (a) | | | 49,297 | | |
| | | | | Fiber Lasers | | | | | |
| | 180,000 | | | Mettler Toledo (a) | | | 30,361 | | |
| | | | | Laboratory Equipment | | | | | |
| | 168,000 | | | Trimble Navigation (a) | | | 6,660 | | |
| | | | | GPS-based Instruments | | | | | |
| | 130,000 | | | FLIR Systems | | | 4,382 | | |
| | | | | Infrared Cameras | | | | | |
| | | | 90,700 | | |
| | | > Semiconductors &
Related Equipment 4.4% | |
| | 1,958,000 | | | Atmel (a) | | | 27,549 | | |
| | | | | Microcontrollers, Radio Frequency &
Memory Semiconductors | | | | | |
| | 760,000 | | | Microsemi (a) | | | 15,580 | | |
| | | | | Analog/Mixed-signal Semiconductors | | | | | |
| | 1,061,750 | | | ON Semiconductor (a) | | | 11,117 | | |
| | | | | Mixed-signal & Power Management
Semiconductors | | | | | |
| | 1,075,000 | | | TriQuint Semiconductor (a) | | | 10,954 | | |
| | | | | Radio Frequency Semiconductors | | | | | |
| | 675,000 | | | Entegris (a) | | | 6,831 | | |
| | | | | Semiconductor Materials Management
Products | | | | | |
| Number of Shares | | | | Value (000) | |
| | 346,000 | | | Monolithic Power Systems (a) | | $ | 5,336 | | |
| | | | | High Performance Analog & Mixed-signal
Integrated Circuits (ICs) | | | | | |
| | 448,000 | | | Applied Micro Circuits (a) | | | 3,969 | | |
| | | | | Communications Semiconductors | | | | | |
| | 430,000 | | | Pericom Semiconductor (a) | | | 3,844 | | |
| | | | | Interface Integrated Circuits (ICs) &
Frequency Control Products | | | | | |
| | | | 85,180 | | |
| | | > Computer Hardware &
Related Equipment 3.9% | |
| | 1,238,000 | | | II-VI (a) | | | 31,693 | | |
| | | | | Laser Optics & Specialty Materials | | | | | |
| | 324,000 | | | Zebra Technologies (a) | | | 13,663 | | |
| | | | | Bar Code Printers | | | | | |
| | 196,000 | | | Amphenol | | | 10,582 | | |
| | | | | Electronic Connectors | | | | | |
| | 280,000 | | | Nice Systems - ADR (Israel) (a) | | | 10,181 | | |
| | | | | Audio & Video Recording Solutions | | | | | |
| | 196,000 | | | Netgear (a) | | | 8,569 | | |
| | | | | Networking Products for Small Business &
Home | | | | | |
| | | | 74,688 | | |
| | | > Telephone and Data Services 2.9% | |
| | 1,617,000 | | | tw telecom (a) | | | 33,197 | | |
| | | | | Fiber Optic Telephone/Data Services | | | | | |
| | 168,800 | | | AboveNet | | | 11,893 | | |
| | | | | Metropolitan Fiber Communications Services | | | | | |
| | 2,030,000 | | | PAETEC Holding (a) | | | 9,724 | | |
| | | | | Telephone/Data Services for Business | | | | | |
| | | | 54,814 | | |
| | | > Telecommunications Equipment 2.9% | |
| | 386,000 | | | Polycom (a) | | | 24,820 | | |
| | | | | Video Conferencing Equipment | | | | | |
| | 732,000 | | | Finisar (a) | | | 13,198 | | |
| | | | | Optical Sub-systems & Components | | | | | |
| | 903,000 | | | Ixia (a) | | | 11,558 | | |
| | | | | Telecom Network Test Equipment | | | | | |
| | 752,000 | | | Infinera (a) | | | 5,196 | | |
| | | | | Optical Networking Equipment | | | | | |
| | | | 54,772 | | |
| | | > Gaming Equipment &
Services 1.8% | |
| | 660,000 | | | Bally Technologies (a) | | | 26,849 | | |
| | | | | Slot Machines & Software | | | | | |
| | 235,000 | | | WMS Industries (a) | | | 7,219 | | |
| | | | | Slot Machine Provider | | | | | |
| | | | 34,068 | | |
| | | > Mobile Communications 1.3% | |
| | 650,000 | | | SBA Communications (a) | | | 24,824 | | |
| | | | | Communications Towers | | | | | |
| | | | 24,824 | | |
| | | > Computer Services 1.0% | |
| | 428,000 | | | ExlService Holdings (a) | | | 9,887 | | |
| | | | | BPO (Business Process Outsourcing) | | | | | |
| | 1,005,500 | | | Hackett Group (a) | | | 5,118 | | |
| | | | | IT Integration & Best Practice Research | | | | | |
See accompanying notes to financial statements.
49
Columbia Acorn USA
Statement of Investments (Unaudited), continued
| Number of Shares | | | | Value (000) | |
| | | > Computer Services—continued | |
| | 710,000 | | | RCM Technologies (a)(c) | | $ | 3,798 | | |
| | | | | Technology & Engineering Services | | | | | |
| | | | 18,803 | | |
| | | > Financial Processors 0.5% | |
| | 188,000 | | | Global Payments | | | 9,588 | | |
| | | | | Credit Card Processor | | | | | |
| | | | 9,588 | | |
| | | > Contract Manufacturing 0.5% | |
| | 261,000 | | | Plexus (a) | | | 9,085 | | |
| | | | | Electronic Manufacturing Services | | | | | |
| | | | 9,085 | | |
| | | > Entertainment Programming 0.2% | |
| | 145,000 | | | IMAX (Canada) (a) | | | 4,702 | | |
| | | | | IMAX Movies, Theatre Equipment & Theatre
Joint Ventures | | | | | |
| | | | 4,702 | | |
| | | > Radio 0.1% | |
| | 511,100 | | | Salem Communications | | | 1,835 | | |
| | | | | Radio Stations for Religious Programming | | | | | |
| | 71,718 | | | Spanish Broadcasting System (a) | | | 50 | | |
| | | | | Spanish Language Radio Stations | | | | | |
| | | | 1,885 | | |
| | | > TV Broadcasting 0.1% | |
| | 975,000 | | | Entravision Communications (a) | | | 1,804 | | |
| | | | | Spanish Language TV & Radio Stations | | | | | |
| | | | 1,804 | | |
| | | > Internet Related 0.1% | |
| | 343,000 | | | TheStreet.com | | | 1,053 | | |
| | | | | Financial Information Websites | | | | | |
| | | | 1,053 | | |
| Information: Total | | | 651,445 | | |
| Consumer Goods & Services 16.9% | | | |
| | | > Retail 6.2% | |
| | 390,000 | | | lululemon athletica (a) | | | 43,610 | | |
| | | | | Premium Active Apparel Retailer | | | | | |
| | 468,500 | | | Abercrombie & Fitch | | | 31,352 | | |
| | | | | Teen Apparel Retailer | | | | | |
| | 254,000 | | | Shutterfly (a) | | | 14,585 | | |
| | | | | Internet Photo-centric Retailer | | | | | |
| | 875,000 | | | Saks (a) | | | 9,774 | | |
| | | | | Luxury Department Store Retailer | | | | | |
| | 805,000 | | | Pier 1 Imports (a) | | | 9,314 | | |
| | | | | Home Furnishing Retailer | | | | | |
| | 481,000 | | | Chico's FAS | | | 7,325 | | |
| | | | | Women's Specialty Retailer | | | | | |
| | 480,000 | | | Talbots (a)(b) | | | 1,603 | | |
| | | | | Women's Specialty Retailer | | | | | |
| | 9,000 | | | The Fresh Market (a) | | | 348 | | |
| | | | | Specialty Food Retailer | | | | | |
| | | | 117,911 | | |
| | | > Travel 3.2% | |
| | 849,700 | | | Gaylord Entertainment (a) | | | 25,491 | | |
| | | | | Convention Hotels | | | | | |
| Number of Shares | | | | Value (000) | |
| | 1,175,950 | | | Avis Budget Group (a) | | $ | 20,097 | | |
| | | | | Second Largest Car Rental Company | | | | | |
| | 750,000 | | | Hertz (a) | | | 11,910 | | |
| | | | | Largest U.S. Rental Car Operator | | | | | |
| | 71,000 | | | Vail Resorts | | | 3,282 | | |
| | | | | Ski Resort Operator & Developer | | | | | |
| | 30,000 | | | HomeAway (a) | | | 1,161 | | |
| | | | | Vacation Rental Online Marketplace | | | | | |
| | | | 61,941 | | |
| | | > Furniture & Textiles 1.9% | |
| | 880,000 | | | Knoll | | | 17,662 | | |
| | | | | Office Furniture | | | | | |
| | 540,000 | | | Interface | | | 10,460 | | |
| | | | | Modular & Broadloom Carpet | | | | | |
| | 260,000 | | | Herman Miller | | | 7,077 | | |
| | | | | Office Furniture | | | | | |
| | | | 35,199 | | |
| | | > Apparel 1.3% | |
| | 192,000 | | | Warnaco Group (a) | | | 10,032 | | |
| | | | | Global Branded Apparel Manufacturer | | | | | |
| | 90,000 | | | Deckers Outdoor (a) | | | 7,932 | | |
| | | | | Fashion Footwear Wholesaler | | | | | |
| | 241,530 | | | True Religion Apparel (a) | | | 7,024 | | |
| | | | | Premium Denim | | | | | |
| | | | 24,988 | | |
| | | > Casinos & Gaming 1.1% | |
| | 270,000 | | | Penn National Gaming (a) | | | 10,892 | | |
| | | | | Regional Casino Operator | | | | | |
| | 645,000 | | | Pinnacle Entertainment (a) | | | 9,610 | | |
| | | | | Regional Casino Operator | | | | | |
| | | | 20,502 | | |
| | | > Food & Beverage 0.8% | |
| | 197,000 | | | Diamond Foods (b) | | | 15,039 | | |
| | | | | Snack Foods & Culinary Ingredients | | | | | |
| | | | 15,039 | | |
| | | > Consumer Goods Distribution 0.7% | |
| | 472,000 | | | Pool | | | 14,070 | | |
| | | | | Distributor of Swimming Pool Supplies &
Equipment | | | | | |
| | | | 14,070 | | |
| | | > Other Durable Goods 0.6% | |
| | 161,000 | | | Cavco Industries (a) | | | 7,245 | | |
| | | | | Manufactured Homes | | | | | |
| | 140,000 | | | Jarden | | | 4,831 | | |
| | | | | Branded Household Products | | | | | |
| | | | 12,076 | | |
| | | > Other Consumer Services 0.5% | |
| | 259,000 | | | Lifetime Fitness (a) | | | 10,337 | | |
| | | | | Sport & Fitness Club Operator | | | | | |
| | | | 10,337 | | |
| | | > Educational Services 0.3% | |
| | 165,000 | | | Universal Technical Institute | | | 3,262 | | |
| | | | | Vocational Training | | | | | |
| | 37,350 | | | ITT Educational Services (a) | | | 2,922 | | |
| | | | | Post-secondary Degree Services | | | | | |
| | | | 6,184 | | |
See accompanying notes to financial statements.
50
| Number of Shares | | | | Value (000) | |
| | | > Leisure Products 0.3% | |
| | 162,000 | | | Thor Industries | | $ | 4,672 | | |
| | | | | RV & Bus Manufacturer | | | | | |
| | | | 4,672 | | |
| | | > Restaurants —% | |
| | 26,600 | | | Bravo Brio Restaurant Group (a) | | | 650 | | |
| | | | | Upscale Casual Italian Restaurants | | | | | |
| | | | 650 | | |
| Consumer Goods & Services: Total | | | 323,569 | | |
| Industrial Goods & Services 15.1% | | | |
| | | > Machinery 11.6% | |
| | 941,250 | | | Ametek | | | 42,262 | | |
| | | | | Aerospace/Industrial Instruments | | | | | |
| | 747,200 | | | Nordson | | | 40,984 | | |
| | | | | Dispensing Systems for Adhesives & Coatings | | | | | |
| | 835,000 | | | ESCO Technologies | | | 30,728 | | |
| | | | | Automatic Electric Meter Readers | | | | | |
| | 445,000 | | | Donaldson | | | 27,003 | | |
| | | | | Industrial Air Filtration | | | | | |
| | 585,000 | | | Pentair | | | 23,611 | | |
| | | | | Pumps & Water Treatment | | | | | |
| | 504,665 | | | HEICO | | | 20,065 | | |
| | | | | FAA Approved Aircraft Replacement Parts | | | | | |
| | 280,000 | | | MOOG (a) | | | 12,186 | | |
| | | | | Motion Control Products for Aerospace,
Defense & Industrial Markets | | | | | |
| | 177,000 | | | Kennametal | | | 7,471 | | |
| | | | | Consumable Cutting Tools | | | | | |
| | 100,000 | | | WABCO Holdings (a) | | | 6,906 | | |
| | | | | Truck & Bus Component Supplier | | | | | |
| | 162,000 | | | Oshkosh (a) | | | 4,688 | | |
| | | | | Specialty Truck Manufacturer | | | | | |
| | 71,800 | | | Toro | | | 4,344 | | |
| | | | | Turf Maintenance Equipment | | | | | |
| | 50,000 | | | Kaydon | | | 1,866 | | |
| | | | | Specialized Friction & Motion Control
Products | | | | | |
| | | | 222,114 | | |
| | | > Industrial Materials &
Specialty Chemicals 1.0% | |
| | 496,000 | | | Drew Industries | | | 12,261 | | |
| | | | | RV & Manufactured Home Components | | | | | |
| | 54,000 | | | Albemarle | | | 3,737 | | |
| | | | | Refinery Catalysts & Other Specialty
Chemicals | | | | | |
| | 135,000 | | | Albany International | | | 3,563 | | |
| | | | | Paper Machine Clothing & Advanced Textiles | | | | | |
| | | | 19,561 | | |
| | | > Electrical Components 0.8% | |
| | 280,000 | | | Acuity Brands | | | 15,618 | | |
| | | | | Commercial Lighting Fixtures | | | | | |
| | | | 15,618 | | |
| | | > Steel 0.5% | |
| | 486,000 | | | GrafTech International (a) | | | 9,851 | | |
| | | | | Industrial Graphite Materials Producer | | | | | |
| | | | 9,851 | | |
| Number of Shares | | | | Value (000) | |
| | | > Other Industrial Services 0.4% | |
| | 265,000 | | | TrueBlue (a) | | $ | 3,837 | | |
| | | | | Temporary Manual Labor | | | | | |
| | 109,000 | | | Forward Air | | | 3,683 | | |
| | | | | Freight Transportation Between Airports | | | | | |
| | | | 7,520 | | |
| | | > Industrial Distribution 0.4% | |
| | 350,000 | | | Interline Brands (a) | | | 6,430 | | |
| | | | | Industrial Distribution | | | | | |
| | | | 6,430 | | |
| | | > Waste Management 0.3% | |
| | 195,000 | | | Waste Connections | | | 6,187 | | |
| | | | | Solid Waste Management | | | | | |
| | | | 6,187 | | |
| | | > Water 0.1% | |
| | 204,200 | | | Mueller Water Products | | | 813 | | |
| | | | | Fire Hydrants, Valves & Ductile Iron Pipes | | | | | |
| | | | 813 | | |
| Industrial Goods & Services: Total | | | 288,094 | | |
| Finance 9.9% | | | |
| | | > Banks 4.9% | |
| | 931,000 | | | Valley National Bancorp | | | 12,671 | | |
| | | | | New Jersey/New York Bank | | | | | |
| | 170,000 | | | SVB Financial Group (a) | | | 10,151 | | |
| | | | | Bank to Venture Capitalists | | | | | |
| | 692,400 | | | Associated Banc-Corp | | | 9,624 | | |
| | | | | Midwest Bank | | | | | |
| | 431,597 | | | Lakeland Financial | | | 9,607 | | |
| | | | | Indiana Bank | | | | | |
| | 480,000 | | | MB Financial | | | 9,235 | | |
| | | | | Chicago Bank | | | | | |
| | 659,800 | | | TCF Financial | | | 9,105 | | |
| | | | | Great Lakes Bank | | | | | |
| | 278,678 | | | Hancock Holding | | | 8,633 | | |
| | | | | Gulf Coast Bank | | | | | |
| | 1,478,200 | | | First Busey | | | 7,820 | | |
| | | | | Illinois Bank | | | | | |
| | 527,700 | | | Pacific Continental | | | 4,828 | | |
| | | | | Pacific Northwest Bank | | | | | |
| | 269,600 | | | Eagle Bancorp (a) | | | 3,586 | | |
| | | | | Metro D.C. Bank | | | | | |
| | 178,826 | | | Sandy Spring Bancorp | | | 3,217 | | |
| | | | | Baltimore/D.C. Bank | | | | | |
| | 210,000 | | | CVB Financial | | | 1,943 | | |
| | | | | Inland Empire Business Bank | | | | | |
| | 90,000 | | | TriCo Bancshares | | | 1,314 | | |
| | | | | California Central Valley Bank | | | | | |
| | 245,300 | | | TrustCo Bank | | | 1,202 | | |
| | | | | New York State Bank | | | | | |
| | 851,247 | | | Guaranty Bancorp (a) | | | 1,141 | | |
| | | | | Colorado Bank | | | | | |
| | | | 94,077 | | |
| | | > Finance Companies 3.3% | |
| | 345,000 | | | World Acceptance (a) | | | 22,622 | | |
| | | | | Personal Loans | | | | | |
See accompanying notes to financial statements.
51
Columbia Acorn USA
Statement of Investments (Unaudited), continued
| Number of Shares | | | | Value (000) | |
| | | > Finance Companies—continued | |
| | 412,500 | | | Aaron's | | $ | 11,657 | | |
| | | | | Rent to Own | | | | | |
| | 335,418 | | | McGrath Rentcorp | | | 9,418 | | |
| | | | | Temporary Space & IT Rentals | | | | | |
| | 285,000 | | | Textainer Group Holdings | | | 8,761 | | |
| | | | | Top International Container Leasor | | | | | |
| | 230,000 | | | CAI International (a) | | | 4,752 | | |
| | | | | International Container Leasing | | | | | |
| | 201,000 | | | H&E Equipment Services (a) | | | 2,812 | | |
| | | | | Heavy Equipment Leasing | | | | | |
| | 42,400 | | | GATX | | | 1,574 | | |
| | | | | Rail Car Lessor | | | | | |
| | 99,200 | | | Marlin Business Services (a) | | | 1,255 | | |
| | | | | Small Equipment Leasing | | | | | |
| | | | 62,851 | | |
| | | > Savings & Loans 0.9% | |
| | 756,000 | | | ViewPoint Financial | | | 10,433 | | |
| | | | | Texas Thrift | | | | | |
| | 215,000 | | | Berkshire Hills Bancorp | | | 4,814 | | |
| | | | | Northeast Thrift | | | | | |
| | 173,073 | | | Kaiser Federal Financial Group | | | 2,132 | | |
| | | | | Los Angeles Savings & Loan | | | | | |
| | | | 17,379 | | |
| | | > Brokerage & Money
Management 0.6% | |
| | 209,500 | | | Eaton Vance | | | 6,333 | | |
| | | | | Specialty Mutual Funds | | | | | |
| | 675,000 | | | MF Global (a) | | | 5,225 | | |
| | | | | Futures Broker | | | | | |
| | | | 11,558 | | |
| | | > Insurance 0.2% | |
| | 39,000 | | | Enstar Group (a) | | | 4,075 | | |
| | | | | Insurance/Reinsurance & Related Services | | | | | |
| | | | 4,075 | | |
| Finance: Total | | | 189,940 | | |
| Health Care 8.8% | | | |
| | | > Biotechnology & Drug Delivery 4.4% | |
| | 520,000 | | | BioMarin Pharmaceutical (a) | | | 14,149 | | |
| | | | | Biotech Focused on Orphan Diseases | | | | | |
| | 491,882 | | | Seattle Genetics (a) | | | 10,094 | | |
| | | | | Antibody-based Therapies for Cancer | | | | | |
| | 232,000 | | | Onyx Pharmaceuticals (a) | | | 8,190 | | |
| | | | | Commercial-stage Biotech Focused on Cancer | | | | | |
| | 840,000 | | | NPS Pharmaceuticals (a) | | | 7,938 | | |
| | | | | Orphan Drugs & Healthy Royalties | | | | | |
| | 850,000 | | | Isis Pharmaceuticals (a) | | | 7,786 | | |
| | | | | Biotech Pioneer in Anti-sense Drugs | | | | | |
| | 375,000 | | | Auxilium Pharmaceuticals (a) | | | 7,350 | | |
| | | | | Biotech Focused on Niche Disease Areas | | | | | |
| | 196,000 | | | InterMune (a) | | | 7,027 | | |
| | | | | Drugs for Pulmonary Fibrosis & Hepatitis C | | | | | |
| | 102,000 | | | United Therapeutics (a) | | | 5,620 | | |
| | | | | Biotech Focused on Rare Diseases | | | | | |
| | 810,000 | | | Micromet (a) | | | 4,649 | | |
| | | | | Next-generation Antibody Technology | | | | | |
| Number of Shares | | | | Value (000) | |
| | 790,000 | | | Chelsea Therapeutics (a) | | $ | 4,029 | | |
| | | | | Biotech Focused on Rare Diseases | | | | | |
| | 455,000 | | | Nabi Biopharmaceuticals (a) | | | 2,448 | | |
| | | | | Biotech Focused on Vaccines | | | | | |
| | 265,000 | | | Anthera Pharmaceuticals (a) | | | 2,165 | | |
| | | | | Biotech Focused on Cardiovascular,
Cancer & Immunology | | | | | |
| | 243,000 | | | Savient Pharmaceuticals (a)(b) | | | 1,820 | | |
| | | | | Biotech Focused on Severe Gout | | | | | |
| | 450,000 | | | Array Biopharma (a) | | | 1,008 | | |
| | | | | Drugs for Cancer & Inflammatory Diseases | | | | | |
| | 18,181 | | | Metabolex, Series A-1 (a)(d) | | | 18 | | |
| | | | | Diabetes Drug Development | | | | | |
| | 738,060 | | | Medicure - Warrants (a)(d) | | | — | | |
| | | | | Cardiovascular Biotech Company | | | | | |
| | 37,500 | | | Locus Pharmaceuticals,
Series A-1, Pfd. (a)(d) | | | — | | |
| | 19,329 | | | Locus Pharmaceuticals,
Series B-1, Pfd. (a)(d) | | | — | | |
| | | | | High Throughput Rational Drug Design | | | | | |
| | | | 84,291 | | |
| | | > Medical Equipment & Devices 2.2% | |
| | 370,000 | | | Alexion Pharmaceuticals (a) | | | 17,401 | | |
| | | | | Biotech Focused on Orphan Diseases | | | | | |
| | 184,000 | | | Sirona Dental Systems (a) | | | 9,770 | | |
| | | | | Manufacturer of Dental Equipment | | | | | |
| | 124,000 | | | Gen-Probe (a) | | | 8,575 | | |
| | | | | Molecular In-vitro Diagnostics | | | | | |
| | 53,000 | | | Idexx Laboratories (a) | | | 4,111 | | |
| | | | | Diagnostic Equipment & Services for Veterinarians | | | | | |
| | 155,000 | | | Pacific Biosciences of California (a) | | | 1,813 | | |
| | | | | Genome Sequencing | | | | | |
| | | | 41,670 | | |
| | | > Medical Supplies 0.9% | |
| | 439,600 | | | Cepheid (a) | | | 15,228 | | |
| | | | | Molecular Diagnostics | | | | | |
| | 49,000 | | | Neogen (a) | | | 2,215 | | |
| | | | | Food & Animal Safety Products | | | | | |
| | | | 17,443 | | |
| | | > Health Care Services 0.8% | |
| | 1,038,900 | | | Health Management Associates (a) | | | 11,199 | | |
| | | | | Non-urban Hospitals | | | | | |
| | 151,000 | | | Community Health Systems (a) | | | 3,878 | | |
| | | | | Non-urban Hospitals | | | | | |
| | | | 15,077 | | |
| | | > Pharmaceuticals 0.3% | |
| | 725,000 | | | Akorn (a) | | | 5,075 | | |
| | | | | Develops, Manufactures & Sells Specialty
Generic Drugs | | | | | |
| | 108,512 | | | Alimera Sciences (a) | | | 884 | | |
| | | | | Ophthalmogy-focused Pharmaceutical Company | | | | | |
| | | | 5,959 | | |
| | | > Hospital Management 0.2% | |
| | 150,000 | | | Kindred Healthcare (a) | | | 3,221 | | |
| | | | | Post-Acute Healthcare Facilities | | | | | |
| | | | 3,221 | | |
| Health Care: Total | | | 167,661 | | |
See accompanying notes to financial statements.
52
| Number of Shares | | | | Value (000) | |
| Energy & Minerals 8.2% | | | |
| | | > Oil Services 4.4% | |
| | 1,000,000 | | | FMC Technologies (a) | | $ | 44,790 | | |
| | | | | Oil & Gas Wellhead Manufacturer | | | | | |
| | 803,000 | | | Atwood Oceanics (a) | | | 35,436 | | |
| | | | | Offshore Drilling Contractor | | | | | |
| | 86,000 | | | Bristow | | | 4,388 | | |
| | | | | Largest Provider of Helicopter Services to
Offshore Oil & Gas Producers | | | | | |
| | | | 84,614 | | |
| | | > Oil & Gas Producers 2.9% | |
| | 1,135,000 | | | Quicksilver Resources (a) | | | 16,753 | | |
| | | | | Natural Gas & Coal Steam Gas Producer | | | | | |
| | 133,000 | | | SM Energy | | | 9,773 | | |
| | | | | Oil & Gas Producer | | | | | |
| | 143,000 | | | Rosetta Resources (a) | | | 7,370 | | |
| | | | | Oil & Gas Producer Exploring in South
Texas & Montana | | | | | |
| | 386,000 | | | Houston American Energy (b) | | | 6,998 | | |
| | | | | Oil & Gas Exploration & Production in
Colombia | | | | | |
| | 168,000 | | | Swift Energy (a) | | | 6,261 | | |
| | | | | Oil & Gas Exploration & Production Company | | | | | |
| | 230,000 | | | Northern Oil & Gas (a)(b) | | | 5,094 | | |
| | | | | Small E&P Company in North Dakota Bakken | | | | | |
| | 73,000 | | | Carrizo Oil & Gas (a) | | | 3,048 | | |
| | | | | Oil & Gas Producer | | | | | |
| | 22,800 | | | Oasis Petroleum (a) | | | 677 | | |
| | | | | Oil Producer in North Dakota | | | | | |
| | | | 55,974 | | |
| | | > Mining 0.9% | |
| | 100,000 | | | Core Laboratories (Netherlands) | | | 11,154 | | |
| | | | | Oil & Gas Reservoir Consulting | | | | | |
| | 600,000 | | | Alexco Resource (a) | | | 4,326 | | |
| | | | | Mining, Exploration & Environmental Services | | | | | |
| | 180,000 | | | Augusta Resource (a) | | | 834 | | |
| | | | | U.S. Copper/Molybdenum Mine | | | | | |
| | | | 16,314 | | |
| Energy & Minerals: Total | | | 156,902 | | |
| Other Industries 6.4% | | | |
| | | > Real Estate 5.2% | |
| | 915,000 | | | Extra Space Storage | | | 19,517 | | |
| | | | | Self Storage Facilities | | | | | |
| | 995,200 | | | BioMed Realty Trust | | | 19,148 | | |
| | | | | Life Science-focused Office Buildings | | | | | |
| | 600,000 | | | Associated Estates Realty | | | 9,750 | | |
| | | | | Multi-family Properties | | | | | |
| | 246,000 | | | Corporate Office Properties | | | 7,653 | | |
| | | | | Office Buildings | | | | | |
| | 870,000 | | | Education Realty Trust | | | 7,456 | | |
| | | | | Student Housing | | | | | |
| | 177,000 | | | Kilroy Realty | | | 6,990 | | |
| | | | | West Coast Office & Industrial Properties | | | | | |
| | 1,380,000 | | | Kite Realty Group | | | 6,872 | | |
| | | | | Community Shopping Centers | | | | | |
| | 1,058,000 | | | DCT Industrial Trust | | | 5,533 | | |
| | | | | Industrial Properties | | | | | |
Number of Shares
or Principal Amount | | | | Value (000) | |
| | 98,619 | | | Macerich | | $ | 5,276 | | |
| | | | | Regional Shopping Malls | | | | | |
| | 191,000 | | | Dupont Fabros Technology (b) | | | 4,813 | | |
| | | | | Technology-focused Office Buildings | | | | | |
| | 100,000 | | | Post Properties | | | 4,076 | | |
| | | | | Multi-family Properties | | | | | |
| | 208,000 | | | Summit Hotel Properties | | | 2,361 | | |
| | | | | Owner of Select Service Hotels | | | | | |
| | | | 99,445 | | |
| | | > Transportation 1.2% | |
| | 410,091 | | | Rush Enterprises, Class A (a) | | | 7,804 | | |
| | 115,000 | | | Rush Enterprises, Class B (a) | | | 1,851 | | |
| | | | | Truck Sales & Services | | | | | |
| | 256,000 | | | World Fuel Services | | | 9,198 | | |
| | | | | Global Fuel Broker | | | | | |
| | 310,000 | | | Heartland Express | | | 5,134 | | |
| | | | | Regional Trucker | | | | | |
| | | | 23,987 | | |
| Other Industries: Total | | | 123,432 | | |
Total Equities: 99.4%
(Cost: $1,231,445) | | | 1,901,043 | | |
| Securities Lending Collateral: 0.7% | | | |
| | 12,943,711 | | | Dreyfus Government Cash
Management Fund (e)
(7 day yield of 0.00%) | | | 12,944 | | |
Total Securities Lending Collateral:
(Cost: $12,944) | | | 12,944 | | |
| Short-Term Obligation: 0.8% | | | |
| | | > Repurchase Agreement: 0.8% | |
| $ | 15,821 | | | Repurchase Agreement with
Fixed Income Clearing Corp.,
dated 6/30/11, due 7/01/11
at 0.01%, collateralized by a
U.S. Government Agency
obligation maturing 8/18/17,
market value $16,141
(repurchase proceeds $15,821) | | | 15,821 | | |
Total Short Term Obligation:
(Cost: $15,821) | | | 15,821 | | |
Total Investments: 100.9%
(Cost: $1,260,210) (f) | | | 1,929,808 | | |
Obligation to Return Collateral for
Securities Loaned: (0.7)% | | | (12,944 | ) | |
| Cash and Other Assets Less Liabilities: (0.2)% | | | (4,519 | ) | |
| Total Net Assets: 100.0% | | $ | 1,912,345 | | |
ADR = American Depositary Receipts.
See accompanying notes to financial statements.
53
Columbia Acorn USA
Statement of Investments (Unaudited), continued
> Notes to Statement of Investments (dollar values in thousands)
(a) Non-income producing security.
(b) All or a portion of this security was on loan at June 30, 2011. The total market value of Fund securities on loan at June 30, 2011 was $12,520.
(c) An affiliated person of the Fund may include any company in which the Fund owns five percent or more of its outstanding voting shares. Holdings and transactions in this affiliated company during the six months ended June 30, 2011, are as follows:
| Affiliate | | Balance of
Shares Held
12/31/10 | | Purchases/
Additions | | Sales/
Reductions | | Balance of
Shares Held
6/30/11 | | Value | | Dividend | |
| RCM Technologies | | | 710,000 | | | | - | | | | - | | | | 710,000 | | | $ | 3,798 | | | $ | - | | |
| Total of Affiliated Transactions | | | 710,000 | | | | - | | | | - | | | | 710,000 | | | $ | 3,798 | | | $ | - | | |
The aggregate cost and value of this affiliated company at June 30, 2011, was $4,479 and $3,798. Investments in this affiliated company represented 0.2% of total net assets at June 30, 2011.
(d) Denotes a restricted security, which is subject to restrictions on resale under federal securities laws. These securities are valued at a fair value determined in good faith under consistently applied procedures established by the Board of Trustees. At June 30, 2011, the market value of these securities amounted to $18, which represented less than 0.01% of total net assets.
Additional information on these securities is as follows:
| Security | | Acquisition
Dates | | Shares | | Cost | | Value | |
| Metabolex, Series A -1 | | 2/11/00 | | | 18,181 | | | $ | 2,000 | | | $ | 18 | | |
| Medicure - Warrants | | 12/22/06 | | | 738,060 | | | | - | | | | - | | |
| Locus Pharmaceuticals, Series A-1 Pfd. | | 9/05/01 | | | 37,500 | | | | 1,500 | | | | - | | |
| Locus Pharmaceuticals, Series B-1 Pfd. | | 2/08/07 | | | 19,329 | | | | 56 | | | | - | | |
| | | | | | | $ | 3,556 | | | $ | 18 | | |
(e) Investment made with cash collateral received from securities lending activity.
(f) At June 30, 2011, for federal income tax purposes, the cost of investments was $1,260,210 and net unrealized appreciation was $669,598, consisting of gross unrealized appreciation of $760,468 and gross unrealized depreciation of $90,870.
Various inputs are used in determining the value of the Fund's investments, following the input prioritization hierarchy established by GAAP. These inputs are summarized in the three broad levels listed below:
• Level 1 – quoted prices in active markets for identical securities
• Level 2 – prices determined using other significant observable inputs (including quoted prices for similar securities, interest rates, prepayment speeds, credit risk and others)
• Level 3 – prices determined using significant unobservable inputs where quoted prices or observable inputs are unavailable or less reliable (including management's own assumptions about the factors market participants would use in pricing an investment)
The inputs or methodologies used for valuing securities are not necessarily an indication of the risk associated with investing in those securities.
Examples of the types of securities in which the Fund would typically invest and how they are classified within this hierarchy are as follows. Typical Level 1 securities include exchange traded domestic equities, mutual funds whose NAVs are published each day and exchange traded foreign equities that are not statistically fair valued. Typical Level 2 securities include exchange traded foreign equities that are statistically fair valued, forward foreign currency exchange contracts and short-term investments valued at amortized cost. Additionally, securities fair valued by the Valuation Committee of the Fund's Board of Trustees that rely on significant observable inputs are also included in level 2. Typical Level 3 securities include any security fair valued by the Valuation Committee that relies on significant unobservable inputs.
See accompanying notes to financial statements.
54
> Notes to Statement of Investments (dollar values in thousands)
The following table summarizes the inputs used, as June 30, 2011, in valuing the Fund's assets:
| Investment Type | | Quoted Prices
(Level 1) | | Other
Significant
Observable
Inputs
(Level 2) | | Significant
Unobservable
Inputs
(Level 3) | | Total | |
| Equities | |
| Information | | $ | 651,445 | | | $ | - | | | $ | - | | | $ | 651,445 | | |
| Consumer Goods & Services | | | 323,569 | | | | - | | | | - | | | | 323,569 | | |
| Industrial Goods & Services | | | 288,094 | | | | - | | | | - | | | | 288,094 | | |
| Finance | | | 189,940 | | | | - | | | | - | | | | 189,940 | | |
| Health Care | | | 167,643 | | | | - | | | | 18 | | | | 167,661 | | |
| Energy & Minerals | | | 156,902 | | | | - | | | | - | | | | 156,902 | | |
| Other Industries | | | 123,432 | | | | - | | | | - | | | | 123,432 | | |
| Total Equities | | | 1,901,025 | | | | - | | | | 18 | | | | 1,901,043 | | |
| Total Securities Lending Collateral | | | 12,944 | | | | - | | | | - | | | | 12,944 | | |
| Total Short-Term Obligation | | | - | | | | 15,821 | | | | - | | | | 15,821 | | |
| Total Investments | | $ | 1,913,969 | | | $ | 15,821 | | | $ | 18 | | | $ | 1,929,808 | | |
The Fund's assets assigned to the Level 2 input category are generally valued using the market approach, in which a security's value is determined through its correlation to prices and information from market transactions for similar or identical assets. Warrants which do not trade are valued as a percentage of the actively trading common stock using a model, based on Black Scholes.
Certain short-term obligations may be valued using amortized cost, an income approach which converts future cash flows to a present value based upon the discount or premium at purchase.
The Fund's assets assigned to the Level 3 input category are valued at fair value as determined in good faith under consistently applied procedures established by and under the general supervision of the Board of Trustees. To determine fair value, management will utilize the valuation technique that they deem the most appropriate in the circumstances. Securities for which no market exists are valued based upon a market approach using some unobservable inputs which may include, but are not limited to, projected earnings, available cash, line of business, multiples, and consideration of the prioritization of the equity in a company's capital structure.
There were no significant transfers of financial assets between levels 1 and 2 during the period.
The following table reconciles asset balances for the six months ending June 30, 2011, in which significant unobservable inputs (Level 3) were used in determining value:
Investments
in Securities | | Balance
as of
December 31,
2010 | | Realized
Gain/(Loss) | | Change in
Unrealized
Appreciation
(Depreciation) | | Purchases | | Sells | | Transfers
into
Level 3 | | Transfers
out of
Level 3 | | Balance
as of
June 30,
2011 | |
| Equities | |
| Health Care | | $ | 20 | | | $ | - | | | $ | (2 | ) | | $ | - | | | $ | - | | | $ | - | | | $ | - | | | $ | 18 | | |
| | | $ | 20 | | | $ | - | | | $ | (2 | ) | | $ | - | | | $ | - | | | $ | - | | | $ | - | | | $ | 18 | | |
The information in the above reconciliation represents fiscal year to date activity for any securities identified as using Level 3 inputs at either the beginning or the end of the current fiscal period.
The change in unrealized depreciation attributed to securities owned at June 30, 2011, which were valued using significant unobservable inputs (Level 3) amounted to $2. This amount is included in net change in unrealized appreciation (depreciation) on the Statements of Changes in Net Assets.
For more information on valuation inputs, and their aggregation into the levels used in the tables above, please refer to the Security Valuation section in the accompanying Notes to Financial Statements.
See accompanying notes to financial statements.
55
Columbia Acorn International Select
Major Portfolio Changes in the Second Quarter (Unaudited)
| | | Number of Shares | |
| | | 03/31/11 | | 06/30/11 | |
| Purchases | |
| Europe | |
| > United Kingdom | |
| Archipelago Resources | | | 2,775,000 | | | | 4,472,797 | | |
| Chemring | | | 1,465,000 | | | | 1,609,133 | | |
| JLT Group | | | 517,000 | | | | 881,100 | | |
| > Netherlands | |
| Imtech | | | 231,504 | | | | 235,519 | | |
| > Germany | |
| Rhoen-Klinikum | | | 200,000 | | | | 297,000 | | |
| > Switzerland | |
| Partners Group | | | 0 | | | | 24,000 | | |
| > Belgium | |
| EVS Broadcast Equipment | | | 0 | | | | 33,800 | | |
| Asia | |
| > Singapore | |
| Ascendas REIT | | | 11,105,000 | | | | 13,130,000 | | |
| Mapletree Industrial Trust REIT | | | 0 | | | | 14,601,100 | | |
| > China | |
| Want Want | | | 0 | | | | 1,655,000 | | |
| Zhaojin Mining Industry | | | 1,324,700 | | | | 2,649,400 | | |
| Other Countries | |
| > South Africa | |
| Rand Merchant Insurance | | | 0 | | | | 4,902,152 | | |
| | | Number of Shares | |
| | | 03/31/11 | | 06/30/11 | |
| Sales | |
| Europe | |
| > United Kingdom | |
| Cobham | | | 2,415,000 | | | | 616,000 | | |
| Intertek Group | | | 412,000 | | | | 400,000 | | |
| Petropavlovsk | | | 568,000 | | | | 0 | | |
| Serco | | | 2,139,000 | | | | 985,000 | | |
| Workspace Group | | | 13,437,411 | | | | 9,710,000 | | |
| > Netherlands | |
| Fugro | | | 175,427 | | | | 117,121 | | |
| > Sweeden | |
| Hexagon | | | 774,666 | | | | 658,666 | | |
| > Switzerland | |
| Bank Sarasin & Cie | | | 99,000 | | | | 0 | | |
| > Ireland | |
| United Drug | | | 3,213,000 | | | | 2,377,800 | | |
| > France | |
| Neopost | | | 130,000 | | | | 48,000 | | |
| > Spain | |
| Red Eléctrica de España | | | 80,000 | | | | 0 | | |
| Asia | |
| > Japan | |
| Benesse | | | 15,400 | | | | 0 | | |
| Gree | | | 521,000 | | | | 280,000 | | |
| > China | |
| Jiangsu Expressway | | | 12,115,400 | | | | 6,727,000 | | |
| > Hong Kong | |
| Hutchison Port Holdings Trust | | | 1,515,000 | | | | 0 | | |
| Other Countries | |
| > Canada | |
| Pan American Silver | | | 132,000 | | | | 0 | | |
| > United States | |
| Atwood Oceanics | | | 143,000 | | | | 112,000 | | |
| > Austriala | |
| UGL | | | 571,848 | | | | 540,000 | | |
| Latin America | |
| > Columbia | |
| Pacific Rubiales Energy | | | 525,000 | | | | 260,000 | | |
See accompanying notes to financial statements.
56
Columbia Acorn International Select
Statement of Investments (Unaudited), June 30, 2011
| Number of Shares | | | | Value (000) | |
| | | | | | | Equities: 87.0% | |
| Europe 41.3% | | | |
| | | > United Kingdom 13.9% | |
| | 1,609,133 | | | Chemring | | $ | 16,529 | | |
| | | | | Defense Manufacturer of Countermeasures &
Energetics | | | | | |
| | 400,000 | | | Intertek Group | | | 12,666 | | |
| | | | | Testing, Inspection & Certification Services | | | | | |
| | 881,100 | | | JLT Group | | | 9,630 | | |
| | | | | International Business Insurance Broker | | | | | |
| | 985,000 | | | Serco | | | 8,734 | | |
| | | | | Facilities Management | | | | | |
| | 9,710,000 | | | Workspace Group | | | 4,714 | | |
| | | | | United Kingdom Real Estate | | | | | |
| | 4,472,797 | | | Archipelago Resources (a) | | | 4,433 | | |
| | | | | Gold Mining Projects in Indonesia,
Vietnam & the Philippines | | | | | |
| | 616,000 | | | Cobham | | | 2,092 | | |
| | | | | Aerospace Components | | | | | |
| | 226,800 | | | Shaftesbury | | | 1,922 | | |
| | | | | London Prime Retail REIT | | | | | |
| | | | 60,720 | | |
| | | > Netherlands 8.7% | |
| | 166,000 | | | AkzoNobel | | | 10,472 | | |
| | | | | Largest Global Supplier of Protective Paints &
Coatings | | | | | |
| | 117,121 | | | Fugro | | | 8,445 | | |
| | | | | Sub-sea Oilfield Services | | | | | |
| | 235,519 | | | Imtech | | | 8,330 | | |
| | | | | Electromechanical & Information &
Communications Technologies Installation &
Maintenance | | | | | |
| | 242,103 | | | Aalberts Industries | | | 5,659 | | |
| | | | | Flow Control & Heat Treatment | | | | | |
| | 45,000 | | | Core Laboratories | | | 5,019 | | |
| | | | | Oil & Gas Reservoir Consulting | | | | | |
| | | | 37,925 | | |
| | | > Germany 6.7% | |
| | 672,000 | | | Wirecard | | | 12,011 | | |
| | | | | Online Payment Processing & Risk
Management | | | | | |
| | 115,500 | | | Rheinmetall | | | 10,225 | | |
| | | | | Defense & Automotive | | | | | |
| | 297,000 | | | Rhoen-Klinikum | | | 7,167 | | |
| | | | | Health Care Services | | | | | |
| | | | 29,403 | | |
| | | > Sweden 3.7% | |
| | 658,666 | | | Hexagon | | | 16,224 | | |
| | | | | Measurement Equipment & Software | | | | | |
| | | | 16,224 | | |
| | | > Switzerland 2.7% | |
| | 51,000 | | | Kuehne & Nagel | | | 7,740 | | |
| | | | | Freight Forwarding/Logistics | | | | | |
| | 24,000 | | | Partners Group | | | 4,248 | | |
| | | | | Private Markets Asset Management | | | | | |
| | | | 11,988 | | |
| Number of Shares | | | | Value (000) | |
| | | > Ireland 1.9% | |
| | 2,377,800 | | | United Drug | | $ | 8,145 | | |
| | | | | Irish Pharmaceutical Wholesaler & Outsourcer | | | | | |
| | | | 8,145 | | |
| | | > Iceland 1.2% | |
| | 4,800,000 | | | Marel (a) | | | 5,081 | | |
| | | | | Largest Manufacturer of Poultry & Fish
Processing Equipment | | | | | |
| | | | 5,081 | | |
| | | > Denmark 1.1% | |
| | 29,000 | | | Novozymes | | | 4,719 | | |
| | | | | Industrial Enzymes | | | | | |
| | | | 4,719 | | |
| | | > France 0.9% | |
| | 48,000 | | | Neopost | | | 4,123 | | |
| | | | | Postage Meter Machines | | | | | |
| | | | 4,123 | | |
| | | > Belgium 0.5% | |
| | 33,800 | | | EVS Broadcast Equipment | | | 2,288 | | |
| | | | | Digital Live Mobile Production Software &
Systems | | | | | |
| | | | 2,288 | | |
| Europe: Total | | | 180,616 | | |
| Asia 29.1% | | | |
| | | > Japan 13.5% | |
| | 2,115,000 | | | Kansai Paint | | | 19,270 | | |
| | | | | Paint Producer in Japan, India, China &
Southeast Asia | | | | | |
| | 480,000 | | | Asahi Diamond Industrial | | | 10,494 | | |
| | | | | Consumable Diamond Tools | | | | | |
| | 8,550 | | | Jupiter Telecommunications | | | 9,566 | | |
| | | | | Largest Cable Service Provider in Japan | | | | | |
| | 4,450 | | | Seven Bank | | | 8,892 | | |
| | | | | ATM Processing Services | | | | | |
| | 280,000 | | | Gree (a) | | | 6,121 | | |
| | | | | Mobile Social Networking Game
Developer/Platform | | | | | |
| | 110,000 | | | Ain Pharmaciez | | | 4,526 | | |
| | | | | Dispensing Pharmacy/Drugstore Operator | | | | | |
| | | | 58,869 | | |
| | | > Singapore 8.2% | |
| | 13,130,000 | | | Ascendas REIT | | | 21,838 | | |
| | | | | Industrial Property Landlord | | | | | |
| | 14,601,100 | | | Mapletree Industrial Trust REIT | | | 13,923 | | |
| | | | | Industrial Property Landlord | | | | | |
| | | | 35,761 | | |
| | | > South Korea 4.4% | |
| | 79,266 | | | NHN (a) | | | 14,053 | | |
| | | | | South Korea's Largest Online Search Engine | | | | | |
| | 151,000 | | | Woongjin Coway | | | 5,385 | | |
| | | | | South Korean Household Appliance Rental
Service Provider | | | | | |
| | | | 19,438 | | |
See accompanying notes to financial statements.
57
Columbia Acorn International Select
Statement of Investments (Unaudited), continued
| Number of Shares | | | | Value (000) | |
| | | > China 3.0% | |
| | 6,727,000 | | | Jiangsu Expressway | | $ | 6,167 | | |
| | | | | Chinese Toll Road Operator | | | | | |
| | 2,649,400 | | | Zhaojin Mining Industry | | | 5,466 | | |
| | | | | Gold Mining & Refining in China | | | | | |
| | 1,655,000 | | | Want Want | | | 1,607 | | |
| | | | | Chinese Branded Consumer Food Company | | | | | |
| | | | 13,240 | | |
| Asia: Total | | | 127,308 | | |
| Other Countries 14.2% | | | |
| | | > South Africa 6.0% | |
| | 1,152,200 | | | Adcock Ingram Holdings | | | 10,123 | | |
| | | | | Manufacturer of Pharmaceuticals &
Medical Supplies | | | | | |
| | 4,902,152 | | | Rand Merchant Insurance | | | 8,954 | | |
| | | | | Directly Sold Property & Casualty
Insurance; Holdings in Other Insurers | | | | | |
| | 122,700 | | | Naspers | | | 6,931 | | |
| | | | | Media in Africa, China, Russia &
Other Emerging Markets | | | | | |
| | | | 26,008 | | |
| | | > Canada 3.0% | |
| | 210,400 | | | CCL Industries | | | 7,234 | | |
| | | | | Leading Global Label Manufacturer | | | | | |
| | 125,000 | | | AG Growth | | | 5,936 | | |
| | | | | Leading Manufacturer of Augers & Grain
Handling Equipment | | | | | |
| | | | 13,170 | | |
| | | > United States 2.3% | |
| | 112,000 | | | Atwood Oceanics (a) | | | 4,943 | | |
| | | | | Offshore Drilling Contractor | | | | | |
| | 67,000 | | | SM Energy | | | 4,923 | | |
| | | | | Oil & Gas Producer | | | | | |
| | | | 9,866 | | |
| | | > Australia 1.8% | |
| | 540,000 | | | UGL | | | 8,070 | | |
| | | | | Engineering & Facilities Management | | | | | |
| | | | 8,070 | | |
| | | > Israel 1.1% | |
| | 310,000 | | | Israel Chemicals | | | 4,947 | | |
| | | | | Producer of Potash, Phosphates, Bromine &
Specialty Chemicals | | | | | |
| | | | 4,947 | | |
| Other Countries: Total | | | 62,061 | | |
| Latin America 2.4% | | | |
| | | > Colombia 1.9% | |
| | 260,000 | | | Pacific Rubiales Energy | | | 6,969 | | |
| | | | | Oil Production & Exploration in Colombia | | | | | |
| | 18,800,000 | | | Quetzal Energy (a)(b) | | | 1,497 | | |
| | | | | Explores for Oil & Gas in Latin America | | | | | |
| | | | 8,466 | | |
Number of Shares
or Principal Amount (000) | | | | Value (000) | |
| | | > Argentina 0.5% | |
| | 1,000,000 | | | Union Agriculture Group (a)(b) | | $ | 2,200 | | |
| | | Farmland Operator in Uruguay | | | | | |
| | | | 2,200 | | |
| Latin America: Total | | | 10,666 | | |
Total Equities: 87.0%
(Cost: $282,220) | | | 380,651 | | |
| Short-Term Obligation: 13.5% | |
| | | > Repurchase Agreement 13.5% | |
| $ | 58,891 | | | Repurchase Agreement with
Fixed Income Clearing Corp.,
dated 6/30/11, due 7/01/11
at 0.01%, collateralized by a
U.S. Government Agency
obligation maturing 9/08/17,
market value $60,070
(repurchase proceeds $58,891) | | | 58,891 | | |
Total Short-Term Obligation 13.5%
(Cost: $58,891) | | | 58,891 | | |
Total Investments: 100.5%
(Cost: $341,111)(c)(d) | | | 439,542 | | |
| Cash and Other Assets Less Liabilities: (0.5)% | | | (2,243 | ) | |
| Total Net Assets: 100% | | $ | 437,299 | | |
See accompanying notes to financial statements.
58
> Notes to Statements of Investments (dollar values in thousands)
(a) Non-income producing security.
(b) Denotes a restricted security, which is subject to restrictions on resale under federal securities laws. These securities are valued at a fair value determined in good faith under consistently applied procedures established by the Board of Trustees. At June 30, 2011, the market value of these securities amounted to $3,697, which represented 0.85% of total net assets.
Additional information on these securities is as follows:
| Security | | Acquisition
Dates | | Shares | | Cost | | Value | |
| Union Agriculture Group | | 12/8/10 | | | 1,000,000 | | | $ | 2,200 | | | $ | 2,200 | | |
| Quetzal Energy | | 1/14/11 | | | 18,800,000 | | | | 2,376 | | | | 1,497 | | |
| | | | | | | $ | 4,576 | | | $ | 3,697 | | |
(c) At June 30, 2011, for federal income tax purposes, the cost of investments was $341,111 and net unrealized appreciation was $98,431, consisting of gross unrealized appreciation of $103,528 and gross unrealized depreciation of $5,097.
(d) On June 30, 2011, the Fund's total investments were denominated in currencies as follows:
| Currency | | Value | | Percentage
of Net Assets | |
| Euro | | $ | 76,865 | | | | 17.6 | | |
| U.S. Dollar | | | 75,976 | | | | 17.4 | | |
| British Pound | | | 60,720 | | | | 13.9 | | |
| Japanese Yen | | | 58,869 | | | | 13.5 | | |
| Singapore Dollar | | | 35,761 | | | | 8.2 | | |
| South African Rand | | | 26,008 | | | | 5.9 | | |
Other currencies less
than 5% of total net assets | | | 105,343 | | | | 24.0 | | |
| | | $ | 439,542 | | | | 100.5 | | |
Various inputs are used in determining the value of the Fund's investments, following the input prioritization hierarchy established by GAAP. These inputs are summarized in the three broad levels listed below:
• Level 1 – quoted prices in active markets for identical securities
• Level 2 – prices determined using other significant observable inputs (including quoted prices for similar securities, interest rates, prepayment speeds, credit risk and others)
• Level 3 – prices determined using significant unobservable inputs where quoted prices or observable inputs are unavailable or less reliable (including management's own assumptions about the factors market participants would use in pricing an investment)
The inputs or methodologies used for valuing securities are not necessarily an indication of the risk associated with investing in those securities.
Examples of the types of securities in which the Fund would typically invest and how they are classified within this hierarchy are as follows. Typical Level 1 securities include exchange traded domestic equities, mutual funds whose NAVs are published each day and exchange traded foreign equities that are not statistically fair valued. Typical Level 2 securities include exchange traded foreign equities that are statistically fair valued, forward foreign currency exchange contracts and short-term investments valued at amortized cost. Additionally, securities fair valued by the Valuation Committee of the Fund's Board of Trustees that rely on significant observable inputs are also included in level 2. Typical Level 3 securities include any security fair valued by the Valuation Committee that relies on significant unobservable inputs.
The following table summarizes the inputs used, as June 30, 2011, in valuing the Fund's assets:
| Investment Type | | Quoted Prices
(Level 1) | | Other
Significant
Observable
Inputs
(Level 2) | | Significant
Unobservable
Inputs
(Level 3) | | Total | |
| Equities | |
| Europe | | $ | 5,019 | | | $ | 175,597 | | | $ | - | | | $ | 180,616 | | |
| Asia | | | - | | | | 127,308 | | | | - | | | | 127,308 | | |
| Other Countries | | | 23,036 | | | | 39,025 | | | | - | | | | 62,061 | | |
| Latin America | | | 6,969 | | | | 1,497 | | | | 2,200 | | | | 10,666 | | |
| Total Equities | | | 35,024 | | | | 343,427 | | | | 2,200 | | | | 380,651 | | |
| Total Short-Term Obligation | | | - | | | | 58,891 | | | | - | | | | 58,891 | | |
| Total Investments | | $ | 35,024 | | | $ | 402,318 | | | $ | 2,200 | | | $ | 439,542 | | |
See accompanying notes to financial statements.
59
Columbia Acorn International Select
Statement of Investments (Unaudited), continued
> Notes to Statements of Investments (dollar values in thousands)
The Fund's assets assigned to the Level 2 input category are generally valued using the market approach, in which a security's value is determined through its correlation to prices and information from market transactions for similar or identical assets. Foreign equities are generally valued at the last sales price on the foreign exchange or market on which they trade. The Fund may use a systematic fair valuation model provided by an independent third party to value securities principally traded in foreign markets in order to adjust for possible stale pricing that may occur between the close of the foreign exchanges and the time for valuation. These models take into account available market data including intraday index, ADR, and ETF movements. Securities acquired via private placement that have a holding period or an extended settlement period are valued at a discount to the same shares that are trading freely on the market. These discounts are determined by the adviser's experience with similar securities or situations. Factors may include, but are not limited to, trade volume, shares outstanding and stock price.
Certain short-term obligations may be valued using amortized cost, an income approach which converts future cash flows to a present value based upon the discount or premium at purchase.
The Fund's assets assigned to the Level 3 input category are valued at fair value as determined in good faith under consistently applied procedures established by and under the general supervision of the Board of Trustees. To determine fair value, management will utilize the valuation technique that they deem the most appropriate in the circumstances. Securities acquired via private placement that are not yet trading are valued using a market approach for which management has determined that the original transaction price is the best representation of fair value. The original cost may be adjusted for the market movement in an index, ETF or similar security during the period it does not trade. Securities for which no market exists are valued based upon a market approach using some unobservable inputs which may include, but are not limited to, projected earnings, available cash, line of business, multiples and consideration of the prioritization of the equity in the company's capital structure.
There were no significant transfers of financial assets between Levels 1 and 2 during the period.
The following table reconciles asset balances for the six months ending June 30, 2011, in which significant unobservable inputs (Level 3) were used in determining value:
Investments
in Securities | | Balance
as of
December 31,
2010 | | Realized
Gain/(Loss) | | Change in
Unrealized
Appreciation
(Depreciation) | | Purchases | | Sales | | Transfers
into
Level 3 | | Transfers
out of
Level 3 | | Balance
as of
June 30,
2011 | |
| Latin America | |
| Argentina | | $ | 2,200 | | | $ | - | | | $ | - | | | $ | - | | | $ | - | | | $ | - | | | $ | - | | | $ | 2,200 | | |
| | | $ | 2,200 | | | $ | - | | | $ | - | | | $ | - | | | $ | - | | | $ | - | | | $ | - | | | $ | 2,200 | | |
The information in the above reconciliation table represents fiscal year to date activity for any securities identified as using Level 3 inputs at either the beginning or the end of the current fiscal period.
The change in unrealized appreciation (depreciation) attributed to securities owned at June 30, 2011, which were valued using significant unobservable inputs (Level 3) amounted to $0. This amount is included in net change unrealized appreciation (depreciation) on the Statements of Changes in Net Assets.
For more information on valuation inputs, and their aggregation into the levels used in the tables above, please refer to the Security Valuation section in the accompanying Notes to Financial Statements.
See accompanying notes to financial statements.
60
Columbia Acorn International Select
Portfolio Diversification (Unaudited)
At June 30, 2011, the Fund's portfolio investments as a percentage of net assets were diversified as follows:
| | | Value (000) | | Percentage
of Net Assets | |
| > Industrial Goods & Services | |
Industrial Materials &
Specialty Chemicals | | $ | 39,408 | | | | 9.0 | | |
| Other Industrial Services | | | 36,806 | | | | 8.4 | | |
| Machinery | | | 35,859 | | | | 8.2 | | |
| Electrical Components | | | 18,621 | | | | 4.3 | | |
| Outsourcing Services | | | 8,734 | | | | 2.0 | | |
| Conglomerates | | | 5,659 | | | | 1.3 | | |
| | | | 145,087 | | | | 33.2 | | |
| > Information | |
| Internet Related | | | 20,984 | | | | 4.8 | | |
| Instrumentation | | | 16,224 | | | | 3.7 | | |
| Financial Processors | | | 12,011 | | | | 2.7 | | |
| CATV | | | 9,566 | | | | 2.2 | | |
| Gaming Equipment & Services | | | 6,121 | | | | 1.4 | | |
| Business Software | | | 2,288 | | | | 0.5 | | |
| | | | 67,194 | | | | 15.3 | | |
| > Other Industries | |
| Real Estate | | | 42,397 | | | | 9.7 | | |
| Transportation | | | 6,167 | | | | 1.4 | | |
| | | | 48,564 | | | | 11.1 | | |
| > Energy & Minerals | |
| Mining | | | 14,918 | | | | 3.4 | | |
| Oil & Gas Producers | | | 13,389 | | | | 3.1 | | |
| Oil Services | | | 13,388 | | | | 3.1 | | |
| Agricultural Commodities | | | 2,200 | | | | 0.5 | | |
| | | | 43,895 | | | | 10.1 | | |
| > Finance | |
| Insurance | | | 18,584 | | | | 4.2 | | |
| Banks | | | 8,892 | | | | 2.0 | | |
| Brokerage & Money Management | | | 4,248 | | | | 1.0 | | |
| | | | 31,724 | | | | 7.2 | | |
| > Health Care | |
| Pharmaceuticals | | | 18,268 | | | | 4.2 | | |
| Health Care Services | | | 7,167 | | | | 1.6 | | |
| | | | 25,435 | | | | 5.8 | | |
| | | Value (000) | | Percentage
of Net Assets | |
| > Consumer Goods & Services | |
| Nondurables | | | 7,234 | | | | 1.7 | | |
| Other Consumer Services | | | 5,385 | | | | 1.2 | | |
| Retail | | | 4,526 | | | | 1.0 | | |
| Food & Beverage | | | 1,607 | | | | 0.4 | | |
| | | | 18,752 | | | | 4.3 | | |
| Total Equities: | | | 380,651 | | | | 87.0 | | |
| Short-Term Obligation: | | | 58,891 | | | | 13.5 | | |
| Total Investments: | | | 439,542 | | | | 100.5 | | |
Cash and Other Assets
Less Liabilities: | | | (2,243 | ) | | | (0.5 | ) | |
| Net Assets: | | $ | 437,299 | | | | 100.0 | | |
See accompanying notes to financial statements.
61
Columbia Acorn Select
Major Portfolio Changes in the Second Quarter (Unaudited)
| | | Number of Shares | |
| | | 03/31/11 | | 06/30/11 | |
| Purchases | |
| Consumer Goods & Services | |
| Gaylord Entertainment | | | 0 | | | | 860,000 | | |
| Industrial Goods & Services | |
| Quanta Services | | | 0 | | | | 1,400,000 | | |
| Information | |
| Finisar | | | 0 | | | | 324,000 | | |
| SBA Communications | | | 505,000 | | | | 755,000 | | |
| WNS - ADR (India) | | | 4,200,000 | | | | 4,227,186 | | |
| Energy & Minerals | |
| Canadian Solar (China) | | | 3,200,000 | | | | 3,300,000 | | |
| Health Care | |
| Akorn | | | 1,996,847 | | | | 2,250,000 | | |
| | | Number of Shares | |
| | | 03/31/11 | | 06/30/11 | |
| Sales | |
| Consumer Goods & Services | |
| Abercrombie & Fitch | | | 1,600,000 | | | | 1,100,000 | | |
| Career Education | | | 1,900,000 | | | | 0 | | |
| Coach | | | 1,135,000 | | | | 1,025,000 | | |
| Hertz | | | 8,650,000 | | | | 8,400,000 | | |
| ITT Educational Services | | | 1,000,000 | | | | 325,000 | | |
| Safeway | | | 3,600,000 | | | | 3,000,000 | | |
| Thor Industries | | | 720,000 | | | | 0 | | |
| Industrial Goods & Services | |
| Ametek | | | 1,860,000 | | | | 1,830,000 | | |
ChemSpec International - ADR
(China) | | | 1,581,700 | | | | 1,500,000 | | |
| Donaldson | | | 800,000 | | | | 785,000 | | |
| Nalco Holding Company | | | 1,000,000 | | | | 0 | | |
| Pall | | | 860,000 | | | | 840,000 | | |
| Waste Management | | | 1,500,000 | | | | 1,200,000 | | |
| Information | |
| American Tower | | | 900,000 | | | | 0 | | |
| Crown Castle International | | | 1,550,000 | | | | 1,510,000 | | |
| Navigant Consulting | | | 2,300,000 | | | | 813,073 | | |
| Sanmina-SCI | | | 7,100,000 | | | | 6,950,000 | | |
| VisionChina Media - ADR (China) | | | 3,675,000 | | | | 3,573,400 | | |
| Energy & Minerals | |
Pacific Rubiales Energy
(Colombia) | | | 3,700,000 | | | | 2,500,000 | | |
Synthesis Energy Systems
(China) | | | 4,426,330 | | | | 3,850,372 | | |
| Finance | |
| CNO Financial Group | | | 12,500,000 | | | | 12,300,000 | | |
| Discover Financial Services | | | 5,150,000 | | | | 5,050,000 | | |
| MF Global | | | 6,000,000 | | | | 5,550,000 | | |
| Other Industries | |
| JB Hunt Transport Services | | | 1,300,000 | | | | 1,275,000 | | |
See accompanying notes to financial statements.
62
Columbia Acorn Select
Statement of Investments (Unaudited), June 30, 2011
| Number of Shares | | | | Value (000) | |
| | | | | | | Equities: 95.1% | |
| Consumer Goods & Services 24.2% | | | |
| | | > Retail 9.9% | |
| | 1,100,000 | | | Abercrombie & Fitch | | $ | 73,612 | | |
| | | | | Teen Apparel Retailer | | | | | |
| | 3,000,000 | | | Safeway | | | 70,110 | | |
| | | | | Supermarkets | | | | | |
| | 350,000 | | | lululemon athletica (a)(b) | | | 39,137 | | |
| | | | | Premium Active Apparel Retailer | | | | | |
| | 250,000 | | | Tiffany & Co. | | | 19,630 | | |
| | | | | Luxury Good Retailer | | | | | |
| | | | 202,489 | | |
| | | > Travel 7.8% | |
| | 8,400,000 | | | Hertz (a) | | | 133,392 | | |
| | | | | Largest U.S. Rental Car Operator | | | | | |
| | 860,000 | | | Gaylord Entertainment (a) | | | 25,800 | | |
| | | | | Convention Hotels | | | | | |
| | | | 159,192 | | |
| | | > Apparel 3.2% | |
| | 1,025,000 | | | Coach | | | 65,528 | | |
| | | | | Designer & Retailer of Branded
Leather Accessories | | | | | |
| | | | 65,528 | | |
| | | > Casinos & Gaming 1.6% | |
| | 335,000,000 | | | RexLot Holdings (China) | | | 32,405 | | |
| | | | | Lottery Equipment Supplier in China | | | | | |
| | | | 32,405 | | |
| | | > Educational Services 1.2% | |
| | 325,000 | | | ITT Educational Services (a)(b) | | | 25,428 | | |
| | | | | Post-secondary Degree Services | | | | | |
| | | | 25,428 | | |
| | | > Food & Beverage 0.3% | |
| | 1,000,000 | | | GLG Life Tech (Canada) (a) | | | 6,720 | | |
| | | | | Produce an All-natural Sweetener
Extracted from the Stevia Plant | | | | | |
| | | | 6,720 | | |
| | | > Other Consumer Services 0.2% | |
| | 2,300,000 | | | IFM Investments (Century 21
China RE) - ADR (China) (a)(c) | | | 3,381 | | |
| | | | | Provides Real Estate Services in China | | | | | |
| | | | 3,381 | | |
| Consumer Goods & Services: Total | | | 495,143 | | |
| Industrial Goods & Services 19.0% | | | |
| | | > Machinery 11.4% | |
| | 1,830,000 | | | Ametek | | | 82,167 | | |
| | | | | Aerospace/Industrial Instruments | | | | | |
| | 785,000 | | | Donaldson | | | 47,634 | | |
| | | | | Industrial Air Filtration | | | | | |
| | 840,000 | | | Pall | | | 47,233 | | |
| | | | | Filtration & Fluids Clarification | | | | | |
| | 885,000 | | | Kennametal | | | 37,356 | | |
| | | | | Consumable Cutting Tools | | | | | |
| | 650,000 | | | Oshkosh (a) | | | 18,811 | | |
| | | | | Specialty Truck Manufacturer | | | | | |
| | | | 233,201 | | |
| Number of Shares | | | | Value (000) | |
| | | > Waste Management 2.2% | |
| | 1,200,000 | | | Waste Management | | $ | 44,724 | | |
| | | | | U.S. Garbage Collection & Disposal | | | | | |
| | | | 44,724 | | |
| | | > Other Industrial Services 1.9% | |
| | 750,000 | | | Expeditors International of Washington | | | 38,392 | | |
| | | | | International Freight Forwarder | | | | | |
| | | | 38,392 | | |
| | | > Industrial Distribution 1.6% | |
| | 220,000 | | | WW Grainger | | | 33,803 | | |
| | | | | Industrial Distribution | | | | | |
| | | | 33,803 | | |
| | | > Outsourcing Services 1.4% | |
| | 1,400,000 | | | Quanta Services (a) | | | 28,280 | | |
| | | | | Electrical & Telecom Construction Services | | | | | |
| | | | 28,280 | | |
| | | > Industrial Materials &
Specialty Chemicals 0.5% | |
| | 1,500,000 | | | ChemSpec International - ADR
(China) (a) | | | 10,800 | | |
| | | | | Specialty Chemicals with Focus on
Fluorinated Chemical Manufacturing | | | | | |
| | | | 10,800 | | |
| Industrial Goods & Services: Total | | | 389,200 | | |
| Information 15.3% | | | |
| | | > Mobile Communications 5.3% | |
| | 1,510,000 | | | Crown Castle International (a) | | | 61,593 | | |
| | | | | Communications Towers | | | | | |
| | 755,000 | | | SBA Communications (a) | | | 28,833 | | |
| | | | | Communications Towers | | | | | |
| | 15,000,000 | | | Globalstar (a)(b)(c) | | | 18,450 | | |
| | | | | Satellite Mobile Voice & Data Carrier | | | | | |
| | | | 108,876 | | |
| | | > Contract Manufacturing 3.5% | |
| | 6,950,000 | | | Sanmina-SCI (a)(c) | | | 71,793 | | |
| | | | | Electronic Manufacturing Services | | | | | |
| | | | 71,793 | | |
| | | > Computer Hardware & Related
Equipment 2.0% | |
| | 750,000 | | | Amphenol | | | 40,493 | | |
| | | | | Electronic Connectors | | | | | |
| | | | 40,493 | | |
| | | > Computer Services 1.8% | |
| | 4,227,186 | | | WNS - ADR (India) (a)(c) | | | 37,580 | | |
| | | | | Offshore BPO (Business Process
Outsourcing) Services | | | | | |
| | | | 37,580 | | |
| | | > Instrumentation 1.0% | |
| | 120,000 | | | Mettler Toledo (a) | | | 20,240 | | |
| | | | | Laboratory Equipment | | | | | |
| | | | 20,240 | | |
See accompanying notes to financial statements.
63
Columbia Acorn Select
Statement of Investments (Unaudited), continued
| Number of Shares | | | | Value (000) | |
| | | > Advertising 0.5% | |
| | 3,573,400 | | | VisionChina Media - ADR
(China) (a)(b) | | $ | 10,113 | | |
| | | | | Advertising on Digital Screens in
China's Mass Transit System | | | | | |
| | | | 10,113 | | |
| | | > Business Software 0.5% | |
| | 182,000 | | | Concur Technologies (a) | | | 9,113 | | |
| | | | | Web Enabled Cost & Expense
Management Software | | | | | |
| | | | 9,113 | | |
| | | > Business Information &
Marketing Services 0.4% | |
| | 813,073 | | | Navigant Consulting (a) | | | 8,529 | | |
| | | | | Financial Consulting Firm | | | | | |
| | | | 8,529 | | |
| | | > Telecommunications Equipment 0.3% | |
| | 324,000 | | | Finisar (a) | | | 5,842 | | |
| | | | | Optical Sub-systems & Components | | | | | |
| | | | 5,842 | | |
| Information: Total | | | 312,579 | | |
| Energy & Minerals 14.7% | | | |
| | | > Oil & Gas Producers 9.4% | |
| | 2,500,000 | | | Pacific Rubiales Energy (Colombia) | | | 67,007 | | |
| | | | | Oil Production & Exploration in Colombia | | | | | |
| | 30,530,000 | | | Canacol Energy (Colombia) (a)(c) | | | 33,555 | | |
| | 4,000,000 | | | Canacol Energy (Colombia) (a)(c)(d) | | | 4,308 | | |
| | | | | Oil Producer in South America | | | | | |
| | 38,343,900 | | | ShaMaran Petroleum (Iraq) (a)(c) | | | 30,216 | | |
| | | | | Oil Exploration in Kurdistan | | | | | |
| | 1,450,000 | | | Houston American Energy (b) | | | 26,288 | | |
| | | | | Oil & Gas Exploration & Production
in Colombia | | | | | |
| | 34,856,000 | | | Petrodorado (Colombia) (a)(c) | | | 11,023 | | |
| | 17,144,000 | | | Petrodorado - Warrants
(Colombia) (a)(c)(d) | | | 1,740 | | |
| | | | | Oil & Gas Exploration & Production
in Colombia, Peru & Paraguay | | | | | |
| | 24,000,000 | | | Canadian Overseas Petroleum
(United Kingdom) (a)(c)(d) | | | 11,096 | | |
| | 12,000,000 | | | Canadian Overseas Petroleum -
Warrants (United Kingdom) (a)(c)(d) | | | 1,635 | | |
| | | | | Oil & Gas Exploration/Production in the
North Sea | | | | | |
| | 13,125,000 | | | Petromanas (Canada) (a)(d) | | | 3,868 | | |
| | 5,000,000 | | | Petromanas (Canada) (a) | | | 1,503 | | |
| | 6,562,500 | | | Petromanas - Warrants (Canada) (a)(d) | | | 167 | | |
| | | | | Exploring for Oil in Albania | | | | | |
| | | | 192,406 | | |
| | | > Alternative Energy 2.4% | |
| | 3,300,000 | | | Canadian Solar (China) (a)(b)(c) | | | 37,950 | | |
| | | | | Solar Cell & Module Manufacturer | | | | | |
| | 3,850,372 | | | Synthesis Energy Systems
(China) (a)(b)(c) | | | 7,200 | | |
| | | | | Owner/Operator of Gasification Plants | | | | | |
| | 1,600,000 | | | Real Goods Solar (a)(c) | | | 4,736 | | |
| | | | | Residential Solar Energy Installer | | | | | |
| | | | 49,886 | | |
| Number of Shares | | | | Value (000) | |
| | | > Agricultural Commodities 1.6% | |
| | 9,090,909 | | | Union Agriculture Group
(Argentina) (a)(d) | | $ | 20,000 | | |
| | | | | Farmland Operator in Uruguay | | | | | |
| | 38,000,000 | | | Eacom Timber (Canada) (a)(c)(d) | | | 11,970 | | |
| | | | | Canadian Lumber Producer | | | | | |
| | | | 31,970 | | |
| | | > Mining 0.8% | |
| | 1,000,000 | | | Kirkland Lake Gold (Canada) (a) | | | 15,760 | | |
| | | | | Gold Mining | | | | | |
| | | | 15,760 | | |
| | | > Oil Services 0.5% | |
| | 10,885,700 | | | Tuscany International Drilling
(Colombia) (a) | | | 10,384 | | |
| | 760,000 | | | Tuscany International Drilling -
Warrants (Colombia) (a) | | | 28 | | |
| | | | | South America-based Drilling
Rig Contractor | | | | | |
| | | | 10,412 | | |
| Energy & Minerals: Total | | | 300,434 | | |
| Finance 14.7% | | | |
| | | > Credit Cards 6.6% | |
| | 5,050,000 | | | Discover Financial Services | | | 135,088 | | |
| | | | | Credit Card Company | | | | | |
| | | | 135,088 | | |
| | | > Insurance 4.8% | |
| | 12,300,000 | | | CNO Financial Group (a) | | | 97,293 | | |
| | | | | Life, Long-term Care & Medical
Supplement Insurance | | | | | |
| | | | 97,293 | | |
| | | > Brokerage & Money Management 3.3% | |
| | 5,550,000 | | | MF Global (a) | | | 42,957 | | |
| | | | | Futures Broker | | | | | |
| | 1,100,000 | | | SEI Investments | | | 24,761 | | |
| | | | | Mutual Fund Administration &
Investment Management | | | | | |
| | | | 67,718 | | |
| Finance: Total | | | 300,099 | | |
| Other Industries 5.5% | | | |
| | | > Transportation 2.9% | |
| | 1,275,000 | | | JB Hunt Transport Services | | | 60,040 | | |
| | | | | Truck & Intermodal Carrier | | | | | |
| | | | 60,040 | | |
| | | > Real Estate 1.8% | |
| | 1,900,000 | | | BioMed Realty Trust | | | 36,556 | | |
| | | | | Life Science-focused Office Buildings | | | | | |
| | | | 36,556 | | |
| | | > Regulated Utilities 0.8% | |
| | 500,000 | | | Wisconsin Energy | | | 15,675 | | |
| | | | | Wisconsin Utility | | | | | |
| | | | 15,675 | | |
| Other Industries: Total | | | 112,271 | | |
See accompanying notes to financial statements.
64
Number of Shares
or Principal Amount (000) | | | | Value (000) | |
| Health Care 1.7% | | | |
| | | > Biotechnology & Drug Delivery 0.9% | |
| | 2,000,000 | | | NPS Pharmaceuticals (a) | | $ | 18,900 | | |
| | | | | Orphan Drugs & Healthy Royalties | | | | | |
| | | | 18,900 | | |
| | | > Pharmaceuticals 0.8% | |
| | 2,250,000 | | | Akorn (a) | | | 15,750 | | |
| | | | | Develops, Manufactures & Sells Specialty
Generic Drugs | | | | | |
| | | | 15,750 | | |
| Health Care: Total | | | 34,650 | | |
Total Equities: 95.1%
(Cost: $1,465,678) | | | 1,944,376 | | |
| Securities Lending Collateral: 3.0% | | | |
| | 61,633,705 | | | Dreyfus Government Cash
Management Fund (e)
(7 day yield of 0.00%) | | | 61,634 | | |
Total Securities Lending Collateral:
(Cost: $61,634) | | | 61,634 | | |
| Short-Term Obligation 4.6% | | | |
| | | > Repurchase Agreement 4.6% | |
| $ | 94,733 | | | Repurchase Agreement with
Fixed Income Clearing Corp.,
dated 6/30/11, due 7/01/11
at 0.01%, collateralized by a
U.S. Government Agency
obligation maturing 8/18/17,
market value $96,628
(repurchase proceeds $94,733) | | | 94,733 | | |
| | | | 94,733 | | |
Total Short-Term Obligation:
(Cost: $94,733) | | | 94,733 | | |
Total Investments: 102.7%
(Cost: $1,622,045)(f) | | | 2,100,743 | | |
Obligation to Return Collateral for
Securities Loaned: (3.0)% | | | (61,634 | ) | |
| Cash and Other Assets Less Liabilities: 0.3% | | | 5,958 | | |
| Total Net Assets: 100.0% | | $ | 2,045,067 | | |
ADR = American Depositary Receipts
See accompanying notes to financial statements.
65
Columbia Acorn Select
Statement of Investments (Unaudited), continued
> Notes to Statement of Investments (dollar values in thousands)
(a) Non-income producing security.
(b) All or a portion of this security was on loan at June 30, 2011. The total market value of Fund securities on loan at June 30, 2011 was $59,666.
(c) An affiliated person of the Fund may include any company in which the Fund owns five percent or more of its outstanding voting shares. Holdings and transactions in these affiliated companies during the six months ended June 30, 2011, are as follows:
| Affiliates | | Balance of
Shares Held
12/31/10 | | Purchases/
Additions | | Sales/
Reductions | | Balance of
Shares Held
6/30/11 | | Value | | Dividend | |
| Canacol Energy | | | 36,240,000 | | | | - | | | | 1,710,000 | | | | 34,530,000 | | | $ | 37,863 | | | $ | - | | |
| Canadian Overseas Petroleum+ | | | 16,800,000 | | | | 36,000,000 | | | | 16,800,000 | | | | 36,000,000 | | | | 12,731 | | | | - | | |
| Canadian Solar | | | 3,200,000 | | | | 100,000 | | | | - | | | | 3,300,000 | | | | 37,950 | | | | - | | |
| Eacom Timber | | | 38,000,000 | | | | - | | | | - | | | | 38,000,000 | | | | 11,970 | | | | - | | |
| Globalstar | | | 15,000,000 | | | | - | | | | - | | | | 15,000,000 | | | | 18,450 | | | | - | | |
| IFM Investments (Century 21 China RE) - ADR | | | 2,300,000 | | | | - | | | | - | | | | 2,300,000 | | | | 3,381 | | | | - | | |
| Petrodorado+ | | | 45,544,000 | | | | 6,456,000 | | | | - | | | | 52,000,000 | | | | 12,763 | | | | - | | |
| Real Goods Solar | | | 1,500,000 | | | | 100,000 | | | | - | | | | 1,600,000 | | | | 4,736 | | | | - | | |
| Sanmina-SCI | | | 7,100,000 | | | | - | | | | 150,000 | | | | 6,950,000 | | | | 71,793 | | | | - | | |
| ShaMaran Petroleum | | | 35,950,000 | | | | 2,843,100 | | | | 449,200 | | | | 38,343,900 | | | | 30,216 | | | | - | | |
| Synthesis Energy Systems | | | 4,500,000 | | | | - | | | | 649,628 | | | | 3,850,372 | | | | 7,200 | | | | - | | |
| Tuscany International Drilling*+ | | | 13,224,000 | | | | - | | | | 1,578,300 | | | | 11,645,700 | | | | 10,412 | | | | - | | |
| VisionChina Media - ADR* | | | 3,675,000 | | | | - | | | | 101,600 | | | | 3,573,400 | | | | 10,113 | | | | - | | |
| WNS - ADR | | | 4,200,000 | | | | 27,186 | | | | - | | | | 4,227,186 | | | | 37,580 | | | | - | | |
| Total of Affiliated Transactions | | | 227,233,000 | | | | 45,526,286 | | | | 21,438,728 | | | | 251,320,558 | | | $ | 307,158 | | | $ | - | | |
* At June 30, 2011, the Fund owned less than five percent of the company's outstanding voting shares.
+ Includes the effects of a corporate action.
The aggregate cost and value of these affiliated companies at June 30, 2011, were $368,957 and $286,633, respectively. Investments in affiliated companies represented 14.0% of the Fund's total net assets at June 30, 2011.
(d) Denotes a restricted security, which is subject to restrictions on resale under federal securities laws. These securities are valued at a fair value determined in good faith under consistently applied procedures established by the Board of Trustees. At June 30, 2011, the value of these securities amounted to $54,784, which represented 2.68% of total net assets.
Additional information on these securities is as follows:
| Security | | Acquisition
Dates | | Shares | | Cost | | Value | |
| Union Agriculture Group | | 12/08/10 | | | 9,090,909 | | | $ | 20,000 | | | $ | 20,000 | | |
| Eacom Timber | | 3/17/10 | | | 38,000,000 | | | | 18,812 | | | | 11,970 | | |
| Canadian Overseas Petroleum | | 11/24/10 | | | 24,000,000 | | | | 10,260 | | | | 11,096 | | |
| Canacol Energy | | 4/15/10 | | | 4,000,000 | | | | 2,963 | | | | 4,308 | | |
| Petromanas | | 5/20/10 | | | 13,125,000 | | | | 4,561 | | | | 3,868 | | |
| Petrodorado - Warrants | | 11/20/09 | | | 17,144,000 | | | | 2,118 | | | | 1,740 | | |
| Canadian Overseas Petroleum - Warrants | | 11/24/10 | | | 12,000,000 | | | | 1,502 | | | | 1,635 | | |
| Petromanas - Warrants | | 5/20/10 | | | 6,562,500 | | | | 380 | | | | 167 | | |
| | | | | | | $ | 60,596 | | | $ | 54,784 | | |
(e) Investment made with cash collateral received from securities lending activity.
(f) At June 30, 2011, for federal income tax purposes, the cost of investments was $1,622,045 and net unrealized appreciation was $478,698, consisting of gross unrealized appreciation of $688,871 and gross unrealized depreciation of $210,173.
Various inputs are used in determining the value of the Fund's investments, following the input prioritization hierarchy established by GAAP. These inputs are summarized in the three broad levels listed below:
• Level 1 – quoted prices in active markets for identical securities
• Level 2 – prices determined using other significant observable inputs (including quoted prices for similar securities, interest rates, prepayment speeds, credit risk and others)
• Level 3 – prices determined using significant unobservable inputs where quoted prices or observable inputs are unavailable or less reliable (including management's own assumptions about the factors market participants would use in pricing an investment)
The inputs or methodology used for valuing securities are not necessarily an indication of the risk associated with investing in those securities.
See accompanying notes to financial statements.
66
> Notes to Statement of Investments (dollar values in thousands)
Examples of the types of securities in which the Fund would typically invest and how they are classified within this hierarchy are as follows. Typical Level 1 securities include exchange traded domestic equities, mutual funds whose NAVs are published each day and exchange traded foreign equities that are not statistically fair valued. Typical Level 2 securities include exchange traded foreign equities that are statistically fair valued, forward foreign currency exchange contracts and short-term investments valued at amortized cost. Additionally, securities fair valued by the Valuation Committee of the Fund's Board of Trustees that rely on significant observable inputs are also included in Level 2. Typical Level 3 securities include any security fair valued by the Valuation Committee that relies on significant unobservable inputs.
The following table summarizes the inputs used, as of June 30, 2011, in valuing the Fund's assets:
| Investment Type | | Quoted Prices
(Level 1) | | Other
Significant
Observable
Inputs
(Level 2) | | Significant
Unobservable
Inputs
(Level 3) | | Total | |
| Equities | |
| Consumer Goods & Services | | $ | 462,738 | | | $ | 32,405 | | | $ | — | | | $ | 495,143 | | |
| Industrial Goods & Services | | | 389,200 | | | | — | | | | — | | | | 389,200 | | |
| Information | | | 312,579 | | | | — | | | | — | | | | 312,579 | | |
| Energy & Minerals | | | 245,650 | | | | 34,784 | | | | 20,000 | | | | 300,434 | | |
| Finance | | | 300,099 | | | | — | | | | — | | | | 300,099 | | |
| Other Industries | | | 112,271 | | | | — | | | | — | | | | 112,271 | | |
| Health Care | | | 34,650 | | | | — | | | | — | | | | 34,650 | | |
| Total Equities | | | 1,857,187 | | | | 67,189 | | | | 20,000 | | | | 1,944,376 | | |
| Total Securities Lending Collateral | | | 61,634 | | | | — | | | | — | | | | 61,634 | | |
| Total Short-Term Obligation | | | — | | | | 94,733 | | | | — | | | | 94,733 | | |
| Total Investments | | $ | 1,918,821 | | | $ | 161,922 | | | $ | 20,000 | | | $ | 2,100,743 | | |
The Fund's assets assigned to the Level 2 input category are generally valued using a market approach, in which a security's value is determined through its correlation to prices and information from observable market transactions for similar or identical assets. Foreign equities are generally valued at the last sales price on the foreign exchange or market on which they trade. The Fund may use a systematic fair valuation model provided by an independent third party to value securities principally traded in foreign markets in order to adjust for possible stale pricing that may occur between the close of the foreign exchanges and the time for valuation. These models take into account available market data including intraday index, ADR, and ETF movements. Securities acquired via private placement that have a holding period or an extended settlement period are valued at a discount to the same shares that are trading freely on the market. These discounts are determined by the adviser's experience with similar securities or situations. Factors may include, but are not limited to, trade volume, shares outstanding and stock price. Warrants which do not trade are valued as a percentage of the actively trading common stocks using a model based on Black Scholes.
Certain short-term obligations may be valued using amortized cost, an income approach which converts future cash flows to a present value based upon the discount or premium at purchase.
The Fund's assets assigned to the Level 3 input category are valued at fair value as determined in good faith under consistently applied procedures established by and under the general supervision of the Board of Trustees. To determine fair value, management will utilize the valuation technique that they deem the most appropriate in the circumstances. Securities acquired via private placement that are not yet trading are valued using a market approach for which management has determined that the original transaction price is the best representation of fair value. The original cost may be adjusted for the market movement in an index, ETF or similar security during the period it does not trade.
There were no significant transfers of financial assets between levels 1 and 2 during the period.
The following table reconciles asset balances for the six months ending June 30, 2011, in which significant unobservable inputs (Level 3) were used in determining value:
Investments
in Securities | | Balance
as of
December 31,
2010 | | Realized
Gain/(Loss) | | Change in
Unrealized
Appreciation
(Depreciation) | | Purchases | | Sales | | Transfers
into
Level 3 | | Transfers
out of
Level 3 | | Balance
as of
June 30,
2011 | |
| Equities | |
| Energy & Minerals | | $ | 20,000 | | | $ | - | | | $ | - | | | $ | - | | | $ | - | | | $ | - | | | $ | - | | | $ | 20,000 | | |
| | | $ | 20,000 | | | $ | - | | | $ | - | | | $ | - | | | $ | - | | | $ | - | | | $ | - | | | $ | 20,000 | | |
The information in the above reconciliation table represents fiscal year to date activity for any securities identified as using Level 3 inputs at either the beginning or the end of the current fiscal period.
The change in unrealized appreciation (depreciation) attributed to securities owned at June 30, 2011, which were valued using significant unobservable inputs (Level 3) amounted to $0. This amount is included in net change in unrealized appreciation (depreciation) on the Statements of Changes in Net Assets.
For more information on valuation inputs, and their aggregation into the levels used in the tables above, please refer to the Security Valuation section in the accompanying Notes to Financial Statements.
See accompanying notes to financial statements.
67
Columbia Thermostat Fund
Statement of Investments (Unaudited), June 30, 2011
| Number of Shares | | | | Value (000) | |
| | | > Affiliated Stock Funds: 60.6% | |
| | 1,221 | | | Columbia Dividend Income Fund,
Class I | | $ | 16,734 | | |
| | 394 | | | Columbia Acorn International,
Class I | | | 16,221 | | |
| | 577 | | | Columbia Marsico Growth Fund,
Class I | | | 12,678 | | |
| | 396 | | | Columbia Acorn Fund, Class I | | | 12,664 | | |
| | 301 | | | Columbia Acorn Select, Class I | | | 8,493 | | |
| | 652 | | | Columbia Large Cap Enhanced
Core Fund, Class I | | | 8,439 | | |
| | 555 | | | Columbia Contrarian Core Fund,
Class I | | | 8,392 | | |
| Total Stock Funds: (Cost: $65,310) | | | 83,621 | | |
| | | > Affiliated Bond Funds: 39.2% | |
| | 2,969 | | | Columbia Intermediate Bond Fund,
Class I | | | 27,015 | | |
| | 1,450 | | | Columbia U.S. Treasury Index Fund,
Class I | | | 16,237 | | |
| | 1,120 | | | Columbia Income Opportunities Fund,
Class I | | | 10,804 | | |
| Total Bond Funds: (Cost: $53,022) | | | 54,056 | | |
| Principal Amount (000) | | | | Value (000) | |
| Short-Term Obligation: 0.4% | |
| | | > Repurchase Agreement: 0.4% | |
| $ | 478 | | | Repurchase Agreement with
Fixed Income Clearing Corp.,
dated 6/30/11, due 7/01/11
at 0.01%, collateralized by a
U.S. Government Agency
obligation maturing 8/18/17,
market value $490
(repurchase proceeds $478) | | $ | 478 | | |
Total Short-Term Obligation:
(Cost: $478) | | | 478 | | |
Total Investments: 100.2%
(Cost: $118,810)(a) | | | 138,155 | | |
| Cash and Other Assets Less Liabilities: (0.2)% | | | (216 | ) | |
| Total Net Assets: 100.0% | | $ | 137,939 | | |
> Notes to Statement of Investments (dollar values in thousands)
(a) At June 30, 2011, for federal income tax purposes, the cost of investments was $118,810 and net unrealized appreciation was $19,345, consisting of gross unrealized appreciation of $19,646 and gross unrealized depreciation of $301.
Various inputs are used in determining the value of the Fund's investments, following the input prioritization hierarchy established by GAAP. These inputs are summarized in the three broad levels listed below:
• Level 1 – quoted prices in active markets for identical securities
• Level 2 – prices determined using other significant observable inputs (including quoted prices for similar securities, interest rates, prepayment speeds, credit risk and others)
• Level 3 – prices determined using significant unobservable inputs where quoted prices or observable inputs are unavailable or less reliable (including management's own assumptions about the factors market participants would use in pricing an investment)
The inputs or methodology used for valuing securities are not necessarily an indication of the risk associated with investing in those securities.
Examples of the types of securities in which the Fund would typically invest and how they are classified within this hierarchy are as follows. Typical Level 1 securities include exchange traded domestic equities, mutual funds whose NAVs are published each day and exchange traded foreign equities that are not statistically fair valued. Typical Level 2 securities include exchange traded foreign equities that are statistically fair valued, forward foreign currency exchange contracts and short-term investments valued at amortized cost. Additionally, securities fair valued by the Valuation Committee of the Fund's Board of Trustees that rely on significant observable inputs are also included in Level 2. Typical Level 3 securities include any security fair valued by the Valuation Committee that relies on significant unobservable inputs.
The following table summarizes the inputs used, as of June 30, 2011, in valuing the Fund's assets:
| Investment Type | | Quoted Prices
(Level 1) | | Other
Significant
Observable
Inputs
(Level 2) | | Significant
Unobservable
Inputs
(Level 3) | | Total | |
| Total Stock Funds | | $ | 83,621 | | | $ | - | | | $ | - | | | $ | 83,621 | | |
| Total Bond Funds | | | 54,056 | | | | - | | | | - | | | | 54,056 | | |
| Total Short-Term Obligation | | | - | | | | 478 | | | | - | | | | 478 | | |
| Total Investments | | $ | 137,677 | | | $ | 478 | | | $ | - | | | $ | 138,155 | | |
The Fund's assets assigned to the Level 2 category include certain short-term obligations generally valued using amortized cost, an income approach which converts future cash flows to a present value based upon the discount or premium at purchase.
There were no significant transfers of financial assets between levels 1 and 2 during the period.
For more information on valuation inputs, and their aggregation into the levels used in table above, please refer to the Security Valuation section in the accompanying Notes to Financial Statements.
See accompanying notes to financial statements.
68
This page intentionally left blank.
69
Columbia Acorn Family of Funds
Statements of Assets and Liabilities (Unaudited)
| June 30, 2011 | | Columbia
Acorn
Fund | | Columbia
Acorn
International | | Columbia
Acorn
USA | | Columbia
Acorn
International
Select | | Columbia
Acorn
Select | | Columbia
Thermostat
Fund | |
| (in thousands) | |
| Assets: | |
| Unaffiliated investments, at cost | | $ | 9,331,368 | | | $ | 4,336,507 | | | $ | 1,239,910 | | | $ | 282,220 | | | $ | 1,158,355 | | | $ | — | | |
Affiliated investments, at cost
(See Note 4) | | | 2,325,878 | | | | 85,252 | | | | 4,479 | | | | — | | | | 368,957 | | | | 118,332 | | |
| Repurchase agreements, at cost | | | 534,686 | | | | 226,923 | | | | 15,821 | | | | 58,891 | | | | 94,733 | | | | 478 | | |
Unaffiliated investments, at value (including
securities on loan: Columbia Acorn Fund
$340,090; Columbia Acorn International
$88,468; Columbia Acorn USA $12,520;
Columbia Acorn International Select
$—; Columbia Acorn Select $59,666;
Columbia Thermostat Fund $—) | | $ | 15,285,789 | | | $ | 6,138,447 | | | $ | 1,910,189 | | | $ | 380,651 | | | $ | 1,719,377 | | | $ | — | | |
Affiliated investments, at value
(See Note 4) | | | 3,845,216 | | | | 104,674 | | | | 3,798 | | | | — | | | | 286,633 | | | | 137,677 | | |
| Repurchase agreements, at value | | | 534,686 | | | | 226,923 | | | | 15,821 | | | | 58,891 | | | | 94,733 | | | | 478 | | |
| Cash | | | 2,224 | | | | — | * | | | — | | | | 1 | | | | 1 | | | | 1 | | |
Foreign currency (cost: Columbia
Acorn Fund $2,127; Columbia
Acorn International $38,419; Columbia
Acorn International Select $525;
Columbia Acorn Select $151) | | | 2,150 | | | | 38,737 | | | | — | | | | 526 | | | | 151 | | | | — | | |
Net unrealized appreciation on forward
foreign currency exchange contracts | | | — | | | | 3,057 | | | | — | | | | — | | | | — | | | | — | | |
| Receivable for: | |
| Investments sold | | | 46,268 | | | | 14,133 | | | | 4,998 | | | | — | | | | 18,286 | | | | 174 | | |
| Fund shares sold | | | 16,431 | | | | 19,476 | | | | 1,248 | | | | 407 | | | | 1,206 | | | | 65 | | |
| Dividends and interest | | | 8,993 | | | | 6,343 | | | | 693 | | | | 329 | | | | 1,378 | | | | — | | |
| Securities lending income | | | 200 | | | | 105 | | | | 15 | | | | 8 | | | | 55 | | | | — | | |
| Foreign tax reclaims | | | 296 | | | | 1,706 | | | | — | | | | 124 | | | | — | | | | — | | |
| Expense reimbursement due from Adviser | | | — | | | | — | | | | — | | | | — | * | | | — | | | | 27 | | |
| Trustees' Deferred Compensation Investments | | | 2,417 | | | | 687 | | | | 197 | | | | 39 | | | | 250 | | | | 23 | | |
| Other assets | | | 147 | | | | 48 | | | | 24 | | | | 3 | | | | 10 | | | | 17 | | |
| Total Assets | | | 19,744,817 | | | | 6,554,336 | | | | 1,936,983 | | | | 440,979 | | | | 2,122,080 | | | | 138,462 | | |
| Liabilities: | |
| Collateral on securities loaned | | | 352,904 | | | | 90,621 | | | | 12,944 | | | | — | | | | 61,634 | | | | — | | |
Net unrealized depreciation on forward
foreign currency exchange contracts | | | — | | | | 2,796 | | | | — | | | | — | | | | — | | | | — | | |
| Payable for: | |
| Investments purchased | | | 77,052 | | | | 9,632 | | | | 5,767 | | | | 2,829 | | | | 8,297 | | | | — | | |
| Fund shares redeemed | | | 45,467 | | | | 4,970 | | | | 3,949 | | | | 258 | | | | 4,551 | | | | 335 | | |
| Management fee | | | 9,786 | | | | 3,956 | | | | 1,299 | | | | 339 | | | | 1,340 | | | | 11 | | |
| Administration fee | | | 578 | | | | 197 | | | | 57 | | | | 14 | | | | 62 | | | | 4 | | |
| 12b-1 Service & Distribution fees | | | 1,591 | | | | 281 | | | | 76 | | | | 26 | | | | 205 | | | | 43 | | |
| Reports to shareholders | | | 821 | | | | 395 | | | | 84 | | | | 74 | | | | 264 | | | | 70 | | |
| Deferred Trustees' fees | | | 2,417 | | | | 687 | | | | 197 | | | | 39 | | | | 250 | | | | 23 | | |
| Transfer agent fees | | | 2,066 | | | | 354 | | | | 236 | | | | 38 | | | | 356 | | | | 24 | | |
| Trustees' fees | | | 18 | | | | — | | | | 1 | | | | — | | | | 2 | | | | — | | |
| Professional fee | | | 140 | | | | 63 | | | | 21 | | | | 22 | | | | 20 | | | | 13 | | |
| Custody fees | | | 75 | | | | 509 | | | | 3 | | | | 32 | | | | 25 | | | | — | | |
| Foreign capital gains tax | | | — | | | | 201 | | | | — | | | | — | | | | — | | | | — | | |
| Other liabilities | | | 43 | | | | 14 | | | | 4 | | | | 9 | | | | 7 | | | | — | | |
| Total Liabilities | | | 492,958 | | | | 114,676 | | | | 24,638 | | | | 3,680 | | | | 77,013 | | | | 523 | | |
| Net Assets | | $ | 19,251,859 | | | $ | 6,439,660 | | | $ | 1,912,345 | | | $ | 437,299 | | | $ | 2,045,067 | | | $ | 137,939 | | |
| Composition of Net Assets: | |
| Paid in capital | | $ | 11,501,455 | | | $ | 4,977,351 | | | $ | 1,263,898 | | | $ | 345,003 | | | $ | 1,567,317 | | | $ | 143,450 | | |
Undistributed/(overdistributed)
net investment income
(Accumulated net investment loss) | | | (101,213 | ) | | | (102,703 | ) | | | (5,413 | ) | | | (4,301 | ) | | | (53,711 | ) | | | 1,525 | | |
| Accumulated net realized gain/(loss) | | | 377,782 | | | | (256,826 | ) | | | (15,738 | ) | | | (1,843 | ) | | | 52,764 | | | | (26,381 | ) | |
| Net unrealized appreciation/(depreciation) on: | |
| Investments | | | 7,473,759 | | | | 1,821,362 | | | | 669,598 | | | | 98,431 | | | | 478,698 | | | | 19,345 | | |
| Foreign capital gains tax | | | — | | | | (201 | ) | | | — | | | | — | | | | — | | | | — | | |
| Foreign currency translations | | | 76 | | | | 677 | | | | — | | | | 9 | | | | (1 | ) | | | — | | |
| Net Assets | | $ | 19,251,859 | | | $ | 6,439,660 | | | $ | 1,912,345 | | | $ | 437,299 | | | $ | 2,045,067 | | | $ | 137,939 | | |
Net asset value per
share – Class A (a) | | $ | 30.95 | | | $ | 41.02 | | | $ | 30.01 | | | $ | 28.69 | | | $ | 27.50 | | | $ | 12.98 | | |
| (Net assets/shares) | | ($3,926,256/126,838) | | ($908,471/22,149) | | ($212,735/7,088) | | ($71,320/2,486) | | ($509,474/18,526) | | ($54,090/4,166) | |
Maximum offering price per
share – Class A (b) | | $ | 32.84 | | | $ | 43.52 | | | $ | 31.84 | | | $ | 30.44 | | | $ | 29.18 | | | $ | 13.77 | | |
(Net asset value per share/front-
end sales charge) | | ($30.95/0.9425) | | ($41.02/0.9425) | | ($30.01/0.9425) | | ($28.69/0.9425) | | ($27.50/0.9425) | | ($12.98/0.9425) | |
Net asset value and offering price per
share – Class B (a) | | $ | 28.62 | | | $ | 39.97 | (d) | | $ | 27.79 | (d) | | $ | 27.42 | (d) | | $ | 25.70 | | | $ | 13.04 | | |
| (Net assets/shares) | | ($188,366/6,581) | | ($23,575/590) | | ($7,112/255) | | ($2,563/93) | | ($53,225/2,071) | | ($21,615/1,658) | |
Net asset value and offering price per
share – Class C (a) | | $ | 28.30 | | | $ | 39.82 | | | $ | 27.57 | (d) | | $ | 27.29 | | | $ | 25.49 | (d) | | $ | 13.02 | | |
| (Net assets/shares) | | ($876,147/30,954) | | ($100,222/2,517) | | ($36,348/1,319) | | ($11,463/420) | | ($87,862/3,446) | | ($22,788/1,750) | |
Net asset value and offering price per
share – Class I | | $ | 31.96 | (d) | | $ | 41.15 | (d) | | $ | 31.18 | (d) | | $ | 29.00 | | | $ | 28.25 | (d) | | | | | |
| (Net assets/shares) | | ($12,665/396) | | ($27,769/675) | | ($3,211/103) | | ($3/0**) | | ($8,496/301) | | | | | |
Net asset value and offering price per
share – Class Z (c) | | $ | 31.95 | | | $ | 41.13 | | | $ | 31.17 | | | $ | 28.98 | | | $ | 28.25 | | | $ | 12.86 | | |
| (Net assets/shares) | | ($14,248,425/446,005) | | ($5,379,623/130,798) | | ($1,652,939/53,033) | | ($351,950/12,145) | | ($1,386,010/49,056) | | ($39,446/3,068) | |
(a) Redemption price per share is equal to net asset value less any applicable contingent deferred sales charge and redemption fee.
(b) On sales of $50,000 or more the offering price is reduced.
(c) Redemption price per share is equal to net asset value less any applicable redemption fee.
(d) Due to rounding of shares outstanding.
* Rounds to less than $500.
** Rounds to less than 500 shares.
See accompanying notes to financial statements.
70
Columbia Acorn Family of Funds
Statements of Operations (Unaudited)
For the Six Months Ended June 30, 2011
| (in thousands) | | Columbia
Acorn
Fund | | Columbia
Acorn
International | | Columbia
Acorn
USA | | Columbia
Acorn
International
Select | | Columbia
Acorn
Select | | Columbia
Thermostat
Fund | |
| Investment Income: | |
| Dividend income | | $ | 62,270 | | | $ | 84,948 | | | $ | 4,453 | | | $ | 5,929 | | | $ | 6,882 | | | $ | — | | |
Dividend income from affiliates
(See Note 4) | | | 5,944 | | | | 2,397 | | | | — | | | | — | | | | — | | | | — | | |
Dividends from affiliated investment
company shares (See Note 4) | | | — | | | | — | | | | — | | | | — | | | | — | | | | 2,023 | | |
| Interest income | | | 167 | | | | 95 | | | | 4 | | | | 6 | | | | 26 | | | | — | * | |
| Securitites lending income, net | | | 1,053 | | | | 454 | | | | 95 | | | | 14 | | | | 131 | | | | — | | |
| | | | 69,434 | | | | 87,894 | | | | 4,552 | | | | 5,949 | | | | 7,039 | | | | 2,023 | | |
| Foreign taxes withheld | | | (1,493 | ) | | | (7,054 | ) | | | (8 | ) | | | (471 | ) | | | (88 | ) | | | — | | |
| Total Investment Income | | | 67,941 | | | | 80,840 | | | | 4,544 | | | | 5,478 | | | | 6,951 | | | | 2,023 | | |
| Expenses: | |
| Management fee | | | 59,852 | | | | 23,819 | | | | 7,935 | | | | 2,084 | | | | 8,907 | | | | 68 | | |
| Administration fee | | | 3,530 | | | | 1,184 | | | | 349 | | | | 84 | | | | 414 | | | | 26 | | |
| 12b-1 Service and Distribution fees: | |
| Class A | | | 4,732 | | | | 1,083 | | | | 271 | | | | 90 | | | | 671 | | | | 60 | | |
| Class B | | | 903 | | | | 99 | | | | 31 | | | | 11 | | | | 237 | | | | 99 | | |
| Class C | | | 4,258 | | | | 547 | | | | 180 | | | | 58 | | | | 468 | | | | 112 | | |
| Transfer agent fees: | |
| Class A | | | 1,554 | | | | 593 | | | | 94 | | | | 57 | | | | 276 | | | | 32 | | |
| Class B | | | 347 | | | | 41 | | | | 14 | | | | 5 | | | | 86 | | | | 28 | | |
| Class C | | | 472 | | | | 83 | | | | 20 | | | | 12 | | | | 68 | | | | 17 | | |
| Class Z | | | 2,623 | | | | 1,225 | | | | 415 | | | | 57 | | | | 445 | | | | 9 | | |
| Custody fees | | | 649 | | | | 2,120 | | | | 28 | | | | 118 | | | | 156 | | | | — | | |
| Trustees' fees | | | 538 | | | | 176 | | | | 51 | | | | 15 | | | | 66 | | | | 5 | | |
| Reports to shareholders | | | 1,018 | | | | 548 | | | | 169 | | | | 70 | | | | 259 | | | | 56 | | |
| Professional fees | | | 559 | | | | 208 | | | | 61 | | | | 32 | | | | 71 | | | | 13 | | |
| Chief compliance officer expenses (See Note 4) | | | 258 | | | | 79 | | | | 25 | | | | 7 | | | | 34 | | | | 2 | | |
| Other expenses | | | 359 | | | | 168 | | | | 76 | | | | 59 | | | | 97 | | | | 41 | | |
| Total expenses | | | 81,652 | | | | 31,973 | | | | 9,719 | | | | 2,759 | | | | 12,255 | | | | 568 | | |
| Less custody fees paid indirectly | | | — | * | | | — | * | | | — | * | | | — | * | | | — | * | | | — | | |
Less reimbursement of expenses by
Investment Adviser | | | — | | | | — | | | | — | | | | — | * | | | — | | | | (129 | ) | |
| Net Expenses | | | 81,652 | | | | 31,973 | | | | 9,719 | | | | 2,759 | | | | 12,255 | | | | 439 | | |
| Net Investment Income/(Loss) | | | (13,711 | ) | | | 48,867 | | | | (5,175 | ) | | | 2,719 | | | | (5,304 | ) | | | 1,584 | | |
Net Realized and Unrealized Gain (Loss)
on Portfolio Positions: | |
| Net realized gain/(loss) on: | |
| Unaffiliated investments | | | 381,947 | | | | 133,208 | | | | 13,002 | | | | 34,920 | | | | 175,643 | | | | 3,561 | | |
| Affiliated investments (See Note 4) | | | 11,248 | | | | (2,643 | ) | | | — | | | | — | | | | (2,797 | ) | | | — | | |
Foreign currency transactions and forward
foreign currency exchange contracts | | | 146 | | | | 1,067 | | | | — | | | | (52 | ) | | | (65 | ) | | | — | | |
Distributions from affiliated investment
company shares | | | — | | | | — | | | | — | | | | — | | | | — | | | | 156 | | |
| Net realized gain | | | 393,341 | | | | 131,632 | | | | 13,002 | | | | 34,868 | | | | 172,781 | | | | 3,717 | | |
Net change in net unrealized
appreciation/(depreciation) on: | |
| Unaffiliated investments | | | 507,051 | | | | 14,580 | | | | 154,928 | | | | (21,427 | ) | | | (79,517 | ) | | | — | | |
| Affiliated investments (See Note 4) | | | 397,583 | | | | 2,549 | | | | 504 | | | | — | | | | (89,482 | ) | | | 552 | | |
Foreign currency translations and forward
foreign currency exchange contracts | | | 46 | | | | (11,766 | ) | | | — | | | | (3 | ) | | | (2 | ) | | | — | | |
| Foreign capital gains tax | | | — | | | | 306 | | | | — | | | | — | | | | — | | | | — | | |
Net change in unrealized appreciation/
(depreciation) | | | 904,680 | | | | 5,669 | | | | 155,432 | | | | (21,430 | ) | | | (169,001 | ) | | | 552 | | |
| Net realized and unrealized gain | | | 1,298,021 | | | | 137,301 | | | | 168,434 | | | | 13,438 | | | | 3,780 | | | | 4,269 | | |
Net Increase/(Decrease) in Net Assets
resulting from Operations | | $ | 1,284,310 | | | $ | 186,168 | | | $ | 163,259 | | | $ | 16,157 | | | $ | (1,524 | ) | | $ | 5,853 | | |
* Rounds to less than $500.
See accompanying notes to financial statements.
71
Columbia Acorn Family of Funds
Statements of Changes in Net Assets
| | | Columbia
Acorn Fund | | Columbia Acorn
International | | Columbia
Acorn USA | |
| Increase (Decrease) in Net Assets | | (Unaudited)
Six months
ended
June 30, | | Year ended
December 31, | | (Unaudited)
Six months
ended
June 30, | | Year ended
December 31, | | (Unaudited)
Six months
ended
June 30, | | Year ended
December 31, | |
| (in thousands) | | 2011 | | 2010 (a)(b) | | 2011 | | 2010 (a)(b) | | 2011 | | 2010 (a)(b) | |
| Operations: | |
| Net investment income/(loss) | | $ | (13,711 | ) | | $ | (7,374 | ) | | $ | 48,867 | | | $ | 45,340 | | | $ | (5,175 | ) | | $ | (5,972 | ) | |
Net realized gain/(loss) on investments, foreign
currency transactions, forward foreign currency exchange contracts
and foreign capital gains tax | | | 382,093 | | | | 971,334 | | | | 134,275 | | | | 276,374 | | | | 13,002 | | | | 96,553 | | |
Net realized gain/(loss) on affiliated investments and
distributions from affiliated investment companies and
affiliated investment company shares | | | 11,248 | | | | 139,546 | | | | (2,643 | ) | | | 5,786 | | | | — | | | | (1,208 | ) | |
Net change in net unrealized appreciation/(depreciation)
on investments, foreign currency translations, forward foreign
currency exchange contracts and foreign capital gains tax | | | 507,097 | | | | 1,864,571 | | | | 3,120 | | | | 752,452 | | | | 154,928 | | | | 224,623 | | |
Net change in net unrealized appreciation/(depreciation)
on affiliated investment companies and affiliated investment
company shares | | | 397,583 | | | | 758,959 | | | | 2,549 | | | | 6,050 | | | | 504 | | | | 4,434 | | |
| Net Increase/(Decrease) from Operations | | | 1,284,310 | | | | 3,727,036 | | | | 186,168 | | | | 1,086,002 | | | | 163,259 | | | | 318,430 | | |
| Distributions to Shareholders From: | |
| Net investment income – Class A | | | (2,047 | ) | | | (2,387 | ) | | | (21,972 | ) | | | (12,578 | ) | | | — | | | | — | | |
| Net realized gain – Class A | | | (38,150 | ) | | | (100,919 | ) | | | — | | | | — | | | | — | | | | — | | |
| Net investment income – Class B | | | — | | | | — | | | | (600 | ) | | | (290 | ) | | | — | | | | — | | |
| Net realized gain – Class B | | | (2,204 | ) | | | (9,116 | ) | | | — | | | | — | | | | — | | | | — | | |
| Net investment income – Class C | | | — | | | | — | | | | (2,369 | ) | | | (714 | ) | | | — | | | | — | | |
| Net realized gain – Class C | | | (9,366 | ) | | | (25,102 | ) | | | — | | | | — | | | | — | | | | — | | |
| Net investment income – Class I | | | (34 | ) | | | — | * | | | (676 | ) | | | (9 | ) | | | — | | | | — | | |
| Net realized gain – Class I | | | (119 | ) | | | — | * | | | — | | | | — | | | | — | | | | — | | |
| Net investment income – Class Z | | | (36,823 | ) | | | (18,634 | ) | | | (131,455 | ) | | | (109,328 | ) | | | — | | | | — | | |
| Net realized gain – Class Z | | | (134,735 | ) | | | (361,156 | ) | | | — | | | | — | | | | — | | | | — | | |
| Total Distributions to Shareholders | | | (223,478 | ) | | | (517,314 | ) | | | (157,072 | ) | | | (122,919 | ) | | | — | | | | — | | |
| Share Transactions: | |
| Subscriptions – Class A | | | 513,660 | | | | 843,928 | | | | 183,011 | | | | 317,458 | | | | 24,680 | | | | 55,029 | | |
| Distributions reinvested – Class A | | | 36,444 | | | | 94,158 | | | | 18,983 | | | | 10,862 | | | | — | | | | — | | |
| Redemptions – Class A | | | (481,606 | ) | | | (866,166 | ) | | | (107,204 | ) | | | (221,501 | ) | | | (45,052 | ) | | | (59,786 | ) | |
| Net Increase/(Decrease) – Class A | | | 68,498 | | | | 71,920 | | | | 94,790 | | | | 106,819 | | | | (20,372 | ) | | | (4,757 | ) | |
| Subscriptions – Class B | | | 278 | | | | 989 | | | | 58 | | | | 35 | | | | 4 | | | | 2 | | |
| Distributions reinvested – Class B | | | 1,814 | | | | 7,325 | | | | 494 | | | | 260 | | | | — | | | | — | | |
| Redemptions – Class B | | | (114,111 | ) | | | (312,686 | ) | | | (6,359 | ) | | | (15,278 | ) | | | (2,795 | ) | | | (13,951 | ) | |
| Net Decrease – Class B | | | (112,019 | ) | | | (304,372 | ) | | | (5,807 | ) | | | (14,983 | ) | | | (2,791 | ) | | | (13,949 | ) | |
| Subscriptions – Class C | | | 66,633 | | | | 76,903 | | | | 11,504 | | | | 24,476 | | | | 1,195 | | | | 1,669 | | |
| Distributions reinvested – Class C | | | 7,134 | | | | 19,273 | | | | 1,844 | | | | 590 | | | | — | | | | — | | |
| Redemptions – Class C | | | (71,870 | ) | | | (145,469 | ) | | | (24,543 | ) | | | (17,799 | ) | | | (3,930 | ) | | | (4,671 | ) | |
| Net Increase/(Decrease) – Class C | | | 1,897 | | | | (49,293 | ) | | | (11,195 | ) | | | 7,267 | | | | (2,735 | ) | | | (3,002 | ) | |
| Subscriptions – Class I | | | 4,307 | | | | 13,063 | | | | 8,133 | | | | 66,675 | | | | 10,803 | | | | 28,852 | | |
| Distributions reinvested – Class I | | | 153 | | | | — | | | | 675 | | | | 9 | | | | — | | | | — | | |
| Redemptions – Class I | | | (4,183 | ) | | | (1,538 | ) | | | (48,107 | ) | | | (2,003 | ) | | | (38,271 | ) | | | (293 | ) | |
| Net Increase/(Decrease) – Class I | | | 277 | | | | 11,525 | | | | (39,299 | ) | | | 64,681 | | | | (27,468 | ) | | | 28,559 | | |
| Subscriptions – Class Z | | | 1,182,084 | | | | 2,077,687 | | | | 589,377 | | | | 1,216,447 | | | | 234,528 | | | | 260,284 | | |
| Distributions reinvested – Class Z | | | 145,609 | | | | 324,149 | | | | 91,324 | | | | 76,344 | | | | — | | | | — | | |
| Redemptions – Class Z | | | (1,194,031 | ) | | | (1,969,778 | ) | | | (433,689 | ) | | | (726,019 | ) | | | (130,622 | ) | | | (276,628 | ) | |
| Net Increase/(Decrease) – Class Z | | | 133,662 | | | | 432,058 | | | | 247,012 | | | | 566,772 | | | | 103,906 | | | | (16,344 | ) | |
| Net Increase/(Decrease) from Share Transactions | | | 92,315 | | | | 161,838 | | | | 285,501 | | | | 730,556 | | | | 50,540 | | | | (9,493 | ) | |
| Redemption Fees | | | — | | | | — | | | | — | | | | 239 | | | | — | | | | — | | |
| Increase from regulatory settlements (See Note 9) | | | — | | | | 1 | | | | — | | | | 447 | | | | — | | | | — | | |
| Total Increase/(Decrease) in Net Assets | | | 1,153,147 | | | | 3,371,561 | | | | 314,597 | | | | 1,694,325 | | | | 213,799 | | | | 308,937 | | |
| Net Assets: | |
| Beginning of period | | | 18,098,712 | | | | 14,727,151 | | | | 6,125,063 | | | | 4,430,738 | | | | 1,698,546 | | | | 1,389,609 | | |
| End of period | | $ | 19,251,859 | | | $ | 18,098,712 | | | $ | 6,439,660 | | | $ | 6,125,063 | | | $ | 1,912,345 | | | $ | 1,698,546 | | |
Undistributed/(Overdistributed) Net Investment Income or
(Accumulated Net Investment Loss) | | $ | (101,213 | ) | | $ | (48,598 | ) | | $ | (102,703 | ) | | $ | 5,502 | | | $ | (5,413 | ) | | $ | (238 | ) | |
(a) Class I Shares commenced operations on September 27, 2010.
(b) Class I Shares reflect activity for the period September 27, 2010 through December 31, 2010.
* Rounds to less than $500.
See accompanying notes to financial statements.
72
| | | Columbia Acorn
International Select | | Columbia
Acorn Select | | Columbia
Thermostat Fund | |
| Increase (Decrease) in Net Assets | | (Unaudited)
Six months
ended
June 30, | | Year ended
December 31, | | (Unaudited)
Six months
ended
June 30, | | Year ended
December 31, | | (Unaudited)
Six months
ended
June 30, | | Year ended
December 31, | |
| (in thousands) | | 2011 | | 2010 (a)(b) | | 2011 | | 2010 (a)(b) | | 2011 | | 2010 | |
| Operations: | |
| Net investment income/(loss) | | $ | 2,719 | | | $ | 2,667 | | | $ | (5,304 | ) | | $ | (11,783 | ) | | $ | 1,584 | | | $ | 1,806 | | |
Net realized gain/(loss) on investments, foreign
currency transactions, forward foreign currency exchange contracts
and foreign capital gains tax | | | 34,868 | | | | 42,527 | | | | 175,578 | | | | 59,672 | | | | — | | | | — | | |
Net realized gain/(loss) on affiliated investments and
distributions from affiliated investment companies and
affiliated investment company shares | | | — | | | | — | | | | (2,797 | ) | | | (38,281 | ) | | | 3,717 | | | | (1,976 | ) | |
Net change in net unrealized appreciation/(depreciation)
on investments, foreign currency translations, forward foreign
currency exchange contracts and foreign capital gains tax | | | (21,430 | ) | | | 38,193 | | | | (79,519 | ) | | | 283,123 | | | | — | | | | — | | |
Net change in net unrealized appreciation/(depreciation)
on affiliated investment companies and affiliated investment
company shares | | | — | | | | — | | | | (89,482 | ) | | | 123,090 | | | | 552 | | | | 19,741 | | |
| Net Increase/(Decrease) from Operations | | | 16,157 | | | | 83,387 | | | | (1,524 | ) | | | 415,821 | | | | 5,853 | | | | 19,571 | | |
| Distributions to Shareholders From: | |
| Net investment income – Class A | | | (770 | ) | | | (776 | ) | | | (7,162 | ) | | | — | | | | (625 | ) | | | (678 | ) | |
| Net realized gain – Class A | | | — | | | | — | | | | — | | | | — | | | | — | | | | — | | |
| Net investment income – Class B | | | (16 | ) | | | (25 | ) | | | (500 | ) | | | — | | | | (249 | ) | | | (239 | ) | |
| Net realized gain – Class B | | | — | | | | — | | | | — | | | | — | | | | — | | | | — | | |
| Net investment income – Class C | | | (50 | ) | | | (65 | ) | | | (672 | ) | | | — | | | | (191 | ) | | | (124 | ) | |
| Net realized gain – Class C | | | — | | | | — | | | | — | | | | — | | | | — | | | | — | | |
| Net investment income – Class I | | | — | * | | | — | | | | (141 | ) | | | — | | | | — | | | | — | | |
| Net realized gain – Class I | | | — | | | | — | | | | — | | | | — | | | | — | | | | — | | |
| Net investment income – Class Z | | | (5,052 | ) | | | (5,241 | ) | | | (22,715 | ) | | | — | | | | (473 | ) | | | (625 | ) | |
| Net realized gain – Class Z | | | — | | | | — | | | | — | | | | — | | | | — | | | | — | | |
| Total Distributions to Shareholders | | | (5,888 | ) | | | (6,107 | ) | | | (31,190 | ) | | | — | | | | (1,538 | ) | | | (1,666 | ) | |
| Share Transactions: | |
| Subscriptions – Class A | | | 10,119 | | | | 18,214 | | | | 40,885 | | | | 115,498 | | | | 12,599 | | | | 8,937 | | |
| Distributions reinvested – Class A | | | 667 | | | | 675 | | | | 6,307 | | | | — | | | | 501 | | | | 609 | | |
| Redemptions – Class A | | | (12,913 | ) | | | (23,778 | ) | | | (85,032 | ) | | | (187,411 | ) | | | (5,038 | ) | | | (13,847 | ) | |
| Net Increase/(Decrease) – Class A | | | (2,127 | ) | | | (4,889 | ) | | | (37,840 | ) | | | (71,913 | ) | | | 8,062 | | | | (4,301 | ) | |
| Subscriptions – Class B | | | 2 | | | | — | * | | | 69 | | | | 34 | | | | 45 | | | | 4 | | |
| Distributions reinvested – Class B | | | 13 | | | | 22 | | | | 391 | | | | — | | | | 181 | | | | 218 | | |
| Redemptions – Class B | | | (557 | ) | | | (1,418 | ) | | | (18,583 | ) | | | (30,406 | ) | | | (8,198 | ) | | | (8,516 | ) | |
| Net Decrease – Class B | | | (542 | ) | | | (1,396 | ) | | | (18,123 | ) | | | (30,372 | ) | | | (7,972 | ) | | | (8,294 | ) | |
| Subscriptions – Class C | | | 636 | | | | 1,883 | | | | 2,746 | | | | 6,743 | | | | 2,665 | | | | 3,195 | | |
| Distributions reinvested – Class C | | | 40 | | | | 55 | | | | 495 | | | | — | | | | 149 | | | | 109 | | |
| Redemptions – Class C | | | (1,405 | ) | | | (3,121 | ) | | | (12,612 | ) | | | (19,302 | ) | | | (2,602 | ) | | | (5,530 | ) | |
| Net Increase/(Decrease) – Class C | | | (729 | ) | | | (1,183 | ) | | | (9,371 | ) | | | (12,559 | ) | | | 212 | | | | (2,226 | ) | |
| Subscriptions – Class I | | | — | | | | 3 | | | | 3,155 | | | | 8,577 | | | | — | | | | — | | |
| Distributions reinvested – Class I | | | — | | | | — | | | | 141 | | | | — | | | | — | | | | — | | |
| Redemptions – Class I | | | — | | | | — | | | | (2,611 | ) | | | (931 | ) | | | — | | | | — | | |
| Net Increase/(Decrease) – Class I | | | — | | | | 3 | | | | 685 | | | | 7,646 | | | | — | | | | — | | |
| Subscriptions – Class Z | | | 28,129 | | | | 67,172 | | | | 108,942 | | | | 358,116 | | | | 5,619 | | | | 7,895 | | |
| Distributions reinvested – Class Z | | | 1,771 | | | | 1,451 | | | | 17,488 | | | | — | | | | 410 | | | | 560 | | |
| Redemptions – Class Z | | | (52,139 | ) | | | (96,502 | ) | | | (266,855 | ) | | | (328,729 | ) | | | (3,982 | ) | | | (18,853 | ) | |
| Net Increase/(Decrease) – Class Z | | | (22,239 | ) | | | (27,879 | ) | | | (140,425 | ) | | | 29,387 | | | | 2,047 | | | | (10,398 | ) | |
| Net Increase/(Decrease) from Share Transactions | | | (25,637 | ) | | | (35,344 | ) | | | (205,074 | ) | | | (77,811 | ) | | | 2,349 | | | | (25,219 | ) | |
| Redemption Fees | | | — | | | | 10 | | | | — | | | | — | | | | — | | | | — | | |
| Increase from regulatory settlements (See Note 9) | | | — | | | | 46 | | | | — | | | | — | | | | — | | | | — | | |
| Total Increase/(Decrease) in Net Assets | | | (15,368 | ) | | | 41,992 | | | | (237,788 | ) | | | 338,010 | | | | 6,664 | | | | (7,314 | ) | |
| Net Assets: | |
| Beginning of period | | | 452,667 | | | | 410,675 | | | | 2,282,855 | | | | 1,944,845 | | | | 131,275 | | | | 138,589 | | |
| End of period | | $ | 437,299 | | | $ | 452,667 | | | $ | 2,045,067 | | | $ | 2,282,855 | | | $ | 137,939 | | | $ | 131,275 | | |
Undistributed/(Overdistributed) Net Investment Income or
(Accumulated Net Investment Loss) | | $ | (4,301 | ) | | $ | (1,132 | ) | | $ | (53,711 | ) | | $ | (17,217 | ) | | $ | 1,525 | | | $ | 1,479 | | |
See accompanying notes to financial statements.
73
Columbia Acorn Family of Funds
Statements of Changes in Net Assets, continued
| | | Columbia
Acorn Fund | | Columbia Acorn
International | | Columbia
Acorn USA | |
| Changes in Shares of Beneficial Interest: | | (Unaudited)
Six months
ended
June 30, | | Year ended
December 31, | | (Unaudited)
Six months
ended
June 30, | | Year ended
December 31, | | (Unaudited)
Six months
ended
June 30, | | Year ended
December 31, | |
| (in thousands) | | 2011 | | 2010 (a)(b) | | 2011 | | 2010 (a)(b) | | 2011 | | 2010 (a)(b) | |
| Subscriptions – Class A | | | 17,024 | | | | 32,735 | | | | 4,451 | | | | 8,744 | | | | 852 | | | | 2,334 | | |
| Shares issued in reinvestment – Class A | | | 1,237 | | | | 3,306 | | | | 463 | | | | 325 | | | | — | | | | — | | |
| Less shares redeemed – Class A | | | (15,908 | ) | | | (34,053 | ) | | | (2,601 | ) | | | (6,188 | ) | | | (1,539 | ) | | | (2,521 | ) | |
| Net Increase/(Decrease) – Class A | | | 2,353 | | | | 1,988 | | | | 2,313 | | | | 2,881 | | | | (687 | ) | | | (187 | ) | |
| Subscriptions – Class B | | | 10 | | | | 38 | | | | 2 | | | | 1 | | | | — | * | | | — | * | |
| Shares issued in reinvestment – Class B | | | 66 | | | | 276 | | | | 12 | | | | 9 | | | | — | | | | — | | |
| Less shares redeemed – Class B | | | (4,094 | ) | | | (13,126 | ) | | | (159 | ) | | | (444 | ) | | | (105 | ) | | | (636 | ) | |
| Net Decrease – Class B | | | (4,018 | ) | | | (12,812 | ) | | | (145 | ) | | | (434 | ) | | | (105 | ) | | | (636 | ) | |
| Subscriptions – Class C | | | 2,406 | | | | 3,197 | | | | 288 | | | | 700 | | | | 45 | | | | 76 | | |
| Shares issued in reinvestment – Class C | | | 265 | | | | 733 | | | | 46 | | | | 19 | | | | — | | | | — | | |
| Less shares redeemed – Class C | | | (2,599 | ) | | | (6,190 | ) | | | (605 | ) | | | (519 | ) | | | (148 | ) | | | (214 | ) | |
| Net Increase/(Decrease) – Class C | | | 72 | | | | (2,260 | ) | | | (271 | ) | | | 200 | | | | (103 | ) | | | (138 | ) | |
| Subscriptions – Class I | | | 138 | | | | 436 | | | | 196 | | | | 1,677 | | | | 361 | | | | 1,025 | | |
| Shares issued in reinvestment – Class I | | | 5 | | | | — | | | | 17 | | | | — | * | | | — | | | | — | | |
| Less shares redeemed – Class I | | | (132 | ) | | | (51 | ) | | | (1,165 | ) | | | (50 | ) | | | (1,273 | ) | | | (10 | ) | |
| Net Increase/(Decrease) – Class I | | | 11 | | | | 385 | | | | (952 | ) | | | 1,627 | | | | (912 | ) | | | 1,015 | | |
| Subscriptions – Class Z | | | 37,835 | | | | 78,950 | | | | 14,274 | | | | 33,971 | | | | 7,994 | | | | 10,643 | | |
| Shares issued in reinvestment – Class Z | | | 4,790 | | | | 11,048 | | | | 2,222 | | | | 2,239 | | | | — | | | | — | | |
| Less shares redeemed – Class Z | | | (38,207 | ) | | | (74,926 | ) | | | (10,531 | ) | | | (20,195 | ) | | | (4,340 | ) | | | (11,173 | ) | |
| Net Increase/(Decrease) – Class Z | | | 4,418 | | | | 15,072 | | | | 5,965 | | | | 16,015 | | | | 3,654 | | | | (530 | ) | |
| Net Increase/(Decrease) in Shares of Beneficial Interest | | | 2,836 | | | | 2,373 | | | | 6,910 | | | | 20,289 | | | | 1,847 | | | | (476 | ) | |
(a) Class I Shares commenced operations on September 27, 2010.
(b) Class I Shares reflect activity for the period September 27, 2010 through December 31, 2010.
* Rounds to less than 500.
See accompanying notes to financial statements.
74
| | | Columbia Acorn
International Select | | Columbia
Acorn Select | | Columbia
Thermostat Fund | |
| Changes in Shares of Beneficial Interest: | | (Unaudited)
Six months
ended
June 30, | | Year ended
December 31, | | (Unaudited)
Six months
ended
June 30, | | Year ended
December 31, | | (Unaudited)
Six months
ended
June 30, | | Year ended
December 31, | |
| (in thousands) | | 2011 | | 2010 (a)(b) | | 2011 | | 2010 (a)(b) | | 2011 | | 2010 | |
| Subscriptions – Class A | | | 355 | | | | 746 | | | | 1,468 | | | | 4,815 | | | | 977 | | | | 765 | | |
| Shares issued in reinvestment – Class A | | | 23 | | | | 31 | | | | 242 | | | | — | | | | 39 | | | | 56 | | |
| Less shares redeemed – Class A | | | (451 | ) | | | (982 | ) | | | (3,056 | ) | | | (7,851 | ) | | | (391 | ) | | | (1,223 | ) | |
| Net Increase/(Decrease) – Class A | | | (73 | ) | | | (205 | ) | | | (1,346 | ) | | | (3,036 | ) | | | 625 | | | | (402 | ) | |
| Subscriptions – Class B | | | — | * | | | — | * | | | 3 | | | | 2 | | | | 4 | | | | — | * | |
| Shares issued in reinvestment – Class B | | | — | * | | | 1 | | | | 16 | | | | — | | | | 14 | | | | 21 | | |
| Less shares redeemed – Class B | | | (20 | ) | | | (62 | ) | | | (719 | ) | | | (1,342 | ) | | | (634 | ) | | | (744 | ) | |
| Net Decrease – Class B | | | (20 | ) | | | (61 | ) | | | (700 | ) | | | (1,340 | ) | | | (616 | ) | | | (723 | ) | |
| Subscriptions – Class C | | | 23 | | | | 83 | | | | 106 | | | | 299 | | | | 207 | | | | 275 | | |
| Shares issued in reinvestment – Class C | | | 1 | | | | 2 | | | | 21 | | | | — | | | | 12 | | | | 10 | | |
| Less shares redeemed – Class C | | | (51 | ) | | | (138 | ) | | | (492 | ) | | | (870 | ) | | | (202 | ) | | | (485 | ) | |
| Net Increase/(Decrease) – Class C | | | (27 | ) | | | (53 | ) | | | (365 | ) | | | (571 | ) | | | 17 | | | | (200 | ) | |
| Subscriptions – Class I | | | — | | | | — | * | | | 111 | | | | 305 | | | | — | | | | — | | |
| Shares issued in reinvestment – Class I | | | — | | | | — | | | | 5 | | | | — | | | | — | | | | — | | |
| Less shares redeemed – Class I | | | — | | | | — | | | | (88 | ) | | | (32 | ) | | | — | | | | — | | |
| Net Increase/(Decrease) – Class I | | | — | | | | — | * | | | 28 | | | | 273 | | | | — | | | | — | | |
| Subscriptions – Class Z | | | 973 | | | | 2,699 | | | | 3,786 | | | | 14,221 | | | | 443 | | | | 697 | | |
| Shares issued in reinvestment – Class Z | | | 61 | | | | 66 | | | | 654 | | | | — | | | | 32 | | | | 51 | | |
| Less shares redeemed – Class Z | | | (1,812 | ) | | | (3,845 | ) | | | (9,298 | ) | | | (13,400 | ) | | | (311 | ) | | | (1,710 | ) | |
| Net Increase/(Decrease) – Class Z | | | (778 | ) | | | (1,080 | ) | | | (4,858 | ) | | | 821 | | | | 164 | | | | (962 | ) | |
| Net Increase/(Decrease) in Shares of Beneficial Interest | | | (898 | ) | | | (1,399 | ) | | | (7,241 | ) | | | (3,853 | ) | | | 190 | | | | (2,287 | ) | |
See accompanying notes to financial statements.
75
Columbia Acorn Family of Funds
Financial Highlights
Columbia Acorn Fund
| Class Z Shares | | (Unaudited)
Six months
ended June 30, | | Year ended December 31, | |
| Selected data for a share outstanding throughout each period | | 2011 | | 2010 | | 2009 | | 2008 | | 2007 | | 2006 | |
| Net Asset Value, Beginning of Period | | $ | 30.19 | | | $ | 24.68 | | | $ | 17.71 | | | $ | 29.61 | | | $ | 29.71 | | | $ | 28.17 | | |
| Income from Investment Operations | |
| Net investment income/(loss) (a) | | | (0.00 | )(b) | | | 0.02 | | | | 0.04 | | | | 0.06 | | | | 0.15 | (c) | | | 0.13 | | |
| Net realized and unrealized gain/(loss) | | | 2.15 | | | | 6.37 | | | | 6.98 | | | | (11.29 | ) | | | 2.17 | | | | 3.92 | | |
| Total from Investment Operations | | | 2.15 | | | | 6.39 | | | | 7.02 | | | | (11.23 | ) | | | 2.32 | | | | 4.05 | | |
| Less Distributions to Shareholders | |
| From net investment income | | | (0.09 | ) | | | (0.04 | ) | | | (0.05 | ) | | | (0.01 | ) | | | (0.12 | ) | | | (0.13 | ) | |
| From net realized gains | | | (0.30 | ) | | | (0.84 | ) | | | — | | | | (0.66 | ) | | | (2.30 | ) | | | (2.38 | ) | |
| Total Distributions to Shareholders | | | (0.39 | ) | | | (0.88 | ) | | | (0.05 | ) | | | (0.67 | ) | | | (2.42 | ) | | | (2.51 | ) | |
| Increase from regulatory settlements | | | — | | | | 0.00 | (b) | | | 0.00 | (b) | | | — | | | | — | | | | — | | |
| Net Asset Value, End of Period | | $ | 31.95 | | | $ | 30.19 | | | $ | 24.68 | | | $ | 17.71 | | | $ | 29.61 | | | $ | 29.71 | | |
| Total Return (d) | | | 7.18 | %(e) | | | 26.00 | % | | | 39.65 | % | | | (38.55 | )% | | | 7.69 | %(f)(g) | | | 14.45 | %(f) | |
| Ratios to Average Net Assets/Supplemental Data | |
| Net expenses (h) | | | 0.75 | %(i) | | | 0.76 | % | | | 0.77 | % | | | 0.76 | % | | | 0.74 | % | | | 0.74 | % | |
| Net investment income/(loss) (h) | | | (0.03 | )%(i) | | | 0.09 | % | | | 0.18 | % | | | 0.26 | % | | | 0.46 | % | | | 0.45 | % | |
| Waiver/Reimbursement | | | — | | | | — | | | | — | | | | — | | | | 0.00 | %(j) | | | 0.01 | % | |
| Portfolio turnover rate | | | 8 | %(e) | | | 28 | % | | | 27 | % | | | 21 | % | | | 20 | % | | | 22 | % | |
| Net assets at end of period (in millions) | | $ | 14,248 | | | $ | 13,330 | | | $ | 10,527 | | | $ | 7,446 | | | $ | 13,038 | | | $ | 12,128 | | |
(a) Per share data was calculated using the average shares outstanding during the period.
(b) Rounds to less than $0.01 per share.
(c) Net investment income per share includes special dividends. The effect of these dividends amounted to $0.03 per share.
(d) Total return at net asset value assuming all distributions reinvested.
(e) Not annualized.
(f) Had the Adviser and/or Transfer Agent not waived fees and/or reimbursed a portion of expenses, total return would have been reduced.
(g) Total return includes a voluntary reimbursement by the Adviser for a realized investment loss due to a trading error. This reimbursement increased total return and net asset value per share by less than 0.01% and less than $0.01, respectively.
(h) The benefits derived from custody fees paid indirectly had an impact of less than 0.01%.
(i) Annualized.
(j) Rounds to less than 0.01%.
Columbia Acorn International
| Class Z Shares | | (Unaudited)
Six months
ended June 30, | | Year ended December 31, | |
| Selected data for a share outstanding throughout each period | | 2011 | | 2010 | | 2009 | | 2008 | | 2007 | | 2006 | |
| Net Asset Value, Beginning of Period | | $ | 40.92 | | | $ | 34.26 | | | $ | 23.13 | | | $ | 43.60 | | | $ | 40.31 | | | $ | 33.44 | | |
| Income from Investment Operations | |
| Net investment income (a) | | | 0.33 | | | | 0.35 | | | | 0.34 | | | | 0.60 | | | | 0.43 | | | | 0.35 | | |
| Net realized and unrealized gain/(loss) | | | 0.90 | | | | 7.23 | | | | 11.31 | | | | (20.26 | ) | | | 6.56 | | | | 10.94 | | |
| Total from Investment Operations | | | 1.23 | | | | 7.58 | | | | 11.65 | | | | (19.66 | ) | | | 6.99 | | | | 11.29 | | |
| Less Distributions to Shareholders | |
| From net investment income | | | (1.02 | ) | | | (0.92 | ) | | | (0.53 | ) | | | (0.21 | ) | | | (0.34 | ) | | | (0.51 | ) | |
| From net realized gains | | | — | | | | — | | | | — | | | | (0.60 | ) | | | (3.36 | ) | | | (3.91 | ) | |
| Total Distributions to Shareholders | | | (1.02 | ) | | | (0.92 | ) | | | (0.53 | ) | | | (0.81 | ) | | | (3.70 | ) | | | (4.42 | ) | |
| Redemption Fees | |
| Redemption fees added to paid in capital | | | — | | | | 0.00 | (a)(b) | | | 0.00 | (a)(b) | | | 0.00 | (a)(b) | | | 0.00 | (a)(b) | | | 0.00 | (a)(b) | |
| Increase from regulatory settlements | | | — | | | | 0.00 | (b) | | | 0.01 | | | | — | | | | — | | | | — | | |
| Net Asset Value, End of Period | | $ | 41.13 | | | $ | 40.92 | | | $ | 34.26 | | | $ | 23.13 | | | $ | 43.60 | | | $ | 40.31 | | |
| Total Return (c) | | | 3.02 | %(d) | | | 22.70 | % | | | 50.97 | % | | | (45.89 | )% | | | 17.28 | %(e) | | | 34.53 | %(e) | |
| Ratios to Average Net Assets/Supplemental Data | |
| Net expenses (f) | | | 0.95 | %(g) | | | 0.97 | % | | | 0.99 | % | | | 0.96 | % | | | 0.91 | % | | | 0.94 | % | |
| Net investment income (f) | | | 1.63 | %(g) | | | 0.99 | % | | | 1.23 | % | | | 1.72 | % | | | 0.96 | % | | | 0.92 | % | |
| Waiver/Reimbursement | | | — | | | | — | | | | — | | | | — | | | | 0.00 | %(h) | | | 0.01 | % | |
| Portfolio turnover rate | | | 12 | %(d) | | | 25 | % | | | 31 | % | | | 38 | % | | | 28 | % | | | 31 | % | |
| Net assets at end of period (in millions) | | $ | 5,380 | | | $ | 5,108 | | | $ | 3,728 | | | $ | 2,372 | | | $ | 4,918 | | | $ | 3,836 | | |
(a) Per share data was calculated using the average shares outstanding during the period.
(b) Rounds to less than $0.01 per share.
(c) Total return at net asset value assuming all distributions reinvested.
(d) Not annualized.
(e) Had the Adviser and/or Transfer Agent not waived fees and/or reimbursed a portion of expenses, total return would have been reduced.
(f) The benefits derived from custody fees paid indirectly had an impact of less than 0.01%.
(g) Annualized.
(h) Rounds to less than 0.01%.
See accompanying notes to financial statements.
76
Columbia Acorn USA
| Class Z Shares | | (Unaudited)
Six months
ended June 30, | | Year ended December 31, | |
| Selected data for a share outstanding throughout each period | | 2011 | | 2010 | | 2009 | | 2008 | | 2007 | | 2006 | |
| Net Asset Value, Beginning of Period | | $ | 28.56 | | | $ | 23.19 | | | $ | 16.39 | | | $ | 27.97 | | | $ | 28.66 | | | $ | 27.03 | | |
| Income from Investment Operations | |
| Net investment loss (a) | | | (0.07 | ) | | | (0.08 | ) | | | (0.07 | ) | | | (0.07 | ) | | | (0.01 | )(b) | | | (0.02 | ) | |
| Net realized and unrealized gain/(loss) | | | 2.68 | | | | 5.45 | | | | 6.87 | | | | (10.55 | ) | | | 1.03 | | | | 2.26 | | |
| Total from Investment Operations | | | 2.61 | | | | 5.37 | | | | 6.80 | | | | (10.62 | ) | | | 1.02 | | | | 2.24 | | |
| Less Distributions to Shareholders | |
| From net realized gains | | | — | | | | — | | | | — | | | | (0.96 | ) | | | (1.71 | ) | | | (0.61 | ) | |
| Increase from regulatory settlements | | | — | | | | — | | | | 0.00 | (c) | | | — | | | | — | | | | — | | |
| Net Asset Value, End of Period | | $ | 31.17 | | | $ | 28.56 | | | $ | 23.19 | | | $ | 16.39 | | | $ | 27.97 | | | $ | 28.66 | | |
| Total Return (d) | | | 9.14 | %(e) | | | 23.16 | % | | | 41.49 | % | | | (39.22 | )% | | | 3.46 | %(f)(g) | | | 8.28 | %(f) | |
| Ratios to Average Net Assets/Supplemental Data | |
| Net expenses (h) | | | 0.99 | %(i) | | | 1.01 | % | | | 1.03 | % | | | 1.01 | % | | | 0.98 | % | | | 0.98 | % | |
| Net investment loss (h) | | | (0.50 | )%(i) | | | (0.34 | )% | | | (0.36 | )% | | | (0.32 | )% | | | (0.03 | )% | | | (0.07 | )% | |
| Waiver/Reimbursement | | | — | | | | — | | | | — | | | | — | | | | 0.00 | %(j) | | | 0.01 | % | |
| Portfolio turnover rate | | | 9 | %(e) | | | 32 | % | | | 28 | % | | | 23 | % | | | 21 | % | | | 13 | % | |
| Net assets at end of period (in millions) | | $ | 1,653 | | | $ | 1,410 | | | $ | 1,158 | | | $ | 758 | | | $ | 1,214 | | | $ | 1,214 | | |
(a) Per share data was calculated using the average shares outstanding during the period.
(b) Net investment income per share includes special dividends. The effect of these dividends amounted to $0.09 per share.
(c) Rounds to less than $0.01 per share.
(d) Total return at net asset value assuming all distributions reinvested.
(e) Not annualized.
(f) Had the Adviser and/or Transfer Agent not waived fees and/or reimbursed a portion of expenses, total return would have been reduced.
(g) Total return includes a voluntary reimbursement by the Adviser for a realized investment loss due to a trading error. This reimbursement increased total return and net asset value per share by less than 0.01% and less than $0.01, respectively.
(h) The benefits derived from custody fees paid indirectly had an impact of less than 0.01%.
(i) Annualized.
(j) Rounds to less than 0.01%.
Columbia Acorn International Select
| Class Z Shares | | (Unaudited)
Six months
ended June 30, | | Year ended December 31, | |
| Selected data for a share outstanding throughout each period | | 2011 | | 2010 | | 2009 | | 2008 | | 2007 | | 2006 | |
| Net Asset Value, Beginning of Period | | $ | 28.33 | | | $ | 23.64 | | | $ | 18.19 | | | $ | 32.02 | | | $ | 27.97 | | | $ | 20.57 | | |
| Income from Investment Operations | |
| Net investment income (a) | | | 0.19 | (b) | | | 0.18 | | | | 0.17 | | | | 0.28 | | | | 0.14 | (c) | | | 0.10 | | |
| Net realized and unrealized gain/(loss) | | | 0.87 | | | | 4.89 | | | | 5.50 | | | | (13.53 | ) | | | 5.96 | | | | 7.35 | | |
| Total from Investment Operations | | | 1.06 | | | | 5.07 | | | | 5.67 | | | | (13.25 | ) | | | 6.10 | | | | 7.45 | | |
| Less Distributions to Shareholders | |
| From net investment income | | | (0.41 | ) | | | (0.38 | ) | | | (0.24 | ) | | | (0.04 | ) | | | (0.28 | ) | | | (0.05 | ) | |
| From net realized gains | | | — | | | | — | | | | — | | | | (0.54 | ) | | | (1.77 | ) | | | — | | |
| Total Distributions to Shareholders | | | (0.41 | ) | | | (0.38 | ) | | | (0.24 | ) | | | (0.58 | ) | | | (2.05 | ) | | | (0.05 | ) | |
| Redemption Fees | |
| Redemption fees added to paid in capital | | | — | | | | 0.00 | (a)(d) | | | 0.00 | (a)(d) | | | 0.00 | (a)(d) | | | 0.00 | (a)(d) | | | 0.00 | (a)(d) | |
| Increase from regulatory settlements | | | — | | | | 0.00 | (d) | | | 0.02 | | | | — | | | | — | | | | — | | |
| Net Asset Value, End of Period | | $ | 28.98 | | | $ | 28.33 | | | $ | 23.64 | | | $ | 18.19 | | | $ | 32.02 | | | $ | 27.97 | | |
| Total Return (e) | | | 3.74 | %(f) | | | 21.89 | % | | | 31.52 | % | | | (42.10 | )% | | | 21.86 | %(g) | | | 36.27 | %(g) | |
| Ratios to Average Net Assets/Supplemental Data | |
| Net expenses (h) | | | 1.15 | %(i) | | | 1.16 | % | | | 1.20 | % | | | 1.21 | % | | | 1.18 | % | | | 1.27 | % | |
| Net investment income (h) | | | 1.33 | %(i) | | | 0.75 | % | | | 0.84 | % | | | 1.09 | % | | | 0.44 | % | | | 0.44 | % | |
| Waiver/Reimbursement | | | — | | | | — | | | | — | | | | — | | | | 0.00 | %(j) | | | 0.01 | % | |
| Portfolio turnover rate | | | 21 | %(f) | | | 42 | % | | | 56 | % | | | 68 | % | | | 57 | % | | | 47 | % | |
| Net assets at end of period (in millions) | | $ | 352 | | | $ | 366 | | | $ | 331 | | | $ | 186 | | | $ | 204 | | | $ | 129 | | |
(a) Per share data was calculated using the average shares outstanding during the period.
(b) Net investment income per share includes special dividends. The effect of these dividends amounted to $0.04 per share.
(c) Net investment income per share includes special dividends. The effect of these dividends amounted to $0.07 per share.
(d) Rounds to less than $0.01 per share.
(e) Total return at net asset value assuming all distributions reinvested.
(f) Not annualized.
(g) Had the Adviser and/or Transfer Agent not waived fees and/or reimbursed a portion of expenses, total return would have been reduced.
(h) The benefits derived from custody fees paid indirectly had an impact of less than 0.01%.
(i) Annualized.
(j) Rounds to less than 0.01%.
See accompanying notes to financial statements.
77
Columbia Acorn Family of Funds
Financial Highlights, continued
Columbia Acorn Select
| Class Z Shares | | (Unaudited)
Six months
ended June 30, | | Year ended December 31, | |
| Selected data for a share outstanding throughout each period | | 2011 | | 2010 | | 2009 | | 2008 | | 2007 | | 2006 | |
| Net Asset Value, Beginning of Period | | $ | 28.73 | | | $ | 23.38 | | | $ | 14.07 | | | $ | 28.41 | | | $ | 26.59 | | | $ | 22.77 | | |
| Income from Investment Operations | |
| Net investment loss (a) | | | (0.05 | ) | | | (0.10 | ) | | | (0.08 | ) | | | (0.12 | ) | | | (0.07 | ) | | | (0.06 | ) | |
| Net realized and unrealized gain/(loss) | | | 0.03 | | | | 5.45 | | | | 9.39 | | | | (13.53 | ) | | | 2.53 | | | | 4.51 | | |
| Total from Investment Operations | | | (0.02 | ) | | | 5.35 | | | | 9.31 | | | | (13.65 | ) | | | 2.46 | | | | 4.45 | | |
| Less Distributions to Shareholders | |
| From net investment income | | | (0.46 | ) | | | — | | | | — | | | | — | | | | — | | | | (0.04 | ) | |
| From net realized gains | | | — | | | | — | | | | — | | | | (0.69 | ) | | | (0.64 | ) | | | (0.59 | ) | |
| Total Distributions to Shareholders | | | (0.46 | ) | | | — | | | | — | | | | (0.69 | ) | | | (0.64 | ) | | | (0.63 | ) | |
| Net Asset Value, End of Period | | $ | 28.25 | | | $ | 28.73 | | | $ | 23.38 | | | $ | 14.07 | | | $ | 28.41 | | | $ | 26.59 | | |
| Total Return (b) | | | 0.02 | %(c) | | | 22.88 | % | | | 66.17 | % | | | (49.18 | )%(d) | | | 9.20 | %(e) | | | 19.68 | %(e) | |
| Ratios to Average Net Assets/Supplemental Data | |
| Net expenses (f) | | | 0.97 | %(g) | | | 0.97 | % | | | 0.99 | % | | | 0.95 | % | | | 0.91 | % | | | 0.96 | % | |
| Net investment loss (f) | | | (0.34 | )%(g) | | | (0.41 | )% | | | (0.47 | )% | | | (0.51 | )% | | | (0.24 | )% | | | (0.26 | )% | |
| Waiver/Reimbursement | | | — | | | | — | | | | — | | | | — | | | | 0.00 | %(h) | | | 0.02 | | |
| Portfolio turnover rate | | | 13 | %(c) | | | 28 | % | | | 19 | % | | | 28 | % | | | 14 | % | | | 21 | % | |
| Net assets at end of period (in millions) | | $ | 1,386 | | | $ | 1,549 | | | $ | 1,241 | | | $ | 780 | | | $ | 1,571 | | | $ | 909 | | |
(a) Per share data was calculated using the average shares outstanding during the period.
(b) Total return at net asset value assuming all distributions reinvested.
(c) Not annualized.
(d) Total return includes a voluntary reimbursement by the Adviser for a realized investment loss due to a trading error. This reimbursement increased total return and net asset value per share by 0.101% and $0.01, respectively.
(e) Had the Adviser and/or Transfer Agent not waived fees and/or reimbursed a portion of expenses, total return would have been reduced.
(f) The benefits derived from custody fees paid indirectly had an impact of less than 0.01%.
(g) Annualized.
(h) Rounds to less than 0.01%.
Columbia Thermostat Fund
| Class Z Shares | | (Unaudited)
Six months
ended June 30, | | Year ended December 31, | |
| Selected data for a share outstanding throughout each period | | 2011 | | 2010 | | 2009 | | 2008 | | 2007 | | 2006 | |
| Net Asset Value, Beginning of Period | | $ | 12.44 | | | $ | 10.80 | | | $ | 8.19 | | | $ | 12.26 | | | $ | 12.57 | | | $ | 12.50 | | |
| Income from Investment Operations | |
| Net investment income (a) | | | 0.17 | | | | 0.21 | | | | 0.13 | | | | 0.24 | | | | 0.52 | | | | 0.49 | | |
| Net realized and unrealized gain/(loss) | | | 0.41 | | | | 1.66 | | | | 2.51 | | | | (3.96 | ) | | | 0.53 | | | | 0.84 | | |
| Total from Investment Operations | | | 0.58 | | | | 1.87 | | | | 2.64 | | | | (3.72 | ) | | | 1.05 | | | | 1.33 | | |
| Less Distributions to Shareholders | |
| From net investment income | | | (0.16 | ) | | | (0.23 | ) | | | (0.03 | ) | | | (0.28 | ) | | | (0.57 | ) | | | (0.54 | ) | |
| From net realized gains | | | — | | | | — | | | | — | | | | (0.07 | ) | | | (0.79 | ) | | | (0.72 | ) | |
| Total Distributions to Shareholders | | | (0.16 | ) | | | (0.23 | ) | | | (0.03 | ) | | | (0.35 | ) | | | (1.36 | ) | | | (1.26 | ) | |
| Net Asset Value, End of Period | | $ | 12.86 | | | $ | 12.44 | | | $ | 10.80 | | | $ | 8.19 | | | $ | 12.26 | | | $ | 12.57 | | |
| Total Return (b)(c) | | | 4.66 | %(d) | | | 17.58 | % | | | 32.29 | % | | | (30.53 | )% | | | 8.49 | % | | | 10.86 | % | |
| Ratios to Average Net Assets/Supplemental Data | |
| Net expenses (e)(f) | | | 0.25 | %(g) | | | 0.25 | % | | | 0.25 | % | | | 0.25 | % | | | 0.25 | % | | | 0.25 | % | |
| Net investment income (f) | | | 2.75 | %(g) | | | 1.87 | % | | | 1.48 | % | | | 2.23 | % | | | 4.05 | % | | | 3.84 | % | |
| Waiver/Reimbursement | | | 0.11 | %(g) | | | 0.12 | % | | | 0.14 | % | | | 0.08 | % | | | 0.15 | % | | | 0.13 | % | |
| Portfolio turnover rate | | | 36 | %(d) | | | 118 | % | | | 17 | % | | | 130 | % | | | 128 | % | | | 66 | % | |
| Net assets at end of period (in millions) | | $ | 39 | | | $ | 36 | | | $ | 42 | | | $ | 35 | | | $ | 36 | | | $ | 31 | | |
(a) Per share data was calculated using the average shares outstanding during the period. Recognition of net investment income by the Fund is affected by the timing of the declaration of dividends by the underlying investment companies in which the Fund invests.
(b) Total return at net asset value assuming all distributions reinvested.
(c) Had the Adviser and/or Transfer Agent not waived fees and/or reimbursed a portion of expenses, total return would have been reduced.
(d) Not annualized.
(e) Does not include expenses of the investment companies in which the Fund invests.
(f) The benefits derived from custody fees paid indirectly had an impact of less than 0.01%.
(g) Annualized.
See accompanying notes to financial statements.
78
Columbia Acorn Family of Funds
Notes to Financial Statements (Unaudited)
1. Nature of Operations
Columbia Acorn Fund, Columbia Acorn International, Columbia Acorn USA, Columbia Acorn International Select, Columbia Acorn Select and Columbia Thermostat Fund (the Funds) are each a series of Columbia Acorn Trust (the Trust), an open-end management investment company organized as a Massachusetts business trust. The investment objective of each Fund is to seek long-term capital appreciation.
Columbia Thermostat Fund pursues its investment objective by investing in shares of other mutual funds. As a "fund of funds" under normal circumstances, the Fund allocates at least 95% of its net assets among a selected group of stock and bond mutual funds (portfolio funds) according to the current level of the Standard & Poor's (S&P) 500 Index in relation to predetermined ranges set by Columbia Wanger Asset Management, LLC (the Adviser). The Fund may invest up to 5% of its net assets plus any cash received that day in cash, repurchase agreements, high quality short-term paper and government securities.
Each Fund may issue an unlimited number of shares. Each Fund currently has five classes of shares – Class A, Class B, Class C, Class I and Class Z – except Columbia Thermostat Fund, which does not have Class I shares. Effective February 29, 2008, the Funds no longer offer Class B shares (other than through dividend reinvestment).
Class A shares are sold with a front-end sales charge. Class A shares bought without an initial sales charge in accounts aggregating $1 million up to $50 million at the time of purchase are subject to a 1.00% contingent deferred sales charge (CDSC) if the shares are redeemed within 12 months of the date of purchase.
Class B shares are subject to a CDSC if redeemed within six years of purchase. Class B shares will convert to Class A shares automatically eight years after purchase.
Class C shares are offered at net asset value but are subject to a CDSC on redemptions made within one year after purchase.
Class I shares are offered continuously at net asset value. There are certain restrictions on the purchase of Class I shares.
Class Z shares are offered at net asset value. There are certain restrictions on who may purchase Class Z shares. Generally, Class Z shares of a Fund may be exchanged for shares of another fund distributed by Columbia Management Distributors, Inc. at no additional charge.
The financial highlights for the Fund's Class A, Class B, Class C and Class I shares are presented in a separate semi-annual report.
Differences in class expenses may result in payment of different dividend distributions for each class. All of the Funds' share classes have equal rights with respect to voting, subject to Fund or class specific matters.
2. Significant Accounting Policies
The preparation of financial statements in accordance with accounting principles generally accepted in the United States of America (GAAP) requires management to make certain estimates and assumptions that affect the reported amounts of assets and liabilities, the disclosures of contingent assets and liabilities at the date of the financial statements and the reported amounts of revenue and expenses during the reporting period. Actual results could differ from those estimates.
>Security valuation
Securities of the Funds are valued at market value or, if a market quotation for a security is not readily available or is deemed not to be reliable because of events or circumstances that have occurred between the market quotation and the time as of which the security is to be valued, the security is valued at a fair value determined in good faith under consistently applied procedures established by the Board of Trustees. With respect to Columbia Thermostat Fund, investments in portfolio funds are valued at their net asset values as reported by the portfolio funds. A security traded on a securities exchange or in an over-the-counter market in which transaction prices are reported is valued at the last sales price at the time of valuation. A security traded principally on NASDAQ is valued at the NASDAQ official closing price. Mutual Funds and Exchange Traded Funds are valued at their closing net asset value as reported to NASDAQ. A security for which there is no reported sale on the valuation date is valued at the latest bid quotation. Short-term investments maturing in 60 days or less are valued at amortized cost, which approximates market value. A security for which a market quotation is not readily available and any other assets are valued at their fair value determined in good faith under consistently applied procedures established by the Board of Trustees. The Funds have retained an independent statistical fair value pricing service that employs a systematic methodology to assist in the fair valuation process for securities principally traded in a foreign market in order to adjust for possible changes in value that may occur between the close of the foreign exchange and the time as of which the securities are to be valued. If a security is valued at fair value, that value may be different from the last quoted market price for the security.
79
Columbia Acorn Family of Funds
Notes to Financial Statements (Unaudited), continued
>Repurchase agreements
Each Fund may engage in repurchase agreement transactions. Each Fund, through its custodian, receives delivery of underlying securities collateralizing repurchase agreements. The counterparty is required to maintain collateral that is at all times at least equal to the repurchase price including interest. In the event of default or bankruptcy by the counterparty to the agreement, realization and/or retention of the collateral may be subject to legal proceedings.
>Foreign currency translations
Values of investments denominated in foreign currencies are converted into U.S. dollars using the New York spot market rate of exchange at the time of valuation. Purchases and sales of investments and dividend and interest income are translated into U.S. dollars using the spot market rate of exchange prevailing on the respective dates of such transactions. The gain or loss resulting from changes in foreign exchange rates is included with net realized and unrealized gain or loss from investments, as appropriate.
>Forward foreign currency exchange contracts
Columbia Acorn International may enter into forward foreign currency exchange contracts in order to seek to minimize the risk from adverse changes in the relationship between the U.S. dollar and foreign currencies. A forward foreign currency exchange contract is a commitment to purchase or sell a foreign currency at a future date at a negotiated forward rate. Forward foreign currency exchange contracts are valued at the interpolated forward exchange rate of the underlying currencies and any market gain or loss, arising from the difference between the original value and the current value of such contract, is included as a component of unrealized gain/(loss) on the Statements of Operations. Open forward foreign currency exchange contracts, if any, are disclosed in the Notes to the Statement of Investments. As forward foreign currency exchange contracts are closed the resulting gain or loss, arising from the difference between the original value of the contract and the closing value of such contract, is included as a component of realized gain/(loss) on the Statements of Operations.
A forward foreign currency exchange contract would limit the risk of loss due to a decline in the value of a particular currency; however, it also would limit any potential gain that might result should the value of the currency increase instead of decrease. These contracts may involve market risk in excess of the unrealized gain or loss reflected on the Statements of Assets and Liabilities. In addition, a Fund could be exposed to counterparty risks if counterparties to the contracts are unable to meet the terms of their contracts. The counterparty risk exposure is, therefore, closely monitored and contracts are only executed with high credit quality financial institutions.
A Fund may use forward foreign currency exchange contracts to buy or sell a foreign currency when the Adviser believes it has exposure to a foreign currency which may suffer or enjoy a movement against another foreign currency to which the Fund has exposure. A Fund will not attempt to hedge all of its foreign portfolio positions.
For additional information on derivative instruments, please see Note 5.
>Securities lending
Each Fund, except Columbia Thermostat Fund, may lend securities up to one-third of the value of its total assets to certain approved brokers, dealers and other financial institutions to earn additional income. In lending its securities, the Fund retains the benefits of owning the securities, including receipt of dividends or interest generated by the security. Each Fund also receives a fee for the loan. Each Fund has the ability to recall the loans at any time and could do so in order to vote proxies or to sell the loaned securities. Each loan is collateralized by cash that exceeds the value of the securities on loan. The market value of the loaned securities is determined daily at the close of business of each Fund and any additional required collateral is delivered to each Fund on the next business day. Each Fund has elected to invest the cash collateral in the Dreyfus Government Cash Management Fund, and the income earned is paid to each Fund, net of any fees remitted to Goldman Sachs Agency Lending as the lending agent and net of any borrower rebates. The Adviser does not retain any fees earned by the lending program. Generally, in the event of borrower default, a Fund has the right to use the collateral to offset any losses incurred. In the event a Fund is delayed or prevented from exercising its right to dispose of the collateral, there may be a potential loss to a Fund. Some of these losses may be indemnified by the lending agent. Each Fund bears the risk of loss with respect to the investment of collateral.
The net lending income earned as of June 30, 2011 by each Fund is included in the Statements of Operations.
>Security transactions and investment income
Security transactions, investment income and shareholder fund transactions are accounted for on the trade date (date the order to buy or sell is executed) and dividend income and realized gain distributions from other funds are recorded on the ex-dividend date, except that certain dividends from foreign securities are recorded as soon as the information is available to the Funds. Interest income is recorded on the accrual basis and includes amortization of discounts on debt obligations
80
when required for federal income tax purposes. Realized gains and losses from security transactions are recorded on an identified cost basis.
Awards, if any, from class action litigation related to securities owned may be recorded as a reduction of cost of those securities. If the applicable securities are no longer owned, the proceeds are recorded as realized gains.
The Funds estimate the tax character of distributions from real estate investment trusts (REITs). Distributions received in excess of income are recorded as a reduction of the cost of the related investments. If the applicable securities are no longer owned, any distributions received in excess of income are recorded as realized gains.
>Restricted securities
Restricted securities are securities that may only be resold upon registration under federal securities laws or in transactions exempt from registration. In some cases, the issuer of restricted securities has agreed to register such securities for resale at the issuer's expense either upon demand by the Funds or in connection with another registered offering of the securities. Many restricted securities may be resold in the secondary market in transactions exempt from registration. Such restricted securities may be determined to be liquid under criteria established by the Board of Trustees.
>Fund share valuation
Fund shares are sold and redeemed on a daily basis at net asset value, subject to any applicable sales charge. Net asset value per share is determined daily as of the close of trading on the New York Stock Exchange (NYSE) on each day the NYSE is open for trading. Generally, income, expenses and realized and unrealized gain/(losses) of a Fund are allocated to each class proportionately on a daily basis for purposes of determining the net asset value of each class. The Rule 12b-1 service and distribution fees and transfer agency fees are charged to each specific class as expenses are incurred. Redemption fees are accounted for as an addition to paid in capital for purposes of determining the net asset value of each class.
>Custody fees/credits
Custody fees are reduced based on each Fund's cash balances maintained with the custodian. The amount is disclosed as a reduction of total expenses on the Statements of Operations.
>Federal income taxes
It is each Fund's policy to comply with the provisions of the Internal Revenue Code available to regulated investment companies and, in the manner provided therein, distribute substantially all their taxable income, as well as any net realized gain on sales of investments and foreign currency transactions reportable for federal income tax purposes. Columbia Thermostat Fund distributes all of its taxable income, as well as any net realized gain on sales of portfolio fund shares and any distributions of net realized gains received by the Fund from its portfolio funds, reportable for federal income tax purposes. Accordingly, the Funds paid no federal income taxes and no federal income tax provision was required.
>Foreign capital gains taxes
Realized gains in certain countries may be subject to foreign taxes at the fund level, at rates ranging from approximately 10% to 15%. The Funds accrue for such foreign taxes on net realized and unrealized gains at the appropriate rate for each jurisdiction.
>Distributions to shareholders
Distributions to shareholders are recorded on the ex-dividend date.
>Indemnification
In the normal course of business, the Trust on behalf of the Funds enters into contracts that contain a variety of representations and warranties and that provide general indemnities. A Fund's maximum exposure under these arrangements is unknown, as this would involve future claims against the Fund. Also, under the Trust's organizational documents, the trustees and officers of the Trust are indemnified against certain liabilities that may arise out of their duties to the Trust. However, based on experience, the Funds expect the risk of loss due to these warranties and indemnities to be remote.
3. Federal Tax Information
The tax character of distributions paid during the year ended December 31, 2010 was as follows:
| | | Ordinary
Income* | | Long-Term
Capital Gains | |
| (in thousands) | |
| Columbia Acorn Fund | | $ | 21,020 | | | $ | 496,293 | | |
| Columbia Acorn International | | | 122,919 | | | | — | | |
| Columbia Acorn USA | | | — | | | | — | | |
| Columbia Acorn International Select | | | 6,107 | | | | — | | |
| Columbia Acorn Select | | | — | | | | — | | |
| Columbia Thermostat Fund | | | 1,666 | | | | — | | |
*For tax purposes short-term capital gain distributions, if any, are considered ordinary income distributions.
The following capital loss carryforwards, determined as of December 31, 2010, may be available to reduce taxable
81
Columbia Acorn Family of Funds
Notes to Financial Statements (Unaudited), continued
income arising from future net realized gains on investments, if any, to the extent permitted by the Internal Revenue Code:
| | | Year of Expiration | | | |
| | | 2011-
2015 | | 2016 | | 2017 | | 2018 | | Total | |
| (in thousands) | |
Columbia Acorn
International | | $ | — | | | $ | — | | | $ | 386,385 | | | $ | — | | | $ | 386,385 | | |
| Columbia Acorn USA | | | — | | | | — | | | | 28,408 | | | | — | | | | 28,408 | | |
Columbia Acorn
International Select | | | — | | | | — | | | | 36,610 | | | | — | | | | 36,610 | | |
Columbia Acorn
Select | | | — | | | | 3,592 | | | | 115,445 | | | | — | | | | 119,037 | | |
Columbia
Thermostat Fund | | | — | | | | 5,193 | | | | 21,738 | | | | 2,954 | | | | 29,885 | | |
Capital loss carryforwards that were utilized for the Funds during the year ended December 31, 2010 were as follows:
| (in thousands) | |
| Columbia Acorn Fund | | $ | 409,911 | | |
| Columbia Acorn International | | | 238,546 | | |
| Columbia Acorn USA | | | 85,334 | | |
| Columbia Acorn International Select | | | 40,289 | | |
| Columbia Acorn Select | | | 8,679 | | |
Management is required to determine whether a tax position of the Funds is more likely than not to be sustained upon examination by the applicable taxing authority, including resolution of any related appeals or litigation processes, based on the technical merits of the position. The tax benefit to be recognized by the Funds is measured as the largest amount of benefit that is greater than fifty percent likely of being realized upon ultimate settlement. Management is not aware of any tax positions for which it is reasonably possible that the total amounts of unrecognized tax benefits will significantly change in the next twelve months. However, management's conclusions may be subject to review and adjustment at a later date based on factors including, but not limited to, new tax laws, regulations, and administrative interpretations (including relevant court decisions). The Funds' federal tax returns for the prior three fiscal years remain subject to examination by the Internal Revenue Service.
4. Transactions with Affiliates
Columbia Wanger Asset Management, LLC (CWAM) is a wholly owned subsidiary of Columbia Management, which in turn is a wholly owned subsidiary of Ameriprise Financial, Inc. (Ameriprise Financial). CWAM furnishes continuing investment supervision to the Funds and is responsible for the overall management of the Funds' business affairs.
CWAM received a monthly advisory fee based on each Fund's average daily net assets at the following annual rates:
Columbia Acorn Fund
| Average Daily Net Assets | | Annual
Fee Rate | |
| Up to $700 million | | | 0.74 | % | |
| $700 million to $2 billion | | | 0.69 | % | |
| $2 billion to $6 billion | | | 0.64 | % | |
| $6 billion and over | | | 0.63 | % | |
Columbia Acorn International
| Average Daily Net Assets | | Annual
Fee Rate | |
| Up to $100 million | | | 1.19 | % | |
| $100 million to $500 million | | | 0.94 | % | |
| $500 million and over | | | 0.74 | % | |
Columbia Acorn USA
| Average Daily Net Assets | | Annual
Fee Rate | |
| Up to $200 million | | | 0.94 | % | |
| $200 million to $500 million | | | 0.89 | % | |
| $500 million to $2 billion | | | 0.84 | % | |
| $2 billion to $3 billion | | | 0.80 | % | |
| $3 billion and over | | | 0.70 | % | |
Columbia Acorn International Select
| Average Daily Net Assets | | Annual
Fee Rate | |
| Up to $500 million | | | 0.94 | % | |
| $500 million and over | | | 0.90 | % | |
Columbia Acorn Select
| Average Daily Net Assets | | Annual
Fee Rate | |
| Up to $700 million | | | 0.85 | % | |
| $700 million to $2 billion | | | 0.80 | % | |
| $2 billion to $3 billion | | | 0.75 | % | |
| $3 billion and over | | | 0.70 | % | |
Columbia Thermostat Fund
| | | Annual
Fee Rate | |
| All Average Daily Net Assets | | | 0.10 | % | |
For the six months ended June 30, 2011, the Funds' annualized effective investment advisory fee rates were as follows:
| Columbia Acorn Fund | | | 0.64 | % | |
| Columbia Acorn International | | | 0.76 | % | |
| Columbia Acorn USA | | | 0.86 | % | |
| Columbia Acorn International Select | | | 0.94 | % | |
| Columbia Acorn Select | | | 0.81 | % | |
| Columbia Thermostat Fund | | | 0.10 | % | |
>Expense Limit
CWAM has voluntarily agreed to reimburse the ordinary operating expenses (exclusive of brokerage commissions, interest, taxes and extraordinary expenses, but inclusive of custodial
82
charges relating to overdrafts, if any) after giving effect to any balance credits from the Funds' custodian, exceeding annually the average daily net assets of the Funds as follows:
| Fund | | Class Z | |
| Columbia Acorn International Select | | | 1.45 | % | |
| Columbia Acorn Select | | | 1.35 | % | |
This arrangement may be modified or terminated by either the Funds or CWAM on 30 days notice.
CWAM has contractually agreed to waive fees and/or reimburse expenses of Columbia Thermostat Fund so that the ordinary operating expenses (exclusive of distribution and service fees, interest and fees on borrowings, and expenses associated with the Fund's investment in other investment companies, but including custodian charges relating to overdrafts, if any), after giving effect to any balance credits from the Fund's custodian, will not exceed 0.25% annually of the Fund's average daily net assets through April 30, 2012. There is no guarantee that this arrangement will continue thereafter.
Expenses reimbursed by CWAM to Columbia Acorn International Select and Columbia Thermostat Fund for the six months ended June 30, 2011, were $363 and $128,651, respectively.
CWAM provides administrative services and receives an administration fee from the Funds at the following annual rates:
Columbia Acorn Trust
Aggregate Average Daily
Net Assets of the Trust: | | Annual
Fee Rate | |
| Up to $8 billion | | | 0.050 | % | |
| $8 billion to $16 billion | | | 0.040 | % | |
| $16 billion to $35 billion | | | 0.030 | % | |
| $35 billion to $45 billion | | | 0.025 | % | |
| $45 billion and over | | | 0.015 | % | |
For the six months ended June 30, 2011, the annualized effective administration fee rate was 0.04% of each Fund's average daily net assets. CWAM has delegated to Columbia Management responsibility to provide certain sub-administrative services to the Funds.
Columbia Management Investment Distributors, Inc., (CMID) a wholly owned subsidiary of Ameriprise Financial, is the distributor of the Funds.
Each Fund has adopted a Rule 12b-1 (distribution and service) plan which requires it to pay CMID a monthly service fee equal to 0.25% annually of the average daily net assets attributable to Class A, Class B and Class C shares and a monthly distribution fee equal to 0.50% and 0.75%, annually, of the average daily net assets attributable to Class B and Class C shares, respectively. CMID receives no compensation with respect to Class Z shares.
Columbia Management Investment Services Corp. (CMIS), a wholly owned subsidiary of Ameriprise Financial, is the transfer agent of the Funds. For its services, each Fund pays CMIS a monthly fee at the annual rate of $17.00 per open account. CMIS also receives reimbursement from the Fund's for certain out-of-pocket expenses. The arrangement with BFDS has been continued by CMIS.
Class I shares do not pay transfer agent fees.
Certain officers and trustees of the Trust are also officers of CWAM. The Trust makes no direct payments to its officers and trustees who are affiliated with CWAM.
The Board of Trustees appointed a Chief Compliance Officer of the Trust in accordance with federal securities regulations. The Funds, along with other affiliated funds, pay their pro-rata share of the expenses associated with the Office of the Chief Compliance Officer. Those expenses are disclosed separately as "Chief compliance officer expenses" in the Statements of Operations.
The Trust offers a deferred compensation plan for its independent trustees. Under that plan, a trustee may elect to defer all or a portion of his or her compensation. Amounts deferred are retained by the Trust and may represent an unfunded obligation of the Trust. The value of amounts deferred is determined by reference to the change in value of Class Z shares of one or more series of the Trust or a money market fund specified by the trustee. Benefits under the deferred compensation plan are payable when the trustee ceases to be a member of the Board of Trustees.
An affiliated person of a Fund may include any company in which a Fund owns five percent or more of its outstanding voting shares. On December 31, 2010, Columbia Acorn Fund, Columbia Acorn International, Columbia Acorn USA and Columbia Acorn Select each held five percent or more of the outstanding voting securities of one or more companies. Details of investments in those affiliated companies are presented on pages 32, 33, 44, 54 and 66, respectively.
During the six months ended June 30, 2011, the Funds engaged in purchase and sale transactions with funds that have a common investment adviser (or affiliated investment advisers), common directors/trustees, and/or common officers.
83
Columbia Acorn Family of Funds
Notes to Financial Statements (Unaudited), continued
Those transactions complied with Rule 17a-7 under the Investment Company Act of 1940 and were as follows:
| | | Purchases | | Sales | |
| (in thousands) | |
| Columbia Acorn Fund | | $ | 25,228 | | | $ | — | | |
| Columbia Acorn International | | | 1,372 | | | | — | | |
| Columbia Acorn USA | | | 578 | | | | — | | |
| Columbia Acorn International Select | | | 213 | | | | — | | |
| Columbia Acorn Select | | | — | | | | 24,857 | | |
5. Objectives and Strategies for Investing in Derivative Instruments
Columbia Acorn International uses derivative instruments including forward foreign currency exchange contracts in order to meet its investment objectives. The Fund employs strategies in differing combinations to permit it to increase, decrease or change the level of exposure to market risk factors. The achievement of any strategy involving derivatives depends on analysis of various risk factors, and if the strategies for the use of derivatives do not work as intended, the Fund may not achieve its investment objectives.
In pursuit of its investment objectives, the Fund is exposed to the following market risks:
Foreign Exchange Rate Risk: Foreign exchange rate risk relates to the change in the U.S. dollar value of a security held that is denominated in a foreign currency. The U.S. dollar value of a foreign-currency-denominated security will decrease as the dollar appreciates against the currency, while the U.S. dollar value will increase as the dollar depreciates against the currency.
The following note provides more detailed information about the derivative type held by the Columbia Acorn International:
Forward Foreign Currency Exchange Contracts
• The Fund entered into forward foreign currency exchange contracts to shift its investment exposure from one currency to another.
• The Fund used forward foreign currency exchange contracts to shift its U.S. dollar exposure in order to achieve a representative weighted mix of major currencies relative to its benchmark and/or to recover an underweight country exposure in its portfolio relative to its benchmark.
Forward foreign currency exchange contracts are agreements to exchange one currency for another at a future date at a specified price. These contracts are used to seek to minimize the exposure to foreign exchange rate fluctuations during the period between the trade and settlement dates of the contract. The Fund may utilize forward foreign currency exchange contracts in connection with the settlement of purchases and sales of securities. The Fund may also enter into these contracts to seek to reduce the exposure to adverse price movements in certain other foreign-currency-denominated assets. Contracts to buy are used to acquire exposure to foreign currencies, while contracts to sell are used to reduce the exposure to foreign exchange rate fluctuations. Forward foreign currency exchange contracts are valued daily at the current exchange rate of the underlying currency, resulting in unrealized gains (losses) which become realized at the time the forward foreign currency exchange contracts are closed or mature. Realized and unrealized gains (losses) arising from such transactions are included in net realized and unrealized gains (losses) on foreign currency transactions. The use of forward foreign currency exchange contracts does not eliminate fluctuations in the prices of the Fund's portfolio securities. While the maximum potential loss from such contracts is the aggregate face value in U.S. dollars at the time the contract was opened, exposure is typically limited to the change in value of the contract (in U.S. dollars) over the period it remains open. The Fund could also be exposed to risk that counterparties of the contracts may be unable to fulfill the terms of the contracts.
During the six months ended June 30, 2011, Columbia Acorn International entered into 92 forward foreign currency exchange contracts.
The following table is a summary of the value of Columbia Acorn International's derivative instruments as of June 30, 2011.
Fair Value of Derivative Instruments
| | | Asset | |
| | | Statement of Assets
and Liabilities | | Fair
Value | |
| (in thousands) | |
| | | | | Unrealized appreciation on
forward foreign currency
exchange contracts | | $ | 3,057 | | |
| | | Liability | |
| | | Statement of Assets
and Liabilities | | Fair
Value | |
| (in thousands) | |
| | | | | Unrealized depreciation on
forward foreign currency
exchange contracts | | $ | 2,796 | | |
84
The effect of derivative instruments on Columbia Acorn International's Statement of Operations for the six months ended June 30, 2011 was as follows:
Amount of Realized Gain or (Loss) and Change in
Unrealized Appreciation or (Depreciation)
On Derivatives Recognized in Income
| | | Risk
Exposure | | Realized
Gain/(Loss) | | Change
in
Unrealized
Appreciation/
(Depreciation) | |
| (in thousands) | |
Forward foreign
currency
exchange
contracts | | Foreign Exchange
Rate Risk | | $ | (84 | ) | | $ | (11,026 | ) | |
6. Borrowing Arrangements
The Trust participates in a $150 million credit facility, along with another Trust managed by CWAM, which was entered into to facilitate portfolio liquidity. Under the facility, interest is charged to each participating fund based on its borrowings at a rate per annum equal to the higher of Federal Funds Rate or Overnight LIBOR plus 1.25%. In addition, a commitment fee of 0.125% per annum of the unutilized line of credit was accrued and apportioned among the participating funds based on their relative net assets. The commitment fee is included in "Other expenses" in the Statements of Operations. No amounts were borrowed by any Fund under this facility for the six months ended June 30, 2011. The Trust enters into this line of credit for one year durations. The Trust has secured the line of credit for the entire year of 2012.
7. Investment Transactions
The aggregate cost of purchases and proceeds from sales, other than short-term obligations, for the six months ended June 30, 2011, were:
Columbia Acorn Fund
| (in thousands) | |
| Investment securities | | | |
| Purchases | | $ | 1,566,628 | | |
| Proceeds from sales | | | 1,538,048 | | |
Columbia Acorn International
| (in thousands) | |
| Investment securities | | | |
| Purchases | | $ | 1,008,306 | | |
| Proceeds from sales | | | 748,658 | | |
Columbia Acorn USA
| (in thousands) | |
| Investment securities | | | |
| Purchases | | $ | 209,631 | | |
| Proceeds from sales | | | 167,239 | | |
Columbia Acorn International Select
| (in thousands) | |
| Investment securities | | | |
| Purchases | | $ | 87,027 | | |
| Proceeds from sales | | | 149,800 | | |
Columbia Acorn Select
| (in thousands) | |
| Investment securities | | | |
| Purchases | | $ | 277,833 | | |
| Proceeds from sales | | | 506,800 | | |
Columbia Thermostat Fund
| (in thousands) | |
| Investment securities | | | |
| Purchases | | $ | 49,334 | | |
| Proceeds from sales | | | 48,426 | | |
8. Regulatory Settlements with Third Parties
During the year ended December 31, 2010, Columbia Acorn International and Columbia Acorn International Select received payments totaling $446,565 and $46,265, respectively, representing distributions from a fair fund established in connection with a regulatory settlement between the Securities and Exchange Commission and a third party broker dealer relating to alleged market timing and late trading in mutual funds, including the Funds. The payments have been included in "Increase from regulatory settlements" in the Statements of Changes in Net Assets.
9. Information Regarding Pending and Settled Legal Proceedings
In June 2004, an action captioned John E. Gallus et al. v. American Express Financial Corp. and American Express Financial Advisors Inc. was filed in the United States District Court for the District of Arizona. The plaintiffs allege that they are investors in several American Express Company (now known as legacy RiverSource) mutual funds and they purport to bring the action derivatively on behalf of those funds under the Investment Company Act of 1940. The plaintiffs allege that fees allegedly paid to the defendants by the funds for investment advisory and administrative services are excessive. The plaintiffs seek remedies including restitution and rescission of investment advisory and distribution agreements. The plaintiffs voluntarily agreed to transfer this case to the United States District Court for the District of Minnesota (the District Court). In response to defendants' motion to dismiss the complaint, the District Court dismissed one of plaintiffs' four claims and granted plaintiffs limited discovery. Defendants moved for summary judgment in April 2007. Summary judgment was granted in the defendants' favor on July 9, 2007. The plaintiffs
85
Columbia Acorn Family of Funds
Notes to Financial Statements (Unaudited), continued
filed a notice of appeal with the Eighth Circuit Court of Appeals (the Eighth Circuit) on August 8, 2007. On April 8, 2009, the Eighth Circuit reversed summary judgment and remanded to the District Court for further proceedings. On August 6, 2009, defendants filed a writ of certiorari with the U.S. Supreme Court (the Supreme Court), asking the Supreme Court to stay the District Court proceedings while the Supreme Court considers and rules in a case captioned Jones v. Harris Associates, which involves issues of law similar to those presented in the Gallus case. On March 30, 2010, the Supreme Court issued its ruling in Jones v. Harris Associates, and on April 5, 2010, the Supreme Court vacated the Eighth Circuit's decision in the Gallus case and remanded the case to the Eighth Circuit for further consideration in light of the Supreme Court's decision in Jones v. Harris Associates. On June 4, 2010, the Eighth Circuit remanded the Gallus case to the District Court for further consideration in light of the Supreme Court's decision in Jones v. Harris Associates. On December 9, 2010, the District Court reinstated its July 9, 2007 summary judgment order in favor of the defendants. On January 10, 2011, plaintiffs filed a notice of appeal with the Eighth Circuit.
In December 2005, without admitting or denying the allegations, American Express Financial Corporation (AEFC, which is now known as Ameriprise Financial, Inc. (Ameriprise Financial)), entered into settlement agreements with the Securities and Exchange Commission (SEC) and Minnesota Department of Commerce (MDOC) related to market timing activities. As a result, AEFC was censured and ordered to cease and desist from committing or causing any violations of certain provisions of the Investment Advisers Act of 1940, the Investment Company Act of 1940, and various Minnesota laws. AEFC agreed to pay disgorgement of $10 million and civil money penalties of $7 million. AEFC also agreed to retain an independent distribution consultant to assist in developing a plan for distribution of all disgorgement and civil penalties ordered by the SEC in accordance with various undertakings detailed at http://www.sec.gov/litigation/admin/ia-2451.pdf. Ameriprise Financial and its affiliates have cooperated with the SEC and the MDOC in these legal proceedings, and have made regular reports to the RiverSource, Seligman and Threadneedle funds' Boards of Directors/Trustees.
Ameriprise Financial and certain of its affiliates have historically been involved in a number of legal, arbitration and regulatory proceedings, including routine litigation, class actions, and governmental actions, concerning matters arising in connection with the conduct of their business activities. Ameriprise Financial believes that the Funds are not currently the subject of, and that neither Ameriprise Financial nor any of its affiliates are the subject of, any pending legal, arbitration or regulatory proceedings that are likely to have a material adverse effect on the Funds or the ability of Ameriprise Financial or its affiliates to perform under their contracts with the Funds. Ameriprise Financial is required to make 10-Q, 10-K and, as necessary, 8-K filings with the SEC on legal and regulatory matters that relate to Ameriprise Financial and its affiliates. Copies of these filings may be obtained by accessing the SEC website at www.sec.gov.
There can be no assurance that these matters, or the adverse publicity associated with them, will not result in increased fund redemptions, reduced sale of fund shares or other adverse consequences to the Funds. Further, although we believe proceedings are not likely to have a material adverse effect on the Funds or the ability of Ameriprise Financial or its affiliates to perform under their contracts with the Funds, these proceedings are subject to uncertainties and, as such, we are unable to estimate the possible loss or range of loss that may result. An adverse outcome in one or more of these proceedings could result in adverse judgments, settlements, fines, penalties or other relief that could have a material adverse effect on the consolidated financial condition or results of operations of Ameriprise Financial.
86
[Excerpt from:]
Columbia Acorn Trust
Management Fee Evaluation of the Senior Officer
Prepared Pursuant to the New York Attorney General's
Assurance of Discontinuance
May 2011
87
Introduction
The New York Attorney General's Assurance of Discontinuance (Order) entered into by Columbia Management Advisors, LLC (CMA) and Columbia Management Distributors, Inc., (CMDI) in February 2005, allows CMA to manage or advise a mutual fund only if the trustees of the fund appoint a Senior Officer to perform specified duties and responsibilities. Among these responsibilities is "managing the process by which proposed management fees (including but not limited to, advisory fees) to be charged the [funds] are negotiated so that they are negotiated in a manner which is at arms' length and reasonable and consistent with this Assurance of Discontinuance."
The Columbia Acorn Trust and Wanger Advisors Trust (collectively, the Trusts) and each series thereof (the Acorn funds, WAT funds or collectively, the Funds) are overseen by the same Board of Trustees (Board). The Order provides that this Board must determine the reasonableness of proposed management fees by using either an annual competitive bidding process supervised by the Senior Officer or Independent Fee Consultant, or by obtaining an annual independent written evaluation prepared by or under the direction of the Senior Officer or the Independent Fee Consultant.
Management fees are only part of the costs and expenses paid by mutual fund shareholders. Fund expenses can vary depending upon the class of shares held but usually include: (1) advisory fees to compensate analysts and portfolio managers for stock research and portfolio management, as well as the cost of operating a trading desk; (2) administrative expenses incurred to prepare registration statements and tax returns, calculate the funds' net asset values, maintain effective compliance procedures and perform recordkeeping services; (3) transfer agency costs for establishing accounts, accepting and disbursing funds, as well as overseeing trading in fund shares; (4) custodial expenses incurred to hold the securities purchased by the funds; and (5) distribution expenses, including commissions paid to brokers that sell the fund shares to investors. Management fees consist of (1) and (2), but not the other services.
Columbia Wanger Asset Management, LLC (CWAM), is the adviser to the Funds, and at present is wholly owned by Ameriprise Financial, Inc. (Ameriprise). The name Columbia Management or Columbia, is used to refer to the group of entities that manage or provide services to funds bearing the brand name Columbia. These entities include Columbia Management Investment Advisers, (CMIA), the successor entity to CMA, Columbia Management Investment Services, Inc. (CMIS) and Columbia Management Investment Distributors, Inc. (CMID), the successor entity to CMDI. The Columbia asset management business, formerly owned by Bank of America Corporation (Bank of America), is now owned by Ameriprise.
The Change of Ownership
On September 29, 2009, Bank of America entered into a Purchase Agreement with Ameriprise providing for, among other things, the sale of CWAM to Ameriprise and the acquisition by Ameriprise of certain assets of Columbia. The sale closed on May 1, 2010. A new advisory agreement is required under these circumstances. In advance of that closing, Columbia and Ameriprise proposed that the Trusts continue, in substance, the then existing advisory agreement governing portfolio management, and the administration services agreement governing certain administration and clerical services. They proposed no material changes to these agreements, no change in services and no changes in fee levels, only those changes necessary to effect the change of ownership. The Board of Trustees approved the new advisory agreements, and on May 27, 2010, shareholders voted to approve them too. The investment management team responsible for the Funds remained with CWAM following the Ameriprise acquisition.
The Investment Company Act of 1940 (1940 Act) effectively bars an increase in management fees for two years following a change in ownership of a fund's advisor (other than for bona fide additional investment advisory services); the purpose of this prohibition is to preclude management from financing the purchase through increased advisory fees. Ameriprise has represented to the Board that it intends to comply with these restrictions, and does not seek increased management fees at this time. Rather, Ameriprise seeks only to renew the advisory and related agreements on their existing terms.
88
Requirements of the Order
The Order applies to any successor to substantially all the assets of CMDI and CMA. Thus, it applies to CMIA and CMID as successors to CMA and CMDI. Under the Order, a fee evaluation must precede the execution of new or the extension of existing advisory and administration services agreements. The existing agreements continue in effect until July 31, 2011.
In conformity with the terms of the Order and past evaluations, this Evaluation addresses only the advisory and administration contracts, and does not extend to the Funds' underwriting and transfer agency agreements.
According to the Order, the Senior Officer's evaluation must consider a number of factors. These factors parallel the standard set forth in the Gartenberg case. They are following:
(1) Management fees (including components thereof) charged to institutional and other clients of CWAM for like services;
(2) Management fees (including any components thereof) charged by other mutual fund companies for like services;
(3) Costs to CWAM and its affiliates of supplying services pursuant to the management fee agreements, excluding any intra-corporate profit;
(4) Profit margins of CWAM and its affiliates from supplying such services;
(5) Possible economies of scale as the Funds grow larger; and
(6) The nature and quality of CWAM's services, including the performance of each Fund.
In 2004, the Boards of the two Trusts, then separate groups, each appointed me Senior Officer under the Order. They also determined not to pursue a competitive bidding process and instead, charged me with the responsibility of evaluating the Funds' proposed advisory and administration fee contracts with CWAM in conformity with the requirements of the Order. In discharging their responsibilities, the independent Trustees have also consulted independent, outside counsel. The Board has asked that I prepare this Evaluation.
Scope of this Evaluation
This Evaluation is qualified in two respects. First, assessing such factors as cost of service, profitability, projected economies of scale, and expected quality of service, involves, at present, a significant element of uncertainty. Ameriprise and Columbia hope to effect cost savings by virtue of the increased scale of their operations. The integration of the two organizations is not, however, complete at this time, so the anticipated benefits are impossible to quantify now and hence cannot effectively be weighed in assessing the reasonableness of the proposed management fee. Profitability data is, to some extent, based on pro forma financial statements. At the same time, Ameriprise and Columbia have assured the Board that the Funds will not suffer diminished services as a result of the combination, nor do they propose to change the fee levels set forth in the existing advisory and administration services agreements. The upshot is that the Fund shareholders will, if the advisory agreements are renewed and asset levels do not decrease, pay no more than they do now, but it is too early to determine whether the change in ownership will result in material changes in the calculus of assessing the fairness of the management fee. Of necessity this must be left to future evaluations.
A second consideration concerns the new funds recently approved by the Board of Trustees. Earlier this year, CWAM and Ameriprise proposed two new Acorn funds: Columbia Acorn Emerging Markets Fund (Acorn Emerging Markets), and Columbia Acorn European Fund (Acorn European). I issued a fee evaluation in February 2011 addressing the management fees proposed for those new funds. In March 2011, the Board approved amendments to the advisory and other agreements necessary to launch the new funds. They have not yet, however, been offered. Consequently, there is nothing to add here to the evaluation done in February, so this Evaluation does not address those funds.
89
Process and Independence
The objectives of the Order are to ensure the independent evaluation of the management fees paid by the Funds as well as to insure that all relevant factors are considered. In my view, this contract process has been conducted at arms-length and with independence in gathering, considering and evaluating all relevant data. At the outset of the process, the Trustees sought and obtained from Ameriprise and Columbia a comprehensive compilation of data regarding Fund performance and expenses, adviser profitability, and other information. The Trustees, acting through their Contract Committee evaluated this information thoroughly, and met often to discuss it. Performance and expense data was obtained from both Morningstar and Lipper, the leading consultants in this area. The rankings prepared by Morningstar and Lipper were independent and prepared in conformity with the methodologies employed by those organizations. Counsel for the Funds and the Independent Trustees considered, as did I, the terms and conditions of the proposed contracts.
My evaluation of the advisory contracts was shaped, as it has been in the past, by my experience as Chief Compliance Officer of the Trusts (CCO). As CCO, I report solely to the Board and have no reporting obligation to, or employment relationship with, Ameriprise or its affiliates. I have commented on compliance matters in evaluating the quality of service provided by CWAM.
This Report, its supporting materials and the data contained in other materials submitted to the Contract Committee, in my view, provide a thorough factual basis upon which the Board, in consultation with independent counsel as it deems appropriate, may conduct management fee negotiations that are in the best interests of the Funds' shareholders.
The Fee Reductions Mandated under the Order
Under the terms of the Order, Columbia agreed to secure certain management fee reductions for the mutual funds advised by its affiliate investment advisers. In some instances, breakpoints were also established. Although neither CWAM nor the Trusts was a party to the Order, CWAM offered and the Board accepted certain advisory fee reductions during 2005. By the terms of the Order, these fees could not be increased before November 30, 2009, and, in fact, have not been increased since. As a result of the Ameriprise acquisition, the Investment Company Act precludes any increases in management fees before May 2012 (other than for bona fide additional investment advisory services). Therefore, CWAM and Ameriprise propose the continuation of the contracts and management fees as they now exist; no increases in these fees are sought, and no reductions offered.
Conclusions
My review of the data and other material above leads to the following conclusions with respect to the factors identified in the Order.
A. Fund Performance
The Domestic Funds: The Acorn Fund has achieved good performance over the past five years, and excellent results over longer periods. Acorn Select and Wanger Select have enjoyed better than average investment returns over the past five years, but have suffered reversals in more recent periods. Both funds expose investors to greater relative risk than the other domestic Funds. Acorn USA and its parallel, Wanger USA are the weakest performers, falling behind their benchmark and peer medians over one and five years. Thermostat is unique and therefore difficult to assess, but has outperformed its benchmark and now enjoys strong rankings from Morningstar.
The International Funds: The international Funds have delivered excellent results over the past five years, and done so while exposing investors to less risk than competing funds. They have also outperformed their benchmarks during this period, but recent results have been more restrained. The international Funds enjoy positive "alpha," confirming the value of their portfolio managers.
90
B. Management Fees Relative to Peers
There is significant variance in management fee rankings across the Funds. Acorn International is the only fund that was ranked in the top quartile by both Morningstar and Lipper. The other Acorn funds tend to fall around the medians identified by one or the other service. The WAT funds are uniformly more expensive than their peers.
C. Management Fees Relative to Institutional Account and Other Mutual Fund Accounts
CWAM's focus is on its mutual funds. The few institutional accounts it does manage vary in rate structures. Some pay advisory fees commensurate with or higher than the Acorn and WAT funds. In a few instances, however, institutional accounts pay lower advisory fees than do the Acorn funds. One such institutional account is significant in size and has been under CWAM's management for over 33 years. Furthermore, CWAM performs sub-advisory services for mutual funds managed by Ameriprise affiliates, CWAM's parent organization, at rates that are lower than those paid by the parallel Acorn funds, though sub-advisory services usually differ from those necessary for the full support of a mutual fund.
D. Administrative Services
The Acorn and WAT funds' administrative fees are within the range of fees charged by competitors, but these rankings suffer from a lack of uniformity in the scope of services encompassed by the fee. CWAM provides excellent administrative support for all the Funds.
E. Costs and Benefits to CWAM and its Affiliates
CWAM's direct costs do not appear excessive. Overhead and indirect costs allocated to CWAM by its parent organization, however, are significant and have varied considerably over the years. CWAM's affiliates report operating losses and although the allocations leading to these losses may bear closer scrutiny, Ameriprise affiliates do not appear to enjoy excessive "fall out" benefits from CWAM's advisory agreement with the Funds. CWAM continues, however, to enjoy substantial benefits from the use of "soft dollar" payments for research.
F. Profitability
CWAM's profit margins may be in the upper range of its competitors, but peer profitability is difficult to assess given differences in products, operations and other factors. Furthermore, there is limited public information available with regard to the profitability of investment advisers.
G. Economies of Scale
Economies of scale do exist at CWAM, and the Board has instituted breakpoints that reduce fess as assets increase. Though asset levels have recovered from recent lows, sustained asset growth will be required to trigger additional fee reductions under the current schedule.
H. Nature and Quality of Service
This category includes a variety of considerations that are difficult to quantify, yet can have a significant bearing on the performance of the Acorn and WAT funds. Several areas merit comment: (1) CWAM has maintained its investment management capacity and an experienced staff; and (2) CWAM has a reasonably designed compliance program that protects shareholders.
I. Process
In my opinion, the process of negotiating an advisory contract for the Funds has been conducted thoroughly and at arms' length. The Board's Contract Committee has sought and obtained extensive data bearing on the reasonableness of the management fees proposed by CWAM. The Trustees have sufficient information to evaluate management's proposal, and negotiate contract terms that are in the best interests of fund shareholders.
91
Recommendation
According to Morningstar, Acorn USA and Wanger USA have delivered performance below peer medians for the past one and five years, while imposing management fees that exceed them. Management has fashioned various initiatives to improve performance, and the Trustees should continue to monitor both Funds closely to assess the impact of those initiatives.
92
Board Approval of the Advisory Agreement
Columbia Acorn Trust (the Trust) has an investment advisory agreement (the Advisory Agreement) with Columbia Wanger Asset Management, LLC (CWAM) under which CWAM manages the Columbia Acorn Funds (the Funds). More than 75% of the trustees of the Trust (the Trustees) are comprised of persons who have no direct or indirect interest in the Advisory Agreement and are not interested persons (as defined in the Investment Company Act of 1940, as amended (the 1940 Act)) of the Trust (the Independent Trustees). The Trustees oversee the management of each Fund and, as required by law, determine at least annually whether to continue the Advisory Agreement for each Fund.
The Contract Committee of the Board (the Committee), which is comprised solely of Independent Trustees, makes recommendations to the Board regarding any proposed continuation of the Advisory Agreement. After the Committee has made its recommendations, the full Board determines whether to approve continuation of the Advisory Agreement. The Board also considers matters bearing on the Advisory Agreement at its various meetings throughout the year, meets at least quarterly with CWAM's portfolio managers and receives monthly reports from CWAM on the performance of the Funds.
In connection with their most recent consideration of the Advisory Agreement for each Fund, the Committee and all Trustees received and reviewed a substantial amount of information provided by CWAM, Columbia Management Investment Advisers, LLC (Columbia Management) and Ameriprise Financial, Inc. (Ameriprise), in response to written requests from the Independent Trustees and their independent legal counsel. Throughout the process, the Trustees had numerous opportunities to ask questions of and request additional materials from CWAM, Columbia Management and Ameriprise.
During each meeting at which the Committee or the Independent Trustees considered the Advisory Agreement, they met in executive session with their independent legal counsel. The Committee also met with representatives of CWAM, Columbia Management and Ameriprise on several occasions. In all, the Committee convened formally on five separate occasions to consider the continuation of the Advisory Agreement. The Board and/or some or all of the Independent Trustees met on other occasions to receive the Committee's status reports, receive presentations from CWAM, Columbia Management and Ameriprise representatives, and to discuss outstanding issues. In addition, the Investment Performance Analysis Committee of the Board, also comprised exclusively of Independent Trustees, reviewed the performance of the Funds and presented its findings to the Board and the Committee throughout the year. The Compliance Committee also provided information to the Committee with respect to relevant matters.
The Trustees reviewed the Advisory Agreement, as well as certain information obtained through CWAM's, Columbia Management's and Ameriprise's responses to independent legal counsel's questionnaires. In addition, the Trustees reviewed the Management Fee Evaluation dated May 2011 (the Fee Evaluation) prepared by the Trust's chief compliance officer, senior vice president and general counsel, who also serves as the Trust's "Senior Officer," as contemplated by the Assurance of Discontinuance dated February 9, 2005 among former affiliates of CWAM and the Office of the New York Attorney General. A summary of the Fee Evaluation is included in this report.
The materials reviewed by the Committee and the Trustees included, among other items, (i) information on the investment performance of each Fund and of independently selected peer groups of funds and of the Funds' performance benchmarks over various time periods, (ii) information on each Fund's advisory fees and other expenses, including information comparing the Fund's fees and expenses to those of peer groups of funds and information about any applicable expense limitations and fee breakpoints, (iii) data on sales and redemptions of Fund shares, and (iv) information on the profitability to CWAM and Ameriprise, as well as potential "fall-out" or ancillary benefits that CWAM and its affiliates may receive as a result of their relationships with the Funds. The Trustees also considered other information such as (i) CWAM's financial condition, (ii) each Fund's investment objective and strategy, (iii) the size, education and experience of CWAM's investment staff and its use of technology, external research and trading cost measurement tools, (iv) the portfolio manager compensation framework, (v) the allocation of the Funds' brokerage, and the use of "soft" commission dollars to pay for research products and services, and (vi) the resources devoted to, and the record of compliance with, the Funds' investment policies and restrictions, policies on personal securities transactions and other compliance policies.
At a meeting held on June 8, 2011, upon recommendations of the Committee, the Board of Trustees unanimously approved the continuation of the Advisory Agreement.
In considering the continuation of the Advisory Agreement, the Trustees reviewed and analyzed various factors that they determined were relevant, none of which by itself was considered dispositive. The material factors and conclusions that formed the basis for the Trustees' determination to approve the continuation of the Advisory Agreement are discussed below.
Nature, quality and extent of services. The Trustees reviewed the nature, quality and extent of the services provided by CWAM and its affiliates to the Funds under the Advisory Agreement, taking into account the investment objective and strategy of each Fund and knowledge gained from meetings with management, which were held on at least a quarterly basis. In addition, the Trustees reviewed the available
93
Board Approval of the Advisory Agreement, continued
resources and key personnel of CWAM and its affiliates, especially those providing investment management services to the Funds. The Trustees also considered other services provided to the Funds by CWAM and its affiliates, including: managing the execution of portfolio transactions and selecting broker-dealers for those transactions; monitoring adherence to the Funds' investment restrictions; producing shareholder reports; providing support services for the Board and committees of the Board; communicating with shareholders; serving as the Funds' administrator; and overseeing the activities of the Funds' other service providers, including monitoring for compliance with various policies and procedures as well as applicable securities laws and regulations.
The Trustees concluded that the nature, quality and extent of the services provided by CWAM and its affiliates to each Fund under the Advisory Agreement were appropriate for the Funds and that the Funds were likely to benefit from the continued provision of those services by CWAM. They also concluded that CWAM currently had sufficient personnel, with appropriate education and experience, to serve the Funds effectively, and that the firm had demonstrated its continuing ability to attract and retain well-qualified personnel. In addition, they took note of the quality of CWAM's compliance record.
Performance of the Funds. The Trustees received and considered detailed performance information at various meetings of the Board, the Committee and the Investment Performance Analysis Committee of the Board throughout the year. They reviewed information comparing each Fund's performance with that of its benchmark(s) and with the performance of comparable funds and peer groups as identified by Lipper Inc. (Lipper) and Morningstar, Inc. (Morningstar). The Trustees evaluated the performance of the Funds over various time periods, including over the one-, three- and five-year periods ending December 31, 2010. The Trustees also considered peer performance rankings based on a rolling five-year period.
The Trustees noted that the international Funds have delivered excellent results over the past five years, and have done so while exposing investors to less risk than competing funds, according to Morningstar. They considered that the domestic Funds have had mixed results. Columbia Acorn Fund has achieved good performance over the one- and three-year periods, and slightly underperformed its peers over the five-year period, ending December 31, 2010; the Fund had excellent results over longer periods. Columbia Acorn Select had better than average results measured against its peers over the three- and five-year periods ending December 31, 2010, but underperformed more recently. Columbia Acorn Select outperformed its benchmark for the five-year period but underperformed over the one- and three-year periods ending December 31, 2010. Columbia Acorn USA fell behind its benchmark and peer group medians over the one-, three- and five-year periods ending December 31, 2010, and Columbia Thermostat Fund outperformed its benchmark (an equally weighted custom composite of the Fund's primary equity and debt indexes) over the one-, three- and five- year periods ending December 31, 2010, and enjoyed strong rankings from Morningstar over each of these periods. The Trustees noted that the Investment Performance Analysis Committee of the Board concluded that Fund performance was generally satisfactory, except that Columbia Acorn USA's performance had slipped below the Lipper and Morningstar medians during the past year. The Trustees considered that CWAM had taken and was taking a number of corrective steps with respect to Columbia Acorn USA's underperformance and that the Investment Performance Analysis Committee of the Board was monitoring the Fund's performance.
The Trustees concluded that, although past performance is not necessarily indicative of future results, the strong overall longer-term performance record of the Funds was an important factor in their evaluation of the quality of services provided by CWAM under the Advisory Agreement for each Fund.
Costs of Services and Profits Realized by CWAM. At various Committee and Board meetings, the Trustees examined detailed information on the fees and expenses of each Fund in comparison to information for comparable funds provided by Lipper and Morningstar. The Trustees reviewed data from Lipper and Morningstar and noted that in general the Funds' total net operating expenses were below their median peer group rankings, with each Fund having lower total net operating expenses than its Lipper peer group median and only Columbia Acorn USA having total net operating expenses above its Morningstar peer group median. As noted in the Fee Evaluation, the actual advisory fees paid by Columbia Acorn Select and Columbia Acorn USA were higher than the median advisory fee of the Funds' Lipper and Morningstar peer groups and the actual advisory fee paid by Columbia Acorn International Select was higher than the median advisory fee of the Fund's Lipper peer group, but not of its Morningstar peer group. The actual advisory fees paid by Columbia Acorn Fund, Columbia Acorn International and Columbia Thermostat Fund were lower than the median advisory fee of the Funds' Morningstar and Lipper peer groups.
The Trustees also considered that Ameriprise represented and agreed that advisory fees would not be raised for the two years following the close of its acquisition of CWAM (May 1, 2010) pursuant to Section 15(f) of the 1940 Act.
The Trustees also reviewed the advisory fee rates charged by CWAM for managing other investment companies (including the Columbia Wanger Funds), sub-advised funds and other institutional separate accounts, as detailed in the Fee Evaluation. The Trustees noted that the Funds' advisory fees were generally comparable to the Columbia Wanger Funds' advisory fees at
94
the same asset levels. The Trustees also examined CWAM's institutional separate account fees for various investment strategies; in some cases those fees were higher than the advisory fees charged to the Funds, and in a few instances the fees were lower. The Trustees noted that CWAM performs significant additional services for the Funds that it does not provide to sub-advised funds or non-mutual fund clients, including administrative services, oversight of the Funds' other service providers, Trustee support, regulatory compliance and numerous other services, and that, in servicing the Funds, CWAM assumes many legal risks that it does not assume in servicing many of its non-fund clients.
The Trustees concluded that the rates of advisory fees payable to CWAM were reasonable in relation to the nature and quality of the services to be provided. The Trustees also concluded that the Funds' overall expense ratios were reasonable, considering the quality of the services provided by CWAM and its affiliates and the investment performance of the Funds.
The Trustees reviewed the analysis of the historic profitability of CWAM in serving as each Fund's investment adviser and of CWAM and its affiliates in their relationships with each Fund. The Committee and Trustees met on several occasions with representatives from Ameriprise to discuss its methodologies for calculating profitability and allocating costs. They considered that Ameriprise calculated profitability and allocated costs on a contract-by-contract and fund-by-fund basis. The Trustees also considered the methodology used by CWAM and Ameriprise in determining compensation payable to portfolio managers and the competitive market for investment management talent. The Trustees were also provided with profitability information from Lipper and Strategic Insight, which compared CWAM's profitability to other similar investment advisers in the mutual fund industry. The Trustees concluded that CWAM's and its affiliates' profits were within a reasonable range of those of competitors with similar business models. The Trustees discussed, however, that profitability comparisons among fund managers may not always be meaningful due to the lack of consistency in data, small number of publicly-owned managers, and the fact that profitability of any investment manager is affected by numerous factors, including its particular organizational structure, the types of funds and other accounts managed, other lines of business, expense allocation methodology, capital structure and cost of capital.
Economies of Scale. At various Committee and Board meetings and other informal meetings, the Trustees considered information about the extent to which CWAM realizes economies of scale in connection with an increase in Fund assets. The Trustees also discussed the potential for Fund sales growth. The Trustees noted that the advisory fee schedule for each Fund, other than Columbia Thermostat Fund, which has relatively modest assets, includes breakpoints in the rate of fees at various asset levels. The Trustees concluded that the fee structure of each Fund was reflective of a sharing between CWAM and the Funds of economies of scale.
Other Benefits to CWAM. The Trustees also reviewed benefits that accrue to CWAM and its affiliates from their relationships with the Funds, as outlined in the Fee Evaluation. They noted that the Funds' transfer agency services are performed by Columbia Management Investment Services Corp., an affiliate of Ameriprise, which receives compensation from the Funds for its services provided. They considered that an affiliate of Ameriprise, Columbia Management Investment Distributors, Inc. (CMID), serves as the Funds' distributor under a distribution agreement, and that it receives fees under the Trust's Rule 12b-1 Plan, most of which CMID paid to broker-dealers. In addition, Columbia Management provides sub-administration services to the Funds. The Committee received information regarding the profitability of each Fund agreement with CWAM affiliates. The Committee and the Board also reviewed information about and discussed the capabilities of each affiliated entity in performing its duties.
The Trustees considered other ways that the Funds and CWAM may potentially benefit from their relationship with each other. For example, the Trustees considered CWAM's use of commissions paid by each Fund on its portfolio brokerage transactions to obtain research products and services benefiting the Funds and/or other clients of CWAM. The Committee reviewed CWAM's annual "soft dollar" report and met with representatives from CWAM to review CWAM's soft dollar spending. The Committee also considered that the Compliance Committee of the Board regularly reviewed third-party prepared reports that evaluated the quality of CWAM's execution of the Funds' portfolio transactions. The Trustees determined that CWAM's use of the Funds' "soft" commission dollars to obtain research products and services was consistent with current regulatory requirements and guidance. They also concluded that CWAM benefits from the receipt of proprietary research products and services acquired through commissions paid on portfolio transactions of the Funds, and that the Funds benefit from CWAM's receipt of those products and services as well as research products and services acquired through commissions paid by other clients of CWAM.
After full consideration of the above factors, as well as other factors that were instructive in evaluating the Advisory Agreement, the Trustees, including the Independent Trustees, unanimously concluded that the continuation of the Advisory Agreement was in the best interest of each Fund. On June 8, 2011, the Trustees approved continuation of the Advisory Agreement through July 31, 2012.
95
Columbia Acorn Family of Funds
Second Quarter Class Z Share Information (Unaudited)
| Minimum Initial Investment in | |
| |
| all Funds | | $0 to $2,000, | |
| | available only to
| |
| | certain eligible
| |
| | investors | |
Minimum Subsequent
Investment in all Funds | | $100 | |
| Exchange Fee | | None | |
| Columbia Acorn Fund | | ACRNX | |
| Management Fee | | | 0.64 | % | |
| 12b-1 Fee | | | None | | |
| Other Expenses | | | 0.11 | % | |
| Net Expense Ratio | | | 0.75 | % | |
| Columbia Acorn International | | ACINX | |
| Management Fee | | | 0.76 | % | |
| 12b-1 Fee | | | None | | |
| Other Expenses | | | 0.19 | % | |
| Net Expense Ratio | | | 0.95 | % | |
| Columbia Acorn USA | | AUSAX | |
| Management Fee | | | 0.86 | % | |
| 12b-1 Fee | | | None | | |
| Other Expenses | | | 0.13 | % | |
| Net Expense Ratio | | | 0.99 | % | |
| Columbia Acorn International Select | | ACFFX | |
| Management Fee | | | 0.94 | % | |
| 12b-1 Fee | | | None | | |
| Other Expenses | | | 0.21 | % | |
| Net Expense Ratio | | | 1.15 | % | |
| Columbia Acorn Select | | ACTWX | |
| Management Fee | | | 0.81 | % | |
| 12b-1 Fee | | | None | | |
| Other Expenses | | | 0.16 | % | |
| Net Expense Ratio | | | 0.97 | % | |
| Columbia Thermostat Fund | | COTZX | |
| Management Fee | | | 0.10 | % | |
| 12b-1 Fee | | | None | | |
| Other Expenses | | | 0.15 | %* | |
| Net Expense Ratio | | | 0.25 | %* | |
Fees and expenses are for the six months ended June 30, 2011. Some share classes of Columbia Acorn Select and Columbia Acorn International Select include the effect of the voluntary undertaking by Columbia Wanger Asset Management, LLC (CWAM) to waive fees and/or reimburse the Funds for any ordinary operating expenses (exclusive of brokerage commissions, interest, taxes and extraordinary expenses, but inclusive of custodian charges relating to overdrafts, if any), after giving effect to any balance credits from the Funds' custodian, in excess of the annual rate of the Funds as follows:
| Fund | | Class Z | |
| Columbia Acorn International Select | | | 1.45 | % | |
| Columbia Acorn Select | | | 1.35 | % | |
These arrangements may be modified or terminated by either the Funds or CWAM upon 30 days notice. Columbia Thermostat Fund's fees and expenses include the effect of CWAM's contractual undertaking to waive fees and/or reimburse the Fund for any ordinary operating expenses (exclusive of distribution and service fees, interest and fees on borrowings and expenses associated with the Fund's investments in other investment companies, but including custodian charges relating to overdrafts, if any), after giving effect to any balance credits from the Fund's custodian, in excess of the annual rate of 0.25% of the average daily net assets. Columbia Thermostat Fund's waiver/reimbursement arrangement is contractual through April 30, 2012. There is no guarantee that this arrangement will continue thereafter.
* Does not include estimated fees and expenses of 0.65% incurred by the Fund from the underlying portfolio funds in which it invests.
96
This page intentionally left blank.
97
Columbia Acorn Family of Funds
Trustees
Laura M. Born
Chair of the Board
Steven N. Kaplan
Vice Chair of the Board
Michelle L. Collins
Maureen M. Culhane
Margaret M. Eisen
John C. Heaton
Charles P. McQuaid
Allan B. Muchin
David J. Rudis
David B. Small
Ralph Wanger (Trustee Emeritus)
Officers
Charles P. McQuaid
President
Ben Andrews
Vice President
Robert A. Chalupnik
Vice President
Michael G. Clarke
Assistant Treasurer
Joseph F. DiMaria
Assistant Treasurer
P. Zachary Egan
Vice President
John M. Kunka
Assistant Treasurer
Joseph C. LaPalm
Vice President
Bruce H. Lauer
Vice President, Secretary and Treasurer
Louis J. Mendes III
Vice President
Robert A. Mohn
Vice President
Christopher J. Olson
Vice President
Christopher O. Petersen
Assistant Secretary
Scott R. Plummer
Assistant Secretary
Linda K. Roth-Wiszowaty
Assistant Secretary
Robert P. Scales
Chief Compliance Officer, Chief Legal Officer,
Senior Vice President and General Counsel
Investment Adviser
Columbia Wanger Asset Management, LLC
227 West Monroe Street, Suite 3000
Chicago, Illinois 60606
1-800-922-6769
Distributor
Columbia Management Investment Distributors, Inc.
225 Franklin Street
Boston, Massachusetts 02110
Transfer Agent, Dividend Disbursing Agent
Columbia Management Investment Services Corp.
P. O. Box 8081
Boston, Massachusetts 02266-8081
1-800-345-6611
Legal Counsel to the Funds
Perkins Coie LLP
Washington, DC
Legal Counsel to the Independent Trustees
Drinker Biddle & Reath LLP
Philadelphia, Pennsylvania
Independent Registered Public Accounting Firm
PricewaterhouseCoopers LLP
Chicago, Illinois
This report, including the schedules of investments, is submitted for the general information of the shareholders of Columbia Acorn Trust.
A description of the policies and procedures that the Funds use to determine how to vote proxies and a copy of the Funds' voting record are available (i) without charge, upon request, by calling 800-922-6769 and (ii) on the Securities and Exchange Commission's website at www.sec.gov. Information regarding how the Funds voted proxies relating to portfolio securities during the 12-month period ended June 30, is available from the SEC's website. Information regarding how the Funds voted proxies relating to portfolio securities is also available at www.columbiamanagement.com under "About Us." From there, click on "Disclosures."
The Funds file a complete schedule of portfolio holdings with the SEC for the first and third quarters of each fiscal year on Form N-Q. The Funds' Form N-Q is available on the SEC's website at www.sec.gov and may be reviewed and copied at the SEC's Public Reference Room in Washington, D.C. Information on the operation of the Public Reference Room may be obtained by calling 1-800-SEC-0330.
Investors should consider the investment objectives, risks, charges and expenses of a mutual fund carefully before investing. For a free prospectus, which contains this and other important information about the funds, visit www.columbiamanagement.com. Read the prospectus carefully before investing.
Columbia Acorn Funds are distributed by Columbia Management Investment Distributors, Inc., member FINRA and managed by Columbia Wanger Asset Management, LLC.
Find out what's new – visit our web site at:
www.columbiamanagement.com
Our e-mail address is:
ServiceInquiries@ColumbiaManagement.com
Shareholders should not include personal information such as account numbers, Social Security numbers or taxpayer identification numbers in e-mail. We are unable to accept account transactions sent via e-mail.
98
Columbia Management®
Columbia Acorn Family of Funds
Class Z Shares
Semiannual Report, June 30, 2011
For More Information
You'll find more information about the Columbia Acorn Family of Funds in the documents described below. Contact Columbia Funds as follows to obtain these documents free of charge:
By Mail: Columbia Funds
c/o Columbia Management Investment Services Corp.
P. O. Box 8081 Boston, MA 02266-8081
By Telephone: 800.345.6611
Online: www.columbiamanagement.com
Shareholder Communications with the Board
The Funds' Board of Trustees has adopted procedures by which shareholders may communicate with the Board. Shareholders who wish to communicate with the Board should send their written communications to the Board by mail, c/o Columbia Wanger Asset Management, LLC, 227 West Monroe Street, Suite 3000, Chicago, Illinois 60606, Attention: Secretary. Shareholder communications must (i) be in writing, (ii) identify the Columbia Acorn Fund to which the communication relates and (iii) state the particular class of shares and number of shares held by the communicating shareholder.
Prospectuses and the Statement of Additional Information (SAI)
The prospectuses and the SAI provide more detailed information about the Funds and their policies. The SAI is legally part of each prospectus (it's incorporated by reference). A copy of each has been filed with the SEC.
Information Provided by the SEC
You can review and copy information about the Funds (including their prospectuses, the SAI and shareholder reports) at the SEC's Public Reference Room in Washington, DC. To find out more about the operation of the Public Reference Room, call the SEC at 202.551.8090. Reports and other information about the Fund are also available in the EDGAR Database on the SEC's website at http://www.sec.gov, or you can receive copies of this information, for a fee, by electronic request at the following e-mail address: publicinfo@sec.gov. You can also obtain copies of this information by writing the Public Reference Section, Securities and Exchange Commission, Washington, DC 20549-0102.
The investment company registration number of Columbia Acorn Trust, of which each of these Funds is a series, is 811-01829.
© 2011 Columbia Management Investment Advisers, LLC. All rights reserved.
225 Franklin Street, Boston, MA 02110
800.345.6611 www.columbiamanagement.com
C-1565 C (8/11) 122754
Q2 2011
Columbia Acorn Family of Funds
Class A, B, C and I Shares
Managed by Columbia Wanger Asset Management, LLC


Second Quarter Report
June 30, 2011
n ColumbiaSM
Acorn® Fund
n ColumbiaSM
Acorn International®
n ColumbiaSM
Acorn USA®
n ColumbiaSM
Acorn International SelectSM
n ColumbiaSM
Acorn SelectSM
n ColumbiaSM
Thermostat FundSM
Not FDIC insured • No bank guarantee • May lose value
2011 Mid-Year Distributions
The following table lists the mid-year distributions for Columbia Acorn Fund, Columbia Acorn International, Columbia Acorn International Select, Columbia Acorn Select and Columbia Thermostat Fund. Columbia Acorn USA did not have mid-year distributions. The record date was June 7, 2011, and the ex-dividend date and the payable date was June 8, 2011.
| | | Short-term
Capital
Gains | | Long-term
Capital
Gains | | Ordinary
Income | | Reinvestment
Price | |
| Columbia Acorn Fund Class A | | | None | | | $ | 0.3037 | | | $ | 0.0163 | | | $ | 29.46 | | |
| Columbia Acorn Fund Class B | | | None | | | $ | 0.3037 | | | | None | | | $ | 27.26 | | |
| Columbia Acorn Fund Class C | | | None | | | $ | 0.3037 | | | | None | | | $ | 26.95 | | |
| Columbia Acorn Fund Class I | | | None | | | $ | 0.3037 | | | $ | 0.0857 | | | $ | 30.41 | | |
| Columbia Acorn International Class A | | | None | | | | None | | | $ | 1.0167 | | | $ | 41.00 | | |
| Columbia Acorn International Class B | | | None | | | | None | | | $ | 0.9985 | | | $ | 39.97 | | |
| Columbia Acorn International Class C | | | None | | | | None | | | $ | 0.9448 | | | $ | 39.82 | | |
| Columbia Acorn International Class I | | | None | | | | None | | | $ | 1.0214 | | | $ | 41.12 | | |
| Columbia Acorn International Select Class A | | | None | | | | None | | | $ | 0.3158 | | | $ | 28.90 | | |
| Columbia Acorn International Select Class B | | | None | | | | None | | | $ | 0.1591 | | | $ | 27.64 | | |
| Columbia Acorn International Select Class C | | | None | | | | None | | | $ | 0.1199 | | | $ | 27.51 | | |
| Columbia Acorn International Select Class I | | | None | | | | None | | | $ | 0.4186 | | | $ | 29.21 | | |
| Columbia Acorn Select Class A | | | None | | | | None | | | $ | 0.3844 | | | $ | 26.05 | | |
| Columbia Acorn Select Class B | | | None | | | | None | | | $ | 0.2283 | | | $ | 24.36 | | |
| Columbia Acorn Select Class C | | | None | | | | None | | | $ | 0.1917 | | | $ | 24.16 | | |
| Columbia Acorn Select Class I | | | None | | | | None | | | $ | 0.4746 | | | $ | 26.76 | | |
| Columbia Thermostat Fund Class A | | | None | | | | None | | | $ | 0.1563 | | | $ | 12.76 | | |
| Columbia Thermostat Fund Class B | | | None | | | | None | | | $ | 0.1387 | | | $ | 12.82 | | |
| Columbia Thermostat Fund Class C | | | None | | | | None | | | $ | 0.1103 | | | $ | 12.81 | | |
Net Asset Value Per Share as of 06/30/11
| | | Columbia
Acorn Fund | | Columbia
Acorn
International | | Columbia
Acorn USA | | Columbia
Acorn
International
Select | | Columbia
Acorn
Select | | Columbia
Thermostat
Fund | |
| Class A | | $ | 30.95 | | | $ | 41.02 | | | $ | 30.01 | | | $ | 28.69 | | | $ | 27.50 | | | $ | 12.98 | | |
| Class B | | $ | 28.62 | | | $ | 39.97 | | | $ | 27.79 | | | $ | 27.42 | | | $ | 25.70 | | | $ | 13.04 | | |
| Class C | | $ | 28.30 | | | $ | 39.82 | | | $ | 27.57 | | | $ | 27.29 | | | $ | 25.49 | | | $ | 13.02 | | |
| Class I | | $ | 31.96 | | | $ | 41.15 | | | $ | 31.18 | | | $ | 29.00 | | | $ | 28.25 | | | | NA | | |
The views expressed in the "Squirrel Chatter II" and "In a Nutshell" commentaries reflect the current views of the respective authors. These views are not guarantees of future performance and involve certain risks, uncertainties and assumptions that are difficult to predict so actual outcomes and results may differ significantly from the views expressed. These views are subject to change at any time based upon economic, market or other conditions and the respective authors disclaim any responsibility to update such views. These views may not be relied upon as investment advice and, because investment decisions for a Columbia Acorn Fund are based on numerous factors, may not be relied upon as an indication of trading intent on behalf of any particular Columbia Acorn Fund. References to specific company's securities should not be construed as a recommendation or investment advice and there can be no assurance that as of the date of publication of this report, the securities mentioned in each Fund's portfolio are still held or that the securities sold have not been repurchased.
Columbia Acorn Funds News
Introducing ColumbiaSM Acorn® Emerging Markets Fund and ColumbiaSM Acorn® European Fund
On August 22, 2011, we launched two new Columbia Acorn Funds: Columbia Acorn Emerging Markets Fund and Columbia Acorn European Fund. These Funds utilize Columbia Wanger Asset Management's time-tested approach to investing, which centers on finding small- to mid-cap stocks in growing businesses with solid long-term prospects. In recent years, our nine international and global analysts have visited over 50 countries in search of investment ideas. These analysts include the portfolio managers running our new Funds, each of whom has exhibited excellent stock-picking skills.
Within the emerging markets, we've noted that most funds invest in large-cap stocks. Their focus is often commodity producers, whose businesses are tied to world macroeconomics, or financial companies, some of which may be quite risky. By focusing on smaller stocks, Columbia Acorn Emerging Markets Fund invests in what we believe to be more innovative, well-run niche businesses, priced at reasonable valuations. We believe that these types of companies should benefit from providing sought-after products and services to growing numbers of local, middle-class consumers, who have increasing spending power. We also believe that many of these companies experience lower levels of competition and better opportunities to internally reinvest profits than larger cap or developed market companies.
Likewise, Columbia Acorn European Fund has a small- to mid-cap stock focus. Because European companies operate in fairly small domestic markets, many are adept at creating niche products that have international appeal. European companies lead the world in machine tool manufacturing, products used to promote energy efficiency, luxury goods items, rail technology and some areas of medical technology. These products are needed, or wanted, in both developed and developing world markets. The integration of the European Union into a single trade zone with a common currency has created greater efficiency and productivity within the region, and opportunities to improve the infrastructure in Central and Eastern Europe are plentiful. Columbia Acorn European Fund's managers have extensive experience investing within the European markets and manage a similar offshore fund, Wanger European Smaller Companies Fund, which is not available to U.S.-domiciled investors.
I am personally investing in both Funds, as are the new Funds' portfolio managers. The Funds entail specific risks that are outlined in their prospectuses, and they may not be suitable for all investors. If interested, please call 1-800-922-6769 or your broker for a prospectus.
New Co-manager Named to Columbia Acorn Select Investment Team
I am pleased to announce that Robert Chalupnik has been named co-manager of Columbia Acorn Select, effective May 1, 2011. Since 2000, Rob has followed industrial stocks as a Columbia Wanger Asset Management analyst. Rob has excelled in finding growing niche businesses selling at reasonable prices. Over his 10 years as an analyst, he has distinguished himself by substantially beating his custom benchmark, which is comprised of most of the industrial stocks included in the Russell 2500 Index. Three of Rob's finds were among the top-10 positions in Columbia Acorn Fund at the end of period. Rob has worked with Columbia Acorn Select lead portfolio manager Ben Andrews since January of this year and together they have added what we believe to be some of Columbia Wanger Asset Management's best ideas into Columbia Acorn Select. Ben remains lead manager of the Fund and welcomes Rob in his new role.

Charles P. McQuaid
President and Chief Investment Officer
Columbia Wanger Asset Management, LLC
Investors should consider the investment objectives, risks, charges and expenses of a mutual fund carefully before investing. For a free prospectus, which contains this and other important information about the fund, visit columbiamanagement.com. The prospectus should be read carefully before investing.
The Russell 2500 Index measures the performance of the 2,500 smallest companies in the Russell 3000 Index, which represents approximately 17% of the total market capitalization of the Russell 3000 Index.
There is no guarantee that any investment strategy will deliver favorable results. The market value of securities and currencies may fall or fail to rise. Market risk may affect a single issuer, sector of the economy, industry or the market as a whole. Investments in foreign securities involve certain risks not associated with investments in U.S. companies, due to political, regulatory, economic, social and other conditions or events occurring in the country, as well as fluctuations in currency and the risks associated with less developed custody and settlement practices. Risks are particularly significant in emerging markets. Investments in small-capitalization companies involve greater risks and volatility than investments in larger, more established companies. See the prospectus for more information on these and other risks associated with the Fund.
Columbia Acorn Family of Funds
Table of Contents
| Share Class Performance | | | 1 | | |
| Fund Performance vs. Benchmark | | | 2 | | |
| Description of Indexes | | | 3 | | |
Squirrel Chatter II: Shale Gas Returns,
Transforming the Energy Outlook | | | 4 | | |
| Understanding Your Expenses | | | 8 | | |
| Columbia Acorn Fund | |
| In a Nutshell | | | 10 | | |
| At a Glance | | | 11 | | |
| Major Portfolio Changes | | | 22 | | |
| Statement of Investments | | | 24 | | |
| Columbia Acorn International | |
| In a Nutshell | | | 12 | | |
| At a Glance | | | 13 | | |
| Major Portfolio Changes | | | 38 | | |
| Statement of Investments | | | 40 | | |
| Portfolio Diversification | | | 49 | | |
| Columbia Acorn USA | |
| In a Nutshell | | | 14 | | |
| At a Glance | | | 15 | | |
| Major Portfolio Changes | | | 50 | | |
| Statement of Investments | | | 51 | | |
| Columbia Acorn International Select | |
| In a Nutshell | | | 16 | | |
| At a Glance | | | 17 | | |
| Major Portfolio Changes | | | 58 | | |
| Statement of Investments | | | 59 | | |
| Portfolio Diversification | | | 63 | | |
| Columbia Acorn Select | |
| In a Nutshell | | | 18 | | |
| At a Glance | | | 19 | | |
| Major Portfolio Changes | | | 64 | | |
| Statement of Investments | | | 65 | | |
| Columbia Thermostat Fund | |
| In a Nutshell | | | 20 | | |
| At a Glance | | | 21 | | |
| Statement of Investments | | | 70 | | |
| Columbia Acorn Family of Funds | |
| Statements of Assets and Liabilities | | | 72 | | |
| Statements of Operations | | | 73 | | |
| Statements of Changes in Net Assets | | | 74 | | |
| Financial Highlights | | | 78 | | |
| Notes to Financial Statements | | | 90 | | |
Management Fee Evaluation of the
Senior Officer | | | 98 | | |
| Board Approval of the Advisory Agreement | | | 103 | | |
| Columbia Acorn Family of Funds Information | | | 106 | | |
Columbia Acorn Funds
Share Class Performance Average Annual Total Returns through 6/30/11
| | | Class A | | Class B* | | Class C | | Class I† | |
| | | Without
Sales Charge | | With
Sales Charge | | Without
Sales Charge | | With
Sales Charge | | Without
Sales Charge | | With
Sales Charge | | Without
Sales Charge | |
| Columbia Acorn Fund (10/16/00) | |
| 3 months** | | | 1.35 | % | | | -4.47 | % | | | 1.18 | % | | | -3.82 | % | | | 1.16 | % | | | 0.16 | % | | | 1.47 | % | |
| Year to date** | | | 7.00 | % | | | 0.86 | % | | | 6.63 | % | | | 1.63 | % | | | 6.59 | % | | | 5.59 | % | | | 7.22 | % | |
| 1 year | | | 38.98 | % | | | 31.01 | % | | | 38.13 | % | | | 33.13 | % | | | 37.93 | % | | | 36.93 | % | | | NA | | |
| 5 years | | | 5.88 | % | | | 4.63 | % | | | 5.21 | % | | | 4.89 | % | | | 5.04 | % | | | 5.04 | % | | | NA | | |
| 10 years | | | 8.80 | % | | | 8.16 | % | | | 8.09 | % | | | 8.09 | % | | | 7.99 | % | | | 7.99 | % | | | NA | | |
| Life of fund | | | 9.77 | % | | | 9.17 | % | | | 9.07 | % | | | 9.07 | % | | | 8.96 | % | | | 8.96 | % | | | 24.30 | %** | |
| Columbia Acorn International (10/16/00) | |
| 3 months** | | | 1.61 | % | | | -4.22 | % | | | 1.43 | % | | | -3.52 | % | | | 1.40 | % | | | 0.41 | % | | | 1.69 | % | |
| Year to date** | | | 2.86 | % | | | -3.05 | % | | | 2.52 | % | | | -2.48 | % | | | 2.45 | % | | | 1.45 | % | | | 3.06 | % | |
| 1 year | | | 31.78 | % | | | 24.19 | % | | | 31.02 | % | | | 26.02 | % | | | 30.78 | % | | | 29.78 | % | | | NA | | |
| 5 years | | | 6.98 | % | | | 5.72 | % | | | 6.31 | % | | | 6.00 | % | | | 6.14 | % | | | 6.14 | % | | | NA | | |
| 10 years | | | 10.87 | % | | | 10.21 | % | | | 10.14 | % | | | 10.14 | % | | | 10.05 | % | | | 10.05 | % | | | NA | | |
| Life of fund | | | 8.05 | % | | | 7.45 | % | | | 7.35 | % | | | 7.35 | % | | | 7.26 | % | | | 7.26 | % | | | 12.85 | %** | |
| Columbia Acorn USA (10/16/00) | |
| 3 months** | | | 1.42 | % | | | -4.43 | % | | | 1.24 | % | | | -3.76 | % | | | 1.25 | % | | | 0.25 | % | | | 1.50 | % | |
| Year to date** | | | 8.97 | % | | | 2.70 | % | | | 8.55 | % | | | 3.55 | % | | | 8.59 | % | | | 7.59 | % | | | 9.17 | % | |
| 1 year | | | 42.90 | % | | | 34.69 | % | | | 42.00 | % | | | 37.00 | % | | | 41.82 | % | | | 40.82 | % | | | NA | | |
| 5 years | | | 4.55 | % | | | 3.32 | % | | | 3.86 | % | | | 3.52 | % | | | 3.73 | % | | | 3.73 | % | | | NA | | |
| 10 years | | | 6.79 | % | | | 6.16 | % | | | 6.08 | % | | | 6.08 | % | | | 5.99 | % | | | 5.99 | % | | | NA | | |
| Life of fund | | | 9.37 | % | | | 8.77 | % | | | 8.65 | % | | | 8.65 | % | | | 8.58 | % | | | 8.58 | % | | | 28.63 | %** | |
| Columbia Acorn International Select (10/16/00) | |
| 3 months** | | | 1.02 | % | | | -4.78 | % | | | 0.83 | % | | | -4.17 | % | | | 0.81 | % | | | -0.19 | % | | | 1.15 | % | |
| Year to date** | | | 3.55 | % | | | -2.41 | % | | | 3.21 | % | | | -1.79 | % | | | 3.12 | % | | | 2.12 | % | | | 3.83 | % | |
| 1 year | | | 30.82 | % | | | 23.31 | % | | | 29.90 | % | | | 24.90 | % | | | 29.78 | % | | | 28.78 | % | | | NA | | |
| 5 years | | | 6.85 | % | | | 5.59 | % | | | 6.15 | % | | | 5.83 | % | | | 5.99 | % | | | 5.99 | % | | | NA | | |
| 10 years | | | 9.13 | % | | | 8.48 | % | | | 8.41 | % | | | 8.41 | % | | | 8.31 | % | | | 8.31 | % | | | NA | | |
| Life of fund | | | 5.88 | % | | | 5.30 | % | | | 5.18 | % | | | 5.18 | % | | | 5.09 | % | | | 5.09 | % | | | 12.66 | %** | |
| Columbia Acorn Select (10/16/00) | |
| 3 months** | | | -1.01 | % | | | -6.70 | % | | | -1.18 | % | | | -6.07 | % | | | -1.22 | % | | | -2.20 | % | | | -0.93 | % | |
| Year to date** | | | -0.12 | % | | | -5.85 | % | | | -0.46 | % | | | -5.39 | % | | | -0.53 | % | | | -1.52 | % | | | 0.04 | % | |
| 1 year | | | 28.66 | % | | | 21.28 | % | | | 27.85 | % | | | 22.85 | % | | | 27.63 | % | | | 26.63 | % | | | NA | | |
| 5 years | | | 4.86 | % | | | 3.63 | % | | | 4.18 | % | | | 3.84 | % | | | 4.02 | % | | | 4.02 | % | | | NA | | |
| 10 years | | | 8.05 | % | | | 7.42 | % | | | 7.33 | % | | | 7.33 | % | | | 7.23 | % | | | 7.23 | % | | | NA | | |
| Life of fund | | | 8.46 | % | | | 7.86 | % | | | 7.74 | % | | | 7.74 | % | | | 7.64 | % | | | 7.64 | % | | | 16.21 | %** | |
| Columbia Thermostat Fund (3/3/03)† | |
| 3 months** | | | 1.38 | % | | | -4.44 | % | | | 1.31 | % | | | -3.69 | % | | | 1.25 | % | | | 0.25 | % | | | — | | |
| Year to date** | | | 4.44 | % | | | -1.58 | % | | | 4.28 | % | | | -0.72 | % | | | 4.06 | % | | | 3.06 | % | | | |
| 1 year | | | 25.05 | % | | | 17.89 | % | | | 24.35 | % | | | 19.35 | % | | | 24.00 | % | | | 23.00 | % | | | — | | |
| 5 years | | | 5.54 | % | | | 4.31 | % | | | 5.01 | % | | | 4.68 | % | | | 4.74 | % | | | 4.74 | % | | | — | | |
| Life of fund | | | 7.95 | % | | | 7.18 | % | | | 7.35 | % | | | 7.35 | % | | | 7.15 | % | | | 7.15 | % | | | — | | |
*The Funds no longer accept investments from new or existing shareholders in Class B shares.
**Not annualized.
†Class I shares commenced operations on September 27, 2010. This share class is offered at net asset value without sales charge and is available only to qualifying institutional investors.
Performance data shown represents past performance and is not a guarantee of future results. The investment return and principal value of an investment will fluctuate so that shares, when redeemed, may be worth more or less than their original cost. Performance results reflect any fee waivers or reimbursements of Fund expenses by the investment adviser and/or any of its affiliates. Absent these fee waivers and/or expense reimbursement arrangements, performance results would have been lower. Current performance may be lower or higher than the performance data shown. Please visit columbiamanagement.com for daily and most recent month-end updates.
The "with sales charge" returns include the maximum initial sales charge of 5.75% for Class A shares, the applicable contingent deferred sales charge (CDSC) for Class B shares (5%, 4%, 3%, 3%, 2%, 1%, 0% for the first through seventh years after purchase, respectively), and the maximum CDSC of 1.00% of Class C shares during the first year after purchase.
Annual operating expense ratios are as stated in each Fund's current prospectus and differences in expense ratios disclosed elsewhere in this report may result from including fee waivers and expense reimbursements as well as different time periods used in calculating the ratios. Columbia Acorn Fund: Class A: 1.07%; Class B: 1.69%; Class C: 1.85%; Class I: 0.72%. Columbia Acorn International: Class A: 1.35%; Class B: 1.96%; Class C: 2.11%; Class I: 0.93%. Columbia Acorn USA: Class A: 1.30%; Class B: 1.98%; Class C: 2.08%; Class I: 0.95%. Columbia Acorn International Select: Class A: 1.56%; Class B: 2.24%; Class C: 2.36%; Class I: 1.13%. Columbia Acorn Select: Class A: 1.28%; Class B: 1.93%; Class C: 2.08%; Class I: 0.92%. Columbia Thermostat Fund has a contractual expense waiver or reimbursement that expires April 30, 2012. Expense ratios without and with the contractual waiver, including fees and expenses associated with the Fund's investments in other investment companies are: Class A: 1.52%, 1.29%; Class B: 2.07%, 1.79%; Class C: 2.28%, 2.04%, respectively.
††A "fund of funds" bears its allocable share of the costs and expenses of the underlying funds in which it invests. Such funds are thus subject to two levels of fees and potentially higher expense ratios than would be associated with an investment in a fund that invests and trades directly in financial instruments under the direction of a single manager.
All results shown assume reinvestment of distributions and do not reflect the deduction of taxes that a shareholder would pay on fund distributions or on the redemption of fund shares.
1
Columbia Acorn Family of Funds
Fund Performance vs. Benchmarks Average Annual Total Returns through 6/30/11
| Class A Shares, without sales charge | | 2nd
quarter* | | Year
to date* | | 1 year | | 3 years | | 5 years | | 10 years | | Life
of Fund | |
Columbia Acorn Fund
(LACAX) (10/16/00) | | | 1.35 | % | | | 7.00 | % | | | 38.98 | % | | | 8.09 | % | | | 5.88 | % | | | 8.80 | % | | | 9.77 | % | |
| Russell 2500 Index | | | -0.59 | % | | | 8.06 | % | | | 39.28 | % | | | 8.17 | % | | | 5.20 | % | | | 7.40 | % | | | 7.60 | % | |
| S&P 500 Index** | | | 0.10 | % | | | 6.02 | % | | | 30.69 | % | | | 3.34 | % | | | 2.94 | % | | | 2.72 | % | | | 1.52 | % | |
| Lipper Small-Cap Core Funds Index | | | -1.36 | % | | | 6.18 | % | | | 36.32 | % | | | 7.54 | % | | | 4.74 | % | | | 6.91 | % | | | 7.30 | % | |
| Lipper Mid-Cap Growth Funds Index | | | -0.04 | % | | | 7.57 | % | | | 39.76 | % | | | 5.63 | % | | | 6.86 | % | | | 4.73 | % | | | 1.67 | % | |
Columbia Acorn International
(LAIAX) (10/16/00) | | | 1.61 | % | | | 2.86 | % | | | 31.78 | % | | | 3.84 | % | | | 6.98 | % | | | 10.87 | % | | | 8.05 | % | |
S&P Global Ex-U.S. Between $500 Million
and $5 Billion Index | | | 0.72 | % | | | 2.63 | % | | | 34.29 | % | | | 5.43 | % | | | 7.09 | % | | | 12.71 | % | | | 11.09 | % | |
| S&P Global Ex-U.S. SmallCap Index | | | 0.59 | % | | | 3.62 | % | | | 35.68 | % | | | 4.10 | % | | | 5.91 | % | | | 11.92 | % | | | 10.24 | % | |
| MSCI EAFE Index (Net) | | | 1.56 | % | | | 4.98 | % | | | 30.36 | % | | | -1.77 | % | | | 1.48 | % | | | 5.66 | % | | | 3.85 | % | |
| Lipper International Small/Mid Growth Funds Index | | | 1.69 | % | | | 2.88 | % | | | 36.54 | % | | | 2.35 | % | | | 4.85 | % | | | 9.71 | % | | | 6.64 | % | |
Columbia Acorn USA
(LAUAX) (10/16/00) | | | 1.42 | % | | | 8.97 | % | | | 42.90 | % | | | 7.78 | % | | | 4.55 | % | | | 6.79 | % | | | 9.37 | % | |
| Russell 2000 Index | | | -1.61 | % | | | 6.21 | % | | | 37.41 | % | | | 7.77 | % | | | 4.08 | % | | | 6.27 | % | | | 6.59 | % | |
| Russell 2500 Index | | | -0.59 | % | | | 8.06 | % | | | 39.28 | % | | | 8.17 | % | | | 5.20 | % | | | 7.40 | % | | | 7.60 | % | |
| S&P 500 Index** | | | 0.10 | % | | | 6.02 | % | | | 30.69 | % | | | 3.34 | % | | | 2.94 | % | | | 2.72 | % | | | 1.52 | % | |
| Lipper Small-Cap Growth Funds Index | | | 0.23 | % | | | 9.07 | % | | | 41.91 | % | | | 7.60 | % | | | 4.77 | % | | | 4.04 | % | | | 2.45 | % | |
Columbia Acorn Int'l Select
(LAFAX) (10/16/00) | | | 1.02 | % | | | 3.55 | % | | | 30.82 | % | | | -0.65 | % | | | 6.85 | % | | | 9.13 | % | | | 5.88 | % | |
S&P Developed Ex-U.S. Between $2 Billion
and $10 Billion Index | | | 0.90 | % | | | 4.04 | % | | | 33.74 | % | | | 1.73 | % | | | 3.73 | % | | | 9.60 | % | | | 8.38 | % | |
| MSCI EAFE Index (Net) | | | 1.56 | % | | | 4.98 | % | | | 30.36 | % | | | -1.77 | % | | | 1.48 | % | | | 5.66 | % | | | 3.85 | % | |
| Lipper International Small/Mid Growth Funds Index | | | 1.69 | % | | | 2.88 | % | | | 36.54 | % | | | 2.35 | % | | | 4.85 | % | | | 9.71 | % | | | 6.64 | % | |
Columbia Acorn Select
(LTFAX) (10/16/00) | | | -1.01 | % | | | -0.12 | % | | | 28.66 | % | | | 2.98 | % | | | 4.86 | % | | | 8.05 | % | | | 8.46 | % | |
| S&P MidCap 400 Index | | | -0.73 | % | | | 8.56 | % | | | 39.38 | % | | | 7.82 | % | | | 6.60 | % | | | 7.94 | % | | | 7.82 | % | |
| S&P 500 Index** | | | 0.10 | % | | | 6.02 | % | | | 30.69 | % | | | 3.34 | % | | | 2.94 | % | | | 2.72 | % | | | 1.52 | % | |
| Lipper Mid-Cap Growth Funds Index | | | -0.04 | % | | | 7.57 | % | | | 39.76 | % | | | 5.63 | % | | | 6.86 | % | | | 4.73 | % | | | 1.67 | % | |
Columbia Thermostat Fund
(CTFAX) (3/3/03)† | | | 1.38 | % | | | 4.44 | % | | | 25.05 | % | | | 5.54 | % | | | 5.54 | % | | | — | | | | 7.95 | % | |
| S&P 500 Index | | | 0.10 | % | | | 6.02 | % | | | 30.69 | % | | | 3.34 | % | | | 2.94 | % | | | — | | | | 7.68 | % | |
| Barclays Capital U.S. Aggregate Bond Index | | | 2.29 | % | | | 2.72 | % | | | 3.90 | % | | | 6.46 | % | | | 6.52 | % | | | — | | | | 4.93 | % | |
| Lipper Flexible Portfolio Funds Index | | | 0.46 | % | | | 5.11 | % | | | 23.38 | % | | | 4.00 | % | | | 5.16 | % | | | — | | | | 8.35 | % | |
| 50/50 Blended Benchmark†† | | | 1.21 | % | | | 4.40 | % | | | 16.88 | % | | | 5.45 | % | | | 5.14 | % | | | — | | | | 6.60 | % | |
*Not annualized.
**Although the Fund typically invests in small- and mid-sized companies, the comparison to the S&P 500 Index is presented to show performance against a widely recognized market index over the life of the Fund.
Performance data shown represents past performance and is not a guarantee of future results. The investment return and principal value of an investment will fluctuate so that shares, when redeemed, may be worth more or less than their original cost. Current performance may be lower or higher than the performance data shown. Please visit columbiamanagement.com for daily and most recent month-end updates.
Performance results reflect any fee waivers or reimbursements of Fund expenses by the investment adviser and/or any of its affiliates. Absent these fee waivers or expense reimbursement arrangements, performance results would have been lower. Annual operating expense ratios are stated as of each Fund's current prospectus and differences in expense ratios disclosed elsewhere in this report may result from including fee waivers and expense reimbursements as well as different time periods used in calculating the ratios. Columbia Acorn Fund: Class A: 1.07%; Class B: 1.69%; Class C: 1.85%, Class I: 0.72%. Columbia Acorn International: Class A: 1.35%; Class B: 1.96%; Class C: 2.11%, Class I: 0.93%. Columbia Acorn USA: Class A: 1.30%; Class B: 1.98%; Class C: 2.08% Class I: 0.95%. Columbia Acorn International Select: Class A: 1.56%; Class B: 2.24%; Class C: 2.36% Class I: 1.13%. Columbia Acorn Select: Class A: 1.28%; Class B: 1.93%; Class C: 2.08%, Class I: 0.92%. Columbia Thermostat Fund has a contractual expense waiver or reimbursement that expires April 30, 2012. Expense ratios without and with the contractual waiver, including fees and expenses associated with the Fund's investments in other investment companies are: Class A: 1.52%, 1.29%; Class B: 2.07%, 1.79%; Class C: 2.28%, 2.04%, respectively.
†A "fund of funds" bears its allocable share of the costs and expenses of the underlying funds in which it invests. Such funds are thus subject to two levels of fees and potentially higher expense ratios than would be associated with an investment in a fund that invests and trades directly in financial instruments under the direction of a single manager.
††The 50/50 Blended Benchmark is a custom supplemental benchmark established by the adviser.
All results shown assume reinvestment of distributions and do not reflect the deduction of taxes that a shareholder would pay on fund distributions or on the redemption of fund shares.
Unlike mutual funds, indexes are not actively managed and do not incur fees or expenses. It is not possible to invest directly in an index. For index definitions, see Page 3.
2
Columbia Acorn Family of Funds
Descriptions of Indexes Included in this Report
• 50/50 Blended Benchmark, established by the Fund's adviser, is an equally weighted custom composite of Columbia Thermostat Fund's primary equity and primary debt benchmarks, the S&P 500 Index and the Barclays Capital U.S. Aggregate Bond Index, respectively. The percentage of the Fund's assets allocated to underlying stock and bond portfolio funds will vary, and accordingly the composition of the Fund's portfolio will not always reflect the composition of the 50/50 Blended Benchmark.
• Barclays Capital U.S. Aggregate Bond Index is a market value-weighted index that tracks the daily price, coupon, pay-downs and total return performance of fixed-rate, publicly placed, dollar-denominated and non-convertible investment grade debt issues with at least $250 million par amount outstanding and with at least one year to final maturity.
• Lipper Indexes include the largest funds tracked by Lipper, Inc. in the named category. Lipper Small-Cap Core Funds Index, 30 largest small-cap core funds; Lipper Mid-Cap Growth Funds Index, 30 largest mid-cap growth funds, including Columbia Acorn Fund and Columbia Acorn Select; Lipper International Small/Mid Growth Funds Index, 10 largest non-U.S. small/mid growth funds, including Columbia Acorn International; Lipper Small-Cap Growth Funds Index, 30 largest small-cap growth funds, including Columbia Acorn USA; Lipper International Funds Index, 30 largest non-U.S. funds, excluding non-U.S. small-cap funds; Lipper Flexible Portfolio Funds Index, an equal-weighted index of the 30 largest mutual funds within the Flexible Portfolio fund classification, as defined by Lipper.
• Morgan Stanley Capital International Europe, Australasia, Far East (MSCI EAFE) Index (Net) is a capitalization-weighted index that tracks the total return of common stocks in 22 developed-market countries within Europe, Australasia and the Far East. The returns of the MSCI EAFE Index (Net) are presented net of the withholding tax rate applicable to foreign non-resident institutional investors in the foreign companies included in the index who do not benefit from double taxation treaties.
• Russell 2000 Index measures the performance of the 2,000 smallest companies in the Russell 3000 Index, which represents approximately 8% of the total market capitalization of the Russell 3000 Index.
• Russell 2500 Index measures the performance of the 2,500 smallest companies in the Russell 3000 Index, which represents approximately 17% of the total market capitalization of the Russell 3000 Index.
• Standard & Poor's (S&P) 500 Index tracks the performance of 500 widely held, large-capitalization U.S. stocks.
• Standard & Poor's (S&P) MidCap 400 Index is a market value-weighted index that tracks the performance of 400 mid-cap U.S. companies.
• S&P Developed Ex-U.S. Between $2B and $10B Index is a subset of the broad market selected by the index sponsor representing the mid-cap developed market, excluding the United States.
• S&P Global Ex-U.S. SmallCap Index consists of the bottom 20% of institutionally investable capital of developed and emerging countries, outside the United States.
• S&P Global Ex-U.S. Between $500M and $5B Index is a subset of the broad market selected by the index sponsor representing the mid- and small-cap developed and emerging markets, excluding the United States.
Unlike mutual funds, indexes are not managed and do not incur fees or expenses. It is not possible to invest directly in an index.
3
Squirrel Chatter II: Shale Gas Returns, Transforming the Energy Outlook
 Just five to seven years ago, it was widely believed that North American natural gas resources were being rapidly depleted. Today, the outlook appears to be very much improved thanks to the ingenuity of a few individuals and a process that should provide natural gas for decades to come.
In 1825, some 34 years before Colonel Edwin Drake1 drilled the first oil well in Titusville, Pennsylvania, William Aaron Hart drilled the first natural gas well, in shale located in Fredonia, New York. By August of that year, five structures in the village were illuminated by natural gas and by November there were 36 gas lights in the village. In 1857, Preston Barmore, the superintendent of the Fredonia Natural Gas Co., was not satisfied with the production from a 122 foot well so he exploded crevices of rock in the well, increasing the supply of gas. Within a few years, the village had 150 gas lights.2
Plenty of natural gas was subsequently found in sandstone formations under impermeable rock, in similar formations as oil, or accompanied by oil. Extracting this natural gas was less costly than drilling for gas in shale, so shale exploration all but ended. Over 300,000 miles of gas pipelines were built, and demand for natural gas grew.3 U.S.-marketed production rose to 1 trillion cubic feet (TCF) of natural gas by 1923, and has ranged from 16.9 to 22.6 TCF since 1973.4 Natural gas is used for heating and manufacturing, and is a feedstock for fertilizers, plastics and chemicals.
Recent Natural Gas Shortages
In 2004, Julian Darley wrote High Noon for Natural Gas, The New Energy Crisis. He reviewed Hubbert's Peak, a theory named after the geologist who researched oil finding and production curves and then correctly predicted that U.S. oil production would peak around 1970. Darley applied Hubbert's Peak to natural gas data and concluded that North American gas production had also peaked and was likely to plunge.
Darley wrote, "The United States and Canada are entering a natural gas crisis ...North American supply is simply no longer able to meet desired consumption."5 He added, "...the worst immediate problem confronting the United States (and Canada) is not oil, but natural gas. It is a natural gas shortage that could seriously interrupt the U.S. economy..."6 Darley noted that the U.S. Energy Information Administration (EIA) made enormous upward revisions for production of natural gas from shale, tight sands and coal beds, but he believed such gains would fail to occur. Instead, importing of liquefied natural gas (LNG) would have to be an interim solution. But LNG, Darley stated, had safety and security risks. Geopolitically, relying on imported LNG would also be problematic, as Russia and Iran had the largest reserves of natural gas.
Darley believed that the 300-plus new natural gas-fired electric generating stations, built between 1980 and 2003 at a cost of $100 billion, were huge mistakes. The power companies had apparently reviewed a 1999 National Petroleum Council report that stated North American natural gas supplies would grow. Darley labeled that report as an "example of the kind of cornucopian delusion that characterizes many in government and most in industry, who believe in nothing but economics and the miracle of capitalism with its unlimited ability to find substitutes for everything."7
Darley thought that with worldwide Peak Oil imminent and North American natural gas production plunging, energy was to become scarce, and the industrial revolution would unwind. He advocated that people should be able to obtain their daily needs within walking distance from where they lived. His long-term solution was to depopulate the earth, such that mankind no longer mined the planet and consumed only the energy that the sun regularly provides. At one child per woman, the population of the earth would be back to one billion in about one hundred years.
Domestic natural gas production fell between 2001 and 2005 and prices increased between 2002 and 2008.8 Most major oil companies and analysts agreed that natural gas production in North America was peaking, and that the U.S. would need substantial imports of LNG. I remember going to an energy conference in early 2006 where this view was widespread. Darley's nightmare scenario seemed to be coming true.
4
Back in the Gas Fields
George Mitchell has been called the Father of the Barnett Natural Gas Field, located in and around Fort Worth, Texas. Over an 18-year period beginning in 1981, his company, Mitchell Energy and Development, experimented with fracturing gas-bearing shale that is located between 6,000 and 14,000 feet below the surface. Geologists knew that shale had lots of pores and the ability to store natural gas, but since pores in shale are rarely interconnected, gas flows poorly through shale. Initial attempts to extract this gas were costly, and production was not economical. Eventually, the company developed a "light sand frac" method that was effective and used less fluid. The combination of reduced costs and rising natural gas prices made such drilling profitable. Mitchell drilled many wells at the Barnett field, producing far more natural gas than most people expected.9
Mitchell needed more funding and sold his company to Devon Energy, a larger, independent producer. Devon had expertise in an additional technology, horizontal drilling, which tilted drill holes at angles or sideways once they hit pay dirt. More gas-bearing shale was consequently exposed to the well. With this added technology, the company drilled 55 wells in the Barnett field in 2003 and the shale gas boom began.10 Some 13,500 gas wells have been drilled in the Barnett field since 199711 and the Barnett field accounted for 6% of total natural gas production in the United States in 2010.12
Drilling at other shale gas formations has also jumped. U.S. shale gas production increased 12-fold in the last decade and currently accounts for about 25% of U.S. natural gas production.13 With greater production, natural gas wellhead prices halved from 2008 to 2010. In its yearly forecast in 2010, the EIA doubled its estimate of U.S. shale gas production for 2035 and predicts shale gas production will hit 46% of U.S. consumption that year.14 Imports will drop from 11% of natural gas consumption in 2009 to 1%.15 With "economics and the miracle of capitalism,"16 we won't need to revert to Darley's dark ages any time soon. The EIA also believes shale gas totaling at least six-times U.S. reserves is recoverable in at least 32 other countries.17
Energy Mix
In 2009, Robert Hefner published The Grand Energy Transition. The book provides perspectives on past and future sources and uses of energy. Hefner believes that energy usage naturally transitions from solids (wood and coal) to liquids (oil) and then to gasses (natural gas, wind and hopefully nuclear fusion). He sees newer fuels as superior to older ones, with each new fuel facilitating new technologies, improvements in the environment and higher living standards.
The transition to coal from wood powered the industrial revolution and allowed millions of acres of forests to regrow. Coal then fell from 80% of the world energy market in 1900 to about 28% currently. Oil ascended to 48% of the world's energy by 1973, displacing much dirty coal and revolutionizing transportation via the introduction of automobiles and airplanes. Oil subsequently dropped to about 36% of world energy consumption. Natural gas has risen from 10% of the world's energy in 1950 to 24% currently.18
Believing in global warming, Hefner notes that the transition from wood to coal to oil to natural gas slashed carbon content and increased hydrogen content of fuels with each transition. Since burning carbon creates carbon dioxide (CO2), the primary greenhouse gas, and burning hydrogen creates water, the natural transitions from solids to liquids to gasses slow global warming. Burning natural gas creates 44% less CO2 than burning coal and 29% less than burning oil. Burning natural gas also emits about 80% less nitrogen oxides, over 90% lower particulates and over 99% less sulfur dioxide than coal or oil.19
Under an earlier belief that the United States was running out of natural gas, the Natural Gas Policy Act (NGPA) and the Fuel Use Act were passed in 1978. The NGPA immediately deregulated prices for gas produced from deep wells and phased out other price controls.20 The Fuel Use Act mandated the phase out of natural gas for electric generation and restricted its industrial uses. Prices for deep gas jumped, but so did drilling. Production grew, and with demand depressed by the Fuel Use Act, prices then collapsed. There was an excess supply of natural gas, known as the "gas bubble," until the year 2000.
Hefner believes that prior price controls and the Fuel Use Act slowed the natural transition from coal and oil to natural gas. As a result of the Fuel Use Act, some 100,000 megawatts of coal-fired electric generating capacity was built in the United States through 1989 that has emitted 15 billion metric tons of CO2 into the atmosphere.21 Hefner
5
believes that the construction of the coal burning plants, not the natural gas burning plants, was the big mistake.
Hefner subscribes to Peak Oil occurring soon, but sees many decades of abundant and relatively cheap natural gas. Hence, he predicts the grand energy transition to natural gas will continue, and he believes natural gas will be a bridge fuel to renewable energy and possibly nuclear fusion. Natural gas complements wind energy quite well, as gas-burning electric plants can quickly power up when the wind slows.
Some 12 million vehicles worldwide are powered by natural gas. Of that number, there are estimated to be 110,000 natural gas-powered vehicles in the United States,22 including thousands of trucks serving the ports of Long Beach and Los Angeles,23 more than 11,000 buses24 and approximately 12,000 Honda Civic GX cars.25 These vehicles burn natural gas currently priced at one-third of the energy equivalent price of oil. Hefner believes that half the autos in the United States should be powered by natural gas, and the dirtiest, coal-burning electric plants should be replaced by natural gas plants. Yearly gas consumption would rise by 13 TCF, but could be met by increased shale gas production.26
Investment Implications
We believe that innovations in producing gas from shale have indeed transformed the U.S. energy outlook. We profitably invested in some of the pioneers of shale gas though, with the current glut of natural gas, the stocks now look less attractive. Supplies of gas may remain high in the short term as some unprofitable drilling persists in order to keep lease rights. Over time, the low prices will likely result in reduced drilling and more constrained supplies. When this happens, natural gas prices should rise to a level where drilling and production are moderately profitable. We continue to look for suppliers and service companies participating in shale gas production. Some shale oil fields are now being developed, including the Bakken field in North Dakota and Canada and the Eagle Ford field in Texas. At this point, we don't think there will be enough shale oil production to revolutionize the oil market, but we do believe we have found some attractive stocks participating in those developments.

Charles P. McQuaid
President and Chief Investment Officer
Columbia Wanger Asset Management, LLC
The information and data provided in this analysis are derived from sources that we deem to be reliable and accurate. These views are not guarantees of future performance and involve certain risks, uncertainties and assumptions that are difficult to predict so actual outcomes and results may differ significantly from the views expressed. The views/opinions expressed in Squirrel Chatter II are those of the author and not of the Columbia Acorn Trust Board, are subject to change at any time based upon economic, market or other conditions, may differ from views expressed by other Columbia Management associates and the respective parties disclaim any responsibility to update such views. These views may not be relied on as investment advice and, because investment decisions for a Columbia Acorn Fund are based on numerous factors, may not be relied on as an indication of trading intent on behalf of any particular Columbia Acorn Fund.
1 Colonel Edwin Drake was an American oil driller, credited with being the first to drill for oil in the United States.
2 Lash, Eileen and Gary, "The Early History of Natural Gas, Kicking Down the Well," The SUNY Fredonia Shale Research Institute, June 3, 2011, http://www.fredonia.edu/shaleinstitute/history.asp.
3 U.S. Energy Information Administration (EIA), http://www.eia.gov/pub/oil_gas/natural_gas/analysis_publications/ngpipeline/index.html.
4 EIA data, including imports primarily from Canada, states the U.S. has been using about 23 trillion cubic feet (TCF) of gas a year, including about 6.6 TCF for industrial purposes. www.eia.gov.
5 Darley, Julian, High Noon for Natural Gas, The New Energy Crisis, (White River Junction, Vermont, Chelsea Green Publishing Company 2004) p. 13.
6 Ibid., p. 2.
7 Ibid., p. 79-80.
8 According to EIA data, domestic natural gas production fell from 20.6 TCF in 2001 to 18.9 TCF in 2005. Average annual wellhead prices rose from $3 to $5 in 2002-2003 to $6 to $8 from 2006-2008. www.eia.gov.
9 Airhart, Marc, "The Father of the Barnett Natural Gas Field," http://geology.com/research/barnett-shale-father.html.
10 Yergin, Daniel, "Stepping on the Gas," Wall Street Journal, April 2, 2011.
11 Presentation for the Organization of Economic Cooperation and Development (OECD), "Shale Gas and the Outlook for U.S. Natural Gas Markets and Global Gas Resources," June 21, 2011, http://www.eia.gov/pressroom/presentations/newell_06212011.pdf.
12 U.S. Department of Energy, Office of Fossil Energy and National Energy Technology Laboratory, "Modern Shale Gas, Development in the United States: A Primer," April 2009, p. ES-1, http://fossil.energy.gov/programs/oilgas/publications/
naturalgas_general/Shale_Gas_Primer_2009.pdf
13 Presentation for the Organization of Economic Cooperation and Development (OECD), "Shale Gas and the Outlook for U.S. Natural Gas Markets and Global Gas Resources," June 21, 2011, http://www.eia.gov/pressroom/presentations/newell_06212011.pdf.
6
14 Lomax, Simon, "Shale-Gas Output May Double by 2035, Reducing Energy Imports, U.S. Says," Bloomberg, December 16, 2010, http://www.bloomberg.com/news/2010-12-16/natural-gas-production-from-shale-may-double-by-35-u-s-agency-forecasts.html.
15 Presentation for the Organization of Economic Cooperation and Development (OECD), "Shale Gas and the Outlook for U.S. Natural Gas Markets and Global Gas Resources," June 21, 2011, http://www.eia.gov/pressroom/presentations/newell_06212011.pdf.
16 Darley, Julian, op. cit., p. 79-80.
17 Presentation for the Organization of Economic Cooperation and Development (OECD), "Shale Gas and the Outlook for U.S. Natural Gas Markets and Global Gas Resources," June 21, 2011, http://www.eia.gov/pressroom/presentations/newell_06212011.pdf.
18 Hefner III, Robert A., The Grand Energy Transition, (Hoboken, New Jersey, John Wiley & Sons, Inc. 2009) p. 27.
19 U.S. Department of Energy, Office of Fossil Energy and National Energy Technology Laboratory, "Modern Shale Gas, Development in the United States: A Primer," April 2009, p. 5, http://fossil.energy.gov/programs/oilgas/publications/naturalgas_general/Shale_
Gas_Primer_2009.pdf
20 Hefner III, Robert A., op. cit., p. 120-121. Having been an independent explorer for natural gas, Hefner was well aware that gas existed in locations independently of oil. (He has been called the "Father of Deep Natural Gas" as his company drilled very deep wells finding only natural gas at very high pressure.) In the 1970s when geologists for major oil companies testified to Congress that the U.S. was running out of natural gas, Hefner dissented, believing that the shortage was caused by price controls in place since 1954. Price controls cause shortages of valuable commodities by boosting demand and restraining supplies.
21 Ibid., p. 122.
22 Natural Gas Vehicles of America, http://www.ngvc.org/mktplace/index.html. Accessed July 20, 2011.
23 Hefner III, Robert A., op. cit., p. 201.
24 Natural Gas Vehicles of America, http://www.ngvc.org/mktplace/index.html. Accessed July 20, 2011.
25 Oberman, Mira, "The Greenest Car You've (Likely) Never Heard Of," Agence France-Presse, April 11, 2011.
26 Hefner III, Robert A., op. cit., p. 203.
7
Understanding Your Expenses
As a Fund shareholder, you incur two types of costs. There are transaction costs, which generally include sales charges on purchases and may include redemption or exchange fees. There are also ongoing costs, which generally include investment advisory fees, distribution and service (Rule 12b-1) fees and other Fund expenses. The following information is intended to help you understand your ongoing costs of investing in the Columbia Acorn Funds and to compare these costs with the ongoing costs of investing in other mutual funds.
Analyzing Your Fund's Expenses
To illustrate these ongoing costs, we have provided examples and calculated the expenses paid by investors in the Class A, B, C and I shares of the Columbia Acorn Funds for the last six months. The information in the following table is based on an initial investment of $1,000, which is invested at the beginning of the reporting period and held for the entire period. Expense information is calculated two ways and each method provides you with different results. The amount listed in the "Actual" column is calculated using each Fund's actual operating expenses and total return for the period. The amount listed in the "Hypothetical" column assumes that the return each year is 5% before expenses and then applies each Fund's actual expense ratio for the period to the hypothetical return. You should not use the hypothetical account values and expenses to estimate either your actual account balance at the end of the period or the expenses you paid during the reporting period. See "Compare With Other Funds" for details on using the hypothetical data.
Compare With Other Funds
Since all mutual funds are required to include the same hypothetical calculations about expenses in shareholder reports, you can use this information to compare the ongoing cost of investing in the Funds with other funds. To do so, compare the 5% hypothetical example with the 5% hypothetical examples that appear in the shareholder reports of other funds. As you compare hypothetical examples of other funds, it is important to note that hypothetical examples are meant to highlight the continuing costs of investing in a fund and do not reflect any transaction costs, such as sales charges or redemption or exchange fees.
Estimating Your Actual Expenses
To estimate the expenses that you actually paid over the period, first you will need your account balance at the end of the period:
• For shareholders who receive their account statements from Columbia Management Investment Services Corp., your account balance is available online at columbiamanagement.com or by calling Shareholder Services at (800) 922-6769.
• For shareholders who receive their account statements from their brokerage firm, contact your brokerage firm to obtain your account balance.
1. Divide your ending account balance by $1,000. For example, if an account balance was $8,600 at the end of the period, the result would be 8.6.
2. In the section of the table titled "Expenses paid during the period," locate the amount for your Fund. You will find this number is in the column labeled "Actual." Multiply this number by the result from step 1. Your answer is an estimate of the expenses you paid on your account during the period.
8
January 1, 2011 – June 30, 2011
| | | Account value at
the beginning of
the period ($) | | Account value at
the end of
the period ($) | | Expenses paid
during the period ($) | | Fund's
annualized
expense
ratio (%)* | |
| | | Actual | | Hypothetical | | Actual | | Hypothetical | | Actual | | Hypothetical | | Actual | |
| Columbia Acorn Fund | |
| Class A | | | 1,000.00 | | | | 1,000.00 | | | | 1,070.00 | | | | 1,019.59 | | | | 5.39 | | | | 5.26 | | | | 1.05 | | |
| Class B | | | 1,000.00 | | | | 1,000.00 | | | | 1,066.30 | | | | 1,016.12 | | | | 8.97 | | | | 8.75 | | | | 1.75 | | |
| Class C | | | 1,000.00 | | | | 1,000.00 | | | | 1,065.90 | | | | 1,015.72 | | | | 9.37 | | | | 9.15 | | | | 1.83 | | |
| Class I** | | | 1,000.00 | | | | 1,000.00 | | | | 1,072.20 | | | | 1,021.22 | | | | 3.70 | | | | 3.61 | | | | 0.72 | | |
| Columbia Acorn International | |
| Class A | | | 1,000.00 | | | | 1,000.00 | | | | 1,028.60 | | | | 1,018.40 | | | | 6.49 | | | | 6.46 | | | | 1.29 | | |
| Class B | | | 1,000.00 | | | | 1,000.00 | | | | 1,025.20 | | | | 1,015.08 | | | | 9.84 | | | | 9.79 | | | | 1.96 | | |
| Class C | | | 1,000.00 | | | | 1,000.00 | | | | 1,024.50 | | | | 1,014.58 | | | | 10.34 | | | | 10.29 | | | | 2.06 | | |
| Class I** | | | 1,000.00 | | | | 1,000.00 | | | | 1,030.60 | | | | 1,020.33 | | | | 4.53 | | | | 4.51 | | | | 0.90 | | |
| Columbia Acorn USA | |
| Class A | | | 1,000.00 | | | | 1,000.00 | | | | 1,089.70 | | | | 1,018.45 | | | | 6.63 | | | | 6.41 | | | | 1.28 | | |
| Class B | | | 1,000.00 | | | | 1,000.00 | | | | 1,085.50 | | | | 1,014.73 | | | | 10.50 | | | | 10.14 | | | | 2.03 | | |
| Class C | | | 1,000.00 | | | | 1,000.00 | | | | 1,085.90 | | | | 1,014.63 | | | | 10.60 | | | | 10.24 | | | | 2.05 | | |
| Class I** | | | 1,000.00 | | | | 1,000.00 | | | | 1,091.70 | | | | 1,020.13 | | | | 4.88 | | | | 4.71 | | | | 0.94 | | |
| Columbia Acorn International Select | |
| Class A | | | 1,000.00 | | | | 1,000.00 | | | | 1,035.50 | | | | 1,017.26 | | | | 7.67 | | | | 7.60 | | | | 1.52 | | |
| Class B† | | | 1,000.00 | | | | 1,000.00 | | | | 1,032.10 | | | | 1,013.88 | | | | 11.08 | | | | 10.99 | | | | 2.20 | | |
| Class C | | | 1,000.00 | | | | 1,000.00 | | | | 1,031.20 | | | | 1,013.24 | | | | 11.73 | | | | 11.63 | | | | 2.33 | | |
| Class I** | | | 1,000.00 | | | | 1,000.00 | | | | 1,038.30 | | | | 1,019.84 | | | | 5.05 | | | | 5.01 | | | | 1.00 | | |
| Columbia Acorn Select | |
| Class A | | | 1,000.00 | | | | 1,000.00 | | | | 998.80 | | | | 1,018.55 | | | | 6.24 | | | | 6.31 | | | | 1.26 | | |
| Class B | | | 1,000.00 | | | | 1,000.00 | | | | 995.40 | | | | 1,015.22 | | | | 9.55 | | | | 9.64 | | | | 1.93 | | |
| Class C | | | 1,000.00 | | | | 1,000.00 | | | | 994.70 | | | | 1,014.58 | | | | 10.19 | | | | 10.29 | | | | 2.06 | | |
| Class I** | | | 1,000.00 | | | | 1,000.00 | | | | 1,000.40 | | | | 1,020.28 | | | | 4.51 | | | | 4.56 | | | | 0.91 | | |
| Columbia Thermostat Fund*** | |
| Class A | | | 1,000.00 | | | | 1,000.00 | | | | 1,044.40 | | | | 1,022.32 | | | | 2.53 | | | | 2.51 | | | | 0.50 | | |
| Class B | | | 1,000.00 | | | | 1,000.00 | | | | 1,042.80 | | | | 1,019.84 | | | | 5.07 | | | | 5.01 | | | | 1.00 | | |
| Class C | | | 1,000.00 | | | | 1,000.00 | | | | 1,040.60 | | | | 1,018.60 | | | | 6.32 | | | | 6.26 | | | | 1.25 | | |
It is important to note that the expense amounts shown in the table are meant to highlight only ongoing costs of investing in the Funds and do not reflect any transaction costs, such as sales charges, redemption or exchange fees. Therefore, the hypothetical examples provided may not help you determine the relative total costs of owning different funds. If these transaction costs were included, your costs would have been higher.
*Expenses paid during the period are equal to each Fund's annualized expense ratio, multiplied by the average account value over the period and then multiplied by the number of days in the Fund's most recent fiscal half-year and divided by 365.
**Class I shares were initially offered by the Funds on September 27, 2010.
***Columbia Thermostat Fund's expenses do not include fees and expenses incurred by the Fund from the underlying portfolio funds in which it invests. Had the investment adviser and/or any of its affiliates not waived fees or reimbursed a portion of expenses, account value at the end of the period would have been reduced.
†Had the investment adviser and/or any of its affiliates not waived fees or reimbursed a portion of expenses, account value at the end of the period would have been reduced. See the Notes to Financial Statements for more information about expense limits.
9
Columbia Acorn Fund
In a Nutshell
 | |  | |
|
| Charles P. McQuaid | | Robert A. Mohn | |
|
| Lead Portfolio Manager | | Co-Portfolio Manager | |
|
Performance data shown represents past performance and is not a guarantee of future results. The investment return and principal value will fluctuate so that shares, when redeemed, may be worth more or less than the original cost. Current performance may be lower or higher than the performance data shown. Please visit columbiamanagement.com for daily and most recent month-end performance updates.
Fund Positions
in Mentioned Holdings
As a percentage of net assets, as of 6/30/11
| lululemon athletica | | | 2.3 | % | |
| Informatica | | | 1.4 | % | |
| Abercrombie & Fitch | | | 1.2 | % | |
| IPG Photonics | | | 1.0 | % | |
| Fugro | | | 1.0 | % | |
| Polycom | | | 0.8 | % | |
| Hansen Natural | | | 0.8 | % | |
| Pacific Rubiales Energy | | | 0.7 | % | |
| Oshkosh | | | 0.5 | % | |
| SRA International | | | 0.3 | % | |
Columbia Acorn Fund rose 1.35% (Class A shares, without sales charge) in the second quarter of 2011, outperforming the 0.59% drop in its primary benchmark, the Russell 2500 Index, and also beating other indexes shown on Page 2. During the first half of 2011, the Fund was up 7.00%, somewhat less than the Russell 2500's gain of 8.06%, and was mixed versus other indexes.
Consumer stocks were marked up during both the quarter and the half. Premium active apparel retailer lululemon athletica was the Fund's top dollar winner during both periods, up 26% in the quarter and 63% in the half. Alternative beverage producer Hansen Natural also provided large gains, rising 34% in the quarter and 55% in the half. Sales momentum at teen apparel retailer Abercrombie & Fitch accelerated, causing its stock to rack up a 14% gain in the quarter and a 16% gain in the half. All three companies had excellent growth in sales and earnings.
Several technology stocks also boosted results for the Fund. IPG Photonics, a company that is coupling laser and fiber optic technology, was Columbia Acorn Fund's second largest dollar gainer in both the quarter and the half, rising 26% and 130%, respectively. The company's quarterly earnings per share grew over six-fold on revenues that nearly doubled versus the prior year. Data integration software company Informatica rose 12% in the quarter and 33% in the half on fine earnings growth. Video conferencing equipment maker Polycom showed a 24% gain in the quarter and a 65% jump in the half on better than expected earnings.
Performance was boosted by takeovers. In the quarter, device maker American Medical Systems appreciated 39% as it agreed to be taken over by Endo Pharmaceuticals. Government I.T. services company SRA International agreed to sell out to a private equity firm, and its stock was up 51% in the half. GSI Commerce and Terremark were subject to takeover offers in the first quarter and their stocks also helped first half results.
The Fund's largest dollar loser in the quarter was sub-sea oilfield services provider Fugro, off 16% on disappointing earnings caused by customers delaying projects. Oshkosh fell 18% in the quarter, on news of a difficult start to military truck production. The Fund's largest dollar loser in the half was Colombian oil producer Pacific Rubiales Energy, off 21%. The stock gave up a fraction of its 2010 gains on exploration results that disappointed some analysts.
Columbia Acorn Fund's foreign stocks were off 3.59% in the quarter and 2.69% in the half.* Fugro and Pacific Rubiales Energy, mentioned above, were the largest foreign losers. The Fund's international stock weight dropped to 10.8% from 11.6% at the end of the first quarter and from 12.6% at the end of 2010.
The markets have been concerned about sovereign debt issues. While the U.S. debt ceiling was raised after the end of the quarter, the debt deal resulted in no fundamental reforms and large remaining uncertainties. A congressional committee will hopefully provide better solutions on schedule, before the end of 2011. The Greek debt situation seems more intractable, but the size of the debt is relatively small. Meanwhile, most of the companies owned by the Fund have been reporting fine earnings gains, which we believe could lead to higher stock prices should macroeconomic concerns ease.
*These returns are not comparable to mutual fund returns, as they are gross of fees and other expenses and do not portray the cash effects incurred by actual mutual funds. Columbia Acorn Fund's foreign stockholdings were not purchased as a balanced, stand-alone portfolio.
Stocks of small- and mid-cap companies pose special risks, including possible illiquidity and greater price volatility than stocks of larger, more established companies. International investing involves special risks, including foreign taxation, currency risks, risks associated with possible differences in financial standards and other risks associated with future political and economic developments.
Portfolio holdings are subject to change periodically and may not be representative of current holdings.
10
Columbia Acorn Fund
At a Glance (Class A Shares - LACAX)
Performance data shown represents past performance and is not a guarantee of future results. The investment return and principal value of an investment will fluctuate so that shares, when redeemed, may be worth more or less than their original cost. Current performance may be lower or higher than the performance data shown. Performance results reflect any fee waivers or reimbursements of Fund expenses by the investment adviser and/or any of its affiliates. Absent these fee waivers and/or expense reimbursement arrangements, performance results would have been lower. Please visit columbiamanagement.com for daily and most recent month-end updates.
Pretax and After-tax Average Annual Total Returns (Based on Class A Share Returns)
through June 30, 2011
| Inception 10/16/00 | | | | Year
to date* | | 1 year | | 5 years | | 10 years | |
| Returns before taxes | | NAV
POP | | | 7.00
0.86 | % | | | 38.98
31.01 | % | | | 5.88
4.63 | % | | | 8.80
8.16 | % | |
Returns after taxes
on distributions | | NAV
POP | | | 6.81
0.68 | | | | 38.15
30.22 | | | | 5.21
3.97 | | | | 8.28
7.64 | | |
Returns after taxes
on distributions and
sale of fund shares | | NAV
POP
| | | 4.75
0.75
| | | | 26.29
21.05
| | | | 4.98
3.89
| | | | 7.72
7.13
| | |
| Russell 2500 Index**(pretax) | | | | | 8.06 | | | | 39.28 | | | | 5.20 | | | | 7.40 | | |
All results shown assume reinvestment of distributions.
*Year to date data is not annualized.
**The Fund's primary benchmark.
After-tax returns are calculated using the highest historical individual federal marginal income tax rates, and do not reflect the impact of state and local taxes. Returns after taxes on distributions and sale of Fund shares reflect the additional tax impact of long-term gains or losses realized when Fund shares are sold. The returns are taxed at the maximum rate and assume shares were purchased at the beginning of the period. Actual after-tax returns depend on the investor's tax situation and may differ from those shown. After-tax returns are not relevant to investors who hold their Fund shares through tax-deferred arrangements such as 401(k) plans or individual retirement accounts. After-tax returns are shown for Class A shares only; after-tax returns for other share classes will vary. Indexes do not reflect any deduction for fees, expenses or taxes.
Public offering price (POP) returns include the maximum sales charge of 5.75% for Class A shares. Net asset value (NAV) returns do not include sales charges or contingent deferred sales charges (CDSC).
The Fund's Class A shares annual operating expense ratio, as stated in the current prospectus, is 1.07%.
Columbia Acorn Fund Portfolio Diversification
as a percentage of net assets, as of 6/30/11

Columbia Acorn Fund Top 10 Holdings
as a percentage of net assets, as of 6/30/11
| 1. | | lululemon athletica
Premium Active Apparel Retailer | | | 2.3
| % | |
| 2. | | Ametek
Aerospace/Industrial Instruments | | | 1.6
| % | |
| 3. | | FMC Technologies
Oil & Gas Wellhead Manufacturer | | | 1.4
| % | |
| 4. | | Informatica
Enterprise Data Integration Software | | | 1.4
| % | |
| 5. | | Mettler Toledo
Laboratory Equipment | | | 1.4
| % | |
| 6. | | Donaldson
Industrial Air Filtration | | | 1.3
| % | |
| 7. | | Crown Castle International
Communications Towers | | | 1.3
| % | |
| 8. | | Abercrombie & Fitch
Teen Apparel Retailer | | | 1.2
| % | |
| 9. | | IPG Photonics
Fiber Lasers | | | 1.1
| % | |
| 10. | | Alexion Pharmaceuticals
Biotech Focused on Orphan Diseases | | | 1.0
| % | |
The Fund's top 10 holdings and portfolio diversification vary with changes in portfolio investments. See the Statement of Investments for a complete list of the Fund's holdings.
The Growth of a $10,000 Investment in Columbia Acorn Fund (Class A)
October 16, 2000 through June 30, 2011
Illustration is based on a hypothetical $10,000 investment from inception in Class A shares of the Fund, which includes a 5.75% maximum initial sales charge. The Russell 2500 Index is unmanaged and returns for both the index and the Fund include reinvested dividends and capital gains. Although the index is provided for use in assessing the Fund's performance, the Fund's holdings may differ significantly from those in the index. It is not possible to invest directly in an index. The graph does not reflect taxes that a shareholder may pay on Fund distributions or on a sale of Fund shares.
Total Net Assets of the Fund: $19.3 billion
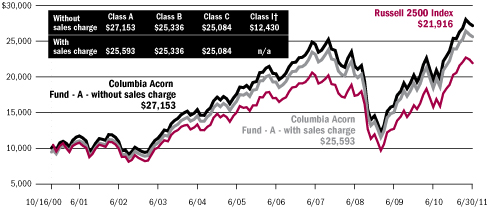
† Class I shares commenced operations on September 27, 2010.
11
Columbia Acorn International
In a Nutshell
 | |  | |
|
| P. Zachary Egan | | Louis J. Mendes III | |
|
| Co-Portfolio Manager | | Co-Portfolio Manager | |
|
Performance data shown represents past performance and is not a guarantee of future results. The investment return and principal value will fluctuate so that shares, when redeemed, may be worth more or less than the original cost. Current performance may be lower or higher than the performance data shown. Please visit columbiamanagement.com for daily and most recent month-end performance updates.
Fund's Positions
in Mentioned Holdings
As a percentage of net assets, as of 6/30/11
| Melco Crown Entertainment | | | 1.4 | % | |
| ShawCor | | | 0.8 | % | |
| Simplo Technology | | | 0.7 | % | |
| President Chain Store | | | 0.5 | % | |
| Gree | | | 0.5 | % | |
| Start Today | | | 0.4 | % | |
| Petropavlovsk | | | 0.4 | % | |
Columbia Acorn International was up 1.61% (Class A shares, without sales charge) in the second quarter of 2011, 0.89% ahead of its primary benchmark, the S&P Global Ex-U.S. Between $500M and $5B Index. This brought the Fund's return for the six months to 2.86%, slightly ahead of the 2.63% gain of its benchmark.
The Fund's absolute returns in the quarter were highest in Asia, driven by Melco Crown Entertainment, which operates a casino in Macau; Simplo Technology, a Taiwanese manufacturer of battery packs for notebook computers and iPads; and President Chain Store, a Taiwanese convenience store operator with inroads into mainland China. Consistent with the performance of these stocks, consumer discretionary and information technology sector holdings were the Fund's best performing globally. In a somewhat subdued quarter for international small-cap stocks overall, the Fund's Japanese holdings also put up a pleasing 5.9% USD return, led by two of the Fund's internet-related stocks: Gree, a social networking site and game developer, and Start Today, an online apparel retailer. These stocks were up 32% and 29%, respectively, likely buoyed by high valuations assigned to U.S. internet-related businesses in recent public and private market transactions.
Energy and resource companies were among the most disappointing in the quarter. ShawCor was a big position and down 18% after reporting first quarter results substantially below expectations. This Canadian company makes money by coating pipelines, and the most profitable work tends to be large offshore projects, and those in Asia, the Middle East, and the North Sea. While the company is bidding on many new projects now, in recent quarters they unfortunately ran into a lull in large projects as work lined up two or three years ago came to an end. Petropavlovsk, a UK-domiciled gold and iron ore miner with mines in Russia, was off over 26% on investor worries that more delays and capital would be required to complete the company's projects. This came on top of general weakness among gold mining stocks.
Eurozone sovereign risk has recently been leading headlines. Europe, including countries not part of the common euro currency, is home to almost 40% of the Fund's assets. This is an overweight position, with risk mitigated and opportunity enhanced, we believe, by the fact that many of these European holdings have significant revenues and earnings outside of Europe. While we are not economists and do not structure the portfolio according to macroeconomic precepts, we expect the euro to survive the present crisis. We believe the protracted public debate reflects the inevitably messy process of allocating economic and political pain among creditor and debtor countries, and private and public actors. Indeed, creditor countries who seek tighter fiscal coordination among eurozone countries going forward have little to gain in ending the crisis until they have extracted such concessions. Markets, however, do not like uncertainty and continued volatility is likely until a solution is reached.
Thank you for your continued confidence in Columbia Acorn International.
International investing involves special risks, including foreign taxation, currency risks, risks associated with possible differences in financial standards and other risks associated with future political and economic developments. Stocks of small- and mid-cap companies pose special risks, including possible illiquidity and greater price volatility than stocks of larger, more established companies. Investing in emerging markets may involve greater risks than investing in more developed countries. In addition, concentration of investments in a single region may result in greater volatility.
Portfolio holdings are subject to change periodically and may not be representative of current holdings.
12
Columbia Acorn International
At a Glance (Class A Shares - LAIAX)
Performance data shown represents past performance and is not a guarantee of future results. The investment return and principal value of an investment will fluctuate so that shares, when redeemed, may be worth more or less than their original cost. Current performance may be lower or higher than the performance data shown. Performance results reflect any fee waivers or reimbursements of Fund expenses by the investment adviser and/or any of its affiliates. Absent these fee waivers and/or expense reimbursement arrangements, performance results would have been lower. Please visit columbiamanagement.com for daily and most recent month-end updates.
Pretax and After-tax Average Annual Total Returns (Based on Class A Share Returns)
through June 30, 2011
| Inception 10/16/00 | | | | Year
to date* | | 1 year | | 5 years | | 10 years | |
| Returns before taxes | | NAV
POP | | | 2.86
-3.05 | % | | | 31.78
24.19 | % | | | 6.98
5.72 | % | | | 10.87
10.21 | % | |
Returns after taxes
on distributions | | NAV
POP | | | 1.98
-3.87 | | | | 30.73
23.19 | | | | 6.18
4.93 | | | | 10.38
9.72 | | |
Returns after taxes
on distributions and
sale of fund shares | | NAV
POP
| | | 1.86
-1.98
| | | | 20.94
15.99
| | | | 5.92
4.82
| | | | 9.68
9.07
| | |
S&P Global Ex-US Between
$500M and $5B Index** (pretax) | | | | | 2.63 | | | | 34.29 | | | | 7.09 | | | | 12.71 | | |
All results shown assume reinvestment of distributions.
*Year to date data is not annualized.
**The Fund's primary benchmark.
After-tax returns are calculated using the highest historical individual federal marginal income tax rates, and do not reflect the impact of state and local taxes. Returns after taxes on distributions and sale of Fund shares reflect the additional tax impact of long-term gains or losses realized when Fund shares are sold. The returns are taxed at the maximum rate and assume shares were purchased at the beginning of the period. Actual after-tax returns depend on the investor's tax situation and may differ from those shown. After-tax returns are not relevant to investors who hold their Fund shares through tax-deferred arrangements such as 401(k) plans or individual retirement accounts. After-tax returns are shown for Class A shares only; after-tax returns for other share classes will vary. Indexes do not reflect any deduction for fees, expenses or taxes.
Public offering price (POP) returns include the maximum sales charge of 5.75% for Class A shares. Net asset value (NAV) returns do not include sales charges or contingent deferred sales charges (CDSC).
The Fund's Class A shares annual operating expense ratio, as stated in the current prospectus, is 1.35%.
Columbia Acorn International Portfolio Diversification
as a percentage of net assets, as of 6/30/11
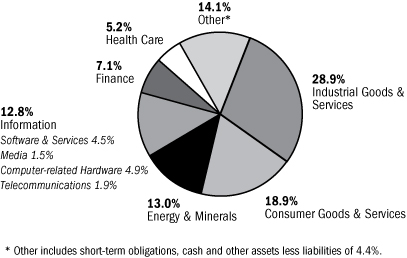
Columbia Acorn International Top 10 Holdings
as a percentage of net assets, as of 6/30/11
| 1. | | Hexagon (Sweden)
Measurement Equipment & Software | | | 1.5
| % | |
| 2. | | Melco Crown Entertainment (Hong Kong)
Macau Casino Operator | | | 1.4
| % | |
| 3. | | Olam International (Singapore)
Agriculture Supply Chain Manager | | | 1.2
| % | |
| 4. | | Localiza Rent A Car (Brazil)
Car Rental | | | 1.2
| % | |
| 5. | | Kansai Paint (Japan)
Paint Producer in Japan, India, China & Southeast Asia | | | 1.1
| % | |
| 6. | | Zhaojin Mining Industry (China)
Gold Mining & Refining in China | | | 1.0
| % | |
| 7. | | Imtech (Netherlands)
Electromechanical & Information & Communications
Technologies Installation & Maintenance | | | 1.0
| % | |
| 8. | | Intertek Group (United Kingdom)
Testing, Inspection & Certification Services | | | 1.0
| % | |
| 9. | | Naspers (South Africa)
Media in Africa, China, Russia & Other Emerging Markets | | | 1.0
| % | |
| 10. | | Fugro (Netherlands)
Sub-sea Oilfield Services | | | 0.9
| % | |
The Fund's top 10 holdings and portfolio diversification vary with changes in portfolio investments. See the Statement of Investments for a complete list of the Fund's holdings.
The Growth of a $10,000 Investment in Columbia Acorn International (Class A)
October 16, 2000 through June 30, 2011
Illustration is based on a hypothetical $10,000 investment from inception in Class A shares of the Fund, which includes a 5.75% maximum initial sales charge. The S&P Global Ex-U.S. Between $500M and $5B Index is unmanaged and returns for both the index and the Fund include reinvested dividends and capital gains. Although the index is provided for use in assessing the Fund's performance, the Fund's holdings may differ significantly from those in the index. It is not possible to invest directly in an index. The graph does not reflect taxes that a shareholder may pay on Fund distributions or on a sale of Fund shares.
Total Net Assets of the Fund: $6.4 billion
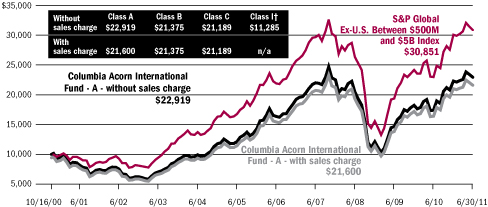
† Class I shares commenced operations on September 27, 2010.
13
Columbia Acorn USA
In a Nutshell
 | | | |
|
| Robert A. Mohn | | | |
|
| Lead Portfolio Manager | | | |
|
Performance data shown represents past performance and is not a guarantee of future results. The investment return and principal value will fluctuate so that shares, when redeemed, may be worth more or less than the original cost. Current performance may be lower or higher than the performance data shown. Please visit columbiamanagement.com for daily and most recent month-end performance updates.
Fund's Positions
in Mentioned Holdings
As a percentage of net assets, as of 6/30/11
| IPG Photonics | | | 2.6 | % | |
| lululemon athletica | | | 2.3 | % | |
| Gaylord Entertainment | | | 1.3 | % | |
| Polycom | | | 1.3 | % | |
| Cepheid | | | 0.8 | % | |
| Diamond Foods | | | 0.8 | % | |
| Finisar | | | 0.7 | % | |
| Ixia | | | 0.6 | % | |
| TriQuint Semiconductor | | | 0.6 | % | |
The equity markets were relatively flat in the second quarter of 2011. Columbia Acorn USA gained 1.42% (Class A shares, without sales charge), outperforming its primary benchmark, the Russell 2000 Index, which dropped 1.61%. Year to date through June 30, 2011, the Fund was up 8.97%, ahead of the 6.21% gain of its benchmark.
Winners for the quarter and half year came from a variety of sectors. IPG Photonics, a fiber laser manufacturer, dominates its market niche and nearly doubled sales versus the prior year. Its stock rose 26% in the quarter and ended the first six-months of 2011 up 130%. Premium active apparel retailer lululemon athletica also had strong revenue growth on ever-increasing awareness of the brand in the United States. The stock rose 26% in the quarter, and was up 63% for the half year. Polycom, a provider of video conferencing equipment, was up 24% in the quarter and finished the half year with a 65% return. The company's business benefited from increased corporate adoption of video conferencing as well as recent stumbles by a close competitor.
Diamond Foods, a provider of nuts and snack foods, announced an agreement to purchase the Pringles brand from Procter & Gamble, a move that will transform Diamond into the second largest snack company in the world, behind Pepsi. The stock rose 37% in the quarter on the news and was up 44% for the half year. Cepheid, a provider of molecular diagnostic equipment, experienced strong sales of its automated genetic testing instruments, which helped drive its stock up 24% in the quarter and 52% for the half year.
On the downside, two names in the optical network equipment business fell due to revenue shortfalls. Finisar, a provider of optical sub-systems and components, was a big winner for the Fund last year but orders have slowed in 2011, leaving Finisar customers with excess inventory. Its stock was off 27% in the quarter and 39% for the six months. Ixia sells telecom test equipment for optical networks and also suffered from a drop in orders. The company's stock fell 19% in the quarter and 22% for the half year.
TriQuint Semiconductor, a manufacturer of radio frequency semiconductors for mobile phones and other wireless devices, disappointed as some handset manufacturers deferred new product launches, sending the company's stock down 21% in the quarter and 17% for the half year. Gaylord Entertainment, an owner of convention hotels, was hurt by a drop in the occupancy rate at its Washington DC hotel, sending the stock down 13% for the quarter and 17% for the half year.
These days, many investors are obsessing over a seeming epidemic of ominous macroeconomic troubles and their potential solutions. Scary stuff like national debt crises, Mediterranean defaults, stubbornly high unemployment, and double-dipping housing prices dominate the news. But we believe that these issues are not as relevant to our philosophy of investing. We don't subscribe to the current fetish of investing based on macroeconomic factors (commonly referred to as "risk-on, risk-off" trading). Even in volatile, uncertain times like today, plenty of individual smaller cap companies are growing faster than their peers and possess bright long-term prospects. We spend our time and effort seeking out these kinds of businesses for your Fund. We'll leave the macro-dancing to the other guys.
Stocks of small- and mid-cap companies pose special risks, including possible illiquidity and greater price volatility than stocks of larger, more established companies.
Portfolio holdings are subject to change periodically and may not be representative of current holdings.
14
Columbia Acorn USA
At a Glance (Class A Shares - LAUAX)
Performance data shown represents past performance and is not a guarantee of future results. The investment return and principal value of an investment will fluctuate so that shares, when redeemed, may be worth more or less than their original cost. Current performance may be lower or higher than the performance data shown. Performance results reflect any fee waivers or reimbursements of Fund expenses by the investment adviser and/or any of its affiliates. Absent these fee waivers and/or expense reimbursement arrangements, performance results would have been lower. Please visit columbiamanagement.com for daily and most recent month-end updates.
Pretax and After-tax Average Annual Total Returns (Based on Class A Share Returns)
through June 30, 2011
| Inception 10/16/00 | | | | Year
to date* | | 1 year | | 5 years | | 10 years | |
| Returns before taxes | | NAV
POP | | | 8.97
2.70 | % | | | 42.90
34.69 | % | | | 4.55
3.32 | % | | | 6.79
6.16 | % | |
Returns after taxes
on distributions | | NAV
POP | | | 8.97
2.70 | | | | 42.90
34.69 | | | | 4.19
2.97 | | | | 6.49
5.86 | | |
Returns after taxes
on distributions and
sale of fund shares | | NAV
POP
| | | 5.83
1.76
| | | | 27.89
22.55
| | | | 3.87
2.81
| | | | 5.93
5.36
| | |
| Russell 2000 Index**(pretax) | | | | | 6.21 | | | | 37.41 | | | | 4.08 | | | | 6.27 | | |
All results shown assume reinvestment of distributions.
*Year to date data is not annualized.
**The Fund's primary benchmark.
After-tax returns are calculated using the highest historical individual federal marginal income tax rates, and do not reflect the impact of state and local taxes. Returns after taxes on distributions and sale of Fund shares reflect the additional tax impact of long-term gains or losses realized when Fund shares are sold. The returns are taxed at the maximum rate and assume shares were purchased at the beginning of the period. Actual after-tax returns depend on the investor's tax situation and may differ from those shown. After-tax returns are not relevant to investors who hold their Fund shares through tax-deferred arrangements such as 401(k) plans or individual retirement accounts. After-tax returns are shown for Class A shares only; after-tax returns for other share classes will vary. Indexes do not reflect any deduction for fees, expenses or taxes.
Public offering price (POP) returns include the maximum sales charge of 5.75% for Class A shares. Net asset value (NAV) returns do not include sales charges or contingent deferred sales charges (CDSC).
The Fund's Class A shares annual operating expense ratio, as stated in the current prospectus, is 1.30%.
Columbia Acorn USA Portfolio Diversification
as a percentage of net assets, as of 6/30/11
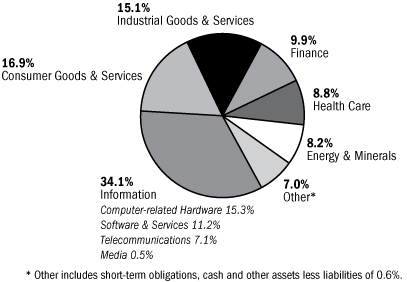
Columbia Acorn USA Top 10 Holdings
as a percentage of net assets, as of 6/30/11
| 1. | | Informatica
Enterprise Data Integration Software | | | 3.0
| % | |
| 2. | | IPG Photonics
Fiber Lasers | | | 2.6
| % | |
| 3. | | FMC Technologies
Oil & Gas Wellhead Manufacturer | | | 2.3
| % | |
| 4. | | lululemon athletica
Premium Active Apparel Retailer | | | 2.3
| % | |
| 5. | | Ametek
Aerospace/Industrial Instruments | | | 2.2
| % | |
| 6. | | Nordson
Dispensing Systems for Adhesives & Coatings | | | 2.1
| % | |
| 7. | | Atwood Oceanics
Offshore Drilling Contractor | | | 1.9
| % | |
| 8. | | Micros Systems
Information Systems for Hotels, Restaurants & Retailers | | | 1.8
| % | |
| 9. | | tw telecom
Fiber Optic Telephone/Data Services | | | 1.7
| % | |
| 10. | | II-VI
Laser Optics & Specialty Materials | | | 1.7
| % | |
The Fund's top 10 holdings and portfolio diversification vary with changes in portfolio investments. See the Statement of Investments for a complete list of the Fund's holdings.
The Growth of a $10,000 Investment in Columbia Acorn USA (Class A)
October 16, 2000 through June 30, 2011
Illustration is based on a hypothetical $10,000 investment from inception in Class A shares of the Fund, which includes a 5.75% maximum initial sales charge. The Russell 2000 Index is unmanaged and returns for both the index and the Fund include reinvested dividends and capital gains. Although the index is provided for use in assessing the Fund's performance, the Fund's holdings may differ significantly from those in the index. It is not possible to invest directly in an index. The graph does not reflect taxes that a shareholder may pay on Fund distributions or on a sale of Fund shares.
Total Net Assets of the Fund: $1.9 billion
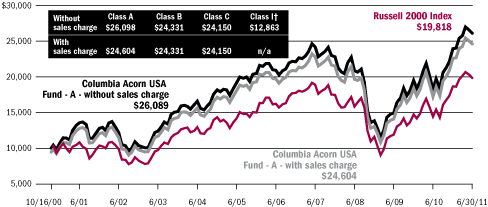
† Class I shares commenced operations on September 27, 2010.
15
Columbia Acorn International Select
In a Nutshell

Christopher J. Olson
Lead Portfolio Manager
Performance data shown represents past performance and is not a guarantee of future results. The investment return and principal value will fluctuate so that shares, when redeemed, may be worth more or less than the original cost. Current performance may be lower or higher than the performance data shown. Please visit columbiamanagement.com for daily and most recent month-end performance updates.
Fund's Positions
in Mentioned Holdings
As a percentage of net assets, as of 6/30/11
| Ascendas REIT | | | 5.0 | % | |
| Hexagon | | | 3.7 | % | |
| Wirecard | | | 2.7 | % | |
| Asahi Diamond Industrial | | | 2.4 | % | |
| Jupiter Telecommunications | | | 2.2 | % | |
| Fugro | | | 1.9 | % | |
| United Drug | | | 1.9 | % | |
| Pacific Rubiales Energy | | | 1.6 | % | |
| Jiangsu Expressway | | | 1.4 | % | |
| Gree | | | 1.4 | % | |
| Workspace Group | | | 1.1 | % | |
| Quetzal Energy | | | 0.3 | % | |
Columbia Acorn International Select ended the second quarter up 1.02% (Class A shares, without sales charge), outperforming the 0.90% gain of its primary benchmark, the S&P Developed Ex-U.S. Between $2B and $10B Index. For the half year, the Fund was up 3.55% versus a 4.04% gain for the benchmark.
The Fund's top three contributors to performance for the quarter were Japanese stocks, as the economic situation in Japan began to stabilize and recover following the March 2011 Tohoku earthquake. Gree, a mobile social networking game developer, was up 32% in the second quarter and 78% for the half year. The company continued to benefit from new product rollouts. Asahi Diamond Industrial, a manufacturer of consumable diamond tools, was up 14% in the quarter and ended the half year with a 16% gain. Its operations were largely unaffected by the earthquake and its revenues remained strong. Jupiter Telecommunications, the largest cable service provider in Japan, had a 15% gain in the quarter on continued subscriber growth. The majority of its operations are in the Tokyo region.
Elsewhere, Ascendas REIT, an industrial property landlord in Singapore, is a large position in the Fund and was up 6% for the quarter and the half year. The company continues to report rental rate increases on strong demand for its properties and its 7% dividend yield has attracted attention in a world of low interest rates. Swedish measurement equipment manufacturer Hexagon continued its strong run, gaining 4% in the quarter and ending the half year up 16%. The company has benefited from continued revenue growth driven mainly by its exposure to emerging markets.
Year to date, German online payment processor and risk manager Wirecard was up 32%. The company is growing revenues at a 20% clip on the back of ongoing growth of e-commerce as well as the introduction of a popular prepaid cash card. Irish pharmaceutical company United Drug rose 21% as investors realized earnings had improved and the stock was very cheap. Workspace Group, a UK real estate company, was up 29% for the half year, benefiting from improving occupancy rates.
Energy stocks dominated the laggards list for the quarter and half. After many quarters of strong performance, Dutch sub-sea oilfield services provider Fugro fell more than 16% in the quarter and was off 11% for the half year. The company reported disappointing earnings, stating that many of its customers opted to delay expected projects. Quetzal Energy, an oil and gas exploration company operating in Latin America, fell 44% in the quarter and was down 37% for the half as a delay in receiving environmental approvals slowed down its drilling program. Pacific Rubiales Energy, a Colombian oil production and exploration company, was off 3% in the quarter and down 21% for the half year on disappointing results from recent explorations.
Outside the energy sector, Petropavlovsk, a UK-listed company operating gold and iron ore mines in Russia, fell 15% in the quarter and was off 24% in Columbia Acorn International Select for the half year. Delays and capital concerns, combined with weakness in gold mining stocks in general, hurt returns. We sold the Fund's position in the stock. Jiangsu Expressway, a Chinese toll road operator, fell 13% in the quarter and was off 15% for the half after the government began to crack down on toll operators who were overcharging. Jiangsu Expressway has kept its charges in line with stated policy but was down nonetheless, as the entire sector was sold off.
International investing involves special risks, including foreign taxation, currency risks, risks associated with possible differences in financial standards and other risks associated with future political and economic developments. Stocks of small- and mid-cap companies pose special risks, including possible illiquidity and greater price volatility than stocks of larger, more established companies. Investing in emerging markets may involve greater risks than investing in more developed countries.
Portfolio holdings are subject to change periodically and may not be representative of current holdings.
16
Columbia Acorn International Select
At a Glance (Class A Shares - LAFAX)
Performance data shown represents past performance and is not a guarantee of future results. The investment return and principal value of an investment will fluctuate so that shares, when redeemed, may be worth more or less than their original cost. Current performance may be lower or higher than the performance data shown. Performance results reflect any fee waivers or reimbursements of Fund expenses by the investment adviser and/or any of its affiliates. Absent these fee waivers and/or expense reimbursement arrangements, performance results would have been lower. Please visit columbiamanagement.com for daily and most recent month-end updates.
Pretax and After-tax Average Annual Total Returns (Based on Class A Share Returns)
through June 30, 2011
| Inception 10/16/00 | | | | Year
to date* | | 1 year | | 5 years | | 10 years | |
| Returns before taxes | | NAV
POP | | | 3.55
-2.41 | % | | | 30.82
23.31 | % | | | 6.85
5.59 | % | | | 9.13
8.48 | % | |
Returns after taxes
on distributions | | NAV
POP | | | 3.16
-2.78 | | | | 30.46
22.97 | | | | 6.51
5.26 | | | | 8.97
8.33 | | |
Returns after taxes
on distributions and
sale of fund shares | | NAV
POP
| | | 2.31
-1.57
| | | | 20.17
15.28
| | | | 5.92
4.82
| | | | 8.16
7.57
| | |
S&P Developed Ex-US Between
$2B and $10B Index** (pretax) | | | | | 4.04 | | | | 33.74 | | | | 3.73 | | | | 9.60 | | |
All results shown assume reinvestment of distributions.
*Year to date data is not annualized.
**The Fund's primary benchmark.
After-tax returns are calculated using the highest historical individual federal marginal income tax rates, and do not reflect the impact of state and local taxes. Returns after taxes on distributions and sale of Fund shares reflect the additional tax impact of long-term gains or losses realized when Fund shares are sold. The returns are taxed at the maximum rate and assume shares were purchased at the beginning of the period. Actual after-tax returns depend on the investor's tax situation and may differ from those shown. After-tax returns are not relevant to investors who hold their Fund shares through tax-deferred arrangements such as 401(k) plans or individual retirement accounts. After-tax returns are shown for Class A shares only; after-tax returns for other share classes will vary. Indexes do not reflect any deduction for fees, expenses or taxes.
Public offering price (POP) returns include the maximum sales charge of 5.75% for Class A shares. Net asset value (NAV) returns do not include sales charges or contingent deferred sales charges (CDSC).
The Fund's Class A shares annual operating expense ratio, as stated in the current prospectus, is 1.56%.
Columbia Acorn International Select Portfolio Diversification
as a percentage of net assets, as of 6/30/11
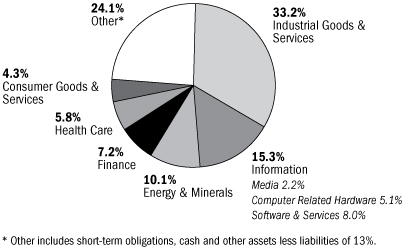
Columbia Acorn International Select Top 10 Holdings
as a percentage of net assets, as of 6/30/11
| 1. | | Ascendas REIT (Singapore)
Singapore Industrial Property Landlord | | | 5.0
| % | |
| 2. | | Kansai Paint (Japan)
Paint Producer in Japan, India, China & Southeast Asia | | | 4.4
| % | |
| 3. | | Chemring (United Kingdom)
Defense Manufacturer of Countermeasures & Energetics | | | 3.8
| % | |
| 4. | | Hexagon (Sweden)
Measurement Equipment & Software | | | 3.7
| % | |
| 5. | | NHN (South Korea)
South Korea's Largest Online Search Engine | | | 3.2
| % | |
| 6. | | Mapletree Industrial Trust (Singapore)
Industrial Property Landlord | | | 3.2
| % | |
| 7. | | Intertek Group (United Kingdom)
Testing, Inspection & Certification Services | | | 2.9
| % | |
| 8. | | Wirecard (Germany)
Online Payment Processing & Risk Management | | | 2.7
| % | |
| 9. | | Asahi Diamond Industrial (Japan)
Consumable Diamond Tools | | | 2.4
| % | |
| 10. | | AkzoNobel (Netherlands)
Largest Global Supplier of Protective Paints & Coatings | | | 2.4
| % | |
The Fund's top 10 holdings and portfolio diversification vary with changes in portfolio investments. See the Statement of Investments for a complete list of the Fund's holdings.
The Growth of a $10,000 Investment in Columbia Acorn International Select (Class A)
October 16, 2000 through June 30, 2011
Illustration is based on a hypothetical $10,000 investment from inception in Class A shares of the Fund, which includes a 5.75% maximum initial sales charge. The S&P Developed Ex-U.S. Between $2B and $10B Index is unmanaged and returns for both the index and the Fund include reinvested dividends and capital gains. Although the index is provided for use in assessing the Fund's performance, the Fund's holdings may differ significantly from those in the index. It is not possible to invest directly in an index. The graph does not reflect taxes that a shareholder may pay on Fund distributions or on a sale of Fund shares.
Total Net Assets of the Fund: $437.3 million
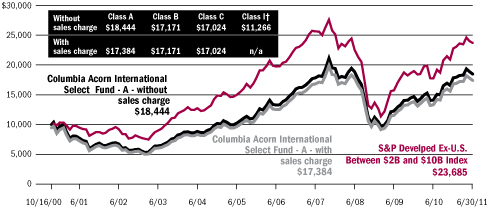
† Class I shares commenced operations on September 27, 2010.
17
Columbia Acorn Select
In a Nutshell
 | |  | |
|
| Ben Andrews | | Robert A. Chalupnik | |
|
| Lead Portfolio Manager | | Co-Portfolio Manager | |
|
Performance data shown represents past performance and is not a guarantee of future results. The investment return and principal value will fluctuate so that shares, when redeemed, may be worth more or less than the original cost. Current performance may be lower or higher than the performance data shown. Please visit columbiamanagement.com for daily and most recent month-end performance updates.
Fund's Positions
in Mentioned Holdings
As a percentage of net assets, as of 6/30/11
| Discover Financial Services | | | 6.6 | % | |
| Abercrombie & Fitch | | | 3.6 | % | |
| Coach | | | 3.2 | % | |
| Canacol Energy | | | 1.9 | % | |
| Quanta Services | | | 1.4 | % | |
| Gaylord Entertainment | | | 1.3 | % | |
| Finisar | | | 0.3 | % | |
Columbia Acorn Select fell 1.01% (Class A shares, without sales charge) in the second quarter of 2011 and was nearly flat for the half year, down 0.12%. The Fund's primary benchmark, the S&P MidCap 400 Index, was down 0.73% in the second quarter and up 8.56% for the six months ended June 30, 2011. The large-cap oriented S&P 500 Index was flat in the second quarter (up 0.10%) and was up 6.02% for the half year. Year-to-date performance was hampered by poor performance of Fund energy stocks and the failure of many holdings to participate in the recent market rally.
Looking first at the stocks that drove the portfolio in the second quarter, Discover Financial Services added 0.77% to the portfolio's return as the company's credit card portfolio continued to heal in the improving economy. This improvement caused investors to increase the valuation they were willing to pay for Discover, bidding up the stock price. Retailers Abercrombie & Fitch and Coach each added approximately 0.60% to the portfolio as their products were well received by consumers.
On the downside, Canacol Energy, an oil and gas explorer/producer, cost the portfolio 0.66% as an exploratory well in Guyana came up dry and the general malaise for Colombian oil producers weighed on the stock. Over the six-month period, energy stocks cost the Fund approximately 3.7% of performance, and were the main laggards in the portfolio. We still believe in these names and will watch them closely as we expect several more drilling results by the end of this year.
Though many of the Fund's stocks did not participate in the stock market rally through June 30, 2011, we believe they have potential to add return in the coming quarters as these companies are growing and we believe they are valued inexpensively compared with their peers.
During the quarter, we sold out of four companies and purchased three new companies. The sales were wireless communications and broadcast tower company American Tower, water treatment applications service provider Nalco Holding Company, for-profit, post-secondary education provider Career Education, and recreational vehicle manufacturer Thor Industries. Our purchases were convention hotelier Gaylord Entertainment, fiber optic sub-systems and components provider Finisar, and electrical and telecom construction services provider Quanta Services. Quanta is a company that we owned previously but sold due to uncertainty about its ability to turn contracts/backlog into sales. There is evidence of this backlog becoming revenue, so we added the company back into the portfolio during the quarter.
I would like to welcome Rob Chalupnik as co-portfolio manager of Columbia Acorn Select. Rob has a strong track record as the domestic industrials analyst at Columbia Wanger Asset Management. I have worked closely with Rob over the years and feel strongly that his knowledge and ability will be additive to the performance of this Fund, not only through his stock picks but through his input on portfolio structure as well.
Thank you for your continued investment in Columbia Acorn Select.
Risks include stock market fluctuations due to economic and business developments. The Fund also has potentially greater price volatility due to the Fund's concentration in a limited number of stocks of mid-size companies. The Fund is a non-diversified fund and may, therefore, have a greater risk of loss from a few issuers than a similar fund that invests more broadly. The Fund may not operate as a non-diversified fund at all times. International investments involve greater potential risks, including less regulation, currency fluctuations, economic instability and political developments.
Portfolio holdings are subject to change periodically and may not be representative of current holdings.
18
Columbia Acorn Select
At a Glance (Class A Shares - LTFAX)
Performance data shown represents past performance and is not a guarantee of future results. The investment return and principal value of an investment will fluctuate so that shares, when redeemed, may be worth more or less than their original cost. Current performance may be lower or higher than the performance data shown. Performance results reflect any fee waivers or reimbursements of Fund expenses by the investment adviser and/or any of its affiliates. Absent these fee waivers and/or expense reimbursement arrangements, performance results would have been lower. Please visit columbiamanagement.com for daily and most recent month-end updates.
Pretax and After-tax Average Annual Total Returns (Based on Class A Share Returns)
through June 30, 2011
| Inception 10/16/00 | | | | Year
to date* | | 1 year | | 5 years | | 10 years | |
| Returns before taxes | | NAV
POP | | | -0.12
-5.85 | % | | | 28.66
21.28 | % | | | 4.86
3.63 | % | | | 8.05
7.42 | % | |
Returns after taxes
on distributions | | NAV
POP | | | -0.63
-6.33 | | | | 28.00
20.66 | | | | 4.54
3.31 | | | | 7.79
7.15 | | |
Returns after taxes
on distributions and
sale of fund shares | | NAV
POP
| | | -0.10
-3.82
| | | | 18.60
13.81
| | | | 4.11
3.04
| | | | 7.07
6.49
| | |
| S&P MidCap 400 Index** (pretax) | | | | | 8.56 | | | | 39.38 | | | | 6.60 | | | | 7.94 | | |
All results shown assume reinvestment of distributions.
*Year to date data is not annualized.
**The Fund's primary benchmark.
After-tax returns are calculated using the highest historical individual federal marginal income tax rates, and do not reflect the impact of state and local taxes. Returns after taxes on distributions and sale of Fund shares reflect the additional tax impact of long-term gains or losses realized when Fund shares are sold. The returns are taxed at the maximum rate and assume shares were purchased at the beginning of the period. Actual after-tax returns depend on the investor's tax situation and may differ from those shown. After-tax returns are not relevant to investors who hold their Fund shares through tax-deferred arrangements such as 401(k) plans or individual retirement accounts. After-tax returns are shown for Class A shares only; after-tax returns for other share classes will vary. Indexes do not reflect any deduction for fees, expenses or taxes.
Public offering price (POP) returns include the maximum sales charge of 5.75% for Class A shares. Net asset value (NAV) returns do not include sales charges or contingent deferred sales charges (CDSC).
The Fund's Class A shares annual operating expense ratio, as stated in the current prospectus, is 1.28%.
Columbia Acorn Select Portfolio Diversification
as a percentage of net assets, as of 6/30/11

Columbia Acorn Select Top 10 Holdings
as a percentage of net assets, as of 6/30/11
| 1. | | Discover Financial Services
Credit Card Company | | | 6.6
| % | |
| 2. | | Hertz
Largest U.S. Rental Car Operator | | | 6.5
| % | |
| 3. | | CNO Financial Group
Life, Long-term Care & Medical Supplement Insurance | | | 4.8
| % | |
| 4. | | Ametek
Aerospace/Industrial Instruments | | | 4.0
| % | |
| 5. | | Abercrombie & Fitch
Teen Apparel Retailer | | | 3.6
| % | |
| 6. | | Sanmina-SCI
Electronic Manufacturing Services | | | 3.5
| % | |
| 7. | | Safeway
Supermarkets | | | 3.4
| % | |
| 8. | | Pacific Rubiales Energy (Colombia)
Oil Production & Exploration in Colombia | | | 3.3
| % | |
| 9. | | Coach
Designer & Retailer of Branded Leather Accessories | | | 3.2
| % | |
| 10. | | Crown Castle International
Communications Towers | | | 3.0
| % | |
The Fund's top 10 holdings and portfolio diversification vary with changes in portfolio investments. See the Statement of Investments for a complete list of the Fund's holdings.
The Growth of a $10,000 Investment in Columbia Acorn Select (Class A)
October 16, 2000 through June 30, 2011
Illustration is based on a hypothetical $10,000 investment from inception in Class A shares of the Fund, which includes a 5.75% maximum initial sales charge. The S&P MidCap 400 Index is unmanaged and returns for both the index and the Fund include reinvested dividends and capital gains. Although the index is provided for use in assessing the Fund's performance, the Fund's holdings may differ significantly from those in the index. It is not possible to invest directly in an index. The graph does not reflect taxes that a shareholder may pay on Fund distributions or on a sale of Fund shares.
Total Net Assets of the Fund: $2.0 billion
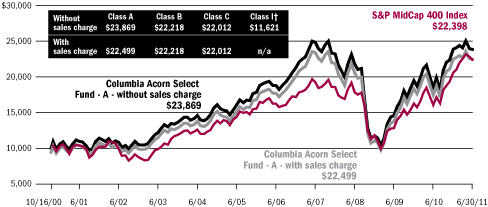
† Class I shares commenced operations on September 27, 2010.
19
Columbia Thermostat Fund
In a Nutshell

Lead Portfolio Manager
Performance data shown represents past performance and is not a guarantee of future results. The investment return and principal value will fluctuate so that shares, when redeemed, may be worth more or less than the original cost. Current performance may be lower or higher than the performance data shown. Please visit columbiamanagement.com for daily and most recent month-end performance updates.
A "fund of fund" bears its allocable share of the costs and expenses of the underlying funds in which it invests. Such funds are thus subject to two levels of fees and potentially higher expense ratios than would be associated with a fund that invests and trades directly in financial instruments under the direction of a single manager.
Columbia Thermostat Fund gained 1.38% (Class A shares, without sales charge) in the second quarter of 2011, outperforming the 0.10% gain of its primary equity benchmark, the S&P 500 Index, and underperforming the 2.29% increase of the Fund's primary debt benchmark, the Barclays Capital U.S. Aggregate Bond Index. Year to date through June 30, 2011, the Fund was up 4.44% while the S&P 500 Index had a 6.02% gain and the Barclays index rose 2.72%.
The Fund hit four reallocation triggers during the second quarter. In April, we reduced stock exposure twice on the strength of the equity market and then in May and June returned to stocks as the equity markets declined. The Fund ended the quarter at the same weight it started, with a 60% exposure to its underlying stock funds and 40% exposure to its bond funds.
The bond portion of the portfolio outperformed the equity portion in the quarter with a 1.50% weighted average return versus a 0.93% weighted average gain for equities. Columbia U.S. Treasury Index Fund was the top performing holding for the quarter, up 2.28%. Year to date, Columbia Thermostat's equity portion had a 5.22% weighted average gain versus a 2.83% gain for the income portion. Columbia Large Cap Enhanced Core Fund led performance with a 7.90% gain for the half-year period.
The markets continue to provide the types of ups and downs that Columbia Thermostat Fund was made for. We are pleased to see that the Fund, as expected, provided a return between that of its equity and income benchmarks for the six-month period.
Results of the Funds Owned in Columbia Thermostat Fund as of June 30, 2011
| Stock Funds | | Weightings | | 2nd | | Year to | |
| Fund | | in category | | quarter | | date | |
Columbia Acorn
International, Class I | | | 20 | % | | | 1.69 | % | | | 3.06 | % | |
Columbia Dividend
Income Fund, Class I | | | 20 | % | | | 0.83 | % | | | 6.07 | % | |
Columbia Acorn Fund,
Class I | | | 15 | % | | | 1.47 | % | | | 7.22 | % | |
Columbia Marsico
Growth Fund, Class I | | | 15 | % | | | 0.87 | % | | | 6.29 | % | |
Columbia Acorn Select,
Class I | | | 10 | % | | | -0.93 | % | | | 0.04 | % | |
Columbia Contrarian
Core Fund, Class I | | | 10 | % | | | 0.60 | % | | | 5.66 | % | |
Columbia Large Cap
Enhanced Core Fund,
Class I | | | 10 | % | | | 0.94 | % | | | 7.90 | % | |
Weighted Average
Equity Return | | | 100 | % | | | 0.93 | % | | | 5.22 | % | |
| Bond Funds | | Weightings | | 2nd | | Year | |
| Fund | | in category | | quarter | | to date | |
Columbia Intermediate
Bond Fund, Class I | | | 50 | % | | | 1.29 | % | | | 2.64 | % | |
Columbia U.S. Treasury
Index Fund, Class I | | | 30 | % | | | 2.28 | % | | | 2.03 | % | |
Columbia Income
Opportunities Fund,
Class I | | | 20 | % | | | 0.82 | % | | | 4.39 | % | |
Weighted Average
Income Return | | | 100 | % | | | 1.50 | % | | | 2.83 | % | |
Columbia Thermostat Fund
Rebalancing in the Second Quarter
| April 11, 2011 | | 55% stocks, 45% bonds | |
| April 28, 2011 | | 50% stocks, 50% bonds | |
| May 31, 2011 | | 55% stocks, 45% bonds | |
| June 7, 2011 | | 60% stocks, 40% bonds | |
The value of an investment in the Fund is based primarily on the performance of the underlying portfolio funds and the allocation of the Fund's assets among them. An investment in the underlying portfolio funds may present certain risks, including stock market fluctuations that occur in response to economic and business developments; and a greater degree of social, political and economic volatility associated with international investing. Stocks of small- and mid-cap companies pose special risks, including possible illiquidity and greater price volatility than stocks of larger, more established companies. Value stocks may also be subject to specific business risks that have caused the stocks to be out of favor. Lower-rated and medium quality debt securities are more speculative and incur more risk. International investing involves special risks, including foreign taxation, currency risks, risks associated with possible differences in financial standards and other risks associated with future political and economic developments. Changes in interest rates and changes in the financial strength of issuers of lower-rated bonds may also affect underlying fund performance. The Fund is also subject to the risk that the investment advisor's decisions regarding asset classes and underlying portfolio funds will not anticipate market trends successfully, resulting in a failure to preserve capital or lower total return. In addition, the Fund may buy and sell shares of the portfolio funds frequently. This may result in higher transaction costs and additional tax liability. This is not an offer of the shares of any other mutual fund mentioned herein.
20
Columbia Thermostat Fund
At a Glance (Class A Shares - CTFAX)
Performance data shown represents past performance and is not a guarantee of future results. The investment return and principal value of an investment will fluctuate so that shares, when redeemed, may be worth more or less than their original cost. Current performance may be lower or higher than the performance data shown. Performance results reflect any fee waivers or reimbursements of Fund expenses by the investment adviser and/or any of its affiliates. Absent these fee waivers and/or expense reimbursement arrangements, performance results would have been lower. Please visit columbiamanagement.com for daily and most recent month-end updates.
Pretax and After-tax Average Annual Total Returns (Based on Class A Share Returns)
through June 30, 2011
| Inception 3/3/03 | | | | Year
to date* | | 1 year | | 5 years | | Life of fund | |
| Returns before taxes | | NAV
POP | | | 4.44
-1.58 | % | | | 25.05
17.89 | % | | | 5.54
4.31 | % | | | 7.95
7.18 | % | |
Returns after taxes
on distributions | | NAV
POP | | | 4.00
-2.00 | | | | 24.46
17.34 | | | | 4.30
3.08 | | | | 6.73
5.97 | | |
Returns after taxes
on distributions and
sale of fund shares | | NAV
POP
| | | 2.88
-1.03
| | | | 16.35
11.69
| | | | 4.16
3.10
| | | | 6.38
5.69
| | |
| S&P 500 Index** (pretax) | | | | | 6.02 | | | | 30.69 | | | | 2.94 | | | | 7.68 | | |
Barclays Capital U.S.
Aggregate Bond Index** (pretax) | | | | | 2.72 | | | | 3.90 | | | | 6.52 | | | | 4.93 | | |
Lipper Flexible Portfolio
Funds Index (pretax) | | | | | 5.11 | | | | 23.38 | | | | 5.16 | | | | 8.35 | | |
All results shown assume reinvestment of distributions.
*Year to date data is not annualized.
**The Fund's primary stock and bond benchmarks.
After-tax returns are calculated using the highest historical individual federal marginal income tax rates, and do not reflect the impact of state and local taxes. Returns after taxes on distributions and sale of Fund shares reflect the additional tax impact of long-term gains or losses realized when Fund shares are sold. The returns are taxed at the maximum rate and assume shares were purchased at the beginning of the period. Actual after-tax returns depend on the investor's tax situation and may differ from those shown. After-tax returns are not relevant to investors who hold their Fund shares through tax-deferred arrangements such as 401(k) plans or individual retirement accounts. After-tax returns are shown for Class A shares only; after-tax returns for other share classes will vary. Indexes do not reflect any deduction for fees, expenses or taxes.
Public offering price (POP) returns include the maximum sales charge of 5.75% for Class A shares. Net asset value (NAV) returns do not include sales charges or contingent deferred sales charges (CDSC).
The Fund's annual operating expense ratio, as stated in the current prospectus, reflects a contractual expense waiver or reimbursement that expires April 30, 2012. Class A expense ratios without and with the contractual waiver, including fees and expenses associated with the Fund's investment in other investment companies, are 1.52% and 1.29%, respectively. Absent the waiver or reimbursement, performance results would have been lower.
Columbia Thermostat Fund Asset Allocation
as a percentage of net assets, as of 6/30/11
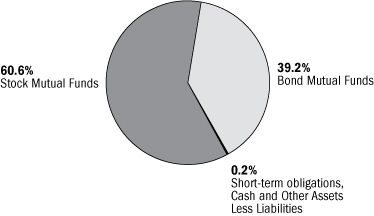
Columbia Thermostat Fund Portfolio Weightings
as a percentage of assets in each investment category, as of 6/30/11
Stock Mutual Funds
| Columbia Acorn International, Class I | | | 20 | % | |
| Columbia Dividend Income Fund, Class I | | | 20 | % | |
| Columbia Acorn Fund, Class I | | | 15 | % | |
| Columbia Marsico Growth Fund, Class I | | | 15 | % | |
| Columbia Acorn Select, Class I | | | 10 | % | |
| Columbia Large Cap Enhanced Core Fund, Class I | | | 10 | % | |
| Columbia Contrarian Core Fund, Class I | | | 10 | % | |
Bond Mutual Funds
| Columbia Intermediate Bond Fund, Class I | | | 50 | % | |
| Columbia U.S. Treasury Index Fund, Class I | | | 30 | % | |
| Columbia Conservative High Yield Fund, Class I | | | 20 | % | |
The Growth of a $10,000 Investment in Columbia Thermostat Fund (Class A)
March 3, 2003 through June 30, 2011
Illustration is based on a hypothetical $10,000 investment from inception in Class A shares of the Fund, which includes a 5.75% maximum initial sales charge. The indexes are unmanaged and returns for both the indexes and the Fund include reinvested dividends and capital gains. Although the indexes are provided for use in assessing the Fund's performance, the Fund's holdings may differ significantly from those in the index. It is not possible to invest directly in an index. The graph does not reflect taxes that a shareholder may pay on Fund distributions or on a sale of Fund shares.
Total Net Assets of the Fund: $137.9 million
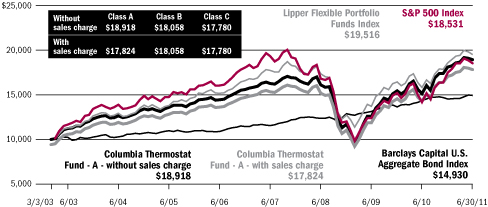
21
Columbia Acorn Fund
Major Portfolio Changes in the Second Quarter (Unaudited)
| | | Number of Shares | |
| | | 03/31/11 | | 06/30/11 | |
| Purchases | |
| Information | |
| ANSYS | | | 2,100,000 | | | | 2,550,000 | | |
| Boingo Wireless | | | 0 | | | | 1,200,000 | | |
| Constant Contact | | | 1,919,615 | | | | 1,950,000 | | |
| ExlService Holdings | | | 1,045,000 | | | | 1,145,000 | | |
| Genpact | | | 0 | | | | 781,635 | | |
| IMAX (Canada) | | | 800,000 | | | | 1,400,000 | | |
| Intralinks | | | 0 | | | | 550,000 | | |
| Ixia | | | 1,720,000 | | | | 2,030,000 | | |
| ON Semiconductor | | | 3,440,000 | | | | 5,117,000 | | |
| Polycom | | | 2,305,000 | | | | 2,455,000 | | |
| Syntel | | | 0 | | | | 580,000 | | |
| TIBCO | | | 0 | | | | 1,381,600 | | |
| Verisk Analytics | | | 450,000 | | | | 900,000 | | |
| Virtusa | | | 2,064,900 | | | | 2,125,000 | | |
| WMS Industries | | | 1,150,000 | | | | 2,100,000 | | |
| WNS - ADR (India) | | | 1,000,000 | | | | 1,027,147 | | |
| Consumer Goods & Services | |
| Cavco Industries | | | 388,907 | | | | 415,000 | | |
| HomeAway | | | 0 | | | | 1,289,880 | | |
| MGM China Holdings (Hong Kong) | | | 0 | | | | 12,000,000 | | |
| P.F. Chang's China Bistro | | | 300,000 | | | | 480,000 | | |
| Phillips-Van Heusen | | | 1,055,000 | | | | 1,410,000 | | |
| Thor Industries | | | 1,190,000 | | | | 1,980,000 | | |
| Industrial Goods & Services | |
| Albemarle | | | 1,575,972 | | | | 1,650,000 | | |
| Imtech (Netherlands) | | | 1,731,432 | | | | 1,767,165 | | |
| Kennametal | | | 2,625,000 | | | | 2,900,000 | | |
| LKQ | | | 450,000 | | | | 900,000 | | |
| Pentair | | | 3,350,000 | | | | 3,535,000 | | |
| Quanta Services | | | 1,950,000 | | | | 2,800,000 | | |
| Ushio (Japan) | | | 1,322,000 | | | | 1,500,000 | | |
| Valmont Industries | | | 0 | | | | 100,000 | | |
| Energy & Minerals | |
| Alexco Resource | | | 2,400,000 | | | | 2,800,000 | | |
| Celtic Exploration (Canada) | | | 0 | | | | 175,400 | | |
| Crew Energy (Canada) | | | 0 | | | | 484,500 | | |
| Fugro (Netherlands) | | | 2,570,626 | | | | 2,641,054 | | |
| Oil States International | | | 463,954 | | | | 743,000 | | |
| Primary Petroleum (Canada) | | | 0 | | | | 2,245,000 | | |
| Silver Standard Resources | | | 800,000 | | | | 900,000 | | |
| Swift Energy | | | 275,000 | | | | 550,000 | | |
| Wolverine Minerals (Canada) | | | 0 | | | | 4,000,000 | | |
| Finance | |
| Alliance Data Systems | | | 275,000 | | | | 400,000 | | |
| Assured Guaranty | | | 0 | | | | 300,000 | | |
| City National | | | 1,045,000 | | | | 1,145,000 | | |
| | | Number of Shares | |
| | | 03/31/11 | | 06/30/11 | |
| Enstar Group | | | 0 | | | | 33,746 | | |
| Financial Engines | | | 0 | | | | 400,000 | | |
| First Busey | | | 3,299,507 | | | | 4,056,427 | | |
| Health Care | |
Adcock Ingram Holdings
(South Africa) | | | 2,259,000 | | | | 2,393,955 | | |
| Akorn | | | 3,733,354 | | | | 4,000,000 | | |
| Alimera Sciences | | | 855,298 | | | | 1,818,154 | | |
| Anthera Pharmaceuticals | | | 1,450,000 | | | | 1,740,000 | | |
| Auxilium Pharmaceuticals | | | 1,200,000 | | | | 2,400,000 | | |
| Community Health Systems | | | 1,380,000 | | | | 1,655,000 | | |
| InterMune | | | 1,731,000 | | | | 2,226,000 | | |
| Kindred Healthcare | | | 0 | | | | 1,450,000 | | |
| Nabi Biopharmaceuticals | | | 2,611,936 | | | | 3,300,000 | | |
| United Therapeutics | | | 510,000 | | | | 780,000 | | |
| Other Industries | |
| Associated Estates Realty | | | 2,200,000 | | | | 2,700,000 | | |
| Genesee & Wyoming | | | 100,000 | | | | 400,000 | | |
| St. Joe | | | 0 | | | | 699,701 | | |
| Summit Hotel Properties | | | 1,092,000 | | | | 1,481,994 | | |
See accompanying notes to financial statements.
22
| | | Number of Shares | |
| | | 03/31/11 | | 06/30/11 | |
| Sales | |
| Information | |
| AboveNet | | | 1,265,000 | | | | 1,199,876 | | |
| Blue Coat Systems | | | 1,260,000 | | | | 313,300 | | |
| Crown Castle International | | | 6,300,000 | | | | 6,000,000 | | |
| Dionex | | | 300,000 | | | | 0 | | |
| Dolby Laboratories | | | 1,140,000 | | | | 815,000 | | |
| Hexagon (Sweden) | | | 5,914,999 | | | | 5,164,999 | | |
| Informatica | | | 5,200,000 | | | | 4,700,000 | | |
| NetSuite | | | 1,800,000 | | | | 1,450,000 | | |
| Plexus | | | 1,490,000 | | | | 1,210,000 | | |
| SRA International | | | 1,655,000 | | | | 1,583,750 | | |
| THQ | | | 3,567,000 | | | | 0 | | |
| Consumer Goods & Services | |
| Blue Nile | | | 180,000 | | | | 62,784 | | |
| Chico's FAS | | | 2,562,000 | | | | 1,933,750 | | |
| CTS Eventim (Germany) | | | 220,000 | | | | 173,436 | | |
| Diamond Foods | | | 1,300,000 | | | | 1,170,000 | | |
| Hansen Natural | | | 2,200,000 | | | | 1,900,000 | | |
| ITT Educational Services | | | 1,080,000 | | | | 350,000 | | |
| lululemon athletica | | | 4,035,000 | | | | 3,991,265 | | |
| Talbots | | | 4,150,000 | | | | 828,500 | | |
| Industrial Goods & Services | |
| American Reprographics | | | 900,000 | | | | 0 | | |
| Lumber Liquidators | | | 700,000 | | | | 0 | | |
| Mersen (France) | | | 753,000 | | | | 524,000 | | |
| Mine Safety Appliances | | | 1,525,000 | | | | 1,300,000 | | |
| Mueller Water Products | | | 1,750,000 | | | | 649,641 | | |
| Nalco | | | 1,800,000 | | | | 831,000 | | |
| Serco (United Kingdom) | | | 2,559,000 | | | | 0 | | |
| Simpson Manufacturing | | | 700,000 | | | | 360,073 | | |
| Energy & Minerals | |
| Atwood Oceanics | | | 3,200,000 | | | | 2,399,000 | | |
| Carrizo Oil & Gas | | | 583,000 | | | | 293,000 | | |
| Gran Tierra Energy (Colombia) | | | 3,131,195 | | | | 0 | | |
| Pan American Silver (Canada) | | | 500,000 | | | | 0 | | |
Synthesis Energy Systems
(China) | | | 1,726,270 | | | | 1,210,300 | | |
| Tesco | | | 1,750,000 | | | | 0 | | |
| Vaalco Energy | | | 750,000 | | | | 0 | | |
| Finance | |
| CAI International | | | 1,450,000 | | | | 1,123,400 | | |
| GATX | | | 1,480,000 | | | | 90,020 | | |
Housing Development Finance
(India) | | | 1,300,000 | | | | 0 | | |
| Investment Technology Group | | | 697,000 | | | | 629,493 | | |
| SVB Financial Group | | | 1,260,000 | | | | 1,160,000 | | |
| TCF Financial | | | 4,150,000 | | | | 3,613,000 | | |
| Wilmington Trust | | | 2,640,000 | | | | 0 | | |
| | | Number of Shares | |
| | | 03/31/11 | | 06/30/11 | |
| Health Care | |
| Allos Therapeutics | | | 2,755,534 | | | | 0 | | |
| American Medical Systems | | | 3,150,000 | | | | 0 | | |
| AthenaHealth | | | 500,000 | | | | 0 | | |
| Gen-Probe | | | 1,065,000 | | | | 700,000 | | |
| Idenix Pharmaceuticals | | | 2,682,497 | | | | 2,300,000 | | |
| Nanosphere | | | 964,499 | | | | 0 | | |
| Nektar Therapeutics | | | 1,091,990 | | | | 0 | | |
| Savient Pharmaceuticals | | | 1,700,000 | | | | 0 | | |
| United Drug (Ireland) | | | 826,526 | | | | 0 | | |
See accompanying notes to financial statements.
23
Columbia Acorn Fund
Statement of Investments (Unaudited), June 30, 2011
| Number of Shares | | | | Value (000) | |
| | | | | | | Equities: 97.5% | |
| Information 27.2% | | | |
| | | > Business Software 6.6% | |
| | 4,700,000 | | | Informatica (a) | | $ | 274,621 | | |
| | | | | Enterprise Data Integration Software | | | | | |
| | 2,550,000 | | | ANSYS (a) | | | 139,408 | | |
| | | | | Simulation Software for
Engineers & Designers | | | | | |
| | 2,700,000 | | | Micros Systems (a) | | | 134,217 | | |
| | | | | Information Systems for Hotels,
Restaurants & Retailers | | | | | |
| | 1,100,000 | | | Quality Systems | | | 96,030 | | |
| | | | | IT Systems for Medical Groups &
Ambulatory Care Centers | | | | | |
| | 1,480,000 | | | Concur Technologies (a) | | | 74,104 | | |
| | | | | Web Enabled Cost & Expense
Management Software | | | | | |
| | 1,700,000 | | | Blackboard (a)(b) | | | 73,763 | | |
| | | | | Education Software | | | | | |
| | 2,250,000 | | | Blackbaud (c) | | | 62,370 | | |
| | | | | Software & Services for Non-profits | | | | | |
| | 1,450,000 | | | NetSuite (a)(b) | | | 56,840 | | |
| | | | | End to End IT Systems Solutions
Delivered Over the Web | | | | | |
| | 2,000,000 | | | Tyler Technologies (a)(c) | | | 53,560 | | |
| | | | | Financial, Tax, Court & Document
Management Systems for Local
Governments | | | | | |
| | 1,950,000 | | | Constant Contact (a)(b)(c) | | | 49,491 | | |
| | | | | E-mail & Other Marketing Campaign
Management Systems Delivered
Over the Web | | | | | |
| | 2,025,000 | | | Kenexa (a)(c) | | | 48,560 | | |
| | | | | Recruiting & Workforce Management
Solutions | | | | | |
| | 1,200,000 | | | Ariba (a) | | | 41,364 | | |
| | | | | Cost Management Software | | | | | |
| | 1,381,600 | | | TIBCO (a) | | | 40,094 | | |
| | | | | Datacenter Software | | | | | |
| | 850,000 | | | Red Hat (a) | | | 39,015 | | |
| | | | | Maintenance & Support for Open
Source & Middleware | | | | | |
| | 920,000 | | | Jack Henry & Associates | | | 27,609 | | |
| | | | | Systems Financial Institutions | | | | | |
| | 690,000 | | | Advent Software (a) | | | 19,437 | | |
| | | | | Asset Management & Trading Systems | | | | | |
| | 900,000 | | | SPS Commerce (a)(c) | | | 16,011 | | |
| | | | | Supply Chain Management Software
Delivered via the Web | | | | | |
| | 550,000 | | | Intralinks (a) | | | 9,504 | | |
| | | | | Collaboration Software | | | | | |
| | 1,500,000 | | | Actuate (a) | | | 8,775 | | |
| | | | | Information Delivery Software & Solutions | | | | | |
| | 1,000,000 | | | InContact (a) | | | 4,750 | | |
| | | | | Call Center Systems Delivered via the
Web & Telecommunications Services | | | | | |
| | | | 1,269,523 | | |
| | | > Instrumentation 3.7% | |
| | 1,600,000 | | | Mettler Toledo (a) | | | 269,872 | | |
| | | | | Laboratory Equipment | | | | | |
| | 2,780,000 | | | IPG Photonics (a)(c) | | | 202,134 | | |
| | | | | Fiber Lasers | | | | | |
| Number of Shares | | | | Value (000) | |
| | 5,164,999 | | | Hexagon (Sweden) | | $ | 127,222 | | |
| | | | | Measurement Equipment & Software | | | | | |
| | 2,035,000 | | | Trimble Navigation (a) | | | 80,667 | | |
| | | | | GPS-based Instruments | | | | | |
| | 600,000 | | | FLIR Systems | | | 20,226 | | |
| | | | | Infrared Cameras | | | | | |
| | 400,000 | | | Hamamatsu Photonics (Japan) | | | 17,295 | | |
| | | | | Optical Sensors for Medical & Industrial
Applications | | | | | |
| | | | 717,416 | | |
| | | > Computer Hardware & Related
Equipment 2.7% | |
| | 3,565,000 | | | Amphenol | | | 192,474 | | |
| | | | | Electronic Connectors | | | | | |
| | 4,550,000 | | | II-VI (a)(c) | | | 116,480 | | |
| | | | | Laser Optics & Specialty Materials | | | | | |
| | 1,605,000 | | | Zebra Technologies (a) | | | 67,683 | | |
| | | | | Bar Code Printers | | | | | |
| | 1,200,000 | | | Netgear (a) | | | 52,464 | | |
| | | | | Networking Products for Small
Business & Home | | | | | |
| | 815,000 | | | Dolby Laboratories (a) | | | 34,605 | | |
| | | | | Audio Technology for Consumer Electronics | | | | | |
| | 800,000 | | | Nice Systems - ADR (Israel) (a) | | | 29,088 | | |
| | | | | Audio & Video Recording Solutions | | | | | |
| | 605,000 | | | Stratasys (a) | | | 20,389 | | |
| | | | | Rapid Prototyping Systems | | | | | |
| | | | 513,183 | | |
| | | > Semiconductors & Related
Equipment 2.1% | |
| | 8,130,000 | | | Atmel (a) | | | 114,389 | | |
| | | | | Microcontrollers, Radio Frequency &
Memory Semiconductors | | | | | |
| | 5,117,000 | | | ON Semiconductor (a) | | | 53,575 | | |
| | | | | Mixed-signal & Power Management
Semiconductors | | | | | |
| | 5,000,000 | | | Entegris (a) | | | 50,600 | | |
| | | | | Semiconductor Materials Management
Products | | | | | |
| | 2,345,000 | | | Microsemi (a) | | | 48,072 | | |
| | | | | Analog/Mixed-signal Semiconductors | | | | | |
| | 500,000 | | | Littelfuse | | | 29,360 | | |
| | | | | Little Fuses | | | | | |
| | 1,900,000 | | | IXYS (a)(c) | | | 28,462 | | |
| | | | | Power Semiconductors | | | | | |
| | 935,000 | | | Supertex (a)(c) | | | 20,944 | | |
| | | | | Analog/Mixed-signal Semiconductors | | | | | |
| | 1,750,000 | | | TriQuint Semiconductor (a) | | | 17,833 | | |
| | | | | Radio Frequency Semiconductors | | | | | |
| | 1,765,000 | | | Pericom Semiconductor (a)(c) | | | 15,779 | | |
| | | | | Interface Integrated Circuits (ICs) &
Frequency Control Products | | | | | |
| | 1,650,000 | | | Applied Micro Circuits (a) | | | 14,619 | | |
| | | | | Communications Semiconductors | | | | | |
| | 800,000 | | | Monolithic Power Systems (a) | | | 12,336 | | |
| | | | | High Performance Analog & Mixed-signal
Integrated Circuits (ICs) | | | | | |
| | | | 405,969 | | |
See accompanying notes to financial statements.
24
| Number of Shares | | | | Value (000) | |
| | | > Telephone and Data Services 2.1% | |
| | 9,500,000 | | | tw telecom (a)(c) | | $ | 195,035 | | |
| | | | | Fiber Optic Telephone/Data Services | | | | | |
| | 1,199,876 | | | AboveNet | | | 84,543 | | |
| | | | | Metropolitan Fiber Communications
Services | | | | | |
| | 9,600,000 | | | PAETEC Holding (a)(c) | | | 45,984 | | |
| | | | | Telephone/Data Services for Business | | | | | |
| | 2,520,000 | | | Cogent Communications (a)(c) | | | 42,865 | | |
| | | | | Internet Data Pipelines | | | | | |
| | 2,000,000 | | | General Communications (a) | | | 24,140 | | |
| | | | | Commercial Communications & Consumer
CATV, Web & Phone in Alaska | | | | | |
| | 1,200,000 | | | Boingo Wireless (a)(b) | | | 10,896 | | |
| | | | | Wholesale & Retail WiFi Networks | | | | | |
| | | | 403,463 | | |
| | | > Mobile Communications 2.0% | |
| | 6,000,000 | | | Crown Castle International (a) | | | 244,740 | | |
| | | | | Communications Towers | | | | | |
| | 3,150,000 | | | SBA Communications (a) | | | 120,298 | | |
| | | | | Communications Towers | | | | | |
| | 1,000,000 | | | MetroPCS Communications (a) | | | 17,210 | | |
| | | | | Discount Cellular Telephone Services | | | | | |
| | 1,500,000 | | | Globalstar (a)(b) | | | 1,845 | | |
| | | | | Satellite Mobile Voice & Data Carrier | | | | | |
| | | | 384,093 | | |
| | | > Telecommunications Equipment 1.6% | |
| | 2,455,000 | | | Polycom (a) | | | 157,856 | | |
| | | | | Video Conferencing Equipment | | | | | |
| | 685,000 | | | F5 Networks (a) | | | 75,521 | | |
| | | | | Internet Traffic Management Equipment | | | | | |
| | 1,725,000 | | | Finisar (a) | | | 31,102 | | |
| | | | | Optical Sub-systems & Components | | | | | |
| | 2,030,000 | | | Ixia (a) | | | 25,984 | | |
| | | | | Telecom Network Test Equipment | | | | | |
| | 1,925,000 | | | Infinera (a) | | | 13,302 | | |
| | | | | Optical Networking Equipment | | | | | |
| | 313,300 | | | Blue Coat Systems (a) | | | 6,849 | | |
| | | | | WAN Acceleration & Network Security | | | | | |
| | | | 310,614 | | |
| | | > Computer Services 1.4% | |
| | 1,583,750 | | | SRA International (a) | | | 48,970 | | |
| | | | | Government IT Services | | | | | |
| | 2,900,000 | | | iGate (b)(c) | | | 47,328 | | |
| | | | | IT & BPO (Business Process Outsourcing)
Services | | | | | |
| | 2,125,000 | | | Virtusa (a)(c) | | | 40,269 | | |
| | | | | Offshore IT Outsourcing | | | | | |
| | 580,000 | | | Syntel | | | 34,290 | | |
| | | | | Offshore I/T Services | | | | | |
| | 1,145,000 | | | ExlService Holdings (a) | | | 26,449 | | |
| | | | | BPO (Business Process Outsourcing) | | | | | |
| | 4,500,000 | | | Hackett Group (a)(c) | | | 22,905 | | |
| | | | | IT Integration & Best Practice Research | | | | | |
| | 1,560,000 | | | Acxiom (a) | | | 20,452 | | |
| | | | | Database Marketing Services | | | | | |
| | 781,635 | | | Genpact (a) | | | 13,475 | | |
| | | | | Business Process Outsourcing | | | | | |
| Number of Shares | | | | Value (000) | |
| | 1,027,147 | | | WNS - ADR (India) (a) | | $ | 9,131 | | |
| | | | | Offshore BPO (Business Process
Outsourcing) Services | | | | | |
| | | | 263,269 | | |
| | | > Gaming Equipment & Services 1.1% | |
| | 3,725,000 | | | Bally Technologies (a)(b)(c) | | | 151,533 | | |
| | | | | Slot Machines & Software | | | | | |
| | 2,100,000 | | | WMS Industries (a) | | | 64,512 | | |
| | | | | Slot Machine Provider | | | | | |
| | | | 216,045 | | |
| | | > CATV 1.0% | |
| | 3,000,000 | | | Discovery Communications,
Series C (a) | | | 109,650 | | |
| | | | | Cable TV Programming | | | | | |
| | 1,250,000 | | | Liberty Global, Series A (a)(b) | | | 56,300 | | |
| | | | | Cable TV Franchises Outside the USA | | | | | |
| | 17,770 | | | Jupiter Telecommunications (Japan) | | | 19,881 | | |
| | | | | Largest Cable Service Provider in Japan | | | | | |
| | | | 185,831 | | |
| | | > Financial Processors 0.9% | |
| | 2,429,000 | | | Global Payments | | | 123,879 | | |
| | | | | Credit Card Processor | | | | | |
| | 5,000,000 | | | Singapore Exchange (Singapore) | | | 30,725 | | |
| | | | | Singapore Equity & Derivatives
Market Operator | | | | | |
| | 750,000 | | | Hong Kong Exchanges and Clearing
(Hong Kong) | | | 15,802 | | |
| | | | | Hong Kong Equity & Derivatives
Market Operator | | | | | |
| | | | 170,406 | | |
| | | > Electronics Distribution 0.5% | |
| | 3,125,000 | | | Avnet (a) | | | 99,625 | | |
| | | | | Electronic Components Distribution | | | | | |
| | | | 99,625 | | |
| | | > Business Information &
Marketing Services 0.5% | |
| | 900,000 | | | FTI Consulting (a)(b) | | | 34,146 | | |
| | | | | Financial Consulting Firm | | | | | |
| | 3,100,000 | | | Navigant Consulting (a)(c) | | | 32,519 | | |
| | | | | Financial Consulting Firm | | | | | |
| | 900,000 | | | Verisk Analytics (a) | | | 31,158 | | |
| | | | | Risk & Decision Analytics | | | | | |
| | | | 97,823 | | |
| | | > Contract Manufacturing 0.4% | |
| | 1,210,000 | | | Plexus (a) | | | 42,120 | | |
| | | | | Electronic Manufacturing Services | | | | | |
| | 2,800,000 | | | Sanmina-SCI (a) | | | 28,924 | | |
| | | | | Electronic Manufacturing Services | | | | | |
| | | | 71,044 | | |
| | | > Internet Related 0.3% | |
| | 435,000 | | | Equinix (a) | | | 43,944 | | |
| | | | | Network Neutral Data Centers | | | | | |
| | 464,305 | | | Mail.ru - GDR (Russia) (a)(d) | | | 15,424 | | |
| | | | | Internet Social Networking & Games
for Russian Speakers | | | | | |
| | 1,000,000 | | | TheStreet.com | | | 3,070 | | |
| | | | | Financial Information Websites | | | | | |
| | | | 62,438 | | |
See accompanying notes to financial statements.
25
Columbia Acorn Fund
Statement of Investments (Unaudited), continued
| Number of Shares | | | | Value (000) | |
| | | > Entertainment Programming 0.2% | |
| | 1,400,000 | | | IMAX (Canada) (a) | | $ | 45,402 | | |
| | | | | IMAX Movies, Theatre Equipment &
Theatre Joint Ventures | | | | | |
| | | | 45,402 | | |
| | | > Radio 0.1% | |
| | 164,991 | | | Saga Communications (a) | | | 6,105 | | |
| | | | | Radio Stations in Small & Mid-sized Cities | | | | | |
| | 1,541,000 | | | Salem Communications (c) | | | 5,532 | | |
| | | | | Radio Stations for Religious Programming | | | | | |
| | 2,400,000 | | | Spanish Broadcasting System (a)(c) | | | 1,680 | | |
| | | | | Spanish Language Radio Stations | | | | | |
| | | | 13,317 | | |
| | | > TV Broadcasting —% | |
| | 2,500,000 | | | Entravision Communications (a) | | | 4,625 | | |
| | | | | Spanish Language TV & Radio Stations | | | | | |
| | 1,750,000 | | | Gray Television (a)(b) | | | 4,620 | | |
| | | | | Mid-market Affiliated TV Stations | | | | | |
| | | | 9,245 | | |
| | | > Advertising —% | |
| | 1,500,000 | | | VisionChina Media - ADR
(China) (a)(b) | | | 4,245 | | |
| | | | | Advertising on Digital Screens in
China's Mass Transit System | | | | | |
| | | | 4,245 | | |
| Information: Total | | | 5,242,951 | | |
| Consumer Goods & Services 18.3% | | | |
| | | > Retail 5.2% | |
| | 3,991,265 | | | lululemon athletica (a)(c) | | | 446,304 | | |
| | | | | Premium Active Apparel Retailer | | | | | |
| | 3,510,000 | | | Abercrombie & Fitch | | | 234,889 | | |
| | | | | Teen Apparel Retailer | | | | | |
| | 2,300,000 | | | Shutterfly (a)(c) | | | 132,066 | | |
| | | | | Internet Photo-centric Retailer | | | | | |
| | 5,600,000 | | | Pier 1 Imports (a) | | | 64,792 | | |
| | | | | Home Furnishing Retailer | | | | | |
| | 5,225,000 | | | Saks (a) | | | 58,363 | | |
| | | | | Luxury Department Store Retailer | | | | | |
| | 1,933,750 | | | Chico's FAS | | | 29,451 | | |
| | | | | Women's Specialty Retailer | | | | | |
| | 525,000 | | | DSW (a) | | | 26,570 | | |
| | | | | Branded Footwear Retailer | | | | | |
| | 1,371,366 | | | Gaiam (c) | | | 6,816 | | |
| | | | | Healthy Living Catalogs & E-Commerce | | | | | |
| | 828,500 | | | Talbots (a)(b) | | | 2,767 | | |
| | | | | Women's Specialty Retailer | | | | | |
| | 62,784 | | | Blue Nile (a)(b) | | | 2,761 | | |
| | | | | Online Jewelry Retailer | | | | | |
| | 66,000 | | | The Fresh Market (a) | | | 2,553 | | |
| | | | | Specialty Food Retailer | | | | | |
| | | | 1,007,332 | | |
| | | > Apparel 3.5% | |
| | 2,100,000 | | | Coach | | | 134,253 | | |
| | | | | Designer & Retailer of Branded
Leather Accessories | | | | | |
| Number of Shares | | | | Value (000) | |
| | 2,190,000 | | | Warnaco Group (a) | | $ | 114,427 | | |
| | | | | Global Branded Apparel Manufacturer | | | | | |
| | 1,120,000 | | | Deckers Outdoor (a) | | | 98,717 | | |
| | | | | Fashion Footwear Wholesaler | | | | | |
| | 1,410,000 | | | Phillips-Van Heusen | | | 92,313 | | |
| | | | | Apparel Wholesaler & Retailer | | | | | |
| | 1,980,000 | | | Guess? | | | 83,279 | | |
| | | | | Branded Apparel, Accessories & Licensor | | | | | |
| | 2,047,000 | | | True Religion Apparel (a)(c) | | | 59,527 | | |
| | | | | Premium Denim | | | | | |
| | 1,400,000 | | | Crocs (a) | | | 36,050 | | |
| | | | | Branded Footwear Wholesaler & Retailer | | | | | |
| | 1,000,000 | | | Hanesbrands (a) | | | 28,550 | | |
| | | | | Apparel Wholesaler | | | | | |
| | 600,000 | | | Steven Madden (a) | | | 22,506 | | |
| | | | | Wholesaler/Retailer of Fashion Footwear | | | | | |
| | 100,197 | | | Zuoan Fashion (China) (a)(b) | | | 560 | | |
| | | | | Men's Apparel Provider in China | | | | | |
| | | | 670,182 | | |
| | | > Travel 2.8% | |
| | 3,850,000 | | | Gaylord Entertainment (a)(c) | | | 115,500 | | |
| | | | | Convention Hotels | | | | | |
| | 3,900,000 | | | Expedia | | | 113,061 | | |
| | | | | Online Travel Services Company | | | | | |
| | 4,600,000 | | | Avis Budget Group (a) | | | 78,614 | | |
| | | | | Second Largest Car Rental Company | | | | | |
| | 1,250,000 | | | Vail Resorts | | | 57,775 | | |
| | | | | Ski Resort Operator & Developer | | | | | |
| | 1,289,880 | | | HomeAway (a) | | | 49,919 | | |
| | | | | Vacation Rental Online Marketplace | | | | | |
| | 3,000,000 | | | Hertz (a) | | | 47,640 | | |
| | | | | Largest U.S. Rental Car Operator | | | | | |
| | 2,000,000 | | | Localiza Rent A Car (Brazil) | | | 35,754 | | |
| | | | | Car Rental | | | | | |
| | 970,000 | | | Choice Hotels | | | 32,359 | | |
| | | | | Franchisor of Budget Hotel Brands | | | | | |
| | | | 530,622 | | |
| | | > Food & Beverage 1.7% | |
| | 1,900,000 | | | Hansen Natural (a) | | | 153,805 | | |
| | | | | Alternative Beverages | | | | | |
| | 1,170,000 | | | Diamond Foods (b)(c) | | | 89,318 | | |
| | | | | Snack Foods & Culinary Ingredients | | | | | |
| | 32,896,000 | | | Olam International (Singapore) | | | 73,128 | | |
| | | | | Agriculture Supply Chain Manager | | | | | |
| | 1,200,000 | | | GLG Life Tech (Canada) (a) | | | 8,064 | | |
| | | | | Produce an All-natural Sweetener
Extracted from the Stevia Plant | | | | | |
| | 240,000 | | | Lance | | | 5,191 | | |
| | | | | Snack Foods | | | | | |
| | | | 329,506 | | |
| | | > Furniture & Textiles 0.9% | |
| | 4,000,000 | | | Knoll (c) | | | 80,280 | | |
| | | | | Office Furniture | | | | | |
| | 2,800,000 | | | Herman Miller | | | 76,216 | | |
| | | | | Office Furniture | | | | | |
| | 1,000,000 | | | Interface | | | 19,370 | | |
| | | | | Modular & Broadloom Carpet | | | | | |
| | | | 175,866 | | |
See accompanying notes to financial statements.
26
| Number of Shares | | | | Value (000) | |
| | | > Casinos & Gaming 0.9% | |
| | 1,590,000 | | | Penn National Gaming (a) | | $ | 64,141 | | |
| | | | | Regional Casino Operator | | | | | |
| | 3,400,000 | | | Pinnacle Entertainment (a)(c) | | | 50,660 | | |
| | | | | Regional Casino Operator | | | | | |
| | 3,000,000 | | | Melco Crown Entertainment - ADR
(Hong Kong) (a) | | | 38,310 | | |
| | | | | Macau Casino Operator | | | | | |
| | 12,000,000 | | | MGM China Holdings (Hong Kong) (a) | | | 22,144 | | |
| | | | | Macau Casino Operator | | | | | |
| | | | 175,255 | | |
| | | > Educational Services 0.7% | |
| | 2,800,000 | | | Career Education (a) | | | 59,220 | | |
| | | | | Post-secondary Education | | | | | |
| | 1,700,000 | | | Universal Technical Institute (c) | | | 33,609 | | |
| | | | | Vocational Training | | | | | |
| | 350,000 | | | ITT Educational Services (a)(b) | | | 27,384 | | |
| | | | | Post-secondary Degree Services | | | | | |
| | 200,000 | | | New Oriental Education &
Technology - ADR (China) (a) | | | 22,344 | | |
| | | | | Education Service Provider | | | | | |
| | 2,000,000 | | | Voyager Learning, Contingent Value
Rights (a)(d) | | | 300 | | |
| | | | | Education Services for the K-12 Market | | | | | |
| | | | 142,857 | | |
| | | > Other Consumer Services 0.7% | |
| | 2,190,000 | | | Lifetime Fitness (a)(c) | | | 87,403 | | |
| | | | | Sport & Fitness Club Operator | | | | | |
| | 14,000,000 | | | Lifestyle International (Hong Kong) | | | 41,319 | | |
| | | | | Mid- to High-end Department Store
Operator in Hong Kong & China | | | | | |
| | 4,250,000 | | | Move (a) | | | 9,307 | | |
| | | | | Real Estate Internet Websites | | | | | |
| | 1,325,000 | | | IFM Investments (Century 21
China RE) - ADR (China) (a) | | | 1,948 | | |
| | | | | Provides Real Estate Services in China | | | | | |
| | | | 139,977 | | |
| | | > Other Durable Goods 0.5% | |
| | 1,720,000 | | | Jarden | | | 59,357 | | |
| | | | | Branded Household Products | | | | | |
| | 415,000 | | | Cavco Industries (a)(c) | | | 18,675 | | |
| | | | | Manufactured Homes | | | | | |
| | 400,000 | | | Tesla Motors (a)(b) | | | 11,652 | | |
| | | | | Design, Manufacture & Sell
High Performance Electric Vehicles | | | | | |
| | | | 89,684 | | |
| | | > Restaurants 0.4% | |
| | 2,000,000 | | | AFC Enterprises (a)(c) | | | 32,900 | | |
| | | | | Popeye's Restaurants | | | | | |
| | 480,000 | | | P.F. Chang's China Bistro | | | 19,315 | | |
| | | | | Mandarin Style Restaurants | | | | | |
| | 675,000 | | | Bravo Brio Restaurant Group (a) | | | 16,490 | | |
| | | | | Upscale Casual Italian Restaurants | | | | | |
| | 450,000 | | | Cheesecake Factory (a) | | | 14,117 | | |
| | | | | Casual Dining Restaurants | | | | | |
| | | | 82,822 | | |
| Number of Shares | | | | Value (000) | |
| | | > Consumer Goods Distribution 0.3% | |
| | 2,100,000 | | | Pool | | $ | 62,601 | | |
| | | | | Distributor of Swimming Pool
Supplies & Equipment | | | | | |
| | | | 62,601 | | |
| | | > Leisure Products 0.3% | |
| | 1,980,000 | | | Thor Industries | | | 57,103 | | |
| | | | | RV & Bus Manufacturer | | | | | |
| | | | 57,103 | | |
| | | > Nondurables 0.3% | |
| | 1,600,000 | | | Helen of Troy (a)(c) | | | 55,248 | | |
| | | | | Hair Dryers & Curling Irons | | | | | |
| | | | 55,248 | | |
| | | > Other Entertainment 0.1% | |
| | 173,436 | | | CTS Eventim (Germany) | | | 11,984 | | |
| | | | | Event Ticket Sales | | | | | |
| | | | 11,984 | | |
| Consumer Goods & Services: Total | | | 3,531,039 | | |
| Industrial Goods & Services 18.3% | | | |
| | | > Machinery 10.1% | |
| | 6,750,000 | | | Ametek | | | 303,075 | | |
| | | | | Aerospace/Industrial Instruments | | | | | |
| | 4,200,000 | | | Donaldson (c) | | | 254,856 | | |
| | | | | Industrial Air Filtration | | | | | |
| | 3,000,000 | | | Nordson | | | 164,550 | | |
| | | | | Dispensing Systems for Adhesives & Coatings | | | | | |
| | 3,535,000 | | | Pentair | | | 142,673 | | |
| | | | | Pumps & Water Treatment | | | | | |
| | 2,900,000 | | | Kennametal | | | 122,409 | | |
| | | | | Consumable Cutting Tools | | | | | |
| | 2,565,000 | | | Clarcor (c) | | | 121,273 | | |
| | | | | Mobile & Industrial Filters | | | | | |
| | 3,650,000 | | | Oshkosh (a) | | | 105,631 | | |
| | | | | Specialty Truck Manufacturer | | | | | |
| | 1,800,000 | | | Pall | | | 101,214 | | |
| | | | | Filtration & Fluids Clarification | | | | | |
| | 2,250,000 | | | HEICO (c) | | | 89,460 | | |
| | | | | FAA Approved Aircraft Replacement Parts | | | | | |
| | 2,050,000 | | | MOOG (a) | | | 89,216 | | |
| | | | | Motion Control Products for Aerospace,
Defense & Industrial Markets | | | | | |
| | 2,200,000 | | | ESCO Technologies (c) | | | 80,960 | | |
| | | | | Automatic Electric Meter Readers | | | | | |
| | 1,150,000 | | | WABCO Holdings (a) | | | 79,419 | | |
| | | | | Truck & Bus Component Supplier | | | | | |
| | 805,000 | | | Toro | | | 48,703 | | |
| | | | | Turf Maintenance Equipment | | | | | |
| | 1,300,000 | | | Mine Safety Appliances | | | 48,542 | | |
| | | | | Safety Equipment | | | | | |
| | 1,300,000 | | | Kaydon | | | 48,516 | | |
| | | | | Specialized Friction & Motion Control Products | | | | | |
| | 600,000 | | | Wabtec | | | 39,432 | | |
| | | | | Freight & Transit Component Supplier | | | | | |
| | 1,600,000 | | | Generac (a) | | | 31,040 | | |
| | | | | Stand-by Power Generators | | | | | |
| | 287,000 | | | Neopost (France) | | | 24,655 | | |
| | | | | Postage Meter Machines | | | | | |
See accompanying notes to financial statements.
27
Columbia Acorn Fund
Statement of Investments (Unaudited), continued
| Number of Shares | | | | Value (000) | |
| | | > Machinery—continued | |
| | 3,500,000 | | | Jain Irrigation Systems (India) | | $ | 13,382 | | |
| | | | | Agricultural Micro-irrigation Systems &
Food Processing | | | | | |
| | 10,000,000 | | | Marel (Iceland) (a) | | | 10,586 | | |
| | | | | Largest Manufacturer of Poultry & Fish
Processing Equipment | | | | | |
| | 100,000 | | | Valmont Industries | | | 9,639 | | |
| | | | | Center Pivot Irrigation Systems & Utility Poles | | | | | |
| | 1,250,000 | | | Spartan Motors | | | 6,750 | | |
| | | | | Specialty Truck & Chassis Manufacturer | | | | | |
| | | | 1,935,981 | | |
| | | > Industrial Materials & Specialty
Chemicals 2.4% | |
| | 1,650,000 | | | Albemarle | | | 114,180 | | |
| | | | | Refinery Catalysts & Other Specialty
Chemicals | | | | | |
| | 650,000 | | | FMC Corp. | | | 55,913 | | |
| | | | | Niche Specialty Chemicals | | | | | |
| | 340,000 | | | Novozymes (Denmark) | | | 55,329 | | |
| | | | | Industrial Enzymes | | | | | |
| | 673,000 | | | Sociedad Quimica y Minera de
Chile - ADR (Chile) | | | 43,557 | | |
| | | | | Producer of Specialty Fertilizers,
Lithium & Iodine | | | | | |
| | 1,260,000 | | | Drew Industries (c) | | | 31,147 | | |
| | | | | RV & Manufactured Home Components | | | | | |
| | 524,000 | | | Mersen (France) | | | 29,559 | | |
| | | | | Advanced Industrial Materials | | | | | |
| | 1,100,000 | | | Albany International | | | 29,029 | | |
| | | | | Paper Machine Clothing & Advanced Textiles | | | | | |
| | 10,000 | | | Sika (Switzerland) | | | 24,109 | | |
| | | | | Chemicals for Construction & Industrial
Applications | | | | | |
| | 831,000 | | | Nalco | | | 23,110 | | |
| | | | | Provider of Water Treatment & Process
Chemicals & Services | | | | | |
| | 350,000 | | | Greif | | | 22,761 | | |
| | | | | Industrial Packaging | | | | | |
| | 2,218,700 | | | Kansai Paint (Japan) | | | 20,215 | | |
| | | | | Paint Producer in Japan, India, China &
Southeast Asia | | | | | |
| | 400,000 | | | Silgan Holdings | | | 16,388 | | |
| | | | | Metal & Plastic Packaging | | | | | |
| | | | 465,297 | | |
| | | > Other Industrial Services 2.0% | |
| | 3,200,000 | | | Expeditors International of Washington | | | 163,808 | | |
| | | | | International Freight Forwarder | | | | | |
| | 1,767,165 | | | Imtech (Netherlands) | | | 62,503 | | |
| | | | | Electromechanical & Information &
Communications Technologies Installation &
Maintenance | | | | | |
| | 1,300,000 | | | Forward Air | | | 43,927 | | |
| | | | | Freight Transportation Between Airports | | | | | |
| | 1,600,000 | | | Mobile Mini (a) | | | 33,904 | | |
| | | | | Portable Storage Units Leasing | | | | | |
| | 900,000 | | | LKQ (a) | | | 23,481 | | |
| | | | | Alternative Auto Parts Distribution | | | | | |
| | 1,000,000 | | | UTI Worldwide | | | 19,690 | | |
| | | | | Freight Forwarding & Logistics | | | | | |
| Number of Shares | | | | Value (000) | |
| | 626,524 | | | Arcadis (Netherlands) | | $ | 15,327 | | |
| | | | | Engineering Consultants | | | | | |
| | 1,050,000 | | | TrueBlue (a) | | | 15,204 | | |
| | | | | Temporary Manual Labor | | | | | |
| | 10,000,000 | | | Hutchison Port Holdings Trust
(Hong Kong) (a) | | | 8,450 | | |
| | | | | Southern China Container Ports | | | | | |
| | | | 386,294 | | |
| | | > Industrial Distribution 1.0% | |
| | 900,000 | | | WW Grainger | | | 138,285 | | |
| | | | | Industrial Distribution | | | | | |
| | 2,600,000 | | | Interline Brands (a)(c) | | | 47,762 | | |
| | | | | Industrial Distribution | | | | | |
| | 100,000 | | | Watsco | | | 6,799 | | |
| | | | | HVAC Distribution | | | | | |
| | | | 192,846 | | |
| | | > Electrical Components 0.6% | |
| | 1,440,000 | | | Acuity Brands | | | 80,323 | | |
| | | | | Commercial Lighting Fixtures | | | | | |
| | 1,500,000 | | | Ushio (Japan) | | | 29,659 | | |
| | | | | Industrial Light Sources | | | | | |
| | 351,000 | | | Saft (France) | | | 12,071 | | |
| | | | | Niche Battery Manufacturer | | | | | |
| | | | 122,053 | | |
| | | > Waste Management 0.6% | |
| | 1,672,500 | | | Waste Connections | | | 53,068 | | |
| | | | | Solid Waste Management | | | | | |
| | 1,000,000 | | | Republic Services | | | 30,850 | | |
| | | | | Solid Waste Management | | | | | |
| | 280,000 | | | Clean Harbors (a) | | | 28,910 | | |
| | | | | Hazardous Waste Services & Disposal | | | | | |
| | | | 112,828 | | |
| | | > Outsourcing Services 0.5% | |
| | 2,800,000 | | | Quanta Services (a) | | | 56,560 | | |
| | | | | Electrical & Telecom Construction Services | | | | | |
| | 1,210,000 | | | Insperity | | | 35,828 | | |
| | | | | Professional Employer Organization | | | | | |
| | 600,000 | | | GP Strategies (a) | | | 8,196 | | |
| | | | | Training Programs | | | | | |
| | | | 100,584 | | |
| | | > Construction 0.4% | |
| | 66,000 | | | NVR (a) | | | 47,882 | | |
| | | | | D.C. Homebuilder | | | | | |
| | 1,800,000 | | | Mills Estruturas e Serviços de
Engenharia (Brazil) | | | 25,951 | | |
| | | | | Civil Engineering & Construction | | | | | |
| | 360,073 | | | Simpson Manufacturing | | | 10,755 | | |
| | | | | Wall Joint Maker | | | | | |
| | | | 84,588 | | |
| | | > Conglomerates 0.4% | |
| | 2,263,654 | | | Aalberts Industries (Netherlands) | | | 52,916 | | |
| | | | | Flow Control & Heat Treatment | | | | | |
| | 600,000 | | | Ibiden (Japan) | | | 18,785 | | |
| | | | | Electronic Parts & Ceramics | | | | | |
| | | | 71,701 | | |
See accompanying notes to financial statements.
28
| Number of Shares | | | | Value (000) | |
| | | > Steel 0.3% | |
| | 2,340,000 | | | GrafTech International (a) | | $ | 47,432 | | |
| | | | | Industrial Graphite Materials Producer | | | | | |
| | | | 47,432 | | |
| | | > Water —% | |
| | 649,641 | | | Mueller Water Products | | | 2,586 | | |
| | | | | Fire Hydrants, Valves & Ductile Iron Pipes | | | | | |
| | | | 2,586 | | |
| Industrial Goods & Services: Total | | | 3,522,190 | | |
| Energy & Minerals 9.8% | | | |
| | | > Oil Services 3.9% | |
| | 6,200,000 | | | FMC Technologies (a) | | | 277,698 | | |
| | | | | Oil & Gas Wellhead Manufacturer | | | | | |
| | 2,641,054 | | | Fugro (Netherlands) | | | 190,424 | | |
| | | | | Sub-sea Oilfield Services | | | | | |
| | 2,399,000 | | | Atwood Oceanics (a) | | | 105,868 | | |
| | | | | Offshore Drilling Contractor | | | | | |
| | 743,000 | | | Oil States International (a) | | | 59,373 | | |
| | | | | Diversified North American Oil Service
Provider | | | | | |
| | 1,670,000 | | | ShawCor (Canada) | | | 51,289 | | |
| | | | | Oil & Gas Pipeline Products | | | | | |
| | 375,000 | | | Bristow | | | 19,132 | | |
| | | | | Largest Provider of Helicopter Services
to Offshore Oil & Gas Producers | | | | | |
| | 528,300 | | | Black Diamond Group (Canada) | | | 17,255 | | |
| | | | | Provides Accommodations/Equipment for
Oil Sands Exploitation | | | | | |
| | 500,000 | | | Hornbeck Offshore (a) | | | 13,750 | | |
| | | | | Supply Vessel Operator in U.S. Gulf of Mexico | | | | | |
| | 2,890,900 | | | Horizon North Logistics (Canada) | | | 13,429 | | |
| | | | | Provides Diversified Oil Service Offering in
Northern Canada | | | | | |
| | 9,519,200 | | | Tuscany International Drilling
(Colombia) (a) | | | 9,080 | | |
| | 1,040,000 | | | Tuscany International Drilling - Warrants
(Colombia) (a) | | | 38 | | |
| | | | | South America-based Drilling Rig Contractor | | | | | |
| | | | 757,336 | | |
| | | > Oil & Gas Producers 3.7% | |
| | 4,810,550 | | | Pacific Rubiales Energy (Colombia) | | | 128,936 | | |
| | | | | Oil Production & Exploration in Colombia | | | | | |
| | 1,650,000 | | | Southwestern Energy (a) | | | 70,752 | | |
| | | | | Oil & Gas Producer | | | | | |
| | 2,700,000 | | | Denbury Resources (a) | | | 54,000 | | |
| | | | | Oil Producer Using Co2 Injection | | | | | |
| | 715,000 | | | SM Energy | | | 52,538 | | |
| | | | | Oil & Gas Producer | | | | | |
| | 974,000 | | | Rosetta Resources (a) | | | 50,200 | | |
| | | | | Oil & Gas Producer Exploring in
South Texas & Montana | | | | | |
| | 2,400,000 | | | Tullow Oil (United Kingdom) | | | 47,763 | | |
| | | | | Oil & Gas Producer | | | | | |
| | 910,000 | | | Ultra Petroleum (a) | | | 41,678 | | |
| | | | | Oil & Gas Producer | | | | | |
| Number of Shares | | | | Value (000) | |
| | 695,000 | | | Range Resources | | $ | 38,572 | | |
| | | | | Oil & Gas Producer | | | | | |
| | 650,000 | | | Baytex (Canada) (b) | | | 35,531 | | |
| | | | | Oil & Gas Producer in Canada | | | | | |
| | 1,200,000 | | | Houston American Energy (b) | | | 21,756 | | |
| | | | | Oil & Gas Exploration & Production
in Colombia | | | | | |
| | 27,063,400 | | | ShaMaran Petroleum (Iraq) (a) | | | 21,326 | | |
| | | | | Oil Exploration in Kurdistan | | | | | |
| | 550,000 | | | Swift Energy (a) | | | 20,499 | | |
| | | | | Oil & Gas Exploration & Production Company | | | | | |
| | 850,000 | | | Northern Oil & Gas (a)(b) | | | 18,828 | | |
| | | | | Small E&P Company in North Dakota Bakken | | | | | |
| | 250,000 | | | Cabot Oil & Gas | | | 16,578 | | |
| | | | | Large Natural Gas Producer in Appalachia &
Gulf Coast | | | | | |
| | 293,000 | | | Carrizo Oil & Gas (a) | | | 12,233 | | |
| | | | | Oil & Gas Producer | | | | | |
| | 37,500,000 | | | Petromanas (Canada) (a)(c)(d) | | | 11,050 | | |
| | 18,750,000 | | | Petromanas - Warrants
(Canada) (a)(c)(d) | | | 476 | | |
| | | | | Exploring for Oil in Albania | | | | | |
| | 26,000,000 | | | Petrodorado (Colombia) (a)(c) | | | 8,222 | | |
| | 24,000,000 | | | Petrodorado - Warrants
(Colombia) (a)(c)(d) | | | 2,436 | | |
| | | | | Oil & Gas Exploration & Production in
Colombia, Peru & Paraguay | | | | | |
| | 42,580,500 | | | Alange Energy (Colombia) (a)(b) | | | 9,713 | | |
| | | | | Oil & Gas Exploration & Production
in Colombia | | | | | |
| | 484,500 | | | Crew Energy (Canada) (a) | | | 7,535 | | |
| | | | | Canadian Oil & Gas Producer | | | | | |
| | 575,000 | | | Venoco (a) | | | 7,326 | | |
| | | | | Oil & Gas Producer in California & Texas | | | | | |
| | 6,300,000 | | | Canacol Energy (Colombia) (a)(d) | | | 6,786 | | |
| | | | | Oil Producer in South America | | | | | |
| | 228,200 | | | Oasis Petroleum (a) | | | 6,773 | | |
| | | | | Oil Producer in North Dakota | | | | | |
| | 1,198,100 | | | Pan Orient (Canada) (a) | | | 6,659 | | |
| | | | | Growth Oriented & Return Focused
Asian Explorer | | | | | |
| | 30,275,000 | | | Petroamerica (Colombia) (a)(c) | | | 5,023 | | |
| | | | | Oil Exploration & Production in Colombia | | | | | |
| | 8,400,000 | | | Canadian Overseas Petroleum
(United Kingdom) (a)(d) | | | 3,884 | | |
| | 4,200,000 | | | Canadian Overseas Petroleum -
Warrants (United Kingdom) (a)(d) | | | 572 | | |
| | | | | Oil & Gas Exploration/Production in the
North Sea | | | | | |
| | 41,100,000 | | | Quetzal Energy (Colombia) (a)(c)(d) | | | 3,273 | | |
| | 8,900,000 | | | Quetzal Energy (Colombia) (a)(c) | | | 738 | | |
| | | | | Explores for Oil & Gas in Latin America | | | | | |
| | 175,400 | | | Celtic Exploration (Canada) (a) | | | 3,879 | | |
| | | | | Canadian Oil & Gas Producer | | | | | |
| | 2,245,000 | | | Primary Petroleum (Canada) (a) | | | 1,117 | | |
| | | | | Targeting Oil Deposits in Western Montana | | | | | |
| | | | 716,652 | | |
See accompanying notes to financial statements.
29
Columbia Acorn Fund
Statement of Investments (Unaudited), continued
| Number of Shares | | | | Value (000) | |
| | | > Mining 1.6% | |
| | 641,000 | | | Core Laboratories (Netherlands) (b) | | $ | 71,497 | | |
| | | | | Oil & Gas Reservoir Consulting | | | | | |
| | 1,950,000 | | | Silver Wheaton (Canada) | | | 64,350 | | |
| | | | | Silver Mining Royalty Company | | | | | |
| | 15,000,000 | | | Zhaojin Mining Industry (China) | | | 30,945 | | |
| | | | | Gold Mining & Refining in China | | | | | |
| | 1,150,000 | | | Ivanhoe Mines (Canada) (a) | | | 29,059 | | |
| | | | | Copper Mine Project in Mongolia | | | | | |
| | 4,432,000 | | | Northam Platinum (South Africa) | | | 27,837 | | |
| | | | | Platinum Mining in South Africa | | | | | |
| | 900,000 | | | Silver Standard Resources (a) | | | 24,021 | | |
| | | | | Silver Mining | | | | | |
| | 2,800,000 | | | Alexco Resource (a) | | | 20,188 | | |
| | | | | Mining, Exploration & Environmental Services | | | | | |
| | 5,000,000 | | | Orko Silver (Canada) (a)(b) | | | 14,464 | | |
| | | | | Silver Exploration & Development | | | | | |
| | 3,816,400 | | | Duluth Metals (Canada) (a) | | | 9,418 | | |
| | | | | Copper & Nickel Miner | | | | | |
| | 5,215,500 | | | Mongolian Mining (Hong Kong) (a) | | | 6,449 | | |
| | | | | Coking Coal Mining in Mongolia | | | | | |
| | 236,400 | | | Tahoe Resources (Canada) (a)(d) | | | 4,368 | | |
| | | | | Silver Project in Guatemala | | | | | |
| | 800,000 | | | Augusta Resource (a) | | | 3,704 | | |
| | | | | U.S. Copper/Molybdenum Mine | | | | | |
| | 4,000,000 | | | Wolverine Minerals (Canada) (a)(c)(d) | | | 2,389 | | |
| | 2,000,000 | | | Wolverine Minerals - Warrants
(Canada) (a)(c)(d) | | | 281 | | |
| | | | | Gold Miner | | | | | |
| | | | 308,970 | | |
| | | > Alternative Energy 0.3% | |
| | 3,000,000 | | | GT Solar International (a)(b) | | | 48,600 | | |
| | | | | Largest Manufacturer of Furnaces &
Reactors to Produce & Cast Polysilicon | | | | | |
| | 500,000 | | | STR Holdings (a)(b) | | | 7,460 | | |
| | | | | Makes Encapsulant for Solar Power
Modules/Provides Quality Assurance | | | | | |
| | 1,210,300 | | | Synthesis Energy Systems
(China) (a)(b) | | | 2,263 | | |
| | | | | Owner/Operator of Gasification Plants | | | | | |
| | | | 58,323 | | |
| | | > Oil Refining, Marketing &
Distribution 0.2% | |
| | 600,000 | | | Vopak (Netherlands) | | | 29,400 | | |
| | | | | World's Largest Operator of Petroleum &
Chemical Storage Terminals | | | | | |
| | | | 29,400 | | |
| | | > Agricultural Commodities 0.1% | |
| | 6,818,182 | | | Union Agriculture Group
(Argentina) (a)(d) | | | 15,000 | | |
| | | | | Farmland Operator in Uruguay | | | | | |
| | | | 15,000 | | |
| Energy & Minerals: Total | | | 1,885,681 | | |
| Number of Shares | | | | Value (000) | |
| Finance 9.5% | | | |
| | | > Banks 3.9% | |
| | 2,800,000 | | | BOK Financial | | $ | 153,356 | | |
| | | | | Tulsa-based Southwest Bank | | | | | |
| | 6,304,320 | | | Valley National Bancorp (b) | | | 85,802 | | |
| | | | | New Jersey/New York Bank | | | | | |
| | 5,413,800 | | | Associated Banc-Corp | | | 75,252 | | |
| | | | | Midwest Bank | | | | | |
| | 2,337,313 | | | Hancock Holding (b) | | | 72,410 | | |
| | | | | Gulf Coast Bank | | | | | |
| | 1,160,000 | | | SVB Financial Group (a) | | | 69,264 | | |
| | | | | Bank to Venture Capitalists | | | | | |
| | 1,145,000 | | | City National | | | 62,116 | | |
| | | | | Bank & Asset Manager | | | | | |
| | 2,860,000 | | | MB Financial (c) | | | 55,026 | | |
| | | | | Chicago Bank | | | | | |
| | 3,613,000 | | | TCF Financial | | | 49,859 | | |
| | | | | Great Lakes Bank | | | | | |
| | 4,300,000 | | | CVB Financial (b) | | | 39,775 | | |
| | | | | Inland Empire Business Bank | | | | | |
| | 4,056,427 | | | First Busey | | | 21,458 | | |
| | | | | Illinois Bank | | | | | |
| | 1,121,188 | | | Sandy Spring Bancorp | | | 20,170 | | |
| | | | | Baltimore/D.C. Bank | | | | | |
| | 1,350,000 | | | TriCo Bancshares (c) | | | 19,710 | | |
| | | | | California Central Valley Bank | | | | | |
| | 772,632 | | | Hudson Valley | | | 14,920 | | |
| | | | | Metro New York City Bank | | | | | |
| | 706,559 | | | Eagle Bancorp (a) | | | 9,397 | | |
| | | | | Metro D.C. Bank | | | | | |
| | 3,764,300 | | | Shinsei Bank (Japan) | | | 3,765 | | |
| | | | | Commercial Bank | | | | | |
| | 246,505 | | | Pacific Continental | | | 2,256 | | |
| | | | | Pacific Northwest Bank | | | | �� | |
| | 583,872 | | | Green Bankshares (a)(b) | | | 1,530 | | |
| | | | | Tennessee Bank | | | | | |
| | | | 756,066 | | |
| | | > Insurance 2.2% | |
| | 2,820,000 | | | Leucadia National | | | 96,162 | | |
| | | | | Insurance Holding Company | | | | | |
| | 9,400,000 | | | CNO Financial Group (a) | | | 74,354 | | |
| | | | | Life, Long-term Care & Medical Supplement
Insurance | | | | | |
| | 1,320,000 | | | Hanover Insurance Group | | | 49,777 | | |
| | | | | Personal & Commercial Lines Insurance | | | | | |
| | 1,200,000 | | | HCC Insurance Holdings | | | 37,800 | | |
| | | | | Specialty Insurance | | | | | |
| | 832,000 | | | Willis Group (Ireland) | | | 34,204 | | |
| | | | | Insurance Broker | | | | | |
| | 1,000,000 | | | Delphi Financial Group | | | 29,210 | | |
| | | | | Workers Compensation & Group Employee
Benefit Products & Services | | | | | |
| | 1,225,000 | | | Tower Group | | | 29,180 | | |
| | | | | Commercial & Personal Lines Insurance | | | | | |
| | 1,420,000 | | | Selective Insurance Group | | | 23,103 | | |
| | | | | Commercial & Personal Lines Insurance | | | | | |
| | 900,000 | | | Brown & Brown | | | 23,094 | | |
| | | | | Insurance Broker | | | | | |
| | 1,600,000 | | | Symetra Financial | | | 21,488 | | |
| | | | | Life Insurance | | | | | |
See accompanying notes to financial statements.
30
| Number of Shares | | | | Value (000) | |
| | | > Insurance—continued | |
| | 300,000 | | | Assured Guaranty | | $ | 4,893 | | |
| | | | | Global Muni Bond Insurance | | | | | |
| | 33,746 | | | Enstar Group (a) | | | 3,526 | | |
| | | | | Insurance/Reinsurance & Related Services | | | | | |
| | | | 426,791 | | |
| | | > Finance Companies 1.6% | |
| | 1,505,202 | | | World Acceptance (a)(c) | | | 98,696 | | |
| | | | | Personal Loans | | | | | |
| | 2,350,000 | | | McGrath Rentcorp (c) | | | 65,988 | | |
| | | | | Temporary Space & IT Rentals | | | | | |
| | 2,300,000 | | | Aaron's | | | 64,998 | | |
| | | | | Rent to Own | | | | | |
| | 3,000,000 | | | H&E Equipment Services (a)(c) | | | 41,970 | | |
| | | | | Heavy Equipment Leasing | | | | | |
| | 1,123,400 | | | CAI International (a)(c) | | | 23,209 | | |
| | | | | International Container Leasing | | | | | |
| | 1,091,000 | | | Marlin Business Services (a)(c) | | | 13,801 | | |
| | | | | Small Equipment Leasing | | | | | |
| | 90,020 | | | GATX | | | 3,342 | | |
| | | | | Rail Car Lessor | | | | | |
| | 78,500 | | | Textainer Group Holdings | | | 2,413 | | |
| | | | | Top International Container Leasor | | | | | |
| | | | 314,417 | | |
| | | > Brokerage & Money Management 1.4% | |
| | 6,198,000 | | | SEI Investments | | | 139,517 | | |
| | | | | Mutual Fund Administration & Investment
Management | | | | | |
| | 3,391,000 | | | Eaton Vance | | | 102,510 | | |
| | | | | Specialty Mutual Funds | | | | | |
| | 400,000 | | | Financial Engines (a) | | | 10,368 | | |
| | | | | Asset management for 401k plans | | | | | |
| | 629,493 | | | Investment Technology Group (a) | | | 8,825 | | |
| | | | | Electronic Trading | | | | | |
| | | | 261,220 | | |
| | | > Credit Cards 0.2% | |
| | 400,000 | | | Alliance Data Systems (a)(b) | | | 37,628 | | |
| | | | | Diversified Credit Card Provider | | | | | |
| | | | 37,628 | | |
| | | > Savings & Loans 0.2% | |
| | 1,024,069 | | | ViewPoint Financial | | | 14,132 | | |
| | | | | Texas Thrift | | | | | |
| | 1,010,000 | | | Provident New York Bancorp | | | 8,444 | | |
| | | | | New York State Thrift | | | | | |
| | 452,146 | | | Kaiser Federal Financial Group | | | 5,570 | | |
| | | | | Los Angeles Savings & Loan | | | | | |
| | 65,991 | | | Berkshire Hills Bancorp | | | 1,478 | | |
| | | | | Northeast Thrift | | | | | |
| | | | 29,624 | | |
| Finance: Total | | | 1,825,746 | | |
| Health Care 8.6% | | | |
| | | > Biotechnology & Drug Delivery 3.2% | |
| | 4,315,000 | | | BioMarin Pharmaceutical (a) | | | 117,411 | | |
| | | | | Biotech Focused on Orphan Diseases | | | | | |
| | 4,181,000 | | | Seattle Genetics (a)(b) | | | 85,794 | | |
| | | | | Antibody-based Therapies for Cancer | | | | | |
| Number of Shares | | | | Value (000) | |
| | 2,226,000 | | | InterMune (a) | | $ | 79,802 | | |
| | | | | Drugs for Pulmonary Fibrosis & Hepatitis C | | | | | |
| | 1,450,000 | | | Onyx Pharmaceuticals (a) | | | 51,185 | | |
| | | | | Commercial-stage Biotech Focused on Cancer | | | | | |
| | 2,400,000 | | | Auxilium Pharmaceuticals (a)(c) | | | 47,040 | | |
| | | | | Biotech Focused on Niche Disease Areas | | | | | |
| | 780,000 | | | United Therapeutics (a) | | | 42,978 | | |
| | | | | Biotech Focused on Rare Diseases | | | | | |
| | 4,500,000 | | | NPS Pharmaceuticals (a)(c) | | | 42,525 | | |
| | | | | Orphan Drugs & Healthy Royalties | | | | | |
| | 4,500,000 | | | Isis Pharmaceuticals (a) | | | 41,220 | | |
| | | | | Biotech Pioneer in Anti-sense Drugs | | | | | |
| | 5,500,000 | | | Micromet (a)(b)(c) | | | 31,570 | | |
| | | | | Next-generation Antibody Technology | | | | | |
| | 4,549,900 | | | Chelsea Therapeutics (a)(b)(c) | | | 23,205 | | |
| | | | | Biotech Focused on Rare Diseases | | | | | |
| | 3,300,000 | | | Nabi Biopharmaceuticals (a)(c) | | | 17,754 | | |
| | | | | Biotech Focused on Vaccines | | | | | |
| | 1,740,000 | | | Anthera Pharmaceuticals (a)(b)(c) | | | 14,216 | | |
| | | | | Biotech Focused on Cardiovascular,
Cancer & Immunology | | | | | |
| | 2,300,000 | | | Idenix Pharmaceuticals (a) | | | 11,500 | | |
| | | | | Developer of Drugs for Infectious Diseases | | | | | |
| | 3,500,000 | | | Array Biopharma (a)(c) | | | 7,840 | | |
| | | | | Drugs for Cancer & Inflammatory Diseases | | | | | |
| | 359,944 | | | MicroDose Technologies (a)(d) | | | 374 | | |
| | | | | Drug Inhaler Development | | | | | |
| | 94,715 | | | Locus Pharmaceuticals (a)(d)(e) | | | — | | |
| | | | | High Throughput Rational Drug Design | | | | | |
| | | | 614,414 | | |
| | | > Medical Equipment & Devices 2.8% | |
| | 4,200,000 | | | Alexion Pharmaceuticals (a)(b) | | | 197,526 | | |
| | | | | Biotech Focused on Orphan Diseases | | | | | |
| | 1,800,000 | | | Sirona Dental Systems (a) | | | 95,580 | | |
| | | | | Manufacturer of Dental Equipment | | | | | |
| | 1,000,000 | | | Edwards Lifesciences (a) | | | 87,180 | | |
| | | | | Heart Valves | | | | | |
| | 700,000 | | | Gen-Probe (a) | | | 48,405 | | |
| | | | | Molecular In-vitro Diagnostics | | | | | |
| | 500,000 | | | Idexx Laboratories (a) | | | 38,780 | | |
| | | | | Diagnostic Equipment & Services for
Veterinarians | | | | | |
| | 550,000 | | | Haemonetics (a) | | | 35,403 | | |
| | | | | Blood & Plasma Collection Equipment | | | | | |
| | 570,000 | | | Orthofix International (a) | | | 24,208 | | |
| | | | | Bone Fixation & Stimulation Devices | | | | | |
| | 1,650,000 | | | Pacific Biosciences of California (a)(b) | | | 19,305 | | |
| | | | | Genome Sequencing | | | | | |
| | | | 546,387 | | |
| | | > Medical Supplies 1.3% | |
| | 3,200,000 | | | Cepheid (a)(c) | | | 110,848 | | |
| | | | | Molecular Diagnostics | | | | | |
| | 2,126,000 | | | Patterson Companies | | | 69,924 | | |
| | | | | Dental, Veterinarian & Medical Distributor | | | | | |
| | 650,000 | | | Henry Schein (a) | | | 46,534 | | |
| | | | | Largest Distributor of Healthcare Products | | | | | |
| | 325,200 | | | Neogen (a) | | | 14,702 | | |
| | | | | Food & Animal Safety Products | | | | | |
See accompanying notes to financial statements.
31
Columbia Acorn Fund
Statement of Investments (Unaudited), continued
| Number of Shares | | | | Value (000) | |
| | | > Medical Supplies—continued | |
| | 200,000 | | | Owens & Minor | | $ | 6,898 | | |
| | | | | Distribution of Medical Supplies | | | | | |
| | | | 248,906 | | |
| | | > Health Care Services 0.8% | |
| | 1,655,000 | | | Community Health Systems (a) | | | 42,500 | | |
| | | | | Non-urban Hospitals | | | | | |
| | 3,800,000 | | | Health Management Associates (a) | | | 40,964 | | |
| | | | | Non-urban Hospitals | | | | | |
| | 400,000 | | | HMS Holdings (a) | | | 30,748 | | |
| | | | | Cost Containment Services | | | | | |
| | 4,250,000 | | | eResearch Technology (a)(c) | | | 27,073 | | |
| | | | | Clinical Research Services | | | | | |
| | 700,000 | | | Allscripts Healthcare Solutions (a) | | | 13,594 | | |
| | | | | IT for Physician Offices & Hospitals | | | | | |
| | | | 154,879 | | |
| | | > Pharmaceuticals 0.3% | |
| | 4,000,000 | | | Akorn (a) | | | 28,000 | | |
| | | | | Develops, Manufactures & Sells Specialty
Generic Drugs | | | | | |
| | 2,393,955 | | | Adcock Ingram Holdings (South Africa) | | | 21,034 | | |
| | | | | Manufacturer of Pharmaceuticals &
Medical Supplies | | | | | |
| | 1,818,154 | | | Alimera Sciences (a)(b)(c) | | | 14,818 | | |
| | | | | Ophthalmogy-focused Pharmaceutical
Company | | | | | |
| | | | 63,852 | | |
| | | > Hospital Management 0.2% | |
| | 1,450,000 | | | Kindred Healthcare (a) | | | 31,131 | | |
| | | | | Post-Acute Healthcare Facilities | | | | | |
| | | | 31,131 | | |
| Health Care: Total | | | 1,659,569 | | |
| Other Industries 5.8% | | | |
| | | > Real Estate 3.5% | |
| | 4,575,000 | | | BioMed Realty Trust | | | 88,023 | | |
| | | | | Life Science-focused Office Buildings | | | | | |
| | 840,000 | | | Federal Realty Investment Trust | | | 71,551 | | |
| | | | | Shopping Centers | | | | | |
| | 2,200,000 | | | Dupont Fabros Technology (b) | | | 55,440 | | |
| | | | | Technology-focused Office Buildings | | | | | |
| | 720,000 | | | Digital Realty Trust (b) | | | 44,481 | | |
| | | | | Technology-focused Office Buildings | | | | | |
| | 1,120,000 | | | Kilroy Realty | | | 44,229 | | |
| | | | | West Coast Office & Industrial Properties | | | | | |
| | 2,700,000 | | | Associated Estates Realty (c) | | | 43,875 | | |
| | | | | Multi-family Properties | | | | | |
| | 975,000 | | | Post Properties | | | 39,741 | | |
| | | | | Multi-family Properties | | | | | |
| | 1,850,000 | | | Extra Space Storage | | | 39,460 | | |
| | | | | Self Storage Facilities | | | | | |
| | 43,000,000 | | | Mapletree Logistics Trust (Singapore) | | | 32,243 | | |
| | | | | Industrial Property Landlord | | | | | |
| | 530,000 | | | Macerich | | | 28,355 | | |
| | | | | Regional Shopping Malls | | | | | |
| | 900,000 | | | Corporate Office Properties | | | 27,999 | | |
| | | | | Office Buildings | | | | | |
| Number of Shares | | | | Value (000) | |
| | 3,000,000 | | | Education Realty Trust | | $ | 25,710 | | |
| | | | | Student Housing | | | | | |
| | 15,000,000 | | | Ascendas REIT (Singapore) | | | 24,949 | | |
| | | | | Industrial Property Landlord | | | | | |
| | 700,000 | | | Washington REIT | | | 22,764 | | |
| | | | | Washington D.C. Diversified Properties | | | | | |
| | 3,750,000 | | | DCT Industrial Trust | | | 19,612 | | |
| | | | | Industrial Properties | | | | | |
| | 1,481,994 | | | Summit Hotel Properties (c) | | | 16,821 | | |
| | | | | Owner of Select Service Hotels | | | | | |
| | 2,800 | | | Orix JREIT (Japan) | | | 15,473 | | |
| | | | | Diversified REIT | | | | | |
| | 3,050,000 | | | Kite Realty Group | | | 15,189 | | |
| | | | | Community Shopping Centers | | | | | |
| | 699,701 | | | St. Joe (a) | | | 14,582 | | |
| | | | | Florida Panhandle Landowner | | | | | |
| | 37,407 | | | Security Capital European Realty
(Luxembourg) (a)(d)(e) | | | — | | |
| | | | | Self Storage Properties | | | | | |
| | | | 670,497 | | |
| | | > Transportation 1.3% | |
| | 1,730,000 | | | JB Hunt Transport Services | | | 81,465 | | |
| | | | | Truck & Intermodal Carrier | | | | | |
| | 2,800,000 | | | Rush Enterprises, Class A (a)(c) | | | 53,284 | | |
| | 550,000 | | | Rush Enterprises, Class B (a)(c) | | | 8,855 | | |
| | | | | Truck Sales & Services | | | | | |
| | 1,260,000 | | | World Fuel Services | | | 45,272 | | |
| | | | | Global Fuel Broker | | | | | |
| | 2,730,000 | | | Heartland Express | | | 45,209 | | |
| | | | | Regional Trucker | | | | | |
| | 400,000 | | | Genesee & Wyoming (a) | | | 23,456 | | |
| | | | | Short-line Operator | | | | | |
| | | | 257,541 | | |
| | | > Regulated Utilities 1.0% | |
| | 2,000,000 | | | Northeast Utilities | | | 70,340 | | |
| | | | | Regulated Electric Utility | | | | | |
| | 1,800,000 | | | Wisconsin Energy | | | 56,430 | | |
| | | | | Wisconsin Utility | | | | | |
| | 500,000 | | | ALLETE | | | 20,520 | | |
| | | | | Regulated Electric Utility in Minnesota | | | | | |
| | 333,000 | | | Red Eléctrica de España (Spain) | | | 20,101 | | |
| | | | | Spanish Power Transmission | | | | | |
| | 3,333,000 | | | Terna (Italy) (b) | | | 15,496 | | |
| | | | | Italian Power Transmission | | | | | |
| | | | 182,887 | | |
| Other Industries: Total | | | 1,110,925 | | |
Total Equities: 97.5%
(Cost: $11,304,342) | | | 18,778,101 | | |
| Securities Lending Collateral – 1.8% | | | |
| | 352,904 | | | Dreyfus Government Cash
Management Fund (f)
(7 day yield of 0.00%) | | | 352,904 | | |
Total Securities Lending Collateral:
(Cost: $352,904) | | | 352,904 | | |
See accompanying notes to financial statements.
32
| Principal Amount | | | | Value (000) | |
| Short-Term Obligation 2.8% | |
| | | > Repurchase Agreement 2.8% | |
| $ | 534,686 | | | Repurchase Agreement with
Fixed Income Clearing Corp.,
dated 6/30/11, due 7/01/11
at 0.01%, collateralized by
U.S. Government Agency
obligations with various
maturities to 12/03/15,
market value $545,385
(repurchase proceeds $534,686) | | $ | 534,686 | | |
| | | | 534,686 | | |
Total Short-Term Obligation:
(Amortized Cost: $534,686) | | | 534,686 | | |
Total Investments: 102.1%
(Cost: $12,191,932)(g)(h) | | | 19,665,691 | | |
Obligation to Return Collateral for
Securities Loaned: (1.8)% | | | (352,904 | ) | |
| Cash and Other Assets Less Liabilities: (0.3)% | | | (60,928 | ) | |
| Total Net Assets: 100.0% | | $ | 19,251,859 | | |
ADR = American Depositary Receipts
GDR = Global Depository Receipts
See accompanying notes to financial statements.
33
Columbia Acorn Fund
Statement of Investments (Unaudited), continued
> Notes to Statement of Investments (dollar values in thousands)
(a) Non-income producing security.
(b) All or a portion of this security was on loan at June 30, 2011. The total market value of Fund securities on loan at June 30, 2011 was $340,090.
(c) An affiliated person of the Fund may include any company in which the Fund owns five percent or more of its outstanding voting shares. Holdings and transactions in these affiliated companies during the six months ended June 30, 2011, are as follows:
| Affiliates | | Balance of
Shares Held
12/31/10 | | Purchases/
Additions | | Sales/
Reductions | | Balance of
Shares Held
6/30/11 | | Value | | Dividend | |
| AFC Enterprises | | | 2,000,000 | | | | - | | | | - | | | | 2,000,000 | | | $ | 32,900 | | | $ | - | | |
| Allos Therapeutics* | | | 7,035,000 | | | | - | | | | 7,035,000 | | | | - | | | | - | | | | - | | |
| Alimera Sciences | | | 361,450 | | | | 1,456,704 | | | | - | | | | 1,818,154 | | | | 14,818 | | | | - | | |
| Anthera Pharmaceuticals | | | 1,450,000 | | | | 290,000 | | | | - | | | | 1,740,000 | | | | 14,216 | | | | - | | |
| Array Biopharma | | | 3,500,000 | | | | - | | | | - | | | | 3,500,000 | | | | 7,840 | | | | - | | |
| Art Technology Group* | | | 9,000,000 | | | | - | | | | 9,000,000 | | | | - | | | | - | | | | - | | |
| Associated Estates Realty | | | 2,200,000 | | | | 500,000 | | | | - | | | | 2,700,000 | | | | 43,875 | | | | 748 | | |
| Auxilium Pharmaceuticals | | | 1,200,000 | | | | 1,200,000 | | | | - | | | | 2,400,000 | | | | 47,040 | | | | - | | |
| Bally Technologies | | | 3,725,000 | | | | - | | | | - | | | | 3,725,000 | | | | 151,533 | | | | - | | |
| Blackbaud | | | 2,250,000 | | | | - | | | | - | | | | 2,250,000 | | | | 62,370 | | | | 540 | | |
| CAI International | | | 1,650,000 | | | | - | | | | 526,600 | | | | 1,123,400 | | | | 23,209 | | | | - | | |
| Cavco Industries | | | 180,000 | | | | 235,000 | | | | - | | | | 415,000 | | | | 18,675 | | | | - | | |
| Cepheid | | | 2,415,000 | | | | 785,000 | | | | - | | | | 3,200,000 | | | | 110,848 | | | | - | | |
| Chelsea Therapeutics | | | 3,449,900 | | | | 1,100,000 | | | | - | | | | 4,549,900 | | | | 23,205 | | | | - | | |
| Clarcor | | | 2,565,000 | | | | - | | | | - | | | | 2,565,000 | | | | 121,273 | | | | 539 | | |
| Cogent Communications | | | 2,800,000 | | | | - | | | | 280,000 | | | | 2,520,000 | | | | 42,865 | | | | - | | |
| Constant Contact | | | 1,400,000 | | | | 550,000 | | | | - | | | | 1,950,000 | | | | 49,491 | | | | - | | |
| Diamond Foods | | | 1,300,000 | | | | - | | | | 130,000 | | | | 1,170,000 | | | | 89,318 | | | | 117 | | |
| Donaldson | | | 4,200,000 | | | | - | | | | - | | | | 4,200,000 | | | | 254,856 | | | | 1,176 | | |
| Drew Industries | | | 1,260,000 | | | | - | | | | - | | | | 1,260,000 | | | | 31,147 | | | | - | | |
| Education Realty Trust* | | | 3,000,000 | | | | - | | | | - | | | | 3,000,000 | | | | 25,710 | | | | 300 | | |
| eResearch Technology | | | 4,250,000 | | | | - | | | | - | | | | 4,250,000 | | | | 27,073 | | | | - | | |
| ESCO Technologies | | | 2,200,000 | | | | - | | | | - | | | | 2,200,000 | | | | 80,960 | | | | 352 | | |
| Gaiam | | | 1,371,366 | | | | - | | | | - | | | | 1,371,366 | | | | 6,816 | | | | - | | |
| Gaylord Entertainment | | | 3,850,000 | | | | - | | | | - | | | | 3,850,000 | | | | 115,500 | | | | - | | |
| H&E Equipment Services | | | 3,000,000 | | | | - | | | | - | | | | 3,000,000 | | | | 41,970 | | | | - | | |
| Hackett Group | | | 4,500,000 | | | | - | | | | - | | | | 4,500,000 | | | | 22,905 | | | | - | | |
| HEICO | | | 1,700,000 | | | | 550,000 | | | | - | | | | 2,250,000 | | | | 89,460 | | | | 102 | | |
| Helen of Troy | | | 1,600,000 | | | | - | | | | - | | | | 1,600,000 | | | | 55,248 | | | | - | | |
| iGate | | | 2,913,065 | | | | - | | | | 13,065 | | | | 2,900,000 | | | | 47,328 | | | | - | | |
| II-VI | | | 2,225,000 | | | | 2,325,000 | | | | - | | | | 4,550,000 | | | | 116,480 | | | | - | | |
| Informatica* | | | 5,200,000 | | | | - | | | | 500,000 | | | | 4,700,000 | | | | 274,621 | | | | - | | |
| Interline Brands | | | 2,600,000 | | | | - | | | | - | | | | 2,600,000 | | | | 47,762 | | | | - | | |
| IPG Photonics | | | 2,710,000 | | | | 70,000 | | | | - | | | | 2,780,000 | | | | 202,134 | | | | - | | |
| IXYS | | | 1,900,000 | | | | - | | | | - | | | | 1,900,000 | | | | 28,462 | | | | - | | |
| Kenexa | | | 2,025,000 | | | | - | | | | - | | | | 2,025,000 | | | | 48,560 | | | | - | | |
| Knoll | | | 4,000,000 | | | | - | | | | - | | | | 4,000,000 | | | | 80,280 | | | | 640 | | |
| Lifetime Fitness | | | 2,190,000 | | | | - | | | | - | | | | 2,190,000 | | | | 87,403 | | | | - | | |
| lululemon athletica | | | 4,035,000 | | | | - | | | | 43,735 | | | | 3,991,265 | | | | 446,304 | | | | - | | |
| Marlin Business Services | | | 1,091,000 | | | | - | | | | - | | | | 1,091,000 | | | | 13,801 | | | | - | | |
| MB Financial | | | 2,860,000 | | | | - | | | | - | | | | 2,860,000 | | | | 55,026 | | | | 57 | | |
| McGrath Rentcorp | | | 2,350,000 | | | | - | | | | - | | | | 2,350,000 | | | | 65,988 | | | | 1,069 | | |
| Micromet | | | 5,500,000 | | | | - | | | | - | | | | 5,500,000 | | | | 31,570 | | | | - | | |
| Nabi Biopharmaceuticals | | | 1,383,454 | | | | 1,916,546 | | | | - | | | | 3,300,000 | | | | 17,754 | | | | - | | |
| Nanosphere* | | | 1,480,056 | | | | - | | | | 1,480,056 | | | | - | | | | - | | | | - | | |
| Navigant Consulting | | | 3,100,000 | | | | - | | | | - | | | | 3,100,000 | | | | 32,519 | | | | - | | |
| NPS Pharmaceuticals | | | 3,200,000 | | | | 1,300,000 | | | | - | | | | 4,500,000 | | | | 42,525 | | | | - | | |
| Orko Silver* | | | 10,000,000 | | | | - | | | | 5,000,000 | | | | 5,000,000 | | | | 14,464 | | | | - | | |
| Orthofix International* | | | 1,150,000 | | | | - | | | | 580,000 | | | | 570,000 | | | | 24,208 | | | | - | | |
| PAETEC Holding | | | 9,600,000 | | | | - | | | | - | | | | 9,600,000 | | | | 45,984 | | | | - | | |
| Pericom Semiconductor | | | 1,765,000 | | | | - | | | | - | | | | 1,765,000 | | | | 15,779 | | | | - | | |
| Petroamerica | | | 30,275,000 | | | | - | | | | - | | | | 30,275,000 | | | | 5,023 | | | | - | | |
| Petrodorado | | | 48,000,000 | | | | 2,000,000 | | | | - | | | | 50,000,000 | | | | 10,658 | | | | - | | |
| Petrolifera Petroleum* | | | 13,950,000 | | | | - | | | | 13,950,000 | | | | - | | | | - | | | | - | | |
| Petromanas | | | 56,250,000 | | | | - | | | | - | | | | 56,250,000 | | | | 11,526 | | | | - | | |
| Pinnacle Entertainment | | | 3,400,000 | | | | - | | | | - | | | | 3,400,000 | | | | 50,660 | | | | - | | |
See accompanying notes to financial statements.
34
> Notes to Statement of Investments (dollar values in thousands)
| Affiliates | | Balance of
Shares Held
12/31/10 | | Purchases/
Additions | | Sales/
Reductions | | Balance of
Shares Held
6/30/11 | | Value | | Dividend | |
| Quetzal Energy | | | - | | | | 50,000,000 | | | | - | | | | 50,000,000 | | | $ | 4,011 | | | $ | - | | |
| Rush Enterprises | | | 3,350,000 | | | | - | | | | - | | | | 3,350,000 | | | | 62,139 | | | | - | | |
| Salem Communications | | | 1,541,000 | | | | - | | | | - | | | | 1,541,000 | | | | 5,532 | | | | - | | |
| Shutterfly | | | 1,700,000 | | | | 600,000 | | | | - | | | | 2,300,000 | | | | 132,066 | | | | - | | |
| Spanish Broadcasting System | | | 2,400,000 | | | | - | | | | - | | | | 2,400,000 | | | | 1,680 | | | | - | | |
| SPS Commerce | | | 856,429 | | | | 43,571 | | | | - | | | | 900,000 | | | | 16,011 | | | | - | | |
| Summit Hotel Properties | | | - | | | | 1,481,994 | | | | - | | | | 1,481,994 | | | | 16,821 | | | | 61 | | |
| Supertex | | | 1,035,000 | | | | - | | | | 100,000 | | | | 935,000 | | | | 20,944 | | | | - | | |
| Talbots* | | | 4,150,000 | | | | - | | | | 3,321,500 | | | | 828,500 | | | | 2,767 | | | | - | | |
| THQ* | | | 3,567,000 | | | | - | | | | 3,567,000 | | | | - | | | | - | | | | - | | |
| TriCo Bancshares | | | 1,350,000 | | | | - | | | | - | | | | 1,350,000 | | | | 19,710 | | | | 243 | | |
| True Religion Apparel | | | 2,047,000 | | | | - | | | | - | | | | 2,047,000 | | | | 59,527 | | | | - | | |
| Tuscany International Drilling*+ | | | 13,319,200 | | | | 4,589,700 | | | | 7,349,700 | | | | 10,559,200 | | | | 9,118 | | | | - | | |
| tw telecom | | | 9,500,000 | | | | - | | | | - | | | | 9,500,000 | | | | 195,035 | | | | - | | |
| Tyler Technologies | | | 2,000,000 | | | | - | | | | - | | | | 2,000,000 | | | | 53,560 | | | | - | | |
| Universal Technical Institute | | | 1,700,000 | | | | - | | | | - | | | | 1,700,000 | | | | 33,609 | | | | - | | |
| Virtusa | | | 2,000,000 | | | | 125,000 | | | | - | | | | 2,125,000 | | | | 40,269 | | | | - | | |
| Warnaco Group* | | | 2,190,000 | | | | - | | | | - | | | | 2,190,000 | | | | 114,427 | | | | - | | |
| Wolverine Minderals | | | - | | | | 6,000,000 | | | | - | | | | 6,000,000 | | | | 2,670 | | | | - | | |
| World Acceptance | | | 1,505,202 | | | | - | | | | - | | | | 1,505,202 | | | | 98,696 | | | | - | | |
| Total of Affiliated Transactions | | | 358,776,122 | | | | 77,118,515 | | | | 52,876,656 | | | | 383,017,981 | | | $ | 4,310,532 | | | $ | 5,944 | | |
* At June 30, 2011, the Fund owned less than five percent of the company's outstanding voting shares.
+ Includes the effects of a corporate action.
The aggregate cost and value of these companies at June 30, 2011, were $2,325,878 and $3,845,216, respectively. Investments in affiliated companies represented 20.0% of the Fund's total net assets at June 30, 2011.
(d) Denotes a restricted security, which is subject to restrictions on resale under federal securities laws. These securities are valued at a fair value determined in good faith under consistently applied procedures established by the Board of Trustees. At June 30, 2011, the market value of these securities amounted to $66,613, which represented 0.35% of total net assets.
Additional information on these securities is as follows:
| Security | | Acquisition
Dates | | Shares | | Cost | | Value | |
| Mail.ru - GDR | | 11/5/10-12/31/10 | | | 464,305 | | | $ | 16,518 | | | $ | 15,424 | | |
| Union Agriculture Group | | 12/08/10 | | | 6,818,182 | | | | 15,000 | | | | 15,000 | | |
| Petromanas | | 5/20/10 | | | 37,500,000 | | | | 13,032 | | | | 11,050 | | |
| Canacol Energy | | 4/15/10 | | | 6,300,000 | | | | 4,667 | | | | 6,786 | | |
| Tahoe Resources | | 5/28/10 | | | 236,400 | | | | 1,350 | | | | 4,368 | | |
| Canadian Overseas Petroleum | | 11/24/10 | | | 8,400,000 | | | | 3,591 | | | | 3,884 | | |
| Quetzal Energy | | 1/14/11 | | | 41,100,000 | | | | 5,193 | | | | 3,273 | | |
| Petrodorado - Warrants | | 11/20/09 | | | 24,000,000 | | | | 2,965 | | | | 2,436 | | |
| Wolverine Minerals | | 6/03/11 | | | 4,000,000 | | | | 2,005 | | | | 2,389 | | |
| Canadian Overseas Petroleum - Warrants | | 11/24/10 | | | 4,200,000 | | | | 526 | | | | 572 | | |
| Petromanas - Warrants | | 5/20/10 | | | 18,750,000 | | | | 1,086 | | | | 476 | | |
| MicroDose Technologies | | 11/24/00 | | | 359,944 | | | | 2,005 | | | | 374 | | |
| Voyager Learning, Contingent Value Rights | | 12/24/09 | | | 2,000,000 | | | | - | | | | 300 | | |
| Wolverine Minerals - Warrants | | 6/03/11 | | | 2,000,000 | | | | 243 | | | | 281 | | |
| Locus Pharmaceuticals | | 9/05/01-2/08/07 | | | 94,715 | | | | 7,780 | | | | - | | |
| Security Capital European Realty | | 8/20/98-7/20/99 | | | 37,407 | | | | 205 | | | | - | | |
| | | | | | | $ | 76,166 | | | $ | 66,613 | | |
(e) Security has no value.
(f) Investment made with cash collateral received from securities lending activity.
(g) At June 30, 2011, for federal income tax purposes, the cost of investments was $12,191,932 and net unrealized appreciation was $7,473,759, consisting of gross unrealized appreciation of $8,160,875 and gross unrealized depreciation of $687,116.
See accompanying notes to financial statements.
35
Columbia Acorn Fund
Statement of Investments (Unaudited), continued
> Notes to Statement of Investments (dollar values in thousands)
(h) On June 30, 2011, the market value of foreign securities represented 10.80% of total net assets. The Fund's foreign portfolio was diversified as follows:
| | | Value | | Percent | |
| Netherlands | | $ | 422,067 | | | | 2.19 | | |
| Canada | | | 326,015 | | | | 1.69 | | |
| Colombia | | | 174,245 | | | | 0.91 | | |
| Singapore | | | 161,045 | | | | 0.84 | | |
| Hong Kong | | | 132,474 | | | | 0.69 | | |
| Sweden | | | 127,222 | | | | 0.66 | | |
| Japan | | | 125,073 | | | | 0.65 | | |
| France | | | 66,285 | | | | 0.34 | | |
| China | | | 62,305 | | | | 0.32 | | |
| Brazil | | | 61,705 | | | | 0.32 | | |
| Denmark | | | 55,329 | | | | 0.29 | | |
| United Kingdon | | | 52,219 | | | | 0.27 | | |
| South Africa | | | 48,871 | | | | 0.25 | | |
| | | Value | | Percent | |
| Chile | | $ | 43,557 | | | | 0.23 | | |
| Ireland | | | 34,204 | | | | 0.18 | | |
| Israel | | | 29,088 | | | | 0.15 | | |
| Switzerland | | | 24,109 | | | | 0.13 | | |
| India | | | 22,513 | | | | 0.12 | | |
| Iraq | | | 21,326 | | | | 0.11 | | |
| Spain | | | 20,101 | | | | 0.10 | | |
| Italy | | | 15,496 | | | | 0.08 | | |
| Russia | | | 15,424 | | | | 0.08 | | |
| Argentina | | | 15,000 | | | | 0.08 | | |
| Germany | | | 11,984 | | | | 0.06 | | |
| Iceland | | | 10,586 | | | | 0.06 | | |
| Luxembourg | | | - | | | | 0.00 | | |
| Total Foreign Portfolio | | $ | 2,078,243 | | | | 10.80 | | |
Various inputs are used in determining the value of the Fund's investments, following the input prioritization hierarchy established by GAAP. These inputs are summarized in the three broad levels listed below:
• Level 1 – quoted prices in active markets for identical securities
• Level 2 – prices determined using other significant observable inputs (including quoted prices for similar securities, interest rates, prepayment speeds, credit risk and others)
• Level 3 – prices determined using significant unobservable inputs where quoted prices or observable inputs are unavailable or less reliable (including management's own assumptions about the factors market participants would use in pricing an investment)
The inputs or methodology used for valuing securities are not necessarily an indication of the risk associated with investing in those securities.
Examples of the types of securities in which the Fund would typically invest and how they are classified within this hierarchy are as follows. Typical Level 1 securities include exchange traded domestic equities, mutual funds whose NAVs are published each day and exchange traded foreign equities that are not statistically fair valued. Typical Level 2 securities include exchange traded foreign equities that are statistically fair valued, forward foreign currency exchange contracts and short-term investments valued at amortized cost. Additionally, securities fair valued by the Valuation Committee of the Fund's Board of Trustees that rely on significant observable inputs are also included in Level 2. Typical Level 3 securities include any security fair valued by the Valuation Committee that relies on significant unobservable inputs.
The following table summarizes the inputs used, as of June 30, 2011, in valuing the Fund's assets:
| Investment Type | | Quoted Prices
(Level 1) | | Other
Significant
Observable
Inputs
(Level 2) | | Significant
Unobservable
Inputs
(Level 3) | | Total | |
| Equities | |
| Information | | $ | 5,032,026 | | | $ | 210,925 | | | $ | - | | | $ | 5,242,951 | | |
| Consumer Goods & Services | | | 3,382,164 | | | | 148,575 | | | | 300 | | | | 3,531,039 | | |
| Industrial Goods & Services | | | 3,153,094 | | | | 369,096 | | | | - | | | | 3,522,190 | | |
| Energy & Minerals | | | 1,502,348 | | | | 368,333 | | | | 15,000 | | | | 1,885,681 | | |
| Finance | | | 1,821,981 | | | | 3,765 | | | | - | | | | 1,825,746 | | |
| Health Care | | | 1,638,161 | | | | 21,034 | | | | 374 | | | | 1,659,569 | | |
| Other Industries | | | 1,002,663 | | | | 108,262 | | | | - | | | | 1,110,925 | | |
| Total Equities | | | 17,532,437 | | | | 1,229,990 | | | | 15,674 | | | | 18,778,101 | | |
| Total Securities Lending Collateral | | | 352,904 | | | | - | | | | - | | | | 352,904 | | |
| Total Short-Term Obligation | | | - | | | | 534,686 | | | | - | | | | 534,686 | | |
| Total Investments | | $ | 17,885,341 | | | $ | 1,764,676 | | | $ | 15,674 | | | $ | 19,665,691 | | |
The Fund's assets assigned to the Level 2 input category are generally valued using a market approach, in which a security's value is determined through its correlation to prices and information from observable market transactions for similar or identical assets. Foreign equities are generally valued at the last sales price on the foreign exchange or market on which they trade. The Fund may use a systematic fair valuation model provided by an independent third party to value securities principally traded in foreign markets in order to adjust for possible stale pricing that may occur between the close of the foreign exchanges and the time for valuation. These models take into account available market data including intraday index, ADR, and ETF movements. Securities acquired via private placement that have a holding period or an extended settlement period are valued at a discount to the same shares that are trading freely on the market. These discounts are determined by the adviser's experience with similar securities or situations. Factors may include, but are not limited to, trade volume, shares outstanding and stock price. Warrants which do not trade are valued as a percentage of the actively trading common stock using a model based on Black Scholes.
See accompanying notes to financial statements.
36
> Notes to Statement of Investments (dollar values in thousands)
Certain short-term obligations may be valued using amortized cost, an income approach which converts future cash flows to a present value based upon the discount or premium at purchase.
The Fund's assets assigned to the Level 3 input category are valued at fair value as determined in good faith under consistently applied procedures established by and under the general supervision of the Board of Trustees. To determine fair value, management will utilize the valuation technique that they deem the most appropriate in the circumstances. Securities acquired via private placement but are not yet trading are valued using the market approach for which management has determined that the original transaction price is the best representation of fair value. The original cost may be adjusted for the market movement in an index, ETF or similar security during the period it does not trade. Securities for which no market exist are valued based upon the market approach using some unobservable inputs which may include, but are not limited to, projected earnings, available cash, line of business, multiples, and consideration of the prioritization of the equity in a company's capital structure.
The following table reconciles asset balances for the six months ending June 30, 2011, in which significant unobservable inputs (Level 3) were used in determining value:
Investments
in Securities | | Balance
as of
December 31,
2010 | | Realized
Gain/(Loss) | | Change in
Unrealized
Appreciation
(Depreciation) | | Purchases | | Sales | | Transfers
into
Level 3 | | Transfers
out of
Level 3 | | Balance
as of
June 30,
2011 | |
| Equities | |
| Consumer Goods & Services | | $ | 262 | | | $ | - | | | $ | 38 | | | $ | - | | | $ | - | | | $ | - | | | $ | - | | | $ | 300 | | |
| Energy & Minerals | | | 15,000 | | | | - | | | | - | | | | - | | | | - | | | | - | | | | - | | | | 15,000 | | |
| Health Care | | | 103 | | | | - | | | | 271 | | | | - | | | | - | | | | - | | | | - | | | | 374 | | |
| | | $ | 15,365 | | | $ | - | | | $ | 309 | | | $ | - | | | $ | - | | | $ | - | | | $ | - | | | $ | 15,674 | | |
The information in the above reconciliation table represents fiscal year to date activity for any securities identified as using Level 3 inputs at either the beginning or the end of the current fiscal period.
The change in unrealized appreciation attributed to securities owned at June 30, 2011, which were valued using significant unobservable inputs (Level 3) amounted to $309. This amount is included in net change in unrealized appreciation (depreciation) on the Statements of Changes in Net Assets.
The following table shows transfers between Level 1 and Level 2 of the fair value hierarchy:
| Transfers In | | Transfers Out | |
| Level 1 | | Level 2 | | Level 1 | | Level 2 | |
| $ | 54,754 | | | $ | - | | | $ | - | | | $ | 54,754 | | |
Financial assets were transferred from Level 2 to Level 1 as they resumed trading during the period.
For more information on valuation inputs, and their aggregation into the levels used in the tables above, please refer to the Security Valuation section in the accompanying Notes to Financial Statements.
See accompanying notes to financial statements.
37
Columbia Acorn International
Major Portfolio Changes in the Second Quarter (Unaudited)
| | | Number of Shares | |
| | | 03/31/11 | | 06/30/11 | |
| Purchases | |
| Europe | |
| > United Kingdom | |
| GlobeOp Financial Services | | | 3,100,000 | | | | 3,758,000 | | |
| JLT Group | | | 2,147,000 | | | | 2,868,800 | | |
| Kesa Electricals | | | 0 | | | | 8,346,000 | | |
| Next | | | 0 | | | | 582,000 | | |
| Smith & Nephew | | | 1,445,775 | | | | 1,630,000 | | |
| > Netherlands | |
| Fugro | | | 763,202 | | | | 784,111 | | |
| Imtech | | | 1,803,729 | | | | 1,841,280 | | |
| USG People | | | 1,079,600 | | | | 1,093,994 | | |
| > France | |
| Gemalto | | | 639,000 | | | | 799,000 | | |
| Teleperformance | | | 670,000 | | | | 1,078,000 | | |
| > Germany | |
| Dürr | | | 0 | | | | 237,511 | | |
| Rhoen-Klinikum | | | 1,110,000 | | | | 1,460,000 | | |
| > Switzerland | |
| Dufry Group | | | 0 | | | | 190,000 | | |
| Partners Group | | | 185,000 | | | | 235,000 | | |
| > Norway | |
| Atea | | | 340,964 | | | | 2,045,964 | | |
| > Belgium | |
| EVS Broadcast Equipment | | | 0 | | | | 145,031 | | |
| Asia | |
| > Japan | |
| Asics | | | 3,008,500 | | | | 3,650,000 | | |
| Hoshizaki Electric | | | 1,532,300 | | | | 1,563,000 | | |
| Ibiden | | | 711,000 | | | | 819,000 | | |
| Japan Airport Terminal | | | 1,250,000 | | | | 1,666,700 | | |
| Kuraray | | | 1,670,000 | | | | 1,974,000 | | |
| Shinsei Bank | | | 13,353,800 | | | | 23,908,800 | | |
| Sintokogio | | | 1,172,500 | | | | 1,794,000 | | |
| Torishima Pump Manufacturing | | | 972,500 | | | | 1,250,500 | | |
| Ushio | | | 1,170,800 | | | | 1,292,500 | | |
| > Singapore | |
| Mapletree Commercial Trust | | | 0 | | | | 30,000,000 | | |
| > Hong Kong | |
| MGM China Holdings | | | 0 | | | | 12,000,000 | | |
| Sa Sa International | | | 33,000,000 | | | | 35,000,000 | | |
| > China | |
| ENN Energy | | | 0 | | | | 6,000,000 | | |
| Noah Holdings - ADR | | | 223,100 | | | | 432,790 | | |
| Want Want | | | 0 | | | | 7,143,600 | | |
| | | Number of Shares | |
| | | 03/31/11 | | 06/30/11 | |
| > Taiwan | |
| China Steel Chemical | | | 2,966,500 | | | | 4,192,000 | | |
| Far Eastone Telecom | | | 4,957,300 | | | | 21,429,000 | | |
| President Chain Store | | | 3,362,500 | | | | 5,665,000 | | |
| St. Shine Optical | | | 1,133,100 | | | | 1,511,000 | | |
| Taiwan Hon Chuan | | | 4,639,400 | | | | 6,911,000 | | |
| > India | |
| Jain Irrigation Systems | | | 7,675,000 | | | | 8,587,418 | | |
Mundra Port & Special
Economic Zone | | | 6,360,300 | | | | 7,496,953 | | |
| United Breweries | | | 0 | | | | 367,138 | | |
| > Thailand | |
| Home Product Center | | | 58,207,800 | | | | 80,000,000 | | |
| > Indonesia | |
| Ace Indonesia | | | 0 | | | | 6,898,100 | | |
| Other Countries | |
| > Canada | |
| Alliance Grain Traders | | | 0 | | | | 501,700 | | |
| Celtic Exploration | | | 0 | | | | 146,200 | | |
| Crew Energy | | | 0 | | | | 367,600 | | |
| > United States | |
| Oil States International | | | 0 | | | | 250,000 | | |
| > South Africa | |
| Coronation Fund Managers | | | 1,788,501 | | | | 8,723,060 | | |
| Rand Merchant Insurance | | | 10,355,359 | | | | 17,625,208 | | |
| Latin America | |
| > Brazil | |
| Multiplus | | | 0 | | | | 1,100,000 | | |
| > Colombia | |
| Canacol Energy | | | 8,058,800 | | | | 8,240,000 | | |
See accompanying notes to financial statements.
38
| | | Number of Shares | |
| | | 03/31/11 | | 06/30/11 | |
| Sales | |
| Europe | |
| > United Kingdom | |
| Cobham | | | 9,259,000 | | | | 5,385,000 | | |
| FlyBe | | | 1,462,658 | | | | 1,376,083 | | |
| Serco | | | 6,700,000 | | | | 3,513,800 | | |
| > France | |
| Eurofins Scientific | | | 600,800 | | | | 489,287 | | |
| Toreador Resources | | | 372,000 | | | | 0 | | |
| > Germany | |
| CTS Eventim | | | 490,000 | | | | 403,286 | | |
| Vossloh | | | 240,000 | | | | 165,000 | | |
| > Sweden | |
| East Capital Explorer | | | 916,662 | | | | 905,452 | | |
| Hexagon | | | 4,382,000 | | | | 3,799,000 | | |
| > Italy | |
| Tod's | | | 452,200 | | | | 257,200 | | |
| > Ireland | |
| United Drug | | | 12,110,000 | | | | 9,669,485 | | |
| > Finland | |
| Poyry | | | 1,706,942 | | | | 410,523 | | |
| Asia | |
| > Japan | |
| Benesse | | | 33,300 | | | | 0 | | |
| Gree | | | 2,226,000 | | | | 1,355,000 | | |
| Start Today | | | 2,421,300 | | | | 1,275,000 | | |
| Suruga Bank | | | 1,750,000 | | | | 0 | | |
| > Singapore | |
| Mapletree Logistics Trust | | | 57,000,000 | | | | 50,000,000 | | |
| > China | |
| China Communication Services | | | 45,000,000 | | | | 41,959,300 | | |
| China Green | | | 10,140,400 | | | | 0 | | |
| China Yurun Food | | | 12,199,600 | | | | 10,764,600 | | |
| Jiangsu Expressway | | | 36,700,000 | | | | 23,146,000 | | |
New Oriental Education &
Technology - ADR | | | 278,315 | | | | 230,000 | | |
| Wasion Group | | | 29,425,300 | | | | 24,244,400 | | |
| Zuoan Fashion | | | 817,360 | | | | 680,503 | | |
| > Taiwan | |
| Formosa International Hotels | | | 1,599,620 | | | | 1,142,620 | | |
| Simplo Technology | | | 7,200,000 | | | | 5,821,000 | | |
| > India | |
| Asian Paints | | | 368,098 | | | | 320,000 | | |
| Housing Development Finance | | | 1,100,000 | | | | 0 | | |
Infrastructure Development
Finance | | | 5,675,000 | | | | 3,550,000 | | |
| Shriram Transport Finance | | | 1,835,000 | | | | 715,000 | | |
| | | Number of Shares | |
| | | 03/31/11 | | 06/30/11 | |
| Other Countries | |
| > Canada | |
| Baytex | | | 735,000 | | | | 574,000 | | |
| Guyana Goldfields | | | 1,355,000 | | | | 1,291,135 | | |
| > United States | |
| Atwood Oceanics | | | 1,340,000 | | | | 1,273,000 | | |
| Tesco | | | 324,000 | | | | 0 | | |
| > Australia | |
| Hastie Group | | | 3,962,289 | | | | 0 | | |
| SAI Global | | | 7,286,896 | | | | 6,281,896 | | |
| Latin America | |
| > Brazil | |
| Localiza Rent A Car | | | 4,700,000 | | | | 4,300,000 | | |
| PDG Realty | | | 5,000,000 | | | | 4,400,000 | | |
See accompanying notes to financial statements.
39
Columbia Acorn International
Statement of Investments (Unaudited), June 30, 2011
| Number of Shares | | | | Value (000) | |
| | | | | | | Equities: 95.6% | |
| Europe 37.4% | | | |
| | | > United Kingdom 7.0% | |
| | 2,000,000 | | | Intertek Group | | $ | 63,331 | | |
| | | | | Testing, Inspection & Certification Services | | | | | |
| | 5,437,000 | | | Chemring | | | 55,847 | | |
| | | | | Defense Manufacturer of
Countermeasures & Energetics | | | | | |
| | 2,868,800 | | | JLT Group | | | 31,355 | | |
| | | | | International Business Insurance Broker | | | | | |
| | 3,513,800 | | | Serco | | | 31,158 | | |
| | | | | Facilities Management | | | | | |
| | 56,093,000 | | | Workspace Group | | | 27,233 | | |
| | | | | United Kingdom Real Estate | | | | | |
| | 26,712,371 | | | Archipelago Resources (a) | | | 26,474 | | |
| | | | | Gold Mining Projects in Indonesia,
Vietnam & the Philippines | | | | | |
| | 3,758,000 | | | GlobeOp Financial Services | | | 23,613 | | |
| | | | | Hedge Fund Administrator | | | | | |
| | 1,976,000 | | | Petropavlovsk | | | 23,151 | | |
| | | | | Gold & Iron Ore Mining in Russia | | | | | |
| | 582,000 | | | Next | | | 21,717 | | |
| | | | | Clothes & Home Retailer in the
United Kingdom | | | | | |
| | 8,346,000 | | | Kesa Electricals | | | 18,445 | | |
| | | | | Europe's Leading Electricals Retailers | | | | | |
| | 2,752,210 | | | Abcam | | | 18,409 | | |
| | | | | Online Sales of Antibodies | | | | | |
| | 680,000 | | | Rotork | | | 18,400 | | |
| | | | | Valve Actuators for Oil & Water Pipelines | | | | | |
| | 5,385,000 | | | Cobham | | | 18,288 | | |
| | | | | Aerospace Components | | | | | |
| | 2,432,000 | | | Premier Oil (a) | | | 17,432 | | |
| | | | | Oil & Gas Producer in Europe, Pakistan &
Asia | | | | | |
| | 1,630,000 | | | Smith & Nephew | | | 17,397 | | |
| | | | | Medical Equipment & Supplies | | | | | |
| | 690,000 | | | Tullow Oil | | | 13,732 | | |
| | | | | Oil & Gas Producer | | | | | |
| | 859,200 | | | Shaftesbury | | | 7,281 | | |
| | | | | London Prime Retail REIT | | | | | |
| | 3,889,000 | | | PureCircle (a)(b) | | | 5,524 | | |
| | | | | Natural Sweeteners | | | | | |
| | 1,650,000 | | | SKIL Ports & Logistics (a) | | | 5,164 | | |
| | | | | Indian Container Port Project | | | | | |
| | 1,549,500 | | | Sterling Resources (a) | | | 2,651 | | |
| | 1,050,500 | | | Sterling Resources (a)(c) | | | 1,761 | | |
| | | | | Oil & Gas Exploration - Europe | | | | | |
| | 1,376,083 | | | FlyBe (a) | | | 4,064 | | |
| | | | | Largest European Regional Airline | | | | | |
| | | | 452,427 | | |
| | | > Netherlands 6.4% | |
| | 1,841,280 | | | Imtech | | | 65,125 | | |
| | | | | Electromechanical & Information &
Communications Technologies
Installation & Maintenance | | | | | |
| | 784,111 | | | Fugro | | | 56,536 | | |
| | | | | Sub-sea Oilfield Services | | | | | |
| Number of Shares | | | | Value (000) | |
| | 1,104,200 | | | Vopak | | $ | 54,106 | | |
| | | | | World's Largest Operator of Petroleum &
Chemical Storage Terminals | | | | | |
| | 2,296,992 | | | Aalberts Industries | | | 53,695 | | |
| | | | | Flow Control & Heat Treatment | | | | | |
| | 1,476,800 | | | Unit 4 Agresso (d) | | | 53,390 | | |
| | | | | Business Software Development | | | | | |
| | 1,272,365 | | | Koninklijke TenCate | | | 51,516 | | |
| | | | | Advanced Textiles & Industrial Fabrics | | | | | |
| | 1,164,669 | | | Arcadis | | | 28,493 | | |
| | | | | Engineering Consultants | | | | | |
| | 249,000 | | | Core Laboratories | | | 27,773 | | |
| | | | | Oil & Gas Reservoir Consulting | | | | | |
| | 1,093,994 | | | USG People | | | 18,918 | | |
| | | | | Temporary Staffing Services | | | | | |
| | | | 409,552 | | |
| | | > France 5.1% | |
| | 610,000 | | | Neopost | | | 52,403 | | |
| | | | | Postage Meter Machines | | | | | |
| | 489,287 | | | Eurofins Scientific | | | 45,070 | | |
| | | | | Food, Pharmaceuticals & Materials
Screening & Testing | | | | | |
| | 799,000 | | | Gemalto | | | 38,207 | | |
| | | | | Smart Card Products & Solutions | | | | | |
| | 274,100 | | | Rubis | | | 34,772 | | |
| | | | | Tank Storage & Liquefied Petroleum Gas
Distribution | | | | | |
| | 1,078,000 | | | Teleperformance | | | 31,680 | | |
| | | | | Call Center Operator | | | | | |
| | 902,900 | | | Saft | | | 31,051 | | |
| | | | | Niche Battery Manufacturer | | | | | |
| | 541,500 | | | Mersen | | | 30,546 | | |
| | | | | Advanced Industrial Materials | | | | | |
| | 322,200 | | | Pierre & Vacances | | | 26,862 | | |
| | | | | Vacation Apartment Lets | | | | | |
| | 213,800 | | | Norbert Dentressangle | | | 25,265 | | |
| | | | | Leading European Logistics & Transport
Group | | | | | |
| | 1,689,100 | | | Hi-Media (a) | | | 10,116 | | |
| | | | | Online Advertiser in Europe | | | | | |
| | | | 325,972 | | |
| | | > Germany 3.9% | |
| | 630,000 | | | Rheinmetall | | | 55,775 | | |
| | | | | Defense & Automotive | | | | | |
| | 2,120,000 | | | Wirecard (b) | | | 37,891 | | |
| | | | | Online Payment Processing & Risk
Management | | | | | |
| | 137,500 | | | Rational | | | 36,240 | | |
| | | | | Commercial Ovens | | | | | |
| | 1,460,000 | | | Rhoen-Klinikum | | | 35,230 | | |
| | | | | Health Care Services | | | | | |
| | 403,286 | | | CTS Eventim | | | 27,867 | | |
| | | | | Event Ticket Sales | | | | | |
| | 165,000 | | | Vossloh | | | 23,157 | | |
| | | | | Rail Infrastructure & Diesel Locomotives | | | | | |
| | 515,000 | | | Elringklinger | | | 18,275 | | |
| | | | | Automobile Components | | | | | |
See accompanying notes to financial statements.
40
| Number of Shares | | | | Value (000) | |
| | | > Germany—continued | |
| | 237,511 | | | Dürr | | $ | 9,644 | | |
| | | | | Automotive Plant Engineering &
Associated Capital Equipment | | | | | |
| | 312,500 | | | Deutsche Beteiligungs | | | 8,814 | | |
| | | | | Private Equity Investment Management | | | | | |
| | | | 252,893 | | |
| | | > Switzerland 3.7% | |
| | 22,300 | | | Sika | | | 53,764 | | |
| | | | | Chemicals for Construction & Industrial
Applications | | | | | |
| | 325,000 | | | Kuehne & Nagel | | | 49,325 | | |
| | | | | Freight Forwarding/Logistics | | | | | |
| | 185,000 | | | Geberit (a) | | | 43,832 | | |
| | | | | Plumbing Supplies | | | | | |
| | 235,000 | | | Partners Group | | | 41,592 | | |
| | | | | Private Markets Asset Management | | | | | |
| | 720,000 | | | Bank Sarasin & Cie | | | 28,517 | | |
| | | | | Private Banking | | | | | |
| | 190,000 | | | Dufry Group (a) | | | 23,932 | | |
| | | | | Operates Airport Duty Free & Duty Paid
Shops | | | | | |
| | | | 240,962 | | |
| | | > Sweden 2.6% | |
| | 3,799,000 | | | Hexagon (b) | | | 93,576 | | |
| | | | | Measurement Equipment & Software | | | | | |
| | 3,887,000 | | | Sweco | | | 38,254 | | |
| | | | | Engineering Consultants | | | | | |
| | 607,000 | | | Unibet (a) | | | 13,171 | | |
| | | | | European Online Gaming Operator | | | | | |
| | 905,452 | | | East Capital Explorer | | | 10,521 | | |
| | | | | Sweden-based RUS/CEE Investment Fund | | | | | |
| | 708,342 | | | Orc Software (b) | | | 9,435 | | |
| | | | | Software for Securities Trading, Analysis &
Risk Management | | | | | |
| | | | 164,957 | | |
| | | > Italy 2.4% | |
| | 257,200 | | | Tod's | | | 34,407 | | |
| | | | | Leather Shoes & Bags | | | | | |
| | 2,083,000 | | | Ansaldo STS | | | 29,195 | | |
| | | | | Railway Systems Integrator | | | | | |
| | 4,311,600 | | | Credito Emiliano | | | 27,273 | | |
| | | | | Italian Regional Bank | | | | | |
| | 9,796,000 | | | CIR | | | 24,533 | | |
| | | | | Italian Holding Company | | | | | |
| | 3,573,000 | | | Geox | | | 21,410 | | |
| | | | | Apparel & Shoe Maker | | | | | |
| | 4,111,000 | | | Terna (b) | | | 19,113 | | |
| | | | | Italian Power Transmission | | | | | |
| | | | 155,931 | | |
| | | > Denmark 1.2% | |
| | 306,000 | | | Novozymes | | | 49,796 | | |
| | | | | Industrial Enzymes | | | | | |
| | 156,000 | | | SimCorp | | | 30,785 | | |
| | | | | Software for Investment Managers | | | | | |
| | | | 80,581 | | |
| Number of Shares | | | | Value (000) | |
| | | > Ireland 1.1% | |
| | 9,669,485 | | | United Drug | | $ | 33,121 | | |
| | | | | Irish Pharmaceutical Wholesaler &
Outsourcer | | | | | |
| | 359,000 | | | Paddy Power | | | 19,517 | | |
| | | | | Irish Betting Services | | | | | |
| | 297,000 | | | Aryzta | | | 15,735 | | |
| | | | | Baked Goods | | | | | |
| | | | 68,373 | | |
| | | > Portugal 0.6% | |
| | 7,278,105 | | | Redes Energéticas Nacionais | | | 26,164 | | |
| | | | | Portuguese Power Transmission & Gas
Transportation | | | | | |
| | 22,568,987 | | | Banco Comercial Português (a) | | | 13,419 | | |
| | | | | Largest Portuguese Banking Franchise | | | | | |
| | | | 39,583 | | |
| | | > Iceland 0.6% | |
| | 35,982,499 | | | Marel (a) | | | 38,090 | | |
| | | | | Largest Manufacturer of Poultry & Fish
Processing Equipment | | | | | |
| | | | 38,090 | | |
| | | > Spain 0.5% | |
| | 579,000 | | | Red Eléctrica de España | | | 34,950 | | |
| | | | | Spanish Power Transmission | | | | | |
| | | | 34,950 | | |
| | | > Finland 0.5% | |
| | 967,777 | | | Stockmann (b) | | | 27,423 | | |
| | | | | Department Store & Fashion Retailer in
Scandinavia & Russia | | | | | |
| | 410,523 | | | Poyry | | | 5,876 | | |
| | | | | Engineering Consultants | | | | | |
| | | | 33,299 | | |
| | | > Czech Republic 0.5% | |
| | 121,268 | | | Komercni Banka (b) | | | 29,574 | | |
| | | | | Leading Czech Republic Universal Bank | | | | | |
| | | | 29,574 | | |
| | | > Russia 0.4% | |
| | 764,506 | | | Mail.ru - GDR (a)(c) | | | 25,397 | | |
| | | | | Internet Social Networking & Games for
Russian Speakers | | | | | |
| | | | 25,397 | | |
| | | > Norway 0.3% | |
| | 2,045,964 | | | Atea | | | 21,521 | | |
| | | | | Leading Nordic IT Hardware/Software
Re-seller & Installation Company | | | | | |
| | | | 21,521 | | |
| | | > Greece 0.2% | |
| | 6,475,300 | | | Intralot | | | 13,803 | | |
| | | | | Lottery & Gaming Systems & Services | | | | | |
| | | | 13,803 | | |
| | | > Poland 0.2% | |
| | 893,900 | | | Central European Distribution (a) | | | 10,012 | | |
| | | | | Largest Spirits Company in Central &
Eastern Europe | | | | | |
| | | | 10,012 | | |
See accompanying notes to financial statements.
41
Columbia Acorn International
Statement of Investments (Unaudited), continued
| Number of Shares | | | | Value (000) | |
| | | > Belgium 0.2% | |
| | 145,031 | | | EVS Broadcast Equipment | | $ | 9,818 | | |
| | | | | Digital Live Mobile Production Software &
Systems | | | | | |
| | | | 9,818 | | |
| Europe: Total | | | 2,407,695 | | |
| Asia 36.8% | | | |
| | | > Japan 16.2% | |
| | 7,568,400 | | | Kansai Paint | | | 68,957 | | |
| | | | | Paint Producer in Japan, India, China &
Southeast Asia | | | | | |
| | 3,650,000 | | | Asics | | | 54,481 | | |
| | | | | Footwear & Apparel | | | | | |
| | 21,000 | | | Seven Bank | | | 41,964 | | |
| | | | | ATM Processing Services | | | | | |
| | 1,846,000 | | | Aeon Delight | | | 37,221 | | |
| | | | | Facility Maintenance & Management | | | | | |
| | 6,400 | | | Orix JREIT | | | 35,367 | | |
| | | | | Diversified REIT | | | | | |
| | 1,563,000 | | | Hoshizaki Electric | | | 34,695 | | |
| | | | | Commercial Kitchen Equipment | | | | | |
| | 15,300 | | | Advance Residence Investment | | | 32,022 | | |
| | | | | Residential REIT | | | | | |
| | 710,000 | | | Hamamatsu Photonics | | | 30,698 | | |
| | | | | Optical Sensors for Medical & Industrial
Applications | | | | | |
| | 3,283,000 | | | Kamigumi | | | 30,682 | | |
| | | | | Port Cargo Handling & Logistics | | | | | |
| | 1,360,000 | | | Asahi Diamond Industrial | | | 29,733 | | |
| | | | | Consumable Diamond Tools | | | | | |
| | 1,355,000 | | | Gree (a) | | | 29,621 | | |
| | | | | Mobile Social Networking Game
Developer/Platform | | | | | |
| | 707,000 | | | Ain Pharmaciez | | | 29,090 | | |
| | | | | Dispensing Pharmacy/Drugstore Operator | | | | | |
| | 1,974,000 | | | Kuraray | | | 28,919 | | |
| | | | | Special Resin, Fine Chemical, Fibers &
Textures | | | | | |
| | 868,000 | | | Kintetsu World Express | | | 28,505 | | |
| | | | | Airfreight Logistics | | | | | |
| | 274,000 | | | Nakanishi | | | 28,232 | | |
| | | | | Dental Tools & Machinery | | | | | |
| | 23,500 | | | Wacom (d) | | | 27,443 | | |
| | | | | Computer Graphic Illustration Devices | | | | | |
| | 24,022 | | | Jupiter Telecommunications | | | 26,875 | | |
| | | | | Largest Cable Service Provider in Japan | | | | | |
| | 819,000 | | | Ibiden | | | 25,641 | | |
| | | | | Electronic Parts & Ceramics | | | | | |
| | 1,292,500 | | | Ushio | | | 25,556 | | |
| | | | | Industrial Light Sources | | | | | |
| | 1,275,000 | | | Start Today | | | 25,461 | | |
| | | | | Online Japanese Apparel Retailer | | | | | |
| | 789,000 | | | Tsumura | | | 25,223 | | |
| | | | | Traditional Chinese/Japanese Herbal Rx
Drugs (Kampo) | | | | | |
| | 23,908,800 | | | Shinsei Bank | | | 23,915 | | |
| | | | | Commercial Bank | | | | | |
| | 1,181,200 | | | Daiseki | | | 23,914 | | |
| | | | | Waste Disposal & Recycling | | | | | |
| Number of Shares | | | | Value (000) | |
| | 509,000 | | | Makita | | $ | 23,719 | | |
| | | | | Power Tools | | | | | |
| | 5,100 | | | Osaka Securities Exchange | | | 22,766 | | |
| | | | | Osaka Securities Exchange | | | | | |
| | 7,174,000 | | | Nippon Sheet Glass | | | 22,306 | | |
| | | | | Sheet Glass for Building & Automotive Use | | | | | |
| | 977,000 | | | Glory | | | 22,006 | | |
| | | | | Currency Handling Systems & Related
Equipment | | | | | |
| | 2,400,000 | | | Shimadzu | | | 21,982 | | |
| | | | | Analytical Instruments, Medical & Industrial
Equipment | | | | | |
| | 906,000 | | | Aeon Mall | | | 21,948 | | |
| | | | | Suburban Shopping Mall Developer,
Owner & Operator | | | | | |
| | 2,850 | | | Fukuoka | | | 21,457 | | |
| | | | | Diversified REIT in Fukuoka | | | | | |
| | 2,870 | | | Kakaku.com | | | 20,181 | | |
| | | | | Online Price Comparison Services for
Consumers | | | | | |
| | 1,250,500 | | | Torishima Pump Manufacturing | | | 20,072 | | |
| | | | | Industrial Pump for Power Generation &
Water Supply Systems | | | | | |
| | 1,666,700 | | | Japan Airport Terminal | | | 19,411 | | |
| | | | | Airport Terminal Operator at Haneda | | | | | |
| | 1,794,000 | | | Sintokogio | | | 18,418 | | |
| | | | | Automated Casting Machines, Surface
Treatment Systems & Consumables | | | | | |
| | 675,780 | | | Icom | | | 17,390 | | |
| | | | | Two Way Radio Communication Equipment | | | | | |
| | 587,800 | | | Miura | | | 17,039 | | |
| | | | | Industrial Boiler Maker, Seller, Distributor &
Manufacturer | | | | | |
| | 4,458 | | | Mori Hills | | | 16,313 | | |
| | | | | Tokyo Centric Diversified REIT | | | | | |
| | 439,800 | | | Pigeon | | | 14,456 | | |
| | | | | Baby Care Products | | | | | |
| | | | 1,043,679 | | |
| | | > Singapore 4.6% | |
| | 35,981,000 | | | Olam International | | | 79,986 | | |
| | | | | Agriculture Supply Chain Manager | | | | | |
| | 23,000,000 | | | CDL Hospitality Trust | | | 38,607 | | |
| | | | | Hotel Owner/Operator | | | | | |
| | 50,000,000 | | | Mapletree Logistics Trust | | | 37,491 | | |
| | | | | Industrial Property Landlord | | | | | |
| | 22,000,000 | | | Ascendas REIT | | | 36,592 | | |
| | | | | Industrial Property Landlord | | | | | |
| | 37,010,000 | | | Mapletree Industrial Trust | | | 35,291 | | |
| | | | | Industrial Property Landlord | | | | | |
| | 4,000,000 | | | Singapore Exchange | | | 24,580 | | |
| | | | | Singapore Equity & Derivatives Market
Operator | | | | | |
| | 30,000,000 | | | Mapletree Commercial Trust (a) | | | 21,127 | | |
| | | | | Retail & Office Property Landlord | | | | | |
| | 13,000,000 | | | Goodpack | | | 19,391 | | |
| | | | | International Bulk Container Leasing | | | | | |
| | | | 293,065 | | |
| | | > Hong Kong 4.3% | |
| | 7,000,000 | | | Melco Crown Entertainment -
ADR (a)(b) | | | 89,390 | | |
| | | | | Macau Casino Operator | | | | | |
See accompanying notes to financial statements.
42
| Number of Shares | | | | Value (000) | |
| | | > Hong Kong—continued | |
| | 18,000,000 | | | Lifestyle International | | $ | 53,125 | | |
| | | | | Mid- to High-end Department Store
Operator in Hong Kong & China | | | | | |
| | 23,335,500 | | | Mongolian Mining (a) | | | 28,855 | | |
| | | | | Coking Coal Mining in Mongolia | | | | | |
| | 30,000,000 | | | Hutchison Port Holdings Trust (a) | | | 25,350 | | |
| | | | | Southern China Container Ports | | | | | |
| | 35,000,000 | | | Sa Sa International | | | 22,487 | | |
| | | | | Cosmetics Retailer | | | | | |
| | 12,000,000 | | | MGM China Holdings (a) | | | 22,144 | | |
| | | | | Macau Casino Operator | | | | | |
| | 8,077,000 | | | L'Occitane International (a) | | | 21,636 | | |
| | | | | Skin Care & Cosmetics Producer | | | | | |
| | 750,000 | | | Hong Kong Exchanges and Clearing | | | 15,802 | | |
| | | | | Hong Kong Equity & Derivatives Market
Operator | | | | | |
| | | | 278,789 | | |
| | | > China 4.2% | |
| | 32,276,000 | | | Zhaojin Mining Industry | | | 66,584 | | |
| | | | | Gold Mining & Refining in China | | | | | |
| | 10,764,600 | | | China Yurun Food | | | 30,437 | | |
| | | | | Meat Processor in China | | | | | |
| | 230,000 | | | New Oriental Education &
Technology - ADR (a) | | | 25,696 | | |
| | | | | Education Service Provider | | | | | |
| | 41,959,300 | | | China Communication Services | | | 24,845 | | |
| | | | | China's Telecom Infrastructure Service
Provider | | | | | |
| | 240,000,000 | | | RexLot Holdings | | | 23,216 | | |
| | | | | Lottery Equipment Supplier in China | | | | | |
| | 23,146,000 | | | Jiangsu Expressway | | | 21,218 | | |
| | | | | Chinese Toll Road Operator | | | | | |
| | 6,000,000 | | | ENN Energy | | | 20,460 | | |
| | | | | China's Largest Private Gas Operator | | | | | |
| | 11,286,200 | | | Shandong Weigao | | | 16,385 | | |
| | | | | Vertically Integrated Hospital
Consumable Manufacturing | | | | | |
| | 247,000 | | | 51job - ADR (a) | | | 13,864 | | |
| | | | | An Integrated Human Resources Service
Provider | | | | | |
| | 24,244,400 | | | Wasion Group | | | 11,413 | | |
| | | | | Electronic Power Meter Total Solution
Provider | | | | | |
| | 7,143,600 | | | Want Want | | | 6,936 | | |
| | | | | Chinese Branded Consumer Food Company | | | | | |
| | 432,790 | | | Noah Holdings - ADR (a)(b) | | | 4,865 | | |
| | | | | Wealth Management Product Distributor
in China | | | | | |
| | 680,503 | | | Zuoan Fashion (a)(b) | | | 3,804 | | |
| | | | | Men's Apparel Provider in China | | | | | |
| | | | 269,723 | | |
| | | > Taiwan 3.5% | |
| | 5,821,000 | | | Simplo Technology | | | 47,049 | | |
| | | | | World's Largest Notebook Battery Pack
Supplier | | | | | |
| | 21,429,000 | | | Far Eastone Telecom | | | 34,202 | | |
| | | | | Taiwan's Third Largest Mobile Operator | | | | | |
| | 5,665,000 | | | President Chain Store | | | 32,821 | | |
| | | | | Taiwan's Number One Convenience Chain
Store Operator | | | | | |
| Number of Shares | | | | Value (000) | |
| | 1,511,000 | | | St. Shine Optical | | $ | 22,957 | | |
| | | | | World's Leading Disposable Contact
Lens OEM | | | | | |
| | 4,192,000 | | | China Steel Chemical | | | 22,456 | | |
| | | | | Sole Coal Chemical Producer in Taiwan | | | | | |
| | 1,142,620 | | | Formosa International Hotels | | | 21,674 | | |
| | | | | Hotel, Food & Beverage Operation &
Hospitality Management Services | | | | | |
| | 6,911,000 | | | Taiwan Hon Chuan | | | 20,837 | | |
| | | | | Beverage Packaging (Bottles, Caps &
Labels) Manufacturer | | | | | |
| | 7,206,000 | | | Everlight Electronics | | | 19,409 | | |
| | | | | LED Packager | | | | | |
| | 2,211,000 | | | Sinyi Realty | | | 4,270 | | |
| | | | | Taiwanese Realty Company | | | | | |
| | | | 225,675 | | |
| | | > India 2.4% | |
| | 8,587,418 | | | Jain Irrigation Systems | | | 32,834 | | |
| | | | | Agricultural Micro-irrigation Systems &
Food Processing | | | | | |
| | 7,496,953 | | | Mundra Port & Special Economic Zone | | | 27,203 | | |
| | | | | Indian West Coast Shipping Port | | | | | |
| | 320,000 | | | Asian Paints | | | 22,666 | | |
| | | | | India's Largest Paint Company | | | | | |
| | 30,574,905 | | | REI Agro | | | 17,444 | | |
| | | | | Basmati Rice Processing | | | | | |
| | 11,814,746 | | | Manappuram General Finance | | | 14,896 | | |
| | | | | Short-term Lending Collateralized by
Household Gold | | | | | |
| | 9,600,000 | | | S. Kumars Nationwide (a) | | | 11,654 | | |
| | | | | Textiles, Clothing & Retail | | | | | |
| | 3,550,000 | | | Infrastructure Development Finance (a) | | | 10,427 | | |
| | | | | Infrastructure Finance in India | | | | | |
| | 715,000 | | | Shriram Transport Finance | | | 9,892 | | |
| | | | | Used Truck Finance | | | | | |
| | 367,138 | | | United Breweries | | | 4,374 | | |
| | | | | India's Largest Brewer | | | | | |
| | | | 151,390 | | |
| | | > South Korea 1.3% | |
| | 1,157,000 | | | Woongjin Coway | | | 41,264 | | |
| | | | | South Korean Household Appliance Rental
Service Provider | | | | | |
| | 150,000 | | | NHN (a) | | | 26,593 | | |
| | | | | South Korea's Largest Online Search Engine | | | | | |
| | 121,132 | | | MegaStudy | | | 16,295 | | |
| | | | | Education Service Provider | | | | | |
| | | | 84,152 | | |
| | | > Thailand 0.3% | |
| | 80,000,000 | | | Home Product Center | | | 21,351 | | |
| | | | | Home Improvement Retailer | | | | | |
| | | | 21,351 | | |
| | | > Indonesia —% | |
| | 6,898,100 | | | Ace Indonesia | | | 2,433 | | |
| | | | | Home Improvement Retailer | | | | | |
| | | | 2,433 | | |
| Asia: Total | | | 2,370,257 | | |
See accompanying notes to financial statements.
43
Columbia Acorn International
Statement of Investments (Unaudited), continued
| Number of Shares | | | | Value (000) | |
| Other Countries 15.8% | | | |
| | | > Canada 5.3% | |
| | 1,710,000 | | | ShawCor | | $ | 52,517 | | |
| | | | | Oil & Gas Pipeline Products | | | | | |
| | 977,500 | | | Ivanhoe Mines (a) | | | 24,700 | | |
| | 855,600 | | | Ivanhoe Mines (a)(e) | | | 21,647 | | |
| | | | | Copper Mine Project in Mongolia | | | | | |
| | 1,301,612 | | | CCL Industries | | | 44,752 | | |
| | | | | Leading Global Label Manufacturer | | | | | |
| | 574,000 | | | Baytex (b) | | | 31,377 | | |
| | | | | Oil & Gas Producer in Canada | | | | | |
| | 540,000 | | | AG Growth | | | 25,644 | | |
| | | | | Leading Manufacturer of Augers & Grain
Handling Equipment | | | | | |
| | 605,000 | | | Onex Capital | | | 23,442 | | |
| | | | | Private Equity Firm | | | | | |
| | 546,500 | | | Black Diamond Group | | | 17,849 | | |
| | | | | Provides Accommodations/Equipment for
Oil Sands Exploitation | | | | | |
| | 872,700 | | | Tahoe Resources (a)(c) | | | 16,125 | | |
| | | | | Silver Project in Guatemala | | | | | |
| | 2,696,000 | | | DeeThree Exploration (a)(c)(d) | | | 9,862 | | |
| | 1,042,877 | | | DeeThree Exploration (a)(d) | | | 3,893 | | |
| | | | | Canadian Oil & Gas Producer | | | | | |
| | 501,700 | | | Alliance Grain Traders | | | 13,421 | | |
| | | | | Global Leader in Pulse Processing &
Distribution | | | | | |
| | 2,214,100 | | | Horizon North Logistics | | | 10,285 | | |
| | | | | Provides Diversified Oil Service Offering
in Northern Canada | | | | | |
| | 5,737,500 | | | Southern Arc Minerals (a)(c)(d) | | | 10,086 | | |
| | | | | Gold & Copper Exploration in Indonesia | | | | | |
| | 1,291,135 | | | Guyana Goldfields (a) | | | 9,170 | | |
| | | | | Gold Mining Projects in Guyana | | | | | |
| | 1,480,610 | | | Pan Orient (a) | | | 8,229 | | |
| | | | | Growth Oriented & Return Focused Asian
Explorer | | | | | |
| | 367,600 | | | Crew Energy (a) | | | 5,717 | | |
| | | | | Canadian Oil & Gas Producer | | | | | |
| | 12,500,000 | | | Eacom Timber (a)(c) | | | 3,937 | | |
| | | | | Canadian Lumber Producer | | | | | |
| | 12,500,000 | | | Petromanas (a)(c) | | | 3,683 | | |
| | 6,250,000 | | | Petromanas - Warrants (a)(c) | | | 159 | | |
| | | | | Exploring for Oil in Albania | | | | | |
| | 146,200 | | | Celtic Exploration (a) | | | 3,233 | | |
| | | | | Canadian Oil & Gas Producer | | | | | |
| | | | 339,728 | | |
| | | > United States 3.8% | |
| | 1,273,000 | | | Atwood Oceanics (a) | | | 56,177 | | |
| | | | | Offshore Drilling Contractor | | | | | |
| | 822,000 | | | Alexion Pharmaceuticals (a) | | | 38,659 | | |
| | | | | Biotech Focused on Orphan Diseases | | | | | |
| | 918,000 | | | World Fuel Services | | | 32,984 | | |
| | | | | Global Fuel Broker | | | | | |
| | 1,145,000 | | | BioMarin Pharmaceutical (a) | | | 31,155 | | |
| | | | | Biotech Focused on Orphan Diseases | | | | | |
| | 658,000 | | | FMC Technologies (a) | | | 29,472 | | |
| | | | | Oil & Gas Wellhead Manufacturer | | | | | |
| Number of Shares | | | | Value (000) | |
| | 250,000 | | | Oil States International (a) | | $ | 19,978 | | |
| | | | | Diversified North American Oil Service
Provider | | | | | |
| | 391,000 | | | Bristow | | | 19,949 | | |
| | | | | Largest Provider of Helicopter Services to
Offshore Oil & Gas Producers | | | | | |
| | 568,000 | | | Textainer Group Holdings | | | 17,460 | | |
| | | | | Top International Container Leasor | | | | | |
| | | | 245,834 | | |
| | | > South Africa 3.8% | |
| | 1,096,000 | | | Naspers | | | 61,909 | | |
| | | | | Media in Africa, China, Russia & Other
Emerging Markets | | | | | |
| | 4,600,000 | | | Mr. Price | | | 46,396 | | |
| | | | | South African Retailer of Apparel,
Household & Sporting Goods | | | | | |
| | 4,625,000 | | | Adcock Ingram Holdings | | | 40,636 | | |
| | | | | Manufacturer of Pharmaceuticals &
Medical Supplies | | | | | |
| | 5,780,900 | | | Northam Platinum | | | 36,309 | | |
| | | | | Platinum Mining in South Africa | | | | | |
| | 17,625,208 | | | Rand Merchant Insurance | | | 32,191 | | |
| | | | | Directly Sold Property & Casualty
Insurance; Holdings in Other Insurers | | | | | |
| | 8,723,060 | | | Coronation Fund Managers | | | 24,898 | | |
| | | | | South African Fund Manager | | | | | |
| | | | 242,339 | | |
| | | > Australia 1.7% | |
| | 2,482,000 | | | UGL | | | 37,092 | | |
| | | | | Engineering & Facilities Management | | | | | |
| | 467,000 | | | Cochlear | | | 36,145 | | |
| | | | | Cochlear Implants | | | | | |
| | 6,281,896 | | | SAI Global | | | 32,009 | | |
| | | | | Publishing, Certification & Compliance Services | | | | | |
| | 1,000,000 | | | Seek | | | 6,936 | | |
| | | | | Online Job Listing & Education | | | | | |
| | | | 112,182 | | |
| | | > Israel 0.7% | |
| | 2,890,000 | | | Israel Chemicals | | | 46,119 | | |
| | | | | Producer of Potash, Phosphates,
Bromine & Specialty Chemicals | | | | | |
| | | | 46,119 | | |
| | | > Kazakhstan 0.3% | |
| | 1,770,000 | | | Halyk Savings Bank of
Kazakhstan - GDR (a) | | | 15,841 | | |
| | | | | Largest Retail Bank & Insurer in Kazakhstan | | | | | |
| | | | 15,841 | | |
| | | > Senegal 0.2% | |
| | 43,000 | | | Sonatel (f) | | | 13,784 | | |
| | | | | Leading Telecoms Operator in
Western Africa | | | | | |
| | | | 13,784 | | |
| | | > Egypt —% | |
| | 235,342 | | | Paints & Chemical Industries (Pachin) | | | 1,509 | | |
| | | | | Paints & Inks in Egypt | | | | | |
| | | | 1,509 | | |
| Other Countries: Total | | | 1,017,336 | | |
See accompanying notes to financial statements.
44
| Number of Shares | | | | Value (000) | |
| Latin America 5.6% | | | |
| | | > Brazil 4.2% | |
| | 4,300,000 | | | Localiza Rent A Car | | $ | 76,872 | | |
| | | | | Car Rental | | | | | |
| | 3,000,000 | | | Mills Estruturas e Serviços de
Engenharia | | | 43,251 | | |
| | | | | Civil Engineering & Construction | | | | | |
| | 5,937,000 | | | Suzano | | | 42,949 | | |
| | | | | Brazilian Pulp & Paper Producer | | | | | |
| | 1,300,000 | | | Natura | | | 32,487 | | |
| | | | | Direct Retailer of Cosmetics | | | | | |
| | 3,400,000 | | | MRV Engenharia | | | 28,234 | | |
| | | | | Brazilian Property Developer | | | | | |
| | 4,400,000 | | | PDG Realty | | | 24,782 | | |
| | | | | Brazilian Property Developer | | | | | |
| | 1,100,000 | | | Multiplus | | | 19,172 | | |
| | | | | Loyalty Program Operator in Brazil | | | | | |
| | | | 267,747 | | |
| | | > Mexico 0.5% | |
| | 580,000 | | | Grupo Aeroportuario del
Sureste - ADR | | | 34,185 | | |
| | | | | Mexican Airport Operator | | | | | |
| | | | 34,185 | | |
| | | > Chile 0.4% | |
| | 340,000 | | | Sociedad Quimica y Minera de
Chile - ADR (b) | | | 22,005 | | |
| | | | | Producer of Specialty Fertilizers,
Lithium & Iodine | | | | | |
| | | | 22,005 | | |
| | | > Argentina 0.3% | |
| | 6,818,182 | | | Union Agriculture Group (a)(c) | | | 15,000 | | |
| | | | | Farmland Operator in Uruguay | | | | | |
| | 5,400,000 | | | Madalena Ventures (a)(c) | | | 3,128 | | |
| | | | | Oil & Gas Exploration in Argentina | | | | | |
| | | | 18,128 | | |
| | | > Colombia 0.2% | |
| | 8,240,000 | | | Canacol Energy (a) | | | 9,056 | | |
| | | | | Oil Producer in South America | | | | | |
| | 20,718,000 | | | Gulf United (a)(c) | | | 6,091 | | |
| | | | | Prospecting for Oil Alongside Large
Producers in Colombia | | | | | |
| | | | 15,147 | | |
| Latin America: Total | | | 357,212 | | |
Total Equities: 95.6%
(Cost: $4,331,138) | | | 6,152,500 | | |
| | | Securities Lending Collateral: 1.4% | |
| | 90,620,846 | | | Dreyfus Government Cash
Management Fund (g)
(7 day yield of 0.00%) | | | 90,621 | | |
Total Securities Lending Collateral:
(Cost: $90,621) | | | 90,621 | | |
| Principal Amount (000) | | | | Value (000) | |
| Short-Term Obligation 3.5% | |
| | | > Repurchase Agreement 3.5% | |
| $ | 226,923 | | | Repurchase Agreement with
Fixed Income Clearing Corp.,
dated 6/30/11, due 7/01/11
at 0.01%, collateralized by
U.S. Government Agency
obligations with various
maturities to 9/08/17,
market value $231,463
(repurchase proceeds $226,923) | | $ | 226,923 | | |
| | | | 226,923 | | |
Total Short-Term Obligation:
(Cost: $226,923) | | | 226,923 | | |
Total Investments: 100.5%
(Cost: $4,648,682)(h)(i) | | | 6,470,044 | | |
Obligation to Return Collateral for
Securities Loaned: (1.4)% | | | (90,621 | ) | |
| Cash and Other Assets Less Liabilities: 0.9% | | | 60,237 | | |
| Total Net Assets: 100.0% | | $ | 6,439,660 | | |
ADR = American Depositary Receipts
GDR = Global Depositary Receipts
See accompanying notes to financial statements.
45
Columbia Acorn International
Statement of Investments (Unaudited), continued
> Notes to Statements of Investments (dollar values in thousands)
(a) Non-income producing security.
(b) All or a portion of this security was on loan at June 30, 2011. The total market value of Fund securities on loan at June 30, 2011 was $88,468.
(c) Denotes a restricted security, which is subject to restrictions on resale under federal securities laws. These securities are valued at a fair value determined in good faith under consistently applied procedures established by the Board of Trustees. At June 30, 2011, the market value of these securities amounted to $95,229, which represented 1.48% of total net assets.
Additional information on these securities is as follows:
| Security | | Acquisition
Dates | | Shares | | Cost | | Value | |
| Mail.ru - GDR | | 11/05/10-12/31/10 | | | 764,506 | | | $ | 26,088 | | | $ | 25,397 | | |
| Tahoe Resources | | 5/28/10 | | | 872,700 | | | | 4,984 | | | | 16,125 | | |
| Union Agriculture Group | | 12/08/10 | | | 6,818,182 | | | | 15,000 | | | | 15,000 | | |
| Southern Arc Minerals | | 2/16/11 | | | 5,737,500 | | | | 9,308 | | | | 10,086 | | |
| DeeThree Exploration | | 9/07/10-3/08/11 | | | 2,696,000 | | | | 9,486 | | | | 9,862 | | |
| Gulf United | | 2/11/11 | | | 20,718,000 | | | | 6,215 | | | | 6,091 | | |
| Eacom Timber | | 3/17/10 | | | 12,500,000 | | | | 6,188 | | | | 3,937 | | |
| Petromanas | | 5/20/10 | | | 12,500,000 | | | | 4,344 | | | | 3,683 | | |
| Madalena Ventures | | 10/21/10 | | | 5,400,000 | | | | 3,422 | | | | 3,128 | | |
| Sterling Resources | | 12/02/10 | | | 1,050,500 | | | | 3,135 | | | | 1,761 | | |
| Petromanas - Warrants | | 5/20/10 | | | 6,250,000 | | | | 362 | | | | 159 | | |
| | | | | | | $ | 88,532 | | | $ | 95,229 | | |
(d) An affiliated person of the Fund may include any company in which the Fund owns five percent or more of its outstanding voting shares. Holdings and transactions in these affiliated companies during the six months ended June 30, 2011, are as follows:
| Affiliates | | Balance of
Shares Held
12/31/10 | |
Purchases/
Additions | |
Sales/
Reductions | | Balance of
Shares Held
6/30/11 | |
Value | |
Dividend | |
| DeeThree Exploration | | | 2,392,877 | | | | 1,346,000 | | | | - | | | | 3,738,877 | | | $ | 13,755 | | | $ | - | | |
| Gulf United* | | | - | | | | 20,718,000 | | | | - | | | | 20,718,000 | | | | 6,091 | | | | - | | |
| Southern Arc Minerals | | | - | | | | 5,737,500 | | | | - | | | | 5,737,500 | | | | 10,086 | | | | - | | |
| Unit 4 Aggresso | | | 1,476,800 | | | | - | | | | - | | | | 1,476,800 | | | | 53,390 | | | | 450 | | |
| United Drug* | | | 12,110,000 | | | | - | | | | 2,440,515 | | | | 9,669,485 | | | | 33,121 | | | | 1,013 | | |
| Wacom | | | 20,900 | | | | 2,600 | | | | - | | | | 23,500 | | | | 27,443 | | | | 721 | | |
| Workspace Group* | | | 60,304,000 | | | | - | | | | 4,211,000 | | | | 56,093,000 | | | | 27,233 | | | | 213 | | |
| Total of Affiliated Transactions | | | 76,304,577 | | | | 27,804,100 | | | | 6,651,515 | | | | 97,457,162 | | | $ | 171,119 | | | $ | 2,397 | | |
* At June 30, 2011, the Fund owned less than five percent of the company's outstanding voting shares.
The aggregate cost and value of these affiliated companies at June 30, 2011, was $85,252 and $104,674, respectively. Investments in affiliated companies represented 1.6% of total net assets at June 30, 2011.
(e) Security is traded on a U.S. exchange.
(f) Illiquid security.
(g) Investment made with cash collateral received from securities lending activity.
(h) At June 30, 2011, for federal income tax purposes, the cost of investments was $4,648,682 and net unrealized apppreciation was $1,821,362, consisting of gross unrealized appreciation of $2,050,001 and gross unrealized depreciation of $228,639.
(i) On June 30, 2011, the Fund's total investments were denominated in currencies as follows:
| Currency | | Value | | Percentage
of Net Assets | |
| Euro | | $ | 1,316,400 | | | | 20.4 | | |
| Japanese Yen | | | 1,043,679 | | | | 16.2 | | |
| U.S. Dollar | | | 904,297 | | | | 14.0 | | |
| British Pound | | | 448,015 | | | | 7.0 | | |
| Hong Kong Dollar | | | 385,544 | | | | 6.0 | | |
| Canadian Dollar | | | 334,678 | | | | 5.2 | | |
Other currencies less
than 5% of total net assets | | | 2,037,431 | | | | 31.7 | | |
| | | $ | 6,470,044 | | | | 100.5 | | |
See accompanying notes to financial statements.
46
> Notes to Statements of Investments (dollar values in thousands)
At June 30, 2011, the Fund had entered into the following forward foreign currency exchange contracts:
Forward Foreign Currency
Exchange Contracts to Buy | | Forward Foreign Currency
Exchange Contracts to Sell | | Principal Amount in
Foreign Currency | | Principal
Amount in U.S. Dollar | | Settlement Date | | Unrealized
Appreciation | |
| AUD | | | | USD | | | | | 40,296 | | | $ | 42,000 | | | 7/15/11 | | $ | 1,165 | | |
| AUD | | | | USD | | | | | 1,408 | | | | 1,500 | | | 7/15/11 | | | 8 | | |
| AUD | | | | USD | | | | | 38,544 | | | | 40,500 | | | 8/15/11 | | | 627 | | |
| AUD | | | | USD | | | | | 1,414 | | | | 1,500 | | | 8/15/11 | | | 8 | | |
| AUD | | | | USD | | | | | 39,736 | | | | 42,000 | | | 9/15/11 | | | 234 | | |
| CAD | | | | USD | | | | | 1,937 | | | | 2,000 | | | 7/15/11 | | | 8 | | |
| CAD | | | | USD | | | | | 3,876 | | | | 4,000 | | | 7/15/11 | | | 18 | | |
| CAD | | | | USD | | | | | 45,558 | | | | 47,000 | | | 8/15/11 | | | 188 | | |
| CAD | | | | USD | | | | | 3,879 | | | | 4,000 | | | 8/15/11 | | | 18 | | |
| CAD | | | | USD | | | | | 49,493 | | | | 51,000 | | | 9/15/11 | | | 226 | | |
| EUR | | | | USD | | | | | 3,877 | | | | 5,500 | | | 7/15/11 | | | 120 | | |
| JPY | | | | USD | | | | | 999,744 | | | | 12,000 | | | 7/15/11 | | | 419 | | |
| JPY | | | | USD | | | | | 484,386 | | | | 6,000 | | | 8/15/11 | | | 18 | | |
| | | | | | | $ | 259,000 | | | | | $ | 3,057 | | |
Forward Foreign Currency
Exchange Contracts to Buy | | Forward Foreign Currency
Exchange Contracts to Sell | | Principal Amount in
Foreign Currency | | Principal
Amount in U.S. Dollar | |
Settlement Date | | Unrealized
Depreciation | |
| USD | AUD | | | | | | | | 1,422 | | | $ | 1,500 | | | 7/15/11 | | $ | (23 | ) | |
| CAD | USD | | | | | | | | 43,344 | | | | 45,000 | | | 7/15/11 | | | (70 | ) | |
| USD | EUR | | | | | | | | 68,493 | | | | 99,000 | | | 7/15/11 | | | (297 | ) | |
| USD | EUR | | | | | | | | 4,150 | | | | 6,000 | | | 7/15/11 | | | (16 | ) | |
| USD | EUR | | | | | | | | 65,972 | | | | 93,500 | | | 8/15/11 | | | (2,060 | ) | |
| USD | EUR | | | | | | | | 4,154 | | | | 6,000 | | | 8/15/11 | | | (17 | ) | |
| USD | EUR | | | | | | | | 68,953 | | | | 99,500 | | | 9/15/11 | | | (290 | ) | |
| USD | JPY | | | | | | | | 484,482 | | | | 6,000 | | | 7/15/11 | | | (18 | ) | |
| JPY | USD | | | | | | | | 40,220 | | | | 500 | | | 7/15/11 | | | - | * | |
| JPY | USD | | | | | | | | 40,214 | | | | 500 | | | 8/15/11 | | | - | * | |
| JPY | USD | | | | | | | | 522,691 | | | | 6,500 | | | 9/15/11 | | | (5 | ) | |
| | | | | | | $ | 364,000 | | | | | $ | (2,796 | ) | |
* Rounds to less than $500.
The counterparty for all forward foreign currency exchange contracts is State Street Bank and Trust Company.
AUD = Australian Dollar
CAD = Canadian Dollar
EUR = Euro
JPY = Japanese Yen
USD = United States Dollar
Various inputs are used in determining the value of the Fund's investments, following the input prioritization hierarchy established by GAAP. These inputs are summarized in the three broad levels listed below:
• Level 1 – quoted prices in active markets for identical securities
• Level 2 – prices determined using other significant observable inputs (including quoted prices for similar securities, interest rates, prepayment speeds, credit risk and others)
• Level 3 – prices determined using significant unobservable inputs where quoted prices or observable inputs are unavailable or less reliable (including management's own assumptions about the factors market participants would use in pricing an investment)
The inputs or methodology used for valuing securities are not necessarily an indication of the risk associated with investing in those securities.
Examples of the types of securities in which the Fund would typically invest and how they are classified within this hierarchy are as follows. Typical Level 1 securities include exchange traded domestic equities, mutual funds whose NAVs are published each day and exchange traded foreign equities that are not statistically fair valued. Typical Level 2 securities include exchange traded foreign equities that are statistically fair valued, forward foreign currency exchange contracts and short-term investments valued at amortized cost. Additionally, securities fair valued by the Valuation Committee of the Fund's Board of Trustees that rely on significant observable inputs are also included in Level 2. Typical Level 3 securities include any security fair valued by the Valuation Committee that relies on significant unobservable inputs.
See accompanying notes to financial statements.
47
Columbia Acorn International
Statement of Investments (Unaudited), continued
> Notes to Statements of Investments (dollar values in thousands)
The following table summarizes the inputs used, as of June 30, 2011, in valuing the Fund's assets:
| Investment Type | |
Quoted Prices
(Level 1) | | Other
Significant
Observable
Inputs
(Level 2) | |
Significant
Unobservable
Inputs
(Level 3) | |
Total | |
| Equities | |
| Europe | | $ | 65,833 | | | $ | 2,341,862 | | | $ | - | | | $ | 2,407,695 | | |
| Asia | | | 162,969 | | | | 2,207,288 | | | | - | | | | 2,370,257 | | |
| Other Countries | | | 541,710 | | | | 475,626 | | | | - | | | | 1,017,336 | | |
| Latin America | | | 332,993 | | | | 9,219 | | | | 15,000 | | | | 357,212 | | |
| Total Equities | | | 1,103,505 | | | | 5,033,995 | | | | 15,000 | | | | 6,152,500 | | |
| Total Securities Lending Collateral | | | 90,621 | | | | - | | | | - | | | | 90,621 | | |
| Total Short-Term Obligation | | | - | | | | 226,923 | | | | - | | | | 226,923 | | |
| Total Investments | | $ | 1,194,126 | | | $ | 5,260,918 | | | $ | 15,000 | | | $ | 6,470,044 | | |
Unrealized Appreciation on Forward Foreign Currency
Exchange Contracts | | | - | | | | 3,057 | | | | - | | | | 3,057 | | |
Unrealized Depreciation on Forward Foreign Currency
Exchange Contracts | | | - | | | | (2,796 | ) | | | - | | | | (2,796 | ) | |
| Total | | $ | 1,194,126 | | | $ | 5,261,179 | | | $ | 15,000 | | | $ | 6,470,305 | | |
The Fund's assets assigned to the Level 2 input category are generally valued using a market approach, in which a security's value is determined through its correlation to prices and information from observable market transactions for similar or identical assets. Foreign equities are generally valued at the last sales price on the foreign exchange or market on which they trade. The Fund may use a systematic fair valuation model provided by an independent third party to value securities principally traded in foreign markets in order to adjust for possible stale pricing that may occur between the close of the foreign exchanges and the time for valuation. These models take into account available market data including intraday index, ADR, and ETF movements. Forward foreign currency exchange contracts are valued at the prevailing forward exchange rate of the underlying currencies. Securities acquired via private placement that have a holding period or an extended settlement period are valued at a discount to the same shares that are trading freely on the market. These discounts are determined by the adviser's experience with similar securities or situations. Factors may include, but are not limited to, trade volume, shares outstanding and stock price.
Certain short-term obligations may be valued using amortized cost, an income approach which converts future cash flows to a present value based upon the discount or premium at purchase.
The Fund's assets assigned to the Level 3 input category are valued at fair value as determined in good faith under consistently applied procedures established by and under the general supervision of the Board of Trustees. To determine fair value, management will utilize the valuation technique that they deem the most appropriate in the circumstances. Securities acquired via private placement that are not yet trading are valued using a market approach for which management has determined that the original transaction price is the best representation of fair value. The original cost may be adjusted for the market movement in an index, ETF or similar security during the period it does not trade.
The following table shows transfers between Level 1 and Level 2 of the fair value hierarchy.
| Transfers In | | Transfers Out | |
| Level 1 | | Level 2 | | Level 1 | | Level 2 | |
| $ | 263,663 | | | $ | 13,490 | | | $ | 13,490 | | | $ | 263,663 | | |
Financial assets were transferred from Level 2 to Level 1 as they resumed trading during the period.
Foreign exchange-traded financial assets were transferred from Level 1 to Level 2.
The following table reconciles asset balances for the six months ending June 30, 2011, in which significant unobservable inputs (Level 3) were used in determining value:
Investments
in Securities | | Balance
as of
December 31,
2010 | |
Realized
Gain/(Loss) | | Change in
Unrealized
Appreciation
(Depreciation) | |
Purchases | |
Sales | |
Transfers
into
Level 3 | |
Transfers
out of
Level 3 | | Balance
as of
June 30,
2011 | |
| Equities | |
| Asia | | $ | 79 | | | $ | (38,558 | ) | | $ | 38,479 | | | $ | - | | | $ | - | | | $ | - | | | $ | - | | | $ | - | | |
| Latin America | | | 15,000 | | | | - | | | | - | | | | - | | | | - | | | | - | | | | - | | | | 15,000 | | |
| | | $ | 15,079 | | | $ | (38,558 | ) | | $ | 38,479 | | | $ | - | | | $ | - | | | $ | - | | | $ | - | | | $ | 15,000 | | |
The information in the above reconciliation table represents fiscal year to date activity for any securities identified as using Level 3 inputs at either the beginning or the end of the current fiscal period.
The change in unrealized appreciation (depreciation) attributed to securities owned at June 30, 2011, which were valued using significant unobservable inputs (Level 3) amounted to $38,479. This amount is included in net change in unrealized appreciation (depreciation) on the Statements of Changes in Net Assets.
For more information on valuation inputs, and their aggregation into the levels used in the tables above, please refer to the Security Valuation section in the accompanying Notes to Financial Statements.
See accompanying notes to financial statements.
48
Columbia Acorn International
Portfolio Diversification (Unaudited)
At June 30, 2011, the Fund's portfolio investments as a percent of net assets were diversified as follows:
| | | Value (000) | | Percentage
of Net Assets | |
| > Industrial Goods & Services | |
| Other Industrial Services | | $ | 541,127 | | | | 8.4 | | |
| Machinery | | | 469,283 | | | | 7.3 | | |
Industrial Materials & Specialty
Chemicals | | | 459,670 | | | | 7.1 | | |
| Electrical Components | | | 130,742 | | | | 2.0 | | |
| Conglomerates | | | 103,870 | | | | 1.6 | | |
| Construction | | | 87,084 | | | | 1.4 | | |
| Outsourcing Services | | | 50,077 | | | | 0.8 | | |
| Industrial Distribution | | | 19,391 | | | | 0.3 | | |
| | | | 1,861,244 | | | | 28.9 | | |
| > Consumer Goods & Services | |
| Retail | | | 247,635 | | | | 3.9 | | |
| Food & Beverage | | | 189,620 | | | | 2.9 | | |
| Casinos & Gaming | | | 181,242 | | | | 2.8 | | |
| Nondurables | | | 147,738 | | | | 2.3 | | |
| Apparel | | | 118,771 | | | | 1.8 | | |
| Other Consumer Services | | | 112,523 | | | | 1.7 | | |
| Travel | | | 107,797 | | | | 1.7 | | |
| Other Entertainment | | | 49,541 | | | | 0.8 | | |
| Educational Services | | | 41,991 | | | | 0.7 | | |
| Consumer Goods Distribution | | | 18,445 | | | | 0.3 | | |
| | | | 1,215,303 | | | | 18.9 | | |
| > Energy & Minerals | |
| Mining | | | 290,874 | | | | 4.5 | | |
| Oil Services | | | 262,762 | | | | 4.1 | | |
| Oil & Gas Producers | | | 120,004 | | | | 1.8 | | |
Oil Refining, Marketing &
Distribution | | | 88,879 | | | | 1.4 | | |
| Agricultural Commodities | | | 75,308 | | | | 1.2 | | |
| | | | 837,827 | | | | 13.0 | | |
| > Information | |
| Instrumentation | | | 146,256 | | | | 2.3 | | |
| Internet Related | | | 141,016 | | | | 2.2 | | |
Computer Hardware & Related
Equipment | | | 112,699 | | | | 1.8 | | |
| Business Software | | | 93,992 | | | | 1.5 | | |
| Financial Processors | | | 78,273 | | | | 1.2 | | |
| Mobile Communications | | | 51,592 | | | | 0.8 | | |
| Telephone and Data Services | | | 45,463 | | | | 0.7 | | |
| Computer Services | | | 30,956 | | | | 0.5 | | |
| Gaming Equipment & Services | | | 29,621 | | | | 0.5 | | |
| CATV | | | 26,875 | | | | 0.4 | | |
| Telecommunications Equipment | | | 24,845 | | | | 0.4 | | |
Semiconductors & Related
Equipment | | | 19,409 | | | | 0.3 | | |
| Advertising | | | 10,116 | | | | 0.2 | | |
| | | | 811,113 | | | | 12.8 | | |
| | | Value (000) | | Percentage
of Net Assets | |
| > Other Industries | |
| Real Estate | | $ | 361,797 | | | | 5.6 | | |
| Transportation | | | 163,746 | | | | 2.5 | | |
| Regulated Utilities | | | 100,687 | | | | 1.6 | | |
| | | | 626,230 | | | | 9.7 | | |
| > Finance | |
| Banks | | | 162,412 | | | | 2.5 | | |
| Brokerage & Money Management | | | 137,955 | | | | 2.1 | | |
| Finance Companies | | | 93,321 | | | | 1.5 | | |
| Insurance | | | 63,547 | | | | 1.0 | | |
| | | | 457,235 | | | | 7.1 | | |
| > Health Care | |
| Medical Equipment & Devices | | | 136,817 | | | | 2.1 | | |
| Pharmaceuticals | | | 98,980 | | | | 1.5 | | |
| Medical Supplies | | | 41,365 | | | | 0.6 | | |
| Health Care Services | | | 35,231 | | | | 0.5 | | |
| Biotechnology & Drug Delivery | | | 31,155 | | | | 0.5 | | |
| | | | 343,548 | | | | 5.2 | | |
| Total Equities: | | | 6,152,500 | | | | 95.6 | | |
| Securities Lending Collateral: | | | 90,621 | | | | 1.4 | | |
| Short-Term Obligation: | | | 226,923 | | | | 3.5 | | |
| Total Investments: | | | 6,470,044 | | | | 100.5 | | |
Obligation to Return
Collateral for Securities
Loaned: | | | (90,621 | ) | | | (1.4 | ) | |
Cash and Other Assets
Less Liabilities: | | | 60,237 | | | | 0.9 | | |
| Net Assets: | | $ | 6,439,660 | | | | 100.0 | | |
See accompanying notes to financial statements.
49
Columbia Acorn USA
Major Portfolio Changes in the Second Quarter (Unaudited)
| | | Number of Shares | |
| | | 03/31/11 | | 06/30/11 | |
| Purchases | |
| Consumer Goods & Services | |
| HomeAway | | | 0 | | | | 30,000 | | |
| Industrial Goods & Services | |
| Drew Industries | | | 326,000 | | | | 496,000 | | |
| ESCO Technologies | | | 735,000 | | | | 835,000 | | |
| HEICO | | | 403,732 | | | | 504,665 | | |
| Nordson | | | 373,600 | | | | 747,200 | | |
| Finance | |
| Enstar Group | | | 0 | | | | 39,000 | | |
| Hancock Holding | | | 40,000 | | | | 278,678 | | |
| TrustCo Bank | | | 0 | | | | 245,300 | | |
| Health Care | |
| Akorn | | | 676,582 | | | | 725,000 | | |
| Auxilium Pharmaceuticals | | | 205,000 | | | | 375,000 | | |
| Community Health Systems | | | 0 | | | | 151,000 | | |
| Isis Pharmaceuticals | | | 626,000 | | | | 850,000 | | |
| Kindred Healthcare | | | 0 | | | | 150,000 | | |
| United Therapeutics | | | 65,000 | | | | 102,000 | | |
| Energy & Minerals | |
| FMC Technologies | | | 500,000 | | | | 1,000,000 | | |
| Swift Energy | | | 84,000 | | | | 168,000 | | |
| Other Industries | |
| Rush Enterprises, Class A | | | 210,091 | | | | 410,091 | | |
| | | Number of Shares | |
| | | 03/31/11 | | 06/30/11 | |
| Sales | |
| Information | |
| Acxiom | | | 172,000 | | | | 0 | | |
| Blue Coat Systems | | | 197,000 | | | | 0 | | |
| Crown Castle International | | | 150,000 | | | | 0 | | |
| Equinix | | | 44,000 | | | | 0 | | |
| SRA International | | | 261,000 | | | | 0 | | |
| Supertex | | | 177,266 | | | | 0 | | |
| Consumer Goods & Services | |
| Chico's FAS | | | 614,000 | | | | 481,000 | | |
| Express | | | 104,508 | | | | 0 | | |
| ITT Educational Services | | | 153,700 | | | | 37,350 | | |
| Knoll | | | 980,000 | | | | 880,000 | | |
| Vail Resorts | | | 150,000 | | | | 71,000 | | |
| Wet Seal | | | 620,000 | | | | 0 | | |
| Industrial Goods & Services | |
| American Reprographics | | | 396,000 | | | | 0 | | |
| Mueller Water Products | | | 550,000 | | | | 204,200 | | |
| Finance | |
| GATX | | | 240,000 | | | | 42,400 | | |
| Investment Technology Group | | | 139,400 | | | | 0 | | |
| Tower Group | | | 222,000 | | | | 0 | | |
| Valley National Bancorp | | | 981,941 | | | | 931,000 | | |
| Whitney Holding | | | 571,000 | | | | 0 | | |
| Wilmington Trust | | | 245,000 | | | | 0 | | |
| Health Care | |
| Allos Therapeutics | | | 446,532 | | | | 0 | | |
| American Medical Systems | | | 72,000 | | | | 0 | | |
| Idenix Pharmaceuticals | | | 428,965 | | | | 0 | | |
| Nektar Therapeutics | | | 146,710 | | | | 0 | | |
| Energy & Minerals | |
| Atwood Oceanics | | | 845,000 | | | | 803,000 | | |
| Carrizo Oil & Gas | | | 146,000 | | | | 73,000 | | |
| Hornbeck Offshore | | | 101,000 | | | | 0 | | |
| Tesco | | | 53,000 | | | | 0 | | |
See accompanying notes to financial statements.
50
Columbia Acorn USA
Statement of Investments (Unaudited), June 30, 2011
| Number of Shares | | | | Value (000) | |
| | | | | | | Equities: 99.4% | |
| Information 34.1% | | | |
| | | > Business Software 9.7% | |
| | 985,000 | | | Informatica (a) | | $ | 57,554 | | |
| | | | | Enterprise Data Integration Software | | | | | |
| | 698,000 | | | Micros Systems (a) | | | 34,698 | | |
| | | | | Information Systems for Hotels,
Restaurants & Retailers | | | | | |
| | 375,000 | | | ANSYS (a) | | | 20,501 | | |
| | | | | Simulation Software for Engineers &
Designers | | | | | |
| | 408,000 | | | Ariba (a) | | | 14,064 | | |
| | | | | Cost Management Software | | | | | |
| | 243,000 | | | Concur Technologies (a) | | | 12,167 | | |
| | | | | Web Enabled Cost & Expense Management
Software | | | | | |
| | 247,000 | | | Blackboard (a)(b) | | | 10,717 | | |
| | | | | Education Software | | | | | |
| | 333,000 | | | Blackbaud | | | 9,231 | | |
| | | | | Software & Services for Non-profits | | | | | |
| | 220,000 | | | Advent Software (a) | | | 6,197 | | |
| | | | | Asset Management & Trading Systems | | | | | |
| | 322,000 | | | SPS Commerce (a) | | | 5,728 | | |
| | | | | Supply Chain Management Software Delivered
via the Web | | | | | |
| | 129,000 | | | NetSuite (a) | | | 5,057 | | |
| | | | | End to End IT Systems Solutions Delivered
Over the Web | | | | | |
| | 198,000 | | | Constant Contact (a) | | | 5,025 | | |
| | | | | E-mail & Other Marketing Campaign
Management Systems Delivered Over the Web | | | | | |
| | 52,000 | | | Quality Systems | | | 4,540 | | |
| | | | | IT Systems for Medical Groups & Ambulatory
Care Centers | | | | | |
| | | | 185,479 | | |
| | | > Instrumentation 4.7% | |
| | 678,000 | | | IPG Photonics (a) | | | 49,297 | | |
| | | | | Fiber Lasers | | | | | |
| | 180,000 | | | Mettler Toledo (a) | | | 30,361 | | |
| | | | | Laboratory Equipment | | | | | |
| | 168,000 | | | Trimble Navigation (a) | | | 6,660 | | |
| | | | | GPS-based Instruments | | | | | |
| | 130,000 | | | FLIR Systems | | | 4,382 | | |
| | | | | Infrared Cameras | | | | | |
| | | | 90,700 | | |
| | | > Semiconductors &
Related Equipment 4.4% | |
| | 1,958,000 | | | Atmel (a) | | | 27,549 | | |
| | | | | Microcontrollers, Radio Frequency &
Memory Semiconductors | | | | | |
| | 760,000 | | | Microsemi (a) | | | 15,580 | | |
| | | | | Analog/Mixed-signal Semiconductors | | | | | |
| | 1,061,750 | | | ON Semiconductor (a) | | | 11,117 | | |
| | | | | Mixed-signal & Power Management
Semiconductors | | | | | |
| | 1,075,000 | | | TriQuint Semiconductor (a) | | | 10,954 | | |
| | | | | Radio Frequency Semiconductors | | | | | |
| | 675,000 | | | Entegris (a) | | | 6,831 | | |
| | | | | Semiconductor Materials Management
Products | | | | | |
| Number of Shares | | | | Value (000) | |
| | 346,000 | | | Monolithic Power Systems (a) | | $ | 5,336 | | |
| | | | | High Performance Analog & Mixed-signal
Integrated Circuits (ICs) | | | | | |
| | 448,000 | | | Applied Micro Circuits (a) | | | 3,969 | | |
| | | | | Communications Semiconductors | | | | | |
| | 430,000 | | | Pericom Semiconductor (a) | | | 3,844 | | |
| | | | | Interface Integrated Circuits (ICs) &
Frequency Control Products | | | | | |
| | | | 85,180 | | |
| | | > Computer Hardware &
Related Equipment 3.9% | |
| | 1,238,000 | | | II-VI (a) | | | 31,693 | | |
| | | | | Laser Optics & Specialty Materials | | | | | |
| | 324,000 | | | Zebra Technologies (a) | | | 13,663 | | |
| | | | | Bar Code Printers | | | | | |
| | 196,000 | | | Amphenol | | | 10,582 | | |
| | | | | Electronic Connectors | | | | | |
| | 280,000 | | | Nice Systems - ADR (Israel) (a) | | | 10,181 | | |
| | | | | Audio & Video Recording Solutions | | | | | |
| | 196,000 | | | Netgear (a) | | | 8,569 | | |
| | | | | Networking Products for Small Business &
Home | | | | | |
| | | | 74,688 | | |
| | | > Telephone and Data Services 2.9% | |
| | 1,617,000 | | | tw telecom (a) | | | 33,197 | | |
| | | | | Fiber Optic Telephone/Data Services | | | | | |
| | 168,800 | | | AboveNet | | | 11,893 | | |
| | | | | Metropolitan Fiber Communications Services | | | | | |
| | 2,030,000 | | | PAETEC Holding (a) | | | 9,724 | | |
| | | | | Telephone/Data Services for Business | | | | | |
| | | | 54,814 | | |
| | | > Telecommunications Equipment 2.9% | |
| | 386,000 | | | Polycom (a) | | | 24,820 | | |
| | | | | Video Conferencing Equipment | | | | | |
| | 732,000 | | | Finisar (a) | | | 13,198 | | |
| | | | | Optical Sub-systems & Components | | | | | |
| | 903,000 | | | Ixia (a) | | | 11,558 | | |
| | | | | Telecom Network Test Equipment | | | | | |
| | 752,000 | | | Infinera (a) | | | 5,196 | | |
| | | | | Optical Networking Equipment | | | | | |
| | | | 54,772 | | |
| | | > Gaming Equipment &
Services 1.8% | |
| | 660,000 | | | Bally Technologies (a) | | | 26,849 | | |
| | | | | Slot Machines & Software | | | | | |
| | 235,000 | | | WMS Industries (a) | | | 7,219 | | |
| | | | | Slot Machine Provider | | | | | |
| | | | 34,068 | | |
| | | > Mobile Communications 1.3% | |
| | 650,000 | | | SBA Communications (a) | | | 24,824 | | |
| | | | | Communications Towers | | | | | |
| | | | 24,824 | | |
| | | > Computer Services 1.0% | |
| | 428,000 | | | ExlService Holdings (a) | | | 9,887 | | |
| | | | | BPO (Business Process Outsourcing) | | | | | |
| | 1,005,500 | | | Hackett Group (a) | | | 5,118 | | |
| | | | | IT Integration & Best Practice Research | | | | | |
See accompanying notes to financial statements.
51
Columbia Acorn USA
Statement of Investments (Unaudited), continued
| Number of Shares | | | | Value (000) | |
| | | > Computer Services—continued | |
| | 710,000 | | | RCM Technologies (a)(c) | | $ | 3,798 | | |
| | | | | Technology & Engineering Services | | | | | |
| | | | 18,803 | | |
| | | > Financial Processors 0.5% | |
| | 188,000 | | | Global Payments | | | 9,588 | | |
| | | | | Credit Card Processor | | | | | |
| | | | 9,588 | | |
| | | > Contract Manufacturing 0.5% | |
| | 261,000 | | | Plexus (a) | | | 9,085 | | |
| | | | | Electronic Manufacturing Services | | | | | |
| | | | 9,085 | | |
| | | > Entertainment Programming 0.2% | |
| | 145,000 | | | IMAX (Canada) (a) | | | 4,702 | | |
| | | | | IMAX Movies, Theatre Equipment & Theatre
Joint Ventures | | | | | |
| | | | 4,702 | | |
| | | > Radio 0.1% | |
| | 511,100 | | | Salem Communications | | | 1,835 | | |
| | | | | Radio Stations for Religious Programming | | | | | |
| | 71,718 | | | Spanish Broadcasting System (a) | | | 50 | | |
| | | | | Spanish Language Radio Stations | | | | | |
| | | | 1,885 | | |
| | | > TV Broadcasting 0.1% | |
| | 975,000 | | | Entravision Communications (a) | | | 1,804 | | |
| | | | | Spanish Language TV & Radio Stations | | | | | |
| | | | 1,804 | | |
| | | > Internet Related 0.1% | |
| | 343,000 | | | TheStreet.com | | | 1,053 | | |
| | | | | Financial Information Websites | | | | | |
| | | | 1,053 | | |
| Information: Total | | | 651,445 | | |
| Consumer Goods & Services 16.9% | | | |
| | | > Retail 6.2% | |
| | 390,000 | | | lululemon athletica (a) | | | 43,610 | | |
| | | | | Premium Active Apparel Retailer | | | | | |
| | 468,500 | | | Abercrombie & Fitch | | | 31,352 | | |
| | | | | Teen Apparel Retailer | | | | | |
| | 254,000 | | | Shutterfly (a) | | | 14,585 | | |
| | | | | Internet Photo-centric Retailer | | | | | |
| | 875,000 | | | Saks (a) | | | 9,774 | | |
| | | | | Luxury Department Store Retailer | | | | | |
| | 805,000 | | | Pier 1 Imports (a) | | | 9,314 | | |
| | | | | Home Furnishing Retailer | | | | | |
| | 481,000 | | | Chico's FAS | | | 7,325 | | |
| | | | | Women's Specialty Retailer | | | | | |
| | 480,000 | | | Talbots (a)(b) | | | 1,603 | | |
| | | | | Women's Specialty Retailer | | | | | |
| | 9,000 | | | The Fresh Market (a) | | | 348 | | |
| | | | | Specialty Food Retailer | | | | | |
| | | | 117,911 | | |
| | | > Travel 3.2% | |
| | 849,700 | | | Gaylord Entertainment (a) | | | 25,491 | | |
| | | | | Convention Hotels | | | | | |
| Number of Shares | | | | Value (000) | |
| | 1,175,950 | | | Avis Budget Group (a) | | $ | 20,097 | | |
| | | | | Second Largest Car Rental Company | | | | | |
| | 750,000 | | | Hertz (a) | | | 11,910 | | |
| | | | | Largest U.S. Rental Car Operator | | | | | |
| | 71,000 | | | Vail Resorts | | | 3,282 | | |
| | | | | Ski Resort Operator & Developer | | | | | |
| | 30,000 | | | HomeAway (a) | | | 1,161 | | |
| | | | | Vacation Rental Online Marketplace | | | | | |
| | | | 61,941 | | |
| | | > Furniture & Textiles 1.9% | |
| | 880,000 | | | Knoll | | | 17,662 | | |
| | | | | Office Furniture | | | | | |
| | 540,000 | | | Interface | | | 10,460 | | |
| | | | | Modular & Broadloom Carpet | | | | | |
| | 260,000 | | | Herman Miller | | | 7,077 | | |
| | | | | Office Furniture | | | | | |
| | | | 35,199 | | |
| | | > Apparel 1.3% | |
| | 192,000 | | | Warnaco Group (a) | | | 10,032 | | |
| | | | | Global Branded Apparel Manufacturer | | | | | |
| | 90,000 | | | Deckers Outdoor (a) | | | 7,932 | | |
| | | | | Fashion Footwear Wholesaler | | | | | |
| | 241,530 | | | True Religion Apparel (a) | | | 7,024 | | |
| | | | | Premium Denim | | | | | |
| | | | 24,988 | | |
| | | > Casinos & Gaming 1.1% | |
| | 270,000 | | | Penn National Gaming (a) | | | 10,892 | | |
| | | | | Regional Casino Operator | | | | | |
| | 645,000 | | | Pinnacle Entertainment (a) | | | 9,610 | | |
| | | | | Regional Casino Operator | | | | | |
| | | | 20,502 | | |
| | | > Food & Beverage 0.8% | |
| | 197,000 | | | Diamond Foods (b) | | | 15,039 | | |
| | | | | Snack Foods & Culinary Ingredients | | | | | |
| | | | 15,039 | | |
| | | > Consumer Goods Distribution 0.7% | |
| | 472,000 | | | Pool | | | 14,070 | | |
| | | | | Distributor of Swimming Pool Supplies &
Equipment | | | | | |
| | | | 14,070 | | |
| | | > Other Durable Goods 0.6% | |
| | 161,000 | | | Cavco Industries (a) | | | 7,245 | | |
| | | | | Manufactured Homes | | | | | |
| | 140,000 | | | Jarden | | | 4,831 | | |
| | | | | Branded Household Products | | | | | |
| | | | 12,076 | | |
| | | > Other Consumer Services 0.5% | |
| | 259,000 | | | Lifetime Fitness (a) | | | 10,337 | | |
| | | | | Sport & Fitness Club Operator | | | | | |
| | | | 10,337 | | |
| | | > Educational Services 0.3% | |
| | 165,000 | | | Universal Technical Institute | | | 3,262 | | |
| | | | | Vocational Training | | | | | |
| | 37,350 | | | ITT Educational Services (a) | | | 2,922 | | |
| | | | | Post-secondary Degree Services | | | | | |
| | | | 6,184 | | |
See accompanying notes to financial statements.
52
| Number of Shares | | | | Value (000) | |
| | | > Leisure Products 0.3% | |
| | 162,000 | | | Thor Industries | | $ | 4,672 | | |
| | | | | RV & Bus Manufacturer | | | | | |
| | | | 4,672 | | |
| | | > Restaurants —% | |
| | 26,600 | | | Bravo Brio Restaurant Group (a) | | | 650 | | |
| | | | | Upscale Casual Italian Restaurants | | | | | |
| | | | 650 | | |
| Consumer Goods & Services: Total | | | 323,569 | | |
| Industrial Goods & Services 15.1% | | | |
| | | > Machinery 11.6% | |
| | 941,250 | | | Ametek | | | 42,262 | | |
| | | | | Aerospace/Industrial Instruments | | | | | |
| | 747,200 | | | Nordson | | | 40,984 | | |
| | | | | Dispensing Systems for Adhesives & Coatings | | | | | |
| | 835,000 | | | ESCO Technologies | | | 30,728 | | |
| | | | | Automatic Electric Meter Readers | | | | | |
| | 445,000 | | | Donaldson | | | 27,003 | | |
| | | | | Industrial Air Filtration | | | | | |
| | 585,000 | | | Pentair | | | 23,611 | | |
| | | | | Pumps & Water Treatment | | | | | |
| | 504,665 | | | HEICO | | | 20,065 | | |
| | | | | FAA Approved Aircraft Replacement Parts | | | | | |
| | 280,000 | | | MOOG (a) | | | 12,186 | | |
| | | | | Motion Control Products for Aerospace,
Defense & Industrial Markets | | | | | |
| | 177,000 | | | Kennametal | | | 7,471 | | |
| | | | | Consumable Cutting Tools | | | | | |
| | 100,000 | | | WABCO Holdings (a) | | | 6,906 | | |
| | | | | Truck & Bus Component Supplier | | | | | |
| | 162,000 | | | Oshkosh (a) | | | 4,688 | | |
| | | | | Specialty Truck Manufacturer | | | | | |
| | 71,800 | | | Toro | | | 4,344 | | |
| | | | | Turf Maintenance Equipment | | | | | |
| | 50,000 | | | Kaydon | | | 1,866 | | |
| | | | | Specialized Friction & Motion Control
Products | | | | | |
| | | | 222,114 | | |
| | | > Industrial Materials &
Specialty Chemicals 1.0% | |
| | 496,000 | | | Drew Industries | | | 12,261 | | |
| | | | | RV & Manufactured Home Components | | | | | |
| | 54,000 | | | Albemarle | | | 3,737 | | |
| | | | | Refinery Catalysts & Other Specialty
Chemicals | | | | | |
| | 135,000 | | | Albany International | | | 3,563 | | |
| | | | | Paper Machine Clothing & Advanced Textiles | | | | | |
| | | | 19,561 | | |
| | | > Electrical Components 0.8% | |
| | 280,000 | | | Acuity Brands | | | 15,618 | | |
| | | | | Commercial Lighting Fixtures | | | | | |
| | | | 15,618 | | |
| | | > Steel 0.5% | |
| | 486,000 | | | GrafTech International (a) | | | 9,851 | | |
| | | | | Industrial Graphite Materials Producer | | | | | |
| | | | 9,851 | | |
| Number of Shares | | | | Value (000) | |
| | | > Other Industrial Services 0.4% | |
| | 265,000 | | | TrueBlue (a) | | $ | 3,837 | | |
| | | | | Temporary Manual Labor | | | | | |
| | 109,000 | | | Forward Air | | | 3,683 | | |
| | | | | Freight Transportation Between Airports | | | | | |
| | | | 7,520 | | |
| | | > Industrial Distribution 0.4% | |
| | 350,000 | | | Interline Brands (a) | | | 6,430 | | |
| | | | | Industrial Distribution | | | | | |
| | | | 6,430 | | |
| | | > Waste Management 0.3% | |
| | 195,000 | | | Waste Connections | | | 6,187 | | |
| | | | | Solid Waste Management | | | | | |
| | | | 6,187 | | |
| | | > Water 0.1% | |
| | 204,200 | | | Mueller Water Products | | | 813 | | |
| | | | | Fire Hydrants, Valves & Ductile Iron Pipes | | | | | |
| | | | 813 | | |
| Industrial Goods & Services: Total | | | 288,094 | | |
| Finance 9.9% | | | |
| | | > Banks 4.9% | |
| | 931,000 | | | Valley National Bancorp | | | 12,671 | | |
| | | | | New Jersey/New York Bank | | | | | |
| | 170,000 | | | SVB Financial Group (a) | | | 10,151 | | |
| | | | | Bank to Venture Capitalists | | | | | |
| | 692,400 | | | Associated Banc-Corp | | | 9,624 | | |
| | | | | Midwest Bank | | | | | |
| | 431,597 | | | Lakeland Financial | | | 9,607 | | |
| | | | | Indiana Bank | | | | | |
| | 480,000 | | | MB Financial | | | 9,235 | | |
| | | | | Chicago Bank | | | | | |
| | 659,800 | | | TCF Financial | | | 9,105 | | |
| | | | | Great Lakes Bank | | | | | |
| | 278,678 | | | Hancock Holding | | | 8,633 | | |
| | | | | Gulf Coast Bank | | | | | |
| | 1,478,200 | | | First Busey | | | 7,820 | | |
| | | | | Illinois Bank | | | | | |
| | 527,700 | | | Pacific Continental | | | 4,828 | | |
| | | | | Pacific Northwest Bank | | | | | |
| | 269,600 | | | Eagle Bancorp (a) | | | 3,586 | | |
| | | | | Metro D.C. Bank | | | | | |
| | 178,826 | | | Sandy Spring Bancorp | | | 3,217 | | |
| | | | | Baltimore/D.C. Bank | | | | | |
| | 210,000 | | | CVB Financial | | | 1,943 | | |
| | | | | Inland Empire Business Bank | | | | | |
| | 90,000 | | | TriCo Bancshares | | | 1,314 | | |
| | | | | California Central Valley Bank | | | | | |
| | 245,300 | | | TrustCo Bank | | | 1,202 | | |
| | | | | New York State Bank | | | | | |
| | 851,247 | | | Guaranty Bancorp (a) | | | 1,141 | | |
| | | | | Colorado Bank | | | | | |
| | | | 94,077 | | |
| | | > Finance Companies 3.3% | |
| | 345,000 | | | World Acceptance (a) | | | 22,622 | | |
| | | | | Personal Loans | | | | | |
See accompanying notes to financial statements.
53
Columbia Acorn USA
Statement of Investments (Unaudited), continued
| Number of Shares | | | | Value (000) | |
| | | > Finance Companies—continued | |
| | 412,500 | | | Aaron's | | $ | 11,657 | | |
| | | | | Rent to Own | | | | | |
| | 335,418 | | | McGrath Rentcorp | | | 9,418 | | |
| | | | | Temporary Space & IT Rentals | | | | | |
| | 285,000 | | | Textainer Group Holdings | | | 8,761 | | |
| | | | | Top International Container Leasor | | | | | |
| | 230,000 | | | CAI International (a) | | | 4,752 | | |
| | | | | International Container Leasing | | | | | |
| | 201,000 | | | H&E Equipment Services (a) | | | 2,812 | | |
| | | | | Heavy Equipment Leasing | | | | | |
| | 42,400 | | | GATX | | | 1,574 | | |
| | | | | Rail Car Lessor | | | | | |
| | 99,200 | | | Marlin Business Services (a) | | | 1,255 | | |
| | | | | Small Equipment Leasing | | | | | |
| | | | 62,851 | | |
| | | > Savings & Loans 0.9% | |
| | 756,000 | | | ViewPoint Financial | | | 10,433 | | |
| | | | | Texas Thrift | | | | | |
| | 215,000 | | | Berkshire Hills Bancorp | | | 4,814 | | |
| | | | | Northeast Thrift | | | | | |
| | 173,073 | | | Kaiser Federal Financial Group | | | 2,132 | | |
| | | | | Los Angeles Savings & Loan | | | | | |
| | | | 17,379 | | |
| | | > Brokerage & Money
Management 0.6% | |
| | 209,500 | | | Eaton Vance | | | 6,333 | | |
| | | | | Specialty Mutual Funds | | | | | |
| | 675,000 | | | MF Global (a) | | | 5,225 | | |
| | | | | Futures Broker | | | | | |
| | | | 11,558 | | |
| | | > Insurance 0.2% | |
| | 39,000 | | | Enstar Group (a) | | | 4,075 | | |
| | | | | Insurance/Reinsurance & Related Services | | | | | |
| | | | 4,075 | | |
| Finance: Total | | | 189,940 | | |
| Health Care 8.8% | | | |
| | | > Biotechnology & Drug Delivery 4.4% | |
| | 520,000 | | | BioMarin Pharmaceutical (a) | | | 14,149 | | |
| | | | | Biotech Focused on Orphan Diseases | | | | | |
| | 491,882 | | | Seattle Genetics (a) | | | 10,094 | | |
| | | | | Antibody-based Therapies for Cancer | | | | | |
| | 232,000 | | | Onyx Pharmaceuticals (a) | | | 8,190 | | |
| | | | | Commercial-stage Biotech Focused on Cancer | | | | | |
| | 840,000 | | | NPS Pharmaceuticals (a) | | | 7,938 | | |
| | | | | Orphan Drugs & Healthy Royalties | | | | | |
| | 850,000 | | | Isis Pharmaceuticals (a) | | | 7,786 | | |
| | | | | Biotech Pioneer in Anti-sense Drugs | | | | | |
| | 375,000 | | | Auxilium Pharmaceuticals (a) | | | 7,350 | | |
| | | | | Biotech Focused on Niche Disease Areas | | | | | |
| | 196,000 | | | InterMune (a) | | | 7,027 | | |
| | | | | Drugs for Pulmonary Fibrosis & Hepatitis C | | | | | |
| | 102,000 | | | United Therapeutics (a) | | | 5,620 | | |
| | | | | Biotech Focused on Rare Diseases | | | | | |
| | 810,000 | | | Micromet (a) | | | 4,649 | | |
| | | | | Next-generation Antibody Technology | | | | | |
| Number of Shares | | | | Value (000) | |
| | 790,000 | | | Chelsea Therapeutics (a) | | $ | 4,029 | | |
| | | | | Biotech Focused on Rare Diseases | | | | | |
| | 455,000 | | | Nabi Biopharmaceuticals (a) | | | 2,448 | | |
| | | | | Biotech Focused on Vaccines | | | | | |
| | 265,000 | | | Anthera Pharmaceuticals (a) | | | 2,165 | | |
| | | | | Biotech Focused on Cardiovascular,
Cancer & Immunology | | | | | |
| | 243,000 | | | Savient Pharmaceuticals (a)(b) | | | 1,820 | | |
| | | | | Biotech Focused on Severe Gout | | | | | |
| | 450,000 | | | Array Biopharma (a) | | | 1,008 | | |
| | | | | Drugs for Cancer & Inflammatory Diseases | | | | | |
| | 18,181 | | | Metabolex, Series A-1 (a)(d) | | | 18 | | |
| | | | | Diabetes Drug Development | | | | | |
| | 738,060 | | | Medicure - Warrants (a)(d) | | | — | | |
| | | | | Cardiovascular Biotech Company | | | | | |
| | 37,500 | | | Locus Pharmaceuticals,
Series A-1, Pfd. (a)(d) | | | — | | |
| | 19,329 | | | Locus Pharmaceuticals,
Series B-1, Pfd. (a)(d) | | | — | | |
| | | | | High Throughput Rational Drug Design | | | | | |
| | | | 84,291 | | |
| | | > Medical Equipment & Devices 2.2% | |
| | 370,000 | | | Alexion Pharmaceuticals (a) | | | 17,401 | | |
| | | | | Biotech Focused on Orphan Diseases | | | | | |
| | 184,000 | | | Sirona Dental Systems (a) | | | 9,770 | | |
| | | | | Manufacturer of Dental Equipment | | | | | |
| | 124,000 | | | Gen-Probe (a) | | | 8,575 | | |
| | | | | Molecular In-vitro Diagnostics | | | | | |
| | 53,000 | | | Idexx Laboratories (a) | | | 4,111 | | |
| | | | | Diagnostic Equipment & Services for Veterinarians | | | | | |
| | 155,000 | | | Pacific Biosciences of California (a) | | | 1,813 | | |
| | | | | Genome Sequencing | | | | | |
| | | | 41,670 | | |
| | | > Medical Supplies 0.9% | |
| | 439,600 | | | Cepheid (a) | | | 15,228 | | |
| | | | | Molecular Diagnostics | | | | | |
| | 49,000 | | | Neogen (a) | | | 2,215 | | |
| | | | | Food & Animal Safety Products | | | | | |
| | | | 17,443 | | |
| | | > Health Care Services 0.8% | |
| | 1,038,900 | | | Health Management Associates (a) | | | 11,199 | | |
| | | | | Non-urban Hospitals | | | | | |
| | 151,000 | | | Community Health Systems (a) | | | 3,878 | | |
| | | | | Non-urban Hospitals | | | | | |
| | | | 15,077 | | |
| | | > Pharmaceuticals 0.3% | |
| | 725,000 | | | Akorn (a) | | | 5,075 | | |
| | | | | Develops, Manufactures & Sells Specialty
Generic Drugs | | | | | |
| | 108,512 | | | Alimera Sciences (a) | | | 884 | | |
| | | | | Ophthalmogy-focused Pharmaceutical Company | | | | | |
| | | | 5,959 | | |
| | | > Hospital Management 0.2% | |
| | 150,000 | | | Kindred Healthcare (a) | | | 3,221 | | |
| | | | | Post-Acute Healthcare Facilities | | | | | |
| | | | 3,221 | | |
| Health Care: Total | | | 167,661 | | |
See accompanying notes to financial statements.
54
| Number of Shares | | | | Value (000) | |
| Energy & Minerals 8.2% | | | |
| | | > Oil Services 4.4% | |
| | 1,000,000 | | | FMC Technologies (a) | | $ | 44,790 | | |
| | | | | Oil & Gas Wellhead Manufacturer | | | | | |
| | 803,000 | | | Atwood Oceanics (a) | | | 35,436 | | |
| | | | | Offshore Drilling Contractor | | | | | |
| | 86,000 | | | Bristow | | | 4,388 | | |
| | | | | Largest Provider of Helicopter Services to
Offshore Oil & Gas Producers | | | | | |
| | | | 84,614 | | |
| | | > Oil & Gas Producers 2.9% | |
| | 1,135,000 | | | Quicksilver Resources (a) | | | 16,753 | | |
| | | | | Natural Gas & Coal Steam Gas Producer | | | | | |
| | 133,000 | | | SM Energy | | | 9,773 | | |
| | | | | Oil & Gas Producer | | | | | |
| | 143,000 | | | Rosetta Resources (a) | | | 7,370 | | |
| | | | | Oil & Gas Producer Exploring in South
Texas & Montana | | | | | |
| | 386,000 | | | Houston American Energy (b) | | | 6,998 | | |
| | | | | Oil & Gas Exploration & Production in
Colombia | | | | | |
| | 168,000 | | | Swift Energy (a) | | | 6,261 | | |
| | | | | Oil & Gas Exploration & Production Company | | | | | |
| | 230,000 | | | Northern Oil & Gas (a)(b) | | | 5,094 | | |
| | | | | Small E&P Company in North Dakota Bakken | | | | | |
| | 73,000 | | | Carrizo Oil & Gas (a) | | | 3,048 | | |
| | | | | Oil & Gas Producer | | | | | |
| | 22,800 | | | Oasis Petroleum (a) | | | 677 | | |
| | | | | Oil Producer in North Dakota | | | | | |
| | | | 55,974 | | |
| | | > Mining 0.9% | |
| | 100,000 | | | Core Laboratories (Netherlands) | | | 11,154 | | |
| | | | | Oil & Gas Reservoir Consulting | | | | | |
| | 600,000 | | | Alexco Resource (a) | | | 4,326 | | |
| | | | | Mining, Exploration & Environmental Services | | | | | |
| | 180,000 | | | Augusta Resource (a) | | | 834 | | |
| | | | | U.S. Copper/Molybdenum Mine | | | | | |
| | | | 16,314 | | |
| Energy & Minerals: Total | | | 156,902 | | |
| Other Industries 6.4% | | | |
| | | > Real Estate 5.2% | |
| | 915,000 | | | Extra Space Storage | | | 19,517 | | |
| | | | | Self Storage Facilities | | | | | |
| | 995,200 | | | BioMed Realty Trust | | | 19,148 | | |
| | | | | Life Science-focused Office Buildings | | | | | |
| | 600,000 | | | Associated Estates Realty | | | 9,750 | | |
| | | | | Multi-family Properties | | | | | |
| | 246,000 | | | Corporate Office Properties | | | 7,653 | | |
| | | | | Office Buildings | | | | | |
| | 870,000 | | | Education Realty Trust | | | 7,456 | | |
| | | | | Student Housing | | | | | |
| | 177,000 | | | Kilroy Realty | | | 6,990 | | |
| | | | | West Coast Office & Industrial Properties | | | | | |
| | 1,380,000 | | | Kite Realty Group | | | 6,872 | | |
| | | | | Community Shopping Centers | | | | | |
| | 1,058,000 | | | DCT Industrial Trust | | | 5,533 | | |
| | | | | Industrial Properties | | | | | |
Number of Shares
or Principal Amount | | | | Value (000) | |
| | 98,619 | | | Macerich | | $ | 5,276 | | |
| | | | | Regional Shopping Malls | | | | | |
| | 191,000 | | | Dupont Fabros Technology (b) | | | 4,813 | | |
| | | | | Technology-focused Office Buildings | | | | | |
| | 100,000 | | | Post Properties | | | 4,076 | | |
| | | | | Multi-family Properties | | | | | |
| | 208,000 | | | Summit Hotel Properties | | | 2,361 | | |
| | | | | Owner of Select Service Hotels | | | | | |
| | | | 99,445 | | |
| | | > Transportation 1.2% | |
| | 410,091 | | | Rush Enterprises, Class A (a) | | | 7,804 | | |
| | 115,000 | | | Rush Enterprises, Class B (a) | | | 1,851 | | |
| | | | | Truck Sales & Services | | | | | |
| | 256,000 | | | World Fuel Services | | | 9,198 | | |
| | | | | Global Fuel Broker | | | | | |
| | 310,000 | | | Heartland Express | | | 5,134 | | |
| | | | | Regional Trucker | | | | | |
| | | | 23,987 | | |
| Other Industries: Total | | | 123,432 | | |
Total Equities: 99.4%
(Cost: $1,231,445) | | | 1,901,043 | | |
| Securities Lending Collateral: 0.7% | | | |
| | 12,943,711 | | | Dreyfus Government Cash
Management Fund (e)
(7 day yield of 0.00%) | | | 12,944 | | |
Total Securities Lending Collateral:
(Cost: $12,944) | | | 12,944 | | |
| Short-Term Obligation: 0.8% | | | |
| | | > Repurchase Agreement: 0.8% | |
| $ | 15,821 | | | Repurchase Agreement with
Fixed Income Clearing Corp.,
dated 6/30/11, due 7/01/11
at 0.01%, collateralized by a
U.S. Government Agency
obligation maturing 8/18/17,
market value $16,141
(repurchase proceeds $15,821) | | | 15,821 | | |
Total Short Term Obligation:
(Cost: $15,821) | | | 15,821 | | |
Total Investments: 100.9%
(Cost: $1,260,210) (f) | | | 1,929,808 | | |
Obligation to Return Collateral for
Securities Loaned: (0.7)% | | | (12,944 | ) | |
| Cash and Other Assets Less Liabilities: (0.2)% | | | (4,519 | ) | |
| Total Net Assets: 100.0% | | $ | 1,912,345 | | |
ADR = American Depositary Receipts.
See accompanying notes to financial statements.
55
Columbia Acorn USA
Statement of Investments (Unaudited), continued
> Notes to Statement of Investments (dollar values in thousands)
(a) Non-income producing security.
(b) All or a portion of this security was on loan at June 30, 2011. The total market value of Fund securities on loan at June 30, 2011 was $12,520.
(c) An affiliated person of the Fund may include any company in which the Fund owns five percent or more of its outstanding voting shares. Holdings and transactions in this affiliated company during the six months ended June 30, 2011, are as follows:
| Affiliate | | Balance of
Shares Held
12/31/10 | | Purchases/
Additions | | Sales/
Reductions | | Balance of
Shares Held
6/30/11 | | Value | | Dividend | |
| RCM Technologies | | | 710,000 | | | | - | | | | - | | | | 710,000 | | | $ | 3,798 | | | $ | - | | |
| Total of Affiliated Transactions | | | 710,000 | | | | - | | | | - | | | | 710,000 | | | $ | 3,798 | | | $ | - | | |
The aggregate cost and value of this affiliated company at June 30, 2011, was $4,479 and $3,798. Investments in this affiliated company represented 0.2% of total net assets at June 30, 2011.
(d) Denotes a restricted security, which is subject to restrictions on resale under federal securities laws. These securities are valued at a fair value determined in good faith under consistently applied procedures established by the Board of Trustees. At June 30, 2011, the market value of these securities amounted to $18, which represented less than 0.01% of total net assets.
Additional information on these securities is as follows:
| Security | | Acquisition
Dates | | Shares | | Cost | | Value | |
| Metabolex, Series A -1 | | 2/11/00 | | | 18,181 | | | $ | 2,000 | | | $ | 18 | | |
| Medicure - Warrants | | 12/22/06 | | | 738,060 | | | | - | | | | - | | |
| Locus Pharmaceuticals, Series A-1 Pfd. | | 9/05/01 | | | 37,500 | | | | 1,500 | | | | - | | |
| Locus Pharmaceuticals, Series B-1 Pfd. | | 2/08/07 | | | 19,329 | | | | 56 | | | | - | | |
| | | | | | | $ | 3,556 | | | $ | 18 | | |
(e) Investment made with cash collateral received from securities lending activity.
(f) At June 30, 2011, for federal income tax purposes, the cost of investments was $1,260,210 and net unrealized appreciation was $669,598, consisting of gross unrealized appreciation of $760,468 and gross unrealized depreciation of $90,870.
Various inputs are used in determining the value of the Fund's investments, following the input prioritization hierarchy established by GAAP. These inputs are summarized in the three broad levels listed below:
• Level 1 – quoted prices in active markets for identical securities
• Level 2 – prices determined using other significant observable inputs (including quoted prices for similar securities, interest rates, prepayment speeds, credit risk and others)
• Level 3 – prices determined using significant unobservable inputs where quoted prices or observable inputs are unavailable or less reliable (including management's own assumptions about the factors market participants would use in pricing an investment)
The inputs or methodologies used for valuing securities are not necessarily an indication of the risk associated with investing in those securities.
Examples of the types of securities in which the Fund would typically invest and how they are classified within this hierarchy are as follows. Typical Level 1 securities include exchange traded domestic equities, mutual funds whose NAVs are published each day and exchange traded foreign equities that are not statistically fair valued. Typical Level 2 securities include exchange traded foreign equities that are statistically fair valued, forward foreign currency exchange contracts and short-term investments valued at amortized cost. Additionally, securities fair valued by the Valuation Committee of the Fund's Board of Trustees that rely on significant observable inputs are also included in level 2. Typical Level 3 securities include any security fair valued by the Valuation Committee that relies on significant unobservable inputs.
See accompanying notes to financial statements.
56
> Notes to Statement of Investments (dollar values in thousands)
The following table summarizes the inputs used, as June 30, 2011, in valuing the Fund's assets:
| Investment Type | | Quoted Prices
(Level 1) | | Other
Significant
Observable
Inputs
(Level 2) | | Significant
Unobservable
Inputs
(Level 3) | | Total | |
| Equities | |
| Information | | $ | 651,445 | | | $ | - | | | $ | - | | | $ | 651,445 | | |
| Consumer Goods & Services | | | 323,569 | | | | - | | | | - | | | | 323,569 | | |
| Industrial Goods & Services | | | 288,094 | | | | - | | | | - | | | | 288,094 | | |
| Finance | | | 189,940 | | | | - | | | | - | | | | 189,940 | | |
| Health Care | | | 167,643 | | | | - | | | | 18 | | | | 167,661 | | |
| Energy & Minerals | | | 156,902 | | | | - | | | | - | | | | 156,902 | | |
| Other Industries | | | 123,432 | | | | - | | | | - | | | | 123,432 | | |
| Total Equities | | | 1,901,025 | | | | - | | | | 18 | | | | 1,901,043 | | |
| Total Securities Lending Collateral | | | 12,944 | | | | - | | | | - | | | | 12,944 | | |
| Total Short-Term Obligation | | | - | | | | 15,821 | | | | - | | | | 15,821 | | |
| Total Investments | | $ | 1,913,969 | | | $ | 15,821 | | | $ | 18 | | | $ | 1,929,808 | | |
The Fund's assets assigned to the Level 2 input category are generally valued using the market approach, in which a security's value is determined through its correlation to prices and information from market transactions for similar or identical assets. Warrants which do not trade are valued as a percentage of the actively trading common stock using a model, based on Black Scholes.
Certain short-term obligations may be valued using amortized cost, an income approach which converts future cash flows to a present value based upon the discount or premium at purchase.
The Fund's assets assigned to the Level 3 input category are valued at fair value as determined in good faith under consistently applied procedures established by and under the general supervision of the Board of Trustees. To determine fair value, management will utilize the valuation technique that they deem the most appropriate in the circumstances. Securities for which no market exists are valued based upon a market approach using some unobservable inputs which may include, but are not limited to, projected earnings, available cash, line of business, multiples, and consideration of the prioritization of the equity in a company's capital structure.
There were no significant transfers of financial assets between levels 1 and 2 during the period.
The following table reconciles asset balances for the six months ending June 30, 2011, in which significant unobservable inputs (Level 3) were used in determining value:
Investments
in Securities | | Balance
as of
December 31,
2010 | | Realized
Gain/(Loss) | | Change in
Unrealized
Appreciation
(Depreciation) | | Purchases | | Sells | | Transfers
into
Level 3 | | Transfers
out of
Level 3 | | Balance
as of
June 30,
2011 | |
| Equities | |
| Health Care | | $ | 20 | | | $ | - | | | $ | (2 | ) | | $ | - | | | $ | - | | | $ | - | | | $ | - | | | $ | 18 | | |
| | | $ | 20 | | | $ | - | | | $ | (2 | ) | | $ | - | | | $ | - | | | $ | - | | | $ | - | | | $ | 18 | | |
The information in the above reconciliation represents fiscal year to date activity for any securities identified as using Level 3 inputs at either the beginning or the end of the current fiscal period.
The change in unrealized depreciation attributed to securities owned at June 30, 2011, which were valued using significant unobservable inputs (Level 3) amounted to $2. This amount is included in net change in unrealized appreciation (depreciation) on the Statements of Changes in Net Assets.
For more information on valuation inputs, and their aggregation into the levels used in the tables above, please refer to the Security Valuation section in the accompanying Notes to Financial Statements.
See accompanying notes to financial statements.
57
Columbia Acorn International Select
Major Portfolio Changes in the Second Quarter (Unaudited)
| | | Number of Shares | |
| | | 03/31/11 | | 06/30/11 | |
| Purchases | |
| Europe | |
| > United Kingdom | |
| Archipelago Resources | | | 2,775,000 | | | | 4,472,797 | | |
| Chemring | | | 1,465,000 | | | | 1,609,133 | | |
| JLT Group | | | 517,000 | | | | 881,100 | | |
| > Netherlands | |
| Imtech | | | 231,504 | | | | 235,519 | | |
| > Germany | |
| Rhoen-Klinikum | | | 200,000 | | | | 297,000 | | |
| > Switzerland | |
| Partners Group | | | 0 | | | | 24,000 | | |
| > Belgium | |
| EVS Broadcast Equipment | | | 0 | | | | 33,800 | | |
| Asia | |
| > Singapore | |
| Ascendas REIT | | | 11,105,000 | | | | 13,130,000 | | |
| Mapletree Industrial Trust REIT | | | 0 | | | | 14,601,100 | | |
| > China | |
| Want Want | | | 0 | | | | 1,655,000 | | |
| Zhaojin Mining Industry | | | 1,324,700 | | | | 2,649,400 | | |
| Other Countries | |
| > South Africa | |
| Rand Merchant Insurance | | | 0 | | | | 4,902,152 | | |
| | | Number of Shares | |
| | | 03/31/11 | | 06/30/11 | |
| Sales | |
| Europe | |
| > United Kingdom | |
| Cobham | | | 2,415,000 | | | | 616,000 | | |
| Intertek Group | | | 412,000 | | | | 400,000 | | |
| Petropavlovsk | | | 568,000 | | | | 0 | | |
| Serco | | | 2,139,000 | | | | 985,000 | | |
| Workspace Group | | | 13,437,411 | | | | 9,710,000 | | |
| > Netherlands | |
| Fugro | | | 175,427 | | | | 117,121 | | |
| > Sweeden | |
| Hexagon | | | 774,666 | | | | 658,666 | | |
| > Switzerland | |
| Bank Sarasin & Cie | | | 99,000 | | | | 0 | | |
| > Ireland | |
| United Drug | | | 3,213,000 | | | | 2,377,800 | | |
| > France | |
| Neopost | | | 130,000 | | | | 48,000 | | |
| > Spain | |
| Red Eléctrica de España | | | 80,000 | | | | 0 | | |
| Asia | |
| > Japan | |
| Benesse | | | 15,400 | | | | 0 | | |
| Gree | | | 521,000 | | | | 280,000 | | |
| > China | |
| Jiangsu Expressway | | | 12,115,400 | | | | 6,727,000 | | |
| > Hong Kong | |
| Hutchison Port Holdings Trust | | | 1,515,000 | | | | 0 | | |
| Other Countries | |
| > Canada | |
| Pan American Silver | | | 132,000 | | | | 0 | | |
| > United States | |
| Atwood Oceanics | | | 143,000 | | | | 112,000 | | |
| > Austriala | |
| UGL | | | 571,848 | | | | 540,000 | | |
| Latin America | |
| > Columbia | |
| Pacific Rubiales Energy | | | 525,000 | | | | 260,000 | | |
See accompanying notes to financial statements.
58
Columbia Acorn International Select
Statement of Investments (Unaudited), June 30, 2011
| Number of Shares | | | | Value (000) | |
| | | | | | | Equities: 87.0% | |
| Europe 41.3% | | | |
| | | > United Kingdom 13.9% | |
| | 1,609,133 | | | Chemring | | $ | 16,529 | | |
| | | | | Defense Manufacturer of Countermeasures &
Energetics | | | | | |
| | 400,000 | | | Intertek Group | | | 12,666 | | |
| | | | | Testing, Inspection & Certification Services | | | | | |
| | 881,100 | | | JLT Group | | | 9,630 | | |
| | | | | International Business Insurance Broker | | | | | |
| | 985,000 | | | Serco | | | 8,734 | | |
| | | | | Facilities Management | | | | | |
| | 9,710,000 | | | Workspace Group | | | 4,714 | | |
| | | | | United Kingdom Real Estate | | | | | |
| | 4,472,797 | | | Archipelago Resources (a) | | | 4,433 | | |
| | | | | Gold Mining Projects in Indonesia,
Vietnam & the Philippines | | | | | |
| | 616,000 | | | Cobham | | | 2,092 | | |
| | | | | Aerospace Components | | | | | |
| | 226,800 | | | Shaftesbury | | | 1,922 | | |
| | | | | London Prime Retail REIT | | | | | |
| | | | 60,720 | | |
| | | > Netherlands 8.7% | |
| | 166,000 | | | AkzoNobel | | | 10,472 | | |
| | | | | Largest Global Supplier of Protective Paints &
Coatings | | | | | |
| | 117,121 | | | Fugro | | | 8,445 | | |
| | | | | Sub-sea Oilfield Services | | | | | |
| | 235,519 | | | Imtech | | | 8,330 | | |
| | | | | Electromechanical & Information &
Communications Technologies Installation &
Maintenance | | | | | |
| | 242,103 | | | Aalberts Industries | | | 5,659 | | |
| | | | | Flow Control & Heat Treatment | | | | | |
| | 45,000 | | | Core Laboratories | | | 5,019 | | |
| | | | | Oil & Gas Reservoir Consulting | | | | | |
| | | | 37,925 | | |
| | | > Germany 6.7% | |
| | 672,000 | | | Wirecard | | | 12,011 | | |
| | | | | Online Payment Processing & Risk
Management | | | | | |
| | 115,500 | | | Rheinmetall | | | 10,225 | | |
| | | | | Defense & Automotive | | | | | |
| | 297,000 | | | Rhoen-Klinikum | | | 7,167 | | |
| | | | | Health Care Services | | | | | |
| | | | 29,403 | | |
| | | > Sweden 3.7% | |
| | 658,666 | | | Hexagon | | | 16,224 | | |
| | | | | Measurement Equipment & Software | | | | | |
| | | | 16,224 | | |
| | | > Switzerland 2.7% | |
| | 51,000 | | | Kuehne & Nagel | | | 7,740 | | |
| | | | | Freight Forwarding/Logistics | | | | | |
| | 24,000 | | | Partners Group | | | 4,248 | | |
| | | | | Private Markets Asset Management | | | | | |
| | | | 11,988 | | |
| Number of Shares | | | | Value (000) | |
| | | > Ireland 1.9% | |
| | 2,377,800 | | | United Drug | | $ | 8,145 | | |
| | | | | Irish Pharmaceutical Wholesaler & Outsourcer | | | | | |
| | | | 8,145 | | |
| | | > Iceland 1.2% | |
| | 4,800,000 | | | Marel (a) | | | 5,081 | | |
| | | | | Largest Manufacturer of Poultry & Fish
Processing Equipment | | | | | |
| | | | 5,081 | | |
| | | > Denmark 1.1% | |
| | 29,000 | | | Novozymes | | | 4,719 | | |
| | | | | Industrial Enzymes | | | | | |
| | | | 4,719 | | |
| | | > France 0.9% | |
| | 48,000 | | | Neopost | | | 4,123 | | |
| | | | | Postage Meter Machines | | | | | |
| | | | 4,123 | | |
| | | > Belgium 0.5% | |
| | 33,800 | | | EVS Broadcast Equipment | | | 2,288 | | |
| | | | | Digital Live Mobile Production Software &
Systems | | | | | |
| | | | 2,288 | | |
| Europe: Total | | | 180,616 | | |
| Asia 29.1% | | | |
| | | > Japan 13.5% | |
| | 2,115,000 | | | Kansai Paint | | | 19,270 | | |
| | | | | Paint Producer in Japan, India, China &
Southeast Asia | | | | | |
| | 480,000 | | | Asahi Diamond Industrial | | | 10,494 | | |
| | | | | Consumable Diamond Tools | | | | | |
| | 8,550 | | | Jupiter Telecommunications | | | 9,566 | | |
| | | | | Largest Cable Service Provider in Japan | | | | | |
| | 4,450 | | | Seven Bank | | | 8,892 | | |
| | | | | ATM Processing Services | | | | | |
| | 280,000 | | | Gree (a) | | | 6,121 | | |
| | | | | Mobile Social Networking Game
Developer/Platform | | | | | |
| | 110,000 | | | Ain Pharmaciez | | | 4,526 | | |
| | | | | Dispensing Pharmacy/Drugstore Operator | | | | | |
| | | | 58,869 | | |
| | | > Singapore 8.2% | |
| | 13,130,000 | | | Ascendas REIT | | | 21,838 | | |
| | | | | Industrial Property Landlord | | | | | |
| | 14,601,100 | | | Mapletree Industrial Trust REIT | | | 13,923 | | |
| | | | | Industrial Property Landlord | | | | | |
| | | | 35,761 | | |
| | | > South Korea 4.4% | |
| | 79,266 | | | NHN (a) | | | 14,053 | | |
| | | | | South Korea's Largest Online Search Engine | | | | | |
| | 151,000 | | | Woongjin Coway | | | 5,385 | | |
| | | | | South Korean Household Appliance Rental
Service Provider | | | | | |
| | | | 19,438 | | |
See accompanying notes to financial statements.
59
Columbia Acorn International Select
Statement of Investments (Unaudited), continued
| Number of Shares | | | | Value (000) | |
| | | > China 3.0% | |
| | 6,727,000 | | | Jiangsu Expressway | | $ | 6,167 | | |
| | | | | Chinese Toll Road Operator | | | | | |
| | 2,649,400 | | | Zhaojin Mining Industry | | | 5,466 | | |
| | | | | Gold Mining & Refining in China | | | | | |
| | 1,655,000 | | | Want Want | | | 1,607 | | |
| | | | | Chinese Branded Consumer Food Company | | | | | |
| | | | 13,240 | | |
| Asia: Total | | | 127,308 | | |
| Other Countries 14.2% | | | |
| | | > South Africa 6.0% | |
| | 1,152,200 | | | Adcock Ingram Holdings | | | 10,123 | | |
| | | | | Manufacturer of Pharmaceuticals &
Medical Supplies | | | | | |
| | 4,902,152 | | | Rand Merchant Insurance | | | 8,954 | | |
| | | | | Directly Sold Property & Casualty
Insurance; Holdings in Other Insurers | | | | | |
| | 122,700 | | | Naspers | | | 6,931 | | |
| | | | | Media in Africa, China, Russia &
Other Emerging Markets | | | | | |
| | | | 26,008 | | |
| | | > Canada 3.0% | |
| | 210,400 | | | CCL Industries | | | 7,234 | | |
| | | | | Leading Global Label Manufacturer | | | | | |
| | 125,000 | | | AG Growth | | | 5,936 | | |
| | | | | Leading Manufacturer of Augers & Grain
Handling Equipment | | | | | |
| | | | 13,170 | | |
| | | > United States 2.3% | |
| | 112,000 | | | Atwood Oceanics (a) | | | 4,943 | | |
| | | | | Offshore Drilling Contractor | | | | | |
| | 67,000 | | | SM Energy | | | 4,923 | | |
| | | | | Oil & Gas Producer | | | | | |
| | | | 9,866 | | |
| | | > Australia 1.8% | |
| | 540,000 | | | UGL | | | 8,070 | | |
| | | | | Engineering & Facilities Management | | | | | |
| | | | 8,070 | | |
| | | > Israel 1.1% | |
| | 310,000 | | | Israel Chemicals | | | 4,947 | | |
| | | | | Producer of Potash, Phosphates, Bromine &
Specialty Chemicals | | | | | |
| | | | 4,947 | | |
| Other Countries: Total | | | 62,061 | | |
| Latin America 2.4% | | | |
| | | > Colombia 1.9% | |
| | 260,000 | | | Pacific Rubiales Energy | | | 6,969 | | |
| | | | | Oil Production & Exploration in Colombia | | | | | |
| | 18,800,000 | | | Quetzal Energy (a)(b) | | | 1,497 | | |
| | | | | Explores for Oil & Gas in Latin America | | | | | |
| | | | 8,466 | | |
Number of Shares
or Principal Amount (000) | | | | Value (000) | |
| | | > Argentina 0.5% | |
| | 1,000,000 | | | Union Agriculture Group (a)(b) | | $ | 2,200 | | |
| | | Farmland Operator in Uruguay | | | | | |
| | | | 2,200 | | |
| Latin America: Total | | | 10,666 | | |
Total Equities: 87.0%
(Cost: $282,220) | | | 380,651 | | |
| Short-Term Obligation: 13.5% | |
| | | > Repurchase Agreement 13.5% | |
| $ | 58,891 | | | Repurchase Agreement with
Fixed Income Clearing Corp.,
dated 6/30/11, due 7/01/11
at 0.01%, collateralized by a
U.S. Government Agency
obligation maturing 9/08/17,
market value $60,070
(repurchase proceeds $58,891) | | | 58,891 | | |
Total Short-Term Obligation 13.5%
(Cost: $58,891) | | | 58,891 | | |
Total Investments: 100.5%
(Cost: $341,111)(c)(d) | | | 439,542 | | |
| Cash and Other Assets Less Liabilities: (0.5)% | | | (2,243 | ) | |
| Total Net Assets: 100% | | $ | 437,299 | | |
See accompanying notes to financial statements.
60
> Notes to Statements of Investments (dollar values in thousands)
(a) Non-income producing security.
(b) Denotes a restricted security, which is subject to restrictions on resale under federal securities laws. These securities are valued at a fair value determined in good faith under consistently applied procedures established by the Board of Trustees. At June 30, 2011, the market value of these securities amounted to $3,697, which represented 0.85% of total net assets.
Additional information on these securities is as follows:
| Security | | Acquisition
Dates | | Shares | | Cost | | Value | |
| Union Agriculture Group | | 12/8/10 | | | 1,000,000 | | | $ | 2,200 | | | $ | 2,200 | | |
| Quetzal Energy | | 1/14/11 | | | 18,800,000 | | | | 2,376 | | | | 1,497 | | |
| | | | | | | $ | 4,576 | | | $ | 3,697 | | |
(c) At June 30, 2011, for federal income tax purposes, the cost of investments was $341,111 and net unrealized appreciation was $98,431, consisting of gross unrealized appreciation of $103,528 and gross unrealized depreciation of $5,097.
(d) On June 30, 2011, the Fund's total investments were denominated in currencies as follows:
| Currency | | Value | | Percentage
of Net Assets | |
| Euro | | $ | 76,865 | | | | 17.6 | | |
| U.S. Dollar | | | 75,976 | | | | 17.4 | | |
| British Pound | | | 60,720 | | | | 13.9 | | |
| Japanese Yen | | | 58,869 | | | | 13.5 | | |
| Singapore Dollar | | | 35,761 | | | | 8.2 | | |
| South African Rand | | | 26,008 | | | | 5.9 | | |
Other currencies less
than 5% of total net assets | | | 105,343 | | | | 24.0 | | |
| | | $ | 439,542 | | | | 100.5 | | |
Various inputs are used in determining the value of the Fund's investments, following the input prioritization hierarchy established by GAAP. These inputs are summarized in the three broad levels listed below:
• Level 1 – quoted prices in active markets for identical securities
• Level 2 – prices determined using other significant observable inputs (including quoted prices for similar securities, interest rates, prepayment speeds, credit risk and others)
• Level 3 – prices determined using significant unobservable inputs where quoted prices or observable inputs are unavailable or less reliable (including management's own assumptions about the factors market participants would use in pricing an investment)
The inputs or methodologies used for valuing securities are not necessarily an indication of the risk associated with investing in those securities.
Examples of the types of securities in which the Fund would typically invest and how they are classified within this hierarchy are as follows. Typical Level 1 securities include exchange traded domestic equities, mutual funds whose NAVs are published each day and exchange traded foreign equities that are not statistically fair valued. Typical Level 2 securities include exchange traded foreign equities that are statistically fair valued, forward foreign currency exchange contracts and short-term investments valued at amortized cost. Additionally, securities fair valued by the Valuation Committee of the Fund's Board of Trustees that rely on significant observable inputs are also included in level 2. Typical Level 3 securities include any security fair valued by the Valuation Committee that relies on significant unobservable inputs.
The following table summarizes the inputs used, as June 30, 2011, in valuing the Fund's assets:
| Investment Type | | Quoted Prices
(Level 1) | | Other
Significant
Observable
Inputs
(Level 2) | | Significant
Unobservable
Inputs
(Level 3) | | Total | |
| Equities | |
| Europe | | $ | 5,019 | | | $ | 175,597 | | | $ | - | | | $ | 180,616 | | |
| Asia | | | - | | | | 127,308 | | | | - | | | | 127,308 | | |
| Other Countries | | | 23,036 | | | | 39,025 | | | | - | | | | 62,061 | | |
| Latin America | | | 6,969 | | | | 1,497 | | | | 2,200 | | | | 10,666 | | |
| Total Equities | | | 35,024 | | | | 343,427 | | | | 2,200 | | | | 380,651 | | |
| Total Short-Term Obligation | | | - | | | | 58,891 | | | | - | | | | 58,891 | | |
| Total Investments | | $ | 35,024 | | | $ | 402,318 | | | $ | 2,200 | | | $ | 439,542 | | |
See accompanying notes to financial statements.
61
Columbia Acorn International Select
Statement of Investments (Unaudited), continued
> Notes to Statements of Investments (dollar values in thousands)
The Fund's assets assigned to the Level 2 input category are generally valued using the market approach, in which a security's value is determined through its correlation to prices and information from market transactions for similar or identical assets. Foreign equities are generally valued at the last sales price on the foreign exchange or market on which they trade. The Fund may use a systematic fair valuation model provided by an independent third party to value securities principally traded in foreign markets in order to adjust for possible stale pricing that may occur between the close of the foreign exchanges and the time for valuation. These models take into account available market data including intraday index, ADR, and ETF movements. Securities acquired via private placement that have a holding period or an extended settlement period are valued at a discount to the same shares that are trading freely on the market. These discounts are determined by the adviser's experience with similar securities or situations. Factors may include, but are not limited to, trade volume, shares outstanding and stock price.
Certain short-term obligations may be valued using amortized cost, an income approach which converts future cash flows to a present value based upon the discount or premium at purchase.
The Fund's assets assigned to the Level 3 input category are valued at fair value as determined in good faith under consistently applied procedures established by and under the general supervision of the Board of Trustees. To determine fair value, management will utilize the valuation technique that they deem the most appropriate in the circumstances. Securities acquired via private placement that are not yet trading are valued using a market approach for which management has determined that the original transaction price is the best representation of fair value. The original cost may be adjusted for the market movement in an index, ETF or similar security during the period it does not trade. Securities for which no market exists are valued based upon a market approach using some unobservable inputs which may include, but are not limited to, projected earnings, available cash, line of business, multiples and consideration of the prioritization of the equity in the company's capital structure.
There were no significant transfers of financial assets between Levels 1 and 2 during the period.
The following table reconciles asset balances for the six months ending June 30, 2011, in which significant unobservable inputs (Level 3) were used in determining value:
Investments
in Securities | | Balance
as of
December 31,
2010 | | Realized
Gain/(Loss) | | Change in
Unrealized
Appreciation
(Depreciation) | | Purchases | | Sales | | Transfers
into
Level 3 | | Transfers
out of
Level 3 | | Balance
as of
June 30,
2011 | |
| Latin America | |
| Argentina | | $ | 2,200 | | | $ | - | | | $ | - | | | $ | - | | | $ | - | | | $ | - | | | $ | - | | | $ | 2,200 | | |
| | | $ | 2,200 | | | $ | - | | | $ | - | | | $ | - | | | $ | - | | | $ | - | | | $ | - | | | $ | 2,200 | | |
The information in the above reconciliation table represents fiscal year to date activity for any securities identified as using Level 3 inputs at either the beginning or the end of the current fiscal period.
The change in unrealized appreciation (depreciation) attributed to securities owned at June 30, 2011, which were valued using significant unobservable inputs (Level 3) amounted to $0. This amount is included in net change unrealized appreciation (depreciation) on the Statements of Changes in Net Assets.
For more information on valuation inputs, and their aggregation into the levels used in the tables above, please refer to the Security Valuation section in the accompanying Notes to Financial Statements.
See accompanying notes to financial statements.
62
Columbia Acorn International Select
Portfolio Diversification (Unaudited)
At June 30, 2011, the Fund's portfolio investments as a percentage of net assets were diversified as follows:
| | | Value (000) | | Percentage
of Net Assets | |
| > Industrial Goods & Services | |
Industrial Materials &
Specialty Chemicals | | $ | 39,408 | | | | 9.0 | | |
| Other Industrial Services | | | 36,806 | | | | 8.4 | | |
| Machinery | | | 35,859 | | | | 8.2 | | |
| Electrical Components | | | 18,621 | | | | 4.3 | | |
| Outsourcing Services | | | 8,734 | | | | 2.0 | | |
| Conglomerates | | | 5,659 | | | | 1.3 | | |
| | | | 145,087 | | | | 33.2 | | |
| > Information | |
| Internet Related | | | 20,984 | | | | 4.8 | | |
| Instrumentation | | | 16,224 | | | | 3.7 | | |
| Financial Processors | | | 12,011 | | | | 2.7 | | |
| CATV | | | 9,566 | | | | 2.2 | | |
| Gaming Equipment & Services | | | 6,121 | | | | 1.4 | | |
| Business Software | | | 2,288 | | | | 0.5 | | |
| | | | 67,194 | | | | 15.3 | | |
| > Other Industries | |
| Real Estate | | | 42,397 | | | | 9.7 | | |
| Transportation | | | 6,167 | | | | 1.4 | | |
| | | | 48,564 | | | | 11.1 | | |
| > Energy & Minerals | |
| Mining | | | 14,918 | | | | 3.4 | | |
| Oil & Gas Producers | | | 13,389 | | | | 3.1 | | |
| Oil Services | | | 13,388 | | | | 3.1 | | |
| Agricultural Commodities | | | 2,200 | | | | 0.5 | | |
| | | | 43,895 | | | | 10.1 | | |
| > Finance | |
| Insurance | | | 18,584 | | | | 4.2 | | |
| Banks | | | 8,892 | | | | 2.0 | | |
| Brokerage & Money Management | | | 4,248 | | | | 1.0 | | |
| | | | 31,724 | | | | 7.2 | | |
| > Health Care | |
| Pharmaceuticals | | | 18,268 | | | | 4.2 | | |
| Health Care Services | | | 7,167 | | | | 1.6 | | |
| | | | 25,435 | | | | 5.8 | | |
| | | Value (000) | | Percentage
of Net Assets | |
| > Consumer Goods & Services | |
| Nondurables | | | 7,234 | | | | 1.7 | | |
| Other Consumer Services | | | 5,385 | | | | 1.2 | | |
| Retail | | | 4,526 | | | | 1.0 | | |
| Food & Beverage | | | 1,607 | | | | 0.4 | | |
| | | | 18,752 | | | | 4.3 | | |
| Total Equities: | | | 380,651 | | | | 87.0 | | |
| Short-Term Obligation: | | | 58,891 | | | | 13.5 | | |
| Total Investments: | | | 439,542 | | | | 100.5 | | |
Cash and Other Assets
Less Liabilities: | | | (2,243 | ) | | | (0.5 | ) | |
| Net Assets: | | $ | 437,299 | | | | 100.0 | | |
See accompanying notes to financial statements.
63
Columbia Acorn Select
Major Portfolio Changes in the Second Quarter (Unaudited)
| | | Number of Shares | |
| | | 03/31/11 | | 06/30/11 | |
| Purchases | |
| Consumer Goods & Services | |
| Gaylord Entertainment | | | 0 | | | | 860,000 | | |
| Industrial Goods & Services | |
| Quanta Services | | | 0 | | | | 1,400,000 | | |
| Information | |
| Finisar | | | 0 | | | | 324,000 | | |
| SBA Communications | | | 505,000 | | | | 755,000 | | |
| WNS - ADR (India) | | | 4,200,000 | | | | 4,227,186 | | |
| Energy & Minerals | |
| Canadian Solar (China) | | | 3,200,000 | | | | 3,300,000 | | |
| Health Care | |
| Akorn | | | 1,996,847 | | | | 2,250,000 | | |
| | | Number of Shares | |
| | | 03/31/11 | | 06/30/11 | |
| Sales | |
| Consumer Goods & Services | |
| Abercrombie & Fitch | | | 1,600,000 | | | | 1,100,000 | | |
| Career Education | | | 1,900,000 | | | | 0 | | |
| Coach | | | 1,135,000 | | | | 1,025,000 | | |
| Hertz | | | 8,650,000 | | | | 8,400,000 | | |
| ITT Educational Services | | | 1,000,000 | | | | 325,000 | | |
| Safeway | | | 3,600,000 | | | | 3,000,000 | | |
| Thor Industries | | | 720,000 | | | | 0 | | |
| Industrial Goods & Services | |
| Ametek | | | 1,860,000 | | | | 1,830,000 | | |
ChemSpec International - ADR
(China) | | | 1,581,700 | | | | 1,500,000 | | |
| Donaldson | | | 800,000 | | | | 785,000 | | |
| Nalco Holding Company | | | 1,000,000 | | | | 0 | | |
| Pall | | | 860,000 | | | | 840,000 | | |
| Waste Management | | | 1,500,000 | | | | 1,200,000 | | |
| Information | |
| American Tower | | | 900,000 | | | | 0 | | |
| Crown Castle International | | | 1,550,000 | | | | 1,510,000 | | |
| Navigant Consulting | | | 2,300,000 | | | | 813,073 | | |
| Sanmina-SCI | | | 7,100,000 | | | | 6,950,000 | | |
| VisionChina Media - ADR (China) | | | 3,675,000 | | | | 3,573,400 | | |
| Energy & Minerals | |
Pacific Rubiales Energy
(Colombia) | | | 3,700,000 | | | | 2,500,000 | | |
Synthesis Energy Systems
(China) | | | 4,426,330 | | | | 3,850,372 | | |
| Finance | |
| CNO Financial Group | | | 12,500,000 | | | | 12,300,000 | | |
| Discover Financial Services | | | 5,150,000 | | | | 5,050,000 | | |
| MF Global | | | 6,000,000 | | | | 5,550,000 | | |
| Other Industries | |
| JB Hunt Transport Services | | | 1,300,000 | | | | 1,275,000 | | |
See accompanying notes to financial statements.
64
Columbia Acorn Select
Statement of Investments (Unaudited), June 30, 2011
| Number of Shares | | | | Value (000) | |
| | | | | | | Equities: 95.1% | |
| Consumer Goods & Services 24.2% | | | |
| | | > Retail 9.9% | |
| | 1,100,000 | | | Abercrombie & Fitch | | $ | 73,612 | | |
| | | | | Teen Apparel Retailer | | | | | |
| | 3,000,000 | | | Safeway | | | 70,110 | | |
| | | | | Supermarkets | | | | | |
| | 350,000 | | | lululemon athletica (a)(b) | | | 39,137 | | |
| | | | | Premium Active Apparel Retailer | | | | | |
| | 250,000 | | | Tiffany & Co. | | | 19,630 | | |
| | | | | Luxury Good Retailer | | | | | |
| | | | 202,489 | | |
| | | > Travel 7.8% | |
| | 8,400,000 | | | Hertz (a) | | | 133,392 | | |
| | | | | Largest U.S. Rental Car Operator | | | | | |
| | 860,000 | | | Gaylord Entertainment (a) | | | 25,800 | | |
| | | | | Convention Hotels | | | | | |
| | | | 159,192 | | |
| | | > Apparel 3.2% | |
| | 1,025,000 | | | Coach | | | 65,528 | | |
| | | | | Designer & Retailer of Branded
Leather Accessories | | | | | |
| | | | 65,528 | | |
| | | > Casinos & Gaming 1.6% | |
| | 335,000,000 | | | RexLot Holdings (China) | | | 32,405 | | |
| | | | | Lottery Equipment Supplier in China | | | | | |
| | | | 32,405 | | |
| | | > Educational Services 1.2% | |
| | 325,000 | | | ITT Educational Services (a)(b) | | | 25,428 | | |
| | | | | Post-secondary Degree Services | | | | | |
| | | | 25,428 | | |
| | | > Food & Beverage 0.3% | |
| | 1,000,000 | | | GLG Life Tech (Canada) (a) | | | 6,720 | | |
| | | | | Produce an All-natural Sweetener
Extracted from the Stevia Plant | | | | | |
| | | | 6,720 | | |
| | | > Other Consumer Services 0.2% | |
| | 2,300,000 | | | IFM Investments (Century 21
China RE) - ADR (China) (a)(c) | | | 3,381 | | |
| | | | | Provides Real Estate Services in China | | | | | |
| | | | 3,381 | | |
| Consumer Goods & Services: Total | | | 495,143 | | |
| Industrial Goods & Services 19.0% | | | |
| | | > Machinery 11.4% | |
| | 1,830,000 | | | Ametek | | | 82,167 | | |
| | | | | Aerospace/Industrial Instruments | | | | | |
| | 785,000 | | | Donaldson | | | 47,634 | | |
| | | | | Industrial Air Filtration | | | | | |
| | 840,000 | | | Pall | | | 47,233 | | |
| | | | | Filtration & Fluids Clarification | | | | | |
| | 885,000 | | | Kennametal | | | 37,356 | | |
| | | | | Consumable Cutting Tools | | | | | |
| | 650,000 | | | Oshkosh (a) | | | 18,811 | | |
| | | | | Specialty Truck Manufacturer | | | | | |
| | | | 233,201 | | |
| Number of Shares | | | | Value (000) | |
| | | > Waste Management 2.2% | |
| | 1,200,000 | | | Waste Management | | $ | 44,724 | | |
| | | | | U.S. Garbage Collection & Disposal | | | | | |
| | | | 44,724 | | |
| | | > Other Industrial Services 1.9% | |
| | 750,000 | | | Expeditors International of Washington | | | 38,392 | | |
| | | | | International Freight Forwarder | | | | | |
| | | | 38,392 | | |
| | | > Industrial Distribution 1.6% | |
| | 220,000 | | | WW Grainger | | | 33,803 | | |
| | | | | Industrial Distribution | | | | | |
| | | | 33,803 | | |
| | | > Outsourcing Services 1.4% | |
| | 1,400,000 | | | Quanta Services (a) | | | 28,280 | | |
| | | | | Electrical & Telecom Construction Services | | | | | |
| | | | 28,280 | | |
| | | > Industrial Materials &
Specialty Chemicals 0.5% | |
| | 1,500,000 | | | ChemSpec International - ADR
(China) (a) | | | 10,800 | | |
| | | | | Specialty Chemicals with Focus on
Fluorinated Chemical Manufacturing | | | | | |
| | | | 10,800 | | |
| Industrial Goods & Services: Total | | | 389,200 | | |
| Information 15.3% | | | |
| | | > Mobile Communications 5.3% | |
| | 1,510,000 | | | Crown Castle International (a) | | | 61,593 | | |
| | | | | Communications Towers | | | | | |
| | 755,000 | | | SBA Communications (a) | | | 28,833 | | |
| | | | | Communications Towers | | | | | |
| | 15,000,000 | | | Globalstar (a)(b)(c) | | | 18,450 | | |
| | | | | Satellite Mobile Voice & Data Carrier | | | | | |
| | | | 108,876 | | |
| | | > Contract Manufacturing 3.5% | |
| | 6,950,000 | | | Sanmina-SCI (a)(c) | | | 71,793 | | |
| | | | | Electronic Manufacturing Services | | | | | |
| | | | 71,793 | | |
| | | > Computer Hardware & Related
Equipment 2.0% | |
| | 750,000 | | | Amphenol | | | 40,493 | | |
| | | | | Electronic Connectors | | | | | |
| | | | 40,493 | | |
| | | > Computer Services 1.8% | |
| | 4,227,186 | | | WNS - ADR (India) (a)(c) | | | 37,580 | | |
| | | | | Offshore BPO (Business Process
Outsourcing) Services | | | | | |
| | | | 37,580 | | |
| | | > Instrumentation 1.0% | |
| | 120,000 | | | Mettler Toledo (a) | | | 20,240 | | |
| | | | | Laboratory Equipment | | | | | |
| | | | 20,240 | | |
See accompanying notes to financial statements.
65
Columbia Acorn Select
Statement of Investments (Unaudited), continued
| Number of Shares | | | | Value (000) | |
| | | > Advertising 0.5% | |
| | 3,573,400 | | | VisionChina Media - ADR
(China) (a)(b) | | $ | 10,113 | | |
| | | | | Advertising on Digital Screens in
China's Mass Transit System | | | | | |
| | | | 10,113 | | |
| | | > Business Software 0.5% | |
| | 182,000 | | | Concur Technologies (a) | | | 9,113 | | |
| | | | | Web Enabled Cost & Expense
Management Software | | | | | |
| | | | 9,113 | | |
| | | > Business Information &
Marketing Services 0.4% | |
| | 813,073 | | | Navigant Consulting (a) | | | 8,529 | | |
| | | | | Financial Consulting Firm | | | | | |
| | | | 8,529 | | |
| | | > Telecommunications Equipment 0.3% | |
| | 324,000 | | | Finisar (a) | | | 5,842 | | |
| | | | | Optical Sub-systems & Components | | | | | |
| | | | 5,842 | | |
| Information: Total | | | 312,579 | | |
| Energy & Minerals 14.7% | | | |
| | | > Oil & Gas Producers 9.4% | |
| | 2,500,000 | | | Pacific Rubiales Energy (Colombia) | | | 67,007 | | |
| | | | | Oil Production & Exploration in Colombia | | | | | |
| | 30,530,000 | | | Canacol Energy (Colombia) (a)(c) | | | 33,555 | | |
| | 4,000,000 | | | Canacol Energy (Colombia) (a)(c)(d) | | | 4,308 | | |
| | | | | Oil Producer in South America | | | | | |
| | 38,343,900 | | | ShaMaran Petroleum (Iraq) (a)(c) | | | 30,216 | | |
| | | | | Oil Exploration in Kurdistan | | | | | |
| | 1,450,000 | | | Houston American Energy (b) | | | 26,288 | | |
| | | | | Oil & Gas Exploration & Production
in Colombia | | | | | |
| | 34,856,000 | | | Petrodorado (Colombia) (a)(c) | | | 11,023 | | |
| | 17,144,000 | | | Petrodorado - Warrants
(Colombia) (a)(c)(d) | | | 1,740 | | |
| | | | | Oil & Gas Exploration & Production
in Colombia, Peru & Paraguay | | | | | |
| | 24,000,000 | | | Canadian Overseas Petroleum
(United Kingdom) (a)(c)(d) | | | 11,096 | | |
| | 12,000,000 | | | Canadian Overseas Petroleum -
Warrants (United Kingdom) (a)(c)(d) | | | 1,635 | | |
| | | | | Oil & Gas Exploration/Production in the
North Sea | | | | | |
| | 13,125,000 | | | Petromanas (Canada) (a)(d) | | | 3,868 | | |
| | 5,000,000 | | | Petromanas (Canada) (a) | | | 1,503 | | |
| | 6,562,500 | | | Petromanas - Warrants (Canada) (a)(d) | | | 167 | | |
| | | | | Exploring for Oil in Albania | | | | | |
| | | | 192,406 | | |
| | | > Alternative Energy 2.4% | |
| | 3,300,000 | | | Canadian Solar (China) (a)(b)(c) | | | 37,950 | | |
| | | | | Solar Cell & Module Manufacturer | | | | | |
| | 3,850,372 | | | Synthesis Energy Systems
(China) (a)(b)(c) | | | 7,200 | | |
| | | | | Owner/Operator of Gasification Plants | | | | | |
| | 1,600,000 | | | Real Goods Solar (a)(c) | | | 4,736 | | |
| | | | | Residential Solar Energy Installer | | | | | |
| | | | 49,886 | | |
| Number of Shares | | | | Value (000) | |
| | | > Agricultural Commodities 1.6% | |
| | 9,090,909 | | | Union Agriculture Group
(Argentina) (a)(d) | | $ | 20,000 | | |
| | | | | Farmland Operator in Uruguay | | | | | |
| | 38,000,000 | | | Eacom Timber (Canada) (a)(c)(d) | | | 11,970 | | |
| | | | | Canadian Lumber Producer | | | | | |
| | | | 31,970 | | |
| | | > Mining 0.8% | |
| | 1,000,000 | | | Kirkland Lake Gold (Canada) (a) | | | 15,760 | | |
| | | | | Gold Mining | | | | | |
| | | | 15,760 | | |
| | | > Oil Services 0.5% | |
| | 10,885,700 | | | Tuscany International Drilling
(Colombia) (a) | | | 10,384 | | |
| | 760,000 | | | Tuscany International Drilling -
Warrants (Colombia) (a) | | | 28 | | |
| | | | | South America-based Drilling
Rig Contractor | | | | | |
| | | | 10,412 | | |
| Energy & Minerals: Total | | | 300,434 | | |
| Finance 14.7% | | | |
| | | > Credit Cards 6.6% | |
| | 5,050,000 | | | Discover Financial Services | | | 135,088 | | |
| | | | | Credit Card Company | | | | | |
| | | | 135,088 | | |
| | | > Insurance 4.8% | |
| | 12,300,000 | | | CNO Financial Group (a) | | | 97,293 | | |
| | | | | Life, Long-term Care & Medical
Supplement Insurance | | | | | |
| | | | 97,293 | | |
| | | > Brokerage & Money Management 3.3% | |
| | 5,550,000 | | | MF Global (a) | | | 42,957 | | |
| | | | | Futures Broker | | | | | |
| | 1,100,000 | | | SEI Investments | | | 24,761 | | |
| | | | | Mutual Fund Administration &
Investment Management | | | | | |
| | | | 67,718 | | |
| Finance: Total | | | 300,099 | | |
| Other Industries 5.5% | | | |
| | | > Transportation 2.9% | |
| | 1,275,000 | | | JB Hunt Transport Services | | | 60,040 | | |
| | | | | Truck & Intermodal Carrier | | | | | |
| | | | 60,040 | | |
| | | > Real Estate 1.8% | |
| | 1,900,000 | | | BioMed Realty Trust | | | 36,556 | | |
| | | | | Life Science-focused Office Buildings | | | | | |
| | | | 36,556 | | |
| | | > Regulated Utilities 0.8% | |
| | 500,000 | | | Wisconsin Energy | | | 15,675 | | |
| | | | | Wisconsin Utility | | | | | |
| | | | 15,675 | | |
| Other Industries: Total | | | 112,271 | | |
See accompanying notes to financial statements.
66
Number of Shares
or Principal Amount (000) | | | | Value (000) | |
| Health Care 1.7% | | | |
| | | > Biotechnology & Drug Delivery 0.9% | |
| | 2,000,000 | | | NPS Pharmaceuticals (a) | | $ | 18,900 | | |
| | | | | Orphan Drugs & Healthy Royalties | | | | | |
| | | | 18,900 | | |
| | | > Pharmaceuticals 0.8% | |
| | 2,250,000 | | | Akorn (a) | | | 15,750 | | |
| | | | | Develops, Manufactures & Sells Specialty
Generic Drugs | | | | | |
| | | | 15,750 | | |
| Health Care: Total | | | 34,650 | | |
Total Equities: 95.1%
(Cost: $1,465,678) | | | 1,944,376 | | |
| Securities Lending Collateral: 3.0% | | | |
| | 61,633,705 | | | Dreyfus Government Cash
Management Fund (e)
(7 day yield of 0.00%) | | | 61,634 | | |
Total Securities Lending Collateral:
(Cost: $61,634) | | | 61,634 | | |
| Short-Term Obligation 4.6% | | | |
| | | > Repurchase Agreement 4.6% | |
| $ | 94,733 | | | Repurchase Agreement with
Fixed Income Clearing Corp.,
dated 6/30/11, due 7/01/11
at 0.01%, collateralized by a
U.S. Government Agency
obligation maturing 8/18/17,
market value $96,628
(repurchase proceeds $94,733) | | | 94,733 | | |
| | | | 94,733 | | |
Total Short-Term Obligation:
(Cost: $94,733) | | | 94,733 | | |
Total Investments: 102.7%
(Cost: $1,622,045)(f) | | | 2,100,743 | | |
Obligation to Return Collateral for
Securities Loaned: (3.0)% | | | (61,634 | ) | |
| Cash and Other Assets Less Liabilities: 0.3% | | | 5,958 | | |
| Total Net Assets: 100.0% | | $ | 2,045,067 | | |
ADR = American Depositary Receipts
See accompanying notes to financial statements.
67
Columbia Acorn Select
Statement of Investments (Unaudited), continued
> Notes to Statement of Investments (dollar values in thousands)
(a) Non-income producing security.
(b) All or a portion of this security was on loan at June 30, 2011. The total market value of Fund securities on loan at June 30, 2011 was $59,666.
(c) An affiliated person of the Fund may include any company in which the Fund owns five percent or more of its outstanding voting shares. Holdings and transactions in these affiliated companies during the six months ended June 30, 2011, are as follows:
| Affiliates | | Balance of
Shares Held
12/31/10 | | Purchases/
Additions | | Sales/
Reductions | | Balance of
Shares Held
6/30/11 | | Value | | Dividend | |
| Canacol Energy | | | 36,240,000 | | | | - | | | | 1,710,000 | | | | 34,530,000 | | | $ | 37,863 | | | $ | - | | |
| Canadian Overseas Petroleum+ | | | 16,800,000 | | | | 36,000,000 | | | | 16,800,000 | | | | 36,000,000 | | | | 12,731 | | | | - | | |
| Canadian Solar | | | 3,200,000 | | | | 100,000 | | | | - | | | | 3,300,000 | | | | 37,950 | | | | - | | |
| Eacom Timber | | | 38,000,000 | | | | - | | | | - | | | | 38,000,000 | | | | 11,970 | | | | - | | |
| Globalstar | | | 15,000,000 | | | | - | | | | - | | | | 15,000,000 | | | | 18,450 | | | | - | | |
| IFM Investments (Century 21 China RE) - ADR | | | 2,300,000 | | | | - | | | | - | | | | 2,300,000 | | | | 3,381 | | | | - | | |
| Petrodorado+ | | | 45,544,000 | | | | 6,456,000 | | | | - | | | | 52,000,000 | | | | 12,763 | | | | - | | |
| Real Goods Solar | | | 1,500,000 | | | | 100,000 | | | | - | | | | 1,600,000 | | | | 4,736 | | | | - | | |
| Sanmina-SCI | | | 7,100,000 | | | | - | | | | 150,000 | | | | 6,950,000 | | | | 71,793 | | | | - | | |
| ShaMaran Petroleum | | | 35,950,000 | | | | 2,843,100 | | | | 449,200 | | | | 38,343,900 | | | | 30,216 | | | | - | | |
| Synthesis Energy Systems | | | 4,500,000 | | | | - | | | | 649,628 | | | | 3,850,372 | | | | 7,200 | | | | - | | |
| Tuscany International Drilling*+ | | | 13,224,000 | | | | - | | | | 1,578,300 | | | | 11,645,700 | | | | 10,412 | | | | - | | |
| VisionChina Media - ADR* | | | 3,675,000 | | | | - | | | | 101,600 | | | | 3,573,400 | | | | 10,113 | | | | - | | |
| WNS - ADR | | | 4,200,000 | | | | 27,186 | | | | - | | | | 4,227,186 | | | | 37,580 | | | | - | | |
| Total of Affiliated Transactions | | | 227,233,000 | | | | 45,526,286 | | | | 21,438,728 | | | | 251,320,558 | | | $ | 307,158 | | | $ | - | | |
* At June 30, 2011, the Fund owned less than five percent of the company's outstanding voting shares.
+ Includes the effects of a corporate action.
The aggregate cost and value of these affiliated companies at June 30, 2011, were $368,957 and $286,633, respectively. Investments in affiliated companies represented 14.0% of the Fund's total net assets at June 30, 2011.
(d) Denotes a restricted security, which is subject to restrictions on resale under federal securities laws. These securities are valued at a fair value determined in good faith under consistently applied procedures established by the Board of Trustees. At June 30, 2011, the value of these securities amounted to $54,784, which represented 2.68% of total net assets.
Additional information on these securities is as follows:
| Security | | Acquisition
Dates | | Shares | | Cost | | Value | |
| Union Agriculture Group | | 12/08/10 | | | 9,090,909 | | | $ | 20,000 | | | $ | 20,000 | | |
| Eacom Timber | | 3/17/10 | | | 38,000,000 | | | | 18,812 | | | | 11,970 | | |
| Canadian Overseas Petroleum | | 11/24/10 | | | 24,000,000 | | | | 10,260 | | | | 11,096 | | |
| Canacol Energy | | 4/15/10 | | | 4,000,000 | | | | 2,963 | | | | 4,308 | | |
| Petromanas | | 5/20/10 | | | 13,125,000 | | | | 4,561 | | | | 3,868 | | |
| Petrodorado - Warrants | | 11/20/09 | | | 17,144,000 | | | | 2,118 | | | | 1,740 | | |
| Canadian Overseas Petroleum - Warrants | | 11/24/10 | | | 12,000,000 | | | | 1,502 | | | | 1,635 | | |
| Petromanas - Warrants | | 5/20/10 | | | 6,562,500 | | | | 380 | | | | 167 | | |
| | | | | | | $ | 60,596 | | | $ | 54,784 | | |
(e) Investment made with cash collateral received from securities lending activity.
(f) At June 30, 2011, for federal income tax purposes, the cost of investments was $1,622,045 and net unrealized appreciation was $478,698, consisting of gross unrealized appreciation of $688,871 and gross unrealized depreciation of $210,173.
Various inputs are used in determining the value of the Fund's investments, following the input prioritization hierarchy established by GAAP. These inputs are summarized in the three broad levels listed below:
• Level 1 – quoted prices in active markets for identical securities
• Level 2 – prices determined using other significant observable inputs (including quoted prices for similar securities, interest rates, prepayment speeds, credit risk and others)
• Level 3 – prices determined using significant unobservable inputs where quoted prices or observable inputs are unavailable or less reliable (including management's own assumptions about the factors market participants would use in pricing an investment)
The inputs or methodology used for valuing securities are not necessarily an indication of the risk associated with investing in those securities.
See accompanying notes to financial statements.
68
> Notes to Statement of Investments (dollar values in thousands)
Examples of the types of securities in which the Fund would typically invest and how they are classified within this hierarchy are as follows. Typical Level 1 securities include exchange traded domestic equities, mutual funds whose NAVs are published each day and exchange traded foreign equities that are not statistically fair valued. Typical Level 2 securities include exchange traded foreign equities that are statistically fair valued, forward foreign currency exchange contracts and short-term investments valued at amortized cost. Additionally, securities fair valued by the Valuation Committee of the Fund's Board of Trustees that rely on significant observable inputs are also included in Level 2. Typical Level 3 securities include any security fair valued by the Valuation Committee that relies on significant unobservable inputs.
The following table summarizes the inputs used, as of June 30, 2011, in valuing the Fund's assets:
| Investment Type | | Quoted Prices
(Level 1) | | Other
Significant
Observable
Inputs
(Level 2) | | Significant
Unobservable
Inputs
(Level 3) | | Total | |
| Equities | |
| Consumer Goods & Services | | $ | 462,738 | | | $ | 32,405 | | | $ | — | | | $ | 495,143 | | |
| Industrial Goods & Services | | | 389,200 | | | | — | | | | — | | | | 389,200 | | |
| Information | | | 312,579 | | | | — | | | | — | | | | 312,579 | | |
| Energy & Minerals | | | 245,650 | | | | 34,784 | | | | 20,000 | | | | 300,434 | | |
| Finance | | | 300,099 | | | | — | | | | — | | | | 300,099 | | |
| Other Industries | | | 112,271 | | | | — | | | | — | | | | 112,271 | | |
| Health Care | | | 34,650 | | | | — | | | | — | | | | 34,650 | | |
| Total Equities | | | 1,857,187 | | | | 67,189 | | | | 20,000 | | | | 1,944,376 | | |
| Total Securities Lending Collateral | | | 61,634 | | | | — | | | | — | | | | 61,634 | | |
| Total Short-Term Obligation | | | — | | | | 94,733 | | | | — | | | | 94,733 | | |
| Total Investments | | $ | 1,918,821 | | | $ | 161,922 | | | $ | 20,000 | | | $ | 2,100,743 | | |
The Fund's assets assigned to the Level 2 input category are generally valued using a market approach, in which a security's value is determined through its correlation to prices and information from observable market transactions for similar or identical assets. Foreign equities are generally valued at the last sales price on the foreign exchange or market on which they trade. The Fund may use a systematic fair valuation model provided by an independent third party to value securities principally traded in foreign markets in order to adjust for possible stale pricing that may occur between the close of the foreign exchanges and the time for valuation. These models take into account available market data including intraday index, ADR, and ETF movements. Securities acquired via private placement that have a holding period or an extended settlement period are valued at a discount to the same shares that are trading freely on the market. These discounts are determined by the adviser's experience with similar securities or situations. Factors may include, but are not limited to, trade volume, shares outstanding and stock price. Warrants which do not trade are valued as a percentage of the actively trading common stocks using a model based on Black Scholes.
Certain short-term obligations may be valued using amortized cost, an income approach which converts future cash flows to a present value based upon the discount or premium at purchase.
The Fund's assets assigned to the Level 3 input category are valued at fair value as determined in good faith under consistently applied procedures established by and under the general supervision of the Board of Trustees. To determine fair value, management will utilize the valuation technique that they deem the most appropriate in the circumstances. Securities acquired via private placement that are not yet trading are valued using a market approach for which management has determined that the original transaction price is the best representation of fair value. The original cost may be adjusted for the market movement in an index, ETF or similar security during the period it does not trade.
There were no significant transfers of financial assets between levels 1 and 2 during the period.
The following table reconciles asset balances for the six months ending June 30, 2011, in which significant unobservable inputs (Level 3) were used in determining value:
Investments
in Securities | | Balance
as of
December 31,
2010 | | Realized
Gain/(Loss) | | Change in
Unrealized
Appreciation
(Depreciation) | | Purchases | | Sales | | Transfers
into
Level 3 | | Transfers
out of
Level 3 | | Balance
as of
June 30,
2011 | |
| Equities | |
| Energy & Minerals | | $ | 20,000 | | | $ | - | | | $ | - | | | $ | - | | | $ | - | | | $ | - | | | $ | - | | | $ | 20,000 | | |
| | | $ | 20,000 | | | $ | - | | | $ | - | | | $ | - | | | $ | - | | | $ | - | | | $ | - | | | $ | 20,000 | | |
The information in the above reconciliation table represents fiscal year to date activity for any securities identified as using Level 3 inputs at either the beginning or the end of the current fiscal period.
The change in unrealized appreciation (depreciation) attributed to securities owned at June 30, 2011, which were valued using significant unobservable inputs (Level 3) amounted to $0. This amount is included in net change in unrealized appreciation (depreciation) on the Statements of Changes in Net Assets.
For more information on valuation inputs, and their aggregation into the levels used in the tables above, please refer to the Security Valuation section in the accompanying Notes to Financial Statements.
See accompanying notes to financial statements.
69
Columbia Thermostat Fund
Statement of Investments (Unaudited), June 30, 2011
| Number of Shares | | | | Value (000) | |
| | | > Affiliated Stock Funds: 60.6% | |
| | 1,221 | | | Columbia Dividend Income Fund,
Class I | | $ | 16,734 | | |
| | 394 | | | Columbia Acorn International,
Class I | | | 16,221 | | |
| | 577 | | | Columbia Marsico Growth Fund,
Class I | | | 12,678 | | |
| | 396 | | | Columbia Acorn Fund, Class I | | | 12,664 | | |
| | 301 | | | Columbia Acorn Select, Class I | | | 8,493 | | |
| | 652 | | | Columbia Large Cap Enhanced
Core Fund, Class I | | | 8,439 | | |
| | 555 | | | Columbia Contrarian Core Fund,
Class I | | | 8,392 | | |
| Total Stock Funds: (Cost: $65,310) | | | 83,621 | | |
| | | > Affiliated Bond Funds: 39.2% | |
| | 2,969 | | | Columbia Intermediate Bond Fund,
Class I | | | 27,015 | | |
| | 1,450 | | | Columbia U.S. Treasury Index Fund,
Class I | | | 16,237 | | |
| | 1,120 | | | Columbia Income Opportunities Fund,
Class I | | | 10,804 | | |
| Total Bond Funds: (Cost: $53,022) | | | 54,056 | | |
| Principal Amount (000) | | | | Value (000) | |
| Short-Term Obligation: 0.4% | |
| | | > Repurchase Agreement: 0.4% | |
| $ | 478 | | | Repurchase Agreement with
Fixed Income Clearing Corp.,
dated 6/30/11, due 7/01/11
at 0.01%, collateralized by a
U.S. Government Agency
obligation maturing 8/18/17,
market value $490
(repurchase proceeds $478) | | $ | 478 | | |
Total Short-Term Obligation:
(Cost: $478) | | | 478 | | |
Total Investments: 100.2%
(Cost: $118,810)(a) | | | 138,155 | | |
| Cash and Other Assets Less Liabilities: (0.2)% | | | (216 | ) | |
| Total Net Assets: 100.0% | | $ | 137,939 | | |
> Notes to Statement of Investments (dollar values in thousands)
(a) At June 30, 2011, for federal income tax purposes, the cost of investments was $118,810 and net unrealized appreciation was $19,345, consisting of gross unrealized appreciation of $19,646 and gross unrealized depreciation of $301.
Various inputs are used in determining the value of the Fund's investments, following the input prioritization hierarchy established by GAAP. These inputs are summarized in the three broad levels listed below:
• Level 1 – quoted prices in active markets for identical securities
• Level 2 – prices determined using other significant observable inputs (including quoted prices for similar securities, interest rates, prepayment speeds, credit risk and others)
• Level 3 – prices determined using significant unobservable inputs where quoted prices or observable inputs are unavailable or less reliable (including management's own assumptions about the factors market participants would use in pricing an investment)
The inputs or methodology used for valuing securities are not necessarily an indication of the risk associated with investing in those securities.
Examples of the types of securities in which the Fund would typically invest and how they are classified within this hierarchy are as follows. Typical Level 1 securities include exchange traded domestic equities, mutual funds whose NAVs are published each day and exchange traded foreign equities that are not statistically fair valued. Typical Level 2 securities include exchange traded foreign equities that are statistically fair valued, forward foreign currency exchange contracts and short-term investments valued at amortized cost. Additionally, securities fair valued by the Valuation Committee of the Fund's Board of Trustees that rely on significant observable inputs are also included in Level 2. Typical Level 3 securities include any security fair valued by the Valuation Committee that relies on significant unobservable inputs.
The following table summarizes the inputs used, as of June 30, 2011, in valuing the Fund's assets:
| Investment Type | | Quoted Prices
(Level 1) | | Other
Significant
Observable
Inputs
(Level 2) | | Significant
Unobservable
Inputs
(Level 3) | | Total | |
| Total Stock Funds | | $ | 83,621 | | | $ | - | | | $ | - | | | $ | 83,621 | | |
| Total Bond Funds | | | 54,056 | | | | - | | | | - | | | | 54,056 | | |
| Total Short-Term Obligation | | | - | | | | 478 | | | | - | | | | 478 | | |
| Total Investments | | $ | 137,677 | | | $ | 478 | | | $ | - | | | $ | 138,155 | | |
The Fund's assets assigned to the Level 2 category include certain short-term obligations generally valued using amortized cost, an income approach which converts future cash flows to a present value based upon the discount or premium at purchase.
There were no significant transfers of financial assets between levels 1 and 2 during the period.
For more information on valuation inputs, and their aggregation into the levels used in table above, please refer to the Security Valuation section in the accompanying Notes to Financial Statements.
See accompanying notes to financial statements.
70
This page intentionally left blank.
71
Columbia Acorn Family of Funds
Statements of Assets and Liabilities (Unaudited)
| June 30, 2011 | | Columbia
Acorn
Fund | | Columbia
Acorn
International | | Columbia
Acorn
USA | | Columbia
Acorn
International
Select | | Columbia
Acorn
Select | | Columbia
Thermostat
Fund | |
| (in thousands) | |
| Assets: | |
| Unaffiliated investments, at cost | | $ | 9,331,368 | | | $ | 4,336,507 | | | $ | 1,239,910 | | | $ | 282,220 | | | $ | 1,158,355 | | | $ | — | | |
Affiliated investments, at cost
(See Note 4) | | | 2,325,878 | | | | 85,252 | | | | 4,479 | | | | — | | | | 368,957 | | | | 118,332 | | |
| Repurchase agreements, at cost | | | 534,686 | | | | 226,923 | | | | 15,821 | | | | 58,891 | | | | 94,733 | | | | 478 | | |
Unaffiliated investments, at value (including
securities on loan: Columbia Acorn Fund
$340,090; Columbia Acorn International
$88,468; Columbia Acorn USA $12,520;
Columbia Acorn International Select
$—; Columbia Acorn Select $59,666;
Columbia Thermostat Fund $—) | | $ | 15,285,789 | | | $ | 6,138,447 | | | $ | 1,910,189 | | | $ | 380,651 | | | $ | 1,719,377 | | | $ | — | | |
Affiliated investments, at value
(See Note 4) | | | 3,845,216 | | | | 104,674 | | | | 3,798 | | | | — | | | | 286,633 | | | | 137,677 | | |
| Repurchase agreements, at value | | | 534,686 | | | | 226,923 | | | | 15,821 | | | | 58,891 | | | | 94,733 | | | | 478 | | |
| Cash | | | 2,224 | | | | — | * | | | — | | | | 1 | | | | 1 | | | | 1 | | |
Foreign currency (cost: Columbia
Acorn Fund $2,127; Columbia
Acorn International $38,419; Columbia
Acorn International Select $525;
Columbia Acorn Select $151) | | | 2,150 | | | | 38,737 | | | | — | | | | 526 | | | | 151 | | | | — | | |
Net unrealized appreciation on forward
foreign currency exchange contracts | | | — | | | | 3,057 | | | | — | | | | — | | | | — | | | | — | | |
| Receivable for: | |
| Investments sold | | | 46,268 | | | | 14,133 | | | | 4,998 | | | | — | | | | 18,286 | | | | 174 | | |
| Fund shares sold | | | 16,431 | | | | 19,476 | | | | 1,248 | | | | 407 | | | | 1,206 | | | | 65 | | |
| Dividends and interest | | | 8,993 | | | | 6,343 | | | | 693 | | | | 329 | | | | 1,378 | | | | — | | |
| Securities lending income | | | 200 | | | | 105 | | | | 15 | | | | 8 | | | | 55 | | | | — | | |
| Foreign tax reclaims | | | 296 | | | | 1,706 | | | | — | | | | 124 | | | | — | | | | — | | |
| Expense reimbursement due from Adviser | | | — | | | | — | | | | — | | | | — | * | | | — | | | | 27 | | |
| Trustees' Deferred Compensation Investments | | | 2,417 | | | | 687 | | | | 197 | | | | 39 | | | | 250 | | | | 23 | | |
| Other assets | | | 147 | | | | 48 | | | | 24 | | | | 3 | | | | 10 | | | | 17 | | |
| Total Assets | | | 19,744,817 | | | | 6,554,336 | | | | 1,936,983 | | | | 440,979 | | | | 2,122,080 | | | | 138,462 | | |
| Liabilities: | |
| Collateral on securities loaned | | | 352,904 | | | | 90,621 | | | | 12,944 | | | | — | | | | 61,634 | | | | — | | |
Net unrealized depreciation on forward
foreign currency exchange contracts | | | — | | | | 2,796 | | | | — | | | | — | | | | — | | | | — | | |
| Payable for: | |
| Investments purchased | | | 77,052 | | | | 9,632 | | | | 5,767 | | | | 2,829 | | | | 8,297 | | | | — | | |
| Fund shares redeemed | | | 45,467 | | | | 4,970 | | | | 3,949 | | | | 258 | | | | 4,551 | | | | 335 | | |
| Management fee | | | 9,786 | | | | 3,956 | | | | 1,299 | | | | 339 | | | | 1,340 | | | | 11 | | |
| Administration fee | | | 578 | | | | 197 | | | | 57 | | | | 14 | | | | 62 | | | | 4 | | |
| 12b-1 Service & Distribution fees | | | 1,591 | | | | 281 | | | | 76 | | | | 26 | | | | 205 | | | | 43 | | |
| Reports to shareholders | | | 821 | | | | 395 | | | | 84 | | | | 74 | | | | 264 | | | | 70 | | |
| Deferred Trustees' fees | | | 2,417 | | | | 687 | | | | 197 | | | | 39 | | | | 250 | | | | 23 | | |
| Transfer agent fees | | | 2,066 | | | | 354 | | | | 236 | | | | 38 | | | | 356 | | | | 24 | | |
| Trustees' fees | | | 18 | | | | — | | | | 1 | | | | — | | | | 2 | | | | — | | |
| Professional fee | | | 140 | | | | 63 | | | | 21 | | | | 22 | | | | 20 | | | | 13 | | |
| Custody fees | | | 75 | | | | 509 | | | | 3 | | | | 32 | | | | 25 | | | | — | | |
| Foreign capital gains tax | | | — | | | | 201 | | | | — | | | | — | | | | — | | | | — | | |
| Other liabilities | | | 43 | | | | 14 | | | | 4 | | | | 9 | | | | 7 | | | | — | | |
| Total Liabilities | | | 492,958 | | | | 114,676 | | | | 24,638 | | | | 3,680 | | | | 77,013 | | | | 523 | | |
| Net Assets | | $ | 19,251,859 | | | $ | 6,439,660 | | | $ | 1,912,345 | | | $ | 437,299 | | | $ | 2,045,067 | | | $ | 137,939 | | |
| Composition of Net Assets: | |
| Paid in capital | | $ | 11,501,455 | | | $ | 4,977,351 | | | $ | 1,263,898 | | | $ | 345,003 | | | $ | 1,567,317 | | | $ | 143,450 | | |
Undistributed/(overdistributed)
net investment income
(Accumulated net investment loss) | | | (101,213 | ) | | | (102,703 | ) | | | (5,413 | ) | | | (4,301 | ) | | | (53,711 | ) | | | 1,525 | | |
| Accumulated net realized gain/(loss) | | | 377,782 | | | | (256,826 | ) | | | (15,738 | ) | | | (1,843 | ) | | | 52,764 | | | | (26,381 | ) | |
| Net unrealized appreciation/(depreciation) on: | |
| Investments | | | 7,473,759 | | | | 1,821,362 | | | | 669,598 | | | | 98,431 | | | | 478,698 | | | | 19,345 | | |
| Foreign capital gains tax | | | — | | | | (201 | ) | | | — | | | | — | | | | — | | | | — | | |
| Foreign currency translations | | | 76 | | | | 677 | | | | — | | | | 9 | | | | (1 | ) | | | — | | |
| Net Assets | | $ | 19,251,859 | | | $ | 6,439,660 | | | $ | 1,912,345 | | | $ | 437,299 | | | $ | 2,045,067 | | | $ | 137,939 | | |
Net asset value per
share – Class A (a) | | $ | 30.95 | | | $ | 41.02 | | | $ | 30.01 | | | $ | 28.69 | | | $ | 27.50 | | | $ | 12.98 | | |
| (Net assets/shares) | | ($3,926,256/126,838) | | ($908,471/22,149) | | ($212,735/7,088) | | ($71,320/2,486) | | ($509,474/18,526) | | ($54,090/4,166) | |
Maximum offering price per
share – Class A (b) | | $ | 32.84 | | | $ | 43.52 | | | $ | 31.84 | | | $ | 30.44 | | | $ | 29.18 | | | $ | 13.77 | | |
(Net asset value per share/front-
end sales charge) | | ($30.95/0.9425) | | ($41.02/0.9425) | | ($30.01/0.9425) | | ($28.69/0.9425) | | ($27.50/0.9425) | | ($12.98/0.9425) | |
Net asset value and offering price per
share – Class B (a) | | $ | 28.62 | | | $ | 39.97 | (d) | | $ | 27.79 | (d) | | $ | 27.42 | (d) | | $ | 25.70 | | | $ | 13.04 | | |
| (Net assets/shares) | | ($188,366/6,581) | | ($23,575/590) | | ($7,112/255) | | ($2,563/93) | | ($53,225/2,071) | | ($21,615/1,658) | |
Net asset value and offering price per
share – Class C (a) | | $ | 28.30 | | | $ | 39.82 | | | $ | 27.57 | (d) | | $ | 27.29 | | | $ | 25.49 | (d) | | $ | 13.02 | | |
| (Net assets/shares) | | ($876,147/30,954) | | ($100,222/2,517) | | ($36,348/1,319) | | ($11,463/420) | | ($87,862/3,446) | | ($22,788/1,750) | |
Net asset value and offering price per
share – Class I | | $ | 31.96 | (d) | | $ | 41.15 | (d) | | $ | 31.18 | (d) | | $ | 29.00 | | | $ | 28.25 | (d) | | | | | |
| (Net assets/shares) | | ($12,665/396) | | ($27,769/675) | | ($3,211/103) | | ($3/0**) | | ($8,496/301) | | | | | |
Net asset value and offering price per
share – Class Z (c) | | $ | 31.95 | | | $ | 41.13 | | | $ | 31.17 | | | $ | 28.98 | | | $ | 28.25 | | | $ | 12.86 | | |
| (Net assets/shares) | | ($14,248,425/446,005) | | ($5,379,623/130,798) | | ($1,652,939/53,033) | | ($351,950/12,145) | | ($1,386,010/49,056) | | ($39,446/3,068) | |
(a) Redemption price per share is equal to net asset value less any applicable contingent deferred sales charge and redemption fee.
(b) On sales of $50,000 or more the offering price is reduced.
(c) Redemption price per share is equal to net asset value less any applicable redemption fee.
(d) Due to rounding of shares outstanding.
* Rounds to less than $500.
** Rounds to less than 500 shares.
See accompanying notes to financial statements.
72
Columbia Acorn Family of Funds
Statements of Operations (Unaudited)
For the Six Months Ended June 30, 2011
| (in thousands) | | Columbia
Acorn
Fund | | Columbia
Acorn
International | | Columbia
Acorn
USA | | Columbia
Acorn
International
Select | | Columbia
Acorn
Select | | Columbia
Thermostat
Fund | |
| Investment Income: | |
| Dividend income | | $ | 62,270 | | | $ | 84,948 | | | $ | 4,453 | | | $ | 5,929 | | | $ | 6,882 | | | $ | — | | |
Dividend income from affiliates
(See Note 4) | | | 5,944 | | | | 2,397 | | | | — | | | | — | | | | — | | | | — | | |
Dividends from affiliated investment
company shares (See Note 4) | | | — | | | | — | | | | — | | | | — | | | | — | | | | 2,023 | | |
| Interest income | | | 167 | | | | 95 | | | | 4 | | | | 6 | | | | 26 | | | | — | * | |
| Securitites lending income, net | | | 1,053 | | | | 454 | | | | 95 | | | | 14 | | | | 131 | | | | — | | |
| | | | 69,434 | | | | 87,894 | | | | 4,552 | | | | 5,949 | | | | 7,039 | | | | 2,023 | | |
| Foreign taxes withheld | | | (1,493 | ) | | | (7,054 | ) | | | (8 | ) | | | (471 | ) | | | (88 | ) | | | — | | |
| Total Investment Income | | | 67,941 | | | | 80,840 | | | | 4,544 | | | | 5,478 | | | | 6,951 | | | | 2,023 | | |
| Expenses: | |
| Management fee | | | 59,852 | | | | 23,819 | | | | 7,935 | | | | 2,084 | | | | 8,907 | | | | 68 | | |
| Administration fee | | | 3,530 | | | | 1,184 | | | | 349 | | | | 84 | | | | 414 | | | | 26 | | |
| 12b-1 Service and Distribution fees: | |
| Class A | | | 4,732 | | | | 1,083 | | | | 271 | | | | 90 | | | | 671 | | | | 60 | | |
| Class B | | | 903 | | | | 99 | | | | 31 | | | | 11 | | | | 237 | | | | 99 | | |
| Class C | | | 4,258 | | | | 547 | | | | 180 | | | | 58 | | | | 468 | | | | 112 | | |
| Transfer agent fees: | |
| Class A | | | 1,554 | | | | 593 | | | | 94 | | | | 57 | | | | 276 | | | | 32 | | |
| Class B | | | 347 | | | | 41 | | | | 14 | | | | 5 | | | | 86 | | | | 28 | | |
| Class C | | | 472 | | | | 83 | | | | 20 | | | | 12 | | | | 68 | | | | 17 | | |
| Class Z | | | 2,623 | | | | 1,225 | | | | 415 | | | | 57 | | | | 445 | | | | 9 | | |
| Custody fees | | | 649 | | | | 2,120 | | | | 28 | | | | 118 | | | | 156 | | | | — | | |
| Trustees' fees | | | 538 | | | | 176 | | | | 51 | | | | 15 | | | | 66 | | | | 5 | | |
| Reports to shareholders | | | 1,018 | | | | 548 | | | | 169 | | | | 70 | | | | 259 | | | | 56 | | |
| Professional fees | | | 559 | | | | 208 | | | | 61 | | | | 32 | | | | 71 | | | | 13 | | |
| Chief compliance officer expenses (See Note 4) | | | 258 | | | | 79 | | | | 25 | | | | 7 | | | | 34 | | | | 2 | | |
| Other expenses | | | 359 | | | | 168 | | | | 76 | | | | 59 | | | | 97 | | | | 41 | | |
| Total expenses | | | 81,652 | | | | 31,973 | | | | 9,719 | | | | 2,759 | | | | 12,255 | | | | 568 | | |
| Less custody fees paid indirectly | | | — | * | | | — | * | | | — | * | | | — | * | | | — | * | | | — | | |
Less reimbursement of expenses by
Investment Adviser | | | — | | | | — | | | | — | | | | — | * | | | — | | | | (129 | ) | |
| Net Expenses | | | 81,652 | | | | 31,973 | | | | 9,719 | | | | 2,759 | | | | 12,255 | | | | 439 | | |
| Net Investment Income/(Loss) | | | (13,711 | ) | | | 48,867 | | | | (5,175 | ) | | | 2,719 | | | | (5,304 | ) | | | 1,584 | | |
Net Realized and Unrealized Gain (Loss)
on Portfolio Positions: | |
| Net realized gain/(loss) on: | |
| Unaffiliated investments | | | 381,947 | | | | 133,208 | | | | 13,002 | | | | 34,920 | | | | 175,643 | | | | 3,561 | | |
| Affiliated investments (See Note 4) | | | 11,248 | | | | (2,643 | ) | | | — | | | | — | | | | (2,797 | ) | | | — | | |
Foreign currency transactions and forward
foreign currency exchange contracts | | | 146 | | | | 1,067 | | | | — | | | | (52 | ) | | | (65 | ) | | | — | | |
Distributions from affiliated investment
company shares | | | — | | | | — | | | | — | | | | — | | | | — | | | | 156 | | |
| Net realized gain | | | 393,341 | | | | 131,632 | | | | 13,002 | | | | 34,868 | | | | 172,781 | | | | 3,717 | | |
Net change in net unrealized
appreciation/(depreciation) on: | |
| Unaffiliated investments | | | 507,051 | | | | 14,580 | | | | 154,928 | | | | (21,427 | ) | | | (79,517 | ) | | | — | | |
| Affiliated investments (See Note 4) | | | 397,583 | | | | 2,549 | | | | 504 | | | | — | | | | (89,482 | ) | | | 552 | | |
Foreign currency translations and forward
foreign currency exchange contracts | | | 46 | | | | (11,766 | ) | | | — | | | | (3 | ) | | | (2 | ) | | | — | | |
| Foreign capital gains tax | | | — | | | | 306 | | | | — | | | | — | | | | — | | | | — | | |
Net change in unrealized appreciation/
(depreciation) | | | 904,680 | | | | 5,669 | | | | 155,432 | | | | (21,430 | ) | | | (169,001 | ) | | | 552 | | |
| Net realized and unrealized gain | | | 1,298,021 | | | | 137,301 | | | | 168,434 | | | | 13,438 | | | | 3,780 | | | | 4,269 | | |
Net Increase/(Decrease) in Net Assets
resulting from Operations | | $ | 1,284,310 | | | $ | 186,168 | | | $ | 163,259 | | | $ | 16,157 | | | $ | (1,524 | ) | | $ | 5,853 | | |
* Rounds to less than $500.
See accompanying notes to financial statements.
73
Columbia Acorn Family of Funds
Statements of Changes in Net Assets
| | | Columbia
Acorn Fund | | Columbia Acorn
International | | Columbia
Acorn USA | |
| Increase (Decrease) in Net Assets | | (Unaudited)
Six months
ended
June 30, | | Year ended
December 31, | | (Unaudited)
Six months
ended
June 30, | | Year ended
December 31, | | (Unaudited)
Six months
ended
June 30, | | Year ended
December 31, | |
| (in thousands) | | 2011 | | 2010 (a)(b) | | 2011 | | 2010 (a)(b) | | 2011 | | 2010 (a)(b) | |
| Operations: | |
| Net investment income/(loss) | | $ | (13,711 | ) | | $ | (7,374 | ) | | $ | 48,867 | | | $ | 45,340 | | | $ | (5,175 | ) | | $ | (5,972 | ) | |
Net realized gain/(loss) on investments, foreign
currency transactions, forward foreign currency exchange contracts
and foreign capital gains tax | | | 382,093 | | | | 971,334 | | | | 134,275 | | | | 276,374 | | | | 13,002 | | | | 96,553 | | |
Net realized gain/(loss) on affiliated investments and
distributions from affiliated investment companies and
affiliated investment company shares | | | 11,248 | | | | 139,546 | | | | (2,643 | ) | | | 5,786 | | | | — | | | | (1,208 | ) | |
Net change in net unrealized appreciation/(depreciation)
on investments, foreign currency translations, forward foreign
currency exchange contracts and foreign capital gains tax | | | 507,097 | | | | 1,864,571 | | | | 3,120 | | | | 752,452 | | | | 154,928 | | | | 224,623 | | |
Net change in net unrealized appreciation/(depreciation)
on affiliated investment companies and affiliated investment
company shares | | | 397,583 | | | | 758,959 | | | | 2,549 | | | | 6,050 | | | | 504 | | | | 4,434 | | |
| Net Increase/(Decrease) from Operations | | | 1,284,310 | | | | 3,727,036 | | | | 186,168 | | | | 1,086,002 | | | | 163,259 | | | | 318,430 | | |
| Distributions to Shareholders From: | |
| Net investment income – Class A | | | (2,047 | ) | | | (2,387 | ) | | | (21,972 | ) | | | (12,578 | ) | | | — | | | | — | | |
| Net realized gain – Class A | | | (38,150 | ) | | | (100,919 | ) | | | — | | | | — | | | | — | | | | — | | |
| Net investment income – Class B | | | — | | | | — | | | | (600 | ) | | | (290 | ) | | | — | | | | — | | |
| Net realized gain – Class B | | | (2,204 | ) | | | (9,116 | ) | | | — | | | | — | | | | — | | | | — | | |
| Net investment income – Class C | | | — | | | | — | | | | (2,369 | ) | | | (714 | ) | | | — | | | | — | | |
| Net realized gain – Class C | | | (9,366 | ) | | | (25,102 | ) | | | — | | | | — | | | | — | | | | — | | |
| Net investment income – Class I | | | (34 | ) | | | — | * | | | (676 | ) | | | (9 | ) | | | — | | | | — | | |
| Net realized gain – Class I | | | (119 | ) | | | — | * | | | — | | | | — | | | | — | | | | — | | |
| Net investment income – Class Z | | | (36,823 | ) | | | (18,634 | ) | | | (131,455 | ) | | | (109,328 | ) | | | — | | | | — | | |
| Net realized gain – Class Z | | | (134,735 | ) | | | (361,156 | ) | | | — | | | | — | | | | — | | | | — | | |
| Total Distributions to Shareholders | | | (223,478 | ) | | | (517,314 | ) | | | (157,072 | ) | | | (122,919 | ) | | | — | | | | — | | |
| Share Transactions: | |
| Subscriptions – Class A | | | 513,660 | | | | 843,928 | | | | 183,011 | | | | 317,458 | | | | 24,680 | | | | 55,029 | | |
| Distributions reinvested – Class A | | | 36,444 | | | | 94,158 | | | | 18,983 | | | | 10,862 | | | | — | | | | — | | |
| Redemptions – Class A | | | (481,606 | ) | | | (866,166 | ) | | | (107,204 | ) | | | (221,501 | ) | | | (45,052 | ) | | | (59,786 | ) | |
| Net Increase/(Decrease) – Class A | | | 68,498 | | | | 71,920 | | | | 94,790 | | | | 106,819 | | | | (20,372 | ) | | | (4,757 | ) | |
| Subscriptions – Class B | | | 278 | | | | 989 | | | | 58 | | | | 35 | | | | 4 | | | | 2 | | |
| Distributions reinvested – Class B | | | 1,814 | | | | 7,325 | | | | 494 | | | | 260 | | | | — | | | | — | | |
| Redemptions – Class B | | | (114,111 | ) | | | (312,686 | ) | | | (6,359 | ) | | | (15,278 | ) | | | (2,795 | ) | | | (13,951 | ) | |
| Net Decrease – Class B | | | (112,019 | ) | | | (304,372 | ) | | | (5,807 | ) | | | (14,983 | ) | | | (2,791 | ) | | | (13,949 | ) | |
| Subscriptions – Class C | | | 66,633 | | | | 76,903 | | | | 11,504 | | | | 24,476 | | | | 1,195 | | | | 1,669 | | |
| Distributions reinvested – Class C | | | 7,134 | | | | 19,273 | | | | 1,844 | | | | 590 | | | | — | | | | — | | |
| Redemptions – Class C | | | (71,870 | ) | | | (145,469 | ) | | | (24,543 | ) | | | (17,799 | ) | | | (3,930 | ) | | | (4,671 | ) | |
| Net Increase/(Decrease) – Class C | | | 1,897 | | | | (49,293 | ) | | | (11,195 | ) | | | 7,267 | | | | (2,735 | ) | | | (3,002 | ) | |
| Subscriptions – Class I | | | 4,307 | | | | 13,063 | | | | 8,133 | | | | 66,675 | | | | 10,803 | | | | 28,852 | | |
| Distributions reinvested – Class I | | | 153 | | | | — | | | | 675 | | | | 9 | | | | — | | | | — | | |
| Redemptions – Class I | | | (4,183 | ) | | | (1,538 | ) | | | (48,107 | ) | | | (2,003 | ) | | | (38,271 | ) | | | (293 | ) | |
| Net Increase/(Decrease) – Class I | | | 277 | | | | 11,525 | | | | (39,299 | ) | | | 64,681 | | | | (27,468 | ) | | | 28,559 | | |
| Subscriptions – Class Z | | | 1,182,084 | | | | 2,077,687 | | | | 589,377 | | | | 1,216,447 | | | | 234,528 | | | | 260,284 | | |
| Distributions reinvested – Class Z | | | 145,609 | | | | 324,149 | | | | 91,324 | | | | 76,344 | | | | — | | | | — | | |
| Redemptions – Class Z | | | (1,194,031 | ) | | | (1,969,778 | ) | | | (433,689 | ) | | | (726,019 | ) | | | (130,622 | ) | | | (276,628 | ) | |
| Net Increase/(Decrease) – Class Z | | | 133,662 | | | | 432,058 | | | | 247,012 | | | | 566,772 | | | | 103,906 | | | | (16,344 | ) | |
| Net Increase/(Decrease) from Share Transactions | | | 92,315 | | | | 161,838 | | | | 285,501 | | | | 730,556 | | | | 50,540 | | | | (9,493 | ) | |
| Redemption Fees | | | — | | | | — | | | | — | | | | 239 | | | | — | | | | — | | |
| Increase from regulatory settlements (See Note 9) | | | — | | | | 1 | | | | — | | | | 447 | | | | — | | | | — | | |
| Total Increase/(Decrease) in Net Assets | | | 1,153,147 | | | | 3,371,561 | | | | 314,597 | | | | 1,694,325 | | | | 213,799 | | | | 308,937 | | |
| Net Assets: | |
| Beginning of period | | | 18,098,712 | | | | 14,727,151 | | | | 6,125,063 | | | | 4,430,738 | | | | 1,698,546 | | | | 1,389,609 | | |
| End of period | | $ | 19,251,859 | | | $ | 18,098,712 | | | $ | 6,439,660 | | | $ | 6,125,063 | | | $ | 1,912,345 | | | $ | 1,698,546 | | |
Undistributed/(Overdistributed) Net Investment Income or
(Accumulated Net Investment Loss) | | $ | (101,213 | ) | | $ | (48,598 | ) | | $ | (102,703 | ) | | $ | 5,502 | | | $ | (5,413 | ) | | $ | (238 | ) | |
(a) Class I Shares commenced operations on September 27, 2010.
(b) Class I Shares reflect activity for the period September 27, 2010 through December 31, 2010.
* Rounds to less than $500.
See accompanying notes to financial statements.
74
| | | Columbia Acorn
International Select | | Columbia
Acorn Select | | Columbia
Thermostat Fund | |
| Increase (Decrease) in Net Assets | | (Unaudited)
Six months
ended
June 30, | | Year ended
December 31, | | (Unaudited)
Six months
ended
June 30, | | Year ended
December 31, | | (Unaudited)
Six months
ended
June 30, | | Year ended
December 31, | |
| (in thousands) | | 2011 | | 2010 (a)(b) | | 2011 | | 2010 (a)(b) | | 2011 | | 2010 | |
| Operations: | |
| Net investment income/(loss) | | $ | 2,719 | | | $ | 2,667 | | | $ | (5,304 | ) | | $ | (11,783 | ) | | $ | 1,584 | | | $ | 1,806 | | |
Net realized gain/(loss) on investments, foreign
currency transactions, forward foreign currency exchange contracts
and foreign capital gains tax | | | 34,868 | | | | 42,527 | | | | 175,578 | | | | 59,672 | | | | — | | | | — | | |
Net realized gain/(loss) on affiliated investments and
distributions from affiliated investment companies and
affiliated investment company shares | | | — | | | | — | | | | (2,797 | ) | | | (38,281 | ) | | | 3,717 | | | | (1,976 | ) | |
Net change in net unrealized appreciation/(depreciation)
on investments, foreign currency translations, forward foreign
currency exchange contracts and foreign capital gains tax | | | (21,430 | ) | | | 38,193 | | | | (79,519 | ) | | | 283,123 | | | | — | | | | — | | |
Net change in net unrealized appreciation/(depreciation)
on affiliated investment companies and affiliated investment
company shares | | | — | | | | — | | | | (89,482 | ) | | | 123,090 | | | | 552 | | | | 19,741 | | |
| Net Increase/(Decrease) from Operations | | | 16,157 | | | | 83,387 | | | | (1,524 | ) | | | 415,821 | | | | 5,853 | | | | 19,571 | | |
| Distributions to Shareholders From: | |
| Net investment income – Class A | | | (770 | ) | | | (776 | ) | | | (7,162 | ) | | | — | | | | (625 | ) | | | (678 | ) | |
| Net realized gain – Class A | | | — | | | | — | | | | — | | | | — | | | | — | | | | — | | |
| Net investment income – Class B | | | (16 | ) | | | (25 | ) | | | (500 | ) | | | — | | | | (249 | ) | | | (239 | ) | |
| Net realized gain – Class B | | | — | | | | — | | | | — | | | | — | | | | — | | | | — | | |
| Net investment income – Class C | | | (50 | ) | | | (65 | ) | | | (672 | ) | | | — | | | | (191 | ) | | | (124 | ) | |
| Net realized gain – Class C | | | — | | | | — | | | | — | | | | — | | | | — | | | | — | | |
| Net investment income – Class I | | | — | * | | | — | | | | (141 | ) | | | — | | | | — | | | | — | | |
| Net realized gain – Class I | | | — | | | | — | | | | — | | | | — | | | | — | | | | — | | |
| Net investment income – Class Z | | | (5,052 | ) | | | (5,241 | ) | | | (22,715 | ) | | | — | | | | (473 | ) | | | (625 | ) | |
| Net realized gain – Class Z | | | — | | | | — | | | | — | | | | — | | | | — | | | | — | | |
| Total Distributions to Shareholders | | | (5,888 | ) | | | (6,107 | ) | | | (31,190 | ) | | | — | | | | (1,538 | ) | | | (1,666 | ) | |
| Share Transactions: | |
| Subscriptions – Class A | | | 10,119 | | | | 18,214 | | | | 40,885 | | | | 115,498 | | | | 12,599 | | | | 8,937 | | |
| Distributions reinvested – Class A | | | 667 | | | | 675 | | | | 6,307 | | | | — | | | | 501 | | | | 609 | | |
| Redemptions – Class A | | | (12,913 | ) | | | (23,778 | ) | | | (85,032 | ) | | | (187,411 | ) | | | (5,038 | ) | | | (13,847 | ) | |
| Net Increase/(Decrease) – Class A | | | (2,127 | ) | | | (4,889 | ) | | | (37,840 | ) | | | (71,913 | ) | | | 8,062 | | | | (4,301 | ) | |
| Subscriptions – Class B | | | 2 | | | | — | * | | | 69 | | | | 34 | | | | 45 | | | | 4 | | |
| Distributions reinvested – Class B | | | 13 | | | | 22 | | | | 391 | | | | — | | | | 181 | | | | 218 | | |
| Redemptions – Class B | | | (557 | ) | | | (1,418 | ) | | | (18,583 | ) | | | (30,406 | ) | | | (8,198 | ) | | | (8,516 | ) | |
| Net Decrease – Class B | | | (542 | ) | | | (1,396 | ) | | | (18,123 | ) | | | (30,372 | ) | | | (7,972 | ) | | | (8,294 | ) | |
| Subscriptions – Class C | | | 636 | | | | 1,883 | | | | 2,746 | | | | 6,743 | | | | 2,665 | | | | 3,195 | | |
| Distributions reinvested – Class C | | | 40 | | | | 55 | | | | 495 | | | | — | | | | 149 | | | | 109 | | |
| Redemptions – Class C | | | (1,405 | ) | | | (3,121 | ) | | | (12,612 | ) | | | (19,302 | ) | | | (2,602 | ) | | | (5,530 | ) | |
| Net Increase/(Decrease) – Class C | | | (729 | ) | | | (1,183 | ) | | | (9,371 | ) | | | (12,559 | ) | | | 212 | | | | (2,226 | ) | |
| Subscriptions – Class I | | | — | | | | 3 | | | | 3,155 | | | | 8,577 | | | | — | | | | — | | |
| Distributions reinvested – Class I | | | — | | | | — | | | | 141 | | | | — | | | | — | | | | — | | |
| Redemptions – Class I | | | — | | | | — | | | | (2,611 | ) | | | (931 | ) | | | — | | | | — | | |
| Net Increase/(Decrease) – Class I | | | — | | | | 3 | | | | 685 | | | | 7,646 | | | | — | | | | — | | |
| Subscriptions – Class Z | | | 28,129 | | | | 67,172 | | | | 108,942 | | | | 358,116 | | | | 5,619 | | | | 7,895 | | |
| Distributions reinvested – Class Z | | | 1,771 | | | | 1,451 | | | | 17,488 | | | | — | | | | 410 | | | | 560 | | |
| Redemptions – Class Z | | | (52,139 | ) | | | (96,502 | ) | | | (266,855 | ) | | | (328,729 | ) | | | (3,982 | ) | | | (18,853 | ) | |
| Net Increase/(Decrease) – Class Z | | | (22,239 | ) | | | (27,879 | ) | | | (140,425 | ) | | | 29,387 | | | | 2,047 | | | | (10,398 | ) | |
| Net Increase/(Decrease) from Share Transactions | | | (25,637 | ) | | | (35,344 | ) | | | (205,074 | ) | | | (77,811 | ) | | | 2,349 | | | | (25,219 | ) | |
| Redemption Fees | | | — | | | | 10 | | | | — | | | | — | | | | — | | | | — | | |
| Increase from regulatory settlements (See Note 9) | | | — | | | | 46 | | | | — | | | | — | | | | — | | | | — | | |
| Total Increase/(Decrease) in Net Assets | | | (15,368 | ) | | | 41,992 | | | | (237,788 | ) | | | 338,010 | | | | 6,664 | | | | (7,314 | ) | |
| Net Assets: | |
| Beginning of period | | | 452,667 | | | | 410,675 | | | | 2,282,855 | | | | 1,944,845 | | | | 131,275 | | | | 138,589 | | |
| End of period | | $ | 437,299 | | | $ | 452,667 | | | $ | 2,045,067 | | | $ | 2,282,855 | | | $ | 137,939 | | | $ | 131,275 | | |
Undistributed/(Overdistributed) Net Investment Income or
(Accumulated Net Investment Loss) | | $ | (4,301 | ) | | $ | (1,132 | ) | | $ | (53,711 | ) | | $ | (17,217 | ) | | $ | 1,525 | | | $ | 1,479 | | |
See accompanying notes to financial statements.
75
Columbia Acorn Family of Funds
Statements of Changes in Net Assets, continued
| | | Columbia
Acorn Fund | | Columbia Acorn
International | | Columbia
Acorn USA | |
| Changes in Shares of Beneficial Interest: | | (Unaudited)
Six months
ended
June 30, | | Year ended
December 31, | | (Unaudited)
Six months
ended
June 30, | | Year ended
December 31, | | (Unaudited)
Six months
ended
June 30, | | Year ended
December 31, | |
| (in thousands) | | 2011 | | 2010 (a)(b) | | 2011 | | 2010 (a)(b) | | 2011 | | 2010 (a)(b) | |
| Subscriptions – Class A | | | 17,024 | | | | 32,735 | | | | 4,451 | | | | 8,744 | | | | 852 | | | | 2,334 | | |
| Shares issued in reinvestment – Class A | | | 1,237 | | | | 3,306 | | | | 463 | | | | 325 | | | | — | | | | — | | |
| Less shares redeemed – Class A | | | (15,908 | ) | | | (34,053 | ) | | | (2,601 | ) | | | (6,188 | ) | | | (1,539 | ) | | | (2,521 | ) | |
| Net Increase/(Decrease) – Class A | | | 2,353 | | | | 1,988 | | | | 2,313 | | | | 2,881 | | | | (687 | ) | | | (187 | ) | |
| Subscriptions – Class B | | | 10 | | | | 38 | | | | 2 | | | | 1 | | | | — | * | | | — | * | |
| Shares issued in reinvestment – Class B | | | 66 | | | | 276 | | | | 12 | | | | 9 | | | | — | | | | — | | |
| Less shares redeemed – Class B | | | (4,094 | ) | | | (13,126 | ) | | | (159 | ) | | | (444 | ) | | | (105 | ) | | | (636 | ) | |
| Net Decrease – Class B | | | (4,018 | ) | | | (12,812 | ) | | | (145 | ) | | | (434 | ) | | | (105 | ) | | | (636 | ) | |
| Subscriptions – Class C | | | 2,406 | | | | 3,197 | | | | 288 | | | | 700 | | | | 45 | | | | 76 | | |
| Shares issued in reinvestment – Class C | | | 265 | | | | 733 | | | | 46 | | | | 19 | | | | — | | | | — | | |
| Less shares redeemed – Class C | | | (2,599 | ) | | | (6,190 | ) | | | (605 | ) | | | (519 | ) | | | (148 | ) | | | (214 | ) | |
| Net Increase/(Decrease) – Class C | | | 72 | | | | (2,260 | ) | | | (271 | ) | | | 200 | | | | (103 | ) | | | (138 | ) | |
| Subscriptions – Class I | | | 138 | | | | 436 | | | | 196 | | | | 1,677 | | | | 361 | | | | 1,025 | | |
| Shares issued in reinvestment – Class I | | | 5 | | | | — | | | | 17 | | | | — | * | | | — | | | | — | | |
| Less shares redeemed – Class I | | | (132 | ) | | | (51 | ) | | | (1,165 | ) | | | (50 | ) | | | (1,273 | ) | | | (10 | ) | |
| Net Increase/(Decrease) – Class I | | | 11 | | | | 385 | | | | (952 | ) | | | 1,627 | | | | (912 | ) | | | 1,015 | | |
| Subscriptions – Class Z | | | 37,835 | | | | 78,950 | | | | 14,274 | | | | 33,971 | | | | 7,994 | | | | 10,643 | | |
| Shares issued in reinvestment – Class Z | | | 4,790 | | | | 11,048 | | | | 2,222 | | | | 2,239 | | | | — | | | | — | | |
| Less shares redeemed – Class Z | | | (38,207 | ) | | | (74,926 | ) | | | (10,531 | ) | | | (20,195 | ) | | | (4,340 | ) | | | (11,173 | ) | |
| Net Increase/(Decrease) – Class Z | | | 4,418 | | | | 15,072 | | | | 5,965 | | | | 16,015 | | | | 3,654 | | | | (530 | ) | |
| Net Increase/(Decrease) in Shares of Beneficial Interest | | | 2,836 | | | | 2,373 | | | | 6,910 | | | | 20,289 | | | | 1,847 | | | | (476 | ) | |
(a) Class I Shares commenced operations on September 27, 2010.
(b) Class I Shares reflect activity for the period September 27, 2010 through December 31, 2010.
* Rounds to less than 500.
See accompanying notes to financial statements.
76
| | | Columbia Acorn
International Select | | Columbia
Acorn Select | | Columbia
Thermostat Fund | |
| Changes in Shares of Beneficial Interest: | | (Unaudited)
Six months
ended
June 30, | | Year ended
December 31, | | (Unaudited)
Six months
ended
June 30, | | Year ended
December 31, | | (Unaudited)
Six months
ended
June 30, | | Year ended
December 31, | |
| (in thousands) | | 2011 | | 2010 (a)(b) | | 2011 | | 2010 (a)(b) | | 2011 | | 2010 | |
| Subscriptions – Class A | | | 355 | | | | 746 | | | | 1,468 | | | | 4,815 | | | | 977 | | | | 765 | | |
| Shares issued in reinvestment – Class A | | | 23 | | | | 31 | | | | 242 | | | | — | | | | 39 | | | | 56 | | |
| Less shares redeemed – Class A | | | (451 | ) | | | (982 | ) | | | (3,056 | ) | | | (7,851 | ) | | | (391 | ) | | | (1,223 | ) | |
| Net Increase/(Decrease) – Class A | | | (73 | ) | | | (205 | ) | | | (1,346 | ) | | | (3,036 | ) | | | 625 | | | | (402 | ) | |
| Subscriptions – Class B | | | — | * | | | — | * | | | 3 | | | | 2 | | | | 4 | | | | — | * | |
| Shares issued in reinvestment – Class B | | | — | * | | | 1 | | | | 16 | | | | — | | | | 14 | | | | 21 | | |
| Less shares redeemed – Class B | | | (20 | ) | | | (62 | ) | | | (719 | ) | | | (1,342 | ) | | | (634 | ) | | | (744 | ) | |
| Net Decrease – Class B | | | (20 | ) | | | (61 | ) | | | (700 | ) | | | (1,340 | ) | | | (616 | ) | | | (723 | ) | |
| Subscriptions – Class C | | | 23 | | | | 83 | | | | 106 | | | | 299 | | | | 207 | | | | 275 | | |
| Shares issued in reinvestment – Class C | | | 1 | | | | 2 | | | | 21 | | | | — | | | | 12 | | | | 10 | | |
| Less shares redeemed – Class C | | | (51 | ) | | | (138 | ) | | | (492 | ) | | | (870 | ) | | | (202 | ) | | | (485 | ) | |
| Net Increase/(Decrease) – Class C | | | (27 | ) | | | (53 | ) | | | (365 | ) | | | (571 | ) | | | 17 | | | | (200 | ) | |
| Subscriptions – Class I | | | — | | | | — | * | | | 111 | | | | 305 | | | | — | | | | — | | |
| Shares issued in reinvestment – Class I | | | — | | | | — | | | | 5 | | | | — | | | | — | | | | — | | |
| Less shares redeemed – Class I | | | — | | | | — | | | | (88 | ) | | | (32 | ) | | | — | | | | — | | |
| Net Increase/(Decrease) – Class I | | | — | | | | — | * | | | 28 | | | | 273 | | | | — | | | | — | | |
| Subscriptions – Class Z | | | 973 | | | | 2,699 | | | | 3,786 | | | | 14,221 | | | | 443 | | | | 697 | | |
| Shares issued in reinvestment – Class Z | | | 61 | | | | 66 | | | | 654 | | | | — | | | | 32 | | | | 51 | | |
| Less shares redeemed – Class Z | | | (1,812 | ) | | | (3,845 | ) | | | (9,298 | ) | | | (13,400 | ) | | | (311 | ) | | | (1,710 | ) | |
| Net Increase/(Decrease) – Class Z | | | (778 | ) | | | (1,080 | ) | | | (4,858 | ) | | | 821 | | | | 164 | | | | (962 | ) | |
| Net Increase/(Decrease) in Shares of Beneficial Interest | | | (898 | ) | | | (1,399 | ) | | | (7,241 | ) | | | (3,853 | ) | | | 190 | | | | (2,287 | ) | |
See accompanying notes to financial statements.
77
Columbia Acorn Family of Funds
Financial Highlights
Columbia Acorn Fund
| Class A Shares | | (Unaudited)
Six months ended
June 30, | | Year ended December 31, | |
| Selected data for a share outstanding throughout each period | | 2011 | | 2010 | | 2009 | | 2008 | | 2007 | | 2006 | |
| Net Asset Value, Beginning of Period | | $ | 29.24 | | | $ | 23.98 | | | $ | 17.22 | | | $ | 28.87 | | | $ | 29.02 | | | $ | 27.57 | | |
| Income from Investment Operations | |
| Net investment income/(loss) (a) | | | (0.05 | ) | | | (0.06 | ) | | | (0.02 | ) | | | (0.01 | ) | | | 0.05 | (b) | | | 0.05 | | |
| Net realized and unrealized gain/(loss) | | | 2.08 | | | | 6.18 | | | | 6.78 | | | | (10.98 | ) | | | 2.13 | | | | 3.82 | | |
| Total from Investment Operations | | | 2.03 | | | | 6.12 | | | | 6.76 | | | | (10.99 | ) | | | 2.18 | | | | 3.87 | | |
| Less Distributions to Shareholders | |
| From net investment income | | | (0.02 | ) | | | (0.02 | ) | | | — | | | | — | | | | (0.03 | ) | | | (0.04 | ) | |
| From net realized gains | | | (0.30 | ) | | | (0.84 | ) | | | — | | | | (0.66 | ) | | | (2.30 | ) | | | (2.38 | ) | |
| Total Distributions to Shareholders | | | (0.32 | ) | | | (0.86 | ) | | | — | | | | (0.66 | ) | | | (2.33 | ) | | | (2.42 | ) | |
| Increase from regulatory settlements | | | — | | | | 0.00 | (c) | | | 0.00 | (c) | | | — | | | | — | | | | — | | |
| Net Asset Value, End of Period | | $ | 30.95 | | | $ | 29.24 | | | $ | 23.98 | | | $ | 17.22 | | | $ | 28.87 | | | $ | 29.02 | | |
| Total Return (d) | | | 7.00 | %(e) | | | 25.61 | % | | | 39.26 | % | | | (38.72 | )% | | | 7.39 | %(f)(g) | | | 14.13 | %(f) | |
| Ratios to Average Net Assets/Supplemental Data | |
| Net expenses (h) | | | 1.05 | %(i) | | | 1.07 | % | | | 1.07 | % | | | 1.05 | % | | | 1.02 | % | | | 1.02 | % | |
| Net investment income/(loss) (h) | | | (0.32 | )%(i) | | | (0.22 | )% | | | (0.12 | )% | | | (0.04 | )% | | | 0.17 | % | | | 0.17 | % | |
| Waiver/reimbursement | | | — | | | | — | | | | — | | | | — | | | | 0.01 | % | | | 0.02 | % | |
| Portfolio turnover rate | | | 8 | %(e) | | | 28 | % | | | 27 | % | | | 21 | % | | | 20 | % | | | 22 | % | |
| Net assets at end of period (000s) | | $ | 3,926,256 | | | $ | 3,639,788 | | | $ | 2,937,761 | | | $ | 2,221,100 | | | $ | 4,300,920 | | | $ | 4,067,868 | | |
(a) Per share data was calculated using the average shares outstanding during the period.
(b) Net investment income per share includes special dividends. The effect of these dividends amounted to $0.03 per share.
(c) Rounds to less than $0.01 per share.
(d) Total return at net asset value assuming all distributions reinvested and no initial sales charge or contingent deferred sales charge.
(e) Not annualized.
(f) Had the Adviser and/or Transfer Agent not waived fees and/or reimbursed a portion of expenses, total return would have been reduced.
(g) Total return includes a voluntary reimbursement by the Adviser for a realized investment loss due to a trading error. This reimbursement increased total return and net asset value per share by less than 0.01% and less than $0.01, respectively.
(h) The benefits derived from custody fees paid indirectly had an impact of less than 0.01%.
(i) Annualized.
| Class B Shares | | (Unaudited)
Six months ended
June 30, | | Year ended December 31, | |
| Selected data for a share outstanding throughout each period | | 2011 | | 2010 | | 2009 | | 2008 | | 2007 | | 2006 | |
| Net Asset Value, Beginning of Period | | $ | 27.14 | | | $ | 22.43 | | | $ | 16.21 | | | $ | 27.39 | | | $ | 27.78 | | | $ | 26.61 | | |
| Income from Investment Operations | |
| Net investment loss (a) | | | (0.15 | ) | | | (0.21 | ) | | | (0.14 | ) | | | (0.15 | ) | | | (0.11 | )(b) | | | (0.13 | ) | |
| Net realized and unrealized gain/(loss) | | | 1.93 | | | | 5.76 | | | | 6.36 | | | | (10.37 | ) | | | 2.02 | | | | 3.68 | | |
| Total from Investment Operations | | | 1.78 | | | | 5.55 | | | | 6.22 | | | | (10.52 | ) | | | 1.91 | | | | 3.55 | | |
| Less Distributions to Shareholders | |
| From net realized gains | | | (0.30 | ) | | | (0.84 | ) | | | — | | | | (0.66 | ) | | | (2.30 | ) | | | (2.38 | ) | |
| Total Distributions to Shareholders | | | (0.30 | ) | | | (0.84 | ) | | | — | | | | (0.66 | ) | | | (2.30 | ) | | | (2.38 | ) | |
| Increase from regulatory settlements | | | — | | | | 0.00 | (c) | | | 0.00 | (c) | | | — | | | | — | | | | — | | |
| Net Asset Value, End of Period | | $ | 28.62 | | | $ | 27.14 | | | $ | 22.43 | | | $ | 16.21 | | | $ | 27.39 | | | $ | 27.78 | | |
| Total Return (d) | | | 6.63 | %(e) | | | 24.81 | % | | | 38.37 | % | | | (39.11 | )% | | | 6.76 | %(f)(g) | | | 13.43 | %(f) | |
| Ratios to Average Net Assets/Supplemental Data | |
| Net expenses (h) | | | 1.75 | %(i) | | | 1.69 | % | | | 1.74 | % | | | 1.65 | % | | | 1.59 | % | | | 1.66 | % | |
| Net investment loss (h) | | | (1.05 | )%(i) | | | (0.88 | )% | | | (0.77 | )% | | | (0.64 | )% | | | (0.39 | )% | | | (0.48 | )% | |
| Waiver/reimbursement | | | — | | | | — | | | | — | | | | — | | | | 0.01 | % | | | 0.02 | % | |
| Portfolio turnover rate | | | 8 | %(e) | | | 28 | % | | | 27 | % | | | 21 | % | | | 20 | % | | | 22 | % | |
| Net assets at end of period (000s) | | $ | 188,366 | | | $ | 287,650 | | | $ | 525,072 | | | $ | 581,587 | | | $ | 1,270,292 | | | $ | 1,404,165 | | |
(a) Per share data was calculated using the average shares outstanding during the period.
(b) Net investment income per share includes special dividends. The effect of these dividends amounted to $0.03 per share.
(c) Rounds to less than $0.01 per share.
(d) Total return at net asset value assuming all distributions reinvested and no contingent deferred sales charge.
(e) Not annualized.
(f) Had the Adviser and/or Transfer Agent not waived fees and/or reimbursed a portion of expenses, total return would have been reduced.
(g) Total return includes a voluntary reimbursement by the Adviser for a realized investment loss due to a trading error. This reimbursement increased total return and net asset value per share by less than 0.01% and less than $0.01, respectively.
(h) The benefits derived from custody fees paid indirectly had an impact of less than 0.01%.
(i) Annualized.
See accompanying notes to financial statements.
78
| Class C Shares | | (Unaudited)
Six months ended
June 30, | | Year ended December 31, | |
| Selected data for a share outstanding throughout each period | | 2011 | | 2010 | | 2009 | | 2008 | | 2007 | | 2006 | |
| Net Asset Value, Beginning of Period | | $ | 26.85 | | | $ | 22.23 | | | $ | 16.09 | | | $ | 27.25 | | | $ | 27.70 | | | $ | 26.58 | | |
| Income from Investment Operations | |
| Net investment loss (a) | | | (0.15 | ) | | | (0.24 | ) | | | (0.17 | ) | | | (0.19 | ) | | | (0.18 | )(b) | | | (0.17 | ) | |
| Net realized and unrealized gain/(loss) | | | 1.90 | | | | 5.70 | | | | 6.31 | | | | (10.31 | ) | | | 2.03 | | | | 3.67 | | |
| Total from Investment Operations | | | 1.75 | | | | 5.46 | | | | 6.14 | | | | (10.50 | ) | | | 1.85 | | | | 3.50 | | |
| Less Distributions to Shareholders | |
| From net realized gains | | | (0.30 | ) | | | (0.84 | ) | | | — | | | | (0.66 | ) | | | (2.30 | ) | | | (2.38 | ) | |
| Total Distributions to Shareholders | | | (0.30 | ) | | | (0.84 | ) | | | — | | | | (0.66 | ) | | | (2.30 | ) | | | (2.38 | ) | |
| Increase from regulatory settlements | | | — | | | | 0.00 | (c) | | | 0.00 | (c) | | | — | | | | — | | | | — | | |
| Net Asset Value, End of Period | | $ | 28.30 | | | $ | 26.85 | | | $ | 22.23 | | | $ | 16.09 | | | $ | 27.25 | | | $ | 27.70 | | |
| Total Return (d) | | | 6.59 | %(e) | | | 24.63 | % | | | 38.16 | % | | | (39.23 | )% | | | 6.56 | %(f)(g) | | | 13.25 | %(f) | |
| Ratios to Average Net Assets/Supplemental Data | |
| Net expenses (h) | | | 1.83 | %(i) | | | 1.85 | % | | | 1.89 | % | | | 1.83 | % | | | 1.79 | % | | | 1.80 | % | |
| Net investment loss (h) | | | (1.10 | )%(i) | | | (1.00 | )% | | | (0.93 | )% | | | (0.82 | )% | | | (0.60 | )% | | | (0.61 | )% | |
| Waiver/reimbursement | | | — | | | | — | | | | — | | | | — | | | | 0.00 | %(j) | | | 0.02 | % | |
| Portfolio turnover rate | | | 8 | %(e) | | | 28 | % | | | 27 | % | | | 21 | % | | | 20 | % | | | 22 | % | |
| Net assets at end of period (000s) | | $ | 876,147 | | | $ | 829,181 | | | $ | 736,818 | | | $ | 622,665 | | | $ | 1,312,243 | | | $ | 1,345,520 | | |
(a) Per share data was calculated using the average shares outstanding during the period.
(b) Net investment income per share includes special dividends. The effect of these dividends amounted to $0.03 per share.
(c) Rounds to less than $0.01 per share.
(d) Total return at net asset value assuming all distributions reinvested and no contingent deferred sales charge.
(e) Not annualized.
(f) Had the Adviser and/or Transfer Agent not waived fees and/or reimbursed a portion of expenses, total return would have been reduced.
(g) Total return includes a voluntary reimbursement by the Adviser for a realized investment loss due to a trading error. This reimbursement increased total return and net asset value per share by less than 0.01% and less than $0.01, respectively.
(h) The benefits derived from custody fees paid indirectly had an impact of less than 0.01%.
(i) Annualized.
(j) Rounds to less than 0.01%.
| Class I Shares | | (Unaudited)
Six months ended
June 30, | | Period ended
December 31, | |
| Selected data for a share outstanding throughout each period | | 2011 | | 2010 (a) | |
| Net Asset Value, Beginning of Period | | $ | 30.19 | | | $ | 26.80 | | |
| Income from Investment Operations | |
| Net investment income/(loss) (b) | | | 0.00 | (c) | | | (0.01 | ) | |
| Net realized and unrealized gain | | | 2.16 | | | | 4.26 | | |
| Total from Investment Operations | | | 2.16 | | | | 4.25 | | |
| Less Distributions to Shareholders | |
| From net investment income | | | (0.09 | ) | | | (0.02 | ) | |
| From net realized gains | | | (0.30 | ) | | | (0.84 | ) | |
| Total Distributions to Shareholders | | | (0.39 | ) | | | (0.86 | ) | |
| Net Asset Value, End of Period | | $ | 31.96 | | | $ | 30.19 | | |
| Total Return (d)(e) | | | 7.22 | % | | | 15.94 | % | |
| Ratios to Average Net Assets/Supplemental Data | |
| Net expenses (f)(g) | | | 0.72 | % | | | 0.71 | % | |
| Net investment income/(loss) (f)(g) | | | 0.00 | %(h) | | | (0.13 | )% | |
| Portfolio turnover rate (e) | | | 8 | % | | | 28 | % | |
| Net assets at end of period (000s) | | $ | 12,665 | | | $ | 11,627 | | |
(a) Class I shares commenced operations on September 27, 2010. Per share data and total return reflect activity from that date.
(b) Per share data was calculated using the average shares outstanding during the period.
(c) Rounds to less than $0.01.
(d) Total return at net asset value assuming all distributions reinvested.
(e) Not annualized.
(f) The benefits derived from custody fees paid indirectly had an impact of less than 0.01%.
(g) Annualized.
(h) Rounds to less than 0.00%.
See accompanying notes to financial statements.
79
Columbia Acorn Family of Funds
Financial Highlights, continued
Columbia Acorn International
| Class A Shares | | (Unaudited)
Six months ended
June 30, | | Year ended December 31, | |
| Selected data for a share outstanding throughout each period | | 2011 | | 2010 | | 2009 | | 2008 | | 2007 | | 2006 | |
| Net Asset Value, Beginning of Period | | $ | 40.87 | | | $ | 34.13 | | | $ | 23.03 | | | $ | 43.42 | | | $ | 40.07 | | | $ | 33.20 | | |
| Income from Investment Operations | |
| Net investment income (a) | | | 0.27 | | | | 0.22 | | | | 0.23 | | | | 0.47 | | | | 0.27 | | | | 0.23 | | |
| Net realized and unrealized gain/(loss) | | | 0.90 | | | | 7.21 | | | | 11.27 | | | | (20.20 | ) | | | 6.52 | | | | 10.87 | | |
| Total from Investment Operations | | | 1.17 | | | | 7.43 | | | | 11.50 | | | | (19.73 | ) | | | 6.79 | | | | 11.10 | | |
| Less Distributions to Shareholders | |
| From net investment income | | | (1.02 | ) | | | (0.69 | ) | | | (0.41 | ) | | | (0.06 | ) | | | (0.08 | ) | | | (0.32 | ) | |
| From net realized gains | | | — | | | | — | | | | — | | | | (0.60 | ) | | | (3.36 | ) | | | (3.91 | ) | |
| Total Distributions to Shareholders | | | (1.02 | ) | | | (0.69 | ) | | | (0.41 | ) | | | (0.66 | ) | | | (3.44 | ) | | | (4.23 | ) | |
| Redemption Fees | |
| Redemption fees added to paid in capital | | | — | | | | 0.00 | (a)(b) | | | 0.00 | (a)(b) | | | 0.00 | (a)(b) | | | 0.00 | (a)(b) | | | 0.00 | (a)(b) | |
| Increase from regulatory settlements | | | — | | | | 0.00 | (b) | | | 0.01 | | | | — | | | | — | | | | — | | |
| Net Asset Value, End of Period | | $ | 41.02 | | | $ | 40.87 | | | $ | 34.13 | | | $ | 23.03 | | | $ | 43.42 | | | $ | 40.07 | | |
| Total Return (c) | | | 2.86 | %(d) | | | 22.23 | % | | | 50.40 | % | | | (46.09 | )% | | | 16.90 | %(e) | | | 34.16 | %(e) | |
| Ratios to Average Net Assets/Supplemental Data | |
| Net expenses (f) | | | 1.29 | %(g) | | | 1.35 | % | | | 1.36 | % | | | 1.31 | % | | | 1.23 | % | | | 1.24 | % | |
| Net investment income (f) | | | 1.31 | %(g) | | | 0.62 | % | | | 0.85 | % | | | 1.36 | % | | | 0.60 | % | | | 0.61 | % | |
| Waiver/reimbursement | | | — | | | | — | | | | — | | | | — | | | | 0.00 | %(h) | | | 0.01 | % | |
| Portfolio turnover rate | | | 12 | %(d) | | | 25 | % | | | 31 | % | | | 38 | % | | | 28 | % | | | 31 | % | |
| Net assets at end of period (000s) | | $ | 908,471 | | | $ | 810,603 | | | $ | 578,599 | | | $ | 366,820 | | | $ | 622,901 | | | $ | 313,401 | | |
(a) Per share data was calculated using the average shares outstanding during the period.
(b) Rounds to less than $0.01 per share.
(c) Total return at net asset value assuming all distributions reinvested and no initial sales charge or contingent deferred sales charge.
(d) Not annualized.
(e) Had the Adviser and/or Transfer Agent not waived fees and/or reimbursed a portion of expenses, total return would have been reduced.
(f) The benefits derived from custody fees paid indirectly had an impact of less than 0.01%.
(g) Annualized.
(h) Rounds to less than 0.01%.
| Class B Shares | | (Unaudited)
Six months ended
June 30, | | Year ended December 31, | |
| Selected data for a share outstanding throughout each period | | 2011 | | 2010 | | 2009 | | 2008 | | 2007 | | 2006 | |
| Net Asset Value, Beginning of Period | | $ | 39.96 | | | $ | 33.22 | | | $ | 22.41 | | | $ | 42.46 | | | $ | 39.39 | | | $ | 32.71 | | |
| Income from Investment Operations | |
| Net investment income/(loss) (a) | | | 0.11 | | | | 0.03 | | | | 0.08 | | | | 0.27 | | | | 0.04 | | | | (0.00 | )(b) | |
| Net realized and unrealized gain/(loss) | | | 0.90 | | | | 7.02 | | | | 10.92 | | | | (19.72 | ) | | | 6.39 | | | | 10.66 | | |
| Total from Investment Operations | | | 1.01 | | | | 7.05 | | | | 11.00 | | | | (19.45 | ) | | | 6.43 | | | | 10.66 | | |
| Less Distributions to Shareholders | |
| From net investment income | | | (1.00 | ) | | | (0.31 | ) | | | (0.20 | ) | | | — | | | | (0.00 | )(b) | | | (0.07 | ) | |
| From net realized gains | | | — | | | | — | | | | — | | | | (0.60 | ) | | | (3.36 | ) | | | (3.91 | ) | |
| Total Distributions to Shareholders | | | (1.00 | ) | | | (0.31 | ) | | | (0.20 | ) | | | (0.60 | ) | | | (3.36 | ) | | | (3.98 | ) | |
| Redemption Fees | |
| Redemption fees added to paid in capital | | | — | | | | 0.00 | (a)(b) | | | 0.00 | (a)(b) | | | 0.00 | (a)(b) | | | 0.00 | (a)(b) | | | 0.00 | (a)(b) | |
| Increase from regulatory settlements | | | — | | | | 0.00 | (b) | | | 0.01 | | | | — | | | | — | | | | — | | |
| Net Asset Value, End of Period | | $ | 39.97 | | | $ | 39.96 | | | $ | 33.22 | | | $ | 22.41 | | | $ | 42.46 | | | $ | 39.39 | | |
| Total Return (c) | | | 2.52 | %(d) | | | 21.49 | % | | | 49.36 | % | | | (46.41 | )% | | | 16.25 | %(e) | | | 33.26 | %(e) | |
| Ratios to Average Net Assets/Supplemental Data | |
| Net expenses (f) | | | 1.96 | %(g) | | | 1.96 | % | | | 2.03 | % | | | 1.90 | % | | | 1.81 | % | | | 1.89 | % | |
| Net investment income/(loss) (f) | | | 0.55 | %(g) | | | 0.08 | % | | | 0.29 | % | | | 0.77 | % | | | 0.08 | % | | | (0.01 | )% | |
| Waiver/reimbursement | | | — | | | | — | | | | — | | | | — | | | | 0.01 | % | | | 0.02 | % | |
| Portfolio turnover rate | | | 12 | %(d) | | | 25 | % | | | 31 | % | | | 38 | % | | | 28 | % | | | 31 | % | |
| Net assets at end of period (000s) | | $ | 23,575 | | | $ | 29,368 | | | $ | 38,835 | | | $ | 39,153 | | | $ | 103,631 | | | $ | 94,165 | | |
(a) Per share data was calculated using the average shares outstanding during the period.
(b) Rounds to less than $0.01 per share.
(c) Total return at net asset value assuming all distributions reinvested and no contingent deferred sales charge.
(d) Not annualized.
(e) Had the Adviser and/or Transfer Agent not waived fees and/or reimbursed a portion of expenses, total return would have been reduced.
(f) The benefits derived from custody fees paid indirectly had an impact of less than 0.01%.
(g) Annualized.
See accompanying notes to financial statements.
80
| Class C Shares | | (Unaudited)
Six months ended
June 30, | | Year ended December 31, | |
| Selected data for a share outstanding throughout each period | | 2011 | | 2010 | | 2009 | | 2008 | | 2007 | | 2006 | |
| Net Asset Value, Beginning of Period | | $ | 39.79 | | | $ | 33.08 | | | $ | 22.30 | | | $ | 42.32 | | | $ | 39.35 | | | $ | 32.68 | | |
| Income from Investment Operations | |
| Net investment income/(loss) (a) | | | 0.10 | | | | (0.05 | ) | | | 0.02 | | | | 0.21 | | | | (0.06 | ) | | | (0.05 | ) | |
| Net realized and unrealized gain/(loss) | | | 0.87 | | | | 7.03 | | | | 10.89 | | | | (19.63 | ) | | | 6.39 | | | | 10.66 | | |
| Total from Investment Operations | | | 0.97 | | | | 6.98 | | | | 10.91 | | | | (19.42 | ) | | | 6.33 | | | | 10.61 | | |
| Less Distributions to Shareholders | |
| From net investment income | | | (0.94 | ) | | | (0.27 | ) | | | (0.14 | ) | | | — | | | | (0.00 | )(b) | | | (0.03 | ) | |
| From net realized gains | | | — | | | | — | | | | — | | | | (0.60 | ) | | | (3.36 | ) | | | (3.91 | ) | |
| Total Distributions to Shareholders | | | (0.94 | ) | | | (0.27 | ) | | | (0.14 | ) | | | (0.60 | ) | | | (3.36 | ) | | | (3.94 | ) | |
| Redemption Fees | |
| Redemption fees added to paid in capital | | | — | | | | 0.00 | (a)(b) | | | 0.00 | (a)(b) | | | 0.00 | (a)(b) | | | 0.00 | (a)(b) | | | 0.00 | (a)(b) | |
| Increase from regulatory settlements | | | — | | | | 0.00 | (b) | | | 0.01 | | | | — | | | | — | | | | — | | |
| Net Asset Value, End of Period | | $ | 39.82 | | | $ | 39.79 | | | $ | 33.08 | | | $ | 22.30 | | | $ | 42.32 | | | $ | 39.35 | | |
| Total Return (c) | | | 2.45 | %(d) | | | 21.34 | % | | | 49.12 | % | | | (46.50 | )% | | | 16.01 | %(e) | | | 33.14 | %(e) | |
| Ratios to Average Net Assets/Supplemental Data | |
| Net expenses (f) | | | 2.06 | %(g) | | | 2.11 | % | | | 2.17 | % | | | 2.08 | % | | | 1.99 | % | | | 2.01 | % | |
| Net investment income/(loss) (f) | | | 0.51 | %(g) | | | (0.13 | )% | | | 0.07 | % | | | 0.60 | % | | | (0.14 | )% | | | (0.14 | )% | |
| Waiver/reimbursement | | | — | | | | — | | | | — | | | | — | | | | 0.00 | %(h) | | | 0.01 | % | |
| Portfolio turnover rate | | | 12 | %(d) | | | 25 | % | | | 31 | % | | | 38 | % | | | 28 | % | | | 31 | % | |
| Net assets at end of period (000s) | | $ | 100,222 | | | $ | 110,931 | | | $ | 85,625 | | | $ | 62,906 | | | $ | 153,416 | | | $ | 99,425 | | |
(a) Per share data was calculated using the average shares outstanding during the period.
(b) Rounds to less than $0.01 per share.
(c) Total return at net asset value assuming all distributions reinvested and no contingent deferred sales charge.
(d) Not annualized.
(e) Had the Adviser and/or Transfer Agent not waived fees and/or reimbursed a portion of expenses, total return would have been reduced.
(f) The benefits derived from custody fees paid indirectly had an impact of less than 0.01%.
(g) Annualized.
(h) Rounds to less than 0.01%.
| Class I Shares | | (Unaudited)
Six months ended
June 30, | | Period ended
December 31, | |
| Selected data for a share outstanding throughout each period | | 2011 | | 2010 (a) | |
| Net Asset Value, Beginning of Period | | $ | 40.92 | | | $ | 37.69 | | |
| Income from Investment Operations | |
| Net investment income (b) | | | 0.27 | | | | 0.08 | | |
| Net realized and unrealized gain | | | 0.98 | | | | 3.49 | | |
| Total from Investment Operations | | | 1.25 | | | | 3.57 | | |
| Less Distributions to Shareholders | |
| From net investment income | | | (1.02 | ) | | | (0.34 | ) | |
| Rdemption Fees | |
| Redemption fees added to paid in capital | | | — | | | | 0.00 | (b)(c) | |
| Net Asset Value, End of Period | | $ | 41.15 | | | $ | 40.92 | | |
| Total Return (d)(e) | | | 3.06 | % | | | 9.50 | % | |
| Ratios to Average Net Assets/Supplemental Data | |
| Net expenses (f)(g) | | | 0.90 | % | | | 0.94 | % | |
| Net investment income (f)(g) | | | 1.34 | % | | | 0.77 | % | |
| Portfolio turnover rate (e) | | | 12 | % | | | 25 | % | |
| Net assets at end of period (000s) | | $ | 27,769 | | | $ | 66,581 | | |
(a) Class I Shares commenced operations on September 27, 2010. Per share data and total return reflect activity from that date.
(b) Per share data was calculated using the average shares outstanding during the period.
(c) Rounds to less than $0.01 per share.
(d) Total return at net asset value assuming all distributions reinvested.
(e) Not annualized.
(f) The benefits derived from custody fees paid indirectly had an impact of less than 0.01%.
(g) Annualized.
See accompanying notes to financial statements.
81
Columbia Acorn Family of Funds
Financial Highlights, continued
Columbia Acorn USA
| Class A Shares | | (Unaudited)
Six months ended
June 30, | | Year ended December 31, | |
| Selected data for a share outstanding throughout each period | | 2011 | | 2010 | | 2009 | | 2008 | | 2007 | | 2006 | |
| Net Asset Value, Beginning of Period | | $ | 27.54 | | | $ | 22.43 | | | $ | 15.90 | | | $ | 27.23 | | | $ | 28.02 | | | $ | 26.52 | | |
| Income from Investment Operations | |
| Net investment loss (a) | | | (0.11 | ) | | | (0.15 | ) | | | (0.11 | ) | | | (0.14 | ) | | | (0.09 | )(b) | | | (0.10 | ) | |
| Net realized and unrealized gain/(loss) | | | 2.58 | | | | 5.26 | | | | 6.64 | | | | (10.23 | ) | | | 1.01 | | | | 2.21 | | |
| Total from Investment Operations | | | 2.47 | | | | 5.11 | | | | 6.53 | | | | (10.37 | ) | | | 0.92 | | | | 2.11 | | |
| Less Distributions to Shareholders | |
| From net realized gains | | | — | | | | — | | | | — | | | | (0.96 | ) | | | (1.71 | ) | | | (0.61 | ) | |
| Increase from regulatory settlements | | | — | | | | — | | | | 0.00 | (c) | | | — | | | | — | | | | — | | |
| Net Asset Value, End of Period | | $ | 30.01 | | | $ | 27.54 | | | $ | 22.43 | | | $ | 15.90 | | | $ | 27.23 | | | $ | 28.02 | | |
| Total Return (d) | | | 8.97 | %(e) | | | 22.78 | % | | | 41.07 | % | | | (39.38 | )% | | | 3.18 | %(f)(g) | | | 7.95 | %(f) | |
| Ratios to Average Net Assets/Supplemental Data | |
| Net expenses (h) | | | 1.28 | %(i) | | | 1.30 | % | | | 1.32 | % | | | 1.29 | % | | | 1.25 | % | | | 1.26 | % | |
| Net investment loss (h) | | | (0.79 | )%(i) | | | (0.64 | )% | | | (0.64 | )% | | | (0.60 | )% | | | (0.29 | )% | | | (0.35 | )% | |
| Waiver/reimbursement | | | — | | | | — | | | | — | | | | — | | | | 0.00 | %(j) | | | 0.01 | % | |
| Portfolio turnover rate | | | 9 | %(e) | | | 32 | % | | | 28 | % | | | 23 | % | | | 21 | % | | | 13 | % | |
| Net assets at end of period (000s) | | $ | 212,735 | | | $ | 214,097 | | | $ | 178,605 | | | $ | 136,597 | | | $ | 245,085 | | | $ | 245,552 | | |
(a) Per share data was calculated using the average shares outstanding during the period.
(b) Net investment income per share includes special dividends. The effect of these dividends amounted to $0.09 per share.
(c) Rounds to less than $0.01 per share.
(d) Total return at net asset value assuming all distributions reinvested and no initial sales charge or contingent deferred sales charge.
(e) Not annualized.
(f) Had the Adviser and/or Transfer Agent not waived fees and/or reimbursed a portion of expenses, total return would have been reduced.
(g) Total return includes a voluntary reimbursement by the Adviser for a realized investment loss due to a trading error. This reimbursement increased total return and net asset value per share by less than 0.01% and less than $0.01, respectively.
(h) The benefits derived from custody fees paid indirectly had an impact of less than 0.01%.
(i) Annualized.
(j) Rounds to less than 0.01%.
| Class B Shares | | (Unaudited)
Six months ended
June 30, | | Year ended December 31, | |
| Selected data for a share outstanding throughout each period | | 2011 | | 2010 | | 2009 | | 2008 | | 2007 | | 2006 | |
| Net Asset Value, Beginning of Period | | $ | 25.60 | | | $ | 20.99 | | | $ | 14.98 | | | $ | 25.87 | | | $ | 26.87 | | | $ | 25.61 | | |
| Income from Investment Operations | |
| Net investment loss (a) | | | (0.20 | ) | | | (0.30 | ) | | | (0.22 | ) | | | (0.27 | ) | | | (0.25 | )(b) | | | (0.27 | ) | |
| Net realized and unrealized gain/(loss) | | | 2.39 | | | | 4.91 | | | | 6.23 | | | | (9.66 | ) | | | 0.96 | | | | 2.14 | | |
| Total from Investment Operations | | | 2.19 | | | | 4.61 | | | | 6.01 | | | | (9.93 | ) | | | 0.71 | | | | 1.87 | | |
| Less Distributions to Shareholders | |
| From net realized gains | | | — | | | | — | | | | — | | | | (0.96 | ) | | | (1.71 | ) | | | (0.61 | ) | |
| Increase from regulatory settlements | | | — | | | | — | | | | 0.00 | (c) | | | — | | | | — | | | | — | | |
| Net Asset Value, End of Period | | $ | 27.79 | | | $ | 25.60 | | | $ | 20.99 | | | $ | 14.98 | | | $ | 25.87 | | | $ | 26.87 | | |
| Total Return (d) | | | 8.55 | %(e) | | | 21.96 | % | | | 40.12 | % | | | (39.75 | )% | | | 2.53 | %(f)(g) | | | 7.29 | %(f) | |
| Ratios to Average Net Assets/Supplemental Data | |
| Net expenses (h) | | | 2.03 | %(i) | | | 1.98 | % | | | 2.02 | % | | | 1.92 | % | | | 1.85 | % | | | 1.93 | % | |
| Net investment loss (h) | | | (1.54 | )%(i) | | | (1.37 | )% | | | (1.33 | )% | | | (1.24 | )% | | | (0.87 | )% | | | (1.01 | )% | |
| Waiver/reimbursement | | | — | | | | — | | | | — | | | | — | | | | 0.01 | % | | | 0.02 | % | |
| Portfolio turnover rate | | | 9 | %(e) | | | 32 | % | | | 28 | % | | | 23 | % | | | 21 | % | | | 13 | % | |
| Net assets at end of period (000s) | | $ | 7,112 | | | $ | 9,222 | | | $ | 20,903 | | | $ | 23,633 | | | $ | 53,820 | | | $ | 65,040 | | |
(a) Per share data was calculated using the average shares outstanding during the period.
(b) Net investment income per share includes special dividends. The effect of these dividends amounted to $0.09 per share.
(c) Rounds to less than $0.01 per share.
(d) Total return at net asset value assuming all distributions reinvested and no contingent deferred sales charge.
(e) Not annualized.
(f) Had the Adviser and/or Transfer Agent not waived fees and/or reimbursed a portion of expenses, total return would have been reduced.
(g) Total return includes a voluntary reimbursement by the Adviser for a realized investment loss due to a trading error. This reimbursement increased total return and net asset value per share by less than 0.01% and less than $0.01, respectively.
(h) The benefits derived from custody fees paid indirectly had an impact of less than 0.01%.
(i) Annualized.
See accompanying notes to financial statements.
82
| Class C Shares | | (Unaudited)
Six months ended
June 30, | | Year ended December 31, | |
| Selected data for a share outstanding throughout each period | | 2011 | | 2010 | | 2009 | | 2008 | | 2007 | | 2006 | |
| Net Asset Value, Beginning of Period | | $ | 25.39 | | | $ | 20.84 | | | $ | 14.89 | | | $ | 25.77 | | | $ | 26.81 | | | $ | 25.59 | | |
| Income from Investment Operations | |
| Net investment loss (a) | | | (0.21 | ) | | | (0.31 | ) | | | (0.24 | ) | | | (0.30 | ) | | | (0.30 | )(b) | | | (0.30 | ) | |
| Net realized and unrealized gain/(loss) | | | 2.39 | | | | 4.86 | | | | 6.19 | | | | (9.62 | ) | | | 0.97 | | | | 2.13 | | |
| Total from Investment Operations | | | 2.18 | | | | 4.55 | | | | 5.95 | | | | (9.92 | ) | | | 0.67 | | | | 1.83 | | |
| Less Distributions to Shareholders | |
| From net realized gains | | | — | | | | — | | | | — | | | | (0.96 | ) | | | (1.71 | ) | | | (0.61 | ) | |
| Increase from regulatory settlements | | | — | | | | — | | | | 0.00 | (c) | | | — | | | | — | | | | — | | |
| Net Asset Value, End of Period | | $ | 27.57 | | | $ | 25.39 | | | $ | 20.84 | | | $ | 14.89 | | | $ | 25.77 | | | $ | 26.81 | | |
| Total Return (d) | | | 8.59 | %(e) | | | 21.83 | % | | | 39.96 | % | | | (39.87 | )% | | | 2.39 | %(f)(g) | | | 7.14 | %(f) | |
| Ratios to Average Net Assets/Supplemental Data | |
| Net expenses (h) | | | 2.05 | %(i) | | | 2.08 | % | | | 2.13 | % | | | 2.08 | % | | | 2.03 | % | | | 2.05 | % | |
| Net investment loss (h) | | | (1.56 | )%(i) | | | (1.41 | )% | | | (1.45 | )% | | | (1.39 | )% | | | (1.07 | )% | | | (1.14 | )% | |
| Waiver/reimbursement | | | — | | | | — | | | | — | | | | — | | | | 0.00 | %(j) | | | 0.01 | % | |
| Portfolio turnover rate | | | 9 | %(e) | | | 32 | % | | | 28 | % | | | 23 | % | | | 21 | % | | | 13 | % | |
| Net assets at end of period (000s) | | $ | 36,348 | | | $ | 36,101 | | | $ | 32,508 | | | $ | 25,899 | | | $ | 50,743 | | | $ | 55,306 | | |
(a) Per share data was calculated using the average shares outstanding during the period.
(b) Net investment income per share includes special dividends. The effect of these dividends amounted to $0.09 per share.
(c) Rounds to less than $0.01 per share.
(d) Total return at net asset value assuming all distributions reinvested and no contingent deferred sales charge.
(e) Not annualized.
(f) Had the Adviser and/or Transfer Agent not waived fees and/or reimbursed a portion of expenses, total return would have been reduced.
(g) Total return includes a voluntary reimbursement by the Adviser for a realized investment loss due to a trading error. This reimbursement increased total return and net asset value per share by less than 0.01% and less than $0.01, respectively.
(h) The benefits derived from custody fees paid indirectly had an impact of less than 0.01%.
(i) Annualized.
(j) Rounds to less than 0.01%.
| Class I Shares | | (Unaudited)
Six months ended
June 30, | | Period ended
December 31, | |
| Selected data for a share outstanding throughout each period | | 2011 | | 2010 (a) | |
| Net Asset Value, Beginning of Period | | $ | 28.56 | | | $ | 24.24 | | |
| Income from Investment Operations | |
| Net investment loss (b) | | | (0.07 | ) | | | (0.03 | ) | |
| Net realized and unrealized gain | | | 2.69 | | | | 4.35 | | |
| Total from Investment Operations | | | 2.62 | | | | 4.32 | | |
| Net Asset Value, End of Period | | $ | 31.18 | | | $ | 28.56 | | |
| Total Return (c)(d) | | | 9.17 | % | | | 17.82 | % | |
| Ratios to Average Net Assets/Supplemental Data: | |
| Net expenses (e)(f) | | | 0.94 | % | | | 0.94 | % | |
| Net investment loss (e)(f) | | | (0.47 | )% | | | (0.35 | )% | |
| Portfolio turnover rate (d) | | | 9 | % | | | 32 | % | |
| Net assets at end of period (000s) | | $ | 3,211 | | | $ | 28,993 | | |
(a) Class I shares commenced operations on September 27, 2010. Per share data and total return reflect activity from that date.
(b) Per share data was calculated using the average shares outstanding during the period.
(c) Total return at net asset value assuming all distributions reinvested.
(d) Not annualized.
(e) The benefits derived from custody fees paid indirectly had an impact of less than 0.01%.
(f) Annualized.
See accompanying notes to financial statements.
83
Columbia Acorn Family of Funds
Financial Highlights, continued
Columbia Acorn International Select
| Class A Shares | | (Unaudited)
Six months ended
June 30, | | Year ended December 31, | |
| Selected data for a share outstanding throughout each period | | 2011 | | 2010 | | 2009 | | 2008 | | 2007 | | 2006 | |
| Net Asset Value, Beginning of Period | | $ | 28.01 | | | $ | 23.39 | | | $ | 17.99 | | | $ | 31.74 | | | $ | 27.68 | | | $ | 20.36 | | |
| Income from Investment Operations | |
| Net investment income (a) | | | 0.14 | (b) | | | 0.08 | | | | 0.10 | | | | 0.20 | | | | 0.04 | (c) | | | 0.03 | | |
| Net realized and unrealized gain/(loss) | | | 0.86 | | | | 4.84 | | | | 5.43 | | | | (13.41 | ) | | | 5.91 | | | | 7.29 | | |
| Total from Investment Operations | | | 1.00 | | | | 4.92 | | | | 5.53 | | | | (13.21 | ) | | | 5.95 | | | | 7.32 | | |
| Less Distributions to Shareholders | |
| From net investment income | | | (0.32 | ) | | | (0.30 | ) | | | (0.15 | ) | | | — | | | | (0.12 | ) | | | — | | |
| From net realized gains | | | — | | | | — | | | | — | | | | (0.54 | ) | | | (1.77 | ) | | | — | | |
| Total Distributions to Shareholders | | | (0.32 | ) | | | (0.30 | ) | | | (0.15 | ) | | | (0.54 | ) | | | (1.89 | ) | | | — | | |
| Redemption Fees | |
| Redemption fees added to paid in capital | | | — | | | | 0.00 | (a)(d) | | | 0.00 | (a)(d) | | | 0.00 | (a)(d) | | | 0.00 | (a)(d) | | | 0.00 | (a)(d) | |
| Increase from regulatory settlements | | | — | | | | 0.00 | (d) | | | 0.02 | | | | — | | | | — | | | | — | | |
| Net Asset Value, End of Period | | $ | 28.69 | | | $ | 28.01 | | | $ | 23.39 | | | $ | 17.99 | | | $ | 31.74 | | | $ | 27.68 | | |
| Total Return (e) | | | 3.55 | %(f) | | | 21.41 | % | | | 31.01 | % | | | (42.30 | )% | | | 21.50 | %(g) | | | 35.97 | %(g) | |
| Ratios to Average Net Assets/Supplemental Data | |
| Net expenses (h) | | | 1.52 | %(i) | | | 1.56 | % | | | 1.56 | % | | | 1.54 | % | | | 1.49 | % | | | 1.58 | % | |
| Net investment income (h) | | | 0.95 | %(i) | | | 0.33 | % | | | 0.53 | % | | | 0.78 | % | | | 0.11 | % | | | 0.11 | % | |
| Waiver/reimbursement | | | — | | | | — | | | | — | | | | — | | | | 0.00 | %(j) | | | 0.02 | % | |
| Portfolio turnover rate | | | 21 | %(f) | | | 42 | % | | | 56 | % | | | 68 | % | | | 57 | % | | | 47 | % | |
| Net assets at end of period (000s) | | $ | 71,320 | | | $ | 71,668 | | | $ | 64,664 | | | $ | 46,522 | | | $ | 48,538 | | | $ | 22,599 | | |
(a) Per share data was calculated using the average shares outstanding during the period.
(b) Net investment income per share includes special dividends. The effect of these dividends amounted to $0.04 per share.
(c) Net investment income per share includes special dividends. The effect of these dividends amounted to $0.07 per share.
(d) Rounds to less than $0.01 per share.
(e) Total return at net asset value assuming all distributions reinvested and no initial sales charge or contingent deferred sales charge.
(f) Not annualized.
(g) Had the Adviser and/or Transfer Agent not waived fees and/or reimbursed a portion of expenses, total return would have been reduced.
(h) The benefits derived from custody fees paid indirectly had an impact of less than 0.01%.
(i) Annualized.
(j) Rounds to less than 0.01%.
| Class B Shares | | (Unaudited)
Six months ended
June 30, | | Year ended December 31, | |
| Selected data for a share outstanding throughout each period | | 2011 | | 2010 | | 2009 | | 2008 | | 2007 | | 2006 | |
| Net Asset Value, Beginning of Period | | $ | 26.72 | | | $ | 22.34 | | | $ | 17.16 | | | $ | 30.50 | | | $ | 26.73 | | | $ | 19.80 | | |
| Income from Investment Operations | |
| Net investment income/(loss) (a) | | | 0.03 | (b) | | | (0.06 | ) | | | (0.01 | ) | | | 0.04 | | | | (0.13 | )(c) | | | (0.12 | ) | |
| Net realized and unrealized gain/(loss) | | | 0.83 | | | | 4.62 | | | | 5.17 | | | | (12.84 | ) | | | 5.67 | | | | 7.05 | | |
| Total from Investment Operations | | | 0.86 | | | | 4.56 | | | | 5.16 | | | | (12.80 | ) | | | 5.54 | | | | 6.93 | | |
| Less Distributions to Shareholders | |
| From net investment income | | | (0.16 | ) | | | (0.18 | ) | | | — | | | | — | | | | — | | | | — | | |
| From net realized gains | | | — | | | | — | | | | — | | | | (0.54 | ) | | | (1.77 | ) | | | — | | |
| Total Distributions to Shareholders | | | (0.16 | ) | | | (0.18 | ) | | | — | | | | (0.54 | ) | �� | | (1.77 | ) | | | — | | |
| Redemption Fees | |
| Redemption fees added to paid in capital | | | — | | | | 0.00 | (a)(d) | | | 0.00 | (a)(d) | | | 0.00 | (a)(d) | | | 0.00 | (a)(d) | | | 0.00 | (a)(d) | |
| Increase from regulatory settlements | | | — | | | | 0.00 | (d) | | | 0.02 | | | | — | | | | — | | | | — | | |
| Net Asset Value, End of Period | | $ | 27.42 | | | $ | 26.72 | | | $ | 22.34 | | | $ | 17.16 | | | $ | 30.50 | | | $ | 26.73 | | |
| Total Return (e) | | | 3.21 | %(f)(g) | | | 20.63 | %(g) | | | 30.19 | %(g) | | | (42.68 | )% | | | 20.69 | %(g) | | | 35.00 | %(g) | |
| Ratios to Average Net Assets/Supplemental Data | |
| Net expenses (h) | | | 2.20 | %(i) | | | 2.20 | % | | | 2.20 | % | | | 2.17 | % | | | 2.10 | % | | | 2.25 | % | |
| Net investment income/(loss) (h) | | | 0.26 | %(i) | | | (0.27 | )% | | | (0.05 | )% | | | 0.16 | % | | | (0.45 | )% | | | (0.53 | )% | |
| Waiver/reimbursement | | | 0.03 | %(i) | | | 0.04 | % | | | 0.12 | % | | | — | | | | 0.01 | % | | | 0.04 | % | |
| Portfolio turnover rate | | | 21 | %(f) | | | 42 | % | | | 56 | % | | | 68 | % | | | 57 | % | | | 47 | % | |
| Net assets at end of period (000s) | | $ | 2,563 | | | $ | 3,030 | | | $ | 3,887 | | | $ | 4,444 | | | $ | 11,941 | | | $ | 9,787 | | |
(a) Per share data was calculated using the average shares outstanding during the period.
(b) Net investment income per share includes special dividends. The effect of these dividends amounted to $0.04 per share.
(c) Net investment income per share includes special dividends. The effect of these dividends amounted to $0.07 per share.
(d) Rounds to less than $0.01 per share.
(e) Total return at net asset value assuming all distributions reinvested and no contingent deferred sales charge.
(f) Not annualized.
(g) Had the Adviser and/or Transfer Agent not waived fees and/or reimbursed a portion of expenses, total return would have been reduced.
(h) The benefits derived from custody fees paid indirectly had an impact of less than 0.01%.
(i) Annualized.
See accompanying notes to financial statements.
84
| Class C Shares | | (Unaudited)
Six months ended
June 30, | | Year ended December 31, | |
| Selected data for a share outstanding throughout each period | | 2011 | | 2010 | | 2009 | | 2008 | | 2007 | | 2006 | |
| Net Asset Value, Beginning of Period | | $ | 26.58 | | | $ | 22.21 | | | $ | 17.08 | | | $ | 30.42 | | | $ | 26.70 | | | $ | 19.80 | | |
| Income from Investment Operations | |
| Net investment income/(loss) (a) | | | 0.02 | (b) | | | (0.10 | ) | | | (0.06 | ) | | | 0.00 | (c) | | | (0.20 | )(d) | | | (0.15 | ) | |
| Net realized and unrealized gain/(loss) | | | 0.81 | | | | 4.60 | | | | 5.17 | | | | (12.80 | ) | | | 5.69 | | | | 7.05 | | |
| Total from Investment Operations | | | 0.83 | | | | 4.50 | | | | 5.11 | | | | (12.80 | ) | | | 5.49 | | | | 6.90 | | |
| Less Distributions to Shareholders | |
| From net investment income | | | (0.12 | ) | | | (0.13 | ) | | | — | | | | — | | | | — | | | | — | | |
| From net realized gains | | | — | | | | — | | | | — | | | | (0.54 | ) | | | (1.77 | ) | | | — | | |
| Total Distributions to Shareholders | | | (0.12 | ) | | | (0.13 | ) | | | — | | | | (0.54 | ) | | | (1.77 | ) | | | — | | |
| Redemption Fees | |
| Redemption fees added to paid in capital | | | — | | | | 0.00 | (a)(b) | | | 0.00 | (a)(b) | | | 0.00 | (a)(b) | | | 0.00 | (a)(b) | | | 0.00 | (a)(b) | |
| Increase from regulatory settlements | | | — | | | | 0.00 | (b) | | | 0.02 | | | | — | | | | — | | | | — | | |
| Net Asset Value, End of Period | | $ | 27.29 | | | $ | 26.58 | | | $ | 22.21 | | | $ | 17.08 | | | $ | 30.42 | | | $ | 26.70 | | |
| Total Return (e) | | | 3.12 | %(f) | | | 20.45 | % | | | 30.04 | % | | | (42.79 | )% | | | 20.53 | %(g) | | | 34.85 | %(g) | |
| Ratios to Average Net Assets/Supplemental Data | |
| Net expenses (h) | | | 2.33 | %(i) | | | 2.36 | % | | | 2.42 | % | | | 2.34 | % | | | 2.29 | % | | | 2.38 | % | |
| Net investment income/(loss) (h) | | | 0.14 | %(i) | | | (0.45 | )% | | | (0.30 | )% | | | 0.01 | % | | | (0.68 | )% | | | (0.67 | )% | |
| Waiver/reimbursement | | | — | | | | — | | | | — | | | | — | | | | 0.01 | % | | | 0.02 | % | |
| Portfolio turnover rate | | | 21 | %(f) | | | 42 | % | | | 56 | % | | | 68 | % | | | 57 | % | | | 47 | % | |
| Net assets at end of period (000s) | | $ | 11,463 | | | $ | 11,885 | | | $ | 11,096 | | | $ | 9,747 | | | $ | 13,023 | | | $ | 7,060 | | |
(a) Per share data was calculated using the average shares outstanding during the period.
(b) Net investment income per share includes special dividends. The effect of these dividends amounted to $0.04 per share.
(c) Rounds to less than $0.01 per share.
(d) Net investment income per share includes special dividends. The effect of these dividends amounted to $0.07 per share.
(e) Total return at net asset value assuming all distributions reinvested and no contingent deferred sales charge.
(f) Not annualized.
(g) Had the Adviser and/or Transfer Agent not waived fees and/or reimbursed a portion of expenses, total return would have been reduced.
(h) The benefits derived from custody fees paid indirectly had an impact of less than 0.01%.
(i) Annualized.
| Class I Shares | | (Unaudited)
Six months ended
June 30, | | Period ended
December 31, | |
| Selected data for a share outstanding throughout each period | | 2011 | | 2010 (a) | |
| Net Asset Value, Beginning of Period | | $ | 28.33 | | | $ | 26.11 | | |
| Income from Investment Operations | |
| Net investment income (b) | | | 0.21 | (c) | | | 0.03 | | |
| Net realized and unrealized gain | | | 0.88 | | | | 2.19 | | |
| Total from Investment Operations | | | 1.09 | | | | 2.22 | | |
| Less Distributions to Shareholders | |
| From net investment income | | | (0.42 | ) | | | — | | |
| Net Asset Value, End of Period | | $ | 29.00 | | | $ | 28.33 | | |
| Total Return (d)(e) | | | 3.83 | | | | 8.50 | % | |
| Ratios to Average Net Assets/Supplemental Data: | |
| Net expenses (f)(g) | | | 1.00 | % | | | 1.14 | % | |
| Net investment income (f)(g) | | | 1.48 | % | | | 0.44 | % | |
| Portfolio turnover rate (e) | | | 21 | % | | | 42 | % | |
| Net assets at end of period (000s) | | $ | 3 | | | $ | 3 | | |
(a) Class I shares commenced operations on September 27, 2010. Per share data and total return reflect activity from that date.
(b) Per share data was calculated using the average shares outstanding during the period.
(c) Net investment income per share includes special dividends. The effect of these dividends amounted to $0.04 per share.
(d) Total return at net asset value assuming all distributions reinvested and no contingent deferred sales charge.
(e) Not annualized.
(f) The benefits derived from custody fees paid indirectly had an impact of less than 0.01%.
(g) Annualized.
See accompanying notes to financial statements.
85
Columbia Acorn Family of Funds
Financial Highlights, continued
Columbia Acorn Select
| Class A Shares | | (Unaudited)
Six months ended
June 30, | | Year ended December 31, | |
| Selected data for a share outstanding throughout each period | | 2011 | | 2010 | | 2009 | | 2008 | | 2007 | | 2006 | |
| Net Asset Value, Beginning of Period | | $ | 27.94 | | | $ | 22.81 | | | $ | 13.77 | | | $ | 27.89 | | | $ | 26.18 | | | $ | 22.47 | | |
| Income from Investment Operations | |
| Net investment loss (a) | | | (0.09 | ) | | | (0.18 | ) | | | (0.14 | ) | | | (0.18 | ) | | | (0.15 | ) | | | (0.13 | ) | |
| Net realized and unrealized gain/(loss) | | | 0.03 | | | | 5.31 | | | | 9.18 | | | | (13.25 | ) | | | 2.50 | | | | 4.45 | | |
| Total from Investment Operations | | | (0.06 | ) | | | 5.13 | | | | 9.04 | | | | (13.43 | ) | | | 2.35 | | | | 4.32 | | |
| Less Distributions to Shareholders | |
| From net investment income | | | (0.38 | ) | | | — | | | | — | | | | — | | | | — | | | | (0.02 | ) | |
| From net realized gains | | | — | | | | — | | | | — | | | | (0.69 | ) | | | (0.64 | ) | | | (0.59 | ) | |
| Total Distributions to Shareholders | | | (0.38 | ) | | | — | | | | — | | | | (0.69 | ) | | | (0.64 | ) | | | (0.61 | ) | |
| Net Asset Value, End of Period | | $ | 27.50 | | | $ | 27.94 | | | $ | 22.81 | | | $ | 13.77 | | | $ | 27.89 | | | $ | 26.18 | | |
| Total Return (b) | | | (0.12 | )%(c) | | | 22.49 | % | | | 65.65 | % | | | (49.31 | )%(d) | | | 8.92 | %(e) | | | 19.32 | %(e) | |
| Ratios to Average Net Assets/Supplemental Data | |
| Net expenses (f) | | | 1.26 | %(g) | | | 1.28 | % | | | 1.30 | % | | | 1.24 | % | | | 1.19 | % | | | 1.24 | % | |
| Net investment loss (f) | | | (0.63 | )%(g) | | | (0.73 | )% | | | (0.78 | )% | | | (0.80 | )% | | | (0.52 | )% | | | (0.54 | )% | |
| Waiver/reimbursement | | | — | | | | — | | | | — | | | | — | | | | 0.00 | %(h) | | | 0.03 | % | |
| Portfolio turnover rate | | | 13 | %(c) | | | 28 | % | | | 19 | % | | | 28 | % | | | 14 | % | | | 21 | % | |
| Net assets at end of period (000s) | | $ | 509,474 | | | $ | 555,263 | | | $ | 522,443 | | | $ | 395,794 | | | $ | 1,117,941 | | | $ | 940,857 | | |
(a) Per share data was calculated using the average shares outstanding during the period.
(b) Total return at net asset value assuming all distributions reinvested and no initial sales charge or contingent deferred sales charge.
(c) Not annualized.
(d) Total return includes a voluntary reimbursement by the Adviser for a realized investment loss due to a trading error. This reimbursement increased total return and net asset value per share by 0.101% and $0.01, respectively.
(e) Had the Adviser and/or Transfer Agent not waived fees and/or reimbursed a portion of expenses, total return would have been reduced.
(f) The benefits derived from custody fees paid indirectly had an impact of less than 0.01%.
(g) Annualized.
(h) Rounds to less than 0.01%.
| Class B Shares | | (Unaudited)
Six months ended
June 30, | | Year ended December 31, | |
| Selected data for a share outstanding throughout each period | | 2011 | | 2010 | | 2009 | | 2008 | | 2007 | | 2006 | |
| Net Asset Value, Beginning of Period | | $ | 26.06 | | | $ | 21.41 | | | $ | 13.02 | | | $ | 26.57 | | | $ | 25.13 | | | $ | 21.71 | | |
| Income from Investment Operations | |
| Net investment loss (a) | | | (0.17 | ) | | | (0.31 | ) | | | (0.24 | ) | | | (0.31 | ) | | | (0.31 | ) | | | (0.28 | ) | |
| Net realized and unrealized gain/(loss) | | | 0.04 | | | | 4.96 | | | | 8.63 | | | | (12.55 | ) | | | 2.39 | | | | 4.29 | | |
| Total from Investment Operations | | | (0.13 | ) | | | 4.65 | | | | 8.39 | | | | (12.86 | ) | | | 2.08 | | | | 4.01 | | |
| Less Distributions to Shareholders | |
| From net investment income | | | (0.23 | ) | | | — | | | | — | | | | — | | | | — | | | | — | | |
| From net realized gains | | | — | | | | — | | | | — | | | | (0.69 | ) | | | (0.64 | ) | | | (0.59 | ) | |
| Total Distributions to Shareholders | | | (0.23 | ) | | | — | | | | — | | | | (0.69 | ) | | | (0.64 | ) | | | (0.59 | ) | |
| Net Asset Value, End of Period | | $ | 25.70 | | | $ | 26.06 | | | $ | 21.41 | | | $ | 13.02 | | | $ | 26.57 | | | $ | 25.13 | | |
| Total Return (b) | | | (0.46 | )%(c) | | | 21.72 | % | | | 64.44 | % | | | (49.62 | )%(d) | | | 8.22 | %(e) | | | 18.54 | %(e) | |
| Ratios to Average Net Assets/Supplemental Data | |
| Net expenses (f) | | | 1.93 | %(g) | | | 1.92 | % | | | 2.01 | % | | | 1.87 | % | | | 1.79 | % | | | 1.91 | % | |
| Net investment loss (f) | | | (1.32 | )%(g) | | | (1.39 | )% | | | (1.49 | )% | | | (1.43 | )% | | | (1.12 | )% | | | (1.21 | )% | |
| Waiver/reimbursement | | | — | | | | — | | | | — | | | | — | | | | 0.01 | % | | | 0.03 | % | |
| Portfolio turnover rate | | | 13 | %(c) | | | 28 | % | | | 19 | % | | | 28 | % | | | 14 | % | | | 21 | % | |
| Net assets at end of period (000s) | | $ | 53,225 | | | $ | 72,203 | | | $ | 88,004 | | | $ | 73,152 | | | $ | 199,182 | | | $ | 214,260 | | |
(a) Per share data was calculated using the average shares outstanding during the period.
(b) Total return at net asset value assuming all distributions reinvested and no contingent deferred sales charge.
(c) Not annualized.
(d) Total return includes a voluntary reimbursement by the Adviser for a realized investment loss due to a trading error. This reimbursement increased total return and net asset value per share by 0.101% and $0.01, respectively.
(e) Had the Adviser and/or Transfer Agent not waived fees and/or reimbursed a portion of expenses, total return would have been reduced.
(f) The benefits derived from custody fees paid indirectly had an impact of less than 0.01%.
(g) Annualized.
See accompanying notes to financial statements.
86
| Class C Shares | | (Unaudited)
Six months ended
June 30, | | Year ended December 31, | |
| Selected data for a share outstanding throughout each period | | 2011 | | 2010 | | 2009 | | 2008 | | 2007 | | 2006 | |
| Net Asset Value, Beginning of Period | | $ | 25.83 | | | $ | 21.25 | | | $ | 12.94 | | | $ | 26.46 | | | $ | 25.07 | | | $ | 21.69 | | |
| Income from Investment Operations | |
| Net investment loss (a) | | | (0.18 | ) | | | (0.34 | ) | | | (0.26 | ) | | | (0.34 | ) | | | (0.36 | ) | | | (0.31 | ) | |
| Net realized and unrealized gain/(loss) | | | 0.03 | | | | 4.92 | | | | 8.57 | | | | (12.49 | ) | | | 2.39 | | | | 4.28 | | |
| Total from Investment Operations | | | (0.15 | ) | | | 4.58 | | | | 8.31 | | | | (12.83 | ) | | | 2.03 | | | | 3.97 | | |
| Less Distributions to Shareholders | |
| From net investment income | | | (0.19 | ) | | | — | | | | — | | | | — | | | | — | | | | — | | |
| From net realized gains | | | — | | | | — | | | | — | | | | (0.69 | ) | | | (0.64 | ) | | | (0.59 | ) | |
| Total Distributions to Shareholders | | | (0.19 | ) | | | — | | | | — | | | | (0.69 | ) | | | (0.64 | ) | | | (0.59 | ) | |
| Net Asset Value, End of Period | | $ | 25.49 | | | $ | 25.83 | | | $ | 21.25 | | | $ | 12.94 | | | $ | 26.46 | | | $ | 25.07 | | |
| Total Return (b) | | | (0.53 | )%(c) | | | 21.55 | % | | | 64.22 | % | | | (49.71 | )%(d) | | | 8.04 | %(e) | | | 18.37 | %(e) | |
| Ratios to Average Net Assets/Supplemental Data | |
| Net expenses (f) | | | 2.06 | %(g) | | | 2.07 | % | | | 2.14 | % | | | 2.04 | % | | | 1.98 | % | | | 2.04 | % | |
| Net investment loss (f) | | | (1.42 | )%(g) | | | (1.52 | )% | | | (1.62 | )% | | | (1.60 | )% | | | (1.31 | )% | | | (1.34 | )% | |
| Waiver/reimbursement | | | — | | | | — | | | | — | | | | — | | | | 0.00 | %(h) | | | 0.03 | % | |
| Portfolio turnover rate | | | 13 | %(c) | | | 28 | % | | | 19 | % | | | 28 | % | | | 14 | % | | | 21 | % | |
| Net assets at end of period (000s) | | $ | 87,862 | | | $ | 98,445 | | | $ | 93,121 | | | $ | 70,962 | | | $ | 197,100 | | | $ | 173,152 | | |
(a) Per share data was calculated using the average shares outstanding during the period.
(b) Total return at net asset value assuming all distributions reinvested and no contingent deferred sales charge.
(c) Not annualized.
(d) Total return includes a voluntary reimbursement by the Adviser for a realized investment loss due to a trading error. This reimbursement increased total return and net asset value per share by 0.101% and $0.01, respectively.
(e) Had the Adviser and/or Transfer Agent not waived fees and/or reimbursed a portion of expenses, total return would have been reduced.
(f) The benefits derived from custody fees paid indirectly had an impact of less than 0.01%.
(g) Annualized.
(h) Rounds to less than 0.01%.
| Class I Shares | | (Unaudited)
Six months ended
June 30, | | Period ended
December 31, | |
| Selected data for a share outstanding throughout each period | | 2011 | | 2010 (a) | |
| Net Asset Value, Beginning of Period | | $ | 28.74 | | | $ | 24.74 | | |
| Income from Investment Operations | |
| Net investment income/(loss) (b) | | | (0.04 | ) | | | 0.01 | | |
| Net realized and unrealized gain | | | 0.02 | | | | 3.99 | | |
| Total from Investment Operations | | | (0.02 | ) | | | 4.00 | | |
| Less Distributions to Shareholders | |
| From net investment income | | | (0.47 | ) | | | — | | |
| Net Asset Value, End of Period | | $ | 28.25 | | | $ | 28.74 | | |
| Total Return (c)(d) | | | 0.04 | % | | | 16.17 | % | |
| Ratios to Average Net Assets/Supplemental Data | |
| Net expenses (e)(f) | | | 0.91 | % | | | 0.91 | % | |
| Net investment income/(loss) (e)(f) | | | (0.26 | )% | | | 0.18 | % | |
| Portfolio turnover rate (d) | | | 13 | % | | | 28 | % | |
| Net assets at end of period (000s) | | $ | 8,496 | | | $ | 7,832 | | |
(a) Class I Shares commenced operations on September 27, 2010. Per share data and total return reflect activity from that date.
(b) Per share data was calculated using the average shares outstanding during the period.
(c) Total return at net asset value assuming all distributions reinvested.
(d) Not annualized.
(e) The benefits derived from custody fees paid indirectly had an impact of less than 0.01%.
(f) Annualized.
See accompanying notes to financial statements.
87
Columbia Acorn Family of Funds
Financial Highlights, continued
Columbia Thermostat Fund
| Class A Shares | | (Unaudited)
Six months ended
June 30, | | Year ended December 31, | |
| Selected data for a share outstanding throughout each period | | 2011 | | 2010 | | 2009 | | 2008 | | 2007 | | 2006 | |
| Net Asset Value, Beginning of Period | | $ | 12.58 | | | $ | 10.90 | | | $ | 8.26 | | | $ | 12.31 | | | $ | 12.59 | | | $ | 12.49 | | |
| Income from Investment Operations | |
| Net investment income (a) | | | 0.16 | | | | 0.19 | | | | 0.11 | | | | 0.22 | | | | 0.49 | | | | 0.45 | | |
| Net realized and unrealized gain/(loss) | | | 0.40 | | | | 1.67 | | | | 2.53 | | | | (3.98 | ) | | | 0.53 | | | | 0.84 | | |
| Total from Investment Operations | | | 0.56 | | | | 1.86 | | | | 2.64 | | | | (3.76 | ) | | | 1.02 | | | | 1.29 | | |
| Less Distributions to Shareholders | |
| From net investment income | | | (0.16 | ) | | | (0.18 | ) | | | (0.00 | )(b) | | | (0.22 | ) | | | (0.51 | ) | | | (0.47 | ) | |
| From net realized gains | | | — | | | | — | | | | — | | | | (0.07 | ) | | | (0.79 | ) | | | (0.72 | ) | |
| Total Distributions to Shareholders | | | (0.16 | ) | | | (0.18 | ) | | | (0.00 | )(b) | | | (0.29 | ) | | | (1.30 | ) | | | (1.19 | ) | |
| Net Asset Value, End of Period | | $ | 12.98 | | | $ | 12.58 | | | $ | 10.90 | | | $ | 8.26 | | | $ | 12.31 | | | $ | 12.59 | | |
| Total Return (c)(d) | | | 4.44 | %(e) | | | 17.28 | % | | | 31.98 | % | | | (30.67 | )% | | | 8.19 | % | | | 10.56 | % | |
| Ratios to Average Net Assets/Supplemental Data | |
| Net expenses (f)(g) | | | 0.50 | %(h) | | | 0.50 | % | | | 0.50 | % | | | 0.50 | % | | | 0.50 | % | | | 0.50 | % | |
| Net investment income (g) | | | 2.56 | %(h) | | | 1.64 | % | | | 1.17 | % | | | 1.99 | % | | | 3.75 | % | | | 3.53 | % | |
| Waiver/reimbursement | | | 0.20 | %(h) | | | 0.22 | % | | | 0.28 | % | | | 0.18 | % | | | 0.18 | % | | | 0.20 | % | |
| Portfolio turnover rate | | | 36 | %(e) | | | 118 | % | | | 17 | % | | | 130 | % | | | 128 | % | | | 66 | % | |
| Net assets at end of period (000s) | | $ | 54,090 | | | $ | 44,527 | | | $ | 42,976 | | | $ | 41,032 | | | $ | 53,246 | | | $ | 58,013 | | |
(a) Per share data was calculated using the average shares outstanding during the period. Recognition of net investment income by the Fund is affected by the timing of the declaration of dividends by the underlying investment companies in which the Fund invests.
(b) Rounds to less than $(0.01) per share.
(c) Total return at net asset value assuming all distributions reinvested and no initial sales charge or contingent deferred sales charge.
(d) Had the Adviser and/or Transfer Agent not waived fees and/or reimbursed a portion of expenses, total return would have been reduced.
(e) Not annualized.
(f) Does not include expenses of the investment companies in which the Fund invests.
(g) The benefits derived from custody fees paid indirectly had an impact of less than 0.01%.
(h) Annualized.
| Class B Shares | | (Unaudited)
Six months ended
June 30, | | Year ended December 31, | |
| Selected data for a share outstanding throughout each period | | 2011 | | 2010 | | 2009 | | 2008 | | 2007 | | 2006 | |
| Net Asset Value, Beginning of Period | | $ | 12.64 | | | $ | 10.93 | | | $ | 8.32 | | | $ | 12.38 | | | $ | 12.62 | | | $ | 12.51 | | |
| Income from Investment Operations | |
| Net investment income (a) | | | 0.12 | | | | 0.13 | | | | 0.06 | | | | 0.16 | | | | 0.42 | | | | 0.38 | | |
| Net realized and unrealized gain/(loss) | | | 0.42 | | | | 1.67 | | | | 2.55 | | | | (4.00 | ) | | | 0.54 | | | | 0.84 | | |
| Total from Investment Operations | | | 0.54 | | | | 1.80 | | | | 2.61 | | | | (3.84 | ) | | | 0.96 | | | | 1.22 | | |
| Less Distributions to Shareholders | |
| From net investment income | | | (0.14 | ) | | | (0.09 | ) | | | — | | | | (0.15 | ) | | | (0.41 | ) | | | (0.39 | ) | |
| From net realized gains | | | — | | | | — | | | | — | | | | (0.07 | ) | | | (0.79 | ) | | | (0.72 | ) | |
| Total Distributions to Shareholders | | | (0.14 | ) | | | (0.09 | ) | | | — | | | | (0.22 | ) | | | (1.20 | ) | | | (1.11 | ) | |
| Net Asset Value, End of Period | | $ | 13.04 | | | $ | 12.64 | | | $ | 10.93 | | | $ | 8.32 | | | $ | 12.38 | | | $ | 12.62 | | |
| Total Return (b)(c) | | | 4.28 | %(d) | | | 16.64 | % | | | 31.37 | % | | | (31.10 | )% | | | 7.71 | % | | | 9.91 | % | |
| Ratios to Average Net Assets/Supplemental Data | |
| Net expenses (e)(f) | | | 1.00 | %(g) | | | 1.00 | % | | | 1.00 | % | | | 1.00 | % | | | 1.00 | % | | | 1.06 | % | |
| Net investment income (f) | | | 1.87 | %(g) | | | 1.10 | % | | | 0.64 | % | | | 1.45 | % | | | 3.25 | % | | | 2.99 | % | |
| Waiver/reimbursement | | | 0.28 | %(g) | | | 0.28 | % | | | 0.32 | % | | | 0.20 | % | | | 0.19 | % | | | 0.23 | % | |
| Portfolio turnover rate | | | 36 | %(d) | | | 118 | % | | | 17 | % | | | 130 | % | | | 128 | % | | | 66 | % | |
| Net assets at end of period (000s) | | $ | 21,615 | | | $ | 28,752 | | | $ | 32,758 | | | $ | 36,673 | | | $ | 67,709 | | | $ | 72,367 | | |
(a) Per share data was calculated using the average shares outstanding during the period. Recognition of net investment income by the Fund is affected by the timing of the declaration of dividends by the underlying investment companies in which the Fund invests.
(b) Total return at net asset value assuming all distributions reinvested and no contingent deferred sales charge.
(c) Had the Adviser and/or Transfer Agent not waived fees and/or reimbursed a portion of expenses, total return would have been reduced.
(d) Not annualized.
(e) Does not include expenses of the investment companies in which the Fund invests.
(f) The benefits derived from custody fees paid indirectly had an impact of less than 0.01%.
(g) Annualized.
See accompanying notes to financial statements.
88
| Class C Shares | | (Unaudited)
Six months ended
June 30, | | Year ended December 31, | |
| Selected data for a share outstanding throughout each period | | 2011 | | 2010 | | 2009 | | 2008 | | 2007 | | 2006 | |
| Net Asset Value, Beginning of Period | | $ | 12.62 | | | $ | 10.91 | | | $ | 8.33 | | | $ | 12.37 | | | $ | 12.62 | | | $ | 12.51 | | |
| Income from Investment Operations | |
| Net investment income (a) | | | 0.11 | | | | 0.10 | | | | 0.03 | | | | 0.13 | | | | 0.39 | | | | 0.36 | | |
| Net realized and unrealized gain/(loss) | | | 0.40 | | | | 1.68 | | | | 2.55 | | | | (3.97 | ) | | | 0.53 | | | | 0.84 | | |
| Total from Investment Operations | | | 0.51 | | | | 1.78 | | | | 2.58 | | | | (3.84 | ) | | | 0.92 | | | | 1.20 | | |
| Less Distributions to Shareholders | |
| From net investment income | | | (0.11 | ) | | | (0.07 | ) | | | — | | | | (0.13 | ) | | | (0.38 | ) | | | (0.37 | ) | |
| From net realized gains | | | — | | | | — | | | | — | | | | (0.07 | ) | | | (0.79 | ) | | | (0.72 | ) | |
| Total Distributions to Shareholders | | | (0.11 | ) | | | (0.07 | ) | | | — | | | | (0.20 | ) | | | (1.17 | ) | | | (1.09 | ) | |
| Net Asset Value, End of Period | | $ | 13.02 | | | $ | 12.62 | | | $ | 10.91 | | | $ | 8.33 | | | $ | 12.37 | | | $ | 12.62 | | |
| Total Return (b)(c) | | | 4.06 | %(d) | | | 16.43 | % | | | 30.97 | % | | | (31.20 | )% | | | 7.36 | % | | | 9.72 | % | |
| Ratios to Average Net Assets/Supplemental Data | |
| Net expenses (e)(f) | | | 1.25 | %(g) | | | 1.25 | % | | | 1.25 | % | | | 1.25 | % | | | 1.25 | % | | | 1.25 | % | |
| Net investment income (f) | | | 1.74 | %(g) | | | 0.88 | % | | | 0.39 | % | | | 1.23 | % | | | 3.02 | % | | | 2.81 | % | |
| Waiver/reimbursement | | | 0.22 | %(g) | | | 0.24 | % | | | 0.30 | % | | | 0.20 | % | | | 0.19 | % | | | 0.23 | % | |
| Portfolio turnover rate | | | 36 | %(d) | | | 118 | % | | | 17 | % | | | 130 | % | | | 128 | % | | | 66 | % | |
| Net assets at end of period (000s) | | $ | 22,788 | | | $ | 21,866 | | | $ | 21,090 | | | $ | 24,383 | | | $ | 26,908 | | | $ | 27,375 | | |
(a) Per share data was calculated using the average shares outstanding during the period. Recognition of net investment income by the Fund is affected by the timing of the declaration of dividends by the underlying investment companies in which the Fund invests.
(b) Total return at net asset value assuming all distributions reinvested and no contingent deferred sales charge.
(c) Had the Adviser and/or Transfer Agent not waived fees and/or reimbursed a portion of expenses, total return would have been reduced.
(d) Not annualized.
(e) Does not include expenses of the investment companies in which the Fund invests.
(f) The benefits derived from custody fees paid indirectly had an impact of less than 0.01%.
(g) Annualized.
See accompanying notes to financial statements.
89
Columbia Acorn Family of Funds
Notes to Financial Statements (Unaudited)
1. Nature of Operations
Columbia Acorn Fund, Columbia Acorn International, Columbia Acorn USA, Columbia Acorn International Select, Columbia Acorn Select and Columbia Thermostat Fund (the Funds) are each a series of Columbia Acorn Trust (the Trust), an open-end management investment company organized as a Massachusetts business trust. The investment objective of each Fund is to seek long-term capital appreciation.
Columbia Thermostat Fund pursues its investment objective by investing in shares of other mutual funds. As a "fund of funds" under normal circumstances, the Fund allocates at least 95% of its net assets among a selected group of stock and bond mutual funds (portfolio funds) according to the current level of the Standard & Poor's (S&P) 500 Index in relation to predetermined ranges set by Columbia Wanger Asset Management, LLC (the Adviser). The Fund may invest up to 5% of its net assets plus any cash received that day in cash, repurchase agreements, high quality short-term paper and government securities.
Each Fund may issue an unlimited number of shares. Each Fund currently has five classes of shares: – Class A, Class B, Class C, Class I and Class Z – except Columbia Thermostat Fund, which does not have Class I shares. Effective February 29, 2008, the Funds no longer offer Class B shares (other than through dividend reinvestment).
Class A shares are sold with a front-end sales charge. Class A shares bought without an initial sales charge in accounts aggregating $1 million up to $50 million at the time of purchase are subject to a 1.00% contingent deferred sales charge (CDSC) if the shares are redeemed within 12 months of the date of purchase.
Class B shares are subject to a CDSC if redeemed within six years of purchase. Class B shares will convert to Class A shares automatically eight years after purchase.
Class C shares are offered at net asset value but are subject to a CDSC on redemptions made within one year after purchase.
Class I shares are offered continuously at net asset value. There are certain restrictions on the purchase of Class I shares.
Class Z shares are offered at net asset value. There are certain restrictions on who may purchase Class Z shares. Generally, Class Z shares of a Fund may be exchanged for shares of another fund distributed by Columbia Management Distributors, Inc. at no additional charge.
The financial highlights for the Fund's Class Z shares are presented in a separate semi-annual report.
Investment income, realized and unrealized gains and losses, and certain fund-level expenses are allocated pro rata on the basis of the relative net assets of all classes, except that each class bears certain expenses specific to that class such as distribution services, transfer agency, and certain other class specific expenses. Differences in class expenses may result in payment of different dividend distributions for each class. All of the Funds' share classes have equal rights with respect to voting, subject to Fund or class specific matters.
2. Significant Accounting Policies
The preparation of financial statements in accordance with accounting principles generally accepted in the United States of America (GAAP) requires management to make certain estimates and assumptions that affect the reported amounts of assets and liabilities, the disclosures of contingent assets and liabilities at the date of the financial statements and the reported amounts of revenue and expenses during the reporting period. Actual results could differ from those estimates.
>Security valuation
Securities of the Funds are valued at market value or, if a market quotation for a security is not readily available or is deemed not to be reliable because of events or circumstances that have occurred between the market quotation and the time as of which the security is to be valued, the security is valued at a fair value determined in good faith under consistently applied procedures established by the Board of Trustees. With respect to Columbia Thermostat Fund, investments in portfolio funds are valued at their net asset values as reported by the portfolio funds. A security traded on a securities exchange or in an over-the-counter market in which transaction prices are reported is valued at the last sales price at the time of valuation. A security traded principally on NASDAQ is valued at the NASDAQ official closing price. Mutual Funds and Exchange Traded Funds are valued at their closing net asset value as reported to NASDAQ. A security for which there is no reported sale on the valuation date is valued at the latest bid quotation. Short-term investments maturing in 60 days or less are valued at amortized cost, which approximates market value. A security for which a market quotation is not readily available and any other assets are valued at their fair value determined in good faith under consistently applied procedures established by the Board of Trustees. The Funds have retained an independent statistical fair value pricing service that employs a systematic methodology to assist in the fair valuation process for securities principally traded in a foreign market in order to adjust for possible changes in value that may occur between the close of the foreign exchange and
90
the time as of which the securities are to be valued. If a security is valued at fair value, that value may be different from the last quoted market price for the security.
>Repurchase agreements
Each Fund may engage in repurchase agreement transactions. Each Fund, through its custodian, receives delivery of underlying securities collateralizing repurchase agreements. The counterparty is required to maintain collateral that is at all times at least equal to the repurchase price including interest. In the event of default or bankruptcy by the counterparty to the agreement, realization and/or retention of the collateral may be subject to legal proceedings.
>Foreign currency translations
Values of investments denominated in foreign currencies are converted into U.S. dollars using the New York spot market rate of exchange at the time of valuation. Purchases and sales of investments and dividend and interest income are translated into U.S. dollars using the spot market rate of exchange prevailing on the respective dates of such transactions. The gain or loss resulting from changes in foreign exchange rates is included with net realized and unrealized gain or loss from investments, as appropriate.
>Forward foreign currency exchange contracts
Columbia Acorn International may enter into forward foreign currency exchange contracts in order to seek to minimize the risk from adverse changes in the relationship between the U.S. dollar and foreign currencies. A forward foreign currency exchange contract is a commitment to purchase or sell a foreign currency at a future date at a negotiated forward rate. Forward foreign currency exchange contracts are valued at the interpolated forward exchange rate of the underlying currencies and any market gain or loss, arising from the difference between the original value and the current value of such contract, is included as a component of unrealized gain/(loss) on the Statements of Operations. Open forward foreign currency exchange contracts, if any, are disclosed in the Notes to the Statement of Investments. As forward foreign currency exchange contracts are closed the resulting gain or loss, arising from the difference between the original value of the contract and the closing value of such contract, is included as a component of realized gain/(loss) on the Statements of Operations.
A forward foreign currency exchange contract would limit the risk of loss due to a decline in the value of a particular currency; however, it also would limit any potential gain that might result should the value of the currency increase instead of decrease. These contracts may involve market risk in excess of the unrealized gain or loss reflected on the Statements of Assets and Liabilities. In addition, a Fund could be exposed to counterparty risks if counterparties to the contracts are unable to meet the terms of their contracts. The counterparty risk exposure is, therefore, closely monitored and contracts are only executed with high credit quality financial institutions.
A Fund may use forward foreign currency exchange contracts to buy or sell a foreign currency when the Adviser believes it has exposure to a foreign currency which may suffer or enjoy a movement against another foreign currency to which the Fund has exposure. A Fund will not attempt to hedge all of its foreign portfolio positions.
For additional information on derivative instruments, please see Note 5.
>Securities lending
Each Fund, except Columbia Thermostat Fund, may lend securities up to one-third of the value of its total assets to certain approved brokers, dealers and other financial institutions to earn additional income. In lending its securities, the Fund retains the benefits of owning the securities, including receipt of dividends or interest generated by the security. Each Fund also receives a fee for the loan. Each Fund has the ability to recall the loans at any time and could do so in order to vote proxies or to sell the loaned securities. Each loan is collateralized by cash that exceeds the value of the securities on loan. The market value of the loaned securities is determined daily at the close of business of each Fund and any additional required collateral is delivered to each Fund on the next business day. Each Fund has elected to invest the cash collateral in the Dreyfus Government Cash Management Fund, and the income earned is paid to each Fund, net of any fees remitted to Goldman Sachs Agency Lending as the lending agent and net of any borrower rebates. The Adviser does not retain any fees earned by the lending program. Generally, in the event of borrower default, a Fund has the right to use the collateral to offset any losses incurred. In the event a Fund is delayed or prevented from exercising its right to dispose of the collateral, there may be a potential loss to a Fund. Some of these losses may be indemnified by the lending agent. Each Fund bears the risk of loss with respect to the investment of collateral.
The net lending income earned as of June 30, 2011 by each Fund is included in the Statements of Operations.
>Security transactions and investment income
Security transactions, investment income and shareholder fund transactions are accounted for on the trade date (date the
91
Columbia Acorn Family of Funds
Notes to Financial Statements (Unaudited), continued
order to buy or sell is executed) and dividend income and realized gain distributions from other funds are recorded on the ex-dividend date, except that certain dividends from foreign securities are recorded as soon as the information is available to the Funds. Interest income is recorded on the accrual basis and includes amortization of discounts on debt obligations when required for federal income tax purposes. Realized gains and losses from security transactions are recorded on an identified cost basis.
Awards, if any, from class action litigation related to securities owned may be recorded as a reduction of cost of those securities. If the applicable securities are no longer owned, the proceeds are recorded as realized gains.
The Funds estimate the tax character of distributions from real estate investment trusts (REITs). Distributions received in excess of income are recorded as a reduction of the cost of the related investments. If the applicable securities are no longer owned, any distributions received in excess of income are recorded as realized gains.
>Restricted securities
Restricted securities are securities that may only be resold upon registration under federal securities laws or in transactions exempt from registration. In some cases, the issuer of restricted securities has agreed to register such securities for resale at the issuer's expense either upon demand by the Funds or in connection with another registered offering of the securities. Many restricted securities may be resold in the secondary market in transactions exempt from registration. Such restricted securities may be determined to be liquid under criteria established by the Board of Trustees.
>Fund share valuation
Fund shares are sold and redeemed on a daily basis at net asset value, subject to any applicable sales charge. Net asset value per share is determined daily as of the close of trading on the New York Stock Exchange (NYSE) on each day the NYSE is open for trading. Generally, income, expenses and realized and unrealized gain/(losses) of a Fund are allocated to each class proportionately on a daily basis for purposes of determining the net asset value of each class. The Rule 12b-1 service and distribution fees and transfer agency fees are charged to each specific class as expenses are incurred. Redemption fees are accounted for as an addition to paid in capital for purposes of determining the net asset value of each class.
>Custody fees/credits
Custody fees are reduced based on each Fund's cash balances maintained with the custodian. The amount is disclosed as a reduction of total expenses on the Statements of Operations.
>Federal income taxes
It is each Fund's policy to comply with the provisions of the Internal Revenue Code available to regulated investment companies and, in the manner provided therein, distribute substantially all their taxable income, as well as any net realized gain on sales of investments and foreign currency transactions reportable for federal income tax purposes. Columbia Thermostat Fund distributes all of its taxable income, as well as any net realized gain on sales of portfolio fund shares and any distributions of net realized gains received by the Fund from its portfolio funds, reportable for federal income tax purposes. Accordingly, the Funds paid no federal income taxes and no federal income tax provision was required.
>Foreign capital gains taxes
Realized gains in certain countries may be subject to foreign taxes at the fund level, at rates ranging from approximately 10% to 15%. The Funds accrue for such foreign taxes on net realized and unrealized gains at the appropriate rate for each jurisdiction.
>Distributions to shareholders
Distributions to shareholders are recorded on the ex-dividend date.
>Indemnification
In the normal course of business, the Trust on behalf of the Funds enters into contracts that contain a variety of representations and warranties and that provide general indemnities. A Fund's maximum exposure under these arrangements is unknown, as this would involve future claims against the Fund. Also, under the Trust's organizational documents, the trustees and officers of the Trust are indemnified against certain liabilities that may arise out of their duties to the Trust. However, based on experience, the Funds expect the risk of loss due to these warranties and indemnities to be remote.
92
3. Federal Tax Information
The tax character of distributions paid during the year ended December 31, 2010 was as follows:
| | | Ordinary
Income* | | Long-Term
Capital Gains | |
| (in thousands) | |
| Columbia Acorn Fund | | $ | 21,020 | | | $ | 496,293 | | |
| Columbia Acorn International | | | 122,919 | | | | — | | |
| Columbia Acorn USA | | | — | | | | — | | |
| Columbia Acorn International Select | | | 6,107 | | | | — | | |
| Columbia Acorn Select | | | — | | | | — | | |
| Columbia Thermostat Fund | | | 1,666 | | | | — | | |
*For tax purposes short-term capital gain distributions, if any, are considered ordinary income distributions.
The following capital loss carryforwards, determined as of December 31, 2010, may be available to reduce taxable income arising from future net realized gains on investments, if any, to the extent permitted by the Internal Revenue Code:
| | | Year of Expiration | | | |
| | | 2011-
2015 | | 2016 | | 2017 | | 2018 | | Total | |
| (in thousands) | |
Columbia Acorn
International | | $ | — | | | $ | — | | | $ | 386,385 | | | $ | — | | | $ | 386,385 | | |
| Columbia Acorn USA | | | — | | | | — | | | | 28,408 | | | | — | | | | 28,408 | | |
Columbia Acorn
International Select | | | — | | | | — | | | | 36,610 | | | | — | | | | 36,610 | | |
Columbia Acorn
Select | | | — | | | | 3,592 | | | | 115,445 | | | | — | | | | 119,037 | | |
Columbia
Thermostat Fund | | | — | | | | 5,193 | | | | 21,738 | | | | 2,954 | | | | 29,885 | | |
Capital loss carryforwards that were utilized for the Funds during the year ended December 31, 2010 were as follows:
| (in thousands) | |
| Columbia Acorn Fund | | $ | 409,911 | | |
| Columbia Acorn International | | | 238,546 | | |
| Columbia Acorn USA | | | 85,334 | | |
| Columbia Acorn International Select | | | 40,289 | | |
| Columbia Acorn Select | | | 8,679 | | |
Management is required to determine whether a tax position of the Funds is more likely than not to be sustained upon examination by the applicable taxing authority, including resolution of any related appeals or litigation processes, based on the technical merits of the position. The tax benefit to be recognized by the Funds is measured as the largest amount of benefit that is greater than fifty percent likely of being realized upon ultimate settlement. Management is not aware of any tax positions for which it is reasonably possible that the total amounts of unrecognized tax benefits will significantly change in the next twelve months. However, management's conclusions may be subject to review and adjustment at a later date based on factors including, but not limited to, new tax laws, regulations, and administrative interpretations (including relevant court decisions). The Funds' federal tax returns for the prior three fiscal years remain subject to examination by the Internal Revenue Service.
4. Transactions with Affiliates
Columbia Wanger Asset Management (CWAM) is a wholly owned subsidiary of Columbia Management, which is a wholly owned subsidiary of Ameriprise Financial, Inc. (Ameriprise Financial). CWAM furnishes continuing investment supervision to the Funds and is responsible for the overall management of the Funds' business affairs.
CWAM receives a monthly advisory fee based on each Fund's average daily net assets at the following annual rates:
Columbia Acorn Fund
| Average Daily Net Assets | | Annual
Fee Rate | |
| Up to $700 million | | | 0.74 | % | |
| $700 million to $2 billion | | | 0.69 | % | |
| $2 billion to $6 billion | | | 0.64 | % | |
| $6 billion and over | | | 0.63 | % | |
Columbia Acorn International
| Average Daily Net Assets | | Annual
Fee Rate | |
| Up to $100 million | | | 1.19 | % | |
| $100 million to $500 million | | | 0.94 | % | |
| $500 million and over | | | 0.74 | % | |
Columbia Acorn USA
| Average Daily Net Assets | | Annual
Fee Rate | |
| Up to $200 million | | | 0.94 | % | |
| $200 million to $500 million | | | 0.89 | % | |
| $500 million to $2 billion | | | 0.84 | % | |
| $2 billion to $3 billion | | | 0.80 | % | |
| $3 billion and over | | | 0.70 | % | |
Columbia Acorn International Select
| Average Daily Net Assets | | Annual
Fee Rate | |
| Up to $500 million | | | 0.94 | % | |
| $500 million and over | | | 0.90 | % | |
Columbia Acorn Select
| Average Daily Net Assets | | Annual
Fee Rate | |
| Up to $700 million | | | 0.85 | % | |
| $700 million to $2 billion | | | 0.80 | % | |
| $2 billion to $3 billion | | | 0.75 | % | |
| $3 billion and over | | | 0.70 | % | |
Columbia Thermostat Fund
| | | Annual
Fee Rate | |
| All Average Daily Net Assets | | | 0.10 | % | |
93
Columbia Acorn Family of Funds
Notes to Financial Statements (Unaudited), continued
For the six months ended June 30, 2011, the Funds' annualized effective investment advisory fee rates were as follows:
| Columbia Acorn Fund | | | 0.64 | % | |
| Columbia Acorn International | | | 0.76 | % | |
| Columbia Acorn USA | | | 0.86 | % | |
| Columbia Acorn International Select | | | 0.94 | % | |
| Columbia Acorn Select | | | 0.81 | % | |
| Columbia Thermostat Fund | | | 0.10 | % | |
>Expense Limit
CWAM has voluntarily agreed to reimburse the ordinary operating expenses (exclusive of brokerage commissions, interest, taxes and extraordinary expenses, but inclusive of custodial charges relating to overdrafts, if any) after giving effect to any balance credits from the Funds' custodian, exceeding annually the average daily net assets of the Funds as follows:
| Fund | | Class A | | Class B | | Class C | | Class I | |
Columbia Acorn
International Select | | | 1.70 | % | | | 2.20 | % | | | 2.45 | % | | | 1.30 | % | |
| Columbia Acorn Select | | | 1.60 | % | | | 2.10 | % | | | 2.35 | % | | | 1.25 | % | |
This arrangement may be modified or terminated by either the Funds or CWAM on 30 days notice.
CWAM has contractually agreed to waive fees and/or reimburse expenses of Columbia Thermostat Fund so that the ordinary operating expenses (exclusive of distribution and service fees, interest and fees on borrowings, and expenses associated with the Fund's investment in other investment companies, but including custodian charges relating to overdrafts, if any), after giving effect to any balance credits from the Fund's custodian, will not exceed 0.25% annually of the Fund's average daily net assets through April 30, 2012. There is no guarantee that this arrangement will continue thereafter.
Expenses reimbursed by CWAM to Columbia Acorn International Select and Columbia Thermostat Fund for the six months ended June 30, 2011, were $363 and $128,651, respectively.
CWAM provides administrative services and receives an administration fee from the Funds at the following annual rates:
Columbia Acorn Trust
Aggregate Average Daily
Net Assets of the Trust: | | Annual
Fee Rate | |
| Up to $8 billion | | | 0.050 | % | |
| $8 billion to $16 billion | | | 0.040 | % | |
| $16 billion to $35 billion | | | 0.030 | % | |
| $35 billion to $45 billion | | | 0.025 | % | |
| $45 billion and over | | | 0.015 | % | |
For the six months ended June 30, 2011, the annualized effective administration fee rate was 0.04% of each Fund's average daily net assets. CWAM has delegated to Columbia Management responsibility to provide certain sub-administrative services to the Funds.
Columbia Management Investment Distributors, Inc. (CMID), a wholly owned subsidiary of Ameriprise Financial, is the distributor of the Funds.
For the six months ended June 30, 2011, Columbia Acorn Fund, Columbia Acorn International, Columbia Acorn USA, Columbia Acorn International Select, Columbia Acorn Select and Columbia Thermostat Fund have been advised that CMDI retained $282 in underwriting discounts in connection with redemptions of Class A shares and received CDSCs of $—*, $48 and $22, in connection with Class A, Class B and Class C share redemptions, respectively.
Each Fund has adopted a Rule 12b-1 (distribution and service) plan which requires it to pay CMID a monthly service fee equal to 0.25% annually of the average daily net assets attributable to Class A, Class B and Class C shares and a monthly distribution fee equal to 0.50% and 0.75%, annually, of the average daily net assets attributable to Class B and Class C shares, respectively. CMID receives no compensation with respect to Class Z shares.
Columbia Management Investment Services Corp. (CMIS), a wholly owned subsidiary of Ameriprise Financial, is the transfer agent of the Funds. For its services, each Fund pays CMIS a monthly fee at the annual rate of $17.00 per open account. CMIS also receives reimbursement from the Fund's for certain out-of-pocket expenses. The arrangement with BFDS has been continued by CMIS.
Class I shares do not pay transfer agent fees.
Certain officers and trustees of the Trust are also officers of CWAM. The Trust makes no direct payments to its officers and trustees who are affiliated with CWAM.
The Board of Trustees appointed a Chief Compliance Officer of the Trust in accordance with federal securities regulations. The Funds, along with other affiliated funds, pay their pro-rata share of the expenses associated with the Office of the Chief Compliance Officer. Those expenses are disclosed separately as "Chief compliance officer expenses" in the Statements of Operations.
The Trust offers a deferred compensation plan for its independent trustees. Under that plan, a trustee may elect to defer all or a portion of his or her compensation. Amounts deferred
*Rounds to less than $500.
94
are retained by the Trust and may represent an unfunded obligation of the Trust. The value of amounts deferred is determined by reference to the change in value of Class Z shares of one or more series of the Trust or a money market fund specified by the trustee. Benefits under the deferred compensation plan are payable when the trustee ceases to be a member of the Board of Trustees.
An affiliated person of a Fund may include any company in which a Fund owns five percent or more of its outstanding voting shares. On December 31, 2010, Columbia Acorn Fund, Columbia Acorn International, Columbia Acorn USA and Columbia Acorn Select each held five percent or more of the outstanding voting securities of one or more companies. Details of investments in those affiliated companies are presented on pages 34, 35, 46, 56 and 68, respectively.
During the six months ended June 30, 2011, the Funds engaged in purchase and sale transactions with funds that have a common investment adviser (or affiliated investment advisers), common directors/trustees, and/or common officers. Those transactions complied with Rule 17a-7 under the Investment Company Act of 1940 and were as follows:
| | | Purchases | | Sales | |
| (in thousands) | |
| Columbia Acorn Fund | | $ | 25,228 | | | $ | — | | |
| Columbia Acorn International | | | 1,372 | | | | — | | |
| Columbia Acorn USA | | | 578 | | | | — | | |
| Columbia Acorn International Select | | | 213 | | | | — | | |
| Columbia Acorn Select | | | — | | | | 24,857 | | |
5. Objectives and Strategies for Investing in Derivative Instruments
Columbia Acorn International uses derivative instruments including forward foreign currency exchange contracts in order to meet its investment objectives. The Fund employs strategies in differing combinations to permit it to increase, decrease or change the level of exposure to market risk factors. The achievement of any strategy involving derivatives depends on analysis of various risk factors, and if the strategies for the use of derivatives do not work as intended, the Fund may not achieve its investment objectives.
In pursuit of its investment objectives, the Fund is exposed to the following market risks:
Foreign Exchange Rate Risk: Foreign exchange rate risk relates to the change in the U.S. dollar value of a security held that is denominated in a foreign currency. The U.S. dollar value of a foreign-currency-denominated security will decrease as the dollar appreciates against the currency, while the U.S. dollar value will increase as the dollar depreciates against the currency.
The following note provides more detailed information about the derivative type held by the Columbia Acorn International:
Forward Foreign Currency Exchange Contracts
• The Fund entered into forward foreign currency exchange contracts to shift its investment exposure from one currency to another.
• The Fund used forward foreign currency exchange contracts to shift its U.S. dollar exposure in order to achieve a representative weighted mix of major currencies relative to its benchmark and/or to recover an underweight country exposure in its portfolio relative to its benchmark.
Forward foreign currency exchange contracts are agreements to exchange one currency for another at a future date at a specified price. These contracts are used to seek to minimize the exposure to foreign exchange rate fluctuations during the period between the trade and settlement dates of the contract. The Fund may utilize forward foreign currency exchange contracts in connection with the settlement of purchases and sales of securities. The Fund may also enter into these contracts to seek to reduce the exposure to adverse price movements in certain other foreign-currency-denominated assets. Contracts to buy are used to acquire exposure to foreign currencies, while contracts to sell are used to reduce the exposure to foreign exchange rate fluctuations. Forward foreign currency exchange contracts are valued daily at the current exchange rate of the underlying currency, resulting in unrealized gains (losses) which become realized at the time the forward foreign currency exchange contracts are closed or mature. Realized and unrealized gains (losses) arising from such transactions are included in net realized and unrealized gains (losses) on foreign currency transactions. The use of forward foreign currency exchange contracts does not eliminate fluctuations in the prices of the Fund's portfolio securities. While the maximum potential loss from such contracts is the aggregate face value in U.S. dollars at the time the contract was opened, exposure is typically limited to the change in value of the contract (in U.S. dollars) over the period it remains open. The Fund could also be exposed to risk that counterparties of the contracts may be unable to fulfill the terms of the contracts.
During the six months ended June 30, 2011, Columbia Acorn International entered into 92 forward foreign currency exchange contracts.
95
Columbia Acorn Family of Funds
Notes to Financial Statements (Unaudited), continued
The following table is a summary of the value of Columbia Acorn International's derivative instruments as of June 30, 2011.
Fair Value of Derivative Instruments
| | | Asset | | Liability | |
| | | Statement of Assets
and Liabilities | | Fair
Value | | Statement of Assets
and Liabilities | | Fair
Value | |
| (in thousands) | | | | | | | | | |
| | | Unrealized appreciation on
forward foreign currency
exchange contracts | | $ | 3,057 | | | Unrealized depreciation on
forward foreign currency
exchange contracts | | $ | 2,796 | | |
The effect of derivative instruments on Columbia Acorn International's Statement of Operations for the six months ended June 30, 2011 was as follows:
Amount of Realized Gain or (Loss) and Change in
Unrealized Appreciation or (Depreciation)
On Derivatives Recognized in Income
| | | Risk
Exposure | | Realized
Gain/(Loss) | | Change in
Unrealized
Appreciation/
(Depreciation) | |
| (in thousands) | |
Forward foreign
currency
exchange
contracts | | Foreign Exchange
Rate Risk | | $ | (84 | ) | | $ | (11,026 | ) | |
6. Borrowing Arrangements
The Trust participates in a $150 million credit facility, along with another Trust managed by CWAM, which was entered into to facilitate portfolio liquidity. Under the facility, interest is charged to each participating fund based on its borrowings at a rate per annum equal to the higher of Federal Funds Rate or Overnight LIBOR plus 1.25%. In addition, a commitment fee of 0.125% per annum of the unutilized line of credit was accrued and apportioned among the participating funds based on their relative net assets. The commitment fee is included in "Other expenses" in the Statements of Operations. No amounts were borrowed by any Fund under this facility for the six months ended June 30, 2011. The Trust enters into this line of credit for one year durations. The Trust has secured the line of credit for the entire year of 2012.
7. Investment Transactions
The aggregate cost of purchases and proceeds from sales, other than short-term obligations, for the six months ended June 30, 2011, were:
Columbia Acorn Fund
| (in thousands) | |
| Investment securities | | | |
| Purchases | | $ | 1,566,628 | | |
| Proceeds from sales | | | 1,538,048 | | |
Columbia Acorn International
| (in thousands) | |
| Investment securities | | | |
| Purchases | | $ | 1,008,306 | | |
| Proceeds from sales | | | 748,658 | | |
Columbia Acorn USA
| (in thousands) | |
| Investment securities | | | |
| Purchases | | $ | 209,631 | | |
| Proceeds from sales | | | 167,239 | | |
Columbia Acorn International Select
| (in thousands) | |
| Investment securities | | | |
| Purchases | | $ | 87,027 | | |
| Proceeds from sales | | | 149,800 | | |
Columbia Acorn Select
| (in thousands) | |
| Investment securities | | | |
| Purchases | | $ | 277,833 | | |
| Proceeds from sales | | | 506,800 | | |
Columbia Thermostat Fund
| (in thousands) | |
| Investment securities | | | |
| Purchases | | $ | 49,334 | | |
| Proceeds from sales | | | 48,426 | | |
8. Regulatory Settlements with Third Parties
During the year ended December 31, 2010, Columbia Acorn International and Columbia Acorn International Select received payments totaling $446,565 and $46,265, respectively, representing distributions from a fair fund established in connection with a regulatory settlement between the Securities and Exchange Commission and a third party broker dealer relating to alleged market timing and late trading in mutual funds, including the Funds. The payments have been included in "Increase from regulatory settlements" in the Statements of Changes in Net Assets.
9. Information Regarding Pending and Settled Legal Proceedings
In June 2004, an action captioned John E. Gallus et al. v. American Express Financial Corp. and American Express
96
Financial Advisors Inc. was filed in the United States District Court for the District of Arizona. The plaintiffs allege that they are investors in several American Express Company (now known as legacy RiverSource) mutual funds and they purport to bring the action derivatively on behalf of those funds under the Investment Company Act of 1940. The plaintiffs allege that fees allegedly paid to the defendants by the funds for investment advisory and administrative services are excessive. The plaintiffs seek remedies including restitution and rescission of investment advisory and distribution agreements. The plaintiffs voluntarily agreed to transfer this case to the United States District Court for the District of Minnesota (the District Court). In response to defendants' motion to dismiss the complaint, the District Court dismissed one of plaintiffs' four claims and granted plaintiffs limited discovery. Defendants moved for summary judgment in April 2007. Summary judgment was granted in the defendants' favor on July 9, 2007. The plaintiffs filed a notice of appeal with the Eighth Circuit Court of Appeals (the Eighth Circuit) on August 8, 2007. On April 8, 2009, the Eighth Circuit reversed summary judgment and remanded to the District Court for further proceedings. On August 6, 2009, defendants filed a writ of certiorari with the U.S. Supreme Court (the Supreme Court), asking the Supreme Court to stay the District Court proceedings while the Supreme Court considers and rules in a case captioned Jones v. Harris Associates, which involves issues of law similar to those presented in the Gallus case. On March 30, 2010, the Supreme Court issued its ruling in Jones v. Harris Associates, and on April 5, 2010, the Supreme Court vacated the Eighth Circuit's decision in the Gallus case and remanded the case to the Eighth Circuit for further consideration in light of the Supreme Court's decision in Jones v. Harris Associates. On June 4, 2010, the Eighth Circuit remanded the Gallus case to the District Court for further consideration in light of the Supreme Court's decision in Jones v. Harris Associates. On December 9, 2010, the District Court reinstated its July 9, 2007 summary judgment order in favor of the defendants. On January 10, 2011, plaintiffs filed a notice of appeal with the Eighth Circuit.
In December 2005, without admitting or denying the allegations, American Express Financial Corporation (AEFC, which is now known as Ameriprise Financial, Inc. (Ameriprise Financial)), entered into settlement agreements with the Securities and Exchange Commission (SEC) and Minnesota Department of Commerce (MDOC) related to market timing activities. As a result, AEFC was censured and ordered to cease and desist from committing or causing any violations of certain provisions of the Investment Advisers Act of 1940, the Investment Company Act of 1940, and various Minnesota laws. AEFC agreed to pay disgorgement of $10 million and civil money penalties of $7 million. AEFC also agreed to retain an independent distribution consultant to assist in developing a plan for distribution of all disgorgement and civil penalties ordered by the SEC in accordance with various undertakings detailed at http://www.sec.gov/litigation/admin/ia-2451.pdf. Ameriprise Financial and its affiliates have cooperated with the SEC and the MDOC in these legal proceedings, and have made regular reports to the RiverSource, Seligman and Threadneedle funds' Boards of Directors/Trustees.
Ameriprise Financial and certain of its affiliates have historically been involved in a number of legal, arbitration and regulatory proceedings, including routine litigation, class actions, and governmental actions, concerning matters arising in connection with the conduct of their business activities. Ameriprise Financial believes that the Funds are not currently the subject of, and that neither Ameriprise Financial nor any of its affiliates are the subject of, any pending legal, arbitration or regulatory proceedings that are likely to have a material adverse effect on the Funds or the ability of Ameriprise Financial or its affiliates to perform under their contracts with the Funds. Ameriprise Financial is required to make 10-Q, 10-K and, as necessary, 8-K filings with the SEC on legal and regulatory matters that relate to Ameriprise Financial and its affiliates. Copies of these filings may be obtained by accessing the SEC website at www.sec.gov.
There can be no assurance that these matters, or the adverse publicity associated with them, will not result in increased fund redemptions, reduced sale of fund shares or other adverse consequences to the Funds. Further, although we believe proceedings are not likely to have a material adverse effect on the Funds or the ability of Ameriprise Financial or its affiliates to perform under their contracts with the Funds, these proceedings are subject to uncertainties and, as such, we are unable to estimate the possible loss or range of loss that may result. An adverse outcome in one or more of these proceedings could result in adverse judgments, settlements, fines, penalties or other relief that could have a material adverse effect on the consolidated financial condition or results of operations of Ameriprise Financial.
97
[Excerpt from:]
Columbia Acorn Trust
Management Fee Evaluation of the Senior Officer
Prepared Pursuant to the New York Attorney General's
Assurance of Discontinuance
May 2011
98
Introduction
The New York Attorney General's Assurance of Discontinuance (Order) entered into by Columbia Management Advisors, LLC (CMA) and Columbia Management Distributors, Inc., (CMDI) in February 2005, allows CMA to manage or advise a mutual fund only if the trustees of the fund appoint a Senior Officer to perform specified duties and responsibilities. Among these responsibilities is "managing the process by which proposed management fees (including but not limited to, advisory fees) to be charged the [funds] are negotiated so that they are negotiated in a manner which is at arms' length and reasonable and consistent with this Assurance of Discontinuance."
The Columbia Acorn Trust and Wanger Advisors Trust (collectively, the Trusts) and each series thereof (the Acorn funds, WAT funds or collectively, the Funds) are overseen by the same Board of Trustees (Board). The Order provides that this Board must determine the reasonableness of proposed management fees by using either an annual competitive bidding process supervised by the Senior Officer or Independent Fee Consultant, or by obtaining an annual independent written evaluation prepared by or under the direction of the Senior Officer or the Independent Fee Consultant.
Management fees are only part of the costs and expenses paid by mutual fund shareholders. Fund expenses can vary depending upon the class of shares held but usually include: (1) advisory fees to compensate analysts and portfolio managers for stock research and portfolio management, as well as the cost of operating a trading desk; (2) administrative expenses incurred to prepare registration statements and tax returns, calculate the funds' net asset values, maintain effective compliance procedures and perform recordkeeping services; (3) transfer agency costs for establishing accounts, accepting and disbursing funds, as well as overseeing trading in fund shares; (4) custodial expenses incurred to hold the securities purchased by the funds; and (5) distribution expenses, including commissions paid to brokers that sell the fund shares to investors. Management fees consist of (1) and (2), but not the other services.
Columbia Wanger Asset Management, LLC (CWAM), is the adviser to the Funds, and at present is wholly owned by Ameriprise Financial, Inc. (Ameriprise). The name Columbia Management or Columbia, is used to refer to the group of entities that manage or provide services to funds bearing the brand name Columbia. These entities include Columbia Management Investment Advisers, (CMIA), the successor entity to CMA, Columbia Management Investment Services, Inc. (CMIS) and Columbia Management Investment Distributors, Inc. (CMID), the successor entity to CMDI. The Columbia asset management business, formerly owned by Bank of America Corporation (Bank of America), is now owned by Ameriprise.
The Change of Ownership
On September 29, 2009, Bank of America entered into a Purchase Agreement with Ameriprise providing for, among other things, the sale of CWAM to Ameriprise and the acquisition by Ameriprise of certain assets of Columbia. The sale closed on May 1, 2010. A new advisory agreement is required under these circumstances. In advance of that closing, Columbia and Ameriprise proposed that the Trusts continue, in substance, the then existing advisory agreement governing portfolio management, and the administration services agreement governing certain administration and clerical services. They proposed no material changes to these agreements, no change in services and no changes in fee levels, only those changes necessary to effect the change of ownership. The Board of Trustees approved the new advisory agreements, and on May 27, 2010, shareholders voted to approve them too. The investment management team responsible for the Funds remained with CWAM following the Ameriprise acquisition.
The Investment Company Act of 1940 (1940 Act) effectively bars an increase in management fees for two years following a change in ownership of a fund's advisor (other than for bona fide additional investment advisory services); the purpose of this prohibition is to preclude management from financing the purchase through increased advisory fees. Ameriprise has represented to the Board that it intends to comply with these restrictions, and does not seek increased management fees at this time. Rather, Ameriprise seeks only to renew the advisory and related agreements on their existing terms.
99
Requirements of the Order
The Order applies to any successor to substantially all the assets of CMDI and CMA. Thus, it applies to CMIA and CMID as successors to CMA and CMDI. Under the Order, a fee evaluation must precede the execution of new or the extension of existing advisory and administration services agreements. The existing agreements continue in effect until July 31, 2011.
In conformity with the terms of the Order and past evaluations, this Evaluation addresses only the advisory and administration contracts, and does not extend to the Funds' underwriting and transfer agency agreements.
According to the Order, the Senior Officer's evaluation must consider a number of factors. These factors parallel the standard set forth in the Gartenberg case. They are following:
(1) Management fees (including components thereof) charged to institutional and other clients of CWAM for like services;
(2) Management fees (including any components thereof) charged by other mutual fund companies for like services;
(3) Costs to CWAM and its affiliates of supplying services pursuant to the management fee agreements, excluding any intra-corporate profit;
(4) Profit margins of CWAM and its affiliates from supplying such services;
(5) Possible economies of scale as the Funds grow larger; and
(6) The nature and quality of CWAM's services, including the performance of each Fund.
In 2004, the Boards of the two Trusts, then separate groups, each appointed me Senior Officer under the Order. They also determined not to pursue a competitive bidding process and instead, charged me with the responsibility of evaluating the Funds' proposed advisory and administration fee contracts with CWAM in conformity with the requirements of the Order. In discharging their responsibilities, the independent Trustees have also consulted independent, outside counsel. The Board has asked that I prepare this Evaluation.
Scope of this Evaluation
This Evaluation is qualified in two respects. First, assessing such factors as cost of service, profitability, projected economies of scale, and expected quality of service, involves, at present, a significant element of uncertainty. Ameriprise and Columbia hope to effect cost savings by virtue of the increased scale of their operations. The integration of the two organizations is not, however, complete at this time, so the anticipated benefits are impossible to quantify now and hence cannot effectively be weighed in assessing the reasonableness of the proposed management fee. Profitability data is, to some extent, based on pro forma financial statements. At the same time, Ameriprise and Columbia have assured the Board that the Funds will not suffer diminished services as a result of the combination, nor do they propose to change the fee levels set forth in the existing advisory and administration services agreements. The upshot is that the Fund shareholders will, if the advisory agreements are renewed and asset levels do not decrease, pay no more than they do now, but it is too early to determine whether the change in ownership will result in material changes in the calculus of assessing the fairness of the management fee. Of necessity this must be left to future evaluations.
A second consideration concerns the new funds recently approved by the Board of Trustees. Earlier this year, CWAM and Ameriprise proposed two new Acorn funds: Columbia Acorn Emerging Markets Fund (Acorn Emerging Markets), and Columbia Acorn European Fund (Acorn European). I issued a fee evaluation in February 2011 addressing the management fees proposed for those new funds. In March 2011, the Board approved amendments to the advisory and other agreements necessary to launch the new funds. They have not yet, however, been offered. Consequently, there is nothing to add here to the evaluation done in February, so this Evaluation does not address those funds.
Process and Independence
The objectives of the Order are to ensure the independent evaluation of the management fees paid by the Funds as well as to insure that all relevant factors are considered. In my view, this contract process has been conducted at arms-length and with
100
independence in gathering, considering and evaluating all relevant data. At the outset of the process, the Trustees sought and obtained from Ameriprise and Columbia a comprehensive compilation of data regarding Fund performance and expenses, adviser profitability, and other information. The Trustees, acting through their Contract Committee evaluated this information thoroughly, and met often to discuss it. Performance and expense data was obtained from both Morningstar and Lipper, the leading consultants in this area. The rankings prepared by Morningstar and Lipper were independent and prepared in conformity with the methodologies employed by those organizations. Counsel for the Funds and the Independent Trustees considered, as did I, the terms and conditions of the proposed contracts.
My evaluation of the advisory contracts was shaped, as it has been in the past, by my experience as Chief Compliance Officer of the Trusts (CCO). As CCO, I report solely to the Board and have no reporting obligation to, or employment relationship with, Ameriprise or its affiliates. I have commented on compliance matters in evaluating the quality of service provided by CWAM.
This Report, its supporting materials and the data contained in other materials submitted to the Contract Committee, in my view, provide a thorough factual basis upon which the Board, in consultation with independent counsel as it deems appropriate, may conduct management fee negotiations that are in the best interests of the Funds' shareholders.
The Fee Reductions Mandated under the Order
Under the terms of the Order, Columbia agreed to secure certain management fee reductions for the mutual funds advised by its affiliate investment advisers. In some instances, breakpoints were also established. Although neither CWAM nor the Trusts was a party to the Order, CWAM offered and the Board accepted certain advisory fee reductions during 2005. By the terms of the Order, these fees could not be increased before November 30, 2009, and, in fact, have not been increased since. As a result of the Ameriprise acquisition, the Investment Company Act precludes any increases in management fees before May 2012 (other than for bona fide additional investment advisory services). Therefore, CWAM and Ameriprise propose the continuation of the contracts and management fees as they now exist; no increases in these fees are sought, and no reductions offered.
Conclusions
My review of the data and other material above leads to the following conclusions with respect to the factors identified in the Order.
A. Fund Performance
The Domestic Funds: The Acorn Fund has achieved good performance over the past five years, and excellent results over longer periods. Acorn Select and Wanger Select have enjoyed better than average investment returns over the past five years, but have suffered reversals in more recent periods. Both funds expose investors to greater relative risk than the other domestic Funds. Acorn USA and its parallel, Wanger USA are the weakest performers, falling behind their benchmark and peer medians over one and five years. Thermostat is unique and therefore difficult to assess, but has outperformed its benchmark and now enjoys strong rankings from Morningstar.
The International Funds: The international Funds have delivered excellent results over the past five years, and done so while exposing investors to less risk than competing funds. They have also outperformed their benchmarks during this period, but recent results have been more restrained. The international Funds enjoy positive "alpha," confirming the value of their portfolio managers.
B. Management Fees Relative to Peers
There is significant variance in management fee rankings across the Funds. Acorn International is the only fund that was ranked in the top quartile by both Morningstar and Lipper. The other Acorn funds tend to fall around the medians identified by one or the other service. The WAT funds are uniformly more expensive than their peers.
101
C. Management Fees Relative to Institutional Account and Other Mutual Fund Accounts
CWAM's focus is on its mutual funds. The few institutional accounts it does manage vary in rate structures. Some pay advisory fees commensurate with or higher than the Acorn and WAT funds. In a few instances, however, institutional accounts pay lower advisory fees than do the Acorn funds. One such institutional account is significant in size and has been under CWAM's management for over 33 years. Furthermore, CWAM performs sub-advisory services for mutual funds managed by Ameriprise affiliates, CWAM's parent organization, at rates that are lower than those paid by the parallel Acorn funds, though sub-advisory services usually differ from those necessary for the full support of a mutual fund.
D. Administrative Services
The Acorn and WAT funds' administrative fees are within the range of fees charged by competitors, but these rankings suffer from a lack of uniformity in the scope of services encompassed by the fee. CWAM provides excellent administrative support for all the Funds.
E. Costs and Benefits to CWAM and its Affiliates
CWAM's direct costs do not appear excessive. Overhead and indirect costs allocated to CWAM by its parent organization, however, are significant and have varied considerably over the years. CWAM's affiliates report operating losses and although the allocations leading to these losses may bear closer scrutiny, Ameriprise affiliates do not appear to enjoy excessive "fall out" benefits from CWAM's advisory agreement with the Funds. CWAM continues, however, to enjoy substantial benefits from the use of "soft dollar" payments for research.
F. Profitability
CWAM's profit margins may be in the upper range of its competitors, but peer profitability is difficult to assess given differences in products, operations and other factors. Furthermore, there is limited public information available with regard to the profitability of investment advisers.
G. Economies of Scale
Economies of scale do exist at CWAM, and the Board has instituted breakpoints that reduce fess as assets increase. Though asset levels have recovered from recent lows, sustained asset growth will be required to trigger additional fee reductions under the current schedule.
H. Nature and Quality of Service
This category includes a variety of considerations that are difficult to quantify, yet can have a significant bearing on the performance of the Acorn and WAT funds. Several areas merit comment: (1) CWAM has maintained its investment management capacity and an experienced staff; and (2) CWAM has a reasonably designed compliance program that protects shareholders.
I. Process
In my opinion, the process of negotiating an advisory contract for the Funds has been conducted thoroughly and at arms' length. The Board's Contract Committee has sought and obtained extensive data bearing on the reasonableness of the management fees proposed by CWAM. The Trustees have sufficient information to evaluate management's proposal, and negotiate contract terms that are in the best interests of fund shareholders.
Recommendation
According to Morningstar, Acorn USA and Wanger USA have delivered performance below peer medians for the past one and five years, while imposing management fees that exceed them. Management has fashioned various initiatives to improve performance, and the Trustees should continue to monitor both Funds closely to assess the impact of those initiatives.
102
Board Approval of the Advisory Agreement
Columbia Acorn Trust (the Trust) has an investment advisory agreement (the Advisory Agreement) with Columbia Wanger Asset Management, LLC (CWAM) under which CWAM manages the Columbia Acorn Funds (the Funds). More than 75% of the trustees of the Trust (the Trustees) are comprised of persons who have no direct or indirect interest in the Advisory Agreement and are not interested persons (as defined in the Investment Company Act of 1940, as amended (the 1940 Act)) of the Trust (the Independent Trustees). The Trustees oversee the management of each Fund and, as required by law, determine at least annually whether to continue the Advisory Agreement for each Fund.
The Contract Committee of the Board (the Committee), which is comprised solely of Independent Trustees, makes recommendations to the Board regarding any proposed continuation of the Advisory Agreement. After the Committee has made its recommendations, the full Board determines whether to approve continuation of the Advisory Agreement. The Board also considers matters bearing on the Advisory Agreement at its various meetings throughout the year, meets at least quarterly with CWAM's portfolio managers and receives monthly reports from CWAM on the performance of the Funds.
In connection with their most recent consideration of the Advisory Agreement for each Fund, the Committee and all Trustees received and reviewed a substantial amount of information provided by CWAM, Columbia Management Investment Advisers, LLC (Columbia Management) and Ameriprise Financial, Inc. (Ameriprise), in response to written requests from the Independent Trustees and their independent legal counsel. Throughout the process, the Trustees had numerous opportunities to ask questions of and request additional materials from CWAM, Columbia Management and Ameriprise.
During each meeting at which the Committee or the Independent Trustees considered the Advisory Agreement, they met in executive session with their independent legal counsel. The Committee also met with representatives of CWAM, Columbia Management and Ameriprise on several occasions. In all, the Committee convened formally on five separate occasions to consider the continuation of the Advisory Agreement. The Board and/or some or all of the Independent Trustees met on other occasions to receive the Committee's status reports, receive presentations from CWAM, Columbia Management and Ameriprise representatives, and to discuss outstanding issues. In addition, the Investment Performance Analysis Committee of the Board, also comprised exclusively of Independent Trustees, reviewed the performance of the Funds and presented its findings to the Board and the Committee throughout the year. The Compliance Committee also provided information to the Committee with respect to relevant matters.
The Trustees reviewed the Advisory Agreement, as well as certain information obtained through CWAM's, Columbia Management's and Ameriprise's responses to independent legal counsel's questionnaires. In addition, the Trustees reviewed the Management Fee Evaluation dated May 2011 (the Fee Evaluation) prepared by the Trust's chief compliance officer, senior vice president and general counsel, who also serves as the Trust's "Senior Officer," as contemplated by the Assurance of Discontinuance dated February 9, 2005 among former affiliates of CWAM and the Office of the New York Attorney General. A summary of the Fee Evaluation is included in this report.
The materials reviewed by the Committee and the Trustees included, among other items, (i) information on the investment performance of each Fund and of independently selected peer groups of funds and of the Funds' performance benchmarks over various time periods, (ii) information on each Fund's advisory fees and other expenses, including information comparing the Fund's fees and expenses to those of peer groups of funds and information about any applicable expense limitations and fee breakpoints, (iii) data on sales and redemptions of Fund shares, and (iv) information on the profitability to CWAM and Ameriprise, as well as potential "fall-out" or ancillary benefits that CWAM and its affiliates may receive as a result of their relationships with the Funds. The Trustees also considered other information such as (i) CWAM's financial condition, (ii) each Fund's investment objective and strategy, (iii) the size, education and experience of CWAM's investment staff and its use of technology, external research and trading cost measurement tools, (iv) the portfolio manager compensation framework, (v) the allocation of the Funds' brokerage, and the use of "soft" commission dollars to pay for research products and services, and (vi) the resources devoted to, and the record of compliance with, the Funds' investment policies and restrictions, policies on personal securities transactions and other compliance policies.
At a meeting held on June 8, 2011, upon recommendations of the Committee, the Board of Trustees unanimously approved the continuation of the Advisory Agreement.
In considering the continuation of the Advisory Agreement, the Trustees reviewed and analyzed various factors that they determined were relevant, none of which by itself was considered dispositive. The material factors and conclusions that formed the basis for the Trustees' determination to approve the continuation of the Advisory Agreement are discussed below.
Nature, quality and extent of services. The Trustees reviewed the nature, quality and extent of the services provided by CWAM and its affiliates to the Funds under the Advisory Agreement, taking into account the investment objective and strategy of each Fund and knowledge gained from meetings with management, which were held on at least a quarterly basis. In addition, the Trustees reviewed the available
103
Board Approval of the Advisory Agreement, continued
resources and key personnel of CWAM and its affiliates, especially those providing investment management services to the Funds. The Trustees also considered other services provided to the Funds by CWAM and its affiliates, including: managing the execution of portfolio transactions and selecting broker-dealers for those transactions; monitoring adherence to the Funds' investment restrictions; producing shareholder reports; providing support services for the Board and committees of the Board; communicating with shareholders; serving as the Funds' administrator; and overseeing the activities of the Funds' other service providers, including monitoring for compliance with various policies and procedures as well as applicable securities laws and regulations.
The Trustees concluded that the nature, quality and extent of the services provided by CWAM and its affiliates to each Fund under the Advisory Agreement were appropriate for the Funds and that the Funds were likely to benefit from the continued provision of those services by CWAM. They also concluded that CWAM currently had sufficient personnel, with appropriate education and experience, to serve the Funds effectively, and that the firm had demonstrated its continuing ability to attract and retain well-qualified personnel. In addition, they took note of the quality of CWAM's compliance record.
Performance of the Funds. The Trustees received and considered detailed performance information at various meetings of the Board, the Committee and the Investment Performance Analysis Committee of the Board throughout the year. They reviewed information comparing each Fund's performance with that of its benchmark(s) and with the performance of comparable funds and peer groups as identified by Lipper Inc. (Lipper) and Morningstar, Inc. (Morningstar). The Trustees evaluated the performance of the Funds over various time periods, including over the one-, three- and five-year periods ending December 31, 2010. The Trustees also considered peer performance rankings based on a rolling five-year period.
The Trustees noted that the international Funds have delivered excellent results over the past five years, and have done so while exposing investors to less risk than competing funds, according to Morningstar. They considered that the domestic Funds have had mixed results. Columbia Acorn Fund has achieved good performance over the one- and three-year periods, and slightly underperformed its peers over the five-year period, ending December 31, 2010; the Fund had excellent results over longer periods. Columbia Acorn Select had better than average results measured against its peers over the three- and five-year periods ending December 31, 2010, but underperformed more recently. Columbia Acorn Select outperformed its benchmark for the five-year period but underperformed over the one- and three-year periods ending December 31, 2010. Columbia Acorn USA fell behind its benchmark and peer group medians over the one-, three- and five-year periods ending December 31, 2010, and Columbia Thermostat Fund outperformed its benchmark (an equally weighted custom composite of the Fund's primary equity and debt indexes) over the one-, three- and five- year periods ending December 31, 2010, and enjoyed strong rankings from Morningstar over each of these periods. The Trustees noted that the Investment Performance Analysis Committee of the Board concluded that Fund performance was generally satisfactory, except that Columbia Acorn USA's performance had slipped below the Lipper and Morningstar medians during the past year. The Trustees considered that CWAM had taken and was taking a number of corrective steps with respect to Columbia Acorn USA's underperformance and that the Investment Performance Analysis Committee of the Board was monitoring the Fund's performance.
The Trustees concluded that, although past performance is not necessarily indicative of future results, the strong overall longer-term performance record of the Funds was an important factor in their evaluation of the quality of services provided by CWAM under the Advisory Agreement for each Fund.
Costs of Services and Profits Realized by CWAM. At various Committee and Board meetings, the Trustees examined detailed information on the fees and expenses of each Fund in comparison to information for comparable funds provided by Lipper and Morningstar. The Trustees reviewed data from Lipper and Morningstar and noted that in general the Funds' total net operating expenses were below their median peer group rankings, with each Fund having lower total net operating expenses than its Lipper peer group median and only Columbia Acorn USA having total net operating expenses above its Morningstar peer group median. As noted in the Fee Evaluation, the actual advisory fees paid by Columbia Acorn Select and Columbia Acorn USA were higher than the median advisory fee of the Funds' Lipper and Morningstar peer groups and the actual advisory fee paid by Columbia Acorn International Select was higher than the median advisory fee of the Fund's Lipper peer group, but not of its Morningstar peer group. The actual advisory fees paid by Columbia Acorn Fund, Columbia Acorn International and Columbia Thermostat Fund were lower than the median advisory fee of the Funds' Morningstar and Lipper peer groups.
The Trustees also considered that Ameriprise represented and agreed that advisory fees would not be raised for the two years following the close of its acquisition of CWAM (May 1, 2010) pursuant to Section 15(f) of the 1940 Act.
The Trustees also reviewed the advisory fee rates charged by CWAM for managing other investment companies (including the Columbia Wanger Funds), sub-advised funds and other institutional separate accounts, as detailed in the Fee Evaluation. The Trustees noted that the Funds' advisory fees were generally comparable to the Columbia Wanger Funds' advisory fees at
104
the same asset levels. The Trustees also examined CWAM's institutional separate account fees for various investment strategies; in some cases those fees were higher than the advisory fees charged to the Funds, and in a few instances the fees were lower. The Trustees noted that CWAM performs significant additional services for the Funds that it does not provide to sub-advised funds or non-mutual fund clients, including administrative services, oversight of the Funds' other service providers, Trustee support, regulatory compliance and numerous other services, and that, in servicing the Funds, CWAM assumes many legal risks that it does not assume in servicing many of its non-fund clients.
The Trustees concluded that the rates of advisory fees payable to CWAM were reasonable in relation to the nature and quality of the services to be provided. The Trustees also concluded that the Funds' overall expense ratios were reasonable, considering the quality of the services provided by CWAM and its affiliates and the investment performance of the Funds.
The Trustees reviewed the analysis of the historic profitability of CWAM in serving as each Fund's investment adviser and of CWAM and its affiliates in their relationships with each Fund. The Committee and Trustees met on several occasions with representatives from Ameriprise to discuss its methodologies for calculating profitability and allocating costs. They considered that Ameriprise calculated profitability and allocated costs on a contract-by-contract and fund-by-fund basis. The Trustees also considered the methodology used by CWAM and Ameriprise in determining compensation payable to portfolio managers and the competitive market for investment management talent. The Trustees were also provided with profitability information from Lipper and Strategic Insight, which compared CWAM's profitability to other similar investment advisers in the mutual fund industry. The Trustees concluded that CWAM's and its affiliates' profits were within a reasonable range of those of competitors with similar business models. The Trustees discussed, however, that profitability comparisons among fund managers may not always be meaningful due to the lack of consistency in data, small number of publicly-owned managers, and the fact that profitability of any investment manager is affected by numerous factors, including its particular organizational structure, the types of funds and other accounts managed, other lines of business, expense allocation methodology, capital structure and cost of capital.
Economies of Scale. At various Committee and Board meetings and other informal meetings, the Trustees considered information about the extent to which CWAM realizes economies of scale in connection with an increase in Fund assets. The Trustees also discussed the potential for Fund sales growth. The Trustees noted that the advisory fee schedule for each Fund, other than Columbia Thermostat Fund, which has relatively modest assets, includes breakpoints in the rate of fees at various asset levels. The Trustees concluded that the fee structure of each Fund was reflective of a sharing between CWAM and the Funds of economies of scale.
Other Benefits to CWAM. The Trustees also reviewed benefits that accrue to CWAM and its affiliates from their relationships with the Funds, as outlined in the Fee Evaluation. They noted that the Funds' transfer agency services are performed by Columbia Management Investment Services Corp., an affiliate of Ameriprise, which receives compensation from the Funds for its services provided. They considered that an affiliate of Ameriprise, Columbia Management Investment Distributors, Inc. (CMID), serves as the Funds' distributor under a distribution agreement, and that it receives fees under the Trust's Rule 12b-1 Plan, most of which CMID paid to broker-dealers. In addition, Columbia Management provides sub-administration services to the Funds. The Committee received information regarding the profitability of each Fund agreement with CWAM affiliates. The Committee and the Board also reviewed information about and discussed the capabilities of each affiliated entity in performing its duties.
The Trustees considered other ways that the Funds and CWAM may potentially benefit from their relationship with each other. For example, the Trustees considered CWAM's use of commissions paid by each Fund on its portfolio brokerage transactions to obtain research products and services benefiting the Funds and/or other clients of CWAM. The Committee reviewed CWAM's annual "soft dollar" report and met with representatives from CWAM to review CWAM's soft dollar spending. The Committee also considered that the Compliance Committee of the Board regularly reviewed third-party prepared reports that evaluated the quality of CWAM's execution of the Funds' portfolio transactions. The Trustees determined that CWAM's use of the Funds' "soft" commission dollars to obtain research products and services was consistent with current regulatory requirements and guidance. They also concluded that CWAM benefits from the receipt of proprietary research products and services acquired through commissions paid on portfolio transactions of the Funds, and that the Funds benefit from CWAM's receipt of those products and services as well as research products and services acquired through commissions paid by other clients of CWAM.
After full consideration of the above factors, as well as other factors that were instructive in evaluating the Advisory Agreement, the Trustees, including the Independent Trustees, unanimously concluded that the continuation of the Advisory Agreement was in the best interest of each Fund. On June 8, 2011, the Trustees approved continuation of the Advisory Agreement through July 31, 2012.
105
Columbia Acorn Family of Funds
Second Quarter Class A, B, C and I Share Information (Unaudited)
Minimum Initial Investment in
all Funds
| |
$2,000 for most
Investors
$1,000 for an IRA | |
Minimum Subsequent
Investment in all Funds | |
$100 | |
| Exchange Fee | | None | |
| Columbia Acorn Fund | | Class A | | Class B* | | Class C | | Class I** | |
| Management Fees | | | 0.64 | % | | | 0.64 | % | | | 0.64 | % | | | 0.64 | % | |
| Distribution and Service (12b-1) Fees | | | 0.25 | % | | | 0.75 | % | | | 1.00 | % | | | 0.00 | % | |
| Other Expenses | | | 0.16 | % | | | 0.36 | % | | | 0.19 | % | | | 0.07 | % | |
| Net Expense Ratio | | | 1.05 | % | | | 1.75 | % | | | 1.83 | % | | | 0.71 | % | |
| Columbia Acorn International | | Class A | | Class B* | | Class C | | Class I** | |
| Management Fees | | | 0.76 | % | | | 0.76 | % | | | 0.76 | % | | | 0.76 | % | |
| Distribution and Service (12b-1) Fees | | | 0.25 | % | | | 0.75 | % | | | 1.00 | % | | | 0.00 | % | |
| Other Expenses | | | 0.28 | % | | | 0.45 | % | | | 0.30 | % | | | 0.14 | % | |
| Net Expense Ratio | | | 1.29 | % | | | 1.96 | % | | | 2.06 | % | | | 0.90 | % | |
| Columbia Acorn USA | | Class A | | Class B* | | Class C | | Class I** | |
| Management Fees | | | 0.86 | % | | | 0.86 | % | | | 0.86 | % | | | 0.86 | % | |
| Distribution and Service (12b-1) Fees | | | 0.25 | % | | | 0.75 | % | | | 1.00 | % | | | 0.00 | % | |
| Other Expenses | | | 0.17 | % | | | 0.42 | % | | | 0.19 | % | | | 0.08 | % | |
| Net Expense Ratio | | | 1.28 | % | | | 2.03 | % | | | 2.05 | % | | | 0.94 | % | |
| Columbia Acorn International Select | | Class A | | Class B* | | Class C | | Class I** | |
| Management Fees | | | 0.94 | % | | | 0.94 | % | | | 0.94 | % | | | 0.94 | % | |
| Distribution and Service (12b-1) Fees | | | 0.25 | % | | | 0.75 | % | | | 1.00 | % | | | 0.00 | % | |
| Other Expenses | | | 0.33 | % | | | 0.51 | % | | | 0.39 | % | | | 0.06 | % | |
| Net Expense Ratio | | | 1.52 | % | | | 2.20 | % | | | 2.33 | % | | | 1.00 | % | |
| Columbia Acorn Select | | Class A | | Class B* | | Class C | | Class I** | |
| Management Fees | | | 0.81 | % | | | 0.81 | % | | | 0.81 | % | | | 0.81 | % | |
| Distribution and Service (12b-1) Fees | | | 0.25 | % | | | 0.75 | % | | | 1.00 | % | | | 0.00 | % | |
| Other Expenses | | | 0.20 | % | | | 0.37 | % | | | 0.25 | % | | | 0.10 | % | |
| Net Expense Ratio | | | 1.26 | % | | | 1.93 | % | | | 2.06 | % | | | 0.91 | % | |
| Columbia Thermostat Fund | | Class A | | Class B* | | Class C | | | |
| Management Fees | | | 0.10 | % | | | 0.10 | % | | | 0.10 | % | | | |
| Distribution and Service (12b-1) Fees | | | 0.25 | % | | | 0.75 | % | | | 1.00 | % | | | |
| Other Expenses*** | | | 0.15 | % | | | 0.15 | % | | | 0.15 | % | | | |
| Net Expense Ratio | | | 0.50 | % | | | 1.00 | % | | | 1.25 | % | | | |
Fees and expenses are for the six months ended June 30, 2011. Some share classes of Columbia Acorn Select and Columbia Acorn International Select include the effect of the voluntary undertaking by Columbia Wanger Asset Management, LLC (CWAM) to waive fees and/or reimburse the Funds for any ordinary operating expenses (exclusive of brokerage commissions, interest, taxes and extraordinary expenses, but inclusive of custodian charges relating to overdrafts, if any), after giving effect to any balance credits from the Funds' custodian, in excess of the annual rate of the Funds as follows:
| Fund | | Class A | | Class B | | Class C | | Class I | |
| Columbia Acorn International Select | | | 1.70 | % | | | 2.20 | % | | | 2.45 | % | | | 1.30 | % | |
| Columbia Acorn Select | | | 1.60 | % | | | 2.10 | % | | | 2.35 | % | | | 1.25 | % | |
These arrangements may be modified or terminated by either the Funds or CWAM upon 30 days notice.
Columbia Thermostat Fund's fees and expenses include the effect of CWAM's contractual undertaking to waive fees and/or reimburse the Fund for any ordinary operating expenses (exclusive of distribution and service fees, interest and fees on borrowings and expenses associated with the Fund's investments in other investment companies, but including custodian charges relating to overdrafts, if any), after giving effect to any balance credits from the Fund's custodian, in excess of the annual rate of 0.25% of the average daily net assets. Columbia Thermostat Fund's waiver/reimbursement arrangement is contractual through April 30, 2012. There is no guarantee that this arrangement will continue thereafter.
* The Funds no longer offer Class B shares (other than through dividend reinvestment).
** Class I shares were initially offered by the Funds on September 27, 2010.
*** Does not include estimated fees and expenses of 0.65% incurred by the Fund from the underlying portfolio funds in which it invests.
106
Columbia Acorn Family of Funds
Trustees
Laura M. Born
Chair of the Board
Steven N. Kaplan
Vice Chair of the Board
Michelle L. Collins
Maureen M. Culhane
Margaret M. Eisen
John C. Heaton
Charles P. McQuaid
Allan B. Muchin
David J. Rudis
David B. Small
Ralph Wanger (Trustee Emeritus)
Officers
Charles P. McQuaid
President
Ben Andrews
Vice President
Robert A. Chalupnik
Vice President
Michael G. Clarke
Assistant Treasurer
Joseph F. DiMaria
Assistant Treasurer
P. Zachary Egan
Vice President
John M. Kunka
Assistant Treasurer
Joseph C. LaPalm
Vice President
Bruce H. Lauer
Vice President, Secretary and Treasurer
Louis J. Mendes III
Vice President
Robert A. Mohn
Vice President
Christopher J. Olson
Vice President
Christopher O. Petersen
Assistant Secretary
Scott R. Plummer
Assistant Secretary
Linda K. Roth-Wiszowaty
Assistant Secretary
Robert P. Scales
Chief Compliance Officer, Chief Legal Officer,
Senior Vice President and General Counsel
Investment Adviser
Columbia Wanger Asset Management, LLC
227 West Monroe Street, Suite 3000
Chicago, Illinois 60606
1-800-922-6769
Distributor
Columbia Management Investment Distributors, Inc.
225 Franklin Street
Boston, Massachusetts 02110
Transfer Agent, Dividend Disbursing Agent
Columbia Management Investment Services Corp.
P. O. Box 8081
Boston, Massachusetts 02266-8081
1-800-345-6611
Legal Counsel to the Funds
Perkins Coie LLP
Washington, DC
Legal Counsel to the Independent Trustees
Drinker Biddle & Reath LLP
Philadelphia, Pennsylvania
Independent Registered Public Accounting Firm
PricewaterhouseCoopers LLP
Chicago, Illinois
This report, including the schedules of investments, is submitted for the general information of the shareholders of Columbia Acorn Trust.
A description of the policies and procedures that the Funds use to determine how to vote proxies and a copy of the Funds' voting record are available (i) without charge, upon request, by calling 800-922-6769 and (ii) on the Securities and Exchange Commission's website at www.sec.gov. Information regarding how the Funds voted proxies relating to portfolio securities during the 12-month period ended June 30, is available from the SEC's website. Information regarding how the Funds voted proxies relating to portfolio securities is also available at www.columbiamanagement.com under "About Us." From there, click on "Disclosures."
The Funds file a complete schedule of portfolio holdings with the SEC for the first and third quarters of each fiscal year on Form N-Q. The Funds' Form N-Q is available on the SEC's website at www.sec.gov and may be reviewed and copied at the SEC's Public Reference Room in Washington, D.C. Information on the operation of the Public Reference Room may be obtained by calling 1-800-SEC-0330.
Investors should consider the investment objectives, risks, charges and expenses of a mutual fund carefully before investing. For a free prospectus, which contains this and other important information about the funds, visit www.columbiamanagement.com. Read the prospectus carefully before investing.
Columbia Acorn Funds are distributed by Columbia Management Investment Distributors, Inc., member FINRA and managed by Columbia Wanger Asset Management, LLC.
Find out what's new – visit our web site at:
www.columbiamanagement.com
Our e-mail address is:
ServiceInquiries@ColumbiaManagement.com
Shareholders should not include personal information such as account numbers, Social Security numbers or taxpayer identification numbers in e-mail. We are unable to accept account transactions sent via e-mail.
Columbia Management®
Columbia Acorn Family of Funds
Class A, B, C and I Shares
Second Quarter Report, June 30, 2011
For More Information
You'll find more information about the Columbia Acorn Family of Funds in the documents described below. Contact Columbia Funds as follows to obtain these documents free of charge:
By Mail: Columbia Funds
c/o Columbia Management Investment Services Corp.
P.O. Box 8081
Boston, MA 02266-8081
By Telephone: 800.345.6611
Online: www.columbiamanagement.com
Shareholder Communications with the Board
The Funds' Board of Trustees has adopted procedures by which shareholders may communicate with the Board. Shareholders who wish to communicate with the Board should send their written communications to the Board by mail, c/o Columbia Wanger Asset Management, LLC, 227 West Monroe Street, Suite 3000, Chicago, Illinois 60606, Attention: Secretary. Shareholder communications must (i) be in writing, (ii) identify the Columbia Acorn Fund to which the communication relates and (iii) state the particular class of shares and number of shares held by the communicating shareholder.
Prospectuses and the Statement of Additional Information (SAI)
The prospectuses and the SAI provide more detailed information about the Funds and their policies. The SAI is legally part of each prospectus (it's incorporated by reference). A copy of each has been filed with the SEC.
Information Provided by the SEC
You can review and copy information about the Funds (including their prospectuses, the SAI and shareholder reports) at the SEC's Public Reference Room in Washington, DC. To find out more about the operation of the Public Reference Room, call the SEC at 202.551.8090. Reports and other information about the Fund are also available in the EDGAR Database on the SEC's website at http://www.sec.gov, or you can receive copies of this information, for a fee, by electronic request at the following e-mail address: publicinfo@sec.gov. You can also obtain copies of this information by writing the Public Reference Section, Securities and Exchange Commission, Washington, DC 20549-0102.
The investment company registration number of Columbia Acorn Trust, of which each of these Funds is a series, is 811-01829.
© 2011 Columbia Management Investment Advisers, LLC. All rights reserved.
225 Franklin Street, Boston, MA 02110
800.345.6611 www.columbiamanagement.com
C-1454 C (8/11) 123272
Item 2. Code of Ethics.
Not applicable for semiannual reports.
Item 3. Audit Committee Financial Expert.
Not applicable for semiannual reports.
Item 4. Principal Accountant Fees and Services.
Not applicable for semiannual reports.
Item 5. Audit Committee of Listed Registrants.
Not applicable.
Item 6. Investments
(a) The registrant’s “Schedule I — Investments in securities of unaffiliated issuers” (as set forth in 17 CFR 210.12-12) is included in Item 1 of this Form N-CSR.
(b) Not applicable.
Item 7. Disclosure of Proxy Voting Policies and Procedures for Closed-End Management Investment Companies.
Not applicable.
Item 8. Portfolio Managers of Closed-End Management Investment Companies.
Not applicable.
Item 9. Purchases of Equity Securities by Closed-End Management Investment Company and Affiliated Purchasers.
Not applicable.
Item 10. Submission of Matters to a Vote of Security Holders.
There were no material changes to the procedures by which shareholders may recommend nominees to the registrant’s board of directors.
Item 11. Controls and Procedures.
(a) The registrant’s principal executive officer and principal financial officers, based on their evaluation of the registrant’s disclosure controls and procedures as of a date within 90 days of the filing of this report, have concluded that such controls and procedures are adequately designed to ensure that material information required to be disclosed by the registrant in Form N-CSR is accumulated and communicated to the registrant’s management, including the principal executive officer and principal financial officer, or persons performing similar functions, as appropriate to allow timely decisions regarding required disclosure.
(b) There was no change in the registrant’s internal control over financial reporting that occurred during the registrant’s second fiscal quarter of the period covered by this report that has materially affected, or is reasonably likely to materially affect, the registrant’s internal control over financial reporting.
Item 12. Exhibits.
(a)(1) Code of ethics required to be disclosed under Item 2 of Form N-CSR: Not applicable for semiannual reports.
(a)(2) Certifications pursuant to Rule 30a-2(a) under the Investment Company Act of 1940 (17 CFR 270.30a-2(a)) attached hereto as Exhibit 99.CERT.
(a)(3) Not applicable.
(b) Certification pursuant to Rule 30a-2(b) under the Investment Company Act of 1940 (17 CFR 270.30a-2(b)) attached hereto as Exhibit 99.906CERT.
SIGNATURES
Pursuant to the requirements of the Securities Exchange Act of 1934 and the Investment Company Act of 1940, the registrant has duly caused this report to be signed on its behalf by the undersigned, thereunto duly authorized.
(registrant) | | Columbia Acorn Trust |
| |
| |
By (Signature and Title) | | /s/ Charles P. McQuaid |
| | Charles P. McQuaid, President |
| | |
| | |
Date | | August 19, 2011 |
| | | | |
Pursuant to the requirements of the Securities Exchange Act of 1934 and the Investment Company Act of 1940, this report has been signed below by the following persons on behalf of the registrant and in the capacities and on the dates indicated.
By (Signature and Title) | | /s/ Charles P. McQuaid |
| | Charles P. McQuaid, President |
| | |
| | |
Date | | August 19, 2011 |
| |
| |
By (Signature and Title) | | /s/ Bruce H. Lauer |
| | Bruce H. Lauer, Treasurer |
| |
| |
Date | | August 19, 2011 |
| | | |