UNITED STATES
SECURITIES AND EXCHANGE COMMISSION
Washington, D.C. 20549
FORM N-CSR
CERTIFIED SHAREHOLDER REPORT OF REGISTERED
MANAGEMENT INVESTMENT COMPANIES
Investment Company Act file number | 811-01829 |
|
Columbia Acorn Trust |
(Exact name of registrant as specified in charter) |
|
One Financial Center, Boston, Massachusetts | | 02111 |
(Address of principal executive offices) | | (Zip code) |
|
Scott R. Plummer 5228 Ameriprise Financial Center One Financial Center Minneapolis, MN 55474 |
(Name and address of agent for service) |
|
Registrant’s telephone number, including area code: | 1-612-671-1947 | |
|
Date of fiscal year end: | December 31 | |
|
Date of reporting period: | June 30, 2010 | |
| | | | | | | | |
Form N-CSR is to be used by management investment companies to file reports with the Commission not later than 10 days after the transmission to stockholders of any report that is required to be transmitted to stockholders under Rule 30e-1 under the Investment Company Act of 1940 (17 CFR 270.30e-1). The Commission may use the information provided on Form N-CSR in its regulatory, disclosure review, inspection, and policymaking roles.
A registrant is required to disclose the information specified by Form N-CSR, and the Commission will make this information public. A registrant is not required to respond to the collection of information contained in Form N-CSR unless the Form displays a currently valid Office of Management and Budget (“OMB”) control number. Please direct comments concerning the accuracy of the information collection burden estimate and any suggestions for reducing the burden to Secretary, Securities and Exchange Commission, 450 Fifth Street, NW, Washington, DC 20549-0609. The OMB has reviewed this collection of information under the clearance requirements of 44 U.S.C. § 3507.
Item 1. Reports to Stockholders.
Q2 2010

Columbia Acorn Family of Funds
Class Z Shares
Managed by Columbia Wanger Asset Management, LLC

Semiannual Report
June 30, 2010
n ColumbiaSM
Acorn® Fund
n ColumbiaSM
Acorn International®
n ColumbiaSM
Acorn USA®
n ColumbiaSM
Acorn International SelectSM
n ColumbiaSM
Acorn SelectSM
n ColumbiaSM
Thermostat FundSM
Not FDIC insured • No bank guarantee • May lose value
You are invited to the 2010 Columbia Acorn Funds Shareholder Information Meeting
When: Wednesday, September 22, 2010
12 noon to 1 p.m. Central time
Where: Chase Bank Auditorium, Plaza Level
10 South Dearborn Street
Chicago, Illinois
A buffet lunch will be served at 11:30 a.m.
If you plan to join us in Chicago, please RSVP by September 20
by calling 1-800-922-6769.
The Chase Bank Auditorium is located within the Chase Tower at the corner of Madison St. and Dearborn St. After entering the building, please take the escalators down to the plaza level and follow the signs to the Chase Bank Auditorium.
View a Replay on our Website
For those who are unable to join us in Chicago, a webcast replay of the meeting will be available during the month of October at www.columbiafunds.com.
The views expressed in the "Squirrel Chatter II" and "In a Nutshell" commentaries reflect the current views of the respective authors. These views are not guarantees of future performance and involve certain risks, uncertainties and assumptions that are difficult to predict so actual outcomes and results may differ significantly from the views expressed. These views are subject to change at any time based upon economic, market or other conditions and the respective authors disclaim any responsibility to update such views. These views may not be relied upon as investment advice and, because investment decisions for a Columbia Acorn Fund are based on numerous factors, may not be relied upon as an indication of trading intent on behalf of any particular Columbia Acorn Fund. References to specific company securities should not be construed as a recommendation or investment advice and there can be no assurance that as of the date of publication of this report, the securities mentioned in each Fund's portfolio are still held or that the securities sold have not been repurchased.
Columbia Acorn Family of Funds
Table of Contents
| Performance At A Glance | | | 2 | | |
|
| Description of Indexes | | | 3 | | |
|
| Squirrel Chatter II: Columbia Acorn Fund At 40 | | | 4 | | |
|
| Understanding Your Expenses | | | 8 | | |
|
| Columbia Acorn Fund | |
|
| In a Nutshell | | | 10 | | |
|
| At a Glance | | | 11 | | |
|
| Major Portfolio Changes | | | 22 | | |
|
| Statement of Investments | | | 25 | | |
|
| Columbia Acorn International | |
|
| In a Nutshell | | | 12 | | |
|
| At a Glance | | | 13 | | |
|
| Major Portfolio Changes | | | 38 | | |
|
| Statement of Investments | | | 40 | | |
|
| Portfolio Diversification | | | 48 | | |
|
| Columbia Acorn USA | |
|
| In a Nutshell | | | 14 | | |
|
| At a Glance | | | 15 | | |
|
| Major Portfolio Changes | | | 49 | | |
|
| Statement of Investments | | | 50 | | |
|
| Columbia Acorn International Select | |
|
| In a Nutshell | | | 16 | | |
|
| At a Glance | | | 17 | | |
|
| Major Portfolio Changes | | | 58 | | |
|
| Statement of Investments | | | 59 | | |
|
| Portfolio Diversification | | | 62 | | |
|
| Columbia Acorn Select | |
|
| In a Nutshell | | | 18 | | |
|
| At a Glance | | | 19 | | |
|
| Major Portfolio Changes | | | 63 | | |
|
| Statement of Investments | | | 64 | | |
|
| Columbia Thermostat Fund | |
|
| In a Nutshell | | | 20 | | |
|
| At a Glance | | | 21 | | |
|
| Statement of Investments | | | 69 | | |
|
| Columbia Acorn Family of Funds | |
|
| Statements of Assets and Liabilities | | | 72 | | |
|
| Statements of Operations | | | 73 | | |
|
| Statements of Changes in Net Assets | | | 74 | | |
|
| Financial Highlights | | | 78 | | |
|
| Notes to Financial Statements | | | 81 | | |
|
Management Fee Evaluation
of the Senior Officer | | | 91 | | |
|
Board Approval of the Proposed Investment
Advisory Agreement | | | 101 | | |
|
| Columbia Acorn Family of Funds Information | | | 107 | | |
|
| Proxy Voting Results | | | 108 | | |
|
2010 Mid-Year Distributions
The following table lists the mid-year distributions for Columbia Acorn Fund, Columbia Acorn International, Columbia Acorn International Select and Columbia Thermostat Fund. Columbia Acorn USA and Columbia Acorn Select did not have a mid-year distribution. The record date was June 8, 2010. The ex-dividend date was June 9, 2010, and the payable date was June 10, 2010.
| | | Short-term
Capital
Gains | | Long-term
Capital
Gains | | Ordinary
Income | | Reinvestment
Price | |
| Columbia Acorn Fund | | None | | None | | $ | 0.0297 | | | $ | 24.21 | | |
| Columbia Acorn International | | None | | None | | $ | 0.5932 | | | $ | 31.44 | | |
| Columbia Acorn International Select | | None | | None | | $ | 0.3759 | | | $ | 22.01 | | |
| Columbia Thermostat Fund | | None | | None | | $ | 0.1599 | | | $ | 10.47 | | |
1
Columbia Acorn Family of Funds
Performance At A Glance Class Z Average Annual Total Returns through 6/30/10
| | | NAV on
6/30/10 | | 2nd
quarter* | | Year
to date* | | 1 year | | 3 years | | 5 years | | 10 years | | Life
of Fund | |
Columbia Acorn Fund
(ACRNX) (6/10/70) | | $ | 23.87 | | | | -9.75 | % | | | -3.16 | % | | | 23.20 | % | | | -7.08 | % | | | 2.43 | % | | | 7.73 | % | | | 14.46 | % | |
| Russell 2500 Index | | | | | | | -9.98 | % | | | -1.69 | % | | | 24.03 | % | | | -7.98 | % | | | 0.98 | % | | | 4.15 | % | | | NA | | |
| S&P 500 Index** | | | | | | | -11.43 | % | | | -6.65 | % | | | 14.43 | % | | | -9.81 | % | | | -0.79 | % | | | -1.59 | % | | | 10.21 | % | |
| Lipper Small-Cap Core Funds Index | | | | | | | -9.04 | % | | | -2.09 | % | | | 21.67 | % | | | -7.59 | % | | | 1.15 | % | | | 4.16 | % | | | NA | | |
| Lipper Mid-Cap Growth Funds Index | | | | | | | -9.76 | % | | | -3.28 | % | | | 21.13 | % | | | -6.51 | % | | | 2.85 | % | | | -2.21 | % | | | NA | | |
Columbia Acorn International
(ACINX) (9/23/92) | | $ | 32.13 | | | | -7.68 | % | | | -4.45 | % | | | 18.91 | % | | | -7.21 | % | | | 7.82 | % | | | 4.68 | % | | | 10.96 | % | |
S&P Global Ex-U.S. Between
$500 Million and $5 Billion Index | | | | | | | -9.15 | % | | | -4.96 | % | | | 18.65 | % | | | -8.18 | % | | | 6.51 | % | | | 7.49 | % | | | 8.09 | % | |
| S&P Global Ex-U.S. SmallCap Index*** | | | | | | | -10.01 | % | | | -6.09 | % | | | 18.59 | % | | | -10.26 | % | | | 5.21 | % | | | 6.39 | % | | | 7.25 | % | |
| MSCI EAFE Index | | | | | | | -13.97 | % | | | -13.23 | % | | | 5.92 | % | | | -13.38 | % | | | 0.88 | % | | | 0.16 | % | | | 5.14 | % | |
Lipper International Small/
Mid Growth Funds Index | | | | | | | -9.88 | % | | | -6.75 | % | | | 17.04 | % | | | -11.18 | % | | | 4.72 | % | | | 2.60 | % | | | NA | | |
Columbia Acorn USA
(AUSAX) (9/4/96) | | $ | 21.74 | | | | -12.13 | % | | | -6.25 | % | | | 22.76 | % | | | -8.68 | % | | | -0.66 | % | | | 6.68 | % | | | 8.81 | % | |
| Russell 2000 Index | | | | | | | -9.92 | % | | | -1.95 | % | | | 21.48 | % | | | -8.60 | % | | | 0.37 | % | | | 3.00 | % | | | 5.85 | % | |
| Russell 2500 Index | | | | | | | -9.98 | % | | | -1.69 | % | | | 24.03 | % | | | -7.98 | % | | | 0.98 | % | | | 4.15 | % | | | 7.50 | % | |
| S&P 500 Index** | | | | | | | -11.43 | % | | | -6.65 | % | | | 14.43 | % | | | -9.81 | % | | | -0.79 | % | | | -1.59 | % | | | 5.17 | % | |
| Lipper Small-Cap Growth Funds Index | | | | | | | -9.46 | % | | | -3.10 | % | | | 18.22 | % | | | -8.80 | % | | | -0.14 | % | | | -2.03 | % | | | 4.06 | % | |
Columbia Acorn Int'l Select
(ACFFX) (11/23/98) | | $ | 22.38 | | | | -5.47 | % | | | -3.71 | % | | | 15.54 | % | | | -7.20 | % | | | 7.02 | % | | | 2.73 | % | | | 8.58 | % | |
S&P Developed Ex-U.S. Between
$2 Billion and $10 Billion Index | | | | | | | -10.15 | % | | | -6.52 | % | | | 12.73 | % | | | -11.58 | % | | | 3.42 | % | | | 5.02 | % | | | 6.42 | % | |
| MSCI EAFE Index | | | | | | | -13.97 | % | | | -13.23 | % | | | 5.92 | % | | | -13.38 | % | | | 0.88 | % | | | 0.16 | % | | | 2.21 | % | |
| Lipper International Funds Index | | | | | | | -12.54 | % | | | -10.89 | % | | | 9.50 | % | | | -11.35 | % | | | 2.62 | % | | | 1.21 | % | | | 3.70 | % | |
Columbia Acorn Select
(ACTWX) (11/23/98) | | $ | 22.27 | | | | -12.36 | % | | | -4.75 | % | | | 27.26 | % | | | -9.05 | % | | | 3.18 | % | | | 6.88 | % | | | 9.23 | % | |
| S&P MidCap 400 Index | | | | | | | -9.59 | % | | | -1.36 | % | | | 24.93 | % | | | -5.90 | % | | | 2.21 | % | | | 5.31 | % | | | 7.56 | % | |
| S&P 500 Index** | | | | | | | -11.43 | % | | | -6.65 | % | | | 14.43 | % | | | -9.81 | % | | | -0.79 | % | | | -1.59 | % | | | 0.72 | % | |
| Lipper Mid-Cap Growth Funds Index | | | | | | | -9.76 | % | | | -3.28 | % | | | 21.13 | % | | | -6.51 | % | | | 2.85 | % | | | -2.21 | % | | | 4.41 | % | |
Columbia Thermostat Fund
(COTZX) (9/25/02)† | | $ | 10.44 | | | | -6.61 | % | | | -1.86 | % | | | 20.59 | % | | | -2.15 | % | | | 2.44 | % | | | — | | | | 5.88 | % | |
| S&P 500 Index | | | | | | | -11.43 | % | | | -6.65 | % | | | 14.43 | % | | | -9.81 | % | | | -0.79 | % | | | — | | | | 5.07 | % | |
Barclays Capital U.S.
Aggregate Bond Index | | | | | | | 3.49 | % | | | 5.33 | % | | | 9.50 | % | | | 7.55 | % | | | 5.54 | % | | | — | | | | 5.21 | % | |
| Lipper Flexible Portfolio Funds Index | | | | | | | -7.43 | % | | | -3.81 | % | | | 15.48 | % | | | -3.73 | % | | | 2.78 | % | | | — | | | | 6.48 | % | |
| 50/50 Blended Benchmark†† | | | | | | | -4.10 | % | | | -0.59 | % | | | 12.34 | % | | | -0.98 | % | | | 2.69 | % | | | — | | | | 5.46 | % | |
*Not annualized.
**The comparison to the S&P 500 Index is presented to show performance against a widely recognized market index over the life of the Fund.
***See Page 3 for additional information.
Performance data quoted represents past performance and current performance may be lower or higher. Past performance is no guarantee of future results. The investment return and principal value of an investment in a Fund will fluctuate so that Fund shares, when redeemed, may be worth more or less than their original cost. Please visit columbiafunds.com for daily and most recent month-end updates.
Net asset value (NAV) returns do not include sales charges or contingent deferred sales charges (CDSC). If they were included, returns would have been lower. Class Z shares are sold only at NAV with no Rule 12b-1 fee. Only eligible investors may purchase Class Z shares of the Funds, directly or by exchange. Please see each Fund's prospectus for eligibility and other details. Class Z shares have limited eligibility and the investment minimum requirement may vary.
Performance results reflect any fee waivers or reimbursements of Fund expenses by the investment advisor and/or any of its affiliates. Absent these fee waivers or expense reimbursement arrangements, performance results would have been lower.
Annual operating expense ratios are as stated in each Fund's current prospectus and differences in expense ratios disclosed elsewhere in this report may result from including fee waivers and expense reimbursements as well as different time periods used in calculating the ratios. Columbia Acorn Fund Class Z: 0.77%. Columbia Acorn International Class Z: 0.99%. Columbia Acorn USA Class Z: 1.03%. Columbia Acorn International Select Class Z: 1.21%. Columbia Acorn Select Class Z: 0.99%. Columbia Thermostat Fund has a contractual expense waiver or reimbursement that expires April 30, 2011. Expense ratios without and with the contractual waiver, including fees and expenses associated with the Fund's investments in other investment companies, for Class Z shares are 1.21% and 1.07%, respectively. Absent the waiver or reimbursement, performance results would have been lower.
†A "fund of funds" bears its allocable share of the costs and expenses of the underlying funds in which it invests. Such funds are thus subject to two levels of fees and potentially higher expense ratios than would be associated with an investment in a fund that invests and trades directly in financial instruments under the direction of a single manager.
††The 50/50 Blended Benchmark is a custom supplemental benchmark established by the advisor.
All results shown assume reinvestment of distributions and do not reflect the deduction of taxes that a shareholder would pay on fund distributions or on the redemption of fund shares.
Unlike mutual funds, indexes are not actively managed and do not incur fees or expenses. It is not possible to invest directly in an index. For index definitions, see Page 3.
The dates in parantheses are the inception dates for each respective Fund.
2
Columbia Acorn Family of Funds
Descriptions of Indexes Included in this Report
• 50/50 Blended Benchmark, established by the Fund's advisor, is an equally weighted custom composite of Columbia Thermostat Fund's primary equity and primary debt benchmarks, the S&P 500 Index and the Barclays Capital U.S. Aggregate Bond Index, respectively. The percentage of the Fund's assets allocated to underlying stock and bond portfolio funds will vary, and accordingly the composition of the Fund's portfolio will not always reflect the composition of the 50/50 Blended Benchmark.
• Barclays Capital U.S. Aggregate Bond Index is a market value-weighted index that tracks the daily price, coupon, pay-downs and total return performance of fixed-rate, publicly placed, dollar-denominated and non-convertible investment grade debt issues with at least $250 million par amount outstanding and with at least one year to final maturity.
• Lipper Indexes include the largest funds tracked by Lipper, Inc. in the named category. Lipper Small-Cap Core Funds Index, 30 largest small-cap core funds; Lipper Mid-Cap Growth Funds Index, 30 largest mid-cap growth funds; Lipper International Small/Mid Growth Funds Index, 10 largest non-U.S. small/mid growth funds, i ncluding Columbia Acorn International; Lipper Small-Cap Growth Funds Index, 30 largest small-cap growth funds; Lipper International Funds Index, 30 largest non-U.S. funds, excluding non-U.S. small-cap funds; Lipper Flexible Portfolio Funds Index, an equal-weighted index of the 30 largest mutual funds within the Flexible Portfolio fund classification, as defined by Lipper.
• Morgan Stanley Capital International Europe, Australasia, Far East (MSCI EAFE) Index is a capitalization-weighted index that tracks the total return of common stocks in 21 developed-market countries within Europe, Australasia and the Far East.
• Russell 2000 Index measures the performance of the 2,000 smallest companies in the Russell 3000 Index, which represents approximately 8% of the total market capitalization of the Russell 3000 Index.
• Russell 2500 Index measures the performance of the 2,500 smallest companies in the Russell 3000 Index, which represents approximately 17% of the total market capitalization of the Russell 3000 Index.
• Standard & Poor's (S&P) 500 Index tracks the performance of 500 widely held, large-capitalization U.S. stocks.
• Standard & Poor's (S&P) MidCap 400 Index is a market value-weighted index that tracks the performance of 400 mid-cap U.S. companies.
• S&P Developed Ex-U.S. Between $2 Billion and $10 Billion Index is a subset of the broad market selected by the index sponsor representing the mid-cap developed market, excluding the United States.
• S&P Global Ex-U.S. SmallCap Index is an unmanaged index consisting of the bottom 20% of institutionally investable capital of developed and emerging countries, outside the United States. The performance of the S&P Global Ex-U.S. SmallCap Index is provided to show how Columbia Acorn International's performance compares to foreign market performance with a similar geographic distribution and wider market cap range than the Fund's primary benchmark.
• S&P Global Ex-U.S. Between $500 Million and $5 Billion Index is a subset of the broad market selected by the index sponsor representing the mid- and small-cap developed and emerging markets, excluding the United States.
Unlike mutual funds, indexes are not managed and do not incur fees or expenses. It is not possible to invest directly in an index.
3
Squirrel Chatter II: Columbia Acorn Fund At 40


America's #1 Performing Mutual Fund
Columbia Acorn Fund just celebrated its 40th birthday as a publicly registered mutual fund. If you had bought the Class Z shares of the Fund at its inception on June 10, 1970, held onto them and reinvested distributions, you would have had a compound rate of return of 14.62% through its birthday. The Fund ranked #1 by Morningstar among the 156 U.S.-based, open-end mutual funds that existed for that entire period.1
Ralph Wanger was the lead portfolio manager of Columbia Acorn Fund for the first 33 years. Chuck McQuaid overlapped with Ralph for 25 years, starting in 1978 as an analyst and then becoming co-manager in 1995. Chuck became lead manager upon Ralph's retirement in 2003, and in total has nearly 32 years with the Fund. Rob Mohn began as an analyst in 1992 and became co-manager in 2003. Ralph and Chuck recently got together to review the history of Columbia Acorn Fund and discuss the reasons for its success:
Ralph: Acorn Fund2 was founded by Chicago investor Irving Harris, of R. J. Levy, Harris, Inc. (later Harris Associates), in order to accommodate customers of his investment advisory business. The Fund started with $7 million. Don Nathanson, an initial director of the Fund who was also president of Grey North Advertising, came up with the name. The metaphor of an acorn growing into an oak tree was excellent. Also, having lived my life as a "W," I was pleased that the Fund started with an "A." When asked at cocktail parties for investment tips, I'd suggest that people pick their mutual funds alphabetically.
It was unusual at that time to have a small-cap fund. Irving liked investing in small companies; he believed that small caps could have more upside than larger caps. Academic study of stock returns had just begun and Irving came across the work done by Shannon Pratt in his doctoral thesis that validated his belief in small caps.3 In addition, large caps were very expensive in 1970, as the "nifty-fifty"4 concept was becoming a bubble. A small-cap fund could also serve as a completion fund for investors that owned a portfolio of large caps. One would generally not want a little company like "Beefsteak Mines"5 as a 3% position in a 30-stock portfolio but could benefit from the upside of Acorn Fund's diversified portfolio of 50 to 100 small caps.
Chuck: Clearly, investing in small-cap stocks helped performance over the 40 years. Academic studies have since confirmed that small caps have outperformed large caps over the long run.6 We believe that smaller companies are more entrepreneurial and have more upside for growth. We also find that some great small caps can go undiscovered, which may mean they are undervalued and potentially good investments. However, small caps have had underperformance cycles.
Ralph: That's right, Chuck. Small caps underperformed large caps through 1973, but when the nifty fifty bubble burst, a bear market nailed all capitalization ranges. In fact, the Acorn Fund almost didn't survive. The Fund was saved by one stock, Houston Oil and Minerals, a tiny company that bought old oil and gas fields and earned modest profits by investing money in workovers to enhance production. They had a shallow gas field in Galveston Bay, and when they drilled deeper, they found lots of gas. Perry Swenson, an analyst at Wood Walker, presented that idea to lots of managers, but as far as I know, I was one of few that bought it. Houston Oil kept performing and put Acorn Fund on the winners list. Acorn was up 65% in 1976 and outside money started coming in.
Owning Houston Oil helped me realize that small- and mid-cap investing is a winner's game, and we should generally let winners run. Selling winners too soon is kind of like pulling up your flowers and keeping the weeds. Acorn Fund has had a fortunate few really big winners that have enabled it to stand out. In addition to Houston Oil, Acorn Fund made great returns in supercomputer company Cray Research, slot machine maker International Game Technologies, cable television franchisor/programmer Telecommunications Inc./Liberty Media, electronics manufacturer Solectron, and freight forwarder Expeditors International of Washington.
4
Chuck: Of those, some Liberty Media spin-outs and Expeditor's International of Washington remain in Columbia Acorn Fund. Expeditors International was a top 20 holding as of June 30, 2010, and, at a cost of $1.3 million, was worth $110 million. But there is more to the Fund than just investing in small caps and letting them run. Ralph, we also invest thematically in Columbia Acorn Fund. When you were recruiting me in 1978, you asked me for a favorite technology stock and I suggested minicomputer maker Digital Equipment, but that was not the answer you were looking for.
Ralph: Letting winners run helps keep portfolio turnover down, and Acorn's much lower than industry average turnover saves transaction costs. Having themes facilitates investing for the long term. The correct answer for investing in technology was not choosing an investment in a mainstream technology producer. Rather, it is to invest in simpler businesses that are downstream from technology, companies that utilize technology to create better products or services. International Game Technologies is my favorite example. The company invented the electronic slot machine that replaced mechanical versions. These new machines helped to transform a bunch of seedy casinos into the modern gaming industry. It was a great stock and was held in the Fund for years.
Chuck: We've utilized the downstream from technology theme continuously. Brilliant and cheap technology enabled the rise of the cable television industry and cable programming companies, and then the creation of cell phone service franchises. We made fine profits in numerous stocks in each of those groups. We continue to own wireless tower companies that rent space to cell phone and other wireless service franchises. Demand grows as more people use more cell phone minutes and receive burgeoning amounts of wireless data. Columbia Acorn Fund's largest holding at the end of the half year was tower company Crown Castle International, a $235 million position that cost $74 million.
Ralph: Acorn Fund was one of the first to invest in small caps, and its low turnover and thematic investing also made it somewhat unusual. But nowadays many investment consultants and investors want to pigeonhole mutual funds into style boxes. This trend contradicts what real-world consultants tell clients to do, which is, "think outside the box." That is what we've always done. Acorn Fund has had a consistent investing style for the past 40 years. Morningstar and Lipper have moved the Fund around from small cap and mid cap and between growth and core as the Fund has grown. We've never worried too much about that. Our job is to make money for shareholders; the rating companies' jobs are to assign style boxes.
Chuck: Yes, being confined to a style box can harm performance. I would have hated to be forced to be a pure growth investor when growth got horribly expensive 10 years ago in the tech/media/telecom bubble. We trimmed many stocks in those areas and took real estate investment trusts to a 7% weight in Acorn Fund. Though a REIT can be a fairly stodgy business, based on how they were valued we expected more upside in those stocks than from the bubble areas. We were right.
Ralph: Thinking outside a style box also includes owning foreign stocks. We began investing in foreign stocks in Acorn Fund in the 1980s. I'd visit companies and they would be whining about foreign competitors beating them up by shipping higher-quality products at lower prices. If some guy in Osaka was putting some guy in Omaha out of business, there was no sense in praying for a recovery in Omaha. Sell Omaha and buy Osaka. Invest in successful companies: "Don't bitch, switch!"
Chuck: Acorn Fund at one point had over 20% of its assets in foreign stocks, but then lots of investors wondered whether the Fund was global or domestic. Many wanted to make their own asset allocations. So we introduced Acorn International and Acorn USA, which were initially brand extensions of Acorn Fund, for investors who did not want a broad mix of foreign and domestic investments. Over the last 10 years, we've kept Columbia Acorn Fund's foreign weight between 7% and 16% of assets, depending on the opportunities we saw. The Fund's foreign investments focus on stocks that are highly recommended by our international analysts. They include a number of energy and materials companies that we believe to be more attractive than many domestic-based companies in the same industries. In 2009, we also made small and successful investments in some emerging mar ket companies; developing economies had lower debt and seemed likely to grow faster.
5
Ralph: We had to adapt management of Acorn Fund as it got bigger. Once I wrote a "Squirrel Chatter" comparing a sole portfolio manager of a large fund to a plate spinner at a carnival. As the number of plates increases, the plate spinner has to run frantically to keep them all cranked up. The audience thinks this is hilarious but it is not funny if it is your plates that are crashing to the floor. We had fine results in 1992 and 1993 but we underperformed in 1994 and 1995. Part of the problem was that we ended 1993 with huge positions in two stocks that accounted for 12% of Acorn Fund. It turns out that we let International Game Technologies and Telecommunications Inc. run too long. They went up a lot through 1993 but had violent corrections in 1994. Although they recovered later, these stocks accounted for over half of the Fund's 7.4% drop that year.
Chuck: That underperformance in 1994 and 1995 caused us to think about a lot more than those two stocks. Ralph had been approving virtually all of the transactions for Acorn Fund, and by then the Fund had over 250 stocks in it. Ralph had become a plate spinner! We concluded that senior analysts knew more about their stocks than the portfolio managers did and could manage their stock positions better than portfolio managers.
Ralph: We had lifted out Acorn Fund from Harris Associates in 1992 and launched Wanger Asset Management. When performance lagged in 1994 and 1995, we had the flexibility to create a more analyst-driven investment process.
Chuck: In order to do so, we began to compare analyst results to performance of their coverage assignments, we granted senior analysts trading authority, and we began to more clearly compensate analysts for quantitative performance. Portfolio managers continued to follow stocks personally, approve transactions by newer analysts, and manage industry and foreign weightings. Since then we have improved our systems, but this team-managed approach remains in place. I think that had a lot to do with Columbia Acorn Fund beating its current primary benchmark, the Russell 2500 Index, for 10 straight years from 1996 to 2005.
Of course, in order to have a team-managed Fund, we have to keep building an analyst team. Our directors of research, Rob Mohn on the domestic side and Zach Egan on the international side, have worked diligently to hire fine analysts. They pursue people who they believe can identify good businesses, have accounting and finance skills, possess a passion for investing, and on the international side, have language skills and cultural knowledge.
Ralph: We believe the team at Columbia Wanger Asset Management (CWAM) has done a fine job for many years. Ownership of the management company has changed several times, but core people and processes have remained intact. The Columbia Acorn Trust board has seen to it that CWAM continues to control its own investing process and has the resources to do so. The Columbia Acorn Funds hold a shareholder information meeting in Chicago each September and we get to meet some of the shareholders who have entrusted us to take care of their money. The fact that we have been conscientious and successful doing that is a point of great pride for me and the entire investment team. I'm happy that I was able to set the course for the Columbia Acorn Funds and that Chuck, Rob, Zach and the rest of the team remain on that course.

Charles P. McQuaid
President and Chief Investment Officer
Columbia Wanger Asset Management, LLC
Trustee, Columbia Acorn Trust and Wanger Advisors Trust
Current Lead Portfolio Manager, Columbia Acorn Fund

Ralph Wanger
Retired Founder, Columbia Wanger Asset Management, LLC
Trustee Emeritus, Columbia Acorn Trust and Wanger Advisors Trust
Former Lead Portfolio Manager, Columbia Acorn Fund
The information and data provided in this analysis are derived from sources that we deem to be reliable and accurate. These views are not guarantees of future performance and involve certain risks, uncertainties and assumptions that are difficult to predict so actual outcomes and results may differ significantly from the views expressed. The views/opinions expressed in "Squirrel Chatter II" are those of the authors and not of the Columbia Acorn Trust Board, are subject to change at any time based upon economic, market or other conditions, may differ from views expressed by other Columbia Management associates and the respective parties disclaim any responsibility to update such views. These views may not be relied on as investment advice and, because investment decisions for a Columbia Acorn Fund are based on numerous factors, may not be relied on as an indication of trading intent on behalf of any particular Columbia Acorn F und.
6
Performance data quoted represents past performance and current performance may be lower or higher. Past performance is no guarantee of future results. The investment return and principal value of an investment in a Fund will fluctuate so that Fund shares, when redeemed, may be worth more or less than their original cost. Please visit www.columbiafunds.com for daily and most recent month-end updates.
Stocks of small- and mid-cap companies pose special risks, including possible illiquidity and greater price volatility than stocks of larger, more established companies. International investing involves special risks, including foreign taxation, currency risks, risks associated with possible differences in financial standards and other risks associated with future political and economic developments.
For standard performance data for each of the Columbia Acorn Funds, please see Page 2 of this report.
1 According to Morningstar, Columbia Acorn Fund Class Z ranked #1 of 156 U.S.-based mutual funds in existence since June 10, 1970:
| | | From Inception to
6/10/2010 | | 10 year | | 5 year | | 1 year | |
| Compound return | | 14.62% | | 8.15% | | 3.84% | | 26.21% | |
| Morningstar ranking | | 1 of 156 | | 9 of 167 | | 30 of 167 | | 12 of 167 | |
Acorn Fund Performance and Morningstar ranking information updated through June 30, 2010:
| | | From Inception to
6/30/2010 | | 10 year | | 5 year | | 1 year | |
| Compound return | | 14.46% | | 7.73% | | 2.43% | | 23.20% | |
| Morningstar ranking | | 1 of 143 | | 10 of 168 | | 44 of 170 | | 17 of 170 | |
Source: ©2010 Morningstar, Inc. All rights reserved.
Morningstar rankings are based on annualized total returns and do not reflect sales charges. Criteria: Open-ended mutual funds; inception date on or before Columbia Acorn Fund; oldest share class only; USD-based currency.
2 "Columbia" was added to the Fund's name in 2003.
3 Shannon Pratt is now chairman and CEO of Shannon Pratt Valuations, Inc., a business valuation firm headquartered in Portland, Oregon. He is also a member of the board of directors of Paulson Capital Corporation, an investment banking firm that specializes in small-cap IPOs.
4 The New York banks that dominated the institutional market at this time believed that the best portfolios should own the best companies and they were willing to own these stocks regardless of price. As a result, many institutional investors owned the same 50 stocks. Other terms for these stocks were "Vestal Virgins" or "one-decision" stocks.
5 Beefsteak Mines was an enticing investment opportunity in the 1940 film, "The Bank Dick," which starred W.C. Fields.
6 Over the last 40 years, small-cap stocks, as represented by the Russell 2000 Index and linked to the Ibbotson US Small Stock Index for the period prior to the Russell 2000's inception, have outperformed large-cap stocks, as represented by the S&P 500 Index. Small caps had an 11.88% total return for the 40 years through 6/30/2010, while large caps had a 10.28% gain.
Have You Been Invested In Columbia Acorn Fund Since 1970?
We are acknowledging shareholders who have been invested in Columbia Acorn Fund since 1970 with an "original owner" certificate. While we have been able to locate investors using our records, it's possible some have been missed. For example, we do not have current account information if your Acorn shares are now held by a brokerage firm. If you have been with us since the beginning and have not received a certificate, please give us a call at 1-800-922-6769.
7
Understanding Your Expenses
As a Fund shareholder, you incur two types of costs. There are transaction costs, which generally include sales charges on purchases and may include redemption or exchange fees. There are also ongoing costs, which generally include investment advisory fees and other Fund expenses. The following information is intended to help you understand your ongoing costs of investing in the Columbia Acorn Funds and to compare these costs with the ongoing costs of investing in other mutual funds.
Analyzing Your Fund's Expenses
To illustrate these ongoing costs, we have provided examples and calculated the expenses paid by investors in the Class Z shares of the Columbia Acorn Funds for the last six months. The information in the following table is based on an initial investment of $1,000, which is invested at the beginning of the reporting period and held for the entire period. Expense information is calculated two ways and each method provides you with different results. The amount listed in the "Actual" column is calculated using each Fund's actual operating expenses and total return for the period. The amount listed in the "Hypothetical" column assumes that the return each year is 5% before expenses and then applies each Fund's actual expense ratio for the period to the hypothetical return. You should not use the hypothetical account values and expenses to estimate either your actual account balance at the end of the period or the expenses you paid during the reporting period. See "Compare With Other Funds" for details on using the hypothetical data.
January 1, 2010 – June 30, 2010
| | | Account value at
the beginning of
the period ($) | | Account value at
the end of
the period ($) | | Expenses paid
during the period ($) | | Fund's
annualized
expense
ratio (%)* | |
| Class Z Shares | | Actual | | Hypothetical | | Actual | | Hypothetical | | Actual | | Hypothetical | | Actual | |
| Columbia Acorn Fund | | | 1,000.00 | | | | 1,000.00 | | | | 968.40 | | | | 1,021.08 | | | | 3.66 | | | | 3.76 | | | | 0.75 | | |
| Columbia Acorn International | | | 1,000.00 | | | | 1,000.00 | | | | 955.50 | | | | 1,020.08 | | | | 4.61 | | | | 4.76 | | | | 0.95 | | |
| Columbia Acorn USA | | | 1,000.00 | | | | 1,000.00 | | | | 937.50 | | | | 1,019.89 | | | | 4.76 | | | | 4.96 | | | | 0.99 | | |
| Columbia Acorn International Select | | | 1,000.00 | | | | 1,000.00 | | | | 962.90 | | | | 1,019.04 | | | | 5.65 | | | | 5.81 | | | | 1.16 | | |
| Columbia Acorn Select | | | 1,000.00 | | | | 1,000.00 | | | | 952.50 | | | | 1,020.08 | | | | 4.60 | | | | 4.76 | | | | 0.95 | | |
| Columbia Thermostat Fund** | | | 1,000.00 | | | | 1,000.00 | | | | 981.40 | | | | 1,023.55 | | | | 1.23 | | | | 1.25 | | | | 0.25 | | |
Expenses paid during the period are equal to each Fund's annualized expense ratio, multiplied by the average account value over the period and then multiplied by the number of days in the Fund's most recent fiscal half-year and divided by 365.
It is important to note that the expense amounts shown in the table are meant to highlight only ongoing costs of investing in the Funds and do not reflect any transaction costs, such as sales charges, redemption or exchange fees. Therefore, the hypothetical examples provided may not help you determine the relative total costs of owning different funds. If these transaction costs were included, your costs would have been higher.
Columbia Thermostat Fund's expenses do not include fees and expenses incurred by the Fund from the underlying portfolio funds in which it invests.
*For the six months ended June 30, 2010.
**Had the investment advisor and/or any of its affiliates not waived fees or reimbursed a portion of expenses, account value at the end of the period would have been reduced.
Compare With Other Funds
Since all mutual funds are required to include the same hypothetical calculations about expenses in shareholder reports, you can use this information to compare the ongoing cost of investing in the Funds with other funds. To do so, compare the 5% hypothetical example with the 5% hypothetical examples that appear in the shareholder reports of other funds. As you compare hypothetical examples of other funds, it is important to note that hypothetical examples are meant to highlight the continuing costs of investing in a fund and do not reflect any transaction costs, such as sales charges or redemption or exchange fees.
8
Estimating Your Actual Expenses
To estimate the expenses that you actually paid over the period, first you will need your account balance at the end of the period:
• For shareholders who receive their account statements from Columbia Management Investment Services Corp., your account balance is available online at columbiafunds.com or by calling Shareholder Services at (800) 922-6769.
• For shareholders who receive their account statements from their brokerage firm, contact your brokerage firm to obtain your account balance.
1. Divide your ending account balance by $1,000. For example, if an account balance was $8,600 at the end of the period, the result would be 8.6.
2. In the section of the table titled "Expenses paid during the period," locate the amount for your Fund. You will find this number is in the column labeled "Actual." Multiply this number by the result from step 1. Your answer is an estimate of the expenses you paid on your account during the period.
9
Columbia Acorn Fund
In a Nutshell
 | |  | |
|
| Charles P. McQuaid | | Robert A. Mohn | |
|
| Lead Portfolio Manager | | Co-Portfolio Manager | |
|
Performance data quoted represents past performance and current performance may be lower or higher. Past performance is no guarantee of future results. The investment return and principal value will fluctuate so that shares, when redeemed, may be worth more or less than the original cost. Please visit www.columbiafunds.com for daily and most recent month-end performance updates.
Fund Positions
in Mentioned Holdings
As a percentage of net assets,
as of 6/30/10
| FMC Technologies | | | 1.2 | % | |
| lululemon athletica | | | 1.1 | % | |
| Fugro | | | 0.8 | % | |
| Pacific Rubiales Energy | | | 0.8 | % | |
| Abercrombie & Fitch | | | 0.6 | % | |
| Atwood Oceanics | | | 0.6 | % | |
| Chico's FAS | | | 0.6 | % | |
| iGate | | | 0.5 | % | |
| Knoll | | | 0.4 | % | |
| Herman Miller | | | 0.4 | % | |
| Coldwater Creek | | | 0.1 | % | |
| Steelcase | | | 0.1 | % | |
The stock market went into reverse in the second quarter of 2010, more than offsetting first quarter gains. Columbia Acorn Fund fell 9.75% in the second quarter and 3.16% in the six-month period ended June 30, 2010. The Fund performed slightly better than its primary benchmark, the Russell 2500 Index, in the quarter, but underperformed it modestly in the half. The Fund and its primary benchmark beat the large-cap S&P 500 Index during both periods. See Page 2 for performance data.
Columbia Acorn Fund's retail stocks, which jumped 95% in 2009 and 12% in the first quarter of 2010, were marked down severely in the second quarter and caused much of the Fund's year-to-date underperformance. Fundamentals for retailers have generally been good, but their stocks appear to be discounted by the possibility of a double-dip recession. Teen apparel retailer Abercrombie & Fitch fell 33% in the quarter and 11% in the half, while women's specialty retailer Chico's FAS dropped 31% and 29%, respectively. Another women's apparel company, Coldwater Creek, submerged 52% in the quarter on concerns about excess inventories. The Fund's largest apparel company, premium yoga apparel retailer lululemon athletica, had exceptionally fine results but its stock nonetheless did a downward dog, falling 10% during the quarter. lululemon athletica was up 23% during the half.
Domestic energy stocks also hurt results. None of the Fund's holdings were directly involved in the BP oil spill, but some suffered collateral damage from the perception of increased risk and the actual moratorium on Gulf of Mexico drilling. Offshore driller Atwood Oceanics sank 26% in the quarter and 29% in the half, while oil and gas wellhead maker FMC Technologies fell 19% and 9%.
In contrast, office furniture stocks were sturdy. They had gotten very cheap and, unlike during the last economic cycle, there is currently no glut of used furniture. As orders improved, so did the stocks. Office furniture makers Knoll, Steelcase and Herman Miller were each up 5% to 21% in the quarter and 18% to 29% in the half.
Columbia Acorn Fund's top dollar winner in the quarter was iGate, up 32%. This India-based IT and business process outsourcing company continues to grow nicely, as its key customers, Canadian financial service companies, are doing well. The Fund's top dollar winner for the half was industrial gas distributor Airgas, up 35% on a takeover offer. We sold the stock in the first quarter.
Foreign stocks were down 7.83% in the quarter, somewhat less than the Fund, but off slightly more than the Fund in the half, falling 4.23%. Colombian oil producer Pacific Rubiales Energy was the Fund's second largest dollar winner in both periods, up 15% in the quarter and 52% in the half as it successfully reinvested cash flow into oil exploration. Sub-sea oilfield services company Fugro, in contrast, was the Fund's largest dollar loser in the quarter, off 28%. Columbia Acorn Fund's foreign holdings remained at about 10.7% in the quarter.
Small- and mid-cap stocks outperformed large caps last year and during the first half of this year. By most measures they appear somewhat expensive compared to larger caps. However, small- and mid-cap earnings growth exceeded large-cap gains in the first quarter of 2010 after lagging for several years. Small companies tend to be more innovative and flexible than larger ones, and most won't be hurt by the recent drop in the euro. Consequently, we think small-cap earnings can continue to outperform, which could bode well for small-cap stocks.
Stocks of small- and mid-cap companies pose special risks, including possible illiquidity and greater price volatility than stocks of larger, more established companies. International investing involves special risks, including foreign taxation, currency risks, risks associated with possible differences in financial standards and other risks associated with future political and economic developments.
Portfolio holdings are subject to change periodically and may not be representative of current holdings.
10
Columbia Acorn Fund (ACRNX)
At a Glance
Performance data quoted represents past performance and current performance may be higher or lower. Past performance is no guarantee of future results. The investment return and principal value of an investment in the Fund will fluctuate so that Fund shares, when redeemed, may be worth more or less than their original cost. Performance results reflect any fee waivers or reimbursements of Fund expenses by the investment advisor and/or any of its affiliates. Absent these fee waivers or expense reimbursement arrangements, performance results would have been lower. Please visit columbiafunds.com for daily and most recent month-end updates.
Pretax and After-tax Average Annual Total Returns (Class Z)
through June 30, 2010
| Inception 6/10/70 | | Year
to date* | | 1 year | | 5 years | | 10 years | |
| Returns before taxes | | | -3.16 | % | | | 23.20 | % | | | 2.43 | % | | | 7.73 | % | |
| Returns after taxes on distributions | | | -3.20 | | | | 23.10 | | | | 1.72 | | | | 6.97 | | |
Returns after taxes on distributions
and sale of fund shares | | | -2.06 | | | | 15.13 | | | | 2.14 | | | | 6.68 | | |
| Russell 2500 Index (pretax)** | | | -1.69 | | | | 24.03 | | | | 0.98 | | | | 4.15 | | |
All results shown assume reinvestment of distributions.
*Year to date data is not annualized.
**The Fund's primary benchmark.
After-tax returns are calculated using the highest historical individual federal marginal income tax rates, and do not reflect the impact of state and local taxes. Returns after taxes on distributions and sale of Fund shares reflect the additional tax impact of long-term gains or losses realized when Fund shares are sold. The returns are taxed at the maximum rate and assume shares were purchased at the beginning of the period. Actual after-tax returns depend on the investor's tax situation and may differ from those shown. After-tax returns are not relevant to investors who hold their Fund shares through tax-deferred arrangements such as 401(k) plans or individual retirement accounts. After-tax returns are shown for Class Z shares only; after-tax returns for other share classes will vary. Indexes do not reflect any deduction for fees, expenses or taxes.
The Fund's Class Z shares annual operating expense ratio, as stated in the current prospectus, is 0.77%.
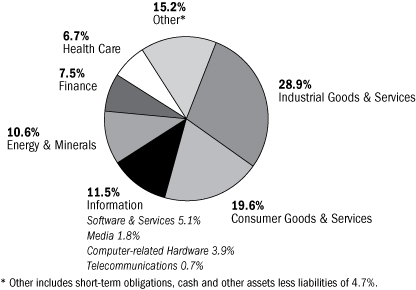
Columbia Acorn Fund Portfolio Diversification
as a percentage of net assets, as of 6/30/10

Columbia Acorn Fund Top 10 Holdings
as a percentage of net assets, as of 6/30/10
| | 1. | | | Crown Castle International
Communications Towers | | 1.7%
| |
| | 2. | | | Ametek
Aerospace/Industrial Instruments | | 1.3%
| |
| | 3. | | | Donaldson
Industrial Air Filtration | | 1.3%
| |
| | 4. | | | Mettler Toledo
Laboratory Equipment | | 1.3%
| |
| | 5. | | | FMC Technologies
Oil & Gas Wellhead Manufacturer | | 1.2%
| |
| | 6. | | | tw telecom
Fiber Optic Telephone/Data Services | | 1.1%
| |
| | 7. | | | lululemon athletica
Premium Active Apparel Retailer | | 1.1%
| |
| | 8. | | | Amphenol
Electronic Connectors | | 1.1%
| |
| | 9. | | | Alexion Pharmaceuticals
Biotech Focused on Orphan Diseases | | 1.0%
| |
| | 10. | | | Bally Technologies
Slot Machines & Software | | 0.9%
| |
The Fund's top 10 holdings and portfolio diversification vary with changes in portfolio investments. See the Statement of Investments for a complete list of the Fund's holdings.
The Growth of a $10,000 Investment in Columbia Acorn Fund (Class Z)
June 10, 1970 through June 30, 2010
This graph compares the results of $10,000 invested in Columbia Acorn Fund at inception on June 10, 1970 to the S&P 500 Index and to an initial $31,777 investment in the Russell 2500 Index on the index's December 31, 1978 inception date. Although the indexes are provided for use in assessing the Fund's performance, the Fund's holdings may differ significantly from those in the indexes. The indexes are unmanaged and returns for both the indexes and the Fund include reinvested dividends and capital gains. It is not possible to invest directly in an index. The graph does not reflect taxes that a shareholder would pay on Fund distributions or on a sale of Fund shares.
Total Net Assets of the Fund: $13.9 billion
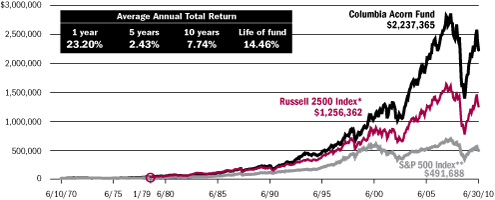
*A $10,000 investment in Columbia Acorn Fund at inception appreciated to $31,777 on December 31, 1978, the inception date of the Russell 2500 Index. For comparison with the Russell 2500 Index, we assigned the index the same value as the Fund at index inception.
**Although the Fund typically invests in small- and mid-sized companies, the comparison to the S&P 500 Index is presented to show performance against a widely recognized market index over the life of the Fund.
11
Columbia Acorn International
In a Nutshell
 | |  | |
|
| P. Zachary Egan | | Louis J. Mendes III | |
|
| Co-Portfolio Manager | | Co-Portfolio Manager | |
|
Performance data quoted represents past performance and current performance may be lower or higher. Past performance is no guarantee of future results. The investment return and principal value will fluctuate so that shares, when redeemed, may be worth more or less than the original cost. Please visit www.columbiafunds.com for daily and most recent month-end performance updates.
Fund's Positions
in Mentioned Holdings
As a percentage of net assets,
as of 6/30/10
| Aeon Delight | | | 0.8 | % | |
| Start Today | | | 0.8 | % | |
| Ain Pharmaciez | | | 0.6 | % | |
Columbia Acorn International was down 7.68% in the second quarter of 2010. This compares with a 9.15% drop of its primary benchmark, the S&P Global Ex-U.S. Between $500 Million and $5 Billion Index. For the six-month period ended June 30, 2010, the Fund was down 4.45% vs. the benchmark drop of 4.96%. On both a quarterly and year-to-date basis, international small-cap stocks continued to post better returns than their large cap counterparts. The large-cap focused MSCI EAFE Index was down 13.97% in the second quarter and 13.23% in the first half. This extends a trend of small-cap outperformance. On trailing three- and five-year numbers, the S&P $500m to $5b cap range international stock universe, excluding emerging market securities, has led the MSCI EAFE Index (which does not contain emerging markets securities) by an annualized 2.27% and 2.80%, respectively.
Continental Europe led the quarterly decline in both the Fund and the benchmark, as investors pondered the prospects for default of one or more of the financially stressed eurozone member states such as Greece or Spain. We agree that the trends in public debt and deficits are worrying and that concern extends to creditor states like Germany, whose banks hold large quantities of public and private debt emanating from its weaker neighbors. However, we believe that the situation is more likely to result in a tighter monetary union, with more effective fiscal constraints on member states, than in the demise of the now 11-year-old euro currency. Consistent with these views, we maintained the Fund's overweight position in continental Europe, which has been the source of many of our best ideas and investment returns in recent years, and we did not categorically avoid the most vulnerable eurozone states.
Within the troubled eurozone states, we have strived to identify investments that should do well even if their capital costs increase with a perceived increase in risk. For example, at quarter end, the Fund had 1.6% of its capital invested in electric transmission companies in Spain, Portugal and Italy. We believe capacity shortfalls and new requirements associated with renewable sources will result in large investments in these networks, and that the regulated returns on these investments will facilitate pricing structures that offset rising capital costs. It's worth noting that continental Europe was a positive contributor to relative return in the quarter due to good stock selection.
Japan, home to an average 17% of the Fund's assets during the quarter, was the best performing region in the Fund, and fueled about half of its relative outperformance. Japanese securities held by the Fund were off 0.2% while Japanese small caps in general were down 5.8%. The difference can be explained by a few big winners in the quarter. Start Today, an online apparel retailer, was up 50% as continuing strong monthly sales figures reflect an industry shift to online purchasing. Ain Pharmaciez, a pharmacy chain operator, was up 40% after guiding investors to expect another strong fiscal year and the stock gained greater visibility with a stock listing move to a more prominent segment of the Tokyo Exchange. Aeon Delight, the biggest facility maintenance company in Japan, returned 38% after announcing an acquisition expected to immediately contribute to earnings per share. Unicharm PetCare, a maker of pet food and toiletries, jum ped 34% after its parent company sought an additional 31% stake to facilitate a full takeover of the company.
International investing involves special risks, including foreign taxation, currency risks, risks associated with possible differences in financial standards and other risks associated with future political and economic developments. Stocks of small- and mid-cap companies pose special risks, including possible illiquidity and greater price volatility than stocks of larger, more established companies. Investing in emerging markets may involve greater risks than investing in more developed countries. In addition, concentration of investments in a single region may result in greater volatility.
Portfolio holdings are subject to change periodically and may not be representative of current holdings.
12
Columbia Acorn International (ACINX)
At a Glance
Performance data quoted represents past performance and current performance may be higher or lower. Past performance is no guarantee of future results. The investment return and principal value of an investment in the Fund will fluctuate so that Fund shares, when redeemed, may be worth more or less than their original cost. Performance results reflect any fee waivers or reimbursements of Fund expenses by the investment advisor and/or any of its affiliates. Absent these fee waivers or expense reimbursement arrangements, performance results would have been lower. Please visit columbiafunds.com for daily and most recent month-end updates.
Pretax and After-tax Average Annual Total Returns (Class Z)
through June 30, 2010
| Inception 9/23/92 | | Year
to date* | | 1 year | | 5 years | | 10 years | |
| Returns before taxes | | | -4.45 | % | | | 18.91 | % | | | 7.82 | % | | | 4.68 | % | |
| Returns after taxes on distributions | | | -5.07 | | | | 18.14 | | | | 6.88 | | | | 3.88 | | |
Returns after taxes on distributions
and sale of fund shares | | | -2.90 | | | | 12.28 | | | | 6.81 | | | | 3.92 | | |
S&P Global Ex-U.S. Between
$500 Million and $5 Billion
Index (pretax)** | | | -4.96 | | | | 18.65 | | | | 6.51 | | | | 7.49 | | |
All results shown assume reinvestment of distributions.
*Year to date data is not annualized.
**The Fund's primary benchmark.
After-tax returns are calculated using the highest historical individual federal marginal income tax rates, and do not reflect the impact of state and local taxes. Returns after taxes on distributions and sale of Fund shares reflect the additional tax impact of long-term gains or losses realized when Fund shares are sold. The returns are taxed at the maximum rate and assume shares were purchased at the beginning of the period. Actual after-tax returns depend on the investor's tax situation and may differ from those shown. After-tax returns are not relevant to investors who hold their Fund shares through tax-deferred arrangements such as 401(k) plans or individual retirement accounts. After-tax returns are shown for Class Z shares only; after-tax returns for other share classes will vary. Indexes do not reflect any deduction for fees, expenses or taxes.
The Fund's Class Z annual operating expense ratio, as stated in the current prospectus, is 0.99%.
Columbia Acorn International Portfolio Diversification
as a percentage of net assets, as of 6/30/10
Columbia Acorn International Top 10 Holdings
as a percentage of net assets, as of 6/30/10
| | 1. | | | Olam International (Singapore)
Agriculture Supply Chain Manager | | 1.5%
| |
| | 2. | | | Naspers (South Africa)
Media in Africa & Other Emerging Markets | | 1.5%
| |
| | 3. | | | Kansai Paint (Japan)
Paint Producer in Japan, India, China & Southeast Asia | | 1.4%
| |
| | 4. | | | Localiza Rent A Car (Brazil)
Car Rental | | 1.3%
| |
| | 5. | | | Serco (United Kingdom)
Facilities Management | | 1.3%
| |
| | 6. | | | Imtech (Netherlands)
Electromechanical & ICT Installation & Maintenance | | 1.1%
| |
| | 7. | | | Hexagon (Sweden)
Measurement Equipment | | 1.1%
| |
| | 8. | | | Suzano (Brazil)
Brazilian Pulp & Paper Producer | | 1.0%
| |
| | 9. | | | Asian Paints (India)
India's Largest Paint Company | | 1.0%
| |
| | 10. | | | ShawCor (Canada)
Oil & Gas Pipeline Products | | 1.0%
| |
The Fund's top 10 holdings and portfolio diversification vary with changes in portfolio investments. See the Statement of Investments for a complete list of the Fund's holdings.
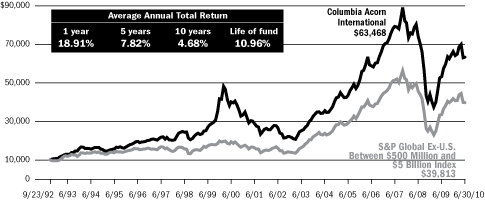
The Growth of a $10,000 Investment in Columbia Acorn International (Class Z)
September 23, 1992 through June 30, 2010
This graph compares the results of $10,000 invested in Columbia Acorn International at inception on September 23, 1992 to the S&P Global Ex-U.S. Between $500 Million and $5 Billion Index. Although the index is provided for use in assessing the Fund's performance, the Fund's holdings may differ significantly from those in the index. The index is unmanaged and returns for both the index and Fund include reinvested dividends and capital gains. It is not possible to invest directly in an index. The graph does not reflect taxes that a shareholder would pay on Fund distributions or on a sale of Fund shares.
Total Net Assets of the Fund: $4.5 billion
13
Columbia Acorn USA
In a Nutshell
 | |
|
| Robert A. Mohn | |
|
| Lead Portfolio Manager | |
|
Performance data quoted represents past performance and current performance may be lower or higher. Past performance is no guarantee of future results. The investment return and principal value will fluctuate so that shares, when redeemed, may be worth more or less than the original cost. Please visit www.columbiafunds.com for daily and most recent month-end performance updates.
Fund Positions
in Mentioned Holdings
As a percentage of net assets,
as of 6/30/10
| FMC Technologies | | | 2.0 | % | |
| AmeriCredit | | | 1.6 | % | |
| Atwood Oceanics | | | 1.5 | % | |
| Bally Technologies | | | 1.4 | % | |
| ESCO Technologies | | | 1.2 | % | |
| lululemon athletica | | | 1.1 | % | |
| Abercrombie & Fitch | | | 0.8 | % | |
| Blue Coat Systems | | | 0.7 | % | |
| Core Laboratories | | | 0.6 | % | |
| Global Payments | | | 0.5 | % | |
| RCM Technologies | | | 0.3 | % | |
| Green Bankshares | | | 0.3 | % | |
| Carrizo Oil & Gas | | | 0.2 | % | |
Columbia Acorn USA ended the second quarter of 2010 down 12.13% while its primary benchmark, the Russell 2000 Index, fell 9.92%. Talk of a double-dip recession and a continued sluggish economy changed the course of market performance in the second quarter, more than erasing first quarter gains. Year to date through June 30, 2010, the Fund was down 6.25% while its primary benchmark was off 1.95%.
As we've mentioned in the past, our energy investments for Columbia Acorn USA have largely focused on offshore oil service companies. The oil disaster in the Gulf of Mexico drove a sell-off in this sector, as the current moratorium on Gulf drilling decreased current demand for deepwater services and new regulations will likely drive up future drilling costs. Atwood Oceanics, an offshore drilling contractor, and FMC Technologies, an oil and gas wellhead manufacturer, were down 26% and 19%, respectively, in the quarter despite having very limited exposure to any Gulf drilling activity and no involvement in the BP crisis. For the six-month period ended June 30, Atwood Oceanics was down 29% and FMC was off 9%.
Consumer stocks were hit hard during the second quarter. Teen apparel retailer Abercrombie & Fitch dropped nearly 33% due to poor April sales in tourist-oriented stores and recession concerns. Bally Technologies, a maker of slot machines, fell 20% in the quarter on lower expectations for slot machine replacement sales, and lagged in the half with a 22% drop.
Individual stocks that struggled in the quarter included auto lender AmeriCredit, down 23% despite reporting strong earnings and lower loan losses. The stock fell on anxiety over the financial health of U.S. borrowers. Blue Coat Systems, a provider of Internet network security services, suffered a steep drop in European sales. Its stock fell 34% in the quarter, and it was also among the Fund's underperformers for the first six months of the year, with a 28% drop.
Another laggard for the half year was credit card processor Global Payments, which fell 32% on concerns of increased competition in the Canadian market. Carrizo Oil & Gas, an oil and gas producer, continued to struggle as U.S. natural gas prices fell. ESCO Technologies, a maker of automatic electric meter readers, ended the six months down 28% on fears the company will not win a California natural gas meter contract.
One of the quarter's few bright spots was Tennessee bank Green Bankshares, which gained 57% in the second quarter after breaking a string of three consecutive quarterly losses. RCM Technologies, a provider of technology and engineering services, gained 42% in the quarter after receiving an acquisition offer. Bucking the downward trend in energy stocks, Core Laboratories gained 13% in the quarter and traded higher than its 2008 peak. The company provides oil and gas reservoir consulting services.
Turning to the six month period, top performance came from Novell, a business software developer that gained 40% on news that Elliott Associates was taking the company private. We opted to sell the Fund's position in the stock and put the assets into other names that we believe have more upside potential. Green Bankshares' semiannual gain topped 261%. lululemon athletica, a retailer of premium yoga apparel for women, enjoyed a more than 23% gain thanks to earnings that nearly tripled from the prior year.
The first half of 2010 has been frustrating, but recent market weakness is providing many investment opportunities in attractively priced small-cap companies that we believe have strong prospects for the future. Looking at the bigger picture, there is no denying the horde of problems facing the world: the stability of the euro, the housing crisis, unemployment, the over-indebted American consumer, the Gulf oil spill. It's certainly easy to despair over these issues and hide out in cash. More difficult, but potentially more profitable, is to realize that however daunting they may seem, economic problems have a habit of resolving over time.
Stocks of small- and mid-cap companies pose special risks, including possible illiquidity and greater price volatility than stocks of larger, more established companies.
Portfolio holdings are subject to change periodically and may not be representative of current holdings.
14
Columbia Acorn USA (AUSAX)
At a Glance
Performance data quoted represents past performance and current performance may be higher or lower. Past performance is no guarantee of future results. The investment return and principal value of an investment in the Fund will fluctuate so that Fund shares, when redeemed, may be worth more or less than their original cost. Performance results reflect any fee waivers or reimbursements of Fund expenses by the investment advisor and/or any of its affiliates. Absent these fee waivers or expense reimbursement arrangements, performance results would have been lower. Please visit columbiafunds.com for daily and most recent month-end updates.
Pretax and After-tax Average Annual Total Returns (Class Z)
through June 30, 2010
| Inception 9/4/96 | | Year
to date* | | 1 year | | 5 years | | 10 years | |
| Returns before taxes | | | -6.25 | % | | | 22.76 | % | | | -0.66 | % | | | 6.68 | % | |
| Returns after taxes on distributions | | | -6.25 | | | | 22.76 | | | | -1.11 | | | | 6.36 | | |
Returns after taxes on distributions
and sale of fund shares | | | -4.06 | | | | 14.79 | | | | -0.49 | | | | 5.90 | | |
| Russell 2000 Index (pretax)** | | | -1.95 | | | | 21.48 | | | | 0.37 | | | | 3.00 | | |
All results shown assume reinvestment of distributions.
*Year to date data is not annualized.
**The Fund's primary benchmark.
After-tax returns are calculated using the highest historical individual federal marginal income tax rates, and do not reflect the impact of state and local taxes. Returns after taxes on distributions and sale of Fund shares reflect the additional tax impact of long-term gains or losses realized when Fund shares are sold. The returns are taxed at the maximum rate and assume shares were purchased at the beginning of the period. Actual after-tax returns depend on the investor's tax situation and may differ from those shown. After-tax returns are not relevant to investors who hold their Fund shares through tax-deferred arrangements such as 401(k) plans or individual retirement accounts. After-tax returns are shown for Class Z shares only; after-tax returns for other share classes will vary. Indexes do not reflect any deduction for fees, expenses or taxes.
The Fund's Class Z annual operating expense ratio, as stated in the current prospectus, is 1.03%.
Columbia Acorn USA Portfolio Diversification
as a percentage of net assets, as of 6/30/10

Columbia Acorn USA Top 10 Holdings
as a percentage of net assets, as of 6/30/10
| | 1. | | | tw telecom
Fiber Optic Telephone/Data Services | | 2.7%
| |
| | 2. | | | FMC Technologies
Oil & Gas Wellhead Manufacturer | | 2.0%
| |
| | 3. | | | Ametek
Aerospace/Industrial Instruments | | 1.9%
| |
| | 4. | | | Informatica
Enterprise Data Integration Software | | 1.8%
| |
| | 5. | | | SL Green Realty
Manhattan Office Buildings | | 1.7%
| |
| | 6. | | | Nordson
Dispensing Systems for Adhesives & Coatings | | 1.6%
| |
| | 7. | | | SBA Communications
Communications Towers | | 1.6%
| |
| | 8. | | | AmeriCredit
Auto Lending | | 1.6%
| |
| | 9. | | | Mettler Toledo
Laboratory Equipment | | 1.6%
| |
| | 10. | | | Micros Systems
Information Systems for Restaurants & Hotels | | 1.5%
| |
The Fund's top 10 holdings and portfolio diversification vary with changes in portfolio investments. See the Statement of Investments for a complete list of the Fund's holdings.
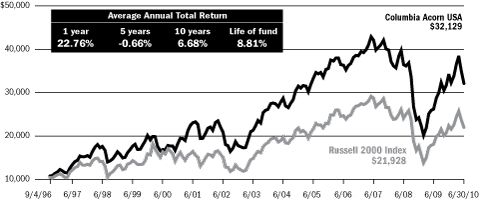
The Growth of a $10,000 Investment in Columbia Acorn USA (Class Z)
September 4, 1996 through June 30, 2010
This graph compares the results of $10,000 invested in Columbia Acorn USA at inception on September 4, 1996 to the Russell 2000 Index. Although the index is provided for use in assessing the Fund's performance, the Fund's holdings may differ significantly from those in the index. The index is unmanaged and returns for both the index and the Fund include reinvested dividends and capital gains. It is not possible to invest directly in an index. The graph does not reflect taxes that a shareholder would pay on Fund distributions or on a sale of Fund shares.
Total Net Assets of the Fund: $1.3 billion
15
Columbia Acorn International Select
In a Nutshell

Christopher J. Olson
Lead Portfolio Manager
Performance data quoted represents past performance and current performance may be lower or higher. Past performance is no guarantee of future results. The investment return and principal value will fluctuate so that shares, when redeemed, may be worth more or less than the original cost. Please visit www.columbiafunds.com for daily and most recent month-end performance updates.
Fund's Positions
in Mentioned Holdings
As a percentage of net assets,
as of 6/30/10
| Naspers | | | 5.5 | % | |
| Pacific Rubiales Energy | | | 3.6 | % | |
| Zhaojin Mining Industry | | | 3.4 | % | |
| Eldorado Gold | | | 3.3 | % | |
| Cobham | | | 2.6 | % | |
| Fugro | | | 2.1 | % | |
| Micro Focus | | | 2.1 | % | |
| Ain Pharmaciez | | | 1.7 | % | |
| Red Eléctrica de Espana | | | 1.2 | % | |
Columbia Acorn International Select ended the second quarter of 2010 down 5.47%, holding up far better than the 10.15% drop of its primary benchmark, the S&P Developed Ex-U.S. Between $2 Billion and $10 Billion Index. For the first half of 2010, the Fund was down 3.71% while its primary benchmark declined 6.52%. The Fund's relative performance was hurt in the first quarter by the strong performance of more cyclical names as investors hoped for a return to solid global economic growth. In the second quarter, the performance of these riskier names declined and the higher quality names in the Fund's portfolio fared better as indicators pointed to disappointing economic growth. We continue to favor companies with stronger franchises, better earnings visibility and more solid balance sheets, as we believe it is likely the global equity markets will remain volatile for some time.
Top performers for the second quarter and half year periods included two gold mining companies: Canada's Eldorado Gold, up more than 47% in the quarter and 26% in the half, and China's Zhaojin Mining Industry, up 22% in the quarter and 21% year to date. Both stocks benefited from rising gold prices in addition to strong production and exploration profiles. Japan's Ain Pharmaciez gained 40% in the quarter and ended the six months up 71%. The pharmacy chain operator provided a strong earnings outlook and moved its stock listing to a more prominent segment of the Tokyo Exchange. Pacific Rubiales Energy, an oil production and exploration company with assets in Colombia, gained 15% in the quarter and ended the half year up 52%. The company has wisely reinvested cash flow into further successful oil exploration. Benefiting from the Chinese government's focus on medical care reform, Shandong Weigao, a manufacturer of hospital consumabl es, gained 13% in the quarter and ended the half year up 42%. We opted to take our profits on the stock given its high valuation, and sold the Fund's position.
Naspers, a media company with assets in South Africa and other emerging markets, was the biggest detractor to Fund gains in both the quarter and half, falling 23% and 17% for the respective periods. Naspers has been a top contributor to performance for several quarters, but concerns about a possible slowdown at its major investment Tencent, an Internet service provider in China, caused a setback. Red Eléctrica de Espana, a Spanish power transmission company, was off 33% for the quarter and 34% for the half, as concerns grew about Spain's financial stability and the Spanish stock market sold off heavily. Cobham, a UK manufacturer of aerospace components, was down 18% for the quarter and 21% for the semiannual period due to concerns that the British and U.S. governments will cut defense budgets. Micro Focus, a UK legacy software provider, was a new addition to the Fund in the quarter, but got off to a rocky start with a 26% drop due to the resignation of the company's chief financial officer. Earnings data released in the second quarter, however, came in strong and met expectations. Dutch sub-sea oilfield services provider Fugro fell 28% in the quarter and ended the half down 18%, tracking the oil services sector that was rocked due to the BP oil spill in the Gulf of Mexico.
International investing involves special risks, including foreign taxation, currency risks, risks associated with possible differences in financial standards and other risks associated with future political and economic developments. Stocks of small- and mid-cap companies pose special risks, including possible illiquidity and greater price volatility than stocks of larger, more established companies. Investing in emerging markets may involve greater risks than investing in more developed countries.
Portfolio holdings are subject to change periodically and may not be representative of current holdings.
16
Columbia Acorn International Select (ACFFX)
At a Glance
Performance data quoted represents past performance and current performance may be higher or lower. Past performance is no guarantee of future results. The investment return and principal value of an investment in the Fund will fluctuate so that Fund shares, when redeemed, may be worth more or less than their original cost. Performance results reflect any fee waivers or reimbursements of Fund expenses by the investment advisor and/or any of its affiliates. Absent these fee waivers or expense reimbursement arrangements, performance results would have been lower. Please visit columbiafunds.com for daily and most recent month-end updates.
Pretax and After-tax Average Annual Total Returns (Class Z)
through June 30, 2010
| Inception 11/23/98 | | Year
to date* | | 1 year | | 5 years | | 10 years | |
| Returns before taxes | | | -3.71 | % | | | 15.54 | % | | | 7.02 | % | | | 2.73 | % | |
| Returns after taxes on distributions | | | -4.28 | | | | 14.87 | | | | 6.64 | | | | 2.52 | | |
Returns after taxes on distributions
and sale of fund shares | | | -2.42 | | | | 10.10 | | | | 6.13 | | | | 2.39 | | |
S&P Developed Ex-U.S. Between
$2 Billion and $10 Billion
Index (pretax)** | | | -6.52 | | | | 12.73 | | | | 3.42 | | | | 5.02 | | |
All results shown assume reinvestment of distributions.
*Year to date data is not annualized.
**The Fund's primary benchmark.
After-tax returns are calculated using the highest historical individual federal marginal income tax rates, and do not reflect the impact of state and local taxes. Returns after taxes on distributions and sale of Fund shares reflect the additional tax impact of long-term gains or losses realized when Fund shares are sold. The returns are taxed at the maximum rate and assume shares were purchased at the beginning of the period. Actual after-tax returns depend on the investor's tax situation and may differ from those shown. After-tax returns are not relevant to investors who hold their Fund shares through tax-deferred arrangements such as 401(k) plans or individual retirement accounts. After-tax returns are shown for Class Z shares only; after-tax returns for other share classes will vary. Indexes do not reflect any deduction for fees, expenses or taxes.
The Fund's Class Z annual operating expense ratio, as stated in the current prospectus, is 1.21%.
Columbia Acorn International Select Portfolio Diversification
as a percentage of net assets, as of 6/30/10

Columbia Acorn International Select Top 10 Holdings
as a percentage of net assets, as of 6/30/10
| | 1. | | | Naspers (South Africa)
Media in Africa & Other Emerging Markets | | 5.5%
| |
| | 2. | | | Serco (United Kingdom)
Facilities Management | | 5.2%
| |
| | 3. | | | Kansai Paint (Japan)
Paint Producer in Japan, India, China & Southeast Asia | | 4.2%
| |
| | 4. | | | Pacific Rubiales Energy (Colombia)
Oil Production & Exploration in Colombia | | 3.6%
| |
| | 5. | | | Zhaojin Mining Industry (China)
Gold Mining & Refining in China | | 3.4%
| |
| | 6. | | | Pan American Silver (Canada)
Silver Mining | | 3.4%
| |
| | 7. | | | Eldorado Gold (Canada)
Gold Miner in Turkey, Greece, China & Brazil | | 3.3%
| |
| | 8. | | | Jiangsu Expressway (China)
Chinese Toll Road Operator | | 3.1%
| |
| | 9. | | | NHN (South Korea)
South Korea's Largest Online Search Engine | | 3.0%
| |
| | 10. | | | Intertek Group (United Kingdom)
Testing, Inspection & Certification Services | | 3.0%
| |
The Fund's top 10 holdings and portfolio diversification vary with changes in portfolio investments. See the Statement of Investments for a complete list of the Fund's holdings.
The Growth of a $10,000 Investment in Columbia Acorn International Select (Class Z)
November 23, 1998 through June 30, 2010
This graph compares the results of $10,000 invested in Columbia Acorn International Select at inception on November 23, 1998 to the S&P Developed Ex-U.S. Between $2 Billion and $10 Billion Index. Although the index is provided for use in assessing the Fund's performance, the Fund's holdings may differ significantly from those in the index. The index and Fund returns include reinvested dividends and capital gains. It is not possible to invest directly in an index. The graph does not reflect taxes that a shareholder would pay on Fund distributions or on a sale of Fund shares.
Total Net Assets of the Fund: $384.7 million

17
Columbia Acorn Select
In a Nutshell

Ben Andrews
Lead Portfolio Manager
Performance data quoted represents past performance and current performance may be lower or higher. Past performance is no guarantee of future results. The investment return and principal value will fluctuate so that shares, when redeemed, may be worth more or less than the original cost. Please visit www.columbiafunds.com for daily and most recent month-end performance updates.
Opinions expressed are those of the author and are not necessarily those of the Advisor, its parent organizations or the Columbia Acorn Trust Board.
Fund's Positions
in Mentioned Holdings
As a percentage of net assets,
as of 6/30/10
| Pacific Rubiales Energy | | | 7.2 | % | |
| ITT Educational Services | | | 3.9 | % | |
| Abercrombie & Fitch | | | 2.8 | % | |
| Canadian Solar | | | 1.7 | % | |
| Canacol Energy | | | 1.6 | % | |
Columbia Acorn Select lost 12.36% in the second quarter of 2010 giving the Fund a year-to-date return of -4.75%. The Fund's loss in the quarter was worse than the S&P MidCap 400 Index's drop of 9.59% and the large-cap S&P 500 Index's 11.43% decline. The market sold off considerably in the second quarter as fears that the U.S. economy is going back into recession grew.
We had only a handful of stocks that were up in the quarter. Of these, two energy names, Pacific Rubiales Energy and Canacol Energy, added 1.1% of return to our portfolio in the quarter. Both companies continue to have success finding oil in Colombia. SkillSoft, a provider of web-based learning tools, was acquired by a group of private investors in the quarter and contributed 0.4% to the portfolio. On the downside, the names were numerous, but Canadian Solar (CSIQ, a solar cell and module manufacturer) cost the Fund 1.7% of total portfolio performance in the second quarter. CSIQ lost ground due to falling solar cell prices and fears that Germany's subsidy cut to the solar industry would hurt demand for new solar installation. Teen apparel retailer Abercrombie & Fitch and ITT Educational Services (ESI) each cost the Fund 1.2% of portfolio performance in the quarter. The latter fell hard on proposed government regulation that could impact providers of post-secondary degree programs like ITT Educational Services. We trimmed ESI's position size in the portfolio in anticipation of the government attacking this industry, but we still own the company because we strongly believe that it educates a portion of American students that traditional not-for-profit colleges largely ignore.
It was a terrible quarter for trying to build capital. We did use the market weakness to invest a couple of percent of the Fund's cash into companies we felt were oversold and that show growth potential in a sluggish economy. The Fund's cash level at the end of the period was 6.5%. In the quarter, we sold out of four companies, had SkillSoft acquired and added five new companies to the portfolio.
According to a U.S. Treasury Department report that was recently released, the U.S. is estimated to run a $1.6 trillion dollar budget deficit this year alone. This will be greater than 10.5% of the country's gross domestic product (GDP) for the year, a mind boggling number. If GDP is down 3% in a year, that would cause a really rough recession, but if all the deficit spending was withdrawn in the next year, thus a minus 10% economy, well, heaven help us. As I see it, over the next several years the U.S. has to reduce this deficit spending while increasing employment to get the country heading toward a sound footing. If not, I believe we may run into a nasty currency crisis. Executing on this strategy will not be an easy task. If the deficit spending is withdrawn too fast, I believe the country could go into recession. But, allowing a budget deficit this big for too long is likely to cause pain to this generation and the next thr ough inflation and/or massive tax increases. Getting unemployment down when the country is already deficit spending like crazy is going to be tricky. I think it needs to start with less government legislation and regulation, which has been keeping our businesses from adding employees until they can understand what is happening in their industries. Uncertainty is a killer in any capital market.
I'm not looking for the next couple of years to be easy, but I never do. Our Fund's portfolio will remain focused on businesses that we feel can grow in a soft economy.
Risks include stock market fluctuations due to economic and business developments. The Fund also has potentially greater price volatility due to the Fund's concentration in a limited number of stocks of mid-size companies. The Fund is a non-diversified fund and may, therefore, have a greater risk of loss from a few issuers than a similar fund that invests more broadly. The Fund may not operate as a non-diversified fund at all times. International investments involve greater potential risks, including less regulation, currency fluctuations, economic instability and political developments.
Portfolio holdings are subject to change periodically and may not be representative of current holdings.
18
Columbia Acorn Select (ACTWX)
At a Glance
Performance data quoted represents past performance and current performance may be higher or lower. Past performance is no guarantee of future results. The investment return and principal value of an investment in the Fund will fluctuate so that Fund shares, when redeemed, may be worth more or less than their original cost. Performance results reflect any fee waivers or reimbursements of Fund expenses by the investment advisor and/or any of its affiliates. Absent these fee waivers or expense reimbursement arrangements, performance results would have been lower. Please visit columbiafunds.com for daily and most recent month-end updates.
Pretax and After-tax Average Annual Total Returns (Class Z)
through June 30, 2010
| Inception 11/23/98 | | Year
to date* | | 1 year | | 5 years | | 10 years | |
| Returns before taxes | | | -4.75 | % | | | 27.26 | % | | | 3.18 | % | | | 6.88 | % | |
| Returns after taxes on distributions | | | -4.75 | | | | 27.26 | | | | 2.88 | | | | 6.63 | | |
Returns after taxes on distributions
and sale of fund shares | | | -3.09 | | | | 17.72 | | | | 2.76 | | | | 6.06 | | |
| S&P MidCap 400 Index (pretax)** | | | -1.36 | | | | 24.93 | | | | 2.21 | | | | 5.31 | | |
All results shown assume reinvestment of distributions.
*Year to date data is not annualized.
**The Fund's primary benchmark.
After-tax returns are calculated using the highest historical individual federal marginal income tax rates, and do not reflect the impact of state and local taxes. Returns after taxes on distributions and sale of Fund shares reflect the additional tax impact of long-term gains or losses realized when Fund shares are sold. The returns are taxed at the maximum rate and assume shares were purchased at the beginning of the period. Actual after-tax returns depend on the investor's tax situation and may differ from those shown. After-tax returns are not relevant to investors who hold their Fund shares through tax-deferred arrangements such as 401(k) plans or individual retirement accounts. After-tax returns are shown for Class Z shares only; after-tax returns for other share classes will vary. Indexes do not reflect any deduction for fees, expenses or taxes.
The Fund's Class Z annual operating expense ratio, as stated in the current prospectus, is 0.99%.
Columbia Acorn Select Portfolio Diversification
as a percentage of net assets, as of 6/30/10
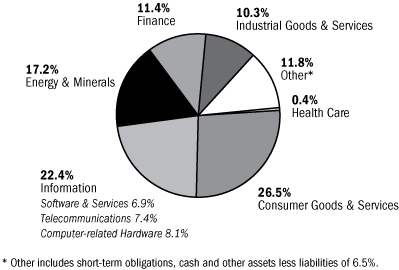
Columbia Acorn Select Top 10 Holdings
as a percentage of net assets, as of 6/30/10
| | 1. | | | Pacific Rubiales Energy (Colombia)
Oil Production & Exploration in Colombia | | 7.2%
| |
| | 2. | | | Sanmina-SCI
Electronic Manufacturing Services | | 5.9%
| |
| | 3. | | | Hertz
Largest U.S. Rental Car Operator | | 4.4%
| |
| | 4. | | | Safeway
Supermarkets | | 4.1%
| |
| | 5. | | | ITT Educational Services
Post-secondary Degree Services | | 3.9%
| |
| | 6. | | | CNO Financial Group
Life, Long-term Care & Medical Supplement Insurance | | 3.6%
| |
| | 7. | | | Crown Castle International
Communications Towers | | 3.1%
| |
| | 8. | | | Abercrombie & Fitch
Teen Apparel Retailer | | 2.8%
| |
| | 9. | | | WNS-ADR (India)
Offshore BPO (Business Process Outsourcing) Services | | 2.6%
| |
| | 10. | | | Expedia
Online Travel Services Company | | 2.6%
| |
The Fund's top 10 holdings and portfolio diversification vary with changes in portfolio investments. See the Statement of Investments for a complete list of the Fund's holdings.
The Growth of a $10,000 Investment in Columbia Acorn Select (Class Z)
November 23, 1998 through June 30, 2010
This graph compares the results of $10,000 invested in Columbia Acorn Select at inception on November 23, 1998 to the S&P MidCap 400 Index. Although the index is provided for use in assessing the Fund's performance, the Fund's holdings differ significantly from those in the index. The index is unmanaged and returns for both the index and the Fund include reinvested dividends and capital gains. It is not possible to invest directly in an index. The graph does not reflect taxes that a shareholder would pay on Fund distributions or on a sale of Fund shares.
Total Net Assets of the Fund: $1.8 billion
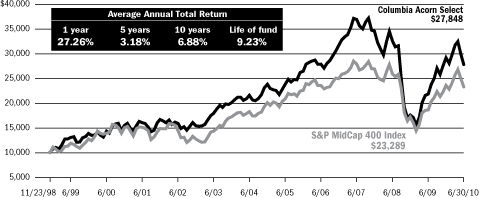
19
Columbia Thermostat Fund
In a Nutshell
 | |
|
| Charles P. McQuaid | |
|
| Lead Portfolio Manager | |
|
Performance data quoted represents past performance and current performance may be lower or higher. Past performance is no guarantee of future results. The investment return and principal value will fluctuate so that shares, when redeemed, may be worth more or less than the original cost. Please visit www.columbiafunds.com for daily and most recent month-end performance updates.
A "fund of fund" bears its allocable share of the costs and expenses of the underlying funds in which it invests. Such funds are thus subject to two levels of fees and potentially higher expense ratios than would be associated with a fund that invests and trades directly in financial instruments under the direction of a single manager.
Columbia Thermostat Fund fell 6.61% in the second quarter of 2010, outperforming the 11.43% drop in the Fund's primary equity benchmark, the S&P 500 Index, but underperforming the 3.49% gain of the Barclays Capital U.S. Aggregate Bond Index, the Fund's primary debt benchmark. For the six-month period ended June 30, 2010, Columbia Thermostat Fund was off 1.86% vs. a 6.65% drop in the S&P 500 Index and a 5.33% gain for the Barclays Capital U.S. Aggregate Bond Index.
The Fund's bond holdings performed well in a quarter that saw equity markets decline as concerns about the health of the U.S. economy grew. The bond segment had a weighted average return of 2.47% in the quarter and was up 5.01% for the half year. Columbia U.S. Treasury Index Fund was the leading performer in the portfolio for both periods.
On the equity side, losses in the quarter ranged from a 7.68% drop in Columbia Acorn International to a 13.45% decline for Columbia Contrarian Core Fund. The equity component's weighted average loss was 10.54% for the quarter and 5.78% for the half year. For the six-month period, Columbia Acorn Fund held up best with a 3.16% drop while Columbia Contrarian Core Fund was hardest hit with an 8.56% decline.
Columbia Thermostat Fund has provided a sound investment option for these volatile times. By design, the Fund takes advantage of the market's ups and downs to sell stocks on strength and buy them on weakness. The Fund reduced its stock exposure as the market rallied in April, and then hiked stock positions when the market swooned in May. As of June 30, 2010, Columbia Thermostat Fund had about 75% of its assets in stock funds and 25% in bond funds.
Results of the Funds Owned in Columbia Thermostat Fund as of June 30, 2010
| Stock Funds | | Weightings | | 2nd | | Year | |
| Fund | | in category | | quarter | | to date | |
Columbia Acorn
International | | | 20 | % | | | -7.68 | % | | | -4.45 | % | |
Columbia Dividend
Income Fund | | | 20 | % | | | -9.86 | % | | | -5.87 | % | |
| Columbia Acorn Fund | | | 15 | % | | | -9.75 | % | | | -3.16 | % | |
Columbia Marsico
Growth Fund | | | 15 | % | | | -12.75 | % | | | -7.80 | % | |
| Columbia Acorn Select | | | 10 | % | | | -12.36 | % | | | -4.75 | % | |
Columbia Contrarian
Core Fund | | | 10 | % | | | -13.45 | % | | | -8.56 | % | |
Columbia Large Cap
Enhanced Core Fund | | | 10 | % | | | -11.03 | % | | | -6.73 | % | |
Weighted Average
Equity Return/Loss | | | 100 | % | | | -10.54 | % | | | -5.78 | % | |
| Bond Funds | | Weightings | | 2nd | | Year | |
| Fund | | in category | | quarter | | to date | |
Columbia Intermediate
Bond Fund | | | 50 | % | | | 2.10 | % | | | 5.22 | % | |
Columbia U.S. Treasury
Index Fund | | | 30 | % | | | 4.61 | % | | | 5.63 | % | |
Columbia Conservative
High Yield Fund | | | 20 | % | | | 0.19 | % | | | 3.50 | % | |
Weighted Average
Income Return | | | 100 | % | | | 2.47 | % | | | 5.01 | % | |
Columbia Thermostat Fund
Rebalancing in the Second Quarter
| April 15, 2010 | | 65% stocks, 35% bonds | |
| May 17, 2010 | | 75% stocks, 25% bonds | |
| May 21, 2010 | | 80% stocks, 20% bonds | |
| June 21, 2010 | | 75% stocks, 25% bonds | |
The value of an investment in the Fund is based primarily on the performance of the underlying portfolio funds and the allocation of the Fund's assets among them. An investment in the underlying portfolio funds may present certain risks, including stock market fluctuations that occur in response to economic and business developments; and a greater degree of social, political and economic volatility associated with international investing. Stocks of small- and mid-cap companies pose special risks, including possible illiquidity and greater price volatility than stocks of larger, more established companies. Value stocks may also be subject to specific business risks that have caused the stocks to be out of favor. Lower-rated and medium quality debt securities are more speculative and incur more risk. International investing involves special risks, including foreign taxation, currency risks, risks associated with possible differ ences in financial standards and other risks associated with future political and economic developments. Changes in interest rates and changes in the financial strength of issuers of lower-rated bonds may also affect underlying fund performance. The Fund is also subject to the risk that the investment advisor's decisions regarding asset classes and underlying portfolio funds will not anticipate market trends successfully, resulting in a failure to preserve capital or lower total return. In addition, the Fund may buy and sell shares of the portfolio funds frequently. This may result in higher transaction costs and additional tax liability. This is not an offer of the shares of any other mutual fund mentioned herein.
20
Columbia Thermostat Fund (COTZX)
At a Glance
Performance data quoted represents past performance and current performance may be higher or lower. Past performance is no guarantee of future results. The investment return and principal value of an investment in the Fund will fluctuate so that Fund shares, when redeemed, may be worth more or less than their original cost. Performance results reflect any fee waivers or reimbursements of Fund expenses by the investment advisor and/or any of its affiliates. Absent these fee waivers or expense reimbursement arrangements, performance results would have been lower. Please visit columbiafunds.com for daily and most recent month-end updates.
Pretax and After-tax Average Annual Total Returns (Class Z)
through June 30, 2010
| Inception 9/25/02 | | Year
to date* | | 1 year | | 5 years | | Life of fund | |
| Returns before taxes | | | -1.86 | % | | | 20.59 | % | | | 2.44 | % | | | 5.88 | % | |
| Returns after taxes on distributions | | | -2.37 | | | | 19.95 | | | | 0.73 | | | | 4.52 | | |
Returns after taxes on distributions
and sale of fund shares | | | -1.21 | | | | 13.38 | | | | 1.41 | | | | 4.53 | | |
| S&P 500 Index (pretax)** | | | -6.65 | | | | 14.43 | | | | -0.79 | | | | 5.07 | | |
Barclays Capital U.S. Aggregate
Bond Index (pretax)** | | | 5.33 | | | | 9.50 | | | | 5.54 | | | | 5.21 | | |
Lipper Flexible Portfolio Funds
Index (pretax) | | | -3.81 | | | | 15.48 | | | | 2.78 | | | | 6.48 | | |
All results shown assume reinvestment of distributions.
*Year to date data is not annualized.
**The Fund's primary stock and bond benchmarks, respectively.
After-tax returns are calculated using the highest historical individual federal marginal income tax rates, and do not reflect the impact of state and local taxes. Returns after taxes on distributions and sale of Fund shares reflect the additional tax impact of long-term gains or losses realized when Fund shares are sold. The returns are taxed at the maximum rate and assume shares were purchased at the beginning of the period. Actual after-tax returns depend on the investor's tax situation and may differ from those shown. After-tax returns are not relevant to investors who hold their Fund shares through tax-deferred arrangements such as 401(k) plans or individual retirement accounts. After-tax returns are shown for Class Z shares only; after-tax returns for other share classes will vary. Indexes do not reflect any deduction for fees, expenses or taxes.
The Fund's Class Z annual operating expense ratio, as stated in the current prospectus, reflects a contractual expense waiver or reimbursement that expires April 30, 2011. Expense ratios without and with the contractual waiver, including fees and expenses associated with the Fund's investment in other investment companies, are 1.21% and 1.07%, respectively. Absent the waiver or reimbursement, performance results would have been lower.
Columbia Thermostat Fund Asset Allocation
as a percentage of net assets, as of 6/30/10
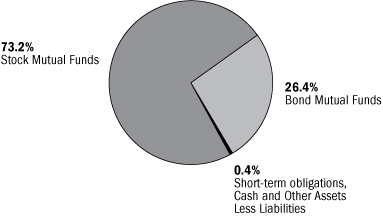
Columbia Thermostat Fund Portfolio Weightings
as a percentage of assets in each investment category, as of 6/30/10
Stock Mutual Funds
| Columbia Acorn International, Class Z | | | 20 | % | |
| Columbia Dividend Income Fund, Class Z | | | 20 | % | |
| Columbia Acorn Fund, Class Z | | | 15 | % | |
| Columbia Marsico Growth Fund, Class Z | | | 15 | % | |
| Columbia Acorn Select, Class Z | | | 10 | % | |
| Columbia Contrarian Core Fund, Class Z | | | 10 | % | |
| Columbia Large Cap Enhanced Core Fund, Class Z | | | 10 | % | |
Bond Mutual Funds
| Columbia Intermediate Bond Fund, Class Z | | | 50 | % | |
| Columbia U.S. Treasury Index Fund, Class Z | | | 30 | % | |
| Columbia Conservative High Yield Fund, Class Z | | | 20 | % | |
The Growth of a $10,000 Investment in Columbia Thermostat Fund (Class Z)
September 25, 2002 through June 30, 2010
This graph compares the results of $10,000 invested in Columbia Thermostat Fund at inception on September 25, 2002 to the S&P 500 Index, the Barclays Capital U.S. Aggregate Bond Index and the Lipper Flexible Portfolio Funds Index ("Lipper Index"). Although the indexes are provided for use in assessing the Fund's performance, the Fund's holdings differ significantly from those in the indexes. The Indexes are unmanaged (although the Funds that comprise the Lipper Index are managed) and returns for the indexes and the Fund include reinvested dividends and capital gains. It is not possible to invest directly in an index. The graph does not reflect taxes that a shareholder would pay on Fund distributions or on a sale of Fund shares.
Total Net Assets of the Fund: $117.1 million
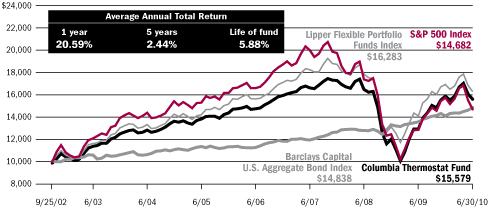
21
Columbia Acorn Fund
Major Portfolio Changes in the Second Quarter (Unaudited)
| | | Number of Shares | |
| | | 03/31/10 | | 06/30/10 | |
| Purchases | |
| Information | |
| AboveNet | | | 600,000 | | | | 1,000,000 | | |
| ANSYS | | | 2,083,291 | | | | 2,100,000 | | |
| Atmel | | | 4,600,000 | | | | 5,840,000 | | |
| Constant Contact | | | 684,245 | | | | 1,400,000 | | |
| Entegris | | | 3,750,000 | | | | 4,500,000 | | |
| FTI Consulting | | | 650,000 | | | | 900,000 | | |
| Jack Henry & Associates | | | 0 | | | | 920,000 | | |
| Monolithic Power Systems | | | 960,000 | | | | 1,000,000 | | |
| NetSuite | | | 1,249,115 | | | | 1,800,000 | | |
| ON Semiconductor | | | 3,214,000 | | | | 3,440,000 | | |
| Terremark Worldwide | | | 0 | | | | 1,000,000 | | |
| Tyler Technologies | | | 1,842,218 | | | | 2,032,845 | | |
| Virtusa | | | 1,926,700 | | | | 2,000,000 | | |
| WNS - ADR (India) | | | 933,334 | | | | 1,000,000 | | |
| Industrial Goods & Services | |
| Aalberts Industries (Netherlands) | | | 2,200,000 | | | | 2,225,287 | | |
| Acuity Brands | | | 1,300,000 | | | | 1,440,000 | | |
| Clean Harbors | | | 180,000 | | | | 280,000 | | |
| Generac | | | 1,447,115 | | | | 1,600,000 | | |
| GrafTech International | | | 1,680,000 | | | | 1,980,000 | | |
| Kansai Paint (Japan) | | | 2,024,000 | | | | 2,200,000 | | |
| Kennametal | | | 0 | | | | 1,200,000 | | |
Mills Estruturas e Servicios de
Engenha (Brazil) | | | 0 | | | | 1,800,000 | | |
| Nordson | | | 1,178,724 | | | | 1,500,000 | | |
| Spartan Motors | | | 0 | | | | 900,000 | | |
| Consumer Goods & Services | |
| Charming Shoppes | | | 7,500,000 | | | | 9,800,000 | | |
| Coldwater Creek | | | 4,528,738 | | | | 4,950,442 | | |
| Dress Barn | | | 0 | | | | 1,200,000 | | |
| Express | | | 0 | | | | 1,008,000 | | |
IFM Investments (Century 21
China RE) - ADR (China) | | | 1,195,400 | | | | 1,325,000 | | |
| Jarden | | | 1,470,000 | | | | 1,720,000 | | |
| Jones Apparel Group | | | 0 | | | | 225,000 | | |
| Kenneth Cole Productions | | | 0 | | | | 400,000 | | |
Lifestyle International
(Hong Kong) | | | 12,738,300 | | | | 14,000,000 | | |
| Localiza Rent A Car (Brazil) | | | 0 | | | | 1,100,000 | | |
| Pier 1 Imports | | | 3,000,000 | | | | 4,500,000 | | |
| Rue21 | | | 495,000 | | | | 1,034,000 | | |
| Talbots | | | 4,250,000 | | | | 4,900,000 | | |
| Tesla | | | 0 | | | | 294,000 | | |
| True Religion Apparel | | | 2,175,000 | | | | 2,475,000 | | |
| Wet Seal | | | 2,984,430 | | | | 5,000,000 | | |
| Finance | |
| Associated Banc-Corp | | | 3,737,900 | | | | 5,063,800 | | |
| City National | | | 445,000 | | | | 745,000 | | |
| | | Number of Shares | |
| | | 03/31/10 | | 06/30/10 | |
| Valley National Bancorp | | | 5,718,205 | | | | 6,004,115 | | |
| Whitney Holding | | | 849,562 | | | | 1,600,000 | | |
| Health Care | |
| Acorda Therapeutics | | | 1,300,000 | | | | 1,500,000 | | |
| AMAG Pharmaceuticals | | | 900,000 | | | | 1,100,000 | | |
| Amylin Pharmaceuticals | | | 0 | | | | 1,055,762 | | |
| Array Biopharma | | | 0 | | | | 3,500,000 | | |
| HMS Holdings | | | 0 | | | | 400,000 | | |
| Idenix Pharmaceuticals | | | 0 | | | | 1,917,820 | | |
| Isis Pharmaceuticals | | | 1,048,600 | | | | 2,261,347 | | |
| Micromet | | | 2,500,000 | | | | 3,463,611 | | |
| Nektar Therapeutics | | | 3,052,000 | | | | 3,300,000 | | |
| NPS Pharmaceuticals | | | 2,749,973 | | | | 3,112,776 | | |
| Seattle Genetics | | | 4,123,200 | | | | 4,951,226 | | |
| Sirona Dental Systems | | | 1,050,000 | | | | 1,500,000 | | |
| The Medicines Company | | | 0 | | | | 1,750,000 | | |
| Xenoport | | | 0 | | | | 2,100,000 | | |
| Energy & Minerals | |
| Alexco Resource | | | 1,500,000 | | | | 2,400,000 | | |
| Baytex (Canada) | | | 347,600 | | | | 650,000 | | |
| Black Diamond Group (Canada) | | | 0 | | | | 500,000 | | |
| Canacol Energy (Colombia) | | | 0 | | | | 6,300,000 | | |
| Core Laboratories (Netherlands) | | | 290,000 | | | | 348,000 | | |
| Gulfmark Offshore | | | 0 | | | | 308,303 | | |
| Oasis Petroleum | | | 0 | | | | 228,200 | | |
| Pan American Silver (Canada) | | | 450,000 | | | | 880,000 | | |
| Petrolifera Petroleum (Colombia) | | | 0 | | | | 8,000,000 | | |
| Petromanas (Canada) | | | 0 | | | | 37,500,000 | | |
| Rosetta Resources | | | 425,000 | | | | 779,000 | | |
| St. Mary Land & Exploration | | | 0 | | | | 715,000 | | |
| Tahoe Resources (Canada) | | | 0 | | | | 236,400 | | |
| Other Industries | |
| BioMed Realty Trust | | | 3,700,000 | | | | 4,000,000 | | |
| Dupont Fabros Technology | | | 0 | | | | 900,000 | | |
| Education Realty Trust | | | 0 | | | | 3,000,000 | | |
| World Fuel Services | | | 925,000 | | | | 1,110,000 | | |
See accompanying notes to financial statements.
22
| | | Number of Shares | |
| | | 03/31/10 | | 06/30/10 | |
| Sales | |
| Information | |
| Amphenol | | | 3,800,000 | | | | 3,750,000 | | |
| Cogent Communications | | | 4,200,000 | | | | 3,400,000 | | |
| Crown Castle International | | | 6,575,000 | | | | 6,300,000 | | |
| Global Payments | | | 2,919,000 | | | | 2,429,000 | | |
| Hexagon (Sweden) | | | 5,200,000 | | | | 5,070,000 | | |
Hong Kong Exchanges and
Clearing (Hong Kong) | | | 2,125,000 | | | | 1,790,000 | | |
| Informatica | | | 6,100,000 | | | | 5,200,000 | | |
| Integrated Device Technology | | | 2,110,000 | | | | 1,460,000 | | |
Jupiter Telecommunications
(Japan) | | | 39,926 | | | | 17,770 | | |
| Mediacom Communications | | | 4,000,000 | | | | 3,000,000 | | |
| Sanmina-SCI | | | 2,950,000 | | | | 2,800,000 | | |
| SES (France) | | | 702,000 | | | | 0 | | |
| Singapore Exchange (Singapore) | | | 10,000,000 | | | | 8,000,000 | | |
| Teradata | | | 220,000 | | | | 0 | | |
| VisionChina Media - ADR (China) | | | 2,194,499 | | | | 1,500,000 | | |
| Zebra Technologies | | | 1,590,000 | | | | 1,505,000 | | |
| Industrial Goods & Services | |
| Crown Holdings | | | 400,000 | | | | 0 | | |
| Drew Industries | | | 1,400,000 | | | | 1,260,000 | | |
Expeditors International of
Washington | | | 3,300,000 | | | | 3,200,000 | | |
| M/I Homes | | | 384,000 | | | | 284,000 | | |
| Martin Marietta Materials | | | 615,000 | | | | 350,000 | | |
| Mine Safety Appliances | | | 1,975,000 | | | | 1,700,000 | | |
| Mobile Mini | | | 1,750,000 | | | | 1,600,000 | | |
| Novozymes (Denmark) | | | 363,000 | | | | 340,000 | | |
| Oshkosh | | | 2,350,000 | | | | 2,200,000 | | |
| Pall | | | 2,150,000 | | | | 1,800,000 | | |
| Quanta Services | | | 1,970,000 | | | | 1,950,000 | | |
| Serco (United Kingdom) | | | 3,000,000 | | | | 2,900,000 | | |
| Simpson Manufacturing | | | 850,000 | | | | 700,000 | | |
Sociedad Quimica y Minera
de Chile - ADR (Chile) | | | 2,000,000 | | | | 1,750,000 | | |
| UTI Worldwide | | | 1,500,000 | | | | 1,000,000 | | |
| Waste Connections | | | 1,200,000 | | | | 1,115,000 | | |
| Watsco | | | 550,000 | | | | 350,000 | | |
| WW Grainger | | | 1,000,000 | | | | 900,000 | | |
| Consumer Goods & Services | |
| Abercrombie & Fitch | | | 3,100,000 | | | | 2,835,000 | | |
| Avis Budget Group | | | 4,700,000 | | | | 4,600,000 | | |
| Choice Hotels | | | 1,100,000 | | | | 970,000 | | |
| Coach | | | 2,800,000 | | | | 2,100,000 | | |
| Expedia | | | 4,600,000 | | | | 4,500,000 | | |
| Gaylord Entertainment | | | 4,000,000 | | | | 3,128,400 | | |
| Helen of Troy | | | 1,700,000 | | | | 1,600,000 | | |
| ITT Educational Services | | | 1,250,000 | | | | 1,030,000 | | |
| | | Number of Shares | |
| | | 03/31/10 | | 06/30/10 | |
| J Crew Group | | | 2,564,000 | | | | 2,219,000 | | |
| Lifetime Fitness | | | 2,150,000 | | | | 1,960,000 | | |
| lululemon athletica | | | 4,685,000 | | | | 4,135,000 | | |
New Oriental Education &
Technology - ADR (China) | | | 300,000 | | | | 230,000 | | |
| P.F. Chang's China Bistro | | | 650,000 | | | | 370,000 | | |
| Princeton Review | | | 3,000,000 | | | | 2,970,000 | | |
| Saks | | | 6,100,000 | | | | 5,225,000 | | |
| SkillSoft - ADR | | | 9,500,000 | | | | 0 | | |
| Smart Balance | | | 3,000,000 | | | | 2,000,000 | | |
| Steelcase | | | 3,000,000 | | | | 1,355,500 | | |
| Thor Industries | | | 1,240,000 | | | | 1,190,000 | | |
| Urban Outfitters | | | 3,805,000 | | | | 3,005,000 | | |
| Finance | |
| AmeriCredit | | | 7,235,000 | | | | 7,085,000 | | |
| Assurant | | | 1,200,000 | | | | 700,000 | | |
| Berkshire Hills Bancorp | | | 234,693 | | | | 65,991 | | |
| Cullen/Frost Bankers | | | 640,000 | | | | 240,000 | | |
| GATX | | | 1,530,000 | | | | 1,480,000 | | |
| H&E Equipment Services | | | 3,300,000 | | | | 3,033,300 | | |
| HCC Insurance Holdings | | | 1,777,995 | | | | 1,200,000 | | |
Housing Development Finance
(India) | | | 450,000 | | | | 325,000 | | |
| People's United | | | 3,200,000 | | | | 0 | | |
| SEI Investments | | | 6,448,000 | | | | 6,198,000 | | |
| SVB Financial Group | | | 1,360,000 | | | | 1,260,000 | | |
| TriCo Bancshares | | | 1,200,000 | | | | 1,100,000 | | |
| World Acceptance | | | 1,532,600 | | | | 1,505,202 | | |
| Health Care | |
| Auxilium Pharmaceuticals | | | 1,350,000 | | | | 751,601 | | |
| Beckman Coulter | | | 350,000 | | | | 0 | | |
| BioMarin | | | 3,250,000 | | | | 3,205,000 | | |
| Charles River Laboratories | | | 500,000 | | | | 0 | | |
| Emdeon | | | 800,000 | | | | 0 | | |
| Healthcare Services Group | | | 850,000 | | | | 0 | | |
| Healthspring | | | 157,904 | | | | 0 | | |
| Human Genome Sciences | | | 1,800,000 | | | | 1,100,000 | | |
| Idexx Laboratories | | | 665,000 | | | | 500,000 | | |
| Illumina | | | 1,300,000 | | | | 1,100,000 | | |
| Immucor | | | 1,000,000 | | | | 980,503 | | |
| InterMune | | | 780,000 | | | | 0 | | |
| Ironwood Pharmaceuticals | | | 440,000 | | | | 0 | | |
| Kinetic Concepts | | | 800,000 | | | | 306,696 | | |
| Onyx Pharmaceuticals | | | 800,000 | | | | 639,920 | | |
| Psychiatric Solutions | | | 872,391 | | | | 0 | | |
| QIAGEN (Netherlands) | | | 1,675,000 | | | | 1,435,000 | | |
| United Therapeutics | | | 660,000 | | | | 560,000 | | |
See accompanying notes to financial statements.
23
Columbia Acorn Fund
Major Portfolio Changes in the Second Quarter (Unaudited), continued
| | | Number of Shares | |
| | | 03/31/10 | | 06/30/10 | |
| Sales (continued) | |
| Energy & Minerals | |
| Carrizo Oil & Gas | | | 900,000 | | | | 583,000 | | |
| Dockwise (Norway) | | | 156,655 | | | | 0 | | |
| Fugro (Netherlands) | | | 2,809,568 | | | | 2,570,626 | | |
| Gran Tierra Energy (Colombia) | | | 4,000,000 | | | | 1,400,000 | | |
| Oceaneering International | | | 1,000,000 | | | | 275,000 | | |
| Silver Wheaton (Canada) | | | 2,700,000 | | | | 2,450,000 | | |
| Southwestern Energy | | | 2,975,000 | | | | 2,160,000 | | |
| St. Mary Land & Exploration | | | 285,000 | | | | 0 | | |
| Tetra Technologies | | | 600,000 | | | | 0 | | |
| Ultra Petroleum | | | 975,000 | | | | 910,000 | | |
| Vaalco Energy | | | 1,500,000 | | | | 750,000 | | |
| Other Industries | |
| American Campus Communities | | | 900,000 | | | | 0 | | |
| Ascendas REIT (Singapore) | | | 22,000,000 | | | | 15,000,000 | | |
| Digital Realty Trust | | | 850,000 | | | | 770,000 | | |
| Northeast Utilities | | | 2,200,000 | | | | 1,500,000 | | |
| Old Dominion Freight Lines | | | 150,000 | | | | 100,000 | | |
| Red Eléctrica de Espana (Spain) | | | 500,000 | | | | 333,000 | | |
| SL Green Realty | | | 440,000 | | | | 150,000 | | |
See accompanying notes to financial statements.
24
Columbia Acorn Fund
Statement of Investments (Unaudited), June 30, 2010
| Number of Shares | | | | Value (000) | |
| | | | | | | | Equities: 95.7% | | |
| Information 25.6% | | | |
| | | > Business Software 5.4% | |
| | 5,200,000 | | | Informatica (a)(b) | | $ | 124,176 | | |
| | | | | Enterprise Data Integration Software | | | | | |
| | 2,100,000 | | | ANSYS (a) | | | 85,197 | | |
| | | | | Simulation Software for Engineers & Designers | | | | | |
| | 2,440,544 | | | Micros Systems (a) | | | 77,780 | | |
| | | | | Information Systems for Restaurants & Hotels | | | | | |
| | 12,500,000 | | | Novell (a) | | | 71,000 | | |
| | | | | Directory, Operating System & Identity
Management Software | | | | | |
| | 1,100,000 | | | Quality Systems | | | 63,789 | | |
| | | | | IT Systems for Medical Groups & Ambulatory
Care Centers | | | | | |
| | 2,250,000 | | | Blackbaud (b) | | | 48,982 | | |
| | | | | Software & Services for Non-profits | | | | | |
| | 1,035,000 | | | Concur Technologies (a) | | | 44,174 | | |
| | | | | Web Enabled Cost & Expense
Management Software | | | | | |
| | 2,032,845 | | | Tyler Technologies (a)(b) | | | 31,550 | | |
| | | | | Financial, Tax, Court & Document
Management Systems for Local Governments | | | | | |
| | 1,400,000 | | | Constant Contact (a)(c) | | | 29,862 | | |
| | | | | E-mail & Other Marketing Campaign
Management Systems Delivered Over the Web | | | | | |
| | 2,425,000 | | | Kenexa (a)(b) | | | 29,100 | | |
| | | | | Recruiting & Workforce Management Solutions | | | | | |
| | 1,000,000 | | | Red Hat (a) | | | 28,940 | | |
| | | | | Maintenance & Support for Open
Source & Middleware | | | | | |
| | 700,000 | | | Blackboard (a) | | | 26,131 | | |
| | | | | Education Software | | | | | |
| | 1,800,000 | | | NetSuite (a)(c) | | | 22,752 | | |
| | | | | End to End IT Systems Solutions Delivered
Over the Web | | | | | |
| | 920,000 | | | Jack Henry & Associates | | | 21,970 | | |
| | | | | Systems Financial Institutions | | | | | |
| | 3,700,000 | | | Actuate (a)(b) | | | 16,465 | | |
| | | | | Information Delivery Software & Solutions | | | | | |
| | 4,800,000 | | | Art Technology Group (a) | | | 16,416 | | |
| | | | | Software & Tools to Optimize Websites
for E-Commerce | | | | | |
| | 700,000 | | | Avid Technology (a) | | | 8,911 | | |
| | | | | Digital Nonlinear Editing Software & Systems | | | | | |
| | 1,000,000 | | | InContact (a) | | | 2,450 | | |
| | | | | Call Center Systems Delivered via the Web &
Telecommunications Services | | | | | |
| | | | 749,645 | | |
| | | > Computer Hardware & Related
Equipment 2.7% | |
| | 3,750,000 | | | Amphenol | | | 147,300 | | |
| | | | | Electronic Connectors | | | | | |
| | 1,140,000 | | | Dolby Laboratories (a) | | | 71,466 | | |
| | | | | Audio Technology for Consumer Electronics | | | | | |
| | 2,225,000 | | | II-VI (a)(b) | | | 65,927 | | |
| | | | | Laser Optics & Specialty Materials | | | | | |
| | 1,505,000 | | | Zebra Technologies (a) | | | 38,182 | | |
| | | | | Bar Code Printers | | | | | |
| | 800,000 | | | Nice Systems - ADR (Israel) (a) | | | 20,392 | | |
| | | | | Audio & Video Recording Solutions | | | | | |
| Number of Shares | | | | Value (000) | |
| | 970,000 | | | Netgear (a) | | $ | 17,305 | | |
| | | | | Networking Products for Small Business & Home | | | | | |
| | 605,000 | | | Stratasys (a)(c) | | | 14,859 | | |
| | | | | Rapid Prototyping Systems | | | | | |
| | | | 375,431 | | |
| | | > Instrumentation 2.7% | |
| | 1,600,000 | | | Mettler Toledo (a) | | | 178,608 | | |
| | | | | Laboratory Equipment | | | | | |
| | 5,070,000 | | | Hexagon (Sweden) | | | 66,019 | | |
| | | | | Measurement Equipment | | | | | |
| | 1,545,000 | | | Trimble Navigation (a) | | | 43,260 | | |
| | | | | GPS-based Instruments | | | | | |
| | 2,275,000 | | | IPG Photonics (a) | | | 34,648 | | |
| | | | | Fiber Lasers | | | | | |
| | 300,000 | | | Dionex (a) | | | 22,338 | | |
| | | | | Ion & Liquid Chromatography | | | | | |
| | 600,000 | | | FLIR Systems (a) | | | 17,454 | | |
| | | | | Infrared Cameras | | | | | |
| | 400,000 | | | Hamamatsu Photonics (Japan) | | | 11,126 | | |
| | | | | Optical Sensors for Medical &
Industrial Applications | | | | | |
| | | | 373,453 | | |
| | | > Mobile Communications 2.5% | |
| | 6,300,000 | | | Crown Castle International (a) | | | 234,738 | | |
| | | | | Communications Towers | | | | | |
| | 3,150,000 | | | SBA Communications (a) | | | 107,131 | | |
| | | | | Communications Towers | | | | | |
| | 1,000,000 | | | MetroPCS Communications (a) | | | 8,190 | | |
| | | | | Discount Cellular Telephone Services | | | | | |
| | 1,500,000 | | | Globalstar (a)(c) | | | 2,310 | | |
| | | | | Satellite Mobile Voice & Data Carrier | | | | | |
| | | | 352,369 | | |
| | | > Telephone and Data Services 2.0% | |
| | 9,500,000 | | | tw telecom (a)(b) | | | 158,460 | | |
| | | | | Fiber Optic Telephone/Data Services | | | | | |
| | 1,000,000 | | | AboveNet (a) | | | 47,180 | | |
| | | | | Metropolitan Fiber Communications Services | | | | | |
| | 9,600,000 | | | PAETEC Holding (a)(b) | | | 32,736 | | |
| | | | | Telephone/Data Services for Business | | | | | |
| | 3,400,000 | | | Cogent Communications (a)(b) | | | 25,772 | | |
| | | | | Internet Data Pipelines | | | | | |
| | 2,000,000 | | | General Communications (a) | | | 15,180 | | |
| | | | | Commercial Communications & Consumer
CATV, Web & Phone in Alaska | | | | | |
| | | | 279,328 | | |
| | | > Telecommunications Equipment 1.5% | |
| | 1,045,000 | | | F5 Networks (a) | | | 71,656 | | |
| | | | | Internet Traffic Management Equipment | | | | | |
| | 1,745,000 | | | Polycom (a) | | | 51,983 | | |
| | | | | Video Conferencing Equipment | | | | | |
| | 1,660,000 | | | Blue Coat Systems (a) | | | 33,914 | | |
| | | | | WAN Acceleration & Network Security | | | | | |
| | 1,165,000 | | | CommScope (a) | | | 27,692 | | |
| | | | | Wireless Infrastructure Equipment &
Telecom Cable | | | | | |
| | 1,715,000 | | | Finisar (a)(c) | | | 25,553 | | |
| | | | | Optical Sub-systems & Components | | | | | |
| | | | 210,798 | | |
See accompanying notes to financial statements.
25
Columbia Acorn Fund
Statement of Investments (Unaudited), continued
| Number of Shares | | | | Value (000) | |
| | | > Semiconductors &
Related Equipment 1.4% | |
| | 5,840,000 | | | Atmel (a) | | $ | 28,032 | | |
| | | | | Microcontrollers, RF & Memory Semiconductors | | | | | |
| | 1,035,000 | | | Supertex (a)(b) | | | 25,523 | | |
| | | | | Analog/Mixed-signal Semiconductors | | | | | |
| | 1,620,000 | | | Microsemi (a) | | | 23,701 | | |
| | | | | Analog/Mixed-signal Semiconductors | | | | | |
| | 3,440,000 | | | ON Semiconductor (a) | | | 21,947 | | |
| | | | | Mixed-signal & Power Management
Semiconductors | | | | | |
| | 4,500,000 | | | Entegris (a) | | | 17,865 | | |
| | | | | Semiconductor Materials Management Products | | | | | |
| | 1,000,000 | | | Monolithic Power Systems (a) | | | 17,860 | | |
| | | | | High Performance Analog & Mixed-signal
Integrated Circuits (ICs) | | | | | |
| | 1,765,000 | | | Pericom Semiconductor (a)(b) | | | 16,944 | | |
| | | | | Interface Integrated Circuits (ICs) & Frequency
Control Products | | | | | |
| | 1,900,000 | | | IXYS (a)(b) | | | 16,796 | | |
| | | | | Power Semiconductors | | | | | |
| | 500,000 | | | Littelfuse (a) | | | 15,805 | | |
| | | | | Little Fuses | | | | | |
| | 1,460,000 | | | Integrated Device Technology (a) | | | 7,227 | | |
| | | | | Communications Semiconductors | | | | | |
| | | | 191,700 | | |
| | | > Computer Services 1.3% | |
| | 5,000,000 | | | iGate (b) | | | 64,100 | | |
| | | | | IT & BPO (Business Process Outsourcing)
Services | | | | | |
| | 2,105,000 | | | SRA International (a) | | | 41,405 | | |
| | | | | Government IT Services | | | | | |
| | 1,340,000 | | | Acxiom (a) | | | 19,685 | | |
| | | | | Database Marketing Services | | | | | |
| | 2,000,000 | | | Virtusa (a)(b) | | | 18,660 | | |
| | | | | Offshore IT Outsourcing | | | | | |
| | 1,045,000 | | | ExlService Holdings (a) | | | 17,943 | | |
| | | | | BPO (Business Process Outsourcing) | | | | | |
| | 4,500,000 | | | Hackett Group (a)(b) | | | 12,645 | | |
| | | | | IT Integration & Best Practice Research | | | | | |
| | 1,000,000 | | | WNS - ADR (India) (a) | | | 11,740 | | |
| | | | | Offshore BPO (Business Process Outsourcing)
Services | | | | | |
| | | | 186,178 | | |
| | | > CATV 1.2% | |
| | 3,000,000 | | | Discovery Communications, Series C (a) | | | 92,790 | | |
| | | | | CATV Programming | | | | | |
| | 1,250,000 | | | Liberty Global, Series A (a) | | | 32,488 | | |
| | | | | Cable TV Franchises Outside the USA | | | | | |
| | 3,000,000 | | | Mediacom Communications (a)(b) | | | 20,160 | | |
| | | | | Cable TV Franchises | | | | | |
| | 17,770 | | | Jupiter Telecommunications (Japan) | | | 16,935 | | |
| | | | | Largest Cable Service Provider in Japan | | | | | |
| | | | 162,373 | | |
| | | > Financial Processors 1.1% | |
| | 2,429,000 | | | Global Payments | | | 88,756 | | |
| | | | | Credit Card Processor | | | | | |
| | 8,000,000 | | | Singapore Exchange (Singapore) | | | 41,861 | | |
| | | | | Singapore Equity & Derivatives
Market Operator | | | | | |
| Number of Shares | | | | Value (000) | |
| | 1,790,000 | | | Hong Kong Exchanges and Clearing
(Hong Kong) | | $ | 27,957 | | |
| | | | | Hong Kong Equity & Derivatives
Market Operator | | | | | |
| | | | 158,574 | | |
| | | > Gaming Equipment & Services 1.1% | |
| | 4,025,000 | | | Bally Technologies (a)(b) | | | 130,370 | | |
| | | | | Slot Machines & Software | | | | | |
| | 380,000 | | | WMS Industries (a) | | | 14,915 | | |
| | | | | Slot Machine Provider | | | | | |
| | | | 145,285 | | |
| | | > Internet Related 0.8% | |
| | 435,000 | | | Equinix (a) | | | 35,331 | | |
| | | | | Network Neutral Data Centers | | | | | |
| | 800,000 | | | Akamai (a) | | | 32,456 | | |
| | | | | Content Delivery Network (CDN) for Better
Delivery of Online Content | | | | | |
| | 188,000 | | | NHN (South Korea) (a) | | | 27,978 | | |
| | | | | South Korea's Largest Online Search Engine | | | | | |
| | 1,000,000 | | | Terremark Worldwide (a) | | | 7,810 | | |
| | | | | Data Center Colocation & IT Managed
Services Provider | | | | | |
| | 1,000,000 | | | TheStreet.com | | | 2,880 | | |
| | | | | Financial Information Websites | | | | | |
| | | | 106,455 | | |
| | | > Contract Manufacturing 0.6% | |
| | 1,605,000 | | | Plexus (a) | | | 42,918 | | |
| | | | | Electronic Manufacturing Services | | | | | |
| | 2,800,000 | | | Sanmina-SCI (a) | | | 38,108 | | |
| | | | | Electronic Manufacturing Services | | | | | |
| | | | 81,026 | | |
| | | > Electronics Distribution 0.5% | |
| | 3,125,000 | | | Avnet (a) | | | 75,344 | | |
| | | | | Electronic Components Distribution | | | | | |
| | | | 75,344 | | |
| | | > Business Information &
Marketing Services 0.5% | |
| | 900,000 | | | FTI Consulting (a) | | | 39,231 | | |
| | | | | Financial Consulting Firm | | | | | |
| | 2,700,000 | | | Navigant Consulting (a)(b) | | | 28,026 | | |
| | | | | Financial Consulting Firm | | | | | |
| | 700,000 | | | InfoGROUP (a) | | | 5,586 | | |
| | | | | Business Data for Sales Leads | | | | | |
| | | | 72,843 | | |
| | | > Consumer Software 0.1% | |
| | 3,500,000 | | | THQ (a)(b) | | | 15,120 | | |
| | | | | Entertainment Software | | | | | |
| | | | 15,120 | | |
| | | > Radio 0.1% | |
| | 1,541,000 | | | Salem Communications (a)(b) | | | 5,717 | | |
| | | | | Radio Stations for Religious Programming | | | | | |
| | 164,991 | | | Saga Communications (a) | | | 3,940 | | |
| | | | | Radio Stations in Small & Mid-sized Cities | | | | | |
| | 2,400,000 | | | Spanish Broadcasting System (a)(b) | | | 2,736 | | |
| | | | | Spanish Language Radio Stations | | | | | |
| | | | 12,393 | | |
See accompanying notes to financial statements.
26
| Number of Shares | | | | Value (000) | |
| | | > TV Broadcasting 0.1% | |
| | 2,500,000 | | | Entravision Communications (a) | | $ | 5,275 | | |
| | | | | Spanish Language TV & Radio Stations | | | | | |
| | 1,750,000 | | | Gray Television (a) | | | 4,217 | | |
| | | | | Mid-market Affiliated TV Stations | | | | | |
| | | | 9,492 | | |
| | | > Advertising —% | |
| | 1,500,000 | | | VisionChina Media - ADR (China) (a) | | | 4,500 | | |
| | | | | Advertising on Digital Screens in China's
Mass Transit System | | | | | |
| | | | 4,500 | | |
| Information: Total | | | 3,562,307 | | |
| Industrial Goods & Services 16.9% | | | |
| | | > Machinery 8.3% | |
| | 4,500,000 | | | Ametek | | | 180,675 | | |
| | | | | Aerospace/Industrial Instruments | | | | | |
| | 4,200,000 | | | Donaldson (b) | | | 179,130 | | |
| | | | | Industrial Air Filtration | | | | | |
| | 3,100,000 | | | Pentair | | | 99,820 | | |
| | | | | Pumps & Water Treatment | | | | | |
| | 2,565,000 | | | Clarcor (b) | | | 91,109 | | |
| | | | | Mobile & Industrial Filters | | | | | |
| | 1,500,000 | | | Nordson | | | 84,120 | | |
| | | | | Dispensing Systems for Adhesives & Coatings | | | | | |
| | 2,200,000 | | | Oshkosh (a) | | | 68,552 | | |
| | | | | Specialty Truck Manufacturer | | | | | |
| | 1,800,000 | | | Pall | | | 61,866 | | |
| | | | | Filtration & Fluids Clarification | | | | | |
| | 2,200,000 | | | ESCO Technologies (b) | | | 56,650 | | |
| | | | | Automatic Electric Meter Readers | | | | | |
| | 1,660,000 | | | MOOG (a) | | | 53,502 | | |
| | | | | Motion Control Products for Aerospace,
Defense & Industrial Markets | | | | | |
| | 1,300,000 | | | Kaydon | | | 42,718 | | |
| | | | | Specialized Friction & Motion Control Products | | | | | |
| | 1,700,000 | | | Mine Safety Appliances | | | 42,126 | | |
| | | | | Safety Equipment | | | | | |
| | 1,531,250 | | | HEICO (b) | | | 41,267 | | |
| | | | | FAA Approved Aircraft Replacement Parts | | | | | |
| | 805,000 | | | Toro | | | 39,542 | | |
| | | | | Turf Maintenance Equipment | | | | | |
| | 1,200,000 | | | Kennametal | | | 30,516 | | |
| | | | | Consumable Cutting Tools | | | | | |
| | 600,000 | | | Wabtec | | | 23,934 | | |
| | | | | Freight & Transit Component Supplier | | | | | |
| | 1,000,000 | | | Jain Irrigation Systems (India) | | | 22,901 | | |
| | | | | Agricultural Micro-irrigation Systems &
Food Processing | | | | | |
| | 1,600,000 | | | Generac (a) | | | 22,416 | | |
| | | | | Stand-by Power Generators | | | | | |
| | 175,000 | | | Neopost (France) | | | 12,664 | | |
| | | | | Postage Meter Machines | | | | | |
| | 900,000 | | | Spartan Motors | | | 3,780 | | |
| | | | | Specialty Truck & Chassis Manufacturer | | | | | |
| | | | 1,157,288 | | |
| Number of Shares | | | | Value (000) | |
| | | > Industrial Materials &
Specialty Chemicals 2.4% | |
| | 1,530,000 | | | Albemarle | | $ | 60,756 | | |
| | | | | Refinery Catalysts & Other Specialty Chemicals | | | | | |
| | 1,750,000 | | | Sociedad Quimica y Minera de
Chile - ADR (Chile) | | | 57,068 | | |
| | | | | Producer of Specialty Fertilizers,
Lithium & Iodine | | | | | |
| | 1,800,000 | | | Nalco Holding Company | | | 36,828 | | |
| | | | | Provider of Water Treatment & Process
Chemicals & Services | | | | | |
| | 340,000 | | | Novozymes (Denmark) | | | 36,087 | | |
| | | | | Industrial Enzymes | | | | | |
| | 1,260,000 | | | Drew Industries (a)(b) | | | 25,452 | | |
| | | | | RV & Manufactured Home Components | | | | | |
| | 741,000 | | | Mersen (France) (c) | | | 25,269 | | |
| | | | | Advanced Industrial Materials | | | | | |
| | 13,900 | | | Sika (Switzerland) | | | 24,566 | | |
| | | | | Chemicals for Construction & Industrial
Applications | | | | | |
| | 350,000 | | | Greif | | | 19,439 | | |
| | | | | Industrial Packaging | | | | | |
| | 2,200,000 | | | Kansai Paint (Japan) | | | 18,828 | | |
| | | | | Paint Producer in Japan, India, China &
Southeast Asia | | | | | |
| | 1,000,000 | | | Albany International | | | 16,190 | | |
| | | | | Paper Machine Clothing & Advanced Textiles | | | | | |
| | 400,000 | | | Silgan Holdings | | | 11,352 | | |
| | | | | Metal & Plastic Packaging | | | | | |
| | | | 331,835 | | |
| | | > Other Industrial Services 1.7% | |
| | 3,200,000 | | | Expeditors International
of Washington | | | 110,432 | | |
| | | | | International Freight Forwarder | | | | | |
| | 1,491,095 | | | Imtech (Netherlands) | | | 38,250 | | |
| | | | | Electromechanical & ICT Installation &
Maintenance | | | | | |
| | 1,300,000 | | | Forward Air | | | 35,425 | | |
| | | | | Freight Transportation Between Airports | | | | | |
| | 1,600,000 | | | Mobile Mini (a) | | | 26,048 | | |
| | | | | Portable Storage Units Leasing | | | | | |
| | 1,000,000 | | | UTI Worldwide | | | 12,380 | | |
| | | | | Freight Forwarding & Logistics | | | | | |
| | 1,050,000 | | | TrueBlue (a) | | | 11,750 | | |
| | | | | Temporary Manual Labor | | | | | |
| | 900,000 | | | American Reprographics (a) | | | 7,857 | | |
| | | | | Document Management & Logistics | | | | | |
| | | | 242,142 | | |
| | | > Industrial Distribution 1.1% | |
| | 900,000 | | | WW Grainger | | | 89,505 | | |
| | | | | Industrial Distribution | | | | | |
| | 2,600,000 | | | Interline Brands (a)(b) | | | 44,954 | | |
| | | | | Industrial Distribution | | | | | |
| | 350,000 | | | Watsco | | | 20,272 | | |
| | | | | HVAC Distribution | | | | | |
| | | | 154,731 | | |
| | | > Construction 0.9% | |
| | 66,000 | | | NVR (a) | | | 43,232 | | |
| | | | | D.C. Homebuilder | | | | | |
See accompanying notes to financial statements.
27
Columbia Acorn Fund
Statement of Investments (Unaudited), continued
| Number of Shares | | | | Value (000) | |
| | | > Construction—continued | |
| | 350,000 | | | Martin Marietta Materials (c) | | $ | 29,684 | | |
| | | | | Aggregates | | | | | |
| | 700,000 | | | Simpson Manufacturing | | | 17,185 | | |
| | | | | Wall Joint Maker | | | | | |
| | 1,800,000 | | | Mills Estruturas e Servicios de
Engenha (Brazil) (a) | | | 13,612 | | |
| | | | | Civil Engineering & Construction | | | | | |
| | 687,500 | | | Ritchie Brothers Auctioneers (c) | | | 12,526 | | |
| | | | | Heavy Equipment Auctioneer | | | | | |
| | 284,000 | | | M/I Homes (a) | | | 2,738 | | |
| | | | | Columbus-based Home Builder | | | | | |
| | | | 118,977 | | |
| | | > Waste Management 0.7% | |
| | 1,500,000 | | | Republic Services | | | 44,595 | | |
| | | | | Solid Waste Management | | | | | |
| | 1,115,000 | | | Waste Connections (a) | | | 38,902 | | |
| | | | | Solid Waste Management | | | | | |
| | 280,000 | | | Clean Harbors (a) | | | 18,595 | | |
| | | | | Hazardous Waste Services & Disposal | | | | | |
| | | | 102,092 | | |
| | | > Outsourcing Services 0.7% | |
| | 1,950,000 | | | Quanta Services (a) | | | 40,267 | | |
| | | | | Electrical & Telecom Construction Services | | | | | |
| | 1,210,000 | | | Administaff | | | 29,234 | | |
| | | | | Professional Employer Organization | | | | | |
| | 2,900,000 | | | Serco (United Kingdom) | | | 25,262 | | |
| | | | | Facilities Management | | | | | |
| | 600,000 | | | GP Strategies (a) | | | 4,356 | | |
| | | | | Training Programs | | | | | |
| | | | 99,119 | | |
| | | > Electrical Components 0.5% | |
| | 1,440,000 | | | Acuity Brands | | | 52,387 | | |
| | | | | Commercial Lighting Fixtures | | | | | |
| | 1,000,000 | | | Ushio (Japan) | | | 15,439 | | |
| | | | | Industrial Light Sources | | | | | |
| | | | 67,826 | | |
| | | > Conglomerates 0.3% | |
| | 2,225,287 | | | Aalberts Industries (Netherlands) | | | 28,687 | | |
| | | | | Flow Control & Heat Treatment | | | | | |
| | 600,000 | | | Ibiden (Japan) | | | 16,176 | | |
| | | | | Electronic Parts & Ceramics | | | | | |
| | | | 44,863 | | |
| | | > Steel 0.2% | |
| | 1,980,000 | | | GrafTech International (a) | | | 28,948 | | |
| | | | | Industrial Graphite Materials Producer | | | | | |
| | | | 28,948 | | |
| | | > Water 0.1% | |
| | 1,750,000 | | | Mueller Water Products | | | 6,492 | | |
| | | | | Fire Hydrants, Valves & Ductile Iron Pipes | | | | | |
| | | | 6,492 | | |
| Industrial Goods & Services: Total | | | 2,354,313 | | |
| Number of Shares | | | | Value (000) | |
| Consumer Goods & Services 16.8% | | | |
| | | > Retail 6.3% | |
| | 4,135,000 | | | lululemon athletica (a)(b)(c) | | $ | 153,905 | | |
| | | | | Premium Active Apparel Retailer | | | | | |
| | 3,005,000 | | | Urban Outfitters (a) | | | 103,342 | | |
| | | | | Apparel & Home Specialty Retailer | | | | | |
| | 2,835,000 | | | Abercrombie & Fitch | | | 87,006 | | |
| | | | | Teen Apparel Retailer | | | | | |
| | 2,219,000 | | | J Crew Group (a) | | | 81,681 | | |
| | | | | Multi-channel Branded Retailer | | | | | |
| | 8,262,000 | | | Chico's FAS | | | 81,629 | | |
| | | | | Women's Specialty Retailer | | | | | |
| | 4,900,000 | | | Talbots (a)(b) | | | 50,519 | | |
| | | | | Women's Specialty Retailer | | | | | |
| | 2,900,000 | | | AnnTaylor Stores (a) | | | 47,183 | | |
| | | | | Women's Apparel Retailer | | | | | |
| | 5,225,000 | | | Saks (a)(c) | | | 39,658 | | |
| | | | | Luxury Department Store Retailer | | | | | |
| | 9,800,000 | | | Charming Shoppes (a)(b) | | | 36,750 | | |
| | | | | Women's Specialty Plus Size Apparel Retailer | | | | | |
| | 1,350,000 | | | Shutterfly (a)(b) | | | 32,346 | | |
| | | | | Internet Photo-centric Retailer | | | | | |
| | 1,034,000 | | | Rue21 (a) | | | 31,372 | | |
| | | | | Fashion Value Apparel Retailer | | | | | |
| | 4,500,000 | | | Pier 1 Imports (a) | | | 28,845 | | |
| | | | | Home Furnishing Retailer | | | | | |
| | 1,200,000 | | | Dress Barn (a) | | | 28,572 | | |
| | | | | Women's & Tween Specialty Retailer | | | | | |
| | 5,000,000 | | | Wet Seal (a) | | | 18,250 | | |
| | | | | Specialty Apparel Retailer | | | | | |
| | 4,950,442 | | | Coldwater Creek (a)(b) | | | 16,633 | | |
| | | | | Women's Apparel Retailer | | | | | |
| | 1,008,000 | | | Express (a) | | | 16,501 | | |
| | | | | Dual Gender Fashion Retailer | | | | | |
| | 1,371,366 | | | Gaiam (b) | | | 8,324 | | |
| | | | | Healthy Living Catalogs & E-Commerce | | | | | |
| | 900,000 | | | Bebe Stores | | | 5,760 | | |
| | | | | Women's Contemporary Specialty Apparel Retailer | | | | | |
| | | | 868,276 | | |
| | | > Travel 2.5% | |
| | 4,500,000 | | | Expedia | | | 84,510 | | |
| | | | | Online Travel Services Company | | | | | |
| | 3,128,400 | | | Gaylord Entertainment (a)(b)(c) | | | 69,106 | | |
| | | | | Convention Hotels | | | | | |
| | 1,950,000 | | | Vail Resorts (a)(b) | | | 68,075 | | |
| | | | | Ski Resort Operator & Developer | | | | | |
| | 4,600,000 | | | Avis Budget Group (a) | | | 45,172 | | |
| | | | | Second Largest Car Rental Company | | | | | |
| | 970,000 | | | Choice Hotels | | | 29,304 | | |
| | | | | Franchisor of Budget Hotel Brands | | | | | |
| | 3,000,000 | | | Hertz (a) | | | 28,380 | | |
| | | | | Largest U.S. Rental Car Operator | | | | | |
| | 1,100,000 | | | Localiza Rent A Car (Brazil) | | | 12,767 | | |
| | | | | Car Rental | | | | | |
| | 141,800 | | | Hyatt Hotels (a) | | | 5,259 | | |
| | | | | Hotel Owner/Operator | | | | | |
| | | | 342,573 | | |
See accompanying notes to financial statements.
28
| Number of Shares | | | | Value (000) | |
| | | > Food & Beverage 1.6% | |
| | 2,200,000 | | | Hansen Natural (a) | | $ | 86,042 | | |
| | | | | Alternative Beverages | | | | | |
| | 37,000,000 | | | Olam International (Singapore) | | | 67,751 | | |
| | | | | Agriculture Supply Chain Manager | | | | | |
| | 810,000 | | | Diamond Foods | | | 33,291 | | |
| | | | | Culinary Ingredients & Snack Foods | | | | | |
| | 819,000 | | | Flowers Foods | | | 20,008 | | |
| | | | | Bread & Baked Goods | | | | | |
| | 1,200,000 | | | GLG Life Tech (Canada) (a) | | | 9,156 | | |
| | | | | Produce an All-natural Sweetener Extracted
from the Stevia Plant | | | | | |
| | 2,000,000 | | | Smart Balance (a) | | | 8,180 | | |
| | | | | Healthy Food Products | | | | | |
| | | | 224,428 | | |
| | | > Educational Services 1.5% | |
| | 1,030,000 | | | ITT Educational Services (a) | | | 85,511 | | |
| | | | | Post-secondary Degree Services | | | | | |
| | 2,500,000 | | | Career Education (a) | | | 57,550 | | |
| | | | | Post-secondary Education | | | | | |
| | 1,700,000 | | | Universal Technical Institute (a)(b) | | | 40,188 | | |
| | | | | Vocational Training | | | | | |
| | 230,000 | | | New Oriental Education &
Technology - ADR (China) (a)(c) | | | 21,434 | | |
| | | | | China's Largest Private Education
Service Provider | | | | | |
| | 2,970,000 | | | Princeton Review (a)(b) | | | 6,890 | | |
| | | | | College Preparation Courses | | | | | |
| | 2,000,000 | | | Voyager Learning, Contingent Value
Rights (a)(d) | | | 336 | | |
| | | | | Education Services for the K-12 Market | | | | | |
| | | | 211,909 | | |
| | | > Apparel 1.0% | |
| | 2,100,000 | | | Coach | | | 76,755 | | |
| | | | | Designer & Retailer of Branded
Leather Accessories | | | | | |
| | 2,475,000 | | | True Religion Apparel (a)(b) | | | 54,623 | | |
| | | | | Premium Denim | | | | | |
| | 400,000 | | | Kenneth Cole Productions (a) | | | 4,404 | | |
| | | | | Wholesaler & Retailer of Lifestyle Brand | | | | | |
| | 225,000 | | | Jones Apparel Group | | | 3,566 | | |
| | | | | Wholesaler of Women's Apparel,
Footwear & Accessories | | | | | |
| | | | 139,348 | | |
| | | > Furniture & Textiles 0.9% | |
| | 4,000,000 | | | Knoll (b) | | | 53,160 | | |
| | | | | Office Furniture | | | | | |
| | 2,800,000 | | | Herman Miller | | | 52,836 | | |
| | | | | Office Furniture | | | | | |
| | 1,000,000 | | | Interface | | | 10,740 | | |
| | | | | Modular & Broadloom Carpet | | | | | |
| | 1,355,500 | | | Steelcase | | | 10,505 | | |
| | | | | Office Furniture | | | | | |
| | | | 127,241 | | |
| | | > Other Consumer Services 0.7% | |
| | 1,960,000 | | | Lifetime Fitness (a) | | | 62,308 | | |
| | | | | Sport & Fitness Club Operator | | | | | |
| | 14,000,000 | | | Lifestyle International (Hong Kong) | | | 27,154 | | |
| | | | | Mid to High-end Department Store Operator
in Hong Kong & China | | | | | |
| Number of Shares | | | | Value (000) | |
| | 1,325,000 | | | IFM Investments (Century 21
China RE) - ADR (China) (a) | | $ | 6,930 | | |
| | | | | Provides Real Estate Services in China | | | | | |
| | | | 96,392 | | |
| | | > Casinos & Gaming 0.6% | |
| | 1,750,000 | | | Penn National Gaming (a) | | | 40,425 | | |
| | | | | Regional Casino Operator | | | | | |
| | 4,050,000 | | | Pinnacle Entertainment (a)(b) | | | 38,313 | | |
| | | | | Regional Casino Operator | | | | | |
| | | | 78,738 | | |
| | | > Nondurables 0.5% | |
| | 1,600,000 | | | Helen of Troy (a)(b) | | | 35,296 | | |
| | | | | Hair Dryers & Curling Irons | | | | | |
| | 550,000 | | | Energizer Holdings (a) | | | 27,654 | | |
| | | | | Household & Personal Care Products | | | | | |
| | | | 62,950 | | |
| | | > Other Durable Goods 0.4% | |
| | 1,720,000 | | | Jarden | | | 46,217 | | |
| | | | | Branded Household Products | | | | | |
| | 294,000 | | | Tesla (a) | | | 7,006 | | |
| | | | | Design, Manufacture & Sell High Performance
Electric Vehicles | | | | | |
| | 180,000 | | | Cavco Industries (a) | | | 6,332 | | |
| | | | | Manufactured Homes | | | | | |
| | | | 59,555 | | |
| | | > Consumer Goods Distribution 0.3% | |
| | 2,100,000 | | | Pool | | | 46,032 | | |
| | | | | Distributor of Swimming Pool
Supplies & Equipment | | | | | |
| | | | 46,032 | | |
| | | > Restaurants 0.2% | |
| | 2,000,000 | | | AFC Enterprises (a)(b) | | | 18,200 | | |
| | | | | Popeye's Restaurants | | | | | |
| | 370,000 | | | P.F. Chang's China Bistro (c) | | | 14,670 | | |
| | | | | Mandarin Style Restaurants | | | | | |
| | | | 32,870 | | |
| | | > Leisure Products 0.2% | |
| | 1,190,000 | | | Thor Industries | | | 28,263 | | |
| | | | | RV & Bus Manufacturer | | | | | |
| | | | 28,263 | | |
| | | > Other Entertainment 0.1% | |
| | 370,000 | | | CTS Eventim (Germany) | | | 17,784 | | |
| | | | | Event Ticket Sales | | | | | |
| | | | 17,784 | | |
| Consumer Goods & Services: Total | | | 2,336,359 | | |
| Finance 11.9% | | | |
| | | > Banks 4.5% | |
| | 2,469,000 | | | BOK Financial | | | 117,204 | | |
| | | | | Tulsa-based Southwest Bank | | | | | |
| | 6,004,115 | | | Valley National Bancorp | | | 81,776 | | |
| | | | | New Jersey/New York Bank | | | | | |
| | 4,150,000 | | | TCF Financial | | | 68,932 | | |
| | | | | Great Lakes Bank | | | | | |
| | 5,063,800 | | | Associated Banc-Corp | | | 62,082 | | |
| | | | | Midwest Bank | | | | | |
See accompanying notes to financial statements.
29
Columbia Acorn Fund
Statement of Investments (Unaudited), continued
| Number of Shares | | | | Value (000) | |
| | | > Banks—continued | |
| | 2,860,000 | | | MB Financial (b) | | $ | 52,595 | | |
| | | | | Chicago Bank | | | | | |
| | 1,260,000 | | | SVB Financial Group (a) | | | 51,950 | | |
| | | | | Bank to Venture Capitalists | | | | | |
| | 745,000 | | | City National | | | 38,166 | | |
| | | | | Bank & Asset Manager | | | | | |
| | 2,640,000 | | | Wilmington Trust | | | 29,278 | | |
| | | | | Delaware Trust Bank | | | | | |
| | 2,140,000 | | | CVB Financial (c) | | | 20,330 | | |
| | | | | Inland Empire Business Bank | | | | | |
| | 1,100,000 | | | TriCo Bancshares (b)(c) | | | 18,623 | | |
| | | | | California Central Valley Bank | | | | | |
| | 702,393 | | | Hudson Valley | | | 16,239 | | |
| | | | | Metro New York City Bank | | | | | |
| | 1,600,000 | | | Whitney Holding | | | 14,800 | | |
| | | | | Gulf Coast Bank | | | | | |
| | 889,000 | | | Sandy Spring Bancorp | | | 12,455 | | |
| | | | | Baltimore/D.C. Bank | | | | | |
| | 240,000 | | | Cullen/Frost Bankers | | | 12,336 | | |
| | | | | Texas Bank | | | | | |
| | 583,872 | | | Green Bankshares (a)(c) | | | 7,456 | | |
| | | | | Tennessee Bank | | | | | |
| | 1,614,507 | | | First Busey | | | 7,314 | | |
| | | | | Illinois Bank | | | | | |
| | 406,559 | | | Eagle Bancorp (a) | | | 4,789 | | |
| | | | | Metro D.C. Bank | | | | | |
| | 246,505 | | | Pacific Continental | | | 2,334 | | |
| | | | | Pacific Northwest Bank | | | | | |
| | | | 618,659 | | |
| | | > Insurance 2.8% | |
| | 2,820,000 | | | Leucadia National (a) | | | 55,018 | | |
| | | | | Insurance Holding Company | | | | | |
| | 1,230,000 | | | Hanover Insurance Group | | | 53,505 | | |
| | | | | Personal & Commercial Lines Insurance | | | | | |
| | 9,400,000 | | | CNO Financial Group (a) | | | 46,530 | | |
| | | | | Life, Long-term Care & Medical
Supplement Insurance | | | | | |
| | 1,450,000 | | | Delphi Financial Group | | | 35,394 | | |
| | | | | Workers Compensation & Group Employee
Benefit Products & Services | | | | | |
| | 100,000 | | | Markel (a) | | | 34,000 | | |
| | | | | Specialty Insurance | | | | | |
| | 1,200,000 | | | HCC Insurance Holdings | | | 29,712 | | |
| | | | | Specialty Insurance | | | | | |
| | 832,000 | | | Willis Group (Ireland) | | | 25,002 | | |
| | | | | Insurance Broker | | | | | |
| | 1,000,000 | | | Aspen Insurance | | | 24,740 | | |
| | | | | Commercial Lines Insurance/Reinsurance | | | | | |
| | 700,000 | | | Assurant | | | 24,290 | | |
| | | | | Specialty Insurance | | | | | |
| | 1,420,000 | | | Selective Insurance Group | | | 21,101 | | |
| | | | | Commercial & Personal Lines Insurance | | | | | |
| | 900,000 | | | Tower Group | | | 19,377 | | |
| | | | | Commercial & Personal Lines Insurance | | | | | |
| | 1,600,000 | | | Symetra Financial | | | 19,200 | | |
| | | | | Life Insurance | | | | | |
| | | | 387,869 | | |
| Number of Shares | | | | Value (000) | |
| | | > Finance Companies 2.6% | |
| | 7,085,000 | | | AmeriCredit (a)(b) | | $ | 129,089 | | |
| | | | | Auto Lending | | | | | |
| | 1,505,202 | | | World Acceptance (a)(b) | | | 57,664 | | |
| | | | | Personal Loans | | | | | |
| | 2,350,000 | | | McGrath Rentcorp (b) | | | 53,533 | | |
| | | | | Temporary Space & IT Rentals | | | | | |
| | 1,480,000 | | | GATX | | | 39,486 | | |
| | | | | Rail Car Lessor | | | | | |
| | 3,033,300 | | | H&E Equipment Services (a)(b) | | | 22,720 | | |
| | | | | Heavy Equipment Leasing | | | | | |
| | 1,282,500 | | | Aaron's | | | 21,892 | | |
| | | | | Rent to Own | | | | | |
| | 1,650,000 | | | CAI International (a)(b) | | | 19,635 | | |
| | | | | International Container Leasing | | | | | |
| | 1,091,000 | | | Marlin Business Services (a)(b) | | | 13,190 | | |
| | | | | Small Equipment Leasing | | | | | |
| | 78,500 | | | Textainer Group Holdings | | | 1,895 | | |
| | | | | Top International Container Leasor | | | | | |
| | | | 359,104 | | |
| | | > Brokerage & Money Management 1.7% | |
| | 6,198,000 | | | SEI Investments | | | 126,191 | | |
| | | | | Mutual Fund Administration &
Investment Management | | | | | |
| | 3,735,000 | | | Eaton Vance | | | 103,124 | | |
| | | | | Specialty Mutual Funds | | | | | |
| | 700,000 | | | Investment Technology Group (a) | | | 11,242 | | |
| | | | | Electronic Trading | | | | | |
| | | | 240,557 | | |
| | | > Savings & Loans 0.3% | |
| | 325,000 | | | Housing Development Finance (India) | | | 20,488 | | |
| | | | | Indian Mortgage Lender | | | | | |
| | 731,478 | | | ViewPoint Financial | | | 10,131 | | |
| | | | | Texas Thrift | | | | | |
| | 1,010,000 | | | Provident New York Bancorp | | | 8,938 | | |
| | | | | New York State Thrift | | | | | |
| | 65,991 | | | Berkshire Hills Bancorp | | | 1,286 | | |
| | | | | Northeast Thrift | | | | | |
| | | | 40,843 | | |
| Finance: Total | | | 1,647,032 | | |
| Health Care 10.7% | | | |
| | | > Medical Equipment & Devices 3.8% | |
| | 2,800,000 | | | Alexion Pharmaceuticals (a) | | | 143,332 | | |
| | | | | Biotech Focused on Orphan Diseases | | | | | |
| | 3,500,000 | | | American Medical Systems (a) | | | 77,420 | | |
| | | | | Medical Devices to Treat Urological Conditions | | | | | |
| | 1,000,000 | | | Edwards Lifesciences (a) | | | 56,020 | | |
| | | | | Heart Valves | | | | | |
| | 1,500,000 | | | Sirona Dental Systems (a) | | | 52,260 | | |
| | | | | Manufacturer of Dental Equipment | | | | | |
| | 1,100,000 | | | Illumina (a) | | | 47,883 | | |
| | | | | Leading Tools & Service Provider for
Genetic Analysis | | | | | |
| | 863,448 | | | Haemonetics (a) | | | 46,212 | | |
| | | | | Blood & Plasma Collection Equipment | | | | | |
| | 900,000 | | | Gen-Probe (a) | | | 40,878 | | |
| | | | | Molecular In-vitro Diagnostics | | | | | |
See accompanying notes to financial statements.
30
| Number of Shares | | | | Value (000) | |
| | | > Medical Equipment & Devices—continued | |
| | 1,150,000 | | | Orthofix International (a)(b) | | $ | 36,858 | | |
| | | | | Bone Fixation & Stimulation Devices | | | | | |
| | 306,696 | | | Kinetic Concepts (a) | | | 11,197 | | |
| | | | | Wound Healing & Tissue Repair Products | | | | | |
| | 694,849 | | | Vermillion (a)(b)(d) | | | 8,131 | | |
| | | | | Ovarian Cancer Diagnostic Test | | | | | |
| | 1,500,000 | | | Nanosphere (a)(b) | | | 6,540 | | |
| | | | | Molecular Diagnostics Company with Best of
Breed Platform | | | | | |
| | | | 526,731 | | |
| | | > Biotechnology & Drug Delivery 3.5% | |
| | 3,205,000 | | | BioMarin (a) | | | 60,767 | | |
| | | | | Biotech Focused on Orphan Diseases | | | | | |
| | 4,951,226 | | | Seattle Genetics (a) | | | 59,365 | | |
| | | | | Antibody-based Therapies for Cancer | | | | | |
| | 1,500,000 | | | Acorda Therapeutics (a) | | | 46,665 | | |
| | | | | Biopharma Company Focused on Nervous
Disorder Drugs | | | | | |
| | 3,300,000 | | | Nektar Therapeutics (a) | | | 39,930 | | |
| | | | | Drug Delivery Technologies | | | | | |
| | 1,100,000 | | | AMAG Pharmaceuticals (a)(b) | | | 37,785 | | |
| | | | | Biotech Focused on Niche Diseases | | | | | |
| | 5,035,000 | | | Allos Therapeutics (a) | | | 30,864 | | |
| | | | | Cancer Drug Development | | | | | |
| | 560,000 | | | United Therapeutics (a) | | | 27,334 | | |
| | | | | Biotech Focused on Rare Diseases | | | | | |
| | 1,100,000 | | | Human Genome Sciences (a) | | | 24,926 | | |
| | | | | Biotech Focused on HCV, Inflammation & Cancer | | | | | |
| | 2,261,347 | | | Isis Pharmaceuticals (a) | | | 21,641 | | |
| | | | | Biotech Pioneer in Anti-sense Drugs | | | | | |
| | 3,463,611 | | | Micromet (a)(c) | | | 21,613 | | |
| | | | | Next-generation Antibody Technology | | | | | |
| | 2,100,000 | | | Xenoport (a)(b)(c) | | | 20,601 | | |
| | | | | Biotech Company with Proprietary Drug
Development Platform | | | | | |
| | 3,112,776 | | | NPS Pharmaceuticals (a)(b) | | | 20,046 | | |
| | | | | Orphan Drugs & Healthy Royalties | | | | | |
| | 1,055,762 | | | Amylin Pharmaceuticals (a) | | | 19,848 | | |
| | | | | Biotech Company Focused on Diabetes & Obesity | | | | | |
| | 751,601 | | | Auxilium Pharmaceuticals (a) | | | 17,663 | | |
| | | | | Biotech Focused on Niche Disease Areas | | | | | |
| | 639,920 | | | Onyx Pharmaceuticals (a) | | | 13,816 | | |
| | | | | Commercial-stage Biotech Focused on Cancer | | | | | |
| | 3,500,000 | | | Array Biopharma (a)(b) | | | 10,675 | | |
| | | | | Drugs for Cancer & Inflammatory Diseases | | | | | |
| | 1,917,820 | | | Idenix Pharmaceuticals (a) | | | 9,589 | | |
| | | | | Developer of Drugs for Infectious Diseases | | | | | |
| | 1,450,000 | | | Anthera (a)(b)(c) | | | 7,772 | | |
| | | | | Biotech Focused on Cardiovascular,
Cancer & Immunology | | | | | |
| | 359,944 | | | MicroDose Technologies (a)(d) | | | 122 | | |
| | | | | Drug Inhaler Development | | | | | |
| | 187,500 | | | Locus Pharmaceuticals,
Series A-1, Pfd. (a)(d) | | | 6 | | |
| | 96,644 | | | Locus Pharmaceuticals,
Series B-1, Pfd. (a)(d) | | | 3 | | |
| | | | | High Throughput Rational Drug Design | | | | | |
| | | | 491,031 | | |
| Number of Shares | | | | Value (000) | |
| | | > Medical Supplies 1.6% | |
| | 2,885,000 | | | Cepheid (a) | | $ | 46,218 | | |
| | | | | Molecular Diagnostics | | | | | |
| | 650,000 | | | Henry Schein (a) | | | 35,685 | | |
| | | | | Largest Distributor of Healthcare Products | | | | | |
| | 500,000 | | | Idexx Laboratories (a)(c) | | | 30,450 | | |
| | | | | Diagnostic Equipment & Services
for Veterinarians | | | | | |
| | 1,435,000 | | | QIAGEN (Netherlands) (a)(c) | | | 27,581 | | |
| | | | | Life Science Tools & Molecular Diagnostics | | | | | |
| | 850,000 | | | ICU Medical (a)(b) | | | 27,344 | | |
| | | | | Intravenous Therapy Products | | | | | |
| | 900,000 | | | Owens & Minor | | | 25,542 | | |
| | | | | Distribution of Medical Supplies | | | | | |
| | 980,503 | | | Immucor (a) | | | 18,679 | | |
| | | | | Automated Blood Typing Reagents | | | | | |
| | 246,670 | | | Techne | | | 14,171 | | |
| | | | | Cytokines, Antibodies & Other Reagents for
Life Science | | | | | |
| | | | 225,670 | | |
| | | > Health Care Services 1.6% | |
| | 3,300,000 | | | PSS World Medical (a)(b) | | | 69,795 | | |
| | | | | Distributor of Medical Supplies | | | | | |
| | 1,250,000 | | | Mednax (a) | | | 69,512 | | |
| | | | | Physician Management for Pediatric &
Anesthesia Practices | | | | | |
| | 4,250,000 | | | eResearch Technology (a)(b) | | | 33,490 | | |
| | | | | Clinical Research Services | | | | | |
| | 400,000 | | | HMS Holdings (a) | | | 21,688 | | |
| | | | | Cost Containment Services | | | | | |
| | 500,000 | | | AthenaHealth (a)(c) | | | 13,065 | | |
| | | | | Revenue Cycle Management for
Physician Offices | | | | | |
| | 700,000 | | | Allscripts-Misys Healthcare (a) | | | 11,270 | | |
| | | | | Clinical IT Solutions for Physician Offices | | | | | |
| | | | 218,820 | | |
| | | > Pharmaceuticals 0.2% | |
| | 1,750,000 | | | The Medicines Company (a) | | | 13,318 | | |
| | | | | Specialty Pharmaceuticals - Cardiovascular | | | | | |
| | 2,600,000 | | | United Drug (Ireland) | | | 7,237 | | |
| | | | | Irish Pharmaceutical Wholesaler & Outsourcer | | | | | |
| | | | 20,555 | | |
| Health Care: Total | | | 1,482,807 | | |
| Energy & Minerals 9.0% | | | |
| | | > Oil & Gas Producers 3.7% | |
| | 4,910,550 | | | Pacific Rubiales Energy (Colombia) (a) | | | 110,061 | | |
| | | | | Oil Production & Exploration in Colombia | | | | | |
| | 2,160,000 | | | Southwestern Energy (a) | | | 83,462 | | |
| | | | | Oil & Gas Producer | | | | | |
| | 1,100,000 | | | Range Resources | | | 44,165 | | |
| | | | | Oil & Gas Producer | | | | | |
| | 910,000 | | | Ultra Petroleum (a) | | | 40,268 | | |
| | | | | Oil & Gas Producer | | | | | |
| | 2,700,000 | | | Denbury Resources (a) | | | 39,528 | | |
| | | | | Oil Producer Using Co2 Injection | | | | | |
| | 2,400,000 | | | Tullow Oil (United Kingdom) | | | 35,750 | | |
| | | | | Oil & Gas Producer | | | | | |
See accompanying notes to financial statements.
31
Columbia Acorn Fund
Statement of Investments (Unaudited), continued
| Number of Shares | | | | Value (000) | |
| | | > Oil & Gas Producers—continued | |
| | 715,000 | | | St. Mary Land & Exploration | | $ | 28,714 | | |
| | | | | Oil & Gas Producer | | | | | |
| | 650,000 | | | Baytex (Canada) | | | 19,417 | | |
| | | | | Oil & Gas Producer in Canada | | | | | |
| | 779,000 | | | Rosetta Resources (a) | | | 15,432 | | |
| | | | | Oil & Gas Producer Exploring in South
Texas & Montana | | | | | |
| | 1,200,000 | | | Houston American Energy (c) | | | 11,832 | | |
| | | | | Oil & Gas Exploration/Production in Colombia | | | | | |
| | 850,000 | | | Northern Oil & Gas (a) | | | 10,914 | | |
| | | | | Small E&P Company in North Dakota Bakken | | | | | |
| | 37,500,000 | | | Petromanas (Canada) (a)(b)(d) | | | 9,722 | | |
| | 18,750,000 | | | Petromanas - Warrants (Canada) (a)(b)(d) | | | 705 | | |
| | | | | Exploring for Oil in Albania | | | | | |
| | 583,000 | | | Carrizo Oil & Gas (a) | | | 9,054 | | |
| | | | | Oil & Gas Producer | | | | | |
| | 250,000 | | | Cabot Oil & Gas | | | 7,830 | | |
| | | | | Large Natural Gas Producer in Appalachia &
Gulf Coast | | | | | |
| | 1,400,000 | | | Gran Tierra Energy (Colombia) (a) | | | 7,036 | | |
| | | | | Oil Exploration & Production in Colombia,
Peru & Argentina | | | | | |
| | 1,198,100 | | | Pan Orient (Canada) (a) | | | 5,796 | | |
| | | | | Growth Oriented & Return Focused Asian Explorer | | | | | |
| | 24,000,000 | | | Petrodorado (Colombia) (a)(b)(d) | | | 5,744 | | |
| | 24,000,000 | | | Petrodorado - Warrants
(Colombia) (a)(b)(d) | | | 2,254 | | |
| | | | | Oil & Gas Exploration & Production in Colombia,
Peru & Paraguay | | | | | |
| | 6,300,000 | | | Canacol Energy (Colombia) (a)(d) | | | 5,220 | | |
| | | | | Oil Producer in South America | | | | | |
| | 8,000,000 | | | Petrolifera Petroleum (Colombia) (a)(b)(d) | | | 4,885 | | |
| | 5,950,000 | | | Petrolifera Petroleum (Colombia) (a)(b) | | | 3,633 | | |
| | | | | Oil & Gas Exploration & Production in
South America | | | | | |
| | 750,000 | | | Vaalco Energy | | | 4,200 | | |
| | | | | Oil & Gas Producer | | | | | |
| | 12,100,000 | | | Alange Energy (Colombia) (a) | | | 3,978 | | |
| | | | | Oil & Gas Exploration/Production in Colombia | | | | | |
| | 13,000,000 | | | Petroamerica (Colombia) (a) | | | 3,908 | | |
| | | | | Oil Exploration & Production in Colombia | | | | | |
| | 228,200 | | | Oasis Petroleum (a) | | | 3,309 | | |
| | | | | Oil Producer in North Dakota | | | | | |
| | | | 516,817 | | |
| | | > Oil Services 3.5% | |
| | 3,100,000 | | | FMC Technologies (a) | | | 163,246 | | |
| | | | | Oil & Gas Wellhead Manufacturer | | | | | |
| | 2,570,626 | | | Fugro (Netherlands) | | | 117,538 | | |
| | | | | Sub-sea Oilfield Services | | | | | |
| | 3,200,000 | | | Atwood Oceanics (a) | | | 81,664 | | |
| | | | | Offshore Drilling Contractor | | | | | |
| | 1,670,000 | | | ShawCor (Canada) | | | 42,121 | | |
| | | | | Oil & Gas Pipeline Products | | | | | |
| | 1,750,000 | | | Tesco (a) | | | 21,490 | | |
| | | | | Developing New Well Drilling Technologies | | | | | |
| | 275,000 | | | Oceaneering International (a) | | | 12,347 | | |
| | | | | Provider of Sub-sea Services & Manufactured
Products | | | | | |
| Number of Shares | | | | Value (000) | |
| | 375,000 | | | Bristow (a) | | $ | 11,025 | | |
| | | | | Largest Provider of Helicopter Services to
Offshore Oil & Gas Producers | | | | | |
| | 10,719,200 | | | Tuscany International Drilling
(Colombia) (a)(b)(d) | | | 10,855 | | |
| | 2,600,000 | | | Tuscany International Drilling - Warrants
(Colombia) (a)(b)(d) | | | 70 | | |
| | | | | South America-based Drilling Rig Contractor | | | | | |
| | 500,000 | | | Black Diamond Group (Canada) | | | 8,243 | | |
| | | | | Provides Accommodations/Equipment for
Oil Sands Exploitation | | | | | |
| | 308,303 | | | Gulfmark Offshore (a) | | | 8,078 | | |
| | | | | Operator of Offshore Supply Vessels | | | | | |
| | 2,953,900 | | | Horizon North Logistics (Canada) (a) | | | 4,578 | | |
| | | | | Provides Diversified Oil Service Offering in
Northern Canada | | | | | |
| | | | 481,255 | | |
| | | > Mining 1.4% | |
| | 348,000 | | | Core Laboratories (Netherlands) (c) | | | 51,368 | | |
| | | | | Oil & Gas Reservoir Consulting | | | | | |
| | 2,450,000 | | | Silver Wheaton (Canada) (a) | | | 49,245 | | |
| | | | | Silver Mining Royalty Company | | | | | |
| | 880,000 | | | Pan American Silver (Canada) | | | 22,246 | | |
| | | | | Silver Mining | | | | | |
| | 400,000 | | | Royal Gold | | | 19,200 | | |
| | | | | Precious Metals Mining Royalty Company | | | | | |
| | 7,500,000 | | | Zhaojin Mining Industry (China) | | | 17,590 | | |
| | | | | Gold Mining & Refining in China | | | | | |
| | 10,000,000 | | | Orko Silver (Canada) (a)(b) | | | 14,560 | | |
| | | | | Silver Exploration & Development | | | | | |
| | 1,000,000 | | | Ivanhoe Mines (Canada) (a) | | | 12,954 | | |
| | | | | Copper Mine Project in Mongolia | | | | | |
| | 2,400,000 | | | Alexco Resource (a) | | | 7,536 | | |
| | | | | Mining, Exploration & Environmental Services | | | | | |
| | 236,400 | | | Tahoe Resources (Canada) (a)(d) | | | 1,415 | | |
| | | | | Silver Project in Guatemala | | | | | |
| | 83,356 | | | Northam Platinum (South Africa) | | | 490 | | |
| | | | | Platinum Mining in South Africa | | | | | |
| | | | 196,604 | | |
| | | > Alternative Energy 0.2% | |
| | 3,000,000 | | | GT Solar International (a) | | | 16,800 | | |
| | | | | Largest Manufacturer of Furnaces & Reactors to
Produce & Cast Polysilicon | | | | | |
| | 400,000 | | | STR Holdings (a) | | | 7,520 | | |
| | | | | Makes Encapsulant for Solar Power
Modules/Provides Quality Assurance | | | | | |
| | 1,800,000 | | | Synthesis Energy Systems (China) (a) | | | 1,980 | | |
| | | | | Owner/Operator of Gasification Plants | | | | | |
| | | | 26,300 | | |
| | | > Oil Refining, Marketing & Distribution 0.2% | |
| | 600,000 | | | Vopak (Netherlands) | | | 22,019 | | |
| | | | | World's Largest Operator of Petroleum &
Chemical Storage Terminals | | | | | |
| | | | 22,019 | | |
| Energy & Minerals: Total | | | 1,242,995 | | |
See accompanying notes to financial statements.
32
| Number of Shares | | | | Value (000) | |
| Other Industries 4.8% | | | |
| | | > Real Estate 2.7% | |
| | 4,000,000 | | | BioMed Realty Trust | | $ | 64,360 | | |
| | | | | Life Science-focused Office Buildings | | | | | |
| | 770,000 | | | Digital Realty Trust (c) | | | 44,413 | | |
| | | | | Technology-focused Office Buildings | | | | | |
| | 525,000 | | | Federal Realty Investment Trust | | | 36,892 | | |
| | | | | Shopping Centers | | | | | |
| | 900,000 | | | Corporate Office Properties | | | 33,984 | | |
| | | | | Office Buildings | | | | | |
| | 752,161 | | | Macerich | | | 28,071 | | |
| | | | | Regional Shopping Malls | | | | | |
| | 40,000,000 | | | Mapletree Logistics Trust (Singapore) | | | 23,748 | | |
| | | | | Asian Logistics Landlord | | | | | |
| | 900,000 | | | Dupont Fabros Technology | | | 22,104 | | |
| | | | | Technology-focused Office Buildings | | | | | |
| | 1,400,000 | | | Extra Space Storage | | | 19,460 | | |
| | | | | Self Storage Facilities | | | | | |
| | 15,000,000 | | | Ascendas REIT (Singapore) | | | 19,362 | | |
| | | | | Singapore Industrial Property Landlord | | | | | |
| | 700,000 | | | Washington REIT | | | 19,313 | | |
| | | | | Washington D.C. Diversified Properties | | | | | |
| | 3,000,000 | | | Education Realty Trust (b) | | | 18,090 | | |
| | | | | Student Housing | | | | | |
| | 3,750,000 | | | DCT Industrial Trust | | | 16,950 | | |
| | | | | Industrial Properties | | | | | |
| | 2,800 | | | Orix JREIT (Japan) | | | 11,673 | | |
| | | | | Diversified REIT | | | | | |
| | 2,300,000 | | | Kite Realty Group | | | 9,614 | | |
| | | | | Community Shopping Centers | | | | | |
| | 150,000 | | | SL Green Realty | | | 8,256 | | |
| | | | | Manhattan Office Buildings | | | | | |
| | 37,407 | | | Security Capital European Realty
(Luxembourg) (a)(d)(e) | | | — | | |
| | | | | Self Storage Properties | | | | | |
| | | | 376,290 | | |
| | | > Transportation 1.3% | |
| | 1,980,000 | | | JB Hunt Transport Services | | | 64,686 | | |
| | | | | Truck & Intermodal Carrier | | | | | |
| | 2,480,000 | | | Heartland Express | | | 36,010 | | |
| | | | | Regional Trucker | | | | | |
| | 2,500,000 | | | Rush Enterprises, Class A (a)(b) | | | 33,400 | | |
| | 500,000 | | | Rush Enterprises, Class B (a)(b) | | | 5,825 | | |
| | | | | Truck Sales & Services | | | | | |
| | 1,110,000 | | | World Fuel Services (c) | | | 28,793 | | |
| | | | | Global Fuel Broker | | | | | |
| | 602,000 | | | American Commercial Lines (a)(c) | | | 13,551 | | |
| | | | | Operator of Inland Barges/Builder of
Barges & Vessels | | | | | |
| | 100,000 | | | Old Dominion Freight Lines (a) | | | 3,514 | | |
| | | | | LTL Trucker | | | | | |
| | | | 185,779 | | |
| | | > Regulated Utilities 0.8% | |
| | 1,500,000 | | | Northeast Utilities | | | 38,220 | | |
| | | | | Regulated Electric Utility | | | | | |
| | 5,833,000 | | | Terna (Italy) | | | 21,007 | | |
| | | | | Italian Power Transmission | | | | | |
Number of Shares
or Principal Amount (000) | | | | Value (000) | |
| | 340,000 | | | Wisconsin Energy | | $ | 17,252 | | |
| | | | | Wisconsin Utility | | | | | |
| | 500,000 | | | ALLETE | | | 17,120 | | |
| | | | | Regulated Electric Utility in Minnesota | | | | | |
| | 333,000 | | | Red Eléctrica de Espana (Spain) | | | 11,903 | | |
| | | | | Spanish Power Transmission | | | | | |
| | | | 105,502 | | |
| Other Industries: Total | | | 667,571 | | |
Total Equities: 95.7%
(Cost: $10,519,526) | | | 13,293,384 | | |
| Securities Lending Collateral: 2.2% | | | |
| | 311,735,665 | | | Dreyfus Government Cash
Management Fund (f)
(7 day yield of 0.03%) | | | 311,736 | | |
Total Securities Lending Collateral:
(Cost: $311,736) | | | 311,736 | | |
| Short-Term Obligations: 4.6% | | | |
| | | > Repurchase Agreement 4.3% | |
| $ | 592,670 | | | Repurchase Agreement with
Fixed Income Clearing Corp.,
dated 6/30/10, due 7/01/10
at 0.00%, collateralized by
U.S. Government Agency
obligations with various
maturities to 1/19/16,
market value $604,527
(repurchase proceeds $592,670) | | | 592,670 | | |
| | | | 592,670 | | |
| | | > Commercial Paper 0.3% | |
| | 50,000 | | | Toyota Motor Credit
0.27% due 7/02/10 | | | 50,000 | | |
| | | | 50,000 | | |
Total Short-Term Obligations:
(Amortized Cost: $642,670) | | | 642,670 | | |
Total Investments: 102.5%
(Cost: $11,473,932)(g)(h) | | | 14,247,790 | | |
Obligation to Return Collateral for
Securities Loaned: (2.2)% | | | (311,736 | ) | |
| Cash and Other Assets Less Liabilities: (0.3)% | | | (41,540 | ) | |
| Total Net Assets: 100.0% | | $ | 13,894,514 | | |
ADR = American Depositary Receipts
See accompanying notes to financial statements.
33
Columbia Acorn Fund
Statement of Investments (Unaudited), continued
> Notes to Statement of Investments (dollar values in thousands)
(a) Non-income producing security.
(b) An affiliated person of the Fund may include any company in which the Fund owns five percent or more of its outstanding voting shares. Holdings and transactions in these affiliated companies during the six months ended June 30, 2010, are as follows:
| Affiliates | | Balance of
Shares Held
12/31/09 | | Purchases/
Additions | | Sales/
Reductions | | Balance of
Shares Held
6/30/10 | | Value | | Dividend | |
| Abercrombie & Fitch* | | | 4,500,000 | | | | - | | | | 1,665,000 | | | | 2,835,000 | | | $ | 87,006 | | | $ | 1,039 | | |
| Actuate | | | 3,700,000 | | | | - | | | | - | | | | 3,700,000 | | | | 16,465 | | | | - | | |
| Administaff* | | | 1,428,224 | | | | - | | | | 218,224 | | | | 1,210,000 | | | | 29,234 | | | | 315 | | |
| AFC Enterprises | | | 2,000,000 | | | | - | | | | - | | | | 2,000,000 | | | | 18,200 | | | | - | | |
| AMAG Pharmaceuticals | | | 600,000 | | | | 650,000 | | | | 150,000 | | | | 1,100,000 | | | | 37,785 | | | | | | |
| AmeriCredit | | | 7,235,000 | | | | 250,000 | | | | 400,000 | | | | 7,085,000 | | | | 129,089 | | | | - | | |
| AnnTaylor Stores* | | | 3,500,000 | | | | - | | | | 600,000 | | | | 2,900,000 | | | | 47,183 | | | | - | | |
| Anthera | | | - | | | | 1,450,000 | | | | - | | | | 1,450,000 | | | | 7,772 | | | | - | | |
| Array Biopharma | | | - | | | | 3,500,000 | | | | - | | | | 3,500,000 | | | | 10,675 | | | | | | |
| Bally Technologies | | | 4,025,000 | | | | - | | | | - | | | | 4,025,000 | | | | 130,370 | | | | - | | |
| Blackbaud | | | 1,800,000 | | | | 450,000 | | | | - | | | | 2,250,000 | | | | 48,982 | | | | 495 | | |
| CAI International | | | 1,650,000 | | | | - | | | | - | | | | 1,650,000 | | | | 19,635 | | | | - | | |
| Cap-Link Ventures* | | | 48,000,000 | | | | - | | | | 48,000,000 | | | | - | | | | - | | | | - | | |
| Charming Shoppes | | | 7,500,000 | | | | 2,300,000 | | | | - | | | | 9,800,000 | | | | 36,750 | | | | - | | |
| Chattem* | | | 1,010,000 | | | | - | | | | 1,010,000 | | | | - | | | | - | | | | - | | |
| Clarcor | | | 2,627,500 | | | | - | | | | 62,500 | | | | 2,565,000 | | | | 91,109 | | | | 500 | | |
| Cogent Communications | | | 4,200,000 | | | | - | | | | 800,000 | | | | 3,400,000 | | | | 25,772 | | | | - | | |
| Coldwater Creek | | | - | | | | 4,950,442 | | | | - | | | | 4,950,442 | | | | 16,633 | | | | | | |
| Donaldson | | | 4,200,000 | | | | - | | | | - | | | | 4,200,000 | | | | 179,130 | | | | 1,008 | | |
| Drew Industries | | | 1,600,000 | | | | - | | | | 340,000 | | | | 1,260,000 | | | | 25,452 | | | | - | | |
| Education Realty Trust | | | - | | | | 3,000,000 | | | | - | | | | 3,000,000 | | | | 18,090 | | | | 70 | | |
| eResearch Technology | | | 4,250,000 | | | | - | | | | - | | | | 4,250,000 | | | | 33,490 | | | | - | | |
| ESCO Technologies | | | 2,200,000 | | | | - | | | | - | | | | 2,200,000 | | | | 56,650 | | | | 352 | | |
| Gaiam | | | 1,371,366 | | | | - | | | | - | | | | 1,371,366 | | | | 8,324 | | | | 206 | | |
| Gaylord Entertainment | | | 3,700,000 | | | | 467,900 | | | | 1,039,500 | | | | 3,128,400 | | | | 69,106 | | | | - | | |
| H&E Equipment Services | | | 3,300,000 | | | | - | | | | 266,700 | | | | 3,033,300 | | | | 22,720 | | | | - | | |
| Hackett Group | | | 4,500,000 | | | | - | | | | - | | | | 4,500,000 | | | | 12,645 | | | | - | | |
| HEICO | | | 1,225,000 | | | | 306,250 | | | | - | | | | 1,531,250 | | | | 41,267 | | | | 74 | | |
| Helen of Troy | | | 1,700,000 | | | | - | | | | 100,000 | | | | 1,600,000 | | | | 35,296 | | | | - | | |
| Herman Miller* | | | 2,800,000 | | | | - | | | | - | | | | 2,800,000 | | | | 52,836 | | | | 123 | | |
| ICU Medical | | | 850,000 | | | | 200,000 | | | | 200,000 | | | | 850,000 | | | | 27,344 | | | | - | | |
| iGate | | | 5,000,000 | | | | - | | | | - | | | | 5,000,000 | | | | 64,100 | | | | 550 | | |
| II-VI | | | 2,400,000 | | | | - | | | | 175,000 | | | | 2,225,000 | | | | 65,927 | | | | - | | |
| Informatica | | | 7,000,000 | | | | - | | | | 1,800,000 | | | | 5,200,000 | | | | 124,176 | | | | - | | |
| Interline Brands | | | 2,600,000 | | | | - | | | | - | | | | 2,600,000 | | | | 44,954 | | | | - | | |
| IPG Photonics* | | | 2,750,000 | | | | - | | | | 475,000 | | | | 2,275,000 | | | | 34,648 | | | | - | | |
| IXYS | | | 1,900,000 | | | | - | | | | - | | | | 1,900,000 | | | | 16,796 | | | | - | | |
| Kenexa | | | 2,425,000 | | | | - | | | | - | | | | 2,425,000 | | | | 29,100 | | | | - | | |
| Knoll | | | 4,000,000 | | | | - | | | | - | | | | 4,000,000 | | | | 53,160 | | | | 160 | | |
| Lifetime Fitness* | | | 2,150,000 | | | | - | | | | 190,000 | | | | 1,960,000 | | | | 62,308 | | | | - | | |
| lululemon athletica | | | 4,200,000 | | | | 485,000 | | | | 550,000 | | | | 4,135,000 | | | | 153,905 | | | | - | | |
| Marlin Business Services | | | 1,091,000 | | | | - | | | | - | | | | 1,091,000 | | | | 13,190 | | | | - | | |
| MB Financial | | | 2,305,600 | | | | 554,400 | | | | - | | | | 2,860,000 | | | | 52,595 | | | | 50 | | |
| McGrath Rentcorp | | | 2,350,000 | | | | - | | | | - | | | | 2,350,000 | | | | 53,533 | | | | 1,046 | | |
| Mediacom Communications | | | 4,000,000 | | | | - | | | | 1,000,000 | | | | 3,000,000 | | | | 20,160 | | | | - | | |
| Mine Safety Appliances* | | | 1,975,000 | | | | - | | | | 275,000 | | | | 1,700,000 | | | | 42,126 | | | | 899 | | |
| Nanosphere | | | 1,232,900 | | | | 267,100 | | | | - | | | | 1,500,000 | | | | 6,540 | | | | - | | |
| Navigant Consulting | | | 2,500,000 | | | | 200,000 | | | | - | | | | 2,700,000 | | | | 28,026 | | | | - | | |
| NPS Pharmaceuticals | | | 2,700,000 | | | | 412,776 | | | | - | | | | 3,112,776 | | | | 20,046 | | | | - | | |
| Orko Silver | | | 10,000,000 | | | | - | | | | - | | | | 10,000,000 | | | | 14,560 | | | | - | | |
| Orthofix International | | | 1,000,000 | | | | 150,000 | | | | - | | | | 1,150,000 | | | | 36,858 | | | | - | | |
| PAETEC Holding | | | 9,600,000 | | | | - | | | | - | | | | 9,600,000 | | | | 32,736 | | | | - | | |
| Pericom Semiconductor | | | 1,765,000 | | | | - | | | | - | | | | 1,765,000 | | | | 16,944 | | | | - | | |
| Petrodorado | | | 48,000,000 | | | | - | | | | - | | | | 48,000,000 | | | | 7,998 | | | | - | | |
| Petrolifera Petroleum | | | - | | | | 13,950,000 | | | | - | | | | 13,950,000 | | | | 8,518 | | | | - | | |
| Petromanas | | | - | | | | 56,250,000 | | | | - | | | | 56,250,000 | | | | 10,427 | | | | - | | |
| Pinnacle Entertainment | | | 4,050,000 | | | | - | | | | - | | | | 4,050,000 | | | | 38,313 | | | | - | | |
| Princeton Review | | | 3,000,000 | | | | - | | | | 30,000 | | | | 2,970,000 | | | | 6,890 | | | | - | | |
See accompanying notes to financial statements.
34
> Notes to Statement of Investments (dollar values in thousands)
| Affiliates | | Balance of
Shares Held
12/31/09 | | Purchases/
Additions | | Sales/
Reductions | | Balance of
Shares Held
6/30/10 | | Value | | Dividend | |
| PSS World Medical | | | 2,750,000 | | | | 550,000 | | | | - | | | | 3,300,000 | | | $ | 69,795 | | | $ | - | | |
| Rush Enterprises | | | 3,000,000 | | | | - | | | | - | | | | 3,000,000 | | | | 39,225 | | | | - | | |
| Salem Communications | | | 1,541,000 | | | | - | | | | - | | | | 1,541,000 | | | | 5,717 | | | | - | | |
| Shutterfly | | | - | | | | 1,350,000 | | | | - | | | | 1,350,000 | | | | 32,346 | | | | - | | |
| SkillSoft - ADR* | | | 9,500,000 | | | | - | | | | 9,500,000 | | | | - | | | | - | | | | - | | |
| Spanish Broadcasting System | | | 2,400,000 | | | | - | | | | - | | | | 2,400,000 | | | | 2,736 | | | | - | | |
| Supertex | | | 1,035,000 | | | | - | | | | - | | | | 1,035,000 | | | | 25,523 | | | | - | | |
| Switch & Data Facilities* | | | 2,500,000 | | | | - | | | | 2,500,000 | | | | - | | | | - | | | | - | | |
| Talbots | | | 4,250,000 | | | | 650,000 | | | | - | | | | 4,900,000 | | | | 50,519 | | | | - | | |
| THQ | | | 3,200,000 | | | | 300,000 | | | | - | | | | 3,500,000 | | | | 15,120 | | | | - | | |
| TriCo Bancshares | | | 1,200,000 | | | | - | | | | 100,000 | | | | 1,100,000 | | | | 18,623 | | | | 255 | | |
| True Religion Apparel | | | 1,500,000 | | | | 975,000 | | | | - | | | | 2,475,000 | | | | 54,623 | | | | - | | |
| Tuscany International Drilling | | | - | | | | 13,319,200 | | | | - | | | | 13,319,200 | | | | 10,925 | | | | - | | |
| tw telecom | | | 9,500,000 | | | | - | | | | - | | | | 9,500,000 | | | | 158,460 | | | | - | | |
| Tyler Technologies | | | 1,134,260 | | | | 1,315,740 | | | | 417,155 | | | | 2,032,845 | | | | 31,550 | | | | - | | |
| Universal Technical Institute | | | 1,750,301 | | | | - | | | | 50,301 | | | | 1,700,000 | | | | 40,188 | | | | - | | |
| Vail Resorts | | | 1,950,000 | | | | - | | | | - | | | | 1,950,000 | | | | 68,075 | | | | - | | |
| Vermillion | | | - | | | | 694,849 | | | | - | | | | 694,849 | | | | 8,131 | | | | - | | |
| Virtusa | | | 1,800,000 | | | | 200,000 | | | | - | | | | 2,000,000 | | | | 18,660 | | | | - | | |
| World Acceptance | | | 1,545,000 | | | | - | | | | 39,798 | | | | 1,505,202 | | | | 57,664 | | | | - | | |
| Xenoport | | | - | | | | 2,100,000 | | | | - | | | | 2,100,000 | | | | 20,601 | | | | - | | |
| Total of Affiliated Transactions | | | 306,022,151 | | | | 111,248,657 | | | | 71,954,178 | | | | 345,316,630 | | | $ | 3,122,025 | | | $ | 7,142 | | |
* At June 30, 2010, the Fund owned less than five percent of the company's outstanding voting shares.
The aggregate cost and value of these companies at June 30, 2010, were $2,848,343 and $3,122,025, respectively. Investments in affiliated companies represented 22.5% of the Fund's total net assets at June 30, 2010.
(c) All or a portion of this security was on loan at June 30, 2010. The total market value of Fund securities on loan at June 30, 2010 was $301,261.
(d) Denotes a restricted security, which is subject to restrictions on resale under federal securities laws. These securities are valued at a fair value determined in good faith under consistently applied procedures established by the Board of Trustees. At June 30, 2010, the market value of these securities amounted to $49,468, which represented 0.36% of total net assets.
Additional information on these securities is as follows:
| Security | | Acquisition
Dates | | Shares | | Cost | | Value | |
| Tuscany International Drilling | | 2/12/10-3/23/10 | | | 10,719,200 | | | $ | 12,997 | | | $ | 10,855 | | |
| Petromanas | | 5/20/10 | | | 37,500,000 | | | | 13,032 | | | | 9,722 | | |
| Vermillion | | 1/07/10 | | | 694,849 | | | | 12,850 | | | | 8,131 | | |
| Petrodorado | | 11/20/09 | | | 24,000,000 | | | | 5,049 | | | | 5,744 | | |
| Canacol Energy | | 4/15/10 | | | 6,300,000 | | | | 4,667 | | | | 5,220 | | |
| Petrolifera Petroleum | | 4/06/10 | | | 8,000,000 | | | | 6,768 | | | | 4,885 | | |
| Petrodorado - Warrants | | 11/20/09 | | | 24,000,000 | | | | 2,965 | | | | 2,254 | | |
| Tahoe Resources | | 5/28/10 | | | 236,400 | | | | 1,350 | | | | 1,415 | | |
| Petromanas - Warrants | | 5/20/10 | | | 18,750,000 | | | | 1,086 | | | | 705 | | |
| Voyager Learning, Contingent Value Rights | | 12/24/09 | | | 2,000,000 | | | | - | | | | 336 | | |
| MicroDose Technologies | | 11/24/00 | | | 359,944 | | | | 2,005 | | | | 122 | | |
| Tuscany International Drilling - Warrants | | 2/12/10 | | | 2,600,000 | | | | 322 | | | | 70 | | |
| Locus Pharmaceuticals, Series A-1 Pfd. | | 9/05/01 | | | 187,500 | | | | 7,500 | | | | 6 | | |
| Locus Pharmaceuticals, Series B-1 Pfd. | | 2/08/07 | | | 96,644 | | | | 280 | | | | 3 | | |
| Security Capital European Realty | | 8/20/98-7/20/99 | | | 37,407 | | | | 205 | | | | - | | |
| | | | | | | | | $ | 71,076 | | | $ | 49,468 | | |
(e) Security has no value.
(f) Investment made with cash collateral received from securities lending activity.
(g) At June 30, 2010, for federal income tax purposes, the cost of investments was $11,473,932 and net unrealized appreciation was $2,773,858, consisting of gross unrealized appreciation of $4,114,495 and gross unrealized depreciation of $1,340,637.
See accompanying notes to financial statements.
35
Columbia Acorn Fund
Statement of Investments (Unaudited), continued
> Notes to Statement of Investments (dollar values in thousands)
(h) On June 30, 2010, the market value of foreign securities represented 10.72% of total net assets. The Fund's foreign portfolio was diversified as follows:
| | | Value | | Percentage
of Net Assets | |
| Netherlands | | $ | 285,443 | | | | 2.05 | | |
| Canada | | | 200,158 | | | | 1.44 | | |
| Colombia | | | 157,644 | | | | 1.13 | | |
| Singapore | | | 152,722 | | | | 1.10 | | |
| Japan | | | 90,177 | | | | 0.65 | | |
| Sweden | | | 66,019 | | | | 0.47 | | |
| United Kingdom | | | 61,012 | | | | 0.44 | | |
| Chile | | | 57,068 | | | | 0.41 | | |
| India | | | 55,129 | | | | 0.40 | | |
| Hong Kong | | | 55,111 | | | | 0.40 | | |
| China | | | 52,434 | | | | 0.38 | | |
| France | | | 37,933 | | | | 0.27 | | |
| | | Value | | Percentage
of Net Assets | |
| Denmark | | $ | 36,087 | | | | 0.26 | | |
| Ireland | | | 32,239 | | | | 0.23 | | |
| South Korea | | | 27,978 | | | | 0.20 | | |
| Brazil | | | 26,379 | | | | 0.20 | | |
| Switzerland | | | 24,566 | | | | 0.18 | | |
| Italy | | | 21,007 | | | | 0.15 | | |
| Israel | | | 20,392 | | | | 0.15 | | |
| Germany | | | 17,784 | | | | 0.13 | | |
| Spain | | | 11,903 | | | | 0.08 | | |
| South Africa | | | 490 | | | | - | | |
| Luxembourg | | | - | | | | - | | |
| Total Foreign Portfolio | | $ | 1,489,675 | | | | 10.72 | | |
The following table summarizes the inputs used, as of June 30, 2010, in valuing the Fund's assets:
| Investment Type | | Quoted Prices
(Level 1) | | Other
Significant
Observable
Inputs
(Level 2) | | Significant
Unobservable
Inputs
(Level 3) | | Total | |
| Equities | |
| Information | | $ | 3,370,431 | | | $ | 191,876 | | | $ | - | | | $ | 3,562,307 | | |
| Industrial Goods & Services | | | 2,090,184 | | | | 264,129 | | | | - | | | | 2,354,313 | | |
| Consumer Goods & Services | | | 2,223,334 | | | | 112,689 | | | | 336 | | | | 2,336,359 | | |
| Finance | | | 1,626,544 | | | | 20,488 | | | | - | | | | 1,647,032 | | |
| Health Care | | | 1,467,308 | | | | 15,368 | | | | 131 | | | | 1,482,807 | | |
| Energy & Minerals | | | 1,013,623 | | | | 229,372 | | | | - | | | | 1,242,995 | | |
| Other Industries | | | 579,878 | | | | 87,693 | | | | - | | | | 667,571 | | |
| Total Equities | | | 12,371,302 | | | | 921,615 | | | | 467 | | | | 13,293,384 | | |
| Total Securities Lending Collateral | | | 311,736 | | | | - | | | | - | | | | 311,736 | | |
| Total Short-Term Obligations | | | - | | | | 642,670 | | | | - | | | | 642,670 | | |
| Total Investments | | $ | 12,683,038 | | | $ | 1,564,285 | | | $ | 467 | | | $ | 14,247,790 | | |
The Fund's assets assigned to the Level 2 input category are generally valued using the market approach, in which a security's value is determined through its correlation to prices and information from market transactions for similar or identical assets. Foreign equities are generally valued at the last sales price on the foreign exchange or market on which they trade. The Fund may use a systematic fair valuation model provided by an independent third party to value securities principally traded in foreign markets in order to adjust for possible stale pricing that may occur between the close of the foreign exchanges and the time for valuation. These models take into account available market data including intraday index, ADR, and ETF movements. Securities acquired via private placement, that have a holding period or an extended settlement period, are valued at a discount to the same shares that are trading freely on the market. These discounts are determined by the advisors experience with similar securities or situations. Factors may include, but are not limited to, trade volume, shares outstanding and stock price.
Certain Short-Term Obligations may be valued using amortized cost, an income approach which converts future cash flows to a present value based upon the discount or premium at purchase.
The Fund's assets assigned to the Level 3 input category are valued at fair value as determined in good faith under consistently applied procedures established by and under the general supervision of the Board of Trustees. To determine fair value, management will utilize the valuation technique that they deem the most appropriate in the circumstances. Securities acquired via private placement but are not yet trading are valued using the market approach for which management has determined that the original transaction price is the best representation of fair value. Securities for which no market exist are valued based upon the market approach using inputs from the investment team but ultimately decided by the Board of Trustees. These may include, but are not limited to, projected earnings, available cash, line of business, multiples, and consideration of the prioritization of the equity in a company's capital structur e.
See accompanying notes to financial statements.
36
> Notes to Statement of Investments (dollar values in thousands)
The following table reconciles asset balances for the six-month period ending June 30, 2010, in which significant unobservable inputs (Level 3) were used in determining value:
Investments
in Securities | | Balance
as of
December 31,
2009 | | Accrued
Discounts/
Premiums | | Realized
Gain/(Loss) | | Change in
Unrealized
Appreciation
(Depreciation) | | Purchase | | (Sales) | | Transfers
into
Level 3 | | Transfers
(out of)
Level 3 | | Balance
as of
June 30,
2010 | |
| Equities | |
| Consumer Goods & Services | | $ | 336 | | | $ | - | | | $ | - | | | $ | - | | | $ | - | | | $ | - | | | $ | - | | | $ | - | | | $ | 336 | | |
| Health Care | | | 176 | | | | - | | | | (4,500 | ) | | | 4,455 | | | | - | | | | - | | | | - | | | | - | | | | 131 | | |
| Energy & Minerals | | | - | | | | - | | | | - | | | | - | | | | 13,319 | | | | - | | | | - | | | | (13,319 | ) | | | - | | |
| | | $ | 512 | | | $ | - | | | $ | (4,500 | ) | | $ | 4,455 | | | $ | 13,319 | | | | - | | | | - | | | $ | (13,319 | ) | | $ | 467 | | |
The information in the above reconciliation table represents fiscal year to date activity for any securities identified as using Level 3 inputs during the current fiscal period.
The change in unrealized appreciation attributed to securities owned at June 30, 2010, which were valued using significant unobservable inputs (Level 3) amounted to $4,455. This amount is included in net change in unrealized appreciation (depreciation) on the Statements of Changes in Net Assets.
For more information on valuation inputs, and their aggregation into the levels used in the tables above, please refer to the Security Valuation section in the accompanying Notes to Financial Statements.
See accompanying notes to financial statements.
37
Columbia Acorn International
Major Portfolio Changes in the Second Quarter (Unaudited)
| | | Number of Shares | |
| | | 03/31/10 | | 06/30/10 | |
| Purchases | |
| Asia | |
| > Japan | |
| Benesse | | | 306,900 | | | | 408,700 | | |
| Hamamatsu Photonics | | | 622,200 | | | | 710,000 | | |
| Hoshizaki Electric | | | 193,400 | | | | 926,900 | | |
| Icom | | | 344,000 | | | | 585,000 | | |
| Japan Airport Terminal | | | 767,600 | | | | 1,000,000 | | |
| Kansai Paint | | | 6,620,600 | | | | 7,140,000 | | |
| Nakanishi | | | 210,000 | | | | 274,000 | | |
| Olympus | | | 480,000 | | | | 800,000 | | |
| Point | | | 478,570 | | | | 660,570 | | |
| Tsumura | | | 600,000 | | | | 789,000 | | |
| > China | |
| Mindray - ADR | | | 703,800 | | | | 850,000 | | |
| > Singapore | |
| CDL Hospitality Trust | | | 30,000,000 | | | | 33,485,000 | | |
| Goodpack | | | 0 | | | | 3,762,900 | | |
| > Hong Kong | |
| L'Occitane International | | | 0 | | | | 6,819,050 | | |
| Melco Crown Entertainment | | | 0 | | | | 5,000,000 | | |
| Europe | |
| > United Kingdom | |
| Abcam | | | 371,800 | | | | 586,942 | | |
| Chemring | | | 660,000 | | | | 680,000 | | |
| Cobham | | | 8,481,400 | | | | 8,700,000 | | |
| Micro Focus | | | 0 | | | | 3,850,000 | | |
| PureCircle | | | 1,200,000 | | | | 3,500,000 | | |
| > Netherlands | |
| Aalberts Industries | | | 1,750,935 | | | | 1,968,060 | | |
| Core Laboratories | | | 62,000 | | | | 103,000 | | |
| Fugro | | | 735,945 | | | | 763,202 | | |
| Imtech | | | 1,871,250 | | | | 1,922,517 | | |
| Unit 4 Agresso | | | 1,385,000 | | | | 1,476,800 | | |
| USG People | | | 0 | | | | 836,400 | | |
| Vopak | | | 520,100 | | | | 1,040,200 | | |
| > Germany | |
| Rhoen-Klinikum | | | 1,265,000 | | | | 1,699,000 | | |
| Wirecard | | | 1,180,000 | | | | 1,590,000 | | |
| > France | |
| Eurofins Scientific | | | 455,700 | | | | 599,271 | | |
| Norbert Dentressangle | | | 160,701 | | | | 201,101 | | |
| Pierre & Vacances | | | 271,000 | | | | 322,200 | | |
| Rubis | | | 170,000 | | | | 206,183 | | |
| Saft | | | 424,300 | | | | 595,614 | | |
| > Switzerland | |
| Bank Sarasin & Cie | | | 591,762 | | | | 660,000 | | |
| Partners Group | | | 0 | | | | 125,000 | | |
| | | Number of Shares | |
| | | 03/31/10 | | 06/30/10 | |
| > Italy | |
| Ansaldo STS | | | 1,169,000 | | | | 1,298,500 | | |
| Credito Emiliano | | | 3,069,000 | | | | 4,311,600 | | |
| Tod's | | | 155,468 | | | | 279,000 | | |
| > Ireland | |
| United Drug | | | 11,249,900 | | | | 11,526,000 | | |
| > Portugal | |
| Banco Comercial Português | | | 12,858,000 | | | | 16,574,000 | | |
| > Iceland | |
| Marel | | | 29,868,604 | | | | 33,804,924 | | |
| Redes Energéticas Nacionais | | | 4,912,072 | | | | 6,801,200 | | |
| Other Countries | |
| > Canada | |
| AG Growth | | | 317,900 | | | | 540,000 | | |
| Baytex | | | 432,900 | | | | 735,000 | | |
| Black Diamond Group | | | 203,800 | | | | 530,000 | | |
| Petromanas | | | 0 | | | | 12,500,000 | | |
| Tahoe Resources | | | 0 | | | | 872,700 | | |
| > United States | |
| FMC Technologies | | | 251,000 | | | | 329,000 | | |
| Textainer Group Holdings | | | 86,001 | | | �� | 360,000 | | |
| > Australia | |
| Billabong International | | | 1,500,000 | | | | 1,741,880 | | |
| Cochlear | | | 262,000 | | | | 319,000 | | |
| Hastie Group | | | 7,158,966 | | | | 10,033,348 | | |
| SAI Global | | | 3,995,081 | | | | 6,124,662 | | |
| > Senegal | |
| Sonatel | | | 7,402 | | | | 24,247 | | |
| Latin America | |
| > Brazil | |
| Localiza Rent A Car | | | 5,000,000 | | | | 5,200,000 | | |
Mills Estruturas e Servicios
de Engenha | | | 0 | | | | 2,858,610 | | |
| Suzano | | | 4,300,000 | | | | 5,375,000 | | |
See accompanying notes to financial statements.
38
| | | Number of Shares | |
| | | 03/31/10 | | 06/30/10 | |
| Sales | |
| Asia | |
| > Japan | |
| As One | | | 208,900 | | | | 128,100 | | |
| Jupiter Telecommunications | | | 27,132 | | | | 13,933 | | |
| Unicharm PetCare | | | 336,300 | | | | 0 | | |
| Zenrin | | | 822,000 | | | | 680,200 | | |
| > China | |
IFM Investments
(Century 21 China RE) - ADR | | | 321,800 | | | | 0 | | |
New Oriental Education &
Technology - ADR | | | 382,000 | | | | 327,429 | | |
| VisionChina Media - ADR | | | 625,700 | | | | 0 | | |
| > Singapore | |
| Ascendas REIT | | | 21,000,000 | | | | 20,000,000 | | |
| > India | |
| Asian Paints | | | 1,008,727 | | | | 908,519 | | |
| Housing Development Finance | | | 450,000 | | | | 400,000 | | |
| Jain Irrigation Systems | | | 2,000,000 | | | | 1,806,000 | | |
| > South Korea | |
| MegaStudy | | | 182,000 | | | | 172,000 | | |
| > Hong Kong | |
Hong Kong Exchanges
and Clearing | | | 2,500,000 | | | | 2,300,000 | | |
| > Indonesia | |
| Perusahaan Gas Negara | | | 70,000,000 | | | | 65,000,000 | | |
| Europe | |
| > United Kingdom | |
| Capita Group | | | 3,300,000 | | | | 2,637,000 | | |
| Keller Group | | | 1,110,000 | | | | 0 | | |
| Spice Group | | | 2,677,433 | | | | 0 | | |
| > Netherlands | |
| Koninklijke TenCate | | | 1,372,989 | | | | 1,298,651 | | |
| > Germany | |
| Elringklinger | | | 750,000 | | | | 650,000 | | |
| Takkt | | | 700,000 | | | | 0 | | |
| > France | |
| SES | | | 759,000 | | | | 0 | | |
| Zodiac Aerospace | | | 408,000 | | | | 205,311 | | |
| > Switzerland | |
| Burckhardt Compression | | | 85,000 | | | | 0 | | |
| > Sweden | |
| Nobia | | | 3,063,701 | | | | 0 | | |
| > Ireland | |
| Aryzta | | | 330,000 | | | | 297,000 | | |
| | | Number of Shares | |
| | | 03/31/10 | | 06/30/10 | |
| > Greece | |
| Bank of Piraeus | | | 1,117,000 | | | | 0 | | |
| > Norway | |
| Dockwise | | | 101,200 | | | | 0 | | |
| Other Countries | |
| > Canada | |
| Eldorado Gold | | | 2,542,000 | | | | 1,983,000 | | |
| > United States | |
| Oceaneering International | | | 346,000 | | | | 192,000 | | |
| > Australia | |
| Australian Stock Exchange | | | 700,000 | | | | 0 | | |
| Perpetual Trustees | | | 700,000 | | | | 539,045 | | |
| Latin America | |
| > Brazil | |
| Natura | | | 2,000,000 | | | | 1,900,000 | | |
| > Mexico | |
Grupo Aeroportuario del
Sureste - ADR | | | 630,000 | | | | 570,000 | | |
| Urbi Desarrollos Urbanos | | | 10,459,400 | | | | 6,837,700 | | |
See accompanying notes to financial statements.
39
Columbia Acorn International
Statement of Investments (Unaudited), June 30, 2010
| Number of Shares | | | | Value (000) | |
| | | | | | | | Equities: 95.3% | | |
| Asia 40.7% | | | |
| | | > Japan 17.7% | |
| | 7,140,000 | | | Kansai Paint | | $ | 61,105 | | |
| | | | | Paint Producer in Japan, India, China &
Southeast Asia | | | | | |
| | 660,570 | | | Point | | | 36,249 | | |
| | | | | Apparel Specialty Retailer | | | | | |
| | 1,846,000 | | | Aeon Delight | | | 35,837 | | |
| | | | | Facility Maintenance & Management | | | | | |
| | 13,071 | | | Start Today | | | 35,814 | | |
| | | | | Largest Online Japanese Apparel Retailer | | | | | |
| | 26,500 | | | Advance Residence Investment (a) | | | 34,206 | | |
| | | | | Residential REIT | | | | | |
| | 20,637 | | | Wacom | | | 30,364 | | |
| | | | | Computer Graphic Illustration Devices | | | | | |
| | 16,442 | | | Seven Bank | | | 29,772 | | |
| | | | | ATM Processing Services | | | | | |
| | 648,000 | | | Ain Pharmaciez | | | 26,232 | | |
| | | | | Dispensing Pharmacy/Drugstore Operator | | | | | |
| | 3,283,000 | | | Kamigumi | | | 25,231 | | |
| | | | | Port Cargo Handling & Logistics | | | | | |
| | 789,000 | | | Tsumura | | | 24,182 | | |
| | | | | Traditional Chinese/Japanese Herbal Rx
Drugs (Kampo) | | | | | |
| | 5,650 | | | Orix JREIT | | | 23,555 | | |
| | | | | Diversified REIT | | | | | |
| | 274,000 | | | Nakanishi | | | 23,461 | | |
| | | | | Dental Tools & Machinery | | | | | |
| | 977,000 | | | Glory | | | 21,266 | | |
| | | | | Currency Handling Systems & Related
Equipment | | | | | |
| | 3,860 | | | Nippon Accommodations Fund | | | 20,284 | | |
| | | | | Residential REIT | | | | | |
| | 710,000 | | | Hamamatsu Photonics | | | 19,749 | | |
| | | | | Optical Sensors for Medical &
Industrial Applications | | | | | |
| | 3,400 | | | Fukuoka | | | 19,618 | | |
| | | | | Diversified REIT in United Kingdom | | | | | |
| | 711,000 | | | Ibiden | | | 19,168 | | |
| | | | | Electronic Parts & Ceramics | | | | | |
| | 800,000 | | | Olympus | | | 18,936 | | |
| | | | | Medical Equipment (Endoscopes) & Cameras | | | | | |
| | 408,700 | | | Benesse | | | 18,613 | | |
| | | | | Education Service Provider | | | | | |
| | 1,501,000 | | | Rohto Pharmaceutical | | | 18,308 | | |
| | | | | Health & Beauty Products | | | | | |
| | 906,000 | | | Aeon Mall | | | 17,977 | | |
| | | | | Suburban Shopping Mall Developer,
Owner & Operator | | | | | |
| | 1,905,500 | | | Asics | | | 17,461 | | |
| | | | | Footwear & Apparel | | | | | |
| | 687,000 | | | Kintetsu World Express | | | 17,298 | | |
| | | | | Airfreight Logistics | | | | | |
| | 4,030 | | | Osaka Securities Exchange | | | 17,087 | | |
| | | | | Osaka Securities Exchange | | | | | |
| | 787,200 | | | Daiseki | | | 16,293 | | |
| | | | | Waste Disposal & Recycling | | | | | |
| Number of Shares | | | | Value (000) | |
| | 926,900 | | | Hoshizaki Electric | | $ | 16,187 | | |
| | | | | Commercial Kitchen Equipment | | | | | |
| | 1,750,000 | | | Suruga Bank | | | 15,854 | | |
| | | | | Regional Bank | | | | | |
| | 590,000 | | | Makita | | | 15,739 | | |
| | | | | Power Tools | | | | | |
| | 1,000,000 | | | Japan Airport Terminal | | | 14,825 | | |
| | | | | Airport Terminal Operator at Haneda | | | | | |
| | 950,000 | | | Ushio | | | 14,667 | | |
| | | | | Industrial Light Sources | | | | | |
| | 3,310 | | | Kakaku.com | | | 13,683 | | |
| | | | | Online Price Comparison Services for Consumers | | | | | |
| | 587,800 | | | Miura | | | 13,398 | | |
| | | | | Industrial Boiler | | | | | |
| | 942,000 | | | Tamron | | | 13,378 | | |
| | | | | Camera Lens Maker | | | | | |
| | 585,000 | | | Icom | | | 13,359 | | |
| | | | | Two Way Radio Communication Equipment | | | | | |
| | 13,933 | | | Jupiter Telecommunications | | | 13,279 | | |
| | | | | Largest Cable Service Provider in Japan | | | | | |
| | 633,800 | | | Torishima Pump Manufacturing | | | 9,757 | | |
| | | | | Industrial Pump for Power Generation &
Water Supply Systems | | | | | |
| | 680,200 | | | Zenrin | | | 7,352 | | |
| | | | | Map Content Publisher | | | | | |
| | 128,100 | | | As One | | | 2,198 | | |
| | | | | Scientific Supplies Distributor | | | | | |
| | | | 791,742 | | |
| | | > China 6.1% | |
| | 7,993,100 | | | Shandong Weigao | | | 34,823 | | |
| | | | | Vertically Integrated Hospital
Consumable Manufacturing | | | | | |
| | 13,930,000 | | | Zhaojin Mining Industry | | | 32,670 | | |
| | | | | Gold Mining & Refining in China | | | | | |
| | 10,107,000 | | | China Yurun Food | | | 31,639 | | |
| | | | | Meat Processor in China | | | | | |
| | 327,429 | | | New Oriental Education &
Technology - ADR (a)(b) | | | 30,513 | | |
| | | | | China's Largest Private Education
Service Provider | | | | | |
| | 29,166,400 | | | China Green | | | 29,242 | | |
| | | | | Chinese Fruit & Vegetable Grower & Processor | | | | | |
| | 31,987,000 | | | Jiangsu Expressway | | | 29,162 | | |
| | | | | Chinese Toll Road Operator | | | | | |
| | 850,000 | | | Mindray - ADR (b) | | | 26,707 | | |
| | | | | Medical Device Manufacturer | | | | | |
| | 240,000,000 | | | RexLot Holdings | | | 21,900 | | |
| | | | | Lottery Equipment Supplier in China | | | | | |
| | 23,426,300 | | | Wasion Group | | | 14,709 | | |
| | | | | Electronic Power Meter Total Solution Provider | | | | | |
| | 24,952,000 | | | China Communication Services | | | 12,155 | | |
| | | | | China's Telecom Infrastructure Service Provider | | | | | |
| | 15,782,000 | | | Sino Ocean Land | | | 11,285 | | |
| | | | | Property Developer in China | | | | | |
| | 15,300,000 | | | Fu Ji Food & Catering Services (a)(c) | | | 157 | | |
| | | | | Food Catering Service Provider in China | | | | | |
| | | | 274,962 | | |
See accompanying notes to financial statements.
40
| Number of Shares | | | | Value (000) | |
| | | > Singapore 4.6% | |
| | 37,000,000 | | | Olam International | | $ | 67,751 | | |
| | | | | Agriculture Supply Chain Manager | | | | | |
| | 70,000,000 | | | Mapletree Logistics Trust | | | 41,558 | | |
| | | | | Asian Logistics Landlord | | | | | |
| | 33,485,000 | | | CDL Hospitality Trust | | | 41,520 | | |
| | | | | Hotel Owner/Operator | | | | | |
| | 5,000,000 | | | Singapore Exchange | | | 26,163 | | |
| | | | | Singapore Equity & Derivatives
Market Operator | | | | | |
| | 20,000,000 | | | Ascendas REIT | | | 25,816 | | |
| | | | | Singapore Industrial Property Landlord | | | | | |
| | 3,762,900 | | | Goodpack | | | 4,478 | | |
| | | | | International Bulk Container Leasing | | | | | |
| | | | 207,286 | | |
| | | > India 4.3% | |
| | 908,519 | | | Asian Paints | | | 44,694 | | |
| | | | | India's Largest Paint Company | | | | | |
| | 1,806,000 | | | Jain Irrigation Systems | | | 41,360 | | |
| | | | | Agricultural Micro-irrigation Systems &
Food Processing | | | | | |
| | 2,396,050 | | | Shriram Transport Finance | | | 29,616 | | |
| | | | | Truck Financing in India | | | | | |
| | 400,000 | | | Housing Development Finance | | | 25,216 | | |
| | | | | Indian Mortgage Lender | | | | | |
| | 1,570,000 | | | Mundra Port & Special Economic Zone | | | 24,705 | | |
| | | | | Indian West Coast Shipping Port | | | | | |
| | 1,450,000 | | | Educomp Solutions | | | 16,388 | | |
| | | | | Multimedia Educational Content & Schools | | | | | |
| | 1,271,000 | | | Patel Engineering | | | 11,603 | | |
| | | | | Civil Engineering & Construction | | | | | |
| | | | 193,582 | | |
| | | > South Korea 2.6% | |
| | 245,000 | | | NHN (a) | | | 36,461 | | |
| | | | | South Korea's Largest Online Search Engine | | | | | |
| | 909,000 | | | Woongjin Coway | | | 30,388 | | |
| | | | | South Korean Household Appliance Rental
Service Provider | | | | | |
| | 172,000 | | | MegaStudy | | | 22,694 | | |
| | | | | Online Education Service Provider | | | | | |
| | 376,000 | | | Mirae Asset Securities | | | 16,474 | | |
| | | | | South Korean Largest Diversified
Financial Company | | | | | |
| | 179,000 | | | Taewoong | | | 8,054 | | |
| | | | | Niche Custom Forging | | | | | |
| | | | 114,071 | | |
| | | > Hong Kong 2.5% | |
| | 22,154,200 | | | Lifestyle International | | | 42,969 | | |
| | | | | Mid to High-end Department Store Operator
in Hong Kong & China | | | | | |
| | 2,300,000 | | | Hong Kong Exchanges and Clearing | | | 35,923 | | |
| | | | | Hong Kong Equity & Derivatives
Market Operator | | | | | |
| | 5,000,000 | | | Melco Crown Entertainment (a)(b) | | | 18,700 | | |
| | | | | Macau Casino Operator | | | | | |
| | 6,819,050 | | | L'Occitane International (a) | | | 14,870 | | |
| | | | | Skin Care & Cosmetics Producer | | | | | |
| | | | 112,462 | | |
| Number of Shares | | | | Value (000) | |
| | | > Taiwan 2.3% | |
| | 6,038,500 | | | Simplo Technology | | $ | 32,694 | | |
| | | | | World's Largest Notebook Battery
Pack Supplier | | | | | |
| | 50,376,000 | | | Yuanta Financial Holdings | | | 26,883 | | |
| | | | | Financial Holding Company in Taiwan | | | | | |
| | 9,297,575 | | | Everlight Electronics | | | 23,771 | | |
| | | | | LED Packager | | | | | |
| | 1,454,200 | | | Formosa International Hotels (a) | | | 17,811 | | |
| | | | | Hotel, Food & Beverage Operation &
Hospitality Management Services | | | | | |
| | | | 101,159 | | |
| | | > Indonesia 0.6% | |
| | 65,000,000 | | | Perusahaan Gas Negara | | | 27,484 | | |
| | | | | Gas Distributor & Pipeline Operator | | | | | |
| | | | 27,484 | | |
| Asia: Total | | | 1,822,748 | | |
| Europe 34.4% | | | |
| | | > United Kingdom 7.5% | |
| | 6,700,000 | | | Serco | | | 58,364 | | |
| | | | | Facilities Management | | | | | |
| | 2,000,000 | | | Intertek Group | | | 42,775 | | |
| | | | | Testing, Inspection & Certification Services | | | | | |
| | 680,000 | | | Chemring | | | 29,847 | | |
| | | | | Defense Manufacturer of Countermeasures &
Energetics | | | | | |
| | 2,637,000 | | | Capita Group | | | 28,932 | | |
| | | | | White Collar, Back Office Outsourcing | | | | | |
| | 8,700,000 | | | Cobham | | | 27,422 | | |
| | | | | Aerospace Components | | | | | |
| | 1,466,000 | | | Schroders | | | 26,383 | | |
| | | | | United Kingdom Top Tier Asset Manager | | | | | |
| | 3,850,000 | | | Micro Focus | | | 24,113 | | |
| | | | | United Kingdom Legacy Software Provider | | | | | |
| | 3,500,000 | | | PureCircle (a) | | | 12,945 | | |
| | | | | Manufactures Natural Sweetener | | | | | |
| | 20,823,776 | | | Archipelago Resources (a) | | | 12,941 | | |
| | | | | Gold Mining Projects in Indonesia, Vietnam &
the Philippines | | | | | |
| | 682,000 | | | Rotork | | | 12,889 | | |
| | | | | Valve Actuators for Oil & Water Pipelines | | | | | |
| | 3,465,000 | | | N Brown Group | | | 12,888 | | |
| | | | | Home Shopping Women's Clothes Retailer | | | | | |
| | 4,600,000 | | | RPS Group | | | 12,788 | | |
| | | | | Environmental Consulting & Planning | | | | | |
| | 1,250,000 | | | Smith & Nephew | | | 11,769 | | |
| | | | | Medical Equipment & Supplies | | | | | |
| | 586,942 | | | Abcam | | | 10,715 | | |
| | | | | Online Sales of Antibodies | | | | | |
| | 690,000 | | | Tullow Oil | | | 10,278 | | |
| | | | | Oil & Gas Producer | | | | | |
| | | | 335,049 | | |
| | | > Netherlands 5.9% | |
| | 1,922,517 | | | Imtech | | | 49,318 | | |
| | | | | Electromechanical & ICT Installation &
Maintenance | | | | | |
See accompanying notes to financial statements.
41
Columbia Acorn International
Statement of Investments (Unaudited), continued
| Number of Shares | | | | Value (000) | |
| | | > Netherlands—continued | |
| | 1,040,200 | | | Vopak | | $ | 38,174 | | |
| | | | | World's Largest Operator of Petroleum &
Chemical Storage Terminals | | | | | |
| | 763,202 | | | Fugro | | | 34,896 | | |
| | | | | Sub-sea Oilfield Services | | | | | |
| | 1,476,800 | | | Unit 4 Agresso (d) | | | 30,572 | | |
| | | | | Business Software Development | | | | | |
| | 1,298,651 | | | Koninklijke TenCate (d) | | | 28,292 | | |
| | | | | Advanced Textiles & Industrial Fabrics | | | | | |
| | 1,968,060 | | | Aalberts Industries | | | 25,371 | | |
| | | | | Flow Control & Heat Treatment | | | | | |
| | 1,088,187 | | | Arcadis | | | 19,491 | | |
| | | | | Engineering Consultants | | | | | |
| | 103,000 | | | Core Laboratories (b) | | | 15,204 | | |
| | | | | Oil & Gas Reservoir Consulting | | | | | |
| | 650,000 | | | QIAGEN (a) | | | 12,592 | | |
| | | | | Life Science Tools & Molecular Diagnostics | | | | | |
| | 836,400 | | | USG People (a) | | | 11,737 | | |
| | | | | Temporary Staffing Services | | | | | |
| | | | 265,647 | | |
| | | > Germany 4.0% | |
| | 1,699,000 | | | Rhoen-Klinikum | | | 37,737 | | |
| | | | | Health Care Services | | | | | |
| | 610,000 | | | CTS Eventim | | | 29,320 | | |
| | | | | Event Ticket Sales | | | | | |
| | 245,000 | | | Vossloh | | | 19,915 | | |
| | | | | Rail Infrastructure & Diesel Locomotives | | | | | |
| | 127,000 | | | Rational | | | 19,614 | | |
| | | | | Commercial Oven Manufacturer | | | | | |
| | 335,000 | | | Wincor Nixdorf | | | 18,744 | | |
| | | | | Retail POS Systems & ATM Machines | | | | | |
| | 960,000 | | | Tognum | | | 17,849 | | |
| | | | | Diesel Engines for Drive & Power
Generation Systems | | | | | |
| | 650,000 | | | Elringklinger | | | 13,909 | | |
| | | | | Automobile Components | | | | | |
| | 1,590,000 | | | Wirecard (b) | | | 13,524 | | |
| | | | | Online Payment Processing & Risk Management | | | | | |
| | 354,500 | | | Deutsche Beteiligungs | | | 8,074 | | |
| | | | | Private Equity Investment Management | | | | | |
| | | | 178,686 | | |
| | | > France 3.3% | |
| | 330,000 | | | Neopost | | | 23,881 | | |
| | | | | Postage Meter Machines | | | | | |
| | 322,200 | | | Pierre & Vacances | | | 21,445 | | |
| | | | | Vacation Apartment Lets | | | | | |
| | 599,271 | | | Eurofins Scientific (a)(b) | | | 21,264 | | |
| | | | | Food, Pharmaceuticals & Materials
Screening & Testing | | | | | |
| | 531,000 | | | Mersen (b) | | | 18,108 | | |
| | | | | Advanced Industrial Materials | | | | | |
| | 595,614 | | | Saft (b) | | | 18,061 | | |
| | | | | Niche Battery Manufacturer | | | | | |
| | 206,183 | | | Rubis | | | 16,670 | | |
| | | | | Tank Storage & Liquefied Petroleum
Gas Distribution | | | | | |
| | 201,101 | | | Norbert Dentressangle | | | 13,206 | | |
| | | | | Leading European Logistics & Transport Group | | | | | |
| Number of Shares | | | | Value (000) | |
| | 205,311 | | | Zodiac Aerospace | | $ | 9,889 | | |
| | | | | Aerospace Supplier | | | | | |
| | 1,337,100 | | | Hi-Media (a) | | | 7,031 | | |
| | | | | Online Advertiser in Europe | | | | | |
| | | | 149,555 | | |
| | | > Switzerland 3.1% | |
| | 20,500 | | | Sika | | | 36,231 | | |
| | | | | Chemicals for Construction &
Industrial Applications | | | | | |
| | 325,000 | | | Kuehne & Nagel | | | 33,290 | | |
| | | | | Freight Forwarding/Logistics | | | | | |
| | 185,000 | | | Geberit | | | 28,688 | | |
| | | | | Plumbing Supplies | | | | | |
| | 660,000 | | | Bank Sarasin & Cie | | | 26,443 | | |
| | | | | Private Banking | | | | | |
| | 125,000 | | | Partners Group | | | 15,083 | | |
| | | | | Private Markets Asset Management | | | | | |
| | | | 139,735 | | |
| | | > Italy 2.3% | |
| | 7,674,000 | | | Terna (b) | | | 27,637 | | |
| | | | | Italian Power Transmission | | | | | |
| | 4,311,600 | | | Credito Emiliano | | | 24,265 | | |
| | | | | Italian Regional Bank | | | | | |
| | 1,298,500 | | | Ansaldo STS | | | 20,733 | | |
| | | | | Railway Systems Integrator | | | | | |
| | 279,000 | | | Tod's | | | 17,589 | | |
| | | | | Leather Shoes & Bags | | | | | |
| | 8,131,000 | | | CIR (a) | | | 13,703 | | |
| | | | | Italian Holding Company | | | | | |
| | | | 103,927 | | |
| | | > Sweden 1.9% | |
| | 3,756,000 | | | Hexagon (b) | | | 48,908 | | |
| | | | | Measurement Equipment | | | | | |
| | 3,887,000 | | | Sweco | | | 24,779 | | |
| | | | | Engineering Consultants | | | | | |
| | 1,078,000 | | | East Capital Explorer (a) | | | 9,780 | | |
| | | | | Sweden-based RUS/CEE Investment Fund | | | | | |
| | | | 83,467 | | |
| | | > Ireland 1.4% | |
| | 11,526,000 | | | United Drug | | | 32,083 | | |
| | | | | Irish Pharmaceutical Wholesaler & Outsourcer | | | | | |
| | 575,000 | | | Paddy Power | | | 17,854 | | |
| | | | | Irish Betting Services | | | | | |
| | 297,000 | | | Aryzta | | | 11,206 | | |
| | | | | Baked Goods | | | | | |
| | | | 61,143 | | |
| | | > Finland 1.2% | |
| | 967,777 | | | Stockmann | | | 29,857 | | |
| | | | | Department Store & Fashion Retailer in
Scandinavia & Russia | | | | | |
| | 1,756,000 | | | Poyry | | | 21,621 | | |
| | | | | Engineering Consultants | | | | | |
| | | | 51,478 | | |
| | | > Portugal 0.8% | |
| | 6,801,200 | | | Redes Energéticas Nacionais | | | 21,923 | | |
| | | | | Portuguese Power Transmission &
Gas Transportation | | | | | |
See accompanying notes to financial statements.
42
| Number of Shares | | | | Value (000) | |
| | | > Portugal—continued | |
| | 16,574,000 | | | Banco Comercial Português | | $ | 12,424 | | |
| | | | | Largest Portuguese Banking Franchise | | | | | |
| | | | 34,347 | | |
| | | > Denmark 0.7% | |
| | 306,000 | | | Novozymes | | | 32,478 | | |
| | | | | Industrial Enzymes | | | | | |
| | | | 32,478 | | |
| | | > Iceland 0.5% | |
| | 33,804,924 | | | Marel (a) | | | 23,734 | | |
| | | | | Largest Manufacturer of Poultry &
Fish Processing Equipment | | | | | |
| | | | 23,734 | | |
| | | > Spain 0.5% | |
| | 579,000 | | | Red Eléctrica de Espana | | | 20,697 | | |
| | | | | Spanish Power Transmission | | | | | |
| | | | 20,697 | | |
| | | > Greece 0.5% | |
| | 6,475,300 | | | Intralot | | | 20,560 | | |
| | | | | Lottery & Gaming Systems & Services | | | | | |
| | | | 20,560 | | |
| | | > Poland 0.4% | |
| | 893,900 | | | Central European Distribution (a) | | | 19,111 | | |
| | | | | Largest Spirits Company in Central &
Eastern Europe | | | | | |
| | | | 19,111 | | |
| | | > Czech Republic 0.4% | |
| | 118,200 | | | Komercni Banka | | | 19,099 | | |
| | | | | Leading Czech Republic Universal Bank | | | | | |
| | | | 19,099 | | |
| Europe: Total | | | 1,538,713 | | |
| Other Countries 14.0% | | | |
| | | > Canada 4.8% | |
| | 1,710,000 | | | ShawCor | | | 43,129 | | |
| | | | | Oil & Gas Pipeline Products | | | | | |
| | 1,983,000 | | | Eldorado Gold | | | 35,541 | | |
| | | | | Gold Miner in Turkey, Greece, China & Brazil | | | | | |
| | 1,154,100 | | | CCL Industries | | | 30,897 | | |
| | | | | Leading Global Label Manufacturer | | | | | |
| | 735,000 | | | Baytex | | | 21,956 | | |
| | | | | Oil & Gas Producer in Canada | | | | | |
| | 540,000 | | | AG Growth | | | 17,805 | | |
| | | | | Leading Manufacturer of Augers &
Grain Handling Equipment | | | | | |
| | 850,000 | | | Ivanhoe Mines (a) | | | 11,011 | | |
| | 744,000 | | | Ivanhoe Mines (a)(e) | | | 9,702 | | |
| | | | | Copper Mine Project in Mongolia | | | | | |
| | 1,355,000 | | | Guyana Goldfields (a)(f) | | | 8,821 | | |
| | | | | Gold Mining Projects in Guyana | | | | | |
| | 530,000 | | | Black Diamond Group | | | 8,738 | | |
| | | | | Provides Accommodations/Equipment for
Oil Sands Exploitation | | | | | |
| | 1,480,610 | | | Pan Orient (a) | | | 7,163 | | |
| | | | | Growth Oriented & Return Focused
Asian Explorer | | | | | |
| Number of Shares | | | | Value (000) | |
| | 12,500,000 | | | Eacom Timber - Subscription
Receipts (a)(f) | | $ | 5,354 | | |
| | | | | Canadian Lumber Producer | | | | | |
| | 872,700 | | | Tahoe Resources (a)(f) | | | 5,222 | | |
| | | | | Silver Project in Guatemala | | | | | |
| | 2,262,100 | | | Horizon North Logistics (a) | | | 3,506 | | |
| | | | | Provides Diversified Oil Service Offering in
Northern Canada | | | | | |
| | 12,500,000 | | | Petromanas (a)(f) | | | 3,241 | | |
| | 6,250,000 | | | Petromanas - Warrants (a)(f) | | | 235 | | |
| | | | | Exploring for Oil in Albania | | | | | |
| | 49,900 | | | WestFire Energy (a) | | | 306 | | |
| | | | | Oil Producer in Alberta & Saskatchewan | | | | | |
| | | | 212,627 | | |
| | | > United States 3.6% | |
| | 1,340,000 | | | Atwood Oceanics (a) | | | 34,197 | | |
| | | | | Offshore Drilling Contractor | | | | | |
| | 625,000 | | | Alexion Pharmaceuticals (a) | | | 31,994 | | |
| | | | | Biotech Focused on Orphan Diseases | | | | | |
| | 742,000 | | | World Fuel Services | | | 19,248 | | |
| | | | | Global Fuel Broker | | | | | |
| | 329,000 | | | FMC Technologies (a) | | | 17,325 | | |
| | | | | Oil & Gas Wellhead Manufacturer | | | | | |
| | 725,000 | | | BioMarin (a) | | | 13,746 | | |
| | | | | Biotech Focused on Orphan Diseases | | | | | |
| | 679,000 | | | Ritchie Brothers Auctioneers (b) | | | 12,371 | | |
| | | | | Heavy Equipment Auctioneer | | | | | |
| | 391,000 | | | Bristow (a) | | | 11,495 | | |
| | | | | Largest Provider of Helicopter Services to
Offshore Oil & Gas Producers | | | | | |
| | 360,000 | | | Textainer Group Holdings | | | 8,690 | | |
| | | | | Top International Container Leasor | | | | | |
| | 192,000 | | | Oceaneering International (a) | | | 8,621 | | |
| | | | | Provider of Sub-sea Services &
Manufactured Products | | | | | |
| | 324,000 | | | Tesco (a) | | | 3,979 | | |
| | | | | Developing New Well Drilling Technologies | | | | | |
| | | | 161,666 | | |
| | | > Australia 2.4% | |
| | 2,482,000 | | | UGL | | | 28,029 | | |
| | | | | Engineering & Facilities Management | | | | | |
| | 6,124,662 | | | SAI Global | | | 20,524 | | |
| | | | | Publishing, Certification & Compliance Services | | | | | |
| | 319,000 | | | Cochlear | | | 19,871 | | |
| | | | | Cochlear Implants for Hearing | | | | | |
| | 539,045 | | | Perpetual Trustees | | | 12,703 | | |
| | | | | Mutual Fund Management | | | | | |
| | 1,741,880 | | | Billabong International | | | 12,685 | | |
| | | | | Action Sports Apparel Brand Manager | | | | | |
| | 10,033,348 | | | Hastie Group | | | 11,548 | | |
| | | | | Mechanical, Electrical & Hydraulic
(MEH) Engineering | | | | | |
| | 731,000 | | | Seek | | | 4,258 | | |
| | | | | Online Job Listing & Education | | | | | |
| | | | 109,618 | | |
See accompanying notes to financial statements.
43
Columbia Acorn International
Statement of Investments (Unaudited), continued
| Number of Shares | | | | Value (000) | |
| | | > South Africa 2.1% | |
| | 1,973,000 | | | Naspers | | $ | 66,313 | | |
| | | | | Media in Africa & Other Emerging Markets | | | | | |
| | 4,600,000 | | | Mr. Price | | | 26,673 | | |
| | | | | South African Retailer of Apparel,
Household & Sporting Goods | | | | | |
| | 114,560 | | | Northam Platinum | | | 673 | | |
| | | | | Platinum Mining in South Africa | | | | | |
| | | | 93,659 | | |
| | | > Israel 0.7% | |
| | 2,890,000 | | | Israel Chemicals | | | 30,138 | | |
| | | | | Producer of Potash, Phosphates, Bromine &
Specialty Chemicals | | | | | |
| | | | 30,138 | | |
| | | > Kazakhstan 0.3% | |
| | 1,770,000 | | | Halyk Savings Bank of
Kazakhstan - GDR (a) | | | 13,752 | | |
| | | | | Largest Retail Bank & Insurer in Kazakhstan | | | | | |
| | | | 13,752 | | |
| | | > Senegal 0.1% | |
| | 24,247 | | | Sonatel | | | 6,102 | | |
| | | | | Leading Telecoms Operator in Western Africa | | | | | |
| | | | 6,102 | | |
| | | > Egypt —% | |
| | 55,299 | | | Paints & Chemical Industries (Pachin) | | | 471 | | |
| | | | | Paints & Inks in Egypt | | | | | |
| | | | 471 | | |
| Other Countries: Total | | | 628,033 | | |
| Latin America 6.2% | | | |
| | | > Brazil 4.7% | |
| | 5,200,000 | | | Localiza Rent A Car | | | 60,354 | | |
| | | | | Car Rental | | | | | |
| | 5,375,000 | | | Suzano | | | 45,293 | | |
| | | | | Brazilian Pulp & Paper Producer | | | | | |
| | 1,900,000 | | | Natura | | | 42,105 | | |
| | | | | Direct Retailer of Cosmetics | | | | | |
| | 2,858,610 | | | Mills Estruturas e Servicios
de Engenha (a) | | | 21,618 | | |
| | | | | Civil Engineering & Construction | | | | | |
| | 3,000,000 | | | MRV Engenharia | | | 21,125 | | |
| | | | | Brazilian Low-income Property Developer | | | | | |
| | 2,500,000 | | | PDG Realty | | | 21,108 | | |
| | | | | Brazilian Low-income Property Developer | | | | | |
| | | | 211,603 | | |
| | | > Mexico 0.9% | |
| | 570,000 | | | Grupo Aeroportuario del Sureste - ADR | | | 25,958 | | |
| | | | | Mexican Airport Operator | | | | | |
| | 6,837,700 | | | Urbi Desarrollos Urbanos (a) | | | 12,688 | | |
| | | | | Affordable Housing Builder | | | | | |
| | | | 38,646 | | |
Number of Shares or
Principal Amount (000) | | | | Value (000) | |
| | | > Chile 0.6% | |
| | 862,000 | | | Sociedad Quimica y Minera
de Chile - ADR | | $ | 28,110 | | |
| | | | | Producer of Specialty Fertilizers,
Lithium & Iodine | | | | | |
| | | | 28,110 | | |
| Latin America: Total | | | 278,359 | | |
Total Equities: 95.3%
(Cost: $3,560,230) | | | 4,267,853 | | |
| Securities Lending Collateral: 1.8% | | | |
| | 82,526,716 | | | Dreyfus Government Cash
Management Fund (g)
(7 day yield of 0.03%) | | | 82,527 | | |
Total Securities Lending Collateral: 1.8%
(Cost: $82,527) | | | 82,527 | | |
| Short-Term Obligations: 4.0% | | | |
| | | > Repurchase Agreement 3.4% | |
| $ | 153,790 | | | Repurchase Agreement with
Fixed Income Clearing Corp.,
dated 6/30/10, due 7/01/10
at 0.00%, collateralized by
U.S. Government Agency
obligations with various
maturities to 8/25/14,
market value $156,866
(repurchase proceeds $153,790) | | | 153,790 | | |
| | | | 153,790 | | |
| | | > Commercial Paper 0.6% | |
| | 22,100 | | | Toyota Motor Credit
0.27% due 7/02/10 | | | 22,100 | | |
| | | | 22,100 | | |
Total Short-Term Obligations:
(Amortized Cost: $175,890) | | | 175,890 | | |
Total Investments: 101.1%
(Cost: $3,818,647)(h)(i) | | | 4,526,270 | | |
Obligation to Return Collateral for
Securities Loaned: (1.8)% | | | (82,527 | ) | |
| Cash and Other Assets Less Liabilities: 0.7% | | | 33,511 | | |
| Total Net Assets: 100.0% | | $ | 4,477,254 | | |
ADR = American Depositary Receipts.
GDR = Global Depositary Receipts.
See accompanying notes to financial statements.
44
> Notes to Statements of Investments (dollar values in thousands)
(a) Non-income producing security.
(b) All or a portion of this security was on loan at June 30, 2010. The total market value of Fund securities on loan at June 30, 2010 was $79,485.
(c) Illiquid security.
(d) An affiliated person of the Fund may include any company in which the Fund owns five percent or more of its outstanding voting shares.
Holdings and transactions in these affiliated companies during the six months ended June 30, 2010, are as follows:
| Affiliates | | Balance of
Shares Held
12/31/09 | | Purchases/
Additions | | Sales/
Reductions | | Balance of
Shares Held
6/30/10 | | Value | | Dividend | |
| Koninklijke TenCate | | | 1,372,989 | | | | 40,382 | | | | 114,720 | | | | 1,298,651 | | | $ | 28,292 | | | $ | 1,119 | | |
| Nippon Residential Investment* | | | 12,500 | | | | - | | | | 12,500 | | | | - | | | | - | | | | 332 | | |
| Unit 4 Agresso | | | 1,385,000 | | | | 91,800 | | | | - | | | | 1,476,800 | | | | 30,572 | | | | 296 | | |
| Total of Affiliated Transactions | | | 2,770,489 | | | | 132,182 | | | | 127,220 | | | | 2,775,451 | | | $ | 58,864 | | | $ | 1,747 | | |
* At June 30, 2010, the Fund owned less than five percent of the company's outstanding voting shares.
The aggregate cost and value of these companies at June 30, 2010, were $48,357 and $58,864, respectively. Investments in affiliated companies represented 1.3% of total net assets at June 30, 2010.
(e) Security is traded on a U.S. exchange.
(f) Denotes a restricted security, which is subject to restrictions on resale under federal securities laws. These securities are valued at a fair value determined in good faith under consistently applied procedures established by the Board of Trustees. At June 30, 2010, the market value of these securities amounted to $22,873, which represented 0.51% of total net assets.
Additional information on these securities is as follows:
| Security | | Acquisition
Dates | | Shares | | Cost | | Value | |
| Eacom Timber - Subscription Receipts | | 3/17/10 | | | 12,500,000 | | | $ | 6,188 | | | $ | 5,354 | | |
| Guyana Goldfields | | 1/19/10 | | | 1,355,000 | | | | 9,134 | | | | 8,821 | | |
| Tahoe Resources | | 5/28/10 | | | 872,700 | | | | 4,984 | | | | 5,222 | | |
| Petromanas | | 5/20/10 | | | 12,500,000 | | | | 4,344 | | | | 3,241 | | |
| Petromanas - Warrants | | 5/20/10 | | | 6,250,000 | | | | 362 | | | | 235 | | |
| | | | | | | | | $ | 25,012 | | | $ | 22,873 | | |
(g) Investment made with cash collateral received from securities lending activity.
(h) At June 30, 2010, for federal income tax purposes, the cost of investments was $3,818,647 and net unrealized apppreciation was $707,623, consisting of gross unrealized appreciation of $1,065,340 and gross unrealized depreciation of $357,717.
(i) On June 30, 2010, the Fund's total investments were denominated in currencies as follows:
| Currency | | Value | | Percentage
of Net Assets | |
| Euro | | $ | 870,836 | | | | 19.5 | | |
| Japanese Yen | | | 791,742 | | | | 17.7 | | |
| U.S. Dollar | | | 607,840 | | | | 13.5 | | |
| British Pound | | | 335,049 | | | | 7.5 | | |
| Hong Kong Dollar | | | 311,504 | | | | 7.0 | | |
Other currencies less
than 5% of total net assets | | | 1,609,299 | | | | 35.9 | | |
| | | $ | 4,526,270 | | | | 101.1 | | |
See accompanying notes to financial statements.
45
Columbia Acorn International
Statement of Investments (Unaudited), continued
> Notes to Statements of Investments (dollar values in thousands)
At June 30, 2010, the Fund had entered into the following forward foreign currency exchange contracts:
Forward Foreign Currency
Exchange Contracts to Sell | | Forward Foreign Currency
Exchange Contracts to Buy | | Principal Amount in
Foreign Currency | | Principal
Amount in U.S. Dollar | | Settlement Date | | Unrealized
Appreciation | |
| AUD | | USD | | | | | 5,842 | | | $ | 5,000 | | | 7/15/10 | | $ | 90 | | |
| AUD | | USD | | | 5,862 | | | | 5,000 | | | 8/13/10 | | | 89 | | |
| CAD | | USD | | | 1,033 | | | | 1,000 | | | 7/15/10 | | | 29 | | |
| CAD | | USD | | | 1,034 | | | | 1,000 | | | 8/13/10 | | | 29 | | |
| EUR | | USD | | | 58,564 | | | | 80,000 | | | 7/15/10 | | | 8,381 | | |
| EUR | | USD | | | 63,519 | | | | 80,000 | | | 8/13/10 | | | 2,310 | | |
| EUR | | USD | | | 55,560 | | | | 68,000 | | | 9/15/10 | | | 31 | | |
| USD | | JPY | | | 2,510,487 | | | | 27,000 | | | 7/15/10 | | | 1,400 | | |
| USD | | JPY | | | 2,506,086 | | | | 27,000 | | | 8/13/10 | | | 1,363 | | |
| USD | | JPY | | | 1,925,658 | | | | 21,000 | | | 9/15/10 | | | 807 | | |
| | | | | | | $ | 315,000 | | | | | $ | 14,529 | | |
Forward Foreign Currency
Exchange Contracts to Buy | | Forward Foreign Currency
Exchange Contracts to Sell | | Principal Amount in
Foreign Currency | | Principal
Amount in U.S. Dollar | | Settlement Date | | Unrealized
(Depreciation) | |
| AUD | | USD | | | | | 28,061 | | | $ | 26,000 | | | 7/15/10 | | $ | (2,415 | ) | |
| AUD | | USD | | | 29,225 | | | | 26,000 | | | 8/13/10 | | | (1,519 | ) | |
| AUD | | USD | | | 24,715 | | | | 21,000 | | | 9/15/10 | | | (377 | ) | |
| CAD | | USD | | | 26,898 | | | | 27,000 | | | 7/15/10 | | | (1,735 | ) | |
| CAD | | USD | | | 27,423 | | | | 27,000 | | | 8/13/10 | | | (1,246 | ) | |
| CAD | | USD | | | 26,878 | | | | 26,000 | | | 9/15/10 | | | (764 | ) | |
| EUR | | USD | | | 9,809 | | | | 12,000 | | | 7/15/10 | | | (4 | ) | |
| EUR | | USD | | | 9,807 | | | | 12,000 | | | 8/13/10 | | | (5 | ) | |
| USD | | JPY | | | 549,900 | | | | 6,000 | | | 7/15/10 | | | (221 | ) | |
| USD | | JPY | | | 550,050 | | | | 6,000 | | | 8/13/10 | | | (225 | ) | |
| | | | | | | $ | 189,000 | | | | | $ | (8,511 | ) | |
The counterparty for all forward foreign currency exchange contracts is State Street Bank and Trust Company.
AUD = Australian Dollar
CAD = Canadian Dollar
EUR = Euro
JPY = Japanese Yen
USD = United States Dollar
The following table summarizes the inputs used, as of June 30, 2010, in valuing the Fund's assets:
| Investment Type | | Quoted Prices
(Level 1) | | Other
Significant
Observable
Inputs
(Level 2) | | Significant
Unobservable
Inputs
(Level 3) | | Total | |
| Equities | |
| Asia | | $ | 75,920 | | | $ | 1,746,671 | | | $ | 157 | | | $ | 1,822,748 | | |
| Europe | | | 34,315 | | | | 1,504,398 | | | | - | | | | 1,538,713 | | |
| Other Countries | | | 360,241 | | | | 267,792 | | | | - | | | | 628,033 | | |
| Latin America | | | 278,359 | | | | - | | | | - | | | | 278,359 | | |
| Total Equities | | | 748,835 | | | | 3,518,861 | | | | 157 | | | | 4,267,853 | | |
| Total Securities Lending Collateral | | | 82,527 | | | | - | | | | - | | | | 82,527 | | |
| Total Short-Term Obligations | | | - | | | | 175,890 | | | | - | | | | 175,890 | | |
| Total Investments | | $ | 831,362 | | | $ | 3,694,751 | | | $ | 157 | | | $ | 4,526,270 | | |
Unrealized Appreciation on Forward Foreign
Currency Exchange Contracts | | | - | | | | 14,529 | | | | - | | | | 14,529 | | |
Unrealized Depreciation on Forward Foreign
Currency Exchange Contracts | | | - | | | | (8,511 | ) | | | - | | | | (8,511 | ) | |
| Total | | $ | 831,362 | | | $ | 3,700,769 | | | $ | 157 | | | $ | 4,532,288 | | |
The Fund's assets assigned to the Level 2 input category are generally valued using the market approach, in which a security's value is determined through its correlation to prices and information from market transactions for similar or identical assets. Foreign equities are generally valued at the last sales price on the foreign exchange or market on which they trade. The Fund may use a systematic fair valuation model provided by an independent third party to value securities principally traded in foreign markets in
See accompanying notes to financial statements.
46
> Notes to Statements of Investments (dollar values in thousands)
order to adjust for possible stale pricing that may occur between the close of the foreign exchanges and the time for valuation. These models take into account available market data including intraday index, ADR, and ETF movements. Forward foreign currency exchange contracts are valued at the prevailing forward exchange rate of the underlying currencies.
Certain Short-Term Obligations may be valued using amortized cost, an income approach which converts future cash flows to a present value based upon the discount or premium at purchase.
The Fund's assets assigned to the Level 3 input category are valued at fair value as determined in good faith under consistently applied procedures established by and under the general supervision of the Board of Trustees. To determine fair value, management will utilize the valuation technique that they deem the most appropriate in the circumstances. Securities for which no market exist are valued based upon the market approach using inputs from the investment team but ultimately decided by the Board of Trustees. These may include, but are not limited to, projected earnings, available cash, line of business, multiples, and consideration of the prioritization of the equity in a company's capital structure.
The following table reconciles asset balances for the six-month period ending June 30, 2010, in which significant unobservable inputs (Level 3) were used in determining value:
Investments
in Securities | | Balance
as of
December 31,
2009 | | Realized
Gain/(Loss) | | Change in
Unrealized
Appreciation
(Depreciation) | | Purchases | | (Sales) | | Transfers
into
Level 3 | | Transfers
(out of)
Level 3 | | Balance
as of
June 30,
2010 | |
| Equities | |
| Asia | | $ | 158 | | | $ | - | | | $ | (1 | ) | | $ | - | | | $ | - | | | $ | - | | | $ | - | | | $ | 157 | | |
| | | $ | 158 | | | $ | - | | | $ | (1 | ) | | $ | - | | | | - | | | | - | | | $ | - | | | $ | 157 | | |
The information in the above reconciliation table represents fiscal year to date activity for any securities identified as using Level 3 inputs during the current fiscal period.
The change in unrealized depreciation attributed to securities owned at June 30, 2010, which were valued using significant unobservable inputs (Level 3) amounted to $(1). This amount is included in net change in unrealized appreciation (depreciation) on the Statements of Changes in Net Assets.
The Funds adopted FASB Accounting Standards Update No. 2010-06 "Fair Value Measurements and Disclosures (Topic 820)" ("the Update"), effective March 31, 2010. The Update applies to Funds' disclosures about transfers in and out of Level 1 and Level 2 of the fair value hierarchy and the reasons for the transfers as well as to disclosures about the valuation techniques and inputs used to measure fair value for investments that fall in either Level 2 or Level 3 fair value hierarchy.
The following table shows transfers between Level 1 and Level 2 of the fair value hierarchy.
| Transfers In | | Transfers Out | |
| Level 1 | | Level 2 | | Level 1 | | Level 2 | |
| $ | 152,770 | | | $ | - | | | $ | - | | | $ | 152,770 | | |
Financial assets were transferred from Level 2 to Level 1 as they resumed trading during the period.
For more information on valuation inputs, and their aggregation into the levels used in the tables above, please refer to the Security Valuation section in the accompanying Notes to Financial Statements.
See accompanying notes to financial statements.
47
Columbia Acorn International
Portfolio Diversification (Unaudited)
At June 30, 2010, the Fund's portfolio investments as a percent of net assets were diversified as follows:
| | | Value (000) | | Percentage
of Net Assets | |
| > Industrial Goods & Services | |
| Other Industrial Services | | $ | 397,393 | | | | 8.9 | | |
Industrial Materials &
Specialty Chemicals | | | 293,535 | | | | 6.6 | | |
| Machinery | | | 276,159 | | | | 6.2 | | |
| Outsourcing Services | | | 99,033 | | | | 2.2 | | |
| Electrical Components | | | 89,997 | | | | 2.0 | | |
| Construction | | | 74,280 | | | | 1.6 | | |
| Conglomerates | | | 58,242 | | | | 1.3 | | |
| Industrial Distribution | | | 6,676 | | | | 0.1 | | |
| | | | 1,295,315 | | | | 28.9 | | |
| > Consumer Goods & Services | |
| Food & Beverage | | | 172,052 | | | | 3.8 | | |
| Retail | | | 155,834 | | | | 3.5 | | |
| Nondurables | | | 123,770 | | | | 2.8 | | |
| Travel | | | 81,800 | | | | 1.8 | | |
| Casinos & Gaming | | | 79,014 | | | | 1.8 | | |
| Other Consumer Services | | | 73,357 | | | | 1.6 | | |
| Educational Services | | | 71,820 | | | | 1.6 | | |
| Apparel | | | 60,003 | | | | 1.3 | | |
| Other Entertainment | | | 47,130 | | | | 1.1 | | |
| Consumer Electronics | | | 13,378 | | | | 0.3 | | |
| | | | 878,158 | | | | 19.6 | | |
| > Information | |
Computer Hardware &
Related Equipment | | | 81,802 | | | | 1.8 | | |
| Financial Processors | | | 75,610 | | | | 1.7 | | |
| Instrumentation | | | 68,657 | | | | 1.5 | | |
| TV Broadcasting | | | 66,312 | | | | 1.5 | | |
| Business Software | | | 54,685 | | | | 1.2 | | |
| Internet Related | | | 54,402 | | | | 1.2 | | |
Semiconductors &
Related Equipment | | | 23,771 | | | | 0.5 | | |
| Publishing | | | 23,740 | | | | 0.5 | | |
| Mobile Communications | | | 13,359 | | | | 0.3 | | |
| CATV | | | 13,279 | | | | 0.3 | | |
Business Information &
Marketing Services | | | 12,788 | | | | 0.3 | | |
| Telecommunications Equipment | | | 12,155 | | | | 0.3 | | |
| Advertising | | | 7,031 | | | | 0.2 | | |
| Telephone and Data Services | | | 6,102 | | | | 0.2 | | |
| | | | 513,693 | | | | 11.5 | | |
| > Energy & Minerals | |
| Oil Services | | | 165,886 | | | | 3.7 | | |
| Mining | | | 131,784 | | | | 2.9 | | |
Oil Refining, Marketing &
Distribution | | | 82,329 | | | | 1.9 | | |
| Agricultural Commodities | | | 50,647 | | | | 1.1 | | |
| Oil & Gas Producers | | | 43,178 | | | | 1.0 | | |
| | | | 473,824 | | | | 10.6 | | |
| | | Value (000) | | Percentage
of Net Assets | |
| > Other Industries | |
| Real Estate | | $ | 272,764 | | | | 6.1 | | |
| Transportation | | | 127,629 | | | | 2.8 | | |
| Regulated Utilities | | | 70,258 | | | | 1.6 | | |
| | | | 470,651 | | | | 10.5 | | |
| > Finance | |
| Brokerage & Money Management | | | 141,823 | | | | 3.2 | | |
| Banks | | | 115,166 | | | | 2.6 | | |
| Finance Companies | | | 55,393 | | | | 1.2 | | |
| Savings & Loans | | | 25,216 | | | | 0.5 | | |
| | | | 337,598 | | | | 7.5 | | |
| > Health Care | |
| Medical Equipment & Devices | | | 167,560 | | | | 3.7 | | |
| Pharmaceuticals | | | 56,265 | | | | 1.3 | | |
| Health Care Services | | | 37,737 | | | | 0.9 | | |
| Medical Supplies | | | 23,306 | | | | 0.5 | | |
| Biotechnology & Drug Delivery | | | 13,746 | | | | 0.3 | | |
| | | | 298,614 | | | | 6.7 | | |
| Total Equities: | | | 4,267,853 | | | | 95.3 | | |
Securities Lending
Collateral: | | | 82,527 | | | | 1.8 | | |
| Short-Term Obligations: | | | 175,890 | | | | 4.0 | | |
| Total Investments: | | | 4,526,270 | | | | 101.1 | | |
Obligation to Return
Collateral for
Securities Loaned: | | | (82,527 | ) | | | (1.8 | ) | |
Cash and Other Assets
Less Liabilities: | | | 33,511 | | | | 0.7 | | |
| Net Assets: | | $ | 4,477,254 | | | | 100.0 | | |
See accompanying notes to financial statements.
48
Columbia Acorn USA
Major Portfolio Changes in the Second Quarter (Unaudited)
| | | Number of Shares | |
| | | 03/31/10 | | 06/30/10 | |
| Purchases | |
| Information | |
| AboveNet | | | 45,000 | | | | 90,000 | | |
| Atmel | | | 550,000 | | | | 1,451,000 | | |
| Blackboard | | | 95,000 | | | | 135,000 | | |
| Constant Contact | | | 64,547 | | | | 132,000 | | |
| Jack Henry & Associates | | | 0 | | | | 174,000 | | |
| SBA Communications | | | 525,000 | | | | 610,000 | | |
| Consumer Goods & Services | |
| Coldwater Creek | | | 417,260 | | | | 455,956 | | |
| Kenneth Cole Productions | | | 0 | | | | 130,000 | | |
| Penn National Gaming | | | 110,000 | | | | 372,000 | | |
| Rue21 | | | 0 | | | | 48,900 | | |
| Finance | |
| Associated Banc-Corp | | | 213,600 | | | | 453,400 | | |
| Green Bankshares | | | 247,203 | | | | 264,703 | | |
| MB Financial | | | 492,125 | | | | 532,000 | | |
| Industrial Goods & Services | |
| Acuity Brands | | | 145,000 | | | | 280,000 | | |
| Kennametal | | | 0 | | | | 73,000 | | |
| Health Care | |
| Amylin Pharmaceuticals | | | 0 | | | | 145,000 | | |
| Array Biopharma | | | 0 | | | | 650,000 | | |
| Idenix Pharmaceuticals | | | 0 | | | | 332,171 | | |
| Isis Pharmaceuticals | | | 199,900 | | | | 421,253 | | |
| NPS Pharmaceuticals | | | 509,900 | | | | 582,500 | | |
| Seattle Genetics | | | 489,300 | | | | 596,537 | | |
| The Medicines Company | | | 0 | | | | 150,000 | | |
| Xenoport | | | 0 | | | | 306,000 | | |
| Other Industries | |
| Dupont Fabros Technology | | | 0 | | | | 138,000 | | |
| Education Realty Trust | | | 0 | | | | 400,000 | | |
| Extra Space Storage | | | 441,000 | | | | 557,000 | | |
| Rush Enterprises, Class B | | | 0 | | | | 115,000 | | |
| World Fuel Services | | | 100,000 | | | | 156,000 | | |
| Energy & Minerals | |
| Alexco Resource | | | 0 | | | | 393,000 | | |
| Northern Oil & Gas | | | 109,000 | | | | 230,000 | | |
| Rosetta Resources | | | 61,000 | | | | 129,000 | | |
| St. Mary Land & Exploration | | | 0 | | | | 133,000 | | |
| | | Number of Shares | |
| | | 03/31/10 | | 06/30/10 | |
| Sales | |
| Information | |
| Blackbaud | | | 525,000 | | | | 370,000 | | |
| Cogent Communications | | | 250,000 | | | | 0 | | |
| Crown Castle International | | | 890,000 | | | | 383,000 | | |
| Global Payments | | | 220,000 | | | | 188,000 | | |
| Informatica | | | 1,155,000 | | | | 985,000 | | |
| Integrated Device Technology | | | 1,168,000 | | | | 701,000 | | |
| Mediacom Communications | | | 335,000 | | | | 0 | | |
| NetSuite | | | 240,000 | | | | 0 | | |
| Novell | | | 918,000 | | | | 0 | | |
| Polycom | | | 480,000 | | | | 429,000 | | |
| Tyler Technologies | | | 136,513 | | | | 0 | | |
| Consumer Goods & Services | |
| Bebe Stores | | | 131,314 | | | | 0 | | |
| Cavco Industries | | | 297,403 | | | | 250,000 | | |
| Gaylord Entertainment | | | 750,000 | | | | 593,700 | | |
| Hansen Natural | | | 90,000 | | | | 0 | | |
| ITT Educational Services | | | 179,000 | | | | 153,700 | | |
| P.F. Chang's China Bistro | | | 40,000 | | | | 0 | | |
| Vitacost.com | | | 125,000 | | | | 0 | | |
| Finance | |
| H&E Equipment Services | | | 625,000 | | | | 542,600 | | |
| MF Global | | | 750,000 | | | | 675,000 | | |
| SEI Investments | | | 150,000 | | | | 0 | | |
| Industrial Goods & Services | |
| Ritchie Brothers Auctioneers | | | 110,000 | | | | 0 | | |
| Health Care | |
| Auxilium Pharmaceuticals | | | 157,000 | | | | 86,678 | | |
| eResearch Technology | | | 283,000 | | | | 0 | | |
| Human Genome Sciences | | | 248,000 | | | | 59,000 | | |
| Illumina | | | 71,000 | | | | 34,000 | | |
| InterMune | | | 117,000 | | | | 0 | | |
| Kinetic Concepts | | | 40,000 | | | | 0 | | |
| Onyx Pharmaceuticals | | | 100,000 | | | | 82,600 | | |
| Other Industries | |
| American Campus Communities | | | 90,000 | | | | 0 | | |
| Digital Realty Trust | | | 100,000 | | | | 22,000 | | |
| Energy & Minerals | |
| Carrizo Oil & Gas | | | 485,000 | | | | 162,000 | | |
| Equitable Resources | | | 111,200 | | | | 0 | | |
| Layne Christensen | | | 179,846 | | | | 0 | | |
| Oceaneering International | | | 95,000 | | | | 38,000 | | |
| Southwestern Energy | | | 137,800 | | | | 0 | | |
See accompanying notes to financial statements.
49
Columbia Acorn USA
Statement of Investments (Unaudited), June 30, 2010
| Number of Shares | | | | Value (000) | |
| | | | | | | | Equities: 99.8% | | |
| Information 31.7% | | | |
| | | > Business Software 7.3% | |
| | 985,000 | | | Informatica (a) | | $ | 23,522 | | |
| | | | | Enterprise Data Integration Software | | | | | |
| | 620,000 | | | Micros Systems (a) | | | 19,759 | | |
| | | | | Information Systems for Restaurants & Hotels | | | | | |
| | 375,000 | | | ANSYS (a) | | | 15,214 | | |
| | | | | Simulation Software for Engineers & Designers | | | | | |
| | 370,000 | | | Blackbaud | | | 8,055 | | |
| | | | | Software & Services for Non-profits | | | | | |
| | 158,000 | | | Concur Technologies (a) | | | 6,743 | | |
| | | | | Web Enabled Cost & Expense
Management Software | | | | | |
| | 135,000 | | | Blackboard (a) | | | 5,040 | | |
| | | | | Education Software | | | | | |
| | 174,000 | | | Jack Henry & Associates | | | 4,155 | | |
| | | | | Systems Financial Institutions | | | | | |
| | 57,000 | | | Quality Systems | | | 3,305 | | |
| | | | | IT Systems for Medical Groups &
Ambulatory Care Centers | | | | | |
| | 959,000 | | | Art Technology Group (a) | | | 3,280 | | |
| | | | | Software & Tools to Optimize Websites
for E-Commerce | | | | | |
| | 132,000 | | | Constant Contact (a) | | | 2,816 | | |
| | | | | E-mail & Other Marketing Campaign
Management Systems Delivered Over the Web | | | | | |
| | 100,000 | | | Avid Technology (a) | | | 1,273 | | |
| | | | | Digital Nonlinear Editing Software & Systems | | | | | |
| | 230,000 | | | Actuate (a) | | | 1,023 | | |
| | | | | Information Delivery Software & Solutions | | | | | |
| | | | 94,185 | | |
| | | > Semiconductors &
Related Equipment 4.1% | |
| | 760,000 | | | Microsemi (a) | | | 11,119 | | |
| | | | | Analog/Mixed-signal Semiconductors | | | | | |
| | 500,000 | | | Monolithic Power Systems (a) | | | 8,930 | | |
| | | | | High Performance Analog & Mixed-signal
Integrated Circuits (ICs) | | | | | |
| | 1,179,750 | | | ON Semiconductor (a) | | | 7,527 | | |
| | | | | Mixed-signal & Power Management
Semiconductors | | | | | |
| | 287,000 | | | Supertex (a) | | | 7,077 | | |
| | | | | Analog/Mixed-signal Semiconductors | | | | | |
| | 1,451,000 | | | Atmel (a) | | | 6,965 | | |
| | | | | Microcontrollers, RF & Memory Semiconductors | | | | | |
| | 480,000 | | | Pericom Semiconductor (a) | | | 4,608 | | |
| | | | | Interface Integrated Circuits (ICs) &
Frequency Control Products | | | | | |
| | 701,000 | | | Integrated Device Technology (a) | | | 3,470 | | |
| | | | | Communications Semiconductors | | | | | |
| | 750,000 | | | Entegris (a) | | | 2,977 | | |
| | | | | Semiconductor Materials Management Products | | | | | |
| | | | 52,673 | | |
| | | > Telephone and Data Services 3.6% | |
| | 2,061,000 | | | tw telecom (a) | | | 34,377 | | |
| | | | | Fiber Optic Telephone/Data Services | | | | | |
| | 2,250,000 | | | PAETEC Holding (a) | | | 7,673 | | |
| | | | | Telephone/Data Services for Business | | | | | |
| Number of Shares | | | | Value (000) | |
| | 90,000 | | | AboveNet (a) | | $ | 4,246 | | |
| | | | | Metropolitan Fiber Communications Services | | | | | |
| | | | 46,296 | | |
| | | > Computer Hardware & Related
Equipment 3.2% | |
| | 549,000 | | | II-VI (a) | | | 16,267 | | |
| | | | | Laser Optics & Specialty Materials | | | | | |
| | 285,600 | | | Amphenol | | | 11,218 | | |
| | | | | Electronic Connectors | | | | | |
| | 280,000 | | | Nice Systems - ADR (Israel) (a) | | | 7,137 | | |
| | | | | Audio & Video Recording Solutions | | | | | |
| | 184,000 | | | Zebra Technologies (a) | | | 4,668 | | |
| | | | | Bar Code Printers | | | | | |
| | 135,000 | | | Netgear (a) | | | 2,409 | | |
| | | | | Networking Products for Small Business & Home | | | | | |
| | | | 41,699 | | |
| | | > Instrumentation 2.9% | |
| | 180,000 | | | Mettler Toledo (a) | | | 20,093 | | |
| | | | | Laboratory Equipment | | | | | |
| | 575,000 | | | IPG Photonics (a) | | | 8,757 | | |
| | | | | Fiber Lasers | | | | | |
| | 168,000 | | | Trimble Navigation (a) | | | 4,704 | | |
| | | | | GPS-based Instruments | | | | | |
| | 130,000 | | | FLIR Systems (a) | | | 3,782 | | |
| | | | | Infrared Cameras | | | | | |
| | | | 37,336 | | |
| | | > Mobile Communications 2.7% | |
| | 610,000 | | | SBA Communications (a) | | | 20,746 | | |
| | | | | Communications Towers | | | | | |
| | 383,000 | | | Crown Castle International (a) | | | 14,271 | | |
| | | | | Communications Towers | | | | | |
| | 88,000 | | | Globalstar (a) | | | 135 | | |
| | | | | Satellite Mobile Voice & Data Carrier | | | | | |
| | | | 35,152 | | |
| | | > Telecommunications Equipment 2.3% | |
| | 429,000 | | | Polycom (a) | | | 12,780 | | |
| | | | | Video Conferencing Equipment | | | | | |
| | 473,000 | | | Blue Coat Systems (a) | | | 9,664 | | |
| | | | | WAN Acceleration & Network Security | | | | | |
| | 320,000 | | | Finisar (a)(b) | | | 4,768 | | |
| | | | | Optical Sub-systems & Components | | | | | |
| | 116,000 | | | CommScope (a) | | | 2,757 | | |
| | | | | Wireless Infrastructure Equipment &
Telecom Cable | | | | | |
| | | | 29,969 | | |
| | | > Computer Services 1.9% | |
| | 395,000 | | | SRA International (a) | | | 7,770 | | |
| | | | | Government IT Services | | | | | |
| | 310,000 | | | ExlService Holdings (a) | | | 5,323 | | |
| | | | | BPO (Business Process Outsourcing) | | | | | |
| | 786,000 | | | RCM Technologies (a)(c) | | | 3,513 | | |
| | | | | Technology & Engineering Services | | | | | |
| | 235,000 | | | iGate | | | 3,013 | | |
| | | | | IT & BPO (Business Process Outsourcing) Services | | | | | |
See accompanying notes to financial statements.
50
| Number of Shares | | | | Value (000) | |
| | | > Computer Services—continued | |
| | 1,005,500 | | | Hackett Group (a) | | $ | 2,825 | | |
| | | | | IT Integration & Best Practice Research | | | | | |
| | 172,000 | | | Acxiom (a) | | | 2,527 | | |
| | | | | Database Marketing Services | | | | | |
| | | | 24,971 | | |
| | | > Gaming Equipment & Services 1.7% | |
| | 570,000 | | | Bally Technologies (a) | | | 18,463 | | |
| | | | | Slot Machines & Software | | | | | |
| | 73,000 | | | WMS Industries (a) | | | 2,865 | | |
| | | | | Slot Machine Provider | | | | | |
| | | | 21,328 | | |
| | | > Internet Related 0.6% | |
| | 79,188 | | | Equinix (a) | | | 6,432 | | |
| | | | | Network Neutral Data Centers | | | | | |
| | 381,740 | | | TheStreet.com | | | 1,099 | | |
| | | | | Financial Information Websites | | | | | |
| | | | 7,531 | | |
| | | > Contract Manufacturing 0.5% | |
| | 261,000 | | | Plexus (a) | | | 6,979 | | |
| | | | | Electronic Manufacturing Services | | | | | |
| | | | 6,979 | | |
| | | > Financial Processors 0.5% | |
| | 188,000 | | | Global Payments | | | 6,870 | | |
| | | | | Credit Card Processor | | | | | |
| | | | 6,870 | | |
| | | > Radio 0.2% | |
| | 511,100 | | | Salem Communications (a) | | | 1,896 | | |
| | | | | Radio Stations for Religious Programming | | | | | |
| | 705,500 | | | Spanish Broadcasting System (a) | | | 804 | | |
| | | | | Spanish Language Radio Stations | | | | | |
| | 18,750 | | | Saga Communications (a) | | | 448 | | |
| | | | | Radio Stations in Small & Mid-sized Cities | | | | | |
| | | | 3,148 | | |
| | | > TV Broadcasting 0.2% | |
| | 975,000 | | | Entravision Communications (a) | | | 2,057 | | |
| | | | | Spanish Language TV & Radio Stations | | | | | |
| | | | 2,057 | | |
| Information: Total | | | 410,194 | | |
| Consumer Goods & Services 17.3% | | | |
| | | > Retail 6.6% | |
| | 390,000 | | | lululemon athletica (a)(b) | | | 14,516 | | |
| | | | | Premium Active Apparel Retailer | | | | | |
| | 360,000 | | | Urban Outfitters (a) | | | 12,380 | | |
| | | | | Apparel & Home Specialty Retailer | | | | | |
| | 281,000 | | | J Crew Group (a) | | | 10,344 | | |
| | | | | Multi-channel Branded Retailer | | | | | |
| | 322,000 | | | Abercrombie & Fitch | | | 9,882 | | |
| | | | | Teen Apparel Retailer | | | | | |
| | 774,000 | | | Chico's FAS | | | 7,647 | | |
| | | | | Women's Specialty Retailer | | | | | |
| | 875,000 | | | Saks (a) | | | 6,641 | | |
| | | | | Luxury Department Store Retailer | | | | | |
| | 480,000 | | | Talbots (a) | | | 4,949 | | |
| | | | | Women's Specialty Retailer | | | | | |
| Number of Shares | | | | Value (000) | |
| | 244,000 | | | AnnTaylor Stores (a) | | $ | 3,970 | | |
| | | | | Women's Apparel Retailer | | | | | |
| | 943,000 | | | Charming Shoppes (a) | | | 3,536 | | |
| | | | | Women's Specialty Plus Size Apparel Retailer | | | | | |
| | 130,000 | | | Shutterfly (a) | | | 3,115 | | |
| | | | | Internet Photo-centric Retailer | | | | | |
| | 440,000 | | | Pier 1 Imports (a) | | | 2,820 | | |
| | | | | Home Furnishing Retailer | | | | | |
| | 715,000 | | | Wet Seal (a) | | | 2,610 | | |
| | | | | Specialty Apparel Retailer | | | | | |
| | 455,956 | | | Coldwater Creek (a) | | | 1,532 | | |
| | | | | Women's Apparel Retailer | | | | | |
| | 48,900 | | | Rue21 (a) | | | 1,484 | | |
| | | | | Fashion Value Apparel Retailer | | | | | |
| | | | 85,426 | | |
| | | > Travel 2.8% | |
| | 593,700 | | | Gaylord Entertainment (a) | | | 13,115 | | |
| | | | | Convention Hotels | | | | | |
| | 797,750 | | | Avis Budget Group (a) | | | 7,834 | | |
| | | | | Second Largest Car Rental Company | | | | | |
| | 220,000 | | | Vail Resorts (a) | | | 7,680 | | |
| | | | | Ski Resort Operator & Developer | | | | | |
| | 750,000 | | | Hertz (a) | | | 7,095 | | |
| | | | | Largest U.S. Rental Car Operator | | | | | |
| | | | 35,724 | | |
| | | > Furniture & Textiles 1.9% | |
| | 980,000 | | | Knoll | | | 13,024 | | |
| | | | | Office Furniture | | | | | |
| | 540,000 | | | Interface | | | 5,800 | | |
| | | | | Modular & Broadloom Carpet | | | | | |
| | 285,000 | | | Herman Miller | | | 5,378 | | |
| | | | | Office Furniture | | | | | |
| | | | 24,202 | | |
| | | > Educational Services 1.3% | |
| | 153,700 | | | ITT Educational Services (a) | | | 12,760 | | |
| | | | | Post-secondary Degree Services | | | | | |
| | 165,000 | | | Universal Technical Institute (a) | | | 3,901 | | |
| | | | | Vocational Training | | | | | |
| | | | 16,661 | | |
| | | > Other Durable Goods 1.0% | |
| | 250,000 | | | Cavco Industries (a) | | | 8,795 | | |
| | | | | Manufactured Homes | | | | | |
| | 154,000 | | | Jarden | | | 4,138 | | |
| | | | | Branded Household Products | | | | | |
| | | | 12,933 | | |
| | | > Casinos & Gaming 1.0% | |
| | 372,000 | | | Penn National Gaming (a) | | | 8,593 | | |
| | | | | Regional Casino Operator | | | | | |
| | 455,000 | | | Pinnacle Entertainment (a) | | | 4,304 | | |
| | | | | Regional Casino Operator | | | | | |
| | | | 12,897 | | |
| | | > Consumer Goods Distribution 0.9% | |
| | 523,500 | | | Pool | | | 11,475 | | |
| | | | | Distributor of Swimming Pool
Supplies & Equipment | | | | | |
| | | | 11,475 | | |
See accompanying notes to financial statements.
51
Columbia Acorn USA
Statement of Investments (Unaudited), continued
| Number of Shares | | | | Value (000) | |
| | | > Apparel 0.6% | |
| | 284,313 | | | True Religion Apparel (a) | | $ | 6,275 | | |
| | | | | Premium Denim | | | | | |
| | 130,000 | | | Kenneth Cole Productions (a) | | | 1,431 | | |
| | | | | Wholesaler & Retailer of Lifestyle Brand | | | | | |
| | | | 7,706 | | |
| | | > Food & Beverage 0.5% | |
| | 162,000 | | | Diamond Foods | | | 6,658 | | |
| | | | | Culinary Ingredients & Snack Foods | | | | | |
| | | | 6,658 | | |
| | | > Other Consumer Services 0.4% | |
| | 182,000 | | | Lifetime Fitness (a) | | | 5,786 | | |
| | | | | Sport & Fitness Club Operator | | | | | |
| | | | 5,786 | | |
| | | > Leisure Products 0.3% | |
| | 180,000 | | | Thor Industries | | | 4,275 | | |
| | | | | RV & Bus Manufacturer | | | | | |
| | | | 4,275 | | |
| Consumer Goods & Services: Total | | | 223,743 | | |
| Finance 13.8% | | | |
| | | > Banks 6.2% | |
| | 981,941 | | | Valley National Bancorp | | | 13,374 | | |
| | | | | New Jersey/New York Bank | | | | | |
| | 659,800 | | | TCF Financial | | | 10,959 | | |
| | | | | Great Lakes Bank | | | | | |
| | 532,000 | | | MB Financial | | | 9,784 | | |
| | | | | Chicago Bank | | | | | |
| | 431,597 | | | Lakeland Financial | | | 8,623 | | |
| | | | | Indiana Bank | | | | | |
| | 170,000 | | | SVB Financial Group (a) | | | 7,009 | | |
| | | | | Bank to Venture Capitalists | | | | | |
| | 453,400 | | | Associated Banc-Corp | | | 5,559 | | |
| | | | | Midwest Bank | | | | | |
| | 508,000 | | | Pacific Continental | | | 4,811 | | |
| | | | | Pacific Northwest Bank | | | | | |
| | 264,703 | | | Green Bankshares (a)(b) | | | 3,380 | | |
| | | | | Tennessee Bank | | | | | |
| | 269,600 | | | Eagle Bancorp (a) | | | 3,176 | | |
| | | | | Metro D.C. Bank | | | | | |
| | 678,200 | | | First Busey | | | 3,072 | | |
| | | | | Illinois Bank | | | | | |
| | 245,000 | | | Wilmington Trust | | | 2,717 | | |
| | | | | Delaware Trust Bank | | | | | |
| | 178,826 | | | Sandy Spring Bancorp | | | 2,506 | | |
| | | | | Baltimore/D.C. Bank | | | | | |
| | 225,000 | | | Whitney Holding | | | 2,081 | | |
| | | | | Gulf Coast Bank | | | | | |
| | 90,000 | | | TriCo Bancshares | | | 1,524 | | |
| | | | | California Central Valley Bank | | | | | |
| | 851,247 | | | Guaranty Bancorp (a) | | | 902 | | |
| | | | | Colorado Bank | | | | | |
| | | | 79,477 | | |
| | | > Finance Companies 5.1% | |
| | 1,136,500 | | | AmeriCredit (a) | | | 20,707 | | |
| | | | | Auto Lending | | | | | |
| Number of Shares | | | | Value (000) | |
| | 397,900 | | | World Acceptance (a) | | $ | 15,244 | | |
| | | | | Personal Loans | | | | | |
| | 345,000 | | | McGrath Rentcorp | | | 7,859 | | |
| | | | | Temporary Space & IT Rentals | | | | | |
| | 265,000 | | | GATX | | | 7,070 | | |
| | | | | Rail Car Lessor | | | | | |
| | 412,500 | | | Aaron's | | | 7,041 | | |
| | | | | Rent to Own | | | | | |
| | 542,600 | | | H&E Equipment Services (a) | | | 4,064 | | |
| | | | | Heavy Equipment Leasing | | | | | |
| | 230,000 | | | CAI International (a) | | | 2,737 | | |
| | | | | International Container Leasing | | | | | |
| | 99,200 | | | Marlin Business Services (a) | | | 1,199 | | |
| | | | | Small Equipment Leasing | | | | | |
| | | | 65,921 | | |
| | | > Brokerage & Money Management 1.1% | |
| | 280,000 | | | Eaton Vance | | | 7,731 | | |
| | | | | Specialty Mutual Funds | | | | | |
| | 675,000 | | | MF Global (a) | | | 3,854 | | |
| | | | | Futures Broker | | | | | |
| | 155,000 | | | Investment Technology Group (a) | | | 2,489 | | |
| | | | | Electronic Trading | | | | | |
| | | | 14,074 | | |
| | | > Savings & Loans 1.0% | |
| | 600,000 | | | ViewPoint Financial | | | 8,310 | | |
| | | | | Texas Thrift | | | | | |
| | 238,090 | | | Berkshire Hills Bancorp | | | 4,638 | | |
| | | | | Northeast Thrift | | | | | |
| | 46,231 | | | K-Fed Bancorp (b) | | | 420 | | |
| | | | | Los Angeles Savings & Loan | | | | | |
| | | | 13,368 | | |
| | | > Insurance 0.4% | |
| | 110,000 | | | Delphi Financial Group | | | 2,685 | | |
| | | | | Workers Compensation & Group Employee
Benefit Products & Services | | | | | |
| | 120,000 | | | Tower Group | | | 2,584 | | |
| | | | | Commercial & Personal Lines Insurance | | | | | |
| | | | 5,269 | | |
| Finance: Total | | | 178,109 | | |
| Industrial Goods & Services 13.3% | | | |
| | | > Machinery 9.5% | |
| | 627,500 | | | Ametek | | | 25,194 | | |
| | | | | Aerospace/Industrial Instruments | | | | | |
| | 373,600 | | | Nordson | | | 20,952 | | |
| | | | | Dispensing Systems for Adhesives & Coatings | | | | | |
| | 445,000 | | | Donaldson | | | 18,979 | | |
| | | | | Industrial Air Filtration | | | | | |
| | 585,000 | | | Pentair | | | 18,837 | | |
| | | | | Pumps & Water Treatment | | | | | |
| | 587,000 | | | ESCO Technologies | | | 15,115 | | |
| | | | | Automatic Electric Meter Readers | | | | | |
| | 195,000 | | | MOOG (a) | | | 6,285 | | |
| | | | | Motion Control Products for Aerospace,
Defense & Industrial Markets | | | | | |
| | 199,000 | | | HEICO | | | 5,363 | | |
| | | | | FAA Approved Aircraft Replacement Parts | | | | | |
See accompanying notes to financial statements.
52
| Number of Shares | | | | Value (000) | |
| | | > Machinery—continued | |
| | 162,000 | | | Oshkosh (a) | | $ | 5,048 | | |
| | | | | Specialty Truck Manufacturer | | | | | |
| | 71,800 | | | Toro | | | 3,527 | | |
| | | | | Turf Maintenance Equipment | | | | | |
| | 73,000 | | | Kennametal | | | 1,856 | | |
| | | | | Consumable Cutting Tools | | | | | |
| | 50,000 | | | Kaydon | | | 1,643 | | |
| | | | | Specialized Friction & Motion Control Products | | | | | |
| | | | 122,799 | | |
| | | > Electrical Components 0.8% | |
| | 280,000 | | | Acuity Brands | | | 10,186 | | |
| | | | | Commercial Lighting Fixtures | | | | | |
| | | | 10,186 | | |
| | | > Industrial Materials &
Specialty Chemicals 0.8% | |
| | 255,000 | | | Drew Industries (a) | | | 5,151 | | |
| | | | | RV & Manufactured Home Components | | | | | |
| | 150,000 | | | Albany International | | | 2,428 | | |
| | | | | Paper Machine Clothing & Advanced Textiles | | | | | |
| | 60,000 | | | Albemarle | | | 2,383 | | |
| | | | | Refinery Catalysts & Other Specialty Chemicals | | | | | |
| | | | 9,962 | | |
| | | > Steel 0.6% | |
| | 540,000 | | | GrafTech International (a) | | | 7,895 | | |
| | | | | Industrial Graphite Materials Producer | | | | | |
| | | | 7,895 | | |
| | | > Other Industrial Services 0.5% | |
| | 396,000 | | | American Reprographics (a) | | | 3,457 | | |
| | | | | Document Management & Logistics | | | | | |
| | 265,000 | | | TrueBlue (a) | | | 2,965 | | |
| | | | | Temporary Manual Labor | | | | | |
| | | | 6,422 | | |
| | | > Industrial Distribution 0.5% | |
| | 350,000 | | | Interline Brands (a) | | | 6,051 | | |
| | | | | Industrial Distribution | | | | | |
| | | | 6,051 | | |
| | | > Waste Management 0.3% | |
| | 130,000 | | | Waste Connections (a) | | | 4,536 | | |
| | | | | Solid Waste Management | | | | | |
| | | | 4,536 | | |
| | | > Construction 0.2% | |
| | 240,000 | | | M/I Homes (a) | | | 2,314 | | |
| | | | | Columbus-based Home Builder | | | | | |
| | | | 2,314 | | |
| | | > Water 0.1% | |
| | 550,000 | | | Mueller Water Products | | | 2,041 | | |
| | | | | Fire Hydrants, Valves & Ductile Iron Pipes | | | | | |
| | | | 2,041 | | |
| Industrial Goods & Services: Total | | | 172,206 | | |
| Number of Shares | | | | Value (000) | |
| Health Care 9.5% | | | |
| | | > Biotechnology & Drug Delivery 4.9% | |
| | 596,537 | | | Seattle Genetics (a) | | $ | 7,153 | | |
| | | | | Antibody-based Therapies for Cancer | | | | | |
| | 220,000 | | | Acorda Therapeutics (a) | | | 6,844 | | |
| | | | | Biopharma Company Focused on Nervous
Disorder Drugs | | | | | |
| | 431,000 | | | Nektar Therapeutics (a) | | | 5,215 | | |
| | | | | Drug Delivery Technologies | | | | | |
| | 266,000 | | | BioMarin (a) | | | 5,043 | | |
| | | | | Biotech Focused on Orphan Diseases | | | | | |
| | 145,000 | | | AMAG Pharmaceuticals (a) | | | 4,981 | | |
| | | | | Biotech Focused on Niche Diseases | | | | | |
| | 797,253 | | | Allos Therapeutics (a) | | | 4,887 | | |
| | | | | Cancer Drug Development | | | | | |
| | 421,253 | | | Isis Pharmaceuticals (a) | | | 4,031 | | |
| | | | | Biotech Pioneer in Anti-sense Drugs | | | | | |
| | 582,500 | | | NPS Pharmaceuticals (a) | | | 3,751 | | |
| | | | | Orphan Drugs & Healthy Royalties | | | | | |
| | 535,089 | | | Micromet (a) | | | 3,339 | | |
| | | | | Next-generation Antibody Technology | | | | | |
| | 306,000 | | | Xenoport (a)(b) | | | 3,002 | | |
| | | | | Biotech Company with Proprietary Drug
Development Platform | | | | | |
| | 57,000 | | | United Therapeutics (a) | | | 2,782 | | |
| | | | | Biotech Focused on Rare Diseases | | | | | |
| | 145,000 | | | Amylin Pharmaceuticals (a) | | | 2,726 | | |
| | | | | Biotech Company Focused on Diabetes & Obesity | | | | | |
| | 86,678 | | | Auxilium Pharmaceuticals (a) | | | 2,037 | | |
| | | | | Biotech Focused on Niche Disease Areas | | | | | |
| | 650,000 | | | Array Biopharma (a) | | | 1,983 | | |
| | | | | Drugs for Cancer & Inflammatory Diseases | | | | | |
| | 82,600 | | | Onyx Pharmaceuticals (a) | | | 1,783 | | |
| | | | | Commercial-stage Biotech Focused on Cancer | | | | | |
| | 332,171 | | | Idenix Pharmaceuticals (a) | | | 1,661 | | |
| | | | | Developer of Drugs for Infectious Diseases | | | | | |
| | 59,000 | | | Human Genome Sciences (a) | | | 1,337 | | |
| | | | | Biotech Focused on HCV, Inflammation & Cancer | | | | | |
| | 220,000 | | | Anthera (a) | | | 1,179 | | |
| | | | | Biotech Focused on Cardiovascular,
Cancer & Immunology | | | | | |
| | 18,181 | | | Metabolex, Series A-1 (a)(d) | | | 31 | | |
| | | | | Diabetes Drug Development | | | | | |
| | 738,060 | | | Medicure - Warrants (a)(d) | | | 5 | | |
| | | | | Cardiovascular Biotech Company | | | | | |
| | 100,000 | | | IsoRay - Warrants (a)(d) | | | 3 | | |
| | | | | Radiology Cancer Company | | | | | |
| | 37,500 | | | Locus Pharmaceuticals,
Series A-1, Pfd. (a)(d) | | | 1 | | |
| | 19,329 | | | Locus Pharmaceuticals,
Series B-1, Pfd. (a)(d) | | | 1 | | |
| | | | | High Throughput Rational Drug Design | | | | | |
| | | | 63,775 | | |
| | | > Medical Equipment & Devices 2.4% | |
| | 235,000 | | | Alexion Pharmaceuticals (a) | | | 12,030 | | |
| | | | | Biotech Focused on Orphan Diseases | | | | | |
| | 165,000 | | | Orthofix International (a) | | | 5,288 | | |
| | | | | Bone Fixation & Stimulation Devices | | | | | |
See accompanying notes to financial statements.
53
Columbia Acorn USA
Statement of Investments (Unaudited), continued
| Number of Shares | | | | Value (000) | |
| | | > Medical Equipment & Devices—continued | |
| | 160,000 | | | American Medical Systems (a) | | $ | 3,539 | | |
| | | | | Medical Devices to Treat Urological Conditions | | | | | |
| | 76,000 | | | Gen-Probe (a) | | | 3,452 | | |
| | | | | Molecular In-vitro Diagnostics | | | | | |
| | 80,000 | | | Sirona Dental Systems (a) | | | 2,787 | | |
| | | | | Manufacturer of Dental Equipment | | | | | |
| | 34,000 | | | Illumina (a) | | | 1,480 | | |
| | | | | Leading Tools & Service Provider for
Genetic Analysis | | | | | |
| | 108,147 | | | Vermillion (a)(d) | | | 1,266 | | |
| | | | | Ovarian Cancer Diagnostic Test | | | | | |
| | 250,000 | | | Nanosphere (a) | | | 1,090 | | |
| | | | | Molecular Diagnostics Company with Best
of Breed Platform | | | | | |
| | | | 30,932 | | |
| | | > Health Care Services 1.2% | |
| | 606,300 | | | PSS World Medical (a) | | | 12,823 | | |
| | | | | Distributor of Medical Supplies | | | | | |
| | 45,000 | | | Mednax (a) | | | 2,503 | | |
| | | | | Physician Management for Pediatric &
Anesthesia Practices | | | | | |
| | | | 15,326 | | |
| | | > Medical Supplies 0.9% | |
| | 361,000 | | | Cepheid (a) | | | 5,783 | | |
| | | | | Molecular Diagnostics | | | | | |
| | 176,460 | | | Immucor (a) | | | 3,361 | | |
| | | | | Automated Blood Typing Reagents | | | | | |
| | 53,000 | | | Idexx Laboratories (a)(b) | | | 3,228 | | |
| | | | | Diagnostic Equipment & Services
for Veterinarians | | | | | |
| | | | 12,372 | | |
| | | > Pharmaceuticals 0.1% | |
| | 150,000 | | | The Medicines Company (a) | | | 1,142 | | |
| | | | | Specialty Pharmaceuticals - Cardiovascular | | | | | |
| | | | 1,142 | | |
| Health Care: Total | | | 123,547 | | |
| Other Industries 7.3% | | | |
| | | > Real Estate 6.3% | |
| | 405,000 | | | SL Green Realty | | | 22,291 | | |
| | | | | Manhattan Office Buildings | | | | | |
| | 836,200 | | | BioMed Realty Trust | | | 13,455 | | |
| | | | | Life Science-focused Office Buildings | | | | | |
| | 280,619 | | | Macerich | | | 10,473 | | |
| | | | | Regional Shopping Malls | | | | | |
| | 246,000 | | | Corporate Office Properties | | | 9,289 | | |
| | | | | Office Buildings | | | | | |
| | 557,000 | | | Extra Space Storage | | | 7,742 | | |
| | | | | Self Storage Facilities | | | | | |
| | 1,450,000 | | | Kite Realty Group | | | 6,061 | | |
| | | | | Community Shopping Centers | | | | | |
| | 1,058,000 | | | DCT Industrial Trust | | | 4,782 | | |
| | | | | Industrial Properties | | | | | |
| | 138,000 | | | Dupont Fabros Technology | | | 3,389 | | |
| | | | | Technology-focused Office Buildings | | | | | |
| | 400,000 | | | Education Realty Trust | | | 2,412 | | |
| | | | | Student Housing | | | | | |
| Number of Shares | | | | Value (000) | |
| | 22,000 | | | Digital Realty Trust | | $ | 1,269 | | |
| | | | | Technology-focused Office Buildings | | | | | |
| | | | 81,163 | | |
| | | > Transportation 1.0% | |
| | 344,720 | | | Heartland Express | | | 5,005 | | |
| | | | | Regional Trucker | | | | | |
| | 156,000 | | | World Fuel Services | | | 4,047 | | |
| | | | | Global Fuel Broker | | | | | |
| | 180,000 | | | Rush Enterprises, Class A (a) | | | 2,405 | | |
| | 115,000 | | | Rush Enterprises, Class B (a) | | | 1,340 | | |
| | | | | Truck Sales & Services | | | | | |
| | | | 12,797 | | |
| Other Industries: Total | | | 93,960 | | |
| Energy & Minerals 6.9% | | | |
| | | > Oil Services 4.2% | |
| | 500,000 | | | FMC Technologies (a) | | | 26,330 | | |
| | | | | Oil & Gas Wellhead Manufacturer | | | | | |
| | 755,000 | | | Atwood Oceanics (a) | | | 19,267 | | |
| | | | | Offshore Drilling Contractor | | | | | |
| | 105,000 | | | Bristow (a) | | | 3,087 | | |
| | | | | Largest Provider of Helicopter Services to
Offshore Oil & Gas Producers | | | | | |
| | 115,375 | | | Exterran Holdings (a) | | | 2,978 | | |
| | | | | Natural Gas Compressor Rental & Fabrication | | | | | |
| | 38,000 | | | Oceaneering International (a) | | | 1,706 | | |
| | | | | Provider of Sub-sea Services &
Manufactured Products | | | | | |
| | 106,000 | | | Tesco (a) | | | 1,302 | | |
| | | | | Developing New Well Drilling Technologies | | | | | |
| | | | 54,670 | | |
| | | > Oil & Gas Producers 2.0% | |
| | 1,135,000 | | | Quicksilver Resources (a) | | | 12,485 | | |
| | | | | Natural Gas & Coal Steam Gas Producer | | | | | |
| | 133,000 | | | St. Mary Land & Exploration | | | 5,341 | | |
| | | | | Oil & Gas Producer | | | | | |
| | 230,000 | | | Northern Oil & Gas (a) | | | 2,953 | | |
| | | | | Small E&P Company in North Dakota Bakken | | | | | |
| | 129,000 | | | Rosetta Resources (a) | | | 2,555 | | |
| | | | | Oil & Gas Producer Exploring in
South Texas & Montana | | | | | |
| | 162,000 | | | Carrizo Oil & Gas (a) | | | 2,516 | | |
| | | | | Oil & Gas Producer | | | | | |
| | 22,800 | | | Oasis Petroleum (a) | | | 331 | | |
| | | | | Oil Producer in North Dakota | | | | | |
| | | | 26,181 | | |
| | | > Mining 0.7% | |
| | 50,000 | | | Core Laboratories (Netherlands) (b) | | | 7,381 | | |
| | | | | Oil & Gas Reservoir Consulting | | | | | |
| | 393,000 | | | Alexco Resource (a) | | | 1,234 | | |
| | | | | Mining, Exploration & Environmental Services | | | | | |
| | | | 8,615 | | |
| Energy & Minerals: Total | | | 89,466 | | |
Total Equities: 99.8%
(Cost: $1,145,424) | | | 1,291,225 | | |
See accompanying notes to financial statements.
54
Number of Shares
or Principal Amount (000) | | | | Value (000) | |
| Securities Lending Collateral: 1.3% | |
| | 16,740,975 | | | Dreyfus Government Cash
Management Fund (e)
(7 day yield of 0.03%) | | $ | 16,741 | | |
Total Securities Lending Collateral:
(Cost: $16,741) | | | 16,741 | | |
| Short-Term Obligation 0.5% | |
| $ | 6,499 | | | Repurchase Agreement with
Fixed Income Clearing Corp.,
dated 6/30/10, due 7/01/10
at 0.00%, collateralized by a
U.S. Government Agency
obligation maturing 8/25/14,
market value $6,631
(repurchase proceeds $6,499) | | | 6,499 | | |
Total Short-Term Obligation:
(Cost: $6,499) | | | 6,499 | | |
Total Investments: 101.6%
(Cost: $1,168,664)(f) | | | 1,314,465 | | |
Obligation to Return Collateral for
Securities Loaned: (1.3)% | | | (16,741 | ) | |
| Cash and Other Assets Less Liabilities: (0.3)% | | | (3,488 | ) | |
| Total Net Assets: 100.0% | | $ | 1,294,236 | | |
ADR = American Depositary Receipts.
See accompanying notes to financial statements.
55
Columbia Acorn USA
Statement of Investments (Unaudited), continued
> Notes to Statement of Investments (dollar values in thousands)
(a) Non-income producing security.
(b) All or a portion of this security was on loan at June 30, 2010. The total market value of Fund securities on loan at June 30, 2010 was $16,139.
(c) An affiliated person of the Fund may include any company in which the Fund owns five percent or more of its outstanding voting shares.
Holdings and transactions in these affiliated companies during the six months ended June 30, 2010, are as follows:
| Affiliate | | Balance of
Shares Held
12/31/09 | | Purchases/
Additions | | Sales/
Reductions | | Balance of
Shares Held
6/30/10 | | Value | | Dividend | |
| Cavco Industries* | | | 327,900 | | | | - | | | | 77,900 | | | | 250,000 | | | $ | 8,795 | | | $ | - | | |
| RCM Technologies | | | 786,000 | | | | - | | | | - | | | | 786,000 | | | | 3,513 | | | | - | | |
| Total of Affiliated Transactions | | | 1,113,900 | | | | - | | | | 77,900 | | | | 1,036,000 | | | $ | 12,308 | | | $ | - | | |
* At June 30, 2010, the Fund owned less than five percent of the company's outstanding voting shares.
The aggregate cost and value of these companies at June 30, 2010, were $13,412 and $12,308, respectively. Investments in the affiliated companies represented 1.0% of total net assets at June 30, 2010.
(d) Denotes a restricted security, which is subject to restrictions on resale under federal securities laws. These securities are valued at a fair value determined in good faith under consistently applied procedures established by the Board of Trustees. At June 30, 2010, the market value of these securities amounted to $1,307 which represented 0.10% of total net assets.
Additional information on these securities is as follows:
| Security | | Acquisition
Dates | | Shares | | Cost | | Value | |
| Vermillion | | 1/07/10 | | | 108,147 | | | $ | 2,000 | | | $ | 1,266 | | |
| Metabolex, Series A | | 2/11/00 | | | 18,181 | | | | 2,000 | | | | 31 | | |
| Medicure - Warrants | | 12/22/06 | | | 738,060 | | | | - | | | | 5 | | |
| IsoRay - Warrants | | 3/21/07 | | | 100,000 | | | | - | | | | 3 | | |
| Locus Pharmaceuticals, Series A-1 Pfd. | | 9/05/01 | | | 37,500 | | | | 1,500 | | | | 1 | | |
| Locus Pharmaceuticals, Series B-1 Pfd. | | 2/08/07 | | | 19,329 | | | | 56 | | | | 1 | | |
| | | | | | | | | $ | 5,556 | | | $ | 1,307 | | |
(e) Investment made with cash collateral received from securities lending activity.
(f) At June 30, 2010, for federal income tax purposes, the cost of investments was $1,168,664 and net unrealized appreciation was $145,801, consisting of gross unrealized appreciation of $321,700 and gross unrealized depreciation of $175,899.
The following table summarizes the inputs used, as of June 30, 2010, in valuing the Fund's assets:
| Investment Type | | Quoted Prices
(Level 1) | | Other
Significant
Observable
Inputs
(Level 2) | | Significant
Unobservable
Inputs
(Level 3) | | Total | |
| Equities | |
| Information | | $ | 410,194 | | | $ | - | | | $ | - | | | $ | 410,194 | | |
| Consumer Goods & Services | | | 223,743 | | | | - | | | | - | | | | 223,743 | | |
| Finance | | | 178,109 | | | | - | | | | - | | | | 178,109 | | |
| Industrial Goods & Services | | | 172,206 | | | | - | | | | - | | | | 172,206 | | |
| Health Care | | | 122,240 | | | | 1,274 | | | | 33 | | | | 123,547 | | |
| Other Industries | | | 93,960 | | | | - | | | | - | | | | 93,960 | | |
| Energy & Minerals | | | 89,466 | | | | - | | | | - | | | | 89,466 | | |
| Total Equities | | | 1,289,918 | | | | 1,274 | | | | 33 | | | | 1,291,225 | | |
| Total Securities Lending Collateral | | | 16,741 | | | | - | | | | - | | | | 16,741 | | |
| Total Short-Term Obligation | | | - | | | | 6,499 | | | | - | | | | 6,499 | | |
| Total Investments | | $ | 1,306,659 | | | $ | 7,773 | | | $ | 33 | | | $ | 1,314,465 | | |
The Fund's assets assigned to the Level 2 input category are generally valued using the market approach, in which a security's value is determined through its correlation to prices and information from market transactions for similar or identical assets. Securities acquired via private placement, that have a holding period or an extended settlement period, are valued at a discount to the same shares that are trading freely on the market. These discounts are determined by the advisor's experience with similar securities or situations. Factors may include, but are not limited to, trade volume, shares outstanding and stock price. Warrants which do not trade are valued as a percentage of the actively trading common stock using a model, based on Black Scholes.
See accompanying notes to financial statements.
56
> Notes to Statement of Investments (dollar values in thousands)
Certain Short-Term Obligations may be valued using amortized cost, an income approach which converts future cash flows to a present value based upon the discount or premium at purchase.
The Fund's assets assigned to the Level 3 input category are valued at fair value as determined in good faith under consistently applied procedures established by and under the general supervision of the Board of Trustees. To determine fair value, management will utilize the valuation technique that they deem the most appropriate in the circumstances. Securities for which no market exist are valued based upon the market approach using inputs from the investment team but ultimately decided by the Board of Trustees. These may include, but are not limited to, projected earnings, available cash, line of business, multiples, and consideration of the prioritization of the equity in a company's capital structure.
The following table reconciles asset balances for the six-month period ending June 30, 2010, in which significant unobservable inputs (Level 3) were used in determining value:
Investments
in Securities | | Balance
as of
December 31,
2009 | | Realized
Gain/(Loss) | | Change in
Unrealized
Appreciation
(Depreciation) | | Purchases | | (Sales) | | Transfers
into
Level 3 | | Transfers
(out of)
Level 3 | | Balance
as of
June 30,
2010 | |
| Equities | |
| Health Care | | $ | 25 | | | $ | - | | | $ | 8 | | | $ | - | | | $ | - | | | $ | - | | | $ | - | | | $ | 33 | | |
| | | $ | 25 | | | $ | - | | | $ | 8 | | | $ | - | | | $ | - | | | $ | - | | | $ | - | | | $ | 33 | | |
The information in the above reconciliation table represents fiscal year to date activity for any securities identified as using Level 3 inputs during the current fiscal period.
The change in unrealized appreciation attributed to securities owned at June 30, 2010, which were valued using significant unobservable inputs (Level 3) amounted to $8. This amount is included in net change in unrealized appreciation (depreciation) on the Statements of Changes in Net Assets.
For more information on valuation inputs, and their aggregation into the levels used in the tables above, please refer to the Security Valuation section in the accompanying Notes to Financial Statements.
See accompanying notes to financial statements.
57
Columbia Acorn International Select
Major Portfolio Changes in the Second Quarter (Unaudited)
| | | Number of Shares | |
| | | 03/31/10 | | 06/30/10 | |
| Purchases | |
| Asia | |
| > Japan | |
| Kansai Paint | | | 1,311,400 | | | | 1,879,000 | | |
| > China | |
| Jiangsu Expressway | | | 8,361,000 | | | | 13,127,000 | | |
| Zhaojin Mining Industry | | | 4,394,000 | | | | 5,515,200 | | |
| > Singapore | |
| Ascendas REIT | | | 7,500,000 | | | | 8,686,700 | | |
| Europe | |
| > United Kingdom | |
| Cobham | | | 2,929,700 | | | | 3,120,000 | | |
| Intertek Group | | | 525,000 | | | | 530,000 | | |
| Micro Focus | | | 0 | | | | 1,280,000 | | |
| > Netherlands | |
| Fugro | | | 169,162 | | | | 175,427 | | |
| Imtech | | | 252,000 | | | | 258,904 | | |
| > Germany | |
| Rhoen-Klinikum | | | 174,000 | | | | 251,000 | | |
| > Ireland | |
| United Drug | | | 2,191,700 | | | | 2,563,000 | | |
| Other Countries | |
| > Canada | |
| AG Growth | | | 73,600 | | | | 125,000 | | |
| Pan American Silver | | | 0 | | | | 510,000 | | |
| > Australia | |
| UGL | | | 759,000 | | | | 870,000 | | |
| | | Number of Shares | |
| | | 03/31/10 | | 06/30/10 | |
| Sales | |
| Asia | |
| > Japan | |
| Nomura Holdings | | | 560,000 | | | | 0 | | |
| Suruga Bank | | | 307,000 | | | | 0 | | |
| > China | |
| Shandong Weigao | | | 1,752,700 | | | | 0 | | |
| > Singapore | |
| Singapore Exchange | | | 702,000 | | | | 0 | | |
| > South Korea | |
| MegaStudy | | | 49,204 | | | | 0 | | |
| Europe | |
| > United Kingdom | |
| Capita Group | | | 1,100,000 | | | | 0 | | |
| Schroders | | | 310,000 | | | | 200,000 | | |
| Serco | | | 2,350,000 | | | | 2,300,000 | | |
| Spice Group | | | 851,400 | | | | 0 | | |
| > France | |
| Zodiac Aerospace | | | 102,000 | | | | 0 | | |
| > Spain | |
| Red Eléctrica de Espana | | | 195,000 | | | | 127,000 | | |
| Other Countries | |
| > Canada | |
| Potash Corp. of Saskatchewan | | | 51,500 | | | | 0 | | |
| > United States | |
| Alexion Pharmaceuticals | | | 90,000 | | | | 0 | | |
| Diamond Offshore | | | 61,000 | | | | 0 | | |
| Oceaneering International | | | 80,000 | | | | 0 | | |
See accompanying notes to financial statements.
58
Columbia Acorn International Select
Statement of Investments (Unaudited), June 30, 2010
| Number of Shares | | | | Value (000) | |
| | | | | | | | Equities: 88.9% | | |
| Asia 33.9% | | | |
| | | > Japan 15.5% | |
| | 1,879,000 | | | Kansai Paint | | $ | 16,081 | | |
| | | | | Paint Producer in Japan, India, China &
Southeast Asia | | | | | |
| | 189,300 | | | Benesse | | | 8,621 | | |
| | | | | Education Service Provider | | | | | |
| | 4,450 | | | Seven Bank | | | 8,058 | | |
| | | | | ATM Processing Services | | | | | |
| | 634,300 | | | Rohto Pharmaceutical | | | 7,737 | | |
| | | | | Health & Beauty Products | | | | | |
| | 160,300 | | | Ain Pharmaciez | | | 6,489 | | |
| | | | | Dispensing Pharmacy/Drugstore Operator | | | | | |
| | 6,060 | | | Jupiter Telecommunications | | | 5,775 | | |
| | | | | Largest Cable Service Provider in Japan | | | | | |
| | 900 | | | Orix JREIT | | | 3,752 | | |
| | | | | Diversified REIT | | | | | |
| | 435,000 | | | Kamigumi | | | 3,343 | | |
| | | | | Port Cargo Handling & Logistics | | | | | |
| | | | 59,856 | | |
| | | > China 6.5% | |
| | 5,515,200 | | | Zhaojin Mining Industry | | | 12,935 | | |
| | | | | Gold Mining & Refining in China | | | | | |
| | 13,127,000 | | | Jiangsu Expressway | | | 11,968 | | |
| | | | | Chinese Toll Road Operator | | | | | |
| | | | 24,903 | | |
| | | > Singapore 5.8% | |
| | 8,686,700 | | | Ascendas REIT | | | 11,212 | | |
| | | | | Singapore Industrial Property Landlord | | | | | |
| | 6,100,000 | | | Olam International | | | 11,170 | | |
| | | | | Agriculture Supply Chain Manager | | | | | |
| | | | 22,382 | | |
| | | > South Korea 4.3% | |
| | 78,000 | | | NHN (a) | | | 11,608 | | |
| | | | | South Korea's Largest Online Search Engine | | | | | |
| | 151,000 | | | Woongjin Coway | | | 5,048 | | |
| | | | | South Korean Household Appliance Rental
Service Provider | | | | | |
| | | | 16,656 | | |
| | | > Hong Kong 1.8% | |
| | 434,700 | | | Hong Kong Exchanges and Clearing | | | 6,790 | | |
| | | | | Hong Kong Equity & Derivatives Market Operator | | | | | |
| | | | 6,790 | | |
| Asia: Total | | | 130,587 | | |
| Europe 32.4% | | | |
| | | > United Kingdom 13.7% | |
| | 2,300,000 | | | Serco | | | 20,035 | | |
| | | | | Facilities Management | | | | | |
| | 530,000 | | | Intertek Group | | | 11,336 | | |
| | | | | Testing, Inspection & Certification Services | | | | | |
| | 3,120,000 | | | Cobham | | | 9,834 | | |
| | | | | Aerospace Components | | | | | |
| | 1,280,000 | | | Micro Focus | | | 8,017 | | |
| | | | | United Kingdom Legacy Software Provider | | | | | |
| Number of Shares | | | | Value (000) | |
| | 200,000 | | | Schroders | | $ | 3,599 | | |
| | | | | United Kingdom Top Tier Asset Manager | | | | | |
| | | | 52,821 | | |
| | | > Netherlands 5.4% | |
| | 175,427 | | | Fugro | | | 8,021 | | |
| | | | | Sub-sea Oilfield Services | | | | | |
| | 258,904 | | | Imtech | | | 6,642 | | |
| | | | | Electromechanical & ICT Installation &
Maintenance | | | | | |
| | 41,000 | | | Core Laboratories (b) | | | 6,052 | | |
| | | | | Oil & Gas Reservoir Consulting | | | | | |
| | | | 20,715 | | |
| | | > Switzerland 2.8% | |
| | 135,900 | | | Bank Sarasin & Cie | | | 5,445 | | |
| | | | | Private Banking | | | | | |
| | 51,000 | | | Kuehne & Nagel | | | 5,224 | | |
| | | | | Freight Forwarding/Logistics | | | | | |
| | | | 10,669 | | |
| | | > Sweden 2.4% | |
| | 715,000 | | | Hexagon | | | 9,310 | | |
| | | | | Measurement Equipment | | | | | |
| | | | 9,310 | | |
| | | > Germany 2.4% | |
| | 251,000 | | | Rhoen-Klinikum | | | 5,575 | | |
| | | | | Health Care Services | | | | | |
| | 412,000 | | | Wirecard (b) | | | 3,504 | | |
| | | | | Online Payment Processing & Risk Management | | | | | |
| | | | 9,079 | | |
| | | > Ireland 1.9% | |
| | 2,563,000 | | | United Drug | | | 7,134 | | |
| | | | | Irish Pharmaceutical Wholesaler & Outsourcer | | | | | |
| | | | 7,134 | | |
| | | > France 1.8% | |
| | 98,000 | | | Neopost | | | 7,092 | | |
| | | | | Postage Meter Machines | | | | | |
| | | | 7,092 | | |
| | | > Spain 1.2% | |
| | 127,000 | | | Red Eléctrica de Espana | | | 4,540 | | |
| | | | | Spanish Power Transmission | | | | | |
| | | | 4,540 | | |
| | | > Denmark 0.8% | |
| | 29,000 | | | Novozymes | | | 3,078 | | |
| | | | | Industrial Enzymes | | | | | |
| | | | 3,078 | | |
| Europe: Total | | | 124,438 | | |
| Other Countries 19.0% | | | |
| | | > Canada 9.0% | |
| | 510,000 | | | Pan American Silver | | | 12,893 | | |
| | | | | Silver Mining | | | | | |
| | 701,250 | | | Eldorado Gold | | | 12,568 | | |
| | | | | Gold Miner in Turkey, Greece, China & Brazil | | | | | |
| | 179,700 | | | CCL Industries | | | 4,811 | | |
| | | | | Leading Global Label Manufacturer | | | | | |
See accompanying notes to financial statements.
59
Columbia Acorn International Select
Statement of Investments (Unaudited), continued
Number of Shares
or Principal Amount (000) | | | | Value (000) | |
| | | > Canada—continued | |
| | 125,000 | | | AG Growth | | $ | 4,121 | | |
| | | | | Leading Manufacturer of Augers & Grain
Handling Equipment | | | | | |
| | | | 34,393 | | |
| | | > South Africa 5.5% | |
| | 630,000 | | | Naspers | | | 21,174 | | |
| | | | | Media in Africa & Other Emerging Markets | | | | | |
| | | | 21,174 | | |
| | | > Australia 2.6% | |
| | 870,000 | | | UGL | | | 9,825 | | |
| | | | | Engineering & Facilities Management | | | | | |
| | | | 9,825 | | |
| | | > United States 1.1% | |
| | 171,000 | | | Atwood Oceanics (a) | | | 4,364 | | |
| | | | | Offshore Drilling Contractor | | | | | |
| | | | 4,364 | | |
| | | > Israel 0.8% | |
| | 310,000 | | | Israel Chemicals | | | 3,233 | | |
| | | | | Producer of Potash, Phosphates, Bromine &
Specialty Chemicals | | | | | |
| | | | 3,233 | | |
| Other Countries: Total | | | 72,989 | | |
| Latin America 3.6% | | | |
| | | > Colombia 3.6% | |
| | 615,000 | | | Pacific Rubiales Energy (a) | | | 13,784 | | |
| | | | | Oil Production & Exploration in Colombia | | | | | |
| | | | 13,784 | | |
| Latin America: Total | | | 13,784 | | |
Total Equities: 88.9%
(Cost: $289,347) | | | 341,798 | | |
| Securities Lending Collateral: 1.7% | | | |
| | 6,592,500 | | | Dreyfus Government Cash
Management Fund (c)
(7 day yield of 0.03%) | | | 6,593 | | |
Total Securities Lending Collateral:
(Cost: $6,593) | | | 6,593 | | |
| Short-Term Obligations: 10.6% | | | |
| | | > Repurchase Agreement 10.1% | |
| $ | 38,904 | | | Repurchase Agreement with
Fixed Income Clearing Corp.,
dated 6/30/10, due 7/01/10
at 0.00%, collateralized by
a U.S. Government Agency
obligation maturing 7/30/14,
market value $39,685
(repurchase proceeds $38,904) | | | 38,904 | | |
| | | | 38,904 | | |
| Principal Amount (000) | | | | Value (000) | |
| | | > Commercial Paper 0.5% | |
| $ | 1,900 | | | Toyota Motor Credit 0.27%
due 7/02/10 | | $ | 1,900 | | |
| | | | 1,900 | | |
Total Short-Term Obligations:
(Cost: $40,804) | | | 40,804 | | |
Total Investments: 101.2%
(Cost: $336,744)(d)(e) | | | 389,195 | | |
Obligation to Return Collateral for
Securities Loaned: (1.7)% | | | (6,593 | ) | |
| Cash and Other Assets Less Liabilities: 0.5% | | | 2,086 | | |
| Total Net Assets: 100.0% | | $ | 384,688 | | |
See accompanying notes to financial statements.
60
> Notes to Statements of Investments (dollar values in thousands)
(a) Non-income producing security.
(b) All or a portion of this security was on loan at June 30, 2010. The total market value of Fund securities on loan at June 30, 2010 was $6,360.
(c) Investment made with cash collateral received from securities lending activity.
(d) At June 30, 2010, for federal income tax purposes, the cost of investments was $336,744 and net unrealized appreciation was $52,451, consisting of gross unrealized appreciation of $70,800 and gross unrealized depreciation of $18,349.
(e) On June 30, 2010, the Fund's total investments were denominated in currencies as follows:
| Currency | | Value | | Percentage
of Net Assets | |
| Japanese Yen | | $ | 59,856 | | | | 15.6 | | |
| British Pound | | | 52,821 | | | | 13.7 | | |
| U.S. Dollar | | | 51,220 | | | | 13.3 | | |
| Canadian Dollar | | | 48,178 | | | | 12.5 | | |
| Euro | | | 42,508 | | | | 11.1 | | |
| Hong Kong Dollar | | | 31,692 | | | | 8.2 | | |
| Singapore Dollar | | | 22,382 | | | | 5.8 | | |
| South African Rand | | | 21,174 | | | | 5.5 | | |
Other currencies less
than 5% of total net assets | | | 52,771 | | | | 13.8 | | |
| | | $ | 382,602 | | | | 99.5 | | |
The following table summarizes the inputs used, as of June 30, 2010, in valuing the Fund's assets:
| Investment Type | | Quoted Prices
(Level 1) | | Other
Significant
Observable
Inputs
(Level 2) | | Significant
Unobservable
Inputs
(Level 3) | | Total | |
| Equities | |
| Asia | | $ | - | | | $ | 130,587 | | | $ | - | | | $ | 130,587 | | |
| Europe | | | 6,052 | | | | 118,386 | | | | - | | | | 124,438 | | |
| Other Countries | | | 38,757 | | | | 34,232 | | | | - | | | | 72,989 | | |
| Latin America | | | 13,784 | | | | - | | | | - | | | | 13,784 | | |
| Total Equities | | | 58,593 | | | | 283,205 | | | | - | | | | 341,798 | | |
| Total Securities Lending Collateral | | | 6,593 | | | | - | | | | - | | | | 6,593 | | |
| Total Short-Term Obligations | | | - | | | | 40,804 | | | | - | | | | 40,804 | | |
| Total Investments | | $ | 65,186 | | | $ | 324,009 | | | $ | - | | | $ | 389,195 | | |
The Fund's assets assigned to the Level 2 input category are generally valued using the market approach, in which a security's value is determined through its correlation to prices and information from market transactions for similar or identical assets. Foreign equities are generally valued at the last sales price on the foreign exchange or market on which they trade. The Fund may use a systematic fair valuation model provided by an independent third party to value securities principally traded in foreign markets in order to adjust for possible stale pricing that may occur between the close of the foreign exchanges and the time for valuation. These models take into account available market data including intraday index, ADR, and ETF movements.
Certain Short-Term Obligations may be valued using amortized cost, an income approach which converts future cash flows to a present value based upon the discount or premium at purchase.
For more information on valuation inputs, and their aggregation into the levels used in the tables above, please refer to the Security Valuation section in the accompanying Notes to Financial Statements.
See accompanying notes to financial statements.
61
Columbia Acorn International Select
Portfolio Diversification (Unaudited)
At June 30, 2010, the Fund's portfolio investments as a percentage of net assets were diversified as follows:
| | | Value (000) | | Percentage
of Net Assets | |
| > Industrial Goods & Services | |
| Other Industrial Services | | $ | 33,027 | | | | 8.6 | | |
Industrial Materials &
Specialty Chemicals | | | 22,392 | | | | 5.8 | | |
| Outsourcing Services | | | 20,035 | | | | 5.2 | | |
| Machinery | | | 11,213 | | | | 2.9 | | |
| Electrical Components | | | 9,834 | | | | 2.6 | | |
| | | | 96,501 | | | | 25.1 | | |
| > Energy & Minerals | |
| Mining | | | 44,448 | | | | 11.6 | | |
| Oil & Gas Producers | | | 13,784 | | | | 3.6 | | |
| Oil Services | | | 12,385 | | | | 3.2 | | |
| | | | 70,617 | | | | 18.4 | | |
| > Information | |
| TV Broadcasting | | | 21,174 | | | | 5.5 | | |
| Internet Related | | | 11,608 | | | | 3.0 | | |
| Financial Processors | | | 10,294 | | | | 2.7 | | |
| Instrumentation | | | 9,310 | | | | 2.4 | | |
| Business Software | | | 8,017 | | | | 2.1 | | |
| CATV | | | 5,775 | | | | 1.5 | | |
| | | | 66,178 | | | | 17.2 | | |
| > Consumer Goods & Services | |
| Other Consumer Services | | | 13,669 | | | | 3.5 | | |
| Nondurables | | | 12,548 | | | | 3.3 | | |
| Food & Beverage | | | 11,170 | | | | 2.9 | | |
| Retail | | | 6,489 | | | | 1.7 | | |
| | | | 43,876 | | | | 11.4 | | |
| > Other Industries | |
| Transportation | | | 15,311 | | | | 4.0 | | |
| Real Estate | | | 14,964 | | | | 3.9 | | |
| Regulated Utilities | | | 4,540 | | | | 1.2 | | |
| | | | 34,815 | | | | 9.1 | | |
| > Finance | |
| Brokerage & Money Management | | | 9,044 | | | | 2.3 | | |
| Banks | | | 8,058 | | | | 2.1 | | |
| | | | 17,102 | | | | 4.4 | | |
| | | Value (000) | | Percentage
of Net Assets | |
| > Health Care | |
| Pharmaceuticals | | $ | 7,134 | | | | 1.9 | | |
| Health Care Services | | | 5,575 | | | | 1.4 | | |
| | | | 12,709 | | | | 3.3 | | |
| Total Equities: | | | 341,798 | | | | 88.9 | | |
Total Securities Lending
Collateral: | | | 6,593 | | | | 1.7 | | |
| Short-Term Obligations: | | | 40,804 | | | | 10.6 | | |
| Total Investments: | | | 389,195 | | | | 101.2 | | |
Obligation to Return
Collateral for
Securities Loaned: | | | (6,593 | ) | | | (1.7 | ) | |
Cash and Other Assets
Less Liabilities: | | | 2,086 | | | | 0.5 | | |
| Net Assets: | | $ | 384,688 | | | | 100.0 | | |
See accompanying notes to financial statements.
62
Columbia Acorn Select
Major Portfolio Changes in the Second Quarter (Unaudited)
| | | Number of Shares | |
| | | 03/31/10 | | 06/30/10 | |
| Purchases | |
| Consumer Goods & Services | |
| Career Education | | | 1,500,000 | | | | 1,600,000 | | |
| GLG Life Tech (Canada) | | | 747,200 | | | | 885,175 | | |
| Hertz | | | 8,000,000 | | | | 8,500,000 | | |
IFM Investments (Century 21
China RE) - ADR (China) | | | 669,300 | | | | 2,100,000 | | |
| lululemon athletica | | | 310,000 | | | | 330,000 | | |
| RexLot Holdings (China) | | | 325,000,000 | | | | 335,000,000 | | |
| Safeway | | | 3,700,000 | | | | 3,800,000 | | |
| Thor Industries | | | 0 | | | | 400,000 | | |
| Tractor Supply Company | | | 0 | | | | 60,000 | | |
| Wet Seal | | | 500,382 | | | | 2,500,000 | | |
| Information | |
| WNS - ADR (India) | | | 4,008,400 | | | | 4,029,900 | | |
| Energy & Minerals | |
| Canacol Energy (Colombia) | | | 32,240,000 | | | | 36,240,000 | | |
| Canadian Solar (China) | | | 2,200,000 | | | | 3,100,000 | | |
| Petromanas (Canada) | | | 0 | | | | 5,000,000 | | |
| Petromanas (Canada) | | | 0 | | | | 13,125,000 | | |
| ShaMaran Petroleum (Iraq) | | | 5,117,000 | | | | 8,200,600 | | |
Synthesis Energy Systems
(China) | | | 3,020,160 | | | | 3,940,000 | | |
| Finance | |
| Discover Financial Services | | | 2,825,000 | | | | 3,325,000 | | |
| MF Global | | | 5,500,000 | | | | 6,500,000 | | |
| Industrial Goods & Services | |
ChemSpec International - ADR
(China) | | | 587,189 | | | | 1,345,000 | | |
| Health Care | |
| NPS Pharmaceuticals | | | 150,393 | | | | 1,239,040 | | |
| Other Industries | |
| American Commercial Lines | | | 900,000 | | | | 1,150,000 | | |
| BioMed Realty Trust | | | 0 | | | | 1,200,000 | | |
| Wisconsin Energy | | | 0 | | | | 200,000 | | |
| | | Number of Shares | |
| | | 03/31/10 | | 06/30/10 | |
| Sales | |
| Consumer Goods & Services | |
| ITT Educational Services | | | 900,000 | | | | 858,000 | | |
| Princeton Review | | | 775,681 | | | | 0 | | |
| SkillSoft - ADR | | | 9,000,000 | | | | 0 | | |
| Steelcase | | | 1,588,000 | | | | 0 | | |
| Information | |
| CardTronics | | | 2,529,536 | | | | 2,100,000 | | |
| China Mass Media - ADR (China) | | | 461,673 | | | | 0 | | |
| VisionChina Media - ADR (China) | | | 3,657,860 | | | | 2,500,000 | | |
| Energy & Minerals | |
| Alange Energy (Colombia) | | | 10,000,000 | | | | 8,000,000 | | |
| Gran Tierra Energy (Colombia) | | | 2,500,000 | | | | 1,828,000 | | |
| Tetra Technologies | | | 4,700,000 | | | | 3,893,000 | | |
| Health Care | |
| Emdeon | | | 27,500 | | | | 0 | | |
See accompanying notes to financial statements.
63
Columbia Acorn Select
Statement of Investments (Unaudited), June 30, 2010
| Number of Shares | | | | Value (000) | |
| | | | | | | | Equities: 93.5% | | |
| Consumer Goods & Services 26.5% | | | |
| | | > Retail 8.2% | |
| | 3,800,000 | | | Safeway | | $ | 74,708 | | |
| | | | | Supermarkets | | | | | |
| | 1,650,000 | | | Abercrombie & Fitch | | | 50,638 | | |
| | | | | Teen Apparel Retailer | | | | | |
| | 330,000 | | | lululemon athletica (a)(b) | | | 12,283 | | |
| | | | | Premium Active Apparel Retailer | | | | | |
| | 2,500,000 | | | Wet Seal (a) | | | 9,125 | | |
| | | | | Specialty Apparel Retailer | | | | | |
| | 60,000 | | | Tractor Supply Company | | | 3,658 | | |
| | | | | Rural America Retailer | | | | | |
| | | | 150,412 | | |
| | | > Travel 6.9% | |
| | 8,500,000 | | | Hertz (a) | | | 80,410 | | |
| | | | | Largest U.S. Rental Car Operator | | | | | |
| | 2,500,000 | | | Expedia | | | 46,950 | | |
| | | | | Online Travel Services Company | | | | | |
| | | | 127,360 | | |
| | | > Educational Services 5.9% | |
| | 858,000 | | | ITT Educational Services (a) | | | 71,231 | | |
| | | | | Post-secondary Degree Services | | | | | |
| | 1,600,000 | | | Career Education (a) | | | 36,832 | | |
| | | | | Post-secondary Education | | | | | |
| | | | 108,063 | | |
| | | > Apparel 2.3% | |
| | 1,135,000 | | | Coach | | | 41,484 | | |
| | | | | Designer & Retailer of Branded Leather
Accessories | | | | | |
| | | | 41,484 | | |
| | | > Casinos & Gaming 1.7% | |
| | 335,000,000 | | | RexLot Holdings (China) | | | 30,569 | | |
| | | | | Lottery Equipment Supplier in China | | | | | |
| | | | 30,569 | | |
| | | > Other Consumer Services 0.6% | |
| | 2,100,000 | | | IFM Investments (Century 21
China RE) - ADR (China) (a) | | | 10,983 | | |
| | | | | Provides Real Estate Services in China | | | | | |
| | | | 10,983 | | |
| | | > Leisure Products 0.5% | |
| | 400,000 | | | Thor Industries | | | 9,500 | | |
| | | | | RV & Bus Manufacturer | | | | | |
| | | | 9,500 | | |
| | | > Food & Beverage 0.4% | |
| | 885,175 | | | GLG Life Tech (Canada) (a) | | | 6,754 | | |
| | | | | Produce an All-natural Sweetener Extracted
from the Stevia Plant | | | | | |
| | 17,500,000 | | | Fu Ji Food & Catering Services
(China) (a)(c) | | | 180 | | |
| | | | | Food Catering Service Provider in China | | | | | |
| | | | 6,934 | | |
| Consumer Goods & Services: Total | | | 485,305 | | |
| Number of Shares | | | | Value (000) | |
| Information 22.4% | | | |
| | | > Mobile Communications 7.4% | |
| | 1,550,000 | | | Crown Castle International (a) | | $ | 57,753 | | |
| | | | | Communications Towers | | | | | |
| | 900,000 | | | American Tower (a) | | | 40,050 | | |
| | | | | Communications Towers in USA & Latin
America | | | | | |
| | 13,400,800 | | | Globalstar (a)(b) | | | 20,637 | | |
| | | | | Satellite Mobile Voice & Data Carrier | | | | | |
| | 505,000 | | | SBA Communications (a) | | | 17,175 | | |
| | | | | Communications Towers | | | | | |
| | | | 135,615 | | |
| | | > Contract Manufacturing 6.0% | |
| | 8,000,000 | | | Sanmina-SCI (a)(d) | | | 108,880 | | |
| | | | | Electronic Manufacturing Services | | | | | |
| | | | 108,880 | | |
| | | > Computer Services 2.7% | |
| | 4,029,900 | | | WNS - ADR (India) (a)(d) | | | 47,311 | | |
| | | | | Offshore BPO (Business Process Outsourcing)
Services | | | | | |
| | 1,000,000 | | | Hackett Group (a) | | | 2,810 | | |
| | | | | IT Integration & Best Practice Research | | | | | |
| | | | 50,121 | | |
| | | > Business Software 2.2% | |
| | 7,000,000 | | | Novell (a) | | | 39,760 | | |
| | | | | Directory, Operating System & Identity
Management Software | | | | | |
| | | | 39,760 | | |
| | | > Computer Hardware & Related
Equipment 1.6% | |
| | 750,000 | | | Amphenol | | | 29,460 | | |
| | | | | Electronic Connectors | | | | | |
| | | | 29,460 | | |
| | | > Financial Processors 1.5% | |
| | 2,100,000 | | | CardTronics (a)(d) | | | 27,216 | | |
| | | | | Operates the World's Largest Network of ATMs | | | | | |
| | | | 27,216 | | |
| | | > Instrumentation 0.6% | |
| | 100,000 | | | Mettler Toledo (a) | | | 11,163 | | |
| | | | | Laboratory Equipment | | | | | |
| | | | 11,163 | | |
| | | > Advertising 0.4% | |
| | 2,500,000 | | | VisionChina Media - ADR
(China) (a)(b) | | | 7,500 | | |
| | | | | Advertising on Digital Screens in China's
Mass Transit System | | | | | |
| | | | 7,500 | | |
| Information: Total | | | 409,715 | | |
| Energy & Minerals 17.2% | | | |
| | | > Oil & Gas Producers 11.6% | |
| | 4,466,666 | | | Pacific Rubiales Energy
(Colombia) (a)(e) | | | 99,612 | | |
| | 1,483,334 | | | Pacific Rubiales Energy (Colombia) (a) | | | 33,246 | | |
| | | | | Oil Production & Exploration in Colombia | | | | | |
See accompanying notes to financial statements.
64
| Number of Shares | | | | Value (000) | |
| | | > Oil & Gas Producers—continued | |
| | 36,240,000 | | | Canacol Energy (Colombia) (a)(d)(e) | | $ | 30,026 | | |
| | | | | Oil Producer in South America | | | | | |
| | 1,050,000 | | | Houston American Energy (b) | | | 10,353 | | |
| | | | | Oil & Gas Exploration/Production in Colombia | | | | | |
| | 25,883,000 | | | ShaMaran Petroleum (Iraq) (a)(d)(e) | | | 9,531 | | |
| | 8,200,600 | | | ShaMaran Petroleum (Iraq) (a)(d) | | | 3,081 | | |
| | | | | Oil Exploration in Kurdistan | | | | | |
| | 1,828,000 | | | Gran Tierra Energy (Colombia) (a) | | | 9,187 | | |
| | | | | Oil Exploration & Production in Colombia,
Peru & Argentina | | | | | |
| | 16,432,900 | | | Petroamerica (Colombia) (a) | | | 4,940 | | |
| | | | | Oil Exploration & Production in Colombia | | | | | |
| | 17,144,000 | | | Petrodorado (Colombia) (a)(e) | | | 4,103 | | |
| | 17,144,000 | | | Petrodorado - Warrants
(Colombia) (a)(e) | | | 1,610 | | |
| | | | | Oil & Gas Exploration & Production in
Colombia, Peru & Paraguay | | | | | |
| | 13,125,000 | | | Petromanas (Canada) (a)(e) | | | 3,403 | | |
| | 5,000,000 | | | Petromanas (Canada) (a) | | | 1,409 | | |
| | 6,562,500 | | | Petromanas - Warrants (Canada) (a)(e) | | | 247 | | |
| | | | | Exploring for Oil in Albania | | | | | |
| | 8,000,000 | | | Alange Energy (Colombia) (a) | | | 2,630 | | |
| | | | | Oil & Gas Exploration/Production in Colombia | | | | | |
| | | | 213,378 | | |
| | | > Oil Services 2.6% | |
| | 3,893,000 | | | Tetra Technologies (a)(d) | | | 35,349 | | |
| | | | | U.S.-based Services Company with Life of
Field Approach | | | | | |
| | 11,324,000 | | | Tuscany International Drilling
(Colombia) (a)(d)(e) | | | 11,467 | | |
| | 1,900,000 | | | Tuscany International Drilling -
Warrants (Colombia) (a)(d)(e) | | | 51 | | |
| | | | | South America-based Drilling Rig Contractor | | | | | |
| | | | 46,867 | | |
| | | > Alternative Energy 2.1% | |
| | 3,100,000 | | | Canadian Solar (China) (a)(d) | | | 30,318 | | |
| | | | | Solar Cell & Module Manufacturer | | | | | |
| | 1,400,000 | | | Real Goods Solar (a)(d) | | | 4,424 | | |
| | | | | Residential Solar Energy Installer | | | | | |
| | 3,940,000 | | | Synthesis Energy Systems
(China) (a)(d) | | | 4,334 | | |
| | | | | Owner/Operator of Gasification Plants | | | | | |
| | | | 39,076 | | |
| | | > Agricultural Commodities 0.9% | |
| | 38,000,000 | | | Eacom Timber - Subscription
Receipts (Canada) (a)(e) | | | 16,277 | | |
| | | | | Canadian Lumber Producer | | | | | |
| | | | 16,277 | | |
| Energy & Minerals: Total | | | 315,598 | | |
| Finance 11.4% | | | |
| | | > Brokerage & Money Management 5.2% | |
| | 6,500,000 | | | MF Global (a) | | | 37,115 | | |
| | | | | Futures Broker | | | | | |
| | 1,300,000 | | | Eaton Vance | | | 35,893 | | |
| | | | | Specialty Mutual Funds | | | | | |
| Number of Shares | | | | Value (000) | |
| | 1,100,000 | | | SEI Investments | | $ | 22,396 | | |
| | | | | Mutual Fund Administration & Investment
Management | | | | | |
| | | | 95,404 | | |
| | | > Insurance 3.7% | |
| | 13,500,000 | | | CNO Financial Group (a)(d) | | | 66,825 | | |
| | | | | Life, Long-term Care & Medical Supplement
Insurance | | | | | |
| | | | 66,825 | | |
| | | > Credit Cards 2.5% | |
| | 3,325,000 | | | Discover Financial Services | | | 46,484 | | |
| | | | | Credit Card Company | | | | | |
| | | | 46,484 | | |
| Finance: Total | | | 208,713 | | |
| Industrial Goods & Services 10.3% | | | |
| | | > Waste Management 2.6% | |
| | 1,500,000 | | | Waste Management | | | 46,935 | | |
| | | | | U.S. Garbage Collection & Disposal | | | | | |
| | | | 46,935 | | |
| | | > Machinery 2.4% | |
| | 1,100,000 | | | Ametek | | | 44,165 | | |
| | | | | Aerospace/Industrial Instruments | | | | | |
| | | | 44,165 | | |
| | | > Outsourcing Services 2.1% | |
| | 1,850,000 | | | Quanta Services (a) | | | 38,202 | | |
| | | | | Electrical & Telecom Construction Services | | | | | |
| | | | 38,202 | | |
| | | > Industrial Materials & Specialty
Chemicals 1.6% | |
| | 1,000,000 | | | Nalco Holding Company | | | 20,460 | | |
| | | | | Provider of Water Treatment & Process
Chemicals & Services | | | | | |
| | 1,345,000 | | | ChemSpec International - ADR
(China) | | | 9,697 | | |
| | | | | Specialty Chemicals with Focus on
Fluorinated Chemical Manufacturing | | | | | |
| | | | 30,157 | | |
| | | > Other Industrial Services 1.1% | |
| | 600,000 | | | Expeditors International of Washington | | | 20,706 | | |
| | | | | International Freight Forwarder | | | | | |
| | | | 20,706 | | |
| | | > Industrial Distribution 0.5% | |
| | 90,000 | | | WW Grainger | | | 8,951 | | |
| | | | | Industrial Distribution | | | | | |
| | | | 8,951 | | |
| Industrial Goods & Services: Total | | | 189,116 | | |
| Other Industries 5.3% | | | |
| | | > Transportation 3.7% | |
| | 1,300,000 | | | JB Hunt Transport Services | | | 42,471 | | |
| | | | | Truck & Intermodal Carrier | | | | | |
| | 1,150,000 | | | American Commercial Lines (a)(d) | | | 25,887 | | |
| | | | | Operator of Inland Barges/Builder of
Barges & Vessels | | | | | |
| | | | 68,358 | | |
See accompanying notes to financial statements.
65
Columbia Acorn Select
Statement of Investments (Unaudited), continued
Number of Shares
or Principal Amount (000) | | | | Value (000) | |
| | | > Real Estate 1.0% | |
| | 1,200,000 | | | BioMed Realty Trust | | $ | 19,308 | | |
| | | | | Life Science-focused Office Buildings | | | | | |
| | | | 19,308 | | |
| | | > Regulated Utilities 0.6% | |
| | 200,000 | | | Wisconsin Energy | | | 10,148 | | |
| | | | | Wisconsin Utility | | | | | |
| | | | 10,148 | | |
| Other Industries: Total | | | 97,814 | | |
| Health Care 0.4% | | | |
| | | > Biotechnology & Drug Delivery 0.4% | |
| | 1,239,040 | | | NPS Pharmaceuticals (a) | | | 7,979 | | |
| | | | | Orphan Drugs & Healthy Royalties | | | | | |
| | | | 7,979 | | |
| Health Care: Total | | | 7,979 | | |
Total Equities: 93.5%
(Cost: $1,594,701) | | | 1,714,240 | | |
| Securities Lending Collateral: 0.4% | | | |
| | 7,520,640 | | | Dreyfus Government Cash
Management Fund (f)
(7 day yield of 0.03%) | | | 7,521 | | |
Total Securities Lending Collateral:
(Cost: $7,521) | | | 7,521 | | |
| Short-Term Obligations: 8.3% | | | |
| | | > Repurchase Agreement 7.8% | |
| $ | 142,599 | | | Repurchase Agreement with
Fixed Income Clearing Corp.,
dated 6/30/10, due 7/01/10
at 0.00%, collateralized by a
U.S. Government Agency
obligation maturing 10/15/14,
market value $145,453
(repurchase proceeds $142,599) | | | 142,599 | | |
| | | | 142,599 | | |
| Principal Amount (000) | | | | Value (000) | |
| | | > Commercial Paper 0.5% | |
| $ | 10,200 | | | Toyota Motor Credit 0.27%
due 7/02/10 | | $ | 10,200 | | |
| | | | 10,200 | | |
Total Short-Term Obligations: 8.3%
(Amortized Cost: $152,799) | | | 152,799 | | |
Total Investments: 102.2%
(Cost: $1,755,021)(g) | | $ | 1,874,560 | | |
Obligation to Return Collateral for
Securities Loaned: (0.4)% | | | (7,521 | ) | |
| Cash and Other Assets Less Liabilities: (1.8)% | | | (33,295 | ) | |
| Total Net Assets: 100.0% | | $ | 1,833,744 | | |
ADR = American Depositary Receipts.
See accompanying notes to financial statements.
66
> Notes to Statement of Investments (dollar values in thousands)
(a) Non-income producing security.
(b) All or a portion of this security was on loan at June 30, 2010. The total market value of Fund securities on loan at June 30, 2010 was $7,060.
(c) Illiquid security.
(d) An affiliated person of the Fund may include any company in which the Fund owns five percent or more of its outstanding voting shares. Holdings and transactions in these affiliated companies during the six months ended June 30, 2010, are as follows:
| Affiliates | | Balance of
Shares Held
12/31/09 | | Purchases/
Additions | | Sales/
Reductions | | Balance of
Shares Held
6/30/10 | | Value | | Dividend | |
| American Commercial Lines | | | 1,125,000 | | | | 250,000 | | | | 225,000 | | | | 1,150,000 | | | $ | 25,887 | | | $ | - | | |
| Canacol Energy | | | 32,240,000 | | | | 4,000,000 | | | | - | | | | 36,240,000 | | | | 30,026 | | | | - | | |
| Canadian Solar | | | 1,900,000 | | | | 1,200,000 | | | | - | | | | 3,100,000 | | | | 30,318 | | | | - | | |
| CardTronics | | | 2,620,000 | | | | - | | | | 520,000 | | | | 2,100,000 | | | | 27,216 | | | | - | | |
| China Mass Media - ADR* | | | 1,662,685 | | | | - | | | | 1,662,685 | | | | - | | | | - | | | | - | | |
| CNO Financial Group | | | 13,500,000 | | | | - | | | | - | | | | 13,500,000 | | | | 66,825 | | | | - | | |
| Globalstar* | | | 13,400,800 | | | | - | | | | - | | | | 13,400,800 | | | | 20,637 | | | | - | | |
| Real Goods Solar | | | 1,400,000 | | | | - | | | | - | | | | 1,400,000 | | | | 4,424 | | | | - | | |
| Sanmina-SCI | | | 8,200,000 | | | | - | | | | 200,000 | | | | 8,000,000 | | | | 108,880 | | | | - | | |
| ShaMaran Petroleum | | | 31,000,000 | | | | 3,083,600 | | | | - | | | | 34,083,600 | | | | 12,612 | | | | - | | |
| SkillSoft - ADR* | | | 9,000,000 | | | | - | | | | 9,000,000 | | | | - | | | | - | | | | - | | |
| Synthesis Energy Systems | | | 2,200,000 | | | | 1,740,000 | | | | - | | | | 3,940,000 | | | | 4,334 | | | | - | | |
| Tetra Technologies | | | 5,000,000 | | | | - | | | | 1,107,000 | | | | 3,893,000 | | | | 35,349 | | | | - | | |
| Tuscany International Drilling | | | - | | | | 13,224,000 | | | | - | | | | 13,224,000 | | | | 11,518 | | | | - | | |
| VisionChina Media - ADR* | | | 4,250,000 | | | | 250,959 | | | | 2,000,959 | | | | 2,500,000 | | | | 7,500 | | | | - | | |
| WNS - ADR | | | 3,913,900 | | | | 116,000 | | | | - | | | | 4,029,900 | | | | 47,311 | | | | - | | |
| Total of Affiliated Transactions | | | 131,412,385 | | | | 23,864,559 | | | | 14,715,644 | | | | 140,561,300 | | | $ | 432,837 | | | $ | - | | |
* At June 30, 2010, the Fund owned less than five percent of the company's outstanding voting shares.
The aggregate cost and value of these companies at June 30, 2010, were $616,960 and $432,837, respectively. Investments in affiliated companies represented 23.6% of the Fund's total net assets at June 30, 2010.
(e) Denotes a restricted security, which is subject to restrictions on resale under federal securities laws. These securities are valued at a fair value determined in good faith under consistently applied procedures established by the Board of Trustees. At June 30, 2010, the market value of these securities amounted to $176,327, which represented 9.62% of total net assets.
Additional information on these securities is as follows:
| Security | | Acquisition
Dates | | Shares | | Cost | | Value | |
| Pacific Rubiales Energy | | 7/12/07 | | | 4,466,666 | | | $ | 17,934 | | | $ | 99,612 | | |
| Canacol Energy | | 9/23/09-4/15/10 | | | 36,240,000 | | | | 11,360 | | | | 30,026 | | |
| Eacom Timber - Subscription Receipts | | 3/17/10 | | | 38,000,000 | | | | 18,812 | | | | 16,277 | | |
| Tuscany International Drilling | | 2/12/10-3/23/10 | | | 11,324,000 | | | | 12,989 | | | | 11,467 | | |
| ShaMaran Petroleum | | 9/15/09 | | | 25,883,000 | | | | 18,117 | | | | 9,531 | | |
| Petrodorado | | 11/20/09 | | | 17,144,000 | | | | 3,607 | | | | 4,103 | | |
| Petromanas | | 5/20/10 | | | 13,125,000 | | | | 4,561 | | | | 3,403 | | |
| Petrodorado - Warrants | | 11/20/09 | | | 17,144,000 | | | | 2,118 | | | | 1,610 | | |
| Petromanas - Warrants | | 5/20/10 | | | 6,562,500 | | | | 380 | | | | 247 | | |
| Tuscany International Drilling - Warrants | | 2/12/10 | | | 1,900,000 | | | | 235 | | | | 51 | | |
| | | | | | | | | $ | 90,113 | | | $ | 176,327 | | |
(f) Investment made with cash collateral received from securities lending activity.
(g) At June 30, 2010, for federal income tax purposes, the cost of investments was $1,755,021 and net unrealized appreciation was $119,539, consisting of gross unrealized appreciation of $473,634 and gross unrealized depreciation of $354,095.
See accompanying notes to financial statements.
67
Columbia Acorn Select
Statement of Investments (Unaudited), continued
> Notes to Statement of Investments (dollar values in thousands)
The following table summarizes the inputs used, as of June 30, 2010, in valuing the Fund's assets:
| Investment Type | | Quoted Prices
(Level 1) | | Other
Significant
Observable
Inputs
(Level 2) | | Significant
Unobservable
Inputs
(Level 3) | | Total | |
| Equities | |
| Consumer Goods & Services | | $ | 454,556 | | | $ | 30,569 | | | $ | 180 | | | $ | 485,305 | | |
| Information | | | 409,715 | | | | - | | | | - | | | | 409,715 | | |
| Energy & Minerals | | | 139,271 | | | | 176,327 | | | | - | | | | 315,598 | | |
| Finance | | | 208,713 | | | | - | | | | - | | | | 208,713 | | |
| Industrial Goods & Services | | | 189,116 | | | | - | | | | - | | | | 189,116 | | |
| Other Industries | | | 97,814 | | | | - | | | | - | | | | 97,814 | | |
| Health Care | | | 7,979 | | | | - | | | | - | | | | 7,979 | | |
| Total Equities | | | 1,507,164 | | | | 206,896 | | | | 180 | | | | 1,714,240 | | |
| Total Securities Lending Collateral | | | 7,521 | | | | - | | | | - | | | | 7,521 | | |
| Total Short-Term Obligations | | | - | | | | 152,799 | | | | - | | | | 152,799 | | |
| Total Investments | | $ | 1,514,685 | | | $ | 359,695 | | | $ | 180 | | | $ | 1,874,560 | | |
The Fund's assets assigned to the Level 2 input category are generally valued using the market approach, in which a security's value is determined through its correlation to prices and information from market transactions for similar or identical assets. Foreign equities are generally valued at the last sales price on the foreign exchange or market on which they trade. The Fund may use a systematic fair valuation model provided by an independent third party to value securities principally traded in foreign markets in order to adjust for possible stale pricing that may occur between the close of the foreign exchanges and the time for valuation. These models take into account available market data including intraday index, ADR, and ETF movements. Securities acquired via private placement, that have a holding period or an extended settlement period, are valued at a discount to the same shares that are trading freely on the market. These discounts are determined by the advisors experience with similar securities or situations. Factors may include, but are not limited to, trade volume, shares outstanding and stock price.
Certain Short-Term Obligations may be valued using amortized cost, an income approach which converts future cash flows to a present value based upon the discount or premium at purchase.
The Fund's assets assigned to the Level 3 input category are valued at fair value as determined in good faith under consistently applied procedures established by and under the general supervision of the Board of Trustees. To determine fair value, management will utilize the valuation technique that they deem the most appropriate in the circumstances. Securities acquired via private placement but are not yet trading are valued using the market approach for which management has determined that the original transaction price is the best representation of fair value. Securities for which no market exist are valued based upon the market approach using inputs from the investment team but ultimately decided by the Board of Trustees. These may include, but are not limited to, projected earnings, available cash, line of business, multiples, and consideration of the prioritization of the equity in a company's capital structur e.
The following table reconciles asset balances for the six-month period ending June 30, 2010, in which significant unobservable inputs (Level 3) were used in determining value:
Investments
in Securities | | Balance
as of
December 31,
2009 | | Realized
Gain/(Loss) | | Change in
Unrealized
Appreciation
(Depreciation) | | Purchases | | (Sales) | | Transfers
into
Level 3 | | Transfers
(out of)
Level 3 | | Balance
as of
June 30,
2010 | |
| Equities | |
| Consumer Goods & Services | | $ | 181 | | | $ | - | | | $ | (1 | ) | | $ | - | | | $ | - | | | $ | - | | | $ | - | | | $ | 180 | | |
| | | $ | 181 | | | $ | - | | | $ | (1 | ) | | $ | - | | | | - | | | | - | | | $ | - | | | $ | 180 | | |
The information in the above reconciliation table represents fiscal year to date activity for any securities identified as using Level 3 inputs during the current fiscal period.
The change in unrealized depreciation attributed to securities owned at June 30, 2010, which were valued using significant unobservable inputs (Level 3) amounted to $(1). This amount is included in net change in unrealized appreciation (depreciation) on the Statement of Changes in Net Assets.
For more information on valuation inputs, and their aggregation into the levels used in the tables above, please refer to the Security Valuation section in the accompanying Notes to Financial Statements.
See accompanying notes to financial statements.
68
Columbia Thermostat Fund
Statement of Investments (Unaudited), June 30, 2010
Number of Shares
or Principal Amount (000) | | | | Value (000) | |
| | | > Stock Funds: 73.2% | |
| | 546,355 | | | Columbia Acorn International,
Class Z | | $ | 17,554 | | |
| | 1,563,532 | | | Columbia Dividend Income Fund,
Class Z | | | 17,230 | | |
| | 534,795 | | | Columbia Acorn Fund, Class Z | | | 12,765 | | |
| | 794,080 | | | Columbia Marsico Growth Fund,
Class Z | | | 12,658 | | |
| | 851,637 | | | Columbia Large Cap Enhanced Core
Fund, Class Z | | | 8,542 | | |
| | 751,788 | | | Columbia Contrarian Core Fund,
Class Z | | | 8,518 | | |
| | 380,153 | | | Columbia Acorn Select, Class Z | | | 8,466 | | |
Total Stock Funds
(Cost: $84,502) | | | 85,733 | | |
| | | > Bond Funds: 26.4% | |
| | 1,712,620 | | | Columbia Intermediate Bond Fund,
Class Z | | | 15,465 | | |
| | 807,679 | | | Columbia U.S. Treasury Index Fund,
Class Z | | | 9,313 | | |
| | 826,078 | | | Columbia Conservative High Yield
Fund, Class Z | | | 6,154 | | |
Total Bond Funds
(Cost: $29,897) | | | 30,932 | | |
| Short-Term Obligation: 0.6% | | | |
| | | > Repurchase Agreement: 0.6% | |
| $ | 660 | | | Repurchase Agreement with
Fixed Income Clearing Corp.,
dated 6/30/10, due 7/01/10
at 0.00%, collateralized by a
U.S. Government Agency
obligation, maturing 1/19/16,
market value $678
(repurchase proceeds $660) | | | 660 | | |
Total Short-Term Obligation
(Cost: $660) | | | 660 | | |
Total Investments: 100.2%
(Cost: $115,059)(a) | | | 117,325 | | |
| Cash and Other Assets Less Liabilities: (0.2)% | | | (196 | ) | |
| Total Net Assets: 100.0% | | $ | 117,129 | | |
See accompanying notes to financial statements.
69
Columbia Thermostat Fund
Statement of Investments (Unaudited), continued
> Notes to Statement of Investments (dollar values in thousands)
(a) At June 30, 2010, for federal income tax purposes, the cost of investments was $115,059 and net unrealized appreciation was $2,266, consisting of gross unrealized appreciation of $7,075 and gross unrealized depreciation of $4,809.
The following table summarizes the inputs used, as of June 30, 2010, in valuing the Fund's assets:
| Investment Type | | Quoted Prices
(Level 1) | | Other
Significant
Observable
Inputs
(Level 2) | | Significant
Unobservable
Inputs
(Level 3) | | Total | |
| Total Stock Funds | | $ | 85,733 | | | $ | - | | | $ | - | | | $ | 85,733 | | |
| Total Bond Funds | | | 30,932 | | | | - | | | | - | | | | 30,932 | | |
| Total Short-Term Obligation | | | - | | | | 660 | | | | - | | | | 660 | | |
| Total Investments | | $ | 116,665 | | | $ | 660 | | | $ | - | | | $ | 117,325 | | |
For more information on valuation inputs, and their aggregation into the levels used in the table above, please refer to the Security Valuation section in the accompanying Notes to Financial Statements.
See accompanying notes to financial statements.
70
This page intentionally left blank.
71
Columbia Acorn Family of Funds
Statements of Assets and Liabilities (Unaudited)
| June 30, 2010 | | Columbia
Acorn
Fund | | Columbia
Acorn
International | | Columbia
Acorn
USA | | Columbia
Acorn
International
Select | | Columbia
Acorn
Select | | Columbia
Thermostat
Fund | |
| (in thousands) | |
| Assets: | |
| Unaffiliated investments, at cost | | $ | 8,032,919 | | | $ | 3,616,500 | | | $ | 1,148,753 | | | $ | 297,840 | | | $ | 995,462 | | | $ | — | | |
Affiliated investments, at cost
(See Note 4) | | | 2,848,343 | | | | 48,357 | | | | 13,412 | | | | — | | | | 616,960 | | | | 114,399 | | |
| Repurchase agreements, at cost | | | 592,670 | | | | 153,790 | | | | 6,499 | | | | 38,904 | | | | 142,599 | | | | 660 | | |
Unaffiliated investments, at value (including
securities on loan: Columbia Acorn Fund
$301,261; Columbia Acorn International
$79,485; Columbia Acorn USA $16,139;
Columbia Acorn International Select
$6,360; Columbia Acorn Select $7,060;
Columbia Thermostat Fund $–) | | $ | 10,533,095 | | | $ | 4,313,616 | | | $ | 1,295,658 | | | $ | 350,291 | | | $ | 1,299,124 | | | $ | — | | |
Affiliated investments, at value
(See Note 4) | | | 3,122,025 | | | | 58,864 | | | | 12,308 | | | | — | | | | 432,837 | | | | 116,665 | | |
| Repurchase agreements, at value | | | 592,670 | | | | 153,790 | | | | 6,499 | | | | 38,904 | | | | 142,599 | | | | 660 | | |
| Cash | | | 1 | | | | — | * | | | — | * | | | — | * | | | 1 | | | | 1 | | |
Foreign currency (cost: Columbia
Acorn Fund $508; Columbia
Acorn International $30,540; Columbia
Acorn International Select $383;
Columbia Acorn Select $–) | | | 507 | | | | 30,603 | | | | — | | | | 383 | | | | — | | | | — | | |
Net unrealized appreciation on forward
foreign currency exchange contracts | | | — | | | | 14,529 | | | | — | | | | — | | | | — | | | | — | | |
| Receivable for: | |
| Investments sold | | | 42,914 | | | | 9,933 | | | | 1,708 | | | | 3,374 | | | | 3,560 | | | | — | | |
| Fund shares sold | | | 12,073 | | | | 8,362 | | | | 1,676 | | | | 1,039 | | | | 1,724 | | | | 85 | | |
| Dividends and interest | | | 7,268 | | | | 6,023 | | | | 570 | | | | 357 | | | | 1,007 | | | | — | | |
| Securities lending income | | | 177 | | | | 107 | | | | 5 | | | | 1 | | | | 11 | | | | — | | |
| Foreign tax reclaims | | | 293 | | | | 1,709 | | | | — | | | | 71 | | | | — | | | | — | | |
| Expense reimbursement due from Advisor | | | — | | | | — | | | | — | | | | — | * | | | — | | | | 23 | | |
| Trustees' Deferred Compensation Investments | | | 2,354 | | | | 636 | | | | 183 | | | | — | | | | 232 | | | | — | | |
| Other assets | | | 29 | | | | 8 | | | | 3 | | | | 1 | | | | 4 | | | | — | * | |
| Total Assets | | | 14,313,406 | | | | 4,598,180 | | | | 1,318,610 | | | | 394,421 | | | | 1,881,099 | | | | 117,434 | | |
| Liabilities: | |
| Collateral on securities loaned | | | 311,736 | | | | 82,527 | | | | 16,741 | | | | 6,593 | | | | 7,521 | | | | — | | |
Net unrealized depreciation on forward
foreign currency exchange contracts | | | — | | | | 8,511 | | | | — | | | | — | | | | — | | | | — | | |
| Payable for: | |
| Investments purchased | | | 66,604 | | | | 19,687 | | | | 4,713 | | | | 2,274 | | | | 20,770 | | | | — | | |
| Fund shares redeemed | | | 24,348 | | | | 5,163 | | | | 1,297 | | | | 343 | | | | 16,644 | | | | 154 | | |
| Management fee | | | 7,758 | | | | 2,861 | | | | 978 | | | | 303 | | | | 1,317 | | | | 10 | | |
| Administration fee | | | 496 | | | | 153 | | | | 46 | | | | 13 | | | | 66 | | | | 4 | | |
| 12b-1 Service & Distribution fees | | | 1,412 | | | | 211 | | | | 71 | | | | 23 | | | | 222 | | | | 43 | | |
| Reports to shareholders | | | 807 | | | | 288 | | | | 101 | | | | 41 | | | | 211 | | | | 33 | | |
| Deferred Trustees' fees | | | 2,354 | | | | 636 | | | | 183 | | | | 33 | | | | 232 | | | | 22 | | |
| Transfer agent fees | | | 1,631 | | | | 238 | | | | 165 | | | | 28 | | | | 278 | | | | 27 | | |
| Trustees' fees | | | 151 | | | | 34 | | | | 13 | | | | 7 | | | | 19 | | | | 4 | | |
| Custody fees | | | 175 | | | | 484 | | | | 8 | | | | 36 | | | | 7 | | | | — | | |
| Foreign capital gains tax | | | 884 | | | | — | | | | — | | | | — | | | | — | | | | — | | |
| Other liabilities | | | 536 | | | | 133 | | | | 58 | | | | 39 | | | | 68 | | | | 8 | | |
| Total Liabilities | | | 418,892 | | | | 120,926 | | | | 24,374 | | | | 9,733 | | | | 47,355 | | | | 305 | | |
| Net Assets | | $ | 13,894,514 | | | $ | 4,477,254 | | | $ | 1,294,236 | | | $ | 384,688 | | | $ | 1,833,744 | | | $ | 117,129 | | |
| Composition of Net Assets: | |
| Paid in capital | | $ | 10,872,711 | | | $ | 4,297,421 | | | $ | 1,218,262 | | | $ | 401,598 | | | $ | 1,838,059 | | | $ | 148,495 | | |
Undistributed/(overdistributed)
net investment income
(Accumulated net investment loss) | | | (43,784 | ) | | | (2,369 | ) | | | (3,976 | ) | | | (2,059 | ) | | | (14,856 | ) | | | 884 | | |
| Accumulated net realized gain/(loss) | | | 292,618 | | | | (531,542 | ) | | | (65,851 | ) | | | (67,314 | ) | | | (108,998 | ) | | | (34,516 | ) | |
| Net unrealized appreciation/(depreciation) on: | |
| Investments | | | 2,773,858 | | | | 707,623 | | | | 145,801 | | | | 52,451 | | | | 119,539 | | | | 2,266 | | |
| Foreign capital gains tax | | | (885 | ) | | | — | | | | — | | | | — | | | | — | | | | — | | |
| Foreign currency translations | | | (4 | ) | | | 6,121 | | | | — | | | | 12 | | | | — | * | | | — | | |
| Net Assets | | $ | 13,894,514 | | | $ | 4,477,254 | | | $ | 1,294,236 | | | $ | 384,688 | | | $ | 1,833,744 | | | $ | 117,129 | | |
Net asset value per
share – Class A (a) | | $ | 23.17 | | | $ | 32.06 | | | $ | 21.00 | | | $ | 22.17 | | | $ | 21.69 | | | $ | 10.54 | | |
| (Net assets/shares) | | | ($2,803,341/120,983) | | | | ($587,525/18,327) | | | | ($173,203/8,248) | | | | ($58,245/2,626) | | | | ($461,681/21,283) | | | | ($41,507/3,936) | | |
Maximum offering price per
share – Class A (b) | | $ | 24.58 | | | $ | 34.02 | | | $ | 22.28 | | | $ | 23.52 | | | $ | 23.01 | | | $ | 11.18 | | |
(Net asset value per share/front-
end sales charge) | | | ($23.17/0.9425) | | | | ($32.06/0.9425) | | | | ($21.00/0.9425) | | | | ($22.17/0.9425) | | | | ($21.69/0.9425) | | | | ($10.54/0.9425) | | |
Net asset value and offering price per
share – Class B (a) | | $ | 21.61 | | | $ | 31.27 | | | $ | 19.57 | | | $ | 21.23 | | | $ | 20.29 | | | $ | 10.60 | | |
| (Net assets/shares) | | | ($317,749/14,702) | | | | ($28,705/918) | | | | ($10,554/539) | | | | ($2,853/134) | | | | ($68,350/3,368) | | | | ($27,358/2,582) | | |
Net asset value and offering price per
share – Class C (a) | | $ | 21.41 | | | $ | 31.17 | | | $ | 19.44 | | | $ | 21.12 | | | $ | 20.13 | | | $ | 10.59 | | |
| (Net assets/shares) | | | ($667,528/31,173) | | | | ($83,580/2,682) | | | | ($28,919/1,488) | | | | ($10,168/482) | | | | ($83,706/4,158) | | | | ($19,014/1,796) | | |
Net asset value and offering price per
share – Class Z (c) | | $ | 23.87 | | | $ | 32.13 | | | $ | 21.74 | | | $ | 22.38 | | | $ | 22.27 | | | $ | 10.44 | | |
| (Net assets/shares) | | | ($10,105,896/423,307) | | | | ($3,777,444/117,557) | | | | ($1,081,560/49,742) | | | | ($313,422/14,005) | | | | ($1,220,007/54,782) | | | | ($29,250/2,801) | | |
(a) Redemption price per share is equal to net asset value less any applicable contingent deferred sales charge and redemption fee.
(b) On sales of $50,000 or more the offering price is reduced.
(c) Redemption price per share is equal to net asset value less any applicable redemption fee.
* Rounds to less than $500.
See accompanying notes to financial statements.
72
Columbia Acorn Family of Funds
Statements of Operations (Unaudited)
For the Six Months Ended June 30, 2010
| (in thousands) | | Columbia
Acorn
Fund | | Columbia
Acorn
International | | Columbia
Acorn
USA | | Columbia
Acorn
International
Select | | Columbia
Acorn
Select | | Columbia
Thermostat
Fund | |
| Investment Income: | |
| Dividend income | | $ | 51,748 | | | $ | 63,100 | | | $ | 3,865 | | | $ | 4,888 | | | $ | 4,806 | | | $ | — | | |
Dividend income from affiliates
(See Note 4) | | | 7,142 | | | | 1,747 | | | | — | | | | — | | | | — | | | | — | | |
Dividends from affiliated investment
company shares (See Note 4) | | | — | | | | — | | | | — | | | | — | | | | — | | | | 1,399 | | |
| Interest income | | | 282 | | | | 100 | | | | 4 | | | | 11 | | | | 91 | | | | — | * | |
| Securities lending income | | | 661 | | | | 367 | | | | 57 | | | | 4 | | | | 31 | | | | — | | |
| | | | 59,833 | | | | 65,314 | | | | 3,926 | | | | 4,903 | | | | 4,928 | | | | 1,399 | | |
| Foreign taxes withheld | | | (966 | ) | | | (5,209 | ) | | | (3 | ) | | | (323 | ) | | | — | | | | — | | |
| Total Investment Income | | | 58,867 | | | | 60,105 | | | | 3,923 | | | | 4,580 | | | | 4,928 | | | | 1,399 | | |
| Expenses: | |
| Management fee | | | 48,211 | | | | 17,400 | | | | 6,181 | | | | 1,889 | | | | 8,314 | | | | 63 | | |
| Administration fee | | | 3,013 | | | | 911 | | | | 287 | | | | 81 | | | | 410 | | | | 25 | | |
| 12b-1 Service and Distribution fees: | |
| Class A | | | 3,760 | | | | 739 | | | | 233 | | | | 77 | | | | 661 | | | | 54 | | |
| Class B | | | 1,649 | | | | 129 | | | | 61 | | | | 13 | | | | 309 | | | | 116 | | |
| Class C | | | 3,673 | | | | 431 | | | | 162 | | | | 55 | | | | 467 | | | | 103 | | |
| Transfer agent fees: | |
| Class A | | | 1,099 | | | | 356 | | | | 70 | | | | 38 | | | | 234 | | | | 35 | | |
| Class B | | | 589 | | | | 56 | | | | 27 | | | | 7 | | | | 113 | | | | 35 | | |
| Class C | | | 464 | | | | 75 | | | | 19 | | | | 12 | | | | 71 | | | | 20 | | |
| Class Z | | | 1,537 | | | | 630 | | | | 230 | | | | 42 | | | | 262 | | | | 9 | | |
| Custody fees | | | 497 | | | | 1,701 | | | | 29 | | | | 118 | | | | 107 | | | | — | | |
| Trustees' fees | | | 417 | | | | 118 | | | | 39 | | | | 14 | | | | 57 | | | | 6 | | |
| Reports to shareholders | | | 1,048 | | | | 451 | | | | 162 | | | | 80 | | | | 257 | | | | 60 | | |
| Chief compliance officer expenses (See Note 4) | | | 256 | | | | 64 | | | | 22 | | | | 6 | | | | 30 | | | | 3 | | |
| Other expenses | | | 683 | | | | 234 | | | | 102 | | | | 80 | | | | 133 | | | | 48 | | |
| Total expenses | | | 66,896 | | | | 23,295 | | | | 7,624 | | | | 2,512 | | | | 11,425 | | | | 577 | | |
| Less custody fees paid indirectly | | | — | * | | | — | * | | | — | * | | | — | * | | | — | * | | | — | | |
Less reimbursement of expenses by
Investment Advisor | | | — | | | | — | | | | — | | | | (2 | ) | | | — | | | | (147 | ) | |
| Net Expenses | | | 66,896 | | | | 23,295 | | | | 7,624 | | | | 2,510 | | | | 11,425 | | | | 430 | | |
| Net Investment Income/(Loss) | | | (8,029 | ) | | | 36,810 | | | | (3,701 | ) | | | 2,070 | | | | (6,497 | ) | | | 969 | | |
Net Realized and Unrealized Gain (Loss)
on Portfolio Positions: | |
| Net realized gain/(loss) on: | |
| Unaffiliated investments | | | 647,094 | | | | 68,526 | | | | 58,566 | | | | 11,747 | | | | 20,162 | | | | (6,494 | ) | |
| Affiliated investments (See Note 4) | | | 91,179 | | | | (482 | ) | | | (332 | ) | | | — | | | | 9,508 | | | | — | | |
Foreign currency transactions and forward
foreign currency exchange contracts | | | (673 | ) | | | 28,671 | | | | — | | | | (107 | ) | | | (185 | ) | | | — | | |
Distributions from affiliated investment
company shares | | | — | | | | — | | | | — | | | | — | | | | — | | | | 8 | | |
| Net realized gain/(loss) | | | 737,600 | | | | 96,715 | | | | 58,234 | | | | 11,640 | | | | 29,485 | | | | (6,486 | ) | |
Net change in net unrealized
appreciation/(depreciation) on: | |
| Unaffiliated investments | | | (862,540 | ) | | | (322,009 | ) | | | (140,997 | ) | | | (29,235 | ) | | | (71,433 | ) | | | — | | |
| Affiliated investments (See Note 4) | | | (309,291 | ) | | | (26,607 | ) | | | 1,689 | | | | — | | | | (50,513 | ) | | | 3,214 | | |
Foreign currency translations and forward
foreign currency exchange contracts | | | (140 | ) | | | 3,476 | | | | — | | | | 21 | | | | — | * | | | — | | |
| Foreign capital gains tax | | | (685 | ) | | | 1,217 | | | | — | | | | — | | | | — | | | | — | | |
Net change in unrealized appreciation/
(depreciation) | | | (1,172,656 | ) | | | (343,923 | ) | | | (139,308 | ) | | | (29,214 | ) | | | (121,946 | ) | | | 3,214 | | |
| Net realized and unrealized loss | | | (435,056 | ) | | | (247,208 | ) | | | (81,074 | ) | | | (17,574 | ) | | | (92,461 | ) | | | (3,272 | ) | |
Net Decrease in Net Assets resulting
from Operations | | $ | (443,085 | ) | | $ | (210,398 | ) | | $ | (84,775 | ) | | $ | (15,504 | ) | | $ | (98,958 | ) | | $ | (2,303 | ) | |
* Rounds to less than $500.
See accompanying notes to financial statements.
73
Columbia Acorn Family of Funds
Statements of Changes in Net Assets
| | | Columbia
Acorn Fund | | Columbia Acorn
International | | Columbia
Acorn USA | |
| Increase (Decrease) in Net Assets | | (Unaudited)
Six months
ended
June 30, | | Year ended
December 31, | | (Unaudited)
Six months
ended
June 30, | | Year ended
December 31, | | (Unaudited)
Six months
ended
June 30, | | Year ended
December 31, | |
| (in thousands) | | 2010 | | 2009 | | 2010 | | 2009 | | 2010 | | 2009 | |
| Operations: | |
| Net investment income/(loss) | | $ | (8,029 | ) | | $ | 2,492 | | | $ | 36,810 | | | $ | 39,229 | | | $ | (3,701 | ) | | $ | (4,927 | ) | |
Net realized gain/(loss) on investments, foreign currency
transactions, forward foreign currency exchange contracts
and foreign capital gains tax | | | 646,421 | | | | (227,359 | ) | | | 97,197 | | | | (246,346 | ) | | | 58,566 | | | | (20,041 | ) | |
Net realized gain/(loss) on affiliated investments and
distributions from affiliated investment companies and
affiliated investment company shares | | | 91,179 | | | | (100,539 | ) | | | (482 | ) | | | (3,829 | ) | | | (332 | ) | | | (110 | ) | |
Net change in net unrealized appreciation/(depreciation)
on investments, foreign currency translations, forward foreign
currency exchange contracts and foreign capital gains tax | | | (863,365 | ) | | | 3,343,490 | | | | (317,316 | ) | | | 1,558,895 | | | | (140,997 | ) | | | 437,114 | | |
Net change in net unrealized appreciation/(depreciation)
on affiliated investment companies and affiliated investment
company shares | | | (309,291 | ) | | | 1,143,521 | | | | (26,607 | ) | | | 49,345 | | | | 1,689 | | | | 1,994 | | |
| Net Increase/(Decrease) from Operations | | | (443,085 | ) | | | 4,161,605 | | | | (210,398 | ) | | | 1,397,294 | | | | (84,775 | ) | | | 414,030 | | |
| Distributions to Shareholders From: | |
| Net investment income – Class A | | | (2,387 | ) | | | — | | | | (8,818 | ) | | | (6,102 | ) | | | — | | | | — | | |
| Net investment income – Class B | | | — | | | | — | | | | (290 | ) | | | (290 | ) | | | — | | | | — | | |
| Net investment income – Class C | | | — | | | | — | | | | (714 | ) | | | (348 | ) | | | — | | | | — | | |
| Net investment income – Class Z | | | (12,574 | ) | | | (20,981 | ) | | | (68,470 | ) | | | (53,467 | ) | | | — | | | | — | | |
| Total Distributions to Shareholders | | | (14,961 | ) | | | (20,981 | ) | | | (78,292 | ) | | | (60,207 | ) | | | — | | | | — | | |
| Share Transactions: | |
| Subscriptions – Class A | | | 440,920 | | | | 639,685 | | | | 135,368 | | | | 181,444 | | | | 34,907 | | | | 54,531 | | |
| Distributions reinvested – Class A | | | 2,161 | | | | — | | | | 7,649 | | | | 5,737 | | | | — | | | | — | | |
| Redemptions – Class A | | | (474,759 | ) | | | (744,769 | ) | | | (96,310 | ) | | | (140,626 | ) | | | (27,905 | ) | | | (66,724 | ) | |
| Net Increase/(Decrease) – Class A | | | (31,678 | ) | | | (105,084 | ) | | | 46,707 | | | | 46,555 | | | | 7,002 | | | | (12,193 | ) | |
| Subscriptions – Class B | | | 15 | | | | 100 | | | | 35 | | | | 14 | | | | 2 | | | | 5 | | |
| Distributions reinvested – Class B | | | — | | | | — | | | | 260 | | | | 264 | | | | — | | | | — | | |
| Redemptions – Class B | | | (205,826 | ) | | | (224,032 | ) | | | (8,706 | ) | | | (14,833 | ) | | | (10,015 | ) | | | (9,892 | ) | |
| Net Decrease – Class B | | | (205,811 | ) | | | (223,932 | ) | | | (8,411 | ) | | | (14,555 | ) | | | (10,013 | ) | | | (9,887 | ) | |
| Subscriptions – Class C | | | 32,116 | | | | 58,069 | | | | 11,565 | | | | 14,494 | | | | 985 | | | | 2,513 | | |
| Distributions reinvested – Class C | | | — | | | | — | | | | 589 | | | | 265 | | | | — | | | | — | | |
| Redemptions – Class C | | | (77,328 | ) | | | (151,419 | ) | | | (8,984 | ) | | | (18,021 | ) | | | (2,513 | ) | | | (5,210 | ) | |
| Net Increase/(Decrease) – Class C | | | (45,212 | ) | | | (93,350 | ) | | | 3,170 | | | | (3,262 | ) | | | (1,528 | ) | | | (2,697 | ) | |
| Subscriptions – Class Z | | | 979,748 | | | | 1,484,719 | | | | 596,697 | | | | 671,256 | | | | 128,111 | | | | 246,578 | | |
| Distributions reinvested – Class Z | | | 10,559 | | | | 17,690 | | | | 48,035 | | | | 38,426 | | | | — | | | | — | | |
| Redemptions – Class Z | | | (1,082,197 | ) | | | (1,364,770 | ) | | | (351,631 | ) | | | (486,805 | ) | | | (134,170 | ) | | | (190,623 | ) | |
| Net Increase/(Decrease) – Class Z | | | (91,890 | ) | | | 137,639 | | | | 293,101 | | | | 222,877 | | | | (6,059 | ) | | | 55,955 | | |
| Net Increase/(Decrease) from Share Transactions | | | (374,591 | ) | | | (284,727 | ) | | | 334,567 | | | | 251,615 | | | | (10,598 | ) | | | 31,178 | | |
| Redemption Fees | | | — | | | | — | | | | 192 | | | | 259 | | | | — | | | | — | | |
| Increase from regulatory settlements (See Note 9) | | | — | | | | 40 | | | | 447 | | | | 1,210 | | | | — | | | | 5 | | |
| Total Increase/(Decrease) in Net Assets | | | (832,637 | ) | | | 3,855,937 | | | | 46,516 | | | | 1,590,171 | | | | (95,373 | ) | | | 445,213 | | |
| Net Assets: | |
| Beginning of period | | | 14,727,151 | | | | 10,871,214 | | | | 4,430,738 | | | | 2,840,567 | | | | 1,389,609 | | | | 944,396 | | |
| End of period | | $ | 13,894,514 | | | $ | 14,727,151 | | | $ | 4,477,254 | | | $ | 4,430,738 | | | $ | 1,294,236 | | | $ | 1,389,609 | | |
Undistributed/(Overdistributed) Net Investment Income or
(Accumulated Net Investment Loss) | | $ | (43,784 | ) | | $ | (20,794 | ) | | $ | (2,369 | ) | | $ | 39,113 | | | $ | (3,976 | ) | | $ | (275 | ) | |
See accompanying notes to financial statements.
74
| | | Columbia Acorn
International Select | | Columbia
Acorn Select | | Columbia
Thermostat Fund | |
| Increase (Decrease) in Net Assets | | (Unaudited)
Six months
ended
June 30, | | Year ended
December 31, | | (Unaudited)
Six months
ended
June 30, | | Year ended
December 31, | | (Unaudited)
Six months
ended
June 30, | | Year ended
December 31, | |
| (in thousands) | | 2010 | | 2009 | | 2010 | | 2009 | | 2010 | | 2009 | |
| Operations: | |
| Net investment income/(loss) | | $ | 2,070 | | | $ | 2,398 | | | $ | (6,497 | ) | | $ | (10,372 | ) | | | 969 | | | $ | 1,281 | | |
Net realized gain/(loss) on investments, foreign currency
transactions, forward foreign currency exchange contracts
and foreign capital gains tax | | | 11,640 | | | | (31,407 | ) | | | 19,977 | | | | 31,689 | | | | — | | | | — | | |
Net realized gain/(loss) on affiliated investments and
distributions from affiliated investment companies and
affiliated investment company shares | | | — | | | | — | | | | 9,508 | | | | (71,935 | ) | | | (6,486 | ) | | | (18,231 | ) | |
Net change in net unrealized appreciation/(depreciation)
on investments, foreign currency translations, forward foreign
currency exchange contracts and foreign capital gains tax | | | (29,214 | ) | | | 127,633 | | | | (71,433 | ) | | | 521,770 | | | | — | | | | — | | |
Net change in net unrealized appreciation/(depreciation)
on affiliated investment companies and affiliated investment
company shares | | | — | | | | — | | | | (50,513 | ) | | | 316,510 | | | | 3,214 | | | | 51,494 | | |
| Net Increase/(Decrease) from Operations | | | (15,504 | ) | | | 98,624 | | | | (98,958 | ) | | | 787,662 | | | | (2,303 | ) | | | 34,544 | | |
| Distributions to Shareholders From: | |
| Net investment income – Class A | | | (776 | ) | | | (456 | ) | | | — | | | | — | | | | (540 | ) | | | (7 | ) | |
| Net investment income – Class B | | | (25 | ) | | | — | | | | — | | | | — | | | | (239 | ) | | | — | | |
| Net investment income – Class C | | | (65 | ) | | | — | | | | — | | | | — | | | | (124 | ) | | | — | | |
| Net investment income – Class Z | | | (5,241 | ) | | | (3,077 | ) | | | — | | | | — | | | | (429 | ) | | | (115 | ) | |
| Total Distributions to Shareholders | | | (6,107 | ) | | | (3,533 | ) | | | — | | | | — | | | | (1,332 | ) | | | (122 | ) | |
| Share Transactions: | |
| Subscriptions – Class A | | | 7,288 | | | | 30,670 | | | | 69,504 | | | | 98,691 | | | | 4,755 | | | | 5,619 | | |
| Distributions reinvested – Class A | | | 675 | | | | 439 | | | | — | | | | — | | | | 497 | | | | 6 | | |
| Redemptions – Class A | | | (11,186 | ) | | | (28,558 | ) | | | (106,301 | ) | | | (190,444 | ) | | | (5,207 | ) | | | (14,381 | ) | |
| Net Increase/(Decrease) – Class A | | | (3,223 | ) | | | 2,551 | | | | (36,797 | ) | | | (91,753 | ) | | | 45 | | | | (8,756 | ) | |
| Subscriptions – Class B | | | 1 | | | | — | | | | 30 | | | | 39 | | | | 1 | | | | — | | |
| Distributions reinvested – Class B | | | 22 | | | | — | | | | — | | | | — | | | | 218 | | | | — | | |
| Redemptions – Class B | | | (910 | ) | | | (1,493 | ) | | | (16,677 | ) | | | (23,638 | ) | | | (4,888 | ) | | | (12,541 | ) | |
| Net Decrease – Class B | | | (887 | ) | | | (1,493 | ) | | | (16,647 | ) | | | (23,599 | ) | | | (4,669 | ) | | | (12,541 | ) | |
| Subscriptions – Class C | | | 1,317 | | | | 1,872 | | | | 5,093 | | | | 6,147 | | | | 955 | | | | 1,960 | | |
| Distributions reinvested – Class C | | | 55 | | | | — | | | | — | | | | — | | | | 109 | | | | — | | |
| Redemptions – Class C | | | (1,765 | ) | | | (3,109 | ) | | | (9,915 | ) | | | (21,888 | ) | | | (2,583 | ) | | | (10,176 | ) | |
| Net Increase/(Decrease) – Class C | | | (393 | ) | | | (1,237 | ) | | | (4,822 | ) | | | (15,741 | ) | | | (1,519 | ) | | | (8,216 | ) | |
| Subscriptions – Class Z | | | 34,186 | | | | 127,520 | | | | 217,150 | | | | 278,829 | | | | 3,854 | | | | 2,684 | | |
| Distributions reinvested – Class Z | | | 1,451 | | | | 833 | | | | — | | | | — | | | | 398 | | | | 106 | | |
| Redemptions – Class Z | | | (35,565 | ) | | | (59,794 | ) | | | (171,027 | ) | | | (310,353 | ) | | | (15,934 | ) | | | (6,183 | ) | |
| Net Increase/(Decrease) – Class Z | | | 72 | | | | 68,559 | | | | 46,123 | | | | (31,524 | ) | | | (11,682 | ) | | | (3,393 | ) | |
| Net Increase/(Decrease) from Share Transactions | | | (4,431 | ) | | | 68,380 | | | | (12,143 | ) | | | (162,617 | ) | | | (17,825 | ) | | | (32,906 | ) | |
| Redemption Fees | | | 8 | | | | 33 | | | | — | | | | — | | | | — | | | | — | | |
| Increase from regulatory settlements (See Note 9) | | | 47 | | | | 265 | | | | — | | | | — | | | | — | | | | — | | |
| Total Increase/(Decrease) in Net Assets | | | (25,987 | ) | | | 163,769 | | | | (111,101 | ) | | | 625,045 | | | | (21,460 | ) | | | 1,516 | | |
| Net Assets: | |
| Beginning of period | | | 410,675 | | | | 246,906 | | | | 1,944,845 | | | | 1,319,800 | | | | 138,589 | | | | 137,073 | | |
| End of period | | $ | 384,688 | | | $ | 410,675 | | | $ | 1,833,744 | | | $ | 1,944,845 | | | $ | 117,129 | | | $ | 138,589 | | |
Undistributed/(Overdistributed) Net Investment Income or
(Accumulated Net Investment Loss) | | $ | (2,059 | ) | | $ | 1,978 | | | $ | (14,856 | ) | | $ | (8,359 | ) | | $ | 884 | | | $ | 1,247 | | |
See accompanying notes to financial statements.
75
Columbia Acorn Family of Funds
Statements of Changes in Net Assets, continued
| | | Columbia
Acorn Fund | | Columbia Acorn
International | | Columbia
Acorn USA | |
| Changes in Shares of Beneficial Interest: | | (Unaudited)
Six months
ended
June 30, | | Year ended
December 31, | | (Unaudited)
Six months
ended
June 30, | | Year ended
December 31, | | (Unaudited)
Six months
ended
June 30, | | Year ended
December 31, | |
| (in thousands) | | 2010 | | 2009 | | 2010 | | 2009 | | 2010 | | 2009 | |
| Subscriptions – Class A | | | 17,559 | | | | 33,142 | | | | 3,959 | | | | 6,366 | | | | 1,500 | | | | 3,208 | | |
| Shares issued in reinvestment – Class A | | | 92 | | | | — | | | | 244 | | | | 208 | | | | — | | | | — | | |
| Less shares redeemed – Class A | | | (19,165 | ) | | | (39,655 | ) | | | (2,831 | ) | | | (5,549 | ) | | | (1,214 | ) | | | (3,839 | ) | |
| Net Increase/(Decrease) – Class A | | | (1,514 | ) | | | (6,513 | ) | | | 1,372 | | | | 1,025 | | | | 286 | | | | (631 | ) | |
| Subscriptions – Class B | | | 1 | | | | 5 | | | | 1 | | | | — | * | | | — | * | | | — | * | |
| Shares issued in reinvestment – Class B | | | — | | | | — | | | | 9 | | | | 10 | | | | — | | | | — | | |
| Less shares redeemed – Class B | | | (8,710 | ) | | | (12,472 | ) | | | (261 | ) | | | (588 | ) | | | (457 | ) | | | (582 | ) | |
| Net Decrease – Class B | | | (8,709 | ) | | | (12,467 | ) | | | (251 | ) | | | (578 | ) | | | (457 | ) | | | (582 | ) | |
| Subscriptions – Class C | | | 1,389 | | | | 3,215 | | | | 348 | | | | 497 | | | | 45 | | | | 148 | | |
| Shares issued in reinvestment – Class C | | | — | | | | — | | | | 20 | | | | 10 | | | | — | | | | — | | |
| Less shares redeemed – Class C | | | (3,358 | ) | | | (8,764 | ) | | | (274 | ) | | | (740 | ) | | | (117 | ) | | | (327 | ) | |
| Net Increase/(Decrease) – Class C | | | (1,969 | ) | | | (5,549 | ) | | | 94 | | | | (233 | ) | | | (72 | ) | | | (179 | ) | |
| Subscriptions – Class Z | | | 38,319 | | | | 75,517 | | | | 17,492 | | | | 23,146 | | | | 5,365 | | | | 14,152 | | |
| Shares issued in reinvestment – Class Z | | | 436 | | | | 750 | | | | 1,528 | | | | 1,391 | | | | — | | | | — | | |
| Less shares redeemed – Class Z | | | (41,963 | ) | | | (70,272 | ) | | | (10,281 | ) | | | (18,261 | ) | | | (5,532 | ) | | | (10,509 | ) | |
| Net Increase/(Decrease) – Class Z | | | (3,208 | ) | | | 5,995 | | | | 8,739 | | | | 6,276 | | | | (167 | ) | | | 3,643 | | |
| Net Increase/(Decrease) in Shares of Beneficial Interest | | | (15,400 | ) | | | (18,534 | ) | | | 9,954 | | | | 6,490 | | | | (410 | ) | | | 2,251 | | |
* Rounds to less than 500.
See accompanying notes to financial statements.
76
| | | Columbia Acorn
International Select | | Columbia
Acorn Select | | Columbia
Thermostat Fund | |
| Changes in Shares of Beneficial Interest: | | (Unaudited)
Six months
ended
June 30, | | Year ended
December 31, | | (Unaudited)
Six months
ended
June 30, | | Year ended
December 31, | | (Unaudited)
Six months
ended
June 30, | | Year ended
December 31, | |
| (in thousands) | | 2010 | | 2009 | | 2010 | | 2009 | | 2010 | | 2009 | |
| Subscriptions – Class A | | | 313 | | | | 1,653 | | | | 2,931 | | | | 5,917 | | | | 414 | | | | 646 | | |
| Shares issued in reinvestment – Class A | | | 31 | | | | 22 | | | | — | | | | — | | | | 47 | | | | 1 | | |
| Less shares redeemed – Class A | | | (482 | ) | | | (1,497 | ) | | | (4,556 | ) | | | (11,758 | ) | | | (468 | ) | | | (1,674 | ) | |
| Net Increase/(Decrease) – Class A | | | (138 | ) | | | 178 | | | | (1,625 | ) | | | (5,841 | ) | | | (7 | ) | | | (1,027 | ) | |
| Subscriptions – Class B | | | — | * | | | — | | | | 1 | | | | 2 | | | | — | * | | | — | | |
| Shares issued in reinvestment – Class B | | | 1 | | | | — | | | | — | | | | — | | | | 20 | | | | — | | |
| Less shares redeemed – Class B | | | (41 | ) | | | (85 | ) | | | (744 | ) | | | (1,512 | ) | | | (435 | ) | | | (1,410 | ) | |
| Net Decrease – Class B | | | (40 | ) | | | (85 | ) | | | (743 | ) | | | (1,510 | ) | | | (415 | ) | | | (1,410 | ) | |
| Subscriptions – Class C | | | 60 | | | | 103 | | | | 228 | | | | 371 | | | | 85 | | | | 212 | | |
| Shares issued in reinvestment – Class C | | | 3 | | | | — | | | | — | | | | — | | | | 10 | | | | — | | |
| Less shares redeemed – Class C | | | (81 | ) | | | (174 | ) | | | (452 | ) | | | (1,474 | ) | | | (232 | ) | | | (1,207 | ) | |
| Net Increase/(Decrease) – Class C | | | (18 | ) | | | (71 | ) | | | (224 | ) | | | (1,103 | ) | | | (137 | ) | | | (995 | ) | |
| Subscriptions – Class Z | | | 1,451 | | | | 6,808 | | | | 8,832 | | | | 15,845 | | | | 353 | | | | 307 | | |
| Shares issued in reinvestment – Class Z | | | 66 | | | | 42 | | | | — | | | | — | | | | 38 | | | | 12 | | |
| Less shares redeemed – Class Z | | | (1,515 | ) | | | (3,083 | ) | | | (7,143 | ) | | | (18,178 | ) | | | (1,456 | ) | | | (727 | ) | |
| Net Increase/(Decrease) – Class Z | | | 2 | | | | 3,767 | | | | 1,689 | | | | (2,333 | ) | | | (1,065 | ) | | | (408 | ) | |
| Net Increase/(Decrease) in Shares of Beneficial Interest | | | (194 | ) | | | 3,789 | | | | (903 | ) | | | (10,787 | ) | | | (1,624 | ) | | | (3,840 | ) | |
See accompanying notes to financial statements.
77
Columbia Acorn Family of Funds
Financial Highlights
Columbia Acorn Fund
| Class Z Shares | | (Unaudited)
Six months
ended June 30, | | Year ended December 31, | |
| Selected data for a share outstanding throughout each period | | 2010 | | 2009 | | 2008 | | 2007 | | 2006 | | 2005 | |
| Net Asset Value, Beginning of Period | | $ | 24.68 | | | $ | 17.71 | | | $ | 29.61 | | | $ | 29.71 | | | $ | 28.17 | | | $ | 26.45 | | |
| Income from Investment Operations | |
| Net investment income (a) | | | 0.00 | (b) | | | 0.04 | | | | 0.06 | | | | 0.15 | (c) | | | 0.13 | | | | 0.15 | | |
| Net realized and unrealized gain/(loss) | | | (0.78 | ) | | | 6.98 | | | | (11.29 | ) | | | 2.17 | | | | 3.92 | | | | 3.28 | | |
| Total from Investment Operations | | | (0.78 | ) | | | 7.02 | | | | (11.23 | ) | | | 2.32 | | | | 4.05 | | | | 3.43 | | |
| Less Distributions to Shareholders | |
| From net investment income | | | (0.03 | ) | | | (0.05 | ) | | | (0.01 | ) | | | (0.12 | ) | | | (0.13 | ) | | | (0.15 | ) | |
| From net realized gains | | | — | | | | — | | | | (0.66 | ) | | | (2.30 | ) | | | (2.38 | ) | | | (1.56 | ) | |
| Total Distributions to Shareholders | | | (0.03 | ) | | | (0.05 | ) | | | (0.67 | ) | | | (2.42 | ) | | | (2.51 | ) | | | (1.71 | ) | |
| Increase from regulatory settlements | | | — | | | | 0.00 | (b) | | | — | | | | — | | | | — | | | | — | | |
| Net Asset Value, End of Period | | $ | 23.87 | | | $ | 24.68 | | | $ | 17.71 | | | $ | 29.61 | | | $ | 29.71 | | | $ | 28.17 | | |
| Total Return (d) | | | (3.16 | )%(e) | | | 39.65 | % | | | (38.55 | )% | | | 7.69 | %(f)(g) | | | 14.45 | %(f) | | | 13.11 | %(f) | |
| Ratios to Average Net Assets/Supplemental Data | |
| Net expenses (h) | | | 0.75 | %(i) | | | 0.77 | % | | | 0.76 | % | | | 0.74 | % | | | 0.74 | % | | | 0.74 | % | |
| Net investment income (h) | | | 0.04 | %(i) | | | 0.18 | % | | | 0.26 | % | | | 0.46 | % | | | 0.45 | % | | | 0.57 | % | |
| Waiver/reimbursement | | | — | | | | — | | | | — | | | | 0.00 | %(j) | | | 0.01 | % | | | 0.02 | % | |
| Portfolio turnover rate | | | 14 | %(e) | | | 27 | % | | | 21 | % | | | 20 | % | | | 22 | % | | | 16 | % | |
| Net assets at end of period (in millions) | | $ | 10,106 | | | $ | 10,527 | | | $ | 7,446 | | | $ | 13,038 | | | $ | 12,128 | | | $ | 10,399 | | |
(a) Per share data was calculated using the average shares outstanding during the period.
(b) Rounds to less than $0.01 per share.
(c) Net investment income per share includes special dividends. The effect of these dividends amounted to $0.03 per share.
(d) Total return at net asset value assuming all distributions reinvested.
(e) Not annualized.
(f) Had the Advisor and/or Transfer Agent not waived fees and/or reimbursed a portion of expenses, total return would have been reduced.
(g) Total return includes a voluntary reimbursement by the Advisor for a realized investment loss due to a trading error. This reimbursement increased total return and net asset value per share by less than 0.01% and less than $0.01, respectively.
(h) The benefits derived from custody fees paid indirectly had an impact of less than 0.01%.
(i) Annualized.
(j) Rounds to less than 0.01%.
Columbia Acorn International
| Class Z Shares | | (Unaudited)
Six months
ended June 30, | | Year ended December 31, | |
| Selected data for a share outstanding throughout each period | | 2010 | | 2009 | | 2008 | | 2007 | | 2006 | | 2005 | |
| Net Asset Value, Beginning of Period | | $ | 34.26 | | | $ | 23.13 | | | $ | 43.60 | | | $ | 40.31 | | | $ | 33.44 | | | $ | 29.03 | | |
| Income from Investment Operations | |
| Net investment income (a) | | | 0.29 | | | | 0.34 | | | | 0.60 | | | | 0.43 | | | | 0.35 | | | | 0.34 | | |
| Net realized and unrealized gain/(loss) | | | (1.83 | ) | | | 11.31 | | | | (20.26 | ) | | | 6.56 | | | | 10.94 | | | | 5.87 | | |
| Total from Investment Operations | | | (1.54 | ) | | | 11.65 | | | | (19.66 | ) | | | 6.99 | | | | 11.29 | | | | 6.21 | | |
| Less Distributions to Shareholders | |
| From net investment income | | | (0.59 | ) | | | (0.53 | ) | | | (0.21 | ) | | | (0.34 | ) | | | (0.51 | ) | | | (0.72 | ) | |
| From net realized gains | | | — | | | | — | | | | (0.60 | ) | | | (3.36 | ) | | | (3.91 | ) | | | (1.08 | ) | |
| Total Distributions to Shareholders | | | (0.59 | ) | | | (0.53 | ) | | | (0.81 | ) | | | (3.70 | ) | | | (4.42 | ) | | | (1.80 | ) | |
| Redemption Fees | |
| Redemption fees added to paid in capital (a)(b) | | | 0.00 | | | | 0.00 | | | | 0.00 | | | | 0.00 | | | | 0.00 | | | | 0.00 | | |
| Increase from regulatory settlements | | | 0.00 | (b) | | | 0.01 | | | | — | | | | — | | | | — | | | | — | | |
| Net Asset Value, End of Period | | $ | 32.13 | | | $ | 34.26 | | | $ | 23.13 | | | $ | 43.60 | | | $ | 40.31 | | | $ | 33.44 | | |
| Total Return (c) | | | (4.45 | )%(d) | | | 50.97 | % | | | (45.89 | )% | | | 17.28 | %(e) | | | 34.53 | %(e) | | | 21.81 | %(e) | |
| Ratios to Average Net Assets/Supplemental Data | |
| Net expenses (f) | | | 0.95 | %(g) | | | 0.99 | % | | | 0.96 | % | | | 0.91 | % | | | 0.94 | % | | | 0.99 | % | |
| Net investment income (f) | | | 1.70 | %(g) | | | 1.23 | % | | | 1.72 | % | | | 0.96 | % | | | 0.92 | % | | | 1.09 | % | |
| Waiver/reimbursement | | | — | | | | — | | | | — | | | | 0.00 | %(h) | | | 0.01 | % | | | 0.02 | % | |
| Portfolio turnover rate | | | 10 | %(d) | | | 31 | % | | | 38 | % | | | 28 | % | | | 31 | % | | | 27 | % | |
| Net assets at end of period (in millions) | | $ | 3,777 | | | $ | 3,728 | | | $ | 2,372 | | | $ | 4,918 | | | $ | 3,836 | | | $ | 2,629 | | |
(a) Per share data was calculated using the average shares outstanding during the period.
(b) Rounds to less than $0.01 per share.
(c) Total return at net asset value assuming all distributions reinvested.
(d) Not annualized.
(e) Had the Advisor and/or Transfer Agent not waived fees and/or reimbursed a portion of expenses, total return would have been reduced.
(f) The benefits derived from custody fees paid indirectly had an impact of less than 0.01%.
(g) Annualized.
(h) Rounds to less than 0.01%.
See accompanying notes to financial statements.
78
Columbia Acorn USA
| Class Z Shares | | (Unaudited)
Six months
ended June 30, | | Year ended December 31, | |
| Selected data for a share outstanding throughout each period | | 2010 | | 2009 | | 2008 | | 2007 | | 2006 | | 2005 | |
| Net Asset Value, Beginning of Period | | $ | 23.19 | | | $ | 16.39 | | | $ | 27.97 | | | $ | 28.66 | | | $ | 27.03 | | | $ | 25.20 | | |
| Income from Investment Operations | |
| Net investment income/(loss) (a) | | | (0.05 | ) | | | (0.07 | ) | | | (0.07 | ) | | | (0.01 | )(b) | | | (0.02 | ) | | | 0.07 | | |
| Net realized and unrealized gain/(loss) | | | (1.40 | ) | | | 6.87 | | | | (10.55 | ) | | | 1.03 | | | | 2.26 | | | | 3.18 | | |
| Total from Investment Operations | | | (1.45 | ) | | | 6.80 | | | | (10.62 | ) | | | 1.02 | | | | 2.24 | | | | 3.25 | | |
| Less Distributions to Shareholders | |
| From net investment income | | | — | | | | — | | | | — | | | | — | | | | — | | | | (0.05 | ) | |
| From net realized gains | | | — | | | | — | | | | (0.96 | ) | | | (1.71 | ) | | | (0.61 | ) | | | (1.37 | ) | |
| Total Distributions to Shareholders | | | — | | | | — | | | | (0.96 | ) | | | (1.71 | ) | | | (0.61 | ) | | | (1.42 | ) | |
| Increase from regulatory settlements | | | — | | | | — | (c) | | | — | | | | — | | | | — | | | | — | | |
| Net Asset Value, End of Period | | $ | 21.74 | | | $ | 23.19 | | | $ | 16.39 | | | $ | 27.97 | | | $ | 28.66 | | | $ | 27.03 | | |
| Total Return (d) | | | (6.25 | )%(e) | | | 41.49 | % | | | (39.22 | )% | | | 3.46 | %(f)(g) | | | 8.28 | %(f) | | | 12.98 | %(f) | |
| Ratios to Average Net Assets/Supplemental Data | |
| Net expenses (h) | | | 0.99 | %(i) | | | 1.03 | % | | | 1.01 | % | | | 0.98 | % | | | 0.98 | % | | | 1.01 | % | |
| Net investment income/(loss) (h) | | | (0.44 | )%(i) | | | (0.36 | )% | | | (0.32 | )% | | | (0.03 | )% | | | (0.07 | )% | | | 0.28 | % | |
| Waiver/reimbursement | | | — | | | | — | | | | — | | | | 0.00 | %(j) | | | 0.01 | % | | | 0.01 | % | |
| Portfolio turnover rate | | | 16 | %(e) | | | 28 | % | | | 23 | % | | | 21 | % | | | 13 | % | | | 13 | % | |
| Net assets at end of period (in millions) | | $ | 1,082 | | | $ | 1,158 | | | $ | 758 | | | $ | 1,214 | | | $ | 1,214 | | | $ | 937 | | |
(a) Per share data was calculated using the average shares outstanding during the period.
(b) Net investment income per share includes special dividends. The effect of these dividends amounted to $0.09 per share.
(c) Rounds to less than $0.01 per share.
(d) Total return at net asset value assuming all distributions reinvested.
(e) Not annualized.
(f) Had the Advisor and/or Transfer Agent not waived fees and/or reimbursed a portion of expenses, total return would have been reduced.
(g) Total return includes a voluntary reimbursement by the Advisor for a realized investment loss due to a trading error. This reimbursement increased total return and net asset value per share by less than 0.01% and less than $0.01, respectively.
(h) The benefits derived from custody fees paid indirectly had an impact of less than 0.01%.
(i) Annualized.
(j) Rounds to less than 0.01%.
Columbia Acorn International Select
| Class Z Shares | | (Unaudited)
Six months
ended June 30, | | Year ended December 31, | |
| Selected data for a share outstanding throughout each period | | 2010 | | 2009 | | 2008 | | 2007 | | 2006 | | 2005 | |
| Net Asset Value, Beginning of Period | | $ | 23.64 | | | $ | 18.19 | | | $ | 32.02 | | | $ | 27.97 | | | $ | 20.57 | | | $ | 18.02 | | |
| Income from Investment Operations | |
| Net investment income (a) | | | 0.13 | | | | 0.17 | | | | 0.28 | | | | 0.14 | (b) | | | 0.10 | | | | 0.13 | | |
| Net realized and unrealized gain/(loss) | | | (1.01 | ) | | | 5.50 | | | | (13.53 | ) | | | 5.96 | | | | 7.35 | | | | 2.70 | | |
| Total from Investment Operations | | | (0.88 | ) | | | 5.67 | | | | (13.25 | ) | | | 6.10 | | | | 7.45 | | | | 2.83 | | |
| Less Distributions to Shareholders | |
| From net investment income | | | (0.38 | ) | | | (0.24 | ) | | | (0.04 | ) | | | (0.28 | ) | | | (0.05 | ) | | | (0.28 | ) | |
| From net realized gains | | | — | | | | — | | | | (0.54 | ) | | | (1.77 | ) | | | — | | | | — | | |
| Total Distributions to Shareholders | | | (0.38 | ) | | | (0.24 | ) | | | (0.58 | ) | | | (2.05 | ) | | | (0.05 | ) | | | (0.28 | ) | |
| Redemption Fees | |
| Redemption fees added to paid in capital (a)(c) | | | 0.00 | | | | 0.00 | | | | 0.00 | | | | 0.00 | | | | 0.00 | | | | 0.00 | | |
| Increase from regulatory settlements | | | 0.00 | (c) | | | 0.02 | | | | — | | | | — | | | | — | | | | — | | |
| Net Asset Value, End of Period | | $ | 22.38 | | | $ | 23.64 | | | $ | 18.19 | | | $ | 32.02 | | | $ | 27.97 | | | $ | 20.57 | | |
| Total Return (d) | | | (3.71 | )%(e) | | | 31.52 | % | | | (42.10 | )% | | | 21.86 | %(f) | | | 36.27 | %(f) | | | 15.98 | %(f) | |
| Ratios to Average Net Assets/Supplemental Data | |
| Net expenses (g) | | | 1.16 | %(h) | | | 1.20 | % | | | 1.21 | % | | | 1.18 | % | | | 1.27 | % | | | 1.45 | % | |
| Net investment income (g) | | | 1.13 | %(h) | | | 0.84 | % | | | 1.09 | % | | | 0.44 | % | | | 0.44 | % | | | 0.72 | % | |
| Waiver/reimbursement | | | — | | | | — | | | | — | | | | 0.00 | %(i) | | | 0.01 | % | | | 0.04 | % | |
| Portfolio turnover rate | | | 18 | %(e) | | | 56 | % | | | 68 | % | | | 57 | % | | | 47 | % | | | 39 | % | |
| Net assets at end of period (in millions) | | $ | 313 | | | $ | 331 | | | $ | 186 | | | $ | 204 | | | $ | 129 | | | $ | 74 | | |
(a) Per share data was calculated using the average shares outstanding during the period.
(b) Net investment income per share includes special dividends. The effect of these dividends amounted to $0.07 per share.
(c) Rounds to less than $0.01 per share.
(d) Total return at net asset value assuming all distributions reinvested.
(e) Not annualized.
(f) Had the Advisor and/or Transfer Agent not waived fees and/or reimbursed a portion of expenses, total return would have been reduced.
(g) The benefits derived from custody fees paid indirectly had an impact of less than 0.01%.
(h) Annualized.
(i) Rounds to less than 0.01%.
See accompanying notes to financial statements.
79
Columbia Acorn Family of Funds
Financial Highlights, continued
Columbia Acorn Select
| Class Z Shares | | (Unaudited)
Six months
ended June 30, | | Year ended December 31, | |
| Selected data for a share outstanding throughout each period | | 2010 | | 2009 | | 2008 | | 2007 | | 2006 | | 2005 | |
| Net Asset Value, Beginning of Period | | $ | 23.38 | | | $ | 14.07 | | | $ | 28.41 | | | $ | 26.59 | | | $ | 22.77 | | | $ | 21.13 | | |
| Income from Investment Operations | |
| Net investment loss (a) | | | (0.06 | ) | | | (0.08 | ) | | | (0.12 | ) | | | (0.07 | ) | | | (0.06 | ) | | | (0.03 | ) | |
| Net realized and unrealized gain/(loss) | | | (1.05 | ) | | | 9.39 | | | | (13.53 | ) | | | 2.53 | | | | 4.51 | | | | 2.35 | | |
| Total from Investment Operations | | | (1.11 | ) | | | 9.31 | | | | (13.65 | ) | | | 2.46 | | | | 4.45 | | | | 2.32 | | |
| Less Distributions to Shareholders | |
| From net investment income | | | — | | | | — | | | | — | | | | — | | | | (0.04 | ) | | | — | | |
| From net realized gains | | | — | | | | — | | | | (0.69 | ) | | | (0.64 | ) | | | (0.59 | ) | | | (0.68 | ) | |
| Total Distributions to Shareholders | | | — | | | | — | | | | (0.69 | ) | | | (0.64 | ) | | | (0.63 | ) | | | (0.68 | ) | |
| Net Asset Value, End of Period | | $ | 22.27 | | | $ | 23.38 | | | $ | 14.07 | | | $ | 28.41 | | | $ | 26.59 | | | $ | 22.77 | | |
| Total Return (b) | | | (4.75 | )%(c) | | | 66.17 | % | | | (49.18 | )%(d) | | | 9.20 | %(e) | | | 19.68 | %(e) | | | 11.08 | %(e) | |
| Ratios to Average Net Assets/Supplemental Data | |
| Net expenses (f) | | | 0.95 | %(g) | | | 0.99 | % | | | 0.95 | % | | | 0.91 | % | | | 0.96 | % | | | 0.99 | % | |
| Net investment loss (f) | | | (0.47 | )%(g) | | | (0.47 | )% | | | (0.51 | )% | | | (0.24 | )% | | | (0.26 | )% | | | (0.16 | )% | |
| Waiver/reimbursement | | | — | | | | — | | | | — | | | | 0.00 | %(h) | | | 0.02 | % | | | 0.03 | % | |
| Portfolio turnover rate | | | 12 | %(c) | | | 19 | % | | | 28 | % | | | 14 | % | | | 21 | % | | | 19 | % | |
| Net assets at end of period (in millions) | | $ | 1,220 | | | $ | 1,241 | | | $ | 780 | | | $ | 1,571 | | | $ | 909 | | | $ | 688 | | |
(a) Per share data was calculated using the average shares outstanding during the period.
(b) Total return at net asset value assuming all distributions reinvested.
(c) Not annualized.
(d) Total return includes a voluntary reimbursement by the Advisor for a realized investment loss due to a trading error. This reimbursement increased total return and net asset value per share by 0.101% and $0.01, respectively.
(e) Had the Advisor and/or Transfer Agent not waived fees and/or reimbursed a portion of expenses, total return would have been reduced.
(f) The benefits derived from custody fees paid indirectly had an impact of less than 0.01%.
(g) Annualized.
(h) Rounds to less than 0.01%.
Columbia Thermostat Fund
| Class Z Shares | | (Unaudited)
Six months
ended June 30, | | Year ended December 31, | |
| Selected data for a share outstanding throughout each period | | 2010 | | 2009 | | 2008 | | 2007 | | 2006 | | 2005 | |
| Net Asset Value, Beginning of Period | | $ | 10.80 | | | $ | 8.19 | | | $ | 12.26 | | | $ | 12.57 | | | $ | 12.50 | | | $ | 13.12 | | |
| Income from Investment Operations | |
| Net investment income (a) | | | 0.11 | | | | 0.13 | | | | 0.24 | | | | 0.52 | | | | 0.49 | | | | 0.43 | | |
| Net realized and unrealized gain/(loss) | | | (0.31 | ) | | | 2.51 | | | | (3.96 | ) | | | 0.53 | | | | 0.84 | | | | 0.28 | | |
| Total from Investment Operations | | | (0.20 | ) | | | 2.64 | | | | (3.72 | ) | | | 1.05 | | | | 1.33 | | | | 0.71 | | |
| Less Distributions to Shareholders | |
| From net investment income | | | (0.16 | ) | | | (0.03 | ) | | | (0.28 | ) | | | (0.57 | ) | | | (0.54 | ) | | | (0.42 | ) | |
| From net realized gains | | | — | | | | — | | | | (0.07 | ) | | | (0.79 | ) | | | (0.72 | ) | | | (0.91 | ) | |
| Total Distributions to Shareholders | | | (0.16 | ) | | | (0.03 | ) | | | (0.35 | ) | | | (1.36 | ) | | | (1.26 | ) | | | (1.33 | ) | |
| Net Asset Value, End of Period | | $ | 10.44 | | | $ | 10.80 | | | $ | 8.19 | | | $ | 12.26 | | | $ | 12.57 | | | $ | 12.50 | | |
| Total Return (b)(c) | | | (1.86 | )%(d) | | | 32.29 | % | | | (30.53 | )% | | | 8.49 | % | | | 10.86 | % | | | 5.50 | % | |
| Ratios to Average Net Assets/Supplemental Data | |
| Net expenses (e)(f) | | | 0.25 | %(g) | | | 0.25 | % | | | 0.25 | % | | | 0.25 | % | | | 0.25 | % | | | 0.25 | % | |
| Net investment income (f) | | | 1.94 | %(g) | | | 1.48 | % | | | 2.23 | % | | | 4.05 | % | | | 3.84 | % | | | 3.28 | % | |
| Waiver/reimbursement | | | 0.13 | %(g) | | | 0.14 | % | | | 0.08 | % | | | 0.15 | % | | | 0.13 | % | | | 0.11 | % | |
| Portfolio turnover rate | | | 79 | %(d) | | | 17 | % | | | 130 | % | | | 128 | % | | | 66 | % | | | 96 | % | |
| Net assets at end of period (in millions) | | $ | 29 | | | $ | 42 | | | $ | 35 | | | $ | 36 | | | $ | 31 | | | $ | 26 | | |
(a) Per share data was calculated using the average shares outstanding during the period. Recognition of net investment income by the Fund is affected by the timing of the declaration of dividends by the underlying investment companies in which the Fund invests.
(b) Total return at net asset value assuming all distributions reinvested.
(c) Had the Advisor and/or Transfer Agent not waived fees and/or reimbursed a portion of expenses, total return would have been reduced.
(d) Not annualized.
(e) Does not include expenses of the investment companies in which the Fund invests.
(f) The benefits derived from custody fees paid indirectly had an impact of less than 0.01%.
(g) Annualized.
See accompanying notes to financial statements.
80
Columbia Acorn Family of Funds
Notes to Financial Statements (Unaudited)
1. Nature of Operations
Columbia Acorn Fund, Columbia Acorn International, Columbia Acorn USA, Columbia Acorn International Select, Columbia Acorn Select and Columbia Thermostat Fund (the "Funds") are each a series of Columbia Acorn Trust (the "Trust"), an open-end management investment company organized as a Massachusetts business trust. The investment objective of each Fund is to seek long-term capital appreciation.
Columbia Thermostat Fund pursues its investment objective by investing in shares of other mutual funds. As a "fund of funds" under normal circumstances, the Fund allocates at least 95% of its net assets among a selected group of stock and bond mutual funds ("portfolio funds") according to the current level of the Standard & Poor's ("S&P") 500 Index in relation to predetermined ranges set by Columbia Wanger Asset Management, LLC ("the Advisor"). The Fund may invest up to 5% of its net assets plus any cash received that day in cash, repurchase agreements, high quality short-term paper and government securities.
Each Fund may issue an unlimited number of shares. Each Fund currently has four classes of shares: Class A, Class B, Class C and Class Z. Effective February 29, 2008, the Funds no longer offer Class B shares (other than through dividend reinvestment).
Class A shares are sold with a front-end sales charge. Class A shares bought without an initial sales charge in accounts aggregating $1 million up to $50 million at the time of purchase are subject to a 1.00% contingent deferred sales charge ("CDSC") if the shares are redeemed within 12 months of the date of purchase.
Class B shares are subject to a CDSC if redeemed within six years of purchase. Class B shares will convert to Class A shares automatically eight years after purchase.
Class C shares are offered at net asset value but are subject to a CDSC on redemptions made within one year after purchase.
Class Z shares are offered at net asset value. There are certain restrictions on who may purchase Class Z shares. Generally, Class Z shares of a Fund may be exchanged for shares of another fund distributed by Columbia Management Distributors, Inc. at no additional charge.
Columbia Acorn International and Columbia Acorn International Select impose a 2.00% redemption fee on shares that are redeemed within 60 days or less of purchase. Effective September 1, 2010, redemption fees will not be imposed on redemptions from either Fund. See the discussion of Fund policies regarding redemption fees in the Funds' prospectuses for more information.
The financial highlights for the Fund's Class A, Class B and Class C shares are presented in a separate semi-annual report.
Differences in class expenses may result in payment of different dividend distributions for each class. All of the Funds' share classes have equal rights with respect to voting, subject to Fund or class specific matters.
2. Significant Accounting Policies
The preparation of financial statements in accordance with accounting principles generally accepted in the United States of America ("GAAP") requires management to make certain estimates and assumptions that affect the reported amounts of assets and liabilities, the disclosures of contingent assets and liabilities at the date of the financial statements and the reported amounts of revenue and expenses during the reporting period. Actual results could differ from those estimates.
>Security valuation
Securities of the Funds are valued at market value or, if a market quotation for a security is not readily available or is deemed not to be reliable because of events or circumstances that have occurred between the market quotation and the time as of which the security is to be valued, the security is valued at a fair value determined in good faith under consistently applied procedures established by the Board of Trustees. With respect to Columbia Thermostat Fund, investments in portfolio funds are valued at their net asset values as reported by the portfolio funds. A security traded on a securities exchange or in an over-the-counter market in which transaction prices are reported is valued at the last sales price at the time of valuation. A security traded principally on NASDAQ is valued at the NASDAQ official closing price. Mutual Funds and Exchange Traded Funds are valued at their closing net asset value as reported to NASDAQ . A security for which there is no reported sale on the valuation date is valued at the latest bid quotation. Short-term investments maturing in 60 days or less are valued at amortized cost, which approximates market value. A security for which a market quotation is not readily available and any other assets are valued at its fair value determined in good faith under consistently applied procedures established by the Board of Trustees. The Funds have retained an independent statistical fair value pricing service that employs a systematic methodology to assist in the fair valuation process for securities principally traded in a foreign market in order to adjust for possible changes in value that may occur between the close of the foreign exchange and the time as of which the securities are to be valued. If a security is valued at fair value, that value may be different from the last quoted market price for the security.
81
Columbia Acorn Family of Funds
Notes to Financial Statements (Unaudited), continued
Various inputs are used in determining the value of each Fund's investments, following the input prioritization hierarchy established by GAAP. These inputs are summarized in the three broad levels listed below:
• Level 1 – quoted prices in active markets for identical securities
• Level 2 – prices determined using other significant observable inputs (including quoted prices for similar securities, interest rates, prepayment speeds, credit risk and others)
• Level 3 – prices determined using significant unobservable inputs where quoted prices or observable inputs are unavailable or less reliable (including management's own assumptions about the factors market participants would use in pricing an investment)
The inputs or methodologies used for valuing securities are not necessarily an indication of the risk associated with investing in those securities.
Examples of the types of securities in which the Funds would typically invest and how they are classified within this hierarchy are as follows. Typical Level 1 securities include exchange traded domestic equities, mutual funds whose NAVs are published each day and exchange traded foreign equities that are not statistically fair valued. Typical Level 2 securities include exchange traded foreign equities that are statistically fair valued, forward foreign currency exchange contracts and short-term investments valued at amortized cost. Additionally, securities fair valued by the Fund's Valuation Committee that rely on significant observable inputs are also included in level 2. Typical Level 3 securities include any security fair valued by the Funds' Valuation Committee that relies on significant unobservable inputs.
On January 21, 2010, the Financial Accounting Standards Board issued an Accounting Standards Update, Fair Value Measurements and Disclosures (Topic 820): Improving Disclosures about Fair Value Measurements (the "Update"), which provides guidance on how investment assets and liabilities are to be valued and disclosed. Specifically, the Update requires reporting entities to disclose the input and valuation techniques used to measure fair value for both recurring and nonrecurring fair value measurements for Level 2 and Level 3 positions. The Update also requires that transfers between all levels (including Level 1 and Level 2) be disclosed on a gross basis (i.e., transfers out must be disclosed separately from transfers in), and requires disclosure of the reason(s) for the transfer. Additionally, purchases, sales, issuances and settlements must be disclosed on a gross basis in the Level 3 rollforward. The effective date of the Update is for interim and annual periods beginning after December 15, 2009; except for the requirement to provide the Level 3 activity for purchases, sales, issuances and settlements on a gross basis, which will be effective for interim and annual periods beginning after December 15, 2010. The Funds adopted the Update effective March 31, 2010.
>Repurchase agreements
Each Fund may engage in repurchase agreement transactions. Each Fund, through its custodian, receives delivery of underlying securities collateralizing repurchase agreements. The counterparty is required to maintain collateral that is at all times at least equal to the repurchase price including interest. In the event of default or bankruptcy by the counterparty to the agreement, realization and/or retention of the collateral may be subject to legal proceedings.
>Foreign currency translations
Values of investments denominated in foreign currencies are converted into U.S. dollars using the New York spot market rate of exchange at the time of valuation. Purchases and sales of investments and dividend and interest income are translated into U.S. dollars using the spot market rate of exchange prevailing on the respective dates of such transactions. The gain or loss resulting from changes in foreign exchange rates is included with net realized and unrealized gain or loss from investments, as appropriate.
>Forward foreign currency exchange contracts
Columbia Acorn International may enter into forward foreign currency exchange contracts in order to seek to minimize the risk from adverse changes in the relationship between the U.S. dollar and foreign currencies. A forward foreign currency exchange contract is a commitment to purchase or sell a foreign currency at a future date at a negotiated forward rate. Forward foreign currency exchange contracts are valued at the interpolated forward exchange rate of the underlying currencies and any market gain or loss, arising from the difference between the original value and the current value of such contract, is included as a component of unrealized gain/(loss) on the Statements of Operations. Open forward foreign currency exchange contracts, if any, are disclosed in the Notes to the Statement of Investments. As forward foreign currency exchange contracts are closed the resulting gain or loss, arising from the difference between the original value of the contract and the closing value of such contract, is included as a component of realized gain/(loss) on the Statements of Operations.
A forward foreign currency exchange contract would limit the risk of loss due to a decline in the value of a particular currency; however, it also would limit any potential gain that might result should the value of the currency increase instead
82
of decrease. These contracts may involve market risk in excess of the unrealized gain or loss reflected on the Statements of Assets and Liabilities. In addition, a Fund could be exposed to counterparty risks if counterparties to the contracts are unable to meet the terms of their contracts. The counterparty risk exposure is, therefore, closely monitored and contracts are only executed with high credit quality financial institutions.
A Fund may use forward foreign currency exchange contracts to buy or sell a foreign currency when the Advisor believes it has exposure to a foreign currency which may suffer or enjoy a movement against another foreign currency to which the Fund has exposure. A Fund will not attempt to hedge all of its foreign portfolio positions.
For additional information on derivative instruments, please see Note 5.
>Securities lending
Each Fund may lend securities up to one-third of the value of its total assets to certain approved brokers, dealers and other financial institutions to earn additional income. In lending its securities, the Fund retains the benefits of owning the securities, including receipt of dividends or interest generated by the security. Each Fund also receives a fee for the loan. Each Fund has the ability to recall the loans at any time and could do so in order to vote proxies or to sell the loaned securities. Each loan is collateralized by cash that exceeds the value of the securities on loan. The market value of the loaned securities is determined daily at the close of business of each Fund and any additional required collateral is delivered to each Fund on the next business day. Each Fund has elected to invest the cash collateral in the Dreyfus Government Cash Management Fund, and the income earned is paid to each Fund, net of any fees remitted to Goldman Sachs Agency Lending as the lending agent and net of any borrower rebates. The Advisor does not retain any fees earned by the lending program. Generally, in the event of borrower default, a Fund has the right to use the collateral to offset any losses incurred. In the event a Fund is delayed or prevented from exercising its right to dispose of the collateral, there may be a potential loss to a Fund. Some of these losses may be indemnified by the lending agent. Each Fund bears the risk of loss with respect to the investment of collateral.
The net lending income earned in 2010 by each Fund is included in the Statements of Operations.
>Security transactions and investment income
Security transactions, investment income and shareholder fund transactions are accounted for on the trade date (date the order to buy or sell is executed) and dividend income and realized gain distributions from other funds are recorded on the ex-dividend date, except that certain dividends from foreign securities are recorded as soon as the information is available to the Funds. Interest income is recorded on the accrual basis and includes amortization of discounts on debt obligations when required for federal income tax purposes. Realized gains and losses from security transactions are recorded on an identified cost basis.
Awards, if any, from class action litigation related to securities owned may be recorded as a reduction of cost of those securities. If the applicable securities are no longer owned, the proceeds are recorded as realized gains.
The Funds estimate the tax character of distributions from real estate investment trusts ("REITs"). Distributions received in excess of income are recorded as a reduction of the cost of the related investments. If the applicable securities are no longer owned, any distributions received in excess of income are recorded as realized gains.
>Restricted securities
Restricted securities are securities that may only be resold upon registration under federal securities laws or in transactions exempt from registration. In some cases, the issuer of restricted securities has agreed to register such securities for resale at the issuer's expense either upon demand by the Funds or in connection with another registered offering of the securities. Many restricted securities may be resold in the secondary market in transactions exempt from registration. Such restricted securities may be determined to be liquid under criteria established by the Board of Trustees.
>Fund share valuation
Fund shares are sold and redeemed on a continuing basis at net asset value, subject to any applicable sales charge. Net asset value per share is determined daily as of the close of trading on the New York Stock Exchange ("NYSE") on each day the NYSE is open for trading. Generally, income, expenses and realized and unrealized gain/(losses) of a Fund are allocated to each class proportionately on a daily basis for purposes of determining the net asset value of each class. The Rule 12b-1 service and distribution fees, if any, and transfer agency fees are charged to each specific class as expenses are incurred. Redemption fees are accounted for as an addition to paid in capital for purposes of determining the net asset value of each class.
>Custody fees/credits
Custody fees are reduced based on each Fund's cash balances maintained with the custodian. The amount is disclosed as a reduction of total expenses on the Statements of Operations.
83
Columbia Acorn Family of Funds
Notes to Financial Statements (Unaudited), continued
>Federal income taxes
The Funds have complied with the provisions of the Internal Revenue Code available to regulated investment companies and, in the manner provided therein, distribute all their taxable income, as well as any net realized gain on sales of investments and foreign currency transactions reportable for federal income tax purposes. Columbia Thermostat Fund distributes all of its taxable income, as well as any net realized gain on sales of portfolio fund shares and any distributions of net realized gains received by the Fund from its portfolio funds, reportable for federal income tax purposes. Accordingly, the Funds paid no federal income taxes and no federal income tax provision was required.
>Foreign capital gains taxes
Realized gains in certain countries may be subject to foreign taxes at the fund level, at rates ranging from approximately 10% to 15%. The Funds accrue for such foreign taxes on net realized and unrealized gains at the appropriate rate for each jurisdiction.
>Distributions to Shareholders
Distributions to shareholders are recorded on the ex-dividend date.
>Indemnification
In the normal course of business, the Trust on behalf of the Funds enters into contracts that contain a variety of representations and warranties and that provide general indemnities. A Fund's maximum exposure under these arrangements is unknown, as this would involve future claims against the Fund. Also, under the Trust's organizational documents, the trustees and officers of the Trust are indemnified against certain liabilities that may arise out of their duties to the Trust. However, based on experience, the Funds expect the risk of loss due to these warranties and indemnities to be minimal.
3. Federal Tax Information
The tax character of distributions paid during the year ended December 31, 2009 was as follows:
| | | Ordinary
Income* | | Long-Term
Capital Gains | |
| (in thousands) | |
| Columbia Acorn Fund | | $ | 20,981 | | | $ | — | | |
| Columbia Acorn International | | | 60,207 | | | | — | | |
| Columbia Acorn USA | | | — | | | | — | | |
| Columbia Acorn International Select | | | 3,533 | | | | — | | |
| Columbia Acorn Select | | | — | | | | — | | |
| Columbia Thermostat Fund | | | 122 | | | | — | | |
*For tax purposes short-term capital gains distributions, if any, are considered ordinary income distributions.
The following capital loss carryforwards, determined as of December 31, 2009, may be available to reduce taxable income arising from future net realized gains on investments, if any, to the extent permitted by the Internal Revenue Code:
| | | Year of Expiration | | | |
| | | 2010 | | 2011-
2015 | | 2016 | | 2017 | | Total | |
| (in thousands) | |
Columbia
Acorn Fund | | $ | — | | | $ | — | | | $ | — | | | $ | 409,911 | | | $ | 409,911 | | |
Columbia Acorn
International | | | — | | | | — | | | | 135,487 | | | | 489,443 | | | | 624,930 | | |
Columbia
Acorn USA | | | 1,518 | * | | | — | | | | 76,008 | | | | 36,216 | | | | 113,742 | | |
Columbia Acorn
International Select | | | — | | | | — | | | | 30,442 | | | | 46,457 | | | | 76,899 | | |
Columbia
Acorn Select | | | — | | | | — | | | | 12,271 | | | | 115,445 | | | | 127,716 | | |
Columbia
Thermostat Fund | | | — | | | | — | | | | 5,193 | | | | 21,738 | | | | 26,931 | | |
*Remains from Columbia Acorn USA's merger with Stein Roe Small Company Growth Fund on 7/26/2002. Utilization of Stein Roe Small Company Growth Fund's losses could be subject to limitations imposed by the Internal Revenue Code.
Management is required to determine whether a tax position of the Funds is more likely than not to be sustained upon examination by the applicable taxing authority, including resolution of any related appeals or litigation processes, based on the technical merits of the position. The tax benefit to be recognized by the Funds is measured as the largest amount of benefit that is greater than fifty percent likely of being realized upon ultimate settlement. Management is not aware of any tax positions for which it is reasonably possible that the total amounts of unrecognized tax benefits will significantly change in the next twelve months. However, management's conclusions may be subject to review and adjustment at a later date based on factors including, but not limited to, new tax laws, regulations, and administrative interpretations (including relevant court decisions). The Funds' federal tax returns for the prior three fiscal ye ars remain subject to examination by the Internal Revenue Service.
4. Transactions with Affiliates
CWAM is a wholly owned subsidiary of Columbia Management Investment Advisors, LLC ("CMIA"), (formerly, RiverSource Investments, LLC), which in turn is a wholly owned subsidiary of Ameriprise Financial, Inc. ("Ameriprise Financial"). CWAM furnishes continuing investment supervision to the Funds and is responsible for the overall management of the Funds' business affairs.
After the close of business on April 30, 2010 (the "Closing"), Ameriprise Financial acquired from Bank of America Corporation ("BOA"), a portion of the asset management business of Columbia Management Group, LLC, including 100% of CWAM. On May 27, 2010, the shareholders of the Funds approved a new investment advisory agreement with
84
CWAM to provide advisory services to the Funds. There were no changes to the Funds' advisory fee rate under the new agreement.
CWAM receives a monthly advisory fee based on each Fund's average daily net assets at the following annual rates:
Columbia Acorn Fund
| Average Daily Net Assets | | Annual
Fee Rate | |
| Up to $700 million | | | 0.74 | % | |
| $700 million to $2 billion | | | 0.69 | % | |
| $2 billion to $6 billion | | | 0.64 | % | |
| $6 billion and over | | | 0.63 | % | |
Columbia Acorn International
| Average Daily Net Assets | | Annual
Fee Rate | |
| Up to $100 million | | | 1.19 | % | |
| $100 million to $500 million | | | 0.94 | % | |
| $500 million and over | | | 0.74 | % | |
Columbia Acorn USA
| Average Daily Net Assets | | Annual
Fee Rate | |
| Up to $200 million | | | 0.94 | % | |
| $200 million to $500 million | | | 0.89 | % | |
| $500 million to $2 billion | | | 0.84 | % | |
| $2 billion to $3 billion | | | 0.80 | % | |
| $3 billion and over | | | 0.70 | % | |
Columbia Acorn International Select
| Average Daily Net Assets | | Annual
Fee Rate | |
| Up to $500 million | | | 0.94 | % | |
| $500 million and over | | | 0.90 | % | |
Columbia Acorn Select
| Average Daily Net Assets | | Annual
Fee Rate | |
| Up to $700 million | | | 0.85 | % | |
| $700 million to $2 billion | | | 0.80 | % | |
| $2 billion to $3 billion | | | 0.75 | % | |
| $3 billion and over | | | 0.70 | % | |
Columbia Thermostat Fund
| | | Annual
Fee Rate | |
| All Average Daily Net Assets | | | 0.10 | % | |
For the six months ended June 30, 2010, the Funds' annualized effective investment advisory fee rates were as follows:
| Columbia Acorn Fund | | | 0.64 | % | |
| Columbia Acorn International | | | 0.77 | % | |
| Columbia Acorn USA | | | 0.86 | % | |
| Columbia Acorn International Select | | | 0.94 | % | |
| Columbia Acorn Select | | | 0.82 | % | |
| Columbia Thermostat Fund | | | 0.10 | % | |
>Expense Limit
CWAM has voluntarily agreed to reimburse the ordinary operating expenses (exclusive of brokerage commissions, interest, taxes and extraordinary expenses, but inclusive of custodial charges relating to overdrafts, if any) after giving effect to any balance credits from the Funds' custodian, exceeding 1.45% annually of the average daily net assets for Columbia Acorn International Select and 1.35% annually of the average daily net assets for Columbia Acorn Select. This arrangement may be modified or terminated by either the Funds or CWAM on 30 days notice.
CWAM has contractually agreed to waive fees and/or reimburse expenses of Columbia Thermostat Fund so that the ordinary operating expenses (exclusive of interest and fees on borrowings, and expenses associated with the Fund's investment in other investment companies, but including custodian charges relating to overdrafts, if any), after giving effect to any balance credits from the Fund's custodian, will not exceed 0.25% annually of the Fund's average daily net assets through April 30, 2011. There is no guarantee that this arrangement will continue thereafter.
Expenses reimbursed by CWAM to Columbia Acorn International Select and Columbia Thermostat Fund for the six months ended June 30, 2010, were $1,586 and $146,782, respectively.
CWAM provides administrative services and receives an administration fee from the Funds at the following annual rates:
Columbia Acorn Trust
Aggregate Average Daily
Net Assets of the Trust: | | Annual
Fee Rate | |
| Up to $8 billion | | | 0.050 | % | |
| $8 billion to $16 billion | | | 0.040 | % | |
| $16 billion to $35 billion | | | 0.030 | % | |
| $35 billion to $45 billion | | | 0.025 | % | |
| $45 billion and over | | | 0.015 | % | |
For the six months ended June 30, 2010, each Fund's annualized effective administration fee rate was 0.04% of average daily net assets. Prior to the Closing, CWAM had delegated to Columbia Management Advisors, LLC ("CMA") an indirect, wholly owned subsidiary of BOA, responsibility to provide certain sub-administrative services to the Funds. Following the Closing, CMIA succeeded CMA as sub-administrator and began providing certain sub-administrative services to the Funds.
Prior to the Closing, Columbia Management Distributors, Inc., an indirect subsidiary of BOA, served as the Funds' distributor and principal underwriter. Following the Closing, Columbia Management Investment Distributors, Inc.,
85
Columbia Acorn Family of Funds
Notes to Financial Statements (Unaudited), continued
(formerly, RiverSource Fund Distributors, Inc.) ("CMID"), a wholly owned subsidiary of Ameriprise Financial, became the distributor of the Funds. There were no changes to the underwriting discount structure of the Funds or the service or distribution fee rates paid by the Funds as a result of the Closing.
Each Fund has adopted a Rule 12b-1 (distribution and service) plan which requires it to pay CMID a monthly service fee equal to 0.25% annually of the average daily net assets attributable to Class A, Class B and Class C shares and a monthly distribution fee equal to 0.50% and 0.75%, annually, of the average daily net assets attributable to Class B and Class C shares, respectively. CMID receives no compensation with respect to Class Z shares.
Prior to the Closing, Columbia Management Services, Inc., an indirect, wholly owned subsidiary of BOA, provided shareholder services to the Funds and contracted with Boston Financial Data Services ("BFDS") to serve as sub-transfer agent. Following the Closing, Columbia Management Investment Services Corp. ("CMIS"), (formerly, RiverSource Service Corporation), a wholly owned subsidiary of Ameriprise Financial, became the transfer agent of the Funds. The transfer agent fee rates paid by the Funds did not change as a result of the change in transfer agent. For its services, each Fund pays CMIS a monthly fee at the annual rate of $17.00 per open account. CMIS also receives reimbursement for certain out-of-pocket expenses and sub-transfer agency expenses. The arrangement with BFDS has been continued by CMIS.
Certain officers and trustees of the Trust are also officers of CWAM. The Trust makes no direct payments to its officers and trustees who are affiliated with CWAM.
The Board of Trustees appointed a Chief Compliance Officer of the Trust in accordance with federal securities regulations. The Funds, along with other affiliated funds, pay their pro-rata share of the expenses associated with the Office of the Chief Compliance Officer. Those expenses are disclosed separately as "Chief compliance officer expenses" in the Statements of Operations.
The Trust offers a deferred compensation plan for its independent trustees. Under that plan, a trustee may elect to defer all or a portion of his or her compensation. Amounts deferred are retained by the Trust and may represent an unfunded obligation of the Trust. The value of amounts deferred is determined by reference to the change in value of Class Z shares of one or more series of the Trust or a money market fund specified by the trustee. Benefits under the deferred compensation plan are payable when the trustee ceases to be a member of the Board of Trustees.
An affiliated person of a Fund may include any company in which a Fund owns five percent or more of its outstanding voting shares. On June 30, 2010, Columbia Acorn Fund, Columbia Acorn International, Columbia Acorn USA and Columbia Acorn Select each held five percent or more of the outstanding voting securities of one or more companies. Details of investments in those affiliated companies are presented on pages 34, 35, 45, 56 and 67, respectively.
During the six months ended June 30, 2010, the Funds engaged in purchase and sale transactions with funds that have a common investment advisor (or affiliated investment advisors), common directors/trustees, and/or common officers. Those transactions complied with Rule 17a-7 under the Investment Company Act of 1940 and were as follows:
| | | Purchases | | Sales | |
| (in thousands) | |
| Columbia Acorn Fund | | $ | 4,215 | | | $ | — | | |
| Columbia Acorn International | | | 3,038 | | | | 1,715 | | |
| Columbia Acorn USA | | | 704 | | | | 1,016 | | |
| Columbia Acorn Select | | | 1,350 | | | | 2,783 | | |
5. Objectives and Strategies for Investing in Derivative Instruments
Columbia Acorn International uses derivatives instruments including forward foreign currency exchange contracts in order to meet its investment objectives. The Fund employs strategies in differing combinations to permit it to increase, decrease or change the level of exposure to market risk factors. The achievement of any strategy involving derivatives depends on analysis of various risk factors, and if the strategies for the use of derivatives do not work as intended, the Fund may not achieve its investment objectives.
In pursuit of its investment objectives, the Fund is exposed to the following market risks:
Foreign Exchange Rate Risk: Foreign exchange rate risk relates to the change in the U.S. dollar value of a security held that is denominated in a foreign currency. The U.S. dollar value of a foreign-currency-denominated security will decrease as the dollar appreciates against the currency, while the U.S. dollar value will increase as the dollar depreciates against the currency.
86
The following notes provide more detailed information about the derivative type held by the Columbia Acorn International:
Forward Foreign Currency Exchange Contracts
• The Fund entered into forward foreign currency exchange contracts to shift its investment exposure from one currency to another.
• The Fund used forward foreign currency exchange contracts to shift its U.S. dollar exposure in order to achieve a representative weighted mix of major currencies relative to its benchmark and/or to recover an underweight country exposure in its portfolio relative to its benchmark.
Forward foreign currency exchange contracts are agreements to exchange one currency for another at a future date at a specified price. These contracts are used to minimize the exposure to foreign exchange rate fluctuations during the period between the trade and settlement dates of the contract. The Fund may utilize forward foreign currency exchange contracts in connection with the settlement of purchases and sales of securities. The Fund may also enter into these contracts to reduce the exposure to adverse price movements in certain other foreign-currency-denominated assets. Contracts to buy are used to acquire exposure to foreign currencies, while contracts to sell are used to reduce the exposure to foreign exchange rate fluctuations. Forward foreign currency exchange contracts are valued daily at the current exchange rate of the underlying currency, resulting in unrealized gains (losses) which become realized at the time the forward foreign currency exchange contracts are closed or mature. Realized and unrealized gains (losses) arising from such transactions are included in net realized and unrealized gains (losses) on foreign currency transactions. The use of forward foreign currency exchange contracts does not eliminate fluctuations in the prices of the Fund's portfolio securities. While the maximum potential loss from such contracts is the aggregate face value in U.S. dollars at the time the contract was opened, exposure is typically limited to the change in value of the contract (in U.S. dollars) over the period it remains open. The Fund could also be exposed to risk that counterparties of the contracts may be unable to fulfill the terms of the contracts.
During the six months ended June 30, 2010, Columbia Acorn International entered into 80 forward foreign currency exchange contracts.
The following table is a summary of the value of the Columbia Acorn International's derivative instruments as of June 30, 2010.
Fair Value of Derivative Instruments
| | | Asset | |
| | | Statement of Assets
and Liabilities | | Fair
Value | |
| (in thousands) | |
| | Unrealized appreciation on | |
| |
| | forward foreign currency | |
| |
| | exchange contracts | | $ | 14,529 | | |
| | | Liability | |
| | | Statement of Assets
and Liabilities | | Fair
Value | |
| (in thousands) | |
| | | Unrealized depreciation on | |
| |
| | | forward foreign currency | |
| |
| | | exchange contracts | | $ | (8,511 | ) | |
The effect of derivative instruments on the Columbia Acorn International's Statement of Operations for the six months ended June 30, 2010 was as follows:
Amount of Realized Gain or (Loss) and Change in
Unrealized Appreciation or (Depreciation)
on Derivatives Recognized in Income
| | | Risk
Exposure | | Realized
Gain/(Loss) | | Change
In
Unrealized
Appreciation/
(Depreciation) | |
| (in thousands) | |
Forward foreign
currency
exchange
contracts | | Foreign Exchange
Rate Risk | | $ | 30,296 | | | $ | 3,534 | | |
6. Borrowing Arrangements
The Trust participates in a $150 million credit facility, along with another Trust managed by CWAM, which was entered into to facilitate portfolio liquidity. Under the facility, interest is charged to each participating fund based on its borrowings at a rate per annum equal to the higher of Federal Funds Rate or Overnight LIBOR plus 1.25%. In addition, a commitment fee of 0.15% per annum of the unutilized line of credit was accrued and apportioned among the participating funds based on their relative net assets. The commitment fee is included in "Other expenses" in the Statements of Operations. No amounts were borrowed by any Fund under this facility for the six months ended June 30, 2010. The Trust enters into this line of credit
87
Columbia Acorn Family of Funds
Notes to Financial Statements (Unaudited), continued
for one year durations. The Trust has secured the line of credit for the entire year of 2010.
7. Investment Transactions
The aggregate cost of purchases and proceeds from sales, other than short-term obligations, for the six months ended June 30, 2010, were:
Columbia Acorn Fund
| (in thousands) | |
| Investment securities | | | |
| Purchases | | $ | 2,076,779 | | |
| Proceeds from sales | | | 2,556,239 | | |
Columbia Acorn International
| (in thousands) | |
| Investment securities | | | |
| Purchases | | $ | 764,037 | | |
| Proceeds from sales | | | 444,140 | | |
Columbia Acorn USA
| (in thousands) | |
| Investment securities | | | |
| Purchases | | $ | 224,470 | | |
| Proceeds from sales | | | 235,047 | | |
Columbia Acorn International Select
| (in thousands) | |
| Investment securities | | | |
| Purchases | | $ | 68,968 | | |
| Proceeds from sales | | | 98,014 | | |
Columbia Acorn Select
| (in thousands) | |
| Investment securities | | | |
| Purchases | | $ | 329,807 | | |
| Proceeds from sales | | | 215,032 | | |
Columbia Thermostat Fund
| (in thousands) | |
| Investment securities | | | |
| Purchases | | $ | 98,677 | | |
| Proceeds from sales | | | 118,085 | | |
8. Redemption Fees
For the six months ended June 30, 2010, the redemption fees imposed by Columbia Acorn International and Columbia Acorn International Select amounted to approximately $192,065 and $7,827, respectively, and are accounted for as additions to paid in capital.
9. Regulatory Settlements with Third Parties
During the six months ended June 30, 2010, Columbia Acorn International and Columbia Acorn International Select received payments totaling $446,565 and $46,265, respectively, representing distributions from a fair fund established in connection with a regulatory settlement between the Securities and Exchange Commission and a third party broker dealer relating to alleged market timing and late trading in mutual funds, including the Funds. The payments have been included in "Increase from regulatory settlements" on the Statements of Changes in Net Assets.
10. Information Regarding Pending and Settled Legal Proceedings
In June 2004, an action captioned John E. Gallus et al. v. American Express Financial Corp. and American Express Financial Advisors Inc. was filed in the United States District Court for the District of Arizona. The plaintiffs allege that they are investors in several American Express Company (now known as RiverSource) mutual funds and they purport to bring the action derivatively on behalf of those funds under the Investment Company Act of 1940. The plaintiffs allege that fees allegedly paid to the defendants by the funds for investment advisory and administrative services are excessive. The plaintiffs seek remedies including restitution and rescission of investment advisory and distribution agreements. The plaintiffs voluntarily agreed to transfer this case to the United States District Court for the District of Minnesota (the District Court). In response to defendants' motion to dismiss the complaint, the District Court dismissed one of plaintiffs' four claims and granted plaintiffs limited discovery. Defendants moved for summary judgment in April 2007. Summary judgment was granted in the defendants' favor on July 9, 2007. The plaintiffs filed a notice of appeal with the Eighth Circuit Court of Appeals (the Eighth Circuit) on August 8, 2007. On April 8, 2009, the Eighth Circuit reversed summary judgment and remanded to the District Court for further proceedings. On August 6, 2009, defendants filed a writ of certiorari with the U.S. Supreme Court (the Supreme Court), asking the Supreme Court to stay the District Court proceedings while the Supreme Court considers and rules in a case captioned Jones v. Harris Associates, which involve s issues of law similar to those presented in the Gallus case. On March 30, 2010, the Supreme Court issued its ruling in Jones v. Harris Associates, and on April 5, 2010, the Supreme Court vacated the Eighth Circuit's decision in the Gallus case and remanded the case to the Eighth Circuit for further consideration in light of the Supreme Court's decision in Jones v. Harris Associates. On June 4, 2010, the Eighth Circuit remanded the Gallus case to the District Court for further consideration in light of the Supreme Court's decision in Jones v. Harris Associates.
In December 2005, without admitting or denying the allegations, American Express Financial Corporation (AEFC,
88
which is now known as Ameriprise Financial, Inc. (Ameriprise Financial)), entered into settlement agreements with the Securities and Exchange Commission (SEC) and Minnesota Department of Commerce (MDOC) related to market timing activities. As a result, AEFC was censured and ordered to cease and desist from committing or causing any violations of certain provisions of the Investment Advisers Act of 1940, the Investment Company Act of 1940, and various Minnesota laws. AEFC agreed to pay disgorgement of $10 million and civil money penalties of $7 million. AEFC also agreed to retain an independent distribution consultant to assist in developing a plan for distribution of all disgorgement and civil penalties ordered by the SEC in accordance with various undertakings detailed at http://www.sec.gov/litigation/admin/ia-2451.pdf. Ameriprise Financial and its affiliates have cooperated with the SEC and the MDOC in these legal proceedings, and have made regular reports to the Columbia Management Funds' Boards of Directors/Trustees.
Ameriprise Financial and certain of its affiliates have historically been involved in a number of legal, arbitration and regulatory proceedings, including routine litigation, class actions, and governmental actions, concerning matters arising in connection with the conduct of their business activities. Ameriprise Financial believes that the Funds are not currently the subject of, and that neither Ameriprise Financial nor any of its affiliates are the subject of, any pending legal, arbitration or regulatory proceedings that are likely to have a material adverse effect on the Funds or the ability of Ameriprise Financial or its affiliates to perform under their contracts with the Funds. Ameriprise Financial is required to make 10-Q, 10-K and, as necessary, 8-K filings with the Securities and Exchange Commission on legal and regulatory matters that relate to Ameriprise Financial and its affiliates. Copies of these filings may be obt ained by accessing the SEC website at www.sec.gov.
There can be no assurance that these matters, or the adverse publicity associated with them, will not result in increased fund redemptions, reduced sale of fund shares or other adverse consequences to the Funds. Further, although we believe proceedings are not likely to have a material adverse effect on the Funds or the ability of Ameriprise Financial or its affiliates to perform under their contracts with the Funds, these proceedings are subject to uncertainties and, as such, we are unable to estimate the possible loss or range of loss that may result. An adverse outcome in one or more of these proceedings could result in adverse judgments, settlements, fines, penalties or other relief that could have a material adverse effect on the consolidated financial condition or results of operations of Ameriprise Financial.
*****
CWAM and the Trustees of the Trust (collectively, the "Columbia defendants") were named as defendants in class and derivative complaints that were consolidated in a Multi-District Action (the MDL Action) in the federal district court of Maryland. These lawsuits contend that defendants permitted certain investors to market time their trades in certain Columbia Acorn Funds. The MDL Action is ongoing. However, all claims against the Trust and the Independent Trustees of the Trust have been dismissed.
Columbia Acorn Trust and CWAM are also defendants in a state court class action lawsuit that alleges, in summary, that the Trust and CWAM exposed shareholders of Columbia Acorn International to trading by market timers by allegedly: (a) failing to properly evaluate daily whether a significant event affecting the value of the Fund's securities had occurred after foreign markets had closed but before the calculation of the Fund's net asset value (NAV); (b) failing to implement the Fund's portfolio valuation and share pricing policies and procedures; and (c) failing to know and implement applicable rules and regulations concerning the calculation of NAV (the Fair Valuation Lawsuit). The United States Court of Appeals for the Seventh Circuit ruled that the plaintiffs' state law claims were preempted under federal law, resulting in the dismissal of plaintiffs' complaint. Plaintiffs appealed the Seventh Circuit's ruling to the United States Supreme Court. The Supreme Court reversed the Seventh Circuit's ruling on jurisdictional grounds and the case was remanded to the state court.
On March 21, 2005, a class action complaint was filed against the Trust and CWAM seeking to rescind the CDSC assessed upon redemption of Class B shares of the Columbia Acorn Funds (the CDSC Lawsuit). In addition to the rescission of sales charges, plaintiffs seek recovery of actual damages, attorneys' fees and costs. The case was transferred to the MDL Action in the federal district court of Maryland.
On September 14, 2007, the plaintiffs and the Columbia defendants named in the MDL Action, including the Columbia family of funds, entered into a stipulation of settlement with respect to all Columbia-related claims in the MDL Action described above, including the CDSC and Fair Valuation Lawsuits.
On April 23, 2010, the parties of the MDL Action filed a motion seeking: (a) preliminary approval of the MDL settlements; (b) the conditional certification of the plaintiff class for
89
Columbia Acorn Family of Funds
Notes to Financial Statements (Unaudited), continued
purposes of settlement; (c) approval of the form and manner of giving notice to the plaintiff class of the proposed settlements; and (d) approval of the proposed schedule for various deadlines in connection with the final settlement hearing. The motion was presented to and approved by the court on May 7, 2010. The final hearing on the fairness of the settlements is scheduled for October 21, 2010.
CWAM believes that the lawsuits are not likely to materially affect its ability to provide investment management services to the Funds.
90
[Excerpt from:]
Columbia Acorn Trust
Management Fee Evaluation of the Senior Officer
Prepared Pursuant to the New York Attorney General's
Assurance of Discontinuance
December 2009
91
Introduction
The New York Attorney General's Assurance of Discontinuance ("Order") entered into by Columbia Management Advisors, LLC ("CMAI") and Columbia Management Distributors, Inc., ("CMDI") in February 2005, allows CMAI to manage or advise a mutual fund only if the trustees of the fund appoint a "Senior Officer" to perform specified duties and responsibilities. One of these responsibilities includes "managing the process by which proposed management fees (including but not limited to, advisory fees) to be charged the [funds] are negotiated so that they are negotiated in a manner which is at arms' length and reasonable and consistent with this Assurance of Discontinuance."
The Columbia Acorn Trust and Wanger Advisors Trust (collectively, the "Trusts") and each series thereof (the "Acorn Funds," "WAT Funds" or collectively, the "Funds") are overseen by the same Board of Trustees ("Board"). The Order provides that this Board must determine the reasonableness of proposed "management fees" by using either an annual competitive bidding process supervised by the Senior Officer or Independent Fee Consultant, or by obtaining "an annual independent written evaluation prepared by or under the direction of the Senior Officer or the Independent Fee Consultant."
"Management fees" are only part of the costs and expenses paid by mutual fund shareholders. Fund expenses can vary depending upon the class of shares held but usually include: (1) investment management or advisory fees to compensate analysts and portfolio managers for stock research and portfolio management, as well as the cost of operating a trading desk; (2) administrative expenses incurred to prepare registration statements and tax returns, calculate the funds' net asset values, maintain effective compliance procedures and perform recordkeeping services; (3) transfer agency costs for establishing accounts, accepting and disbursing funds, as well as overseeing trading in fund shares; (4) custodial expenses incurred to hold the securities purchased by the funds; and (5) distribution expenses, including commissions paid to brokers that sell the fund shares to investors.
Columbia Wanger Asset Management, L.P. ("CWAM"), is the adviser to the Funds, and at present is a part of Columbia Management Group ("Columbia"), an umbrella organization that also includes CMAI, Columbia Management Services, Inc. ("CMSI") and CMDI. Columbia is owned by Bank of America Corporation ("Bank of America").
The Proposed Change of Ownership
On September 29, 2009, Bank of America entered into a Purchase Agreement ("APA") with Ameriprise Financial, Inc. ("Ameriprise") providing for, among other things, the sale of CWAM to Ameriprise and the acquisition by Ameriprise of certain assets of Columbia. The Columbia assets to be acquired by Ameriprise include the functions currently performed by CMAI, CMSI and CMDI. Because some of Columbia's operations are supported by Bank of America staff and facilities outside of Columbia, Ameriprise and Bank of America entered into a Transition Services Agreement ("TSA") that, among other things, provides for the continuation of those services for a period of time. The parties contemplate a closing date of the APA in Spring 2010, and closing is conditioned upon the approval by the Board of a new advisory agreement between the Trusts and CWAM, as well as agreements with the entities that will succeed CMSI, CMDI and CMAI. These entities& #151;RiverSource Fund Services, Inc. ("RFS"), RiverSource Fund Distributors, Inc. ("RFD") and RiverSource Investments, LLC—are wholly owned subsidiaries of Ameriprise and currently support the RiverSource family of mutual funds. Therefore, if the sale is consummated as contemplated by the various agreements, CWAM's ownership will change from Bank of America to Ameriprise, as will the Funds' primary service providers.1
Columbia and Ameriprise have proposed that the Trusts continue, in substance, the existing advisory agreement governing portfolio management, and the administration services agreement governing certain administration and clerical services. They propose no material changes to these agreements, no change in services and no changes in fee levels, only those changes necessary to effect the change of ownership. The fees paid under these two agreements are referred to as "management fees." Other fund
1 The Funds' custodian is State Street Bank and Trust Company. No change in custodian is required by the APA nor is such a change contemplated at this time.
92
expenses will be governed by separate agreements, in particular agreements with two Ameriprise affiliates: RFD, the broker-dealer that will underwrite and distribute the Funds' shares, and RFS the Funds' proposed transfer agent.
While the proposed agreements themselves suggest no substantive changes in the services provided to the Funds, Ameriprise and Columbia have informed the Board that they intend to embark on a process of integrating the operations of the two organizations with respect to administration and other services. Among the objectives of that integration are the reduction of costs, and increased economies of scale. Further, CWAM will be subject to new management oversight by Ameriprise which, among other things, will establish the compensation structure for CWAM's portfolio managers and analysts.
Requirements of the Order
The Order applies to any successor to substantially all the assets of CMDI and CMAI. Under the Order, a fee evaluation must precede the execution of new advisory and administration services agreements; there is no express exception from this requirement for agreements that are intended solely to transfer ownership of the existing service providers. I have been advised by Columbia that it believes the Order requires the preparation of this fee evaluation.
In conformity with the terms of the Order and past evaluations, this evaluation addresses only the advisory and administration contracts, and does not extend to any proposed new underwriting and transfer agency agreements.
According to the Order, the Senior Officer's evaluation must consider at least the following:
(1) Management fees (including components thereof) charged to institutional and other clients of CWAM for like services;
(2) Management fees (including any components thereof) charged by other mutual fund companies for like services;
(3) Costs to CWAM and its affiliates of supplying services pursuant to the management fee agreements, excluding any intra-corporate profit;
(4) Profit margins of CWAM and its affiliates from supplying such services;
(5) Possible economies of scale as the Funds grow larger; and
(6) The nature and quality of CWAM's services, including the performance of each Fund.
In 2004, the Boards of the two Trusts, then separate groups, each appointed me Senior Officer under the Order. They also determined not to pursue a competitive bidding process and instead, charged me with the responsibility of evaluating the Funds' proposed advisory and administration fee contracts with CWAM in conformity with the requirements of the Order. In discharging their responsibilities, the independent Trustees have also consulted independent, outside counsel. The Board has asked that I prepare this evaluation.
2009 Evaluation
In May 2009, I submitted to the Board the fourth annual evaluation prepared under the Order. That evaluation, based on performance and fee data as of December 31, 2008, was considered by the Board in renewing the advisory and administration services agreements that were effective on July 31, 2009. That evaluation followed the same structure as the earlier studies. Some areas were given more emphasis, while others were given less. Still, the fundamental information gathered for that evaluation was largely the same as past years. That evaluation is referred to here as the "2009 Study."
Process and Independence
The objectives of the Order are to ensure the independent evaluation of the management fees paid by the Funds as well as to insure that all relevant factors are considered. In my view, this contract process has been conducted at arms-length and with independence
93
in gathering, considering and evaluating all relevant data. At the outset of the process, the Trustees sought and obtained from Ameriprise and Columbia a comprehensive compilation of data regarding Fund performance and expenses, adviser profitability, and other information. The Trustees, acting through their Performance Committee and the Ad Hoc Committee, evaluated this information thoroughly, and met often to discuss it. Performance and expense data was obtained from both Morningstar and Lipper, the leading consultants in this area. The rankings prepared by Morningstar and Lipper were independent and prepared in conformity with the methodologies employed by those organizations. Counsel for the Funds and the Independent Trustees considered, as did I, the terms and conditions of the existing contracts, and evaluated them in light of the proposed transaction.
In the course of its work, the Trustees also gave careful consideration to the conclusions and recommendations contained in the 2009 Study.
My evaluation of the advisory contracts was shaped, as it has been in the past, by my experience as Chief Compliance Officer of the Trusts ("CCO"). As CCO, I report solely to the Board and have no reporting obligation to, or employment relationship with, Columbia or its affiliates. I have commented on compliance matters in evaluating the quality of service provided by CWAM.
This Report, its supporting materials and the data contained in other materials submitted to the Ad Hoc and Performance Committees of the Board, in my view, provide a thorough factual basis upon which the Board, in consultation with independent counsel as it deems appropriate, may conduct management fee negotiations that are in the best interests of the Funds' shareholders.
The Fee Reductions Mandated under the Order
Under the terms of the Order, Columbia agreed to secure certain management fee reductions for the mutual funds advised by its affiliate investment advisers. In some instances, breakpoints were also established. Although neither CWAM nor the Trusts was a party to the Order, CWAM offered and the Board accepted certain advisory fee reductions during 2005. By the terms of the Order, these fees may not be increased before November 30, 2009, and under the Investment Company Act, may not be increased before March 2012 or later (other than for bona fide additional investment advisory services), if the closing date of the transaction is later than March 2010. I have used these advisory fee levels, as modified thereafter, in this evaluation because they are the fees in the current agreements that CWAM and Ameriprise propose should be continued. Hence, these fee levels are the starting point of an evaluation.
Conclusions
My review of the data and other material above leads to the following conclusions with respect to the factors identified in the Order.
A. Fund Performance
The Domestic Funds: The Acorn Fund has achieved good performance over the past five years, and achieved those results with less risk than its peers. Acorn Select and Wanger Select have enjoyed strong investment returns in the past year, resulting in improved rankings that place those funds near or in the top third of their peers over the trailing five year period. These results are achieved, however, with greater relative risk than the other domestic Funds. Acorn USA and its parallel, Wanger USA have not been as strong as the other Funds relative to their peers over this period, turning in a largely average performance, though both Funds have outperformed their benchmarks. Thermostat is unique and therefore difficult to assess, but now enjoys a Morningstar rank above its peer median. The overall trend for performance of the domestic Funds is pos itive, and further, all domestic Funds enjoy positive alpha, confirming that their portfolio managers add value to performance.
94
The International Funds: The international Funds experienced a challenging 12 month period relative to their peers, but their five year rankings remain at or above the median. These Funds have enjoyed periods of strong out-performance during that five year stretch. Further, they have outperformed their benchmarks during the past five years, and done so while exposing shareholders to less risk than competitors. Finally, all the international Funds enjoy positive alpha, again confirming the value of their portfolio managers.
B. Management Fees Relative to Peers
There is significant variance in management fee rankings across the Funds. Acorn International is the only fund that was ranked in the top quartile by both Morningstar and Lipper. The other Acorn funds tend to fall around the medians identified by one or the other service. The WAT funds are uniformly more expensive than their peers.
C. Management Fees Relative to Institutional Account and Other Mutual Fund Accounts
CWAM's focus is on its mutual funds. The few institutional accounts it does manage vary in rate structures. Some pay advisory fees commensurate with or higher than the Acorn and WAT funds. In a few instances, however, institutional accounts pay lower advisory fees than do the Acorn funds. One such institutional account is significant in size and has been under CWAM's management for over 31 years. Further, CWAM performs sub-advisory services for two mutual funds managed by RiverSource, a fund family operated by Ameriprise, at rates that are lower than those paid by the parallel Acorn funds, though sub-advisory services can differ from those necessary for the full support of a mutual fund.
D. Administrative Services
The Acorn and WAT funds' administrative fees are generally less competitive than are the fees charged by competitors, but these rankings suffer from a lack of uniformity in the scope of services encompassed by the fee. CWAM and CMAI provide excellent administrative support for all the Funds.
E. Costs and Benefits to CWAM and its Affiliates
CWAM's direct costs do not appear excessive. Overhead and indirect costs allocated to CWAM by its parent organizations, however, are significant and have varied considerably over the years. CWAM's affiliates report operating losses and therefore do not appear to enjoy excessive "fall out" benefits from CWAM's advisory agreement with the Funds. CWAM continues to enjoy substantial benefits from the use of "soft dollar" payments for research.
F. Profitability
CWAM's profit margins have declined in recent periods, as have the margins of many fund companies, but it still maintains margins that appear to be in the upper range of its competitors.
G. Economies of Scale
Economies of scale do exist at CWAM, and the Board has instituted breakpoints that reflect that reality. In the past two years, however, asset levels have generally declined, and sustained asset growth will be required to trigger additional fee reductions under the current schedule. Asset declines have not, however, resulted in significant fee increases.
95
H. Nature and Quality of Service
This category includes a variety of considerations that are difficult to quantify, yet can have a significant bearing on the performance of the Acorn and WAT funds. Several areas merit comment.
1. Capacity. CWAM has maintained its investment management capacity even in a difficult environment.
2. Compliance. CWAM has a reasonably designed compliance program that protects shareholders.
I. Process
In my opinion, the process of negotiating an advisory contract for the Funds has been conducted thoroughly and at arms' length. The Ad Hoc Committee has taken the steps necessary to assess the proposed change of ownership and recommended appropriate measures to protect Fund shareholders. It has also taken steps to encourage an agreement on an appropriate incentive plan for CWAM that will facilitate the continuity of management, motivate CWAM professionals and that will align their efforts with the interests of Fund shareholders. The Trustees have sufficient information to evaluate management's proposal, and negotiate contract terms that are in the best interests of fund shareholders.
****
Recommendations
I believe the Trustees should:
1. Continue to monitor closely the performance of Acorn USA and Wanger USA, to assess the impact of the portfolio changes implemented by the portfolio manager.
2. Focus their review on the WAT funds' management fee levels in relation to their peers, in particular the fees paid by Wanger Select, which are, in the views of both Morningstar and Lipper, significantly higher than their peers.
3. Take appropriate steps to insure that any integration of the two organizations does not adversely impact Fund shareholders, and continue their efforts to facilitate an agreement on an appropriate incentive plan for CWAM personnel that will both motivate them and align their interests with Fund shareholders.
4. Consider the fees paid by (sub-advisory fees) and to (revenue sharing payments) the proposed new parent organization, Ameriprise or its mutual funds, to identify and address all conflicts of interest.
Robert P. Scales
December 2009
96
[Excerpt from:]
Columbia Acorn Trust
Supplement to the
Management Fee Evaluation of the Senior Officer
Prepared Pursuant to the New York Attorney General's
Assurance of Discontinuance
April 2010
97
Introduction
In December 2009, I prepared a fee evaluation required under the New York Attorney General's Assurance of Discontinuance ("Order") entered into by Columbia Management Advisors, LLC ("CMAI") and Columbia Management Distributors, Inc., ("CMDI") in February 2005. That Order allows CMAI to manage or advise a mutual fund only if the trustees of the fund appoint a "Senior Officer" to perform specified duties and responsibilities. One of these responsibilities includes "managing the process by which proposed management fees (including but not limited to, advisory fees) to be charged the [funds] are negotiated so that they are negotiated in a manner which is at arms' length and reasonable and consistent with this Assurance of Discontinuance."
The Columbia Acorn Trust and Wanger Advisors Trust (collectively, the "Trusts") and each series thereof (the "Acorn Funds," "WAT Funds" or collectively, the "Funds") are overseen by the same Board of Trustees ("Board"). The Order provides that this Board must determine the reasonableness of proposed "management fees" by using either an annual competitive bidding process supervised by the Senior Officer or Independent Fee Consultant, or by obtaining "an annual independent written evaluation prepared by or under the direction of the Senior Officer or the Independent Fee Consultant."
Columbia Wanger Asset Management, L.P. ("CWAM"), is the adviser to the Funds, and at present is a part of Columbia Management Group ("Columbia"), an umbrella organization that also includes CMAI, Columbia Management Services, Inc. ("CMSI") and CMDI. Columbia is owned by Bank of America Corporation ("Bank of America").
On September 29, 2009, Bank of America entered into a Purchase Agreement ("APA") with Ameriprise Financial, Inc. ("Ameriprise") providing for, among other things, the sale of CWAM to Ameriprise and the acquisition by Ameriprise of certain assets of Columbia. The parties contemplate a closing date of the APA in Spring 2010, and closing is conditioned upon the approval by the Board of a new advisory agreement between the Trusts and CWAM, as well as agreements with the entities that will succeed CMSI, CMDI and CMAI. These entities—RiverSource Fund Services, Inc. ("RFS"), RiverSource Fund Distributors, Inc. ("RFD") and RiverSource Investments, LLC—are wholly owned subsidiaries of Ameriprise and currently support the RiverSource family of mutual funds. Therefore, if the sale is consummated as contemplated by the various agreements, CWAM's ownership will change from Bank of America to Ameriprise, as will the Funds' primary s ervice providers.
Ameriprise, through various separate accounts ("Accounts") established by certain of its insurance company affiliates, is currently an investor in the WAT Funds on behalf of contract holders in variable insurance policies and variable annuity contracts (together, the "Contracts") that Ameriprise or its affiliates have marketed to their clients. In the WAT structure, the insurance companies purchase shares in the WAT Funds on behalf of the Accounts, which fund the Contracts. The insurance company enters into a participation agreement with Wanger Advisors Trust to purchase shares on behalf of its Accounts. The Accounts are the actual investors in the Wanger Funds, not the individual contract holders. Through this structure, Ameriprise controlled Accounts hold approximately $2 billion or two-thirds of the WAT Funds' total assets; approximately nine other insurance companies also participate in the WAT Funds and hold the remaining a ssets in those Funds. Ameriprise also maintains a small account with CWAM that is a sub-account for a RiverSource mutual fund. This sub-account is not subject to oversight by the WAT or Acorn Board.
Columbia and Ameriprise have proposed that the Trusts continue, in substance, the existing advisory agreement governing portfolio management, and the administration services agreement governing certain administration and clerical services. They propose no change in services and no changes in fee levels, only those changes necessary to effect the change of ownership. The fees paid under these two agreements are referred to as "management fees."
Reasons for this Supplement
This Supplement is prompted by notice given by Ameriprise, after completion of the fee evaluation in December, that following the closing of the transaction, it anticipates a redemption of approximately $1 billion of its clients' investments in two of the WAT
98
Funds (Wanger USA and Wanger International), and re-investment of most of the proceeds in one or more RiverSource mutual funds; CWAM will sub-advise these funds in two new sub-accounts at CWAM and effect investment strategies substantially identical to those pursued by the WAT Funds from which those funds were redeemed. One of the sub-accounts will parallel WAT International/Acorn International, and the other Wanger USA/Acorn USA. Ameriprise has advised the Board of the sub-advisory fees to be paid to CWAM and such sub-advisory fees will be lower than the advisory fee paid to CWAM by the parallel WAT Fund. Sub-advised accounts of this kind are generally considered institutional accounts and sub-advisory services are priced differently (and usually lower) than the advisory fees for mutual funds that are not sub-advised.
The Order and the Investment Company Act require fund trustees to consider, among other things, the proposed management fees (including components thereof) charged to institutional and other clients of the adviser for like services. As the Fee Evaluation notes, CWAM historically has maintained very few institutional accounts with relatively few assets under management. The new Ameriprise accounts are, therefore, a departure from past practice at CWAM.
Ameriprise's intentions pose the following issues with respect to assessing the reasonableness of the management fee proposed by Ameriprise for the WAT and Acorn Funds:
1. How do the Funds' fees compare to the fees paid by the parallel institutional accounts?
2. What impact might the redemption have on the fees paid by the shareholders who remain in the WAT Funds after the Ameriprise action?
3. Would expanded assets in the institutional accounts strain CWAM's limited capacity to manage the Acorn and WAT Funds?
This Supplement is intended solely to address these points as additional information for consideration by the Trustees in assessing the reasonableness of the management fees proposed by Ameriprise.
****
Conclusions
The conclusions and recommendations in the December 2009 Fee Evaluation remain valid today. Consideration of the Ameriprise redemption proposal leads to the following additional conclusions and recommendations.
A. Reasonableness of the Advisory Fees and Related Considerations
CWAM will soon manage assets in a sub-advised account at fee levels that reflect a substantial discount to the parallel mutual fund. Ameriprise has set forth the differences in services that support its claim that this divergence in fees is justified. These justifications should be revisited by the Trustees. In addition, the redemption will result in higher fees for remaining participants in the WAT Funds, and will result in brokerage and other expenses for Fund participants. These costs should also be a part of the Trustees' calculus in assessing fees. Lastly, the prospect of increased assets for CWAM management raises potential future issues of investment capacity.
B. Process
In my opinion, the process of negotiating an advisory contract for the Funds has been conducted thoroughly and at arms' length. The Board's Contract Committee and its Ad Hoc Committee engaged in a careful assessment of the repercussions of the
99
Ameriprise redemption proposal, assessed as best as possible its potential costs, and revisited the breakpoint schedules of the WAT and Acorn Funds to determine whether WAT Fund participants are treated equitably in relation to Acorn Fund shareholders. It also gave consideration to the fee differential between institutional and mutual fund accounts. The Trustees met on a number occasions with me and with counsel, and gave close attention to a variety of materials including data submitted by Ameriprise and the legal analysis of counsel. The Trustees have sufficient information to evaluate management's proposals, and negotiate contract terms that are in the best interests of fund shareholders. Lastly, the Trustees considered the recommendations set forth below and the Contract Committee adopted them as appropriate measures to protect shareholders.
Recommendations
In light of the developments discussed in this Supplement, I recommend that the Trustees:
1. Consider imposing an expense cap on Wanger International and Wanger USA that will insulate those participants who remain after the Ameriprise redemption from the impact of increased advisory fees.
2. Consider including in the advisory or related contracts with Ameriprise a provision requiring Ameriprise to reimburse the direct costs of its redemption, insulating remaining Fund participants from the commission and other expenses that will be required to effect the redemption.
3. Consider seeking an agreement on the part of Ameriprise to seek Board approval of new institutional and sub-advised accounts that will result in increased assets under management at CWAM, thereby protecting existing investors from dilution of CWAM's limited investment management capacity.
Robert P. Scales
April 2010
100
Board Approval of the Proposed Investment Advisory Agreement
The Board of Trustees unanimously approved the proposed Investment Advisory Agreement with Columbia Wanger Asset Management, LLC ("Columbia WAM") (the "Proposed Advisory Agreement") for each Fund of the Trust at meetings held on February 24, 2010 and April 6, 2010.
The Ad Hoc Committee on the Sale of Columbia Management Group of the Board and the Contract Committee of the Board (together, the "Committees"), which are comprised solely of Trustees who have no direct or indirect interest in the Proposed Advisory Agreement and who are not "interested persons" (as defined in the Investment Company Act of 1940, as amended (the "1940 Act")), of the Trust (the "Independent Trustees"), and all Trustees received and reviewed a substantial amount of information provided by Columbia WAM and Ameriprise Financial, Inc. ("Ameriprise") in response to requests from the Independent Trustees and their independent legal counsel. Throughout the process, the Trustees had numerous opportunities to ask questions of and request additional materials from Columbia WAM and Ameriprise.
During each meeting at which the Committees or the Independent Trustees considered the Proposed Advisory Agreement, they met in executive session with their independent legal counsel. The Committees also met separately with representatives of Ameriprise, Columbia Management Group, LLC ("CMG") and Columbia WAM management on several different occasions. In all, one or other of the Committees convened formally on 22 separate occasions to consider the sale of a portion of the asset management business of CMG, including 100% of Columbia WAM, by Bank of America Corporation ("Bank of America") to Ameriprise (the "Transaction"), and convened informally on many other occasions. The Board and/or some or all of the Independent Trustees met on at least 6 other occasions to receive the Committees' status reports on the Transaction, receive presentations from Ameriprise and Columbia WAM representatives, and to discuss outstanding issues. In a ddition, the Independent Trustees' counsel and the Trust's Chief Compliance Officer conducted on-site due diligence sessions at Ameriprise. As they considered the Proposed Advisory Agreement, the Independent Trustees were advised by independent legal counsel.
The Trustees reviewed the Proposed Advisory Agreement, as well as certain information obtained through Ameriprise's responses to initial and supplemental questionnaires prepared at the request of the Trustees by counsel to the Funds and independent legal counsel to the Independent Trustees. In addition, the Trustees reviewed the Management Fee Evaluation dated December 2009 and the Supplement thereto dated April 2010 (the "Fee Evaluation") prepared by the Trust's chief compliance officer, senior vice president and general counsel, who also serves as the Trust's "Senior Officer," as contemplated by the Assurance of Discontinuance dated February 9, 2005 among affiliates of Columbia WAM and the Office of the New York Attorney General. Finally, the Trustees considered certain additional contractual protections they had obtained from Ameriprise in the event of a material compliance violation or harm caused to shareholders during the conversion of certain operational services as a result of the Transaction.
The materials reviewed by the Committees and the Trustees included, among other items, (i) information on the investment performance of each Fund and of independently selected peer groups of funds and of the Fund's performance benchmarks over various time periods, (ii) information on each Fund's advisory fees and other expenses, including information comparing the Fund's fees and expenses to those of peer groups of funds and information about any applicable expense limitations and fee breakpoints, (iii) data on sales and redemptions of Fund shares, and (iv) information on the profitability to Columbia WAM and Ameriprise, as well as potential "fall-out" or ancillary benefits that Columbia WAM and its affiliates may receive as a result of their relationships with the Funds. The Trustees also considered other information such as (i) Columbia WAM's financial condition, (ii) each Fund's investment objective and strategy, (iii) the si ze, education and experience of Columbia WAM's investment staff and its use of technology, external research and trading cost measurement tools, (iv) information on Ameriprise's approach to retention and compensation of portfolio managers and the terms of the new incentive compensation plan for Columbia WAM investment personnel, (v) the allocation of the Funds' brokerage, and the use of "soft" commission dollars to pay for research products and services, (vi) the resources devoted to, and the record of compliance with, the Funds' investment policies and restrictions, policies on personal securities transactions and other compliance policies, and (vii) Ameriprise's management structure, financial condition and its intentions for managing the Funds and the respective service providers.
In considering whether to approve the Proposed Advisory Agreement, the Trustees reviewed and analyzed various factors that they determined were relevant, none of which by itself was considered dispositive. However, the material factors
101
Board Approval of the Proposed Investment Advisory Agreement, continued
and conclusions that formed the basis for the Trustees' determination to approve the Proposed Advisory Agreement are discussed separately below.
Nature, quality and extent of services. The Trustees reviewed the expected nature, quality and extent of the services to be provided by Columbia WAM and its affiliates to the Funds under the Proposed Advisory Agreement, taking into account the investment objective and strategy of each Fund. In addition, the Trustees reviewed the available resources and key personnel of Columbia WAM and Ameriprise, especially those providing investment management services to the Funds. The Trustees also considered other services to be provided to the Funds by Columbia WAM, including: managing the execution of portfolio transactions and selecting broker-dealers for those transactions; monitoring adherence to the Funds' investment restrictions; producing shareholder reports; providing support services for the Board and committees of the Board; communicating with sharehol ders; serving as the Funds' administrator; and overseeing the activities of the Funds' other service providers, including monitoring for compliance with various policies and procedures as well as applicable securities laws and regulations. The Trustees reviewed each of these factors in light of the expected change of control of Columbia WAM and the likelihood of possible changes as a result of the Transaction.
In addition, in connection with the Transaction, the Board considered:
• the reputation, financial strength, regulatory histories and resources of Ameriprise and its affiliates;
• the terms of the Proposed Advisory Agreement, including the difference between the Current and Proposed Advisory Agreements, as set forth in this Proxy Statement, including that Columbia WAM had agreed to a higher standard of care for non-investment services in the Proposed Advisory Agreement;
• the terms and conditions of other agreements and arrangements relating to the future operations of the Funds, including the Underwriting Agreement and the Transition Services Agreement, both between Ameriprise and Bank of America; the Administration Services Agreement, between Columbia WAM and the Funds; the Transfer, Dividend Disbursing and Shareholders' Servicing Agent Agreement, between RiverSource Services Corporation and the Funds; the Distribution Agreement between RiverSource Fund Distributors, Inc. and the Funds; and the Transition, Integration and Conversion Principles Agreement and the Compliance Agreement, both between Ameriprise and the Funds;
• that the Trustees recently had completed a full annual review of the Current Advisory Agreement for each Fund under the 1940 Act, and had determined that they were satisfied with the nature, extent and quality of services provided thereunder and that they had determined that the management fees were reasonable in relation to the services rendered; and
• that Ameriprise and Bank of America, and not the Funds, would bear all costs of obtaining approvals of the Proposed Advisory Agreement, including legal and Trustee fees and costs resulting from the Transaction.
The Trustees concluded that the expected nature, quality and extent of the services to be provided by Columbia WAM to each Fund under the Proposed Advisory Agreement were appropriate for the Funds. They also concluded that Columbia WAM currently had sufficient personnel, with appropriate education and experience, to serve the Funds effectively, and that the firm had demonstrated its continuing ability to attract and retain well-qualified personnel. The Trustees also believed that Columbia WAM investment personnel would continue to be compensated pursuant to a plan that was designed to align their interests with those of Fund shareholders. The Trustees also considered that Columbia WAM had maintained its investment management capacity and resources throughout a difficult economic environment. In addition, they took note of the quality of Columbia WAM's compliance record. The Trustees also took into consideration that Ameriprise h ad offered its assurances that the services provided to the Funds following the Transaction would be consistent with or better than the manner and level at which such services were currently being performed for the Funds and that there would be no diminution of services to the Funds or their shareholders as a result of the Transaction. In this regard, the Trustees considered that certain current senior executives of CMG who are currently responsible for oversight of certain services provided to the Funds would continue to oversee those services after the closing of the Transaction. The Trustees also believed that the higher standard of care in the Proposed Advisory Agreement would benefit shareholders. The Trustees further recognized that the investment personnel of Columbia WAM would, effective upon a change of control of Columbia WAM to Ameriprise, be subject to employment agreements and other terms of employment created for the purpose of retaining skilled investment personnel. Assuming such personnel rem ain in place following the change in control, the Trustees concluded
102
that the Transaction would not result in a diminution of investment services provided to the Funds.
Performance of the Funds. The Trustees received and considered detailed performance information at various meetings of the Board and of the Investment Performance Analysis Committee of the Board throughout the year in addition to performance information considered in connection with the Transaction. They reviewed information comparing each Fund's performance with that of its benchmark(s) and with the performance of comparable funds and peer groups as identified by Lipper Inc. ("Lipper") and Morningstar, Inc. ("Morningstar"). The Trustees evaluated the performance of the Funds over various time periods. However, they gave somewhat more consideration to the rolling three-year performance of each Fund.
More particularly, with respect to the domestic Funds, the Trustees noted that Columbia Acorn Fund and Columbia Acorn Select outperformed their respective peer group medians for the three-year period ended September 30, 2009. Columbia Acorn Fund outperformed its benchmark, while Columbia Acorn Select underperformed its benchmark, over the same three-year period. Columbia Acorn USA underperformed its peer group medians but outperformed its benchmark over the three-year period. The Trustees considered that the Columbia Thermostat Fund's Morningstar ranking placed it ahead of its peer group median for the three-year period, although they discussed that the Fund was unique and that the peer group selected by Morningstar may have different investment policies and strategies. For the three-year period, Columbia Thermostat Fund underperformed the 50/50 Blended Benchmark, an equally weighted custom composite of the S&P 500® Inde x and the Barclays Capital U.S. Aggregate Bond Index, the Fund's primary equity and debt indexes, respectively, established by Columbia WAM. For the five-year period ended September 30, 2009, Columbia Acorn Fund, Columbia Acorn USA and Columbia Acorn Select outperformed or equaled their respective peer group medians and each outperformed its primary benchmark, while Columbia Thermostat Fund outperformed its Morningstar peer group median but underperformed the 50/50 Blended Benchmark.
With respect to the international Funds, the Trustees considered that Columbia Acorn International and Columbia Acorn International Select both outperformed their Morningstar peer group medians and benchmarks for the three-year and five-year periods ended September 30, 2009. Columbia Acorn International Select also outperformed its Lipper peer group medians for the three-year and five-year periods, while Columbia Acorn International equaled its Lipper peer group medians for the same periods.
The Trustees concluded that, although past performance is not necessarily indicative of future results, the strong overall longer-term performance record of the Funds was an important factor in the evaluation of the expected quality of services to be provided by Columbia WAM under the Proposed Advisory Agreement for each Fund and also supported approval.
Costs of Services and Profits Realized by Columbia WAM. The Trustees noted that Ameriprise and Columbia WAM were not proposing any changes in investment advisory or administration fees or total operating expenses in connection with the Transaction. At various Committee and Board meetings and other informal meetings, the Trustees examined detailed information on the fees and expenses of each Fund in comparison to information for comparable funds provided by Lipper and Morningstar. The Trustees reviewed the observations in the Fee Evaluation relating to the lack of uniformity in the Funds' rankings, but noted that in general, the fees were close to or below the median peer group rank. As noted in the Fee Evaluation, the actual advisory fees paid by Columbia Acorn Select and Columbia Acorn International Select were higher than the median advisory fee of the Funds' Morningstar and Lipper peer groups and the actual advisory fee paid by Columbia Acorn USA was higher than the median advisory fee of the Fund's Morningstar peer group, but not of its Lipper peer group. The actual advisory fees paid by Columbia Acorn Fund, Columbia Acorn International and Columbia Thermostat Fund were lower than the median advisory fee of the Funds' Morningstar and Lipper peer groups. Total management fees for three of the six Funds, however, were equal to or lower than their respective Morningstar peer group medians, and total management fees for three of the six Funds were equal to or lower than their respective Lipper peer group medians. The Trustees also considered that the total expenses paid by investors compared to total expenses charged by other peer funds, which they also considered to be a meaningful comparison.
The Trustees reviewed the analysis of the historic profitability of Columbia WAM in serving as each Fund's investment adviser and of Columbia WAM and its affiliates in their relationships with each Fund, as well as an explanation of the methodology utilized in allocating various expenses among the Funds and other business units, each of which was included in the Fee Evaluation. The Trustees considered the
103
Board Approval of the Proposed Investment Advisory Agreement, continued
current methodology used by Columbia WAM in determining compensation payable to portfolio managers and the competitive market for investment management talent. In addition, the Trustees considered the expected profitability of Columbia WAM related to the Funds following the Transaction; however, they determined that profitability projections at this time were speculative, at best. The Trustees noted that Columbia WAM's profit margins had declined recently, in line with industry trends, as a result of reduced assets under management. Nevertheless, based on limited comparative data, its current margins appeared to be in the upper range of competitors. They discussed how profitability comparisons among fund managers are of limited probative value due to the small number of publicly-owned managers, and that the profitability of any investment manager is affected by numerous factors, including its particular organizational structure, the types of funds and other accounts managed, other lines of business, expense allocation methodology, capital structure and cost of capital.
The Trustees also reviewed the advisory fee rates charged by Columbia WAM for managing other investment companies (including the Columbia Wanger Funds), sub-advised funds and other institutional separate accounts, as detailed in the Fee Evaluation. The Trustees noted that the Columbia Acorn Funds' advisory fees were generally comparable to the Columbia Wanger Funds' advisory fees. Columbia WAM's institutional separate account fees for various investment strategies were also examined; in some cases those fees were higher than the advisory fees charged to the Funds, and in some instances the fees were lower. The Trustees noted that Columbia WAM performs significant additional services for the Funds that it does not provide to sub-advised funds or non-mutual fund clients, including administrative services, oversight of the Funds' other service providers, trustee support, regulatory compliance and numerous other services, and that, in servicing the Funds, Columbia WAM assumes many legal risks that it does not assume in servicing many of its non-fund clients.
The Trustees concluded that the rates of advisory fees and other compensation to be payable by the Funds to Columbia WAM and its affiliates were reasonable in relation to the nature and quality of the services to be provided, taking into account the fees charged by other advisers for managing comparable mutual funds with similar strategies and the fees Columbia WAM charges to other clients. The Trustees also concluded that the Funds' estimated overall expense ratios were reasonable, considering the quality of services provided by Columbia WAM and its affiliates and the investment performance of the Funds.
Economies of Scale. At various Committee and Board meetings and other informal meetings, the Trustees considered information about the extent to which Columbia WAM realizes economies of scale in connection with an increase in Fund assets. The Trustees noted that the advisory fee schedule for each Fund, other than Columbia Thermostat Fund, which has relatively modest assets, includes breakpoints in the rate of fees at various asset levels. The Trustees concluded that the fee structure of each Fund was reasonable and reflective of a sharing between Columbia WAM and the Funds of economies of scale.
Other Benefits to Columbia WAM. The Trustees also reviewed benefits that could be expected to accrue to Columbia WAM and its affiliates from their relationships with the Funds, as outlined in the Fee Evaluation. They noted that, in connection with the Transaction, the Funds' transfer agency agreement would be assigned to RiverSource Service Corporation (now known as Columbia Management Investment Services Corp.), an affiliate of Ameriprise, which would receive compensation from the Funds for services provided. They considered that an affiliate of Ameriprise, RiverSource Funds Distributors, Inc. (now known as Columbia Management Investment Distributors, Inc.), would serve as the new distributor under a distribution agreement containing substantially the same terms as the Funds' existing distribution agreement with an affiliate of Columbia WAM, and that the Funds' new distributor would receive Rule 12b-1 Plan fees on the same basis as paid to the current distributor. In addition, the sub-administration agreement between Columbia WAM and a current affiliate would be transferred to an Ameriprise affiliate. The Trustees also considered other ways that the Funds and Columbia WAM may potentially benefit from their relationship with each other. For example, the Trustees considered Columbia WAM's use of commissions paid by each Fund on its portfolio brokerage transactions to obtain research products and services benefiting the Fund and/or other clients of Columbia WAM and noted that no material changes were being contemplated by Columbia WAM regarding its policies and procedures in respect of soft dollars as a result of the change in ownership of Columbia WAM. They determined that Columbia WAM's use of the Funds' "soft" commission dollars to obtain research products and services was consistent with current regulatory requirements and guidance. They also concluded that Columbia WAM
104
benefits from the receipt of proprietary research products and services acquired through commissions paid on portfolio transactions of the Funds, and that the Funds benefit from Columbia WAM's receipt of those products and services as well as research products and services acquired through commissions paid by other clients of Columbia WAM.
Section 15(f) of the 1940 Act. The Trustees also considered whether the arrangements between Columbia WAM and the Funds comply with the conditions of Section 15(f) of the 1940 Act. Section 15(f) provides a non-exclusive safe harbor under which an investment adviser to an investment company or any of its affiliated persons may receive any amount or benefit in connection with a change in control of the investment adviser provided two conditions are met. First, for a period of three years after closing of the transaction, at least 75% of the board members of the investment company may not be "interested persons" (as defined in the 1940 Act) of the investment adviser or predecessor adviser. Second, an "unfair burden" must not be imposed upon the investment company as a result of the transaction or any express or implied terms, conditions or understandings applicable thereto. The term "unfair burden" is defined in Section 15(f) to include any arrangement during the two-year period after the closing of the transaction whereby the investment adviser (or predecessor or successor adviser) or any interested person of any such investment adviser, receives or is entitled to receive any compensation, directly or indirectly, from the investment company or its shareholders (other than fees for bona fide additional investment advisory or other services) or from any person in connection with the purchase or sale of securities or other property to, from or on behalf of the investment company (other than bona fide ordinary compensation as principal underwriter for the investment company).
In connection with the first condition of Section 15(f), the Trustees concluded that upon closing of the Transaction at least 75% of the Trustees would not be "interested persons" (as defined in the 1940 Act) of the Adviser and would be in compliance with this provision of Section 15(f). With respect to the second condition of Section 15(f), Columbia WAM and Ameriprise represented in writing that no advisory or distribution fee increases were contemplated during the two years following the Transaction. The Trustees also noted that, to the extent future transactions are contemplated and recommended following the Transaction, Columbia WAM and Ameriprise represented that they would not seek any change that would impose an "unfair burden" on the Trust.
After full consideration of the above factors, as well as other factors that were instructive in evaluating the Proposed Advisory Agreement for each Fund, the Trustees, including the Independent Trustees, concluded on February 24, 2010 that the approval of the Proposed Advisory Agreement was in the best interest of each Fund, and they approved the Agreement and recommended that the shareholders of each Fund approve the Agreement for their Fund.
Following the Board's approval of the Proposed Advisory Agreement for each Fund on February 24, 2010, Ameriprise advised the Board that it anticipated that a significant amount of the existing assets of Wanger International and Wanger USA, representing the interests of owners of contracts issued by life insurance companies affiliated with Ameriprise, would be redeemed in spring 2010. These two Columbia Wanger Funds are managed substantially similarly to Columbia Acorn International and Columbia Acorn USA, respectively. These assets would be reinvested in two RiverSource Funds (the "New Institutional Accounts") that have similar investment objectives and strategies to Columbia Acorn International and Columbia Acorn USA. The New Institutional Accounts would be sub-advised by Columbia WAM for investment sub-advisory fees that were proposed to be lower than the advisory fees of their Columbia Acorn Fund counterparts. The Board there fore determined that the existence of the New Institutional Accounts to be sub-advised by Columbia WAM warranted another review of the Proposed Advisory Agreement for each Fund and the fees paid thereunder.
The Committees then met on four occasions in March 2010, including once with representatives of Ameriprise, to review and consider the New Institutional Accounts and the implications of these transactions with respect to their consideration of the Proposed Advisory Agreement for each Fund. In their deliberations, the Trustees received and reviewed a supplement dated April 2010 ("Supplement") to the Fee Evaluation prepared by the Senior Officer, which contained an analysis of the fees related to the New Institutional Accounts. The Trustees were also advised by independent counsel at each of these meetings.
The Trustees considered information submitted by Ameriprise regarding the sub-advisory fees payable to Columbia WAM for investment advisory services rendered to the accounts. The Trustees also considered that the sub-advisory fees payable were substantially the same as an existing RiverSource Fund account sub-advised by Columbia WAM. The Trustees considered the explanations previously provided by Columbia WAM for the differences in advisory fees paid by the
105
Board Approval of the Proposed Investment Advisory Agreement, continued
Funds and Columbia WAM's other similar institutional accounts. The Trustees also considered Ameriprise's and Columbia WAM's agreement that they would not agree to, or submit a proposal to, manage any further new institutional accounts without the express approval of the Board. The Board believed that this provision was necessary in order to protect Columbia WAM's investment capacity and the resulting quality of its investment services with respect to the Funds.
The Trustees also considered the performance of the Funds over various time periods ended December 31, 2009. Columbia Acorn Fund outperformed its Lipper peer group median and primary benchmark over the three-year period ended December 31, 2009, but underperformed its Morningstar peer group median over that same period. Columbia Acorn USA outperformed its peer group medians and primary benchmark over the three-year period. Columbia Acorn Select underperformed its primary benchmark, but outperformed its peer group medians for the three-year period. Both Columbia Acorn International and Columbia Acorn International Select outperformed their respective peer group medians and each outperformed its primary benchmark for the three-year period. Columbia Thermostat Fund outperformed its peer group medians but underperformed its 50/50 Blended Benchmark for the same three-year period. For the five-year period ended December 31, 2009, Colum bia Thermostat Fund outperformed its 50/50 Blended Benchmark and each other Fund outperformed its primary benchmark.
Taking all of the foregoing factors into account as well as the continued satisfactory performance of the Funds since the last Board meeting and other factors they deemed relevant, the Trustees, including all of the independent Trustees, concluded again on April 6, 2010 that the approval of the Proposed Advisory Agreement was in the best interest of each Fund, and they affirmed the approval of the Agreement and recommended that the shareholders of each Fund approve the Agreement for their Fund.
106
Columbia Acorn Family of Funds
Second Quarter Class Z Share Information
Minimum Initial Investment in
all Funds
| |
$2,500
$1,000 for an IRA | |
Minimum Subsequent
Investment in all Funds | | $50 | |
| Exchange Fee | | None | |
| Columbia Acorn Fund | | | ACRNX | | |
| Management Fee | | | 0.64 | % | |
| 12b-1 Fee | | | None | | |
| Other Expenses | | | 0.11 | % | |
| Net Expense Ratio | | | 0.75 | % | |
| Columbia Acorn International | | | ACINX | | |
| Management Fee | | | 0.77 | % | |
| 12b-1 Fee | | | None | | |
| Other Expenses | | | 0.18 | % | |
| Net Expense Ratio | | | 0.95 | % | |
| Columbia Acorn USA | | | AUSAX | | |
| Management Fee | | | 0.86 | % | |
| 12b-1 Fee | | | None | | |
| Other Expenses | | | 0.13 | % | |
| Net Expense Ratio | | | 0.99 | % | |
| Columbia Acorn International Select | | | ACFFX | | |
| Management Fee | | | 0.94 | % | |
| 12b-1 Fee | | | None | | |
| Other Expenses | | | 0.22 | % | |
| Net Expense Ratio | | | 1.16 | % | |
| Columbia Acorn Select | | | ACTWX | | |
| Management Fee | | | 0.82 | % | |
| 12b-1 Fee | | | None | | |
| Other Expenses | | | 0.13 | % | |
| Net Expense Ratio | | | 0.95 | % | |
| Columbia Thermostat Fund | | | COTZX | | |
| Management Fee | | | 0.10 | % | |
| 12b-1 Fee | | | None | | |
| Other Expenses | | | 0.15 | %* | |
| Net Expense Ratio | | | 0.25 | % | |
Fees and expenses are for the six months ended June 30, 2010, and for Columbia Thermostat Fund include the effect of CWAM's undertaking to waive fees and/or reimburse the Fund for any ordinary operating expenses (exclusive of interest and fees on borrowings, and expenses associated with the Fund's investment in other investment companies, but inclusive of custodian charges relating to overdrafts, if any), after giving effect to any balance credits from the Fund's custodian in excess of the annual rate of 0.25% of the average daily net assets. Columbia Thermostat Fund's reimbursement arrangement is contractual through April 30, 2011.
* Does not include estimated fees and expenses of 0.78% incurred by the Fund from the underlying portfolio funds in which it invests.
107
Proxy Voting Results
On May 27, 2010, a special meeting of shareholders of Columbia Acorn Trust (the "Trust") was held to ask shareholders of each Fund of the Trust to: (1) consider and vote on a proposed Investment Advisory Agreement for the Fund with CWAM, which became a subsidiary of Ameriprise Financial; and (2) elect eleven trustees to the Trust's Board of Trustees (the "Board"). A proxy statement that described the proposals was mailed to shareholders of record as of April 8, 2010.
Proposal 1: A proposed Investment Advisory Agreement with CWAM was approved for each Fund, as follows:
| Fund | | Votes For | | Votes Against | | Abstentions | | Broker Non-Votes* | |
| Columbia Acorn Fund | | | 295,054,542 | | | | 5,887,228 | | | | 5,202,819 | | | | 60,105,675 | | |
| Columbia Acorn International | | | 76,381,712 | | | | 1,384,255 | | | | 884,737 | | | | 23,551,750 | | |
| Columbia Acorn USA | | | 25,415,392 | | | | 2,189,936 | | | | 247,672 | | | | 4,134,020 | | |
| Columbia Acorn International Select | | | 12,377,245 | | | | 61,231 | | | | 76,202 | | | | 2,740,103 | | |
| Columbia Acorn Select | | | 38,931,903 | | | | 504,251 | | | | 515,982 | | | | 10,453,962 | | |
| Columbia Thermostat Fund | | | 6,034,518 | | | | 68,703 | | | | 142,714 | | | | 1,824,178 | | |
* Shares held of record by a financial intermediary, such as a broker or nominee, typically held in "street name," as to which (i) written voting instructions on the matter have not been received from the beneficial owners or persons entitled to vote and (ii) the intermediary does not have discretionary voting power on the matter.
Proposal 2: Each of the trustee nominees was elected to the Board as follows:
| Fund | | Votes For | | Votes Against | | Abstentions | |
| Laura M. Born | | | 560,169,724 | | | | 14,001,005 | | | | 0 | | |
| Michelle L. Collins | | | 559,790,048 | | | | 14,380,682 | | | | 0 | | |
| Maureen M. Culhane | | | 559,638,902 | | | | 14,531,828 | | | | 0 | | |
| Margaret M. Eisen | | | 560,119,886 | | | | 14,050,843 | | | | 0 | | |
| John C. Heaton | | | 559,671,052 | | | | 14,499,677 | | | | 0 | | |
| Steven N. Kaplan | | | 560,434,242 | | | | 13,736,487 | | | | 0 | | |
| David C. Kleinman | | | 526,427,211 | | | | 47,743,518 | | | | 0 | | |
| Charles P. McQuaid** | | | 557,062,152 | | | | 17,108,578 | | | | 0 | | |
| Allan B. Muchin | | | 559,839,896 | | | | 14,330,833 | | | | 0 | | |
| David B. Small | | | 560,065,265 | | | | 14,105,464 | | | | 0 | | |
| James A. Star | | | 560,735,460 | | | | 13,435,269 | | | | 0 | | |
** Mr. McQuaid is an "interested person" of the Trust and of CWAM because he is an officer of the Trust and of CWAM.
108
Columbia Acorn Family of Funds
Trustees
James A. Star
Chairman of the Board
Steven N. Kaplan
Vice Chairman of the Board
Laura M. Born
Michelle L. Collins
Maureen M. Culhane
Margaret M. Eisen
John C. Heaton
David C. Kleinman
Charles P. McQuaid
Allan B. Muchin
David B. Small
Ralph Wanger (Trustee Emeritus)
Officers
Charles P. McQuaid
President
Ben Andrews
Vice President
Michael G. Clarke
Assistant Treasurer
P. Zachary Egan
Vice President
John M. Kunka
Assistant Treasurer
Joseph C. LaPalm
Vice President
Bruce H. Lauer
Vice President, Secretary and Treasurer
Louis J. Mendes III
Vice President
Robert A. Mohn
Vice President
Christopher J. Olson
Vice President
Christopher O. Petersen
Assistant Secretary
Scott R. Plummer
Assistant Secretary
Linda K. Roth-Wiszowaty
Assistant Secretary
Robert P. Scales
Chief Compliance Officer, Chief Legal Officer,
Senior Vice President and General Counsel
Investment Advisor
Columbia Wanger Asset Management, LLC
227 West Monroe Street, Suite 3000
Chicago, Illinois 60606
1-800-922-6769
Distributor*
Columbia Management Investment Distributors, Inc.
One Financial Center
Boston, Massachusetts 02111-2621
Transfer Agent, Dividend Disbursing Agent*
Columbia Management Investment Services Corp.
P. O. Box 8081
Boston, Massachusetts 02266-8081
1-800-345-6611
Legal Counsel to the Funds
K&L Gates LLP
Washington, DC
Legal Counsel to the Independent Trustees
Drinker Biddle & Reath LLP
Philadelphia, Pennsylvania
Independent Registered Public Accounting Firm
PricewaterhouseCoopers LLP
Chicago, Illinois
*As of May 1, 2010
This report, including the schedules of investments, is submitted for the general information of the shareholders of Columbia Acorn Trust.
A description of the policies and procedures that the Funds use to determine how to vote proxies and a copy of the Funds' voting record are available (i) without charge, upon request, by calling 800-922-6769 and (ii) on the Securities and Exchange Commission's website at www.sec.gov. Information regarding how the Funds voted proxies relating to portfolio securities during the 12-month period ended June 30, is available from the SEC's website. Information regarding how the Funds voted proxies relating to portfolio securities is also available at http://institutional.columbiamanagement.com.
The Funds file a complete schedule of portfolio holdings with the SEC for the first and third quarters of each fiscal year on Form N-Q. The Funds' Form N-Q is available on the SEC's website at www.sec.gov and may be reviewed and copied at the SEC's Public Reference Room in Washington, D.C. Information on the operation of the Public Reference Room may be obtained by calling 1-800-SEC-0330.
Investors should consider the investment objectives, risks, charges and expenses of a mutual fund carefully before investing. For a free prospectus, which contains this and other important information about the funds, visit www.columbiafunds.com. Read the prospectus carefully before investing.
On April 30, 2010, Ameriprise Financial, Inc. ("Ameriprise Financial"), the parent company of RiverSource Investments, LLC, acquired the long-term asset management business of Columbia Management Group, LLC, including certain of its affiliates, which were, prior to this acquisition, part of Bank of America Corporation. In connection with the acquisition, Ameriprise Financial acquired Columbia Wanger Asset Management, LLC ("CWAM"). CWAM will continue as the investment advisor for the Columbia Acorn and Wanger Funds and no changes are anticipated in the existing investment management team. Ameriprise Financial also acquired Columbia Management Distributors, Inc., now known as Columbia Management Investment Distributors, Inc., member FINRA, which is the distributor a nd principal underwriter of the Funds.
CWAM is a registered investment advisor and an indirect wholly owned subsidiary of Ameriprise Financial, Inc.
Find out what's new – visit our web site at:
www.columbiafunds.com
Our e-mail address is:
ServiceInquiries@ColumbiaManagement.com
Shareholders should not include personal information such as account numbers, Social Security numbers or taxpayer identification numbers in e-mail. We are unable to accept account transactions sent via e-mail.

Columbia Acorn Family of Funds
Class Z Shares
Semiannual Report, June 30, 2010
For More Information
You'll find more information about the Columbia Acorn Family Funds in the documents described below. Contact Columbia Funds as follows to obtain these documents free of charge:
By Mail: Columbia Funds
c/o Columbia Management Investment Services Corp.
P.O. Box 8081
Boston, MA 02266-8081
By Telephone: 800.345.6611
Online: www.columbiafunds.com
Shareholder Communications with the Board
The Funds' Board of Trustees has adopted procedures by which shareholders may communicate with the Board. Shareholders who wish to communicate with the Board should send their written communications to the Board by mail, c/o Columbia Wanger Asset Management, LLC, 227 West Monroe Street, Suite 3000, Chicago, Illinois 60606, Attention: Secretary. Shareholder communications must (i) be in writing, (ii) identify the Columbia Acorn Fund to which the communication relates and (iii) state the particular class of shares and number of shares held by the communicating shareholder.
Prospectuses and the Statement of Additional Information (SAI)
The prospectuses and the SAI provide more detailed information about the Funds and their policies. The SAI is legally part of each prospectus (it's incorporated by reference). A copy of each has been filed with the SEC.
Information Provided by the SEC
You can review and copy information about the Funds (including their prospectuses, the SAI and shareholder reports) at the SEC's Public Reference Room in Washington, DC. To find out more about the operation of the Public Reference Room, call the SEC at 202.551.8090. Reports and other information about the Fund are also available in the EDGAR Database on the SEC's website at http://www.sec.gov, or you can receive copies of this information, for a fee, by electronic request at the following e-mail address: publicinfo@sec.gov. You can also obtain copies of this information by writing the Public Reference Section, Securities and Exchange Commission, Washington, DC 20549-0102.
The investment company registration number of Columbia Acorn Trust, of which each of these Funds is a series, is 811-01829.
© 2010 Columbia Management Investment Distributors, Inc.
One Financial Center, Boston, MA 02111-2621
800.345.6611 www.columbiamanagement.com
C-1565 A (8/10) 103800
Q2 2010

Columbia Acorn Family of Funds
Class A, B and C Shares
Managed by Columbia Wanger Asset Management, LLC

Semiannual Report
June 30, 2010
n ColumbiaSM
Acorn® Fund
n ColumbiaSM
Acorn International®
n ColumbiaSM
Acorn USA®
n ColumbiaSM
Acorn International SelectSM
n ColumbiaSM
Acorn SelectSM
n ColumbiaSM
Thermostat FundSM
Not FDIC insured • No bank guarantee • May lose value
The views expressed in the "Squirrel Chatter II" and "In a Nutshell" commentaries reflect the current views of the respective authors. These views are not guarantees of future performance and involve certain risks, uncertainties and assumptions that are difficult to predict so actual outcomes and results may differ significantly from the views expressed. These views are subject to change at any time based upon economic, market or other conditions and the respective authors disclaim any responsibility to update such views. These views may not be relied upon as investment advice and, because investment decisions for a Columbia Acorn Fund are based on numerous factors, may not be relied upon as an indication of trading intent on behalf of any particular Columbia Acorn Fund. References to specific company securities should not be construed as a recommendation or investment advice and there can be no assurance that as of the date of publication of this report, the securities mentioned in each Fund's portfolio are still held or that the securities sold have not been repurchased.
You are invited to the 2010 Columbia Acorn Funds Shareholder Information Meeting
When: Wednesday, September 22, 2010
12 noon to 1 p.m. Central time
Where: Chase Bank Auditorium, Plaza Level
10 South Dearborn Street
Chicago, Illinois
A buffet lunch will be served at 11:30 a.m.
If you plan to join us in Chicago, please RSVP by September 20
by calling 1-800-922-6769.
The Chase Bank Auditorium is located within the Chase Tower at the corner of Madison St. and Dearborn St. After entering the building, please take the escalators down to the plaza level and follow the signs to the Chase Bank Auditorium.
View a Replay on our Website
For those who are unable to join us in Chicago, a webcast replay of the meeting will be available during the month of October at www.columbiafunds.com.
Columbia Acorn Family of Funds
Table of Contents
| Share Class Performance | | | 2 | | |
|
| Fund Performance vs. Benchmarks | | | 3 | | |
|
| Description of Indexes | | | 4 | | |
|
| Net Asset Value Per Share | | | 4 | | |
|
| Squirrel Chatter II: Columbia Acorn Fund At 40 | | | 5 | | |
|
| Understanding Your Expenses | | | 9 | | |
|
| Columbia Acorn Fund | |
|
| In a Nutshell | | | 11 | | |
|
| At a Glance | | | 12 | | |
|
| Major Portfolio Changes | | | 23 | | |
|
| Statement of Investments | | | 26 | | |
|
| Columbia Acorn International | |
|
| In a Nutshell | | | 13 | | |
|
| At a Glance | | | 14 | | |
|
| Major Portfolio Changes | | | 39 | | |
|
| Statement of Investments | | | 41 | | |
|
| Portfolio Diversification | | | 49 | | |
|
| Columbia Acorn USA | |
|
| In a Nutshell | | | 15 | | |
|
| At a Glance | | | 16 | | |
|
| Major Portfolio Changes | | | 50 | | |
|
| Statement of Investments | | | 51 | | |
|
| Columbia Acorn International Select | |
|
| In a Nutshell | | | 17 | | |
|
| At a Glance | | | 18 | | |
|
| Major Portfolio Changes | | | 59 | | |
|
| Statement of Investments | | | 60 | | |
|
| Portfolio Diversification | | | 63 | | |
|
| Columbia Acorn Select | |
|
| In a Nutshell | | | 19 | | |
|
| At a Glance | | | 20 | | |
|
| Major Portfolio Changes | | | 64 | | |
|
| Statement of Investments | | | 65 | | |
|
| Columbia Thermostat Fund | |
|
| In a Nutshell | | | 21 | | |
|
| At a Glance | | | 22 | | |
|
| Statement of Investments | | | 70 | | |
|
| Columbia Acorn Family of Funds | |
|
| Statements of Assets and Liabilities | | | 72 | | |
|
| Statements of Operations | | | 73 | | |
|
| Statements of Changes in Net Assets | | | 75 | | |
|
| Financial Highlights | | | 79 | | |
|
| Notes to Financial Statements | | | 91 | | |
|
Management Fee Evaluation
of the Senior Officer | | | 101 | | |
|
Board Approval of the Proposed Investment
Advisory Agreement | | | 111 | | |
|
| Columbia Acorn Family of Funds Information | | | 117 | | |
|
| Proxy Voting Results | | | 118 | | |
|
2010 Mid-Year Distributions
The following table lists the mid-year distributions for Columbia Acorn Fund, Columbia Acorn International, Columbia Acorn International Select and Columbia Thermostat Fund. Columbia Acorn USA and Columbia Acorn Select did not have a mid-year distribution. The record date was June 8, 2010. The ex-dividend date was June 9, 2010, and the payable date was June 10, 2010.
| | | Short-term
Capital
Gains | | Long-term
Capital
Gains | | Ordinary
Income | | Reinvestment
Price | |
| Columbia Acorn Fund – Class A (no Class B or Class C distributions) | | None | | None | | $ | 0.0197 | | | $ | 23.50 | | |
| Columbia Acorn International – Class A | | None | | None | | $ | 0.4910 | | | $ | 31.37 | | |
| Columbia Acorn International – Class B | | None | | None | | $ | 0.3060 | | | $ | 30.61 | | |
| Columbia Acorn International – Class C | | None | | None | | $ | 0.2674 | | | $ | 30.51 | | |
| Columbia Acorn International Select – Class A | | None | | None | | $ | 0.3027 | | | $ | 21.81 | | |
| Columbia Acorn International Select – Class B | | None | | None | | $ | 0.1781 | | | $ | 20.89 | | |
| Columbia Acorn International Select – Class C | | None | | None | | $ | 0.1346 | | | $ | 20.79 | | |
| Columbia Thermostat Fund – Class A | | None | | None | | $ | 0.1372 | | | $ | 10.57 | | |
| Columbia Thermostat Fund – Class B | | None | | None | | $ | 0.0918 | | | $ | 10.63 | | |
| Columbia Thermostat Fund – Class C | | None | | None | | $ | 0.0691 | | | $ | 10.62 | | |
1
Columbia Acorn Family of Funds
Share Class Performance Average Annual Total Returns through 6/30/10
| | | Class A | | Class B* | | Class C | |
| | | Without
Sales Charge | | With
Sales Charge | | Without
Sales Charge | | With
Sales Charge | | Without
Sales Charge | | With
Sales Charge | |
| Columbia Acorn Fund (10/16/00) | |
| 3 months** | | | -9.80 | % | | | -14.99 | % | | | -9.96 | % | | | -14.46 | % | | | -9.97 | % | | | -10.87 | % | |
| Year to date** | | | -3.30 | % | | | -8.86 | % | | | -3.66 | % | | | -8.47 | % | | | -3.69 | % | | | -4.65 | % | |
| 1 year | | | 22.83 | % | | | 15.76 | % | | | 22.02 | % | | | 17.02 | % | | | 21.86 | % | | | 20.86 | % | |
| 3 years | | | -7.34 | % | | | -9.15 | % | | | -7.93 | % | | | -8.78 | % | | �� | -8.08 | % | | | -8.08 | % | |
| 5 years | | | 2.14 | % | | | 0.94 | % | | | 1.48 | % | | | 1.16 | % | | | 1.33 | % | | | 1.33 | % | |
| Life of fund | | | 7.14 | % | | | 6.49 | % | | | 6.44 | % | | | 6.44 | % | | | 6.35 | % | | | 6.35 | % | |
Columbia Acorn
International (10/16/00) | |
| 3 months** | | | -7.73 | % | | | -13.04 | % | | | -7.92 | % | | | -12.48 | % | | | -7.93 | % | | | -8.84 | % | |
| Year to date** | | | -4.59 | % | | | -10.08 | % | | | -4.93 | % | | | -9.64 | % | | | -4.95 | % | | | -5.89 | % | |
| 1 year | | | 18.54 | % | | | 11.72 | % | | | 17.76 | % | | | 12.76 | % | | | 17.59 | % | | | 16.59 | % | |
| 3 years | | | -7.54 | % | | | -9.35 | % | | | -8.13 | % | | | -8.97 | % | | | -8.27 | % | | | -8.27 | % | |
| 5 years | | | 7.45 | % | | | 6.19 | % | | | 6.76 | % | | | 6.45 | % | | | 6.62 | % | | | 6.62 | % | |
| Life of fund | | | 5.86 | % | | | 5.22 | % | | | 5.17 | % | | | 5.17 | % | | | 5.09 | % | | | 5.09 | % | |
| Columbia Acorn USA (10/16/00) | |
| 3 months** | | | -12.17 | % | | | -17.22 | % | | | -12.36 | % | | | -16.74 | % | | | -12.31 | % | | | -13.19 | % | |
| Year to date** | | | -6.38 | % | | | -11.76 | % | | | -6.77 | % | | | -11.43 | % | | | -6.72 | % | | | -7.65 | % | |
| 1 year | | | 22.38 | % | | | 15.34 | % | | | 21.48 | % | | | 16.48 | % | | | 21.42 | % | | | 20.42 | % | |
| 3 years | | | -8.92 | % | | | -10.71 | % | | | -9.54 | % | | | -10.37 | % | | | -9.64 | % | | | -9.64 | % | |
| 5 years | | | -0.94 | % | | | -2.11 | % | | | -1.60 | % | | | -1.94 | % | | | -1.72 | % | | | -1.72 | % | |
| Life of fund | | | 6.40 | % | | | 5.75 | % | | | 5.70 | % | | | 5.70 | % | | | 5.63 | % | | | 5.63 | % | |
Columbia Acorn International
Select (10/16/00) | |
| 3 months** | | | -5.60 | % | | | -11.02 | % | | | -5.68 | % | | | -10.35 | % | | | -5.78 | % | | | -6.71 | % | |
| Year to date** | | | -3.90 | % | | | -9.43 | % | | | -4.16 | % | | | -8.91 | % | | | -4.29 | % | | | -5.24 | % | |
| 1 year | | | 15.15 | % | | | 8.53 | % | | | 14.44 | % | | | 9.44 | % | | | 14.16 | % | | | 13.16 | % | |
| 3 years | | | -7.53 | % | | | -9.33 | % | | | -8.11 | % | | | -8.96 | % | | | -8.26 | % | | | -8.26 | % | |
| 5 years | | | 6.67 | % | | | 5.42 | % | | | 5.99 | % | | | 5.67 | % | | | 5.83 | % | | | 5.83 | % | |
| Life of fund | | | 3.60 | % | | | 2.97 | % | | | 2.91 | % | | | 2.91 | % | | | 2.83 | % | | | 2.83 | % | |
| Columbia Acorn Select (10/16/00) | |
| 3 months** | | | -12.43 | % | | | -17.47 | % | | | -12.58 | % | | | -16.95 | % | | | -12.59 | % | | | -13.47 | % | |
| Year to date** | | | -4.91 | % | | | -10.38 | % | | | -5.23 | % | | | -9.97 | % | | | -5.27 | % | | | -6.22 | % | |
| 1 year | | | 26.92 | % | | | 19.62 | % | | | 26.02 | % | | | 21.02 | % | | | 25.81 | % | | | 24.81 | % | |
| 3 years | | | -9.32 | % | | | -11.09 | % | | | -9.92 | % | | | -10.79 | % | | | -10.06 | % | | | -10.06 | % | |
| 5 years | | | 2.88 | % | | | 1.67 | % | | | 2.20 | % | | | 1.83 | % | | | 2.05 | % | | | 2.05 | % | |
| Life of fund | | | 6.57 | % | | | 5.92 | % | | | 5.86 | % | | | 5.86 | % | | | 5.77 | % | | | 5.77 | % | |
Columbia Thermostat
Fund (3/3/03)† | |
| 3 months** | | | -6.75 | % | | | -12.11 | % | | | -6.79 | % | | | -11.41 | % | | | -6.83 | % | | | -7.75 | % | |
| Year to date** | | | -2.05 | % | | | -7.68 | % | | | -2.18 | % | | | -7.03 | % | | | -2.30 | % | | | -3.27 | % | |
| 1 year | | | 20.23 | % | | | 13.32 | % | | | 19.73 | % | | | 14.73 | % | | | 19.49 | % | | | 18.49 | % | |
| 3 years | | | -2.38 | % | | | -4.29 | % | | | -2.87 | % | | | -3.75 | % | | | -3.11 | % | | | -3.11 | % | |
| 5 years | | | 2.17 | % | | | 0.96 | % | | | 1.65 | % | | | 1.34 | % | | | 1.42 | % | | | 1.42 | % | |
| Life of fund | | | 5.81 | % | | | 4.96 | % | | | 5.22 | % | | | 5.22 | % | | | 5.04 | % | | | 5.04 | % | |
*The Funds no longer accept investments from new or existing shareholders in Class B shares.
**Not annualized.
Performance data quoted represents past performance and current performance may be lower or higher. Past performance is no guarantee of future results. The investment return and principal value of an investment in a Fund will fluctuate so that Fund shares, when redeemed, may be worth more or less than their original cost. Please visit columbiafunds.com for daily and most recent month-end performance updates.
The "with sales charge" returns include the maximum initial sales charge of 5.75% for Class A shares, the applicable contingent deferred sales charge (CDSC) for Class B shares (5%, 4%, 3%, 3%, 2%, 1%, 0% for the first through seventh years after purchase, respectively), and the maximum CDSC of 1.00% of Class C shares during the first year after purchase.
Annual operating expense ratios are as stated in each Fund's current prospectus and differences in expense ratios disclosed elsewhere in this report may result from including fee waivers and expense reimbursements as well as different time periods used in calculating the ratios. Columbia Acorn Fund: Class A: 1.07%; Class B: 1.74%; Class C: 1.89%. Columbia Acorn International: Class A: 1.36%; Class B: 2.03%; Class C: 2.17%. Columbia Acorn USA: Class A: 1.32%; Class B: 2.02%; Class C: 2.13%. Columbia Acorn International Select: Class A: 1.58%; Class B: 2.33%; Class C: 2.43%. Columbia Acorn Select: Class A: 1.30%; Class B: 2.01%; Class C: 2.14%. Columbia Thermostat Fund has a contractual expense waiver or reimbursement that expires April 30, 2011. Expense ratios without and with the contractual waiver, including fees and expenses associated with the Fund's investments in other investment companies are, respectively: Class A: 1.60%, 1.32%; Class B: 2.14%, 1.82%; Class C: 2.37%, 2.07%.
Performance results reflect any fee waivers or reimbursements of Fund expenses by the investment advisor and/or any of its affiliates. Absent these fee waivers or expense reimbursement arrangements, performance results would have been lower.
†A "fund of funds" bears its allocable share of the costs and expenses of the underlying funds in which it invests. Such funds are thus subject to two levels of fees and potentially higher expense ratios than would be associated with an investment in a fund that invests and trades directly in financial instruments under the direction of a single manager.
All results shown assume reinvestment of distributions and do not reflect the deduction of taxes that a shareholder would pay on fund distributions or on the redemption of fund shares.
2
Columbia Acorn Family of Funds
Fund Performance vs. Benchmarks Average Annual Total Returns through 6/30/10
| Class A Shares, without sales charge | | 2nd
quarter* | | Year
to date* | | 1 year | | 3 years | | 5 years | | Life
of Fund | |
Columbia Acorn Fund
(LACAX) (10/16/00) | | | -9.80 | % | | | -3.30 | % | | | 22.83 | % | | | -7.34 | % | | | 2.14 | % | | | 7.14 | % | |
| Russell 2500 Index | | | -9.98 | % | | | -1.69 | % | | | 24.03 | % | | | -7.98 | % | | | 0.98 | % | | | 4.78 | % | |
| S&P 500 Index** | | | -11.43 | % | | | -6.65 | % | | | 14.43 | % | | | -9.81 | % | | | -0.79 | % | | | -1.08 | % | |
| Lipper Small-Cap Core Funds Index | | | -9.04 | % | | | -2.09 | % | | | 21.67 | % | | | -7.59 | % | | | 1.15 | % | | | 4.68 | % | |
| Lipper Mid-Cap Growth Funds Index | | | -9.76 | % | | | -3.28 | % | | | 21.13 | % | | | -6.51 | % | | | 2.85 | % | | | -1.61 | % | |
Columbia Acorn International
(LAIAX) (10/16/00) | | | -7.73 | % | | | -4.59 | % | | | 18.54 | % | | | -7.54 | % | | | 7.45 | % | | | 5.86 | % | |
| S&P Global Ex-U.S. Between $500 Million and $5 Billion Index | | | -9.15 | % | | | -4.96 | % | | | 18.65 | % | | | -8.18 | % | | | 6.51 | % | | | 8.94 | % | |
| S&P Global Ex-U.S. SmallCap Index*** | | | -10.01 | % | | | -6.09 | % | | | 18.59 | % | | | -10.26 | % | | | 5.21 | % | | | 7.90 | % | |
| MSCI EAFE Index (Net) | | | -13.97 | % | | | -13.23 | % | | | 5.92 | % | | | -13.38 | % | | | 0.88 | % | | | 1.45 | % | |
| Lipper International Small/Mid Growth Funds Index | | | -9.88 | % | | | -6.75 | % | | | 17.04 | % | | | -11.18 | % | | | 4.72 | % | | | 3.96 | % | |
Columbia Acorn USA
(LAUAX) (10/16/00) | | | -12.17 | % | | | -6.38 | % | | | 22.38 | % | | | -8.92 | % | | | -0.94 | % | | | 6.40 | % | |
| Russell 2000 Index | | | -9.92 | % | | | -1.95 | % | | | 21.48 | % | | | -8.60 | % | | | 0.37 | % | | | 3.84 | % | |
| Russell 2500 Index | | | -9.98 | % | | | -1.69 | % | | | 24.03 | % | | | -7.98 | % | | | 0.98 | % | | | 4.78 | % | |
| S&P 500 Index** | | | -11.43 | % | | | -6.65 | % | | | 14.43 | % | | | -9.81 | % | | | -0.79 | % | | | -1.08 | % | |
| Lipper Small-Cap Growth Funds Index | | | -9.46 | % | | | -3.10 | % | | | 18.22 | % | | | -8.80 | % | | | -0.14 | % | | | -0.93 | % | |
Columbia Acorn Int'l Select
(LAFAX) (10/16/00) | | | -5.60 | % | | | -3.90 | % | | | 15.15 | % | | | -7.53 | % | | | 6.67 | % | | | 3.60 | % | |
| S&P Developed Ex-U.S. Between $2 Billion and $10 Billion Index | | | -10.15 | % | | | -6.52 | % | | | 12.73 | % | | | -11.58 | % | | | 3.42 | % | | | 6.06 | % | |
| MSCI EAFE Index (Net) | | | -13.97 | % | | | -13.23 | % | | | 5.92 | % | | | -13.38 | % | | | 0.88 | % | | | 1.45 | % | |
| Lipper International Funds Index | | | -12.54 | % | | | -10.89 | % | | | 9.50 | % | | | -11.35 | % | | | 2.62 | % | | | 2.56 | % | |
Columbia Acorn Select
(LTFAX) (10/16/00) | | | -12.43 | % | | | -4.91 | % | | | 26.92 | % | | | -9.32 | % | | | 2.88 | % | | | 6.57 | % | |
| S&P MidCap 400 Index | | | -9.59 | % | | | -1.36 | % | | | 24.93 | % | | | -5.90 | % | | | 2.21 | % | | | 5.01 | % | |
| S&P 500 Index** | | | -11.43 | % | | | -6.65 | % | | | 14.43 | % | | | -9.81 | % | | | -0.79 | % | | | -1.08 | % | |
| Lipper Mid-Cap Growth Funds Index | | | -9.76 | % | | | -3.28 | % | | | 21.13 | % | | | -6.51 | % | | | 2.85 | % | | | -1.61 | % | |
Columbia Thermostat Fund
(CTFAX) (3/3/03)† | | | -6.75 | % | | | -2.05 | % | | | 20.23 | % | | | -2.38 | % | | | 2.17 | % | | | 5.81 | % | |
| S&P 500 Index | | | -11.43 | % | | | -6.65 | % | | | 14.43 | % | | | -9.81 | % | | | -0.79 | % | | | 4.88 | % | |
| Barclays Capital U.S. Aggregate Bond Index | | | 3.49 | % | | | 5.33 | % | | | 9.50 | % | | | 7.55 | % | | | 5.54 | % | | | 5.07 | % | |
| Lipper Flexible Portfolio Funds Index | | | -7.43 | % | | | -3.81 | % | | | 15.48 | % | | | -3.73 | % | | | 2.78 | % | | | 6.45 | % | |
| 50/50 Blended Benchmark†† | | | -4.10 | % | | | -0.59 | % | | | 12.34 | % | | | -0.98 | % | | | 2.69 | % | | | 5.27 | % | |
*Not annualized.
**The comparison to the S&P 500 Index is presented to show performance against a widely recognized market index over the life of the Fund.
***See Page 4 for additional information.
Performance data quoted represents past performance and current performance may be lower or higher. Past performance is no guarantee of future results. The investment return and principal value of an investment in a Fund will fluctuate so that Fund shares, when redeemed, may be worth more or less than their original cost. Please visit columbiafunds.com for daily and most recent month-end updates.
Annual operating expense ratios are as stated in each Fund's current prospectus and differences in expense ratios disclosed elsewhere in this report may result from including fee waivers and expense reimbursements as well as different time periods used in calculating the ratios. Columbia Acorn Fund: Class A: 1.07%; Class B: 1.74%; Class C: 1.89%. Columbia Acorn International: Class A: 1.36%; Class B: 2.03%; Class C: 2.17%. Columbia Acorn USA: Class A: 1.32%; Class B: 2.02%; Class C: 2.13%. Columbia Acorn International Select: Class A: 1.58%; Class B: 2.33%; Class C: 2.43%. Columbia Acorn Select: Class A: 1.30%; Class B: 2.01%; Class C: 2.14%. Columbia Thermostat Fund has a contractual expense waiver or reimbursement that expires April 30, 2011. Expense ratios without and with the contractual waiver, including fees and expenses associated with the Fund's investments in other investment companies are: Class A: 1.60%, 1.32%; Class B: 2.14%, 1.82%; Class C: 2.37%, 2.07%, respectively.
Performance results reflect any fee waivers or reimbursements of Fund expenses by the investment advisor and/or any of its affiliates. Absent these fee waivers or expense reimbursement arrangements, performance results would have been lower.
†A "fund of funds" bears its allocable share of the costs and expenses of the underlying funds in which it invests. Such funds are thus subject to two levels of fees and potentially higher expense ratios than would be associated with an investment in a fund that invests and trades directly in financial instruments under the direction of a single manager.
††The 50/50 Blended Benchmark is a custom supplemental benchmark established by the advisor.
All results shown assume reinvestment of distributions and do not reflect the deduction of taxes that a shareholder would pay on fund distributions or on the redemption of fund shares.
Unlike mutual funds, indexes are not actively managed and do not incur fees or expenses. It is not possible to invest directly in an index. For index definitions, see Page 4.
The dates in parantheses are the inception dates for each respective Fund.
3
Columbia Acorn Family of Funds
Descriptions of Indexes Included in this Report
• 50/50 Blended Benchmark, established by the Fund's advisor, is an equally weighted custom composite of Columbia Thermostat Fund's primary equity and primary debt benchmarks, the S&P 500 Index and the Barclays Capital U.S. Aggregate Bond Index, respectively. The percentage of the Fund's assets allocated to underlying stock and bond portfolio funds will vary, and accordingly the composition of the Fund's portfolio will not always reflect the composition of the 50/50 Blended Benchmark.
• Barclays Capital U.S. Aggregate Bond Index is a market value-weighted index that tracks the daily price, coupon, pay-downs and total return performance of fixed-rate, publicly placed, dollar-denominated and non-convertible investment grade debt issues with at least $250 million par amount outstanding and with at least one year to final maturity.
• Lipper Indexes include the largest funds tracked by Lipper, Inc. in the named category. Lipper Small-Cap Core Funds Index, 30 largest small-cap core funds; Lipper Mid-Cap Growth Funds Index, 30 largest mid-cap growth funds; Lipper International Small/Mid Growth Funds Index, 10 largest non-U.S. small/mid growth funds, i ncluding Columbia Acorn International; Lipper Small-Cap Growth Funds Index, 30 largest small-cap growth funds; Lipper International Funds Index, 30 largest non-U.S. funds, excluding non-U.S. small-cap funds; Lipper Flexible Portfolio Funds Index, an equal-weighted index of the 30 largest mutual funds within the Flexible Portfolio fund classification, as defined by Lipper.
• Morgan Stanley Capital International Europe, Australasia, Far East (MSCI EAFE) Index is a capitalization-weighted index that tracks the total return of common stocks in 21 developed-market countries within Europe, Australasia and the Far East.
• Russell 2000 Index measures the performance of the 2,000 smallest companies in the Russell 3000 Index, which represents approximately 8% of the total market capitalization of the Russell 3000 Index.
• Russell 2500 Index measures the performance of the 2,500 smallest companies in the Russell 3000 Index, which represents approximately 17% of the total market capitalization of the Russell 3000 Index.
• Standard & Poor's (S&P) 500 Index tracks the performance of 500 widely held, large-capitalization U.S. stocks.
• Standard & Poor's (S&P) MidCap 400 Index is a market value-weighted index that tracks the performance of 400 mid-cap U.S. companies.
• S&P Developed Ex-U.S. Between $2 Billion and $10 Billion Index is a subset of the broad market selected by the index sponsor representing the mid-cap developed market, excluding the United States.
• S&P Global Ex-U.S. SmallCap Index is an unmanaged index consisting of the bottom 20% of institutionally investable capital of developed and emerging countries, outside the United States. The performance of the S&P Global Ex-U.S. SmallCap Index is provided to show how Columbia Acorn International's performance compares to foreign market performance with a similar geographic distribution and wider market cap range than the Fund's primary benchmark.
• S&P Global Ex-U.S. Between $500 Million and $5 Billion Index is a subset of the broad market selected by the index sponsor representing the mid- and small-cap developed and emerging markets, excluding the United States.
Unlike mutual funds, indexes are not managed and do not incur fees or expenses. It is not possible to invest directly in an index.
Net Asset Value Per Share as of 06/30/2010
| | | Columbia
Acorn Fund | | Columbia
Acorn
International | | Columbia
Acorn USA | | Columbia
Acorn
International
Select | | Columbia
Acorn
Select | | Columbia
Thermostat
Fund | |
| Class A | | $ | 23.17 | | | $ | 32.06 | | | $ | 21.00 | | | $ | 22.17 | | | $ | 21.69 | | | $ | 10.54 | | |
| Class B | | $ | 21.61 | | | $ | 31.27 | | | $ | 19.57 | | | $ | 21.23 | | | $ | 20.29 | | | $ | 10.60 | | |
| Class C | | $ | 21.41 | | | $ | 31.17 | | | $ | 19.44 | | | $ | 21.12 | | | $ | 20.13 | | | $ | 10.59 | | |
Performance data shown represents past performance and is not a guarantee of future results. The investment return and principal value of an investment will fluctuate so that shares, when redeemed, may be worth more or less than their original cost. Current performance may be lower or higher than the performance data shown. Please visit www.columbiafunds.com for performance data current to the most recent month-end.
4
Squirrel Chatter II: Columbia Acorn Fund At 40


America's #1 Performing Mutual Fund
Columbia Acorn Fund just celebrated its 40th birthday as a publicly registered mutual fund. If you had bought the Class Z shares of the Fund at its inception on June 10, 1970, held onto them and reinvested distributions, you would have had a compound rate of return of 14.62% through its birthday. The Fund ranked #1 by Morningstar among the 156 U.S.-based, open-end mutual funds that existed for that entire period.1
Ralph Wanger was the lead portfolio manager of Columbia Acorn Fund for the first 33 years. Chuck McQuaid overlapped with Ralph for 25 years, starting in 1978 as an analyst and then becoming co-manager in 1995. Chuck became lead manager upon Ralph's retirement in 2003, and in total has nearly 32 years with the Fund. Rob Mohn began as an analyst in 1992 and became co-manager in 2003. Ralph and Chuck recently got together to review the history of Columbia Acorn Fund and discuss the reasons for its success:
Ralph: Acorn Fund2 was founded by Chicago investor Irving Harris, of R. J. Levy, Harris, Inc. (later Harris Associates), in order to accommodate customers of his investment advisory business. The Fund started with $7 million. Don Nathanson, an initial director of the Fund who was also president of Grey North Advertising, came up with the name. The metaphor of an acorn growing into an oak tree was excellent. Also, having lived my life as a "W," I was pleased that the Fund started with an "A." When asked at cocktail parties for investment tips, I'd suggest that people pick their mutual funds alphabetically.
It was unusual at that time to have a small-cap fund. Irving liked investing in small companies; he believed that small caps could have more upside than larger caps. Academic study of stock returns had just begun and Irving came across the work done by Shannon Pratt in his doctoral thesis that validated his belief in small caps.3 In addition, large caps were very expensive in 1970, as the "nifty-fifty"4 concept was becoming a bubble. A small-cap fund could also serve as a completion fund for investors that owned a portfolio of large caps. One would generally not want a little company like "Beefsteak Mines"5 as a 3% position in a 30-stock portfolio but could benefit from the upside of Acorn Fund's diversified portfolio of 50 to 100 small caps.
Chuck: Clearly, investing in small-cap stocks helped performance over the 40 years. Academic studies have since confirmed that small caps have outperformed large caps over the long run.6 We believe that smaller companies are more entrepreneurial and have more upside for growth. We also find that some great small caps can go undiscovered, which may mean they are undervalued and potentially good investments. However, small caps have had underperformance cycles.
Ralph: That's right, Chuck. Small caps underperformed large caps through 1973, but when the nifty fifty bubble burst, a bear market nailed all capitalization ranges. In fact, the Acorn Fund almost didn't survive. The Fund was saved by one stock, Houston Oil and Minerals, a tiny company that bought old oil and gas fields and earned modest profits by investing money in workovers to enhance production. They had a shallow gas field in Galveston Bay, and when they drilled deeper, they found lots of gas. Perry Swenson, an analyst at Wood Walker, presented that idea to lots of managers, but as far as I know, I was one of few that bought it. Houston Oil kept performing and put Acorn Fund on the winners list. Acorn was up 65% in 1976 and outside money started coming in.
Owning Houston Oil helped me realize that small- and mid-cap investing is a winner's game, and we should generally let winners run. Selling winners too soon is kind of like pulling up your flowers and keeping the weeds. Acorn Fund has had a fortunate few really big winners that have enabled it to stand out. In addition to Houston Oil, Acorn Fund made great returns in supercomputer company Cray Research, slot machine maker International Game Technologies, cable television franchisor/programmer Telecommunications Inc./Liberty Media, electronics manufacturer Solectron, and freight forwarder Expeditors International of Washington.
5
Chuck: Of those, some Liberty Media spin-outs and Expeditors International of Washington remain in Columbia Acorn Fund. Expeditors International was a top 20 holding as of June 30, 2010, and, at a cost of $1.3 million, was worth $110 million. But there is more to the Fund than just investing in small caps and letting them run. Ralph, we also invest thematically in Columbia Acorn Fund. When you were recruiting me in 1978, you asked me for a favorite technology stock and I suggested minicomputer maker Digital Equipment, but that was not the answer you were looking for.
Ralph: Letting winners run helps keep portfolio turnover down, and Acorn's much lower than industry average turnover saves transaction costs. Having themes facilitates investing for the long term. The correct answer for investing in technology was not choosing an investment in a mainstream technology producer. Rather, it is to invest in simpler businesses that are downstream from technology, companies that utilize technology to create better products or services. International Game Technologies is my favorite example. The company invented the electronic slot machine that replaced mechanical versions. These new machines helped to transform a bunch of seedy casinos into the modern gaming industry. It was a great stock and was held in the Fund for years.
Chuck: We've utilized the downstream from technology theme continuously. Brilliant and cheap technology enabled the rise of the cable television industry and cable programming companies, and then the creation of cell phone service franchises. We made fine profits in numerous stocks in each of those groups. We continue to own wireless tower companies that rent space to cell phone and other wireless service franchises. Demand grows as more people use more cell phone minutes and receive burgeoning amounts of wireless data. Columbia Acorn Fund's largest holding at the end of the half year was tower company Crown Castle International, a $235 million position that cost $74 million.
Ralph: Acorn Fund was one of the first to invest in small caps, and its low turnover and thematic investing also made it somewhat unusual. But nowadays many investment consultants and investors want to pigeonhole mutual funds into style boxes. This trend contradicts what real-world consultants tell clients to do, which is, "think outside the box." That is what we've always done. Acorn Fund has had a consistent investing style for the past 40 years. Morningstar and Lipper have moved the Fund around from small cap and mid cap and between growth and core as the Fund has grown. We've never worried too much about that. Our job is to make money for shareholders; the rating companies' jobs are to assign style boxes.
Chuck: Yes, being confined to a style box can harm performance. I would have hated to be forced to be a pure growth investor when growth got horribly expensive 10 years ago in the tech/media/telecom bubble. We trimmed many stocks in those areas and took real estate investment trusts to a 7% weight in Acorn Fund. Though a REIT can be a fairly stodgy business, based on how they were valued we expected more upside in those stocks than from the bubble areas. We were right.
Ralph: Thinking outside a style box also includes owning foreign stocks. We began investing in foreign stocks in Acorn Fund in the 1980s. I'd visit companies and they would be whining about foreign competitors beating them up by shipping higher-quality products at lower prices. If some guy in Osaka was putting some guy in Omaha out of business, there was no sense in praying for a recovery in Omaha. Sell Omaha and buy Osaka. Invest in successful companies: "Don't bitch, switch!"
Chuck: Acorn Fund at one point had over 20% of its assets in foreign stocks, but then lots of investors wondered whether the Fund was global or domestic. Many wanted to make their own asset allocations. So we introduced Acorn International and Acorn USA, which were initially brand extensions of Acorn Fund, for investors who did not want a broad mix of foreign and domestic investments. Over the last 10 years, we've kept Columbia Acorn Fund's foreign weight between 7% and 16% of assets, depending on the opportunities we saw. The Fund's foreign investments focus on stocks that are highly recommended by our international analysts. They include a number of energy and materials companies that we believe to be more attractive than many domestic-based companies in the same industries. In 2009, we also made small and successful investments in some emerging mar ket companies; developing economies had lower debt and seemed likely to grow faster.
6
Ralph: We had to adapt management of Acorn Fund as it got bigger. Once I wrote a "Squirrel Chatter" comparing a sole portfolio manager of a large fund to a plate spinner at a carnival. As the number of plates increases, the plate spinner has to run frantically to keep them all cranked up. The audience thinks this is hilarious but it is not funny if it is your plates that are crashing to the floor. We had fine results in 1992 and 1993 but we underperformed in 1994 and 1995. Part of the problem was that we ended 1993 with huge positions in two stocks that accounted for 12% of Acorn Fund. It turns out that we let International Game Technologies and Telecommunications Inc. run too long. They went up a lot through 1993 but had violent corrections in 1994. Although they recovered later, these stocks accounted for over half of the Fund's 7.4% drop that year.
Chuck: That underperformance in 1994 and 1995, caused us to think about a lot more than those two stocks. Ralph had been approving virtually all of the transactions for Acorn Fund, and by then the Fund had over 250 stocks in it. Ralph had become a plate spinner! We concluded that senior analysts knew more about their stocks than the portfolio managers did and could manage their stock positions better than portfolio managers.
Ralph: We had lifted out Acorn Fund from Harris Associates in 1992 and launched Wanger Asset Management. When performance lagged in 1994 and 1995, we had the flexibility to create a more analyst-driven investment process.
Chuck: In order to do so, we began to compare analyst results to performance of their coverage assignments, we granted senior analysts trading authority, and we began to more clearly compensate analysts for quantitative performance. Portfolio managers continued to follow stocks personally, approve transactions by newer analysts, and manage industry and foreign weightings. Since then we have improved our systems, but this team-managed approach remains in place. I think that had a lot to do with Columbia Acorn Fund beating its current primary benchmark, the Russell 2500 Index, for 10 straight years from 1996 to 2005.
Of course, in order to have a team-managed Fund, we have to keep building an analyst team. Our directors of research, Rob Mohn on the domestic side and Zach Egan on the international side, have worked diligently to hire fine analysts. They pursue people who they believe can identify good businesses, have accounting and finance skills, possess a passion for investing, and on the international side, have language skills and cultural knowledge.
Ralph: We believe the team at Columbia Wanger Asset Management (CWAM) has done a fine job for many years. Ownership of the management company has changed several times, but core people and processes have remained intact. The Columbia Acorn Trust board has seen to it that CWAM continues to control its own investing process and has the resources to do so. The Columbia Acorn Funds hold a shareholder information meeting in Chicago each September and we get to meet some of the shareholders who have entrusted us to take care of their money. The fact that we have been conscientious and successful doing that is a point of great pride for me and the entire investment team. I'm happy that I was able to set the course for the Columbia Acorn Funds and that Chuck, Rob, Zach and the rest of the team remain on that course.

Charles P. McQuaid
President and Chief Investment Officer
Columbia Wanger Asset Management, LLC
Trustee, Columbia Acorn Trust and Wanger Advisors Trust
Current Lead Portfolio Manager, Columbia Acorn Fund

Ralph Wanger
Retired Founder, Columbia Wanger Asset Management, LLC
Trustee Emeritus, Columbia Acorn Trust and Wanger Advisors Trust
Former Lead Portfolio Manager, Columbia Acorn Fund
The information and data provided in this analysis are derived from sources that we deem to be reliable and accurate. These views are not guarantees of future performance and involve certain risks, uncertainties and assumptions that are difficult to predict so actual outcomes and results may differ significantly from the views expressed. The views/opinions expressed in "Squirrel Chatter II" are those of the authors and not of the Columbia Acorn Trust Board, are subject to change at any time based upon economic, market or other conditions, may differ from views expressed by other Columbia Management associates and the respective parties disclaim any responsibility to update such views. These views may not be relied on as investment advice and, because investment decisions for a Columbia Acorn Fund are based on numerous factors, may not be relied on as an indication of trading intent on behalf of any particular Columbia Acorn F und.
7
Performance data quoted represents past performance and current performance may be lower or higher. Past performance is no guarantee of future results. The investment return and principal value of an investment in a Fund will fluctuate so that Fund shares, when redeemed, may be worth more or less than their original cost. Please visit www.columbiafunds.com for daily and most recent month-end updates.
Stocks of small- and mid-cap companies pose special risks, including possible illiquidity and greater price volatility than stocks of larger, more established companies. International investing involves special risks, including foreign taxation, currency risks, risks associated with possible differences in financial standards and other risks associated with future political and economic developments.
For standard performance data for each of the Columbia Acorn Funds, please see Page 2 of this report.
1 Class Z shares have limited eligibility and the investment minimum requirement may vary. Only eligible investors may purchase Class Z shares of the Fund, directly or by exchange. Please see the Fund's prospectus for eligibility, and other details.
According to Morningstar, Columbia Acorn Fund Class Z ranked #1 of 156 U.S.-based mutual funds in existence since June 10, 1970:
| | | From Inception to
6/10/2010 | | 10 year | | 5 year | | 1 year | |
| Compound return | | 14.62% | | 8.15% | | 3.84% | | 26.21% | |
| Morningstar ranking | | 1 of 156 | | 9 of 167 | | 30 of 167 | | 12 of 167 | |
Acorn Fund Class Z performance and Morningstar ranking information updated through June 30, 2010:
| | | From Inception to
6/30/2010 | | 10 year | | 5 year | | 1 year | |
| Compound return | | 14.46% | | 7.73% | | 2.43% | | 23.20% | |
| Morningstar ranking | | 1 of 143 | | 10 of 168 | | 44 of 170 | | 17 of 170 | |
Source: ©2010 Morningstar, Inc. All rights reserved.
Morningstar rankings are based on annualized total returns and do not reflect sales charges. Criteria: Open-ended mutual funds; inception date on or before Columbia Acorn Fund; oldest share class only; USD-based currency.
2 "Columbia" was added to the Fund's name in 2003.
3 Shannon Pratt is now chairman and CEO of Shannon Pratt Valuations, Inc., a business valuation firm headquartered in Portland, Oregon. He is also a member of the board of directors of Paulson Capital Corporation, an investment banking firm that specializes in small-cap IPOs.
4 The New York banks that dominated the institutional market at this time believed that the best portfolios should own the best companies and they were willing to own these stocks regardless of price. As a result, many institutional investors owned the same 50 stocks. Other terms for these stocks were "Vestal Virgins" or "one-decision" stocks.
5 Beefsteak Mines was an enticing investment opportunity in the 1940 film, "The Bank Dick," which starred W.C. Fields.
6 Over the last 40 years, small-cap stocks, as represented by the Russell 2000 Index and linked to the Ibbotson US Small Stock Index for the period prior to the Russell 2000's inception, have outperformed large-cap stocks, as represented by the S&P 500 Index. Small caps had an 11.88% total return for the 40 years through 6/30/2010, while large caps had a 10.28% gain.
8
Understanding Your Expenses
As a Fund shareholder, you incur two types of costs. There are transaction costs, which generally include sales charges on purchases and may include redemption or exchange fees. There are also ongoing costs, which generally include investment advisory fees, distribution and service (Rule 12b-1) fees and other Fund expenses. The following information is intended to help you understand your ongoing costs of investing in the Columbia Acorn Funds and to compare these costs with the ongoing costs of investing in other mutual funds.
Analyzing Your Fund's Expenses
To illustrate these ongoing costs, we have provided examples and calculated the expenses paid by investors in the Class A, B and C shares of the Columbia Acorn Funds for the last six months. The information in the following table is based on an initial investment of $1,000, which is invested at the beginning of the reporting period and held for the entire period. Expense information is calculated two ways and each method provides you with different results. The amount listed in the "Actual" column is calculated using each Fund's actual operating expenses and total return for the period. The amount listed in the "Hypothetical" column assumes that the return each year is 5% before expenses and then applies each Fund's actual expense ratio for the period to the hypothetical return. You should not use the hypothetical account values and expenses to estimate either your actual account balance at the end of the period or the expenses you paid during the reporting period. See "Compare With Other Funds" for details on using the hypothetical data.
January 1, 2010 – June 30, 2010
| | | Account value at
the beginning of
the period ($) | | Account value at
the end of
the period ($) | | Expenses paid
during the period ($) | | Fund's
annualized
expense
ratio (%)* | |
| | | Actual | | Hypothetical | | Actual | | Hypothetical | | Actual | | Hypothetical | | Actual | |
| Columbia Acorn Fund | |
| Class A | | | 1,000.00 | | | | 1,000.00 | | | | 967.00 | | | | 1,019.59 | | | | 5.12 | | | | 5.26 | | | | 1.05 | | |
| Class B | | | 1,000.00 | | | | 1,000.00 | | | | 963.40 | | | | 1,016.17 | | | | 8.47 | | | | 8.70 | | | | 1.74 | | |
| Class C | | | 1,000.00 | | | | 1,000.00 | | | | 963.10 | | | | 1,015.62 | | | | 9.00 | | | | 9.25 | | | | 1.85 | | |
| Columbia Acorn International | |
| Class A | | | 1,000.00 | | | | 1,000.00 | | | | 954.10 | | | | 1,018.40 | | | | 6.25 | | | | 6.46 | | | | 1.29 | | |
| Class B | | | 1,000.00 | | | | 1,000.00 | | | | 950.70 | | | | 1,014.88 | | | | 9.67 | | | | 9.99 | | | | 2.00 | | |
| Class C | | | 1,000.00 | | | | 1,000.00 | | | | 950.50 | | | | 1,014.38 | | | | 10.16 | | | | 10.49 | | | | 2.10 | | |
| Columbia Acorn USA | |
| Class A | | | 1,000.00 | | | | 1,000.00 | | | | 936.20 | | | | 1,018.45 | | | | 6.14 | | | | 6.41 | | | | 1.28 | | |
| Class B | | | 1,000.00 | | | | 1,000.00 | | | | 932.30 | | | | 1,014.63 | | | | 9.82 | | | | 10.24 | | | | 2.05 | | |
| Class C | | | 1,000.00 | | | | 1,000.00 | | | | 932.80 | | | | 1,014.53 | | | | 9.92 | | | | 10.34 | | | | 2.07 | | |
| Columbia Acorn International Select | |
| Class A | | | 1,000.00 | | | | 1,000.00 | | | | 961.00 | | | | 1,017.36 | | | | 7.29 | | | | 7.50 | | | | 1.50 | | |
| Class B** | | | 1,000.00 | | | | 1,000.00 | | | | 958.40 | | | | 1,013.88 | | | | 10.68 | | | | 10.99 | | | | 2.20 | | |
| Class C | | | 1,000.00 | | | | 1,000.00 | | | | 957.10 | | | | 1,013.14 | | | | 11.40 | | | | 11.73 | | | | 2.35 | | |
9
| | | Account value at
the beginning of
the period ($) | | Account value at
the end of
the period ($) | | Expenses paid
during the period ($) | | Fund's
annualized
expense
ratio (%)* | |
| | | Actual | | Hypothetical | | Actual | | Hypothetical | | Actual | | Hypothetical | | Actual | |
| Columbia Acorn Select | |
| Class A | | | 1,000.00 | | | | 1,000.00 | | | | 950.90 | | | | 1,018.60 | | | | 6.05 | | | | 6.26 | | | | 1.25 | | |
| Class B | | | 1,000.00 | | | | 1,000.00 | | | | 947.70 | | | | 1,015.17 | | | | 9.37 | | | | 9.69 | | | | 1.94 | | |
| Class C | | | 1,000.00 | | | | 1,000.00 | | | | 947.30 | | | | 1,014.53 | | | | 9.99 | | | | 10.34 | | | | 2.07 | | |
| Columbia Thermostat Fund** | |
| Class A | | | 1,000.00 | | | | 1,000.00 | | | | 979.50 | | | | 1,022.32 | | | | 2.45 | | | | 2.51 | | | | 0.50 | | |
| Class B | | | 1,000.00 | | | | 1,000.00 | | | | 978.20 | | | | 1,019.84 | | | | 4.90 | | | | 5.01 | | | | 1.00 | | |
| Class C | | | 1,000.00 | | | | 1,000.00 | | | | 977.00 | | | | 1,018.60 | | | | 6.13 | | | | 6.26 | | | | 1.25 | | |
Expenses paid during the period are equal to each Fund's annualized expense ratio, multiplied by the average account value over the period and then multiplied by the number of days in the Fund's most recent fiscal half-year and divided by 365.
It is important to note that the expense amounts shown in the table are meant to highlight only ongoing costs of investing in the Funds and do not reflect any transaction costs, such as sales charges, redemption or exchange fees. Therefore, the hypothetical examples provided may not help you determine the relative total costs of owning different funds. If these transaction costs were included, your costs would have been higher.
Columbia Thermostat Fund's expenses do not include fees and expenses incurred by the Fund from the underlying portfolio funds in which it invests.
*For the six months ended June 30, 2010.
**Had the investment advisor and/or any of its affiliates not waived fees or reimbursed a portion of expenses, account value at the end of the period would have been reduced.
Compare With Other Funds
Since all mutual funds are required to include the same hypothetical calculations about expenses in shareholder reports, you can use this information to compare the ongoing cost of investing in the Funds with other funds. To do so, compare the 5% hypothetical example with the 5% hypothetical examples that appear in the shareholder reports of other funds. As you compare hypothetical examples of other funds, it is important to note that hypothetical examples are meant to highlight the continuing costs of investing in a fund and do not reflect any transaction costs, such as sales charges or redemption or exchange fees.
Estimating Your Actual Expenses
To estimate the expenses that you actually paid over the period, first you will need your account balance at the end of the period:
• For shareholders who receive their account statements from Columbia Management Investment Services Corp., your account balance is available online at columbiafunds.com or by calling Shareholder Services at (800) 922-6769.
• For shareholders who receive their account statements from their brokerage firm, contact your brokerage firm to obtain your account balance.
1. Divide your ending account balance by $1,000. For example, if an account balance was $8,600 at the end of the period, the result would be 8.6.
2. In the section of the table titled "Expenses paid during the period," locate the amount for your Fund. You will find this number is in the column labeled "Actual." Multiply this number by the result from step 1. Your answer is an estimate of the expenses you paid on your account during the period.
10
Columbia Acorn Fund
In a Nutshell
 | |  | |
|
| Charles P. McQuaid | | Robert A. Mohn | |
|
| Lead Portfolio Manager | | Co-Portfolio Manager | |
|
Performance data quoted represents past performance and current performance may be lower or higher. Past performance is no guarantee of future results. The investment return and principal value will fluctuate so that shares, when redeemed, may be worth more or less than the original cost. Please visit www.columbiafunds.com for daily and most recent month-end performance updates.
Fund Positions
in Mentioned Holdings
As a percentage of net assets,
as of 6/30/10
| FMC Technologies | | | 1.2 | % | |
| lululemon athletica | | | 1.1 | % | |
| Fugro | | | 0.8 | % | |
| Pacific Rubiales Energy | | | 0.8 | % | |
| Abercrombie & Fitch | | | 0.6 | % | |
| Atwood Oceanics | | | 0.6 | % | |
| Chico's FAS | | | 0.6 | % | |
| iGate | | | 0.5 | % | |
| Knoll | | | 0.4 | % | |
| Herman Miller | | | 0.4 | % | |
| Coldwater Creek | | | 0.1 | % | |
| Steelcase | | | 0.1 | % | |
The stock market went into reverse in the second quarter of 2010, more than offsetting first quarter gains. Columbia Acorn Fund fell 9.80% (Class A shares, without sales charge) in the second quarter and 3.30% in the six-month period ended June 30, 2010. The Fund performed slightly better than its primary benchmark, the Russell 2500 Index, in the quarter, but underperformed it modestly in the half. The Fund and its primary benchmark beat the large-cap S&P 500 Index during both periods. See Page 3 for performance data.
Columbia Acorn Fund's retail stocks, which jumped 95% in 2009 and 12% in the first quarter of 2010, were marked down severely in the second quarter and caused much of the Fund's year-to-date underperformance. Fundamentals for retailers have generally been good, but their stocks appear to be discounted by the possibility of a double-dip recession. Teen apparel retailer Abercrombie & Fitch fell 33% in the quarter and 11% in the half, while women's specialty retailer Chico's FAS dropped 31% and 29%, respectively. Another women's apparel company, Coldwater Creek, submerged 52% in the quarter on concerns about excess inventories. The Fund's largest apparel company, premium yoga apparel retailer lululemon athletica, had exceptionally fine results but its stock nonetheless did a downward dog, falling 10% during the quarter. lululemon athletica was up 23% during the half.
Domestic energy stocks also hurt results. None of the Fund's holdings were directly involved in the BP oil spill, but some suffered collateral damage from the perception of increased risk and the actual moratorium on Gulf of Mexico drilling. Offshore driller Atwood Oceanics sank 26% in the quarter and 29% in the half, while oil and gas wellhead maker FMC Technologies fell 19% and 9%.
In contrast, office furniture stocks were sturdy. They had gotten very cheap and, unlike during the last economic cycle, there is currently no glut of used furniture. As orders improved, so did the stocks. Office furniture makers Knoll, Steelcase and Herman Miller were each up 5% to 21% in the quarter and 18% to 29% in the half.
Columbia Acorn Fund's top dollar winner in the quarter was iGate, up 32%. This India-based IT and business process outsourcing company continues to grow nicely, as its key customers, Canadian financial service companies, are doing well. The Fund's top dollar winner for the half was industrial gas distributor Airgas, up 35% on a takeover offer. We sold the stock in the first quarter.
Foreign stocks were down 7.83% in the quarter, somewhat less than the Fund, but off slightly more than the Fund in the half, falling 4.23%. Colombian oil producer Pacific Rubiales Energy was the Fund's second largest dollar winner in both periods, up 15% in the quarter and 52% in the half as it successfully reinvested cash flow into oil exploration. Sub-sea oilfield services company Fugro, in contrast, was the Fund's largest dollar loser in the quarter, off 28%. Columbia Acorn Fund's foreign holdings remained at about 10.7% in the quarter.
Small- and mid-cap stocks outperformed large caps last year and during the first half of this year. By most measures they appear somewhat expensive compared to larger caps. However, small- and mid-cap earnings growth exceeded large-cap gains in the first quarter of 2010 after lagging for several years. Small companies tend to be more innovative and flexible than larger ones, and most won't be hurt by the recent drop in the euro. Consequently, we think small-cap earnings can continue to outperform, which could bode well for small-cap stocks.
Stocks of small- and mid-cap companies pose special risks, including possible illiquidity and greater price volatility than stocks of larger, more established companies. International investing involves special risks, including foreign taxation, currency risks, risks associated with possible differences in financial standards and other risks associated with future political and economic developments.
Portfolio holdings are subject to change periodically and may not be representative of current holdings.
11
Columbia Acorn Fund
At a Glance (Class A Shares – LACAX)
Performance data quoted represents past performance and current performance may be higher or lower. Past performance is no guarantee of future results. The investment return and principal value of an investment in the Fund will fluctuate so that Fund shares, when redeemed, may be worth more or less than their original cost. Performance results reflect any fee waivers or reimbursements of Fund expenses by the investment advisor and/or any of its affiliates. Absent these fee waivers or expense reimbursement arrangements, performance results would have been lower. Please visit columbiafunds.com for daily and most recent month-end updates.
Pretax and After-tax Average Annual Total Returns (Based on Class A Shares)
through June 30, 2010
| Inception 10/16/00 | | | | Year
to date* | | 1 year | | 5 years | | Life of fund | |
| Returns before taxes | | NAV
POP | | -3.30%
-8.86 | | 22.83%
15.76 | | 2.14%
0.94 | | 7.14%
6.49 | |
Returns after taxes
on distributions | | NAV
POP | | -3.33
-8.88 | | 22.79
15.73 | | 1.45
0.26 | | 6.38
5.74 | |
Returns after taxes
on distributions and
sale of fund shares | | NAV
POP
| | -2.14
-5.76
| | 14.84
10.25
| | 1.90
0.86
| | 6.15
5.56
| |
Russell 2500 Index
(pretax)** | | | | -1.69 | | 24.03 | | 0.98 | | 4.78 | |
All results shown assume reinvestment of distributions.
*Year to date data is not annualized.
**The Fund's primary benchmark.
After-tax returns are calculated using the highest historical individual federal marginal income tax rates, and do not reflect the impact of state and local taxes. Returns after taxes on distributions and sale of Fund shares reflect the additional tax impact of long-term gains or losses realized when Fund shares are sold. The returns are taxed at the maximum rate and assume shares were purchased at the beginning of the period. Actual after-tax returns depend on the investor's tax situation and may differ from those shown. After-tax returns are not relevant to investors who hold their Fund shares through tax-deferred arrangements such as 401(k) plans or individual retirement accounts. After-tax returns are shown for Class A shares only; after-tax returns for other share classes will vary. Indexes do not reflect any deduction for fees, expenses or taxes.
Public offering price (POP) returns include the maximum sales charge of 5.75% for Class A shares. Net asset value (NAV) returns do not include sales charges or contingent deferred sales charges (CDSC).
The Fund's Class A shares annual operating expense ratio, as stated in the current prospectus, is 1.07%.
Columbia Acorn Fund Portfolio Diversification
as a percentage of net assets, as of 6/30/10
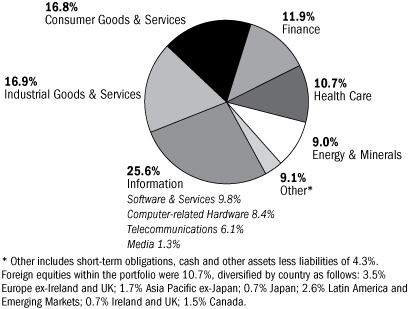
Columbia Acorn Fund Top 10 Holdings
as a percentage of net assets, as of 6/30/10
| | 1. | | | Crown Castle International
Communications Towers | | 1.7%
| |
| | 2. | | | Ametek
Aerospace/Industrial Instruments | | 1.3%
| |
| | 3. | | | Donaldson
Industrial Air Filtration | | 1.3%
| |
| | 4. | | | Mettler Toledo
Laboratory Equipment | | 1.3%
| |
| | 5. | | | FMC Technologies
Oil & Gas Wellhead Manufacturer | | 1.2%
| |
| | 6. | | | tw telecom
Fiber Optic Telephone/Data Services | | 1.1%
| |
| | 7. | | | lululemon athletica
Premium Active Apparel Retailer | | 1.1%
| |
| | 8. | | | Amphenol
Electronic Connectors | | 1.1%
| |
| | 9. | | | Alexion Pharmaceuticals
Biotech Focused on Orphan Diseases | | 1.0%
| |
| | 10. | | | Bally Technologies
Slot Machines & Software | | 0.9%
| |
The Fund's top 10 holdings and portfolio diversification vary with changes in portfolio investments. See the Statement of Investments for a complete list of the Fund's holdings.
The Growth of a $10,000 Investment in Columbia Acorn Fund (Class A)
October 16, 2000 through June 30, 2010
Illustration is based on a hypothetical $10,000 investment from inception in Class A shares of the Fund, which includes a 5.75% maximum initial sales charge. The Russell 2500 Index is unmanaged and returns for both the index and the Fund include reinvested dividends and capital gains. Although the index is provided for use in assessing the Fund's performance, the Fund's holdings may differ significantly from those in the index. It is not possible to invest directly in an index. The graph does not reflect taxes that a shareholder would pay on Fund distributions or on a sale of Fund shares.
Total Net Assets of the Fund: $13.9 billion
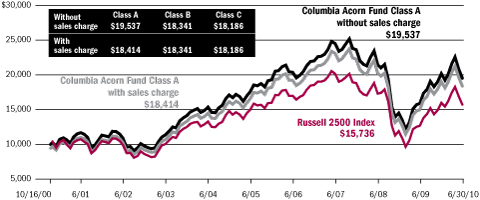
12
Columbia Acorn International
In a Nutshell
 | |  | |
|
| P. Zachary Egan | | Louis J. Mendes III | |
|
| Co-Portfolio Manager | | Co-Portfolio Manager | |
|
Performance data quoted represents past performance and current performance may be lower or higher. Past performance is no guarantee of future results. The investment return and principal value will fluctuate so that shares, when redeemed, may be worth more or less than the original cost. Please visit www.columbiafunds.com for daily and most recent month-end performance updates.
Fund's Positions
in Mentioned Holdings
As a percentage of net assets,
as of 6/30/10
| Aeon Delight | | | 0.8 | % | |
| Start Today | | | 0.8 | % | |
| Ain Pharmaciez | | | 0.6 | % | |
Columbia Acorn International was down 7.73% (Class A shares, without sales charge) in the second quarter of 2010. This compares with a 9.15% drop of its primary benchmark, the S&P Global Ex-U.S. Between $500 Million and $5 Billion Index. For the six-month period ended June 30, 2010, the Fund was down 4.59% vs. the benchmark drop of 4.96%. On both a quarterly and year-to-date basis, international small-cap stocks continued to post better returns than their large cap counterparts. The large-cap focused MSCI EAFE Index was down 13.97% in the second quarter and 13.23% in the first half. This extends a trend of small-cap outperformance. On trailing three- and five-year numbers, the S&P $500m to $5b cap range international stock universe, excluding emerging market securities, has led the MSCI EAFE Index (which does not contain emerging markets securities) by an annualized 2.27% and 2.80%, respectively.
Continental Europe led the quarterly decline in both the Fund and the benchmark, as investors pondered the prospects for default of one or more of the financially stressed eurozone member states such as Greece or Spain. We agree that the trends in public debt and deficits are worrying and that concern extends to creditor states like Germany, whose banks hold large quantities of public and private debt emanating from its weaker neighbors. However, we believe that the situation is more likely to result in a tighter monetary union, with more effective fiscal constraints on member states, than in the demise of the now 11-year-old euro currency. Consistent with these views, we maintained the Fund's overweight position in continental Europe, which has been the source of many of our best ideas and investment returns in recent years, and we did not categorically avoid the most vulnerable eurozone states.
Within the troubled eurozone states, we have strived to identify investments that should do well even if their capital costs increase with a perceived increase in risk. For example, at quarter end, the Fund had 1.6% of its capital invested in electric transmission companies in Spain, Portugal and Italy. We believe capacity shortfalls and new requirements associated with renewable sources will result in large investments in these networks, and that the regulated returns on these investments will facilitate pricing structures that offset rising capital costs. It's worth noting that continental Europe was a positive contributor to relative return in the quarter due to good stock selection.
Japan, home to an average 17% of the Fund's assets during the quarter, was the best performing region in the Fund, and fueled about half of its relative outperformance. Japanese securities held by the Fund were off 0.2% while Japanese small caps in general were down 5.8%. The difference can be explained by a few big winners in the quarter. Start Today, an online apparel retailer, was up 50% as continuing strong monthly sales figures reflect an industry shift to online purchasing. Ain Pharmaciez, a pharmacy chain operator, was up 40% after guiding investors to expect another strong fiscal year and the stock gained greater visibility with a stock listing move to a more prominent segment of the Tokyo Exchange. Aeon Delight, the biggest facility maintenance company in Japan, returned 38% after announcing an acquisition expected to immediately contribute to earnings per share. Unicharm PetCare, a maker of pet food and toiletries, jum ped 34% after its parent company sought an additional 31% stake to facilitate a full takeover of the company.
International investing involves special risks, including foreign taxation, currency risks, risks associated with possible differences in financial standards and other risks associated with future political and economic developments. Stocks of small- and mid-cap companies pose special risks, including possible illiquidity and greater price volatility than stocks of larger, more established companies. Investing in emerging markets may involve greater risks than investing in more developed countries. In addition, concentration of investments in a single region may result in greater volatility.
Portfolio holdings are subject to change periodically and may not be representative of current holdings.
13
Columbia Acorn
International
At a Glance (Class A Shares – LAIAX)
Performance data quoted represents past performance and current performance may be higher or lower. Past performance is no guarantee of future results. The investment return and principal value of an investment in the Fund will fluctuate so that Fund shares, when redeemed, may be worth more or less than their original cost. Performance results reflect any fee waivers or reimbursements of Fund expenses by the investment advisor and/or any of its affiliates. Absent these fee waivers or expense reimbursement arrangements, performance results would have been lower. Please visit columbiafunds.com for daily and most recent month-end updates.
Pretax and After-tax Average Annual Total Returns (Based on Class A Shares)
through June 30, 2010
| Inception 10/16/00 | | | | Year
to date* | | 1 year | | 5 years | | Life of fund | |
| Returns before taxes | | NAV
POP | | -4.59%
-10.08 | | 18.54%
11.72 | | 7.45%
6.19 | | 5.86%
5.22 | |
Returns after taxes
on distributions | | NAV
POP | | -5.11
-10.57 | | 17.90
11.12 | | 6.61
5.35 | | 5.11
4.47 | |
Returns after taxes
on distributions and
sale of fund shares | | NAV
POP | | -2.99
-6.56 | | 12.04
7.61 | | 6.51
5.40 | | 5.02
4.44 | |
S&P Global Ex-U.S.
Between $500 Million
and $5 Billion Index
(pretax)** | | | | -4.96 | | 18.65 | | 6.51 | | 8.94 | |
All results shown assume reinvestment of distributions.
*Year to date data is not annualized.
**The Fund's primary benchmark.
After-tax returns are calculated using the highest historical individual federal marginal income tax rates, and do not reflect the impact of state and local taxes. Returns after taxes on distributions and sale of Fund shares reflect the additional tax impact of long-term gains or losses realized when Fund shares are sold. The returns are taxed at the maximum rate and assume shares were purchased at the beginning of the period. Actual after-tax returns depend on the investor's tax situation and may differ from those shown. After-tax returns are not relevant to investors who hold their Fund shares through tax-deferred arrangements such as 401(k) plans or individual retirement accounts. After-tax returns are shown for Class A shares only; after-tax returns for other share classes will vary. Indexes do not reflect any deduction for fees, expenses or taxes.
Public offering price (POP) returns include the maximum sales charge of 5.75% for Class A shares. Net asset value (NAV) returns do not include sales charges or contingent deferred sales charges (CDSC).
The Fund's Class A shares annual operating expense ratio, as stated in the current prospectus, is 1.36%.
Columbia Acorn International Portfolio Diversification
as a percentage of net assets, as of 6/30/10

Columbia Acorn International Top 10 Holdings
as a percentage of net assets, as of 6/30/10
| | 1. | | | Olam International (Singapore)
Agriculture Supply Chain Manager | | 1.5%
| |
| | 2. | | | Naspers (South Africa)
Media in Africa & Other Emerging Markets | | 1.5%
| |
| | 3. | | | Kansai Paint (Japan)
Paint Producer in Japan, India, China & Southeast Asia | | 1.4%
| |
| | 4. | | | Localiza Rent A Car (Brazil)
Car Rental | | 1.3%
| |
| | 5. | | | Serco (United Kingdom)
Facilities Management | | 1.3%
| |
| | 6. | | | Imtech (Netherlands)
Electromechanical & ICT Installation & Maintenance | | 1.1%
| |
| | 7. | | | Hexagon (Sweden)
Measurement Equipment | | 1.1%
| |
| | 8. | | | Suzano (Brazil)
Brazilian Pulp & Paper Producer | | 1.0%
| |
| | 9. | | | Asian Paints (India)
India's Largest Paint Company | | 1.0%
| |
| | 10. | | | ShawCor (Canada)
Oil & Gas Pipeline Products | | 1.0%
| |
The Fund's top 10 holdings and portfolio diversification vary with changes in portfolio investments. See the Statement of Investments for a complete list of the Fund's holdings.
The Growth of a $10,000 Investment in Columbia Acorn International (Class A)
October 16, 2000 through June 30, 2010
Illustration is based on a hypothetical $10,000 investment from inception in Class A shares of the Fund, which includes a 5.75% maximum initial sales charge. The S&P Global Ex-U.S. Between $500 Million and $5 Billion Index is unmanaged and returns for both the index and the Fund include reinvested dividends and capital gains. Although the index is provided for use in assessing the Fund's performance, the Fund's holdings may differ significantly from those in the index. It is not possible to invest directly in an index. The graph does not reflect taxes that a shareholder would pay on Fund distributions or on a sale of Fund shares.
Total Net Assets of the Fund: $4.5 billion
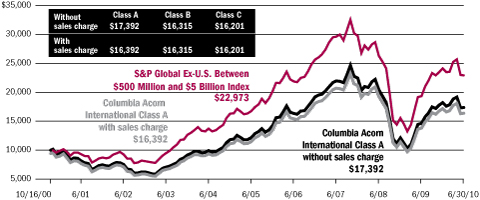
14
Columbia Acorn USA
In a Nutshell
 | |
|
| Robert A. Mohn | |
|
| Lead Portfolio Manager | |
|
Performance data quoted represents past performance and current performance may be lower or higher. Past performance is no guarantee of future results. The investment return and principal value will fluctuate so that shares, when redeemed, may be worth more or less than the original cost. Please visit www.columbiafunds.com for daily and most recent month-end performance updates.
Fund Positions
in Mentioned Holdings
As a percentage of net assets,
as of 6/30/10
| FMC Technologies | | | 2.0 | % | |
| AmeriCredit | | | 1.6 | % | |
| Atwood Oceanics | | | 1.5 | % | |
| Bally Technologies | | | 1.4 | % | |
| ESCO Technologies | | | 1.2 | % | |
| lululemon athletica | | | 1.1 | % | |
| Abercrombie & Fitch | | | 0.8 | % | |
| Blue Coat Systems | | | 0.7 | % | |
| Core Laboratories | | | 0.6 | % | |
| Global Payments | | | 0.5 | % | |
| RCM Technologies | | | 0.3 | % | |
| Green Bankshares | | | 0.3 | % | |
| Carrizo Oil & Gas | | | 0.2 | % | |
Columbia Acorn USA ended the second quarter of 2010 down 12.17% (Class A shares, without sales charge) while its primary benchmark, the Russell 2000 Index, fell 9.92%. Talk of a double-dip recession and a continued sluggish economy changed the course of market performance in the second quarter, more than erasing first quarter gains. Year to date through June 30, 2010, the Fund was down 6.38% while its primary benchmark was off 1.95%.
As we've mentioned in the past, our energy investments for Columbia Acorn USA have largely focused on offshore oil service companies. The oil disaster in the Gulf of Mexico drove a sell-off in this sector, as the current moratorium on Gulf drilling decreased current demand for deepwater services and new regulations will likely drive up future drilling costs. Atwood Oceanics, an offshore drilling contractor, and FMC Technologies, an oil and gas wellhead manufacturer, were down 26% and 19%, respectively, in the quarter despite having very limited exposure to any Gulf drilling activity and no involvement in the BP crisis. For the six-month period ended June 30, Atwood Oceanics was down 29% and FMC was off 9%.
Consumer stocks were hit hard during the second quarter. Teen apparel retailer Abercrombie & Fitch dropped nearly 33% due to poor April sales in tourist-oriented stores and recession concerns. Bally Technologies, a maker of slot machines, fell 20% in the quarter on lower expectations for slot machine replacement sales, and lagged in the half with a 22% drop.
Individual stocks that struggled in the quarter included auto lender AmeriCredit, down 23% despite reporting strong earnings and lower loan losses. The stock fell on anxiety over the financial health of U.S. borrowers. Blue Coat Systems, a provider of Internet network security services, suffered a steep drop in European sales. Its stock fell 34% in the quarter, and it was also among the Fund's underperformers for the first six months of the year, with a 28% drop.
Another laggard for the half year was credit card processor Global Payments, which fell 32% on concerns of increased competition in the Canadian market. Carrizo Oil & Gas, an oil and gas producer, continued to struggle as U.S. natural gas prices fell. ESCO Technologies, a maker of automatic electric meter readers, ended the six months down 28% on fears the company will not win a California natural gas meter contract.
One of the quarter's few bright spots was Tennessee bank Green Bankshares, which gained 57% in the second quarter after breaking a string of three consecutive quarterly losses. RCM Technologies, a provider of technology and engineering services, gained 42% in the quarter after receiving an acquisition offer. Bucking the downward trend in energy stocks, Core Laboratories gained 13% in the quarter and traded higher than its 2008 peak. The company provides oil and gas reservoir consulting services.
Turning to the six month period, top performance came from Novell, a business software developer that gained 40% on news that Elliott Associates was taking the company private. We opted to sell the Fund's position in the stock and put the assets into other names that we believe have more upside potential. Green Bankshares' semiannual gain topped 261%. lululemon athletica, a retailer of premium yoga apparel for women, enjoyed a more than 23% gain thanks to earnings that nearly tripled from the prior year.
The first half of 2010 has been frustrating, but recent market weakness is providing many investment opportunities in attractively priced small-cap companies that we believe have strong prospects for the future. Looking at the bigger picture, there is no denying the horde of problems facing the world: the stability of the euro, the housing crisis, unemployment, the over-indebted American consumer, the Gulf oil spill. It's certainly easy to despair over these issues and hide out in cash. More difficult, but potentially more profitable, is to realize that however daunting they may seem, economic problems have a habit of resolving over time.
Stocks of small- and mid-cap companies pose special risks, including possible illiquidity and greater price volatility than stocks of larger, more established companies.
Portfolio holdings are subject to change periodically and may not be representative of current holdings.
15
Columbia Acorn USA
At a Glance (Class A Shares – LAUAX)
Performance data quoted represents past performance and current performance may be higher or lower. Past performance is no guarantee of future results. The investment return and principal value of an investment in the Fund will fluctuate so that Fund shares, when redeemed, may be worth more or less than their original cost. Performance results reflect any fee waivers or reimbursements of Fund expenses by the investment advisor and/or any of its affiliates. Absent these fee waivers or expense reimbursement arrangements, performance results would have been lower. Please visit columbiafunds.com for daily and most recent month-end updates.
Pretax and After-tax Average Annual Total Returns (Based on Class A Shares)
through June 30, 2010
| Inception 10/16/00 | | | | Year
to date* | | 1 year | | 5 years | | Life of fund | |
| Returns before taxes | | NAV
POP | | -6.38%
-11.76 | | 22.38%
15.34 | | -0.94%
-2.11 | | 6.40%
5.75 | |
Returns after taxes
on distributions | | NAV
POP | | -6.38
-11.76 | | 22.38
15.34 | | -1.40
-2.56 | | 6.09
5.45 | |
Returns after taxes
on distributions and
sale of fund shares | | NAV
POP | | -4.14
-7.64 | | 14.55
9.97 | | -0.72
-1.70 | | 5.67
5.08 | |
Russell 2000 Index
(pretax)** | | | | -1.95 | | 21.48 | | 0.37 | | 3.84 | |
All results shown assume reinvestment of distributions.
*Year to date data is not annualized.
**The Fund's primary benchmark.
After-tax returns are calculated using the highest historical individual federal marginal income tax rates, and do not reflect the impact of state and local taxes. Returns after taxes on distributions and sale of Fund shares reflect the additional tax impact of long-term gains or losses realized when Fund shares are sold. The returns are taxed at the maximum rate and assume shares were purchased at the beginning of the period. Actual after-tax returns depend on the investor's tax situation and may differ from those shown. After-tax returns are not relevant to investors who hold their Fund shares through tax-deferred arrangements such as 401(k) plans or individual retirement accounts. After-tax returns are shown for Class A shares only; after-tax returns for other share classes will vary. Indexes do not reflect any deduction for fees, expenses or taxes.
Public offering price (POP) returns include the maximum sales charge of 5.75% for Class A shares. Net asset value (NAV) returns do not include sales charges or contingent deferred sales charges (CDSC).
The Fund's Class A shares annual operating expense ratio, as stated in the current prospectus, is 1.32%.
Columbia Acorn USA Portfolio Diversification
as a percentage of net assets, as of 6/30/10

Columbia Acorn USA Top 10 Holdings
as a percentage of net assets, as of 6/30/10
| | 1. | | | tw telecom
Fiber Optic Telephone/Data Services | | 2.7%
| |
| | 2. | | | FMC Technologies
Oil & Gas Wellhead Manufacturer | | 2.0%
| |
| | 3. | | | Ametek
Aerospace/Industrial Instruments | | 1.9%
| |
| | 4. | | | Informatica
Enterprise Data Integration Software | | 1.8%
| |
| | 5. | | | SL Green Realty
Manhattan Office Buildings | | 1.7%
| |
| | 6. | | | Nordson
Dispensing Systems for Adhesives & Coatings | | 1.6%
| |
| | 7. | | | SBA Communications
Communications Towers | | 1.6%
| |
| | 8. | | | AmeriCredit
Auto Lending | | 1.6%
| |
| | 9. | | | Mettler Toledo
Laboratory Equipment | | 1.6%
| |
| | 10. | | | Micros Systems
Information Systems for Restaurants & Hotels | | 1.5%
| |
The Fund's top 10 holdings and portfolio diversification vary with changes in portfolio investments. See the Statement of Investments for a complete list of the Fund's holdings.
The Growth of a $10,000 Investment in Columbia Acorn USA (Class A)
October 16, 2000 through June 30, 2010
Illustration is based on a hypothetical $10,000 investment from inception in Class A shares of the Fund, which includes a 5.75% maximum initial sales charge. The Russell 2000 Index is unmanaged and returns for both the index and the Fund include reinvested dividends and capital gains. Although the index is provided for use in assessing the Fund's performance, the Fund's holdings may differ significantly from those in the index. It is not possible to invest directly in an index. The graph does not reflect taxes that a shareholder would pay on Fund distributions or on a sale of Fund shares.
Total Net Assets of the Fund: $1.3 billion
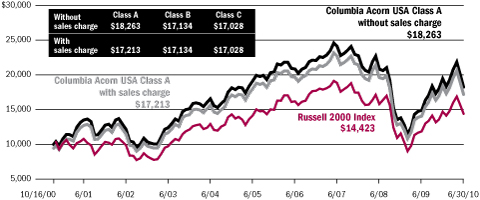
16
Columbia Acorn International Select
In a Nutshell

Christopher J. Olson
Lead Portfolio Manager
Performance data quoted represents past performance and current performance may be lower or higher. Past performance is no guarantee of future results. The investment return and principal value will fluctuate so that shares, when redeemed, may be worth more or less than the original cost. Please visit www.columbiafunds.com for daily and most recent month-end performance updates.
Fund's Positions
in Mentioned Holdings
As a percentage of net assets,
as of 6/30/10
| Naspers | | | 5.5 | % | |
| Pacific Rubiales Energy | | | 3.6 | % | |
| Zhaojin Mining Industry | | | 3.4 | % | |
| Eldorado Gold | | | 3.3 | % | |
| Cobham | | | 2.6 | % | |
| Fugro | | | 2.1 | % | |
| Micro Focus | | | 2.1 | % | |
| Ain Pharmaciez | | | 1.7 | % | |
| Red Eléctrica de Espana | | | 1.2 | % | |
Columbia Acorn International Select ended the second quarter of 2010 down 5.60% (Class A shares, without sales charge), holding up far better than the 10.15% drop of its primary benchmark, the S&P Developed Ex-U.S. Between $2 Billion and $10 Billion Index. For the first half of 2010, the Fund was down 3.90% while its primary benchmark declined 6.52%. The Fund's relative performance was hurt in the first quarter by the strong performance of more cyclical names as investors hoped for a return to solid global economic growth. In the second quarter, the performance of these riskier names declined and the higher quality names in the Fund's portfolio fared better as indicators pointed to disappointing economic growth. We continue to favor companies with stronger franchises, better earnings visibility and more solid balance sheets, as we believe it is likely the global equity markets will remain volatile for some time.
Top performers for the second quarter and half year periods included two gold mining companies: Canada's Eldorado Gold, up more than 47% in the quarter and 26% in the half, and China's Zhaojin Mining Industry, up 22% in the quarter and 21% year to date. Both stocks benefited from rising gold prices in addition to strong production and exploration profiles. Japan's Ain Pharmaciez gained 40% in the quarter and ended the six months up 71%. The pharmacy chain operator provided a strong earnings outlook and moved its stock listing to a more prominent segment of the Tokyo Exchange. Pacific Rubiales Energy, an oil production and exploration company with assets in Colombia, gained 15% in the quarter and ended the half year up 52%. The company has wisely reinvested cash flow into further successful oil exploration. Benefiting from the Chinese government's focus on medical care reform, Shandong Weigao, a manufacturer of hospital consumabl es, gained 13% in the quarter and ended the half year up 42%. We opted to take our profits on the stock given its high valuation, and sold the Fund's position.
Naspers, a media company with assets in South Africa and other emerging markets, was the biggest detractor to Fund gains in both the quarter and half, falling 23% and 17% for the respective periods. Naspers has been a top contributor to performance for several quarters, but concerns about a possible slowdown at its major investment Tencent, an Internet service provider in China, caused a setback. Red Eléctrica de Espana, a Spanish power transmission company, was off 33% for the quarter and 34% for the half, as concerns grew about Spain's financial stability and the Spanish stock market sold off heavily. Cobham, a UK manufacturer of aerospace components, was down 18% for the quarter and 21% for the semiannual period due to concerns that the British and U.S. governments will cut defense budgets. Micro Focus, a UK legacy software provider, was a new addition to the Fund in the quarter, but got off to a rocky start with a 26% drop due to the resignation of the company's chief financial officer. Earnings data released in the second quarter, however, came in strong and met expectations. Dutch sub-sea oilfield services provider Fugro fell 28% in the quarter and ended the half down 18%, tracking the oil services sector that was rocked due to the BP oil spill in the Gulf of Mexico.
International investing involves special risks, including foreign taxation, currency risks, risks associated with possible differences in financial standards and other risks associated with future political and economic developments. Stocks of small- and mid-cap companies pose special risks, including possible illiquidity and greater price volatility than stocks of larger, more established companies. Investing in emerging markets may involve greater risks than investing in more developed countries.
Portfolio holdings are subject to change periodically and may not be representative of current holdings.
17
Columbia Acorn
International Select
At a Glance (Class A Shares – LAFAX)
Performance data quoted represents past performance and current performance may be higher or lower. Past performance is no guarantee of future results. The investment return and principal value of an investment in the Fund will fluctuate so that Fund shares, when redeemed, may be worth more or less than their original cost. Performance results reflect any fee waivers or reimbursements of Fund expenses by the investment advisor and/or any of its affiliates. Absent these fee waivers or expense reimbursement arrangements, performance results would have been lower. Please visit columbiafunds.com for daily and most recent month-end updates.
Pretax and After-tax Average Annual Total Returns (Based on Class A Shares)
through June 30, 2010
| Inception 10/16/00 | | | | Year
to date* | | 1 year | | 5 years | | Life of fund | |
| Returns before taxes | | NAV
POP | | -3.90%
-9.43 | | 15.15%
8.53 | | 6.67%
5.42 | | 3.60%
2.97 | |
Returns after taxes
on distributions | | NAV
POP | | -4.36
-9.86 | | 14.60
8.01 | | 6.36
5.11 | | 3.43
2.80 | |
Returns after taxes
on distributions and
sale of fund shares | | NAV
POP | | -2.54
-6.13 | | 9.84
5.54 | | 5.84
4.74 | | 3.17
2.61 | |
S&P Developed Ex-U.S.
Between $2 Billion and
$10 Billion Index
(pretax)** | | | | -6.52 | | 12.73 | | 3.42 | | 6.06 | |
All results shown assume reinvestment of distributions.
*Year to date data is not annualized.
**The Fund's primary benchmark.
After-tax returns are calculated using the highest historical individual federal marginal income tax rates, and do not reflect the impact of state and local taxes. Returns after taxes on distributions and sale of Fund shares reflect the additional tax impact of long-term gains or losses realized when Fund shares are sold. The returns are taxed at the maximum rate and assume shares were purchased at the beginning of the period. Actual after-tax returns depend on the investor's tax situation and may differ from those shown. After-tax returns are not relevant to investors who hold their Fund shares through tax-deferred arrangements such as 401(k) plans or individual retirement accounts. After-tax returns are shown for Class A shares only; after-tax returns for other share classes will vary. Indexes do not reflect any deduction for fees, expenses or taxes.
Public offering price (POP) returns include the maximum sales charge of 5.75% for Class A shares. Net asset value (NAV) returns do not include sales charges or contingent deferred sales charges (CDSC).
The Fund's Class A shares annual operating expense ratio, as stated in the current prospectus, is 1.58%.
Columbia Acorn International Select Portfolio Diversification
as a percentage of net assets, as of 6/30/10
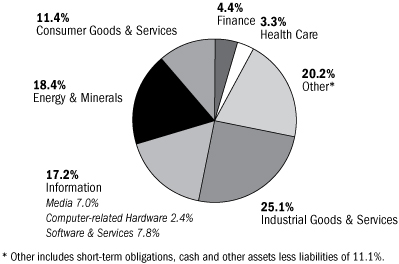
Columbia Acorn International Select Top 10 Holdings
as a percentage of net assets, as of 6/30/10
| | 1. | | | Naspers (South Africa)
Media in Africa & Other Emerging Markets | | 5.5%
| |
| | 2. | | | Serco (United Kingdom)
Facilities Management | | 5.2%
| |
| | 3. | | | Kansai Paint (Japan)
Paint Producer in Japan, India, China & Southeast Asia | | 4.2%
| |
| | 4. | | | Pacific Rubiales Energy (Colombia)
Oil Production & Exploration in Colombia | | 3.6%
| |
| | 5. | | | Zhaojin Mining Industry (China)
Gold Mining & Refining in China | | 3.4%
| |
| | 6. | | | Pan American Silver (Canada)
Silver Mining | | 3.4%
| |
| | 7. | | | Eldorado Gold (Canada)
Gold Miner in Turkey, Greece, China & Brazil | | 3.3%
| |
| | 8. | | | Jiangsu Expressway (China)
Chinese Toll Road Operator | | 3.1%
| |
| | 9. | | | NHN (South Korea)
South Korea's Largest Online Search Engine | | 3.0%
| |
| | 10. | | | Intertek Group (United Kingdom)
Testing, Inspection & Certification Services | | 3.0%
| |
The Fund's top 10 holdings and portfolio diversification vary with changes in portfolio investments. See the Statement of Investments for a complete list of the Fund's holdings.
The Growth of a $10,000 Investment in Columbia Acorn International Select (Class A)
October 16, 2000 through June 30, 2010
Illustration is based on a hypothetical $10,000 investment from inception in Class A shares of the Fund, which includes a 5.75% maximum initial sales charge. The S&P Developed Ex-U.S. Between $2 Billion and $10 Billion Index is unmanaged and returns for both the index and the Fund include reinvested dividends and capital gains. Although the index is provided for use in assessing the Fund's performance, the Fund's holdings may differ significantly from those in the index. It is not possible to invest directly in an index. The graph does not reflect taxes that a shareholder would pay on Fund distributions or on a sale of Fund shares.
Total Net Assets of the Fund: $384.7 million
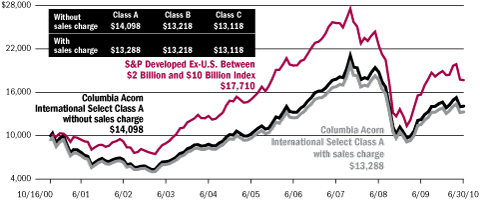
18
Columbia Acorn Select
In a Nutshell

Ben Andrews
Lead Portfolio Manager
Performance data quoted represents past performance and current performance may be lower or higher. Past performance is no guarantee of future results. The investment return and principal value will fluctuate so that shares, when redeemed, may be worth more or less than the original cost. Please visit www.columbiafunds.com for daily and most recent month-end performance updates.
Opinions expressed are those of the author and are not necessarily those of the Advisor, its parent organizations or the Columbia Acorn Trust Board.
Fund's Positions
in Mentioned Holdings
As a percentage of net assets,
as of 6/30/10
| Pacific Rubiales Energy | | | 7.2 | % | |
| ITT Educational Services | | | 3.9 | % | |
| Abercrombie & Fitch | | | 2.8 | % | |
| Canadian Solar | | | 1.7 | % | |
| Canacol Energy | | | 1.6 | % | |
Columbia Acorn Select lost 12.43% (Class A shares, without sales charge) in the second quarter of 2010 giving the Fund a year-to-date return of -4.91%. The Fund's loss in the quarter was worse than the S&P MidCap 400 Index's drop of 9.59% and the large-cap S&P 500 Index's 11.43% decline. The market sold off considerably in the second quarter as fears that the U.S. economy is going back into recession grew.
We had only a handful of stocks that were up in the quarter. Of these, two energy names, Pacific Rubiales Energy and Canacol Energy, added 1.1% of return to our portfolio in the quarter. Both companies continue to have success finding oil in Colombia. SkillSoft, a provider of web-based learning tools, was acquired by a group of private investors in the quarter and contributed 0.4% to the portfolio. On the downside, the names were numerous, but Canadian Solar (CSIQ, a solar cell and module manufacturer) cost the Fund 1.7% of total portfolio performance in the second quarter. CSIQ lost ground due to falling solar cell prices and fears that Germany's subsidy cut to the solar industry would hurt demand for new solar installation. Teen apparel retailer Abercrombie & Fitch and ITT Educational Services (ESI) each cost the Fund 1.2% of portfolio performance in the quarter. The latter fell hard on proposed government regulation that could impact providers of post-secondary degree programs like ITT Educational Services. We trimmed ESI's position size in the portfolio in anticipation of the government attacking this industry, but we still own the company because we strongly believe that it educates a portion of American students that traditional not-for-profit colleges largely ignore.
It was a terrible quarter for trying to build capital. We did use the market weakness to invest a couple of percent of the Fund's cash into companies we felt were oversold and that show growth potential in a sluggish economy. The Fund's cash level at the end of the period was 6.5%. In the quarter, we sold out of four companies, had SkillSoft acquired and added five new companies to the portfolio.
According to a U.S. Treasury Department report that was recently released, the U.S. is estimated to run a $1.6 trillion dollar budget deficit this year alone. This will be greater than 10.5% of the country's gross domestic product (GDP) for the year, a mind boggling number. If GDP is down 3% in a year, that would cause a really rough recession, but if all the deficit spending was withdrawn in the next year, thus a minus 10% economy, well, heaven help us. As I see it, over the next several years the U.S. has to reduce this deficit spending while increasing employment to get the country heading toward a sound footing. If not, I believe we may run into a nasty currency crisis. Executing on this strategy will not be an easy task. If the deficit spending is withdrawn too fast, I believe the country could go into recession. But, allowing a budget deficit this big for too long is likely to cause pain to this generation and the next thr ough inflation and/or massive tax increases. Getting unemployment down when the country is already deficit spending like crazy is going to be tricky. I think it needs to start with less government legislation and regulation, which has been keeping our businesses from adding employees until they can understand what is happening in their industries. Uncertainty is a killer in any capital market.
I'm not looking for the next couple of years to be easy, but I never do. Our Fund's portfolio will remain focused on businesses that we feel can grow in a soft economy.
Risks include stock market fluctuations due to economic and business developments. The Fund also has potentially greater price volatility due to the Fund's concentration in a limited number of stocks of mid-size companies. The Fund is a non-diversified fund and may, therefore, have a greater risk of loss from a few issuers than a similar fund that invests more broadly. The Fund may not operate as a non-diversified fund at all times. International investments involve greater potential risks, including less regulation, currency fluctuations, economic instability and political developments.
Portfolio holdings are subject to change periodically and may not be representative of current holdings.
19
Columbia Acorn Select
At a Glance (Class A Shares – LTFAX)
Performance data quoted represents past performance and current performance may be higher or lower. Past performance is no guarantee of future results. The investment return and principal value of an investment in the Fund will fluctuate so that Fund shares, when redeemed, may be worth more or less than their original cost. Performance results reflect any fee waivers or reimbursements of Fund expenses by the investment advisor and/or any of its affiliates. Absent these fee waivers or expense reimbursement arrangements, performance results would have been lower. Please visit columbiafunds.com for daily and most recent month-end updates.
Pretax and After-tax Average Annual Total Returns (Based on Class A Shares)
through June 30, 2010
| Inception 10/16/00 | | | | Year
to date* | | 1 year | | 5 years | | Life of fund | |
| Returns before taxes | | NAV
POP | | -4.91%
-10.38 | | 26.92%
19.62 | | 2.88%
1.67 | | 6.57%
5.92 | |
Returns after taxes
on distributions | | NAV
POP | | -4.91
-10.38 | | 26.92
19.62 | | 2.59
1.39 | | 6.33
5.68 | |
Returns after taxes
on distributions and
sale of fund shares | | NAV
POP | | -3.19
-6.75 | | 17.50
12.75 | | 2.50
1.46 | | 5.78
5.19 | |
S&P MidCap 400
Index (pretax)** | | | | -1.36 | | 24.93 | | 2.21 | | 5.01 | |
All results shown assume reinvestment of distributions.
*Year to date data is not annualized.
**The Fund's primary benchmark.
After-tax returns are calculated using the highest historical individual federal marginal income tax rates, and do not reflect the impact of state and local taxes. Returns after taxes on distributions and sale of Fund shares reflect the additional tax impact of long-term gains or losses realized when Fund shares are sold. The returns are taxed at the maximum rate and assume shares were purchased at the beginning of the period. Actual after-tax returns depend on the investor's tax situation and may differ from those shown. After-tax returns are not relevant to investors who hold their Fund shares through tax-deferred arrangements such as 401(k) plans or individual retirement accounts. After-tax returns are shown for Class A shares only; after-tax returns for other share classes will vary. Indexes do not reflect any deduction for fees, expenses or taxes.
Public offering price (POP) returns include the maximum sales charge of 5.75% for Class A shares. Net asset value (NAV) returns do not include sales charges or contingent deferred sales charges (CDSC).
The Fund's Class A shares annual operating expense ratio, as stated in the current prospectus, is 1.30%.
Columbia Acorn Select Portfolio Diversification
as a percentage of net assets, as of 6/30/10

Columbia Acorn Select Top 10 Holdings
as a percentage of net assets, as of 6/30/10
| | 1. | | | Pacific Rubiales Energy (Colombia)
Oil Production & Exploration in Colombia | | 7.2%
| |
| | 2. | | | Sanmina-SCI
Electronic Manufacturing Services | | 5.9%
| |
| | 3. | | | Hertz
Largest U.S. Rental Car Operator | | 4.4%
| |
| | 4. | | | Safeway
Supermarkets | | 4.1%
| |
| | 5. | | | ITT Educational Services
Post-secondary Degree Services | | 3.9%
| |
| | 6. | | | CNO Financial Group
Life, Long-term Care & Medical Supplement Insurance | | 3.6%
| |
| | 7. | | | Crown Castle International
Communications Towers | | 3.1%
| |
| | 8. | | | Abercrombie & Fitch
Teen Apparel Retailer | | 2.8%
| |
| | 9. | | | WNS-ADR (India)
Offshore BPO (Business Process Outsourcing) Services | | 2.6%
| |
| | 10. | | | Expedia
Online Travel Services Company | | 2.6%
| |
The Fund's top 10 holdings and portfolio diversification vary with changes in portfolio investments. See the Statement of Investments for a complete list of the Fund's holdings.
The Growth of a $10,000 Investment in Columbia Acorn Select (Class A)
October 16, 2000 through June 30, 2010
Illustration is based on a hypothetical $10,000 investment from inception in Class A shares of the Fund, which includes a 5.75% maximum initial sales charge. The S&P MidCap 400 Index is unmanaged and returns for both the index and the Fund include reinvested dividends and capital gains. Although the index is provided for use in assessing the Fund's performance, the Fund's holdings may differ significantly from those in the index. It is not possible to invest directly in an index. The graph does not reflect taxes that a shareholder would pay on Fund distributions or on a sale of Fund shares.
Total Net Assets of the Fund: $1.8 billion
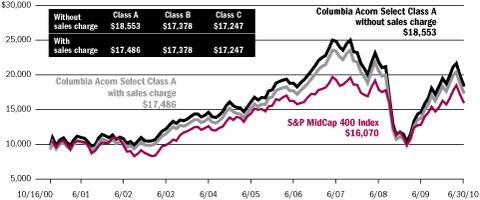
20
Columbia Thermostat Fund
In a Nutshell
 | |
|
| Charles P. McQuaid | |
|
| Lead Portfolio Manager | |
|
Performance data quoted represents past performance and current performance may be lower or higher. Past performance is no guarantee of future results. The investment return and principal value will fluctuate so that shares, when redeemed, may be worth more or less than the original cost. Please visit www.columbiafunds.com for daily and most recent month-end performance updates.
A "fund of fund" bears its allocable share of the costs and expenses of the underlying funds in which it invests. Such funds are thus subject to two levels of fees and potentially higher expense ratios than would be associated with a fund that invests and trades directly in financial instruments under the direction of a single manager.
Columbia Thermostat Fund fell 6.75% (Class A shares, without sales charge) in the second quarter of 2010, outperforming the 11.43% drop in the Fund's primary equity benchmark, the S&P 500 Index, but underperforming the 3.49% gain of the Barclays Capital U.S. Aggregate Bond Index, the Fund's primary debt benchmark. For the six-month period ended June 30, 2010, Columbia Thermostat Fund was off 2.05% vs. a 6.65% drop in the S&P 500 Index and a 5.33% gain for the Barclays Capital U.S. Aggregate Bond Index.
The Fund's bond holdings performed well in a quarter that saw equity markets decline as concerns about the health of the U.S. economy grew. The bond segment had a weighted average return of 2.47% in the quarter and was up 5.01% for the half year. Columbia U.S. Treasury Index Fund was the leading performer in the portfolio for both periods.
On the equity side, losses in the quarter ranged from a 7.68% drop in Columbia Acorn International to a 13.45% decline for Columbia Contrarian Core Fund. The equity component's weighted average loss was 10.54% for the quarter and 5.78% for the half year. For the six-month period, Columbia Acorn Fund held up best with a 3.16% drop while Columbia Contrarian Core Fund was hardest hit with an 8.56% decline.
Columbia Thermostat Fund has provided a sound investment option for these volatile times. By design, the Fund takes advantage of the market's ups and downs to sell stocks on strength and buy them on weakness. The Fund reduced its stock exposure as the market rallied in April, and then hiked stock positions when the market swooned in May. As of June 30, 2010, Columbia Thermostat Fund had about 75% of its assets in stock funds and 25% in bond funds.
Results of the Funds Owned in Columbia Thermostat Fund as of June 30, 2010
| Stock Funds | | Weightings | | 2nd | | Year | |
| Fund | | in category | | quarter | | to date | |
Columbia Acorn
International Z | | | 20 | % | | | -7.68 | % | | | -4.45 | % | |
Columbia Dividend
Income Fund Z | | | 20 | % | | | -9.86 | % | | | -5.87 | % | |
| Columbia Acorn Fund Z | | | 15 | % | | | -9.75 | % | | | -3.16 | % | |
Columbia Marsico
Growth Fund Z | | | 15 | % | | | -12.75 | % | | | -7.80 | % | |
| Columbia Acorn Select Z | | | 10 | % | | | -12.36 | % | | | -4.75 | % | |
Columbia Contrarian
Core Fund Z | | | 10 | % | | | -13.45 | % | | | -8.56 | % | |
Columbia Large Cap
Enhanced Core Fund Z | | | 10 | % | | | -11.03 | % | | | -6.73 | % | |
Weighted Average
Equity Return/Loss | | | 100 | % | | | -10.54 | % | | | -5.78 | % | |
| Bond Funds | | Weightings | | 2nd | | Year | |
| Fund | | in category | | quarter | | to date | |
Columbia Intermediate
Bond Fund Z | | | 50 | % | | | 2.10 | % | | | 5.22 | % | |
Columbia U.S. Treasury
Index Fund Z | | | 30 | % | | | 4.61 | % | | | 5.63 | % | |
Columbia Conservative
High Yield Fund Z | | | 20 | % | | | 0.19 | % | | | 3.50 | % | |
Weighted Average
Income Return | | | 100 | % | | | 2.47 | % | | | 5.01 | % | |
Columbia Thermostat Fund
Rebalancing in the Second Quarter
| April 15, 2010 | | 65% stocks, 35% bonds | |
| May 17, 2010 | | 75% stocks, 25% bonds | |
| May 21, 2010 | | 80% stocks, 20% bonds | |
| June 21, 2010 | | 75% stocks, 25% bonds | |
The value of an investment in the Fund is based primarily on the performance of the underlying portfolio funds and the allocation of the Fund's assets among them. An investment in the underlying portfolio funds may present certain risks, including stock market fluctuations that occur in response to economic and business developments; and a greater degree of social, political and economic volatility associated with international investing. Stocks of small- and mid-cap companies pose special risks, including possible illiquidity and greater price volatility than stocks of larger, more established companies. Value stocks may also be subject to specific business risks that have caused the stocks to be out of favor. Lower-rated and medium quality debt securities are more speculative and incur more risk. International investing involves special risks, including foreign taxation, currency risks, risks associated with possible differ ences in financial standards and other risks associated with future political and economic developments. Changes in interest rates and changes in the financial strength of issuers of lower-rated bonds may also affect underlying fund performance. The Fund is also subject to the risk that the investment advisor's decisions regarding asset classes and underlying portfolio funds will not anticipate market trends successfully, resulting in a failure to preserve capital or lower total return. In addition, the Fund may buy and sell shares of the portfolio funds frequently. This may result in higher transaction costs and additional tax liability. This is not an offer of the shares of any other mutual fund mentioned herein.
21
Columbia Thermostat
Fund
At a Glance (Class A Shares – CTFAX)
Performance data quoted represents past performance and current performance may be higher or lower. Past performance is no guarantee of future results. The investment return and principal value of an investment in the Fund will fluctuate so that Fund shares, when redeemed, may be worth more or less than their original cost. Performance results reflect any fee waivers or reimbursements of Fund expenses by the investment advisor and/or any of its affiliates. Absent these fee waivers or expense reimbursement arrangements, performance results would have been lower. Please visit columbiafunds.com for daily and most recent month-end updates.
Pretax and After-tax Average Annual Total Returns (Based on Class A Shares)
through June 30, 2010
| Inception 3/3/03 | | | | Year
to date* | | 1 year | | 5 years | | Life of fund | |
| Returns before taxes | | NAV
POP | | -2.05%
-7.68 | | 20.23%
13.32 | | 2.17%
0.96 | | 5.81%
4.96 | |
Returns after taxes
on distributions | | NAV
POP | | -2.49
-8.09 | | 19.70
12.81 | | 0.60
-0.58 | | 4.48
3.64 | |
Returns after taxes on
distributions and sale
of fund shares | | NAV
POP
| | -1.33
-4.99
| | 13.15
8.66
| | 1.24
0.22
| | 4.49
3.75
| |
| S&P 500 Index (pretax)** | | | | -6.65 | | 14.43 | | -0.79 | | 4.88 | |
Barclays Capital
U.S. Aggregate Bond
Index (pretax)** | | | | 5.33 | | 9.50 | | 5.54 | | 5.07 | |
Lipper Flexible Portfolio
Funds Index (pretax) | | | | -3.81 | | 15.48 | | 2.78 | | 6.45 | |
All results shown assume reinvestment of distributions.
*Year to date data is not annualized.
**The Fund's primary stock and bond benchmarks, respectively.
After-tax returns are calculated using the highest historical individual federal marginal income tax rates, and do not reflect the impact of state and local taxes. Returns after taxes on distributions and sale of Fund shares reflect the additional tax impact of long-term gains or losses realized when Fund shares are sold. The returns are taxed at the maximum rate and assume shares were purchased at the beginning of the period. Actual after-tax returns depend on the investor's tax situation and may differ from those shown. After-tax returns are not relevant to investors who hold their Fund shares through tax-deferred arrangements such as 401(k) plans or individual retirement accounts. After-tax returns are shown for Class A shares only; after-tax returns for other share classes will vary. Indexes do not reflect any deduction for fees, expenses or taxes.
Public offering price (POP) returns include the maximum sales charge of 5.75% for Class A shares. Net asset value (NAV) returns do not include sales charges or contingent deferred sales charges (CDSC).
The Fund's annual operating expense ratio, as stated in the current prospectus, reflects a contractual expense waiver or reimbursement that expires April 30, 2011. Class A expense ratios without and with the contractual waiver, including fees and expenses associated with the Fund's investment in other investment companies, are 1.60% and 1.32%, respectively. Absent the waiver or reimbursement, performance results would have been lower.
Columbia Thermostat Fund Asset Allocation
as a percentage of net assets, as of 6/30/10

Columbia Thermostat Fund Portfolio Weightings
as a percentage of assets in each investment category, as of 6/30/10
Stock Mutual Funds
| Columbia Acorn International, Class Z | | | 20 | % | |
| Columbia Dividend Income Fund, Class Z | | | 20 | % | |
| Columbia Acorn Fund, Class Z | | | 15 | % | |
| Columbia Marsico Growth Fund, Class Z | | | 15 | % | |
| Columbia Acorn Select, Class Z | | | 10 | % | |
| Columbia Contrarian Core Fund, Class Z | | | 10 | % | |
| Columbia Large Cap Enhanced Core Fund, Class Z | | | 10 | % | |
Bond Mutual Funds
| Columbia Intermediate Bond Fund, Class Z | | | 50 | % | |
| Columbia U.S. Treasury Index Fund, Class Z | | | 30 | % | |
| Columbia Conservative High Yield Fund, Class Z | | | 20 | % | |
The Growth of a $10,000 Investment in Columbia Thermostat Fund (Class A)
March 3, 2003 through June 30, 2010
Illustration is based on a hypothetical $10,000 investment from inception in Class A shares of the Fund, which includes a 5.75% maximum initial sales charge. The indexes are unmanaged and returns for both the indexes and the Fund include reinvested dividends and capital gains. Although the indexes are provided for use in assessing the Fund's performance, the Fund's holdings may differ significantly from those in the index. It is not possible to invest directly in an index. The graph does not reflect taxes that a shareholder would pay on Fund distributions or on a sale of Fund shares.
Total Net Assets of the Fund: $117.1 million
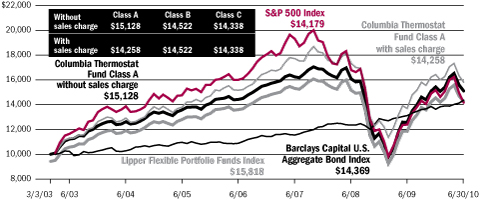
22
Columbia Acorn Fund
Major Portfolio Changes in the Second Quarter (Unaudited)
| | | Number of Shares | |
| | | 03/31/10 | | 06/30/10 | |
| Purchases | |
| Information | |
| AboveNet | | | 600,000 | | | | 1,000,000 | | |
| ANSYS | | | 2,083,291 | | | | 2,100,000 | | |
| Atmel | | | 4,600,000 | | | | 5,840,000 | | |
| Constant Contact | | | 684,245 | | | | 1,400,000 | | |
| Entegris | | | 3,750,000 | | | | 4,500,000 | | |
| FTI Consulting | | | 650,000 | | | | 900,000 | | |
| Jack Henry & Associates | | | 0 | | | | 920,000 | | |
| Monolithic Power Systems | | | 960,000 | | | | 1,000,000 | | |
| NetSuite | | | 1,249,115 | | | | 1,800,000 | | |
| ON Semiconductor | | | 3,214,000 | | | | 3,440,000 | | |
| Terremark Worldwide | | | 0 | | | | 1,000,000 | | |
| Tyler Technologies | | | 1,842,218 | | | | 2,032,845 | | |
| Virtusa | | | 1,926,700 | | | | 2,000,000 | | |
| WNS - ADR (India) | | | 933,334 | | | | 1,000,000 | | |
| Industrial Goods & Services | |
| Aalberts Industries (Netherlands) | | | 2,200,000 | | | | 2,225,287 | | |
| Acuity Brands | | | 1,300,000 | | | | 1,440,000 | | |
| Clean Harbors | | | 180,000 | | | | 280,000 | | |
| Generac | | | 1,447,115 | | | | 1,600,000 | | |
| GrafTech International | | | 1,680,000 | | | | 1,980,000 | | |
| Kansai Paint (Japan) | | | 2,024,000 | | | | 2,200,000 | | |
| Kennametal | | | 0 | | | | 1,200,000 | | |
Mills Estruturas e Servicios de
Engenha (Brazil) | | | 0 | | | | 1,800,000 | | |
| Nordson | | | 1,178,724 | | | | 1,500,000 | | |
| Spartan Motors | | | 0 | | | | 900,000 | | |
| Consumer Goods & Services | |
| Charming Shoppes | | | 7,500,000 | | | | 9,800,000 | | |
| Coldwater Creek | | | 4,528,738 | | | | 4,950,442 | | |
| Dress Barn | | | 0 | | | | 1,200,000 | | |
| Express | | | 0 | | | | 1,008,000 | | |
IFM Investments (Century 21
China RE) - ADR (China) | | | 1,195,400 | | | | 1,325,000 | | |
| Jarden | | | 1,470,000 | | | | 1,720,000 | | |
| Jones Apparel Group | | | 0 | | | | 225,000 | | |
| Kenneth Cole Productions | | | 0 | | | | 400,000 | | |
Lifestyle International
(Hong Kong) | | | 12,738,300 | | | | 14,000,000 | | |
| Localiza Rent A Car (Brazil) | | | 0 | | | | 1,100,000 | | |
| Pier 1 Imports | | | 3,000,000 | | | | 4,500,000 | | |
| Rue21 | | | 495,000 | | | | 1,034,000 | | |
| Talbots | | | 4,250,000 | | | | 4,900,000 | | |
| Tesla | | | 0 | | | | 294,000 | | |
| True Religion Apparel | | | 2,175,000 | | | | 2,475,000 | | |
| Wet Seal | | | 2,984,430 | | | | 5,000,000 | | |
| Finance | |
| Associated Banc-Corp | | | 3,737,900 | | | | 5,063,800 | | |
| City National | | | 445,000 | | | | 745,000 | | |
| | | Number of Shares | |
| | | 03/31/10 | | 06/30/10 | |
| Valley National Bancorp | | | 5,718,205 | | | | 6,004,115 | | |
| Whitney Holding | | | 849,562 | | | | 1,600,000 | | |
| Health Care | |
| Acorda Therapeutics | | | 1,300,000 | | | | 1,500,000 | | |
| AMAG Pharmaceuticals | | | 900,000 | | | | 1,100,000 | | |
| Amylin Pharmaceuticals | | | 0 | | | | 1,055,762 | | |
| Array Biopharma | | | 0 | | | | 3,500,000 | | |
| HMS Holdings | | | 0 | | | | 400,000 | | |
| Idenix Pharmaceuticals | | | 0 | | | | 1,917,820 | | |
| Isis Pharmaceuticals | | | 1,048,600 | | | | 2,261,347 | | |
| Micromet | | | 2,500,000 | | | | 3,463,611 | | |
| Nektar Therapeutics | | | 3,052,000 | | | | 3,300,000 | | |
| NPS Pharmaceuticals | | | 2,749,973 | | | | 3,112,776 | | |
| Seattle Genetics | | | 4,123,200 | | | | 4,951,226 | | |
| Sirona Dental Systems | | | 1,050,000 | | | | 1,500,000 | | |
| The Medicines Company | | | 0 | | | | 1,750,000 | | |
| Xenoport | | | 0 | | | | 2,100,000 | | |
| Energy & Minerals | |
| Alexco Resource | | | 1,500,000 | | | | 2,400,000 | | |
| Baytex (Canada) | | | 347,600 | | | | 650,000 | | |
| Black Diamond Group (Canada) | | | 0 | | | | 500,000 | | |
| Canacol Energy (Colombia) | | | 0 | | | | 6,300,000 | | |
| Core Laboratories (Netherlands) | | | 290,000 | | | | 348,000 | | |
| Gulfmark Offshore | | | 0 | | | | 308,303 | | |
| Oasis Petroleum | | | 0 | | | | 228,200 | | |
| Pan American Silver (Canada) | | | 450,000 | | | | 880,000 | | |
| Petrolifera Petroleum (Colombia) | | | 0 | | | | 8,000,000 | | |
| Petromanas (Canada) | | | 0 | | | | 37,500,000 | | |
| Rosetta Resources | | | 425,000 | | | | 779,000 | | |
| St. Mary Land & Exploration | | | 0 | | | | 715,000 | | |
| Tahoe Resources (Canada) | | | 0 | | | | 236,400 | | |
| Other Industries | |
| BioMed Realty Trust | | | 3,700,000 | | | | 4,000,000 | | |
| Dupont Fabros Technology | | | 0 | | | | 900,000 | | |
| Education Realty Trust | | | 0 | | | | 3,000,000 | | |
| World Fuel Services | | | 925,000 | | | | 1,110,000 | | |
See accompanying notes to financial statements.
23
| | | Number of Shares | |
| | | 03/31/10 | | 06/30/10 | |
| Sales | |
| Information | |
| Amphenol | | | 3,800,000 | | | | 3,750,000 | | |
| Cogent Communications | | | 4,200,000 | | | | 3,400,000 | | |
| Crown Castle International | | | 6,575,000 | | | | 6,300,000 | | |
| Global Payments | | | 2,919,000 | | | | 2,429,000 | | |
| Hexagon (Sweden) | | | 5,200,000 | | | | 5,070,000 | | |
Hong Kong Exchanges and
Clearing (Hong Kong) | | | 2,125,000 | | | | 1,790,000 | | |
| Informatica | | | 6,100,000 | | | | 5,200,000 | | |
| Integrated Device Technology | | | 2,110,000 | | | | 1,460,000 | | |
Jupiter Telecommunications
(Japan) | | | 39,926 | | | | 17,770 | | |
| Mediacom Communications | | | 4,000,000 | | | | 3,000,000 | | |
| Sanmina-SCI | | | 2,950,000 | | | | 2,800,000 | | |
| SES (France) | | | 702,000 | | | | 0 | | |
| Singapore Exchange (Singapore) | | | 10,000,000 | | | | 8,000,000 | | |
| Teradata | | | 220,000 | | | | 0 | | |
| VisionChina Media - ADR (China) | | | 2,194,499 | | | | 1,500,000 | | |
| Zebra Technologies | | | 1,590,000 | | | | 1,505,000 | | |
| Industrial Goods & Services | |
| Crown Holdings | | | 400,000 | | | | 0 | | |
| Drew Industries | | | 1,400,000 | | | | 1,260,000 | | |
Expeditors International of
Washington | | | 3,300,000 | | | | 3,200,000 | | |
| M/I Homes | | | 384,000 | | | | 284,000 | | |
| Martin Marietta Materials | | | 615,000 | | | | 350,000 | | |
| Mine Safety Appliances | | | 1,975,000 | | | | 1,700,000 | | |
| Mobile Mini | | | 1,750,000 | | | | 1,600,000 | | |
| Novozymes (Denmark) | | | 363,000 | | | | 340,000 | | |
| Oshkosh | | | 2,350,000 | | | | 2,200,000 | | |
| Pall | | | 2,150,000 | | | | 1,800,000 | | |
| Quanta Services | | | 1,970,000 | | | | 1,950,000 | | |
| Serco (United Kingdom) | | | 3,000,000 | | | | 2,900,000 | | |
| Simpson Manufacturing | | | 850,000 | | | | 700,000 | | |
Sociedad Quimica y Minera
de Chile - ADR (Chile) | | | 2,000,000 | | | | 1,750,000 | | |
| UTI Worldwide | | | 1,500,000 | | | | 1,000,000 | | |
| Waste Connections | | | 1,200,000 | | | | 1,115,000 | | |
| Watsco | | | 550,000 | | | | 350,000 | | |
| WW Grainger | | | 1,000,000 | | | | 900,000 | | |
| Consumer Goods & Services | |
| Abercrombie & Fitch | | | 3,100,000 | | | | 2,835,000 | | |
| Avis Budget Group | | | 4,700,000 | | | | 4,600,000 | | |
| Choice Hotels | | | 1,100,000 | | | | 970,000 | | |
| Coach | | | 2,800,000 | | | | 2,100,000 | | |
| Expedia | | | 4,600,000 | | | | 4,500,000 | | |
| Gaylord Entertainment | | | 4,000,000 | | | | 3,128,400 | | |
| Helen of Troy | | | 1,700,000 | | | | 1,600,000 | | |
| ITT Educational Services | | | 1,250,000 | | | | 1,030,000 | | |
| | | Number of Shares | |
| | | 03/31/10 | | 06/30/10 | |
| J Crew Group | | | 2,564,000 | | | | 2,219,000 | | |
| Lifetime Fitness | | | 2,150,000 | | | | 1,960,000 | | |
| lululemon athletica | | | 4,685,000 | | | | 4,135,000 | | |
New Oriental Education &
Technology - ADR (China) | | | 300,000 | | | | 230,000 | | |
| P.F. Chang's China Bistro | | | 650,000 | | | | 370,000 | | |
| Princeton Review | | | 3,000,000 | | | | 2,970,000 | | |
| Saks | | | 6,100,000 | | | | 5,225,000 | | |
| SkillSoft - ADR | | | 9,500,000 | | | | 0 | | |
| Smart Balance | | | 3,000,000 | | | | 2,000,000 | | |
| Steelcase | | | 3,000,000 | | | | 1,355,500 | | |
| Thor Industries | | | 1,240,000 | | | | 1,190,000 | | |
| Urban Outfitters | | | 3,805,000 | | | | 3,005,000 | | |
| Finance | |
| AmeriCredit | | | 7,235,000 | | | | 7,085,000 | | |
| Assurant | | | 1,200,000 | | | | 700,000 | | |
| Berkshire Hills Bancorp | | | 234,693 | | | | 65,991 | | |
| Cullen/Frost Bankers | | | 640,000 | | | | 240,000 | | |
| GATX | | | 1,530,000 | | | | 1,480,000 | | |
| H&E Equipment Services | | | 3,300,000 | | | | 3,033,300 | | |
| HCC Insurance Holdings | | | 1,777,995 | | | | 1,200,000 | | |
Housing Development Finance
(India) | | | 450,000 | | | | 325,000 | | |
| People's United | | | 3,200,000 | | | | 0 | | |
| SEI Investments | | | 6,448,000 | | | | 6,198,000 | | |
| SVB Financial Group | | | 1,360,000 | | | | 1,260,000 | | |
| TriCo Bancshares | | | 1,200,000 | | | | 1,100,000 | | |
| World Acceptance | | | 1,532,600 | | | | 1,505,202 | | |
| Health Care | |
| Auxilium Pharmaceuticals | | | 1,350,000 | | | | 751,601 | | |
| Beckman Coulter | | | 350,000 | | | | 0 | | |
| BioMarin | | | 3,250,000 | | | | 3,205,000 | | |
| Charles River Laboratories | | | 500,000 | | | | 0 | | |
| Emdeon | | | 800,000 | | | | 0 | | |
| Healthcare Services Group | | | 850,000 | | | | 0 | | |
| Healthspring | | | 157,904 | | | | 0 | | |
| Human Genome Sciences | | | 1,800,000 | | | | 1,100,000 | | |
| Idexx Laboratories | | | 665,000 | | | | 500,000 | | |
| Illumina | | | 1,300,000 | | | | 1,100,000 | | |
| Immucor | | | 1,000,000 | | | | 980,503 | | |
| InterMune | | | 780,000 | | | | 0 | | |
| Ironwood Pharmaceuticals | | | 440,000 | | | | 0 | | |
| Kinetic Concepts | | | 800,000 | | | | 306,696 | | |
| Onyx Pharmaceuticals | | | 800,000 | | | | 639,920 | | |
| Psychiatric Solutions | | | 872,391 | | | | 0 | | |
| QIAGEN (Netherlands) | | | 1,675,000 | | | | 1,435,000 | | |
| United Therapeutics | | | 660,000 | | | | 560,000 | | |
See accompanying notes to financial statements.
24
Columbia Acorn Fund
Major Portfolio Changes in the Second Quarter (Unaudited), continued
| | | Number of Shares | |
| | | 03/31/10 | | 06/30/10 | |
| Sales (continued) | |
| Energy & Minerals | |
| Carrizo Oil & Gas | | | 900,000 | | | | 583,000 | | |
| Dockwise (Norway) | | | 156,655 | | | | 0 | | |
| Fugro (Netherlands) | | | 2,809,568 | | | | 2,570,626 | | |
| Gran Tierra Energy (Colombia) | | | 4,000,000 | | | | 1,400,000 | | |
| Oceaneering International | | | 1,000,000 | | | | 275,000 | | |
| Silver Wheaton (Canada) | | | 2,700,000 | | | | 2,450,000 | | |
| Southwestern Energy | | | 2,975,000 | | | | 2,160,000 | | |
| St. Mary Land & Exploration | | | 285,000 | | | | 0 | | |
| Tetra Technologies | | | 600,000 | | | | 0 | | |
| Ultra Petroleum | | | 975,000 | | | | 910,000 | | |
| Vaalco Energy | | | 1,500,000 | | | | 750,000 | | |
| Other Industries | |
| American Campus Communities | | | 900,000 | | | | 0 | | |
| Ascendas REIT (Singapore) | | | 22,000,000 | | | | 15,000,000 | | |
| Digital Realty Trust | | | 850,000 | | | | 770,000 | | |
| Northeast Utilities | | | 2,200,000 | | | | 1,500,000 | | |
| Old Dominion Freight Lines | | | 150,000 | | | | 100,000 | | |
| Red Eléctrica de Espana (Spain) | | | 500,000 | | | | 333,000 | | |
| SL Green Realty | | | 440,000 | | | | 150,000 | | |
See accompanying notes to financial statements.
25
Columbia Acorn Fund
Statement of Investments (Unaudited), June 30, 2010
| Number of Shares | | | | Value (000) | |
| | | | | | | | Equities: 95.7% | | |
| Information 25.6% | | | |
| | | > Business Software 5.4% | |
| | 5,200,000 | | | Informatica (a)(b) | | $ | 124,176 | | |
| | | | | Enterprise Data Integration Software | | | | | |
| | 2,100,000 | | | ANSYS (a) | | | 85,197 | | |
| | | | | Simulation Software for Engineers & Designers | | | | | |
| | 2,440,544 | | | Micros Systems (a) | | | 77,780 | | |
| | | | | Information Systems for Restaurants & Hotels | | | | | |
| | 12,500,000 | | | Novell (a) | | | 71,000 | | |
| | | | | Directory, Operating System & Identity
Management Software | | | | | |
| | 1,100,000 | | | Quality Systems | | | 63,789 | | |
| | | | | IT Systems for Medical Groups & Ambulatory
Care Centers | | | | | |
| | 2,250,000 | | | Blackbaud (b) | | | 48,982 | | |
| | | | | Software & Services for Non-profits | | | | | |
| | 1,035,000 | | | Concur Technologies (a) | | | 44,174 | | |
| | | | | Web Enabled Cost & Expense
Management Software | | | | | |
| | 2,032,845 | | | Tyler Technologies (a)(b) | | | 31,550 | | |
| | | | | Financial, Tax, Court & Document
Management Systems for Local Governments | | | | | |
| | 1,400,000 | | | Constant Contact (a)(c) | | | 29,862 | | |
| | | | | E-mail & Other Marketing Campaign
Management Systems Delivered Over the Web | | | | | |
| | 2,425,000 | | | Kenexa (a)(b) | | | 29,100 | | |
| | | | | Recruiting & Workforce Management Solutions | | | | | |
| | 1,000,000 | | | Red Hat (a) | | | 28,940 | | |
| | | | | Maintenance & Support for Open
Source & Middleware | | | | | |
| | 700,000 | | | Blackboard (a) | | | 26,131 | | |
| | | | | Education Software | | | | | |
| | 1,800,000 | | | NetSuite (a)(c) | | | 22,752 | | |
| | | | | End to End IT Systems Solutions Delivered
Over the Web | | | | | |
| | 920,000 | | | Jack Henry & Associates | | | 21,970 | | |
| | | | | Systems Financial Institutions | | | | | |
| | 3,700,000 | | | Actuate (a)(b) | | | 16,465 | | |
| | | | | Information Delivery Software & Solutions | | | | | |
| | 4,800,000 | | | Art Technology Group (a) | | | 16,416 | | |
| | | | | Software & Tools to Optimize Websites
for E-Commerce | | | | | |
| | 700,000 | | | Avid Technology (a) | | | 8,911 | | |
| | | | | Digital Nonlinear Editing Software & Systems | | | | | |
| | 1,000,000 | | | InContact (a) | | | 2,450 | | |
| | | | | Call Center Systems Delivered via the Web &
Telecommunications Services | | | | | |
| | | | 749,645 | | |
| | | > Computer Hardware & Related
Equipment 2.7% | |
| | 3,750,000 | | | Amphenol | | | 147,300 | | |
| | | | | Electronic Connectors | | | | | |
| | 1,140,000 | | | Dolby Laboratories (a) | | | 71,466 | | |
| | | | | Audio Technology for Consumer Electronics | | | | | |
| | 2,225,000 | | | II-VI (a)(b) | | | 65,927 | | |
| | | | | Laser Optics & Specialty Materials | | | | | |
| | 1,505,000 | | | Zebra Technologies (a) | | | 38,182 | | |
| | | | | Bar Code Printers | | | | | |
| | 800,000 | | | Nice Systems - ADR (Israel) (a) | | | 20,392 | | |
| | | | | Audio & Video Recording Solutions | | | | | |
| Number of Shares | | | | Value (000) | |
| | 970,000 | | | Netgear (a) | | $ | 17,305 | | |
| | | | | Networking Products for Small Business & Home | | | | | |
| | 605,000 | | | Stratasys (a)(c) | | | 14,859 | | |
| | | | | Rapid Prototyping Systems | | | | | |
| | | | 375,431 | | |
| | | > Instrumentation 2.7% | |
| | 1,600,000 | | | Mettler Toledo (a) | | | 178,608 | | |
| | | | | Laboratory Equipment | | | | | |
| | 5,070,000 | | | Hexagon (Sweden) | | | 66,019 | | |
| | | | | Measurement Equipment | | | | | |
| | 1,545,000 | | | Trimble Navigation (a) | | | 43,260 | | |
| | | | | GPS-based Instruments | | | | | |
| | 2,275,000 | | | IPG Photonics (a) | | | 34,648 | | |
| | | | | Fiber Lasers | | | | | |
| | 300,000 | | | Dionex (a) | | | 22,338 | | |
| | | | | Ion & Liquid Chromatography | | | | | |
| | 600,000 | | | FLIR Systems (a) | | | 17,454 | | |
| | | | | Infrared Cameras | | | | | |
| | 400,000 | | | Hamamatsu Photonics (Japan) | | | 11,126 | | |
| | | | | Optical Sensors for Medical &
Industrial Applications | | | | | |
| | | | 373,453 | | |
| | | > Mobile Communications 2.5% | |
| | 6,300,000 | | | Crown Castle International (a) | | | 234,738 | | |
| | | | | Communications Towers | | | | | |
| | 3,150,000 | | | SBA Communications (a) | | | 107,131 | | |
| | | | | Communications Towers | | | | | |
| | 1,000,000 | | | MetroPCS Communications (a) | | | 8,190 | | |
| | | | | Discount Cellular Telephone Services | | | | | |
| | 1,500,000 | | | Globalstar (a)(c) | | | 2,310 | | |
| | | | | Satellite Mobile Voice & Data Carrier | | | | | |
| | | | 352,369 | | |
| | | > Telephone and Data Services 2.0% | |
| | 9,500,000 | | | tw telecom (a)(b) | | | 158,460 | | |
| | | | | Fiber Optic Telephone/Data Services | | | | | |
| | 1,000,000 | | | AboveNet (a) | | | 47,180 | | |
| | | | | Metropolitan Fiber Communications Services | | | | | |
| | 9,600,000 | | | PAETEC Holding (a)(b) | | | 32,736 | | |
| | | | | Telephone/Data Services for Business | | | | | |
| | 3,400,000 | | | Cogent Communications (a)(b) | | | 25,772 | | |
| | | | | Internet Data Pipelines | | | | | |
| | 2,000,000 | | | General Communications (a) | | | 15,180 | | |
| | | | | Commercial Communications & Consumer
CATV, Web & Phone in Alaska | | | | | |
| | | | 279,328 | | |
| | | > Telecommunications Equipment 1.5% | |
| | 1,045,000 | | | F5 Networks (a) | | | 71,656 | | |
| | | | | Internet Traffic Management Equipment | | | | | |
| | 1,745,000 | | | Polycom (a) | | | 51,983 | | |
| | | | | Video Conferencing Equipment | | | | | |
| | 1,660,000 | | | Blue Coat Systems (a) | | | 33,914 | | |
| | | | | WAN Acceleration & Network Security | | | | | |
| | 1,165,000 | | | CommScope (a) | | | 27,692 | | |
| | | | | Wireless Infrastructure Equipment &
Telecom Cable | | | | | |
| | 1,715,000 | | | Finisar (a)(c) | | | 25,553 | | |
| | | | | Optical Sub-systems & Components | | | | | |
| | | | 210,798 | | |
See accompanying notes to financial statements.
26
Columbia Acorn Fund
Statement of Investments (Unaudited), continued
| Number of Shares | | | | Value (000) | |
| | | > Semiconductors &
Related Equipment 1.4% | |
| | 5,840,000 | | | Atmel (a) | | $ | 28,032 | | |
| | | | | Microcontrollers, RF & Memory Semiconductors | | | | | |
| | 1,035,000 | | | Supertex (a)(b) | | | 25,523 | | |
| | | | | Analog/Mixed-signal Semiconductors | | | | | |
| | 1,620,000 | | | Microsemi (a) | | | 23,701 | | |
| | | | | Analog/Mixed-signal Semiconductors | | | | | |
| | 3,440,000 | | | ON Semiconductor (a) | | | 21,947 | | |
| | | | | Mixed-signal & Power Management
Semiconductors | | | | | |
| | 4,500,000 | | | Entegris (a) | | | 17,865 | | |
| | | | | Semiconductor Materials Management Products | | | | | |
| | 1,000,000 | | | Monolithic Power Systems (a) | | | 17,860 | | |
| | | | | High Performance Analog & Mixed-signal
Integrated Circuits (ICs) | | | | | |
| | 1,765,000 | | | Pericom Semiconductor (a)(b) | | | 16,944 | | |
| | | | | Interface Integrated Circuits (ICs) & Frequency
Control Products | | | | | |
| | 1,900,000 | | | IXYS (a)(b) | | | 16,796 | | |
| | | | | Power Semiconductors | | | | | |
| | 500,000 | | | Littelfuse (a) | | | 15,805 | | |
| | | | | Little Fuses | | | | | |
| | 1,460,000 | | | Integrated Device Technology (a) | | | 7,227 | | |
| | | | | Communications Semiconductors | | | | | |
| | | | 191,700 | | |
| | | > Computer Services 1.3% | |
| | 5,000,000 | | | iGate (b) | | | 64,100 | | |
| | | | | IT & BPO (Business Process Outsourcing)
Services | | | | | |
| | 2,105,000 | | | SRA International (a) | | | 41,405 | | |
| | | | | Government IT Services | | | | | |
| | 1,340,000 | | | Acxiom (a) | | | 19,685 | | |
| | | | | Database Marketing Services | | | | | |
| | 2,000,000 | | | Virtusa (a)(b) | | | 18,660 | | |
| | | | | Offshore IT Outsourcing | | | | | |
| | 1,045,000 | | | ExlService Holdings (a) | | | 17,943 | | |
| | | | | BPO (Business Process Outsourcing) | | | | | |
| | 4,500,000 | | | Hackett Group (a)(b) | | | 12,645 | | |
| | | | | IT Integration & Best Practice Research | | | | | |
| | 1,000,000 | | | WNS - ADR (India) (a) | | | 11,740 | | |
| | | | | Offshore BPO (Business Process Outsourcing)
Services | | | | | |
| | | | 186,178 | | |
| | | > CATV 1.2% | |
| | 3,000,000 | | | Discovery Communications, Series C (a) | | | 92,790 | | |
| | | | | CATV Programming | | | | | |
| | 1,250,000 | | | Liberty Global, Series A (a) | | | 32,488 | | |
| | | | | Cable TV Franchises Outside the USA | | | | | |
| | 3,000,000 | | | Mediacom Communications (a)(b) | | | 20,160 | | |
| | | | | Cable TV Franchises | | | | | |
| | 17,770 | | | Jupiter Telecommunications (Japan) | | | 16,935 | | |
| | | | | Largest Cable Service Provider in Japan | | | | | |
| | | | 162,373 | | |
| | | > Financial Processors 1.1% | |
| | 2,429,000 | | | Global Payments | | | 88,756 | | |
| | | | | Credit Card Processor | | | | | |
| | 8,000,000 | | | Singapore Exchange (Singapore) | | | 41,861 | | |
| | | | | Singapore Equity & Derivatives
Market Operator | | | | | |
| Number of Shares | | | | Value (000) | |
| | 1,790,000 | | | Hong Kong Exchanges and Clearing
(Hong Kong) | | $ | 27,957 | | |
| | | | | Hong Kong Equity & Derivatives
Market Operator | | | | | |
| | | | 158,574 | | |
| | | > Gaming Equipment & Services 1.1% | |
| | 4,025,000 | | | Bally Technologies (a)(b) | | | 130,370 | | |
| | | | | Slot Machines & Software | | | | | |
| | 380,000 | | | WMS Industries (a) | | | 14,915 | | |
| | | | | Slot Machine Provider | | | | | |
| | | | 145,285 | | |
| | | > Internet Related 0.8% | |
| | 435,000 | | | Equinix (a) | | | 35,331 | | |
| | | | | Network Neutral Data Centers | | | | | |
| | 800,000 | | | Akamai (a) | | | 32,456 | | |
| | | | | Content Delivery Network (CDN) for Better
Delivery of Online Content | | | | | |
| | 188,000 | | | NHN (South Korea) (a) | | | 27,978 | | |
| | | | | South Korea's Largest Online Search Engine | | | | | |
| | 1,000,000 | | | Terremark Worldwide (a) | | | 7,810 | | |
| | | | | Data Center Colocation & IT Managed
Services Provider | | | | | |
| | 1,000,000 | | | TheStreet.com | | | 2,880 | | |
| | | | | Financial Information Websites | | | | | |
| | | | 106,455 | | |
| | | > Contract Manufacturing 0.6% | |
| | 1,605,000 | | | Plexus (a) | | | 42,918 | | |
| | | | | Electronic Manufacturing Services | | | | | |
| | 2,800,000 | | | Sanmina-SCI (a) | | | 38,108 | | |
| | | | | Electronic Manufacturing Services | | | | | |
| | | | 81,026 | | |
| | | > Electronics Distribution 0.5% | |
| | 3,125,000 | | | Avnet (a) | | | 75,344 | | |
| | | | | Electronic Components Distribution | | | | | |
| | | | 75,344 | | |
| | | > Business Information &
Marketing Services 0.5% | |
| | 900,000 | | | FTI Consulting (a) | | | 39,231 | | |
| | | | | Financial Consulting Firm | | | | | |
| | 2,700,000 | | | Navigant Consulting (a)(b) | | | 28,026 | | |
| | | | | Financial Consulting Firm | | | | | |
| | 700,000 | | | InfoGROUP (a) | | | 5,586 | | |
| | | | | Business Data for Sales Leads | | | | | |
| | | | 72,843 | | |
| | | > Consumer Software 0.1% | |
| | 3,500,000 | | | THQ (a)(b) | | | 15,120 | | |
| | | | | Entertainment Software | | | | | |
| | | | 15,120 | | |
| | | > Radio 0.1% | |
| | 1,541,000 | | | Salem Communications (a)(b) | | | 5,717 | | |
| | | | | Radio Stations for Religious Programming | | | | | |
| | 164,991 | | | Saga Communications (a) | | | 3,940 | | |
| | | | | Radio Stations in Small & Mid-sized Cities | | | | | |
| | 2,400,000 | | | Spanish Broadcasting System (a)(b) | | | 2,736 | | |
| | | | | Spanish Language Radio Stations | | | | | |
| | | | 12,393 | | |
See accompanying notes to financial statements.
27
| Number of Shares | | | | Value (000) | |
| | | > TV Broadcasting 0.1% | |
| | 2,500,000 | | | Entravision Communications (a) | | $ | 5,275 | | |
| | | | | Spanish Language TV & Radio Stations | | | | | |
| | 1,750,000 | | | Gray Television (a) | | | 4,217 | | |
| | | | | Mid-market Affiliated TV Stations | | | | | |
| | | | 9,492 | | |
| | | > Advertising —% | |
| | 1,500,000 | | | VisionChina Media - ADR (China) (a) | | | 4,500 | | |
| | | | | Advertising on Digital Screens in China's
Mass Transit System | | | | | |
| | | | 4,500 | | |
| Information: Total | | | 3,562,307 | | |
| Industrial Goods & Services 16.9% | | | |
| | | > Machinery 8.3% | |
| | 4,500,000 | | | Ametek | | | 180,675 | | |
| | | | | Aerospace/Industrial Instruments | | | | | |
| | 4,200,000 | | | Donaldson (b) | | | 179,130 | | |
| | | | | Industrial Air Filtration | | | | | |
| | 3,100,000 | | | Pentair | | | 99,820 | | |
| | | | | Pumps & Water Treatment | | | | | |
| | 2,565,000 | | | Clarcor (b) | | | 91,109 | | |
| | | | | Mobile & Industrial Filters | | | | | |
| | 1,500,000 | | | Nordson | | | 84,120 | | |
| | | | | Dispensing Systems for Adhesives & Coatings | | | | | |
| | 2,200,000 | | | Oshkosh (a) | | | 68,552 | | |
| | | | | Specialty Truck Manufacturer | | | | | |
| | 1,800,000 | | | Pall | | | 61,866 | | |
| | | | | Filtration & Fluids Clarification | | | | | |
| | 2,200,000 | | | ESCO Technologies (b) | | | 56,650 | | |
| | | | | Automatic Electric Meter Readers | | | | | |
| | 1,660,000 | | | MOOG (a) | | | 53,502 | | |
| | | | | Motion Control Products for Aerospace,
Defense & Industrial Markets | | | | | |
| | 1,300,000 | | | Kaydon | | | 42,718 | | |
| | | | | Specialized Friction & Motion Control Products | | | | | |
| | 1,700,000 | | | Mine Safety Appliances | | | 42,126 | | |
| | | | | Safety Equipment | | | | | |
| | 1,531,250 | | | HEICO (b) | | | 41,267 | | |
| | | | | FAA Approved Aircraft Replacement Parts | | | | | |
| | 805,000 | | | Toro | | | 39,542 | | |
| | | | | Turf Maintenance Equipment | | | | | |
| | 1,200,000 | | | Kennametal | | | 30,516 | | |
| | | | | Consumable Cutting Tools | | | | | |
| | 600,000 | | | Wabtec | | | 23,934 | | |
| | | | | Freight & Transit Component Supplier | | | | | |
| | 1,000,000 | | | Jain Irrigation Systems (India) | | | 22,901 | | |
| | | | | Agricultural Micro-irrigation Systems &
Food Processing | | | | | |
| | 1,600,000 | | | Generac (a) | | | 22,416 | | |
| | | | | Stand-by Power Generators | | | | | |
| | 175,000 | | | Neopost (France) | | | 12,664 | | |
| | | | | Postage Meter Machines | | | | | |
| | 900,000 | | | Spartan Motors | | | 3,780 | | |
| | | | | Specialty Truck & Chassis Manufacturer | | | | | |
| | | | 1,157,288 | | |
| Number of Shares | | | | Value (000) | |
| | | > Industrial Materials &
Specialty Chemicals 2.4% | |
| | 1,530,000 | | | Albemarle | | $ | 60,756 | | |
| | | | | Refinery Catalysts & Other Specialty Chemicals | | | | | |
| | 1,750,000 | | | Sociedad Quimica y Minera de
Chile - ADR (Chile) | | | 57,068 | | |
| | | | | Producer of Specialty Fertilizers,
Lithium & Iodine | | | | | |
| | 1,800,000 | | | Nalco Holding Company | | | 36,828 | | |
| | | | | Provider of Water Treatment & Process
Chemicals & Services | | | | | |
| | 340,000 | | | Novozymes (Denmark) | | | 36,087 | | |
| | | | | Industrial Enzymes | | | | | |
| | 1,260,000 | | | Drew Industries (a)(b) | | | 25,452 | | |
| | | | | RV & Manufactured Home Components | | | | | |
| | 741,000 | | | Mersen (France) (c) | | | 25,269 | | |
| | | | | Advanced Industrial Materials | | | | | |
| | 13,900 | | | Sika (Switzerland) | | | 24,566 | | |
| | | | | Chemicals for Construction & Industrial
Applications | | | | | |
| | 350,000 | | | Greif | | | 19,439 | | |
| | | | | Industrial Packaging | | | | | |
| | 2,200,000 | | | Kansai Paint (Japan) | | | 18,828 | | |
| | | | | Paint Producer in Japan, India, China &
Southeast Asia | | | | | |
| | 1,000,000 | | | Albany International | | | 16,190 | | |
| | | | | Paper Machine Clothing & Advanced Textiles | | | | | |
| | 400,000 | | | Silgan Holdings | | | 11,352 | | |
| | | | | Metal & Plastic Packaging | | | | | |
| | | | 331,835 | | |
| | | > Other Industrial Services 1.7% | |
| | 3,200,000 | | | Expeditors International
of Washington | | | 110,432 | | |
| | | | | International Freight Forwarder | | | | | |
| | 1,491,095 | | | Imtech (Netherlands) | | | 38,250 | | |
| | | | | Electromechanical & ICT Installation &
Maintenance | | | | | |
| | 1,300,000 | | | Forward Air | | | 35,425 | | |
| | | | | Freight Transportation Between Airports | | | | | |
| | 1,600,000 | | | Mobile Mini (a) | | | 26,048 | | |
| | | | | Portable Storage Units Leasing | | | | | |
| | 1,000,000 | | | UTI Worldwide | | | 12,380 | | |
| | | | | Freight Forwarding & Logistics | | | | | |
| | 1,050,000 | | | TrueBlue (a) | | | 11,750 | | |
| | | | | Temporary Manual Labor | | | | | |
| | 900,000 | | | American Reprographics (a) | | | 7,857 | | |
| | | | | Document Management & Logistics | | | | | |
| | | | 242,142 | | |
| | | > Industrial Distribution 1.1% | |
| | 900,000 | | | WW Grainger | | | 89,505 | | |
| | | | | Industrial Distribution | | | | | |
| | 2,600,000 | | | Interline Brands (a)(b) | | | 44,954 | | |
| | | | | Industrial Distribution | | | | | |
| | 350,000 | | | Watsco | | | 20,272 | | |
| | | | | HVAC Distribution | | | | | |
| | | | 154,731 | | |
| | | > Construction 0.9% | |
| | 66,000 | | | NVR (a) | | | 43,232 | | |
| | | | | D.C. Homebuilder | | | | | |
See accompanying notes to financial statements.
28
Columbia Acorn Fund
Statement of Investments (Unaudited), continued
| Number of Shares | | | | Value (000) | |
| | | > Construction—continued | |
| | 350,000 | | | Martin Marietta Materials (c) | | $ | 29,684 | | |
| | | | | Aggregates | | | | | |
| | 700,000 | | | Simpson Manufacturing | | | 17,185 | | |
| | | | | Wall Joint Maker | | | | | |
| | 1,800,000 | | | Mills Estruturas e Servicios de
Engenha (Brazil) (a) | | | 13,612 | | |
| | | | | Civil Engineering & Construction | | | | | |
| | 687,500 | | | Ritchie Brothers Auctioneers (c) | | | 12,526 | | |
| | | | | Heavy Equipment Auctioneer | | | | | |
| | 284,000 | | | M/I Homes (a) | | | 2,738 | | |
| | | | | Columbus-based Home Builder | | | | | |
| | | | 118,977 | | |
| | | > Waste Management 0.7% | |
| | 1,500,000 | | | Republic Services | | | 44,595 | | |
| | | | | Solid Waste Management | | | | | |
| | 1,115,000 | | | Waste Connections (a) | | | 38,902 | | |
| | | | | Solid Waste Management | | | | | |
| | 280,000 | | | Clean Harbors (a) | | | 18,595 | | |
| | | | | Hazardous Waste Services & Disposal | | | | | |
| | | | 102,092 | | |
| | | > Outsourcing Services 0.7% | |
| | 1,950,000 | | | Quanta Services (a) | | | 40,267 | | |
| | | | | Electrical & Telecom Construction Services | | | | | |
| | 1,210,000 | | | Administaff | | | 29,234 | | |
| | | | | Professional Employer Organization | | | | | |
| | 2,900,000 | | | Serco (United Kingdom) | | | 25,262 | | |
| | | | | Facilities Management | | | | | |
| | 600,000 | | | GP Strategies (a) | | | 4,356 | | |
| | | | | Training Programs | | | | | |
| | | | 99,119 | | |
| | | > Electrical Components 0.5% | |
| | 1,440,000 | | | Acuity Brands | | | 52,387 | | |
| | | | | Commercial Lighting Fixtures | | | | | |
| | 1,000,000 | | | Ushio (Japan) | | | 15,439 | | |
| | | | | Industrial Light Sources | | | | | |
| | | | 67,826 | | |
| | | > Conglomerates 0.3% | |
| | 2,225,287 | | | Aalberts Industries (Netherlands) | | | 28,687 | | |
| | | | | Flow Control & Heat Treatment | | | | | |
| | 600,000 | | | Ibiden (Japan) | | | 16,176 | | |
| | | | | Electronic Parts & Ceramics | | | | | |
| | | | 44,863 | | |
| | | > Steel 0.2% | |
| | 1,980,000 | | | GrafTech International (a) | | | 28,948 | | |
| | | | | Industrial Graphite Materials Producer | | | | | |
| | | | 28,948 | | |
| | | > Water 0.1% | |
| | 1,750,000 | | | Mueller Water Products | | | 6,492 | | |
| | | | | Fire Hydrants, Valves & Ductile Iron Pipes | | | | | |
| | | | 6,492 | | |
| Industrial Goods & Services: Total | | | 2,354,313 | | |
| Number of Shares | | | | Value (000) | |
| Consumer Goods & Services 16.8% | | | |
| | | > Retail 6.3% | |
| | 4,135,000 | | | lululemon athletica (a)(b)(c) | | $ | 153,905 | | |
| | | | | Premium Active Apparel Retailer | | | | | |
| | 3,005,000 | | | Urban Outfitters (a) | | | 103,342 | | |
| | | | | Apparel & Home Specialty Retailer | | | | | |
| | 2,835,000 | | | Abercrombie & Fitch | | | 87,006 | | |
| | | | | Teen Apparel Retailer | | | | | |
| | 2,219,000 | | | J Crew Group (a) | | | 81,681 | | |
| | | | | Multi-channel Branded Retailer | | | | | |
| | 8,262,000 | | | Chico's FAS | | | 81,629 | | |
| | | | | Women's Specialty Retailer | | | | | |
| | 4,900,000 | | | Talbots (a)(b) | | | 50,519 | | |
| | | | | Women's Specialty Retailer | | | | | |
| | 2,900,000 | | | AnnTaylor Stores (a) | | | 47,183 | | |
| | | | | Women's Apparel Retailer | | | | | |
| | 5,225,000 | | | Saks (a)(c) | | | 39,658 | | |
| | | | | Luxury Department Store Retailer | | | | | |
| | 9,800,000 | | | Charming Shoppes (a)(b) | | | 36,750 | | |
| | | | | Women's Specialty Plus Size Apparel Retailer | | | | | |
| | 1,350,000 | | | Shutterfly (a)(b) | | | 32,346 | | |
| | | | | Internet Photo-centric Retailer | | | | | |
| | 1,034,000 | | | Rue21 (a) | | | 31,372 | | |
| | | | | Fashion Value Apparel Retailer | | | | | |
| | 4,500,000 | | | Pier 1 Imports (a) | | | 28,845 | | |
| | | | | Home Furnishing Retailer | | | | | |
| | 1,200,000 | | | Dress Barn (a) | | | 28,572 | | |
| | | | | Women's & Tween Specialty Retailer | | | | | |
| | 5,000,000 | | | Wet Seal (a) | | | 18,250 | | |
| | | | | Specialty Apparel Retailer | | | | | |
| | 4,950,442 | | | Coldwater Creek (a)(b) | | | 16,633 | | |
| | | | | Women's Apparel Retailer | | | | | |
| | 1,008,000 | | | Express (a) | | | 16,501 | | |
| | | | | Dual Gender Fashion Retailer | | | | | |
| | 1,371,366 | | | Gaiam (b) | | | 8,324 | | |
| | | | | Healthy Living Catalogs & E-Commerce | | | | | |
| | 900,000 | | | Bebe Stores | | | 5,760 | | |
| | | | | Women's Contemporary Specialty Apparel Retailer | | | | | |
| | | | 868,276 | | |
| | | > Travel 2.5% | |
| | 4,500,000 | | | Expedia | | | 84,510 | | |
| | | | | Online Travel Services Company | | | | | |
| | 3,128,400 | | | Gaylord Entertainment (a)(b)(c) | | | 69,106 | | |
| | | | | Convention Hotels | | | | | |
| | 1,950,000 | | | Vail Resorts (a)(b) | | | 68,075 | | |
| | | | | Ski Resort Operator & Developer | | | | | |
| | 4,600,000 | | | Avis Budget Group (a) | | | 45,172 | | |
| | | | | Second Largest Car Rental Company | | | | | |
| | 970,000 | | | Choice Hotels | | | 29,304 | | |
| | | | | Franchisor of Budget Hotel Brands | | | | | |
| | 3,000,000 | | | Hertz (a) | | | 28,380 | | |
| | | | | Largest U.S. Rental Car Operator | | | | | |
| | 1,100,000 | | | Localiza Rent A Car (Brazil) | | | 12,767 | | |
| | | | | Car Rental | | | | | |
| | 141,800 | | | Hyatt Hotels (a) | | | 5,259 | | |
| | | | | Hotel Owner/Operator | | | | | |
| | | | 342,573 | | |
See accompanying notes to financial statements.
29
| Number of Shares | | | | Value (000) | |
| | | > Food & Beverage 1.6% | |
| | 2,200,000 | | | Hansen Natural (a) | | $ | 86,042 | | |
| | | | | Alternative Beverages | | | | | |
| | 37,000,000 | | | Olam International (Singapore) | | | 67,751 | | |
| | | | | Agriculture Supply Chain Manager | | | | | |
| | 810,000 | | | Diamond Foods | | | 33,291 | | |
| | | | | Culinary Ingredients & Snack Foods | | | | | |
| | 819,000 | | | Flowers Foods | | | 20,008 | | |
| | | | | Bread & Baked Goods | | | | | |
| | 1,200,000 | | | GLG Life Tech (Canada) (a) | | | 9,156 | | |
| | | | | Produce an All-natural Sweetener Extracted
from the Stevia Plant | | | | | |
| | 2,000,000 | | | Smart Balance (a) | | | 8,180 | | |
| | | | | Healthy Food Products | | | | | |
| | | | 224,428 | | |
| | | > Educational Services 1.5% | |
| | 1,030,000 | | | ITT Educational Services (a) | | | 85,511 | | |
| | | | | Post-secondary Degree Services | | | | | |
| | 2,500,000 | | | Career Education (a) | | | 57,550 | | |
| | | | | Post-secondary Education | | | | | |
| | 1,700,000 | | | Universal Technical Institute (a)(b) | | | 40,188 | | |
| | | | | Vocational Training | | | | | |
| | 230,000 | | | New Oriental Education &
Technology - ADR (China) (a)(c) | | | 21,434 | | |
| | | | | China's Largest Private Education
Service Provider | | | | | |
| | 2,970,000 | | | Princeton Review (a)(b) | | | 6,890 | | |
| | | | | College Preparation Courses | | | | | |
| | 2,000,000 | | | Voyager Learning, Contingent Value
Rights (a)(d) | | | 336 | | |
| | | | | Education Services for the K-12 Market | | | | | |
| | | | 211,909 | | |
| | | > Apparel 1.0% | |
| | 2,100,000 | | | Coach | | | 76,755 | | |
| | | | | Designer & Retailer of Branded
Leather Accessories | | | | | |
| | 2,475,000 | | | True Religion Apparel (a)(b) | | | 54,623 | | |
| | | | | Premium Denim | | | | | |
| | 400,000 | | | Kenneth Cole Productions (a) | | | 4,404 | | |
| | | | | Wholesaler & Retailer of Lifestyle Brand | | | | | |
| | 225,000 | | | Jones Apparel Group | | | 3,566 | | |
| | | | | Wholesaler of Women's Apparel,
Footwear & Accessories | | | | | |
| | | | 139,348 | | |
| | | > Furniture & Textiles 0.9% | |
| | 4,000,000 | | | Knoll (b) | | | 53,160 | | |
| | | | | Office Furniture | | | | | |
| | 2,800,000 | | | Herman Miller | | | 52,836 | | |
| | | | | Office Furniture | | | | | |
| | 1,000,000 | | | Interface | | | 10,740 | | |
| | | | | Modular & Broadloom Carpet | | | | | |
| | 1,355,500 | | | Steelcase | | | 10,505 | | |
| | | | | Office Furniture | | | | | |
| | | | 127,241 | | |
| | | > Other Consumer Services 0.7% | |
| | 1,960,000 | | | Lifetime Fitness (a) | | | 62,308 | | |
| | | | | Sport & Fitness Club Operator | | | | | |
| | 14,000,000 | | | Lifestyle International (Hong Kong) | | | 27,154 | | |
| | | | | Mid to High-end Department Store Operator
in Hong Kong & China | | | | | |
| Number of Shares | | | | Value (000) | |
| | 1,325,000 | | | IFM Investments (Century 21
China RE) - ADR (China) (a) | | $ | 6,930 | | |
| | | | | Provides Real Estate Services in China | | | | | |
| | | | 96,392 | | |
| | | > Casinos & Gaming 0.6% | |
| | 1,750,000 | | | Penn National Gaming (a) | | | 40,425 | | |
| | | | | Regional Casino Operator | | | | | |
| | 4,050,000 | | | Pinnacle Entertainment (a)(b) | | | 38,313 | | |
| | | | | Regional Casino Operator | | | | | |
| | | | 78,738 | | |
| | | > Nondurables 0.5% | |
| | 1,600,000 | | | Helen of Troy (a)(b) | | | 35,296 | | |
| | | | | Hair Dryers & Curling Irons | | | | | |
| | 550,000 | | | Energizer Holdings (a) | | | 27,654 | | |
| | | | | Household & Personal Care Products | | | | | |
| | | | 62,950 | | |
| | | > Other Durable Goods 0.4% | |
| | 1,720,000 | | | Jarden | | | 46,217 | | |
| | | | | Branded Household Products | | | | | |
| | 294,000 | | | Tesla (a) | | | 7,006 | | |
| | | | | Design, Manufacture & Sell High Performance
Electric Vehicles | | | | | |
| | 180,000 | | | Cavco Industries (a) | | | 6,332 | | |
| | | | | Manufactured Homes | | | | | |
| | | | 59,555 | | |
| | | > Consumer Goods Distribution 0.3% | |
| | 2,100,000 | | | Pool | | | 46,032 | | |
| | | | | Distributor of Swimming Pool
Supplies & Equipment | | | | | |
| | | | 46,032 | | |
| | | > Restaurants 0.2% | |
| | 2,000,000 | | | AFC Enterprises (a)(b) | | | 18,200 | | |
| | | | | Popeye's Restaurants | | | | | |
| | 370,000 | | | P.F. Chang's China Bistro (c) | | | 14,670 | | |
| | | | | Mandarin Style Restaurants | | | | | |
| | | | 32,870 | | |
| | | > Leisure Products 0.2% | |
| | 1,190,000 | | | Thor Industries | | | 28,263 | | |
| | | | | RV & Bus Manufacturer | | | | | |
| | | | 28,263 | | |
| | | > Other Entertainment 0.1% | |
| | 370,000 | | | CTS Eventim (Germany) | | | 17,784 | | |
| | | | | Event Ticket Sales | | | | | |
| | | | 17,784 | | |
| Consumer Goods & Services: Total | | | 2,336,359 | | |
| Finance 11.9% | | | |
| | | > Banks 4.5% | |
| | 2,469,000 | | | BOK Financial | | | 117,204 | | |
| | | | | Tulsa-based Southwest Bank | | | | | |
| | 6,004,115 | | | Valley National Bancorp | | | 81,776 | | |
| | | | | New Jersey/New York Bank | | | | | |
| | 4,150,000 | | | TCF Financial | | | 68,932 | | |
| | | | | Great Lakes Bank | | | | | |
| | 5,063,800 | | | Associated Banc-Corp | | | 62,082 | | |
| | | | | Midwest Bank | | | | | |
See accompanying notes to financial statements.
30
Columbia Acorn Fund
Statement of Investments (Unaudited), continued
| Number of Shares | | | | Value (000) | |
| | | > Banks—continued | |
| | 2,860,000 | | | MB Financial (b) | | $ | 52,595 | | |
| | | | | Chicago Bank | | | | | |
| | 1,260,000 | | | SVB Financial Group (a) | | | 51,950 | | |
| | | | | Bank to Venture Capitalists | | | | | |
| | 745,000 | | | City National | | | 38,166 | | |
| | | | | Bank & Asset Manager | | | | | |
| | 2,640,000 | | | Wilmington Trust | | | 29,278 | | |
| | | | | Delaware Trust Bank | | | | | |
| | 2,140,000 | | | CVB Financial (c) | | | 20,330 | | |
| | | | | Inland Empire Business Bank | | | | | |
| | 1,100,000 | | | TriCo Bancshares (b)(c) | | | 18,623 | | |
| | | | | California Central Valley Bank | | | | | |
| | 702,393 | | | Hudson Valley | | | 16,239 | | |
| | | | | Metro New York City Bank | | | | | |
| | 1,600,000 | | | Whitney Holding | | | 14,800 | | |
| | | | | Gulf Coast Bank | | | | | |
| | 889,000 | | | Sandy Spring Bancorp | | | 12,455 | | |
| | | | | Baltimore/D.C. Bank | | | | | |
| | 240,000 | | | Cullen/Frost Bankers | | | 12,336 | | |
| | | | | Texas Bank | | | | | |
| | 583,872 | | | Green Bankshares (a)(c) | | | 7,456 | | |
| | | | | Tennessee Bank | | | | | |
| | 1,614,507 | | | First Busey | | | 7,314 | | |
| | | | | Illinois Bank | | | | | |
| | 406,559 | | | Eagle Bancorp (a) | | | 4,789 | | |
| | | | | Metro D.C. Bank | | | | | |
| | 246,505 | | | Pacific Continental | | | 2,334 | | |
| | | | | Pacific Northwest Bank | | | | | |
| | | | 618,659 | | |
| | | > Insurance 2.8% | |
| | 2,820,000 | | | Leucadia National (a) | | | 55,018 | | |
| | | | | Insurance Holding Company | | | | | |
| | 1,230,000 | | | Hanover Insurance Group | | | 53,505 | | |
| | | | | Personal & Commercial Lines Insurance | | | | | |
| | 9,400,000 | | | CNO Financial Group (a) | | | 46,530 | | |
| | | | | Life, Long-term Care & Medical
Supplement Insurance | | | | | |
| | 1,450,000 | | | Delphi Financial Group | | | 35,394 | | |
| | | | | Workers Compensation & Group Employee
Benefit Products & Services | | | | | |
| | 100,000 | | | Markel (a) | | | 34,000 | | |
| | | | | Specialty Insurance | | | | | |
| | 1,200,000 | | | HCC Insurance Holdings | | | 29,712 | | |
| | | | | Specialty Insurance | | | | | |
| | 832,000 | | | Willis Group (Ireland) | | | 25,002 | | |
| | | | | Insurance Broker | | | | | |
| | 1,000,000 | | | Aspen Insurance | | | 24,740 | | |
| | | | | Commercial Lines Insurance/Reinsurance | | | | | |
| | 700,000 | | | Assurant | | | 24,290 | | |
| | | | | Specialty Insurance | | | | | |
| | 1,420,000 | | | Selective Insurance Group | | | 21,101 | | |
| | | | | Commercial & Personal Lines Insurance | | | | | |
| | 900,000 | | | Tower Group | | | 19,377 | | |
| | | | | Commercial & Personal Lines Insurance | | | | | |
| | 1,600,000 | | | Symetra Financial | | | 19,200 | | |
| | | | | Life Insurance | | | | | |
| | | | 387,869 | | |
| Number of Shares | | | | Value (000) | |
| | | > Finance Companies 2.6% | |
| | 7,085,000 | | | AmeriCredit (a)(b) | | $ | 129,089 | | |
| | | | | Auto Lending | | | | | |
| | 1,505,202 | | | World Acceptance (a)(b) | | | 57,664 | | |
| | | | | Personal Loans | | | | | |
| | 2,350,000 | | | McGrath Rentcorp (b) | | | 53,533 | | |
| | | | | Temporary Space & IT Rentals | | | | | |
| | 1,480,000 | | | GATX | | | 39,486 | | |
| | | | | Rail Car Lessor | | | | | |
| | 3,033,300 | | | H&E Equipment Services (a)(b) | | | 22,720 | | |
| | | | | Heavy Equipment Leasing | | | | | |
| | 1,282,500 | | | Aaron's | | | 21,892 | | |
| | | | | Rent to Own | | | | | |
| | 1,650,000 | | | CAI International (a)(b) | | | 19,635 | | |
| | | | | International Container Leasing | | | | | |
| | 1,091,000 | | | Marlin Business Services (a)(b) | | | 13,190 | | |
| | | | | Small Equipment Leasing | | | | | |
| | 78,500 | | | Textainer Group Holdings | | | 1,895 | | |
| | | | | Top International Container Leasor | | | | | |
| | | | 359,104 | | |
| | | > Brokerage & Money Management 1.7% | |
| | 6,198,000 | | | SEI Investments | | | 126,191 | | |
| | | | | Mutual Fund Administration &
Investment Management | | | | | |
| | 3,735,000 | | | Eaton Vance | | | 103,124 | | |
| | | | | Specialty Mutual Funds | | | | | |
| | 700,000 | | | Investment Technology Group (a) | | | 11,242 | | |
| | | | | Electronic Trading | | | | | |
| | | | 240,557 | | |
| | | > Savings & Loans 0.3% | |
| | 325,000 | | | Housing Development Finance (India) | | | 20,488 | | |
| | | | | Indian Mortgage Lender | | | | | |
| | 731,478 | | | ViewPoint Financial | | | 10,131 | | |
| | | | | Texas Thrift | | | | | |
| | 1,010,000 | | | Provident New York Bancorp | | | 8,938 | | |
| | | | | New York State Thrift | | | | | |
| | 65,991 | | | Berkshire Hills Bancorp | | | 1,286 | | |
| | | | | Northeast Thrift | | | | | |
| | | | 40,843 | | |
| Finance: Total | | | 1,647,032 | | |
| Health Care 10.7% | | | |
| | | > Medical Equipment & Devices 3.8% | |
| | 2,800,000 | | | Alexion Pharmaceuticals (a) | | | 143,332 | | |
| | | | | Biotech Focused on Orphan Diseases | | | | | |
| | 3,500,000 | | | American Medical Systems (a) | | | 77,420 | | |
| | | | | Medical Devices to Treat Urological Conditions | | | | | |
| | 1,000,000 | | | Edwards Lifesciences (a) | | | 56,020 | | |
| | | | | Heart Valves | | | | | |
| | 1,500,000 | | | Sirona Dental Systems (a) | | | 52,260 | | |
| | | | | Manufacturer of Dental Equipment | | | | | |
| | 1,100,000 | | | Illumina (a) | | | 47,883 | | |
| | | | | Leading Tools & Service Provider for
Genetic Analysis | | | | | |
| | 863,448 | | | Haemonetics (a) | | | 46,212 | | |
| | | | | Blood & Plasma Collection Equipment | | | | | |
| | 900,000 | | | Gen-Probe (a) | | | 40,878 | | |
| | | | | Molecular In-vitro Diagnostics | | | | | |
See accompanying notes to financial statements.
31
| Number of Shares | | | | Value (000) | |
| | | > Medical Equipment & Devices—continued | |
| | 1,150,000 | | | Orthofix International (a)(b) | | $ | 36,858 | | |
| | | | | Bone Fixation & Stimulation Devices | | | | | |
| | 306,696 | | | Kinetic Concepts (a) | | | 11,197 | | |
| | | | | Wound Healing & Tissue Repair Products | | | | | |
| | 694,849 | | | Vermillion (a)(b)(d) | | | 8,131 | | |
| | | | | Ovarian Cancer Diagnostic Test | | | | | |
| | 1,500,000 | | | Nanosphere (a)(b) | | | 6,540 | | |
| | | | | Molecular Diagnostics Company with Best of
Breed Platform | | | | | |
| | | | 526,731 | | |
| | | > Biotechnology & Drug Delivery 3.5% | |
| | 3,205,000 | | | BioMarin (a) | | | 60,767 | | |
| | | | | Biotech Focused on Orphan Diseases | | | | | |
| | 4,951,226 | | | Seattle Genetics (a) | | | 59,365 | | |
| | | | | Antibody-based Therapies for Cancer | | | | | |
| | 1,500,000 | | | Acorda Therapeutics (a) | | | 46,665 | | |
| | | | | Biopharma Company Focused on Nervous
Disorder Drugs | | | | | |
| | 3,300,000 | | | Nektar Therapeutics (a) | | | 39,930 | | |
| | | | | Drug Delivery Technologies | | | | | |
| | 1,100,000 | | | AMAG Pharmaceuticals (a)(b) | | | 37,785 | | |
| | | | | Biotech Focused on Niche Diseases | | | | | |
| | 5,035,000 | | | Allos Therapeutics (a) | | | 30,864 | | |
| | | | | Cancer Drug Development | | | | | |
| | 560,000 | | | United Therapeutics (a) | | | 27,334 | | |
| | | | | Biotech Focused on Rare Diseases | | | | | |
| | 1,100,000 | | | Human Genome Sciences (a) | | | 24,926 | | |
| | | | | Biotech Focused on HCV, Inflammation & Cancer | | | | | |
| | 2,261,347 | | | Isis Pharmaceuticals (a) | | | 21,641 | | |
| | | | | Biotech Pioneer in Anti-sense Drugs | | | | | |
| | 3,463,611 | | | Micromet (a)(c) | | | 21,613 | | |
| | | | | Next-generation Antibody Technology | | | | | |
| | 2,100,000 | | | Xenoport (a)(b)(c) | | | 20,601 | | |
| | | | | Biotech Company with Proprietary Drug
Development Platform | | | | | |
| | 3,112,776 | | | NPS Pharmaceuticals (a)(b) | | | 20,046 | | |
| | | | | Orphan Drugs & Healthy Royalties | | | | | |
| | 1,055,762 | | | Amylin Pharmaceuticals (a) | | | 19,848 | | |
| | | | | Biotech Company Focused on Diabetes & Obesity | | | | | |
| | 751,601 | | | Auxilium Pharmaceuticals (a) | | | 17,663 | | |
| | | | | Biotech Focused on Niche Disease Areas | | | | | |
| | 639,920 | | | Onyx Pharmaceuticals (a) | | | 13,816 | | |
| | | | | Commercial-stage Biotech Focused on Cancer | | | | | |
| | 3,500,000 | | | Array Biopharma (a)(b) | | | 10,675 | | |
| | | | | Drugs for Cancer & Inflammatory Diseases | | | | | |
| | 1,917,820 | | | Idenix Pharmaceuticals (a) | | | 9,589 | | |
| | | | | Developer of Drugs for Infectious Diseases | | | | | |
| | 1,450,000 | | | Anthera (a)(b)(c) | | | 7,772 | | |
| | | | | Biotech Focused on Cardiovascular,
Cancer & Immunology | | | | | |
| | 359,944 | | | MicroDose Technologies (a)(d) | | | 122 | | |
| | | | | Drug Inhaler Development | | | | | |
| | 187,500 | | | Locus Pharmaceuticals,
Series A-1, Pfd. (a)(d) | | | 6 | | |
| | 96,644 | | | Locus Pharmaceuticals,
Series B-1, Pfd. (a)(d) | | | 3 | | |
| | | | | High Throughput Rational Drug Design | | | | | |
| | | | 491,031 | | |
| Number of Shares | | | | Value (000) | |
| | | > Medical Supplies 1.6% | |
| | 2,885,000 | | | Cepheid (a) | | $ | 46,218 | | |
| | | | | Molecular Diagnostics | | | | | |
| | 650,000 | | | Henry Schein (a) | | | 35,685 | | |
| | | | | Largest Distributor of Healthcare Products | | | | | |
| | 500,000 | | | Idexx Laboratories (a)(c) | | | 30,450 | | |
| | | | | Diagnostic Equipment & Services
for Veterinarians | | | | | |
| | 1,435,000 | | | QIAGEN (Netherlands) (a)(c) | | | 27,581 | | |
| | | | | Life Science Tools & Molecular Diagnostics | | | | | |
| | 850,000 | | | ICU Medical (a)(b) | | | 27,344 | | |
| | | | | Intravenous Therapy Products | | | | | |
| | 900,000 | | | Owens & Minor | | | 25,542 | | |
| | | | | Distribution of Medical Supplies | | | | | |
| | 980,503 | | | Immucor (a) | | | 18,679 | | |
| | | | | Automated Blood Typing Reagents | | | | | |
| | 246,670 | | | Techne | | | 14,171 | | |
| | | | | Cytokines, Antibodies & Other Reagents for
Life Science | | | | | |
| | | | 225,670 | | |
| | | > Health Care Services 1.6% | |
| | 3,300,000 | | | PSS World Medical (a)(b) | | | 69,795 | | |
| | | | | Distributor of Medical Supplies | | | | | |
| | 1,250,000 | | | Mednax (a) | | | 69,512 | | |
| | | | | Physician Management for Pediatric &
Anesthesia Practices | | | | | |
| | 4,250,000 | | | eResearch Technology (a)(b) | | | 33,490 | | |
| | | | | Clinical Research Services | | | | | |
| | 400,000 | | | HMS Holdings (a) | | | 21,688 | | |
| | | | | Cost Containment Services | | | | | |
| | 500,000 | | | AthenaHealth (a)(c) | | | 13,065 | | |
| | | | | Revenue Cycle Management for
Physician Offices | | | | | |
| | 700,000 | | | Allscripts-Misys Healthcare (a) | | | 11,270 | | |
| | | | | Clinical IT Solutions for Physician Offices | | | | | |
| | | | 218,820 | | |
| | | > Pharmaceuticals 0.2% | |
| | 1,750,000 | | | The Medicines Company (a) | | | 13,318 | | |
| | | | | Specialty Pharmaceuticals - Cardiovascular | | | | | |
| | 2,600,000 | | | United Drug (Ireland) | | | 7,237 | | |
| | | | | Irish Pharmaceutical Wholesaler & Outsourcer | | | | | |
| | | | 20,555 | | |
| Health Care: Total | | | 1,482,807 | | |
| Energy & Minerals 9.0% | | | |
| | | > Oil & Gas Producers 3.7% | |
| | 4,910,550 | | | Pacific Rubiales Energy (Colombia) (a) | | | 110,061 | | |
| | | | | Oil Production & Exploration in Colombia | | | | | |
| | 2,160,000 | | | Southwestern Energy (a) | | | 83,462 | | |
| | | | | Oil & Gas Producer | | | | | |
| | 1,100,000 | | | Range Resources | | | 44,165 | | |
| | | | | Oil & Gas Producer | | | | | |
| | 910,000 | | | Ultra Petroleum (a) | | | 40,268 | | |
| | | | | Oil & Gas Producer | | | | | |
| | 2,700,000 | | | Denbury Resources (a) | | | 39,528 | | |
| | | | | Oil Producer Using Co2 Injection | | | | | |
| | 2,400,000 | | | Tullow Oil (United Kingdom) | | | 35,750 | | |
| | | | | Oil & Gas Producer | | | | | |
See accompanying notes to financial statements.
32
Columbia Acorn Fund
Statement of Investments (Unaudited), continued
| Number of Shares | | | | Value (000) | |
| | | > Oil & Gas Producers—continued | |
| | 715,000 | | | St. Mary Land & Exploration | | $ | 28,714 | | |
| | | | | Oil & Gas Producer | | | | | |
| | 650,000 | | | Baytex (Canada) | | | 19,417 | | |
| | | | | Oil & Gas Producer in Canada | | | | | |
| | 779,000 | | | Rosetta Resources (a) | | | 15,432 | | |
| | | | | Oil & Gas Producer Exploring in South
Texas & Montana | | | | | |
| | 1,200,000 | | | Houston American Energy (c) | | | 11,832 | | |
| | | | | Oil & Gas Exploration/Production in Colombia | | | | | |
| | 850,000 | | | Northern Oil & Gas (a) | | | 10,914 | | |
| | | | | Small E&P Company in North Dakota Bakken | | | | | |
| | 37,500,000 | | | Petromanas (Canada) (a)(b)(d) | | | 9,722 | | |
| | 18,750,000 | | | Petromanas - Warrants (Canada) (a)(b)(d) | | | 705 | | |
| | | | | Exploring for Oil in Albania | | | | | |
| | 583,000 | | | Carrizo Oil & Gas (a) | | | 9,054 | | |
| | | | | Oil & Gas Producer | | | | | |
| | 250,000 | | | Cabot Oil & Gas | | | 7,830 | | |
| | | | | Large Natural Gas Producer in Appalachia &
Gulf Coast | | | | | |
| | 1,400,000 | | | Gran Tierra Energy (Colombia) (a) | | | 7,036 | | |
| | | | | Oil Exploration & Production in Colombia,
Peru & Argentina | | | | | |
| | 1,198,100 | | | Pan Orient (Canada) (a) | | | 5,796 | | |
| | | | | Growth Oriented & Return Focused Asian Explorer | | | | | |
| | 24,000,000 | | | Petrodorado (Colombia) (a)(b)(d) | | | 5,744 | | |
| | 24,000,000 | | | Petrodorado - Warrants
(Colombia) (a)(b)(d) | | | 2,254 | | |
| | | | | Oil & Gas Exploration & Production in Colombia,
Peru & Paraguay | | | | | |
| | 6,300,000 | | | Canacol Energy (Colombia) (a)(d) | | | 5,220 | | |
| | | | | Oil Producer in South America | | | | | |
| | 8,000,000 | | | Petrolifera Petroleum (Colombia) (a)(b)(d) | | | 4,885 | | |
| | 5,950,000 | | | Petrolifera Petroleum (Colombia) (a)(b) | | | 3,633 | | |
| | | | | Oil & Gas Exploration & Production in
South America | | | | | |
| | 750,000 | | | Vaalco Energy | | | 4,200 | | |
| | | | | Oil & Gas Producer | | | | | |
| | 12,100,000 | | | Alange Energy (Colombia) (a) | | | 3,978 | | |
| | | | | Oil & Gas Exploration/Production in Colombia | | | | | |
| | 13,000,000 | | | Petroamerica (Colombia) (a) | | | 3,908 | | |
| | | | | Oil Exploration & Production in Colombia | | | | | |
| | 228,200 | | | Oasis Petroleum (a) | | | 3,309 | | |
| | | | | Oil Producer in North Dakota | | | | | |
| | | | 516,817 | | |
| | | > Oil Services 3.5% | |
| | 3,100,000 | | | FMC Technologies (a) | | | 163,246 | | |
| | | | | Oil & Gas Wellhead Manufacturer | | | | | |
| | 2,570,626 | | | Fugro (Netherlands) | | | 117,538 | | |
| | | | | Sub-sea Oilfield Services | | | | | |
| | 3,200,000 | | | Atwood Oceanics (a) | | | 81,664 | | |
| | | | | Offshore Drilling Contractor | | | | | |
| | 1,670,000 | | | ShawCor (Canada) | | | 42,121 | | |
| | | | | Oil & Gas Pipeline Products | | | | | |
| | 1,750,000 | | | Tesco (a) | | | 21,490 | | |
| | | | | Developing New Well Drilling Technologies | | | | | |
| | 275,000 | | | Oceaneering International (a) | | | 12,347 | | |
| | | | | Provider of Sub-sea Services & Manufactured
Products | | | | | |
| Number of Shares | | | | Value (000) | |
| | 375,000 | | | Bristow (a) | | $ | 11,025 | | |
| | | | | Largest Provider of Helicopter Services to
Offshore Oil & Gas Producers | | | | | |
| | 10,719,200 | | | Tuscany International Drilling
(Colombia) (a)(b)(d) | | | 10,855 | | |
| | 2,600,000 | | | Tuscany International Drilling - Warrants
(Colombia) (a)(b)(d) | | | 70 | | |
| | | | | South America-based Drilling Rig Contractor | | | | | |
| | 500,000 | | | Black Diamond Group (Canada) | | | 8,243 | | |
| | | | | Provides Accommodations/Equipment for
Oil Sands Exploitation | | | | | |
| | 308,303 | | | Gulfmark Offshore (a) | | | 8,078 | | |
| | | | | Operator of Offshore Supply Vessels | | | | | |
| | 2,953,900 | | | Horizon North Logistics (Canada) (a) | | | 4,578 | | |
| | | | | Provides Diversified Oil Service Offering in
Northern Canada | | | | | |
| | | | 481,255 | | |
| | | > Mining 1.4% | |
| | 348,000 | | | Core Laboratories (Netherlands) (c) | | | 51,368 | | |
| | | | | Oil & Gas Reservoir Consulting | | | | | |
| | 2,450,000 | | | Silver Wheaton (Canada) (a) | | | 49,245 | | |
| | | | | Silver Mining Royalty Company | | | | | |
| | 880,000 | | | Pan American Silver (Canada) | | | 22,246 | | |
| | | | | Silver Mining | | | | | |
| | 400,000 | | | Royal Gold | | | 19,200 | | |
| | | | | Precious Metals Mining Royalty Company | | | | | |
| | 7,500,000 | | | Zhaojin Mining Industry (China) | | | 17,590 | | |
| | | | | Gold Mining & Refining in China | | | | | |
| | 10,000,000 | | | Orko Silver (Canada) (a)(b) | | | 14,560 | | |
| | | | | Silver Exploration & Development | | | | | |
| | 1,000,000 | | | Ivanhoe Mines (Canada) (a) | | | 12,954 | | |
| | | | | Copper Mine Project in Mongolia | | | | | |
| | 2,400,000 | | | Alexco Resource (a) | | | 7,536 | | |
| | | | | Mining, Exploration & Environmental Services | | | | | |
| | 236,400 | | | Tahoe Resources (Canada) (a)(d) | | | 1,415 | | |
| | | | | Silver Project in Guatemala | | | | | |
| | 83,356 | | | Northam Platinum (South Africa) | | | 490 | | |
| | | | | Platinum Mining in South Africa | | | | | |
| | | | 196,604 | | |
| | | > Alternative Energy 0.2% | |
| | 3,000,000 | | | GT Solar International (a) | | | 16,800 | | |
| | | | | Largest Manufacturer of Furnaces & Reactors to
Produce & Cast Polysilicon | | | | | |
| | 400,000 | | | STR Holdings (a) | | | 7,520 | | |
| | | | | Makes Encapsulant for Solar Power
Modules/Provides Quality Assurance | | | | | |
| | 1,800,000 | | | Synthesis Energy Systems (China) (a) | | | 1,980 | | |
| | | | | Owner/Operator of Gasification Plants | | | | | |
| | | | 26,300 | | |
| | | > Oil Refining, Marketing & Distribution 0.2% | |
| | 600,000 | | | Vopak (Netherlands) | | | 22,019 | | |
| | | | | World's Largest Operator of Petroleum &
Chemical Storage Terminals | | | | | |
| | | | 22,019 | | |
| Energy & Minerals: Total | | | 1,242,995 | | |
See accompanying notes to financial statements.
33
| Number of Shares | | | | Value (000) | |
| Other Industries 4.8% | | | |
| | | > Real Estate 2.7% | |
| | 4,000,000 | | | BioMed Realty Trust | | $ | 64,360 | | |
| | | | | Life Science-focused Office Buildings | | | | | |
| | 770,000 | | | Digital Realty Trust (c) | | | 44,413 | | |
| | | | | Technology-focused Office Buildings | | | | | |
| | 525,000 | | | Federal Realty Investment Trust | | | 36,892 | | |
| | | | | Shopping Centers | | | | | |
| | 900,000 | | | Corporate Office Properties | | | 33,984 | | |
| | | | | Office Buildings | | | | | |
| | 752,161 | | | Macerich | | | 28,071 | | |
| | | | | Regional Shopping Malls | | | | | |
| | 40,000,000 | | | Mapletree Logistics Trust (Singapore) | | | 23,748 | | |
| | | | | Asian Logistics Landlord | | | | | |
| | 900,000 | | | Dupont Fabros Technology | | | 22,104 | | |
| | | | | Technology-focused Office Buildings | | | | | |
| | 1,400,000 | | | Extra Space Storage | | | 19,460 | | |
| | | | | Self Storage Facilities | | | | | |
| | 15,000,000 | | | Ascendas REIT (Singapore) | | | 19,362 | | |
| | | | | Singapore Industrial Property Landlord | | | | | |
| | 700,000 | | | Washington REIT | | | 19,313 | | |
| | | | | Washington D.C. Diversified Properties | | | | | |
| | 3,000,000 | | | Education Realty Trust (b) | | | 18,090 | | |
| | | | | Student Housing | | | | | |
| | 3,750,000 | | | DCT Industrial Trust | | | 16,950 | | |
| | | | | Industrial Properties | | | | | |
| | 2,800 | | | Orix JREIT (Japan) | | | 11,673 | | |
| | | | | Diversified REIT | | | | | |
| | 2,300,000 | | | Kite Realty Group | | | 9,614 | | |
| | | | | Community Shopping Centers | | | | | |
| | 150,000 | | | SL Green Realty | | | 8,256 | | |
| | | | | Manhattan Office Buildings | | | | | |
| | 37,407 | | | Security Capital European Realty
(Luxembourg) (a)(d)(e) | | | — | | |
| | | | | Self Storage Properties | | | | | |
| | | | 376,290 | | |
| | | > Transportation 1.3% | |
| | 1,980,000 | | | JB Hunt Transport Services | | | 64,686 | | |
| | | | | Truck & Intermodal Carrier | | | | | |
| | 2,480,000 | | | Heartland Express | | | 36,010 | | |
| | | | | Regional Trucker | | | | | |
| | 2,500,000 | | | Rush Enterprises, Class A (a)(b) | | | 33,400 | | |
| | 500,000 | | | Rush Enterprises, Class B (a)(b) | | | 5,825 | | |
| | | | | Truck Sales & Services | | | | | |
| | 1,110,000 | | | World Fuel Services (c) | | | 28,793 | | |
| | | | | Global Fuel Broker | | | | | |
| | 602,000 | | | American Commercial Lines (a)(c) | | | 13,551 | | |
| | | | | Operator of Inland Barges/Builder of
Barges & Vessels | | | | | |
| | 100,000 | | | Old Dominion Freight Lines (a) | | | 3,514 | | |
| | | | | LTL Trucker | | | | | |
| | | | 185,779 | | |
| | | > Regulated Utilities 0.8% | |
| | 1,500,000 | | | Northeast Utilities | | | 38,220 | | |
| | | | | Regulated Electric Utility | | | | | |
| | 5,833,000 | | | Terna (Italy) | | | 21,007 | | |
| | | | | Italian Power Transmission | | | | | |
Number of Shares
or Principal Amount (000) | | | | Value (000) | |
| | 340,000 | | | Wisconsin Energy | | $ | 17,252 | | |
| | | | | Wisconsin Utility | | | | | |
| | 500,000 | | | ALLETE | | | 17,120 | | |
| | | | | Regulated Electric Utility in Minnesota | | | | | |
| | 333,000 | | | Red Eléctrica de Espana (Spain) | | | 11,903 | | |
| | | | | Spanish Power Transmission | | | | | |
| | | | 105,502 | | |
| Other Industries: Total | | | 667,571 | | |
Total Equities: 95.7%
(Cost: $10,519,526) | | | 13,293,384 | | |
| Securities Lending Collateral: 2.2% | | | |
| | 311,735,665 | | | Dreyfus Government Cash
Management Fund (f)
(7 day yield of 0.03%) | | | 311,736 | | |
Total Securities Lending Collateral:
(Cost: $311,736) | | | 311,736 | | |
| Short-Term Obligations: 4.6% | | | |
| | | > Repurchase Agreement 4.3% | |
| $ | 592,670 | | | Repurchase Agreement with
Fixed Income Clearing Corp.,
dated 6/30/10, due 7/01/10
at 0.00%, collateralized by
U.S. Government Agency
obligations with various
maturities to 1/19/16,
market value $604,527
(repurchase proceeds $592,670) | | | 592,670 | | |
| | | | 592,670 | | |
| | | > Commercial Paper 0.3% | |
| | 50,000 | | | Toyota Motor Credit
0.27% due 7/02/10 | | | 50,000 | | |
| | | | 50,000 | | |
Total Short-Term Obligations:
(Amortized Cost: $642,670) | | | 642,670 | | |
Total Investments: 102.5%
(Cost: $11,473,932)(g)(h) | | | 14,247,790 | | |
Obligation to Return Collateral for
Securities Loaned: (2.2)% | | | (311,736 | ) | |
| Cash and Other Assets Less Liabilities: (0.3)% | | | (41,540 | ) | |
| Total Net Assets: 100.0% | | $ | 13,894,514 | | |
ADR = American Depositary Receipts
See accompanying notes to financial statements.
34
Columbia Acorn Fund
Statement of Investments (Unaudited), continued
> Notes to Statement of Investments (dollar values in thousands)
(a) Non-income producing security.
(b) An affiliated person of the Fund may include any company in which the Fund owns five percent or more of its outstanding voting shares. Holdings and transactions in these affiliated companies during the six months ended June 30, 2010, are as follows:
| Affiliates | | Balance of
Shares Held
12/31/09 | | Purchases/
Additions | | Sales/
Reductions | | Balance of
Shares Held
6/30/10 | | Value | | Dividend | |
| Abercrombie & Fitch* | | | 4,500,000 | | | | - | | | | 1,665,000 | | | | 2,835,000 | | | $ | 87,006 | | | $ | 1,039 | | |
| Actuate | | | 3,700,000 | | | | - | | | | - | | | | 3,700,000 | | | | 16,465 | | | | - | | |
| Administaff* | | | 1,428,224 | | | | - | | | | 218,224 | | | | 1,210,000 | | | | 29,234 | | | | 315 | | |
| AFC Enterprises | | | 2,000,000 | | | | - | | | | - | | | | 2,000,000 | | | | 18,200 | | | | - | | |
| AMAG Pharmaceuticals | | | 600,000 | | | | 650,000 | | | | 150,000 | | | | 1,100,000 | | | | 37,785 | | | | | | |
| AmeriCredit | | | 7,235,000 | | | | 250,000 | | | | 400,000 | | | | 7,085,000 | | | | 129,089 | | | | - | | |
| AnnTaylor Stores* | | | 3,500,000 | | | | - | | | | 600,000 | | | | 2,900,000 | | | | 47,183 | | | | - | | |
| Anthera | | | - | | | | 1,450,000 | | | | - | | | | 1,450,000 | | | | 7,772 | | | | - | | |
| Array Biopharma | | | - | | | | 3,500,000 | | | | - | | | | 3,500,000 | | | | 10,675 | | | | | | |
| Bally Technologies | | | 4,025,000 | | | | - | | | | - | | | | 4,025,000 | | | | 130,370 | | | | - | | |
| Blackbaud | | | 1,800,000 | | | | 450,000 | | | | - | | | | 2,250,000 | | | | 48,982 | | | | 495 | | |
| CAI International | | | 1,650,000 | | | | - | | | | - | | | | 1,650,000 | | | | 19,635 | | | | - | | |
| Cap-Link Ventures* | | | 48,000,000 | | | | - | | | | 48,000,000 | | | | - | | | | - | | | | - | | |
| Charming Shoppes | | | 7,500,000 | | | | 2,300,000 | | | | - | | | | 9,800,000 | | | | 36,750 | | | | - | | |
| Chattem* | | | 1,010,000 | | | | - | | | | 1,010,000 | | | | - | | | | - | | | | - | | |
| Clarcor | | | 2,627,500 | | | | - | | | | 62,500 | | | | 2,565,000 | | | | 91,109 | | | | 500 | | |
| Cogent Communications | | | 4,200,000 | | | | - | | | | 800,000 | | | | 3,400,000 | | | | 25,772 | | | | - | | |
| Coldwater Creek | | | - | | | | 4,950,442 | | | | - | | | | 4,950,442 | | | | 16,633 | | | | | | |
| Donaldson | | | 4,200,000 | | | | - | | | | - | | | | 4,200,000 | | | | 179,130 | | | | 1,008 | | |
| Drew Industries | | | 1,600,000 | | | | - | | | | 340,000 | | | | 1,260,000 | | | | 25,452 | | | | - | | |
| Education Realty Trust | | | - | | | | 3,000,000 | | | | - | | | | 3,000,000 | | | | 18,090 | | | | 70 | | |
| eResearch Technology | | | 4,250,000 | | | | - | | | | - | | | | 4,250,000 | | | | 33,490 | | | | - | | |
| ESCO Technologies | | | 2,200,000 | | | | - | | | | - | | | | 2,200,000 | | | | 56,650 | | | | 352 | | |
| Gaiam | | | 1,371,366 | | | | - | | | | - | | | | 1,371,366 | | | | 8,324 | | | | 206 | | |
| Gaylord Entertainment | | | 3,700,000 | | | | 467,900 | | | | 1,039,500 | | | | 3,128,400 | | | | 69,106 | | | | - | | |
| H&E Equipment Services | | | 3,300,000 | | | | - | | | | 266,700 | | | | 3,033,300 | | | | 22,720 | | | | - | | |
| Hackett Group | | | 4,500,000 | | | | - | | | | - | | | | 4,500,000 | | | | 12,645 | | | | - | | |
| HEICO | | | 1,225,000 | | | | 306,250 | | | | - | | | | 1,531,250 | | | | 41,267 | | | | 74 | | |
| Helen of Troy | | | 1,700,000 | | | | - | | | | 100,000 | | | | 1,600,000 | | | | 35,296 | | | | - | | |
| Herman Miller* | | | 2,800,000 | | | | - | | | | - | | | | 2,800,000 | | | | 52,836 | | | | 123 | | |
| ICU Medical | | | 850,000 | | | | 200,000 | | | | 200,000 | | | | 850,000 | | | | 27,344 | | | | - | | |
| iGate | | | 5,000,000 | | | | - | | | | - | | | | 5,000,000 | | | | 64,100 | | | | 550 | | |
| II-VI | | | 2,400,000 | | | | - | | | | 175,000 | | | | 2,225,000 | | | | 65,927 | | | | - | | |
| Informatica | | | 7,000,000 | | | | - | | | | 1,800,000 | | | | 5,200,000 | | | | 124,176 | | | | - | | |
| Interline Brands | | | 2,600,000 | | | | - | | | | - | | | | 2,600,000 | | | | 44,954 | | | | - | | |
| IPG Photonics* | | | 2,750,000 | | | | - | | | | 475,000 | | | | 2,275,000 | | | | 34,648 | | | | - | | |
| IXYS | | | 1,900,000 | | | | - | | | | - | | | | 1,900,000 | | | | 16,796 | | | | - | | |
| Kenexa | | | 2,425,000 | | | | - | | | | - | | | | 2,425,000 | | | | 29,100 | | | | - | | |
| Knoll | | | 4,000,000 | | | | - | | | | - | | | | 4,000,000 | | | | 53,160 | | | | 160 | | |
| Lifetime Fitness* | | | 2,150,000 | | | | - | | | | 190,000 | | | | 1,960,000 | | | | 62,308 | | | | - | | |
| lululemon athletica | | | 4,200,000 | | | | 485,000 | | | | 550,000 | | | | 4,135,000 | | | | 153,905 | | | | - | | |
| Marlin Business Services | | | 1,091,000 | | | | - | | | | - | | | | 1,091,000 | | | | 13,190 | | | | - | | |
| MB Financial | | | 2,305,600 | | | | 554,400 | | | | - | | | | 2,860,000 | | | | 52,595 | | | | 50 | | |
| McGrath Rentcorp | | | 2,350,000 | | | | - | | | | - | | | | 2,350,000 | | | | 53,533 | | | | 1,046 | | |
| Mediacom Communications | | | 4,000,000 | | | | - | | | | 1,000,000 | | | | 3,000,000 | | | | 20,160 | | | | - | | |
| Mine Safety Appliances* | | | 1,975,000 | | | | - | | | | 275,000 | | | | 1,700,000 | | | | 42,126 | | | | 899 | | |
| Nanosphere | | | 1,232,900 | | | | 267,100 | | | | - | | | | 1,500,000 | | | | 6,540 | | | | - | | |
| Navigant Consulting | | | 2,500,000 | | | | 200,000 | | | | - | | | | 2,700,000 | | | | 28,026 | | | | - | | |
| NPS Pharmaceuticals | | | 2,700,000 | | | | 412,776 | | | | - | | | | 3,112,776 | | | | 20,046 | | | | - | | |
| Orko Silver | | | 10,000,000 | | | | - | | | | - | | | | 10,000,000 | | | | 14,560 | | | | - | | |
| Orthofix International | | | 1,000,000 | | | | 150,000 | | | | - | | | | 1,150,000 | | | | 36,858 | | | | - | | |
| PAETEC Holding | | | 9,600,000 | | | | - | | | | - | | | | 9,600,000 | | | | 32,736 | | | | - | | |
| Pericom Semiconductor | | | 1,765,000 | | | | - | | | | - | | | | 1,765,000 | | | | 16,944 | | | | - | | |
| Petrodorado | | | 48,000,000 | | | | - | | | | - | | | | 48,000,000 | | | | 7,998 | | | | - | | |
| Petrolifera Petroleum | | | - | | | | 13,950,000 | | | | - | | | | 13,950,000 | | | | 8,518 | | | | - | | |
| Petromanas | | | - | | | | 56,250,000 | | | | - | | | | 56,250,000 | | | | 10,427 | | | | - | | |
| Pinnacle Entertainment | | | 4,050,000 | | | | - | | | | - | | | | 4,050,000 | | | | 38,313 | | | | - | | |
| Princeton Review | | | 3,000,000 | | | | - | | | | 30,000 | | | | 2,970,000 | | | | 6,890 | | | | - | | |
See accompanying notes to financial statements.
35
> Notes to Statement of Investments (dollar values in thousands)
| Affiliates | | Balance of
Shares Held
12/31/09 | | Purchases/
Additions | | Sales/
Reductions | | Balance of
Shares Held
6/30/10 | | Value | | Dividend | |
| PSS World Medical | | | 2,750,000 | | | | 550,000 | | | | - | | | | 3,300,000 | | | $ | 69,795 | | | $ | - | | |
| Rush Enterprises | | | 3,000,000 | | | | - | | | | - | | | | 3,000,000 | | | | 39,225 | | | | - | | |
| Salem Communications | | | 1,541,000 | | | | - | | | | - | | | | 1,541,000 | | | | 5,717 | | | | - | | |
| Shutterfly | | | - | | | | 1,350,000 | | | | - | | | | 1,350,000 | | | | 32,346 | | | | - | | |
| SkillSoft - ADR* | | | 9,500,000 | | | | - | | | | 9,500,000 | | | | - | | | | - | | | | - | | |
| Spanish Broadcasting System | | | 2,400,000 | | | | - | | | | - | | | | 2,400,000 | | | | 2,736 | | | | - | | |
| Supertex | | | 1,035,000 | | | | - | | | | - | | | | 1,035,000 | | | | 25,523 | | | | - | | |
| Switch & Data Facilities* | | | 2,500,000 | | | | - | | | | 2,500,000 | | | | - | | | | - | | | | - | | |
| Talbots | | | 4,250,000 | | | | 650,000 | | | | - | | | | 4,900,000 | | | | 50,519 | | | | - | | |
| THQ | | | 3,200,000 | | | | 300,000 | | | | - | | | | 3,500,000 | | | | 15,120 | | | | - | | |
| TriCo Bancshares | | | 1,200,000 | | | | - | | | | 100,000 | | | | 1,100,000 | | | | 18,623 | | | | 255 | | |
| True Religion Apparel | | | 1,500,000 | | | | 975,000 | | | | - | | | | 2,475,000 | | | | 54,623 | | | | - | | |
| Tuscany International Drilling | | | - | | | | 13,319,200 | | | | - | | | | 13,319,200 | | | | 10,925 | | | | - | | |
| tw telecom | | | 9,500,000 | | | | - | | | | - | | | | 9,500,000 | | | | 158,460 | | | | - | | |
| Tyler Technologies | | | 1,134,260 | | | | 1,315,740 | | | | 417,155 | | | | 2,032,845 | | | | 31,550 | | | | - | | |
| Universal Technical Institute | | | 1,750,301 | | | | - | | | | 50,301 | | | | 1,700,000 | | | | 40,188 | | | | - | | |
| Vail Resorts | | | 1,950,000 | | | | - | | | | - | | | | 1,950,000 | | | | 68,075 | | | | - | | |
| Vermillion | | | - | | | | 694,849 | | | | - | | | | 694,849 | | | | 8,131 | | | | - | | |
| Virtusa | | | 1,800,000 | | | | 200,000 | | | | - | | | | 2,000,000 | | | | 18,660 | | | | - | | |
| World Acceptance | | | 1,545,000 | | | | - | | | | 39,798 | | | | 1,505,202 | | | | 57,664 | | | | - | | |
| Xenoport | | | - | | | | 2,100,000 | | | | - | | | | 2,100,000 | | | | 20,601 | | | | - | | |
| Total of Affiliated Transactions | | | 306,022,151 | | | | 111,248,657 | | | | 71,954,178 | | | | 345,316,630 | | | $ | 3,122,025 | | | $ | 7,142 | | |
* At June 30, 2010, the Fund owned less than five percent of the company's outstanding voting shares.
The aggregate cost and value of these companies at June 30, 2010, were $2,848,343 and $3,122,025, respectively. Investments in affiliated companies represented 22.5% of the Fund's total net assets at June 30, 2010.
(c) All or a portion of this security was on loan at June 30, 2010. The total market value of Fund securities on loan at June 30, 2010 was $301,261.
(d) Denotes a restricted security, which is subject to restrictions on resale under federal securities laws. These securities are valued at a fair value determined in good faith under consistently applied procedures established by the Board of Trustees. At June 30, 2010, the market value of these securities amounted to $49,468, which represented 0.36% of total net assets.
Additional information on these securities is as follows:
| Security | | Acquisition
Dates | | Shares | | Cost | | Value | |
| Tuscany International Drilling | | 2/12/10-3/23/10 | | | 10,719,200 | | | $ | 12,997 | | | $ | 10,855 | | |
| Petromanas | | 5/20/10 | | | 37,500,000 | | | | 13,032 | | | | 9,722 | | |
| Vermillion | | 1/07/10 | | | 694,849 | | | | 12,850 | | | | 8,131 | | |
| Petrodorado | | 11/20/09 | | | 24,000,000 | | | | 5,049 | | | | 5,744 | | |
| Canacol Energy | | 4/15/10 | | | 6,300,000 | | | | 4,667 | | | | 5,220 | | |
| Petrolifera Petroleum | | 4/06/10 | | | 8,000,000 | | | | 6,768 | | | | 4,885 | | |
| Petrodorado - Warrants | | 11/20/09 | | | 24,000,000 | | | | 2,965 | | | | 2,254 | | |
| Tahoe Resources | | 5/28/10 | | | 236,400 | | | | 1,350 | | | | 1,415 | | |
| Petromanas - Warrants | | 5/20/10 | | | 18,750,000 | | | | 1,086 | | | | 705 | | |
| Voyager Learning, Contingent Value Rights | | 12/24/09 | | | 2,000,000 | | | | - | | | | 336 | | |
| MicroDose Technologies | | 11/24/00 | | | 359,944 | | | | 2,005 | | | | 122 | | |
| Tuscany International Drilling - Warrants | | 2/12/10 | | | 2,600,000 | | | | 322 | | | | 70 | | |
| Locus Pharmaceuticals, Series A-1 Pfd. | | 9/05/01 | | | 187,500 | | | | 7,500 | | | | 6 | | |
| Locus Pharmaceuticals, Series B-1 Pfd. | | 2/08/07 | | | 96,644 | | | | 280 | | | | 3 | | |
| Security Capital European Realty | | 8/20/98-7/20/99 | | | 37,407 | | | | 205 | | | | - | | |
| | | | | | | | | $ | 71,076 | | | $ | 49,468 | | |
(e) Security has no value.
(f) Investment made with cash collateral received from securities lending activity.
(g) At June 30, 2010, for federal income tax purposes, the cost of investments was $11,473,932 and net unrealized appreciation was $2,773,858, consisting of gross unrealized appreciation of $4,114,495 and gross unrealized depreciation of $1,340,637.
See accompanying notes to financial statements.
36
Columbia Acorn Fund
Statement of Investments (Unaudited), continued
> Notes to Statement of Investments (dollar values in thousands)
(h) On June 30, 2010, the market value of foreign securities represented 10.72% of total net assets. The Fund's foreign portfolio was diversified as follows:
| | | Value | | Percentage
of Net Assets | |
| Netherlands | | $ | 285,443 | | | | 2.05 | | |
| Canada | | | 200,158 | | | | 1.44 | | |
| Colombia | | | 157,644 | | | | 1.13 | | |
| Singapore | | | 152,722 | | | | 1.10 | | |
| Japan | | | 90,177 | | | | 0.65 | | |
| Sweden | | | 66,019 | | | | 0.47 | | |
| United Kingdom | | | 61,012 | | | | 0.44 | | |
| Chile | | | 57,068 | | | | 0.41 | | |
| India | | | 55,129 | | | | 0.40 | | |
| Hong Kong | | | 55,111 | | | | 0.40 | | |
| China | | | 52,434 | | | | 0.38 | | |
| France | | | 37,933 | | | | 0.27 | | |
| | | Value | | Percentage
of Net Assets | |
| Denmark | | $ | 36,087 | | | | 0.26 | | |
| Ireland | | | 32,239 | | | | 0.23 | | |
| South Korea | | | 27,978 | | | | 0.20 | | |
| Brazil | | | 26,379 | | | | 0.20 | | |
| Switzerland | | | 24,566 | | | | 0.18 | | |
| Italy | | | 21,007 | | | | 0.15 | | |
| Israel | | | 20,392 | | | | 0.15 | | |
| Germany | | | 17,784 | | | | 0.13 | | |
| Spain | | | 11,903 | | | | 0.08 | | |
| South Africa | | | 490 | | | | - | | |
| Luxembourg | | | - | | | | - | | |
| Total Foreign Portfolio | | $ | 1,489,675 | | | | 10.72 | | |
The following table summarizes the inputs used, as of June 30, 2010, in valuing the Fund's assets:
| Investment Type | | Quoted Prices
(Level 1) | | Other
Significant
Observable
Inputs
(Level 2) | | Significant
Unobservable
Inputs
(Level 3) | | Total | |
| Equities | |
| Information | | $ | 3,370,431 | | | $ | 191,876 | | | $ | - | | | $ | 3,562,307 | | |
| Industrial Goods & Services | | | 2,090,184 | | | | 264,129 | | | | - | | | | 2,354,313 | | |
| Consumer Goods & Services | | | 2,223,334 | | | | 112,689 | | | | 336 | | | | 2,336,359 | | |
| Finance | | | 1,626,544 | | | | 20,488 | | | | - | | | | 1,647,032 | | |
| Health Care | | | 1,467,308 | | | | 15,368 | | | | 131 | | | | 1,482,807 | | |
| Energy & Minerals | | | 1,013,623 | | | | 229,372 | | | | - | | | | 1,242,995 | | |
| Other Industries | | | 579,878 | | | | 87,693 | | | | - | | | | 667,571 | | |
| Total Equities | | | 12,371,302 | | | | 921,615 | | | | 467 | | | | 13,293,384 | | |
| Total Securities Lending Collateral | | | 311,736 | | | | - | | | | - | | | | 311,736 | | |
| Total Short-Term Obligations | | | - | | | | 642,670 | | | | - | | | | 642,670 | | |
| Total Investments | | $ | 12,683,038 | | | $ | 1,564,285 | | | $ | 467 | | | $ | 14,247,790 | | |
The Fund's assets assigned to the Level 2 input category are generally valued using the market approach, in which a security's value is determined through its correlation to prices and information from market transactions for similar or identical assets. Foreign equities are generally valued at the last sales price on the foreign exchange or market on which they trade. The Fund may use a systematic fair valuation model provided by an independent third party to value securities principally traded in foreign markets in order to adjust for possible stale pricing that may occur between the close of the foreign exchanges and the time for valuation. These models take into account available market data including intraday index, ADR, and ETF movements. Securities acquired via private placement, that have a holding period or an extended settlement period, are valued at a discount to the same shares that are trading freely on the market. These discounts are determined by the advisors experience with similar securities or situations. Factors may include, but are not limited to, trade volume, shares outstanding and stock price.
Certain Short-Term Obligations may be valued using amortized cost, an income approach which converts future cash flows to a present value based upon the discount or premium at purchase.
The Fund's assets assigned to the Level 3 input category are valued at fair value as determined in good faith under consistently applied procedures established by and under the general supervision of the Board of Trustees. To determine fair value, management will utilize the valuation technique that they deem the most appropriate in the circumstances. Securities acquired via private placement but are not yet trading are valued using the market approach for which management has determined that the original transaction price is the best representation of fair value. Securities for which no market exist are valued based upon the market approach using inputs from the investment team but ultimately decided by the Board of Trustees. These may include, but are not limited to, projected earnings, available cash, line of business, multiples, and consideration of the prioritization of the equity in a company's capital structur e.
See accompanying notes to financial statements.
37
> Notes to Statement of Investments (dollar values in thousands)
The following table reconciles asset balances for the six-month period ending June 30, 2010, in which significant unobservable inputs (Level 3) were used in determining value:
Investments
in Securities | | Balance
as of
December 31,
2009 | | Accrued
Discounts/
Premiums | | Realized
Gain/(Loss) | | Change in
Unrealized
Appreciation
(Depreciation) | | Purchase | | (Sales) | | Transfers
into
Level 3 | | Transfers
(out of)
Level 3 | | Balance
as of
June 30,
2010 | |
| Equities | |
| Consumer Goods & Services | | $ | 336 | | | $ | - | | | $ | - | | | $ | - | | | $ | - | | | $ | - | | | $ | - | | | $ | - | | | $ | 336 | | |
| Health Care | | | 176 | | | | - | | | | (4,500 | ) | | | 4,455 | | | | - | | | | - | | | | - | | | | - | | | | 131 | | |
| Energy & Minerals | | | - | | | | - | | | | - | | | | - | | | | 13,319 | | | | - | | | | - | | | | (13,319 | ) | | | - | | |
| | | $ | 512 | | | $ | - | | | $ | (4,500 | ) | | $ | 4,455 | | | $ | 13,319 | | | $ | - | | | $ | - | | | $ | (13,319 | ) | | $ | 467 | | |
The information in the above reconciliation table represents fiscal year to date activity for any securities identified as using Level 3 inputs during the current fiscal period.
The change in unrealized appreciation attributed to securities owned at June 30, 2010, which were valued using significant unobservable inputs (Level 3) amounted to $4,455. This amount is included in net change in unrealized appreciation (depreciation) on the Statements of Changes in Net Assets.
For more information on valuation inputs, and their aggregation into the levels used in the tables above, please refer to the Security Valuation section in the accompanying Notes to Financial Statements.
See accompanying notes to financial statements.
38
Columbia Acorn International
Major Portfolio Changes in the Second Quarter (Unaudited)
| | | Number of Shares | |
| | | 03/31/10 | | 06/30/10 | |
| Purchases | |
| Asia | |
| > Japan | |
| Benesse | | | 306,900 | | | | 408,700 | | |
| Hamamatsu Photonics | | | 622,200 | | | | 710,000 | | |
| Hoshizaki Electric | | | 193,400 | | | | 926,900 | | |
| Icom | | | 344,000 | | | | 585,000 | | |
| Japan Airport Terminal | | | 767,600 | | | | 1,000,000 | | |
| Kansai Paint | | | 6,620,600 | | | | 7,140,000 | | |
| Nakanishi | | | 210,000 | | | | 274,000 | | |
| Olympus | | | 480,000 | | | | 800,000 | | |
| Point | | | 478,570 | | | | 660,570 | | |
| Tsumura | | | 600,000 | | | | 789,000 | | |
| > China | |
| Mindray - ADR | | | 703,800 | | | | 850,000 | | |
| > Singapore | |
| CDL Hospitality Trust | | | 30,000,000 | | | | 33,485,000 | | |
| Goodpack | | | 0 | | | | 3,762,900 | | |
| > Hong Kong | |
| L'Occitane International | | | 0 | | | | 6,819,050 | | |
| Melco Crown Entertainment | | | 0 | | | | 5,000,000 | | |
| Europe | |
| > United Kingdom | |
| Abcam | | | 371,800 | | | | 586,942 | | |
| Chemring | | | 660,000 | | | | 680,000 | | |
| Cobham | | | 8,481,400 | | | | 8,700,000 | | |
| Micro Focus | | | 0 | | | | 3,850,000 | | |
| PureCircle | | | 1,200,000 | | | | 3,500,000 | | |
| > Netherlands | |
| Aalberts Industries | | | 1,750,935 | | | | 1,968,060 | | |
| Core Laboratories | | | 62,000 | | | | 103,000 | | |
| Fugro | | | 735,945 | | | | 763,202 | | |
| Imtech | | | 1,871,250 | | | | 1,922,517 | | |
| Unit 4 Agresso | | | 1,385,000 | | | | 1,476,800 | | |
| USG People | | | 0 | | | | 836,400 | | |
| Vopak | | | 520,100 | | | | 1,040,200 | | |
| > Germany | |
| Rhoen-Klinikum | | | 1,265,000 | | | | 1,699,000 | | |
| Wirecard | | | 1,180,000 | | | | 1,590,000 | | |
| > France | |
| Eurofins Scientific | | | 455,700 | | | | 599,271 | | |
| Norbert Dentressangle | | | 160,701 | | | | 201,101 | | |
| Pierre & Vacances | | | 271,000 | | | | 322,200 | | |
| Rubis | | | 170,000 | | | | 206,183 | | |
| Saft | | | 424,300 | | | | 595,614 | | |
| > Switzerland | |
| Bank Sarasin & Cie | | | 591,762 | | | | 660,000 | | |
| Partners Group | | | 0 | | | | 125,000 | | |
| | | Number of Shares | |
| | | 03/31/10 | | 06/30/10 | |
| > Italy | |
| Ansaldo STS | | | 1,169,000 | | | | 1,298,500 | | |
| Credito Emiliano | | | 3,069,000 | | | | 4,311,600 | | |
| Tod's | | | 155,468 | | | | 279,000 | | |
| > Ireland | |
| United Drug | | | 11,249,900 | | | | 11,526,000 | | |
| > Portugal | |
| Banco Comercial Português | | | 12,858,000 | | | | 16,574,000 | | |
| > Iceland | |
| Marel | | | 29,868,604 | | | | 33,804,924 | | |
| Redes Energéticas Nacionais | | | 4,912,072 | | | | 6,801,200 | | |
| Other Countries | |
| > Canada | |
| AG Growth | | | 317,900 | | | | 540,000 | | |
| Baytex | | | 432,900 | | | | 735,000 | | |
| Black Diamond Group | | | 203,800 | | | | 530,000 | | |
| Petromanas | | | 0 | | | | 12,500,000 | | |
| Tahoe Resources | | | 0 | | | | 872,700 | | |
| > United States | |
| FMC Technologies | | | 251,000 | | | | 329,000 | | |
| Textainer Group Holdings | | | 86,001 | | | | 360,000 | | |
| > Australia | |
| Billabong International | | | 1,500,000 | | | | 1,741,880 | | |
| Cochlear | | | 262,000 | | | | 319,000 | | |
| Hastie Group | | | 7,158,966 | | | | 10,033,348 | | |
| SAI Global | | | 3,995,081 | | | | 6,124,662 | | |
| > Senegal | |
| Sonatel | | | 7,402 | | | | 24,247 | | |
| Latin America | |
| > Brazil | |
| Localiza Rent A Car | | | 5,000,000 | | | | 5,200,000 | | |
Mills Estruturas e Servicios
de Engenha | | | 0 | | | | 2,858,610 | | |
| Suzano | | | 4,300,000 | | | | 5,375,000 | | |
See accompanying notes to financial statements.
39
| | | Number of Shares | |
| | | 03/31/10 | | 06/30/10 | |
| Sales | |
| Asia | |
| > Japan | |
| As One | | | 208,900 | | | | 128,100 | | |
| Jupiter Telecommunications | | | 27,132 | | | | 13,933 | | |
| Unicharm PetCare | | | 336,300 | | | | 0 | | |
| Zenrin | | | 822,000 | | | | 680,200 | | |
| > China | |
IFM Investments
(Century 21 China RE) - ADR | | | 321,800 | | | | 0 | | |
New Oriental Education &
Technology - ADR | | | 382,000 | | | | 327,429 | | |
| VisionChina Media - ADR | | | 625,700 | | | | 0 | | |
| > Singapore | |
| Ascendas REIT | | | 21,000,000 | | | | 20,000,000 | | |
| > India | |
| Asian Paints | | | 1,008,727 | | | | 908,519 | | |
| Housing Development Finance | | | 450,000 | | | | 400,000 | | |
| Jain Irrigation Systems | | | 2,000,000 | | | | 1,806,000 | | |
| > South Korea | |
| MegaStudy | | | 182,000 | | | | 172,000 | | |
| > Hong Kong | |
Hong Kong Exchanges
and Clearing | | | 2,500,000 | | | | 2,300,000 | | |
| > Indonesia | |
| Perusahaan Gas Negara | | | 70,000,000 | | | | 65,000,000 | | |
| Europe | |
| > United Kingdom | |
| Capita Group | | | 3,300,000 | | | | 2,637,000 | | |
| Keller Group | | | 1,110,000 | | | | 0 | | |
| Spice Group | | | 2,677,433 | | | | 0 | | |
| > Netherlands | |
| Koninklijke TenCate | | | 1,372,989 | | | | 1,298,651 | | |
| > Germany | |
| Elringklinger | | | 750,000 | | | | 650,000 | | |
| Takkt | | | 700,000 | | | | 0 | | |
| > France | |
| SES | | | 759,000 | | | | 0 | | |
| Zodiac Aerospace | | | 408,000 | | | | 205,311 | | |
| > Switzerland | |
| Burckhardt Compression | | | 85,000 | | | | 0 | | |
| > Sweden | |
| Nobia | | | 3,063,701 | | | | 0 | | |
| > Ireland | |
| Aryzta | | | 330,000 | | | | 297,000 | | |
| | | Number of Shares | |
| | | 03/31/10 | | 06/30/10 | |
| > Greece | |
| Bank of Piraeus | | | 1,117,000 | | | | 0 | | |
| > Norway | |
| Dockwise | | | 101,200 | | | | 0 | | |
| Other Countries | |
| > Canada | |
| Eldorado Gold | | | 2,542,000 | | | | 1,983,000 | | |
| > United States | |
| Oceaneering International | | | 346,000 | | | | 192,000 | | |
| > Australia | |
| Australian Stock Exchange | | | 700,000 | | | | 0 | | |
| Perpetual Trustees | | | 700,000 | | | | 539,045 | | |
| Latin America | |
| > Brazil | |
| Natura | | | 2,000,000 | | | | 1,900,000 | | |
| > Mexico | |
Grupo Aeroportuario del
Sureste - ADR | | | 630,000 | | | | 570,000 | | |
| Urbi Desarrollos Urbanos | | | 10,459,400 | | | | 6,837,700 | | |
See accompanying notes to financial statements.
40
Columbia Acorn International
Statement of Investments (Unaudited), June 30, 2010
| Number of Shares | | | | Value (000) | |
| | | | | | | | Equities: 95.3% | | |
| Asia 40.7% | | | |
| | | > Japan 17.7% | |
| | 7,140,000 | | | Kansai Paint | | $ | 61,105 | | |
| | | | | Paint Producer in Japan, India, China &
Southeast Asia | | | | | |
| | 660,570 | | | Point | | | 36,249 | | |
| | | | | Apparel Specialty Retailer | | | | | |
| | 1,846,000 | | | Aeon Delight | | | 35,837 | | |
| | | | | Facility Maintenance & Management | | | | | |
| | 13,071 | | | Start Today | | | 35,814 | | |
| | | | | Largest Online Japanese Apparel Retailer | | | | | |
| | 26,500 | | | Advance Residence Investment (a) | | | 34,206 | | |
| | | | | Residential REIT | | | | | |
| | 20,637 | | | Wacom | | | 30,364 | | |
| | | | | Computer Graphic Illustration Devices | | | | | |
| | 16,442 | | | Seven Bank | | | 29,772 | | |
| | | | | ATM Processing Services | | | | | |
| | 648,000 | | | Ain Pharmaciez | | | 26,232 | | |
| | | | | Dispensing Pharmacy/Drugstore Operator | | | | | |
| | 3,283,000 | | | Kamigumi | | | 25,231 | | |
| | | | | Port Cargo Handling & Logistics | | | | | |
| | 789,000 | | | Tsumura | | | 24,182 | | |
| | | | | Traditional Chinese/Japanese Herbal Rx
Drugs (Kampo) | | | | | |
| | 5,650 | | | Orix JREIT | | | 23,555 | | |
| | | | | Diversified REIT | | | | | |
| | 274,000 | | | Nakanishi | | | 23,461 | | |
| | | | | Dental Tools & Machinery | | | | | |
| | 977,000 | | | Glory | | | 21,266 | | |
| | | | | Currency Handling Systems & Related
Equipment | | | | | |
| | 3,860 | | | Nippon Accommodations Fund | | | 20,284 | | |
| | | | | Residential REIT | | | | | |
| | 710,000 | | | Hamamatsu Photonics | | | 19,749 | | |
| | | | | Optical Sensors for Medical &
Industrial Applications | | | | | |
| | 3,400 | | | Fukuoka | | | 19,618 | | |
| | | | | Diversified REIT in United Kingdom | | | | | |
| | 711,000 | | | Ibiden | | | 19,168 | | |
| | | | | Electronic Parts & Ceramics | | | | | |
| | 800,000 | | | Olympus | | | 18,936 | | |
| | | | | Medical Equipment (Endoscopes) & Cameras | | | | | |
| | 408,700 | | | Benesse | | | 18,613 | | |
| | | | | Education Service Provider | | | | | |
| | 1,501,000 | | | Rohto Pharmaceutical | | | 18,308 | | |
| | | | | Health & Beauty Products | | | | | |
| | 906,000 | | | Aeon Mall | | | 17,977 | | |
| | | | | Suburban Shopping Mall Developer,
Owner & Operator | | | | | |
| | 1,905,500 | | | Asics | | | 17,461 | | |
| | | | | Footwear & Apparel | | | | | |
| | 687,000 | | | Kintetsu World Express | | | 17,298 | | |
| | | | | Airfreight Logistics | | | | | |
| | 4,030 | | | Osaka Securities Exchange | | | 17,087 | | |
| | | | | Osaka Securities Exchange | | | | | |
| | 787,200 | | | Daiseki | | | 16,293 | | |
| | | | | Waste Disposal & Recycling | | | | | |
| Number of Shares | | | | Value (000) | |
| | 926,900 | | | Hoshizaki Electric | | $ | 16,187 | | |
| | | | | Commercial Kitchen Equipment | | | | | |
| | 1,750,000 | | | Suruga Bank | | | 15,854 | | |
| | | | | Regional Bank | | | | | |
| | 590,000 | | | Makita | | | 15,739 | | |
| | | | | Power Tools | | | | | |
| | 1,000,000 | | | Japan Airport Terminal | | | 14,825 | | |
| | | | | Airport Terminal Operator at Haneda | | | | | |
| | 950,000 | | | Ushio | | | 14,667 | | |
| | | | | Industrial Light Sources | | | | | |
| | 3,310 | | | Kakaku.com | | | 13,683 | | |
| | | | | Online Price Comparison Services for Consumers | | | | | |
| | 587,800 | | | Miura | | | 13,398 | | |
| | | | | Industrial Boiler | | | | | |
| | 942,000 | | | Tamron | | | 13,378 | | |
| | | | | Camera Lens Maker | | | | | |
| | 585,000 | | | Icom | | | 13,359 | | |
| | | | | Two Way Radio Communication Equipment | | | | | |
| | 13,933 | | | Jupiter Telecommunications | | | 13,279 | | |
| | | | | Largest Cable Service Provider in Japan | | | | | |
| | 633,800 | | | Torishima Pump Manufacturing | | | 9,757 | | |
| | | | | Industrial Pump for Power Generation &
Water Supply Systems | | | | | |
| | 680,200 | | | Zenrin | | | 7,352 | | |
| | | | | Map Content Publisher | | | | | |
| | 128,100 | | | As One | | | 2,198 | | |
| | | | | Scientific Supplies Distributor | | | | | |
| | | | 791,742 | | |
| | | > China 6.1% | |
| | 7,993,100 | | | Shandong Weigao | | | 34,823 | | |
| | | | | Vertically Integrated Hospital
Consumable Manufacturing | | | | | |
| | 13,930,000 | | | Zhaojin Mining Industry | | | 32,670 | | |
| | | | | Gold Mining & Refining in China | | | | | |
| | 10,107,000 | | | China Yurun Food | | | 31,639 | | |
| | | | | Meat Processor in China | | | | | |
| | 327,429 | | | New Oriental Education &
Technology - ADR (a)(b) | | | 30,513 | | |
| | | | | China's Largest Private Education
Service Provider | | | | | |
| | 29,166,400 | | | China Green | | | 29,242 | | |
| | | | | Chinese Fruit & Vegetable Grower & Processor | | | | | |
| | 31,987,000 | | | Jiangsu Expressway | | | 29,162 | | |
| | | | | Chinese Toll Road Operator | | | | | |
| | 850,000 | | | Mindray - ADR (b) | | | 26,707 | | |
| | | | | Medical Device Manufacturer | | | | | |
| | 240,000,000 | | | RexLot Holdings | | | 21,900 | | |
| | | | | Lottery Equipment Supplier in China | | | | | |
| | 23,426,300 | | | Wasion Group | | | 14,709 | | |
| | | | | Electronic Power Meter Total Solution Provider | | | | | |
| | 24,952,000 | | | China Communication Services | | | 12,155 | | |
| | | | | China's Telecom Infrastructure Service Provider | | | | | |
| | 15,782,000 | | | Sino Ocean Land | | | 11,285 | | |
| | | | | Property Developer in China | | | | | |
| | 15,300,000 | | | Fu Ji Food & Catering Services (a)(c) | | | 157 | | |
| | | | | Food Catering Service Provider in China | | | | | |
| | | | 274,962 | | |
See accompanying notes to financial statements.
41
| Number of Shares | | | | Value (000) | |
| | | > Singapore 4.6% | |
| | 37,000,000 | | | Olam International | | $ | 67,751 | | |
| | | | | Agriculture Supply Chain Manager | | | | | |
| | 70,000,000 | | | Mapletree Logistics Trust | | | 41,558 | | |
| | | | | Asian Logistics Landlord | | | | | |
| | 33,485,000 | | | CDL Hospitality Trust | | | 41,520 | | |
| | | | | Hotel Owner/Operator | | | | | |
| | 5,000,000 | | | Singapore Exchange | | | 26,163 | | |
| | | | | Singapore Equity & Derivatives
Market Operator | | | | | |
| | 20,000,000 | | | Ascendas REIT | | | 25,816 | | |
| | | | | Singapore Industrial Property Landlord | | | | | |
| | 3,762,900 | | | Goodpack | | | 4,478 | | |
| | | | | International Bulk Container Leasing | | | | | |
| | | | 207,286 | | |
| | | > India 4.3% | |
| | 908,519 | | | Asian Paints | | | 44,694 | | |
| | | | | India's Largest Paint Company | | | | | |
| | 1,806,000 | | | Jain Irrigation Systems | | | 41,360 | | |
| | | | | Agricultural Micro-irrigation Systems &
Food Processing | | | | | |
| | 2,396,050 | | | Shriram Transport Finance | | | 29,616 | | |
| | | | | Truck Financing in India | | | | | |
| | 400,000 | | | Housing Development Finance | | | 25,216 | | |
| | | | | Indian Mortgage Lender | | | | | |
| | 1,570,000 | | | Mundra Port & Special Economic Zone | | | 24,705 | | |
| | | | | Indian West Coast Shipping Port | | | | | |
| | 1,450,000 | | | Educomp Solutions | | | 16,388 | | |
| | | | | Multimedia Educational Content & Schools | | | | | |
| | 1,271,000 | | | Patel Engineering | | | 11,603 | | |
| | | | | Civil Engineering & Construction | | | | | |
| | | | 193,582 | | |
| | | > South Korea 2.6% | |
| | 245,000 | | | NHN (a) | | | 36,461 | | |
| | | | | South Korea's Largest Online Search Engine | | | | | |
| | 909,000 | | | Woongjin Coway | | | 30,388 | | |
| | | | | South Korean Household Appliance Rental
Service Provider | | | | | |
| | 172,000 | | | MegaStudy | | | 22,694 | | |
| | | | | Online Education Service Provider | | | | | |
| | 376,000 | | | Mirae Asset Securities | | | 16,474 | | |
| | | | | South Korean Largest Diversified
Financial Company | | | | | |
| | 179,000 | | | Taewoong | | | 8,054 | | |
| | | | | Niche Custom Forging | | | | | |
| | | | 114,071 | | |
| | | > Hong Kong 2.5% | |
| | 22,154,200 | | | Lifestyle International | | | 42,969 | | |
| | | | | Mid to High-end Department Store Operator
in Hong Kong & China | | | | | |
| | 2,300,000 | | | Hong Kong Exchanges and Clearing | | | 35,923 | | |
| | | | | Hong Kong Equity & Derivatives
Market Operator | | | | | |
| | 5,000,000 | | | Melco Crown Entertainment (a)(b) | | | 18,700 | | |
| | | | | Macau Casino Operator | | | | | |
| | 6,819,050 | | | L'Occitane International (a) | | | 14,870 | | |
| | | | | Skin Care & Cosmetics Producer | | | | | |
| | | | 112,462 | | |
| Number of Shares | | | | Value (000) | |
| | | > Taiwan 2.3% | |
| | 6,038,500 | | | Simplo Technology | | $ | 32,694 | | |
| | | | | World's Largest Notebook Battery
Pack Supplier | | | | | |
| | 50,376,000 | | | Yuanta Financial Holdings | | | 26,883 | | |
| | | | | Financial Holding Company in Taiwan | | | | | |
| | 9,297,575 | | | Everlight Electronics | | | 23,771 | | |
| | | | | LED Packager | | | | | |
| | 1,454,200 | | | Formosa International Hotels (a) | | | 17,811 | | |
| | | | | Hotel, Food & Beverage Operation &
Hospitality Management Services | | | | | |
| | | | 101,159 | | |
| | | > Indonesia 0.6% | |
| | 65,000,000 | | | Perusahaan Gas Negara | | | 27,484 | | |
| | | | | Gas Distributor & Pipeline Operator | | | | | |
| | | | 27,484 | | |
| Asia: Total | | | 1,822,748 | | |
| Europe 34.4% | | | |
| | | > United Kingdom 7.5% | |
| | 6,700,000 | | | Serco | | | 58,364 | | |
| | | | | Facilities Management | | | | | |
| | 2,000,000 | | | Intertek Group | | | 42,775 | | |
| | | | | Testing, Inspection & Certification Services | | | | | |
| | 680,000 | | | Chemring | | | 29,847 | | |
| | | | | Defense Manufacturer of Countermeasures &
Energetics | | | | | |
| | 2,637,000 | | | Capita Group | | | 28,932 | | |
| | | | | White Collar, Back Office Outsourcing | | | | | |
| | 8,700,000 | | | Cobham | | | 27,422 | | |
| | | | | Aerospace Components | | | | | |
| | 1,466,000 | | | Schroders | | | 26,383 | | |
| | | | | United Kingdom Top Tier Asset Manager | | | | | |
| | 3,850,000 | | | Micro Focus | | | 24,113 | | |
| | | | | United Kingdom Legacy Software Provider | | | | | |
| | 3,500,000 | | | PureCircle (a) | | | 12,945 | | |
| | | | | Manufactures Natural Sweetener | | | | | |
| | 20,823,776 | | | Archipelago Resources (a) | | | 12,941 | | |
| | | | | Gold Mining Projects in Indonesia, Vietnam &
the Philippines | | | | | |
| | 682,000 | | | Rotork | | | 12,889 | | |
| | | | | Valve Actuators for Oil & Water Pipelines | | | | | |
| | 3,465,000 | | | N Brown Group | | | 12,888 | | |
| | | | | Home Shopping Women's Clothes Retailer | | | | | |
| | 4,600,000 | | | RPS Group | | | 12,788 | | |
| | | | | Environmental Consulting & Planning | | | | | |
| | 1,250,000 | | | Smith & Nephew | | | 11,769 | | |
| | | | | Medical Equipment & Supplies | | | | | |
| | 586,942 | | | Abcam | | | 10,715 | | |
| | | | | Online Sales of Antibodies | | | | | |
| | 690,000 | | | Tullow Oil | | | 10,278 | | |
| | | | | Oil & Gas Producer | | | | | |
| | | | 335,049 | | |
| | | > Netherlands 5.9% | |
| | 1,922,517 | | | Imtech | | | 49,318 | | |
| | | | | Electromechanical & ICT Installation &
Maintenance | | | | | |
See accompanying notes to financial statements.
42
Columbia Acorn International
Statement of Investments (Unaudited), continued
| Number of Shares | | | | Value (000) | |
| | | > Netherlands—continued | |
| | 1,040,200 | | | Vopak | | $ | 38,174 | | |
| | | | | World's Largest Operator of Petroleum &
Chemical Storage Terminals | | | | | |
| | 763,202 | | | Fugro | | | 34,896 | | |
| | | | | Sub-sea Oilfield Services | | | | | |
| | 1,476,800 | | | Unit 4 Agresso (d) | | | 30,572 | | |
| | | | | Business Software Development | | | | | |
| | 1,298,651 | | | Koninklijke TenCate (d) | | | 28,292 | | |
| | | | | Advanced Textiles & Industrial Fabrics | | | | | |
| | 1,968,060 | | | Aalberts Industries | | | 25,371 | | |
| | | | | Flow Control & Heat Treatment | | | | | |
| | 1,088,187 | | | Arcadis | | | 19,491 | | |
| | | | | Engineering Consultants | | | | | |
| | 103,000 | | | Core Laboratories (b) | | | 15,204 | | |
| | | | | Oil & Gas Reservoir Consulting | | | | | |
| | 650,000 | | | QIAGEN (a) | | | 12,592 | | |
| | | | | Life Science Tools & Molecular Diagnostics | | | | | |
| | 836,400 | | | USG People (a) | | | 11,737 | | |
| | | | | Temporary Staffing Services | | | | | |
| | | | 265,647 | | |
| | | > Germany 4.0% | |
| | 1,699,000 | | | Rhoen-Klinikum | | | 37,737 | | |
| | | | | Health Care Services | | | | | |
| | 610,000 | | | CTS Eventim | | | 29,320 | | |
| | | | | Event Ticket Sales | | | | | |
| | 245,000 | | | Vossloh | | | 19,915 | | |
| | | | | Rail Infrastructure & Diesel Locomotives | | | | | |
| | 127,000 | | | Rational | | | 19,614 | | |
| | | | | Commercial Oven Manufacturer | | | | | |
| | 335,000 | | | Wincor Nixdorf | | | 18,744 | | |
| | | | | Retail POS Systems & ATM Machines | | | | | |
| | 960,000 | | | Tognum | | | 17,849 | | |
| | | | | Diesel Engines for Drive & Power
Generation Systems | | | | | |
| | 650,000 | | | Elringklinger | | | 13,909 | | |
| | | | | Automobile Components | | | | | |
| | 1,590,000 | | | Wirecard (b) | | | 13,524 | | |
| | | | | Online Payment Processing & Risk Management | | | | | |
| | 354,500 | | | Deutsche Beteiligungs | | | 8,074 | | |
| | | | | Private Equity Investment Management | | | | | |
| | | | 178,686 | | |
| | | > France 3.3% | |
| | 330,000 | | | Neopost | | | 23,881 | | |
| | | | | Postage Meter Machines | | | | | |
| | 322,200 | | | Pierre & Vacances | | | 21,445 | | |
| | | | | Vacation Apartment Lets | | | | | |
| | 599,271 | | | Eurofins Scientific (a)(b) | | | 21,264 | | |
| | | | | Food, Pharmaceuticals & Materials
Screening & Testing | | | | | |
| | 531,000 | | | Mersen (b) | | | 18,108 | | |
| | | | | Advanced Industrial Materials | | | | | |
| | 595,614 | | | Saft (b) | | | 18,061 | | |
| | | | | Niche Battery Manufacturer | | | | | |
| | 206,183 | | | Rubis | | | 16,670 | | |
| | | | | Tank Storage & Liquefied Petroleum
Gas Distribution | | | | | |
| | 201,101 | | | Norbert Dentressangle | | | 13,206 | | |
| | | | | Leading European Logistics & Transport Group | | | | | |
| Number of Shares | | | | Value (000) | |
| | 205,311 | | | Zodiac Aerospace | | $ | 9,889 | | |
| | | | | Aerospace Supplier | | | | | |
| | 1,337,100 | | | Hi-Media (a) | | | 7,031 | | |
| | | | | Online Advertiser in Europe | | | | | |
| | | | 149,555 | | |
| | | > Switzerland 3.1% | |
| | 20,500 | | | Sika | | | 36,231 | | |
| | | | | Chemicals for Construction &
Industrial Applications | | | | | |
| | 325,000 | | | Kuehne & Nagel | | | 33,290 | | |
| | | | | Freight Forwarding/Logistics | | | | | |
| | 185,000 | | | Geberit | | | 28,688 | | |
| | | | | Plumbing Supplies | | | | | |
| | 660,000 | | | Bank Sarasin & Cie | | | 26,443 | | |
| | | | | Private Banking | | | | | |
| | 125,000 | | | Partners Group | | | 15,083 | | |
| | | | | Private Markets Asset Management | | | | | |
| | | | 139,735 | | |
| | | > Italy 2.3% | |
| | 7,674,000 | | | Terna (b) | | | 27,637 | | |
| | | | | Italian Power Transmission | | | | | |
| | 4,311,600 | | | Credito Emiliano | | | 24,265 | | |
| | | | | Italian Regional Bank | | | | | |
| | 1,298,500 | | | Ansaldo STS | | | 20,733 | | |
| | | | | Railway Systems Integrator | | | | | |
| | 279,000 | | | Tod's | | | 17,589 | | |
| | | | | Leather Shoes & Bags | | | | | |
| | 8,131,000 | | | CIR (a) | | | 13,703 | | |
| | | | | Italian Holding Company | | | | | |
| | | | 103,927 | | |
| | | > Sweden 1.9% | |
| | 3,756,000 | | | Hexagon (b) | | | 48,908 | | |
| | | | | Measurement Equipment | | | | | |
| | 3,887,000 | | | Sweco | | | 24,779 | | |
| | | | | Engineering Consultants | | | | | |
| | 1,078,000 | | | East Capital Explorer (a) | | | 9,780 | | |
| | | | | Sweden-based RUS/CEE Investment Fund | | | | | |
| | | | 83,467 | | |
| | | > Ireland 1.4% | |
| | 11,526,000 | | | United Drug | | | 32,083 | | |
| | | | | Irish Pharmaceutical Wholesaler & Outsourcer | | | | | |
| | 575,000 | | | Paddy Power | | | 17,854 | | |
| | | | | Irish Betting Services | | | | | |
| | 297,000 | | | Aryzta | | | 11,206 | | |
| | | | | Baked Goods | | | | | |
| | | | 61,143 | | |
| | | > Finland 1.2% | |
| | 967,777 | | | Stockmann | | | 29,857 | | |
| | | | | Department Store & Fashion Retailer in
Scandinavia & Russia | | | | | |
| | 1,756,000 | | | Poyry | | | 21,621 | | |
| | | | | Engineering Consultants | | | | | |
| | | | 51,478 | | |
| | | > Portugal 0.8% | |
| | 6,801,200 | | | Redes Energéticas Nacionais | | | 21,923 | | |
| | | | | Portuguese Power Transmission &
Gas Transportation | | | | | |
See accompanying notes to financial statements.
43
| Number of Shares | | | | Value (000) | |
| | | > Portugal—continued | |
| | 16,574,000 | | | Banco Comercial Português | | $ | 12,424 | | |
| | | | | Largest Portuguese Banking Franchise | | | | | |
| | | | 34,347 | | |
| | | > Denmark 0.7% | |
| | 306,000 | | | Novozymes | | | 32,478 | | |
| | | | | Industrial Enzymes | | | | | |
| | | | 32,478 | | |
| | | > Iceland 0.5% | |
| | 33,804,924 | | | Marel (a) | | | 23,734 | | |
| | | | | Largest Manufacturer of Poultry &
Fish Processing Equipment | | | | | |
| | | | 23,734 | | |
| | | > Spain 0.5% | |
| | 579,000 | | | Red Eléctrica de Espana | | | 20,697 | | |
| | | | | Spanish Power Transmission | | | | | |
| | | | 20,697 | | |
| | | > Greece 0.5% | |
| | 6,475,300 | | | Intralot | | | 20,560 | | |
| | | | | Lottery & Gaming Systems & Services | | | | | |
| | | | 20,560 | | |
| | | > Poland 0.4% | |
| | 893,900 | | | Central European Distribution (a) | | | 19,111 | | |
| | | | | Largest Spirits Company in Central &
Eastern Europe | | | | | |
| | | | 19,111 | | |
| | | > Czech Republic 0.4% | |
| | 118,200 | | | Komercni Banka | | | 19,099 | | |
| | | | | Leading Czech Republic Universal Bank | | | | | |
| | | | 19,099 | | |
| Europe: Total | | | 1,538,713 | | |
| Other Countries 14.0% | | | |
| | | > Canada 4.8% | |
| | 1,710,000 | | | ShawCor | | | 43,129 | | |
| | | | | Oil & Gas Pipeline Products | | | | | |
| | 1,983,000 | | | Eldorado Gold | | | 35,541 | | |
| | | | | Gold Miner in Turkey, Greece, China & Brazil | | | | | |
| | 1,154,100 | | | CCL Industries | | | 30,897 | | |
| | | | | Leading Global Label Manufacturer | | | | | |
| | 735,000 | | | Baytex | | | 21,956 | | |
| | | | | Oil & Gas Producer in Canada | | | | | |
| | 540,000 | | | AG Growth | | | 17,805 | | |
| | | | | Leading Manufacturer of Augers &
Grain Handling Equipment | | | | | |
| | 850,000 | | | Ivanhoe Mines (a) | | | 11,011 | | |
| | 744,000 | | | Ivanhoe Mines (a)(e) | | | 9,702 | | |
| | | | | Copper Mine Project in Mongolia | | | | | |
| | 1,355,000 | | | Guyana Goldfields (a)(f) | | | 8,821 | | |
| | | | | Gold Mining Projects in Guyana | | | | | |
| | 530,000 | | | Black Diamond Group | | | 8,738 | | |
| | | | | Provides Accommodations/Equipment for
Oil Sands Exploitation | | | | | |
| | 1,480,610 | | | Pan Orient (a) | | | 7,163 | | |
| | | | | Growth Oriented & Return Focused
Asian Explorer | | | | | |
| Number of Shares | | | | Value (000) | |
| | 12,500,000 | | | Eacom Timber - Subscription
Receipts (a)(f) | | $ | 5,354 | | |
| | | | | Canadian Lumber Producer | | | | | |
| | 872,700 | | | Tahoe Resources (a)(f) | | | 5,222 | | |
| | | | | Silver Project in Guatemala | | | | | |
| | 2,262,100 | | | Horizon North Logistics (a) | | | 3,506 | | |
| | | | | Provides Diversified Oil Service Offering in
Northern Canada | | | | | |
| | 12,500,000 | | | Petromanas (a)(f) | | | 3,241 | | |
| | 6,250,000 | | | Petromanas - Warrants (a)(f) | | | 235 | | |
| | | | | Exploring for Oil in Albania | | | | | |
| | 49,900 | | | WestFire Energy (a) | | | 306 | | |
| | | | | Oil Producer in Alberta & Saskatchewan | | | | | |
| | | | 212,627 | | |
| | | > United States 3.6% | |
| | 1,340,000 | | | Atwood Oceanics (a) | | | 34,197 | | |
| | | | | Offshore Drilling Contractor | | | | | |
| | 625,000 | | | Alexion Pharmaceuticals (a) | | | 31,994 | | |
| | | | | Biotech Focused on Orphan Diseases | | | | | |
| | 742,000 | | | World Fuel Services | | | 19,248 | | |
| | | | | Global Fuel Broker | | | | | |
| | 329,000 | | | FMC Technologies (a) | | | 17,325 | | |
| | | | | Oil & Gas Wellhead Manufacturer | | | | | |
| | 725,000 | | | BioMarin (a) | | | 13,746 | | |
| | | | | Biotech Focused on Orphan Diseases | | | | | |
| | 679,000 | | | Ritchie Brothers Auctioneers (b) | | | 12,371 | | |
| | | | | Heavy Equipment Auctioneer | | | | | |
| | 391,000 | | | Bristow (a) | | | 11,495 | | |
| | | | | Largest Provider of Helicopter Services to
Offshore Oil & Gas Producers | | | | | |
| | 360,000 | | | Textainer Group Holdings | | | 8,690 | | |
| | | | | Top International Container Leasor | | | | | |
| | 192,000 | | | Oceaneering International (a) | | | 8,621 | | |
| | | | | Provider of Sub-sea Services &
Manufactured Products | | | | | |
| | 324,000 | | | Tesco (a) | | | 3,979 | | |
| | | | | Developing New Well Drilling Technologies | | | | | |
| | | | 161,666 | | |
| | | > Australia 2.4% | |
| | 2,482,000 | | | UGL | | | 28,029 | | |
| | | | | Engineering & Facilities Management | | | | | |
| | 6,124,662 | | | SAI Global | | | 20,524 | | |
| | | | | Publishing, Certification & Compliance Services | | | | | |
| | 319,000 | | | Cochlear | | | 19,871 | | |
| | | | | Cochlear Implants for Hearing | | | | | |
| | 539,045 | | | Perpetual Trustees | | | 12,703 | | |
| | | | | Mutual Fund Management | | | | | |
| | 1,741,880 | | | Billabong International | | | 12,685 | | |
| | | | | Action Sports Apparel Brand Manager | | | | | |
| | 10,033,348 | | | Hastie Group | | | 11,548 | | |
| | | | | Mechanical, Electrical & Hydraulic
(MEH) Engineering | | | | | |
| | 731,000 | | | Seek | | | 4,258 | | |
| | | | | Online Job Listing & Education | | | | | |
| | | | 109,618 | | |
See accompanying notes to financial statements.
44
Columbia Acorn International
Statement of Investments (Unaudited), continued
| Number of Shares | | | | Value (000) | |
| | | > South Africa 2.1% | |
| | 1,973,000 | | | Naspers | | $ | 66,313 | | |
| | | | | Media in Africa & Other Emerging Markets | | | | | |
| | 4,600,000 | | | Mr. Price | | | 26,673 | | |
| | | | | South African Retailer of Apparel,
Household & Sporting Goods | | | | | |
| | 114,560 | | | Northam Platinum | | | 673 | | |
| | | | | Platinum Mining in South Africa | | | | | |
| | | | 93,659 | | |
| | | > Israel 0.7% | |
| | 2,890,000 | | | Israel Chemicals | | | 30,138 | | |
| | | | | Producer of Potash, Phosphates, Bromine &
Specialty Chemicals | | | | | |
| | | | 30,138 | | |
| | | > Kazakhstan 0.3% | |
| | 1,770,000 | | | Halyk Savings Bank of
Kazakhstan - GDR (a) | | | 13,752 | | |
| | | | | Largest Retail Bank & Insurer in Kazakhstan | | | | | |
| | | | 13,752 | | |
| | | > Senegal 0.1% | |
| | 24,247 | | | Sonatel | | | 6,102 | | |
| | | | | Leading Telecoms Operator in Western Africa | | | | | |
| | | | 6,102 | | |
| | | > Egypt —% | |
| | 55,299 | | | Paints & Chemical Industries (Pachin) | | | 471 | | |
| | | | | Paints & Inks in Egypt | | | | | |
| | | | 471 | | |
| Other Countries: Total | | | 628,033 | | |
| Latin America 6.2% | | | |
| | | > Brazil 4.7% | |
| | 5,200,000 | | | Localiza Rent A Car | | | 60,354 | | |
| | | | | Car Rental | | | | | |
| | 5,375,000 | | | Suzano | | | 45,293 | | |
| | | | | Brazilian Pulp & Paper Producer | | | | | |
| | 1,900,000 | | | Natura | | | 42,105 | | |
| | | | | Direct Retailer of Cosmetics | | | | | |
| | 2,858,610 | | | Mills Estruturas e Servicios
de Engenha (a) | | | 21,618 | | |
| | | | | Civil Engineering & Construction | | | | | |
| | 3,000,000 | | | MRV Engenharia | | | 21,125 | | |
| | | | | Brazilian Low-income Property Developer | | | | | |
| | 2,500,000 | | | PDG Realty | | | 21,108 | | |
| | | | | Brazilian Low-income Property Developer | | | | | |
| | | | 211,603 | | |
| | | > Mexico 0.9% | |
| | 570,000 | | | Grupo Aeroportuario del Sureste - ADR | | | 25,958 | | |
| | | | | Mexican Airport Operator | | | | | |
| | 6,837,700 | | | Urbi Desarrollos Urbanos (a) | | | 12,688 | | |
| | | | | Affordable Housing Builder | | | | | |
| | | | 38,646 | | |
Number of Shares or
Principal Amount (000) | | | | Value (000) | |
| | | > Chile 0.6% | |
| | 862,000 | | | Sociedad Quimica y Minera
de Chile - ADR | | $ | 28,110 | | |
| | | | | Producer of Specialty Fertilizers,
Lithium & Iodine | | | | | |
| | | | 28,110 | | |
| Latin America: Total | | | 278,359 | | |
Total Equities: 95.3%
(Cost: $3,560,230) | | | 4,267,853 | | |
| Securities Lending Collateral: 1.8% | | | |
| | 82,526,716 | | | Dreyfus Government Cash
Management Fund (g)
(7 day yield of 0.03%) | | | 82,527 | | |
Total Securities Lending Collateral: 1.8%
(Cost: $82,527) | | | 82,527 | | |
| Short-Term Obligations: 4.0% | | | |
| | | > Repurchase Agreement 3.4% | |
| $ | 153,790 | | | Repurchase Agreement with
Fixed Income Clearing Corp.,
dated 6/30/10, due 7/01/10
at 0.00%, collateralized by
U.S. Government Agency
obligations with various
maturities to 8/25/14,
market value $156,866
(repurchase proceeds $153,790) | | | 153,790 | | |
| | | | 153,790 | | |
| | | > Commercial Paper 0.6% | |
| | 22,100 | | | Toyota Motor Credit
0.27% due 7/02/10 | | | 22,100 | | |
| | | | 22,100 | | |
Total Short-Term Obligations:
(Amortized Cost: $175,890) | | | 175,890 | | |
Total Investments: 101.1%
(Cost: $3,818,647)(h)(i) | | | 4,526,270 | | |
Obligation to Return Collateral for
Securities Loaned: (1.8)% | | | (82,527 | ) | |
| Cash and Other Assets Less Liabilities: 0.7% | | | 33,511 | | |
| Total Net Assets: 100.0% | | $ | 4,477,254 | | |
ADR = American Depositary Receipts.
GDR = Global Depositary Receipts.
See accompanying notes to financial statements.
45
> Notes to Statements of Investments (dollar values in thousands)
(a) Non-income producing security.
(b) All or a portion of this security was on loan at June 30, 2010. The total market value of Fund securities on loan at June 30, 2010 was $79,485.
(c) Illiquid security.
(d) An affiliated person of the Fund may include any company in which the Fund owns five percent or more of its outstanding voting shares.
Holdings and transactions in these affiliated companies during the six months ended June 30, 2010, are as follows:
| Affiliates | | Balance of
Shares Held
12/31/09 | | Purchases/
Additions | | Sales/
Reductions | | Balance of
Shares Held
6/30/10 | | Value | | Dividend | |
| Koninklijke TenCate | | | 1,372,989 | | | | 40,382 | | | | 114,720 | | | | 1,298,651 | | | $ | 28,292 | | | $ | 1,119 | | |
| Nippon Residential Investment* | | | 12,500 | | | | - | | | | 12,500 | | | | - | | | | - | | | | 332 | | |
| Unit 4 Agresso | | | 1,385,000 | | | | 91,800 | | | | - | | | | 1,476,800 | | | | 30,572 | | | | 296 | | |
| Total of Affiliated Transactions | | | 2,770,489 | | | | 132,182 | | | | 127,220 | | | | 2,775,451 | | | $ | 58,864 | | | $ | 1,747 | | |
* At June 30, 2010, the Fund owned less than five percent of the company's outstanding voting shares.
The aggregate cost and value of these companies at June 30, 2010, were $48,357 and $58,864, respectively. Investments in affiliated companies represented 1.3% of total net assets at June 30, 2010.
(e) Security is traded on a U.S. exchange.
(f) Denotes a restricted security, which is subject to restrictions on resale under federal securities laws. These securities are valued at a fair value determined in good faith under consistently applied procedures established by the Board of Trustees. At June 30, 2010, the market value of these securities amounted to $22,873, which represented 0.51% of total net assets.
Additional information on these securities is as follows:
| Security | | Acquisition
Dates | | Shares | | Cost | | Value | |
| Eacom Timber - Subscription Receipts | | 3/17/10 | | | 12,500,000 | | | $ | 6,188 | | | $ | 5,354 | | |
| Guyana Goldfields | | 1/19/10 | | | 1,355,000 | | | | 9,134 | | | | 8,821 | | |
| Tahoe Resources | | 5/28/10 | | | 872,700 | | | | 4,984 | | | | 5,222 | | |
| Petromanas | | 5/20/10 | | | 12,500,000 | | | | 4,344 | | | | 3,241 | | |
| Petromanas - Warrants | | 5/20/10 | | | 6,250,000 | | | | 362 | | | | 235 | | |
| | | | | | | | | $ | 25,012 | | | $ | 22,873 | | |
(g) Investment made with cash collateral received from securities lending activity.
(h) At June 30, 2010, for federal income tax purposes, the cost of investments was $3,818,647 and net unrealized apppreciation was $707,623, consisting of gross unrealized appreciation of $1,065,340 and gross unrealized depreciation of $357,717.
(i) On June 30, 2010, the Fund's total investments were denominated in currencies as follows:
| Currency | | Value | | Percentage
of Net Assets | |
| Euro | | $ | 870,836 | | | | 19.5 | | |
| Japanese Yen | | | 791,742 | | | | 17.7 | | |
| U.S. Dollar | | | 607,840 | | | | 13.5 | | |
| British Pound | | | 335,049 | | | | 7.5 | | |
| Hong Kong Dollar | | | 311,504 | | | | 7.0 | | |
Other currencies less
than 5% of total net assets | | | 1,609,299 | | | | 35.9 | | |
| | | $ | 4,526,270 | | | | 101.1 | | |
See accompanying notes to financial statements.
46
Columbia Acorn International
Statement of Investments (Unaudited), continued
> Notes to Statements of Investments (dollar values in thousands)
At June 30, 2010, the Fund had entered into the following forward foreign currency exchange contracts:
Forward Foreign Currency
Exchange Contracts to Sell | | Forward Foreign Currency
Exchange Contracts to Buy | | Principal Amount in
Foreign Currency | | Principal
Amount in U.S. Dollar | | Settlement Date | | Unrealized
Appreciation | |
| AUD | | USD | | | | | 5,842 | | | $ | 5,000 | | | 7/15/10 | | $ | 90 | | |
| AUD | | USD | | | 5,862 | | | | 5,000 | | | 8/13/10 | | | 89 | | |
| CAD | | USD | | | 1,033 | | | | 1,000 | | | 7/15/10 | | | 29 | | |
| CAD | | USD | | | 1,034 | | | | 1,000 | | | 8/13/10 | | | 29 | | |
| EUR | | USD | | | 58,564 | | | | 80,000 | | | 7/15/10 | | | 8,381 | | |
| EUR | | USD | | | 63,519 | | | | 80,000 | | | 8/13/10 | | | 2,310 | | |
| EUR | | USD | | | 55,560 | | | | 68,000 | | | 9/15/10 | | | 31 | | |
| USD | | JPY | | | 2,510,487 | | | | 27,000 | | | 7/15/10 | | | 1,400 | | |
| USD | | JPY | | | 2,506,086 | | | | 27,000 | | | 8/13/10 | | | 1,363 | | |
| USD | | JPY | | | 1,925,658 | | | | 21,000 | | | 9/15/10 | | | 807 | | |
| | | | | | | $ | 315,000 | | | | | $ | 14,529 | | |
Forward Foreign Currency
Exchange Contracts to Buy | | Forward Foreign Currency
Exchange Contracts to Sell | | Principal Amount in
Foreign Currency | | Principal
Amount in U.S. Dollar | | Settlement Date | | Unrealized
(Depreciation) | |
| AUD | | USD | | | | | 28,061 | | | $ | 26,000 | | | 7/15/10 | | $ | (2,415 | ) | |
| AUD | | USD | | | 29,225 | | | | 26,000 | | | 8/13/10 | | | (1,519 | ) | |
| AUD | | USD | | | 24,715 | | | | 21,000 | | | 9/15/10 | | | (377 | ) | |
| CAD | | USD | | | 26,898 | | | | 27,000 | | | 7/15/10 | | | (1,735 | ) | |
| CAD | | USD | | | 27,423 | | | | 27,000 | | | 8/13/10 | | | (1,246 | ) | |
| CAD | | USD | | | 26,878 | | | | 26,000 | | | 9/15/10 | | | (764 | ) | |
| EUR | | USD | | | 9,809 | | | | 12,000 | | | 7/15/10 | | | (4 | ) | |
| EUR | | USD | | | 9,807 | | | | 12,000 | | | 8/13/10 | | | (5 | ) | |
| USD | | JPY | | | 549,900 | | | | 6,000 | | | 7/15/10 | | | (221 | ) | |
| USD | | JPY | | | 550,050 | | | | 6,000 | | | 8/13/10 | | | (225 | ) | |
| | | | | | | $ | 189,000 | | | | | $ | (8,511 | ) | |
The counterparty for all forward foreign currency exchange contracts is State Street Bank and Trust Company.
AUD = Australian Dollar
CAD = Canadian Dollar
EUR = Euro
JPY = Japanese Yen
USD = United States Dollar
The following table summarizes the inputs used, as of June 30, 2010, in valuing the Fund's assets:
| Investment Type | | Quoted Prices
(Level 1) | | Other
Significant
Observable
Inputs
(Level 2) | | Significant
Unobservable
Inputs
(Level 3) | | Total | |
| Equities | |
| Asia | | $ | 75,920 | | | $ | 1,746,671 | | | $ | 157 | | | $ | 1,822,748 | | |
| Europe | | | 34,315 | | | | 1,504,398 | | | | - | | | | 1,538,713 | | |
| Other Countries | | | 360,241 | | | | 267,792 | | | | - | | | | 628,033 | | |
| Latin America | | | 278,359 | | | | - | | | | - | | | | 278,359 | | |
| Total Equities | | | 748,835 | | | | 3,518,861 | | | | 157 | | | | 4,267,853 | | |
| Total Securities Lending Collateral | | | 82,527 | | | | - | | | | - | | | | 82,527 | | |
| Total Short-Term Obligations | | | - | | | | 175,890 | | | | - | | | | 175,890 | | |
| Total Investments | | $ | 831,362 | | | $ | 3,694,751 | | | $ | 157 | | | $ | 4,526,270 | | |
Unrealized Appreciation on Forward Foreign
Currency Exchange Contracts | | | - | | | | 14,529 | | | | - | | | | 14,529 | | |
Unrealized Depreciation on Forward Foreign
Currency Exchange Contracts | | | - | | | | (8,511 | ) | | | - | | | | (8,511 | ) | |
| Total | | $ | 831,362 | | | $ | 3,700,769 | | | $ | 157 | | | $ | 4,532,288 | | |
The Fund's assets assigned to the Level 2 input category are generally valued using the market approach, in which a security's value is determined through its correlation to prices and information from market transactions for similar or identical assets. Foreign equities are generally valued at the last sales price on the foreign exchange or market on which they trade. The Fund may use a systematic fair valuation model provided by an independent third party to value securities principally traded in foreign markets in
See accompanying notes to financial statements.
47
> Notes to Statements of Investments (dollar values in thousands)
order to adjust for possible stale pricing that may occur between the close of the foreign exchanges and the time for valuation. These models take into account available market data including intraday index, ADR, and ETF movements. Forward foreign currency exchange contracts are valued at the prevailing forward exchange rate of the underlying currencies.
Certain Short-Term Obligations may be valued using amortized cost, an income approach which converts future cash flows to a present value based upon the discount or premium at purchase.
The Fund's assets assigned to the Level 3 input category are valued at fair value as determined in good faith under consistently applied procedures established by and under the general supervision of the Board of Trustees. To determine fair value, management will utilize the valuation technique that they deem the most appropriate in the circumstances. Securities for which no market exist are valued based upon the market approach using inputs from the investment team but ultimately decided by the Board of Trustees. These may include, but are not limited to, projected earnings, available cash, line of business, multiples, and consideration of the prioritization of the equity in a company's capital structure.
The following table reconciles asset balances for the six-month period ending June 30, 2010, in which significant unobservable inputs (Level 3) were used in determining value:
Investments
in Securities | | Balance
as of
December 31,
2009 | | Realized
Gain/(Loss) | | Change in
Unrealized
Appreciation
(Depreciation) | | Purchases | | (Sales) | | Transfers
into
Level 3 | | Transfers
(out of)
Level 3 | | Balance
as of
June 30,
2010 | |
| Equities | |
| Asia | | $ | 158 | | | $ | - | | | $ | (1 | ) | | $ | - | | | $ | - | | | $ | - | | | $ | - | | | $ | 157 | | |
| | | $ | 158 | | | $ | - | | | $ | (1 | ) | | $ | - | | | $ | - | | | $ | - | | | $ | - | | | $ | 157 | | |
The information in the above reconciliation table represents fiscal year to date activity for any securities identified as using Level 3 inputs during the current fiscal period.
The change in unrealized depreciation attributed to securities owned at June 30, 2010, which were valued using significant unobservable inputs (Level 3) amounted to $(1). This amount is included in net change in unrealized appreciation (depreciation) on the Statements of Changes in Net Assets.
The Funds adopted FASB Accounting Standards Update No. 2010-06 "Fair Value Measurements and Disclosures (Topic 820)" ("the Update"), effective March 31, 2010. The Update applies to Funds' disclosures about transfers in and out of Level 1 and Level 2 of the fair value hierarchy and the reasons for the transfers as well as to disclosures about the valuation techniques and inputs used to measure fair value for investments that fall in either Level 2 or Level 3 fair value hierarchy.
The following table shows transfers between Level 1 and Level 2 of the fair value hierarchy.
| Transfers In | | Transfers Out | |
| Level 1 | | Level 2 | | Level 1 | | Level 2 | |
| $ | 152,770 | | | $ | - | | | $ | - | | | $ | 152,770 | | |
Financial assets were transferred from Level 2 to Level 1 as they resumed trading during the period.
For more information on valuation inputs, and their aggregation into the levels used in the tables above, please refer to the Security Valuation section in the accompanying Notes to Financial Statements.
See accompanying notes to financial statements.
48
Columbia Acorn International
Portfolio Diversification (Unaudited)
At June 30, 2010, the Fund's portfolio investments as a percent of net assets were diversified as follows:
| | | Value (000) | | Percentage
of Net Assets | |
| > Industrial Goods & Services | |
| Other Industrial Services | | $ | 397,393 | | | | 8.9 | | |
Industrial Materials &
Specialty Chemicals | | | 293,535 | | | | 6.6 | | |
| Machinery | | | 276,159 | | | | 6.2 | | |
| Outsourcing Services | | | 99,033 | | | | 2.2 | | |
| Electrical Components | | | 89,997 | | | | 2.0 | | |
| Construction | | | 74,280 | | | | 1.6 | | |
| Conglomerates | | | 58,242 | | | | 1.3 | | |
| Industrial Distribution | | | 6,676 | | | | 0.1 | | |
| | | | 1,295,315 | | | | 28.9 | | |
| > Consumer Goods & Services | |
| Food & Beverage | | | 172,052 | | | | 3.8 | | |
| Retail | | | 155,834 | | | | 3.5 | | |
| Nondurables | | | 123,770 | | | | 2.8 | | |
| Travel | | | 81,800 | | | | 1.8 | | |
| Casinos & Gaming | | | 79,014 | | | | 1.8 | | |
| Other Consumer Services | | | 73,357 | | | | 1.6 | | |
| Educational Services | | | 71,820 | | | | 1.6 | | |
| Apparel | | | 60,003 | | | | 1.3 | | |
| Other Entertainment | | | 47,130 | | | | 1.1 | | |
| Consumer Electronics | | | 13,378 | | | | 0.3 | | |
| | | | 878,158 | | | | 19.6 | | |
| > Information | |
Computer Hardware &
Related Equipment | | | 81,802 | | | | 1.8 | | |
| Financial Processors | | | 75,610 | | | | 1.7 | | |
| Instrumentation | | | 68,657 | | | | 1.5 | | |
| TV Broadcasting | | | 66,312 | | | | 1.5 | | |
| Business Software | | | 54,685 | | | | 1.2 | | |
| Internet Related | | | 54,402 | | | | 1.2 | | |
Semiconductors &
Related Equipment | | | 23,771 | | | | 0.5 | | |
| Publishing | | | 23,740 | | | | 0.5 | | |
| Mobile Communications | | | 13,359 | | | | 0.3 | | |
| CATV | | | 13,279 | | | | 0.3 | | |
Business Information &
Marketing Services | | | 12,788 | | | | 0.3 | | |
| Telecommunications Equipment | | | 12,155 | | | | 0.3 | | |
| Advertising | | | 7,031 | | | | 0.2 | | |
| Telephone and Data Services | | | 6,102 | | | | 0.2 | | |
| | | | 513,693 | | | | 11.5 | | |
| > Energy & Minerals | |
| Oil Services | | | 165,886 | | | | 3.7 | | |
| Mining | | | 131,784 | | | | 2.9 | | |
Oil Refining, Marketing &
Distribution | | | 82,329 | | | | 1.9 | | |
| Agricultural Commodities | | | 50,647 | | | | 1.1 | | |
| Oil & Gas Producers | | | 43,178 | | | | 1.0 | | |
| | | | 473,824 | | | | 10.6 | | |
| | | Value (000) | | Percentage
of Net Assets | |
| > Other Industries | |
| Real Estate | | $ | 272,764 | | | | 6.1 | | |
| Transportation | | | 127,629 | | | | 2.8 | | |
| Regulated Utilities | | | 70,258 | | | | 1.6 | | |
| | | | 470,651 | | | | 10.5 | | |
| > Finance | |
| Brokerage & Money Management | | | 141,823 | | | | 3.2 | | |
| Banks | | | 115,166 | | | | 2.6 | | |
| Finance Companies | | | 55,393 | | | | 1.2 | | |
| Savings & Loans | | | 25,216 | | | | 0.5 | | |
| | | | 337,598 | | | | 7.5 | | |
| > Health Care | |
| Medical Equipment & Devices | | | 167,560 | | | | 3.7 | | |
| Pharmaceuticals | | | 56,265 | | | | 1.3 | | |
| Health Care Services | | | 37,737 | | | | 0.9 | | |
| Medical Supplies | | | 23,306 | | | | 0.5 | | |
| Biotechnology & Drug Delivery | | | 13,746 | | | | 0.3 | | |
| | | | 298,614 | | | | 6.7 | | |
| Total Equities: | | | 4,267,853 | | | | 95.3 | | |
Securities Lending
Collateral: | | | 82,527 | | | | 1.8 | | |
| Short-Term Obligations: | | | 175,890 | | | | 4.0 | | |
| Total Investments: | | | 4,526,270 | | | | 101.1 | | |
Obligation to Return
Collateral for
Securities Loaned: | | | (82,527 | ) | | | (1.8 | ) | |
Cash and Other Assets
Less Liabilities: | | | 33,511 | | | | 0.7 | | |
| Net Assets: | | $ | 4,477,254 | | | | 100.0 | | |
See accompanying notes to financial statements.
49
Columbia Acorn USA
Major Portfolio Changes in the Second Quarter (Unaudited)
| | | Number of Shares | |
| | | 03/31/10 | | 06/30/10 | |
| Purchases | |
| Information | |
| AboveNet | | | 45,000 | | | | 90,000 | | |
| Atmel | | | 550,000 | | | | 1,451,000 | | |
| Blackboard | | | 95,000 | | | | 135,000 | | |
| Constant Contact | | | 64,547 | | | | 132,000 | | |
| Jack Henry & Associates | | | 0 | | | | 174,000 | | |
| SBA Communications | | | 525,000 | | | | 610,000 | | |
| Consumer Goods & Services | |
| Coldwater Creek | | | 417,260 | | | | 455,956 | | |
| Kenneth Cole Productions | | | 0 | | | | 130,000 | | |
| Penn National Gaming | | | 110,000 | | | | 372,000 | | |
| Rue21 | | | 0 | | | | 48,900 | | |
| Finance | |
| Associated Banc-Corp | | | 213,600 | | | | 453,400 | | |
| Green Bankshares | | | 247,203 | | | | 264,703 | | |
| MB Financial | | | 492,125 | | | | 532,000 | | |
| Industrial Goods & Services | |
| Acuity Brands | | | 145,000 | | | | 280,000 | | |
| Kennametal | | | 0 | | | | 73,000 | | |
| Health Care | |
| Amylin Pharmaceuticals | | | 0 | | | | 145,000 | | |
| Array Biopharma | | | 0 | | | | 650,000 | | |
| Idenix Pharmaceuticals | | | 0 | | | | 332,171 | | |
| Isis Pharmaceuticals | | | 199,900 | | | | 421,253 | | |
| NPS Pharmaceuticals | | | 509,900 | | | | 582,500 | | |
| Seattle Genetics | | | 489,300 | | | | 596,537 | | |
| The Medicines Company | | | 0 | | | | 150,000 | | |
| Xenoport | | | 0 | | | | 306,000 | | |
| Other Industries | |
| Dupont Fabros Technology | | | 0 | | | | 138,000 | | |
| Education Realty Trust | | | 0 | | | | 400,000 | | |
| Extra Space Storage | | | 441,000 | | | | 557,000 | | |
| Rush Enterprises, Class B | | | 0 | | | | 115,000 | | |
| World Fuel Services | | | 100,000 | | | | 156,000 | | |
| Energy & Minerals | |
| Alexco Resource | | | 0 | | | | 393,000 | | |
| Northern Oil & Gas | | | 109,000 | | | | 230,000 | | |
| Rosetta Resources | | | 61,000 | | | | 129,000 | | |
| St. Mary Land & Exploration | | | 0 | | | | 133,000 | | |
| | | Number of Shares | |
| | | 03/31/10 | | 06/30/10 | |
| Sales | |
| Information | |
| Blackbaud | | | 525,000 | | | | 370,000 | | |
| Cogent Communications | | | 250,000 | | | | 0 | | |
| Crown Castle International | | | 890,000 | | | | 383,000 | | |
| Global Payments | | | 220,000 | | | | 188,000 | | |
| Informatica | | | 1,155,000 | | | | 985,000 | | |
| Integrated Device Technology | | | 1,168,000 | | | | 701,000 | | |
| Mediacom Communications | | | 335,000 | | | | 0 | | |
| NetSuite | | | 240,000 | | | | 0 | | |
| Novell | | | 918,000 | | | | 0 | | |
| Polycom | | | 480,000 | | | | 429,000 | | |
| Tyler Technologies | | | 136,513 | | | | 0 | | |
| Consumer Goods & Services | |
| Bebe Stores | | | 131,314 | | | | 0 | | |
| Cavco Industries | | | 297,403 | | | | 250,000 | | |
| Gaylord Entertainment | | | 750,000 | | | | 593,700 | | |
| Hansen Natural | | | 90,000 | | | | 0 | | |
| ITT Educational Services | | | 179,000 | | | | 153,700 | | |
| P.F. Chang's China Bistro | | | 40,000 | | | | 0 | | |
| Vitacost.com | | | 125,000 | | | | 0 | | |
| Finance | |
| H&E Equipment Services | | | 625,000 | | | | 542,600 | | |
| MF Global | | | 750,000 | | | | 675,000 | | |
| SEI Investments | | | 150,000 | | | | 0 | | |
| Industrial Goods & Services | |
| Ritchie Brothers Auctioneers | | | 110,000 | | | | 0 | | |
| Health Care | |
| Auxilium Pharmaceuticals | | | 157,000 | | | | 86,678 | | |
| eResearch Technology | | | 283,000 | | | | 0 | | |
| Human Genome Sciences | | | 248,000 | | | | 59,000 | | |
| Illumina | | | 71,000 | | | | 34,000 | | |
| InterMune | | | 117,000 | | | | 0 | | |
| Kinetic Concepts | | | 40,000 | | | | 0 | | |
| Onyx Pharmaceuticals | | | 100,000 | | | | 82,600 | | |
| Other Industries | |
| American Campus Communities | | | 90,000 | | | | 0 | | |
| Digital Realty Trust | | | 100,000 | | | | 22,000 | | |
| Energy & Minerals | |
| Carrizo Oil & Gas | | | 485,000 | | | | 162,000 | | |
| Equitable Resources | | | 111,200 | | | | 0 | | |
| Layne Christensen | | | 179,846 | | | | 0 | | |
| Oceaneering International | | | 95,000 | | | | 38,000 | | |
| Southwestern Energy | | | 137,800 | | | | 0 | | |
See accompanying notes to financial statements.
50
Columbia Acorn USA
Statement of Investments (Unaudited), June 30, 2010
| Number of Shares | | | | Value (000) | |
| | | | | | | | Equities: 99.8% | | |
| Information 31.7% | | | |
| | | > Business Software 7.3% | |
| | 985,000 | | | Informatica (a) | | $ | 23,522 | | |
| | | | | Enterprise Data Integration Software | | | | | |
| | 620,000 | | | Micros Systems (a) | | | 19,759 | | |
| | | | | Information Systems for Restaurants & Hotels | | | | | |
| | 375,000 | | | ANSYS (a) | | | 15,214 | | |
| | | | | Simulation Software for Engineers & Designers | | | | | |
| | 370,000 | | | Blackbaud | | | 8,055 | | |
| | | | | Software & Services for Non-profits | | | | | |
| | 158,000 | | | Concur Technologies (a) | | | 6,743 | | |
| | | | | Web Enabled Cost & Expense
Management Software | | | | | |
| | 135,000 | | | Blackboard (a) | | | 5,040 | | |
| | | | | Education Software | | | | | |
| | 174,000 | | | Jack Henry & Associates | | | 4,155 | | |
| | | | | Systems Financial Institutions | | | | | |
| | 57,000 | | | Quality Systems | | | 3,305 | | |
| | | | | IT Systems for Medical Groups &
Ambulatory Care Centers | | | | | |
| | 959,000 | | | Art Technology Group (a) | | | 3,280 | | |
| | | | | Software & Tools to Optimize Websites
for E-Commerce | | | | | |
| | 132,000 | | | Constant Contact (a) | | | 2,816 | | |
| | | | | E-mail & Other Marketing Campaign
Management Systems Delivered Over the Web | | | | | |
| | 100,000 | | | Avid Technology (a) | | | 1,273 | | |
| | | | | Digital Nonlinear Editing Software & Systems | | | | | |
| | 230,000 | | | Actuate (a) | | | 1,023 | | |
| | | | | Information Delivery Software & Solutions | | | | | |
| | | | 94,185 | | |
| | | > Semiconductors &
Related Equipment 4.1% | |
| | 760,000 | | | Microsemi (a) | | | 11,119 | | |
| | | | | Analog/Mixed-signal Semiconductors | | | | | |
| | 500,000 | | | Monolithic Power Systems (a) | | | 8,930 | | |
| | | | | High Performance Analog & Mixed-signal
Integrated Circuits (ICs) | | | | | |
| | 1,179,750 | | | ON Semiconductor (a) | | | 7,527 | | |
| | | | | Mixed-signal & Power Management
Semiconductors | | | | | |
| | 287,000 | | | Supertex (a) | | | 7,077 | | |
| | | | | Analog/Mixed-signal Semiconductors | | | | | |
| | 1,451,000 | | | Atmel (a) | | | 6,965 | | |
| | | | | Microcontrollers, RF & Memory Semiconductors | | | | | |
| | 480,000 | | | Pericom Semiconductor (a) | | | 4,608 | | |
| | | | | Interface Integrated Circuits (ICs) &
Frequency Control Products | | | | | |
| | 701,000 | | | Integrated Device Technology (a) | | | 3,470 | | |
| | | | | Communications Semiconductors | | | | | |
| | 750,000 | | | Entegris (a) | | | 2,977 | | |
| | | | | Semiconductor Materials Management Products | | | | | |
| | | | 52,673 | | |
| | | > Telephone and Data Services 3.6% | |
| | 2,061,000 | | | tw telecom (a) | | | 34,377 | | |
| | | | | Fiber Optic Telephone/Data Services | | | | | |
| | 2,250,000 | | | PAETEC Holding (a) | | | 7,673 | | |
| | | | | Telephone/Data Services for Business | | | | | |
| Number of Shares | | | | Value (000) | |
| | 90,000 | | | AboveNet (a) | | $ | 4,246 | | |
| | | | | Metropolitan Fiber Communications Services | | | | | |
| | | | 46,296 | | |
| | | > Computer Hardware & Related
Equipment 3.2% | |
| | 549,000 | | | II-VI (a) | | | 16,267 | | |
| | | | | Laser Optics & Specialty Materials | | | | | |
| | 285,600 | | | Amphenol | | | 11,218 | | |
| | | | | Electronic Connectors | | | | | |
| | 280,000 | | | Nice Systems - ADR (Israel) (a) | | | 7,137 | | |
| | | | | Audio & Video Recording Solutions | | | | | |
| | 184,000 | | | Zebra Technologies (a) | | | 4,668 | | |
| | | | | Bar Code Printers | | | | | |
| | 135,000 | | | Netgear (a) | | | 2,409 | | |
| | | | | Networking Products for Small Business & Home | | | | | |
| | | | 41,699 | | |
| | | > Instrumentation 2.9% | |
| | 180,000 | | | Mettler Toledo (a) | | | 20,093 | | |
| | | | | Laboratory Equipment | | | | | |
| | 575,000 | | | IPG Photonics (a) | | | 8,757 | | |
| | | | | Fiber Lasers | | | | | |
| | 168,000 | | | Trimble Navigation (a) | | | 4,704 | | |
| | | | | GPS-based Instruments | | | | | |
| | 130,000 | | | FLIR Systems (a) | | | 3,782 | | |
| | | | | Infrared Cameras | | | | | |
| | | | 37,336 | | |
| | | > Mobile Communications 2.7% | |
| | 610,000 | | | SBA Communications (a) | | | 20,746 | | |
| | | | | Communications Towers | | | | | |
| | 383,000 | | | Crown Castle International (a) | | | 14,271 | | |
| | | | | Communications Towers | | | | | |
| | 88,000 | | | Globalstar (a) | | | 135 | | |
| | | | | Satellite Mobile Voice & Data Carrier | | | | | |
| | | | 35,152 | | |
| | | > Telecommunications Equipment 2.3% | |
| | 429,000 | | | Polycom (a) | | | 12,780 | | |
| | | | | Video Conferencing Equipment | | | | | |
| | 473,000 | | | Blue Coat Systems (a) | | | 9,664 | | |
| | | | | WAN Acceleration & Network Security | | | | | |
| | 320,000 | | | Finisar (a)(b) | | | 4,768 | | |
| | | | | Optical Sub-systems & Components | | | | | |
| | 116,000 | | | CommScope (a) | | | 2,757 | | |
| | | | | Wireless Infrastructure Equipment &
Telecom Cable | | | | | |
| | | | 29,969 | | |
| | | > Computer Services 1.9% | |
| | 395,000 | | | SRA International (a) | | | 7,770 | | |
| | | | | Government IT Services | | | | | |
| | 310,000 | | | ExlService Holdings (a) | | | 5,323 | | |
| | | | | BPO (Business Process Outsourcing) | | | | | |
| | 786,000 | | | RCM Technologies (a)(c) | | | 3,513 | | |
| | | | | Technology & Engineering Services | | | | | |
| | 235,000 | | | iGate | | | 3,013 | | |
| | | | | IT & BPO (Business Process Outsourcing) Services | | | | | |
See accompanying notes to financial statements.
51
| Number of Shares | | | | Value (000) | |
| | | > Computer Services—continued | |
| | 1,005,500 | | | Hackett Group (a) | | $ | 2,825 | | |
| | | | | IT Integration & Best Practice Research | | | | | |
| | 172,000 | | | Acxiom (a) | | | 2,527 | | |
| | | | | Database Marketing Services | | | | | |
| | | | 24,971 | | |
| | | > Gaming Equipment & Services 1.7% | |
| | 570,000 | | | Bally Technologies (a) | | | 18,463 | | |
| | | | | Slot Machines & Software | | | | | |
| | 73,000 | | | WMS Industries (a) | | | 2,865 | | |
| | | | | Slot Machine Provider | | | | | |
| | | | 21,328 | | |
| | | > Internet Related 0.6% | |
| | 79,188 | | | Equinix (a) | | | 6,432 | | |
| | | | | Network Neutral Data Centers | | | | | |
| | 381,740 | | | TheStreet.com | | | 1,099 | | |
| | | | | Financial Information Websites | | | | | |
| | | | 7,531 | | |
| | | > Contract Manufacturing 0.5% | |
| | 261,000 | | | Plexus (a) | | | 6,979 | | |
| | | | | Electronic Manufacturing Services | | | | | |
| | | | 6,979 | | |
| | | > Financial Processors 0.5% | |
| | 188,000 | | | Global Payments | | | 6,870 | | |
| | | | | Credit Card Processor | | | | | |
| | | | 6,870 | | |
| | | > Radio 0.2% | |
| | 511,100 | | | Salem Communications (a) | | | 1,896 | | |
| | | | | Radio Stations for Religious Programming | | | | | |
| | 705,500 | | | Spanish Broadcasting System (a) | | | 804 | | |
| | | | | Spanish Language Radio Stations | | | | | |
| | 18,750 | | | Saga Communications (a) | | | 448 | | |
| | | | | Radio Stations in Small & Mid-sized Cities | | | | | |
| | | | 3,148 | | |
| | | > TV Broadcasting 0.2% | |
| | 975,000 | | | Entravision Communications (a) | | | 2,057 | | |
| | | | | Spanish Language TV & Radio Stations | | | | | |
| | | | 2,057 | | |
| Information: Total | | | 410,194 | | |
| Consumer Goods & Services 17.3% | | | |
| | | > Retail 6.6% | |
| | 390,000 | | | lululemon athletica (a)(b) | | | 14,516 | | |
| | | | | Premium Active Apparel Retailer | | | | | |
| | 360,000 | | | Urban Outfitters (a) | | | 12,380 | | |
| | | | | Apparel & Home Specialty Retailer | | | | | |
| | 281,000 | | | J Crew Group (a) | | | 10,344 | | |
| | | | | Multi-channel Branded Retailer | | | | | |
| | 322,000 | | | Abercrombie & Fitch | | | 9,882 | | |
| | | | | Teen Apparel Retailer | | | | | |
| | 774,000 | | | Chico's FAS | | | 7,647 | | |
| | | | | Women's Specialty Retailer | | | | | |
| | 875,000 | | | Saks (a) | | | 6,641 | | |
| | | | | Luxury Department Store Retailer | | | | | |
| | 480,000 | | | Talbots (a) | | | 4,949 | | |
| | | | | Women's Specialty Retailer | | | | | |
| Number of Shares | | | | Value (000) | |
| | 244,000 | | | AnnTaylor Stores (a) | | $ | 3,970 | | |
| | | | | Women's Apparel Retailer | | | | | |
| | 943,000 | | | Charming Shoppes (a) | | | 3,536 | | |
| | | | | Women's Specialty Plus Size Apparel Retailer | | | | | |
| | 130,000 | | | Shutterfly (a) | | | 3,115 | | |
| | | | | Internet Photo-centric Retailer | | | | | |
| | 440,000 | | | Pier 1 Imports (a) | | | 2,820 | | |
| | | | | Home Furnishing Retailer | | | | | |
| | 715,000 | | | Wet Seal (a) | | | 2,610 | | |
| | | | | Specialty Apparel Retailer | | | | | |
| | 455,956 | | | Coldwater Creek (a) | | | 1,532 | | |
| | | | | Women's Apparel Retailer | | | | | |
| | 48,900 | | | Rue21 (a) | | | 1,484 | | |
| | | | | Fashion Value Apparel Retailer | | | | | |
| | | | 85,426 | | |
| | | > Travel 2.8% | |
| | 593,700 | | | Gaylord Entertainment (a) | | | 13,115 | | |
| | | | | Convention Hotels | | | | | |
| | 797,750 | | | Avis Budget Group (a) | | | 7,834 | | |
| | | | | Second Largest Car Rental Company | | | | | |
| | 220,000 | | | Vail Resorts (a) | | | 7,680 | | |
| | | | | Ski Resort Operator & Developer | | | | | |
| | 750,000 | | | Hertz (a) | | | 7,095 | | |
| | | | | Largest U.S. Rental Car Operator | | | | | |
| | | | 35,724 | | |
| | | > Furniture & Textiles 1.9% | |
| | 980,000 | | | Knoll | | | 13,024 | | |
| | | | | Office Furniture | | | | | |
| | 540,000 | | | Interface | | | 5,800 | | |
| | | | | Modular & Broadloom Carpet | | | | | |
| | 285,000 | | | Herman Miller | | | 5,378 | | |
| | | | | Office Furniture | | | | | |
| | | | 24,202 | | |
| | | > Educational Services 1.3% | |
| | 153,700 | | | ITT Educational Services (a) | | | 12,760 | | |
| | | | | Post-secondary Degree Services | | | | | |
| | 165,000 | | | Universal Technical Institute (a) | | | 3,901 | | |
| | | | | Vocational Training | | | | | |
| | | | 16,661 | | |
| | | > Other Durable Goods 1.0% | |
| | 250,000 | | | Cavco Industries (a) | | | 8,795 | | |
| | | | | Manufactured Homes | | | | | |
| | 154,000 | | | Jarden | | | 4,138 | | |
| | | | | Branded Household Products | | | | | |
| | | | 12,933 | | |
| | | > Casinos & Gaming 1.0% | |
| | 372,000 | | | Penn National Gaming (a) | | | 8,593 | | |
| | | | | Regional Casino Operator | | | | | |
| | 455,000 | | | Pinnacle Entertainment (a) | | | 4,304 | | |
| | | | | Regional Casino Operator | | | | | |
| | | | 12,897 | | |
| | | > Consumer Goods Distribution 0.9% | |
| | 523,500 | | | Pool | | | 11,475 | | |
| | | | | Distributor of Swimming Pool
Supplies & Equipment | | | | | |
| | | | 11,475 | | |
See accompanying notes to financial statements.
52
Columbia Acorn USA
Statement of Investments (Unaudited), continued
| Number of Shares | | | | Value (000) | |
| | | > Apparel 0.6% | |
| | 284,313 | | | True Religion Apparel (a) | | $ | 6,275 | | |
| | | | | Premium Denim | | | | | |
| | 130,000 | | | Kenneth Cole Productions (a) | | | 1,431 | | |
| | | | | Wholesaler & Retailer of Lifestyle Brand | | | | | |
| | | | 7,706 | | |
| | | > Food & Beverage 0.5% | |
| | 162,000 | | | Diamond Foods | | | 6,658 | | |
| | | | | Culinary Ingredients & Snack Foods | | | | | |
| | | | 6,658 | | |
| | | > Other Consumer Services 0.4% | |
| | 182,000 | | | Lifetime Fitness (a) | | | 5,786 | | |
| | | | | Sport & Fitness Club Operator | | | | | |
| | | | 5,786 | | |
| | | > Leisure Products 0.3% | |
| | 180,000 | | | Thor Industries | | | 4,275 | | |
| | | | | RV & Bus Manufacturer | | | | | |
| | | | 4,275 | | |
| Consumer Goods & Services: Total | | | 223,743 | | |
| Finance 13.8% | | | |
| | | > Banks 6.2% | |
| | 981,941 | | | Valley National Bancorp | | | 13,374 | | |
| | | | | New Jersey/New York Bank | | | | | |
| | 659,800 | | | TCF Financial | | | 10,959 | | |
| | | | | Great Lakes Bank | | | | | |
| | 532,000 | | | MB Financial | | | 9,784 | | |
| | | | | Chicago Bank | | | | | |
| | 431,597 | | | Lakeland Financial | | | 8,623 | | |
| | | | | Indiana Bank | | | | | |
| | 170,000 | | | SVB Financial Group (a) | | | 7,009 | | |
| | | | | Bank to Venture Capitalists | | | | | |
| | 453,400 | | | Associated Banc-Corp | | | 5,559 | | |
| | | | | Midwest Bank | | | | | |
| | 508,000 | | | Pacific Continental | | | 4,811 | | |
| | | | | Pacific Northwest Bank | | | | | |
| | 264,703 | | | Green Bankshares (a)(b) | | | 3,380 | | |
| | | | | Tennessee Bank | | | | | |
| | 269,600 | | | Eagle Bancorp (a) | | | 3,176 | | |
| | | | | Metro D.C. Bank | | | | | |
| | 678,200 | | | First Busey | | | 3,072 | | |
| | | | | Illinois Bank | | | | | |
| | 245,000 | | | Wilmington Trust | | | 2,717 | | |
| | | | | Delaware Trust Bank | | | | | |
| | 178,826 | | | Sandy Spring Bancorp | | | 2,506 | | |
| | | | | Baltimore/D.C. Bank | | | | | |
| | 225,000 | | | Whitney Holding | | | 2,081 | | |
| | | | | Gulf Coast Bank | | | | | |
| | 90,000 | | | TriCo Bancshares | | | 1,524 | | |
| | | | | California Central Valley Bank | | | | | |
| | 851,247 | | | Guaranty Bancorp (a) | | | 902 | | |
| | | | | Colorado Bank | | | | | |
| | | | 79,477 | | |
| | | > Finance Companies 5.1% | |
| | 1,136,500 | | | AmeriCredit (a) | | | 20,707 | | |
| | | | | Auto Lending | | | | | |
| Number of Shares | | | | Value (000) | |
| | 397,900 | | | World Acceptance (a) | | $ | 15,244 | | |
| | | | | Personal Loans | | | | | |
| | 345,000 | | | McGrath Rentcorp | | | 7,859 | | |
| | | | | Temporary Space & IT Rentals | | | | | |
| | 265,000 | | | GATX | | | 7,070 | | |
| | | | | Rail Car Lessor | | | | | |
| | 412,500 | | | Aaron's | | | 7,041 | | |
| | | | | Rent to Own | | | | | |
| | 542,600 | | | H&E Equipment Services (a) | | | 4,064 | | |
| | | | | Heavy Equipment Leasing | | | | | |
| | 230,000 | | | CAI International (a) | | | 2,737 | | |
| | | | | International Container Leasing | | | | | |
| | 99,200 | | | Marlin Business Services (a) | | | 1,199 | | |
| | | | | Small Equipment Leasing | | | | | |
| | | | 65,921 | | |
| | | > Brokerage & Money Management 1.1% | |
| | 280,000 | | | Eaton Vance | | | 7,731 | | |
| | | | | Specialty Mutual Funds | | | | | |
| | 675,000 | | | MF Global (a) | | | 3,854 | | |
| | | | | Futures Broker | | | | | |
| | 155,000 | | | Investment Technology Group (a) | | | 2,489 | | |
| | | | | Electronic Trading | | | | | |
| | | | 14,074 | | |
| | | > Savings & Loans 1.0% | |
| | 600,000 | | | ViewPoint Financial | | | 8,310 | | |
| | | | | Texas Thrift | | | | | |
| | 238,090 | | | Berkshire Hills Bancorp | | | 4,638 | | |
| | | | | Northeast Thrift | | | | | |
| | 46,231 | | | K-Fed Bancorp (b) | | | 420 | | |
| | | | | Los Angeles Savings & Loan | | | | | |
| | | | 13,368 | | |
| | | > Insurance 0.4% | |
| | 110,000 | | | Delphi Financial Group | | | 2,685 | | |
| | | | | Workers Compensation & Group Employee
Benefit Products & Services | | | | | |
| | 120,000 | | | Tower Group | | | 2,584 | | |
| | | | | Commercial & Personal Lines Insurance | | | | | |
| | | | 5,269 | | |
| Finance: Total | | | 178,109 | | |
| Industrial Goods & Services 13.3% | | | |
| | | > Machinery 9.5% | |
| | 627,500 | | | Ametek | | | 25,194 | | |
| | | | | Aerospace/Industrial Instruments | | | | | |
| | 373,600 | | | Nordson | | | 20,952 | | |
| | | | | Dispensing Systems for Adhesives & Coatings | | | | | |
| | 445,000 | | | Donaldson | | | 18,979 | | |
| | | | | Industrial Air Filtration | | | | | |
| | 585,000 | | | Pentair | | | 18,837 | | |
| | | | | Pumps & Water Treatment | | | | | |
| | 587,000 | | | ESCO Technologies | | | 15,115 | | |
| | | | | Automatic Electric Meter Readers | | | | | |
| | 195,000 | | | MOOG (a) | | | 6,285 | | |
| | | | | Motion Control Products for Aerospace,
Defense & Industrial Markets | | | | | |
| | 199,000 | | | HEICO | | | 5,363 | | |
| | | | | FAA Approved Aircraft Replacement Parts | | | | | |
See accompanying notes to financial statements.
53
| Number of Shares | | | | Value (000) | |
| | | > Machinery—continued | |
| | 162,000 | | | Oshkosh (a) | | $ | 5,048 | | |
| | | | | Specialty Truck Manufacturer | | | | | |
| | 71,800 | | | Toro | | | 3,527 | | |
| | | | | Turf Maintenance Equipment | | | | | |
| | 73,000 | | | Kennametal | | | 1,856 | | |
| | | | | Consumable Cutting Tools | | | | | |
| | 50,000 | | | Kaydon | | | 1,643 | | |
| | | | | Specialized Friction & Motion Control Products | | | | | |
| | | | 122,799 | | |
| | | > Electrical Components 0.8% | |
| | 280,000 | | | Acuity Brands | | | 10,186 | | |
| | | | | Commercial Lighting Fixtures | | | | | |
| | | | 10,186 | | |
| | | > Industrial Materials &
Specialty Chemicals 0.8% | |
| | 255,000 | | | Drew Industries (a) | | | 5,151 | | |
| | | | | RV & Manufactured Home Components | | | | | |
| | 150,000 | | | Albany International | | | 2,428 | | |
| | | | | Paper Machine Clothing & Advanced Textiles | | | | | |
| | 60,000 | | | Albemarle | | | 2,383 | | |
| | | | | Refinery Catalysts & Other Specialty Chemicals | | | | | |
| | | | 9,962 | | |
| | | > Steel 0.6% | |
| | 540,000 | | | GrafTech International (a) | | | 7,895 | | |
| | | | | Industrial Graphite Materials Producer | | | | | |
| | | | 7,895 | | |
| | | > Other Industrial Services 0.5% | |
| | 396,000 | | | American Reprographics (a) | | | 3,457 | | |
| | | | | Document Management & Logistics | | | | | |
| | 265,000 | | | TrueBlue (a) | | | 2,965 | | |
| | | | | Temporary Manual Labor | | | | | |
| | | | 6,422 | | |
| | | > Industrial Distribution 0.5% | |
| | 350,000 | | | Interline Brands (a) | | | 6,051 | | |
| | | | | Industrial Distribution | | | | | |
| | | | 6,051 | | |
| | | > Waste Management 0.3% | |
| | 130,000 | | | Waste Connections (a) | | | 4,536 | | |
| | | | | Solid Waste Management | | | | | |
| | | | 4,536 | | |
| | | > Construction 0.2% | |
| | 240,000 | | | M/I Homes (a) | | | 2,314 | | |
| | | | | Columbus-based Home Builder | | | | | |
| | | | 2,314 | | |
| | | > Water 0.1% | |
| | 550,000 | | | Mueller Water Products | | | 2,041 | | |
| | | | | Fire Hydrants, Valves & Ductile Iron Pipes | | | | | |
| | | | 2,041 | | |
| Industrial Goods & Services: Total | | | 172,206 | | |
| Number of Shares | | | | Value (000) | |
| Health Care 9.5% | | | |
| | | > Biotechnology & Drug Delivery 4.9% | |
| | 596,537 | | | Seattle Genetics (a) | | $ | 7,153 | | |
| | | | | Antibody-based Therapies for Cancer | | | | | |
| | 220,000 | | | Acorda Therapeutics (a) | | | 6,844 | | |
| | | | | Biopharma Company Focused on Nervous
Disorder Drugs | | | | | |
| | 431,000 | | | Nektar Therapeutics (a) | | | 5,215 | | |
| | | | | Drug Delivery Technologies | | | | | |
| | 266,000 | | | BioMarin (a) | | | 5,043 | | |
| | | | | Biotech Focused on Orphan Diseases | | | | | |
| | 145,000 | | | AMAG Pharmaceuticals (a) | | | 4,981 | | |
| | | | | Biotech Focused on Niche Diseases | | | | | |
| | 797,253 | | | Allos Therapeutics (a) | | | 4,887 | | |
| | | | | Cancer Drug Development | | | | | |
| | 421,253 | | | Isis Pharmaceuticals (a) | | | 4,031 | | |
| | | | | Biotech Pioneer in Anti-sense Drugs | | | | | |
| | 582,500 | | | NPS Pharmaceuticals (a) | | | 3,751 | | |
| | | | | Orphan Drugs & Healthy Royalties | | | | | |
| | 535,089 | | | Micromet (a) | | | 3,339 | | |
| | | | | Next-generation Antibody Technology | | | | | |
| | 306,000 | | | Xenoport (a)(b) | | | 3,002 | | |
| | | | | Biotech Company with Proprietary Drug
Development Platform | | | | | |
| | 57,000 | | | United Therapeutics (a) | | | 2,782 | | |
| | | | | Biotech Focused on Rare Diseases | | | | | |
| | 145,000 | | | Amylin Pharmaceuticals (a) | | | 2,726 | | |
| | | | | Biotech Company Focused on Diabetes & Obesity | | | | | |
| | 86,678 | | | Auxilium Pharmaceuticals (a) | | | 2,037 | | |
| | | | | Biotech Focused on Niche Disease Areas | | | | | |
| | 650,000 | | | Array Biopharma (a) | | | 1,983 | | |
| | | | | Drugs for Cancer & Inflammatory Diseases | | | | | |
| | 82,600 | | | Onyx Pharmaceuticals (a) | | | 1,783 | | |
| | | | | Commercial-stage Biotech Focused on Cancer | | | | | |
| | 332,171 | | | Idenix Pharmaceuticals (a) | | | 1,661 | | |
| | | | | Developer of Drugs for Infectious Diseases | | | | | |
| | 59,000 | | | Human Genome Sciences (a) | | | 1,337 | | |
| | | | | Biotech Focused on HCV, Inflammation & Cancer | | | | | |
| | 220,000 | | | Anthera (a) | | | 1,179 | | |
| | | | | Biotech Focused on Cardiovascular,
Cancer & Immunology | | | | | |
| | 18,181 | | | Metabolex, Series A-1 (a)(d) | | | 31 | | |
| | | | | Diabetes Drug Development | | | | | |
| | 738,060 | | | Medicure - Warrants (a)(d) | | | 5 | | |
| | | | | Cardiovascular Biotech Company | | | | | |
| | 100,000 | | | IsoRay - Warrants (a)(d) | | | 3 | | |
| | | | | Radiology Cancer Company | | | | | |
| | 37,500 | | | Locus Pharmaceuticals,
Series A-1, Pfd. (a)(d) | | | 1 | | |
| | 19,329 | | | Locus Pharmaceuticals,
Series B-1, Pfd. (a)(d) | | | 1 | | |
| | | | | High Throughput Rational Drug Design | | | | | |
| | | | 63,775 | | |
| | | > Medical Equipment & Devices 2.4% | |
| | 235,000 | | | Alexion Pharmaceuticals (a) | | | 12,030 | | |
| | | | | Biotech Focused on Orphan Diseases | | | | | |
| | 165,000 | | | Orthofix International (a) | | | 5,288 | | |
| | | | | Bone Fixation & Stimulation Devices | | | | | |
See accompanying notes to financial statements.
54
Columbia Acorn USA
Statement of Investments (Unaudited), continued
| Number of Shares | | | | Value (000) | |
| | | > Medical Equipment & Devices—continued | |
| | 160,000 | | | American Medical Systems (a) | | $ | 3,539 | | |
| | | | | Medical Devices to Treat Urological Conditions | | | | | |
| | 76,000 | | | Gen-Probe (a) | | | 3,452 | | |
| | | | | Molecular In-vitro Diagnostics | | | | | |
| | 80,000 | | | Sirona Dental Systems (a) | | | 2,787 | | |
| | | | | Manufacturer of Dental Equipment | | | | | |
| | 34,000 | | | Illumina (a) | | | 1,480 | | |
| | | | | Leading Tools & Service Provider for
Genetic Analysis | | | | | |
| | 108,147 | | | Vermillion (a)(d) | | | 1,266 | | |
| | | | | Ovarian Cancer Diagnostic Test | | | | | |
| | 250,000 | | | Nanosphere (a) | | | 1,090 | | |
| | | | | Molecular Diagnostics Company with Best
of Breed Platform | | | | | |
| | | | 30,932 | | |
| | | > Health Care Services 1.2% | |
| | 606,300 | | | PSS World Medical (a) | | | 12,823 | | |
| | | | | Distributor of Medical Supplies | | | | | |
| | 45,000 | | | Mednax (a) | | | 2,503 | | |
| | | | | Physician Management for Pediatric &
Anesthesia Practices | | | | | |
| | | | 15,326 | | |
| | | > Medical Supplies 0.9% | |
| | 361,000 | | | Cepheid (a) | | | 5,783 | | |
| | | | | Molecular Diagnostics | | | | | |
| | 176,460 | | | Immucor (a) | | | 3,361 | | |
| | | | | Automated Blood Typing Reagents | | | | | |
| | 53,000 | | | Idexx Laboratories (a)(b) | | | 3,228 | | |
| | | | | Diagnostic Equipment & Services
for Veterinarians | | | | | |
| | | | 12,372 | | |
| | | > Pharmaceuticals 0.1% | |
| | 150,000 | | | The Medicines Company (a) | | | 1,142 | | |
| | | | | Specialty Pharmaceuticals - Cardiovascular | | | | | |
| | | | 1,142 | | |
| Health Care: Total | | | 123,547 | | |
| Other Industries 7.3% | | | |
| | | > Real Estate 6.3% | |
| | 405,000 | | | SL Green Realty | | | 22,291 | | |
| | | | | Manhattan Office Buildings | | | | | |
| | 836,200 | | | BioMed Realty Trust | | | 13,455 | | |
| | | | | Life Science-focused Office Buildings | | | | | |
| | 280,619 | | | Macerich | | | 10,473 | | |
| | | | | Regional Shopping Malls | | | | | |
| | 246,000 | | | Corporate Office Properties | | | 9,289 | | |
| | | | | Office Buildings | | | | | |
| | 557,000 | | | Extra Space Storage | | | 7,742 | | |
| | | | | Self Storage Facilities | | | | | |
| | 1,450,000 | | | Kite Realty Group | | | 6,061 | | |
| | | | | Community Shopping Centers | | | | | |
| | 1,058,000 | | | DCT Industrial Trust | | | 4,782 | | |
| | | | | Industrial Properties | | | | | |
| | 138,000 | | | Dupont Fabros Technology | | | 3,389 | | |
| | | | | Technology-focused Office Buildings | | | | | |
| | 400,000 | | | Education Realty Trust | | | 2,412 | | |
| | | | | Student Housing | | | | | |
| Number of Shares | | | | Value (000) | |
| | 22,000 | | | Digital Realty Trust | | $ | 1,269 | | |
| | | | | Technology-focused Office Buildings | | | | | |
| | | | 81,163 | | |
| | | > Transportation 1.0% | |
| | 344,720 | | | Heartland Express | | | 5,005 | | |
| | | | | Regional Trucker | | | | | |
| | 156,000 | | | World Fuel Services | | | 4,047 | | |
| | | | | Global Fuel Broker | | | | | |
| | 180,000 | | | Rush Enterprises, Class A (a) | | | 2,405 | | |
| | 115,000 | | | Rush Enterprises, Class B (a) | | | 1,340 | | |
| | | | | Truck Sales & Services | | | | | |
| | | | 12,797 | | |
| Other Industries: Total | | | 93,960 | | |
| Energy & Minerals 6.9% | | | |
| | | > Oil Services 4.2% | |
| | 500,000 | | | FMC Technologies (a) | | | 26,330 | | |
| | | | | Oil & Gas Wellhead Manufacturer | | | | | |
| | 755,000 | | | Atwood Oceanics (a) | | | 19,267 | | |
| | | | | Offshore Drilling Contractor | | | | | |
| | 105,000 | | | Bristow (a) | | | 3,087 | | |
| | | | | Largest Provider of Helicopter Services to
Offshore Oil & Gas Producers | | | | | |
| | 115,375 | | | Exterran Holdings (a) | | | 2,978 | | |
| | | | | Natural Gas Compressor Rental & Fabrication | | | | | |
| | 38,000 | | | Oceaneering International (a) | | | 1,706 | | |
| | | | | Provider of Sub-sea Services &
Manufactured Products | | | | | |
| | 106,000 | | | Tesco (a) | | | 1,302 | | |
| | | | | Developing New Well Drilling Technologies | | | | | |
| | | | 54,670 | | |
| | | > Oil & Gas Producers 2.0% | |
| | 1,135,000 | | | Quicksilver Resources (a) | | | 12,485 | | |
| | | | | Natural Gas & Coal Steam Gas Producer | | | | | |
| | 133,000 | | | St. Mary Land & Exploration | | | 5,341 | | |
| | | | | Oil & Gas Producer | | | | | |
| | 230,000 | | | Northern Oil & Gas (a) | | | 2,953 | | |
| | | | | Small E&P Company in North Dakota Bakken | | | | | |
| | 129,000 | | | Rosetta Resources (a) | | | 2,555 | | |
| | | | | Oil & Gas Producer Exploring in
South Texas & Montana | | | | | |
| | 162,000 | | | Carrizo Oil & Gas (a) | | | 2,516 | | |
| | | | | Oil & Gas Producer | | | | | |
| | 22,800 | | | Oasis Petroleum (a) | | | 331 | | |
| | | | | Oil Producer in North Dakota | | | | | |
| | | | 26,181 | | |
| | | > Mining 0.7% | |
| | 50,000 | | | Core Laboratories (Netherlands) (b) | | | 7,381 | | |
| | | | | Oil & Gas Reservoir Consulting | | | | | |
| | 393,000 | | | Alexco Resource (a) | | | 1,234 | | |
| | | | | Mining, Exploration & Environmental Services | | | | | |
| | | | 8,615 | | |
| Energy & Minerals: Total | | | 89,466 | | |
Total Equities: 99.8%
(Cost: $1,145,424) | | | 1,291,225 | | |
See accompanying notes to financial statements.
55
Number of Shares
or Principal Amount (000) | | | | Value (000) | |
| Securities Lending Collateral: 1.3% | |
| | 16,740,975 | | | Dreyfus Government Cash
Management Fund (e)
(7 day yield of 0.03%) | | $ | 16,741 | | |
Total Securities Lending Collateral:
(Cost: $16,741) | | | 16,741 | | |
| Short-Term Obligation 0.5% | |
| $ | 6,499 | | | Repurchase Agreement with
Fixed Income Clearing Corp.,
dated 6/30/10, due 7/01/10
at 0.00%, collateralized by a
U.S. Government Agency
obligation maturing 8/25/14,
market value $6,631
(repurchase proceeds $6,499) | | | 6,499 | | |
Total Short-Term Obligation:
(Cost: $6,499) | | | 6,499 | | |
Total Investments: 101.6%
(Cost: $1,168,664)(f) | | | 1,314,465 | | |
Obligation to Return Collateral for
Securities Loaned: (1.3)% | | | (16,741 | ) | |
| Cash and Other Assets Less Liabilities: (0.3)% | | | (3,488 | ) | |
| Total Net Assets: 100.0% | | $ | 1,294,236 | | |
ADR = American Depositary Receipts.
See accompanying notes to financial statements.
56
Columbia Acorn USA
Statement of Investments (Unaudited), continued
> Notes to Statement of Investments (dollar values in thousands)
(a) Non-income producing security.
(b) All or a portion of this security was on loan at June 30, 2010. The total market value of Fund securities on loan at June 30, 2010 was $16,139.
(c) An affiliated person of the Fund may include any company in which the Fund owns five percent or more of its outstanding voting shares.
Holdings and transactions in these affiliated companies during the six months ended June 30, 2010, are as follows:
| Affiliate | | Balance of
Shares Held
12/31/09 | | Purchases/
Additions | | Sales/
Reductions | | Balance of
Shares Held
6/30/10 | | Value | | Dividend | |
| Cavco Industries* | | | 327,900 | | | | - | | | | 77,900 | | | | 250,000 | | | $ | 8,795 | | | $ | - | | |
| RCM Technologies | | | 786,000 | | | | - | | | | - | | | | 786,000 | | | | 3,513 | | | | - | | |
| Total of Affiliated Transactions | | | 1,113,900 | | | | - | | | | 77,900 | | | | 1,036,000 | | | $ | 12,308 | | | $ | - | | |
* At June 30, 2010, the Fund owned less than five percent of the company's outstanding voting shares.
The aggregate cost and value of these companies at June 30, 2010, were $13,412 and $12,308, respectively. Investments in the affiliated companies represented 1.0% of total net assets at June 30, 2010.
(d) Denotes a restricted security, which is subject to restrictions on resale under federal securities laws. These securities are valued at a fair value determined in good faith under consistently applied procedures established by the Board of Trustees. At June 30, 2010, the market value of these securities amounted to $1,307 which represented 0.10% of total net assets.
Additional information on these securities is as follows:
| Security | | Acquisition
Dates | | Shares | | Cost | | Value | |
| Vermillion | | 1/07/10 | | | 108,147 | | | $ | 2,000 | | | $ | 1,266 | | |
| Metabolex, Series A | | 2/11/00 | | | 18,181 | | | | 2,000 | | | | 31 | | |
| Medicure - Warrants | | 12/22/06 | | | 738,060 | | | | - | | | | 5 | | |
| IsoRay - Warrants | | 3/21/07 | | | 100,000 | | | | - | | | | 3 | | |
| Locus Pharmaceuticals, Series A-1 Pfd. | | 9/05/01 | | | 37,500 | | | | 1,500 | | | | 1 | | |
| Locus Pharmaceuticals, Series B-1 Pfd. | | 2/08/07 | | | 19,329 | | | | 56 | | | | 1 | | |
| | | | | | | | | $ | 5,556 | | | $ | 1,307 | | |
(e) Investment made with cash collateral received from securities lending activity.
(f) At June 30, 2010, for federal income tax purposes, the cost of investments was $1,168,664 and net unrealized appreciation was $145,801, consisting of gross unrealized appreciation of $321,700 and gross unrealized depreciation of $175,899.
The following table summarizes the inputs used, as of June 30, 2010, in valuing the Fund's assets:
| Investment Type | | Quoted Prices
(Level 1) | | Other
Significant
Observable
Inputs
(Level 2) | | Significant
Unobservable
Inputs
(Level 3) | | Total | |
| Equities | |
| Information | | $ | 410,194 | | | $ | - | | | $ | - | | | $ | 410,194 | | |
| Consumer Goods & Services | | | 223,743 | | | | - | | | | - | | | | 223,743 | | |
| Finance | | | 178,109 | | | | - | | | | - | | | | 178,109 | | |
| Industrial Goods & Services | | | 172,206 | | | | - | | | | - | | | | 172,206 | | |
| Health Care | | | 122,240 | | | | 1,274 | | | | 33 | | | | 123,547 | | |
| Other Industries | | | 93,960 | | | | - | | | | - | | | | 93,960 | | |
| Energy & Minerals | | | 89,466 | | | | - | | | | - | | | | 89,466 | | |
| Total Equities | | | 1,289,918 | | | | 1,274 | | | | 33 | | | | 1,291,225 | | |
| Total Securities Lending Collateral | | | 16,741 | | | | - | | | | - | | | | 16,741 | | |
| Total Short-Term Obligation | | | - | | | | 6,499 | | | | - | | | | 6,499 | | |
| Total Investments | | $ | 1,306,659 | | | $ | 7,773 | | | $ | 33 | | | $ | 1,314,465 | | |
The Fund's assets assigned to the Level 2 input category are generally valued using the market approach, in which a security's value is determined through its correlation to prices and information from market transactions for similar or identical assets. Securities acquired via private placement, that have a holding period or an extended settlement period, are valued at a discount to the same shares that are trading freely on the market. These discounts are determined by the advisor's experience with similar securities or situations. Factors may include, but are not limited to, trade volume, shares outstanding and stock price. Warrants which do not trade are valued as a percentage of the actively trading common stock using a model, based on Black Scholes.
See accompanying notes to financial statements.
57
> Notes to Statement of Investments (dollar values in thousands)
Certain Short-Term Obligations may be valued using amortized cost, an income approach which converts future cash flows to a present value based upon the discount or premium at purchase.
The Fund's assets assigned to the Level 3 input category are valued at fair value as determined in good faith under consistently applied procedures established by and under the general supervision of the Board of Trustees. To determine fair value, management will utilize the valuation technique that they deem the most appropriate in the circumstances. Securities for which no market exist are valued based upon the market approach using inputs from the investment team but ultimately decided by the Board of Trustees. These may include, but are not limited to, projected earnings, available cash, line of business, multiples, and consideration of the prioritization of the equity in a company's capital structure.
The following table reconciles asset balances for the six-month period ending June 30, 2010, in which significant unobservable inputs (Level 3) were used in determining value:
Investments
in Securities | | Balance
as of
December 31,
2009 | | Realized
Gain/(Loss) | | Change in
Unrealized
Appreciation
(Depreciation) | | Purchases | | (Sales) | | Transfers
into
Level 3 | | Transfers
(out of)
Level 3 | | Balance
as of
June 30,
2010 | |
| Equities | |
| Health Care | | $ | 25 | | | $ | - | | | $ | 8 | | | $ | - | | | $ | - | | | $ | - | | | $ | - | | | $ | 33 | | |
| | | $ | 25 | | | $ | - | | | $ | 8 | | | $ | - | | | $ | - | | | $ | - | | | $ | - | | | $ | 33 | | |
The information in the above reconciliation table represents fiscal year to date activity for any securities identified as using Level 3 inputs during the current fiscal period.
The change in unrealized appreciation attributed to securities owned at June 30, 2010, which were valued using significant unobservable inputs (Level 3) amounted to $8. This amount is included in net change in unrealized appreciation (depreciation) on the Statements of Changes in Net Assets.
For more information on valuation inputs, and their aggregation into the levels used in the tables above, please refer to the Security Valuation section in the accompanying Notes to Financial Statements.
See accompanying notes to financial statements.
58
Columbia Acorn International Select
Major Portfolio Changes in the Second Quarter (Unaudited)
| | | Number of Shares | |
| | | 03/31/10 | | 06/30/10 | |
| Purchases | |
| Asia | |
| > Japan | |
| Kansai Paint | | | 1,311,400 | | | | 1,879,000 | | |
| > China | |
| Jiangsu Expressway | | | 8,361,000 | | | | 13,127,000 | | |
| Zhaojin Mining Industry | | | 4,394,000 | | | | 5,515,200 | | |
| > Singapore | |
| Ascendas REIT | | | 7,500,000 | | | | 8,686,700 | | |
| Europe | |
| > United Kingdom | |
| Cobham | | | 2,929,700 | | | | 3,120,000 | | |
| Intertek Group | | | 525,000 | | | | 530,000 | | |
| Micro Focus | | | 0 | | | | 1,280,000 | | |
| > Netherlands | |
| Fugro | | | 169,162 | | | | 175,427 | | |
| Imtech | | | 252,000 | | | | 258,904 | | |
| > Germany | |
| Rhoen-Klinikum | | | 174,000 | | | | 251,000 | | |
| > Ireland | |
| United Drug | | | 2,191,700 | | | | 2,563,000 | | |
| Other Countries | |
| > Canada | |
| AG Growth | | | 73,600 | | | | 125,000 | | |
| Pan American Silver | | | 0 | | | | 510,000 | | |
| > Australia | |
| UGL | | | 759,000 | | | | 870,000 | | |
| | | Number of Shares | |
| | | 03/31/10 | | 06/30/10 | |
| Sales | |
| Asia | |
| > Japan | |
| Nomura Holdings | | | 560,000 | | | | 0 | | |
| Suruga Bank | | | 307,000 | | | | 0 | | |
| > China | |
| Shandong Weigao | | | 1,752,700 | | | | 0 | | |
| > Singapore | |
| Singapore Exchange | | | 702,000 | | | | 0 | | |
| > South Korea | |
| MegaStudy | | | 49,204 | | | | 0 | | |
| Europe | |
| > United Kingdom | |
| Capita Group | | | 1,100,000 | | | | 0 | | |
| Schroders | | | 310,000 | | | | 200,000 | | |
| Serco | | | 2,350,000 | | | | 2,300,000 | | |
| Spice Group | | | 851,400 | | | | 0 | | |
| > France | |
| Zodiac Aerospace | | | 102,000 | | | | 0 | | |
| > Spain | |
| Red Eléctrica de Espana | | | 195,000 | | | | 127,000 | | |
| Other Countries | |
| > Canada | |
| Potash Corp. of Saskatchewan | | | 51,500 | | | | 0 | | |
| > United States | |
| Alexion Pharmaceuticals | | | 90,000 | | | | 0 | | |
| Diamond Offshore | | | 61,000 | | | | 0 | | |
| Oceaneering International | | | 80,000 | | | | 0 | | |
See accompanying notes to financial statements.
59
Columbia Acorn International Select
Statement of Investments (Unaudited), June 30, 2010
| Number of Shares | | | | Value (000) | |
| | | | | | | | Equities: 88.9% | | |
| Asia 33.9% | | | |
| | | > Japan 15.5% | |
| | 1,879,000 | | | Kansai Paint | | $ | 16,081 | | |
| | | | | Paint Producer in Japan, India, China &
Southeast Asia | | | | | |
| | 189,300 | | | Benesse | | | 8,621 | | |
| | | | | Education Service Provider | | | | | |
| | 4,450 | | | Seven Bank | | | 8,058 | | |
| | | | | ATM Processing Services | | | | | |
| | 634,300 | | | Rohto Pharmaceutical | | | 7,737 | | |
| | | | | Health & Beauty Products | | | | | |
| | 160,300 | | | Ain Pharmaciez | | | 6,489 | | |
| | | | | Dispensing Pharmacy/Drugstore Operator | | | | | |
| | 6,060 | | | Jupiter Telecommunications | | | 5,775 | | |
| | | | | Largest Cable Service Provider in Japan | | | | | |
| | 900 | | | Orix JREIT | | | 3,752 | | |
| | | | | Diversified REIT | | | | | |
| | 435,000 | | | Kamigumi | | | 3,343 | | |
| | | | | Port Cargo Handling & Logistics | | | | | |
| | | | 59,856 | | |
| | | > China 6.5% | |
| | 5,515,200 | | | Zhaojin Mining Industry | | | 12,935 | | |
| | | | | Gold Mining & Refining in China | | | | | |
| | 13,127,000 | | | Jiangsu Expressway | | | 11,968 | | |
| | | | | Chinese Toll Road Operator | | | | | |
| | | | 24,903 | | |
| | | > Singapore 5.8% | |
| | 8,686,700 | | | Ascendas REIT | | | 11,212 | | |
| | | | | Singapore Industrial Property Landlord | | | | | |
| | 6,100,000 | | | Olam International | | | 11,170 | | |
| | | | | Agriculture Supply Chain Manager | | | | | |
| | | | 22,382 | | |
| | | > South Korea 4.3% | |
| | 78,000 | | | NHN (a) | | | 11,608 | | |
| | | | | South Korea's Largest Online Search Engine | | | | | |
| | 151,000 | | | Woongjin Coway | | | 5,048 | | |
| | | | | South Korean Household Appliance Rental
Service Provider | | | | | |
| | | | 16,656 | | |
| | | > Hong Kong 1.8% | |
| | 434,700 | | | Hong Kong Exchanges and Clearing | | | 6,790 | | |
| | | | | Hong Kong Equity & Derivatives Market Operator | | | | | |
| | | | 6,790 | | |
| Asia: Total | | | 130,587 | | |
| Europe 32.4% | | | |
| | | > United Kingdom 13.7% | |
| | 2,300,000 | | | Serco | | | 20,035 | | |
| | | | | Facilities Management | | | | | |
| | 530,000 | | | Intertek Group | | | 11,336 | | |
| | | | | Testing, Inspection & Certification Services | | | | | |
| | 3,120,000 | | | Cobham | | | 9,834 | | |
| | | | | Aerospace Components | | | | | |
| | 1,280,000 | | | Micro Focus | | | 8,017 | | |
| | | | | United Kingdom Legacy Software Provider | | | | | |
| Number of Shares | | | | Value (000) | |
| | 200,000 | | | Schroders | | $ | 3,599 | | |
| | | | | United Kingdom Top Tier Asset Manager | | | | | |
| | | | 52,821 | | |
| | | > Netherlands 5.4% | |
| | 175,427 | | | Fugro | | | 8,021 | | |
| | | | | Sub-sea Oilfield Services | | | | | |
| | 258,904 | | | Imtech | | | 6,642 | | |
| | | | | Electromechanical & ICT Installation &
Maintenance | | | | | |
| | 41,000 | | | Core Laboratories (b) | | | 6,052 | | |
| | | | | Oil & Gas Reservoir Consulting | | | | | |
| | | | 20,715 | | |
| | | > Switzerland 2.8% | |
| | 135,900 | | | Bank Sarasin & Cie | | | 5,445 | | |
| | | | | Private Banking | | | | | |
| | 51,000 | | | Kuehne & Nagel | | | 5,224 | | |
| | | | | Freight Forwarding/Logistics | | | | | |
| | | | 10,669 | | |
| | | > Sweden 2.4% | |
| | 715,000 | | | Hexagon | | | 9,310 | | |
| | | | | Measurement Equipment | | | | | |
| | | | 9,310 | | |
| | | > Germany 2.4% | |
| | 251,000 | | | Rhoen-Klinikum | | | 5,575 | | |
| | | | | Health Care Services | | | | | |
| | 412,000 | | | Wirecard (b) | | | 3,504 | | |
| | | | | Online Payment Processing & Risk Management | | | | | |
| | | | 9,079 | | |
| | | > Ireland 1.9% | |
| | 2,563,000 | | | United Drug | | | 7,134 | | |
| | | | | Irish Pharmaceutical Wholesaler & Outsourcer | | | | | |
| | | | 7,134 | | |
| | | > France 1.8% | |
| | 98,000 | | | Neopost | | | 7,092 | | |
| | | | | Postage Meter Machines | | | | | |
| | | | 7,092 | | |
| | | > Spain 1.2% | |
| | 127,000 | | | Red Eléctrica de Espana | | | 4,540 | | |
| | | | | Spanish Power Transmission | | | | | |
| | | | 4,540 | | |
| | | > Denmark 0.8% | |
| | 29,000 | | | Novozymes | | | 3,078 | | |
| | | | | Industrial Enzymes | | | | | |
| | | | 3,078 | | |
| Europe: Total | | | 124,438 | | |
| Other Countries 19.0% | | | |
| | | > Canada 9.0% | |
| | 510,000 | | | Pan American Silver | | | 12,893 | | |
| | | | | Silver Mining | | | | | |
| | 701,250 | | | Eldorado Gold | | | 12,568 | | |
| | | | | Gold Miner in Turkey, Greece, China & Brazil | | | | | |
| | 179,700 | | | CCL Industries | | | 4,811 | | |
| | | | | Leading Global Label Manufacturer | | | | | |
See accompanying notes to financial statements.
60
Columbia Acorn International Select
Statement of Investments (Unaudited), continued
Number of Shares
or Principal Amount (000) | | | | Value (000) | |
| | | > Canada—continued | |
| | 125,000 | | | AG Growth | | $ | 4,121 | | |
| | | | | Leading Manufacturer of Augers & Grain
Handling Equipment | | | | | |
| | | | 34,393 | | |
| | | > South Africa 5.5% | |
| | 630,000 | | | Naspers | | | 21,174 | | |
| | | | | Media in Africa & Other Emerging Markets | | | | | |
| | | | 21,174 | | |
| | | > Australia 2.6% | |
| | 870,000 | | | UGL | | | 9,825 | | |
| | | | | Engineering & Facilities Management | | | | | |
| | | | 9,825 | | |
| | | > United States 1.1% | |
| | 171,000 | | | Atwood Oceanics (a) | | | 4,364 | | |
| | | | | Offshore Drilling Contractor | | | | | |
| | | | 4,364 | | |
| | | > Israel 0.8% | |
| | 310,000 | | | Israel Chemicals | | | 3,233 | | |
| | | | | Producer of Potash, Phosphates, Bromine &
Specialty Chemicals | | | | | |
| | | | 3,233 | | |
| Other Countries: Total | | | 72,989 | | |
| Latin America 3.6% | | | |
| | | > Colombia 3.6% | |
| | 615,000 | | | Pacific Rubiales Energy (a) | | | 13,784 | | |
| | | | | Oil Production & Exploration in Colombia | | | | | |
| | | | 13,784 | | |
| Latin America: Total | | | 13,784 | | |
Total Equities: 88.9%
(Cost: $289,347) | | | 341,798 | | |
| Securities Lending Collateral: 1.7% | | | |
| | 6,592,500 | | | Dreyfus Government Cash
Management Fund (c)
(7 day yield of 0.03%) | | | 6,593 | | |
Total Securities Lending Collateral:
(Cost: $6,593) | | | 6,593 | | |
| Short-Term Obligations: 10.6% | | | |
| | | > Repurchase Agreement 10.1% | |
| $ | 38,904 | | | Repurchase Agreement with
Fixed Income Clearing Corp.,
dated 6/30/10, due 7/01/10
at 0.00%, collateralized by
a U.S. Government Agency
obligation maturing 7/30/14,
market value $39,685
(repurchase proceeds $38,904) | | | 38,904 | | |
| | | | 38,904 | | |
| Principal Amount (000) | | | | Value (000) | |
| | | > Commercial Paper 0.5% | |
| $ | 1,900 | | | Toyota Motor Credit 0.27%
due 7/02/10 | | $ | 1,900 | | |
| | | | 1,900 | | |
Total Short-Term Obligations:
(Cost: $40,804) | | | 40,804 | | |
Total Investments: 101.2%
(Cost: $336,744)(d)(e) | | | 389,195 | | |
Obligation to Return Collateral for
Securities Loaned: (1.7)% | | | (6,593 | ) | |
| Cash and Other Assets Less Liabilities: 0.5% | | | 2,086 | | |
| Total Net Assets: 100.0% | | $ | 384,688 | | |
See accompanying notes to financial statements.
61
> Notes to Statements of Investments (dollar values in thousands)
(a) Non-income producing security.
(b) All or a portion of this security was on loan at June 30, 2010. The total market value of Fund securities on loan at June 30, 2010 was $6,360.
(c) Investment made with cash collateral received from securities lending activity.
(d) At June 30, 2010, for federal income tax purposes, the cost of investments was $336,744 and net unrealized appreciation was $52,451, consisting of gross unrealized appreciation of $70,800 and gross unrealized depreciation of $18,349.
(e) On June 30, 2010, the Fund's total investments were denominated in currencies as follows:
| Currency | | Value | | Percentage
of Net Assets | |
| Japanese Yen | | $ | 59,856 | | | | 15.6 | | |
| British Pound | | | 52,821 | | | | 13.7 | | |
| U.S. Dollar | | | 51,220 | | | | 13.3 | | |
| Canadian Dollar | | | 48,178 | | | | 12.5 | | |
| Euro | | | 42,508 | | | | 11.1 | | |
| Hong Kong Dollar | | | 31,692 | | | | 8.2 | | |
| Singapore Dollar | | | 22,382 | | | | 5.8 | | |
| South African Rand | | | 21,174 | | | | 5.5 | | |
Other currencies less
than 5% of total net assets | | | 52,771 | | | | 13.8 | | |
| | | $ | 382,602 | | | | 99.5 | | |
The following table summarizes the inputs used, as of June 30, 2010, in valuing the Fund's assets:
| Investment Type | | Quoted Prices
(Level 1) | | Other
Significant
Observable
Inputs
(Level 2) | | Significant
Unobservable
Inputs
(Level 3) | | Total | |
| Equities | |
| Asia | | $ | - | | | $ | 130,587 | | | $ | - | | | $ | 130,587 | | |
| Europe | | | 6,052 | | | | 118,386 | | | | - | | | | 124,438 | | |
| Other Countries | | | 38,757 | | | | 34,232 | | | | - | | | | 72,989 | | |
| Latin America | | | 13,784 | | | | - | | | | - | | | | 13,784 | | |
| Total Equities | | | 58,593 | | | | 283,205 | | | | - | | | | 341,798 | | |
| Total Securities Lending Collateral | | | 6,593 | | | | - | | | | - | | | | 6,593 | | |
| Total Short-Term Obligations | | | - | | | | 40,804 | | | | - | | | | 40,804 | | |
| Total Investments | | $ | 65,186 | | | $ | 324,009 | | | $ | - | | | $ | 389,195 | | |
The Fund's assets assigned to the Level 2 input category are generally valued using the market approach, in which a security's value is determined through its correlation to prices and information from market transactions for similar or identical assets. Foreign equities are generally valued at the last sales price on the foreign exchange or market on which they trade. The Fund may use a systematic fair valuation model provided by an independent third party to value securities principally traded in foreign markets in order to adjust for possible stale pricing that may occur between the close of the foreign exchanges and the time for valuation. These models take into account available market data including intraday index, ADR, and ETF movements.
Certain Short-Term Obligations may be valued using amortized cost, an income approach which converts future cash flows to a present value based upon the discount or premium at purchase.
For more information on valuation inputs, and their aggregation into the levels used in the tables above, please refer to the Security Valuation section in the accompanying Notes to Financial Statements.
See accompanying notes to financial statements.
62
Columbia Acorn International Select
Portfolio Diversification (Unaudited)
At June 30, 2010, the Fund's portfolio investments as a percentage of net assets were diversified as follows:
| | | Value (000) | | Percentage
of Net Assets | |
| > Industrial Goods & Services | |
| Other Industrial Services | | $ | 33,027 | | | | 8.6 | | |
Industrial Materials &
Specialty Chemicals | | | 22,392 | | | | 5.8 | | |
| Outsourcing Services | | | 20,035 | | | | 5.2 | | |
| Machinery | | | 11,213 | | | | 2.9 | | |
| Electrical Components | | | 9,834 | | | | 2.6 | | |
| | | | 96,501 | | | | 25.1 | | |
| > Energy & Minerals | |
| Mining | | | 44,448 | | | | 11.6 | | |
| Oil & Gas Producers | | | 13,784 | | | | 3.6 | | |
| Oil Services | | | 12,385 | | | | 3.2 | | |
| | | | 70,617 | | | | 18.4 | | |
| > Information | |
| TV Broadcasting | | | 21,174 | | | | 5.5 | | |
| Internet Related | | | 11,608 | | | | 3.0 | | |
| Financial Processors | | | 10,294 | | | | 2.7 | | |
| Instrumentation | | | 9,310 | | | | 2.4 | | |
| Business Software | | | 8,017 | | | | 2.1 | | |
| CATV | | | 5,775 | | | | 1.5 | | |
| | | | 66,178 | | | | 17.2 | | |
| > Consumer Goods & Services | |
| Other Consumer Services | | | 13,669 | | | | 3.5 | | |
| Nondurables | | | 12,548 | | | | 3.3 | | |
| Food & Beverage | | | 11,170 | | | | 2.9 | | |
| Retail | | | 6,489 | | | | 1.7 | | |
| | | | 43,876 | | | | 11.4 | | |
| > Other Industries | |
| Transportation | | | 15,311 | | | | 4.0 | | |
| Real Estate | | | 14,964 | | | | 3.9 | | |
| Regulated Utilities | | | 4,540 | | | | 1.2 | | |
| | | | 34,815 | | | | 9.1 | | |
| > Finance | |
| Brokerage & Money Management | | | 9,044 | | | | 2.3 | | |
| Banks | | | 8,058 | | | | 2.1 | | |
| | | | 17,102 | | | | 4.4 | | |
| | | Value (000) | | Percentage
of Net Assets | |
| > Health Care | |
| Pharmaceuticals | | $ | 7,134 | | | | 1.9 | | |
| Health Care Services | | | 5,575 | | | | 1.4 | | |
| | | | 12,709 | | | | 3.3 | | |
| Total Equities: | | | 341,798 | | | | 88.9 | | |
Total Securities Lending
Collateral: | | | 6,593 | | | | 1.7 | | |
| Short-Term Obligations: | | | 40,804 | | | | 10.6 | | |
| Total Investments: | | | 389,195 | | | | 101.2 | | |
Obligation to Return
Collateral for
Securities Loaned: | | | (6,593 | ) | | | (1.7 | ) | |
Cash and Other Assets
Less Liabilities: | | | 2,086 | | | | 0.5 | | |
| Net Assets: | | $ | 384,688 | | | | 100.0 | | |
See accompanying notes to financial statements.
63
Columbia Acorn Select
Major Portfolio Changes in the Second Quarter (Unaudited)
| | | Number of Shares | |
| | | 03/31/10 | | 06/30/10 | |
| Purchases | |
| Consumer Goods & Services | |
| Career Education | | | 1,500,000 | | | | 1,600,000 | | |
| GLG Life Tech (Canada) | | | 747,200 | | | | 885,175 | | |
| Hertz | | | 8,000,000 | | | | 8,500,000 | | |
IFM Investments (Century 21
China RE) - ADR (China) | | | 669,300 | | | | 2,100,000 | | |
| lululemon athletica | | | 310,000 | | | | 330,000 | | |
| RexLot Holdings (China) | | | 325,000,000 | | | | 335,000,000 | | |
| Safeway | | | 3,700,000 | | | | 3,800,000 | | |
| Thor Industries | | | 0 | | | | 400,000 | | |
| Tractor Supply Company | | | 0 | | | | 60,000 | | |
| Wet Seal | | | 500,382 | | | | 2,500,000 | | |
| Information | |
| WNS - ADR (India) | | | 4,008,400 | | | | 4,029,900 | | |
| Energy & Minerals | |
| Canacol Energy (Colombia) | | | 32,240,000 | | | | 36,240,000 | | |
| Canadian Solar (China) | | | 2,200,000 | | | | 3,100,000 | | |
| Petromanas (Canada) | | | 0 | | | | 5,000,000 | | |
| Petromanas (Canada) | | | 0 | | | | 13,125,000 | | |
| ShaMaran Petroleum (Iraq) | | | 5,117,000 | | | | 8,200,600 | | |
Synthesis Energy Systems
(China) | | | 3,020,160 | | | | 3,940,000 | | |
| Finance | |
| Discover Financial Services | | | 2,825,000 | | | | 3,325,000 | | |
| MF Global | | | 5,500,000 | | | | 6,500,000 | | |
| Industrial Goods & Services | |
ChemSpec International - ADR
(China) | | | 587,189 | | | | 1,345,000 | | |
| Health Care | |
| NPS Pharmaceuticals | | | 150,393 | | | | 1,239,040 | | |
| Other Industries | |
| American Commercial Lines | | | 900,000 | | | | 1,150,000 | | |
| BioMed Realty Trust | | | 0 | | | | 1,200,000 | | |
| Wisconsin Energy | | | 0 | | | | 200,000 | | |
| | | Number of Shares | |
| | | 03/31/10 | | 06/30/10 | |
| Sales | |
| Consumer Goods & Services | |
| ITT Educational Services | | | 900,000 | | | | 858,000 | | |
| Princeton Review | | | 775,681 | | | | 0 | | |
| SkillSoft - ADR | | | 9,000,000 | | | | 0 | | |
| Steelcase | | | 1,588,000 | | | | 0 | | |
| Information | |
| CardTronics | | | 2,529,536 | | | | 2,100,000 | | |
| China Mass Media - ADR (China) | | | 461,673 | | | | 0 | | |
| VisionChina Media - ADR (China) | | | 3,657,860 | | | | 2,500,000 | | |
| Energy & Minerals | |
| Alange Energy (Colombia) | | | 10,000,000 | | | | 8,000,000 | | |
| Gran Tierra Energy (Colombia) | | | 2,500,000 | | | | 1,828,000 | | |
| Tetra Technologies | | | 4,700,000 | | | | 3,893,000 | | |
| Health Care | |
| Emdeon | | | 27,500 | | | | 0 | | |
See accompanying notes to financial statements.
64
Columbia Acorn Select
Statement of Investments (Unaudited), June 30, 2010
| Number of Shares | | | | Value (000) | |
| | | | | | | | Equities: 93.5% | | |
| Consumer Goods & Services 26.5% | | | |
| | | > Retail 8.2% | |
| | 3,800,000 | | | Safeway | | $ | 74,708 | | |
| | | | | Supermarkets | | | | | |
| | 1,650,000 | | | Abercrombie & Fitch | | | 50,638 | | |
| | | | | Teen Apparel Retailer | | | | | |
| | 330,000 | | | lululemon athletica (a)(b) | | | 12,283 | | |
| | | | | Premium Active Apparel Retailer | | | | | |
| | 2,500,000 | | | Wet Seal (a) | | | 9,125 | | |
| | | | | Specialty Apparel Retailer | | | | | |
| | 60,000 | | | Tractor Supply Company | | | 3,658 | | |
| | | | | Rural America Retailer | | | | | |
| | | | 150,412 | | |
| | | > Travel 6.9% | |
| | 8,500,000 | | | Hertz (a) | | | 80,410 | | |
| | | | | Largest U.S. Rental Car Operator | | | | | |
| | 2,500,000 | | | Expedia | | | 46,950 | | |
| | | | | Online Travel Services Company | | | | | |
| | | | 127,360 | | |
| | | > Educational Services 5.9% | |
| | 858,000 | | | ITT Educational Services (a) | | | 71,231 | | |
| | | | | Post-secondary Degree Services | | | | | |
| | 1,600,000 | | | Career Education (a) | | | 36,832 | | |
| | | | | Post-secondary Education | | | | | |
| | | | 108,063 | | |
| | | > Apparel 2.3% | |
| | 1,135,000 | | | Coach | | | 41,484 | | |
| | | | | Designer & Retailer of Branded Leather
Accessories | | | | | |
| | | | 41,484 | | |
| | | > Casinos & Gaming 1.7% | |
| | 335,000,000 | | | RexLot Holdings (China) | | | 30,569 | | |
| | | | | Lottery Equipment Supplier in China | | | | | |
| | | | 30,569 | | |
| | | > Other Consumer Services 0.6% | |
| | 2,100,000 | | | IFM Investments (Century 21
China RE) - ADR (China) (a) | | | 10,983 | | |
| | | | | Provides Real Estate Services in China | | | | | |
| | | | 10,983 | | |
| | | > Leisure Products 0.5% | |
| | 400,000 | | | Thor Industries | | | 9,500 | | |
| | | | | RV & Bus Manufacturer | | | | | |
| | | | 9,500 | | |
| | | > Food & Beverage 0.4% | |
| | 885,175 | | | GLG Life Tech (Canada) (a) | | | 6,754 | | |
| | | | | Produce an All-natural Sweetener Extracted
from the Stevia Plant | | | | | |
| | 17,500,000 | | | Fu Ji Food & Catering Services
(China) (a)(c) | | | 180 | | |
| | | | | Food Catering Service Provider in China | | | | | |
| | | | 6,934 | | |
| Consumer Goods & Services: Total | | | 485,305 | | |
| Number of Shares | | | | Value (000) | |
| Information 22.4% | | | |
| | | > Mobile Communications 7.4% | |
| | 1,550,000 | | | Crown Castle International (a) | | $ | 57,753 | | |
| | | | | Communications Towers | | | | | |
| | 900,000 | | | American Tower (a) | | | 40,050 | | |
| | | | | Communications Towers in USA & Latin
America | | | | | |
| | 13,400,800 | | | Globalstar (a)(b) | | | 20,637 | | |
| | | | | Satellite Mobile Voice & Data Carrier | | | | | |
| | 505,000 | | | SBA Communications (a) | | | 17,175 | | |
| | | | | Communications Towers | | | | | |
| | | | 135,615 | | |
| | | > Contract Manufacturing 6.0% | |
| | 8,000,000 | | | Sanmina-SCI (a)(d) | | | 108,880 | | |
| | | | | Electronic Manufacturing Services | | | | | |
| | | | 108,880 | | |
| | | > Computer Services 2.7% | |
| | 4,029,900 | | | WNS - ADR (India) (a)(d) | | | 47,311 | | |
| | | | | Offshore BPO (Business Process Outsourcing)
Services | | | | | |
| | 1,000,000 | | | Hackett Group (a) | | | 2,810 | | |
| | | | | IT Integration & Best Practice Research | | | | | |
| | | | 50,121 | | |
| | | > Business Software 2.2% | |
| | 7,000,000 | | | Novell (a) | | | 39,760 | | |
| | | | | Directory, Operating System & Identity
Management Software | | | | | |
| | | | 39,760 | | |
| | | > Computer Hardware & Related
Equipment 1.6% | |
| | 750,000 | | | Amphenol | | | 29,460 | | |
| | | | | Electronic Connectors | | | | | |
| | | | 29,460 | | |
| | | > Financial Processors 1.5% | |
| | 2,100,000 | | | CardTronics (a)(d) | | | 27,216 | | |
| | | | | Operates the World's Largest Network of ATMs | | | | | |
| | | | 27,216 | | |
| | | > Instrumentation 0.6% | |
| | 100,000 | | | Mettler Toledo (a) | | | 11,163 | | |
| | | | | Laboratory Equipment | | | | | |
| | | | 11,163 | | |
| | | > Advertising 0.4% | |
| | 2,500,000 | | | VisionChina Media - ADR
(China) (a)(b) | | | 7,500 | | |
| | | | | Advertising on Digital Screens in China's
Mass Transit System | | | | | |
| | | | 7,500 | | |
| Information: Total | | | 409,715 | | |
| Energy & Minerals 17.2% | | | |
| | | > Oil & Gas Producers 11.6% | |
| | 4,466,666 | | | Pacific Rubiales Energy
(Colombia) (a)(e) | | | 99,612 | | |
| | 1,483,334 | | | Pacific Rubiales Energy (Colombia) (a) | | | 33,246 | | |
| | | | | Oil Production & Exploration in Colombia | | | | | |
See accompanying notes to financial statements.
65
| Number of Shares | | | | Value (000) | |
| | | > Oil & Gas Producers—continued | |
| | 36,240,000 | | | Canacol Energy (Colombia) (a)(d)(e) | | $ | 30,026 | | |
| | | | | Oil Producer in South America | | | | | |
| | 1,050,000 | | | Houston American Energy (b) | | | 10,353 | | |
| | | | | Oil & Gas Exploration/Production in Colombia | | | | | |
| | 25,883,000 | | | ShaMaran Petroleum (Iraq) (a)(d)(e) | | | 9,531 | | |
| | 8,200,600 | | | ShaMaran Petroleum (Iraq) (a)(d) | | | 3,081 | | |
| | | | | Oil Exploration in Kurdistan | | | | | |
| | 1,828,000 | | | Gran Tierra Energy (Colombia) (a) | | | 9,187 | | |
| | | | | Oil Exploration & Production in Colombia,
Peru & Argentina | | | | | |
| | 16,432,900 | | | Petroamerica (Colombia) (a) | | | 4,940 | | |
| | | | | Oil Exploration & Production in Colombia | | | | | |
| | 17,144,000 | | | Petrodorado (Colombia) (a)(e) | | | 4,103 | | |
| | 17,144,000 | | | Petrodorado - Warrants
(Colombia) (a)(e) | | | 1,610 | | |
| | | | | Oil & Gas Exploration & Production in
Colombia, Peru & Paraguay | | | | | |
| | 13,125,000 | | | Petromanas (Canada) (a)(e) | | | 3,403 | | |
| | 5,000,000 | | | Petromanas (Canada) (a) | | | 1,409 | | |
| | 6,562,500 | | | Petromanas - Warrants (Canada) (a)(e) | | | 247 | | |
| | | | | Exploring for Oil in Albania | | | | | |
| | 8,000,000 | | | Alange Energy (Colombia) (a) | | | 2,630 | | |
| | | | | Oil & Gas Exploration/Production in Colombia | | | | | |
| | | | 213,378 | | |
| | | > Oil Services 2.6% | |
| | 3,893,000 | | | Tetra Technologies (a)(d) | | | 35,349 | | |
| | | | | U.S.-based Services Company with Life of
Field Approach | | | | | |
| | 11,324,000 | | | Tuscany International Drilling
(Colombia) (a)(d)(e) | | | 11,467 | | |
| | 1,900,000 | | | Tuscany International Drilling -
Warrants (Colombia) (a)(d)(e) | | | 51 | | |
| | | | | South America-based Drilling Rig Contractor | | | | | |
| | | | 46,867 | | |
| | | > Alternative Energy 2.1% | |
| | 3,100,000 | | | Canadian Solar (China) (a)(d) | | | 30,318 | | |
| | | | | Solar Cell & Module Manufacturer | | | | | |
| | 1,400,000 | | | Real Goods Solar (a)(d) | | | 4,424 | | |
| | | | | Residential Solar Energy Installer | | | | | |
| | 3,940,000 | | | Synthesis Energy Systems
(China) (a)(d) | | | 4,334 | | |
| | | | | Owner/Operator of Gasification Plants | | | | | |
| | | | 39,076 | | |
| | | > Agricultural Commodities 0.9% | |
| | 38,000,000 | | | Eacom Timber - Subscription
Receipts (Canada) (a)(e) | | | 16,277 | | |
| | | | | Canadian Lumber Producer | | | | | |
| | | | 16,277 | | |
| Energy & Minerals: Total | | | 315,598 | | |
| Finance 11.4% | | | |
| | | > Brokerage & Money Management 5.2% | |
| | 6,500,000 | | | MF Global (a) | | | 37,115 | | |
| | | | | Futures Broker | | | | | |
| | 1,300,000 | | | Eaton Vance | | | 35,893 | | |
| | | | | Specialty Mutual Funds | | | | | |
| Number of Shares | | | | Value (000) | |
| | 1,100,000 | | | SEI Investments | | $ | 22,396 | | |
| | | | | Mutual Fund Administration & Investment
Management | | | | | |
| | | | 95,404 | | |
| | | > Insurance 3.7% | |
| | 13,500,000 | | | CNO Financial Group (a)(d) | | | 66,825 | | |
| | | | | Life, Long-term Care & Medical Supplement
Insurance | | | | | |
| | | | 66,825 | | |
| | | > Credit Cards 2.5% | |
| | 3,325,000 | | | Discover Financial Services | | | 46,484 | | |
| | | | | Credit Card Company | | | | | |
| | | | 46,484 | | |
| Finance: Total | | | 208,713 | | |
| Industrial Goods & Services 10.3% | | | |
| | | > Waste Management 2.6% | |
| | 1,500,000 | | | Waste Management | | | 46,935 | | |
| | | | | U.S. Garbage Collection & Disposal | | | | | |
| | | | 46,935 | | |
| | | > Machinery 2.4% | |
| | 1,100,000 | | | Ametek | | | 44,165 | | |
| | | | | Aerospace/Industrial Instruments | | | | | |
| | | | 44,165 | | |
| | | > Outsourcing Services 2.1% | |
| | 1,850,000 | | | Quanta Services (a) | | | 38,202 | | |
| | | | | Electrical & Telecom Construction Services | | | | | |
| | | | 38,202 | | |
| | | > Industrial Materials & Specialty
Chemicals 1.6% | |
| | 1,000,000 | | | Nalco Holding Company | | | 20,460 | | |
| | | | | Provider of Water Treatment & Process
Chemicals & Services | | | | | |
| | 1,345,000 | | | ChemSpec International - ADR
(China) | | | 9,697 | | |
| | | | | Specialty Chemicals with Focus on
Fluorinated Chemical Manufacturing | | | | | |
| | | | 30,157 | | |
| | | > Other Industrial Services 1.1% | |
| | 600,000 | | | Expeditors International of Washington | | | 20,706 | | |
| | | | | International Freight Forwarder | | | | | |
| | | | 20,706 | | |
| | | > Industrial Distribution 0.5% | |
| | 90,000 | | | WW Grainger | | | 8,951 | | |
| | | | | Industrial Distribution | | | | | |
| | | | 8,951 | | |
| Industrial Goods & Services: Total | | | 189,116 | | |
| Other Industries 5.3% | | | |
| | | > Transportation 3.7% | |
| | 1,300,000 | | | JB Hunt Transport Services | | | 42,471 | | |
| | | | | Truck & Intermodal Carrier | | | | | |
| | 1,150,000 | | | American Commercial Lines (a)(d) | | | 25,887 | | |
| | | | | Operator of Inland Barges/Builder of
Barges & Vessels | | | | | |
| | | | 68,358 | | |
See accompanying notes to financial statements.
66
Columbia Acorn Select
Statement of Investments (Unaudited), continued
Number of Shares
or Principal Amount (000) | | | | Value (000) | |
| | | > Real Estate 1.0% | |
| | 1,200,000 | | | BioMed Realty Trust | | $ | 19,308 | | |
| | | | | Life Science-focused Office Buildings | | | | | |
| | | | 19,308 | | |
| | | > Regulated Utilities 0.6% | |
| | 200,000 | | | Wisconsin Energy | | | 10,148 | | |
| | | | | Wisconsin Utility | | | | | |
| | | | 10,148 | | |
| Other Industries: Total | | | 97,814 | | |
| Health Care 0.4% | | | |
| | | > Biotechnology & Drug Delivery 0.4% | |
| | 1,239,040 | | | NPS Pharmaceuticals (a) | | | 7,979 | | |
| | | | | Orphan Drugs & Healthy Royalties | | | | | |
| | | | 7,979 | | |
| Health Care: Total | | | 7,979 | | |
Total Equities: 93.5%
(Cost: $1,594,701) | | | 1,714,240 | | |
| Securities Lending Collateral: 0.4% | | | |
| | 7,520,640 | | | Dreyfus Government Cash
Management Fund (f)
(7 day yield of 0.03%) | | | 7,521 | | |
Total Securities Lending Collateral:
(Cost: $7,521) | | | 7,521 | | |
| Short-Term Obligations: 8.3% | | | |
| | | > Repurchase Agreement 7.8% | |
| $ | 142,599 | | | Repurchase Agreement with
Fixed Income Clearing Corp.,
dated 6/30/10, due 7/01/10
at 0.00%, collateralized by a
U.S. Government Agency
obligation maturing 10/15/14,
market value $145,453
(repurchase proceeds $142,599) | | | 142,599 | | |
| | | | 142,599 | | |
| Principal Amount (000) | | | | Value (000) | |
| | | > Commercial Paper 0.5% | |
| $ | 10,200 | | | Toyota Motor Credit 0.27%
due 7/02/10 | | $ | 10,200 | | |
| | | | 10,200 | | |
Total Short-Term Obligations: 8.3%
(Amortized Cost: $152,799) | | | 152,799 | | |
Total Investments: 102.2%
(Cost: $1,755,021)(g) | | $ | 1,874,560 | | |
Obligation to Return Collateral for
Securities Loaned: (0.4)% | | | (7,521 | ) | |
| Cash and Other Assets Less Liabilities: (1.8)% | | | (33,295 | ) | |
| Total Net Assets: 100.0% | | $ | 1,833,744 | | |
ADR = American Depositary Receipts.
See accompanying notes to financial statements.
67
> Notes to Statement of Investments (dollar values in thousands)
(a) Non-income producing security.
(b) All or a portion of this security was on loan at June 30, 2010. The total market value of Fund securities on loan at June 30, 2010 was $7,060.
(c) Illiquid security.
(d) An affiliated person of the Fund may include any company in which the Fund owns five percent or more of its outstanding voting shares. Holdings and transactions in these affiliated companies during the six months ended June 30, 2010, are as follows:
| Affiliates | | Balance of
Shares Held
12/31/09 | | Purchases/
Additions | | Sales/
Reductions | | Balance of
Shares Held
6/30/10 | | Value | | Dividend | |
| American Commercial Lines | | | 1,125,000 | | | | 250,000 | | | | 225,000 | | | | 1,150,000 | | | $ | 25,887 | | | $ | - | | |
| Canacol Energy | | | 32,240,000 | | | | 4,000,000 | | | | - | | | | 36,240,000 | | | | 30,026 | | | | - | | |
| Canadian Solar | | | 1,900,000 | | | | 1,200,000 | | | | - | | | | 3,100,000 | | | | 30,318 | | | | - | | |
| CardTronics | | | 2,620,000 | | | | - | | | | 520,000 | | | | 2,100,000 | | | | 27,216 | | | | - | | |
| China Mass Media - ADR* | | | 1,662,685 | | | | - | | | | 1,662,685 | | | | - | | | | - | | | | - | | |
| CNO Financial Group | | | 13,500,000 | | | | - | | | | - | | | | 13,500,000 | | | | 66,825 | | | | - | | |
| Globalstar* | | | 13,400,800 | | | | - | | | | - | | | | 13,400,800 | | | | 20,637 | | | | - | | |
| Real Goods Solar | | | 1,400,000 | | | | - | | | | - | | | | 1,400,000 | | | | 4,424 | | | | - | | |
| Sanmina-SCI | | | 8,200,000 | | | | - | | | | 200,000 | | | | 8,000,000 | | | | 108,880 | | | | - | | |
| ShaMaran Petroleum | | | 31,000,000 | | | | 3,083,600 | | | | - | | | | 34,083,600 | | | | 12,612 | | | | - | | |
| SkillSoft - ADR* | | | 9,000,000 | | | | - | | | | 9,000,000 | | | | - | | | | - | | | | - | | |
| Synthesis Energy Systems | | | 2,200,000 | | | | 1,740,000 | | | | - | | | | 3,940,000 | | | | 4,334 | | | | - | | |
| Tetra Technologies | | | 5,000,000 | | | | - | | | | 1,107,000 | | | | 3,893,000 | | | | 35,349 | | | | - | | |
| Tuscany International Drilling | | | - | | | | 13,224,000 | | | | - | | | | 13,224,000 | | | | 11,518 | | | | - | | |
| VisionChina Media - ADR* | | | 4,250,000 | | | | 250,959 | | | | 2,000,959 | | | | 2,500,000 | | | | 7,500 | | | | - | | |
| WNS - ADR | | | 3,913,900 | | | | 116,000 | | | | - | | | | 4,029,900 | | | | 47,311 | | | | - | | |
| Total of Affiliated Transactions | | | 131,412,385 | | | | 23,864,559 | | | | 14,715,644 | | | | 140,561,300 | | | $ | 432,837 | | | $ | - | | |
* At June 30, 2010, the Fund owned less than five percent of the company's outstanding voting shares.
The aggregate cost and value of these companies at June 30, 2010, were $616,960 and $432,837, respectively. Investments in affiliated companies represented 23.6% of the Fund's total net assets at June 30, 2010.
(e) Denotes a restricted security, which is subject to restrictions on resale under federal securities laws. These securities are valued at a fair value determined in good faith under consistently applied procedures established by the Board of Trustees. At June 30, 2010, the market value of these securities amounted to $176,327, which represented 9.62% of total net assets.
Additional information on these securities is as follows:
| Security | | Acquisition
Dates | | Shares | | Cost | | Value | |
| Pacific Rubiales Energy | | 7/12/07 | | | 4,466,666 | | | $ | 17,934 | | | $ | 99,612 | | |
| Canacol Energy | | 9/23/09-4/15/10 | | | 36,240,000 | | | | 11,360 | | | | 30,026 | | |
| Eacom Timber - Subscription Receipts | | 3/17/10 | | | 38,000,000 | | | | 18,812 | | | | 16,277 | | |
| Tuscany International Drilling | | 2/12/10-3/23/10 | | | 11,324,000 | | | | 12,989 | | | | 11,467 | | |
| ShaMaran Petroleum | | 9/15/09 | | | 25,883,000 | | | | 18,117 | | | | 9,531 | | |
| Petrodorado | | 11/20/09 | | | 17,144,000 | | | | 3,607 | | | | 4,103 | | |
| Petromanas | | 5/20/10 | | | 13,125,000 | | | | 4,561 | | | | 3,403 | | |
| Petrodorado - Warrants | | 11/20/09 | | | 17,144,000 | | | | 2,118 | | | | 1,610 | | |
| Petromanas - Warrants | | 5/20/10 | | | 6,562,500 | | | | 380 | | | | 247 | | |
| Tuscany International Drilling - Warrants | | 2/12/10 | | | 1,900,000 | | | | 235 | | | | 51 | | |
| | | | | | | | | $ | 90,113 | | | $ | 176,327 | | |
(f) Investment made with cash collateral received from securities lending activity.
(g) At June 30, 2010, for federal income tax purposes, the cost of investments was $1,755,021 and net unrealized appreciation was $119,539, consisting of gross unrealized appreciation of $473,634 and gross unrealized depreciation of $354,095.
See accompanying notes to financial statements.
68
Columbia Acorn Select
Statement of Investments (Unaudited), continued
> Notes to Statement of Investments (dollar values in thousands)
The following table summarizes the inputs used, as of June 30, 2010, in valuing the Fund's assets:
| Investment Type | | Quoted Prices
(Level 1) | | Other
Significant
Observable
Inputs
(Level 2) | | Significant
Unobservable
Inputs
(Level 3) | | Total | |
| Equities | |
| Consumer Goods & Services | | $ | 454,556 | | | $ | 30,569 | | | $ | 180 | | | $ | 485,305 | | |
| Information | | | 409,715 | | | | - | | | | - | | | | 409,715 | | |
| Energy & Minerals | | | 139,271 | | | | 176,327 | | | | - | | | | 315,598 | | |
| Finance | | | 208,713 | | | | - | | | | - | | | | 208,713 | | |
| Industrial Goods & Services | | | 189,116 | | | | - | | | | - | | | | 189,116 | | |
| Other Industries | | | 97,814 | | | | - | | | | - | | | | 97,814 | | |
| Health Care | | | 7,979 | | | | - | | | | - | | | | 7,979 | | |
| Total Equities | | | 1,507,164 | | | | 206,896 | | | | 180 | | | | 1,714,240 | | |
| Total Securities Lending Collateral | | | 7,521 | | | | - | | | | - | | | | 7,521 | | |
| Total Short-Term Obligations | | | - | | | | 152,799 | | | | - | | | | 152,799 | | |
| Total Investments | | $ | 1,514,685 | | | $ | 359,695 | | | $ | 180 | | | $ | 1,874,560 | | |
The Fund's assets assigned to the Level 2 input category are generally valued using the market approach, in which a security's value is determined through its correlation to prices and information from market transactions for similar or identical assets. Foreign equities are generally valued at the last sales price on the foreign exchange or market on which they trade. The Fund may use a systematic fair valuation model provided by an independent third party to value securities principally traded in foreign markets in order to adjust for possible stale pricing that may occur between the close of the foreign exchanges and the time for valuation. These models take into account available market data including intraday index, ADR, and ETF movements. Securities acquired via private placement, that have a holding period or an extended settlement period, are valued at a discount to the same shares that are trading freely on the market. These discounts are determined by the advisors experience with similar securities or situations. Factors may include, but are not limited to, trade volume, shares outstanding and stock price.
Certain Short-Term Obligations may be valued using amortized cost, an income approach which converts future cash flows to a present value based upon the discount or premium at purchase.
The Fund's assets assigned to the Level 3 input category are valued at fair value as determined in good faith under consistently applied procedures established by and under the general supervision of the Board of Trustees. To determine fair value, management will utilize the valuation technique that they deem the most appropriate in the circumstances. Securities acquired via private placement but are not yet trading are valued using the market approach for which management has determined that the original transaction price is the best representation of fair value. Securities for which no market exist are valued based upon the market approach using inputs from the investment team but ultimately decided by the Board of Trustees. These may include, but are not limited to, projected earnings, available cash, line of business, multiples, and consideration of the prioritization of the equity in a company's capital structur e.
The following table reconciles asset balances for the six-month period ending June 30, 2010, in which significant unobservable inputs (Level 3) were used in determining value:
Investments
in Securities | | Balance
as of
December 31,
2009 | | Realized
Gain/(Loss) | | Change in
Unrealized
Appreciation
(Depreciation) | | Purchases | | (Sales) | | Transfers
into
Level 3 | | Transfers
(out of)
Level 3 | | Balance
as of
June 30,
2010 | |
| Equities | |
| Consumer Goods & Services | | $ | 181 | | | $ | - | | | $ | (1 | ) | | $ | - | | | $ | - | | | $ | - | | | $ | - | | | $ | 180 | | |
| | | $ | 181 | | | $ | - | | | $ | (1 | ) | | $ | - | | | $ | - | | | $ | - | | | $ | - | | | $ | 180 | | |
The information in the above reconciliation table represents fiscal year to date activity for any securities identified as using Level 3 inputs during the current fiscal period.
The change in unrealized depreciation attributed to securities owned at June 30, 2010, which were valued using significant unobservable inputs (Level 3) amounted to $(1). This amount is included in net change in unrealized appreciation (depreciation) on the Statement of Changes in Net Assets.
For more information on valuation inputs, and their aggregation into the levels used in the tables above, please refer to the Security Valuation section in the accompanying Notes to Financial Statements.
See accompanying notes to financial statements.
69
Columbia Thermostat Fund
Statement of Investments (Unaudited), June 30, 2010
Number of Shares
or Principal Amount (000) | | | | Value (000) | |
| | | > Stock Funds: 73.2% | |
| | 546,355 | | | Columbia Acorn International,
Class Z | | $ | 17,554 | | |
| | 1,563,532 | | | Columbia Dividend Income Fund,
Class Z | | | 17,230 | | |
| | 534,795 | | | Columbia Acorn Fund, Class Z | | | 12,765 | | |
| | 794,080 | | | Columbia Marsico Growth Fund,
Class Z | | | 12,658 | | |
| | 851,637 | | | Columbia Large Cap Enhanced Core
Fund, Class Z | | | 8,542 | | |
| | 751,788 | | | Columbia Contrarian Core Fund,
Class Z | | | 8,518 | | |
| | 380,153 | | | Columbia Acorn Select, Class Z | | | 8,466 | | |
Total Stock Funds
(Cost: $84,502) | | | 85,733 | | |
| | | > Bond Funds: 26.4% | |
| | 1,712,620 | | | Columbia Intermediate Bond Fund,
Class Z | | | 15,465 | | |
| | 807,679 | | | Columbia U.S. Treasury Index Fund,
Class Z | | | 9,313 | | |
| | 826,078 | | | Columbia Conservative High Yield
Fund, Class Z | | | 6,154 | | |
Total Bond Funds
(Cost: $29,897) | | | 30,932 | | |
| Short-Term Obligation: 0.6% | | | |
| | | > Repurchase Agreement: 0.6% | |
| $ | 660 | | | Repurchase Agreement with
Fixed Income Clearing Corp.,
dated 6/30/10, due 7/01/10
at 0.00%, collateralized by a
U.S. Government Agency
obligation, maturing 1/19/16,
market value $678
(repurchase proceeds $660) | | | 660 | | |
Total Short-Term Obligation
(Cost: $660) | | | 660 | | |
Total Investments: 100.2%
(Cost: $115,059)(a) | | | 117,325 | | |
| Cash and Other Assets Less Liabilities: (0.2)% | | | (196 | ) | |
| Total Net Assets: 100.0% | | $ | 117,129 | | |
See accompanying notes to financial statements.
70
Columbia Thermostat Fund
Statement of Investments (Unaudited), continued
> Notes to Statement of Investments (dollar values in thousands)
(a) At June 30, 2010, for federal income tax purposes, the cost of investments was $115,059 and net unrealized appreciation was $2,266, consisting of gross unrealized appreciation of $7,075 and gross unrealized depreciation of $4,809.
The following table summarizes the inputs used, as of June 30, 2010, in valuing the Fund's assets:
| Investment Type | | Quoted Prices
(Level 1) | | Other
Significant
Observable
Inputs
(Level 2) | | Significant
Unobservable
Inputs
(Level 3) | | Total | |
| Total Stock Funds | | $ | 85,733 | | | $ | - | | | $ | - | | | $ | 85,733 | | |
| Total Bond Funds | | | 30,932 | | | | - | | | | - | | | | 30,932 | | |
| Total Short-Term Obligation | | | - | | | | 660 | | | | - | | | | 660 | | |
| Total Investments | | $ | 116,665 | | | $ | 660 | | | $ | - | | | $ | 117,325 | | |
For more information on valuation inputs, and their aggregation into the levels used in the table above, please refer to the Security Valuation section in the accompanying Notes to Financial Statements.
See accompanying notes to financial statements.
71
Columbia Acorn Family of Funds
Statements of Assets and Liabilities (Unaudited)
| June 30, 2010 | | Columbia
Acorn
Fund | | Columbia
Acorn
International | | Columbia
Acorn
USA | | Columbia
Acorn
International
Select | | Columbia
Acorn
Select | | Columbia
Thermostat
Fund | |
| (in thousands) | |
| Assets: | |
| Unaffiliated investments, at cost | | $ | 8,032,919 | | | $ | 3,616,500 | | | $ | 1,148,753 | | | $ | 297,840 | | | $ | 995,462 | | | $ | — | | |
Affiliated investments, at cost
(See Note 4) | | | 2,848,343 | | | | 48,357 | | | | 13,412 | | | | — | | | | 616,960 | | | | 114,399 | | |
| Repurchase agreements, at cost | | | 592,670 | | | | 153,790 | | | | 6,499 | | | | 38,904 | | | | 142,599 | | | | 660 | | |
Unaffiliated investments, at value (including
securities on loan: Columbia Acorn Fund
$301,261; Columbia Acorn International
$79,485; Columbia Acorn USA $16,139;
Columbia Acorn International Select
$6,360; Columbia Acorn Select $7,060;
Columbia Thermostat Fund $–) | | $ | 10,533,095 | | | $ | 4,313,616 | | | $ | 1,295,658 | | | $ | 350,291 | | | $ | 1,299,124 | | | $ | — | | |
Affiliated investments, at value
(See Note 4) | | | 3,122,025 | | | | 58,864 | | | | 12,308 | | | | — | | | | 432,837 | | | | 116,665 | | |
| Repurchase agreements, at value | | | 592,670 | | | | 153,790 | | | | 6,499 | | | | 38,904 | | | | 142,599 | | | | 660 | | |
| Cash | | | 1 | | | | — | * | | | — | * | | | — | * | | | 1 | | | | 1 | | |
Foreign currency (cost: Columbia
Acorn Fund $508; Columbia
Acorn International $30,540; Columbia
Acorn International Select $383;
Columbia Acorn Select $–) | | | 507 | | | | 30,603 | | | | — | | | | 383 | | | | — | | | | — | | |
Net unrealized appreciation on forward
foreign currency exchange contracts | | | — | | | | 14,529 | | | | — | | | | — | | | | — | | | | — | | |
| Receivable for: | |
| Investments sold | | | 42,914 | | | | 9,933 | | | | 1,708 | | | | 3,374 | | | | 3,560 | | | | — | | |
| Fund shares sold | | | 12,073 | | | | 8,362 | | | | 1,676 | | | | 1,039 | | | | 1,724 | | | | 85 | | |
| Dividends and interest | | | 7,268 | | | | 6,023 | | | | 570 | | | | 357 | | | | 1,007 | | | | — | | |
| Securities lending income | | | 177 | | | | 107 | | | | 5 | | | | 1 | | | | 11 | | | | — | | |
| Foreign tax reclaims | | | 293 | | | | 1,709 | | | | — | | | | 71 | | | | — | | | | — | | |
| Expense reimbursement due from Advisor | | | — | | | | — | | | | — | | | | — | * | | | — | | | | 23 | | |
| Trustees' Deferred Compensation Investments | | | 2,354 | | | | 636 | | | | 183 | | | | — | | | | 232 | | | | — | | |
| Other assets | | | 29 | | | | 8 | | | | 3 | | | | 1 | | | | 4 | | | | — | * | |
| Total Assets | | | 14,313,406 | | | | 4,598,180 | | | | 1,318,610 | | | | 394,421 | | | | 1,881,099 | | | | 117,434 | | |
| Liabilities: | |
| Collateral on securities loaned | | | 311,736 | | | | 82,527 | | | | 16,741 | | | | 6,593 | | | | 7,521 | | | | — | | |
Net unrealized depreciation on forward
foreign currency exchange contracts | | | — | | | | 8,511 | | | | — | | | | — | | | | — | | | | — | | |
| Payable for: | |
| Investments purchased | | | 66,604 | | | | 19,687 | | | | 4,713 | | | | 2,274 | | | | 20,770 | | | | — | | |
| Fund shares redeemed | | | 24,348 | | | | 5,163 | | | | 1,297 | | | | 343 | | | | 16,644 | | | | 154 | | |
| Management fee | | | 7,758 | | | | 2,861 | | | | 978 | | | | 303 | | | | 1,317 | | | | 10 | | |
| Administration fee | | | 496 | | | | 153 | | | | 46 | | | | 13 | | | | 66 | | | | 4 | | |
| 12b-1 Service & Distribution fees | | | 1,412 | | | | 211 | | | | 71 | | | | 23 | | | | 222 | | | | 43 | | |
| Reports to shareholders | | | 807 | | | | 288 | | | | 101 | | | | 41 | | | | 211 | | | | 33 | | |
| Deferred Trustees' fees | | | 2,354 | | | | 636 | | | | 183 | | | | 33 | | | | 232 | | | | 22 | | |
| Transfer agent fees | | | 1,631 | | | | 238 | | | | 165 | | | | 28 | | | | 278 | | | | 27 | | |
| Trustees' fees | | | 151 | | | | 34 | | | | 13 | | | | 7 | | | | 19 | | | | 4 | | |
| Custody fees | | | 175 | | | | 484 | | | | 8 | | | | 36 | | | | 7 | | | | — | | |
| Foreign capital gains tax | | | 884 | | | | — | | | | — | | | | — | | | | — | | | | — | | |
| Other liabilities | | | 536 | | | | 133 | | | | 58 | | | | 39 | | | | 68 | | | | 8 | | |
| Total Liabilities | | | 418,892 | | | | 120,926 | | | | 24,374 | | | | 9,733 | | | | 47,355 | | | | 305 | | |
| Net Assets | | $ | 13,894,514 | | | $ | 4,477,254 | | | $ | 1,294,236 | | | $ | 384,688 | | | $ | 1,833,744 | | | $ | 117,129 | | |
| Composition of Net Assets: | |
| Paid in capital | | $ | 10,872,711 | | | $ | 4,297,421 | | | $ | 1,218,262 | | | $ | 401,598 | | | $ | 1,838,059 | | | $ | 148,495 | | |
Undistributed/(overdistributed)
net investment income
(Accumulated net investment loss) | | | (43,784 | ) | | | (2,369 | ) | | | (3,976 | ) | | | (2,059 | ) | | | (14,856 | ) | | | 884 | | |
| Accumulated net realized gain/(loss) | | | 292,618 | | | | (531,542 | ) | | | (65,851 | ) | | | (67,314 | ) | | | (108,998 | ) | | | (34,516 | ) | |
| Net unrealized appreciation/(depreciation) on: | |
| Investments | | | 2,773,858 | | | | 707,623 | | | | 145,801 | | | | 52,451 | | | | 119,539 | | | | 2,266 | | |
| Foreign capital gains tax | | | (885 | ) | | | — | | | | — | | | | — | | | | — | | | | — | | |
| Foreign currency translations | | | (4 | ) | | | 6,121 | | | | — | | | | 12 | | | | — | * | | | — | | |
| Net Assets | | $ | 13,894,514 | | | $ | 4,477,254 | | | $ | 1,294,236 | | | $ | 384,688 | | | $ | 1,833,744 | | | $ | 117,129 | | |
Net asset value per
share – Class A (a) | | $ | 23.17 | | | $ | 32.06 | | | $ | 21.00 | | | $ | 22.17 | | | $ | 21.69 | | | $ | 10.54 | | |
| (Net assets/shares) | | | ($2,803,341/120,983) | | | | ($587,525/18,327) | | | | ($173,203/8,248) | | | | ($58,245/2,626) | | | | ($461,681/21,283) | | | | ($41,507/3,936) | | |
Maximum offering price per
share – Class A (b) | | $ | 24.58 | | | $ | 34.02 | | | $ | 22.28 | | | $ | 23.52 | | | $ | 23.01 | | | $ | 11.18 | | |
(Net asset value per share/front-
end sales charge) | | | ($23.17/0.9425) | | | | ($32.06/0.9425) | | | | ($21.00/0.9425) | | | | ($22.17/0.9425) | | | | ($21.69/0.9425) | | | | ($10.54/0.9425) | | |
Net asset value and offering price per
share – Class B (a) | | $ | 21.61 | | | $ | 31.27 | | | $ | 19.57 | | | $ | 21.23 | | | $ | 20.29 | | | $ | 10.60 | | |
| (Net assets/shares) | | | ($317,749/14,702) | | | | ($28,705/918) | | | | ($10,554/539) | | | | ($2,853/134) | | | | ($68,350/3,368) | | | | ($27,358/2,582) | | |
Net asset value and offering price per
share – Class C (a) | | $ | 21.41 | | | $ | 31.17 | | | $ | 19.44 | | | $ | 21.12 | | | $ | 20.13 | | | $ | 10.59 | | |
| (Net assets/shares) | | | ($667,528/31,173) | | | | ($83,580/2,682) | | | | ($28,919/1,488) | | | | ($10,168/482) | | | | ($83,706/4,158) | | | | ($19,014/1,796) | | |
Net asset value and offering price per
share – Class Z (c) | | $ | 23.87 | | | $ | 32.13 | | | $ | 21.74 | | | $ | 22.38 | | | $ | 22.27 | | | $ | 10.44 | | |
| (Net assets/shares) | | | ($10,105,896/423,307) | | | | ($3,777,444/117,557) | | | | ($1,081,560/49,742) | | | | ($313,422/14,005) | | | | ($1,220,007/54,782) | | | | ($29,250/2,801) | | |
(a) Redemption price per share is equal to net asset value less any applicable contingent deferred sales charge and redemption fee.
(b) On sales of $50,000 or more the offering price is reduced.
(c) Redemption price per share is equal to net asset value less any applicable redemption fee.
* Rounds to less than $500.
See accompanying notes to financial statements.
72
Columbia Acorn Family of Funds
Statements of Operations (Unaudited)
For the Six Months Ended June 30, 2010
| (in thousands) | | Columbia
Acorn
Fund | | Columbia
Acorn
International | | Columbia
Acorn
USA | | Columbia
Acorn
International
Select | | Columbia
Acorn
Select | | Columbia
Thermostat
Fund | |
| Investment Income: | |
| Dividend income | | $ | 51,748 | | | $ | 63,100 | | | $ | 3,865 | | | $ | 4,888 | | | $ | 4,806 | | | $ | — | | |
Dividend income from affiliates
(See Note 4) | | | 7,142 | | | | 1,747 | | | | — | | | | — | | | | — | | | | — | | |
Dividends from affiliated investment
company shares (See Note 4) | | | — | | | | — | | | | — | | | | — | | | | — | | | | 1,399 | | |
| Interest income | | | 282 | | | | 100 | | | | 4 | | | | 11 | | | | 91 | | | | — | * | |
| Securities lending income | | | 661 | | | | 367 | | | | 57 | | | | 4 | | | | 31 | | | | — | | |
| | | | 59,833 | | | | 65,314 | | | | 3,926 | | | | 4,903 | | | | 4,928 | | | | 1,399 | | |
| Foreign taxes withheld | | | (966 | ) | | | (5,209 | ) | | | (3 | ) | | | (323 | ) | | | — | | | | — | | |
| Total Investment Income | | | 58,867 | | | | 60,105 | | | | 3,923 | | | | 4,580 | | | | 4,928 | | | | 1,399 | | |
| Expenses: | |
| Management fee | | | 48,211 | | | | 17,400 | | | | 6,181 | | | | 1,889 | | | | 8,314 | | | | 63 | | |
| Administration fee | | | 3,013 | | | | 911 | | | | 287 | | | | 81 | | | | 410 | | | | 25 | | |
| 12b-1 Service and Distribution fees: | |
| Class A | | | 3,760 | | | | 739 | | | | 233 | | | | 77 | | | | 661 | | | | 54 | | |
| Class B | | | 1,649 | | | | 129 | | | | 61 | | | | 13 | | | | 309 | | | | 116 | | |
| Class C | | | 3,673 | | | | 431 | | | | 162 | | | | 55 | | | | 467 | | | | 103 | | |
| Transfer agent fees: | |
| Class A | | | 1,099 | | | | 356 | | | | 70 | | | | 38 | | | | 234 | | | | 35 | | |
| Class B | | | 589 | | | | 56 | | | | 27 | | | | 7 | | | | 113 | | | | 35 | | |
| Class C | | | 464 | | | | 75 | | | | 19 | | | | 12 | | | | 71 | | | | 20 | | |
| Class Z | | | 1,537 | | | | 630 | | | | 230 | | | | 42 | | | | 262 | | | | 9 | | |
| Custody fees | | | 497 | | | | 1,701 | | | | 29 | | | | 118 | | | | 107 | | | | — | | |
| Trustees' fees | | | 417 | | | | 118 | | | | 39 | | | | 14 | | | | 57 | | | | 6 | | |
| Reports to shareholders | | | 1,048 | | | | 451 | | | | 162 | | | | 80 | | | | 257 | | | | 60 | | |
| Chief compliance officer expenses (See Note 4) | | | 256 | | | | 64 | | | | 22 | | | | 6 | | | | 30 | | | | 3 | | |
| Other expenses | | | 683 | | | | 234 | | | | 102 | | | | 80 | | | | 133 | | | | 48 | | |
| Total expenses | | | 66,896 | | | | 23,295 | | | | 7,624 | | | | 2,512 | | | | 11,425 | | | | 577 | | |
| Less custody fees paid indirectly | | | — | * | | | — | * | | | — | * | | | — | * | | | — | * | | | — | | |
Less reimbursement of expenses by
Investment Advisor | | | — | | | | — | | | | — | | | | (2 | ) | | | — | | | | (147 | ) | |
| Net Expenses | | | 66,896 | | | | 23,295 | | | | 7,624 | | | | 2,510 | | | | 11,425 | | | | 430 | | |
| Net Investment Income/(Loss) | | | (8,029 | ) | | | 36,810 | | | | (3,701 | ) | | | 2,070 | | | | (6,497 | ) | | | 969 | | |
Net Realized and Unrealized Gain (Loss)
on Portfolio Positions: | |
| Net realized gain/(loss) on: | |
| Unaffiliated investments | | | 647,094 | | | | 68,526 | | | | 58,566 | | | | 11,747 | | | | 20,162 | | | | (6,494 | ) | |
| Affiliated investments (See Note 4) | | | 91,179 | | | | (482 | ) | | | (332 | ) | | | — | | | | 9,508 | | | | — | | |
Foreign currency transactions and forward
foreign currency exchange contracts | | | (673 | ) | | | 28,671 | | | | — | | | | (107 | ) | | | (185 | ) | | | — | | |
Distributions from affiliated investment
company shares | | | — | | | | — | | | | — | | | | — | | | | — | | | | 8 | | |
| Net realized gain/(loss) | | | 737,600 | | | | 96,715 | | | | 58,234 | | | | 11,640 | | | | 29,485 | | | | (6,486 | ) | |
Net change in net unrealized
appreciation/(depreciation) on: | |
| Unaffiliated investments | | | (862,540 | ) | | | (322,009 | ) | | | (140,997 | ) | | | (29,235 | ) | | | (71,433 | ) | | | — | | |
| Affiliated investments (See Note 4) | | | (309,291 | ) | | | (26,607 | ) | | | 1,689 | | | | — | | | | (50,513 | ) | | | 3,214 | | |
Foreign currency translations and forward
foreign currency exchange contracts | | | (140 | ) | | | 3,476 | | | | — | | | | 21 | | | | — | * | | | — | | |
| Foreign capital gains tax | | | (685 | ) | | | 1,217 | | | | — | | | | — | | | | — | | | | — | | |
Net change in unrealized appreciation/
(depreciation) | | | (1,172,656 | ) | | | (343,923 | ) | | | (139,308 | ) | | | (29,214 | ) | | | (121,946 | ) | | | 3,214 | | |
| Net realized and unrealized loss | | | (435,056 | ) | | | (247,208 | ) | | | (81,074 | ) | | | (17,574 | ) | | | (92,461 | ) | | | (3,272 | ) | |
Net Decrease in Net Assets resulting
from Operations | | $ | (443,085 | ) | | $ | (210,398 | ) | | $ | (84,775 | ) | | $ | (15,504 | ) | | $ | (98,958 | ) | | $ | (2,303 | ) | |
* Rounds to less than $500.
See accompanying notes to financial statements.
73
This page intentionally left blank.
74
Columbia Acorn Family of Funds
Statements of Changes in Net Assets
| | | Columbia
Acorn Fund | | Columbia Acorn
International | | Columbia
Acorn USA | |
| Increase (Decrease) in Net Assets | | (Unaudited)
Six months
ended
June 30, | | Year ended
December 31, | | (Unaudited)
Six months
ended
June 30, | | Year ended
December 31, | | (Unaudited)
Six months
ended
June 30, | | Year ended
December 31, | |
| (in thousands) | | 2010 | | 2009 | | 2010 | | 2009 | | 2010 | | 2009 | |
| Operations: | |
| Net investment income/(loss) | | $ | (8,029 | ) | | $ | 2,492 | | | $ | 36,810 | | | $ | 39,229 | | | $ | (3,701 | ) | | $ | (4,927 | ) | |
Net realized gain/(loss) on investments, foreign currency
transactions, forward foreign currency exchange contracts
and foreign capital gains tax | | | 646,421 | | | | (227,359 | ) | | | 97,197 | | | | (246,346 | ) | | | 58,566 | | | | (20,041 | ) | |
Net realized gain/(loss) on affiliated investments and
distributions from affiliated investment companies and
affiliated investment company shares | | | 91,179 | | | | (100,539 | ) | | | (482 | ) | | | (3,829 | ) | | | (332 | ) | | | (110 | ) | |
Net change in net unrealized appreciation/(depreciation)
on investments, foreign currency translations, forward foreign
currency exchange contracts and foreign capital gains tax | | | (863,365 | ) | | | 3,343,490 | | | | (317,316 | ) | | | 1,558,895 | | | | (140,997 | ) | | | 437,114 | | |
Net change in net unrealized appreciation/(depreciation)
on affiliated investment companies and affiliated investment
company shares | | | (309,291 | ) | | | 1,143,521 | | | | (26,607 | ) | | | 49,345 | | | | 1,689 | | | | 1,994 | | |
| Net Increase/(Decrease) from Operations | | | (443,085 | ) | | | 4,161,605 | | | | (210,398 | ) | | | 1,397,294 | | | | (84,775 | ) | | | 414,030 | | |
| Distributions to Shareholders From: | |
| Net investment income – Class A | | | (2,387 | ) | | | — | | | | (8,818 | ) | | | (6,102 | ) | | | — | | | | — | | |
| Net investment income – Class B | | | — | | | | — | | | | (290 | ) | | | (290 | ) | | | — | | | | — | | |
| Net investment income – Class C | | | — | | | | — | | | | (714 | ) | | | (348 | ) | | | — | | | | — | | |
| Net investment income – Class Z | | | (12,574 | ) | | | (20,981 | ) | | | (68,470 | ) | | | (53,467 | ) | | | — | | | | — | | |
| Total Distributions to Shareholders | | | (14,961 | ) | | | (20,981 | ) | | | (78,292 | ) | | | (60,207 | ) | | | — | | | | — | | |
| Share Transactions: | |
| Subscriptions – Class A | | | 440,920 | | | | 639,685 | | | | 135,368 | | | | 181,444 | | | | 34,907 | | | | 54,531 | | |
| Distributions reinvested – Class A | | | 2,161 | | | | — | | | | 7,649 | | | | 5,737 | | | | — | | | | — | | |
| Redemptions – Class A | | | (474,759 | ) | | | (744,769 | ) | | | (96,310 | ) | | | (140,626 | ) | | | (27,905 | ) | | | (66,724 | ) | |
| Net Increase/(Decrease) – Class A | | | (31,678 | ) | | | (105,084 | ) | | | 46,707 | | | | 46,555 | | | | 7,002 | | | | (12,193 | ) | |
| Subscriptions – Class B | | | 15 | | | | 100 | | | | 35 | | | | 14 | | | | 2 | | | | 5 | | |
| Distributions reinvested – Class B | | | — | | | | — | | | | 260 | | | | 264 | | | | — | | | | — | | |
| Redemptions – Class B | | | (205,826 | ) | | | (224,032 | ) | | | (8,706 | ) | | | (14,833 | ) | | | (10,015 | ) | | | (9,892 | ) | |
| Net Decrease – Class B | | | (205,811 | ) | | | (223,932 | ) | | | (8,411 | ) | | | (14,555 | ) | | | (10,013 | ) | | | (9,887 | ) | |
| Subscriptions – Class C | | | 32,116 | | | | 58,069 | | | | 11,565 | | | | 14,494 | | | | 985 | | | | 2,513 | | |
| Distributions reinvested – Class C | | | — | | | | — | | | | 589 | | | | 265 | | | | — | | | | — | | |
| Redemptions – Class C | | | (77,328 | ) | | | (151,419 | ) | | | (8,984 | ) | | | (18,021 | ) | | | (2,513 | ) | | | (5,210 | ) | |
| Net Increase/(Decrease) – Class C | | | (45,212 | ) | | | (93,350 | ) | | | 3,170 | | | | (3,262 | ) | | | (1,528 | ) | | | (2,697 | ) | |
| Subscriptions – Class Z | | | 979,748 | | | | 1,484,719 | | | | 596,697 | | | | 671,256 | | | | 128,111 | | | | 246,578 | | |
| Distributions reinvested – Class Z | | | 10,559 | | | | 17,690 | | | | 48,035 | | | | 38,426 | | | | — | | | | — | | |
| Redemptions – Class Z | | | (1,082,197 | ) | | | (1,364,770 | ) | | | (351,631 | ) | | | (486,805 | ) | | | (134,170 | ) | | | (190,623 | ) | |
| Net Increase/(Decrease) – Class Z | | | (91,890 | ) | | | 137,639 | | | | 293,101 | | | | 222,877 | | | | (6,059 | ) | | | 55,955 | | |
| Net Increase/(Decrease) from Share Transactions | | | (374,591 | ) | | | (284,727 | ) | | | 334,567 | | | | 251,615 | | | | (10,598 | ) | | | 31,178 | | |
| Redemption Fees | | | — | | | | — | | | | 192 | | | | 259 | | | | — | | | | — | | |
| Increase from regulatory settlements (See Note 9) | | | — | | | | 40 | | | | 447 | | | | 1,210 | | | | — | | | | 5 | | |
| Total Increase/(Decrease) in Net Assets | | | (832,637 | ) | | | 3,855,937 | | | | 46,516 | | | | 1,590,171 | | | | (95,373 | ) | | | 445,213 | | |
| Net Assets: | |
| Beginning of period | | | 14,727,151 | | | | 10,871,214 | | | | 4,430,738 | | | | 2,840,567 | | | | 1,389,609 | | | | 944,396 | | |
| End of period | | $ | 13,894,514 | | | $ | 14,727,151 | | | $ | 4,477,254 | | | $ | 4,430,738 | | | $ | 1,294,236 | | | $ | 1,389,609 | | |
Undistributed/(Overdistributed) Net Investment Income or
(Accumulated Net Investment Loss) | | $ | (43,784 | ) | | $ | (20,794 | ) | | $ | (2,369 | ) | | $ | 39,113 | | | $ | (3,976 | ) | | $ | (275 | ) | |
See accompanying notes to financial statements.
75
| | | Columbia Acorn
International Select | | Columbia
Acorn Select | | Columbia
Thermostat Fund | |
| Increase (Decrease) in Net Assets | | (Unaudited)
Six months
ended
June 30, | | Year ended
December 31, | | (Unaudited)
Six months
ended
June 30, | | Year ended
December 31, | | (Unaudited)
Six months
ended
June 30, | | Year ended
December 31, | |
| (in thousands) | | 2010 | | 2009 | | 2010 | | 2009 | | 2010 | | 2009 | |
| Operations: | |
| Net investment income/(loss) | | $ | 2,070 | | | $ | 2,398 | | | $ | (6,497 | ) | | $ | (10,372 | ) | | | 969 | | | $ | 1,281 | | |
Net realized gain/(loss) on investments, foreign currency
transactions, forward foreign currency exchange contracts
and foreign capital gains tax | | | 11,640 | | | | (31,407 | ) | | | 19,977 | | | | 31,689 | | | | — | | | | — | | |
Net realized gain/(loss) on affiliated investments and
distributions from affiliated investment companies and
affiliated investment company shares | | | — | | | | — | | | | 9,508 | | | | (71,935 | ) | | | (6,486 | ) | | | (18,231 | ) | |
Net change in net unrealized appreciation/(depreciation)
on investments, foreign currency translations, forward foreign
currency exchange contracts and foreign capital gains tax | | | (29,214 | ) | | | 127,633 | | | | (71,433 | ) | | | 521,770 | | | | — | | | | — | | |
Net change in net unrealized appreciation/(depreciation)
on affiliated investment companies and affiliated investment
company shares | | | — | | | | — | | | | (50,513 | ) | | | 316,510 | | | | 3,214 | | | | 51,494 | | |
| Net Increase/(Decrease) from Operations | | | (15,504 | ) | | | 98,624 | | | | (98,958 | ) | | | 787,662 | | | | (2,303 | ) | | | 34,544 | | |
| Distributions to Shareholders From: | |
| Net investment income – Class A | | | (776 | ) | | | (456 | ) | | | — | | | | — | | | | (540 | ) | | | (7 | ) | |
| Net investment income – Class B | | | (25 | ) | | | — | | | | — | | | | — | | | | (239 | ) | | | — | | |
| Net investment income – Class C | | | (65 | ) | | | — | | | | — | | | | — | | | | (124 | ) | | | — | | |
| Net investment income – Class Z | | | (5,241 | ) | | | (3,077 | ) | | | — | | | | — | | | | (429 | ) | | | (115 | ) | |
| Total Distributions to Shareholders | | | (6,107 | ) | | | (3,533 | ) | | | — | | | | — | | | | (1,332 | ) | | | (122 | ) | |
| Share Transactions: | |
| Subscriptions – Class A | | | 7,288 | | | | 30,670 | | | | 69,504 | | | | 98,691 | | | | 4,755 | | | | 5,619 | | |
| Distributions reinvested – Class A | | | 675 | | | | 439 | | | | — | | | | — | | | | 497 | | | | 6 | | |
| Redemptions – Class A | | | (11,186 | ) | | | (28,558 | ) | | | (106,301 | ) | | | (190,444 | ) | | | (5,207 | ) | | | (14,381 | ) | |
| Net Increase/(Decrease) – Class A | | | (3,223 | ) | | | 2,551 | | | | (36,797 | ) | | | (91,753 | ) | | | 45 | | | | (8,756 | ) | |
| Subscriptions – Class B | | | 1 | | | | — | | | | 30 | | | | 39 | | | | 1 | | | | — | | |
| Distributions reinvested – Class B | | | 22 | | | | — | | | | — | | | | — | | | | 218 | | | | — | | |
| Redemptions – Class B | | | (910 | ) | | | (1,493 | ) | | | (16,677 | ) | | | (23,638 | ) | | | (4,888 | ) | | | (12,541 | ) | |
| Net Decrease – Class B | | | (887 | ) | | | (1,493 | ) | | | (16,647 | ) | | | (23,599 | ) | | | (4,669 | ) | | | (12,541 | ) | |
| Subscriptions – Class C | | | 1,317 | | | | 1,872 | | | | 5,093 | | | | 6,147 | | | | 955 | | | | 1,960 | | |
| Distributions reinvested – Class C | | | 55 | | | | — | | | | — | | | | — | | | | 109 | | | | — | | |
| Redemptions – Class C | | | (1,765 | ) | | | (3,109 | ) | | | (9,915 | ) | | | (21,888 | ) | | | (2,583 | ) | | | (10,176 | ) | |
| Net Increase/(Decrease) – Class C | | | (393 | ) | | | (1,237 | ) | | | (4,822 | ) | | | (15,741 | ) | | | (1,519 | ) | | | (8,216 | ) | |
| Subscriptions – Class Z | | | 34,186 | | | | 127,520 | | | | 217,150 | | | | 278,829 | | | | 3,854 | | | | 2,684 | | |
| Distributions reinvested – Class Z | | | 1,451 | | | | 833 | | | | — | | | | — | | | | 398 | | | | 106 | | |
| Redemptions – Class Z | | | (35,565 | ) | | | (59,794 | ) | | | (171,027 | ) | | | (310,353 | ) | | | (15,934 | ) | | | (6,183 | ) | |
| Net Increase/(Decrease) – Class Z | | | 72 | | | | 68,559 | | | | 46,123 | | | | (31,524 | ) | | | (11,682 | ) | | | (3,393 | ) | |
| Net Increase/(Decrease) from Share Transactions | | | (4,431 | ) | | | 68,380 | | | | (12,143 | ) | | | (162,617 | ) | | | (17,825 | ) | | | (32,906 | ) | |
| Redemption Fees | | | 8 | | | | 33 | | | | — | | | | — | | | | — | | | | — | | |
| Increase from regulatory settlements (See Note 9) | | | 47 | | | | 265 | | | | — | | | | — | | | | — | | | | — | | |
| Total Increase/(Decrease) in Net Assets | | | (25,987 | ) | | | 163,769 | | | | (111,101 | ) | | | 625,045 | | | | (21,460 | ) | | | 1,516 | | |
| Net Assets: | |
| Beginning of period | | | 410,675 | | | | 246,906 | | | | 1,944,845 | | | | 1,319,800 | | | | 138,589 | | | | 137,073 | | |
| End of period | | $ | 384,688 | | | $ | 410,675 | | | $ | 1,833,744 | | | $ | 1,944,845 | | | $ | 117,129 | | | $ | 138,589 | | |
Undistributed/(Overdistributed) Net Investment Income or
(Accumulated Net Investment Loss) | | $ | (2,059 | ) | | $ | 1,978 | | | $ | (14,856 | ) | | $ | (8,359 | ) | | $ | 884 | | | $ | 1,247 | | |
See accompanying notes to financial statements.
76
Columbia Acorn Family of Funds
Statements of Changes in Net Assets, continued
| | | Columbia
Acorn Fund | | Columbia Acorn
International | | Columbia
Acorn USA | |
| Changes in Shares of Beneficial Interest: | | (Unaudited)
Six months
ended
June 30, | | Year ended
December 31, | | (Unaudited)
Six months
ended
June 30, | | Year ended
December 31, | | (Unaudited)
Six months
ended
June 30, | | Year ended
December 31, | |
| (in thousands) | | 2010 | | 2009 | | 2010 | | 2009 | | 2010 | | 2009 | |
| Subscriptions – Class A | | | 17,559 | | | | 33,142 | | | | 3,959 | | | | 6,366 | | | | 1,500 | | | | 3,208 | | |
| Shares issued in reinvestment – Class A | | | 92 | | | | — | | | | 244 | | | | 208 | | | | — | | | | — | | |
| Less shares redeemed – Class A | | | (19,165 | ) | | | (39,655 | ) | | | (2,831 | ) | | | (5,549 | ) | | | (1,214 | ) | | | (3,839 | ) | |
| Net Increase/(Decrease) – Class A | | | (1,514 | ) | | | (6,513 | ) | | | 1,372 | | | | 1,025 | | | | 286 | | | | (631 | ) | |
| Subscriptions – Class B | | | 1 | | | | 5 | | | | 1 | | | | — | * | | | — | * | | | — | * | |
| Shares issued in reinvestment – Class B | | | — | | | | — | | | | 9 | | | | 10 | | | | — | | | | — | | |
| Less shares redeemed – Class B | | | (8,710 | ) | | | (12,472 | ) | | | (261 | ) | | | (588 | ) | | | (457 | ) | | | (582 | ) | |
| Net Decrease – Class B | | | (8,709 | ) | | | (12,467 | ) | | | (251 | ) | | | (578 | ) | | | (457 | ) | | | (582 | ) | |
| Subscriptions – Class C | | | 1,389 | | | | 3,215 | | | | 348 | | | | 497 | | | | 45 | | | | 148 | | |
| Shares issued in reinvestment – Class C | | | — | | | | — | | | | 20 | | | | 10 | | | | — | | | | — | | |
| Less shares redeemed – Class C | | | (3,358 | ) | | | (8,764 | ) | | | (274 | ) | | | (740 | ) | | | (117 | ) | | | (327 | ) | |
| Net Increase/(Decrease) – Class C | | | (1,969 | ) | | | (5,549 | ) | | | 94 | | | | (233 | ) | | | (72 | ) | | | (179 | ) | |
| Subscriptions – Class Z | | | 38,319 | | | | 75,517 | | | | 17,492 | | | | 23,146 | | | | 5,365 | | | | 14,152 | | |
| Shares issued in reinvestment – Class Z | | | 436 | | | | 750 | | | | 1,528 | | | | 1,391 | | | | — | | | | — | | |
| Less shares redeemed – Class Z | | | (41,963 | ) | | | (70,272 | ) | | | (10,281 | ) | | | (18,261 | ) | | | (5,532 | ) | | | (10,509 | ) | |
| Net Increase/(Decrease) – Class Z | | | (3,208 | ) | | | 5,995 | | | | 8,739 | | | | 6,276 | | | | (167 | ) | | | 3,643 | | |
| Net Increase/(Decrease) in Shares of Beneficial Interest | | | (15,400 | ) | | | (18,534 | ) | | | 9,954 | | | | 6,490 | | | | (410 | ) | | | 2,251 | | |
* Rounds to less than 500.
See accompanying notes to financial statements.
77
| | | Columbia Acorn
International Select | | Columbia
Acorn Select | | Columbia
Thermostat Fund | |
| Changes in Shares of Beneficial Interest: | | (Unaudited)
Six months
ended
June 30, | | Year ended
December 31, | | (Unaudited)
Six months
ended
June 30, | | Year ended
December 31, | | (Unaudited)
Six months
ended
June 30, | | Year ended
December 31, | |
| (in thousands) | | 2010 | | 2009 | | 2010 | | 2009 | | 2010 | | 2009 | |
| Subscriptions – Class A | | | 313 | | | | 1,653 | | | | 2,931 | | | | 5,917 | | | | 414 | | | | 646 | | |
| Shares issued in reinvestment – Class A | | | 31 | | | | 22 | | | | — | | | | — | | | | 47 | | | | 1 | | |
| Less shares redeemed – Class A | | | (482 | ) | | | (1,497 | ) | | | (4,556 | ) | | | (11,758 | ) | | | (468 | ) | | | (1,674 | ) | |
| Net Increase/(Decrease) – Class A | | | (138 | ) | | | 178 | | | | (1,625 | ) | | | (5,841 | ) | | | (7 | ) | | | (1,027 | ) | |
| Subscriptions – Class B | | | — | * | | | — | | | | 1 | | | | 2 | | | | — | * | | | — | | |
| Shares issued in reinvestment – Class B | | | 1 | | | | — | | | | — | | | | — | | | | 20 | | | | — | | |
| Less shares redeemed – Class B | | | (41 | ) | | | (85 | ) | | | (744 | ) | | | (1,512 | ) | | | (435 | ) | | | (1,410 | ) | |
| Net Decrease – Class B | | | (40 | ) | | | (85 | ) | | | (743 | ) | | | (1,510 | ) | | | (415 | ) | | | (1,410 | ) | |
| Subscriptions – Class C | | | 60 | | | | 103 | | | | 228 | | | | 371 | | | | 85 | | | | 212 | | |
| Shares issued in reinvestment – Class C | | | 3 | | | | — | | | | — | | | | — | | | | 10 | | | | — | | |
| Less shares redeemed – Class C | | | (81 | ) | | | (174 | ) | | | (452 | ) | | | (1,474 | ) | | | (232 | ) | | | (1,207 | ) | |
| Net Increase/(Decrease) – Class C | | | (18 | ) | | | (71 | ) | | | (224 | ) | | | (1,103 | ) | | | (137 | ) | | | (995 | ) | |
| Subscriptions – Class Z | | | 1,451 | | | | 6,808 | | | | 8,832 | | | | 15,845 | | | | 353 | | | | 307 | | |
| Shares issued in reinvestment – Class Z | | | 66 | | | | 42 | | | | — | | | | — | | | | 38 | | | | 12 | | |
| Less shares redeemed – Class Z | | | (1,515 | ) | | | (3,083 | ) | | | (7,143 | ) | | | (18,178 | ) | | | (1,456 | ) | | | (727 | ) | |
| Net Increase/(Decrease) – Class Z | | | 2 | | | | 3,767 | | | | 1,689 | | | | (2,333 | ) | | | (1,065 | ) | | | (408 | ) | |
| Net Increase/(Decrease) in Shares of Beneficial Interest | | | (194 | ) | | | 3,789 | | | | (903 | ) | | | (10,787 | ) | | | (1,624 | ) | | | (3,840 | ) | |
See accompanying notes to financial statements.
78
Columbia Acorn Family of Funds
Financial Highlights
Columbia Acorn Fund
| Class A Shares | | (Unaudited)
Six months
ended June 30, | | Year Ended December 31, | |
| Selected data for a share outstanding throughout each period | | 2010 | | 2009 | | 2008 | | 2007 | | 2006 | | 2005 | |
| Net Asset Value, Beginning of Period | | $ | 23.98 | | | $ | 17.22 | | | $ | 28.87 | | | $ | 29.02 | | | $ | 27.57 | | | $ | 25.93 | | |
| Income from Investment Operations | |
| Net investment income/(loss) (a) | | | (0.03 | ) | | | (0.02 | ) | | | (0.01 | ) | | | 0.05 | (b) | | | 0.05 | | | | 0.07 | | |
| Net realized and unrealized gain/(loss) | | | (0.76 | ) | | | 6.78 | | | | (10.98 | ) | | | 2.13 | | | | 3.82 | | | | 3.20 | | |
| Total from Investment Operations | | | (0.79 | ) | | | 6.76 | | | | (10.99 | ) | | | 2.18 | | | | 3.87 | | | | 3.27 | | |
| Less Distributions to Shareholders | |
| From net investment income | | | (0.02 | ) | | | — | | | | — | | | | (0.03 | ) | | | (0.04 | ) | | | (0.07 | ) | |
| From net realized gains | | | — | | | | — | | | | (0.66 | ) | | | (2.30 | ) | | | (2.38 | ) | | | (1.56 | ) | |
| Total Distributions to Shareholders | | | (0.02 | ) | | | — | | | | (0.66 | ) | | | (2.33 | ) | | | (2.42 | ) | | | (1.63 | ) | |
| Increase from regulatory settlements | | | — | | | | 0.00 | (c) | | | — | | | | — | | | | — | | | | — | | |
| Net Asset Value, End of Period | | $ | 23.17 | | | $ | 23.98 | | | $ | 17.22 | | | $ | 28.87 | | | $ | 29.02 | | | $ | 27.57 | | |
| Total Return (d) | | | (3.30 | )%(e) | | | 39.26 | % | | | (38.72 | )% | | | 7.39 | %(f)(g) | | | 14.13 | %(f) | | | 12.76 | %(f) | |
| Ratios to Average Net Assets/Supplemental Data | |
| Net expenses (h) | | | 1.05 | %(i) | | | 1.07 | % | | | 1.05 | % | | | 1.02 | % | | | 1.02 | % | | | 1.03 | % | |
| Net investment income/(loss) (h) | | | (0.26 | )%(i) | | | (0.12 | )% | | | (0.04 | )% | | | 0.17 | % | | | 0.17 | % | | | 0.28 | % | |
| Waiver/Reimbursement | | | — | | | | — | | | | — | | | | 0.01 | % | | | 0.02 | % | | | 0.02 | % | |
| Portfolio turnover rate | | | 14 | %(e) | | | 27 | % | | | 21 | % | | | 20 | % | | | 22 | % | | | 16 | % | |
| Net assets at end of period (000s) | | $ | 2,803,341 | | | $ | 2,937,761 | | | $ | 2,221,100 | | | $ | 4,300,920 | | | $ | 4,067,868 | | | $ | 3,349,461 | | |
(a) Per share data was calculated using the average shares outstanding during the period.
(b) Net investment income per share includes special dividends. The effect of these dividends amounted to $0.03 per share.
(c) Rounds to less than $0.01 per share.
(d) Total return at net asset value assuming all distributions reinvested and no initial sales charge or contingent deferred sales charge.
(e) Not annualized.
(f) Had the Advisor and/or Transfer Agent not waived fees and/or reimbursed a portion of expenses, total return would have been reduced.
(g) Total return includes a voluntary reimbursement by the Advisor for a realized investment loss due to a trading error. This reimbursement increased total return and net asset value per share by less than 0.01% and less than $0.01, respectively.
(h) The benefits derived from custody fees paid indirectly had an impact of less than 0.01%.
(i) Annualized.
| Class B Shares | | (Unaudited)
Six months
ended June 30, | | Year Ended December 31, | |
| Selected data for a share outstanding throughout each period | | 2010 | | 2009 | | 2008 | | 2007 | | 2006 | | 2005 | |
| Net Asset Value, Beginning of Period | | $ | 22.43 | | | $ | 16.21 | | | $ | 27.39 | | | $ | 27.78 | | | $ | 26.61 | | | $ | 25.19 | | |
| Income from Investment Operations | |
| Net investment loss (a) | | | (0.11 | ) | | | (0.14 | ) | | | (0.15 | ) | | | (0.11 | )(b) | | | (0.13 | ) | | | (0.11 | ) | |
| Net realized and unrealized gain/(loss) | | | (0.71 | ) | | | 6.36 | | | | (10.37 | ) | | | 2.02 | | | | 3.68 | | | | 3.09 | | |
| Total from Investment Operations | | | (0.82 | ) | | | 6.22 | | | | (10.52 | ) | | | 1.91 | | | | 3.55 | | | | 2.98 | | |
| Less Distributions to Shareholders | |
| From net realized gains | | | — | | | | — | | | | (0.66 | ) | | | (2.30 | ) | | | (2.38 | ) | | | (1.56 | ) | |
| Total Distributions to Shareholders | | | — | | | | — | | | | (0.66 | ) | | | (2.30 | ) | | | (2.38 | ) | | | (1.56 | ) | |
| Increase from regulatory settlements | | | — | | | | 0.00 | (c) | | | — | | | | — | | | | — | | | | — | | |
| Net Asset Value, End of Period | | $ | 21.61 | | | $ | 22.43 | | | $ | 16.21 | | | $ | 27.39 | | | $ | 27.78 | | | $ | 26.61 | | |
| Total Return (d) | | | (3.66 | )%(e) | | | 38.37 | % | | | (39.11 | )% | | | 6.76 | %(f)(g) | | | 13.43 | %(f) | | | 11.98 | %(f) | |
| Ratios to Average Net Assets/Supplemental Data | |
| Net expenses (h) | | | 1.74 | %(i) | | | 1.74 | % | | | 1.65 | % | | | 1.59 | % | | | 1.66 | % | | | 1.72 | % | |
| Net investment loss (h) | | | (0.98 | )%(i) | | | (0.77 | )% | | | (0.64 | )% | | | (0.39 | )% | | | (0.48 | )% | | | (0.42 | )% | |
| Waiver/Reimbursement | | | — | | | | — | | | | — | | | | 0.01 | % | | | 0.02 | % | | | 0.02 | % | |
| Portfolio turnover rate | | | 14 | %(e) | | | 27 | % | | | 21 | % | | | 20 | % | | | 22 | % | | | 16 | % | |
| Net assets at end of period (000s) | | $ | 317,749 | | | $ | 525,072 | | | $ | 581,587 | | | $ | 1,270,292 | | | $ | 1,404,165 | | | $ | 1,422,580 | | |
(a) Per share data was calculated using the average shares outstanding during the period.
(b) Net investment income per share includes special dividends. The effect of these dividends amounted to $0.03 per share.
(c) Rounds to less than $0.01 per share.
(d) Total return at net asset value assuming all distributions reinvested and no contingent deferred sales charge.
(e) Not annualized.
(f) Had the Advisor and/or Transfer Agent not waived fees and/or reimbursed a portion of expenses, total return would have been reduced.
(g) Total return includes a voluntary reimbursement by the Advisor for a realized investment loss due to a trading error. This reimbursement increased total return and net asset value per share by less than 0.01% and less than $0.01, respectively.
(h) The benefits derived from custody fees paid indirectly had an impact of less than 0.01%.
(i) Annualized.
See accompanying notes to financial statements.
79
Columbia Acorn Fund
| Class C Shares | | (Unaudited)
Six months
ended June 30, | | Year Ended December 31, | |
| Selected data for a share outstanding throughout each period | | 2010 | | 2009 | | 2008 | | 2007 | | 2006 | | 2005 | |
| Net Asset Value, Beginning of Period | | $ | 22.23 | | | $ | 16.09 | | | $ | 27.25 | | | $ | 27.70 | | | $ | 26.58 | | | $ | 25.18 | | |
| Income from Investment Operations | |
| Net investment loss (a) | | | (0.12 | ) | | | (0.17 | ) | | | (0.19 | ) | | | (0.18 | )(b) | | | (0.17 | ) | | | (0.13 | ) | |
| Net realized and unrealized gain/(loss) | | | (0.70 | ) | | | 6.31 | | | | (10.31 | ) | | | 2.03 | | | | 3.67 | | | | 3.09 | | |
| Total from Investment Operations | | | (0.82 | ) | | | 6.14 | | | | (10.50 | ) | | | 1.85 | | | | 3.50 | | | | 2.96 | | |
| Less Distributions to Shareholders | |
| From net realized gains | | | — | | | | — | | | | (0.66 | ) | | | (2.30 | ) | | | (2.38 | ) | | | (1.56 | ) | |
| Total Distributions to Shareholders | | | — | | | | — | | | | (0.66 | ) | | | (2.30 | ) | | | (2.38 | ) | | | (1.56 | ) | |
| Increase from regulatory settlements | | | — | | | | 0.00 | (c) | | | — | | | | — | | | | — | | | | — | | |
| Net Asset Value, End of Period | | $ | 21.41 | | | $ | 22.23 | | | $ | 16.09 | | | $ | 27.25 | | | $ | 27.70 | | | $ | 26.58 | | |
| Total Return (d) | | | (3.69 | )%(e) | | | 38.16 | % | | | (39.23 | )% | | | 6.56 | %(f)(g) | | | 13.25 | %(f) | | | 11.90 | %(f) | |
| Ratios to Average Net Assets/Supplemental Data | |
| Net expenses (h) | | | 1.85 | %(i) | | | 1.89 | % | | | 1.83 | % | | | 1.79 | % | | | 1.80 | % | | | 1.82 | % | |
| Net investment loss (h) | | | (1.07 | )%(i) | | | (0.93 | )% | | | (0.82 | )% | | | (0.60 | )% | | | (0.61 | )% | | | (0.51 | )% | |
| Waiver/Reimbursement | | | — | | | | — | | | | — | | | | 0.00 | %(j) | | | 0.02 | % | | | 0.02 | % | |
| Portfolio turnover rate | | | 14 | %(e) | | | 27 | % | | | 21 | % | | | 20 | % | | | 22 | % | | | 16 | % | |
| Net assets at end of period (000s) | | $ | 667,528 | | | $ | 736,818 | | | $ | 622,665 | | | $ | 1,312,243 | | | $ | 1,345,520 | | | $ | 1,220,339 | | |
(a) Per share data was calculated using the average shares outstanding during the period.
(b) Net investment income per share includes special dividends. The effect of these dividends amounted to $0.03 per share.
(c) Rounds to less than $0.01 per share.
(d) Total return at net asset value assuming all distributions reinvested and no contingent deferred sales charge.
(e) Not annualized.
(f) Had the Advisor and/or Transfer Agent not waived fees and/or reimbursed a portion of expenses, total return would have been reduced.
(g) Total return includes a voluntary reimbursement by the Advisor for a realized investment loss due to a trading error. This reimbursement increased total return and net asset value per share by less than 0.01% and less than $0.01, respectively.
(h) The benefits derived from custody fees paid indirectly had an impact of less than 0.01%.
(i) Annualized.
(j) Rounds to less than 0.01%.
See accompanying notes to financial statements.
80
Columbia Acorn Family of Funds
Financial Highlights
Columbia Acorn International
| Class A Shares | | (Unaudited)
Six months
ended June 30, | | Year Ended December 31, | |
| Selected data for a share outstanding throughout each period | | 2010 | | 2009 | | 2008 | | 2007 | | 2006 | | 2005 | |
| Net Asset Value, Beginning of Period | | $ | 34.13 | | | $ | 23.03 | | | $ | 43.42 | | | $ | 40.07 | | | $ | 33.20 | | | $ | 28.75 | | |
| Income from Investment Operations | |
| Net investment income (a) | | | 0.23 | | | | 0.23 | | | | 0.47 | | | | 0.27 | | | | 0.23 | | | | 0.22 | | |
| Net realized and unrealized gain/(loss) | | | (1.81 | ) | | | 11.27 | | | | (20.20 | ) | | | 6.52 | | | | 10.87 | | | | 5.84 | | |
| Total from Investment Operations | | | (1.58 | ) | | | 11.50 | | | | (19.73 | ) | | | 6.79 | | | | 11.10 | | | | 6.06 | | |
| Less Distributions to Shareholders | |
| From net investment income | | | (0.49 | ) | | | (0.41 | ) | | | (0.06 | ) | | | (0.08 | ) | | | (0.32 | ) | | | (0.53 | ) | |
| From net realized gains | | | — | | | | — | | | | (0.60 | ) | | | (3.36 | ) | | | (3.91 | ) | | | (1.08 | ) | |
| Total Distributions to Shareholders | | | (0.49 | ) | | | (0.41 | ) | | | (0.66 | ) | | | (3.44 | ) | | | (4.23 | ) | | | (1.61 | ) | |
| Redemption Fees | |
| Redemption fees added to paid in capital (a)(b) | | | 0.00 | | | | 0.00 | | | | 0.00 | | | | 0.00 | | | | 0.00 | | | | 0.00 | | |
| Increase from regulatory settlements | | | 0.00 | (b) | | | 0.01 | | | | — | | | | — | | | | — | | | | — | | |
| Net Asset Value, End of Period | | $ | 32.06 | | | $ | 34.13 | | | $ | 23.03 | | | $ | 43.42 | | | $ | 40.07 | | | $ | 33.20 | | |
| Total Return (c) | | | (4.59 | )%(d) | | | 50.40 | % | | | (46.09 | )% | | | 16.90 | %(e) | | | 34.16 | %(e) | | | 21.42 | %(e) | |
| Ratios to Average Net Assets/Supplemental Data | |
| Net expenses (f) | | | 1.29 | %(g) | | | 1.36 | % | | | 1.31 | % | | | 1.23 | % | | | 1.24 | % | | | 1.30 | % | |
| Net investment income (f) | | | 1.37 | %(g) | | | 0.85 | % | | | 1.36 | % | | | 0.60 | % | | | 0.61 | % | | | 0.72 | % | |
| Waiver/Reimbursement | | | — | | | | — | | | | — | | | | 0.00 | %(h) | | | 0.01 | % | | | 0.02 | % | |
| Portfolio turnover rate | | | 10 | %(d) | | | 31 | % | | | 38 | % | | | 28 | % | | | 31 | % | | | 27 | % | |
| Net assets at end of period (000s) | | $ | 587,525 | | | $ | 578,599 | | | $ | 366,820 | | | $ | 622,901 | | | $ | 313,401 | | | $ | 142,204 | | |
(a) Per share data was calculated using the average shares outstanding during the period.
(b) Rounds to less than $0.01 per share.
(c) Total return at net asset value assuming all distributions reinvested and no initial sales charge or contingent deferred sales charge.
(d) Not annualized.
(e) Had the Advisor and/or Transfer Agent not waived fees and/or reimbursed a portion of expenses, total return would have been reduced.
(f) The benefits derived from custody fees paid indirectly had an impact of less than 0.01%.
(g) Annualized.
(h) Rounds to less than 0.01%.
| Class B Shares | | (Unaudited)
Six months
ended June 30, | | Year Ended December 31, | |
| Selected data for a share outstanding throughout each period | | 2010 | | 2009 | | 2008 | | 2007 | | 2006 | | 2005 | |
| Net Asset Value, Beginning of Period | | $ | 33.22 | | | $ | 22.41 | | | $ | 42.46 | | | $ | 39.39 | | | $ | 32.71 | | | $ | 28.18 | | |
| Income from Investment Operations | |
| Net investment income/(loss) (a) | | | 0.10 | | | | 0.08 | | | | 0.27 | | | | 0.04 | | | | (0.00 | )(b) | | | 0.02 | | |
| Net realized and unrealized gain/(loss) | | | (1.74 | ) | | | 10.92 | | | | (19.72 | ) | | | 6.39 | | | | 10.66 | | | | 5.73 | | |
| Total from Investment Operations | | | (1.64 | ) | | | 11.00 | | | | (19.45 | ) | | | 6.43 | | | | 10.66 | | | | 5.75 | | |
| Less Distributions to Shareholders | |
| From net investment income | | | (0.31 | ) | | | (0.20 | ) | | | — | | | | (0.00 | )(b) | | | (0.07 | ) | | | (0.14 | ) | |
| From net realized gains | | | — | | | | — | | | | (0.60 | ) | | | (3.36 | ) | | | (3.91 | ) | | | (1.08 | ) | |
| Total Distributions to Shareholders | | | (0.31 | ) | | | (0.20 | ) | | | (0.60 | ) | | | (3.36 | ) | | | (3.98 | ) | | | (1.22 | ) | |
| Redemption Fees | |
| Redemption fees added to paid in capital (a)(b) | | | 0.00 | | | | 0.00 | | | | 0.00 | | | | 0.00 | | | | 0.00 | | | | 0.00 | | |
| Increase from regulatory settlements | | | 0.00 | (b) | | | 0.01 | | | | — | | | | — | | | | — | | | | — | | |
| Net Asset Value, End of Period | | $ | 31.27 | | | $ | 33.22 | | | $ | 22.41 | | | $ | 42.46 | | | $ | 39.39 | | | $ | 32.71 | | |
| Total Return (c) | | | (4.93 | )%(d) | | | 49.36 | % | | | (46.41 | )% | | | 16.25 | %(e) | | | 33.26 | %(e) | | | 20.57 | %(e) | |
| Ratios to Average Net Assets/Supplemental Data | |
| Net expenses (f) | | | 2.00 | %(g) | | | 2.03 | % | | | 1.90 | % | | | 1.81 | % | | | 1.89 | % | | | 2.01 | % | |
| Net investment income/(loss) (f) | | | 0.58 | %(g) | | | 0.29 | % | | | 0.77 | % | | | 0.08 | % | | | (0.01 | )% | | | 0.08 | % | |
| Waiver/Reimbursement | | | — | | | | — | | | | — | | | | 0.01 | % | | | 0.02 | % | | | 0.02 | % | |
| Portfolio turnover rate | | | 10 | %(d) | | | 31 | % | | | 38 | % | | | 28 | % | | | 31 | % | | | 27 | % | |
| Net assets at end of period (000s) | | $ | 28,705 | | | $ | 38,835 | | | $ | 39,153 | | | $ | 103,631 | | | $ | 94,165 | | | $ | 73,572 | | |
(a) Per share data was calculated using the average shares outstanding during the period.
(b) Rounds to less than $0.01 per share.
(c) Total return at net asset value assuming all distributions reinvested and no contingent deferred sales charge.
(d) Not annualized.
(e) Had the Advisor and/or Transfer Agent not waived fees and/or reimbursed a portion of expenses, total return would have been reduced.
(f) The benefits derived from custody fees paid indirectly had an impact of less than 0.01%.
(g) Annualized.
See accompanying notes to financial statements.
81
Columbia Acorn International
| Class C Shares | | (Unaudited)
Six months
ended June 30, | | Year Ended December 31, | |
| Selected data for a share outstanding throughout each period | | 2010 | | 2009 | | 2008 | | 2007 | | 2006 | | 2005 | |
| Net Asset Value, Beginning of Period | | $ | 33.08 | | | $ | 22.30 | | | $ | 42.32 | | | $ | 39.35 | | | $ | 32.68 | | | $ | 28.19 | | |
| Income from Investment Operations | |
| Net investment income/(loss) (a) | | | 0.09 | | | | 0.02 | | | | 0.21 | | | | (0.06 | ) | | | (0.05 | ) | | | (0.00 | )(b) | |
| Net realized and unrealized gain/(loss) | | | (1.73 | ) | | | 10.89 | | | | (19.63 | ) | | | 6.39 | | | | 10.66 | | | | 5.71 | | |
| Total from Investment Operations | | | (1.64 | ) | | | 10.91 | | | | (19.42 | ) | | | 6.33 | | | | 10.61 | | | | 5.71 | | |
| Less Distributions to Shareholders | |
| From net investment income | | | (0.27 | ) | | | (0.14 | ) | | | — | | | | (0.00 | )(b) | | | (0.03 | ) | | | (0.14 | ) | |
| From net realized gains | | | — | | | | — | | | | (0.60 | ) | | | (3.36 | ) | | | (3.91 | ) | | | (1.08 | ) | |
| Total Distributions to Shareholders | | | (0.27 | ) | | | (0.14 | ) | | | (0.60 | ) | | | (3.36 | ) | | | (3.94 | ) | | | (1.22 | ) | |
| Redemption Fees | |
| Redemption fees added to paid in capital (a)(b) | | | 0.00 | | | | 0.00 | | | | 0.00 | | | | 0.00 | | | | 0.00 | | | | 0.00 | | |
| Increase from regulatory settlements | | | 0.00 | (b) | | | 0.01 | | | | — | | | | — | | | | — | | | | — | | |
| Net Asset Value, End of Period | | $ | 31.17 | | | $ | 33.08 | | | $ | 22.30 | | | $ | 42.32 | | | $ | 39.35 | | | $ | 32.68 | | |
| Total Return (c) | | | (4.95 | )%(d) | | | 49.12 | % | | | (46.50 | )% | | | 16.01 | %(e) | | | 33.14 | %(e) | | | 20.45 | %(e) | |
| Ratios to Average Net Assets/Supplemental Data | |
| Net expenses (f) | | | 2.10 | %(g) | | | 2.17 | % | | | 2.08 | % | | | 1.99 | % | | | 2.01 | % | | | 2.09 | % | |
| Net investment income/(loss) (f) | | | 0.55 | %(g) | | | 0.07 | % | | | 0.60 | % | | | (0.14 | )% | | | (0.14 | )% | | | (0.01 | )% | |
| Waiver/Reimbursement | | | — | | | | — | | | | — | | | | 0.00 | %(h) | | | 0.01 | % | | | 0.02 | % | |
| Portfolio turnover rate | | | 10 | %(d) | | | 31 | % | | | 38 | % | | | 28 | % | | | 31 | % | | | 27 | % | |
| Net assets at end of period (000s) | | $ | 83,580 | | | $ | 85,625 | | | $ | 62,906 | | | $ | 153,416 | | | $ | 99,425 | | | $ | 47,325 | | |
(a) Per share data was calculated using the average shares outstanding during the period.
(b) Rounds to less than $0.01 per share.
(c) Total return at net asset value assuming all distributions reinvested and no contingent deferred sales charge.
(d) Not annualized.
(e) Had the Advisor and/or Transfer Agent not waived fees and/or reimbursed a portion of expenses, total return would have been reduced.
(f) The benefits derived from custody fees paid indirectly had an impact of less than 0.01%.
(g) Annualized.
(h) Rounds to less than 0.01%.
See accompanying notes to financial statements.
82
Columbia Acorn Family of Funds
Financial Highlights, continued
Columbia Acorn USA
| Class A Shares | | (Unaudited)
Six months
ended June 30, | | Year Ended December 31, | |
| Selected data for a share outstanding throughout each period | | 2010 | | 2009 | | 2008 | | 2007 | | 2006 | | 2005 | |
| Net Asset Value, Beginning of Period | | $ | 22.43 | | | $ | 15.90 | | | $ | 27.23 | | | $ | 28.02 | | | $ | 26.52 | | | $ | 24.77 | | |
| Income from Investment Operations | |
| Net investment loss (a) | | | (0.08 | ) | | | (0.11 | ) | | | (0.14 | ) | | | (0.09 | )(b) | | | (0.10 | ) | | | (0.01 | ) | |
| Net realized and unrealized gain/(loss) | | | (1.35 | ) | | | 6.64 | | | | (10.23 | ) | | | 1.01 | | | | 2.21 | | | | 3.13 | | |
| Total from Investment Operations | | | (1.43 | ) | | | 6.53 | | | | (10.37 | ) | | | 0.92 | | | | 2.11 | | | | 3.12 | | |
| Less Distributions to Shareholders | |
| From net realized gains | | | — | | | | — | | | | (0.96 | ) | | | (1.71 | ) | | | (0.61 | ) | | | (1.37 | ) | |
| Increase from regulatory settlements | | | — | | | | — | (c) | | | — | | | | — | | | | — | | | | — | | |
| Net Asset Value, End of Period | | $ | 21.00 | | | $ | 22.43 | | | $ | 15.90 | | | $ | 27.23 | | | $ | 28.02 | | | $ | 26.52 | | |
| Total Return (d) | | | (6.38 | )%(e) | | | 41.07 | % | | | (39.38 | )% | | | 3.18 | %(f)(g) | | | 7.95 | %(f) | | | 12.68 | %(f) | |
| Ratios to Average Net Assets/Supplemental Data | |
| Net expenses (h) | | | 1.28 | %(i) | | | 1.32 | % | | | 1.29 | % | | | 1.25 | % | | | 1.26 | % | | | 1.31 | % | |
| Net investment loss (h) | | | (0.73 | )%(i) | | | (0.64 | )% | | | (0.60 | )% | | | (0.29 | )% | | | (0.35 | )% | | | (0.02 | )% | |
| Waiver/Reimbursement | | | — | | | | — | | | | — | | | | 0.00 | %(j) | | | 0.01 | % | | | 0.01 | % | |
| Portfolio turnover rate | | | 16 | %(e) | | | 28 | % | | | 23 | % | | | 21 | % | | | 13 | % | | | 13 | % | |
| Net assets at end of period (000s) | | $ | 173,203 | | | $ | 178,605 | | | $ | 136,597 | | | $ | 245,085 | | | $ | 245,552 | | | $ | 168,922 | | |
(a) Per share data was calculated using the average shares outstanding during the period.
(b) Net investment income per share includes special dividends. The effect of these dividends amounted to $0.09 per share.
(c) Rounds to less than $0.01 per share.
(d) Total return at net asset value assuming all distributions reinvested and no initial sales charge or contingent deferred sales charge.
(e) Not annualized.
(f) Had the Advisor and/or Transfer Agent not waived fees and/or reimbursed a portion of expenses, total return would have been reduced.
(g) Total return includes a voluntary reimbursement by the Advisor for a realized investment loss due to a trading error. This reimbursement increased total return and net asset value per share by less than 0.01% and less than $0.01, respectively.
(h) The benefits derived from custody fees paid indirectly had an impact of less than 0.01%.
(i) Annualized.
(j) Rounds to less than 0.01%.
| Class B Shares | | (Unaudited)
Six months
ended June 30, | | Year Ended December 31, | |
| Selected data for a share outstanding throughout each period | | 2010 | | 2009 | | 2008 | | 2007 | | 2006 | | 2005 | |
| Net Asset Value, Beginning of Period | | $ | 20.99 | | | $ | 14.98 | | | $ | 25.87 | | | $ | 26.87 | | | $ | 25.61 | | | $ | 24.14 | | |
| Income from Investment Operations | |
| Net investment loss (a) | | | (0.16 | ) | | | (0.22 | ) | | | (0.27 | ) | | | (0.25 | )(b) | | | (0.27 | ) | | | (0.18 | ) | |
| Net realized and unrealized gain/(loss) | | | (1.26 | ) | | | 6.23 | | | | (9.66 | ) | | | 0.96 | | | | 2.14 | | | | 3.02 | | |
| Total from Investment Operations | | | (1.42 | ) | | | 6.01 | | | | (9.93 | ) | | | 0.71 | | | | 1.87 | | | | 2.84 | | |
| Less Distributions to Shareholders | |
| From net realized gains | | | — | | | | — | | | | (0.96 | ) | | | (1.71 | ) | | | (0.61 | ) | | | (1.37 | ) | |
| Increase from regulatory settlements | | | — | | | | — | (c) | | | — | | | | — | | | | — | | | | — | | |
| Net Asset Value, End of Period | | $ | 19.57 | | | $ | 20.99 | | | $ | 14.98 | | | $ | 25.87 | | | $ | 26.87 | | | $ | 25.61 | | |
| Total Return (d) | | | (6.77 | )%(e) | | | 40.12 | % | | | (39.75 | )% | | | 2.53 | %(f)(g) | | | 7.29 | %(f) | | | 11.84 | %(f) | |
| Ratios to Average Net Assets/Supplemental Data | |
| Net expenses (h) | | | 2.05 | %(i) | | | 2.02 | % | | | 1.92 | % | | | 1.85 | % | | | 1.93 | % | | | 2.00 | % | |
| Net investment loss (h) | | | (1.50 | )%(i) | | | (1.33 | )% | | | (1.24 | )% | | | (0.87 | )% | | | (1.01 | )% | | | (0.72 | )% | |
| Waiver/Reimbursement | | | — | | | | — | | | | — | | | | 0.01 | % | | | 0.02 | % | | | 0.01 | % | |
| Portfolio turnover rate | | | 16 | %(e) | | | 28 | % | | | 23 | % | | | 21 | % | | | 13 | % | | | 13 | % | |
| Net assets at end of period (000s) | | $ | 10,554 | | | $ | 20,903 | | | $ | 23,633 | | | $ | 53,820 | | | $ | 65,040 | | | $ | 73,168 | | |
(a) Per share data was calculated using the average shares outstanding during the period.
(b) Net investment income per share includes special dividends. The effect of these dividends amounted to $0.09 per share.
(c) Rounds to less than $0.01 per share.
(d) Total return at net asset value assuming all distributions reinvested and no contingent deferred sales charge.
(e) Not annualized.
(f) Had the Advisor and/or Transfer Agent not waived fees and/or reimbursed a portion of expenses, total return would have been reduced.
(g) Total return includes a voluntary reimbursement by the Advisor for a realized investment loss due to a trading error. This reimbursement increased total return and net asset value per share by less than 0.01% and less than $0.01, respectively.
(h) The benefits derived from custody fees paid indirectly had an impact of less than 0.01%.
(i) Annualized.
See accompanying notes to financial statements.
83
Columbia Acorn USA
| Class C Shares | | (Unaudited)
Six months
ended June 30, | | Year Ended December 31, | |
| Selected data for a share outstanding throughout each period | | 2010 | | 2009 | | 2008 | | 2007 | | 2006 | | 2005 | |
| Net Asset Value, Beginning of Period | | $ | 20.84 | | | $ | 14.89 | | | $ | 25.77 | | | $ | 26.81 | | | $ | 25.59 | | | $ | 24.14 | | |
| Income from Investment Operations | |
| Net investment loss (a) | | | (0.16 | ) | | | (0.24 | ) | | | (0.30 | ) | | | (0.30 | )(b) | | | (0.30 | ) | | | (0.20 | ) | |
| Net realized and unrealized gain/(loss) | | | (1.24 | ) | | | 6.19 | | | | (9.62 | ) | | | 0.97 | | | | 2.13 | | | | 3.02 | | |
| Total from Investment Operations | | | (1.40 | ) | | | 5.95 | | | | (9.92 | ) | | | 0.67 | | | | 1.83 | | | | 2.82 | | |
| Less Distributions to Shareholders | |
| From net realized gains | | | — | | | | — | | | | (0.96 | ) | | | (1.71 | ) | | | (0.61 | ) | | | (1.37 | ) | |
| Increase from regulatory settlements | | | — | | | | — | (c) | | | — | | | | — | | | | — | | | | — | | |
| Net Asset Value, End of Period | | $ | 19.44 | | | $ | 20.84 | | | $ | 14.89 | | | $ | 25.77 | | | $ | 26.81 | | | $ | 25.59 | | |
| Total Return (d) | | | (6.72 | )%(e) | | | 39.96 | % | | | (39.87 | )% | | | 2.39 | %(f)(g) | | | 7.14 | %(f) | | | 11.76 | %(f) | |
| Ratios to Average Net Assets/Supplemental Data | |
| Net expenses (h) | | | 2.07 | %(i) | | | 2.13 | % | | | 2.08 | % | | | 2.03 | % | | | 2.05 | % | | | 2.10 | % | |
| Net investment loss (h) | | | (1.53 | )%(i) | | | (1.45 | )% | | | (1.39 | )% | | | (1.07 | )% | | | (1.14 | )% | | | (0.81 | )% | |
| Waiver/Reimbursement | | | — | | | | — | | | | — | | | | 0.00 | %(j) | | | 0.01 | % | | | 0.01 | % | |
| Portfolio turnover rate | | | 16 | %(e) | | | 28 | % | | | 23 | % | | | 21 | % | | | 13 | % | | | 13 | % | |
| Net assets at end of period (000s) | | $ | 28,919 | | | $ | 32,508 | | | $ | 25,899 | | | $ | 50,743 | | | $ | 55,306 | | | $ | 42,844 | | |
(a) Per share data was calculated using the average shares outstanding during the period.
(b) Net investment income per share includes special dividends. The effect of these dividends amounted to $0.09 per share.
(c) Rounds to less than $0.01 per share.
(d) Total return at net asset value assuming all distributions reinvested and no contingent deferred sales charge.
(e) Not annualized.
(f) Had the Advisor and/or Transfer Agent not waived fees and/or reimbursed a portion of expenses, total return would have been reduced.
(g) Total return includes a voluntary reimbursement by the Advisor for a realized investment loss due to a trading error. This reimbursement increased total return and net asset value per share by less than 0.01% and less than $0.01, respectively.
(h) The benefits derived from custody fees paid indirectly had an impact of less than 0.01%.
(i) Annualized.
(j) Rounds to less than 0.01%.
See accompanying notes to financial statements.
84
Columbia Acorn Family of Funds
Financial Highlights, continued
Columbia Acorn International Select
| Class A Shares | | (Unaudited)
Six months
ended June 30, | | Year Ended December 31, | |
| Selected data for a share outstanding throughout each period | | 2010 | | 2009 | | 2008 | | 2007 | | 2006 | | 2005 | |
| Net Asset Value, Beginning of Period | | $ | 23.39 | | | $ | 17.99 | | | $ | 31.74 | | | $ | 27.68 | | | $ | 20.36 | | | $ | 17.85 | | |
| Income from Investment Operations | |
| Net investment income (a) | | | 0.09 | | | | 0.10 | | | | 0.20 | | | | 0.04 | (b) | | | 0.03 | | | | 0.06 | | |
| Net realized and unrealized gain/(loss) | | | (1.01 | ) | | | 5.43 | | | | (13.41 | ) | | | 5.91 | | | | 7.29 | | | | 2.69 | | |
| Total from Investment Operations | | | (0.92 | ) | | | 5.53 | | | | (13.21 | ) | | | 5.95 | | | | 7.32 | | | | 2.75 | | |
| Less Distributions to Shareholders | |
| From net investment income | | | (0.30 | ) | | | (0.15 | ) | | | — | | | | (0.12 | ) | | | — | | | | (0.24 | ) | |
| From net realized gains | | | — | | | | — | | | | (0.54 | ) | | | (1.77 | ) | | | — | | | | — | | |
| Total Distributions to Shareholders | | | (0.30 | ) | | | (0.15 | ) | | | (0.54 | ) | | | (1.89 | ) | | | — | | | | (0.24 | ) | |
| Redemption Fees | |
| Redemption fees added to paid in capital (a)(c) | | | 0.00 | | | | 0.00 | | | | 0.00 | | | | 0.00 | | | | 0.00 | | | | 0.00 | | |
| Increase from regulatory settlements | | | 0.00 | (c) | | | 0.02 | | | | — | | | | — | | | | — | | | | — | | |
| Net Asset Value, End of Period | | $ | 22.17 | | | $ | 23.39 | | | $ | 17.99 | | | $ | 31.74 | | | $ | 27.68 | | | $ | 20.36 | | |
| Total Return (d) | | | (3.90 | )%(e) | | | 31.01 | % | | | (42.30 | )% | | | 21.50 | %(f) | | | 35.97 | %(f) | | | 15.60 | %(f) | |
| Ratios to Average Net Assets/Supplemental Data | |
| Net expenses (g) | | | 1.50 | %(h) | | | 1.56 | % | | | 1.54 | % | | | 1.49 | % | | | 1.58 | % | | | 1.70 | % | |
| Net investment income (g) | | | 0.76 | %(h) | | | 0.53 | % | | | 0.78 | % | | | 0.11 | % | | | 0.11 | % | | | 0.34 | % | |
| Waiver/Reimbursement | | | — | | | | — | | | | — | | | | 0.00 | %(i) | | | 0.02 | % | | | 0.10 | % | |
| Portfolio turnover rate | | | 18 | %(e) | | | 56 | % | | | 68 | % | | | 57 | % | | | 47 | % | | | 39 | % | |
| Net assets at end of period (000s) | | $ | 58,245 | | | $ | 64,664 | | | $ | 46,522 | | | $ | 48,538 | | | $ | 22,599 | | | $ | 10,219 | | |
(a) Per share data was calculated using the average shares outstanding during the period.
(b) Net investment income per share includes special dividends. The effect of these dividends amounted to $0.07 per share.
(c) Rounds to less than $0.01 per share.
(d) Total return at net asset value assuming all distributions reinvested and no initial sales charge or contingent deferred sales charge.
(e) Not annualized.
(f) Had the Advisor and/or Transfer Agent not waived fees and/or reimbursed a portion of expenses, total return would have been reduced.
(g) The benefits derived from custody fees paid indirectly had an impact of less than 0.01%.
(h) Annualized.
(i) Rounds to less than 0.01%.
| Class B Shares | | (Unaudited)
Six months
ended June 30, | | Year Ended December 31, | |
| Selected data for a share outstanding throughout each period | | 2010 | | 2009 | | 2008 | | 2007 | | 2006 | | 2005 | |
| Net Asset Value, Beginning of Period | | $ | 22.34 | | | $ | 17.16 | | | $ | 30.50 | | | $ | 26.73 | | | $ | 19.80 | | | $ | 17.36 | | |
| Income from Investment Operations | |
| Net investment income/(loss) (a) | | | 0.01 | | | | (0.01 | ) | | | 0.04 | | | | (0.13 | )(b) | | | (0.12 | ) | | | (0.03 | ) | |
| Net realized and unrealized gain/(loss) | | | (0.94 | ) | | | 5.17 | | | | (12.84 | ) | | | 5.67 | | | | 7.05 | | | | 2.61 | | |
| Total from Investment Operations | | | (0.93 | ) | | | 5.16 | | | | (12.80 | ) | | | 5.54 | | | | 6.93 | | | | 2.58 | | |
| Less Distributions to Shareholders | |
| From net investment income | | | (0.18 | ) | | | — | | | | — | | | | — | | | | — | | | | (0.14 | ) | |
| From net realized gains | | | — | | | | — | | | | (0.54 | ) | | | (1.77 | ) | | | — | | | | — | | |
| Total Distributions to Shareholders | | | (0.18 | ) | | | — | | | | (0.54 | ) | | | (1.77 | ) | | | — | | | | (0.14 | ) | |
| Redemption Fees | |
| Redemption fees added to paid in capital (a)(c) | | | 0.00 | | | | 0.00 | | | | 0.00 | | | | 0.00 | | | | 0.00 | | | | 0.00 | | |
| Increase from regulatory settlements | | | 0.00 | (c) | | | 0.02 | | | | — | | | | — | | | | — | | | | — | | |
| Net Asset Value, End of Period | | $ | 21.23 | | | $ | 22.34 | | | $ | 17.16 | | | $ | 30.50 | | | $ | 26.73 | | | $ | 19.80 | | |
| Total Return (d) | | | (4.16 | )%(e)(f) | | | 30.19 | %(f) | | | (42.68 | )% | | | 20.69 | %(f) | | | 35.00 | %(f) | | | 14.97 | %(f) | |
| Ratios to Average Net Assets/Supplemental Data | |
| Net expenses (g) | | | 2.20 | %(h) | | | 2.20 | % | | | 2.17 | % | | | 2.10 | % | | | 2.25 | % | | | 2.30 | % | |
| Net investment income/(loss) (g) | | | 0.06 | %(h) | | | (0.05 | )% | | | 0.16 | % | | | (0.45 | )% | | | (0.53 | )% | | | (0.16 | )% | |
| Waiver/Reimbursement | | | 0.10 | %(h) | | | 0.12 | % | | | — | | | | 0.01 | % | | | 0.04 | % | | | 0.28 | % | |
| Portfolio turnover rate | | | 18 | %(e) | | | 56 | % | | | 68 | % | | | 57 | % | | | 47 | % | | | 39 | % | |
| Net assets at end of period (000s) | | $ | 2,853 | | | $ | 3,887 | | | $ | 4,444 | | | $ | 11,941 | | | $ | 9,787 | | | $ | 6,594 | | |
(a) Per share data was calculated using the average shares outstanding during the period.
(b) Net investment income per share includes special dividends. The effect of these dividends amounted to $0.07 per share.
(c) Rounds to less than $0.01 per share.
(d) Total return at net asset value assuming all distributions reinvested and no contingent deferred sales charge.
(e) Not annualized.
(f) Had the Advisor and/or Transfer Agent not waived fees and/or reimbursed a portion of expenses, total return would have been reduced.
(g) The benefits derived from custody fees paid indirectly had an impact of less than 0.01%.
(h) Annualized.
See accompanying notes to financial statements.
85
Columbia Acorn International Select
| Class C Shares | | (Unaudited)
Six months
ended June 30, | | Year Ended December 31, | |
| Selected data for a share outstanding throughout each period | | 2010 | | 2009 | | 2008 | | 2007 | | 2006 | | 2005 | |
| Net Asset Value, Beginning of Period | | $ | 22.21 | | | $ | 17.08 | | | $ | 30.42 | | | $ | 26.70 | | | $ | 19.80 | | | $ | 17.38 | | |
| Income from Investment Operations | |
| Net investment income/(loss)(a) | | | (0.01 | ) | | | (0.06 | ) | | | 0.00 | (b) | | | (0.20 | )(c) | | | (0.15 | ) | | | (0.05 | ) | |
| Net realized and unrealized gain/(loss) | | | (0.95 | ) | | | 5.17 | | | | (12.80 | ) | | | 5.69 | | | | 7.05 | | | | 2.60 | | |
| Total from Investment Operations | | | (0.96 | ) | | | 5.11 | | | | (12.80 | ) | | | 5.49 | | | | 6.90 | | | | 2.55 | | |
| Less Distributions to Shareholders | |
| From net investment income | | | (0.13 | ) | | | — | | | | — | | | | — | | | | — | | | | (0.13 | ) | |
| From net realized gains | | | — | | | | — | | | | (0.54 | ) | | | (1.77 | ) | | | — | | | | — | | |
| Total Distributions to Shareholders | | | (0.13 | ) | | | — | | | | (0.54 | ) | | | (1.77 | ) | | | — | | | | (0.13 | ) | |
| Redemption Fees | |
| Redemption fees added to paid in capital (a)(b) | | | 0.00 | | | | 0.00 | | | | 0.00 | | | | 0.00 | | | | 0.00 | | | | 0.00 | | |
| Increase from regulatory settlements | | | 0.00 | (b) | | | 0.02 | | | | — | | | | — | | | | — | | | | — | | |
| Net Asset Value, End of Period | | $ | 21.12 | | | $ | 22.21 | | | $ | 17.08 | | | $ | 30.42 | | | $ | 26.70 | | | $ | 19.80 | | |
| Total Return (d) | | | (4.29 | )%(e) | | | 30.04 | % | | | (42.79 | )% | | | 20.53 | %(f) | | | 34.85 | %(f) | | | 14.77 | %(f) | |
| Ratios to Average Net Assets/Supplemental Data | |
| Net expenses (g) | | | 2.35 | %(h) | | | 2.42 | % | | | 2.34 | % | | | 2.29 | % | | | 2.38 | % | | | 2.45 | % | |
| Net investment income/(loss) (g) | | | (0.06 | )%(h) | | | (0.30 | )% | | | 0.01 | % | | | (0.68 | )% | | | (0.67 | )% | | | (0.30 | )% | |
| Waiver/Reimbursement | | | — | | | | — | | | | — | | | | 0.01 | % | | | 0.02 | % | | | 0.17 | % | |
| Portfolio turnover rate | | | 18 | %(e) | | | 56 | % | | | 68 | % | | | 57 | % | | | 47 | % | | | 39 | % | |
| Net assets at end of period (000s) | | $ | 10,168 | | | $ | 11,096 | | | $ | 9,747 | | | $ | 13,023 | | | $ | 7,060 | | | $ | 4,083 | | |
(a) Per share data was calculated using the average shares outstanding during the period.
(b) Rounds to less than $0.01 per share.
(c) Net investment income per share includes special dividends. The effect of these dividends amounted to $0.07 per share.
(d) Total return at net asset value assuming all distributions reinvested and no contingent deferred sales charge.
(e) Not annualized.
(f) Had the Advisor and/or Transfer Agent not waived fees and/or reimbursed a portion of expenses, total return would have been reduced.
(g) The benefits derived from custody fees paid indirectly had an impact of less than 0.01%.
(h) Annualized.
See accompanying notes to financial statements.
86
Columbia Acorn Family of Funds
Financial Highlights, continued
Columbia Acorn Select
| Class A Shares | | (Unaudited)
Six months
ended June 30, | | Year Ended December 31, | |
| Selected data for a share outstanding throughout each period | | 2010 | | 2009 | | 2008 | | 2007 | | 2006 | | 2005 | |
| Net Asset Value, Beginning of Period | | $ | 22.81 | | | $ | 13.77 | | | $ | 27.89 | | | $ | 26.18 | | | $ | 22.47 | | | $ | 20.83 | | |
| Income from Investment Operations | |
| Net investment loss (a) | | | (0.09 | ) | | | (0.14 | ) | | | (0.18 | ) | | | (0.15 | ) | | | (0.13 | ) | | | (0.09 | ) | |
| Net realized and unrealized gain/(loss) | | | (1.03 | ) | | | 9.18 | | | | (13.25 | ) | | | 2.50 | | | | 4.45 | | | | 2.32 | | |
| Total from Investment Operations | | | (1.12 | ) | | | 9.04 | | | | (13.43 | ) | | | 2.35 | | | | 4.32 | | | | 2.23 | | |
| Less Distributions to Shareholders | |
| From net investment income | | | — | | | | — | | | | — | | | | — | | | | (0.02 | ) | | | — | | |
| From net realized gains | | | — | | | | — | | | | (0.69 | ) | | | (0.64 | ) | | | (0.59 | ) | | | (0.59 | ) | |
| Total Distributions to Shareholders | | | — | | | | — | | | | (0.69 | ) | | | (0.64 | ) | | | (0.61 | ) | | | (0.59 | ) | |
| Net Asset Value, End of Period | | $ | 21.69 | | | $ | 22.81 | | | $ | 13.77 | | | $ | 27.89 | | | $ | 26.18 | | | $ | 22.47 | | |
| Total Return (b) | | | (4.91 | )%(c) | | | 65.65 | % | | | (49.31 | )%(d) | | | 8.92 | %(e) | | | 19.32 | %(e) | | | 10.78 | %(e) | |
| Ratios to Average Net Assets/Supplemental Data | |
| Net expenses (f) | | | 1.25 | %(g) | | | 1.30 | % | | | 1.24 | % | | | 1.19 | % | | | 1.24 | % | | | 1.26 | % | |
| Net investment loss (f) | | | (0.77 | )%(g) | | | (0.78 | )% | | | (0.80 | )% | | | (0.52 | )% | | | (0.54 | )% | | | (0.42 | )% | |
| Waiver/Reimbursement | | | — | | | | — | | | | — | | | | 0.00 | %(h) | | | 0.03 | % | | | 0.03 | % | |
| Portfolio turnover rate | | | 12 | %(c) | | | 19 | % | | | 28 | % | | | 14 | % | | | 21 | % | | | 19 | % | |
| Net assets at end of period (000s) | | $ | 461,681 | | | $ | 522,443 | | | $ | 395,794 | | | $ | 1,117,941 | | | $ | 940,857 | | | $ | 744,178 | | |
(a) Per share data was calculated using the average shares outstanding during the period.
(b) Total return at net asset value assuming all distributions reinvested and no initial sales charge or contingent deferred sales charge.
(c) Not annualized.
(d) Total return includes a voluntary reimbursement by the Advisor for a realized investment loss due to a trading error. This reimbursement increased total return and net asset value per share by 0.101% and $0.01, respectively.
(e) Had the Advisor and/or Transfer Agent not waived fees and/or reimbursed a portion of expenses, total return would have been reduced.
(f) The benefits derived from custody fees paid indirectly had an impact of less than 0.01%.
(g) Annualized.
(h) Rounds to less than 0.01%.
| Class B Shares | | (Unaudited)
Six months
ended June 30, | | Year Ended December 31, | |
| Selected data for a share outstanding throughout each period | | 2010 | | 2009 | | 2008 | | 2007 | | 2006 | | 2005 | |
| Net Asset Value, Beginning of Period | | $ | 21.41 | | | $ | 13.02 | | | $ | 26.57 | | | $ | 25.13 | | | $ | 21.71 | | | $ | 20.23 | | |
| Income from Investment Operations | |
| Net investment loss (a) | | | (0.16 | ) | | | (0.24 | ) | | | (0.31 | ) | | | (0.31 | ) | | | (0.28 | ) | | | (0.23 | ) | |
| Net realized and unrealized gain/(loss) | | | (0.96 | ) | | | 8.63 | | | | (12.55 | ) | | | 2.39 | | | | 4.29 | | | | 2.24 | | |
| Total from Investment Operations | | | (1.12 | ) | | | 8.39 | | | | (12.86 | ) | | | 2.08 | | | | 4.01 | | | | 2.01 | | |
| Less Distributions to Shareholders | |
| From net realized gains | | | — | | | | — | | | | (0.69 | ) | | | (0.64 | ) | | | (0.59 | ) | | | (0.53 | ) | |
| Net Asset Value, End of Period | | $ | 20.29 | | | $ | 21.41 | | | $ | 13.02 | | | $ | 26.57 | | | $ | 25.13 | | | $ | 21.71 | | |
| Total Return (b) | | | (5.23 | )%(c) | | | 64.44 | % | | | (49.62 | )%(d) | | | 8.22 | %(e) | | | 18.54 | %(e) | | | 10.01 | %(e) | |
| Ratios to Average Net Assets/Supplemental Data | |
| Net expenses (f) | | | 1.94 | %(g) | | | 2.01 | % | | | 1.87 | % | | | 1.79 | % | | | 1.91 | % | | | 1.99 | % | |
| Net investment loss (f) | | | (1.47 | )%(g) | | | (1.49 | )% | | | (1.43 | )% | | | (1.12 | )% | | | (1.21 | )% | | | (1.15 | )% | |
| Waiver/Reimbursement | | | — | | | | — | | | | — | | | | 0.01 | % | | | 0.03 | % | | | 0.03 | % | |
| Portfolio turnover rate | | | 12 | %(c) | | | 19 | % | | | 28 | % | | | 14 | % | | | 21 | % | | | 19 | % | |
| Net assets at end of period (000s) | | $ | 68,350 | | | $ | 88,004 | | | $ | 73,152 | | | $ | 199,182 | | | $ | 214,260 | | | $ | 206,441 | | |
(a) Per share data was calculated using the average shares outstanding during the period.
(b) Total return at net asset value assuming all distributions reinvested and no contingent deferred sales charge.
(c) Not annualized.
(d) Total return includes a voluntary reimbursement by the Advisor for a realized investment loss due to a trading error. This reimbursement increased total return and net asset value per share by 0.101% and $0.01, respectively.
(e) Had the Advisor and/or Transfer Agent not waived fees and/or reimbursed a portion of expenses, total return would have been reduced.
(f) The benefits derived from custody fees paid indirectly had an impact of less than 0.01%.
(g) Annualized.
See accompanying notes to financial statements.
87
Columbia Acorn Select
| Class C Shares | | (Unaudited)
Six months
ended June 30, | | Year Ended December 31, | |
| Selected data for a share outstanding throughout each period | | 2010 | | 2009 | | 2008 | | 2007 | | 2006 | | 2005 | |
| Net Asset Value, Beginning of Period | | $ | 21.25 | | | $ | 12.94 | | | $ | 26.46 | | | $ | 25.07 | | | $ | 21.69 | | | $ | 20.23 | | |
| Income from Investment Operations | |
| Net investment loss (a) | | | (0.17 | ) | | | (0.26 | ) | | | (0.34 | ) | | | (0.36 | ) | | | (0.31 | ) | | | (0.25 | ) | |
| Net realized and unrealized gain/(loss) | | | (0.95 | ) | | | 8.57 | | | | (12.49 | ) | | | 2.39 | | | | 4.28 | | | | 2.24 | | |
| Total from Investment Operations | | | (1.12 | ) | | | 8.31 | | | | (12.83 | ) | | | 2.03 | | | | 3.97 | | | | 1.99 | | |
| Less Distributions to Shareholders | |
| From net realized gains | | | — | | | | — | | | | (0.69 | ) | | | (0.64 | ) | | | (0.59 | ) | | | (0.53 | ) | |
| Net Asset Value, End of Period | | $ | 20.13 | | | $ | 21.25 | | | $ | 12.94 | | | $ | 26.46 | | | $ | 25.07 | | | $ | 21.69 | | |
| Total Return (b) | | | (5.27 | )%(c) | | | 64.22 | % | | | (49.71 | )%(d) | | | 8.04 | %(e) | | | 18.37 | %(e) | | | 9.91 | %(e) | |
| Ratios to Average Net Assets/Supplemental Data | |
| Net expenses (f) | | | 2.07 | %(g) | | | 2.14 | % | | | 2.04 | % | | | 1.98 | % | | | 2.04 | % | | | 2.08 | % | |
| Net investment loss (f) | | | (1.59 | )%(g) | | | (1.62 | )% | | | (1.60 | )% | | | (1.31 | )% | | | (1.34 | )% | | | (1.24 | )% | |
| Waiver/Reimbursement | | | — | | | | — | | | | — | | | | 0.00 | %(h) | | | 0.03 | % | | | 0.03 | % | |
| Portfolio turnover rate | | | 12 | %(c) | | | 19 | % | | | 28 | % | | | 14 | % | | | 21 | % | | | 19 | % | |
| Net assets at end of period (000s) | | $ | 83,706 | | | $ | 93,121 | | | $ | 70,962 | | | $ | 197,100 | | | $ | 173,152 | | | $ | 149,160 | | |
(a) Per share data was calculated using the average shares outstanding during the period.
(b) Total return at net asset value assuming all distributions reinvested and no contingent deferred sales charge.
(c) Not annualized.
(d) Total return includes a voluntary reimbursement by the Advisor for a realized investment loss due to a trading error. This reimbursement increased total return and net asset value per share by 0.101% and $0.01, respectively.
(e) Had the Advisor and/or Transfer Agent not waived fees and/or reimbursed a portion of expenses, total return would have been reduced.
(f) The benefits derived from custody fees paid indirectly had an impact of less than 0.01%.
(g) Annualized.
(h) Rounds to less than 0.01%.
See accompanying notes to financial statements.
88
Columbia Acorn Family of Funds
Financial Highlights, continued
Columbia Thermostat Fund
| Class A Shares | | (Unaudited)
Six months
ended June 30, | | Year Ended December 31, | |
| Selected data for a share outstanding throughout each period | | 2010 | | 2009 | | 2008 | | 2007 | | 2006 | | 2005 | |
| Net Asset Value, Beginning of Period | | $ | 10.90 | | | $ | 8.26 | | | $ | 12.31 | | | $ | 12.59 | | | $ | 12.49 | | | $ | 13.11 | | |
| Income from Investment Operations | |
| Net investment income (a) | | | 0.10 | | | | 0.11 | | | | 0.22 | | | | 0.49 | | | | 0.45 | | | | 0.39 | | |
| Net realized and unrealized gain/(loss) | | | (0.32 | ) | | | 2.53 | | | | (3.98 | ) | | | 0.53 | | | | 0.84 | | | | 0.29 | | |
| Total from Investment Operations | | | (0.22 | ) | | | 2.64 | | | | (3.76 | ) | | | 1.02 | | | | 1.29 | | | | 0.68 | | |
| Less Distributions to Shareholders | |
| From net investment income | | | (0.14 | ) | | | (0.00 | )(b) | | | (0.22 | ) | | | (0.51 | ) | | | (0.47 | ) | | | (0.39 | ) | |
| From net realized gains | | | — | | | | — | | | | (0.07 | ) | | | (0.79 | ) | | | (0.72 | ) | | | (0.91 | ) | |
| Total Distributions to Shareholders | | | (0.14 | ) | | | (0.00 | )(b) | | | (0.29 | ) | | | (1.30 | ) | | | (1.19 | ) | | | (1.30 | ) | |
| Net Asset Value, End of Period | | $ | 10.54 | | | $ | 10.90 | | | $ | 8.26 | | | $ | 12.31 | | | $ | 12.59 | | | $ | 12.49 | | |
| Total Return (c)(d) | | | (2.05 | )%(e) | | | 31.98 | % | | | (30.67 | )% | | | 8.19 | % | | | 10.56 | % | | | 5.25 | % | |
| Ratios to Average Net Assets/Supplemental Data | |
| Net expenses (f)(g) | | | 0.50 | %(h) | | | 0.50 | % | | | 0.50 | % | | | 0.50 | % | | | 0.50 | % | | | 0.50 | % | |
| Net investment income (g) | | | 1.76 | %(h) | | | 1.17 | % | | | 1.99 | % | | | 3.75 | % | | | 3.53 | % | | | 2.97 | % | |
| Waiver/Reimbursement | | | 0.24 | %(h) | | | 0.28 | % | | | 0.18 | % | | | 0.18 | % | | | 0.20 | % | | | 0.15 | % | |
| Portfolio turnover rate | | | 79 | %(e) | | | 17 | % | | | 130 | % | | | 128 | % | | | 66 | % | | | 96 | % | |
| Net assets at end of period (000s) | | $ | 41,507 | | | $ | 42,976 | | | $ | 41,032 | | | $ | 53,246 | | | $ | 58,013 | | | $ | 71,034 | | |
(a) Per share data was calculated using the average shares outstanding during the period. Recognition of net investment income by the Fund is affected by the timing of the declaration of dividends by the underlying investment companies in which the Fund invests.
(b) Rounds to less than $(0.01) per share.
(c) Total return at net asset value assuming all distributions reinvested and no initial sales charge or contingent deferred sales charge.
(d) Had the Advisor and/or Transfer Agent not waived fees and/or reimbursed a portion of expenses, total return would have been reduced.
(e) Not annualized.
(f) Does not include expenses of the investment companies in which the Fund invests.
(g) The benefits derived from custody fees paid indirectly had an impact of less than 0.01%.
(h) Annualized.
| Class B Shares | | (Unaudited)
Six months
ended June 30, | | Year Ended December 31, | |
| Selected data for a share outstanding throughout each period | | 2010 | | 2009 | | 2008 | | 2007 | | 2006 | | 2005 | |
| Net Asset Value, Beginning of Period | | $ | 10.93 | | | $ | 8.32 | | | $ | 12.38 | | | $ | 12.62 | | | $ | 12.51 | | | $ | 13.14 | | |
| Income from Investment Operations | |
| Net investment income (a) | | | 0.07 | | | | 0.06 | | | | 0.16 | | | | 0.42 | | | | 0.38 | | | | 0.31 | | |
| Net realized and unrealized gain/(loss) | | | (0.31 | ) | | | 2.55 | | | | (4.00 | ) | | | 0.54 | | | | 0.84 | | | | 0.28 | | |
| Total from Investment Operations | | | (0.24 | ) | | | 2.61 | | | | (3.84 | ) | | | 0.96 | | | | 1.22 | | | | 0.59 | | |
| Less Distributions to Shareholders | |
| From net investment income | | | (0.09 | ) | | | — | | | | (0.15 | ) | | | (0.41 | ) | | | (0.39 | ) | | | (0.31 | ) | |
| From net realized gains | | | — | | | | — | | | | (0.07 | ) | | | (0.79 | ) | | | (0.72 | ) | | | (0.91 | ) | |
| Total Distributions to Shareholders | | | (0.09 | ) | | | — | | | | (0.22 | ) | | | (1.20 | ) | | | (1.11 | ) | | | (1.22 | ) | |
| Net Asset Value, End of Period | | $ | 10.60 | | | $ | 10.93 | | | $ | 8.32 | | | $ | 12.38 | | | $ | 12.62 | | | $ | 12.51 | | |
| Total Return (b)(c) | | | (2.18 | )%(d) | | | 31.37 | % | | | (31.10 | )% | | | 7.71 | % | | | 9.91 | % | | | 4.56 | % | |
| Ratios to Average Net Assets/Supplemental Data | |
| Net expenses (e)(f) | | | 1.00 | %(g) | | | 1.00 | % | | | 1.00 | % | | | 1.00 | % | | | 1.06 | % | | | 1.10 | % | |
| Net investment income (f) | | | 1.21 | %(g) | | | 0.64 | % | | | 1.45 | % | | | 3.25 | % | | | 2.99 | % | | | 2.39 | % | |
| Waiver/Reimbursement | | | 0.31 | %(g) | | | 0.32 | % | | | 0.20 | % | | | 0.19 | % | | | 0.23 | % | | | 0.19 | % | |
| Portfolio turnover rate | | | 79 | %(d) | | | 17 | % | | | 130 | % | | | 128 | % | | | 66 | % | | | 96 | % | |
| Net assets at end of period (000s) | | $ | 27,358 | | | $ | 32,758 | | | $ | 36,673 | | | $ | 67,709 | | | $ | 72,367 | | | $ | 78,444 | | |
(a) Per share data was calculated using the average shares outstanding during the period. Recognition of net investment income by the Fund is affected by the timing of the declaration of dividends by the underlying investment companies in which the Fund invests.
(b) Total return at net asset value assuming all distributions reinvested and no contingent deferred sales charge.
(c) Had the Advisor and/or Transfer Agent not waived fees and/or reimbursed a portion of expenses, total return would have been reduced.
(d) Not annualized.
(e) Does not include expenses of the investment companies in which the Fund invests.
(f) The benefits derived from custody fees paid indirectly had an impact of less than 0.01%.
(g) Annualized.
See accompanying notes to financial statements.
89
Columbia Thermostat Fund
| Class C Shares | | (Unaudited)
Six months
ended June 30, | | Year Ended December 31, | |
| Selected data for a share outstanding throughout each period | | 2010 | | 2009 | | 2008 | | 2007 | | 2006 | | 2005 | |
| Net Asset Value, Beginning of Period | | $ | 10.91 | | | $ | 8.33 | | | $ | 12.37 | | | $ | 12.62 | | | $ | 12.51 | | | $ | 13.13 | | |
| Income from Investment Operations | |
| Net investment income (a) | | | 0.05 | | | | 0.03 | | | | 0.13 | | | | 0.39 | | | | 0.36 | | | | 0.29 | | |
| Net realized and unrealized gain/(loss) | | | (0.30 | ) | | | 2.55 | | | | (3.97 | ) | | | 0.53 | | | | 0.84 | | | | 0.29 | | |
| Total from Investment Operations | | | (0.25 | ) | | | 2.58 | | | | (3.84 | ) | | | 0.92 | | | | 1.20 | | | | 0.58 | | |
| Less Distributions to Shareholders | |
| From net investment income | | | (0.07 | ) | | | — | | | | (0.13 | ) | | | (0.38 | ) | | | (0.37 | ) | | | (0.29 | ) | |
| From net realized gains | | | — | | | | — | | | | (0.07 | ) | | | (0.79 | ) | | | (0.72 | ) | | | (0.91 | ) | |
| Total Distributions to Shareholders | | | (0.07 | ) | | | — | | | | (0.20 | ) | | | (1.17 | ) | | | (1.09 | ) | | | (1.20 | ) | |
| Net Asset Value, End of Period | | $ | 10.59 | | | $ | 10.91 | | | $ | 8.33 | | | $ | 12.37 | | | $ | 12.62 | | | $ | 12.51 | | |
| Total Return (b)(c) | | | (2.30 | )%(d) | | | 30.97 | % | | | (31.20 | )% | | | 7.36 | % | | | 9.72 | % | | | 4.49 | % | |
| Ratios to Average Net Assets/Supplemental Data | |
| Net expenses (e)(f) | | | 1.25 | %(g) | | | 1.25 | % | | | 1.25 | % | | | 1.25 | % | | | 1.25 | % | | | 1.25 | % | |
| Net investment income (f) | | | 0.98 | %(g) | | | 0.39 | % | | | 1.23 | % | | | 3.02 | % | | | 2.81 | % | | | 2.21 | % | |
| Waiver/Reimbursement | | | 0.27 | %(g) | | | 0.30 | % | | | 0.20 | % | | | 0.19 | % | | | 0.23 | % | | | 0.19 | % | |
| Portfolio turnover rate | | | 79 | %(d) | | | 17 | % | | | 130 | % | | | 128 | % | | | 66 | % | | | 96 | % | |
| Net assets at end of period (000s) | | $ | 19,014 | | | $ | 21,090 | | | $ | 24,383 | | | $ | 26,908 | | | $ | 27,375 | | | $ | 28,316 | | |
(a) Per share data was calculated using the average shares outstanding during the period. Recognition of net investment income by the Fund is affected by the timing of the declaration of dividends by the underlying investment companies in which the Fund invests.
(b) Total return at net asset value assuming all distributions reinvested and no contingent deferred sales charge.
(c) Had the Advisor and/or Transfer Agent not waived fees and/or reimbursed a portion of expenses, total return would have been reduced.
(d) Not annualized.
(e) Does not include expenses of the investment companies in which the Fund invests.
(f) The benefits derived from custody fees paid indirectly had an impact of less than 0.01%.
(g) Annualized.
See accompanying notes to financial statements.
90
Columbia Acorn Family of Funds
Notes to Financial Statements (Unaudited)
1. Nature of Operations
Columbia Acorn Fund, Columbia Acorn International, Columbia Acorn USA, Columbia Acorn International Select, Columbia Acorn Select and Columbia Thermostat Fund (the "Funds") are each a series of Columbia Acorn Trust (the "Trust"), an open-end management investment company organized as a Massachusetts business trust. The investment objective of each Fund is to seek long-term capital appreciation.
Columbia Thermostat Fund pursues its investment objective by investing in shares of other mutual funds. As a "fund of funds" under normal circumstances, the Fund allocates at least 95% of its net assets among a selected group of stock and bond mutual funds ("portfolio funds") according to the current level of the Standard & Poor's ("S&P") 500 Index in relation to predetermined ranges set by Columbia Wanger Asset Management, LLC (the "Advisor"). The Fund may invest up to 5% of its net assets plus any cash received that day in cash, repurchase agreements, high quality short-term paper and government securities.
Each Fund may issue an unlimited number of shares. Each Fund currently has four classes of shares: Class A, Class B, Class C and Class Z. Effective February 29, 2008, the Funds no longer offer Class B shares (other than through dividend reinvestment).
Class A shares are sold with a front-end sales charge. Class A shares bought without an initial sales charge in accounts aggregating $1 million up to $50 million at the time of purchase are subject to a 1.00% contingent deferred sales charge ("CDSC") if the shares are redeemed within 12 months of the date of purchase.
Class B shares are subject to a CDSC if redeemed within six years of purchase. Class B shares will convert to Class A shares automatically eight years after purchase.
Class C shares are offered at net asset value but are subject to a CDSC on redemptions made within one year after purchase.
Class Z shares are offered at net asset value. There are certain restrictions on who may purchase Class Z shares. Generally, Class Z shares of a Fund may be exchanged for shares of another fund distributed by Columbia Management Distributors, Inc. at no additional charge.
Columbia Acorn International and Columbia Acorn International Select impose a 2.00% redemption fee on shares that are redeemed within 60 days or less of purchase. Effective September 1, 2010, redemption fees will not be imposed on redemptions from either Fund. See the discussion of Fund policies regarding redemption fees in the Funds' prospectuses for more information.
The financial highlights for the Fund's Class Z shares are presented in a separate semi-annual report.
Investment income, realized and unrealized gains and losses, and certain fund-level expenses are allocated pro rata on the basis of the relative net assets of all classes, except that each class bears certain expenses specific to that class such as distribution services, transfer agency, and certain other class specific expenses. Differences in class expenses may result in payment of different dividend distributions for each class. All of the Funds' share classes have equal rights with respect to voting, subject to Fund or class specific matters.
2. Significant Accounting Policies
The preparation of financial statements in accordance with accounting principles generally accepted in the United States of America ("GAAP") requires management to make certain estimates and assumptions that affect the reported amounts of assets and liabilities, the disclosures of contingent assets and liabilities at the date of the financial statements and the reported amounts of revenue and expenses during the reporting period. Actual results could differ from those estimates.
>Security valuation
Securities of the Funds are valued at market value or, if a market quotation for a security is not readily available or is deemed not to be reliable because of events or circumstances that have occurred between the market quotation and the time as of which the security is to be valued, the security is valued at a fair value determined in good faith under consistently applied procedures established by the Board of Trustees. With respect to Columbia Thermostat Fund, investments in portfolio funds are valued at their net asset values as reported by the portfolio funds. A security traded on a securities exchange or in an over-the-counter market in which transaction prices are reported is valued at the last sales price at the time of valuation. A security traded principally on NASDAQ is valued at the NASDAQ official closing price. Mutual Funds and Exchange Traded Funds are valued at their closing net asset value as reported to NASDAQ . A security for which there is no reported sale on the valuation date is valued at the latest bid quotation. Short-term investments maturing in 60 days or less are valued at amortized cost, which approximates market value. A security for which a market quotation is not readily available and any other assets are valued at its fair value determined in good faith under consistently applied procedures established by the Board of Trustees. The Funds have retained an independent
91
statistical fair value pricing service that employs a systematic methodology to assist in the fair valuation process for securities principally traded in a foreign market in order to adjust for possible changes in value that may occur between the close of the foreign exchange and the time as of which the securities are to be valued. If a security is valued at fair value, that value may be different from the last quoted market price for the security.
Various inputs are used in determining the value of each Fund's investments, following the input prioritization hierarchy established by GAAP. These inputs are summarized in the three broad levels listed below:
• Level 1 – quoted prices in active markets for identical securities
• Level 2 – prices determined using other significant observable inputs (including quoted prices for similar securities, interest rates, prepayment speeds, credit risk and others)
• Level 3 – prices determined using significant unobservable inputs where quoted prices or observable inputs are unavailable or less reliable (including management's own assumptions about the factors market participants would use in pricing an investment)
The inputs or methodologies used for valuing securities are not necessarily an indication of the risk associated with investing in those securities.
Examples of the types of securities in which the Funds would typically invest and how they are classified within this hierarchy are as follows. Typical Level 1 securities include exchange traded domestic equities, mutual funds whose NAVs are published each day and exchange traded foreign equities that are not statistically fair valued. Typical Level 2 securities include exchange traded foreign equities that are statistically fair valued, forward foreign currency exchange contracts and short-term investments valued at amortized cost. Additionally, securities fair valued by the Fund's Valuation Committee that rely on significant observable inputs are also included in level 2. Typical Level 3 securities include any security fair valued by the Funds' Valuation Committee that relies on significant unobservable inputs.
On January 21, 2010, the Financial Accounting Standards Board issued an Accounting Standards Update, Fair Value Measurements and Disclosures (Topic 820): Improving Disclosures about Fair Value Measurements (the "Update"), which provides guidance on how investment assets and liabilities are to be valued and disclosed. Specifically, the Update requires reporting entities to disclose the input and valuation techniques used to measure fair value for both recurring and nonrecurring fair value measurements for Level 2 and Level 3 positions. The Update also requires that transfers between all levels (including Level 1 and Level 2) be disclosed on a gross basis (i.e., transfers out must be disclosed separately from transfers in), and requires disclosure of the reason(s) for the transfer. Additionally, purchases, sales, issuances and settlements must be disclosed on a gross basis in the Level 3 rollforward. The effective date of the Update is for interim and annual periods beginning after December 15, 2009; except for the requirement to provide the Level 3 activity for purchases, sales, issuances and settlements on a gross basis, which will be effective for interim and annual periods beginning after December 15, 2010. The Funds adopted the Update effective March 31, 2010.
>Repurchase agreements
Each Fund may engage in repurchase agreement transactions. Each Fund, through its custodian, receives delivery of underlying securities collateralizing repurchase agreements. The counterparty is required to maintain collateral that is at all times at least equal to the repurchase price including interest. In the event of default or bankruptcy by the counterparty to the agreement, realization and/or retention of the collateral may be subject to legal proceedings.
>Foreign currency translations
Values of investments denominated in foreign currencies are converted into U.S. dollars using the New York spot market rate of exchange at the time of valuation. Purchases and sales of investments and dividend and interest income are translated into U.S. dollars using the spot market rate of exchange prevailing on the respective dates of such transactions. The gain or loss resulting from changes in foreign exchange rates is included with net realized and unrealized gain or loss from investments, as appropriate.
>Forward foreign currency exchange contracts
Columbia Acorn International may enter into forward foreign currency exchange contracts in order to seek to minimize the risk from adverse changes in the relationship between the U.S. dollar and foreign currencies. A forward foreign currency exchange contract is a commitment to purchase or sell a foreign currency at a future date at a negotiated forward rate. Forward foreign currency exchange contracts are valued at the interpolated forward exchange rate of the underlying currencies and any market gain or loss, arising from the difference between the original value and the current value of such contract, is included as a component of unrealized gain/(loss) on the Statements of Operations. Open forward foreign
92
Columbia Acorn Family of Funds
Notes to Financial Statements (Unaudited), continued
currency exchange contracts, if any, are disclosed in the Notes to the Statement of Investments. As forward foreign currency exchange contracts are closed the resulting gain or loss, arising from the difference between the original value of the contract and the closing value of such contract, is included as a component of realized gain/(loss) on the Statements of Operations.
A forward foreign currency exchange contract would limit the risk of loss due to a decline in the value of a particular currency; however, it also would limit any potential gain that might result should the value of the currency increase instead of decrease. These contracts may involve market risk in excess of the unrealized gain or loss reflected on the Statements of Assets and Liabilities. In addition, a Fund could be exposed to counterparty risks if counterparties to the contracts are unable to meet the terms of their contracts. The counterparty risk exposure is, therefore, closely monitored and contracts are only executed with high credit quality financial institutions.
A Fund may use forward foreign currency exchange contracts to buy or sell a foreign currency when the Advisor believes it has exposure to a foreign currency which may suffer or enjoy a movement against another foreign currency to which the Fund has exposure. A Fund will not attempt to hedge all of its foreign portfolio positions.
For additional information on derivative instruments, please see Note 5.
>Securities lending
Each Fund may lend securities up to one-third of the value of its total assets to certain approved brokers, dealers and other financial institutions to earn additional income. In lending its securities, the Fund retains the benefits of owning the securities, including receipt of dividends or interest generated by the security. Each Fund also receives a fee for the loan. Each Fund has the ability to recall the loans at any time and could do so in order to vote proxies or to sell the loaned securities. Each loan is collateralized by cash that exceeds the value of the securities on loan. The market value of the loaned securities is determined daily at the close of business of each Fund and any additional required collateral is delivered to each Fund on the next business day. Each Fund has elected to invest the cash collateral in the Dreyfus Government Cash Management Fund, and the income earned is paid to each Fund, net of any fees remitted to Goldman Sachs Agency Lending as the lending agent and net of any borrower rebates. The Advisor does not retain any fees earned by the lending program. Generally, in the event of borrower default, a Fund has the right to use the collateral to offset any losses incurred. In the event a Fund is delayed or prevented from exercising its right to dispose of the collateral, there may be a potential loss to a Fund. Some of these losses may be indemnified by the lending agent. Each Fund bears the risk of loss with respect to the investment of collateral.
The net lending income earned in 2010 by each Fund is included in the Statements of Operations.
>Security transactions and investment income
Security transactions, investment income and shareholder fund transactions are accounted for on the trade date (date the order to buy or sell is executed) and dividend income and realized gain distributions from other funds are recorded on the ex-dividend date, except that certain dividends from foreign securities are recorded as soon as the information is available to the Funds. Interest income is recorded on the accrual basis and includes amortization of discounts on debt obligations when required for federal income tax purposes. Realized gains and losses from security transactions are recorded on an identified cost basis.
Awards, if any, from class action litigation related to securities owned may be recorded as a reduction of cost of those securities. If the applicable securities are no longer owned, the proceeds are recorded as realized gains.
The Funds estimate the tax character of distributions from real estate investment trusts ("REITs"). Distributions received in excess of income are recorded as a reduction of the cost of the related investments. If the applicable securities are no longer owned, any distributions received in excess of income are recorded as realized gains.
>Restricted securities
Restricted securities are securities that may only be resold upon registration under federal securities laws or in transactions exempt from registration. In some cases, the issuer of restricted securities has agreed to register such securities for resale at the issuer's expense either upon demand by the Funds or in connection with another registered offering of the securities. Many restricted securities may be resold in the secondary market in transactions exempt from registration. Such restricted securities may be determined to be liquid under criteria established by the Board of Trustees.
>Fund share valuation
Fund shares are sold and redeemed on a continuing basis at net asset value, subject to any applicable sales charge. Net asset value per share is determined daily as of the close of trading on the New York Stock Exchange ("NYSE") on each
93
day the NYSE is open for trading. Generally, income, expenses and realized and unrealized gain/(losses) of a Fund are allocated to each class proportionately on a daily basis for purposes of determining the net asset value of each class. The Rule 12b-1 service and distribution fees and transfer agency fees are charged to each specific class as expenses are incurred. Redemption fees are accounted for as an addition to paid in capital for purposes of determining the net asset value of each class.
>Custody fees/credits
Custody fees are reduced based on each Fund's cash balances maintained with the custodian. The amount is disclosed as a reduction of total expenses on the Statements of Operations.
>Federal income taxes
The Funds have complied with the provisions of the Internal Revenue Code available to regulated investment companies and, in the manner provided therein, distribute all their taxable income, as well as any net realized gain on sales of investments and foreign currency transactions reportable for federal income tax purposes. Columbia Thermostat Fund distributes all of its taxable income, as well as any net realized gain on sales of portfolio fund shares and any distributions of net realized gains received by the Fund from its portfolio funds, reportable for federal income tax purposes. Accordingly, the Funds paid no federal income taxes and no federal income tax provision was required.
>Foreign capital gains taxes
Realized gains in certain countries may be subject to foreign taxes at the fund level, at rates ranging from approximately 10% to 15%. The Funds accrue for such foreign taxes on net realized and unrealized gains at the appropriate rate for each jurisdiction.
>Distributions to Shareholders
Distributions to shareholders are recorded on the ex-dividend date.
>Indemnification
In the normal course of business, the Trust on behalf of the Funds enters into contracts that contain a variety of representations and warranties and that provide general indemnities. A Fund's maximum exposure under these arrangements is unknown, as this would involve future claims against the Fund. Also, under the Trust's organizational documents, the trustees and officers of the Trust are indemnified against certain liabilities that may arise out of their duties to the Trust. However, based on experience, the Funds expect the risk of loss due to these warranties and indemnities to be minimal.
3. Federal Tax Information
The tax character of distributions paid during the year ended December 31, 2009 was as follows:
| | | Ordinary
Income* | | Long-Term
Capital Gains | |
| (in thousands) | |
| Columbia Acorn Fund | | $ | 20,981 | | | $ | — | | |
| Columbia Acorn International | | | 60,207 | | | | — | | |
| Columbia Acorn USA | | | — | | | | — | | |
| Columbia Acorn International Select | | | 3,533 | | | | — | | |
| Columbia Acorn Select | | | — | | | | — | | |
| Columbia Thermostat Fund | | | 122 | | | | — | | |
*For tax purposes short-term capital gains distributions, if any, are considered ordinary income distributions.
The following capital loss carryforwards, determined as of December 31, 2009, may be available to reduce taxable income arising from future net realized gains on investments, if any, to the extent permitted by the Internal Revenue Code:
| | | Year of Expiration | | | |
| | | 2010 | | 2011-
2015 | | 2016 | | 2017 | | Total | |
| (in thousands) | |
Columbia
Acorn Fund | | $ | — | | | $ | — | | | $ | — | | | $ | 409,911 | | | $ | 409,911 | | |
Columbia Acorn
International | | | — | | | | — | | | | 135,487 | | | | 489,443 | | | | 624,930 | | |
Columbia
Acorn USA | | | 1,518 | * | | | — | | | | 76,008 | | | | 36,216 | | | | 113,742 | | |
Columbia Acorn
International Select | | | — | | | | — | | | | 30,442 | | | | 46,457 | | | | 76,899 | | |
Columbia
Acorn Select | | | — | | | | — | | | | 12,271 | | | | 115,445 | | | | 127,716 | | |
Columbia
Thermostat Fund | | | — | | | | — | | | | 5,193 | | | | 21,738 | | | | 26,931 | | |
*Remains from Columbia Acorn USA's merger with Stein Roe Small Company Growth Fund on 7/26/2002. Utilization of Stein Roe Small Company Growth Fund's losses could be subject to limitations imposed by the Internal Revenue Code.
Management is required to determine whether a tax position of the Funds is more likely than not to be sustained upon examination by the applicable taxing authority, including resolution of any related appeals or litigation processes, based on the technical merits of the position. The tax benefit to be recognized by the Funds is measured as the largest amount of benefit that is greater than fifty percent likely of being realized upon ultimate settlement. Management is not aware of any tax positions for which it is reasonably possible that the total amounts of unrecognized tax benefits will significantly change in the next twelve months. However, management's conclusions may be subject to review and adjustment at a later date based on factors including, but not limited to, new tax laws, regulations, and administrative interpretations (including relevant court decisions). The Funds' federal tax returns for the prior
94
Columbia Acorn Family of Funds
Notes to Financial Statements (Unaudited), continued
three fiscal years remain subject to examination by the Internal Revenue Service.
4. Transactions with Affiliates
CWAM is a wholly owned subsidiary of Columbia Management Investment Advisors, LLC ("CMIA"), (formerly, Riversource Investments, LLC), which in turn is a wholly owned subsidiary of Ameriprise Financial, Inc. ("Ameriprise Financial"). CWAM furnishes continuing investment supervision to the Funds and is responsible for the overall management of the Funds' business affairs.
After the close of business on April 30, 2010 (the "Closing"), Ameriprise Financial acquired from Bank of America Corporation ("BOA"), a portion of the asset management business of Columbia Management Group, LLC, including 100% of CWAM. On May 27, 2010, the shareholders of the Funds approved a new investment advisory agreement with CWAM to provide advisory services to the Funds. There were no changes to the Funds' advisory fee rate under the new agreement.
CWAM receives a monthly advisory fee based on each Fund's average daily net assets at the following annual rates:
Columbia Acorn Fund
| Average Daily Net Assets | | Annual
Fee Rate | |
| Up to $700 million | | | 0.74 | % | |
| $700 million to $2 billion | | | 0.69 | % | |
| $2 billion to $6 billion | | | 0.64 | % | |
| $6 billion and over | | | 0.63 | % | |
Columbia Acorn International
| Average Daily Net Assets | | Annual
Fee Rate | |
| Up to $100 million | | | 1.19 | % | |
| $100 million to $500 million | | | 0.94 | % | |
| $500 million and over | | | 0.74 | % | |
Columbia Acorn USA
| Average Daily Net Assets | | Annual
Fee Rate | |
| Up to $200 million | | | 0.94 | % | |
| $200 million to $500 million | | | 0.89 | % | |
| $500 million to $2 billion | | | 0.84 | % | |
| $2 billion to $3 billion | | | 0.80 | % | |
| $3 billion and over | | | 0.70 | % | |
Columbia Acorn International Select
| Average Daily Net Assets | | Annual
Fee Rate | |
| Up to $500 million | | | 0.94 | % | |
| $500 million and over | | | 0.90 | % | |
Columbia Acorn Select
| Average Daily Net Assets | | Annual
Fee Rate | |
| Up to $700 million | | | 0.85 | % | |
| $700 million to $2 billion | | | 0.80 | % | |
| $2 billion to $3 billion | | | 0.75 | % | |
| $3 billion and over | | | 0.70 | % | |
Columbia Thermostat Fund
| | | Annual
Fee Rate | |
| All Average Daily Net Assets | | | 0.10 | % | |
For the six months ended June 30, 2010, the Funds' annualized effective investment advisory fee rates were as follows:
| Columbia Acorn Fund | | | 0.64 | % | |
| Columbia Acorn International | | | 0.77 | % | |
| Columbia Acorn USA | | | 0.86 | % | |
| Columbia Acorn International Select | | | 0.94 | % | |
| Columbia Acorn Select | | | 0.82 | % | |
| Columbia Thermostat Fund | | | 0.10 | % | |
>Expense Limit
CWAM has voluntarily agreed to reimburse the ordinary operating expenses (exclusive of distribution and service fees, brokerage commissions, interest, taxes and extraordinary expenses, but inclusive of custodial charges relating to overdrafts, if any) after giving effect to any balance credits from the Funds' custodian, exceeding 1.45% annually of the average daily net assets for Columbia Acorn International Select and 1.35% annually of the average daily net assets for Columbia Acorn Select. This arrangement may be modified or terminated by either the Funds or CWAM on 30 days notice.
CWAM has contractually agreed to waive fees and/or reimburse expenses of Columbia Thermostat Fund so that the ordinary operating expenses (exclusive of distribution and service fees, interest and fees on borrowings, and expenses associated with the Fund's investment in other investment companies, but including custodian charges relating to overdrafts, if any), after giving effect to any balance credits from the Fund's custodian, will not exceed 0.25% annually of the Fund's average daily net assets through April 30, 2011. There is no guarantee that this arrangement will continue thereafter.
Expenses reimbursed by CWAM to Columbia Acorn International Select and Columbia Thermostat Fund for the six months ended June 30, 2010, were $1,586 and $146,782, respectively.
95
CWAM provides administrative services and receives an administration fee from the Funds at the following annual rates:
Columbia Acorn Trust
Aggregate Average Daily
Net Assets of the Trust: | | Annual
Fee Rate | |
| Up to $8 billion | | | 0.050 | % | |
| $8 billion to $16 billion | | | 0.040 | % | |
| $16 billion to $35 billion | | | 0.030 | % | |
| $35 billion to $45 billion | | | 0.025 | % | |
| $45 billion and over | | | 0.015 | % | |
For the six months ended June 30, 2010, each Fund's annualized effective administration fee rate was 0.04% of average daily net assets. Prior to the Closing, CWAM had delegated to Columbia Management Advisors, LLC ("CMA") an indirect, wholly owned subsidiary of BOA, responsibility to provide certain sub-administrative services to the Funds. Following the Closing, CMIA succeeded CMA as sub-administrator and began providing certain sub-administrative services to the Funds.
Prior to the Closing, Columbia Management Distributors, Inc., an indirect subsidiary of BOA, served as the Funds' distributor and principal underwriter. Following the Closing, Columbia Management Investment Distributors, Inc., (formerly, Riversource Fund Distributors, Inc.) ("CMID"), a wholly owned subsidiary of Ameriprise Financial, became the distributor of the Funds. There were no changes to the underwriting discount structure of the Funds or the service or distribution fee rates paid by the Funds as a result of the Closing.
For the six months ended June 30, 2010, Columbia Acorn Fund, Columbia Acorn International, Columbia Acorn USA, Columbia Acorn International Select, Columbia Acorn Select and Columbia Thermostat Fund have been advised that CMDI retained $186,932 in underwriting discounts in connection with redemptions of Class A shares and received CDSCs of $1,291, $124,189 and $24,045, in connection with Class A, Class B and Class C share redemptions, respectively.
Each Fund has adopted a Rule 12b-1 (distribution and service) plan which requires it to pay CMID a monthly service fee equal to 0.25% annually of the average daily net assets attributable to Class A, Class B and Class C shares and a monthly distribution fee equal to 0.50% and 0.75%, annually, of the average daily net assets attributable to Class B and Class C shares, respectively. CMID receives no compensation with respect to Class Z shares.
Prior to the Closing, Columbia Management Services, Inc., an indirect, wholly owned subsidiary of BOA, provided shareholder services to the Funds and contracted with Boston Financial Data Services ("BFDS") to serve as sub-transfer agent. Following the Closing, Columbia Management Investment Services Corp. ("CMIS"), (formerly, Riversource Service Corporation) a wholly owned subsidiary of Ameriprise Financial, became the transfer agent of the Funds. The transfer agent fee rates paid by the Funds did not change as a result of the change in transfer agent. For its services, each Fund pays CMIS a monthly fee at the annual rate of $17.00 per open account. CMIS also receives reimbursement for certain out-of-pocket expenses and sub-transfer agency expenses. The arrangement with BFDS has been continued by CMIS.
Certain officers and trustees of the Trust are also officers of CWAM. The Trust makes no direct payments to its officers and trustees who are affiliated with CWAM.
The Board of Trustees appointed a Chief Compliance Officer of the Trust in accordance with federal securities regulations. The Funds, along with other affiliated funds, pay their pro-rata share of the expenses associated with the Office of the Chief Compliance Officer. Those expenses are disclosed separately as "Chief compliance officer expenses" in the Statements of Operations.
The Trust offers a deferred compensation plan for its independent trustees. Under that plan, a trustee may elect to defer all or a portion of his or her compensation. Amounts deferred are retained by the Trust and may represent an unfunded obligation of the Trust. The value of amounts deferred is determined by reference to the change in value of Class Z shares of one or more series of the Trust or a money market fund specified by the trustee. Benefits under the deferred compensation plan are payable when the trustee ceases to be a member of the Board of Trustees.
An affiliated person of a Fund may include any company in which a Fund owns five percent or more of its outstanding voting shares. On June 30, 2010, Columbia Acorn Fund, Columbia Acorn International, Columbia Acorn USA and Columbia Acorn Select each held five percent or more of the outstanding voting securities of one or more companies. Details of investments in those affiliated companies are presented on pages 35, 36, 46, 57 and 68, respectively.
During the six months ended June 30, 2010, the Funds engaged in purchase and sale transactions with funds that have a common investment advisor (or affiliated investment advisors), common directors/trustees, and/or common officers.
96
Columbia Acorn Family of Funds
Notes to Financial Statements (Unaudited), continued
Those transactions complied with Rule 17a-7 under the Investment Company Act of 1940 and were as follows:
| | | Purchases | | Sales | |
| (in thousands) | |
| Columbia Acorn Fund | | $ | 4,215 | | | $ | — | | |
| Columbia Acorn International | | | 3,038 | | | | 1,715 | | |
| Columbia Acorn USA | | | 704 | | | | 1,016 | | |
| Columbia Acorn Select | | | 1,350 | | | | 2,783 | | |
5. Objectives and Strategies for Investing in Derivative Instruments
Columbia Acorn International uses derivatives instruments including forward foreign currency exchange contracts in order to meet its investment objectives. The Fund employs strategies in differing combinations to permit it to increase, decrease or change the level of exposure to market risk factors. The achievement of any strategy involving derivatives depends on analysis of various risk factors, and if the strategies for the use of derivatives do not work as intended, the Fund may not achieve its investment objectives.
In pursuit of its investment objectives, the Fund is exposed to the following market risks:
Foreign Exchange Rate Risk: Foreign exchange rate risk relates to the change in the U.S. dollar value of a security held that is denominated in a foreign currency. The U.S. dollar value of a foreign-currency-denominated security will decrease as the dollar appreciates against the currency, while the U.S. dollar value will increase as the dollar depreciates against the currency.
The following notes provide more detailed information about the derivative type held by the Columbia Acorn International:
Forward Foreign Currency Exchange Contracts
• The Fund entered into forward foreign currency exchange contracts to shift its investment exposure from one currency to another.
• The Fund used forward foreign currency exchange contracts to shift its U.S. dollar exposure in order to achieve a representative weighted mix of major currencies relative to its benchmark and/or to recover an underweight country exposure in its portfolio relative to its benchmark.
Forward foreign currency exchange contracts are agreements to exchange one currency for another at a future date at a specified price. These contracts are used to minimize the exposure to foreign exchange rate fluctuations during the period between the trade and settlement dates of the contract. The Fund may utilize forward foreign currency exchange contracts in connection with the settlement of purchases and sales of securities. The Fund may also enter into these contracts to reduce the exposure to adverse price movements in certain other foreign-currency-denominated assets. Contracts to buy are used to acquire exposure to foreign currencies, while contracts to sell are used to reduce the exposure to foreign exchange rate fluctuations. Forward foreign currency exchange contracts are valued daily at the current exchange rate of the underlying currency, resulting in unrealized gains (losses) which become realized at the time the forward foreign currency exchange contracts are closed or mature. Realized and unrealized gains (losses) arising from such transactions are included in net realized and unrealized gains (losses) on foreign currency transactions. The use of forward foreign currency exchange contracts does not eliminate fluctuations in the prices of the Fund's portfolio securities. While the maximum potential loss from such contracts is the aggregate face value in U.S. dollars at the time the contract was opened, exposure is typically limited to the change in value of the contract (in U.S. dollars) over the period it remains open. The Fund could also be exposed to risk that counterparties of the contracts may be unable to fulfill the terms of the contracts.
During the six months ended June 30, 2010, Columbia Acorn International entered into 80 forward foreign currency exchange contracts.
The following table is a summary of the value of the Columbia Acorn International's derivative instruments as of June 30, 2010.
Fair Value of Derivative Instruments
| | | Asset | |
| | Statement of Assets
and Liabilities | | Fair Value | |
| (in thousands) | |
| | | Unrealized appreciation on
forward foreign currency
exchange contracts | | $14,529 | |
| | | Liability | |
| | Statement of Assets
and Liabilities | | Fair Value | |
| (in thousands) | |
| | | Unrealized depreciation on
forward foreign currency
exchange contracts | | $(8,511) | |
97
The effect of derivative instruments on the Columbia Acorn International's Statement of Operations for the six months ended June 30, 2010 was as follows:
Amount of Realized Gain or (Loss) and Change in Unrealized Appreciation or (Depreciation) On Derivatives Recognized in Income
| | | Risk
Exposure | | Realized
Gain/(Loss) | | Change
In
Unrealized
Appreciation/
(Depreciation) | |
| (in thousands) | |
Forward foreign
currency
exchange
contracts | | Foreign Exchange
Rate Risk | | $ | 30,296 | | | $ | 3,534 | | |
6. Borrowing Arrangements
The Trust participates in a $150 million credit facility, along with another Trust managed by CWAM, which was entered into to facilitate portfolio liquidity. Under the facility, interest is charged to each participating fund based on its borrowings at a rate per annum equal to the higher of Federal Funds Rate or Overnight LIBOR plus 1.25%. In addition, a commitment fee of 0.15% per annum of the unutilized line of credit was accrued and apportioned among the participating funds based on their relative net assets. The commitment fee is included in "Other expenses" in the Statements of Operations. No amounts were borrowed by any Fund under this facility for the six months ended June 30, 2010. The Trust enters into this line of credit for one year durations. The Trust has secured the line of credit for the entire year of 2010.
7. Investment Transactions
The aggregate cost of purchases and proceeds from sales, other than short-term obligations, for the six months ended June 30, 2010, were:
Columbia Acorn Fund
| (in thousands) | |
| Investment securities | |
| Purchases | | $ | 2,076,779 | | |
| Proceeds from sales | | | 2,556,239 | | |
Columbia Acorn International
| (in thousands) | |
| Investment securities | |
| Purchases | | $ | 764,037 | | |
| Proceeds from sales | | | 444,140 | | |
Columbia Acorn USA
| (in thousands) | |
| Investment securities | |
| Purchases | | $ | 224,470 | | |
| Proceeds from sales | | | 235,047 | | |
Columbia Acorn International Select
| (in thousands) | |
| Investment securities | |
| Purchases | | $ | 68,968 | | |
| Proceeds from sales | | | 98,014 | | |
Columbia Acorn Select
| (in thousands) | |
| Investment securities | |
| Purchases | | $ | 329,807 | | |
| Proceeds from sales | | | 215,032 | | |
Columbia Thermostat Fund
| (in thousands) | |
| Investment securities | |
| Purchases | | $ | 98,677 | | |
| Proceeds from sales | | | 118,085 | | |
8. Redemption Fees
For the six months ended June 30, 2010, the redemption fees imposed by Columbia Acorn International and Columbia Acorn International Select amounted to approximately $192,065 and $7,827, respectively, and are accounted for as additions to paid in capital.
9. Regulatory Settlements with Third Parties
During the six months ended June 30, 2010, Columbia Acorn International and Columbia Acorn International Select received payments totaling $446,565 and $46,265, respectively, representing distributions from a fair fund established in connection with a regulatory settlement between the Securities and Exchange Commission and a third party broker dealer relating to alleged market timing and late trading in mutual funds, including the Funds. The payments have been included in "Increase from regulatory settlements" on the Statements of Changes in Net Assets.
10. Information Regarding Pending and Settled Legal Proceedings
In June 2004, an action captioned John E. Gallus et al. v. American Express Financial Corp. and American Express Financial Advisors Inc. was filed in the United States District Court for the District of Arizona. The plaintiffs allege that they are investors in several American Express Company (now known as RiverSource) mutual funds and they purport to bring the action derivatively on behalf of those funds under the Investment Company Act of 1940. The plaintiffs allege that fees allegedly paid to the defendants by the funds for investment advisory and administrative services are excessive. The plaintiffs seek remedies including restitution and rescission of investment advisory and distribution agreements. The plaintiffs voluntarily agreed to transfer this case to the United
98
Columbia Acorn Family of Funds
Notes to Financial Statements (Unaudited), continued
States District Court for the District of Minnesota (the District Court). In response to defendants' motion to dismiss the complaint, the District Court dismissed one of plaintiffs' four claims and granted plaintiffs limited discovery. Defendants moved for summary judgment in April 2007. Summary judgment was granted in the defendants' favor on July 9, 2007. The plaintiffs filed a notice of appeal with the Eighth Circuit Court of Appeals (the Eighth Circuit) on August 8, 2007. On April 8, 2009, the Eighth Circuit reversed summary judgment and remanded to the District Court for further proceedings. On August 6, 2009, defendants filed a writ of certiorari with the U.S. Supreme Court (the Supreme Court), asking the Supreme Court to stay the District Court proceedings while the Supreme Court considers and rules in a case captioned Jones v. Harris Associates, which involves issues of law similar to those presented in the Gallus case. On March 30, 2010, the Supreme Court issued its ruling in Jones v. Harris Associates, and on April 5, 2010, the Supreme Court vacated the Eighth Circuit's decision in the Gallus case and remanded the case to the Eighth Circuit for further consideration in light of the Supreme Court's decision in Jones v. Harris Associates. On June 4, 2010, the Eighth Circuit remanded the Gallus case to the District Court for further consideration in light of the Supreme Court's decision in Jones v. Harris A ssociates.
In December 2005, without admitting or denying the allegations, American Express Financial Corporation (AEFC, which is now known as Ameriprise Financial, Inc. (Ameriprise Financial)), entered into settlement agreements with the Securities and Exchange Commission (SEC) and Minnesota Department of Commerce (MDOC) related to market timing activities. As a result, AEFC was censured and ordered to cease and desist from committing or causing any violations of certain provisions of the Investment Advisers Act of 1940, the Investment Company Act of 1940, and various Minnesota laws. AEFC agreed to pay disgorgement of $10 million and civil money penalties of $7 million. AEFC also agreed to retain an independent distribution consultant to assist in developing a plan for distribution of all disgorgement and civil penalties ordered by the SEC in accordance with various undertakings detailed at http://www.sec.gov/litigation/admin/ia-2451.pdf. Ameriprise Financial and its affiliates have cooperated with the SEC and the MDOC in these legal proceedings, and have made regular reports to the RiverSource, Seligman and Threadneedle funds' Boards of Directors/Trustees.
Ameriprise Financial and certain of its affiliates have historically been involved in a number of legal, arbitration and regulatory proceedings, including routine litigation, class actions, and governmental actions, concerning matters arising in connection with the conduct of their business activities. Ameriprise Financial believes that the Funds are not currently the subject of, and that neither Ameriprise Financial nor any of its affiliates are the subject of, any pending legal, arbitration or regulatory proceedings that are likely to have a material adverse effect on the Funds or the ability of Ameriprise Financial or its affiliates to perform under their contracts with the Funds. Ameriprise Financial is required to make 10-Q, 10-K and, as necessary, 8-K filings with the Securities and Exchange Commission on legal and regulatory matters that relate to Ameriprise Financial and its affiliates. Copies of these filings may be obt ained by accessing the SEC website at www.sec.gov.
There can be no assurance that these matters, or the adverse publicity associated with them, will not result in increased fund redemptions, reduced sale of fund shares or other adverse consequences to the Funds. Further, although we believe proceedings are not likely to have a material adverse effect on the Funds or the ability of Ameriprise Financial or its affiliates to perform under their contracts with the Funds, these proceedings are subject to uncertainties and, as such, we are unable to estimate the possible loss or range of loss that may result. An adverse outcome in one or more of these proceedings could result in adverse judgments, settlements, fines, penalties or other relief that could have a material adverse effect on the consolidated financial condition or results of operations of Ameriprise Financial.
*****
CWAM and the Trustees of the Trust (collectively, the "Columbia defendants") were named as defendants in class and derivative complaints that were consolidated in a Multi-District Action (the MDL Action) in the federal district court of Maryland. These lawsuits contend that defendants permitted certain investors to market time their trades in certain Columbia Acorn Funds. The MDL Action is ongoing. However, all claims against the Trust and the Independent Trustees of the Trust have been dismissed.
Columbia Acorn Trust and CWAM are also defendants in a state court class action lawsuit that alleges, in summary, that the Trust and CWAM exposed shareholders of Columbia Acorn International to trading by market timers by allegedly: (a) failing to properly evaluate daily whether a significant event affecting the value of the Fund's securities had occurred after foreign markets had closed but before the calculation of the Fund's net asset value (NAV); (b) failing to implement the Fund's portfolio valuation and share pricing
99
policies and procedures; and (c) failing to know and implement applicable rules and regulations concerning the calculation of NAV (the Fair Valuation Lawsuit). The United States Court of Appeals for the Seventh Circuit ruled that the plaintiffs' state law claims were preempted under federal law, resulting in the dismissal of plaintiffs' complaint. Plaintiffs appealed the Seventh Circuit's ruling to the United States Supreme Court. The Supreme Court reversed the Seventh Circuit's ruling on jurisdictional grounds and the case was remanded to the state court.
On March 21, 2005, a class action complaint was filed against the Trust and CWAM seeking to rescind the CDSC assessed upon redemption of Class B shares of the Columbia Acorn Funds (the CDSC Lawsuit). In addition to the rescission of sales charges, plaintiffs seek recovery of actual damages, attorneys' fees and costs. The case was transferred to the MDL Action in the federal district court of Maryland.
On September 14, 2007, the plaintiffs and the Columbia defendants named in the MDL Action, including the Columbia family of funds, entered into a stipulation of settlement with respect to all Columbia-related claims in the MDL Action described above, including the CDSC and Fair Valuation Lawsuits.
On April 23, 2010, the parties to the MDL Action filed a motion seeking: (a) preliminary approval of the MDL settlements; (b) the conditional certification of the plaintiff class for purposes of settlement; (c) approval of the form and manner of giving notice to the plaintiff class of the proposed settlements; and (d) approval of the proposed schedule for various deadlines in connection with the final settlement hearing. The motion was presented to and approved by the court on May 7, 2010. The final hearing on the fairness of the settlements is scheduled for October 21, 2010.
CWAM believes that the lawsuits are not likely to materially affect its ability to provide investment management services to the Funds.
100
[Excerpt from:]
Columbia Acorn Trust
Management Fee Evaluation of the Senior Officer
Prepared Pursuant to the New York Attorney General's
Assurance of Discontinuance
December 2009
101
Introduction
The New York Attorney General's Assurance of Discontinuance ("Order") entered into by Columbia Management Advisors, LLC ("CMAI") and Columbia Management Distributors, Inc., ("CMDI") in February 2005, allows CMAI to manage or advise a mutual fund only if the trustees of the fund appoint a "Senior Officer" to perform specified duties and responsibilities. One of these responsibilities includes "managing the process by which proposed management fees (including but not limited to, advisory fees) to be charged the [funds] are negotiated so that they are negotiated in a manner which is at arms' length and reasonable and consistent with this Assurance of Discontinuance."
The Columbia Acorn Trust and Wanger Advisors Trust (collectively, the "Trusts") and each series thereof (the "Acorn Funds," "WAT Funds" or collectively, the "Funds") are overseen by the same Board of Trustees ("Board"). The Order provides that this Board must determine the reasonableness of proposed "management fees" by using either an annual competitive bidding process supervised by the Senior Officer or Independent Fee Consultant, or by obtaining "an annual independent written evaluation prepared by or under the direction of the Senior Officer or the Independent Fee Consultant."
"Management fees" are only part of the costs and expenses paid by mutual fund shareholders. Fund expenses can vary depending upon the class of shares held but usually include: (1) investment management or advisory fees to compensate analysts and portfolio managers for stock research and portfolio management, as well as the cost of operating a trading desk; (2) administrative expenses incurred to prepare registration statements and tax returns, calculate the funds' net asset values, maintain effective compliance procedures and perform recordkeeping services; (3) transfer agency costs for establishing accounts, accepting and disbursing funds, as well as overseeing trading in fund shares; (4) custodial expenses incurred to hold the securities purchased by the funds; and (5) distribution expenses, including commissions paid to brokers that sell the fund shares to investors.
Columbia Wanger Asset Management, L.P. ("CWAM"), is the adviser to the Funds, and at present is a part of Columbia Management Group ("Columbia"), an umbrella organization that also includes CMAI, Columbia Management Services, Inc. ("CMSI") and CMDI. Columbia is owned by Bank of America Corporation ("Bank of America").
The Proposed Change of Ownership
On September 29, 2009, Bank of America entered into a Purchase Agreement ("APA") with Ameriprise Financial, Inc. ("Ameriprise") providing for, among other things, the sale of CWAM to Ameriprise and the acquisition by Ameriprise of certain assets of Columbia. The Columbia assets to be acquired by Ameriprise include the functions currently performed by CMAI, CMSI and CMDI. Because some of Columbia's operations are supported by Bank of America staff and facilities outside of Columbia, Ameriprise and Bank of America entered into a Transition Services Agreement ("TSA") that, among other things, provides for the continuation of those services for a period of time. The parties contemplate a closing date of the APA in Spring 2010, and closing is conditioned upon the approval by the Board of a new advisory agreement between the Trusts and CWAM, as well as agreements with the entities that will succeed CMSI, CMDI and CMAI. These entities& #151;RiverSource Fund Services, Inc. ("RFS"), RiverSource Fund Distributors, Inc. ("RFD") and RiverSource Investments, LLC—are wholly owned subsidiaries of Ameriprise and currently support the RiverSource family of mutual funds. Therefore, if the sale is consummated as contemplated by the various agreements, CWAM's ownership will change from Bank of America to Ameriprise, as will the Funds' primary service providers.1
Columbia and Ameriprise have proposed that the Trusts continue, in substance, the existing advisory agreement governing portfolio management, and the administration services agreement governing certain administration and clerical services. They propose no material changes to these agreements, no change in services and no changes in fee levels, only those changes necessary to effect the change of ownership. The fees paid under these two agreements are referred to as "management fees." Other fund
1 The Funds' custodian is State Street Bank and Trust Company. No change in custodian is required by the APA nor is such a change contemplated at this time.
102
expenses will be governed by separate agreements, in particular agreements with two Ameriprise affiliates: RFD, the broker-dealer that will underwrite and distribute the Funds' shares, and RFS the Funds' proposed transfer agent.
While the proposed agreements themselves suggest no substantive changes in the services provided to the Funds, Ameriprise and Columbia have informed the Board that they intend to embark on a process of integrating the operations of the two organizations with respect to administration and other services. Among the objectives of that integration are the reduction of costs, and increased economies of scale. Further, CWAM will be subject to new management oversight by Ameriprise which, among other things, will establish the compensation structure for CWAM's portfolio managers and analysts.
Requirements of the Order
The Order applies to any successor to substantially all the assets of CMDI and CMAI. Under the Order, a fee evaluation must precede the execution of new advisory and administration services agreements; there is no express exception from this requirement for agreements that are intended solely to transfer ownership of the existing service providers. I have been advised by Columbia that it believes the Order requires the preparation of this fee evaluation.
In conformity with the terms of the Order and past evaluations, this evaluation addresses only the advisory and administration contracts, and does not extend to any proposed new underwriting and transfer agency agreements.
According to the Order, the Senior Officer's evaluation must consider at least the following:
(1) Management fees (including components thereof) charged to institutional and other clients of CWAM for like services;
(2) Management fees (including any components thereof) charged by other mutual fund companies for like services;
(3) Costs to CWAM and its affiliates of supplying services pursuant to the management fee agreements, excluding any intra-corporate profit;
(4) Profit margins of CWAM and its affiliates from supplying such services;
(5) Possible economies of scale as the Funds grow larger; and
(6) The nature and quality of CWAM's services, including the performance of each Fund.
In 2004, the Boards of the two Trusts, then separate groups, each appointed me Senior Officer under the Order. They also determined not to pursue a competitive bidding process and instead, charged me with the responsibility of evaluating the Funds' proposed advisory and administration fee contracts with CWAM in conformity with the requirements of the Order. In discharging their responsibilities, the independent Trustees have also consulted independent, outside counsel. The Board has asked that I prepare this evaluation.
2009 Evaluation
In May 2009, I submitted to the Board the fourth annual evaluation prepared under the Order. That evaluation, based on performance and fee data as of December 31, 2008, was considered by the Board in renewing the advisory and administration services agreements that were effective on July 31, 2009. That evaluation followed the same structure as the earlier studies. Some areas were given more emphasis, while others were given less. Still, the fundamental information gathered for that evaluation was largely the same as past years. That evaluation is referred to here as the "2009 Study."
Process and Independence
The objectives of the Order are to ensure the independent evaluation of the management fees paid by the Funds as well as to insure that all relevant factors are considered. In my view, this contract process has been conducted at arms-length and with independence
103
in gathering, considering and evaluating all relevant data. At the outset of the process, the Trustees sought and obtained from Ameriprise and Columbia a comprehensive compilation of data regarding Fund performance and expenses, adviser profitability, and other information. The Trustees, acting through their Performance Committee and the Ad Hoc Committee, evaluated this information thoroughly, and met often to discuss it. Performance and expense data was obtained from both Morningstar and Lipper, the leading consultants in this area. The rankings prepared by Morningstar and Lipper were independent and prepared in conformity with the methodologies employed by those organizations. Counsel for the Funds and the Independent Trustees considered, as did I, the terms and conditions of the existing contracts, and evaluated them in light of the proposed transaction.
In the course of its work, the Trustees also gave careful consideration to the conclusions and recommendations contained in the 2009 Study.
My evaluation of the advisory contracts was shaped, as it has been in the past, by my experience as Chief Compliance Officer of the Trusts ("CCO"). As CCO, I report solely to the Board and have no reporting obligation to, or employment relationship with, Columbia or its affiliates. I have commented on compliance matters in evaluating the quality of service provided by CWAM.
This Report, its supporting materials and the data contained in other materials submitted to the Ad Hoc and Performance Committees of the Board, in my view, provide a thorough factual basis upon which the Board, in consultation with independent counsel as it deems appropriate, may conduct management fee negotiations that are in the best interests of the Funds' shareholders.
The Fee Reductions Mandated under the Order
Under the terms of the Order, Columbia agreed to secure certain management fee reductions for the mutual funds advised by its affiliate investment advisers. In some instances, breakpoints were also established. Although neither CWAM nor the Trusts was a party to the Order, CWAM offered and the Board accepted certain advisory fee reductions during 2005. By the terms of the Order, these fees may not be increased before November 30, 2009, and under the Investment Company Act, may not be increased before March 2012 or later (other than for bona fide additional investment advisory services), if the closing date of the transaction is later than March 2010. I have used these advisory fee levels, as modified thereafter, in this evaluation because they are the fees in the current agreements that CWAM and Ameriprise propose should be continued. Hence, these fee levels are the starting point of an evaluation.
Conclusions
My review of the data and other material above leads to the following conclusions with respect to the factors identified in the Order.
A. Fund Performance
The Domestic Funds: The Acorn Fund has achieved good performance over the past five years, and achieved those results with less risk than its peers. Acorn Select and Wanger Select have enjoyed strong investment returns in the past year, resulting in improved rankings that place those funds near or in the top third of their peers over the trailing five year period. These results are achieved, however, with greater relative risk than the other domestic Funds. Acorn USA and its parallel, Wanger USA have not been as strong as the other Funds relative to their peers over this period, turning in a largely average performance, though both Funds have outperformed their benchmarks. Thermostat is unique and therefore difficult to assess, but now enjoys a Morningstar rank above its peer median. The overall trend for performance of the domestic Funds is pos itive, and further, all domestic Funds enjoy positive alpha, confirming that their portfolio managers add value to performance.
104
The International Funds: The international Funds experienced a challenging 12 month period relative to their peers, but their five year rankings remain at or above the median. These Funds have enjoyed periods of strong out-performance during that five year stretch. Further, they have outperformed their benchmarks during the past five years, and done so while exposing shareholders to less risk than competitors. Finally, all the international Funds enjoy positive alpha, again confirming the value of their portfolio managers.
B. Management Fees Relative to Peers
There is significant variance in management fee rankings across the Funds. Acorn International is the only fund that was ranked in the top quartile by both Morningstar and Lipper. The other Acorn funds tend to fall around the medians identified by one or the other service. The WAT funds are uniformly more expensive than their peers.
C. Management Fees Relative to Institutional Account and Other Mutual Fund Accounts
CWAM's focus is on its mutual funds. The few institutional accounts it does manage vary in rate structures. Some pay advisory fees commensurate with or higher than the Acorn and WAT funds. In a few instances, however, institutional accounts pay lower advisory fees than do the Acorn funds. One such institutional account is significant in size and has been under CWAM's management for over 31 years. Further, CWAM performs sub-advisory services for two mutual funds managed by RiverSource, a fund family operated by Ameriprise, at rates that are lower than those paid by the parallel Acorn funds, though sub-advisory services can differ from those necessary for the full support of a mutual fund.
D. Administrative Services
The Acorn and WAT funds' administrative fees are generally less competitive than are the fees charged by competitors, but these rankings suffer from a lack of uniformity in the scope of services encompassed by the fee. CWAM and CMAI provide excellent administrative support for all the Funds.
E. Costs and Benefits to CWAM and its Affiliates
CWAM's direct costs do not appear excessive. Overhead and indirect costs allocated to CWAM by its parent organizations, however, are significant and have varied considerably over the years. CWAM's affiliates report operating losses and therefore do not appear to enjoy excessive "fall out" benefits from CWAM's advisory agreement with the Funds. CWAM continues to enjoy substantial benefits from the use of "soft dollar" payments for research.
F. Profitability
CWAM's profit margins have declined in recent periods, as have the margins of many fund companies, but it still maintains margins that appear to be in the upper range of its competitors.
G. Economies of Scale
Economies of scale do exist at CWAM, and the Board has instituted breakpoints that reflect that reality. In the past two years, however, asset levels have generally declined, and sustained asset growth will be required to trigger additional fee reductions under the current schedule. Asset declines have not, however, resulted in significant fee increases.
105
H. Nature and Quality of Service
This category includes a variety of considerations that are difficult to quantify, yet can have a significant bearing on the performance of the Acorn and WAT funds. Several areas merit comment.
1. Capacity. CWAM has maintained its investment management capacity even in a difficult environment.
2. Compliance. CWAM has a reasonably designed compliance program that protects shareholders.
I. Process
In my opinion, the process of negotiating an advisory contract for the Funds has been conducted thoroughly and at arms' length. The Ad Hoc Committee has taken the steps necessary to assess the proposed change of ownership and recommended appropriate measures to protect Fund shareholders. It has also taken steps to encourage an agreement on an appropriate incentive plan for CWAM that will facilitate the continuity of management, motivate CWAM professionals and that will align their efforts with the interests of Fund shareholders. The Trustees have sufficient information to evaluate management's proposal, and negotiate contract terms that are in the best interests of fund shareholders.
****
Recommendations
I believe the Trustees should:
1. Continue to monitor closely the performance of Acorn USA and Wanger USA, to assess the impact of the portfolio changes implemented by the portfolio manager.
2. Focus their review on the WAT funds' management fee levels in relation to their peers, in particular the fees paid by Wanger Select, which are, in the views of both Morningstar and Lipper, significantly higher than their peers.
3. Take appropriate steps to insure that any integration of the two organizations does not adversely impact Fund shareholders, and continue their efforts to facilitate an agreement on an appropriate incentive plan for CWAM personnel that will both motivate them and align their interests with Fund shareholders.
4. Consider the fees paid by (sub-advisory fees) and to (revenue sharing payments) the proposed new parent organization, Ameriprise or its mutual funds, to identify and address all conflicts of interest.
Robert P. Scales
December 2009
106
[Excerpt from:]
Columbia Acorn Trust
Supplement to the
Management Fee Evaluation of the Senior Officer
Prepared Pursuant to the New York Attorney General's
Assurance of Discontinuance
April 2010
107
Introduction
In December 2009, I prepared a fee evaluation required under the New York Attorney General's Assurance of Discontinuance ("Order") entered into by Columbia Management Advisors, LLC ("CMAI") and Columbia Management Distributors, Inc., ("CMDI") in February 2005. That Order allows CMAI to manage or advise a mutual fund only if the trustees of the fund appoint a "Senior Officer" to perform specified duties and responsibilities. One of these responsibilities includes "managing the process by which proposed management fees (including but not limited to, advisory fees) to be charged the [funds] are negotiated so that they are negotiated in a manner which is at arms' length and reasonable and consistent with this Assurance of Discontinuance."
The Columbia Acorn Trust and Wanger Advisors Trust (collectively, the "Trusts") and each series thereof (the "Acorn Funds," "WAT Funds" or collectively, the "Funds") are overseen by the same Board of Trustees ("Board"). The Order provides that this Board must determine the reasonableness of proposed "management fees" by using either an annual competitive bidding process supervised by the Senior Officer or Independent Fee Consultant, or by obtaining "an annual independent written evaluation prepared by or under the direction of the Senior Officer or the Independent Fee Consultant."
Columbia Wanger Asset Management, L.P. ("CWAM"), is the adviser to the Funds, and at present is a part of Columbia Management Group ("Columbia"), an umbrella organization that also includes CMAI, Columbia Management Services, Inc. ("CMSI") and CMDI. Columbia is owned by Bank of America Corporation ("Bank of America").
On September 29, 2009, Bank of America entered into a Purchase Agreement ("APA") with Ameriprise Financial, Inc. ("Ameriprise") providing for, among other things, the sale of CWAM to Ameriprise and the acquisition by Ameriprise of certain assets of Columbia. The parties contemplate a closing date of the APA in Spring 2010, and closing is conditioned upon the approval by the Board of a new advisory agreement between the Trusts and CWAM, as well as agreements with the entities that will succeed CMSI, CMDI and CMAI. These entities—RiverSource Fund Services, Inc. ("RFS"), RiverSource Fund Distributors, Inc. ("RFD") and RiverSource Investments, LLC—are wholly owned subsidiaries of Ameriprise and currently support the RiverSource family of mutual funds. Therefore, if the sale is consummated as contemplated by the various agreements, CWAM's ownership will change from Bank of America to Ameriprise, as will the Funds' primary s ervice providers.
Ameriprise, through various separate accounts ("Accounts") established by certain of its insurance company affiliates, is currently an investor in the WAT Funds on behalf of contract holders in variable insurance policies and variable annuity contracts (together, the "Contracts") that Ameriprise or its affiliates have marketed to their clients. In the WAT structure, the insurance companies purchase shares in the WAT Funds on behalf of the Accounts, which fund the Contracts. The insurance company enters into a participation agreement with Wanger Advisors Trust to purchase shares on behalf of its Accounts. The Accounts are the actual investors in the Wanger Funds, not the individual contract holders. Through this structure, Ameriprise controlled Accounts hold approximately $2 billion or two-thirds of the WAT Funds' total assets; approximately nine other insurance companies also participate in the WAT Funds and hold the remaining a ssets in those Funds. Ameriprise also maintains a small account with CWAM that is a sub-account for a RiverSource mutual fund. This sub-account is not subject to oversight by the WAT or Acorn Board.
Columbia and Ameriprise have proposed that the Trusts continue, in substance, the existing advisory agreement governing portfolio management, and the administration services agreement governing certain administration and clerical services. They propose no change in services and no changes in fee levels, only those changes necessary to effect the change of ownership. The fees paid under these two agreements are referred to as "management fees."
Reasons for this Supplement
This Supplement is prompted by notice given by Ameriprise, after completion of the fee evaluation in December, that following the closing of the transaction, it anticipates a redemption of approximately $1 billion of its clients' investments in two of the WAT
108
Funds (Wanger USA and Wanger International), and re-investment of most of the proceeds in one or more RiverSource mutual funds; CWAM will sub-advise these funds in two new sub-accounts at CWAM and effect investment strategies substantially identical to those pursued by the WAT Funds from which those funds were redeemed. One of the sub-accounts will parallel WAT International/Acorn International, and the other Wanger USA/Acorn USA. Ameriprise has advised the Board of the sub-advisory fees to be paid to CWAM and such sub-advisory fees will be lower than the advisory fee paid to CWAM by the parallel WAT Fund. Sub-advised accounts of this kind are generally considered institutional accounts and sub-advisory services are priced differently (and usually lower) than the advisory fees for mutual funds that are not sub-advised.
The Order and the Investment Company Act require fund trustees to consider, among other things, the proposed management fees (including components thereof) charged to institutional and other clients of the adviser for like services. As the Fee Evaluation notes, CWAM historically has maintained very few institutional accounts with relatively few assets under management. The new Ameriprise accounts are, therefore, a departure from past practice at CWAM.
Ameriprise's intentions pose the following issues with respect to assessing the reasonableness of the management fee proposed by Ameriprise for the WAT and Acorn Funds:
1. How do the Funds' fees compare to the fees paid by the parallel institutional accounts?
2. What impact might the redemption have on the fees paid by the shareholders who remain in the WAT Funds after the Ameriprise action?
3. Would expanded assets in the institutional accounts strain CWAM's limited capacity to manage the Acorn and WAT Funds?
This Supplement is intended solely to address these points as additional information for consideration by the Trustees in assessing the reasonableness of the management fees proposed by Ameriprise.
****
Conclusions
The conclusions and recommendations in the December 2009 Fee Evaluation remain valid today. Consideration of the Ameriprise redemption proposal leads to the following additional conclusions and recommendations.
A. Reasonableness of the Advisory Fees and Related Considerations
CWAM will soon manage assets in a sub-advised account at fee levels that reflect a substantial discount to the parallel mutual fund. Ameriprise has set forth the differences in services that support its claim that this divergence in fees is justified. These justifications should be revisited by the Trustees. In addition, the redemption will result in higher fees for remaining participants in the WAT Funds, and will result in brokerage and other expenses for Fund participants. These costs should also be a part of the Trustees' calculus in assessing fees. Lastly, the prospect of increased assets for CWAM management raises potential future issues of investment capacity.
B. Process
In my opinion, the process of negotiating an advisory contract for the Funds has been conducted thoroughly and at arms' length. The Board's Contract Committee and its Ad Hoc Committee engaged in a careful assessment of the repercussions of the
109
Ameriprise redemption proposal, assessed as best as possible its potential costs, and revisited the breakpoint schedules of the WAT and Acorn Funds to determine whether WAT Fund participants are treated equitably in relation to Acorn Fund shareholders. It also gave consideration to the fee differential between institutional and mutual fund accounts. The Trustees met on a number occasions with me and with counsel, and gave close attention to a variety of materials including data submitted by Ameriprise and the legal analysis of counsel. The Trustees have sufficient information to evaluate management's proposals, and negotiate contract terms that are in the best interests of fund shareholders. Lastly, the Trustees considered the recommendations set forth below and the Contract Committee adopted them as appropriate measures to protect shareholders.
Recommendations
In light of the developments discussed in this Supplement, I recommend that the Trustees:
1. Consider imposing an expense cap on Wanger International and Wanger USA that will insulate those participants who remain after the Ameriprise redemption from the impact of increased advisory fees.
2. Consider including in the advisory or related contracts with Ameriprise a provision requiring Ameriprise to reimburse the direct costs of its redemption, insulating remaining Fund participants from the commission and other expenses that will be required to effect the redemption.
3. Consider seeking an agreement on the part of Ameriprise to seek Board approval of new institutional and sub-advised accounts that will result in increased assets under management at CWAM, thereby protecting existing investors from dilution of CWAM's limited investment management capacity.
Robert P. Scales
April 2010
110
Board Approval of the Proposed Investment Advisory Agreement
The Board of Trustees unanimously approved the proposed Investment Advisory Agreement with Columbia Wanger Asset Management, LLC ("Columbia WAM") (the "Proposed Advisory Agreement") for each Fund of the Trust at meetings held on February 24, 2010 and April 6, 2010.
The Ad Hoc Committee on the Sale of Columbia Management Group of the Board and the Contract Committee of the Board (together, the "Committees"), which are comprised solely of Trustees who have no direct or indirect interest in the Proposed Advisory Agreement and who are not "interested persons" (as defined in the Investment Company Act of 1940, as amended (the "1940 Act")), of the Trust (the "Independent Trustees"), and all Trustees received and reviewed a substantial amount of information provided by Columbia WAM and Ameriprise Financial, Inc. ("Ameriprise") in response to requests from the Independent Trustees and their independent legal counsel. Throughout the process, the Trustees had numerous opportunities to ask questions of and request additional materials from Columbia WAM and Ameriprise.
During each meeting at which the Committees or the Independent Trustees considered the Proposed Advisory Agreement, they met in executive session with their independent legal counsel. The Committees also met separately with representatives of Ameriprise, Columbia Management Group, LLC ("CMG") and Columbia WAM management on several different occasions. In all, one or other of the Committees convened formally on 22 separate occasions to consider the sale of a portion of the asset management business of CMG, including 100% of Columbia WAM, by Bank of America Corporation ("Bank of America") to Ameriprise (the "Transaction"), and convened informally on many other occasions. The Board and/or some or all of the Independent Trustees met on at least 6 other occasions to receive the Committees' status reports on the Transaction, receive presentations from Ameriprise and Columbia WAM representatives, and to discuss outstanding issues. In a ddition, the Independent Trustees' counsel and the Trust's Chief Compliance Officer conducted on-site due diligence sessions at Ameriprise. As they considered the Proposed Advisory Agreement, the Independent Trustees were advised by independent legal counsel.
The Trustees reviewed the Proposed Advisory Agreement, as well as certain information obtained through Ameriprise's responses to initial and supplemental questionnaires prepared at the request of the Trustees by counsel to the Funds and independent legal counsel to the Independent Trustees. In addition, the Trustees reviewed the Management Fee Evaluation dated December 2009 and the Supplement thereto dated April 2010 (the "Fee Evaluation") prepared by the Trust's chief compliance officer, senior vice president and general counsel, who also serves as the Trust's "Senior Officer," as contemplated by the Assurance of Discontinuance dated February 9, 2005 among affiliates of Columbia WAM and the Office of the New York Attorney General. Finally, the Trustees considered certain additional contractual protections they had obtained from Ameriprise in the event of a material compliance violation or harm caused to shareholders during the conversion of certain operational services as a result of the Transaction.
The materials reviewed by the Committees and the Trustees included, among other items, (i) information on the investment performance of each Fund and of independently selected peer groups of funds and of the Fund's performance benchmarks over various time periods, (ii) information on each Fund's advisory fees and other expenses, including information comparing the Fund's fees and expenses to those of peer groups of funds and information about any applicable expense limitations and fee breakpoints, (iii) data on sales and redemptions of Fund shares, and (iv) information on the profitability to Columbia WAM and Ameriprise, as well as potential "fall-out" or ancillary benefits that Columbia WAM and its affiliates may receive as a result of their relationships with the Funds. The Trustees also considered other information such as (i) Columbia WAM's financial condition, (ii) each Fund's investment objective and strategy, (iii) the si ze, education and experience of Columbia WAM's investment staff and its use of technology, external research and trading cost measurement tools, (iv) information on Ameriprise's approach to retention and compensation of portfolio managers and the terms of the new incentive compensation plan for Columbia WAM investment personnel, (v) the allocation of the Funds' brokerage, and the use of "soft" commission dollars to pay for research products and services, (vi) the resources devoted to, and the record of compliance with, the Funds' investment policies and restrictions, policies on personal securities transactions and other compliance policies, and (vii) Ameriprise's management structure, financial condition and its intentions for managing the Funds and the respective service providers.
In considering whether to approve the Proposed Advisory Agreement, the Trustees reviewed and analyzed various factors that they determined were relevant, none of which by itself was considered dispositive. However, the material factors and conclusions that formed the basis for the Trustees' determination to approve the Proposed Advisory Agreement are discussed separately below.
111
Nature, quality and extent of services. The Trustees reviewed the expected nature, quality and extent of the services to be provided by Columbia WAM and its affiliates to the Funds under the Proposed Advisory Agreement, taking into account the investment objective and strategy of each Fund. In addition, the Trustees reviewed the available resources and key personnel of Columbia WAM and Ameriprise, especially those providing investment management services to the Funds. The Trustees also considered other services to be provided to the Funds by Columbia WAM, including: managing the execution of portfolio transactions and selecting broker-dealers for those transactions; monitoring adherence to the Funds' investment restrictions; producing shareholder reports; providing support services for the Board and committees of the Board; communicating with sharehol ders; serving as the Funds' administrator; and overseeing the activities of the Funds' other service providers, including monitoring for compliance with various policies and procedures as well as applicable securities laws and regulations. The Trustees reviewed each of these factors in light of the expected change of control of Columbia WAM and the likelihood of possible changes as a result of the Transaction.
In addition, in connection with the Transaction, the Board considered:
• the reputation, financial strength, regulatory histories and resources of Ameriprise and its affiliates;
• the terms of the Proposed Advisory Agreement, including the difference between the Current and Proposed Advisory Agreements, as set forth in this Proxy Statement, including that Columbia WAM had agreed to a higher standard of care for non-investment services in the Proposed Advisory Agreement;
• the terms and conditions of other agreements and arrangements relating to the future operations of the Funds, including the Underwriting Agreement and the Transition Services Agreement, both between Ameriprise and Bank of America; the Administration Services Agreement, between Columbia WAM and the Funds; the Transfer, Dividend Disbursing and Shareholders' Servicing Agent Agreement, between RiverSource Services Corporation and the Funds; the Distribution Agreement between RiverSource Fund Distributors, Inc. and the Funds; and the Transition, Integration and Conversion Principles Agreement and the Compliance Agreement, both between Ameriprise and the Funds;
• that the Trustees recently had completed a full annual review of the Current Advisory Agreement for each Fund under the 1940 Act, and had determined that they were satisfied with the nature, extent and quality of services provided thereunder and that they had determined that the management fees were reasonable in relation to the services rendered; and
• that Ameriprise and Bank of America, and not the Funds, would bear all costs of obtaining approvals of the Proposed Advisory Agreement, including legal and Trustee fees and costs resulting from the Transaction.
The Trustees concluded that the expected nature, quality and extent of the services to be provided by Columbia WAM to each Fund under the Proposed Advisory Agreement were appropriate for the Funds. They also concluded that Columbia WAM currently had sufficient personnel, with appropriate education and experience, to serve the Funds effectively, and that the firm had demonstrated its continuing ability to attract and retain well-qualified personnel. The Trustees also believed that Columbia WAM investment personnel would continue to be compensated pursuant to a plan that was designed to align their interests with those of Fund shareholders. The Trustees also considered that Columbia WAM had maintained its investment management capacity and resources throughout a difficult economic environment. In addition, they took note of the quality of Columbia WAM's compliance record. The Trustees also took into consideration that Ameriprise h ad offered its assurances that the services provided to the Funds following the Transaction would be consistent with or better than the manner and level at which such services were currently being performed for the Funds and that there would be no diminution of services to the Funds or their shareholders as a result of the Transaction. In this regard, the Trustees considered that certain current senior executives of CMG who are currently responsible for oversight of certain services provided to the Funds would continue to oversee those services after the closing of the Transaction. The Trustees also believed that the higher standard of care in the Proposed Advisory Agreement would benefit shareholders. The Trustees further recognized that the investment personnel of Columbia WAM would, effective upon a change of control of Columbia WAM to Ameriprise, be subject to employment agreements and other terms of employment created for the purpose of retaining skilled investment personnel. Assuming such personnel rem ain in place following the change in control, the Trustees concluded that the Transaction would not result in a diminution of investment services provided to the Funds.
112
Board Approval of the Proposed Investment Advisory Agreement, continued
Performance of the Funds. The Trustees received and considered detailed performance information at various meetings of the Board and of the Investment Performance Analysis Committee of the Board throughout the year in addition to performance information considered in connection with the Transaction. They reviewed information comparing each Fund's performance with that of its benchmark(s) and with the performance of comparable funds and peer groups as identified by Lipper Inc. ("Lipper") and Morningstar, Inc. ("Morningstar"). The Trustees evaluated the performance of the Funds over various time periods. However, they gave somewhat more consideration to the rolling three-year performance of each Fund.
More particularly, with respect to the domestic Funds, the Trustees noted that Columbia Acorn Fund and Columbia Acorn Select outperformed their respective peer group medians for the three-year period ended September 30, 2009. Columbia Acorn Fund outperformed its benchmark, while Columbia Acorn Select underperformed its benchmark, over the same three-year period. Columbia Acorn USA underperformed its peer group medians but outperformed its benchmark over the three-year period. The Trustees considered that the Columbia Thermostat Fund's Morningstar ranking placed it ahead of its peer group median for the three-year period, although they discussed that the Fund was unique and that the peer group selected by Morningstar may have different investment policies and strategies. For the three-year period, Columbia Thermostat Fund underperformed the 50/50 Blended Benchmark, an equally weighted custom composite of the S&P 500® Inde x and the Barclays Capital U.S. Aggregate Bond Index, the Fund's primary equity and debt indexes, respectively, established by Columbia WAM. For the five-year period ended September 30, 2009, Columbia Acorn Fund, Columbia Acorn USA and Columbia Acorn Select outperformed or equaled their respective peer group medians and each outperformed its primary benchmark, while Columbia Thermostat Fund outperformed its Morningstar peer group median but underperformed the 50/50 Blended Benchmark.
With respect to the international Funds, the Trustees considered that Columbia Acorn International and Columbia Acorn International Select both outperformed their Morningstar peer group medians and benchmarks for the three-year and five-year periods ended September 30, 2009. Columbia Acorn International Select also outperformed its Lipper peer group medians for the three-year and five-year periods, while Columbia Acorn International equaled its Lipper peer group medians for the same periods.
The Trustees concluded that, although past performance is not necessarily indicative of future results, the strong overall longer-term performance record of the Funds was an important factor in the evaluation of the expected quality of services to be provided by Columbia WAM under the Proposed Advisory Agreement for each Fund and also supported approval.
Costs of Services and Profits Realized by Columbia WAM. The Trustees noted that Ameriprise and Columbia WAM were not proposing any changes in investment advisory or administration fees or total operating expenses in connection with the Transaction. At various Committee and Board meetings and other informal meetings, the Trustees examined detailed information on the fees and expenses of each Fund in comparison to information for comparable funds provided by Lipper and Morningstar. The Trustees reviewed the observations in the Fee Evaluation relating to the lack of uniformity in the Funds' rankings, but noted that in general, the fees were close to or below the median peer group rank. As noted in the Fee Evaluation, the actual advisory fees paid by Columbia Acorn Select and Columbia Acorn International Select were higher than the median advisory fee of the Funds' Morningstar and Lipper peer groups and the actual advisory fee paid by Columbia Acorn USA was higher than the median advisory fee of the Fund's Morningstar peer group, but not of its Lipper peer group. The actual advisory fees paid by Columbia Acorn Fund, Columbia Acorn International and Columbia Thermostat Fund were lower than the median advisory fee of the Funds' Morningstar and Lipper peer groups. Total management fees for three of the six Funds, however, were equal to or lower than their respective Morningstar peer group medians, and total management fees for three of the six Funds were equal to or lower than their respective Lipper peer group medians. The Trustees also considered that the total expenses paid by investors compared to total expenses charged by other peer funds, which they also considered to be a meaningful comparison.
The Trustees reviewed the analysis of the historic profitability of Columbia WAM in serving as each Fund's investment adviser and of Columbia WAM and its affiliates in their relationships with each Fund, as well as an explanation of the methodology utilized in allocating various expenses among the Funds and other business units, each of which was included in the Fee Evaluation. The Trustees considered the current methodology used by Columbia WAM in determining compensation payable to portfolio managers and the competitive market for investment management talent. In addition, the Trustees considered the expected profitability of Columbia
113
WAM related to the Funds following the Transaction; however, they determined that profitability projections at this time were speculative, at best. The Trustees noted that Columbia WAM's profit margins had declined recently, in line with industry trends, as a result of reduced assets under management. Nevertheless, based on limited comparative data, its current margins appeared to be in the upper range of competitors. They discussed how profitability comparisons among fund managers are of limited probative value due to the small number of publicly-owned managers, and that the profitability of any investment manager is affected by numerous factors, including its particular organizational structure, the types of funds and other accounts managed, other lines of business, expense allocation methodology, capital structure and cost of capital.
The Trustees also reviewed the advisory fee rates charged by Columbia WAM for managing other investment companies (including the Columbia Wanger Funds), sub-advised funds and other institutional separate accounts, as detailed in the Fee Evaluation. The Trustees noted that the Columbia Acorn Funds' advisory fees were generally comparable to the Columbia Wanger Funds' advisory fees. Columbia WAM's institutional separate account fees for various investment strategies were also examined; in some cases those fees were higher than the advisory fees charged to the Funds, and in some instances the fees were lower. The Trustees noted that Columbia WAM performs significant additional services for the Funds that it does not provide to sub-advised funds or non-mutual fund clients, including administrative services, oversight of the Funds' other service providers, trustee support, regulatory compliance and numerous other services, and that, in servicing the Funds, Columbia WAM assumes many legal risks that it does not assume in servicing many of its non-fund clients.
The Trustees concluded that the rates of advisory fees and other compensation to be payable by the Funds to Columbia WAM and its affiliates were reasonable in relation to the nature and quality of the services to be provided, taking into account the fees charged by other advisers for managing comparable mutual funds with similar strategies and the fees Columbia WAM charges to other clients. The Trustees also concluded that the Funds' estimated overall expense ratios were reasonable, considering the quality of services provided by Columbia WAM and its affiliates and the investment performance of the Funds.
Economies of Scale. At various Committee and Board meetings and other informal meetings, the Trustees considered information about the extent to which Columbia WAM realizes economies of scale in connection with an increase in Fund assets. The Trustees noted that the advisory fee schedule for each Fund, other than Columbia Thermostat Fund, which has relatively modest assets, includes breakpoints in the rate of fees at various asset levels. The Trustees concluded that the fee structure of each Fund was reasonable and reflective of a sharing between Columbia WAM and the Funds of economies of scale.
Other Benefits to Columbia WAM. The Trustees also reviewed benefits that could be expected to accrue to Columbia WAM and its affiliates from their relationships with the Funds, as outlined in the Fee Evaluation. They noted that, in connection with the Transaction, the Funds' transfer agency agreement would be assigned to RiverSource Service Corporation (now known as Columbia Management Investment Services Corp.), an affiliate of Ameriprise, which would receive compensation from the Funds for services provided. They considered that an affiliate of Ameriprise, RiverSource Funds Distributors, Inc. (now known as Columbia Management Investment Distributors, Inc.), would serve as the new distributor under a distribution agreement containing substantially the same terms as the Funds' existing distribution agreement with an affiliate of Columbia WAM, and that the Funds' new distributor would receive Rule 12b-1 Plan fees on the same basis as paid to the current distributor. In addition, the sub-administration agreement between Columbia WAM and a current affiliate would be transferred to an Ameriprise affiliate. The Trustees also considered other ways that the Funds and Columbia WAM may potentially benefit from their relationship with each other. For example, the Trustees considered Columbia WAM's use of commissions paid by each Fund on its portfolio brokerage transactions to obtain research products and services benefiting the Fund and/or other clients of Columbia WAM and noted that no material changes were being contemplated by Columbia WAM regarding its policies and procedures in respect of soft dollars as a result of the change in ownership of Columbia WAM. They determined that Columbia WAM's use of the Funds' "soft" commission dollars to obtain research products and services was consistent with current regulatory requirements and guidance. They also concluded that Columbia WAM benefits from the receipt of proprietary research products and services acquired through commissions paid on portfolio transactions of the Funds, and that the Funds benefit from Columbia WAM's receipt of those products and services as well as research products and services acquired through commissions paid by other clients of Columbia WAM.
114
Board Approval of the Proposed Investment Advisory Agreement, continued
Section 15(f) of the 1940 Act. The Trustees also considered whether the arrangements between Columbia WAM and the Funds comply with the conditions of Section 15(f) of the 1940 Act. Section 15(f) provides a non-exclusive safe harbor under which an investment adviser to an investment company or any of its affiliated persons may receive any amount or benefit in connection with a change in control of the investment adviser provided two conditions are met. First, for a period of three years after closing of the transaction, at least 75% of the board members of the investment company may not be "interested persons" (as defined in the 1940 Act) of the investment adviser or predecessor adviser. Second, an "unfair burden" must not be imposed upon the investment company as a result of the transaction or any express or implied terms, conditions or understandings applicable thereto. The term "unfair burden" is defined in Section 15(f) to include any arrangement during the two-year period after the closing of the transaction whereby the investment adviser (or predecessor or successor adviser) or any interested person of any such investment adviser, receives or is entitled to receive any compensation, directly or indirectly, from the investment company or its shareholders (other than fees for bona fide additional investment advisory or other services) or from any person in connection with the purchase or sale of securities or other property to, from or on behalf of the investment company (other than bona fide ordinary compensation as principal underwriter for the investment company).
In connection with the first condition of Section 15(f), the Trustees concluded that upon closing of the Transaction at least 75% of the Trustees would not be "interested persons" (as defined in the 1940 Act) of the Adviser and would be in compliance with this provision of Section 15(f). With respect to the second condition of Section 15(f), Columbia WAM and Ameriprise represented in writing that no advisory or distribution fee increases were contemplated during the two years following the Transaction. The Trustees also noted that, to the extent future transactions are contemplated and recommended following the Transaction, Columbia WAM and Ameriprise represented that they would not seek any change that would impose an "unfair burden" on the Trust.
After full consideration of the above factors, as well as other factors that were instructive in evaluating the Proposed Advisory Agreement for each Fund, the Trustees, including the Independent Trustees, concluded on February 24, 2010 that the approval of the Proposed Advisory Agreement was in the best interest of each Fund, and they approved the Agreement and recommended that the shareholders of each Fund approve the Agreement for their Fund.
Following the Board's approval of the Proposed Advisory Agreement for each Fund on February 24, 2010, Ameriprise advised the Board that it anticipated that a significant amount of the existing assets of Wanger International and Wanger USA, representing the interests of owners of contracts issued by life insurance companies affiliated with Ameriprise, would be redeemed in spring 2010. These two Columbia Wanger Funds are managed substantially similarly to Columbia Acorn International and Columbia Acorn USA, respectively. These assets would be reinvested in two RiverSource Funds (the "New Institutional Accounts") that have similar investment objectives and strategies to Columbia Acorn International and Columbia Acorn USA. The New Institutional Accounts would be sub-advised by Columbia WAM for investment sub-advisory fees that were proposed to be lower than the advisory fees of their Columbia Acorn Fund counterparts. The Board there fore determined that the existence of the New Institutional Accounts to be sub-advised by Columbia WAM warranted another review of the Proposed Advisory Agreement for each Fund and the fees paid thereunder.
The Committees then met on four occasions in March 2010, including once with representatives of Ameriprise, to review and consider the New Institutional Accounts and the implications of these transactions with respect to their consideration of the Proposed Advisory Agreement for each Fund. In their deliberations, the Trustees received and reviewed a supplement dated April 2010 ("Supplement") to the Fee Evaluation prepared by the Senior Officer, which contained an analysis of the fees related to the New Institutional Accounts. The Trustees were also advised by independent counsel at each of these meetings.
The Trustees considered information submitted by Ameriprise regarding the sub-advisory fees payable to Columbia WAM for investment advisory services rendered to the accounts. The Trustees also considered that the sub-advisory fees payable were substantially the same as an existing RiverSource Fund account sub-advised by Columbia WAM. The Trustees considered the explanations previously provided by Columbia WAM for the differences in advisory fees paid by the Funds and Columbia WAM's other similar institutional accounts. The Trustees also considered Ameriprise's and Columbia WAM's agreement that they would not agree to, or submit a proposal to, manage any further new institutional accounts without the express approval of the Board. The Board believed that this provision was necessary in order to protect
115
Columbia WAM's investment capacity and the resulting quality of its investment services with respect to the Funds.
The Trustees also considered the performance of the Funds over various time periods ended December 31, 2009. Columbia Acorn Fund outperformed its Lipper peer group median and primary benchmark over the three-year period ended December 31, 2009, but underperformed its Morningstar peer group median over that same period. Columbia Acorn USA outperformed its peer group medians and primary benchmark over the three-year period. Columbia Acorn Select underperformed its primary benchmark, but outperformed its peer group medians for the three-year period. Both Columbia Acorn International and Columbia Acorn International Select outperformed their respective peer group medians and each outperformed its primary benchmark for the three-year period. Columbia Thermostat Fund outperformed its peer group medians but underperformed its 50/50 Blended Benchmark for the same three-year period. For the five-year period ended December 31, 2009, Colum bia Thermostat Fund outperformed its 50/50 Blended Benchmark and each other Fund outperformed its primary benchmark.
Taking all of the foregoing factors into account as well as the continued satisfactory performance of the Funds since the last Board meeting and other factors they deemed relevant, the Trustees, including all of the independent Trustees, concluded again on April 6, 2010 that the approval of the Proposed Advisory Agreement was in the best interest of each Fund, and they affirmed the approval of the Agreement and recommended that the shareholders of each Fund approve the Agreement for their Fund.
116
Columbia Acorn Family of Funds
Second Quarter Class A, B and C Share Information
Minimum Initial Investment in
all Funds
| | $2,500
$1,000 for an IRA | |
Minimum Subsequent
Investment in all Funds | | $50 | |
| Exchange Fee | | None | |
| Columbia Acorn Fund | | Class A | | Class B* | | Class C | |
| Management Fees | | | 0.64 | % | | | 0.64 | % | | | 0.64 | % | |
| Distribution and Service (12b-1) Fees | | | 0.25 | % | | | 0.75 | % | | | 1.00 | % | |
| Other Expenses | | | 0.16 | % | | | 0.35 | % | | | 0.21 | % | |
| Net Expense Ratio | | | 1.05 | % | | | 1.74 | % | | | 1.85 | % | |
| Columbia Acorn International | | Class A | | Class B* | | Class C | |
| Management Fees | | | 0.77 | % | | | 0.77 | % | | | 0.77 | % | |
| Distribution and Service (12b-1) Fees | | | 0.25 | % | | | 0.75 | % | | | 1.00 | % | |
| Other Expenses | | | 0.27 | % | | | 0.48 | % | | | 0.33 | % | |
| Net Expense Ratio | | | 1.29 | % | | | 2.00 | % | | | 2.10 | % | |
| Columbia Acorn USA | | Class A | | Class B* | | Class C | |
| Management Fees | | | 0.86 | % | | | 0.86 | % | | | 0.86 | % | |
| Distribution and Service (12b-1) Fees | | | 0.25 | % | | | 0.75 | % | | | 1.00 | % | |
| Other Expenses | | | 0.17 | % | | | 0.44 | % | | | 0.21 | % | |
| Net Expense Ratio | | | 1.28 | % | | | 2.05 | % | | | 2.07 | % | |
| Columbia Acorn International Select | | Class A | | Class B* | | Class C | |
| Management Fees | | | 0.94 | % | | | 0.94 | % | | | 0.94 | % | |
| Distribution and Service (12b-1) Fees | | | 0.25 | % | | | 0.75 | % | | | 1.00 | % | |
| Other Expenses | | | 0.31 | % | | | 0.51 | % | | | 0.41 | % | |
| Net Expense Ratio | | | 1.50 | % | | | 2.20 | % | | | 2.35 | % | |
| Columbia Acorn Select | | Class A | | Class B* | | Class C | |
| Management Fees | | | 0.82 | % | | | 0.82 | % | | | 0.82 | % | |
| Distribution and Service (12b-1) Fees | | | 0.25 | % | | | 0.75 | % | | | 1.00 | % | |
| Other Expenses | | | 0.18 | % | | | 0.37 | % | | | 0.25 | % | |
| Net Expense Ratio | | | 1.25 | % | | | 1.94 | % | | | 2.07 | % | |
| Columbia Thermostat Fund | | Class A | | Class B* | | Class C | |
| Management Fees | | | 0.10 | % | | | 0.10 | % | | | 0.10 | % | |
| Distribution and Service (12b-1) Fees | | | 0.25 | % | | | 0.75 | % | | | 1.00 | % | |
| Other Expenses** | | | 0.15 | % | | | 0.15 | % | | | 0.15 | % | |
| Net Expense Ratio | | | 0.50 | % | | | 1.00 | % | | | 1.25 | % | |
Fees and expenses are for the six months ended June 30, 2010. Some share classes of Columbia Acorn Select and Columbia Acorn International Select include the effect of CWAM's voluntary undertaking to waive fees and/or reimburse the Funds for any ordinary operating expenses (exclusive of distribution and service fees, brokerage commissions, interest, taxes and extraordinary expenses, but inclusive of custodian charges relating to overdrafts, if any), after giving effect to any balance credits from the Funds' custodian, in excess of the annual rate of 1.35% and 1.45%, respectively, of the average daily net assets. These arrangements may be modified or terminated by either the Funds or CWAM upon 30 days notice. Columbia Thermostat Fund's fees and expenses include the effect of CWAM's contractual undertaking to waive fees and/or reimburse the Fund for any ordinary operating expenses (exclusive of distribution and service fees, interest and fees on borrowings, and expenses associated with the Fund's investment in other investment companies, but including custodian charges relating to overdrafts, if any), after giving effect to any balance credits from the Fund's custodian, in excess of the annual rate of 0.25% of the average daily net assets. Columbia Thermostat Fund's reimbursement arrangement is contractual through April 30, 2011. There is no guarantee that this arrangement will continue thereafter.
* The Funds no longer offer Class B shares (other than through dividend reinvestment).
** Does not include estimated fees and expenses of 0.78% incurred by the Fund from the underlying portfolio funds in which it invests.
117
Proxy Voting Results
On May 27, 2010, a special meeting of shareholders of Columbia Acorn Trust (the "Trust") was held to ask shareholders of each Fund of the Trust to: (1) consider and vote on a proposed Investment Advisory Agreement for the Fund with CWAM, which became a subsidiary of Ameriprise Financial; and (2) elect eleven trustees to the Trust's Board of Trustees (the "Board"). A proxy statement that described the proposals was mailed to shareholders of record as of April 8, 2010.
Proposal 1: A proposed Investment Advisory Agreement with CWAM was approved for each Fund, as follows:
| Fund | | Votes For | | Votes Against | | Abstentions | | Broker Non-Votes* | |
| Columbia Acorn Fund | | | 295,054,542 | | | | 5,887,228 | | | | 5,202,819 | | | | 60,105,675 | | |
| Columbia Acorn International | | | 76,381,712 | | | | 1,384,255 | | | | 884,737 | | | | 23,551,750 | | |
| Columbia Acorn USA | | | 25,415,392 | | | | 2,189,936 | | | | 247,672 | | | | 4,134,020 | | |
| Columbia Acorn International Select | | | 12,377,245 | | | | 61,231 | | | | 76,202 | | | | 2,740,103 | | |
| Columbia Acorn Select | | | 38,931,903 | | | | 504,251 | | | | 515,982 | | | | 10,453,962 | | |
| Columbia Thermostat Fund | | | 6,034,518 | | | | 68,703 | | | | 142,714 | | | | 1,824,178 | | |
* Shares held of record by a financial intermediary, such as a broker or nominee, typically held in "street name," as to which (i) written voting instructions on the matter have not been received from the beneficial owners or persons entitled to vote and (ii) the intermediary does not have discretionary voting power on the matter.
Proposal 2: Each of the trustee nominees was elected to the Board as follows:
| Fund | | Votes For | | Votes Against | | Abstentions | |
| Laura M. Born | | | 560,169,724 | | | | 14,001,005 | | | | 0 | | |
| Michelle L. Collins | | | 559,790,048 | | | | 14,380,682 | | | | 0 | | |
| Maureen M. Culhane | | | 559,638,902 | | | | 14,531,828 | | | | 0 | | |
| Margaret M. Eisen | | | 560,119,886 | | | | 14,050,843 | | | | 0 | | |
| John C. Heaton | | | 559,671,052 | | | | 14,499,677 | | | | 0 | | |
| Steven N. Kaplan | | | 560,434,242 | | | | 13,736,487 | | | | 0 | | |
| David C. Kleinman | | | 526,427,211 | | | | 47,743,518 | | | | 0 | | |
| Charles P. McQuaid** | | | 557,062,152 | | | | 17,108,578 | | | | 0 | | |
| Allan B. Muchin | | | 559,839,896 | | | | 14,330,833 | | | | 0 | | |
| David B. Small | | | 560,065,265 | | | | 14,105,464 | | | | 0 | | |
| James A. Star | | | 560,735,460 | | | | 13,435,269 | | | | 0 | | |
** Mr. McQuaid is an "interested person" of the Trust and of CWAM because he is an officer of the Trust and of CWAM.
118
Columbia Acorn Family of Funds
Trustees
James A. Star
Chairman of the Board
Steven N. Kaplan
Vice Chairman of the Board
Laura M. Born
Michelle L. Collins
Maureen M. Culhane
Margaret M. Eisen
John C. Heaton
David C. Kleinman
Charles P. McQuaid
Allan B. Muchin
David B. Small
Ralph Wanger (Trustee Emeritus)
Officers
Charles P. McQuaid
President
Ben Andrews
Vice President
Michael G. Clarke
Assistant Treasurer
P. Zachary Egan
Vice President
John M. Kunka
Assistant Treasurer
Joseph C. LaPalm
Vice President
Bruce H. Lauer
Vice President, Secretary and Treasurer
Louis J. Mendes III
Vice President
Robert A. Mohn
Vice President
Christopher J. Olson
Vice President
Christopher O. Petersen
Assistant Secretary
Scott R. Plummer
Assistant Secretary
Linda K. Roth-Wiszowaty
Assistant Secretary
Robert P. Scales
Chief Compliance Officer, Chief Legal Officer,
Senior Vice President and General Counsel
Investment Advisor
Columbia Wanger Asset Management, LLC
227 West Monroe Street, Suite 3000
Chicago, Illinois 60606
1-800-922-6769
Distributor*
Columbia Management Investment Distributors, Inc.
One Financial Center
Boston, Massachusetts 02111-2621
Transfer Agent, Dividend Disbursing Agent*
Columbia Management Investment Services Corp.
P. O. Box 8081
Boston, Massachusetts 02266-8081
1-800-345-6611
Legal Counsel to the Funds
K&L Gates LLP
Washington, DC
Legal Counsel to the Independent Trustees
Drinker Biddle & Reath LLP
Philadelphia, Pennsylvania
Independent Registered Public Accounting Firm
PricewaterhouseCoopers LLP
Chicago, Illinois
*As of May 1, 2010
This report, including the schedules of investments, is submitted for the general information of the shareholders of Columbia Acorn Trust.
A description of the policies and procedures that the Funds use to determine how to vote proxies and a copy of the Funds' voting record are available (i) without charge, upon request, by calling 800-922-6769 and (ii) on the Securities and Exchange Commission's website at www.sec.gov. Information regarding how the Funds voted proxies relating to portfolio securities during the 12-month period ended June 30, is available from the SEC's website. Information regarding how the Funds voted proxies relating to portfolio securities is also available at http://institutional.columbiamanagement.com.
The Funds file a complete schedule of portfolio holdings with the SEC for the first and third quarters of each fiscal year on Form N-Q. The Funds' Form N-Q is available on the SEC's website at www.sec.gov and may be reviewed and copied at the SEC's Public Reference Room in Washington, D.C. Information on the operation of the Public Reference Room may be obtained by calling 1-800-SEC-0330.
Investors should consider the investment objectives, risks, charges and expenses of a mutual fund carefully before investing. For a free prospectus, which contains this and other important information about the funds, visit www.columbiafunds.com. Read the prospectus carefully before investing.
On April 30, 2010, Ameriprise Financial, Inc. ("Ameriprise Financial"), the parent company of RiverSource Investments, LLC, acquired the long-term asset management business of Columbia Management Group, LLC, including certain of its affiliates, which were, prior to this acquisition, part of Bank of America Corporation. In connection with the acquisition, Ameriprise Financial acquired Columbia Wanger Asset Management, LLC ("CWAM"). CWAM will continue as the investment advisor for the Columbia Acorn and Wanger Funds and no changes are anticipated in the existing investment management team. Ameriprise Financial also acquired Columbia Management Distributors, Inc., now known as Columbia Management Investment Distributors, Inc., member FINRA, which is the distributor a nd principal underwriter of the Funds.
CWAM is a registered investment advisor and an indirect wholly owned subsidiary of Ameriprise Financial, Inc.
Find out what's new – visit our web site at:
www.columbiafunds.com
Our e-mail address is:
ServiceInquiries@ColumbiaManagement.com
Shareholders should not include personal information such as account numbers, Social Security numbers or taxpayer identification numbers in e-mail. We are unable to accept account transactions sent via e-mail.
119

Columbia Acorn Family of Funds
Class A, B and C Shares
Semiannual Report, June 30, 2010
For More Information
You'll find more information about the Columbia Acorn Family Funds in the documents described below. Contact Columbia Funds as follows to obtain these documents free of charge:
By Mail: Columbia Funds
c/o Columbia Management Investment Services Corp.
P.O. Box 8081
Boston, MA 02266-8081
By Telephone: 800.345.6611
Online: www.columbiafunds.com
Shareholder Communications with the Board
The Funds' Board of Trustees has adopted procedures by which shareholders may communicate with the Board. Shareholders who wish to communicate with the Board should send their written communications to the Board by mail, c/o Columbia Wanger Asset Management, LLC, 227 West Monroe Street, Suite 3000, Chicago, Illinois 60606, Attention: Secretary. Shareholder communications must (i) be in writing, (ii) identify the Columbia Acorn Fund to which the communication relates and (iii) state the particular class of shares and number of shares held by the communicating shareholder.
Prospectuses and the Statement of Additional Information (SAI)
The prospectuses and the SAI provide more detailed information about the Funds and their policies. The SAI is legally part of each prospectus (it's incorporated by reference). A copy of each has been filed with the SEC.
Information Provided by the SEC
You can review and copy information about the Funds (including their prospectuses, the SAI and shareholder reports) at the SEC's Public Reference Room in Washington, DC. To find out more about the operation of the Public Reference Room, call the SEC at 202.551.8090. Reports and other information about the Fund are also available in the EDGAR Database on the SEC's website at http://www.sec.gov, or you can receive copies of this information, for a fee, by electronic request at the following e-mail address: publicinfo@sec.gov. You can also obtain copies of this information by writing the Public Reference Section, Securities and Exchange Commission, Washington, DC 20549-0102.
The investment company registration number of Columbia Acorn Trust, of which each of these Funds is a series, is 811-01829.
© 2010 Columbia Management Investment Distributors, Inc.
One Financial Center, Boston, MA 02111-2621
800.345.6611 www.columbiamanagement.com
C-1450 A (8/10) 104871
Item 2. Code of Ethics.
Not applicable for semiannual reports.
Item 3. Audit Committee Financial Expert.
Not applicable for semiannual reports.
Item 4. Principal Accountant Fees and Services.
Not applicable for semiannual reports.
Item 5. Audit Committee of Listed Registrants.
Not applicable.
Item 6. Investments
(a) The registrant’s “Schedule I — Investments in securities of unaffiliated issuers” (as set forth in 17 CFR 210.12-12) is included in Item 1 of this Form N-CSR.
(b) Not applicable.
Item 7. Disclosure of Proxy Voting Policies and Procedures for Closed-End Management Investment Companies.
Not applicable.
Item 8. Portfolio Managers of Closed-End Management Investment Companies.
Not applicable.
Item 9. Purchases of Equity Securities by Closed-End Management Investment Company and Affiliated Purchasers.
Not applicable.
Item 10. Submission of Matters to a Vote of Security Holders.
There were no material changes to the procedures by which shareholders may recommend nominees to the registrant’s board of directors.
Item 11. Controls and Procedures.
(a) The registrant’s principal executive officer and principal financial officers, based on their evaluation of the registrant’s disclosure controls and procedures as of a date within 90 days of the filing of this report, have concluded that such controls and procedures are adequately designed to ensure that material information required to be disclosed by the registrant in Form N-CSR is accumulated and communicated to the registrant’s management, including the principal executive officer and principal financial officer, or persons performing similar functions, as appropriate to allow timely decisions regarding required disclosure.
(b) There was no change in the registrant’s internal control over financial reporting that occurred during the registrant’s second fiscal quarter of the period covered by this report that has materially affected, or is reasonably likely to materially affect, the registrant’s internal control over financial reporting.
Item 12. Exhibits.
(a)(1) Code of ethics required to be disclosed under Item 2 of Form N-CSR: Not applicable for semiannual reports.
(a)(2) Certifications pursuant to Rule 30a-2(a) under the Investment Company Act of 1940 (17 CFR 270.30a-2(a)) attached hereto as Exhibit 99.CERT.
(a)(3) Not applicable.
(b) Certification pursuant to Rule 30a-2(b) under the Investment Company Act of 1940 (17 CFR 270.30a-2(b)) attached hereto as Exhibit 99.906CERT.
SIGNATURES
Pursuant to the requirements of the Securities Exchange Act of 1934 and the Investment Company Act of 1940, the registrant has duly caused this report to be signed on its behalf by the undersigned, thereunto duly authorized.
(registrant) | | Columbia Acorn Trust |
| | |
| | |
By (Signature and Title) | | /s/ Charles P. McQuaid |
| | Charles P. McQuaid, President |
| | |
| | |
Date | | August 23, 2010 |
| | |
| | |
Pursuant to the requirements of the Securities Exchange Act of 1934 and the Investment Company Act of 1940, this report has been signed below by the following persons on behalf of the registrant and in the capacities and on the dates indicated. |
| | |
| | |
By (Signature and Title) | | /s/ Charles P. McQuaid |
| | Charles P. McQuaid, President |
| | |
| | |
Date | | August 23, 2010 |
| | |
| | |
By (Signature and Title) | | /s/ Bruce H. Lauer |
| | Bruce H. Lauer, Treasurer |
| | |
| | |
Date | | August 23, 2010 |
| | | | |