UNITED STATES
SECURITIES AND EXCHANGE COMMISSION
Washington, D.C. 20549
FORM N-CSR
CERTIFIED SHAREHOLDER REPORT OF REGISTERED
MANAGEMENT INVESTMENT COMPANIES
Investment Company Act file number | 811-01829 |
|
Columbia Acorn Trust |
(Exact name of registrant as specified in charter) |
|
227 W. Monroe Street Suite 3000 Chicago, IL | | 60606 |
(Address of principal executive offices) | | (Zip code) |
|
Paul B. Goucher, Esq. Columbia Management Investment Advisers, LLC 100 Park Avenue New York, New York 10017 P. Zachary Egan Columbia Acorn Trust 227 West Monroe Street, Suite 3000 Chicago, Illinois 60606 Mary C. Moynihan Perkins Coie LLP 700 13th Street, NW Suite 600 Washington, DC 20005 |
(Name and address of agent for service) |
|
Registrant’s telephone number, including area code: | (312) 634-9200 | |
|
Date of fiscal year end: | December 31 | |
|
Date of reporting period: | June 30, 2015 | |
| | | | | | | | |
Form N-CSR is to be used by management investment companies to file reports with the Commission not later than 10 days after the transmission to stockholders of any report that is required to be transmitted to stockholders under Rule 30e-1 under the Investment Company Act of 1940 (17 CFR 270.30e-1). The Commission may use the information provided on Form N-CSR in its regulatory, disclosure review, inspection, and policymaking roles.
A registrant is required to disclose the information specified by Form N-CSR, and the Commission will make this information public. A registrant is not required to respond to the collection of information contained in Form N-CSR unless the Form displays a currently valid Office of Management and Budget (“OMB”) control number. Please direct comments concerning the accuracy of the information collection burden estimate and any suggestions for reducing the burden to Secretary, Securities and Exchange Commission, 450 Fifth Street, NW, Washington, DC 20549-0609. The OMB has reviewed this collection of information under the clearance requirements of 44 U.S.C. § 3507.
Item 1. Reports to Stockholders.

SEMIANNUAL REPORT
June 30, 2015


COLUMBIA ACORN FAMILY OF FUNDS
Class A, B, C, I, R, R4, R5, Y and Z Shares
Managed by Columbia Wanger Asset Management, LLC
Columbia Acorn® Fund
Columbia Acorn International®
Columbia Acorn USA®
Columbia Acorn International SelectSM
Columbia Acorn SelectSM
Columbia Thermostat FundSM
Columbia Acorn Emerging Markets FundSM
Columbia Acorn European FundSM

COLUMBIA ACORN FAMILY OF FUNDS
NET ASSET VALUE PER SHARE as of 6/30/15
| | | Columbia
Acorn® Fund | | Columbia
Acorn
International® | | Columbia
Acorn
USA® | | Columbia
Acorn
International
SelectSM | | Columbia
Acorn
SelectSM | | Columbia
Thermostat
FundSM | | Columbia
Acorn
Emerging
Markets
FundSM | | Columbia
Acorn
European
FundSM | |
Class A | | $ | 30.63 | | | $ | 43.41 | | | $ | 30.38 | | | $ | 22.76 | | | $ | 20.52 | | | $ | 14.72 | | | $ | 12.34 | | | $ | 15.23 | | |
Class B | | $ | 26.51 | | | $ | 41.87 | | | $ | 26.07 | | | $ | 21.37 | | | $ | 17.26 | | | $ | 14.79 | | | | N/A | | | | N/A | | |
Class C | | $ | 25.87 | | | $ | 41.69 | | | $ | 25.84 | | | $ | 21.23 | | | $ | 16.91 | | | $ | 14.77 | | | $ | 12.23 | | | $ | 15.05 | | |
Class I | | $ | 32.53 | | | $ | 43.57 | | | $ | 32.65 | | | $ | 23.06 | | | $ | 22.00 | | | | N/A | | | $ | 12.39 | | | $ | 15.24 | | |
Class R | | | N/A | | | $ | 43.32 | | | | N/A | | | | N/A | | | | N/A | | | | N/A | | | | N/A | | | | N/A | | |
Class R4 | | $ | 33.02 | | | $ | 43.80 | | | $ | 33.17 | | | $ | 23.22 | | | $ | 22.37 | | | $ | 14.62 | | | $ | 12.46 | | | $ | 15.31 | | |
Class R5 | | $ | 33.07 | | | $ | 43.50 | | | $ | 33.20 | | | $ | 23.21 | | | $ | 22.41 | | | $ | 14.63 | | | $ | 12.45 | | | $ | 15.39 | | |
Class Y | | $ | 33.15 | | | $ | 43.85 | | | $ | 33.30 | | | $ | 23.20 | | | $ | 22.50 | | | $ | 14.62 | | | $ | 12.35 | | | | N/A | | |
Class Z | | $ | 32.44 | | | $ | 43.52 | | | $ | 32.45 | | | $ | 23.07 | | | $ | 21.87 | | | $ | 14.55 | | | $ | 12.38 | | | $ | 15.25 | | |
Class I shares are available only to the Columbia funds, such as Columbia Thermostat Fund, and are not available to individual investors. Class R, R4, R5, Y and Z shares are sold at net asset value and have limited eligibility. Please see the Funds' prospectuses for details. The Columbia Acorn Family of Funds offer multiple share classes, not all necessarily available through all financial intermediaries, and the ratings assigned to the various share classes by mutual fund rating agencies may vary. Contact us for details.
2015 YEAR-END CAPITAL GAIN DISTRIBUTION ESTIMATE as of 7/31/151
To assist shareholders in year-end planning, we are providing capital gain distribution estimates for the Funds. The estimates below reflect undistributed net realized capital gains through July 31, 2015 and may not include all required tax adjustments. Distributions are not the result of material changes in investment strategy. The Funds have sold investments in order to satisfy shareholder redemptions, which has triggered the realization of capital gains. The Funds continue to have material unrealized gains in certain of their holdings. Please note that these figures are subject to change as required capital gain distributions, including appropriate tax adjustments, are determined as of October 31, 2015. In addition, further sales of Fund investments through October 31 and changes in outstanding Fund shares through the record date will affect the final per share distributions. Distributions will not be considered final until their declaration on the ex-dividend date for the capital gain distribution.
| Fund Name | | Expected
Record
Date and
Payable Date | | Range of Estimated
Total Capital Gain
Distribution2 | | Class A
Share NAV
at 7/31 | | Range of Total
Capital Gain
Distribution as %
of 7/31
Class A NAV | |
Columbia Acorn Fund | | December 2015 | | $ | 8.00 | to $9.00 | | $ | 30.36 | | | | 26.35 | % to 29.64% | |
Columbia Acorn International | | December 2015 | | $ | 2.60 | to $2.85 | | $ | 42.63 | | | | 6.10 | % to 6.69% | |
Columbia Acorn USA | | December 2015 | | $ | 5.50 | to $6.50 | | $ | 30.06 | | | | 18.30 | % to 21.62% | |
Columbia Acorn International Select | | December 2015 | | | None | | | $ | 22.19 | | | | — | | |
Columbia Acorn Select | | December 2015 | | $ | 4.00 | to $4.75 | | $ | 20.28 | | | | 19.72 | % to 23.42% | |
Columbia Acorn Thermostat Fund | | December 2015 | | $ | 0.05 | to $0.10 | | $ | 14.77 | | | | 0.34 | % to 0.68% | |
Columbia Acorn Emerging Markets Fund | | December 2015 | | | None | | | $ | 11.72 | | | | — | | |
Columbia Acorn European Fund | | December 2015 | | | None | | | $ | 15.27 | | | | — | | |
1 None of Columbia Wanger Asset Management, the Columbia Acorn Funds or Columbia Threadneedle Investments provide tax or legal advice. Please consult a tax advisor or tax attorney for specific tax or legal advice.
2 Estimated amounts shown include only long-term capital gains for all Columbia Acorn Funds, except Columbia Acorn Select, for which the estimated total range shown includes between $0.70 and $0.95 of short-term capital gains.
The views expressed in the report commentaries reflect the current views of the respective authors. These views are not guarantees of future performance and involve certain risks, uncertainties and assumptions that are difficult to predict, so actual outcomes and results may differ significantly from the views expressed. These views are subject to change at any time based upon economic, market or other conditions and the respective authors disclaim any responsibility to update such views. These views may not be relied upon as investment advice and, because investment decisions for a Columbia Acorn Fund are based on numerous factors, may not be relied upon as an indication of trading intent on behalf of any particular Columbia Acorn Fund. References to a specific company's securities should not be construed as a recommendation or investment advice and there can be no assurance that as of the date of publication of this report, the securities mentioned in each Fund's portfolio are still held or that the securities sold have not been repurchased.
Acorn®, Acorn USA® and Acorn International® are service marks owned and registered by Columbia Acorn Trust.
COLUMBIA ACORN FAMILY OF FUNDS
TABLE OF CONTENTS
Share Class Performance | | | 2 | | |
Fund Performance vs. Benchmarks | | | 3 | | |
Columbia Acorn® Fund | |
In a Nutshell | | | 4 | | |
At a Glance | | | 5 | | |
Major Portfolio Changes | | | 28 | | |
Statement of Investments | | | 31 | | |
Columbia Acorn International® | |
In a Nutshell | | | 6 | | |
At a Glance | | | 7 | | |
Major Portfolio Changes | | | 39 | | |
Statement of Investments | | | 41 | | |
Portfolio Diversification | | | 49 | | |
Columbia Acorn USA® | |
In a Nutshell | | | 8 | | |
At a Glance | | | 9 | | |
Major Portfolio Changes | | | 50 | | |
Statement of Investments | | | 51 | | |
Columbia Acorn International SelectSM | |
In a Nutshell | | | 10 | | |
At a Glance | | | 11 | | |
Major Portfolio Changes | | | 56 | | |
Statement of Investments | | | 57 | | |
Portfolio Diversification | | | 61 | | |
Columbia Acorn SelectSM | |
In a Nutshell | | | 12 | | |
At a Glance | | | 13 | | |
Major Portfolio Changes | | | 62 | | |
Statement of Investments | | | 63 | | |
Columbia Thermostat FundSM | |
In a Nutshell | | | 14 | | |
At a Glance | | | 15 | | |
Statement of Investments | | | 67 | | |
Columbia Acorn Emerging Markets FundSM | |
In a Nutshell | | | 16 | | |
At a Glance | | | 17 | | |
Major Portfolio Changes | | | 69 | | |
Statement of Investments | | | 71 | | |
Portfolio Diversification | | | 76 | | |
Columbia Acorn European FundSM | |
In a Nutshell | | | 18 | | |
At a Glance | | | 19 | | |
Major Portfolio Changes | | | 77 | | |
Statement of Investments | | | 79 | | |
Portfolio Diversification | | | 83 | | |
Squirrel Chatter: Battery Technology and its Implications | | | 20 | | |
Mid-Year Distributions | | | 23 | | |
Understanding Your Expenses | | | 25 | | |
Columbia Acorn Family of FundsSM | |
Statements of Assets and Liabilities | | | 84 | | |
Statements of Operations | | | 86 | | |
Statements of Changes in Net Assets | | | 88 | | |
Financial Highlights | | | 94 | | |
Notes to Financial Statements | | | 110 | | |
Board of Approval of the Advisory Agreement | | | 120 | | |
Results of Special Meeting of Shareholders | | | 125 | | |
Description of Indexes | | | 126 | | |
Expense Information | | | 127 | | |
A COMMENT ON TRADING VOLUMES
Market conditions are always changing and vary by country and industry sector, and investing in international markets involves unique risks. In the wake of the 2007-2009 financial crisis, trading volumes in both emerging and developed international markets declined significantly and have stayed at generally reduced levels since then. Although it is difficult to accurately assess trends in trading volumes in foreign markets, because some amount of activity has migrated to alternative trading venues, a reduction in trading volumes poses challenges to the Funds. This is particularly so because the Funds focus on small- and mid-cap companies that usually have lower trading volumes and often take sizeable positions in portfolio companies. As a result of lower trading volumes, it may take longer to buy or sell securities, which can exacerbate a Fund's exposure to volatile markets. A Fund may also be limited in its ability to execute favorable trades in portfolio securities in response to changes in company prices and fundamentals. If a Fund is forced to sell securities to meet redemption requests or other cash needs, or in the case of an event affecting liquidity in a particular market or markets, it may be forced to dispose of those securities under disadvantageous circumstances and at a loss. As a Fund grows in size, these considerations take on increasing significance and may adversely impact performance.
1
COLUMBIA ACORN FAMILY OF FUNDS
SHARE CLASS PERFORMANCE Average Annual Total Returns through 6/30/15
| | Class A | | Class B | | Class C | | Class I | | Class R | | Class R4 | | Class R5 | | Class Y | | Class Z | |
| | Without
Sales
Charge | | With
Sales
Charge | | Without
Sales
Charge | | With
Sales
Charge | | Without
Sales
Charge | | With
Sales
Charge | | | | | | | | | | | | | |
Columbia Acorn® Fund | |
Year to date* | | | 6.45 | % | | | 0.32 | % | | | 6.04 | % | | | 1.04 | % | | | 6.07 | % | | | 5.07 | % | | | 6.63 | % | | | N/A | | | | 6.56 | % | | | 6.58 | % | | | 6.63 | % | | | 6.61 | % | |
| 1 year | | | 4.45 | % | | | -1.56 | % | | | 3.64 | % | | | -0.48 | % | | | 3.69 | % | | | 2.87 | % | | | 4.81 | % | | | N/A | | | | 4.68 | % | | | 4.76 | % | | | 4.81 | % | | | 4.73 | % | |
| 5 years | | | 15.21 | % | | | 13.85 | % | | | 14.51 | % | | | 14.28 | % | | | 14.37 | % | | | 14.37 | % | | | 15.62 | % | | | N/A | | | | 15.52 | % | | | 15.57 | % | | | 15.60 | % | | | 15.55 | % | |
| 10 years | | | 8.48 | % | | | 7.83 | % | | | 7.80 | % | | | 7.80 | % | | | 7.65 | % | | | 7.65 | % | | | 8.82 | % | | | N/A | | | | 8.78 | % | | | 8.80 | % | | | 8.81 | % | | | 8.79 | % | |
Columbia Acorn International® | |
Year to date* | | | 5.05 | % | | | -0.99 | % | | | 4.61 | % | | | -0.39 | % | | | 4.63 | % | | | 3.63 | % | | | 5.23 | % | | | 4.86 | % | | | 5.12 | % | | | 5.19 | % | | | 5.24 | % | | | 5.18 | % | |
| 1 year | | | -5.29 | % | | | -10.74 | % | | | -6.04 | % | | | -10.48 | % | | | -6.00 | % | | | -6.89 | % | | | -4.92 | % | | | -5.65 | % | | | -5.12 | % | | | -4.99 | % | | | -4.92 | % | | | -5.02 | % | |
| 5 years | | | 10.21 | % | | | 8.91 | % | | | 9.43 | % | | | 9.15 | % | | | 9.39 | % | | | 9.39 | % | | | 10.65 | % | | | 9.85 | % | | | 10.52 | % | | | 10.59 | % | | | 10.61 | % | | | 10.57 | % | |
| 10 years | | | 8.82 | % | | | 8.18 | % | | | 8.09 | % | | | 8.09 | % | | | 7.99 | % | | | 7.99 | % | | | 9.22 | % | | | 8.49 | % | | | 9.16 | % | | | 9.19 | % | | | 9.21 | % | | | 9.19 | % | |
Columbia Acorn USA® | |
Year to date* | | | 7.14 | % | | | 0.97 | % | | | 6.45 | % | | | 1.45 | % | | | 6.76 | % | | | 5.76 | % | | | 7.34 | % | | | N/A | | | | 7.26 | % | | | 7.32 | % | | | 7.33 | % | | | 7.25 | % | |
| 1 year | | | 7.96 | % | | | 1.74 | % | | | 6.72 | % | | | 2.50 | % | | | 7.22 | % | | | 6.38 | % | | | 8.39 | % | | | N/A | | | | 8.19 | % | | | 8.28 | % | | | 8.36 | % | | | 8.21 | % | |
| 5 years | | | 16.67 | % | | | 15.30 | % | | | 15.78 | % | | | 15.56 | % | | | 15.84 | % | | | 15.84 | % | | | 17.13 | % | | | N/A | | | | 17.00 | % | | | 17.03 | % | | | 17.07 | % | | | 16.98 | % | |
| 10 years | | | 7.50 | % | | | 6.87 | % | | | 6.74 | % | | | 6.74 | % | | | 6.70 | % | | | 6.70 | % | | | 7.87 | % | | | N/A | | | | 7.81 | % | | | 7.82 | % | | | 7.84 | % | | | 7.80 | % | |
Columbia Acorn International SelectSM | |
Year to date* | | | 3.70 | % | | | -2.24 | % | | | 3.36 | % | | | -1.64 | % | | | 3.36 | % | | | 2.36 | % | | | 3.88 | % | | | N/A | | | | 3.86 | % | | | 3.90 | % | | | 3.91 | % | | | 3.88 | % | |
| 1 year | | | -12.04 | % | | | -17.09 | % | | | -12.67 | % | | | -16.52 | % | | | -12.70 | % | | | -13.47 | % | | | -11.75 | % | | | N/A | | | | -11.80 | % | | | -11.74 | % | | | -11.71 | % | | | -11.76 | % | |
| 5 years | | | 8.86 | % | | | 7.58 | % | | | 8.14 | % | | | 7.85 | % | | | 8.02 | % | | | 8.02 | % | | | 9.27 | % | | | N/A | | | | 9.19 | % | | | 9.23 | % | | | 9.25 | % | | | 9.21 | % | |
| 10 years | | | 7.76 | % | | | 7.12 | % | | | 7.06 | % | | | 7.06 | % | | | 6.92 | % | | | 6.92 | % | | | 8.14 | % | | | N/A | | | | 8.10 | % | | | 8.12 | % | | | 8.13 | % | | | 8.11 | % | |
Columbia Acorn SelectSM | |
Year to date* | | | 5.96 | % | | | -0.12 | % | | | 5.50 | % | | | 0.72 | % | | | 5.55 | % | | | 4.60 | % | | | 6.19 | % | | | N/A | | | | 6.08 | % | | | 6.12 | % | | | 6.14 | % | | | 6.07 | % | |
| 1 year | | | 6.96 | % | | | 0.80 | % | | | 6.05 | % | | | 2.06 | % | | | 6.15 | % | | | 5.36 | % | | | 7.35 | % | | | N/A | | | | 7.19 | % | | | 7.31 | % | | | 7.33 | % | | | 7.25 | % | |
| 5 years | | | 12.69 | % | | | 11.36 | % | | | 11.91 | % | | | 11.69 | % | | | 11.84 | % | | | 11.84 | % | | | 13.12 | % | | | N/A | | | | 12.98 | % | | | 13.03 | % | | | 13.06 | % | | | 13.01 | % | |
| 10 years | | | 7.67 | % | | | 7.04 | % | | | 6.95 | % | | | 6.95 | % | | | 6.84 | % | | | 6.84 | % | | | 8.04 | % | | | N/A | | | | 7.97 | % | | | 7.99 | % | | | 8.01 | % | | | 7.98 | % | |
Columbia Thermostat FundSM | |
Year to date* | | | 1.08 | % | | | -4.75 | % | | | 0.81 | % | | | -4.13 | % | | | 0.74 | % | | | -0.25 | % | | | N/A | | | | N/A | | | | 1.23 | % | | | 1.23 | % | | | 1.23 | % | | | 1.23 | % | |
| 1 year | | | 2.46 | % | | | -3.43 | % | | | 1.94 | % | | | -2.94 | % | | | 1.70 | % | | | 0.72 | % | | | N/A | | | | N/A | | | | 2.74 | % | | | 2.68 | % | | | 2.74 | % | | | 2.69 | % | |
| 5 years | | | 10.51 | % | | | 9.22 | % | | | 9.94 | % | | | 9.67 | % | | | 9.67 | % | | | 9.67 | % | | | N/A | | | | N/A | | | | 10.78 | % | | | 10.79 | % | | | 10.82 | % | | | 10.78 | % | |
| 10 years | | | 6.26 | % | | | 5.63 | % | | | 5.72 | % | | | 5.72 | % | | | 5.47 | % | | | 5.47 | % | | | N/A | | | | N/A | | | | 6.53 | % | | | 6.53 | % | | | 6.55 | % | | | 6.53 | % | |
Columbia Acorn Emerging Markets FundSM | |
Year to date* | | | -2.99 | % | | | -8.59 | % | | | N/A | | | | N/A | | | | -3.32 | % | | | -4.29 | % | | | -2.82 | % | | | N/A | | | | -2.88 | % | | | -2.89 | % | | | -2.83 | % | | | -2.83 | % | |
| 1 year | | | -10.09 | % | | | -15.25 | % | | | N/A | | | | N/A | | | | -10.73 | % | | | -11.62 | % | | | -9.80 | % | | | N/A | | | | -9.87 | % | | | -9.85 | % | | | -9.77 | % | | | -9.85 | % | |
Life of Fund | | | 6.10 | % | | | 4.49 | % | | | N/A | | | | N/A | | | | 5.34 | % | | | 5.34 | % | | | 6.50 | % | | | N/A | | | | 6.45 | % | | | 6.46 | % | | | 6.48 | % | | | 6.40 | % | |
Columbia Acorn European FundSM | |
Year to date* | | | 6.66 | % | | | 0.56 | % | | | N/A | | | | N/A | | | | 6.29 | % | | | 5.29 | % | | | 6.80 | % | | | N/A | | | | 6.77 | % | | | 6.81 | % | | | N/A | | | | 6.80 | % | |
| 1 year | | | -3.84 | % | | | -9.35 | % | | | N/A | | | | N/A | | | | -4.57 | % | | | -5.52 | % | | | -3.54 | % | | | N/A | | | | -3.57 | % | | | -3.57 | % | | | N/A | | | | -3.58 | % | |
Life of Fund | | | 12.32 | % | | | 10.61 | % | | | N/A | | | | N/A | | | | 11.50 | % | | | 11.50 | % | | | 12.64 | % | | | N/A | | | | 12.62 | % | | | 12.61 | % | | | N/A | | | | 12.61 | % | |
*Not annualized.
Returns for Class A shares are shown with and without the maximum initial sales charge of 5.75%. Returns for Class B shares are shown with and without the applicable contingent deferred sales charge (CDSC) of 5.00% in the first year, declining to 1.00% in the sixth year and eliminated thereafter. Returns for Class C shares are shown with and without the maximum CDSC of 1.00% for the first year after purchase. The Funds' other classes are not subject to sales charges and have limited eligibility. Please see the Funds' prospectuses for details. Performance for different share classes will vary based on differences in sales charges and certain fees associated with each class.
All results shown assume reinvestment of distributions during the period. Returns do not reflect the deduction of taxes that a shareholder may pay on Fund distributions or on the redemption of Fund shares. Performance results may reflect the effect of any fee waivers or reimbursements of Fund expenses by the investment manager and/or any of its affiliates. Absent these fee waivers and/or expense reimbursement arrangements, performance results may have been lower. Please see Page 127 of this report for information on contractual fee waiver and expense reimbursement agreements in place on June 30, 2015, for Columbia Thermostat Fund, Columbia Acorn Emerging Markets Fund and Columbia Acorn European Fund and voluntary fee waiver and expense reimbursement arrangements in place for Columbia Acorn International, Columbia Acorn International Select and Columbia Acorn Select.
The performance information shown represents past performance and is not a guarantee of future results. The investment return and principal value of your investment will fluctuate so that shares, when redeemed, may be worth more or less than their original cost. Current performance may be lower or higher than the performance data shown. You may obtain performance information current to the most recent month-end by contacting your financial intermediary, visiting columbiathreadneedle.com/us or calling 800.922.6769.
The returns shown include the returns of each Fund's Class Z shares, each Fund's oldest share class, in cases where the inception date of the Fund is earlier than the inception date of the particular share class or where a period shown dates to before the inception date of the share class. These returns are adjusted to reflect any higher class-related operating expenses of the newer share classes, as applicable. Please visit columbiathreadneedleus.com/investment-products/mutual-funds/appended-performance for more information.
Continued on Page 3.
2
FUND PERFORMANCE VS. BENCHMARKS Class Z Average Annual Total Returns through 6/30/15
| Class Z Shares | | 2nd
quarter* | | Year to
date* | | 1 year | | 5 years | | 10 years | | Life of
Fund | |
| Columbia Acorn® Fund (ACRNX) (6/10/70) | | | 2.54 | % | | | 6.61 | % | | | 4.73 | % | | | 15.55 | % | | | 8.79 | % | | | 14.58 | % | |
Russell 2500 Index | | | -0.34 | % | | | 4.81 | % | | | 5.92 | % | | | 17.85 | % | | | 9.09 | % | | | N/A | | |
S&P 500 Index** | | | 0.28 | % | | | 1.23 | % | | | 7.42 | % | | | 17.34 | % | | | 7.89 | % | | | 10.96 | % | |
Russell 2000 Index | | | 0.42 | % | | | 4.75 | % | | | 6.49 | % | | | 17.08 | % | | | 8.40 | % | | | N/A | | |
Lipper Mid-Cap Growth Funds Index | | | 0.44 | % | | | 5.54 | % | | | 9.19 | % | | | 16.74 | % | | | 9.57 | % | | | N/A | | |
| Columbia Acorn International® (ACINX) (9/23/92) | | | 0.81 | % | | | 5.18 | % | | | -5.02 | % | | | 10.57 | % | | | 9.19 | % | | | 10.87 | % | |
S&P Global Ex-U.S. Between $500M and $5B Index | | | 2.91 | % | | | 7.97 | % | | | -1.52 | % | | | 9.91 | % | | | 8.20 | % | | | 8.48 | % | |
S&P Global Ex-U.S. SmallCap Index | | | 4.55 | % | | | 8.42 | % | | | -2.26 | % | | | 10.54 | % | | | 7.84 | % | | | 7.97 | % | |
MSCI EAFE Index (Net) | | | 0.62 | % | | | 5.52 | % | | | -4.22 | % | | | 9.54 | % | | | 5.12 | % | | | 6.09 | % | |
Lipper International Small/Mid Growth Funds Index | | | 4.35 | % | | | 10.16 | % | | | -0.41 | % | | | 13.26 | % | | | 8.91 | % | | | N/A | | |
| Columbia Acorn USA® (AUSAX) (9/4/96) | | | 2.02 | % | | | 7.25 | % | | | 8.21 | % | | | 16.98 | % | | | 7.80 | % | | | 10.93 | % | |
Russell 2000 Index | | | 0.42 | % | | | 4.75 | % | | | 6.49 | % | | | 17.08 | % | | | 8.40 | % | | | 8.72 | % | |
Lipper Small-Cap Growth Funds Index | | | 1.71 | % | | | 7.54 | % | | | 9.63 | % | | | 17.43 | % | | | 8.29 | % | | | 7.44 | % | |
| Columbia Acorn Int'l SelectSM (ACFFX) (11/23/98) | | | 2.37 | % | | | 3.88 | % | | | -11.76 | % | | | 9.21 | % | | | 8.11 | % | | | 8.77 | % | |
S&P Developed Ex-U.S. Between $2B and $10B Index | | | 2.27 | % | | | 8.00 | % | | | -1.35 | % | | | 10.68 | % | | | 6.99 | % | | | 7.68 | % | |
MSCI EAFE Index (Net) | | | 0.62 | % | | | 5.52 | % | | | -4.22 | % | | | 9.54 | % | | | 5.12 | % | | | 4.37 | % | |
Lipper International Small/Mid Growth Funds Index | | | 4.35 | % | | | 10.16 | % | | | -0.41 | % | | | 13.26 | % | | | 8.91 | % | | | 10.35 | % | |
| Columbia Acorn SelectSM (ACTWX) (11/23/98) | | | 3.16 | % | | | 6.07 | % | | | 7.25 | % | | | 13.01 | % | | | 7.98 | % | | | 10.35 | % | |
S&P MidCap 400 Index | | | -1.06 | % | | | 4.20 | % | | | 6.40 | % | | | 17.82 | % | | | 9.74 | % | | | 10.55 | % | |
S&P 500 Index** | | | 0.28 | % | | | 1.23 | % | | | 7.42 | % | | | 17.34 | % | | | 7.89 | % | | | 5.46 | % | |
Lipper Mid-Cap Core Funds Index | | | -0.57 | % | | | 3.43 | % | | | 5.21 | % | | | 16.45 | % | | | 8.67 | % | | | 9.14 | % | |
| Columbia Thermostat FundSM (COTZX) (9/25/02) | | | -0.26 | % | | | 1.23 | % | | | 2.69 | % | | | 10.78 | % | | | 6.53 | % | | | 7.77 | % | |
S&P 500 Index | | | 0.28 | % | | | 1.23 | % | | | 7.42 | % | | | 17.34 | % | | | 7.89 | % | | | 9.72 | % | |
Barclays U.S. Aggregate Bond Index | | | -1.68 | % | | | -0.10 | % | | | 1.86 | % | | | 3.35 | % | | | 4.44 | % | | | 4.48 | % | |
Lipper Flexible Portfolio Funds Index | | | -0.46 | % | | | 1.01 | % | | | -0.59 | % | | | 9.87 | % | | | 6.26 | % | | | 7.79 | % | |
50/50 Blended Benchmark | | | -0.70 | % | | | 0.66 | % | | | 4.73 | % | | | 10.36 | % | | | 6.46 | % | | | 7.35 | % | |
| Columbia Acorn Emerging Markets FundSM (CEFZX) (8/19/11) | | | -2.06 | % | | | -2.83 | % | | | -9.85 | % | | | — | | | | — | | | | 6.40 | % | |
S&P Emerging Markets Between $500M and $5B Index | | | 1.17 | % | | | 3.05 | % | | | -2.71 | % | | | — | | | | — | | | | 3.68 | % | |
MSCI Emerging Markets Small Cap Index (Net) | | | 4.50 | % | | | 8.25 | % | | | 0.34 | % | | | — | | | | — | | | | 3.10 | % | |
Lipper Emerging Markets Index | | | 0.66 | % | | | 1.72 | % | | | -7.05 | % | | | — | | | | — | | | | 2.35 | % | |
| Columbia Acorn European FundSM (CAEZX) (8/19/11) | | | 2.30 | % | | | 6.80 | % | | | -3.58 | % | | | — | | | | — | | | | 12.61 | % | |
S&P Europe Between $500M and $5B Index | | | 5.03 | % | | | 10.62 | % | | | -1.86 | % | | | — | | | | — | | | | 14.88 | % | |
Euromoney Smaller European Companies (inc. UK) Index | | | 5.49 | % | | | 10.15 | % | | | -5.39 | % | | | — | | | | — | | | | 12.92 | % | |
Lipper European Region Index | | | 1.89 | % | | | 6.42 | % | | | -4.28 | % | | | — | | | | — | | | | 12.26 | % | |
The inception dates for Class A, B and C shares (if offered) are as follows: Columbia Acorn Fund, Columbia Acorn International, Columbia Acorn USA, Columbia Acorn International Select and Columbia Acorn Select, 10/16/00; Columbia Thermostat Fund, 3/3/03; Columbia Acorn Emerging Markets Fund and Columbia Acorn European Fund, 8/19/11. The inception dates for Class I shares are as follows: Columbia Acorn Fund, Columbia Acorn International, Columbia Acorn USA, Columbia Acorn International Select and Columbia Acorn Select, 9/27/10; Columbia Acorn Emerging Markets Fund and Columbia Acorn European Fund, 8/19/11. The inception date for Class R shares for Columbia Acorn International is 8/2/11. The inception date for Class R4, R5 and Y shares (if offered) is as follows: Columbia Acorn Fund, Columbia Acorn USA, Columbia Acorn International Select, Columbia Acorn Select, Columbia Thermostat Fund, Columbia Acorn Emerging Markets Fund and Columbia Acorn European Fund, 11/8/12, except that Class Y shares of Columbia Acorn Emerging Markets Fund commenced operations on 6/13/13 and Class R4 shares of Columbia Acorn European Fund commenced operations on 6/25/14. The inception date for Class R5 shares of Columbia Acorn International is 8/2/11. The inception date for Class R4 and Y shares of Columbia Acorn International is 11/8/12. The inception date for Class Z shares is as follows: Columbia Acorn Fund, 6/10/70; Columbia Acorn International, 9/23/92; Columbia Acorn USA, 9/4/96; Columbia Acorn International Select and Columbia Acorn Select, 11/23/98; Columbia Thermostat Fund, 9/25/02; Columbia Acorn Emerging Markets Fund and Columbia Acorn European Fund, 8/19/11.
*Not annualized.
**Although the Fund typically invests in small- and mid-sized companies, the comparison to the S&P 500® Index is presented to show performance against a widely recognized market index over the life of the Fund.
Please see Page 126 for a description of the indexes listed above.
3
COLUMBIA ACORN® FUND
IN A NUTSHELL

| | 
| |
Robert A. Mohn*
Co-Portfolio Manager | | P. Zachary Egan
Co-Portfolio Manager | |

| | 
| |
Fritz Kaegi
Co-Portfolio Manager | | David L. Frank
Co-Portfolio Manager | |
Performance data shown represents past performance and is not a guarantee of future results. The investment return and principal value will fluctuate so that shares, when redeemed, may be worth more or less than the original cost. Current performance may be lower or higher than the performance data shown. Please visit columbiathreadneedle.com/us for daily and most recent month-end performance updates.
Market risk may affect a single issuer, sector of the economy, industry or the market as a whole. Investments in small- and mid-cap companies involve risks and volatility and possible illiquidity greater than investments in larger, more established companies. Foreign investments subject the Fund to political, economic, market, social and other risks within a particular country, as well as to potential currency instabilities and less stringent financial and accounting standards generally applicable to U.S. issuers. Risks are enhanced for emerging market issuers. The Fund may invest significantly in issuers within a particular sector, which may be negatively affected by market, economic or other conditions, making the Fund more vulnerable to unfavorable developments in the sector.
Columbia Acorn Fund Class Z shares gained 2.54% in the second quarter of 2015, outperforming the Fund's primary benchmark, the Russell 2500 Index, which declined by 0.34% during the period. For the six months ended June 30, the Fund rose by 6.61%, topping the 4.81% gain by the Russell 2500 Index. Good stock selection in the health care sector, and specifically in biotech-related names, represented about two-thirds of the outperformance during the second quarter. Most of the remaining outperformance relative to the benchmark resulted from good stock selection in the financials sector.
Within health care, the "orphan drug" investment theme came to fruition with Alexion's takeover of Synageva BioPharma at a 128% premium to pre-announcement trading levels. Returning 109% during the quarter and 119% for the first half of the year, Synageva was at the core of the investment theme begun in 2007 to invest in companies developing drugs to treat "orphan" diseases—serious ailments that affect small numbers of people—which benefit from a favorable regulatory approval process. Orphan drug developers Ultragenyx Pharmaceutical (up 65% for the quarter) and Sarepta Therapeutics (up 129%), as well as biotech Seattle Genetics (up 37%), all rose on the Synageva take-out offer and accounted for most of the rest of the Fund's outperformance in health care. For the year-to-date period, these stocks had gains of 135%, 110% and 51%, respectively. We believe the results achieved within our orphan drug theme offer a good example of how our research structure and investment process can deliver unique value for Fund investors over the long term.
Within financials, investment manager SEI Investments led the outperformance, gaining 12% in the second quarter and 23% year to date. The company's actively managed investment strategies continued to attract strong net cash inflows. The Fund also benefited from a takeover offer for HCC Insurance, which rose 36% and was sold during the quarter.
Fund industrial stocks fell 1.6% in the second quarter, outperforming a 2.5% decline for the industrial sector within the benchmark. However, the Fund's overweight position resulted in a larger negative impact versus the benchmark's much smaller weighting in the sector. Notable detractors for the Fund included satellite owner Globalstar, down 37% for the quarter and 23% for the half year on regulatory worries about the company's wireless spectrum. Avis Budget Group fell 25% in the quarter and 33% for the half year on investor worries about pricing conditions in the car rental industry. Portable power generator maker Generac declined 18% for the quarter and 15% for the half year following management's lowered 2015 earnings guidance.
Columbia Acorn Fund continued to have significant net redemptions during the first half of 2015, following significant net redemptions during 2014. These redemptions have caused the Fund to realize large amounts of long-term capital gain, as many of the positions liquidated in connection with the redemptions had
appreciated considerably in value during the periods they were held by the Fund. The Fund seeks to minimize the amount of gains distributions affecting its taxable shareholders, consistent with the execution of its investment strategy and the trading activity required by Fund flows. Similarly, CWAM's experienced trading desk makes every effort to minimize the impact of this trading on the prices of Fund portfolio holdings.
Over the past 12 months, and against the backdrop of these Fund net redemptions, we have reduced meaningfully the number of positions owned by the Fund. At June 30, 2015, the Fund had 184 positions, compared to 205 at March 31, 2015, 277 at December 31, 2014, and 320 at June 30, 2014. Our 10 largest positions accounted for 18.5% of Fund assets at quarter end, up slightly from 18.3% at March 31. While past performance is not indicative of future results, the Fund has thrived at this level of concentration in the past. The Fund's holdings may become slightly more concentrated in the future as the result of having fewer overall holdings or more concentration in the largest holdings. Our investment team's key focus going forward is on adding new holdings when valuations are attractive and appropriately sizing the positions the Fund currently owns.
We were comfortable with the Fund's sector positioning versus its benchmark at quarter end. For the reasons described in our first quarter 2015 report, our largest overweight versus the benchmark remained the industrials sector, and our largest underweight remained the financials sector at the second quarter end. During the quarter, the Fund's industrials weight declined by a percentage point, while its financials underweight did not change. The majority of the financials underweight related to the REITs portion of the financials sector.
P. Zachary Egan and Fritz Kaegi joined the management team of Columbia Acorn Fund as co-portfolio managers on May 1, 2015. Mr. Egan has 16 years of industry experience and also serves as President and Chief International Investment Officer of Columbia Wanger, as well as co-portfolio manager of Columbia Acorn International. Mr. Kaegi brings 17 years of industry experience to the Fund and also serves as co-portfolio manager of Columbia Acorn Emerging Markets Fund.
Fund's Positions in Mentioned Holdings
As a percentage of net assets, as of 6/30/15
SEI Investments | | | 2.7 | % | |
Ultragenyx Pharmaceutical | | | 1.5 | | |
Generac | | | 0.9 | | |
Seattle Genetics | | | 0.7 | | |
Avis Budget Group | | | 0.7 | | |
Sarepta Therapeutics | | | 0.6 | | |
Globalstar | | | 0.6 | | |
Fund holdings are as of the date given, are subject to change at any time, and are not recommendations to buy or sell any security. Top holdings exclude short-term holdings and cash, if applicable.
* It is expected that Robert A. Mohn, co-portfolio manager of Columbia Acorn Fund, will step down from this role in the fourth quarter of 2015. Mr. Mohn will continue to perform portfolio management services for the Fund leading up to his departure to ensure a smooth transition in management.
4
COLUMBIA ACORN® FUND
AT A GLANCE
Total Net Assets of the Fund:
$11.8 billion
Performance data shown below represents past performance, does not guarantee future results, assumes reinvestment of dividends and distributions and does not reflect the deduction of taxes that a shareholder may pay on Fund distributions or the redemption of Fund shares. The investment return and principal value of an investment will fluctuate so that shares, when redeemed, may be worth more or less than their original cost. Current performance may be lower or higher than the performance data shown. Performance data reflects fee waivers or reimbursements of Fund expenses, if any; in their absence, performance results would have been lower. Indexes are unmanaged; their results do not reflect the effect of expenses or sales charges. Securities in the Fund may not match those in an index. Please visit columbiathreadneedle.com/us for performance data current to the most recent month-end.
The Growth of a $10,000 Investment in Columbia Acorn® Fund Class Z Shares
June 10, 1970 (Fund inception) through June 30, 2015
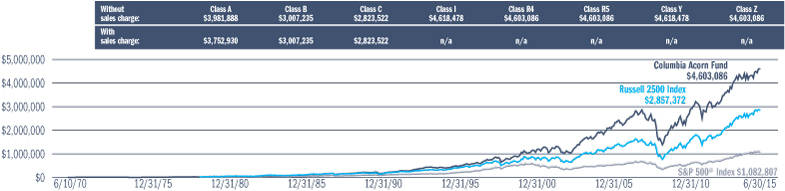
This chart shows the change in value of a hypothetical $10,000 investment in Class Z shares of the Fund during the stated time period. A $10,000 investment in Columbia Acorn Fund at inception appreciated to $31,777 on December 31, 1978, the inception date of the Russell 2500 Index. For comparison with the Russell 2500 Index, we assigned the index the same value as the Fund at index inception. Although the Fund typically invests in small- and mid-sized companies, the comparison to the S&P 500 Index is presented to show performance against a widely recognized market index over the life of the Fund.
Average Annual Total Returns for period ended June 30, 2015
| | | 2nd
quarter | | Year to
date | | 1 year | | 5 years | | 10 years | | Life of
Fund | |
| Class Z (6/10/70 inception) | | | 2.54 | % | | | 6.61 | % | | | 4.73 | % | | | 15.55 | % | | | 8.79 | % | | | 14.58 | % | |
| Class A (10/16/00 inception) | |
without sales charge | | | 2.46 | | | | 6.45 | | | | 4.45 | | | | 15.21 | | | | 8.48 | | | | 14.21 | | |
with sales charge | | | -3.43 | | | | 0.32 | | | | -1.56 | | | | 13.85 | | | | 7.83 | | | | 14.06 | | |
Russell 2500 Index* | | | -0.34 | | | | 4.81 | | | | 5.92 | | | | 17.85 | | | | 9.09 | | | | N/A | | |
Results for other share classes can be found on Page 2.
*The Fund's primary benchmark. Please see Page 126 for index descriptions.
Returns for Class A shown with and without the maximum initial sales charge of 5.75%. As stated in the May 1, 2015, prospectus, the Fund's annual operating expense ratio is 0.79% for Class Z shares and 1.08% for Class A shares. The returns shown for periods prior to the inception of the Fund's Class A shares append the returns of the Fund's Class Z shares, the Fund's oldest share class. These returns are adjusted to reflect any higher class-related operating expenses of the newer share classes, as applicable. Please visit columbiathreadneedleus.com/investment-products/mutual-funds/appended-performance for more information.
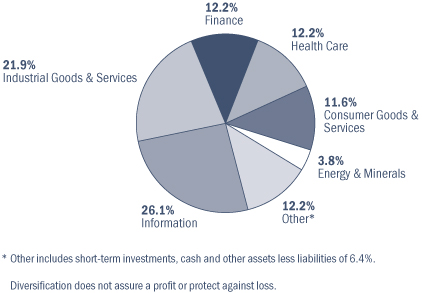
Portfolio Diversification
as a percentage of net assets, as of 6/30/15
Top 10 Holdings
as a percentage of net assets, as of 6/30/15
| 1. | | SEI Investments
Mutual Fund Administration & Investment
Management | | | 2.7
| % | |
| 2. | | Donaldson
Industrial Air Filtration | | | 2.4
| % | |
| 3. | | Ametek
Aerospace/Industrial Instruments | | | 2.1
| % | |
| 4. | | Cepheid
Molecular Diagnostics | | | 2.1
| % | |
| 5. | | LKQ
Alternative Auto Parts Distribution | | | 1.7
| % | |
| 6. | | Amphenol
Electronic Connectors | | | 1.7
| % | |
| 7. | | Mettler-Toledo International
Laboratory Equipment | | | 1.5
| % | |
| 8. | | Ultragenyx Pharmaceutical
Biotech Focused on "Ultra-Orphan" Drugs | | | 1.5
| % | |
| 9. | | Nordson
Dispensing Systems for Adhesives & Coatings | | | 1.4
| % | |
| 10. | | Associated Banc-Corp
Midwest Bank | | | 1.4
| % | |
The Fund's top 10 holdings and portfolio diversification vary with changes in portfolio investments. See the Statement of Investments for a complete list of the Fund's holdings.
5
COLUMBIA ACORN INTERNATIONAL®
IN A NUTSHELL

| | 
| |
P. Zachary Egan
Co-Portfolio Manager | | Louis J. Mendes
Co-Portfolio Manager | |
Performance data shown represents past performance and is not a guarantee of future results. The investment return and principal value will fluctuate so that shares, when redeemed, may be worth more or less than the original cost. Current performance may be lower or higher than the performance data shown. Please visit columbiathreadneedle.com/us for daily and most recent month-end performance updates.
Market risk may affect a single issuer, sector of the economy, industry or the market as a whole. International investing involves certain risks and volatility due to potential political, economic or currency instabilities and different, potentially less stringent, financial and accounting standards than those generally applicable to U.S. issuers. Risks are enhanced for emerging market issuers. Investments in small- and mid-cap companies involve risks and volatility and possible illiquidity greater than investments in larger, more established companies. Please also see "A Comment on Trading Volumes" on Page 1 of this report.
Columbia Acorn International Class Z shares gained 0.81% in the second quarter of 2015, bringing its year-to-date return to 5.18%. This was 2.79% behind the Fund's primary benchmark, the S&P Global ex-U.S. Between $500M and $5B® Index, which rose 7.97% year to date.
The majority of the Fund's underperformance for the half year was the result of weak relative performance in Asia, excluding Japan, which comprised roughly 27% of both the Fund and the benchmark. The strong rally in Chinese domestic shares (described in more detail below) helped lift China-related shares listed in Hong Kong in the benchmark nearly 25%, and the Fund's China-related holdings did not keep pace. In Hong Kong itself, Fund holdings continued to be negatively impacted by weak domestic demand in consumer stocks, as well as the continued decline in the Macau gaming sector. Elsewhere in Asia, underperformance in Korea was primarily due to the Fund's lack of holdings in the health care sector, which rallied over 100% on positive news regarding drug approvals. On the upside, in Japan, where the Fund's weight roughly matched that of the benchmark, good stock selection helped Fund stocks outperform the benchmark during the first half of 2015.
Although the principal Chinese stock exchanges in Shanghai and Shenzen are by regulation inaccessible to most non-Chinese investors, including the Fund, this so-called "A-share market" is the world's second largest equity market, calculated in U.S. dollars.* In the 12 months ended June 30, 2015, the Shanghai A and Shenzen A share indexes rose 109% and 125%, respectively, inclusive of a major correction in June. The rally has captured the imagination of millions of new domestic Chinese investors who have rushed to open brokerage accounts and speculate in the market. Margin lending reached record highs in June, representing an estimated 12% of the free-float market capitalization of marginable stocks, according to Reuters. The launch in November 2014 of the "Shanghai-Hong Kong Connect," a partnership between the Hong Kong and Shanghai exchanges that allows traders registered on each exchange to invest in stocks on the other, was thought to be the global investors' gateway into the China A-share market. In fact, it has resulted to date in large amounts of money flowing from Chinese investors into shares listed on the Hong Kong exchange, significantly bolstering that market.
Given this market environment, Columbia Acorn International's underweight in China-related shares has hurt relative performance, but we have been skeptical of the hype around the Shanghai-Hong Kong Connect and the rapid rise in speculation by Chinese investors, which we believe warrant caution for global investors like the Fund. We continue to be cautious about allocating capital in the region, although we have recently initiated some new positions there, as discussed below. The Chinese political leadership has been engaged for some time in a very public
project to transform its large economy from one that has been almost solely export-oriented and investment-led, into one more focused on its internal market and meeting the needs of the Chinese consumer and citizen. This re-orientation is necessitated by an economic growth imperative in light of industrial capacity overinvestment and increasing demands for an enhanced quality of life. In recent months, some elements of a policy framework designed to address these goals have become clearer, which we believe create some attractive opportunities for long-term investors like the Fund. In particular, we like the prospects for entrepreneurial Chinese companies focused on health care, certain types of infrastructure development, and meeting the goals of evolving environmental regulation.
Consistent with this view, we have recently increased the Fund's exposure to China, although it remains slightly underweight compared to the benchmark. We initiated positions in China Everbright International, a municipal waste-to-energy operating facility, and SIIC Environment, a municipal water treatment operator, both of which will benefit from efforts to clean up a highly polluted environment after years of heavy industrial growth. Another new position, Phoenix Healthcare Group, has been winning contracts to manage public hospitals, and through modern organizational and information systems, it is increasing health care delivery standards while turning around loss-making, former state-managed operations. At June 30, the Fund's exposure to China (through Hong Kong-listed, Singapore-listed and U.S.-listed shares) was approximately 6%, compared to 3% at December 31, 2014.
During the first half of 2015, there was significant world focus and dramatic headlines about the potential exit of Greece from the eurozone and the possible impact. While a Greek exit from the common euro currency cannot be ruled out, we think that it is an unlikely outcome and one that entails little contagion risk for the rest of Europe because of the way the debt is held. Whatever the outcome, we do not believe it would portend a broader dissolution of the eurozone. Consequently, we have not modified the Fund's portfolio to anticipate this scenario. We remain overweight in Europe relative to the benchmark by approximately three percentage points.
*Data source: the World Federation of Exchanges.
Fund's Positions in Mentioned Holdings
As a percentage of net assets, as of 6/30/15
China Everbright International | | | 0.7 | % | |
SIIC Environment | | | 0.3 | | |
Phoenix Healthcare Group | | | 0.3 | | |
Fund holdings are as of the date given, are subject to change at any time, and are not recommendations to buy or sell any security. Top holdings exclude short-term holdings and cash, if applicable.
6
COLUMBIA ACORN INTERNATIONAL®
AT A GLANCE
Total Net Assets of the Fund:
$7.9 billion
Performance data shown below represents past performance, does not guarantee future results, assumes reinvestment of dividends and distributions and does not reflect the deduction of taxes that a shareholder may pay on Fund distributions or the redemption of Fund shares. The investment return and principal value of an investment will fluctuate so that shares, when redeemed, may be worth more or less than their original cost. Current performance may be lower or higher than the performance data shown. Performance data reflects fee waivers or reimbursements of Fund expenses, if any; in their absence, performance results would have been lower. Indexes are unmanaged; their results do not reflect the effect of expenses or sales charges. Securities in the Fund may not match those in an index. Please visit columbiathreadneedle.com/us for performance data current to the most recent month-end.
The Growth of a $10,000 Investment in Columbia Acorn International® Class Z Shares
September 23, 1992 (Fund inception) through June 30, 2015
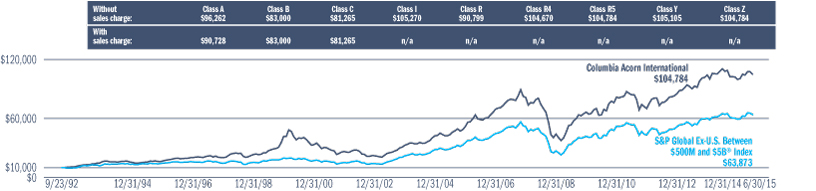
This chart shows the change in value of a hypothetical $10,000 investment in Class Z shares of the Fund during the stated time period.
Average Annual Total Returns for period ended June 30, 2015
| | | 2nd
quarter | | Year to
date | | 1 year | | 5 years | | 10 years | | Life of
Fund | |
| Class Z (9/23/92 inception) | | | 0.81 | % | | | 5.18 | % | | | -5.02 | % | | | 10.57 | % | | | 9.19 | % | | | 10.87 | % | |
| Class A (10/16/00 inception) | |
without sales charge | | | 0.74 | | | | 5.05 | | | | -5.29 | | | | 10.21 | | | | 8.82 | | | | 10.46 | | |
with sales charge | | | -5.05 | | | | -0.99 | | | | -10.74 | | | | 8.91 | | | | 8.18 | | | | 10.17 | | |
S&P Global Ex-U.S.
Between $500M and $5B® Index* | | | 2.91 | | | | 7.97 | | | | -1.52 | | | | 9.91 | | | | 8.20 | | | | 8.48 | | |
Results for other share classes can be found on Page 2.
*The Fund's primary benchmark. Please see Page 126 for index descriptions.
Returns for Class A shown with and without the maximum initial sales charge of 5.75%. As stated in the May 1, 2015, prospectus, the Fund's annual operating expense ratio is 0.93% for Class Z shares and 1.26% for Class A shares. The returns shown for periods prior to the inception of the Fund's Class A shares append the returns of the Fund's Class Z shares, the Fund's oldest share class. These returns are adjusted to reflect any higher class-related operating expenses of the newer share classes, as applicable. Please visit columbiathreadneedleus.com/investment-products/mutual-funds/appended-performance for more information.
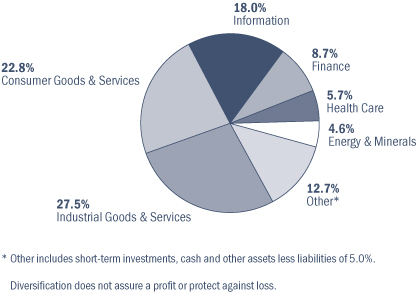
Portfolio Diversification
as a percentage of net assets, as of 6/30/15
Top 10 Holdings
as a percentage of net assets, as of 6/30/15
| 1. | | Coronation Fund Managers (South Africa)
South African Fund Manager | | | 1.2
| % | |
| 2. | | CCL Industries (Canada)
Global Label Converter | | | 1.0
| % | |
| 3. | | Zee Entertainment Enterprises (India)
Indian Programmer of Pay Television Content | | | 1.0
| % | |
| 4. | | Distribuidora Internacional
de Alimentación (Spain)
Discount Retailer in Spain & Latin America | | | 1.0
| % | |
| 5. | | SimCorp (Denmark)
Software for Investment Managers | | | 1.0
| % | |
| 6. | | Spotless (Australia)
Facility Management & Catering Company | | | 1.0
| % | |
| 7. | | Spirax Sarco (United Kingdom)
Steam Systems for Manufacturing &
Process Industries | | | 0.8
| % | |
| 8. | | President Chain Store (Taiwan)
Convenience Chain Store Operator in Taiwan | | | 0.8
| % | |
| 9. | | Singapore Exchange (Singapore)
Singapore Equity & Derivatives Market Operator | | | 0.8
| % | |
| 10. | | Partners Group (Switzerland)
Private Markets Asset Management | | | 0.8
| % | |
The Fund's top 10 holdings and portfolio diversification vary with changes in portfolio investments. See the Statement of Investments for a complete list of the Fund's holdings.
7
COLUMBIA ACORN USA®
IN A NUTSHELL

| | 
| |
Robert A. Mohn*
Co-Portfolio Manager | | William J. Doyle*
Co-Portfolio Manager | |
Performance data shown represents past performance and is not a guarantee of future results. The investment return and principal value will fluctuate so that shares, when redeemed, may be worth more or less than the original cost. Current performance may be lower or higher than the performance data shown. Please visit columbiathreadneedle.com/us for daily and most recent month-end performance updates.
Market risk may affect a single issuer, sector of the economy, industry or the market as a whole. Investments in small- and mid-cap companies involve risks and volatility and possible illiquidity greater than investments in larger, more established companies. The Fund may invest significantly in issuers within a particular sector, which may be negatively affected by market, economic or other conditions, making the Fund more vulnerable to unfavorable developments in the sector.
Columbia Acorn USA Class Z shares gained 2.02% in the second quarter of 2015, outperforming the Fund's primary benchmark, the Russell 2000 Index, which rose 0.42%. Year to date through June 30, the Fund was up 7.25%, well ahead of the 4.75% gain of its benchmark. Strong performance in the health care sector, particularly in biotech stocks, fueled the Fund's strong relative performance for both periods.
Four of the top five contributors to Fund performance in the second quarter were biotech names. Three of these four biotech winners develop drugs to fight orphan diseases—rare diseases that affect a small percentage of the population. Focusing on orphan drug companies has been one of the Fund's investment themes. Synageva BioPharma gained 109% in the quarter on news it was being acquired by Alexion Pharmaceuticals. For the half-year period, Synageva was up 120%. We sold the Fund's position in the stock during the quarter to capture its strong gains. Ultragenyx Pharmaceutical saw its stock rise on Synageva's announcement and on news of positive test results for an orphan drug in its pipeline. Ultragenyx gained 64% in the quarter and was up 137% for the half year. Sarepta Therapeutics, up 129% in the quarter and 110% for the half year, also bounced on the Synageva news and on a favorable review from the FDA of its drug to treat Duchenne muscular dystrophy. Our remaining biotech winner was Seattle Genetics, a developer of antibody-based therapies for cancer, which gained 37% in the quarter and ended the half year up 51%, as its stock benefited from strength in the sector.
Other winners in the quarter included Texas thrift LegacyTexas, which gained 34% as concerns over its energy loan book abated. Virtusa, a provider of offshore IT outsourcing services, rose 24% in the quarter on strong revenue growth fueled by demand from financial services clients.
Rental car companies Hertz and Avis Budget Group slumped in the quarter, falling 16% and 25%, respectively, as rental car pricing year over year grew less than Wall Street analysts believed it would. We are comfortable with the rate of pricing growth. With a 34% loss for Avis Budget Group and a 27% decline for Hertz, these stocks were the Fund's biggest detractors for the six-month period.
The Fund also experienced some declines in the industrial sector. Generac, a manufacturer of standby power generators, had weak year-over-year sales, as electrical power outages fell well below trend. Generac's stock dropped 18% in the quarter and was off 15% year to date. Oshkosh, a specialty truck manufacturer, was added to the Fund in the second quarter but got off to a bumpy start. Its 22% decline followed the company's release of weak
revenue guidance within its aerial work platform business segment. A provider of international container leases, CAI International fell 16% in the second quarter as sharp declines in steel prices have lowered the cost of buying ocean going container boxes, and lower box prices have translated into falling daily rental rates for CAI's fleet.
We are encouraged by Columbia Acorn USA's performance to date in 2015 and with the progress being made in the Fund's longer term results. For the one-year period ended June 30, 2015, Columbia Acorn USA's 8.21% gain was 1.72% ahead of its benchmark, and Fund results for the five- and 10-year periods were less than a percentage point off the benchmark. This quarter we also saw our orphan drug biotech theme come to fruition. Orphan pharmaceutical Synageva BioPharma, for example, was added to the Fund in the first quarter of 2012 and the position produced a cumulative gain within Columbia Acorn USA of 574% upon its sale in the second quarter. After the biotech group's multi-year run-up, we believe that the sector's valuations appear stretched. With the removal of Synageva BioPharma from the portfolio and some selective trimming of other positions, we have recently reduced the Fund's exposure to this area.
Fund's Positions in Mentioned Holdings
As a percentage of net assets, as of 6/30/15
Ultragenyx Pharmaceutical | | | 1.5 | % | |
Avis Budget Group | | | 1.4 | | |
Sarepta Therapeutics | | | 1.0 | | |
LegacyTexas | | | 1.0 | | |
Virtusa | | | 0.9 | | |
Generac | | | 0.9 | | |
CAI International | | | 0.8 | | |
Hertz | | | 0.7 | | |
Seattle Genetics | | | 0.7 | | |
Oshkosh | | | 0.5 | | |
Fund holdings are as of the date given, are subject to change at any time, and are not recommendations to buy or sell any security. Top holdings exclude short-term holdings and cash, if applicable.
* It is expected that Robert A. Mohn, co-portfolio manager of Columbia Acorn USA, will step down in the fourth quarter of 2015. William J. Doyle, current co-portfolio manager of Columbia Acorn USA, will continue in that role. Mr. Mohn will continue to perform portfolio management services for the Fund leading up to his departure to ensure a smooth transition in management.
8
COLUMBIA ACORN USA®
AT A GLANCE
Total Net Assets of the Fund:
$1.3 billion
Performance data shown below represents past performance, does not guarantee future results, assumes reinvestment of dividends and distributions and does not reflect the deduction of taxes that a shareholder may pay on Fund distributions or the redemption of Fund shares. The investment return and principal value of an investment will fluctuate so that shares, when redeemed, may be worth more or less than their original cost. Current performance may be lower or higher than the performance data shown. Performance data reflects fee waivers or reimbursements of Fund expenses, if any; in their absence, performance results would have been lower. Indexes are unmanaged; their results do not reflect the effect of expenses or sales charges. Securities in the Fund may not match those in an index. Please visit columbiathreadneedle.com/us for performance data current to the most recent month-end.
The Growth of a $10,000 Investment in Columbia Acorn USA® Class Z Shares
September 4, 1996 (Fund inception) through June 30, 2015
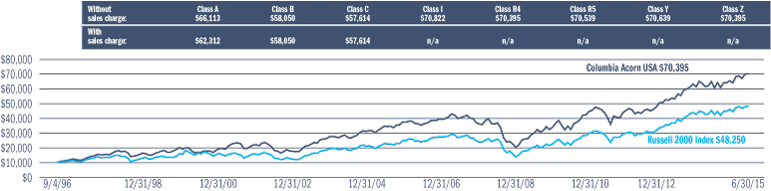
This chart shows the change in value of a hypothetical $10,000 investment in Class Z shares of the Fund during the stated time period.
Average Annual Total Returns for period ended June 30, 2015
| | | 2nd
quarter | | Year to
date | | 1 year | | 5 years | | 10 years | | Life of
Fund | |
| Class Z (9/4/96 inception) | | | 2.02 | % | | | 7.25 | % | | | 8.21 | % | | | 16.98 | % | | | 7.80 | % | | | 10.93 | % | |
| Class A (10/16/00 inception) | |
without sales charge | | | 1.96 | | | | 7.14 | | | | 7.96 | | | | 16.67 | | | | 7.50 | | | | 10.56 | | |
with sales charge | | | -3.91 | | | | 0.97 | | | | 1.74 | | | | 15.30 | | | | 6.87 | | | | 10.21 | | |
Russell 2000 Index* | | | 0.42 | | | | 4.75 | | | | 6.49 | | | | 17.08 | | | | 8.40 | | | | 8.72 | | |
Results for other share classes can be found on Page 2.
*The Fund's primary benchmark. Please see Page 126 for index descriptions.
Returns for Class A shown with and without the maximum initial sales charge of 5.75%. As stated in the May 1, 2015, prospectus, the Fund's annual operating expense ratio is 1.08% for Class Z shares and 1.34% for Class A shares. The returns shown for periods prior to the inception of the Fund's Class A shares append the returns of the Fund's Class Z shares, the Fund's oldest share class. These returns are adjusted to reflect any higher class-related operating expenses of the newer share classes, as applicable. Please visit columbiathreadneedleus.com/investment-products/mutual-funds/appended-performance for more information.
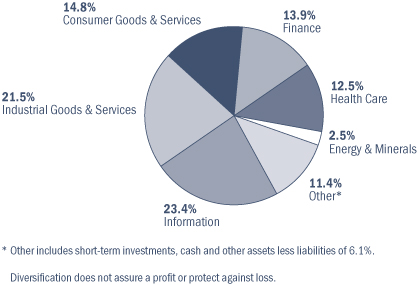
Portfolio Diversification
as a percentage of net assets, as of 6/30/15
Top 10 Holdings
as a percentage of net assets, as of 6/30/15
| 1. | | Ametek
Aerospace/Industrial Instruments | | | 3.3
| % | |
| 2. | | Nordson
Dispensing Systems for Adhesives & Coatings | | | 3.1
| % | |
| 3. | | Mettler-Toledo International
Laboratory Equipment | | | 3.1
| % | |
| 4. | | Extra Space Storage
Self Storage Facilities | | | 2.9
| % | |
| 5. | | HEICO
FAA-approved Aircraft Replacement Parts | | | 2.8
| % | |
| 6. | | Donaldson
Industrial Air Filtration | | | 2.6
| % | |
| 7. | | IPG Photonics
Fiber Lasers | | | 2.5
| % | |
| 8. | | Cepheid
Molecular Diagnostics | | | 2.1
| % | |
| 9. | | Drew Industries
RV & Manufactured Home Components | | | 1.7
| % | |
| 10. | | Ansys
Simulation Software for Engineers & Designers | | | 1.6
| % | |
The Fund's top 10 holdings and portfolio diversification vary with changes in portfolio investments. See the Statement of Investments for a complete list of the Fund's holdings.
9
COLUMBIA ACORN INTERNATIONAL SELECTSM
IN A NUTSHELL

| | 
| |
Christopher J. Olson
Co-Portfolio Manager | | Andreas Waldburg-Wolfegg
Co-Portfolio Manager | |
Performance data shown represents past performance and is not a guarantee of future results. The investment return and principal value will fluctuate so that shares, when redeemed, may be worth more or less than the original cost. Current performance may be lower or higher than the performance data shown. Please visit columbiathreadneedle.com/us for daily and most recent month-end performance updates.
Market risk may affect a single issuer, sector of the economy, industry or the market as a whole. Foreign investments subject the Fund to political, economic, market, social and other risks within a particular country, as well as to potential currency instabilities and less stringent financial and accounting standards generally applicable to U.S. issuers. Risks are enhanced for emerging market issuers. Investments in small- and mid-cap companies involve risks and volatility and possible illiquidity greater than investments in larger, more established companies. The Fund may invest significantly in issuers within a particular sector, which may be negatively affected by market, economic or other conditions, making the Fund more vulnerable to unfavorable developments in the sector. Please also see "A Comment on Trading Volumes" on Page 1 of this report.
Columbia Acorn International Select Class Z shares ended the second quarter of 2015 up 2.37%, topping the 2.27% gain of the Fund's primary benchmark, the S&P Developed Ex-U.S. Between $2B and $10B® Index. For the six-month period ended June 30, the Fund was up 3.88% while the benchmark gained 8.00% for the same period. On a sector basis, Fund industrials outperformed relative to the benchmark for both periods, while materials and financials negatively impacted performance. On a regional basis, good stock selection in Asia, excluding Japan, was a positive during the quarter. Columbia Acorn International Select also outperformed in the UK and Ireland in the second quarter, though a lesser weighting than the benchmark diminished its impact relative to the index.
The top contributor to Fund performance in the second quarter and for the half year period was CJ Corp, a holding company of Korean consumer conglomerates. Up 66% in the quarter and 86% for the half, investors responded favorably to the company's new management and its successful implementation of restructuring programs. In the United Kingdom, WH Smith, a newsprint, book and stationery retailer, gained 24% in the second quarter, benefiting from strong air passenger demand in its travel division. WH Smith was added to the portfolio in the first quarter and, at the second quarter end, was up 15%. Silver and gold miner Tahoe Resources rebounded in the second quarter, gaining 11% after a weak first quarter left the stock looking inexpensive. Tahoe's strong quarter was not enough to overcome earlier weakness, however, leaving its stock with a 12% loss for the half year. CCL Industries, a global label converter based in Canada, gained 10% in the second quarter and was up 14% for the half year period on continued strong revenue growth.
In Japan, Japan Tobacco, a maker of cigarettes, had another strong quarter, gaining 14% as investor fears surrounding its Russian operations abated and management undertook a stock buyback. Japan Tobacco's stock was up 30% for the semiannual period. KDDI, a mobile and fixed line communication service provider in Japan, gained 7% in the quarter and was up 16% for the half year, as it has continued to deliver consistent earnings growth driven by higher average revenue per user and by subscriber growth.
The biggest detractor from gains in the quarter and half was Coronation Fund Managers, a South African fund manager. Down 15% in the quarter and 31% year to date, its stock suffered from significantly lower performance fees compared to those earned last year. Beadell Resources, a gold miner operating in Brazil, and Goldcorp, a Canadian
gold miner, were also among the detractors. Beadell fell 26% in the quarter and was off 18% for the half-year period, while Goldcorp declined 10% in the quarter and ended the half down 11%. Both were affected by weak gold prices. Park24, a parking lot operator in Japan, gained nearly 40% in the first quarter as investors migrated toward more stable domestic businesses, but the second quarter took away some of that gain, as its stock fell 17% on a weaker than expected recovery in parking lot demand. Park24 returned 16% year to date. Nippon Prologis REIT, a logistics REIT in Japan, was down 15% for the second quarter and the half year as investors rotated into other sectors after several years of outperformance.
Andreas Waldburg-Wolfegg was named co-portfolio manager of Columbia Acorn International Select, effective May 1, 2015. Mr. Waldburg-Wolfegg brings 22 years of industry experience to the portfolio and also serves as co-portfolio manager of Columbia Acorn European Fund.
Fund's Positions in Mentioned Holdings
As a percentage of net assets, as of 6/30/15
KDDI | | | 3.9 | % | |
Tahoe Resources | | | 3.2 | | |
CJ Corp | | | 3.1 | | |
CCL Industries | | | 2.8 | | |
Japan Tobacco | | | 2.5 | | |
WH Smith | | | 2.5 | | |
Coronation Fund Managers | | | 2.0 | | |
Goldcorp | | | 1.9 | | |
Nippon Prologis REIT | | | 1.3 | | |
Park24 | | | 1.0 | | |
Beadell Resources | | | 0.8 | | |
Fund holdings are as of the date given, are subject to change at any time, and are not recommendations to buy or sell any security. Top holdings exclude short-term holdings and cash, if applicable.
10
COLUMBIA ACORN INTERNATIONAL SELECTSM
AT A GLANCE
Total Net Assets of the Fund:
$223.4 million
Performance data shown below represents past performance, does not guarantee future results, assumes reinvestment of dividends and distributions and does not reflect the deduction of taxes that a shareholder may pay on Fund distributions or the redemption of Fund shares. The investment return and principal value of an investment will fluctuate so that shares, when redeemed, may be worth more or less than their original cost. Current performance may be lower or higher than the performance data shown. Performance data reflects fee waivers or reimbursements of Fund expenses, if any; in their absence, performance results would have been lower. Indexes are unmanaged; their results do not reflect the effect of expenses or sales charges. Securities in the Fund may not match those in an index. Please visit columbiathreadneedle.com/us for performance data current to the most recent month-end.
The Growth of a $10,000 Investment in Columbia Acorn International SelectSM Class Z Shares
November 23, 1998 (Fund inception) through June 30, 2015
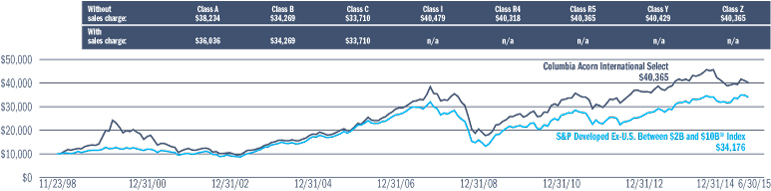
This chart shows the change in value of a hypothetical $10,000 investment in Class Z shares of the Fund during the stated time period.
Average Annual Total Returns for period ended June 30, 2015
| | | 2nd
quarter | | Year to
date | | 1 year | | 5 years | | 10 years | | Life of
Fund | |
| Class Z (11/23/98 inception) | | | 2.37 | % | | | 3.88 | % | | | -11.76 | % | | | 9.21 | % | | | 8.11 | % | | | 8.77 | % | |
| Class A (10/16/00 inception) | |
without sales charge | | | 2.26 | | | | 3.70 | | | | -12.04 | | | | 8.86 | | | | 7.76 | | | | 8.41 | | |
with sales charge | | | -3.60 | | | | -2.24 | | | | -17.09 | | | | 7.58 | | | | 7.12 | | | | 8.03 | | |
S&P Developed Ex-U.S.
Between $2B and $10B® Index* | | | 2.27 | | | | 8.00 | | | | -1.35 | | | | 10.68 | | | | 6.99 | | | | 7.68 | | |
Results for other share classes can be found on Page 2.
*The Fund's primary benchmark. Please see Page 126 for index descriptions.
Returns for Class A shown with and without the maximum initial sales charge of 5.75%. As stated in the May 1, 2015, prospectus, the Fund's annual operating expense ratio is 1.18% for Class Z shares and 1.47% for Class A shares. The returns shown for periods prior to the inception of the Fund's Class A shares append the returns of the Fund's Class Z shares, the Fund's oldest share class. These returns are adjusted to reflect any higher class-related operating expenses of the newer share classes, as applicable. Please visit columbiathreadneedleus.com/investment-products/mutual-funds/appended-performance for more information.
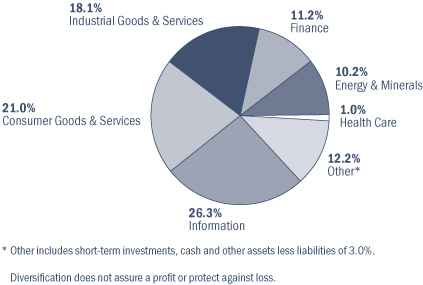
Portfolio Diversification
as a percentage of net assets, as of 6/30/15
Top 10 Holdings
as a percentage of net assets, as of 6/30/15
| 1. | | Naspers (South Africa)
Media in Africa, China, Russia & other
Emerging Markets | | | 4.3
| % | |
| 2. | | CapitaLand Mall Trust (Singapore)
Singapore Commercial Property Real Estate
Investment Trust | | | 4.2
| % | |
| 3. | | Singapore Exchange (Singapore)
Singapore Equity & Derivatives Market Operator | | | 4.1
| % | |
| 4. | | KDDI (Japan)
Mobile & Fixed Line Communication Service
Provider in Japan | | | 3.9
| % | |
| 5. | | Recruit Holdings (Japan)
Recruitment & Media Services | | | 3.6
| % | |
| 6. | | Secom (Japan)
Security Services | | | 3.5
| % | |
| 7. | | Tahoe Resources (Guatemala)
Silver & Gold Projects in Guatemala & Peru | | | 3.2
| % | |
| 8. | | CJ Corp (Korea)
Holding Company of Korean Consumer
Conglomerate | | | 3.1
| % | |
| 9. | | Partners Group (Switzerland)
Private Markets Asset Management | | | 2.8
| % | |
| 10. | | CCL Industries (Canada)
Global Label Converter | | | 2.8
| % | |
The Fund's top 10 holdings and portfolio diversification vary with changes in portfolio investments. See the Statement of Investments for a complete list of the Fund's holdings.
11
COLUMBIA ACORN SELECTSM
IN A NUTSHELL

| | 
| |
Robert A. Chalupnik
Lead Portfolio Manager | | Matthew S. Szafranski
Co-Portfolio Manager | |
Performance data shown represents past performance and is not a guarantee of future results. The investment return and principal value will fluctuate so that shares, when redeemed, may be worth more or less than the original cost. Current performance may be lower or higher than the performance data shown. Please visit columbiathreadneedle.com/us for daily and most recent month-end performance updates.
Market risk may affect a single issuer, sector of the economy, industry or the market as a whole. Investments in small- and mid-cap companies involve risks and volatility and possible illiquidity greater than investments in larger, more established companies. Foreign investments subject the Fund to risks, including political, economic, market, social and other risks, within a particular country, as well as to potential currency instabilities and less stringent financial and accounting standards generally applicable to U.S. issuers. Risks are enhanced for emerging market issuers. The Fund may invest significantly in issuers within a particular sector, which may be negatively affected by market, economic or other conditions, making the Fund more vulnerable to unfavorable developments in the sector.
Columbia Acorn Select Class Z shares ended the second quarter of 2015 up 3.16%, outperforming the 1.06% decline of its primary benchmark, the S&P MidCap 400 Index. For the six months ended June 30, the Fund was up 6.07% versus a 4.20% gain for the benchmark. Solid performance from Fund health care stocks, specifically biotech-related names, contributed to the Fund's outperformance for both periods. Being underweight in utilities also benefited the Fund, as this group was down nearly 7% for the quarter and 12% year to date in the benchmark. We have not held any utility stocks during the past year due to high valuations for these low-growth companies.
Synageva BioPharma, a biotech company focused on orphan diseases, surged 110% in the quarter after announcing that the company was being acquired by Alexion Pharmaceuticals. For the half year, the stock was up nearly 121%. We chose to sell this position on the positive news. Ultragenyx Pharmaceutical is also focused on drugs that treat very rare diseases. Its stock was up nearly 64%, as the sector bounced with Synageva. Ultragenyx also benefited from favorable news for several of its pipeline drugs. For the half year, Ultragenyx was up nearly 109%.
Other winners included LKQ, a distributor of alternative auto parts for the collision industry. Up 18% in the quarter and 7% for the half year, LKQ enjoyed sales growth across all of its business segments and also benefited from a rebound in margins after a tough fourth quarter. SEI Investments, a mutual fund administrator and investment manager, gained 12% in the quarter and 23% for the half year, as its actively managed investment strategies attracted strong cash inflows.
In addition to Synageva BioPharma, the issuers of two other Fund positions announced that they were being sold during the second quarter. Pall, a life science and industrial filtration company, gained 22% in the quarter following the news that it was being acquired by Danaher. Pall's stock was up 21% for the half year. Informatica, an enterprise data integration software company, was the third acquisition. Informatica's stock was up only 9% in the quarter, as much of the 25% year-to-date gain was realized earlier in the year when news broke that the company had hired an investment banker to contact potential buyers. We sold out of both positions following the announcements.
On the downside, several Fund consumer stocks declined in the second quarter. The Fresh Market, a specialty food retailer, was off over 20% for the quarter and the half year. While earnings were slightly above industry estimates, comparative quarterly sales data missed expectations. An unusually large number of competitive store openings have
hurt the company's overall sales, but we expect this trend to normalize. Fossil, a manufacturer of watches and jewelry, was down nearly 16% in the quarter and 14% for the half. A decline in North American sales of Fossil's Michael Kors line, and buzz around the Apple Watch and other wearable technology, negatively impacted returns. United Natural Foods, a distributor of natural/organic foods to grocery stores, was off 17% for the quarter and 18% for the half year as the specialty grocery industry experienced a general slowdown early in the year.
Other laggards included Solera Holdings, a developer of software for the automotive insurance claims processing industry, which fell 13% in the second quarter and ended the half year down 9%. With 60% of its sales outside of the United States, currency headwinds played a role in Solera's decline. Donaldson, an air filtration company, fell 5% in the quarter and was off over 6% for the half year. As mentioned last quarter, the company has suffered from weaker sales to its agriculture end market and has also been impacted by the strong U.S. dollar.
After several years of no take-out activity in the Fund, Columbia Acorn Select had three in the quarter and four so far in 2015. Acquisitions of Fund holdings have benefited the Fund historically, and typically confirm the investment merit of the business.
Our strategy remains unchanged. We continue to invest in growing businesses that trade at what we believe to be reasonable valuations relative to the quality and fundamentals of the business.
Matthew S. Szafranski was named co-portfolio manager of Columbia Acorn Select on May 1, 2015. As an analyst, Mr. Szafranski covers leisure, lodging, gaming, restaurants and consumer staples companies for our domestic team.
Fund's Positions in Mentioned Holdings
As a percentage of net assets, as of 6/30/15
Donaldson | | | 5.0 | % | |
LKQ | | | 5.0 | | |
SEI Investments | | | 4.6 | | |
The Fresh Market | | | 3.6 | | |
Solera Holdings | | | 2.6 | | |
Fossil | | | 2.0 | | |
United Natural Foods | | | 1.4 | | |
Ultragenyx Pharmaceutical | | | 1.4 | | |
Fund holdings are as of the date given, are subject to change at any time, and are not recommendations to buy or sell any security. Top holdings exclude short-term holdings and cash, if applicable.
12
COLUMBIA ACORN SELECTSM
AT A GLANCE
Total Net Assets of the Fund:
$604.7 million
Performance data shown below represents past performance, does not guarantee future results, assumes reinvestment of dividends and distributions and does not reflect the deduction of taxes that a shareholder may pay on Fund distributions or the redemption of Fund shares. The investment return and principal value of an investment will fluctuate so that shares, when redeemed, may be worth more or less than their original cost. Current performance may be lower or higher than the performance data shown. Performance data reflects fee waivers or reimbursements of Fund expenses, if any; in their absence, performance results would have been lower. Indexes are unmanaged; their results do not reflect the effect of expenses or sales charges. Securities in the Fund may not match those in an index. Please visit columbiathreadneedle.com/us for performance data current to the most recent month-end.
The Growth of a $10,000 Investment in Columbia Acorn SelectSM Class Z Shares
November 23, 1998 (Fund inception) through June 30, 2015
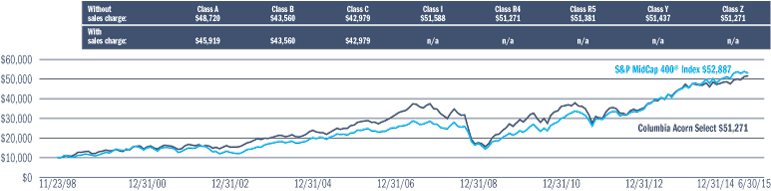
This chart shows the change in value of a hypothetical $10,000 investment in Class Z shares of the Fund during the stated time period.
Average Annual Total Returns for period ended June 30, 2015
| | | 2nd
quarter | | Year to
date | | 1 year | | 5 years | | 10 years | | Life of
Fund | |
| Class Z (11/23/98 inception) | | | 3.16 | % | | | 6.07 | % | | | 7.25 | % | | | 13.01 | % | | | 7.98 | % | | | 10.35 | % | |
| Class A (10/16/00 inception) | |
without sales charge | | | 3.12 | | | | 5.96 | | | | 6.96 | | | | 12.69 | | | | 7.67 | | | | 10.01 | | |
with sales charge | | | -2.82 | | | | -0.12 | | | | 0.80 | | | | 11.36 | | | | 7.04 | | | | 9.62 | | |
S&P MidCap 400® Index* | | | -1.06 | | | | 4.20 | | | | 6.40 | | | | 17.82 | | | | 9.74 | | | | 10.55 | | |
Results for other share classes can be found on Page 2.
*The Fund's primary benchmark. Please see Page 126 for index descriptions.
Returns for Class A shown with and without the maximum initial sales charge of 5.75%. As stated in the May 1, 2015, prospectus, the Fund's annual operating expense ratio is 0.84% for Class Z shares and 1.12% for Class A shares. The returns shown for periods prior to the inception of the Fund's Class A shares append the returns of the Fund's Class Z shares, the Fund's oldest share class. These returns are adjusted to reflect any higher class-related operating expenses of the newer share classes, as applicable. Please visit columbiathreadneedleus.com/investment-products/mutual-funds/appended-performance for more information.
Portfolio Diversification
as a percentage of net assets, as of 6/30/15
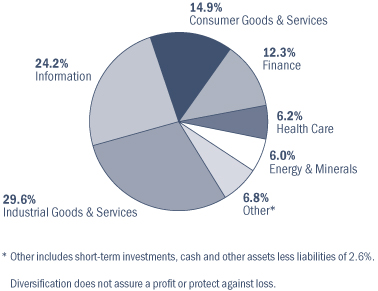
Top 10 Holdings
as a percentage of net assets, as of 6/30/15
| 1. | | Ametek
Aerospace/Industrial Instruments | | | 6.4
| % | |
| 2. | | Donaldson
Industrial Air Filtration | | | 5.0
| % | |
| 3. | | LKQ
Alternative Auto Parts Distribution | | | 5.0
| % | |
| 4. | | SEI Investments
Mutual Fund Administration & Investment
Management | | | 4.6
| % | |
| 5. | | The Fresh Market
Specialty Food Retailer | | | 3.6
| % | |
| 6. | | Vail Resorts
Ski Resort Operator & Developer | | | 3.2
| % | |
| 7. | | Associated Banc-Corp
Midwest Bank | | | 3.1
| % | |
| 8. | | Nordson
Dispensing Systems for Adhesives & Coatings | | | 3.0
| % | |
| 9. | | Airgas
Industrial Gas Distributor | | | 2.9
| % | |
| 10. | | Gentex
Manufacturer of Auto Parts | | | 2.8
| % | |
The Fund's top 10 holdings and portfolio diversification vary with changes in portfolio investments. See the Statement of Investments for a complete list of the Fund's holdings.
13
COLUMBIA THERMOSTAT FUNDSM
IN A NUTSHELL

| | 
| |
Charles P. McQuaid
Lead Portfolio Manager | | Christopher J. Olson
Co-Portfolio Manager | |
Performance data shown represents past performance and is not a guarantee of future results. The investment return and principal value will fluctuate so that shares, when redeemed, may be worth more or less than the original cost. Current performance may be lower or higher than the performance data shown. Please visit columbiathreadneedle.com/us for daily and most recent month-end performance updates.
A "fund of funds" bears its allocable share of the costs and expenses of the underlying funds in which it invests. Such funds are thus subject to two levels of fees and potentially higher expense ratios than would be associated with a fund that invests and trades directly in financial instruments under the direction of a single manager.
The value of an investment in the Fund is based primarily on the performance of the underlying funds in which it invests. The Fund is subject to the risk that the investment manager's decisions regarding asset classes and underlying funds will not anticipate market trends successfully, resulting in a failure to preserve capital or lower total return. The Investment Manager may prefer an underlying fund in the Columbia Acorn Family of Funds over alternative investments. There can be no assurance that the Columbia Acorn Funds will outperform similar funds managed by the Investment Manager's affiliates. This is not an offer of the shares of any other mutual fund mentioned herein.
Our fund of funds, Columbia Thermostat Fund, saw its Class Z shares drop 0.26% in the second quarter of 2015. This compares to a 0.28% quarterly gain of the Fund's primary equity benchmark, the S&P 500® Index. The Fund's primary debt benchmark, the Barclays U.S. Aggregate Bond Index, fell 1.68% in the quarter, and the 50/50 Blended Benchmark was off 0.70% for the same period. For the half year, the Fund's 1.23% gain matched the S&P 500 Index, outpaced its Barclay's benchmark, which was off 0.10%, and topped the 0.66% gain of the 50/50 Blended Benchmark.
The weighted average gain for the Fund's equity portfolio was 1.02% for the second quarter, led by the performance of Columbia Acorn Select, up 3.19%. For the six months through June 30, the weighted average equity gain was 3.65%, led by the 8.35% gain of Columbia Select Large Cap Growth Fund. For both periods, five of seven of Thermostat's stock funds beat the S&P 500, and four beat their own benchmarks.
The bond portion of the Fund had a weighted average loss in the second quarter, falling 0.34%. Columbia Intermediate Bond Fund was the biggest detractor, falling 1.61% in the quarter. Year to date, the bond portfolio had a weighted average gain of 1.15%, due largely to the 2.69% gain of Columbia Income Opportunities Fund. During both periods, all four bond funds beat the Barclay's benchmark and beat or nearly matched their own benchmarks.
As mentioned last quarter, as a result of the periodic review called for by Columbia Thermostat's prospectus, we made several changes that went into effect May 1, 2015. On the equity side, we decreased the Fund's weighting in Columbia Acorn Fund and increased its weight in Columbia Contrarian Core Fund. On the bond side, we decreased exposure to Columbia Intermediate Bond Fund and increased the Fund's weight in Columbia U.S. Government Mortgage Fund. These changes are intended to bring the Fund closer to a market weight in larger cap stocks, and, on the bond side, modestly boost the yield of Thermostat's bond portfolio. We note that over the last several years, we've reduced the weighted average duration of Thermostat's bond portfolio, which should benefit shareholders if interest rates rise.
Also effective May 1, 2015, we revised the stock/bond allocation table. The Fund now moves to 10% stocks at an S&P 500 level over 2,225, up from 2,020. The Fund now moves to 90% stocks at a level of 1,100 or less, up from 970. In between, a 75 point move in the S&P 500 triggers a 5% point change in allocation of stock and bond funds. As a result of this revision, Thermostat increased its equity weight from 10% to 20% and cut its bond weight from 90% to 80% on May 1.
The Fund hit one reallocation trigger in the second quarter following the adoption of the new stock/bond allocation table, increasing stock exposure further, to 25%, and cutting its bond weight to 75% on June 30.
While Thermostat's return was slightly negative in the quarter and modestly positive for the half year, we are pleased with its
performance relative to its benchmarks. Thermostat matched the S&P 500 for the half year while having at most 25% in equities (and that only for the last day of the period) at a time when the bond index was off slightly. This is primarily due to good performance of the underlying funds, discussed above.
Results of the Funds Owned in Columbia Thermostat Fund
as of June 30, 2015
Stock Funds
| Fund | | Weightings
in category | | 2nd
quarter
performance | | Year to date
performance | |
Columbia Acorn
International, Class I | | | 20 | % | | | 0.81 | % | | | 5.23 | % | |
Columbia Contrarian
Core Fund, Class I | | | 20 | %* | | | 1.83 | % | | | 3.10 | % | |
Columbia Dividend
Income Fund, Class I | | | 20 | % | | | -0.82 | % | | | -1.15 | % | |
Columbia Acorn Fund,
Class I | | | 10 | %* | | | 2.53 | % | | | 6.63 | % | |
Columbia Acorn Select,
Class I | | | 10 | % | | | 3.19 | % | | | 6.19 | % | |
Columbia Large Cap
Enhanced Core Fund,
Class I | | | 10 | % | | | -0.44 | % | | | 0.87 | % | |
Columbia Select Large
Cap Growth Fund, Class I | | | 10 | % | | | 2.48 | % | | | 8.35 | % | |
Weighted Average
Equity Gain | | | 100 | % | | | 1.02 | % | | | 3.65 | % | |
Bond Funds
| Fund | | Weightings
in category | | 2nd
quarter
performance | | Year to date
performance | |
Columbia Short Term
Bond Fund, Class I | | | 40 | % | | | 0.15 | % | | | 0.73 | % | |
Columbia Intermediate
Bond Fund, Class I | | | 20 | %* | | | -1.61 | % | | | 0.29 | % | |
Columbia Income
Opportunities Fund, Class I | | | 20 | % | | | -0.22 | % | | | 2.69 | % | |
Columbia U.S. Government
Mortgage Fund, Class I | | | 20 | %* | | | 0.04 | % | | | 1.32 | % | |
Weighted Average
Income Gain/Loss | | | 100 | % | | | -0.34 | % | | | 1.15 | % | |
* Change effective with the May 1, 2015 prospectus. Weighted average returns through the end of the period reflect linked returns between the previous fund weightings and the current weights in these positions.
Columbia Thermostat Fund Rebalancing in the Second Quarter
May 1, 2015 | | 20% stocks, 80% bonds | |
June 30, 2015 | | 25% stocks, 75% bonds | |
The Fund's investments in the underlying funds may present certain risks, including the following. Market risk may affect a single issuer, sector of the economy, industry or the market as a whole. The Fund's investment in other funds subjects it to the investment performance (positive or negative), risks and expenses of these underlying funds. Investments in small- and mid-cap companies involve risks and volatility and possible illiquidity greater than in investments in larger, more established companies. There are risks associated with fixed income investments, including credit risk, market risk, interest rate risk and prepayment and extension risk. In general, bond prices fall when interest rates rise and vice versa. This effect is more pronounced for longer term securities. Non-investment-grade (high-yield or junk) securities present greater price volatility and more risk to principal and income than higher rated securities. Foreign investments subject the Fund to political, economic, market, social and other risks within a particular country, as well as to potential currency instabilities and less stringent financial and accounting standards generally applicable to U.S. issuers. Risks are enhanced for emerging market issuers.
14
COLUMBIA THERMOSTAT FUNDSM
AT A GLANCE
Total Net Assets of the Fund:
$1.1 billion
Performance data shown below represents past performance, does not guarantee future results, assumes reinvestment of dividends and distributions and does not reflect the deduction of taxes that a shareholder may pay on Fund distributions or the redemption of Fund shares. The investment return and principal value of an investment will fluctuate so that shares, when redeemed, may be worth more or less than their original cost. Current performance may be lower or higher than the performance data shown. Performance data reflects fee waivers or reimbursements of Fund expenses, if any; in their absence, performance results would have been lower. Indexes are unmanaged; their results do not reflect the effect of expenses or sales charges. Securities in the Fund may not match those in an index. Please visit columbiathreadneedle.com/us for performance data current to the most recent month-end.
The Growth of a $10,000 Investment in Columbia Thermostat FundSM Class Z Shares
September 25, 2002 (Fund inception) through June 30, 2015
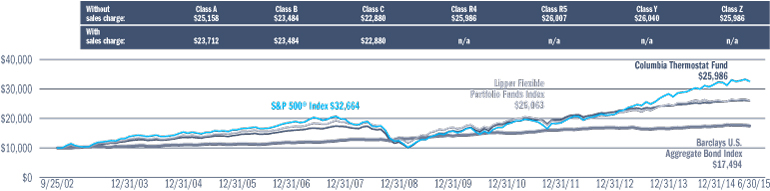
This chart shows the change in value of a hypothetical $10,000 investment in Class Z shares of the Fund during the stated time period.
Average Annual Total Returns for period ended June 30, 2015
| | | 2nd
quarter | | Year to
date | | 1 year | | 5 years | | 10 years | | Life of
Fund | |
| Class Z (9/25/02 inception) | | | -0.26 | % | | | 1.23 | % | | | 2.69 | % | | | 10.78 | % | | | 6.53 | % | | | 7.77 | % | |
| Class A (3/3/03 inception) | |
without sales charge | | | -0.33 | | | | 1.08 | | | | 2.46 | | | | 10.51 | | | | 6.26 | | | | 7.50 | | |
with sales charge | | | -6.06 | | | | -4.75 | | | | -3.43 | | | | 9.22 | | | | 5.63 | | | | 7.00 | | |
S&P 500® Index* | | | 0.28 | | | | 1.23 | | | | 7.42 | | | | 17.34 | | | | 7.89 | | | | 9.72 | | |
Barclays U.S. Aggregate
Bond Index* | | | -1.68 | | | | -0.10 | | | | 1.86 | | | | 3.35 | | | | 4.44 | | | | 4.48 | | |
Results for other share classes can be found on Page 2.
*The Fund's primary benchmarks. Please see Page 126 for index descriptions.
Returns for Class A shown with and without the maximum initial sales charge of 5.75%. As stated in the May 1, 2015, prospectus, the Fund's annual operating expense ratio is 0.77% for Class Z shares and 1.02% for Class A shares. The returns shown for periods prior to the inception of the Fund's Class A shares append the returns of the Fund's Class Z shares, the Fund's oldest share class. These returns are adjusted to reflect any higher class-related operating expenses of the newer share classes, as applicable. Please visit columbiathreadneedleus.com/investment-products/mutual-funds/appended-performance for more information.
Asset Allocation
as a percentage of net assets, as of 6/30/15
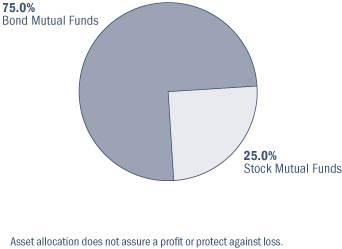
Portfolio Weightings
as a percentage of assets in each investment category, as of 6/30/15
Stock Mutual Funds
Columbia Acorn International, Class I | | | 20 | % | |
Columbia Contrarian Core Fund, Class I | | | 20 | %* | |
Columbia Dividend Income Fund, Class I | | | 20 | % | |
Columbia Acorn Fund, Class I | | | 10 | %* | |
Columbia Acorn Select, Class I | | | 10 | % | |
Columbia Large Cap Enhanced Core Fund,
Class I | | | 10 | % | |
Columbia Select Large Cap Growth Fund,
Class I | | | 10 | % | |
Bond Mutual Funds
Columbia Short Term Bond Fund, Class I | | | 40 | % | |
Columbia Intermediate Bond Fund, Class I | | | 20 | %* | |
Columbia Income Opportunities Fund,
Class I | | | 20 | % | |
Columbia U.S. Government Mortgage Fund,
Class I | | | 20 | %* | |
*Change effective with the May 1, 2015 prospectus. Weighted average returns through the end of the period reflect linked returns between the previous fund weightings and the current weights in these positions.
15
COLUMBIA ACORN EMERGING MARKETS FUNDSM
IN A NUTSHELL

| | 
| |
Fritz Kaegi
Co-Portfolio Manager | | Stephen Kusmierczak
Co-Portfolio Manager | |

| | 
| |
Louis J. Mendes
Co-Portfolio Manager | | Satoshi Matsunaga
Co-Portfolio Manager | |
Performance data shown represents past performance and is not a guarantee of future results. The investment return and principal value will fluctuate so that shares, when redeemed, may be worth more or less than the original cost. Current performance may be lower or higher than the performance data shown. Please visit columbiathreadneedle.com/us for daily and most recent month-end performance updates.
Market risk may affect a single issuer, sector of the economy, industry or the market as a whole. International investing involves certain risks and volatility due to potential political, economic or currency instabilities and different, potentially less stringent, financial and accounting standards than those generally applicable to U.S. issuers. Risks are enhanced for emerging and frontier market issuers. Investments in small- and mid-cap companies involve risks and volatility and possible illiquidity greater than investments in larger, more established companies. Please also see "A Comment on Trading Volumes" on Page 1 of this report.
Columbia Acorn Emerging Markets Fund Class Z shares lost 2.06% in the second quarter of 2015, underperforming the 1.17% gain of the Fund's primary benchmark, the S&P Emerging Markets Between $500M and $5B® Index. For the first six months of the year, the Fund was down 2.83%, trailing the benchmark's gain of 3.05% by 588 basis points.* Since its inception in August 2011, the Fund has returned an annualized gain of 6.40% compared to the benchmark's 3.68% return, or 272 basis points of outperformance on an annualized basis. The Fund lagged the benchmark in the first half of the year primarily due to the underperformance of Fund stocks with exposure to Southeast Asia and China.
During the quarter and half year, the Fund's main overweight positions underperformed. Southeast Asia, where the Fund had a 21% weight that was seven percentage points over the benchmark, was the worst performing region in the benchmark during the quarter. For most of its existence, Columbia Acorn Emerging Markets Fund has been significantly underweight in China, which was the best performing market in the benchmark in the first half of the year. By the end of June, however, we added about 12 percentage points to the Fund's exposure, as Chinese authorities began to implement market-based policy reforms in certain sectors including environmental protection and health care. While we were skeptical of the high valuations of many China-related stocks, we made several new investments within these sectors at what we believe are reasonable prices. This brought the Fund's exposure to China to slightly over the benchmark weight. Concurrently, many Southeast Asian stocks, which are generally illiquid, were impacted by slower economic growth and tighter liquidity in the region.
The Fund's largest contributor to returns during the second quarter was Chinese tobacco packaging supplier AMVIG Holdings. Its stock gained 15% in the second quarter and was up 31% for the half year, benefiting from the overall Chinese market rally. PChome Online, the only listed e-commerce company in Taiwan, was up 28% in the second quarter and 55% for the half year, as it continued to see strong revenue growth due to Taiwanese consumers' switch to online retail channels. A retail bank and insurer in Kazakhstan, Halyk Savings Bank of Kazakhstan, was up 24% in the quarter as it doubled its dividend and fears about further depreciation of the tenge, Kazakhstan's currency, subsided somewhat. Year to date its stock was up 8%.
The largest percentage decline in the quarter and half year period was Melco Crown (Philippines) Resorts, an operator of an integrated casino resort in the Philippines. Despite a successful grand opening in February, the stock fell 45% in
the quarter and was off 63% for the half year, as market participants seem to fear that negative gaming revenue trends in Macau will spread over Asian casinos. Its stock decline was much sharper than its affiliate Melco International, a Macau casino operator, which declined 36% for the half year and 16% in the second quarter. RFM, the dominant pasta and ice cream manufacturer in the Philippines, was off 22% in the second quarter despite solid first quarter earnings. Its removal from a major index at the end of May seemed to trigger a large sell-off of this small-cap stock. Year to date, RFM was off 17%. Coronation Fund Managers, the leading asset manager in South Africa, fell 14% in the second quarter and declined 30% for the half year due to significantly lower performance fees compared to those earned last year.
Responding to tighter liquidity in local markets, we have been reducing the Fund's overweight in Southeast Asia and, as mentioned, increasing its exposure to China. The stocks we have added with Chinese exposure have unique themes supported by structural tailwinds. We believe that waste treatment companies China Everbright Water and SIIC Environment, for example, should benefit from increased attention in China to environmental issues. Both companies operate in China but are listed in Singapore. We believe that our focus on higher quality businesses that are poised to benefit from positive long-term trends should provide investors with above average risk-adjusted returns.
Satoshi Matsunaga was named co-portfolio manager of Columbia Acorn Emerging Markets Fund, effective May 1, 2015. Mr. Matsunaga has 11 years of industry experience and covers Southeast Asian companies as an analyst. Also effective May 1, P. Zachary Egan is no longer a co-portfolio manager of the Fund.
*A basis point is 1/100 of a percent.
Fund's Positions in Mentioned Holdings
As a percentage of net assets, as of 6/30/15
AMVIG Holdings | | | 3.1 | % | |
Coronation Fund Managers | | | 2.9 | | |
Halyk Savings Bank of Kazakhstan - GDR | | | 2.6 | | |
PChome Online | | | 1.7 | | |
SIIC Environment | | | 1.5 | | |
RFM | | | 1.2 | | |
Melco Crown (Philippines) Resorts | | | 1.0 | | |
China Everbright Water | | | 0.9 | | |
Melco International | | | 0.9 | | |
Fund holdings are as of the date given, are subject to change at any time, and are not recommendations to buy or sell any security. Top holdings exclude short-term holdings and cash, if applicable.
Columbia Acorn Emerging Markets Fund is closed to most new investors and new accounts with certain exceptions. Refer to the Fund's prospectus for details.
16
COLUMBIA ACORN EMERGING MARKETS FUNDSM
AT A GLANCE
Total Net Assets of the Fund:
$416.8 million
Performance data shown below represents past performance, does not guarantee future results, assumes reinvestment of dividends and distributions and does not reflect the deduction of taxes that a shareholder may pay on Fund distributions or the redemption of Fund shares. The investment return and principal value of an investment will fluctuate so that shares, when redeemed, may be worth more or less than their original cost. Current performance may be lower or higher than the performance data shown. Performance data reflects fee waivers or reimbursements of Fund expenses, if any; in their absence, performance results would have been lower. Indexes are unmanaged; their results do not reflect the effect of expenses or sales charges. Securities in the Fund may not match those in an index. Please visit columbiathreadneedle.com/us for performance data current to the most recent month-end.
The Growth of a $10,000 Investment in Columbia Acorn Emerging Markets FundSM Class Z Shares
August 19, 2011 (Fund inception) through June 30, 2015
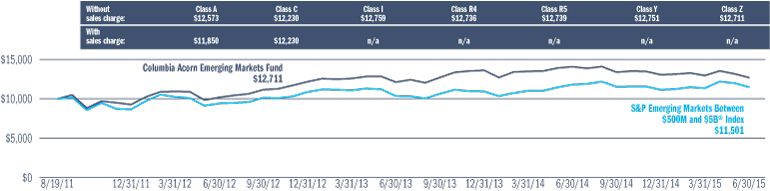
This chart shows the change in value of a hypothetical $10,000 investment in Class Z shares of the Fund during the stated time period.
Average Annual Total Returns for period ended June 30, 2015
| | 2nd quarter | | Year to date | | 1 year | | Life of Fund | |
| Class Z (8/19/11 inception) | | | -2.06 | % | | | -2.83 | % | | | -9.85 | % | | | 6.40 | % | |
| Class A (8/19/11 inception) | | | | | | | | | |
without sales charge | | | -2.14 | | | | -2.99 | | | | -10.09 | | | | 6.10 | | |
with sales charge | | | -7.77 | | | | -8.59 | | | | -15.25 | | | | 4.49 | | |
S&P Emerging Markets Between
$500M and $5B® Index* | | | 1.17 | | | | 3.05 | | | | -2.71 | | | | 3.68 | | |
Results for other share classes can be found on Page 2.
*The Fund's primary benchmark. Please see Page 126 for index descriptions.
Returns for Class A shown with and without the maximum initial sales charge of 5.75%. As stated in the May 1, 2015, prospectus, the Fund's annual operating expense ratio is 1.33% for Class Z shares and 1.57% for Class A shares.
Portfolio Diversification
as a percentage of net assets, as of 6/30/15
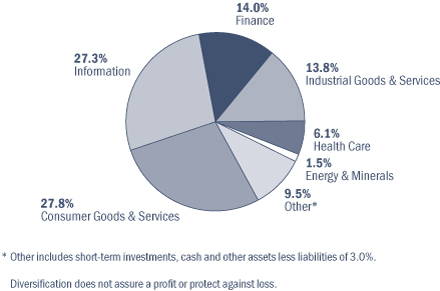
Top 10 Holdings
as a percentage of net assets, as of 6/30/15
| 1. | | Zee Entertainment Enterprises (India)
Indian Programmer of Pay Television Content | | | 3.4
| % | |
| 2. | | AMVIG Holdings (China)
Chinese Tobacco Packaging Material Supplier | | | 3.1
| % | |
| 3. | | Coronation Fund Managers (South Africa)
South African Fund Manager | | | 2.9
| % | |
| 4. | | Halyk Savings Bank of
Kazakhstan–GDR (Kazakhstan)
Retail Bank & Insurer in Kazakhstan | | | 2.6
| % | |
| 5. | | Koh Young Technology (Korea)
Inspection Systems for Printed Circuit Boards | | | 2.1
| % | |
| 6. | | Adani Ports & Special Economic
Zone (India)
Indian West Coast Shipping Port | | | 2.0
| % | |
| 7. | | Rand Merchant Insurance (South Africa)
Directly Sold Property & Casualty Insurance;
Holdings in other Insurers | | | 1.9
| % | |
| 8. | | CAR Inc (China)
Consolidator of Chinese Auto Rental Sector | | | 1.9
| % | |
| 9. | | Cable and Wireless (United Kingdom)
Telecommunications Service Provider in the
Caribbean | | | 1.8
| % | |
| 10. | | PChome Online (Taiwan)
Taiwanese Internet Retail Company | | | 1.7
| % | |
The Fund's top 10 holdings and portfolio diversification vary with changes in portfolio investments. See the Statement of Investments for a complete list of the Fund's holdings.
17
COLUMBIA ACORN EUROPEAN FUNDSM
IN A NUTSHELL

| | 
| |
Andreas Waldburg-Wolfegg
Co-Portfolio Manager | | Stephen
Kusmierczak
Co-Portfolio Manager | |
Performance data shown represents past performance and is not a guarantee of future results. The investment return and principal value will fluctuate so that shares, when redeemed, may be worth more or less than the original cost. Current performance may be lower or higher than the performance data shown. Please visit columbiathreadneedle.com/us for daily and most recent month-end performance updates.
Market risk may affect a single issuer, sector of the economy, industry or the market as a whole. International investing involves certain risks and volatility due to potential political, economic or currency instabilities and different, potentially less stringent, financial and accounting standards than those generally applicable to U.S. issuers. Risks are enhanced for emerging market issuers. Investments in small- and mid-cap companies involve risks and volatility and possible illiquidity greater than investments in larger, more established companies. Please also see "A Comment on Trading Volumes" on Page 1 of this report.
Columbia Acorn European Fund Class Z shares gained 2.30% in the second quarter of 2015, underperforming by 273 basis points* the 5.03% gain of its primary benchmark, the S&P Europe Between $500M and $5B Index. Year to date, the Fund was up 6.80% and trailed the benchmark return of 10.62% by 382 basis points. Since inception, the Fund has delivered an absolute return of 12.61% on an annualized basis, but lagged the benchmark return of 14.88%.
The Fund's largest contributor to performance both in the quarter and for the half year was Cambian, a provider of mental health rehabilitation to adults and children in the United Kingdom. Cambian has demonstrated better outcomes at lower costs based on data-driven protocols, and is a key beneficiary of a government outsourcing effort. The stock gained 37% in the second quarter and was up 50% for the half year. French transport and logistics company Norbert Dentressangle was the next largest contributor in the quarter and half. Its 43% second quarter jump followed a takeout offer and helped drive a 64% year-to-date gain. We sold this long-term holding on the announcement. Ocado, an online grocer in the United Kingdom, gained 35% in the quarter, as the company announced its intention to sign another contract with a traditional grocer for the delivery of its state-of-the-art online grocery system. We believe the company should be a long-term winner as more traditional grocery retail goes online with its better, fresher grocery assortment and lower capital requirements. Year to date, Ocado gained 13%. Denmark's SimCorp, a developer of software for investment managers, saw a continued recovery in new license wins as asset managers responded to new compliance rules introduced following the financial crisis. The stock gained 55% in the half, making it the third largest performance contributor for that period, and gained 23% in the second quarter.
The Fund underperformed in three of its four European regions in the second quarter, with the leading detractors being the Nordic region and Northern and Central Europe. The Mediterranean was the only outperforming region for the Fund, yet also contained the Fund's largest performance detractor, French postage meter equipment company Neopost. Revenues for Neopost have been depressed by weak European demand, while profits from faster-growing new businesses have not offset declines in its core equipment business. Neopost's stock declined over 20% in the quarter and the first half, making it the Fund's biggest detractor for both periods. The second biggest underperformer for both the quarter and half year was UK-based industrial lighting company Dialight. The company announced the departure of its CEO, followed by a profit warning, sending its stock down 28% in the quarter and 35% for the half. The Fund's next two large detractors
were from Scandinavia. Munksjo,† a Finnish specialty paper maker, declined 14% on little news after reaching a record high at the end of the first quarter. For the half year, its stock was up slightly over 1%. Atea, the largest IT hardware and software reseller and integrator in the Nordic region, dropped 17% in the quarter after the company disclosed that Danish salespeople bribed a regional government official. We believe that the problem is not representative of wider company culture and that reputational damage will be limited. Subsequently, we took advantage of the decline to add to the position. Year to date, Atea was down 10%.
The Fund's underperformance for the half-year period was caused by weak stock picking and was not the result of poor sectoral or geographic positioning versus the benchmark. As bottom-up stock pickers, we do not steer the Fund toward sectors or regions. Our bottom-up approach did, however, result in the Fund having an overweight position in consumer discretionary stocks, which was among the best performing major sectors in the benchmark over the six months. Yet the Fund's gain of 13% in this sector fell short of the benchmark return of 14%. In eight of the 10 industry sectors, stock selection cost the Fund some performance relative to the benchmark during the first half.
*A basis point is 1/100 of a percent.
Fund's Positions in Mentioned Holdings
As a percentage of net assets, as of 6/30/15
Munksjo | | | 3.6 | %† | |
Neopost | | | 2.1 | | |
SimCorp | | | 1.8 | | |
Cambian | | | 1.7 | | |
Ocado | | | 1.2 | | |
Dialight | | | 1.0 | | |
Atea | | | 1.0 | | |
Fund holdings are as of the date given, are subject to change at any time, and are not recommendations to buy or sell any security. Top holdings exclude short-term holdings and cash, if applicable.
†The Fund holds shares traded on both the Finnish and Swedish exchanges.
18
COLUMBIA ACORN EUROPEAN FUNDSM
AT A GLANCE
Total Net Assets of the Fund:
$56.4 million
Performance data shown below represents past performance, does not guarantee future results, assumes reinvestment of dividends and distributions and does not reflect the deduction of taxes that a shareholder may pay on Fund distributions or the redemption of Fund shares. The investment return and principal value of an investment will fluctuate so that shares, when redeemed, may be worth more or less than their original cost. Current performance may be lower or higher than the performance data shown. Performance data reflects fee waivers or reimbursements of Fund expenses, if any; in their absence, performance results would have been lower. Indexes are unmanaged; their results do not reflect the effect of expenses or sales charges. Securities in the Fund may not match those in an index. Please visit columbiathreadneedle.com/us for performance data current to the most recent month-end.
The Growth of a $10,000 Investment in Columbia Acorn European FundSM Class Z Shares
August 19, 2011 (Fund inception) through June 30, 2015

This chart shows the change in value of a hypothetical $10,000 investment in Class Z shares of the Fund during the stated time period.
Average Annual Total Returns for period ended June 30, 2015
| | 2nd quarter | | Year to date | | 1 year | | Life of Fund | |
| Class Z (8/19/11 inception) | | | 2.30 | % | | | 6.80 | % | | | -3.58 | % | | | 12.61 | % | |
| Class A (8/19/11 inception) | |
without sales charge | | | 2.24 | | | | 6.66 | | | | -3.84 | | | | 12.32 | | |
with sales charge | | | -3.62 | | | | 0.56 | | | | -9.35 | | | | 10.61 | | |
S&P Europe Between $500M and
$5B® Index* | | | 5.03 | | | | 10.62 | | | | -1.86 | | | | 14.88 | | |
Results for other share classes can be found on Page 2.
*The Fund's primary benchmark. Please see Page 126 for index descriptions.
Returns for Class A shown with and without the maximum initial sales charge of 5.75%. As stated in the May 1, 2015, prospectus, the Fund's annual operating expense ratio is 1.50% for Class Z shares and 1.75% for Class A shares.
Portfolio Diversification
as a percentage of net assets, as of 6/30/15
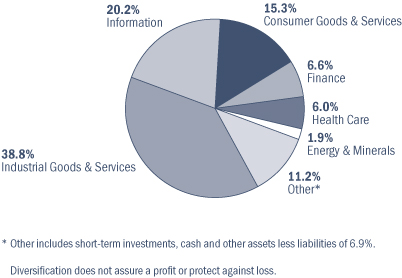
Top 10 Holdings
as a percentage of net assets, as of 6/30/15
1. | | Munksjo (Finland)†
Specialty Paper Maker | | | 3.6
| % | |
| 2. | | Assura (United Kingdom)
UK Primary Health Care Property Developer | | | 2.8
| % | |
| 3. | | Distribuidora Internacional
de Alimentación (Spain)
Discount Retailer in Spain & Latin America | | | 2.7
| % | |
| 4. | | Partners Group (Switzerland)
Private Markets Asset Management | | | 2.4
| % | |
| 5. | | Charles Taylor (United Kingdom)
Insurance Services | | | 2.4
| % | |
| 6. | | Spirax Sarco (United Kingdom)
Steam Systems for Manufacturing &
Process Industries | | | 2.3
| % | |
| 7. | | Neopost (France)
Postage Meter Machines | | | 2.1
| % | |
| 8. | | Aurelius (Germany)
European Turnaround Investor | | | 2.1
| % | |
| 9. | | Cable and Wireless (United Kingdom)
Telecommunications Service Provider in the
Caribbean | | | 1.9
| % | |
| 10. | | William Demant Holding (Denmark)
Manufacture & Distribution of Hearing Aids &
Diagnostic Equipment | | | 1.9
| % | |
†The Fund holds shares traded on both the Finnish and Swedish exchanges.
The Fund's top 10 holdings and portfolio diversification vary with changes in portfolio investments. See the Statement of Investments for a complete list of the Fund's holdings.
19
SQUIRREL CHATTER: BATTERY TECHNOLOGY AND ITS IMPLICATIONS

Battery History
Alessandro Volta was a professor of physics at the University of Pavia in Italy at a time of great debate about electricity. He was also a skilled maker of scientific instruments, including machines that could generate an electrostatic charge. After reading a paper noting a torpedo fish could create electric shocks, and proposing that the process creating the charge could be imitated, Volta created the undisputed first battery.1 As described in a paper he wrote in March 1800, the battery consisted of a column of zinc and copper discs separated by brine-soaked cardboard.2
Within months, others were making variations of Volta's battery and improved versions were developed. The batteries were largely used in laboratory equipment, often to enable electrolysis, which resulted in scientific discoveries such as the separation of water into oxygen and hydrogen, as well as discoveries of other elements including sodium and magnesium.3 For several decades, electroplating of metal appears to have been the primary commercial use of batteries.4
All batteries have anode and cathode electrodes as well as an acid or alkaline electrolyte, which facilitates movement of electricity between the electrodes. Components in existing batteries have been refined over time and often later replaced by new materials. In 1839, Sir William Robert Grove, a Welsh judge and physical scientist, made a version utilizing zinc in sulfuric acid and platinum in nitric acid, which produced a then-powerful charge of 1.8 volts but emitted poisonous nitric oxide gas. In the 1850s, German chemist Robert Bunsen created a much cheaper version of Grove's battery by substituting carbon for platinum.5
Telegraphs were developed in the 1830s and 1840s, and became widespread after inventor Samuel Morse's 1844 Washington, D.C. to Baltimore link. That initial line used huge Grove batteries at both ends plus 150-pound Grove batteries at relay points in between. Within 30 years there were 650,000 land miles of telegraph cable6 and, since telegraphs then needed battery
powered relays every few miles to boost their signals, commercial demand for batteries boomed. Telegraph office batteries initially needed regular care on strict schedules. The electrodes had to be cleaned or replaced, and the electrolyte needed replenishing.7
The first practical rechargeable battery was developed in 18598 by French physicist Gaston Planté using lead because it was readily available, cheap and amenable to recharging.9 The next battery breakthrough came in 1866 when French engineer Georges Leclanché created a simple, cheap battery consisting of a glass jar with manganese dioxide and zinc electrodes, a small bar of carbon, and an ammonium chloride electrolyte, which was then a common household chemical (sal ammoniac) used in cleaning and baking. This was the first battery not to use acid and, when discharged, replacing the sal ammoniac would revitalize it. Millions were produced for telegraphs, doorbells and telephones, though the battery was good only for intermittent use.10
German chemist Carl Gassner in 1887 patented his "dry cell" battery, consisting of a zinc can as the anode, ammonium chloride and plaster of paris as a dry electrolyte and carbon as the cathode. Producing a steady 1.5 volts, this was apparently the first battery requiring no maintenance. This compact six-inch long battery was durable and was mass-produced to power alarm clocks and bicycle lights.11
Batteries powered many of the first cars. The 1894 Electrobat had 1,500 pounds of lead-acid batteries.12 Of the 4,200 automobiles sold in the United States in the year 1900, battery powered cars were the most popular, followed by steam powered cars. Fewer than 1,000 were powered by gasoline.13
American inventor and businessman Thomas Edison was a proponent of battery-powered cars, and was determined to create a new rechargeable battery with triple the capacity of the lead-acid battery.14 His team experimented with hundreds of different compounds for a better automotive battery. When chided about failed experiments, he said, "No, I didn't fail. I discovered 24,999 ways that the storage battery does not work."15 Ultimately
20
he developed a battery with nickel and iron electrodes and a potassium-based electrolyte that outperformed existing lead-acid batteries by 233%.16 But it was expensive and gasoline-powered cars dominated once the automatic starter (as opposed to a crank) became ubiquitous.
In the 1950s, inventor Samuel Ruben created the alkaline manganese battery in a new AAA size, and licensed it to Mallory, which later became Duracell. That battery was popular in Kodak flash cameras. Canadian-American chemist Lewis Urry of Eveready invented the modern alkaline battery in 1959.17 His primary innovation was to use powdered zinc, which has dramatically more surface area than solid zinc. Labelled the Energizer, it had 40 times the capacity of the then-ubiquitous zinc-carbon battery.18
As power-hungry portable electronics took off after 1980, the quest for high energy, rechargeable batteries intensified. Nickel-cadmium batteries were invented, but had a "memory effect," which reduced capacity if recharged before depletion, and contained toxic cadmium. Nickel-metal-hydride batteries were also developed, powering cell phones and the first hybrid cars. These batteries had high capacity for the time, but tended to self-discharge when not in use.
Lithium Batteries
Chemists were long aware of lithium's potential in batteries. Lithium is the lightest metal, has half the density of water and, pound per pound, a lithium battery should be able to produce 30 times the energy of a lead-acid battery. However, lithium is too volatile to exist by itself in nature. It will burn or explode when exposed to air and pure lithium must be stored in oil to prevent it from reacting.
Exxon had a venture capital division that recruited British chemist Stanley Whittingham in the 1970s to pursue development of lithium batteries. Whittingham created a coin-sized battery with a lithium-aluminum alloy and a sulfide electrode. The first rechargeable lithium battery was used in a solar-powered watch shipped in 1977. But larger batteries ignited in Exxon's laboratories, and Exxon later exited the business and sold its patents.19
John Goodenough achieved the breakthrough in lithium batteries. A University of Chicago Ph.D. working at Oxford, he experimented with metal oxides, which could be charged and discharged at higher voltages than sulfides.
He also realized that as lithium ions migrate from a sulfide-based cathode, sections of the cathode tend to hollow out and collapse, reducing the ability of the battery to be recharged. Metal oxides in the cathode, in effect, reinforce its structure.
In 1980, Goodenough's team announced the lithium-cobalt-oxide battery.20 His belief in oxides proved correct, as the battery produced about 4 volts versus the 2.4 volts Whittingham achieved.21 "It was the first lithium-ion cathode with the capacity to power both compact and relatively large devices...far superior to anything on the market," said author Steve Levine in his recently published book, The Powerhouse.22 Yet because the battery was unusual, no companies in Europe or the Americas licensed it.
South African Ph.D. Mike Thackeray joined Goodenough during a stint at Oxford and helped invent a nickel-manganese-cobalt (NMC) cathode in place of Goodenough's lithium-cobalt-oxide. The NMC version has less safety risk than Goodenough's first lithium battery and theoretically should provide more energy.23 A version of this battery is used in the Chevrolet Volt.
Battery research funding diminished in the United States during the 1980s, a period of low oil prices and excitement about superconductivity. In Japan, however, battery research continued in earnest. After a decade of work, Japanese researcher Akira Yoshino combined Goodenough's lithium-cobalt-oxide cathode with a carbon anode and, in 1991, Sony shipped a resulting lithium-ion battery for small electronic devices. Later, Sony changed the anode to graphite, which was benign and better absorbed lithium ions, resulting in more power for longer periods. The Sony batteries were wildly successful, spurring knockoffs as well as additional lithium battery research.24
Electric Cars and Other Uses for Batteries
Improving performance and dropping costs have enabled much more sophisticated portable electronics but the biggest potential market for batteries is in automobiles. Thomas Edison said that the internal combustion engine would be a bridge between generations of battery powered cars, and he yet could be proven right (albeit late).25
The basic physics problem confronting battery powered vehicles is the energy density of gasoline versus batteries. A kilogram of gasoline contains about
21
12,700 watt hours of energy,26 while lithium batteries currently used in automobiles have energy densities ranging from 155 to 233 watt hours per kilogram.27 However, electric motors are over 90% efficient, three times that of gasoline engines,28 and electric vehicles can recapture up to half of energy expended through regenerative breaking,29 reducing the effective energy density gap somewhat.
Another key use for improved batteries is within the electric grid. Renewable power from solar and wind is by nature intermittent, and higher capacity, lower cost batteries will allow the adoption of more renewable energy. As battery performance improves and costs fall, expect to see more electric automobiles and renewable energy.
Potential Breakthroughs
In his book, Levine describes the inventions of various forms of lithium batteries and Argonne National Laboratory's successful effort to win funding as The Joint Center for Energy Storage Research. Argonne's goal is another battery breakthrough, achieving five times the performance at one-fifth the cost in five years. The Joint Center is looking beyond lithium. Argonne's senior scientist George Crabtree notes that new concepts, such as use of materials with double ions, use of reactions on the electrode surface instead of inside them and liquid electrodes, are worth exploring.
Investment Implications
Predicting which battery technology will succeed and which battery companies will profit is extremely difficult and risky. I've been on numerous battery technology wild goose chases, and can vaguely recall talking to Argonne researchers back in the late 1970s. The Columbia Acorn Funds' shareholders have instead benefitted from investing downstream, in companies that prospered from improved battery technology. For example, domestic funds had profitable investments in cell phone service providers as the industry consolidated years ago, and more recently in cell tower companies.

Charles P. McQuaid
Portfolio Manager, Analyst and Advisor
Columbia Wanger Asset Management, LLC
The information and data provided in this analysis are derived from sources that we deem to be reliable and accurate. These views are not guarantees of future performance and involve certain risks, uncertainties and assumptions that are difficult to predict so actual outcomes and results may differ significantly from the views expressed. The views/opinions expressed here are those of the author and not of the Columbia Acorn Trust Board, are subject to change at any time based upon economic, market or other conditions, may differ from views expressed by other Columbia Management associates and the respective parties disclaim any responsibility to update such views. These views may not be relied on as investment advice and, because investment decisions for a Columbia Acorn Fund are based on numerous factors, may not be relied on as an indication of trading intent on behalf of any particular Columbia Acorn Fund.
1 In 1936, archeologist Wilhelm Koenig found a five by three inch broken clay jar in Eastern Iraq that held a rolled sheet of copper and an iron rod. It dated back to between 200 BC and 200 AD. Koenig realized that with an acid or alkaline liquid, the device would be a functioning battery. Several similar jars have since been found. Google "Baghdad battery" to pursue the mystery and controversy.
2 Seth Fletcher, Bottled Lightning: Superbatteries, Electric Cars, and the New Lithium Economy (New York, Hill and Wang, 2011), p. 11.
3 Henry Schlesinger, The Battery: How Portable Power Sparked a Technological Revolution (New York, HarperCollins, 2010), p. 77.
4 Ibid., p. 50, 65.
5 Ibid., p. 96.
6 Ibid., p. 110, 130.
7 Ibid., p. 139.
8 Fletcher, op. cit., p. 13.
9 Schlesinger, op. cit., p. 145.
10 Ibid., p. 142-143.
11 Ibid., p. 179.
12 Ibid., p. 174.
13 Jim Motavalli, High Voltage: The Fast Track To Plug In the Auto Industry (New York, Rodale, 2011), p. xii.
14 Fletcher, op. cit., p. 14.
15 Schlesinger, op. cit., p. 174.
16 Fletcher, op. cit., 15.
17 NNDB website: nndb.com/people/004/000206383. Accessed April 2, 2015.
18 Schlesinger, op. cit., p. 250.
19 Steve Levine, The Powerhouse: Inside the Invention of a Battery to Save the World (New York, Viking, 2015), p. 21.
20 Ibid., p. 25.
21 Fletcher, op. cit., p. 44.
22 Levine, op. cit., p. 25.
23 Ibid., p. 41-44.
24 Ibid., p. 35.
25 Schlesinger, op. cit., p. 174.
26 Hypertextbook website: hypertextbook.com/facts/2003/ArthurGolnik.shtml. Accessed April 1, 2015.
27 Luke Ottaway, "What Makes Tesla's Batteries So Great?" Torque News, October 19, 2014, on website at: torquenews.com/2250/what-makes-tesla-s-batteries-so-great. Accessed April 3, 2015.
28 Tobias Fleiter and Wolfgang Eichhammer, "Energy efficiency in electric motor systems: Technology, saving potentials and policy options for developing countries," Working Paper 11/2011, p. 5, published by United Nations Industrial Development Organization, unido.org. Accessed April 21, 2015.
29 Source: ProEv Inc. article titled, "Regenerative Braking Efficiency," 2015.
22
COLUMBIA ACORN FAMILY OF FUNDS
2015 MID-YEAR DISTRIBUTIONS
The following table lists the mid-year distributions for the Columbia Acorn Family of Funds. The record date was June 2, 2015,
and the ex-dividend and payable date was June 3, 2015. Columbia Acorn Emerging Markets Fund did not have any distributions.
Fund | | Short-term
Capital
Gain | | Long-term
Capital
Gain | | Ordinary
Income | | Reinvestment
Price | |
Columbia Acorn® Fund | |
Class A | | | None | | | $ | 1.64099 | | | | None | | | $ | 30.97 | | |
Class B | | | None | | | $ | 1.64099 | | | | None | | | $ | 26.82 | | |
Class C | | | None | | | $ | 1.64099 | | | | None | | | $ | 26.17 | | |
Class I | | | None | | | $ | 1.64099 | | | | None | | | $ | 32.88 | | |
Class R4 | | | None | | | $ | 1.64099 | | | | None | | | $ | 33.39 | | |
Class R5 | | | None | | | $ | 1.64099 | | | | None | | | $ | 33.43 | | |
Class Y | | | None | | | $ | 1.64099 | | | | None | | | $ | 33.51 | | |
Class Z | | | None | | | $ | 1.64099 | | | | None | | | $ | 32.79 | | |
Columbia Acorn International® | |
Class A | | | None | | | $ | 0.38368 | | | | None | | | $ | 44.63 | | |
Class B | | | None | | | $ | 0.38368 | | | | None | | | $ | 43.07 | | |
Class C | | | None | | | $ | 0.38368 | | | | None | | | $ | 42.89 | | |
Class I | | | None | | | $ | 0.38368 | | | | None | | | $ | 44.79 | | |
Class R | | | None | | | $ | 0.38368 | | | | None | | | $ | 44.55 | | |
Class R4 | | | None | | | $ | 0.38368 | | | | None | | | $ | 45.03 | | |
Class R5 | | | None | | | $ | 0.38368 | | | | None | | | $ | 44.72 | | |
Class Y | | | None | | | $ | 0.38368 | | | | None | | | $ | 45.07 | | |
Class Z | | | None | | | $ | 0.38368 | | | | None | | | $ | 44.73 | | |
Columbia Acorn USA® | |
Class A | | | None | | | $ | 0.84005 | | | | None | | | $ | 30.74 | | |
Class B | | | None | | | $ | 0.84005 | | | | None | | | $ | 26.41 | | |
Class C | | | None | | | $ | 0.84005 | | | | None | | | $ | 26.16 | | |
Class I | | | None | | | $ | 0.84005 | | | | None | | | $ | 33.03 | | |
Class R4 | | | None | | | $ | 0.84005 | | | | None | | | $ | 33.57 | | |
Class R5 | | | None | | | $ | 0.84005 | | | | None | | | $ | 33.60 | | |
Class Y | | | None | | | $ | 0.84005 | | | | None | | | $ | 33.69 | | |
Class Z | | | None | | | $ | 0.84005 | | | | None | | | $ | 32.84 | | |
23
COLUMBIA ACORN FAMILY OF FUNDS
2015 MID-YEAR DISTRIBUTIONS, CONTINUED
Fund | | Short-term
Capital
Gain | | Long-term
Capital
Gain | | Ordinary
Income | | Reinvestment
Price | |
Columbia Acorn International SelectSM | |
Class A | | | None | | | | None | | | $ | 0.09778 | | | $ | 23.31 | | |
Class B | | | None | | | | None | | | $ | 0.01466 | | | $ | 21.90 | | |
Class C | | | None | | | | None | | | $ | 0.00000 | | | $ | 21.75 | | |
Class I | | | None | | | | None | | | $ | 0.09778 | | | $ | 23.61 | | |
Class R4 | | | None | | | | None | | | $ | 0.09778 | | | $ | 23.78 | | |
Class R5 | | | None | | | | None | | | $ | 0.09778 | | | $ | 23.76 | | |
Class Y | | | None | | | | None | | | $ | 0.09778 | | | $ | 23.75 | | |
Class Z | | | None | | | | None | | | $ | 0.09778 | | | $ | 23.61 | | |
Columbia Acorn SelectSM | |
Class A | | | None | | | $ | 1.77870 | | | | None | | | $ | 20.70 | | |
Class B | | | None | | | $ | 1.77870 | | | | None | | | $ | 17.42 | | |
Class C | | | None | | | $ | 1.77870 | | | | None | | | $ | 17.07 | | |
Class I | | | None | | | $ | 1.77870 | | | | None | | | $ | 22.18 | | |
Class R4 | | | None | | | $ | 1.77870 | | | | None | | | $ | 22.56 | | |
Class R5 | | | None | | | $ | 1.77870 | | | | None | | | $ | 22.60 | | |
Class Y | | | None | | | $ | 1.77870 | | | | None | | | $ | 22.69 | | |
Class Z | | | None | | | $ | 1.77870 | | | | None | | | $ | 22.06 | | |
Columbia Thermostat FundSM | |
Class A | | $ | 0.11593 | | | $ | 0.16409 | | | $ | 0.02233 | | | $ | 14.80 | | |
Class B | | $ | 0.11593 | | | $ | 0.16409 | | | $ | 0.02233 | | | $ | 14.88 | | |
Class C | | $ | 0.11593 | | | $ | 0.16409 | | | $ | 0.02233 | | | $ | 14.86 | | |
Class R4 | | $ | 0.11593 | | | $ | 0.16409 | | | $ | 0.02233 | | | $ | 14.69 | | |
Class R5 | | $ | 0.11593 | | | $ | 0.16409 | | | $ | 0.02233 | | | $ | 14.71 | | |
Class Y | | $ | 0.11593 | | | $ | 0.16409 | | | $ | 0.02233 | | | $ | 14.69 | | |
Class Z | | $ | 0.11593 | | | $ | 0.16409 | | | $ | 0.02233 | | | $ | 14.62 | | |
Columbia Acorn European FundSM | |
Class A | | | None | | | | None | | | $ | 0.06806 | | | $ | 15.97 | | |
Class C | | | None | | | | None | | | $ | 0.00000 | | | $ | 15.79 | | |
Class I | | | None | | | | None | | | $ | 0.06806 | | | $ | 15.98 | | |
Class R4 | | | None | | | | None | | | $ | 0.06806 | | | $ | 16.06 | | |
Class R5 | | | None | | | | None | | | $ | 0.06806 | | | $ | 16.13 | | |
Class Z | | | None | | | | None | | | $ | 0.06806 | | | $ | 15.99 | | |
24
UNDERSTANDING YOUR EXPENSES
As a shareholder, you incur two types of costs. There are transaction costs, which generally include sales charges on purchases and may include redemption fees. There are also ongoing costs, which generally include management fees, distribution and service (Rule 12b-1) fees, and other Fund expenses. The following information is intended to help you understand your ongoing costs (in dollars) of investing in the Fund and to help you compare these costs with the ongoing costs of investing in other mutual funds.
Analyzing Your Fund's Expenses
To illustrate these ongoing costs, we have provided examples and calculated the expenses paid by investors in Class A, B, C, I, R, R4, R5, Y and Z shares of the Funds during the period. The actual and hypothetical information in the tables is based on an initial investment of $1,000 at the beginning of the period indicated and held for the entire period. Expense information is calculated two ways and each method provides you with different information. The amount listed in the "Actual" column is calculated using the Funds' actual operating expenses and total return for the period. You may use the Actual information, together with the amount invested, to estimate the expenses that you paid over the period. Simply divide your account value by $1,000 (for example, an $8,600 account value divided by $1,000 = 8.6), then multiply the results by the expenses paid during the period under the Actual column. The amount listed in the "Hypothetical" column assumes a 5% annual rate of return before expenses (which is not the Funds' actual return) and then applies the Funds' actual expense ratio for the period to the hypothetical return. You should not use the hypothetical account values and expenses to estimate either your actual account balance at the end of the period or the expenses you paid during the period. See "Compare With Other Funds" below for details on how to use the hypothetical data.
In addition to the ongoing expenses which the Funds bear directly, Columbia Thermostat Fund's shareholders indirectly bear the Fund's allocable share of the costs and expenses of each underlying fund in which the Fund invests. You can also estimate the effective expenses paid during the period, which includes the indirect fees associated with investing in the underlying funds, by using the amounts listed in the effective expenses paid during the period column in the "Fund of Funds" table.
Compare With Other Funds
Since all mutual funds are required to include the same hypothetical calculations about expenses in shareholder reports, you can use this information to compare the ongoing cost of investing in the Funds with other funds. To do so, compare the hypothetical example with the 5% hypothetical examples that appear in the shareholder reports of other funds. As you compare hypothetical examples of other funds, it is important to note that hypothetical examples are meant to highlight the ongoing costs of investing in a fund only and do not reflect any transaction costs, such as sales charges, or redemption or exchange fees. Therefore, the hypothetical calculations are useful in comparing ongoing costs only, and will not help you determine the relative total costs of owning different funds. If transaction costs were included in these calculations, your costs would be higher.
January 1, 2015 – June 30, 2015
| | | Account value at
the beginning of
the period ($) | | Account value at
the end of
the period ($) | | Expenses paid
during the period ($) | | Fund's
annualized
expense
ratio (%) | |
| | | Actual | | Hypothetical | | Actual | | Hypothetical | | Actual | | Hypothetical | | Actual | |
Columbia Acorn® Fund | |
Class A | | | 1,000.00 | | | | 1,000.00 | | | | 1,064.50 | | | | 1,019.39 | | | | 5.58 | | | | 5.46 | | | | 1.09 | | |
Class B | | | 1,000.00 | | | | 1,000.00 | | | | 1,060.40 | | | | 1,015.42 | | | | 9.66 | | | | 9.44 | | | | 1.89 | | |
Class C | | | 1,000.00 | | | | 1,000.00 | | | | 1,060.70 | | | | 1,015.92 | | | | 9.15 | | | | 8.95 | | | | 1.79 | | |
Class I | | | 1,000.00 | | | | 1,000.00 | | | | 1,066.30 | | | | 1,021.22 | | | | 3.69 | | | | 3.61 | | | | 0.72 | | |
Class R4 | | | 1,000.00 | | | | 1,000.00 | | | | 1,065.60 | | | | 1,020.48 | | | | 4.46 | | | | 4.36 | | | | 0.87 | | |
Class R5 | | | 1,000.00 | | | | 1,000.00 | | | | 1,065.80 | | | | 1,020.98 | | | | 3.94 | | | | 3.86 | | | | 0.77 | | |
Class Y | | | 1,000.00 | | | | 1,000.00 | | | | 1,066.30 | | | | 1,021.22 | | | | 3.69 | | | | 3.61 | | | | 0.72 | | |
Class Z | | | 1,000.00 | | | | 1,000.00 | | | | 1,066.10 | | | | 1,020.83 | | | | 4.10 | | | | 4.01 | | | | 0.80 | | |
25
UNDERSTANDING YOUR EXPENSES, continued
| | | Account value at
the beginning of
the period ($) | | Account value at
the end of
the period ($) | | Expenses paid
during the period ($) | | Fund's
annualized
expense
ratio (%) | |
| | | Actual | | Hypothetical | | Actual | | Hypothetical | | Actual | | Hypothetical | | Actual | |
Columbia Acorn International® | |
Class A | | | 1,000.00 | | | | 1,000.00 | | | | 1,050.50 | | | | 1,018.65 | | | | 6.30 | | | | 6.21 | | | | 1.24 | | |
Class B | | | 1,000.00 | | | | 1,000.00 | | | | 1,046.10 | | | | 1,014.48 | | | | 10.55 | | | | 10.39 | | | | 2.08 | | |
Class C | | | 1,000.00 | | | | 1,000.00 | | | | 1,046.30 | | | | 1,014.98 | | | | 10.05 | | | | 9.89 | | | | 1.98 | | |
Class I | | | 1,000.00 | | | | 1,000.00 | | | | 1,052.30 | | | | 1,020.48 | | | | 4.43 | | | | 4.36 | | | | 0.87 | | |
Class R | | | 1,000.00 | | | | 1,000.00 | | | | 1,048.60 | | | | 1,016.86 | | | | 8.13 | | | | 8.00 | | | | 1.60 | | |
Class R4 | | | 1,000.00 | | | | 1,000.00 | | | | 1,051.20 | | | | 1,019.59 | | | | 5.34 | | | | 5.26 | | | | 1.05 | | |
Class R5 | | | 1,000.00 | | | | 1,000.00 | | | | 1,051.90 | | | | 1,020.28 | | | | 4.63 | | | | 4.56 | | | | 0.91 | | |
Class Y | | | 1,000.00 | | | | 1,000.00 | | | | 1,052.40 | | | | 1,020.48 | | | | 4.43 | | | | 4.36 | | | | 0.87 | | |
Class Z | | | 1,000.00 | | | | 1,000.00 | | | | 1,051.80 | | | | 1,020.08 | | | | 4.83 | | | | 4.76 | | | | 0.95 | | |
Columbia Acorn USA® | |
Class A | | | 1,000.00 | | | | 1,000.00 | | | | 1,071.40 | | | | 1,018.15 | | | | 6.88 | | | | 6.71 | | | | 1.34 | | |
Class B | | | 1,000.00 | | | | 1,000.00 | | | | 1,064.50 | | | | 1,012.30 | | | | 12.90 | | | | 12.57 | | | | 2.52 | | |
Class C | | | 1,000.00 | | | | 1,000.00 | | | | 1,067.60 | | | | 1,014.83 | | | | 10.30 | | | | 10.04 | | | | 2.01 | | |
Class I | | | 1,000.00 | | | | 1,000.00 | | | | 1,073.40 | | | | 1,020.18 | | | | 4.78 | | | | 4.66 | | | | 0.93 | | |
Class R4 | | | 1,000.00 | | | | 1,000.00 | | | | 1,072.60 | | | | 1,019.39 | | | | 5.60 | | | | 5.46 | | | | 1.09 | | |
Class R5 | | | 1,000.00 | | | | 1,000.00 | | | | 1,073.20 | | | | 1,019.84 | | | | 5.14 | | | | 5.01 | | | | 1.00 | | |
Class Y | | | 1,000.00 | | | | 1,000.00 | | | | 1,073.30 | | | | 1,020.08 | | | | 4.88 | | | | 4.76 | | | | 0.95 | | |
Class Z | | | 1,000.00 | | | | 1,000.00 | | | | 1,072.50 | | | | 1,019.39 | | | | 5.60 | | | | 5.46 | | | | 1.09 | | |
Columbia Acorn International SelectSM | |
Class A | | | 1,000.00 | | | | 1,000.00 | | | | 1,037.00 | | | | 1,017.26 | | | | 7.68 | | | | 7.60 | | | | 1.52 | | |
Class B | | | 1,000.00 | | | | 1,000.00 | | | | 1,033.60 | | | | 1,013.88 | | | | 11.09 | | | | 10.99 | | | | 2.20 | | |
Class C | | | 1,000.00 | | | | 1,000.00 | | | | 1,033.60 | | | | 1,013.44 | | | | 11.55 | | | | 11.43 | | | | 2.29 | | |
Class I | | | 1,000.00 | | | | 1,000.00 | | | | 1,038.80 | | | | 1,018.89 | | | | 6.02 | | | | 5.96 | | | | 1.19 | | |
Class R4 | | | 1,000.00 | | | | 1,000.00 | | | | 1,038.60 | | | | 1,018.60 | | | | 6.32 | | | | 6.26 | | | | 1.25 | | |
Class R5 | | | 1,000.00 | | | | 1,000.00 | | | | 1,039.00 | | | | 1,018.94 | | | | 5.97 | | | | 5.91 | | | | 1.18 | | |
Class Y | | | 1,000.00 | | | | 1,000.00 | | | | 1,039.10 | | | | 1,019.24 | | | | 5.66 | | | | 5.61 | | | | 1.12 | | |
Class Z | | | 1,000.00 | | | | 1,000.00 | | | | 1,038.80 | | | | 1,018.74 | | | | 6.17 | | | | 6.11 | | | | 1.22 | | |
Columbia Acorn SelectSM | |
Class A | | | 1,000.00 | | | | 1,000.00 | | | | 1,059.60 | | | | 1,018.50 | | | | 6.49 | | | | 6.36 | | | | 1.27 | | |
Class B | | | 1,000.00 | | | | 1,000.00 | | | | 1,055.00 | | | | 1,014.38 | | | | 10.70 | | | | 10.49 | | | | 2.10 | | |
Class C | | | 1,000.00 | | | | 1,000.00 | | | | 1,055.50 | | | | 1,014.88 | | | | 10.19 | | | | 9.99 | | | | 2.00 | | |
Class I | | | 1,000.00 | | | | 1,000.00 | | | | 1,061.90 | | | | 1,020.43 | | | | 4.50 | | | | 4.41 | | | | 0.88 | | |
Class R4 | | | 1,000.00 | | | | 1,000.00 | | | | 1,060.80 | | | | 1,019.64 | | | | 5.31 | | | | 5.21 | | | | 1.04 | | |
Class R5 | | | 1,000.00 | | | | 1,000.00 | | | | 1,061.20 | | | | 1,019.98 | | | | 4.96 | | | | 4.86 | | | | 0.97 | | |
Class Y | | | 1,000.00 | | | | 1,000.00 | | | | 1,061.40 | | | | 1,020.33 | | | | 4.60 | | | | 4.51 | | | | 0.90 | | |
Class Z | | | 1,000.00 | | | | 1,000.00 | | | | 1,060.70 | | | | 1,019.84 | | | | 5.11 | | | | 5.01 | | | | 1.00 | | |
26
| | | Account value at
the beginning of
the period ($) | | Account value at
the end of
the period ($) | | Expenses paid
during the period ($) | | Fund's
annualized
expense
ratio (%) | |
| | | Actual | | Hypothetical | | Actual | | Hypothetical | | Actual | | Hypothetical | | Actual | |
Columbia Acorn Emerging Markets FundSM | |
Class A | | | 1,000.00 | | | | 1,000.00 | | | | 970.10 | | | | 1,016.76 | | | | 7.91 | | | | 8.10 | | | | 1.62 | | |
Class C | | | 1,000.00 | | | | 1,000.00 | | | | 966.80 | | | | 1,012.99 | | | | 11.61 | | | | 11.88 | | | | 2.38 | | |
Class I | | | 1,000.00 | | | | 1,000.00 | | | | 971.80 | | | | 1,018.40 | | | | 6.31 | | | | 6.46 | | | | 1.29 | | |
Class R4 | | | 1,000.00 | | | | 1,000.00 | | | | 971.20 | | | | 1,018.20 | | | | 6.50 | | | | 6.66 | | | | 1.33 | | |
Class R5 | | | 1,000.00 | | | | 1,000.00 | | | | 971.10 | | | | 1,018.30 | | | | 6.40 | | | | 6.56 | | | | 1.31 | | |
Class Y | | | 1,000.00 | | | | 1,000.00 | | | | 971.70 | | | | 1,018.70 | | | | 6.01 | | | | 6.16 | | | | 1.23 | | |
Class Z | | | 1,000.00 | | | | 1,000.00 | | | | 971.70 | | | | 1,018.00 | | | | 6.70 | | | | 6.85 | | | | 1.37 | | |
Columbia Acorn European FundSM | |
Class A | | | 1,000.00 | | | | 1,000.00 | | | | 1,066.60 | | | | 1,016.12 | | | | 8.97 | | | | 8.75 | | | | 1.75 | | |
Class C | | | 1,000.00 | | | | 1,000.00 | | | | 1,062.90 | | | | 1,012.40 | | | | 12.79 | | | | 12.47 | | | | 2.50 | | |
Class I | | | 1,000.00 | | | | 1,000.00 | | | | 1,068.00 | | | | 1,017.60 | | | | 7.43 | | | | 7.25 | | | | 1.45 | | |
Class R4 | | | 1,000.00 | | | | 1,000.00 | | | | 1,067.70 | | | | 1,017.36 | | | | 7.69 | | | | 7.50 | | | | 1.50 | | |
Class R5 | | | 1,000.00 | | | | 1,000.00 | | | | 1,068.10 | | | | 1,017.36 | | | | 7.69 | | | | 7.50 | | | | 1.50 | | |
Class Z | | | 1,000.00 | | | | 1,000.00 | | | | 1,068.00 | | | | 1,017.36 | | | | 7.69 | | | | 7.50 | | | | 1.50 | | |
Fund of Funds—Columbia Thermostat Fund
January 1, 2015 – June 30, 2015
| | | Account value at
the beginning of
the period ($) | | Account value at
the end of
the period ($) | | Expenses paid
during the period ($) | | Fund's
annualized
expense
ratio (%) | | Effective
expenses
paid during
the period ($) | | Fund's
effective
annualized
expense
ratio (%) | |
| | | Actual | | Hypothetical | | Actual | | Hypothetical | | Actual | | Hypothetical | | Actual | | Actual | | Hypothetical | | Actual | |
Columbia Thermostat FundSM | |
Class A | | | 1,000.00 | | | | 1,000.00 | | | | 1,010.80 | | | | 1,022.32 | | | | 2.49 | | | | 2.51 | | | | 0.50 | | | | 5.04 | | | | 5.06 | | | | 1.01 | | |
Class B | | | 1,000.00 | | | | 1,000.00 | | | | 1,008.10 | | | | 1,019.84 | | | | 4.98 | | | | 5.01 | | | | 1.00 | | | | 7.52 | | | | 7.56 | | | | 1.51 | | |
Class C | | | 1,000.00 | | | | 1,000.00 | | | | 1,007.40 | | | | 1,018.60 | | | | 6.22 | | | | 6.26 | | | | 1.25 | | | | 8.76 | | | | 8.81 | | | | 1.76 | | |
Class R4 | | | 1,000.00 | | | | 1,000.00 | | | | 1,012.30 | | | | 1,023.55 | | | | 1.25 | | | | 1.25 | | | | 0.25 | | | | 3.79 | | | | 3.81 | | | | 0.76 | | |
Class R5 | | | 1,000.00 | | | | 1,000.00 | | | | 1,012.30 | | | | 1,023.65 | | | | 1.15 | | | | 1.15 | | | | 0.23 | | | | 3.69 | | | | 3.71 | | | | 0.74 | | |
Class Y | | | 1,000.00 | | | | 1,000.00 | | | | 1,012.30 | | | | 1,023.90 | | | | 0.90 | | | | 0.90 | | | | 0.18 | | | | 3.44 | | | | 3.46 | | | | 0.69 | | |
Class Z | | | 1,000.00 | | | | 1,000.00 | | | | 1,012.30 | | | | 1,023.60 | | | | 1.20 | | | | 1.20 | | | | 0.24 | | | | 3.74 | | | | 3.76 | | | | 0.75 | | |
Expenses paid during the period are equal to the annualized expense ratio, multiplied by the average account value over the period and then multiplied by the number of days in the Fund's most recent fiscal half year and divided by 365.
Except with respect to Columbia Thermostat Fund, expenses do not include any fees and expenses incurred indirectly by a Fund from the underlying funds in which the Fund may invest (also referred to as "acquired funds"), including affiliated and non-affiliated pooled investments vehicles (including mutual funds and exchange traded funds).
In the case of Columbia Thermostat Fund, effective expenses paid during the period and the Fund's effective annualized expense ratio include expenses borne directly by the class plus the Fund's pro rata portion of the ongoing expenses charged by the underlying funds in which it invests using the expense ratio of each class of each underlying fund as of the underlying fund's most recent shareholder report.
Had the investment manager and/or certain of its affiliates not waived/reimbursed certain fees and expenses for Columbia Acorn International, Columbia Acorn International Select, Columbia Acorn Select, Columbia Thermostat Fund and Columbia Acorn European Fund, account value at the end of the period would have been reduced. See Note 4 to the Financial Statements (Unaudited).
27
COLUMBIA ACORN® FUND
MAJOR PORTFOLIO CHANGES IN THE SECOND QUARTER (UNAUDITED)
| | | Number of Shares | |
| | | 3/31/15 | | 6/30/15 | |
Purchases | |
Information | |
Bankrate | | | 7,250,000 | | | | 7,350,000 | | |
Cadence Design Systems | | | 4,155,000 | | | | 4,514,783 | | |
Sanmina | | | 3,100,000 | | | | 3,467,599 | | |
Health Care | |
Abaxis | | | 595,000 | | | | 631,624 | | |
Agios Pharmaceuticals | | | 275,000 | | | | 346,692 | | |
Align Technology | | | 513,000 | | | | 777,276 | | |
Henry Schein | | | 291,100 | | | | 349,334 | | |
VWR | | | 1,375,400 | | | | 1,850,600 | | |
Wright Medical Group | | | 1,729,500 | | | | 1,829,940 | | |
Consumer Goods & Services | |
Gentex | | | 2,732,952 | | | | 4,350,000 | | |
Hertz | | | 2,531,000 | | | | 2,800,000 | | |
HomeAway | | | 2,142,000 | | | | 2,160,506 | | |
The Fresh Market | | | 1,492,000 | | | | 2,561,000 | | |
Zulily | | | 425,245 | | | | 2,405,817 | | |
Other Industries | |
Heartland Express | | | 1,800,000 | | | | 2,296,684 | | |
Energy & Minerals | |
PDC Energy | | | 501,000 | | | | 681,333 | | |
| | | Number of Shares | |
| | | 3/31/15 | | 6/30/15 | |
Sales | |
Information | |
Amphenol | | | 4,010,000 | | | | 3,468,610 | | |
Ansys | | | 1,806,000 | | | | 1,530,948 | | |
Atmel | | | 4,467,000 | | | | 3,736,317 | | |
Audience | | | 1,644,000 | | | | 0 | | |
Avnet | | | 1,621,000 | | | | 1,151,958 | | |
Belden | | | 450,000 | | | | 427,810 | | |
Boingo Wireless | | | 2,900,000 | | | | 2,727,319 | | |
CalAmp | | | 1,619,000 | | | | 1,269,759 | | |
Cogent Communications | | | 1,572,000 | | | | 769,047 | | |
Crown Castle International | | | 800,000 | | | | 747,504 | | |
DemandWare | | | 561,300 | | | | 0 | | |
Discovery Communications
Series C | | | 1,154,000 | | | | 402,028 | | |
Envestnet | | | 610,000 | | | | 0 | | |
F5 Networks | | | 629,000 | | | | 491,008 | | |
Fleetmatics | | | 699,000 | | | | 0 | | |
FLIR Systems | | | 1,895,000 | | | | 1,596,221 | | |
Genpact | | | 1,531,000 | | | | 1,419,083 | | |
Global Eagle Entertainment | | | 2,001,000 | | | | 1,808,895 | | |
Global Payments | | | 1,261,000 | | | | 941,314 | | |
Gogo | | | 3,458,800 | | | | 2,208,178 | | |
GTT Communications | | | 2,601,000 | | | | 2,502,088 | | |
Hackett Group | | | 2,700,000 | | | | 2,643,045 | | |
IGATE | | | 3,650,000 | | | | 0 | | |
IMAX (Canada) | | | 1,250,000 | | | | 860,159 | | |
inContact | | | 3,741,000 | | | | 2,244,897 | | |
Infinera | | | 2,568,000 | | | | 1,940,827 | | |
Informatica | | | 2,080,000 | | | | 0 | | |
IPG Photonics | | | 1,399,000 | | | | 1,143,460 | | |
Lamar Advertising | | | 725,000 | | | | 550,749 | | |
Liberty Global Series A | | | 800,000 | | | | 661,980 | | |
Liberty Global Series C | | | 366,000 | | | | 235,822 | | |
Littelfuse | | | 367,000 | | | | 319,938 | | |
Mettler-Toledo International | | | 911,000 | | | | 532,255 | | |
Monolithic Power Systems | | | 427,000 | | | | 378,172 | | |
Navigant Consulting | | | 3,100,000 | | | | 3,041,462 | | |
Rogers | | | 539,000 | | | | 494,334 | | |
| RPX | | | 2,570,000 | | | | 1,908,954 | | |
Rubicon Technology | | | 2,500,000 | | | | 2,371,155 | | |
SBA Communications | | | 1,300,000 | | | | 839,317 | | |
Solera Holdings | | | 1,668,000 | | | | 1,650,392 | | |
SPS Commerce | | | 1,076,000 | | | | 940,526 | | |
Stratasys | | | 504,000 | | | | 0 | | |
Towerstream | | | 4,000,000 | | | | 3,775,680 | | |
Trimble Navigation | | | 3,458,000 | | | | 2,575,640 | | |
Tyler Technologies | | | 220,000 | | | | 0 | | |
Ultimate Software | | | 554,000 | | | | 543,708 | | |
VeriFone Holdings | | | 1,250,000 | | | | 1,003,359 | | |
Verint Systems | | | 1,306,000 | | | | 1,258,046 | | |
Verisign | | | 1,210,000 | | | | 887,506 | | |
See accompanying notes to financial statements.
28
| | | Number of Shares | |
| | | 3/31/15 | | 6/30/15 | |
Sales (continued) | |
Information—continued | |
Verisk Analytics | | | 1,429,000 | | | | 1,170,274 | | |
Virtusa | | | 1,570,000 | | | | 1,263,525 | | |
Vonage | | | 14,500,000 | | | | 14,475,223 | | |
Zayo Group Holdings | | | 1,150,000 | | | | 867,000 | | |
Zebra Technologies | | | 474,000 | | | | 432,513 | | |
Zee Entertainment Enterprises | | | 5,500,000 | | | | 0 | | |
Industrial Goods & Services | |
Acuity Brands | | | 726,000 | | | | 0 | | |
Airgas | | | 853,000 | | | | 823,571 | | |
Allegion | | | 626,000 | | | | 609,008 | | |
Ametek | | | 6,910,000 | | | | 4,569,066 | | |
Drew Industries | | | 1,610,000 | | | | 1,434,286 | | |
Expeditors International of
Washington | | | 1,800,000 | | | | 1,674,435 | | |
Fortune Brands Home & Security | | | 660,000 | | | | 0 | | |
Forward Air | | | 1,500,000 | | | | 1,359,907 | | |
Generac | | | 2,982,000 | | | | 2,563,598 | | |
HEICO | | | 3,514,750 | | | | 2,962,178 | | |
Kennametal | | | 2,592,000 | | | | 1,344,966 | | |
LKQ | | | 7,481,000 | | | | 6,748,927 | | |
Middleby | | | 968,200 | | | | 803,972 | | |
Moog | | | 2,027,000 | | | | 1,440,787 | | |
Nordson | | | 3,034,000 | | | | 2,147,586 | | |
NVR | | | 96,000 | | | | 76,850 | | |
Oshkosh Corporation | | | 2,100,000 | | | | 1,942,945 | | |
Pall | | | 846,000 | | | | 0 | | |
Quanta Services | | | 3,400,000 | | | | 3,357,357 | | |
Thermon | | | 1,983,829 | | | | 1,639,635 | | |
Toro | | | 1,486,000 | | | | 1,353,698 | | |
WABCO Holdings | | | 946,000 | | | | 595,235 | | |
Wabtec | | | 1,021,000 | | | | 625,474 | | |
WESCO International | | | 1,553,000 | | | | 851,347 | | |
Finance | |
Allied World Assurance
Company Holdings | | | 2,000,000 | | | | 864,371 | | |
Associated Banc-Corp | | | 9,414,000 | | | | 7,931,448 | | |
BOK Financial | | | 2,027,000 | | | | 1,799,411 | | |
CNO Financial Group | | | 7,300,000 | | | | 5,651,291 | | |
Eaton Vance | | | 3,463,508 | | | | 2,914,581 | | |
First Busey | | | 4,296,286 | | | | 4,112,881 | | |
Hancock Holding | | | 1,730,000 | | | | 1,350,879 | | |
HCC Insurance Holdings | | | 910,000 | | | | 0 | | |
Leucadia National | | | 3,875,000 | | | | 3,760,346 | | |
MB Financial | | | 2,420,000 | | | | 1,790,025 | | |
McGrath Rentcorp | | | 1,345,000 | | | | 1,167,476 | | |
MSCI | | | 195,201 | | | | 0 | | |
RLI | | | 800,000 | | | | 606,457 | | |
Sandy Spring Bancorp | | | 1,163,480 | | | | 1,014,983 | | |
SEI Investments | | | 7,368,774 | | | | 6,522,307 | | |
| | | Number of Shares | |
| | | 3/31/15 | | 6/30/15 | |
| SVB Financial Group | | | 840,000 | | | | 677,700 | | |
TrustCo Bank | | | 3,136,500 | | | | 3,089,176 | | |
WEX | | | 863,000 | | | | 703,142 | | |
World Acceptance | | | 787,422 | | | | 530,000 | | |
Heath Care | |
Akorn | | | 3,048,000 | | | | 2,503,151 | | |
Allscripts Healthcare Solutions | | | 2,746,200 | | | | 1,749,965 | | |
Alnylam Pharmaceuticals | | | 302,300 | | | | 0 | | |
Bio-Techne | | | 1,169,200 | | | | 1,123,116 | | |
Castlight Health | | | 487,818 | | | | 0 | | |
Celldex Therapeutics | | | 2,140,400 | | | | 1,902,687 | | |
Cepheid | | | 4,909,800 | | | | 4,065,050 | | |
Envision Healthcare Holdings | | | 1,239,000 | | | | 1,155,575 | | |
Intercept Pharmaceuticals | | | 269,200 | | | | 220,978 | | |
Medidata Solutions | | | 1,549,500 | | | | 1,430,434 | | |
Sarepta Therapeutics | | | 2,523,900 | | | | 2,404,789 | | |
Seattle Genetics | | | 2,548,000 | | | | 1,823,556 | | |
Sirona Dental Systems | | | 460,900 | | | | 435,820 | | |
Synageva BioPharma | | | 1,950,318 | | | | 0 | | |
Consumer Goods & Services | |
Avis Budget Group | | | 2,450,000 | | | | 1,806,776 | | |
Burlington Stores | | | 786,900 | | | | 0 | | |
Casey's General Stores | | | 791,839 | | | | 596,335 | | |
Cavco Industries | | | 500,000 | | | | 455,025 | | |
DSW | | | 533,500 | | | | 0 | | |
Knoll | | | 2,836,000 | | | | 2,520,350 | | |
Michaels Stores | | | 642,492 | | | | 0 | | |
Papa John's International | | | 950,000 | | | | 937,570 | | |
Pool | | | 1,444,000 | | | | 1,274,436 | | |
Popeyes Louisiana Kitchen | | | 650,000 | | | | 454,079 | | |
PVH | | | 456,000 | | | | 0 | | |
Select Comfort | | | 2,224,284 | | | | 2,158,630 | | |
Shutterfly | | | 771,056 | | | | 0 | | |
United Natural Foods | | | 1,286,000 | | | | 1,192,643 | | |
Urban Outfitters | | | 508,000 | | | | 492,129 | | |
Vail Resorts | | | 895,600 | | | | 817,499 | | |
Williams-Sonoma | | | 595,200 | | | | 567,295 | | |
Other Industries | |
EdR | | | 2,450,000 | | | | 2,325,332 | | |
Eversource Energy | | | 1,600,000 | | | | 1,036,839 | | |
Extra Space Storage | | | 1,467,000 | | | | 1,002,619 | | |
Federal Realty | | | 717,000 | | | | 658,669 | | |
JB Hunt Transport Services | | | 669,000 | | | | 578,406 | | |
Jones Lang LaSalle | | | 325,000 | | | | 282,596 | | |
Kirby | | | 720,000 | | | | 0 | | |
Rush Enterprises, Class A | | | 2,650,000 | | | | 2,173,034 | | |
Rush Enterprises, Class B | | | 550,000 | | | | 460,172 | | |
Wisconsin Energy | | | 577,000 | | | | 0 | | |
See accompanying notes to financial statements.
29
COLUMBIA ACORN® FUND
MAJOR PORTFOLIO CHANGES IN THE SECOND QUARTER (UNAUDITED), CONTINUED
| | | Number of Shares | |
| | | 3/31/15 | | 6/30/15 | |
Sales (continued) | |
Energy & Minerals | |
Alamos Gold (Canada) | | | 3,500,000 | | | | 3,421,322 | | |
Argonaut Gold (Canada) | | | 9,014,700 | | | | 8,582,916 | | |
Carrizo Oil & Gas | | | 1,037,000 | | | | 944,733 | | |
Cimarex Energy | | | 420,000 | | | | 402,497 | | |
Clayton Williams | | | 281,000 | | | | 265,636 | | |
Core Labs (Netherlands) | | | 423,000 | | | | 407,938 | | |
Energen Corporation | | | 732,000 | | | | 501,139 | | |
Hornbeck Offshore | | | 1,470,000 | | | | 1,147,145 | | |
Kirkland Lake Gold (Canada) | | | 6,697,200 | | | | 6,115,764 | | |
Petromanas (Canada) | | | 67,500,000 | | | | 64,294,000 | | |
Rosetta Resources | | | 1,550,000 | | | | 0 | | |
ShawCor (Canada) | | | 1,797,579 | | | | 1,740,523 | | |
SM Energy | | | 778,000 | | | | 685,658 | | |
See accompanying notes to financial statements.
30
COLUMBIA ACORN® FUND
STATEMENT OF INVESTMENTS (UNAUDITED), JUNE 30, 2015
Number of Shares | | | | Value | |
| | | | | | | Equities: 93.6% | |
Information 26.1% | | | |
| | | > Business Software 5.4% | |
| | 1,530,948 | | | Ansys (a) | | $ | 139,683,695 | | |
| | | | | Simulation Software for
Engineers & Designers | | | | | |
| | 543,708 | | | Ultimate Software (a) | | | 89,352,973 | | |
| | | | | Human Capital Management Systems | | | | | |
| | 4,514,783 | | | Cadence Design Systems (a) | | | 88,760,634 | | |
| | | | | Electronic Design Automation Software | | | | | |
| | 1,258,046 | | | Verint Systems (a) | | | 76,420,004 | | |
| | | | | Contact Center & Security Software | | | | | |
| | 1,650,392 | | | Solera Holdings | | | 73,541,468 | | |
| | | | | Software for Automotive Insurance
Claims Processing | | | | | |
| | 940,526 | | | SPS Commerce (a)(b) | | | 61,886,611 | | |
| | | | | Supply Chain Management Software
Delivered via the Web | | | | | |
| | 570,149 | | | NetSuite (a) | | | 52,311,171 | | |
| | | | | End-to-end IT Solution Delivered via the Web | | | | | |
| | 1,134,283 | | | Textura (a)(c) | | | 31,567,096 | | |
| | | | | Construction Vendor Management Software | | | | | |
| | 2,244,897 | | | inContact (a) | | | 22,157,133 | | |
| | | | | Call Center Systems Delivered via the
Web & Telco Services | | | | | |
| | 205,225 | | | Cvent (a) | | | 5,290,700 | | |
| | | | | Software for Corporate Event Planners &
Marketing Platform for Hotels | | | | | |
| | | | 640,971,485 | | |
| | | > Instrumentation 3.3% | |
| | 532,255 | | | Mettler-Toledo International (a) | | | 181,743,792 | | |
| | | | | Laboratory Equipment | | | | | |
| | 1,143,460 | | | IPG Photonics (a) | | | 97,394,206 | | |
| | | | | Fiber Lasers | | | | | |
| | 2,575,640 | | | Trimble Navigation (a) | | | 60,424,514 | | |
| | | | | GPS-based Instruments | | | | | |
| | 1,596,221 | | | FLIR Systems | | | 49,195,531 | | |
| | | | | Infrared Cameras | | | | | |
| | | | 388,758,043 | | |
| | | > Computer Hardware & Related
Equipment 3.0% | |
| | 3,468,610 | | | Amphenol | | | 201,075,322 | | |
| | | | | Electronic Connectors | | | | | |
| | 432,513 | | | Zebra Technologies (a) | | | 48,030,569 | | |
| | | | | Bar Code Printers & Mobile Computers | | | | | |
| | 427,810 | | | Belden | | | 34,751,006 | | |
| | | | | Specialty Cable | | | | | |
| | 1,003,359 | | | VeriFone Holdings (a) | | | 34,074,071 | | |
| | | | | Point of Sale Systems | | | | | |
| | 494,334 | | | Rogers (a) | | | 32,695,251 | | |
| | | | | Printed Circuit Materials & High
Performance Foams | | | | | |
| | | | 350,626,219 | | |
| | | > Mobile Communications 2.5% | |
| | 839,317 | | | SBA Communications (a) | | | 96,496,275 | | |
| | | | | Communications Towers | | | | | |
| | 34,500,000 | | | Globalstar (a) | | | 72,795,000 | | |
| | | | | Satellite Mobile Voice & Data Carrier | | | | | |
Number of Shares | | | | Value | |
| | 747,504 | | | Crown Castle International | | $ | 60,024,571 | | |
| | | | | Communications Towers | | | | | |
| | 2,208,178 | | | Gogo (a)(c) | | | 47,321,255 | | |
| | | | | Provider of Wi-Fi on Airplanes | | | | | |
| | 1,808,895 | | | Global Eagle Entertainment (a)(c) | | | 23,551,813 | | |
| | | | | Provider of Entertainment &
Wi-Fi on Airplanes | | | | | |
| | | | 300,188,914 | | |
| | | > Business Information & Marketing
Services 2.3% | |
| | 1,170,274 | | | Verisk Analytics (a) | | | 85,149,136 | | |
| | | | | Risk & Decision Analytics | | | | | |
| | 7,350,000 | | | Bankrate (a)(b) | | | 77,101,500 | | |
| | | | | Internet Advertising for the Insurance,
Credit Card & Banking Markets | | | | | |
| | 3,041,462 | | | Navigant Consulting (a)(b) | | | 45,226,540 | | |
| | | | | Financial Consulting Firm | | | | | |
| | 1,908,954 | | | RPX (a) | | | 32,261,323 | | |
| | | | | Patent Aggregation &
Defensive Patent Consulting | | | | | |
| | 223,000 | | | Dun & Bradstreet | | | 27,206,000 | | |
| | | | | Commercial Data Provider | | | | | |
| | | | 266,944,499 | | |
| | | > Computer Services 1.9% | |
| | 1,263,525 | | | Virtusa (a) | | | 64,945,185 | | |
| | | | | Offshore IT Outsourcing | | | | | |
| | 2,021,597 | | | WNS - ADR (a) | | | 54,077,720 | | |
| | | | | Offshore Business Process Outsourcing
Services | | | | | |
| | 1,333,000 | | | ExlService Holdings (a) | | | 46,095,140 | | |
| | | | | Business Process Outsourcing | | | | | |
| | 2,643,045 | | | Hackett Group (b) | | | 35,496,094 | | |
| | | | | IT Integration & Best Practice Research | | | | | |
| | 1,419,083 | | | Genpact (a) | | | 30,269,040 | | |
| | | | | Business Process Outsourcing | | | | | |
| | | | 230,883,179 | | |
| | | > Internet Related 1.3% | |
| | 14,475,223 | | | Vonage (a)(b) | | | 71,073,345 | | |
| | | | | Business & Consumer Internet Telephony | | | | | |
| | 887,506 | | | Verisign (a)(c) | | | 54,776,870 | | |
| | | | | Internet Domain Registry for .com/.net
(Approximately 50% of World Domains) | | | | | |
| | 1,830,000 | | | RetailMeNot (a) | | | 32,628,900 | | |
| | | | | Digital Coupon Marketplace | | | | | |
| | | | 158,479,115 | | |
| | | > Financial Processors 1.3% | |
| | 941,314 | | | Global Payments | | | 97,378,933 | | |
| | | | | Credit Card Processor | | | | | |
| | 1,005,000 | | | CoreLogic (a) | | | 39,888,450 | | |
| | | | | Data Processing Services for Real Estate,
Insurance, & Mortgages | | | | | |
| | 1,600,000 | | | Liquidity Services (a)(b) | | | 15,408,000 | | |
| | | | | E-Auctions for Surplus & Salvage Goods | | | | | |
| | | | 152,675,383 | | |
| | | > Telephone & Data Services 1.2% | |
| | 2,502,088 | | | GTT Communications (a)(b) | | | 59,724,841 | | |
| | | | | Provider of High Capacity Data Transit | | | | | |
| | 769,047 | | | Cogent Communications | | | 26,024,550 | | |
| | | | | Internet Data Pipelines | | | | | |
See accompanying notes to financial statements.
31
COLUMBIA ACORN® FUND
STATEMENT OF INVESTMENTS (UNAUDITED), CONTINUED
Number of Shares | | | | Value | |
| | | > Telephone & Data Services—continued | |
| | 2,727,319 | | | Boingo Wireless (a)(b) | | $ | 22,527,655 | | |
| | | | | Wi-Fi & Cellular Communications
Networks | | | | | |
| | 867,000 | | | Zayo Group Holdings (a)(c) | | | 22,299,240 | | |
| | | | | Fiber Optic Data Communications | | | | | |
| | 3,775,680 | | | Towerstream (a)(b) | | | 6,758,467 | | |
| | | | | High Speed Wireless, Rooftop Antenna
Space & Wi-Fi Offload | | | | | |
| | | | 137,334,753 | | |
| | | > Telecommunications Equipment 1.0% | |
| | 491,008 | | | F5 Networks (a) | | | 59,092,813 | | |
| | | | | Internet Traffic Management Equipment | | | | | |
| | 1,940,827 | | | Infinera (a) | | | 40,718,551 | | |
| | | | | Optical Networking Equipment | | | | | |
| | 1,269,759 | | | CalAmp (a) | | | 23,185,799 | | |
| | | | | Machine-to-machine Communications | | | | | |
| | | | 122,997,163 | | |
| | | > Semiconductors &
Related Equipment 0.8% | |
| | 3,736,317 | | | Atmel | | | 36,821,404 | | |
| | | | | Microcontrollers, Radio Frequency &
Memory Semiconductors | | | | | |
| | 319,938 | | | Littelfuse | | | 30,358,917 | | |
| | | | | Little Fuses | | | | | |
| | 378,172 | | | Monolithic Power Systems | | | 19,177,102 | | |
| | | | | High Performance Analog & Mixed
Signal Integrated Circuits | | | | | |
| | 2,371,155 | | | Rubicon Technology (a)(b)(c) | | | 5,761,907 | | |
| | | | | Producer of Sapphire for the Lighting,
Electronics & Automotive Industries | | | | | |
| | | | 92,119,330 | | |
| | | > Contract Manufacturing 0.6% | |
| | 3,467,599 | | | Sanmina (a) | | | 69,906,796 | | |
| | | | | Electronic Manufacturing Services | | | | | |
| | | > Cable TV 0.5% | |
| | 661,980 | | | Liberty Global Series A (a) | | | 35,793,259 | | |
| | 235,822 | | | Liberty Global Series C (a) | | | 11,939,668 | | |
| | | | | Cable TV Franchises Outside of the
United States | | | | | |
| | 402,028 | | | Discovery Communications
Series C (a) | | | 12,495,030 | | |
| | | | | Cable TV Programming | | | | | |
| | | | 60,227,957 | | |
| | | > Electronics Distribution 0.4% | |
| | 1,151,958 | | | Avnet | | | 47,356,993 | | |
| | | | | Electronic Components Distribution | | | | | |
| | | > Entertainment Programming 0.3% | |
| | 860,159 | | | IMAX (Canada) (a) | | | 34,638,603 | | |
| | | | | IMAX Movies, Theater Equipment &
Theater Joint Ventures | | | | | |
| | | > Advertising 0.3% | |
| | 550,749 | | | Lamar Advertising | | | 31,657,053 | | |
| | | | | Outdoor Advertising | | | | | |
Information: Total | | | 3,085,765,485 | | |
Number of Shares | | | | Value | |
Industrial Goods & Services 21.9% | | | |
| | | > Machinery 13.5% | |
| | 7,949,116 | | | Donaldson (b) | | $ | 284,578,353 | | |
| | | | | Industrial Air Filtration | | | | | |
| | 4,569,066 | | | Ametek | | | 250,293,435 | | |
| | | | | Aerospace/Industrial Instruments | | | | | |
| | 2,147,586 | | | Nordson | | | 167,275,474 | | |
| | | | | Dispensing Systems for Adhesives &
Coatings | | | | | |
| | 2,962,178 | | | HEICO (b) | | | 150,389,777 | | |
| | | | | FAA-approved Aircraft Replacement Parts | | | | | |
| | 2,563,598 | | | Generac (a)(c) | | | 101,903,021 | | |
| | | | | Standby Power Generators | | | | | |
| | 1,440,787 | | | Moog (a) | | | 101,834,825 | | |
| | | | | Motion Control Products for Aerospace,
Defense & Industrial Markets | | | | | |
| | 1,353,698 | | | Toro | | | 91,753,650 | | |
| | | | | Turf Maintenance Equipment | | | | | |
| | 803,972 | | | Middleby (a) | | | 90,229,778 | | |
| | | | | Manufacturer of Cooking Equipment | | | | | |
| | 1,942,945 | | | Oshkosh Corporation | | | 82,342,009 | | |
| | | | | Specialty Truck Manufacturer | | | | | |
| | 595,235 | | | WABCO Holdings (a) | | | 73,642,474 | | |
| | | | | Truck & Bus Component Supplier | | | | | |
| | 625,474 | | | Wabtec | | | 58,944,670 | | |
| | | | | Freight & Transit Component Supplier | | | | | |
| | 1,489,000 | | | ESCO Technologies (b) | | | 55,703,490 | | |
| | | | | Industrial Filtration & Advanced
Measurement Equipment | | | | | |
| | 1,344,966 | | | Kennametal | | | 45,890,240 | | |
| | | | | Consumable Cutting Tools | | | | | |
| | 954,332 | | | Dorman Products (a)(c) | | | 45,483,463 | | |
| | | | | Aftermarket Auto Parts Distributor | | | | | |
| | | | 1,600,264,659 | | |
| | | > Other Industrial Services 3.8% | |
| | 6,748,927 | | | LKQ (a) | | | 204,121,297 | | |
| | | | | Alternative Auto Parts Distribution | | | | | |
| | 1,798,000 | | | Robert Half International | | | 99,789,000 | | |
| | | | | Temporary & Permanent Staffing in
Finance, Accounting & other Professions | | | | | |
| | 1,674,435 | | | Expeditors International of
Washington | | | 77,199,826 | | |
| | | | | International Freight Forwarder | | | | | |
| | 1,359,907 | | | Forward Air | | | 71,068,740 | | |
| | | | | Freight Transportation Between Airports | | | | | |
| | | | 452,178,863 | | |
| | | > Construction 1.5% | |
| | 76,850 | | | NVR (a) | | | 102,979,000 | | |
| | | | | Homebuilder | | | | | |
| | 2,865,200 | | | PGT (a)(b) | | | 41,574,052 | | |
| | | | | Wind Resistant Windows & Doors | | | | | |
| | 609,008 | | | Allegion | | | 36,625,741 | | |
| | | | | Mechanical & Electronic Security Systems | | | | | |
| | | | 181,178,793 | | |
| | | > Industrial Distribution 1.2% | |
| | 823,571 | | | Airgas | | | 87,117,340 | | |
| | | | | Industrial Gas Distributor | | | | | |
| | 851,347 | | | WESCO International (a) | | | 58,436,458 | | |
| | | | | Industrial Distributor | | | | | |
| | | | 145,553,798 | | |
See accompanying notes to financial statements.
32
Number of Shares | | | | Value | |
| | | > Outsourcing Services 0.8% | |
| | 3,357,357 | | | Quanta Services (a) | | $ | 96,759,029 | | |
| | | | | Electrical Transmission & Pipeline
Contracting Services | | | | | |
| | | > Industrial Materials & Specialty
Chemicals 0.7% | |
| | 1,434,286 | | | Drew Industries (b) | | | 83,217,274 | | |
| | | | | RV & Manufactured Home Components | | | | | |
| | | > Electrical Components 0.4% | |
| | 1,639,635 | | | Thermon (a)(b) | | | 39,466,014 | | |
| | | | | Global Engineered Thermal
Solutions | | | | | |
Industrial Goods & Services: Total | | | 2,598,618,430 | | |
Finance 12.2% | | | |
| | | > Banks 4.8% | |
| | 7,931,448 | | | Associated Banc-Corp (b) | | | 160,770,451 | | |
| | | | | Midwest Bank | | | | | |
| | 1,799,411 | | | BOK Financial | | | 125,203,018 | | |
| | | | | Tulsa-based Southwest Bank | | | | | |
| | 677,700 | | | SVB Financial Group (a) | | | 97,575,246 | | |
| | | | | Bank to Venture Capitalists | | | | | |
| | 1,790,025 | | | MB Financial | | | 61,648,461 | | |
| | | | | Chicago Bank | | | | | |
| | 1,350,879 | | | Hancock Holding | | | 43,106,549 | | |
| | | | | Gulf Coast Bank | | | | | |
| | 1,014,983 | | | Sandy Spring Bancorp | | | 28,399,224 | | |
| | | | | Baltimore & Washington, D.C. Bank | | | | | |
| | 4,112,881 | | | First Busey | | | 27,021,628 | | |
| | | | | Illinois Bank | | | | | |
| | 3,089,176 | | | TrustCo Bank | | | 21,716,907 | | |
| | | | | New York State Bank | | | | | |
| | | | 565,441,484 | | |
| | | > Brokerage & Money Management 3.8% | |
| | 6,522,307 | | | SEI Investments | | | 319,788,712 | | |
| | | | | Mutual Fund Administration &
Investment Management | | | | | |
| | 2,914,581 | | | Eaton Vance | | | 114,047,554 | | |
| | | | | Specialty Mutual Funds | | | | | |
| | 11,000,000 | | | Sprott (Canada) (c) | | | 21,753,403 | | |
| | | | | Asset Manager Focused on Resources,
Particularly Gold & Silver | | | | | |
| | | | 455,589,669 | | |
| | | > Insurance 1.4% | |
| | 5,651,291 | | | CNO Financial Group | | | 103,701,190 | | |
| | | | | Life, Long-term Care & Medical
Supplement Insurance | | | | | |
| | 864,371 | | | Allied World Assurance
Company Holdings | | | 37,358,115 | | |
| | | | | Commercial Lines Insurance/Reinsurance | | | | | |
| | 606,457 | | | RLI | | | 31,165,825 | | |
| | | | | Specialty Insurance | | | | | |
| | | | 172,225,130 | | |
| | | > Diversified Financial Companies 0.8% | |
| | 3,760,346 | | | Leucadia National | | | 91,301,201 | | |
| | | | | Holding Company | | | | | |
| | | > Finance Companies 0.7% | |
| | 1,167,476 | | | McGrath Rentcorp | | | 35,526,295 | | |
| | | | | Mini-rental Conglomerate | | | | | |
Number of Shares | | | | Value | |
| | 530,000 | | | World Acceptance (a)(b)(c) | | $ | 32,600,300 | | |
| | | | | Personal Loans | | | | | |
| | 839,000 | | | CAI International (a) | | | 17,275,010 | | |
| | | | | International Container Leasing | | | | | |
| | | | 85,401,605 | | |
| | | > Credit Cards 0.7% | |
| | 703,142 | | | WEX (a) | | | 80,137,094 | | |
| | | | | Card Processor | | | | | |
Finance: Total | | | 1,450,096,183 | | |
Health Care 12.2% | | | |
| | | > Biotechnology & Drug Delivery 4.0% | |
| | 1,712,134 | | | Ultragenyx Pharmaceutical (a) | | | 175,305,400 | | |
| | | | | Biotech Focused on "Ultra-Orphan" Drugs | | | | | |
| | 1,823,556 | | | Seattle Genetics (a) | | | 88,260,111 | | |
| | | | | Antibody-based Therapies for Cancer | | | | | |
| | 2,404,789 | | | Sarepta Therapeutics (a)(b)(c) | | | 73,177,729 | | |
| | | | | Biotech Focused on Rare Diseases | | | | | |
| | 220,978 | | | Intercept Pharmaceuticals (a) | | | 53,339,670 | | |
| | | | | Biotech Developing Drugs for
Several Diseases | | | | | |
| | 1,902,687 | | | Celldex Therapeutics (a) | | | 47,985,766 | | |
| | | | | Biotech Developing Drugs for Cancer | | | | | |
| | 346,692 | | | Agios Pharmaceuticals (a)(c) | | | 38,531,349 | | |
| | | | | Biotech Focused on Cancer &
Orphan Diseases | | | | | |
| | 359,944 | | | MicroDose Therapeutx
Contingent Value Rights (a)(d)(e) | | | 359,944 | | |
| | | | | Drug Inhaler Development | | | | | |
| | | | 476,959,969 | | |
| | | > Medical Supplies 3.9% | |
| | 4,065,050 | | | Cepheid (a)(b) | | | 248,577,807 | | |
| | | | | Molecular Diagnostics | | | | | |
| | 1,123,116 | | | Bio-Techne | | | 110,593,233 | | |
| | | | | Maker of Consumables & Systems for
the Life Science Market | | | | | |
| | 349,334 | | | Henry Schein (a) | | | 49,647,348 | | |
| | | | | Distributor of Dental, Vet &
Medical Products | | | | | |
| | 1,850,600 | | | VWR (a) | | | 49,466,538 | | |
| | | | | Distributor of Lab Supplies | | | | | |
| | | | 458,284,926 | | |
| | | > Health Care Services 1.9% | |
| | 1,430,434 | | | Medidata Solutions (a) | | | 77,701,175 | | |
| | | | | Cloud-based Software for Drug Studies | | | | | |
| | 1,647,700 | | | HealthSouth | | | 75,893,062 | | |
| | | | | Inpatient Rehabilitation Facilities &
Home Health Care | | | | | |
| | 1,155,575 | | | Envision Healthcare
Holdings (a) | | | 45,622,101 | | |
| | | | | Provider of Health Care Outsourcing
Services | | | | | |
| | 1,749,965 | | | Allscripts Healthcare Solutions (a) | | | 23,939,521 | | |
| | | | | Health Care IT | | | | | |
| | | | 223,155,859 | | |
| | | > Medical Equipment & Devices 1.5% | |
| | 777,276 | | | Align Technology (a) | | | 48,742,978 | | |
| | | | | Invisalign System to Correct Malocclusion
(Crooked Teeth) | | | | | |
| | 1,829,940 | | | Wright Medical Group (a) | | | 48,054,224 | | |
| | | | | Foot & Ankle Replacement | | | | | |
| | 435,820 | | | Sirona Dental Systems (a) | | | 43,765,044 | | |
| | | | | Manufacturer of Dental Equipment | | | | | |
See accompanying notes to financial statements.
33
COLUMBIA ACORN® FUND
STATEMENT OF INVESTMENTS (UNAUDITED), CONTINUED
Number of Shares | | | | Value | |
| | | > Medical Equipment & Devices—continued | |
| | 631,624 | | | Abaxis | | $ | 32,516,004 | | |
| | | | | Instruments & Tests for Vet &
Medical Markets | | | | | |
| | | | 173,078,250 | | |
| | | > Pharmaceuticals 0.9% | |
| | 2,503,151 | | | Akorn (a) | | | 109,287,573 | | |
| | | | | Developer, Manufacturer &
Distributor of Specialty
Generic Drugs | | | | | |
Health Care: Total | | | 1,440,766,577 | | |
Consumer Goods & Services 11.6% | | | |
| | | > Travel 2.8% | |
| | 817,499 | | | Vail Resorts | | | 89,270,891 | | |
| | | | | Ski Resort Operator & Developer | | | | | |
| | 1,806,776 | | | Avis Budget Group (a) | | | 79,642,686 | | |
| | | | | Car Rental Company | | | | | |
| | 2,160,506 | | | HomeAway (a) | | | 67,234,946 | | |
| | | | | Vacation Rental Online Marketplace | | | | | |
| | 2,800,000 | | | Hertz (a) | | | 50,736,000 | | |
| | | | | U.S. Rental Car Operator | | | | | |
| | 720,955 | | | Choice Hotels | | | 39,111,809 | | |
| | | | | Franchisor of Budget Hotel Brands | | | | | |
| | | | 325,996,332 | | |
| | | > Retail 2.6% | |
| | 2,561,000 | | | The Fresh Market (a)(b) | | | 82,310,540 | | |
| | | | | Specialty Food Retailer | | | | | |
| | 874,735 | | | Fossil (a) | | | 60,671,619 | | |
| | | | | Watch Designer & Retailer | | | | | |
| | 596,335 | | | Casey's General Stores | | | 57,093,113 | | |
| | | | | Owner/Operator of Convenience Stores | | | | | |
| | 567,295 | | | Williams-Sonoma | | | 46,671,360 | | |
| | | | | Home Goods & Furnishing Retailer | | | | | |
| | 2,405,817 | | | Zulily (a)(c) | | | 31,371,854 | | |
| | | | | E-Commerce Retailer Offering
Flash Sale Events | | | | | |
| | 492,129 | | | Urban Outfitters (a) | | | 17,224,515 | | |
| | | | | Multi-channel Apparel & Accessory Retailer | | | | | |
| | 2,100,000 | | | Gaiam (a)(b) | | | 13,734,000 | | |
| | | | | Promoter of Healthy Living through
Catalogs, E-Commerce & Gaiam TV | | | | | |
| | | | 309,077,001 | | |
| | | > Restaurants 1.8% | |
| | 937,570 | | | Papa John's International | | | 70,889,668 | | |
| | | | | Franchisor of Pizza Restaurants | | | | | |
| | 403,000 | | | Domino's Pizza | | | 45,700,200 | | |
| | | | | Franchisor of Pizza Restaurants | | | | | |
| | 856,484 | | | Fiesta Restaurant Group (a) | | | 42,824,200 | | |
| | | | | Owner/Operator of Two Restaurant
Chains: Pollo Tropical & Taco Cabana | | | | | |
| | 576,000 | | | Dunkin Brands | | | 31,680,000 | | |
| | | | | Franchisor of Quick Service Restaurants | | | | | |
| | 454,079 | | | Popeyes Louisiana Kitchen (a) | | | 27,240,199 | | |
| | | | | Popeyes Restaurants | | | | | |
| | | | 218,334,267 | | |
| | | > Other Durable Goods 1.6% | |
| | 4,350,000 | | | Gentex | | | 71,427,000 | | |
| | | | | Manufacturer of Auto Parts | | | | | |
| | 2,158,630 | | | Select Comfort (a) | | | 64,910,004 | | |
| | | | | Specialty Mattresses | | | | | |
| | 455,025 | | | Cavco Industries (a)(b) | | | 34,327,086 | | |
| | | | | Manufactured Homes | | | | | |
Number of Shares | | | | Value | |
| | 411,825 | | | Tenneco (a) | | $ | 23,655,228 | | |
| | | | | Auto Parts for Emission Control,
Suspension | | | | | |
| | | | 194,319,318 | | |
| | | > Consumer Goods Distribution 1.6% | |
| | 1,274,436 | | | Pool | | | 89,439,919 | | |
| | | | | Swimming Pool Supplies &
Equipment Distributor | | | | | |
| | 1,192,643 | | | United Natural Foods (a) | | | 75,947,506 | | |
| | | | | Distributor of Natural/Organic Foods
to Grocery Stores | | | | | |
| | 863,000 | | | The Chefs' Warehouse (a)(c) | | | 18,330,120 | | |
| | | | | Distributor of Specialty Foods to Fine
Dining Restaurants | | | | | |
| | | | 183,717,545 | | |
| | | > Furniture & Textiles 0.9% | |
| | 2,520,350 | | | Knoll (b) | | | 63,084,360 | | |
| | | | | Office Furniture | | | | | |
| | 540,000 | | | Caesarstone (Israel) | | | 37,011,600 | | |
| | | | | Quartz Countertops | | | | | |
| | | | 100,095,960 | | |
| | | > Other Consumer Services 0.3% | |
| | 978,253 | | | Blackhawk Network (a) | | | 40,304,024 | | |
| | | | | Third-party Distributor of Prepaid
Content, Mostly Gift Cards | | | | | |
Consumer Goods & Services: Total | | | 1,371,844,447 | | |
Other Industries 5.8% | | | |
| | | > Real Estate 3.8% | |
| | 658,669 | | | Federal Realty | | | 84,368,912 | | |
| | | | | Shopping Centers & Mixed Use Projects | | | | | |
| | 2,325,332 | | | EdR | | | 72,922,411 | | |
| | | | | Student Housing | | | | | |
| | 1,316,297 | | | Post Properties | | | 71,567,068 | | |
| | | | | Multifamily Properties | | | | | |
| | 1,002,619 | | | Extra Space Storage | | | 65,390,811 | | |
| | | | | Self Storage Facilities | | | | | |
| | 183,970 | | | Amerco | | | 60,141,633 | | |
| | | | | North American Moving & Storage King | | | | | |
| | 282,596 | | | Jones Lang LaSalle | | | 48,323,916 | | |
| | | | | Real Estate Services | | | | | |
| | 2,148,681 | | | Terreno Realty (b) | | | 42,329,016 | | |
| | | | | Industrial Properties | | | | | |
| | | | 445,043,767 | | |
| | | > Transportation 1.6% | |
| | 2,173,034 | | | Rush Enterprises,
Class A (a)(b) | | | 56,955,221 | | |
| | 460,172 | | | Rush Enterprises,
Class B (a)(b) | | | 11,044,128 | | |
| | | | | Truck Sales & Service | | | | | |
| | 578,406 | | | JB Hunt Transport Services | | | 47,481,349 | | |
| | | | | Truck & Intermodal Carrier | | | | | |
| | 2,296,684 | | | Heartland Express | | | 46,461,917 | | |
| | | | | Regional Trucker | | | | | |
| | 380,000 | | | Genesee & Wyoming (a) | | | 28,948,400 | | |
| | | | | Short-line Operator | | | | | |
| | | | 190,891,015 | | |
See accompanying notes to financial statements.
34
Number of Shares | | | | Value | |
| | | > Regulated Utilities 0.4% | |
| | 1,036,839 | | | Eversource Energy | | $ | 47,082,859 | | |
| | | | | Regulated Electric Utility | | | | | |
Other Industries: Total | | | 683,017,641 | | |
Energy & Minerals 3.8% | | | |
| | | > Oil & Gas Producers 1.9% | |
| | 944,733 | | | Carrizo Oil & Gas (a) | | | 46,518,653 | | |
| | | | | Oil & Gas Producer | | | | | |
| | 402,497 | | | Cimarex Energy | | | 44,399,444 | | |
| | | | | Oil & Gas Producer in Texas, New
Mexico & Oklahoma | | | | | |
| | 681,333 | | | PDC Energy (a) | | | 36,546,702 | | |
| | | | | Oil & Gas Producer in the United States | | | | | |
| | 501,139 | | | Energen Corporation | | | 34,227,793 | | |
| | | | | Oil & Gas Producer with
Natural Gas Utility | | | | | |
| | 685,658 | | | SM Energy | | | 31,622,547 | | |
| | | | | Oil & Gas Producer | | | | | |
| | 265,636 | | | Clayton Williams (a) | | | 17,465,567 | | |
| | | | | Oil & Gas Producer | | | | | |
| | 107,561,001 | | | ShaMaran Petroleum
(Iraq) (a)(b) | | | 7,965,887 | | |
| | | | | Oil Exploration & Production in Kurdistan | | | | | |
| | 64,294,000 | | | Petromanas (Canada) (a)(b)(c) | | | 2,831,201 | | |
| | | | | Exploring for Oil in Albania | | | | | |
| | 24,115,500 | | | Canadian Overseas Petroleum
(Canada) (a)(b) | | | 1,544,628 | | |
| | 8,400,000 | | | Canadian Overseas Petroleum
(Canada) (a)(b)(e) | | | 511,129 | | |
| | | | | Oil & Gas Exploration Offshore West Africa | | | | | |
| | | | 223,633,551 | | |
| | | > Mining 0.9% | |
| | 407,938 | | | Core Labs (Netherlands) (c) | | | 46,521,249 | | |
| | | | | Oil & Gas Reservoir Consulting | | | | | |
| | 6,115,764 | | | Kirkland Lake Gold
(Canada) (a)(b) | | | 27,567,455 | | |
| | | | | Gold Mining | | | | | |
| | 3,421,322 | | | Alamos Gold (Canada) | | | 19,366,490 | | |
| | | | | Gold Mining | | | | | |
| | 8,582,916 | | | Argonaut Gold (Canada) (a)(b)(c) | | | 11,544,675 | | |
| | | | | Gold & Silver Mining | | | | | |
| | 3,412,300 | | | Silvercrest Mines (a) | | | 3,387,712 | | |
| | | | | Gold & Silver Mining | | | | | |
| | 3,000,000 | | | Kaminak Gold (a) | | | 1,897,518 | | |
| | | | | Exploration Stage Canadian Gold Miner | | | | | |
| | | | 110,285,099 | | |
| | | > Oil Services 0.9% | |
| | 1,740,523 | | | ShawCor (Canada) | | | 50,989,381 | | |
| | | | | Oil & Gas Pipeline Products | | | | | |
Number of Shares | | | | Value | |
| | 774,708 | | | Gulfport Energy (a) | | $ | 31,181,997 | | |
| | | | | Oil & Gas Producer Focused on Utica
Shale in Ohio | | | | | |
| | 1,147,145 | | | Hornbeck Offshore (a) | | | 23,550,887 | | |
| | | | | Supply Vessel Operator in Gulf of Mexico | | | | | |
| | | | 105,722,265 | | |
| | | > Agricultural Commodities 0.1% | |
| | 1,306,818 | | | Union Agriculture Group
(Uruguay) (a)(d)(e) | | | 12,336,362 | | |
| | | | | Farmland Operator in Uruguay | | | | | |
Energy & Minerals: Total | | | 451,977,277 | | |
Total Equities: 93.6%
(Cost: $6,035,022,717) | | | 11,082,086,040 | (f) | |
Short-Term Investments 6.8% | | | |
| | 520,578,010 | | | JPMorgan U.S. Government
Money Market Fund, Agency
Shares (7 day yield
of 0.01%) | | | 520,578,010 | | |
| | 280,000,000 | | | JPMorgan U.S. Government
Money Market Fund, IM
Shares (7 day yield of 0.01%) | | | 280,000,000 | | |
Total Short-Term Investments: 6.8%
(Cost: $800,578,010) | | | 800,578,010 | | |
Securities Lending Collateral 1.7% | | | |
| | 205,638,386 | | | Dreyfus Government Cash
Management Fund,
Institutional Shares
(7 day yield of 0.01%) (g) | | | 205,638,386 | | |
Total Securities Lending Collateral: 1.7%
(Cost: $205,638,386) | | | 205,638,386 | | |
Total Investments: 102.1%
(Cost: $7,041,239,113)(h) | | | 12,088,302,436 | | |
Obligation to Return Collateral for
Securities Loaned: (1.7)% | | | (205,638,386 | ) | |
Cash and Other Assets Less
Liabilities: (0.4)% | | | (45,065,488 | ) | |
Net Assets: 100.0% | | $ | 11,837,598,562 | | |
ADR - American Depositary Receipts
See accompanying notes to financial statements.
35
COLUMBIA ACORN® FUND
STATEMENT OF INVESTMENTS (UNAUDITED), CONTINUED
> Notes to Statement of Investments
(a) Non-income producing security.
(b) An affiliated person of the Fund, as defined in the Investment Company Act of 1940, may include any company in which the Fund owns five percent or more of its outstanding voting shares. Holdings and transactions in these affiliated companies during the period ended June 30, 2015, are as follows:
Security | | Balance of
Shares Held
12/31/14 | | Purchases/
Additions | | Sales/
Reductions | | Balance of
Shares Held
6/30/15 | | Value | | Dividend | |
Donaldson | | | 7,952,000 | | | | - | | | | 2,884 | | | | 7,949,116 | | | $ | 284,578,353 | | | $ | 2,663,430 | | |
Cepheid | | | 5,350,800 | | | | - | | | | 1,285,750 | | | | 4,065,050 | | | | 248,577,807 | | | | - | | |
Nordson (1) | | | 3,130,000 | | | | - | | | | 982,414 | | | | 2,147,586 | | | | 167,275,474 | | | | 1,197,148 | | |
Associated Banc-Corp | | | 9,000,000 | | | | 414,000 | | | | 1,482,552 | | | | 7,931,448 | | | | 160,770,451 | | | | 1,789,603 | | |
HEICO | | | 3,626,750 | | | | - | | | | 664,572 | | | | 2,962,178 | | | | 150,389,777 | | | | - | | |
Generac (1) | | | 3,632,000 | | | | - | | | | 1,068,402 | | | | 2,563,598 | | | | 101,903,021 | | | | - | | |
Moog (1) | | | 2,456,000 | | | | - | | | | 1,015,213 | | | | 1,440,787 | | | | 101,834,825 | | | | - | | |
Drew Industries | | | 1,610,000 | | | | - | | | | 175,714 | | | | 1,434,286 | | | | 83,217,274 | | | | 3,220,000 | | |
The Fresh Market | | 1,492,000 | | 1,069,000 | | - | | 2,561,000 | | 82,310,540 | |
Bankrate | | | 6,300,300 | | | | 1,049,700 | | | | - | | | | 7,350,000 | | | | 77,101,500 | | | | - | | |
Sarepta Therapeutics | | | 2,523,900 | | | | - | | | | 119,111 | | | | 2,404,789 | | | | 73,177,729 | | | | - | | |
EdR (1) | | | 2,450,000 | | | | - | | | | 124,668 | | | | 2,325,332 | | | | 72,922,411 | | | | 1,721,362 | | |
Vonage | | | 14,044,775 | | | | 455,225 | | | | 24,777 | | | | 14,475,223 | | | | 71,073,345 | | | | - | | |
Rush Enterprises | | | 3,200,000 | | | | - | | | | 566,794 | | | | 2,633,206 | | | | 67,999,349 | | | | - | | |
Virtusa (1) | | | 1,658,000 | | | | - | | | | 394,475 | | | | 1,263,525 | | | | 64,945,185 | | | | - | | |
Knoll | | | 3,366,000 | | | | - | | | | 845,650 | | | | 2,520,350 | | | | 63,084,360 | | | | 674,971 | | |
SPS Commerce | | | 1,330,000 | | | | - | | | | 389,474 | | | | 940,526 | | | | 61,886,611 | | | | - | | |
GTT Communications | | | 1,950,000 | | | | 651,000 | | | | 98,912 | | | | 2,502,088 | | | | 59,724,841 | | | | - | | |
ESCO Technologies | | | 1,948,000 | | | | - | | | | 459,000 | | | | 1,489,000 | | | | 55,703,490 | | | | 238,240 | | |
Navigant Consulting | | | 4,128,523 | | | | - | | | | 1,087,061 | | | | 3,041,462 | | | | 45,226,540 | | | | - | | |
Terreno Realty | | | 2,150,000 | | | | - | | | | 1,319 | | | | 2,148,681 | | | | 42,329,016 | | | | 344,000 | | |
PGT | | | 3,592,200 | | | | - | | | | 727,000 | | | | 2,865,200 | | | | 41,574,052 | | | | - | | |
Thermon | | | 1,940,094 | | | | 43,735 | | | | 344,194 | | | | 1,639,635 | | | | 39,466,014 | | | | - | | |
McGrath Rentcorp (1) | | | 1,580,000 | | | | - | | | | 412,524 | | | | 1,167,476 | | | | 35,526,294 | | | | 704,154 | | |
Hackett Group | | | 2,903,719 | | | | - | | | | 260,674 | | | | 2,643,045 | | | | 35,496,094 | | | | 264,305 | | |
Cavco Industries | | | 500,000 | | | | - | | | | 44,975 | | | | 455,025 | | | | 34,327,086 | | | | - | | |
World Acceptance | | | 808,343 | | | | - | | | | 278,343 | | | | 530,000 | | | | 32,600,300 | | | | - | | |
Kirkland Lake Gold | | | 6,347,100 | | | | 350,100 | | | | 581,436 | | | | 6,115,764 | | | | 27,567,455 | | | | - | | |
Boingo Wireless | | | 2,800,000 | | | | 100,000 | | | | 172,681 | | | | 2,727,319 | | | | 22,527,655 | | | | - | | |
inContact (1) | | | 3,741,000 | | | | - | | | | 1,496,103 | | | | 2,244,897 | | | | 22,157,133 | | | | - | | |
CAI International (1) | | | 1,500,000 | | | | - | | | | 661,000 | | | | 839,000 | | | | 17,275,010 | | | | - | | |
Liquidity Services | | | 1,600,000 | | | | - | | | | - | | | | 1,600,000 | | | | 15,408,000 | | | | - | | |
Gaiam | | | 2,100,000 | | | | - | | | | - | | | | 2,100,000 | | | | 13,734,000 | | | | - | | |
Argonaut Gold | | | 9,014,700 | | | | - | | | | 431,784 | | | | 8,582,916 | | | | 11,544,675 | | | | - | | |
ShaMaran Petroleum | | | 28,962,000 | | | | 78,599,001 | | | | | | 107,561,001 | | | | 7,965,887 | | | | - | | |
Towerstream | | | 4,000,000 | | | | - | | | | 224,320 | | | | 3,775,680 | | | | 6,758,467 | | | | - | | |
Rubicon Technology | | | 2,500,000 | | | | - | | | | 128,845 | | | | 2,371,155 | | | | 5,761,907 | | | | - | | |
Petromanas | | | 67,500,000 | | | | - | | | | 3,206,000 | | | | 64,294,000 | | | | 2,831,201 | | | | - | | |
Canadian Overseas Petroleum | | | 32,515,500 | | | | - | | | | - | | | | 32,515,500 | | | | 2,055,757 | | | | - | | |
Allied Nevada Gold (1) | | | 7,103,513 | | | | - | | | | 7,103,513 | | | | - | | | | - | | | | - | | |
Amber Road (1) | | | 2,000,000 | | | | - | | | | 2,000,000 | | | | - | | | | - | | | | - | | |
Audience (1) | | | 2,150,000 | | | | - | | | | 2,150,000 | | | | - | | | | - | | | | - | | |
Boulder Brands (1) | | | 3,484,000 | | | | - | | | | 3,484,000 | | | | - | | | | - | | | | - | | |
E2Open (1) | | | 2,575,000 | | | | - | | | | 2,575,000 | | | | - | | | | - | | | | - | | |
Marlin Business Services (1) | | | 902,210 | | | | - | | | | 902,210 | | | | - | | | | - | | | | - | | |
Petrodorado Energy (1) | | | 2,600,000 | | | | - | | | | 2,600,000 | | | | - | | | | - | | | | - | | |
RGS Energy (1) | | | 5,000,000 | | | | - | | | | 5,000,000 | | | | - | | | | - | | | | - | | |
Synageva BioPharma (1) | | | 2,419,209 | | | | - | | | | 2,419,209 | | | | - | | | | - | | | | - | | |
Total of Affiliated Transactions | | | 285,437,636 | | | | 82,731,761 | | | | 47,992,553 | | | | 320,176,844 | | | $ | 2,510,608,886 | | | $ | 12,817,213 | | |
(1) At June 30, 2015, the Fund owned less than five percent of the company's outstanding voting shares.
The aggregate cost and value of these companies at June 30, 2015, was $1,156,736,525 and $1,926,769,533, respectively. Investments in affiliated companies represented 16.28% of the Fund's total net assets at June 30, 2015.
(c) All or a portion of this security was on loan at June 30, 2015. The total market value of securities on loan at June 30, 2015 was $205,238,253.
(d) Illiquid security.
See accompanying notes to financial statements.
36
> Notes to Statement of Investments
(e) Denotes a restricted security, which is subject to restrictions on resale under federal securities laws. These securities are valued at fair value determined in good faith under consistently applied procedures established by the Fund's Board of Trustees. At June 30, 2015, the market value of these securities amounted to $13,207,435, which represented 0.11% of total net assets. Additional information on these securities is as follows:
Security | | Acquisition
Dates | | Shares/Units | | Cost | | Value | |
Union Agriculture Group | | 12/8/10-6/27/12 | | | 1,306,818 | | | $ | 15,000,000 | | | $ | 12,336,362 | | |
Canadian Overseas Petroleum | | 11/24/10 | | | 8,400,000 | | | | 3,591,152 | | | | 511,129 | | |
MicroDose Therapeutx Contingent Value Rights | | 8/14/13 | | | 359,944 | | | | - | | | | 359,944 | | |
| | | | | | | $ | 18,591,152 | | | $ | 13,207,435 | | |
(f) On June 30, 2015, the market value of foreign securities represented 2.32% of total net assets. The Fund's foreign portfolio was diversified as follows:
Country | | Value | | Percentage
of Net Assets | |
Canada | | $ | 170,746,965 | | | | 1.45 | | |
Netherlands | | | 46,521,249 | | | | 0.39 | | |
Israel | | | 37,011,600 | | | | 0.31 | | |
Uruguay | | | 12,336,362 | | | | 0.10 | | |
Iraq | | | 7,965,887 | | | | 0.07 | | |
Total Foreign Portfolio | | $ | 274,582,063 | | | | 2.32 | | |
(g) Investment made with cash collateral received from securities lending activity.
(h) At June 30, 2015, for federal income tax purposes, the cost of investments was approximately $7,041,239,113 and net unrealized appreciation was $5,047,063,323 consisting of gross unrealized appreciation of $5,338,831,371 and gross unrealized depreciation of $291,768,048.
Fair Value Measurements
Various inputs are used in determining the value of the Fund's investments, following the input prioritization hierarchy established by accounting principles generally accepted in the United States of America (GAAP). These inputs are summarized in the three broad levels listed below:
• Level 1 – quoted prices in active markets for identical securities
• Level 2 – prices determined using other significant observable inputs (including quoted prices for similar securities, interest rates, prepayment speeds, credit risk and others)
• Level 3 – prices determined using significant unobservable inputs where quoted prices or observable inputs are unavailable or less reliable (including management's own assumptions about the factors market participants would use in pricing an investment)
The inputs or methodology used for valuing securities are not necessarily an indication of the risk associated with investing in those securities.
Examples of the types of securities in which the Fund would typically invest and how they are classified within this hierarchy are as follows. Typical Level 1 securities include exchange traded domestic equities, mutual funds whose NAVs are published each day and exchange traded foreign equities that are not statistically fair valued. Typical Level 2 securities include exchange traded foreign equities that are statistically fair valued, forward foreign currency exchange contracts and short-term investments valued at amortized cost. Additionally, securities fair valued by CWAM's Valuation Committee (the Committee) that rely on significant observable inputs are also included in Level 2. Typical Level 3 securities include any security fair valued by the Committee that relies on significant unobservable inputs.
The Committee is responsible for applying the Trust's Portfolio Pricing Policy and the CWAM pricing procedures (the Policies), which are approved by and subject to the oversight of the Board.
The Committee meets as necessary, and no less frequently than quarterly, to determine fair values for securities for which market quotations are not readily available or for which CWAM believes that available market quotations are unreliable. The Committee also reviews the continuing appropriateness of the Policies. In circumstances where a security has been fair valued, the Committee will also review the continuing appropriateness of the current value of the security. The Policies address, among other things: circumstances under which market quotations will be deemed readily available; selection of third party pricing vendors; appropriate pricing methodologies; events that require fair valuation and fair value techniques; circumstances under which securities will be deemed to pose a potential for stale pricing, including when securities are illiquid, restricted, or in default; and certain delegations of authority to determine fair values to the Fund's investment manager. The Committee may also meet to discuss additional valuation matters, which may include review of back-testing results, review of time-sensitive information or approval of other valuation related actions, and to review the appropriateness of the Policies.
For investments categorized as Level 3, the significant unobservable inputs used in the fair value measurement of the Fund's securities may include: (i) data specific to the issuer or comparable issuers, (ii) general market or specific sector news and (iii) quoted prices and specific or similar security transactions. The Committee considers this data and any changes from prior periods in order to assess the reasonableness of observable and unobservable inputs, any assumptions or internal models used to value those securities and changes in fair value. Significant changes in any of these factors could result in lower or higher fair value measurements. Various factors impact the frequency of monitoring (which may occur as often as daily), however the Committee may determine that changes to inputs, assumptions and models are not required with the same frequency.
See accompanying notes to financial statements.
37
COLUMBIA ACORN® FUND
STATEMENT OF INVESTMENTS (UNAUDITED), CONTINUED
> Notes to Statement of Investments
The following table summarizes the inputs used, as of June 30, 2015, in valuing the Fund's assets:
Investment Type | | Quoted Prices
(Level 1) | | Other
Significant
Observable
Inputs
(Level 2) | | Significant
Unobservable
Inputs
(Level 3) | | Total | |
Equities | |
Information | | $ | 3,085,765,485 | | | $ | - | | | $ | - | | | $ | 3,085,765,485 | | |
Industrial Goods & Services | | | 2,598,618,430 | | | | - | | | | - | | | | 2,598,618,430 | | |
Finance | | | 1,450,096,183 | | | | - | | | | - | | | | 1,450,096,183 | | |
Health Care | | | 1,440,406,633 | | | | - | | | | 359,944 | | | | 1,440,766,577 | | |
Consumer Goods & Services | | | 1,371,844,447 | | | | - | | | | - | | | | 1,371,844,447 | | |
Other Industries | | | 683,017,641 | | | | - | | | | - | | | | 683,017,641 | | |
Energy & Minerals | | | 439,129,786 | | | | 511,129 | | | | 12,336,362 | | | | 451,977,277 | | |
Total Equities | | | 11,068,878,605 | | | | 511,129 | | | | 12,696,306 | | | | 11,082,086,040 | | |
Total Short-Term Investments | | | 800,578,010 | | | | - | | | | - | | | | 800,578,010 | | |
Total Securities Lending Collateral | | | 205,638,386 | | | | - | | | | - | | | | 205,638,386 | | |
Total Investments | | $ | 12,075,095,001 | | | $ | 511,129 | | | $ | 12,696,306 | | | $ | 12,088,302,436 | | |
The Fund's assets assigned to the Level 2 input category are generally valued using a market approach, in which a security's value is determined through its correlation to prices and information from observable market transactions for similar or identical assets. Securities acquired via private placement that have a holding period or an extended settlement period are valued at a discount to the same shares that are trading freely on the market. These discounts are determined by the investment manager's experience with similar securities or situations. Factors may include, but are not limited to, trade volume, shares outstanding and stock price.
There were no transfers of financial assets between levels during the period.
The Fund does not hold any significant investments (greater than one percent of net assets) categorized as Level 3.
Certain securities classified as Level 3 are valued by the Committee at fair value, using a market approach, as determined in good faith under consistently applied procedures established by and under the general supervision of the Board. To determine fair value for these securities, for which no market exists, the Committee utilizes the valuation technique it deems most appropriate in the circumstances, using some unobservable inputs, which may include, but are not limited to estimated earnings of the company and the position of the security within the company's capital structure. The Committee also may use some observable inputs, which may include, but are not limited to, trades of similar securities and market multiples derived from a set of comparable companies. Significant increases or decreases to any of these inputs could result in a significantly lower or higher fair value measurement.
See accompanying notes to financial statements.
38
COLUMBIA ACORN INTERNATIONAL®
MAJOR PORTFOLIO CHANGES IN THE SECOND QUARTER (UNAUDITED)
| | | Number of Shares | |
| | | 3/31/15 | | 6/30/15 | |
Purchases | |
Asia | |
| > Japan | |
Aeon Mall | | | 2,710,000 | | | | 3,000,000 | | |
Aica Kogyo | | | 1,012,000 | | | | 1,237,000 | | |
Aozora Bank | | | 8,340,000 | | | | 10,440,000 | | |
Asahi Intecc | | | 0 | | | | 105,400 | | |
Cocokara Fine | | | 0 | | | | 68,100 | | |
Disco | | | 292,400 | | | | 343,400 | | |
Dowa Holdings | | | 0 | | | | 2,600,000 | | |
Glory | | | 1,798,600 | | | | 1,840,000 | | |
IHI | | | 4,235,000 | | | | 7,100,000 | | |
Nihon Parkerizing | | | 1,753,060 | | | | 1,822,292 | | |
Nippon Paint Holdings | | | 624,000 | | | | 915,000 | | |
Otsuka | | | 629,900 | | | | 641,900 | | |
Santen Pharmaceutical | | | 2,728,000 | | | | 2,911,000 | | |
| > Taiwan | |
Advantech | | | 3,034,686 | | | | 3,054,686 | | |
Delta Electronics | | | 3,761,000 | | | | 6,351,000 | | |
Far EasTone Telecom | | | 14,140,000 | | | | 17,600,000 | | |
Largan Precision | | | 293,000 | | | | 399,000 | | |
Lite-On Technology | | | 10,016,881 | | | | 16,430,881 | | |
Novatek Microelectronics | | | 5,871,000 | | | | 8,126,000 | | |
Silergy | | | 0 | | | | 820,000 | | |
Vanguard International
Semiconductor | | | 13,516,000 | | | | 27,141,000 | | |
Voltronic Power | | | 1,000,000 | | | | 1,519,000 | | |
| > China | |
| 51job - ADR | | | 0 | | | | 375,000 | | |
CAR Inc | | | 0 | | | | 27,000,000 | | |
China Everbright International | | | 28,645,000 | | | | 29,650,000 | | |
Chongqing Rural
Commercial Bank | | | 0 | | | | 40,167,000 | | |
Jiangnan Group | | | 0 | | | | 102,280,000 | | |
NewOcean Energy | | | 32,790,000 | | | | 48,234,000 | | |
Phoenix Healthcare Group | | | 0 | | | | 11,984,000 | | |
Shanghai Industrial | | | 0 | | | | 8,673,000 | | |
TravelSky Technology | | | 0 | | | | 14,556,000 | | |
| > Korea | |
CJ Hellovision | | | 578,438 | | | | 2,908,469 | | |
Hyundai Marine & Fire Insurance | | | 0 | | | | 444,715 | | |
KCC | | | 0 | | | | 65,494 | | |
Koh Young Technology | | | 0 | | | | 43,923 | | |
| > India | |
Amara Raja | | | 0 | | | | 519,553 | | |
Container Corporation of India | | | 1,204,602 | | | | 1,382,783 | | |
| > Singapore | |
China Everbright Water | | | 0 | | | | 28,242,100 | | |
SIIC Environment | | | 0 | | | | 165,731,200 | | |
| | | Number of Shares | |
| | | 3/31/15 | | 6/30/15 | |
| > Hong Kong | |
Mapletree Greater China
Commercial Trust | | | 52,849,000 | | | | 63,364,000 | | |
Samsonite International | | | 0 | | | | 12,000,000 | | |
Vitasoy International | | | 9,347,000 | | | | 9,675,000 | | |
| > Indonesia | |
Matahari Department Store | | | 19,000,000 | | | | 24,195,600 | | |
Surya Citra Media | | | 11,854,300 | | | | 61,947,300 | | |
Philippines | |
Universal Robina | | | 3,106,980 | | | | 5,900,000 | | |
| > Malaysia | |
Astro Malaysia Holdings | | | 410,300 | | | | 19,000,000 | | |
Europe | |
| > United Kingdom | |
Halfords | | | 4,372,390 | | | | 4,712,000 | | |
Regus | | | 0 | | | | 8,840,000 | | |
Rightmove | | | 872,000 | | | | 1,009,000 | | |
WH Smith | | | 2,430,000 | | | | 2,638,000 | | |
| > Sweden | |
Recipharm | | | 979,403 | | | | 1,205,000 | | |
Swedish Match | | | 856,000 | | | | 967,247 | | |
| > Germany | |
Elringklinger | | | 745,000 | | | | 885,000 | | |
| > Denmark | |
William Demant Holding | | | 0 | | | | 700,000 | | |
| > Netherlands | |
Arcadis | | | 790,670 | | | | 849,025 | | |
| > France | |
Eutelsat | | | 1,110,000 | | | | 1,445,000 | | |
Saft | | | 729,096 | | | | 745,310 | | |
| > Finland | |
Konecranes | | | 711,000 | | | | 1,103,420 | | |
| > Italy | |
Hera | | | 0 | | | | 4,213,201 | | |
Industria Macchine Automatiche | | | 385,950 | | | | 459,000 | | |
Other Countries | |
| > Australia | |
Spotless | | | 46,578,144 | | | | 47,446,000 | | |
| > Egypt | |
Commercial International
Bank of Egypt | | | 3,119,000 | | | | 5,963,570 | | |
Latin America | |
| > Brazil | |
Odontoprev | | | 6,487,000 | | | | 7,000,000 | | |
| > Mexico | |
Grupo Aeroportuario del
Sureste - ADR | | | 252,000 | | | | 283,000 | | |
Qualitas | | | 12,339,000 | | | | 13,215,000 | | |
See accompanying notes to financial statements.
39
COLUMBIA ACORN INTERNATIONAL®
MAJOR PORTFOLIO CHANGES IN THE SECOND QUARTER (UNAUDITED), CONTINUED
| | | Number of Shares | |
| | | 3/31/15 | | 6/30/15 | |
Sales | |
Asia | |
| > Japan | |
Omron | | | 512,000 | | | | 0 | | |
Makita | | | 258,000 | | | | 0 | | |
Aeon Financial Service | | | 1,600,000 | | | | 1,400,000 | | |
Ariake Japan | | | 876,300 | | | | 833,800 | | |
Benesse | | | 1,301,200 | | | | 987,200 | | |
Daiseki | | | 1,580,000 | | | | 1,270,000 | | |
Ezaki Glico | | | 746,500 | | | | 655,500 | | |
Japan Airport Terminal | | | 600,000 | | | | 550,000 | | |
Kansai Paint | | | 2,978,600 | | | | 1,692,600 | | |
Nakanishi | | | 643,000 | | | | 580,000 | | |
NGK Insulators | | | 2,700,000 | | | | 2,400,000 | | |
Nippon Kayaku | | | 3,143,000 | | | | 3,111,000 | | |
Nippon Shokubai | | | 2,066,000 | | | | 1,502,000 | | |
OBIC | | | 772,000 | | | | 665,000 | | |
Park24 | | | 1,960,000 | | | | 1,678,000 | | |
Rohto Pharmaceutical | | | 1,676,000 | | | | 0 | | |
Suruga Bank | | | 1,470,000 | | | | 1,270,000 | | |
Toto | | | 2,000,000 | | | | 1,550,000 | | |
Toyo Suisan Kaisha | | | 370,900 | | | | 0 | | |
| > Taiwan | |
Chroma Ate | | | 7,611,000 | | | | 3,061,000 | | |
Hermes Microvision | | | 211,750 | | | | 0 | | |
PChome Online | | | 2,300,000 | | | | 2,124,346 | | |
| > China | |
Sino Biopharmaceutical | | | 23,671,000 | | | | 19,730,000 | | |
| > Korea | |
CJ Corp | | | 249,671 | | | | 215,971 | | |
KT&G | | | 536,317 | | | | 478,317 | | |
LS Industrial Systems | | | 631,865 | | | | 494,303 | | |
| > India | |
Asian Paints | | | 3,423,265 | | | | 0 | | |
Bosch | | | 90,000 | | | | 0 | | |
| > Singapore | |
Ascendas REIT | | | 13,500,000 | | | | 0 | | |
CDL Hospitality Trust | | | 17,742,000 | | | | 7,795,600 | | |
Mapletree Commercial Trust | | | 55,000,000 | | | | 50,000,000 | | |
Mapletree Industrial Trust | | | 15,000,000 | | | | 10,502,000 | | |
Mapletree Logistics Trust | | | 20,865,750 | | | | 13,847,750 | | |
| > Hong Kong | |
Kingboard Chemicals | | | 4,358,000 | | | | 0 | | |
Lifestyle International | | | 13,120,000 | | | | 8,099,500 | | |
Melco Crown Entertainment - ADR | | | 1,800,000 | | | | 1,130,000 | | |
Sa Sa International | | | 25,223,000 | | | | 0 | | |
| > Indonesia | |
Ace Indonesia | | | 324,290,000 | | | | 312,000,000 | | |
Mayora Indah | | | 6,000,000 | | | | 3,993,900 | | |
Tower Bersama Infrastructure | | | 33,000,000 | | | | 31,000,000 | | |
| | | Number of Shares | |
| | | 3/31/15 | | 6/30/15 | |
| > Philippines | |
Robinsons Retail Holdings | | | 16,000,000 | | | | 13,500,000 | | |
| > Malaysia | |
7-Eleven Malaysia Holdings | | | 43,839,000 | | | | 41,700,000 | | |
Aeon | | | 17,441,500 | | | | 0 | | |
Europe | |
| > United Kingdom | |
Abcam | | | 4,800,000 | | | | 4,440,000 | | |
Babcock International | | | 3,300,000 | | | | 1,568,000 | | |
| RPS Group | | | 5,800,000 | | | | 0 | | |
Whitbread | | | 473,398 | | | | 0 | | |
| > Sweden | |
Sweco | | | 3,255,024 | | | | 2,925,024 | | |
| > France | |
Hi-Media | | | 1,831,204 | | | | 0 | | |
Norbert Dentressangle | | | 163,400 | | | | 0 | | |
| > Spain | |
Bolsas y Mercados Españoles | | | 830,000 | | | | 535,000 | | |
Viscofan | | | 671,000 | | | | 379,000 | | |
| > Switzerland | |
Geberit | | | 179,000 | | | | 116,500 | | |
| > Italy | |
Pirelli | | | 1,909,000 | | | | 0 | | |
| > Belguim | |
EVS Broadcast Equipment | | | 516,965 | | | | 450,656 | | |
Other Countries | |
| > Canada | |
CCL Industries | | | 800,772 | | | | 651,772 | | |
Granite Oil | | | 1,496,551 | | | | 376,629 | | |
| > Australia | |
Challenger Financial | | | 12,550,000 | | | | 6,170,000 | | |
Domino's Pizza Enterprises | | | 2,428,257 | | | | 2,123,737 | | |
| > South Africa | |
Mr. Price | | | 2,644,083 | | | | 0 | | |
Naspers | | | 493,188 | | | | 142,892 | | |
Northam Platinum | | | 8,679,940 | | | | 8,665,223 | | |
Rand Merchant Insurance | | | 19,045,300 | | | | 16,575,943 | | |
| > United States | |
Synageva BioPharma | | | 350,000 | | | | 0 | | |
Textainer Group Holdings | | | 933,297 | | | | 440,152 | | |
See accompanying notes to financial statements.
40
COLUMBIA ACORN INTERNATIONAL®
STATEMENT OF INVESTMENTS (UNAUDITED), JUNE 30, 2015
Number of Shares | | | | Value | |
| | | | | | | Equities: 95.0% | |
Asia 48.6% | | | |
| | | > Japan 21.4% | |
| | 2,400,000 | | | NGK Insulators | | $ | 61,754,562 | | |
| | | | | Ceramic Products for Auto, Power &
Electronics | | | | | |
| | 3,000,000 | | | Aeon Mall | | | 56,177,319 | | |
| | | | | Suburban Shopping Mall Developer,
Owner & Operator | | | | | |
| | 1,840,000 | | | Glory | | | 54,434,934 | | |
| | | | | Currency Handling Systems &
Related Equipment | | | | | |
| | 1,050,000 | | | FamilyMart | | | 48,284,413 | | |
| | | | | Convenience Store Operator | | | | | |
| | 3,600,000 | | | Ushio | | | 46,859,844 | | |
| | | | | Industrial Light Sources | | | | | |
| | 2,911,000 | | | Santen Pharmaceutical | | | 41,186,944 | | |
| | | | | Specialty Pharma (Ophthalmic Medicine) | | | | | |
| | 28,000 | | | Orix JREIT | | | 40,328,910 | | |
| | | | | Diversified REIT | | | | | |
| | 930,000 | | | JIN (a) | | | 40,086,843 | | |
| | | | | Eyeglasses Retailer | | | | | |
| | 1,440,000 | | | NGK Spark Plug | | | 39,879,625 | | |
| | | | | Automobile Parts | | | | | |
| | 276,620 | | | Hirose Electric | | | 39,633,751 | | |
| | | | | Electrical Connectors | | | | | |
| | 4,938,000 | | | NOF | | | 39,615,966 | | |
| | | | | Specialty Chemicals, Life Science &
Rocket Fuels | | | | | |
| | 10,440,000 | | | Aozora Bank | | | 39,390,270 | | |
| | | | | Commercial Bank | | | | | |
| | 1,400,000 | | | Aeon Financial Service | | | 38,842,347 | | |
| | | | | Diversified Consumer-related Finance
Company in Japan | | | | | |
| | 1,225,000 | | | Recruit Holdings | | | 37,355,472 | | |
| | | | | Recruitment & Media Services | | | | | |
| | 774,400 | | | Kintetsu World Express | | | 34,753,252 | | |
| | | | | Airfreight Logistics | | | | | |
| | 833,800 | | | Ariake Japan | | | 34,121,552 | | |
| | | | | Commercial Soup & Sauce Extracts | | | | | |
| | 3,111,000 | | | Nippon Kayaku | | | 33,540,496 | | |
| | | | | Functional Chemicals, Pharmaceuticals &
Auto Safety Systems | | | | | |
| | 7,100,000 | | | IHI | | | 33,058,830 | | |
| | | | | Industrial Conglomerates | | | | | |
| | 655,500 | | | Ezaki Glico | | | 32,553,977 | | |
| | | | | Confectionary, Ice Cream &
Dairy Products | | | | | |
| | 1,440,000 | | | OSG | | | 30,867,635 | | |
| | | | | Consumable Cutting Tools | | | | | |
| | 6,149 | | | Kenedix Office Investment | | | 30,799,306 | | |
| | | | | Tokyo Mid-size Office REIT | | | | | |
| | 2,736,000 | | | Moshi Moshi Hotline | | | 30,613,337 | | |
| | | | | Call Center Operator | | | | | |
| | 641,900 | | | Otsuka | | | 29,964,939 | | |
| | | | | One-stop IT Services & Office
Supplies Provider | | | | | |
| | 550,000 | | | Japan Airport Terminal | | | 29,934,058 | | |
| | | | | Airport Terminal Operator at Haneda | | | | | |
| | 665,000 | | | OBIC | | | 29,647,517 | | |
| | | | | Computer Software | | | | | |
Number of Shares | | | | Value | |
| | 1,402,000 | | | Tamron (b) | | $ | 29,588,201 | | |
| | | | | Camera Lenses | | | | | |
| | 1,237,000 | | | Aica Kogyo | | | 28,734,121 | | |
| | | | | Laminated Sheets, Building
Materials & Chemical Adhesives | | | | | |
| | 1,678,000 | | | Park24 | | | 28,726,486 | | |
| | | | | Parking Lot Operator | | | | | |
| | 343,400 | | | Disco | | | 28,388,467 | | |
| | | | | Semiconductor Dicing &
Grinding Equipment | | | | | |
| | 1,600,000 | | | Doshisha | | | 28,371,416 | | |
| | | | | Consumer Goods Wholesaler | | | | | |
| | 1,550,000 | | | Toto | | | 27,937,018 | | |
| | | | | Toilets & Bathroom Fittings | | | | | |
| | 1,950,000 | | | Misumi Group | | | 27,683,587 | | |
| | | | | Industrial Components Distributor | | | | | |
| | 1,270,000 | | | Suruga Bank | | | 27,204,839 | | |
| | | | | Regional Bank | | | | | |
| | 1,692,600 | | | Kansai Paint | | | 26,223,796 | | |
| | | | | Paint Producer in Japan, India,
China & Southeast Asia | | | | | |
| | 915,000 | | | Nippon Paint Holdings | | | 25,785,258 | | |
| | | | | Paints for Automotive, Decorative &
Industrial Usage | | | | | |
| | 1,020,000 | | | Nabtesco | | | 25,585,412 | | |
| | | | | Machinery Components | | | | | |
| | 987,200 | | | Benesse | | | 24,748,518 | | |
| | | | | Education Service Provider | | | | | |
| | 2,600,000 | | | Dowa Holdings | | | 24,570,606 | | |
| | | | | Environmental/Recycling, Nonferrous
Metals, Electric Material &
Metal Processing | | | | | |
| | 1,270,000 | | | Daiseki | | | 24,566,764 | | |
| | | | | Waste Disposal & Recycling | | | | | |
| | 309,000 | | | Rinnai | | | 24,332,239 | | |
| | | | | Gas Appliances for Home &
Commercial Use | | | | | |
| | 822,700 | | | Hamamatsu Photonics | | | 24,259,066 | | |
| | | | | Optical Sensors for Medical &
Industrial Applications | | | | | |
| | 12,050 | | | Japan Retail Fund | | | 24,096,254 | | |
| | | | | Retail REIT in Japan | | | | | |
| | 682,800 | | | Kaken Pharmaceutical | | | 23,837,563 | | |
| | | | | Pharmaceutical & Agrochemical Producer | | | | | |
| | 1,107,000 | | | Stanley Electric | | | 23,055,295 | | |
| | | | | Automobile Lighting & LED Equipment | | | | | |
| | 5,092 | | | Industrial & Infrastructure Fund | | | 22,993,242 | | |
| | | | | Industrial REIT in Japan | | | | | |
| | 390,000 | | | Hoshizaki Electric | | | 22,939,588 | | |
| | | | | Commercial Kitchen Equipment | | | | | |
| | 580,000 | | | Nakanishi | | | 22,915,296 | | |
| | | | | Dental Tools & Machinery | | | | | |
| | 698,480 | | | Milbon | | | 22,226,065 | | |
| | | | | Hair Products for Salons | | | | | |
| | 1,914,500 | | | Asahi Diamond Industrial | | | 21,569,614 | | |
| | | | | Consumable Diamond Tools | | | | | |
| | 313,200 | | | Hikari Tsushin | | | 21,109,057 | | |
| | | | | Office IT/Mobiles/Insurance Distribution | | | | | |
| | 1,502,000 | | | Nippon Shokubai | | | 20,545,926 | | |
| | | | | Producer of Acrylic Acid & Super
Absorbent Polymers Used in
Disposable Diapers | | | | | |
See accompanying notes to financial statements.
41
COLUMBIA ACORN INTERNATIONAL®
STATEMENT OF INVESTMENTS (UNAUDITED), CONTINUED
Number of Shares | | | | Value | |
| | | > Japan—continued | |
| | 771,000 | | | Icom (b) | | $ | 19,416,989 | | |
| | | | | Two Way Radio Communication
Equipment | | | | | |
| | 1,822,292 | | | Nihon Parkerizing | | | 18,484,348 | | |
| | | | | Metal Surface Treatment Chemicals &
Processing Service | | | | | |
| | 352,600 | | | MonotaRO | | | 15,478,331 | | |
| | | | | Online Maintenance, Repair &
Operations Goods Distributor in Japan | | | | | |
| | 105,400 | | | Asahi Intecc | | | 7,221,100 | | |
| | | | | Medical Guidewires for Surgery | | | | | |
| | 68,100 | | | Cocokara Fine | | | 2,342,643 | | |
| | | | | Drugstores | | | | | |
| | | | 1,688,623,204 | | |
| | | > Taiwan 5.5% | |
| | 9,100,000 | | | President Chain Store | | | 63,977,061 | | |
| | | | | Convenience Chain Store Operator
in Taiwan | | | | | |
| | 399,000 | | | Largan Precision | | | 45,546,177 | | |
| | | | | Mobile Device Camera Lenses & Modules | | | | | |
| | 27,141,000 | | | Vanguard International
Semiconductor | | | 43,312,321 | | |
| | | | | Semiconductor Foundry | | | | | |
| | 17,600,000 | | | Far EasTone Telecom | | | 42,543,202 | | |
| | | | | Mobile Operator in Taiwan | | | | | |
| | 8,126,000 | | | Novatek Microelectronics | | | 39,194,777 | | |
| | | | | Display Related Integrated Circuit
Designer | | | | | |
| | 2,124,346 | | | PChome Online | | | 35,066,912 | | |
| | | | | Taiwanese Internet Retail Company | | | | | |
| | 2,081,000 | | | St. Shine Optical | | | 33,078,861 | | |
| | | | | Disposable Contact Lens Original
Equipment Manufacturer | | | | | |
| | 6,351,000 | | | Delta Electronics | | | 32,490,893 | | |
| | | | | Industrial Automation, Switching
Power Supplies & Passive Components | | | | | |
| | 1,925,000 | | | Ginko International | | | 24,194,974 | | |
| | | | | Contact Lens Maker in China | | | | | |
| | 3,054,686 | | | Advantech | | | 20,974,520 | | |
| | | | | Industrial PC & Components | | | | | |
| | 16,430,881 | | | Lite-On Technology | | | 19,277,247 | | |
| | | | | Mobile Device, LED & PC Server
Component Supplier | | | | | |
| | 1,519,000 | | | Voltronic Power | | | 19,144,351 | | |
| | | | | Uninterruptible Power Supply Products | | | | | |
| | 820,000 | | | Silergy | | | 8,446,176 | | |
| | | | | Chinese Provider of Analog & Mixed
Digital Integrated Circuits | | | | | |
| | 3,061,000 | | | Chroma Ate | | | 6,765,020 | | |
| | | | | Automatic Test Systems, Testing &
Measurement Instruments | | | | | |
| | | | 434,012,492 | | |
| | | > China 5.4% | |
| | 27,000,000 | | | CAR Inc (c) | | | 57,380,915 | | |
| | | | | Consolidator of Chinese Auto Rental Sector | | | | | |
| | 29,650,000 | | | China Everbright International | | | 53,103,100 | | |
| | | | | Municipal Waste Operator | | | | | |
| | 90,360,000 | | | Sihuan Pharmaceuticals (d) | | | 40,813,582 | | |
| | | | | Chinese Generic Drug Manufacturer | | | | | |
Number of Shares | | | | Value | |
| | 40,167,000 | | | Chongqing Rural
Commercial Bank | | $ | 32,128,392 | | |
| | | | | Rural Commercial Bank | | | | | |
| | 760,000 | | | WuXi PharmaTech - ADR (c) | | | 32,117,600 | | |
| | | | | Contract Research Organization in China | | | | | |
| | 102,280,000 | | | Jiangnan Group | | | 29,387,362 | | |
| | | | | Cable & Wire Manufacturer | | | | | |
| | 8,673,000 | | | Shanghai Industrial | | | 29,365,135 | | |
| | | | | Shanghai State Owned Enterprise | | | | | |
| | 560,388 | | | BitAuto - ADR (c) | | | 28,607,808 | | |
| | | | | Automotive Information Website for
Buyers & Dealers | | | | | |
| | 47,500,000 | | | AMVIG Holdings (b) | | | 24,511,227 | | |
| | | | | Chinese Tobacco Packaging
Material Supplier | | | | | |
| | 19,730,000 | | | Sino Biopharmaceutical | | | 22,874,405 | | |
| | | | | Pharmaceutical Developer | | | | | |
| | 11,984,000 | | | Phoenix Healthcare Group | | | 22,795,729 | | |
| | | | | Private Hospital Management Group | | | | | |
| | 48,234,000 | | | NewOcean Energy | | | 22,388,210 | | |
| | | | | Southern China Liquefied Petroleum
Gas Distributor | | | | | |
| | 14,556,000 | | | TravelSky Technology | | | 21,412,133 | | |
| | | | | Chinese Air Travel Transaction Processor | | | | | |
| | 375,000 | | | 51job - ADR (a)(c) | | | 12,465,000 | | |
| | | | | Integrated Human Resource Services | | | | | |
| | | | 429,350,598 | | |
| | | > Korea 3.7% | |
| | 215,971 | | | CJ Corp | | | 57,218,066 | | |
| | | | | Holding Company of Korean Consumer
Conglomerate | | | | | |
| | 478,317 | | | KT&G | | | 40,694,144 | | |
| | | | | Tobacco & Ginseng Products | | | | | |
| | 145,900 | | | Nongshim | | | 37,941,772 | | |
| | | | | Instant Noodles, Snacks & Bottled Water | | | | | |
| | 2,908,469 | | | CJ Hellovision | | | 33,369,816 | | |
| | | | | Cable TV, Broadband & Mobile Virtual
Network Operator | | | | | |
| | 1,119,428 | | | LF Corp | | | 30,365,821 | | |
| | | | | Apparel Design & Retail | | | | | |
| | 65,494 | | | KCC | | | 28,819,139 | | |
| | | | | Paint & Housing Material Manufacturer | | | | | |
| | 494,303 | | | LS Industrial Systems | | | 20,222,385 | | |
| | | | | Electrical & Automation Equipment | | | | | |
| | 1,187,900 | | | Cheil Worldwide (c) | | | 18,389,280 | | |
| | | | | Advertising | | | | | |
| | 475,576 | | | Grand Korea Leisure (a) | | | 13,259,594 | | |
| | | | | 'Foreigner Only' Casino Group in Korea | | | | | |
| | 444,715 | | | Hyundai Marine & Fire
Insurance | | | 11,747,308 | | |
| | | | | Property & Casualty Insurance | | | | | |
| | 43,923 | | | Koh Young Technology | | | 1,616,573 | | |
| | | | | Inspection Systems for Printed
Circuit Boards | | | | | |
| | | | 293,643,898 | | |
| | | > India 3.2% | |
| | 13,478,000 | | | Zee Entertainment Enterprises | | | 77,791,018 | | |
| | | | | Indian Programmer of Pay Television Content | | | | | |
| | 6,229,667 | | | Bharti Infratel | | | 43,728,975 | | |
| | | | | Communications Towers | | | | | |
See accompanying notes to financial statements.
42
Number of Shares | | | | Value | |
| | | > India—continued | |
| | 1,382,783 | | | Container Corporation of India | | $ | 36,369,661 | | |
| | | | | Railway Cargo Services | | | | | |
| | 920,000 | | | Colgate Palmolive India | | | 29,443,867 | | |
| | | | | Consumer Products in Oral Care | | | | | |
| | 6,095,000 | | | Adani Ports & Special
Economic Zone | | | 29,416,788 | | |
| | | | | Indian West Coast Shipping Port | | | | | |
| | 1,850,000 | | | United Breweries | | | 27,087,202 | | |
| | | | | Indian Brewer | | | | | |
| | 519,553 | | | Amara Raja | | | 7,193,649 | | |
| | | | | Indian Maker of Auto & Industrial
Batteries, Mostly for the Replacement Market | | | | | |
| | | | 251,031,160 | | |
| | | > Singapore 2.8% | |
| | 11,000,000 | | | Singapore Exchange | | | 63,900,636 | | |
| | | | | Singapore Equity & Derivatives
Market Operator | | | | | |
| | 50,000,000 | | | Mapletree Commercial Trust | | | 54,373,910 | | |
| | | | | Retail & Office Property Landlord | | | | | |
| | 165,731,200 | | | SIIC Environment (c) | | | 23,976,605 | | |
| | | | | Waste Water Treatment Operator | | | | | |
| | 8,500,000 | | | Petra Foods | | | 22,088,577 | | |
| | | | | Chocolate Manufacturer in Southeast Asia | | | | | |
| | 28,242,100 | | | China Everbright Water (c) | | | 20,664,322 | | |
| | | | | Waste Water Treatment Operator | | | | | |
| | 10,502,000 | | | Mapletree Industrial Trust | | | 12,165,563 | | |
| | | | | Industrial Property Landlord | | | | | |
| | 13,847,750 | | | Mapletree Logistics Trust | | | 11,618,189 | | |
| | | | | Industrial Property Landlord | | | | | |
| | 7,795,600 | | | CDL Hospitality Trust | | | 9,434,479 | | |
| | | | | Hotel Owner Operator | | | | | |
| | | | 218,222,281 | | |
| | | > Hong Kong 2.1% | |
| | 63,364,000 | | | Mapletree Greater China
Commercial Trust | | | 47,967,609 | | |
| | | | | Retail & Office Property Landlord | | | | | |
| | 12,000,000 | | | Samsonite International | | | 41,430,891 | | |
| | | | | Mass Market Luggage &
Travel Accessories | | | | | |
| | 1,130,000 | | | Melco Crown
Entertainment - ADR (a) | | | 22,181,900 | | |
| | | | | Macau Casino Operator | | | | | |
| | 15,000,000 | | | Melco International | | | 21,177,446 | | |
| | | | | Macau Casino Operator | | | | | |
| | 9,675,000 | | | Vitasoy International | | | 16,475,415 | | |
| | | | | Hong Kong Soy Food Brand | | | | | |
| | 8,099,500 | | | Lifestyle International | | | 15,025,486 | | |
| | | | | Mid- to High-end Department Store
Operator in Hong Kong & China | | | | | |
| | | | 164,258,747 | | |
| | | > Indonesia 1.5% | |
| | 24,195,600 | | | Matahari Department Store | | | 29,987,974 | | |
| | | | | Department Store Chain in Indonesia | | | | | |
| | 31,000,000 | | | Tower Bersama Infrastructure | | | 21,449,466 | | |
| | | | | Communications Towers | | | | | |
| | 50,000,000 | | | Link Net (c) | | | 19,032,439 | | |
| | | | | Fixed Broadband & Cable TV
Service Provider | | | | | |
Number of Shares | | | | Value | |
| | 312,000,000 | | | Ace Indonesia | | $ | 15,078,048 | | |
| | | | | Home Improvement Retailer | | | | | |
| | 61,947,300 | | | Surya Citra Media | | | 13,331,907 | | |
| | | | | Free to Air TV Station in Indonesia | | | | | |
| | 220,150,800 | | | Arwana Citramulia | | | 8,751,541 | | |
| | | | | Ceramic Tiles for Home Decoration | | | | | |
| | 3,993,900 | | | Mayora Indah | | | 7,784,014 | | |
| | | | | Consumer Branded Food Manufacturer | | | | | |
| | 54,631,700 | | | MNC Sky Vision (c) | | | 5,941,569 | | |
| | | | | Satellite Pay TV Operator in Indonesia | | | | | |
| | | | 121,356,958 | | |
| | | > Philippines 1.1% | |
| | 35,000,000 | | | Puregold Price Club | | | 28,705,730 | | |
| | | | | Supermarket Operator in the Philippines | | | | | |
| | 5,900,000 | | | Universal Robina | | | 25,368,880 | | |
| | | | | Branded Consumer Food Manufacturer
in the Philippines | | | | | |
| | 13,500,000 | | | Robinsons Retail Holdings | | | 22,290,419 | | |
| | | | | Multi-format Retailer in the Philippines | | | | | |
| | 90,000,000 | | | Melco Crown (Philippines)
Resorts (c) | | | 10,215,102 | | |
| | | | | Integrated Resort Operator in Manila | | | | | |
| | | | 86,580,131 | | |
| | | > Thailand 1.0% | |
| | 4,360,000 | | | Airports of Thailand | | | 39,026,289 | | |
| | | | | Airport Operator of Thailand | | | | | |
| | 114,913,600 | | | Home Product Center | | | 22,924,221 | | |
| | | | | Home Improvement Retailer | | | | | |
| | 14,485,000 | | | Robinson Department Store | | | 19,163,300 | | |
| | | | | Department Store Operator in Thailand | | | | | |
| | | | 81,113,810 | | |
| | | > Cambodia 0.5% | |
| | 55,000,000 | | | Nagacorp | | | 40,491,993 | | |
| | | | | Casino & Entertainment Complex in
Cambodia | | | | | |
| | | > Malaysia 0.4% | |
| | 41,700,000 | | | 7-Eleven Malaysia Holdings | | | 17,683,541 | | |
| | | | | Exclusive 7-Eleven Franchisor for
Malaysia | | | | | |
| | 19,000,000 | | | Astro Malaysia Holdings | | | 15,505,254 | | |
| | | | | Pay TV Operator in Malaysia | | | | | |
| | | | 33,188,795 | | |
Asia: Total | | | 3,841,874,067 | | |
Europe 30.0% | | | |
| | | > United Kingdom 10.1% | |
| | 1,253,571 | | | Spirax Sarco | | | 66,831,015 | | |
| | | | | Steam Systems for Manufacturing &
Process Industries | | | | | |
| | 2,638,000 | | | WH Smith | | | 63,334,946 | | |
| | | | | Newsprint, Books & General Stationery
Retailer | | | | | |
| | 1,009,000 | | | Rightmove | | | 51,953,268 | | |
| | | | | Internet Real Estate Listings | | | | | |
| | 45,000,000 | | | Cable and Wireless | | | 47,090,359 | | |
| | | | | Telecommunications Service Provider
in the Caribbean | | | | | |
See accompanying notes to financial statements.
43
COLUMBIA ACORN INTERNATIONAL®
STATEMENT OF INVESTMENTS (UNAUDITED), CONTINUED
Number of Shares | | | | Value | |
| | | > United Kingdom—continued | |
| | 1,980,000 | | | Aggreko | | $ | 44,768,366 | | |
| | | | | Temporary Power & Temperature
Control Services | | | | | |
| | 2,540,000 | | | Jardine Lloyd Thompson Group | | | 41,665,776 | | |
| | | | | International Business Insurance Broker | | | | | |
| | 4,712,000 | | | Halfords | | | 39,091,692 | | |
| | | | | UK Retailer of Leisure Goods & Auto Parts | | | | | |
| | 8,840,000 | | | Regus | | | 36,280,286 | | |
| | | | | Rental of Office Space in Full Service
Business Centers | | | | | |
| | 4,440,000 | | | Abcam | | | 36,137,491 | | |
| | | | | Online Sales of Antibodies | | | | | |
| | 958,646 | | | Fidessa Group | | | 34,267,698 | | |
| | | | | Software for Financial Trading Systems | | | | | |
| | 39,805,000 | | | Assura | | | 34,242,622 | | |
| | | | | UK Primary Health Care Property Developer | | | | | |
| | 4,712,000 | | | Ocado (c) | | | 33,013,230 | | |
| | | | | Online Grocery Retailer | | | | | |
| | 2,725,000 | | | Halma | | | 32,626,219 | | |
| | | | | Health & Safety Sensor Technology | | | | | |
| | 2,660,000 | | | Domino's Pizza UK & Ireland | | | 32,474,907 | | |
| | | | | Pizza Delivery in the UK, Ireland &
Germany | | | | | |
| | 14,379,428 | | | Connect Group (b) | | | 32,026,534 | | |
| | | | | Newspaper & Magazine Distributor | | | | | |
| | 7,430,000 | | | Polypipe | | | 31,695,960 | | |
| | | | | Manufacturer of Plastic Piping &
Fittings | | | | | |
| | 1,568,000 | | | Babcock International | | | 26,608,174 | | |
| | | | | Public Sector Outsourcer | | | | | |
| | 908,500 | | | AVEVA | | | 25,808,848 | | |
| | | | | Engineering Software | | | | | |
| | 5,650,001 | | | Elementis | | | 22,779,828 | | |
| | | | | Specialty Chemicals | | | | | |
| | 1,280,000 | | | Smith & Nephew | | | 21,600,287 | | |
| | | | | Medical Equipment & Supplies | | | | | |
| | 1,480,000 | | | Shaftesbury | | | 20,184,905 | | |
| | | | | London Prime Retail REIT | | | | | |
| | 3,075,000 | | | PureCircle (a)(c) | | | 19,567,953 | | |
| | | | | Natural Sweeteners | | | | | |
| | | | 794,050,364 | | |
| | | > Sweden 3.3% | |
| | 1,666,208 | | | Hexagon | | | 60,378,521 | | |
| | | | | Design, Measurement & Visualization
Software & Equipment | | | | | |
| | 948,422 | | | Unibet | | | 57,775,848 | | |
| | | | | European Online Gaming Operator | | | | | |
| | 2,925,024 | | | Sweco (a) | | | 38,371,787 | | |
| | | | | Engineering Consultants | | | | | |
| | 1,137,000 | | | Modern Times Group (a) | | | 30,503,423 | | |
| | | | | Nordic TV Broadcaster | | | | | |
| | 967,247 | | | Swedish Match | | | 27,512,783 | | |
| | | | | Swedish Snus | | | | | |
| | 1,044,000 | | | Mekonomen | | | 25,502,271 | | |
| | | | | Nordic Integrated Wholesaler/Retailer
of Automotive Parts & Service | | | | | |
| | 1,205,000 | | | Recipharm | | | 22,530,564 | | |
| | | | | Contract Development Manufacturing
Organization | | | | | |
| | | | 262,575,197 | | |
Number of Shares | | | | Value | |
| | | > Germany 3.2% | |
| | 608,000 | | | MTU Aero Engines | | $ | 57,188,394 | | |
| | | | | Airplane Engine Components & Services | | | | | |
| | 1,350,000 | | | Wirecard (a) | | | 51,698,362 | | |
| | | | | Online Payment Processing &
Risk Management | | | | | |
| | 117,000 | | | Rational | | | 42,972,601 | | |
| | | | | Commercial Ovens | | | | | |
| | 795,000 | | | NORMA Group | | | 40,189,519 | | |
| | | | | Clamps for Automotive &
Industrial Applications | | | | | |
| | 795,000 | | | Aurelius | | | 33,985,381 | | |
| | | | | European Turnaround Investor | | | | | |
| | 885,000 | | | Elringklinger | | | 23,792,869 | | |
| | | | | Automobile Components | | | | | |
| | | | 249,827,126 | | |
| | | > Denmark 2.4% | |
| | 1,932,063 | | | SimCorp | | | 76,942,989 | | |
| | | | | Software for Investment Managers | | | | | |
| | 1,315,800 | | | Novozymes | | | 62,546,658 | | |
| | | | | Industrial Enzymes | | | | | |
| | 700,000 | | | William Demant Holding (c) | | | 53,400,380 | | |
| | | | | Manufacture & Distribution of Hearing
Aids & Diagnostic Equipment | | | | | |
| | | | 192,890,027 | | |
| | | > Netherlands 2.4% | |
| | 2,103,770 | | | Aalberts Industries | | | 62,481,112 | | |
| | | | | Flow Control & Heat Treatment | | | | | |
| | 718,124 | | | Vopak | | | 36,239,170 | | |
| | | | | Operator of Petroleum & Chemical
Storage Terminals | | | | | |
| | 324,700 | | | Gemalto (a) | | | 28,915,893 | | |
| | | | | Digital Security Solutions | | | | | |
| | 1,201,000 | | | Brunel (a) | | | 23,826,337 | | |
| | | | | Temporary Specialist & Energy Staffing | | | | | |
| | 849,025 | | | Arcadis | | | 23,351,022 | | |
| | | | | Engineering Consultants | | | | | |
| | 114,395 | | | Core Labs (a) | | | 13,045,606 | | |
| | | | | Oil & Gas Reservoir Consulting | | | | | |
| | | | 187,859,140 | | |
| | | > France 2.0% | |
| | 1,350,000 | | | Neopost | | | 58,087,286 | | |
| | | | | Postage Meter Machines | | | | | |
| | 1,445,000 | | | Eutelsat | | | 46,637,223 | | |
| | | | | Fixed Satellite Services | | | | | |
| | 745,310 | | | Saft | | | 29,081,799 | | |
| | | | | Niche Battery Manufacturer | | | | | |
| | 90,000 | | | Eurofins Scientific (a) | | | 27,401,888 | | |
| | | | | Food, Pharmaceuticals & Materials
Screening & Testing | | | | | |
| | | | 161,208,196 | | |
| | | > Spain 2.0% | |
| | 10,110,000 | | | Distribuidora Internacional
de Alimentación | | | 77,207,235 | | |
| | | | | Discount Retailer in Spain &
Latin America | | | | | |
| | 6,564,000 | | | Prosegur | | | 36,003,933 | | |
| | | | | Security Guards | | | | | |
| | 379,000 | | | Viscofan | | | 22,922,144 | | |
| | | | | Sausage Casings Maker | | | | | |
See accompanying notes to financial statements.
44
Number of Shares | | | | Value | |
| | | > Spain—continued | |
| | 535,000 | | | Bolsas y Mercados Españoles | | $ | 21,639,007 | | |
| | | | | Spanish Stock Markets | | | | | |
| | | | 157,772,319 | | |
| | | > Switzerland 1.6% | |
| | 213,500 | | | Partners Group | | | 63,825,071 | | |
| | | | | Private Markets Asset Management | | | | | |
| | 116,500 | | | Geberit | | | 38,839,563 | | |
| | | | | Plumbing Systems | | | | | |
| | 72,500 | | | INFICON | | | 24,775,389 | | |
| | | | | Gas Detection Instruments | | | | | |
| | | | 127,440,023 | | |
| | | > Finland 1.2% | |
| | 1,669,000 | | | Tikkurila | | | 33,175,995 | | |
| | | | | Decorative & Industrial Paint in
Scandinavia, Central & Eastern Europe | | | | | |
| | 1,103,420 | | | Konecranes | | | 32,143,749 | | |
| | | | | Manufacture & Service of Industrial
Cranes & Port Handling Equipment | | | | | |
| | 7,766,000 | | | Sponda | | | 28,657,721 | | |
| | | | | Office, Retail & Logistics Properties | | | | | |
| | | | 93,977,465 | | |
| | | > Norway 0.6% | |
| | 3,529,000 | | | Orkla | | | 27,771,276 | | |
| | | | | Food & Brands, Aluminum,
Chemicals Conglomerate | | | | | |
| | 2,613,864 | | | Atea | | | 23,336,732 | | |
| | | | | Nordic IT Hardware/Software
Reseller & Integrator | | | | | |
| | | | 51,108,008 | | |
| | | > Kazakhstan 0.6% | |
| | 5,143,000 | | | Halyk Savings Bank of
Kazakhstan - GDR | | | 43,715,500 | | |
| | | | | Retail Bank & Insurer in Kazakhstan | | | | | |
| | | > Italy 0.4% | |
| | 459,000 | | | Industria Macchine Automatiche | | | 21,389,727 | | |
| | | | | Food & Drugs Packaging & Machinery | | | | | |
| | 4,213,201 | | | Hera | | | 10,540,259 | | |
| | | | | Northern Italian Utility | | | | | |
| | | | 31,929,986 | | |
| | | > Belgium 0.2% | |
| | 450,656 | | | EVS Broadcast Equipment | | | 13,062,755 | | |
| | | | | Digital Live Mobile Production
Software & Systems | | | | | |
Europe: Total | | | 2,367,416,106 | | |
Other Countries 13.7% | | | |
| | | > Canada 4.4% | |
| | 651,772 | | | CCL Industries | | | 79,945,132 | | |
| | | | | Global Label Converter | | | | | |
| | 898,000 | | | Vermilion Energy (a) | | | 38,788,711 | | |
| | | | | Canadian Exploration &
Production Company | | | | | |
| | 3,188,000 | | | CAE | | | 37,954,812 | | |
| | | | | Flight Simulator Equipment &
Training Centers | | | | | |
| | 1,067,730 | | | ShawCor | | | 31,279,616 | | |
| | | | | Oil & Gas Pipeline Products | | | | | |
| | 490,200 | | | Onex Capital | | | 27,123,877 | | |
| | | | | Private Equity | | | | | |
Number of Shares | | | | Value | |
| | 2,115,898 | | | Rona | | $ | 25,716,038 | | |
| | | | | Canadian Home Improvement Retailer | | | | | |
| | 1,010,000 | | | PrairieSky Royalty | | | 25,464,291 | | |
| | | | | Canadian Owner of Oil & Gas
Mineral Interests | | | | | |
| | 726,000 | | | Keyera (a) | | | 24,238,751 | | |
| | | | | Integrated Supply of Hydrocarbon
Processing, Transport & Storage | | | | | |
| | 1,358,857 | | | Baytex (a) | | | 21,138,984 | | |
| | | | | Oil & Gas Producer in Canada | | | | | |
| | 537,943 | | | Ag Growth | | | 20,169,632 | | |
| | | | | Manufacturer of Augers & Grain
Handling Equipment | | | | | |
| | 2,245,052 | | | Boulder Energy (c) | | | 14,919,081 | | |
| | | | | Canadian Exploration & Production | | | | | |
| | 376,629 | | | Granite Oil | | | 1,896,715 | | |
| | | | | Canadian Oil & Gas Producer | | | | | |
| | | | 348,635,640 | | |
| | | > Australia 3.3% | |
| | 47,446,000 | | | Spotless | | | 76,374,145 | | |
| | | | | Facility Management &
Catering Company | | | | | |
| | 2,123,737 | | | Domino's Pizza Enterprises | | | 58,320,313 | | |
| | | | | Domino's Pizza Operator in
Australia & New Zealand | | | | | |
| | 4,270,000 | | | Amcor | | | 45,123,234 | | |
| | | | | Global Leader in Flexible &
Rigid Packaging | | | | | |
| | 6,170,000 | | | Challenger Financial | | | 31,982,776 | | |
| | | | | Annuity Provider in Australia | | | | | |
| | 4,900,000 | | | Estia Health (c) | | | 22,683,575 | | |
| | | | | Residential Aged Care Operator | | | | | |
| | 5,260,000 | | | IAG | | | 22,614,715 | | |
| | | | | General Insurance Provider | | | | | |
| | 1,070,000 | | | Austbrokers | | | 7,430,028 | | |
| | | | | Local Australian Small Business
Insurance Broker | | | | | |
| | | | 264,528,786 | | |
| | | > South Africa 2.5% | |
| | 13,683,594 | | | Coronation Fund Managers | | | 92,689,872 | | |
| | | | | South African Fund Manager | | | | | |
| | 16,575,943 | | | Rand Merchant Insurance | | | 57,864,565 | | |
| | | | | Directly Sold Property & Casualty
Insurance; Holdings in other Insurers | | | | | |
| | 8,665,223 | | | Northam Platinum (c) | | | 28,675,150 | | |
| | | | | Platinum Mining in South Africa | | | | | |
| | 142,892 | | | Naspers | | | 22,257,138 | | |
| | | | | Media in Africa, China, Russia &
other Emerging Markets | | | | | |
| | | | 201,486,725 | | |
| | | > United States 1.2% | |
| | 350,000 | | | Cimarex Energy | | | 38,608,500 | | |
| | | | | Oil & Gas Producer in Texas, New
Mexico & Oklahoma | | | | | |
| | 912,000 | | | Bladex | | | 29,348,160 | | |
| | | | | Latin American Trade Financing House | | | | | |
| | 634,500 | | | Hornbeck Offshore (a)(c) | | | 13,026,285 | | |
| | | | | Supply Vessel Operator in Gulf of Mexico | | | | | |
| | 440,152 | | | Textainer Group Holdings (a) | | | 11,448,354 | | |
| | | | | Top International Container Leasor | | | | | |
| | | | 92,431,299 | | |
See accompanying notes to financial statements.
45
COLUMBIA ACORN INTERNATIONAL®
STATEMENT OF INVESTMENTS (UNAUDITED), CONTINUED
Number of Shares | | | | Value | |
| | | > New Zealand 1.0% | |
| | 10,800,000 | | | Auckland International Airport | | $ | 36,146,416 | | |
| | | | | Auckland Airport Operator | | | | | |
| | 8,000,000 | | | Sky City Entertainment | | | 22,761,597 | | |
| | | | | Casino & Entertainment Complex | | | | | |
| | 4,011,000 | | | Ryman Healthcare | | | 21,527,161 | | |
| | | | | Retirement Village Operator | | | | | |
| | | | 80,435,174 | | |
| | | > Israel 0.7% | |
| | 791,000 | | | Caesarstone | | | 54,215,140 | | |
| | | | | Quartz Countertops | | | | | |
| | | > Egypt 0.6% | |
| | 5,963,570 | | | Commercial International
Bank of Egypt | | | 43,753,008 | | |
| | | | | Private Universal Bank in Egypt | | | | | |
Other Countries: Total | | | 1,085,485,772 | | |
Latin America 2.7% | | | |
| | | > Brazil 1.0% | |
| | 3,500,000 | | | Localiza Rent A Car | | | 34,649,899 | | |
| | | | | Car Rental | | | | | |
| | 7,000,000 | | | Odontoprev | | | 24,383,262 | | |
| | | | | Dental Insurance | | | | | |
| | 1,400,000 | | | Linx | | | 21,681,515 | | |
| | | | | Retail Management Software in Brazil | | | | | |
| | | | 80,714,676 | | |
| | | > Mexico 0.8% | |
| | 283,000 | | | Grupo Aeroportuario del
Sureste - ADR | | | 40,149,210 | | |
| | | | | Mexican Airport Operator | | | | | |
| | 13,215,000 | | | Qualitas (c) | | | 21,868,755 | | |
| | | | | Auto Insurer in Mexico &
Central America | | | | | |
| | | | 62,017,965 | | |
| | | > Colombia 0.3% | |
| | 23,377,000 | | | Isagen | | | 24,945,373 | | |
| | | | | Colombian Electricity Provider | | | | | |
| | | > Guatemala 0.2% | |
| | 1,626,600 | | | Tahoe Resources | | | 19,717,153 | | |
| | | | | Silver & Gold Projects in
Guatemala & Peru | | | | | |
| | | > Chile 0.2% | |
| | 921,000 | | | Sociedad Quimica y Minera
de Chile - ADR | | | 14,754,420 | | |
| | | | | Producer of Specialty Fertilizers,
Lithium & Iodine | | | | | |
Number of Shares | | | | Value | |
| | | > Uruguay 0.2% | |
| | 1,306,818 | | | Union Agriculture
Group (c)(d)(e) | | $ | 12,336,362 | | |
| | | | | Farmland Operator in Uruguay | | | | | |
Latin America: Total | | | 214,485,949 | | |
Total Equities: 95.0%
(Cost: $6,121,766,899) | | | 7,509,261,894 | (f) | |
Short-Term Investments 4.2% | | | |
| | 220,000,000 | | | JPMorgan U.S. Government
Money Market Fund, IM
Shares (7 day yield of 0.01%) | | | 220,000,000 | | |
| | 114,794,388 | | | JPMorgan U.S. Government
Money Market Fund, Agency
Shares (7 day yield of 0.01%) | | | 114,794,388 | | |
Total Short-Term Investments: 4.2%
(Cost: $334,794,388) | | | 334,794,388 | | |
Securities Lending Collateral 2.4% | | | |
| | 186,393,214 | | | Dreyfus Government Cash
Management Fund,
Institutional Shares
(7 day yield of 0.01%) (g) | | | 186,393,214 | | |
Total Securities Lending Collateral: 2.4%
(Cost: $186,393,214) | | | 186,393,214 | | |
Total Investments: 101.6%
(Cost: $6,642,954,501)(h) | | | 8,030,449,496 | | |
Obligation to Return Collateral for
Securities Loaned: (2.4)% | | | (186,393,214 | ) | |
Cash and Other Assets Less
Liabilities: 0.8% | | | 58,285,708 | | |
Net Assets: 100.0% | | $ | 7,902,341,990 | | |
ADR - American Depositary Receipts
GDR - Global Depositary Receipts
REIT - Real Estate Investment Trust
See accompanying notes to financial statements.
46
> Notes to Statement of Investments
(a) All or a portion of this security was on loan at June 30, 2015. The total market value of securities on loan at June 30, 2015 was $178,244,535.
(b) An affiliated person of the Fund, as defined in the Investment Company Act of 1940, may include any company in which the Fund owns five percent or more of its outstanding voting shares. Holdings and transactions in these affiliated companies during the period ended June 30, 2015, are as follows:
Security | | Balance of
Shares Held
12/31/14 | | Purchases/
Additions | | Sales/
Reductions | | Balance of
Shares Held
6/30/15 | | Value | | Dividend | |
Connect Group | | | 14,379,428 | | | | - | | | | - | | | | 14,379,428 | | | $ | 32,026,534 | | | $ | 2,165,486 | | |
Tamron | | | 1,402,000 | | | | - | | | | - | | | | 1,402,000 | | | | 29,588,201 | | | | 283,129 | | |
AMVIG Holdings | | | 35,119,000 | | | | 12,381,000 | | | | - | | | | 47,500,000 | | | | 24,511,227 | | | | 1,771,515 | | |
Icom | | | 835,000 | | | | - | | | | 64,000 | | | | 771,000 | | | | 19,416,989 | | | | 140,145 | | |
Total of Affiliated Transactions | | | 51,735,428 | | | | 12,381,000 | | | | 64,000 | | | | 64,052,428 | | | $ | 105,542,951 | | | $ | 4,360,275 | | |
The aggregate cost and value of these companies at June 30, 2015, was $113,439,966 and $105,542,951, respectively. Investments in affiliated companies represented 1.34% of the Fund's total net assets at June 30, 2015.
(c) Non-income producing security.
(d) Illiquid security.
(e) Denotes a restricted security, which is subject to restrictions on resale under federal securities laws. This security is valued at fair value determined in good faith under consistently applied procedures established by the Fund's Board of Trustees. At June 30, 2015, the market value of this security amounted to $12,336,362, which represented 0.16% of total net assets. Additional information on this security is as follows:
Security | | Acquisition
Dates | | Shares/Units | | Cost | | Value | |
Union Agriculture Group | | 12/8/10-6/27/12 | | | 1,306,818 | | | $ | 15,000,000 | | | $ | 12,336,362 | | |
(f) On June 30, 2015, the Fund's total equity investments were denominated in currencies as follows:
Currency | | Value | | Percentage
of Net Assets | |
Japanese Yen | | $ | 1,688,623,204 | | | | 21.4 | | |
Euro | | | 882,591,381 | | | | 11.2 | | |
British Pound | | | 794,050,364 | | | | 10.0 | | |
Hong Kong Dollar | | | 490,761,422 | | | | 6.2 | | |
Taiwan Dollar | | | 434,012,492 | | | | 5.5 | | |
Other currencies less
than 5% of total net assets | | | 3,219,223,031 | | | | 40.7 | | |
Total Equities | | $ | 7,509,261,894 | | | | 95.0 | | |
(g) Investment made with cash collateral received from securities lending activity.
(h) At June 30, 2015, for federal income tax purposes, the cost of investments was approximately $6,642,954,501 and net unrealized appreciation was $1,387,494,995 consisting of gross unrealized appreciation of $1,807,290,071 and gross unrealized depreciation of $419,795,076.
Fair Value Measurements
Various inputs are used in determining the value of the Fund's investments, following the input prioritization hierarchy established by accounting principles generally accepted in the United States of America (GAAP). These inputs are summarized in the three broad levels listed below:
• Level 1 – quoted prices in active markets for identical securities
• Level 2 – prices determined using other significant observable inputs (including quoted prices for similar securities, interest rates, prepayment speeds, credit risk and others)
• Level 3 – prices determined using significant unobservable inputs where quoted prices or observable inputs are unavailable or less reliable (including management's own assumptions about the factors market participants would use in pricing an investment)
The inputs or methodology used for valuing securities are not necessarily an indication of the risk associated with investing in those securities.
Examples of the types of securities in which the Fund would typically invest and how they are classified within this hierarchy are as follows. Typical Level 1 securities include exchange traded domestic equities, mutual funds whose NAVs are published each day and exchange traded foreign equities that are not statistically fair valued. Typical Level 2 securities include exchange traded foreign equities that are statistically fair valued, forward foreign currency exchange contracts and short-term investments valued at amortized cost. Additionally, securities fair valued by CWAM's Valuation Committee (the Committee) that rely on significant observable inputs are also included in Level 2. Typical Level 3 securities include any security fair valued by the Committee that relies on significant unobservable inputs.
The Committee is responsible for applying the Trust's Portfolio Pricing Policy and the CWAM pricing procedures (the Policies), which are approved by and subject to the oversight of the Board.
See accompanying notes to financial statements.
47
COLUMBIA ACORN INTERNATIONAL®
STATEMENT OF INVESTMENTS (UNAUDITED), CONTINUED
> Notes to Statement of Investments
The Committee meets as necessary, and no less frequently than quarterly, to determine fair values for securities for which market quotations are not readily available or for which CWAM believes that available market quotations are unreliable. The Committee also reviews the continuing appropriateness of the Policies. In circumstances where a security has been fair valued, the Committee will also review the continuing appropriateness of the current value of the security. The Policies address, among other things: circumstances under which market quotations will be deemed readily available; selection of third party pricing vendors; appropriate pricing methodologies; events that require fair valuation and fair value techniques; circumstances under which securities will be deemed to pose a potential for stale pricing, including when securities are illiquid, restricted, or in default; and certain delegations of authority to determine fair values to the Fund's investment manager. The Committee may also meet to discuss additional valuation matters, which may include review of back-testing results, review of time-sensitive information or approval of other valuation related actions, and to review the appropriateness of the Policies.
For investments categorized as Level 3, the significant unobservable inputs used in the fair value measurement of the Fund's securities may include: (i) data specific to the issuer or comparable issuers, (ii) general market or specific sector news and (iii) quoted prices and specific or similar security transactions. The Committee considers this data and any changes from prior periods in order to assess the reasonableness of observable and unobservable inputs, any assumptions or internal models used to value those securities and changes in fair value. Significant changes in any of these factors could result in lower or higher fair value measurements. Various factors impact the frequency of monitoring (which may occur as often as daily), however the Committee may determine that changes to inputs, assumptions and models are not required with the same frequency.
The following table summarizes the inputs used, as of June 30, 2015, in valuing the Fund's assets:
Investment Type | | Quoted Prices
(Level 1) | | Other
Significant
Observable
Inputs
(Level 2) | | Significant
Unobservable
Inputs
(Level 3) | | Total | |
Equities | |
Asia | | $ | 95,372,308 | | | $ | 3,705,688,177 | | | $ | 40,813,582 | | | $ | 3,841,874,067 | | |
Europe | | | 13,045,606 | | | | 2,354,370,500 | | | | - | | | | 2,367,416,106 | | |
Other Countries | | | 495,282,079 | | | | 590,203,693 | | | | - | | | | 1,085,485,772 | | |
Latin America | | | 202,149,587 | | | | - | | | | 12,336,362 | | | | 214,485,949 | | |
Total Equities | | | 805,849,580 | | | | 6,650,262,370 | | | | 53,149,944 | | | | 7,509,261,894 | | |
Total Short-Term Investments | | | 334,794,388 | | | | - | | | | - | | | | 334,794,388 | | |
Total Securities Lending Collateral | | | 186,393,214 | | | | - | | | | - | | | | 186,393,214 | | |
Total Investments | | $ | 1,327,037,182 | | | $ | 6,650,262,370 | | | $ | 53,149,944 | | | $ | 8,030,449,496 | | |
The Fund's assets assigned to the Level 2 input category are generally valued using a market approach, in which a security's value is determined through its correlation to prices and information from observable market transactions for similar or identical assets. Foreign equities are generally valued at the last sale price on the foreign exchange or market on which they trade. The Fund may use a statistical fair valuation model, in accordance with the policy adopted by the Board, provided by an independent third party to value securities principally traded in foreign markets in order to adjust for possible stale pricing that may occur between the close of the foreign exchanges and the time for valuation. These models take into account available market data including intraday index, ADR, and ETF movements.
There were no transfers of financial assets between Levels 1 and 2 during the period.
The Fund does not hold any significant investments (greater than one percent of net assets) categorized as Level 3.
Financial assets were transferred from Level 2 to Level 3 as trading halted during the period. As a result, as of period end, the Committee determined to value the security(s) under consistently applied procedures established by and under the general supervision of the Board.
The following table shows transfers between Level 2 and Level 3 of the fair value hierarchy:
Transfers In | | Transfers Out | |
| Level 2 | | Level 3 | | Level 2 | | Level 3 | |
| $ | - | | | $ | 55,274,689 | | | $ | 55,274,689 | | | $ | - | | |
Transfers in and/or out of Level 3 are determined based on the fair value at the beginning of the period for security positions held throughout the period.
Certain securities classified as Level 3 are valued by the Committee at fair value, using a market approach, as determined in good faith under consistently applied procedures established by and under the general supervision of the Board. To determine fair value for these securities, for which no market exists, the Committee utilizes the valuation technique it deems most appropriate in the circumstances, using some unobservable inputs, which may include, but are not limited to estimated earnings of the company and the position of the security within the company's capital structure. The Committee also may use some observable inputs, which may include, but are not limited to, trades of similar securities. Significant increases or decreases to any of these inputs could result in a significantly lower or higher fair value measurement.
See accompanying notes to financial statements.
48
COLUMBIA ACORN INTERNATIONAL®
PORTFOLIO DIVERSIFICATION (UNAUDITED)
At June 30, 2015, the Fund's portfolio investments as a percentage of net assets were diversified as follows:
| | | Value | | Percentage
of Net Assets | |
| > Industrial Goods & Services | |
Machinery | | $ | 495,014,931 | | | | 6.2 | | |
Industrial Materials & Specialty
Chemicals | | | 457,184,821 | | | | 5.8 | | |
Other Industrial Services | | | 402,120,164 | | | | 5.1 | | |
Electrical Components | | | 226,939,703 | | | | 2.9 | | |
Conglomerates | | | 210,820,970 | | | | 2.7 | | |
Outsourcing Services | | | 199,092,875 | | | | 2.5 | | |
Construction | | | 70,535,524 | | | | 0.9 | | |
Waste Management | | | 53,103,100 | | | | 0.7 | | |
Water | | | 44,640,927 | | | | 0.5 | | |
Industrial Distribution | | | 15,478,331 | | | | 0.2 | | |
| | | | 2,174,931,346 | | | | 27.5 | | |
| > Consumer Goods & Services | |
Retail | | | 609,456,518 | | | | 7.7 | | |
Food & Beverage | | | 273,424,269 | | | | 3.5 | | |
Casinos & Gaming | | | 187,863,479 | | | | 2.4 | | |
Nondurables | | | 142,865,342 | | | | 1.8 | | |
Consumer Goods Distribution | | | 110,950,873 | | | | 1.4 | | |
Other Durable Goods | | | 94,460,809 | | | | 1.2 | | |
Travel | | | 92,030,814 | | | | 1.2 | | |
Restaurants | | | 90,795,220 | | | | 1.1 | | |
Furniture & Textiles | | | 54,215,140 | | | | 0.7 | | |
Leisure Products | | | 41,430,891 | | | | 0.5 | | |
Apparel | | | 30,365,821 | | | | 0.4 | | |
Consumer Electronics | | | 29,588,201 | | | | 0.4 | | |
Educational Services | | | 24,748,518 | | | | 0.3 | | |
Other Consumer Services | | | 15,025,487 | | | | 0.2 | | |
| | | | 1,797,221,382 | | | | 22.8 | | |
| > Information | |
Business Software | | | 270,139,222 | | | | 3.4 | | |
Computer Hardware & Related
Equipment | | | 133,865,659 | | | | 1.7 | | |
Mobile Communications | | | 127,138,632 | | | | 1.6 | | |
Semiconductors & Related
Equipment | | | 119,341,741 | | | | 1.5 | | |
Financial Processors | | | 115,598,998 | | | | 1.5 | | |
Internet Related | | | 115,283,213 | | | | 1.4 | | |
Entertainment Programming | | | 77,791,018 | | | | 1.0 | | |
Satellite Broadcasting & Services | | | 68,084,046 | | | | 0.9 | | |
Instrumentation | | | 65,266,878 | | | | 0.8 | | |
Advertising | | | 55,744,752 | | | | 0.7 | | |
Computer Services | | | 53,301,671 | | | | 0.7 | | |
Cable TV | | | 52,402,255 | | | | 0.7 | | |
Telephone & Data Services | | | 47,090,360 | | | | 0.6 | | |
Telecommunications Equipment | | | 45,546,177 | | | | 0.6 | | |
TV Broadcasting | | | 43,835,330 | | | | 0.5 | | |
Business Information & Marketing
Services | | | 30,613,337 | | | | 0.4 | | |
| | | | 1,421,043,289 | | | | 18.0 | | |
| | | Value | | Percentage
of Net Assets | |
| > Finance | |
Banks | | $ | 254,382,516 | | | | 3.2 | | |
Insurance | | | 219,557,185 | | | | 2.8 | | |
Brokerage & Money Management | | | 156,514,943 | | | | 2.0 | | |
Finance Companies | | | 38,572,230 | | | | 0.5 | | |
Financial Processors | | | 21,639,007 | | | | 0.2 | | |
| | | | 690,665,881 | | | | 8.7 | | |
| > Other Industries | |
Real Estate | | | 393,040,028 | | | | 5.0 | | |
Transportation | | | 181,625,633 | | | | 2.3 | | |
Regulated Utilities | | | 35,485,633 | | | | 0.4 | | |
| | | | 610,151,294 | | | | 7.7 | | |
| > Health Care | |
Pharmaceuticals | | | 183,360,658 | | | | 2.3 | | |
Medical Equipment & Devices | | | 105,137,062 | | | | 1.3 | | |
Medical Supplies | | | 93,411,326 | | | | 1.2 | | |
Health Care Services | | | 44,210,736 | | | | 0.6 | | |
Hospital Management | | | 22,795,729 | | | | 0.3 | | |
| | | | 448,915,511 | | | | 5.7 | | |
| > Energy & Minerals | |
Oil & Gas Producers | | | 140,816,282 | | | | 1.8 | | |
Oil Refining, Marketing &
Distribution | | | 82,866,131 | | | | 1.0 | | |
Mining | | | 61,437,909 | | | | 0.8 | | |
Oil Services | | | 44,305,901 | | | | 0.6 | | |
Non-Ferrous Metals | | | 24,570,606 | | | | 0.3 | | |
Agricultural Commodities | | | 12,336,362 | | | | 0.1 | | |
| | | | 366,333,191 | | | | 4.6 | | |
Total Equities: | | | 7,509,261,894 | | | | 95.0 | | |
Short-Term Investments: | | | 334,794,388 | | | | 4.2 | | |
Securities Lending Collateral: | | | 186,393,214 | | | | 2.4 | | |
Total Investments: | | | 8,030,449,496 | | | | 101.6 | | |
Obligation to Return
Collateral for Securities
Loaned: | | | (186,393,214 | ) | | | (2.4 | ) | |
Cash and Other Assets
Less Liabilities: | | | 58,285,708 | | | | 0.8 | | |
Net Assets: | | $ | 7,902,341,990 | | | | 100.0 | | |
See accompanying notes to financial statements.
49
COLUMBIA ACORN USA®
MAJOR PORTFOLIO CHANGES IN THE SECOND QUARTER (UNAUDITED)
| | | Number of Shares | |
| | | 3/31/15 | | 6/30/15 | |
Purchases | |
Information | |
Audience | | | 0 | | | | 722,320 | | |
Bankrate | | | 218,000 | | | | 719,487 | | |
DemandWare | | | 145,000 | | | | 197,360 | | |
Liquidity Services | | | 153,000 | | | | 294,000 | | |
Lumos Networks | | | 0 | | | | 304,372 | | |
Navigant Consulting | | | 0 | | | | 366,739 | | |
Sanmina | | | 0 | | | | 350,804 | | |
Textura | | | 373,934 | | | | 482,473 | | |
Industrial Goods & Services | |
Donaldson | | | 855,000 | | | | 948,000 | | |
Dorman Products | | | 149,293 | | | | 182,079 | | |
Generac | | | 276,000 | | | | 299,171 | | |
Lumber Liquidators | | | 0 | | | | 96,000 | | |
Oshkosh Corporation | | | 0 | | | | 166,548 | | |
Consumer Goods & Services | |
Arctic Cat | | | 0 | | | | 111,261 | | |
Blue Nile | | | 0 | | | | 87,000 | | |
Casey's General Stores | | | 73,931 | | | | 86,242 | | |
Fiesta Restaurant Group | | | 68,000 | | | | 130,773 | | |
Fossil | | | 0 | | | | 33,310 | | |
Gaiam | | | 0 | | | | 193,577 | | |
Gentex | | | 296,000 | | | | 399,477 | | |
Hertz | | | 345,000 | | | | 506,306 | | |
Knoll | | | 357,000 | | | | 383,060 | | |
Papa John's International | | | 79,000 | | | | 138,235 | | |
Select Comfort | | | 297,000 | | | | 377,438 | | |
The Fresh Market | | | 234,000 | | | | 494,833 | | |
Zulily | | | 0 | | | | 252,955 | | |
Finance | |
Hancock Holding | | | 228,000 | | | | 268,466 | | |
Lakeland Financial | | | 392,597 | | | | 421,366 | | |
LegacyTexas | | | 373,487 | | | | 422,366 | | |
Leucadia National | | | 0 | | | | 243,993 | | |
SEI Investments | | | 139,000 | | | | 343,089 | | |
Health Care | |
Agios Pharmaceuticals | | | 26,000 | | | | 46,972 | | |
Allscripts Healthcare Solutions | | | 343,600 | | | | 506,139 | | |
Sarepta Therapeutics | | | 338,500 | | | | 429,694 | | |
Sirona Dental Systems | | | 0 | | | | 63,289 | | |
Ultragenyx Pharmaceutical | | | 154,000 | | | | 193,081 | | |
VWR | | | 86,300 | | | | 229,638 | | |
Wright Medical Group | | | 200,300 | | | | 258,854 | | |
Energy & Minerals | |
Core Labs (Netherlands) | | | 39,000 | | | | 49,965 | | |
Gulfport Energy | | | 51,000 | | | | 93,267 | | |
| | | Number of Shares | |
| | | 3/31/15 | | 6/30/15 | |
Sales | |
Information | |
Atmel | | | 970,000 | | | | 249,822 | | |
Envestnet | | | 82,000 | | | | 0 | | |
Fleetmatics | | | 97,000 | | | | 0 | | |
inContact | | | 394,187 | | | | 315,276 | | |
Informatica | | | 214,000 | | | | 0 | | |
Mettler-Toledo International | | | 141,000 | | | | 117,400 | | |
| RPX | | | 211,000 | | | | 0 | | |
Rubicon Technology | | | 600,000 | | | | 499,644 | | |
SBA Communications | | | 23,000 | | | | 0 | | |
Trimble Navigation | | | 274,000 | | | | 0 | | |
Industrial Goods & Services | |
Acuity Brands | | | 64,000 | | | | 0 | | |
Drew Industries | | | 539,000 | | | | 389,722 | | |
Kennametal | | | 239,000 | | | | 143,520 | | |
Consumer Goods & Services | |
Burlington Stores | | | 207,500 | | | | 0 | | |
Caesarstone (Israel) | | | 189,814 | | | | 150,828 | | |
Choice Hotels | | | 89,666 | | | | 71,306 | | |
Michaels Stores | | | 203,784 | | | | 0 | | |
Shutterfly | | | 147,845 | | | | 0 | | |
The Chefs' Warehouse | | | 268,276 | | | | 129,908 | | |
United Natural Foods | | | 134,000 | | | | 101,595 | | |
Finance | |
First Busey | | | 1,484,641 | | | | 1,109,542 | | |
Marlin Business Services | | | 418,543 | | | | 334,361 | | |
MB Financial | | | 733,000 | | | | 529,623 | | |
Patriot National | | | 515,590 | | | | 497,176 | | |
World Acceptance | | | 135,125 | | | | 108,257 | | |
Heath Care | |
Akorn | | | 442,117 | | | | 358,549 | | |
Alnylam Pharmaceuticals | | | 40,100 | | | | 0 | | |
Bio-Techne | | | 135,200 | | | | 114,086 | | |
Celldex Therapeutics | | | 280,300 | | | | 260,148 | | |
Seattle Genetics | | | 286,800 | | | | 183,203 | | |
Synageva BioPharma | | | 271,469 | | | | 0 | | |
Other Industries | |
EdR | | | 328,933 | | | | 228,671 | | |
Extra Space Storage | | | 611,000 | | | | 587,914 | | |
Post Properties | | | 91,000 | | | | 0 | | |
Energy & Minerals | |
Rosetta Resources | | | 159,000 | | | | 0 | | |
See accompanying notes to financial statements.
50
COLUMBIA ACORN USA®
STATEMENT OF INVESTMENTS (UNAUDITED), JUNE 30, 2015
Number of Shares | | | | Value | |
| | | | | | | Equities: 93.9% | |
Information 23.4% | | | |
| | | > Business Software 7.1% | |
| | 230,000 | | | Ansys (a) | | $ | 20,985,200 | | |
| | | | | Simulation Software for
Engineers & Designers | | | | | |
| | 245,682 | | | SPS Commerce | | | 16,165,876 | | |
| | | | | Supply Chain Management Software
Delivered via the Web | | | | | |
| | 197,360 | | | DemandWare (a) | | | 14,028,349 | | |
| | | | | E-Commerce Website Platform for
Retailers & Apparel Manufacturers | | | | | |
| | 482,473 | | | Textura (b) | | | 13,427,223 | | |
| | | | | Construction Vendor Management Software | | | | | |
| | 111,053 | | | NetSuite | | | 10,189,113 | | |
| | | | | Enterprise Software Delivered via the Web | | | | | |
| | 196,527 | | | Solera Holdings | | | 8,757,243 | | |
| | | | | Software for Automotive Insurance
Claims Processing | | | | | |
| | 816,768 | | | Amber Road (a) | | | 5,733,711 | | |
| | | | | Global Trade Management Software
Delivered via the Web | | | | | |
| | 315,276 | | | inContact | | | 3,111,774 | | |
| | | | | Call Center Systems Delivered via the
Web & Telco Services | | | | | |
| | 30,092 | | | Cvent (a) | | | 775,772 | | |
| | | | | Software for Corporate Event Planners &
Marketing Platform for Hotels | | | | | |
| | | | 93,174,261 | | |
| | | > Instrumentation 5.6% | |
| | 117,400 | | | Mettler-Toledo International | | | 40,087,404 | | |
| | | | | Laboratory Equipment | | | | | |
| | 383,000 | | | IPG Photonics | | | 32,622,025 | | |
| | | | | Fiber Lasers | | | | | |
| | | | 72,709,429 | | |
| | | > Computer Services 3.5% | |
| | 554,605 | | | ExlService Holdings (a) | | | 19,178,241 | | |
| | | | | Business Process Outsourcing | | | | | |
| | 231,502 | | | Virtusa | | | 11,899,203 | | |
| | | | | Offshore IT Outsourcing | | | | | |
| | 291,459 | | | WNS - ADR | | | 7,796,528 | | |
| | | | | Offshore Business Process
Outsourcing Services | | | | | |
| | 432,000 | | | Hackett Group | | | 5,801,760 | | |
| | | | | IT Integration & Best Practice Research | | | | | |
| | 302,000 | | | RCM Technologies | | | 1,709,320 | | |
| | | | | Technology & Engineering Services | | | | | |
| | | | 46,385,052 | | |
| | | > Computer Hardware &
Related Equipment 1.0% | |
| | 113,253 | | | Rogers | | | 7,490,553 | | |
| | | | | Printed Circuit Materials & High
Performance Foams | | | | | |
| | 73,282 | | | Belden | | | 5,952,697 | | |
| | | | | Specialty Cable | | | | | |
| | | | 13,443,250 | | |
Number of Shares | | | | Value | |
| | | > Business Information &
Marketing Services 1.0% | |
| | 719,487 | | | Bankrate (a) | | $ | 7,547,418 | | |
| | | | | Internet Advertising for the Insurance,
Credit Card & Banking Markets | | | | | |
| | 366,739 | | | Navigant Consulting | | | 5,453,409 | | |
| | | | | Financial Consulting Firm | | | | | |
| | | | 13,000,827 | | |
| | | > Mobile Communications 0.9% | |
| | 401,486 | | | Gogo (b) | | | 8,603,845 | | |
| | | | | Provider of Wi-Fi on Airplanes | | | | | |
| | 722,320 | | | Audience (a)(b) | | | 3,532,145 | | |
| | | | | Improving Voice Quality for Mobile Devices | | | | | |
| | | | 12,135,990 | | |
| | | > Financial Processors 0.8% | |
| | 77,000 | | | Global Payments | | | 7,965,650 | | |
| | | | | Credit Card Processor | | | | | |
| | 294,000 | | | Liquidity Services | | | 2,831,220 | | |
| | | | | E-Auctions for Surplus & Salvage Goods | | | | | |
| | | | 10,796,870 | | |
| | | > Semiconductors & Related
Equipment 0.8% | |
| | 138,235 | | | Monolithic Power Systems | | | 7,009,897 | | |
| | | | | High Performance Analog & Mixed
Signal Integrated Circuits | | | | | |
| | 249,822 | | | Atmel | | | 2,461,996 | | |
| | | | | Microcontrollers, Radio Frequency &
Memory Semiconductors | | | | | |
| | 499,644 | | | Rubicon Technology (b) | | | 1,214,135 | | |
| | | | | Producer of Sapphire for the Lighting,
Electronics & Automotive Industries | | | | | |
| | | | 10,686,028 | | |
| | | > Telephone & Data Services 0.7% | |
| | 621,000 | | | Boingo Wireless (a) | | | 5,129,460 | | |
| | | | | Wi-Fi & Cellular Communications Networks | | | | | |
| | 304,372 | | | Lumos Networks | | | 4,501,662 | | |
| | | | | Telephone & Fiber Optic Data Services | | | | | |
| | | | 9,631,122 | | |
| | | > Telecommunications Equipment 0.7% | |
| | 444,683 | | | Infinera | | | 9,329,449 | | |
| | | | | Optical Networking Equipment | | | | | |
| | | > Internet Related 0.7% | |
| | 249,567 | | | RetailMeNot | | | 4,449,780 | | |
| | | | | Digital Coupon Marketplace | | | | | |
| | 826,078 | | | Vonage | | | 4,056,043 | | |
| | | | | Business & Consumer Internet Telephony | | | | | |
| | | | 8,505,823 | | |
| | | > Contract Manufacturing 0.6% | |
| | 350,804 | | | Sanmina | | | 7,072,209 | | |
| | | | | Electronic Manufacturing Services | | | | | |
Information: Total | | | 306,870,310 | | |
See accompanying notes to financial statements.
51
COLUMBIA ACORN USA®
STATEMENT OF INVESTMENTS (UNAUDITED), CONTINUED
Number of Shares | | | | Value | |
Industrial Goods & Services 21.5% | | | |
| | | > Machinery 18.3% | |
| | 793,000 | | | Ametek | | $ | 43,440,540 | | |
| | | | | Aerospace/Industrial Instruments | | | | | |
| | 515,000 | | | Nordson | | | 40,113,350 | | |
| | | | | Dispensing Systems for
Adhesives & Coatings | | | | | |
| | 725,500 | | | HEICO | | | 36,833,635 | | |
| | | | | FAA-approved Aircraft Replacement Parts | | | | | |
| | 948,000 | | | Donaldson | | | 33,938,400 | | |
| | | | | Industrial Air Filtration | | | | | |
| | 238,000 | | | Moog | | | 16,821,840 | | |
| | | | | Motion Control Products for Aerospace,
Defense & Industrial Markets | | | | | |
| | 222,000 | | | Toro | | | 15,047,160 | | |
| | | | | Turf Maintenance Equipment | | | | | |
| | 299,171 | | | Generac (a)(b) | | | 11,892,047 | | |
| | | | | Standby Power Generators | | | | | |
| | 278,135 | | | ESCO Technologies | | | 10,405,030 | | |
| | | | | Industrial Filtration & Advanced
Measurement Equipment | | | | | |
| | 79,943 | | | Middleby | | | 8,972,003 | | |
| | | | | Manufacturer of Cooking Equipment | | | | | |
| | 182,079 | | | Dorman Products (a)(b) | | | 8,677,885 | | |
| | | | | Aftermarket Auto Parts Distributor | | | | | |
| | 166,548 | | | Oshkosh | | | 7,058,304 | | |
| | | | | Specialty Truck Manufacturer | | | | | |
| | 143,520 | | | Kennametal | | | 4,896,903 | | |
| | | | | Consumable Cutting Tools | | | | | |
| | 76,612 | | | Graham | | | 1,569,780 | | |
| | | | | Designer & Builder of Vacuum &
Heat Transfer Equipment for
Process Industries | | | | | |
| | | | 239,666,877 | | |
| | | > Industrial Materials &
Specialty Chemicals 1.7% | |
| | 389,722 | | | Drew Industries | | | 22,611,671 | | |
| | | | | RV & Manufactured Home Components | | | | | |
| | | > Construction 0.6% | |
| | 389,722 | | | PGT | | | 5,654,866 | | |
| | | | | Wind Resistant Windows & Doors | | | | | |
| | 96,000 | | | Lumber Liquidators (b) | | | 1,988,160 | | |
| | | | | Hardwood Flooring Retailer | | | | | |
| | | | 7,643,026 | | |
| | | > Industrial Distribution 0.5% | |
| | 90,000 | | | WESCO International | | | 6,177,600 | | |
| | | | | Industrial Distributor | | | | | |
| | | > Electrical Components 0.4% | |
| | 235,103 | | | Thermon | | | 5,658,929 | | |
| | | | | Global Engineered Thermal Solutions | | | | | |
Industrial Goods & Services: Total | | | 281,758,103 | | |
Consumer Goods & Services 14.8% | | | |
| | | > Travel 3.3% | |
| | 425,950 | | | Avis Budget Group (a) | | | 18,775,876 | | |
| | | | | Car Rental Company | | | | | |
| | 506,306 | | | Hertz | | | 9,174,265 | | |
| | | | | U.S. Rental Car Operator | | | | | |
Number of Shares | | | | Value | |
| | 246,491 | | | HomeAway | | $ | 7,670,800 | | |
| | | | | Vacation Rental Online Marketplace | | | | | |
| | 71,306 | | | Choice Hotels | | | 3,868,350 | | |
| | | | | Franchisor of Budget Hotel Brands | | | | | |
| | 28,314 | | | Vail Resorts | | | 3,091,889 | | |
| | | | | Ski Resort Operator & Developer | | | | | |
| | | | 42,581,180 | | |
| | | > Retail 2.6% | |
| | 494,833 | | | The Fresh Market (a)(b) | | | 15,903,933 | | |
| | | | | Specialty Food Retailer | | | | | |
| | 86,242 | | | Casey's General Stores | | | 8,256,809 | | |
| | | | | Owner/Operator of Convenience Stores | | | | | |
| | 252,955 | | | Zulily (b) | | | 3,298,533 | | |
| | | | | E-Commerce Retailer Offering
Flash Sale Events | | | | | |
| | 87,000 | | | Blue Nile (a) | | | 2,643,930 | | |
| | | | | Online Jewelry Retailer | | | | | |
| | 33,310 | | | Fossil (a) | | | 2,310,382 | | |
| | | | | Watch Designer & Retailer | | | | | |
| | 193,577 | | | Gaiam (a) | | | 1,265,993 | | |
| | | | | Promoter of Healthy Living through
Catalogs, E-Commerce & Gaiam TV | | | | | |
| | | | 33,679,580 | | |
| | | > Other Durable Goods 2.4% | |
| | 187,000 | | | Cavco Industries (a) | | | 14,107,280 | | |
| | | | | Manufactured Homes | | | | | |
| | 377,438 | | | Select Comfort | | | 11,349,561 | | |
| | | | | Specialty Mattresses | | | | | |
| | 399,477 | | | Gentex | | | 6,559,412 | | |
| | | | | Manufacturer of Auto Parts | | | | | |
| | | | 32,016,253 | | |
| | | > Consumer Goods Distribution 2.0% | |
| | 249,822 | | | Pool | | | 17,532,508 | | |
| | | | | Swimming Pool Supplies &
Equipment Distributor | | | | | |
| | 101,595 | | | United Natural Foods | | | 6,469,569 | | |
| | | | | Distributor of Natural/Organic
Foods to Grocery Stores | | | | | |
| | 129,908 | | | The Chefs' Warehouse (a)(b) | | | 2,759,246 | | |
| | | | | Distributor of Specialty Foods to
Fine Dining Restaurants | | | | | |
| | | | 26,761,323 | | |
| | | > Furniture & Textiles 1.5% | |
| | 150,828 | | | Caesarstone (Israel) | | | 10,337,751 | | |
| | | | | Quartz Countertops | | | | | |
| | 383,060 | | | Knoll | | | 9,587,992 | | |
| | | | | Office Furniture | | | | | |
| | | | 19,925,743 | | |
| | | > Restaurants 1.3% | |
| | 138,235 | | | Papa John's International | | | 10,451,948 | | |
| | | | | Franchisor of Pizza Restaurants | | | | | |
| | 130,773 | | | Fiesta Restaurant Group (a) | | | 6,538,650 | | |
| | | | | Owner/Operator of Two Restaurant
Chains: Pollo Tropical & Taco Cabana | | | | | |
| | | | 16,990,598 | | |
| | | > Other Consumer Services 0.9% | |
| | 298,954 | | | Blackhawk Network (a) | | | 12,316,905 | | |
| | | | | Third-party Distributor of Prepaid
Content, Mostly Gift Cards | | | | | |
See accompanying notes to financial statements.
52
Number of Shares | | | | Value | |
| | | > Leisure Products 0.8% | |
| | 363,764 | | | Performance Sports Group | | $ | 6,547,752 | | |
| | | | | Sporting Goods Manufacturer | | | | | |
| | 111,261 | | | Arctic Cat | | | 3,694,978 | | |
| | | | | Manufacturer of ATVs & Snowmobiles | | | | | |
| | | | 10,242,730 | | |
Consumer Goods & Services: Total | | | 194,514,312 | | |
Finance 13.9% | | | |
| | | > Banks 8.0% | |
| | 131,573 | | | SVB Financial Group | | | 18,943,881 | | |
| | | | | Bank to Venture Capitalists | | | | | |
| | 421,366 | | | Lakeland Financial | | | 18,274,643 | | |
| | | | | Indiana Bank | | | | | |
| | 529,623 | | | MB Financial | | | 18,240,216 | | |
| | | | | Chicago Bank | | | | | |
| | 881,038 | | | Associated Banc-Corp | | | 17,858,640 | | |
| | | | | Midwest Bank | | | | | |
| | 268,466 | | | Hancock Holding | | | 8,566,750 | | |
| | | | | Gulf Coast Bank | | | | | |
| | 1,109,542 | | | First Busey | | | 7,289,691 | | |
| | | | | Illinois Bank | | | | | |
| | 695,000 | | | TrustCo Bank | | | 4,885,850 | | |
| | | | | New York State Bank | | | | | |
| | 162,981 | | | Sandy Spring Bancorp | | | 4,560,208 | | |
| | | | | Baltimore & Washington, D.C. Bank | | | | | |
| | 311,445 | | | First Commonwealth | | | 2,986,758 | | |
| | | | | Western Pennsylvania Bank | | | | | |
| | 168,031 | | | Guaranty Bancorp | | | 2,774,192 | | |
| | | | | Colorado Bank | | | | | |
| | | | 104,380,829 | | |
| | | > Finance Companies 2.2% | |
| | 490,177 | | | CAI International (a) | | | 10,092,744 | | |
| | | | | International Container Leasing | | | | | |
| | 108,257 | | | World Acceptance (b) | | | 6,658,888 | | |
| | | | | Personal Loans | | | | | |
| | 214,681 | | | McGrath Rentcorp | | | 6,532,743 | | |
| | | | | Mini-rental Conglomerate | | | | | |
| | 334,361 | | | Marlin Business Services | | | 5,644,014 | | |
| | | | | Small Equipment Leasing | | | | | |
| | | | 28,928,389 | | |
| | | > Brokerage & Money
Management 1.3% | |
| | 343,089 | | | SEI Investments | | | 16,821,654 | | |
| | | | | Mutual Fund Administration &
Investment Management | | | | | |
| | | > Insurance 1.0% | |
| | 497,176 | | | Patriot National | | | 7,954,816 | | |
| | | | | Underwriting, Claims
Administration & Case
Management Outsourcing for
Workers Comp Insurers | | | | | |
| | 134,904 | | | Allied World Assurance
Company Holdings | | | 5,830,551 | | |
| | | | | Commercial Lines Insurance/Reinsurance | | | | | |
| | | | 13,785,367 | | |
| | | > Savings & Loans 1.0% | |
| | 422,366 | | | LegacyTexas | | | 12,755,453 | | |
| | | | | Texas Thrift | | | | | |
Number of Shares | | | | Value | |
| | | > Diversified Financial Companies 0.4% | |
| | 243,993 | | | Leucadia National | | $ | 5,924,150 | | |
| | | | | Holding Company | | | | | |
Finance: Total | | | 182,595,842 | | |
Health Care 12.5% | | | |
| | | > Biotechnology & Drug Delivery 4.4% | |
| | 193,081 | | | Ultragenyx Pharmaceutical | | | 19,769,564 | | |
| | | | | Biotech Focused on "Ultra-Orphan" Drugs | | | | | |
| | 429,694 | | | Sarepta Therapeutics (b) | | | 13,075,588 | | |
| | | | | Biotech Focused on Rare Diseases | | | | | |
| | 183,203 | | | Seattle Genetics (b) | | | 8,867,025 | | |
| | | | | Antibody-based Therapies for Cancer | | | | | |
| | 260,148 | | | Celldex Therapeutics (a) | | | 6,560,933 | | |
| | | | | Biotech Developing Drugs for Cancer | | | | | |
| | 46,972 | | | Agios Pharmaceuticals (a)(b) | | | 5,220,468 | | |
| | | | | Biotech Focused on Cancer &
Orphan Diseases | | | | | |
| | 16,655 | | | Intercept Pharmaceuticals | | | 4,020,184 | | |
| | | | | Biotech Developing Drugs for
Several Diseases | | | | | |
| | | | 57,513,762 | | |
| | | > Medical Supplies 3.4% | |
| | 449,680 | | | Cepheid (a) | | | 27,497,932 | | |
| | | | | Molecular Diagnostics | | | | | |
| | 114,086 | | | Bio-Techne | | | 11,234,048 | | |
| | | | | Maker of Consumables & Systems
for the Life Science Market | | | | | |
| | 229,638 | | | VWR | | | 6,138,224 | | |
| | | | | Distributor of Lab Supplies | | | | | |
| | | | 44,870,204 | | |
| | | > Health Care Services 2.2% | |
| | 183,886 | | | Medidata Solutions | | | 9,988,687 | | |
| | | | | Cloud-based Software for Drug Studies | | | | | |
| | 506,139 | | | Allscripts Healthcare
Solutions (a) | | | 6,923,982 | | |
| | | | | Health Care IT | | | | | |
| | 144,897 | | | HealthSouth | | | 6,673,956 | | |
| | | | | Inpatient Rehabilitation
Facilities & Home Health Care | | | | | |
| | 116,584 | | | Envision Healthcare
Holdings (a) | | | 4,602,736 | | |
| | | | | Provider of Health Care
Outsourcing Services | | | | | |
| | | | 28,189,361 | | |
| | | > Medical Equipment & Devices 1.3% | |
| | 258,854 | | | Wright Medical Group | | | 6,797,506 | | |
| | | | | Foot & Ankle Replacement | | | | | |
| | 63,289 | | | Sirona Dental Systems | | | 6,355,482 | | |
| | | | | Manufacturer of Dental Equipment | | | | | |
| | 77,961 | | | Abaxis | | | 4,013,432 | | |
| | | | | Instruments & Tests for Vet &
Medical Markets | | | | | |
| | | | 17,166,420 | | |
| | | > Pharmaceuticals 1.2% | |
| | 358,549 | | | Akorn (a) | | | 15,654,249 | | |
| | | | | Developer, Manufacturer &
Distributor of Specialty
Generic Drugs | | | | | |
Health Care: Total | | | 163,393,996 | | |
See accompanying notes to financial statements.
53
COLUMBIA ACORN USA®
STATEMENT OF INVESTMENTS (UNAUDITED), CONTINUED
Number of Shares | | | | Value | |
Other Industries 5.3% | | | |
| | | > Real Estate 3.5% | |
| | 587,914 | | | Extra Space Storage | | $ | 38,343,751 | | |
| | | | | Self Storage Facilities | | | | | |
| | 228,671 | | | EdR | | | 7,171,123 | | |
| | | | | Student Housing | | | | | |
| | | | 45,514,874 | | |
| | | > Transportation 1.8% | |
| | 468,091 | | | Rush Enterprises, Class A | | | 12,268,665 | | |
| | 105,000 | | | Rush Enterprises, Class B | | | 2,520,000 | | |
| | | | | Truck Sales & Service | | | | | |
| | 416,370 | | | Heartland Express | | | 8,423,165 | | |
| | | | | Regional Trucker | | | | | |
| | | | 23,211,830 | | |
Other Industries: Total | | | 68,726,704 | | |
Energy & Minerals 2.5% | | | |
| | | > Oil & Gas Producers 1.6% | |
| | 138,235 | | | Carrizo Oil & Gas (a) | | | 6,806,691 | | |
| | | | | Oil & Gas Producer | | | | | |
| | 97,943 | | | PDC Energy | | | 5,253,663 | | |
| | | | | Oil & Gas Producer in the
United States | | | | | |
| | 66,620 | | | Clayton Williams (b) | | | 4,380,265 | | |
| | | | | Oil & Gas Producer | | | | | |
| | 101,595 | | | SM Energy | | | 4,685,561 | | |
| | | | | Oil & Gas Producer | | | | | |
| | | | 21,126,180 | | |
| | | > Oil Services 0.5% | |
| | 93,267 | | | Gulfport Energy | | | 3,753,997 | | |
| | | | | Oil & Gas Producer Focused on
Utica Shale in Ohio | | | | | |
| | 133,239 | | | Hornbeck Offshore | | | 2,735,396 | | |
| | | | | Supply Vessel Operator in
Gulf of Mexico | | | | | |
| | | | 6,489,393 | | |
Number of Shares | | | | Value | |
| | | > Mining 0.4% | |
| | 49,965 | | | Core Labs (Netherlands) (b) | | $ | 5,698,009 | | |
| | | | | Oil & Gas Reservoir Consulting | | | | | |
Energy & Minerals: Total | | | 33,313,582 | | |
Total Equities: 93.9%
(Cost: $697,779,609) | | | 1,231,172,849 | (c) | |
Short-Term Investments 6.3% | | | |
| | 82,842,913 | | | JPMorgan U.S. Government
Money Market Fund, Agency
Shares (7 day yield of 0.01%) | | | 82,842,913 | | |
Total Short-Term Investments: 6.3%
(Cost: $82,842,913) | | | 82,842,913 | | |
Securities Lending Collateral 4.1% | | | |
| | 53,302,525 | | | Dreyfus Government Cash
Management Fund,
Institutional Shares
(7 day yield of 0.01%) (d) | | | 53,302,525 | | |
Total Securities Lending Collateral: 4.1%
(Cost: $53,302,525) | | | 53,302,525 | | |
Total Investments: 104.3%
(Cost: $833,925,047)(e) | | | 1,367,318,287 | | |
Obligation to Return Collateral for
Securities Loaned: (4.1)% | | | (53,302,525 | ) | |
Cash and Other Assets Less
Liabilities: (0.2)% | | | (2,439,622 | ) | |
Net Assets: 100.0% | | $ | 1,311,576,140 | | |
ADR - American Depositary Receipts
See accompanying notes to financial statements.
> Notes to Statement of Investments
(a) Non-income producing security.
(b) All or a portion of this security was on loan at June 30, 2015. The total market value of securities on loan at June 30, 2015 was $53,095,035.
(c) On June 30, 2015, the market value of foreign securities represented 1.22% of total net assets. The Fund's foreign portfolio was diversified as follows:
Country | | Value | | Percentage
of Net Assets | |
Israel | | $ | 10,337,751 | | | | 0.79 | | |
Netherlands | | | 5,698,009 | | | | 0.43 | | |
Total Foreign Portfolio | | $ | 16,035,760 | | | | 1.22 | | |
(d) Investment made with cash collateral received from securities lending activity.
(e) At June 30, 2015, for federal income tax purposes, the cost of investments was approximately $833,925,047 and net unrealized appreciation was $533,393,240 consisting of gross unrealized appreciation of $562,908,526 and gross unrealized depreciation of $29,515,286.
54
> Notes to Statement of Investments
Fair Value Measurements
Various inputs are used in determining the value of the Fund's investments, following the input prioritization hierarchy established by accounting principles generally accepted in the United States of America (GAAP). These inputs are summarized in the three broad levels listed below:
• Level 1 – quoted prices in active markets for identical securities
• Level 2 – prices determined using other significant observable inputs (including quoted prices for similar securities, interest rates, prepayment speeds, credit risk and others)
• Level 3 – prices determined using significant unobservable inputs where quoted prices or observable inputs are unavailable or less reliable (including management's own assumptions about the factors market participants would use in pricing an investment)
The inputs or methodology used for valuing securities are not necessarily an indication of the risk associated with investing in those securities.
Examples of the types of securities in which the Fund would typically invest and how they are classified within this hierarchy are as follows. Typical Level 1 securities include exchange traded domestic equities, mutual funds whose NAVs are published each day and exchange traded foreign equities that are not statistically fair valued. Typical Level 2 securities include exchange traded foreign equities that are statistically fair valued, forward foreign currency exchange contracts and short-term investments valued at amortized cost. Additionally, securities fair valued by CWAM's Valuation Committee (the Committee) that rely on significant observable inputs are also included in Level 2. Typical Level 3 securities include any security fair valued by the Committee that relies on significant unobservable inputs.
The Committee is responsible for applying the Trust's Portfolio Pricing Policy and the CWAM pricing procedures (the Policies), which are approved by and subject to the oversight of the Board.
The Committee meets as necessary, and no less frequently than quarterly, to determine fair values for securities for which market quotations are not readily available or for which CWAM believes that available market quotations are unreliable. The Committee also reviews the continuing appropriateness of the Policies. In circumstances where a security has been fair valued, the Committee will also review the continuing appropriateness of the current value of the security. The Policies address, among other things: circumstances under which market quotations will be deemed readily available; selection of third party pricing vendors; appropriate pricing methodologies; events that require fair valuation and fair value techniques; circumstances under which securities will be deemed to pose a potential for stale pricing, including when securities are illiquid, restricted, or in default; and certain delegations of authority to determine fair values to the Fund's investment manager. The Committee may also meet to discuss additional valuation matters, which may include review of back-testing results, review of time-sensitive information or approval of other valuation related actions, and to review the appropriateness of the Policies.
For investments categorized as Level 3, the significant unobservable inputs used in the fair value measurement of the Fund's securities may include: (i) data specific to the issuer or comparable issuers, (ii) general market or specific sector news and (iii) quoted prices and specific or similar security transactions. The Committee considers this data and any changes from prior periods in order to assess the reasonableness of observable and unobservable inputs, any assumptions or internal models used to value those securities and changes in fair value. Significant changes in any of these factors could result in lower or higher fair value measurements. Various factors impact the frequency of monitoring (which may occur as often as daily), however the Committee may determine that changes to inputs, assumptions and models are not required with the same frequency.
The following table summarizes the inputs used, as of June 30, 2015, in valuing the Fund's assets:
Investment Type | | Quoted Prices
(Level 1) | | Other
Significant
Observable
Inputs
(Level 2) | | Significant
Unobservable
Inputs
(Level 3) | | Total | |
Equities | |
Information | | $ | 306,870,310 | | | $ | - | | | $ | - | | | $ | 306,870,310 | | |
Industrial Goods & Services | | | 281,758,103 | | | | - | | | | - | | | | 281,758,103 | | |
Consumer Goods & Services | | | 194,514,312 | | | | - | | | | - | | | | 194,514,312 | | |
Finance | | | 182,595,842 | | | | - | | | | - | | | | 182,595,842 | | |
Health Care | | | 163,393,996 | | | | - | | | | - | | | | 163,393,996 | | |
Other Industries | | | 68,726,704 | | | | - | | | | - | | | | 68,726,704 | | |
Energy & Minerals | | | 33,313,582 | | | | - | | | | - | | | | 33,313,582 | | |
Total Equities | | | 1,231,172,849 | | | | - | | | | - | | | | 1,231,172,849 | | |
Total Short-Term Investments | | | 82,842,913 | | | | - | | | | - | | | | 82,842,913 | | |
Total Securities Lending Collateral | | | 53,302,525 | | | | - | | | | - | | | | 53,302,525 | | |
Total Investments | | $ | 1,367,318,287 | | | $ | - | | | $ | - | | | $ | 1,367,318,287 | | |
There were no transfers of financial assets between levels during the period.
See accompanying notes to financial statements.
55
COLUMBIA ACORN INTERNATIONAL SELECTSM
MAJOR PORTFOLIO CHANGES IN THE SECOND QUARTER (UNAUDITED)
| | | Number of Shares | |
| | | 3/31/15 | | 6/30/15 | |
Purchases | |
Asia | |
| > Hong Kong | |
Hong Kong Exchanges and Clearing | | | 0 | | | | 121,517 | | |
| > Taiwan | |
Largan Precision | | | 0 | | | | 22,000 | | |
Europe | |
| > United Kingdom | |
WH Smith | | | 126,000 | | | | 232,000 | | |
| > Germany | |
MTU Aero Engines | | | 56,000 | | | | 62,300 | | |
| > France | |
Vivendi | | | 0 | | | | 111,000 | | |
| > Denmark | |
Novozymes | | | 65,500 | | | | 71,500 | | |
Other Countries | |
| > Canada | |
Vermilion Energy | | | 56,000 | | | | 85,000 | | |
| > South Africa | |
Naspers | | | 33,000 | | | | 61,000 | | |
| > United States | |
Anadarko Petroleum | | | 0 | | | | 27,000 | | |
| | | Number of Shares | |
| | | 3/31/15 | | 6/30/15 | |
Sales | |
Asia | |
| > Japan | |
Japan Tobacco | | | 190,000 | | | | 160,000 | | |
KDDI | | | 399,000 | | | | 359,000 | | |
NGK Spark Plug | | | 206,300 | | | | 190,600 | | |
Park24 | | | 181,000 | | | | 128,000 | | |
Recruit Holdings | | | 297,400 | | | | 262,000 | | |
Secom | | | 132,000 | | | | 120,000 | | |
Seven Bank | | | 777,000 | | | | 0 | | |
| > Korea | |
CJ Corp | | | 37,194 | | | | 26,294 | | |
| > Singapore | |
Ascendas REIT | | | 2,650,000 | | | | 0 | | |
CapitaLand Mall Trust | | | 6,491,000 | | | | 5,824,000 | | |
Singapore Exchange | | | 2,036,000 | | | | 1,564,000 | | |
Europe | |
| > United Kingdom | |
Babcock International | | | 330,000 | | | | 162,000 | | |
Whitbread | | | 47,689 | | | | 32,000 | | |
| > Germany | |
Telefonica Deutschland | | | 1,305,500 | | | | 976,500 | | |
| > Spain | |
Viscofan | | | 44,000 | | | | 39,000 | | |
| > Norway | |
Orkla | | | 511,000 | | | | 453,000 | | |
Other Countries | |
| > Canada | |
CCL Industries | | | 67,000 | | | | 51,000 | | |
| > Australia | |
Amcor | | | 350,000 | | | | 320,000 | | |
Challenger Financial | | | 2,062,000 | | | | 670,000 | | |
See accompanying notes to financial statements.
56
COLUMBIA ACORN INTERNATIONAL SELECTSM
STATEMENT OF INVESTMENTS (UNAUDITED), JUNE 30, 2015
Number of Shares | | | | Value | |
| | | | | | | Equities: 97.0% | |
Asia 42.6% | | | |
| | | > Japan 23.0% | |
| | 359,000 | | | KDDI | | $ | 8,663,371 | | |
| | | | | Mobile & Fixed Line Communication
Service Provider in Japan | | | | | |
| | 262,000 | | | Recruit Holdings | | | 7,989,497 | | |
| | | | | Recruitment & Media Services | | | | | |
| | 120,000 | | | Secom | | | 7,795,868 | | |
| | | | | Security Services | | | | | |
| | 160,000 | | | Japan Tobacco | | | 5,687,885 | | |
| | | | | Cigarettes | | | | | |
| | 190,600 | | | NGK Spark Plug | | | 5,278,511 | | |
| | | | | Automobile Parts | | | | | |
| | 2,400 | | | Orix JREIT | | | 3,456,764 | | |
| | | | | Diversified REIT | | | | | |
| | 1,530 | | | Nippon Prologis REIT | | | 2,815,417 | | |
| | | | | Logistics REIT in Japan | | | | | |
| | 1,300 | | | Japan Retail Fund | | | 2,599,596 | | |
| | | | | Retail REIT in Japan | | | | | |
| | 133,000 | | | Aeon Mall | | | 2,490,528 | | |
| | | | | Suburban Shopping Mall Developer,
Owner & Operator | | | | | |
| | 30,700 | | | Rinnai | | | 2,417,475 | | |
| | | | | Gas Appliances for Home &
Commercial Use | | | | | |
| | 128,000 | | | Park24 | | | 2,191,293 | | |
| | | | | Parking Lot Operator | | | | | |
| | | | 51,386,205 | | |
| | | > Korea 8.4% | |
| | 26,294 | | | CJ Corp | | | 6,966,175 | | |
| | | | | Holding Company of Korean
Consumer Conglomerate | | | | | |
| | 23,200 | | | Samsung Fire and Marine | | | 6,113,229 | | |
| | | | | Non-life Insurance | | | | | |
| | 66,800 | | | KT&G | | | 5,683,195 | | |
| | | | | Tobacco & Ginseng Products | | | | | |
| | | | 18,762,599 | | |
| | | > Singapore 8.2% | |
| | 5,824,000 | | | CapitaLand Mall Trust | | | 9,289,774 | | |
| | | | | Singapore Commercial Property
Real Estate Investment Trust | | | | | |
| | 1,564,000 | | | Singapore Exchange | | | 9,085,509 | | |
| | | | | Singapore Equity & Derivatives
Market Operator | | | | | |
| | | | 18,375,283 | | |
| | | > Hong Kong 1.9% | |
| | 121,517 | | | Hong Kong Exchanges and
Clearing | | | 4,281,599 | | |
| | | | | Hong Kong Equity & Derivatives
Market Operator | | | | | |
| | | > Taiwan 1.1% | |
| | 22,000 | | | Largan Precision | | | 2,511,318 | | |
| | | | | Mobile Device Camera
Lenses & Modules | | | | | |
Asia: Total | | | 95,317,004 | | |
Number of Shares | | | | Value | |
Europe 32.0% | | | |
| | | > United Kingdom 7.9% | |
| | 232,000 | | | WH Smith | | $ | 5,570,018 | | |
| | | | | Newsprint, Books & General
Stationery Retailer | | | | | |
| | 162,000 | | | Babcock International | | | 2,749,059 | | |
| | | | | Public Sector Outsourcer | | | | | |
| | 32,000 | | | Whitbread | | | 2,486,849 | | |
| | | | | UK Hotelier & Coffee Shop | | | | | |
| | 147,000 | | | Jardine Lloyd Thompson Group | | | 2,411,366 | | |
| | | | | International Business Insurance Broker | | | | | |
| | 100,000 | | | Aggreko | | | 2,261,028 | | |
| | | | | Temporary Power & Temperature
Control Services | | | | | |
| | 130,000 | | | Smith & Nephew | | | 2,193,779 | | |
| | | | | Medical Equipment & Supplies | | | | | |
| | | | 17,672,099 | | |
| | | > Germany 7.0% | |
| | 62,300 | | | MTU Aero Engines | | | 5,859,929 | | |
| | | | | Airplane Engine Components &
Services | | | | | |
| | 976,500 | | | Telefonica Deutschland | | | 5,628,324 | | |
| | | | | Mobile & Fixed-line Communications
in Germany | | | | | |
| | 107,400 | | | Wirecard (a) | | | 4,112,892 | | |
| | | | | Online Payment Processing &
Risk Management | | | | | |
| | | | 15,601,145 | | |
| | | > Switzerland 3.8% | |
| | 21,040 | | | Partners Group | | | 6,289,834 | | |
| | | | | Private Markets Asset Management | | | | | |
| | 6,600 | | | Geberit | | | 2,200,353 | | |
| | | | | Plumbing Systems | | | | | |
| | | | 8,490,187 | | |
| | | > France 3.4% | |
| | 146,000 | | | Eutelsat | | | 4,712,135 | | |
| | | | | Fixed Satellite Services | | | | | |
| | 111,000 | | | Vivendi (a) | | | 2,799,805 | | |
| | | | | Global Media Conglomerate | | | | | |
| | | | 7,511,940 | | |
| | | > Spain 3.3% | |
| | 655,000 | | | Distribuidora Internacional
de Alimentación | | | 5,002,051 | | |
| | | | | Discount Retailer in Spain &
Latin America | | | | | |
| | 39,000 | | | Viscofan | | | 2,358,743 | | |
| | | | | Sausage Casings Maker | | | | | |
| | | | 7,360,794 | | |
| | | > Sweden 2.5% | |
| | 120,000 | | | Swedish Match | | | 3,413,331 | | |
| | | | | Swedish Snus | | | | | |
| | 62,900 | | | Hexagon | | | 2,279,313 | | |
| | | | | Design, Measurement & Visualization
Software & Equipment | | | | | |
| | | | 5,692,644 | | |
| | | > Norway 1.6% | |
| | 453,000 | | | Orkla | | | 3,564,859 | | |
| | | | | Food & Brands, Aluminum,
Chemicals Conglomerate | | | | | |
See accompanying notes to financial statements.
57
COLUMBIA ACORN INTERNATIONAL SELECTSM
STATEMENT OF INVESTMENTS (UNAUDITED), CONTINUED
Number of Shares | | | | Value | |
| | | > Denmark 1.5% | |
| | 71,500 | | | Novozymes | | $ | 3,398,758 | | |
| | | | | Industrial Enzymes | | | | | |
| | | > Netherlands 1.0% | |
| | 44,000 | | | Vopak | | | 2,220,401 | | |
| | | | | Operator of Petroleum & Chemical
Storage Terminals | | | | | |
Europe: Total | | | 71,512,827 | | |
Other Countries 17.6% | | | |
| | | > Canada 6.3% | |
| | 51,000 | | | CCL Industries | | | 6,255,565 | | |
| | | | | Global Label Converter | | | | | |
| | 258,000 | | | Goldcorp | | | 4,179,600 | | |
| | | | | Gold Mining | | | | | |
| | 85,000 | | | Vermilion Energy (a) | | | 3,671,537 | | |
| | | | | Canadian Exploration &
Production Company | | | | | |
| | | | 14,106,702 | | |
| | | > South Africa 6.3% | |
| | 61,000 | | | Naspers | | | 9,501,479 | | |
| | | | | Media in Africa, China, Russia &
other Emerging Markets | | | | | |
| | 663,000 | | | Coronation Fund Managers | | | 4,491,027 | | |
| | | | | South African Fund Manager | | | | | |
| | | | 13,992,506 | | |
| | | > Australia 4.1% | |
| | 670,000 | | | Challenger Financial | | | 3,473,008 | | |
| | | | | Annuity Provider in Australia | | | | | |
| | 320,000 | | | Amcor | | | 3,381,601 | | |
| | | | | Global Leader in Flexible &
Rigid Packaging | | | | | |
| | 514,000 | | | IAG | | | 2,209,879 | | |
| | | | | General Insurance Provider | | | | | |
| | | | 9,064,488 | | |
| | | > United States 0.9% | |
| | 27,000 | | | Anadarko Petroleum | | | 2,107,620 | | |
| | | | | Worldwide Production of Oil & Gas | | | | | |
Other Countries: Total | | | 39,271,316 | | |
Latin America 4.8% | | | |
| | | > Guatemala 3.2% | |
| | 588,000 | | | Tahoe Resources | | | 7,127,558 | | |
| | | | | Silver & Gold Projects in
Guatemala & Peru | | | | | |
Number of Shares | | | | Value | |
| | | > Uruguay 0.8% | |
| | 191,666 | | | Union Agriculture Group (b)(c)(d) | | $ | 1,809,327 | | |
| | | | | Farmland Operator in Uruguay | | | | | |
| | | > Brazil 0.8% | |
| | 12,057,582 | | | Beadell Resources | | | 1,735,415 | | |
| | | | | Gold Mining in Brazil | | | | | |
Latin America: Total | | | 10,672,300 | | |
Total Equities: 97.0%
(Cost: $194,334,492) | | | 216,773,447 | (e) | |
Short-Term Investments 3.1% | | | |
| | 7,097,178 | | | JPMorgan U.S. Government
Money Market Fund, IM
Shares (7 day yield of 0.01%) | | | 7,097,178 | | |
Total Short-Term Investments: 3.1%
(Cost: $7,097,178) | | | 7,097,178 | | |
Securities Lending Collateral 3.8% | | | |
| | 8,381,123 | | | Dreyfus Government Cash
Management Fund,
Institutional Shares
(7 day yield of 0.01%) (f) | | | 8,381,123 | | |
Total Securities Lending Collateral: 3.8%
(Cost: $8,381,123) | | | 8,381,123 | | |
Total Investments: 103.9%
(Cost: $209,812,793)(g) | | | 232,251,748 | | |
Obligation to Return Collateral for
Securities Loaned: (3.8)% | | | (8,381,123 | ) | |
Cash and Other Assets Less
Liabilities: (0.1)% | | | (439,042 | ) | |
Net Assets: 100.0% | | $ | 223,431,583 | | |
REIT - Real Estate Investment Trust
> Notes to Statement of Investments
(a) All or a portion of this security was on loan at June 30, 2015. The total market value of securities on loan at June 30, 2015 was $7,925,539.
(b) Non-income producing security.
(c) Denotes a restricted security, which is subject to restrictions on resale under federal securities laws. This security is valued at fair value determined in good faith under consistently applied procedures established by the Fund's Board of Trustees. At June 30, 2015, the market value of this security amounted to $1,809,327, which represented 0.81% of total net assets. Additional information on this security is as follows:
Security | | Acquisition
Dates | | Shares/Units | | Cost | | Value | |
Union Agriculture Group | | 12/8/10-6/27/12 | | | 191,666 | | | $ | 2,200,000 | | | $ | 1,809,327 | | |
(d) Illiquid security.
See accompanying notes to financial statements.
58
> Notes to Statement of Investments
(e) On June 30, 2015, the Fund's total equity investments were denominated in currencies as follows:
Currency | | Value | | Percentage
of Net Assets | |
Japanese Yen | | $ | 51,386,205 | | | | 23.0 | | |
Euro | | | 32,694,280 | | | | 14.6 | | |
South Korean Won | | | 18,762,599 | | | | 8.4 | | |
Singapore Dollar | | | 18,375,283 | | | | 8.2 | | |
British Pound | | | 17,672,099 | | | | 7.9 | | |
Canadian Dollar | | | 17,054,660 | | | | 7.6 | | |
South African Rand | | | 13,992,506 | | | | 6.3 | | |
Other currencies less
than 5% of total net assets | | | 46,835,815 | | | | 21.0 | | |
Total Equities | | $ | 216,773,447 | | | | 97.0 | | |
(f) Investment made with cash collateral received from securities lending activity.
(g) At June 30, 2015, for federal income tax purposes, the cost of investments was approximately $209,812,793 and net unrealized appreciation was $22,438,955 consisting of gross unrealized appreciation of $39,310,920 and gross unrealized depreciation of $16,871,965.
At June 30, 2015, the Fund had entered into the following forward foreign currency exchange contracts:
Forward Foreign
Currency Exchange
Contracts to Buy | | Forward Foreign
Currency Exchange
Contracts to Sell | | Principal Amount
in Foreign Currency | | Principal Amount
in U.S. Dollar | | Settlement
Date | | Unrealized
Appreciation
(Depreciation) | |
USD | | | | ZAR | | | | | 112,653,000 | | | $ | 9,000,000 | | | 7/15/15 | | $ | (237,682 | ) | |
The counterparty for all forward foreign currency exchange contracts is Morgan Stanley.
USD - U.S. Dollar
ZAR - South African Rand
Fair Value Measurements
Various inputs are used in determining the value of the Fund's investments, following the input prioritization hierarchy established by accounting principles generally accepted in the United States of America (GAAP). These inputs are summarized in the three broad levels listed below:
• Level 1 – quoted prices in active markets for identical securities
• Level 2 – prices determined using other significant observable inputs (including quoted prices for similar securities, interest rates, prepayment speeds, credit risk and others)
• Level 3 – prices determined using significant unobservable inputs where quoted prices or observable inputs are unavailable or less reliable (including management's own assumptions about the factors market participants would use in pricing an investment)
The inputs or methodology used for valuing securities are not necessarily an indication of the risk associated with investing in those securities.
Examples of the types of securities in which the Fund would typically invest and how they are classified within this hierarchy are as follows. Typical Level 1 securities include exchange traded domestic equities, mutual funds whose NAVs are published each day and exchange traded foreign equities that are not statistically fair valued. Typical Level 2 securities include exchange traded foreign equities that are statistically fair valued, forward foreign currency exchange contracts and short-term investments valued at amortized cost. Additionally, securities fair valued by CWAM's Valuation Committee (the Committee) that rely on significant observable inputs are also included in Level 2. Typical Level 3 securities include any security fair valued by the Committee that relies on significant unobservable inputs.
The Committee is responsible for applying the Trust's Portfolio Pricing Policy and the CWAM pricing procedures (the Policies), which are approved by and subject to the oversight of the Board.
The Committee meets as necessary, and no less frequently than quarterly, to determine fair values for securities for which market quotations are not readily available or for which CWAM believes that available market quotations are unreliable. The Committee also reviews the continuing appropriateness of the Policies. In circumstances where a security has been fair valued, the Committee will also review the continuing appropriateness of the current value of the security. The Policies address, among other things: circumstances under which market quotations will be deemed readily available; selection of third party pricing vendors; appropriate pricing methodologies; events that require fair valuation and fair value techniques; circumstances under which securities will be deemed to pose a potential for stale pricing, including when securities are illiquid, restricted, or in default; and certain delegations of authority to determine fair values to the Fund's investment manager. The Committee may also meet to discuss additional valuation matters, which may include review of back-testing results, review of time-sensitive information or approval of other valuation related actions, and to review the appropriateness of the Policies.
For investments categorized as Level 3, the significant unobservable inputs used in the fair value measurement of the Fund's securities may include: (i) data specific to the issuer or comparable issuers, (ii) general market or specific sector news and (iii) quoted prices and specific or similar security transactions. The Committee considers this data and any changes from prior periods in order to assess the reasonableness of observable and unobservable inputs, any assumptions or internal models used to value
See accompanying notes to financial statements.
59
COLUMBIA ACORN INTERNATIONAL SELECTSM
STATEMENT OF INVESTMENTS (UNAUDITED), CONTINUED
> Notes to Statement of Investments
those securities and changes in fair value. Significant changes in any of these factors could result in lower or higher fair value measurements. Various factors impact the frequency of monitoring (which may occur as often as daily), however the Committee may determine that changes to inputs, assumptions and models are not required with the same frequency.
The following table summarizes the inputs used, as of June 30, 2015, in valuing the Fund's assets:
Investment Type | | Quoted Prices
(Level 1) | | Other
Significant
Observable
Inputs
(Level 2) | | Significant
Unobservable
Inputs
(Level 3) | | Total | |
Equities | |
Asia | | $ | – | | | $ | 95,317,004 | | | $ | – | | | $ | 95,317,004 | | |
Europe | | | – | | | | 71,512,827 | | | | – | | | | 71,512,827 | | |
Other Countries | | | 16,214,322 | | | | 23,056,994 | | | | – | | | | 39,271,316 | | |
Latin America | | | 7,127,558 | | | | 1,735,415 | | | | 1,809,327 | | | | 10,672,300 | | |
Total Equities | | | 23,341,880 | | | | 191,622,240 | | | | 1,809,327 | | | | 216,773,447 | | |
Total Short-Term Investments | | | 7,097,178 | | | | – | | | | – | | | | 7,097,178 | | |
Total Securities Lending Collateral | | | 8,381,123 | | | | – | | | | – | | | | 8,381,123 | | |
Total Investments | | $ | 38,820,181 | | | $ | 191,622,240 | | | $ | 1,809,327 | | | $ | 232,251,748 | | |
Derivatives | |
Liabilities | | | | | | | | | |
Forward Foreign Currency Exchange Contracts | | | – | | | | (237,682 | ) | | | – | | | | (237,682 | ) | |
Total | | $ | 38,820,181 | | | $ | 191,384,558 | | | $ | 1,809,327 | | | $ | 232,014,066 | | |
The Fund's assets assigned to the Level 2 input category are generally valued using a market approach, in which a security's value is determined through its correlation to prices and information from observable market transactions for similar or identical assets. Foreign equities are generally valued at the last sale price on the foreign exchange or market on which they trade. The Fund may use a statistical fair valuation model, in accordance with the policy adopted by the Board, provided by an independent third party to value securities principally traded in foreign markets in order to adjust for possible stale pricing that may occur between the close of the foreign exchanges and the time for valuation. These models take into account available market data including intraday index, ADR, and ETF movements. Forward foreign currency exchange contracts are valued at the prevailing forward exchange rate of the underlying currencies.
There were no transfers of financial assets between levels during the period.
The Fund does not hold any significant investments (greater than one percent of net assets) categorized as Level 3.
Certain securities classified as Level 3 are valued by the Committee at fair value, using a market approach, as determined in good faith under consistently applied procedures established by and under the general supervision of the Board. To determine fair value for these securities, for which no market exists, the Committee utilizes the valuation technique it deems most appropriate in the circumstances, using some unobservable inputs, which may include, but are not limited to estimated earnings of the company and the position of the security within the company's capital structure. The Committee also may use some observable inputs, which may include, but are not limited to, trades of similar securities and market multiples derived from a set of comparable companies. Significant increases or decreases to any of these inputs could result in a significantly lower or higher fair value measurement.
See accompanying notes to financial statements.
60
COLUMBIA ACORN INTERNATIONAL SELECTSM
PORTFOLIO DIVERSIFICATION (UNAUDITED)
At June 30, 2015, the Fund's portfolio investments as a percentage of net assets were diversified as follows:
| | | Value | | Percentage
of Net Assets | |
| > Information | |
Financial Processors | | $ | 17,480,000 | | | | 7.8 | | |
Internet Related | | | 9,501,479 | | | | 4.3 | | |
Mobile Communications | | | 8,663,371 | | | | 3.9 | | |
Advertising | | | 7,989,497 | | | | 3.6 | | |
Telephone & Data Services | | | 5,628,324 | | | | 2.5 | | |
Satellite Broadcasting & Services | | | 4,712,135 | | | | 2.1 | | |
Telecommunications Equipment | | | 2,511,318 | | | | 1.1 | | |
Business Software | | | 2,279,313 | | | | 1.0 | | |
| | | | 58,765,437 | | | | 26.3 | | |
| > Consumer Goods & Services | |
Nondurables | | | 17,626,644 | | | | 7.9 | | |
Retail | | | 10,572,069 | | | | 4.7 | | |
Other Durable Goods | | | 7,695,987 | | | | 3.4 | | |
Food & Beverage | | | 5,772,074 | | | | 2.6 | | |
Other Consumer Services | | | 2,799,805 | | | | 1.3 | | |
Restaurants | | | 2,486,849 | | | | 1.1 | | |
| | | | 46,953,428 | | | | 21.0 | | |
| > Industrial Goods & Services | |
Other Industrial Services | | | 18,108,119 | | | | 8.1 | | |
Conglomerates | | | 10,531,034 | | | | 4.7 | | |
Industrial Materials &
Specialty Chemicals | | | 6,780,359 | | | | 3.1 | | |
Outsourcing Services | | | 2,749,059 | | | | 1.2 | | |
Construction | | | 2,200,353 | | | | 1.0 | | |
| | | | 40,368,924 | | | | 18.1 | | |
| > Finance | |
Insurance | | | 14,207,481 | | | | 6.4 | | |
Brokerage & Money Management | | | 10,780,861 | | | | 4.8 | | |
| | | | 24,988,342 | | | | 11.2 | | |
| > Energy & Minerals | |
Mining | | | 13,042,573 | | | | 5.8 | | |
Oil & Gas Producers | | | 5,779,157 | | | | 2.6 | | |
Oil Refining, Marketing &
Distribution | | | 2,220,402 | | | | 1.0 | | |
Agricultural Commodities | | | 1,809,327 | | | | 0.8 | | |
| | | | 22,851,459 | | | | 10.2 | | |
| > Other Industries | |
Real Estate | | | 20,652,078 | | | | 9.2 | | |
| | | | 20,652,078 | | | | 9.2 | | |
| | | Value | | Percentage
of Net Assets | |
| > Health Care | |
Medical Equipment & Devices | | $ | 2,193,779 | | | | 1.0 | | |
| | | | 2,193,779 | | | | 1.0 | | |
Total Equities: | | | 216,773,447 | | | | 97.0 | | |
Short-Term Investments: | | | 7,097,178 | | | | 3.1 | | |
Securities Lending Collateral: | | | 8,381,123 | | | | 3.8 | | |
Total Investments: | | | 232,251,748 | | | | 103.9 | | |
Obligation to Return
Collateral for Securities
Loaned: | | | (8,381,123 | ) | | | (3.8 | ) | |
Cash and Other Assets
Less Liabilities: | | | (439,042 | ) | | | (0.1 | ) | |
Net Assets: | | $ | 223,431,583 | | | | 100.0 | | |
See accompanying notes to financial statements.
61
COLUMBIA ACORN SELECTSM
MAJOR PORTFOLIO CHANGES IN THE SECOND QUARTER (UNAUDITED)
| | | Number of Shares | |
| | | 3/31/15 | | 6/30/15 | |
Purchases | |
Industrial Goods & Services | |
Donaldson | | | 764,000 | | | | 850,000 | | |
Expeditors International of Washington | | | 0 | | | | 269,000 | | |
Generac | | | 0 | | | | 268,000 | | |
Robert Half International | | | 0 | | | | 200,000 | | |
Information | |
Bankrate | | | 595,000 | | | | 871,000 | | |
Crown Castle International | | | 0 | | | | 162,000 | | |
Ultimate Software | | | 0 | | | | 78,000 | | |
Consumer Goods & Services | |
Fossil | | | 120,000 | | | | 174,000 | | |
Gentex | | | 0 | | | | 1,035,000 | | |
GLG Life Tech (Canada) | | | 1,315,000 | | | | 2,539,770 | | |
The Fresh Market | | | 444,578 | | | | 669,000 | | |
Vail Resorts | | | 157,080 | | | | 175,000 | | |
Health Care | |
VWR | | | 325,000 | | | | 376,300 | | |
Energy & Minerals | |
Core Labs (Netherlands) | | | 47,000 | | | | 60,000 | | |
Gulfport Energy | | | 109,000 | | | | 134,000 | | |
| | | Number of Shares | |
| | | 3/31/15 | | 6/30/15 | |
Sales | |
Industrial Goods & Services | |
Ametek | | | 754,000 | | | | 703,000 | | |
Kennametal | | | 260,000 | | | | 0 | | |
LKQ | | | 1,050,000 | | | | 996,000 | | |
Nordson | | | 264,000 | | | | 230,000 | | |
Pall | | | 163,000 | | | | 0 | | |
Quanta Services | | | 500,000 | | | | 374,000 | | |
Information | |
Amphenol | | | 495,000 | | | | 287,000 | | |
F5 Networks | | | 181,000 | | | | 125,000 | | |
Informatica | | | 147,000 | | | | 0 | | |
Mettler-Toledo International | | | 59,500 | | | | 44,800 | | |
SBA Communications | | | 60,000 | | | | 0 | | |
Solera Holdings | | | 390,000 | | | | 350,000 | | |
Trimble Navigation | | | 525,000 | | | | 459,000 | | |
WNS - ADR | | | 875,000 | | | | 455,000 | | |
Finance | |
CNO Financial Group | | | 960,000 | | | | 787,000 | | |
Heath Care | |
Henry Schein | | | 41,000 | | | | 31,000 | | |
Seattle Genetics | | | 148,000 | | | | 0 | | |
Synageva BioPharma | | | 121,769 | | | | 0 | | |
Ultragenyx Pharmaceutical | | | 91,000 | | | | 80,000 | | |
Energy & Minerals | |
Cimarex Energy | | | 45,000 | | | | 0 | | |
Other Industries | |
EdR | | | 275,000 | | | | 256,000 | | |
Extra Space Storage | | | 166,000 | | | | 122,000 | | |
Post Properties | | | 197,000 | | | | 176,000 | | |
See accompanying notes to financial statements.
62
COLUMBIA ACORN SELECTSM
STATEMENT OF INVESTMENTS (UNAUDITED), JUNE 30, 2015
Number of Shares | | | | Value | |
| | | | | | | Equities: 97.4% | |
Industrial Goods & Services 29.6% | | | |
| | | > Machinery 16.1% | |
| | 703,000 | | | Ametek | | $ | 38,510,340 | | |
| | | | | Aerospace/Industrial Instruments | | | | | |
| | 850,000 | | | Donaldson | | | 30,430,000 | | |
| | | | | Industrial Air Filtration | | | | | |
| | 230,000 | | | Nordson | | | 17,914,700 | | |
| | | | | Dispensing Systems for Adhesives &
Coatings | | | | | |
| | 268,000 | | | Generac (a)(b) | | | 10,653,000 | | |
| | | | | Standby Power Generators | | | | | |
| | | | 97,508,040 | | |
| | | > Other Industrial Services 8.8% | |
| | 996,000 | | | LKQ (a) | | | 30,124,020 | | |
| | | | | Alternative Auto Parts Distribution | | | | | |
| | 269,000 | | | Expeditors International of
Washington | | | 12,402,245 | | |
| | | | | International Freight Forwarder | | | | | |
| | 200,000 | | | Robert Half International | | | 11,100,000 | | |
| | | | | Temporary & Permanent Staffing in
Finance, Accounting & other Professions | | | | | |
| | | | 53,626,265 | | |
| | | > Industrial Distribution 2.9% | |
| | 165,000 | | | Airgas | | | 17,453,700 | | |
| | | | | Industrial Gas Distributor | | | | | |
| | | > Outsourcing Services 1.8% | |
| | 374,000 | | | Quanta Services (a) | | | 10,778,680 | | |
| | | | | Electrical Transmission & Pipeline
Contracting Services | | | | | |
Industrial Goods & Services: Total | | | 179,366,685 | | |
Information 24.2% | | | |
| | | > Business Software 6.9% | |
| | 350,000 | | | Solera Holdings | | | 15,596,000 | | |
| | | | | Software for Automotive Insurance
Claims Processing | | | | | |
| | 149,000 | | | Ansys (a) | | | 13,594,760 | | |
| | | | | Simulation Software for Engineers &
Designers | | | | | |
| | 78,000 | | | Ultimate Software (a) | | | 12,818,520 | | |
| | | | | Human Capital Management Systems | | | | | |
| | | | 42,009,280 | | |
| | | > Instrumentation 4.3% | |
| | 44,800 | | | Mettler-Toledo International (a) | | | 15,297,408 | | |
| | | | | Laboratory Equipment | | | | | |
| | 459,000 | | | Trimble Navigation (a) | | | 10,768,140 | | |
| | | | | GPS-based Instruments | | | | | |
| | | | 26,065,548 | | |
| | | > Computer Hardware &
Related Equipment 2.8% | |
| | 287,000 | | | Amphenol | | | 16,637,390 | | |
| | | | | Electronic Connectors | | | | | |
| | | > Telecommunications Equipment 2.5% | |
| | 125,000 | | | F5 Networks (a) | | | 15,043,750 | | |
| | | | | Internet Traffic Management Equipment | | | | | |
Number of Shares | | | | Value | |
| | | > Mobile Communications 2.2% | |
| | 162,000 | | | Crown Castle International | | $ | 13,008,600 | | |
| | | | | Communications Towers | | | | | |
| | | > Computer Services 2.0% | |
| | 455,000 | | | WNS - ADR (a) | | | 12,171,250 | | |
| | | | | Offshore Business Process
Outsourcing Services | | | | | |
| | | > Business Information &
Marketing Services 1.5% | |
| | 871,000 | | | Bankrate (a) | | | 9,136,790 | | |
| | | | | Internet Advertising for the
Insurance, Credit Card &
Banking Markets | | | | | |
| | | > Internet Related 1.3% | |
| | 1,635,000 | | | Vonage (a) | | | 8,027,850 | | |
| | | | | Business & Consumer Internet
Telephony | | | | | |
| | | > Semiconductors &
Related Equipment 0.7% | |
| | 423,000 | | | Atmel | | | 4,168,665 | | |
| | | | | Microcontrollers, Radio Frequency &
Memory Semiconductors | | | | | |
Information: Total | | | 146,269,123 | | |
Consumer Goods & Services 14.9% | | | |
| | | > Retail 5.6% | |
| | 669,000 | | | The Fresh Market (a)(b) | | | 21,501,660 | | |
| | | | | Specialty Food Retailer | | | | | |
| | 174,000 | | | Fossil (a) | | | 12,068,640 | | |
| | | | | Watch Designer & Retailer | | | | | |
| | | | 33,570,300 | | |
| | | > Travel 3.2% | |
| | 175,000 | | | Vail Resorts | | | 19,110,000 | | |
| | | | | Ski Resort Operator & Developer | | | | | |
| | | > Other Durable Goods 2.8% | |
| | 1,035,000 | | | Gentex | | | 16,994,700 | | |
| | | | | Manufacturer of Auto Parts | | | | | |
| | | > Other Consumer Services 1.8% | |
| | 268,000 | | | Blackhawk Network (a) | | | 11,041,600 | | |
| | | | | Third-party Distributor of Prepaid
Content, Mostly Gift Cards | | | | | |
| | | > Consumer Goods Distribution 1.4% | |
| | 134,000 | | | United Natural Foods (a) | | | 8,533,120 | | |
| | | | | Distributor of Natural/Organic
Foods to Grocery Stores | | | | | |
| | | > Food & Beverage 0.1% | |
| | 2,539,770 | | | GLG Life Tech (Canada) (a)(b)(c) | | | 650,702 | | |
| | | | | Producer of an All-natural Sweetener
Extracted from the Stevia Plant | | | | | |
Consumer Goods & Services: Total | | | 89,900,422 | | |
Finance 12.3% | | | |
| | | > Brokerage & Money
Management 6.8% | |
| | 562,000 | | | SEI Investments | | | 27,554,860 | | |
| | | | | Mutual Fund Administration &
Investment Management | | | | | |
See accompanying notes to financial statements.
63
COLUMBIA ACORN SELECTSM
STATEMENT OF INVESTMENTS (UNAUDITED), CONTINUED
Number of Shares | | | | Value | |
| | | > Brokerage & Money
Management—continued | |
| | 348,000 | | | Eaton Vance | | $ | 13,617,240 | | |
| | | | | Specialty Mutual Funds | | | | | |
| | | | 41,172,100 | | |
| | | > Banks 3.1% | |
| | 915,000 | | | Associated Banc-Corp | | | 18,547,050 | | |
| | | | | Midwest Bank | | | | | |
| | | > Insurance 2.4% | |
| | 787,000 | | | CNO Financial Group | | | 14,441,450 | | |
| | | | | Life, Long-term Care & Medical
Supplement Insurance | | | | | |
Finance: Total | | | 74,160,600 | | |
Health Care 6.2% | | | |
| | | > Medical Supplies 4.8% | |
| | 243,000 | | | Cepheid (a) | | | 14,859,450 | | |
| | | | | Molecular Diagnostics | | | | | |
| | 376,300 | | | VWR (a) | | | 10,058,499 | | |
| | | | | Distributor of Lab Supplies | | | | | |
| | 31,000 | | | Henry Schein (a) | | | 4,405,720 | | |
| | | | | Distributor of Dental, Vet &
Medical Products | | | | | |
| | | | 29,323,669 | | |
| | | > Biotechnology & Drug Delivery 1.4% | |
| | 80,000 | | | Ultragenyx Pharmaceutical (a) | | | 8,191,200 | | |
| | | | | Biotech Focused on "Ultra-Orphan"
Drugs | | | | | |
Health Care: Total | | | 37,514,869 | | |
Energy & Minerals 6.0% | | | |
| | | > Agricultural Commodities 2.7% | |
| | 1,742,424 | | | Union Agriculture Group
(Uruguay) (a)(d)(e) | | | 16,448,482 | | |
| | | | | Farmland Operator in Uruguay | | | | | |
| | | > Oil & Gas Producers 1.2% | |
| | 118,000 | | | Carrizo Oil & Gas (a) | | | 5,810,320 | | |
| | | | | Oil & Gas Producer | | | | | |
| | 22,500,000 | | | Canadian Overseas
Petroleum (Canada) (a)(c)(d) | | | 1,369,095 | | |
| | | | | Oil & Gas Exploration Offshore
West Africa | | | | | |
| | 4,250,000 | | | Petromanas (Canada) (a)(b) | | | 187,150 | | |
| | | | | Exploring for Oil in Albania | | | | | |
| | | | 7,366,565 | | |
| | | > Mining 1.2% | |
| | 60,000 | | | Core Labs (Netherlands) (b) | | | 6,842,400 | | |
| | | | | Oil & Gas Reservoir Consulting | | | | | |
Number of Shares | | | | Value | |
| | | > Oil Services 0.9% | |
| | 134,000 | | | Gulfport Energy (a) | | $ | 5,393,500 | | |
| | | | | Oil & Gas Producer Focused on
Utica Shale in Ohio | | | | | |
Energy & Minerals: Total | | | 36,050,947 | | |
Other Industries 4.2% | | | |
| | | > Real Estate 4.2% | |
| | 176,000 | | | Post Properties | | | 9,569,120 | | |
| | | | | Multifamily Properties | | | | | |
| | 256,000 | | | EdR | | | 8,028,160 | | |
| | | | | Student Housing | | | | | |
| | 122,000 | | | Extra Space Storage | | | 7,956,840 | | |
| | | | | Self Storage Facilities | | | | | |
| | | | 25,554,120 | | |
Other Industries: Total | | | 25,554,120 | | |
Total Equities: 97.4%
(Cost: $452,506,157) | | | 588,816,766 | (f) | |
Short-Term Investments 1.4% | | | |
| | 8,467,201 | | | JPMorgan U.S. Government
Money Market Fund, Agency
Shares (7 day yield of 0.01%) | | | 8,467,201 | | |
Total Short-Term Investments: 1.4%
(Cost: $8,467,201) | | | 8,467,201 | | |
Securities Lending Collateral 2.3% | | | |
| | 14,060,046 | | | Dreyfus Government Cash
Management Fund,
Institutional Shares
(7 day yield of 0.01%) (g) | | | 14,060,046 | | |
Total Securities Lending Collateral: 2.3%
(Cost: $14,060,046) | | | 14,060,046 | | |
Total Investments: 101.1%
(Cost: $475,033,404)(h) | | | 611,344,013 | | |
Obligation to Return Collateral for
Securities Loaned: (2.3)% | | | (14,060,046 | ) | |
Cash and Other Assets Less
Liabilities: 1.2% | | | 7,464,877 | | |
Net Assets: 100.0% | | $ | 604,748,844 | | |
ADR - American Depositary Receipts
See accompanying notes to financial statements.
> Notes to Statement of Investments
(a) Non-income producing security.
(b) All or a portion of this security was on loan at June 30, 2015. The total market value of securities on loan at June 30, 2015 was $13,779,499.
64
> Notes to Statement of Investments
(c) An affiliated person of the Fund, as defined in the Investment Company Act of 1940, may include any company in which the Fund owns five percent or more of its outstanding voting shares. Holdings and transactions in these affiliated companies during the period ended June 30, 2015, are as follows:
Security | | Balance of
Shares Held
12/31/14 | | Purchases/
Additions | | Sales/
Reductions | | Balance of
Shares Held
6/30/15 | | Value | | Dividend | |
Canadian Overseas Petroleum | | | 22,500,000 | | | | - | | | | - | | | | 22,500,000 | | | $ | 1,369,095 | | | $ | - | | |
GLG Life Tech | | | 1,500,000 | | | | 1,224,770 | | | | 185,000 | | | | 2,539,770 | | | | 650,702 | | | | |
Petrodorado Energy (1) | | | 3,370,000 | | | | - | | | | 3,370,000 | | | | - | | | | - | | | | - | | |
Total of Affiliated Transactions | | | 27,370,000 | | | | 1,224,770 | | | | 3,555,000 | | | | 25,039,770 | | | $ | 2,019,797 | | | $ | - | | |
(1) At June 30, 2015, the Fund owned less than five percent of the company's outstanding voting shares.
The aggregate cost and value of these companies at June 30, 2015, was $17,688,954 and $2,019,797, respectively. Investments in affiliated companies represented 0.33% of the Fund's total net assets at June 30, 2015.
(d) Denotes a restricted security, which is subject to restrictions on resale under federal securities laws. These securities are valued at fair value determined in good faith under consistently applied procedures established by the Fund's Board of Trustees. At June 30, 2015, the market value of these securities amounted to $17,817,577, which represented 2.95% of total net assets. Additional information on these securities is as follows:
Security | | Acquisition
Dates | | Shares/Units | | Cost | | Value | |
Union Agriculture Group | | 12/8/10-6/27/12 | | | 1,742,424 | | | $ | 20,000,000 | | | $ | 16,448,482 | | |
Canadian Overseas Petroleum | | 11/24/10 | | | 22,500,000 | | | | 9,596,330 | | | | 1,369,095 | | |
| | | | | | | $ | 29,596,330 | | | $ | 17,817,577 | | |
(e) Illiquid security.
(f) On June 30, 2015, the market value of foreign securities represented 4.22% of total net assets. The Fund's foreign portfolio was diversified as follows:
Country | | Value | | Percentage
of Net Assets | |
Uruguay | | $ | 16,448,483 | | | | 2.72 | | |
Netherlands | | | 6,842,400 | | | | 1.13 | | |
Canada | | | 2,206,947 | | | | 0.37 | | |
Total Foreign Portfolio | | $ | 25,497,830 | | | | 4.22 | | |
(g) Investment made with cash collateral received from securities lending activity.
(h) At June 30, 2015, for federal income tax purposes, the cost of investments was approximately $475,033,404 and net unrealized appreciation was $136,310,609 consisting of gross unrealized appreciation of $168,433,250 and gross unrealized depreciation of $32,122,641.
Fair Value Measurements
Various inputs are used in determining the value of the Fund's investments, following the input prioritization hierarchy established by accounting principles generally accepted in the United States of America (GAAP). These inputs are summarized in the three broad levels listed below:
• Level 1 – quoted prices in active markets for identical securities
• Level 2 – prices determined using other significant observable inputs (including quoted prices for similar securities, interest rates, prepayment speeds, credit risk and others)
• Level 3 – prices determined using significant unobservable inputs where quoted prices or observable inputs are unavailable or less reliable (including management's own assumptions about the factors market participants would use in pricing an investment)
The inputs or methodology used for valuing securities are not necessarily an indication of the risk associated with investing in those securities.
Examples of the types of securities in which the Fund would typically invest and how they are classified within this hierarchy are as follows. Typical Level 1 securities include exchange traded domestic equities, mutual funds whose NAVs are published each day and exchange traded foreign equities that are not statistically fair valued. Typical Level 2 securities include exchange traded foreign equities that are statistically fair valued, forward foreign currency exchange contracts and short-term investments valued at amortized cost. Additionally, securities fair valued by CWAM's Valuation Committee (the Committee) that rely on significant observable inputs are also included in Level 2. Typical Level 3 securities include any security fair valued by the Committee that relies on significant unobservable inputs.
The Committee is responsible for applying the Trust's Portfolio Pricing Policy and the CWAM pricing procedures (the Policies), which are approved by and subject to the oversight of the Board.
The Committee meets as necessary, and no less frequently than quarterly, to determine fair values for securities for which market quotations are not readily available or for which CWAM believes that available market quotations are unreliable. The Committee also reviews the continuing appropriateness of the Policies. In circumstances where a security has been fair valued, the Committee will also review the continuing appropriateness of the current value of the security. The Policies address, among other things: circumstances under which market quotations will be deemed readily available; selection of third party pricing vendors; appropriate pricing methodologies; events that
See accompanying notes to financial statements.
65
COLUMBIA ACORN SELECTSM
STATEMENT OF INVESTMENTS (UNAUDITED), CONTINUED
> Notes to Statement of Investments
require fair valuation and fair value techniques; circumstances under which securities will be deemed to pose a potential for stale pricing, including when securities are illiquid, restricted, or in default; and certain delegations of authority to determine fair values to the Fund's investment manager. The Committee may also meet to discuss additional valuation matters, which may include review of back-testing results, review of time-sensitive information or approval of other valuation related actions, and to review the appropriateness of the Policies.
For investments categorized as Level 3, the significant unobservable inputs used in the fair value measurement of the Fund's securities may include: (i) data specific to the issuer or comparable issuers, (ii) general market or specific sector news and (iii) quoted prices and specific or similar security transactions. The Committee considers this data and any changes from prior periods in order to assess the reasonableness of observable and unobservable inputs, any assumptions or internal models used to value those securities and changes in fair value. Significant changes in any of these factors could result in lower or higher fair value measurements. Various factors impact the frequency of monitoring (which may occur as often as daily), however the Committee may determine that changes to inputs, assumptions and models are not required with the same frequency.
The following table summarizes the inputs used, as of June 30, 2015, in valuing the Fund's assets:
Investment Type | | Quoted Prices
(Level 1) | | Other
Significant
Observable
Inputs
(Level 2) | | Significant
Unobservable
Inputs
(Level 3) | | Total | |
Equities | |
Industrial Goods & Services | | $ | 179,366,685 | | | $ | - | | | $ | - | | | $ | 179,366,685 | | |
Information | | | 146,269,123 | | | | - | | | | - | | | | 146,269,123 | | |
Consumer Goods & Services | | | 89,900,422 | | | | - | | | | - | | | | 89,900,422 | | |
Finance | | | 74,160,600 | | | | - | | | | - | | | | 74,160,600 | | |
Health Care | | | 37,514,869 | | | | - | | | | - | | | | 37,514,869 | | |
Energy & Minerals | | | 18,233,370 | | | | 1,369,095 | | | | 16,448,482 | | | | 36,050,947 | | |
Other Industries | | | 25,554,120 | | | | - | | | | - | | | | 25,554,120 | | |
Total Equities | | | 570,999,189 | | | | 1,369,095 | | | | 16,448,482 | | | | 588,816,766 | | |
Total Short-Term Investments | | | 8,467,201 | | | | - | | | | - | | | | 8,467,201 | | |
Total Securities Lending Collateral | | | 14,060,046 | | | | - | | | | - | | | | 14,060,046 | | |
Total Investments | | $ | 593,526,436 | | | $ | 1,369,095 | | | $ | 16,448,482 | | | $ | 611,344,013 | | |
The Fund's assets assigned to the Level 2 input category are generally valued using a market approach, in which a security's value is determined through its correlation to prices and information from observable market transactions for similar or identical assets. Securities acquired via private placement that have a holding period or an extended settlement period are valued at a discount to the same shares that are trading freely on the market. These discounts are determined by the investment manager's experience with similar securities or situations. Factors may include, but are not limited to, trade volume, shares outstanding and stock price.
There were no transfers of financial assets between levels during the period.
The following table reconciles asset balances for the period ending June 30, 2015, in which significant observable and/or unobservable inputs (Level 3) were used in determining value:
Investments in Securities | | Balance as
of December 31,
2014 | | Realized
Gain (Loss) | | Change
in Unrealized
Appreciation
(Depreciation) | | Purchases | | Sales | | Transfers
into
Level 3 | | Transfers
out of
Level 3 | | Balance as
of June 30,
2015 | |
Equities | |
Energy & Minerals | | $ | 15,908,331 | | | $ | - | | | $ | 540,151 | | | $ | - | | | $ | - | | | $ | - | | | $ | - | | | $ | 16,448,482 | | |
The information in the above reconciliation table represents fiscal year to date activity for any securities identified as using Level 3 inputs at either the beginning or the end of the current fiscal period.
The change in unrealized appreciation attributed to securities owned at June 30, 2015, which were valued using significant unobservable inputs (Level 3), amounted to $540,151.
Quantitative information pertaining to Level 3 unobservable fair value measurements
| | Fair Value at
June 30, 2015 | | Valuation Technique(s) | | Unabservable Input(s) | | Range (Weighted
Average) | |
Equities
Energy & Minerals | | $ | 16,448,482 | | | Market comparable
companies | | Discount for lack
of marketability | | | 7 | %—23% | |
Certain securities classified as Level 3 are valued by the Committee at fair value, using a market approach, as determined in good faith under consistently applied procedures established by and under the general supervision of the Board. To determine fair value for these securities, for which no market exists, the Committee utilizes the valuation technique it deems most appropriate in the circumstances, using some unobservable inputs, which may include, but are not limited to estimated earnings of the company and the position of the security within the company's capital structure. The Committee also may use some observable inputs, which may include, but are not limited to, trades of similar securities and market multiples derived from a set of comparable companies. Significant increases or decreases to any of these inputs could result in a significantly lower or higher fair value measurement.
See accompanying notes to financial statements.
66
COLUMBIA THERMOSTAT FUNDSM
STATEMENT OF INVESTMENTS (UNAUDITED), JUNE 30, 2015
Number of Shares | | | | Value | |
| | | > Affiliated Bond Funds 75.1% | |
| | 35,516,291 | | | Columbia Short Term Bond
Fund, Class I Shares (a) | | $ | 353,387,100 | | |
| | 17,854,552 | | | Columbia Income Opportunities
Fund, Class I Shares (a) | | | 177,474,246 | | |
| | 32,127,882 | | | Columbia U.S. Government
Mortgage Fund, Class I
Shares (a) | | | 177,024,633 | | |
| | 19,415,464 | | | Columbia Intermediate Bond
Fund, Class I Shares (a) | | | 176,874,874 | | |
Total Affiliated Bond Funds:
(Cost: $879,787,703) | | | 884,760,853 | | |
| | | > Affiliated Stock Funds 25.0% | |
| | 1,355,680 | | | Columbia Acorn International,
Class I Shares (a) | | | 59,066,971 | | |
| | 2,645,290 | | | Columbia Contrarian Core
Fund, Class I Shares (a) | | | 58,989,967 | | |
| | 3,184,853 | | | Columbia Dividend Income
Fund, Class I Shares (a) | | | 58,919,778 | | |
| | 1,606,465 | | | Columbia Select Large Cap
Growth Fund, Class I
Shares (a)(b) | | | 29,623,205 | | |
| | 909,100 | | | Columbia Acorn Fund,
Class I Shares (a)(b) | | | 29,573,038 | | |
| | 1,341,246 | | | Columbia Acorn Select,
Class I Shares (a)(b) | | | 29,507,415 | | |
| | 1,383,097 | | | Columbia Large Cap Enhanced
Core Fund, Class I Shares (a) | | | 29,487,629 | | |
Total Affiliated Stock Funds:
(Cost: $266,299,011) | | | 295,168,003 | | |
Number of Shares | | | | Value | |
| | | > Short-Term Investments 0.5% | |
| | 5,691,503 | | | JPMorgan U.S. Government
Money Market Fund, Agency
Shares (7 day yield of 0.01%) | | $ | 5,691,503 | | |
Total Short-Term Investments:
(Cost: $5,691,503) | | | 5,691,503 | | |
Total Investments: 100.6%
(Cost: $1,151,778,217)(c) | | | 1,185,620,359 | | |
Cash and Other Assets Less
Liabilities: (0.6)% | | | (7,318,809 | ) | |
Net Assets: 100.0% | | $ | 1,178,301,550 | | |
> Notes to Statement of Investments
(a) An affiliated person of the Fund, as defined in the Investment Company Act of 1940, may include any company in which the Fund owns five percent or more of its outstanding voting shares. Holdings and transactions in these affiliated companies during the period ended June 30, 2015, are as follows:
Security | | Balance of
Shares Held
12/31/14 | | Purchases/
Additions | | Sales/
Reductions | | Balance of
Shares Held
6/30/15 | | Value | | Dividend | |
Columbia Short Term Bond Fund, Class I Shares | | | 42,849,246 | | | | 2,763,972 | | | | 10,096,927 | | | | 35,516,291 | | | $ | 353,387,100 | | | $ | 2,222,711 | | |
Columbia Income Opportunities Fund, Class I Shares | | | 21,780,174 | | | | 1,600,546 | | | | 5,526,168 | | | | 17,854,552 | | | | 177,474,246 | | | | 5,023,196 | | |
Columbia U.S. Government Mortgage Fund, Class I Shares | | | 28,883,507 | | | | 7,407,947 | | | | 4,163,572 | | | | 32,127,882 | | | | 177,024,633 | | | | 2,621,759 | | |
Columbia Intermediate Bond Fund, Class I Shares | | | 28,994,280 | | | | 1,854,895 | | | | 11,433,711 | | | | 19,415,464 | | | | 176,874,874 | | | | 3,236,595 | | |
Columbia Acorn International, Class I Shares | | | 898,450 | | | | 848,428 | | | | 391,198 | | | | 1,355,680 | | | | 59,066,971 | | | | - | | |
Columbia Contrarian Core Fund, Class I Shares | | | 1,291,662 | | | | 1,933,262 | | | | 579,634 | | | | 2,645,290 | | | | 58,989,967 | | | | - | | |
Columbia Dividend Income Fund, Class I Shares | | | 1,962,468 | | | | 1,978,105 | | | | 755,720 | | | | 3,184,853 | | | | 58,919,778 | | | | 489,414 | | |
Columbia Select Large Cap Growth Fund, Class I Shares | | | 1,023,561 | | | | 1,065,033 | | | | 482,129 | | | | 1,606,465 | | | | 29,623,205 | | | | - | | |
Columbia Acorn Fund, Class I Shares | | | 879,308 | | | | 420,682 | | | | 390,890 | | | | 909,100 | | | | 29,573,038 | | | | - | | |
Columbia Acorn Select, Class I Shares | | | 836,113 | | | | 888,927 | | | | 383,794 | | | | 1,341,246 | | | | 29,507,415 | | | | - | | |
Columbia Large Cap Enhanced Core Fund, Class I Shares | | | 870,296 | | | | 861,625 | | | | 348,824 | | | | 1,383,097 | | | | 29,487,629 | | | | 207,636 | | |
Total of Affiliated Transactions | | | 130,269,065 | | | | 21,623,422 | | | | 34,552,567 | | | | 117,339,920 | | | $ | 1,179,928,856 | | | $ | 13,801,311 | | |
The aggregate cost and value of these companies at June 30, 2015, was $1,146,086,714 and $1,179,928,856, respectively. Investments in affiliated companies represented 100.14% of the Fund's total net assets at June 30, 2015.
(b) Non-income producing security.
(c) At June 30, 2015, for federal income tax purposes, the cost of investments was approximately $1,151,778,217 and net unrealized appreciation was $33,842,142 consisting of gross unrealized appreciation of $34,822,062 and gross unrealized depreciation of $979,920.
See accompanying notes to financial statements.
67
COLUMBIA THERMOSTAT FUNDSM
STATEMENT OF INVESTMENTS (UNAUDITED), CONTINUED
> Notes to Statement of Investments
Fair Value Measurements
Various inputs are used in determining the value of the Fund's investments, following the input prioritization hierarchy established by accounting principles generally accepted in the United States of America (GAAP). These inputs are summarized in the three broad levels listed below:
• Level 1 – quoted prices in active markets for identical securities
• Level 2 – prices determined using other significant observable inputs (including quoted prices for similar securities, interest rates, prepayment speeds, credit risk and others)
• Level 3 – prices determined using significant unobservable inputs where quoted prices or observable inputs are unavailable or less reliable (including management's own assumptions about the factors market participants would use in pricing an investment)
The inputs or methodology used for valuing securities are not necessarily an indication of the risk associated with investing in those securities.
Examples of the types of securities in which the Fund would typically invest and how they are classified within this hierarchy are as follows. Typical Level 1 securities include mutual funds whose NAVs are published each day.
CWAM's Valuation Committee (the Committee), is responsible for applying the Trust's Portfolio Pricing Policy and the CWAM pricing procedures (the Policies), which are approved by and subject to the oversight of the Board.
The Committee meets as necessary, and no less frequently than quarterly, to determine fair values for securities for which market quotations are not readily available or for which CWAM believes that available market quotations are unreliable. The Committee also reviews the continuing appropriateness of the Policies. In circumstances where a security has been fair valued, the Committee will also review the continuing appropriateness of the current value of the security. The Policies address, among other things: circumstances under which market quotations will be deemed readily available; selection of third party pricing vendors; appropriate pricing methodologies; events that require fair valuation and fair value techniques; circumstances under which securities will be deemed to pose a potential for stale pricing, including when securities are illiquid, restricted, or in default; and certain delegations of authority to determine fair values to the Fund's investment manager. The Committee may also meet to discuss additional valuation matters, which may include review of back-testing results, review of time-sensitive information or approval of other valuation related actions, and to review the appropriateness of the Policies.
For investments categorized as Level 3, the significant unobservable inputs used in the fair value measurement of the Fund's securities may include: (i) data specific to the issuer or comparable issuers, (ii) general market or specific sector news and (iii) quoted prices and specific or similar security transactions. The Committee considers this data and any changes from prior periods in order to assess the reasonableness of observable and unobservable inputs, any assumptions or internal models used to value those securities and changes in fair value. Significant changes in any of these factors could result in lower or higher fair value measurements. Various factors impact the frequency of monitoring (which may occur as often as daily), however the Committee may determine that changes to inputs, assumptions and models are not required with the same frequency.
The following table summarizes the inputs used, as of June 30, 2015, in valuing the Fund's assets:
Investment Type | | Quoted Prices
(Level 1) | | Other
Significant
Observable
Inputs
(Level 2) | | Significant
Unobservable
Inputs
(Level 3) | | Total | |
Total Affiliated Bond Funds | | $ | 884,760,853 | | | $ | - | | | $ | - | | | $ | 884,760,853 | | |
Total Affiliated Stock Funds | | | 295,168,003 | | | | - | | | | - | | | | 295,168,003 | | |
Total Short-Term Investments | | | 5,691,503 | | | | - | | | | - | | | | 5,691,503 | | |
Total Investments | | $ | 1,185,620,359 | | | $ | - | | | $ | - | | | $ | 1,185,620,359 | | |
There were no transfers of financial assets between levels during the period.
See accompanying notes to financial statements.
68
COLUMBIA ACORN EMERGING MARKETS FUNDSM
MAJOR PORTFOLIO CHANGES IN THE SECOND QUARTER (UNAUDITED)
| | | Number of Shares | |
| | | 3/31/15 | | 6/30/15 | |
Purchases | |
Asia | |
| > China | |
| 51job - ADR | | | 0 | | | | 66,000 | | |
Canvest Environment Protection | | | 0 | | | | 9,263,000 | | |
CapitaLand Retail China Trust | | | 0 | | | | 3,757,000 | | |
CAR Inc | | | 0 | | | | 3,668,000 | | |
Chongqing Rural
Commercial Bank | | | 0 | | | | 5,600,000 | | |
Jiangnan Group | | | 0 | | | | 15,338,000 | | |
NewOcean Energy | | | 11,330,000 | | | | 13,784,000 | | |
Phoenix Healthcare Group | | | 0 | | | | 2,265,000 | | |
Phoenix New Media - ADR | | | 257,000 | | | | 464,000 | | |
Shanghai Industrial | | | 0 | | | | 1,207,000 | | |
TravelSky Technology | | | 0 | | | | 2,459,000 | | |
Xinhua Winshare Publishing | | | 2,146,000 | | | | 3,303,000 | | |
| > Taiwan | |
Far EasTone Telecom | | | 0 | | | | 1,900,000 | | |
Largan Precision | | | 55,000 | | | | 59,000 | | |
Novatek Microelectronics | | | 0 | | | | 881,000 | | |
Silergy | | | 0 | | | | 160,000 | | |
Vanguard International
Semiconductor | | | 2,814,000 | | | | 4,177,000 | | |
Voltronic Power | | | 404,000 | | | | 424,000 | | |
| > India | |
Amara Raja | | | 0 | | | | 110,352 | | |
Container Corporation of India | | | 140,070 | | | | 160,788 | | |
| > Indonesia | |
Surya Citra Media | | | 0 | | | | 18,149,000 | | |
| > Thailand | |
Mega Lifesciences | | | 0 | | | | 6,899,100 | | |
| > Singapore | |
China Everbright Water | | | 0 | | | | 5,345,200 | | |
SIIC Environment | | | 0 | | | | 42,467,800 | | |
| > Malaysia | |
Astro Malaysia Holdings | | | 114,500 | | | | 5,300,000 | | |
Latin America | |
| > Mexico | |
Grupo Aeroportuario del
Sureste - ADR | | | 40,525 | | | | 48,525 | | |
Qualitas | | | 2,500,000 | | | | 3,748,000 | | |
Other Countries | |
| > Egypt | |
Commercial International
Bank of Egypt | | | 593,000 | | | | 975,991 | | |
Europe | |
| > United Kingdom | |
PureCircle | | | 580,790 | | | | 736,860 | | |
| | | Number of Shares | |
| | | 3/31/15 | | 6/30/15 | |
Sales | |
Asia | |
| > China | |
AMVIG Holdings | | | 31,000,000 | | | | 25,200,000 | | |
China Everbright International | | | 3,128,000 | | | | 2,340,000 | | |
Sino Biopharmaceutical | | | 4,925,000 | | | | 0 | | |
WuXi PharmaTech - ADR | | | 121,000 | | | | 117,000 | | |
| > Taiwan | |
Advantech | | | 598,988 | | | | 575,988 | | |
Chroma Ate | | | 2,050,990 | | | | 775,990 | | |
Ginko International | | | 360,000 | | | | 340,000 | | |
PChome Online | | | 570,000 | | | | 440,000 | | |
President Chain Store | | | 1,240,000 | | | | 940,000 | | |
| > India | |
Bosch | | | 17,632 | | | | 0 | | |
United Breweries | | | 353,739 | | | | 318,483 | | |
| > Indonesia | |
Ace Indonesia | | | 82,889,190 | | | | 0 | | |
Link Net | | | 11,800,000 | | | | 10,600,000 | | |
Matahari Department Store | | | 4,248,600 | | | | 4,068,700 | | |
Mayora Indah | | | 2,300,000 | | | | 0 | | |
MNC Sky Vision | | | 61,839,700 | | | | 59,276,600 | | |
Tower Bersama Infrastructure | | | 6,744,300 | | | | 6,406,300 | | |
| > Philippines | |
Melco Crown (Philippines)
Resorts | | | 41,313,300 | | | | 34,926,300 | | |
Puregold Price Club | | | 5,613,200 | | | | 5,087,200 | | |
Robinsons Retail Holdings | | | 2,636,090 | | | | 2,451,090 | | |
| > Thailand | |
Robinson Department Store | | | 3,737,700 | | | | 3,271,700 | | |
Samui Airport Property Fund | | | 10,016,800 | | | | 8,732,800 | | |
| > Singapore | |
Petra Foods | | | 1,829,000 | | | | 1,397,400 | | |
| > Hong Kong | |
Melco International | | | 5,817,000 | | | | 2,616,000 | | |
Sa Sa International | | | 5,583,799 | | | | 0 | | |
| > Korea | |
Grand Korea Leisure | | | 98,149 | | | | 0 | | |
Koh Young Technology | | | 256,088 | | | | 241,088 | | |
The Basic House | | | 421,000 | | | | 0 | | |
| > Malaysia | |
7-Eleven Malaysia Holdings | | | 12,777,900 | | | | 10,000,000 | | |
Aeon | | | 4,006,700 | | | | 0 | | |
| > Japan | |
Kansai Paint | | | 310,760 | | | | 0 | | |
See accompanying notes to financial statements.
69
COLUMBIA ACORN EMERGING MARKETS FUNDSM
MAJOR PORTFOLIO CHANGES IN THE SECOND QUARTER (UNAUDITED), CONTINUED
| | | Number of Shares | |
| | | 3/31/15 | | 6/30/15 | |
Sales (continued) | |
Latin America | |
| > Brazil | |
Beadell Resources | | | 335,646 | | | | 0 | | |
Localiza Rent A Car | | | 677,970 | | | | 595,970 | | |
| > Chile | |
Forus | | | 1,943,078 | | | | 1,586,000 | | |
Other Countries | |
| > South Africa | |
Coronation Fund Managers | | | 1,955,513 | | | | 1,795,460 | | |
Mr. Price | | | 288,041 | | | | 0 | | |
Rand Merchant Insurance | | | 2,599,148 | | | | 2,262,148 | | |
| > United States | |
Bladex | | | 171,094 | | | | 140,000 | | |
Europe | |
| > United Kingdom | |
Cable and Wireless | | | 10,175,965 | | | | 7,207,000 | | |
| > France | |
Eutelsat | | | 200,000 | | | | 0 | | |
| > Italy | |
Pirelli | | | 270,882 | | | | 0 | | |
| > Spain | |
Prosegur | | | 1,148,390 | | | | 0 | | |
| > Sweden | |
Hexagon | | | 207,455 | | | | 0 | | |
See accompanying notes to financial statements.
70
COLUMBIA ACORN EMERGING MARKETS FUNDSM
STATEMENT OF INVESTMENTS (UNAUDITED), JUNE 30, 2015
Number of Shares | | | | Value | |
| | | | | | | Equities: 97.0% | |
Asia 71.8% | | | |
| | | > China 21.3% | |
| | 25,200,000 | | | AMVIG Holdings | | $ | 13,003,851 | | |
| | | | | Chinese Tobacco Packaging
Material Supplier | | | | | |
| | 3,668,000 | | | CAR Inc (a) | | | 7,795,304 | | |
| | | | | Consolidator of Chinese Auto
Rental Sector | | | | | |
| | 126,613 | | | BitAuto - ADR (a) | | | 6,463,594 | | |
| | | | | Automotive Information Website for
Buyers & Dealers | | | | | |
| | 13,784,000 | | | NewOcean Energy | | | 6,397,958 | | |
| | | | | Southern China Liquefied Petroleum
Gas Distributor | | | | | |
| | 11,951,000 | | | Sihuan Pharmaceuticals (b) | | | 5,397,998 | | |
| | | | | Chinese Generic Drug Manufacturer | | | | | |
| | 117,000 | | | WuXi PharmaTech - ADR (a) | | | 4,944,420 | | |
| | | | | Contract Research Organization in China | | | | | |
| | 9,263,000 | | | Canvest Environment
Protection (a) | | | 4,900,661 | | |
| | | | | Guangdong Waste-to-energy Operator | | | | | |
| | 3,757,000 | | | CapitaLand Retail China Trust | | | 4,853,681 | | |
| | | | | China Commercial Property Real
Estate Investment Trust | | | | | |
| | 5,600,000 | | | Chongqing Rural Commercial
Bank | | | 4,479,274 | | |
| | | | | Rural Commercial Bank | | | | | |
| | 15,338,000 | | | Jiangnan Group | | | 4,406,955 | | |
| | | | | Cable & Wire Manufacturer | | | | | |
| | 2,265,000 | | | Phoenix Healthcare Group | | | 4,308,438 | | |
| | | | | Private Hospital Management Group | | | | | |
| | 2,340,000 | | | China Everbright International | | | 4,190,936 | | |
| | | | | Municipal Waste Operator | | | | | |
| | 1,207,000 | | | Shanghai Industrial | | | 4,086,673 | | |
| | | | | Shanghai State Owned Enterprise | | | | | |
| | 3,303,000 | | | Xinhua Winshare Publishing | | | 3,957,433 | | |
| | | | | Sichuan Publisher, Distributor &
Retailer | | | | | |
| | 464,000 | | | Phoenix New Media - ADR (a) | | | 3,674,880 | | |
| | | | | Internet Advertising | | | | | |
| | 2,459,000 | | | TravelSky Technology | | | 3,617,232 | | |
| | | | | Chinese Air Travel Transaction
Processor | | | | | |
| | 66,000 | | | 51job - ADR (a)(c) | | | 2,193,840 | | |
| | | | | Integrated Human Resource Services | | | | | |
| | | | 88,673,128 | | |
| | | > Taiwan 14.3% | |
| | 440,000 | | | PChome Online | | | 7,263,149 | | |
| | | | | Taiwanese Internet Retail Company | | | | | |
| | 59,000 | | | Largan Precision | | | 6,734,898 | | |
| | | | | Mobile Device Camera Lenses &
Modules | | | | | |
| | 420,000 | | | St. Shine Optical | | | 6,676,176 | | |
| | | | | Disposable Contact Lens Original
Equipment Manufacturer | | | | | |
| | 4,177,000 | | | Vanguard International
Semiconductor | | | 6,665,766 | | |
| | | | | Semiconductor Foundry | | | | | |
| | 940,000 | | | President Chain Store | | | 6,608,620 | | |
| | | | | Convenience Chain Store Operator
in Taiwan | | | | | |
Number of Shares | | | | Value | |
| | 424,000 | | | Voltronic Power | | $ | 5,343,782 | | |
| | | | | Uninterruptible Power Supply Products | | | | | |
| | 1,900,000 | | | Far EasTone Telecom | | | 4,592,732 | | |
| | | | | Mobile Operator in Taiwan | | | | | |
| | 340,000 | | | Ginko International | | | 4,273,398 | | |
| | | | | Contact Lens Maker in China | | | | | |
| | 881,000 | | | Novatek Microelectronics | | | 4,249,397 | | |
| | | | | Display Related Integrated Circuit
Designer | | | | | |
| | 575,988 | | | Advantech | | | 3,954,931 | | |
| | | | | Industrial PC & Components | | | | | |
| | 775,990 | | | Chroma Ate | | | 1,714,991 | | |
| | | | | Automatic Test Systems, Testing &
Measurement Instruments | | | | | |
| | 160,000 | | | Silergy | | | 1,648,034 | | |
| | | | | Chinese Provider of Analog & Mixed
Digital Integrated Circuits | | | | | |
| | | | 59,725,874 | | |
| | | > India 10.6% | |
| | 2,422,982 | | | Zee Entertainment Enterprises | | | 13,984,733 | | |
| | | | | Indian Programmer of Pay
Television Content | | | | | |
| | 1,737,269 | | | Adani Ports & Special
Economic Zone | | | 8,384,721 | | |
| | | | | Indian West Coast Shipping Port | | | | | |
| | 190,350 | | | Colgate Palmolive India | | | 6,092,000 | | |
| | | | | Consumer Products in Oral Care | | | | | |
| | 730,342 | | | Bharti Infratel | | | 5,126,616 | | |
| | | | | Communications Towers | | | | | |
| | 318,483 | | | United Breweries | | | 4,663,142 | | |
| | | | | Indian Brewer | | | | | |
| | 160,788 | | | Container Corporation of India | | | 4,229,011 | | |
| | | | | Railway Cargo Services | | | | | |
| | 110,352 | | | Amara Raja | | | 1,527,917 | | |
| | | | | Indian Maker of Auto & Industrial
Batteries, Mostly for the Replacement
Market | | | | | |
| | | | 44,008,140 | | |
| | | > Indonesia 6.4% | |
| | 59,276,600 | | | MNC Sky Vision (a) | | | 6,446,733 | | |
| | | | | Satellite Pay TV Operator in Indonesia | | | | | |
| | 4,068,700 | | | Matahari Department Store | | | 5,042,738 | | |
| | | | | Department Store Chain in Indonesia | | | | | |
| | 6,406,300 | | | Tower Bersama Infrastructure | | | 4,432,636 | | |
| | | | | Communications Towers | | | | | |
| | 10,600,000 | | | Link Net (a) | | | 4,034,877 | | |
| | | | | Fixed Broadband & Cable TV
Service Provider | | | | | |
| | 18,149,000 | | | Surya Citra Media | | | 3,905,914 | | |
| | | | | Free to Air TV Station in Indonesia | | | | | |
| | 66,827,701 | | | Arwana Citramulia | | | 2,656,567 | | |
| | | | | Ceramic Tiles for Home Decoration | | | | | |
| | | | 26,519,465 | | |
| | | > Philippines 4.2% | |
| | 56,400,000 | | | RFM | | | 5,186,260 | | |
| | | | | Flour, Bread, Pasta & Ice Cream
Manufacturer/Distributor in the
Philippines | | | | | |
| | 5,087,200 | | | Puregold Price Club | | | 4,172,337 | | |
| | | | | Supermarket Operator in the
Philippines | | | | | |
See accompanying notes to financial statements.
71
COLUMBIA ACORN EMERGING MARKETS FUNDSM
STATEMENT OF INVESTMENTS (UNAUDITED), CONTINUED
Number of Shares | | | | Value | |
| | | > Philippines—continued | |
| | 2,451,090 | | | Robinsons Retail Holdings | | $ | 4,047,098 | | |
| | | | | Multi-format Retailer in the
Philippines | | | | | |
| | 34,926,300 | | | Melco Crown (Philippines)
Resorts (a) | | | 3,964,174 | | |
| | | | | Integrated Resort Operator in Manila | | | | | |
| | | | 17,369,869 | | |
| | | > Thailand 4.1% | |
| | 8,732,800 | | | Samui Airport Property Fund | | | 4,679,832 | | |
| | | | | Thai Airport Operator | | | | | |
| | 22,534,651 | | | Home Product Center | | | 4,495,459 | | |
| | | | | Home Improvement Retailer | | | | | |
| | 3,271,700 | | | Robinson Department Store | | | 4,328,379 | | |
| | | | | Department Store Operator in Thailand | | | | | |
| | 6,899,100 | | | Mega Lifesciences | | | 3,796,406 | | |
| | | | | Manufacturer of Health
Supplements & Pharmaceutical
Products | | | | | |
| | | | 17,300,076 | | |
| | | > Singapore 3.3% | |
| | 42,467,800 | | | SIIC Environment (a) | | | 6,143,886 | | |
| | | | | Waste Water Treatment Operator | | | | | |
| | 5,345,200 | | | China Everbright Water (a) | | | 3,911,003 | | |
| | | | | Waste Water Treatment Operator | | | | | |
| | 1,397,400 | | | Petra Foods | | | 3,631,362 | | |
| | | | | Chocolate Manufacturer in
Southeast Asia | | | | | |
| | | | 13,686,251 | | |
| | | > Hong Kong 2.4% | |
| | 3,698,000 | | | Vitasoy International | | | 6,297,269 | | |
| | | | | Hong Kong Soy Food Brand | | | | | |
| | 2,616,000 | | | Melco International | | | 3,693,347 | | |
| | | | | Macau Casino Operator | | | | | |
| | | | 9,990,616 | | |
| | | > Korea 2.1% | |
| | 241,088 | | | Koh Young Technology | | | 8,873,171 | | |
| | | | | Inspection Systems for Printed
Circuit Boards | | | | | |
| | | > Malaysia 2.0% | |
| | 5,300,000 | | | Astro Malaysia Holdings | | | 4,325,150 | | |
| | | | | Pay TV Operator in Malaysia | | | | | |
| | 10,000,000 | | | 7-Eleven Malaysia Holdings | | | 4,240,657 | | |
| | | | | Exclusive 7-Eleven Franchisor for
Malaysia | | | | | |
| | | | 8,565,807 | | |
| | | > Cambodia 1.1% | |
| | 6,300,000 | | | Nagacorp | | | 4,638,174 | | |
| | | | | Casino & Entertainment Complex
in Cambodia | | | | | |
Asia: Total | | | 299,350,571 | | |
Latin America 10.7% | | | |
| | | > Mexico 4.1% | |
| | 48,525 | | | Grupo Aeroportuario del
Sureste - ADR | | | 6,884,242 | | |
| | | | | Mexican Airport Operator | | | | | |
Number of Shares | | | | Value | |
| | 3,748,000 | | | Qualitas (a) | | $ | 6,202,353 | | |
| | | | | Auto Insurer in Mexico &
Central America | | | | | |
| | 2,747,000 | | | Hoteles City Express (a) | | | 4,005,805 | | |
| | | | | Budget Hotel Operator in Mexico | | | | | |
| | | | 17,092,400 | | |
| | | > Brazil 3.7% | |
| | 595,970 | | | Localiza Rent A Car | | | 5,900,086 | | |
| | | | | Car Rental | | | | | |
| | 1,430,100 | | | Odontoprev | | | 4,981,500 | | |
| | | | | Dental Insurance | | | | | |
| | 280,000 | | | Linx | | | 4,336,303 | | |
| | | | | Retail Management Software in Brazil | | | | | |
| | | | 15,217,889 | | |
| | | > Colombia 1.5% | |
| | 6,047,782 | | | Isagen | | | 6,453,530 | | |
| | | | | Colombian Electricity Provider | | | | | |
| | | > Chile 1.4% | |
| | 1,586,000 | | | Forus | | | 5,678,365 | | |
| | | | | Multi-brand Latin American
Wholesaler & Retailer | | | | | |
Latin America: Total | | | 44,442,184 | | |
Other Countries 7.6% | | | |
| | | > South Africa 4.8% | |
| | 1,795,460 | | | Coronation Fund Managers (c) | | | 12,162,079 | | |
| | | | | South African Fund Manager | | | | | |
| | 2,262,148 | | | Rand Merchant Insurance | | | 7,896,879 | | |
| | | | | Directly Sold Property & Casualty
Insurance; Holdings in other Insurers | | | | | |
| | | | 20,058,958 | | |
| | | > Egypt 1.7% | |
| | 975,991 | | | Commercial International
Bank of Egypt | | | 7,160,567 | | |
| | | | | Private Universal Bank in Egypt | | | | | |
| | | > United States 1.1% | |
| | 140,000 | | | Bladex | | | 4,505,200 | | |
| | | | | Latin American Trade
Financing House | | | | | |
Other Countries: Total | | | 31,724,725 | | |
Europe 6.9% | | | |
| | | > United Kingdom 2.9% | |
| | 7,207,000 | | | Cable and Wireless | | | 7,541,783 | | |
| | | | | Telecommunications Service
Provider in the Caribbean | | | | | |
| | 736,860 | | | PureCircle (a)(c) | | | 4,689,054 | | |
| | | | | Natural Sweeteners | | | | | |
| | | | 12,230,837 | | |
| | | > Kazakhstan 2.6% | |
| | 1,268,483 | | | Halyk Savings Bank of
Kazakhstan - GDR | | | 10,782,106 | | |
| | | | | Retail Bank & Insurer in Kazakhstan | | | | | |
See accompanying notes to financial statements.
72
Number of Shares | | | | Value | |
| | | > Finland 1.4% | |
| | 290,000 | | | Tikkurila | | $ | 5,764,553 | | |
| | | Decorative & Industrial Paint in
Scandinavia, Central & Eastern
Europe | | | | | |
Europe: Total | | | 28,777,496 | | |
Total Equities: 97.0%
(Cost: $404,387,769) | | | 404,294,976 | (d) | |
Short-Term Investments 3.4% | |
| | 13,916,492 | | | JPMorgan U.S. Government
Money Market Fund, IM
Shares (7 day yield of 0.01%) | | | 13,916,492 | | |
Total Short-Term Investments: 3.4%
(Cost: $13,916,492) | | | 13,916,492 | | |
Number of Shares | | | | Value | |
Securities Lending Collateral 0.6% | |
| | 2,703,540 | | | Dreyfus Government Cash
Management Fund,
Institutional Shares
(7 day yield of 0.01%) (e) | | $ | 2,703,540 | | |
Total Securities Lending Collateral: 0.6%
(Cost: $2,703,540) | | | 2,703,540 | | |
Total Investments: 101.0%
(Cost: $421,007,801)(f) | | | 420,915,008 | | |
Obligation to Return Collateral for
Securities Loaned: (0.6)% | | | (2,703,540 | ) | |
Cash and Other Assets Less
Liabilities: (0.4)% | | | (1,339,423 | ) | |
Net Assets: 100.0% | | $ | 416,872,045 | | |
ADR - American Depositary Receipts
GDR - Global Depositary Receipts
> Notes to Statement of Investments
(a) Non-income producing security.
(b) Illiquid security.
(c) All or a portion of this security was on loan at June 30, 2015. The total market value of securities on loan at June 30, 2015 was $2,610,061.
(d) On June 30, 2015, the Fund's total equity investments were denominated in currencies as follows:
Currency | | Value | | Percentage of
Net Assets | |
Hong Kong Dollar | | $ | 81,171,504 | | | | 19.5 | | |
Taiwan Dollar | | | 59,725,874 | | | | 14.3 | | |
Indian Rupee | | | 44,008,140 | | | | 10.5 | | |
U.S. Dollar | | | 39,448,281 | | | | 9.5 | | |
Indonesian Rupiah | | | 26,519,464 | | | | 6.4 | | |
Other currencies less than
5% of total net assets | | | 153,421,713 | | | | 36.8 | | |
Total Equities | | $ | 404,294,976 | | | | 97.0 | | |
(e) Investment made with cash collateral received from securities lending activity.
(f) At June 30, 2015, for federal income tax purposes, the cost of investments was approximately $421,007,801 and net unrealized depreciation was $92,793 consisting of gross unrealized appreciation of $47,147,719 and gross unrealized depreciation of $47,240,512.
Fair Value Measurements
Various inputs are used in determining the value of the Fund's investments, following the input prioritization hierarchy established by accounting principles generally accepted in the United States of America (GAAP). These inputs are summarized in the three broad levels listed below:
• Level 1 – quoted prices in active markets for identical securities
• Level 2 – prices determined using other significant observable inputs (including quoted prices for similar securities, interest rates, prepayment speeds, credit risk and others)
• Level 3 – prices determined using significant unobservable inputs where quoted prices or observable inputs are unavailable or less reliable (including management's own assumptions about the factors market participants would use in pricing an investment)
The inputs or methodology used for valuing securities are not necessarily an indication of the risk associated with investing in those securities.
See accompanying notes to financial statements.
73
COLUMBIA ACORN EMERGING MARKETS FUNDSM
STATEMENT OF INVESTMENTS (UNAUDITED), CONTINUED
> Notes to Statement of Investments
Examples of the types of securities in which the Fund would typically invest and how they are classified within this hierarchy are as follows. Typical Level 1 securities include exchange traded domestic equities, mutual funds whose NAVs are published each day and exchange traded foreign equities that are not statistically fair valued. Typical Level 2 securities include exchange traded foreign equities that are statistically fair valued, forward foreign currency exchange contracts and short-term investments valued at amortized cost. Additionally, securities fair valued by CWAM's Valuation Committee (the Committee) that rely on significant observable inputs are also included in Level 2. Typical Level 3 securities include any security fair valued by the Committee that relies on significant unobservable inputs.
The Committee is responsible for applying the Trust's Portfolio Pricing Policy and the CWAM pricing procedures (the Policies), which are approved by and subject to the oversight of the Board.
The Committee meets as necessary, and no less frequently than quarterly, to determine fair values for securities for which market quotations are not readily available or for which CWAM believes that available market quotations are unreliable. The Committee also reviews the continuing appropriateness of the Policies. In circumstances where a security has been fair valued, the Committee will also review the continuing appropriateness of the current value of the security. The Policies address, among other things: circumstances under which market quotations will be deemed readily available; selection of third party pricing vendors; appropriate pricing methodologies; events that require fair valuation and fair value techniques; circumstances under which securities will be deemed to pose a potential for stale pricing, including when securities are illiquid, restricted, or in default; and certain delegations of authority to determine fair values to the Fund's investment manager. The Committee may also meet to discuss additional valuation matters, which may include review of back-testing results, review of time-sensitive information or approval of other valuation related actions, and to review the appropriateness of the Policies.
For investments categorized as Level 3, the significant unobservable inputs used in the fair value measurement of the Fund's securities may include: (i) data specific to the issuer or comparable issuers, (ii) general market or specific sector news and (iii) quoted prices and specific or similar security transactions. The Committee considers this data and any changes from prior periods in order to assess the reasonableness of observable and unobservable inputs, any assumptions or internal models used to value those securities and changes in fair value. Significant changes in any of these factors could result in lower or higher fair value measurements. Various factors impact the frequency of monitoring (which may occur as often as daily), however the Committee may determine that changes to inputs, assumptions and models are not required with the same frequency.
The following table summarizes the inputs used, as of June 30, 2015, in valuing the Fund's assets:
Investment Type | | Quoted Prices
(Level 1) | | Other
Significant
Observable
Inputs
(Level 2) | | Significant
Unobservable
Inputs
(Level 3) | |
Total | |
Equities | |
Asia | | $ | 17,276,734 | | | $ | 276,675,839 | | | $ | 5,397,998 | | | $ | 299,350,571 | | |
Latin America | | | 44,442,184 | | | | - | | | | - | | | | 44,442,184 | | |
Other Countries | | | 4,505,200 | | | | 27,219,525 | | | | - | | | | 31,724,725 | | |
Europe | | | - | | | | 28,777,496 | | | | - | | | | 28,777,496 | | |
Total Equities | | | 66,224,118 | | | | 332,672,860 | | | | 5,397,998 | | | | 404,294,976 | | |
Total Short-Term Investments | | | 13,916,492 | | | | - | | | | - | | | | 13,916,492 | | |
Total Securities Lending Collateral | | | 2,703,540 | | | | - | | | | - | | | | 2,703,540 | | |
Total Investments | | $ | 82,844,150 | | | $ | 332,672,860 | | | $ | 5,397,998 | | | $ | 420,915,008 | | |
The Fund's assets assigned to the Level 2 input category are generally valued using a market approach, in which a security's value is determined through its correlation to prices and information from observable market transactions for similar or identical assets. Foreign equities are generally valued at the last sale price on the foreign exchange or market on which they trade. The Fund may use a statistical fair valuation model, in accordance with the policy adopted by the Board, provided by an independent third party to value securities principally traded in foreign markets in order to adjust for possible stale pricing that may occur between the close of the foreign exchanges and the time for valuation. These models take into account available market data including intraday index, ADR, and ETF movements.
There were no transfers of financial assets between Levels 1 and 2 during the period.
The following table reconciles asset balances for the period ending June 30, 2015, in which significant observable and/or unobservable inputs (Level 3) were used in determining value:
Investments in Securities | | Balance as
of December 31,
2014 | | Realized
Gain (Loss) | | Change
in Unrealized
Appreciation
(Depreciation) | | Purchases | | Sales | | Transfers
into
Level 3 | | Transfers
out of
Level 3 | | Balance as
of June 30,
2015 | |
Equities | |
Asia | | $ | - | | | $ | - | | | $ | (2,551,314 | ) | | $ | - | | | $ | - | | | $ | 7,949,312 | | | $ | - | | | $ | 5,397,998 | | |
The information in the above reconciliation table represents fiscal year to date activity for any securities identified as using Level 3 inputs at either the beginning or the end of the current fiscal period.
See accompanying notes to financial statements.
74
> Notes to Statement of Investments
The change in unrealized depreciation attributed to securities owned at June 30, 2015, which were valued using significant unobservable inputs (Level 3), amounted to $2,551,314.
Quantitative information pertaining to Level 3 unobservable fair value measurements
| | | Fair Value at
June 30, 2015 | | Valuation Technique(s) | | Unabservable Input(s) | | Range (Weighted
Average) | |
Equities
Asia | | $ | 5,397,998 | | | Float price
with market index | | Discount for lack
of liquidity | | | 10 | % | |
Financial assets were transferred from Level 2 to Level 3 as trading halted during the period. As a result, as of period end, management determined to value the security(s) under consistently applied procedures established by and under the general supervision of the Board of Trustees.
The following table shows transfers between Level 2 and Level 3 of the fair value hierarchy:
Transfers In | | Transfers Out | |
| Level 2 | | Level 3 | | Level 2 | | Level 3 | |
| $ | - | | | $ | 7,949,312 | | | $ | 7,949,312 | | | $ | - | | |
Transfers in and/or out of Level 3 are determined based on the fair value at the beginning of the period for security positions held throughout the period.
Certain securities classified as Level 3 are valued by the Committee at fair value, using a market approach, as determined in good faith under consistently applied procedures established by and under the general supervision of the Board. To determine fair value for these securities, for which no market exists, the Committee utilizes the valuation technique it deems most appropriate in the circumstances, using some unobservable inputs, which may include, but are not limited to estimated earnings of the company and the position of the security within the company's capital structure. The Committee also may use some observable inputs, which may include, but are not limited to, trades of similar securities or indicies. Significant increases or decreases to any of these inputs could result in a significantly lower or higher fair value measurement.
See accompanying notes to financial statements.
75
COLUMBIA ACORN EMERGING MARKETS FUNDSM
PORTFOLIO DIVERSIFICATION (UNAUDITED)
At June 30, 2015, the Fund's portfolio investments as a percentage of net assets were diversified as follows:
| | | Value | | Percentage
of Net Assets | |
| > Consumer Goods & Services | |
Retail | | $ | 49,834,234 | | | | 12.0 | | |
Food & Beverage | | | 24,467,088 | | | | 5.9 | | |
Travel | | | 17,701,194 | | | | 4.2 | | |
Casinos & Gaming | | | 12,295,695 | | | | 2.9 | | |
Consumer Goods Distribution | | | 9,888,407 | | | | 2.4 | | |
Other Durable Goods | | | 1,527,916 | | | | 0.4 | | |
| | | | 115,714,534 | | | | 27.8 | | |
| > Information | |
Mobile Communications | | | 14,151,983 | | | | 3.4 | | |
Entertainment Programming | | | 13,984,733 | | | | 3.4 | | |
Semiconductors & Related
Equipment | | | 12,563,198 | | | | 3.0 | | |
Internet Related | | | 12,332,314 | | | | 3.0 | | |
Satellite Broadcasting & Services | | | 10,771,883 | | | | 2.6 | | |
Instrumentation | | | 10,588,162 | | | | 2.5 | | |
Computer Hardware & Related
Equipment | | | 9,298,713 | | | | 2.2 | | |
Business Software | | | 7,953,536 | | | | 1.9 | | |
Telephone & Data Services | | | 7,541,783 | | | | 1.8 | | |
Telecommunications Equipment | | | 6,734,898 | | | | 1.6 | | |
Cable TV | | | 4,034,877 | | | | 1.0 | | |
TV Broadcasting | | | 3,905,913 | | | | 0.9 | | |
| | | | 113,861,993 | | | | 27.3 | | |
| > Finance | |
Banks | | | 26,927,146 | | | | 6.5 | | |
Insurance | | | 19,080,732 | | | | 4.6 | | |
Brokerage & Money Management | | | 12,162,080 | | | | 2.9 | | |
| | | | 58,169,958 | | | | 14.0 | | |
| > Industrial Goods & Services | |
Industrial Materials & Specialty
Chemicals | | | 21,424,971 | | | | 5.1 | | |
Water | | | 10,054,889 | | | | 2.4 | | |
Waste Management | | | 9,091,597 | | | | 2.2 | | |
Other Industrial Services | | | 8,384,721 | | | | 2.0 | | |
Electrical Components | | | 4,406,955 | | | | 1.1 | | |
Conglomerates | | | 4,086,674 | | | | 1.0 | | |
| | | | 57,449,807 | | | | 13.8 | | |
| | | Value | | Percentage
of Net Assets | |
| > Other Industries | |
Transportation | | $ | 15,793,086 | | | | 3.8 | | |
Regulated Utilities | | | 6,453,530 | | | | 1.5 | | |
Real Estate | | | 4,853,681 | | | | 1.2 | | |
| | | | 27,100,297 | | | | 6.5 | | |
| > Health Care | |
Medical Supplies | | | 10,949,574 | | | | 2.6 | | |
Pharmaceuticals | | | 10,342,418 | | | | 2.5 | | |
Hospital Management | | | 4,308,438 | | | | 1.0 | | |
| | | | 25,600,430 | | | | 6.1 | | |
| > Energy & Minerals | |
Oil Refining, Marketing & Distribution | | | 6,397,957 | | | | 1.5 | | |
| | | | 6,397,957 | | | | 1.5 | | |
Total Equities: | | | 404,294,976 | | | | 97.0 | | |
Short-Term Investments: | | | 13,916,492 | | | | 3.4 | | |
Securities Lending Collateral: | | | 2,703,540 | | | | 0.6 | | |
Total Investments: | | | 420,915,008 | | | | 101.0 | | |
Obligation to Return
Collateral for Securities
Loaned: | | | (2,703,540 | ) | | | (0.6 | ) | |
Cash and Other Assets
Less Liabilities: | | | (1,339,423 | ) | | | (0.4 | ) | |
Net Assets: | | $ | 416,872,045 | | | | 100.0 | | |
See accompanying notes to financial statements.
76
COLUMBIA ACORN EUROPEAN FUNDSM
MAJOR PORTFOLIO CHANGES IN THE SECOND QUARTER (UNAUDITED)
| | | Number of Shares | |
| | | 3/31/15 | | 6/30/15 | |
Purchases | |
Europe | |
| > United Kingdom | |
Abcam | | | 63,970 | | | | 66,010 | | |
Aggreko | | | 26,960 | | | | 33,220 | | |
Assura | | | 1,667,855 | | | | 1,811,485 | | |
AVEVA | | | 18,550 | | | | 20,150 | | |
Cable and Wireless | | | 950,000 | | | | 1,043,540 | | |
Cambian | | | 199,280 | | | | 204,460 | | |
Charles Taylor | | | 241,240 | | | | 384,788 | | |
Dialight | | | 55,260 | | | | 70,640 | | |
Domino's Pizza UK & Ireland | | | 37,830 | | | | 44,010 | | |
Elementis | | | 95,860 | | | | 114,720 | | |
Fidessa Group | | | 18,470 | | | | 23,460 | | |
Halfords | | | 76,159 | | | | 81,000 | | |
Halma | | | 39,570 | | | | 46,890 | | |
Ocado | | | 92,240 | | | | 95,010 | | |
Polypipe | | | 101,620 | | | | 125,110 | | |
PureCircle | | | 53,548 | | | | 97,930 | | |
Regus | | | 0 | | | | 137,120 | | |
Rightmove | | | 9,670 | | | | 10,760 | | |
WH Smith | | | 32,710 | | | | 35,360 | | |
| > France | |
AKKA Technologies | | | 13,874 | | | | 17,288 | | |
Bonduelle | | | 15,690 | | | | 19,310 | | |
Cegedim | | | 14,480 | | | | 15,360 | | |
Eurofins Scientific | | | 1,540 | | | | 1,830 | | |
Eutelsat | | | 18,960 | | | | 32,020 | | |
Neopost | | | 16,720 | | | | 27,860 | | |
Saft | | | 12,681 | | | | 13,821 | | |
| > Germany | |
Aurelius | | | 23,640 | | | | 27,900 | | |
Elringklinger | | | 13,410 | | | | 18,950 | | |
MTU Aero Engines | | | 7,000 | | | | 9,730 | | |
NORMA Group | | | 16,360 | | | | 19,770 | | |
Rational | | | 1,200 | | | | 1,430 | | |
Telefonica Deutschland | | | 70,780 | | | | 94,780 | | |
Wirecard | | | 14,360 | | | | 18,900 | | |
| > Sweden | |
Hexagon | | | 21,733 | | | | 24,633 | | |
Mekonomen | | | 18,960 | | | | 25,800 | | |
Modern Times Group | | | 16,160 | | | | 21,470 | | |
Recipharm | | | 29,580 | | | | 44,030 | | |
Sweco | | | 41,270 | | | | 63,050 | | |
Swedish Match | | | 17,970 | | | | 25,662 | | |
Unibet | | | 11,851 | | | | 14,591 | | |
| | | Number of Shares | |
| | | 3/31/15 | | 6/30/15 | |
| > Finland | |
Konecranes | | | 15,240 | | | | 25,836 | | |
Munksjo | | | 68,380 | | | | 185,880 | | |
Sponda | | | 123,070 | | | | 160,990 | | |
Tikkurila | | | 28,801 | | | | 33,751 | | |
| > Netherlands | |
Aalberts Industries | | | 26,330 | | | | 32,560 | | |
Arcadis | | | 12,819 | | | | 20,005 | | |
Brunel | | | 27,271 | | | | 35,741 | | |
Core Labs | | | 3,920 | | | | 4,400 | | |
Gemalto | | | 5,490 | | | | 6,060 | | |
Vopak | | | 0 | | | | 11,490 | | |
| > Spain | |
Bolsas y Mercados Españoles | | | 10,370 | | | | 12,520 | | |
Distribuidora Internacional
de Alimentación | | | 169,200 | | | | 202,320 | | |
Prosegur | | | 109,950 | | | | 142,750 | | |
| > Switzerland | |
INFICON | | | 1,150 | | | | 1,530 | | |
Partners Group | | | 3,250 | | | | 4,480 | | |
| > Denmark | |
SimCorp | | | 15,490 | | | | 25,640 | | |
William Demant Holding | | | 0 | | | | 14,000 | | |
| > Norway | |
Atea | | | 36,180 | | | | 62,050 | | |
Orkla | | | 70,370 | | | | 87,370 | | |
| > Italy | |
Hera | | | 0 | | | | 105,433 | | |
| > Belgium | |
EVS Broadcast Equipment | | | 11,070 | | | | 19,420 | | |
See accompanying notes to financial statements.
77
COLUMBIA ACORN EUROPEAN FUNDSM
MAJOR PORTFOLIO CHANGES IN THE SECOND QUARTER (UNAUDITED), CONTINUED
| | | Number of Shares | |
| | | 3/31/15 | | 6/30/15 | |
Sales | |
Europe | |
| > United Kingdom | |
Babcock International | | | 56,990 | | | | 49,910 | | |
Charles Taylor | | | 96,338 | | | | 0 | | |
Jardine Lloyd Thompson Group | | | 38,560 | | | | 35,000 | | |
| RPS Group | | | 120,090 | | | | 0 | | |
Whitbread | | | 7,954 | | | | 0 | | |
| > France | |
Norbert Dentressangle | | | 2,690 | | | | 0 | | |
| > Spain | |
Viscofan | | | 10,430 | | | | 8,720 | | |
| > Switzerland | |
Geberit | | | 2,740 | | | | 2,530 | | |
| > Italy | |
Pirelli | | | 24,990 | | | | 0 | | |
See accompanying notes to financial statements.
78
COLUMBIA ACORN EUROPEAN FUNDSM
STATEMENT OF INVESTMENTS (UNAUDITED), JUNE 30, 2015
Number of Shares | | | | Value | |
| | | | | | | Equities: 93.1% | |
Europe 93.1% | | | |
| | | > United Kingdom 30.9% | |
| | 1,811,485 | | | Assura | | $ | 1,558,347 | | |
| | | | | UK Primary Health Care
Property Developer | | | | | |
| | 384,788 | | | Charles Taylor | | | 1,330,116 | | |
| | | | | Insurance Services | | | | | |
| | 24,357 | | | Spirax Sarco | | | 1,298,533 | | |
| | | | | Steam Systems for Manufacturing &
Process Industries | | | | | |
| | 1,043,540 | | | Cable and Wireless | | | 1,092,015 | | |
| | | | | Telecommunications Service Provider
in the Caribbean | | | | | |
| | 204,460 | | | Cambian | | | 962,970 | | |
| | | | | Mental Health Facilities & Programs | | | | | |
| | 35,360 | | | WH Smith | | | 848,947 | | |
| | | | | Newsprint, Books & General
Stationery Retailer | | | | | |
| | 49,910 | | | Babcock International | | | 846,948 | | |
| | | | | Public Sector Outsourcer | | | | | |
| | 23,460 | | | Fidessa Group | | | 838,600 | | |
| | | | | Software for Financial Trading Systems | | | | | |
| | 33,220 | | | Aggreko | | | 751,114 | | |
| | | | | Temporary Power & Temperature
Control Services | | | | | |
| | 81,000 | | | Halfords | | | 671,992 | | |
| | | | | UK Retailer of Leisure Goods & Auto Parts | | | | | |
| | 95,010 | | | Ocado (a) | | | 665,659 | | |
| | | | | Online Grocery Retailer | | | | | |
| | 97,930 | | | PureCircle (a)(b) | | | 623,184 | | |
| | | | | Natural Sweeteners | | | | | |
| | 35,000 | | | Jardine Lloyd Thompson Group | | | 574,135 | | |
| | | | | International Business Insurance Broker | | | | | |
| | 20,150 | | | AVEVA | | | 572,425 | | |
| | | | | Engineering Software | | | | | |
| | 70,640 | | | Dialight | | | 567,175 | | |
| | | | | LED Products for Hazardous &
Industrial Environments | | | | | |
| | 137,120 | | | Regus | | | 562,755 | | |
| | | | | Rental of Office Space in Full
Service Business Centers | | | | | |
| | 46,890 | | | Halma | | | 561,410 | | |
| | | | | Health & Safety Sensor Technology | | | | | |
| | 10,760 | | | Rightmove | | | 554,031 | | |
| | | | | Internet Real Estate Listings | | | | | |
| | 44,010 | | | Domino's Pizza UK & Ireland | | | 537,301 | | |
| | | | | Pizza Delivery in the UK,
Ireland & Germany | | | | | |
| | 66,010 | | | Abcam | | | 537,260 | | |
| | | | | Online Sales of Antibodies | | | | | |
| | 125,110 | | | Polypipe | | | 533,712 | | |
| | | | | Manufacturer of Plastic Piping & Fittings | | | | | |
| | 225,231 | | | Connect Group | | | 501,645 | | |
| | | | | Newspaper & Magazine Distributor | | | | | |
| | 114,720 | | | Elementis | | | 462,531 | | |
| | | | | Specialty Chemicals | | | | | |
| | | | 17,452,805 | | |
Number of Shares | | | | Value | |
| | | > France 10.2% | |
| | 27,860 | | | Neopost | | $ | 1,198,749 | | |
| | | | | Postage Meter Machines | | | | | |
| | 32,020 | | | Eutelsat | | | 1,033,442 | | |
| | | | | Fixed Satellite Services | | | | | |
| | 15,360 | | | Cegedim (a) | | | 648,318 | | |
| | | | | Medical Market Research/IT Services | | | | | |
| | 17,288 | | | AKKA Technologies | | | 614,825 | | |
| | | | | Engineering Consultancy | | | | | |
| | 1,830 | | | Eurofins Scientific | | | 557,172 | | |
| | | | | Food, Pharmaceuticals & Materials
Screening & Testing | | | | | |
| | 13,821 | | | Saft | | | 539,292 | | |
| | | | | Niche Battery Manufacturer | | | | | |
| | 19,310 | | | Bonduelle | | | 490,833 | | |
| | | | | Producer of Canned, Deep-frozen &
Fresh Vegetables | | | | | |
| | 263,340 | | | HiPay Group (a) | | | 349,366 | | |
| | | | | Online Payment Processor in Europe | | | | | |
| | 263,340 | | | Hi-Media (a)(b) | | | 320,007 | | |
| | | | | Online Advertiser in Europe | | | | | |
| | | | 5,752,004 | | |
| | | > Germany 9.6% | |
| | 27,900 | | | Aurelius | | | 1,192,695 | | |
| | | | | European Turnaround Investor | | | | | |
| | 19,770 | | | NORMA Group | | | 999,430 | | |
| | | | | Clamps for Automotive & Industrial
Applications | | | | | |
| | 9,730 | | | MTU Aero Engines | | | 915,202 | | |
| | | | | Airplane Engine Components & Services | | | | | |
| | 18,900 | | | Wirecard (b) | | | 723,777 | | |
| | | | | Online Payment Processing & Risk
Management | | | | �� | |
| | 94,780 | | | Telefonica Deutschland | | | 546,290 | | |
| | | | | Mobile & Fixed-line Communications
in Germany | | | | | |
| | 1,430 | | | Rational | | | 525,221 | | |
| | | | | Commercial Ovens | | | | | |
| | 18,950 | | | Elringklinger | | | 509,463 | | |
| | | | | Automobile Components | | | | | |
| | | | 5,412,078 | | |
| | | > Sweden 9.5% | |
| | 24,633 | | | Hexagon | | | 892,628 | | |
| | | | | Design, Measurement & Visualization
Software & Equipment | | | | | |
| | 14,591 | | | Unibet | | | 888,853 | | |
| | | | | European Online Gaming Operator | | | | | |
| | 63,050 | | | Sweco | | | 827,118 | | |
| | | | | Engineering Consultants | | | | | |
| | 44,030 | | | Recipharm | | | 823,254 | | |
| | | | | Contract Development Manufacturing
Organization | | | | | |
| | 25,662 | | | Swedish Match | | | 729,941 | | |
| | | | | Swedish Snus | | | | | |
| | 25,800 | | | Mekonomen | | | 630,228 | | |
| | | | | Nordic Integrated Wholesaler/Retailer of
Automotive Parts & Service | | | | | |
| | 21,470 | | | Modern Times Group (b) | | | 575,997 | | |
| | | | | Nordic TV Broadcaster | | | | | |
| | | | 5,368,019 | | |
See accompanying notes to financial statements.
79
COLUMBIA ACORN EUROPEAN FUNDSM
STATEMENT OF INVESTMENTS (UNAUDITED), CONTINUED
Number of Shares | | | | Value | |
| | | > Finland 7.1% | |
| | 92,850 | | | Munksjo (c) | | $ | 1,010,840 | | |
| | 93,030 | | | Munksjo | | | 995,659 | | |
| | | | | Specialty Paper Maker | | | | | |
| | 25,836 | | | Konecranes | | | 752,629 | | |
| | | | | Manufacture & Service of Industrial
Cranes & Port Handling Equipment | | | | | |
| | 33,751 | | | Tikkurila | | | 670,894 | | |
| | | | | Decorative & Industrial Paint in
Scandinavia, Central & Eastern Europe | | | | | |
| | 160,990 | | | Sponda | | | 594,078 | | |
| | | | | Office, Retail & Logistics Properties | | | | | |
| | | | 4,024,100 | | |
| | | > Netherlands 6.8% | |
| | 32,560 | | | Aalberts Industries | | | 967,019 | | |
| | | | | Flow Control & Heat Treatment | | | | | |
| | 35,741 | | | Brunel | | | 709,057 | | |
| | | | | Temporary Specialist & Energy Staffing | | | | | |
| | 11,490 | | | Vopak | | | 579,828 | | |
| | | | | Operator of Petroleum & Chemical
Storage Terminals | | | | | |
| | 20,005 | | | Arcadis | | | 550,204 | | |
| | | | | Engineering Consultants | | | | | |
| | 6,060 | | | Gemalto | | | 539,668 | | |
| | | | | Digital Security Solutions | | | | | |
| | 4,400 | | | Core Labs (b) | | | 501,776 | | |
| | | | | Oil & Gas Reservoir Consulting | | | | | |
| | | | 3,847,552 | | |
| | | > Spain 6.0% | |
| | 202,320 | | | Distribuidora Internacional de
Alimentación | | | 1,545,061 | | |
| | | | | Discount Retailer in Spain &
Latin America | | | | | |
| | 142,750 | | | Prosegur | | | 782,992 | | |
| | | | | Security Guards | | | | | |
| | 8,720 | | | Viscofan | | | 527,391 | | |
| | | | | Sausage Casings Maker | | | | | |
| | 12,520 | | | Bolsas y Mercados Españoles | | | 506,393 | | |
| | | | | Spanish Stock Markets | | | | | |
| | | | 3,361,837 | | |
| | | > Switzerland 4.8% | |
| | 4,480 | | | Partners Group | | | 1,339,280 | | |
| | | | | Private Markets Asset Management | | | | | |
| | 2,530 | | | Geberit | | | 843,469 | | |
| | | | | Plumbing Systems | | | | | |
| | 1,530 | | | INFICON | | | 522,846 | | |
| | | | | Gas Detection Instruments | | | | | |
| | | | 2,705,595 | | |
| | | > Denmark 3.7% | |
| | 14,000 | | | William Demant Holding (a) | | | 1,068,008 | | |
| | | | | Manufacture & Distribution of
Hearing Aids & Diagnostic Equipment | | | | | |
| | 25,640 | | | SimCorp | | | 1,021,094 | | |
| | | | | Software for Investment Managers | | | | | |
| | | | 2,089,102 | | |
Number of Shares | | | | Value | |
| | | > Norway 2.2% | |
| | 87,370 | | | Orkla | | $ | 687,553 | | |
| | | | | Food & Brands, Aluminum,
Chemicals Conglomerate | | | | | |
| | 62,050 | | | Atea | | | 553,986 | | |
| | | | | Nordic IT Hardware/Software
Reseller & Integrator | | | | | |
| | | | 1,241,539 | | |
| | | > Italy 1.3% | |
| | 10,540 | | | Industria Macchine Automatiche | | | 491,172 | | |
| | | | | Food & Drugs Packaging & Machinery | | | | | |
| | 105,433 | | | Hera | | | 263,764 | | |
| | | | | Northern Italian Utility | | | | | |
| | | | 754,936 | | |
| | | > Belgium 1.0% | |
| | 19,420 | | | EVS Broadcast Equipment | | | 562,910 | | |
| | | | | Digital Live Mobile Production
Software & Systems | | | | | |
Europe: Total | | | 52,572,477 | | |
Total Equities: 93.1%
(Cost: $50,576,150) | | | 52,572,477 | (d) | |
Short-Term Investments 6.4% | | | |
| | 3,621,171 | | | JPMorgan U.S. Government
Money Market Fund, IM
Shares (7 day yield of 0.01%) | | | 3,621,171 | | |
Total Short-Term Investments: 6.4%
(Cost: $3,621,171) | | | 3,621,171 | | |
Securities Lending Collateral 3.2% | | | |
| | 1,790,781 | | | Dreyfus Government Cash
Management Fund,
Institutional Shares
(7 day yield of 0.01%) (e) | | | 1,790,781 | | |
Total Securities Lending Collateral: 3.2%
(Cost: $1,790,781) | | | 1,790,781 | | |
Total Investments: 102.7%
(Cost: $55,988,102)(f) | | | 57,984,429 | | |
Obligation to Return Collateral for
Securities Loaned: (3.2)% | | | (1,790,781 | ) | |
Cash and Other Assets Less Liabilities: 0.5% | | | 290,425 | | |
Net Assets: 100.0% | | $ | 56,484,073 | | |
See accompanying notes to financial statements.
80
> Notes to Statement of Investments
(a) Non-income producing security.
(b) All or a portion of this security was on loan at June 30, 2015. The total market value of securities on loan at June 30, 2015 was $1,540,884.
(c) Security is traded on a Swedish exchange.
(d) On June 30, 2015, the Fund's total equity investments were denominated in currencies as follows:
Currency | | Value | | Percentage
of Net Assets | |
Euro | | $ | 22,202,800 | | | | 39.3 | | |
British Pound | | | 17,452,806 | | | | 30.9 | | |
Swedish Krona | | | 6,378,859 | | | | 11.3 | | |
Other currencies less than
5% of total net assets | | | 6,538,012 | | | | 11.6 | | |
Total Equities | | $ | 52,572,477 | | | | 93.1 | | |
(e) Investment made with cash collateral received from securities lending activity.
(f) At June 30, 2015, for federal income tax purposes, the cost of investments was approximately $55,988,102 and net unrealized appreciation was $1,996,327 consisting of gross unrealized appreciation of $4,973,486 and gross unrealized depreciation of $2,977,159.
Fair Value Measurements
Various inputs are used in determining the value of the Fund's investments, following the input prioritization hierarchy established by accounting principles generally accepted in the United States of America (GAAP). These inputs are summarized in the three broad levels listed below:
• Level 1 – quoted prices in active markets for identical securities
• Level 2 – prices determined using other significant observable inputs (including quoted prices for similar securities, interest rates, prepayment speeds, credit risk and others)
• Level 3 – prices determined using significant unobservable inputs where quoted prices or observable inputs are unavailable or less reliable (including management's own assumptions about the factors market participants would use in pricing an investment)
The inputs or methodology used for valuing securities are not necessarily an indication of the risk associated with investing in those securities.
Examples of the types of securities in which the Fund would typically invest and how they are classified within this hierarchy are as follows. Typical Level 1 securities include exchange traded domestic equities, mutual funds whose NAVs are published each day and exchange traded foreign equities that are not statistically fair valued. Typical Level 2 securities include exchange traded foreign equities that are statistically fair valued, forward foreign currency exchange contracts and short-term investments valued at amortized cost. Additionally, securities fair valued by CWAM's Valuation Committee (the Committee) that rely on significant observable inputs are also included in Level 2. Typical Level 3 securities include any security fair valued by the Committee that relies on significant unobservable inputs.
The Committee is responsible for applying the Trust's Portfolio Pricing Policy and the CWAM pricing procedures (the Policies), which are approved by and subject to the oversight of the Board.
The Committee meets as necessary, and no less frequently than quarterly, to determine fair values for securities for which market quotations are not readily available or for which CWAM believes that available market quotations are unreliable. The Committee also reviews the continuing appropriateness of the Policies. In circumstances where a security has been fair valued, the Committee will also review the continuing appropriateness of the current value of the security. The Policies address, among other things: circumstances under which market quotations will be deemed readily available; selection of third party pricing vendors; appropriate pricing methodologies; events that require fair valuation and fair value techniques; circumstances under which securities will be deemed to pose a potential for stale pricing, including when securities are illiquid, restricted, or in default; and certain delegations of authority to determine fair values to the Fund's investment manager. The Committee may also meet to discuss additional valuation matters, which may include review of back-testing results, review of time-sensitive information or approval of other valuation related actions, and to review the appropriateness of the Policies.
For investments categorized as Level 3, the significant unobservable inputs used in the fair value measurement of the Fund's securities may include: (i) data specific to the issuer or comparable issuers, (ii) general market or specific sector news and (iii) quoted prices and specific or similar security transactions. The Committee considers this data and any changes from prior periods in order to assess the reasonableness of observable and unobservable inputs, any assumptions or internal models used to value those securities and changes in fair value. Significant changes in any of these factors could result in lower or higher fair value measurements. Various factors impact the frequency of monitoring (which may occur as often as daily), however the Committee may determine that changes to inputs, assumptions and models are not required with the same frequency.
See accompanying notes to financial statements.
81
COLUMBIA ACORN EUROPEAN FUNDSM
STATEMENT OF INVESTMENTS (UNAUDITED), CONTINUED
> Notes to Statement of Investments
The following table summarizes the inputs used, as of June 30, 2015, in valuing the Fund's assets:
Investment Type | | Quoted Prices
(Level 1) | | Other
Significant
Observable
Inputs
(Level 2) | | Significant
Unobservable
Inputs
(Level 3) | | Total | |
Equities | |
Europe | | $ | 501,776 | | | $ | 52,070,701 | | | $ | - | | | $ | 52,572,477 | | |
Total Equities | | | 501,776 | | | | 52,070,701 | | | | - | | | | 52,572,477 | | |
Total Short-Term Investments | | | 3,621,171 | | | | - | | | | - | | | | 3,621,171 | | |
Total Securities Lending Collateral | | | 1,790,781 | | | | - | | | | - | | | | 1,790,781 | | |
Total Investments | | $ | 5,913,728 | | | $ | 52,070,701 | | | $ | - | | | $ | 57,984,429 | | |
The Fund's assets assigned to the Level 2 input category are generally valued using a market approach, in which a security's value is determined through its correlation to prices and information from observable market transactions for similar or identical assets. Foreign equities are generally valued at the last sale price on the foreign exchange or market on which they trade. The Fund may use a statistical fair valuation model, in accordance with the policy adopted by the Board, provided by an independent third party to value securities principally traded in foreign markets in order to adjust for possible stale pricing that may occur between the close of the foreign exchanges and the time for valuation. These models take into account available market data including intraday index, ADR, and ETF movements.
There were no transfers of financial assets between levels during the period.
See accompanying notes to financial statements.
82
COLUMBIA ACORN EUROPEAN FUNDSM
PORTFOLIO DIVERSIFICATION (UNAUDITED)
At June 30, 2015, the Fund's portfolio investments as a percentage of net assets were diversified as follows:
| | | Value | | Percentage
of Net Assets | |
| > Industrial Goods & Services | |
Machinery | | $ | 5,788,579 | | | | 10.2 | | |
Industrial Materials & Specialty
Chemicals | | | 3,649,388 | | | | 6.5 | | |
Other Industrial Services | | | 3,600,811 | | | | 6.4 | | |
Outsourcing Services | | | 3,516,577 | | | | 6.2 | | |
Conglomerates | | | 2,847,267 | | | | 5.0 | | |
Construction | | | 1,377,181 | | | | 2.5 | | |
Electrical Components | | | 1,106,466 | | | | 2.0 | | |
| | | | 21,886,269 | | | | 38.8 | | |
| > Information | |
Business Software | | | 3,324,747 | | | | 5.9 | | |
Telephone & Data Services | | | 1,638,305 | | | | 2.9 | | |
Computer Services | | | 1,202,304 | | | | 2.1 | | |
Computer Hardware & Related
Equipment | | | 1,102,578 | | | | 2.0 | | |
Satellite Broadcasting & Services | | | 1,033,442 | | | | 1.8 | | |
Financial Processors | | | 723,777 | | | | 1.3 | | |
Advertising | | | 669,373 | | | | 1.2 | | |
TV Broadcasting | | | 575,997 | | | | 1.0 | | |
Instrumentation | | | 561,411 | | | | 1.0 | | |
Internet Related | | | 554,031 | | | | 1.0 | | |
| | | | 11,385,965 | | | | 20.2 | | |
| > Consumer Goods & Services | |
Retail | | | 4,361,889 | | | | 7.7 | | |
Food & Beverage | | | 2,371,348 | | | | 4.2 | | |
Casinos & Gaming | | | 888,852 | | | | 1.5 | | |
Restaurants | | | 537,301 | | | | 1.0 | | |
Consumer Goods Distribution | | | 501,645 | | | | 0.9 | | |
| | | | 8,661,035 | | | | 15.3 | | |
| > Finance | |
Insurance | | | 1,904,251 | | | | 3.4 | | |
Brokerage & Money Management | | | 1,339,280 | | | | 2.3 | | |
Financial Processors | | | 506,393 | | | | 0.9 | | |
| | | | 3,749,924 | | | | 6.6 | | |
| > Health Care | |
Medical Equipment & Devices | | | 1,068,008 | | | | 1.9 | | |
Health Care Services | | | 962,970 | | | | 1.7 | | |
Pharmaceuticals | | | 823,254 | | | | 1.4 | | |
Medical Supplies | | | 537,260 | | | | 1.0 | | |
| | | | 3,391,492 | | | | 6.0 | | |
| > Other Industries | |
Real Estate | | | 2,152,424 | | | | 3.8 | | |
Regulated Utilities | | | 263,764 | | | | 0.5 | | |
| | | | 2,416,188 | | | | 4.3 | | |
| | | Value | | Percentage
of Net Assets | |
| > Energy & Minerals | |
Oil Refining, Marketing & Distribution | | $ | 579,828 | | | | 1.0 | | |
Mining | | | 501,776 | | | | 0.9 | | |
| | | | 1,081,604 | | | | 1.9 | | |
Total Equities: | | | 52,572,477 | | | | 93.1 | | |
Short-Term Investments: | | | 3,621,171 | | | | 6.4 | | |
Securities Lending Collateral: | | | 1,790,781 | | | | 3.2 | | |
Total Investments: | | | 57,984,429 | | | | 102.7 | | |
Obligation to Return
Collateral for Securities
Loaned: | | | (1,790,781 | ) | | | (3.2 | ) | |
Cash and Other Assets
Less Liabilities: | | | 290,425 | | | | 0.5 | | |
Net Assets: | | $ | 56,484,073 | | | | 100.0 | | |
See accompanying notes to financial statements.
83
COLUMBIA ACORN FAMILY OF FUNDS
STATEMENTS OF ASSETS AND LIABILITIES (UNAUDITED)
June 30, 2015 | | Columbia
Acorn®
Fund | | Columbia
Acorn
International® | | Columbia
Acorn
USA® | | Columbia
Acorn
International
SelectSM | |
Assets: | |
Unaffiliated investments, at cost | | $ | 5,884,502,588 | | | $ | 6,529,514,535 | | | $ | 833,925,047 | | | $ | 209,812,793 | | |
Affiliated investments, at cost | | | 1,156,736,525 | | | | 113,439,966 | | | | — | | | | — | | |
Unaffiliated investments, at value (including securities on loan: Columbia Acorn Fund $205,238,253;
Columbia Acorn International $178,244,535; Columbia Acorn USA $53,095,035; Columbia Acorn
International Select $7,925,539; Columbia Acorn Select $13,779,499; Columbia Thermostat
Fund $—; Columbia Acorn Emerging Markets Fund $2,610,061; Columbia Acorn European
Fund $1,540,884) | | $ | 10,161,532,903 | | | $ | 7,924,906,545 | | | $ | 1,367,318,287 | | | $ | 232,251,748 | | |
Affiliated investments, at value | | | 1,926,769,533 | | | | 105,542,951 | | | | — | | | | — | | |
Cash | | | — | | | | 22,910 | | | | — | | | | — | | |
Foreign currency (cost: Columbia Acorn Fund $—; Columbia Acorn International $1,962,772;
Columbia Acorn USA $—; Columbia Acorn International Select $109; Columbia Acorn
Select $—; Columbia Thermostat Fund $—; Columbia Acorn Emerging Markets
Fund $133,903; Columbia Acorn European Fund $—) | | | — | | | | 1,963,010 | | | | — | | | | 109 | | |
Receivable for: | |
Investments sold | | | 22,561,608 | | | | 74,143,778 | | | | 2,685,183 | | | | — | | |
Fund shares sold | | | 13,527,673 | | | | 22,195,532 | | | | 1,644,367 | | | | 47,983 | | |
Dividends | | | 5,422,840 | | | | 11,796,885 | | | | 448,579 | | | | 142,284 | | |
Securities lending income | | | 163,252 | | | | 111,073 | | | | 42,863 | | | | 9,658 | | |
Foreign tax reclaims | | | 58,756 | | | | 6,327,061 | | | | — | | | | 245,012 | | |
Expense reimbursement due from Investment Manager | | | — | | | | 1,115 | | | | — | | | | 1 | | |
Trustees' deferred compensation plan | | | 3,732,536 | | | | 1,231,519 | | | | 321,717 | | | | — | | |
Prepaid expenses | | | 235,962 | | | | 212,075 | | | | 26,965 | | | | 9,701 | | |
Other assets | | | 103,205 | | | | 9,030 | | | | 12,324 | | | | 6,107 | | |
Total Assets | | | 12,134,108,268 | | | | 8,148,463,484 | | | | 1,372,500,285 | | | | 232,712,603 | | |
Liabilities: | |
Payable to custodian bank | | | — | | | | — | | | | — | | | | — | | |
Collateral on securities loaned | | | 205,638,386 | | | | 186,393,214 | | | | 53,302,525 | | | | 8,381,123 | | |
Unrealized depreciation on forward foreign currency exchange contracts | | | — | | | | — | | | | — | | | | 237,682 | | |
Payable for: | |
Investments purchased | | | 23,067,085 | | | | 33,282,970 | | | | 5,356,578 | | | | — | | |
Fund shares redeemed | | | 60,749,497 | | | | 23,014,517 | | | | 1,470,847 | | | | 501,728 | | |
Investment advisory fee | | | 209,364 | | | | 163,116 | | | | 30,940 | | | | 5,766 | | |
Administration fee | | | 13,026 | | | | 8,680 | | | | 1,436 | | | | 247 | | |
12b-1 Service and Distribution fees | | | 34,562 | | | | 9,583 | | | | 1,907 | | | | 507 | | |
Reports to shareholders | | | 644,720 | | | | 413,610 | | | | 69,025 | | | | 25,541 | | |
Transfer agent fees | | | 2,166,867 | | | | 930,150 | | | | 330,219 | | | | 22,034 | | |
Trustees' fees | | | 31,863 | | | | 16,478 | | | | 2,600 | | | | 58,523 | | |
Custody fees | | | 75,687 | | | | 556,460 | | | | 5,788 | | | | 18,269 | | |
Professional fee | | | 128,228 | | | | 94,243 | | | | 27,857 | | | | 24,716 | | |
Chief compliance officer expenses | | | 17,885 | | | | 4,396 | | | | 1,205 | | | | 275 | | |
Deferred foreign capital gains tax payable | | | — | | | | — | | | | — | | | | — | | |
Trustees' deferred compensation plan | | | 3,732,536 | | | | 1,231,519 | | | | 321,717 | | | | — | | |
Other liabilities | | | — | | | | 2,558 | | | | 1,501 | | | | 4,609 | | |
Total Liabilities | | | 296,509,706 | | | | 246,121,494 | | | | 60,924,145 | | | | 9,281,020 | | |
Net Assets | | $ | 11,837,598,562 | | | $ | 7,902,341,990 | | | $ | 1,311,576,140 | | | $ | 223,431,583 | | |
Composition of Net Assets: | |
Paid-in capital | | $ | 3,870,452,801 | | | $ | 6,126,660,558 | | | $ | 564,952,456 | | | $ | 209,031,074 | | |
Undistributed (Overdistributed) net investment income (loss) | | | (14,257,690 | ) | | | (32,804,029 | ) | | | (2,316,494 | ) | | | (5,561,522 | ) | |
Accumulated net realized gain (loss) | | | 2,934,350,221 | | | | 421,421,418 | | | | 215,546,938 | | | | (2,232,353 | ) | |
Net unrealized appreciation (depreciation) on: | |
Unaffiliated investments | | | 4,277,030,315 | | | | 1,395,392,010 | | | | 533,393,240 | | | | 22,438,955 | | |
Affiliated investments | | | 770,033,008 | | | | (7,897,015 | ) | | | — | | | | — | | |
Foreign currency translations | | | (10,093 | ) | | | (430,952 | ) | | | — | | | | (6,889 | ) | |
Forward foreign currency exchange contracts | | | — | | | | — | | | | — | | | | (237,682 | ) | |
Foreign capital gains tax | | | — | | | | — | | | | — | | | | — | | |
Net Assets | | $ | 11,837,598,562 | | | $ | 7,902,341,990 | | | $ | 1,311,576,140 | | | $ | 223,431,583 | | |
Net asset value per share – Class A (a) | | $ | 30.63 | | | $ | 43.41 | | | $ | 30.38 | | | $ | 22.76 | | |
(Net assets/shares)
| | ($ | 2,201,584,812/
71,874,546) | | | ($ | 964,828,350/
22,226,587) | | | ($ | 136,711,178/
4,500,769) | | | ($ | 43,965,056/
1,931,638) | | |
Maximum offering price per share – Class A (b) | | $ | 32.50 | | | $ | 46.06 | | | $ | 32.23 | | | $ | 24.15 | | |
(Net asset value per share/front-end sales charge) | | ($ | 30.63/ 0.9425 | ) | | ($ | 43.41/ 0.9425 | ) | | ($ | 30.38/ 0.9425 | ) | | ($ | 22.76/ 0.9425 | ) | |
Net asset value and offering price per share – Class B (a) | | $ | 26.51 | | | $ | 41.87 | | | $ | 26.07 | | | $ | 21.37 | | |
(Net assets/shares) | | ($ | 3,569,962/ 134,688 | ) | | ($ | 3,915,301/ 93,518 | ) | | ($ | 129,868/ 4,981 | ) | | ($ | 136,004/ 6,363 | ) | |
Net asset value and offering price per share – Class C (a) | | $ | 25.87 | | | $ | 41.69 | | | $ | 25.84 | | | $ | 21.23 | | |
(Net assets/shares)
| | ($ | 712,925,650/
27,553,005) | | | ($ | 104,159,630/
2,498,144) | | | ($ | 35,239,436/
1,363,848) | | | ($ | 7,250,111/
341,543) | | |
Net asset value and offering price per share – Class I (c) | | $ | 32.53 | | | $ | 43.57 | | | $ | 32.65 | (d) | | $ | 23.06 | (d) | |
(Net assets/shares)
| | ($ | 29,576,462/
909,167) | | | ($ | 59,073,900/
1,355,734) | | | ($ | 2,292/ 70
| ) | | ($ | 2,125/ 92
| ) | |
Net asset value and offering price per share – Class R (c) | | $ | — | | | $ | 43.32 | | | $ | — | | | $ | — | | |
(Net assets/shares) | | ($ | —/ — | ) | | ($ | 4,989,417/ 115,180 | ) | | ($ | —/ — | ) | | ($ | —/ — | ) | |
Net asset value and offering price per share – Class R4 (c) | | $ | 33.02 | | | $ | 43.80 | | | $ | 33.17 | | | $ | 23.22 | | |
(Net assets/shares)
| | ($ | 200,539,115/
6,073,263) | | | ($ | 500,423,263/
11,423,910) | | | ($ | 12,550,745/
378,329) | | | ($ | 1,080,091/
46,510) | | |
Net asset value and offering price per share – Class R5 (c) | | $ | 33.07 | | | $ | 43.50 | | | $ | 33.20 | | | $ | 23.21 | | |
(Net assets/shares)
| | ($ | 198,784,398/
6,010,226) | | | ($ | 410,552,304/
9,437,135) | | | ($ | 35,962,075/
1,083,095) | | | ($ | 3,484,879/
150,154) | | |
Net asset value and offering price per share – Class Y (c) | | $ | 33.15 | | | $ | 43.85 | | | $ | 33.30 | | | $ | 23.20 | | |
(Net assets/shares)
| | ($ | 204,378,360/
6,165,101) | | | ($ | 300,536,288/
6,853,996) | | | ($ | 36,734,493/
1,103,115) | | | ($ | 10,763,082/
463,850) | | |
Net asset value and offering price per share – Class Z (c) | | $ | 32.44 | | | $ | 43.52 | | | $ | 32.45 | | | $ | 23.07 | | |
(Net assets/shares)
| | ($ | 8,286,239,803/
255,433,395) | | | ($ | 5,553,863,537/
127,618,393) | | | ($ | 1,054,246,053/
32,485,476) | | | ($ | 156,750,235/
6,795,995) | | |
(a) Redemption price per share is equal to net asset value less any applicable contingent deferred sales charge.
(b) On sales of $50,000 or more the offering price is reduced.
(c) Redemption price per share is equal to net asset value.
(d) Net asset value per share rounds to this amount due to fractional shares outstanding.
See accompanying notes to financial statements.
84
June 30, 2015 | | Columbia
Acorn
SelectSM | | Columbia
Thermostat
FundSM | | Columbia
Acorn
Emerging Markets
FundSM | | Columbia
Acorn
European
FundSM | |
Assets: | |
Unaffiliated investments, at cost | | $ | 457,344,450 | | | $ | 5,691,503 | | | $ | 421,007,801 | | | $ | 55,988,102 | | |
Affiliated investments, at cost | | | 17,688,954 | | | | 1,146,086,714 | | | | — | | | | — | | |
Unaffiliated investments, at value (including securities on loan: Columbia Acorn Fund $205,238,253;
Columbia Acorn International $178,244,535; Columbia Acorn USA $53,095,035; Columbia Acorn
International Select $7,925,539; Columbia Acorn Select $13,779,499; Columbia Thermostat
Fund $—; Columbia Acorn Emerging Markets Fund $2,610,061; Columbia Acorn European
Fund $1,540,884) | | $ | 609,324,216 | | | $ | 5,691,503 | | | $ | 420,915,008 | | | $ | 57,984,429 | | |
Affiliated investments, at value | | | 2,019,797 | | | | 1,179,928,856 | | | | — | | | | — | | |
Cash | | | — | | | | — | | | | — | | | | — | | |
Foreign currency (cost: Columbia Acorn Fund $—; Columbia Acorn International $1,962,772;
Columbia Acorn USA $—; Columbia Acorn International Select $109; Columbia Acorn
Select $—; Columbia Thermostat Fund $—; Columbia Acorn Emerging Markets
Fund $133,903; Columbia Acorn European Fund $—) | | | — | | | | — | | | | 133,903 | | | | — | | |
Receivable for: | |
Investments sold | | | 4,358,956 | | | | 63,059,408 | | | | 13,335 | | | | — | | |
Fund shares sold | | | 6,195,956 | | | | 1,531,557 | | | | 555,580 | | | | 408,776 | | |
Dividends | | | 355,508 | | | | 1,906,627 | | | | 989,327 | | | | 88,822 | | |
Securities lending income | | | 4,380 | | | | — | | | | 2,560 | | | | 2,456 | | |
Foreign tax reclaims | | | — | | | | — | | | | 11,676 | | | | 50,979 | | |
Expense reimbursement due from Investment Manager | | | 4 | | | | 733 | | | | — | | | | 299 | | |
Trustees' deferred compensation plan | | | 332,407 | | | | — | | | | — | | | | — | | |
Prepaid expenses | | | 22,069 | | | | 32,920 | | | | 21,272 | | | | 1,943 | | |
Other assets | | | 8,211 | | | | 21,385 | | | | 11,756 | | | | 19,629 | | |
Total Assets | | | 622,621,504 | | | | 1,252,172,989 | | | | 422,654,417 | | | | 58,557,333 | | |
Liabilities: | |
Payable to custodian bank | | | — | | | | — | | | | — | | | | 10 | | |
Collateral on securities loaned | | | 14,060,046 | | | | — | | | | 2,703,540 | | | | 1,790,781 | | |
Unrealized depreciation on forward foreign currency exchange contracts | | | — | | | | — | | | | — | | | | — | | |
Payable for: | |
Investments purchased | | | 2,388,210 | | | | 64,732,398 | | | | 2,034,748 | | | | 139,818 | | |
Fund shares redeemed | | | 910,250 | | | | 8,872,800 | | | | 610,917 | | | | 92,473 | | |
Investment advisory fee | | | 10,639 | | | | 3,248 | | | | 11,970 | | | | 1,874 | | |
Administration fee | | | 658 | | | | 1,306 | | | | 454 | | | | 63 | | |
12b-1 Service and Distribution fees | | | 2,882 | | | | 13,434 | | | | 1,881 | | | | 422 | | |
Reports to shareholders | | | 59,465 | | | | 68,675 | | | | 46,603 | | | | 12,072 | | |
Transfer agent fees | | | 70,191 | | | | 76,766 | | | | 46,950 | | | | 3,447 | | |
Trustees' fees | | | 1,177 | | | | 76,395 | | | | 18,624 | | | | 2,233 | | |
Custody fees | | | 4,411 | | | | 634 | | | | 87,583 | | | | 6,570 | | |
Professional fee | | | 26,266 | | | | 25,009 | | | | 16,531 | | | | 23,465 | | |
Chief compliance officer expenses | | | 77 | | | | 774 | | | | 386 | | | | 29 | | |
Deferred foreign capital gains tax payable | | | — | | | | — | | | | 200,892 | | | | — | | |
Trustees' deferred compensation plan | | | 332,407 | | | | — | | | | — | | | | — | | |
Other liabilities | | | 5,981 | | | | — | | | | 1,293 | | | | 3 | | |
Total Liabilities | | | 17,872,660 | | | | 73,871,439 | | | | 5,782,372 | | | | 2,073,260 | | |
Net Assets | | $ | 604,748,844 | | | $ | 1,178,301,550 | | | $ | 416,872,045 | | | $ | 56,484,073 | | |
Composition of Net Assets: | |
Paid-in capital | | $ | 361,957,932 | | | $ | 1,133,261,458 | | | $ | 430,309,656 | | | $ | 56,641,648 | | |
Undistributed (Overdistributed) net investment income (loss) | | | (1,364,620 | ) | | | 9,640,304 | | | | 186,119 | | | | 438,439 | | |
Accumulated net realized gain (loss) | | | 107,844,886 | | | | 1,557,646 | | | | (13,334,597 | ) | | | (2,590,825 | ) | |
Net unrealized appreciation (depreciation) on: | |
Unaffiliated investments | | | 151,979,766 | | | | — | | | | (92,793 | ) | | | 1,996,327 | | |
Affiliated investments | | | (15,669,157 | ) | | | 33,842,142 | | | | — | | | | — | | |
Foreign currency translations | | | 37 | | | | — | | | | 4,552 | | | | (1,516 | ) | |
Forward foreign currency exchange contracts | | | — | | | | — | | | | — | | | | — | | |
Foreign capital gains tax | | | — | | | | — | | | | (200,892 | ) | | | — | | |
Net Assets | | $ | 604,748,844 | | | $ | 1,178,301,550 | | | $ | 416,872,045 | | | $ | 56,484,073 | | |
Net asset value per share – Class A (a) | | $ | 20.52 | | | $ | 14.72 | | | $ | 12.34 | | | $ | 15.23 | | |
(Net assets/shares)
| | ($ | 244,592,468/
11,920,327) | | | ($ | 427,618,435/
29,051,227) | | | ($ | 138,930,231/
11,260,046) | | | ($ | 34,321,233/
2,253,306) | | |
Maximum offering price per share – Class A (b) | | $ | 21.77 | | | $ | 15.62 | | | $ | 13.09 | | | $ | 16.16 | | |
(Net asset value per share/front-end sales charge) | | ($ | 20.52/ 0.9425 | ) | | ($ | 14.72/ 0.9425 | ) | | ($ | 12.34/ 0.9425 | ) | | ($ | 15.23/ 0.9425 | ) | |
Net asset value and offering price per share – Class B (a) | | $ | 17.26 | | | $ | 14.79 | | | $ | — | | | $ | — | | |
(Net assets/shares) | | ($ | 533,043/ 30,882 | ) | | ($ | 936,608/ 63,321 | ) | | ($ | —/ — | ) | | ($ | —/ — | ) | |
Net asset value and offering price per share – Class C (a) | | $ | 16.91 | | | $ | 14.77 | | | $ | 12.23 | | | $ | 15.05 | | |
(Net assets/shares)
| | ($ | 43,848,238/
2,592,709) | | | ($ | 380,771,475/
25,786,150) | | | ($ | 34,754,361/
2,842,556) | | | ($ | 6,711,435/
445,849) | | |
Net asset value and offering price per share – Class I (c) | | $ | 22.00 | | | $ | — | | | $ | 12.39 | (d) | | $ | 15.24 | (d) | |
(Net assets/shares)
| | ($ | 29,504,706/
1,341,340) | | | ($ | —/—
| ) | | ($ | 2,464/ 199
| ) | | ($ | 2,570/ 169
| ) | |
Net asset value and offering price per share – Class R (c) | | $ | — | | | $ | — | | | $ | — | | | $ | — | | |
(Net assets/shares) | | ($ | —/ — | ) | | ($ | —/ — | ) | | ($ | —/ — | ) | | ($ | —/ — | ) | |
Net asset value and offering price per share – Class R4 (c) | | $ | 22.37 | | | $ | 14.62 | | | $ | 12.46 | | | $ | 15.31 | | |
(Net assets/shares)
| | ($ | 1,282,018/
57,321) | | | ($ | 21,958,860/
1,502,364) | | | ($ | 13,811,663/
1,108,467) | | | ($ | 596,718/
38,966) | | |
Net asset value and offering price per share – Class R5 (c) | | $ | 22.41 | | | $ | 14.63 | | | $ | 12.45 | | | $ | 15.39 | | |
(Net assets/shares)
| | ($ | 2,301,531/
102,717) | | | ($ | 4,748,730/
324,569) | | | ($ | 18,725,068/
1,503,468) | | | ($ | 1,857,724/
120,724) | | |
Net asset value and offering price per share – Class Y (c) | | $ | 22.50 | | | $ | 14.62 | | | $ | 12.35 | (d) | | $ | — | | |
(Net assets/shares)
| | ($ | 4,134,662/
183,748) | | | ( | $341,764/
23,380) | | | ($ | 2,341/ 190
| ) | | ($ | —/—
| ) | |
Net asset value and offering price per share – Class Z (c) | | $ | 21.87 | | | $ | 14.55 | | | $ | 12.38 | | | $ | 15.25 | | |
(Net assets/shares)
| | ($ | 278,552,178/
12,734,723) | | | ($ | 341,925,678/
23,504,812) | | | ($ | 210,645,917/
17,019,818) | | | ($ | 12,994,393/
852,156) | | |
See accompanying notes to financial statements.
85
COLUMBIA ACORN FAMILY OF FUNDS
STATEMENTS OF OPERATIONS (UNAUDITED) FOR THE SIX MONTHS ENDED JUNE 30, 2015
| | | Columbia
Acorn®
Fund | | Columbia
Acorn
International® | | Columbia
Acorn
USA® | | Columbia
Acorn
International
SelectSM | |
Investment Income: | |
Dividends | | $ | 37,435,400 | | | $ | 103,560,690 | | | $ | 5,368,854 | | | $ | 3,256,827 | | |
Dividends from affiliates | | | 12,817,213 | | | | 4,360,275 | | | | — | | | | — | | |
Dividends from affiliated investment company shares | | | — | | | | — | | | | — | | | | — | | |
Interest | | | 1,816 | | | | 1,103,748 | | | | — | | | | 414,370 | | |
Income from securities lending – net | | | 2,162,958 | | | | 1,056,847 | | | | 256,375 | | | | 52,206 | | |
| | | 52,417,387 | | | | 110,081,560 | | | | 5,625,229 | | | | 3,723,403 | | |
Foreign taxes withheld | | | (345,122 | ) | | | (10,747,369 | ) | | | (7,755 | ) | | | (260,399 | ) | |
Total Investment Income | | | 52,072,265 | | | | 99,334,191 | | | | 5,617,474 | | | | 3,463,004 | | |
Expenses: | |
Investment advisory fee | | | 44,604,960 | | | | 29,994,326 | | | | 5,819,239 | | | | 1,146,008 | | |
Administration fee | | | 2,717,589 | | | | 1,559,011 | | | | 263,888 | | | | 47,860 | | |
12b-1 Service and Distribution fees: | |
Class A | | | 3,045,470 | | | | 1,213,818 | | | | 174,773 | | | | 62,187 | | |
Class B | | | 19,548 | | | | 19,736 | | | | 708 | | | | 930 | | |
Class C | | | 3,704,961 | | | | 527,236 | | | | 179,834 | | | | 38,798 | | |
Class R | | | — | | | | 12,333 | | | | — | | | | — | | |
Transfer agency fees: | |
Class A | | | 1,431,185 | | | | 797,171 | | | | 94,207 | | | | 35,303 | | |
Class B | | | 11,104 | | | | 13,155 | | | | 775 | | | | 528 | | |
Class C | | | 267,824 | | | | 72,767 | | | | 10,851 | | | | 6,247 | | |
Class R | | | — | | | | 5,933 | | | | — | | | | — | | |
Class R4 | | | 168,432 | | | | 441,668 | | | | 6,968 | | | | 615 | | |
Class R5 | | | 62,633 | | | | 104,276 | | | | 9,713 | | | | 833 | | |
Class Z | | | 4,115,768 | | | | 2,557,255 | | | | 738,242 | | | | 74,979 | | |
Trustees' fees | | | 462,467 | | | | 245,332 | | | | 42,232 | | | | 11,662 | | |
Custody fees | | | 91,961 | | | | 769,454 | | | | 11,891 | | | | 24,813 | | |
Registration and blue sky fees | | | 78,070 | | | | 104,115 | | | | 49,165 | | | | 46,731 | | |
Reports to shareholders | | | 825,027 | | | | 770,972 | | | | 97,035 | | | | 46,060 | | |
Audit fees | | | 47,976 | | | | 51,477 | | | | 21,344 | | | | 24,908 | | |
Legal fees | | | 518,023 | | | | 307,210 | | | | 44,910 | | | | 8,877 | | |
Chief compliance officer expenses | | | 258,240 | | | | 141,370 | | | | 24,303 | | | | 4,414 | | |
Other expenses | | | 282,953 | | | | 259,067 | | | | 31,775 | | | | 13,186 | | |
Total Expenses | | | 62,714,191 | | | | 39,967,682 | | | | 7,621,853 | | | | 1,594,939 | | |
Less reimbursement of expenses by Investment Manager and its affiliates | | | — | | | | (205,545 | ) | | | — | | | | (116 | ) | |
Less advisory fee waiver | | | — | | | | — | | | | — | | | | — | | |
Net Expenses | | | 62,714,191 | | | | 39,762,137 | | | | 7,621,853 | | | | 1,594,823 | | |
Net Investment Income (Loss) | | | (10,641,926 | ) | | | 59,572,054 | | | | (2,004,379 | ) | | | 1,868,181 | | |
Net Realized and Unrealized Gain (Loss) on Investments: | |
Net realized gain (loss) on: | |
Unaffiliated investments | | | 2,536,315,696 | | | | 468,170,226 | | | | 216,222,274 | | | | 6,347,553 | | |
Affiliated investments | | | 406,561,058 | | | | (175,391 | ) | | | — | | | | — | | |
Distributions from affiliated investment company shares | | | — | | | | — | | | | — | | | | — | | |
Foreign currency translations | | | (197,976 | ) | | | (2,345,642 | ) | | | — | | | | (86,725 | ) | |
Forward foreign currency exchange contracts | | | — | | | | — | | | | — | | | | 291,763 | | |
Futures contracts | | | 2,900,917 | | | | — | | | | — | | | | — | | |
Net realized gain | | | 2,945,579,695 | | | | 465,649,193 | | | | 216,222,274 | | | | 6,552,591 | | |
Net change in net unrealized appreciation (depreciation) on: | |
Unaffiliated investments | | | (1,568,742,526 | ) | | | (129,136,187 | ) | | | (117,673,779 | ) | | | 1,640,686 | | |
Affiliated investments | | | (474,699,646 | ) | | | (1,045,560 | ) | | | — | | | | — | | |
Foreign currency translations | | | 1,107 | | | | 192,366 | | | | — | | | | 17,920 | | |
Forward foreign currency exchange contracts | | | — | | | | — | | | | — | | | | (140,501 | ) | |
Foreign capital gains tax | | | 1,217,682 | | | | 771,879 | | | | — | | | | — | | |
Net change in unrealized appreciation (depreciation) | | | (2,042,223,383 | ) | | | (129,217,502 | ) | | | (117,673,779 | ) | | | 1,518,105 | | |
Net realized and unrealized gain (loss) | | | 903,356,312 | | | | 336,431,691 | | | | 98,548,495 | | | | 8,070,696 | | |
Net Increase (Decrease) in Net Assets from Operations | | $ | 892,714,386 | | | $ | 396,003,745 | | | $ | 96,544,116 | | | $ | 9,938,877 | | |
See accompanying notes to financial statements.
86
| | | Columbia
Acorn
SelectSM | | Columbia
Thermostat
FundSM | | Columbia
Acorn
Emerging Markets
FundSM | | Columbia
Acorn
European
FundSM | |
Investment Income: | |
Dividends | | $ | 2,635,490 | | | $ | 279 | | | $ | 6,449,859 | | | $ | 955,274 | | |
Dividends from affiliates | | | — | | | | — | | | | — | | | | — | | |
Dividends from affiliated investment company shares | | | — | | | | 13,801,311 | | | | — | | | | — | | |
Interest | | | — | | | | — | | | | 55,264 | | | | — | | |
Income from securities lending – net | | | 20,213 | | | | — | | | | 16,465 | | | | 12,745 | | |
| | | 2,655,703 | | | | 13,801,590 | | | | 6,521,588 | | | | 968,019 | | |
Foreign taxes withheld | | | (7,178 | ) | | | — | | | | (355,763 | ) | | | (115,455 | ) | |
Total Investment Income | | | 2,648,525 | | | | 13,801,590 | | | | 6,165,825 | | | | 852,564 | | |
Expenses: | |
Investment advisory fee | | | 2,659,877 | | | | 612,624 | | | | 2,396,766 | | | | 266,531 | | |
Administration fee | | | 122,858 | | | | 240,525 | | | | 89,223 | | | | 8,811 | | |
12b-1 Service and Distribution fees: | |
Class A | | | 316,212 | | | | 551,831 | | | | 189,178 | | | | 32,738 | | |
Class B | | | 2,810 | | | | 4,114 | | | | — | | | | — | | |
Class C | | | 228,674 | | | | 1,969,943 | | | | 195,080 | | | | 28,956 | | |
Class R | | | — | | | | — | | | | — | | | | — | | |
Transfer agency fees: | |
Class A | | | 151,533 | | | | 165,948 | | | | 91,432 | | | | 13,999 | | |
Class B | | | 2,665 | | | | 1,318 | | | | — | | | | — | | |
Class C | | | 22,690 | | | | 142,447 | | | | 24,351 | | | | 3,483 | | |
Class R | | | — | | | | — | | | | — | | | | — | | |
Class R4 | | | 886 | | | | 8,027 | | | | 5,715 | | | | 538 | | |
Class R5 | | | 2,256 | | | | 1,101 | | | | 4,924 | | | | 428 | | |
Class Z | | | 140,524 | | | | 108,791 | | | | 132,189 | | | | 4,474 | | |
Trustees' fees | | | 20,240 | | | | 37,903 | | | | 17,520 | | | | 1,788 | | |
Custody fees | | | 7,347 | | | | 1,520 | | | | 121,680 | | | | 9,541 | | |
Registration and blue sky fees | | | 49,470 | | | | 63,637 | | | | 49,755 | | | | 37,717 | | |
Reports to shareholders | | | 95,274 | | | | 125,003 | | | | 72,758 | | | | 17,590 | | |
Audit fees | | | 21,344 | | | | 11,686 | | | | 34,598 | | | | 20,832 | | |
Legal fees | | | 21,220 | | | | 49,279 | | | | 15,906 | | | | 1,259 | | |
Chief compliance officer expenses | | | 10,855 | | | | 22,512 | | | | 8,279 | | | | 668 | | |
Other expenses | | | 19,325 | | | | 26,901 | | | | 44,195 | | | | 9,181 | | |
Total Expenses | | | 3,896,060 | | | | 4,145,110 | | | | 3,493,549 | | | | 458,534 | | |
Less reimbursement of expenses by Investment Manager and its affiliates | | | (1,016 | ) | | | (100,577 | ) | | | — | | | | (60,916 | ) | |
Less advisory fee waiver | | | (207,859 | ) | | | — | | | | — | | | | — | | |
Net Expenses | | | 3,687,185 | | | | 4,044,533 | | | | 3,493,549 | | | | 397,618 | | |
Net Investment Income (Loss) | | | (1,038,660 | ) | | | 9,757,057 | | | | 2,672,276 | | | | 454,946 | | |
Net Realized and Unrealized Gain (Loss) on Investments: | |
Net realized gain (loss) on: | |
Unaffiliated investments | | | 122,757,395 | | | | — | | | | 2,178,549 | | | | 130,811 | | |
Affiliated investments | | | (14,793,039 | ) | | | 746,952 | | | | — | | | | — | | |
Distributions from affiliated investment company shares | | | — | | | | 4,641,797 | | | | — | | | | — | | |
Foreign currency translations | | | (3,634 | ) | | | — | | | | (292,856 | ) | | | (958 | ) | |
Forward foreign currency exchange contracts | | | — | | | | — | | | | — | | | | — | | |
Futures contracts | | | — | | | | — | | | | — | | | | — | | |
Net realized gain | | | 107,960,722 | | | | 5,388,749 | | | | 1,885,693 | | | | 129,853 | | |
Net change in net unrealized appreciation (depreciation) on: | |
Unaffiliated investments | | | (75,415,098 | ) | | | — | | | | (17,639,889 | ) | | | 1,568,374 | | |
Affiliated investments | | | 5,306,853 | | | | (2,463,415 | ) | | | — | | | | — | | |
Foreign currency translations | | | 37 | | | | — | | | | 14,903 | | | | 1,705 | | |
Forward foreign currency exchange contracts | | | — | | | | — | | | | — | | | | — | | |
Foreign capital gains tax | | | — | | | | — | | | | 469,883 | | | | — | | |
Net change in unrealized appreciation (depreciation) | | | (70,108,208 | ) | | | (2,463,415 | ) | | | (17,155,103 | ) | | | 1,570,079 | | |
Net realized and unrealized gain (loss) | | | 37,852,514 | | | | 2,925,334 | | | | (15,269,410 | ) | | | 1,699,932 | | |
Net Increase (Decrease) in Net Assets from Operations | | $ | 36,813,854 | | | $ | 12,682,391 | | | $ | (12,597,134 | ) | | $ | 2,154,878 | | |
See accompanying notes to financial statements.
87
COLUMBIA ACORN FAMILY OF FUNDS
STATEMENTS OF CHANGES IN NET ASSETS
| | | Columbia
Acorn® Fund | | Columbia Acorn
International® | | Columbia
Acorn USA® | | Columbia Acorn
International SelectSM | |
Increase (Decrease) in Net Assets | | (Unaudited)
Six months
ended
June 30, | | Year ended
December 31, | | (Unaudited)
Six months
ended
June 30, | | Year ended
December 31, | | (Unaudited)
Six months
ended
June 30, | | Year ended
December 31, | | (Unaudited)
Six months
ended
June 30, | | Year ended
December 31, | |
| | | 2015 | | 2014 | | 2015 | | 2014 | | 2015 | | 2014 | | 2015 | | 2014 | |
Operations: | |
Net investment income (loss) | | $ | (10,641,926 | ) | | $ | (4,904,097 | ) | | $ | 59,572,054 | | | $ | 95,286,191 | | | $ | (2,004,379 | ) | | $ | (6,182,121 | ) | | $ | 1,868,181 | | | $ | 4,277,133 | | |
Net realized gain (loss) on investments, foreign currency
translations, forward foreign currency exchange contracts,
futures contracts and foreign capital gains tax | | | 2,539,018,637 | | | | 2,436,637,992 | | | | 465,824,584 | | | | 480,895,123 | | | | 216,222,274 | | | | 257,777,850 | | | | 6,552,591 | | | | 26,265,551 | | |
Net realized gain (loss) on affiliated investments and
distributions from affiliated investment company shares | | | 406,561,058 | | | | 821,706,250 | | | | (175,391 | ) | | | (17,504,372 | ) | | | — | | | | — | | | | — | | | | — | | |
Net change in net unrealized appreciation (depreciation)
on investments, foreign currency translations, forward
foreign currency exchange contracts, futures contracts,
options and foreign capital gains tax | | | (1,567,523,737 | ) | | | (2,178,954,324 | ) | | | (128,171,942 | ) | | | (908,876,254 | ) | | | (117,673,779 | ) | | | (207,204,706 | ) | | | 1,518,105 | | | | (51,145,788 | ) | |
Net change in net unrealized appreciation (depreciation)
on affiliated investments, affiliated options and affiliated
investment company shares | | | (474,699,646 | ) | | | (983,776,070 | ) | | | (1,045,560 | ) | | | (10,747,516 | ) | | | — | | | | — | | | | — | | | | — | | |
Net Increase (Decrease) in Net Assets from Operations | | | 892,714,386 | | | | 90,709,751 | | | | 396,003,745 | | | | (360,946,828 | ) | | | 96,544,116 | | | | 44,391,023 | | | | 9,938,877 | | | | (20,603,104 | ) | |
Distributions to Shareholders From: | |
Net investment income – Class A | | | — | | | | — | | | | — | | | | (11,982,984 | ) | | | — | | | | — | | | | (195,302 | ) | | | (224,613 | ) | |
Net realized gain – Class A | | | (116,633,259 | ) | | | (486,737,575 | ) | | | (8,544,526 | ) | | | (51,297,757 | ) | | | (3,745,127 | ) | | | (28,022,455 | ) | | | — | | | | (6,609,718 | ) | |
Net investment income – Class B | | | — | | | | — | | | | — | | | | (33,111 | ) | | | — | | | | — | | | | (116 | ) | | | — | | |
Net realized gain – Class B | | | (230,292 | ) | | | (1,499,818 | ) | | | (39,614 | ) | | | (404,076 | ) | | | (4,529 | ) | | | (50,293 | ) | | | — | | | | (51,627 | ) | |
Net investment income – Class C | | | — | | | | — | | | | — | | | | (500,190 | ) | | | — | | | | — | | | | — | | | | — | | |
Net realized gain – Class C | | | (43,650,093 | ) | | | (148,638,681 | ) | | | (961,655 | ) | | | (5,765,804 | ) | | | (1,139,915 | ) | | | (7,386,824 | ) | | | — | | | | (1,052,637 | ) | |
Net investment income – Class I | | | — | | | | — | | | | — | | | | (432,624 | ) | | | — | | | | — | | | | (9 | ) | | | (19 | ) | |
Net realized gain – Class I | | | (1,148,694 | ) | | | (3,521,541 | ) | | | (403,320 | ) | | | (1,776,863 | ) | | | (59 | ) | | | (424 | ) | | | — | | | | (267 | ) | |
Net investment income – Class R | | | — | | | | — | | | | — | | | | (45,702 | ) | | | — | | | | — | | | | — | | | | — | | |
Net realized gain – Class R | | | — | | | | — | | | | (42,993 | ) | | | (308,877 | ) | | | — | | | | — | | | | — | | | | — | | |
Net investment income – Class R4 | | | — | | | | — | | | | — | | | | (5,947,002 | ) | | | — | | | | — | | | | (4,558 | ) | | | (7,289 | ) | |
Net realized gain – Class R4 | | | (9,648,616 | ) | | | (21,919,022 | ) | | | (4,288,552 | ) | | | (21,064,501 | ) | | | (308,779 | ) | | | (1,294,173 | ) | | | — | | | | (123,308 | ) | |
Net investment income – Class R5 | | | — | | | | — | | | | — | | | | (6,469,747 | ) | | | — | | | | — | | | | (14,655 | ) | | | (19,269 | ) | |
Net realized gain – Class R5 | | | (9,334,102 | ) | | | (83,114,711 | ) | | | (3,698,560 | ) | | | (20,627,952 | ) | | | (1,044,575 | ) | | | (5,923,118 | ) | | | — | | | | (294,842 | ) | |
Net investment income – Class Y | | | — | | | | — | | | | — | | | | (3,631,416 | ) | | | — | | | | — | | | | (45,324 | ) | | | (94,386 | ) | |
Net realized gain – Class Y | | | (9,941,189 | ) | | | (70,995,899 | ) | | | (2,167,824 | ) | | | (11,216,211 | ) | | | (900,699 | ) | | | (5,748,134 | ) | | | — | | | | (1,353,410 | ) | |
Net investment income – Class Z | | | — | | | | — | | | | — | | | | (88,209,132 | ) | | | — | | | | — | | | | (677,019 | ) | | | (1,436,806 | ) | |
Net realized gain – Class Z | | | (417,947,664 | ) | | | (1,866,279,508 | ) | | | (49,616,630 | ) | | | (300,186,783 | ) | | | (26,752,653 | ) | | | (197,817,289 | ) | | | — | | | | (23,156,256 | ) | |
Total Distributions to Shareholders | | | (608,533,909 | ) | | | (2,682,706,755 | ) | | | (69,763,674 | ) | | | (529,900,732 | ) | | | (33,896,336 | ) | | | (246,242,710 | ) | | | (936,983 | ) | | | (34,424,447 | ) | |
Share Transactions: | |
Subscriptions – Class A | | | 93,074,864 | | | | 387,297,277 | | | | 88,084,398 | | | | 235,302,578 | | | | 6,628,133 | | | | 25,880,527 | | | | 4,747,419 | | | | 17,687,288 | | |
Distributions reinvested – Class A | | | 108,977,754 | | | | 458,120,888 | | | | 8,303,010 | | | | 61,324,199 | | | | 3,534,801 | | | | 25,490,248 | | | | 189,769 | | | | 6,671,741 | | |
Redemptions – Class A | | | (732,743,039 | ) | | | (1,539,008,962 | ) | | | (116,920,214 | ) | | | (328,383,569 | ) | | | (27,438,727 | ) | | | (81,566,768 | ) | | | (16,257,050 | ) | | | (33,811,493 | ) | |
Net Increase (Decrease) – Class A | | | (530,690,421 | ) | | | (693,590,797 | ) | | | (20,532,806 | ) | | | (31,756,792 | ) | | | (17,275,793 | ) | | | (30,195,993 | ) | | | (11,319,862 | ) | | | (9,452,464 | ) | |
Distributions reinvested – Class B | | | 219,826 | | | | 1,459,028 | | | | 38,735 | | | | 428,823 | | | | 4,509 | | | | 50,412 | | | | 115 | | | | 51,402 | | |
Redemptions – Class B | | | (3,939,069 | ) | | | (11,842,669 | ) | | | (2,900,267 | ) | | | (6,307,820 | ) | | | (117,003 | ) | | | (333,713 | ) | | | (231,008 | ) | | | (493,902 | ) | |
Net Increase (Decrease) – Class B | | | (3,719,243 | ) | | | (10,383,641 | ) | | | (2,861,532 | ) | | | (5,878,997 | ) | | | (112,494 | ) | | | (283,301 | ) | | | (230,893 | ) | | | (442,500 | ) | |
Subscriptions – Class C | | | 19,260,660 | | | | 69,519,166 | | | | 6,306,990 | | | | 20,327,395 | | | | 876,651 | | | | 2,990,564 | | | | 414,983 | | | | 1,124,408 | | |
Distributions reinvested – Class C | | | 36,898,128 | | | | 124,358,458 | | | | 861,856 | | | | 5,543,900 | | | | 1,076,963 | | | | 7,016,021 | | | | — | | | | 965,830 | | |
Redemptions – Class C | | | (120,261,072 | ) | | | (204,072,123 | ) | | | (10,534,195 | ) | | | (20,718,133 | ) | | | (4,445,839 | ) | | | (7,454,664 | ) | | | (1,493,115 | ) | | | (2,579,871 | ) | |
Net Increase (Decrease) – Class C | | | (64,102,284 | ) | | | (10,194,499 | ) | | | (3,365,349 | ) | | | 5,153,162 | | | | (2,492,225 | ) | | | 2,551,921 | | | | (1,078,132 | ) | | | (489,633 | ) | |
Subscriptions – Class I | | | 12,665,465 | | | | 82,894,450 | | | | 37,365,938 | | | | 106,632,159 | | | | — | | | | — | | | | — | | | | — | | |
Distributions reinvested – Class I | | | 1,148,584 | | | | 3,521,166 | | | | 403,299 | | | | 2,209,323 | | | | — | | | | — | | | | — | | | | — | | |
Redemptions – Class I | | | (12,470,677 | ) | | | (79,941,110 | ) | | | (18,043,810 | ) | | | (98,916,651 | ) | | | — | | | | (1,200 | ) | | | — | | | | (100 | ) | |
Net Increase (Decrease) – Class I | | | 1,343,372 | | | | 6,474,506 | | | | 19,725,427 | | | | 9,924,831 | | | | — | | | | (1,200 | ) | | | — | | | | (100 | ) | |
Subscriptions – Class R | | | — | | | | — | | | | 733,516 | | | | 3,552,904 | | | | — | | | | — | | | | — | | | | — | | |
Distributions reinvested – Class R | | | — | | | | — | | | | 39,018 | | | | 324,934 | | | | — | | | | — | | | | — | | | | — | | |
Redemptions – Class R | | | — | | | | — | | | | (1,525,848 | ) | | | (3,574,734 | ) | | | — | | | | — | | | | — | | | | — | | |
Net Increase (Decrease) – Class R | | | — | | | | — | | | | (753,314 | ) | | | 303,104 | | | | — | | | | — | | | | — | | | | — | | |
(a) Class R4 shares reflect activity for the period from June 25, 2014 (commencement of operations) through December 31, 2014.
See accompanying notes to financial statements.
88
| | | Columbia
Acorn SelectSM | | Columbia
Thermostat FundSM | | Columbia Acorn
Emerging Markets FundSM | | Columbia Acorn
European FundSM | |
Increase (Decrease) in Net Assets | | (Unaudited)
Six months
ended
June 30, | | Year ended
December 31, | | (Unaudited)
Six months
ended
June 30, | | Year ended
December 31, | | (Unaudited)
Six months
ended
June 30, | | Year ended
December 31, | | (Unaudited)
Six months
ended
June 30, | | Year ended
December 31, | |
| | | 2015 | | 2014 | | 2015 | | 2014 | | 2015 | | 2014 | | 2015 | | 2014 (a) | |
Operations: | |
Net investment income (loss) | | $ | (1,038,660 | ) | | $ | (3,672,062 | ) | | $ | 9,757,057 | | | $ | 22,277,306 | | | $ | 2,672,276 | | | $ | 2,430,118 | | | $ | 454,946 | | | $ | 404,894 | | |
Net realized gain (loss) on investments, foreign currency
translations, forward foreign currency exchange contracts,
futures contracts and foreign capital gains tax | | | 122,753,761 | | | | 158,802,272 | | | | — | | | | 35 | | | | 1,885,693 | | | | (9,229,406 | ) | | | 129,853 | | | | (2,712,928 | ) | |
Net realized gain (loss) on affiliated investments and
distributions from affiliated investment company shares | | | (14,793,039 | ) | | | (5,568,755 | ) | | | 5,388,749 | | | | 38,178,162 | | | | — | | | | — | | | | — | | | | — | | |
Net change in net unrealized appreciation (depreciation)
on investments, foreign currency translations, forward
foreign currency exchange contracts, futures contracts,
options and foreign capital gains tax | | | (75,415,061 | ) | | | (133,989,051 | ) | | | — | | | | — | | | | (17,155,103 | ) | | | (14,640,892 | ) | | | 1,570,079 | | | | (3,116,709 | ) | |
Net change in net unrealized appreciation (depreciation)
on affiliated investments, affiliated options and affiliated
investment company shares | | | 5,306,853 | | | | 854,842 | | | | (2,463,415 | ) | | | 4,982,086 | | | | — | | | | — | | | | — | | | | — | | |
Net Increase (Decrease) in Net Assets from Operations | | | 36,813,854 | | | | 16,427,246 | | | | 12,682,391 | | | | 65,437,589 | | | | (12,597,134 | ) | | | (21,440,180 | ) | | | 2,154,878 | | | | (5,424,743 | ) | |
Distributions to Shareholders From: | |
Net investment income – Class A | | | — | | | | — | | | | (651,664 | ) | | | (8,397,874 | ) | | | — | | | | (1,094,797 | ) | | | (144,797 | ) | | | (84,996 | ) | |
Net realized gain – Class A | | | (19,933,244 | ) | | | (56,636,824 | ) | | | (8,171,921 | ) | | | (6,398,591 | ) | | | — | | | | — | | | | — | | | | (169,484 | ) | |
Net investment income – Class B | | | — | | | | — | | | | (1,472 | ) | | | (17,083 | ) | | | — | | | | — | | | | — | | | | — | | |
Net realized gain – Class B | | | (54,843 | ) | | | (297,506 | ) | | | (18,462 | ) | | | (18,454 | ) | | | — | | | | — | | | | — | | | | — | | |
Net investment income – Class C | | | — | | | | — | | | | (571,885 | ) | | | (4,546,957 | ) | | | — | | | | — | | | | — | | | | — | | |
Net realized gain – Class C | | | (4,321,966 | ) | | | (12,212,259 | ) | | | (7,171,478 | ) | | | (5,614,280 | ) | | | — | | | | — | | | | — | | | | (21,837 | ) | |
Net investment income – Class I | | | — | | | | — | | | | — | | | | — | | | | — | | | | (25 | ) | | | (12 | ) | | | (17 | ) | |
Net realized gain – Class I | | | (1,777,897 | ) | | | (3,400,475 | ) | | | — | | | | — | | | | — | | | | — | | | | — | | | | (13 | ) | |
Net investment income – Class R | | | — | | | | — | | | | — | | | | — | | | | — | | | | — | | | | — | | | | — | | |
Net realized gain – Class R | | | — | | | | — | | | | — | | | | — | | | | — | | | | — | | | | — | | | | — | | |
Net investment income – Class R4 | | | — | | | | — | | | | (33,548 | ) | | | (496,795 | ) | | | — | | | | (139,747 | ) | | | (5,491 | ) | | | (1,628 | ) | |
Net realized gain – Class R4 | | | (97,950 | ) | | | (246,466 | ) | | | (420,695 | ) | | | (305,871 | ) | | | — | | | | — | | | | — | | | | — | | |
Net investment income – Class R5 | | | — | | | | — | | | | (6,981 | ) | | | (65,599 | ) | | | — | | | | (184,675 | ) | | | (8,163 | ) | | | (11,230 | ) | |
Net realized gain – Class R5 | | | (168,761 | ) | | | (2,042,106 | ) | | | (87,538 | ) | | | (42,379 | ) | | | — | | | | — | | | | — | | | | (14,316 | ) | |
Net investment income – Class Y | | | — | | | | — | | | | (510 | ) | | | (8,730 | ) | | | — | | | | (23 | ) | | | — | | | | — | | |
Net realized gain – Class Y | | | (308,593 | ) | | | (715,032 | ) | | | (6,396 | ) | | | (5,549 | ) | | | — | | | | — | | | | — | | | | — | | |
Net investment income – Class Z | | | — | | | | — | | | | (525,890 | ) | | | (8,020,198 | ) | | | — | | | | (2,086,821 | ) | | | (57,214 | ) | | | (58,745 | ) | |
Net realized gain – Class Z | | | (21,865,469 | ) | | | (67,822,345 | ) | | | (6,594,711 | ) | | | (5,142,454 | ) | | | — | | | | — | | | | — | | | | (81,656 | ) | |
Total Distributions to Shareholders | | | (48,528,723 | ) | | | (143,373,013 | ) | | | (24,263,151 | ) | | | (39,080,814 | ) | | | — | | | | (3,506,088 | ) | | | (215,677 | ) | | | (443,922 | ) | |
Share Transactions: | |
Subscriptions – Class A | | | 8,193,734 | | | | 23,903,410 | | | | 45,853,873 | | | | 109,228,793 | | | | 6,883,085 | | | | 111,765,309 | | | | 15,911,293 | | | | 30,709,434 | | |
Distributions reinvested – Class A | | | 18,677,112 | | | | 52,931,442 | | | | 7,892,484 | | | | 13,288,881 | | | | — | | | | 1,088,373 | | | | 142,046 | | | | 251,848 | | |
Redemptions – Class A | | | (41,337,076 | ) | | | (94,474,957 | ) | | | (72,357,439 | ) | | | (196,252,756 | ) | | | (24,763,642 | ) | | | (122,334,919 | ) | | | (3,926,616 | ) | | | (25,970,474 | ) | |
Net Increase (Decrease) – Class A | | | (14,466,230 | ) | | | (17,640,105 | ) | | | (18,611,082 | ) | | | (73,735,082 | ) | | | (17,880,557 | ) | | | (9,481,237 | ) | | | 12,126,723 | | | | 4,990,808 | | |
Distributions reinvested – Class B | | | 58,413 | | | | 295,790 | | | | 19,596 | | | | 35,043 | | | | — | | | | — | | | | — | | | | — | | |
Redemptions – Class B | | | (525,387 | ) | | | (1,910,917 | ) | | | (304,881 | ) | | | (1,111,595 | ) | | | — | | | | — | | | | — | | | | — | | |
Net Increase (Decrease) – Class B | | | (466,974 | ) | | | (1,615,127 | ) | | | (285,285 | ) | | | (1,076,552 | ) | | | — | | | | — | | | | — | | | | — | | |
Subscriptions – Class C | | | 1,010,251 | | | | 3,943,141 | | | | 26,702,268 | | | | 71,129,998 | | | | 977,118 | | | | 16,317,984 | | | | 1,920,560 | | | | 5,134,061 | | |
Distributions reinvested – Class C | | | 3,593,300 | | | | 10,065,907 | | | | 5,964,048 | | | | 7,780,938 | | | | — | | | | — | | | | — | | | | 21,837 | | |
Redemptions – Class C | | | (7,507,276 | ) | | | (15,355,912 | ) | | | (51,531,364 | ) | | | (113,101,789 | ) | | | (6,234,688 | ) | | | (5,604,206 | ) | | | (604,204 | ) | | | (974,284 | ) | |
Net Increase (Decrease) – Class C | | | (2,903,725 | ) | | | (1,346,864 | ) | | | (18,865,048 | ) | | | (34,190,853 | ) | | | (5,257,570 | ) | | | 10,713,778 | | | | 1,316,356 | | | | 4,181,614 | | |
Subscriptions – Class I | | | 18,384,816 | | | | 54,126,443 | | | | — | | | | — | | | | — | | | | — | | | | — | | | | — | | |
Distributions reinvested – Class I | | | 1,777,731 | | | | 3,400,003 | | | | — | | | | — | | | | — | | | | 24 | | | | 12 | | | | 29 | | |
Redemptions – Class I | | | (8,606,952 | ) | | | (52,140,680 | ) | | | — | | | | — | | | | — | | | | (4,200 | ) | | | — | | | | (5,500 | ) | |
Net Increase (Decrease) – Class I | | | 11,555,595 | | | | 5,385,766 | | | | — | | | | — | | | | — | | | | (4,176 | ) | | | 12 | | | | (5,471 | ) | |
Subscriptions – Class R | | | — | | | | — | | | | — | | | | — | | | | — | | | | — | | | | — | | | | — | | |
Distributions reinvested – Class R | | | — | | | | — | | | | — | | | | — | | | | — | | | | — | | | | — | | | | — | | |
Redemptions – Class R | | | — | | | | — | | | | — | | | | — | | | | — | | | | — | | | | — | | | | — | | |
Net Increase (Decrease) – Class R | | | — | | | | — | | | | — | | | | — | | | | — | | | | — | | | | — | | | | — | | |
See accompanying notes to financial statements.
89
COLUMBIA ACORN FAMILY OF FUNDS
STATEMENTS OF CHANGES IN NET ASSETS, CONTINUED
| | | Columbia
Acorn® Fund | | Columbia Acorn
International® | | Columbia
Acorn USA® | | Columbia Acorn
International SelectSM | |
Increase (Decrease) in Net Assets | | (Unaudited)
Six months
ended
June 30, | | Year ended
December 31, | | (Unaudited)
Six months
ended
June 30, | | Year ended
December 31, | | (Unaudited)
Six months
ended
June 30, | | Year ended
December 31, | | (Unaudited)
Six months
ended
June 30, | | Year ended
December 31, | |
| | | 2015 | | 2014 | | 2015 | | 2014 | | 2015 | | 2014 | | 2015 | | 2014 | |
Subscriptions – Class R4 | | | 26,909,090 | | | | 207,170,623 | | | | 88,752,391 | | | | 175,589,777 | | | | 5,867,334 | | | | 2,470,102 | | | | 206,979 | | | | 1,034,431 | | |
Distributions reinvested – Class R4 | | | 9,466,765 | | | | 21,432,710 | | | | 4,274,668 | | | | 26,888,828 | | | | 308,779 | | | | 1,284,629 | | | | 4,548 | | | | 130,285 | | |
Redemptions – Class R4 | | | (91,625,255 | ) | | | (32,595,900 | ) | | | (35,154,540 | ) | | | (86,239,207 | ) | | | (2,023,855 | ) | | | (1,252,295 | ) | | | (138,931 | ) | | | (342,802 | ) | |
Net Increase (Decrease) – Class R4 | | | (55,249,400 | ) | | | 196,007,433 | | | | 57,872,519 | | | | 116,239,398 | | | | 4,152,258 | | | | 2,502,436 | | | | 72,596 | | | | 821,914 | | |
Subscriptions – Class R5 | | | 33,894,346 | | | | 195,425,964 | | | | 59,817,513 | | | | 247,362,038 | | | | 4,751,339 | | | | 37,680,269 | | | | 1,365,563 | | | | 3,308,092 | | |
Distributions reinvested – Class R5 | | | 9,316,968 | | | | 82,145,922 | | | | 3,667,913 | | | | 27,089,438 | | | | 1,044,517 | | | | 5,922,697 | | | | 14,647 | | | | 313,832 | | |
Redemptions – Class R5 | | | (305,121,170 | ) | | | (237,599,243 | ) | | | (67,481,458 | ) | | | (105,520,799 | ) | | | (8,301,534 | ) | | | (8,503,850 | ) | | | (594,870 | ) | | | (1,308,702 | ) | |
Net Increase (Decrease) – Class R5 | | | (261,909,856 | ) | | | 39,972,643 | | | | (3,996,032 | ) | | | 168,930,677 | | | | (2,505,678 | ) | | | 35,099,116 | | | | 785,340 | | | | 2,313,222 | | |
Subscriptions – Class Y | | | 16,187,530 | | | | 199,351,710 | | | | 78,821,805 | | | | 103,024,265 | | | | 1,359,915 | | | | 36,144,225 | | | | 4,567,512 | | | | 2,689,199 | | |
Distributions reinvested – Class Y | | | 9,941,189 | | | | 70,995,899 | | | | 2,167,824 | | | | 14,847,627 | | | | 900,640 | | | | 5,747,713 | | | | 45,315 | | | | 1,447,516 | | |
Redemptions – Class Y | | | (206,239,197 | ) | | | (1,053,713,427 | ) | | | (14,205,570 | ) | | | (21,611,148 | ) | | | (2,723,131 | ) | | | (48,745,200 | ) | | | (6,110,931 | ) | | | (3,306,180 | ) | |
Net Increase (Decrease) – Class Y | | | (180,110,478 | ) | | | (783,365,818 | ) | | | 66,784,059 | | | | 96,260,744 | | | | (462,576 | ) | | | (6,853,262 | ) | | | (1,498,104 | ) | | | 830,535 | | |
Subscriptions – Class Z | | | 259,804,464 | | | | 982,362,041 | | | | 319,142,620 | | | | 856,537,476 | | | | 66,614,074 | | | | 102,940,940 | | | | 7,097,551 | | | | 43,516,847 | | |
Distributions reinvested – Class Z | | | 353,829,315 | | | | 1,619,840,849 | | | | 37,832,464 | | | | 294,475,850 | | | | 23,540,112 | | | | 173,222,058 | | | | 424,872 | | | | 14,556,758 | | |
Redemptions – Class Z | | | (3,900,353,409 | ) | | | (4,171,520,886 | ) | | | (627,224,272 | ) | | | (1,213,184,358 | ) | | | (219,745,605 | ) | | | (480,201,144 | ) | | | (32,743,379 | ) | | | (99,596,462 | ) | |
Net Increase (Decrease) – Class Z | | | (3,286,719,630 | ) | | | (1,569,317,996 | ) | | | (270,249,188 | ) | | | (62,171,032 | ) | | | (129,591,419 | ) | | | (204,038,146 | ) | | | (25,220,956 | ) | | | (41,522,857 | ) | |
Net Increase (Decrease) from Share Transactions | | | (4,381,157,940 | ) | | | (2,824,398,169 | ) | | | (157,376,216 | ) | | | 297,005,095 | | | | (148,287,927 | ) | | | (201,218,429 | ) | | | (38,490,011 | ) | | | (47,941,883 | ) | |
Total Increase (Decrease) in Net Assets | | | (4,096,977,463 | ) | | | (5,416,395,173 | ) | | | 168,863,855 | | | | (593,842,465 | ) | | | (85,640,147 | ) | | | (403,070,116 | ) | | | (29,488,117 | ) | | | (102,969,434 | ) | |
Net Assets: | |
Beginning of period | | | 15,934,576,025 | | | | 21,350,971,198 | | | | 7,733,478,135 | | | | 8,327,320,600 | | | | 1,397,216,287 | | | | 1,800,286,403 | | | | 252,919,700 | | | | 355,889,134 | | |
End of period | | $ | 11,837,598,562 | | | $ | 15,934,576,025 | | | $ | 7,902,341,990 | | | $ | 7,733,478,135 | | | $ | 1,311,576,140 | | | $ | 1,397,216,287 | | | $ | 223,431,583 | | | $ | 252,919,700 | | |
Undistributed (Overdistributed) net investment income (loss) | | $ | (14,257,690 | ) | | $ | (3,615,764 | ) | | $ | (32,804,029 | ) | | $ | (92,376,083 | ) | | $ | (2,316,494 | ) | | $ | (312,115 | ) | | $ | (5,561,522 | ) | | $ | (6,492,720 | ) | |
(a) Class R4 shares reflect activity for the period from June 25, 2014 (commencement of operations) through December 31, 2014.
See accompanying notes to financial statements.
90
| | Columbia
Acorn SelectSM | | Columbia
Thermostat FundSM | | Columbia Acorn
Emerging Markets FundSM | | Columbia Acorn
European FundSM | |
Increase (Decrease) in Net Assets | | (Unaudited)
Six months
ended
June 30, | | Year ended
December 31, | | (Unaudited)
Six months
ended
June 30, | | Year ended
December 31, | | (Unaudited)
Six months
ended
June 30, | | Year ended
December 31, | | (Unaudited)
Six months
ended
June 30, | | Year ended
December 31, | |
| | | 2015 | | 2014 | | 2015 | | 2014 | | 2015 | | 2014 | | 2015 | | 2014 (a) | |
Subscriptions – Class R4 | | | 226,027 | | | | 533,691 | | | | 5,863,575 | | | | 12,515,863 | | | | 842,219 | | | | 6,532,869 | | | | 998,747 | | | | 325,474 | | |
Distributions reinvested – Class R4 | | | 97,950 | | | | 246,466 | | | | 454,185 | | | | 802,565 | | | | — | | | | 139,724 | | | | 5,481 | | | | 1,614 | | |
Redemptions – Class R4 | | | (213,594 | ) | | | (753,003 | ) | | | (7,597,882 | ) | | | (4,731,799 | ) | | | (2,063,377 | ) | | | (3,899,691 | ) | | | (742,929 | ) | | | (93 | ) | |
Net Increase (Decrease) – Class R4 | | | 110,383 | | | | 27,154 | | | | (1,280,122 | ) | | | 8,586,629 | | | | (1,221,158 | ) | | | 2,772,902 | | | | 261,299 | | | | 326,995 | | |
Subscriptions – Class R5 | | | 1,109,136 | | | | 2,302,873 | | | | 1,791,379 | | | | 3,265,267 | | | | 1,928,259 | | | | 13,884,224 | | | | 232,837 | | | | 3,323,523 | | |
Distributions reinvested – Class R5 | | | 168,596 | | | | 2,041,638 | | | | 94,518 | | | | 106,949 | | | | — | | | | 184,675 | | | | 8,152 | | | | 25,520 | | |
Redemptions – Class R5 | | | (10,118,449 | ) | | | (3,845,123 | ) | | | (626,682 | ) | | | (815,418 | ) | | | (2,288,862 | ) | | | (7,252,982 | ) | | | (109,065 | ) | | | (3,409,088 | ) | |
Net Increase (Decrease) – Class R5 | | | (8,840,717 | ) | | | 499,388 | | | | 1,259,215 | | | | 2,556,798 | | | | (360,603 | ) | | | 6,815,917 | | | | 131,924 | | | | (60,045 | ) | |
Subscriptions – Class Y | | | 1,049,300 | | | | 538,245 | | | | 17,030 | | | | 435,256 | | | | — | | | | — | | | | — | | | | — | | |
Distributions reinvested – Class Y | | | 308,428 | | | | 714,565 | | | | 6,853 | | | | 14,183 | | | | — | | | | — | | | | — | | | | — | | |
Redemptions – Class Y | | | (787,637 | ) | | | (1,818,170 | ) | | | (81,317 | ) | | | (53,320 | ) | | | — | | | | (200 | ) | | | — | | | | — | | |
Net Increase (Decrease) – Class Y | | | 570,091 | | | | (565,360 | ) | | | (57,434 | ) | | | 396,119 | | | | — | | | | (200 | ) | | | — | | | | — | | |
Subscriptions – Class Z | | | 7,799,032 | | | | 41,269,615 | | | | 43,253,933 | | | | 158,234,941 | | | | 20,668,240 | | | | 181,236,447 | | | | 6,255,614 | | | | 21,621,093 | | |
Distributions reinvested – Class Z | | | 17,593,307 | | | | 52,107,171 | | | | 4,862,392 | | | | 8,772,626 | | | | — | | | | 2,002,496 | | | | 56,774 | | | | 139,509 | | |
Redemptions – Class Z | | | (61,063,835 | ) | | | (146,142,628 | ) | | | (80,807,320 | ) | | | (172,293,477 | ) | | | (48,814,280 | ) | | | (101,479,206 | ) | | | (2,236,638 | ) | | | (15,477,555 | ) | |
Net Increase (Decrease) – Class Z | | | (35,671,496 | ) | | | (52,765,842 | ) | | | (32,690,995 | ) | | | (5,285,910 | ) | | | (28,146,040 | ) | | | 81,759,737 | | | | 4,075,750 | | | | 6,283,047 | | |
Net Increase (Decrease) from Share Transactions | | | (50,113,073 | ) | | | (68,020,990 | ) | | | (70,530,751 | ) | | | (102,748,851 | ) | | | (52,865,928 | ) | | | 92,576,721 | | | | 17,912,064 | | | | 15,716,948 | | |
Total Increase (Decrease) in Net Assets | | | (61,827,942 | ) | | | (194,966,757 | ) | | | (82,111,511 | ) | | | (76,392,076 | ) | | | (65,463,062 | ) | | | 67,630,453 | | | | 19,851,265 | | | | 9,848,283 | | |
Net Assets: | |
Beginning of period | | | 666,576,786 | | | | 861,543,543 | | | | 1,260,413,061 | | | | 1,336,805,137 | | | | 482,335,107 | | | | 414,704,654 | | | | 36,632,808 | | | | 26,784,525 | | |
End of period | | $ | 604,748,844 | | | $ | 666,576,786 | | | $ | 1,178,301,550 | | | $ | 1,260,413,061 | | | $ | 416,872,045 | | | $ | 482,335,107 | | | $ | 56,484,073 | | | $ | 36,632,808 | | |
Undistributed (Overdistributed) net investment income (loss) | | $ | (1,364,620 | ) | | $ | (325,960 | ) | | $ | 9,640,304 | | | $ | 1,675,197 | | | $ | 186,119 | | | $ | (2,486,157 | ) | | $ | 438,439 | | | $ | 199,170 | | |
See accompanying notes to financial statements.
91
COLUMBIA ACORN FAMILY OF FUNDS
STATEMENTS OF CHANGES IN NET ASSETS, CONTINUED
| | | Columbia
Acorn® Fund | | Columbia Acorn
International® | | Columbia
Acorn USA® | | Columbia Acorn
International SelectSM | |
Changes in Shares of Beneficial Interest: | | (Unaudited)
Six months
ended
June 30, | | Year ended
December 31, | | (Unaudited)
Six months
ended
June 30, | | Year ended
December 31, | | (Unaudited)
Six months
ended
June 30, | | Year ended
December 31, | | (Unaudited)
Six months
ended
June 30, | | Year ended
December 31, | |
| | | 2015 | | 2014 | | 2015 | | 2014 | | 2015 | | 2014 | | 2015 | | 2014 | |
Subscriptions – Class A | | | 3,001,408 | | | | 11,177,523 | | | | 2,019,396 | | | | 5,069,057 | | | | 218,678 | | | | 786,132 | | | | 207,243 | | | | 638,165 | | |
Shares issued in reinvestment and capital gains – Class A | | | 3,518,818 | | | | 14,955,024 | | | | 186,041 | | | | 1,433,668 | | | | 114,990 | | | | 878,620 | | | | 8,141 | | | | 298,993 | | |
Less shares redeemed – Class A | | | (23,581,767 | ) | | | (45,358,767 | ) | | | (2,688,008 | ) | | | (7,155,380 | ) | | | (916,961 | ) | | | (2,482,524 | ) | | | (707,956 | ) | | | (1,259,425 | ) | |
Net Increase (Decrease) – Class A | | | (17,061,541 | ) | | | (19,226,220 | ) | | | (482,571 | ) | | | (652,655 | ) | | | (583,293 | ) | | | (817,772 | ) | | | (492,572 | ) | | | (322,267 | ) | |
Shares issued in reinvestment and capital gains – Class B | | | 8,196 | | | | 53,837 | | | | 899 | | | | 10,251 | | | | 171 | | | | 1,994 | | | | 5 | | | | 2,445 | | |
Less shares redeemed – Class B | | | (144,946 | ) | | | (380,244 | ) | | | (68,720 | ) | | | (141,082 | ) | | | (4,445 | ) | | | (11,206 | ) | | | (10,810 | ) | | | (19,481 | ) | |
Net Increase (Decrease) – Class B | | | (136,750 | ) | | | (326,407 | ) | | | (67,821 | ) | | | (130,831 | ) | | | (4,274 | ) | | | (9,212 | ) | | | (10,805 | ) | | | (17,036 | ) | |
Subscriptions – Class C | | | 730,815 | | | | 2,380,665 | | | | 149,874 | | | | 455,251 | | | | 34,670 | | | | 106,036 | | | | 19,698 | | | | 43,902 | | |
Shares issued in reinvestment and capital gains – Class C | | | 1,409,940 | | | | 4,736,715 | | | | 20,095 | | | | 134,128 | | | | 41,168 | | | | 281,787 | | | | — | | | | 46,423 | | |
Less shares redeemed – Class C | | | (4,540,215 | ) | | | (6,832,781 | ) | | | (251,372 | ) | | | (471,635 | ) | | | (172,409 | ) | | | (259,303 | ) | | | (70,361 | ) | | | (104,212 | ) | |
Net Increase (Decrease) – Class C | | | (2,399,460 | ) | | | 284,599 | | | | (81,403 | ) | | | 117,744 | | | | (96,571 | ) | | | 128,520 | | | | (50,663 | ) | | | (13,887 | ) | |
Subscriptions – Class I | | | 385,749 | | | | 2,381,215 | | | | 839,510 | | | | 2,360,586 | | | | — | | | | — | | | | — | | | | — | | |
Shares issued in reinvestment and capital gains – Class I | | | 34,933 | | | | 107,212 | | | | 9,004 | | | | 50,640 | | | | — | | | | — | | | | — | | | | — | | |
Less shares redeemed – Class I | | | (390,890 | ) | | | (2,154,531 | ) | | | (421,989 | ) | | | (2,111,846 | ) | | | — | | | | (33 | ) | | | — | | | | (4 | ) | |
Net Increase (Decrease) – Class I | | | 29,792 | | | | 333,896 | | | | 426,525 | | | | 299,380 | | | | — | | | | (33 | ) | | | — | | | | (4 | ) | |
Subscriptions – Class R | | | — | | | | — | | | | 16,869 | | | | 77,000 | | | | — | | | | — | | | | — | | | | — | | |
Shares issued in reinvestment and capital gains – Class R | | | — | | | | — | | | | 876 | | | | 7,564 | | | | — | | | | — | | | | — | | | | — | | |
Less shares redeemed – Class R | | | — | | | | — | | | | (35,993 | ) | | | (76,075 | ) | | | — | | | | — | | | | — | | | | — | | |
Net Increase (Decrease) – Class R | | | — | | | | — | | | | (18,248 | ) | | | 8,489 | | | | — | | | | — | | | | — | | | | — | | |
Subscriptions – Class R4 | | | 809,837 | | | | 5,988,744 | | | | 2,024,389 | | | | 3,770,182 | | | | 180,371 | | | | 69,547 | | | | 8,955 | | | | 36,025 | | |
Shares issued in reinvestment and capital gains – Class R4 | | | 283,521 | | | | 658,166 | | | | 94,930 | | | | 626,322 | | | | 9,198 | | | | 40,840 | | | | 191 | | | | 5,756 | | |
Less shares redeemed – Class R4 | | | (2,724,716 | ) | | | (900,585 | ) | | | (796,214 | ) | | | (1,864,318 | ) | | | (62,062 | ) | | | (35,802 | ) | | | (6,018 | ) | | | (13,656 | ) | |
Net Increase (Decrease) – Class R4 | �� | | (1,631,358 | ) | | | 5,746,325 | | | | 1,323,105 | | | | 2,532,186 | | | | 127,507 | | | | 74,585 | | | | 3,128 | | | | 28,125 | | |
Subscriptions – Class R5 | | | 1,017,113 | | | | 5,371,622 | | | | 1,367,792 | | | | 5,374,903 | | | | 143,679 | | | | 1,039,918 | | | | 59,649 | | | | 113,565 | | |
Shares issued in reinvestment and capital gains – Class R5 | | | 278,701 | | | | 2,508,272 | | | | 82,020 | | | | 636,802 | | | | 31,087 | | | | 188,407 | | | | 616 | | | | 13,893 | | |
Less shares redeemed – Class R5 | | | (9,365,032 | ) | | | (6,914,002 | ) | | | (1,553,029 | ) | | | (2,352,664 | ) | | | (248,523 | ) | | | (237,562 | ) | | | (25,705 | ) | | | (46,841 | ) | |
Net Increase (Decrease) – Class R5 | | | (8,069,218 | ) | | | 965,892 | | | | (103,217 | ) | | | 3,659,041 | | | | (73,757 | ) | | | 990,763 | | | | 34,560 | | | | 80,617 | | |
Subscriptions – Class Y | | | 484,810 | | | | 5,405,607 | | | | 1,777,478 | | | | 2,180,767 | | | | 41,219 | | | | 989,024 | | | | 200,381 | | | | 95,911 | | |
Shares issued in reinvestment and capital gains – Class Y | | | 296,663 | | | | 2,114,206 | | | | 48,099 | | | | 346,391 | | | | 26,733 | | | | 182,296 | | | | 1,908 | | | | 63,827 | | |
Less shares redeemed – Class Y | | | (6,233,037 | ) | | | (28,273,237 | ) | | | (326,129 | ) | | | (474,107 | ) | | | (82,849 | ) | | | (1,378,135 | ) | | | (262,844 | ) | | | (122,660 | ) | |
Net Increase (Decrease) – Class Y | | | (5,451,564 | ) | | | (20,753,424 | ) | | | 1,499,448 | | | | 2,053,051 | | | | (14,897 | ) | | | (206,815 | ) | | | (60,555 | ) | | | 37,078 | | |
Subscriptions – Class Z | | | 7,992,106 | | | | 27,275,542 | | | | 7,316,293 | | | | 18,575,064 | | | | 2,094,137 | | | | 2,943,870 | | | | 308,447 | | | | 1,572,550 | | |
Shares issued in reinvestment and capital gains – Class Z | | | 10,790,770 | | | | 50,258,476 | | | | 845,796 | | | | 6,885,453 | | | | 716,812 | | | | 5,614,121 | | | | 17,995 | | | | 645,241 | | |
Less shares redeemed – Class Z | | | (118,273,039 | ) | | | (116,645,260 | ) | | | (14,388,129 | ) | | | (26,436,650 | ) | | | (6,814,650 | ) | | | (13,762,562 | ) | | | (1,413,766 | ) | | | (3,750,710 | ) | |
Net Increase (Decrease) – Class Z | | | (99,490,163 | ) | | | (39,111,242 | ) | | | (6,226,040 | ) | | | (976,133 | ) | | | (4,003,701 | ) | | | (5,204,571 | ) | | | (1,087,324 | ) | | | (1,532,919 | ) | |
Net Increase (Decrease) in Shares of Beneficial Interest | | | (134,210,262 | ) | | | (72,086,581 | ) | | | (3,730,222 | ) | | | 6,910,272 | | | | (4,648,986 | ) | | | (5,044,535 | ) | | | (1,664,231 | ) | | | (1,740,293 | ) | |
(a) Class R4 shares reflect activity for the period from June 25, 2014 (commencement of operations) through December 31, 2014.
See accompanying notes to financial statements.
92
| | | Columbia
Acorn SelectSM | | Columbia
Thermostat FundSM | | Columbia Acorn
Emerging Markets FundSM | | Columbia Acorn
European FundSM | |
Changes in Shares of Beneficial Interest: | | (Unaudited)
Six months
ended
June 30, | | Year ended
December 31, | | (Unaudited)
Six months
ended
June 30, | | Year ended
December 31, | | (Unaudited)
Six months
ended
June 30, | | Year ended
December 31, | | (Unaudited)
Six months
ended
June 30, | | Year ended
December 31, | |
| | | 2015 | | 2014 | | 2015 | | 2014 | | 2015 | | 2014 | | 2015 | | 2014 (a) | |
Subscriptions – Class A | | | 385,509 | | | | 999,673 | | | | 3,052,476 | | | | 7,304,585 | | | | 537,683 | | | | 8,480,721 | | | | 1,036,044 | | | | 1,976,901 | | |
Shares issued in reinvestment and capital gains – Class A | | | 902,276 | | | | 2,437,585 | | | | 533,276 | | | | 893,241 | | | | — | | | | 85,241 | | | | 8,895 | | | | 16,205 | | |
Less shares redeemed – Class A | | | (1,931,637 | ) | | | (3,902,541 | ) | | | (4,831,255 | ) | | | (13,113,073 | ) | | | (1,931,087 | ) | | | (9,160,435 | ) | | | (263,175 | ) | | | (1,738,341 | ) | |
Net Increase (Decrease) – Class A | | | (643,852 | ) | | | (465,283 | ) | | | (1,245,503 | ) | | | (4,915,247 | ) | | | (1,393,404 | ) | | | (594,473 | ) | | | 781,764 | | | | 254,765 | | |
Shares issued in reinvestment and capital gains – Class B | | | 3,340 | | | | 15,514 | | | | 1,317 | | | | 2,338 | | | | — | | | | — | | | | — | | | | — | | |
Less shares redeemed – Class B | | | (28,681 | ) | | | (88,114 | ) | | | (20,211 | ) | | | (74,245 | ) | | | — | | | | — | | | | — | | | | — | | |
Net Increase (Decrease) – Class B | | | (25,341 | ) | | | (72,600 | ) | | | (18,894 | ) | | | (71,907 | ) | | | — | | | | — | | | | — | | | | — | | |
Subscriptions – Class C | | | 58,108 | | | | 200,609 | | | | 1,773,144 | | | | 4,743,432 | | | | 76,643 | | | | 1,237,012 | | | | 126,614 | | | | 335,241 | | |
Shares issued in reinvestment and capital gains – Class C | | | 210,504 | | | | 546,759 | | | | 401,349 | | | | 519,687 | | | | — | | | | — | | | | — | | | | 1,380 | | |
Less shares redeemed – Class C | | | (422,778 | ) | | | (740,621 | ) | | | (3,417,847 | ) | | | (7,542,466 | ) | | | (490,751 | ) | | | (430,442 | ) | | | (40,534 | ) | | | (66,938 | ) | |
Net Increase (Decrease) – Class C | | | (154,166 | ) | | | 6,747 | | | | (1,243,354 | ) | | | (2,279,347 | ) | | | (414,108 | ) | | | 806,570 | | | | 86,080 | | | | 269,683 | | |
Subscriptions – Class I | | | 808,777 | | | | 2,177,235 | | | | — | | | | — | | | | — | | | | — | | | | — | | | | — | | |
Shares issued in reinvestment and capital gains – Class I | | | 80,150 | | | | 143,898 | | | | — | | | | — | | | | — | | | | 2 | | | | 1 | | | | 2 | | |
Less shares redeemed – Class I | | | (383,794 | ) | | | (1,994,457 | ) | | | — | | | | — | | | | — | | | | (313 | ) | | | — | | | | (346 | ) | |
Net Increase (Decrease) – Class I | | | 505,133 | | | | 326,676 | | | | — | | | | — | | | | — | | | | (311 | ) | | | 1 | | | | (344 | ) | |
Subscriptions – Class R | | | — | | | | — | | | | — | | | | — | | | | — | | | | — | | | | — | | | | — | | |
Shares issued in reinvestment and capital gains – Class R | | | — | | | | — | | | | — | | | | — | | | | — | | | | — | | | | — | | | | — | | |
Less shares redeemed – Class R | | | — | | | | — | | | | — | | | | — | | | | — | | | | — | | | | — | | | | — | | |
Net Increase (Decrease) – Class R | | | — | | | | — | | | | — | | | | — | | | | — | | | | — | | | | — | | | | — | | |
Subscriptions – Class R4 | | | 9,802 | | | | 20,220 | | | | 392,890 | | | | 838,999 | | | | 64,182 | | | | 479,110 | | | | 65,859 | | | | 20,884 | | |
Shares issued in reinvestment and capital gains – Class R4 | | | 4,342 | | | | 10,486 | | | | 30,918 | | | | 54,396 | | | | — | | | | 10,917 | | | | 341 | | | | 111 | | |
Less shares redeemed – Class R4 | | | (9,260 | ) | | | (29,113 | ) | | | (509,605 | ) | | | (318,210 | ) | | | (161,433 | ) | | | (291,550 | ) | | | (48,223 | ) | | | (6 | ) | |
Net Increase (Decrease) – Class R4 | | | 4,884 | | | | 1,593 | | | | (85,797 | ) | | | 575,185 | | | | (97,251 | ) | | | 198,477 | | | | 17,977 | | | | 20,989 | | |
Subscriptions – Class R5 | | | 47,798 | | | | 87,557 | | | | 120,660 | | | | 219,576 | | | | 149,120 | | | | 1,041,821 | | | | 14,668 | | | | 208,383 | | |
Shares issued in reinvestment and capital gains – Class R5 | | | 7,460 | | | | 87,341 | | | | 6,425 | | | | 7,242 | | | | — | | | | 14,425 | | | | 505 | | | | 1,646 | | |
Less shares redeemed – Class R5 | | | (422,172 | ) | | | (146,321 | ) | | | (42,152 | ) | | | (54,794 | ) | | | (176,947 | ) | | | (536,066 | ) | | | (7,307 | ) | | | (216,692 | ) | |
Net Increase (Decrease) – Class R5 | | | (366,914 | ) | | | 28,577 | | | | 84,933 | | | | 172,024 | | | | (27,827 | ) | | | 520,180 | | | | 7,866 | | | | (6,663 | ) | |
Subscriptions – Class Y | | | 44,436 | | | | 20,305 | | | | 1,139 | | | | 29,656 | | | | — | | | | — | | | | — | | | | — | | |
Shares issued in reinvestment and capital gains – Class Y | | | 13,593 | | | | 30,390 | | | | 466 | | | | 962 | | | | — | | | | — | | | | — | | | | — | | |
Less shares redeemed – Class Y | | | (33,664 | ) | | | (69,067 | ) | | | (5,450 | ) | | | (3,571 | ) | | | — | | | | (15 | ) | | | — | | | | — | | |
Net Increase (Decrease) – Class Y | | | 24,365 | | | | (18,372 | ) | | | (3,845 | ) | | | 27,047 | | | | — | | | | (15 | ) | | | — | | | | — | | |
Subscriptions – Class Z | | | 345,373 | | | | 1,616,671 | | | | 2,923,035 | | | | 10,700,096 | | | | 1,608,739 | | | | 13,528,786 | | | | 407,744 | | | | 1,375,486 | | |
Shares issued in reinvestment and capital gains – Class Z | | | 797,521 | | | | 2,273,717 | | | | 332,585 | | | | 597,366 | | | | — | | | | 157,433 | | | | 3,551 | | | | 9,056 | | |
Less shares redeemed – Class Z | | | (2,703,400 | ) | | | (5,760,728 | ) | | | (5,453,493 | ) | | | (11,671,258 | ) | | | (3,816,904 | ) | | | (7,722,797 | ) | | | (151,860 | ) | | | (1,072,883 | ) | |
Net Increase (Decrease) – Class Z | | | (1,560,506 | ) | | | (1,870,340 | ) | | | (2,197,873 | ) | | | (373,796 | ) | | | (2,208,165 | ) | | | 5,963,422 | | | | 259,435 | | | | 311,659 | | |
Net Increase (Decrease) in Shares of Beneficial Interest | | | (2,216,397 | ) | | | (2,063,002 | ) | | | (4,710,333 | ) | | | (6,866,041 | ) | | | (4,140,755 | ) | | | 6,893,850 | | | | 1,153,123 | | | | 850,089 | | |
See accompanying notes to financial statements.
93
COLUMBIA ACORN FAMILY OF FUNDS
FINANCIAL HIGHLIGHTS
The following tables are intended to help you understand the Fund's financial performance. Certain information reflects financial results for a single share of a class held for the periods shown. Per share net investment income (loss) amounts are calculated based on average shares outstanding during the period. Total return assumes reinvestment of all dividends and distributions, if any. Total return does not reflect payment of sales charges, if any. Total return and portfolio turnover are not annualized for periods of less than one year. The portfolio turnover rate is calculated without regard to purchase and sales transactions of short-term instruments and certain derivatives, if any. If such transactions were included, the Fund's portfolio turnover rate may be higher.
Columbia Acorn® Fund
| | | | | Income from Investment Operations | | | | Less Distributions to Shareholders | | | | | |
(Selected data for a share outstanding
throughout each period) | | Net Asset
Value,
Beginning of
Period | | Net
investment
income (loss) | | Net realized
and
unrealized
gain (loss) | | Total from
Investment
Operations | | Net
investment
income | | Net
realized gains | | Total
Distributions to
Shareholders | | Increase from
regulatory
settlements | |
Class A | |
Six Months Ended June 30,
2015 (Unaudited) | | $ | 30.30 | | | | (0.05 | ) | | | 2.02 | | | | 1.97 | | | | — | | | | (1.64 | ) | | | (1.64 | ) | | | — | | |
Year Ended December 31, 2014 | | $ | 35.78 | | | | (0.08 | ) | | | 0.21 | | | | 0.13 | | | | — | | | | (5.61 | ) | | | (5.61 | ) | | | — | | |
Year Ended December 31, 2013 | | $ | 29.36 | | | | (0.06 | ) | | | 8.84 | | | | 8.78 | | | | (0.04 | ) | | | (2.32 | ) | | | (2.36 | ) | | | — | | |
Year Ended December 31, 2012 | | $ | 26.63 | | | | 0.08 | | | | 4.53 | | | | 4.61 | | | | (0.06 | ) | | | (1.82 | ) | | | (1.88 | ) | | | — | | |
Year Ended December 31, 2011 | | $ | 29.24 | | | | (0.10 | ) | | | (1.30 | ) | | | (1.40 | ) | | | (0.02 | ) | | | (1.19 | ) | | | (1.21 | ) | | | — | | |
Year Ended December 31, 2010 | | $ | 23.98 | | | | (0.06 | ) | | | 6.18 | | | | 6.12 | | | | (0.02 | ) | | | (0.84 | ) | | | (0.86 | ) | | | 0.00 | (d) | |
Class B | |
Six Months Ended June 30,
2015 (Unaudited) | | $ | 26.53 | | | | (0.16 | ) | | | 1.78 | | | | 1.62 | | | | — | | | | (1.64 | ) | | | (1.64 | ) | | | — | | |
Year Ended December 31, 2014 | | $ | 32.25 | | | | (0.29 | ) | | | 0.18 | | | | (0.11 | ) | | | — | | | | (5.61 | ) | | | (5.61 | ) | | | — | | |
Year Ended December 31, 2013 | | $ | 26.80 | | | | (0.25 | ) | | | 8.02 | | | | 7.77 | | | | — | | | | (2.32 | ) | | | (2.32 | ) | | | — | | |
Year Ended December 31, 2012 | | $ | 24.53 | | | | (0.11 | ) | | | 4.20 | | | | 4.09 | | | | — | | | | (1.82 | ) | | | (1.82 | ) | | | — | | |
Year Ended December 31, 2011 | | $ | 27.14 | | | | (0.27 | ) | | | (1.15 | ) | | | (1.42 | ) | | | — | | | | (1.19 | ) | | | (1.19 | ) | | | — | | |
Year Ended December 31, 2010 | | $ | 22.43 | | | | (0.21 | ) | | | 5.76 | | | | 5.55 | | | | — | | | | (0.84 | ) | | | (0.84 | ) | | | 0.00 | (d) | |
Class C | |
Six Months Ended June 30,
2015 (Unaudited) | | $ | 25.92 | | | | (0.14 | ) | | | 1.73 | | | | 1.59 | | | | — | | | | (1.64 | ) | | | (1.64 | ) | | | — | | |
Year Ended December 31, 2014 | | $ | 31.64 | | | | (0.28 | ) | | | 0.17 | | | | (0.11 | ) | | | — | | | | (5.61 | ) | | | (5.61 | ) | | | — | | |
Year Ended December 31, 2013 | | $ | 26.34 | | | | (0.26 | ) | | | 7.88 | | | | 7.62 | | | | — | | | | (2.32 | ) | | | (2.32 | ) | | | — | | |
Year Ended December 31, 2012 | | $ | 24.18 | | | | (0.12 | ) | | | 4.10 | | | | 3.98 | | | | — | | | | (1.82 | ) | | | (1.82 | ) | | | — | | |
Year Ended December 31, 2011 | | $ | 26.85 | | | | (0.29 | ) | | | (1.19 | ) | | | (1.48 | ) | | | — | | | | (1.19 | ) | | | (1.19 | ) | | | — | | |
Year Ended December 31, 2010 | | $ | 22.23 | | | | (0.24 | ) | | | 5.70 | | | | 5.46 | | | | — | | | | (0.84 | ) | | | (0.84 | ) | | | 0.00 | (d) | |
Class I | |
Six Months Ended June 30,
2015 (Unaudited) | | $ | 32.03 | | | | 0.01 | | | | 2.13 | | | | 2.14 | | | | — | | | | (1.64 | ) | | | (1.64 | ) | | | — | | |
Year Ended December 31, 2014 | | $ | 37.37 | | | | 0.05 | | | | 0.22 | | | | 0.27 | | | | — | | | | (5.61 | ) | | | (5.61 | ) | | | — | | |
Year Ended December 31, 2013 | | $ | 30.47 | | | | 0.06 | | | | 9.20 | | | | 9.26 | | | | (0.04 | ) | | | (2.32 | ) | | | (2.36 | ) | | | — | | |
Year Ended December 31, 2012 | | $ | 27.57 | | | | 0.26 | | | | 4.62 | | | | 4.88 | | | | (0.16 | ) | | | (1.82 | ) | | | (1.98 | ) | | | — | | |
Year Ended December 31, 2011 | | $ | 30.19 | | | | 0.01 | | | | (1.35 | ) | | | (1.34 | ) | | | (0.09 | ) | | | (1.19 | ) | | | (1.28 | ) | | | — | | |
Year Ended December 31, 2010(e) | | $ | 26.80 | | | | (0.01 | ) | | | 4.26 | | | | 4.25 | | | | (0.02 | ) | | | (0.84 | ) | | | (0.86 | ) | | | — | | |
Class R4 | |
Six Months Ended June 30,
2015 (Unaudited) | | $ | 32.51 | | | | (0.02 | ) | | | 2.17 | | | | 2.15 | | | | — | | | | (1.64 | ) | | | (1.64 | ) | | | — | | |
Year Ended December 31, 2014 | | $ | 37.88 | | | | 0.02 | | | | 0.22 | | | | 0.24 | | | | — | | | | (5.61 | ) | | | (5.61 | ) | | | — | | |
Year Ended December 31, 2013 | | $ | 30.90 | | | | 0.06 | | | | 9.29 | | | | 9.35 | | | | (0.05 | ) | | | (2.32 | ) | | | (2.37 | ) | | | — | | |
Year Ended December 31, 2012(f) | | $ | 30.59 | | | | 0.05 | | | | 1.84 | | | | 1.89 | | | | (0.12 | ) | | | (1.46 | ) | | | (1.58 | ) | | | — | | |
Class R5 | |
Six Months Ended June 30,
2015 (Unaudited) | | $ | 32.55 | | | | (0.01 | ) | | | 2.17 | | | | 2.16 | | | | — | | | | (1.64 | ) | | | (1.64 | ) | | | — | | |
Year Ended December 31, 2014 | | $ | 37.89 | | | | 0.04 | | | | 0.23 | | | | 0.27 | | | | — | | | | (5.61 | ) | | | (5.61 | ) | | | — | | |
Year Ended December 31, 2013 | | $ | 30.88 | | | | 0.07 | | | | 9.30 | | | | 9.37 | | | | (0.04 | ) | | | (2.32 | ) | | | (2.36 | ) | | | — | | |
Year Ended December 31, 2012(g) | | $ | 30.59 | | | | 0.06 | | | | 1.83 | | | | 1.89 | | | | (0.14 | ) | | | (1.46 | ) | | | (1.60 | ) | | | — | | |
Class Y | |
Six Months Ended June 30,
2015 (Unaudited) | | $ | 32.61 | | | | 0.00 | (d) | | | 2.18 | | | | 2.18 | | | | — | | | | (1.64 | ) | | | (1.64 | ) | | | — | | |
Year Ended December 31, 2014 | | $ | 37.93 | | | | 0.05 | | | | 0.24 | | | | 0.29 | | | | — | | | | (5.61 | ) | | | (5.61 | ) | | | — | | |
Year Ended December 31, 2013 | | $ | 30.90 | | | | 0.09 | | | | 9.31 | | | | 9.40 | | | | (0.05 | ) | | | (2.32 | ) | | | (2.37 | ) | | | — | | |
Year Ended December 31, 2012(h) | | $ | 30.62 | | | | 0.09 | | | | 1.80 | | | | 1.89 | | | | (0.15 | ) | | | (1.46 | ) | | | (1.61 | ) | | | — | | |
Class Z | |
Six Months Ended June 30,
2015 (Unaudited) | | $ | 31.95 | | | | (0.01 | ) | | | 2.14 | | | | 2.13 | | | | — | | | | (1.64 | ) | | | (1.64 | ) | | | — | | |
Year Ended December 31, 2014 | | $ | 37.32 | | | | 0.02 | | | | 0.22 | | | | 0.24 | | | | — | | | | (5.61 | ) | | | (5.61 | ) | | | — | | |
Year Ended December 31, 2013 | | $ | 30.45 | | | | 0.04 | | | | 9.19 | | | | 9.23 | | | | (0.04 | ) | | | (2.32 | ) | | | (2.36 | ) | | | — | | |
Year Ended December 31, 2012 | | $ | 27.56 | | | | 0.17 | | | | 4.69 | | | | 4.86 | | | | (0.15 | ) | | | (1.82 | ) | | | (1.97 | ) | | | — | | |
Year Ended December 31, 2011 | | $ | 30.19 | | | | (0.01 | ) | | | (1.34 | ) | | | (1.35 | ) | | | (0.09 | ) | | | (1.19 | ) | | | (1.28 | ) | | | — | | |
Year Ended December 31, 2010 | | $ | 24.68 | | | | 0.02 | | | | 6.37 | | | | 6.39 | | | | (0.04 | ) | | | (0.84 | ) | | | (0.88 | ) | | | 0.00 | (d) | |
Notes to Financial Highlights
(a) In addition to the fees and expenses that the Fund bears directly, the Fund indirectly bears a pro rata share of the fees and expenses of any other funds in which it invests, if any. Such indirect expenses are not included in the Fund's reported expense ratios.
(b) Annualized.
(c) The benefits derived from custody fees paid indirectly had an impact of less than 0.01%.
(d) Rounds to zero.
(e) Class I shares commenced operations on September 27, 2010. Per share data and total return reflect activity from that date.
(f) Class R4 shares commenced operations on November 8, 2012. Per share data and total return reflect activity from that date.
(g) Class R5 shares commenced operations on November 8, 2012. Per share data and total return reflect activity from that date.
(h) Class Y shares commenced operations on November 8, 2012. Per share data and total return reflect activity from that date.
See accompanying notes to financial statements.
94
| | | | | | | Ratio to Average Net Assets | | Supplemental Data | |
(Selected data for a share outstanding
throughout each period) | | Net Asset
Value, End of
Period | | Total Return | | Total gross
expenses
(a) | | Total net
expenses
(a) | | Net
investment
income (loss) | | Portfolio
turnover rate | | Net assets,
end of period
(000s) | |
Class A | |
Six Months Ended June 30,
2015 (Unaudited) | | $ | 30.63 | | | | 6.45 | % | | | 1.09 | %(b) | | | 1.09 | %(b) | | | (0.33 | )%(b) | | | 10 | % | | $ | 2,201,585 | | |
Year Ended December 31, 2014 | | $ | 30.30 | | | | 0.55 | % | | | 1.08 | % | | | 1.08 | % | | | (0.22 | )% | | | 17 | % | | $ | 2,694,610 | | |
Year Ended December 31, 2013 | | $ | 35.78 | | | | 30.53 | % | | | 1.07 | % | | | 1.07 | % | | | (0.17 | )% | | | 18 | % | | $ | 3,869,734 | | |
Year Ended December 31, 2012 | | $ | 29.36 | | | | 17.62 | % | | | 1.06 | % | | | 1.06 | %(c) | | | 0.27 | % | | | 16 | % | | $ | 3,233,494 | | |
Year Ended December 31, 2011 | | $ | 26.63 | | | | (4.91 | )% | | | 1.06 | % | | | 1.06 | %(c) | | | (0.33 | )% | | | 18 | % | | $ | 3,246,833 | | |
Year Ended December 31, 2010 | | $ | 29.24 | | | | 25.61 | % | | | 1.07 | % | | | 1.07 | %(c) | | | (0.22 | )% | | | 28 | % | | $ | 3,639,788 | | |
Class B | |
Six Months Ended June 30,
2015 (Unaudited) | | $ | 26.51 | | | | 6.04 | % | | | 1.89 | %(b) | | | 1.89 | %(b) | | | (1.16 | )%(b) | | | 10 | % | | $ | 3,570 | | |
Year Ended December 31, 2014 | | $ | 26.53 | | | | (0.16 | )% | | | 1.75 | % | | | 1.75 | % | | | (0.91 | )% | | | 17 | % | | $ | 7,201 | | |
Year Ended December 31, 2013 | | $ | 32.25 | | | | 29.63 | % | | | 1.73 | % | | | 1.73 | % | | | (0.84 | )% | | | 18 | % | | $ | 19,278 | | |
Year Ended December 31, 2012 | | $ | 26.80 | | | | 16.98 | % | | | 1.65 | % | | | 1.64 | %(c) | | | (0.42 | )% | | | 16 | % | | $ | 33,623 | | |
Year Ended December 31, 2011 | | $ | 24.53 | | | | (5.34 | )% | | | 1.67 | % | | | 1.67 | %(c) | | | (0.98 | )% | | | 18 | % | | $ | 67,153 | | |
Year Ended December 31, 2010 | | $ | 27.14 | | | | 24.81 | % | | | 1.69 | % | | | 1.69 | %(c) | | | (0.88 | )% | | | 28 | % | | $ | 287,650 | | |
Class C | |
Six Months Ended June 30,
2015 (Unaudited) | | $ | 25.87 | | | | 6.07 | % | | | 1.79 | %(b) | | | 1.79 | %(b) | | | (1.03 | )%(b) | | | 10 | % | | $ | 712,926 | | |
Year Ended December 31, 2014 | | $ | 25.92 | | | | (0.16 | )% | | | 1.77 | % | | | 1.77 | % | | | (0.92 | )% | | | 17 | % | | $ | 776,370 | | |
Year Ended December 31, 2013 | | $ | 31.64 | | | | 29.58 | % | | | 1.78 | % | | | 1.78 | % | | | (0.88 | )% | | | 18 | % | | $ | 938,644 | | |
Year Ended December 31, 2012 | | $ | 26.34 | | | | 16.77 | % | | | 1.80 | % | | | 1.80 | %(c) | | | (0.46 | )% | | | 16 | % | | $ | 756,709 | | |
Year Ended December 31, 2011 | | $ | 24.18 | | | | (5.63 | )% | | | 1.82 | % | | | 1.82 | %(c) | | | (1.10 | )% | | | 18 | % | | $ | 721,446 | | |
Year Ended December 31, 2010 | | $ | 26.85 | | | | 24.63 | % | | | 1.85 | % | | | 1.85 | %(c) | | | (1.00 | )% | | | 28 | % | | $ | 829,181 | | |
Class I | |
Six Months Ended June 30,
2015 (Unaudited) | | $ | 32.53 | | | | 6.63 | % | | | 0.72 | %(b) | | | 0.72 | %(b) | | | 0.03 | %(b) | | | 10 | % | | $ | 29,576 | | |
Year Ended December 31, 2014 | | $ | 32.03 | | | | 0.91 | % | | | 0.70 | % | | | 0.70 | % | | | 0.14 | % | | | 17 | % | | $ | 28,164 | | |
Year Ended December 31, 2013 | | $ | 37.37 | | | | 30.99 | % | | | 0.70 | % | | | 0.70 | % | | | 0.16 | % | | | 18 | % | | $ | 20,383 | | |
Year Ended December 31, 2012 | | $ | 30.47 | | | | 18.02 | % | | | 0.72 | % | | | 0.72 | %(c) | | | 0.86 | % | | | 16 | % | | $ | 58,652 | | |
Year Ended December 31, 2011 | | $ | 27.57 | | | | (4.57 | )% | | | 0.72 | % | | | 0.72 | %(c) | | | 0.02 | % | | | 18 | % | | $ | 16,397 | | |
Year Ended December 31, 2010(e) | | $ | 30.19 | | | | 15.94 | % | | | 0.71 | %(b) | | | 0.71 | %(b)(c) | | | (0.13 | )%(b) | | | 28 | % | | $ | 11,627 | | |
Class R4 | |
Six Months Ended June 30,
2015 (Unaudited) | | $ | 33.02 | | | | 6.56 | % | | | 0.87 | %(b) | | | 0.87 | %(b) | | | (0.11 | )%(b) | | | 10 | % | | $ | 200,539 | | |
Year Ended December 31, 2014 | | $ | 32.51 | | | | 0.81 | % | | | 0.84 | % | | | 0.84 | % | | | 0.05 | % | | | 17 | % | | $ | 250,457 | | |
Year Ended December 31, 2013 | | $ | 37.88 | | | | 30.85 | % | | | 0.80 | % | | | 0.80 | % | | | 0.16 | % | | | 18 | % | | $ | 74,188 | | |
Year Ended December 31, 2012(f) | | $ | 30.90 | | | | 6.31 | % | | | 0.87 | %(b) | | | 0.86 | %(b)(c) | | | 1.24 | %(b) | | | 16 | % | | $ | 17 | | |
Class R5 | |
Six Months Ended June 30,
2015 (Unaudited) | | $ | 33.07 | | | | 6.58 | % | | | 0.77 | %(b) | | | 0.77 | %(b) | | | (0.04 | )%(b) | | | 10 | % | | $ | 198,784 | | |
Year Ended December 31, 2014 | | $ | 32.55 | | | | 0.89 | % | | | 0.76 | % | | | 0.76 | % | | | 0.10 | % | | | 17 | % | | $ | 458,223 | | |
Year Ended December 31, 2013 | | $ | 37.89 | | | | 30.94 | % | | | 0.75 | % | | | 0.75 | % | | | 0.20 | % | | | 18 | % | | $ | 496,906 | | |
Year Ended December 31, 2012(g) | | $ | 30.88 | | | | 6.33 | % | | | 0.82 | %(b) | | | 0.81 | %(b)(c) | | | 1.29 | %(b) | | | 16 | % | | $ | 3 | | |
Class Y | |
Six Months Ended June 30,
2015 (Unaudited) | | $ | 33.15 | | | | 6.63 | % | | | 0.72 | %(b) | | | 0.72 | %(b) | | | 0.00 | %(b)(d) | | | 10 | % | | $ | 204,378 | | |
Year Ended December 31, 2014 | | $ | 32.61 | | | | 0.94 | % | | | 0.70 | % | | | 0.70 | % | | | 0.13 | % | | | 17 | % | | $ | 378,780 | | |
Year Ended December 31, 2013 | | $ | 37.93 | | | | 30.99 | % | | | 0.70 | % | | | 0.70 | % | | | 0.26 | % | | | 18 | % | | $ | 1,227,891 | | |
Year Ended December 31, 2012(h) | | $ | 30.90 | | | | 6.34 | % | | | 0.75 | %(b) | | | 0.75 | %(b)(c) | | | 2.21 | %(b) | | | 16 | % | | $ | 67,012 | | |
Class Z | |
Six Months Ended June 30,
2015 (Unaudited) | | $ | 32.44 | | | | 6.61 | % | | | 0.80 | %(b) | | | 0.80 | %(b) | | | (0.05 | )%(b) | | | 10 | % | | $ | 8,286,240 | | |
Year Ended December 31, 2014 | | $ | 31.95 | | | | 0.82 | % | | | 0.79 | % | | | 0.79 | % | | | 0.07 | % | | | 17 | % | | $ | 11,340,770 | | |
Year Ended December 31, 2013 | | $ | 37.32 | | | | 30.90 | % | | | 0.78 | % | | | 0.78 | % | | | 0.12 | % | | | 18 | % | | $ | 14,703,948 | | |
Year Ended December 31, 2012 | | $ | 30.45 | | | | 17.93 | % | | | 0.78 | % | | | 0.78 | %(c) | | | 0.57 | % | | | 16 | % | | $ | 13,374,355 | | |
Year Ended December 31, 2011 | | $ | 27.56 | | | | (4.61 | )% | | | 0.76 | % | | | 0.76 | %(c) | | | (0.03 | )% | | | 18 | % | | $ | 12,284,748 | | |
Year Ended December 31, 2010 | | $ | 30.19 | | | | 26.00 | % | | | 0.76 | % | | | 0.76 | %(c) | | | 0.09 | % | | | 28 | % | | $ | 13,330,466 | | |
See accompanying notes to financial statements.
95
COLUMBIA ACORN FAMILY OF FUNDS
FINANCIAL HIGHLIGHTS, CONTINUED
Columbia Acorn International®
| | | | | Income from Investment Operations | | | | Less Distributions to Shareholders | | | | | |
(Selected data for a share outstanding
throughout each period) | | Net Asset
Value,
Beginning of
Period | | Net
investment
income (loss) | | Net realized
and
unrealized
gain (loss) | | Reimbursement
from
affiliate | | Total from
Investment
Operations | | Net
investment
income | | Net
realized gains | | Total
Distributions to
Shareholders | | Redemption
fees added
to paid in
capital | |
Class A | |
Six Months Ended June 30,
2015 (Unaudited) | | $ | 41.68 | | | | 0.27 | | | | 1.84 | | | | — | | | | 2.11 | | | | — | | | | (0.38 | ) | | | (0.38 | ) | | | — | | |
Year Ended December 31, 2014 | | $ | 46.63 | | | | 0.42 | | | | (2.51 | ) | | | — | | | | (2.09 | ) | | | (0.55 | ) | | | (2.31 | ) | | | (2.86 | ) | | | — | | |
Year Ended December 31, 2013 | | $ | 40.79 | | | | 0.45 | | | | 8.37 | | | | — | | | | 8.82 | | | | (1.05 | ) | | | (1.93 | ) | | | (2.98 | ) | | | — | | |
Year Ended December 31, 2012 | | $ | 34.15 | | | | 0.47 | | | | 6.75 | | | | — | | | | 7.22 | | | | (0.58 | ) | | | — | | | | (0.58 | ) | | | — | | |
Year Ended December 31, 2011 | | $ | 40.87 | | | | 0.32 | | | | (6.02 | ) | | | 0.00 | (d) | | | (5.70 | ) | | | (1.02 | ) | | | — | | | | (1.02 | ) | | | — | | |
Year Ended December 31, 2010 | | $ | 34.13 | | | | 0.22 | | | | 7.21 | | | | — | | | | 7.43 | | | | (0.69 | ) | | | — | | | | (0.69 | ) | | | 0.00 | (d) | |
Class B | |
Six Months Ended June 30,
2015 (Unaudited) | | $ | 40.38 | | | | 0.06 | | | | 1.81 | | | | — | | | | 1.87 | | | | — | | | | (0.38 | ) | | | (0.38 | ) | | | — | | |
Year Ended December 31, 2014 | | $ | 45.24 | | | | 0.07 | | | | (2.42 | ) | | | — | | | | (2.35 | ) | | | (0.20 | ) | | | (2.31 | ) | | | (2.51 | ) | | | — | | |
Year Ended December 31, 2013 | | $ | 39.67 | | | | 0.12 | | | | 8.10 | | | | — | | | | 8.22 | | | | (0.72 | ) | | | (1.93 | ) | | | (2.65 | ) | | | — | | |
Year Ended December 31, 2012 | | $ | 33.17 | | | | 0.19 | | | | 6.55 | | | | — | | | | 6.74 | | | | (0.24 | ) | | | — | | | | (0.24 | ) | | | — | | |
Year Ended December 31, 2011 | | $ | 39.96 | | | | 0.06 | | | | (5.85 | ) | | | 0.00 | (d) | | | (5.79 | ) | | | (1.00 | ) | | | — | | | | (1.00 | ) | | | — | | |
Year Ended December 31, 2010 | | $ | 33.22 | | | | 0.03 | | | | 7.02 | | | | — | | | | 7.05 | | | | (0.31 | ) | | | — | | | | (0.31 | ) | | | 0.00 | (d) | |
Class C | |
Six Months Ended June 30,
2015 (Unaudited) | | $ | 40.20 | | | | 0.11 | | | | 1.76 | | | | — | | | | 1.87 | | | | — | | | | (0.38 | ) | | | (0.38 | ) | | | — | | |
Year Ended December 31, 2014 | | $ | 45.04 | | | | 0.07 | | | | (2.40 | ) | | | — | | | | (2.33 | ) | | | (0.20 | ) | | | (2.31 | ) | | | (2.51 | ) | | | — | | |
Year Ended December 31, 2013 | | $ | 39.50 | | | | 0.10 | | | | 8.08 | | | | — | | | | 8.18 | | | | (0.71 | ) | | | (1.93 | ) | | | (2.64 | ) | | | — | | |
Year Ended December 31, 2012 | | $ | 33.03 | | | | 0.18 | | | | 6.52 | | | | — | | | | 6.70 | | | | (0.23 | ) | | | — | | | | (0.23 | ) | | | — | | |
Year Ended December 31, 2011 | | $ | 39.79 | | | | 0.04 | | | | (5.86 | ) | | | 0.00 | (d) | | | (5.82 | ) | | | (0.94 | ) | | | — | | | | (0.94 | ) | | | — | | |
Year Ended December 31, 2010 | | $ | 33.08 | | | | (0.05 | ) | | | 7.03 | | | | — | | | | 6.98 | | | | (0.27 | ) | | | — | | | | (0.27 | ) | | | 0.00 | (d) | |
Class I | |
Six Months Ended June 30,
2015 (Unaudited) | | $ | 41.76 | | | | 0.35 | | | | 1.84 | | | | — | | | | 2.19 | | | | — | | | | (0.38 | ) | | | (0.38 | ) | | | — | | |
Year Ended December 31, 2014 | | $ | 46.71 | | | | 0.59 | | | | (2.51 | ) | | | — | | | | (1.92 | ) | | | (0.72 | ) | | | (2.31 | ) | | | (3.03 | ) | | | — | | |
Year Ended December 31, 2013 | | $ | 40.86 | | | | 0.66 | | | | 8.34 | | | | — | | | | 9.00 | | | | (1.22 | ) | | | (1.93 | ) | | | (3.15 | ) | | | — | | |
Year Ended December 31, 2012 | | $ | 34.33 | | | | 0.57 | | | | 6.83 | | | | — | | | | 7.40 | | | | (0.87 | ) | | | — | | | | (0.87 | ) | | | — | | |
Year Ended December 31, 2011 | | $ | 40.92 | | | | 0.37 | | | | (5.94 | ) | | | 0.00 | (d) | | | (5.57 | ) | | | (1.02 | ) | | | — | | | | (1.02 | ) | | | — | | |
Year Ended December 31, 2010(g) | | $ | 37.69 | | | | 0.08 | | | | 3.49 | | | | — | | | | 3.57 | | | | (0.34 | ) | | | — | | | | (0.34 | ) | | | 0.00 | (d) | |
Class R | |
Six Months Ended June 30,
2015 (Unaudited) | | $ | 41.67 | | | | 0.19 | | | | 1.84 | | | | — | | | | 2.03 | | | | — | | | | (0.38 | ) | | | (0.38 | ) | | | — | | |
Year Ended December 31, 2014 | | $ | 46.60 | | | | 0.24 | | | | (2.50 | ) | | | — | | | | (2.26 | ) | | | (0.36 | ) | | | (2.31 | ) | | | (2.67 | ) | | | — | | |
Year Ended December 31, 2013 | | $ | 40.79 | | | | 0.26 | | | | 8.36 | | | | — | | | | 8.62 | | | | (0.88 | ) | | | (1.93 | ) | | | (2.81 | ) | | | — | | |
Year Ended December 31, 2012 | | $ | 34.11 | | | | 0.21 | | | | 6.89 | | | | — | | | | 7.10 | | | | (0.42 | ) | | | — | | | | (0.42 | ) | | | — | | |
Year Ended December 31, 2011(h) | | $ | 40.11 | | | | (0.00 | )(d) | | | (6.00 | ) | | | 0.00 | (d) | | | (6.00 | ) | | | — | | | | — | | | | — | | | | — | | |
Class R4 | |
Six Months Ended June 30,
2015 (Unaudited) | | $ | 42.02 | | | | 0.33 | | | | 1.83 | | | | — | | | | 2.16 | | | | — | | | | (0.38 | ) | | | (0.38 | ) | | | — | | |
Year Ended December 31, 2014 | | $ | 46.99 | | | | 0.50 | | | | (2.52 | ) | | | — | | | | (2.02 | ) | | | (0.64 | ) | | | (2.31 | ) | | | (2.95 | ) | | | — | | |
Year Ended December 31, 2013 | | $ | 41.08 | | | | 0.34 | | | | 8.67 | | | | — | | | | 9.01 | | | | (1.17 | ) | | | (1.93 | ) | | | (3.10 | ) | | | — | | |
Year Ended December 31, 2012(i) | | $ | 39.86 | | | | (0.00 | )(d) | | | 1.81 | | | | — | | | | 1.81 | | | | (0.59 | ) | | | — | | | | (0.59 | ) | | | — | | |
Class R5 | |
Six Months Ended June 30,
2015 (Unaudited) | | $ | 41.71 | | | | 0.35 | | | | 1.82 | | | | — | | | | 2.17 | | | | — | | | | (0.38 | ) | | | (0.38 | ) | | | — | | |
Year Ended December 31, 2014 | | $ | 46.66 | | | | 0.57 | | | | (2.51 | ) | | | — | | | | (1.94 | ) | | | (0.70 | ) | | | (2.31 | ) | | | (3.01 | ) | | | — | | |
Year Ended December 31, 2013 | | $ | 40.81 | | | | 0.63 | | | | 8.34 | | | | — | | | | 8.97 | | | | (1.19 | ) | | | (1.93 | ) | | | (3.12 | ) | | | — | | |
Year Ended December 31, 2012 | | $ | 34.31 | | | | 0.75 | | | | 6.62 | | | | — | | | | 7.37 | | | | (0.87 | ) | | | — | | | | (0.87 | ) | | | — | | |
Year Ended December 31, 2011(j) | | $ | 40.24 | | | | 0.09 | | | | (6.02 | ) | | | 0.00 | (d) | | | (5.93 | ) | | | — | | | | — | | | | — | | | | — | | |
Class Y | |
Six Months Ended June 30,
2015 (Unaudited) | | $ | 42.02 | | | | 0.36 | | | | 1.85 | | | | — | | | | 2.21 | | | | — | | | | (0.38 | ) | | | (0.38 | ) | | | — | | |
Year Ended December 31, 2014 | | $ | 46.99 | | | | 0.58 | | | | (2.52 | ) | | | — | | | | (1.94 | ) | | | (0.72 | ) | | | (2.31 | ) | | | (3.03 | ) | | | — | | |
Year Ended December 31, 2013 | | $ | 41.08 | | | | 0.57 | | | | 8.48 | | | | — | | | | 9.05 | | | | (1.21 | ) | | | (1.93 | ) | | | (3.14 | ) | | | — | | |
Year Ended December 31, 2012(k) | | $ | 39.90 | | | | 0.04 | | | | 1.78 | | | | — | | | | 1.82 | | | | (0.64 | ) | | | — | | | | (0.64 | ) | | | — | | |
Class Z | |
Six Months Ended June 30,
2015 (Unaudited) | | $ | 41.73 | | | | 0.34 | | | | 1.83 | | | | — | | | | 2.17 | | | | — | | | | (0.38 | ) | | | (0.38 | ) | | | — | | |
Year Ended December 31, 2014 | | $ | 46.68 | | | | 0.56 | | | | (2.51 | ) | | | — | | | | (1.95 | ) | | | (0.69 | ) | | | (2.31 | ) | | | (3.00 | ) | | | — | | |
Year Ended December 31, 2013 | | $ | 40.84 | | | | 0.58 | | | | 8.38 | | | | — | | | | 8.96 | | | | (1.19 | ) | | | (1.93 | ) | | | (3.12 | ) | | | — | | |
Year Ended December 31, 2012 | | $ | 34.31 | | | | 0.59 | | | | 6.78 | | | | — | | | | 7.37 | | | | (0.84 | ) | | | — | | | | (0.84 | ) | | | — | | |
Year Ended December 31, 2011 | | $ | 40.92 | | | | 0.48 | | | | (6.07 | ) | | | 0.00 | (d) | | | (5.59 | ) | | | (1.02 | ) | | | — | | | | (1.02 | ) | | | — | | |
Year Ended December 31, 2010 | | $ | 34.26 | | | | 0.35 | | | | 7.23 | | | | — | | | | 7.58 | | | | (0.92 | ) | | | — | | | | (0.92 | ) | | | 0.00 | (d) | |
Notes to Financial Highlights
(a) In addition to the fees and expenses that the Fund bears directly, the Fund indirectly bears a pro rata share of the fees and expenses of any other funds in which it invests, if any. Such indirect expenses are not included in the Fund's reported expense ratios.
(b) Had the Investment Manager and/or Transfer Agent not waived fees and/or reimbursed a portion of expenses, total return would have been reduced.
(c) Annualized.
(d) Rounds to zero.
(e) The benefits derived from custody fees paid indirectly had an impact of 0.01%.
(f) During the year ended December 31, 2011, Columbia Management reimbursed the Fund for a loss on a trading error. Had the Fund not received this reimbursement, total return would have been lower by less than 0.01%.
(g) Class I shares commenced operations on September 27, 2010. Per share data and total return reflect activity from that date.
(h) Class R shares commenced operations on August 2, 2011. Per share data and total return reflect activity from that date.
(i) Class R4 shares commenced operations on November 8, 2012. Per share data and total return reflect activity from that date.
(j) Class R5 shares commenced operations on August 2, 2011. Per share data and total return reflect activity from that date.
(k) Class Y shares commenced operations on November 8, 2012. Per share data and total return reflect activity from that date.
See accompanying notes to financial statements.
96
| | | | | | | | | Ratio to Average Net Assets | | Supplemental Data | |
(Selected data for a share outstanding
throughout each period) | | Increase from
regulatory
settlements | | Net Asset
Value, End of
Period | | Total Return | | Total gross
expenses
(a) | | Total net
expenses
(a) | | Net
investment
income (loss) | | Portfolio
turnover rate | | Net assets,
end of period
(000s) | |
Class A | |
Six Months Ended June 30,
2015 (Unaudited) | | | — | | | $ | 43.41 | | | | 5.05 | %(b) | | | 1.28 | %(c) | | | 1.24 | %(c) | | | 1.27 | %(c) | | | 23 | % | | $ | 964,828 | | |
Year Ended December 31, 2014 | | | — | | | $ | 41.68 | | | | (4.58 | )%(b) | | | 1.26 | % | | | 1.22 | % | | | 0.91 | % | | | 28 | % | | $ | 946,553 | | |
Year Ended December 31, 2013 | | | — | | | $ | 46.63 | | | | 22.00 | %(b) | | | 1.27 | % | | | 1.23 | % | | | 1.02 | % | | | 45 | % | | $ | 1,089,263 | | |
Year Ended December 31, 2012 | | | 0.00 | (d) | | $ | 40.79 | | | | 21.21 | %(b) | | | 1.28 | % | | | 1.24 | %(e) | | | 1.22 | % | | | 33 | % | | $ | 1,007,236 | | |
Year Ended December 31, 2011 | | | 0.00 | (d) | | $ | 34.15 | | | | (14.37 | )%(b)(f) | | | 1.32 | % | | | 1.30 | %(e) | | | 0.84 | % | | | 32 | % | | $ | 918,112 | | |
Year Ended December 31, 2010 | | | 0.00 | (d) | | $ | 40.87 | | | | 22.23 | % | | | 1.35 | % | | | 1.35 | %(e) | | | 0.62 | % | | | 25 | % | | $ | 810,603 | | |
Class B | |
Six Months Ended June 30,
2015 (Unaudited) | | | — | | | $ | 41.87 | | | | 4.61 | %(b) | | | 2.11 | %(c) | | | 2.08 | %(c) | | | 0.28 | %(c) | | | 23 | % | | $ | 3,915 | | |
Year Ended December 31, 2014 | | | — | | | $ | 40.38 | | | | (5.29 | )%(b) | | | 2.00 | % | | | 1.97 | % | | | 0.16 | % | | | 28 | % | | $ | 6,516 | | |
Year Ended December 31, 2013 | | | — | | | $ | 45.24 | | | | 21.08 | %(b) | | | 2.00 | % | | | 1.97 | % | | | 0.27 | % | | | 45 | % | | $ | 13,218 | | |
Year Ended December 31, 2012 | | | 0.00 | (d) | | $ | 39.67 | | | | 20.33 | %(b) | | | 2.00 | % | | | 1.97 | %(e) | | | 0.51 | % | | | 33 | % | | $ | 17,910 | | |
Year Ended December 31, 2011 | | | 0.00 | (d) | | $ | 33.17 | | | | (14.92 | )%(b)(f) | | | 1.98 | % | | | 1.96 | %(e) | | | 0.15 | % | | | 32 | % | | $ | 24,510 | | |
Year Ended December 31, 2010 | | | 0.00 | (d) | | $ | 39.96 | | | | 21.49 | % | | | 1.96 | % | | | 1.96 | %(e) | | | 0.08 | % | | | 25 | % | | $ | 29,368 | | |
Class C | |
Six Months Ended June 30,
2015 (Unaudited) | | | — | | | $ | 41.69 | | | | 4.63 | %(b) | | | 2.00 | %(c) | | | 1.98 | %(c) | | | 0.52 | %(c) | | | 23 | % | | $ | 104,160 | | |
Year Ended December 31, 2014 | | | — | | | $ | 40.20 | | | | (5.27 | )%(b) | | | 1.99 | % | | | 1.97 | % | | | 0.16 | % | | | 28 | % | | $ | 103,691 | | |
Year Ended December 31, 2013 | | | — | | | $ | 45.04 | | | | 21.07 | %(b) | | | 2.01 | % | | | 1.99 | % | | | 0.23 | % | | | 45 | % | | $ | 110,875 | | |
Year Ended December 31, 2012 | | | 0.00 | (d) | | $ | 39.50 | | | | 20.31 | %(b) | | | 2.02 | % | | | 2.00 | %(e) | | | 0.48 | % | | | 33 | % | | $ | 92,748 | | |
Year Ended December 31, 2011 | | | 0.00 | (d) | | $ | 33.03 | | | | (15.02 | )%(b)(f) | | | 2.07 | % | | | 2.06 | %(e) | | | 0.10 | % | | | 32 | % | | $ | 97,328 | | |
Year Ended December 31, 2010 | | | 0.00 | (d) | | $ | 39.79 | | | | 21.34 | % | | | 2.11 | % | | | 2.11 | %(e) | | | (0.13 | )% | | | 25 | % | | $ | 110,931 | | |
Class I | |
Six Months Ended June 30,
2015 (Unaudited) | | | — | | | $ | 43.57 | | | | 5.23 | % | | | 0.87 | %(c) | | | 0.87 | %(c) | | | 1.64 | %(c) | | | 23 | % | | $ | 59,074 | | |
Year Ended December 31, 2014 | | | — | | | $ | 41.76 | | | | (4.20 | )% | | | 0.85 | % | | | 0.85 | % | | | 1.26 | % | | | 28 | % | | $ | 38,804 | | |
Year Ended December 31, 2013 | | | — | | | $ | 46.71 | | | | 22.43 | % | | | 0.85 | % | | | 0.85 | % | | | 1.49 | % | | | 45 | % | | $ | 29,418 | | |
Year Ended December 31, 2012 | | | 0.00 | (d) | | $ | 40.86 | | | | 21.69 | % | | | 0.88 | % | | | 0.88 | %(e) | | | 1.48 | % | | | 33 | % | | $ | 97,484 | | |
Year Ended December 31, 2011 | | | 0.00 | (d) | | $ | 34.33 | | | | (14.02 | )%(f) | | | 0.91 | % | | | 0.91 | %(e) | | | 0.99 | % | | | 32 | % | | $ | 50,335 | | |
Year Ended December 31, 2010(g) | | | — | | | $ | 40.92 | | | | 9.50 | % | | | 0.94 | %(c) | | | 0.94 | %(c)(e) | | | 0.77 | %(c) | | | 25 | % | | $ | 66,581 | | |
Class R | |
Six Months Ended June 30,
2015 (Unaudited) | | | — | | | $ | 43.32 | | | | 4.86 | % | | | 1.60 | %(c) | | | 1.60 | %(c) | | | 0.89 | %(c) | | | 23 | % | | $ | 4,989 | | |
Year Ended December 31, 2014 | | | — | | | $ | 41.67 | | | | (4.95 | )% | | | 1.63 | % | | | 1.63 | % | | | 0.52 | % | | | 28 | % | | $ | 5,560 | | |
Year Ended December 31, 2013 | | | — | | | $ | 46.60 | | | | 21.50 | % | | | 1.63 | % | | | 1.63 | % | | | 0.58 | % | | | 45 | % | | $ | 5,822 | | |
Year Ended December 31, 2012 | | | 0.00 | (d) | | $ | 40.79 | | | | 20.83 | % | | | 1.52 | % | | | 1.51 | %(e) | | | 0.54 | % | | | 33 | % | | $ | 2,799 | | |
Year Ended December 31, 2011(h) | | | 0.00 | (d) | | $ | 34.11 | | | | (14.96 | )% | | | 1.59 | %(c) | | | 1.59 | %(c)(e) | | | (0.02 | )%(c) | | | 32 | % | | $ | 2,130 | | |
Class R4 | |
Six Months Ended June 30,
2015 (Unaudited) | | | — | | | $ | 43.80 | | | | 5.12 | % | | | 1.05 | %(c) | | | 1.05 | %(c) | | | 1.49 | %(c) | | | 23 | % | | $ | 500,423 | | |
Year Ended December 31, 2014 | | | — | | | $ | 42.02 | | | | (4.39 | )% | | | 1.04 | % | | | 1.04 | % | | | 1.07 | % | | | 28 | % | | $ | 424,425 | | |
Year Ended December 31, 2013 | | | — | | | $ | 46.99 | | | | 22.32 | % | | | 1.03 | % | | | 1.03 | % | | | 0.73 | % | | | 45 | % | | $ | 355,616 | | |
Year Ended December 31, 2012(i) | | | — | | | $ | 41.08 | | | | 4.57 | % | | | 1.03 | %(c) | | | 1.02 | %(c)(e) | | | (0.02 | )%(c) | | | 33 | % | | $ | 15 | | |
Class R5 | |
Six Months Ended June 30,
2015 (Unaudited) | | | — | | | $ | 43.50 | | | | 5.19 | % | | | 0.91 | %(c) | | | 0.91 | %(c) | | | 1.60 | %(c) | | | 23 | % | | $ | 410,552 | | |
Year Ended December 31, 2014 | | | — | | | $ | 41.71 | | | | (4.25 | )% | | | 0.90 | % | | | 0.90 | % | | | 1.23 | % | | | 28 | % | | $ | 397,882 | | |
Year Ended December 31, 2013 | | | — | | | $ | 46.66 | | | | 22.38 | % | | | 0.91 | % | | | 0.91 | % | | | 1.40 | % | | | 45 | % | | $ | 274,415 | | |
Year Ended December 31, 2012 | | | 0.00 | (d) | | $ | 40.81 | | | | 21.61 | % | | | 0.89 | % | | | 0.89 | %(e) | | | 1.99 | % | | | 33 | % | | $ | 242 | | |
Year Ended December 31, 2011(j) | | | 0.00 | (d) | | $ | 34.31 | | | | (14.74 | )% | | | 0.91 | %(c) | | | 0.91 | %(c)(e) | | | 0.65 | %(c) | | | 32 | % | | $ | 2,038 | | |
Class Y | |
Six Months Ended June 30,
2015 (Unaudited) | | | — | | | $ | 43.85 | | | | 5.24 | % | | | 0.87 | %(c) | | | 0.87 | %(c) | | | 1.66 | %(c) | | | 23 | % | | $ | 300,536 | | |
Year Ended December 31, 2014 | | | — | | | $ | 42.02 | | | | (4.21 | )% | | | 0.85 | % | | | 0.85 | % | | | 1.25 | % | | | 28 | % | | $ | 225,012 | | |
Year Ended December 31, 2013 | | | — | | | $ | 46.99 | | | | 22.44 | % | | | 0.86 | % | | | 0.86 | % | | | 1.26 | % | | | 45 | % | | $ | 155,140 | | |
Year Ended December 31, 2012(k) | | | — | | | $ | 41.08 | | | | 4.59 | % | | | 0.91 | %(c) | | | 0.90 | %(c)(e) | | | 0.75 | %(c) | | | 33 | % | | $ | 30,856 | | |
Class Z | |
Six Months Ended June 30,
2015 (Unaudited) | | | — | | | $ | 43.52 | | | | 5.18 | % | | | 0.95 | %(c) | | | 0.95 | %(c) | | | 1.55 | %(c) | | | 23 | % | | $ | 5,553,864 | | |
Year Ended December 31, 2014 | | | — | | | $ | 41.73 | | | | (4.28 | )% | | | 0.93 | % | | | 0.93 | % | | | 1.20 | % | | | 28 | % | | $ | 5,585,035 | | |
Year Ended December 31, 2013 | | | — | | | $ | 46.68 | | | | 22.33 | % | | | 0.93 | % | | | 0.93 | % | | | 1.30 | % | | | 45 | % | | $ | 6,293,552 | | |
Year Ended December 31, 2012 | | | 0.00 | (d) | | $ | 40.84 | | | | 21.60 | % | | | 0.93 | % | | | 0.93 | %(e) | | | 1.53 | % | | | 33 | % | | $ | 5,494,506 | | |
Year Ended December 31, 2011 | | | 0.00 | (d) | | $ | 34.31 | | | | (14.06 | )%(f) | | | 0.95 | % | | | 0.95 | %(e) | | | 1.24 | % | | | 32 | % | | $ | 4,322,500 | | |
Year Ended December 31, 2010 | | | 0.00 | (d) | | $ | 40.92 | | | | 22.70 | % | | | 0.97 | % | | | 0.97 | %(e) | | | 0.99 | % | | | 25 | % | | $ | 5,107,580 | | |
See accompanying notes to financial statements.
97
COLUMBIA ACORN FAMILY OF FUNDS
FINANCIAL HIGHLIGHTS, CONTINUED
Columbia Acorn USA®
| | | | | Income from Investment Operations | | | | Less Distributions to Shareholders | | | |
(Selected data for a share outstanding
throughout each period) | | Net Asset
Value,
Beginning of
Period | | Net
investment
income (loss) | | Net realized
and
unrealized
gain (loss) | | Total from
Investment
Operations | | Net
investment
income | | Net
realized gains | | Total
Distributions to
Shareholders | |
Class A | |
Six Months Ended June 30,
2015 (Unaudited) | | $ | 29.13 | | | | (0.07 | ) | | | 2.16 | | | | 2.09 | | | | — | | | | (0.84 | ) | | | (0.84 | ) | |
Year Ended December 31, 2014 | | $ | 34.15 | | | | (0.20 | ) | | | 1.22 | | | | 1.02 | | | | — | | | | (6.04 | ) | | | (6.04 | ) | |
Year Ended December 31, 2013 | | $ | 28.21 | | | | (0.15 | ) | | | 9.09 | | | | 8.94 | | | | — | | | | (3.00 | ) | | | (3.00 | ) | |
Year Ended December 31, 2012 | | $ | 25.94 | | | | 0.02 | | | | 4.73 | | | | 4.75 | | | | (0.11 | ) | | | (2.37 | ) | | | (2.48 | ) | |
Year Ended December 31, 2011 | | $ | 27.54 | | | | (0.22 | ) | | | (1.21 | ) | | | (1.43 | ) | | | — | | | | (0.17 | ) | | | (0.17 | ) | |
Year Ended December 31, 2010 | | $ | 22.43 | | | | (0.15 | ) | | | 5.26 | | | | 5.11 | | | | — | | | | — | | | | — | | |
Class B | |
Six Months Ended June 30,
2015 (Unaudited) | | $ | 25.27 | | | | (0.22 | ) | | | 1.86 | | | | 1.64 | | | | — | | | | (0.84 | ) | | | (0.84 | ) | |
Year Ended December 31, 2014 | | $ | 30.70 | | | | (0.46 | ) | | | 1.07 | | | | 0.61 | | | | — | | | | (6.04 | ) | | | (6.04 | ) | |
Year Ended December 31, 2013 | | $ | 25.81 | | | | (0.39 | ) | | | 8.28 | | | | 7.89 | | | | — | | | | (3.00 | ) | | | (3.00 | ) | |
Year Ended December 31, 2012 | | $ | 23.98 | | | | (0.19 | ) | | | 4.39 | | | | 4.20 | | | | — | | | | (2.37 | ) | | | (2.37 | ) | |
Year Ended December 31, 2011 | | $ | 25.60 | | | | (0.37 | ) | | | (1.08 | ) | | | (1.45 | ) | | | — | | | | (0.17 | ) | | | (0.17 | ) | |
Year Ended December 31, 2010 | | $ | 20.99 | | | | (0.30 | ) | | | 4.91 | | | | 4.61 | | | | — | | | | — | | | | — | | |
Class C | |
Six Months Ended June 30,
2015 (Unaudited) | | $ | 24.98 | | | | (0.15 | ) | | | 1.85 | | | | 1.70 | | | | — | | | | (0.84 | ) | | | (0.84 | ) | |
Year Ended December 31, 2014 | | $ | 30.33 | | | | (0.37 | ) | | | 1.06 | | | | 0.69 | | | | — | | | | (6.04 | ) | | | (6.04 | ) | |
Year Ended December 31, 2013 | | $ | 25.49 | | | | (0.33 | ) | | | 8.17 | | | | 7.84 | | | | — | | | | (3.00 | ) | | | (3.00 | ) | |
Year Ended December 31, 2012 | | $ | 23.72 | | | | (0.16 | ) | | | 4.30 | | | | 4.14 | | | | — | | | | (2.37 | ) | | | (2.37 | ) | |
Year Ended December 31, 2011 | | $ | 25.39 | | | | (0.39 | ) | | | (1.11 | ) | | | (1.50 | ) | | | — | | | | (0.17 | ) | | | (0.17 | ) | |
Year Ended December 31, 2010 | | $ | 20.84 | | | | (0.31 | ) | | | 4.86 | | | | 4.55 | | | | — | | | | — | | | | — | | |
Class I | |
Six Months Ended June 30,
2015 (Unaudited) | | $ | 31.19 | | | | (0.02 | ) | | | 2.32 | | | | 2.30 | | | | — | | | | (0.84 | ) | | | (0.84 | ) | |
Year Ended December 31, 2014 | | $ | 35.99 | | | | (0.06 | ) | | | 1.30 | | | | 1.24 | | | | — | | | | (6.04 | ) | | | (6.04 | ) | |
Year Ended December 31, 2013 | | $ | 29.47 | | | | (0.02 | ) | | | 9.54 | | | | 9.52 | | | | — | | | | (3.00 | ) | | | (3.00 | ) | |
Year Ended December 31, 2012 | | $ | 27.00 | | | | (0.10 | ) | | | 5.16 | | | | 5.06 | | | | (0.22 | ) | | | (2.37 | ) | | | (2.59 | ) | |
Year Ended December 31, 2011 | | $ | 28.56 | | | | (0.14 | ) | | | (1.25 | ) | | | (1.39 | ) | | | — | | | | (0.17 | ) | | | (0.17 | ) | |
Year Ended December 31, 2010(e) | | $ | 24.24 | | | | (0.03 | ) | | | 4.35 | | | | 4.32 | | | | — | | | | — | | | | — | | |
Class R4 | |
Six Months Ended June 30,
2015 (Unaudited) | | $ | 31.70 | | | | (0.04 | ) | | | 2.35 | | | | 2.31 | | | | — | | | | (0.84 | ) | | | (0.84 | ) | |
Year Ended December 31, 2014 | | $ | 36.55 | | | | (0.11 | ) | | | 1.30 | | | | 1.19 | | | | — | | | | (6.04 | ) | | | (6.04 | ) | |
Year Ended December 31, 2013 | | $ | 29.92 | | | | 0.00 | (f) | | | 9.63 | | | | 9.63 | | | | — | | | | (3.00 | ) | | | (3.00 | ) | |
Year Ended December 31, 2012(g) | | $ | 30.06 | | | | 0.06 | | | | 2.28 | | | | 2.34 | | | | (0.16 | ) | | | (2.32 | ) | | | (2.48 | ) | |
Class R5 | |
Six Months Ended June 30,
2015 (Unaudited) | | $ | 31.71 | | | | (0.03 | ) | | | 2.36 | | | | 2.33 | | | | — | | | | (0.84 | ) | | | (0.84 | ) | |
Year Ended December 31, 2014 | | $ | 36.53 | | | | (0.06 | ) | | | 1.28 | | | | 1.22 | | | | — | | | | (6.04 | ) | | | (6.04 | ) | |
Year Ended December 31, 2013 | | $ | 29.90 | | | | 0.02 | | | | 9.61 | | | | 9.63 | | | | — | | | | (3.00 | ) | | | (3.00 | ) | |
Year Ended December 31, 2012(h) | | $ | 30.06 | | | | 0.07 | | | | 2.27 | | | | 2.34 | | | | (0.18 | ) | | | (2.32 | ) | | | (2.50 | ) | |
Class Y | |
Six Months Ended June 30,
2015 (Unaudited) | | $ | 31.80 | | | | (0.02 | ) | | | 2.36 | | | | 2.34 | | | | — | | | | (0.84 | ) | | | (0.84 | ) | |
Year Ended December 31, 2014 | | $ | 36.59 | | | | (0.07 | ) | | | 1.32 | | | | 1.25 | | | | — | | | | (6.04 | ) | | | (6.04 | ) | |
Year Ended December 31, 2013 | | $ | 29.93 | | | | 0.02 | | | | 9.64 | | | | 9.66 | | | | — | | | | (3.00 | ) | | | (3.00 | ) | |
Year Ended December 31, 2012(i) | | $ | 30.10 | | | | 0.07 | | | | 2.27 | | | | 2.34 | | | | (0.19 | ) | | | (2.32 | ) | | | (2.51 | ) | |
Class Z | |
Six Months Ended June 30,
2015 (Unaudited) | | $ | 31.03 | | | | (0.04 | ) | | | 2.30 | | | | 2.26 | | | | — | | | | (0.84 | ) | | | (0.84 | ) | |
Year Ended December 31, 2014 | | $ | 35.90 | | | | (0.12 | ) | | | 1.29 | | | | 1.17 | | | | — | | | | (6.04 | ) | | | (6.04 | ) | |
Year Ended December 31, 2013 | | $ | 29.45 | | | | (0.07 | ) | | | 9.52 | | | | 9.45 | | | | — | | | | (3.00 | ) | | | (3.00 | ) | |
Year Ended December 31, 2012 | | $ | 26.98 | | | | 0.11 | | | | 4.92 | | | | 5.03 | | | | (0.19 | ) | | | (2.37 | ) | | | (2.56 | ) | |
Year Ended December 31, 2011 | | $ | 28.56 | | | | (0.14 | ) | | | (1.27 | ) | | | (1.41 | ) | | | — | | | | (0.17 | ) | | | (0.17 | ) | |
Year Ended December 31, 2010 | | $ | 23.19 | | | | (0.08 | ) | | | 5.45 | | | | 5.37 | | | | — | | | | — | | | | — | | |
Notes to Financial Highlights
(a) In addition to the fees and expenses that the Fund bears directly, the Fund indirectly bears a pro rata share of the fees and expenses of any other funds in which it invests, if any. Such indirect expenses are not included in the Fund's reported expense ratios.
(b) Annualized.
(c) Ratios include line of credit interest expense which is less than 0.01%.
(d) The benefits derived from custody fees paid indirectly had an impact of less than 0.01%.
(e) Class I shares commenced operations on September 27, 2010. Per share data and total return reflect activity from that date.
(f) Rounds to zero.
(g) Class R4 shares commenced operations on November 8, 2012. Per share data and total return reflect activity from that date.
(h) Class R5 shares commenced operations on November 8, 2012. Per share data and total return reflect activity from that date.
(i) Class Y shares commenced operations on November 8, 2012. Per share data and total return reflect activity from that date.
See accompanying notes to financial statements.
98
| | | | | | | Ratio to Average Net Assets | | Supplemental Data | |
(Selected data for a share outstanding
throughout each period) | | Net Asset
Value, End of
Period | | Total Return | | Total gross
expenses
(a) | | Total net
expenses
(a) | | Net
investment
income (loss) | | Portfolio
turnover rate | | Net assets,
end of period
(000s) | |
Class A | |
Six Months Ended June 30,
2015 (Unaudited) | | $ | 30.38 | | | | 7.14 | % | | | 1.34 | %(b) | | | 1.34 | %(b) | | | (0.50 | )%(b) | | | 18 | % | | $ | 136,711 | | |
Year Ended December 31, 2014 | | $ | 29.13 | | | | 3.35 | % | | | 1.33 | % | | | 1.33 | % | | | (0.60 | )% | | | 12 | % | | $ | 148,089 | | |
Year Ended December 31, 2013 | | $ | 34.15 | | | | 32.34 | % | | | 1.32 | % | | | 1.32 | % | | | (0.46 | )% | | | 17 | % | | $ | 201,559 | | |
Year Ended December 31, 2012 | | $ | 28.21 | | | | 18.67 | % | | | 1.32 | %(c) | | | 1.32 | %(c)(d) | | | 0.08 | % | | | 14 | % | | $ | 152,164 | | |
Year Ended December 31, 2011 | | $ | 25.94 | | | | (5.21 | )% | | | 1.30 | % | | | 1.30 | %(d) | | | (0.78 | )% | | | 20 | % | | $ | 167,038 | | |
Year Ended December 31, 2010 | | $ | 27.54 | | | | 22.78 | % | | | 1.30 | % | | | 1.30 | %(d) | | | (0.64 | )% | | | 32 | % | | $ | 214,097 | | |
Class B | |
Six Months Ended June 30,
2015 (Unaudited) | | $ | 26.07 | | | | 6.45 | % | | | 2.52 | %(b) | | | 2.52 | %(b) | | | (1.70 | )%(b) | | | 18 | % | | $ | 130 | | |
Year Ended December 31, 2014 | | $ | 25.27 | | | | 2.37 | % | | | 2.26 | % | | | 2.26 | % | | | (1.55 | )% | | | 12 | % | | $ | 234 | | |
Year Ended December 31, 2013 | | $ | 30.70 | | | | 31.28 | % | | | 2.15 | % | | | 2.15 | % | | | (1.33 | )% | | | 17 | % | | $ | 567 | | |
Year Ended December 31, 2012 | | $ | 25.81 | | | | 17.87 | % | | | 1.99 | %(c) | | | 1.99 | %(c)(d) | | | (0.71 | )% | | | 14 | % | | $ | 1,056 | | |
Year Ended December 31, 2011 | | $ | 23.98 | | | | (5.68 | )% | | | 1.92 | % | | | 1.92 | %(d) | | | (1.42 | )% | | | 20 | % | | $ | 2,253 | | |
Year Ended December 31, 2010 | | $ | 25.60 | | | | 21.96 | % | | | 1.98 | % | | | 1.98 | %(d) | | | (1.37 | )% | | | 32 | % | | $ | 9,222 | | |
Class C | |
Six Months Ended June 30,
2015 (Unaudited) | | $ | 25.84 | | | | 6.76 | % | | | 2.01 | %(b) | | | 2.01 | %(b) | | | (1.17 | )%(b) | | | 18 | % | | $ | 35,239 | | |
Year Ended December 31, 2014 | | $ | 24.98 | | | | 2.67 | % | | | 2.00 | % | | | 2.00 | % | | | (1.26 | )% | | | 12 | % | | $ | 36,476 | | |
Year Ended December 31, 2013 | | $ | 30.33 | | | | 31.47 | % | | | 2.00 | % | | | 2.00 | % | | | (1.14 | )% | | | 17 | % | | $ | 40,395 | | |
Year Ended December 31, 2012 | | $ | 25.49 | | | | 17.82 | % | | | 2.05 | %(c) | | | 2.05 | %(c)(d) | | | (0.61 | )% | | | 14 | % | | $ | 31,410 | | |
Year Ended December 31, 2011 | | $ | 23.72 | | | | (5.92 | )% | | | 2.05 | % | | | 2.05 | %(d) | | | (1.53 | )% | | | 20 | % | | $ | 30,584 | | |
Year Ended December 31, 2010 | | $ | 25.39 | | | | 21.83 | % | | | 2.08 | % | | | 2.08 | %(d) | | | (1.41 | )% | | | 32 | % | | $ | 36,101 | | |
Class I | |
Six Months Ended June 30,
2015 (Unaudited) | | $ | 32.65 | | | | 7.34 | % | | | 0.93 | %(b) | | | 0.93 | %(b) | | | (0.10 | )%(b) | | | 18 | % | | $ | 2 | | |
Year Ended December 31, 2014 | | $ | 31.19 | | | | 3.80 | % | | | 0.88 | % | | | 0.88 | % | | | (0.17 | )% | | | 12 | % | | $ | 2 | | |
Year Ended December 31, 2013 | | $ | 35.99 | | | | 32.93 | % | | | 0.90 | % | | | 0.90 | % | | | (0.04 | )% | | | 17 | % | | $ | 4 | | |
Year Ended December 31, 2012 | | $ | 29.47 | | | | 19.10 | % | | | 0.96 | % | | | 0.96 | %(d) | | | (0.33 | )% | | | 14 | % | | $ | 3 | | |
Year Ended December 31, 2011 | | $ | 27.00 | | | | (4.88 | )% | | | 0.94 | % | | | 0.94 | %(d) | | | (0.47 | )% | | | 20 | % | | $ | 2,635 | | |
Year Ended December 31, 2010(e) | | $ | 28.56 | | | | 17.82 | % | | | 0.94 | %(b) | | | 0.94 | %(b)(d) | | | (0.35 | )%(b) | | | 32 | % | | $ | 28,993 | | |
Class R4 | |
Six Months Ended June 30,
2015 (Unaudited) | | $ | 33.17 | | | | 7.26 | % | | | 1.09 | %(b) | | | 1.09 | %(b) | | | (0.22 | )%(b) | | | 18 | % | | $ | 12,551 | | |
Year Ended December 31, 2014 | | $ | 31.70 | | | | 3.60 | % | | | 1.07 | % | | | 1.07 | % | | | (0.32 | )% | | | 12 | % | | $ | 7,952 | | |
Year Ended December 31, 2013 | | $ | 36.55 | | | | 32.80 | % | | | 1.00 | % | | | 1.00 | % | | | 0.01 | % | | | 17 | % | | $ | 6,441 | | |
Year Ended December 31, 2012(g) | | $ | 29.92 | | | | 8.06 | % | | | 1.14 | %(b)(c) | | | 1.14 | %(b)(c)(d) | | | 1.51 | %(b) | | | 14 | % | | $ | 15 | | |
Class R5 | |
Six Months Ended June 30,
2015 (Unaudited) | | $ | 33.20 | | | | 7.32 | % | | | 1.00 | %(b) | | | 1.00 | %(b) | | | (0.16 | )%(b) | | | 18 | % | | $ | 35,962 | | |
Year Ended December 31, 2014 | | $ | 31.71 | | | | 3.68 | % | | | 0.99 | % | | | 0.99 | % | | | (0.17 | )% | | | 12 | % | | $ | 36,689 | | |
Year Ended December 31, 2013 | | $ | 36.53 | | | | 32.83 | % | | | 0.97 | % | | | 0.97 | % | | | 0.06 | % | | | 17 | % | | $ | 6,068 | | |
Year Ended December 31, 2012(h) | | $ | 29.90 | | | | 8.06 | % | | | 1.12 | %(b) | | | 1.12 | %(b)(d) | | | 1.53 | %(b) | | | 14 | % | | $ | 2 | | |
Class Y | |
Six Months Ended June 30,
2015 (Unaudited) | | $ | 33.30 | | | | 7.33 | % | | | 0.95 | %(b) | | | 0.95 | %(b) | | | (0.11 | )%(b) | | | 18 | % | | $ | 36,734 | | |
Year Ended December 31, 2014 | | $ | 31.80 | | | | 3.76 | % | | | 0.93 | % | | | 0.93 | % | | | (0.19 | )% | | | 12 | % | | $ | 35,551 | | |
Year Ended December 31, 2013 | | $ | 36.59 | | | | 32.89 | % | | | 0.93 | % | | | 0.93 | % | | | 0.07 | % | | | 17 | % | | $ | 48,479 | | |
Year Ended December 31, 2012(i) | | $ | 29.93 | | | | 8.07 | % | | | 1.04 | %(b) | | | 1.04 | %(b)(d) | | | 1.62 | %(b) | | | 14 | % | | $ | 2 | | |
Class Z | |
Six Months Ended June 30,
2015 (Unaudited) | | $ | 32.45 | | | | 7.25 | % | | | 1.09 | %(b) | | | 1.09 | %(b) | | | (0.26 | )%(b) | | | 18 | % | | $ | 1,054,246 | | |
Year Ended December 31, 2014 | | $ | 31.03 | | | | 3.61 | % | | | 1.08 | % | | | 1.08 | % | | | (0.34 | )% | | | 12 | % | | $ | 1,132,223 | | |
Year Ended December 31, 2013 | | $ | 35.90 | | | | 32.72 | % | | | 1.06 | % | | | 1.06 | % | | | (0.20 | )% | | | 17 | % | | $ | 1,496,775 | | |
Year Ended December 31, 2012 | | $ | 29.45 | | | | 18.98 | % | | | 1.07 | %(c) | | | 1.07 | %(c)(d) | | | 0.36 | % | | | 14 | % | | $ | 1,415,442 | | |
Year Ended December 31, 2011 | | $ | 26.98 | | | | (4.95 | )% | | | 1.00 | % | | | 1.00 | %(d) | | | (0.48 | )% | | | 20 | % | | $ | 1,355,934 | | |
Year Ended December 31, 2010 | | $ | 28.56 | | | | 23.16 | % | | | 1.01 | % | | | 1.01 | %(d) | | | (0.34 | )% | | | 32 | % | | $ | 1,410,133 | | |
See accompanying notes to financial statements.
99
COLUMBIA ACORN FAMILY OF FUNDS
FINANCIAL HIGHLIGHTS, CONTINUED
Columbia Acorn International SelectSM
| | | | | Income from Investment Operations | | | | Less Distributions to Shareholders | | | | | |
(Selected data for a share outstanding
throughout each period) | | Net Asset
Value,
Beginning of
Period | | Net
investment
income (loss) | | Net realized
and
unrealized
gain (loss) | | Total from
Investment
Operations | | Net
investment
income | | Net
realized gains | | Total
Distributions to
Shareholders | | Redemption
fees added
to paid in
capital | |
Class A | |
Six Months Ended June 30,
2015 (Unaudited) | | $ | 22.04 | | | | 0.15 | | | | 0.67 | | | | 0.82 | | | | (0.10 | ) | | | — | | | | (0.10 | ) | | | — | | |
Year Ended December 31, 2014 | | $ | 26.91 | | | | 0.29 | | | | (2.17 | ) | | | (1.88 | ) | | | (0.10 | ) | | | (2.89 | ) | | | (2.99 | ) | | | — | | |
Year Ended December 31, 2013 | | $ | 25.61 | | | | 0.29 | | | | 3.29 | | | | 3.58 | | | | (0.37 | ) | | | (1.91 | ) | | | (2.28 | ) | | | — | | |
Year Ended December 31, 2012 | | $ | 24.26 | | | | 0.39 | | | | 4.92 | | | | 5.31 | | | | (1.75 | ) | | | (2.21 | ) | | | (3.96 | ) | | | — | | |
Year Ended December 31, 2011 | | $ | 28.01 | | | | 0.18 | | | | (2.95 | ) | | | (2.77 | ) | | | (0.59 | ) | | | (0.39 | ) | | | (0.98 | ) | | | — | | |
Year Ended December 31, 2010 | | $ | 23.39 | | | | 0.08 | | | | 4.84 | | | | 4.92 | | | | (0.30 | ) | | | — | | | | (0.30 | ) | | | 0.00 | (f) | |
Class B | |
Six Months Ended June 30,
2015 (Unaudited) | | $ | 20.69 | | | | 0.04 | | | | 0.65 | | | | 0.69 | | | | (0.01 | ) | | | — | | | | (0.01 | ) | | | — | | |
Year Ended December 31, 2014 | | $ | 25.53 | | | | 0.10 | | | | (2.05 | ) | | | (1.95 | ) | | | — | | | | (2.89 | ) | | | (2.89 | ) | | | — | | |
Year Ended December 31, 2013 | | $ | 24.40 | | | | 0.11 | | | | 3.12 | | | | 3.23 | | | | (0.19 | ) | | | (1.91 | ) | | | (2.10 | ) | | | — | | |
Year Ended December 31, 2012 | | $ | 23.27 | | | | 0.23 | | | | 4.69 | | | | 4.92 | | | | (1.58 | ) | | | (2.21 | ) | | | (3.79 | ) | | | — | | |
Year Ended December 31, 2011 | | $ | 26.72 | | | | 0.01 | | | | (2.82 | ) | | | (2.81 | ) | | | (0.25 | ) | | | (0.39 | ) | | | (0.64 | ) | | | — | | |
Year Ended December 31, 2010 | | $ | 22.34 | | | | (0.06 | ) | | | 4.62 | | | | 4.56 | | | | (0.18 | ) | | | — | | | | (0.18 | ) | | | 0.00 | (f) | |
Class C | |
Six Months Ended June 30,
2015 (Unaudited) | | $ | 20.54 | | | | 0.06 | | | | 0.63 | | | | 0.69 | | | | — | | | | — | | | | — | | | | — | | |
Year Ended December 31, 2014 | | $ | 25.39 | | | | 0.07 | | | | (2.03 | ) | | | (1.96 | ) | | | — | | | | (2.89 | ) | | | (2.89 | ) | | | — | | |
Year Ended December 31, 2013 | | $ | 24.28 | | | | 0.08 | | | | 3.10 | | | | 3.18 | | | | (0.16 | ) | | | (1.91 | ) | | | (2.07 | ) | | | — | | |
Year Ended December 31, 2012 | | $ | 23.17 | | | | 0.18 | | | | 4.67 | | | | 4.85 | | | | (1.53 | ) | | | (2.21 | ) | | | (3.74 | ) | | | — | | |
Year Ended December 31, 2011 | | $ | 26.58 | | | | (0.04 | ) | | | (2.81 | ) | | | (2.85 | ) | | | (0.17 | ) | | | (0.39 | ) | | | (0.56 | ) | | | — | | |
Year Ended December 31, 2010 | | $ | 22.21 | | | | (0.10 | ) | | | 4.60 | | | | 4.50 | | | | (0.13 | ) | | | — | | | | (0.13 | ) | | | 0.00 | (f) | |
Class I | |
Six Months Ended June 30,
2015 (Unaudited) | | $ | 22.29 | | | | 0.19 | | | | 0.68 | | | | 0.87 | | | | (0.10 | ) | | | — | | | | (0.10 | ) | | | — | | |
Year Ended December 31, 2014 | | $ | 27.19 | | | | 0.39 | | | | (2.20 | ) | | | (1.81 | ) | | | (0.20 | ) | | | (2.89 | ) | | | (3.09 | ) | | | — | | |
Year Ended December 31, 2013 | | $ | 25.85 | | | | 0.39 | | | | 3.32 | | | | 3.71 | | | | (0.46 | ) | | | (1.91 | ) | | | (2.37 | ) | | | — | | |
Year Ended December 31, 2012 | | $ | 24.45 | | | | 0.51 | | | | 4.94 | | | | 5.45 | | | | (1.84 | ) | | | (2.21 | ) | | | (4.05 | ) | | | — | | |
Year Ended December 31, 2011 | | $ | 28.33 | | | | 0.31 | | | | (2.97 | ) | | | (2.66 | ) | | | (0.83 | ) | | | (0.39 | ) | | | (1.22 | ) | | | — | | |
Year Ended December 31, 2010(h) | | $ | 26.11 | | | | 0.03 | | | | 2.19 | | | | 2.22 | | | | — | | | | — | | | | — | | | | — | | |
Class R4 | |
Six Months Ended June 30,
2015 (Unaudited) | | $ | 22.45 | | | | 0.19 | | | | 0.68 | | | | 0.87 | | | | (0.10 | ) | | | — | | | | (0.10 | ) | | | — | | |
Year Ended December 31, 2014 | | $ | 27.36 | | | | 0.37 | | | | (2.22 | ) | | | (1.85 | ) | | | (0.17 | ) | | | (2.89 | ) | | | (3.06 | ) | | | — | | |
Year Ended December 31, 2013 | | $ | 25.99 | | | | 0.29 | | | | 3.42 | | | | 3.71 | | | | (0.43 | ) | | | (1.91 | ) | | | (2.34 | ) | | | — | | |
Year Ended December 31, 2012(i) | | $ | 29.98 | | | | (0.02 | ) | | | (0.09 | )(j) | | | (0.11 | ) | | | (1.79 | ) | | | (2.09 | ) | | | (3.88 | ) | | | — | | |
Class R5 | |
Six Months Ended June 30,
2015 (Unaudited) | | $ | 22.43 | | | | 0.21 | | | | 0.67 | | | | 0.88 | | | | (0.10 | ) | | | — | | | | (0.10 | ) | | | — | | |
Year Ended December 31, 2014 | | $ | 27.34 | | | | 0.36 | | | | (2.19 | ) | | | (1.83 | ) | | | (0.19 | ) | | | (2.89 | ) | | | (3.08 | ) | | | — | | |
Year Ended December 31, 2013 | | $ | 25.98 | | | | 0.38 | | | | 3.35 | | | | 3.73 | | | | (0.46 | ) | | | (1.91 | ) | | | (2.37 | ) | | | — | | |
Year Ended December 31, 2012(k) | | $ | 29.98 | | | | (0.02 | ) | | | (0.09 | )(j) | | | (0.11 | ) | | | (1.80 | ) | | | (2.09 | ) | | | (3.89 | ) | | | — | | |
Class Y | |
Six Months Ended June 30,
2015 (Unaudited) | | $ | 22.42 | | | | 0.20 | | | | 0.68 | | | | 0.88 | | | | (0.10 | ) | | | — | | | | (0.10 | ) | | | — | | |
Year Ended December 31, 2014 | | $ | 27.33 | | | | 0.40 | | | | (2.21 | ) | | | (1.81 | ) | | | (0.21 | ) | | | (2.89 | ) | | | (3.10 | ) | | | — | | |
Year Ended December 31, 2013 | | $ | 25.98 | | | | 0.11 | | | | 3.62 | | | | 3.73 | | | | (0.47 | ) | | | (1.91 | ) | | | (2.38 | ) | | | — | | |
Year Ended December 31, 2012(l) | | $ | 29.99 | | | | (0.02 | ) | | | (0.09 | )(j) | | | (0.11 | ) | | | (1.81 | ) | | | (2.09 | ) | | | (3.90 | ) | | | — | | |
Class Z | |
Six Months Ended June 30,
2015 (Unaudited) | | $ | 22.30 | | | | 0.19 | | | | 0.68 | | | | 0.87 | | | | (0.10 | ) | | | — | | | | (0.10 | ) | | | — | | |
Year Ended December 31, 2014 | | $ | 27.20 | | | | 0.38 | | | | (2.21 | ) | | | (1.83 | ) | | | (0.18 | ) | | | (2.89 | ) | | | (3.07 | ) | | | — | | |
Year Ended December 31, 2013 | | $ | 25.86 | | | | 0.37 | | | | 3.33 | | | | 3.70 | | | | (0.45 | ) | | | (1.91 | ) | | | (2.36 | ) | | | — | | |
Year Ended December 31, 2012 | | $ | 24.46 | | | | 0.49 | | | | 4.95 | | | | 5.44 | | | | (1.83 | ) | | | (2.21 | ) | | | (4.04 | ) | | | — | | |
Year Ended December 31, 2011 | | $ | 28.33 | | | | 0.29 | | | | (2.98 | ) | | | (2.69 | ) | | | (0.79 | ) | | | (0.39 | ) | | | (1.18 | ) | | | — | | |
Year Ended December 31, 2010 | | $ | 23.64 | | | | 0.18 | | | | 4.89 | | | | 5.07 | | | | (0.38 | ) | | | — | | | | (0.38 | ) | | | 0.00 | (f) | |
Notes to Financial Highlights
(a) In addition to the fees and expenses that the Fund bears directly, the Fund indirectly bears a pro rata share of the fees and expenses of any other funds in which it invests, if any. Such indirect expenses are not included in the Fund's reported expense ratios.
(b) Annualized.
(c) Ratios include line of credit interest expense which is less than 0.01%.
(d) The benefits derived from custody fees paid indirectly had an impact of 0.01%.
(e) The benefits derived from custody fees paid indirectly had an impact of less than 0.01%.
(f) Rounds to zero.
(g) Had the Investment Manager and/or Transfer Agent not waived fees and/or reimbursed a portion of expenses, total return would have been reduced.
(h) Class I shares commenced operations on September 27, 2010. Per share data and total return reflect activity from that date.
(i) Class R4 shares commenced operations on November 8, 2012. Per share data and total return reflect activity from that date.
(j) Calculation of the net gain (loss) per share (both realized and unrealized) does not correlate to the aggregate realized and unrealized gain (loss) presented in the Statements of Operations due to the timing of subscriptions and redemptions of Fund shares in relation to fluctuations in the market value of the portfolio.
(k) Class R5 shares commenced operations on November 8, 2012. Per share data and total return reflect activity from that date.
(l) Class Y shares commenced operations on November 8, 2012. Per share data and total return reflect activity from that date.
See accompanying notes to financial statements.
100
| | | | | | | | | Ratio to Average Net Assets | | Supplemental Data | |
(Selected data for a share outstanding
throughout each period) | | Increase from
regulatory
settlements | | Net Asset
Value, End of
Period | | Total Return | | Total gross
expenses
(a) | | Total net
expenses
(a) | | Net
investment
income (loss) | | Portfolio
turnover rate | | Net assets,
end of period
(000s) | |
Class A | |
Six Months Ended June 30,
2015 (Unaudited) | | | — | | | $ | 22.76 | | | | 3.70 | % | | | 1.52 | %(b) | | | 1.52 | %(b) | | | 1.32 | %(b) | | | 29 | % | | $ | 43,965 | | |
Year Ended December 31, 2014 | | | — | | | $ | 22.04 | | | | (7.06 | )% | | | 1.47 | % | | | 1.47 | % | | | 1.05 | % | | | 58 | % | | $ | 53,419 | | |
Year Ended December 31, 2013 | | | — | | | $ | 26.91 | | | | 14.42 | % | | | 1.47 | % | | | 1.47 | % | | | 1.08 | % | | | 72 | % | | $ | 73,911 | | |
Year Ended December 31, 2012 | | | — | | | $ | 25.61 | | | | 22.05 | % | | | 1.49 | %(c) | | | 1.49 | %(c)(d) | | | 1.43 | % | | | 63 | % | | $ | 74,167 | | |
Year Ended December 31, 2011 | | | — | | | $ | 24.26 | | | | (10.11 | )% | | | 1.51 | % | | | 1.51 | %(e) | | | 0.66 | % | | | 44 | % | | $ | 56,350 | | |
Year Ended December 31, 2010 | | | 0.00 | (f) | | $ | 28.01 | | | | 21.41 | % | | | 1.56 | % | | | 1.56 | %(e) | | | 0.33 | % | | | 42 | % | | $ | 71,668 | | |
Class B | |
Six Months Ended June 30,
2015 (Unaudited) | | | — | | | $ | 21.37 | | | | 3.36 | %(g) | | | 2.29 | %(b) | | | 2.20 | %(b) | | | 0.38 | %(b) | | | 29 | % | | $ | 136 | | |
Year Ended December 31, 2014 | | | — | | | $ | 20.69 | | | | (7.71 | )% | | | 2.11 | % | | | 2.11 | % | | | 0.39 | % | | | 58 | % | | $ | 355 | | |
Year Ended December 31, 2013 | | | — | | | $ | 25.53 | | | | 13.67 | % | | | 2.14 | % | | | 2.14 | % | | | 0.43 | % | | | 72 | % | | $ | 873 | | |
Year Ended December 31, 2012 | | | — | | | $ | 24.40 | | | | 21.29 | % | | | 2.11 | %(c) | | | 2.10 | %(c)(d) | | | 0.87 | % | | | 63 | % | | $ | 1,250 | | |
Year Ended December 31, 2011 | | | — | | | $ | 23.27 | | | | (10.64 | )% | | | 2.14 | % | | | 2.14 | %(e) | | | 0.04 | % | | | 44 | % | | $ | 1,774 | | |
Year Ended December 31, 2010 | | | 0.00 | (f) | | $ | 26.72 | | | | 20.63 | %(g) | | | 2.24 | % | | | 2.20 | %(e) | | | (0.27 | )% | | | 42 | % | | $ | 3,030 | | |
Class C | |
Six Months Ended June 30,
2015 (Unaudited) | | | — | | | $ | 21.23 | | | | 3.36 | % | | | 2.29 | %(b) | | | 2.29 | %(b) | | | 0.53 | %(b) | | | 29 | % | | $ | 7,250 | | |
Year Ended December 31, 2014 | | | — | | | $ | 20.54 | | | | (7.80 | )% | | | 2.23 | % | | | 2.23 | % | | | 0.29 | % | | | 58 | % | | $ | 8,057 | | |
Year Ended December 31, 2013 | | | — | | | $ | 25.39 | | | | 13.52 | % | | | 2.26 | % | | | 2.26 | % | | | 0.32 | % | | | 72 | % | | $ | 10,311 | | |
Year Ended December 31, 2012 | | | — | | | $ | 24.28 | | | | 21.10 | % | | | 2.28 | %(c) | | | 2.27 | %(c)(d) | | | 0.67 | % | | | 63 | % | | $ | 9,786 | | |
Year Ended December 31, 2011 | | | — | | | $ | 23.17 | | | | (10.81 | )% | | | 2.31 | % | | | 2.31 | %(e) | | | (0.14 | )% | | | 44 | % | | $ | 8,704 | | |
Year Ended December 31, 2010 | | | 0.00 | (f) | | $ | 26.58 | | | | 20.45 | % | | | 2.36 | % | | | 2.36 | %(e) | | | (0.45 | )% | | | 42 | % | | $ | 11,885 | | |
Class I | |
Six Months Ended June 30,
2015 (Unaudited) | | | — | | | $ | 23.06 | | | | 3.88 | % | | | 1.19 | %(b) | | | 1.19 | %(b) | | | 1.68 | %(b) | | | 29 | % | | $ | 2 | | |
Year Ended December 31, 2014 | | | — | | | $ | 22.29 | | | | (6.72 | )% | | | 1.11 | % | | | 1.11 | % | | | 1.41 | % | | | 58 | % | | $ | 2 | | |
Year Ended December 31, 2013 | | | — | | | $ | 27.19 | | | | 14.82 | % | | | 1.13 | % | | | 1.13 | % | | | 1.43 | % | | | 72 | % | | $ | 3 | | |
Year Ended December 31, 2012 | | | — | | | $ | 25.85 | | | | 22.48 | % | | | 1.15 | % | | | 1.14 | %(d) | | | 1.84 | % | | | 63 | % | | $ | 2 | | |
Year Ended December 31, 2011 | | | — | | | $ | 24.45 | | | | (9.68 | )% | | | 1.04 | % | | | 1.04 | %(e) | | | 1.12 | % | | | 44 | % | | $ | 2 | | |
Year Ended December 31, 2010(h) | | | — | | | $ | 28.33 | | | | 8.50 | % | | | 1.14 | %(b) | | | 1.14 | %(b)(e) | | | 0.44 | %(b) | | | 42 | % | | $ | 3 | | |
Class R4 | |
Six Months Ended June 30,
2015 (Unaudited) | | | — | | | $ | 23.22 | | | | 3.86 | % | | | 1.25 | %(b) | | | 1.25 | %(b) | | | 1.66 | %(b) | | | 29 | % | | $ | 1,080 | | |
Year Ended December 31, 2014 | | | — | | | $ | 22.45 | | | | (6.83 | )% | | | 1.21 | % | | | 1.21 | % | | | 1.33 | % | | | 58 | % | | $ | 974 | | |
Year Ended December 31, 2013 | | | — | | | $ | 27.36 | | | | 14.72 | % | | | 1.24 | % | | | 1.24 | % | | | 1.06 | % | | | 72 | % | | $ | 417 | | |
Year Ended December 31, 2012(i) | | | — | | | $ | 25.99 | | | | (0.27 | )% | | | 1.30 | %(b)(c) | | | 1.30 | %(b)(c)(d) | | | (0.55 | )%(b) | | | 63 | % | | $ | 13 | | |
Class R5 | |
Six Months Ended June 30,
2015 (Unaudited) | | | — | | | $ | 23.21 | | | | 3.90 | % | | | 1.18 | %(b) | | | 1.18 | %(b) | | | 1.78 | %(b) | | | 29 | % | | $ | 3,485 | | |
Year Ended December 31, 2014 | | | — | | | $ | 22.43 | | | | (6.77 | )% | | | 1.15 | % | | | 1.15 | % | | | 1.30 | % | | | 58 | % | | $ | 2,593 | | |
Year Ended December 31, 2013 | | | — | | | $ | 27.34 | | | | 14.80 | %(g) | | | 1.15 | % | | | 1.15 | % | | | 1.40 | % | | | 72 | % | | $ | 956 | | |
Year Ended December 31, 2012(k) | | | — | | | $ | 25.98 | | | | (0.27 | )% | | | 1.29 | %(b) | | | 1.28 | %(b)(d) | | | (0.55 | )%(b) | | | 63 | % | | $ | 2 | | |
Class Y | |
Six Months Ended June 30,
2015 (Unaudited) | | | — | | | $ | 23.20 | | | | 3.91 | % | | | 1.12 | %(b) | | | 1.12 | %(b) | | | 1.73 | %(b) | | | 29 | % | | $ | 10,763 | | |
Year Ended December 31, 2014 | | | — | | | $ | 22.42 | | | | (6.71 | )% | | | 1.09 | % | | | 1.09 | % | | | 1.43 | % | | | 58 | % | | $ | 11,755 | | |
Year Ended December 31, 2013 | | | — | | | $ | 27.33 | | | | 14.82 | % | | | 1.09 | % | | | 1.09 | % | | | 0.40 | % | | | 72 | % | | $ | 13,318 | | |
Year Ended December 31, 2012(l) | | | — | | | $ | 25.98 | | | | (0.25 | )% | | | 1.21 | %(b) | | | 1.20 | %(b)(d) | | | (0.48 | )%(b) | | | 63 | % | | $ | 2 | | |
Class Z | |
Six Months Ended June 30,
2015 (Unaudited) | | | — | | | $ | 23.07 | | | | 3.88 | % | | | 1.22 | %(b) | | | 1.22 | %(b) | | | 1.62 | %(b) | | | 29 | % | | $ | 156,750 | | |
Year Ended December 31, 2014 | | | — | | | $ | 22.30 | | | | (6.79 | )% | | | 1.17 | % | | | 1.17 | % | | | 1.36 | % | | | 58 | % | | $ | 175,764 | | |
Year Ended December 31, 2013 | | | — | | | $ | 27.20 | | | | 14.75 | % | | | 1.19 | % | | | 1.19 | % | | | 1.37 | % | | | 72 | % | | $ | 256,100 | | |
Year Ended December 31, 2012 | | | — | | | $ | 25.86 | | | | 22.42 | % | | | 1.20 | %(c) | | | 1.19 | %(c)(d) | | | 1.77 | % | | | 63 | % | | $ | 295,231 | | |
Year Ended December 31, 2011 | | | — | | | $ | 24.46 | | | | (9.76 | )% | | | 1.14 | % | | | 1.14 | %(e) | | | 1.03 | % | | | 44 | % | | $ | 259,553 | | |
Year Ended December 31, 2010 | | | 0.00 | (f) | | $ | 28.33 | | | | 21.89 | % | | | 1.16 | % | | | 1.16 | %(e) | | | 0.75 | % | | | 42 | % | | $ | 366,081 | | |
See accompanying notes to financial statements.
101
COLUMBIA ACORN FAMILY OF FUNDS
FINANCIAL HIGHLIGHTS, CONTINUED
Columbia Acorn SelectSM
| | | | | Income from Investment Operations | | | | Less Distributions to Shareholders | | | |
(Selected data for a share outstanding
throughout each period) | | Net Asset
Value,
Beginning of
Period | | Net
investment
income (loss) | | Net realized
and
unrealized
gain (loss) | | Reimbursement
from
affiliate | | Total from
Investment
Operations | | Net
investment
income | | Net
realized gains | | Total
Distributions to
Shareholders | |
Class A | |
Six Months Ended June 30,
2015 (Unaudited) | | $ | 21.03 | | | | (0.04 | ) | | | 1.31 | | | | — | | | | 1.27 | | | | — | | | | (1.78 | ) | | | (1.78 | ) | |
Year Ended December 31, 2014 | | $ | 25.57 | | | | (0.14 | ) | | | 0.64 | | | | — | | | | 0.50 | | | | — | | | | (5.04 | ) | | | (5.04 | ) | |
Year Ended December 31, 2013 | | $ | 24.72 | | | | (0.15 | ) | | | 7.92 | | | | — | | | | 7.77 | | | | (0.07 | ) | | | (6.85 | ) | | | (6.92 | ) | |
Year Ended December 31, 2012 | | $ | 22.95 | | | | 0.03 | | | | 3.78 | | | | — | | | | 3.81 | | | | — | | | | (2.04 | ) | | | (2.04 | ) | |
Year Ended December 31, 2011 | | $ | 27.94 | | | | (0.15 | ) | | | (4.46 | ) | | | — | | | | (4.61 | ) | | | (0.38 | ) | | | — | | | | (0.38 | ) | |
Year Ended December 31, 2010 | | $ | 22.81 | | | | (0.18 | ) | | | 5.31 | | | | — | | | | 5.13 | | | | — | | | | — | | | | — | | |
Class B | |
Six Months Ended June 30,
2015 (Unaudited) | | $ | 18.03 | | | | (0.12 | ) | | | 1.13 | | | | — | | | | 1.01 | | | | — | | | | (1.78 | ) | | | (1.78 | ) | |
Year Ended December 31, 2014 | | $ | 22.81 | | | | (0.31 | ) | | | 0.57 | | | | — | | | | 0.26 | | | | — | | | | (5.04 | ) | | | (5.04 | ) | |
Year Ended December 31, 2013 | | $ | 22.75 | | | | (0.33 | ) | | | 7.24 | | | | — | | | | 6.91 | | | | — | | | | (6.85 | ) | | | (6.85 | ) | |
Year Ended December 31, 2012 | | $ | 21.40 | | | | (0.15 | ) | | | 3.54 | | | | — | | | | 3.39 | | | | — | | | | (2.04 | ) | | | (2.04 | ) | |
Year Ended December 31, 2011 | | $ | 26.06 | | | | (0.30 | ) | | | (4.13 | ) | | | — | | | | (4.43 | ) | | | (0.23 | ) | | | — | | | | (0.23 | ) | |
Year Ended December 31, 2010 | | $ | 21.41 | | | | (0.31 | ) | | | 4.96 | | | | — | | | | 4.65 | | | | — | | | | — | | | | — | | |
Class C | |
Six Months Ended June 30,
2015 (Unaudited) | | $ | 17.69 | | | | (0.10 | ) | | | 1.10 | | | | — | | | | 1.00 | | | | — | | | | (1.78 | ) | | | (1.78 | ) | |
Year Ended December 31, 2014 | | $ | 22.46 | | | | (0.28 | ) | | | 0.55 | | | | — | | | | 0.27 | | | | — | | | | (5.04 | ) | | | (5.04 | ) | |
Year Ended December 31, 2013 | | $ | 22.48 | | | | (0.32 | ) | | | 7.15 | | | | — | | | | 6.83 | | | | — | | | | (6.85 | ) | | | (6.85 | ) | |
Year Ended December 31, 2012 | | $ | 21.20 | | | | (0.14 | ) | | | 3.46 | | | | — | | | | 3.32 | | | | — | | | | (2.04 | ) | | | (2.04 | ) | |
Year Ended December 31, 2011 | | $ | 25.83 | | | | (0.32 | ) | | | (4.12 | ) | | | — | | | | (4.44 | ) | | | (0.19 | ) | | | — | | | | (0.19 | ) | |
Year Ended December 31, 2010 | | $ | 21.25 | | | | (0.34 | ) | | | 4.92 | | | | — | | | | 4.58 | | | | — | | | | — | | | | — | | |
Class I | |
Six Months Ended June 30,
2015 (Unaudited) | | $ | 22.38 | | | | 0.00 | (f) | | | 1.40 | | | | — | | | | 1.40 | | | | — | | | | (1.78 | ) | | | (1.78 | ) | |
Year Ended December 31, 2014 | | $ | 26.81 | | | | (0.05 | ) | | | 0.66 | | | | — | | | | 0.61 | | | | — | | | | (5.04 | ) | | | (5.04 | ) | |
Year Ended December 31, 2013 | | $ | 25.63 | | | | (0.06 | ) | | | 8.25 | | | | — | | | | 8.19 | | | | (0.16 | ) | | | (6.85 | ) | | | (7.01 | ) | |
Year Ended December 31, 2012 | | $ | 23.65 | | | | 0.23 | | | | 3.79 | | | | — | | | | 4.02 | | | | — | | | | (2.04 | ) | | | (2.04 | ) | |
Year Ended December 31, 2011 | | $ | 28.74 | | | | (0.03 | ) | | | (4.59 | ) | | | — | | | | (4.62 | ) | | | (0.47 | ) | | | — | | | | (0.47 | ) | |
Year Ended December 31, 2010(g) | | $ | 24.74 | | | | 0.01 | | | | 3.99 | | | | — | | | | 4.00 | | | | — | | | | — | | | | — | | |
Class R4 | |
Six Months Ended June 30,
2015 (Unaudited) | | $ | 22.75 | | | | (0.02 | ) | | | 1.42 | | | | — | | | | 1.40 | | | | — | | | | (1.78 | ) | | | (1.78 | ) | |
Year Ended December 31, 2014 | | $ | 27.20 | | | | (0.10 | ) | | | 0.69 | | | | — | | | | 0.59 | | | | — | | | | (5.04 | ) | | | (5.04 | ) | |
Year Ended December 31, 2013 | | $ | 25.92 | | | | (0.06 | ) | | | 8.32 | | | | — | | | | 8.26 | | | | (0.13 | ) | | | (6.85 | ) | | | (6.98 | ) | |
Year Ended December 31, 2012(h) | | $ | 25.91 | | | | 0.00 | (f) | | | 1.52 | | | | — | | | | 1.52 | | | | — | | | | (1.51 | ) | | | (1.51 | ) | |
Class R5 | |
Six Months Ended June 30,
2015 (Unaudited) | | $ | 22.78 | | | | (0.03 | ) | | | 1.44 | | | | — | | | | 1.41 | | | | — | | | | (1.78 | ) | | | (1.78 | ) | |
Year Ended December 31, 2014 | | $ | 27.20 | | | | (0.07 | ) | | | 0.69 | | | | — | | | | 0.62 | | | | — | | | | (5.04 | ) | | | (5.04 | ) | |
Year Ended December 31, 2013 | | $ | 25.93 | | | | (0.04 | ) | | | 8.31 | | | | — | | | | 8.27 | | | | (0.15 | ) | | | (6.85 | ) | | | (7.00 | ) | |
Year Ended December 31, 2012(i) | | $ | 25.91 | | | | 0.00 | (f) | | | 1.53 | | | | — | | | | 1.53 | | | | — | | | | (1.51 | ) | | | (1.51 | ) | |
Class Y | |
Six Months Ended June 30,
2015 (Unaudited) | | $ | 22.86 | | | | (0.00 | )(f) | | | 1.42 | | | | — | | | | 1.42 | | | | — | | | | (1.78 | ) | | | (1.78 | ) | |
Year Ended December 31, 2014 | | $ | 27.27 | | | | (0.06 | ) | | | 0.69 | | | | — | | | | 0.63 | | | | — | | | | (5.04 | ) | | | (5.04 | ) | |
Year Ended December 31, 2013 | | $ | 25.98 | | | | (0.03 | ) | | | 8.34 | | | | — | | | | 8.31 | | | | (0.17 | ) | | | (6.85 | ) | | | (7.02 | ) | |
Year Ended December 31, 2012(j) | | $ | 25.96 | | | | 0.01 | | | | 1.52 | | | | — | | | | 1.53 | | | | — | | | | (1.51 | ) | | | (1.51 | ) | |
Class Z | |
Six Months Ended June 30,
2015 (Unaudited) | | $ | 22.28 | | | | (0.02 | ) | | | 1.39 | | | | — | | | | 1.37 | | | | — | | | | (1.78 | ) | | | (1.78 | ) | |
Year Ended December 31, 2014 | | $ | 26.72 | | | | (0.08 | ) | | | 0.68 | | | | — | | | | 0.60 | | | | — | | | | (5.04 | ) | | | (5.04 | ) | |
Year Ended December 31, 2013 | | $ | 25.57 | | | | (0.07 | ) | | | 8.21 | | | | — | | | | 8.14 | | | | (0.14 | ) | | | (6.85 | ) | | | (6.99 | ) | |
Year Ended December 31, 2012 | | $ | 23.62 | | | | 0.11 | | | | 3.88 | | | | — | | | | 3.99 | | | | — | | | | (2.04 | ) | | | (2.04 | ) | |
Year Ended December 31, 2011 | | $ | 28.73 | | | | (0.07 | ) | | | (4.58 | ) | | | 0.00 | (f) | | | (4.65 | ) | | | (0.46 | ) | | | — | | | | (0.46 | ) | |
Year Ended December 31, 2010 | | $ | 23.38 | | | | (0.10 | ) | | | 5.45 | | | | — | | | | 5.35 | | | | — | | | | — | | | | — | | |
Notes to Financial Highlights
(a) In addition to the fees and expenses that the Fund bears directly, the Fund indirectly bears a pro rata share of the fees and expenses of any other funds in which it invests, if any. Such indirect expenses are not included in the Fund's reported expense ratios.
(b) Had the Investment Manager and/or Transfer Agent not waived fees and/or reimbursed a portion of expenses, total return would have been reduced.
(c) Annualized.
(d) Ratios include line of credit interest expense which is less than 0.01%.
(e) The benefits derived from custody fees paid indirectly had an impact of less than 0.01%.
(f) Rounds to zero.
(g) Class I shares commenced operations on September 27, 2010. Per share data and total return reflect activity from that date.
(h) Class R4 shares commenced operations on November 8, 2012. Per share data and total return reflect activity from that date.
(i) Class R5 shares commenced operations on November 8, 2012. Per share data and total return reflect activity from that date.
(j) Class Y shares commenced operations on November 8, 2012. Per share data and total return reflect activity from that date.
(k) During the year ended December 31, 2011, the Fund received a reimbursement from an affiliate. Had the Fund not received this payment, the total return would have been lower by 0.01%.
See accompanying notes to financial statements.
102
| | | | | | | Ratio to Average Net Assets | | Supplemental Data | |
(Selected data for a share outstanding
throughout each period) | | Net Asset
Value, End of
Period | | Total Return | | Total gross
expenses
(a) | | Total net
expenses
(a) | | Net
investment
income (loss) | | Portfolio
turnover rate | | Net assets,
end of period
(000s) | |
Class A | |
Six Months Ended June 30,
2015 (Unaudited) | | $ | 20.52 | | | | 5.96 | %(b) | | | 1.34 | %(c) | | | 1.27 | %(c) | | | (0.42 | )%(c) | | | 33 | % | | $ | 244,592 | | |
Year Ended December 31, 2014 | | $ | 21.03 | | | | 2.17 | % | | | 1.32 | % | | | 1.32 | % | | | (0.58 | )% | | | 17 | % | | $ | 264,234 | | |
Year Ended December 31, 2013 | | $ | 25.57 | | | | 33.77 | % | | | 1.31 | %(d) | | | 1.31 | %(d) | | | (0.54 | )% | | | 20 | % | | $ | 333,193 | | |
Year Ended December 31, 2012 | | $ | 24.72 | | | | 16.87 | % | | | 1.31 | %(d) | | | 1.31 | %(d)(e) | | | 0.13 | % | | | 15 | % | | $ | 271,628 | | |
Year Ended December 31, 2011 | | $ | 22.95 | | | | (16.65 | )% | | | 1.28 | % | | | 1.28 | %(e) | | | (0.57 | )% | | | 21 | % | | $ | 340,325 | | |
Year Ended December 31, 2010 | | $ | 27.94 | | | | 22.49 | % | | | 1.28 | % | | | 1.28 | %(e) | | | (0.73 | )% | | | 28 | % | | $ | 555,263 | | |
Class B | |
Six Months Ended June 30,
2015 (Unaudited) | | $ | 17.26 | | | | 5.50 | %(b) | | | 2.42 | %(c) | | | 2.10 | %(c) | | | (1.30 | )%(c) | | | 33 | % | | $ | 533 | | |
Year Ended December 31, 2014 | | $ | 18.03 | | | | 1.35 | %(b) | | | 2.14 | % | | | 2.10 | % | | | (1.40 | )% | | | 17 | % | | $ | 1,014 | | |
Year Ended December 31, 2013 | | $ | 22.81 | | | | 32.81 | %(b) | | | 2.05 | %(d) | | | 2.03 | %(d) | | | (1.32 | )% | | | 20 | % | | $ | 2,938 | | |
Year Ended December 31, 2012 | | $ | 22.75 | | | | 16.11 | % | | | 1.91 | %(d) | | | 1.90 | %(d)(e) | | | (0.62 | )% | | | 15 | % | | $ | 9,938 | | |
Year Ended December 31, 2011 | | $ | 21.40 | | | | (17.11 | )% | | | 1.88 | % | | | 1.88 | %(e) | | | (1.21 | )% | | | 21 | % | | $ | 26,126 | | |
Year Ended December 31, 2010 | | $ | 26.06 | | | | 21.72 | % | | | 1.92 | % | | | 1.92 | %(e) | | | (1.39 | )% | | | 28 | % | | $ | 72,203 | | |
Class C | |
Six Months Ended June 30,
2015 (Unaudited) | | $ | 16.91 | | | | 5.55 | %(b) | | | 2.07 | %(c) | | | 2.00 | %(c) | | | (1.15 | )%(c) | | | 33 | % | | $ | 43,848 | | |
Year Ended December 31, 2014 | | $ | 17.69 | | | | 1.42 | % | | | 2.04 | % | | | 2.04 | % | | | (1.30 | )% | | | 17 | % | | $ | 48,591 | | |
Year Ended December 31, 2013 | | $ | 22.46 | | | | 32.85 | % | | | 2.04 | %(d) | | | 2.04 | %(d) | | | (1.28 | )% | | | 20 | % | | $ | 61,537 | | |
Year Ended December 31, 2012 | | $ | 22.48 | | | | 15.93 | % | | | 2.07 | %(d) | | | 2.06 | %(d)(e) | | | (0.59 | )% | | | 15 | % | | $ | 57,309 | | |
Year Ended December 31, 2011 | | $ | 21.20 | | | | (17.27 | )% | | | 2.05 | % | | | 2.05 | %(e) | | | (1.34 | )% | | | 21 | % | | $ | 62,887 | | |
Year Ended December 31, 2010 | | $ | 25.83 | | | | 21.55 | % | | | 2.07 | % | | | 2.07 | %(e) | | | (1.52 | )% | | | 28 | % | | $ | 98,445 | | |
Class I | |
Six Months Ended June 30,
2015 (Unaudited) | | $ | 22.00 | | | | 6.19 | %(b) | | | 0.98 | %(c) | | | 0.88 | %(c) | | | 0.02 | %(c) | | | 33 | % | | $ | 29,505 | | |
Year Ended December 31, 2014 | | $ | 22.38 | | | | 2.49 | % | | | 0.94 | % | | | 0.94 | % | | | (0.20 | )% | | | 17 | % | | $ | 18,718 | | |
Year Ended December 31, 2013 | | $ | 26.81 | | | | 34.31 | % | | | 0.94 | %(d) | | | 0.94 | %(d) | | | (0.21 | )% | | | 20 | % | | $ | 13,660 | | |
Year Ended December 31, 2012 | | $ | 25.63 | | | | 17.26 | % | | | 0.96 | %(d) | | | 0.95 | %(d)(e) | | | 0.89 | % | | | 15 | % | | $ | 39,054 | | |
Year Ended December 31, 2011 | | $ | 23.65 | | | | (16.25 | )% | | | 0.92 | % | | | 0.92 | %(e) | | | (0.12 | )% | | | 21 | % | | $ | 10,944 | | |
Year Ended December 31, 2010(g) | | $ | 28.74 | | | | 16.17 | % | | | 0.91 | %(c) | | | 0.91 | %(c)(e) | | | 0.18 | %(c) | | | 28 | % | | $ | 7,832 | | |
Class R4 | |
Six Months Ended June 30,
2015 (Unaudited) | | $ | 22.37 | | | | 6.08 | %(b) | | | 1.11 | %(c) | | | 1.04 | %(c) | | | (0.18 | )%(c) | | | 33 | % | | $ | 1,282 | | |
Year Ended December 31, 2014 | | $ | 22.75 | | | | 2.39 | % | | | 1.12 | % | | | 1.12 | % | | | (0.37 | )% | | | 17 | % | | $ | 1,193 | | |
Year Ended December 31, 2013 | | $ | 27.20 | | | | 34.16 | % | | | 1.02 | %(d) | | | 1.02 | %(d) | | | (0.20 | )% | | | 20 | % | | $ | 1,383 | | |
Year Ended December 31, 2012(h) | | $ | 25.92 | | | | 5.92 | % | | | 1.07 | %(c) | | | 1.06 | %(c)(e) | | | 0.02 | %(c) | | | 15 | % | | $ | 15 | | |
Class R5 | |
Six Months Ended June 30,
2015 (Unaudited) | | $ | 22.41 | | | | 6.12 | %(b) | | | 1.01 | %(c) | | | 0.97 | %(c) | | | (0.28 | )%(c) | | | 33 | % | | $ | 2,302 | | |
Year Ended December 31, 2014 | | $ | 22.78 | | | | 2.50 | % | | | 1.00 | % | | | 1.00 | % | | | (0.26 | )% | | | 17 | % | | $ | 10,697 | | |
Year Ended December 31, 2013 | | $ | 27.20 | | | | 34.21 | % | | | 0.97 | %(d) | | | 0.97 | %(d) | | | (0.13 | )% | | | 20 | % | | $ | 11,996 | | |
Year Ended December 31, 2012(i) | | $ | 25.93 | | | | 5.96 | % | | | 0.99 | %(c) | | | 0.99 | %(c)(e) | | | 0.08 | %(c) | | | 15 | % | | $ | 3 | | |
Class Y | |
Six Months Ended June 30,
2015 (Unaudited) | | $ | 22.50 | | | | 6.14 | %(b) | | | 0.97 | %(c) | | | 0.90 | %(c) | | | (0.02 | )%(c) | | | 33 | % | | $ | 4,135 | | |
Year Ended December 31, 2014 | | $ | 22.86 | | | | 2.53 | % | | | 0.95 | % | | | 0.95 | % | | | (0.22 | )% | | | 17 | % | | $ | 3,644 | | |
Year Ended December 31, 2013 | | $ | 27.27 | | | | 34.30 | % | | | 0.93 | %(d) | | | 0.93 | %(d) | | | (0.09 | )% | | | 20 | % | | $ | 4,847 | | |
Year Ended December 31, 2012(j) | | $ | 25.98 | | | | 5.94 | % | | | 0.92 | %(c) | | | 0.92 | %(c)(e) | | | 0.15 | %(c) | | | 15 | % | | $ | 3 | | |
Class Z | |
Six Months Ended June 30,
2015 (Unaudited) | | $ | 21.87 | | | | 6.07 | %(b) | | | 1.06 | %(c) | | | 1.00 | %(c) | | | (0.15 | )%(c) | | | 33 | % | | $ | 278,552 | | |
Year Ended December 31, 2014 | | $ | 22.28 | | | | 2.47 | % | | | 1.04 | % | | | 1.04 | % | | | (0.30 | )% | | | 17 | % | | $ | 318,487 | | |
Year Ended December 31, 2013 | | $ | 26.72 | | | | 34.16 | % | | | 1.02 | %(d) | | | 1.02 | %(d) | | | (0.26 | )% | | | 20 | % | | $ | 431,990 | | |
Year Ended December 31, 2012 | | $ | 25.57 | | | | 17.15 | % | | | 1.03 | %(d) | | | 1.03 | %(d)(e) | | | 0.40 | % | | | 15 | % | | $ | 587,678 | | |
Year Ended December 31, 2011 | | $ | 23.62 | | | | (16.37 | )%(k) | | | 0.97 | % | | | 0.97 | %(e) | | | (0.28 | )% | | | 21 | % | | $ | 850,338 | | |
Year Ended December 31, 2010 | | $ | 28.73 | | | | 22.88 | % | | | 0.97 | % | | | 0.97 | %(e) | | | (0.41 | )% | | | 28 | % | | $ | 1,549,112 | | |
See accompanying notes to financial statements.
103
COLUMBIA ACORN FAMILY OF FUNDS
FINANCIAL HIGHLIGHTS, CONTINUED
Columbia Thermostat FundSM
| | | | | Income from Investment Operations | | | | Less Distributions to Shareholders | | | |
(Selected data for a share outstanding
throughout each period) | | Net Asset
Value,
Beginning of
Period | | Net
investment
income | | Net realized
and
unrealized
gain | | Total from
Investment
Operations | | Net
investment
income | | Net
realized gains | | Total
Distributions to
Shareholders | |
Class A | |
Six Months Ended June 30,
2015 (Unaudited) | | $ | 14.86 | | | | 0.13 | | | | 0.03 | | | | 0.16 | | | | (0.02 | ) | | | (0.28 | ) | | | (0.30 | ) | |
Year Ended December 31, 2014 | | $ | 14.58 | | | | 0.28 | | | | 0.49 | | | | 0.77 | | | | (0.28 | ) | | | (0.21 | ) | | | (0.49 | ) | |
Year Ended December 31, 2013 | | $ | 14.29 | | | | 0.29 | | | | 1.00 | | | | 1.29 | | | | (0.25 | ) | | | (0.75 | ) | | | (1.00 | ) | |
Year Ended December 31, 2012 | | $ | 12.82 | | | | 0.32 | | | | 1.39 | | | | 1.71 | | | | (0.24 | ) | | | — | | | | (0.24 | ) | |
Year Ended December 31, 2011 | | $ | 12.58 | | | | 0.28 | | | | 0.30 | | | | 0.58 | | | | (0.34 | ) | | | — | | | | (0.34 | ) | |
Year Ended December 31, 2010 | | $ | 10.90 | | | | 0.19 | | | | 1.67 | | | | 1.86 | | | | (0.18 | ) | | | — | | | | (0.18 | ) | |
Class B | |
Six Months Ended June 30,
2015 (Unaudited) | | $ | 14.97 | | | | 0.09 | | | | 0.03 | | | | 0.12 | | | | (0.02 | ) | | | (0.28 | ) | | | (0.30 | ) | |
Year Ended December 31, 2014 | | $ | 14.68 | | | | 0.21 | | | | 0.50 | | | | 0.71 | | | | (0.21 | ) | | | (0.21 | ) | | | (0.42 | ) | |
Year Ended December 31, 2013 | | $ | 14.39 | | | | 0.19 | | | | 1.03 | | | | 1.22 | | | | (0.18 | ) | | | (0.75 | ) | | | (0.93 | ) | |
Year Ended December 31, 2012 | | $ | 12.91 | | | | 0.20 | | | | 1.45 | | | | 1.65 | | | | (0.17 | ) | | | — | | | | (0.17 | ) | |
Year Ended December 31, 2011 | | $ | 12.64 | | | | 0.15 | | | | 0.38 | | | | 0.53 | | | | (0.26 | ) | | | — | | | | (0.26 | ) | |
Year Ended December 31, 2010 | | $ | 10.93 | | | | 0.13 | | | | 1.67 | | | | 1.80 | | | | (0.09 | ) | | | — | | | | (0.09 | ) | |
Class C | |
Six Months Ended June 30,
2015 (Unaudited) | | $ | 14.96 | | | | 0.08 | | | | 0.03 | | | | 0.11 | | | | (0.02 | ) | | | (0.28 | ) | | | (0.30 | ) | |
Year Ended December 31, 2014 | | $ | 14.68 | | | | 0.17 | | | | 0.49 | | | | 0.66 | | | | (0.17 | ) | | | (0.21 | ) | | | (0.38 | ) | |
Year Ended December 31, 2013 | | $ | 14.39 | | | | 0.18 | | | | 1.00 | | | | 1.18 | | | | (0.14 | ) | | | (0.75 | ) | | | (0.89 | ) | |
Year Ended December 31, 2012 | | $ | 12.91 | | | | 0.22 | | | | 1.39 | | | | 1.61 | | | | (0.13 | ) | | | — | | | | (0.13 | ) | |
Year Ended December 31, 2011 | | $ | 12.62 | | | | 0.18 | | | | 0.31 | | | | 0.49 | | | | (0.20 | ) | | | — | | | | (0.20 | ) | |
Year Ended December 31, 2010 | | $ | 10.91 | | | | 0.10 | | | | 1.68 | | | | 1.78 | | | | (0.07 | ) | | | — | | | | (0.07 | ) | |
Class R4 | |
Six Months Ended June 30,
2015 (Unaudited) | | $ | 14.74 | | | | 0.15 | | | | 0.03 | | | | 0.18 | | | | (0.02 | ) | | | (0.28 | ) | | | (0.30 | ) | |
Year Ended December 31, 2014 | | $ | 14.46 | | | | 0.32 | | | | 0.49 | | | | 0.81 | | | | (0.32 | ) | | | (0.21 | ) | | | (0.53 | ) | |
Year Ended December 31, 2013 | | $ | 14.19 | | | | 0.36 | | | | 0.95 | | | | 1.31 | | | | (0.29 | ) | | | (0.75 | ) | | | (1.04 | ) | |
Year Ended December 31, 2012(e) | | $ | 14.08 | | | | 0.09 | | | | 0.28 | | | | 0.37 | | | | (0.26 | ) | | | — | | | | (0.26 | ) | |
Class R5 | |
Six Months Ended June 30,
2015 (Unaudited) | | $ | 14.75 | | | | 0.15 | | | | 0.03 | | | | 0.18 | | | | (0.02 | ) | | | (0.28 | ) | | | (0.30 | ) | |
Year Ended December 31, 2014 | | $ | 14.47 | | | | 0.31 | | | | 0.50 | | | | 0.81 | | | | (0.32 | ) | | | (0.21 | ) | | | (0.53 | ) | |
Year Ended December 31, 2013 | | $ | 14.19 | | | | 0.37 | | | | 0.96 | | | | 1.33 | | | | (0.30 | ) | | | (0.75 | ) | | | (1.05 | ) | |
Year Ended December 31, 2012(f) | | $ | 14.08 | | | | 0.09 | | | | 0.27 | | | | 0.36 | | | | (0.25 | ) | | | — | | | | (0.25 | ) | |
Class Y | |
Six Months Ended June 30,
2015 (Unaudited) | | $ | 14.74 | | | | 0.15 | | | | 0.03 | | | | 0.18 | | | | (0.02 | ) | | | (0.28 | ) | | | (0.30 | ) | |
Year Ended December 31, 2014 | | $ | 14.46 | | | | 0.32 | | | | 0.50 | | | | 0.82 | | | | (0.33 | ) | | | (0.21 | ) | | | (0.54 | ) | |
Year Ended December 31, 2013 | | $ | 14.18 | | | | 0.33 | | | | 1.01 | | | | 1.34 | | | | (0.31 | ) | | | (0.75 | ) | | | (1.06 | ) | |
Year Ended December 31, 2012(g) | | $ | 14.08 | | | | 0.09 | | | | 0.27 | | | | 0.36 | | | | (0.26 | ) | | | — | | | | (0.26 | ) | |
Class Z | |
Six Months Ended June 30,
2015 (Unaudited) | | $ | 14.67 | | | | 0.15 | | | | 0.03 | | | | 0.18 | | | | (0.02 | ) | | | (0.28 | ) | | | (0.30 | ) | |
Year Ended December 31, 2014 | | $ | 14.40 | | | | 0.32 | | | | 0.48 | | | | 0.80 | | | | (0.32 | ) | | | (0.21 | ) | | | (0.53 | ) | |
Year Ended December 31, 2013 | | $ | 14.13 | | | | 0.32 | | | | 0.99 | | | | 1.31 | | | | (0.29 | ) | | | (0.75 | ) | | | (1.04 | ) | |
Year Ended December 31, 2012 | | $ | 12.67 | | | | 0.34 | | | | 1.39 | | | | 1.73 | | | | (0.27 | ) | | | — | | | | (0.27 | ) | |
Year Ended December 31, 2011 | | $ | 12.44 | | | | 0.31 | | | | 0.29 | | | | 0.60 | | | | (0.37 | ) | | | — | | | | (0.37 | ) | |
Year Ended December 31, 2010 | | $ | 10.80 | | | | 0.21 | | | | 1.66 | | | | 1.87 | | | | (0.23 | ) | | | — | | | | (0.23 | ) | |
Notes to Financial Highlights
(a) Had the Investment Manager and/or Transfer Agent not waived fees and/or reimbursed a portion of expenses, total return would have been reduced.
(b) In addition to the fees and expenses that the Fund bears directly, the Fund indirectly bears a pro rata share of the fees and expenses of the underlying funds in which the Fund invests, if any. Such indirect expenses are not included in the Fund's reported expense ratios.
(c) Annualized.
(d) The benefits derived from custody fees paid indirectly had an impact of less than 0.01%.
(e) Class R4 shares commenced operations on November 8, 2012. Per share data and total return reflect activity from that date.
(f) Class R5 shares commenced operations on November 8, 2012. Per share data and total return reflect activity from that date.
(g) Class Y shares commenced operations on November 8, 2012. Per share data and total return reflect activity from that date.
See accompanying notes to financial statements.
104
| | | | | | | Ratio to Average Net Assets | | Supplemental Data | |
(Selected data for a share outstanding
throughout each period) | | Net Asset
Value, End of
Period | | Total Return
(a) | | Total gross
expenses
(b) | | Total net
expenses
(b) | | Net
investment
income | | Portfolio
turnover rate | | Net assets,
end of period
(000s) | |
Class A | |
Six Months Ended June 30,
2015 (Unaudited) | | $ | 14.72 | | | | 1.08 | % | | | 0.52 | %(c) | | | 0.50 | %(c) | | | 1.75 | %(c) | | | 24 | % | | $ | 427,618 | | |
Year Ended December 31, 2014 | | $ | 14.86 | | | | 5.30 | % | | | 0.51 | % | | | 0.50 | % | | | 1.88 | % | | | 95 | % | | $ | 450,258 | | |
Year Ended December 31, 2013 | | $ | 14.58 | | | | 9.07 | % | | | 0.52 | % | | | 0.50 | % | | | 1.91 | % | | | 92 | % | | $ | 513,293 | | |
Year Ended December 31, 2012 | | $ | 14.29 | | | | 13.34 | % | | | 0.58 | % | | | 0.50 | %(d) | | | 2.28 | % | | | 109 | % | | $ | 323,750 | | |
Year Ended December 31, 2011 | | $ | 12.82 | | | | 4.62 | % | | | 0.67 | % | | | 0.50 | %(d) | | | 2.17 | % | | | 130 | % | | $ | 79,744 | | |
Year Ended December 31, 2010 | | $ | 12.58 | | | | 17.28 | % | | | 0.72 | % | | | 0.50 | %(d) | | | 1.64 | % | | | 118 | % | | $ | 44,527 | | |
Class B | |
Six Months Ended June 30,
2015 (Unaudited) | | $ | 14.79 | | | | 0.81 | % | | | 1.18 | %(c) | | | 1.00 | %(c) | | | 1.25 | %(c) | | | 24 | % | | $ | 937 | | |
Year Ended December 31, 2014 | | $ | 14.97 | | | | 4.83 | % | | | 1.15 | % | | | 1.00 | % | | | 1.39 | % | | | 95 | % | | $ | 1,231 | | |
Year Ended December 31, 2013 | | $ | 14.68 | | | | 8.49 | % | | | 1.15 | % | | | 1.00 | % | | | 1.29 | % | | | 92 | % | | $ | 2,263 | | |
Year Ended December 31, 2012 | | $ | 14.39 | | | | 12.78 | % | | | 1.16 | % | | | 1.00 | %(d) | | | 1.47 | % | | | 109 | % | | $ | 4,480 | | |
Year Ended December 31, 2011 | | $ | 12.91 | | | | 4.19 | % | | | 1.23 | % | | | 1.00 | %(d) | | | 1.18 | % | | | 130 | % | | $ | 11,318 | | |
Year Ended December 31, 2010 | | $ | 12.64 | | | | 16.64 | % | | | 1.28 | % | | | 1.00 | %(d) | | | 1.10 | % | | | 118 | % | | $ | 28,752 | | |
Class C | |
Six Months Ended June 30,
2015 (Unaudited) | | $ | 14.77 | | | | 0.74 | % | | | 1.27 | %(c) | | | 1.25 | %(c) | | | 1.00 | %(c) | | | 24 | % | | $ | 380,771 | | |
Year Ended December 31, 2014 | | $ | 14.96 | | | | 4.50 | % | | | 1.26 | % | | | 1.25 | % | | | 1.14 | % | | | 95 | % | | $ | 404,456 | | |
Year Ended December 31, 2013 | | $ | 14.68 | | | | 8.23 | % | | | 1.27 | % | | | 1.25 | % | | | 1.16 | % | | | 92 | % | | $ | 430,173 | | |
Year Ended December 31, 2012 | | $ | 14.39 | | | | 12.52 | % | | | 1.32 | % | | | 1.25 | %(d) | | | 1.56 | % | | | 109 | % | | $ | 253,641 | | |
Year Ended December 31, 2011 | | $ | 12.91 | | | | 3.87 | % | | | 1.43 | % | | | 1.25 | %(d) | | | 1.40 | % | | | 130 | % | | $ | 33,378 | | |
Year Ended December 31, 2010 | | $ | 12.62 | | | | 16.43 | % | | | 1.49 | % | | | 1.25 | %(d) | | | 0.88 | % | | | 118 | % | | $ | 21,866 | | |
Class R4 | |
Six Months Ended June 30,
2015 (Unaudited) | | $ | 14.62 | | | | 1.23 | % | | | 0.27 | %(c) | | | 0.25 | %(c) | | | 2.00 | %(c) | | | 24 | % | | $ | 21,959 | | |
Year Ended December 31, 2014 | | $ | 14.74 | | | | 5.61 | % | | | 0.26 | % | | | 0.25 | % | | | 2.14 | % | | | 95 | % | | $ | 23,412 | | |
Year Ended December 31, 2013 | | $ | 14.46 | | | | 9.26 | % | | | 0.28 | % | | | 0.25 | % | | | 2.39 | % | | | 92 | % | | $ | 14,651 | | |
Year Ended December 31, 2012(e) | | $ | 14.19 | | | | 2.60 | % | | | 0.42 | %(c) | | | 0.25 | %(c)(d) | | | 4.59 | %(c) | | | 109 | % | | $ | 15 | | |
Class R5 | |
Six Months Ended June 30,
2015 (Unaudited) | | $ | 14.63 | | | | 1.23 | % | | | 0.25 | %(c) | | | 0.23 | %(c) | | | 2.02 | %(c) | | | 24 | % | | $ | 4,749 | | |
Year Ended December 31, 2014 | | $ | 14.75 | | | | 5.62 | % | | | 0.24 | % | | | 0.23 | % | | | 2.11 | % | | | 95 | % | | $ | 3,536 | | |
Year Ended December 31, 2013 | | $ | 14.47 | | | | 9.35 | % | | | 0.25 | % | | | 0.23 | % | | | 2.44 | % | | | 92 | % | | $ | 979 | | |
Year Ended December 31, 2012(f) | | $ | 14.19 | | | | 2.58 | % | | | 0.35 | %(c) | | | 0.27 | %(c)(d) | | | 4.60 | %(c) | | | 109 | % | | $ | 3 | | |
Class Y | |
Six Months Ended June 30,
2015 (Unaudited) | | $ | 14.62 | | | | 1.23 | % | | | 0.19 | %(c) | | | 0.18 | %(c) | | | 2.08 | %(c) | | | 24 | % | | $ | 342 | | |
Year Ended December 31, 2014 | | $ | 14.74 | | | | 5.68 | % | | | 0.19 | % | | | 0.18 | % | | | 2.19 | % | | | 95 | % | | $ | 401 | | |
Year Ended December 31, 2013 | | $ | 14.46 | | | | 9.46 | % | | | 0.14 | % | | | 0.14 | % | | | 2.23 | % | | | 92 | % | | $ | 3 | | |
Year Ended December 31, 2012(g) | | $ | 14.18 | | | | 2.55 | % | | | 0.30 | %(c) | | | 0.22 | %(c)(d) | | | 4.63 | %(c) | | | 109 | % | | $ | 3 | | |
Class Z | |
Six Months Ended June 30,
2015 (Unaudited) | | $ | 14.55 | | | | 1.23 | % | | | 0.25 | %(c) | | | 0.24 | %(c) | | | 2.01 | %(c) | | | 24 | % | | $ | 341,926 | | |
Year Ended December 31, 2014 | | $ | 14.67 | | | | 5.57 | % | | | 0.25 | % | | | 0.24 | % | | | 2.16 | % | | | 95 | % | | $ | 377,119 | | |
Year Ended December 31, 2013 | | $ | 14.40 | | | | 9.30 | % | | | 0.26 | % | | | 0.25 | % | | | 2.14 | % | | | 92 | % | | $ | 375,444 | | |
Year Ended December 31, 2012 | | $ | 14.13 | | | | 13.69 | % | | | 0.30 | % | | | 0.25 | %(d) | | | 2.48 | % | | | 109 | % | | $ | 292,732 | | |
Year Ended December 31, 2011 | | $ | 12.67 | | | | 4.85 | % | | | 0.34 | % | | | 0.25 | %(d) | | | 2.43 | % | | | 130 | % | | $ | 65,167 | | |
Year Ended December 31, 2010 | | $ | 12.44 | | | | 17.58 | % | | | 0.37 | % | | | 0.25 | %(d) | | | 1.87 | % | | | 118 | % | | $ | 36,130 | | |
See accompanying notes to financial statements.
105
COLUMBIA ACORN FAMILY OF FUNDS
FINANCIAL HIGHLIGHTS, CONTINUED
Columbia Acorn Emerging Markets FundSM
| | | | Income from Investment Operations | | | | Less Distributions to
Shareholders | | | | | |
(Selected data for a share outstanding
throughout each period) | | Net Asset
Value,
Beginning of
Period | | Net
investment
income (loss) | | Net realized
and
unrealized
gain (loss) | | Total from
Investment
Operations | | Net
investment
income | | Total
Distributions to
Shareholders | | Net Asset
Value, End of
Period | |
Class A | |
Six Months Ended June 30,
2015 (Unaudited) | | $ | 12.72 | | | | 0.07 | | | | (0.45 | ) | | | (0.38 | ) | | | — | | | | — | | | $ | 12.34 | | |
Year Ended December 31, 2014 | | $ | 13.37 | | | | 0.06 | | | | (0.63 | ) | | | (0.57 | ) | | | (0.08 | ) | | | (0.08 | ) | | $ | 12.72 | | |
Year Ended December 31, 2013 | | $ | 12.04 | | | | 0.07 | | | | 1.34 | | | | 1.41 | | | | (0.08 | ) | | | (0.08 | ) | | $ | 13.37 | | |
Year Ended December 31, 2012 | | $ | 9.26 | | | | 0.08 | | | | 2.78 | | | | 2.86 | | | | (0.08 | ) | | | (0.08 | ) | | $ | 12.04 | | |
Year Ended December 31, 2011(e) | | $ | 10.00 | | | | (0.00 | )(f) | | | (0.74 | ) | | | (0.74 | ) | | | — | | | | — | | | $ | 9.26 | | |
Class C | |
Six Months Ended June 30,
2015 (Unaudited) | | $ | 12.65 | | | | 0.02 | | | | (0.44 | ) | | | (0.42 | ) | | | — | | | | — | | | $ | 12.23 | | |
Year Ended December 31, 2014 | | $ | 13.32 | | | | (0.05 | ) | | | (0.62 | ) | | | (0.67 | ) | | | — | | | | — | | | $ | 12.65 | | |
Year Ended December 31, 2013 | | $ | 12.01 | | | | (0.03 | ) | | | 1.34 | | | | 1.31 | | | | — | | | | — | | | $ | 13.32 | | |
Year Ended December 31, 2012 | | $ | 9.24 | | | | (0.02 | ) | | | 2.79 | | | | 2.77 | | | | — | | | | — | | | $ | 12.01 | | |
Year Ended December 31, 2011(h) | | $ | 10.00 | | | | (0.02 | ) | | | (0.74 | ) | | | (0.76 | ) | | | — | | | | — | | | $ | 9.24 | | |
Class I | |
Six Months Ended June 30,
2015 (Unaudited) | | $ | 12.75 | | | | 0.09 | | | | (0.45 | ) | | | (0.36 | ) | | | — | | | | — | | | $ | 12.39 | | |
Year Ended December 31, 2014 | | $ | 13.41 | | | | 0.06 | | | | (0.60 | ) | | | (0.54 | ) | | | (0.12 | ) | | | (0.12 | ) | | $ | 12.75 | | |
Year Ended December 31, 2013 | | $ | 12.08 | | | | 0.08 | | | | 1.37 | | | | 1.45 | | | | (0.12 | ) | | | (0.12 | ) | | $ | 13.41 | | |
Year Ended December 31, 2012 | | $ | 9.29 | | | | 0.11 | | | | 2.80 | | | | 2.91 | | | | (0.12 | ) | | | (0.12 | ) | | $ | 12.08 | | |
Year Ended December 31, 2011(i) | | $ | 10.00 | | | | 0.01 | | | | (0.72 | ) | | | (0.71 | ) | | | — | | | | — | | | $ | 9.29 | | |
Class R4 | |
Six Months Ended June 30,
2015 (Unaudited) | | $ | 12.83 | | | | 0.09 | | | | (0.46 | ) | | | (0.37 | ) | | | — | | | | — | | | $ | 12.46 | | |
Year Ended December 31, 2014 | | $ | 13.49 | | | | 0.09 | | | | (0.63 | ) | | | (0.54 | ) | | | (0.12 | ) | | | (0.12 | ) | | $ | 12.83 | | |
Year Ended December 31, 2013 | | $ | 12.14 | | | | 0.12 | | | | 1.35 | | | | 1.47 | | | | (0.12 | ) | | | (0.12 | ) | | $ | 13.49 | | |
Year Ended December 31, 2012(j) | | $ | 11.44 | | | | (0.01 | ) | | | 0.81 | | | | 0.80 | | | | (0.10 | ) | | | (0.10 | ) | | $ | 12.14 | | |
Class R5 | |
Six Months Ended June 30,
2015 (Unaudited) | | $ | 12.82 | | | | 0.09 | | | | (0.46 | ) | | | (0.37 | ) | | | — | | | | — | | | $ | 12.45 | | |
Year Ended December 31, 2014 | | $ | 13.48 | | | | 0.10 | | | | (0.64 | ) | | | (0.54 | ) | | | (0.12 | ) | | | (0.12 | ) | | $ | 12.82 | | |
Year Ended December 31, 2013 | | $ | 12.14 | | | | 0.12 | | | | 1.34 | | | | 1.46 | | | | (0.12 | ) | | | (0.12 | ) | | $ | 13.48 | | |
Year Ended December 31, 2012(k) | | $ | 11.44 | | | | (0.00 | )(f) | | | 0.81 | | | | 0.81 | | | | (0.11 | ) | | | (0.11 | ) | | $ | 12.14 | | |
Class Y | |
Six Months Ended June 30,
2015 (Unaudited) | | $ | 12.71 | | | | 0.10 | | | | (0.46 | ) | | | (0.36 | ) | | | — | | | | — | | | $ | 12.35 | | |
Year Ended December 31, 2014 | | $ | 13.36 | | | | 0.09 | | | | (0.62 | ) | | | (0.53 | ) | | | (0.12 | ) | | | (0.12 | ) | | $ | 12.71 | | |
Year Ended December 31, 2013(l) | | $ | 12.22 | | | | 0.07 | | | | 1.20 | | | | 1.27 | | | | (0.13 | ) | | | (0.13 | ) | | $ | 13.36 | | |
Class Z | |
Six Months Ended June 30,
2015 (Unaudited) | | $ | 12.74 | | | | 0.09 | | | | (0.45 | ) | | | (0.36 | ) | | | — | | | | — | | | $ | 12.38 | | |
Year Ended December 31, 2014 | | $ | 13.40 | | | | 0.08 | | | | (0.63 | ) | | | (0.55 | ) | | | (0.11 | ) | | | (0.11 | ) | | $ | 12.74 | | |
Year Ended December 31, 2013 | | $ | 12.07 | | | | 0.11 | | | | 1.33 | | | | 1.44 | | | | (0.11 | ) | | | (0.11 | ) | | $ | 13.40 | | |
Year Ended December 31, 2012 | | $ | 9.28 | | | | 0.12 | | | | 2.79 | | | | 2.91 | | | | (0.12 | ) | | | (0.12 | ) | | $ | 12.07 | | |
Year Ended December 31, 2011(m) | | $ | 10.00 | | | | 0.01 | | | | (0.73 | ) | | | (0.72 | ) | | | — | | | | — | | | $ | 9.28 | | |
Notes to Financial Highlights
(a) Annualized.
(b) In addition to the fees and expenses that the Fund bears directly, the Fund indirectly bears a pro rata share of the fees and expenses of any other funds in which it invests, if any. Such indirect expenses are not included in the Fund's reported expense ratios.
(c) Had the Investment Manager and/or Transfer Agent not waived fees and/or reimbursed a portion of expenses, total return would have been reduced.
(d) The benefits derived from custody fees paid indirectly had an impact of 0.01%.
(e) Class A shares commenced operations on August 19, 2011. Per share data and total return reflect activity from that date.
(f) Rounds to zero.
(g) The benefits derived from custody fees paid indirectly had an impact of less than 0.01%.
(h) Class C shares commenced operations on August 19, 2011. Per share data and total return reflect activity from that date.
(i) Class I shares commenced operations on August 19, 2011. Per share data and total return reflect activity from that date.
(j) Class R4 shares commenced operations on November 8, 2012. Per share data and total return reflect activity from that date.
(k) Class R5 shares commenced operations on November 8, 2012. Per share data and total return reflect activity from that date.
(l) Class Y shares commenced operations on June 13, 2013. Per share data and total return reflect activity from that date.
(m) Class Z shares commenced operations on August 19, 2011. Per share data and total return reflect activity from that date.
See accompanying notes to financial statements.
106
| | | | Ratio to Average Net Assets | | Supplemental Data | |
(Selected data for a share outstanding
throughout each period) | | Total Return | | Total gross
expenses | | Total net
expenses | | Net
investment
income (loss) | | Portfolio
turnover rate | | Net assets,
end of period
(000s) | |
Class A | |
Six Months Ended June 30,
2015 (Unaudited) | | | (2.99 | )% | | | 1.62 | %(a)(b) | | | 1.62 | %(a)(b) | | | 1.08 | %(a) | | | 33 | % | | $ | 138,930 | | |
Year Ended December 31, 2014 | | | (4.28 | )% | | | 1.56 | %(b) | | | 1.56 | %(b) | | | 0.42 | % | | | 45 | % | | $ | 160,969 | | |
Year Ended December 31, 2013 | | | 11.73 | %(c) | | | 1.80 | %(b) | | | 1.76 | %(b) | | | 0.52 | % | | | 36 | % | | $ | 177,158 | | |
Year Ended December 31, 2012 | | | 30.86 | %(c) | | | 6.42 | %(b) | | | 1.77 | %(b)(d) | | | 0.77 | % | | | 30 | % | | $ | 3,103 | | |
Year Ended December 31, 2011(e) | | | (7.40 | )%(c) | | | 20.13 | %(a) | | | 1.85 | %(a)(g) | | | (0.01 | )%(a) | | | 9 | % | | $ | 332 | | |
Class C | |
Six Months Ended June 30,
2015 (Unaudited) | | | (3.32 | )% | | | 2.38 | %(a)(b) | | | 2.38 | %(a)(b) | | | 0.33 | %(a) | | | 33 | % | | $ | 34,754 | | |
Year Ended December 31, 2014 | | | (5.03 | )% | | | 2.33 | %(b) | | | 2.33 | %(b) | | | (0.36 | )% | | | 45 | % | | $ | 41,208 | | |
Year Ended December 31, 2013 | | | 10.91 | %(c) | | | 2.55 | %(b) | | | 2.51 | %(b) | | | (0.23 | )% | | | 36 | % | | $ | 32,636 | | |
Year Ended December 31, 2012 | | | 29.98 | %(c) | | | 7.18 | %(b) | | | 2.56 | %(b)(d) | | | (0.15 | )% | | | 30 | % | | $ | 615 | | |
Year Ended December 31, 2011(h) | | | (7.60 | )%(c) | | | 25.06 | %(a) | | | 2.60 | %(a)(g) | | | (0.68 | )%(a) | | | 9 | % | | $ | 127 | | |
Class I | |
Six Months Ended June 30,
2015 (Unaudited) | | | (2.82 | )% | | | 1.29 | %(a)(b) | | | 1.29 | %(a)(b) | | | 1.46 | %(a) | | | 33 | % | | $ | 2 | | |
Year Ended December 31, 2014 | | | (4.01 | )% | | | 1.22 | %(b) | | | 1.22 | %(b) | | | 0.44 | % | | | 45 | % | | $ | 3 | | |
Year Ended December 31, 2013 | | | 12.06 | %(c) | | | 1.73 | %(b) | | | 1.39 | %(b) | | | 0.65 | % | | | 36 | % | | $ | 7 | | |
Year Ended December 31, 2012 | | | 31.39 | %(c) | | | 6.18 | %(b) | | | 1.41 | %(b)(d) | | | 1.05 | % | | | 30 | % | | $ | 6 | | |
Year Ended December 31, 2011(i) | | | (7.10 | )%(c) | | | 19.31 | %(a) | | | 1.41 | %(a)(g) | | | 0.17 | %(a) | | | 9 | % | | $ | 5 | | |
Class R4 | |
Six Months Ended June 30,
2015 (Unaudited) | | | (2.88 | )% | | | 1.33 | %(a)(b) | | | 1.33 | %(a)(b) | | | 1.41 | %(a) | | | 33 | % | | $ | 13,812 | | |
Year Ended December 31, 2014 | | | (4.03 | )% | | | 1.28 | %(b) | | | 1.28 | %(b) | | | 0.66 | % | | | 45 | % | | $ | 15,467 | | |
Year Ended December 31, 2013 | | | 12.13 | %(c) | | | 1.44 | %(b) | | | 1.44 | %(b) | | | 0.92 | % | | | 36 | % | | $ | 13,583 | | |
Year Ended December 31, 2012(j) | | | 7.04 | %(c) | | | 5.86 | %(a)(b) | | | 1.54 | %(a)(b)(d) | | | (0.31 | )%(a) | | | 30 | % | | $ | 16 | | |
Class R5 | |
Six Months Ended June 30,
2015 (Unaudited) | | | (2.89 | )% | | | 1.31 | %(a)(b) | | | 1.31 | %(a)(b) | | | 1.43 | %(a) | | | 33 | % | | $ | 18,725 | | |
Year Ended December 31, 2014 | | | (4.02 | )% | | | 1.26 | %(b) | | | 1.26 | %(b) | | | 0.72 | % | | | 45 | % | | $ | 19,632 | | |
Year Ended December 31, 2013 | | | 12.07 | %(c) | | | 1.42 | %(b) | | | 1.42 | %(b) | | | 0.94 | % | | | 36 | % | | $ | 13,625 | | |
Year Ended December 31, 2012(k) | | | 7.11 | %(c) | | | 5.81 | %(a)(b) | | | 1.46 | %(a)(b)(d) | | | (0.22 | )%(a) | | | 30 | % | | $ | 3 | | |
Class Y | |
Six Months Ended June 30,
2015 (Unaudited) | | | (2.83 | )% | | | 1.23 | %(a)(b) | | | 1.23 | %(a)(b) | | | 1.52 | %(a) | | | 33 | % | | $ | 2 | | |
Year Ended December 31, 2014 | | | (3.95 | )% | | | 1.22 | %(b) | | | 1.22 | %(b) | | | 0.68 | % | | | 45 | % | | $ | 2 | | |
Year Ended December 31, 2013(l) | | | 10.43 | %(c) | | | 1.36 | %(a)(b) | | | 1.36 | %(a)(b) | | | 0.97 | %(a) | | | 36 | % | | $ | 3 | | |
Class Z | |
Six Months Ended June 30,
2015 (Unaudited) | | | (2.83 | )% | | | 1.37 | %(a)(b) | | | 1.37 | %(a)(b) | | | 1.35 | %(a) | | | 33 | % | | $ | 210,646 | | |
Year Ended December 31, 2014 | | | (4.12 | )% | | | 1.33 | %(b) | | | 1.33 | %(b) | | | 0.62 | % | | | 45 | % | | $ | 245,053 | | |
Year Ended December 31, 2013 | | | 11.92 | %(c) | | | 1.58 | %(b) | | | 1.54 | %(b) | | | 0.89 | % | | | 36 | % | | $ | 177,693 | | |
Year Ended December 31, 2012 | | | 31.35 | %(c) | | | 6.15 | %(b) | | | 1.46 | %(b)(d) | | | 1.07 | % | | | 30 | % | | $ | 6,846 | | |
Year Ended December 31, 2011(m) | | | (7.20 | )%(c) | | | 19.52 | %(a) | | | 1.46 | %(a)(g) | | | 0.15 | %(a) | | | 9 | % | | $ | 2,765 | | |
See accompanying notes to financial statements.
107
COLUMBIA ACORN FAMILY OF FUNDS
FINANCIAL HIGHLIGHTS, CONTINUED
Columbia Acorn European FundSM
| | | | | Income from Investment Operations | | | | Less Distributions to Shareholders | | | |
(Selected data for a share outstanding
throughout each period) | | Net Asset
Value,
Beginning of
Period | | Net
investment
income (loss) | | Net realized
and
unrealized
gain (loss) | | Total from
Investment
Operations | | Net
investment
income | | Net
realized gains | | Total
Distributions to
Shareholders | |
Class A | |
Six Months Ended June 30,
2015 (Unaudited) | | $ | 14.34 | | | | 0.15 | | | | 0.81 | | | | 0.96 | | | | (0.07 | ) | | | — | | | | (0.07 | ) | |
Year Ended December 31, 2014 | | $ | 15.68 | | | | 0.13 | | | | (1.34 | ) | | | (1.21 | ) | | | (0.05 | ) | | | (0.08 | ) | | | (0.13 | ) | |
Year Ended December 31, 2013 | | $ | 11.76 | | | | (0.02 | ) | | | 3.97 | | | | 3.95 | | | | (0.01 | ) | | | (0.02 | ) | | | (0.03 | ) | |
Year Ended December 31, 2012 | | $ | 9.43 | | | | 0.03 | | | | 2.37 | | | | 2.40 | | | | (0.07 | ) | | | (0.00 | )(d) | | | (0.07 | ) | |
Year Ended December 31, 2011(f) | | $ | 10.00 | | | | (0.03 | ) | | | (0.46 | ) | | | (0.49 | ) | | | (0.06 | ) | | | (0.02 | ) | | | (0.08 | ) | |
Class C | |
Six Months Ended June 30,
2015 (Unaudited) | | $ | 14.16 | | | | 0.09 | | | | 0.80 | | | | 0.89 | | | | — | | | | — | | | | — | | |
Year Ended December 31, 2014 | | $ | 15.54 | | | | (0.01 | ) | | | (1.29 | ) | | | (1.30 | ) | | | — | | | | (0.08 | ) | | | (0.08 | ) | |
Year Ended December 31, 2013 | | $ | 11.73 | | | | (0.15 | ) | | | 3.98 | | | | 3.83 | | | | — | | | | (0.02 | ) | | | (0.02 | ) | |
Year Ended December 31, 2012 | | $ | 9.44 | | | | (0.15 | ) | | | 2.46 | | | | 2.31 | | | | (0.02 | ) | | | (0.00 | )(d) | | | (0.02 | ) | |
Year Ended December 31, 2011(h) | | $ | 10.00 | | | | (0.06 | ) | | | (0.45 | ) | | | (0.51 | ) | | | (0.03 | ) | | | (0.02 | ) | | | (0.05 | ) | |
Class I | |
Six Months Ended June 30,
2015 (Unaudited) | | $ | 14.33 | | | | 0.16 | | | | 0.82 | | | | 0.98 | | | | (0.07 | ) | | | — | | | | (0.07 | ) | |
Year Ended December 31, 2014 | | $ | 15.67 | | | | 0.11 | | | | (1.27 | ) | | | (1.16 | ) | | | (0.10 | ) | | | (0.08 | ) | | | (0.18 | ) | |
Year Ended December 31, 2013 | | $ | 11.75 | | | | 0.12 | | | | 3.88 | | | | 4.00 | | | | (0.06 | ) | | | (0.02 | ) | | | (0.08 | ) | |
Year Ended December 31, 2012 | | $ | 9.43 | | | | 0.10 | | | | 2.32 | | | | 2.42 | | | | (0.10 | ) | | | (0.00 | )(d) | | | (0.10 | ) | |
Year Ended December 31, 2011(i) | | $ | 10.00 | | | | (0.02 | ) | | | (0.46 | ) | | | (0.48 | ) | | | (0.07 | ) | | | (0.02 | ) | | | (0.09 | ) | |
Class R4 | |
Six Months Ended June 30,
2015 (Unaudited) | | $ | 14.40 | | | | 0.20 | | | | 0.78 | | | | 0.98 | | | | (0.07 | ) | | | — | | | | (0.07 | ) | |
Year Ended December 31, 2014(j) | | $ | 15.85 | | | | (0.02 | ) | | | (1.34 | ) | | | (1.36 | ) | | | (0.09 | ) | | | — | | | | (0.09 | ) | |
Class R5 | |
Six Months Ended June 30,
2015 (Unaudited) | | $ | 14.47 | | | | 0.16 | | | | 0.83 | | | | 0.99 | | | | (0.07 | ) | | | — | | | | (0.07 | ) | |
Year Ended December 31, 2014 | | $ | 15.82 | | | | 0.14 | | | | (1.32 | ) | | | (1.18 | ) | | | (0.09 | ) | | | (0.08 | ) | | | (0.17 | ) | |
Year Ended December 31, 2013 | | $ | 11.86 | | | | (0.04 | ) | | | 4.06 | | | | 4.02 | | | | (0.04 | ) | | | (0.02 | ) | | | (0.06 | ) | |
Year Ended December 31, 2012(k) | | $ | 11.19 | | | | (0.02 | ) | | | 0.77 | | | | 0.75 | | | | (0.08 | ) | | | — | | | | (0.08 | ) | |
Class Z | |
Six Months Ended June 30,
2015 (Unaudited) | | $ | 14.34 | | | | 0.18 | | | | 0.80 | | | | 0.98 | | | | (0.07 | ) | | | — | | | | (0.07 | ) | |
Year Ended December 31, 2014 | | $ | 15.68 | | | | 0.15 | | | | (1.32 | ) | | | (1.17 | ) | | | (0.09 | ) | | | (0.08 | ) | | | (0.17 | ) | |
Year Ended December 31, 2013 | | $ | 11.76 | | | | 0.11 | | | | 3.88 | | | | 3.99 | | | | (0.05 | ) | | | (0.02 | ) | | | (0.07 | ) | |
Year Ended December 31, 2012 | | $ | 9.44 | | | | 0.08 | | | | 2.34 | | | | 2.42 | | | | (0.10 | ) | | | (0.00 | )(d) | | | (0.10 | ) | |
Year Ended December 31, 2011(l) | | $ | 10.00 | | | | (0.02 | ) | | | (0.46 | ) | | | (0.48 | ) | | | (0.06 | ) | | | (0.02 | ) | | | (0.08 | ) | |
Notes to Financial Highlights
(a) Had the Investment Manager and/or Transfer Agent not waived fees and/or reimbursed a portion of expenses, total return would have been reduced.
(b) In addition to the fees and expenses that the Fund bears directly, the Fund indirectly bears a pro rata share of the fees and expenses of any other funds in which it invests, if any. Such indirect expenses are not included in the Fund's reported expense ratios.
(c) Annualized.
(d) Rounds to zero.
(e) The benefits derived from custody fees paid indirectly had an impact of 0.01%.
(f) Class A shares commenced operations on August 19, 2011. Per share data and total return reflect activity from that date.
(g) The benefits derived from custody fees paid indirectly had an impact of 0.02%.
(h) Class C shares commenced operations on August 19, 2011. Per share data and total return reflect activity from that date.
(i) Class I shares commenced operations on August 19, 2011. Per share data and total return reflect activity from that date.
(j) Class R4 shares commenced operations on June 25, 2014. Per share data and total return reflect activity from that date.
(k) Class R5 shares commenced operations on November 8, 2012. Per share data and total return reflect activity from that date.
(l) Class Z shares commenced operations on August 19, 2011. Per share data and total return reflect activity from that date.
See accompanying notes to financial statements.
108
| | | | | | | Ratio to Average Net Assets | | Supplemental Data | |
(Selected data for a share outstanding
throughout each period) | | Net Asset
Value, End of
Period | | Total Return
(a) | | Total gross
expenses | | Total net
expenses | | Net
investment
income (loss) | | Portfolio
turnover rate | | Net assets,
end of period
(000s) | |
Class A | |
Six Months Ended June 30,
2015 (Unaudited) | | $ | 15.23 | | | | 6.66 | % | | | 2.03 | %(b)(c) | | | 1.75 | %(b)(c) | | | 2.06 | %(c) | | | 15 | % | | $ | 34,321 | | |
Year Ended December 31, 2014 | | $ | 14.34 | | | | (7.77 | )% | | | 2.05 | %(b) | | | 1.75 | %(b) | | | 0.86 | % | | | 74 | % | | $ | 21,101 | | |
Year Ended December 31, 2013 | | $ | 15.68 | | | | 33.64 | % | | | 3.33 | %(b) | | | 1.74 | %(b) | | | (0.11 | )% | | | 42 | % | | $ | 19,078 | | |
Year Ended December 31, 2012 | | $ | 11.76 | | | | 25.46 | % | | | 12.35 | %(b) | | | 1.61 | %(b)(e) | | | 0.23 | % | | | 37 | % | | $ | 453 | | |
Year Ended December 31, 2011(f) | | $ | 9.43 | | | | (4.97 | )% | | | 33.59 | %(c) | | | 1.75 | %(c)(g) | | | (0.84 | )%(c) | | | 17 | % | | $ | 154 | | |
Class C | |
Six Months Ended June 30,
2015 (Unaudited) | | $ | 15.05 | | | | 6.29 | % | | | 2.80 | %(b)(c) | | | 2.50 | %(b)(c) | | | 1.18 | %(c) | | | 15 | % | | $ | 6,711 | | |
Year Ended December 31, 2014 | | $ | 14.16 | | | | (8.44 | )% | | | 2.84 | %(b) | | | 2.50 | %(b) | | | (0.10 | )% | | | 74 | % | | $ | 5,096 | | |
Year Ended December 31, 2013 | | $ | 15.54 | | | | 32.63 | % | | | 4.19 | %(b) | | | 2.50 | %(b) | | | (1.10 | )% | | | 42 | % | | $ | 1,400 | | |
Year Ended December 31, 2012 | | $ | 11.73 | | | | 24.46 | % | | | 12.83 | %(b) | | | 2.32 | %(b)(e) | | | (1.33 | )% | | | 37 | % | | $ | 89 | | |
Year Ended December 31, 2011(h) | | $ | 9.44 | | | | (5.14 | )% | | | 35.79 | %(c) | | | 2.50 | %(c)(g) | | | (1.66 | )%(c) | | | 17 | % | | $ | 5 | | |
Class I | |
Six Months Ended June 30,
2015 (Unaudited) | | $ | 15.24 | | | | 6.80 | % | | | 1.71 | %(b)(c) | | | 1.45 | %(b)(c) | | | 2.13 | %(c) | | | 15 | % | | $ | 3 | | |
Year Ended December 31, 2014 | | $ | 14.33 | | | | (7.49 | )% | | | 1.71 | %(b) | | | 1.46 | %(b) | | | 0.74 | % | | | 74 | % | | $ | 2 | | |
Year Ended December 31, 2013 | | $ | 15.67 | | | | 34.06 | % | | | 3.99 | %(b) | | | 1.41 | %(b) | | | 0.88 | % | | | 42 | % | | $ | 8 | | |
Year Ended December 31, 2012 | | $ | 11.75 | | | | 25.71 | % | | | 12.05 | %(b) | | | 1.31 | %(b)(e) | | | 0.94 | % | | | 37 | % | | $ | 6 | | |
Year Ended December 31, 2011(i) | | $ | 9.43 | | | | (4.81 | )% | | | 30.00 | %(c) | | | 1.31 | %(c)(g) | | | (0.47 | )%(c) | | | 17 | % | | $ | 5 | | |
Class R4 | |
Six Months Ended June 30,
2015 (Unaudited) | | $ | 15.31 | | | | 6.77 | % | | | 1.77 | %(b)(c) | | | 1.50 | %(b)(c) | | | 2.61 | %(c) | | | 15 | % | | $ | 597 | | |
Year Ended December 31, 2014(j) | | $ | 14.40 | | | | (8.60 | )% | | | 1.87 | %(b)(c) | | | 1.50 | %(b)(c) | | | (0.30 | )%(c) | | | 74 | % | | $ | 302 | | |
Class R5 | |
Six Months Ended June 30,
2015 (Unaudited) | | $ | 15.39 | | | | 6.81 | % | | | 1.73 | %(b)(c) | | | 1.50 | %(b)(c) | | | 2.10 | %(c) | | | 15 | % | | $ | 1,858 | | |
Year Ended December 31, 2014 | | $ | 14.47 | | | | (7.54 | )% | | | 1.75 | %(b) | | | 1.52 | %(b) | | | 0.92 | % | | | 74 | % | | $ | 1,633 | | |
Year Ended December 31, 2013 | | $ | 15.82 | | | | 33.97 | % | | | 2.76 | %(b) | | | 1.51 | %(b) | | | (0.29 | )% | | | 42 | % | | $ | 1,891 | | |
Year Ended December 31, 2012(k) | | $ | 11.86 | | | | 6.70 | % | | | 14.07 | %(b)(c) | | | 1.36 | %(b)(c)(e) | | | (1.07 | )%(c) | | | 37 | % | | $ | 3 | | |
Class Z | |
Six Months Ended June 30,
2015 (Unaudited) | | $ | 15.25 | | | | 6.80 | % | | | 1.75 | %(b)(c) | | | 1.50 | %(b)(c) | | | 2.37 | %(c) | | | 15 | % | | $ | 12,994 | | |
Year Ended December 31, 2014 | | $ | 14.34 | | | | (7.52 | )% | | | 1.79 | %(b) | | | 1.50 | %(b) | | | 0.97 | % | | | 74 | % | | $ | 8,499 | | |
Year Ended December 31, 2013 | | $ | 15.68 | | | | 33.98 | % | | | 3.98 | %(b) | | | 1.45 | %(b) | | | 0.83 | % | | | 42 | % | | $ | 4,407 | | |
Year Ended December 31, 2012 | | $ | 11.76 | | | | 25.66 | % | | | 12.07 | %(b) | | | 1.33 | %(b)(e) | | | 0.76 | % | | | 37 | % | | $ | 2,727 | | |
Year Ended December 31, 2011(l) | | $ | 9.44 | | | | (4.78 | )% | | | 30.26 | %(c) | | | 1.37 | %(c)(g) | | | (0.52 | )%(c) | | | 17 | % | | $ | 1,516 | | |
See accompanying notes to financial statements.
109
COLUMBIA ACORN FAMILY OF FUNDS
NOTES TO FINANCIAL STATEMENTS (UNAUDITED)
1. Nature of Operations
Columbia Acorn Fund, Columbia Acorn International, Columbia Acorn USA, Columbia Acorn International Select, Columbia Acorn Select, Columbia Thermostat Fund, Columbia Acorn Emerging Markets Fund and Columbia Acorn European Fund (each a Fund and collectively, the Funds) are each a series of Columbia Acorn Trust (the Trust). The Trust is registered under the Investment Company Act of 1940, as amended (the 1940 Act), as an open-end management investment company organized as a Massachusetts business trust. The investment objective of each Fund is to seek long-term capital appreciation.
Columbia Thermostat Fund pursues its investment objective by investing in shares of other mutual funds. As a "fund of funds", under normal circumstances, the Fund allocates at least 95% of its net assets among a selected group of affiliated stock and bond mutual funds (underlying funds) according to the current level of the Standard & Poor's (S&P) 500 Index in relation to predetermined ranges set by Columbia Wanger Asset Management, LLC (the Investment Manager or CWAM). The Fund may invest up to 5% of its net assets plus any cash received that day in cash, repurchase agreements, high quality short-term paper and government securities.
Each Fund may issue an unlimited number of shares. Columbia Acorn Fund, Columbia Acorn USA, Columbia Acorn International Select and Columbia Acorn Select each currently offers Class A, Class B, Class C, Class I, Class R4, Class R5, Class Y and Class Z shares. Columbia Acorn International currently offers Class A, Class B, Class C, Class I, Class R, Class R4, Class R5, Class Y and Class Z shares. Columbia Thermostat Fund currently offers Class A, Class B, Class C, Class R4, Class R5, Class Y and Class Z shares. Columbia Acorn Emerging Markets Fund currently offers Class A, Class C, Class I, Class R4, Class R5, Class Y and Class Z shares. Columbia Acorn European Fund currently offers Class A, Class C, Class I, Class R4, Class R5 and Class Z shares. Effective February 29, 2008, the Funds generally no longer accept investments by new or existing investors in the Funds' Class B shares, except in connection with the reinvestment of any dividend and/or capital gain distributions in Class B shares of the Funds and exchanges by existing Class B shareholders of certain other funds within the Columbia Acorn Family of Funds.
Class A shares are sold with a front-end sales charge. Columbia Acorn Emerging Markets Fund is closed to most new investors and new accounts with certain exceptions. Class A shares bought without an initial sales charge in accounts aggregating $1 million to $50 million at the time of purchase
are subject to a 1.00% contingent deferred sales charge (CDSC) if the shares are redeemed within 12 months of purchase, and a 0.50% CDSC if the shares are redeemed more than 12, but less than 18, months after purchase, with certain limited exceptions.
Class B shares are subject to CDSC if redeemed within six years of purchase. Class B shares will convert to Class A shares automatically eight years after purchase.
Class C shares are offered at net asset value but are subject to a CDSC on redemptions made within one year after purchase.
Class I, Class R, Class R4, Class R5 and Class Y shares are offered at net asset value. There are certain restrictions on who may purchase these share classes.
Class Z shares are offered at net asset value. There are certain restrictions on who may purchase Class Z shares. Generally, Class Z shares of a Fund may be exchanged for shares of another fund distributed by Columbia Management Investment Distributors, Inc. (CMID) at no additional charge.
Investment income, realized and unrealized gains and losses, and certain fund-level expenses are allocated pro rata on the basis of the relative net assets of all classes, except that each class bears certain expenses specific to that class such as distribution services, transfer agent fees, and certain other class specific expenses. Differences in class expenses may result in payment of different dividend distributions for each class. All of the Funds' share classes have equal rights with respect to voting, subject to Fund or class-specific matters.
2. Summary of Significant Accounting Policies
>Basis of preparation
Each Fund is an investment company that applies the accounting and reporting guidance in the Financial Accounting Standards Board (FASB) Accounting Standards Codification Topic 946, Financial Services – Investment Companies (ASC 946). The financial statements are prepared in accordance with U.S. generally accepted accounting principles (GAAP) which requires management to make certain estimates and assumptions that affect the reported amounts of assets and liabilities, the disclosure of contingent assets and liabilities at the date of the financial statements and the reported amounts of income and expenses during the reporting period. Actual results could differ from those estimates.
The following is a summary of significant accounting policies followed by the Funds in the preparation of their financial statements.
110
>Security valuation
Securities of the Funds are valued at market value or, if a market quotation for a security is not readily available or is deemed not to be reliable because of events or circumstances that have occurred between the market quotation and the time as of which the security is to be valued, the security is valued at a fair value determined in good faith under consistently applied procedures established by the Board of Trustees (the Board). With respect to Columbia Thermostat Fund, investments in underlying funds are valued at their net asset values as reported by the underlying funds. A security traded on a securities exchange or in an over-the-counter market in which transaction prices are reported is valued at the last sales price at the time of valuation. A security traded principally on NASDAQ is valued at the NASDAQ official closing price. Exchange traded funds are valued at their closing net asset value as reported on the applicable exchange.
Short-term investments maturing in 60 days or less are valued at amortized cost, which approximates market value.
Forward foreign currency exchange contracts are marked-to-market based upon foreign currency exchange rates provided by a pricing service.
The Trust has retained an independent statistical fair value pricing service that employs a systematic methodology to assist in the fair valuation process for securities principally traded in a foreign market in order to adjust for possible changes in value that may occur between the close of the foreign exchange and the time as of which the securities are to be valued. If a security is valued at fair value, that value may be different from the last quoted market price for the security. A security for which there is no reported sale on the valuation date is valued at the mean of the latest bid and ask quotations.
>Foreign currency translations
Values of investments denominated in foreign currencies are converted into U.S. dollars using the New York spot market rate of exchange at the time of valuation. Purchases and sales of investments and dividend and interest income are translated into U.S. dollars using the spot market rate of exchange prevailing on the respective dates of such transactions. The gain or loss resulting from changes in foreign exchange rates is included with net realized and unrealized gain or loss from investments, as appropriate.
>Restricted securities
Restricted securities are securities that may only be resold upon registration under federal securities laws or in
transactions exempt from registration. In some cases, the issuer of restricted securities has agreed to register such securities for resale at the issuer's expense either upon demand by the Fund or in connection with another registered offering of the securities. Many restricted securities may be resold in the secondary market in transactions exempt from registration. Such restricted securities may be determined to be liquid under criteria established by the Board.
>Derivative instruments
Columbia Acorn Fund invested in futures contracts and Columbia Acorn International Select invested in forward foreign currency exchange contracts on a limited basis during the six months ended June 30, 2015, as detailed below. Derivatives may involve various risks, including the potential inability of the counterparty to fulfill its obligation under the terms of the contract, the potential for an illiquid secondary market (making it difficult for the Fund to sell, including at favorable prices) and the potential for market movements which may expose the Fund to gains or losses in excess of the amount shown in the Statements of Assets and Liabilities.
For financial reporting purposes, the Funds do not offset derivative assets and derivative liabilities that are subject to netting arrangements in the Statements of Assets and Liabilities.
>Forward foreign currency exchange contracts
Forward foreign currency exchange contracts are agreements between two parties to buy and sell a currency at a set price on a future date. Columbia Acorn International Select utilized forward foreign currency exchange contracts to hedge the currency exposure associated with some or all of the Fund's securities. These instruments may be used for other purposes in future periods. The Fund's use of forward foreign currency exchange contracts was not material to the net assets of the Fund.
The values of forward foreign currency exchange contracts fluctuate with changes in foreign currency exchange rates. Changes in the value of these contracts are recorded as unrealized appreciation or depreciation until the contract is exercised or has expired. The Fund will realize a gain or loss when the forward foreign currency exchange contract is closed or expires.
The use of forward foreign currency exchange contracts does not eliminate fluctuations in the prices of the Fund's portfolio securities. The risks of forward foreign currency exchange contracts include movement in the values of the foreign currencies relative to the U.S. dollar (or other foreign currencies) and
111
COLUMBIA ACORN FAMILY OF FUNDS
NOTES TO FINANCIAL STATEMENTS (UNAUDITED), CONTINUED
the possibility that counterparties will not complete their contractual obligations, which may be in excess of the amount reflected, if any, in the Statements of Assets and Liabilities.
>Futures contracts
Futures contracts are exchange traded and represent commitments for the future purchase or sale of an asset at a specified price on a specified date. Columbia Acorn Fund bought and sold futures contracts to maintain appropriate equity market exposure while keeping sufficient cash to accommodate daily redemptions. These instruments may be used for other purposes in future periods. Upon entering into futures contracts, the Fund bears risks that it may not achieve the anticipated benefits of the futures contracts and may realize a loss. Additional risks include counterparty credit risk, the possibility of an illiquid market, and that a change in the value of the contract or option may not correlate with changes in the value of the underlying asset. The Fund's use of futures contracts was not material to the net assets of the Fund.
Upon entering into a futures contract, the Fund pledges cash or securities with the broker in an amount sufficient to meet the initial margin requirement. The initial margin deposit must be maintained at an established level over the life of the contract. Cash deposited as initial margin is recorded in the Statements of Assets and Liabilities as margin deposits. Securities deposited as initial margin are designated in the Statement of Investments. Subsequent payments (variation margin) are made or received by the Fund each day. The variation margin payments are equal to the daily change in the contract value and are recorded as variation margin receivable or payable and are offset in unrealized gains or losses. The Fund recognizes a realized gain or loss when the contract is closed or expires. Futures contracts involve, to varying degrees, risk of loss in excess of the variation margin disclosed in the Statements of Assets and Liabilities.
>Effects of derivative transactions in the financial statements
The following tables are intended to provide additional information about the effect of derivatives on the financial statements of Columbia Acorn Fund and Columbia Acorn International Select including: the fair value of derivatives by risk category and the location of those fair values in the Statements of Assets and Liabilities; and the impact of derivative transactions over the period in the Statements of Operations, including realized gains or losses and unrealized gains or losses. The derivative schedules following the Statement of Investments
present additional information regarding derivative instruments outstanding at the end of the period, if any.
Columbia Acorn Fund
At June 30, 2015, the Fund had no outstanding derivatives.
The following table indicates the effect of derivative instruments (not considered to be hedging instruments for accounting disclosure purposes) in the Statements of Operations for the six months ended June 30, 2015:
Amount of Realized Gain (Loss) on
Derivatives Recognized in Income
Risk Exposure Category | | Futures Contracts | |
Equity risk | | $ | 2,900,917 | | |
The following table provides a summary of the average outstanding volume by derivative instrument for the six months ended June 30, 2015:
Derivative Instrument | | Average notional amounts* | |
Futures contracts – Short | | $ | — | | |
* Based on the ending quarterly outstanding amounts for the six months ended June 30, 2015. While there was no notional amount of futures contracts outstanding at any quarter end, the Fund did enter into futures contracts during the six months; the gain (loss) associated with this activity is presented in the Statements of Operations.
Columbia Acorn International Select
The following table provides a summary of the fair value of derivative instruments (not considered to be hedging instruments for accounting disclosure purposes) at June 30, 2015:
| | Liability Derivatives | |
Risk Exposure
Category | | Statements of Assets
and Liabilities Location | | Fair
Value ($) | |
Foreign exchange risk
| | Unrealized depreciation on
forward foreign currency
exchange contracts | | $ | 237,682 | | |
The following table indicates the effect of derivative instruments (not considered to be hedging instruments for accounting disclosure purposes) in the Statements of Operations for the six months ended June 30, 2015:
Amount of Realized Gain (Loss) on
Derivatives Recognized in Income
| Risk Exposure Category | | Forward
Foreign Currency
Exchange Contracts ($) | |
Foreign exchange risk | | | 291,763 | | |
Change in Unrealized Appreciation (Depreciation)
on Derivatives Recognized in Income
| Risk Exposure Category | | Forward
Foreign Currency
Exchange Contracts ($) | |
Foreign exchange risk | | | (140,501 | ) | |
112
The following table provides a summary of the average outstanding volume by derivative instrument for the six months ended June 30, 2015:
| Derivative Instrument | | Average unrealized
appreciation($)* | | Average
unrealized
depreciation($)* | |
Forward foreign currency
exchange contracts | | | — | | | | (165,158 | ) | |
* Based on the ending quarterly outstanding amounts for the six months ended June 30, 2015.
>Security transactions and investment income
Security transactions, investment income and shareholder fund transactions are accounted for on the trade date (date the order to buy or sell is executed) and dividend income and realized gain distributions from other funds are recorded on the ex-dividend date, except that certain dividends from foreign securities are recorded as soon as the information is available to the Funds. Interest income is recorded on the accrual basis and includes amortization of discounts on debt obligations when required for federal income tax purposes. Realized gains and losses from security transactions are recorded on an identified cost basis.
Awards, if any, from class action litigation related to securities owned may be recorded as a reduction of cost of those securities. If the applicable securities are no longer owned, the proceeds are recorded as realized gains.
The Funds may receive distributions from holdings in equity securities, exchange-traded funds (ETFs), other regulated investment companies (RICs), and real estate investment trusts (REITs), which report information on the tax character of their distributions annually. These distributions are allocated to dividend income, capital gain and return of capital based on actual information reported. Return of capital is recorded as a reduction of the cost basis of securities held. If the Funds no longer own the applicable securities, return of capital is recorded as a realized gain. With respect to REITs, to the extent actual information has not yet been reported, estimates for return of capital may be made by the Funds' management. Management's estimates are subsequently adjusted when the actual character of the distributions is disclosed by the REITs, which could result in a proportionate change in return of capital to shareholders.
>Fund share valuation
Fund shares are sold and redeemed on a daily basis at net asset value, subject to any applicable sales charge. Net asset value per share is determined daily as of the close of trading on the New York Stock Exchange (NYSE) on each day the NYSE is open for trading. Generally, income, expenses and realized and unrealized gain/(losses) of a Fund are allocated to each class proportionately on a daily basis for purposes of determining the net asset value of each class. The distribution and service fees and transfer agent fees are charged to each specific class as expenses are incurred. Redemption fees are accounted for as an addition to paid in capital for purposes of determining the net asset value of each class.
>Securities lending
Each Fund, except Columbia Thermostat Fund, may lend securities up to one-third of the value of its total assets to certain approved brokers, dealers and other financial institutions to earn additional income. The Funds retain the benefits of owning the securities, including the economic equivalent of dividends or interest generated by the security. The Funds also receive a fee for the loan. The Funds have the ability to recall the loans at any time and could do so in order to vote proxies or to sell the loaned securities. Each loan is collateralized by cash that exceeds the value of the securities on loan. The market value of the loaned securities is determined daily at the close of business of a Fund and any additional required collateral is delivered to the Fund on the next business day. The Funds have elected to invest the cash collateral in the Dreyfus Government Cash Management Fund. The income earned from the securities lending program is paid to each Fund, net of any fees remitted to Goldman Sachs Agency Lending, the Funds' lending agent, and net of any borrower rebates. The Investment Manager does not retain any fees earned by the lending program. Generally, in the event of borrower default, a Fund has the right to use the collateral to offset any losses incurred. In the event a Fund is delayed or prevented from exercising its right to dispose of the collateral, there may be a potential loss to the Fund. Some of these losses may be indemnified by the lending agent. The Funds bear the risk of loss with respect to the investment of collateral. The net securities lending income earned as of June 30, 2015 by each Fund is included in the Statements of Operations.
113
COLUMBIA ACORN FAMILY OF FUNDS
NOTES TO FINANCIAL STATEMENTS (UNAUDITED), CONTINUED
>Offsetting of Assets and Liabilities
The following table presents each Fund's gross and net amount of assets and liabilities available for offset under netting agreements and under a securities lending agreement as well as the related collateral received by each Fund as of June 30, 2015:
| | | Columbia
Acorn
Fund | | Columbia
Acorn
International | | Columbia
Acorn
USA | | Columbia Acorn
International Select | | Columbia
Acorn
Select | | Columbia
Acorn
Emerging
Markets
Fund | | Columbia
Acorn
European
Fund | |
| | | Goldman
Sachs & Co. | | Goldman
Sachs & Co. | | Goldman
Sachs & Co. | | Goldman
Sachs & Co. | | Morgan
Stanley | | Goldman
Sachs & Co. | | Goldman
Sachs & Co. | | Goldman
Sachs & Co. | |
Liabilities: | |
Forward foreign
currency exchange
contracts | | $ | — | | | $ | — | | | $ | — | | | $ | — | | | $ | 237,682 | | | $ | — | | | $ | — | | | $ | — | | |
Securities loaned | | | 205,638,386 | | | | 186,393,214 | | | | 53,302,525 | | | | 8,381,123 | | | | — | | | | 14,060,046 | | | | 2,703,540 | | | | 1,790,781 | | |
Total Liabilities | | | 205,638,386 | | | | 186,393,214 | | | | 53,302,525 | | | | 8,381,123 | | | | 237,682 | | | | 14,060,046 | | | | 2,703,540 | | | | 1,790,781 | | |
Total Financial
and Derivative
Net Assets | | | (205,638,386 | ) | | | (186,393,214 | ) | | | (53,302,525 | ) | | | (8,381,123 | ) | | | (237,682 | ) | | | (14,060,046 | ) | | | (2,703,540 | ) | | | (1,790,781 | ) | |
Financial Instruments | | | 205,238,253 | | | | 178,244,535 | | | | 53,095,035 | | | | 7,925,539 | | | | — | | | | 13,779,499 | | | | 2,610,061 | | | | 1,540,884 | | |
Net Amount(a) | | $ | (400,133 | ) | | $ | (8,148,679 | ) | | $ | (207,490 | ) | | $ | (455,584 | ) | | $ | (237,682 | ) | | $ | (280,547 | ) | | $ | (93,479 | ) | | $ | (249,897 | ) | |
(a) Represents the net amount due from/ (to) counterparties in the event of default.
>Federal income taxes
It is each Fund's policy to comply with the provisions of the Internal Revenue Code available to regulated investment companies and, in the manner provided therein, distribute substantially all their taxable income, as well as any net realized gain on sales of investments and foreign currency transactions reportable for federal income tax purposes. Columbia Thermostat Fund distributes all of its taxable income, as well as any net realized gain on sales of portfolio fund shares and any distributions of net realized gains received by the Fund from its portfolio funds, reportable for federal income tax purposes. Accordingly, the Funds paid no federal income taxes and no federal income tax provision was required.
>Foreign capital gains taxes
Realized gains in certain countries may be subject to foreign taxes at the fund level. The Funds accrue for such foreign taxes on realized and unrealized gains at the appropriate rate for each jurisdiction. The amount, if any, is disclosed as a liability on the Statements of Assets and Liabilities.
>Distributions to shareholders
Distributions to shareholders are recorded on the ex-dividend date.
>Indemnification
In the normal course of business, the Trust on behalf of the Funds enters into contracts that contain a variety of representations and warranties and that provide general indemnities. A Fund's maximum exposure under these arrangements is unknown, as this would involve future claims against the Fund.
Also, under the Trust's organizational documents, the trustees and officers of the Trust are indemnified against certain liabilities that may arise out of their duties to the Trust. However, based on experience, the Funds expect the risk of loss due to these warranties and indemnities to be remote.
>Recent Accounting Pronouncement
Transfers and Servicing (Topic 860), Repurchase-to-Maturity Transactions, Repurchase Financings, and Disclosures
In June 2014, the Financial Accounting Standards Board (FASB) issued Accounting Standards Update (ASU) No. 2014-11, Transfers and Servicing (Topic 860), Repurchase-to-Maturity Transactions, Repurchase Financings, and Disclosures. ASU No. 2014-11 changes the accounting for transactions accounted for as secured borrowings and expands disclosure requirements related to securities lending and similar transactions. The disclosure requirements are effective for annual periods beginning after December 15, 2014, and for interim periods beginning after March 15, 2015. At this time, management is evaluating the implications of this guidance and the impact it will have on the financial statement amounts and footnote disclosures, if any.
3. Federal Tax Information
The timing and character of income and capital gain distributions are determined in accordance with income tax regulations, which may differ from GAAP. Reclassifications are made to the Funds' capital accounts for permanent tax differences to reflect income and gains available for distribution (or available capital loss carryforwards) under income tax regulations.
114
The following capital loss carryforward, determined as of December 31, 2014, may be available to reduce taxable income arising from future net realized gains on investments, if any, to the extent permitted by the Internal Revenue Code:
| | | Year of Expiration | | | |
| | | 2015 | | 2016 | | No Expiration
Short-Term | | Total | |
Columbia Acorn International | | $ | 2,521,892 | | | $ | 30,456,700 | | | $ | — | | | $ | 32,978,592 | | |
Columbia Acorn Emerging Markets Fund | | | — | | | | — | | | | 14,671,234 | | | | 14,671,234 | | |
Columbia Acorn European Fund | | | — | | | | — | | | | 2,338,404 | | | | 2,338,404 | | |
Under current tax rules, Regulated Investment Companies can elect to treat certain late-year ordinary losses incurred and post-October capital losses (capital losses realized after October 31) as arising on the first day of the following taxable year. The Funds have elected to treat the following late-year ordinary losses and post-October capital losses at December 31, 2014, as arising on January 1, 2015:
Fund | | Late-Year
Ordinary
Losses | | Post-October
Capital
Losses | |
Columbia Acorn
International Select | | $ | — | | | $ | 8,767,586 | | |
Columbia Acorn Emerging
Markets Fund | | | 533,398 | | | | — | | |
Management of the Funds has concluded that there are no significant uncertain tax positions in any Fund that would require recognition in the financial statements. However, management's conclusion may be subject to review and adjustment at a later date based on factors including, but not limited to, new tax laws, regulations, and administrative interpretations (including relevant court decisions). Generally, the Funds' federal tax returns for the prior three fiscal years remain subject to examination by the Internal Revenue Service.
4. Transactions With Affiliates
CWAM is a wholly-owned subsidiary of Columbia Management Investment Advisers, LLC (Columbia Management), which is a wholly-owned subsidiary of Ameriprise Financial, Inc. (Ameriprise Financial). CWAM furnishes continuing investment supervision to the Funds and is responsible for the overall management of the Funds' business affairs.
CWAM receives a monthly advisory fee based on each Fund's average daily net assets at the following annual rates:
Columbia Acorn Fund
Average Daily Net Assets | | Annual
Fee Rate | |
Up to $700 million | | | 0.74 | % | |
$700 million to $2 billion | | | 0.69 | % | |
$2 billion to $6 billion | | | 0.64 | % | |
| $6 billion and over | | | 0.63 | % | |
Columbia Acorn International
Average Daily Net Assets | | Annual
Fee Rate | |
Up to $100 million | | | 1.19 | % | |
$100 million to $500 million | | | 0.94 | % | |
| $500 million and over | | | 0.74 | % | |
Columbia Acorn USA
Average Daily Net Assets | | Annual
Fee Rate | |
Up to $200 million | | | 0.94 | % | |
$200 million to $500 million | | | 0.89 | % | |
$500 million to $2 billion | | | 0.84 | % | |
$2 billion to $3 billion | | | 0.80 | % | |
| $3 billion and over | | | 0.70 | % | |
Columbia Acorn International Select
Average Daily Net Assets | | Annual
Fee Rate | |
Up to $500 million | | | 0.94 | % | |
| $500 million and over | | | 0.90 | % | |
Columbia Acorn Select
Average Daily Net Assets | | Annual
Fee Rate | |
Up to $700 million | | | 0.85 | % | |
$700 million to $2 billion | | | 0.80 | % | |
$2 billion to $3 billion | | | 0.75 | % | |
| $3 billion and over | | | 0.70 | % | |
Columbia Thermostat Fund
| | Annual
Fee Rate | |
All Average Daily Net Assets | | | 0.10 | % | |
Columbia Acorn Emerging Markets Fund
Average Daily Net Assets | | Annual
Fee Rate | |
Up to $100 million | | | 1.25 | % | |
$100 million to $500 million | | | 1.00 | % | |
| $500 million and over | | | 0.80 | % | |
Columbia Acorn European Fund
Average Daily Net Assets | | Annual
Fee Rate | |
Up to $100 million | | | 1.19 | % | |
$100 million to $500 million | | | 0.94 | % | |
| $500 million and over | | | 0.74 | % | |
115
COLUMBIA ACORN FAMILY OF FUNDS
NOTES TO FINANCIAL STATEMENTS (UNAUDITED), CONTINUED
Effective May 1, 2015, CWAM has contractually agreed to waive 0.20% of the advisory fee otherwise payable to it by Columbia Acorn Select through April 30, 2016. When determining whether the Fund's total expenses exceed the voluntary expense cap described below, the Fund's net advisory fee, reflecting application of the 0.20% waiver, will be used to calculate the Fund's total expenses. This arrangement may only be modified or amended with approval from all parties to the arrangement, including the Fund and CWAM.
For the six months ended June 30, 2015, the annualized effective investment advisory fee rates (net of the advisory fee waiver for Columbia Acorn Select) were as follows:
Fund | |
Columbia Acorn Fund | | | 0.64 | % | |
Columbia Acorn International | | | 0.76 | % | |
Columbia Acorn USA | | | 0.87 | % | |
Columbia Acorn International Select | | | 0.94 | % | |
Columbia Acorn Select | | | 0.78 | % | |
Columbia Thermostat Fund | | | 0.10 | % | |
Columbia Acorn Emerging Markets Fund | | | 1.05 | % | |
Columbia Acorn European Fund | | | 1.19 | % | |
>Expense limits
Columbia Management Investment Services Corp. (CMIS), a wholly owned subsidiary of Ameriprise Financial, has voluntarily agreed to waive a portion of the total annual Fund operating expenses attributable to transfer agency fees incurred by Class A, Class B and Class C shares of Columbia Acorn International such that the Fund's total annual Fund operating expenses will be reduced by 0.04%, 0.03% and 0.02% for Class A, Class B and Class C shares of the Fund, respectively.
Effective May 1, 2015, CWAM has voluntarily agreed to reimburse expenses so that the Funds' ordinary operating expenses (excluding transaction costs and certain other investment-related expenses, interest and fees on borrowings and expenses associated with each Fund's investments in other investment companies, if any) after giving effect to any balance credits or overdraft charges from the Funds' custodian, do not exceed the following annual rates as a percentage of each class' average daily net assets:
Fund | | Class A | | Class B | | Class C | | Class I | | Class R4 | | Class R5 | | Class Y | | Class Z | |
Columbia Acorn International Select | | | 1.70 | % | | | 2.20 | % | | | 2.45 | % | | | 1.37 | % | | | 1.45 | % | | | 1.42 | % | | | 1.37 | % | | | 1.45 | % | |
Columbia Acorn Select | | | 1.60 | % | | | 2.10 | % | | | 2.35 | % | | | 1.25 | % | | | 1.35 | % | | | 1.30 | % | | | 1.25 | % | | | 1.35 | % | |
These arrangements may be modified or terminated by either the Funds or CWAM on 30 days notice.
Through April 30, 2015, CWAM voluntarily agreed to reimburse expenses so that the Funds' ordinary operating expenses (excluding transaction costs and certain other investment-related expenses, interest and fees on borrowings and expenses associated with each Fund's investments in other investment companies, if any) after giving effect to any balance credits or overdraft charges from the Funds' custodian, do not exceed the following annual rates as a percentage of each class' average daily net assets:
Fund | | Class A | | Class B | | Class C | | Class I | | Class R4 | | Class R5 | | Class Y | | Class Z | |
Columbia Acorn International Select | | | 1.70 | % | | | 2.20 | % | | | 2.45 | % | | | 1.37 | % | | | 1.45 | % | | | 1.42 | % | | | 1.37 | % | | | 1.45 | % | |
Columbia Acorn Select | | | 1.60 | % | | | 2.10 | % | | | 2.35 | % | | | 1.22 | % | | | 1.35 | % | | | 1.27 | % | | | 1.22 | % | | | 1.35 | % | |
Effective May 1, 2015, CWAM has contractually agreed to waive fees and/or reimburse expenses through April 30, 2016, so that the Funds' ordinary operating expenses (excluding transaction costs and certain other investment-related expenses, interest and fees on borrowings and expenses associated with each Fund's investments in other investment companies, if any, and in the case of Columbia Thermostat Fund its underlying portfolio funds), do not exceed the following annual rates as a percentage of each class' average daily net assets:
Fund | | Class A | | Class B | | Class C | | Class I | | Class R4 | | Class R5 | | Class Y | | Class Z | |
Columbia Thermostat Fund | | | 0.50 | % | | | 1.00 | % | | | 1.25 | % | | | — | % | | | 0.25 | % | | | 0.24 | % | | | 0.19 | % | | | 0.25 | % | |
Columbia Acorn Emerging Markets Fund | | | 1.85 | % | | | — | % | | | 2.60 | % | | | 1.48 | % | | | 1.60 | % | | | 1.53 | % | | | 1.48 | % | | | 1.60 | % | |
Columbia Acorn European Fund | | | 1.75 | % | | | — | % | | | 2.50 | % | | | 1.41 | % | | | 1.50 | % | | | 1.46 | % | | | — | % | | | 1.50 | % | |
There is no guarantee that these agreements will continue thereafter.
116
Through April 30, 2015, CWAM contractually waived fees and/or reimburse expenses so that the Funds' ordinary operating expenses (excluding transaction costs and certain other investment-related expenses, interest and fees on borrowings and expenses associated with each Fund's investments in other investment companies, if any, and in the case of Columbia Thermostat Fund its underlying portfolio funds), did not exceed the following annual rates as a percentage of each class' average daily net assets:
Fund | | Class A | | Class B | | Class C | | Class I | | Class R4 | | Class R5 | | Class Y | | Class Z | |
Columbia Thermostat Fund | | | 0.50 | % | | | 1.00 | % | | | 1.25 | % | | | — | % | | | 0.25 | % | | | 0.23 | % | | | 0.18 | % | | | 0.25 | % | |
Columbia Acorn Emerging Markets Fund | | | 1.85 | % | | | — | % | | | 2.60 | % | | | 1.46 | % | | | 1.60 | % | | | 1.51 | % | | | 1.46 | % | | | 1.60 | % | |
Columbia Acorn European Fund | | | 1.75 | % | | | — | % | | | 2.50 | % | | | 1.47 | % | | | 1.50 | %* | | | 1.52 | % | | | — | % | | | 1.50 | % | |
* Effective June 25, 2014 (the commencement of operations of Columbia Acorn European Fund Class R4 shares) through April 30, 2015.
Expenses waived and/or reimbursed by CWAM and its affiliates for the six months ended June 30, 2015, were as follows:
Fund | | Expenses
Reimbursed | |
Columbia Acorn International | | $ | 205,545 | | |
Columbia Acorn International Select | | | 116 | | |
Columbia Acorn Select | | | 208,875 | | |
Columbia Thermostat Fund | | | 100,577 | | |
Columbia Acorn European Fund | | | 60,916 | | |
CWAM is contractually entitled to recoup from each of Columbia Acorn Emerging Markets Fund and Columbia Acorn European Fund any fees waived and/or expenses reimbursed with respect to any share class offered by Columbia Acorn Emerging Markets Fund and Columbia Acorn European Fund for a one year period following the date of such fee waiver and/or reimbursement, if such recovery does not cause the ordinary operating expenses of the Fund (excluding transaction costs and certain other investment-related expenses, interest and fees on borrowings and expenses associated with the Fund's investment in other investment companies, if any) to exceed the annual rates set forth above, or to exceed such annual rate as may be in place at the time of the recoupment, whichever is less. For the six months ended June 30, 2015, there was no recoupment of fees.
CWAM provides administrative services and receives an administration fee from the Funds at the following annual rates:
Columbia Acorn Trust
Aggregate Average Daily
Net Assets of the Trust | | Annual
Fee Rate | |
Up to $8 billion | | | 0.050 | % | |
$8 billion to $16 billion | | | 0.040 | % | |
$16 billion to $35 billion | | | 0.030 | % | |
$35 billion to $45 billion | | | 0.025 | % | |
| $45 billion and over | | | 0.015 | % | |
For the six months ended June 30, 2015, the annualized effective administration fee rate was 0.04% of each Fund's average daily net assets. CWAM has delegated to Columbia Management responsibility to provide certain sub-administrative services to the Funds.
CMID, a wholly owned subsidiary of Ameriprise Financial, is the distributor of the Funds.
Sales charges, including front-end and CDSCs, received by the Distributor for distributing each Fund's shares for the six months ended June 30, 2015 are as follows:
| | | Underwriting
Discounts | | CDSCs | |
(Unaudited) | | Class A | | Class A | | Class B | | Class C | |
Columbia Acorn Fund | | $ | 338,769 | | | $ | 4,549 | | | $ | 288 | | | $ | 14,428 | | |
Columbia Acorn
International | | | 250,175 | | | | 160 | | | | 421 | | | | 3,933 | | |
Columbia Acorn USA | | | 25,606 | | | | 7 | | | | — | | | | 302 | | |
Columbia Acorn
International Select | | | 17,130 | | | | — | | | | — | | | | 270 | | |
Columbia Acorn Select | | | 19,682 | | | | 7 | | | | 72 | | | | 470 | | |
Columbia
Thermostat Fund | | | 428,213 | | | | 477 | | | | — | | | | 15,940 | | |
Columbia Acorn
Emerging Markets Fund | | | 28,505 | | | | 2,520 | | | | — | | | | 4,369 | | |
Columbia Acorn
European Fund | | | 122,786 | | | | — | | | | — | | | | 1,038 | | |
Each Fund has adopted a distribution and service plan which requires it to pay CMID a monthly service fee equal to 0.25% annually of the average daily net assets attributable to Class A, Class B and Class C shares and a monthly distribution fee equal to 0.50%, 0.75% and 0.50%, annually, of the average daily net assets attributable to Class B, Class C and Class R shares, respectively. CMID receives no compensation with respect to Class R4, Class R5, Class Y and Class Z shares.
CMIS is the transfer agent of the Funds. CMIS receives monthly account-based service fees based on the number of open Fund accounts. Each Fund pays CMIS a monthly fee at the annual rate of $20.00 per open account. Subject to certain limitations, the Funds reimburse payments made by CMIS to financial intermediaries for the shareholder services that the intermediaries provide, in amounts that vary by share class and with the type of intermediary and type of shareholder services provided.
The Transfer Agent also receives compensation from fees for various shareholder services and reimbursements for
117
COLUMBIA ACORN FAMILY OF FUNDS
NOTES TO FINANCIAL STATEMENTS (UNAUDITED), CONTINUED
certain out-of-pocket fees. Total transfer agency fees for Class R5 shares are subject to an annual limitation of not more than 0.05% of the average daily net assets attributable to
Class R5 shares. Class I shares and Class Y shares do not pay transfer agency fees.
For the six months ended June 30, 2015, the Funds' annualized effective transfer agency fee rates as a percentage of average daily net assets of each class were as follows:
Fund | | Class A | | Class B | | Class C | | Class R | | Class R4 | | Class R5 | | Class Z | |
Columbia Acorn Fund | | | 0.12 | % | | | 0.43 | % | | | 0.07 | % | | | — | % | | | 0.15 | % | | | 0.05 | % | | | 0.08 | % | |
Columbia Acorn International | | | 0.16 | % | | | 0.50 | % | | | 0.14 | % | | | 0.24 | % | | | 0.19 | % | | | 0.05 | % | | | 0.09 | % | |
Columbia Acorn USA | | | 0.13 | % | | | 0.82 | % | | | 0.06 | % | | | — | % | | | 0.13 | % | | | 0.05 | % | | | 0.14 | % | |
Columbia Acorn International Select | | | 0.14 | % | | | 0.43 | % | | | 0.16 | % | | | — | % | | | 0.12 | % | | | 0.05 | % | | | 0.09 | % | |
Columbia Acorn Select | | | 0.12 | % | | | 0.71 | % | | | 0.10 | % | | | — | % | | | 0.14 | % | | | 0.05 | % | | | 0.10 | % | |
Columbia Thermostat Fund | | | 0.08 | % | | | 0.24 | % | | | 0.07 | % | | | — | % | | | 0.07 | % | | | 0.05 | % | | | 0.06 | % | |
Columbia Acorn Emerging Markets Fund | | | 0.12 | % | | | — | % | | | 0.12 | % | | | — | % | | | 0.08 | % | | | 0.05 | % | | | 0.12 | % | |
Columbia Acorn European Fund | | | 0.11 | % | | | — | % | | | 0.12 | % | | | — | % | | | 0.12 | % | | | 0.05 | % | | | 0.09 | % | |
Columbia Acorn International and certain other associated investment companies, have severally, but not jointly, guaranteed the performance and observance of all the terms and conditions of a lease entered into by Seligman Data Corp. (SDC), the former transfer agent to certain associated investment companies, including the payment of rent by SDC (the Guaranty). The lease and the Guaranty expire in January 2019. At June 30, 2015, Columbia Acorn International's total potential future obligation over the life of the Guaranty is $73,154. The liability remaining at June 30, 2015 for non-recurring charges associated with the lease amounted to $48,491 and is included within the "Payable for Other liabilities" in the Statements of Assets and Liabilities.
Certain officers and trustees of the Trust are also officers of CWAM. The Trust makes no direct payments to its officers and trustees who are affiliated with CWAM.
The Board has appointed a Chief Compliance Officer of the Trust in accordance with federal securities regulations. The Funds, along with other affiliated funds, are allocated a portion of the expenses associated with the office of the Chief Compliance Officer based on relative net assets of each Fund.
The Trust offers a deferred compensation plan for its independent trustees. Under that plan, a trustee may elect to defer all or a portion of his or her compensation. Amounts deferred are retained by the Trust and may represent an unfunded obligation of the Trust. The value of amounts deferred is determined by reference to the change in value of Class Z shares of one or more series of the Trust or a money market fund as specified by the trustee. Benefits under the deferred compensation plan are payable in accordance with the plan.
An affiliated person of a Fund may include any company in which a Fund owns five percent or more of its outstanding voting shares during the year. On June 30, 2015, Columbia
Acorn Fund, Columbia Acorn International, Columbia Acorn Select and Columbia Thermostat Fund each held five percent or more of the outstanding voting securities of one or more companies or a company which is under common ownership or control with the Funds. Details of investments in those affiliated companies are presented in the Notes to Statement of Investments of each Fund listed above.
For the six months ended June 30, 2015, the Funds engaged in purchase and sales transactions with funds that have a common investment manager (or affiliated investment managers), common directors/trustees, and/or common officers. Those transactions complied with Rule 17a-7 under the 1940 Act and totaled as follows:
| | | Purchases | | Sales | |
Columbia Acorn Fund | | $ | 2,123,910 | | | $ | 80,683,340 | | |
Columbia Acorn International | | | 5,184,017 | | | | 4,390,120 | | |
Columbia Acorn USA | | | 27,330,576 | | | | — | | |
Columbia Acorn
International Select | | | 4,390,120 | | | | — | | |
Columbia Acorn Select | | | 477,660 | | | | 1,646,145 | | |
5. Borrowing Arrangements
During the period January 1, 2015 through April 29, 2015, the Trust participated in a credit facility with JPMorgan Chase Bank, N.A., along with Wanger Advisors Trust, another trust managed by CWAM, in the amount of $150 million. Effective April 30, 2015, the Trust entered into a revolving credit facility in the amount of $400 million with a syndicate of banks led by JPMorgan Chase Bank, N.A. to facilitate portfolio liquidity. Under each facility, interest is charged to each participating fund based on its borrowings at a rate per annum equal to the Federal Funds Rate plus 1.00%. In addition, a commitment fee of 0.08% per annum of the unutilized line of credit is accrued and apportioned among the participating funds based on their relative net assets. The commitment fee is
118
disclosed as a part of "Other expenses" in the Statements of Operations. The Trust expects to renew this line of credit for one year durations each April at then current market rates and terms. No amounts were borrowed for the benefit of a Fund under the line of credit during the six months ended June 30, 2015.
6. Investment Transactions
The aggregate cost of purchases and proceeds from sales, other than short-term obligations, for the six months ended June 30, 2015, were:
| | | Purchases | | Proceeds from
Sales | |
Columbia Acorn Fund | | $ | 1,365,431,754 | | | $ | 6,751,400,816 | | |
Columbia
Acorn International | | | 1,770,682,787 | | | | 1,881,417,841 | | |
Columbia Acorn USA | | | 233,724,259 | | | | 484,621,285 | | |
Columbia Acorn
International Select | | | 67,375,025 | | | | 84,896,595 | | |
Columbia Acorn Select | | | 200,103,679 | | | | 309,545,960 | | |
Columbia
Thermostat Fund | | | 293,214,020 | | | | 365,608,303 | | |
Columbia Acorn
Emerging Markets Fund | | | 143,663,333 | | | | 170,523,998 | | |
Columbia Acorn
European Fund | | | 22,009,509 | | | | 6,225,185 | | |
The amount of purchase and sales activity impacts the portfolio turnover rate reported in the Financial Highlights.
7. Shareholder Concentration
At June 30, 2015, the table below details the affiliated and significant unaffiliated shareholder account ownership of outstanding shares of each Fund. The Funds have no knowledge about whether any portion of these unaffiliated shares were owned beneficially. Subscription and redemption activity of these accounts may have a significant effect on the operations of the Funds.
Fund | | Number of
unaffiliated
accounts | | Percentage of
shares
outstanding
held –
unaffiliated | | Percentage of
shares
outstanding
held –
affiliated | |
Columbia Acorn Fund | | | 1 | | | | 13.8 | % | | | — | % | |
Columbia Acorn International | | | 1 | | | | 16.9 | % | | | — | % | |
Columbia Acorn USA | | | 3 | | | | 56.9 | % | | | — | % | |
Columbia Acorn
International Select | | | 2 | | | | 38.2 | % | | | 11.5 | % | |
Columbia Acorn Select | | | 2 | | | | 33.4 | % | | | 14.1 | % | |
Columbia Thermostat Fund | | | 1 | | | | 20.0 | % | | | 24.5 | % | |
Columbia Acorn Emerging
Markets Fund | | | 3 | | | | 45.0 | % | | | 23.5 | % | |
Columbia Acorn European Fund | | | 1 | | | | 12.2 | % | | | 54.8 | % | |
8. Subsequent Events
Management has evaluated the events and transactions that have occurred through the date the financial statements were issued and noted no items requiring adjustment of the financial statements or additional disclosure.
9. Information Regarding Pending and Settled Legal Proceedings
Ameriprise Financial and certain of its affiliates have historically been involved in a number of legal, arbitration and regulatory proceedings, including routine litigation, class actions, and governmental actions, concerning matters arising in connection with the conduct of their business activities. Ameriprise Financial believes that the Funds are not currently the subject of, and that neither Ameriprise Financial nor any of its affiliates are the subject of, any pending legal, arbitration or regulatory proceedings that are likely to have a material adverse effect on the Funds or the ability of Ameriprise Financial or its affiliates to perform under their contracts with the Funds. Ameriprise Financial is required to make quarterly (10-Q), annual (10-K) and, as necessary, 8-K filings with the Securities and Exchange Commission on legal and regulatory matters that relate to Ameriprise Financial and its affiliates. Copies of these filings may be obtained by accessing the SEC website at www.sec.gov.
There can be no assurance that these matters, or the adverse publicity associated with them, will not result in increased fund redemptions, reduced sale of fund shares or other adverse consequences to the Funds. Further, although we believe proceedings are not likely to have a material adverse effect on the Funds or the ability of Ameriprise Financial or its affiliates to perform under their contracts with the Funds, these proceedings are subject to uncertainties and, as such, we are unable to estimate the possible loss or range of loss that may result. An adverse outcome in one or more of these proceedings could result in adverse judgments, settlements, fines, penalties or other relief that could have a material adverse effect on the consolidated financial condition or results of operations of Ameriprise Financial.
119
BOARD APPROVAL OF THE ADVISORY AGREEMENT
Columbia Acorn Trust (the "Trust") has an investment advisory agreement (the "Advisory Agreement") with Columbia Wanger Asset Management, LLC ("CWAM") under which CWAM manages the Columbia Acorn Funds (each, a "Fund," and together, the "Funds"). More than 75% of the trustees of the Trust (the "Trustees") are persons who have no direct or indirect interest in the Advisory Agreement and are not "interested persons" (as defined in the Investment Company Act of 1940, as amended (the "1940 Act")) of the Trust (the "Independent Trustees"). The Trustees oversee the management of each Fund and, as required by law, determine at least annually whether to continue the Advisory Agreement for each Fund.
The Contract Committee (the "Committee") of the Board of Trustees (the "Board"), which is comprised solely of Independent Trustees, makes recommendations to the Board regarding any proposed continuation of the Advisory Agreement. After the Committee has made its recommendations, the full Board determines whether to approve continuation of the Advisory Agreement. The Board also considers matters bearing on the Advisory Agreement at its various meetings throughout the year, meets at least quarterly with CWAM's portfolio managers (as does the Board's Investment Performance Analysis Committee), and receives monthly reports from CWAM on the performance of the Funds.
In connection with their most recent consideration of the Advisory Agreement for each Fund, the Committee and all Trustees received and reviewed a substantial amount of information provided by CWAM, Columbia Management Investment Advisers, LLC ("Columbia Management") and Ameriprise Financial, Inc. ("Ameriprise") in response to written requests from the Independent Trustees and their independent legal counsel. In addition, the Trustees reviewed the Management Fee Evaluation dated June 2015 (the "Fee Evaluation") prepared by the Trust's chief compliance officer, senior vice president and general counsel, at the request of the Board. Throughout the process, the Trustees had numerous opportunities to ask questions of and request additional materials from CWAM, Columbia Management and Ameriprise.
During each meeting at which the Committee or the Independent Trustees considered the Advisory Agreement, they met in executive session with their independent legal counsel. The Committee also met with representatives of
CWAM, Columbia Management and Ameriprise on several occasions. In all, the Committee convened formally on six separate occasions to consider the continuation of the Advisory Agreement. The Board and/or some or all of the Independent Trustees met on other occasions to receive the Committee's status reports, receive presentations from CWAM, Columbia Management and Ameriprise representatives, and to discuss outstanding issues. In addition, the Investment Performance Analysis Committee of the Board, also comprised exclusively of Independent Trustees, reviewed the performance of the Funds, met in two joint meetings with the Contract Committee, and presented its findings to the Board and the Committee throughout the year. The Compliance Committee of the Board also provided information to the Committee with respect to relevant matters.
The materials reviewed by the Committee and the Trustees included, among other items, (i) information on the investment performance of each Fund and of independently selected peer groups of funds and of the Funds' performance benchmarks over various time periods, (ii) information on each Fund's advisory fees and other expenses, including information comparing the Fund's fees and expenses to those of peer groups of funds and information about any applicable expense limitations and fee breakpoints, (iii) data on sales and redemptions of Fund shares, and (iv) information on the profitability to CWAM and Ameriprise, as well as potential "fall-out" or ancillary benefits that CWAM and its affiliates may receive as a result of their relationships with the Funds. The Trustees also considered other information such as (i) CWAM's financial condition, (ii) each Fund's investment objective and strategy, (iii) the size, education and experience of CWAM's investment staff and its use of technology, external research and trading cost measurement tools, (iv) the portfolio manager compensation framework, (v) the allocation of the Funds' brokerage, and the use of "soft" commission dollars to pay for research products and services, (vi) CWAM's risk management program, (vii) the resources devoted to, and the record of compliance with, the Funds' investment policies and restrictions, policies on personal securities transactions and other compliance policies, and (viii) capacity restraints as a result of increasing size of certain of the Funds.
At a meeting held on June 2, 2015 ("Contract Meeting"), the Board considered and unanimously approved
120
the continuation of the Advisory Agreement. In considering the continuation of the Advisory Agreement, the Trustees reviewed and analyzed various factors that they determined were relevant, none of which by itself was considered dispositive. The material factors and conclusions that formed the basis for the Trustees' determination to approve the continuation of the Advisory Agreement are discussed below.
Nature, quality and extent of services. The Trustees reviewed the nature, quality and extent of the services provided by CWAM and its affiliates to the Funds under the Advisory Agreement, taking into account the investment objective and strategy of each Fund and knowledge gained from meetings with management, which were held on at least a quarterly basis. In addition, the Trustees reviewed the available resources and key personnel of CWAM and its affiliates, especially those providing investment management services to the Funds. The Trustees also considered other services provided to the Funds by CWAM and its affiliates, including: managing the execution of portfolio transactions and selecting broker-dealers for those transactions; monitoring adherence to the Funds' investment restrictions; producing shareholder reports; providing support services for the Board and committees of the Board; managing the Funds' securities lending program; communicating with shareholders; serving as the Funds' administrator; and overseeing the activities of the Funds' other service providers, including monitoring for compliance with various policies and procedures as well as applicable securities laws and regulations.
The Trustees concluded that the nature, quality and extent of the services provided by CWAM and its affiliates to each Fund under the Advisory Agreement were appropriate for the Funds and that the Funds were likely to benefit from the continued provision of those services by CWAM. They also concluded that CWAM currently had sufficient personnel, with appropriate education and experience, to serve the Funds effectively, and that the firm had demonstrated its continuing ability to attract and retain well-qualified personnel. The Trustees also considered that Ameriprise had committed to the Board that CWAM would have sufficient investment management resources to improve performance, including funds to hire additional analysts and other investment and operational personnel. Based on these
assurances, the Trustees believed that CWAM would have sufficient resources to attract new personnel to improve performance. In addition, they considered the quality of CWAM's compliance record.
Performance of the Funds. The Trustees received and considered detailed performance information at various meetings of the Board, the Committee and the Investment Performance Analysis Committee of the Board throughout the year. They reviewed information comparing each Fund's performance with that of its benchmark(s) and with the performance of comparable funds and peer groups as identified by Lipper Inc. ("Lipper") and Morningstar, Inc. ("Morningstar"). The Trustees evaluated the performance of the Funds over various time periods, including over the one-, three- and five-year periods ending December 31, 2014 as well as longer periods in some cases. The Trustees also considered peer performance rankings for the same time periods. The Trustees generally focus on the three-year period in reaching their assessments. In the case of underperforming Funds, however, the Trustees focused on more recent performance in order to evaluate CWAM's remediation efforts.
The Trustees noted that Columbia Acorn International had outperformed its benchmark over the past three- and five-year periods, and had done so while exposing investors to less risk than competing funds, according to Morningstar, but had underperformed against its peers over the one-, three- and five-year periods. The Trustees noted that the decline in performance was being monitored closely by the Board and the Investment Performance Analysis Committee and that CWAM had discussed with the Performance Committee a number of steps designed to enhance the Funds' performance.
The Trustees considered that Columbia Acorn International Select's performance was well below the median in the Lipper and Morningstar rankings, respectively, for the one-, three- and five-year periods. The Trustees noted that the Fund had outperformed its benchmark during the five-year period, but not in the more recent periods. The Trustees considered CWAM's explanation for the underperformance, which focused on risk aversion. The Trustees had received a plan for the improved performance for the Fund from CWAM, which they continued to monitor.
121
The Trustees reviewed the performance for Columbia Acorn Emerging Markets Fund and Columbia Acorn European Fund and noted that both Funds ranked in the top third of Morningstar peers for the three-year period while exposing shareholders to less risk. While Columbia Acorn Emerging Markets Fund had outperformed its benchmark for the three-year period, the Trustees considered that Columbia Acorn European Fund had underperformed its benchmark.
The Trustees considered that the domestic Funds generally had produced unsatisfactory results but that CWAM had put in place a number of intensive remediation plans to improve performance. Columbia Acorn Fund underperformed its peers over the one-, three- and five-year periods, ending December 31, 2014, and the Fund underperformed its benchmark during the same periods. The Trustees also evaluated the Fund's Morningstar risk ratings. They considered CWAM's explanation for the Fund's underperformance, which related to poor security selection and portfolio construction techniques. The Trustees requested and received in 2013 a performance remediation plan from CWAM that included portfolio manager changes, analyst process improvements, incentive compensation changes designed to reward outperformance, and other changes. The Trustees received updated plans in 2014 and early 2015 that emphasized a more disciplined stock selection and portfolio construction process, among other changes. As noted above, the Trustees also sought and received from Ameriprise additional resources for CWAM to enable it to hire additional personnel or other resources for the specific purpose of improving performance. The Trustees understood that the remediation plan may take some time to bear fruit but believed it to be reasonably designed to improve Fund performance.
The Trustees considered that Columbia Acorn Select underperformed its peers and benchmark over the one-, three- and five-year periods ending December 31, 2014 and exposed investors to more risk and volatility versus its peers. The Trustees considered that CWAM had taken steps to reduce risk and volatility in the Fund's portfolio and added additional resources to the management of the Fund in the past year in order to improve performance. The Trustees believed that CWAM was devoting appropriate resources to Columbia Acorn Select's underperformance.
The Trustees considered that Columbia Acorn USA had outperformed its Lipper peer group for the one-year period ending December 31, 2014 but was still lagging in the longer term, although it performed at the median of Morningstar peers for the three-year period while underperforming in other periods. The Trustees noted that the Fund had also underperformed its benchmark in all periods. The Trustees also considered Columbia Acorn USA's risk ratings versus peers. The Trustees considered CWAM's explanation for the Fund's underperformance and concluded that the performance remediation plans implemented by CWAM were reasonably designed to improve the Fund's performance.
The Trustees considered that Columbia Thermostat Fund outperformed its stated benchmark, a 50/50 blend of the Fund's primary equity and debt benchmarks, over the five-year period ending December 31, 2014. It also enjoyed strong rankings from Morningstar versus its peer groups over the five year period, but less so over three years. The Trustees noted that Lipper could not construct an appropriate peer group for the Fund because of its unique strategy and that Morningstar's constantly changing peer group made its ratings somewhat less than reliable. The Trustees noted that more recent performance had declined versus both the benchmark and peers, although the Fund's risk rankings were satisfactory versus peers.
The Trustees concluded that CWAM had taken and continued to take a number of corrective steps to improve performance of the underperforming Funds, that CWAM had reported that these steps were being successfully implemented although still in process; and that the Investment Performance Analysis Committee of the Board was monitoring the underperforming Funds' performance closely. In addition the Trustees considered that the current and former Chief Investment Officer (the "CIO") of CWAM had reported to them at numerous Committee and Board meetings on the corrective steps being taken to improve performance, and Committee representatives met separately with the CIO on multiple occasions to discuss the underperforming Funds.
Costs of Services and Profits Realized by CWAM. At various Committee and Board meetings, the Trustees examined detailed information on the fees and expenses of each Fund in comparison to information for comparable funds provided by Lipper and Morningstar. The Trustees reviewed data from
122
Lipper and Morningstar and believed that in general the Funds' total net operating expenses were competitive with peers for Columbia Acorn Fund, Columbia Acorn International, Columbia International Select and Columbia Thermostat Fund and that the Columbia Acorn USA, Columbia Acorn Select and Columbia Emerging Markets Fund had total net operating expenses that were lower than the median in one service but higher than the median in the other service. They considered Columbia Acorn European Fund had total net expenses that were less competitive with its peer groups in both services.
The Trustees also took into account that: the actual advisory fees paid by Columbia Acorn International and Columbia Acorn International Select were lower than both their Morningstar and Lipper peer groups or at the median; the actual advisory fees paid by Columbia Acorn Select, Columbia Acorn USA, Columbia Emerging Markets Fund and Columbia Acorn European Fund were higher than the median advisory fee of the Funds' Lipper and Morningstar peer groups; and the actual advisory fee paid by Columbia Acorn Fund and Columbia Thermostat Fund were below the Funds' Morningstar peer groups, but above the Lipper peer groups. In light of the sustained underperformance of Columbia Acorn Select, the Trustees requested and received at the Contract Meeting a contractual fee waiver from CWAM in the amount of 20 basis points for the advisory fee from CWAM for a one year period ending April 30, 2016.
The Trustees also reviewed the advisory fee rates charged by CWAM for managing other investment companies, sub-advised funds and other institutional separate accounts, as detailed in materials provided to the Committee by CWAM and in the Fee Evaluation. The Trustees noted that the Columbia Acorn Funds' advisory fees were generally comparable to the Columbia Wanger Funds' advisory fees at the same asset levels. The Trustees also examined CWAM's institutional separate account fees for various investment strategies and determined that institutional account advisory fees tended to be lower than the Funds with parallel investment strategies. The Trustees noted that CWAM performs significant additional services for the Funds that it does not provide to sub-advised funds or non-mutual fund clients, including administrative and fund accounting services, oversight of the Funds' other service providers, Trustee support, regulatory compliance and
numerous other services, and that, in servicing the Funds, CWAM assumes many legal and business risks that it does not assume in servicing many of its non-fund clients.
The Trustees reviewed the analysis of the historic profitability of CWAM in serving as each Fund's investment adviser and of CWAM and its affiliates in their relationships with each Fund. The Committee and Trustees met with representatives from Ameriprise to discuss its methodologies for calculating profitability and allocating costs. They considered that Ameriprise calculated profitability and allocated costs on a contract-by-contract and Fund-by-Fund basis. The Trustees also considered the methodology used by CWAM and Ameriprise in determining compensation payable to portfolio managers and the competitive market for investment management talent. The Trustees were also provided with profitability information from Lipper, which compared CWAM's profitability to other similar investment advisers in the mutual fund industry. The Trustees discussed, however, that profitability comparisons among fund managers may not always be meaningful due to the lack of consistency in data, small number of publicly-owned managers, and the fact that profitability of any investment manager is affected by numerous factors, including its particular organizational structure, the types of funds and other accounts managed, other lines of business, expense allocation methodology, capital structure and other factors.
Economies of Scale. At various Committee and Board meetings and other informal meetings, the Trustees considered information about the extent to which CWAM realizes economies of scale in connection with an increase in Fund assets. The Trustees noted that the advisory fee schedule for each Fund, other than Columbia Thermostat Fund, includes breakpoints in the rate of fees at various asset levels. The Trustees concluded that the fee structure of the Advisory Agreement for each Fund reflected a sharing of economies of scale between CWAM and the Funds.
Other Benefits to CWAM. The Trustees also reviewed benefits that accrue to CWAM and its affiliates from their relationships with the Funds, based upon information provided to them by Ameriprise and as outlined in the Fee Evaluation. They noted that the Funds' transfer agency services are performed by Columbia Management Investment Services Corp., an affiliate of Ameriprise, which receives compensation from the Funds for its services provided. They
123
considered that an affiliate of Ameriprise, Columbia Management Investment Distributors, Inc. ("CMID"), serves as the Funds' distributor under a distribution agreement, and that it receives fees under the Columbia Acorn Trust's Rule 12b-1 Plan, most of which CMID pays to broker-dealers, but no fees for its services to the Columbia Wanger Funds. In addition, Columbia Management provides sub-administration services to the Funds. The Committee received information regarding the profitability of each Fund agreement with CWAM affiliates. The Committee and the Board also reviewed information about and discussed the capabilities of each affiliated entity in performing its duties.
The Trustees considered other ways that the Funds and CWAM may potentially benefit from their relationship with each other. For example, the Trustees considered CWAM's use of commissions paid by each Fund on its portfolio brokerage transactions to obtain research products and services benefiting the Funds and/or other clients of CWAM. The Compliance Committee of the Board reviewed CWAM's annual "soft dollar" report during the year and met with representatives from CWAM to review CWAM's soft dollar spending. The Trustees also considered that the Compliance Committee regularly reviewed third-party prepared reports that evaluated the quality of CWAM's execution of the Funds' portfolio transactions. The Trustees noted that these reports showed that CWAM's execution capabilities were generally better than industry peers. The Trustees determined that CWAM's use of the Funds' "soft" commission dollars to obtain research products and services was consistent with current regulatory requirements and guidance. They also concluded that CWAM benefits from the receipt of proprietary research products and services acquired through commissions paid on portfolio transactions of the Funds, and that the Funds benefitted from CWAM's receipt of those products and services as well as research products and services acquired through commissions paid by other clients of CWAM. Finally, the Trustees considered that CWAM's affiliates benefit from management fees received from Columbia Thermostat's investment in other Columbia mutual funds.
After full consideration of the above factors, as well as other factors that were instructive in evaluating the Advisory Agreement, the Trustees, including the Independent Trustees by separate vote, concluded that the advisory fees
were reasonable and that the continuation of the Advisory Agreement was in the best interest of each Fund. At the Contract Meeting, the Trustees approved continuation of the Advisory Agreement through July 31, 2016.
124
RESULTS OF SPECIAL MEETING OF SHAREHOLDERS (UNAUDITED)
A Special Meeting of Shareholders of Columbia Acorn Trust (the Trust), was held on February 27, 2015 to ask shareholders to vote in favor of the election of nine nominated trustees to the Board. A proxy statement that described the proposals was mailed to shareholders of record as of December 31, 2014.
Proposal: Each of the trustee nominees was elected to the Board as follows:
Trustee | | For | | Against/Withhold | | Abstain/Broker
Non-Votes | |
Laura M. Born | | | 639,164,070.883 | | | | 10,694,881.943 | | | | 0 | | |
Maureen M. Culhane | | | 638,800,970.381 | | | | 11,057,982.445 | | | | 0 | | |
Margaret M. Eisen | | | 638,866,948.678 | | | | 10,992,004.148 | | | | 0 | | |
Thomas M. Goldstein | | | 639,138,773.640 | | | | 10,720,179.186 | | | | 0 | | |
John C. Heaton | | | 553,323,641.483 | | | | 96,535,311.343 | | | | 0 | | |
Steven N. Kaplan | | | 638,876,388.150 | | | | 10,982,564.676 | | | | 0 | | |
Charles R. Phillips | | | 639,256,774.865 | | | | 10,602,177.961 | | | | 0 | | |
David J. Rudis | | | 553,224,405.014 | | | | 96,634,547.812 | | | | 0 | | |
P. Zachary Egan | | | 639,498,208.627 | | | | 10,360,744.199 | | | | 0 | | |
125
COLUMBIA ACORN FAMILY OF FUNDS
DESCRIPTIONS OF INDEXES INCLUDED IN THIS REPORT
• 50/50 Blended Benchmark, established by the Fund's investment manager, is an equally weighted custom composite of Columbia Thermostat Fund's primary equity and primary debt benchmarks, the S&P 500® Index and the Barclays U.S. Aggregate Bond Index, respectively. The percentage of the Fund's assets allocated to underlying stock and bond portfolio funds will vary, and accordingly the composition of the Fund's portfolio will not always reflect the composition of the 50/50 Blended Benchmark.
• Barclays U.S. Aggregate Bond Index is a market value-weighted index that tracks the daily price, coupon, pay-downs and total return performance of fixed-rate, publicly placed, dollar-denominated and non-convertible investment grade debt issues with at least $250 million par amount outstanding and with at least one year to final maturity.
• Euromoney Smaller European Companies (inc. UK) Index is an index of smaller companies in Europe including the UK market. The Euromoney Smaller European Companies Index covers companies of small- and mid-cap market capitalization in Europe's developed markets. The index is rebalanced on a quarterly basis.
• Lipper Indexes are composed of the 10 or 30 largest funds in the Lipper investment objective grouping. Lipper Mid-Cap Growth Funds Index, 30 largest mid-cap growth funds, including Columbia Acorn Fund; Lipper International Small/Mid Growth Funds Index, 10 largest non-U.S. small/mid growth funds, including Columbia Acorn International and Columbia Acorn International Select; Lipper Small-Cap Growth Funds Index, 30 largest small-cap growth funds, including Columbia Acorn USA; Lipper Mid-Cap Core Funds Index, 30 largest mid-cap core funds; Lipper Flexible Portfolio Funds Index, an equal-weighted index of the 30 largest mutual funds within the Flexible Portfolio fund classification, as defined by Lipper; Lipper Emerging Markets Index, 30 largest emerging markets funds; Lipper European Region Index, 10 largest European funds.
• MSCI Europe, Australasia and Far East (EAFE) Index (Net) is a capitalization-weighted index that tracks the total return of common stocks in 21 developed-market countries within Europe, Australasia and the Far East. The returns of the MSCI EAFE Index (Net) are presented net of the withholding tax rate applicable to foreign non-resident institutional investors in the foreign companies included in the index who do not benefit from double taxation treaties.
• MSCI Emerging Markets Small Cap Index (Net), a widely recognized international benchmark, is a free float-adjusted market capitalization index that is designed to measure small-cap emerging market equity performance in 23 emerging market countries, as determined by MSCI. The MSCI Emerging Markets Small Cap Index (Net) currently consists of the following emerging market country indexes: Brazil, Chile, China, Colombia, Czech Republic, Egypt, Greece, Hungary, India, Indonesia, Korea, Malaysia, Mexico, Peru, Philippines, Poland, Qatar, Russia, South Africa, Taiwan, Thailand, Turkey and United Arab Emirates.
• Russell 2000 Index measures the performance of the 2,000 smallest companies in the Russell 3000 Index, which represents approximately 10% of the total market capitalization of the Russell 3000 Index.
• Russell 2500 Index measures the performance of the 2,500 smallest companies in the Russell 3000 Index, which represents approximately 17% of the total market capitalization of the Russell 3000 Index.
• Standard & Poor's (S&P) 500® Index tracks the performance of 500 widely held, large-capitalization U.S. stocks.
• S&P MidCap 400® Index is a market value-weighted index that tracks the performance of 400 mid-cap U.S. companies.
• S&P Developed Ex-U.S. Between $2B and $10B® Index is a subset of the broad market selected by the index sponsor that represents the mid-cap developed market, excluding the United States.
• S&P Emerging Markets Between $500M and $5B® Index represents the institutionally investable capital of 23 emerging market countries, as determined by S&P, with market caps ranging between $500 million to $5 billion. The index currently consists of the following emerging market country indexes: Brazil, Chile, China, Colombia, Czech Republic, Egypt, Greece, Hungary, India, Indonesia, Malaysia, Mexico, Morocco, Peru, Philippines, Poland, Qatar, Russia, South Africa, Taiwan, Thailand, Turkey and United Arab Emirates.
• S&P Europe Between $500M and $5B® Index represents the institutionally investable capital of 16 European countries, as determined by S&P, with market caps ranging between $500 million to $5 billion. The index consists of the following European countries: Austria, Belgium, Denmark, Finland, France, Germany, Ireland, Italy, Luxembourg, the Netherlands, Norway, Portugal, Spain, Sweden, Switzerland and the United Kingdom.
• S&P Global Ex-U.S. SmallCap® Index consists of the bottom 20% of institutionally investable capital of developed and emerging countries, excluding the United States.
• S&P Global Ex-U.S. Between $500M and $5B® Index is a subset of the broad market selected by the index sponsor that represents the mid- and small-cap developed and emerging markets, excluding the United States.
Unlike mutual funds, indexes are not managed and do not incur fees or expenses. It is not possible to invest directly in an index.
126
COLUMBIA ACORN FAMILY OF FUNDS EXPENSE INFORMATION
as of 6/30/15
Columbia Acorn® Fund | | Class A | | Class B(a) | | Class C | | Class I | | Class R | | Class R4 | | Class R5 | | Class Y | | Class Z | |
Management Fees | | | 0.64 | % | | | 0.64 | % | | | 0.64 | % | | | 0.64 | % | | | | | | | 0.64 | % | | | 0.64 | % | | | 0.64 | % | | | 0.64 | % | |
Distribution and Service (12b-1) Fees | | | 0.25 | % | | | 0.75 | % | | | 1.00 | % | | | 0.00 | % | | | | | | | 0.00 | % | | | 0.00 | % | | | 0.00 | % | | | 0.00 | % | |
Other Expenses | | | 0.20 | % | | | 0.50 | % | | | 0.15 | % | | | 0.08 | % | | | | | | | 0.23 | % | | | 0.13 | % | | | 0.08 | % | | | 0.16 | % | |
Net Expense Ratio | | | 1.09 | % | | | 1.89 | % | | | 1.79 | % | | | 0.72 | % | | | | | 0.87 | % | | | 0.77 | % | | | 0.72 | % | | | 0.80 | % | |
Columbia Acorn International® | |
Management Fees | | | 0.76 | % | | | 0.76 | % | | | 0.76 | % | | | 0.76 | % | | | 0.76 | % | | | 0.76 | % | | | 0.76 | % | | | 0.76 | % | | | 0.76 | % | |
Distribution and Service (12b-1) Fees | | | 0.25 | % | | | 0.75 | % | | | 1.00 | % | | | 0.00 | % | | | 0.50 | % | | | 0.00 | % | | | 0.00 | % | | | 0.00 | % | | | 0.00 | % | |
Other Expenses | | | 0.23 | % | | | 0.57 | % | | | 0.22 | % | | | 0.11 | % | | | 0.34 | % | | | 0.29 | % | | | 0.15 | % | | | 0.11 | % | | | 0.19 | % | |
Net Expense Ratio | | | 1.24 | % | | | 2.08 | % | | | 1.98 | % | | | 0.87 | % | | | 1.60 | % | | | 1.05 | % | | | 0.91 | % | | | 0.87 | % | | | 0.95 | % | |
Columbia Acorn USA® | |
Management Fees | | | 0.87 | % | | | 0.87 | % | | | 0.87 | % | | | 0.87 | % | | | | | | | 0.87 | % | | | 0.87 | % | | | 0.87 | % | | | 0.87 | % | |
Distribution and Service (12b-1) Fees | | | 0.25 | % | | | 0.75 | % | | | 1.00 | % | | | 0.00 | % | | | | | | | 0.00 | % | | | 0.00 | % | | | 0.00 | % | | | 0.00 | % | |
Other Expenses | | | 0.22 | % | | | 0.90 | % | | | 0.14 | % | | | 0.06 | % | | | | | | | 0.22 | % | | | 0.13 | % | | | 0.08 | % | | | 0.22 | % | |
Net Expense Ratio | | | 1.34 | % | | | 2.52 | % | | | 2.01 | % | | | 0.93 | % | | | | | 1.09 | % | | | 1.00 | % | | | 0.95 | % | | | 1.09 | % | |
Columbia Acorn International SelectSM | |
Management Fees | | | 0.94 | % | | | 0.94 | % | | | 0.94 | % | | | 0.94 | % | | | | | | | 0.94 | % | | | 0.94 | % | | | 0.94 | % | | | 0.94 | % | |
Distribution and Service (12b-1) Fees | | | 0.25 | % | | | 0.75 | % | | | 1.00 | % | | | 0.00 | % | | | | | | | 0.00 | % | | | 0.00 | % | | | 0.00 | % | | | 0.00 | % | |
Other Expenses | | | 0.33 | % | | | 0.51 | % | | | 0.35 | % | | | 0.25 | % | | | | | | | 0.31 | % | | | 0.24 | % | | | 0.18 | % | | | 0.28 | % | |
Net Expense Ratio | | | 1.52 | % | | | 2.20 | % | | | 2.29 | % | | | 1.19 | % | | | | | 1.25 | % | | | 1.18 | % | | | 1.12 | % | | | 1.22 | % | |
Columbia Acorn SelectSM | |
Management Fees | | | 0.78 | % | | | 0.78 | % | | | 0.78 | % | | | 0.78 | % | | | | | | | 0.78 | % | | | 0.78 | % | | | 0.78 | % | | | 0.78 | % | |
Distribution and Service (12b-1) Fees | | | 0.25 | % | | | 0.75 | % | | | 1.00 | % | | | 0.00 | % | | | | | | | 0.00 | % | | | 0.00 | % | | | 0.00 | % | | | 0.00 | % | |
Other Expenses | | | 0.24 | % | | | 0.57 | % | | | 0.22 | % | | | 0.10 | % | | | | | | | 0.26 | % | | | 0.19 | % | | | 0.12 | % | | | 0.22 | % | |
Net Expense Ratio | | | 1.27 | % | | | 2.10 | % | | | 2.00 | % | | | 0.88 | % | | | | | 1.04 | % | | | 0.97 | % | | | 0.90 | % | | | 1.00 | % | |
Columbia Thermostat FundSM | |
Management Fees | | | 0.10 | % | | | 0.10 | % | | | 0.10 | % | | | | | | | | | | | 0.10 | % | | | 0.10 | % | | | 0.10 | % | | | 0.10 | % | |
Distribution and Service (12b-1) Fees | | | 0.25 | % | | | 0.75 | % | | | 1.00 | % | | | | | | | | | | | 0.00 | % | | | 0.00 | % | | | 0.00 | % | | | 0.00 | % | |
Other Expenses | | | 0.15 | % | | | 0.15 | % | | | 0.15 | % | | | | | | | | | | | 0.15 | % | | | 0.13 | % | | | 0.08 | % | | | 0.14 | % | |
Net Expense Ratio(b) | | | 0.50 | % | | | 1.00 | % | | | 1.25 | % | | | | | | | 0.25 | % | | | 0.23 | % | | | 0.18 | % | | | 0.24 | % | |
Columbia Acorn Emerging Markets FundSM(c) | |
Management Fees | | | 1.05 | % | | | | | | | 1.05 | % | | | 1.05 | % | | | | | | | 1.05 | % | | | 1.05 | % | | | 1.05 | % | | | 1.05 | % | |
Distribution and Service (12b-1) Fees | | | 0.25 | % | | | | | | | 1.00 | % | | | 0.00 | % | | | | | | | 0.00 | % | | | 0.00 | % | | | 0.00 | % | | | 0.00 | % | |
Other Expenses | | | 0.32 | % | | | | | | | 0.33 | % | | | 0.24 | % | | | | | | | 0.28 | % | | | 0.26 | % | | | 0.18 | % | | | 0.32 | % | |
Net Expense Ratio | | | 1.62 | % | | | | | 2.38 | % | | | 1.29 | % | | | | | 1.33 | % | | | 1.31 | % | | | 1.23 | % | | | 1.37 | % | |
Columbia Acorn European FundSM | |
Management Fees | | | 1.19 | % | | | | | | | 1.19 | % | | | 1.19 | % | | | | | | | 1.19 | % | | | 1.19 | % | | | | | | | 1.19 | % | |
Distribution and Service (12b-1) Fees | | | 0.25 | % | | | | | | | 1.00 | % | | | 0.00 | % | | | | | | | 0.00 | % | | | 0.00 | % | | | | | | | 0.00 | % | |
Other Expenses | | | 0.31 | % | | | | | | | 0.31 | % | | | 0.26 | % | | | | | | | 0.31 | % | | | 0.31 | % | | | | | | | 0.31 | % | |
Net Expense Ratio | | | 1.75 | % | | | | | 2.50 | % | | | 1.45 | % | | | | | 1.50 | % | | | 1.50 | % | | | | | 1.50 | % | |
See the Funds' prospectuses for information on minimum initial investment amounts and other details of buying, selling and exchanging shares of the Funds.
Fees and expenses are for the six months ended June 30, 2015. The fees and expenses of Columbia Acorn International Select and Columbia Acorn Select include the effect of the voluntary undertaking by Columbia Wanger Asset Management, LLC (CWAM) to reimburse each Fund so that the ordinary operating expenses (excluding transaction costs and certain other investment-related expenses, interest and fees on borrowings and expenses associated with the Fund's investment in other investment companies, if any), after giving effect to any balance credits or overdraft charges from the Fund's custodian, do not exceed the following annual rates as a percentage of each class' average daily net assets:
Fund | | Class A | | Class B | | Class C | | Class I | | Class R4 | | Class R5 | | Class Y | | Class Z | |
Columbia Acorn International Select | | | 1.70 | % | | | 2.20 | % | | | 2.45 | % | | | 1.37 | % | | | 1.45 | % | | | 1.42 | % | | | 1.37 | % | | | 1.45 | % | |
Columbia Acorn Select | | | 1.60 | % | | | 2.10 | % | | | 2.35 | % | | | 1.25 | % | | | 1.35 | % | | | 1.30 | % | | | 1.25 | % | | | 1.35 | % | |
These arrangements may be modified or terminated by either the Funds or CWAM on 30 days' notice.
Effective May 1, 2015, CWAM has contractually agreed to waive 0.20% of the advisory fee otherwise payable to it by Columbia Acorn Select through April 30, 2016. When determining whether the Fund's total expenses exceed the voluntary expense cap described above, the Fund's net advisory fee, reflecting application of the 0.20% waiver, will be used to calculate the Fund's total expenses. This arrangement may only be modified or amended with approval from all parties to the arrangement, including the Fund and CWAM.
The fees and expenses of Columbia Thermostat Fund include the effect of CWAM's contractual undertaking to waive fees and/or reimburse expenses of the Fund so that the ordinary operating expenses (excluding transaction costs and certain other investment-related expenses, interest and fees on borrowings and expenses associated with the Fund's investment in underlying portfolio funds), do not exceed annually the rates of 0.50%, 1.00%, 1.25%, 0.25%, 0.24%, 0.19% and 0.25% of the Fund's average daily net assets attributable to Class A, Class B, Class C, Class R4, Class R5, Class Y and Class Z shares, respectively, through April 30, 2016. There is no guarantee that this agreement will continue thereafter.
The fees and expenses of Columbia Acorn Emerging Markets Fund and Columbia Acorn European Fund include the effect of CWAM's contractual undertaking to waive fees and/or reimburse expenses of each Fund so that the ordinary operating expenses (excluding transaction costs and certain other investment-related expenses, interest and fees on borrowings and expenses associated with the Fund's investment in other investment companies, if any), of each Fund's Class A, Class C, Class I, Class R4, Class R5, Class Y (if offered) and Class Z shares through April 30, 2016, do not exceed the following annual rates as a percentage of each class' average daily net assets:
Fund | | Class A | | Class C | | Class I | | Class R4 | | Class R5 | | Class Y | | Class Z | |
Columbia Acorn Emerging Markets Fund | | | 1.85 | % | | | 2.60 | % | | | 1.48 | % | | | 1.60 | % | | | 1.53 | % | | | 1.48 | % | | | 1.60 | % | |
Columbia Acorn European Fund | | | 1.75 | % | | | 2.50 | % | | | 1.41 | % | | | 1.50 | % | | | 1.46 | % | | | — | | | | 1.50 | % | |
There is no guarantee that these arrangements will continue thereafter.
The fees and expenses of Columbia Acorn International include the effect of the voluntary undertaking by CMIS to waive a portion of total annual Fund operating expenses attributable to transfer agency expenses incurred by Class A, Class B and Class C shares of Columbia Acorn International such that the Fund's total annual Fund operating expenses will be reduced by 0.04%, 0.03% and 0.02% for Class A, Class B and Class C shares of the Fund, respectively.
(a) The Funds generally no longer accept investments by new or existing investors in Class B shares, except in connection with the reinvestment of any dividend and/or capital gain distributions in Class B shares of the Funds and exchanges by existing Class B shareholders of certain other funds within the Columbia Acorn Family of Funds.
(b) Does not include estimated fees and expenses of 0.51% incurred by the Fund from the underlying portfolio funds in which it invests.
(c) Effective July 11, 2014, Columbia Acorn Emerging Markets Fund is closed to most new investors and new accounts, except as described in the Fund's prospectus, dated May 1, 2015.
127
COLUMBIA ACORN FAMILY OF FUNDS
Trustees
Laura M. Born
Chair of the Board
Steven N. Kaplan
Vice Chair of the Board
Maureen M. Culhane
P. Zachary Egan
Margaret M. Eisen
Thomas M. Goldstein
John C. Heaton
Charles R. Phillips
David J. Rudis
Ralph Wanger (Trustee Emeritus)
Officers
P. Zachary Egan
President
Alan G. Berkshire
Vice President
Robert A. Chalupnik
Vice President
Michael G. Clarke
Assistant Treasurer
Joseph F. DiMaria
Assistant Treasurer
William J. Doyle
Vice President
David L. Frank
Vice President
Paul B. Goucher
Assistant Secretary
Fritz Kaegi
Vice President
John M. Kunka
Treasurer and Principal Accounting and Financial Officer
Stephen Kusmierczak
Vice President
Joseph C. LaPalm
Vice President
Ryan C. Larrenaga
Assistant Secretary
Satoshi Matsunaga
Vice President
Charles P. McQuaid
Vice President
Louis J. Mendes
Vice President
Robert A. Mohn
Vice President
Christopher J. Olson
Vice President
Robert P. Scales
Chief Compliance Officer, Chief Legal Officer,
Senior Vice President and General Counsel
Matthew S. Szafranski
Vice President
Andreas Waldburg-Wolfegg
Vice President
Linda K. Roth-Wiszowaty
Secretary
Investment Manager
Columbia Wanger Asset Management, LLC
227 West Monroe Street, Suite 3000
Chicago, Illinois 60606
1-800-922-6769
Distributor
Columbia Management Investment Distributors, Inc.
225 Franklin Street
Boston, Massachusetts 02110
Transfer Agent, Dividend Disbursing Agent
Columbia Management Investment Services Corp.
P. O. Box 8081
Boston, Massachusetts 02266-8081
1-800-345-6611
Legal Counsel to the Funds
Perkins Coie LLP
Washington, DC
Legal Counsel to the Independent Trustees
Drinker Biddle & Reath LLP
Philadelphia, Pennsylvania
Independent Registered Public Accounting Firm
PricewaterhouseCoopers LLP
Chicago, Illinois
This report, including the schedules of investments, is submitted for the general information of the shareholders of Columbia Acorn Trust.
A description of the policies and procedures that the Funds use to determine how to vote proxies and a copy of the Funds' voting record are available (i) without charge, upon request, by calling 800-922-6769 and (ii) on the Securities and Exchange Commission's website at www.sec.gov. Information regarding how the Funds voted proxies relating to portfolio securities during the 12-month period ended June 30, is available from the SEC's website. Information regarding how the Funds voted proxies relating to portfolio securities is also available at columbiathreadneedle.com/us under "About Us." From there, click on "Disclosures."
The Funds file a complete schedule of portfolio holdings with the SEC for the first and third quarters of each fiscal year on Form N-Q. The Funds' Form N-Q is available on the SEC's website at www.sec.gov and may be reviewed and copied at the SEC's Public Reference Room in Washington, D.C. Information on the operation of the Public Reference Room may be obtained by calling 1-800-SEC-0330. The Funds' complete portfolio holdings are disclosed at columbiathreadneedle.com/us approximately 30 to 40 days after each month-end.
Investors should consider the investment objectives, risks, charges and expenses of a mutual fund carefully before investing. For a free prospectus and, if available, a summary prospectus, which contains this and other important information about the funds, visit columbiathreadneedle.com/us. Read the prospectus carefully before investing.
Columbia Acorn Family of Funds are distributed by Columbia Management Investment Distributors, Inc., member FINRA and managed by Columbia Wanger Asset Management, LLC.
Find out what's new – visit our website at:
columbiathreadneedle.com/us
Our e-mail address is:
serviceinquiries@columbiathreadneedle.com
Shareholders should not include personal information such as account numbers, Social Security numbers or taxpayer identification numbers in e-mail. We are unable to accept account transactions sent via e-mail.
128
This document contains Global Industry Classification Standard data. The Global Industry Classification Standard ("GICS") was developed by and is the exclusive property and a service mark of MSCI Inc. ("MSCI") and Standard & Poor's Financial Services LLC ("S&P") and is licensed for use by Columbia Wanger Asset Management, LLC. Neither MSCI, S&P, nor any other party involved in making or compiling the GICS or any GICS classifications makes any express or implied warranties or representations with respect to such standard or classification (or the results to be obtained by the use thereof), and all such parties hereby expressly disclaim all warranties of originality, accuracy, completeness, merchantability and fitness for a particular purpose with respect to any of such standard or classification. Without limiting any of the foregoing, in no event shall MSCI, S&P, any of their affiliates or any third party involved in making or compiling the GICS or any GICS classifications have any liability for any direct, indirect, special, punitive, consequential or any other damages (including lost profits) even if notified of the possibility of such damages.
Columbia Acorn Family of Funds
Class A, B, C, I, R, R4, R5, Y and Z Shares
Semiannual Report, June 30, 2015
225 Franklin Street, Boston, MA 02110
For More Information
You'll find more information about the Columbia Acorn Family of Funds in the documents described below. Contact Columbia Funds as follows to obtain these documents free of charge:
By Mail: Columbia Funds
c/o Columbia Management Investment Services Corp.
P.O. Box 8081
Boston, MA 02266-8081
By Telephone: 800.345.6611
Online: columbiathreadneedle.com/us
Shareholder Communications with the Board
The Funds' Board of Trustees has adopted procedures by which shareholders may communicate with the Board. Shareholders who wish to communicate with the Board should send their written communications to the Board by mail, c/o Columbia Wanger Asset Management, LLC, 227 West Monroe Street, Suite 3000, Chicago, Illinois 60606, Attention: Secretary. Shareholder communications must (i) be in writing, (ii) identify the Columbia Acorn Fund to which the communication relates and (iii) state the particular class of shares and number of shares held by the communicating shareholder.
Prospectuses and the Statement of Additional Information (SAI)
The prospectuses and the SAI provide more detailed information about the Funds and their policies. The SAI is legally part of each prospectus (it's incorporated by reference). A copy of each has been filed with the SEC.
Information Provided by the SEC
You can review and copy information about the Funds (including their prospectuses, the SAI and shareholder reports) at the SEC's Public Reference Room in Washington, DC. To find out more about the operation of the Public Reference Room, call the SEC at 202.551.8090. Reports and other information about the Fund are also available in the EDGAR Database on the SEC's website at http://www.sec.gov, or you can receive copies of this information, for a fee, by electronic request at the following e-mail address: publicinfo@sec.gov. You can also obtain copies of this information by writing the Public Reference Section, Securities and Exchange Commission, Washington, DC 20549-0102.
The investment company registration number of Columbia Acorn Trust, of which each of these Funds is a series, is 811-01829.
© 2015 Columbia Management Investment Advisers, LLC. All rights reserved.
800.345.6611 columbiathreadneedle.com/us
SAR110_12_E01_(08/15) 1275823

Item 2. Code of Ethics.
Not applicable for semiannual reports.
Item 3. Audit Committee Financial Expert.
Not applicable for semiannual reports.
Item 4. Principal Accountant Fees and Services.
Not applicable for semiannual reports.
Item 5. Audit Committee of Listed Registrants.
Not applicable.
Item 6. Investments
(a) The registrant’s “Schedule I — Investments in securities of unaffiliated issuers” (as set forth in 17 CFR 210.12-12) is included in Item 1 of this Form N-CSR.
(b) Not applicable.
Item 7. Disclosure of Proxy Voting Policies and Procedures for Closed-End Management Investment Companies.
Not applicable.
Item 8. Portfolio Managers of Closed-End Management Investment Companies.
Not applicable.
Item 9. Purchases of Equity Securities by Closed-End Management Investment Company and Affiliated Purchasers.
Not applicable.
Item 10. Submission of Matters to a Vote of Security Holders.
There were no material changes to the procedures by which shareholders may recommend nominees to the registrant’s board of directors.
Item 11. Controls and Procedures.
(a) The registrant’s principal executive officer and principal financial officers, based on their evaluation of the registrant’s disclosure controls and procedures as of a date within 90 days of the filing of this report, have concluded that such controls and procedures are adequately designed to ensure that material information required to be disclosed by the registrant in Form N-CSR is accumulated and communicated to the registrant’s management, including the principal executive officer and principal financial officer, or persons performing similar functions, as appropriate to allow timely decisions regarding required disclosure.
(b) There was no change in the registrant’s internal control over financial reporting that occurred during the registrant’s second fiscal quarter of the period covered by this report that has materially affected, or is reasonably likely to materially affect, the registrant’s internal control over financial reporting.
Item 12. Exhibits.
(a)(1) Code of ethics required to be disclosed under Item 2 of Form N-CSR: Not applicable for semiannual reports.
(a)(2) Certifications pursuant to Rule 30a-2(a) under the Investment Company Act of 1940 (17 CFR 270.30a-2(a)) attached hereto as Exhibit 99.CERT.
(a)(3) Not applicable.
(b) Certification pursuant to Rule 30a-2(b) under the Investment Company Act of 1940 (17 CFR 270.30a-2(b)) attached hereto as Exhibit 99.906CERT.
SIGNATURES
Pursuant to the requirements of the Securities Exchange Act of 1934 and the Investment Company Act of 1940, the registrant has duly caused this report to be signed on its behalf by the undersigned, thereunto duly authorized.
(registrant) | | Columbia Acorn Trust | |
| | |
| | |
By (Signature and Title) | | /s/ P. Zachary Egan | |
| | P. Zachary Egan, President | |
| | |
| | |
Date | | August 19, 2015 | |
| | | | | | |
Pursuant to the requirements of the Securities Exchange Act of 1934 and the Investment Company Act of 1940, this report has been signed below by the following persons on behalf of the registrant and in the capacities and on the dates indicated.
By (Signature and Title) | | /s/ P. Zachary Egan | |
| | P. Zachary Egan, President | |
| | |
| | |
Date | | August 19, 2015 | |
| | |
| | |
By (Signature and Title) | | /s/ John M. Kunka | |
| | John M. Kunka, Treasurer | |
| | |
| | |
Date | | August 19, 2015 | |
| | | | | | |