UNITED STATES
SECURITIES AND EXCHANGE COMMISSION
Washington, D.C. 20549
FORM N-CSR
CERTIFIED SHAREHOLDER REPORT OF REGISTERED
MANAGEMENT INVESTMENT COMPANIES
Investment Company Act file number 811-01829
Columbia Acorn Trust
(Exact name of registrant as specified in charter)
227 W. Monroe Street
Suite 3000
Chicago, IL 60606
(Address of principal executive offices) (Zip code)
Ryan C. Larrenaga
c/o Columbia Management
Investment Advisers, LLC
225 Franklin Street
Boston, MA 02110
Alan Berkshire
Columbia Acorn Trust
227 West Monroe Street, Suite 3000
Chicago, Illinois 60606
Mary C. Moynihan
Perkins Coie LLP
700 13th Street, NW
Suite 600
Washington, DC 20005
(Name and address of agent for service)
Registrant’s telephone number, including area code: (312) 634-9200
Date of fiscal year end: December 31
Date of reporting period: June 30, 2018
Form N-CSR is to be used by management investment companies to file reports with the Commission not later than 10 days after the transmission to stockholders of any report that is required to be transmitted to stockholders under Rule 30e-1 under the Investment Company Act of 1940 (17 CFR 270.30e-1). The Commission may use the information provided on Form N-CSR in its regulatory, disclosure review, inspection, and policymaking roles.
A registrant is required to disclose the information specified by Form N-CSR, and the Commission will make this information public. A registrant is not required to respond to the collection of information contained in Form N-CSR unless the Form displays a currently valid Office of Management and Budget (“OMB”) control number. Please direct comments concerning the accuracy of the information collection burden estimate and any suggestions for reducing the burden to Secretary, Securities and Exchange Commission, 450 Fifth Street, NW, Washington, DC 20549-0609. The OMB has reviewed this collection of information under the clearance requirements of 44 U.S.C. § 3507.
Item 1. Reports to Stockholders.

SemiAnnual Report
June 30, 2018
Columbia Acorn® Fund
Columbia Acorn International®
Columbia Acorn USA®
Columbia Acorn International SelectSM
Columbia Acorn SelectSM
Columbia Thermostat FundSM
Columbia Acorn Emerging Markets FundSM
Columbia Acorn European FundSM
Not FDIC Insured • No bank guarantee • May lose value
| 3 |
| 5 |
| 7 |
| 10 |
| 12 |
| 14 |
| 16 |
| 18 |
| 20 |
| 22 |
| 24 |
| 26 |
| 28 |
| 30 |
| 32 |
| 34 |
| 36 |
| 37 |
| 40 |
| 78 |
| 82 |
| 86 |
| 94 |
| 126 |
| 143 |
| 148 |
| 150 |
Columbia Acorn Family of Funds | Semiannual Report 2018
Fund at a glance
Columbia Acorn® Fund (Unaudited)
Investment objective
Columbia Acorn® Fund (the Fund) seeks long-term capital appreciation.
Portfolio management
Matthew A. Litfin, CFA
Lead Portfolio Manager since 2016
Service with Fund since 2015
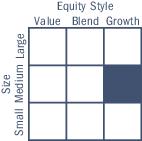
Morningstar style boxTM
The Morningstar Style Box is based on a fund’s portfolio holdings. For equity funds, the vertical axis shows the market capitalization of the stocks owned, and the horizontal axis shows investment style (value, blend, or growth). Information shown is based on the most recent data provided by Morningstar.
© 2018 Morningstar, Inc. All rights reserved. The Morningstar information contained herein: (1) is proprietary to Morningstar and/or its content providers; (2) may not be copied or distributed; and (3) is not warranted to be accurate, complete or timely. Neither Morningstar nor its content providers are responsible for any damages or losses arising from any use of this information.
| Average annual total returns (%) (for the period ended June 30, 2018) |
| | | Inception | 6 Months
cumulative | 1 Year | 5 Years | 10 Years | Life |
| Class A | Excluding sales charges | 10/16/00 | 10.21 | 22.62 | 12.07 | 9.92 | 14.06 |
| | Including sales charges | | 3.86 | 15.57 | 10.75 | 9.27 | 13.92 |
| Advisor Class | 11/08/12 | 10.38 | 22.98 | 12.32 | 10.21 | 14.42 |
| Class C | Excluding sales charges | 10/16/00 | 9.81 | 21.64 | 11.25 | 9.10 | 13.19 |
| | Including sales charges | | 8.81 | 20.88 | 11.25 | 9.10 | 13.19 |
| Institutional Class | 06/10/70 | 10.31 | 22.97 | 12.38 | 10.24 | 14.42 |
| Institutional 2 Class | 11/08/12 | 10.37 | 23.00 | 12.41 | 10.25 | 14.43 |
| Institutional 3 Class | 11/08/12 | 10.38 | 23.14 | 12.47 | 10.29 | 14.43 |
| Russell 2500 Growth Index | | 8.04 | 21.53 | 13.87 | 11.38 | - |
Performance numbers reflect all Fund expenses. Returns for Class A shares are shown with and without the maximum initial sales charge of 5.75%. Returns for Class C shares are shown with and without the maximum contingent deferred sales charge of 1.00% for the first year after purchase. The Fund’s other classes are not subject to sales charges, but may be subject to other fees and expenses, and have limited eligibility. Please see the Fund’s prospectus for details. Performance for different share classes will vary based on differences in sales charges and certain fees and expenses associated with each class.
As stated in the May 1, 2018 prospectus, the Fund’s annual operating expense ratio is 0.86% for Institutional Class shares and 1.11% for Class A shares.
All results shown assume reinvestment of distributions during the period. Returns do not reflect the deduction of taxes that a shareholder may pay on Fund distributions or on the redemption of Fund shares. Performance results may reflect the effect of any fee waivers or reimbursements of Fund expenses by the investment manager and/or any of its affiliates. Absent these fee waivers and/or expense reimbursement arrangements, performance results may have been lower.
The performance information shown represents past performance and is not a guarantee of future results. The investment return and principal value of your investment will fluctuate so that shares, when redeemed, may be worth more or less than their original cost. Current performance may be lower or higher than the performance data shown. You may obtain performance information current to the most recent month-end by contacting your financial intermediary, visiting columbiathreadneedleus.com/investor/ or calling 800.922.6769.
The returns shown for periods prior to the share class inception date (including returns for the Life of the Fund, if shown, which are since Fund inception) include the returns of the Fund’s oldest share class. These returns are adjusted to reflect any higher class-related operating expenses of the newer share classes, as applicable. Please visit columbiathreadneedleus.com/investor/investment-products/mutual-funds/appended-performance for more information.
The Russell 2500 Growth Index measures the performance of those Russell 2500 companies with higher price-to-book ratios and higher forecasted growth values.
Unlike mutual funds, indexes are not managed and do not incur fees or expenses. It is not possible to invest directly in an index.
Columbia Acorn Family of Funds | Semiannual Report 2018
| 3 |
Fund at a glance (continued)
Columbia Acorn® Fund (Unaudited)
| Top ten holdings (%) (at June 30, 2018) | |
Masimo Corp.
Medical signal processing and sensor technology for non-invasive monitoring of physiological parameters | 1.9 |
Old Dominion Freight Line, Inc.
Inter-regional and multi-regional motor carrier | 1.7 |
Pra Health Sciences, Inc.
Global contract research organization | 1.6 |
Bio-Techne Corp.
Biotechnology products and clinical diagnostic controls | 1.6 |
Encompass Health Corp.
Inpatient rehabilitative healthcare services | 1.4 |
Pool Corp.
Swimming pool supplies, equipment and leisure products | 1.3 |
Cadence Design Systems, Inc.
Software technology, design and consulting services and technology | 1.3 |
Amedisys, Inc.
Provider of alternate-site health care services | 1.3 |
Texas Roadhouse, Inc.
Moderately priced, full service restaurant chain | 1.3 |
Ligand Pharmaceuticals, Inc.
Drugs that regulate hormone activated intracellular receptors | 1.3 |
Percentages indicated are based upon total investments (excluding Money Market Funds and Securities Lending Collateral).
For further detail about these holdings, please refer to the section entitled “Portfolio of Investments."
Fund holdings are as of the date given, are subject to change at any time, and are not recommendations to buy or sell any security.
| Portfolio breakdown (%) (at June 30, 2018) |
| Common Stocks | 95.8 |
| Limited Partnerships | 0.4 |
| Money Market Funds | 2.7 |
| Securities Lending Collateral | 1.1 |
| Total | 100.0 |
Percentages indicated are based upon total investments. The Fund’s portfolio composition is subject to change.
| Equity sector breakdown (%) (at June 30, 2018) |
| Consumer Discretionary | 21.0 |
| Consumer Staples | 2.8 |
| Energy | 1.2 |
| Financials | 8.8 |
| Health Care | 20.7 |
| Industrials | 14.9 |
| Information Technology | 24.0 |
| Materials | 2.7 |
| Real Estate | 3.0 |
| Telecommunication Services | 0.9 |
| Total | 100.0 |
Percentages indicated are based upon total equity investments. The Fund’s portfolio composition is subject to change.
| 4 | Columbia Acorn Family of Funds | Semiannual Report 2018 |
Manager Discussion of Fund Performance
Columbia Acorn® Fund
Matthew A. Litfin, CFA
Lead Portfolio Manager
Columbia Acorn® Fund Institutional Class gained 10.31% for the six-month period ended June 30, 2018, outperforming the Fund’s benchmark, the Russell 2500 Growth Index, which returned 8.04% for the same period. Equity selection was the primary driver of relative performance. Sector weightings also benefited the Fund. Within the benchmark, information technology and health care were the top performing sectors, gaining 16.2% and 16.0% respectively. The materials sector lagged, returning -5.6% for the period.
The year began on a positive note, with the momentum of late 2017 carrying into January 2018 amid strengthening economic growth, rising corporate earnings and continued optimism surrounding the federal tax overhaul enacted in December. The rally came up short in early February, however, after unexpectedly strong wage growth sparked fears that the U.S. Federal Reserve (the Fed) would feel compelled to speed up the pace of its interest rate increases. Stocks subsequently recovered as concerns regarding the Fed gradually abated, but the markets retreated once again in March in reaction to escalating rhetoric surrounding U.S. trade policy. Despite these fluctuations — which stood in marked contrast to the low volatility of 2017— broad-based U.S. stock indices closed only modestly lower for the first quarter.
As the second quarter progressed, market performance was supported by a combination of robust economic growth, strong first-quarter corporate profits and rising earnings estimates. These factors helped to offset a variety of possible headwinds, including the potential for a global trade war, signs of a possible slowdown in growth overseas, and the Fed raising rates in June while signaling two more hikes by year end.
Stock selection within the health care and consumer discretionary sectors contributed to returns, while selection within the information technology and financials sectors detracted. While our investment approach focuses on adding value through equity selection versus making significant sector bets, sector weightings had a positive impact on the Fund’s relative performance during the six-month period. An underweight in the materials sector and an overweight in health care contributed, while a slight underweight in information technology detracted.
In terms of individual positions, leading positive contributors included Bioverativ, Amedisys and TransUnion. Shares of Bioverativ, a multinational biotechnology firm that specializes in hemophilia treatments, were up sharply based on Sanofi’s proposal to acquire the company at a significant premium to its market price. In the case of Amedisys, a leading provider of home health, hospice and personal care services, the company reported strong financial results. Amedisys’ investments in improving care quality scores are paying off, resulting in patient volume growth. Receding investor concerns regarding potential home health reimbursement cuts also were beneficial during the period. Lastly, holdings in TransUnion, which provides credit data and decision analytics to individuals and corporate lenders globally, benefited from top-line-growth outperformance during the quarter. While TransUnion’s key offering has been successful, we also project continued growth as the company expands its offerings outside of core lending markets to other business segments such as insurance companies.
Detractors from performance during the period included holdings in Celldex Therapeutics and Cognex. In the case of Celldex Therapeutics, a biotechnology firm focused on cancer treatments, the company experienced a decline in its share price following a failed breast cancer study for its lead product Glembatumumab Vedotin. The Fund exited the position. Finally, the Fund’s holdings in Cognex detracted as the company’s shares pulled back due to global uncertainty surrounding the impact of China tariffs on the supply chain. As Cognex continues to be a best-in-class supplier of machine vision systems, we believe that the longer term growth opportunities for the company remain intact.
U.S. trade policy disputes and interest rate concerns were among many persistent sources of market volatility in 2018. In our view, higher volatility levels and the increased number of economic and market divergences that have been occurring on a global scale have the potential to create attractive
Columbia Acorn Family of Funds | Semiannual Report 2018
| 5 |
Manager Discussion of Fund Performance (continued)
Columbia Acorn® Fund
opportunities. We believe that an investment philosophy that favors higher quality, faster growing companies, as measured across return on invested capital, revenue and earnings growth, and superior debt ratios, can be particularly advantageous in this environment.
Columbia Wanger has specialized in investing in small- and mid-cap stocks since 1970. While cognizant of macroeconomic trends, our investment process takes a bottom-up approach, relying on intensive fundamental research and disciplined valuation techniques. We are focused on investing the Fund in companies with sustainable competitive advantages, entrepreneurial management and the potential to gain market share. Our team creates and closely monitors a specific and unique investment thesis for every company in which the Fund invests. We will continue to employ our time-tested process to look for opportunities for investors to benefit from growth in undervalued small- and mid-cap businesses.
Market risk may affect a single issuer, sector of the economy, industry or the market as a whole. Investments in small- and mid-cap companies involve risks and volatility and possible illiquidity greater than investments in larger, more established companies. Foreign investments subject the Fund to political, economic, market, social and other risks within a particular country, as well as to potential currency instabilities and less stringent financial and accounting standards generally applicable to U.S. issuers. Risks are enhanced for emerging market issuers. The Fund may invest significantly in issuers within a particular sector, which may be negatively affected by market, economic or other conditions, making the Fund more vulnerable to unfavorable developments in the sector. See the Fund’s prospectus for more information on these and other risks.
The views expressed in this report reflect the current views of the respective parties. These views are not guarantees of future performance and involve certain risks, uncertainties and assumptions that are difficult to predict, so actual outcomes and results may differ significantly from the views expressed. These views are subject to change at any time based upon economic, market or other conditions and the respective parties disclaim any responsibility to update such views. These views may not be relied on as investment advice and, because investment decisions for a Columbia Acorn Fund are based on numerous factors, may not be relied on as an indication of trading intent on behalf of any particular Columbia Acorn Fund. References to specific securities should not be construed as a recommendation or investment advice.
| 6 | Columbia Acorn Family of Funds | Semiannual Report 2018 |
Fund at a glance
Columbia Acorn International® (Unaudited)
Investment objective
Columbia Acorn International® (the Fund) seeks long-term capital appreciation.
Portfolio management
Louis J. Mendes, CFA
Co-Portfolio Manager since 2003
Service with Fund since 2001
Tae Han (Simon) Kim, CFA
Co-Portfolio Manager since December 2017
Service with Fund since 2011
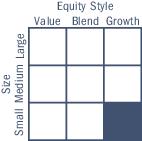
Morningstar style boxTM
The Morningstar Style Box is based on a fund’s portfolio holdings. For equity funds, the vertical axis shows the market capitalization of the stocks owned, and the horizontal axis shows investment style (value, blend, or growth). Information shown is based on the most recent data provided by Morningstar.
© 2018 Morningstar, Inc. All rights reserved. The Morningstar information contained herein: (1) is proprietary to Morningstar and/or its content providers; (2) may not be copied or distributed; and (3) is not warranted to be accurate, complete or timely. Neither Morningstar nor its content providers are responsible for any damages or losses arising from any use of this information.
| Average annual total returns (%) (for the period ended June 30, 2018) |
| | | Inception | 6 Months
cumulative | 1 Year | 5 Years | 10 Years | Life |
| Class A | Excluding sales charges | 10/16/00 | -0.06 | 11.32 | 6.85 | 5.22 | 9.97 |
| | Including sales charges | | -5.81 | 4.92 | 5.59 | 4.60 | 9.72 |
| Advisor Class | 11/08/12 | 0.07 | 11.59 | 7.08 | 5.52 | 10.36 |
| Class C | Excluding sales charges | 10/16/00 | -0.42 | 10.48 | 6.05 | 4.43 | 9.16 |
| | Including sales charges | | -1.38 | 9.48 | 6.05 | 4.43 | 9.16 |
| Institutional Class | 09/23/92 | 0.07 | 11.60 | 7.14 | 5.55 | 10.37 |
| Institutional 2 Class | 08/02/11 | 0.11 | 11.67 | 7.18 | 5.57 | 10.38 |
| Institutional 3 Class | 11/08/12 | 0.13 | 11.73 | 7.24 | 5.60 | 10.39 |
| Class R | 08/02/11 | -0.17 | 11.04 | 6.49 | 4.90 | 9.69 |
| MSCI ACWI ex USA SMID Cap Index (Net) | | -2.90 | 9.69 | 8.15 | 4.78 | - |
| MSCI ACWI ex USA SMID Cap Growth Index (Net) | | -1.38 | 12.07 | 8.81 | 4.23 | - |
Performance numbers reflect all Fund expenses. Returns for Class A shares are shown with and without the maximum initial sales charge of 5.75%. Returns for Class C shares are shown with and without the maximum contingent deferred sales charge of 1.00% for the first year after purchase. The Fund’s other classes are not subject to sales charges, but may be subject to other fees and expenses, and have limited eligibility. Please see the Fund’s prospectus for details. Performance for different share classes will vary based on differences in sales charges and certain fees and expenses associated with each class.
As stated in the May 1, 2018 prospectus, the Fund’s annual operating expense ratio is 0.99% for Institutional Class shares and 1.24% for Class A shares.
All results shown assume reinvestment of distributions during the period. Returns do not reflect the deduction of taxes that a shareholder may pay on Fund distributions or on the redemption of Fund shares. Performance results may reflect the effect of any fee waivers or reimbursements of Fund expenses by the investment manager and/or any of its affiliates. Absent these fee waivers and/or expense reimbursement arrangements, performance results may have been lower.
The performance information shown represents past performance and is not a guarantee of future results. The investment return and principal value of your investment will fluctuate so that shares, when redeemed, may be worth more or less than their original cost. Current performance may be lower or higher than the performance data shown. You may obtain performance information current to the most recent month-end by contacting your financial intermediary, visiting columbiathreadneedleus.com/investor/ or calling 800.922.6769.
The returns shown for periods prior to the share class inception date (including returns for the Life of the Fund, if shown, which are since Fund inception) include the returns of the Fund’s oldest share class. These returns are adjusted to reflect any higher class-related operating expenses of the newer share classes, as applicable. Please visit columbiathreadneedleus.com/investor/investment-products/mutual-funds/appended-performance for more information.
The MSCI ACWI ex USA SMID Cap Index (Net) captures a mid- and small-cap representation across 22 of 23 developed market countries (excluding the U.S.) and 24 emerging market countries. The index covers approximately 28% of the free float-adjusted market capitalization in each country.
The MSCI ACWI ex USA SMID Cap Growth Index (Net) captures mid-and small cap representation across 22 developed markets countries and 24 emerging markets countries.
Unlike mutual funds, indexes are not managed and do not incur fees or expenses. It is not possible to invest directly in an index.
Columbia Acorn Family of Funds | Semiannual Report 2018
| 7 |
Fund at a glance (continued)
Columbia Acorn International® (Unaudited)
| Top ten holdings (%) (at June 30, 2018) | |
CCL Industries, Inc. (Canada)
Manufacturing services and specialty packaging products for the non-durable consumer products market | 3.0 |
Rentokil Initial PLC (United Kingdom)
Fully integrated facilities management and essential support services | 2.7 |
Hexagon AB, Class B (Sweden)
Design, measurement and visualisation technologies | 2.4 |
MTU Aero Engines AG (Germany)
Develops and manufactures engines and offers commercial engine services and support | 2.2 |
Brembo SpA (Italy)
Braking systems and components | 1.9 |
Halma PLC (United Kingdom)
Products that detect hazards and protect assets and people in public and commercial buildings | 1.9 |
Unibet Group PLC (Malta)
Online gambling services | 1.8 |
Novozymes AS, Class B (Denmark)
Enzymes for industrial use | 1.8 |
Spirax-Sarco Engineering PLC (United Kingdom)
Consultation, service and products for the control and efficient management of steam and industrial fluids | 1.8 |
SimCorp AS (Denmark)
Global provider of highly specialised software for the investment management industry | 1.8 |
Percentages indicated are based upon total investments (excluding Money Market Funds and Securities Lending Collateral).
For further detail about these holdings, please refer to the section entitled “Portfolio of Investments."
Fund holdings are as of the date given, are subject to change at any time, and are not recommendations to buy or sell any security.
| Equity sector breakdown (%) (at June 30, 2018) |
| Consumer Discretionary | 18.5 |
| Consumer Staples | 5.4 |
| Energy | 0.9 |
| Financials | 9.4 |
| Health Care | 8.1 |
| Industrials | 25.2 |
| Information Technology | 19.9 |
| Materials | 10.5 |
| Real Estate | 2.1 |
| Total | 100.0 |
Percentages indicated are based upon total equity investments. The Fund’s portfolio composition is subject to change.
| 8 | Columbia Acorn Family of Funds | Semiannual Report 2018 |
Fund at a glance (continued)
Columbia Acorn International® (Unaudited)
| Country breakdown (%) (at June 30, 2018) |
| Australia | 1.7 |
| Belgium | 0.4 |
| Brazil | 1.2 |
| Cambodia | 0.5 |
| Canada | 5.8 |
| Cayman Islands | 1.9 |
| China | 4.3 |
| Denmark | 4.7 |
| France | 0.4 |
| Germany | 9.7 |
| Hong Kong | 1.0 |
| India | 1.4 |
| Indonesia | 0.8 |
| Ireland | 1.1 |
| Italy | 3.2 |
| Japan | 22.2 |
| Malta | 1.8 |
| Mexico | 1.6 |
| Netherlands | 1.4 |
| Philippines | 0.5 |
| Poland | 0.3 |
| Russian Federation | 0.4 |
| Singapore | 1.8 |
| South Africa | 1.5 |
| South Korea | 4.2 |
| Spain | 0.8 |
| Sweden | 4.7 |
| Switzerland | 2.4 |
| Taiwan | 0.7 |
| Thailand | 0.9 |
| United Kingdom | 12.8 |
| United States(a) | 3.9 |
| Total | 100.0 |
| (a) | Includes investments in Money Market Funds. |
Country breakdown is based primarily on issuer’s place of organization/incorporation. Percentages indicated are based upon total investments. The Fund’s portfolio composition is subject to change.
Columbia Acorn Family of Funds | Semiannual Report 2018
| 9 |
Manager Discussion of Fund Performance
Columbia Acorn International®
Louis J. Mendes, CFA
Co-Portfolio Manager
Tae Han (Simon) Kim, CFA
Co-Portfolio Manager
Columbia Acorn International® Institutional Class returned 0.07% for the six-month period ended June 30, 2018, outperforming the Fund’s benchmark, the MSCI ACWI ex USA SMID Cap Index (Net), which returned -2.90% for the same time period.
International small-cap stocks finished the first half of the year with a roughly flat return. The foreign markets, in general, experienced headwinds from the combination of weaker-than-expected growth, uncertainty regarding U.S. trade policy, and the shift toward tighter monetary policy by the world’s central banks. Political disruptions, including the ongoing Brexit negotiations and renewed worries about Italy’s elevated government debt, also weighed on sentiment. Returns for U.S.-based investors were further pressured by the adverse impact of currency translation, as the euro, Japanese yen, and other major foreign currencies declined in value relative to the U.S. dollar. Despite these issues, small-cap stocks performed reasonably well and exceeded the returns of their large-cap counterparts.
In this potentially challenging environment, the Fund posted a positive return and outpaced its benchmark on the strength of our individual stock selection. The Fund’s holdings outperformed the corresponding benchmark components by a comfortable margin in the information technology and industrials sectors, and to a somewhat lesser extent in the health care, financials, and consumer staples sectors. Our relative strength in these areas was offset to some degree by our weaker showing in the consumer discretionary, energy, and real estate sectors.
The German payment-processing company Wirecard was the top contributor to performance among individual stocks. Wirecard has benefited as the market for electronic payment transactions has grown in tandem with the expansion of e-commerce. The company demonstrated robust organic growth with an encouraging sales pipeline, leading to outperformance for its stock in the first half of the year. SimCorp also contributed to our healthy showing in the technology sector. A Denmark-based provider of specialized software for the investment management industry, SimCorp benefited from two strong earnings reports, rising profit margins, and the announcement of a dividend increase. Hexagon (Sweden) and Rightmove (United Kingdom) were additional contributors in technology, as was the Fund’s overweight position in the sector.
The Fund’s strong showing in the industrials space was another key contributor to performance, as our holdings combined to produce a gain even as the overall sector experienced a loss in the benchmark. U.K.-based Rentokil, which provides pest control solutions, was a key contributor in the sector. The company demonstrated the ability to leverage technology to improve efficiency and offer higher value-added services, resulting in solid organic growth. The Chinese online recruiting services firm 51job also posted a gain despite the poor showing for China’s stock market, as investors responded favorably after the company reported revenues that came in well above expectations.
Outside of technology and industrials, the Fund benefited from the gains for the Japanese convenience store operator FamilyMart UNY Holdings, which rallied after the company received a tender offer bid. A number of health care stocks also finished among the Fund’s top contributors in the first half of the year, including Ultragenyx Pharmaceutical (United States), Sartorius (Germany), and Ipsen (France).
On the negative side, the U.K. software company Micro Focus International was the largest detractor from results. The company specializes in consolidating legacy software franchises, and its management has a long track record of improving the profitability of mature software companies. More recently, however, investors reacted unfavorably to its acquisition of HP Software. In addition, Micro Focus announced declining revenues and the unexpected departure of its chief executive officer. We chose to eliminate the position from the portfolio. The Fund was also hurt by its positions in the Brazilian companies Qualicorp Consultoria e Corretora de Seguros (healthcare services) and Raia Drogasil (food retailing). Both stocks declined amid the broader weakness in Brazil’s stock market, which was brought about by the combination of slower growth, a sharp downturn in the nation’s
| 10 | Columbia Acorn Family of Funds | Semiannual Report 2018 |
Manager Discussion of Fund Performance (continued)
Columbia Acorn International®
currency, and uncertainty surrounding Brazil’s October elections. We also lost some ground through a position in Korea Zinc, a smelter of zinc, lead and precious metals, that came under pressure from falling prices in its end markets.
At the close of the period, our bottom-up process translated to overweight positions in the information technology, industrials, health care and consumer discretionary sectors. Conversely, the Fund’s most sizable underweights were in slower growing market segments such as utilities, real estate, and telecommunications services. The Fund was also underweight in the materials and energy sectors, where the performance of individual stocks is tied more to the direction of commodity prices than organic, bottom-up growth trends.
As the first half of 2018 ended, the global economy remained on a solid footing. However, the divergences in economic trends in the first half of the year represented a departure from the synchronized global growth that helped support equities in 2017. Given the ongoing strength in corporations’ revenues and bottom-line earnings, we view these divergences — and the associated market volatility — as a source of opportunity for individual stock selection.
We think these circumstances, in total, indicate that stock selection may begin to play a larger role in Fund performance than it did in the bull market of 2016-2017. We believe an investment philosophy that favors higher quality, faster growing companies, as measured across metrics such as return on invested capital, revenue and earnings growth, and superior debt ratios, is well suited to this evolving investment backdrop.
Market risk may affect a single issuer, sector of the economy, industry or the market as a whole. International investing involves certain risks and volatility due to potential political, economic or currency instabilities and different, potentially less stringent, financial and accounting standards than those generally applicable to U.S. issuers. Risks are enhanced for emerging market issuers. Investments in small- and mid-cap companies involve risks and volatility and possible illiquidity greater than investments in larger, more established companies. The Fund may invest significantly in issuers within a particular sector, which may be negatively affected by market, economic or other conditions, making the Fund more vulnerable to unfavorable developments in the sector. See the Fund’s prospectus for more information on these and other risks.
The views expressed in this report reflect the current views of the respective parties. These views are not guarantees of future performance and involve certain risks, uncertainties and assumptions that are difficult to predict, so actual outcomes and results may differ significantly from the views expressed. These views are subject to change at any time based upon economic, market or other conditions and the respective parties disclaim any responsibility to update such views. These views may not be relied on as investment advice and, because investment decisions for a Columbia Acorn Fund are based on numerous factors, may not be relied on as an indication of trading intent on behalf of any particular Columbia Acorn Fund. References to specific securities should not be construed as a recommendation or investment advice.
Columbia Acorn Family of Funds | Semiannual Report 2018
| 11 |
Fund at a glance
Columbia Acorn USA® (Unaudited)
Investment objective
Columbia Acorn USA® (the Fund) seeks long-term capital appreciation.
Portfolio management
Matthew A. Litfin, CFA
Lead Portfolio Manager since 2016
Service with Fund since 2015
Richard Watson, CFA
Co-Portfolio Manager since November 2017
Service with Fund since 2006
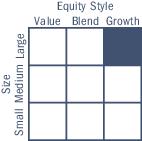
Morningstar style boxTM
The Morningstar Style Box is based on a fund’s portfolio holdings. For equity funds, the vertical axis shows the market capitalization of the stocks owned, and the horizontal axis shows investment style (value, blend, or growth). Information shown is based on the most recent data provided by Morningstar.
© 2018 Morningstar, Inc. All rights reserved. The Morningstar information contained herein: (1) is proprietary to Morningstar and/or its content providers; (2) may not be copied or distributed; and (3) is not warranted to be accurate, complete or timely. Neither Morningstar nor its content providers are responsible for any damages or losses arising from any use of this information.
| Average annual total returns (%) (for the period ended June 30, 2018) |
| | | Inception | 6 Months
cumulative | 1 Year | 5 Years | 10 Years | Life |
| Class A | Excluding sales charges | 10/16/00 | 15.24 | 23.39 | 13.34 | 10.41 | 10.81 |
| | Including sales charges | | 8.63 | 16.30 | 12.01 | 9.76 | 10.51 |
| Advisor Class | 11/08/12 | 15.43 | 23.68 | 13.64 | 10.70 | 11.17 |
| Class C | Excluding sales charges | 10/16/00 | 14.78 | 22.45 | 12.56 | 9.61 | 10.01 |
| | Including sales charges | | 13.78 | 21.78 | 12.56 | 9.61 | 10.01 |
| Institutional Class | 09/04/96 | 15.37 | 23.67 | 13.64 | 10.70 | 11.17 |
| Institutional 2 Class | 11/08/12 | 15.44 | 23.83 | 13.74 | 10.76 | 11.20 |
| Institutional 3 Class | 11/08/12 | 15.45 | 23.84 | 13.80 | 10.79 | 11.21 |
| Russell 2000 Growth Index | | 9.70 | 21.86 | 13.65 | 11.24 | - |
Performance numbers reflect all Fund expenses. Returns for Class A shares are shown with and without the maximum initial sales charge of 5.75%. Returns for Class C shares are shown with and without the maximum contingent deferred sales charge of 1.00% for the first year after purchase. The Fund’s other classes are not subject to sales charges, but may be subject to other fees and expenses, and have limited eligibility. Please see the Fund’s prospectus for details. Performance for different share classes will vary based on differences in sales charges and certain fees and expenses associated with each class.
As stated in the May 1, 2018 prospectus, the Fund’s annual operating expense ratio is 1.17% for Institutional Class shares and 1.42% for Class A shares.
All results shown assume reinvestment of distributions during the period. Returns do not reflect the deduction of taxes that a shareholder may pay on Fund distributions or on the redemption of Fund shares. Performance results may reflect the effect of any fee waivers or reimbursements of Fund expenses by the investment manager and/or any of its affiliates. Absent these fee waivers and/or expense reimbursement arrangements, performance results may have been lower.
The performance information shown represents past performance and is not a guarantee of future results. The investment return and principal value of your investment will fluctuate so that shares, when redeemed, may be worth more or less than their original cost. Current performance may be lower or higher than the performance data shown. You may obtain performance information current to the most recent month-end by contacting your financial intermediary, visiting columbiathreadneedleus.com/investor/ or calling 800.922.6769.
The returns shown for periods prior to the share class inception date (including returns for the Life of the Fund, if shown, which are since Fund inception) include the returns of the Fund’s oldest share class. These returns are adjusted to reflect any higher class-related operating expenses of the newer share classes, as applicable. Please visit columbiathreadneedleus.com/investor/investment-products/mutual-funds/appended-performance for more information.
The Russell 2000 Growth Index, an unmanaged index, measures the performance of those Russell 2000 Index companies with higher price-to-book ratios and higher forecasted growth values.
Unlike mutual funds, indexes are not managed and do not incur fees or expenses. It is not possible to invest directly in an index.
| 12 | Columbia Acorn Family of Funds | Semiannual Report 2018 |
Fund at a glance (continued)
Columbia Acorn USA® (Unaudited)
| Top ten holdings (%) (at June 30, 2018) | |
First Busey Corp.
Multi-bank holding company | 1.6 |
Houlihan Lokey, Inc.
Investment bank | 1.6 |
HealthEquity, Inc.
Technology-enabled services platforms for consumers to make healthcare saving and spending decisions | 1.5 |
Dave & Buster’s Entertainment, Inc.
Venues that combine dining and entertainment for adults and families | 1.5 |
Cabot Microelectronics Corp.
Slurries used in chemical mechanical planarization | 1.5 |
ICF International, Inc.
Management, technology, policy consulting, and implementation services | 1.5 |
Orion Engineered Carbons SA
Global supplier of Carbon Black | 1.5 |
Texas Roadhouse, Inc.
Moderately priced, full service restaurant chain | 1.4 |
iRhythm Technologies, Inc.
Medical instruments | 1.4 |
Extended Stay America, Inc.
Hotels and motels | 1.4 |
Percentages indicated are based upon total investments (excluding Money Market Funds and Securities Lending Collateral).
For further detail about these holdings, please refer to the section entitled “Portfolio of Investments."
Fund holdings are as of the date given, are subject to change at any time, and are not recommendations to buy or sell any security.
| Portfolio breakdown (%) (at June 30, 2018) |
| Common Stocks | 94.5 |
| Limited Partnerships | 0.5 |
| Money Market Funds | 3.7 |
| Securities Lending Collateral | 1.3 |
| Total | 100.0 |
Percentages indicated are based upon total investments. The Fund’s portfolio composition is subject to change.
| Equity sector breakdown (%) (at June 30, 2018) |
| Consumer Discretionary | 17.6 |
| Consumer Staples | 5.0 |
| Energy | 1.5 |
| Financials | 14.5 |
| Health Care | 26.5 |
| Industrials | 10.1 |
| Information Technology | 18.1 |
| Materials | 2.8 |
| Real Estate | 3.4 |
| Telecommunication Services | 0.5 |
| Total | 100.0 |
Percentages indicated are based upon total equity investments. The Fund’s portfolio composition is subject to change.
Columbia Acorn Family of Funds | Semiannual Report 2018
| 13 |
Manager Discussion of Fund Performance
Columbia Acorn USA®
Matthew A. Litfin, CFA
Lead Portfolio Manager
Richard Watson, CFA
Co-Portfolio Manager
Columbia Acorn USA® Institutional Class gained 15.37% for the six-month period ended June 30, 2018. The Fund significantly outperformed its benchmark, the Russell 2000 Growth Index, which returned 9.70% for the same period. Equity selection was the primary driver of relative performance. Sector weightings also benefited the Fund. Within the benchmark, the information technology and heath care sectors were the best performing sectors, gaining 17.9% and 17.0% respectively. The utilities sector lagged, losing 5.4% during the period.
The year began on a positive note, with the momentum of late 2017 carrying into January amid strengthening economic growth, rising corporate earnings and continued optimism surrounding the federal tax overhaul enacted in December. The rally came up short in early February, however, after unexpectedly strong wage growth sparked fears that the U.S. Federal Reserve (the Fed) would feel compelled to speed up the pace of its interest rate increases. Stocks subsequently recovered as concerns regarding the Fed gradually abated, but the markets retreated once again in March in reaction to escalating rhetoric surrounding U.S. trade policy. Despite these fluctuations — which stood in marked contrast to the low volatility of 2017— broad-based U.S. stock indices closed only modestly lower for the first quarter of 2018.
As the second quarter progressed, market performance was supported by a combination of robust economic growth, strong first-quarter corporate profits and rising earnings estimates. These factors helped to offset a variety of possible headwinds, including the apparent launch of a global trade war, signs of a possible slowdown in growth overseas, and the Fed raising rates in June while signaling two more hikes by year end. For the six months ended June 30, 2018, the U.S. stock market, as gauged by the widely followed S&P 500 Index, posted a 2.65% return. Within the U.S. stock market, growth and small-cap stocks notably outperformed their value and large-cap counterparts, respectively, over the first half of 2018.
Overall equity selection was by far the largest contributor to the Fund’s performance during the six-month period, especially within the health care sector. Stock picks within the information technology and financials sectors also were additive, while selection within the industrials sector detracted. While our investment approach focuses on adding value through equity selection versus making significant sector bets, sector weightings had a positive impact on the Fund’s relative performance during the six-month period. An underweight in the industrials sector contributed to returns while an underweight in the information technology sector and an overweight in the financials sector detracted.
In terms of individual positions, leading positive contributors included Alteryx, Agios Pharmaceuticals and Sientra. The Fund’s holdings in Alteryx, which provides unique software tools for managing and analyzing data derived from many disparate sources, posted solid gains during the period as demand for the company’s solutions continued to drive stronger-than-expected revenue growth. Shares of Agios Pharmaceuticals, an emerging biotechnology company with the best-in-class leukemia drugs Idhifa and Ivosidenib, rose during the period. Agios benefited from positive early feedback on Idhifa sales as well as favorable drug pipeline advancement. Sientra, a medical device company focused on aesthetics, posted gains following an FDA approval that facilitated the company’s re-entry into the lucrative breast implant market.
Detractors from performance during the period included holdings in Anika Therapeutics, WageWorks and Dave & Busters. Anika Therapeutics, which develops injections to manage knee osteoarthritis pain, suffered two significant setbacks during the period: a small product recall and later the failure of a critical phase III clinical trial for its next-generation injection, CINGAL. In the case of WageWorks, a leading administrator of tax-advantaged employee benefit programs, its shares traded down after the company surprisingly delayed the filing of a key financial report. WageWorks has subsequently made organizational changes to correct the issues, which had a relatively small impact on financial statements. WageWorks’ strategy, fundamental business and growth opportunities appear to be intact.
| 14 | Columbia Acorn Family of Funds | Semiannual Report 2018 |
Manager Discussion of Fund Performance (continued)
Columbia Acorn USA®
Lastly, shares of Dave & Busters, a family-focused restaurant concept that offers a variety of entertainment including video gaming, retreated due to disappointing fourth-quarter results driven by a combination of challenging comparisons for gaming revenue, weather and competition.
U.S. trade policy disputes and interest rate concerns were among many persistent sources of market volatility in 2018. In our view, higher volatility levels and the increased number of economic and market divergences that are occurring on a global scale have the potential to create attractive opportunities. We believe that an investment philosophy that favors higher quality, faster growing companies, as measured across return on invested capital, revenue and earnings growth, and superior debt ratios, can be particularly advantageous in this environment.
Columbia Wanger has specialized in investing in small- and mid-cap stocks since 1970. While cognizant of macroeconomic trends, our investment process takes a bottom-up approach, relying on intensive fundamental research and disciplined valuation techniques. We are focused on investing the Fund in companies with sustainable competitive advantages, entrepreneurial management and the potential to gain market share. Our team creates and closely monitors a specific and unique investment thesis for every company in which the Fund invests. We will continue to employ our time-tested process to look for opportunities for investors to benefit from growth in undervalued small- and mid-cap businesses.
Market risk may affect a single issuer, sector of the economy, industry or the market as a whole. Investments in small- and mid-cap companies involve risks and volatility greater than investments in larger, more established companies. The Fund may invest significantly in issuers within a particular sector, which may be negatively affected by market, economic or other conditions, making the fund more vulnerable to unfavorable developments in the sector. See the Fund’s prospectus for more information on these and other risks.
The views expressed in this report reflect the current views of the respective parties. These views are not guarantees of future performance and involve certain risks, uncertainties and assumptions that are difficult to predict, so actual outcomes and results may differ significantly from the views expressed. These views are subject to change at any time based upon economic, market or other conditions and the respective parties disclaim any responsibility to update such views. These views may not be relied on as investment advice and, because investment decisions for a Columbia Acorn Fund are based on numerous factors, may not be relied on as an indication of trading intent on behalf of any particular Columbia Acorn Fund. References to specific securities should not be construed as a recommendation or investment advice.
Columbia Acorn Family of Funds | Semiannual Report 2018
| 15 |
Fund at a glance
Columbia Acorn International SelectSM (Unaudited)
Investment objective
Columbia Acorn International SelectSM (the Fund) seeks long-term capital appreciation.
Portfolio management
Stephen Kusmierczak, CFA
Portfolio Manager since 2016
Service with Fund since 2001
Morningstar style boxTM
The Morningstar Style Box is based on a fund’s portfolio holdings. For equity funds, the vertical axis shows the market capitalization of the stocks owned, and the horizontal axis shows investment style (value, blend, or growth). Information shown is based on the most recent data provided by Morningstar.
© 2018 Morningstar, Inc. All rights reserved. The Morningstar information contained herein: (1) is proprietary to Morningstar and/or its content providers; (2) may not be copied or distributed; and (3) is not warranted to be accurate, complete or timely. Neither Morningstar nor its content providers are responsible for any damages or losses arising from any use of this information.
| Average annual total returns (%) (for the period ended June 30, 2018) |
| | | Inception | 6 Months
cumulative | 1 Year | 5 Years | 10 Years | Life |
| Class A | Excluding sales charges | 10/16/00 | 1.80 | 14.66 | 7.48 | 4.25 | 8.62 |
| | Including sales charges | | -4.05 | 8.05 | 6.21 | 3.63 | 8.29 |
| Advisor Class | 11/08/12 | 1.90 | 14.92 | 7.75 | 4.57 | 8.96 |
| Class C | Excluding sales charges | 10/16/00 | 1.38 | 13.75 | 6.65 | 3.43 | 7.80 |
| | Including sales charges | | 0.38 | 12.75 | 6.65 | 3.43 | 7.80 |
| Institutional Class | 11/23/98 | 1.88 | 14.91 | 7.78 | 4.58 | 8.96 |
| Institutional 2 Class | 11/08/12 | 1.97 | 14.99 | 7.84 | 4.61 | 8.98 |
| Institutional 3 Class | 11/08/12 | 1.97 | 15.05 | 7.89 | 4.64 | 8.99 |
| MSCI ACWI ex USA Index (Net) | | -3.77 | 7.28 | 5.99 | 2.54 | - |
| MSCI ACWI ex USA Growth Index (Net) | | -2.28 | 9.90 | 7.18 | 3.01 | - |
Performance numbers reflect all Fund expenses. Returns for Class A shares are shown with and without the maximum initial sales charge of 5.75%. Returns for Class C shares are shown with and without the maximum contingent deferred sales charge of 1.00% for the first year after purchase. The Fund’s other classes are not subject to sales charges, but may be subject to other fees and expenses, and have limited eligibility. Please see the Fund’s prospectus for details. Performance for different share classes will vary based on differences in sales charges and certain fees and expenses associated with each class.
As stated in the May 1, 2018 prospectus, the Fund’s annual operating expense ratio is 1.15% for Institutional Class shares and 1.40% for Class A shares.
All results shown assume reinvestment of distributions during the period. Returns do not reflect the deduction of taxes that a shareholder may pay on Fund distributions or on the redemption of Fund shares. Performance results may reflect the effect of any fee waivers or reimbursements of Fund expenses by the investment manager and/or any of its affiliates. Absent these fee waivers and/or expense reimbursement arrangements, performance results may have been lower.
The performance information shown represents past performance and is not a guarantee of future results. The investment return and principal value of your investment will fluctuate so that shares, when redeemed, may be worth more or less than their original cost. Current performance may be lower or higher than the performance data shown. You may obtain performance information current to the most recent month-end by contacting your financial intermediary, visiting columbiathreadneedleus.com/investor/ or calling 800.922.6769.
The returns shown for periods prior to the share class inception date (including returns for the Life of the Fund, if shown, which are since Fund inception) include the returns of the Fund’s oldest share class. These returns are adjusted to reflect any higher class-related operating expenses of the newer share classes, as applicable. Please visit columbiathreadneedleus.com/investor/investment-products/mutual-funds/appended-performance for more information.
The MSCI ACWI ex USA Index (Net) captures a large- and mid-cap representation across 22 of 23 developed market countries (excluding the U.S.) and 24 emerging market countries. The index covers approximately 85% of the global equity opportunity set outside the United States.
The MSCI ACWI ex USA Growth Index (Net) captures large-and mid-cap representation across 22 developed markets countries and 24 emerging markets countries.
Unlike mutual funds, indexes are not managed and do not incur fees or expenses. It is not possible to invest directly in an index.
| 16 | Columbia Acorn Family of Funds | Semiannual Report 2018 |
Fund at a glance (continued)
Columbia Acorn International SelectSM (Unaudited)
| Top ten holdings (%) (at June 30, 2018) | |
Koninklijke Philips NV (Netherlands)
Health technology focused on improving people’s health | 4.9 |
Hexagon AB, Class B (Sweden)
Design, measurement and visualisation technologies | 4.7 |
Novozymes AS, Class B (Denmark)
Enzymes for industrial use | 4.5 |
NetEase, Inc., ADR (China)
Internet technology company that develops applications, services and Internet technologies | 4.3 |
CCL Industries, Inc. (Canada)
Manufacturing services and specialty packaging products for the non-durable consumer products market | 4.2 |
Partners Group Holding AG (Switzerland)
Global private markets asset management firm | 4.2 |
MTU Aero Engines AG (Germany)
Develops and manufactures engines and offers commercial engine services and support | 4.2 |
Recruit Holdings Co., Ltd. (Japan)
Information providing services in human resource, housing, bridal, travel, restaurants, beauty, automobiles, and education and more | 4.1 |
Wirecard AG (Germany)
Internet payment and processing services | 3.8 |
Sony Financial Holdings, Inc. (Japan)
Financial holding company | 3.7 |
Percentages indicated are based upon total investments (excluding Money Market Funds and Securities Lending Collateral).
For further detail about these holdings, please refer to the section entitled “Portfolio of Investments."
Fund holdings are as of the date given, are subject to change at any time, and are not recommendations to buy or sell any security.
| Equity sector breakdown (%) (at June 30, 2018) |
| Consumer Discretionary | 16.2 |
| Financials | 7.9 |
| Health Care | 10.7 |
| Industrials | 25.5 |
| Information Technology | 20.5 |
| Materials | 13.7 |
| Real Estate | 5.5 |
| Total | 100.0 |
Percentages indicated are based upon total equity investments. The Fund’s portfolio composition is subject to change.
| Country breakdown (%) (at June 30, 2018) |
| Australia | 1.8 |
| Canada | 4.1 |
| China | 7.1 |
| Denmark | 4.3 |
| France | 2.1 |
| Germany | 10.8 |
| India | 3.0 |
| Italy | 3.2 |
| Japan | 17.2 |
| Jersey | 3.0 |
| Mexico | 1.9 |
| Netherlands | 5.7 |
| Singapore | 2.0 |
| South Africa | 2.4 |
| South Korea | 3.0 |
| Sweden | 7.3 |
| Switzerland | 4.0 |
| Taiwan | 2.0 |
| United Kingdom | 11.3 |
| United States(a) | 3.8 |
| Total | 100.0 |
| (a) | Includes investments in Money Market Funds. |
Country breakdown is based primarily on issuer’s place of organization/incorporation. Percentages indicated are based upon total investments. The Fund’s portfolio composition is subject to change.
Columbia Acorn Family of Funds | Semiannual Report 2018
| 17 |
Manager Discussion of Fund Performance
Columbia Acorn International SelectSM
Stephen Kusmierczak, CFA
Portfolio Manager
Columbia Acorn International SelectSM Institutional Class returned 1.88% for the six-month period ended June 30, 2018, which compared with a return of -3.77% for its benchmark, the MSCI ACWI ex USA Index (Net).
The negative return for the benchmark reflected the generally challenging environment for international equities in the first half of 2018. The asset class came under pressure from evidence that economic conditions were slowing outside of the United States, which marked a reversal from the hopes for synchronized global growth that drove market performance in late 2017. Specific news events also weighed on returns, including uncertainty regarding the Brexit negotiations, the continued rise of populist politics across Europe, and shifts in U.S trade policy. The foreign markets were further pressured by the downturn in the major global currencies in relation to the U.S. dollar, which significantly reduced returns for U.S.-based investors. On the plus side, these headwinds were offset by the strength in corporate earnings and analysts’ upward revisions to their expectations for future profitability.
Despite a potentially challenging environment, the Fund generated a positive absolute return and outpaced its benchmark. The most important factor in our relative strength was our tilt toward small- and mid-cap companies, which generally outperformed the large-cap stocks represented in the benchmark. This aspect of our positioning was reflected in individual stock selection, where the Fund’s investments in the financials, health care and industrials sectors finished well ahead of the corresponding benchmark components. The Fund’s sizable underweight in the financials sector, which lagged the broader market by a wide margin, was an additional positive. We also added value through stock selection in the consumer staples and information technology sectors. Conversely, the Fund lost some ground from the underperformance of its holdings in the materials and consumer discretionary sectors. A zero weighting in energy, which posted a gain well in excess of the headline benchmark return due to the rally in oil prices, also detracted from results.
The German payment-processing company Wirecard was the top contributor to performance at the individual stock level. Wirecard has benefited as the market for electronic payment transactions has grown in tandem with the expansion of e-commerce. The company demonstrated robust organic growth with an encouraging sales pipeline, leading to outperformance for its stock in the first half of the year. Hexagon AB, the Fund’s second largest holding at the close of the period, was also a leading contributor in the information technology sector. A provider of measurement equipment and software used in advanced manufacturing and construction, Hexagon rallied after a Norwegian court declared that the chief executive officer was innocent of insider trading charges. The unanimous verdict eliminated a controversy that had been weighing on sentiment. Additionally, the company reported accelerating organic revenues and a further improvement in profit margins in its core businesses.
In the health care sector, shares of Sartorius, a Germany-based international leader in supplying biomanufacturing equipment, laboratory products and lab services, advanced after the company released a plan that outlined its growth outlook through 2025. Ipsen, a French biotechnology company, also moved higher due to rising revenues and favorable developments in its product pipeline.
Outside of the information technology and health care sectors, the Fund benefited from gains by the Japanese convenience store operator FamilyMart UNY Holdings, which rallied after receiving a takeover bid at a significant premium.
NetEase, a China-based online game and content developer that continues to innovate and introduce new games to its large and diversified portfolio, was the largest detractor in the first half of 2018. The company’s share price declined as its lack of new game titles led to a lackluster showing for its mobile gaming business. We added to the position because we believe this to be a short-term issue that should be remedied once NetEase’s strong pipeline of mobile games is released later this year. The U.K. software company Micro Focus International was also a detractor. The company specializes in consolidating legacy software franchises, and its management has a long track record of improving the
| 18 | Columbia Acorn Family of Funds | Semiannual Report 2018 |
Manager Discussion of Fund Performance (continued)
Columbia Acorn International SelectSM
profitability of mature software companies. More recently, however, investors reacted unfavorably to its acquisition of HP Software. In addition, Micro Focus announced declining revenues and the unexpected departure of its chief executive officer. We chose to eliminate the position. Sweden-based Trelleborg, a leading global provider of specialized solutions for sealing, dampening and protecting industrial applications, was another detractor of note. While Trelleborg reported solid results, its shares traded down late in the period due to general market worries rather than company-specific news. We added to the position on the belief that the company can continue gaining market share.
Our bottom-up process translated to overweight positions in the consumer discretionary, materials and health care sectors as of June 30, 2018. We maintained a zero weighting in energy, where we believe the performance of individual stocks is tied more to the direction of commodity prices than organic, bottom-up growth trends, as well as the slower growing telecommunications and utilities sectors.
Trade policy disputes among the United States and its global trading partners were among many persistent sources of market volatility in the first half 2018. However, we think the heightened volatility and growing divergences in the economic and market performance of various countries creates fertile ground for individual stock selection. We believe an investment philosophy that favors higher quality, faster growing companies based on metrics such as return on invested capital, revenue and earnings growth, and superior debt ratios, is well suited to this environment.
Market risk may affect a single issuer, sector of the economy, industry or the market as a whole. Foreign investments subject the Fund to political, economic, market, social and other risks within a particular country, as well as to potential currency instabilities and less stringent financial and accounting standards generally applicable to U.S. issuers. Risks are enhanced for emerging market issuers. Investments in small- and mid-cap companies involve risks and volatility and possible illiquidity greater than investments in larger, more established companies. The Fund may invest significantly in issuers within a particular sector, which may be negatively affected by market, economic or other conditions, making the Fund more vulnerable to unfavorable developments in the sector. See the Fund’s prospectus for more information on these and other risks.
The views expressed in this report reflect the current views of the respective parties. These views are not guarantees of future performance and involve certain risks, uncertainties and assumptions that are difficult to predict, so actual outcomes and results may differ significantly from the views expressed. These views are subject to change at any time based upon economic, market or other conditions and the respective parties disclaim any responsibility to update such views. These views may not be relied on as investment advice and, because investment decisions for a Columbia Acorn Fund are based on numerous factors, may not be relied on as an indication of trading intent on behalf of any particular Columbia Acorn Fund. References to specific securities should not be construed as a recommendation or investment advice.
Columbia Acorn Family of Funds | Semiannual Report 2018
| 19 |
Fund at a glance
Columbia Acorn SelectSM (Unaudited)
Investment objective
Columbia Acorn SelectSM (the Fund) seeks long-term capital appreciation.
Portfolio management
David L. Frank, CFA
Portfolio Manager since 2015
Service with Fund since 2002
Morningstar style boxTM
The Morningstar Style Box is based on a fund’s portfolio holdings. For equity funds, the vertical axis shows the market capitalization of the stocks owned, and the horizontal axis shows investment style (value, blend, or growth). Information shown is based on the most recent data provided by Morningstar.
© 2018 Morningstar, Inc. All rights reserved. The Morningstar information contained herein: (1) is proprietary to Morningstar and/or its content providers; (2) may not be copied or distributed; and (3) is not warranted to be accurate, complete or timely. Neither Morningstar nor its content providers are responsible for any damages or losses arising from any use of this information.
| Average annual total returns (%) (for the period ended June 30, 2018) |
| | | Inception | 6 Months
cumulative | 1 Year | 5 Years | 10 Years | Life |
| Class A | Excluding sales charges | 10/16/00 | 6.16 | 20.19 | 12.64 | 8.02 | 10.30 |
| | Including sales charges | | 0.07 | 13.30 | 11.32 | 7.38 | 9.97 |
| Advisor Class | 11/08/12 | 6.25 | 20.45 | 12.90 | 8.30 | 10.63 |
| Class C | Excluding sales charges | 10/16/00 | 5.81 | 19.23 | 11.81 | 7.20 | 9.47 |
| | Including sales charges | | 4.86 | 18.23 | 11.81 | 7.20 | 9.47 |
| Institutional Class | 11/23/98 | 6.32 | 20.41 | 12.94 | 8.32 | 10.64 |
| Institutional 2 Class | 11/08/12 | 6.33 | 20.53 | 12.99 | 8.35 | 10.65 |
| Institutional 3 Class | 11/08/12 | 6.37 | 20.59 | 13.05 | 8.38 | 10.67 |
| Russell 2500 Growth Index | | 8.04 | 21.53 | 13.87 | 11.38 | - |
Performance numbers reflect all Fund expenses. Returns for Class A shares are shown with and without the maximum initial sales charge of 5.75%. Returns for Class C shares are shown with and without the maximum contingent deferred sales charge of 1.00% for the first year after purchase. The Fund’s other classes are not subject to sales charges, but may be subject to other fees and expenses, and have limited eligibility. Please see the Fund’s prospectus for details. Performance for different share classes will vary based on differences in sales charges and certain fees and expenses associated with each class.
As stated in the May 1, 2018 prospectus, the Fund’s annual operating expense ratio is 0.92% for Institutional Class shares and 1.17% for Class A shares.
All results shown assume reinvestment of distributions during the period. Returns do not reflect the deduction of taxes that a shareholder may pay on Fund distributions or on the redemption of Fund shares. Performance results may reflect the effect of any fee waivers or reimbursements of Fund expenses by the investment manager and/or any of its affiliates. Absent these fee waivers and/or expense reimbursement arrangements, performance results may have been lower.
The performance information shown represents past performance and is not a guarantee of future results. The investment return and principal value of your investment will fluctuate so that shares, when redeemed, may be worth more or less than their original cost. Current performance may be lower or higher than the performance data shown. You may obtain performance information current to the most recent month-end by contacting your financial intermediary, visiting columbiathreadneedleus.com/investor/ or calling 800.922.6769.
The returns shown for periods prior to the share class inception date (including returns for the Life of the Fund, if shown, which are since Fund inception) include the returns of the Fund’s oldest share class. These returns are adjusted to reflect any higher class-related operating expenses of the newer share classes, as applicable. Please visit columbiathreadneedleus.com/investor/investment-products/mutual-funds/appended-performance for more information.
The Russell 2500 Growth Index measures the performance of those Russell 2500 companies with higher price-to-book ratios and higher forecasted growth values.
Unlike mutual funds, indexes are not managed and do not incur fees or expenses. It is not possible to invest directly in an index.
| 20 | Columbia Acorn Family of Funds | Semiannual Report 2018 |
Fund at a glance (continued)
Columbia Acorn SelectSM (Unaudited)
| Top ten holdings (%) (at June 30, 2018) | |
Vail Resorts, Inc.
Operates resorts globally | 5.5 |
Masimo Corp.
Medical signal processing and sensor technology for non-invasive monitoring of physiological parameters | 5.5 |
VeriSign, Inc.
Domain names and Internet security services | 5.2 |
JB Hunt Transport Services, Inc.
Logistics services | 5.1 |
ANSYS, Inc.
Software solutions for design analysis and optimization | 5.0 |
CDW Corp.
IT products and services | 4.6 |
LCI Industries
Recreational vehicles and equipment | 4.6 |
GoDaddy, Inc., Class A
Cloud-based web platform for small businesses, web design professionals and individuals | 4.5 |
SVB Financial Group
Holding company for Silicon Valley Bank | 4.1 |
Cavco Industries, Inc.
Designs and manufactures systems-built structures | 4.0 |
Percentages indicated are based upon total investments (excluding Money Market Funds).
For further detail about these holdings, please refer to the section entitled “Portfolio of Investments."
Fund holdings are as of the date given, are subject to change at any time, and are not recommendations to buy or sell any security.
| Portfolio breakdown (%) (at June 30, 2018) |
| Common Stocks | 98.0 |
| Money Market Funds | 2.0 |
| Total | 100.0 |
Percentages indicated are based upon total investments. The Fund’s portfolio composition is subject to change.
| Equity sector breakdown (%) (at June 30, 2018) |
| Consumer Discretionary | 20.6 |
| Financials | 15.7 |
| Health Care | 14.5 |
| Industrials | 16.5 |
| Information Technology | 24.4 |
| Materials | 3.3 |
| Real Estate | 5.0 |
| Total | 100.0 |
Percentages indicated are based upon total equity investments. The Fund’s portfolio composition is subject to change.
Columbia Acorn Family of Funds | Semiannual Report 2018
| 21 |
Manager Discussion of Fund Performance
Columbia Acorn SelectSM
David L. Frank, CFA
Portfolio Manager
Columbia Acorn SelectSM Institutional Class returned 6.32% for the six-month period ended June 30, 2018. The Fund’s benchmark, the Russell 2500 Growth Index, returned 8.04% for the same period. The Fund’s relative performance was aided by positioning in the financials, information technology and health care sectors, while selection in the consumer discretionary and industrials sectors detracted.
The year began on a positive note, with the momentum of late 2017 carrying into January 2018 amid strengthening economic growth, rising corporate earnings, and continued optimism surrounding the tax reform package enacted in December. The rally came to an abrupt halt in early February, however, after unexpectedly strong wage growth data sparked fears that the U.S. Federal Reserve (Fed) would feel compelled to speed up the pace of its interest rate increases. Stocks subsequently recovered as concerns about the Fed gradually abated, but the markets retreated once again in March in reaction to escalating rhetoric around U.S. trade policy. Despite these fluctuations — which stood in marked contrast to the low volatility of 2017— broad-based U.S. stock indexes closed only modestly lower for the first quarter of 2018.
As the second quarter progressed, market performance was supported by the combination of robust economic growth, strong first-quarter corporate profits and rising earnings estimates for the remainder of 2018. These factors helped offset a variety of possible headwinds, including the apparent launch of a global trade war, signs of a possible slowdown in growth overseas, and the Fed raising rates in June while signaling two more hikes by year-end. For the six months ended June 30, 2018, the U.S. stock market, as gauged by the widely followed S&P 500 Index, posted a positive return of 2.65%. Within the U.S. stock market, growth and small cap stocks notably outperformed their value and large cap counterparts, respectively, over the first half of 2018.
Overall, stock selection detracted from the Fund’s performance relative to the benchmark for the six months ended June 30, 2018. While picks in the consumer discretionary and industrials sectors lagged, selection was notably positive within the health care, information technology, materials and financials sectors. Sector allocation detracted from relative performance, principally due to an underweight in the information technology sector and overweight in the financials sectors. An underweight in the materials sector aided performance.
In terms of individual positions, leading positive contributors included GoDaddy, Encompass Health and SVB Financial Group. GoDaddy is the leading provider of domain name registrations, which the company leverages to sell digital marketing solutions to its large base of customers. The stock rose during the period driven by strong earnings results, which demonstrated GoDaddy’s ability to maintain double-digit revenue growth with solid cash flow return on invested capital. After GoDaddy reported earnings, we took advantage of the surge in price to take profits by reducing the Fund’s position. Encompass Health is a leading provider of inpatient rehab, home health and hospice services primarily to Medicare patients. Consistent execution, steady market share gains and a stabilizing reimbursement environment led to greater investor appreciation of the business. Silicon Valley-based SVB Financial Group is the premier lender for venture-capital-backed starts ups. The bank has ridden the wave of higher funding for new technology companies, growing at over a 20% pace the past several quarters. It has also benefited from higher interest rates more than other banks due to a very high degree of variable rate loans and zero cost deposits.
The most significant detractors for the period included LCI Industries, LKQ Corp., and Natus Medical. Shares of LCI Industries, a components supplier to RV manufacturers, sold off sharply in the first quarter of 2018 due to two factors. Investors worried that higher steel and aluminum prices, partially due to proposed tariffs, would take time for the company to pass through to customers. There were also concerns that dealer inventories have grown too large. We believe that these materials and inventory issues will prove transitory as long as the middle-income U.S. consumer remains in a buying mode. LKQ sells alternative and specialty repair parts and accessories to the automotive industry. The company reported disappointing quarterly results driven by higher freight and labor costs as well as issues around ramping up a new, large distribution center. We view these issues as temporary and
| 22 | Columbia Acorn Family of Funds | Semiannual Report 2018 |
Manager Discussion of Fund Performance (continued)
Columbia Acorn SelectSM
believe that LKQ is well positioned to benefit from increased usage of its lower cost alternative parts, as it consolidates certain regional markets. Natus Medical provides newborn, neurological and audiological diagnostic equipment to hospitals and clinics. Weakening growth across segments and poor operational execution has led to impaired earnings power that we believe is likely to persist. The Fund exited the position during the period.
U.S. trade policy disputes and interest rate concerns were among many persistent sources of market volatility in 2018. In our view, the higher volatility and greater number of economic and market divergences that have occurred on a global scale may have the potential to create good opportunities for stock pickers. We believe an investment philosophy that favors higher quality, faster growing companies, as measured across metrics such as return on invested capital, revenue and earnings growth and superior debt ratios, can be particularly advantageous in this environment.
While cognizant of macroeconomic trends, our investment process takes a bottom-up approach, relying on intensive fundamental research and disciplined valuation techniques. We are focused on investing the Fund in companies with sustainable competitive advantages, entrepreneurial management and the potential to gain market share. Our team creates and closely monitors a specific and unique investment thesis for each company in which the Fund invests. We will continue to employ our time-tested process to look for opportunities for investors to benefit from growth in undervalued small- and mid-cap businesses.
Market risk may affect a single issuer, sector of the economy, industry or the market as a whole. Investments in small- and mid-cap companies involve risks and volatility and possible illiquidity greater than investments in larger, more established companies. Foreign investments subject the Fund to risks, including political, economic, market, social and other risks, within a particular country, as well as to potential currency instabilities and less stringent financial and accounting standards generally applicable to U.S. issuers. Risks are enhanced for emerging market issuers. The Fund may invest significantly in issuers within a particular sector, which may be negatively affected by market, economic or other conditions, making the Fund more vulnerable to unfavorable developments in the sector. See the Fund’s prospectus for more information on these and other risks.
The views expressed in this report reflect the current views of the respective parties. These views are not guarantees of future performance and involve certain risks, uncertainties and assumptions that are difficult to predict, so actual outcomes and results may differ significantly from the views expressed. These views are subject to change at any time based upon economic, market or other conditions and the respective parties disclaim any responsibility to update such views. These views may not be relied on as investment advice and, because investment decisions for a Columbia Acorn Fund are based on numerous factors, may not be relied on as an indication of trading intent on behalf of any particular Columbia Acorn Fund. References to specific securities should not be construed as a recommendation or investment advice.
Columbia Acorn Family of Funds | Semiannual Report 2018
| 23 |
Fund at a glance
Columbia Thermostat FundSM (Unaudited)
Investment objective
Columbia Thermostat FundSM (the Fund) seeks long-term capital appreciation.
Portfolio management
Anwiti Bahuguna, Ph.D.
Co-Portfolio Manager since May 2018
Service with Fund since May 2018
Joshua Kutin, CFA
Co-Portfolio Manager since May 2018
Service with Fund since May 2018
| Average annual total returns (%) (for the period ended June 30, 2018) |
| | | Inception | 6 Months
cumulative | 1 Year | 5 Years | 10 Years | Life |
| Class A | Excluding sales charges | 03/03/03 | 0.50 | 2.53 | 4.06 | 5.41 | 6.63 |
| | Including sales charges | | -5.26 | -3.36 | 2.83 | 4.79 | 6.23 |
| Advisor Class | 11/08/12 | 0.58 | 2.74 | 4.31 | 5.67 | 6.90 |
| Class C | Excluding sales charges | 03/03/03 | 0.02 | 1.76 | 3.26 | 4.62 | 5.83 |
| | Including sales charges | | -0.96 | 0.78 | 3.26 | 4.62 | 5.83 |
| Institutional Class | 09/25/02 | 0.58 | 2.82 | 4.32 | 5.68 | 6.90 |
| Institutional 2 Class | 11/08/12 | 0.57 | 2.82 | 4.33 | 5.69 | 6.91 |
| Institutional 3 Class | 11/08/12 | 0.58 | 2.88 | 4.37 | 5.71 | 6.92 |
| Blended Benchmark | | 0.58 | 6.86 | 7.85 | 7.20 | - |
| S&P 500 Index | | 2.65 | 14.37 | 13.42 | 10.17 | - |
| Bloomberg Barclays U.S. Aggregate Bond Index | | -1.62 | -0.40 | 2.27 | 3.72 | - |
Performance numbers reflect all Fund expenses. Returns for Class A shares are shown with and without the maximum initial sales charge of 5.75%. Returns for Class C shares are shown with and without the maximum contingent deferred sales charge of 1.00% for the first year after purchase. The Fund’s other classes are not subject to sales charges, but may be subject to other fees and expenses, and have limited eligibility. Please see the Fund’s prospectus for details. Performance for different share classes will vary based on differences in sales charges and certain fees and expenses associated with each class
As stated in the May 1, 2018 prospectus, the Fund’s annual operating expense ratio is 0.60% for Institutional Class shares and 0.85% for Class A shares.
All results shown assume reinvestment of distributions during the period. Returns do not reflect the deduction of taxes that a shareholder may pay on Fund distributions or on the redemption of Fund shares. Performance results may reflect the effect of any fee waivers or reimbursements of Fund expenses by the investment manager and/or any of its affiliates. Absent these fee waivers and/or expense reimbursement arrangements, performance results may have been lower.
The performance information shown represents past performance and is not a guarantee of future results. The investment return and principal value of your investment will fluctuate so that shares, when redeemed, may be worth more or less than their original cost. Current performance may be lower or higher than the performance data shown. You may obtain performance information current to the most recent month-end by contacting your financial intermediary, visiting columbiathreadneedleus.com/investor/ or calling 800.922.6769.
The returns shown for periods prior to the share class inception date (including returns for the Life of the Fund, if shown, which are since Fund inception) include the returns of the Fund’s oldest share class. These returns are adjusted to reflect any higher class-related operating expenses of the newer share classes, as applicable. Please visit columbiathreadneedleus.com/investor/investment-products/mutual-funds/appended-performance for more information.
The Fund’s performance prior to May 2018 reflects returns achieved following a principal investment strategy with a single form of allocation table. While the Fund now follows a principal investment strategy with two potential forms of allocation table, the form of the Fund’s currently effective allocation table has been in place since the Fund’s inception in 2002. The Fund’s performance prior to May 2018 reflects the current form of allocation table.
The Blended Benchmark, established by the Fund’s investment manager, is an equally weighted custom composite of Columbia Thermostat Fund’s primary equity and primary debt benchmarks, the S&P 500® Index and the Bloomberg Barclays U.S. Aggregate Bond Index, respectively. The percentage of the Fund’s assets allocated to underlying stock and bond portfolio funds will vary, and accordingly the composition of the Fund’s portfolio will not always reflect the composition of the Blended Benchmark.
The Standard & Poor’s (S&P) 500® Index tracks the performance of 500 widely held, large-capitalization U.S. stocks.
The Bloomberg Barclays U.S. Aggregate Bond Index is a market value-weighted index that tracks the daily price, coupon, pay-downs and total return performance of fixed-rate, publicly placed, dollar-denominated and non-convertible investment-grade debt issues with at least $250 million par amount outstanding and with at least one year to final maturity.
Unlike mutual funds, indexes are not managed and do not incur fees or expenses. It is not possible to invest directly in an index.
| 24 | Columbia Acorn Family of Funds | Semiannual Report 2018 |
Fund at a glance (continued)
Columbia Thermostat FundSM (Unaudited)
| Portfolio breakdown (%) (at June 30, 2018) |
| Equity Funds | 14.8 |
| Exchange-Traded Funds | 8.5 |
| Fixed-Income Funds | 76.7 |
| Money Market Funds | 0.0 (a) |
| Total | 100.0 |
Percentages indicated are based upon total investments. The Fund’s portfolio composition is subject to change.
Columbia Acorn Family of Funds | Semiannual Report 2018
| 25 |
Manager Discussion of Fund Performance
Columbia Thermostat FundSM
Anwiti Bahuguna, Ph.D.
Co-Portfolio Manager
Joshua Kutin, CFA
Co-Portfolio Manager
Columbia Thermostat Fund Institutional Class gained 0.58% for the six-month period ended June 30, 2018. During the same time period, the Fund’s primary equity benchmark, the S&P 500 Index, gained 2.65%, and the Fund’s primary debt benchmark, the Bloomberg Barclays U.S. Aggregate Bond Index, lost 1.62%. The Fund’s custom Blended Benchmark gained 0.58%,which matched the performance of the Fund.
The Fund’s high allocation to relatively conservative underlying short-term bond portfolios helped performance during the first half of the period, when equities saw a large drawdown and higher duration fixed income assets sold off. The second half of the period saw a reversal for the Fund as the performance of equities picked up and fixed-income assets continued their sell-off.
The year got off to a fast start, as the S&P 500 Index posted its best January in 21 years. Volatility across capital markets increased substantially in February and March, slowing equity momentum. A pickup in U.S. economic growth, however, helped boost investor confidence in the second half of the six-month period. The Fund’s equity portfolio had a weighted average gain of 3.21% in the first half of 2018. Five of the seven underlying equity funds returned positive returns for the period. Top performers within the equity portfolio during the period were Columbia Acorn® Fund, up 10.38% and Columbia Acorn SelectSM, up 6.37%.
Rising interest rates weighed on bond prices during the period. Columbia Thermostat Fund’s bond portfolio ended the first half of the year with a weighted average loss of 0.69%. Of five underlying funds in the bond portfolio, only one returned in positive territory during the period – Columbia Short Term Bond Fund, returning 0.04%. Columbia Corporate Income Fund was the worst performer in the bond portfolio, returning -3.26% for the six-month period.
There were five reallocation triggers in the first half of the year. Columbia Thermostat Fund began the period allocated 10% to stocks and 90% to bonds. On February 8, the S&P 500 Index fell below the 2,592 threshold, triggering a reallocation to 15% stocks and 85% bonds. On March 9, the S&P 500 Index rose above 2,592 and the Fund reallocated back to 10% stocks and 90% bonds. On May 1, the Fund reset its stock/bond allocation table. This annual reset caused the stock/bond allocation to move to 25% stocks and 75% bonds. On May 31, the S&P 500 Index rose above the 2,396 threshold, triggering a reallocation to 20% stocks and 80% bonds. On June 8, the S&P index rose above 2,392 and the Fund reallocated back to 15% stocks and 85% bonds.
Results of the Funds Owned in Columbia Thermostat Fund as of June 30, 2018
| Fund | Weightings
in category | 2nd quarter
performance | Year to date
performance |
| Columbia Large Cap Index Fund, Institutional 3 Class | 40% | 3.38% | 2.55% |
| Columbia Acorn Fund, Institutional 3 Class | 10% | 6.47% | 10.38% |
| Columbia Acorn International, Institutional 3 Class | 10% | -2.06% | 0.13% |
| Columbia Acorn Select, Institutional 3 Class | 10% | 7.17% | 6.37% |
| Columbia Contrarian Core, Institutional 3 Class | 10% | 1.83% | -0.65% |
| Columbia Dividend Income, Institutional 3 Class | 10% | 0.70% | -1.28% |
| Columbia Large Cap Enhanced Core, Institutional 3 Class | 10% | 2.99% | 2.66% |
| Weighted Average Equity Gain/Loss | 100% | 3.05% | 3.21% |
| Fund | Weightings
in category | 2nd quarter
performance | Year to date
performance |
| Columbia U.S. Treasury Index, Institutional 3 Class | 35% | 0.02% | -1.18% |
| Columbia Short Term Bond, Institutional 3 Class | 25% | 0.32% | 0.04% |
| Columbia Quality Income, Institutional 3 Class | 20% | 0.69% | -0.14% |
| Columbia Corporate Income, Institutional 3 Class | 10% | -0.90% | -3.26% |
| Columbia Diversified Fixed Income Allocation ETF | 10% | -0.89% | -2.31% |
| Weighted Average Income Gain/Loss | 100% | 0.05% | -0.69% |
| 26 | Columbia Acorn Family of Funds | Semiannual Report 2018 |
Manager Discussion of Fund Performance (continued)
Columbia Thermostat FundSM
Columbia Thermostat Fund Rebalancing During the First Half of the Year
February 9, 2018: 15% Equity, 85% Bonds
March 12, 2018: 10% Equity, 90% Bonds
May 1, 2018: 25% Equity, 75% Bonds
June 1, 2018: 20% Equity, 80% Bonds
June 11, 2018: 15% Equity, 85% Bonds
A “fund of fund” bears its allocable share of the costs and expenses of the underlying funds in which it invests. Such funds are thus subject to two levels of fees and potentially higher expense ratios than would be associated with a fund that invests and trades directly in financial instruments under the direction of a single manager.
The Fund’s investments in the underlying funds may present certain risks, including the following. Market risk may affect a single issuer, sector of the economy, industry or the market as a whole. The Fund’s investment in other funds subjects it to the investment performance (positive or negative), risks and expenses of these underlying funds. Investments in small- and mid-cap companies involve risks and volatility and possible illiquidity greater than in investments in larger, more established companies. There are risks associated with fixed-income investments, including credit risk, market risk, interest rate risk and prepayment and extension risk. In general, bond prices fall when interest rates rise and vice versa. This effect is more pronounced for longer term securities. Non-investment-grade (high-yield or junk) securities present greater price volatility and more risk to principal and income than higher rated securities. Foreign investments subject the Fund to political, economic, market, social and other risks within a particular country, as well as to potential currency instabilities and less stringent financial and accounting standards generally applicable to U.S. issuers. Risks are enhanced for emerging market issuers. See the Fund’s prospectus for more information on these and other risks.
The views expressed in this report reflect the current views of the respective parties. These views are not guarantees of future performance and involve certain risks, uncertainties and assumptions that are difficult to predict, so actual outcomes and results may differ significantly from the views expressed. These views are subject to change at any time based upon economic, market or other conditions and the respective parties disclaim any responsibility to update such views. These views may not be relied on as investment advice and, because investment decisions for a Columbia Acorn Fund are based on numerous factors, may not be relied on as an indication of trading intent on behalf of any particular Columbia Acorn Fund. References to specific securities should not be construed as a recommendation or investment advice.
The value of an investment in the Fund is based primarily on the performance of the underlying funds in which it invests. The Fund is subject to the risk that the investment manager’s decisions regarding asset classes and underlying funds will not anticipate market trends successfully, resulting in a failure to reserve capital or lower total return. The Investment Manager may prefer an underlying fund in the Columbia Acorn Family of Funds over alternative investments. There can be no assurance that the Columbia Acorn Funds will outperform similar funds managed by the Investment Manager’s affiliates. This is not an offer of the shares of any other mutual fund mentioned herein.
Columbia Acorn Family of Funds | Semiannual Report 2018
| 27 |
Fund at a glance
Columbia Acorn Emerging Markets FundSM (Unaudited)
Investment objective
Columbia Acorn Emerging Markets FundSM (the Fund) seeks long-term capital appreciation.
Portfolio management
Satoshi Matsunaga, CFA
Co-Portfolio Manager since 2015
Service with Fund since 2011
Charles C. Young
Co-Portfolio Manager since December 2017
Service with Fund since 2011
Morningstar style boxTM
The Morningstar Style Box is based on a fund’s portfolio holdings. For equity funds, the vertical axis shows the market capitalization of the stocks owned, and the horizontal axis shows investment style (value, blend, or growth). Information shown is based on the most recent data provided by Morningstar.
© 2018 Morningstar, Inc. All rights reserved. The Morningstar information contained herein: (1) is proprietary to Morningstar and/or its content providers; (2) may not be copied or distributed; and (3) is not warranted to be accurate, complete or timely. Neither Morningstar nor its content providers are responsible for any damages or losses arising from any use of this information.
| Average annual total returns (%) (for the period ended June 30, 2018) |
| | | Inception | 6 Months
cumulative | 1 Year | 5 Years | Life |
| Class A | Excluding sales charges | 08/19/11 | -5.51 | 5.75 | 1.56 | 3.94 |
| | Including sales charges | | -10.96 | -0.32 | 0.36 | 3.05 |
| Advisor Class | 11/08/12 | -5.38 | 6.03 | 1.84 | 4.26 |
| Class C | Excluding sales charges | 08/19/11 | -5.88 | 4.94 | 0.80 | 3.18 |
| | Including sales charges | | -6.82 | 3.94 | 0.80 | 3.18 |
| Institutional Class | 08/19/11 | -5.34 | 6.07 | 1.82 | 4.22 |
| Institutional 2 Class | 11/08/12 | -5.31 | 6.11 | 1.91 | 4.31 |
| Institutional 3 Class | 06/13/13 | -5.28 | 6.17 | 1.96 | 4.34 |
| MSCI Emerging Markets SMID Cap Index (Net) | | -7.32 | 6.44 | 4.01 | - |
Performance numbers reflect all Fund expenses. Returns for Class A shares are shown with and without the maximum initial sales charge of 5.75%. Returns for Class C shares are shown with and without the maximum contingent deferred sales charge of 1.00% for the first year after purchase. The Fund’s other classes are not subject to sales charges, but may be subject to other fees and expenses, and have limited eligibility. Please see the Fund’s prospectus for details. Performance for different share classes will vary based on differences in sales charges and certain fees and expenses associated with each class.
As stated in the May 1, 2018 prospectus, the Fund’s annual operating expense ratio is 1.30% for Institutional Class shares and 1.55% for Class A shares.
All results shown assume reinvestment of distributions during the period. Returns do not reflect the deduction of taxes that a shareholder may pay on Fund distributions or on the redemption of Fund shares. Performance results may reflect the effect of any fee waivers or reimbursements of Fund expenses by the investment manager and/or any of its affiliates. Absent these fee waivers and/or expense reimbursement arrangements, performance results may have been lower.
The performance information shown represents past performance and is not a guarantee of future results. The investment return and principal value of your investment will fluctuate so that shares, when redeemed, may be worth more or less than their original cost. Current performance may be lower or higher than the performance data shown. You may obtain performance information current to the most recent month-end by contacting your financial intermediary, visiting columbiathreadneedleus.com/investor/ or calling 800.922.6769.
The returns shown for periods prior to the share class inception date (including returns for the Life of the Fund, if shown, which are since Fund inception) include the returns of the Fund’s oldest share class. These returns are adjusted to reflect any higher class-related operating expenses of the newer share classes, as applicable. Please visit columbiathreadneedleus.com/investor/investment-products/mutual-funds/appended-performance for more information.
The MSCI Emerging Markets SMID Cap Index (Net) captures a mid- and small-cap representation across 24 emerging market countries. The index covers approximately 29% of the free float-adjusted market capitalization in each country.
Unlike mutual funds, indexes are not managed and do not incur fees or expenses. It is not possible to invest directly in an index.
| 28 | Columbia Acorn Family of Funds | Semiannual Report 2018 |
Fund at a glance (continued)
Columbia Acorn Emerging Markets FundSM (Unaudited)
| Top ten holdings (%) (at June 30, 2018) | |
Vitasoy International Holdings Ltd. (Hong Kong)
Food and beverages | 3.8 |
Xiabuxiabu Catering Management China Holdings Co., Ltd. (Cayman Islands)
Chain of restaurants in China | 3.7 |
Koh Young Technology, Inc. (South Korea)
3D measurement and inspection equipment for testing various machineries | 3.5 |
New Oriental Education & Technology Group, Inc., ADR (China)
Educational services | 3.2 |
Qualitas Controladora SAB de CV (Mexico)
Insurance holding company | 3.1 |
Zee Entertainment Enterprises Ltd. (India)
Hindi films, serials, game shows and children’s programs | 3.1 |
NagaCorp Ltd. (Cambodia)
Leisure and tourism company | 3.0 |
51job, Inc., ADR (China)
Integrated human resource services | 3.0 |
GRUH Finance Ltd. (India)
Provides a range of home loans as well as insurance products | 2.9 |
Gourmet Master Co., Ltd. (Cayman Islands)
Coffee & bakery cafes | 2.8 |
Percentages indicated are based upon total investments (excluding Money Market Funds).
For further detail about these holdings, please refer to the section entitled “Portfolio of Investments."
Fund holdings are as of the date given, are subject to change at any time, and are not recommendations to buy or sell any security.
| Equity sector breakdown (%) (at June 30, 2018) |
| Consumer Discretionary | 26.8 |
| Consumer Staples | 9.8 |
| Financials | 22.2 |
| Health Care | 4.0 |
| Industrials | 10.7 |
| Information Technology | 19.5 |
| Materials | 4.1 |
| Telecommunication Services | 2.9 |
| Total | 100.0 |
Percentages indicated are based upon total equity investments. The Fund’s portfolio composition is subject to change.
| Country breakdown (%) (at June 30, 2018) |
| Brazil | 4.7 |
| Cambodia | 2.9 |
| Cayman Islands | 11.9 |
| China | 10.1 |
| Egypt | 1.3 |
| Hong Kong | 6.1 |
| India | 9.0 |
| Indonesia | 4.3 |
| Japan | 1.0 |
| Malaysia | 1.2 |
| Mexico | 4.3 |
| Philippines | 2.3 |
| Poland | 0.9 |
| Russian Federation | 1.4 |
| South Africa | 6.3 |
| South Korea | 14.1 |
| Spain | 1.0 |
| Taiwan | 9.0 |
| Thailand | 2.9 |
| Turkey | 1.4 |
| United States(a) | 3.9 |
| Total | 100.0 |
| (a) | Includes investments in Money Market Funds. |
Country breakdown is based primarily on issuer’s place of organization/incorporation. Percentages indicated are based upon total investments. The Fund’s portfolio composition is subject to change.
Columbia Acorn Family of Funds | Semiannual Report 2018
| 29 |
Manager Discussion of Fund Performance
Columbia Acorn Emerging Markets FundSM
Satoshi Matsunaga, CFA
Co-Portfolio Manager
Charles C. Young
Co-Portfolio Manager
Columbia Acorn Emerging Markets FundSM Institutional Class returned -5.34% for the six-month period ended June 30, 2018, which compared with a return of -7.32% for the Fund’s benchmark, the MSCI Emerging Markets SMID Cap Index (Net).
Emerging market stocks came under pressure in the first half of 2018, as several factors combined to weaken sentiment with respect to the asset class. Entering the period, there were already signs that global growth had peaked and that the macroeconomic backdrop could become less benign for risk-based assets in the not-too-distant future. As 2018 progressed, the launch of a trade war between the United States and China did nothing to ease concerns about the global economy. An escalating and prolonged dispute over trade would increase the challenges faced by China as it seeks to deleverage while simultaneously maintaining growth within the government’s stated target range. In this vein, the decline in the Chinese renminbi seen in the second quarter of 2018 raised concerns about the potential for the trade war to transform into a currency war, which would have significant implications for emerging market economies. Over the same period, the U.S. dollar embarked on an upward leg, stressing the financial outlook for emerging market issuers of U.S. dollar-denominated debt. Finally, a pending slate of hotly contested national elections further dimmed investor interest in emerging markets.
The Fund’s relative performance was helped by strong stock selection in India, South Korea and China, which was partly offset by unfavorable selection in Hong Kong, Brazil and Taiwan. At the sector level, we added value through positive selection in the financials and industrials sectors, while the Fund’s holdings in the health care and information technology sectors lagged.
With respect to individual Fund holdings, a position in Qualitas Controladora was among the leading positive contributors to performance relative to the benchmark. Mexico’s largest auto insurer since 2007, the company saw its shares rally on strong fourth-quarter 2017 results that beat analyst expectations. We believe the growth opportunity for Qualitas is a function of both rising auto insurance industry penetration of the underserved Mexican market and potential market share gains by the company. Another leading contributor was Vitasoy, a Hong Kong-based soy and health drink producer that is expanding its business to mainland China. Initial operating results have been very encouraging, indicating that the company’s products are gaining traction in China and that the company stands to gain share in the huge Chinese domestic market. A position in Hong Kong-based NagaCorp was also among the top contributors. NagaCorp operates what is arguably the most significant entertainment destination in Phnom Penh, the capital city of Cambodia. The company recently opened its second casino in Phnom Penh and continues to see strong underlying demand for its leisure offerings. We see NagaCorp as well positioned to benefit from growth in visitors from around the region, particularly China.
On the downside, Raia Drogasil operates Brazil’s largest drugstore chain with over 1,600 stores and significant market share. The company is well positioned to grow faster than the overall industry as it consolidates a fragmented market undergoing structural changes. However, Raia Drogasil was not immune to industry headwinds as competition in the generic drug space and fewer new drug offerings impacted drugstore industry revenues in Brazil, translating to weak fourth-quarter sales in 2017. A position in Korea Zinc, a smelter of zinc, lead and precious metals, detracted as well. The stock underperformed as a softening in zinc prices reduced smelter revenues and processing fees declined as tight supply gave leverage to zinc miners. We believe pricing and earnings should improve as the zinc cycle continues to mature, and that the company’s valuation remains compelling. Modetour Network, South Korea’s second-largest group package tour provider, was another leading detractor. The stock underperformed due to weak first quarter results, largely driven by South Korea’s hosting of the Winter Olympics. A weakening currency also raised the effective price of package tours, dampening demand. We added to the position on weakness during the second quarter, as outbound travel demand continues to grow structurally in South Korea based on higher incomes and increased leisure time.
| 30 | Columbia Acorn Family of Funds | Semiannual Report 2018 |
Manager Discussion of Fund Performance (continued)
Columbia Acorn Emerging Markets FundSM
We continue to believe that emerging markets offer unique opportunities to discover small- and mid-cap companies in the early phases of market development and capital formation. We currently expect growth in emerging markets to outpace that of developed markets over longer time horizons. Demographic trends, including growing populations and rising middle-class consumers, have provided long-term tailwinds. In addition, emerging market stocks were trading at more attractive valuations than most developed equity markets, especially with respect to small- to mid-cap stocks, at the close of the six-month period.
In the near term, we believe it is possible that the heightened equity market volatility seen in recent months may persist for a while. There have been several drivers of volatility, including U.S. trade policy, a stronger U.S. dollar along with a weaker renminbi, and concerns over growth in China. Measures taken by the Chinese government to curb credit-fueled growth have led to signs of consumer weakness and less investment spending. We will continue to monitor these issues in China and other broader risks including corporate debt levels, geopolitical tensions, currency movements and narrowing market leadership.
The relatively high volatility and divergences among economies and markets that we have seen have the potential to create opportunities for stock pickers. We believe our investment philosophy, which favors higher quality, faster growing companies, is well suited for the current environment.
Market risk may affect a single issuer, sector of the economy, industry or the market as a whole. International investing involves certain risks and volatility due to potential political, economic or currency instabilities and different, potentially less stringent, financial and accounting standards than those generally applicable to U.S. issuers. Risks are enhanced for emerging and frontier market issuers. Investments in small- and mid-cap companies involve risks and volatility and possible illiquidity greater than investments in larger, more established companies. See the Fund’s prospectus for more information on these and other risks.
The views expressed in this report reflect the current views of the respective parties. These views are not guarantees of future performance and involve certain risks, uncertainties and assumptions that are difficult to predict, so actual outcomes and results may differ significantly from the views expressed. These views are subject to change at any time based upon economic, market or other conditions and the respective parties disclaim any responsibility to update such views. These views may not be relied on as investment advice and, because investment decisions for a Columbia Acorn Fund are based on numerous factors, may not be relied on as an indication of trading intent on behalf of any particular Columbia Acorn Fund. References to specific securities should not be construed as a recommendation or investment advice.
Columbia Acorn Family of Funds | Semiannual Report 2018
| 31 |
Fund at a glance
Columbia Acorn European FundSM (Unaudited)
Investment objective
Columbia Acorn European FundSM (the Fund) seeks long-term capital appreciation.
Portfolio management
Stephen Kusmierczak, CFA
Portfolio Manager since 2011
Service with Fund since 2011
Morningstar style boxTM
The Morningstar Style Box is based on a fund’s portfolio holdings. For equity funds, the vertical axis shows the market capitalization of the stocks owned, and the horizontal axis shows investment style (value, blend, or growth). Information shown is based on the most recent data provided by Morningstar.
© 2018 Morningstar, Inc. All rights reserved. The Morningstar information contained herein: (1) is proprietary to Morningstar and/or its content providers; (2) may not be copied or distributed; and (3) is not warranted to be accurate, complete or timely. Neither Morningstar nor its content providers are responsible for any damages or losses arising from any use of this information.
| Average annual total returns (%) (for the period ended June 30, 2018) |
| | | Inception | 6 Months
cumulative | 1 Year | 5 Years | Life |
| Class A | Excluding sales charges | 08/19/11 | 0.59 | 12.32 | 9.87 | 11.01 |
| | Including sales charges | | -5.21 | 5.86 | 8.57 | 10.06 |
| Advisor Class | 06/25/14 | 0.74 | 12.57 | 10.18 | 11.31 |
| Class C | Excluding sales charges | 08/19/11 | 0.23 | 11.47 | 9.06 | 10.20 |
| | Including sales charges | | -0.77 | 10.47 | 9.06 | 10.20 |
| Institutional Class | 08/19/11 | 0.69 | 12.53 | 10.15 | 11.30 |
| Institutional 2 Class | 11/08/12 | 0.79 | 12.70 | 10.18 | 11.32 |
| Institutional 3 Class | 03/01/17 | 0.70 | 12.62 | 10.17 | 11.31 |
| MSCI AC Europe Small Cap Index (Net) | | -1.29 | 11.82 | 11.98 | - |
Returns for Class A shares are shown with and without the maximum initial sales charge of 5.75%. Returns for Class C shares are shown with and without the maximum contingent deferred sales charge of 1.00% for the first year after purchase. The Fund’s other classes are not subject to sales charges, but may be subject to other fees and expenses, and have limited eligibility. Please see the Fund’s prospectus for details. Performance for different share classes will vary based on differences in sales charges and certain fees and expenses associated with each class.
As stated in the May 1, 2018 prospectus, the Fund’s annual operating expense ratio is 1.21% for Institutional Class shares and 1.46% for Class A shares.
Performance numbers reflect all Fund expenses. All results shown assume reinvestment of distributions during the period. Returns do not reflect the deduction of taxes that a shareholder may pay on Fund distributions or on the redemption of Fund shares. Performance results may reflect the effect of any fee waivers or reimbursements of Fund expenses by the investment manager and/or any of its affiliates. Absent these fee waivers and/or expense reimbursement arrangements, performance results may have been lower.
The performance information shown represents past performance and is not a guarantee of future results. The investment return and principal value of your investment will fluctuate so that shares, when redeemed, may be worth more or less than their original cost. Current performance may be lower or higher than the performance data shown. You may obtain performance information current to the most recent month-end by contacting your financial intermediary, visiting columbiathreadneedleus.com/investor/ or calling 800.922.6769.
The returns shown for periods prior to the share class inception date (including returns for the Life of the Fund, if shown, which are since Fund inception) include the returns of the Fund’s oldest share class. These returns are adjusted to reflect any higher class-related operating expenses of the newer share classes, as applicable. Please visit columbiathreadneedleus.com/investor/investment-products/mutual-funds/appended-performance for more information.
The MSCI AC Europe Small Cap Index (Net) captures a small-cap representation across 21 markets in Europe. The index covers approximately 14% of the free float-adjusted market capitalization across each market country in Europe.
Unlike mutual funds, indexes are not managed and do not incur fees or expenses. It is not possible to invest directly in an index.
| 32 | Columbia Acorn Family of Funds | Semiannual Report 2018 |
Fund at a glance (continued)
Columbia Acorn European FundSM (Unaudited)
| Top ten holdings (%) (at June 30, 2018) | |
Sectra AB, B Shares (Sweden)
Medical and communication systems | 3.8 |
Wirecard AG (Germany)
Internet payment and processing services | 3.3 |
Nemetschek SE (Germany)
Standard software for designing, constructing and managing buildings and real estate | 3.3 |
Rentokil Initial PLC (United Kingdom)
Fully integrated facilities management and essential support services | 3.2 |
Unibet Group PLC (Malta)
Online gambling services | 3.1 |
SimCorp AS (Denmark)
Global provider of highly specialised software for the investment management industry | 3.0 |
Halma PLC (United Kingdom)
Products that detect hazards and protect assets and people in public and commercial buildings | 3.0 |
Spirax-Sarco Engineering PLC (United Kingdom)
Consultation, service and products for the control and efficient management of steam and industrial fluids | 2.9 |
Brembo SpA (Italy)
Braking systems and components | 2.8 |
Sweco AB, Class B (Sweden)
Consulting company specializing in engineering, environmental technology, and architecture | 2.7 |
Percentages indicated are based upon total investments (excluding Money Market Funds and Securities Lending Collateral).
For further detail about these holdings, please refer to the section entitled “Portfolio of Investments."
Fund holdings are as of the date given, are subject to change at any time, and are not recommendations to buy or sell any security.
| Equity sector breakdown (%) (at June 30, 2018) |
| Consumer Discretionary | 20.4 |
| Consumer Staples | 1.1 |
| Financials | 9.6 |
| Health Care | 10.2 |
| Industrials | 30.1 |
| Information Technology | 22.0 |
| Materials | 4.1 |
| Real Estate | 2.5 |
| Total | 100.0 |
Percentages indicated are based upon total equity investments. The Fund’s portfolio composition is subject to change.
| Country breakdown (%) (at June 30, 2018) |
| Belgium | 1.6 |
| Denmark | 5.7 |
| Finland | 2.4 |
| France | 1.8 |
| Germany | 23.5 |
| Ireland | 1.6 |
| Italy | 5.2 |
| Luxembourg | 1.6 |
| Malta | 3.0 |
| Netherlands | 2.4 |
| Norway | 3.0 |
| Poland | 0.9 |
| Russian Federation | 1.0 |
| Spain | 1.1 |
| Sweden | 11.5 |
| Switzerland | 7.9 |
| Turkey | 0.9 |
| United Kingdom | 22.4 |
| United States(a) | 2.5 |
| Total | 100.0 |
| (a) | Includes investments in Money Market Funds. |
Country breakdown is based primarily on issuer’s place of organization/incorporation. Percentages indicated are based upon total investments. The Fund’s portfolio composition is subject to change.
Columbia Acorn Family of Funds | Semiannual Report 2018
| 33 |
Manager Discussion of Fund Performance
Columbia Acorn European FundSM
Stephen Kusmierczak, CFA
Portfolio Manager
Columbia Acorn European FundSM Institutional Class returned 0.69% for the six-month period ended June 30, 2018, outperforming the -1.29% return of the Fund’s benchmark, the MSCI AC Europe Small Cap Index (Net).
After staging a strong rally in 2017, European equities delivered more uneven results in the first half of 2018. Stocks generally weakened due to adverse headlines related to the growing influence of populism in the region’s politics, as well as renewed concerns about Italy’s elevated government debt. External factors, including uncertainty surrounding U.S. trade policy and the prospect of rising interest rates in the United States, also fueled instability in stock prices. For U.S. investors, the declining value of the major European currencies versus the U.S. dollar was an additional factor leading to negative total returns for the regional equity indexes. On the positive side, stock prices continued to be supported by the backdrop of positive global growth and healthy corporate earnings. Rising profits helped propel small-cap stocks to a meaningful performance advantage over their large-cap peers, as did their lower degree of exposure to broader macroeconomic concerns.
The Fund posted a gain and comfortably outperformed the negative total return for its benchmark. Stock selection was the primary driver of relative strength, led by our investments in the industrials, health care and information technology sectors. Sector allocation was also a net positive, with the benefit of overweights in technology and health care outweighing the adverse effect of not holding any energy stocks during the period. On the negative side, the Fund lost some relative performance from its stock selection in consumer discretionary and financials.
Among individual stocks, the German payment-processing company Wirecard made the largest contribution to performance. The company, which has benefited as the market for electronic payment transactions has grown in tandem with the expansion of e-commerce, demonstrated robust organic growth with an encouraging sales pipeline. Nemetschek, another German technology stock, was an additional contributor of note. A provider of design software used in large building and infrastructure construction, Nemetschek generated strong growth in the license sales for one of its key products. We continued to hold the investment on the belief that the company is positioned to benefit from increasing penetration in a variety of businesses. Simcard, a Denmark-based provider of specialized software for the investment management industry, further contributed to our healthy showing in technology. The company reported higher earnings, rising profit margins, and a dividend increase, boosting its shares.
The health care sector was also home to a number of the Fund’s top performers for the six-month period. Sartorius, a Germany-based international leader in supplying biomanufacturing equipment, laboratory products and lab services, was a top contributor due in part to its release of a plan that outlined its growth outlook through 2025. William Demant Holding A/S (Denmark) and Sectra AB (Sweden) were also top contributors in health care.
On the other side of the ledger, some of the Fund’s key detractors came from the consumer discretionary sector. eDreams ODIGEO, a leading European online travel agent based in Luxembourg, had the largest negative impact on returns both in the consumer discretionary sector and in the portfolio as a whole. The stock had doubled after the company began a strategic review for a potential sale in November 2017, but it slid in early March after announcing that it would stay independent. However, the prospect of a takeover by a larger rival was not our primary reason for investing in the stock. We remain encouraged by progress the company has made in increasing profitability and diversifying revenue streams, and we believe its shares are trading at an attractive valuation. Unibet Group, WH Smith and Fielmann AG also underperformed the broader consumer discretionary sector and hurt the Fund’s results. Unibet Group is an online gambling operator registered in Malta. WH Smith is a stationary and book retailer in the United Kingdom. Fielmann AG is a German optical retailer, specializing in prescription sunglasses, specialty glasses, sunglasses, contact lenses and optical supplies. Elsewhere, the Turkish company Logo Yazilim, which sells enterprise resource planning
| 34 | Columbia Acorn Family of Funds | Semiannual Report 2018 |
Manager Discussion of Fund Performance (continued)
Columbia Acorn European FundSM
software to small businesses, was a notable detractor. Logo Yazilim reported strong results with operating margins and net income that exceeded consensus expectations, but the stock traded down as the Turkish stock market declined due to heightened economic and political uncertainty.
Our bottom-up process translated to overweight positions in the information technology, consumer discretionary and health care sectors as of the end of June. At the same time, the portfolio had zero weightings in market segments with fewer quality growth companies, including utilities, consumer staples, and telecommunications services. We maintained a zero weighting in energy, where stock-specific performance is tied more to the direction of commodity prices than organic, bottom-up growth trends.
We are encouraged by the growing divergences in individual stock returns that occurred the first half of 2018. This represents a departure from the latter half of 2017, when expectations for synchronized global growth fueled a high correlation in performance among individual companies. Although this shift contributed to heightened market volatility, we believe that these divergences have also created a more favorable environment for stock selection. We believe an investment philosophy that favors higher quality, faster growing companies, based on metrics such as return on invested capital, revenue and earnings growth, and superior debt ratios, is well suited to this evolving investment backdrop.
Market risk may affect a single issuer, sector of the economy, industry or the market as a whole. International investing involves certain risks and volatility due to potential political, economic or currency instabilities and different, potentially less stringent, financial and accounting standards than those generally applicable to U.S. issuers. Investments in small- and mid-cap companies involve risks and volatility and possible illiquidity greater than investments in larger, more established companies. See the Fund’s prospectus for more information on these and other risks.
The views expressed in this report reflect the current views of the respective parties. These views are not guarantees of future performance and involve certain risks, uncertainties and assumptions that are difficult to predict, so actual outcomes and results may differ significantly from the views expressed. These views are subject to change at any time based upon economic, market or other conditions and the respective parties disclaim any responsibility to update such views. These views may not be relied on as investment advice and, because investment decisions for a Columbia Acorn Fund are based on numerous factors, may not be relied on as an indication of trading intent on behalf of any particular Columbia Acorn Fund. References to specific securities should not be construed as a recommendation or investment advice.
Columbia Acorn Family of Funds | Semiannual Report 2018
| 35 |
2018 Mid-Year Distributions
The following table details the mid-year distributions for the Columbia Acorn Funds. The information is provided on a per share basis for each share class of the Funds.
| Fund | Ordinary
income | Short-term
capital
gain | Long-term
capital
gain | Record
date | Ex-dividend
date | Payable
date |
| Columbia Acorn® Fund | | | | | | |
| Class A | None | 0.10674 | 0.54539 | 6/11/2018 | 6/12/2018 | 6/12/2018 |
| Advisor Class | None | 0.14518 | 0.54539 | 6/11/2018 | 6/12/2018 | 6/12/2018 |
| Class C | None | None | 0.54539 | 6/11/2018 | 6/12/2018 | 6/12/2018 |
| Institutional Class | None | 0.14518 | 0.54539 | 6/11/2018 | 6/12/2018 | 6/12/2018 |
| Institutional 2 Class | None | 0.14825 | 0.54539 | 6/11/2018 | 6/12/2018 | 6/12/2018 |
| Institutional 3 Class | None | 0.15594 | 0.54539 | 6/11/2018 | 6/12/2018 | 6/12/2018 |
| Columbia Acorn International® | | | | | | |
| Class A | 0.23669 | None | 1.38063 | 6/11/2018 | 6/12/2018 | 6/12/2018 |
| Advisor Class | 0.23669 | None | 1.38063 | 6/11/2018 | 6/12/2018 | 6/12/2018 |
| Class C | 0.23669 | None | 1.38063 | 6/11/2018 | 6/12/2018 | 6/12/2018 |
| Institutional Class | 0.23669 | None | 1.38063 | 6/11/2018 | 6/12/2018 | 6/12/2018 |
| Institutional 2 Class | 0.23669 | None | 1.38063 | 6/11/2018 | 6/12/2018 | 6/12/2018 |
| Institutional 3 Class | 0.23669 | None | 1.38063 | 6/11/2018 | 6/12/2018 | 6/12/2018 |
| Class R | 0.23669 | None | 1.38063 | 6/11/2018 | 6/12/2018 | 6/12/2018 |
| Columbia Acorn USA® | | | | | | |
| Class A | None | 0.07369 | 0.39855 | 6/11/2018 | 6/12/2018 | 6/12/2018 |
| Advisor Class | None | 0.11401 | 0.39855 | 6/11/2018 | 6/12/2018 | 6/12/2018 |
| Class C | None | None | 0.39855 | 6/11/2018 | 6/12/2018 | 6/12/2018 |
| Institutional Class | None | 0.12102 | 0.39855 | 6/11/2018 | 6/12/2018 | 6/12/2018 |
| Institutional 2 Class | None | 0.13505 | 0.39855 | 6/11/2018 | 6/12/2018 | 6/12/2018 |
| Institutional 3 Class | None | 0.14031 | 0.39855 | 6/11/2018 | 6/12/2018 | 6/12/2018 |
| Columbia Acorn SelectSM | | | | | | |
| Class A | None | 0.29153 | 0.91638 | 6/11/2018 | 6/12/2018 | 6/12/2018 |
| Advisor Class | None | 0.32744 | 0.91638 | 6/11/2018 | 6/12/2018 | 6/12/2018 |
| Class C | None | 0.18378 | 0.91638 | 6/11/2018 | 6/12/2018 | 6/12/2018 |
| Institutional Class | None | 0.32744 | 0.91638 | 6/11/2018 | 6/12/2018 | 6/12/2018 |
| Institutional 2 Class | None | 0.33606 | 0.91638 | 6/11/2018 | 6/12/2018 | 6/12/2018 |
| Institutional 3 Class | None | 0.34325 | 0.91638 | 6/11/2018 | 6/12/2018 | 6/12/2018 |
| Columbia Thermostat FundSM | | | | | | |
| Class A | 0.01830 | 0.02984 | 0.15556 | 6/11/2018 | 6/12/2018 | 6/12/2018 |
| Advisor Class | 0.01830 | 0.02984 | 0.15556 | 6/11/2018 | 6/12/2018 | 6/12/2018 |
| Class C | 0.01830 | 0.02984 | 0.15556 | 6/11/2018 | 6/12/2018 | 6/12/2018 |
| Institutional Class | 0.01830 | 0.02984 | 0.15556 | 6/11/2018 | 6/12/2018 | 6/12/2018 |
| Institutional 2 Class | 0.01830 | 0.02984 | 0.15556 | 6/11/2018 | 6/12/2018 | 6/12/2018 |
| Institutional 3 Class | 0.01830 | 0.02984 | 0.15556 | 6/11/2018 | 6/12/2018 | 6/12/2018 |
| Columbia Acorn European FundSM | | | | | | |
| Class A | 0.11981 | None | None | 6/11/2018 | 6/12/2018 | 6/12/2018 |
| Advisor Class | 0.11981 | None | None | 6/11/2018 | 6/12/2018 | 6/12/2018 |
| Class C | 0.11981 | None | None | 6/11/2018 | 6/12/2018 | 6/12/2018 |
| Institutional Class | 0.11981 | None | None | 6/11/2018 | 6/12/2018 | 6/12/2018 |
| Institutional 2 Class | 0.11981 | None | None | 6/11/2018 | 6/12/2018 | 6/12/2018 |
| Institutional 3 Class | 0.11981 | None | None | 6/11/2018 | 6/12/2018 | 6/12/2018 |
There were no mid-year distributions for Acorn International SelectSM or Acorn Emerging MarketsSM.
| 36 | Columbia Acorn Family of Funds | Semiannual Report 2018 |
Understanding Your Fund’s Expenses
(Unaudited)
As a shareholder, you incur two types of costs. There are transaction costs, which generally include sales charges on purchases and may include redemption fees. There are also ongoing costs, which generally include investment advisory fees, distribution and service (Rule 12b-1) fees, and other Fund expenses. The following information is intended to help you understand your ongoing costs (in dollars) of investing in the Fund and to help you compare these costs with the ongoing costs of investing in other mutual funds.
Analyzing your Fund’s expenses
To illustrate these ongoing costs, we have provided examples and calculated the expenses paid by investors in each share class of the Funds during the period. The actual and hypothetical information in the tables is based on an initial investment of $1,000 at the beginning of the period indicated and held for the entire period. Expense information is calculated two ways and each method provides you with different information. The amount listed in the “Actual” column is calculated using the Funds’ actual operating expenses and total return for the period. You may use the Actual information, together with the amount invested, to estimate the expenses that you paid over the period. Simply divide your account value by $1,000 (for example, an $8,600 account value divided by $1,000 = 8.6), then multiply the results by the expenses paid during the period under the Actual column. The amount listed in the “Hypothetical” column assumes a 5% annual rate of return before expenses (which is not the Funds’ actual return) and then applies the Funds’ actual expense ratio for the period to the hypothetical return. You should not use the hypothetical account values and expenses to estimate either your actual account balance at the end of the period or the expenses you paid during the period. See “Compare with other funds” below for details on how to use the hypothetical data.
In addition to the ongoing expenses which the Funds bear directly, Columbia Thermostat Fund’s shareholders indirectly bear the Fund’s allocable share of the costs and expenses of each underlying fund in which the Fund invests. You can also estimate the effective expenses paid during the period, which includes the indirect fees associated with investing in the underlying funds, by using the amounts listed in the effective expenses paid during the period column in the “Fund of Funds” table.
Compare with other funds
Since all mutual funds are required to include the same hypothetical calculations about expenses in shareholder reports, you can use this information to compare the ongoing cost of investing in the Funds with other funds. To do so, compare the hypothetical example with the 5% hypothetical examples that appear in the shareholder reports of other funds. As you compare hypothetical examples of other funds, it is important to note that hypothetical examples are meant to highlight the ongoing costs of investing in a fund only and do not reflect any transaction costs, such as sales charges, or redemption or exchange fees. Therefore, the hypothetical calculations are useful in comparing ongoing costs only, and will not help you determine the relative total costs of owning different funds. If transaction costs were included in these calculations, your costs would be higher.
| January 1, 2018 — June 30, 2018 |
| | Account value at the
beginning of the
period ($) | Account value at the
end of the
period ($) | Expenses paid during
the period ($) | Fund’s annualized
expense ratio (%) |
| | Actual | Hypothetical | Actual | Hypothetical | Actual | Hypothetical | Actual |
| Columbia Acorn® Fund |
| Class A | 1,000.00 | 1,000.00 | 1,102.10 | 1,019.55 | 5.66 | 5.44 | 1.08 |
| Advisor Class | 1,000.00 | 1,000.00 | 1,103.80 | 1,020.79 | 4.35 | 4.18 | 0.83 |
| Class C | 1,000.00 | 1,000.00 | 1,098.10 | 1,015.81 | 9.57 | 9.20 | 1.83 |
| Institutional Class | 1,000.00 | 1,000.00 | 1,103.10 | 1,020.79 | 4.35 | 4.18 | 0.83 |
| Institutional 2 Class | 1,000.00 | 1,000.00 | 1,103.70 | 1,020.89 | 4.25 | 4.08 | 0.81 |
| Institutional 3 Class | 1,000.00 | 1,000.00 | 1,103.80 | 1,021.14 | 3.99 | 3.83 | 0.76 |
Columbia Acorn Family of Funds | Semiannual Report 2018
| 37 |
Understanding Your Fund’s Expenses (continued)
(Unaudited)
| January 1, 2018 — June 30, 2018 |
| | Account value at the
beginning of the
period ($) | Account value at the
end of the
period ($) | Expenses paid during
the period ($) | Fund’s annualized
expense ratio (%) |
| | Actual | Hypothetical | Actual | Hypothetical | Actual | Hypothetical | Actual |
| Columbia Acorn International® |
| Class A | 1,000.00 | 1,000.00 | 999.40 | 1,018.75 | 6.18 | 6.24 | 1.24 |
| Advisor Class | 1,000.00 | 1,000.00 | 1,000.70 | 1,020.00 | 4.94 | 4.99 | 0.99 |
| Class C | 1,000.00 | 1,000.00 | 995.80 | 1,015.01 | 9.90 | 10.00 | 1.99 |
| Institutional Class | 1,000.00 | 1,000.00 | 1,000.70 | 1,020.00 | 4.94 | 4.99 | 0.99 |
| Institutional 2 Class | 1,000.00 | 1,000.00 | 1,001.10 | 1,020.29 | 4.64 | 4.68 | 0.93 |
| Institutional 3 Class | 1,000.00 | 1,000.00 | 1,001.30 | 1,020.59 | 4.34 | 4.38 | 0.87 |
| Class R | 1,000.00 | 1,000.00 | 998.30 | 1,017.50 | 7.42 | 7.49 | 1.49 |
| Columbia Acorn USA® |
| Class A | 1,000.00 | 1,000.00 | 1,152.40 | 1,017.80 | 7.67 | 7.19 | 1.43 |
| Advisor Class | 1,000.00 | 1,000.00 | 1,154.30 | 1,019.05 | 6.34 | 5.94 | 1.18 |
| Class C | 1,000.00 | 1,000.00 | 1,147.80 | 1,014.06 | 11.67 | 10.95 | 2.18 |
| Institutional Class | 1,000.00 | 1,000.00 | 1,153.70 | 1,019.05 | 6.34 | 5.94 | 1.18 |
| Institutional 2 Class | 1,000.00 | 1,000.00 | 1,154.40 | 1,019.45 | 5.91 | 5.54 | 1.10 |
| Institutional 3 Class | 1,000.00 | 1,000.00 | 1,154.50 | 1,019.70 | 5.64 | 5.29 | 1.05 |
| Columbia Acorn International SelectSM |
| Class A | 1,000.00 | 1,000.00 | 1,018.00 | 1,017.95 | 7.04 | 7.04 | 1.40 |
| Advisor Class | 1,000.00 | 1,000.00 | 1,019.00 | 1,019.20 | 5.79 | 5.79 | 1.15 |
| Class C | 1,000.00 | 1,000.00 | 1,013.80 | 1,014.21 | 10.79 | 10.80 | 2.15 |
| Institutional Class | 1,000.00 | 1,000.00 | 1,018.80 | 1,019.20 | 5.79 | 5.79 | 1.15 |
| Institutional 2 Class | 1,000.00 | 1,000.00 | 1,019.70 | 1,019.60 | 5.39 | 5.39 | 1.07 |
| Institutional 3 Class | 1,000.00 | 1,000.00 | 1,019.70 | 1,019.85 | 5.14 | 5.14 | 1.02 |
| Columbia Acorn SelectSM |
| Class A | 1,000.00 | 1,000.00 | 1,061.60 | 1,019.20 | 5.91 | 5.79 | 1.15 |
| Advisor Class | 1,000.00 | 1,000.00 | 1,062.50 | 1,020.44 | 4.63 | 4.53 | 0.90 |
| Class C | 1,000.00 | 1,000.00 | 1,058.10 | 1,015.46 | 9.75 | 9.55 | 1.90 |
| Institutional Class | 1,000.00 | 1,000.00 | 1,063.20 | 1,020.44 | 4.63 | 4.53 | 0.90 |
| Institutional 2 Class | 1,000.00 | 1,000.00 | 1,063.30 | 1,020.74 | 4.32 | 4.23 | 0.84 |
| Institutional 3 Class | 1,000.00 | 1,000.00 | 1,063.70 | 1,020.99 | 4.06 | 3.98 | 0.79 |
| Columbia Acorn Emerging Markets FundSM |
| Class A | 1,000.00 | 1,000.00 | 944.90 | 1,017.40 | 7.32 | 7.59 | 1.51 |
| Advisor Class | 1,000.00 | 1,000.00 | 946.20 | 1,018.65 | 6.11 | 6.34 | 1.26 |
| Class C | 1,000.00 | 1,000.00 | 941.20 | 1,013.66 | 10.94 | 11.35 | 2.26 |
| Institutional Class | 1,000.00 | 1,000.00 | 946.60 | 1,018.65 | 6.11 | 6.34 | 1.26 |
| Institutional 2 Class | 1,000.00 | 1,000.00 | 946.90 | 1,019.00 | 5.78 | 5.99 | 1.19 |
| Institutional 3 Class | 1,000.00 | 1,000.00 | 947.20 | 1,019.25 | 5.53 | 5.74 | 1.14 |
| Columbia Acorn European FundSM |
| Class A | 1,000.00 | 1,000.00 | 1,005.90 | 1,017.75 | 7.20 | 7.24 | 1.44 |
| Advisor Class | 1,000.00 | 1,000.00 | 1,007.40 | 1,019.00 | 5.96 | 5.99 | 1.19 |
| Class C | 1,000.00 | 1,000.00 | 1,002.30 | 1,014.01 | 10.93 | 11.00 | 2.19 |
| Institutional Class | 1,000.00 | 1,000.00 | 1,006.90 | 1,019.00 | 5.95 | 5.99 | 1.19 |
| Institutional 2 Class | 1,000.00 | 1,000.00 | 1,007.90 | 1,019.30 | 5.66 | 5.69 | 1.13 |
| Institutional 3 Class | 1,000.00 | 1,000.00 | 1,007.00 | 1,019.55 | 5.40 | 5.44 | 1.08 |
| 38 | Columbia Acorn Family of Funds | Semiannual Report 2018 |
Understanding Your Fund’s Expenses (continued)
(Unaudited)
Fund of Funds—Columbia Thermostat Fund
| January 1, 2018 — June 30, 2018 |
| | Account value at the
beginning of the
period ($) | Account value at the
end of the
period ($) | Expenses paid during
the period ($) | Fund’s annualized
expense ratio (%) | Effective expenses
paid during the
period ($) | Fund’s effective
annualized
expense ratio (%) |
| | Actual | Hypothetical | Actual | Hypothetical | Actual | Hypothetical | Actual | Actual | Hypothetical | Actual |
| Class A | 1,000.00 | 1,000.00 | 1,005.00 | 1,022.44 | 2.50 | 2.52 | 0.50 | 4.60 | 4.64 | 0.92 |
| Advisor Class | 1,000.00 | 1,000.00 | 1,005.80 | 1,023.68 | 1.25 | 1.26 | 0.25 | 3.35 | 3.38 | 0.67 |
| Class C | 1,000.00 | 1,000.00 | 1,000.20 | 1,018.70 | 6.23 | 6.29 | 1.25 | 8.33 | 8.40 | 1.67 |
| Institutional Class | 1,000.00 | 1,000.00 | 1,005.80 | 1,023.68 | 1.25 | 1.26 | 0.25 | 3.35 | 3.38 | 0.67 |
| Institutional 2 Class | 1,000.00 | 1,000.00 | 1,005.70 | 1,023.83 | 1.10 | 1.11 | 0.22 | 3.20 | 3.23 | 0.64 |
| Institutional 3 Class | 1,000.00 | 1,000.00 | 1,005.80 | 1,024.08 | 0.85 | 0.86 | 0.17 | 2.95 | 2.98 | 0.59 |
Expenses paid during the period are equal to the annualized expense ratio, multiplied by the average account value over the period and then multiplied by the number of days in the Fund’s most recent fiscal half year and divided by 365.
Except with respect to Columbia Thermostat Fund, expenses do not include any fees and expenses incurred indirectly by a Fund from the underlying funds in which the Fund may invest (also referred to as “acquired funds”), including affiliated and non-affiliated pooled investments vehicles (including mutual funds and exchange traded funds).
In the case of Columbia Thermostat Fund, effective expenses paid during the period and the Fund’s effective annualized expense ratio include expenses borne directly by the class plus the Fund’s pro rata portion of the ongoing expenses charged by the underlying funds in which it invests using the expense ratio of each class of each underlying fund as of the underlying fund’s most recent shareholder report.
Had the investment manager and/or certain of its affiliates not waived/reimbursed certain fees and expenses for the Funds, account value at the end of the period would have been reduced.
Columbia Acorn Family of Funds | Semiannual Report 2018
| 39 |
Portfolio of Investments
Columbia Acorn® Fund, June 30, 2018 (Unaudited)
(Percentages represent value of investments compared to net assets)
Investments in securities
| Common Stocks 96.0% |
| Issuer | Shares | Value ($) |
| Consumer Discretionary 19.8% |
| Auto Components 3.6% |
Cooper-Standard Holding, Inc.(a)
Sealing, fuel and brake delivery, fluid transfer systems, anti-vibration systems components, subsystems, and modules | 381,375 | 49,834,271 |
Dorman Products, Inc.(a)
Automotive products and home hardware | 419,384 | 28,648,121 |
Gentex Corp.
Products that use electro-optic technology | 1,395,983 | 32,135,529 |
LCI Industries
Recreational vehicles and equipment | 314,881 | 28,386,522 |
Tenneco, Inc.
Emission control and ride control products and systems | 710,483 | 31,232,833 |
| Total | | 170,237,276 |
| Distributors 1.7% |
LKQ Corp.(a)
Automotive products and services | 593,633 | 18,936,893 |
Pool Corp.
Swimming pool supplies, equipment and leisure products | 404,067 | 61,216,150 |
| Total | | 80,153,043 |
| Diversified Consumer Services 2.5% |
Adtalem Global Education, Inc.(a)
Higher education institutions | 962,394 | 46,291,152 |
Bright Horizons Family Solutions, Inc.(a)
Child care and early education services | 290,295 | 29,761,043 |
Grand Canyon Education, Inc.(a)
Online post secondary education | 398,464 | 44,472,567 |
| Total | | 120,524,762 |
| Hotels, Restaurants & Leisure 5.2% |
Dave & Buster’s Entertainment, Inc.(a)
Venues that combine dining and entertainment for adults and families | 751,597 | 35,776,017 |
Domino’s Pizza, Inc.
Network of company-owned and franchise Domino’s Pizza stores | 91,833 | 25,912,518 |
Dunkin’ Brands Group, Inc.
Quick service restaurants serving hot and cold coffee and baked goods | 439,602 | 30,363,310 |
Extended Stay America, Inc.
Hotels and motels | 1,545,157 | 33,390,843 |
| Common Stocks (continued) |
| Issuer | Shares | Value ($) |
Papa John’s International, Inc.(b)
Pizza delivery and carry-out restaurants | 174,618 | 8,856,625 |
Texas Roadhouse, Inc.
Moderately priced, full service restaurant chain | 885,011 | 57,977,070 |
Vail Resorts, Inc.
Operates resorts globally | 81,062 | 22,226,390 |
Wingstop, Inc.
Cooked-to-order chicken wings | 643,639 | 33,546,465 |
| Total | | 248,049,238 |
| Household Durables 1.6% |
Cavco Industries, Inc.(a)
Designs and manufactures systems-built structures | 139,806 | 29,030,716 |
iRobot Corp.(a),(b)
Manufactures robots for cleaning | 376,562 | 28,532,102 |
NVR, Inc.(a)
Builds and markets homes and conducts mortgage banking activities | 6,100 | 18,119,135 |
| Total | | 75,681,953 |
| Internet & Direct Marketing Retail 0.8% |
Wayfair, Inc., Class A(a)
Retails household goods online | 303,419 | 36,034,040 |
| Leisure Products 0.8% |
Brunswick Corp.
Consumer products serving the outdoor and indoor active recreation markets | 614,352 | 39,613,417 |
| Media 0.5% |
Cable One, Inc.
Cable company | 33,500 | 24,565,215 |
| Specialty Retail 2.5% |
Five Below, Inc.(a)
Specialty value retailer | 319,361 | 31,204,763 |
Monro, Inc.
Automotive undercar repair and tire services | 362,003 | 21,032,374 |
Tractor Supply Co.
Retail farm store chain | 561,854 | 42,976,213 |
Ulta Beauty, Inc.(a)
Chain of beauty stores | 94,556 | 22,075,044 |
| Total | | 117,288,394 |
The accompanying Notes to Financial Statements are an integral part of this statement.
| 40 | Columbia Acorn Family of Funds | Semiannual Report 2018 |
Portfolio of Investments (continued)
Columbia Acorn® Fund, June 30, 2018 (Unaudited)
| Common Stocks (continued) |
| Issuer | Shares | Value ($) |
| Textiles, Apparel & Luxury Goods 0.6% |
Carter’s, Inc.
Markets baby and young children’s apparel | 260,000 | 28,181,400 |
| Total Consumer Discretionary | 940,328,738 |
| Consumer Staples 2.7% |
| Food & Staples Retailing 1.1% |
U.S. Foods Holding Corp.(a)
Catering services | 1,336,033 | 50,528,768 |
| Household Products 1.2% |
Central Garden & Pet Co.(a),(c)
Lawn, garden & pet supply products | 745,000 | 32,392,600 |
WD-40 Co.
Multi-purpose lubricant products and heavy-duty hand cleaners | 164,398 | 24,043,207 |
| Total | | 56,435,807 |
| Personal Products 0.4% |
Inter Parfums, Inc.
Fragrances and related products | 367,951 | 19,685,379 |
| Total Consumer Staples | 126,649,954 |
| Energy 1.1% |
| Oil, Gas & Consumable Fuels 1.1% |
Cimarex Energy Co.
Crude oil and natural gas | 147,390 | 14,995,459 |
Diamondback Energy, Inc.
Independent oil and natural gas company | 294,534 | 38,751,838 |
| Total | | 53,747,297 |
| Total Energy | 53,747,297 |
| Financials 8.5% |
| Banks 1.6% |
BOK Financial Corp.
Multi-bank holding company | 367,144 | 34,515,207 |
SVB Financial Group(a)
Holding company for Silicon Valley Bank | 148,227 | 42,802,029 |
| Total | | 77,317,236 |
| Common Stocks (continued) |
| Issuer | Shares | Value ($) |
| Capital Markets 5.8% |
Ares Management LP
Asset management firm | 1,465,000 | 30,325,500 |
Eaton Vance Corp.
Creates, markets, and manages mutual funds | 943,078 | 49,219,241 |
Factset Research Systems, Inc.
Global economic and financial data to analysts, investment bankers, and financial professionals | 164,763 | 32,639,550 |
Houlihan Lokey, Inc.
Investment bank | 624,963 | 32,010,605 |
Lazard Ltd., Class A
Corporate Advisory & Asset Management | 1,173,299 | 57,386,054 |
MarketAxess Holdings, Inc.
Electronic, multi-dealer to client platform for bond trading | 160,939 | 31,843,391 |
Raymond James Financial, Inc.
Financial services to individuals, corporations, and municipalities | 446,709 | 39,913,449 |
| Total | | 273,337,790 |
| Consumer Finance 0.6% |
Credit Acceptance Corp.(a)
Funding, receivables management, collection, sales training, and related services to automobile dealers | 82,711 | 29,230,067 |
| Insurance 0.5% |
Primerica, Inc.
Distributes financial products to middle income households | 245,000 | 24,402,000 |
| Total Financials | 404,287,093 |
| Health Care 20.0% |
| Biotechnology 4.0% |
Agios Pharmaceuticals, Inc.(a)
Therapeutics in the field of cancer metabolism | 212,809 | 17,924,902 |
Alkermes PLC(a)
Develops treatments for central nervous system disorders | 485,253 | 19,973,013 |
Ligand Pharmaceuticals, Inc.(a)
Drugs that regulate hormone activated intracellular receptors | 277,166 | 57,420,480 |
Loxo Oncology, Inc.(a)
Researches and develops cancer drugs | 114,070 | 19,788,864 |
The accompanying Notes to Financial Statements are an integral part of this statement.
Columbia Acorn Family of Funds | Semiannual Report 2018
| 41 |
Portfolio of Investments (continued)
Columbia Acorn® Fund, June 30, 2018 (Unaudited)
| Common Stocks (continued) |
| Issuer | Shares | Value ($) |
Seattle Genetics, Inc.(a)
Monoclonal antibody-based drugs to treat cancer and related diseases | 674,494 | 44,779,657 |
Ultragenyx Pharmaceutical, Inc.(a)
Therapeutics and sialic acid for treating metabolic, body myopathy, glucuronidase, and rare genetic diseases | 392,364 | 30,161,021 |
| Total | | 190,047,937 |
| Health Care Equipment & Supplies 6.9% |
Align Technology, Inc.(a)
Designs, manufactures, and markets the Invisalign System | 73,647 | 25,197,584 |
AxoGen, Inc.(a)
Technologies for peripheral nerve reconstruction and regeneration | 624,339 | 31,373,035 |
Haemonetics Corp.(a)
Automated blood processing systems | 276,947 | 24,836,607 |
iRhythm Technologies, Inc.(a)
Medical instruments | 421,643 | 34,207,897 |
LivaNova PLC(a)
Medical technology focusing on neuromodulation, cardiac surgery and rhythm management | 305,000 | 30,445,100 |
Masimo Corp.(a)
Medical signal processing and sensor technology for non-invasive monitoring of physiological parameters | 870,420 | 84,996,513 |
Penumbra, Inc.(a)
Peripheral vascular & neurovascular devices | 128,000 | 17,683,200 |
ResMed, Inc.
Medical equipment for the treatment of sleep disordered breathing | 322,545 | 33,409,211 |
Varex Imaging Corp.(a)
X-ray imaging components | 669,059 | 24,815,398 |
Varian Medical Systems, Inc.(a)
Medical equipment | 182,447 | 20,747,873 |
| Total | | 327,712,418 |
| Health Care Providers & Services 4.1% |
Amedisys, Inc.(a)
Provider of alternate-site health care services | 692,504 | 59,181,392 |
AMN Healthcare Services, Inc.(a)
Temporary healthcare staffing | 475,389 | 27,857,795 |
Chemed Corp.
Hospice and palliative care services | 132,300 | 42,575,463 |
Encompass Health Corp.
Inpatient rehabilitative healthcare services | 930,237 | 62,995,650 |
| Total | | 192,610,300 |
| Common Stocks (continued) |
| Issuer | Shares | Value ($) |
| Health Care Technology 1.6% |
Evolent Health, Inc., Class A(a)
Purpose-built platform enables providers to migrate their payment models | 1,111,064 | 23,387,897 |
Veeva Systems Inc., Class A(a)
Cloud-based business services | 710,556 | 54,613,334 |
| Total | | 78,001,231 |
| Life Sciences Tools & Services 3.4% |
Bio-Techne Corp.
Biotechnology products and clinical diagnostic controls | 482,462 | 71,380,253 |
Mettler-Toledo International, Inc.(a)
Weighing instruments for use in laboratory, industrial, and food retailing applications | 30,543 | 17,673,096 |
Pra Health Sciences, Inc.(a)
Global contract research organization | 784,432 | 73,234,572 |
| Total | | 162,287,921 |
| Total Health Care | 950,659,807 |
| Industrials 14.3% |
| Aerospace & Defense 0.7% |
HEICO Corp., Class A
Aerospace products and services | 559,795 | 34,119,505 |
| Air Freight & Logistics 0.5% |
Expeditors International of Washington, Inc.
Global logistics company | 330,439 | 24,155,091 |
| Commercial Services & Supplies 1.8% |
Brink’s Co. (The)
Provides security services globally | 380,358 | 30,333,550 |
Copart, Inc.(a)
Services to process and sell salvage vehicles through auctions | 438,776 | 24,817,171 |
Unifirst Corp.
Workplace uniforms and protective clothing | 176,205 | 31,170,664 |
| Total | | 86,321,385 |
The accompanying Notes to Financial Statements are an integral part of this statement.
| 42 | Columbia Acorn Family of Funds | Semiannual Report 2018 |
Portfolio of Investments (continued)
Columbia Acorn® Fund, June 30, 2018 (Unaudited)
| Common Stocks (continued) |
| Issuer | Shares | Value ($) |
| Machinery 6.4% |
Gardner Denver Holdings, Inc.(a)
Vacuum systems, bottle blowers, pumps and air & gas compressors | 575,000 | 16,899,250 |
Graco, Inc.
Technology for the management of fluids in industrial and commercial applications | 1,234,634 | 55,830,149 |
ITT, Inc.
Engineered components & customized technology solutions | 523,500 | 27,363,345 |
Nordson Corp.
Systems that apply adhesives, sealants, and coatings to products during manufacturing | 258,744 | 33,225,317 |
Oshkosh Corp.
Fire and emergency apparatuses and specialty commercial, and military trucks | 441,462 | 31,043,608 |
Toro Co. (The)
Turf equipment | 918,438 | 55,335,889 |
WABCO Holdings, Inc.(a)
Electronic braking, stability, suspension, and transmission control systems commercial vehicles | 388,178 | 45,424,590 |
Woodward, Inc.
Energy control systems and components for aircraft, industrial engines and turbines | 504,500 | 38,775,870 |
| Total | | 303,898,018 |
| Professional Services 1.9% |
CoStar Group, Inc.(a)
Provides building-specific information to the United States commercial real estate industry and related industries | 61,466 | 25,362,716 |
ManpowerGroup, Inc.
Non-governmental employment services | 367,737 | 31,647,446 |
Robert Half International, Inc.
Temporary and permanent staffing services | 528,720 | 34,419,672 |
| Total | | 91,429,834 |
| Road & Rail 2.1% |
JB Hunt Transport Services, Inc.
Logistics services | 165,266 | 20,088,083 |
Old Dominion Freight Line, Inc.
Inter-regional and multi-regional motor carrier | 534,818 | 79,666,489 |
| Total | | 99,754,572 |
| Trading Companies & Distributors 0.9% |
Watsco, Inc.
Air conditioning, heating, and refrigeration equipment | 234,128 | 41,740,340 |
| Total Industrials | 681,418,745 |
| Common Stocks (continued) |
| Issuer | Shares | Value ($) |
| Information Technology 23.2% |
| Electronic Equipment, Instruments & Components 3.3% |
CDW Corp.
IT products and services | 606,575 | 49,005,194 |
Cognex Corp.
Machine vision systems | 780,000 | 34,795,800 |
Coherent, Inc.(a)
Laser-based photonic products | 58,000 | 9,072,360 |
II-VI, Inc.(a)
Optical and optoelectronic devices | 500,550 | 21,748,898 |
IPG Photonics Corp.(a)
High-power fiber lasers and amplifiers | 187,098 | 41,279,432 |
| Total | | 155,901,684 |
| Internet Software & Services 3.5% |
Alteryx, Inc., Class A(a),(b)
Data storage, retrieval, management, reporting, and analytics solutions | 685,198 | 26,147,156 |
Mimecast Ltd.(a)
Cloud security and risk management services for corporate information and email | 476,700 | 19,644,807 |
MINDBODY, Inc., Class A(a)
Business management software | 911,360 | 35,178,496 |
Nutanix, Inc., Class A(a)
Enterprise cloud platforms | 353,803 | 18,245,621 |
Q2 Holdings, Inc.(a)
Secure, cloud-based virtual banking solutions | 390,631 | 22,285,498 |
Quotient Technology, Inc.(a)
Operates a promotion platform | 1,597,710 | 20,930,001 |
VeriSign, Inc.(a)
Domain names and Internet security services | 177,571 | 24,401,807 |
| Total | | 166,833,386 |
| IT Services 4.6% |
Black Knight, Inc.(a)
Integrated technology, work flow automation, data and analytic solutions | 622,215 | 33,319,613 |
Booz Allen Hamilton Holdings Corp.
Technology consulting services to the U.S. government in the defense, intelligence, and civil markets | 1,062,403 | 46,458,883 |
Broadridge Financial Solutions, Inc.
Technology-based outsourcing solutions to the financial services industry | 294,817 | 33,933,437 |
CoreLogic, Inc.(a)
Consumer, financial and property information, analytics and services to business and government | 368,760 | 19,138,644 |
The accompanying Notes to Financial Statements are an integral part of this statement.
Columbia Acorn Family of Funds | Semiannual Report 2018
| 43 |
Portfolio of Investments (continued)
Columbia Acorn® Fund, June 30, 2018 (Unaudited)
| Common Stocks (continued) |
| Issuer | Shares | Value ($) |
EPAM Systems, Inc.(a)
Provides software development, outsourcing services, e-business, enterprise relationship management and content management solutions | 291,000 | 36,180,030 |
Gartner, Inc.(a)
Research and analysis on computer hardware, software, communications, and information technology | 212,622 | 28,257,464 |
GreenSky, Inc., Class A(a)
Technology company | 1,096,242 | 23,185,518 |
| Total | | 220,473,589 |
| Semiconductors & Semiconductor Equipment 6.1% |
Advanced Energy Industries, Inc.(a)
Engineered precision power conversion, measurement and control solutions | 665,818 | 38,677,368 |
Brooks Automation, Inc.
Automation solutions for the global semiconductor and related industries | 1,123,474 | 36,647,722 |
Cabot Microelectronics Corp.
Slurries used in chemical mechanical planarization | 384,000 | 41,303,040 |
Inphi Corp.(a),(b)
Analog semiconductor solutions | 634,916 | 20,704,611 |
MKS Instruments, Inc.
Instruments and components used to control and analyze gases in semiconductor manufacturing | 437,784 | 41,895,929 |
Monolithic Power Systems, Inc.
Power management solutions | 225,441 | 30,134,698 |
Semtech Corp.(a)
Analog and mixed-signal semiconductors | 861,391 | 40,528,446 |
Teradyne, Inc.
Semiconductor test products and services | 1,005,400 | 38,275,578 |
| Total | | 288,167,392 |
| Software 5.7% |
ANSYS, Inc.(a)
Software solutions for design analysis and optimization | 207,331 | 36,112,914 |
Blackline, Inc.(a)
Develops and markets enterprise software | 497,040 | 21,586,447 |
Cadence Design Systems, Inc.(a)
Software technology, design and consulting services and technology | 1,388,503 | 60,136,065 |
CyberArk Software Ltd.(a)
IT security solutions | 423,051 | 26,635,291 |
Guidewire Software, Inc.(a)
Enterprise software for the property and casualty insurance industry | 226,040 | 20,067,831 |
Proofpoint, Inc.(a)
On-demand data protection solutions | 191,000 | 22,024,210 |
| Common Stocks (continued) |
| Issuer | Shares | Value ($) |
Qualys, Inc.(a)
Information technology security risk and compliance management solutions | 417,251 | 35,174,259 |
Synopsys, Inc.(a)
Electronic design automation solutions | 294,590 | 25,208,066 |
Ultimate Software Group, Inc. (The)(a)
Software solutions | 89,935 | 23,141,175 |
| Total | | 270,086,258 |
| Total Information Technology | 1,101,462,309 |
| Materials 2.6% |
| Chemicals 1.6% |
Celanese Corp., Class A
Global integrated producer of chemicals and advanced materials | 271,263 | 30,126,469 |
PolyOne Corp.
International polymer services company | 575,000 | 24,851,500 |
Quaker Chemical Corp.
Custom-formulated chemical specialty products | 151,400 | 23,447,318 |
| Total | | 78,425,287 |
| Containers & Packaging 1.0% |
Avery Dennison Corp.
Pressure-sensitive materials and a variety of tickets, tags and labels | 279,691 | 28,556,451 |
Sealed Air Corp.
Packaging and performance-based materials and equipment | 448,600 | 19,043,070 |
| Total | | 47,599,521 |
| Total Materials | 126,024,808 |
| Real Estate 2.9% |
| Equity Real Estate Investment Trusts (REITS) 2.2% |
Coresite Realty Corp.
Develops, owns & operates data centers | 321,881 | 35,670,853 |
Equity LifeStyle Properties, Inc.
Acquires properties such as camping grounds and seasonal resort communities | 213,266 | 19,599,145 |
Lamar Advertising Co., Class A
Outdoor advertising structures | 684,333 | 46,746,787 |
| Total | | 102,016,785 |
| Real Estate Management & Development 0.7% |
Jones Lang LaSalle, Inc.
Real estate and investment management services | 210,632 | 34,962,806 |
| Total Real Estate | 136,979,591 |
The accompanying Notes to Financial Statements are an integral part of this statement.
| 44 | Columbia Acorn Family of Funds | Semiannual Report 2018 |
Portfolio of Investments (continued)
Columbia Acorn® Fund, June 30, 2018 (Unaudited)
| Common Stocks (continued) |
| Issuer | Shares | Value ($) |
| Telecommunication Services 0.9% |
| Diversified Telecommunication Services 0.4% |
Zayo Group Holdings, Inc.(a)
Global provider of bandwidth infrastructure services | 547,191 | 19,961,528 |
| Wireless Telecommunication Services 0.5% |
Boingo Wireless, Inc.(a)
Mobile internet services | 965,652 | 21,814,078 |
| Total Telecommunication Services | 41,775,606 |
Total Common Stocks
(Cost: $3,106,264,249) | 4,563,333,948 |
|
| Limited Partnerships 0.4% |
| | |
| Consumer Discretionary 0.4% |
| Hotels, Restaurants & Leisure 0.4% |
Cedar Fair LP
Owns and operates amusement parks | 326,046 | 20,544,159 |
| Total Consumer Discretionary | 20,544,159 |
Total Limited Partnerships
(Cost: $21,498,282) | 20,544,159 |
|
| Securities Lending Collateral 1.1% |
| | Shares | Value ($) |
Dreyfus Government Cash Management Fund, Institutional Shares, 1.810%(d),(e)
| 50,735,444 | 50,735,444 |
Total Securities Lending Collateral
(Cost: $50,735,444) | 50,735,444 |
|
| Money Market Funds 2.7% |
| | |
| JPMorgan U.S. Government Money Market Fund, IM Shares, 1.819%(d) | 127,557,532 | 127,557,532 |
Total Money Market Funds
(Cost: $127,557,532) | 127,557,532 |
Total Investments in Securities
(Cost $3,306,055,507) | 4,762,171,083 |
| Obligation to Return Collateral for Securities Loaned | | (50,735,444) |
| Other Assets & Liabilities, Net | | 42,360,019 |
| Net Assets | $4,753,795,658 |
Notes to Portfolio of Investments
| (a) | Non-income producing security. |
| (b) | All or a portion of this security was on loan at June 30, 2018. The total market value of securities on loan at June 30, 2018 was $49,634,346. |
| (c) | An affiliated person of the Fund, as defined in the Investment Company Act of 1940, may include any company in which the Fund owns five percent or more of its outstanding voting shares. Holdings and transactions in these affiliated companies during the six months ended June 30, 2018, are as follows. The aggregate cost and value of these companies at June 30, 2018, was $30,351,061 and $32,392,600, respectively. Investments in affiliated companies represented 0.68% of the Fund’s total net assets at June 30, 2018. |
| Issuer | Beginning
shares | Shares
purchased | Shares
sold | Ending
shares | Realized gain
(loss) —
affiliated
issuers ($) | Net change in
unrealized
appreciation
(depreciation) —
affiliated
issuers ($) | Dividend —
affiliated issuers
($) | Value —
affiliated
issuers
at end of
period ($) |
| Celldex Therapeutics, Inc. † |
| | 8,126,489 | — | (8,126,489) | — | (17,193,753) | 1,501,758 | — | — |
| Central Garden & Pet Co. ‡ |
| | — | 745,000 | — | 745,000 | — | 2,041,539 | — | 32,392,600 |
| Total of Affiliated Transactions | | | | | (17,193,753) | 3,543,297 | — | 32,392,600 |
| † | Issuer was not an affiliate at the end of period. |
| ‡ | Issuer was not an affiliate at the beginning of period. |
| (d) | The rate shown is the seven-day current annualized yield at June 30, 2018. |
| (e) | Investment made with cash collateral received from securities lending activity. |
The accompanying Notes to Financial Statements are an integral part of this statement.
Columbia Acorn Family of Funds | Semiannual Report 2018
| 45 |
Portfolio of Investments (continued)
Columbia Acorn® Fund, June 30, 2018 (Unaudited)
Fair value measurements
Various inputs are used in determining the value of the Fund’s investments, following the input prioritization hierarchy established by accounting principles generally accepted in the United States of America (GAAP). These inputs are summarized in the three broad levels listed below:
| ■ | Level 1 – quoted prices in active markets for identical securities |
| ■ | Level 2 – prices determined using other significant observable inputs (including quoted prices for similar securities, interest rates, prepayment speeds, credit risk and others) |
| ■ | Level 3 – prices determined using significant unobservable inputs where quoted prices or observable inputs are unavailable or less reliable (including management’s own assumptions about the factors market participants would use in pricing an investment) |
The inputs or methodology used for valuing securities are not necessarily an indication of the risk associated with investing in those securities.
Examples of the types of securities in which the Fund would typically invest and how they are classified within this hierarchy are as follows. Typical Level 1 securities include exchange traded domestic equities, mutual funds whose net asset values are published each day and exchange traded foreign equities that are not statistically fair valued. Typical Level 2 securities include exchange traded foreign equities that are statistically fair valued, forward foreign currency exchange contracts and short-term investments valued at amortized cost. Additionally, securities fair valued by Columbia Wanger Asset Management’s Valuation Committee (the Committee) that rely on significant observable inputs are also included in Level 2. Typical Level 3 securities include any security fair valued by the Committee that relies on significant unobservable inputs.
The Committee is responsible for applying the Columbia Acorn Trust Portfolio Pricing Policy and the Columbia Wanger Asset Management pricing procedures (the Policies), which are approved by and subject to the oversight of the Board of Trustees.
The Committee meets as necessary, and no less frequently than quarterly, to determine fair values for securities for which market quotations are not readily available or for which Columbia Wanger Asset Management believes that available market quotations are unreliable. The Committee also reviews the continuing appropriateness of the Policies. In circumstances where a security has been fair valued, the Committee will also review the continuing appropriateness of the current value of the security. The Policies address, among other things: circumstances under which market quotations will be deemed readily available; selection of third party pricing vendors; appropriate pricing methodologies; events that require fair valuation and fair value techniques; circumstances under which securities will be deemed to pose a potential for stale pricing, including when securities are illiquid, restricted, or in default; and certain delegations of authority to determine fair values to the Fund’s investment manager. The Committee may also meet to discuss additional valuation matters, which may include review of back-testing results, review of time-sensitive information or approval of other valuation related actions, and to review the appropriateness of the Policies.
For investments categorized as Level 3, the significant unobservable inputs used in the fair value measurement of the Fund’s securities may include: (i) data specific to the issuer or comparable issuers, (ii) general market or specific sector news and (iii) quoted prices and specific or similar security transactions. The Committee considers this data and any changes from prior periods in order to assess the reasonableness of observable and unobservable inputs, any assumptions or internal models used to value those securities and changes in fair value. Significant changes in any of these factors could result in lower or higher fair value measurements. Various factors impact the frequency of monitoring (which may occur as often as daily), however the Committee may determine that changes to inputs, assumptions and models are not required with the same frequency.
The following table is a summary of the inputs used to value the Fund’s investments at June 30, 2018:
| | Level 1
quoted prices in active
markets for identical
assets ($) | Level 2
other significant
observable inputs ($) | Level 3
significant
unobservable inputs ($) | Total ($) |
| Investments in Securities | | | | |
| Common Stocks | | | | |
| Consumer Discretionary | 940,328,738 | — | — | 940,328,738 |
| Consumer Staples | 126,649,954 | — | — | 126,649,954 |
| Energy | 53,747,297 | — | — | 53,747,297 |
| Financials | 404,287,093 | — | — | 404,287,093 |
| Health Care | 950,659,807 | — | — | 950,659,807 |
| Industrials | 681,418,745 | — | — | 681,418,745 |
| Information Technology | 1,101,462,309 | — | — | 1,101,462,309 |
| Materials | 126,024,808 | — | — | 126,024,808 |
| Real Estate | 136,979,591 | — | — | 136,979,591 |
| Telecommunication Services | 41,775,606 | — | — | 41,775,606 |
| Total Common Stocks | 4,563,333,948 | — | — | 4,563,333,948 |
| Limited Partnerships | | | | |
| Consumer Discretionary | 20,544,159 | — | — | 20,544,159 |
| Total Limited Partnerships | 20,544,159 | — | — | 20,544,159 |
| Securities Lending Collateral | 50,735,444 | — | — | 50,735,444 |
| Money Market Funds | 127,557,532 | — | — | 127,557,532 |
| Total Investments in Securities | 4,762,171,083 | — | — | 4,762,171,083 |
There were no transfers of financial assets between levels during the period.
The accompanying Notes to Financial Statements are an integral part of this statement.
| 46 | Columbia Acorn Family of Funds | Semiannual Report 2018 |
Portfolio of Investments
Columbia Acorn International®, June 30, 2018 (Unaudited)
(Percentages represent value of investments compared to net assets)
Investments in securities
| Common Stocks 96.3% |
| Issuer | Shares | Value ($) |
| Australia 1.7% |
carsales.com Ltd.
Automotive & related industry websites | 3,859,000 | 43,135,487 |
DuluxGroup Ltd.
Manufactures and supplies paints and other surface coatings | 3,872,000 | 21,893,919 |
National Storage REIT
Owns self storage facilities | 726,693 | 884,776 |
| Total | 65,914,182 |
| Belgium 0.4% |
Melexis NV
Advanced integrated semiconductors, sensor ICs, and programmable sensor IC systems | 159,030 | 14,722,465 |
| Brazil 1.2% |
Odontoprev SA
Dental benefits company | 3,809,000 | 12,972,663 |
Qualicorp SA
Insurance and benefits packages | 3,746,000 | 17,784,016 |
Raia Drogasil SA
Chain of pharmaceutical stores | 1,082,000 | 18,288,543 |
| Total | 49,045,222 |
| Cambodia 0.5% |
NagaCorp Ltd.
Leisure and tourism company | 20,536,000 | 18,625,081 |
| Canada 5.8% |
CAE, Inc.
Training solutions based on simulation technology and integrated training services | 2,499,934 | 51,932,604 |
CCL Industries, Inc.
Manufacturing services and specialty packaging products for the non-durable consumer products market | 2,353,220 | 115,365,329 |
CES Energy Solutions Corp.
Oil and natural gas industry | 3,140,000 | 10,724,223 |
ShawCor Ltd.
Energy services company | 1,209,367 | 23,476,245 |
Winpak Ltd.
Packaging materials and machines for the protection of perishables | 880,000 | 29,452,706 |
| Total | 230,951,107 |
| Common Stocks (continued) |
| Issuer | Shares | Value ($) |
| Cayman Islands 1.9% |
Gourmet Master Co., Ltd.
Coffee & bakery cafes | 1,450,656 | 14,015,162 |
Parade Technologies Ltd.
Fabless semiconductor company | 1,986,000 | 33,219,208 |
Silicon Motion Technology Corp., ADR
Semiconductor products | 567,000 | 29,988,630 |
| Total | 77,223,000 |
| China 4.3% |
51job, Inc., ADR(a)
Integrated human resource services | 352,772 | 34,444,658 |
58.Com, Inc., ADR(a)
Local life service platform | 315,107 | 21,849,520 |
China Medical System Holdings Ltd.
Pharmaceutical and medical products | 9,151,000 | 18,227,395 |
New Oriental Education & Technology Group, Inc., ADR
Educational services | 466,864 | 44,193,346 |
Shenzhou International Group Holdings Ltd.
Manufactures and processes textiles | 2,498,000 | 30,738,849 |
TravelSky Technology Ltd., Class H
IT solutions for China’s air travel and tourism industries | 7,100,000 | 20,608,700 |
| Total | 170,062,468 |
| Denmark 4.7% |
Novozymes AS, Class B
Enzymes for industrial use | 1,372,079 | 69,397,344 |
SimCorp AS
Global provider of highly specialised software for the investment management industry | 838,367 | 67,711,570 |
William Demant Holding AS(a)
Hearing aids, audiometers, tympanometers, diagnostic instruments, and wireless communication equipment | 1,221,031 | 49,002,509 |
| Total | 186,111,423 |
| France 0.4% |
Elior Group SA
Provides catering, cleaning, and facility management services | 1,208,500 | 17,418,090 |
The accompanying Notes to Financial Statements are an integral part of this statement.
Columbia Acorn Family of Funds | Semiannual Report 2018
| 47 |
Portfolio of Investments (continued)
Columbia Acorn International®, June 30, 2018 (Unaudited)
| Common Stocks (continued) |
| Issuer | Shares | Value ($) |
| Germany 8.7% |
AURELIUS Equity Opportunities SE & Co. KGaA
Loans to distressed companies | 245,007 | 14,501,555 |
CTS Eventim AG & Co. KGaA
Online ticket sales | 570,000 | 27,985,699 |
Fielmann AG
Prescription eyeglasses, specialty glasses, sunglasses, contact lenses, and optical supplies | 440,000 | 30,421,714 |
KION Group AG
Material handling solutions | 316,000 | 22,682,305 |
MTU Aero Engines AG
Develops and manufactures engines and offers commercial engine services and support | 445,000 | 85,235,959 |
Nemetschek SE
Standard software for designing, constructing and managing buildings and real estate | 191,000 | 22,892,617 |
Rational AG
Food preparation appliances/processors and kitchen accessories | 66,275 | 43,158,868 |
Stroeer SE & Co. KGaA
Digital multi-channel media company | 627,251 | 37,870,210 |
Wirecard AG
Internet payment and processing services | 367,000 | 58,727,497 |
| Total | 343,476,424 |
| Hong Kong 1.0% |
ASM Pacific Technology Ltd.
Machines, tools & materials used in the semiconductor industry | 1,646,800 | 20,755,490 |
Value Partners Group Ltd.
Independent, value oriented asset management group | 24,498,000 | 19,262,552 |
| Total | 40,018,042 |
| India 1.4% |
Havells India Ltd.
Manufactures electrical products | 2,775,000 | 22,001,400 |
Zee Entertainment Enterprises Ltd.
Hindi films, serials, game shows and children’s programs | 4,125,681 | 32,781,554 |
| Total | 54,782,954 |
| Indonesia 0.8% |
PT Matahari Department Store Tbk
Retail clothes, accessories, bags, shoes, cosmetics, household appliances, and management consulting services. | 52,107,800 | 31,913,673 |
| Common Stocks (continued) |
| Issuer | Shares | Value ($) |
| Ireland 1.1% |
UDG Healthcare PLC
Commercialisation solutions for health care companies | 4,148,000 | 45,077,710 |
| Italy 3.2% |
Brembo SpA
Braking systems and components | 5,509,337 | 74,303,145 |
Davide Campari-Milano SpA
Global producer & distributor of branded spirits, wines and soft drinks | 3,276,000 | 26,889,168 |
Industria Macchine Automatiche SpA
Packaging machinery for the food, pharmaceuticals, and cosmetics industries | 290,000 | 25,163,674 |
| Total | 126,355,987 |
| Japan 22.2% |
Aeon Credit Service Co., Ltd.
Credit card company | 1,491,000 | 31,779,216 |
Aeon Mall Co., Ltd.
Large-scale shopping malls | 2,345,500 | 42,076,033 |
Amano Corp.
Electronic time recorders and information systems | 913,000 | 21,566,523 |
Asahi Intecc Co., Ltd.
Manufactures medical tools and stainless wire rope | 955,400 | 36,072,162 |
Azbil Corp.
Provides measurement and control technologies | 456,000 | 19,841,191 |
cocokara fine, Inc.
Drug chain stores | 349,000 | 21,458,075 |
CyberAgent, Inc.
Operates websites, internet advertising agency and creates PC and mobile contents | 419,300 | 25,146,818 |
Daiseki Co., Ltd.
Waste Disposal & Recycling | 582,400 | 17,075,157 |
Disco Corp.
Abrasive and precision industrial machinery for cutting and grinding purposes | 164,800 | 28,056,052 |
Fuji Oil Holdings, Inc.
Specialty vegetable oils and fats | 1,276,000 | 45,869,447 |
Glory Ltd.
Vending machines, coin-operated lockers, money handling machines, and data processing terminals | 1,032,900 | 28,860,106 |
Hikari Tsushin, Inc.
Distribution network, telecommunication, office automation equipment, in-house products and individual insurance plans | 384,428 | 67,466,834 |
Kansai Paint
Paints and related products | 1,050,000 | 21,790,104 |
The accompanying Notes to Financial Statements are an integral part of this statement.
| 48 | Columbia Acorn Family of Funds | Semiannual Report 2018 |
Portfolio of Investments (continued)
Columbia Acorn International®, June 30, 2018 (Unaudited)
| Common Stocks (continued) |
| Issuer | Shares | Value ($) |
KH Neochem Co., Ltd.
Manufactures and sells petroleum chemical products | 15,500 | 468,981 |
Mandom Corp.
Cosmetic products for men and women | 688,400 | 21,410,004 |
Miura Co., Ltd.
Industrial boilers and related equipment | 960,400 | 23,303,967 |
MonotaRO Co., Ltd(b)
Machine tools, engine parts, and factory consumable goods | 522,800 | 23,095,027 |
Nabtesco Corp.
Aircraft and hydraulic products | 640,000 | 19,663,936 |
NGK Insulators Ltd.
Electrical insulators, industrial ceramic products, environmental systems and electronic parts | 1,375,200 | 24,434,667 |
Nissan Chemical Industries Ltd.
Variety of chemical products | 902,000 | 42,017,011 |
Obic Co., Ltd.
Computer system integration, office automation, consultation, and system support services | 400,100 | 33,054,899 |
OSG Corp.
Manufactures machine tool equipment | 1,128,300 | 23,207,593 |
Otsuka Corp.
Computer information system and software | 494,000 | 19,338,793 |
Persol Holdings Co., Ltd.
Human resource solutions | 1,768,000 | 39,374,059 |
Santen Pharmaceutical Co., Ltd.
Ophthalmic medicine | 2,662,000 | 46,309,257 |
Sekisui Chemical Co., Ltd.
Unit residential houses in addition to parcels of land | 2,639,500 | 44,899,473 |
Seria Co., Ltd.
Operates 100 yen chain stores | 991,000 | 47,493,151 |
Sohgo Security Services Co., Ltd.
Around the clock security services | 641,400 | 30,176,377 |
Sony Financial Holdings, Inc.
Financial holding company | 1,113,000 | 21,206,102 |
Ushio, Inc.
Lamps and optical equipment | 1,246,100 | 15,825,090 |
| Total | 882,336,105 |
| Malta 1.8% |
Unibet Group PLC
Online gambling services | 5,704,948 | 71,470,248 |
| Mexico 1.6% |
Grupo Aeroportuario del Sureste SAB de CV, ADR(b)
Operates airports in Mexico | 393,900 | 62,693,124 |
| Common Stocks (continued) |
| Issuer | Shares | Value ($) |
| Netherlands 1.4% |
Aalberts Industries NV
Industrial services and flow control systems | 1,183,797 | 56,550,545 |
| Philippines 0.5% |
Universal Robina Corp.
Branded consumer foods | 8,800,000 | 19,919,185 |
| Poland 0.3% |
KRUK SA
Debt collection services | 214,000 | 11,404,434 |
| Russian Federation 0.4% |
TCS Group Holding PLC, GDR
Online retail financial services | 821,000 | 16,994,700 |
| Singapore 1.8% |
Mapletree Commercial Trust
Singapore-focused real estate investment trust | 32,720,300 | 37,703,776 |
Singapore Exchange
Singapore’s Securities and derivatives exchange and clearing houses | 6,123,200 | 32,176,825 |
| Total | 69,880,601 |
| South Africa 1.5% |
Clicks Group Ltd.
Owns and operates chains of retail stores | 2,058,748 | 29,395,655 |
PSG Group Ltd.
Diversified financial services | 1,986,169 | 31,242,983 |
| Total | 60,638,638 |
| South Korea 4.2% |
CJ Logistics Corp.(a)
Logistics services | 178,764 | 26,959,739 |
GS Retail Co., Ltd.
Chain of retail stores | 670,961 | 26,477,297 |
Koh Young Technology, Inc.
3D measurement and inspection equipment for testing various machineries | 251,000 | 22,946,339 |
Korea Investment Holdings Co., Ltd.
Financial holding company | 493,000 | 37,172,010 |
Korea Zinc Co. Ltd.
Non-ferrous metal smelting | 114,000 | 39,485,869 |
Modetour Network, Inc.
Travel services | 555,515 | 13,548,516 |
| Total | 166,589,770 |
| Spain 0.8% |
Prosegur Cia de Seguridad SA, Registered Shares
Security and transportation services | 5,000,000 | 32,571,239 |
The accompanying Notes to Financial Statements are an integral part of this statement.
Columbia Acorn Family of Funds | Semiannual Report 2018
| 49 |
Portfolio of Investments (continued)
Columbia Acorn International®, June 30, 2018 (Unaudited)
| Common Stocks (continued) |
| Issuer | Shares | Value ($) |
| Sweden 4.8% |
Hexagon AB, Class B
Design, measurement and visualisation technologies | 1,662,231 | 92,365,463 |
NetEnt AB
Develops and markets computer gaming software | 3,854,000 | 20,470,993 |
Sweco AB, Class B
Consulting company specializing in engineering, environmental technology, and architecture | 772,443 | 18,185,612 |
Trelleborg AB, Class B
Manufactures and distributes industrial products | 2,710,587 | 57,637,139 |
| Total | 188,659,207 |
| Switzerland 2.4% |
Bossard Holding AG, Class A, Registered Shares
Fastening devices, industrial adhesives & tools | 73,000 | 13,532,630 |
Inficon Holding AG
Vacuum instruments used to monitor and control production processes | 25,000 | 12,707,761 |
Partners Group Holding AG
Global private markets asset management firm | 92,000 | 67,256,229 |
| Total | 93,496,620 |
| Taiwan 0.7% |
Silergy Corp.
High performance analog integrated circuits | 1,085,000 | 26,364,772 |
| Thailand 0.9% |
Muangthai Leasing PCL, Foreign Registered Shares
Commercial lending company | 7,444,200 | 7,418,599 |
Tisco Financial Group PCL
Bank holding company | 10,621,000 | 26,903,597 |
| Total | 34,322,196 |
| United Kingdom 12.8% |
Ascential PLC
Media and consultancy services | 3,537,056 | 21,055,720 |
Croda International PLC
Chemicals and chemical products | 691,401 | 43,680,741 |
Domino’s Pizza Group PLC
Pizza delivery stores | 6,479,327 | 29,571,199 |
DS Smith PLC
Provides corrugated packaging services | 3,449,569 | 23,635,292 |
Halma PLC
Products that detect hazards and protect assets and people in public and commercial buildings | 4,062,325 | 73,147,466 |
Intermediate Capital Group PLC
Private equity firm | 3,049,079 | 44,171,721 |
| Common Stocks (continued) |
| Issuer | Shares | Value ($) |
Rentokil Initial PLC
Fully integrated facilities management and essential support services | 22,831,609 | 105,268,103 |
Rightmove PLC
Website that lists properties across Britain | 944,752 | 66,040,501 |
Spirax-Sarco Engineering PLC
Consultation, service and products for the control and efficient management of steam and industrial fluids | 802,262 | 68,796,870 |
WH Smith PLC
Retails books, magazines, newspapers, and periodicals | 1,294,564 | 34,075,612 |
| Total | 509,443,225 |
| United States 1.1% |
Ultragenyx Pharmaceutical, Inc.(a)
Therapeutics and sialic acid for treating metabolic, body myopathy, glucuronidase, and rare genetic diseases | 590,087 | 45,359,988 |
Total Common Stocks
(Cost: $2,642,697,569) | 3,820,392,425 |
| Preferred Stocks 1.1% |
| Issuer | | Shares | Value ($) |
| Germany 1.1% |
Sartorius AG
Precision electronic equipment and components | | 295,000 | 43,917,004 |
Total Preferred Stocks
(Cost: $29,150,140) | 43,917,004 |
| Securities Lending Collateral 0.4% |
| | Shares | Value ($) |
Dreyfus Government Cash Management Fund, Institutional Shares, 1.810%(c),(d)
| 14,853,961 | 14,853,961 |
Total Securities Lending Collateral
(Cost: $14,853,961) | 14,853,961 |
|
The accompanying Notes to Financial Statements are an integral part of this statement.
| 50 | Columbia Acorn Family of Funds | Semiannual Report 2018 |
Portfolio of Investments (continued)
Columbia Acorn International®, June 30, 2018 (Unaudited)
| Money Market Funds 2.4% |
| | Shares | Value ($) |
JPMorgan U.S. Government Money Market Fund, IM Shares, 1.819%(c)
| 95,244,402 | 95,244,402 |
Total Money Market Funds
(Cost: $95,244,402) | 95,244,402 |
Total Investments in Securities
(Cost: $2,781,946,072) | 3,974,407,792 |
| Obligation to Return Collateral for Securities Loaned | | (14,853,961) |
| Other Assets & Liabilities, Net | | 5,629,536 |
| Net Assets | $3,965,183,367 |
At June 30, 2018, securities and/or cash totaling $1,371,900 were pledged as collateral.
Investments in derivatives
| Long futures contracts |
| Description | Number of
contracts | Expiration
date | Trading
currency | Notional
amount | Value/Unrealized
appreciation ($) | Value/Unrealized
depreciation ($) |
| MSCI EAFE Index | 239 | 09/2018 | USD | 23,367,030 | — | (921,931) |
| MSCI Emerging Markets Index | 114 | 09/2018 | USD | 6,060,810 | — | (379,899) |
| Total | | | | | — | (1,301,830) |
Notes to Portfolio of Investments
| (a) | Non-income producing security. |
| (b) | All or a portion of this security was on loan at June 30, 2018. The total market value of securities on loan at June 30, 2018 was $14,348,902. |
| (c) | The rate shown is the seven-day current annualized yield at June 30, 2018. |
| (d) | Investment made with cash collateral received from securities lending activity. |
Abbreviation Legend
| ADR | American Depositary Receipt |
| GDR | Global Depositary Receipt |
Fair value measurements
Various inputs are used in determining the value of the Fund’s investments, following the input prioritization hierarchy established by accounting principles generally accepted in the United States of America (GAAP). These inputs are summarized in the three broad levels listed below:
| ■ | Level 1 – quoted prices in active markets for identical securities |
| ■ | Level 2 – prices determined using other significant observable inputs (including quoted prices for similar securities, interest rates, prepayment speeds, credit risk and others) |
| ■ | Level 3 – prices determined using significant unobservable inputs where quoted prices or observable inputs are unavailable or less reliable (including management’s own assumptions about the factors market participants would use in pricing an investment) |
The inputs or methodology used for valuing securities are not necessarily an indication of the risk associated with investing in those securities.
Examples of the types of securities in which the Fund would typically invest and how they are classified within this hierarchy are as follows. Typical Level 1 securities include exchange traded domestic equities, mutual funds whose net asset values are published each day and exchange traded foreign equities that are not statistically fair valued. Typical Level 2 securities include exchange traded foreign equities that are statistically fair valued, forward foreign currency exchange contracts and short-term investments valued at amortized cost. Additionally, securities fair valued by Columbia Wanger Asset Management’s Valuation Committee (the Committee) that rely on significant observable inputs are also included in Level 2. Typical Level 3 securities include any security fair valued by the Committee that relies on significant unobservable inputs.
The Committee is responsible for applying the Columbia Acorn Trust Portfolio Pricing Policy and the Columbia Wanger Asset Management pricing procedures (the Policies), which are approved by and subject to the oversight of the Board of Trustees.
The accompanying Notes to Financial Statements are an integral part of this statement.
Columbia Acorn Family of Funds | Semiannual Report 2018
| 51 |
Portfolio of Investments (continued)
Columbia Acorn International®, June 30, 2018 (Unaudited)
Fair value measurements (continued)
The Committee meets as necessary, and no less frequently than quarterly, to determine fair values for securities for which market quotations are not readily available or for which Columbia Wanger Asset Management believes that available market quotations are unreliable. The Committee also reviews the continuing appropriateness of the Policies. In circumstances where a security has been fair valued, the Committee will also review the continuing appropriateness of the current value of the security. The Policies address, among other things: circumstances under which market quotations will be deemed readily available; selection of third party pricing vendors; appropriate pricing methodologies; events that require fair valuation and fair value techniques; circumstances under which securities will be deemed to pose a potential for stale pricing, including when securities are illiquid, restricted, or in default; and certain delegations of authority to determine fair values to the Fund’s investment manager. The Committee may also meet to discuss additional valuation matters, which may include review of back-testing results, review of time-sensitive information or approval of other valuation related actions, and to review the appropriateness of the Policies.
For investments categorized as Level 3, the significant unobservable inputs used in the fair value measurement of the Fund’s securities may include: (i) data specific to the issuer or comparable issuers, (ii) general market or specific sector news and (iii) quoted prices and specific or similar security transactions. The Committee considers this data and any changes from prior periods in order to assess the reasonableness of observable and unobservable inputs, any assumptions or internal models used to value those securities and changes in fair value. Significant changes in any of these factors could result in lower or higher fair value measurements. Various factors impact the frequency of monitoring (which may occur as often as daily), however the Committee may determine that changes to inputs, assumptions and models are not required with the same frequency.
The following table is a summary of the inputs used to value the Fund’s investments at June 30, 2018:
| | Level 1
quoted prices in active
markets for identical
assets ($) | Level 2
other significant
observable inputs ($) | Level 3
significant
unobservable inputs ($) | Total ($) |
| Investments in Securities | | | | |
| Common Stocks | | | | |
| Australia | — | 65,914,182 | — | 65,914,182 |
| Belgium | — | 14,722,465 | — | 14,722,465 |
| Brazil | 49,045,222 | — | — | 49,045,222 |
| Cambodia | — | 18,625,081 | — | 18,625,081 |
| Canada | 230,951,107 | — | — | 230,951,107 |
| Cayman Islands | 29,988,630 | 47,234,370 | — | 77,223,000 |
| China | 100,487,524 | 69,574,944 | — | 170,062,468 |
| Denmark | — | 186,111,423 | — | 186,111,423 |
| France | — | 17,418,090 | — | 17,418,090 |
| Germany | — | 343,476,424 | — | 343,476,424 |
| Hong Kong | — | 40,018,042 | — | 40,018,042 |
| India | — | 54,782,954 | — | 54,782,954 |
| Indonesia | — | 31,913,673 | — | 31,913,673 |
| Ireland | — | 45,077,710 | — | 45,077,710 |
| Italy | — | 126,355,987 | — | 126,355,987 |
| Japan | — | 882,336,105 | — | 882,336,105 |
| Malta | — | 71,470,248 | — | 71,470,248 |
| Mexico | 62,693,124 | — | — | 62,693,124 |
| Netherlands | — | 56,550,545 | — | 56,550,545 |
| Philippines | — | 19,919,185 | — | 19,919,185 |
| Poland | — | 11,404,434 | — | 11,404,434 |
| Russian Federation | — | 16,994,700 | — | 16,994,700 |
| Singapore | — | 69,880,601 | — | 69,880,601 |
| South Africa | — | 60,638,638 | — | 60,638,638 |
| South Korea | — | 166,589,770 | — | 166,589,770 |
| Spain | — | 32,571,239 | — | 32,571,239 |
| Sweden | — | 188,659,207 | — | 188,659,207 |
| Switzerland | — | 93,496,620 | — | 93,496,620 |
| Taiwan | — | 26,364,772 | — | 26,364,772 |
| Thailand | — | 34,322,196 | — | 34,322,196 |
The accompanying Notes to Financial Statements are an integral part of this statement.
| 52 | Columbia Acorn Family of Funds | Semiannual Report 2018 |
Portfolio of Investments (continued)
Columbia Acorn International®, June 30, 2018 (Unaudited)
Fair value measurements (continued)
| | Level 1
quoted prices in active
markets for identical
assets ($) | Level 2
other significant
observable inputs ($) | Level 3
significant
unobservable inputs ($) | Total ($) |
| United Kingdom | — | 509,443,225 | — | 509,443,225 |
| United States | 45,359,988 | — | — | 45,359,988 |
| Total Common Stocks | 518,525,595 | 3,301,866,830 | — | 3,820,392,425 |
| Preferred Stocks | | | | |
| Germany | — | 43,917,004 | — | 43,917,004 |
| Total Preferred Stocks | — | 43,917,004 | — | 43,917,004 |
| Securities Lending Collateral | 14,853,961 | — | — | 14,853,961 |
| Money Market Funds | 95,244,402 | — | — | 95,244,402 |
| Total Investments in Securities | 628,623,958 | 3,345,783,834 | — | 3,974,407,792 |
| Investments in Derivatives | | | | |
| Liability | | | | |
| Futures Contracts | (1,301,830) | — | — | (1,301,830) |
| Total | 627,322,128 | 3,345,783,834 | — | 3,973,105,962 |
The Fund’s assets assigned to the Level 2 input category are generally valued using a market approach, in which a security’s value is determined through its correlation to prices and information from observable market transactions for similar or identical assets. Foreign equities are generally valued at the last sale price on the foreign exchange or market on which they trade. The Fund may use a statistical fair valuation model, in accordance with the policy adopted by the Board of Trustees, provided by an independent third party to value securities principally traded in foreign markets in order to adjust for possible stale pricing that may occur between the close of the foreign exchanges and the time for valuation. These models take into account available market data including intraday index, ADR, and ETF movements.
Derivative instruments are valued at unrealized appreciation (depreciation).
There were no transfers of financial assets between levels during the period.
The accompanying Notes to Financial Statements are an integral part of this statement.
Columbia Acorn Family of Funds | Semiannual Report 2018
| 53 |
Portfolio of Investments
Columbia Acorn USA®, June 30, 2018 (Unaudited)
(Percentages represent value of investments compared to net assets)
Investments in securities
| Common Stocks 96.0% |
| Issuer | Shares | Value ($) |
| Consumer Discretionary 16.5% |
| Auto Components 4.2% |
Cooper-Standard Holding, Inc.(a)
Sealing, fuel and brake delivery, fluid transfer systems, anti-vibration systems components, subsystems, and modules | 31,571 | 4,125,382 |
Dorman Products, Inc.(a)
Automotive products and home hardware | 56,417 | 3,853,845 |
LCI Industries
Recreational vehicles and equipment | 31,012 | 2,795,732 |
Tenneco, Inc.
Emission control and ride control products and systems | 86,306 | 3,794,012 |
| Total | | 14,568,971 |
| Distributors 0.7% |
Pool Corp.
Swimming pool supplies, equipment and leisure products | 15,683 | 2,375,975 |
| Diversified Consumer Services 2.0% |
Adtalem Global Education, Inc.(a)
Higher education institutions | 86,631 | 4,166,951 |
Bright Horizons Family Solutions, Inc.(a)
Child care and early education services | 27,091 | 2,777,370 |
| Total | | 6,944,321 |
| Hotels, Restaurants & Leisure 6.4% |
Churchill Downs, Inc.
Horse racing company, home of the Kentucky Derby | 6,100 | 1,808,650 |
Dave & Buster’s Entertainment, Inc.(a)
Venues that combine dining and entertainment for adults and families | 107,565 | 5,120,094 |
Extended Stay America, Inc.
Hotels and motels | 219,362 | 4,740,413 |
Red Rock Resorts, Inc., Class A
Casino & entertainment properties | 94,821 | 3,176,503 |
Texas Roadhouse, Inc.
Moderately priced, full service restaurant chain | 73,402 | 4,808,565 |
Wingstop, Inc.
Cooked-to-order chicken wings | 53,473 | 2,787,013 |
| Total | | 22,441,238 |
| Common Stocks (continued) |
| Issuer | Shares | Value ($) |
| Household Durables 1.9% |
Cavco Industries, Inc.(a)
Designs and manufactures systems-built structures | 12,809 | 2,659,789 |
iRobot Corp.(a),(b)
Manufactures robots for cleaning | 50,947 | 3,860,254 |
| Total | | 6,520,043 |
| Leisure Products 1.3% |
Brunswick Corp.
Consumer products serving the outdoor and indoor active recreation markets | 39,106 | 2,521,555 |
MCBC Holdings, Inc.(a)
Sport boats | 67,851 | 1,964,286 |
| Total | | 4,485,841 |
| Total Consumer Discretionary | 57,336,389 |
| Consumer Staples 4.8% |
| Beverages 0.7% |
MGP Ingredients, Inc.
Distillery ingredients and products | 26,305 | 2,336,147 |
| Food & Staples Retailing 0.6% |
BJ’s Wholesale Club Holdings, Inc.(a)
Warehouse club | 86,742 | 2,051,448 |
| Food Products 0.7% |
Hostess Brands, Inc.(a)
Packaged baked sweet goods | 184,781 | 2,513,022 |
| Household Products 1.8% |
Central Garden & Pet Co.(a)
Lawn, garden & pet supply products | 98,115 | 4,266,040 |
WD-40 Co.
Multi-purpose lubricant products and heavy-duty hand cleaners | 12,594 | 1,841,873 |
| Total | | 6,107,913 |
| Personal Products 1.0% |
Inter Parfums, Inc.
Fragrances and related products | 68,457 | 3,662,449 |
| Total Consumer Staples | 16,670,979 |
| Energy 1.5% |
| Energy Equipment & Services 0.6% |
Core Laboratories NV
Reservoir description, production enhancement, and reservoir management services | 15,262 | 1,926,217 |
The accompanying Notes to Financial Statements are an integral part of this statement.
| 54 | Columbia Acorn Family of Funds | Semiannual Report 2018 |
Portfolio of Investments (continued)
Columbia Acorn USA®, June 30, 2018 (Unaudited)
| Common Stocks (continued) |
| Issuer | Shares | Value ($) |
| Oil, Gas & Consumable Fuels 0.9% |
PDC Energy, Inc.(a)
Petroleum products | 52,746 | 3,188,496 |
| Total Energy | 5,114,713 |
| Financials 13.9% |
| Banks 5.4% |
First Busey Corp.
Multi-bank holding company | 167,976 | 5,328,199 |
Great Southern Bancorp, Inc.
Real estate, commercial real estate, commercial business, consumer, and construction loans | 51,689 | 2,956,611 |
Lakeland Financial Corp.
Bank holding company | 89,676 | 4,321,486 |
Sandy Spring Bancorp, Inc.
Holding company for Sandy Spring Bank | 78,505 | 3,219,490 |
Trico Bancshares
Holding company for Tri Counties Bank | 80,866 | 3,028,432 |
| Total | | 18,854,218 |
| Capital Markets 4.0% |
Ares Management LP
Asset management firm | 163,552 | 3,385,526 |
Hamilton Lane, Inc., Class A
Private market investment solutions | 37,493 | 1,798,539 |
Houlihan Lokey, Inc.
Investment bank | 103,363 | 5,294,253 |
OM Asset Management Plc
Asset management company | 234,507 | 3,344,070 |
| Total | | 13,822,388 |
| Consumer Finance 1.9% |
FirstCash, Inc.
Owns and operates pawn stores | 51,897 | 4,662,945 |
PRA Group, Inc.(a)
Provides outsourced receivables management | 50,500 | 1,946,775 |
| Total | | 6,609,720 |
| Thrifts & Mortgage Finance 2.6% |
Merchants Bancorp
Bank holding company | 96,445 | 2,751,576 |
OceanFirst Financial Corp.
New Jersey banks | 116,000 | 3,475,360 |
Walker & Dunlop, Inc.
Commercial real estate financial services | 52,386 | 2,915,281 |
| Total | | 9,142,217 |
| Total Financials | 48,428,543 |
| Common Stocks (continued) |
| Issuer | Shares | Value ($) |
| Health Care 25.6% |
| Biotechnology 8.2% |
Agios Pharmaceuticals, Inc.(a)
Therapeutics in the field of cancer metabolism | 26,518 | 2,233,611 |
Amicus Therapeutics, Inc.(a)
Orally-administered, small molecule drugs to treat human genetic diseases | 136,000 | 2,124,320 |
Clovis Oncology, Inc.(a)
Pre-commercial Biotech Company | 40,649 | 1,848,310 |
Genomic Health, Inc.(a)
Development and commercialization of genomic-based clinical diagnostic tests for cancer | 48,712 | 2,455,085 |
Kiniksa Pharmaceuticals Ltd., Class A(a)
Clinical-stage biopharmaceutical company | 191,445 | 3,321,571 |
Ligand Pharmaceuticals, Inc.(a)
Drugs that regulate hormone activated intracellular receptors | 21,813 | 4,518,999 |
Loxo Oncology, Inc.(a)
Researches and develops cancer drugs | 10,090 | 1,750,413 |
MacroGenics, Inc.(a)
Treatments for autoimmune disorders, cancer and infectious diseases | 157,974 | 3,262,163 |
Repligen Corp.(a)
Supplier to Biopharma Industry | 98,200 | 4,619,328 |
Ultragenyx Pharmaceutical, Inc.(a)
Therapeutics and sialic acid for treating metabolic, body myopathy, glucuronidase, and rare genetic diseases | 28,778 | 2,212,165 |
| Total | | 28,345,965 |
| Health Care Equipment & Supplies 8.9% |
Atrion Corp.
Medical products and components | 4,256 | 2,551,046 |
AxoGen, Inc.(a)
Technologies for peripheral nerve reconstruction and regeneration | 60,047 | 3,017,362 |
Haemonetics Corp.(a)
Automated blood processing systems | 23,359 | 2,094,835 |
iRhythm Technologies, Inc.(a)
Medical instruments | 58,885 | 4,777,340 |
Masimo Corp.(a)
Medical signal processing and sensor technology for non-invasive monitoring of physiological parameters | 44,630 | 4,358,120 |
Orthofix International NV(a)
Spine fixation and other orthopedic & spine solutions | 44,759 | 2,543,206 |
Sientra, Inc.(a)
Plastic surgery implantable devices | 158,757 | 3,097,349 |
The accompanying Notes to Financial Statements are an integral part of this statement.
Columbia Acorn Family of Funds | Semiannual Report 2018
| 55 |
Portfolio of Investments (continued)
Columbia Acorn USA®, June 30, 2018 (Unaudited)
| Common Stocks (continued) |
| Issuer | Shares | Value ($) |
Tactile Systems Technology, Inc.(a)
Technology for treating lymphedema, chronic swelling & venous ulcers | 74,500 | 3,874,000 |
Tandem Diabetes Care, Inc.(a)
Produces medical devices | 108,605 | 2,391,482 |
Varex Imaging Corp.(a)
X-ray imaging components | 63,906 | 2,370,274 |
| Total | | 31,075,014 |
| Health Care Providers & Services 6.5% |
Amedisys, Inc.(a)
Provider of alternate-site health care services | 54,257 | 4,636,803 |
AMN Healthcare Services, Inc.(a)
Temporary healthcare staffing | 79,676 | 4,669,014 |
Chemed Corp.
Hospice and palliative care services | 9,300 | 2,992,833 |
Encompass Health Corp.
Inpatient rehabilitative healthcare services | 27,093 | 1,834,738 |
HealthEquity, Inc.(a)
Technology-enabled services platforms for consumers to make healthcare saving and spending decisions | 68,924 | 5,176,192 |
Tivity Health, Inc.(a)
Health fitness solutions | 90,512 | 3,186,022 |
| Total | | 22,495,602 |
| Pharmaceuticals 2.0% |
Optinose, Inc.(a)
Health care services | 127,333 | 3,562,778 |
Reata Pharmaceuticals, Inc., Class A(a)
Biopharmaceutical company | 94,058 | 3,289,208 |
| Total | | 6,851,986 |
| Total Health Care | 88,768,567 |
| Industrials 9.7% |
| Building Products 0.7% |
American Woodmark Corp.(a)
Kitchen cabinets and vanities | 27,764 | 2,541,794 |
| Commercial Services & Supplies 2.9% |
Brink’s Co. (The)
Provides security services globally | 24,745 | 1,973,414 |
Healthcare Services Group, Inc.
Housekeeping, laundry, linen, facility maintenance, and food services | 61,498 | 2,656,099 |
Knoll, Inc.
Branded office furniture products and textiles | 85,250 | 1,774,052 |
Unifirst Corp.
Workplace uniforms and protective clothing | 21,172 | 3,745,327 |
| Total | | 10,148,892 |
| Common Stocks (continued) |
| Issuer | Shares | Value ($) |
| Machinery 1.3% |
ESCO Technologies, Inc.
Engineered products and solutions | 50,404 | 2,908,311 |
Toro Co. (The)
Turf equipment | 24,965 | 1,504,141 |
| Total | | 4,412,452 |
| Professional Services 2.8% |
Exponent, Inc.
Science and engineering consulting firm | 50,520 | 2,440,116 |
ICF International, Inc.
Management, technology, policy consulting, and implementation services | 69,174 | 4,914,813 |
Wageworks, Inc.(a)
Tax-advantaged programs for consumer-directed health, commuter, and other employee spending account benefits | 49,359 | 2,467,950 |
| Total | | 9,822,879 |
| Road & Rail 1.2% |
Saia, Inc.(a)
Trucking transportation | 48,935 | 3,956,395 |
| Trading Companies & Distributors 0.8% |
SiteOne Landscape Supply, Inc.(a)
Landscape supplies | 33,681 | 2,828,193 |
| Total Industrials | 33,710,605 |
| Information Technology 17.4% |
| Electronic Equipment, Instruments & Components 2.3% |
ePlus, Inc.(a)
Provides IT hardware, software and services | 50,373 | 4,740,099 |
II-VI, Inc.(a)
Optical and optoelectronic devices | 75,819 | 3,294,336 |
| Total | | 8,034,435 |
The accompanying Notes to Financial Statements are an integral part of this statement.
| 56 | Columbia Acorn Family of Funds | Semiannual Report 2018 |
Portfolio of Investments (continued)
Columbia Acorn USA®, June 30, 2018 (Unaudited)
| Common Stocks (continued) |
| Issuer | Shares | Value ($) |
| Internet Software & Services 4.5% |
Alteryx, Inc., Class A(a),(b)
Data storage, retrieval, management, reporting, and analytics solutions | 87,704 | 3,346,785 |
Apptio, Inc., Class A(a)
Cloud-based business management solutions | 96,043 | 3,476,757 |
Mimecast Ltd.(a)
Cloud security and risk management services for corporate information and email | 68,743 | 2,832,899 |
MINDBODY, Inc., Class A(a)
Business management software | 91,441 | 3,529,622 |
Q2 Holdings, Inc.(a)
Secure, cloud-based virtual banking solutions | 45,459 | 2,593,436 |
| Total | | 15,779,499 |
| IT Services 0.7% |
CoreLogic, Inc.(a)
Consumer, financial and property information, analytics and services to business and government | 45,489 | 2,360,879 |
| Semiconductors & Semiconductor Equipment 5.8% |
Advanced Energy Industries, Inc.(a)
Engineered precision power conversion, measurement and control solutions | 64,515 | 3,747,676 |
Brooks Automation, Inc.
Automation solutions for the global semiconductor and related industries | 118,369 | 3,861,197 |
Cabot Microelectronics Corp.
Slurries used in chemical mechanical planarization | 46,369 | 4,987,450 |
Inphi Corp.(a)
Analog semiconductor solutions | 75,682 | 2,467,990 |
Monolithic Power Systems, Inc.
Power management solutions | 15,821 | 2,114,793 |
Semtech Corp.(a)
Analog and mixed-signal semiconductors | 62,780 | 2,953,799 |
| Total | | 20,132,905 |
| Common Stocks (continued) |
| Issuer | Shares | Value ($) |
| Software 4.1% |
Blackline, Inc.(a)
Develops and markets enterprise software | 67,398 | 2,927,095 |
CyberArk Software Ltd.(a)
IT security solutions | 51,747 | 3,257,991 |
Qualys, Inc.(a)
Information technology security risk and compliance management solutions | 47,268 | 3,984,692 |
Zscaler, Inc.(a),(b)
Cloud-based internet security platform | 53,174 | 1,900,971 |
Zuora, Inc., Class A(a),(b)
Develops cloud based software | 82,088 | 2,232,794 |
| Total | | 14,303,543 |
| Total Information Technology | 60,611,261 |
| Materials 2.8% |
| Chemicals 2.8% |
Orion Engineered Carbons SA
Global supplier of Carbon Black | 158,522 | 4,890,404 |
PolyOne Corp.
International polymer services company | 41,000 | 1,772,020 |
Quaker Chemical Corp.
Custom-formulated chemical specialty products | 18,651 | 2,888,480 |
| Total | | 9,550,904 |
| Total Materials | 9,550,904 |
| Real Estate 3.3% |
| Equity Real Estate Investment Trusts (REITS) 2.6% |
CoreCivic, Inc.
Detention and corrections services | 101,617 | 2,427,630 |
Coresite Realty Corp.
Develops, owns & operates data centers | 25,612 | 2,838,322 |
UMH Properties, Inc.
Real estate investment trust | 244,551 | 3,753,858 |
| Total | | 9,019,810 |
| Real Estate Management & Development 0.7% |
Colliers International Group, Inc.
Commercial real estate, residential property management and property services | 32,866 | 2,487,956 |
| Total Real Estate | 11,507,766 |
The accompanying Notes to Financial Statements are an integral part of this statement.
Columbia Acorn Family of Funds | Semiannual Report 2018
| 57 |
Portfolio of Investments (continued)
Columbia Acorn USA®, June 30, 2018 (Unaudited)
| Common Stocks (continued) |
| Issuer | Shares | Value ($) |
| Telecommunication Services 0.5% |
| Wireless Telecommunication Services 0.5% |
Boingo Wireless, Inc.(a)
Mobile internet services | 75,000 | 1,694,250 |
| Total Telecommunication Services | 1,694,250 |
Total Common Stocks
(Cost: $248,565,011) | 333,393,977 |
|
| Limited Partnerships 0.5% |
| | |
| Consumer Discretionary 0.5% |
| Hotels, Restaurants & Leisure 0.5% |
Cedar Fair LP
Owns and operates amusement parks | 25,900 | 1,631,959 |
| Total Consumer Discretionary | 1,631,959 |
Total Limited Partnerships
(Cost: $1,711,740) | 1,631,959 |
|
| Securities Lending Collateral 1.3% |
| | Shares | Value ($) |
Dreyfus Government Cash Management Fund, Institutional Shares, 1.810%(c),(d)
| 4,633,100 | 4,633,100 |
Total Securities Lending Collateral
(Cost: $4,633,100) | 4,633,100 |
|
| Money Market Funds 3.8% |
| | |
| JPMorgan U.S. Government Money Market Fund, Agency Shares, 1.713%(c) | 13,232,780 | 13,232,780 |
Total Money Market Funds
(Cost: $13,232,780) | 13,232,780 |
Total Investments in Securities
(Cost $268,142,631) | 352,891,816 |
| Obligation to Return Collateral for Securities Loaned | | (4,633,100) |
| Other Assets & Liabilities, Net | | (898,605) |
| Net Assets | $347,360,111 |
Notes to Portfolio of Investments
| (a) | Non-income producing security. |
| (b) | All or a portion of this security was on loan at June 30, 2018. The total market value of securities on loan at June 30, 2018 was $4,523,791. |
| (c) | The rate shown is the seven-day current annualized yield at June 30, 2018. |
| (d) | Investment made with cash collateral received from securities lending activity. |
Fair value measurements
Various inputs are used in determining the value of the Fund’s investments, following the input prioritization hierarchy established by accounting principles generally accepted in the United States of America (GAAP). These inputs are summarized in the three broad levels listed below:
| ■ | Level 1 – quoted prices in active markets for identical securities |
| ■ | Level 2 – prices determined using other significant observable inputs (including quoted prices for similar securities, interest rates, prepayment speeds, credit risk and others) |
| ■ | Level 3 – prices determined using significant unobservable inputs where quoted prices or observable inputs are unavailable or less reliable (including management’s own assumptions about the factors market participants would use in pricing an investment) |
The inputs or methodology used for valuing securities are not necessarily an indication of the risk associated with investing in those securities.
Examples of the types of securities in which the Fund would typically invest and how they are classified within this hierarchy are as follows. Typical Level 1 securities include exchange traded domestic equities, mutual funds whose net asset values are published each day and exchange traded foreign equities that are not statistically fair valued. Typical Level 2 securities include exchange traded foreign equities that are statistically fair valued, forward foreign currency exchange contracts and short-term investments valued at amortized cost. Additionally, securities fair valued by Columbia Wanger Asset Management’s Valuation Committee (the Committee) that rely on significant observable inputs are also included in Level 2. Typical Level 3 securities include any security fair valued by the Committee that relies on significant unobservable inputs.
The Committee is responsible for applying the Columbia Acorn Trust Portfolio Pricing Policy and the Columbia Wanger Asset Management pricing procedures (the Policies), which are approved by and subject to the oversight of the Board of Trustees.
The Committee meets as necessary, and no less frequently than quarterly, to determine fair values for securities for which market quotations are not readily available or for which Columbia Wanger Asset Management believes that available market quotations are unreliable. The Committee also reviews the continuing appropriateness of the Policies. In circumstances where a security has been fair valued, the Committee will also review the continuing appropriateness of the current value of the security. The Policies address, among other things: circumstances under which market quotations will be deemed readily available; selection of third party pricing vendors; appropriate pricing methodologies; events that require fair valuation and fair value techniques; circumstances under which securities will be deemed to pose a potential for stale pricing, including when securities are illiquid, restricted, or in default; and certain delegations of authority to determine fair values to the Fund’s investment manager. The Committee may also meet to discuss additional valuation matters, which may include review of back-testing results, review of time-sensitive information or approval of other valuation related actions, and to review the appropriateness of the Policies.
The accompanying Notes to Financial Statements are an integral part of this statement.
| 58 | Columbia Acorn Family of Funds | Semiannual Report 2018 |
Portfolio of Investments (continued)
Columbia Acorn USA®, June 30, 2018 (Unaudited)
Fair value measurements (continued)
For investments categorized as Level 3, the significant unobservable inputs used in the fair value measurement of the Fund’s securities may include: (i) data specific to the issuer or comparable issuers, (ii) general market or specific sector news and (iii) quoted prices and specific or similar security transactions. The Committee considers this data and any changes from prior periods in order to assess the reasonableness of observable and unobservable inputs, any assumptions or internal models used to value those securities and changes in fair value. Significant changes in any of these factors could result in lower or higher fair value measurements. Various factors impact the frequency of monitoring (which may occur as often as daily), however the Committee may determine that changes to inputs, assumptions and models are not required with the same frequency.
The following table is a summary of the inputs used to value the Fund’s investments at June 30, 2018:
| | Level 1
quoted prices in active
markets for identical
assets ($) | Level 2
other significant
observable inputs ($) | Level 3
significant
unobservable inputs ($) | Total ($) |
| Investments in Securities | | | | |
| Common Stocks | | | | |
| Consumer Discretionary | 57,336,389 | — | — | 57,336,389 |
| Consumer Staples | 16,670,979 | — | — | 16,670,979 |
| Energy | 5,114,713 | — | — | 5,114,713 |
| Financials | 48,428,543 | — | — | 48,428,543 |
| Health Care | 88,768,567 | — | — | 88,768,567 |
| Industrials | 33,710,605 | — | — | 33,710,605 |
| Information Technology | 60,611,261 | — | — | 60,611,261 |
| Materials | 9,550,904 | — | — | 9,550,904 |
| Real Estate | 11,507,766 | — | — | 11,507,766 |
| Telecommunication Services | 1,694,250 | — | — | 1,694,250 |
| Total Common Stocks | 333,393,977 | — | — | 333,393,977 |
| Limited Partnerships | | | | |
| Consumer Discretionary | 1,631,959 | — | — | 1,631,959 |
| Total Limited Partnerships | 1,631,959 | — | — | 1,631,959 |
| Securities Lending Collateral | 4,633,100 | — | — | 4,633,100 |
| Money Market Funds | 13,232,780 | — | — | 13,232,780 |
| Total Investments in Securities | 352,891,816 | — | — | 352,891,816 |
There were no transfers of financial assets between levels during the period.
The accompanying Notes to Financial Statements are an integral part of this statement.
Columbia Acorn Family of Funds | Semiannual Report 2018
| 59 |
Portfolio of Investments
Columbia Acorn International SelectSM, June 30, 2018 (Unaudited)
(Percentages represent value of investments compared to net assets)
Investments in securities
| Common Stocks 93.9% |
| Issuer | Shares | Value ($) |
| Australia 1.8% |
DuluxGroup Ltd.
Manufactures and supplies paints and other surface coatings | 382,000 | 2,159,989 |
| Canada 4.1% |
CCL Industries, Inc.
Manufacturing services and specialty packaging products for the non-durable consumer products market | 99,600 | 4,882,836 |
| China 7.2% |
NetEase, Inc., ADR
Internet technology company that develops applications, services and Internet technologies | 19,600 | 4,952,332 |
New Oriental Education & Technology Group, Inc., ADR
Educational services | 37,600 | 3,559,216 |
| Total | 8,511,548 |
| Denmark 4.4% |
Novozymes AS, Class B
Enzymes for industrial use | 102,955 | 5,207,283 |
| France 2.1% |
Legrand SA
Products and systems for electrical installations and information networks | 35,000 | 2,563,649 |
| Germany 7.7% |
MTU Aero Engines AG
Develops and manufactures engines and offers commercial engine services and support | 25,000 | 4,788,537 |
Wirecard AG
Internet payment and processing services | 27,600 | 4,416,564 |
| Total | 9,205,101 |
| India 3.0% |
Zee Entertainment Enterprises Ltd.
Hindi films, serials, game shows and children’s programs | 452,000 | 3,591,471 |
| Italy 3.3% |
Brembo SpA
Braking systems and components | 288,000 | 3,884,189 |
| Common Stocks (continued) |
| Issuer | Shares | Value ($) |
| Japan 17.4% |
Aeon Mall Co., Ltd.
Large-scale shopping malls | 221,600 | 3,975,292 |
Hikari Tsushin, Inc.
Distribution network, telecommunication, office automation equipment, in-house products and individual insurance plans | 13,900 | 2,439,440 |
Recruit Holdings Co., Ltd.
Information providing services in human resource, housing, bridal, travel, restaurants, beauty, automobiles, and education and more | 171,200 | 4,728,315 |
Santen Pharmaceutical Co., Ltd.
Ophthalmic medicine | 165,200 | 2,873,888 |
Sekisui Chemical Co., Ltd.
Unit residential houses in addition to parcels of land | 139,000 | 2,364,473 |
Sony Financial Holdings, Inc.
Financial holding company | 224,500 | 4,277,421 |
| Total | 20,658,829 |
| Jersey 3.0% |
Ferguson PLC
Heating and plumbing products | 43,704 | 3,535,996 |
| Mexico 1.9% |
Grupo Aeroportuario del Sureste SAB de CV, ADR(a)
Operates airports in Mexico | 14,000 | 2,228,240 |
| Netherlands 5.8% |
Aalberts Industries NV
Industrial services and flow control systems | 24,500 | 1,170,376 |
Koninklijke Philips NV
Health technology focused on improving people’s health | 134,620 | 5,703,577 |
| Total | 6,873,953 |
| Singapore 2.0% |
Mapletree Commercial Trust
Singapore-focused real estate investment trust | 2,041,000 | 2,351,855 |
| South Africa 2.4% |
Naspers Ltd., Class N
Electronic and print media industries | 11,300 | 2,849,225 |
| South Korea 3.0% |
Korea Zinc Co. Ltd.
Non-ferrous metal smelting | 10,200 | 3,532,946 |
The accompanying Notes to Financial Statements are an integral part of this statement.
| 60 | Columbia Acorn Family of Funds | Semiannual Report 2018 |
Portfolio of Investments (continued)
Columbia Acorn International SelectSM, June 30, 2018 (Unaudited)
| Common Stocks (continued) |
| Issuer | Shares | Value ($) |
| Sweden 7.4% |
Hexagon AB, Class B
Design, measurement and visualisation technologies | 96,600 | 5,367,788 |
Trelleborg AB, Class B
Manufactures and distributes industrial products | 159,000 | 3,380,930 |
| Total | 8,748,718 |
| Switzerland 4.0% |
Partners Group Holding AG
Global private markets asset management firm | 6,574 | 4,805,896 |
| Taiwan 2.0% |
Largan Precision Co., Ltd.
Optical lens modules and optoelectronic components | 16,000 | 2,350,519 |
| United Kingdom 11.4% |
Halma PLC
Products that detect hazards and protect assets and people in public and commercial buildings | 194,071 | 3,494,502 |
Rentokil Initial PLC
Fully integrated facilities management and essential support services | 912,142 | 4,205,549 |
Rightmove PLC
Website that lists properties across Britain | 43,800 | 3,061,728 |
Spirax-Sarco Engineering PLC
Consultation, service and products for the control and efficient management of steam and industrial fluids | 33,000 | 2,829,870 |
| Total | 13,591,649 |
Total Common Stocks
(Cost: $81,811,970) | 111,533,892 |
| Preferred Stocks 3.1% |
| Issuer | | Shares | Value ($) |
| Germany 3.1% |
Sartorius AG
Precision electronic equipment and components | | 25,000 | 3,721,780 |
Total Preferred Stocks
(Cost: $2,475,898) | 3,721,780 |
| Securities Lending Collateral 1.1% |
| | Shares | Value ($) |
Dreyfus Government Cash Management Fund, Institutional Shares, 1.810%(b),(c)
| 1,312,200 | 1,312,200 |
Total Securities Lending Collateral
(Cost: $1,312,200) | 1,312,200 |
|
| Money Market Funds 2.7% |
| | |
JPMorgan U.S. Government Money Market Fund, IM Shares, 1.819%(b)
| 3,253,463 | 3,253,463 |
Total Money Market Funds
(Cost: $3,253,463) | 3,253,463 |
Total Investments in Securities
(Cost: $88,853,531) | 119,821,335 |
| Obligation to Return Collateral for Securities Loaned | | (1,312,200) |
| Other Assets & Liabilities, Net | | 306,252 |
| Net Assets | $118,815,387 |
Notes to Portfolio of Investments
| (a) | All or a portion of this security was on loan at June 30, 2018. The total market value of securities on loan at June 30, 2018 was $1,289,196. |
| (b) | The rate shown is the seven-day current annualized yield at June 30, 2018. |
| (c) | Investment made with cash collateral received from securities lending activity. |
Abbreviation Legend
| ADR | American Depositary Receipt |
Fair value measurements
Various inputs are used in determining the value of the Fund’s investments, following the input prioritization hierarchy established by accounting principles generally accepted in the United States of America (GAAP). These inputs are summarized in the three broad levels listed below:
| ■ | Level 1 – quoted prices in active markets for identical securities |
| ■ | Level 2 – prices determined using other significant observable inputs (including quoted prices for similar securities, interest rates, prepayment speeds, credit risk and others) |
| ■ | Level 3 – prices determined using significant unobservable inputs where quoted prices or observable inputs are unavailable or less reliable (including management’s own assumptions about the factors market participants would use in pricing an investment) |
The inputs or methodology used for valuing securities are not necessarily an indication of the risk associated with investing in those securities.
The accompanying Notes to Financial Statements are an integral part of this statement.
Columbia Acorn Family of Funds | Semiannual Report 2018
| 61 |
Portfolio of Investments (continued)
Columbia Acorn International SelectSM, June 30, 2018 (Unaudited)
Fair value measurements (continued)
Examples of the types of securities in which the Fund would typically invest and how they are classified within this hierarchy are as follows. Typical Level 1 securities include exchange traded domestic equities, mutual funds whose net asset values are published each day and exchange traded foreign equities that are not statistically fair valued. Typical Level 2 securities include exchange traded foreign equities that are statistically fair valued, forward foreign currency exchange contracts and short-term investments valued at amortized cost. Additionally, securities fair valued by Columbia Wanger Asset Management’s Valuation Committee (the Committee) that rely on significant observable inputs are also included in Level 2. Typical Level 3 securities include any security fair valued by the Committee that relies on significant unobservable inputs.
The Committee is responsible for applying the Columbia Acorn Trust Portfolio Pricing Policy and the Columbia Wanger Asset Management pricing procedures (the Policies), which are approved by and subject to the oversight of the Board of Trustees.
The Committee meets as necessary, and no less frequently than quarterly, to determine fair values for securities for which market quotations are not readily available or for which Columbia Wanger Asset Management believes that available market quotations are unreliable. The Committee also reviews the continuing appropriateness of the Policies. In circumstances where a security has been fair valued, the Committee will also review the continuing appropriateness of the current value of the security. The Policies address, among other things: circumstances under which market quotations will be deemed readily available; selection of third party pricing vendors; appropriate pricing methodologies; events that require fair valuation and fair value techniques; circumstances under which securities will be deemed to pose a potential for stale pricing, including when securities are illiquid, restricted, or in default; and certain delegations of authority to determine fair values to the Fund’s investment manager. The Committee may also meet to discuss additional valuation matters, which may include review of back-testing results, review of time-sensitive information or approval of other valuation related actions, and to review the appropriateness of the Policies.
For investments categorized as Level 3, the significant unobservable inputs used in the fair value measurement of the Fund’s securities may include: (i) data specific to the issuer or comparable issuers, (ii) general market or specific sector news and (iii) quoted prices and specific or similar security transactions. The Committee considers this data and any changes from prior periods in order to assess the reasonableness of observable and unobservable inputs, any assumptions or internal models used to value those securities and changes in fair value. Significant changes in any of these factors could result in lower or higher fair value measurements. Various factors impact the frequency of monitoring (which may occur as often as daily), however the Committee may determine that changes to inputs, assumptions and models are not required with the same frequency.
The following table is a summary of the inputs used to value the Fund’s investments at June 30, 2018:
| | Level 1
quoted prices in active
markets for identical
assets ($) | Level 2
other significant
observable inputs ($) | Level 3
significant
unobservable inputs ($) | Total ($) |
| Investments in Securities | | | | |
| Common Stocks | | | | |
| Australia | — | 2,159,989 | — | 2,159,989 |
| Canada | 4,882,836 | — | — | 4,882,836 |
| China | 8,511,548 | — | — | 8,511,548 |
| Denmark | — | 5,207,283 | — | 5,207,283 |
| France | — | 2,563,649 | — | 2,563,649 |
| Germany | — | 9,205,101 | — | 9,205,101 |
| India | — | 3,591,471 | — | 3,591,471 |
| Italy | — | 3,884,189 | — | 3,884,189 |
| Japan | — | 20,658,829 | — | 20,658,829 |
| Jersey | — | 3,535,996 | — | 3,535,996 |
| Mexico | 2,228,240 | — | — | 2,228,240 |
| Netherlands | — | 6,873,953 | — | 6,873,953 |
| Singapore | — | 2,351,855 | — | 2,351,855 |
| South Africa | — | 2,849,225 | — | 2,849,225 |
| South Korea | — | 3,532,946 | — | 3,532,946 |
| Sweden | — | 8,748,718 | — | 8,748,718 |
| Switzerland | — | 4,805,896 | — | 4,805,896 |
| Taiwan | — | 2,350,519 | — | 2,350,519 |
| United Kingdom | — | 13,591,649 | — | 13,591,649 |
| Total Common Stocks | 15,622,624 | 95,911,268 | — | 111,533,892 |
| Preferred Stocks | | | | |
| Germany | — | 3,721,780 | — | 3,721,780 |
| Total Preferred Stocks | — | 3,721,780 | — | 3,721,780 |
| Securities Lending Collateral | 1,312,200 | — | — | 1,312,200 |
| Money Market Funds | 3,253,463 | — | — | 3,253,463 |
| Total Investments in Securities | 20,188,287 | 99,633,048 | — | 119,821,335 |
The Fund’s assets assigned to the Level 2 input category are generally valued using a market approach, in which a security’s value is determined through its correlation to prices and information from observable market transactions for similar or identical assets. Foreign equities are generally valued at the last sale price on the foreign exchange or market on which they trade. The Fund may use a statistical fair valuation model, in accordance with the policy adopted by the Board of Trustees, provided by an independent third party to value securities principally traded in foreign markets in order to adjust for possible stale pricing that may occur between the close of the foreign exchanges and the time for valuation. These models take into account available market data including intraday index, ADR, and ETF movements.
The accompanying Notes to Financial Statements are an integral part of this statement.
| 62 | Columbia Acorn Family of Funds | Semiannual Report 2018 |
Portfolio of Investments (continued)
Columbia Acorn International SelectSM, June 30, 2018 (Unaudited)
Fair value measurements (continued)
There were no transfers of financial assets between levels during the period.
The accompanying Notes to Financial Statements are an integral part of this statement.
Columbia Acorn Family of Funds | Semiannual Report 2018
| 63 |
Portfolio of Investments
Columbia Acorn SelectSM, June 30, 2018 (Unaudited)
(Percentages represent value of investments compared to net assets)
Investments in securities
| Common Stocks 98.0% |
| Issuer | Shares | Value ($) |
| Consumer Discretionary 20.2% |
| Auto Components 4.5% |
LCI Industries
Recreational vehicles and equipment | 153,182 | 13,809,357 |
| Distributors 3.9% |
LKQ Corp.(a)
Automotive products and services | 378,404 | 12,071,088 |
| Hotels, Restaurants & Leisure 5.4% |
Vail Resorts, Inc.
Operates resorts globally | 60,436 | 16,570,947 |
| Household Durables 4.0% |
Cavco Industries, Inc.(a)
Designs and manufactures systems-built structures | 58,222 | 12,089,798 |
| Media 2.4% |
Liberty Global PLC, Class A(a)
Broadband, distribution, and content companies | 268,692 | 7,399,778 |
| Total Consumer Discretionary | 61,940,968 |
| Financials 15.4% |
| Banks 4.1% |
SVB Financial Group(a)
Holding company for Silicon Valley Bank | 43,149 | 12,459,705 |
| Capital Markets 8.5% |
Ares Management LP
Asset management firm | 296,416 | 6,135,811 |
Eaton Vance Corp.
Creates, markets, and manages mutual funds | 219,159 | 11,437,908 |
Lazard Ltd., Class A
Corporate Advisory & Asset Management | 171,663 | 8,396,038 |
| Total | | 25,969,757 |
| Consumer Finance 2.8% |
FirstCash, Inc.
Owns and operates pawn stores | 97,132 | 8,727,310 |
| Total Financials | 47,156,772 |
| Common Stocks (continued) |
| Issuer | Shares | Value ($) |
| Health Care 14.2% |
| Biotechnology 4.1% |
Genomic Health, Inc.(a)
Development and commercialization of genomic-based clinical diagnostic tests for cancer | 166,223 | 8,377,639 |
Ultragenyx Pharmaceutical, Inc.(a)
Therapeutics and sialic acid for treating metabolic, body myopathy, glucuronidase, and rare genetic diseases | 54,290 | 4,173,273 |
| Total | | 12,550,912 |
| Health Care Equipment & Supplies 6.2% |
Anika Therapeutics, Inc.(a)
Integrated orthopedic medicines company | 81,300 | 2,601,600 |
Masimo Corp.(a)
Medical signal processing and sensor technology for non-invasive monitoring of physiological parameters | 169,012 | 16,504,022 |
| Total | | 19,105,622 |
| Health Care Providers & Services 3.9% |
Encompass Health Corp.
Inpatient rehabilitative healthcare services | 176,917 | 11,980,819 |
| Total Health Care | 43,637,353 |
| Industrials 16.2% |
| Machinery 6.4% |
Nordson Corp.
Systems that apply adhesives, sealants, and coatings to products during manufacturing | 70,520 | 9,055,473 |
Oshkosh Corp.
Fire and emergency apparatuses and specialty commercial, and military trucks | 152,090 | 10,694,969 |
| Total | | 19,750,442 |
| Professional Services 1.2% |
Wageworks, Inc.(a)
Tax-advantaged programs for consumer-directed health, commuter, and other employee spending account benefits | 70,638 | 3,531,900 |
| Road & Rail 5.0% |
JB Hunt Transport Services, Inc.
Logistics services | 125,270 | 15,226,569 |
| Trading Companies & Distributors 3.6% |
SiteOne Landscape Supply, Inc.(a)
Landscape supplies | 132,393 | 11,117,040 |
| Total Industrials | 49,625,951 |
The accompanying Notes to Financial Statements are an integral part of this statement.
| 64 | Columbia Acorn Family of Funds | Semiannual Report 2018 |
Portfolio of Investments (continued)
Columbia Acorn SelectSM, June 30, 2018 (Unaudited)
| Common Stocks (continued) |
| Issuer | Shares | Value ($) |
| Information Technology 23.9% |
| Electronic Equipment, Instruments & Components 6.1% |
CDW Corp.
IT products and services | 172,311 | 13,921,006 |
Coherent, Inc.(a)
Laser-based photonic products | 31,192 | 4,879,052 |
| Total | | 18,800,058 |
| Internet Software & Services 12.0% |
GoDaddy, Inc., Class A(a)
Cloud-based web platform for small businesses, web design professionals and individuals | 190,509 | 13,449,935 |
SPS Commerce, Inc.(a)
On-demand supply chain management solutions through an online hosted software suite | 103,064 | 7,573,143 |
VeriSign, Inc.(a)
Domain names and Internet security services | 114,173 | 15,689,654 |
| Total | | 36,712,732 |
| IT Services 0.9% |
GreenSky, Inc., Class A(a)
Technology company | 125,500 | 2,654,325 |
| Software 4.9% |
ANSYS, Inc.(a)
Software solutions for design analysis and optimization | 87,056 | 15,163,414 |
| Total Information Technology | 73,330,529 |
| Materials 3.2% |
| Chemicals 3.2% |
Celanese Corp., Class A
Global integrated producer of chemicals and advanced materials | 90,152 | 10,012,281 |
| Total Materials | 10,012,281 |
| Common Stocks (continued) |
| Issuer | Shares | Value ($) |
| Real Estate 4.9% |
| Equity Real Estate Investment Trusts (REITS) 4.9% |
Coresite Realty Corp.
Develops, owns & operates data centers | 94,017 | 10,418,964 |
UMH Properties, Inc.
Real estate investment trust | 299,584 | 4,598,614 |
| Total | | 15,017,578 |
| Total Real Estate | 15,017,578 |
Total Common Stocks
(Cost: $219,930,078) | 300,721,432 |
|
| Money Market Funds 2.0% |
| | Shares | Value ($) |
| JPMorgan U.S. Government Money Market Fund, Agency Shares, 1.713%(b) | 6,094,730 | 6,094,730 |
Total Money Market Funds
(Cost: $6,094,730) | 6,094,730 |
Total Investments in Securities
(Cost $226,024,808) | 306,816,162 |
| Other Assets & Liabilities, Net | | 80,515 |
| Net Assets | $306,896,677 |
Notes to Portfolio of Investments
| (a) | Non-income producing security. |
| (b) | The rate shown is the seven-day current annualized yield at June 30, 2018. |
Fair value measurements
Various inputs are used in determining the value of the Fund’s investments, following the input prioritization hierarchy established by accounting principles generally accepted in the United States of America (GAAP). These inputs are summarized in the three broad levels listed below:
| ■ | Level 1 – quoted prices in active markets for identical securities |
| ■ | Level 2 – prices determined using other significant observable inputs (including quoted prices for similar securities, interest rates, prepayment speeds, credit risk and others) |
| ■ | Level 3 – prices determined using significant unobservable inputs where quoted prices or observable inputs are unavailable or less reliable (including management’s own assumptions about the factors market participants would use in pricing an investment) |
The inputs or methodology used for valuing securities are not necessarily an indication of the risk associated with investing in those securities.
The accompanying Notes to Financial Statements are an integral part of this statement.
Columbia Acorn Family of Funds | Semiannual Report 2018
| 65 |
Portfolio of Investments (continued)
Columbia Acorn SelectSM, June 30, 2018 (Unaudited)
Fair value measurements (continued)
Examples of the types of securities in which the Fund would typically invest and how they are classified within this hierarchy are as follows. Typical Level 1 securities include exchange traded domestic equities, mutual funds whose net asset values are published each day and exchange traded foreign equities that are not statistically fair valued. Typical Level 2 securities include exchange traded foreign equities that are statistically fair valued, forward foreign currency exchange contracts and short-term investments valued at amortized cost. Additionally, securities fair valued by Columbia Wanger Asset Management’s Valuation Committee (the Committee) that rely on significant observable inputs are also included in Level 2. Typical Level 3 securities include any security fair valued by the Committee that relies on significant unobservable inputs.
The Committee is responsible for applying the Columbia Acorn Trust Portfolio Pricing Policy and the Columbia Wanger Asset Management pricing procedures (the Policies), which are approved by and subject to the oversight of the Board of Trustees.
The Committee meets as necessary, and no less frequently than quarterly, to determine fair values for securities for which market quotations are not readily available or for which Columbia Wanger Asset Management believes that available market quotations are unreliable. The Committee also reviews the continuing appropriateness of the Policies. In circumstances where a security has been fair valued, the Committee will also review the continuing appropriateness of the current value of the security. The Policies address, among other things: circumstances under which market quotations will be deemed readily available; selection of third party pricing vendors; appropriate pricing methodologies; events that require fair valuation and fair value techniques; circumstances under which securities will be deemed to pose a potential for stale pricing, including when securities are illiquid, restricted, or in default; and certain delegations of authority to determine fair values to the Fund’s investment manager. The Committee may also meet to discuss additional valuation matters, which may include review of back-testing results, review of time-sensitive information or approval of other valuation related actions, and to review the appropriateness of the Policies.
For investments categorized as Level 3, the significant unobservable inputs used in the fair value measurement of the Fund’s securities may include: (i) data specific to the issuer or comparable issuers, (ii) general market or specific sector news and (iii) quoted prices and specific or similar security transactions. The Committee considers this data and any changes from prior periods in order to assess the reasonableness of observable and unobservable inputs, any assumptions or internal models used to value those securities and changes in fair value. Significant changes in any of these factors could result in lower or higher fair value measurements. Various factors impact the frequency of monitoring (which may occur as often as daily), however the Committee may determine that changes to inputs, assumptions and models are not required with the same frequency.
The following table is a summary of the inputs used to value the Fund’s investments at June 30, 2018:
| | Level 1
quoted prices in active
markets for identical
assets ($) | Level 2
other significant
observable inputs ($) | Level 3
significant
unobservable inputs ($) | Total ($) |
| Investments in Securities | | | | |
| Common Stocks | | | | |
| Consumer Discretionary | 61,940,968 | — | — | 61,940,968 |
| Financials | 47,156,772 | — | — | 47,156,772 |
| Health Care | 43,637,353 | — | — | 43,637,353 |
| Industrials | 49,625,951 | — | — | 49,625,951 |
| Information Technology | 73,330,529 | — | — | 73,330,529 |
| Materials | 10,012,281 | — | — | 10,012,281 |
| Real Estate | 15,017,578 | — | — | 15,017,578 |
| Total Common Stocks | 300,721,432 | — | — | 300,721,432 |
| Money Market Funds | 6,094,730 | — | — | 6,094,730 |
| Total Investments in Securities | 306,816,162 | — | — | 306,816,162 |
There were no transfers of financial assets between levels during the period.
The accompanying Notes to Financial Statements are an integral part of this statement.
| 66 | Columbia Acorn Family of Funds | Semiannual Report 2018 |
Portfolio of Investments
Columbia Thermostat FundSM, June 30, 2018 (Unaudited)
(Percentages represent value of investments compared to net assets)
Investments in securities
| Equity Funds 14.7% |
| Issuer | Shares | Value ($) |
| Dividend Income 1.5% |
Columbia Dividend Income Fund, Institutional 3 Class(a)
| 506,588 | 11,099,351 |
| Total Dividend Income | 11,099,351 |
| International Small Mid Cap 1.4% |
Columbia Acorn International®, Institutional 3 Class(a)
| 238,051 | 10,821,800 |
| Total International Small Mid Cap | 10,821,800 |
| U.S. Large Cap 8.9% |
Columbia Contrarian Core Fund, Institutional 3 Class(a)
| 425,388 | 11,106,876 |
Columbia Large Cap Enhanced Core Fund, Institutional 3 Class(a)
| 456,670 | 11,028,585 |
Columbia Large Cap Index Fund, Institutional 3 Class(a)
| 906,027 | 44,286,604 |
| Total U.S. Large Cap | 66,422,065 |
| U.S. Mid Cap 1.5% |
Columbia Acorn SelectSM, Institutional 3 Class(a),(b)
| 629,349 | 10,906,616 |
| Total U.S. Mid Cap | 10,906,616 |
| U.S. Small Mid Cap 1.4% |
Columbia Acorn® Fund, Institutional 3 Class(a),(b)
| 627,612 | 10,895,341 |
| Total U.S. Small Mid Cap | 10,895,341 |
Total Equity Funds
(Cost: $92,433,826) | 110,145,173 |
|
| Exchange-Traded Funds 8.5% |
| | |
Columbia Diversified Fixed Income Allocation ETF(a)
| 3,324,457 | 63,495,134 |
Total Exchange-Traded Funds
(Cost: $64,662,787) | 63,495,134 |
|
| Fixed-Income Funds 76.3% |
| Issuer | Shares | Value ($) |
| Investment Grade 76.3% |
Columbia Corporate Income Fund, Institutional 3 Class(a)
| 6,491,877 | 63,685,316 |
Columbia Quality Income Fund, Institutional 3 Class(a)
| 24,020,128 | 127,306,677 |
Columbia Short Term Bond Fund, Institutional 3 Class(a)
| 16,122,001 | 158,962,924 |
Columbia U.S. Treasury Index Fund, Institutional 3 Class(a)
| 20,464,496 | 222,449,075 |
| Total Investment Grades | 572,403,992 |
Total Fixed-Income Funds
(Cost: $578,063,756) | 572,403,992 |
|
| Money Market Funds 0.0% |
| | Shares | Value ($) |
| JPMorgan U.S. Government Money Market Fund, Agency Shares, 1.713%(c) | 63,234 | 63,234 |
Total Money Market Funds
(Cost: $63,234) | 63,234 |
Total Investments in Securities
(Cost $735,223,603) | 746,107,533 |
| Other Assets & Liabilities, Net | | 3,507,258 |
| Net Assets | $749,614,791 |
The accompanying Notes to Financial Statements are an integral part of this statement.
Columbia Acorn Family of Funds | Semiannual Report 2018
| 67 |
Portfolio of Investments (continued)
Columbia Thermostat FundSM, June 30, 2018 (Unaudited)
Notes to Portfolio of Investments
| (a) | An affiliated person of the Fund, as defined in the Investment Company Act of 1940, may include any company in which the Fund owns five percent or more of its outstanding voting shares. Holdings and transactions in these affiliated companies during the six months ended June 30, 2018, are as follows. The aggregate cost and value of these companies at June 30, 2018, was $735,160,369 and $746,044,299, respectively. Investments in affiliated companies represented 99.52% of the Fund’s total net assets at June 30, 2018. |
| Issuer | Beginning
shares | Shares
purchased | Shares
sold | Ending
shares | Realized gain
(loss) —
affiliated
issuers ($) | Net change in
unrealized
appreciation
(depreciation) —
affiliated
issuers ($) | Dividend —
affiliated
issuers ($) | Capital gain
distributions —
affiliated
issuers ($) | Value —
affiliated
issuers
at end of
period ($) |
| Columbia Acorn International®, Institutional 3 Class |
| | 364,288 | 448,801 | (575,038) | 238,051 | 3,269,053 | (2,680,101) | 55,295 | 322,537 | 10,821,800 |
| Columbia Acorn SelectSM, Institutional 3 Class |
| | 487,249 | 976,845 | (834,745) | 629,349 | 1,312,474 | (426,384) | — | 745,292 | 10,906,616 |
| Columbia Acorn® Fund, Institutional 3 Class |
| | 519,202 | 1,008,947 | (900,537) | 627,612 | 899,947 | 822,104 | — | 431,586 | 10,895,341 |
| Columbia Contrarian Core Fund, Institutional 3 Class |
| | 323,920 | 639,919 | (538,451) | 425,388 | 761,545 | (194,939) | — | — | 11,106,876 |
| Columbia Corporate Income Fund, Institutional 3 Class |
| | — | 8,121,614 | (1,629,737) | 6,491,877 | (148,731) | (878,682) | 641,980 | — | 63,685,316 |
| Columbia Diversified Fixed Income Allocation ETF |
| | — | 4,136,944 | (812,487) | 3,324,457 | (189,008) | (1,167,653) | 531,843 | — | 63,495,134 |
| Columbia Dividend Income Fund, Institutional 3 Class |
| | 759,793 | 971,998 | (1,225,203) | 506,588 | 3,896,513 | (3,101,572) | 96,328 | — | 11,099,351 |
| Columbia Income Opportunities Fund, Institutional 3 Class |
| | 7,774,323 | 59,913 | (7,834,236) | — | 2,103,636 | (3,913,900) | 696,670 | — | — |
| Columbia Large Cap Enhanced Core Fund, Institutional 3 Class |
| | 345,654 | 682,669 | (571,653) | 456,670 | 915,747 | (448,564) | 24,193 | 471,984 | 11,028,585 |
| Columbia Large Cap Index Fund, Institutional 3 Class |
| | — | 1,607,561 | (701,534) | 906,027 | (72,932) | (108,300) | 109,472 | 1,182,953 | 44,286,604 |
| Columbia Quality Income Fund, Institutional 3 Class |
| | 28,648,549 | 4,631,447 | (9,259,868) | 24,020,128 | (938,544) | (1,699,450) | 2,131,429 | — | 127,306,677 |
| Columbia Select Large Cap Equity Fund, Institutional 3 Class |
| | 595,505 | 330,247 | (925,752) | — | 1,195,080 | (595,150) | — | — | — |
| Columbia Select Large Cap Growth Fund, Institutional 3 Class |
| | 492,597 | 265,317 | (757,914) | — | 3,424,753 | (1,924,787) | — | — | — |
| Columbia Short Term Bond Fund, Institutional 3 Class |
| | 31,104,620 | 1,989,754 | (16,972,373) | 16,122,001 | (1,574,271) | (264,992) | 1,382,296 | — | 158,962,924 |
| Columbia Total Return Bond Fund, Institutional 3 Class |
| | 17,065,809 | 71,871 | (17,137,680) | — | (2,138,391) | (854,368) | 764,183 | — | — |
| Columbia U.S. Treasury Index Fund, Institutional 3 Class |
| | 6,949,835 | 19,632,274 | (6,117,613) | 20,464,496 | (874,800) | (442,147) | 1,571,007 | — | 222,449,075 |
| Total of Affiliated Transactions | | | | | 11,842,071 | (17,878,885) | 8,004,696 | 3,154,352 | 746,044,299 |
| (b) | Non-income producing security. |
| (c) | The rate shown is the seven-day current annualized yield at June 30, 2018. |
Fair value measurements
Various inputs are used in determining the value of the Fund’s investments, following the input prioritization hierarchy established by accounting principles generally accepted in the United States of America (GAAP). These inputs are summarized in the three broad levels listed below:
The accompanying Notes to Financial Statements are an integral part of this statement.
| 68 | Columbia Acorn Family of Funds | Semiannual Report 2018 |
Portfolio of Investments (continued)
Columbia Thermostat FundSM, June 30, 2018 (Unaudited)
Fair value measurements (continued)
| ■ | Level 1 – quoted prices in active markets for identical securities |
| ■ | Level 2 – prices determined using other significant observable inputs (including quoted prices for similar securities, interest rates, prepayment speeds, credit risk and others) |
| ■ | Level 3 – prices determined using significant unobservable inputs where quoted prices or observable inputs are unavailable or less reliable (including management’s own assumptions about the factors market participants would use in pricing an investment) |
The inputs or methodology used for valuing securities are not necessarily an indication of the risk associated with investing in those securities.
Examples of the types of securities in which the Fund would typically invest and how they are classified within this hierarchy are as follows. Typical Level 1 securities include mutual funds whose net asset values are published each day.
The Committee is responsible for applying the Columbia Acorn Trust Portfolio Pricing Policy and the Columbia Wanger Asset Management pricing procedures (the Policies), which are approved by and subject to the oversight of the Board of Trustees.
The Committee meets as necessary, and no less frequently than quarterly, to determine fair values for securities for which market quotations are not readily available or for which Columbia Wanger Asset Management believes that available market quotations are unreliable. The Committee also reviews the continuing appropriateness of the Policies. In circumstances where a security has been fair valued, the Committee will also review the continuing appropriateness of the current value of the security. The Policies address, among other things: circumstances under which market quotations will be deemed readily available; selection of third party pricing vendors; appropriate pricing methodologies; events that require fair valuation and fair value techniques; circumstances under which securities will be deemed to pose a potential for stale pricing, including when securities are illiquid, restricted, or in default; and certain delegations of authority to determine fair values to the Fund’s investment manager. The Committee may also meet to discuss additional valuation matters, which may include review of back-testing results, review of time-sensitive information or approval of other valuation related actions, and to review the appropriateness of the Policies.
For investments categorized as Level 3, the significant unobservable inputs used in the fair value measurement of the Fund’s securities may include: (i) data specific to the issuer or comparable issuers, (ii) general market or specific sector news and (iii) quoted prices and specific or similar security transactions. The Committee considers this data and any changes from prior periods in order to assess the reasonableness of observable and unobservable inputs, any assumptions or internal models used to value those securities and changes in fair value. Significant changes in any of these factors could result in lower or higher fair value measurements. Various factors impact the frequency of monitoring (which may occur as often as daily), however the Committee may determine that changes to inputs, assumptions and models are not required with the same frequency.
The following table is a summary of the inputs used to value the Fund’s investments at June 30, 2018:
| | Level 1
quoted prices in active
markets for identical
assets ($) | Level 2
other significant
observable inputs ($) | Level 3
significant
unobservable inputs ($) | Total ($) |
| Investments in Securities | | | | |
| Equity Funds | 110,145,173 | — | — | 110,145,173 |
| Exchange-Traded Funds | 63,495,134 | — | — | 63,495,134 |
| Fixed-Income Funds | 572,403,992 | — | — | 572,403,992 |
| Money Market Funds | 63,234 | — | — | 63,234 |
| Total Investments in Securities | 746,107,533 | — | — | 746,107,533 |
There were no transfers of financial assets between levels during the period.
The accompanying Notes to Financial Statements are an integral part of this statement.
Columbia Acorn Family of Funds | Semiannual Report 2018
| 69 |
Portfolio of Investments
Columbia Acorn Emerging Markets FundSM, June 30, 2018 (Unaudited)
(Percentages represent value of investments compared to net assets)
Investments in securities
| Common Stocks 96.5% |
| Issuer | Shares | Value ($) |
| Brazil 4.7% |
Odontoprev SA
Dental benefits company | 560,000 | 1,907,244 |
Qualicorp SA
Insurance and benefits packages | 158,000 | 750,100 |
Raia Drogasil SA
Chain of pharmaceutical stores | 88,000 | 1,487,423 |
| Total | 4,144,767 |
| Cambodia 2.9% |
NagaCorp Ltd.
Leisure and tourism company | 2,848,000 | 2,582,988 |
| Cayman Islands 12.0% |
Gourmet Master Co., Ltd.
Coffee & bakery cafes | 245,088 | 2,367,858 |
Huazhu Group Ltd., ADR
Hotel operator and franchisor | 29,600 | 1,242,904 |
Parade Technologies Ltd.
Fabless semiconductor company | 111,000 | 1,856,663 |
Silicon Motion Technology Corp., ADR
Semiconductor products | 36,799 | 1,946,299 |
Xiabuxiabu Catering Management China Holdings Co., Ltd.
Chain of restaurants in China | 1,456,000 | 3,179,422 |
| Total | 10,593,146 |
| China 10.2% |
51job, Inc., ADR(a)
Integrated human resource services | 26,116 | 2,549,966 |
58.Com, Inc., ADR(a)
Local life service platform | 25,893 | 1,795,421 |
China Medical System Holdings Ltd.
Pharmaceutical and medical products | 396,000 | 788,772 |
New Oriental Education & Technology Group, Inc., ADR
Educational services | 28,500 | 2,697,810 |
TravelSky Technology Ltd., Class H
IT solutions for China’s air travel and tourism industries | 401,000 | 1,163,956 |
| Total | 8,995,925 |
| Egypt 1.3% |
Commercial International Bank of Egypt
Provides a range of financial services | 237,000 | 1,130,975 |
| Common Stocks (continued) |
| Issuer | Shares | Value ($) |
| Hong Kong 6.1% |
ASM Pacific Technology Ltd.
Machines, tools & materials used in the semiconductor industry | 68,800 | 867,123 |
Value Partners Group Ltd.
Independent, value oriented asset management group | 1,653,000 | 1,299,739 |
Vitasoy International Holdings Ltd.
Food and beverages | 1,008,000 | 3,220,771 |
| Total | 5,387,633 |
| India 9.0% |
Care Ratings Ltd.
Credit rating services | 101,000 | 1,849,315 |
GRUH Finance Ltd.
Provides a range of home loans as well as insurance products | 558,148 | 2,480,258 |
Havells India Ltd.
Manufactures electrical products | 129,000 | 1,022,768 |
Zee Entertainment Enterprises Ltd.
Hindi films, serials, game shows and children’s programs | 329,472 | 2,617,896 |
| Total | 7,970,237 |
| Indonesia 4.3% |
PT Link Net Tbk
High-speed internet connection through fiber optic lines | 3,902,900 | 1,196,492 |
PT Matahari Department Store Tbk
Retail clothes, accessories, bags, shoes, cosmetics, household appliances, and management consulting services. | 2,300,000 | 1,408,646 |
PT Tower Bersama Infrastructure Tbk
Telecommunication infrastructure services to Indonesian wireless carriers | 3,550,000 | 1,235,735 |
| Total | 3,840,873 |
| Japan 1.0% |
Mandom Corp.
Cosmetic products for men and women | 29,000 | 901,932 |
| Malaysia 1.2% |
AEON Credit Service M Bhd
Consumer financing products | 295,000 | 1,051,169 |
The accompanying Notes to Financial Statements are an integral part of this statement.
| 70 | Columbia Acorn Family of Funds | Semiannual Report 2018 |
Portfolio of Investments (continued)
Columbia Acorn Emerging Markets FundSM, June 30, 2018 (Unaudited)
| Common Stocks (continued) |
| Issuer | Shares | Value ($) |
| Mexico 4.3% |
Grupo Aeroportuario del Sureste SAB de CV, ADR(b)
Operates airports in Mexico | 7,000 | 1,114,120 |
Qualitas Controladora SAB de CV
Insurance holding company | 1,079,000 | 2,660,522 |
| Total | 3,774,642 |
| Philippines 2.3% |
D&L Industries, Inc.
Customized raw materials | 6,000,000 | 1,142,268 |
Security Bank Corp.
Financial products & services | 229,000 | 856,389 |
| Total | 1,998,657 |
| Poland 0.9% |
KRUK SA
Debt collection services | 15,000 | 799,376 |
| Russian Federation 1.4% |
TCS Group Holding PLC, GDR
Online retail financial services | 59,000 | 1,221,300 |
| South Africa 6.4% |
Clicks Group Ltd.
Owns and operates chains of retail stores | 114,687 | 1,637,548 |
Famous Brands Ltd.(a)
Food and beverage company | 258,936 | 2,140,650 |
PSG Group Ltd.
Diversified financial services | 117,696 | 1,851,390 |
| Total | 5,629,588 |
| South Korea 14.2% |
CJ Logistics Corp.(a)
Logistics services | 11,681 | 1,761,634 |
GS Retail Co., Ltd.
Chain of retail stores | 27,911 | 1,101,417 |
Koh Young Technology, Inc.
3D measurement and inspection equipment for testing various machineries | 32,515 | 2,972,511 |
Korea Investment Holdings Co., Ltd.
Financial holding company | 26,676 | 2,011,360 |
Korea Zinc Co. Ltd.
Non-ferrous metal smelting | 6,800 | 2,355,297 |
Modetour Network, Inc.
Travel services | 94,518 | 2,305,210 |
| Total | 12,507,429 |
| Common Stocks (continued) |
| Issuer | Shares | Value ($) |
| Spain 1.0% |
Prosegur Cia de Seguridad SA, Registered Shares
Security and transportation services | 131,000 | 853,366 |
| Taiwan 9.0% |
Basso Industry Corp.
Pneumatic nailers and staplers | 639,000 | 1,362,382 |
Largan Precision Co., Ltd.
Optical lens modules and optoelectronic components | 9,000 | 1,322,167 |
Silergy Corp.
High performance analog integrated circuits | 75,000 | 1,822,450 |
Sinbon Electronics Co., Ltd.
Cable, connectors & modems | 587,000 | 1,601,977 |
Voltronic Power Technology Corp.
Uninterruptible power supply products, inverters, multiple surface mounted devices and other power products | 108,000 | 1,844,112 |
| Total | 7,953,088 |
| Thailand 2.9% |
Beauty Community PCL
Cosmetic and beauty products | 2,436,000 | 895,757 |
Muangthai Leasing PCL, Foreign Registered Shares
Commercial lending company | 446,600 | 445,064 |
Tisco Financial Group PCL
Bank holding company | 500,000 | 1,266,529 |
| Total | 2,607,350 |
| Turkey 1.4% |
Logo Yazilim Sanayi Ve Ticaret AS(a)
Enterprise resource planning software | 139,000 | 1,272,645 |
Total Common Stocks
(Cost: $72,615,336) | 85,217,086 |
|
| Securities Lending Collateral 0.4% |
| | Shares | Value ($) |
Dreyfus Government Cash Management Fund, Institutional Shares, 1.810%(c),(d)
| 405,000 | 405,000 |
Total Securities Lending Collateral
(Cost: $405,000) | 405,000 |
|
The accompanying Notes to Financial Statements are an integral part of this statement.
Columbia Acorn Family of Funds | Semiannual Report 2018
| 71 |
Portfolio of Investments (continued)
Columbia Acorn Emerging Markets FundSM, June 30, 2018 (Unaudited)
| Money Market Funds 3.5% |
| | Shares | Value ($) |
JPMorgan U.S. Government Money Market Fund, IM Shares, 1.819%(c)
| 3,062,786 | 3,062,786 |
Total Money Market Funds
(Cost: $3,062,786) | 3,062,786 |
Total Investments in Securities
(Cost: $76,083,122) | 88,684,872 |
| Obligation to Return Collateral for Securities Loaned | | (405,000) |
| Other Assets & Liabilities, Net | | 54,436 |
| Net Assets | $88,334,308 |
Notes to Portfolio of Investments
| (a) | Non-income producing security. |
| (b) | All or a portion of this security was on loan at June 30, 2018. The total market value of securities on loan at June 30, 2018 was $397,900. |
| (c) | The rate shown is the seven-day current annualized yield at June 30, 2018. |
| (d) | Investment made with cash collateral received from securities lending activity. |
Abbreviation Legend
| ADR | American Depositary Receipt |
| GDR | Global Depositary Receipt |
Fair value measurements
Various inputs are used in determining the value of the Fund’s investments, following the input prioritization hierarchy established by accounting principles generally accepted in the United States of America (GAAP). These inputs are summarized in the three broad levels listed below:
| ■ | Level 1 – quoted prices in active markets for identical securities |
| ■ | Level 2 – prices determined using other significant observable inputs (including quoted prices for similar securities, interest rates, prepayment speeds, credit risk and others) |
| ■ | Level 3 – prices determined using significant unobservable inputs where quoted prices or observable inputs are unavailable or less reliable (including management’s own assumptions about the factors market participants would use in pricing an investment) |
The inputs or methodology used for valuing securities are not necessarily an indication of the risk associated with investing in those securities.
Examples of the types of securities in which the Fund would typically invest and how they are classified within this hierarchy are as follows. Typical Level 1 securities include exchange traded domestic equities, mutual funds whose net asset values are published each day and exchange traded foreign equities that are not statistically fair valued. Typical Level 2 securities include exchange traded foreign equities that are statistically fair valued, forward foreign currency exchange contracts and short-term investments valued at amortized cost. Additionally, securities fair valued by Columbia Wanger Asset Management’s Valuation Committee (the Committee) that rely on significant observable inputs are also included in Level 2. Typical Level 3 securities include any security fair valued by the Committee that relies on significant unobservable inputs.
The Committee is responsible for applying the Columbia Acorn Trust Portfolio Pricing Policy and the Columbia Wanger Asset Management pricing procedures (the Policies), which are approved by and subject to the oversight of the Board of Trustees.
The Committee meets as necessary, and no less frequently than quarterly, to determine fair values for securities for which market quotations are not readily available or for which Columbia Wanger Asset Management believes that available market quotations are unreliable. The Committee also reviews the continuing appropriateness of the Policies. In circumstances where a security has been fair valued, the Committee will also review the continuing appropriateness of the current value of the security. The Policies address, among other things: circumstances under which market quotations will be deemed readily available; selection of third party pricing vendors; appropriate pricing methodologies; events that require fair valuation and fair value techniques; circumstances under which securities will be deemed to pose a potential for stale pricing, including when securities are illiquid, restricted, or in default; and certain delegations of authority to determine fair values to the Fund’s investment manager. The Committee may also meet to discuss additional valuation matters, which may include review of back-testing results, review of time-sensitive information or approval of other valuation related actions, and to review the appropriateness of the Policies.
For investments categorized as Level 3, the significant unobservable inputs used in the fair value measurement of the Fund’s securities may include: (i) data specific to the issuer or comparable issuers, (ii) general market or specific sector news and (iii) quoted prices and specific or similar security transactions. The Committee considers this data and any changes from prior periods in order to assess the reasonableness of observable and unobservable inputs, any assumptions or internal models used to value those securities and changes in fair value. Significant changes in any of these factors could result in lower or higher fair value measurements. Various factors impact the frequency of monitoring (which may occur as often as daily), however the Committee may determine that changes to inputs, assumptions and models are not required with the same frequency.
The accompanying Notes to Financial Statements are an integral part of this statement.
| 72 | Columbia Acorn Family of Funds | Semiannual Report 2018 |
Portfolio of Investments (continued)
Columbia Acorn Emerging Markets FundSM, June 30, 2018 (Unaudited)
Fair value measurements (continued)
The following table is a summary of the inputs used to value the Fund’s investments at June 30, 2018:
| | Level 1
quoted prices in active
markets for identical
assets ($) | Level 2
other significant
observable inputs ($) | Level 3
significant
unobservable inputs ($) | Total ($) |
| Investments in Securities | | | | |
| Common Stocks | | | | |
| Brazil | 4,144,767 | — | — | 4,144,767 |
| Cambodia | — | 2,582,988 | — | 2,582,988 |
| Cayman Islands | 3,189,203 | 7,403,943 | — | 10,593,146 |
| China | 7,043,197 | 1,952,728 | — | 8,995,925 |
| Egypt | — | 1,130,975 | — | 1,130,975 |
| Hong Kong | — | 5,387,633 | — | 5,387,633 |
| India | — | 7,970,237 | — | 7,970,237 |
| Indonesia | — | 3,840,873 | — | 3,840,873 |
| Japan | — | 901,932 | — | 901,932 |
| Malaysia | — | 1,051,169 | — | 1,051,169 |
| Mexico | 3,774,642 | — | — | 3,774,642 |
| Philippines | — | 1,998,657 | — | 1,998,657 |
| Poland | — | 799,376 | — | 799,376 |
| Russian Federation | — | 1,221,300 | — | 1,221,300 |
| South Africa | — | 5,629,588 | — | 5,629,588 |
| South Korea | — | 12,507,429 | — | 12,507,429 |
| Spain | — | 853,366 | — | 853,366 |
| Taiwan | — | 7,953,088 | — | 7,953,088 |
| Thailand | — | 2,607,350 | — | 2,607,350 |
| Turkey | — | 1,272,645 | — | 1,272,645 |
| Total Common Stocks | 18,151,809 | 67,065,277 | — | 85,217,086 |
| Securities Lending Collateral | 405,000 | — | — | 405,000 |
| Money Market Funds | 3,062,786 | — | — | 3,062,786 |
| Total Investments in Securities | 21,619,595 | 67,065,277 | — | 88,684,872 |
The Fund’s assets assigned to the Level 2 input category are generally valued using a market approach, in which a security’s value is determined through its correlation to prices and information from observable market transactions for similar or identical assets. Foreign equities are generally valued at the last sale price on the foreign exchange or market on which they trade. The Fund may use a statistical fair valuation model, in accordance with the policy adopted by the Board of Trustees, provided by an independent third party to value securities principally traded in foreign markets in order to adjust for possible stale pricing that may occur between the close of the foreign exchanges and the time for valuation. These models take into account available market data including intraday index, ADR, and ETF movements.
There were no transfers of financial assets between levels during the period.
The accompanying Notes to Financial Statements are an integral part of this statement.
Columbia Acorn Family of Funds | Semiannual Report 2018
| 73 |
Portfolio of Investments
Columbia Acorn European FundSM, June 30, 2018 (Unaudited)
(Percentages represent value of investments compared to net assets)
Investments in securities
| Common Stocks 96.8% |
| Issuer | Shares | Value ($) |
| Belgium 1.6% |
Melexis NV
Advanced integrated semiconductors, sensor ICs, and programmable sensor IC systems | 19,371 | 1,793,302 |
| Denmark 5.8% |
ALK-Abello AS(a)
Pharmaceuticals for allergy vaccinations | 6,861 | 1,143,262 |
SimCorp AS
Global provider of highly specialised software for the investment management industry | 41,214 | 3,328,691 |
William Demant Holding AS(b)
Hearing aids, audiometers, tympanometers, diagnostic instruments, and wireless communication equipment | 50,241 | 2,016,276 |
| Total | 6,488,229 |
| Finland 2.4% |
Ahlstrom-Munksjo Oyj
Industrial paper | 67,778 | 1,222,546 |
Ahlstrom-Munksjo Oyj(c)
Industrial paper | 82,213 | 1,490,651 |
| Total | 2,713,197 |
| France 1.8% |
Akka Technologies
High-technology engineering consulting services | 28,816 | 2,055,858 |
| Germany 22.0% |
AURELIUS Equity Opportunities SE & Co. KGaA
Loans to distressed companies | 30,014 | 1,776,478 |
CTS Eventim AG & Co. KGaA
Online ticket sales | 51,261 | 2,516,798 |
Deutsche Beteiligungs AG
Private equity company, investing in domestic medium-sized companies | 26,050 | 1,031,418 |
Fielmann AG
Prescription eyeglasses, specialty glasses, sunglasses, contact lenses, and optical supplies | 22,146 | 1,531,180 |
MTU Aero Engines AG
Develops and manufactures engines and offers commercial engine services and support | 12,349 | 2,365,346 |
Nemetschek SE
Standard software for designing, constructing and managing buildings and real estate | 30,204 | 3,620,150 |
Norma Group SE
Plastic and metal-based components and systems in connecting technology | 21,026 | 1,436,568 |
| Common Stocks (continued) |
| Issuer | Shares | Value ($) |
Rational AG
Food preparation appliances/processors and kitchen accessories | 3,607 | 2,348,910 |
Stroeer SE & Co. KGaA
Digital multi-channel media company | 32,815 | 1,981,202 |
Vapiano SE(b)
Chain of restaurants | 71,159 | 1,679,763 |
Varta AG(b)
Manufactures and markets a wide range of industrial, commercial and miniaturized batteries | 28,977 | 785,750 |
Wirecard AG
Internet payment and processing services | 22,879 | 3,661,107 |
| Total | 24,734,670 |
| Ireland 1.6% |
UDG Healthcare PLC
Commercialisation solutions for health care companies | 169,213 | 1,838,895 |
| Italy 5.2% |
Brembo SpA
Braking systems and components | 228,119 | 3,076,588 |
Davide Campari-Milano SpA
Global producer & distributor of branded spirits, wines and soft drinks | 145,165 | 1,191,503 |
Industria Macchine Automatiche SpA
Packaging machinery for the food, pharmaceuticals, and cosmetics industries | 18,776 | 1,629,218 |
| Total | 5,897,309 |
| Luxembourg 1.7% |
eDreams ODIGEO SA(b)
Online travel company | 466,018 | 1,891,869 |
| Malta 3.0% |
Unibet Group PLC
Online gambling services | 271,181 | 3,397,292 |
| Netherlands 2.4% |
Aalberts Industries NV
Industrial services and flow control systems | 57,813 | 2,761,755 |
| Norway 3.0% |
Atea ASA
Nordic and Baltic supplier of IT infrastructure | 162,131 | 2,334,851 |
XXL ASA
Multi-sports retail store | 133,240 | 1,077,058 |
| Total | 3,411,909 |
The accompanying Notes to Financial Statements are an integral part of this statement.
| 74 | Columbia Acorn Family of Funds | Semiannual Report 2018 |
Portfolio of Investments (continued)
Columbia Acorn European FundSM, June 30, 2018 (Unaudited)
| Common Stocks (continued) |
| Issuer | Shares | Value ($) |
| Poland 0.9% |
KRUK SA
Debt collection services | 19,295 | 1,028,264 |
| Russian Federation 1.0% |
TCS Group Holding PLC, GDR
Online retail financial services | 54,000 | 1,117,800 |
| Spain 1.1% |
Prosegur Cia de Seguridad SA, Registered Shares
Security and transportation services | 195,343 | 1,272,513 |
| Sweden 11.7% |
AddTech AB, Class B
High-tech industrial components and systems | 51,227 | 1,129,472 |
Byggmax Group AB(a)
Discount provider of building materials | 168,340 | 731,712 |
NetEnt AB
Develops and markets computer gaming software | 254,416 | 1,351,362 |
Sectra AB, B Shares
Medical and communication systems | 158,796 | 4,194,399 |
Sweco AB, Class B
Consulting company specializing in engineering, environmental technology, and architecture | 127,061 | 2,991,395 |
Trelleborg AB, Class B
Manufactures and distributes industrial products | 128,163 | 2,725,221 |
| Total | 13,123,561 |
| Switzerland 8.0% |
Belimo Holding AG, Registered Shares
Manufactures heating, ventilation and air conditioning equipment | 216 | 940,079 |
Bossard Holding AG, Class A, Registered Shares
Fastening devices, industrial adhesives & tools | 11,100 | 2,057,701 |
Inficon Holding AG
Vacuum instruments used to monitor and control production processes | 3,890 | 1,977,328 |
Kardex AG
Storage, warehouse and materials handling systems | 8,800 | 1,217,714 |
Partners Group Holding AG
Global private markets asset management firm | 3,825 | 2,796,251 |
| Total | 8,989,073 |
| Turkey 0.9% |
Logo Yazilim Sanayi Ve Ticaret AS(b)
Enterprise resource planning software | 109,492 | 1,002,478 |
| Common Stocks (continued) |
| Issuer | Shares | Value ($) |
| United Kingdom 22.7% |
Ascential PLC
Media and consultancy services | 297,956 | 1,773,700 |
Assura PLC
Primary healthcare property group | 2,110,582 | 1,603,058 |
Big Yellow Group PLC
Self-storage company | 93,728 | 1,174,939 |
Croda International PLC
Chemicals and chemical products | 28,718 | 1,814,321 |
Domino’s Pizza Group PLC
Pizza delivery stores | 298,662 | 1,363,073 |
Halma PLC
Products that detect hazards and protect assets and people in public and commercial buildings | 182,470 | 3,285,611 |
Hastings Group Holdings PLC
General insurance services to the automobile and home insurance products | 321,271 | 1,076,594 |
Intermediate Capital Group PLC
Private equity firm | 132,186 | 1,914,966 |
Polypipe Group PLC
Plastic piping systems | 191,479 | 970,238 |
Rentokil Initial PLC
Fully integrated facilities management and essential support services | 776,908 | 3,582,035 |
Rightmove PLC
Website that lists properties across Britain | 30,259 | 2,115,179 |
Spirax-Sarco Engineering PLC
Consultation, service and products for the control and efficient management of steam and industrial fluids | 37,402 | 3,207,357 |
WH Smith PLC
Retails books, magazines, newspapers, and periodicals | 62,620 | 1,648,288 |
| Total | 25,529,359 |
Total Common Stocks
(Cost: $89,049,582) | 109,047,333 |
| Preferred Stocks 1.9% |
| Issuer | | Shares | Value ($) |
| Germany 1.9% |
Sartorius AG
Precision electronic equipment and components | | 14,206 | 2,114,864 |
Total Preferred Stocks
(Cost: $1,401,736) | 2,114,864 |
The accompanying Notes to Financial Statements are an integral part of this statement.
Columbia Acorn Family of Funds | Semiannual Report 2018
| 75 |
Portfolio of Investments (continued)
Columbia Acorn European FundSM, June 30, 2018 (Unaudited)
| Securities Lending Collateral 1.0% |
| | Shares | Value ($) |
Dreyfus Government Cash Management Fund, Institutional Shares, 1.810%(d),(e)
| 1,168,500 | 1,168,500 |
Total Securities Lending Collateral
(Cost: $1,168,500) | 1,168,500 |
|
| Money Market Funds 1.5% |
| | |
JPMorgan U.S. Government Money Market Fund, IM Shares, 1.819%(d)
| 1,646,588 | 1,646,588 |
Total Money Market Funds
(Cost: $1,646,588) | 1,646,588 |
Total Investments in Securities
(Cost: $93,266,406) | 113,977,285 |
| Obligation to Return Collateral for Securities Loaned | | (1,168,500) |
| Other Assets & Liabilities, Net | | (212,437) |
| Net Assets | $112,596,348 |
Notes to Portfolio of Investments
| (a) | All or a portion of this security was on loan at June 30, 2018. The total market value of securities on loan at June 30, 2018 was $1,140,391. |
| (b) | Non-income producing security. |
| (c) | Security is traded on a Swedish exchange. |
| (d) | The rate shown is the seven-day current annualized yield at June 30, 2018. |
| (e) | Investment made with cash collateral received from securities lending activity. |
Abbreviation Legend
| GDR | Global Depositary Receipt |
Fair value measurements
Various inputs are used in determining the value of the Fund’s investments, following the input prioritization hierarchy established by accounting principles generally accepted in the United States of America (GAAP). These inputs are summarized in the three broad levels listed below:
| ■ | Level 1 – quoted prices in active markets for identical securities |
| ■ | Level 2 – prices determined using other significant observable inputs (including quoted prices for similar securities, interest rates, prepayment speeds, credit risk and others) |
| ■ | Level 3 – prices determined using significant unobservable inputs where quoted prices or observable inputs are unavailable or less reliable (including management’s own assumptions about the factors market participants would use in pricing an investment) |
The inputs or methodology used for valuing securities are not necessarily an indication of the risk associated with investing in those securities.
Examples of the types of securities in which the Fund would typically invest and how they are classified within this hierarchy are as follows. Typical Level 1 securities include exchange traded domestic equities, mutual funds whose net asset values are published each day and exchange traded foreign equities that are not statistically fair valued. Typical Level 2 securities include exchange traded foreign equities that are statistically fair valued, forward foreign currency exchange contracts and short-term investments valued at amortized cost. Additionally, securities fair valued by Columbia Wanger Asset Management’s Valuation Committee (the Committee) that rely on significant observable inputs are also included in Level 2. Typical Level 3 securities include any security fair valued by the Committee that relies on significant unobservable inputs.
The Committee is responsible for applying the Columbia Acorn Trust Portfolio Pricing Policy and the Columbia Wanger Asset Management pricing procedures (the Policies), which are approved by and subject to the oversight of the Board of Trustees.
The Committee meets as necessary, and no less frequently than quarterly, to determine fair values for securities for which market quotations are not readily available or for which Columbia Wanger Asset Management believes that available market quotations are unreliable. The Committee also reviews the continuing appropriateness of the Policies. In circumstances where a security has been fair valued, the Committee will also review the continuing appropriateness of the current value of the security. The Policies address, among other things: circumstances under which market quotations will be deemed readily available; selection of third party pricing vendors; appropriate pricing methodologies; events that
The accompanying Notes to Financial Statements are an integral part of this statement.
| 76 | Columbia Acorn Family of Funds | Semiannual Report 2018 |
Portfolio of Investments (continued)
Columbia Acorn European FundSM, June 30, 2018 (Unaudited)
Fair value measurements (continued)
require fair valuation and fair value techniques; circumstances under which securities will be deemed to pose a potential for stale pricing, including when securities are illiquid, restricted, or in default; and certain delegations of authority to determine fair values to the Fund’s investment manager. The Committee may also meet to discuss additional valuation matters, which may include review of back-testing results, review of time-sensitive information or approval of other valuation related actions, and to review the appropriateness of the Policies.
For investments categorized as Level 3, the significant unobservable inputs used in the fair value measurement of the Fund’s securities may include: (i) data specific to the issuer or comparable issuers, (ii) general market or specific sector news and (iii) quoted prices and specific or similar security transactions. The Committee considers this data and any changes from prior periods in order to assess the reasonableness of observable and unobservable inputs, any assumptions or internal models used to value those securities and changes in fair value. Significant changes in any of these factors could result in lower or higher fair value measurements. Various factors impact the frequency of monitoring (which may occur as often as daily), however the Committee may determine that changes to inputs, assumptions and models are not required with the same frequency.
The following table is a summary of the inputs used to value the Fund’s investments at June 30, 2018:
| | Level 1
quoted prices in active
markets for identical
assets ($) | Level 2
other significant
observable inputs ($) | Level 3
significant
unobservable inputs ($) | Total ($) |
| Investments in Securities | | | | |
| Common Stocks | | | | |
| Belgium | — | 1,793,302 | — | 1,793,302 |
| Denmark | — | 6,488,229 | — | 6,488,229 |
| Finland | — | 2,713,197 | — | 2,713,197 |
| France | — | 2,055,858 | — | 2,055,858 |
| Germany | — | 24,734,670 | — | 24,734,670 |
| Ireland | — | 1,838,895 | — | 1,838,895 |
| Italy | — | 5,897,309 | — | 5,897,309 |
| Luxembourg | — | 1,891,869 | — | 1,891,869 |
| Malta | — | 3,397,292 | — | 3,397,292 |
| Netherlands | — | 2,761,755 | — | 2,761,755 |
| Norway | — | 3,411,909 | — | 3,411,909 |
| Poland | — | 1,028,264 | — | 1,028,264 |
| Russian Federation | — | 1,117,800 | — | 1,117,800 |
| Spain | — | 1,272,513 | — | 1,272,513 |
| Sweden | — | 13,123,561 | — | 13,123,561 |
| Switzerland | — | 8,989,073 | — | 8,989,073 |
| Turkey | — | 1,002,478 | — | 1,002,478 |
| United Kingdom | — | 25,529,359 | — | 25,529,359 |
| Total Common Stocks | — | 109,047,333 | — | 109,047,333 |
| Preferred Stocks | | | | |
| Germany | — | 2,114,864 | — | 2,114,864 |
| Total Preferred Stocks | — | 2,114,864 | — | 2,114,864 |
| Securities Lending Collateral | 1,168,500 | — | — | 1,168,500 |
| Money Market Funds | 1,646,588 | — | — | 1,646,588 |
| Total Investments in Securities | 2,815,088 | 111,162,197 | — | 113,977,285 |
The Fund’s assets assigned to the Level 2 input category are generally valued using a market approach, in which a security’s value is determined through its correlation to prices and information from observable market transactions for similar or identical assets. Foreign equities are generally valued at the last sale price on the foreign exchange or market on which they trade. The Fund may use a statistical fair valuation model, in accordance with the policy adopted by the Board of Trustees, provided by an independent third party to value securities principally traded in foreign markets in order to adjust for possible stale pricing that may occur between the close of the foreign exchanges and the time for valuation. These models take into account available market data including intraday index, ADR, and ETF movements.
There were no transfers of financial assets between levels during the period.
The accompanying Notes to Financial Statements are an integral part of this statement.
Columbia Acorn Family of Funds | Semiannual Report 2018
| 77 |
Statement of Assets and Liabilities
June 30, 2018 (Unaudited)
| | Columbia
Acorn®
Fund | Columbia
Acorn
International® | Columbia
Acorn
USA® | Columbia
Acorn
International
SelectSM |
| Assets | | | | |
| Investments in securities, at value* | | | | |
| Unaffiliated issuers (cost $3,275,704,446, $2,781,946,072, $268,142,631, $88,853,531, respectively) | $4,729,778,483 | $3,974,407,792 | $352,891,816 | $119,821,335 |
| Affiliated issuers (cost $30,351,061, $—, $—, $—, respectively) | 32,392,600 | — | — | — |
| Foreign currency (cost $—, $1,012,513, $—, $37,523, respectively) | — | 1,014,849 | — | 36,744 |
| Margin deposits on: | | | | |
| Futures contracts | — | 1,371,900 | — | — |
| Receivable for: | | | | |
| Investments sold | 48,429,034 | 811,443 | 2,011,476 | — |
| Capital shares sold | 1,455,668 | 1,871,608 | 262,402 | 270,316 |
| Dividends | 1,823,104 | 3,303,794 | 185,604 | 201,505 |
| Securities lending income | 27,019 | 7,070 | 4,703 | 58 |
| Foreign tax reclaims | — | 4,447,126 | 164 | 89,791 |
| Variation margin for futures contracts | — | 252,435 | — | — |
| Expense reimbursement due from Investment Manager | — | — | 351 | 489 |
| Prepaid expenses | 31,497 | 32,909 | 2,229 | 817 |
| Trustees’ deferred compensation plan | 3,476,108 | 1,771,290 | 336,877 | — |
| Other assets | — | 3,401 | — | — |
| Total assets | 4,817,413,513 | 3,989,295,617 | 355,695,622 | 120,421,055 |
| Liabilities | | | | |
| Due to custodian | — | — | — | 69,586 |
| Due upon return of securities on loan | 50,735,444 | 14,853,961 | 4,633,100 | 1,312,200 |
| Payable for: | | | | |
| Investments purchased | 2,148,155 | 1,503,905 | 3,182,569 | — |
| Capital shares purchased | 6,474,434 | 4,953,535 | 73,875 | 99,148 |
| Investment advisory fee | 87,113 | 82,954 | 8,741 | 2,855 |
| Distribution and/or service fees | 12,142 | 4,502 | 623 | 323 |
| Transfer agent fees | 412,366 | 383,859 | 35,005 | 11,145 |
| Administration fees | 6,216 | 5,126 | 454 | 153 |
| Trustees’ fees | 12,243 | 13,272 | 3,191 | 53,232 |
| Compensation of chief compliance officer | — | — | 193 | — |
| Other expenses | 253,634 | 527,360 | 60,883 | 57,026 |
| Trustees’ deferred compensation plan | 3,476,108 | 1,771,290 | 336,877 | — |
| Other liabilities | — | 12,486 | — | — |
| Total liabilities | 63,617,855 | 24,112,250 | 8,335,511 | 1,605,668 |
| Net assets applicable to outstanding capital stock | $4,753,795,658 | $3,965,183,367 | $347,360,111 | $118,815,387 |
| Represented by | | | | |
| Paid in capital | 2,994,392,691 | 2,210,721,421 | 234,003,006 | 81,439,512 |
| Undistributed (excess of distributions over) net investment income | (38,449) | 12,611,314 | (661,914) | 519,601 |
| Accumulated net realized gain | 303,325,840 | 550,692,969 | 29,269,834 | 5,887,899 |
| Unrealized appreciation (depreciation) on: | | | | |
| Investments - unaffiliated issuers | 1,454,074,037 | 1,192,461,720 | 84,749,185 | 30,967,804 |
| Investments - affiliated issuers | 2,041,539 | — | — | — |
| Foreign currency translations | — | (2,227) | — | 571 |
| Futures contracts | — | (1,301,830) | — | — |
| Total - representing net assets applicable to outstanding capital stock | $4,753,795,658 | $3,965,183,367 | $347,360,111 | $118,815,387 |
| * Value of securities on loan | 49,634,346 | 14,348,902 | 4,523,791 | 1,289,196 |
The accompanying Notes to Financial Statements are an integral part of this statement.
| 78 | Columbia Acorn Family of Funds | Semiannual Report 2018 |
Statement of Assets and Liabilities (continued)
June 30, 2018 (Unaudited)
| | Columbia
Acorn®
Fund | Columbia
Acorn
International® | Columbia
Acorn
USA® | Columbia
Acorn
International
SelectSM |
| Class A | | | | |
| Net assets | $848,905,467 | $415,541,471 | $50,822,748 | $27,687,391 |
| Shares outstanding | 62,353,247 | 9,247,900 | 3,650,188 | 941,569 |
| Net asset value per share(a) | $13.61 | $44.93 | $13.92 | $29.41 |
| Maximum sales charge | 5.75% | 5.75% | 5.75% | 5.75% |
| Maximum offering price per share(b) (calculated by dividing the net asset value per share by 1.0 minus the maximum sales charge for Class A shares) | $14.44 | $47.67 | $14.77 | $31.20 |
| Advisor Class | | | | |
| Net assets | $49,882,672 | $77,843,741 | $19,073,259 | $1,003,885 |
| Shares outstanding | 2,923,833 | 1,713,397 | 1,056,164 | 33,437 |
| Net asset value per share(c) | $17.06 | $45.43 | $18.06 | $30.02 |
| Class C | | | | |
| Net assets | $230,376,218 | $55,771,319 | $10,026,465 | $5,030,771 |
| Shares outstanding | 34,365,505 | 1,302,106 | 1,404,507 | 184,794 |
| Net asset value per share(a) | $6.70 | $42.83 | $7.14 | $27.22 |
| Institutional Class | | | | |
| Net assets | $3,513,311,119 | $2,687,589,704 | $205,984,074 | $75,280,427 |
| Shares outstanding | 215,372,887 | 59,659,720 | 12,087,904 | 2,525,978 |
| Net asset value per share(c) | $16.31 | $45.05 | $17.04 | $29.80 |
| Institutional 2 Class | | | | |
| Net assets | $47,150,693 | $325,738,022 | $3,700,559 | $1,075,969 |
| Shares outstanding | 2,739,781 | 7,232,403 | 203,462 | 35,845 |
| Net asset value per share(c) | $17.21 | $45.04 | $18.19 | $30.02 |
| Institutional 3 Class | | | | |
| Net assets | $64,169,489 | $389,854,273 | $57,753,006 | $8,736,944 |
| Shares outstanding | 3,695,928 | 8,575,280 | 3,145,694 | 291,227 |
| Net asset value per share(c) | $17.36 | $45.46 | $18.36 | $30.00 |
| Class R | | | | |
| Net assets | $— | $12,844,837 | $— | $— |
| Shares outstanding | — | 286,216 | — | — |
| Net asset value per share(c) | $— | $44.88 | $— | $— |
| (a) | Redemption price per share is equal to net asset value less any applicable contingent deferred sales charge. |
| (b) | On sales of $50,000 or more the offering price is reduced. |
| (c) | Redemption price per share is equal to net asset value. |
The accompanying Notes to Financial Statements are an integral part of this statement.
Columbia Acorn Family of Funds | Semiannual Report 2018
| 79 |
Statement of Assets and Liabilities (continued)
June 30, 2018 (Unaudited)
| | Columbia
Acorn
SelectSM | Columbia
Thermostat
FundSM | Columbia
Acorn
Emerging Markets
FundSM | Columbia
Acorn
European
FundSM |
| Assets | | | | |
| Investments in securities, at value* | | | | |
| Unaffiliated issuers (cost $226,024,808, $63,234, $76,083,122, $93,266,406, respectively) | $306,816,162 | $63,234 | $88,684,872 | $113,977,285 |
| Affiliated issuers (cost $—, $735,160,369, $—, $—, respectively) | — | 746,044,299 | — | — |
| Cash | — | — | 20,705 | — |
| Foreign currency (cost $—, $—, $—, $6,499, respectively) | — | — | — | 6,507 |
| Receivable for: | | | | |
| Investments sold | 1,367,334 | 3,686,786 | 69,238 | 20,813 |
| Capital shares sold | 85,062 | 1,059,134 | 25,547 | 157,042 |
| Dividends | 229,908 | 982,637 | 96,528 | 135,875 |
| Securities lending income | — | — | 19 | 2,957 |
| Foreign tax reclaims | — | — | 429 | 162,894 |
| Expense reimbursement due from Investment Manager | — | 1,452 | 1,246 | 1,136 |
| Prepaid expenses | 2,054 | 6,103 | 675 | 567 |
| Trustees’ deferred compensation plan | 280,084 | — | — | — |
| Other assets | — | 8,014 | 4,395 | 14,208 |
| Total assets | 308,780,604 | 751,851,659 | 88,903,654 | 114,479,284 |
| Liabilities | | | | |
| Due to custodian | — | 10,935 | — | — |
| Due upon return of securities on loan | — | — | 405,000 | 1,168,500 |
| Payable for: | | | | |
| Investments purchased | 1,255,184 | 982,637 | 38 | 112,855 |
| Capital shares purchased | 255,349 | 928,978 | 58,324 | 540,078 |
| Investment advisory fee | 5,463 | 2,054 | 2,990 | 3,546 |
| Distribution and/or service fees | 1,272 | 7,192 | 559 | 651 |
| Transfer agent fees | 27,697 | 65,924 | 10,651 | 9,671 |
| Administration fees | 401 | 980 | 114 | 145 |
| Trustees’ fees | 826 | 182,555 | 35,770 | 9,319 |
| Compensation of chief compliance officer | — | 62 | — | — |
| Custodian fees | 1,406 | 120 | 30,151 | 11,136 |
| Other expenses | 56,245 | 55,431 | 24,699 | 27,035 |
| Trustees’ deferred compensation plan | 280,084 | — | — | — |
| Other liabilities | — | — | 1,050 | — |
| Total liabilities | 1,883,927 | 2,236,868 | 569,346 | 1,882,936 |
| Net assets applicable to outstanding capital stock | $306,896,677 | $749,614,791 | $88,334,308 | $112,596,348 |
| Represented by | | | | |
| Paid in capital | 205,196,251 | 719,936,527 | 150,983,886 | 98,686,583 |
| Undistributed (excess of distributions over) net investment income | 67,326 | 5,365,800 | (267,833) | 73,445 |
| Accumulated net realized gain (loss) | 20,841,746 | 13,428,534 | (74,982,589) | (6,874,714) |
| Unrealized appreciation (depreciation) on: | | | | |
| Investments - unaffiliated issuers | 80,791,354 | — | 12,601,750 | 20,710,879 |
| Investments - affiliated issuers | — | 10,883,930 | — | — |
| Foreign currency translations | — | — | (906) | 155 |
| Total - representing net assets applicable to outstanding capital stock | $306,896,677 | $749,614,791 | $88,334,308 | $112,596,348 |
| * Value of securities on loan | — | — | 397,900 | 1,140,391 |
The accompanying Notes to Financial Statements are an integral part of this statement.
| 80 | Columbia Acorn Family of Funds | Semiannual Report 2018 |
Statement of Assets and Liabilities (continued)
June 30, 2018 (Unaudited)
| | Columbia
Acorn
SelectSM | Columbia
Thermostat
FundSM | Columbia
Acorn
Emerging Markets
FundSM | Columbia
Acorn
European
FundSM |
| Class A | | | | |
| Net assets | $105,638,878 | $224,218,745 | $29,176,157 | $35,428,360 |
| Shares outstanding | 7,358,785 | 15,467,908 | 2,332,214 | 1,838,707 |
| Net asset value per share(a) | $14.36 | $14.50 | $12.51 | $19.27 |
| Maximum sales charge | 5.75% | 5.75% | 5.75% | 5.75% |
| Maximum offering price per share(b) (calculated by dividing the net asset value per share by 1.0 minus the maximum sales charge for Class A shares) | $15.24 | $15.38 | $13.27 | $20.45 |
| Advisor Class | | | | |
| Net assets | $5,625,805 | $14,014,371 | $1,114,815 | $2,847,329 |
| Shares outstanding | 329,524 | 974,338 | 88,071 | 146,875 |
| Net asset value per share(c) | $17.07 | $14.38 | $12.66 | $19.39 |
| Class C | | | | |
| Net assets | $20,076,671 | $206,076,816 | $13,343,225 | $15,302,128 |
| Shares outstanding | 2,209,121 | 14,169,701 | 1,082,982 | 803,472 |
| Net asset value per share(a) | $9.09 | $14.54 | $12.32 | $19.05 |
| Institutional Class | | | | |
| Net assets | $155,930,654 | $289,196,388 | $43,048,932 | $53,801,869 |
| Shares outstanding | 9,513,605 | 20,214,931 | 3,422,499 | 2,788,983 |
| Net asset value per share(c) | $16.39 | $14.31 | $12.58 | $19.29 |
| Institutional 2 Class | | | | |
| Net assets | $2,080,152 | $15,648,005 | $747,817 | $5,213,468 |
| Shares outstanding | 121,175 | 1,086,627 | 59,032 | 267,416 |
| Net asset value per share(c) | $17.17 | $14.40 | $12.67 | $19.50 |
| Institutional 3 Class | | | | |
| Net assets | $17,544,517 | $460,466 | $903,362 | $3,194 |
| Shares outstanding | 1,012,106 | 32,017 | 71,890 | 166 |
| Net asset value per share(c) | $17.33 | $14.38 | $12.57 | $19.19 (d) |
| (a) | Redemption price per share is equal to net asset value less any applicable contingent deferred sales charge. |
| (b) | On sales of $50,000 or more the offering price is reduced. |
| (c) | Redemption price per share is equal to net asset value. |
| (d) | Net asset value per share rounds to this amount due to fractional shares outstanding. |
The accompanying Notes to Financial Statements are an integral part of this statement.
Columbia Acorn Family of Funds | Semiannual Report 2018
| 81 |
Statement of Operations
Six Months Ended June 30, 2018 (Unaudited)
| | Columbia
Acorn®
Fund | Columbia
Acorn
International® | Columbia
Acorn
USA® | Columbia
Acorn
International
SelectSM |
| Net investment income | | | | |
| Income: | | | | |
| Dividends — unaffiliated issuers | $23,821,143 | $57,136,325 | $1,610,354 | $1,488,106 |
| Income from securities lending — net | 134,116 | 348,858 | 31,536 | 5,431 |
| Foreign taxes withheld | — | (5,024,295) | (12,565) | (139,248) |
| Total income | 23,955,259 | 52,460,888 | 1,629,325 | 1,354,289 |
| Expenses: | | | | |
| Investment advisory fee | 15,805,540 | 17,975,708 | 1,534,383 | 562,302 |
| Distribution and/or service fees | | | | |
| Class A | 1,048,207 | 565,595 | 60,521 | 33,532 |
| Class C | 1,215,747 | 312,792 | 49,659 | 26,491 |
| Class R | — | 32,839 | — | — |
| Transfer agent fees | | | | |
| Class A | 400,806 | 274,338 | 32,481 | 19,422 |
| Advisor Class | 22,099 | 53,577 | 11,589 | 740 |
| Class C | 116,184 | 37,926 | 6,664 | 3,832 |
| Institutional Class | 1,662,999 | 1,801,968 | 130,585 | 60,893 |
| Institutional 2 Class | 15,956 | 105,602 | 2,884 | 204 |
| Institutional 3 Class | 930 | 3,510 | 442 | 45 |
| Class R | — | 7,969 | — | — |
| Administration fees | 1,114,274 | 1,104,851 | 78,611 | 29,771 |
| Trustees’ fees | 240,117 | 249,282 | 17,965 | 6,443 |
| Custodian fees | 14,758 | 392,186 | 5,449 | 12,611 |
| Printing and postage fees | 167,800 | 221,029 | 23,633 | 14,223 |
| Registration fees | 56,643 | 70,080 | 45,170 | 44,868 |
| Audit fees | 60,122 | 88,546 | 20,884 | 23,567 |
| Legal fees | 326,378 | 336,219 | 22,756 | 9,016 |
| Compensation of chief compliance officer | 7,291 | 7,603 | 416 | 209 |
| Other | 96,578 | 111,772 | 15,281 | 11,141 |
| Total expenses | 22,372,429 | 23,753,392 | 2,059,373 | 859,310 |
| Fees waived or expenses reimbursed by Investment Manager and its affiliates | — | — | (20,378) | (77,510) |
| Fees waived by transfer agent | | | | |
| Class A | (107,308) | (25,477) | — | — |
| Advisor Class | (5,938) | (4,958) | — | — |
| Class C | (31,082) | (3,519) | — | — |
| Institutional Class | (445,076) | (166,434) | — | — |
| Institutional 2 Class | (1,441) | (7,553) | (347) | (49) |
| Institutional 3 Class | (930) | (3,510) | (442) | (45) |
| Class R | — | (743) | — | — |
| Expense reduction | (7,700) | (8,672) | (1,420) | (640) |
| Total net expenses | 21,772,954 | 23,532,526 | 2,036,786 | 781,066 |
| Net investment income (loss) | 2,182,305 | 28,928,362 | (407,461) | 573,223 |
The accompanying Notes to Financial Statements are an integral part of this statement.
| 82 | Columbia Acorn Family of Funds | Semiannual Report 2018 |
Statement of Operations (continued)
Six Months Ended June 30, 2018 (Unaudited)
| | Columbia
Acorn®
Fund | Columbia
Acorn
International® | Columbia
Acorn
USA® | Columbia
Acorn
International
SelectSM |
| Realized and unrealized gain (loss) — net | | | | |
| Net realized gain (loss) on: | | | | |
| Investments — unaffiliated issuers | $331,454,232 | $560,211,254 | $30,015,888 | $12,420,442 |
| Investments — affiliated issuers | (17,193,753) | — | — | — |
| Foreign currency translations | — | (1,116,371) | — | (31,847) |
| Futures contracts | — | (4,806,843) | — | — |
| Net realized gain | 314,260,479 | 554,288,040 | 30,015,888 | 12,388,595 |
| Net change in unrealized appreciation (depreciation) on: | | | | |
| Investments — unaffiliated issuers | 147,693,178 | (550,765,494) | 18,577,973 | (10,636,769) |
| Investments — affiliated issuers | 3,543,297 | — | — | — |
| Foreign currency translations | — | (133,356) | — | (3,480) |
| Futures contracts | — | (1,301,830) | — | — |
| Foreign capital gains tax | — | — | — | 14,814 |
| Net change in unrealized appreciation (depreciation) | 151,236,475 | (552,200,680) | 18,577,973 | (10,625,435) |
| Net realized and unrealized gain | 465,496,954 | 2,087,360 | 48,593,861 | 1,763,160 |
| Net increase in net assets resulting from operations | $467,679,259 | $31,015,722 | $48,186,400 | $2,336,383 |
The accompanying Notes to Financial Statements are an integral part of this statement.
Columbia Acorn Family of Funds | Semiannual Report 2018
| 83 |
Statement of Operations (continued)
Six Months Ended June 30, 2018 (Unaudited)
| | Columbia
Acorn
SelectSM | Columbia
Thermostat
FundSM | Columbia
Acorn
Emerging Markets
FundSM | Columbia
Acorn
European
FundSM |
| Net investment income | | | | |
| Income: | | | | |
| Dividends — unaffiliated issuers | $1,901,958 | $12,949 | $1,104,489 | $1,952,194 |
| Dividends — affiliated issuers | — | 8,004,696 | — | — |
| Income from securities lending — net | 2,441 | — | 15,734 | 22,879 |
| Foreign taxes withheld | — | — | (62,127) | (183,226) |
| Total income | 1,904,399 | 8,017,645 | 1,058,096 | 1,791,847 |
| Expenses: | | | | |
| Investment advisory fee | 1,301,250 | 399,813 | 628,878 | 670,914 |
| Distribution and/or service fees | | | | |
| Class A | 129,951 | 298,142 | 40,942 | 45,189 |
| Class C | 108,059 | 1,136,075 | 75,225 | 78,889 |
| Transfer agent fees | | | | |
| Class A | 72,953 | 122,813 | 19,455 | 20,408 |
| Advisor Class | 3,790 | 7,661 | 719 | 2,440 |
| Class C | 15,153 | 116,913 | 8,936 | 8,906 |
| Institutional Class | 109,107 | 156,474 | 29,948 | 30,847 |
| Institutional 2 Class | 519 | 4,164 | 314 | 1,450 |
| Institutional 3 Class | 171 | 25 | 12 | 5 |
| Administration fees | 72,145 | 188,396 | 23,883 | 27,389 |
| Trustees’ fees | 15,584 | 44,573 | 5,305 | 4,994 |
| Custodian fees | 1,957 | 826 | 43,571 | 16,176 |
| Printing and postage fees | 25,881 | 47,026 | 13,369 | 9,964 |
| Registration fees | 43,731 | 50,526 | 43,559 | 45,807 |
| Audit fees | 20,885 | 11,526 | 23,707 | 20,542 |
| Legal fees | 21,041 | 56,797 | 7,287 | 8,084 |
| Compensation of chief compliance officer | 481 | 1,276 | 164 | 179 |
| Other | 14,382 | 24,686 | 12,300 | 13,867 |
| Total expenses | 1,957,040 | 2,667,712 | 977,574 | 1,006,050 |
| Fees waived or expenses reimbursed by Investment Manager and its affiliates | (306,177) | (235,339) | (224,168) | (190,304) |
| Fees waived by transfer agent | | | | |
| Class A | (15,774) | — | — | — |
| Advisor Class | (820) | — | — | — |
| Class C | (3,267) | — | — | — |
| Institutional Class | (23,593) | — | — | — |
| Institutional 2 Class | (44) | (464) | (70) | (127) |
| Institutional 3 Class | (171) | (25) | (12) | (5) |
| Expense reduction | (1,320) | (580) | (40) | — |
| Total net expenses | 1,605,874 | 2,431,304 | 753,284 | 815,614 |
| Net investment income | 298,525 | 5,586,341 | 304,812 | 976,233 |
The accompanying Notes to Financial Statements are an integral part of this statement.
| 84 | Columbia Acorn Family of Funds | Semiannual Report 2018 |
Statement of Operations (continued)
Six Months Ended June 30, 2018 (Unaudited)
| | Columbia
Acorn
SelectSM | Columbia
Thermostat
FundSM | Columbia
Acorn
Emerging Markets
FundSM | Columbia
Acorn
European
FundSM |
| Realized and unrealized gain (loss) — net | | | | |
| Net realized gain (loss) on: | | | | |
| Investments — unaffiliated issuers | $21,043,823 | $— | $6,901,551 | $1,313,081 |
| Investments — affiliated issuers | — | 11,842,071 | — | — |
| Capital gain distributions from underlying affiliated funds | — | 3,154,352 | — | — |
| Foreign currency translations | — | — | (17,995) | (10,084) |
| Net realized gain | 21,043,823 | 14,996,423 | 6,883,556 | 1,302,997 |
| Net change in unrealized appreciation (depreciation) on: | | | | |
| Investments — unaffiliated issuers | (1,874,899) | — | (12,234,088) | (2,049,457) |
| Investments — affiliated issuers | — | (17,878,885) | — | — |
| Foreign currency translations | — | — | (1,313) | (2,855) |
| Foreign capital gains tax | — | — | 33,847 | — |
| Net change in unrealized appreciation (depreciation) | (1,874,899) | (17,878,885) | (12,201,554) | (2,052,312) |
| Net realized and unrealized gain (loss) | 19,168,924 | (2,882,462) | (5,317,998) | (749,315) |
| Net increase (decrease) in net assets resulting from operations | $19,467,449 | $2,703,879 | $(5,013,186) | $226,918 |
The accompanying Notes to Financial Statements are an integral part of this statement.
Columbia Acorn Family of Funds | Semiannual Report 2018
| 85 |
Statement of Changes in Net Assets
| | Columbia
Acorn® Fund | Columbia Acorn
International® |
| | Six Months Ended
June 30, 2018
(Unaudited) | Year Ended
December 31, 2017 | Six Months Ended
June 30, 2018
(Unaudited) | Year Ended
December 31, 2017 |
| Operations | | | | |
| Net investment income | $2,182,305 | $1,039,192 | $28,928,362 | $39,851,045 |
| Net realized gain | 314,260,479 | 1,176,258,449 | 554,288,040 | 451,888,883 |
| Net change in unrealized appreciation (depreciation) | 151,236,475 | (110,071,852) | (552,200,680) | 880,348,446 |
| Net increase in net assets resulting from operations | 467,679,259 | 1,067,225,789 | 31,015,722 | 1,372,088,374 |
| Distributions to shareholders | | | | |
| Net investment income | | | | |
| Class A | — | — | (2,142,268) | (7,118,778) |
| Advisor Class | — | — | (416,769) | (1,687,012) |
| Class B | — | — | — | (2,069) |
| Class C | — | — | (314,157) | (387,660) |
| Institutional Class | — | — | (13,895,282) | (57,030,081) |
| Institutional 2 Class | — | — | (1,673,225) | (7,070,007) |
| Institutional 3 Class | — | — | (2,221,224) | (8,860,457) |
| Class R | — | — | (65,365) | (149,105) |
| Net realized gains | | | | |
| Class A | (38,912,823) | (198,597,993) | (12,495,999) | (23,914,812) |
| Advisor Class | (1,964,901) | (7,546,403) | (2,431,042) | (5,256,918) |
| Class C | (18,218,848) | (98,221,494) | (1,832,499) | (3,412,394) |
| Institutional Class | (144,705,603) | (708,224,553) | (81,052,175) | (160,560,346) |
| Institutional 2 Class | (2,396,441) | (13,004,610) | (9,760,044) | (21,942,004) |
| Institutional 3 Class | (2,561,382) | (11,007,435) | (12,956,559) | (35,892,439) |
| Class R | — | — | (381,279) | (676,321) |
| Total distributions to shareholders | (208,759,998) | (1,036,602,488) | (141,637,887) | (333,960,403) |
| Decrease in net assets from capital stock activity | (143,297,319) | (221,183,341) | (831,154,471) | (784,106,134) |
| Total increase (decrease) in net assets | 115,621,942 | (190,560,040) | (941,776,636) | 254,021,837 |
| Net assets at beginning of period | 4,638,173,716 | 4,828,733,756 | 4,906,960,003 | 4,652,938,166 |
| Net assets at end of period | $4,753,795,658 | $4,638,173,716 | $3,965,183,367 | $4,906,960,003 |
| Undistributed (excess of distributions over) net investment income | $(38,449) | $(2,220,754) | $12,611,314 | $4,411,242 |
The accompanying Notes to Financial Statements are an integral part of this statement.
| 86 | Columbia Acorn Family of Funds | Semiannual Report 2018 |
Statement of Changes in Net Assets (continued)
| | Columbia
Acorn USA® | Columbia Acorn
International SelectSM |
| | Six Months Ended
June 30, 2018
(Unaudited) | Year Ended
December 31, 2017 | Six Months Ended
June 30, 2018
(Unaudited) | Year Ended
December 31, 2017 |
| Operations | | | | |
| Net investment income (loss) | $(407,461) | $(1,573,689) | $573,223 | $298,210 |
| Net realized gain | 30,015,888 | 212,362,115 | 12,388,595 | 8,192,558 |
| Net change in unrealized appreciation (depreciation) | 18,577,973 | (119,147,241) | (10,625,435) | 26,161,018 |
| Net increase in net assets resulting from operations | 48,186,400 | 91,641,185 | 2,336,383 | 34,651,786 |
| Distributions to shareholders | | | | |
| Net investment income | | | | |
| Class A | — | — | — | (9,521) |
| Advisor Class | — | — | — | (4,562) |
| Institutional Class | — | — | — | (228,058) |
| Institutional 2 Class | — | — | — | (1,921) |
| Institutional 3 Class | — | — | — | (26,734) |
| Net realized gains | | | | |
| Class A | (1,673,917) | (15,531,538) | — | — |
| Advisor Class | (506,255) | (4,118,797) | — | — |
| Class C | (542,232) | (4,827,537) | — | — |
| Institutional Class | (6,094,532) | (61,910,319) | — | — |
| Institutional 2 Class | (333,927) | (3,183,971) | — | — |
| Institutional 3 Class | (1,656,979) | (12,346,845) | — | — |
| Total distributions to shareholders | (10,807,842) | (101,919,007) | — | (270,796) |
| Decrease in net assets from capital stock activity | (12,696,045) | (310,665,005) | (14,315,800) | (3,597,759) |
| Total increase (decrease) in net assets | 24,682,513 | (320,942,827) | (11,979,417) | 30,783,231 |
| Net assets at beginning of period | 322,677,598 | 643,620,425 | 130,794,804 | 100,011,573 |
| Net assets at end of period | $347,360,111 | $322,677,598 | $118,815,387 | $130,794,804 |
| Undistributed (excess of distributions over) net investment income | $(661,914) | $(254,453) | $519,601 | $(53,622) |
The accompanying Notes to Financial Statements are an integral part of this statement.
Columbia Acorn Family of Funds | Semiannual Report 2018
| 87 |
Statement of Changes in Net Assets (continued)
| | Columbia
Acorn SelectSM | Columbia
Thermostat FundSM |
| | Six Months Ended
June 30, 2018
(Unaudited) | Year Ended
December 31, 2017 | Six Months Ended
June 30, 2018
(Unaudited) | Year Ended
December 31, 2017 |
| Operations | | | | |
| Net investment income (loss) | $298,525 | $(353,608) | $5,586,341 | $15,437,578 |
| Net realized gain | 21,043,823 | 40,516,594 | 14,996,423 | 23,654,073 |
| Net change in unrealized appreciation (depreciation) | (1,874,899) | 32,742,921 | (17,878,885) | 10,450,897 |
| Net increase in net assets resulting from operations | 19,467,449 | 72,905,907 | 2,703,879 | 49,542,548 |
| Distributions to shareholders | | | | |
| Net investment income | | | | |
| Class A | — | — | (281,543) | (9,278,829) |
| Advisor Class | — | — | (17,921) | (559,209) |
| Class C | — | — | (263,369) | (5,769,999) |
| Institutional Class | — | — | (369,303) | (12,343,315) |
| Institutional 2 Class | — | — | (19,414) | (468,756) |
| Institutional 3 Class | — | — | (613) | (17,424) |
| Net realized gains | | | | |
| Class A | (8,172,215) | (13,531,635) | (2,852,358) | (3,927,704) |
| Advisor Class | (381,928) | (268,631) | (181,559) | (231,441) |
| Class C | (2,369,599) | (4,068,306) | (2,668,232) | (3,875,776) |
| Institutional Class | (11,183,196) | (17,384,449) | (3,740,545) | (4,913,074) |
| Institutional 2 Class | (139,019) | (135,711) | (196,684) | (192,959) |
| Institutional 3 Class | (1,194,290) | (2,568,205) | (6,205) | (7,159) |
| Total distributions to shareholders | (23,440,247) | (37,956,937) | (10,597,746) | (41,585,645) |
| Increase (decrease) in net assets from capital stock activity | 1,991,539 | (34,460,018) | (101,722,388) | (256,152,474) |
| Total increase (decrease) in net assets | (1,981,259) | 488,952 | (109,616,255) | (248,195,571) |
| Net assets at beginning of period | 308,877,936 | 308,388,984 | 859,231,046 | 1,107,426,617 |
| Net assets at end of period | $306,896,677 | $308,877,936 | $749,614,791 | $859,231,046 |
| Undistributed (excess of distributions over) net investment income | $67,326 | $(231,199) | $5,365,800 | $731,622 |
The accompanying Notes to Financial Statements are an integral part of this statement.
| 88 | Columbia Acorn Family of Funds | Semiannual Report 2018 |
Statement of Changes in Net Assets (continued)
| | Columbia Acorn
Emerging Markets FundSM | Columbia Acorn
European FundSM |
| | Six Months Ended
June 30, 2018
(Unaudited) | Year Ended
December 31, 2017 | Six Months Ended
June 30, 2018
(Unaudited) | Year Ended
December 31, 2017 (a) |
| Operations | | | | |
| Net investment income (loss) | $304,812 | $(23,854) | $976,233 | $318,469 |
| Net realized gain | 6,883,556 | 4,959,333 | 1,302,997 | 2,113,437 |
| Net change in unrealized appreciation (depreciation) | (12,201,554) | 26,081,316 | (2,052,312) | 17,443,548 |
| Net increase (decrease) in net assets resulting from operations | (5,013,186) | 31,016,795 | 226,918 | 19,875,454 |
| Distributions to shareholders | | | | |
| Net investment income | | | | |
| Class A | — | — | (219,414) | (276,319) |
| Advisor Class | — | — | (17,370) | (26,878) |
| Class C | — | — | (95,170) | (21,994) |
| Institutional Class | — | — | (336,429) | (555,415) |
| Institutional 2 Class | — | — | (31,742) | (51,520) |
| Institutional 3 Class | — | — | (20) | (2,414) |
| Total distributions to shareholders | — | — | (700,145) | (934,540) |
| Increase (decrease) in net assets from capital stock activity | (12,874,741) | (30,554,959) | 10,512,152 | 37,264,196 |
| Total increase (decrease) in net assets | (17,887,927) | 461,836 | 10,038,925 | 56,205,110 |
| Net assets at beginning of period | 106,222,235 | 105,760,399 | 102,557,423 | 46,352,313 |
| Net assets at end of period | $88,334,308 | $106,222,235 | $112,596,348 | $102,557,423 |
| Undistributed (excess of distributions over) net investment income | $(267,833) | $(572,645) | $73,445 | $(202,643) |
| (a) | Institutional 3 Class shares are based on operations from March 1, 2017 (commencement of operations) through the stated period end. |
The accompanying Notes to Financial Statements are an integral part of this statement.
Columbia Acorn Family of Funds | Semiannual Report 2018
| 89 |
Statement of Changes in Net Assets (continued)
| | Columbia
Acorn® Fund | Columbia Acorn
International® |
| | Six Months Ended | Year Ended | Six Months Ended | Year Ended |
| | June 30, 2018 (Unaudited) | December 31, 2017 | June 30, 2018 (Unaudited) | December 31, 2017 |
| | Shares | Dollars ($) | Shares | Dollars ($) | Shares | Dollars ($) | Shares | Dollars ($) |
| Capital stock activity |
| Class A | | | | | | | | |
| Subscriptions | 2,473,481 | 34,144,492 | 5,214,954 | 73,286,260 | 428,957 | 20,377,529 | 1,610,233 | 69,246,137 |
| Distributions reinvested | 2,504,584 | 35,339,675 | 13,895,471 | 179,901,741 | 299,787 | 14,036,038 | 650,590 | 29,823,976 |
| Redemptions | (6,889,440) | (93,523,081) | (24,594,980) | (349,452,663) | (1,496,933) | (70,913,815) | (7,526,663) | (320,009,215) |
| Net decrease | (1,911,375) | (24,038,914) | (5,484,555) | (96,264,662) | (768,189) | (36,500,248) | (5,265,840) | (220,939,102) |
| Advisor Class | | | | | | | | |
| Subscriptions | 891,009 | 14,928,324 | 1,188,440 | 20,475,315 | 229,098 | 10,984,063 | 507,657 | 22,001,991 |
| Distributions reinvested | 96,676 | 1,709,227 | 404,423 | 6,463,098 | 60,129 | 2,846,525 | 149,964 | 6,941,523 |
| Redemptions | (466,054) | (8,006,298) | (1,298,639) | (22,111,783) | (696,828) | (33,381,820) | (1,218,557) | (52,979,195) |
| Net increase (decrease) | 521,631 | 8,631,253 | 294,224 | 4,826,630 | (407,601) | (19,551,232) | (560,936) | (24,035,681) |
| Class B | | | | | | | | |
| Distributions reinvested | — | — | — | — | — | — | 48 | 2,052 |
| Redemptions | — | — | — | — | — | — | (13,438) | (556,263) |
| Net decrease | — | — | — | — | — | — | (13,390) | (554,211) |
| Class C | | | | | | | | |
| Subscriptions | 684,050 | 4,715,351 | 1,151,804 | 9,081,597 | 44,646 | 2,029,375 | 90,241 | 3,793,139 |
| Distributions reinvested | 2,550,866 | 17,728,517 | 14,018,509 | 94,772,247 | 47,150 | 2,105,242 | 83,543 | 3,674,876 |
| Redemptions | (6,301,699) | (43,490,923) | (13,966,397) | (120,313,372) | (220,827) | (9,969,923) | (526,608) | (21,906,351) |
| Net increase (decrease) | (3,066,783) | (21,047,055) | 1,203,916 | (16,459,528) | (129,031) | (5,835,306) | (352,824) | (14,438,336) |
| Class I | | | | | | | | |
| Redemptions | — | — | (704,360) | (11,413,339) | — | — | (587,108) | (24,144,151) |
| Net decrease | — | — | (704,360) | (11,413,339) | — | — | (587,108) | (24,144,151) |
| Institutional Class | | | | | | | | |
| Subscriptions | 3,537,290 | 57,558,006 | 11,660,704 | 189,841,275 | 1,387,120 | 66,179,017 | 7,013,514 | 296,426,276 |
| Distributions reinvested | 7,826,930 | 132,278,156 | 41,736,204 | 640,071,038 | 1,531,166 | 71,873,009 | 3,676,468 | 168,682,272 |
| Redemptions | (17,450,140) | (283,879,793) | (55,995,598) | (919,152,154) | (10,183,774) | (485,430,861) | (32,696,730) | (1,462,774,955) |
| Net decrease | (6,085,920) | (94,043,631) | (2,598,690) | (89,239,841) | (7,265,488) | (347,378,835) | (22,006,748) | (997,666,407) |
| Institutional 2 Class | | | | | | | | |
| Subscriptions | 481,596 | 8,251,367 | 1,892,132 | 34,420,349 | 1,100,440 | 52,556,979 | 4,209,934 | 183,599,629 |
| Distributions reinvested | 134,386 | 2,396,110 | 809,341 | 13,002,370 | 172,585 | 8,097,665 | 525,236 | 24,092,915 |
| Redemptions | (2,069,733) | (35,810,125) | (1,361,035) | (23,541,410) | (3,127,347) | (150,356,713) | (3,251,747) | (145,206,557) |
| Net increase (decrease) | (1,453,751) | (25,162,648) | 1,340,438 | 23,881,309 | (1,854,322) | (89,702,069) | 1,483,423 | 62,485,987 |
| Institutional 3 Class | | | | | | | | |
| Subscriptions | 2,226,794 | 37,557,668 | 3,152,141 | 55,149,044 | 3,226,936 | 154,516,327 | 14,596,689 | 678,353,931 |
| Distributions reinvested | 142,378 | 2,561,382 | 669,887 | 11,007,435 | 270,497 | 12,810,747 | 964,050 | 44,705,035 |
| Redemptions | (1,582,769) | (27,755,374) | (5,871,346) | (102,670,389) | (10,368,645) | (499,598,247) | (6,419,328) | (294,475,318) |
| Net increase (decrease) | 786,403 | 12,363,676 | (2,049,318) | (36,513,910) | (6,871,212) | (332,271,173) | 9,141,411 | 428,583,648 |
| Class R | | | | | | | | |
| Subscriptions | — | — | — | — | 63,801 | 3,028,250 | 247,904 | 10,356,515 |
| Distributions reinvested | — | — | — | — | 9,054 | 423,450 | 17,022 | 780,530 |
| Redemptions | — | — | — | — | (70,826) | (3,367,308) | (103,693) | (4,534,926) |
| Net increase | — | — | — | — | 2,029 | 84,392 | 161,233 | 6,602,119 |
| Total net decrease | (11,209,795) | (143,297,319) | (7,998,345) | (221,183,341) | (17,293,814) | (831,154,471) | (18,000,779) | (784,106,134) |
The accompanying Notes to Financial Statements are an integral part of this statement.
| 90 | Columbia Acorn Family of Funds | Semiannual Report 2018 |
Statement of Changes in Net Assets (continued)
| | Columbia
Acorn USA® | Columbia Acorn
International SelectSM |
| | Six Months Ended | Year Ended | Six Months Ended | Year Ended |
| | June 30, 2018 (Unaudited) | December 31, 2017 | June 30, 2018 (Unaudited) | December 31, 2017 |
| | Shares | Dollars ($) | Shares | Dollars ($) | Shares | Dollars ($) | Shares | Dollars ($) |
| Capital stock activity |
| Class A | | | | | | | | |
| Subscriptions | 190,151 | 2,581,500 | 488,025 | 7,442,932 | 147,938 | 4,368,090 | 433,475 | 11,022,848 |
| Distributions reinvested | 109,999 | 1,565,282 | 1,137,099 | 14,397,674 | — | — | 318 | 9,147 |
| Redemptions | (492,626) | (6,539,973) | (3,181,282) | (49,739,118) | (117,915) | (3,435,196) | (466,338) | (11,345,132) |
| Net increase (decrease) | (192,476) | (2,393,191) | (1,556,158) | (27,898,512) | 30,023 | 932,894 | (32,545) | (313,137) |
| Advisor Class | | | | | | | | |
| Subscriptions | 120,618 | 2,096,703 | 591,993 | 11,469,434 | 4,888 | 147,605 | 22,202 | 594,789 |
| Distributions reinvested | 27,439 | 506,255 | 255,091 | 4,118,796 | — | — | 156 | 4,554 |
| Redemptions | (108,730) | (1,835,900) | (174,410) | (3,344,051) | (33,241) | (1,004,847) | (11,360) | (303,363) |
| Net increase (decrease) | 39,327 | 767,058 | 672,674 | 12,244,179 | (28,353) | (857,242) | 10,998 | 295,980 |
| Class C | | | | | | | | |
| Subscriptions | 42,634 | 298,861 | 99,275 | 974,077 | 23,799 | 663,360 | 27,511 | 676,101 |
| Distributions reinvested | 73,371 | 535,611 | 703,494 | 4,761,201 | — | — | — | — |
| Redemptions | (206,675) | (1,453,592) | (510,499) | (5,076,159) | (26,240) | (726,165) | (57,659) | (1,371,955) |
| Net increase (decrease) | (90,670) | (619,120) | 292,270 | 659,119 | (2,441) | (62,805) | (30,148) | (695,854) |
| Class I | | | | | | | | |
| Redemptions | — | — | (70) | (1,266) | — | — | (92) | (2,211) |
| Net decrease | — | — | (70) | (1,266) | — | — | (92) | (2,211) |
| Institutional Class | | | | | | | | |
| Subscriptions | 453,468 | 7,551,957 | 1,272,209 | 22,899,278 | 116,816 | 3,495,425 | 632,322 | 15,614,831 |
| Distributions reinvested | 329,326 | 5,733,556 | 3,701,495 | 58,121,333 | — | — | 5,869 | 170,675 |
| Redemptions | (1,150,376) | (18,567,552) | (21,166,533) | (389,628,621) | (643,118) | (19,128,066) | (992,393) | (25,627,432) |
| Net decrease | (367,582) | (5,282,039) | (16,192,829) | (308,608,010) | (526,302) | (15,632,641) | (354,202) | (9,841,926) |
| Institutional 2 Class | | | | | | | | |
| Subscriptions | 13,033 | 235,480 | 494,678 | 10,218,003 | 17,051 | 509,501 | 6,125 | 155,951 |
| Distributions reinvested | 17,961 | 333,890 | 194,941 | 3,183,608 | — | — | 65 | 1,913 |
| Redemptions | (452,742) | (8,459,675) | (828,227) | (15,512,332) | (2,052) | (61,867) | (5,576) | (139,156) |
| Net increase (decrease) | (421,748) | (7,890,305) | (138,608) | (2,110,721) | 14,999 | 447,634 | 614 | 18,708 |
| Institutional 3 Class | | | | | | | | |
| Subscriptions | 341,961 | 6,014,035 | 540,484 | 10,276,457 | 53,177 | 1,600,589 | 268,318 | 7,467,361 |
| Distributions reinvested | 86,114 | 1,615,497 | 694,408 | 11,402,230 | — | — | 914 | 26,725 |
| Redemptions | (279,518) | (4,907,980) | (340,563) | (6,628,481) | (24,738) | (744,229) | (21,261) | (553,405) |
| Net increase | 148,557 | 2,721,552 | 894,329 | 15,050,206 | 28,439 | 856,360 | 247,971 | 6,940,681 |
| Total net decrease | (884,592) | (12,696,045) | (16,028,392) | (310,665,005) | (483,635) | (14,315,800) | (157,404) | (3,597,759) |
The accompanying Notes to Financial Statements are an integral part of this statement.
Columbia Acorn Family of Funds | Semiannual Report 2018
| 91 |
Statement of Changes in Net Assets (continued)
| | Columbia
Acorn SelectSM | Columbia
Thermostat FundSM |
| | Six Months Ended | Year Ended | Six Months Ended | Year Ended |
| | June 30, 2018 (Unaudited) | December 31, 2017 | June 30, 2018 (Unaudited) | December 31, 2017 |
| | Shares | Dollars ($) | Shares | Dollars ($) | Shares | Dollars ($) | Shares | Dollars ($) |
| Capital stock activity |
| Class A | | | | | | | | |
| Subscriptions | 328,954 | 4,899,025 | 831,684 | 11,552,003 | 551,921 | 8,040,248 | 1,609,689 | 23,841,063 |
| Distributions reinvested | 480,856 | 7,183,998 | 859,784 | 11,678,407 | 203,298 | 2,951,887 | 840,860 | 12,338,875 |
| Redemptions | (726,382) | (10,719,638) | (3,504,699) | (48,437,824) | (2,901,754) | (42,306,099) | (12,154,415) | (179,914,818) |
| Net increase (decrease) | 83,428 | 1,363,385 | (1,813,231) | (25,207,414) | (2,146,535) | (31,313,964) | (9,703,866) | (143,734,880) |
| Advisor Class | | | | | | | | |
| Subscriptions | 54,534 | 947,948 | 297,546 | 4,898,165 | 102,547 | 1,481,257 | 565,162 | 8,354,290 |
| Distributions reinvested | 21,493 | 381,928 | 16,388 | 268,631 | 13,850 | 199,441 | 54,380 | 790,505 |
| Redemptions | (71,752) | (1,248,306) | (45,047) | (730,797) | (260,873) | (3,771,932) | (582,985) | (8,576,681) |
| Net increase (decrease) | 4,275 | 81,570 | 268,887 | 4,435,999 | (144,476) | (2,091,234) | 36,557 | 568,114 |
| Class C | | | | | | | | |
| Subscriptions | 21,566 | 207,931 | 86,931 | 825,976 | 282,972 | 4,146,396 | 1,107,876 | 16,440,929 |
| Distributions reinvested | 241,896 | 2,288,336 | 428,882 | 3,895,445 | 167,551 | 2,441,219 | 536,248 | 7,916,684 |
| Redemptions | (406,308) | (3,885,401) | (1,148,372) | (11,025,586) | (3,299,845) | (48,358,753) | (7,807,143) | (116,029,441) |
| Net decrease | (142,846) | (1,389,134) | (632,559) | (6,304,165) | (2,849,322) | (41,771,138) | (6,163,019) | (91,671,828) |
| Class I | | | | | | | | |
| Redemptions | — | — | (738,244) | (11,402,065) | — | — | — | — |
| Net decrease | — | — | (738,244) | (11,402,065) | — | — | — | — |
| Institutional Class | | | | | | | | |
| Subscriptions | 226,577 | 3,802,714 | 1,381,191 | 21,252,498 | 1,994,905 | 28,686,020 | 8,573,428 | 125,070,056 |
| Distributions reinvested | 613,385 | 10,464,345 | 1,040,184 | 15,939,038 | 203,861 | 2,919,298 | 844,055 | 12,217,159 |
| Redemptions | (856,729) | (14,398,152) | (2,758,485) | (43,032,113) | (4,198,974) | (60,399,722) | (10,927,093) | (160,162,349) |
| Net decrease | (16,767) | (131,093) | (337,110) | (5,840,577) | (2,000,208) | (28,794,404) | (1,509,610) | (22,875,134) |
| Institutional 2 Class | | | | | | | | |
| Subscriptions | 27,342 | 475,841 | 61,419 | 987,353 | 291,979 | 4,227,897 | 385,136 | 5,673,263 |
| Distributions reinvested | 7,773 | 138,903 | 8,423 | 135,545 | 14,986 | 216,098 | 45,470 | 661,715 |
| Redemptions | (14,360) | (250,211) | (37,575) | (614,799) | (147,770) | (2,139,265) | (333,143) | (4,893,764) |
| Net increase | 20,755 | 364,533 | 32,267 | 508,099 | 159,195 | 2,304,730 | 97,463 | 1,441,214 |
| Institutional 3 Class | | | | | | | | |
| Subscriptions | 959,459 | 16,600,425 | 1,808,898 | 29,600,372 | 1,203 | 17,379 | 36,425 | 537,605 |
| Distributions reinvested | 66,196 | 1,194,173 | 161,019 | 2,568,039 | 471 | 6,781 | 1,683 | 24,446 |
| Redemptions | (873,995) | (16,092,320) | (1,396,136) | (22,818,306) | (5,571) | (80,538) | (29,767) | (442,011) |
| Net increase (decrease) | 151,660 | 1,702,278 | 573,781 | 9,350,105 | (3,897) | (56,378) | 8,341 | 120,040 |
| Total net increase (decrease) | 100,505 | 1,991,539 | (2,646,209) | (34,460,018) | (6,985,243) | (101,722,388) | (17,234,134) | (256,152,474) |
The accompanying Notes to Financial Statements are an integral part of this statement.
| 92 | Columbia Acorn Family of Funds | Semiannual Report 2018 |
Statement of Changes in Net Assets (continued)
| | Columbia Acorn
Emerging Markets FundSM | Columbia Acorn
European FundSM |
| | Six Months Ended | Year Ended | Six Months Ended | Year Ended |
| | June 30, 2018 (Unaudited) | December 31, 2017 | June 30, 2018 (Unaudited) | December 31, 2017 (a) |
| | Shares | Dollars ($) | Shares | Dollars ($) | Shares | Dollars ($) | Shares | Dollars ($) |
| Capital stock activity |
| Class A | | | | | | | | |
| Subscriptions | 186,773 | 2,507,757 | 441,162 | 5,127,794 | 530,172 | 10,519,924 | 1,140,391 | 20,187,059 |
| Distributions reinvested | — | — | — | — | 10,793 | 219,313 | 14,776 | 276,319 |
| Redemptions | (421,434) | (5,659,354) | (2,868,148) | (31,102,071) | (388,165) | (7,643,584) | (1,330,219) | (21,179,443) |
| Net increase (decrease) | (234,661) | (3,151,597) | (2,426,986) | (25,974,277) | 152,800 | 3,095,653 | (175,052) | (716,065) |
| Advisor Class | | | | | | | | |
| Subscriptions | 9,323 | 127,673 | 47,248 | 568,561 | 160,438 | 3,176,212 | 126,977 | 2,378,990 |
| Distributions reinvested | — | — | — | — | 849 | 17,351 | 1,412 | 26,840 |
| Redemptions | (21,184) | (289,426) | (78,974) | (905,107) | (166,370) | (3,335,733) | (1,986) | (33,180) |
| Net increase (decrease) | (11,861) | (161,753) | (31,726) | (336,546) | (5,083) | (142,170) | 126,403 | 2,372,650 |
| Class C | | | | | | | | |
| Subscriptions | 35,023 | 462,458 | 86,043 | 990,408 | 162,523 | 3,193,335 | 337,990 | 5,828,257 |
| Distributions reinvested | — | — | — | — | 4,735 | 95,138 | 1,230 | 21,994 |
| Redemptions | (139,868) | (1,839,688) | (483,515) | (5,492,520) | (94,207) | (1,856,939) | (117,103) | (1,947,925) |
| Net increase (decrease) | (104,845) | (1,377,230) | (397,472) | (4,502,112) | 73,051 | 1,431,534 | 222,117 | 3,902,326 |
| Class I | | | | | | | | |
| Redemptions | — | — | (205) | (2,252) | — | — | (173) | (2,700) |
| Net decrease | — | — | (205) | (2,252) | — | — | (173) | (2,700) |
| Institutional Class | | | | | | | | |
| Subscriptions | 172,605 | 2,353,262 | 2,164,060 | 23,600,425 | 825,009 | 16,369,846 | 2,162,206 | 36,835,519 |
| Distributions reinvested | — | — | — | — | 16,480 | 335,198 | 29,529 | 554,395 |
| Redemptions | (768,040) | (10,345,447) | (2,100,848) | (24,137,744) | (593,733) | (11,632,543) | (454,340) | (7,965,911) |
| Net increase (decrease) | (595,435) | (7,992,185) | 63,212 | (537,319) | 247,756 | 5,072,501 | 1,737,395 | 29,424,003 |
| Institutional 2 Class | | | | | | | | |
| Subscriptions | 4,448 | 60,818 | 34,601 | 400,968 | 132,200 | 2,679,765 | 283,318 | 5,035,710 |
| Distributions reinvested | — | — | — | — | 1,543 | 31,723 | 2,733 | 51,481 |
| Redemptions | (22,381) | (296,701) | (38,991) | (455,733) | (71,217) | (1,441,414) | (169,753) | (2,999,705) |
| Net increase (decrease) | (17,933) | (235,883) | (4,390) | (54,765) | 62,526 | 1,270,074 | 116,298 | 2,087,486 |
| Institutional 3 Class | | | | | | | | |
| Subscriptions | 11,793 | 158,477 | 72,757 | 905,959 | 39 | 764 | 11,313 | 202,597 |
| Distributions reinvested | — | — | — | — | — | — | 126 | 2,367 |
| Redemptions | (8,629) | (114,570) | (4,221) | (53,647) | (10,843) | (216,204) | (469) | (8,468) |
| Net increase (decrease) | 3,164 | 43,907 | 68,536 | 852,312 | (10,804) | (215,440) | 10,970 | 196,496 |
| Total net increase (decrease) | (961,571) | (12,874,741) | (2,729,031) | (30,554,959) | 520,246 | 10,512,152 | 2,037,958 | 37,264,196 |
| (a) | Institutional 3 Class shares are based on operations from March 1, 2017 (commencement of operations) through the stated period end. |
The accompanying Notes to Financial Statements are an integral part of this statement.
Columbia Acorn Family of Funds | Semiannual Report 2018
| 93 |
Financial Highlights
Columbia Acorn® Fund
The following tables are intended to help you understand the Fund’s financial performance. Certain information reflects financial results for a single share of a class held for the periods shown. Per share net investment income (loss) amounts are calculated based on average shares outstanding during the period. Total return assumes reinvestment of all dividends and distributions, if any. Total return does not reflect payment of sales charges, if any. Total return and portfolio turnover are not annualized for periods of less than one year. The portfolio turnover rate is calculated without regard to purchase and sales transactions of short-term instruments and certain derivatives, if any. If such transactions were included, the Fund’s portfolio turnover rate may be higher.
| | Net asset value,
beginning of
period | Net
investment
income
(loss) | Net
realized
and
unrealized
gain (loss) | Total from
investment
operations | Distributions
from net
investment
income | Distributions
from net
realized
gains | Total
distributions to
shareholders |
| Class A |
| Six Months Ended 6/30/2018 (Unaudited) | $12.92 | (0.00) (b) | 1.34 | 1.34 | — | (0.65) | (0.65) |
| Year Ended 12/31/2017 | $13.35 | (0.02) | 3.23 | 3.21 | — | (3.64) | (3.64) |
| Year Ended 12/31/2016 | $17.63 | (0.03) | 1.73 | 1.70 | — | (5.98) | (5.98) |
| Year Ended 12/31/2015 | $30.30 | (0.12) | (0.27) (g) | (0.39) | — | (12.28) | (12.28) |
| Year Ended 12/31/2014 | $35.78 | (0.08) | 0.21 | 0.13 | — | (5.61) | (5.61) |
| Year Ended 12/31/2013 | $29.36 | (0.06) | 8.84 | 8.78 | (0.04) | (2.32) | (2.36) |
| Advisor Class |
| Six Months Ended 6/30/2018 (Unaudited) | $16.06 | 0.02 | 1.67 | 1.69 | — | (0.69) | (0.69) |
| Year Ended 12/31/2017 | $15.83 | 0.02 | 3.85 | 3.87 | — | (3.64) | (3.64) |
| Year Ended 12/31/2016 | $19.84 | 0.00 | 1.97 | 1.97 | — | (5.98) | (5.98) |
| Year Ended 12/31/2015 | $32.51 | (0.07) | (0.32) (g) | (0.39) | — | (12.28) | (12.28) |
| Year Ended 12/31/2014 | $37.88 | 0.02 | 0.22 | 0.24 | — | (5.61) | (5.61) |
| Year Ended 12/31/2013 | $30.90 | 0.06 | 9.29 | 9.35 | (0.05) | (2.32) | (2.37) |
| Class C |
| Six Months Ended 6/30/2018 (Unaudited) | $6.58 | (0.03) | 0.70 | 0.67 | — | (0.55) | (0.55) |
| Year Ended 12/31/2017 | $8.34 | (0.08) | 1.96 | 1.88 | — | (3.64) | (3.64) |
| Year Ended 12/31/2016 | $13.16 | (0.11) | 1.27 | 1.16 | — | (5.98) | (5.98) |
| Year Ended 12/31/2015 | $25.92 | (0.27) | (0.21) (g) | (0.48) | — | (12.28) | (12.28) |
| Year Ended 12/31/2014 | $31.64 | (0.28) | 0.17 | (0.11) | — | (5.61) | (5.61) |
| Year Ended 12/31/2013 | $26.34 | (0.26) | 7.88 | 7.62 | — | (2.32) | (2.32) |
| Institutional Class |
| Six Months Ended 6/30/2018 (Unaudited) | $15.39 | 0.02 | 1.59 | 1.61 | — | (0.69) | (0.69) |
| Year Ended 12/31/2017 | $15.29 | 0.02 | 3.72 | 3.74 | — | (3.64) | (3.64) |
| Year Ended 12/31/2016 | $19.34 | 0.01 | 1.92 | 1.93 | — | (5.98) | (5.98) |
| Year Ended 12/31/2015 | $31.95 | (0.04) | (0.29) (g) | (0.33) | — | (12.28) | (12.28) |
| Year Ended 12/31/2014 | $37.32 | 0.02 | 0.22 | 0.24 | — | (5.61) | (5.61) |
| Year Ended 12/31/2013 | $30.45 | 0.04 | 9.19 | 9.23 | (0.04) | (2.32) | (2.36) |
| Institutional 2 Class |
| Six Months Ended 6/30/2018 (Unaudited) | $16.20 | 0.02 | 1.68 | 1.70 | — | (0.69) | (0.69) |
| Year Ended 12/31/2017 | $15.94 | 0.02 | 3.88 | 3.90 | — | (3.64) | (3.64) |
| Year Ended 12/31/2016 | $19.92 | 0.01 | 1.99 | 2.00 | — | (5.98) | (5.98) |
| Year Ended 12/31/2015 | $32.55 | (0.04) | (0.31) (g) | (0.35) | — | (12.28) | (12.28) |
| Year Ended 12/31/2014 | $37.89 | 0.04 | 0.23 | 0.27 | — | (5.61) | (5.61) |
| Year Ended 12/31/2013 | $30.88 | 0.07 | 9.30 | 9.37 | (0.04) | (2.32) | (2.36) |
The accompanying Notes to Financial Statements are an integral part of this statement.
| 94 | Columbia Acorn Family of Funds | Semiannual Report 2018 |
Financial Highlights (continued)
Columbia Acorn® Fund
| | Net
asset
value,
end of
period | Total
return | Total gross
expense
ratio to
average
net assets(a) | Total net
expense
ratio to
average
net assets(a) | Net investment
income (loss)
ratio to
average
net assets | Portfolio
turnover | Net
assets,
end of
period
(000’s) |
| Class A |
| Six Months Ended 6/30/2018 (Unaudited) | $13.61 | 10.21% (c) | 1.10% (d) | 1.08% (d),(e) | (0.06%) (d) | 27% | $848,905 |
| Year Ended 12/31/2017 | $12.92 | 24.91% | 1.09% | 1.08% (e) | (0.13%) | 72% | $830,454 |
| Year Ended 12/31/2016 | $13.35 | 10.06% | 1.10% (f) | 1.10% (f) | (0.21%) | 85% | $931,460 |
| Year Ended 12/31/2015 | $17.63 | (1.87%) | 1.08% | 1.08% | (0.39%) | 21% | $1,388,893 |
| Year Ended 12/31/2014 | $30.30 | 0.55% | 1.08% | 1.08% | (0.22%) | 17% | $2,694,610 |
| Year Ended 12/31/2013 | $35.78 | 30.53% | 1.07% | 1.07% | (0.17%) | 18% | $3,869,734 |
| Advisor Class |
| Six Months Ended 6/30/2018 (Unaudited) | $17.06 | 10.38% (c) | 0.85% (d) | 0.83% (d),(e) | 0.19% (d) | 27% | $49,883 |
| Year Ended 12/31/2017 | $16.06 | 25.19% | 0.84% | 0.83% (e) | 0.12% | 72% | $38,588 |
| Year Ended 12/31/2016 | $15.83 | 10.32% | 0.89% (f) | 0.89% (f) | 0.00% (b) | 85% | $33,378 |
| Year Ended 12/31/2015 | $19.84 | (1.75%) | 0.89% | 0.89% | (0.23%) | 21% | $50,335 |
| Year Ended 12/31/2014 | $32.51 | 0.81% | 0.84% | 0.84% | 0.05% | 17% | $250,457 |
| Year Ended 12/31/2013 | $37.88 | 30.85% | 0.80% | 0.80% | 0.16% | 18% | $74,188 |
| Class C |
| Six Months Ended 6/30/2018 (Unaudited) | $6.70 | 9.81% (c) | 1.85% (d) | 1.83% (d),(e) | (0.81%) (d) | 27% | $230,376 |
| Year Ended 12/31/2017 | $6.58 | 23.88% | 1.84% | 1.83% (e) | (0.88%) | 72% | $246,450 |
| Year Ended 12/31/2016 | $8.34 | 9.29% | 1.84% (f) | 1.84% (f) | (0.95%) | 85% | $302,119 |
| Year Ended 12/31/2015 | $13.16 | (2.57%) | 1.80% | 1.80% | (1.11%) | 21% | $456,348 |
| Year Ended 12/31/2014 | $25.92 | (0.16%) | 1.77% | 1.77% | (0.92%) | 17% | $776,370 |
| Year Ended 12/31/2013 | $31.64 | 29.58% | 1.78% | 1.78% | (0.88%) | 18% | $938,644 |
| Institutional Class |
| Six Months Ended 6/30/2018 (Unaudited) | $16.31 | 10.31% (c) | 0.85% (d) | 0.83% (d),(e) | 0.19% (d) | 27% | $3,513,311 |
| Year Ended 12/31/2017 | $15.39 | 25.24% | 0.84% | 0.83% (e) | 0.12% | 72% | $3,407,214 |
| Year Ended 12/31/2016 | $15.29 | 10.39% | 0.82% (f) | 0.82% (f) | 0.07% | 85% | $3,425,935 |
| Year Ended 12/31/2015 | $19.34 | (1.57%) | 0.80% | 0.80% | (0.11%) | 21% | $5,062,313 |
| Year Ended 12/31/2014 | $31.95 | 0.82% | 0.79% | 0.79% | 0.07% | 17% | $11,340,770 |
| Year Ended 12/31/2013 | $37.32 | 30.90% | 0.78% | 0.78% | 0.12% | 18% | $14,703,948 |
| Institutional 2 Class |
| Six Months Ended 6/30/2018 (Unaudited) | $17.21 | 10.37% (c) | 0.81% (d) | 0.81% (d) | 0.20% (d) | 27% | $47,151 |
| Year Ended 12/31/2017 | $16.20 | 25.21% | 0.82% | 0.81% | 0.14% | 72% | $67,932 |
| Year Ended 12/31/2016 | $15.94 | 10.43% | 0.81% (f) | 0.81% (f) | 0.08% | 85% | $45,475 |
| Year Ended 12/31/2015 | $19.92 | (1.60%) | 0.77% | 0.77% | (0.11%) | 21% | $76,412 |
| Year Ended 12/31/2014 | $32.55 | 0.89% | 0.76% | 0.76% | 0.10% | 17% | $458,223 |
| Year Ended 12/31/2013 | $37.89 | 30.94% | 0.75% | 0.75% | 0.20% | 18% | $496,906 |
The accompanying Notes to Financial Statements are an integral part of this statement.
Columbia Acorn Family of Funds | Semiannual Report 2018
| 95 |
Financial Highlights (continued)
Columbia Acorn® Fund
| | Net asset value,
beginning of
period | Net
investment
income
(loss) | Net
realized
and
unrealized
gain (loss) | Total from
investment
operations | Distributions
from net
investment
income | Distributions
from net
realized
gains | Total
distributions to
shareholders |
| Institutional 3 Class |
| Six Months Ended 6/30/2018 (Unaudited) | $16.34 | 0.02 | 1.70 | 1.72 | — | (0.70) | (0.70) |
| Year Ended 12/31/2017 | $16.04 | 0.03 | 3.91 | 3.94 | — | (3.64) | (3.64) |
| Year Ended 12/31/2016 | $20.00 | 0.02 | 2.00 | 2.02 | — | (5.98) | (5.98) |
| Year Ended 12/31/2015 | $32.61 | (0.02) | (0.31) (g) | (0.33) | — | (12.28) | (12.28) |
| Year Ended 12/31/2014 | $37.93 | 0.05 | 0.24 | 0.29 | — | (5.61) | (5.61) |
| Year Ended 12/31/2013 | $30.90 | 0.09 | 9.31 | 9.40 | (0.05) | (2.32) | (2.37) |
| Notes to Financial Highlights |
| (a) | In addition to the fees and expenses that the Fund bears directly, the Fund indirectly bears a pro rata share of the fees and expenses of any other funds in which it invests. Such indirect expenses are not included in the Fund’s reported expense ratios. |
| (b) | Rounds to zero. |
| (c) | Had the Investment Manager and/or Transfer Agent not waived fees and/or reimbursed a portion of expenses, total return would have been reduced. |
| (d) | Annualized. |
| (e) | The benefits derived from expense reductions had an impact of less than 0.01%. |
| (f) | Ratios include line of credit interest expense which is less than 0.01%. |
| (g) | Calculation of the net gain (loss) per share (both realized and unrealized) does not correlate to the aggregate realized and unrealized gain (loss) presented in the Statements of Operations due to the timing of subscriptions and redemptions of Fund shares in relation to fluctuations in the market value of the portfolio. |
The accompanying Notes to Financial Statements are an integral part of this statement.
| 96 | Columbia Acorn Family of Funds | Semiannual Report 2018 |
Financial Highlights (continued)
Columbia Acorn® Fund
| | Net
asset
value,
end of
period | Total
return | Total gross
expense
ratio to
average
net assets(a) | Total net
expense
ratio to
average
net assets(a) | Net investment
income (loss)
ratio to
average
net assets | Portfolio
turnover | Net
assets,
end of
period
(000’s) |
| Institutional 3 Class |
| Six Months Ended 6/30/2018 (Unaudited) | $17.36 | 10.38% (c) | 0.76% (d) | 0.76% (d) | 0.27% (d) | 27% | $64,169 |
| Year Ended 12/31/2017 | $16.34 | 25.31% | 0.76% | 0.76% | 0.19% | 72% | $47,536 |
| Year Ended 12/31/2016 | $16.04 | 10.50% | 0.76% (f) | 0.76% (f) | 0.12% | 85% | $79,518 |
| Year Ended 12/31/2015 | $20.00 | (1.54%) | 0.73% | 0.73% | (0.06%) | 21% | $130,546 |
| Year Ended 12/31/2014 | $32.61 | 0.94% | 0.70% | 0.70% | 0.13% | 17% | $378,780 |
| Year Ended 12/31/2013 | $37.93 | 30.99% | 0.70% | 0.70% | 0.26% | 18% | $1,227,891 |
The accompanying Notes to Financial Statements are an integral part of this statement.
Columbia Acorn Family of Funds | Semiannual Report 2018
| 97 |
Financial Highlights
Columbia Acorn International®
| | Net asset value,
beginning of
period | Net
investment
income
(loss) | Net
realized
and
unrealized
gain (loss) | Total from
investment
operations | Distributions
from net
investment
income | Distributions
from net
realized
gains | Total
distributions to
shareholders |
| Class A |
| Six Months Ended 6/30/2018 (Unaudited) | $46.51 | 0.24 | (0.20) (b) | 0.04 | (0.24) | (1.38) | (1.62) |
| Year Ended 12/31/2017 | $37.71 | 0.25 | 11.71 | 11.96 | (0.67) | (2.49) | (3.16) |
| Year Ended 12/31/2016 | $39.08 | 0.35 | (1.31) | (0.96) | (0.15) | (0.26) | (0.41) |
| Year Ended 12/31/2015 | $41.68 | 0.39 | (1.02) | (0.63) | (0.40) | (1.57) | (1.97) |
| Year Ended 12/31/2014 | $46.63 | 0.42 | (2.51) | (2.09) | (0.55) | (2.31) | (2.86) |
| Year Ended 12/31/2013 | $40.79 | 0.45 | 8.37 | 8.82 | (1.05) | (1.93) | (2.98) |
| Advisor Class |
| Six Months Ended 6/30/2018 (Unaudited) | $46.95 | 0.30 | (0.20) (b) | 0.10 | (0.24) | (1.38) | (1.62) |
| Year Ended 12/31/2017 | $38.03 | 0.36 | 11.82 | 12.18 | (0.77) | (2.49) | (3.26) |
| Year Ended 12/31/2016 | $39.41 | 0.48 | (1.38) | (0.90) | (0.22) | (0.26) | (0.48) |
| Year Ended 12/31/2015 | $42.02 | 0.47 | (1.03) | (0.56) | (0.48) | (1.57) | (2.05) |
| Year Ended 12/31/2014 | $46.99 | 0.50 | (2.52) | (2.02) | (0.64) | (2.31) | (2.95) |
| Year Ended 12/31/2013 | $41.08 | 0.34 | 8.67 | 9.01 | (1.17) | (1.93) | (3.10) |
| Class C |
| Six Months Ended 6/30/2018 (Unaudited) | $44.57 | 0.06 | (0.18) (b) | (0.12) | (0.24) | (1.38) | (1.62) |
| Year Ended 12/31/2017 | $36.18 | (0.06) | 11.20 | 11.14 | (0.26) | (2.49) | (2.75) |
| Year Ended 12/31/2016 | $37.65 | 0.05 | (1.26) | (1.21) | — | (0.26) | (0.26) |
| Year Ended 12/31/2015 | $40.20 | 0.07 | (0.97) | (0.90) | (0.08) | (1.57) | (1.65) |
| Year Ended 12/31/2014 | $45.04 | 0.07 | (2.40) | (2.33) | (0.20) | (2.31) | (2.51) |
| Year Ended 12/31/2013 | $39.50 | 0.10 | 8.08 | 8.18 | (0.71) | (1.93) | (2.64) |
| Institutional Class |
| Six Months Ended 6/30/2018 (Unaudited) | $46.57 | 0.30 | (0.20) (b) | 0.10 | (0.24) | (1.38) | (1.62) |
| Year Ended 12/31/2017 | $37.74 | 0.37 | 11.73 | 12.10 | (0.78) | (2.49) | (3.27) |
| Year Ended 12/31/2016 | $39.12 | 0.44 | (1.32) | (0.88) | (0.24) | (0.26) | (0.50) |
| Year Ended 12/31/2015 | $41.73 | 0.51 | (1.03) | (0.52) | (0.52) | (1.57) | (2.09) |
| Year Ended 12/31/2014 | $46.68 | 0.56 | (2.51) | (1.95) | (0.69) | (2.31) | (3.00) |
| Year Ended 12/31/2013 | $40.84 | 0.58 | 8.38 | 8.96 | (1.19) | (1.93) | (3.12) |
| Institutional 2 Class |
| Six Months Ended 6/30/2018 (Unaudited) | $46.54 | 0.30 | (0.18) (b) | 0.12 | (0.24) | (1.38) | (1.62) |
| Year Ended 12/31/2017 | $37.72 | 0.38 | 11.72 | 12.10 | (0.79) | (2.49) | (3.28) |
| Year Ended 12/31/2016 | $39.10 | 0.44 | (1.30) | (0.86) | (0.26) | (0.26) | (0.52) |
| Year Ended 12/31/2015 | $41.71 | 0.54 | (1.05) | (0.51) | (0.53) | (1.57) | (2.10) |
| Year Ended 12/31/2014 | $46.66 | 0.57 | (2.51) | (1.94) | (0.70) | (2.31) | (3.01) |
| Year Ended 12/31/2013 | $40.81 | 0.63 | 8.34 | 8.97 | (1.19) | (1.93) | (3.12) |
| Institutional 3 Class |
| Six Months Ended 6/30/2018 (Unaudited) | $46.95 | 0.34 | (0.21) (b) | 0.13 | (0.24) | (1.38) | (1.62) |
| Year Ended 12/31/2017 | $38.02 | 0.40 | 11.83 | 12.23 | (0.81) | (2.49) | (3.30) |
| Year Ended 12/31/2016 | $39.41 | 0.47 | (1.32) | (0.85) | (0.28) | (0.26) | (0.54) |
| Year Ended 12/31/2015 | $42.02 | 0.53 | (1.01) | (0.48) | (0.56) | (1.57) | (2.13) |
| Year Ended 12/31/2014 | $46.99 | 0.58 | (2.52) | (1.94) | (0.72) | (2.31) | (3.03) |
| Year Ended 12/31/2013 | $41.08 | 0.57 | 8.48 | 9.05 | (1.21) | (1.93) | (3.14) |
The accompanying Notes to Financial Statements are an integral part of this statement.
| 98 | Columbia Acorn Family of Funds | Semiannual Report 2018 |
Financial Highlights (continued)
Columbia Acorn International®
| | Net
asset
value,
end of
period | Total
return | Total gross
expense
ratio to
average
net assets(a) | Total net
expense
ratio to
average
net assets(a) | Net investment
income (loss)
ratio to
average
net assets | Portfolio
turnover | Net
assets,
end of
period
(000’s) |
| Class A |
| Six Months Ended 6/30/2018 (Unaudited) | $44.93 | (0.06%) (c) | 1.25% (d) | 1.24% (d),(e) | 1.00% (d) | 14% | $415,541 |
| Year Ended 12/31/2017 | $46.51 | 31.91% (c) | 1.23% | 1.20% (e) | 0.56% | 37% | $465,830 |
| Year Ended 12/31/2016 | $37.71 | (2.51%) (c) | 1.27% | 1.23% | 0.90% | 46% | $576,235 |
| Year Ended 12/31/2015 | $39.08 | (1.59%) (c) | 1.28% | 1.24% | 0.93% | 50% | $812,479 |
| Year Ended 12/31/2014 | $41.68 | (4.58%) (c) | 1.26% | 1.22% | 0.91% | 28% | $946,553 |
| Year Ended 12/31/2013 | $46.63 | 22.00% (c) | 1.27% | 1.23% | 1.02% | 45% | $1,089,263 |
| Advisor Class |
| Six Months Ended 6/30/2018 (Unaudited) | $45.43 | 0.07% (c) | 1.00% (d) | 0.99% (d),(e) | 1.26% (d) | 14% | $77,844 |
| Year Ended 12/31/2017 | $46.95 | 32.21% | 0.98% | 0.98% (e) | 0.81% | 37% | $99,578 |
| Year Ended 12/31/2016 | $38.03 | (2.32%) | 1.05% | 1.05% | 1.22% | 46% | $101,988 |
| Year Ended 12/31/2015 | $39.41 | (1.41%) | 1.06% | 1.06% | 1.10% | 50% | $486,763 |
| Year Ended 12/31/2014 | $42.02 | (4.39%) | 1.04% | 1.04% | 1.07% | 28% | $424,425 |
| Year Ended 12/31/2013 | $46.99 | 22.32% | 1.03% | 1.03% | 0.73% | 45% | $355,616 |
| Class C |
| Six Months Ended 6/30/2018 (Unaudited) | $42.83 | (0.42%) (c) | 2.00% (d) | 1.99% (d),(e) | 0.26% (d) | 14% | $55,771 |
| Year Ended 12/31/2017 | $44.57 | 30.93% (c) | 1.98% | 1.97% (e) | (0.15%) | 37% | $63,787 |
| Year Ended 12/31/2016 | $36.18 | (3.26%) (c) | 2.01% | 1.99% | 0.13% | 46% | $64,548 |
| Year Ended 12/31/2015 | $37.65 | (2.33%) (c) | 2.01% | 1.99% | 0.18% | 50% | $88,606 |
| Year Ended 12/31/2014 | $40.20 | (5.27%) (c) | 1.99% | 1.97% | 0.16% | 28% | $103,691 |
| Year Ended 12/31/2013 | $45.04 | 21.07% (c) | 2.01% | 1.99% | 0.23% | 45% | $110,875 |
| Institutional Class |
| Six Months Ended 6/30/2018 (Unaudited) | $45.05 | 0.07% (c) | 1.00% (d) | 0.99% (d),(e) | 1.24% (d) | 14% | $2,687,590 |
| Year Ended 12/31/2017 | $46.57 | 32.24% | 0.98% | 0.98% (e) | 0.85% | 37% | $3,116,383 |
| Year Ended 12/31/2016 | $37.74 | (2.28%) | 0.98% | 0.98% | 1.13% | 46% | $3,356,348 |
| Year Ended 12/31/2015 | $39.12 | (1.33%) | 0.97% | 0.97% | 1.21% | 50% | $4,645,797 |
| Year Ended 12/31/2014 | $41.73 | (4.28%) | 0.93% | 0.93% | 1.20% | 28% | $5,585,035 |
| Year Ended 12/31/2013 | $46.68 | 22.33% | 0.93% | 0.93% | 1.30% | 45% | $6,293,552 |
| Institutional 2 Class |
| Six Months Ended 6/30/2018 (Unaudited) | $45.04 | 0.11% (c) | 0.93% (d) | 0.93% (d) | 1.25% (d) | 14% | $325,738 |
| Year Ended 12/31/2017 | $46.54 | 32.27% | 0.93% | 0.93% | 0.87% | 37% | $422,916 |
| Year Ended 12/31/2016 | $37.72 | (2.23%) | 0.93% | 0.93% | 1.15% | 46% | $286,786 |
| Year Ended 12/31/2015 | $39.10 | (1.29%) | 0.92% | 0.92% | 1.26% | 50% | $320,252 |
| Year Ended 12/31/2014 | $41.71 | (4.25%) | 0.90% | 0.90% | 1.23% | 28% | $397,882 |
| Year Ended 12/31/2013 | $46.66 | 22.38% | 0.91% | 0.91% | 1.40% | 45% | $274,415 |
| Institutional 3 Class |
| Six Months Ended 6/30/2018 (Unaudited) | $45.46 | 0.13% (c) | 0.88% (d) | 0.87% (d) | 1.43% (d) | 14% | $389,854 |
| Year Ended 12/31/2017 | $46.95 | 32.36% | 0.88% | 0.88% | 0.89% | 37% | $725,247 |
| Year Ended 12/31/2016 | $38.02 | (2.19%) | 0.88% | 0.88% | 1.20% | 46% | $239,733 |
| Year Ended 12/31/2015 | $39.41 | (1.23%) | 0.88% | 0.88% | 1.26% | 50% | $318,326 |
| Year Ended 12/31/2014 | $42.02 | (4.21%) | 0.85% | 0.85% | 1.25% | 28% | $225,012 |
| Year Ended 12/31/2013 | $46.99 | 22.44% | 0.86% | 0.86% | 1.26% | 45% | $155,140 |
The accompanying Notes to Financial Statements are an integral part of this statement.
Columbia Acorn Family of Funds | Semiannual Report 2018
| 99 |
Financial Highlights (continued)
Columbia Acorn International®
| | Net asset value,
beginning of
period | Net
investment
income
(loss) | Net
realized
and
unrealized
gain (loss) | Total from
investment
operations | Distributions
from net
investment
income | Distributions
from net
realized
gains | Total
distributions to
shareholders |
| Class R |
| Six Months Ended 6/30/2018 (Unaudited) | $46.51 | 0.18 | (0.19) (b) | (0.01) | (0.24) | (1.38) | (1.62) |
| Year Ended 12/31/2017 | $37.71 | 0.21 | 11.63 | 11.84 | (0.55) | (2.49) | (3.04) |
| Year Ended 12/31/2016 | $39.07 | 0.21 | (1.30) | (1.09) | (0.01) | (0.26) | (0.27) |
| Year Ended 12/31/2015 | $41.67 | 0.23 | (1.02) | (0.79) | (0.24) | (1.57) | (1.81) |
| Year Ended 12/31/2014 | $46.60 | 0.24 | (2.50) | (2.26) | (0.36) | (2.31) | (2.67) |
| Year Ended 12/31/2013 | $40.79 | 0.26 | 8.36 | 8.62 | (0.88) | (1.93) | (2.81) |
| Notes to Financial Highlights |
| (a) | In addition to the fees and expenses that the Fund bears directly, the Fund indirectly bears a pro rata share of the fees and expenses of any other funds in which it invests, if any. Such indirect expenses are not included in the Fund’s reported expense ratios. |
| (b) | Calculation of the net gain (loss) per share (both realized and unrealized) does not correlate to the aggregate realized and unrealized gain (loss) presented in the Statements of Operations due to the timing of subscriptions and redemptions of Fund shares in relation to fluctuations in the market value of the portfolio. |
| (c) | Had the Investment Manager and/or Transfer Agent not waived fees and/or reimbursed a portion of expenses, total return would have been reduced. |
| (d) | Annualized. |
| (e) | The benefits derived from expense reductions had an impact of less than 0.01%. |
The accompanying Notes to Financial Statements are an integral part of this statement.
| 100 | Columbia Acorn Family of Funds | Semiannual Report 2018 |
Financial Highlights (continued)
Columbia Acorn International®
| | Net
asset
value,
end of
period | Total
return | Total gross
expense
ratio to
average
net assets(a) | Total net
expense
ratio to
average
net assets(a) | Net investment
income (loss)
ratio to
average
net assets | Portfolio
turnover | Net
assets,
end of
period
(000’s) |
| Class R |
| Six Months Ended 6/30/2018 (Unaudited) | $44.88 | (0.17%) (c) | 1.50% (d) | 1.49% (d),(e) | 0.77% (d) | 14% | $12,845 |
| Year Ended 12/31/2017 | $46.51 | 31.58% | 1.49% | 1.48% (e) | 0.46% | 37% | $13,218 |
| Year Ended 12/31/2016 | $37.71 | (2.82%) | 1.55% | 1.55% | 0.55% | 46% | $4,637 |
| Year Ended 12/31/2015 | $39.07 | (1.98%) | 1.62% | 1.62% | 0.54% | 50% | $4,945 |
| Year Ended 12/31/2014 | $41.67 | (4.95%) | 1.63% | 1.63% | 0.52% | 28% | $5,560 |
| Year Ended 12/31/2013 | $46.60 | 21.50% | 1.63% | 1.63% | 0.58% | 45% | $5,822 |
The accompanying Notes to Financial Statements are an integral part of this statement.
Columbia Acorn Family of Funds | Semiannual Report 2018
| 101 |
Financial Highlights
Columbia Acorn USA®
| | Net asset value,
beginning of
period | Net
investment
income
(loss) | Net
realized
and
unrealized
gain (loss) | Total from
investment
operations | Distributions
from net
realized
gains | Total
distributions to
shareholders |
| Class A |
| Six Months Ended 6/30/2018 (Unaudited) | $12.48 | (0.03) | 1.94 | 1.91 | (0.47) | (0.47) |
| Year Ended 12/31/2017 | $14.95 | (0.09) | 2.84 | 2.75 | (5.22) | (5.22) |
| Year Ended 12/31/2016 | $20.25 | (0.11) | 2.43 | 2.32 | (7.62) | (7.62) |
| Year Ended 12/31/2015 | $29.13 | (0.18) | (0.18) (e) | (0.36) | (8.52) | (8.52) |
| Year Ended 12/31/2014 | $34.15 | (0.20) | 1.22 | 1.02 | (6.04) | (6.04) |
| Year Ended 12/31/2013 | $28.21 | (0.15) | 9.09 | 8.94 | (3.00) | (3.00) |
| Advisor Class |
| Six Months Ended 6/30/2018 (Unaudited) | $16.08 | (0.02) | 2.51 | 2.49 | (0.51) | (0.51) |
| Year Ended 12/31/2017 | $17.93 | (0.06) | 3.43 | 3.37 | (5.22) | (5.22) |
| Year Ended 12/31/2016 | $22.85 | (0.07) | 2.77 | 2.70 | (7.62) | (7.62) |
| Year Ended 12/31/2015 | $31.70 | (0.13) | (0.20) (e) | (0.33) | (8.52) | (8.52) |
| Year Ended 12/31/2014 | $36.55 | (0.11) | 1.30 | 1.19 | (6.04) | (6.04) |
| Year Ended 12/31/2013 | $29.92 | 0.00 (f) | 9.63 | 9.63 | (3.00) | (3.00) |
| Class C |
| Six Months Ended 6/30/2018 (Unaudited) | $6.56 | (0.04) | 1.02 | 0.98 | (0.40) | (0.40) |
| Year Ended 12/31/2017 | $10.05 | (0.13) | 1.86 | 1.73 | (5.22) | (5.22) |
| Year Ended 12/31/2016 | $16.00 | (0.18) | 1.85 | 1.67 | (7.62) | (7.62) |
| Year Ended 12/31/2015 | $24.98 | (0.33) | (0.13) (e) | (0.46) | (8.52) | (8.52) |
| Year Ended 12/31/2014 | $30.33 | (0.37) | 1.06 | 0.69 | (6.04) | (6.04) |
| Year Ended 12/31/2013 | $25.49 | (0.33) | 8.17 | 7.84 | (3.00) | (3.00) |
| Institutional Class |
| Six Months Ended 6/30/2018 (Unaudited) | $15.21 | (0.02) | 2.37 | 2.35 | (0.52) | (0.52) |
| Year Ended 12/31/2017 | $17.20 | (0.05) | 3.28 | 3.23 | (5.22) | (5.22) |
| Year Ended 12/31/2016 | $22.19 | (0.07) | 2.70 | 2.63 | (7.62) | (7.62) |
| Year Ended 12/31/2015 | $31.03 | (0.12) | (0.20) (e) | (0.32) | (8.52) | (8.52) |
| Year Ended 12/31/2014 | $35.90 | (0.12) | 1.29 | 1.17 | (6.04) | (6.04) |
| Year Ended 12/31/2013 | $29.45 | (0.07) | 9.52 | 9.45 | (3.00) | (3.00) |
| Institutional 2 Class |
| Six Months Ended 6/30/2018 (Unaudited) | $16.21 | (0.01) | 2.52 | 2.51 | (0.53) | (0.53) |
| Year Ended 12/31/2017 | $18.02 | (0.03) | 3.44 | 3.41 | (5.22) | (5.22) |
| Year Ended 12/31/2016 | $22.90 | (0.06) | 2.80 | 2.74 | (7.62) | (7.62) |
| Year Ended 12/31/2015 | $31.71 | (0.10) | (0.19) (e) | (0.29) | (8.52) | (8.52) |
| Year Ended 12/31/2014 | $36.53 | (0.06) | 1.28 | 1.22 | (6.04) | (6.04) |
| Year Ended 12/31/2013 | $29.90 | 0.02 | 9.61 | 9.63 | (3.00) | (3.00) |
The accompanying Notes to Financial Statements are an integral part of this statement.
| 102 | Columbia Acorn Family of Funds | Semiannual Report 2018 |
Financial Highlights (continued)
Columbia Acorn USA®
| | Net
asset
value,
end of
period | Total
return | Total gross
expense
ratio to
average
net assets(a) | Total net
expense
ratio to
average
net assets(a) | Net investment
income (loss)
ratio to
average
net assets | Portfolio
turnover | Net
assets,
end of
period
(000’s) |
| Class A |
| Six Months Ended 6/30/2018 (Unaudited) | $13.92 | 15.24% (b) | 1.44% (c) | 1.43% (c),(d) | (0.45%) (c) | 35% | $50,823 |
| Year Ended 12/31/2017 | $12.48 | 19.14% (b) | 1.44% | 1.43% (d) | (0.55%) | 84% | $47,960 |
| Year Ended 12/31/2016 | $14.95 | 12.70% | 1.41% | 1.41% | (0.58%) | 98% | $80,721 |
| Year Ended 12/31/2015 | $20.25 | (1.60%) | 1.34% | 1.34% | (0.63%) | 35% | $95,048 |
| Year Ended 12/31/2014 | $29.13 | 3.35% | 1.33% | 1.33% | (0.60%) | 12% | $148,089 |
| Year Ended 12/31/2013 | $34.15 | 32.34% | 1.32% | 1.32% | (0.46%) | 17% | $201,559 |
| Advisor Class |
| Six Months Ended 6/30/2018 (Unaudited) | $18.06 | 15.43% (b) | 1.19% (c) | 1.18% (c),(d) | (0.20%) (c) | 35% | $19,073 |
| Year Ended 12/31/2017 | $16.08 | 19.42% (b) | 1.21% | 1.20% (d) | (0.31%) | 84% | $16,355 |
| Year Ended 12/31/2016 | $17.93 | 12.93% | 1.18% | 1.18% | (0.35%) | 98% | $6,172 |
| Year Ended 12/31/2015 | $22.85 | (1.36%) | 1.12% | 1.12% | (0.40%) | 35% | $8,224 |
| Year Ended 12/31/2014 | $31.70 | 3.60% | 1.07% | 1.07% | (0.32%) | 12% | $7,952 |
| Year Ended 12/31/2013 | $36.55 | 32.80% | 1.00% | 1.00% | 0.01% | 17% | $6,441 |
| Class C |
| Six Months Ended 6/30/2018 (Unaudited) | $7.14 | 14.78% (b) | 2.19% (c) | 2.18% (c),(d) | (1.21%) (c) | 35% | $10,026 |
| Year Ended 12/31/2017 | $6.56 | 18.30% (b) | 2.19% | 2.19% (d) | (1.31%) | 84% | $9,802 |
| Year Ended 12/31/2016 | $10.05 | 11.92% | 2.13% | 2.13% | (1.31%) | 98% | $12,088 |
| Year Ended 12/31/2015 | $16.00 | (2.28%) | 2.02% | 2.02% | (1.32%) | 35% | $17,255 |
| Year Ended 12/31/2014 | $24.98 | 2.67% | 2.00% | 2.00% | (1.26%) | 12% | $36,476 |
| Year Ended 12/31/2013 | $30.33 | 31.47% | 2.00% | 2.00% | (1.14%) | 17% | $40,395 |
| Institutional Class |
| Six Months Ended 6/30/2018 (Unaudited) | $17.04 | 15.37% (b) | 1.19% (c) | 1.18% (c),(d) | (0.20%) (c) | 35% | $205,984 |
| Year Ended 12/31/2017 | $15.21 | 19.44% (b) | 1.16% | 1.16% (d) | (0.27%) | 84% | $189,408 |
| Year Ended 12/31/2016 | $17.20 | 13.00% | 1.16% | 1.16% | (0.34%) | 98% | $492,739 |
| Year Ended 12/31/2015 | $22.19 | (1.36%) | 1.10% | 1.10% | (0.40%) | 35% | $768,658 |
| Year Ended 12/31/2014 | $31.03 | 3.61% | 1.08% | 1.08% | (0.34%) | 12% | $1,132,223 |
| Year Ended 12/31/2013 | $35.90 | 32.72% | 1.06% | 1.06% | (0.20%) | 17% | $1,496,775 |
| Institutional 2 Class |
| Six Months Ended 6/30/2018 (Unaudited) | $18.19 | 15.44% (b) | 1.11% (c) | 1.10% (c) | (0.14%) (c) | 35% | $3,701 |
| Year Ended 12/31/2017 | $16.21 | 19.56% (b) | 1.08% | 1.08% | (0.17%) | 84% | $10,133 |
| Year Ended 12/31/2016 | $18.02 | 13.09% | 1.07% | 1.07% | (0.27%) | 98% | $13,764 |
| Year Ended 12/31/2015 | $22.90 | (1.23%) | 1.01% | 1.01% | (0.30%) | 35% | $27,112 |
| Year Ended 12/31/2014 | $31.71 | 3.68% | 0.99% | 0.99% | (0.17%) | 12% | $36,689 |
| Year Ended 12/31/2013 | $36.53 | 32.83% | 0.97% | 0.97% | 0.06% | 17% | $6,068 |
The accompanying Notes to Financial Statements are an integral part of this statement.
Columbia Acorn Family of Funds | Semiannual Report 2018
| 103 |
Financial Highlights (continued)
Columbia Acorn USA®
| | Net asset value,
beginning of
period | Net
investment
income
(loss) | Net
realized
and
unrealized
gain (loss) | Total from
investment
operations | Distributions
from net
realized
gains | Total
distributions to
shareholders |
| Institutional 3 Class |
| Six Months Ended 6/30/2018 (Unaudited) | $16.36 | (0.01) | 2.55 | 2.54 | (0.54) | (0.54) |
| Year Ended 12/31/2017 | $18.14 | (0.03) | 3.47 | 3.44 | (5.22) | (5.22) |
| Year Ended 12/31/2016 | $22.99 | (0.04) | 2.81 | 2.77 | (7.62) | (7.62) |
| Year Ended 12/31/2015 | $31.80 | (0.08) | (0.21) (e) | (0.29) | (8.52) | (8.52) |
| Year Ended 12/31/2014 | $36.59 | (0.07) | 1.32 | 1.25 | (6.04) | (6.04) |
| Year Ended 12/31/2013 | $29.93 | 0.02 | 9.64 | 9.66 | (3.00) | (3.00) |
| Notes to Financial Highlights |
| (a) | In addition to the fees and expenses that the Fund bears directly, the Fund indirectly bears a pro rata share of the fees and expenses of any other funds in which it invests, if any. Such indirect expenses are not included in the Fund’s reported expense ratios. |
| (b) | Had the Investment Manager and/or Transfer Agent not waived fees and/or reimbursed a portion of expenses, total return would have been reduced. |
| (c) | Annualized. |
| (d) | The benefits derived from expense reductions had an impact of less than 0.01%. |
| (e) | Calculation of the net gain (loss) per share (both realized and unrealized) does not correlate to the aggregate realized and unrealized gain (loss) presented in the Statements of Operations due to the timing of subscriptions and redemptions of Fund shares in relation to fluctuations in the market value of the portfolio. |
| (f) | Rounds to zero. |
The accompanying Notes to Financial Statements are an integral part of this statement.
| 104 | Columbia Acorn Family of Funds | Semiannual Report 2018 |
Financial Highlights (continued)
Columbia Acorn USA®
| | Net
asset
value,
end of
period | Total
return | Total gross
expense
ratio to
average
net assets(a) | Total net
expense
ratio to
average
net assets(a) | Net investment
income (loss)
ratio to
average
net assets | Portfolio
turnover | Net
assets,
end of
period
(000’s) |
| Institutional 3 Class |
| Six Months Ended 6/30/2018 (Unaudited) | $18.36 | 15.45% (b) | 1.06% (c) | 1.05% (c) | (0.06%) (c) | 35% | $57,753 |
| Year Ended 12/31/2017 | $16.36 | 19.60% (b) | 1.05% | 1.05% | (0.17%) | 84% | $49,019 |
| Year Ended 12/31/2016 | $18.14 | 13.18% | 1.01% | 1.01% | (0.18%) | 98% | $38,136 |
| Year Ended 12/31/2015 | $22.99 | (1.23%) | 0.97% | 0.97% | (0.25%) | 35% | $41,658 |
| Year Ended 12/31/2014 | $31.80 | 3.76% | 0.93% | 0.93% | (0.19%) | 12% | $35,551 |
| Year Ended 12/31/2013 | $36.59 | 32.89% | 0.93% | 0.93% | 0.07% | 17% | $48,479 |
The accompanying Notes to Financial Statements are an integral part of this statement.
Columbia Acorn Family of Funds | Semiannual Report 2018
| 105 |
Financial Highlights
Columbia Acorn International SelectSM
| | Net asset value,
beginning of
period | Net
investment
income
(loss) | Net
realized
and
unrealized
gain (loss) | Total from
investment
operations | Distributions
from net
investment
income | Distributions
from net
realized
gains | Tax
return of
capital | Total
distributions to
shareholders |
| Class A |
| Six Months Ended 6/30/2018 (Unaudited) | $28.89 | 0.12 | 0.40 | 0.52 | — | — | — | — |
| Year Ended 12/31/2017 | $21.36 | 0.02 | 7.52 | 7.54 | (0.01) | — | — | (0.01) |
| Year Ended 12/31/2016 | $21.33 | 0.10 | 0.09 (e) | 0.19 | (0.14) | — | (0.02) | (0.16) |
| Year Ended 12/31/2015 | $22.04 | 0.17 | (0.45) | (0.28) | (0.42) | — | (0.01) | (0.43) |
| Year Ended 12/31/2014 | $26.91 | 0.29 | (2.17) | (1.88) | (0.10) | (2.89) | — | (2.99) |
| Year Ended 12/31/2013 | $25.61 | 0.29 | 3.29 | 3.58 | (0.37) | (1.91) | — | (2.28) |
| Advisor Class |
| Six Months Ended 6/30/2018 (Unaudited) | $29.46 | 0.13 | 0.43 | 0.56 | — | — | — | — |
| Year Ended 12/31/2017 | $21.77 | 0.08 | 7.68 | 7.76 | (0.07) | — | — | (0.07) |
| Year Ended 12/31/2016 | $21.74 | 0.17 | 0.08 (e) | 0.25 | (0.20) | — | (0.02) | (0.22) |
| Year Ended 12/31/2015 | $22.45 | 0.22 | (0.44) | (0.22) | (0.48) | — | (0.01) | (0.49) |
| Year Ended 12/31/2014 | $27.36 | 0.37 | (2.22) | (1.85) | (0.17) | (2.89) | — | (3.06) |
| Year Ended 12/31/2013 | $25.99 | 0.29 | 3.42 | 3.71 | (0.43) | (1.91) | — | (2.34) |
| Class C |
| Six Months Ended 6/30/2018 (Unaudited) | $26.85 | 0.01 | 0.36 | 0.37 | — | — | — | — |
| Year Ended 12/31/2017 | $19.99 | (0.15) | 7.01 | 6.86 | — | — | — | — |
| Year Ended 12/31/2016 | $19.96 | (0.06) | 0.09 (e) | 0.03 | — | — | — | — |
| Year Ended 12/31/2015 | $20.54 | (0.01) | (0.41) | (0.42) | (0.15) | — | (0.01) | (0.16) |
| Year Ended 12/31/2014 | $25.39 | 0.07 | (2.03) | (1.96) | — | (2.89) | — | (2.89) |
| Year Ended 12/31/2013 | $24.28 | 0.08 | 3.10 | 3.18 | (0.16) | (1.91) | — | (2.07) |
| Institutional Class |
| Six Months Ended 6/30/2018 (Unaudited) | $29.25 | 0.14 | 0.41 | 0.55 | — | — | — | — |
| Year Ended 12/31/2017 | $21.61 | 0.09 | 7.62 | 7.71 | (0.07) | — | — | (0.07) |
| Year Ended 12/31/2016 | $21.58 | 0.16 | 0.09 (e) | 0.25 | (0.20) | — | (0.02) | (0.22) |
| Year Ended 12/31/2015 | $22.30 | 0.24 | (0.46) | (0.22) | (0.49) | — | (0.01) | (0.50) |
| Year Ended 12/31/2014 | $27.20 | 0.38 | (2.21) | (1.83) | (0.18) | (2.89) | — | (3.07) |
| Year Ended 12/31/2013 | $25.86 | 0.37 | 3.33 | 3.70 | (0.45) | (1.91) | — | (2.36) |
| Institutional 2 Class |
| Six Months Ended 6/30/2018 (Unaudited) | $29.44 | 0.16 | 0.42 | 0.58 | — | — | — | — |
| Year Ended 12/31/2017 | $21.76 | 0.11 | 7.66 | 7.77 | (0.09) | — | — | (0.09) |
| Year Ended 12/31/2016 | $21.72 | 0.16 | 0.11 (e) | 0.27 | (0.21) | — | (0.02) | (0.23) |
| Year Ended 12/31/2015 | $22.43 | 0.22 | (0.42) | (0.20) | (0.50) | — | (0.01) | (0.51) |
| Year Ended 12/31/2014 | $27.34 | 0.36 | (2.19) | (1.83) | (0.19) | (2.89) | — | (3.08) |
| Year Ended 12/31/2013 | $25.98 | 0.38 | 3.35 | 3.73 | (0.46) | (1.91) | — | (2.37) |
The accompanying Notes to Financial Statements are an integral part of this statement.
| 106 | Columbia Acorn Family of Funds | Semiannual Report 2018 |
Financial Highlights (continued)
Columbia Acorn International SelectSM
| | Proceeds from
regulatory
settlements | Net
asset
value,
end of
period | Total
return | Total gross
expense
ratio to
average
net assets(a) | Total net
expense
ratio to
average
net assets(a) | Net investment
income (loss)
ratio to
average
net assets | Portfolio
turnover | Net
assets,
end of
period
(000’s) |
| Class A |
| Six Months Ended 6/30/2018 (Unaudited) | — | $29.41 | 1.80% (b) | 1.53% (c) | 1.40% (c),(d) | 0.79% (c) | 23% | $27,687 |
| Year Ended 12/31/2017 | — | $28.89 | 35.30% (b) | 1.54% | 1.40% (d) | 0.07% | 49% | $26,336 |
| Year Ended 12/31/2016 | — | $21.36 | 0.90% (b) | 1.55% (f) | 1.48% (f) | 0.49% | 49% | $20,165 |
| Year Ended 12/31/2015 | 0.00 (g) | $21.33 | (1.30%) (h) | 1.55% | 1.55% | 0.74% | 59% | $33,772 |
| Year Ended 12/31/2014 | — | $22.04 | (7.06%) | 1.47% | 1.47% | 1.05% | 58% | $53,419 |
| Year Ended 12/31/2013 | — | $26.91 | 14.42% | 1.47% | 1.47% | 1.08% | 72% | $73,911 |
| Advisor Class |
| Six Months Ended 6/30/2018 (Unaudited) | — | $30.02 | 1.90% (b) | 1.27% (c) | 1.15% (c),(d) | 0.89% (c) | 23% | $1,004 |
| Year Ended 12/31/2017 | — | $29.46 | 35.67% (b) | 1.29% | 1.15% (d) | 0.30% | 49% | $1,820 |
| Year Ended 12/31/2016 | — | $21.77 | 1.15% (b) | 1.29% (f) | 1.21% (f) | 0.77% | 49% | $1,106 |
| Year Ended 12/31/2015 | 0.00 (g) | $21.74 | (1.00%) (h) | 1.27% | 1.27% | 0.97% | 59% | $898 |
| Year Ended 12/31/2014 | — | $22.45 | (6.83%) | 1.21% | 1.21% | 1.33% | 58% | $974 |
| Year Ended 12/31/2013 | — | $27.36 | 14.72% | 1.24% | 1.24% | 1.06% | 72% | $417 |
| Class C |
| Six Months Ended 6/30/2018 (Unaudited) | — | $27.22 | 1.38% (b) | 2.28% (c) | 2.15% (c),(d) | 0.05% (c) | 23% | $5,031 |
| Year Ended 12/31/2017 | — | $26.85 | 34.32% (b) | 2.29% | 2.15% (d) | (0.64%) | 49% | $5,027 |
| Year Ended 12/31/2016 | — | $19.99 | 0.15% (b) | 2.31% (f) | 2.23% (f) | (0.29%) | 49% | $4,346 |
| Year Ended 12/31/2015 | 0.00 (g) | $19.96 | (2.05%) (h) | 2.32% | 2.32% | (0.06%) | 59% | $5,390 |
| Year Ended 12/31/2014 | — | $20.54 | (7.80%) | 2.23% | 2.23% | 0.29% | 58% | $8,057 |
| Year Ended 12/31/2013 | — | $25.39 | 13.52% | 2.26% | 2.26% | 0.32% | 72% | $10,311 |
| Institutional Class |
| Six Months Ended 6/30/2018 (Unaudited) | — | $29.80 | 1.88% (b) | 1.27% (c) | 1.15% (c),(d) | 0.97% (c) | 23% | $75,280 |
| Year Ended 12/31/2017 | — | $29.25 | 35.70% (b) | 1.29% | 1.15% (d) | 0.36% | 49% | $89,266 |
| Year Ended 12/31/2016 | — | $21.61 | 1.18% (b) | 1.26% (f) | 1.19% (f) | 0.74% | 49% | $73,631 |
| Year Ended 12/31/2015 | 0.00 (g) | $21.58 | (1.03%) (h) | 1.24% | 1.24% | 1.05% | 59% | $96,311 |
| Year Ended 12/31/2014 | — | $22.30 | (6.79%) | 1.17% | 1.17% | 1.36% | 58% | $175,764 |
| Year Ended 12/31/2013 | — | $27.20 | 14.75% | 1.19% | 1.19% | 1.37% | 72% | $256,100 |
| Institutional 2 Class |
| Six Months Ended 6/30/2018 (Unaudited) | — | $30.02 | 1.97% (b) | 1.20% (c) | 1.07% (c) | 1.10% (c) | 23% | $1,076 |
| Year Ended 12/31/2017 | — | $29.44 | 35.72% (b) | 1.22% | 1.08% | 0.41% | 49% | $614 |
| Year Ended 12/31/2016 | — | $21.76 | 1.25% (b) | 1.23% (f) | 1.19% (f) | 0.76% | 49% | $440 |
| Year Ended 12/31/2015 | 0.00 (g) | $21.72 | (0.94%) (h) | 1.21% | 1.21% | 0.96% | 59% | $2,268 |
| Year Ended 12/31/2014 | — | $22.43 | (6.77%) | 1.15% | 1.15% | 1.30% | 58% | $2,593 |
| Year Ended 12/31/2013 | — | $27.34 | 14.80% (b) | 1.15% | 1.15% | 1.40% | 72% | $956 |
The accompanying Notes to Financial Statements are an integral part of this statement.
Columbia Acorn Family of Funds | Semiannual Report 2018
| 107 |
Financial Highlights (continued)
Columbia Acorn International SelectSM
| | Net asset value,
beginning of
period | Net
investment
income
(loss) | Net
realized
and
unrealized
gain (loss) | Total from
investment
operations | Distributions
from net
investment
income | Distributions
from net
realized
gains | Tax
return of
capital | Total
distributions to
shareholders |
| Institutional 3 Class |
| Six Months Ended 6/30/2018 (Unaudited) | $29.42 | 0.18 | 0.40 | 0.58 | — | — | — | — |
| Year Ended 12/31/2017 | $21.74 | (0.07) | 7.86 | 7.79 | (0.11) | — | — | (0.11) |
| Year Ended 12/31/2016 | $21.71 | 0.16 | 0.12 (e) | 0.28 | (0.23) | — | (0.02) | (0.25) |
| Year Ended 12/31/2015 | $22.42 | 0.28 | (0.47) | (0.19) | (0.51) | — | (0.01) | (0.52) |
| Year Ended 12/31/2014 | $27.33 | 0.40 | (2.21) | (1.81) | (0.21) | (2.89) | — | (3.10) |
| Year Ended 12/31/2013 | $25.98 | 0.11 | 3.62 | 3.73 | (0.47) | (1.91) | — | (2.38) |
| Notes to Financial Highlights |
| (a) | In addition to the fees and expenses that the Fund bears directly, the Fund indirectly bears a pro rata share of the fees and expenses of any other funds in which it invests, if any. Such indirect expenses are not included in the Fund’s reported expense ratios. |
| (b) | Had the Investment Manager and/or Transfer Agent not waived fees and/or reimbursed a portion of expenses, total return would have been reduced. |
| (c) | Annualized. |
| (d) | The benefits derived from expense reductions had an impact of less than 0.01%. |
| (e) | Calculation of the net gain (loss) per share (both realized and unrealized) does not correlate to the aggregate realized and unrealized gain (loss) presented in the Statements of Operations due to the timing of subscriptions and redemptions of Fund shares in relation to fluctuations in the market value of the portfolio. |
| (f) | Expenses have been reduced due to a reimbursement of expenses overbilled by a third party. If the reimbursement had been excluded, the expense ratios would have been higher by the percentages shown for each class in the table below. All fee waivers and expense reimbursements by the Investment Manager and its affiliates were applied before giving effect to this third party reimbursement. |
| Year Ended | Class A | Advisor
Class | Class C | Institutional
Class | Institutional 2
Class | Institutional 3
Class |
| 12/31/2016 | 0.06 % | 0.06 % | 0.06 % | 0.06 % | 0.04 % | 0.09 % |
| (g) | Rounds to zero. |
| (h) | The Fund received proceeds from regulatory settlements. Had the Fund not received these proceeds, the total return would have been lower by 0.02%. |
The accompanying Notes to Financial Statements are an integral part of this statement.
| 108 | Columbia Acorn Family of Funds | Semiannual Report 2018 |
Financial Highlights (continued)
Columbia Acorn International SelectSM
| | Proceeds from
regulatory
settlements | Net
asset
value,
end of
period | Total
return | Total gross
expense
ratio to
average
net assets(a) | Total net
expense
ratio to
average
net assets(a) | Net investment
income (loss)
ratio to
average
net assets | Portfolio
turnover | Net
assets,
end of
period
(000’s) |
| Institutional 3 Class |
| Six Months Ended 6/30/2018 (Unaudited) | — | $30.00 | 1.97% (b) | 1.13% (c) | 1.02% (c) | 1.19% (c) | 23% | $8,737 |
| Year Ended 12/31/2017 | — | $29.42 | 35.81% (b) | 1.17% | 1.03% | (0.24%) | 49% | $7,732 |
| Year Ended 12/31/2016 | — | $21.74 | 1.29% (b) | 1.12% (f) | 1.04% (f) | 0.74% | 49% | $322 |
| Year Ended 12/31/2015 | 0.00 (g) | $21.71 | (0.89%) (h) | 1.14% | 1.14% | 1.21% | 59% | $660 |
| Year Ended 12/31/2014 | — | $22.42 | (6.71%) | 1.09% | 1.09% | 1.43% | 58% | $11,755 |
| Year Ended 12/31/2013 | — | $27.33 | 14.82% | 1.09% | 1.09% | 0.40% | 72% | $13,318 |
The accompanying Notes to Financial Statements are an integral part of this statement.
Columbia Acorn Family of Funds | Semiannual Report 2018
| 109 |
Financial Highlights
Columbia Acorn SelectSM
| | Net asset value,
beginning of
period | Net
investment
income
(loss) | Net
realized
and
unrealized
gain | Total from
investment
operations | Distributions
from net
investment
income | Distributions
from net
realized
gains | Total
distributions to
shareholders |
| Class A |
| Six Months Ended 6/30/2018 (Unaudited) | $14.62 | 0.01 | 0.94 | 0.95 | — | (1.21) | (1.21) |
| Year Ended 12/31/2017 | $13.13 | (0.03) | 3.31 | 3.28 | — | (1.79) | (1.79) |
| Year Ended 12/31/2016 | $13.94 | (0.04) | 1.56 | 1.52 | — | (2.33) | (2.33) |
| Year Ended 12/31/2015 | $21.03 | (0.09) | 0.14 | 0.05 | — | (7.14) | (7.14) |
| Year Ended 12/31/2014 | $25.57 | (0.14) | 0.64 | 0.50 | — | (5.04) | (5.04) |
| Year Ended 12/31/2013 | $24.72 | (0.15) | 7.92 | 7.77 | (0.07) | (6.85) | (6.92) |
| Advisor Class |
| Six Months Ended 6/30/2018 (Unaudited) | $17.19 | 0.03 | 1.09 | 1.12 | — | (1.24) | (1.24) |
| Year Ended 12/31/2017 | $15.13 | 0.01 | 3.84 | 3.85 | — | (1.79) | (1.79) |
| Year Ended 12/31/2016 | $15.69 | (0.00) (f) | 1.77 | 1.77 | — | (2.33) | (2.33) |
| Year Ended 12/31/2015 | $22.75 | (0.04) | 0.12 | 0.08 | — | (7.14) | (7.14) |
| Year Ended 12/31/2014 | $27.20 | (0.10) | 0.69 | 0.59 | — | (5.04) | (5.04) |
| Year Ended 12/31/2013 | $25.92 | (0.06) | 8.32 | 8.26 | (0.13) | (6.85) | (6.98) |
| Class C |
| Six Months Ended 6/30/2018 (Unaudited) | $9.59 | (0.03) | 0.63 | 0.60 | — | (1.10) | (1.10) |
| Year Ended 12/31/2017 | $9.22 | (0.09) | 2.25 | 2.16 | — | (1.79) | (1.79) |
| Year Ended 12/31/2016 | $10.51 | (0.10) | 1.14 | 1.04 | — | (2.33) | (2.33) |
| Year Ended 12/31/2015 | $17.69 | (0.19) | 0.15 | (0.04) | — | (7.14) | (7.14) |
| Year Ended 12/31/2014 | $22.46 | (0.28) | 0.55 | 0.27 | — | (5.04) | (5.04) |
| Year Ended 12/31/2013 | $22.48 | (0.32) | 7.15 | 6.83 | — | (6.85) | (6.85) |
| Institutional Class |
| Six Months Ended 6/30/2018 (Unaudited) | $16.54 | 0.03 | 1.06 | 1.09 | — | (1.24) | (1.24) |
| Year Ended 12/31/2017 | $14.63 | 0.01 | 3.69 | 3.70 | — | (1.79) | (1.79) |
| Year Ended 12/31/2016 | $15.24 | (0.00) (f) | 1.72 | 1.72 | — | (2.33) | (2.33) |
| Year Ended 12/31/2015 | $22.28 | (0.03) | 0.13 | 0.10 | — | (7.14) | (7.14) |
| Year Ended 12/31/2014 | $26.72 | (0.08) | 0.68 | 0.60 | — | (5.04) | (5.04) |
| Year Ended 12/31/2013 | $25.57 | (0.07) | 8.21 | 8.14 | (0.14) | (6.85) | (6.99) |
| Institutional 2 Class |
| Six Months Ended 6/30/2018 (Unaudited) | $17.28 | 0.04 | 1.10 | 1.14 | — | (1.25) | (1.25) |
| Year Ended 12/31/2017 | $15.20 | 0.02 | 3.85 | 3.87 | — | (1.79) | (1.79) |
| Year Ended 12/31/2016 | $15.74 | 0.01 | 1.78 | 1.79 | — | (2.33) | (2.33) |
| Year Ended 12/31/2015 | $22.78 | (0.08) | 0.18 | 0.10 | — | (7.14) | (7.14) |
| Year Ended 12/31/2014 | $27.20 | (0.07) | 0.69 | 0.62 | — | (5.04) | (5.04) |
| Year Ended 12/31/2013 | $25.93 | (0.04) | 8.31 | 8.27 | (0.15) | (6.85) | (7.00) |
The accompanying Notes to Financial Statements are an integral part of this statement.
| 110 | Columbia Acorn Family of Funds | Semiannual Report 2018 |
Financial Highlights (continued)
Columbia Acorn SelectSM
| | Net
asset
value,
end of
period | Total
return | Total gross
expense
ratio to
average
net assets(a) | Total net
expense
ratio to
average
net assets(a) | Net investment
income (loss)
ratio to
average
net assets | Portfolio
turnover | Net
assets,
end of
period
(000’s) |
| Class A |
| Six Months Ended 6/30/2018 (Unaudited) | $14.36 | 6.16% (b) | 1.38% (c) | 1.15% (c),(d) | 0.10% (c) | 32% | $105,639 |
| Year Ended 12/31/2017 | $14.62 | 26.42% (b) | 1.37% | 1.16% (d) | (0.20%) | 41% | $106,330 |
| Year Ended 12/31/2016 | $13.13 | 11.54% (b) | 1.37% | 1.17% | (0.27%) | 75% | $119,364 |
| Year Ended 12/31/2015 | $13.94 | (0.73%) (b) | 1.35% (e) | 1.22% (e) | (0.42%) | 55% | $146,864 |
| Year Ended 12/31/2014 | $21.03 | 2.17% | 1.32% | 1.32% | (0.58%) | 17% | $264,234 |
| Year Ended 12/31/2013 | $25.57 | 33.77% | 1.31% (e) | 1.31% (e) | (0.54%) | 20% | $333,193 |
| Advisor Class |
| Six Months Ended 6/30/2018 (Unaudited) | $17.07 | 6.25% (b) | 1.13% (c) | 0.90% (c),(d) | 0.34% (c) | 32% | $5,626 |
| Year Ended 12/31/2017 | $17.19 | 26.71% (b) | 1.14% | 0.91% (d) | 0.05% | 41% | $5,590 |
| Year Ended 12/31/2016 | $15.13 | 11.86% (b) | 1.13% | 0.93% | (0.02%) | 75% | $853 |
| Year Ended 12/31/2015 | $15.69 | (0.53%) (b) | 1.12% (e) | 0.99% (e) | (0.18%) | 55% | $932 |
| Year Ended 12/31/2014 | $22.75 | 2.39% | 1.12% | 1.12% | (0.37%) | 17% | $1,193 |
| Year Ended 12/31/2013 | $27.20 | 34.16% | 1.02% (e) | 1.02% (e) | (0.20%) | 20% | $1,383 |
| Class C |
| Six Months Ended 6/30/2018 (Unaudited) | $9.09 | 5.81% (b) | 2.13% (c) | 1.90% (c),(d) | (0.66%) (c) | 32% | $20,077 |
| Year Ended 12/31/2017 | $9.59 | 25.40% (b) | 2.12% | 1.91% (d) | (0.95%) | 41% | $22,559 |
| Year Ended 12/31/2016 | $9.22 | 10.67% (b) | 2.11% | 1.91% | (1.01%) | 75% | $27,524 |
| Year Ended 12/31/2015 | $10.51 | (1.41%) (b) | 2.08% (e) | 1.95% (e) | (1.15%) | 55% | $34,589 |
| Year Ended 12/31/2014 | $17.69 | 1.42% | 2.04% | 2.04% | (1.30%) | 17% | $48,591 |
| Year Ended 12/31/2013 | $22.46 | 32.85% | 2.04% (e) | 2.04% (e) | (1.28%) | 20% | $61,537 |
| Institutional Class |
| Six Months Ended 6/30/2018 (Unaudited) | $16.39 | 6.32% (b) | 1.13% (c) | 0.90% (c),(d) | 0.35% (c) | 32% | $155,931 |
| Year Ended 12/31/2017 | $16.54 | 26.59% (b) | 1.13% | 0.91% (d) | 0.04% | 41% | $157,664 |
| Year Ended 12/31/2016 | $14.63 | 11.88% (b) | 1.10% | 0.90% | (0.02%) | 75% | $144,313 |
| Year Ended 12/31/2015 | $15.24 | (0.44%) (b) | 1.07% (e) | 0.95% (e) | (0.15%) | 55% | $183,642 |
| Year Ended 12/31/2014 | $22.28 | 2.47% | 1.04% | 1.04% | (0.30%) | 17% | $318,487 |
| Year Ended 12/31/2013 | $26.72 | 34.16% | 1.02% (e) | 1.02% (e) | (0.26%) | 20% | $431,990 |
| Institutional 2 Class |
| Six Months Ended 6/30/2018 (Unaudited) | $17.17 | 6.33% (b) | 1.05% (c) | 0.84% (c) | 0.43% (c) | 32% | $2,080 |
| Year Ended 12/31/2017 | $17.28 | 26.72% (b) | 1.06% | 0.85% | 0.11% | 41% | $1,735 |
| Year Ended 12/31/2016 | $15.20 | 11.96% (b) | 1.05% | 0.85% | 0.07% | 75% | $1,036 |
| Year Ended 12/31/2015 | $15.74 | (0.44%) (b) | 1.02% (e) | 0.95% (e) | (0.33%) | 55% | $911 |
| Year Ended 12/31/2014 | $22.78 | 2.50% | 1.00% | 1.00% | (0.26%) | 17% | $10,697 |
| Year Ended 12/31/2013 | $27.20 | 34.21% | 0.97% (e) | 0.97% (e) | (0.13%) | 20% | $11,996 |
The accompanying Notes to Financial Statements are an integral part of this statement.
Columbia Acorn Family of Funds | Semiannual Report 2018
| 111 |
Financial Highlights (continued)
Columbia Acorn SelectSM
| | Net asset value,
beginning of
period | Net
investment
income
(loss) | Net
realized
and
unrealized
gain | Total from
investment
operations | Distributions
from net
investment
income | Distributions
from net
realized
gains | Total
distributions to
shareholders |
| Institutional 3 Class |
| Six Months Ended 6/30/2018 (Unaudited) | $17.43 | 0.04 | 1.12 | 1.16 | — | (1.26) | (1.26) |
| Year Ended 12/31/2017 | $15.31 | 0.02 | 3.89 | 3.91 | — | (1.79) | (1.79) |
| Year Ended 12/31/2016 | $15.83 | 0.02 | 1.79 | 1.81 | — | (2.33) | (2.33) |
| Year Ended 12/31/2015 | $22.86 | 0.00 (f) | 0.11 | 0.11 | — | (7.14) | (7.14) |
| Year Ended 12/31/2014 | $27.27 | (0.06) | 0.69 | 0.63 | — | (5.04) | (5.04) |
| Year Ended 12/31/2013 | $25.98 | (0.03) | 8.34 | 8.31 | (0.17) | (6.85) | (7.02) |
| Notes to Financial Highlights |
| (a) | In addition to the fees and expenses that the Fund bears directly, the Fund indirectly bears a pro rata share of the fees and expenses of any other funds in which it invests, if any. Such indirect expenses are not included in the Fund’s reported expense ratios. |
| (b) | Had the Investment Manager and/or Transfer Agent not waived fees and/or reimbursed a portion of expenses, total return would have been reduced. |
| (c) | Annualized. |
| (d) | The benefits derived from expense reductions had an impact of less than 0.01%. |
| (e) | Ratios include line of credit interest expense which is less than 0.01%. |
| (f) | Rounds to zero. |
The accompanying Notes to Financial Statements are an integral part of this statement.
| 112 | Columbia Acorn Family of Funds | Semiannual Report 2018 |
Financial Highlights (continued)
Columbia Acorn SelectSM
| | Net
asset
value,
end of
period | Total
return | Total gross
expense
ratio to
average
net assets(a) | Total net
expense
ratio to
average
net assets(a) | Net investment
income (loss)
ratio to
average
net assets | Portfolio
turnover | Net
assets,
end of
period
(000’s) |
| Institutional 3 Class |
| Six Months Ended 6/30/2018 (Unaudited) | $17.33 | 6.37% (b) | 0.99% (c) | 0.79% (c) | 0.41% (c) | 32% | $17,545 |
| Year Ended 12/31/2017 | $17.43 | 26.79% (b) | 1.00% | 0.80% | 0.15% | 41% | $15,001 |
| Year Ended 12/31/2016 | $15.31 | 12.02% (b) | 1.00% | 0.80% | 0.10% | 75% | $4,389 |
| Year Ended 12/31/2015 | $15.83 | (0.39%) (b) | 0.98% (e) | 0.85% (e) | 0.02% | 55% | $5,056 |
| Year Ended 12/31/2014 | $22.86 | 2.53% | 0.95% | 0.95% | (0.22%) | 17% | $3,644 |
| Year Ended 12/31/2013 | $27.27 | 34.30% | 0.93% (e) | 0.93% (e) | (0.09%) | 20% | $4,847 |
The accompanying Notes to Financial Statements are an integral part of this statement.
Columbia Acorn Family of Funds | Semiannual Report 2018
| 113 |
Financial Highlights
Columbia Thermostat FundSM
| | Net asset value,
beginning of
period | Net
investment
income | Net
realized
and
unrealized
gain (loss) | Total from
investment
operations | Distributions
from net
investment
income | Distributions
from net
realized
gains | Total
distributions to
shareholders |
| Class A |
| Six Months Ended 6/30/2018 (Unaudited) | $14.63 | 0.11 | (0.04) | 0.07 | (0.01) | (0.19) | (0.20) |
| Year Ended 12/31/2017 | $14.60 | 0.25 | 0.50 | 0.75 | (0.50) | (0.22) | (0.72) |
| Year Ended 12/31/2016 | $14.31 | 0.20 | 0.44 | 0.64 | (0.08) | (0.27) | (0.35) |
| Year Ended 12/31/2015 | $14.86 | 0.27 | (0.26) | 0.01 | (0.28) | (0.28) | (0.56) |
| Year Ended 12/31/2014 | $14.58 | 0.28 | 0.49 | 0.77 | (0.28) | (0.21) | (0.49) |
| Year Ended 12/31/2013 | $14.29 | 0.29 | 1.00 | 1.29 | (0.25) | (0.75) | (1.00) |
| Advisor Class |
| Six Months Ended 6/30/2018 (Unaudited) | $14.50 | 0.13 | (0.05) | 0.08 | (0.01) | (0.19) | (0.20) |
| Year Ended 12/31/2017 | $14.47 | 0.29 | 0.50 | 0.79 | (0.54) | (0.22) | (0.76) |
| Year Ended 12/31/2016 | $14.19 | 0.24 | 0.42 | 0.66 | (0.11) | (0.27) | (0.38) |
| Year Ended 12/31/2015 | $14.74 | 0.30 | (0.25) | 0.05 | (0.32) | (0.28) | (0.60) |
| Year Ended 12/31/2014 | $14.46 | 0.32 | 0.49 | 0.81 | (0.32) | (0.21) | (0.53) |
| Year Ended 12/31/2013 | $14.19 | 0.36 | 0.95 | 1.31 | (0.29) | (0.75) | (1.04) |
| Class C |
| Six Months Ended 6/30/2018 (Unaudited) | $14.74 | 0.06 | (0.06) | 0.00 (e) | (0.01) | (0.19) | (0.20) |
| Year Ended 12/31/2017 | $14.62 | 0.14 | 0.51 | 0.65 | (0.31) | (0.22) | (0.53) |
| Year Ended 12/31/2016 | $14.41 | 0.09 | 0.44 | 0.53 | (0.05) | (0.27) | (0.32) |
| Year Ended 12/31/2015 | $14.96 | 0.16 | (0.26) | (0.10) | (0.17) | (0.28) | (0.45) |
| Year Ended 12/31/2014 | $14.68 | 0.17 | 0.49 | 0.66 | (0.17) | (0.21) | (0.38) |
| Year Ended 12/31/2013 | $14.39 | 0.18 | 1.00 | 1.18 | (0.14) | (0.75) | (0.89) |
| Institutional Class |
| Six Months Ended 6/30/2018 (Unaudited) | $14.43 | 0.13 | (0.05) | 0.08 | (0.01) | (0.19) | (0.20) |
| Year Ended 12/31/2017 | $14.40 | 0.29 | 0.50 | 0.79 | (0.54) | (0.22) | (0.76) |
| Year Ended 12/31/2016 | $14.12 | 0.23 | 0.43 | 0.66 | (0.11) | (0.27) | (0.38) |
| Year Ended 12/31/2015 | $14.67 | 0.31 | (0.26) | 0.05 | (0.32) | (0.28) | (0.60) |
| Year Ended 12/31/2014 | $14.40 | 0.32 | 0.48 | 0.80 | (0.32) | (0.21) | (0.53) |
| Year Ended 12/31/2013 | $14.13 | 0.32 | 0.99 | 1.31 | (0.29) | (0.75) | (1.04) |
| Institutional 2 Class |
| Six Months Ended 6/30/2018 (Unaudited) | $14.52 | 0.13 | (0.05) | 0.08 | (0.01) | (0.19) | (0.20) |
| Year Ended 12/31/2017 | $14.49 | 0.29 | 0.50 | 0.79 | (0.54) | (0.22) | (0.76) |
| Year Ended 12/31/2016 | $14.20 | 0.24 | 0.43 | 0.67 | (0.11) | (0.27) | (0.38) |
| Year Ended 12/31/2015 | $14.75 | 0.31 | (0.26) | 0.05 | (0.32) | (0.28) | (0.60) |
| Year Ended 12/31/2014 | $14.47 | 0.31 | 0.50 | 0.81 | (0.32) | (0.21) | (0.53) |
| Year Ended 12/31/2013 | $14.19 | 0.37 | 0.96 | 1.33 | (0.30) | (0.75) | (1.05) |
The accompanying Notes to Financial Statements are an integral part of this statement.
| 114 | Columbia Acorn Family of Funds | Semiannual Report 2018 |
Financial Highlights (continued)
Columbia Thermostat FundSM
| | Net
asset
value,
end of
period | Total
return(a) | Total gross
expense
ratio to
average
net assets(b) | Total net
expense
ratio to
average
net assets(b) | Net investment
income
ratio to
average
net assets | Portfolio
turnover | Net
assets,
end of
period
(000’s) |
| Class A |
| Six Months Ended 6/30/2018 (Unaudited) | $14.50 | 0.50% | 0.56% (c) | 0.50% (c),(d) | 1.50% (c) | 77% | $224,219 |
| Year Ended 12/31/2017 | $14.63 | 5.19% | 0.54% | 0.50% (d) | 1.70% | 33% | $257,752 |
| Year Ended 12/31/2016 | $14.60 | 4.47% | 0.54% | 0.50% | 1.39% | 95% | $398,781 |
| Year Ended 12/31/2015 | $14.31 | 0.07% | 0.52% | 0.50% | 1.82% | 69% | $387,967 |
| Year Ended 12/31/2014 | $14.86 | 5.30% | 0.51% | 0.50% | 1.88% | 95% | $450,258 |
| Year Ended 12/31/2013 | $14.58 | 9.07% | 0.52% | 0.50% | 1.91% | 92% | $513,293 |
| Advisor Class |
| Six Months Ended 6/30/2018 (Unaudited) | $14.38 | 0.58% | 0.31% (c) | 0.25% (c),(d) | 1.76% (c) | 77% | $14,014 |
| Year Ended 12/31/2017 | $14.50 | 5.49% | 0.29% | 0.25% (d) | 1.98% | 33% | $16,227 |
| Year Ended 12/31/2016 | $14.47 | 4.69% | 0.30% | 0.25% | 1.64% | 95% | $15,664 |
| Year Ended 12/31/2015 | $14.19 | 0.33% | 0.28% | 0.25% | 2.06% | 69% | $17,453 |
| Year Ended 12/31/2014 | $14.74 | 5.61% | 0.26% | 0.25% | 2.14% | 95% | $23,412 |
| Year Ended 12/31/2013 | $14.46 | 9.26% | 0.28% | 0.25% | 2.39% | 92% | $14,651 |
| Class C |
| Six Months Ended 6/30/2018 (Unaudited) | $14.54 | 0.02% | 1.31% (c) | 1.25% (c),(d) | 0.76% (c) | 77% | $206,077 |
| Year Ended 12/31/2017 | $14.74 | 4.48% | 1.29% | 1.25% (d) | 0.96% | 33% | $250,784 |
| Year Ended 12/31/2016 | $14.62 | 3.69% | 1.28% | 1.25% | 0.63% | 95% | $338,930 |
| Year Ended 12/31/2015 | $14.41 | (0.68%) | 1.27% | 1.25% | 1.08% | 69% | $364,684 |
| Year Ended 12/31/2014 | $14.96 | 4.50% | 1.26% | 1.25% | 1.14% | 95% | $404,456 |
| Year Ended 12/31/2013 | $14.68 | 8.23% | 1.27% | 1.25% | 1.16% | 92% | $430,173 |
| Institutional Class |
| Six Months Ended 6/30/2018 (Unaudited) | $14.31 | 0.58% | 0.31% (c) | 0.25% (c),(d) | 1.75% (c) | 77% | $289,196 |
| Year Ended 12/31/2017 | $14.43 | 5.52% | 0.29% | 0.25% (d) | 1.97% | 33% | $320,483 |
| Year Ended 12/31/2016 | $14.40 | 4.72% | 0.28% | 0.25% | 1.64% | 95% | $341,629 |
| Year Ended 12/31/2015 | $14.12 | 0.33% | 0.26% | 0.25% | 2.08% | 69% | $325,159 |
| Year Ended 12/31/2014 | $14.67 | 5.57% | 0.25% | 0.24% | 2.16% | 95% | $377,119 |
| Year Ended 12/31/2013 | $14.40 | 9.30% | 0.26% | 0.25% | 2.14% | 92% | $375,444 |
| Institutional 2 Class |
| Six Months Ended 6/30/2018 (Unaudited) | $14.40 | 0.57% | 0.26% (c) | 0.22% (c) | 1.78% (c) | 77% | $15,648 |
| Year Ended 12/31/2017 | $14.52 | 5.51% | 0.26% | 0.23% | 1.97% | 33% | $13,464 |
| Year Ended 12/31/2016 | $14.49 | 4.77% | 0.27% | 0.24% | 1.66% | 95% | $12,024 |
| Year Ended 12/31/2015 | $14.20 | 0.33% | 0.25% | 0.24% | 2.14% | 69% | $6,114 |
| Year Ended 12/31/2014 | $14.75 | 5.62% | 0.24% | 0.23% | 2.11% | 95% | $3,536 |
| Year Ended 12/31/2013 | $14.47 | 9.35% | 0.25% | 0.23% | 2.44% | 92% | $979 |
The accompanying Notes to Financial Statements are an integral part of this statement.
Columbia Acorn Family of Funds | Semiannual Report 2018
| 115 |
Financial Highlights (continued)
Columbia Thermostat FundSM
| | Net asset value,
beginning of
period | Net
investment
income | Net
realized
and
unrealized
gain (loss) | Total from
investment
operations | Distributions
from net
investment
income | Distributions
from net
realized
gains | Total
distributions to
shareholders |
| Institutional 3 Class |
| Six Months Ended 6/30/2018 (Unaudited) | $14.50 | 0.14 | (0.06) | 0.08 | (0.01) | (0.19) | (0.20) |
| Year Ended 12/31/2017 | $14.46 | 0.30 | 0.51 | 0.81 | (0.55) | (0.22) | (0.77) |
| Year Ended 12/31/2016 | $14.18 | 0.25 | 0.42 | 0.67 | (0.12) | (0.27) | (0.39) |
| Year Ended 12/31/2015 | $14.74 | 0.31 | (0.26) | 0.05 | (0.33) | (0.28) | (0.61) |
| Year Ended 12/31/2014 | $14.46 | 0.32 | 0.50 | 0.82 | (0.33) | (0.21) | (0.54) |
| Year Ended 12/31/2013 | $14.18 | 0.33 | 1.01 | 1.34 | (0.31) | (0.75) | (1.06) |
| Notes to Financial Highlights |
| (a) | Had the Investment Manager and/or Transfer Agent not waived fees and/or reimbursed a portion of expenses, total return would have been reduced. |
| (b) | In addition to the fees and expenses that the Fund bears directly, the Fund indirectly bears a pro rata share of the fees and expenses of any other funds in which it invests, if any. Such indirect expenses are not included in the Fund’s reported expense ratios. |
| (c) | Annualized. |
| (d) | The benefits derived from expense reductions had an impact of less than 0.01%. |
| (e) | Rounds to zero. |
The accompanying Notes to Financial Statements are an integral part of this statement.
| 116 | Columbia Acorn Family of Funds | Semiannual Report 2018 |
Financial Highlights (continued)
Columbia Thermostat FundSM
| | Net
asset
value,
end of
period | Total
return(a) | Total gross
expense
ratio to
average
net assets(b) | Total net
expense
ratio to
average
net assets(b) | Net investment
income
ratio to
average
net assets | Portfolio
turnover | Net
assets,
end of
period
(000’s) |
| Institutional 3 Class |
| Six Months Ended 6/30/2018 (Unaudited) | $14.38 | 0.58% | 0.22% (c) | 0.17% (c) | 1.87% (c) | 77% | $460 |
| Year Ended 12/31/2017 | $14.50 | 5.64% | 0.21% | 0.18% | 2.04% | 33% | $521 |
| Year Ended 12/31/2016 | $14.46 | 4.76% | 0.21% | 0.19% | 1.71% | 95% | $399 |
| Year Ended 12/31/2015 | $14.18 | 0.32% | 0.20% | 0.19% | 2.08% | 69% | $352 |
| Year Ended 12/31/2014 | $14.74 | 5.68% | 0.19% | 0.18% | 2.19% | 95% | $401 |
| Year Ended 12/31/2013 | $14.46 | 9.46% | 0.14% | 0.14% | 2.23% | 92% | $3 |
The accompanying Notes to Financial Statements are an integral part of this statement.
Columbia Acorn Family of Funds | Semiannual Report 2018
| 117 |
Financial Highlights
Columbia Acorn Emerging Markets FundSM
| | Net asset value,
beginning of
period | Net
investment
income
(loss) | Net
realized
and
unrealized
gain (loss) | Total from
investment
operations | Distributions
from net
investment
income | Tax
return of
capital | Total
distributions to
shareholders |
| Class A |
| Six Months Ended 6/30/2018 (Unaudited) | $13.24 | 0.04 | (0.77) | (0.73) | — | — | — |
| Year Ended 12/31/2017 | $9.84 | (0.02) | 3.42 | 3.40 | — | — | — |
| Year Ended 12/31/2016 | $10.24 | (0.01) | (0.32) | (0.33) | (0.03) | (0.04) | (0.07) |
| Year Ended 12/31/2015 | $12.72 | 0.10 | (2.42) | (2.32) | (0.15) | (0.01) | (0.16) |
| Year Ended 12/31/2014 | $13.37 | 0.06 | (0.63) | (0.57) | (0.08) | — | (0.08) |
| Year Ended 12/31/2013 | $12.04 | 0.07 | 1.34 | 1.41 | (0.08) | — | (0.08) |
| Advisor Class |
| Six Months Ended 6/30/2018 (Unaudited) | $13.38 | 0.06 | (0.78) | (0.72) | — | — | — |
| Year Ended 12/31/2017 | $9.92 | 0.02 | 3.44 | 3.46 | — | — | — |
| Year Ended 12/31/2016 | $10.32 | 0.01 | (0.31) | (0.30) | (0.06) | (0.04) | (0.10) |
| Year Ended 12/31/2015 | $12.83 | 0.17 | (2.49) | (2.32) | (0.18) | (0.01) | (0.19) |
| Year Ended 12/31/2014 | $13.49 | 0.09 | (0.63) | (0.54) | (0.12) | — | (0.12) |
| Year Ended 12/31/2013 | $12.14 | 0.12 | 1.35 | 1.47 | (0.12) | — | (0.12) |
| Class C |
| Six Months Ended 6/30/2018 (Unaudited) | $13.09 | (0.01) | (0.76) | (0.77) | — | — | — |
| Year Ended 12/31/2017 | $9.80 | (0.09) | 3.38 | 3.29 | — | — | — |
| Year Ended 12/31/2016 | $10.20 | (0.09) | (0.31) | (0.40) | — | — | — |
| Year Ended 12/31/2015 | $12.65 | 0.01 | (2.39) | (2.38) | (0.06) | (0.01) | (0.07) |
| Year Ended 12/31/2014 | $13.32 | (0.05) | (0.62) | (0.67) | — | — | — |
| Year Ended 12/31/2013 | $12.01 | (0.03) | 1.34 | 1.31 | — | — | — |
| Institutional Class |
| Six Months Ended 6/30/2018 (Unaudited) | $13.29 | 0.05 | (0.76) | (0.71) | — | — | — |
| Year Ended 12/31/2017 | $9.85 | 0.03 | 3.41 | 3.44 | — | — | — |
| Year Ended 12/31/2016 | $10.26 | (0.00) (f) | (0.31) | (0.31) | (0.06) | (0.04) | (0.10) |
| Year Ended 12/31/2015 | $12.74 | 0.13 | (2.42) | (2.29) | (0.18) | (0.01) | (0.19) |
| Year Ended 12/31/2014 | $13.40 | 0.08 | (0.63) | (0.55) | (0.11) | — | (0.11) |
| Year Ended 12/31/2013 | $12.07 | 0.11 | 1.33 | 1.44 | (0.11) | — | (0.11) |
| Institutional 2 Class |
| Six Months Ended 6/30/2018 (Unaudited) | $13.38 | 0.06 | (0.77) | (0.71) | — | — | — |
| Year Ended 12/31/2017 | $9.91 | 0.04 | 3.43 | 3.47 | — | — | — |
| Year Ended 12/31/2016 | $10.32 | (0.02) | (0.28) | (0.30) | (0.07) | (0.04) | (0.11) |
| Year Ended 12/31/2015 | $12.82 | 0.15 | (2.45) | (2.30) | (0.19) | (0.01) | (0.20) |
| Year Ended 12/31/2014 | $13.48 | 0.10 | (0.64) | (0.54) | (0.12) | — | (0.12) |
| Year Ended 12/31/2013 | $12.14 | 0.12 | 1.34 | 1.46 | (0.12) | — | (0.12) |
The accompanying Notes to Financial Statements are an integral part of this statement.
| 118 | Columbia Acorn Family of Funds | Semiannual Report 2018 |
Financial Highlights (continued)
Columbia Acorn Emerging Markets FundSM
| | Net
asset
value,
end of
period | Total
return | Total gross
expense
ratio to
average
net assets(a) | Total net
expense
ratio to
average
net assets(a) | Net investment
income (loss)
ratio to
average
net assets | Portfolio
turnover | Net
assets,
end of
period
(000’s) |
| Class A |
| Six Months Ended 6/30/2018 (Unaudited) | $12.51 | (5.51%) (b) | 1.95% (c) | 1.51% (c),(d) | 0.60% (c) | 27% | $29,176 |
| Year Ended 12/31/2017 | $13.24 | 34.55% (b) | 1.98% | 1.70% (d) | (0.14%) | 47% | $33,982 |
| Year Ended 12/31/2016 | $9.84 | (3.20%) (b) | 1.84% (e) | 1.84% (e) | (0.11%) | 43% | $49,141 |
| Year Ended 12/31/2015 | $10.24 | (18.25%) | 1.67% | 1.67% | 0.88% | 58% | $88,574 |
| Year Ended 12/31/2014 | $12.72 | (4.28%) | 1.56% | 1.56% | 0.42% | 45% | $160,969 |
| Year Ended 12/31/2013 | $13.37 | 11.73% (b) | 1.80% | 1.76% | 0.52% | 36% | $177,158 |
| Advisor Class |
| Six Months Ended 6/30/2018 (Unaudited) | $12.66 | (5.38%) (b) | 1.70% (c) | 1.26% (c),(d) | 0.84% (c) | 27% | $1,115 |
| Year Ended 12/31/2017 | $13.38 | 34.88% (b) | 1.73% | 1.43% (d) | 0.19% | 47% | $1,337 |
| Year Ended 12/31/2016 | $9.92 | (2.91%) | 1.57% (e) | 1.57% (e) | 0.09% | 43% | $1,306 |
| Year Ended 12/31/2015 | $10.32 | (18.04%) | 1.36% | 1.36% | 1.37% | 58% | $3,459 |
| Year Ended 12/31/2014 | $12.83 | (4.03%) | 1.28% | 1.28% | 0.66% | 45% | $15,467 |
| Year Ended 12/31/2013 | $13.49 | 12.13% (b) | 1.44% | 1.44% | 0.92% | 36% | $13,583 |
| Class C |
| Six Months Ended 6/30/2018 (Unaudited) | $12.32 | (5.88%) (b) | 2.70% (c) | 2.26% (c),(d) | (0.16%) (c) | 27% | $13,343 |
| Year Ended 12/31/2017 | $13.09 | 33.57% (b) | 2.74% | 2.43% (d) | (0.78%) | 47% | $15,546 |
| Year Ended 12/31/2016 | $9.80 | (3.92%) (b) | 2.60% (e) | 2.59% (e) | (0.87%) | 43% | $15,534 |
| Year Ended 12/31/2015 | $10.20 | (18.83%) | 2.42% | 2.42% | 0.12% | 58% | $22,953 |
| Year Ended 12/31/2014 | $12.65 | (5.03%) | 2.33% | 2.33% | (0.36%) | 45% | $41,208 |
| Year Ended 12/31/2013 | $13.32 | 10.91% (b) | 2.55% | 2.51% | (0.23%) | 36% | $32,636 |
| Institutional Class |
| Six Months Ended 6/30/2018 (Unaudited) | $12.58 | (5.34%) (b) | 1.70% (c) | 1.26% (c),(d) | 0.81% (c) | 27% | $43,049 |
| Year Ended 12/31/2017 | $13.29 | 34.92% (b) | 1.74% | 1.42% (d) | 0.28% | 47% | $53,415 |
| Year Ended 12/31/2016 | $9.85 | (3.04%) (b) | 1.59% (e) | 1.58% (e) | (0.04%) | 43% | $38,969 |
| Year Ended 12/31/2015 | $10.26 | (17.98%) | 1.42% | 1.42% | 1.12% | 58% | $147,688 |
| Year Ended 12/31/2014 | $12.74 | (4.12%) | 1.33% | 1.33% | 0.62% | 45% | $245,053 |
| Year Ended 12/31/2013 | $13.40 | 11.92% (b) | 1.58% | 1.54% | 0.89% | 36% | $177,693 |
| Institutional 2 Class |
| Six Months Ended 6/30/2018 (Unaudited) | $12.67 | (5.31%) (b) | 1.65% (c) | 1.19% (c) | 0.92% (c) | 27% | $748 |
| Year Ended 12/31/2017 | $13.38 | 35.02% (b) | 1.65% | 1.33% | 0.33% | 47% | $1,030 |
| Year Ended 12/31/2016 | $9.91 | (2.90%) | 1.46% (e) | 1.46% (e) | (0.23%) | 43% | $806 |
| Year Ended 12/31/2015 | $10.32 | (17.96%) | 1.34% | 1.34% | 1.22% | 58% | $12,643 |
| Year Ended 12/31/2014 | $12.82 | (4.02%) | 1.26% | 1.26% | 0.72% | 45% | $19,632 |
| Year Ended 12/31/2013 | $13.48 | 12.07% (b) | 1.42% | 1.42% | 0.94% | 36% | $13,625 |
The accompanying Notes to Financial Statements are an integral part of this statement.
Columbia Acorn Family of Funds | Semiannual Report 2018
| 119 |
Financial Highlights (continued)
Columbia Acorn Emerging Markets FundSM
| | Net asset value,
beginning of
period | Net
investment
income
(loss) | Net
realized
and
unrealized
gain (loss) | Total from
investment
operations | Distributions
from net
investment
income | Tax
return of
capital | Total
distributions to
shareholders |
| Institutional 3 Class |
| Six Months Ended 6/30/2018 (Unaudited) | $13.27 | 0.07 | (0.77) | (0.70) | — | — | — |
| Year Ended 12/31/2017 | $9.82 | 0.02 | 3.43 | 3.45 | — | — | — |
| Year Ended 12/31/2016 | $10.23 | 0.03 | (0.33) | (0.30) | (0.07) | (0.04) | (0.11) |
| Year Ended 12/31/2015 | $12.71 | 0.15 | (2.43) | (2.28) | (0.19) | (0.01) | (0.20) |
| Year Ended 12/31/2014 | $13.36 | 0.09 | (0.62) | (0.53) | (0.12) | — | (0.12) |
| Year Ended 12/31/2013(g) | $12.22 | 0.07 | 1.20 | 1.27 | (0.13) | — | (0.13) |
| Notes to Financial Highlights |
| (a) | In addition to the fees and expenses that the Fund bears directly, the Fund indirectly bears a pro rata share of the fees and expenses of any other funds in which it invests. Such indirect expenses are not included in the Fund’s reported expense ratios. |
| (b) | Had the Investment Manager and/or Transfer Agent not waived fees and/or reimbursed a portion of expenses, total return would have been reduced. |
| (c) | Annualized. |
| (d) | The benefits derived from expense reductions had an impact of less than 0.01%. |
| (e) | Ratios include line of credit interest expense which is less than 0.01%. |
| (f) | Rounds to zero. |
| (g) | Institutional 3 Class shares commenced operations on June 13, 2013. Per share data and total return reflect activity from that date. |
The accompanying Notes to Financial Statements are an integral part of this statement.
| 120 | Columbia Acorn Family of Funds | Semiannual Report 2018 |
Financial Highlights (continued)
Columbia Acorn Emerging Markets FundSM
| | Net
asset
value,
end of
period | Total
return | Total gross
expense
ratio to
average
net assets(a) | Total net
expense
ratio to
average
net assets(a) | Net investment
income (loss)
ratio to
average
net assets | Portfolio
turnover | Net
assets,
end of
period
(000’s) |
| Institutional 3 Class |
| Six Months Ended 6/30/2018 (Unaudited) | $12.57 | (5.28%) (b) | 1.59% (c) | 1.14% (c) | 0.99% (c) | 27% | $903 |
| Year Ended 12/31/2017 | $13.27 | 35.13% (b) | 1.59% | 1.14% | 0.16% | 47% | $912 |
| Year Ended 12/31/2016 | $9.82 | (2.92%) (b) | 1.45% | 1.45% | 0.29% | 43% | $2 |
| Year Ended 12/31/2015 | $10.23 | (17.90%) | 1.27% | 1.27% | 1.24% | 58% | $2 |
| Year Ended 12/31/2014 | $12.71 | (3.95%) | 1.22% | 1.22% | 0.68% | 45% | $2 |
| Year Ended 12/31/2013(g) | $13.36 | 10.43% (b) | 1.36% (c) | 1.36% (c) | 0.97% (c) | 36% | $3 |
The accompanying Notes to Financial Statements are an integral part of this statement.
Columbia Acorn Family of Funds | Semiannual Report 2018
| 121 |
Financial Highlights
Columbia Acorn European FundSM
| | Net asset value,
beginning of
period | Net
investment
income
(loss) | Net
realized
and
unrealized
gain (loss) | Total from
investment
operations | Distributions
from net
investment
income | Distributions
from net
realized
gains | Total
distributions to
shareholders |
| Class A |
| Six Months Ended 6/30/2018 (Unaudited) | $19.27 | 0.16 | (0.04) | 0.12 | (0.12) | — | (0.12) |
| Year Ended 12/31/2017 | $14.12 | 0.06 | 5.28 | 5.34 | (0.19) | — | (0.19) |
| Year Ended 12/31/2016 | $14.75 | 0.16 | (0.67) | (0.51) | (0.12) | — | (0.12) |
| Year Ended 12/31/2015 | $14.34 | 0.10 | 0.50 | 0.60 | (0.19) | — | (0.19) |
| Year Ended 12/31/2014 | $15.68 | 0.13 | (1.34) | (1.21) | (0.05) | (0.08) | (0.13) |
| Year Ended 12/31/2013 | $11.76 | (0.02) | 3.97 | 3.95 | (0.01) | (0.02) | (0.03) |
| Advisor Class |
| Six Months Ended 6/30/2018 (Unaudited) | $19.36 | 0.18 | (0.03) | 0.15 | (0.12) | — | (0.12) |
| Year Ended 12/31/2017 | $14.18 | 0.10 | 5.32 | 5.42 | (0.24) | — | (0.24) |
| Year Ended 12/31/2016 | $14.82 | 0.17 | (0.65) | (0.48) | (0.16) | — | (0.16) |
| Year Ended 12/31/2015 | $14.40 | 0.24 | 0.41 | 0.65 | (0.23) | — | (0.23) |
| Year Ended 12/31/2014(e) | $15.85 | (0.02) | (1.34) | (1.36) | (0.09) | — | (0.09) |
| Class C |
| Six Months Ended 6/30/2018 (Unaudited) | $19.12 | 0.09 | (0.04) | 0.05 | (0.12) | — | (0.12) |
| Year Ended 12/31/2017 | $13.99 | (0.04) | 5.21 | 5.17 | (0.04) | — | (0.04) |
| Year Ended 12/31/2016 | $14.63 | 0.03 | (0.64) | (0.61) | (0.03) | — | (0.03) |
| Year Ended 12/31/2015 | $14.16 | (0.00) (f) | 0.48 | 0.48 | (0.01) | — | (0.01) |
| Year Ended 12/31/2014 | $15.54 | (0.01) | (1.29) | (1.30) | — | (0.08) | (0.08) |
| Year Ended 12/31/2013 | $11.73 | (0.15) | 3.98 | 3.83 | — | (0.02) | (0.02) |
| Institutional Class |
| Six Months Ended 6/30/2018 (Unaudited) | $19.27 | 0.19 | (0.05) | 0.14 | (0.12) | — | (0.12) |
| Year Ended 12/31/2017 | $14.11 | 0.14 | 5.26 | 5.40 | (0.24) | — | (0.24) |
| Year Ended 12/31/2016 | $14.75 | 0.19 | (0.67) | (0.48) | (0.16) | — | (0.16) |
| Year Ended 12/31/2015 | $14.34 | 0.15 | 0.49 | 0.64 | (0.23) | — | (0.23) |
| Year Ended 12/31/2014 | $15.68 | 0.15 | (1.32) | (1.17) | (0.09) | (0.08) | (0.17) |
| Year Ended 12/31/2013 | $11.76 | 0.11 | 3.88 | 3.99 | (0.05) | (0.02) | (0.07) |
| Institutional 2 Class |
| Six Months Ended 6/30/2018 (Unaudited) | $19.46 | 0.20 | (0.04) | 0.16 | (0.12) | — | (0.12) |
| Year Ended 12/31/2017 | $14.25 | 0.20 | 5.25 | 5.45 | (0.24) | — | (0.24) |
| Year Ended 12/31/2016 | $14.89 | 0.18 | (0.66) | (0.48) | (0.16) | — | (0.16) |
| Year Ended 12/31/2015 | $14.47 | 0.15 | 0.50 | 0.65 | (0.23) | — | (0.23) |
| Year Ended 12/31/2014 | $15.82 | 0.14 | (1.32) | (1.18) | (0.09) | (0.08) | (0.17) |
| Year Ended 12/31/2013 | $11.86 | (0.04) | 4.06 | 4.02 | (0.04) | (0.02) | (0.06) |
The accompanying Notes to Financial Statements are an integral part of this statement.
| 122 | Columbia Acorn Family of Funds | Semiannual Report 2018 |
Financial Highlights (continued)
Columbia Acorn European FundSM
| | Net
asset
value,
end of
period | Total
return(a) | Total gross
expense
ratio to
average
net assets(b) | Total net
expense
ratio to
average
net assets(b) | Net investment
income (loss)
ratio to
average
net assets | Portfolio
turnover | Net
assets,
end of
period
(000’s) |
| Class A |
| Six Months Ended 6/30/2018 (Unaudited) | $19.27 | 0.59% | 1.77% (c) | 1.44% (c) | 1.64% (c) | 12% | $35,428 |
| Year Ended 12/31/2017 | $19.27 | 37.89% | 1.94% | 1.58% (d) | 0.33% | 34% | $32,487 |
| Year Ended 12/31/2016 | $14.12 | (3.47%) | 2.00% | 1.75% | 1.07% | 40% | $26,269 |
| Year Ended 12/31/2015 | $14.75 | 4.17% | 2.06% | 1.75% | 0.67% | 37% | $40,368 |
| Year Ended 12/31/2014 | $14.34 | (7.77%) | 2.05% | 1.75% | 0.86% | 74% | $21,101 |
| Year Ended 12/31/2013 | $15.68 | 33.64% | 3.33% | 1.74% | (0.11%) | 42% | $19,078 |
| Advisor Class |
| Six Months Ended 6/30/2018 (Unaudited) | $19.39 | 0.74% | 1.52% (c) | 1.19% (c) | 1.81% (c) | 12% | $2,847 |
| Year Ended 12/31/2017 | $19.36 | 38.29% | 1.71% | 1.28% (d) | 0.55% | 34% | $2,942 |
| Year Ended 12/31/2016 | $14.18 | (3.27%) | 1.79% | 1.50% | 1.15% | 40% | $362 |
| Year Ended 12/31/2015 | $14.82 | 4.48% | 1.81% | 1.50% | 1.59% | 37% | $408 |
| Year Ended 12/31/2014(e) | $14.40 | (8.60%) | 1.87% (c) | 1.50% (c) | (0.30%) (c) | 74% | $302 |
| Class C |
| Six Months Ended 6/30/2018 (Unaudited) | $19.05 | 0.23% | 2.52% (c) | 2.19% (c) | 0.93% (c) | 12% | $15,302 |
| Year Ended 12/31/2017 | $19.12 | 36.95% | 2.69% | 2.31% (d) | (0.25%) | 34% | $13,965 |
| Year Ended 12/31/2016 | $13.99 | (4.21%) | 2.75% | 2.50% | 0.18% | 40% | $7,112 |
| Year Ended 12/31/2015 | $14.63 | 3.41% | 2.82% | 2.50% | (0.02%) | 37% | $7,220 |
| Year Ended 12/31/2014 | $14.16 | (8.44%) | 2.84% | 2.50% | (0.10%) | 74% | $5,096 |
| Year Ended 12/31/2013 | $15.54 | 32.63% | 4.19% | 2.50% | (1.10%) | 42% | $1,400 |
| Institutional Class |
| Six Months Ended 6/30/2018 (Unaudited) | $19.29 | 0.69% | 1.52% (c) | 1.19% (c) | 1.88% (c) | 12% | $53,802 |
| Year Ended 12/31/2017 | $19.27 | 38.35% | 1.69% | 1.29% (d) | 0.77% | 34% | $48,965 |
| Year Ended 12/31/2016 | $14.11 | (3.29%) | 1.73% | 1.50% | 1.29% | 40% | $11,345 |
| Year Ended 12/31/2015 | $14.75 | 4.43% | 1.78% | 1.50% | 1.01% | 37% | $11,766 |
| Year Ended 12/31/2014 | $14.34 | (7.52%) | 1.79% | 1.50% | 0.97% | 74% | $8,499 |
| Year Ended 12/31/2013 | $15.68 | 33.98% | 3.98% | 1.45% | 0.83% | 42% | $4,407 |
| Institutional 2 Class |
| Six Months Ended 6/30/2018 (Unaudited) | $19.50 | 0.79% | 1.46% (c) | 1.13% (c) | 2.06% (c) | 12% | $5,213 |
| Year Ended 12/31/2017 | $19.46 | 38.32% | 1.64% | 1.28% | 1.14% | 34% | $3,988 |
| Year Ended 12/31/2016 | $14.25 | (3.23%) | 1.68% | 1.47% | 1.26% | 40% | $1,262 |
| Year Ended 12/31/2015 | $14.89 | 4.48% | 1.75% | 1.48% | 0.98% | 37% | $2,122 |
| Year Ended 12/31/2014 | $14.47 | (7.54%) | 1.75% | 1.52% | 0.92% | 74% | $1,633 |
| Year Ended 12/31/2013 | $15.82 | 33.97% | 2.76% | 1.51% | (0.29%) | 42% | $1,891 |
The accompanying Notes to Financial Statements are an integral part of this statement.
Columbia Acorn Family of Funds | Semiannual Report 2018
| 123 |
Financial Highlights (continued)
Columbia Acorn European FundSM
| | Net asset value,
beginning of
period | Net
investment
income
(loss) | Net
realized
and
unrealized
gain (loss) | Total from
investment
operations | Distributions
from net
investment
income | Distributions
from net
realized
gains | Total
distributions to
shareholders |
| Institutional 3 Class |
| Six Months Ended 6/30/2018 (Unaudited) | $19.17 | (0.02) | 0.16 (g) | 0.14 | (0.12) | — | (0.12) |
| Year Ended 12/31/2017(h) | $15.02 | 0.03 | 4.40 | 4.43 | (0.28) | — | (0.28) |
| Notes to Financial Highlights |
| (a) | Had the Investment Manager and/or Transfer Agent not waived fees and/or reimbursed a portion of expenses, total return would have been reduced. |
| (b) | In addition to the fees and expenses that the Fund bears directly, the Fund indirectly bears a pro rata share of the fees and expenses of any other funds in which it invests, if any. Such indirect expenses are not included in the Fund’s reported expense ratios. |
| (c) | Annualized. |
| (d) | The benefits derived from expense reductions had an impact of less than 0.01%. |
| (e) | Advisor Class shares commenced operations on June 25, 2014. Per share data and total return reflect activity from that date. |
| (f) | Rounds to zero. |
| (g) | Calculation of the net gain (loss) per share (both realized and unrealized) does not correlate to the aggregate realized and unrealized gain (loss) presented in the Statement of Operations due to the timing of subscriptions and redemptions of Fund shares in relation to fluctuations in the market value of the portfolio. |
| (h) | Institutional 3 Class shares commenced operations on March 1, 2017. Per share data and total return reflect activity from that date. |
The accompanying Notes to Financial Statements are an integral part of this statement.
| 124 | Columbia Acorn Family of Funds | Semiannual Report 2018 |
Financial Highlights (continued)
Columbia Acorn European FundSM
| | Net
asset
value,
end of
period | Total
return(a) | Total gross
expense
ratio to
average
net assets(b) | Total net
expense
ratio to
average
net assets(b) | Net investment
income (loss)
ratio to
average
net assets | Portfolio
turnover | Net
assets,
end of
period
(000’s) |
| Institutional 3 Class |
| Six Months Ended 6/30/2018 (Unaudited) | $19.19 | 0.70% | 1.41% (c) | 1.08% (c) | (0.20%) (c) | 12% | $3 |
| Year Ended 12/31/2017(h) | $19.17 | 29.55% | 1.58% (c) | 1.09% (c) | 0.17% (c) | 34% | $210 |
The accompanying Notes to Financial Statements are an integral part of this statement.
Columbia Acorn Family of Funds | Semiannual Report 2018
| 125 |
Notes to Financial Statements
June 30, 2018 (Unaudited)
Note 1. Organization
Columbia Acorn® Fund, Columbia Acorn International®, Columbia Acorn USA®, Columbia Acorn International SelectSM, Columbia Acorn SelectSM, Columbia Thermostat FundSM, Columbia Acorn Emerging Markets FundSM and Columbia Acorn European FundSM (each a Fund and collectively, the Funds) are each a series of Columbia Acorn Trust (the Trust). The Trust is registered under the Investment Company Act of 1940, as amended (the 1940 Act), as an open-end management investment company organized as a Massachusetts business trust. The investment objective of each Fund is to seek long-term capital appreciation.
Columbia Thermostat FundSM pursues its investment objective by investing in shares of other mutual funds. As a “fund of funds”, under normal circumstances, the Fund allocates at least 95% of its net assets among a selected group of affiliated stock and bond mutual funds (underlying funds) according to the current level of the Standard & Poor’s (S&P) 500 Index in relation to predetermined ranges set by Columbia Wanger Asset Management, LLC (the Investment Manager or CWAM). The Fund may invest up to 5% of its net assets plus any cash received that day in cash, repurchase agreements, high quality short-term paper and government securities.
Fund shares
Each Fund may issue an unlimited number of shares. Each of Columbia Acorn® Fund, Columbia Acorn USA®, Columbia Acorn International SelectSM, Columbia Acorn SelectSM, Columbia Thermostat FundSM, Columbia Acorn Emerging Markets FundSM and Columbia Acorn European FundSM currently offers Class A, Advisor Class, Class C, Institutional Class, Institutional 2 Class and Institutional 3 Class shares. Columbia Acorn International® currently offers Class A, Advisor Class, Class C, Institutional Class, Institutional 2 Class, Institutional 3 Class and Class R shares.
Class A shares are sold with a front-end sales charge. Class A shares bought without an initial sales charge in accounts aggregating $1 million to $50 million at the time of purchase are subject to a 1.00% contingent deferred sales charge (CDSC) if the shares are redeemed within 12 months after purchase, and a 0.50% CDSC if the shares are redeemed more than 12, but less than 18, months after purchase, with certain limited exceptions.
Advisor Class shares are offered at net asset value. There are certain restrictions on who may purchase these shares.
Class C shares are offered at net asset value but are subject to a CDSC on redemptions made within one year after purchase.
Institutional Class shares are offered at net asset value. There are certain restrictions on who may purchase Institutional Class shares. Generally, Institutional Class shares of a Fund may be exchanged for shares of another fund distributed by Columbia Management Investment Distributors, Inc. (CMID) at no additional charge.
Institutional 2 Class shares are offered at net asset value. There are certain restrictions on who may purchase these shares.
Institutional 3 Class shares are offered at net asset value. There are certain restrictions on who may purchase these shares.
Class R shares are not subject to sales charges and are generally available only to certain retirement plans and other investors as described in the Fund’s prospectus.
Investment income, realized and unrealized gains and losses, and certain fund-level expenses are allocated pro rata on the basis of the relative net assets of all classes, except that each class bears certain expenses specific to that class such as distribution services, transfer agent fees, and certain other class specific expenses. Differences in class expenses may result in payment of different dividend distributions for each class. All of the Funds’ share classes have equal rights with respect to voting, subject to Fund or class-specific matters.
| 126 | Columbia Acorn Family of Funds | Semiannual Report 2018 |
Notes to Financial Statements (continued)
June 30, 2018 (Unaudited)
Note 2. Summary of significant accounting policies
Basis of preparation
Each Fund is an investment company that applies the accounting and reporting guidance in the Financial Accounting Standards Board (FASB) Accounting Standards Codification Topic 946, Financial Services - Investment Companies (ASC 946). The financial statements are prepared in accordance with U.S. generally accepted accounting principles (GAAP), which requires management to make certain estimates and assumptions that affect the reported amounts of assets and liabilities, the disclosure of contingent assets and liabilities at the date of the financial statements and the reported amounts of income and expenses during the reporting period. Actual results could differ from those estimates.
The following is a summary of significant accounting policies followed by the Funds in the preparation of their financial statements.
Security valuation
Securities of the Funds are valued at market value or, if a market quotation for a security is not readily available or is deemed not to be reliable because of events or circumstances that have occurred between the market quotation and the time as of which the security is to be valued, the security is valued at a fair value determined in good faith under consistently applied procedures established by the Board of Trustees. With respect to Columbia Thermostat FundSM, investments in underlying funds are valued at their net asset values as reported by the underlying funds. A security traded on a securities exchange or in an over-the-counter market in which transaction prices are reported is valued at the last sales price at the time of valuation. A security traded principally on NASDAQ is valued at the NASDAQ official closing price. Exchange traded funds are valued at their closing net asset value as reported on the applicable exchange. A security for which there is no reported sale on the valuation date is valued by comparison of the mean of the latest bid and ask quotations.
Foreign equity securities are generally valued based on the closing price on the foreign exchange in which such securities are primarily traded. If any foreign equity security closing prices are not readily available, the securities are valued at the mean of the latest quoted bid and ask prices on such exchanges or markets. Foreign currency exchange rates are generally determined at 4:00 p.m. Eastern (U.S.) time. Many securities markets and exchanges outside the U.S. close prior to the close of the New York Stock Exchange; therefore, the closing prices for securities in such markets or on such exchanges may not fully reflect events that occur after such close but before the close of the New York Stock Exchange. In situations where foreign markets are closed, where a significant event has occurred after the foreign exchange closes but before the time at which the Fund’s share price is calculated, and in the event of significant movement in the trigger index for the statistical fair valuation process established by the Board of Trustees, foreign securities will be fair valued pursuant to a policy adopted by the Board of Trustees. The Trust has retained an independent statistical fair value pricing service that employs a systematic methodology to assist in the fair valuation process for securities principally traded in a foreign market in order to adjust for possible changes in value that may occur between the close of the foreign market and the time as of which the securities are to be valued. If a security is valued at a fair value, that value may be different from the last quoted market price for the security.
Short-term investments maturing in 60 days or less are valued at amortized cost, which approximates market value.
Foreign currency transactions and translations
Values of investments denominated in foreign currencies are converted into U.S. dollars using the New York spot market rate of exchange at the time of valuation. Purchases and sales of investments and dividend and interest income are translated into U.S. dollars using the spot market rate of exchange prevailing on the respective dates of such transactions. The gain or loss resulting from changes in foreign exchange rates is included with net realized and unrealized gain or loss from investments, as appropriate.
Columbia Acorn Family of Funds | Semiannual Report 2018
| 127 |
Notes to Financial Statements (continued)
June 30, 2018 (Unaudited)
Derivative instruments
Columbia Acorn International® invested in futures contracts on a limited basis during the six months ended June 30, 2018, as detailed below. Derivatives may involve various risks, including the potential inability of the counterparty to fulfill its obligation under the terms of the contract, the potential for an illiquid secondary market (making it difficult for the Fund to sell, including at favorable prices) and the potential for market movements which may expose the Fund to gains or losses in excess of the amount shown in the Statements of Assets and Liabilities.
For financial reporting purposes, the Funds do not offset derivative assets and derivative liabilities that are subject to netting arrangements in the Statements of Assets and Liabilities.
Futures contracts
Futures contracts are exchange-traded and represent commitments for the future purchase or sale of an asset at a specified price on a specified date. Columbia Acorn International® bought and sold futures contracts to maintain appropriate equity market exposure while keeping sufficient cash to accommodate daily redemptions. These instruments may be used for other purposes in future periods. Upon entering into futures contracts, the Fund bears risks that it may not achieve the anticipated benefits of the futures contracts and may realize a loss. Additional risks include counterparty credit risk, the possibility of an illiquid market, and that a change in the value of the contract or option may not correlate with changes in the value of the underlying asset.
Upon entering into a futures contract, the Fund deposits cash or securities with the broker, known as a futures commission merchant (FCM), in an amount sufficient to meet the initial margin requirement. The initial margin deposit must be maintained at an established level over the life of the contract. Cash deposited as initial margin is recorded in the Statement of Assets and Liabilities as margin deposits. Securities deposited as initial margin are designated in the Portfolio of Investments. Subsequent payments (variation margin) are made or received by the Fund each day. The variation margin payments are equal to the daily change in the contract value and are recorded as variation margin receivable or payable and are offset in unrealized gains or losses. The Fund recognizes a realized gain or loss when the contract is closed or expires. Futures contracts involve, to varying degrees, risk of loss in excess of the variation margin disclosed in the Statement of Assets and Liabilities.
Effects of derivative transactions in the financial statements
The following tables are intended to provide additional information about the effect of derivatives on the financial statements of Columbia Acorn International® including: the fair value of derivatives by risk category and the location of those fair values in the Statements of Assets and Liabilities; and the impact of derivative transactions over the period in the Statements of Operations, including realized gains or losses and unrealized gains or losses. The derivative schedules following the Portfolio of Investments present additional information regarding derivative instruments outstanding at the end of the period, if any.
Columbia Acorn International®
The following table is a summary of the fair value of derivative instruments (not considered to be hedging instruments for accounting disclosure purposes) at June 30, 2018:
| | Liability derivatives | |
Risk exposure
category | Statement
of assets and liabilities
location | Fair value ($) |
| Equity risk | Net assets — unrealized depreciation on futures contracts | 1,301,830* |
| * | Includes cumulative appreciation (depreciation) as reported in the tables following the Portfolio of Investments. Only the current day’s variation margin is reported in receivables or payables in the Statement of Assets and Liabilities. |
| 128 | Columbia Acorn Family of Funds | Semiannual Report 2018 |
Notes to Financial Statements (continued)
June 30, 2018 (Unaudited)
The following table indicates the effect of derivative instruments (not considered to be hedging instruments for accounting disclosure purposes) in the Statement of Operations for the six months ended June 30, 2018:
| Amount of realized gain (loss) on derivatives recognized in income |
| Risk exposure category | Futures
contracts
($) |
| Equity risk | (4,806,843) |
| |
| Change in unrealized appreciation (depreciation) on derivatives recognized in income |
| Risk exposure category | Futures
contracts
($) |
| Equity risk | (1,301,830) |
The following table is a summary of the average outstanding volume by derivative instrument for the six months ended June 30, 2018:
| Derivative instrument | Average notional
amounts ($)* |
| Futures contracts — long | 77,389,935 |
| * | Based on the ending quarterly outstanding amounts for the six months ended June 30, 2018. |
Security transactions and investment income
Security transactions, investment income and shareholder fund transactions are accounted for on the trade date (date the order to buy or sell is executed) and dividend income and realized gain distributions from other funds are recorded on the ex-dividend date, except that certain dividends from foreign securities are recorded as soon as the information is available to the Funds. Interest income is recorded on the accrual basis and includes amortization of discounts on debt obligations when required for federal income tax purposes. Realized gains and losses from security transactions are recorded on an identified cost basis.
Awards, if any, from class action litigation related to securities owned may be recorded as a reduction of cost of those securities. If the applicable securities are no longer owned, the proceeds are recorded as realized gains.
The Funds may receive distributions from holdings in exchange-traded funds (ETFs), limited partnerships (LPs), other regulated investment companies (RICs), and real estate investment trusts (REITs), which report information on the character of their distributions annually. These distributions are allocated to dividend income, capital gain and return of capital based on actual information reported. To the extent actual information has not yet been reported by the REITs, estimates for return of capital may be made by the Funds’ management. Return of capital is recorded as a reduction of the cost basis of securities held. If the Funds no longer own the applicable securities, return of capital is recorded as a realized gain. Management’s estimates are subsequently adjusted when the actual character of the distributions is disclosed by the REITs, which could result in a proportionate change in return of capital to shareholders. No estimates are made for ETFs and RICs.
Fund share valuation
Fund shares are sold and redeemed on a daily basis at net asset value, subject to any applicable sales charge. Net asset value per share is determined daily as of the close of trading on the New York Stock Exchange (NYSE) on each day the NYSE is open for trading. Generally, income, expenses and realized and unrealized gain/(losses) of a Fund are allocated to each class proportionately on a daily basis for purposes of determining the net asset value of each class. The distribution and service fees and transfer agent fees are charged to each specific class as expenses are incurred. Redemption fees are accounted for as an addition to paid in capital for purposes of determining the net asset value of each class.
Columbia Acorn Family of Funds | Semiannual Report 2018
| 129 |
Notes to Financial Statements (continued)
June 30, 2018 (Unaudited)
Securities lending
Each Fund, except Columbia Thermostat FundSM, may lend securities up to one-third of the value of its total assets to certain approved brokers, dealers and other financial institutions to earn additional income. The Funds retain the benefits of owning the securities, including the economic equivalent of dividends or interest generated by the security. The Funds also receive a fee for the loan. The Funds have the ability to recall the loans at any time and could do so in order to vote proxies or to sell the loaned securities. Each loan is collateralized by cash that exceeds the value of the securities on loan. The market value of the loaned securities is determined daily at the close of business of a Fund and any additional required collateral is delivered to the Fund on the next business day. The Funds have elected to invest the cash collateral in the Dreyfus Government Cash Management Fund. The income earned from the securities lending program is paid to each Fund, net of any fees remitted to Goldman Sachs Agency Lending, the Funds’ lending agent, and net of any borrower rebates. The Investment Manager does not retain any fees earned by the lending program. Generally, in the event of borrower default, a Fund has the right to use the collateral to offset any losses incurred. In the event a Fund is delayed or prevented from exercising its right to dispose of the collateral, there may be a potential loss to the Fund. Some of these losses may be indemnified by the lending agent. The Funds bear the risk of loss with respect to the investment of collateral. The net securities lending income earned as of June 30, 2018 by each Fund is included in the Statements of Operations.
Offsetting of assets and liabilities
The following table presents each Fund’s gross and net amount of assets and liabilities available for offset under netting agreements and under a securities lending agreement as well as the related collateral received by each Fund as of June 30, 2018:
| | Columbia
Acorn® Fund | Columbia Acorn
International® | Columbia
Acorn USA® | Columbia Acorn
International SelectSM | Columbia Acorn
Emerging Markets FundSM | Columbia Acorn
European FundSM |
| | Goldman
Sachs ($) | Goldman
Sachs ($) | Goldman
Sachs ($) | Goldman
Sachs ($) | Goldman
Sachs ($) | Goldman
Sachs ($) |
| Liabilities | | | | | | |
| Collateral on Securities loaned(a) | 50,735,444 | 14,853,961 | 4,633,100 | 1,312,200 | 405,000 | 1,168,500 |
| Total Liabilities | 50,735,444 | 14,853,961 | 4,633,100 | 1,312,200 | 405,000 | 1,168,500 |
| Total Financial and Derivative Net Assets | (50,735,444) | (14,853,961) | (4,633,100) | (1,312,200) | (405,000) | (1,168,500) |
| Financial Instruments | 49,634,346 | 14,348,902 | 4,523,791 | 1,289,196 | 397,900 | 1,140,391 |
| Net Amount (b) | (1,101,098) | (505,059) | (109,309) | (23,004) | (7,100) | (28,109) |
| (a) | Columbia Acorn SelectSM and Columbia Thermostat FundSM had no securities on loan outstanding at June 30, 2018. |
| (b) | Represents the net amount due from/(to) counterparties in the event of default. |
Securities lending transactions
The following table indicates the total amount of securities loaned by type, reconciled to gross liability payable upon return of the securities loaned by the Fund as of June 30, 2018:
| | Overnight and
continuous | Up to
30 days | 30-90
days | Greater than
90 days | Total |
| Columbia Acorn® Fund | | | | | |
| Securities lending transactions | | | | | |
| Equity securities | $49,634,346 | $— | $— | $— | $49,634,346 |
| Gross amount of recognized liabilities for securities lending (collateral received) | | | | | 50,735,444 |
| Amounts due to counterparty in the event of default | | | | | $1,101,098 |
| 130 | Columbia Acorn Family of Funds | Semiannual Report 2018 |
Notes to Financial Statements (continued)
June 30, 2018 (Unaudited)
| | Overnight and
continuous | Up to
30 days | 30-90
days | Greater than
90 days | Total |
| Columbia Acorn International® | | | | | |
| Securities lending transactions | | | | | |
| Equity securities | $14,348,902 | $— | $— | $— | $14,348,902 |
| Gross amount of recognized liabilities for securities lending (collateral received) | | | | | 14,853,961 |
| Amounts due to counterparty in the event of default | | | | | $505,059 |
| Columbia Acorn USA® | | | | | |
| Securities lending transactions | | | | | |
| Equity securities | $4,523,791 | $— | $— | $— | $4,523,791 |
| Gross amount of recognized liabilities for securities lending (collateral received) | | | | | 4,633,100 |
| Amounts due to counterparty in the event of default | | | | | $109,309 |
| Columbia Acorn International SelectSM | | | | | |
| Securities lending transactions | | | | | |
| Equity securities | $1,289,196 | $— | $— | $— | $1,289,196 |
| Gross amount of recognized liabilities for securities lending (collateral received) | | | | | 1,312,200 |
| Amounts due to counterparty in the event of default | | | | | $23,004 |
| Columbia Acorn Emerging Markets FundSM | | | | | |
| Securities lending transactions | | | | | |
| Equity securities | $397,900 | $— | $— | $— | $397,900 |
| Gross amount of recognized liabilities for securities lending (collateral received) | | | | | 405,000 |
| Amounts due to counterparty in the event of default | | | | | $7,100 |
| Columbia Acorn European FundSM | | | | | |
| Securities lending transactions | | | | | |
| Equity securities | $1,140,391 | $— | $— | $— | $1,140,391 |
| Gross amount of recognized liabilities for securities lending (collateral received) | | | | | 1,168,500 |
| Amounts due to counterparty in the event of default | | | | | $28,109 |
Federal income tax status
It is each Fund’s policy to comply with the provisions of the Internal Revenue Code available to regulated investment companies and, in the manner provided therein, distribute substantially all their taxable income, as well as any net realized gain on sales of investments and foreign currency transactions reportable for federal income tax purposes. Columbia Thermostat FundSM distributes all of its taxable income, as well as any net realized gain on sales of portfolio fund shares and any distributions of net realized gains received by the Fund from its portfolio funds, reportable for federal income tax purposes. Accordingly, the Funds paid no federal income taxes and no federal income tax provision was required.
Foreign taxes
Realized gains in certain countries may be subject to foreign taxes at the fund level. The Funds accrue for such foreign taxes on realized and unrealized gains at the appropriate rate for each jurisdiction. The amount, if any, is disclosed as a liability on the Statements of Assets and Liabilities.
Distributions to shareholders
Distributions to shareholders are recorded on the ex-dividend date.
Guarantees and indemnification
In the normal course of business, the Trust on behalf of the Funds enters into contracts that contain a variety of representations and warranties and that provide general indemnities. A Fund’s maximum exposure under these arrangements is unknown, as this would involve future claims against the Fund. Also, under the Trust’s organizational documents, the trustees and officers of the Trust are indemnified against certain liabilities that may arise out of their duties to the Trust. However, based on experience, the Funds expect the risk of loss due to these warranties and indemnities to be remote.
Columbia Acorn Family of Funds | Semiannual Report 2018
| 131 |
Notes to Financial Statements (continued)
June 30, 2018 (Unaudited)
Recent accounting pronouncement
Accounting Standards Update 2017-08 Premium Amortization on Purchased Callable Debt Securities
In March 2017, the Financial Accounting Standards Board issued Accounting Standards Update (ASU) No. 2017-08 Premium Amortization on Purchased Callable Debt Securities. ASU No. 2017-08 updates the accounting standards to shorten the amortization period for certain purchased callable debt securities, held at a premium, to be amortized to the earliest call date. The update applies to securities with explicit, noncontingent call features that are callable at fixed prices and on preset dates. The standard is effective for annual periods beginning after December 15, 2018 and interim periods within those fiscal years. At this time, management is evaluating the implication of this guidance and the impact it will have on the financial statement amounts and footnote disclosures, if any.
Note 3. Fees and other transactions with affiliates
Investment management fees
CWAM is a wholly-owned subsidiary of Columbia Management Investment Advisers, LLC (Columbia Management), which is a wholly-owned subsidiary of Ameriprise Financial, Inc. (Ameriprise Financial). CWAM furnishes continuing investment supervision to the Funds and is responsible for the overall management of the Funds’ business affairs.
CWAM receives a monthly advisory fee based on each Fund’s daily net assets at the following annual rates:
| Columbia Acorn® Fund |
| Average daily net assets | Annual
fee rate |
| Up to $700 million | 0.74% |
| $700 million to $2 billion | 0.69% |
| $2 billion to $6 billion | 0.64% |
| $6 billion and over | 0.63% |
| Columbia Acorn International® |
| Average daily net assets | Annual
fee rate |
| Up to $100 million | 1.19% |
| $100 million to $500 million | 0.94% |
| $500 million and over | 0.74% |
| Columbia Acorn USA® |
| Average daily net assets | Annual
fee rate |
| Up to $200 million | 0.94% |
| $200 million to $500 million | 0.89% |
| $500 million to $2 billion | 0.84% |
| $2 billion to $3 billion | 0.80% |
| $3 billion and over | 0.70% |
| Columbia Acorn International SelectSM |
| Average daily net assets | Annual
fee rate |
| Up to $500 million | 0.89% |
| $500 million and over | 0.85% |
| 132 | Columbia Acorn Family of Funds | Semiannual Report 2018 |
Notes to Financial Statements (continued)
June 30, 2018 (Unaudited)
| Columbia Acorn SelectSM |
| Average daily net assets | Annual
fee rate |
| Up to $700 million | 0.85% |
| $700 million to $2 billion | 0.80% |
| $2 billion to $3 billion | 0.75% |
| $3 billion and over | 0.70% |
| Columbia Thermostat FundSM |
| | Annual
fee rate |
| All Assets | 0.10% |
| Columbia Acorn Emerging Markets FundSM |
| Average daily net assets | Annual
fee rate |
| Up to $100 million | 1.25% |
| $100 million to $500 million | 1.00% |
| $500 million and over | 0.80% |
| Columbia Acorn European FundSM |
| Average daily net assets | Annual
fee rate |
| Up to $100 million | 1.19% |
| $100 million to $500 million | 0.94% |
| $500 million and over | 0.74% |
Through April 30, 2019, CWAM has contractually agreed to waive 0.20% of the advisory fee otherwise payable to it by Columbia Acorn Select. When determining whether the Fund’s total expenses exceed the voluntary expense cap described below, the Fund’s net advisory fee, reflecting application of the 0.20% waiver, will be used to calculate the Fund’s total expenses. This arrangement may only be amended or terminated with approval from the Fund’s Board of Trustees and the Investment Manager.
For the six months ended June 30, 2018, the annualized effective investment advisory fee rates (net of the advisory fee waiver for Columbia Acorn SelectSM) were as follows:
| Fund | Effective investment advisory fee rate (%) |
| Columbia Acorn® Fund | 0.67 |
| Columbia Acorn International® | 0.77 |
| Columbia Acorn USA® | 0.92 |
| Columbia Acorn International SelectSM | 0.89 |
| Columbia Acorn SelectSM | 0.65 |
| Columbia Thermostat FundSM | 0.10 |
| Columbia Acorn Emerging Markets FundSM | 1.24 |
| Columbia Acorn European FundSM | 1.15 |
Participating Affiliates
The Investment Manager and its investment advisory affiliates, including Columbia Management (Affiliates), may coordinate in providing services to their clients. From time to time, the Investment Manager may engage its Affiliates to provide a variety of services such as trading and discretionary investment management (including portfolio management) to certain accounts managed by the Investment Manager, including Columbia Thermostat FundSM. These Affiliates will provide services to the Investment Manager pursuant to personnel-sharing agreements or similar inter-company arrangements and the Fund will pay no additional fees and expenses as a result of any such arrangements. These Affiliates, like the Investment Manager, are direct or indirect subsidiaries of Ameriprise Financial and are registered with the appropriate respective regulators and, where required, the Securities and Exchange Commission and the Commodity Futures Trading Commission in the United States.
Columbia Acorn Family of Funds | Semiannual Report 2018
| 133 |
Notes to Financial Statements (continued)
June 30, 2018 (Unaudited)
Pursuant to some of these arrangements, certain employees of Columbia Management and other Affiliates may serve as “associated persons” of the Investment Manager and, in this capacity, subject to the oversight and supervision of the Investment Manager and consistent with the investment objectives, policies and limitations set forth in the Fund’s prospectus and SAI, and the Investment Manager’s and the Funds’ compliance policies and procedures, may provide such services to the Fund on behalf of the Investment Manager.
Administration fees
CWAM provides administrative services and receives an administration fee from the Funds at the following annual rates:
| Columbia Acorn Trust |
Aggregate average daily
net assets of the trust | Annual
fee rate |
| Up to $8 billion | 0.050% |
| $8 billion to $16 billion | 0.040% |
| $16 billion to $35 billion | 0.030% |
| $35 billion to $45 billion | 0.025% |
| $45 billion and over | 0.015% |
For the six months ended June 30, 2018, the annualized effective administration fee rate was 0.047% of each Fund’s average daily net assets. CWAM has delegated to Columbia Management responsibility to provide certain sub-administrative services to the Funds.
Compensation of board members
Certain officers and trustees of the Trust are also officers of CWAM or Columbia Management. The Trust makes no direct payments to its officers and trustees who are affiliated with CWAM or Columbia Management. The Trust offers a deferred compensation plan for its independent trustees. Under that plan, a trustee may elect to defer all or a portion of his or her compensation. Amounts deferred are retained by the Trust and may represent an unfunded obligation of the Trust. The value of amounts deferred is determined by reference to the change in value of Institutional Class shares of one or more series of Columbia Acorn Trust or a money market fund as specified by the trustee. Benefits under the deferred compensation plan are payable in accordance with the plan.
Compensation of Chief Compliance Officer
The Board of Trustees has appointed a Chief Compliance Officer to the Funds in accordance with federal securities regulations. As disclosed in the Statement of Operations, a portion of the Chief Compliance Officer’s total compensation is allocated to the Funds, along with other allocations to affiliated funds governed by the Board of Trustees, based on relative net assets.
Transactions with affiliates
An affiliated person of a Fund may include any company in which a Fund owns five percent or more of its outstanding voting shares during the year. On June 30, 2018, Columbia Thermostat FundSM and Columbia Acorn® Fund held five percent or more of the outstanding voting securities of one or more companies or a company which is under common ownership or control with the Funds. Details of investments in those affiliated companies are presented in the Notes to Portfolio of Investments of each Fund listed above.
For the six months ended June 30, 2018, the Funds engaged in purchase and sales transactions with funds that have a common investment manager (or affiliated investment managers), common directors/trustees, and/or common officers. Those transactions complied with Rule 17a-7 under the 1940 Act and totaled as follows.
| Fund | Purchases ($) | Sales ($) | Realized
gain/(loss)
from sale
transactions ($) |
| Columbia Acorn International® | — | 2,485,568 | (11,943) |
| 134 | Columbia Acorn Family of Funds | Semiannual Report 2018 |
Notes to Financial Statements (continued)
June 30, 2018 (Unaudited)
Transfer agency fees
Under a Transfer, Dividend Disbursing and Shareholders’ Servicing Agent Agreement, Columbia Management Investment Services Corp. (the Transfer Agent), an affiliate of the Investment Manager and a wholly-owned subsidiary of Ameriprise Financial, is responsible for providing transfer agency, dividend disbursing and shareholder services to the Funds for which the Funds pay transfer agency fees. The Transfer Agent has contracted with DST Asset Manager Solutions, Inc. (DST) to provide certain services and assist the Transfer Agent carrying out its duties. The Transfer Agent pays the fees of DST for its services and DST is not entitled to reimbursement for such fees from the Fund (with the exception of out-of-pocket fees). In addition, the Transfer Agent enters into agreements with various financial intermediaries through which investors may hold Fund shares, including Ameriprise Financial and its affiliates. These intermediaries also may provide shareholder services (Additional Shareholder Services) for which they are compensated by the Transfer Agent, which is in turn compensated by the Funds. Additional Shareholder Services may include sub-accounting, sub-transfer agency, participant recordkeeping, shareholder or participant reporting, shareholder or participant transaction processing, shareholder or participant tax monitoring and reporting and/or the provision of call center support and other customer services.
The Fund pays the Transfer Agent a monthly transfer agency fee that varies by account type (on a per account or asset-based basis) based on the cost of servicing the Funds. In addition, subject to certain limitations described in the Funds’ prospectuses and except with respect to Institutional 3 Class shares, the Funds pay a fee to the Transfer Agent for the Additional Shareholder Services provided by financial intermediaries who maintain shares through omnibus or networked accounts in amounts that vary by share class and with the distribution channel, type of intermediary and type of services provided.
The Funds compensate the Transfer Agent for certain out-of-pocket expenses as approved by the Board from time to time. Such out-of-pocket expenses may include networking account fees paid to dealer firms by the Transfer Agent with respect to shareholder accounts established or maintained pursuant to the National Securities Clearing Corporation’s (NSCC) networking system. A significant portion of such networking account fees are paid by the Transfer Agent to dealer firms affiliated with Ameriprise Financial and its affiliates.
Effective July 1, 2017 through June 30, 2019, the Transfer Agent has contractually agreed to limit the total fees payable to it by Columbia Acorn® Fund to an annual rate of not more than 0.07% for all share classes of the Fund other than Institutional 2 Class and Institutional 3 Class unless sooner terminated at the sole discretion of the Board of Trustees.
Effective July 1, 2017 through June 30, 2019, the Transfer Agent has contractually agreed to limit the total fees payable to it by Columbia Acorn International® to an annual rate of not more than 0.11% for all share classes of the Fund other than Institutional 2 Class and Institutional 3 Class unless sooner terminated at the sole discretion of the Board of Trustees.
Effective July 1, 2017 through June 30, 2019, the Transfer Agent has contractually agreed to limit the total fees payable to it by Columbia Acorn SelectSM to an annual rate of not more than 0.11% for all share classes of the Fund other than Institutional 2 Class and Institutional 3 Class unless sooner terminated at the sole discretion of the Board of Trustees.
Effective July 1, 2017 through June 30, 2019, the Transfer Agent has contractually agreed to limit the total fees payable to it by Columbia Acorn USA® to an annual rate of not more than 0.14% for all share classes of the Fund other than Institutional 2 Class and Institutional 3 Class unless sooner terminated at the sole discretion of the Board of Trustees.
For each Fund, effective July 1, 2017 through June 30, 2019, Institutional 2 Class shares are subject to a contractual transfer agency fee annual limitation of not more than 0.05% and Institutional 3 Class shares are subject to a contractual transfer agency fee annual limitation of not more than 0.00% of the average daily net assets attributable to each share class unless sooner terminated at the sole discretion of the Board of Trustees.
Columbia Acorn Family of Funds | Semiannual Report 2018
| 135 |
Notes to Financial Statements (continued)
June 30, 2018 (Unaudited)
For the six months ended June 30, 2018, the Funds’ annualized effective transfer agency fee rates, as a percentage of average daily net assets of each class were as follows:
| Fund | Class A
(%) | Advisor
Class (%) | Class C
(%) | Institutional
Class (%) | Institutional 2
Class (%) | Institutional 3
Class (%) | Class R
(%) |
| Columbia Acorn® Fund | 0.07 | 0.07 | 0.07 | 0.07 | 0.05 | 0.00 | — |
| Columbia Acorn International® | 0.11 | 0.11 | 0.11 | 0.11 | 0.05 | 0.00 | 0.11 |
| Columbia Acorn USA® | 0.13 | 0.13 | 0.13 | 0.13 | 0.05 | 0.00 | — |
| Columbia Acorn International SelectSM | 0.14 | 0.14 | 0.14 | 0.14 | 0.05 | 0.00 | — |
| Columbia Acorn SelectSM | 0.11 | 0.11 | 0.11 | 0.11 | 0.05 | 0.00 | — |
| Columbia Thermostat FundSM | 0.10 | 0.10 | 0.10 | 0.10 | 0.05 | 0.00 | — |
| Columbia Acorn Emerging Markets FundSM | 0.12 | 0.12 | 0.12 | 0.12 | 0.05 | 0.00 | — |
| Columbia Acorn European FundSM | 0.11 | 0.11 | 0.11 | 0.11 | 0.05 | 0.00 | — |
Columbia Acorn International® and certain other associated investment companies, have severally, but not jointly, guaranteed the performance and observance of all the terms and conditions of a lease entered into by Seligman Data Corp. (SDC), the former transfer agent to certain associated investment companies, including the payment of rent by SDC (the Guaranty). The lease and the Guaranty expire in January 2019. At June 30, 2018, the total potential future obligation from Columbia Acorn International® over the life of the Guaranty is $11,909. The liability remaining at June 30, 2018 for non-recurring charges associated with the lease amounted to $9,140 and is included within the payable for other liabilities in the Statements of Assets and Liabilities.
An annual minimum account balance fee of $20 may apply to certain accounts with a value below the applicable share class’s initial minimum investment requirements to reduce the impact of small accounts on transfer agency fees. These minimum account balance fees are remitted to the Funds and recorded as part of expense reductions in the Statement of Operations.
For the six months ended June 30, 2018, these minimum account balance fees reduced total expenses as follows:
| Fund | Amount ($) |
| Columbia Acorn® Fund | 7,700 |
| Columbia Acorn International® | 8,672 |
| Columbia Acorn USA® | 1,420 |
| Columbia Acorn International SelectSM | 640 |
| Columbia Acorn SelectSM | 1,320 |
| Columbia Thermostat FundSM | 580 |
| Columbia Acorn Emerging Markets FundSM | 40 |
| Columbia Acorn European FundSM | — |
Distribution and service fees
CMID, a wholly owned subsidiary of Ameriprise Financial, is the distributor of the Funds. Each Fund has adopted a distribution and service plan which requires it to pay CMID a monthly service fee equal to 0.25% annually of the average daily net assets attributable to Class A and Class C shares and a monthly distribution fee equal to 0.75% and 0.50%, annually, of the average daily net assets attributable to Class C and Class R shares, respectively. CMID receives no compensation with respect to Advisor Class, Institutional Class, Institutional 2 Class and Institutional 3 Class shares.
| 136 | Columbia Acorn Family of Funds | Semiannual Report 2018 |
Notes to Financial Statements (continued)
June 30, 2018 (Unaudited)
Sales charges
Sales charges, including front-end charges and CDSCs, received by the Distributor for distributing Fund shares for the six months ended June 30, 2018, if any, are listed below:
| | Underwriting discounts ($) | CDSCs ($) | |
| Fund | Class A | Class A | Class C |
| Columbia Acorn® Fund | 188,294 | 1,543 | 1,545 |
| Columbia Acorn International® | 81,452 | 4 | 448 |
| Columbia Acorn USA® | 16,061 | 42 | 926 |
| Columbia Acorn International SelectSM | 45,347 | 139 | 2 |
| Columbia Acorn SelectSM | 12,943 | 61 | 26 |
| Columbia Thermostat FundSM | 88,097 | 695 | 3,132 |
| Columbia Acorn Emerging Markets FundSM | 12,669 | 196 | 60 |
| Columbia Acorn European FundSM | 78,722 | 44 | 427 |
Expenses waived/reimbursed by the Investment Manager and its affiliates
Through June 30, 2019, CWAM has contractually agreed to waive fees and/or reimburse expenses so that the Funds’ ordinary operating expenses (excluding transaction costs and certain other investment-related expenses, interest and fees on borrowings and expenses associated with the Fund’s investments in other investment companies, if any) do not exceed the following annual rates as a percentage of each class’ average daily net assets:
| Fund | Class A | Advisor | Class C | Institutional | Institutional 2 | Institutional 3 |
| Columbia Acorn Emerging Markets Fund | 1.55% | 1.30% | 2.30% | 1.30% | 1.19% | 1.14% |
| Columbia Acorn European Fund | 1.45% | 1.20% | 2.20% | 1.20% | 1.13% | 1.08% |
This arrangement may not be modified or terminated, except by a vote of the Fund’s Board and CWAM.
Effective May 1, 2018 through April 30, 2019, CWAM contractually agreed to waive fees and/or reimburse expenses so that the Funds’ ordinary operating expenses (excluding transaction costs and certain other investment-related expenses, interest and fees on borrowings, if any), do not exceed the following annual rates as a percentage of each class’ average daily net assets:
| Fund | Class A | Advisor | Class C | Institutional Class | Institutional Class 2 | Institutional Class 3 |
| Columbia Acorn Fund | 1.11% | 0.86% | 1.86% | 0.86% | 0.84% | 0.79% |
| Columbia Acorn USA Fund | 1.42% | 1.17% | 2.17% | 1.17% | 1.08% | 1.03% |
There is no guarantee that these agreements will continue thereafter.
Effective May 1, 2018, CWAM has contractually agreed to waive fees and/or reimburse expenses through April 30, 2019, so that the Funds’ ordinary operating expenses (excluding transaction costs and certain other investment-related expenses, interest and fees on borrowings and expenses associated with each Fund’s investments in other investment companies, if any, and in the case of Columbia Thermostat FundSM its underlying portfolio funds), do not exceed the following annual rates as a percentage of each class’ average daily net assets:
| Fund | Class A | Advisor | Class C | Institutional | Institutional Class 2 | Institutional Class 3 |
| Columbia Acorn International Select | 1.40% | 1.15% | 2.15% | 1.15% | 1.06% | 1.01% |
| Columbia Thermostat Fund | 0.50% | 0.25% | 1.25% | 0.25% | 0.20% | 0.15% |
There is no guarantee that these agreements will continue thereafter.
Columbia Acorn Family of Funds | Semiannual Report 2018
| 137 |
Notes to Financial Statements (continued)
June 30, 2018 (Unaudited)
Prior to May 1, 2018, CWAM voluntarily agreed to reimburse expenses so that the Funds’ ordinary operating expenses (excluding transaction costs and certain other investment-related expenses, interest and fees on borrowings and expenses associated with each Fund’s investments in other investment companies, if any) after giving effect to any balance credits or overdraft charges from the Funds’ custodian, did not exceed the following annual rates as a percentage of each class’ average daily net assets:
| Fund | Class A | Advisor | Class C | Institutional | Institutional Class 2 | Institutional Class 3 |
| Columbia Acorn Select | 1.60% | 1.35% | 2.35% | 1.35% | 1.29% | 1.24% |
Prior to May 1, 2018, CWAM had contractually agreed to waive fees and/or reimburse expenses so that the Funds’ ordinary operating expenses (excluding transaction costs and certain other investment-related expenses, interest and fees on borrowings and expenses associated with each Fund’s investments in other investment companies, if any, and in the case of Columbia Thermostat FundSM its underlying portfolio funds), did not exceed the following annual rates as a percentage of each class’ average daily net assets:
| Fund | Class A | Advisor | Class C | Institutional Class | Institutional Class 2 | Institutional Class 3 |
| Columbia Acorn International Select | 1.40% | 1.15% | 2.15% | 1.15% | 1.08% | 1.03% |
| Columbia Thermostat Fund | 0.50% | 0.25% | 1.25% | 0.25% | 0.23% | 0.18% |
Prior to May 1, 2018, Columbia Acorn Fund and Columbia Acorn USA Fund did not have a contractual agreement to waive fees and/or reimburse expenses.
In addition to the contractual agreement, CWAM has voluntarily agreed to waive fees and/or reimburse Fund expenses (excluding certain fees and expenses described above) so that Columbia Acorn USA®, Columbia Acorn Emerging Markets FundSM and Columbia Acorn European FundSM Fund level expenses (expenses directly attributable to the Fund and not to a specific share class) are waived proportionately across all share classes, but each Fund’s net operating expenses shall not exceed the contractual annual rates listed in the table above. This arrangement may be revised or discontinued at any time.
Expenses waived and/or reimbursed by CWAM and its affiliates for the six months ended June 30, 2018, were as follows:
| Fund | Expenses waived and/or
reimbursed ($) |
| Columbia Acorn® Fund | 591,775 |
| Columbia Acorn International® | 212,194 |
| Columbia Acorn USA® | 21,167 |
| Columbia Acorn International SelectSM | 77,604 |
| Columbia Acorn SelectSM | 349,846 |
| Columbia Thermostat FundSM | 235,828 |
| Columbia Acorn Emerging Markets FundSM | 224,250 |
| Columbia Acorn European FundSM | 190,436 |
Note 4. Federal tax information
The timing and character of income and capital gain distributions are determined in accordance with income tax regulations, which may differ from GAAP because of temporary or permanent book to tax differences.
| 138 | Columbia Acorn Family of Funds | Semiannual Report 2018 |
Notes to Financial Statements (continued)
June 30, 2018 (Unaudited)
At June 30, 2018, the approximate cost of all investments for federal income tax purposes and the aggregate gross approximate unrealized appreciation and depreciation based on that cost was:
| Fund | Tax cost ($) | Gross
unrealized
appreciation ($) | Gross
unrealized
(depreciation) ($) | Net unrealized
appreciation ($) |
| Columbia Acorn® Fund | 3,306,055,000 | 1,497,538,000 | (41,422,000) | 1,456,116,000 |
| Columbia Acorn International® | 2,781,946,000 | 1,354,532,000 | (163,372,000) | 1,191,160,000 |
| Columbia Acorn USA® | 268,143,000 | 90,861,000 | (6,112,000) | 84,749,000 |
| Columbia Acorn International SelectSM | 88,853,000 | 33,469,000 | (2,501,000) | 30,968,000 |
| Columbia Acorn SelectSM | 226,025,000 | 85,132,000 | (4,341,000) | 80,791,000 |
| Columbia Thermostat FundSM | 735,224,000 | 17,820,000 | (6,936,000) | 10,884,000 |
| Columbia Acorn Emerging Markets FundSM | 76,083,000 | 19,693,000 | (7,091,000) | 12,602,000 |
| Columbia Acorn European FundSM | 93,266,000 | 24,517,000 | (3,806,000) | 20,711,000 |
The following capital loss carryforwards, determined at December 31, 2017, may be available to reduce taxable income arising from future net realized gains on investments, if any, to the extent permitted by the Internal Revenue Code. Capital loss carryforwards with no expiration are required to be utilized prior to any capital losses which carry an expiration date. As a result of this ordering rule, capital loss carryforwards which carry an expiration date may be more likely to expire unused.
| Fund | 2018 ($) | 2019 ($) | No expiration
short-term ($) | No expiration
long-term ($) | Total ($) |
| Columbia Acorn International SelectSM | — | — | 6,453,644 | — | 6,453,644 |
| Columbia Acorn Emerging Markets FundSM | — | — | 44,045,008 | 37,169,770 | 81,214,778 |
| Columbia Acorn European FundSM | — | — | 5,685,111 | 2,064,121 | 7,749,232 |
Under current tax rules, regulated investment companies can elect to treat certain late-year ordinary losses incurred and post-October capital losses (capital losses realized after October 31) as arising on the first day of the following taxable year. The Funds will elect to treat the following late-year ordinary losses and post-October capital losses at December 31, 2017 as arising on January 1, 2018.
| Fund | Late year
ordinary losses ($) | Post-October
capital losses ($) |
| Columbia Acorn Emerging Markets FundSM | 57,729 | — |
Management of the Funds has concluded that there are no significant uncertain tax positions in the Funds that would require recognition in the financial statements. However, management’s conclusion may be subject to review and adjustment at a later date based on factors including, but not limited to, new tax laws, regulations, and administrative interpretations (including relevant court decisions). Generally, the Funds’ federal tax returns for the prior three fiscal years remain subject to examination by the Internal Revenue Service.
Columbia Acorn Family of Funds | Semiannual Report 2018
| 139 |
Notes to Financial Statements (continued)
June 30, 2018 (Unaudited)
Note 5. Portfolio information
The aggregate cost of purchases and proceeds from sales, other than short-term obligations, for the six months ended June 30, 2018, were:
| | Purchases
($) | Proceeds
from sales
($) |
| Columbia Acorn® Fund | 1,246,291,998 | 1,734,478,065 |
| Columbia Acorn International® | 612,908,304 | 1,556,288,509 |
| Columbia Acorn USA® | 114,587,042 | 153,673,591 |
| Columbia Acorn International SelectSM | 28,141,887 | 39,937,470 |
| Columbia Acorn SelectSM | 95,741,924 | 118,003,578 |
| Columbia Thermostat FundSM | 618,002,879 | 725,482,615 |
| Columbia Acorn Emerging Markets FundSM | 26,141,993 | 38,446,698 |
| Columbia Acorn European FundSM | 27,095,644 | 13,862,820 |
The amount of purchase and sales activity impacts the portfolio turnover rate reported in the Financial Highlights.
Note 6. Line of credit
Each Fund has access to a revolving credit facility with a syndicate of banks led by Citibank, N.A., HSBC Bank USA, N.A. and JPMorgan Chase Bank, N.A. whereby the Funds may borrow for the temporary funding of shareholder redemptions or for other temporary or emergency purposes. The credit facility, which is a collective agreement between the Funds and certain other funds managed by the Investment Manager, severally and not jointly, permits collective borrowings up to $1 billion. Interest is charged to each participating fund based on its borrowings at a rate equal to the higher of (i) the overnight federal funds rate plus 1.00% or (ii) the one-month LIBOR rate plus 1.00%. Each borrowing under the credit facility matures no later than 60 days after the date of borrowing. Each Fund also pays a commitment fee equal to its pro rata share of the amount of the credit facility at a rate of 0.15% per annum. The commitment fee is included in other expenses in the Statement of Operations.
No Fund had borrowings during the six months ended June 30, 2018.
Note 7. Significant risks
Consumer discretionary sector risk
Columbia Acorn® Fund, Columbia Acorn SelectSM, Columbia Acorn Emerging Markets FundSM and Columbia Acorn European FundSM may be more susceptible to the particular risks that may affect companies in the consumer discretionary sector than if they were invested in a wider variety of companies in unrelated sectors. Companies in the discretionary sector are subject to certain risks, including fluctuations in the performance of the overall domestic and international economy, interest rate changes, increased competition and consumer confidence. Performance of such companies may be affected by factors including reduced disposable household income, reduced consumer spending, changing demographics and consumer tastes.
Financial sector risk
Columbia Acorn Emerging Markets FundSM may be more susceptible to the particular risks that may affect companies in the financial services sector than if it were invested in a wider variety of companies in unrelated sectors. Companies in the financial services sector are subject to certain risks, including the risk of regulatory change, decreased liquidity in credit markets and unstable interest rates. Such companies may have concentrated portfolios, such as a high level of loans to real estate developers, which makes them vulnerable to economic conditions that affect that industry. Performance of such companies may be affected by competitive pressures and exposure to investments or agreements that, under certain circumstances, may lead to losses (e.g., subprime loans). Companies in the financial services sector are subject to extensive
| 140 | Columbia Acorn Family of Funds | Semiannual Report 2018 |
Notes to Financial Statements (continued)
June 30, 2018 (Unaudited)
governmental regulation that may limit the amount and types of loans and other financial commitments they can make, and interest rates and fees that they may charge. In addition, profitability of such companies is largely dependent upon the availability and the cost of capital.
Foreign securities and emerging market countries risk
Investing in foreign securities may include certain risks and considerations not typically associated with investing in U.S. securities, such as fluctuating currency values and changing local and regional economic, political and social conditions, which may result in greater market volatility. In addition, certain foreign securities may not be as liquid as U.S. securities. Investing in emerging markets may accentuate these risks. These countries are also more likely to experience high levels of inflation, deflation or currency devaluation which could hurt their economies and securities markets. To the extent that Columbia Acorn International® , Columbia Acorn International SelectSM, Columbia Acorn Emerging Markets FundSM and Columbia Acorn European FundSM concentrates their investment exposure to any one or a few specific countries, the Funds will be particularly susceptible to the various conditions, events or other factors impacting those countries and may, therefore, have a greater risk than that of a fund which is more geographically diversified.
Health care sector risk
Columbia Acorn® Fund and Columbia Acorn USA® may be more susceptible to the particular risks that may affect companies in the health care sector than if they were invested in a wider variety of companies in unrelated sectors. Companies in the health care sector are subject to certain risks, including restrictions on government reimbursement for medical expenses, government approval of medical products and services, competitive pricing pressures, and the rising cost of medical products and services (especially for companies dependent upon a relatively limited number of products or services). Performance of such companies may be affected by factors including, government regulation, obtaining and protecting patents (or the failure to do so), product liability and other similar litigation as well as product obsolescence.
Industrial sector risk
Columbia Acorn International®, Columbia Acorn International SelectSM and Columbia Acorn European FundSM may be more susceptible to the particular risks that may affect companies in the industrials sector than if they were invested in a wider variety of companies in unrelated sectors. Companies in the industrials sector are subject to certain risks, including changes in supply and demand for their specific product or service and for industrial sector products in general, including decline in demand for such products due to rapid technological developments and frequent new product introduction. Performance of such companies may be affected by factors including government regulation, world events and economic conditions and risks for environmental damage and product liability claims.
Shareholder concentration risk
At June 30, 2018, the table below details the affiliated and significant unaffiliated shareholder account ownership of outstanding shares of each Fund. The Funds have no knowledge about whether any portion of these unaffiliated shares were owned beneficially. Subscription and redemption activity of these accounts may have a significant effect on the operations of the Funds.
| Fund | Number of
unaffiliated
accounts | Percentage of
shares
outstanding
held —
unaffiliated (%) | Percentage of
shares
outstanding
held —
affiliated (%) |
| Columbia Acorn® Fund | 1 | 10.1 | — |
| Columbia Acorn International® | 1 | 14.8 | — |
| Columbia Acorn USA® | 1 | 25.5 | — |
| Columbia Acorn International SelectSM | 1 | 13.5 | 18.0 |
| Columbia Acorn SelectSM | 1 | 20.0 | 12.6 |
| Columbia Thermostat FundSM | 1 | 16.9 | 23.0 |
| Columbia Acorn Emerging Markets FundSM | 1 | 12.3 | 30.9 |
| Columbia Acorn European FundSM | 3 | 33.8 | 30.3 |
Columbia Acorn Family of Funds | Semiannual Report 2018
| 141 |
Notes to Financial Statements (continued)
June 30, 2018 (Unaudited)
Technology and technology-related investment risk
Columbia Acorn® Fund, Columbia Acorn International SelectSM, Columbia Acorn SelectSM and Columbia Acorn European FundSM may be more susceptible to the particular risks that may affect companies in the information technology sector, as well as other technology-related sectors (collectively, the technology sectors) than if they were invested in a wider variety of companies in unrelated sectors. Companies in the technology sectors are subject to certain risks, including the risk that new services, equipment or technologies will not be accepted by consumers and businesses or will become rapidly obsolete. Performance of such companies may be affected by factors including obtaining and protecting patents (or the failure to do so) and significant competitive pressures, including aggressive pricing of their products or services, new market entrants, competition for market share and short product cycles due to an accelerated rate of technological developments. Such competitive pressures may lead to limited earnings and/or falling profit margins. As a result, the value of their securities may fall or fail to rise. In addition, many technology sector companies have limited operating histories and prices of these companies’ securities historically have been more volatile than other securities, especially over the short term.
Note 8. Subsequent events
Management has evaluated the events and transactions that have occurred through the date the financial statements were issued and noted no items requiring adjustment of the financial statements or additional disclosure.
Note 9. Information regarding pending and settled legal proceedings
Ameriprise Financial and certain of its affiliates have historically been involved in a number of legal, arbitration and regulatory proceedings, including routine litigation, class actions, and governmental actions, concerning matters arising in connection with the conduct of their business activities. Ameriprise Financial believes that the Funds are not currently the subject of, and that neither Ameriprise Financial nor any of its affiliates are the subject of, any pending legal, arbitration or regulatory proceedings that are likely to have a material adverse effect on the Funds or the ability of Ameriprise Financial or its affiliates to perform under their contracts with the Funds. Ameriprise Financial is required to make quarterly (10-Q), annual (10-K) and, as necessary, 8-K filings with the Securities and Exchange Commission (SEC) on legal and regulatory matters that relate to Ameriprise Financial and its affiliates. Copies of these filings may be obtained by accessing the SEC website at www.sec.gov.
There can be no assurance that these matters, or the adverse publicity associated with them, will not result in increased Fund redemptions, reduced sale of Fund shares or other adverse consequences to the Funds. Further, although we believe proceedings are not likely to have a material adverse effect on the Funds or the ability of Ameriprise Financial or its affiliates to perform under their contracts with the Funds, these proceedings are subject to uncertainties and, as such, we are unable to estimate the possible loss or range of loss that may result. An adverse outcome in one or more of these proceedings could result in adverse judgments, settlements, fines, penalties or other relief that could have a material adverse effect on the consolidated financial condition or results of operations of Ameriprise Financial.
| 142 | Columbia Acorn Family of Funds | Semiannual Report 2018 |
Board Approval of the Advisory Agreement
Columbia Acorn Trust (the “Trust”) has an investment advisory agreement (the “Advisory Agreement”) with Columbia Wanger Asset Management, LLC (“CWAM”) under which CWAM manages the Columbia Acorn Funds (each, a “Fund,” and together, the “Funds”). More than 75% of the trustees of the Trust (the “Trustees”) are persons who have no direct or indirect interest in the Advisory Agreement and are not “interested persons” (as defined in the Investment Company Act of 1940, as amended (the “1940 Act”)) of the Trust (the “Independent Trustees”). The Trustees oversee the management of each Fund and, as required by law, determine at least annually whether to continue the Advisory Agreement for each Fund.
The Contract Committee (the “Contract Committee”) of the Board of Trustees (the “Board”), which is comprised solely of Independent Trustees, makes recommendations to the Board regarding any proposed continuation of the Advisory Agreement. After the Contract Committee has made its recommendations, the full Board determines whether to approve continuation of the Advisory Agreement. The Board also considers matters bearing on the Advisory Agreement at its various meetings throughout the year, meets at least quarterly with CWAM investment personnel (as does the Board’s Investment Performance Analysis Committee (the “Performance Committee”)), and receives monthly reports from CWAM on the performance of the Funds.
In connection with their most recent consideration of the Advisory Agreement for the Funds, the Contract Committee and all Trustees received and reviewed a substantial amount of information provided by CWAM, Columbia Management Investment Advisers, LLC (“Columbia Management”) and the parent of CWAM and Columbia Management, Ameriprise Financial, Inc. (“Ameriprise”), in response to written requests from the Independent Trustees and their independent legal counsel. Throughout the process, the Trustees had numerous opportunities to ask questions of and request additional materials from CWAM, Columbia Management and Ameriprise.
During each meeting at which the Contract Committee or the Independent Trustees considered the Advisory Agreement, they met in at least one executive session with their independent legal counsel. Members of the Contract Committee and their independent counsel also met with representatives of CWAM, Columbia Management and Ameriprise on several occasions. In all, the Contract Committee convened formally on five separate occasions to consider the continuation of the Advisory Agreement. The Board and/or some or all of the Independent Trustees met on other occasions to receive the Contract Committee’s status reports, receive presentations from CWAM, Columbia Management and Ameriprise representatives, and/or to discuss outstanding issues. In addition, the Performance Committee, also comprised exclusively of Independent Trustees, reviewed the performance of the Funds, met in joint meetings with the Contract Committee, and reported to the Board and/or the Contract Committee throughout the year. The chair of the Compliance Committee of the Board (the “Compliance Committee”) made available relevant information with respect to matters within the realm of its oversight responsibilities.
The materials reviewed by the Contract Committee and the Trustees included, among other items: (i) information on the investment performance of each Fund relative to independently selected peer groups of funds and the Funds’ performance benchmarks over various time periods, as presented and analyzed by an independent consultant; (ii) information on each Fund’s advisory fees and other expenses, including information comparing the Fund’s fees and expenses to those of peer groups of funds and information about any applicable expense limitations and fee breakpoints; (iii) data on sales and redemptions of Fund shares; and (iv) information on the profitability to CWAM and its affiliates, as well as potential “fall-out” or ancillary benefits that CWAM and its affiliates may receive as a result of their relationships with the Funds. The Contract Committee and the Board also considered other information such as: (i) CWAM’s financial condition; (ii) each Fund’s investment objective and strategies; (iii) the size, education, experience and resources of CWAM’s investment staff and its use of technology, external research and trading cost measurement tools and level of resources devoted to the Funds; (iv) turnover of investment management personnel; (v) the portfolio manager compensation framework; (vi) the allocation of the Funds’ brokerage, and the use of “soft” commission dollars to pay for research products and services; (vii) CWAM’s risk management program; (viii) the resources devoted to, and the record of compliance with, the Funds’ investment policies and restrictions, policies on personal securities transactions and other compliance policies and procedures; and (ix) CWAM’s and its affiliates’ conflicts of interest.
Columbia Acorn Family of Funds | Semiannual Report 2018
| 143 |
Board Approval of the Advisory Agreement (continued)
At a meeting held on June 12, 2018, the Board considered and unanimously approved the continuation of the Advisory Agreement for each Fund. In considering the continuation of the Advisory Agreement, the Trustees reviewed and analyzed various factors that they determined were relevant, none of which by itself was considered dispositive. The material factors and conclusions that formed the basis for the Trustees’ determination to approve the continuation of the Advisory Agreement are discussed below.
Nature, quality and extent of services
The Trustees reviewed the nature, quality and extent of the services provided by CWAM and its affiliates to the Funds under the Advisory Agreement, taking into account the investment objective and strategy of each Fund, its shareholder base, and knowledge gained from meetings with management, which were held on at least a quarterly basis. In addition, the Trustees reviewed the available resources and key personnel of CWAM and its affiliates, especially those providing investment management services to the Funds. The Trustees also considered other services provided to the Funds by CWAM and its affiliates, including: managing the execution of portfolio transactions and selecting broker-dealers for those transactions; monitoring adherence to the Funds’ investment restrictions; providing support services for the Board and committees of the Board; managing the Funds’ securities lending program; communicating with shareholders; serving as the Funds’ administrator; and overseeing the activities of the Funds’ other service providers, including monitoring for compliance with various policies and procedures as well as applicable securities laws and regulations. The Trustees also noted the quality of CWAM’s compliance record.
The Trustees took into account the extensive changes made by CWAM to the investment processes of Columbia Acorn Fund, Columbia Acorn USA and Columbia Acorn Select in the past two years to improve Fund performance, including but not limited to: the continued addition of more systematic and quantitative tools and risk-based analyses into the portfolio management and construction process; the significant reduction in the number of Fund holdings and the increased concentration of the portfolios in high conviction names; and certain portfolio manager and analyst changes. In the case of Columbia Thermostat Fund, the Trustees also considered the extensive evaluation of, and related changes made in the past year by CWAM to the structure and forms of the investment allocation table employed by the Fund in pursuing its investment strategy, and the addition of new portfolio managers for the Fund. The Trustees believed that CWAM’s extensive and focused efforts to improve these domestic Funds’ performance were reasonable and appropriate.
For the four international Funds, the Trustees took into account changes made by CWAM in the past two years to improve Fund performance, including but not limited to: changes to certain Funds’ portfolio holdings, which began in 2015; the addition of more systematic and quantitative tools and risk-based analyses into the portfolio management and construction process; an emphasis on more liquid stocks with more growth potential; and certain portfolio manager and analyst changes.
The Trustees concluded that the nature, quality and extent of the services provided by CWAM and its affiliates to each Fund under the Advisory Agreement were appropriate for the Funds and that the Funds were likely to benefit from the continued provision of those services by CWAM. They also concluded that CWAM currently had sufficient personnel, with appropriate education and experience, to serve the Funds effectively, and that the firm had demonstrated its continuing ability to attract and retain well-qualified personnel. The Trustees also considered that Ameriprise had previously committed to the Board that CWAM would have sufficient investment management resources to continue to improve performance, including but not limited to resources to continue hiring analysts and other investment and operational personnel, as necessary.
Performance of the Funds
The Trustees received and considered detailed performance information at various meetings of the Board, the Contract Committee and the Performance Committee throughout the year. They reviewed information comparing each Fund’s performance with that of its benchmarks and with the performance of comparable funds and peer groups as identified by independent consultant Broadridge Financial Solutions, Inc. (“Broadridge”). The Trustees evaluated the performance and risk characteristics of the Funds over various time periods, including over the one-, three- and five-year periods ended December 31, 2017. The Trustees also considered more recent peer performance rankings for certain Funds in order to evaluate CWAM’s progress in improving Fund performance.
| 144 | Columbia Acorn Family of Funds | Semiannual Report 2018 |
Board Approval of the Advisory Agreement (continued)
The Trustees noted that Columbia Acorn International’s performance was ranked below median against its Broadridge peers over the one-, three- and five-year periods ended December 31, 2017. It was noted that the Fund outperformed its primary benchmark for the one-year period. For the one-year period ended April 30, 2018, the Trustees took into account that the Fund had underperformed its peer group but that the Fund had performed about the same as its primary benchmark. The Trustees considered that CWAM had instituted a plan to improve returns.
The Trustees considered that Columbia Acorn International Select’s performance was ranked above median among its Broadridge peers for the one- and three-year periods ended December 31, 2017 and was ranked below the median of its peer group for the five-year period. The Trustees also reviewed Fund performance versus the benchmark for the same periods and determined that it was satisfactory. For the one-year period ended April 30, 2018, the Trustees took into account that the Fund outperformed its peer group and that performance relative to its primary benchmark was satisfactory. The Trustees believed that the Fund’s improved performance was evidence that CWAM’s remediation efforts, including a focus on higher capitalization and more liquid stocks, were contributing positively to the Fund’s returns.
The Trustees noted that Columbia Acorn European Fund had outperformed its Broadridge peer group for the one-, three- and five-year periods ended December 31, 2017 and that for the one-year period the Fund had also performed well against its benchmark. For the one-year period ended April 30, 2018, the Trustees took into account that the Fund’s performance versus its peer group and relative to its primary benchmark was within expectations. The Trustees also considered that the Fund had recently been gaining assets.
The Trustees noted that Columbia Acorn Emerging Markets Fund had performed in the top quartile of the Broadridge peer group median for the one-year period ended December 31, 2017, but that performance for the three- and five-year periods was at or below median. The Trustees also noted that the Fund’s performance versus its benchmark was disappointing for the three-and five-year time periods but that one-year performance was satisfactory. The Trustees considered that the Fund’s more recent performance as of April 30, 2018 versus peers was just below median and about the same as its benchmark.
The Trustees considered that Columbia Acorn Fund had outperformed its Broadridge peer group median over the one- and three-year periods ended December 31, 2017, but had underperformed over the five-year period. The Trustees also considered that the Fund performed well for the one-year period ended April 30, 2018, and that performance relative to the primary benchmark was satisfactory. Based on this information, the Trustees believed that the steps taken by CWAM over the past two years were having a positive impact on Fund performance.
The Trustees considered that Columbia Acorn Select had outperformed its Broadridge peer group median over the one-, three- and five-year periods ended December 31, 2017 and that performance versus the Fund’s benchmark was satisfactory for the one- and three-year periods. For the one-year period ended April 30, 2018, the Trustees noted that the Fund had outperformed its peer group and equaled its primary benchmark in absolute returns. Based on this information, the Trustees believed that CWAM’s performance remediation efforts, including the additional management resources provided to the Fund over the past three years, were having a positive impact on performance.
The Trustees considered that Columbia Acorn USA had outperformed the median of its Broadridge peer group for the three-year period ended December 31, 2017, but had underperformed for the one-and five-year periods. They determined the Fund’s performance versus its primary benchmark was satisfactory for the one-year period. More recently the Fund had underperformed its peers and benchmark, and the Trustees determined that they would continue to monitor the Fund’s performance.
The Trustees noted that Broadridge could not construct an appropriate peer group for Columbia Thermostat Fund because of its unique investment strategy. The Trustees observed that the Fund’s performance was generally in the third or fourth quartiles compared to the peer universe, and that performance as of May 31, 2018 was below both the peer universe and the blended benchmark. The Trustees considered that the structure and forms of the asset allocation table used by the Fund in pursuing its investment strategy had been revised effective May 1, 2018 and that year-to-date returns through May 31, 2018 had shown improvement versus the Broadridge universe. In addition, the Trustees took into account the Fund’s recent portfolio manager changes and their belief that CWAM was devoting appropriate attention to improving the Fund’s performance.
Columbia Acorn Family of Funds | Semiannual Report 2018
| 145 |
Board Approval of the Advisory Agreement (continued)
The Trustees concluded that CWAM had taken, and continued to take, a number of corrective steps to improve performance of the underperforming Funds, although in some cases it would take some time to determine their effectiveness, and that the Performance Committee was monitoring the underperforming Funds’ performance closely. In addition, the Trustees considered that CWAM’s Chief Investment Officer, Director of Research (U.S.) and Director of International Research had reported to them at numerous Contract Committee, Performance Committee and Board meetings on the corrective steps being taken to improve Fund performance.
Costs of services and profits realized by CWAM
At various Committee and Board meetings, the Trustees examined detailed information on the fees and expenses of each Fund in comparison to information for comparable funds provided by Broadridge. The Trustees noted that the Institutional share class (Class Inst) of each of the Funds except Columbia Acorn European Fund had total net operating expenses that were at or lower than the Fund’s Broadridge peer group median. They considered that the Class A shares of Columbia Acorn USA, Columbia Acorn International Select and Columbia Acorn European Fund had total net operating expenses that were above the median.
The Trustees also took into account that: the actual advisory fees paid by Columbia Acorn Fund, Columbia Acorn International, Columbia Acorn Select, and Columbia Acorn Emerging Markets Fund were below the Broadridge median; Columbia Acorn Emerging Markets Fund were at the median; and Columbia Acorn USA, Columbia Acorn International Select, Columbia Acorn European Fund and Columbia Thermostat Fund were above the Broadridge median.
The Trustees considered that CWAM had agreed to continue its contractual waiver of 20 basis points of its advisory fee for Columbia Acorn Select for each of the years ended April 30, 2017, April 30, 2018, and April 30, 2019. They took into consideration that CWAM had previously lowered Columbia Acorn International Select’s advisory fee by five basis points and had agreed to extend for another year the Fund’s existing expense cap to keep expenses at current levels and that CWAM had agreed to extend for another year its agreement to waive fees and/or reimburse expenses for both Columbia Acorn Emerging Markets Fund and Columbia Acorn European Fund. The Trustees also considered that CWAM had extended for another year the existing cap on Columbia Thermostat Fund’s expenses and had agreed to a new one-year cap on the expenses of Columbia Acorn Fund and Columbia Acorn USA to maintain expenses at their current levels. The Trustees also considered the total expenses of each Fund versus five-year performance, as prepared by Broadridge, in considering the total expense levels of each Fund.
The Trustees also reviewed the advisory fee rates charged by CWAM for managing another investment company as sub-adviser that had investment strategies similar to Columbia Acorn USA. The Trustees determined that the Columbia Acorn USA’s advisory fees were higher than CWAM’s sub-advisory fees for the sub-advised fund. The Trustees considered the information provided by CWAM regarding its performance of significant additional services for Columbia Acorn USA that it did not provide to its sub-advisory client, including administrative and fund accounting services, oversight of the Fund’s other service providers, Trustee support, regulatory compliance and numerous other services, and that in servicing the Fund, CWAM assumed many legal and business risks that it does not assume in serving as sub-adviser. It was noted that the advisory fees charged by Columbia Acorn USA, Columbia Acorn Select and Columbia Acorn International were generally comparable to their Columbia Wanger Fund counterparts at the same asset levels.
The Trustees reviewed the analysis of CWAM’s profitability in serving as each Fund’s investment manager and of CWAM and its affiliates in their relationships with each Fund. The Contract Committee and the Board met with representatives from Ameriprise to discuss its methodologies for calculating profitability and allocating costs. They considered that Ameriprise calculated profitability and allocated costs on a contract-by-contract and Fund-by-Fund basis. The Trustees also reviewed the methodology used by CWAM and Ameriprise in determining compensation payable to portfolio managers and the competitive market for investment management talent. The Trustees were also provided with profitability information from a third-party consultant, Strategic Insight, which compared CWAM’s profitability to other similar investment managers in the mutual fund industry. The Trustees discussed, however, that profitability comparisons among fund managers may not always be meaningful due to the lack of consistency in data, small number of publicly-owned managers, and the fact that profitability of any investment manager is affected by numerous factors, including its particular organizational structure, the types of funds
| 146 | Columbia Acorn Family of Funds | Semiannual Report 2018 |
Board Approval of the Advisory Agreement (continued)
and other accounts managed, other lines of business, expense allocation methodology, capital structure and other factors. The Trustees evaluated CWAM’s profitability in light of the additional resources that had been, and would continue to be, provided to it by Ameriprise to assist in improving performance.
Economies of scale
At various Committee and Board meetings and other informal meetings, the Trustees considered information about the extent to which CWAM realized economies of scale in connection with an increase in Fund assets. It was noted, however, that many of the Funds had lost substantial assets over the past several years. The Trustees noted that the advisory fee schedule for each Fund, other than Columbia Thermostat Fund, includes breakpoints in the rate of fees at various asset levels. In evaluating whether CWAM was sharing economies of scale with Fund shareholders, the Trustees also took into account the various fee waivers/reimbursements and expense caps that CWAM had agreed to for many of the Funds for 2018 and 2019. The Trustees concluded that the fee structure of the Advisory Agreement for each Fund reflected a sharing of economies of scale between CWAM and the Funds.
Other Benefits to CWAM. The Trustees also reviewed benefits that accrued to CWAM and its affiliates from their relationships with the Funds, based upon information provided to them by Ameriprise. They noted that the Funds’ transfer agency services were performed by Columbia Management Investment Services Corp., an affiliate of Ameriprise, which receives compensation from the Funds for its transfer agent services. They considered that another affiliate of Ameriprise, Columbia Management Investment Distributors, Inc. (“CMID”), served as the Funds’ distributor under a distribution agreement, and that it received fees under the Trust’s Rule 12b-1 Plan, most of which CMID paid to broker-dealers, but received no additional compensation for its services to the Funds. In addition, they considered that Columbia Management provided sub-administration services to the Funds. The Contract Committee and the Board received information regarding the profitability of these Fund agreements to the CWAM affiliates and also reviewed information about and discussed the capabilities of each affiliated entity in performing its respective duties.
The Trustees considered other ways that the Funds and CWAM might potentially benefit from their relationship with each other. For example, the Trustees considered CWAM’s use of commissions paid by each Fund on its portfolio brokerage transactions to obtain research products and services benefiting the Funds and/or other clients of CWAM. They noted that the Compliance Committee reviewed CWAM’s annual “soft dollar” report during the year and met with representatives from CWAM to review CWAM’s soft dollar spending. The Trustees also considered that the Compliance Committee regularly reviewed third-party prepared reports that evaluated the quality of CWAM’s execution of the Funds’ portfolio transactions. The Trustees determined that CWAM’s use of the Funds’ “soft” commission dollars to obtain research products and services was consistent with current regulatory requirements and guidance. They also concluded that CWAM benefited from the receipt of proprietary research products and services acquired through commissions paid on portfolio transactions of the Funds, and that the Funds benefitted from CWAM’s receipt of those products and services as well as research products and services acquired through commissions paid by other clients of CWAM. Finally, the Trustees considered that CWAM’s affiliates benefited from management fees received from Columbia Thermostat Fund’s investment in other Columbia mutual funds.
After full consideration of the above factors, as well as other factors that were instructive in evaluating the Advisory Agreement, the Trustees, including the Independent Trustees by separate vote, concluded that the advisory fees were reasonable and that the continuation of the Advisory Agreement was in the best interest of each Fund. At the Board meeting held on June 12, 2018 the Trustees approved continuation of the Advisory Agreement for each Fund through July 31, 2019.
Columbia Acorn Family of Funds | Semiannual Report 2018
| 147 |
Expense Information
as of June 30, 2018
| Columbia Acorn® Fund | Class A | Class AD | Class C | Class I1 | Class I2 | Class I3 | Class R |
| Investment advisory fee | 0.67% | 0.67% | 0.67% | 0.67% | 0.67% | 0.67% | | | |
| Distribution and/or service fees | 0.25% | 0.00% | 1.00% | 0.00% | 0.00% | 0.00% | | | |
| Other expenses (a) | 0.16% | 0.16% | 0.16% | 0.16% | 0.14% | 0.09% | | | |
| Net expense ratio | 1.08% | 0.83% | 1.83% | 0.83% | 0.81% | 0.76% | | | |
| Columbia Acorn International® |
| Investment advisory fee | 0.77% | 0.77% | 0.77% | 0.77% | 0.77% | 0.77% | 0.77% | | |
| Distribution and/or service fees | 0.25% | 0.00% | 1.00% | 0.00% | 0.00% | 0.00% | 0.50% | | |
| Other expenses (a) | 0.22% | 0.22% | 0.22% | 0.22% | 0.16% | 0.10% | 0.22% | | |
| Net expense ratio | 1.24% | 0.99% | 1.99% | 0.99% | 0.93% | 0.87% | 1.49% | | |
| Columbia Acorn USA® |
| Investment advisory fee | 0.92% | 0.92% | 0.92% | 0.92% | 0.92% | 0.92% | | | |
| Distribution and/or service fees | 0.25% | 0.00% | 1.00% | 0.00% | 0.00% | 0.00% | | | |
| Other expenses (a) | 0.26% | 0.26% | 0.26% | 0.26% | 0.18% | 0.13% | | | |
| Net expense ratio | 1.43% | 1.18% | 2.18% | 1.18% | 1.10% | 1.05% | | | |
| Columbia Acorn International SelectSM |
| Investment advisory fee | 0.89% | 0.89% | 0.89% | 0.89% | 0.89% | 0.89% | | | |
| Distribution and/or service fees | 0.25% | 0.00% | 1.00% | 0.00% | 0.00% | 0.00% | | | |
| Other expenses (a) | 0.26% | 0.26% | 0.26% | 0.26% | 0.18% | 0.13% | | | |
| Net expense ratio | 1.40% | 1.15% | 2.15% | 1.15% | 1.07% | 1.02% | | | |
| Columbia Acorn SelectSM |
| Investment advisory fee | 0.65% | 0.65% | 0.65% | 0.65% | 0.65% | 0.65% | | | |
| Distribution and/or service fees | 0.25% | 0.00% | 1.00% | 0.00% | 0.00% | 0.00% | | | |
| Other expenses (a) | 0.25% | 0.25% | 0.25% | 0.25% | 0.19% | 0.14% | | | |
| Net expense ratio | 1.15% | 0.90% | 1.90% | 0.90% | 0.84% | 0.79% | | | |
| Columbia Thermostat FundSM |
| Investment advisory fee | 0.10% | 0.10% | 0.10% | 0.10% | 0.10% | 0.10% | | | |
| Distribution and/or service fees | 0.25% | 0.00% | 1.00% | 0.00% | 0.00% | 0.00% | | | |
| Other expenses (a) | 0.15% | 0.15% | 0.15% | 0.15% | 0.12% | 0.07% | | | |
| Net expense ratio (b) | 0.50% | 0.25% | 1.25% | 0.25% | 0.22% | 0.17% | | | |
| Columbia Acorn Emerging Markets FundSM |
| Investment advisory fee | 1.24% | 1.24% | 1.24% | 1.24% | 1.24% | 1.24% | | | |
| Distribution and/or service fees | 0.25% | 0.00% | 1.00% | 0.00% | 0.00% | 0.00% | | | |
| Other expenses (a) | 0.02% | 0.02% | 0.02% | 0.02% | -0.05% | -0.10% | | | |
| Net expense ratio | 1.51% | 1.26% | 2.26% | 1.26% | 1.19% | 1.14% | | | |
| Columbia Acorn European FundSM |
| Investment advisory fee | 1.15% | 1.15% | 1.15% | 1.15% | 1.15% | 1.15% | | | |
| Distribution and/or service fees | 0.25% | 0.00% | 1.00% | 0.00% | 0.00% | 0.00% | | | |
| Other expenses (a) | 0.04% | 0.04% | 0.04% | 0.04% | -0.02% | -0.07% | | | |
| Net expense ratio | 1.44% | 1.19% | 2.19% | 1.19% | 1.13% | 1.08% | | | |
See the Funds’ prospectuses for information on minimum initial investment amounts and other details of buying, selling and exchanging shares of the Funds.
Fees and expenses are for the six months ended June 30, 2018. Please see Note 3, “Fees and Other Transactions With Affiliates” in the Notes to Financial Statements of this report for information on fee waivers and/or expense reimbursements in place for the Funds.
| (a) | Other expenses include certain fee waivers and/or reimbursements, if applicable, which can potentially exceed other expenses charged. |
| (b) | Does not include estimated fees and expenses of 0.42% incurred by the Fund from the underlying portfolio funds in which it invests. |
| 148 | Columbia Acorn Family of Funds | Semiannual Report 2018 |
[THIS PAGE INTENTIONALLY LEFT BLANK]
The Fund mails one shareholder report to each shareholder address. If you would like more than one report, please call shareholder services at 800.345.6611 and additional reports will be sent to you.
Proxy voting policies and procedures
The policy of the Board of Trustees is to vote the proxies of the companies in which the Fund holds investments consistent with the procedures as stated in the SAI. You may obtain a copy of the SAI without charge by calling 800.345.6611; contacting your financial intermediary; visiting columbiathreadneedleus.com/investor/; or searching the website of the SEC at sec.gov. Information regarding how the Fund voted proxies relating to portfolio securities is filed with the SEC by August 31st for the most recent 12-month period ending June 30th of that year, and is available without charge by visiting columbiathreadneedleus.com/investor/, or searching the website of the SEC at sec.gov.
Quarterly schedule of investments
The Fund files a complete schedule of portfolio holdings with the SEC for the first and third quarters of each fiscal year on Form N-Q. The Fund’s Form N-Q is available on the SEC’s website at sec.gov and may be reviewed and copied at the SEC’s Public Reference Room in Washington, D.C. Information on the operation of the Public Reference Room may be obtained by calling 800.SEC.0330. The Fund’s complete schedule of portfolio holdings, as filed on Form N-Q, can also be obtained without charge, upon request, by calling 800.345.6611.
Additional Fund information
For more information about the Fund, please visit columbiathreadneedleus.com/investor/ or call 800.345.6611. Customer Service Representatives are available to answer your questions Monday through Friday from 8 a.m. to 7 p.m. Eastern time.
Fund investment manager
Columbia Wanger Asset Management, LLC
227 West Monroe, Suite 3000
Chicago, IL 60606
888.4.WANGER
(888.492.6437)
Fund distributor
Columbia Management Investment Distributors, Inc.
225 Franklin Street
Boston, MA 02110
Fund transfer agent
Columbia Management Investment Services Corp.
P.O. Box 8081
Boston, MA 02266-8081
| 150 | Columbia Acorn Family of Funds | Semiannual Report 2018 |
Additional information (continued)
Trustees
Laura M. Born, Chair of the Board
David J. Rudis, Vice Chair of the Board
Maureen M. Culhane
P. Zachary Egan
Margaret M. Eisen
Eric A. Feldstein
John C. Heaton
Charles R. Phillips
Ralph Wanger (Trustee Emeritus)
Officers
P. Zachary Egan, President
Alan G. Berkshire, Vice President
Michael G. Clarke, Assistant Treasurer
David L. Frank, Vice President
Paul B. Goucher, Assistant Secretary
Tae Han (Simon) Kim, Vice President
John M. Kunka, Vice President, Treasurer and Principal Financial and Accounting Officer
Stephen Kusmierczak, Vice President
Joseph C. LaPalm, Vice President
Ryan C. Larrenaga, Assistant Secretary
Matthew A. Litfin, Vice President
Satoshi Matsunaga, Vice President
Thomas P. McGuire, Chief Compliance Officer
Louis J. Mendes, Vice President
Julian Quero, Assistant Treasurer
Martha A. Skinner, Assistant Treasurer
Richard Watson, Vice President
Linda K. Roth-Wiszowaty, Secretary
Charles Young, Vice President
Columbia Acorn Family of Funds | Semiannual Report 2018
| 151 |
Columbia Acorn Family of Funds
Through October 31, 2018:
P.O. Box 8081
Boston, MA 02266-8081
Effective November 1, 2018:
P.O. Box 219104
Kansas City, MO 64121-9104
Please read and consider the investment objectives, risks, charges and expenses for any fund carefully before investing. For a prospectus and summary prospectus, which contains this and other important information about the Funds, go to columbiathreadneedleus.com/investor/. The Funds are distributed by Columbia Management Investment Distributors, Inc., member FINRA, and managed by Columbia Wanger Asset Management, LLC.
Columbia Threadneedle Investments (Columbia Threadneedle) is the global brand name of the Columbia and Threadneedle group ofcompanies. All rights reserved. Columbia Management Investment Distributors, Inc., 225 Franklin Street, Boston, MA 02110-2804
© 2018 Columbia Management Investment Advisers, LLC.
columbiathreadneedleus.com/investor/
Item 2. Code of Ethics.
Not applicable for semiannual reports.
Item 3. Audit Committee Financial Expert.
Not applicable for semiannual reports.
Item 4. Principal Accountant Fees and Services.
Not applicable for semiannual reports.
Item 5. Audit Committee of Listed Registrants.
Not applicable.
Item 6. Investments
| | (a) | The registrant’s “Schedule I – Investments in securities of unaffiliated issuers” (as set forth in 17 CFR 210.12-12) is included in Item 1 of this Form N-CSR. |
Item 7. Disclosure of Proxy Voting Policies and Procedures for Closed-End Management Investment Companies.
Not applicable.
Item 8. Portfolio Managers of Closed-End Management Investment Companies.
Not applicable.
Item 9. Purchases of Equity Securities by Closed-End Management Investment Company and Affiliated Purchasers.
Not applicable.
Item 10. Submission of Matters to a Vote of Security Holders.
There were no material changes to the procedures by which shareholders may recommend nominees to the registrant’s board of directors.
Item 11. Controls and Procedures.
| | (a) | The registrant’s principal executive officer and principal financial officers, based on their evaluation of the registrant’s disclosure controls and procedures as of a |
| | date within 90 days of the filing of this report, have concluded that such controls and procedures are adequately designed to ensure that material information required to be disclosed by the registrant in Form N-CSR is accumulated and communicated to the registrant’s management, including the principal executive officer and principal financial officer, or persons performing similar functions, as appropriate to allow timely decisions regarding required disclosure. |
| | (b) | There was no change in the registrant’s internal control over financial reporting that occurred during the registrant’s second fiscal quarter of the period covered by this report that has materially affected, or is reasonably likely to materially affect, the registrant’s internal control over financial reporting. |
Item 12. Disclosure of Securities Lending Activities for Closed-End Management Investment Companies
Not applicable.
Item 13. Exhibits.
(a)(1) Code of ethics required to be disclosed under Item 2 of Form N-CSR: Not applicable for semiannual reports.
(a)(2) Certifications pursuant to Rule 30a-2(a) under the Investment Company Act of 1940 (17 CFR 270.30a-2(a)) attached hereto as Exhibit 99.CERT.
(a)(3) Not applicable.
(b) Certification pursuant to Rule 30a-2(b) under the Investment Company Act of 1940 (17 CFR 270.30a-2(b)) attached hereto as Exhibit 99.906CERT.
SIGNATURES
Pursuant to the requirements of the Securities Exchange Act of 1934 and the Investment Company Act of 1940, the registrant has duly caused this report to be signed on its behalf by the undersigned, thereunto duly authorized.
| | |
| (registrant) | | Columbia Acorn Trust |
| |
| By (Signature and Title) | | /s/ Alan Berkshire |
| | Alan Berkshire, President and Principal Executive Officer |
| |
| Date | | August 17, 2018 |
Pursuant to the requirements of the Securities Exchange Act of 1934 and the Investment Company Act of 1940, this report has been signed below by the following persons on behalf of the registrant and in the capacities and on the dates indicated.
| | |
| By (Signature and Title) | | /s/ Alan Berkshire |
| | Alan Berkshire, President and Principal Executive Officer |
| |
| Date | | August 17, 2018 |
| |
| By (Signature and Title) | | /s/ John M. Kunka |
| | John M. Kunka, Treasurer and Principal Accounting and Financial Officer |
| |
| Date | | August 17, 2018 |