UNITED STATES
SECURITIES AND EXCHANGE COMMISSION
Washington, D.C. 20549
FORM N-CSR
CERTIFIED SHAREHOLDER REPORT OF REGISTERED MANAGEMENT INVESTMENT COMPANIES
Investment Company Act file number 811-01829
Columbia Acorn Trust
(Exact name of registrant as specified in charter)
71 S Wacker Dr.
Suite 2500
Chicago, IL 60606,USA
(Address of principal executive offices) (Zip code)
Ryan C. Larrenaga
c/o Columbia Management Investment Advisers, LLC
290 Congress Street
Boston, Massachusetts 02210
Daniel J. Beckman
c/o Columbia Management Investment Advisers, LLC
290 Congress Street
Boston, Massachusetts 02210
Mary C. Moynihan
Perkins Coie LLP
700 13th Street, NW
Suite 800
Washington, DC 20005
(Name and address of agent for service)
Registrant's telephone number, including area code: (312) 634-9200
Date of fiscal year end: December 31
Date of reporting period: December 31, 2022
Form N-CSR is to be used by management investment companies to file reports with the Commission not later than 10 days after the transmission to stockholders of any report that is required to be transmitted to stockholders under Rule 30e-1 under the Investment Company Act of 1940 (17 CFR 270.30e-1). The Commission may use the information provided on Form N-CSR in its regulatory, disclosure review, inspection, and policymaking roles.
A registrant is required to disclose the information specified by Form N-CSR, and the Commission will make this information public. A registrant is not required to respond to the collection of information contained in Form N-CSR unless the Form displays a currently valid Office of Management and Budget ("OMB") control number. Please direct comments concerning the accuracy of the information collection burden estimate and any suggestions for reducing the burden to Secretary, Securities and Exchange Commission, 100 F Street, NE, Washington, DC 20549. The OMB has reviewed this collection of information under the clearance requirements of 44 U.S.C. § 3507.
Item 1. Reports to Stockholders.

Annual Report
December 31, 2022
Columbia
Acorn® Fund
Columbia
Acorn International®
Columbia
Acorn USA®
Columbia
Acorn International SelectSM
Columbia
Thermostat FundSM
Columbia
Acorn European FundSM
Not FDIC or NCUA Insured • No Financial Institution Guarantee • May Lose Value
| 3 |
| 5 |
| 7 |
| 9 |
| 11 |
| 13 |
| 15 |
| 17 |
| 19 |
| 21 |
| 23 |
| 25 |
| 27 |
| 30 |
| 51 |
| 55 |
| 58 |
| 64 |
| 88 |
| 108 |
| 109 |
| 110 |
| 113 |
Columbia Acorn Family of Funds | Annual Report 2022
Fund at a glance
Columbia Acorn® Fund (Unaudited)
Investment objective
Columbia Acorn® Fund (the Fund) seeks long-term capital appreciation.
Portfolio management
Erika K. Maschmeyer, CFA
Lead Portfolio Manager since February 2023
Service with Fund since 2016
John L. Emerson, CFA
Portfolio Manager since 2021
Service with Fund since 2003
Effective February 10, 2023, Daniel Cole no longer serves as a Portfolio Manager of the Fund.
Morningstar style boxTM
The Morningstar Style Box is based on a fund’s portfolio holdings. For equity funds, the vertical axis shows the market capitalization of the stocks owned, and the horizontal axis shows investment style (value, blend, or growth). Information shown is based on the most recent data provided by Morningstar.
© 2023 Morningstar, Inc. All rights reserved. The Morningstar information contained herein: (1) is proprietary to Morningstar and/or its content providers; (2) may not be copied or distributed; and (3) is not warranted to be accurate, complete or timely. Neither Morningstar nor its content providers are responsible for any damages or losses arising from any use of this information.
| Average annual total returns (%) (for the period ended December 31, 2022) |
| | | Inception | 1 Year | 5 Years | 10 Years | Life of Fund |
| Class A | Excluding sales charges | 10/16/00 | -34.01 | 2.10 | 6.98 | 12.79 |
| | Including sales charges | | -37.80 | 0.89 | 6.35 | 12.67 |
| Advisor Class | 11/08/12 | -33.79 | 2.36 | 7.24 | 13.14 |
| Class C | Excluding sales charges | 10/16/00 | -34.48 | 1.34 | 6.19 | 11.94 |
| | Including sales charges | | -35.10 | 1.34 | 6.19 | 11.94 |
| Institutional Class | 06/10/70 | -33.78 | 2.35 | 7.27 | 13.15 |
| Institutional 2 Class | 11/08/12 | -33.83 | 2.38 | 7.29 | 13.15 |
| Institutional 3 Class | 11/08/12 | -33.77 | 2.44 | 7.35 | 13.17 |
| Russell 2500 Growth Index | | -26.21 | 5.97 | 10.62 | - |
Performance numbers reflect all Fund expenses. Returns for Class A shares are shown with and without the maximum initial sales charge of 5.75%. Returns for Class C shares are shown with and without the maximum contingent deferred sales charge of 1.00% for the first year after purchase. The Fund’s other share classes are not subject to sales charges, but may be subject to other fees and expenses, and have limited eligibility. Please see the Fund’s prospectus for details. Performance for different share classes will vary based on differences in sales charges and certain fees and expenses associated with each share class.
As stated in the May 1, 2022 prospectus, the Fund’s annual operating expense ratio is 0.83% for Institutional Class shares and 1.08% for Class A shares.
All results shown assume reinvestment of distributions during the period. Returns do not reflect the deduction of taxes that a shareholder may pay on Fund distributions or on the redemption of Fund shares. Performance results reflect the effect of fee waivers or reimbursements of Fund expenses by the Columbia Wanger Asset Management, LLC (the Investment Manager) and/or its affiliates. Absent these fee waivers and/or expense reimbursement arrangements, performance results may have been lower.
The performance information shown represents past performance and is not a guarantee of future results. The investment return and principal value of your investment will fluctuate so that shares, when redeemed, may be worth more or less than their original cost. Current performance may be lower or higher than the performance data shown. You may obtain performance information current to the most recent month-end by contacting your financial intermediary, visiting columbiathreadneedleus.com/investor/ or calling 800.922.6769.
The returns shown for periods prior to the share class inception date (including returns for the Life of the Fund, if shown, which are since Fund inception) include the returns of the Fund’s Institutional Class. These returns are adjusted to reflect any higher class-related operating expenses of the newer share classes, as applicable. Please visit columbiathreadneedleus.com/investor/investment-products/mutual-funds/appended-performance for more information.
The Russell 2500 Growth Index measures the performance of those Russell 2500 companies with higher price-to-book ratios and higher forecasted growth values.
Unlike mutual funds, indexes are not managed and do not incur fees or expenses. It is not possible to invest directly in an index.
Columbia Acorn Family of Funds | Annual Report 2022
| 3 |
Fund at a glance (continued)
Columbia Acorn® Fund (Unaudited)
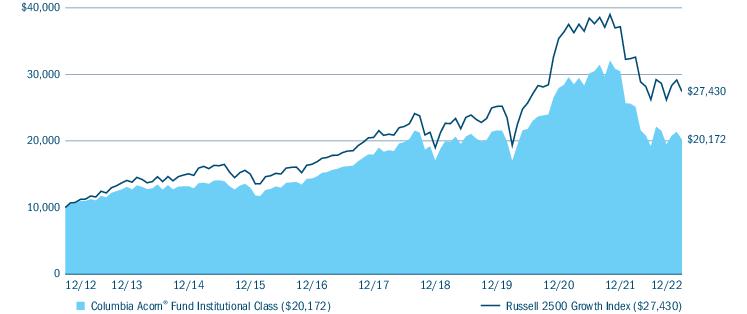
The Growth of a $10,000 Investment in Columbia Acorn® Fund Institutional Class Shares
December 31, 2012 through December 31, 2022
This chart shows the change in value of a hypothetical $10,000 investment in Institutional Class shares of the Fund during the stated time period. Although the index is provided for use in assessing the Fund’s performance, the Fund’s holdings may differ significantly from those in an index. Performance numbers reflect all Fund expenses.
| Portfolio breakdown (%) (at December 31, 2022) |
| Common Stocks | 97.0 |
| Money Market Funds | 3.0 |
| Total | 100.0 |
Percentages indicated are based upon total investments excluding investments in derivatives, if any. The Fund’s portfolio composition is subject to change.
| Equity sector breakdown (%) (at December 31, 2022) |
| Communication Services | 2.7 |
| Consumer Discretionary | 19.1 |
| Consumer Staples | 2.4 |
| Energy | 3.8 |
| Financials | 6.9 |
| Health Care | 19.0 |
| Industrials | 20.7 |
| Information Technology | 19.9 |
| Materials | 2.5 |
| Real Estate | 3.0 |
| Total | 100.0 |
Percentages indicated are based upon total equity investments. The Fund’s portfolio composition is subject to change.
| 4 | Columbia Acorn Family of Funds | Annual Report 2022 |
Manager Discussion of Fund Performance
Columbia Acorn® Fund (Unaudited)
Columbia Acorn® Fund Institutional Class shares returned -33.78% for the 12-month period ended December 31, 2022, trailing the -26.21% return of the Fund’s primary benchmark, the Russell 2500 Growth Index for the same period.
Market overview
In 2022, global markets took a pummeling, as looser monetary policies and stimulus spending from the previous two years came home to roost. At the start of the year, the rhetoric from the Federal Reserve (Fed) on inflation amid a tight labor market and supply chain bottlenecks had primed the market for interest rate hikes. The unexpected Russian invasion of Ukraine in February 2022 added further inflationary pressure on energy and food prices, dampening market sentiment. The Fed subsequently embarked on an interest rate-raising trajectory that extended through the year with seven interest rate raises, resulting in, by June 2022, consumer sentiment reaching its lowest point in over a year. Following this, bearish investor sentiment continued to prevail despite a rollover in energy prices and an easing in supply chain disruptions. Markets rebounded in the fourth quarter on more benign economic data and expectations of a Fed pivot on interest rate hikes. Unfortunately, this was not substantial enough to reverse the damage of the previous nine months.
Small-cap stocks trailed large-cap stocks, and growth stocks considerably underperformed value stocks during the year due to their greater sensitivity to rising interest rates. In other words, higher rates reduce the value of companies’ future earnings when measured in today’s dollars. Also, less economically-sensitive companies that trade at lower valuations provide more defense in a volatile and uncertain environment. From a sector perspective, the poorest performing sectors in the Russell 2500 Growth Index were the communication services, real estate, health care, consumer discretionary and information technology sectors. While interest rates had a bearing on information technology and smaller cap names, tight labor costs had an impact on services names. Energy benefited from high inflation, the only sector in the benchmark with positive returns for the year.
Factor correlations were skewed because of extreme volatility of inflation data, coupled with extreme market reaction to that data. Company fundamentals were additionally lost in the upheaval. Stocks, especially among longer duration names, suffered declines from a compression of multiples and the types of higher quality, profitable growers we seek were most severely impacted in a backdrop of rising rates. In response, we remain focused on investing in growing companies that we believe have outstanding business models and competitive advantages. We are selective across sectors, looking for opportunities that, from a bottom-up perspective, have the ability to stand on their own and relatively detach from the surrounding macro environment.
The Fund’s notable detractors during the period
| • | Kornit Digital Ltd. is an Israeli-American international company that manufactures, markets and services a range of digital printing applications for the textile industry. Prior to 2022, Kornit benefited from several years of robust demand for its equipment as customers scrambled to meet sky-rocketing demand from end-customers. However, the re-calibration of e-commerce growth in a post-COVID scenario, coupled with macro headwinds, resulted in a greater-than-expected pause in demand. |
| • | The Trade Desk, Inc., is a technology platform company, enabling real-time programmatic advertising designed to personalize digital content delivery to users. Higher interest rates and fears that a recession would disproportionately hurt programmatic advertising weighed on investor sentiment. |
| • | 10x Genomics, Inc. is an American biotechnology company designing, and manufacturing gene sequencing technology used in scientific research. The stock lost ground amid the broader downturn in companies with high future-earnings expectations that saw near term impact to operating profits, coupled with supply chain disruptions from China and Europe. We sold the position during the period. |
The Fund’s notable contributors during the period
| • | Wingstop, Inc. is a multinational chain of restaurants specializing in chicken wings. Following a temporary slower COVID period, Wingstop boosted Fund performance with re-accelerating sales as customers began to re-prioritize going out to restaurants. |
Columbia Acorn Family of Funds | Annual Report 2022
| 5 |
Manager Discussion of Fund Performance (continued)
Columbia Acorn® Fund (Unaudited)
| • | Axon Enterprise, Inc. is the manufacturer of Tasers and market leading provider of law enforcement technology including body and vehicle cameras. The company utilized its monopolistic position to make market expansions into judiciary, corrections, federal agency and other governmental affairs. Revenue, along with international contract wins and strong revenue forecasts, helped to separate Axon Enterprise from an uncertain and challenging macro environment. |
| • | Enphase Energy, Inc., a global energy management company that is a leading provider of solar technologies in the information technology sector, benefited from strong performance and positive guidance and is improving its long-term prospects as it expands into Europe. This company is strongly positioned to capitalize on growing demand for solar energy. Rising energy prices were also a tailwind as it resulted in solar energy being seen as more attractively valued. We sold the position during the period. |
Market risk may affect a single issuer, sector of the economy, industry or the market as a whole. Investments in small- and mid-cap companies involve risks and volatility and possible illiquidity greater than investments in larger, more established companies. Foreign investments subject the Fund to political, economic, market, social and other risks within a particular country, as well as to potential currency instabilities and less stringent financial and accounting standards generally applicable to U.S. issuers. Risks are enhanced for emerging market issuers. The Fund may invest significantly in issuers within a particular sector, which may be negatively affected by market, economic or other conditions, making the Fund more vulnerable to unfavorable developments in the sector. See the Fund’s prospectus for more information on these and other risks.
The views expressed in this report reflect the current views of the respective parties. These views are not guarantees of future performance and involve certain risks, uncertainties and assumptions that are difficult to predict, so actual outcomes and results may differ significantly from the views expressed. These views are subject to change at any time based upon economic, market or other conditions and the respective parties disclaim any responsibility to update such views. These views may not be relied on as investment advice and, because investment decisions for a Columbia Acorn Fund are based on numerous factors, may not be relied on as an indication of trading intent on behalf of any particular Columbia Acorn Fund. References to specific securities should not be construed as a recommendation or investment advice.
| 6 | Columbia Acorn Family of Funds | Annual Report 2022 |
Fund at a glance
Columbia Acorn International® (Unaudited)
Investment objective
Columbia Acorn International® (the Fund) seeks long-term capital appreciation.
Portfolio management
Tae Han (Simon) Kim, CFA
Co-Portfolio Manager since 2017
Service with Fund since 2011
Hans F. Stege
Co-Portfolio Manager since 2020
Service with Fund since 2017
Morningstar style boxTM
The Morningstar Style Box is based on a fund’s portfolio holdings. For equity funds, the vertical axis shows the market capitalization of the stocks owned, and the horizontal axis shows investment style (value, blend, or growth). Information shown is based on the most recent data provided by Morningstar.
© 2023 Morningstar, Inc. All rights reserved. The Morningstar information contained herein: (1) is proprietary to Morningstar and/or its content providers; (2) may not be copied or distributed; and (3) is not warranted to be accurate, complete or timely. Neither Morningstar nor its content providers are responsible for any damages or losses arising from any use of this information.
| Average annual total returns (%) (for the period ended December 31, 2022) |
| | | Inception | 1 Year | 5 Years | 10 Years | Life of Fund |
| Class A | Excluding sales charges | 10/16/00 | -33.81 | -1.46 | 3.19 | 8.17 |
| | Including sales charges | | -37.61 | -2.62 | 2.58 | 7.96 |
| Advisor Class | 11/08/12 | -33.62 | -1.21 | 3.43 | 8.53 |
| Class C | Excluding sales charges | 10/16/00 | -34.30 | -2.20 | 2.42 | 7.36 |
| | Including sales charges | | -34.94 | -2.20 | 2.42 | 7.36 |
| Institutional Class | 09/23/92 | -33.63 | -1.21 | 3.46 | 8.54 |
| Institutional 2 Class | 08/02/11 | -33.60 | -1.15 | 3.51 | 8.56 |
| Institutional 3 Class | 11/08/12 | -33.58 | -1.11 | 3.56 | 8.58 |
| Class R | 08/02/11 | -33.96 | -1.71 | 2.88 | 7.89 |
| MSCI ACWI ex USA SMID Cap Growth Index (Net) | | -25.66 | 0.01 | 4.57 | - |
| MSCI ACWI ex USA SMID Cap Index (Net) | | -19.49 | 0.16 | 4.56 | - |
Performance numbers reflect all Fund expenses. Returns for Class A shares are shown with and without the maximum initial sales charge of 5.75%. Returns for Class C shares are shown with and without the maximum contingent deferred sales charge of 1.00% for the first year after purchase. The Fund’s other share classes are not subject to sales charges, but may be subject to other fees and expenses, and have limited eligibility. Please see the Fund’s prospectus for details. Performance for different share classes will vary based on differences in sales charges and certain fees and expenses associated with each share class.
As stated in the May 1, 2022 prospectus, the Fund’s annual operating expense ratio is 0.98% for Institutional Class shares and 1.23% for Class A shares.
All results shown assume reinvestment of distributions during the period. Returns do not reflect the deduction of taxes that a shareholder may pay on Fund distributions or on the redemption of Fund shares. Performance results reflect the effect of fee waivers or reimbursements of Fund expenses by the Investment Manager and/or its affiliates. Absent these fee waivers and/or expense reimbursement arrangements, performance results may have been lower.
The performance information shown represents past performance and is not a guarantee of future results. The investment return and principal value of your investment will fluctuate so that shares, when redeemed, may be worth more or less than their original cost. Current performance may be lower or higher than the performance data shown. You may obtain performance information current to the most recent month-end by contacting your financial intermediary, visiting columbiathreadneedleus.com/investor/ or calling 800.922.6769.
The returns shown for periods prior to the share class inception date (including returns for the Life of the Fund, if shown, which are since Fund inception) include the returns of the Fund’s Institutional Class. These returns are adjusted to reflect any higher class-related operating expenses of the newer share classes, as applicable. Please visit columbiathreadneedleus.com/investor/investment-products/mutual-funds/appended-performance for more information.
The MSCI ACWI ex USA SMID Cap Growth Index (Net) captures a mid- and small-cap representation across 22 developed market countries and 24 emerging market countries.
The MSCI ACWI ex USA SMID Cap Index (Net) captures a mid- and small-cap representation across 22 of 23 developed market countries (excluding the United States) and 24 emerging market countries. The index covers approximately 28% of the free float-adjusted market capitalization in each country.
Unlike mutual funds, indexes are not managed and do not incur fees or expenses. It is not possible to invest directly in an index.
Columbia Acorn Family of Funds | Annual Report 2022
| 7 |
Fund at a glance (continued)
Columbia Acorn International® (Unaudited)
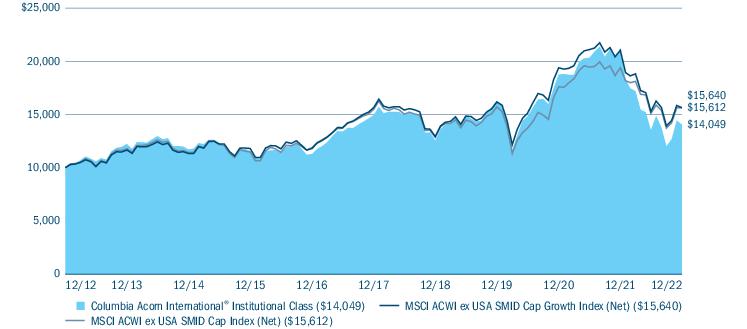
The Growth of a $10,000 Investment in Columbia Acorn International® Institutional Class Shares
December 31, 2012 through December 31, 2022
This chart shows the change in value of a hypothetical $10,000 investment in Institutional Class shares of the Fund during the stated time period. Although the indexes are provided for use in assessing the Fund’s performance, the Fund’s holdings may differ significantly from those in an index. Performance numbers reflect all Fund expenses.
| Equity sector breakdown (%) (at December 31, 2022) |
| Communication Services | 6.1 |
| Consumer Discretionary | 7.8 |
| Consumer Staples | 2.7 |
| Energy | 1.1 |
| Financials | 5.9 |
| Health Care | 17.3 |
| Industrials | 25.4 |
| Information Technology | 24.9 |
| Materials | 4.1 |
| Real Estate | 4.7 |
| Total | 100.0 |
Percentages indicated are based upon total equity investments. The Fund’s portfolio composition is subject to change.
| Country breakdown (%) (at December 31, 2022) |
| Australia | 6.4 |
| Austria | 0.5 |
| Brazil | 1.0 |
| Canada | 4.6 |
| China | 2.3 |
| Denmark | 2.8 |
| Country breakdown (%) (at December 31, 2022) |
| Finland | 2.1 |
| France | 0.8 |
| Germany | 5.9 |
| Italy | 3.6 |
| Japan | 14.5 |
| Mexico | 2.1 |
| Netherlands | 3.5 |
| New Zealand | 2.1 |
| South Korea | 4.4 |
| Spain | 0.6 |
| Sweden | 9.6 |
| Switzerland | 4.0 |
| Taiwan | 5.3 |
| United Kingdom | 17.5 |
| United States(a) | 4.9 |
| Vietnam | 1.5 |
| Total | 100.0 |
| (a) | Includes investments in Money Market Funds. |
Country breakdown is based primarily on issuer’s place of organization/incorporation. Percentages indicated are based upon total investments excluding investments in derivatives, if any. The Fund’s portfolio composition is subject to change.
| 8 | Columbia Acorn Family of Funds | Annual Report 2022 |
Manager Discussion of Fund Performance
Columbia Acorn International® (Unaudited)
Columbia Acorn International® Institutional Class shares returned -33.63% for the 12-month period ended December 31, 2022, underperforming the -25.66% return of the Fund’s primary benchmark, the MSCI ACWI ex USA SMID Cap Growth Index (Net) for the same period. The Fund’s secondary benchmark, the MSCI ACWI ex USA SMID Cap Index (Net), ended the 12-month period with a return of -19.49%.
Market overview
In 2022, international equities experienced steep declines in a reversal of the previous year’s robust return trajectory. Geopolitical headwinds, high inflation levels and hawkish global central bank responses underscored the period. At the start of the year, our more positive outlook was quickly dampened by Russia’s unexpected invasion of Ukraine, which exacerbated the still lingering COVID-era effects of a tight labor market, high commodity and food prices, and supply chain disruptions. Global central banks pivoted towards monetary tightening and by the start of the second half of the year, fears of a recession were at a peak. This was particularly true for Europe, where uncertainty over gas supplies for the impending winter combined with a weak Euro and weighed on investor sentiment. However, in the fourth quarter, more benign inflation data, easing energy supplies in Europe and a China-reopening fueled a rally in stocks that mitigated declines from the previous nine months.
Also in 2022, international small-cap growth stocks underperformed value stocks. This divergence was most prevalent in the information technology sector, as more richly valued software and services names were pummeled. Amid economic uncertainty and higher interest rates, more defensive large caps outperformed small caps. During the majority of the year, high profitability growth companies we favored provided less of a shield as they declined along with other growth stocks. This trend reversed in the fourth quarter when quality growth companies generated positive returns, following an inflation reversal in Europe.
As we enter 2023, in what continues to be an uncertain environment, we believe that capable management teams in higher quality businesses will be better able to navigate this period of unique disruption. We are somewhat more optimistic circumstances in Europe than we were mid-year 2022. Natural gas prices underlying much higher electricity prices for most of 2022 have retreated to pre-Ukraine war levels, providing relief for European consumers. The European Central Bank is not raising rates as aggressively as is the U.S. Federal Reserve. In most of Europe excluding the U.K., labor shortages and wage pressures have not been as salient a factor in driving inflation as in the United States. Multi-year labor bargaining agreements help dampen inflationary pressures. We are also hopeful that China’s reversal on its COVID policy will trigger an acceleration of GDP after the first quarter. German exports, for example, have typically benefited from a vibrant Chinese economy. We recognize that Russia’s war on Ukraine continues to weigh on the macro environment and poses an exogenous risk to the markets.
The Fund’s notable detractors during the period
| • | Parade Technologies Ltd. is a fabless semiconductor company offering high-speed interface and display systems used in computers, consumer electronics, and display panels. In 2022, the company was negatively impacted as the semiconductor industry entered a downturn driven by a destocking in personal computers. Parade is a leader in technology and has consistently retained the largest market share in the display segment. We expect that it will be able to replicate that success in high-speed applications relating to servers, driven by structural growth of high-performance computing. |
| • | Hypoport provides technology platforms that support the German credit, real estate and insurance industries through EUROSPACE, the largest B2B marketplace for loan products in Germany. 2022 saw large shifts in Germany’s property market, as prices fell amid higher interest rates. Beyond the challenges of higher mortgage rates, banks have been tightening lending conditions as they have become more risk-cognizant on real estate loans. However, the company remains fundamentally sound and continues to gain market share, which we believe should enable strong growth even in a higher interest rate environment. |
| • | Silergy Corp. designs and manufactures a broad range of high performance analog integrated circuits. The company’s stock price declined as the semiconductor industry headed into a downcycle driven by weakening demand and a |
Columbia Acorn Family of Funds | Annual Report 2022
| 9 |
Manager Discussion of Fund Performance (continued)
Columbia Acorn International® (Unaudited)
| | reduction in inventory in consumer electronics. The company is actively expanding into new applications with higher margins and longer growth trajectory such as automotives. It is also reducing its exposure to more cyclical consumer applications. We maintain our position due to a more favorable long-term outlook. |
The Fund’s notable contributors during the period
| • | Munters Group is a Swedish company that provides stand-alone dehumidification and air treatment solutions to the food, pharma, agriculture and electronics industries. Munters has consistently won large de-humidification contracts, causing it to report several quarters of consecutive record order book increases. Its energy-saving cooling solutions for data centers and de-humidification equipment for electric vehicle lithium-ion battery plants are in high demand.We are watching carefully if the company can overcome recent supply chain challenges to meet its target profitability level. |
| • | Corporacion Inmobiliaria Vesta SAB de CV is a real estate owner, developer and asset administrator of industrial buildings and distribution centers in Mexico. Vesta’s competitive advantage is in anticipating demand given its proximity to customers. The company outperformed in 2022 as it benefited from an acceleration in nearshoring (outsourcing business to a neighboring country or region) demand. This, coupled with relatively limited supply due to high construction costs, led to a surge in leasing spreads. We believe that Vesta will continue to benefit from a favorable supply-demand environment. |
| • | Jeisys Medical, Inc. is a manufacturer of high-end medical aesthetic devices for aestheticians, plastic surgeons, physicians and health care professionals. During the year, earnings were buoyed by strong demand, particularly in the United States and Japan. In addition, the company benefited from its synergies with U.S. laser manufacturer Cynosure, underscoring brisk growth in the aesthetic market that is being propelled forward by an aging population. Continued product innovation driven by a strong competitive market in South Korea has also had a bearing on performance. |
Market risk may affect a single issuer, sector of the economy, industry or the market as a whole. International investing involves certain risks and volatility due to potential political, economic or currency instabilities and different, potentially less stringent, financial and accounting standards than those generally applicable to U.S. issuers. Risks are enhanced for emerging market issuers. Investments in small- and mid-cap companies involve risks and volatility and possible illiquidity greater than investments in larger, more established companies. The Fund may invest significantly in issuers within a particular sector, which may be negatively affected by market, economic or other conditions, making the Fund more vulnerable to unfavorable developments in the sector. See the Fund’s prospectus for more information on these and other risks.
The views expressed in this report reflect the current views of the respective parties. These views are not guarantees of future performance and involve certain risks, uncertainties and assumptions that are difficult to predict, so actual outcomes and results may differ significantly from the views expressed. These views are subject to change at any time based upon economic, market or other conditions and the respective parties disclaim any responsibility to update such views. These views may not be relied on as investment advice and, because investment decisions for a Columbia Acorn Fund are based on numerous factors, may not be relied on as an indication of trading intent on behalf of any particular Columbia Acorn Fund. References to specific securities should not be construed as a recommendation or investment advice.
| 10 | Columbia Acorn Family of Funds | Annual Report 2022 |
Fund at a glance
Columbia Acorn USA® (Unaudited)
Investment objective
Columbia Acorn USA® (the Fund) seeks long-term capital appreciation.
Portfolio management
Erika K. Maschmeyer, CFA
Lead Portfolio Manager since February 2023
Service with Fund since 2016
John L. Emerson, CFA
Portfolio Manager since 2021
Service with Fund since 2003
Effective February 10, 2023, Daniel Cole no longer serves as a Portfolio Manager of the Fund.
Morningstar style boxTM
The Morningstar Style Box is based on a fund’s portfolio holdings. For equity funds, the vertical axis shows the market capitalization of the stocks owned, and the horizontal axis shows investment style (value, blend, or growth). Information shown is based on the most recent data provided by Morningstar.
© 2023 Morningstar, Inc. All rights reserved. The Morningstar information contained herein: (1) is proprietary to Morningstar and/or its content providers; (2) may not be copied or distributed; and (3) is not warranted to be accurate, complete or timely. Neither Morningstar nor its content providers are responsible for any damages or losses arising from any use of this information.
| Average annual total returns (%) (for the period ended December 31, 2022) |
| | | Inception | 1 Year | 5 Years | 10 Years | Life of Fund |
| Class A | Excluding sales charges | 10/16/00 | -33.75 | 2.68 | 7.51 | 8.84 |
| | Including sales charges | | -37.57 | 1.47 | 6.87 | 8.60 |
| Advisor Class | 11/08/12 | -33.55 | 2.95 | 7.79 | 9.18 |
| Class C | Excluding sales charges | 10/16/00 | -34.23 | 1.90 | 6.73 | 8.05 |
| | Including sales charges | | -34.86 | 1.90 | 6.73 | 8.05 |
| Institutional Class | 09/04/96 | -33.60 | 2.92 | 7.77 | 9.18 |
| Institutional 2 Class | 11/08/12 | -33.51 | 3.00 | 7.87 | 9.21 |
| Institutional 3 Class | 11/08/12 | -33.56 | 3.03 | 7.91 | 9.23 |
| Russell 2500 Growth Index | | -26.21 | 5.97 | 10.62 | - |
| Russell 2000 Growth Index | | -26.36 | 3.51 | 9.20 | - |
Performance numbers reflect all Fund expenses. Returns for Class A shares are shown with and without the maximum initial sales charge of 5.75%. Returns for Class C shares are shown with and without the maximum contingent deferred sales charge of 1.00% for the first year after purchase. The Fund’s other share classes are not subject to sales charges, but may be subject to other fees and expenses, and have limited eligibility. Please see the Fund’s prospectus for details. Performance for different share classes will vary based on differences in sales charges and certain fees and expenses associated with each share class.
As stated in the May 1, 2022 prospectus, as supplemented, the Fund’s annual operating expense ratio is 0.83% for Institutional Class shares and 1.08% for Class A shares.
All results shown assume reinvestment of distributions during the period. Returns do not reflect the deduction of taxes that a shareholder may pay on Fund distributions or on the redemption of Fund shares. Performance results reflect the effect of fee waivers or reimbursements of Fund expenses by the Investment Manager and/or its affiliates. Absent these fee waivers and/or expense reimbursement arrangements, performance results may have been lower.
The performance information shown represents past performance and is not a guarantee of future results. The investment return and principal value of your investment will fluctuate so that shares, when redeemed, may be worth more or less than their original cost. Current performance may be lower or higher than the performance data shown. You may obtain performance information current to the most recent month-end by contacting your financial intermediary, visiting columbiathreadneedleus.com/investor/ or calling 800.922.6769.
The returns shown for periods prior to the share class inception date (including returns for the Life of the Fund, if shown, which are since Fund inception) include the returns of the Fund’s Institutional Class. These returns are adjusted to reflect any higher class-related operating expenses of the newer share classes, as applicable. Please visit columbiathreadneedleus.com/investor/investment-products/mutual-funds/appended-performance for more information.
The Russell 2500 Growth Index, an unmanaged index, measures the performance of those Russell 2500 companies with higher price-to-book ratios and higher forecasted growth values.
The Russell 2000 Growth Index, an unmanaged index, measures the performance of those Russell 2000 Index companies with higher price-to-book ratios and higher forecasted growth values.
Effective May 1, 2022, the Fund increased the market capitalization range of the companies in which it invests a majority of its assets and began comparing its performance to that of the Russell 2500 Growth Index. The Investment Manager believes that the Russell 2500 Growth Index provides a more appropriate comparison than the Russell 2000 Growth Index for investors measuring the Fund’s relative performance. Information on both the Russell 2000 Growth Index and the Russell 2500 Growth Index will be shown for a one-year transition period. The Fund’s performance prior to May 1, 2022 reflects returns achieved pursuant to a strategy with a different market capitalization limit on the companies in which the Fund invests a majority of its assets. If the Fund’s current strategies had been in place for the prior periods, results shown would have been different.
Unlike mutual funds, indexes are not managed and do not incur fees or expenses. It is not possible to invest directly in an index.
Columbia Acorn Family of Funds | Annual Report 2022
| 11 |
Fund at a glance (continued)
Columbia Acorn USA® (Unaudited)
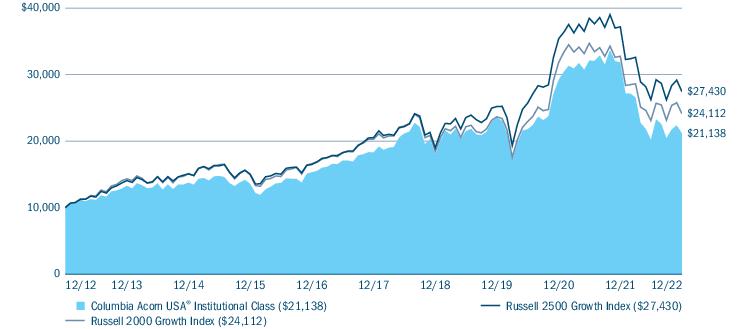
The Growth of a $10,000 Investment in Columbia Acorn USA® Institutional Class Shares
December 31, 2012 through December 31, 2022
This chart shows the change in value of a hypothetical $10,000 investment in Institutional Class shares of the Fund during the stated time period. Although the indexes are provided for use in assessing the Fund’s performance, the Fund’s holdings may differ significantly from those in an index. Performance numbers reflect all Fund expenses.
| Portfolio breakdown (%) (at December 31, 2022) |
| Common Stocks | 96.8 |
| Money Market Funds | 2.9 |
| Securities Lending Collateral | 0.3 |
| Total | 100.0 |
Percentages indicated are based upon total investments excluding investments in derivatives, if any. The Fund’s portfolio composition is subject to change.
| Equity sector breakdown (%) (at December 31, 2022) |
| Communication Services | 2.7 |
| Consumer Discretionary | 19.0 |
| Consumer Staples | 2.4 |
| Energy | 3.8 |
| Financials | 6.9 |
| Health Care | 19.2 |
| Industrials | 20.7 |
| Information Technology | 19.8 |
| Materials | 2.5 |
| Real Estate | 3.0 |
| Total | 100.0 |
Percentages indicated are based upon total equity investments. The Fund’s portfolio composition is subject to change.
| 12 | Columbia Acorn Family of Funds | Annual Report 2022 |
Manager Discussion of Fund Performance
Columbia Acorn USA® (Unaudited)
In December 2022, the Board of Trustees of Columbia Acorn USA determined that a reorganization of the Fund is in the best interest of the Fund and its shareholders and voted to approve an Agreement and Plan of Reorganization to reorganize the Fund with and into Columbia Acorn Fund, another series of Columbia Acorn Trust with substantially similar principal investment strategies and the same portfolio management as the Fund. Pursuant to applicable law (including the Investment Company Act of 1940) the reorganization will be implemented without shareholder approval. The reorganization is expected to occur in the second quarter of 2023 and is expected to be a tax-free reorganization for U.S. federal income tax purposes. Additional information about the reorganization has been made available to shareholders in a combined Information Statement/Prospectus that is also available at www.sec.gov.
The Fund’s performance during 2022 includes the impact of companies held by the Fund prior to changes that became effective May 1, 2022, including an increase in the market capitalization range of the companies in which the Fund invests a majority of its assets and a corresponding change in the Fund’s primary benchmark.
Columbia Acorn USA® Institutional Class shares returned -33.60% for the 12-month period ended December 31, 2022, trailing the -26.21% return of the Fund’s primary benchmark, the Russell 2500 Growth Index for the same period. The Russell 2000 Growth Index, the Fund’s former primary benchmark, returned -26.36% for the same time period.
Market overview
In 2022, global markets took a pummeling, as looser monetary policies and stimulus spending from the previous two years came home to roost. At the start of the year, the rhetoric from the Federal Reserve (Fed) on inflation amid a tight labor market and supply chain bottlenecks had primed the market for interest rate hikes. The Russian invasion of Ukraine in February 2022 added further inflationary pressure on energy and food prices, dampening market sentiment. The Fed subsequently embarked on an interest rate-raising trajectory that extended through the year with seven interest rate raises, resulting in, by June 2022, consumer sentiment reaching its lowest point in over a year. Following this, bearish investor sentiment continued to prevail despite a rollover in energy prices and an easing in supply chain disruptions. Markets rebounded in the fourth quarter on more benign economic data and expectations of a Fed pivot on interest rate hikes. Unfortunately, this was not substantial enough to reverse the damage of the previous nine months.
Small-cap stocks trailed large-cap stocks, and growth stocks considerably underperformed value stocks during the year due to their greater sensitivity to rising interest rates. In other words, higher rates reduce the value of companies’ future earnings when measured in today’s dollars. Also, less economically-sensitive companies that trade at lower valuations provide more defense in a volatile and uncertain environment. From a sector perspective, the poorest performing sectors in the Russell 2500 Growth Index were the communication services, real estate, health care, consumer discretionary and information technology sectors. While interest rates had a bearing on information technology and smaller cap names, tight labor costs had an impact on services names. Energy benefited from high inflation, the only sector within the benchmark with positive returns for the year.
Factor correlations were skewed because of extreme volatility of inflation data, coupled with extreme market reaction to that data. Company fundamentals were additionally lost in the upheaval. Stocks, especially among longer duration names, suffered declines from a compression of multiples and the types of higher quality, profitable growers we seek were most severely impacted in a backdrop of rising rates. In response, we remain focused on investing in growing companies that we believe have outstanding business models and competitive advantages. We are selective across sectors, looking for opportunities that, from a bottom-up perspective, have the ability to stand on their own and relatively detach from the surrounding macro environment.
The Fund’s notable detractors during the period
| • | Kornit Digital Ltd. is an Israeli-American international company that manufactures, markets and services a range of digital printing applications for the textile industry. Prior to 2022, Kornit benefited from several years of robust demand for its equipment as customers scrambled to meet sky-rocketing demand from end-customers. However, the re-calibration of e-commerce growth in a post-COVID scenario, coupled with macro headwinds, resulted in a greater-than-expected pause in demand. |
Columbia Acorn Family of Funds | Annual Report 2022
| 13 |
Manager Discussion of Fund Performance (continued)
Columbia Acorn USA® (Unaudited)
| • | SiteOne Landscape Supply, Inc. is the largest and only national wholesale distributor of landscape supplies. While the fundamentals of SiteOne remain sound, the company was impacted by broader exogenous factors including global supply chain issues, product inflation and economic uncertainty. |
| • | Amedisys, Inc. is a leading provider of home health, hospice and personal care. During the year, the U.S. Centers for Medicaid & Medicare Services (CMS) proposed new reimbursement guidelines for home health services, adding to an increasingly complex backdrop for the home health sector. The proposed adjustment was at the lower end of investor expectations. This caused angst over future potential EBITDA (earnings before interest, taxes, depreciation and amortization) revisions and earnings forecasts for the company. |
The Fund’s notable contributors during the period
| • | CoStar Group is a company that provides commercial real estate information, analytics, and online marketplaces. The company’s top three products (CoStar, Apartments.com and LoopNet) had strong sales growth based off consistent, subscription based recurring revenues that beat expectations. CoStar has done a good job of articulating its strategy for moving into the residential marketplace business. Improving multi-family market conditions also provided tailwinds during the year. |
| • | Stock selection in the consumer discretionary sector was a significant positive contributor, much of which is attributable to Wingstop, Inc., a multinational chain of restaurants specializing in chicken wings. Following a temporary slower COVID period, Wingstop boosted Fund performance with re-accelerating sales as customers began to re-prioritize going out to restaurants. |
| • | Axon Enterprise is the manufacturer of Tasers and market leading provider of law enforcement technology including body and vehicle cameras. The company utilized its monopolistic position to make market expansions into judiciary, corrections, federal agency and other governmental affairs. Revenue along with international contract wins and strong revenue forecasts helped to separate Axon Enterprise from an uncertain and challenging macro environment. |
Market risk may affect a single issuer, sector of the economy, industry or the market as a whole. Investments in small- and mid-cap companies involve risks and volatility greater than investments in larger, more established companies. The Fund may invest significantly in issuers within a particular sector, which may be negatively affected by market, economic or other conditions, making the fund more vulnerable to unfavorable developments in the sector. See the Fund’s prospectus for more information on these and other risks.
The views expressed in this report reflect the current views of the respective parties. These views are not guarantees of future performance and involve certain risks, uncertainties and assumptions that are difficult to predict, so actual outcomes and results may differ significantly from the views expressed. These views are subject to change at any time based upon economic, market or other conditions and the respective parties disclaim any responsibility to update such views. These views may not be relied on as investment advice and, because investment decisions for a Columbia Acorn Fund are based on numerous factors, may not be relied on as an indication of trading intent on behalf of any particular Columbia Acorn Fund. References to specific securities should not be construed as a recommendation or investment advice.
| 14 | Columbia Acorn Family of Funds | Annual Report 2022 |
Fund at a glance
Columbia Acorn International SelectSM (Unaudited)
Investment objective
Columbia Acorn International SelectSM (the Fund) seeks long-term capital appreciation.
Portfolio management
Stephen Kusmierczak, CFA
Lead Portfolio Manager or Co-Portfolio Manager since 2016
Service with Fund since 2001
Hans F. Stege
Co-Portfolio Manager since 2019
Service with Fund since 2017
Morningstar style boxTM
The Morningstar Style Box is based on a fund’s portfolio holdings. For equity funds, the vertical axis shows the market capitalization of the stocks owned, and the horizontal axis shows investment style (value, blend, or growth). Information shown is based on the most recent data provided by Morningstar.
© 2023 Morningstar, Inc. All rights reserved. The Morningstar information contained herein: (1) is proprietary to Morningstar and/or its content providers; (2) may not be copied or distributed; and (3) is not warranted to be accurate, complete or timely. Neither Morningstar nor its content providers are responsible for any damages or losses arising from any use of this information.
| Average annual total returns (%) (for the period ended December 31, 2022) |
| | | Inception | 1 Year | 5 Years | 10 Years | Life of Fund |
| Class A | Excluding sales charges | 10/16/00 | -36.80 | -0.73 | 3.28 | 6.71 |
| | Including sales charges | | -40.43 | -1.90 | 2.67 | 6.45 |
| Advisor Class | 11/08/12 | -36.63 | -0.48 | 3.55 | 7.03 |
| Class C | Excluding sales charges | 10/16/00 | -37.29 | -1.48 | 2.50 | 5.91 |
| | Including sales charges | | -37.89 | -1.48 | 2.50 | 5.91 |
| Institutional Class | 11/23/98 | -36.65 | -0.49 | 3.55 | 7.04 |
| Institutional 2 Class | 11/08/12 | -36.57 | -0.39 | 3.63 | 7.07 |
| Institutional 3 Class | 11/08/12 | -36.56 | -0.35 | 3.68 | 7.09 |
| MSCI ACWI ex USA Growth Index (Net) | | -23.05 | 1.49 | 4.68 | - |
| MSCI ACWI ex USA Index (Net) | | -16.00 | 0.88 | 3.80 | - |
Performance numbers reflect all Fund expenses. Returns for Class A shares are shown with and without the maximum initial sales charge of 5.75%. Returns for Class C shares are shown with and without the maximum contingent deferred sales charge of 1.00% for the first year after purchase. The Fund’s other share classes are not subject to sales charges, but may be subject to other fees and expenses, and have limited eligibility. Please see the Fund’s prospectus for details. Performance for different share classes will vary based on differences in sales charges and certain fees and expenses associated with each share class.
As stated in the May 1, 2022 prospectus, the Fund’s annual operating expense ratio is 0.99% for Institutional Class shares and 1.24% for Class A shares.
All results shown assume reinvestment of distributions during the period. Returns do not reflect the deduction of taxes that a shareholder may pay on Fund distributions or on the redemption of Fund shares. Performance results reflect the effect of fee waivers or reimbursements of Fund expenses by the Investment Manager and/or its affiliates. Absent these fee waivers and/or expense reimbursement arrangements, performance results may have been lower.
The performance information shown represents past performance and is not a guarantee of future results. The investment return and principal value of your investment will fluctuate so that shares, when redeemed, may be worth more or less than their original cost. Current performance may be lower or higher than the performance data shown. You may obtain performance information current to the most recent month-end by contacting your financial intermediary, visiting columbiathreadneedleus.com/investor/ or calling 800.922.6769.
The returns shown for periods prior to the share class inception date (including returns for the Life of the Fund, if shown, which are since Fund inception) include the returns of the Fund’s Institutional Class. These returns are adjusted to reflect any higher class-related operating expenses of the newer share classes, as applicable. Please visit columbiathreadneedleus.com/investor/investment-products/mutual-funds/appended-performance for more information.
The MSCI ACWI ex USA Growth Index (Net) captures a large- and mid-cap representation across 22 developed market countries and 24 emerging market countries.
The MSCI ACWI ex USA Index (Net) captures a large- and mid-cap representation across 22 of 23 developed market countries (excluding the United States) and 24 emerging market countries. The index covers approximately 85% of the global equity opportunity set outside the United States.
Unlike mutual funds, indexes are not managed and do not incur fees or expenses. It is not possible to invest directly in an index.
Columbia Acorn Family of Funds | Annual Report 2022
| 15 |
Fund at a glance (continued)
Columbia Acorn International SelectSM (Unaudited)
The Growth of a $10,000 Investment in Columbia Acorn International SelectSM Institutional Class Shares
December 31, 2012 through December 31, 2022
This chart shows the change in value of a hypothetical $10,000 investment in Institutional Class shares of the Fund during the stated time period. Although the indexes are provided for use in assessing the Fund’s performance, the Fund’s holdings may differ significantly from those in an index. Performance numbers reflect all Fund expenses.
| Equity sector breakdown (%) (at December 31, 2022) |
| Communication Services | 5.1 |
| Consumer Discretionary | 9.3 |
| Financials | 9.5 |
| Health Care | 19.2 |
| Industrials | 31.8 |
| Information Technology | 23.2 |
| Materials | 1.9 |
| Total | 100.0 |
Percentages indicated are based upon total equity investments. The Fund’s portfolio composition is subject to change.
| Country breakdown (%) (at December 31, 2022) |
| Australia | 4.1 |
| Brazil | 2.8 |
| Canada | 1.9 |
| China | 7.0 |
| Denmark | 1.7 |
| Finland | 4.0 |
| Germany | 2.4 |
| Italy | 3.9 |
| Japan | 13.1 |
| Netherlands | 4.0 |
| New Zealand | 3.9 |
| South Korea | 2.4 |
| Sweden | 11.3 |
| Switzerland | 13.5 |
| Taiwan | 5.9 |
| United Kingdom | 17.2 |
| United States(a) | 0.9 |
| Total | 100.0 |
| (a) | Includes investments in Money Market Funds. |
Country breakdown is based primarily on issuer’s place of organization/incorporation. Percentages indicated are based upon total investments excluding investments in derivatives, if any. The Fund’s portfolio composition is subject to change.
| 16 | Columbia Acorn Family of Funds | Annual Report 2022 |
Manager Discussion of Fund Performance
Columbia Acorn International SelectSM (Unaudited)
Columbia Acorn International SelectSM Institutional Class shares returned -36.65% for the 12-month period ended December 31, 2022, underperforming the -23.05% return of the Fund’s primary benchmark, the MSCI ACWI ex USA Growth Index (Net) for the same period. The Fund’s secondary benchmark, the MSCI ACWI ex USA Index (Net), ended the 12-month period with a return of -16.00%.
Market overview
In 2022, international equities experienced steep declines in a reversal of the previous year’s robust return trajectory. Geopolitical headwinds, high inflation levels and hawkish global central bank responses underscored the period. At the start of the year, our more positive outlook was quickly dampened by Russia’s unexpected invasion of Ukraine, which exacerbated the still lingering COVID-era effects of a tight labor market, high commodity and food prices and supply chain disruptions. Global central banks pivoted towards monetary tightening and by the start of the second half of the year, fears of a recession were at a peak. This was particularly true for Europe, where uncertainty over gas supplies for the impending winter combined with a weak Euro and weighed on investor sentiment. However, in the fourth quarter, more benign inflation data, easing energy supplies in Europe and a China-reopening fueled a rally in stocks that mitigated declines from the previous nine months.
Also in 2022, international small-cap growth stocks underperformed value stocks. This divergence was most prevalent in the information technology sector, as more richly valued software and services names were pummeled. Amid economic uncertainty and higher interest rates, more defensive large caps outperformed small caps. During the majority of the year, high profitability growth companies we favored provided less of a shield as they declined along with other growth stocks. This trend reversed in the fourth quarter when quality growth companies generated positive returns, following an inflation reversal in Europe.
As we enter 2023 in what continues to be an uncertain environment, we believe that capable management teams in higher quality businesses will be better able to navigate this period of unique disruption. We are somewhat more optimistic about circumstances in Europe than we were mid-year 2022. Natural gas prices underlying much higher electricity prices for most of 2022 have retreated to pre-Ukraine war levels. This provides relief for European consumers. The European Central Bank is not raising rates as aggressively as is the U.S. Federal Reserve. In most of Europe excluding the U.K., labor shortages and wage pressures have not been as salient a factor in driving inflation as in the United States. Multi-year labor bargaining agreements help dampen inflationary pressures. We are also hopeful that China’s reversal on its COVID policy will trigger an acceleration of GDP after the first quarter. German exports, for example, have typically benefited from a vibrant Chinese economy. We recognize that Russia’s war on Ukraine continues to weigh on the macro environment and poses an exogenous risk to the markets.
The Fund’s notable detractors during the period
| • | Parade Technologies Ltd. is a fabless semiconductor company offering high-speed interface and display systems used in computers, consumer electronics and display panels. In 2022, the company was negatively impacted as the semiconductor industry entered a downturn driven by a destocking in personal computers. Parade is a leader in technology and has consistently retained the largest market share in the display segment. We expect that Parade will be able to replicate that success in high-speed applications relating to servers, driven by structural growth of high-performance computing. |
| • | Dechra Pharmaceuticals PLC is a U.K.-based company that is involved in the development and marketing of veterinary products. During the period, investors had concerns over generic competition mostly because of two competing Indian manufacturers, Cronos Pharma and Felix Generics, that are more aggressively pursuing animal pharma markets in the United States. We believe these concerns are exaggerated. Most of Dechra’s generics portfolio addresses relatively niche markets. These small markets will likely prove to be uneconomical for new generic entrants which do not enjoy the scale benefits of a large group like Dechra. |
| • | Nemetschek SE is a Germany-based company that develops and sells its software into the architecture, engineering and construction verticals (construction that is built vertically, such as skyscrapers or high rises). While still a largely underpenetrated field, the company’s share price weakened in 2022 amid concerns of a slowing residential and commercial construction market. The company has also seen some management turnover as it undergoes the next |
Columbia Acorn Family of Funds | Annual Report 2022
| 17 |
Manager Discussion of Fund Performance (continued)
Columbia Acorn International SelectSM (Unaudited)
| | stages of brand harmonization and transitioning of products into license to subscription models. We continue to monitor the effect of recent management changes, but are optimistic regarding the business growth prospects for the Nemetschek in the fast-evolving ‘design, build and manage’ software space in which our team has particular expertise. |
The Fund’s notable contributors during the period
| • | Disco Corporation, headquartered in Japan, is one of the world’s largest manufacturers of specialized cutting and polishing equipment, such as wafer saws, used in semiconductor manufacturing. During the year, the company managed to buck the downcycle in semiconductors and posted double digit returns. This was supported by new growth in the area of silicon carbide (a version of the traditional semiconductor that has significantly higher breakdown strength and hardness) and expansion into the areas of power semiconductors and wafer transport. |
| • | HOSHIZAKI Corp. is a Japanese manufacturer of ‘cold’ commercial kitchen equipment, including ice machines, water filters, freezers, prep tables and refrigerated display cases. The company had strong returns in 2022 as a result of robust demand for their products that was boosted by a post-COVID recovery in restaurant businesses. Other factors that buttressed performance were a resolution of production issues in Japan as supply chain disruptions eased, as well as the positive effect from price hikes globally, which came through during the year. |
| • | Spirax-Sarco Engineering PLC is a global manufacturer of a wide range of applications for industrial and commercial steam systems, electric thermal solutions and peristaltic pumps used across multiple industries. The company has benefited from the strong demand for pressure reducing valves in a backdrop of solid global demand for oil and gas, chemicals and power. In addition, during the year, strong growth from its Watson Marlow division (based off strength in the biopharmaceutical industry) and acquisitions of thermal solutions companies, Vulcanic Group and Durex International Corporation, helped to boost performance. |
Market risk may affect a single issuer, sector of the economy, industry or the market as a whole. Foreign investments subject the Fund to political, economic, market, social and other risks within a particular country, as well as to potential currency instabilities and less stringent financial and accounting standards generally applicable to U.S. issuers. Risks are enhanced for emerging market issuers. Investments in small- and mid-cap companies involve risks and volatility and possible illiquidity greater than investments in larger, more established companies. The Fund may invest significantly in issuers within a particular sector, which may be negatively affected by market, economic or other conditions, making the Fund more vulnerable to unfavorable developments in the sector. See the Fund’s prospectus for more information on these and other risks.
The views expressed in this report reflect the current views of the respective parties. These views are not guarantees of future performance and involve certain risks, uncertainties and assumptions that are difficult to predict, so actual outcomes and results may differ significantly from the views expressed. These views are subject to change at any time based upon economic, market or other conditions and the respective parties disclaim any responsibility to update such views. These views may not be relied on as investment advice and, because investment decisions for a Columbia Acorn Fund are based on numerous factors, may not be relied on as an indication of trading intent on behalf of any particular Columbia Acorn Fund. References to specific securities should not be construed as a recommendation or investment advice.
| 18 | Columbia Acorn Family of Funds | Annual Report 2022 |
Fund at a glance
Columbia Thermostat FundSM (Unaudited)
Investment objective
Columbia Thermostat FundSM (the Fund) seeks long-term capital appreciation.
Portfolio management
Anwiti Bahuguna, Ph.D.
Lead or Co-Portfolio Manager since 2018
Service with Fund since 2018
Alex M. Rivas
Portfolio Manager since May 2022
Service with Fund since 2018
| Average annual total returns (%) (for the period ended December 31, 2022) |
| | | Inception | 1 Year | 5 Years | 10 Years | Life of Fund |
| Class A | Excluding sales charges | 03/03/03 | -13.14 | 6.47 | 5.62 | 6.73 |
| | Including sales charges | | -18.14 | 5.22 | 5.00 | 6.42 |
| Advisor Class | 11/08/12 | -12.89 | 6.74 | 5.89 | 7.00 |
| Class C | Excluding sales charges | 03/03/03 | -13.75 | 5.68 | 4.84 | 5.94 |
| | Including sales charges | | -14.60 | 5.68 | 4.84 | 5.94 |
| Institutional Class | 09/25/02 | -12.92 | 6.73 | 5.89 | 7.00 |
| Institutional 2 Class | 11/08/12 | -12.88 | 6.78 | 5.93 | 7.02 |
| Institutional 3 Class | 11/08/12 | -12.82 | 6.82 | 5.97 | 7.04 |
| Blended Benchmark | | -15.26 | 5.03 | 6.94 | - |
| S&P 500® Index | | -18.11 | 9.42 | 12.56 | - |
| Bloomberg U.S. Aggregate Bond Index | | -13.01 | 0.02 | 1.06 | - |
Performance numbers reflect all Fund expenses. Returns for Class A shares are shown with and without the maximum initial sales charge of 5.75%. Returns for Class C shares are shown with and without the maximum contingent deferred sales charge of 1.00% for the first year after purchase. The Fund’s other share classes are not subject to sales charges, but may be subject to other fees and expenses, and have limited eligibility. Please see the Fund’s prospectus for details. Performance for different share classes will vary based on differences in sales charges and certain fees and expenses associated with each share class.
As stated in the May 1, 2022 prospectus, the Fund’s annual operating expense ratio is 0.61% for Institutional Class shares and 0.86% for Class A shares.
All results shown assume reinvestment of distributions during the period. Returns do not reflect the deduction of taxes that a shareholder may pay on Fund distributions or on the redemption of Fund shares. Performance results reflect the effect of fee waivers or reimbursements of Fund expenses by the Investment Manager and/or its affiliates. Absent these fee waivers and/or expense reimbursement arrangements, performance results may have been lower.
The performance information shown represents past performance and is not a guarantee of future results. The investment return and principal value of your investment will fluctuate so that shares, when redeemed, may be worth more or less than their original cost. Current performance may be lower or higher than the performance data shown. You may obtain performance information current to the most recent month-end by contacting your financial intermediary, visiting columbiathreadneedleus.com/investor/ or calling 800.922.6769.
The returns shown for periods prior to the share class inception date (including returns for the Life of the Fund, if shown, which are since Fund inception) include the returns of the Fund’s Institutional Class. These returns are adjusted to reflect any higher class-related operating expenses of the newer share classes, as applicable. Please visit columbiathreadneedleus.com/investor/investment-products/mutual-funds/appended-performance for more information.
The Fund’s performance prior to May 1, 2018 reflects returns achieved following a principal investment strategy pursuant to which day-to-day investment decisions for the Fund were made according to only one potential form of predetermined asset allocation table. Since May 1, 2018, the Fund has followed a principal investment strategy that calls for the Investment Manager, on at least an annual basis, to determine whether the Fund’s assets should be allocated according to one of two different forms of allocation table based on the Investment Manager’s assessment of the equity market.
From the Fund’s inception through April 2020, the asset allocation table in place reflected the Investment Manager’s determination that the equity market was “expensive”. For a one-year period from May 1, 2020 through April 30, 2021, the Fund switched to the "normal" equity market table with a 50% equity floor because the Fund’s portfolio managers determined the market to be "normal." On May 1, 2021, the Fund moved back to the asset allocation table that was in place from the Fund’s inception in 2002 through April 30, 2020 based on the portfolio managers’ determination that the equity market is currently "expensive." On May 2, 2022 (since May 1, 2022 fell on a Sunday), based on the S&P 500® Index’s cyclically adjusted price-to-earnings ratio, the Investment Manager determined that the Fund will remain in an “expensive market” classification, with stock allocations ranging from 10% -90%.
The Blended Benchmark, established by the Investment Manager, is an equally weighted custom composite of the Fund’s primary equity and primary debt benchmarks, the S&P 500® Index and the Bloomberg U.S. Aggregate Bond Index, respectively. The percentage of the Fund’s assets allocated to underlying stock and bond portfolio funds will vary, and accordingly the composition of the Fund’s portfolio will not always reflect the composition of the Blended Benchmark.
The S&P 500® Index tracks the performance of 500 widely held, large-capitalization U.S. stocks.
Columbia Acorn Family of Funds | Annual Report 2022
| 19 |
Fund at a glance (continued)
Columbia Thermostat FundSM (Unaudited)
The Bloomberg U.S. Aggregate Bond Index is a market value-weighted index that tracks the daily price, coupon, pay-downs and total return performance of fixed-rate, publicly placed, dollar-denominated and non-convertible investment-grade debt issues with at least $250 million par amount outstanding and with at least one year to final maturity.
Unlike mutual funds, indexes are not managed and do not incur fees or expenses. It is not possible to invest directly in an index.
The Growth of a $10,000 Investment in Columbia Thermostat FundSM Institutional Class Shares
December 31, 2012 through December 31, 2022
This chart shows the change in value of a hypothetical $10,000 investment in Institutional Class shares of the Fund during the stated time period. Although the indexes are provided for use in assessing the Fund’s performance, the Fund’s holdings may differ significantly from those in an index. Performance numbers reflect all Fund expenses.
| Portfolio breakdown (%) (at December 31, 2022) |
| Equity Funds | 13.5 |
| Exchange-Traded Equity Funds | 1.5 |
| Exchange-Traded Fixed Income Funds | 8.5 |
| Fixed Income Funds | 76.2 |
| Money Market Funds | 0.3 |
| Total | 100.0 |
Percentages indicated are based upon total investments excluding investments in derivatives, if any. The Fund’s portfolio composition is subject to change.
| 20 | Columbia Acorn Family of Funds | Annual Report 2022 |
Manager Discussion of Fund Performance
Columbia Thermostat FundSM (Unaudited)
Columbia Thermostat FundSM Institutional Class shares returned -12.92% for the 12-month period ended December 31, 2022. During the same time period, the Fund’s primary equity benchmark, the S&P 500® Index, returned -18.11%, and the Fund’s primary debt benchmark, the Bloomberg U.S. Aggregate Bond Index, returned -13.01%. The Fund outperformed its custom Blended Benchmark, which returned -15.26% during 2022.
Market overview
U.S. equities declined in 2022, posting the worst annual performance, as measured by the S&P 500® Index, since the global financial crisis in 2008 and the dot-com meltdown in 2002. In stark contrast to the previous calendar year, in which U.S. equities accelerated to 70 record highs throughout the period and all 11 economic sectors delivered double-digit gains, 2022 saw a choppy but steady downward trajectory as investor sentiment wavered between worry and hope. Six of the 11 sectors within the S&P 500® Index fell by double-digits. Energy stocks performed best, continuing the post-pandemic momentum driven by rising oil prices. Utilities stocks were the only other broad category to produce positive results, but just barely, as investors sought stability and at least some certainty about future earnings.
Results were driven largely by expectations around the course of inflation and corresponding action by the U.S. Federal Reserve (Fed), which hiked rates seven times by a combined 4.25 percentage points over the course of the year. Some upside during the period was sparked by investors’ interpretation of Fed Chair Jerome Powell’s remarks after the Federal Open Market Committee announced an anticipated 75-basis point rate hike at the end of July 2022. (A basis point is 1/100 of a percent.) What many seemingly heard were hints that rate hikes would slow in concert with softening economic growth. That takeaway evaporated a month later when Powell spoke at Jackson Hole and prioritized fighting inflation no matter how much pain the economy might suffer. His inflation-fighting resolve was confirmed by an additional 75-basis point hike in September, along with a forecast showing no expectations for rate cuts until 2024.
A similar about-face was repeated near year-end as sentiment abruptly turned positive to start the fourth quarter but stalled in mid-December when the Fed raised rates by 50 basis points. Although the hike was widely anticipated and marked a step down from the previous 75-basis point increases, it disappointed investors who had hoped for softening language about future increases. Slowing global growth and China’s COVID-19 lockdown policy compounded rate worries, as did an increasing realization that earnings estimates had been implausibly optimistic for much of the year.
Credit-related sectors produced negative absolute returns and negative excess returns relative to U.S Treasuries during the 12-month period that ended December 31, 2022. On an excess returns basis, high-yield corporates performed the worst, followed by emerging market bonds and agency mortgage-backed securities. Asset-backed securities, federal agencies, and commercial mortgage-backed securities outperformed other sectors, although the sectors still generated negative excess returns. Shorter duration bonds outperformed longer duration bonds. Within the short-term investment-grade corporate market, lower rated securities generated positive excess returns and outperformed higher quality securities. The trend was reversed in the longer term investment-grade corporate market, with higher rated securities outperforming lower quality securities and excess returns for all ratings buckets being negative.
Contributors and detractors
The Fund’s equity portfolio had a weighted average return of -19.84% in 2022. All seven underlying equity funds posted negative returns for the period. Columbia Select Mid Cap Value Fund was the equity portfolio’s top performer, returning -9.02% for the year. Columbia Acorn® Fund was the equity portfolio’s worst performer, with a return of -33.77% for the year.
The Fund’s bond portfolio ended the year with a weighted average return of -13.31%. All six underlying bond funds posted negative returns for the period. Columbia Short Term Bond Fund was the strongest performer, returning -4.59% for the year. Columbia Total Return Bond Fund was the worst performer in the bond portfolio, returning -17.37% for the year.
Columbia Acorn Family of Funds | Annual Report 2022
| 21 |
Manager Discussion of Fund Performance (continued)
Columbia Thermostat FundSM (Unaudited)
Portfolio reallocations
The Fund’s allocation table is updated annually. Based on the S&P 500® Index’s cyclically adjusted price-to-earnings ratio, the Fund will remain in an “expensive market” classification, with stock allocations ranging from 10% -90%. On May 2, 2022 (since May 1, 2022 fell on a Sunday), the Fund moved from an allocation of 10% stocks and 90% fixed income to an allocation of 15% stocks and 85% bonds. There were 16 rebalancings of the Fund’s portfolio during the period, ending with the Fund at an allocation of 15% stocks and 85% bonds.
The Fund’s investments in the underlying funds may present certain risks, including the following: Market risk may affect a single issuer, sector of the economy, industry or the market as a whole. The Fund’s investment in other funds subjects it to the investment performance (positive or negative), risks and expenses of these underlying funds. Investments in small- and mid-cap companies involve risks and volatility and possible illiquidity greater than ininvestments in larger, more established companies. There are risks associated with fixed-income investments, including credit risk, market risk, interest rate risk and prepayment and extension risk. In general, bond prices fall when interest rates rise and vice versa. This effect is more pronounced for longer term securities. Non-investment-grade(high-yield or junk) securities present greater price volatility and more risk to principal and income than higher rated securities. Foreign investments subject the Fund to political, economic, market, social and other risks within a particular country, as well as to potential currency instabilities and less stringent financial and accounting standards generally applicable to U.S. issuers. Risks are enhanced for emerging market issuers. See the Fund’s prospectus for more information on these and other risks.
The views expressed in this report reflect the current views of the respective parties. These views are not guarantees of future performance and involve certain risks, uncertainties and assumptions that are difficult to predict, so actual outcomes and results may differ significantly from the views expressed. These views are subject to change at any time based upon economic, market or other conditions and the respective parties disclaim any responsibility to update such views. These views may not be relied on as investment advice and, because investment decisions for a Columbia Acorn Fund are based on numerous factors, may not be relied on as an indication of trading intent on behalf of any particular Columbia Acorn Fund. References to specific securities should not be construed as a recommendation or investment advice.
The value of an investment in the Fund is based primarily on the performance of the underlying funds in which it invests. The Fund is subject to the risk that the investment manager’s decisions regarding asset classes and underlying funds will not anticipate market trends successfully, resulting in a failure to reserve capital or lower total return. The Investment Manager may select an underlying fund in the Columbia Acorn Family of Funds or broader Columbia Funds complex over alternative investments. There can be no assurance that the Columbia Acorn Funds will outperform similar funds managed by the Investment Manager’s affiliates. This is not an offer of the shares of any other mutual fund mentioned herein.
| 22 | Columbia Acorn Family of Funds | Annual Report 2022 |
Fund at a glance
Columbia Acorn European FundSM (Unaudited)
Investment objective
Columbia Acorn European FundSM (the Fund) seeks long-term capital appreciation.
Portfolio management
Stephen Kusmierczak, CFA
Portfolio Manager or Co-Portfolio Manager since 2011
Service with Fund since 2011
Sebastien Pigeon, CFA
Co-Portfolio Manager since 2021
Service with Fund since 2015
Morningstar style boxTM
The Morningstar Style Box is based on a fund’s portfolio holdings. For equity funds, the vertical axis shows the market capitalization of the stocks owned, and the horizontal axis shows investment style (value, blend, or growth). Information shown is based on the most recent data provided by Morningstar.
© 2023 Morningstar, Inc. All rights reserved. The Morningstar information contained herein: (1) is proprietary to Morningstar and/or its content providers; (2) may not be copied or distributed; and (3) is not warranted to be accurate, complete or timely. Neither Morningstar nor its content providers are responsible for any damages or losses arising from any use of this information.
| Average annual total returns (%) (for the period ended December 31, 2022) |
| | | Inception | 1 Year | 5 Years | 10 Years | Life of Fund |
| Class A | Excluding sales charges | 08/19/11 | -38.16 | 1.80 | 6.45 | 7.30 |
| | Including sales charges | | -41.71 | 0.60 | 5.82 | 6.74 |
| Advisor Class* | 06/25/14 | -38.03 | 2.05 | 6.73 | 7.58 |
| Class C | Excluding sales charges | 08/19/11 | -38.64 | 1.04 | 5.66 | 6.51 |
| | Including sales charges | | -39.25 | 1.04 | 5.66 | 6.51 |
| Institutional Class | 08/19/11 | -38.02 | 2.05 | 6.72 | 7.57 |
| Institutional 2 Class | 11/08/12 | -37.97 | 2.13 | 6.77 | 7.61 |
| Institutional 3 Class* | 03/01/17 | -37.96 | 2.14 | 6.77 | 7.62 |
| MSCI AC Europe Small Cap Index (Net) | | -26.59 | -0.18 | 6.48 | - |
Performance numbers reflect all Fund expenses. Returns for Class A shares are shown with and without the maximum initial sales charge of 5.75%. Returns for Class C shares are shown with and without the maximum contingent deferred sales charge of 1.00% for the first year after purchase. The Fund’s other share classes are not subject to sales charges, but may be subject to other fees and expenses, and have limited eligibility. Please see the Fund’s prospectus for details. Performance for different share classes will vary based on differences in sales charges and certain fees and expenses associated with each share class.
As stated in the May 1, 2022 prospectus, the Fund’s annual operating expense ratio is 1.20% for Institutional Class shares and 1.45% for Class A shares.
All results shown assume reinvestment of distributions during the period. Returns do not reflect the deduction of taxes that a shareholder may pay on Fund distributions or on the redemption of Fund shares. Performance results reflect the effect of fee waivers or reimbursements of Fund expenses by the Investment Manager and/or its affiliates. Absent these fee waivers and/or expense reimbursement arrangements, performance results may have been lower.
The performance information shown represents past performance and is not a guarantee of future results. The investment return and principal value of your investment will fluctuate so that shares, when redeemed, may be worth more or less than their original cost. Current performance may be lower or higher than the performance data shown. You may obtain performance information current to the most recent month-end by contacting your financial intermediary, visiting columbiathreadneedleus.com/investor/ or calling 800.922.6769.
| * | The returns shown for periods prior to the share class inception date (including returns for the Life of the Fund, if shown, which are since Fund inception) include the returns of the Fund’s Institutional Class. These returns are adjusted to reflect any higher class-related operating expenses of the newer share classes, as applicable. Please visit columbiathreadneedleus.com/investor/investment-products/mutual-funds/appended-performance for more information. |
The MSCI AC Europe Small Cap Index (Net) captures a small-cap representation across 20 markets in Europe. The index covers approximately 14% of the free float-adjusted market capitalization across each market country in Europe.
Unlike mutual funds, indexes are not managed and do not incur fees or expenses. It is not possible to invest directly in an index.
Columbia Acorn Family of Funds | Annual Report 2022
| 23 |
Fund at a glance (continued)
Columbia Acorn European FundSM (Unaudited)
The Growth of a $10,000 Investment in Columbia Acorn European FundSM Institutional Class Shares
December 31, 2012 through December 31, 2022
This chart shows the change in value of a hypothetical $10,000 investment in Institutional Class shares of the Fund during the stated time period. Although the index is provided for use in assessing the Fund’s performance, the Fund’s holdings may differ significantly from those in an index. Performance numbers reflect all Fund expenses.
| Equity sector breakdown (%) (at December 31, 2022) |
| Communication Services | 6.0 |
| Consumer Discretionary | 1.2 |
| Consumer Staples | 5.7 |
| Financials | 4.9 |
| Health Care | 19.3 |
| Industrials | 36.9 |
| Information Technology | 22.4 |
| Materials | 1.6 |
| Real Estate | 2.0 |
| Total | 100.0 |
Percentages indicated are based upon total equity investments. The Fund’s portfolio composition is subject to change.
| Country breakdown (%) (at December 31, 2022) |
| Austria | 0.6 |
| Denmark | 4.4 |
| Finland | 2.9 |
| France | 1.5 |
| Germany | 11.0 |
| Italy | 10.2 |
| Netherlands | 6.2 |
| Russian Federation | 0.0(a) |
| Spain | 1.1 |
| Sweden | 17.5 |
| Switzerland | 7.6 |
| United Kingdom | 30.4 |
| United States(b) | 6.6 |
| Total | 100.0 |
| (a) | Rounds to zero. |
| (b) | Includes investments in Money Market Funds. |
Country breakdown is based primarily on issuer’s place of organization/incorporation. Percentages indicated are based upon total investments excluding investments in derivatives, if any. The Fund’s portfolio composition is subject to change.
| 24 | Columbia Acorn Family of Funds | Annual Report 2022 |
Manager Discussion of Fund Performance
Columbia Acorn European FundSM (Unaudited)
Columbia Acorn European FundSM Institutional Class shares returned -38.02% for the 12-month period ended December 31, 2022, underperforming the -26.59% return of the Fund’s primary benchmark, the MSCI AC Europe Small Cap Index (Net) for the same period.
Market overview
In 2022, international equities experienced steep declines in a reversal of the previous year’s robust return trajectory. Geopolitical headwinds, high inflation levels and hawkish global central bank responses underscored the period. At the start of the year, our more positive outlook was quickly dampened by Russia’s invasion of Ukraine, which exacerbated the still lingering COVID-era effects of a tight labor market, high commodity and food prices and supply chain disruptions. Global central banks pivoted towards monetary tightening and by the start of the second half of the year, fears of a recession were at a peak. This was particularly true for Europe, where uncertainty over gas supplies for the impending winter combined with a weak Euro and weighed on investor sentiment. However, in the fourth quarter, more benign inflation data, easing energy supplies in Europe and a China-reopening fueled a rally in stocks that mitigated declines from the previous nine months.
Also in 2022, international small-cap growth stocks underperformed value stocks. This divergence was most prevalent in the information technology sector, as more richly valued software and services names were pummeled. Amid economic uncertainty and higher interest rates, more defensive large caps outperformed small caps. During the majority of the year, high profitability growth companies we favored provided less of a shield as they declined along with other growth stocks. This trend reversed in the fourth quarter when quality growth companies generated positive returns, following an inflation reversal in Europe.
As we enter 2023 in what continues to be an uncertain environment, we believe that capable management teams in higher quality businesses will be better able to navigate this period of unique disruption. We are somewhat more optimistic about the circumstances in Europe than we were mid-year 2022. Natural gas prices underlying much higher electricity prices for most of 2022 have retreated to pre-Ukraine war levels, providing relief for European consumers. The European Central Bank is not raising rates as aggressively as is the U.S. Federal Reserve. In most of Europe excluding the U.K., labor shortages and wage pressures have not been as salient a factor in driving inflation as in the United States. Multi-year labor bargaining agreements help dampen inflationary pressures. We are also hopeful that China’s reversal on its COVID policy will trigger an acceleration of GDP after the first quarter. German exports, for example, have typically benefited from a vibrant Chinese economy. We recognize that Russia’s war on Ukraine continues to weigh on the macro environment and poses an exogenous risk to the markets.
The Fund’s notable detractors during the period
| • | Dechra Pharmaceuticals PLC is a U.K.-based company that is involved in the development and marketing of veterinary products. During the period, investors had concerns over generic competition mostly because of two competing Indian manufacturers, Cronos Pharma and Felix Generics, that are more aggressively pursuing animal pharma markets in the United States. We believe these concerns are exaggerated. Most of Dechra’s generics portfolio addresses relatively niche markets. These small markets will likely prove to be uneconomical for new generic entrants which do not enjoy the scale benefits of a large group like Dechra. |
| • | Hypoport provides technology platforms that support the German credit, real estate and insurance industries through EUROSPACE, the largest B2B market place for loan products in Germany. 2022 saw large shifts in Germany’s property market, as prices fell amid higher interest rates. Beyond the challenges of higher mortgage rates, banks have been tightening lending conditions as they have become more risk-cognizant on real estate loans. However, the company remains fundamentally sound and continues to take market share, which should enable strong growth even in a higher rate environment. |
| • | Intermediate Capital Group PLC is a U.K.-headquartered investment firm with a strong position in the private debt and equity markets. Intermediate Capital Group ended the year among the Fund’s top detractors because, for the first nine months of the year, the company was weighed down by concerns over the impact of rising interest rates on new issuance of debt. However, in the fourth quarter of 2022, as these concerns reached an inflection point, there was a reversal in investor sentiment and the stock bounced back strongly. We believe private debt is an interesting and underfollowed asset class versus its equity counterpart, and we like the Fund’s position in this name. |
Columbia Acorn Family of Funds | Annual Report 2022
| 25 |
Manager Discussion of Fund Performance (continued)
Columbia Acorn European FundSM (Unaudited)
The Fund’s notable contributors during the period
| • | Munters Group is a Swedish company that provides stand-alone dehumidification and air treatment solutions to the food, pharma, agriculture and electronics industries. Munters has consistently won large de-humidification contracts, causing it to report several quarters of consecutive record order book increases. Its energy-saving cooling solutions for data centers and de-humidification equipment for electric vehicle lithium-ion battery plants are in high demand. We are watching carefully if the company can overcome recent supply chain challenges to meet its target profitability level. Energy savings, especially in climate control, is an important theme for the Fund. |
| • | Argenx SE is a well-managed Netherlands-based biotechnology company developing antibody-based medicines. At the end of 2021, the company received FDA approval for its first drug product, Vyvgart. During 2022, sales of the drug exceeded expectations. Additionally, investors have been optimistic about prospects for the company’s more convenient subcutaneous formulation, which is equally efficacious and expected to be approved in 2023. We remain optimistic this positive momentum will continue, especially as direct competition seems to be two to three years behind. |
| • | Inter Parfums designs and markets a portfolio of fragrances for 20+ mass and luxury brands under license agreements. In 2022, the company’s strong portfolio of brands enjoyed a recovery in a post-COVID re-opening that has seen a return to perfume usage. In addition, the stock received a boost during the period when the company signed an exclusive fragrance license agreement with fashion sports brand, Lacoste, to create, develop, produce and market all perfume and cosmetics lines. |
Market risk may affect a single issuer, sector of the economy, industry or the market as a whole. International investing involves certain risks and volatility due to potential political, economic or currency instabilities and different, potentially less stringent, financial and accounting standards than those generally applicable to U.S. issuers. Investments in small- and mid-cap companies involve risks and volatility and possible illiquidity greater than investments in larger, more established companies. The Fund may invest significantly in issuers within a particular sector, which may be negatively affected by market, economic or other conditions, making the Fund more vulnerable to unfavorable developments in the sector. See the Fund’s prospectus for more information on these and other risks.
The views expressed in this report reflect the current views of the respective parties. These views are not guarantees of future performance and involve certain risks, uncertainties and assumptions that are difficult to predict, so actual outcomes and results may differ significantly from the views expressed.These views are subject to change at any time based upon economic, market or other conditions and the respective parties disclaim any responsibility to update such views. These views may not be relied on as investment advice and, because investment decisions for a Columbia Acorn Fund are based on numerous factors, may not be relied on as an indication of trading intent on behalf of any particular Columbia Acorn Fund. References to specific securities should not be construed as a recommendation or investment advice.
| 26 | Columbia Acorn Family of Funds | Annual Report 2022 |
Understanding Your Fund’s Expenses
(Unaudited)
As a shareholder, you incur two types of costs. There are shareholder transaction costs, which generally include sales charges on purchases and may include redemption fees. There are also ongoing fund costs, which generally include investment advisory fees, distribution and service (Rule 12b-1) fees, and other Fund expenses. The following information is intended to help you understand your ongoing costs (in dollars) of investing in the Fund and to help you compare these costs with the ongoing costs of investing in other mutual funds.
Analyzing your Fund’s expenses
To illustrate these ongoing costs, we have provided examples and calculated the expenses paid by investors in each share class of the Funds during the period. The actual and hypothetical information in the tables is based on an initial investment of $1,000 at the beginning of the period indicated and held for the entire period. Expense information is calculated two ways and each method provides you with different information. The amount listed in the “Actual” column is calculated using the Funds’ actual operating expenses and total return for the period. You may use the Actual information, together with the amount invested, to estimate the expenses that you paid over the period. Simply divide your account value by $1,000 (for example, an $8,600 account value divided by $1,000 = 8.6), then multiply the results by the expenses paid during the period under the Actual column. The amount listed in the “Hypothetical” column assumes a 5% annual rate of return before expenses (which is not the Funds’ actual return) and then applies the Funds’ actual expense ratio for the period to the hypothetical return. You should not use the hypothetical account values and expenses to estimate either your actual account balance at the end of the period or the expenses you paid during the period. See “Compare with other funds” below for details on how to use the hypothetical data.
In addition to the ongoing expenses which the Funds bear directly, Columbia Thermostat FundSM’s shareholders indirectly bear the Fund’s allocable share of the costs and expenses of each underlying fund in which the Fund invests. You can also estimate the effective expenses paid during the period, which includes the indirect fees associated with investing in the underlying funds, by using the amounts listed in the effective expenses paid during the period column in the “Fund of Funds” table.
Compare with other funds
Since all mutual funds are required to include the same hypothetical calculations about expenses in shareholder reports, you can use this information to compare the ongoing cost of investing in the Funds with other funds. To do so, compare the hypothetical example with the 5% hypothetical examples that appear in the shareholder reports of other funds. As you compare hypothetical examples of other funds, it is important to note that hypothetical examples are meant to highlight the ongoing costs of investing in a fund only and do not reflect any transaction costs, such as sales charges, or redemption or exchange fees. Therefore, the hypothetical calculations are useful in comparing ongoing costs only, and will not help you determine the relative total costs of owning different funds. If transaction costs were included in these calculations, your costs would be higher.
| July 1, 2022 — December 31, 2022 |
| | Account value at the
beginning of the
period ($) | Account value at the
end of the
period ($) | Expenses paid during
the period ($) | Fund’s annualized
expense ratio (%) |
| | Actual | Hypothetical | Actual | Hypothetical | Actual | Hypothetical | Actual |
| Columbia Acorn® Fund |
| Class A | 1,000.00 | 1,000.00 | 1,047.60 | 1,019.75 | 5.44 | 5.37 | 1.06 |
| Advisor Class | 1,000.00 | 1,000.00 | 1,049.60 | 1,021.01 | 4.16 | 4.10 | 0.81 |
| Class C | 1,000.00 | 1,000.00 | 1,043.60 | 1,016.04 | 9.22 | 9.10 | 1.80 |
| Institutional Class | 1,000.00 | 1,000.00 | 1,050.40 | 1,021.01 | 4.16 | 4.10 | 0.81 |
| Institutional 2 Class | 1,000.00 | 1,000.00 | 1,049.90 | 1,021.16 | 4.01 | 3.95 | 0.78 |
| Institutional 3 Class | 1,000.00 | 1,000.00 | 1,050.10 | 1,021.21 | 3.96 | 3.90 | 0.77 |
Columbia Acorn Family of Funds | Annual Report 2022
| 27 |
Understanding Your Fund’s Expenses (continued)
(Unaudited)
| July 1, 2022 — December 31, 2022 |
| | Account value at the
beginning of the
period ($) | Account value at the
end of the
period ($) | Expenses paid during
the period ($) | Fund’s annualized
expense ratio (%) |
| | Actual | Hypothetical | Actual | Hypothetical | Actual | Hypothetical | Actual |
| Columbia Acorn International® |
| Class A | 1,000.00 | 1,000.00 | 1,035.90 | 1,018.90 | 6.28 | 6.23 | 1.23 |
| Advisor Class | 1,000.00 | 1,000.00 | 1,037.60 | 1,020.16 | 5.01 | 4.96 | 0.98 |
| Class C | 1,000.00 | 1,000.00 | 1,032.40 | 1,015.14 | 10.09 | 10.00 | 1.98 |
| Institutional Class | 1,000.00 | 1,000.00 | 1,037.70 | 1,020.16 | 5.01 | 4.96 | 0.98 |
| Institutional 2 Class | 1,000.00 | 1,000.00 | 1,037.70 | 1,020.46 | 4.70 | 4.66 | 0.92 |
| Institutional 3 Class | 1,000.00 | 1,000.00 | 1,037.50 | 1,020.66 | 4.49 | 4.46 | 0.88 |
| Class R | 1,000.00 | 1,000.00 | 1,035.00 | 1,017.65 | 7.55 | 7.49 | 1.48 |
| Columbia Acorn USA® |
| Class A | 1,000.00 | 1,000.00 | 1,046.50 | 1,019.65 | 5.54 | 5.47 | 1.08 |
| Advisor Class | 1,000.00 | 1,000.00 | 1,047.00 | 1,020.91 | 4.26 | 4.20 | 0.83 |
| Class C | 1,000.00 | 1,000.00 | 1,041.80 | 1,015.89 | 9.37 | 9.25 | 1.83 |
| Institutional Class | 1,000.00 | 1,000.00 | 1,046.60 | 1,020.91 | 4.26 | 4.20 | 0.83 |
| Institutional 2 Class | 1,000.00 | 1,000.00 | 1,047.40 | 1,021.06 | 4.11 | 4.05 | 0.80 |
| Institutional 3 Class | 1,000.00 | 1,000.00 | 1,047.70 | 1,021.26 | 3.90 | 3.85 | 0.76 |
| Columbia Acorn International SelectSM |
| Class A | 1,000.00 | 1,000.00 | 989.40 | 1,018.80 | 6.23 | 6.33 | 1.25 |
| Advisor Class | 1,000.00 | 1,000.00 | 991.10 | 1,020.05 | 4.99 | 5.06 | 1.00 |
| Class C | 1,000.00 | 1,000.00 | 985.60 | 1,015.04 | 9.96 | 10.10 | 2.00 |
| Institutional Class | 1,000.00 | 1,000.00 | 991.00 | 1,020.05 | 4.99 | 5.06 | 1.00 |
| Institutional 2 Class | 1,000.00 | 1,000.00 | 991.50 | 1,020.61 | 4.44 | 4.51 | 0.89 |
| Institutional 3 Class | 1,000.00 | 1,000.00 | 991.50 | 1,020.86 | 4.19 | 4.26 | 0.84 |
| Columbia Acorn European FundSM |
| Class A | 1,000.00 | 1,000.00 | 1,016.30 | 1,017.80 | 7.33 | 7.33 | 1.45 |
| Advisor Class | 1,000.00 | 1,000.00 | 1,017.10 | 1,019.05 | 6.07 | 6.07 | 1.20 |
| Class C | 1,000.00 | 1,000.00 | 1,012.80 | 1,014.04 | 11.10 | 11.11 | 2.20 |
| Institutional Class | 1,000.00 | 1,000.00 | 1,017.60 | 1,019.05 | 6.07 | 6.07 | 1.20 |
| Institutional 2 Class | 1,000.00 | 1,000.00 | 1,017.90 | 1,019.35 | 5.77 | 5.77 | 1.14 |
| Institutional 3 Class | 1,000.00 | 1,000.00 | 1,018.20 | 1,019.50 | 5.62 | 5.62 | 1.11 |
Fund of Funds—Columbia Thermostat FundSM
| July 1, 2022 — December 31, 2022 |
| | Account value at the
beginning of the
period ($) | Account value at the
end of the
period ($) | Expenses paid during
the period ($) | Fund’s annualized
expense ratio (%) | Effective expenses
paid during the
period ($) | Fund’s effective
annualized
expense ratio (%) |
| | Actual | Hypothetical | Actual | Hypothetical | Actual | Hypothetical | Actual | Actual | Hypothetical | Actual |
| Class A | 1,000.00 | 1,000.00 | 991.70 | 1,022.61 | 2.45 | 2.48 | 0.49 | 4.24 | 4.31 | 0.85 |
| Advisor Class | 1,000.00 | 1,000.00 | 993.50 | 1,023.87 | 1.20 | 1.22 | 0.24 | 3.00 | 3.04 | 0.60 |
| Class C | 1,000.00 | 1,000.00 | 988.20 | 1,018.85 | 6.18 | 6.28 | 1.24 | 7.97 | 8.10 | 1.60 |
| Institutional Class | 1,000.00 | 1,000.00 | 992.80 | 1,023.87 | 1.20 | 1.22 | 0.24 | 3.00 | 3.04 | 0.60 |
| Institutional 2 Class | 1,000.00 | 1,000.00 | 993.40 | 1,024.07 | 1.00 | 1.01 | 0.20 | 2.80 | 2.84 | 0.56 |
| Institutional 3 Class | 1,000.00 | 1,000.00 | 993.80 | 1,024.27 | 0.80 | 0.81 | 0.16 | 2.60 | 2.64 | 0.52 |
Expenses paid during the period are equal to the annualized expense ratio, multiplied by the average account value over the period and then multiplied by the number of days in the Fund’s most recent fiscal half year and divided by 365.
Except with respect to Columbia Thermostat FundSM, expenses do not include any fees and expenses incurred indirectly by a Fund from the underlying funds in which the Fund may invest (also referred to as “acquired funds”), including affiliated and non-affiliated pooled investments vehicles (including mutual funds and exchange traded funds).
| 28 | Columbia Acorn Family of Funds | Annual Report 2022 |
Understanding Your Fund’s Expenses (continued)
(Unaudited)
In the case of Columbia Thermostat FundSM, effective expenses paid during the period and the Fund’s effective annualized expense ratio include expenses borne directly by the class plus the Fund’s pro rata portion of the ongoing expenses charged by the underlying funds in which it invests using the expense ratio of each class of each underlying fund as of the underlying fund’s most recent shareholder report.
Had the Investment Manager and/or certain of its affiliates not waived/reimbursed certain fees and expenses for the Funds, account value at the end of the period would have been reduced.
Columbia Acorn Family of Funds | Annual Report 2022
| 29 |
Portfolio of Investments
Columbia Acorn® Fund, December 31, 2022
(Percentages represent value of investments compared to net assets)
Investments in securities
| Common Stocks 97.2% |
| Issuer | Shares | Value ($) |
| Communication Services 2.6% |
| Entertainment 1.6% |
| Take-Two Interactive Software, Inc.(a) | 388,309 | 40,434,616 |
| Media 1.0% |
| Trade Desk, Inc. (The), Class A(a) | 549,801 | 24,647,579 |
| Total Communication Services | 65,082,195 |
| Consumer Discretionary 18.5% |
| Auto Components 0.9% |
| Dorman Products, Inc.(a) | 291,841 | 23,601,182 |
| Diversified Consumer Services 2.4% |
| Bright Horizons Family Solutions, Inc.(a) | 578,074 | 36,476,469 |
| Chegg, Inc.(a) | 880,056 | 22,239,015 |
| Total | | 58,715,484 |
| Hotels, Restaurants & Leisure 7.2% |
| Churchill Downs, Inc. | 274,113 | 57,955,712 |
| Planet Fitness, Inc., Class A(a) | 677,884 | 53,417,259 |
| Wingstop, Inc. | 493,783 | 67,954,416 |
| Total | | 179,327,387 |
| Household Durables 2.3% |
| Skyline Champion Corp.(a) | 1,104,814 | 56,908,969 |
| Internet & Direct Marketing Retail 1.0% |
| Etsy, Inc.(a) | 203,287 | 24,349,717 |
| Specialty Retail 4.7% |
| Five Below, Inc.(a) | 382,265 | 67,611,211 |
| Floor & Decor Holdings, Inc., Class A(a) | 277,987 | 19,356,235 |
| Williams-Sonoma, Inc. | 264,009 | 30,339,914 |
| Total | | 117,307,360 |
| Total Consumer Discretionary | 460,210,099 |
| Consumer Staples 2.4% |
| Food & Staples Retailing 0.7% |
| BJ’s Wholesale Club Holdings, Inc.(a) | 250,162 | 16,550,718 |
| Household Products 1.7% |
| WD-40 Co. | 261,685 | 42,186,239 |
| Total Consumer Staples | 58,736,957 |
| Common Stocks (continued) |
| Issuer | Shares | Value ($) |
| Energy 3.7% |
| Oil, Gas & Consumable Fuels 3.7% |
| Antero Resources Corp.(a) | 765,755 | 23,730,748 |
| Diamondback Energy, Inc. | 257,680 | 35,245,470 |
| Matador Resources Co. | 587,042 | 33,602,284 |
| Total | | 92,578,502 |
| Total Energy | 92,578,502 |
| Financials 6.7% |
| Banks 1.8% |
| Lakeland Financial Corp. | 196,978 | 14,373,484 |
| Pinnacle Financial Partners, Inc. | 403,897 | 29,646,040 |
| Total | | 44,019,524 |
| Capital Markets 3.2% |
| Ares Management Corp., Class A | 522,274 | 35,744,433 |
| GCM Grosvenor, Inc., Class A(b) | 3,261,587 | 24,820,677 |
| Houlihan Lokey, Inc., Class A | 217,781 | 18,981,792 |
| Total | | 79,546,902 |
| Insurance 1.7% |
| Ryan Specialty Holdings, Inc., Class A(a) | 1,035,084 | 42,966,337 |
| Total Financials | 166,532,763 |
| Health Care 18.4% |
| Biotechnology 3.2% |
| Exact Sciences Corp.(a) | 324,921 | 16,086,839 |
| Insmed, Inc.(a) | 842,546 | 16,834,069 |
| Intellia Therapeutics, Inc.(a) | 183,000 | 6,384,870 |
| Natera, Inc.(a) | 993,550 | 39,910,903 |
| Total | | 79,216,681 |
| Health Care Equipment & Supplies 3.4% |
| Axonics, Inc.(a) | 129,274 | 8,083,503 |
| Inspire Medical Systems, Inc.(a) | 111,666 | 28,126,432 |
| Insulet Corp.(a) | 166,703 | 49,075,696 |
| Total | | 85,285,631 |
The accompanying Notes to Financial Statements are an integral part of this statement.
| 30 | Columbia Acorn Family of Funds | Annual Report 2022 |
Portfolio of Investments (continued)
Columbia Acorn® Fund, December 31, 2022
| Common Stocks (continued) |
| Issuer | Shares | Value ($) |
| Health Care Providers & Services 4.4% |
| Amedisys, Inc.(a) | 394,573 | 32,962,628 |
| Chemed Corp. | 141,985 | 72,473,404 |
| P3 Health Partners, Inc., Class A(a),(b) | 2,500,000 | 4,600,000 |
| Total | | 110,036,032 |
| Health Care Technology 0.4% |
| Doximity, Inc., Class A(a) | 323,894 | 10,869,883 |
| Life Sciences Tools & Services 7.0% |
| Bio-Techne Corp. | 814,904 | 67,539,243 |
| Repligen Corp.(a) | 340,265 | 57,610,267 |
| West Pharmaceutical Services, Inc. | 205,533 | 48,372,192 |
| Total | | 173,521,702 |
| Total Health Care | 458,929,929 |
| Industrials 20.1% |
| Aerospace & Defense 2.8% |
| Axon Enterprise, Inc.(a) | 215,461 | 35,751,444 |
| Curtiss-Wright Corp. | 208,261 | 34,777,504 |
| Total | | 70,528,948 |
| Building Products 1.3% |
| Simpson Manufacturing Co., Inc. | 166,499 | 14,761,801 |
| Trex Company, Inc.(a) | 413,582 | 17,506,926 |
| Total | | 32,268,727 |
| Commercial Services & Supplies 1.2% |
| Rollins, Inc. | 789,964 | 28,865,285 |
| Electrical Equipment 3.6% |
| AMETEK, Inc. | 278,820 | 38,956,730 |
| Atkore, Inc.(a) | 257,702 | 29,228,561 |
| Generac Holdings, Inc.(a) | 208,119 | 20,949,259 |
| Total | | 89,134,550 |
| Machinery 5.5% |
| Evoqua Water Technologies Corp.(a) | 721,704 | 28,579,478 |
| Ingersoll Rand, Inc. | 365,482 | 19,096,434 |
| Middleby Corp. (The)(a) | 375,993 | 50,345,463 |
| SPX Technologies, Inc.(a) | 582,255 | 38,225,041 |
| Total | | 136,246,416 |
| Common Stocks (continued) |
| Issuer | Shares | Value ($) |
| Professional Services 3.5% |
| CoStar Group, Inc.(a) | 722,346 | 55,822,899 |
| ICF International, Inc. | 330,012 | 32,687,689 |
| Total | | 88,510,588 |
| Trading Companies & Distributors 2.2% |
| SiteOne Landscape Supply, Inc.(a) | 473,575 | 55,559,819 |
| Total Industrials | 501,114,333 |
| Information Technology 19.3% |
| Communications Equipment 0.7% |
| Calix, Inc.(a) | 239,070 | 16,359,560 |
| Electronic Equipment, Instruments & Components 1.8% |
| CDW Corp. | 250,791 | 44,786,257 |
| IT Services 3.6% |
| Endava PLC, ADR(a) | 227,592 | 17,410,788 |
| MongoDB, Inc.(a) | 234,701 | 46,198,545 |
| VeriSign, Inc.(a) | 125,888 | 25,862,430 |
| Total | | 89,471,763 |
| Semiconductors & Semiconductor Equipment 1.9% |
| Monolithic Power Systems, Inc. | 92,607 | 32,746,761 |
| Wolfspeed, Inc.(a) | 220,093 | 15,195,221 |
| Total | | 47,941,982 |
| Software 11.3% |
| Bill.com Holdings, Inc.(a) | 210,341 | 22,918,755 |
| Crowdstrike Holdings, Inc., Class A(a) | 330,299 | 34,777,182 |
| Datadog, Inc., Class A(a) | 295,613 | 21,727,556 |
| Five9, Inc.(a) | 680,319 | 46,166,447 |
| HubSpot, Inc.(a) | 115,063 | 33,268,165 |
| Paycom Software, Inc.(a) | 207,487 | 64,385,291 |
| Sprout Social, Inc., Class A(a) | 230,834 | 13,032,888 |
| Workiva, Inc., Class A(a) | 285,752 | 23,994,595 |
| Zscaler, Inc.(a) | 199,415 | 22,314,539 |
| Total | | 282,585,418 |
| Total Information Technology | 481,144,980 |
The accompanying Notes to Financial Statements are an integral part of this statement.
Columbia Acorn Family of Funds | Annual Report 2022
| 31 |
Portfolio of Investments (continued)
Columbia Acorn® Fund, December 31, 2022
| Common Stocks (continued) |
| Issuer | Shares | Value ($) |
| Materials 2.5% |
| Chemicals 1.7% |
| Albemarle Corp. | 76,395 | 16,567,020 |
| Avient Corp. | 750,897 | 25,350,283 |
| Total | | 41,917,303 |
| Construction Materials 0.8% |
| Vulcan Materials Co. | 107,121 | 18,757,958 |
| Total Materials | 60,675,261 |
| Real Estate 3.0% |
| Real Estate Management & Development 3.0% |
| Colliers International Group, Inc. | 517,006 | 47,585,232 |
| FirstService Corp. | 209,311 | 25,651,063 |
| Total | | 73,236,295 |
| Total Real Estate | 73,236,295 |
Total Common Stocks
(Cost $2,444,055,714) | 2,418,241,314 |
|
| Money Market Funds 3.0% |
| | Shares | Value ($) |
| Columbia Short-Term Cash Fund, 4.318%(b),(c) | 75,795,925 | 75,773,186 |
Total Money Market Funds
(Cost $75,768,189) | 75,773,186 |
Total Investments in Securities
(Cost: $2,519,823,903) | 2,494,014,500 |
| Other Assets & Liabilities, Net | | (4,765,380) |
| Net Assets | 2,489,249,120 |
Notes to Portfolio of Investments
| (a) | Non-income producing investment. |
| (b) | As defined in the Investment Company Act of 1940, as amended, an affiliated company is one in which the Fund owns 5% or more of the company’s outstanding voting securities, or a company which is under common ownership or control with the Fund. The value of the holdings and transactions in these affiliated companies during the year ended December 31, 2022 are as follows: |
| Affiliated issuers | Beginning
of period($) | Purchases($) | Sales($) | Net change in
unrealized
appreciation
(depreciation)($) | End of
period($) | Realized gain
(loss)($) | Dividends($) | End of
period shares |
| Columbia Short-Term Cash Fund, 4.318% |
| | 81,660,901 | 1,176,748,138 | (1,182,640,172) | 4,319 | 75,773,186 | 2,661 | 1,044,015 | 75,795,925 |
| GCM Grosvenor, Inc., Class A |
| | 23,373,000 | 8,782,055 | — | (7,334,378) | 24,820,677 | — | 1,233,692 | 3,261,587 |
| P3 Health Partners, Inc., Class A‡ |
| | — | — | — | (20,400,000) | 4,600,000 | — | — | 2,500,000 |
| Total | 105,033,901 | | | (27,730,059) | 105,193,863 | 2,661 | 2,277,707 | |
| ‡ | Issuer was not an affiliate at the beginning of period. |
| (c) | The rate shown is the seven-day current annualized yield at December 31, 2022. |
Abbreviation Legend
| ADR | American Depositary Receipt |
Fair value measurements
Various inputs are used in determining the value of the Fund’s investments, following the input prioritization hierarchy established by accounting principles generally accepted in the United States of America (GAAP). These inputs are summarized in the three broad levels listed below:
| ■ | Level 1 – quoted prices in active markets for identical securities |
The accompanying Notes to Financial Statements are an integral part of this statement.
| 32 | Columbia Acorn Family of Funds | Annual Report 2022 |
Portfolio of Investments (continued)
Columbia Acorn® Fund, December 31, 2022
Fair value measurements (continued)
| ■ | Level 2 – prices determined using other significant observable inputs (including quoted prices for similar securities, interest rates, prepayment speeds, credit risk and others) |
| ■ | Level 3 – prices determined using significant unobservable inputs where quoted prices or observable inputs are unavailable or less reliable (including management’s own assumptions about the factors market participants would use in pricing an investment) |
The inputs or methodology used for valuing securities are not necessarily an indication of the risk associated with investing in those securities.
Examples of the types of securities in which the Fund would typically invest and how they are classified within this hierarchy are as follows. Typical Level 1 securities include exchange traded domestic equities, mutual funds whose net asset values are published each day and exchange traded foreign equities that are not typically statistically fair valued. Typical Level 2 securities include exchange traded foreign equities that are traded in the European region or Asia Pacific region time zones which are typically statistically fair valued, forward foreign currency exchange contracts and short-term investments valued at amortized cost. Additionally, securities fair valued by the Investment Manager’s Valuation Committee (the Committee) that rely on significant observable inputs are also included in Level 2. Typical Level 3 securities include any security fair valued by the Committee that relies on significant unobservable inputs.
In connection with Rule 2a-5 under the Investment Company Act of 1940, as amended, which became effective September 8, 2022, the Board of Trustees has designated the Investment Manager as the Fund’s valuation designee. The Investment Manager, in turn, has authorized its Valuation Committee (the Committee) to make fair value determinations and to carry out supervisory and certain other functions relating to the valuation of Fund portfolio securities, pursuant to the valuation policies and procedures approved by the Board of Trustees (the Policies).
The Committee meets as necessary, and no less frequently than quarterly, to determine fair values for securities for which market quotations are not readily available or for which the Investment Manager believes that available market quotations are unreliable. The Committee also reviews the continuing appropriateness of the Policies. In circumstances where a security has been fair valued, the Committee will also review the continuing appropriateness of the current value of the security. The Policies address, among other things: circumstances under which market quotations will be deemed readily available; selection of third party pricing vendors; appropriate pricing methodologies; events that require fair valuation and fair value techniques; circumstances under which securities will be deemed to pose a potential for stale pricing, including when securities are illiquid, restricted, or in default; and certain delegations of authority to determine fair values to the Investment Manager. The Committee may also meet to discuss additional valuation matters, which may include review of back-testing results, review of time-sensitive information or approval of other valuation related actions, and to review the appropriateness of the Policies.
The following table is a summary of the inputs used to value the Fund’s investments at December 31, 2022:
| | Level 1 ($) | Level 2 ($) | Level 3 ($) | Total ($) |
| Investments in Securities | | | | |
| Common Stocks | | | | |
| Communication Services | 65,082,195 | — | — | 65,082,195 |
| Consumer Discretionary | 460,210,099 | — | — | 460,210,099 |
| Consumer Staples | 58,736,957 | — | — | 58,736,957 |
| Energy | 92,578,502 | — | — | 92,578,502 |
| Financials | 166,532,763 | — | — | 166,532,763 |
| Health Care | 458,929,929 | — | — | 458,929,929 |
| Industrials | 501,114,333 | — | — | 501,114,333 |
| Information Technology | 481,144,980 | — | — | 481,144,980 |
| Materials | 60,675,261 | — | — | 60,675,261 |
| Real Estate | 73,236,295 | — | — | 73,236,295 |
| Total Common Stocks | 2,418,241,314 | — | — | 2,418,241,314 |
| Money Market Funds | 75,773,186 | — | — | 75,773,186 |
| Total Investments in Securities | 2,494,014,500 | — | — | 2,494,014,500 |
See the Portfolio of Investments for all investment classifications not indicated in the table.
The accompanying Notes to Financial Statements are an integral part of this statement.
Columbia Acorn Family of Funds | Annual Report 2022
| 33 |
Portfolio of Investments
Columbia Acorn International®, December 31, 2022
(Percentages represent value of investments compared to net assets)
Investments in securities
| Common Stocks 98.8% |
| Issuer | Shares | Value ($) |
| Australia 6.4% |
| Bapcor Ltd. | 2,817,959 | 12,348,658 |
| carsales.com Ltd. | 1,163,917 | 16,379,275 |
| IDP Education Ltd. | 1,682,669 | 31,010,301 |
| Johns Lyng Group Ltd. | 3,025,695 | 12,721,415 |
| Pro Medicus Ltd. | 268,576 | 10,038,199 |
| Total | 82,497,848 |
| Austria 0.5% |
| Kontron AG(a) | 362,372 | 5,906,851 |
| Brazil 1.0% |
| TOTVS SA | 2,456,209 | 12,849,187 |
| Canada 4.6% |
| Altus Group Ltd.(a) | 430,766 | 17,192,463 |
| ARC Resources Ltd.(a) | 494,553 | 6,665,873 |
| Osisko Gold Royalties Ltd. | 2,367,857 | 28,540,197 |
| Whitecap Resources, Inc. | 913,546 | 7,246,295 |
| Total | 59,644,828 |
| China 2.3% |
| Shenzhou International Group Holdings Ltd. | 1,035,100 | 11,543,287 |
| Silergy Corp. | 1,254,000 | 17,712,646 |
| Total | 29,255,933 |
| Denmark 2.8% |
| ALK-Abello A/S(b) | 1,521,219 | 21,219,577 |
| Netcompany Group AS(b) | 362,909 | 15,442,621 |
| Total | 36,662,198 |
| Finland 2.2% |
| Valmet OYJ | 1,028,541 | 27,765,152 |
| France 0.8% |
| Robertet SA | 11,095 | 9,936,382 |
| Germany 6.0% |
| Amadeus Fire AG | 34,405 | 4,246,249 |
| Eckert & Ziegler Strahlen- und Medizintechnik AG | 395,968 | 19,569,759 |
| Hypoport SE(b) | 95,379 | 9,899,560 |
| Jenoptik AG | 969,576 | 26,370,819 |
| Nemetschek SE | 322,355 | 16,480,836 |
| Total | 76,567,223 |
| Common Stocks (continued) |
| Issuer | Shares | Value ($) |
| Italy 3.7% |
| Amplifon SpA | 696,713 | 20,803,703 |
| Carel Industries SpA | 306,550 | 7,711,977 |
| GVS SpA(b) | 1,419,848 | 6,169,270 |
| Nexi SpA(b) | 1,574,414 | 12,428,330 |
| Total | 47,113,280 |
| Japan 14.7% |
| CyberAgent, Inc. | 1,414,600 | 12,593,879 |
| Daiseki Co., Ltd. | 953,519 | 32,727,839 |
| Disco Corp. | 69,300 | 19,751,960 |
| Fuso Chemical Co., Ltd. | 522,400 | 13,397,170 |
| Hikari Tsushin, Inc. | 217,728 | 30,646,141 |
| Hoshizaki Corp. | 830,200 | 29,191,521 |
| NSD Co., Ltd. | 447,800 | 7,738,900 |
| Obic Co., Ltd. | 97,500 | 14,313,884 |
| Seiren Co., Ltd. | 309,000 | 5,663,930 |
| Simplex Holdings, Inc. | 794,300 | 12,551,027 |
| Solasto Corp. | 1,875,800 | 10,259,714 |
| Total | 188,835,965 |
| Mexico 2.1% |
| Corporación Inmobiliaria Vesta SAB de CV | 11,645,314 | 27,597,598 |
| Netherlands 3.6% |
| Argenx SE, ADR(b) | 17,265 | 6,540,500 |
| BE Semiconductor Industries NV | 104,732 | 6,382,466 |
| IMCD NV | 230,066 | 32,909,003 |
| Total | 45,831,969 |
| New Zealand 2.1% |
| Fisher & Paykel Healthcare Corp., Ltd. | 1,906,301 | 27,275,526 |
| South Korea 4.4% |
| Jeisys Medical, Inc. | 2,322,373 | 15,727,360 |
| KEPCO Plant Service & Engineering Co., Ltd.(b) | 245,542 | 6,445,910 |
| Koh Young Technology, Inc.(b) | 1,073,581 | 10,891,218 |
| Korea Investment Holdings Co., Ltd.(b) | 565,920 | 24,016,642 |
| Total | 57,081,130 |
| Spain 0.7% |
| Befesa SA | 174,753 | 8,429,930 |
The accompanying Notes to Financial Statements are an integral part of this statement.
| 34 | Columbia Acorn Family of Funds | Annual Report 2022 |
Portfolio of Investments (continued)
Columbia Acorn International®, December 31, 2022
| Common Stocks (continued) |
| Issuer | Shares | Value ($) |
| Sweden 9.7% |
| AddTech AB, B Shares | 1,788,406 | 25,531,615 |
| Dometic Group AB | 1,186,295 | 7,674,643 |
| Hexagon AB, Class B | 4,198,732 | 44,024,092 |
| Munters Group AB | 2,328,569 | 22,956,751 |
| Sectra AB, Class B(b) | 1,210,509 | 17,309,206 |
| Sweco AB, Class B | 772,261 | 7,405,540 |
| Total | 124,901,847 |
| Switzerland 4.0% |
| Belimo Holding AG, Registered Shares | 62,595 | 29,862,695 |
| Inficon Holding AG | 25,186 | 22,053,070 |
| Total | 51,915,765 |
| Taiwan 5.3% |
| Parade Technologies Ltd. | 771,000 | 19,319,151 |
| Sinbon Electronics Co., Ltd. | 2,217,000 | 19,804,594 |
| Universal Vision Biotechnology Co., Ltd. | 1,105,550 | 10,731,215 |
| Voltronic Power Technology Corp. | 367,408 | 18,433,488 |
| Total | 68,288,448 |
| United Kingdom 17.7% |
| Abcam PLC, ADR(b) | 1,192,169 | 18,550,150 |
| Auto Trader Group PLC | 3,058,899 | 19,048,849 |
| Dechra Pharmaceuticals PLC | 785,627 | 24,762,819 |
| Diploma PLC | 595,928 | 20,033,708 |
| Genus PLC | 455,892 | 16,365,906 |
| Halma PLC | 630,872 | 15,024,186 |
| Intermediate Capital Group PLC | 2,325,589 | 32,109,831 |
| Rentokil Initial PLC | 2,929,586 | 17,998,696 |
| Common Stocks (continued) |
| Issuer | Shares | Value ($) |
| Rightmove PLC | 4,822,464 | 29,833,885 |
| Safestore Holdings PLC | 1,323,802 | 15,095,844 |
| Spirax-Sarco Engineering PLC | 149,106 | 19,045,397 |
| Total | 227,869,271 |
| United States 2.7% |
| Inter Parfums, Inc. | 357,797 | 34,534,566 |
| Vietnam 1.5% |
| Asia Commercial Bank JSC(b) | 9,760,665 | 9,058,981 |
| FPT Corp. | 3,038,340 | 9,896,989 |
| Total | 18,955,970 |
Total Common Stocks
(Cost $1,087,628,692) | 1,269,716,867 |
|
| Securities Lending Collateral 1.4% |
| | |
| Dreyfus Government Cash Management Fund, Institutional Shares, 4.190%(c),(d) | 17,725,620 | 17,725,620 |
Total Securities Lending Collateral
(Cost $17,725,620) | 17,725,620 |
|
| Money Market Funds 0.9% |
| | Shares | Value ($) |
| Columbia Short-Term Cash Fund, 4.318%(c),(e) | 10,831,588 | 10,828,339 |
Total Money Market Funds
(Cost $10,827,278) | 10,828,339 |
Total Investments in Securities
(Cost $1,116,181,590) | 1,298,270,826 |
| Obligation to Return Collateral for Securities Loaned | | (17,725,620) |
| Other Assets & Liabilities, Net | | 4,181,207 |
| Net Assets | $1,284,726,413 |
Notes to Portfolio of Investments
| (a) | All or a portion of this security was on loan at December 31, 2022. The total market value of securities on loan at December 31, 2022 was $16,762,998. |
| (b) | Non-income producing investment. |
| (c) | The rate shown is the seven-day current annualized yield at December 31, 2022. |
| (d) | Investment made with cash collateral received from securities lending activity. |
The accompanying Notes to Financial Statements are an integral part of this statement.
Columbia Acorn Family of Funds | Annual Report 2022
| 35 |
Portfolio of Investments (continued)
Columbia Acorn International®, December 31, 2022
Notes to Portfolio of Investments (continued)
| (e) | As defined in the Investment Company Act of 1940, as amended, an affiliated company is one in which the Fund owns 5% or more of the company’s outstanding voting securities, or a company which is under common ownership or control with the Fund. The value of the holdings and transactions in these affiliated companies during the year ended December 31, 2022 are as follows: |
| Affiliated issuers | Beginning
of period($) | Purchases($) | Sales($) | Net change in
unrealized
appreciation
(depreciation)($) | End of
period($) | Realized gain
(loss)($) | Dividends($) | End of
period shares |
| Columbia Short-Term Cash Fund, 4.318% |
| | 22,664,312 | 401,580,830 | (413,417,864) | 1,061 | 10,828,339 | (1,729) | 295,501 | 10,831,588 |
Abbreviation Legend
| ADR | American Depositary Receipt |
Fair value measurements
Various inputs are used in determining the value of the Fund’s investments, following the input prioritization hierarchy established by accounting principles generally accepted in the United States of America (GAAP). These inputs are summarized in the three broad levels listed below:
| ■ | Level 1 – quoted prices in active markets for identical securities |
| ■ | Level 2 – prices determined using other significant observable inputs (including quoted prices for similar securities, interest rates, prepayment speeds, credit risk and others) |
| ■ | Level 3 – prices determined using significant unobservable inputs where quoted prices or observable inputs are unavailable or less reliable (including management’s own assumptions about the factors market participants would use in pricing an investment) |
The inputs or methodology used for valuing securities are not necessarily an indication of the risk associated with investing in those securities.
Examples of the types of securities in which the Fund would typically invest and how they are classified within this hierarchy are as follows. Typical Level 1 securities include exchange traded domestic equities, mutual funds whose net asset values are published each day and exchange traded foreign equities that are not typically statistically fair valued. Typical Level 2 securities include exchange traded foreign equities that are traded in the European region or Asia Pacific region time zones which are typically statistically fair valued, forward foreign currency exchange contracts and short-term investments valued at amortized cost. Additionally, securities fair valued by the Investment Manager’s Valuation Committee (the Committee) that rely on significant observable inputs are also included in Level 2. Typical Level 3 securities include any security fair valued by the Committee that relies on significant unobservable inputs.
In connection with Rule 2a-5 under the Investment Company Act of 1940, as amended, which became effective September 8, 2022, the Board of Trustees has designated the Investment Manager as the Fund’s valuation designee. The Investment Manager, in turn, has authorized its Valuation Committee (the Committee) to make fair value determinations and to carry out supervisory and certain other functions relating to the valuation of Fund portfolio securities, pursuant to the valuation policies and procedures approved by the Board of Trustees (the Policies).
The Committee meets as necessary, and no less frequently than quarterly, to determine fair values for securities for which market quotations are not readily available or for which the Investment Manager believes that available market quotations are unreliable. The Committee also reviews the continuing appropriateness of the Policies. In circumstances where a security has been fair valued, the Committee will also review the continuing appropriateness of the current value of the security. The Policies address, among other things: circumstances under which market quotations will be deemed readily available; selection of third party pricing vendors; appropriate pricing methodologies; events that require fair valuation and fair value techniques; circumstances under which securities will be deemed to pose a potential for stale pricing, including when securities are illiquid, restricted, or in default; and certain delegations of authority to determine fair values to the Investment Manager. The Committee may also meet to discuss additional valuation matters, which may include review of back-testing results, review of time-sensitive information or approval of other valuation related actions, and to review the appropriateness of the Policies.
The following table is a summary of the inputs used to value the Fund’s investments at December 31, 2022:
| | Level 1 ($) | Level 2 ($) | Level 3 ($) | Total ($) |
| Investments in Securities | | | | |
| Common Stocks | | | | |
| Australia | — | 82,497,848 | — | 82,497,848 |
| Austria | — | 5,906,851 | — | 5,906,851 |
| Brazil | 12,849,187 | — | — | 12,849,187 |
| Canada | 59,644,828 | — | — | 59,644,828 |
| China | — | 29,255,933 | — | 29,255,933 |
| Denmark | — | 36,662,198 | — | 36,662,198 |
| Finland | — | 27,765,152 | — | 27,765,152 |
| France | — | 9,936,382 | — | 9,936,382 |
| Germany | — | 76,567,223 | — | 76,567,223 |
| Italy | — | 47,113,280 | — | 47,113,280 |
| Japan | — | 188,835,965 | — | 188,835,965 |
| Mexico | 27,597,598 | — | — | 27,597,598 |
The accompanying Notes to Financial Statements are an integral part of this statement.
| 36 | Columbia Acorn Family of Funds | Annual Report 2022 |
Portfolio of Investments (continued)
Columbia Acorn International®, December 31, 2022
Fair value measurements (continued)
| | Level 1 ($) | Level 2 ($) | Level 3 ($) | Total ($) |
| Netherlands | 6,540,500 | 39,291,469 | — | 45,831,969 |
| New Zealand | — | 27,275,526 | — | 27,275,526 |
| South Korea | — | 57,081,130 | — | 57,081,130 |
| Spain | — | 8,429,930 | — | 8,429,930 |
| Sweden | — | 124,901,847 | — | 124,901,847 |
| Switzerland | — | 51,915,765 | — | 51,915,765 |
| Taiwan | — | 68,288,448 | — | 68,288,448 |
| United Kingdom | 18,550,150 | 209,319,121 | — | 227,869,271 |
| United States | 34,534,566 | — | — | 34,534,566 |
| Vietnam | — | 18,955,970 | — | 18,955,970 |
| Total Common Stocks | 159,716,829 | 1,110,000,038 | — | 1,269,716,867 |
| Securities Lending Collateral | 17,725,620 | — | — | 17,725,620 |
| Money Market Funds | 10,828,339 | — | — | 10,828,339 |
| Total Investments in Securities | 188,270,788 | 1,110,000,038 | — | 1,298,270,826 |
See the Portfolio of Investments for all investment classifications not indicated in the table.
The Fund’s assets assigned to the Level 2 input category are generally valued using a market approach, in which a security’s value is determined through its correlation to prices and information from observable market transactions for similar or identical assets. Foreign equities are generally valued at the last sale price on the foreign exchange or market on which they trade. The Fund may use a statistical fair valuation model, in accordance with the policy adopted by the Board of Trustees, provided by an independent third party to value securities principally traded in foreign markets in order to adjust for possible stale pricing that may occur between the close of the foreign exchanges and the time for valuation. These models take into account available market data including intraday index, ADR, and ETF movements.
The accompanying Notes to Financial Statements are an integral part of this statement.
Columbia Acorn Family of Funds | Annual Report 2022
| 37 |
Portfolio of Investments
Columbia Acorn USA®, December 31, 2022
(Percentages represent value of investments compared to net assets)
Investments in securities
| Common Stocks 97.4% |
| Issuer | Shares | Value ($) |
| Communication Services 2.6% |
| Entertainment 1.6% |
| Take-Two Interactive Software, Inc.(a) | 24,645 | 2,566,284 |
| Media 1.0% |
| Trade Desk, Inc. (The), Class A(a) | 34,894 | 1,564,298 |
| Total Communication Services | 4,130,582 |
| Consumer Discretionary 18.5% |
| Auto Components 0.9% |
| Dorman Products, Inc.(a) | 18,522 | 1,497,874 |
| Diversified Consumer Services 2.4% |
| Bright Horizons Family Solutions, Inc.(a) | 36,688 | 2,315,013 |
| Chegg, Inc.(a) | 55,854 | 1,411,430 |
| Total | | 3,726,443 |
| Hotels, Restaurants & Leisure 7.2% |
| Churchill Downs, Inc. | 17,397 | 3,678,248 |
| Planet Fitness, Inc., Class A(a) | 43,023 | 3,390,212 |
| Wingstop, Inc. | 31,339 | 4,312,873 |
| Total | | 11,381,333 |
| Household Durables 2.3% |
| Skyline Champion Corp.(a) | 70,118 | 3,611,778 |
| Internet & Direct Marketing Retail 1.0% |
| Etsy, Inc.(a) | 12,902 | 1,545,402 |
| Specialty Retail 4.7% |
| Five Below, Inc.(a) | 24,261 | 4,291,043 |
| Floor & Decor Holdings, Inc., Class A(a) | 17,643 | 1,228,482 |
| Williams-Sonoma, Inc. | 16,756 | 1,925,600 |
| Total | | 7,445,125 |
| Total Consumer Discretionary | 29,207,955 |
| Consumer Staples 2.4% |
| Food & Staples Retailing 0.7% |
| BJ’s Wholesale Club Holdings, Inc.(a) | 15,877 | 1,050,422 |
| Household Products 1.7% |
| WD-40 Co. | 16,608 | 2,677,376 |
| Total Consumer Staples | 3,727,798 |
| Common Stocks (continued) |
| Issuer | Shares | Value ($) |
| Energy 3.7% |
| Oil, Gas & Consumable Fuels 3.7% |
| Antero Resources Corp.(a) | 48,600 | 1,506,114 |
| Diamondback Energy, Inc. | 16,354 | 2,236,900 |
| Matador Resources Co. | 37,257 | 2,132,591 |
| Total | | 5,875,605 |
| Total Energy | 5,875,605 |
| Financials 6.7% |
| Banks 1.8% |
| Lakeland Financial Corp. | 12,501 | 912,198 |
| Pinnacle Financial Partners, Inc. | 25,634 | 1,881,536 |
| Total | | 2,793,734 |
| Capital Markets 3.2% |
| Ares Management Corp., Class A | 33,147 | 2,268,581 |
| GCM Grosvenor, Inc., Class A(b) | 207,001 | 1,575,278 |
| Houlihan Lokey, Inc., Class A | 13,822 | 1,204,725 |
| Total | | 5,048,584 |
| Insurance 1.7% |
| Ryan Specialty Holdings, Inc., Class A(a) | 65,693 | 2,726,916 |
| Total Financials | 10,569,234 |
| Health Care 18.7% |
| Biotechnology 3.2% |
| Exact Sciences Corp.(a) | 20,622 | 1,020,995 |
| Insmed, Inc.(a) | 53,473 | 1,068,391 |
| Intellia Therapeutics, Inc.(a) | 11,614 | 405,212 |
| Natera, Inc.(a) | 63,057 | 2,533,000 |
| Total | | 5,027,598 |
| Health Care Equipment & Supplies 3.4% |
| Axonics, Inc.(a) | 8,040 | 502,741 |
| Inspire Medical Systems, Inc.(a) | 7,087 | 1,785,074 |
| Insulet Corp.(a) | 10,580 | 3,114,646 |
| Total | | 5,402,461 |
The accompanying Notes to Financial Statements are an integral part of this statement.
| 38 | Columbia Acorn Family of Funds | Annual Report 2022 |
Portfolio of Investments (continued)
Columbia Acorn USA®, December 31, 2022
| Common Stocks (continued) |
| Issuer | Shares | Value ($) |
| Health Care Providers & Services 4.4% |
| Amedisys, Inc.(a) | 25,042 | 2,092,009 |
| Chemed Corp. | 9,011 | 4,599,485 |
| P3 Health Partners, Inc., Class A(a),(b) | 158,666 | 291,945 |
| Total | | 6,983,439 |
| Health Care Technology 0.5% |
| Doximity, Inc., Class A(a) | 20,556 | 689,859 |
| Life Sciences Tools & Services 7.2% |
| Bio-Techne Corp. | 51,719 | 4,286,471 |
| DNA Script(a),(c),(d),(e) | 1,139 | 354,568 |
| Repligen Corp.(a) | 21,595 | 3,656,250 |
| West Pharmaceutical Services, Inc. | 13,044 | 3,069,905 |
| Total | | 11,367,194 |
| Total Health Care | 29,470,551 |
| Industrials 20.1% |
| Aerospace & Defense 2.8% |
| Axon Enterprise, Inc.(a) | 13,675 | 2,269,093 |
| Curtiss-Wright Corp. | 13,218 | 2,207,274 |
| Total | | 4,476,367 |
| Building Products 1.3% |
| Simpson Manufacturing Co., Inc. | 10,567 | 936,870 |
| Trex Company, Inc.(a) | 26,248 | 1,111,078 |
| Total | | 2,047,948 |
| Commercial Services & Supplies 1.2% |
| Rollins, Inc. | 50,136 | 1,831,969 |
| Electrical Equipment 3.6% |
| AMETEK, Inc. | 17,696 | 2,472,485 |
| Atkore, Inc.(a) | 16,355 | 1,854,984 |
| Generac Holdings, Inc.(a) | 13,209 | 1,329,618 |
| Total | | 5,657,087 |
| Machinery 5.5% |
| Evoqua Water Technologies Corp.(a) | 45,804 | 1,813,838 |
| Ingersoll Rand, Inc. | 23,196 | 1,211,991 |
| Middleby Corp. (The)(a) | 23,863 | 3,195,256 |
| SPX Technologies, Inc.(a) | 36,954 | 2,426,030 |
| Total | | 8,647,115 |
| Common Stocks (continued) |
| Issuer | Shares | Value ($) |
| Professional Services 3.5% |
| CoStar Group, Inc.(a) | 45,845 | 3,542,902 |
| ICF International, Inc. | 20,945 | 2,074,602 |
| Total | | 5,617,504 |
| Trading Companies & Distributors 2.2% |
| SiteOne Landscape Supply, Inc.(a) | 30,056 | 3,526,170 |
| Total Industrials | 31,804,160 |
| Information Technology 19.3% |
| Communications Equipment 0.7% |
| Calix, Inc.(a) | 15,173 | 1,038,288 |
| Electronic Equipment, Instruments & Components 1.8% |
| CDW Corp. | 15,917 | 2,842,458 |
| IT Services 3.6% |
| Endava PLC, ADR(a) | 14,444 | 1,104,966 |
| MongoDB, Inc.(a) | 14,896 | 2,932,129 |
| VeriSign, Inc.(a) | 7,990 | 1,641,465 |
| Total | | 5,678,560 |
| Semiconductors & Semiconductor Equipment 1.9% |
| Monolithic Power Systems, Inc. | 5,877 | 2,078,166 |
| Wolfspeed, Inc.(a) | 13,968 | 964,351 |
| Total | | 3,042,517 |
| Software 11.3% |
| Bill.com Holdings, Inc.(a) | 13,350 | 1,454,616 |
| Crowdstrike Holdings, Inc., Class A(a) | 20,963 | 2,207,194 |
| Datadog, Inc., Class A(a) | 18,761 | 1,378,934 |
| Five9, Inc.(a) | 43,177 | 2,929,991 |
| HubSpot, Inc.(a) | 7,303 | 2,111,516 |
| Paycom Software, Inc.(a) | 13,168 | 4,086,162 |
| Sprout Social, Inc., Class A(a) | 14,650 | 827,139 |
| Workiva, Inc., Class A(a) | 18,136 | 1,522,880 |
| Zscaler, Inc.(a) | 12,656 | 1,416,207 |
| Total | | 17,934,639 |
| Total Information Technology | 30,536,462 |
The accompanying Notes to Financial Statements are an integral part of this statement.
Columbia Acorn Family of Funds | Annual Report 2022
| 39 |
Portfolio of Investments (continued)
Columbia Acorn USA®, December 31, 2022
| Common Stocks (continued) |
| Issuer | Shares | Value ($) |
| Materials 2.4% |
| Chemicals 1.7% |
| Albemarle Corp. | 4,849 | 1,051,554 |
| Avient Corp. | 47,657 | 1,608,900 |
| Total | | 2,660,454 |
| Construction Materials 0.7% |
| Vulcan Materials Co. | 6,799 | 1,190,573 |
| Total Materials | 3,851,027 |
| Real Estate 3.0% |
| Real Estate Management & Development 3.0% |
| Colliers International Group, Inc. | 32,812 | 3,020,017 |
| FirstService Corp. | 13,284 | 1,627,954 |
| Total | | 4,647,971 |
| Total Real Estate | 4,647,971 |
Total Common Stocks
(Cost $154,999,349) | 153,821,345 |
|
| Securities Lending Collateral 0.3% |
| Issuer | Shares | Value ($) |
| Dreyfus Government Cash Management Fund, Institutional Shares, 4.190%(f),(g) | 493,800 | 493,800 |
Total Securities Lending Collateral
(Cost $493,800) | 493,800 |
|
| Money Market Funds 2.9% |
| | Shares | Value ($) |
| Columbia Short-Term Cash Fund, 4.318%(f),(h) | 4,533,180 | 4,531,820 |
Total Money Market Funds
(Cost $4,531,065) | 4,531,820 |
Total Investments in Securities
(Cost: $160,024,214) | 158,846,965 |
| Obligation to Return Collateral for Securities Loaned | | (493,800) |
| Other Assets & Liabilities, Net | | (435,730) |
| Net Assets | 157,917,435 |
Notes to Portfolio of Investments
| (a) | Non-income producing investment. |
| (b) | All or a portion of this security was on loan at December 31, 2022. The total market value of securities on loan at December 31, 2022 was $461,096. |
| (c) | Represents fair value as determined in good faith under procedures approved by the Board of Trustees. At December 31, 2022, the total value of these securities amounted to $354,568, which represents 0.22% of total net assets. |
| (d) | Denotes a restricted security, which is subject to legal or contractual restrictions on resale under federal securities laws. Disposal of a restricted investment may involve time-consuming negotiations and expenses, and prompt sale at an acceptable price may be difficult to achieve. Private placement securities are generally considered to be restricted, although certain of those securities may be traded between qualified institutional investors under the provisions of Section 4(a)(2) and Rule 144A. The Fund will not incur any registration costs upon such a trade. These securities are valued at fair value determined in good faith under consistently applied procedures established by the Fund’s Board of Trustees. At December 31, 2022, the total market value of these securities amounted to $354,568, which represents 0.22% of total net assets. Additional information on these securities is as follows: |
| Security | Acquisition
Dates | Shares | Cost ($) | Value ($) |
| DNA Script | 10/01/2021 | 1,139 | 993,179 | 354,568 |
| (e) | Valuation based on significant unobservable inputs. |
| (f) | The rate shown is the seven-day current annualized yield at December 31, 2022. |
| (g) | Investment made with cash collateral received from securities lending activity. |
| (h) | As defined in the Investment Company Act of 1940, as amended, an affiliated company is one in which the Fund owns 5% or more of the company’s outstanding voting securities, or a company which is under common ownership or control with the Fund. The value of the holdings and transactions in these affiliated companies during the year ended December 31, 2022 are as follows: |
| Affiliated issuers | Beginning
of period($) | Purchases($) | Sales($) | Net change in
unrealized
appreciation
(depreciation)($) | End of
period($) | Realized gain
(loss)($) | Dividends($) | End of
period shares |
| Columbia Short-Term Cash Fund, 4.318% |
| | 8,759,126 | 94,687,901 | (98,915,964) | 757 | 4,531,820 | (626) | 80,901 | 4,533,180 |
The accompanying Notes to Financial Statements are an integral part of this statement.
| 40 | Columbia Acorn Family of Funds | Annual Report 2022 |
Portfolio of Investments (continued)
Columbia Acorn USA®, December 31, 2022
Abbreviation Legend
| ADR | American Depositary Receipt |
Fair value measurements
Various inputs are used in determining the value of the Fund’s investments, following the input prioritization hierarchy established by accounting principles generally accepted in the United States of America (GAAP). These inputs are summarized in the three broad levels listed below:
| ■ | Level 1 – quoted prices in active markets for identical securities |
| ■ | Level 2 – prices determined using other significant observable inputs (including quoted prices for similar securities, interest rates, prepayment speeds, credit risk and others) |
| ■ | Level 3 – prices determined using significant unobservable inputs where quoted prices or observable inputs are unavailable or less reliable (including management’s own assumptions about the factors market participants would use in pricing an investment) |
The inputs or methodology used for valuing securities are not necessarily an indication of the risk associated with investing in those securities.
Examples of the types of securities in which the Fund would typically invest and how they are classified within this hierarchy are as follows. Typical Level 1 securities include exchange traded domestic equities, mutual funds whose net asset values are published each day and exchange traded foreign equities that are not typically statistically fair valued. Typical Level 2 securities include exchange traded foreign equities that are traded in the European region or Asia Pacific region time zones which are typically statistically fair valued, forward foreign currency exchange contracts and short-term investments valued at amortized cost. Additionally, securities fair valued by the Investment Manager’s Valuation Committee (the Committee) that rely on significant observable inputs are also included in Level 2. Typical Level 3 securities include any security fair valued by the Committee that relies on significant unobservable inputs.
In connection with Rule 2a-5 under the Investment Company Act of 1940, as amended, which became effective September 8, 2022, the Board of Trustees has designated the Investment Manager as the Fund’s valuation designee. The Investment Manager, in turn, has authorized its Valuation Committee (the Committee) to make fair value determinations and to carry out supervisory and certain other functions relating to the valuation of Fund portfolio securities, pursuant to the valuation policies and procedures approved by the Board of Trustees (the Policies).
The Committee meets as necessary, and no less frequently than quarterly, to determine fair values for securities for which market quotations are not readily available or for which the Investment Manager believes that available market quotations are unreliable. The Committee also reviews the continuing appropriateness of the Policies. In circumstances where a security has been fair valued, the Committee will also review the continuing appropriateness of the current value of the security. The Policies address, among other things: circumstances under which market quotations will be deemed readily available; selection of third party pricing vendors; appropriate pricing methodologies; events that require fair valuation and fair value techniques; circumstances under which securities will be deemed to pose a potential for stale pricing, including when securities are illiquid, restricted, or in default; and certain delegations of authority to determine fair values to the Investment Manager. The Committee may also meet to discuss additional valuation matters, which may include review of back-testing results, review of time-sensitive information or approval of other valuation related actions, and to review the appropriateness of the Policies.
The following table is a summary of the inputs used to value the Fund’s investments at December 31, 2022:
| | Level 1 ($) | Level 2 ($) | Level 3 ($) | Total ($) |
| Investments in Securities | | | | |
| Common Stocks | | | | |
| Communication Services | 4,130,582 | — | — | 4,130,582 |
| Consumer Discretionary | 29,207,955 | — | — | 29,207,955 |
| Consumer Staples | 3,727,798 | — | — | 3,727,798 |
| Energy | 5,875,605 | — | — | 5,875,605 |
| Financials | 10,569,234 | — | — | 10,569,234 |
| Health Care | 29,115,983 | — | 354,568 | 29,470,551 |
| Industrials | 31,804,160 | — | — | 31,804,160 |
| Information Technology | 30,536,462 | — | — | 30,536,462 |
| Materials | 3,851,027 | — | — | 3,851,027 |
| Real Estate | 4,647,971 | — | — | 4,647,971 |
| Total Common Stocks | 153,466,777 | — | 354,568 | 153,821,345 |
| Securities Lending Collateral | 493,800 | — | — | 493,800 |
| Money Market Funds | 4,531,820 | — | — | 4,531,820 |
| Total Investments in Securities | 158,492,397 | — | 354,568 | 158,846,965 |
See the Portfolio of Investments for all investment classifications not indicated in the table.
The Fund does not hold any significant investments (greater than one percent of net assets) categorized as Level 3.
The accompanying Notes to Financial Statements are an integral part of this statement.
Columbia Acorn Family of Funds | Annual Report 2022
| 41 |
Portfolio of Investments
Columbia Acorn International SelectSM, December 31, 2022
(Percentages represent value of investments compared to net assets)
Investments in securities
| Common Stocks 98.8% |
| Issuer | Shares | Value ($) |
| Australia 4.0% |
| IDP Education Ltd. | 498,540 | 9,187,711 |
| Brazil 2.8% |
| TOTVS SA | 1,224,410 | 6,405,266 |
| Canada 1.9% |
| CCL Industries, Inc. | 100,323 | 4,285,585 |
| China 7.0% |
| NetEase, Inc., ADR | 70,202 | 5,098,771 |
| Shenzhou International Group Holdings Ltd. | 581,500 | 6,484,805 |
| Silergy Corp. | 304,000 | 4,293,975 |
| Total | 15,877,551 |
| Denmark 1.7% |
| ALK-Abello A/S(a) | 281,902 | 3,932,268 |
| Finland 4.0% |
| Valmet OYJ | 333,857 | 9,012,368 |
| Germany 2.3% |
| Nemetschek SE | 104,136 | 5,324,094 |
| Italy 3.9% |
| Amplifon SpA | 157,413 | 4,700,319 |
| Nexi SpA(a) | 527,233 | 4,161,946 |
| Total | 8,862,265 |
| Japan 13.1% |
| Disco Corp. | 16,500 | 4,702,848 |
| Hikari Tsushin, Inc. | 36,400 | 5,123,454 |
| Hoshizaki Corp. | 104,700 | 3,681,465 |
| Obic Co., Ltd. | 34,700 | 5,094,275 |
| Recruit Holdings Co., Ltd. | 354,000 | 11,080,900 |
| Total | 29,682,942 |
| Netherlands 4.0% |
| IMCD NV | 62,927 | 9,001,177 |
| New Zealand 3.9% |
| Fisher & Paykel Healthcare Corp., Ltd. | 616,099 | 8,815,200 |
| South Korea 2.4% |
| Korea Investment Holdings Co., Ltd.(a) | 130,223 | 5,526,433 |
| Common Stocks (continued) |
| Issuer | Shares | Value ($) |
| Sweden 11.3% |
| Hexagon AB, Class B | 1,122,140 | 11,765,741 |
| Sectra AB, Class B(a) | 662,356 | 9,471,104 |
| Sweco AB, Class B | 451,411 | 4,328,773 |
| Total | 25,565,618 |
| Switzerland 13.4% |
| Belimo Holding AG, Registered Shares | 22,216 | 10,598,764 |
| Lonza Group AG, Registered Shares | 20,777 | 10,198,920 |
| Partners Group Holding AG | 11,025 | 9,762,459 |
| Total | 30,560,143 |
| Taiwan 5.9% |
| Parade Technologies Ltd. | 232,000 | 5,813,285 |
| Voltronic Power Technology Corp. | 151,852 | 7,618,675 |
| Total | 13,431,960 |
| United Kingdom 17.2% |
| Dechra Pharmaceuticals PLC | 187,717 | 5,916,806 |
| Diploma PLC | 192,398 | 6,467,972 |
| Halma PLC | 195,633 | 4,658,990 |
| Intermediate Capital Group PLC | 434,157 | 5,994,485 |
| Rentokil Initial PLC | 923,540 | 5,674,015 |
| Rightmove PLC | 1,021,675 | 6,320,531 |
| Spirax-Sarco Engineering PLC | 31,083 | 3,970,250 |
| Total | 39,003,049 |
Total Common Stocks
(Cost $222,314,262) | 224,473,630 |
|
| Money Market Funds 0.9% |
| | Shares | Value ($) |
| Columbia Short-Term Cash Fund, 4.318%(b),(c) | 2,143,835 | 2,143,192 |
Total Money Market Funds
(Cost $2,143,175) | 2,143,192 |
Total Investments in Securities
(Cost $224,457,437) | 226,616,822 |
| Other Assets & Liabilities, Net | | 596,662 |
| Net Assets | $227,213,484 |
The accompanying Notes to Financial Statements are an integral part of this statement.
| 42 | Columbia Acorn Family of Funds | Annual Report 2022 |
Portfolio of Investments (continued)
Columbia Acorn International SelectSM, December 31, 2022
Notes to Portfolio of Investments
| (a) | Non-income producing investment. |
| (b) | The rate shown is the seven-day current annualized yield at December 31, 2022. |
| (c) | As defined in the Investment Company Act of 1940, as amended, an affiliated company is one in which the Fund owns 5% or more of the company’s outstanding voting securities, or a company which is under common ownership or control with the Fund. The value of the holdings and transactions in these affiliated companies during the year ended December 31, 2022 are as follows: |
| Affiliated issuers | Beginning
of period($) | Purchases($) | Sales($) | Net change in
unrealized
appreciation
(depreciation)($) | End of
period($) | Realized gain
(loss)($) | Dividends($) | End of
period shares |
| Columbia Short-Term Cash Fund, 4.318% |
| | 4,210,604 | 78,520,494 | (80,587,923) | 17 | 2,143,192 | (1,116) | 36,071 | 2,143,835 |
Abbreviation Legend
| ADR | American Depositary Receipt |
Fair value measurements
Various inputs are used in determining the value of the Fund’s investments, following the input prioritization hierarchy established by accounting principles generally accepted in the United States of America (GAAP). These inputs are summarized in the three broad levels listed below:
| ■ | Level 1 – quoted prices in active markets for identical securities |
| ■ | Level 2 – prices determined using other significant observable inputs (including quoted prices for similar securities, interest rates, prepayment speeds, credit risk and others) |
| ■ | Level 3 – prices determined using significant unobservable inputs where quoted prices or observable inputs are unavailable or less reliable (including management’s own assumptions about the factors market participants would use in pricing an investment) |
The inputs or methodology used for valuing securities are not necessarily an indication of the risk associated with investing in those securities.
Examples of the types of securities in which the Fund would typically invest and how they are classified within this hierarchy are as follows. Typical Level 1 securities include exchange traded domestic equities, mutual funds whose net asset values are published each day and exchange traded foreign equities that are not typically statistically fair valued. Typical Level 2 securities include exchange traded foreign equities that are traded in the European region or Asia Pacific region time zones which are typically statistically fair valued, forward foreign currency exchange contracts and short-term investments valued at amortized cost. Additionally, securities fair valued by the Investment Manager’s Valuation Committee (the Committee) that rely on significant observable inputs are also included in Level 2. Typical Level 3 securities include any security fair valued by the Committee that relies on significant unobservable inputs.
In connection with Rule 2a-5 under the Investment Company Act of 1940, as amended, which became effective September 8, 2022, the Board of Trustees has designated the Investment Manager as the Fund’s valuation designee. The Investment Manager, in turn, has authorized its Valuation Committee (the Committee) to make fair value determinations and to carry out supervisory and certain other functions relating to the valuation of Fund portfolio securities, pursuant to the valuation policies and procedures approved by the Board of Trustees (the Policies).
The Committee meets as necessary, and no less frequently than quarterly, to determine fair values for securities for which market quotations are not readily available or for which the Investment Manager believes that available market quotations are unreliable. The Committee also reviews the continuing appropriateness of the Policies. In circumstances where a security has been fair valued, the Committee will also review the continuing appropriateness of the current value of the security. The Policies address, among other things: circumstances under which market quotations will be deemed readily available; selection of third party pricing vendors; appropriate pricing methodologies; events that require fair valuation and fair value techniques; circumstances under which securities will be deemed to pose a potential for stale pricing, including when securities are illiquid, restricted, or in default; and certain delegations of authority to determine fair values to the Investment Manager. The Committee may also meet to discuss additional valuation matters, which may include review of back-testing results, review of time-sensitive information or approval of other valuation related actions, and to review the appropriateness of the Policies.
The following table is a summary of the inputs used to value the Fund’s investments at December 31, 2022:
| | Level 1 ($) | Level 2 ($) | Level 3 ($) | Total ($) |
| Investments in Securities | | | | |
| Common Stocks | | | | |
| Australia | — | 9,187,711 | — | 9,187,711 |
| Brazil | 6,405,266 | — | — | 6,405,266 |
| Canada | 4,285,585 | — | — | 4,285,585 |
| China | 5,098,771 | 10,778,780 | — | 15,877,551 |
| Denmark | — | 3,932,268 | — | 3,932,268 |
| Finland | — | 9,012,368 | — | 9,012,368 |
| Germany | — | 5,324,094 | — | 5,324,094 |
| Italy | — | 8,862,265 | — | 8,862,265 |
| Japan | — | 29,682,942 | — | 29,682,942 |
| Netherlands | — | 9,001,177 | — | 9,001,177 |
| New Zealand | — | 8,815,200 | — | 8,815,200 |
The accompanying Notes to Financial Statements are an integral part of this statement.
Columbia Acorn Family of Funds | Annual Report 2022
| 43 |
Portfolio of Investments (continued)
Columbia Acorn International SelectSM, December 31, 2022
Fair value measurements (continued)
| | Level 1 ($) | Level 2 ($) | Level 3 ($) | Total ($) |
| South Korea | — | 5,526,433 | — | 5,526,433 |
| Sweden | — | 25,565,618 | — | 25,565,618 |
| Switzerland | — | 30,560,143 | — | 30,560,143 |
| Taiwan | — | 13,431,960 | — | 13,431,960 |
| United Kingdom | — | 39,003,049 | — | 39,003,049 |
| Total Common Stocks | 15,789,622 | 208,684,008 | — | 224,473,630 |
| Money Market Funds | 2,143,192 | — | — | 2,143,192 |
| Total Investments in Securities | 17,932,814 | 208,684,008 | — | 226,616,822 |
See the Portfolio of Investments for all investment classifications not indicated in the table.
The Fund’s assets assigned to the Level 2 input category are generally valued using a market approach, in which a security’s value is determined through its correlation to prices and information from observable market transactions for similar or identical assets. Foreign equities are generally valued at the last sale price on the foreign exchange or market on which they trade. The Fund may use a statistical fair valuation model, in accordance with the policy adopted by the Board of Trustees, provided by an independent third party to value securities principally traded in foreign markets in order to adjust for possible stale pricing that may occur between the close of the foreign exchanges and the time for valuation. These models take into account available market data including intraday index, ADR, and ETF movements.
The accompanying Notes to Financial Statements are an integral part of this statement.
| 44 | Columbia Acorn Family of Funds | Annual Report 2022 |
Portfolio of Investments
Columbia Thermostat FundSM, December 31, 2022
(Percentages represent value of investments compared to net assets)
Investments in securities
| Equity Funds 13.5% |
| | Shares | Value ($) |
| International 1.5% |
| Columbia Emerging Markets Fund, Institutional 3 Class(a),(b) | 1,794,642 | 20,889,634 |
| U.S. Large Cap 9.0% |
| Columbia Contrarian Core Fund, Institutional 3 Class(a) | 1,206,514 | 30,404,160 |
| Columbia Large Cap Enhanced Core Fund, Institutional 3 Class(a) | 1,462,528 | 30,435,205 |
| Columbia Large Cap Index Fund, Institutional 3 Class(a) | 1,401,415 | 61,073,643 |
| Total | 121,913,008 |
| U.S. Mid Cap 1.5% |
| Columbia Select Mid Cap Value Fund, Institutional 3 Class(a) | 1,729,649 | 20,582,824 |
| U.S. Small Mid Cap 1.5% |
| Columbia Acorn® Fund, Institutional 3 Class(a),(b) | 2,038,392 | 20,526,610 |
Total Equity Funds
(Cost $174,419,480) | 183,912,076 |
|
| Exchange-Traded Equity Funds 1.5% |
| | |
| U.S. Large Cap 1.5% |
| Columbia Research Enhanced Core ETF(a) | 890,379 | 20,231,103 |
Total Exchange-Traded Equity Funds
(Cost $19,098,748) | 20,231,103 |
|
| Exchange-Traded Fixed Income Funds 8.5% |
| | |
| Multisector 8.5% |
| Columbia Diversified Fixed Income Allocation ETF(a) | 6,658,630 | 115,127,713 |
Total Exchange-Traded Fixed Income Funds
(Cost $132,394,928) | 115,127,713 |
|
| Fixed Income Funds 76.3% |
| | Shares | Value ($) |
| Investment Grade 76.3% |
| Columbia Corporate Income Fund, Institutional 3 Class(a) | 13,143,466 | 114,873,896 |
| Columbia Quality Income Fund, Institutional 3 Class(a) | 12,940,944 | 230,219,391 |
| Columbia Short Term Bond Fund, Institutional 3 Class(a) | 18,426,091 | 172,099,694 |
| Columbia Total Return Bond Fund, Institutional 3 Class(a) | 3,876,029 | 114,885,482 |
| Columbia U.S. Treasury Index Fund, Institutional 3 Class(a) | 40,226,047 | 401,455,944 |
| Total | 1,033,534,407 |
Total Fixed Income Funds
(Cost $1,169,095,487) | 1,033,534,407 |
|
| Money Market Funds 0.3% |
| | |
| Columbia Short-Term Cash Fund, 4.318%(a),(c) | 3,994,203 | 3,993,005 |
Total Money Market Funds
(Cost $3,993,004) | 3,993,005 |
Total Investments in Securities
(Cost: $1,499,001,647) | 1,356,798,304 |
| Other Assets & Liabilities, Net | | (1,813,041) |
| Net Assets | 1,354,985,263 |
The accompanying Notes to Financial Statements are an integral part of this statement.
Columbia Acorn Family of Funds | Annual Report 2022
| 45 |
Portfolio of Investments (continued)
Columbia Thermostat FundSM, December 31, 2022
Notes to Portfolio of Investments
| (a) | As defined in the Investment Company Act of 1940, as amended, an affiliated company is one in which the Fund owns 5% or more of the company’s outstanding voting securities, or a company which is under common ownership or control with the Fund. The value of the holdings and transactions in these affiliated companies during the year ended December 31, 2022 are as follows: |
| Affiliated issuers | Beginning
of period($) | Purchases($) | Sales($) | Net change in
unrealized
appreciation
(depreciation)($) | End of
period($) | Capital gain
distributions($) | Realized gain
(loss)($) | Dividends —
affiliated
issuers ($) | End of
period shares |
| Columbia Acorn® Fund, Institutional 3 Class |
| | 21,041,129 | 83,783,288 | (82,542,002) | (1,755,805) | 20,526,610 | 1,830,014 | (4,282,155) | — | 2,038,392 |
| Columbia Contrarian Core Fund, Institutional 3 Class |
| | 31,401,672 | 116,522,473 | (109,276,232) | (8,243,753) | 30,404,160 | 2,698,590 | 2,366,804 | 191,129 | 1,206,514 |
| Columbia Corporate Income Fund, Institutional 3 Class |
| | 186,858,848 | 66,338,069 | (122,017,497) | (16,305,524) | 114,873,896 | — | (16,381,285) | 4,453,012 | 13,143,466 |
| Columbia Diversified Fixed Income Allocation ETF |
| | 186,759,029 | 58,398,675 | (109,992,030) | (20,037,961) | 115,127,713 | — | (14,841,155) | 4,337,844 | 6,658,630 |
| Columbia Emerging Markets Fund, Institutional 3 Class |
| | 21,148,316 | 76,514,823 | (80,391,217) | 3,617,712 | 20,889,634 | — | (11,228,719) | — | 1,794,642 |
| Columbia Large Cap Enhanced Core Fund, Institutional 3 Class |
| | 31,422,661 | 118,368,764 | (114,916,058) | (4,440,162) | 30,435,205 | 4,535,571 | (2,597,221) | 475,166 | 1,462,528 |
| Columbia Large Cap Index Fund, Institutional 3 Class |
| | 62,412,872 | 240,668,293 | (227,447,003) | (14,560,519) | 61,073,643 | 10,558,587 | (1,966,655) | 1,164,050 | 1,401,415 |
| Columbia Quality Income Fund, Institutional 3 Class |
| | 373,669,379 | 136,208,876 | (244,080,212) | (35,578,652) | 230,219,391 | — | (27,491,986) | 7,909,106 | 12,940,944 |
| Columbia Research Enhanced Core ETF |
| | 18,034,082 | 77,605,525 | (71,997,222) | (3,411,282) | 20,231,103 | — | 2,210,208 | 285,402 | 890,379 |
| Columbia Select Mid Cap Value Fund, Institutional 3 Class |
| | 21,178,767 | 77,843,906 | (74,578,682) | (3,861,167) | 20,582,824 | 2,190,469 | 1,980,732 | 314,628 | 1,729,649 |
| Columbia Short Term Bond Fund, Institutional 3 Class |
| | 280,062,035 | 103,045,943 | (203,066,317) | (7,941,967) | 172,099,694 | — | (7,903,826) | 4,576,017 | 18,426,091 |
| Columbia Short-Term Cash Fund, 4.318% |
| | 3,640,167 | 289,846,278 | (289,493,441) | 1 | 3,993,005 | — | (2,017) | 82,720 | 3,994,203 |
| Columbia Total Return Bond Fund, Institutional 3 Class |
| | 186,937,454 | 69,728,739 | (122,092,607) | (19,688,104) | 114,885,482 | — | (14,869,391) | 5,034,243 | 3,876,029 |
| Columbia U.S. Treasury Index Fund, Institutional 3 Class |
| | 653,104,595 | 238,866,357 | (454,109,093) | (36,405,915) | 401,455,944 | — | (46,154,580) | 7,446,698 | 40,226,047 |
| Total | 2,077,671,006 | | | (168,613,098) | 1,356,798,304 | 21,813,231 | (141,161,246) | 36,270,015 | |
| (b) | Non-income producing investment. |
| (c) | The rate shown is the seven-day current annualized yield at December 31, 2022. |
Fair value measurements
Various inputs are used in determining the value of the Fund’s investments, following the input prioritization hierarchy established by accounting principles generally accepted in the United States of America (GAAP). These inputs are summarized in the three broad levels listed below:
| ■ | Level 1 – quoted prices in active markets for identical securities |
| ■ | Level 2 – prices determined using other significant observable inputs (including quoted prices for similar securities, interest rates, prepayment speeds, credit risk and others) |
| ■ | Level 3 – prices determined using significant unobservable inputs where quoted prices or observable inputs are unavailable or less reliable (including management’s own assumptions about the factors market participants would use in pricing an investment) |
The inputs or methodology used for valuing securities are not necessarily an indication of the risk associated with investing in those securities.
Examples of the types of securities in which the Fund would typically invest and how they are classified within this hierarchy are as follows. Typical Level 1 securities include mutual funds whose net asset values are published each day.
The accompanying Notes to Financial Statements are an integral part of this statement.
| 46 | Columbia Acorn Family of Funds | Annual Report 2022 |
Portfolio of Investments (continued)
Columbia Thermostat FundSM, December 31, 2022
Fair value measurements (continued)
In connection with Rule 2a-5 under the Investment Company Act of 1940, as amended, which became effective September 8, 2022, the Board of Trustees has designated the Investment Manager as the Fund’s valuation designee. The Investment Manager, in turn, has authorized its Valuation Committee (the Committee) to make fair value determinations and to carry out supervisory and certain other functions relating to the valuation of Fund portfolio securities, pursuant to the valuation policies and procedures approved by the Board of Trustees (the Policies).
The Committee meets as necessary, and no less frequently than quarterly, to determine fair values for securities for which market quotations are not readily available or for which the Investment Manager believes that available market quotations are unreliable. The Committee also reviews the continuing appropriateness of the Policies. In circumstances where a security has been fair valued, the Committee will also review the continuing appropriateness of the current value of the security. The Policies address, among other things: circumstances under which market quotations will be deemed readily available; selection of third party pricing vendors; appropriate pricing methodologies; events that require fair valuation and fair value techniques; circumstances under which securities will be deemed to pose a potential for stale pricing, including when securities are illiquid, restricted, or in default; and certain delegations of authority to determine fair values to the Investment Manager. The Committee may also meet to discuss additional valuation matters, which may include review of back-testing results, review of time-sensitive information or approval of other valuation related actions, and to review the appropriateness of the Policies.
The following table is a summary of the inputs used to value the Fund’s investments at December 31, 2022:
| | Level 1 ($) | Level 2 ($) | Level 3 ($) | Total ($) |
| Investments in Securities | | | | |
| Equity Funds | 183,912,076 | — | — | 183,912,076 |
| Exchange-Traded Equity Funds | 20,231,103 | — | — | 20,231,103 |
| Exchange-Traded Fixed Income Funds | 115,127,713 | — | — | 115,127,713 |
| Fixed Income Funds | 1,033,534,407 | — | — | 1,033,534,407 |
| Money Market Funds | 3,993,005 | — | — | 3,993,005 |
| Total Investments in Securities | 1,356,798,304 | — | — | 1,356,798,304 |
See the Portfolio of Investments for all investment classifications not indicated in the table.
The accompanying Notes to Financial Statements are an integral part of this statement.
Columbia Acorn Family of Funds | Annual Report 2022
| 47 |
Portfolio of Investments
Columbia Acorn European FundSM, December 31, 2022
(Percentages represent value of investments compared to net assets)
Investments in securities
| Common Stocks 97.6% |
| Issuer | Shares | Value ($) |
| Austria 0.6% |
| Kontron AG(a) | 27,203 | 443,423 |
| Denmark 4.4% |
| ALK-Abello A/S(b) | 132,891 | 1,853,705 |
| Netcompany Group AS(b) | 32,541 | 1,384,695 |
| Total | 3,238,400 |
| Finland 2.9% |
| Valmet OYJ | 79,806 | 2,154,339 |
| France 1.6% |
| Robertet SA | 1,274 | 1,140,960 |
| Germany 11.0% |
| Amadeus Fire AG | 3,156 | 389,512 |
| Eckert & Ziegler Strahlen- und Medizintechnik AG | 24,652 | 1,218,365 |
| Hypoport SE(b) | 4,184 | 434,265 |
| Jenoptik AG | 79,121 | 2,151,957 |
| Nemetschek SE | 27,656 | 1,413,950 |
| Washtec AG | 68,313 | 2,524,614 |
| Total | 8,132,663 |
| Italy 10.2% |
| Amplifon SpA | 52,064 | 1,554,620 |
| Carel Industries SpA | 118,889 | 2,990,929 |
| GVS SpA(b) | 70,625 | 306,867 |
| Intercos SpA(b) | 87,103 | 1,184,141 |
| Nexi SpA(b) | 185,517 | 1,464,460 |
| Total | 7,501,017 |
| Netherlands 6.2% |
| Argenx SE(b) | 2,063 | 774,463 |
| BE Semiconductor Industries NV | 11,953 | 728,427 |
| IMCD NV | 21,373 | 3,057,227 |
| Total | 4,560,117 |
| Russian Federation —% |
| TCS Group Holding PLC GDR(b),(c),(d),(e),(f) | 17,858 | 0 |
| Spain 1.1% |
| Befesa SA | 17,398 | 839,264 |
| Common Stocks (continued) |
| Issuer | Shares | Value ($) |
| Sweden 17.5% |
| AddTech AB, B Shares | 166,659 | 2,379,255 |
| Dometic Group AB | 134,840 | 872,337 |
| Hexagon AB, Class B | 275,693 | 2,890,667 |
| Munters Group AB | 306,979 | 3,026,425 |
| Sectra AB, Class B(b) | 188,869 | 2,700,659 |
| Sweco AB, Class B | 109,471 | 1,049,764 |
| Total | 12,919,107 |
| Switzerland 7.6% |
| Belimo Holding AG, Registered Shares | 5,693 | 2,716,005 |
| Inficon Holding AG | 1,129 | 988,562 |
| Kardex Energy AG | 7,133 | 1,171,104 |
| Partners Group Holding AG | 825 | 730,524 |
| Total | 5,606,195 |
| United Kingdom 30.5% |
| Abcam PLC, ADR(b) | 135,681 | 2,111,196 |
| Auto Trader Group PLC | 306,702 | 1,909,942 |
| Dechra Pharmaceuticals PLC | 70,178 | 2,211,998 |
| Diploma PLC | 68,414 | 2,299,919 |
| Genus PLC | 40,518 | 1,454,541 |
| Halma PLC | 67,155 | 1,599,293 |
| Intermediate Capital Group PLC | 170,717 | 2,357,121 |
| Rentokil Initial PLC | 345,237 | 2,121,056 |
| Rightmove PLC | 391,292 | 2,420,705 |
| Safestore Holdings PLC | 127,687 | 1,456,066 |
| Spirax-Sarco Engineering PLC | 19,669 | 2,512,333 |
| Total | 22,454,170 |
| United States 4.0% |
| Inter Parfums, Inc. | 30,364 | 2,930,733 |
Total Common Stocks
(Cost $61,124,775) | 71,920,388 |
|
| Securities Lending Collateral 0.5% |
| | |
| Dreyfus Government Cash Management Fund, Institutional Shares, 4.190%(g),(h) | 365,056 | 365,056 |
Total Securities Lending Collateral
(Cost $365,056) | 365,056 |
|
The accompanying Notes to Financial Statements are an integral part of this statement.
| 48 | Columbia Acorn Family of Funds | Annual Report 2022 |
Portfolio of Investments (continued)
Columbia Acorn European FundSM, December 31, 2022
| Money Market Funds 2.2% |
| | Shares | Value ($) |
| Columbia Short-Term Cash Fund, 4.318%(g),(i) | 1,603,361 | 1,602,880 |
Total Money Market Funds
(Cost $1,602,846) | 1,602,880 |
Total Investments in Securities
(Cost $63,092,677) | 73,888,324 |
| Obligation to Return Collateral for Securities Loaned | | (365,056) |
| Other Assets & Liabilities, Net | | 113,489 |
| Net Assets | $73,636,757 |
Notes to Portfolio of Investments
| (a) | All or a portion of this security was on loan at December 31, 2022. The total market value of securities on loan at December 31, 2022 was $343,744. |
| (b) | Non-income producing investment. |
| (c) | Represents privately placed and other securities and instruments exempt from Securities and Exchange Commission registration (collectively, private placements), such as Section 4(a)(2) and Rule 144A eligible securities, which are often sold only to qualified institutional buyers. At December 31, 2022, the total value of these securities amounted to $0, which represents less than 0.01% of total net assets. |
| (d) | Represents fair value as determined in good faith under procedures approved by the Board of Trustees. At December 31, 2022, the total value of these securities amounted to $0, which represents less than 0.01% of total net assets. |
| (e) | Denotes a restricted security, which is subject to legal or contractual restrictions on resale under federal securities laws. Disposal of a restricted investment may involve time-consuming negotiations and expenses, and prompt sale at an acceptable price may be difficult to achieve. Private placement securities are generally considered to be restricted, although certain of those securities may be traded between qualified institutional investors under the provisions of Section 4(a)(2) and Rule 144A. The Fund will not incur any registration costs upon such a trade. These securities are valued at fair value determined in good faith under consistently applied procedures established by the Fund’s Board of Trustees. At December 31, 2022, the total market value of these securities amounted to $0, which represents less than 0.01% of total net assets. Additional information on these securities is as follows: |
| Security | Acquisition
Dates | Shares | Cost ($) | Value ($) |
| TCS Group Holding PLC GDR | 01/22/2021—03/02/2021 | 17,858 | 784,598 | — |
| (f) | Valuation based on significant unobservable inputs. |
| (g) | The rate shown is the seven-day current annualized yield at December 31, 2022. |
| (h) | Investment made with cash collateral received from securities lending activity. |
| (i) | As defined in the Investment Company Act of 1940, as amended, an affiliated company is one in which the Fund owns 5% or more of the company’s outstanding voting securities, or a company which is under common ownership or control with the Fund. The value of the holdings and transactions in these affiliated companies during the year ended December 31, 2022 are as follows: |
| Affiliated issuers | Beginning
of period($) | Purchases($) | Sales($) | Net change in
unrealized
appreciation
(depreciation)($) | End of
period($) | Realized gain
(loss)($) | Dividends($) | End of
period shares |
| Columbia Short-Term Cash Fund, 4.318% |
| | 2,948,499 | 66,143,022 | (67,488,675) | 34 | 1,602,880 | (300) | 11,426 | 1,603,361 |
Abbreviation Legend
| ADR | American Depositary Receipt |
| GDR | Global Depositary Receipt |
Fair value measurements
Various inputs are used in determining the value of the Fund’s investments, following the input prioritization hierarchy established by accounting principles generally accepted in the United States of America (GAAP). These inputs are summarized in the three broad levels listed below:
| ■ | Level 1 – quoted prices in active markets for identical securities |
| ■ | Level 2 – prices determined using other significant observable inputs (including quoted prices for similar securities, interest rates, prepayment speeds, credit risk and others) |
The accompanying Notes to Financial Statements are an integral part of this statement.
Columbia Acorn Family of Funds | Annual Report 2022
| 49 |
Portfolio of Investments (continued)
Columbia Acorn European FundSM, December 31, 2022
Fair value measurements (continued)
| ■ | Level 3 – prices determined using significant unobservable inputs where quoted prices or observable inputs are unavailable or less reliable (including management’s own assumptions about the factors market participants would use in pricing an investment) |
The inputs or methodology used for valuing securities are not necessarily an indication of the risk associated with investing in those securities.
Examples of the types of securities in which the Fund would typically invest and how they are classified within this hierarchy are as follows. Typical Level 1 securities include exchange traded domestic equities, mutual funds whose net asset values are published each day and exchange traded foreign equities that are not typically statistically fair valued. Typical Level 2 securities include exchange traded foreign equities that are traded in the European region or Asia Pacific region time zones which are typically statistically fair valued, forward foreign currency exchange contracts and short-term investments valued at amortized cost. Additionally, securities fair valued by the Investment Manager’s Valuation Committee (the Committee) that rely on significant observable inputs are also included in Level 2. Typical Level 3 securities include any security fair valued by the Committee that relies on significant unobservable inputs.
In connection with Rule 2a-5 under the Investment Company Act of 1940, as amended, which became effective September 8, 2022, the Board of Trustees has designated the Investment Manager as the Fund’s valuation designee. The Investment Manager, in turn, has authorized its Valuation Committee (the Committee) to make fair value determinations and to carry out supervisory and certain other functions relating to the valuation of Fund portfolio securities, pursuant to the valuation policies and procedures approved by the Board of Trustees (the Policies).
The Committee meets as necessary, and no less frequently than quarterly, to determine fair values for securities for which market quotations are not readily available or for which the Investment Manager believes that available market quotations are unreliable. The Committee also reviews the continuing appropriateness of the Policies. In circumstances where a security has been fair valued, the Committee will also review the continuing appropriateness of the current value of the security. The Policies address, among other things: circumstances under which market quotations will be deemed readily available; selection of third party pricing vendors; appropriate pricing methodologies; events that require fair valuation and fair value techniques; circumstances under which securities will be deemed to pose a potential for stale pricing, including when securities are illiquid, restricted, or in default; and certain delegations of authority to determine fair values to the Investment Manager. The Committee may also meet to discuss additional valuation matters, which may include review of back-testing results, review of time-sensitive information or approval of other valuation related actions, and to review the appropriateness of the Policies.
The following table is a summary of the inputs used to value the Fund’s investments at December 31, 2022:
| | Level 1 ($) | Level 2 ($) | Level 3 ($) | Total ($) |
| Investments in Securities | | | | |
| Common Stocks | | | | |
| Austria | — | 443,423 | — | 443,423 |
| Denmark | — | 3,238,400 | — | 3,238,400 |
| Finland | — | 2,154,339 | — | 2,154,339 |
| France | — | 1,140,960 | — | 1,140,960 |
| Germany | — | 8,132,663 | — | 8,132,663 |
| Italy | — | 7,501,017 | — | 7,501,017 |
| Netherlands | — | 4,560,117 | — | 4,560,117 |
| Russian Federation | — | — | 0* | 0* |
| Spain | — | 839,264 | — | 839,264 |
| Sweden | — | 12,919,107 | — | 12,919,107 |
| Switzerland | — | 5,606,195 | — | 5,606,195 |
| United Kingdom | 2,111,196 | 20,342,974 | — | 22,454,170 |
| United States | 2,930,733 | — | — | 2,930,733 |
| Total Common Stocks | 5,041,929 | 66,878,459 | 0* | 71,920,388 |
| Securities Lending Collateral | 365,056 | — | — | 365,056 |
| Money Market Funds | 1,602,880 | — | — | 1,602,880 |
| Total Investments in Securities | 7,009,865 | 66,878,459 | 0* | 73,888,324 |
See the Portfolio of Investments for all investment classifications not indicated in the table.
The Fund’s assets assigned to the Level 2 input category are generally valued using a market approach, in which a security’s value is determined through its correlation to prices and information from observable market transactions for similar or identical assets. Foreign equities are generally valued at the last sale price on the foreign exchange or market on which they trade. The Fund may use a statistical fair valuation model, in accordance with the policy adopted by the Board of Trustees, provided by an independent third party to value securities principally traded in foreign markets in order to adjust for possible stale pricing that may occur between the close of the foreign exchanges and the time for valuation. These models take into account available market data including intraday index, ADR, and ETF movements.
The Fund does not hold any significant investments (greater than one percent of net assets) categorized as Level 3.
The accompanying Notes to Financial Statements are an integral part of this statement.
| 50 | Columbia Acorn Family of Funds | Annual Report 2022 |
Statement of Assets and Liabilities
December 31, 2022
| | Columbia
Acorn®
Fund | Columbia
Acorn
International® | Columbia
Acorn
USA® |
| Assets | | | |
| Investments in securities, at value* | | | |
| Unaffiliated issuers (cost $2,386,971,298, $1,105,354,312, $155,493,149, respectively) | $2,388,820,637 | $1,287,442,487 | $154,315,145 |
| Affiliated issuers (cost $132,852,605, $10,827,278, $4,531,065, respectively) | 105,193,863 | 10,828,339 | 4,531,820 |
| Cash | — | 36,966 | — |
| Foreign currency (cost $—, $914,913, $—, respectively) | — | 937,032 | — |
| Receivable for: | | | |
| Investments sold | — | 1,304,869 | — |
| Capital shares sold | 325,161 | 201,932 | 148,377 |
| Dividends | 815,323 | 3,781,695 | 61,276 |
| Securities lending income | 45 | 82,387 | 2,978 |
| Foreign tax reclaims | 11,994 | 2,893,193 | 1,995 |
| Expense reimbursement due from Investment Manager | — | 2,960 | 874 |
| Prepaid expenses | 88,384 | 39,798 | 5,323 |
| Trustees’ deferred compensation plan | — | — | 1,602 |
| Total assets | 2,495,255,407 | 1,307,551,658 | 159,069,390 |
| Liabilities | | | |
| Due upon return of securities on loan | — | 17,725,620 | 493,800 |
| Payable for: | | | |
| Investments purchased | — | 51,195 | — |
| Capital shares purchased | 2,516,529 | 3,254,550 | 326,042 |
| Investment advisory fee | 47,727 | 29,815 | 3,228 |
| Distribution and/or service fees | 3,852 | 1,193 | 215 |
| Transfer agent fees | 187,935 | 94,322 | 15,669 |
| Administration fees | 3,440 | 1,783 | 218 |
| Trustees’ fees(a) | 3,087,664 | 1,500,893 | 266,888 |
| Compensation of chief compliance officer | 8,051 | 3,728 | 495 |
| Other expenses | 151,089 | 162,146 | 45,400 |
| Total liabilities | 6,006,287 | 22,825,245 | 1,151,955 |
| Net assets applicable to outstanding capital stock | $2,489,249,120 | $1,284,726,413 | $157,917,435 |
| Represented by | | | |
| Paid in capital | 3,076,884,556 | 1,257,391,554 | 194,040,929 |
| Total distributable earnings (loss) | (587,635,436) | 27,334,859 | (36,123,494) |
| Total - representing net assets applicable to outstanding capital stock | $2,489,249,120 | $1,284,726,413 | $157,917,435 |
| * Includes the value of securities on loan | — | 16,762,998 | 461,096 |
The accompanying Notes to Financial Statements are an integral part of this statement.
Columbia Acorn Family of Funds | Annual Report 2022
| 51 |
Statement of Assets and Liabilities (continued)
December 31, 2022
| | Columbia
Acorn®
Fund | Columbia
Acorn
International® | Columbia
Acorn
USA® |
| Class A | | | |
| Net assets | $521,242,760 | $151,724,943 | $28,457,344 |
| Shares outstanding | 84,596,110 | 7,108,800 | 4,518,186 |
| Net asset value per share(b) | $6.16 | $21.34 | $6.30 |
| Maximum sales charge | 5.75% | 5.75% | 5.75% |
| Maximum offering price per share(c) (calculated by dividing the net asset value per share by 1.0 minus the maximum sales charge for Class A shares) | $6.54 | $22.64 | $6.68 |
| Advisor Class | | | |
| Net assets | $21,945,858 | $6,643,591 | $14,777,591 |
| Shares outstanding | 2,255,508 | 304,497 | 1,413,160 |
| Net asset value per share(d) | $9.73 | $21.82 | $10.46 |
| Class C | | | |
| Net assets | $9,152,521 | $4,069,854 | $694,366 |
| Shares outstanding | 1,062,607 | 212,743 | 73,254 |
| Net asset value per share(b) | $8.61 | $19.13 | $9.48 |
| Institutional Class | | | |
| Net assets | $1,865,518,334 | $906,414,857 | $98,678,567 |
| Shares outstanding | 207,998,028 | 42,240,360 | 10,459,275 |
| Net asset value per share(d) | $8.97 | $21.46 | $9.43 |
| Institutional 2 Class | | | |
| Net assets | $23,445,051 | $80,058,556 | $3,147,667 |
| Shares outstanding | 2,369,529 | 3,732,441 | 297,040 |
| Net asset value per share(d) | $9.89 | $21.45 | $10.60 |
| Institutional 3 Class | | | |
| Net assets | $47,944,596 | $133,737,955 | $12,161,900 |
| Shares outstanding | 4,762,272 | 6,122,175 | 1,128,906 |
| Net asset value per share(d) | $10.07 | $21.84 | $10.77 |
| Class R | | | |
| Net assets | $— | $2,076,657 | $— |
| Shares outstanding | — | 97,531 | — |
| Net asset value per share(d) | $— | $21.29 | $— |
| (a) | Includes Trustees’ fees deferred as well as any gains or losses on the Trustees’ deferred compensation balances as a result of market fluctuations of $3,076,926, $1,495,948 and $266,229, respectively. Prior to January 1, 2022, the Trustees’ deferred fees were presented separately. |
| (b) | Redemption price per share is equal to net asset value less any applicable contingent deferred sales charge. |
| (c) | On sales of $50,000 or more the offering price is reduced. |
| (d) | Redemption price per share is equal to net asset value. |
The accompanying Notes to Financial Statements are an integral part of this statement.
| 52 | Columbia Acorn Family of Funds | Annual Report 2022 |
Statement of Assets and Liabilities (continued)
December 31, 2022
| | Columbia
Acorn
International
SelectSM | Columbia
Thermostat
FundSM | Columbia
Acorn
European
FundSM |
| Assets | | | |
| Investments in securities, at value* | | | |
| Unaffiliated issuers (cost $222,314,262, $—, $61,489,831, respectively) | $224,473,630 | $— | $72,285,444 |
| Affiliated issuers (cost $2,143,175, $1,499,001,647, $1,602,846, respectively) | 2,143,192 | 1,356,798,304 | 1,602,880 |
| Cash | — | 1,070 | — |
| Foreign currency (cost $—, $—, $631, respectively) | — | — | 631 |
| Receivable for: | | | |
| Capital shares sold | 12,792 | 2,171,748 | 64,765 |
| Dividends | 703,487 | 3,541,526 | 60,826 |
| Securities lending income | — | — | 6,032 |
| Foreign tax reclaims | 636,454 | — | 168,631 |
| Expense reimbursement due from Investment Manager | 2,039 | 1,859 | 852 |
| Prepaid expenses | 7,158 | 52,063 | 1,990 |
| Total assets | 227,978,752 | 1,362,566,570 | 74,192,051 |
| Liabilities | | | |
| Due upon return of securities on loan | — | — | 365,056 |
| Payable for: | | | |
| Investments purchased | — | 3,527,481 | 4,227 |
| Capital shares purchased | 453,388 | 3,518,579 | 105,751 |
| Investment advisory fee | 5,633 | 3,734 | 2,431 |
| Distribution and/or service fees | 900 | 6,609 | 266 |
| Transfer agent fees | 27,446 | 125,044 | 8,430 |
| Administration fees | 316 | 1,867 | 102 |
| Trustees’ fees | 205,443 | 298,324 | 21,238 |
| Compensation of chief compliance officer | 686 | 4,433 | 215 |
| Audit fees | 29,500 | 11,000 | 29,500 |
| Other expenses | 41,956 | 84,236 | 18,078 |
| Total liabilities | 765,268 | 7,581,307 | 555,294 |
| Net assets applicable to outstanding capital stock | $227,213,484 | $1,354,985,263 | $73,636,757 |
| Represented by | | | |
| Paid in capital | 252,643,996 | 1,619,118,651 | 81,966,533 |
| Total distributable earnings (loss) | (25,430,512) | (264,133,388) | (8,329,776) |
| Total - representing net assets applicable to outstanding capital stock | $227,213,484 | $1,354,985,263 | $73,636,757 |
| * Includes the value of securities on loan | — | — | 343,744 |
The accompanying Notes to Financial Statements are an integral part of this statement.
Columbia Acorn Family of Funds | Annual Report 2022
| 53 |
Statement of Assets and Liabilities (continued)
December 31, 2022
| | Columbia
Acorn
International
SelectSM | Columbia
Thermostat
FundSM | Columbia
Acorn
European
FundSM |
| Class A | | | |
| Net assets | $124,962,560 | $450,566,340 | $28,891,602 |
| Shares outstanding | 5,793,626 | 31,371,666 | 1,402,057 |
| Net asset value per share(a) | $21.57 | $14.36 | $20.61 |
| Maximum sales charge | 5.75% | 5.75% | 5.75% |
| Maximum offering price per share(b) (calculated by dividing the net asset value per share by 1.0 minus the maximum sales charge for Class A shares) | $22.89 | $15.24 | $21.87 |
| Advisor Class | | | |
| Net assets | $924,164 | $76,472,148 | $1,161,195 |
| Shares outstanding | 41,619 | 5,389,311 | 55,630 |
| Net asset value per share(c) | $22.21 | $14.19 | $20.87 |
| Class C | | | |
| Net assets | $1,085,397 | $126,801,655 | $2,372,271 |
| Shares outstanding | 56,658 | 8,758,671 | 119,522 |
| Net asset value per share(a) | $19.16 | $14.48 | $19.85 |
| Institutional Class | | | |
| Net assets | $79,828,552 | $600,671,207 | $38,307,475 |
| Shares outstanding | 3,630,219 | 42,651,042 | 1,844,339 |
| Net asset value per share(c) | $21.99 | $14.08 | $20.77 |
| Institutional 2 Class | | | |
| Net assets | $9,224,826 | $90,290,169 | $2,862,882 |
| Shares outstanding | 415,184 | 6,354,033 | 136,098 |
| Net asset value per share(c) | $22.22 | $14.21 | $21.04 |
| Institutional 3 Class | | | |
| Net assets | $11,187,985 | $10,183,744 | $41,332 |
| Shares outstanding | 503,684 | 718,183 | 1,996 |
| Net asset value per share(c) | $22.21 | $14.18 | $20.71 |
| (a) | Redemption price per share is equal to net asset value less any applicable contingent deferred sales charge. |
| (b) | On sales of $50,000 or more the offering price is reduced. |
| (c) | Redemption price per share is equal to net asset value. |
The accompanying Notes to Financial Statements are an integral part of this statement.
| 54 | Columbia Acorn Family of Funds | Annual Report 2022 |
Statement of Operations
Year Ended December 31, 2022
| | Columbia
Acorn®
Fund | Columbia
Acorn
International® | Columbia
Acorn
USA® |
| Net investment income | | | |
| Income: | | | |
| Dividends — unaffiliated issuers | $14,177,196 | $30,342,480 | $1,035,653 |
| Dividends — affiliated issuers | 2,277,707 | 295,501 | 80,901 |
| Income from securities lending — net | 95,563 | 1,554,981 | 52,735 |
| European Union tax reclaim | 335,931 | 1,274,798 | — |
| Foreign taxes withheld | (48,697) | (3,084,681) | (3,775) |
| Total income | 16,837,700 | 30,383,079 | 1,165,514 |
| Expenses: | | | |
| Investment advisory fee | 20,846,354 | 12,797,768 | 1,559,789 |
| Distribution and/or service fees | | | |
| Class A | 1,561,278 | 464,174 | 87,424 |
| Class C | 146,402 | 59,135 | 9,951 |
| Class R | — | 11,990 | — |
| Transfer agent fees | | | |
| Class A | 530,280 | 200,292 | 40,475 |
| Advisor Class | 23,997 | 7,012 | 18,955 |
| Class C | 12,442 | 6,336 | 1,146 |
| Institutional Class | 1,937,452 | 1,212,701 | 134,996 |
| Institutional 2 Class | 19,134 | 50,503 | 1,560 |
| Institutional 3 Class | 3,885 | 8,266 | 1,095 |
| Class R | — | 2,584 | — |
| Administration fees | 1,517,335 | 777,265 | 94,952 |
| Trustees’ fees(a) | (557,997) | (274,876) | (58,031) |
| Custodian fees | 19,140 | 303,068 | 7,029 |
| Printing and postage fees | 118,421 | 102,117 | 31,568 |
| Registration fees | 124,587 | 121,412 | 97,368 |
| Audit fees | 33,971 | 98,225 | 30,722 |
| Legal fees | 475,633 | 240,410 | 29,455 |
| Line of credit interest | — | 42 | 476 |
| Interest on collateral | — | 50 | — |
| Compensation of chief compliance officer | 15,966 | 7,835 | 1,017 |
| Other | 234,406 | 136,526 | 25,694 |
| Total expenses | 27,062,686 | 16,332,835 | 2,115,641 |
| Fees waived or expenses reimbursed by Investment Manager and its affiliates | — | (663,165) | (165,063) |
| Fees waived by transfer agent | | | |
| Class A | — | — | (8,401) |
| Advisor Class | — | — | (4,050) |
| Class C | — | — | (224) |
| Institutional Class | — | — | (28,411) |
| Institutional 2 Class | (1,019) | (14,154) | (180) |
| Institutional 3 Class | — | (8,266) | (525) |
| Expense reduction | (7,579) | (7,775) | (1,300) |
| Total net expenses | 27,054,088 | 15,639,475 | 1,907,487 |
| Net investment income (loss) | (10,216,388) | 14,743,604 | (741,973) |
The accompanying Notes to Financial Statements are an integral part of this statement.
Columbia Acorn Family of Funds | Annual Report 2022
| 55 |
Statement of Operations (continued)
Year Ended December 31, 2022
| | Columbia
Acorn®
Fund | Columbia
Acorn
International® | Columbia
Acorn
USA® |
| Realized and unrealized gain (loss) — net | | | |
| Net realized gain (loss) on: | | | |
| Investments — unaffiliated issuers | $(553,195,783) | $(51,660,648) | $(34,950,434) |
| Investments — affiliated issuers | 2,661 | (1,729) | (626) |
| Foreign currency translations | (80) | (759,090) | (186) |
| Futures contracts | — | (5,769,485) | — |
| Net realized loss | (553,193,202) | (58,190,952) | (34,951,246) |
| Net change in unrealized appreciation (depreciation) on: | | | |
| Investments — unaffiliated issuers | (885,236,449) | (733,632,504) | (58,213,351) |
| Investments — affiliated issuers | (27,730,059) | 1,061 | 757 |
| Foreign currency translations | — | (110,044) | — |
| Net change in unrealized appreciation (depreciation) | (912,966,508) | (733,741,487) | (58,212,594) |
| Net realized and unrealized loss | (1,466,159,710) | (791,932,439) | (93,163,840) |
| Net decrease in net assets resulting from operations | $(1,476,376,098) | $(777,188,835) | $(93,905,813) |
| (a) | Includes Trustees’ fees deferred during the current period as well as any gains or (losses) on the Trustees’ deferred compensation balances as a result of market fluctuations of $(899,395), $(448,817) and $(79,707), respectively. |
The accompanying Notes to Financial Statements are an integral part of this statement.
| 56 | Columbia Acorn Family of Funds | Annual Report 2022 |
Statement of Operations (continued)
Year Ended December 31, 2022
| | Columbia
Acorn
International
SelectSM | Columbia
Thermostat
FundSM | Columbia
Acorn
European
FundSM |
| Net investment income | | | |
| Income: | | | |
| Dividends — unaffiliated issuers | $5,478,278 | $— | $1,899,771 |
| Dividends — affiliated issuers | 36,071 | 36,270,015 | 11,426 |
| Income from securities lending — net | 8,197 | — | 137,067 |
| European Union tax reclaim | 210,688 | — | — |
| Foreign taxes withheld | (570,218) | — | (194,838) |
| Total income | 5,163,016 | 36,270,015 | 1,853,426 |
| Expenses: | | | |
| Investment advisory fee | 2,684,730 | 1,668,082 | 1,265,030 |
| Distribution and/or service fees | | | |
| Class A | 387,045 | 1,295,496 | 98,849 |
| Class C | 13,822 | 1,556,255 | 38,412 |
| Transfer agent fees | | | |
| Class A | 289,978 | 491,469 | 44,755 |
| Advisor Class | 2,723 | 115,916 | 2,009 |
| Class C | 2,580 | 147,680 | 4,324 |
| Institutional Class | 194,658 | 693,965 | 60,053 |
| Institutional 2 Class | 14,164 | 66,065 | 6,498 |
| Institutional 3 Class | 872 | 1,503 | 9 |
| Administration fees | 150,173 | 830,931 | 55,153 |
| Trustees’ fees(a) | (11,468) | 88,148 | 7,695 |
| Custodian fees | 65,522 | 2,769 | 38,294 |
| Printing and postage fees | 59,158 | 133,848 | 27,696 |
| Registration fees | 97,065 | 156,347 | 99,160 |
| Audit fees | 52,582 | 12,222 | 33,222 |
| Legal fees | 46,477 | 267,274 | 16,866 |
| Line of credit interest | 311 | 4,403 | 2,616 |
| Compensation of chief compliance officer | 1,542 | 8,359 | 617 |
| Other | 46,767 | 110,832 | 34,063 |
| Total expenses | 4,098,701 | 7,651,564 | 1,835,321 |
| Fees waived or expenses reimbursed by Investment Manager and its affiliates | (746,708) | (777,232) | (370,233) |
| Fees waived by transfer agent | | | |
| Institutional 2 Class | — | — | (1,841) |
| Institutional 3 Class | — | — | (9) |
| Expense reduction | (11,529) | (280) | (160) |
| Total net expenses | 3,340,464 | 6,874,052 | 1,463,078 |
| Net investment income | 1,822,552 | 29,395,963 | 390,348 |
| Realized and unrealized gain (loss) — net | | | |
| Net realized gain (loss) on: | | | |
| Investments — unaffiliated issuers | (26,776,061) | — | (15,398,885) |
| Investments — affiliated issuers | (1,116) | (141,161,246) | (300) |
| Capital gain distributions from underlying affiliated funds | — | 21,813,231 | — |
| Foreign currency translations | (137,232) | — | (150,000) |
| Net realized loss | (26,914,409) | (119,348,015) | (15,549,185) |
| Net change in unrealized appreciation (depreciation) on: | | | |
| Investments — unaffiliated issuers | (143,802,013) | — | (60,738,307) |
| Investments — affiliated issuers | 17 | (168,613,098) | 34 |
| Foreign currency translations | (17,494) | — | (9,921) |
| Net change in unrealized appreciation (depreciation) | (143,819,490) | (168,613,098) | (60,748,194) |
| Net realized and unrealized loss | (170,733,899) | (287,961,113) | (76,297,379) |
| Net decrease in net assets resulting from operations | $(168,911,347) | $(258,565,150) | $(75,907,031) |
| (a) | Includes Trustees’ fees deferred during the current period as well as any gains or (losses) on the Trustees’ deferred compensation balances as a result of market fluctuations of $(45,760), $(92,264) and $(5,624), respectively. |
The accompanying Notes to Financial Statements are an integral part of this statement.
Columbia Acorn Family of Funds | Annual Report 2022
| 57 |
Statement of Changes in Net Assets
| | Columbia
Acorn® Fund | Columbia Acorn
International® |
| | Year Ended
December 31, 2022 | Year Ended
December 31, 2021 | Year Ended
December 31, 2022 | Year Ended
December 31, 2021 |
| Operations | | | | |
| Net investment income (loss) | $(10,216,388) | $(29,391,237) | $14,743,604 | $6,349,262 |
| Net realized gain (loss) | (553,193,202) | 1,089,409,474 | (58,190,952) | 296,728,330 |
| Net change in unrealized appreciation (depreciation) | (912,966,508) | (638,363,380) | (733,741,487) | (3,405,718) |
| Net increase (decrease) in net assets resulting from operations | (1,476,376,098) | 421,654,857 | (777,188,835) | 299,671,874 |
| Distributions to shareholders | | | | |
| Net investment income and net realized gains | | | | |
| Class A | (41,011,712) | (263,150,366) | (5,361,144) | (40,052,526) |
| Advisor Class | (1,229,726) | (8,201,757) | (168,978) | (1,374,206) |
| Class C | (608,986) | (5,787,484) | (185,732) | (1,615,464) |
| Institutional Class | (106,713,651) | (758,479,695) | (31,799,977) | (254,146,337) |
| Institutional 2 Class | (1,365,961) | (10,983,732) | (2,796,677) | (20,003,620) |
| Institutional 3 Class | (3,270,753) | (16,278,812) | (4,521,218) | (26,466,011) |
| Class R | — | — | (65,963) | (491,746) |
| Total distributions to shareholders | (154,200,789) | (1,062,881,846) | (44,899,689) | (344,149,910) |
| Increase (decrease) in net assets from capital stock activity | (408,797,663) | 300,010,089 | (232,973,136) | (113,274,517) |
| Total decrease in net assets | (2,039,374,550) | (341,216,900) | (1,055,061,660) | (157,752,553) |
| Net assets at beginning of year | 4,528,623,670 | 4,869,840,570 | 2,339,788,073 | 2,497,540,626 |
| Net assets at end of year | $2,489,249,120 | $4,528,623,670 | $1,284,726,413 | $2,339,788,073 |
The accompanying Notes to Financial Statements are an integral part of this statement.
| 58 | Columbia Acorn Family of Funds | Annual Report 2022 |
Statement of Changes in Net Assets (continued)
| | Columbia
Acorn USA® | Columbia Acorn
International SelectSM |
| | Year Ended
December 31, 2022 | Year Ended
December 31, 2021 | Year Ended
December 31, 2022 | Year Ended
December 31, 2021 |
| Operations | | | | |
| Net investment income (loss) | $(741,973) | $(2,657,286) | $1,822,552 | $(32,728) |
| Net realized gain (loss) | (34,951,246) | 86,878,712 | (26,914,409) | 33,656,269 |
| Net change in unrealized appreciation (depreciation) | (58,212,594) | (52,709,057) | (143,819,490) | 15,107,406 |
| Net increase (decrease) in net assets resulting from operations | (93,905,813) | 31,512,369 | (168,911,347) | 48,730,947 |
| Distributions to shareholders | | | | |
| Net investment income and net realized gains | | | | |
| Class A | (2,107,177) | (17,031,591) | (5,779,291) | (10,962,872) |
| Advisor Class | (595,586) | (5,338,855) | (51,312) | (121,956) |
| Class C | (37,617) | (429,752) | (57,732) | (93,404) |
| Institutional Class | (4,744,627) | (41,782,773) | (3,890,418) | (7,965,017) |
| Institutional 2 Class | (95,567) | (727,072) | (975,433) | (2,689,582) |
| Institutional 3 Class | (555,076) | (10,854,053) | (506,064) | (1,456,872) |
| Total distributions to shareholders | (8,135,650) | (76,164,096) | (11,260,250) | (23,289,703) |
| Increase (decrease) in net assets from capital stock activity | (42,343,012) | 10,790,642 | (72,701,020) | (41,489,686) |
| Total decrease in net assets | (144,384,475) | (33,861,085) | (252,872,617) | (16,048,442) |
| Net assets at beginning of year | 302,301,910 | 336,162,995 | 480,086,101 | 496,134,543 |
| Net assets at end of year | $157,917,435 | $302,301,910 | $227,213,484 | $480,086,101 |
The accompanying Notes to Financial Statements are an integral part of this statement.
Columbia Acorn Family of Funds | Annual Report 2022
| 59 |
Statement of Changes in Net Assets (continued)
| | Columbia
Thermostat FundSM | Columbia Acorn
European FundSM |
| | Year Ended
December 31, 2022 | Year Ended
December 31, 2021 | Year Ended
December 31, 2022 | Year Ended
December 31, 2021 |
| Operations | | | | |
| Net investment income (loss) | $29,395,963 | $27,407,324 | $390,348 | $(559,819) |
| Net realized gain (loss) | (119,348,015) | 268,766,569 | (15,549,185) | (181,469) |
| Net change in unrealized appreciation (depreciation) | (168,613,098) | (179,749,247) | (60,748,194) | 28,909,961 |
| Net increase (decrease) in net assets resulting from operations | (258,565,150) | 116,424,646 | (75,907,031) | 28,168,673 |
| Distributions to shareholders | | | | |
| Net investment income and net realized gains | | | | |
| Class A | (13,588,692) | (80,263,851) | — | (114,318) |
| Advisor Class | (3,137,330) | (22,778,179) | — | (12,346) |
| Class C | (2,912,905) | (23,284,536) | — | — |
| Institutional Class | (20,546,977) | (121,876,270) | — | (446,763) |
| Institutional 2 Class | (3,327,846) | (23,468,843) | — | (117,513) |
| Institutional 3 Class | (337,655) | (1,952,903) | — | (292) |
| Total distributions to shareholders | (43,851,405) | (273,624,582) | — | (691,232) |
| Increase (decrease) in net assets from capital stock activity | (416,791,137) | 525,118,998 | (64,395,632) | 77,822,786 |
| Total increase (decrease) in net assets | (719,207,692) | 367,919,062 | (140,302,663) | 105,300,227 |
| Net assets at beginning of year | 2,074,192,955 | 1,706,273,893 | 213,939,420 | 108,639,193 |
| Net assets at end of year | $1,354,985,263 | $2,074,192,955 | $73,636,757 | $213,939,420 |
The accompanying Notes to Financial Statements are an integral part of this statement.
| 60 | Columbia Acorn Family of Funds | Annual Report 2022 |
Statement of Changes in Net Assets (continued)
| | Columbia
Acorn® Fund | Columbia Acorn
International® |
| | Year Ended | Year Ended | Year Ended | Year Ended |
| | December 31, 2022 | December 31, 2021 | December 31, 2022 | December 31, 2021 |
| | Shares | Dollars ($) | Shares | Dollars ($) | Shares | Dollars ($) | Shares | Dollars ($) |
| Capital stock activity |
| Class A | | | | | | | | |
| Subscriptions | 3,841,202 | 27,530,049 | 5,982,210 | 71,946,347 | 417,699 | 10,032,981 | 525,959 | 18,837,295 |
| Distributions reinvested | 5,676,330 | 37,236,731 | 23,766,788 | 239,307,360 | 226,394 | 5,150,468 | 1,182,480 | 38,446,481 |
| Redemptions | (16,825,830) | (118,360,587) | (15,366,129) | (195,707,426) | (2,035,521) | (46,371,623) | (1,469,807) | (52,814,377) |
| Net increase (decrease) | (7,308,298) | (53,593,807) | 14,382,869 | 115,546,281 | (1,391,428) | (31,188,174) | 238,632 | 4,469,399 |
| Advisor Class | | | | | | | | |
| Subscriptions | 521,853 | 5,802,489 | 418,484 | 7,441,995 | 133,125 | 2,888,745 | 45,084 | 1,658,003 |
| Distributions reinvested | 101,973 | 1,054,403 | 456,762 | 6,995,207 | 7,277 | 168,978 | 41,395 | 1,374,206 |
| Redemptions | (949,277) | (10,134,232) | (794,625) | (14,613,929) | (110,258) | (2,607,879) | (457,336) | (16,418,304) |
| Net increase (decrease) | (325,451) | (3,277,340) | 80,621 | (176,727) | 30,144 | 449,844 | (370,857) | (13,386,095) |
| Class C | | | | | | | | |
| Subscriptions | 130,090 | 1,338,904 | 120,678 | 1,999,707 | 24,534 | 566,274 | 26,738 | 858,219 |
| Distributions reinvested | 64,371 | 592,861 | 418,581 | 5,742,544 | 9,069 | 185,720 | 54,287 | 1,610,276 |
| Redemptions | (920,653) | (8,750,945) | (2,211,079) | (37,166,378) | (176,264) | (3,789,782) | (361,954) | (11,928,781) |
| Net decrease | (726,192) | (6,819,180) | (1,671,820) | (29,424,127) | (142,661) | (3,037,788) | (280,929) | (9,460,286) |
| Institutional Class | | | | | | | | |
| Subscriptions | 3,404,616 | 34,714,184 | 4,017,788 | 66,770,286 | 2,161,892 | 49,621,347 | 1,856,604 | 64,984,126 |
| Distributions reinvested | 10,327,259 | 98,418,808 | 49,029,210 | 694,440,015 | 1,159,396 | 26,480,610 | 6,346,780 | 207,227,903 |
| Redemptions | (45,679,386) | (461,943,597) | (28,170,590) | (472,694,167) | (12,972,429) | (296,525,222) | (7,403,458) | (266,653,814) |
| Net increase (decrease) | (31,947,511) | (328,810,605) | 24,876,408 | 288,516,134 | (9,651,141) | (220,423,265) | 799,926 | 5,558,215 |
| Institutional 2 Class | | | | | | | | |
| Subscriptions | 543,152 | 6,139,315 | 499,108 | 9,331,106 | 925,676 | 22,125,006 | 769,576 | 27,594,261 |
| Distributions reinvested | 129,844 | 1,365,961 | 706,732 | 10,980,954 | 48,905 | 1,116,012 | 292,244 | 9,532,906 |
| Redemptions | (1,684,638) | (18,199,954) | (1,236,384) | (22,900,725) | (1,060,983) | (24,110,868) | (1,003,375) | (36,329,973) |
| Net increase (decrease) | (1,011,642) | (10,694,678) | (30,544) | (2,588,665) | (86,402) | (869,850) | 58,445 | 797,194 |
| Institutional 3 Class | | | | | | | | |
| Subscriptions | 8,597,429 | 90,011,192 | 1,316,568 | 24,299,474 | 3,157,192 | 74,140,786 | 1,798,774 | 66,229,977 |
| Distributions reinvested | 304,164 | 3,254,550 | 1,022,162 | 16,168,756 | 151,936 | 3,530,989 | 735,758 | 24,286,390 |
| Redemptions | (9,111,813) | (98,867,795) | (5,936,701) | (112,331,037) | (2,507,211) | (55,246,843) | (5,148,935) | (192,165,037) |
| Net increase (decrease) | (210,220) | (5,602,053) | (3,597,971) | (71,862,807) | 801,917 | 22,424,932 | (2,614,403) | (101,648,670) |
| Class R | | | | | | | | |
| Subscriptions | — | — | — | — | 13,918 | 319,569 | 17,904 | 666,373 |
| Distributions reinvested | — | — | — | — | 2,902 | 65,963 | 15,168 | 491,746 |
| Redemptions | — | — | — | — | (30,471) | (714,367) | (21,131) | (762,393) |
| Net increase (decrease) | — | — | — | — | (13,651) | (328,835) | 11,941 | 395,726 |
| Total net increase (decrease) | (41,529,314) | (408,797,663) | 34,039,563 | 300,010,089 | (10,453,222) | (232,973,136) | (2,157,245) | (113,274,517) |
The accompanying Notes to Financial Statements are an integral part of this statement.
Columbia Acorn Family of Funds | Annual Report 2022
| 61 |
Statement of Changes in Net Assets (continued)
| | Columbia
Acorn USA® | Columbia Acorn
International SelectSM |
| | Year Ended | Year Ended | Year Ended | Year Ended |
| | December 31, 2022 | December 31, 2021 | December 31, 2022 | December 31, 2021 |
| | Shares | Dollars ($) | Shares | Dollars ($) | Shares | Dollars ($) | Shares | Dollars ($) |
| Capital stock activity |
| Class A | | | | | | | | |
| Subscriptions | 530,741 | 3,899,740 | 304,197 | 3,931,345 | 164,236 | 4,018,820 | 297,746 | 10,412,479 |
| Distributions reinvested | 298,366 | 2,002,035 | 1,601,884 | 16,216,954 | 221,041 | 5,355,805 | 296,896 | 10,055,469 |
| Redemptions | (1,540,916) | (11,218,320) | (1,023,646) | (14,153,596) | (1,227,506) | (29,435,787) | (805,715) | (28,236,000) |
| Net increase (decrease) | (711,809) | (5,316,545) | 882,435 | 5,994,703 | (842,229) | (20,061,162) | (211,073) | (7,768,052) |
| Advisor Class | | | | | | | | |
| Subscriptions | 88,075 | 1,030,814 | 129,536 | 2,717,808 | 2,601 | 75,193 | 13,489 | 488,352 |
| Distributions reinvested | 53,560 | 595,586 | 329,508 | 5,338,855 | 2,056 | 51,217 | 3,497 | 121,768 |
| Redemptions | (197,847) | (2,655,272) | (188,579) | (3,873,759) | (30,779) | (738,678) | (28,744) | (1,028,388) |
| Net increase (decrease) | (56,212) | (1,028,872) | 270,465 | 4,182,904 | (26,122) | (612,268) | (11,758) | (418,268) |
| Class C | | | | | | | | |
| Subscriptions | 6,081 | 63,436 | 11,681 | 227,915 | 5,905 | 133,531 | 7,563 | 241,176 |
| Distributions reinvested | 3,710 | 37,617 | 28,737 | 429,313 | 2,663 | 57,570 | 3,065 | 93,006 |
| Redemptions | (56,903) | (633,092) | (66,603) | (1,284,123) | (19,273) | (417,002) | (50,207) | (1,577,049) |
| Net decrease | (47,112) | (532,039) | (26,185) | (626,895) | (10,705) | (225,901) | (39,579) | (1,242,867) |
| Institutional Class | | | | | | | | |
| Subscriptions | 274,928 | 2,952,082 | 466,246 | 8,703,797 | 249,962 | 6,149,181 | 336,387 | 11,967,996 |
| Distributions reinvested | 452,099 | 4,539,072 | 2,718,115 | 39,971,652 | 140,836 | 3,474,436 | 206,883 | 7,130,545 |
| Redemptions | (1,718,503) | (18,220,042) | (1,266,859) | (22,954,249) | (1,200,621) | (28,390,658) | (632,053) | (22,509,312) |
| Net increase (decrease) | (991,476) | (10,728,888) | 1,917,502 | 25,721,200 | (809,823) | (18,767,041) | (88,783) | (3,410,771) |
| Institutional 2 Class | | | | | | | | |
| Subscriptions | 129,024 | 1,491,727 | 62,684 | 1,319,886 | 57,386 | 1,552,892 | 45,098 | 1,648,451 |
| Distributions reinvested | 8,381 | 94,452 | 44,190 | 726,755 | 39,142 | 975,433 | 77,216 | 2,689,582 |
| Redemptions | (37,716) | (428,990) | (81,033) | (1,693,362) | (1,107,129) | (27,154,884) | (935,896) | (33,189,189) |
| Net increase (decrease) | 99,689 | 1,157,189 | 25,841 | 353,279 | (1,010,601) | (24,626,559) | (813,582) | (28,851,156) |
| Institutional 3 Class | | | | | | | | |
| Subscriptions | 114,696 | 1,510,978 | 571,882 | 12,216,299 | 81,296 | 2,018,245 | 81,741 | 2,892,773 |
| Distributions reinvested | 48,296 | 553,480 | 650,390 | 10,837,536 | 20,303 | 505,535 | 41,832 | 1,454,524 |
| Redemptions | (2,021,372) | (27,958,315) | (2,150,296) | (47,888,384) | (388,252) | (10,931,869) | (116,418) | (4,145,869) |
| Net increase (decrease) | (1,858,380) | (25,893,857) | (928,024) | (24,834,549) | (286,653) | (8,408,089) | 7,155 | 201,428 |
| Total net increase (decrease) | (3,565,300) | (42,343,012) | 2,142,034 | 10,790,642 | (2,986,133) | (72,701,020) | (1,157,620) | (41,489,686) |
The accompanying Notes to Financial Statements are an integral part of this statement.
| 62 | Columbia Acorn Family of Funds | Annual Report 2022 |
Statement of Changes in Net Assets (continued)
| | Columbia
Thermostat FundSM | Columbia Acorn
European FundSM |
| | Year Ended | Year Ended | Year Ended | Year Ended |
| | December 31, 2022 | December 31, 2021 | December 31, 2022 | December 31, 2021 |
| | Shares | Dollars ($) | Shares | Dollars ($) | Shares | Dollars ($) | Shares | Dollars ($) |
| Capital stock activity |
| Class A | | | | | | | | |
| Subscriptions | 4,779,635 | 74,320,265 | 13,658,871 | 258,098,220 | 499,655 | 12,080,215 | 959,587 | 29,875,035 |
| Distributions reinvested | 854,305 | 12,622,769 | 4,372,709 | 75,185,933 | — | — | 3,639 | 114,289 |
| Redemptions | (10,973,721) | (168,238,979) | (8,921,161) | (167,460,803) | (1,088,987) | (24,655,242) | (501,562) | (15,663,044) |
| Net increase (decrease) | (5,339,781) | (81,295,945) | 9,110,419 | 165,823,350 | (589,332) | (12,575,027) | 461,664 | 14,326,280 |
| Advisor Class | | | | | | | | |
| Subscriptions | 2,848,884 | 43,186,337 | 6,093,506 | 114,247,815 | 25,378 | 563,008 | 120,472 | 3,957,317 |
| Distributions reinvested | 213,969 | 3,128,499 | 1,338,083 | 22,736,494 | — | — | 388 | 12,325 |
| Redemptions | (7,914,592) | (119,461,531) | (4,415,649) | (82,862,865) | (61,288) | (1,400,836) | (93,445) | (2,989,540) |
| Net increase (decrease) | (4,851,739) | (73,146,695) | 3,015,940 | 54,121,444 | (35,910) | (837,828) | 27,415 | 980,102 |
| Class C | | | | | | | | |
| Subscriptions | 1,908,866 | 30,241,005 | 3,926,971 | 74,641,306 | 14,975 | 413,475 | 69,074 | 2,141,558 |
| Distributions reinvested | 182,360 | 2,729,808 | 1,266,735 | 21,949,471 | — | — | — | — |
| Redemptions | (4,418,887) | (67,545,215) | (5,444,288) | (102,926,754) | (114,266) | (2,516,468) | (62,866) | (1,823,948) |
| Net increase (decrease) | (2,327,661) | (34,574,402) | (250,582) | (6,335,977) | (99,291) | (2,102,993) | 6,208 | 317,610 |
| Institutional Class | | | | | | | | |
| Subscriptions | 13,490,772 | 206,555,299 | 23,405,839 | 433,982,285 | 620,948 | 15,491,624 | 1,874,052 | 58,837,993 |
| Distributions reinvested | 1,162,441 | 16,843,875 | 6,038,529 | 101,815,509 | — | — | 13,945 | 440,394 |
| Redemptions | (26,101,191) | (392,930,550) | (15,840,307) | (291,081,612) | (2,102,704) | (51,583,730) | (557,815) | (17,639,234) |
| Net increase (decrease) | (11,447,978) | (169,531,376) | 13,604,061 | 244,716,182 | (1,481,756) | (36,092,106) | 1,330,182 | 41,639,153 |
| Institutional 2 Class | | | | | | | | |
| Subscriptions | 2,306,144 | 35,639,654 | 8,585,734 | 161,733,267 | 783,511 | 22,322,468 | 965,317 | 31,689,444 |
| Distributions reinvested | 227,328 | 3,327,846 | 1,375,116 | 23,468,768 | — | — | 3,676 | 117,489 |
| Redemptions | (6,232,497) | (93,772,730) | (7,028,851) | (132,937,074) | (1,410,448) | (35,115,863) | (343,736) | (11,227,611) |
| Net increase (decrease) | (3,699,025) | (54,805,230) | 2,931,999 | 52,264,961 | (626,937) | (12,793,395) | 625,257 | 20,579,322 |
| Institutional 3 Class | | | | | | | | |
| Subscriptions | 241,620 | 3,652,789 | 810,188 | 15,437,620 | 189 | 5,717 | 681 | 21,164 |
| Distributions reinvested | 23,163 | 336,817 | 115,933 | 1,952,462 | — | — | 9 | 265 |
| Redemptions | (473,981) | (7,427,095) | (156,737) | (2,861,044) | — | — | (1,377) | (41,110) |
| Net increase (decrease) | (209,198) | (3,437,489) | 769,384 | 14,529,038 | 189 | 5,717 | (687) | (19,681) |
| Total net increase (decrease) | (27,875,382) | (416,791,137) | 29,181,221 | 525,118,998 | (2,833,037) | (64,395,632) | 2,450,039 | 77,822,786 |
The accompanying Notes to Financial Statements are an integral part of this statement.
Columbia Acorn Family of Funds | Annual Report 2022
| 63 |
Financial Highlights
Columbia Acorn® Fund
The following tables are intended to help you understand the Funds’ financial performance. Certain information reflects financial results for a single share of a class held for the periods shown. Per share net investment income (loss) amounts are calculated based on average shares outstanding during the period. Total return assumes reinvestment of all dividends and distributions, if any. Total return does not reflect payment of sales charges, if any. Total return and portfolio turnover are not annualized for periods of less than one year. The portfolio turnover rate is calculated without regard to purchase and sales transactions of short-term instruments and certain derivatives, if any. If such transactions were included, a Fund’s portfolio turnover rate may be higher.
| | Net asset value,
beginning of
period | Net
investment
income
(loss) | Net
realized
and
unrealized
gain (loss) | Total from
investment
operations | Distributions
from net
investment
income | Distributions
from net
realized
gains | Total
distributions to
shareholders |
| Class A |
| Year Ended 12/31/2022 | $10.01 | (0.04) | (3.34) | (3.38) | — | (0.47) | (0.47) |
| Year Ended 12/31/2021 | $12.69 | (0.10) | 1.07 | 0.97 | (0.14) | (3.51) | (3.65) |
| Year Ended 12/31/2020 | $11.71 | (0.06) | 3.24 | 3.18 | — | (2.20) | (2.20) |
| Year Ended 12/31/2019 | $10.65 | (0.04) | 2.78 | 2.74 | — | (1.68) | (1.68) |
| Year Ended 12/31/2018 | $12.92 | (0.03) | (0.48) | (0.51) | — | (1.76) | (1.76) |
| Advisor Class |
| Year Ended 12/31/2022 | $15.37 | (0.03) | (5.14) | (5.17) | — | (0.47) | (0.47) |
| Year Ended 12/31/2021 | $17.65 | (0.10) | 1.54 | 1.44 | (0.13) | (3.59) | (3.72) |
| Year Ended 12/31/2020 | $15.52 | (0.05) | 4.38 | 4.33 | — | (2.20) | (2.20) |
| Year Ended 12/31/2019 | $13.63 | (0.01) | 3.58 | 3.57 | — | (1.68) | (1.68) |
| Year Ended 12/31/2018 | $16.06 | 0.01 | (0.64) | (0.63) | — | (1.80) | (1.80) |
| Class C(e) |
| Year Ended 12/31/2022 | $13.72 | (0.13) | (4.57) | (4.70) | — | (0.41) | (0.41) |
| Year Ended 12/31/2021 | $16.14 | (0.26) | 1.40 | 1.14 | (0.13) | (3.43) | (3.56) |
| Year Ended 12/31/2020 | $16.57 | (0.20) | 4.08 | 3.88 | — | (4.31) | (4.31) |
| Year Ended 12/31/2019 | $18.75 | (0.20) | 4.74 | 4.54 | — | (6.72) | (6.72) |
| Year Ended 12/31/2018 | $26.34 | (0.24) | (0.71) | (0.95) | — | (6.64) | (6.64) |
| Institutional Class |
| Year Ended 12/31/2022 | $14.22 | (0.03) | (4.75) | (4.78) | — | (0.47) | (0.47) |
| Year Ended 12/31/2021 | $16.60 | (0.09) | 1.43 | 1.34 | (0.13) | (3.59) | (3.72) |
| Year Ended 12/31/2020 | $14.70 | (0.04) | 4.14 | 4.10 | — | (2.20) | (2.20) |
| Year Ended 12/31/2019 | $12.98 | (0.01) | 3.41 | 3.40 | — | (1.68) | (1.68) |
| Year Ended 12/31/2018 | $15.39 | 0.01 | (0.62) | (0.61) | — | (1.80) | (1.80) |
| Institutional 2 Class |
| Year Ended 12/31/2022 | $15.62 | (0.03) | (5.23) | (5.26) | — | (0.47) | (0.47) |
| Year Ended 12/31/2021 | $17.88 | (0.10) | 1.57 | 1.47 | (0.13) | (3.60) | (3.73) |
| Year Ended 12/31/2020 | $15.69 | (0.04) | 4.43 | 4.39 | — | (2.20) | (2.20) |
| Year Ended 12/31/2019 | $13.76 | (0.00)(f) | 3.61 | 3.61 | — | (1.68) | (1.68) |
| Year Ended 12/31/2018 | $16.20 | 0.01 | (0.65) | (0.64) | — | (1.80) | (1.80) |
The accompanying Notes to Financial Statements are an integral part of this statement.
| 64 | Columbia Acorn Family of Funds | Annual Report 2022 |
Financial Highlights (continued)
Columbia Acorn® Fund
| | Net
asset
value,
end of
period | Total
return | Total gross
expense
ratio to
average
net assets(a) | Total net
expense
ratio to
average
net assets(a) | Net investment
income (loss)
ratio to
average
net assets | Portfolio
turnover | Net
assets,
end of
period
(000’s) |
| Class A |
| Year Ended 12/31/2022 | $6.16 | (34.01%) | 1.08%(b) | 1.08%(b),(c) | (0.53%) | 64% | $521,243 |
| Year Ended 12/31/2021 | $10.01 | 8.79% | 1.08% | 1.08%(c) | (0.80%) | 75% | $919,643 |
| Year Ended 12/31/2020 | $12.69 | 29.18%(d) | 1.11% | 1.11%(c) | (0.56%) | 86% | $983,709 |
| Year Ended 12/31/2019 | $11.71 | 26.21%(d) | 1.11% | 1.10%(c) | (0.30%) | 101% | $810,966 |
| Year Ended 12/31/2018 | $10.65 | (5.22%)(d) | 1.10% | 1.08%(c) | (0.20%) | 66% | $768,031 |
| Advisor Class |
| Year Ended 12/31/2022 | $9.73 | (33.79%) | 0.83%(b) | 0.83%(b),(c) | (0.27%) | 64% | $21,946 |
| Year Ended 12/31/2021 | $15.37 | 9.03% | 0.83% | 0.83%(c) | (0.55%) | 75% | $39,676 |
| Year Ended 12/31/2020 | $17.65 | 29.44%(d) | 0.86% | 0.86%(c) | (0.30%) | 86% | $44,139 |
| Year Ended 12/31/2019 | $15.52 | 26.58%(d) | 0.86% | 0.85%(c) | (0.05%) | 101% | $44,248 |
| Year Ended 12/31/2018 | $13.63 | (5.00%)(d) | 0.85% | 0.83%(c) | 0.05% | 66% | $40,425 |
| Class C(e) |
| Year Ended 12/31/2022 | $8.61 | (34.48%) | 1.83%(b) | 1.83%(b),(c) | (1.29%) | 64% | $9,153 |
| Year Ended 12/31/2021 | $13.72 | 7.95% | 1.83% | 1.83%(c) | (1.54%) | 75% | $24,546 |
| Year Ended 12/31/2020 | $16.14 | 28.27%(d) | 1.86% | 1.86%(c) | (1.30%) | 86% | $55,861 |
| Year Ended 12/31/2019 | $16.57 | 25.12%(d) | 1.86% | 1.85%(c) | (1.05%) | 101% | $69,471 |
| Year Ended 12/31/2018 | $18.75 | (5.86%)(d) | 1.85% | 1.82%(c) | (0.94%) | 66% | $81,149 |
| Institutional Class |
| Year Ended 12/31/2022 | $8.97 | (33.78%) | 0.83%(b) | 0.83%(b),(c) | (0.28%) | 64% | $1,865,518 |
| Year Ended 12/31/2021 | $14.22 | 8.99% | 0.83% | 0.83%(c) | (0.55%) | 75% | $3,413,006 |
| Year Ended 12/31/2020 | $16.60 | 29.51%(d) | 0.86% | 0.86%(c) | (0.30%) | 86% | $3,569,794 |
| Year Ended 12/31/2019 | $14.70 | 26.60%(d) | 0.86% | 0.85%(c) | (0.05%) | 101% | $3,117,486 |
| Year Ended 12/31/2018 | $12.98 | (5.09%)(d) | 0.85% | 0.83%(c) | 0.05% | 66% | $2,816,948 |
| Institutional 2 Class |
| Year Ended 12/31/2022 | $9.89 | (33.83%)(d) | 0.81%(b) | 0.80%(b) | (0.26%) | 64% | $23,445 |
| Year Ended 12/31/2021 | $15.62 | 9.09%(d) | 0.80% | 0.80% | (0.52%) | 75% | $52,797 |
| Year Ended 12/31/2020 | $17.88 | 29.50%(d) | 0.83% | 0.82% | (0.27%) | 86% | $61,000 |
| Year Ended 12/31/2019 | $15.69 | 26.63%(d) | 0.83% | 0.82% | (0.02%) | 101% | $51,584 |
| Year Ended 12/31/2018 | $13.76 | (5.00%)(d) | 0.81% | 0.80% | 0.08% | 66% | $37,124 |
The accompanying Notes to Financial Statements are an integral part of this statement.
Columbia Acorn Family of Funds | Annual Report 2022
| 65 |
Financial Highlights (continued)
Columbia Acorn® Fund
| | Net asset value,
beginning of
period | Net
investment
income
(loss) | Net
realized
and
unrealized
gain (loss) | Total from
investment
operations | Distributions
from net
investment
income | Distributions
from net
realized
gains | Total
distributions to
shareholders |
| Institutional 3 Class |
| Year Ended 12/31/2022 | $15.88 | (0.02) | (5.32) | (5.34) | — | (0.47) | (0.47) |
| Year Ended 12/31/2021 | $18.12 | (0.09) | 1.60 | 1.51 | (0.14) | (3.61) | (3.75) |
| Year Ended 12/31/2020 | $15.87 | (0.04) | 4.49 | 4.45 | — | (2.20) | (2.20) |
| Year Ended 12/31/2019 | $13.89 | 0.00(f) | 3.66 | 3.66 | — | (1.68) | (1.68) |
| Year Ended 12/31/2018 | $16.34 | 0.02 | (0.66) | (0.64) | — | (1.81) | (1.81) |
| Notes to Financial Highlights |
| (a) | In addition to the fees and expenses that the Fund bears directly, the Fund indirectly bears a pro rata share of the fees and expenses of any other funds in which it invests, if any. Such indirect expenses are not included in the Fund’s reported expense ratios. |
| (b) | Ratios include Trustees’ fees deferred during the current period as well as any gains or losses on the Trustees’ deferred compensation balances as a result of market fluctuations. If these had been excluded, expenses would have been higher by 0.03%. |
| (c) | The benefits derived from expense reductions had an impact of less than 0.01%. |
| (d) | Had the Investment Manager and/or Transfer Agent not waived fees and/or reimbursed a portion of expenses, total return would have been reduced. |
| (e) | Per share amounts have been adjusted on a retroactive basis to reflect a 4 to 1 reverse stock split completed after the close of business on September 11, 2020. |
| (f) | Rounds to zero. |
The accompanying Notes to Financial Statements are an integral part of this statement.
| 66 | Columbia Acorn Family of Funds | Annual Report 2022 |
Financial Highlights (continued)
Columbia Acorn® Fund
| | Net
asset
value,
end of
period | Total
return | Total gross
expense
ratio to
average
net assets(a) | Total net
expense
ratio to
average
net assets(a) | Net investment
income (loss)
ratio to
average
net assets | Portfolio
turnover | Net
assets,
end of
period
(000’s) |
| Institutional 3 Class |
| Year Ended 12/31/2022 | $10.07 | (33.77%) | 0.77%(b) | 0.77%(b) | (0.23%) | 64% | $47,945 |
| Year Ended 12/31/2021 | $15.88 | 9.16% | 0.75% | 0.75% | (0.46%) | 75% | $78,955 |
| Year Ended 12/31/2020 | $18.12 | 29.54%(d) | 0.78% | 0.78% | (0.25%) | 86% | $155,338 |
| Year Ended 12/31/2019 | $15.87 | 26.74%(d) | 0.78% | 0.77% | 0.03% | 101% | $65,408 |
| Year Ended 12/31/2018 | $13.89 | (4.98%)(d) | 0.76% | 0.76% | 0.13% | 66% | $54,688 |
The accompanying Notes to Financial Statements are an integral part of this statement.
Columbia Acorn Family of Funds | Annual Report 2022
| 67 |
Financial Highlights
Columbia Acorn International®
| | Net asset value,
beginning of
period | Net
investment
income
(loss) | Net
realized
and
unrealized
gain (loss) | Total from
investment
operations | Distributions
from net
investment
income | Distributions
from net
realized
gains | Total
distributions to
shareholders |
| Class A |
| Year Ended 12/31/2022 | $33.19 | 0.17(c) | (11.35) | (11.18) | — | (0.67) | (0.67) |
| Year Ended 12/31/2021 | $34.31 | 0.01 | 4.08 | 4.09 | (0.38) | (4.83) | (5.21) |
| Year Ended 12/31/2020 | $34.20 | 0.06 | 4.51 | 4.57 | (0.20) | (4.26) | (4.46) |
| Year Ended 12/31/2019 | $29.48 | 0.25 | 8.19 | 8.44 | (0.65) | (3.07) | (3.72) |
| Year Ended 12/31/2018 | $46.51 | 0.23 | (7.41) | (7.18) | (0.29) | (9.56) | (9.85) |
| Advisor Class |
| Year Ended 12/31/2022 | $33.82 | 0.22(c) | (11.55) | (11.33) | — | (0.67) | (0.67) |
| Year Ended 12/31/2021 | $34.95 | 0.05 | 4.20 | 4.25 | (0.55) | (4.83) | (5.38) |
| Year Ended 12/31/2020 | $34.67 | 0.16 | 4.58 | 4.74 | (0.20) | (4.26) | (4.46) |
| Year Ended 12/31/2019 | $29.84 | 0.33 | 8.30 | 8.63 | (0.73) | (3.07) | (3.80) |
| Year Ended 12/31/2018 | $46.95 | 0.46 | (7.61) | (7.15) | (0.40) | (9.56) | (9.96) |
| Class C |
| Year Ended 12/31/2022 | $30.07 | (0.02)(c) | (10.25) | (10.27) | — | (0.67) | (0.67) |
| Year Ended 12/31/2021 | $31.43 | (0.24) | 3.72 | 3.48 | (0.01) | (4.83) | (4.84) |
| Year Ended 12/31/2020 | $31.92 | (0.17) | 4.14 | 3.97 | (0.20) | (4.26) | (4.46) |
| Year Ended 12/31/2019 | $27.63 | 0.00(h) | 7.65 | 7.65 | (0.29) | (3.07) | (3.36) |
| Year Ended 12/31/2018 | $44.57 | (0.05) | (7.09) | (7.14) | (0.24) | (9.56) | (9.80) |
| Institutional Class |
| Year Ended 12/31/2022 | $33.28 | 0.23(c) | (11.38) | (11.15) | — | (0.67) | (0.67) |
| Year Ended 12/31/2021 | $34.47 | 0.10 | 4.09 | 4.19 | (0.55) | (4.83) | (5.38) |
| Year Ended 12/31/2020 | $34.25 | 0.14 | 4.54 | 4.68 | (0.20) | (4.26) | (4.46) |
| Year Ended 12/31/2019 | $29.51 | 0.33 | 8.21 | 8.54 | (0.73) | (3.07) | (3.80) |
| Year Ended 12/31/2018 | $46.57 | 0.34 | (7.44) | (7.10) | (0.40) | (9.56) | (9.96) |
| Institutional 2 Class |
| Year Ended 12/31/2022 | $33.25 | 0.24(c) | (11.37) | (11.13) | — | (0.67) | (0.67) |
| Year Ended 12/31/2021 | $34.46 | 0.12 | 4.09 | 4.21 | (0.59) | (4.83) | (5.42) |
| Year Ended 12/31/2020 | $34.22 | 0.16 | 4.54 | 4.70 | (0.20) | (4.26) | (4.46) |
| Year Ended 12/31/2019 | $29.49 | 0.35 | 8.20 | 8.55 | (0.75) | (3.07) | (3.82) |
| Year Ended 12/31/2018 | $46.54 | 0.37 | (7.43) | (7.06) | (0.43) | (9.56) | (9.99) |
| Institutional 3 Class |
| Year Ended 12/31/2022 | $33.83 | 0.26(c) | (11.58) | (11.32) | — | (0.67) | (0.67) |
| Year Ended 12/31/2021 | $34.99 | 0.15 | 4.14 | 4.29 | (0.62) | (4.83) | (5.45) |
| Year Ended 12/31/2020 | $34.67 | 0.19 | 4.59 | 4.78 | (0.20) | (4.26) | (4.46) |
| Year Ended 12/31/2019 | $29.83 | 0.37 | 8.30 | 8.67 | (0.76) | (3.07) | (3.83) |
| Year Ended 12/31/2018 | $46.95 | 0.51 | (7.62) | (7.11) | (0.45) | (9.56) | (10.01) |
The accompanying Notes to Financial Statements are an integral part of this statement.
| 68 | Columbia Acorn Family of Funds | Annual Report 2022 |
Financial Highlights (continued)
Columbia Acorn International®
| | Net
asset
value,
end of
period | Total
return(a) | Total gross
expense
ratio to
average
net assets(b) | Total net
expense
ratio to
average
net assets(b) | Net investment
income (loss)
ratio to
average
net assets | Portfolio
turnover | Net
assets,
end of
period
(000’s) |
| Class A |
| Year Ended 12/31/2022 | $21.34 | (33.81%) | 1.27%(d),(e),(f) | 1.23%(d),(e),(f),(g) | 0.71% | 29% | $151,725 |
| Year Ended 12/31/2021 | $33.19 | 12.63% | 1.24% | 1.23%(g) | 0.03% | 27% | $282,125 |
| Year Ended 12/31/2020 | $34.31 | 14.68% | 1.28%(f) | 1.24%(f),(g) | 0.21% | 55% | $283,478 |
| Year Ended 12/31/2019 | $34.20 | 29.56% | 1.27%(f) | 1.24%(f),(g) | 0.76% | 32% | $307,872 |
| Year Ended 12/31/2018 | $29.48 | (16.13%) | 1.25%(f) | 1.24%(f),(g) | 0.51% | 32% | $296,349 |
| Advisor Class |
| Year Ended 12/31/2022 | $21.82 | (33.62%) | 1.04%(d),(e),(f) | 0.98%(d),(e),(f),(g) | 0.96% | 29% | $6,644 |
| Year Ended 12/31/2021 | $33.82 | 12.88% | 0.99% | 0.98%(g) | 0.14% | 27% | $9,279 |
| Year Ended 12/31/2020 | $34.95 | 14.98% | 1.03%(f) | 0.99%(f),(g) | 0.52% | 55% | $22,549 |
| Year Ended 12/31/2019 | $34.67 | 29.86% | 1.02%(f) | 0.99%(f),(g) | 1.00% | 32% | $12,733 |
| Year Ended 12/31/2018 | $29.84 | (15.90%) | 1.00%(f) | 0.99%(f),(g) | 0.97% | 32% | $12,740 |
| Class C |
| Year Ended 12/31/2022 | $19.13 | (34.30%) | 2.02%(d),(e),(f) | 1.98%(d),(e),(f),(g) | (0.07%) | 29% | $4,070 |
| Year Ended 12/31/2021 | $30.07 | 11.76% | 1.99% | 1.98%(g) | (0.74%) | 27% | $10,687 |
| Year Ended 12/31/2020 | $31.43 | 13.82% | 2.02%(f) | 1.99%(f),(g) | (0.57%) | 55% | $19,998 |
| Year Ended 12/31/2019 | $31.92 | 28.61% | 2.02%(f) | 2.00%(f),(g) | 0.01% | 32% | $18,749 |
| Year Ended 12/31/2018 | $27.63 | (16.76%) | 2.00%(f) | 1.99%(f),(g) | (0.11%) | 32% | $22,817 |
| Institutional Class |
| Year Ended 12/31/2022 | $21.46 | (33.63%) | 1.03%(d),(e),(f) | 0.98%(d),(e),(f),(g) | 0.96% | 29% | $906,415 |
| Year Ended 12/31/2021 | $33.28 | 12.89% | 0.99% | 0.98%(g) | 0.28% | 27% | $1,727,042 |
| Year Ended 12/31/2020 | $34.47 | 14.99% | 1.03%(f) | 0.99%(f),(g) | 0.46% | 55% | $1,760,927 |
| Year Ended 12/31/2019 | $34.25 | 29.89% | 1.02%(f) | 0.99%(f),(g) | 1.01% | 32% | $1,947,995 |
| Year Ended 12/31/2018 | $29.51 | (15.93%) | 1.00%(f) | 0.99%(f),(g) | 0.76% | 32% | $1,824,055 |
| Institutional 2 Class |
| Year Ended 12/31/2022 | $21.45 | (33.60%) | 0.97%(d),(e),(f) | 0.92%(d),(e),(f) | 1.04% | 29% | $80,059 |
| Year Ended 12/31/2021 | $33.25 | 12.97% | 0.95% | 0.92% | 0.34% | 27% | $126,973 |
| Year Ended 12/31/2020 | $34.46 | 15.06% | 0.97%(f) | 0.92%(f) | 0.53% | 55% | $129,576 |
| Year Ended 12/31/2019 | $34.22 | 29.95% | 0.97%(f) | 0.93%(f) | 1.06% | 32% | $183,763 |
| Year Ended 12/31/2018 | $29.49 | (15.85%) | 0.93%(f) | 0.93%(f) | 0.81% | 32% | $160,488 |
| Institutional 3 Class |
| Year Ended 12/31/2022 | $21.84 | (33.58%) | 0.92%(d),(e),(f) | 0.88%(d),(e),(f) | 1.10% | 29% | $133,738 |
| Year Ended 12/31/2021 | $33.83 | 13.00% | 0.90% | 0.88% | 0.40% | 27% | $179,991 |
| Year Ended 12/31/2020 | $34.99 | 15.10% | 0.93%(f) | 0.88%(f) | 0.60% | 55% | $277,614 |
| Year Ended 12/31/2019 | $34.67 | 30.04% | 0.92%(f) | 0.89%(f) | 1.12% | 32% | $239,441 |
| Year Ended 12/31/2018 | $29.83 | (15.82%) | 0.88%(f) | 0.88%(f) | 1.10% | 32% | $198,933 |
The accompanying Notes to Financial Statements are an integral part of this statement.
Columbia Acorn Family of Funds | Annual Report 2022
| 69 |
Financial Highlights (continued)
Columbia Acorn International®
| | Net asset value,
beginning of
period | Net
investment
income
(loss) | Net
realized
and
unrealized
gain (loss) | Total from
investment
operations | Distributions
from net
investment
income | Distributions
from net
realized
gains | Total
distributions to
shareholders |
| Class R |
| Year Ended 12/31/2022 | $33.19 | 0.11(c) | (11.34) | (11.23) | — | (0.67) | (0.67) |
| Year Ended 12/31/2021 | $34.24 | (0.08) | 4.07 | 3.99 | (0.21) | (4.83) | (5.04) |
| Year Ended 12/31/2020 | $34.22 | (0.01) | 4.49 | 4.48 | (0.20) | (4.26) | (4.46) |
| Year Ended 12/31/2019 | $29.44 | 0.06 | 8.27 | 8.33 | (0.48) | (3.07) | (3.55) |
| Year Ended 12/31/2018 | $46.51 | 0.12 | (7.39) | (7.27) | (0.24) | (9.56) | (9.80) |
| Notes to Financial Highlights |
| (a) | Had the Investment Manager and/or Transfer Agent not waived fees and/or reimbursed a portion of expenses, total return would have been reduced. |
| (b) | In addition to the fees and expenses that the Fund bears directly, the Fund indirectly bears a pro rata share of the fees and expenses of any other funds in which it invests, if any. Such indirect expenses are not included in the Fund’s reported expense ratios. |
| (c) | Net investment income per share includes European Union tax reclaims. The effect of these reclaims amounted to $0.02 per share. |
| (d) | Ratios include Trustees’ fees deferred during the current period as well as any gains or losses on the Trustees’ deferred compensation balances as a result of market fluctuations. If these had been excluded, expenses would have been higher by 0.03%. |
| (e) | Ratios include interest on collateral expense which is less than 0.01%. |
| (f) | Ratios include line of credit interest expense which is less than 0.01%. |
| (g) | The benefits derived from expense reductions had an impact of less than 0.01%. |
| (h) | Rounds to zero. |
The accompanying Notes to Financial Statements are an integral part of this statement.
| 70 | Columbia Acorn Family of Funds | Annual Report 2022 |
Financial Highlights (continued)
Columbia Acorn International®
| | Net
asset
value,
end of
period | Total
return(a) | Total gross
expense
ratio to
average
net assets(b) | Total net
expense
ratio to
average
net assets(b) | Net investment
income (loss)
ratio to
average
net assets | Portfolio
turnover | Net
assets,
end of
period
(000’s) |
| Class R |
| Year Ended 12/31/2022 | $21.29 | (33.96%) | 1.52%(d),(e),(f) | 1.48%(d),(e),(f),(g) | 0.47% | 29% | $2,077 |
| Year Ended 12/31/2021 | $33.19 | 12.34% | 1.49% | 1.48%(g) | (0.22%) | 27% | $3,691 |
| Year Ended 12/31/2020 | $34.24 | 14.40% | 1.53%(f) | 1.49%(f),(g) | (0.04%) | 55% | $3,398 |
| Year Ended 12/31/2019 | $34.22 | 29.21% | 1.52%(f) | 1.50%(f),(g) | 0.19% | 32% | $3,696 |
| Year Ended 12/31/2018 | $29.44 | (16.32%) | 1.50%(f) | 1.49%(f),(g) | 0.26% | 32% | $10,049 |
The accompanying Notes to Financial Statements are an integral part of this statement.
Columbia Acorn Family of Funds | Annual Report 2022
| 71 |
Financial Highlights
Columbia Acorn USA®
| | Net asset value,
beginning of
period | Net
investment
income
(loss) | Net
realized
and
unrealized
gain (loss) | Total from
investment
operations | Distributions
from net
investment
income | Distributions
from net
realized
gains | Total
distributions to
shareholders |
| Class A |
| Year Ended 12/31/2022 | $10.14 | (0.04) | (3.36) | (3.40) | — | (0.44) | (0.44) |
| Year Ended 12/31/2021 | $13.58 | (0.15) | 1.20 | 1.05 | (0.12) | (4.37) | (4.49) |
| Year Ended 12/31/2020 | $11.69 | (0.10) | 2.76 | 2.66 | — | (0.77) | (0.77) |
| Year Ended 12/31/2019 | $10.28 | (0.05) | 3.14 | 3.09 | (0.01) | (1.67) | (1.68) |
| Year Ended 12/31/2018 | $12.48 | (0.07) | (0.04) | (0.11) | — | (2.09) | (2.09) |
| Advisor Class |
| Year Ended 12/31/2022 | $16.37 | (0.04) | (5.43) | (5.47) | — | (0.44) | (0.44) |
| Year Ended 12/31/2021 | $19.32 | (0.16) | 1.75 | 1.59 | (0.13) | (4.41) | (4.54) |
| Year Ended 12/31/2020 | $16.31 | (0.10) | 3.91 | 3.81 | — | (0.80) | (0.80) |
| Year Ended 12/31/2019 | $13.77 | (0.03) | 4.25 | 4.22 | (0.01) | (1.67) | (1.68) |
| Year Ended 12/31/2018 | $16.08 | (0.05) | (0.09) | (0.14) | — | (2.17) | (2.17) |
| Class C(f) |
| Year Ended 12/31/2022 | $15.03 | (0.15) | (4.97) | (5.12) | — | (0.43) | (0.43) |
| Year Ended 12/31/2021 | $18.14 | (0.34) | 1.64 | 1.30 | (0.13) | (4.28) | (4.41) |
| Year Ended 12/31/2020 | $16.47 | (0.25) | 3.60 | 3.35 | — | (1.68) | (1.68) |
| Year Ended 12/31/2019 | $18.07 | (0.24) | 5.32 | 5.08 | — | (6.68) | (6.68) |
| Year Ended 12/31/2018 | $26.22 | (0.36) | 0.17(g) | (0.19) | — | (7.96) | (7.96) |
| Institutional Class |
| Year Ended 12/31/2022 | $14.83 | (0.04) | (4.92) | (4.96) | — | (0.44) | (0.44) |
| Year Ended 12/31/2021 | $17.90 | (0.15) | 1.62 | 1.47 | (0.13) | (4.41) | (4.54) |
| Year Ended 12/31/2020 | $15.17 | (0.10) | 3.63 | 3.53 | — | (0.80) | (0.80) |
| Year Ended 12/31/2019 | $12.90 | (0.03) | 3.98 | 3.95 | (0.01) | (1.67) | (1.68) |
| Year Ended 12/31/2018 | $15.21 | (0.04) | (0.09) | (0.13) | — | (2.18) | (2.18) |
| Institutional 2 Class |
| Year Ended 12/31/2022 | $16.57 | (0.03) | (5.50) | (5.53) | — | (0.44) | (0.44) |
| Year Ended 12/31/2021 | $19.50 | (0.15) | 1.77 | 1.62 | (0.12) | (4.43) | (4.55) |
| Year Ended 12/31/2020 | $16.46 | (0.10) | 3.95 | 3.85 | — | (0.81) | (0.81) |
| Year Ended 12/31/2019 | $13.87 | (0.01) | 4.28 | 4.27 | (0.01) | (1.67) | (1.68) |
| Year Ended 12/31/2018 | $16.21 | (0.03) | (0.11) | (0.14) | — | (2.20) | (2.20) |
The accompanying Notes to Financial Statements are an integral part of this statement.
| 72 | Columbia Acorn Family of Funds | Annual Report 2022 |
Financial Highlights (continued)
Columbia Acorn USA®
| | Net
asset
value,
end of
period | Total
return(a) | Total gross
expense
ratio to
average
net assets(b) | Total net
expense
ratio to
average
net assets(b) | Net investment
income (loss)
ratio to
average
net assets | Portfolio
turnover | Net
assets,
end of
period
(000’s) |
| Class A |
| Year Ended 12/31/2022 | $6.30 | (33.75%) | 1.32%(c),(d) | 1.21%(c),(d),(e) | (0.59%) | 105% | $28,457 |
| Year Ended 12/31/2021 | $10.14 | 8.74% | 1.40%(d) | 1.39%(d),(e) | (1.03%) | 69% | $53,016 |
| Year Ended 12/31/2020 | $13.58 | 23.70% | 1.44% | 1.40%(e) | (0.91%) | 94% | $59,050 |
| Year Ended 12/31/2019 | $11.69 | 30.88% | 1.45%(d) | 1.41%(d),(e) | (0.43%) | 91% | $56,578 |
| Year Ended 12/31/2018 | $10.28 | (2.15%) | 1.44%(d) | 1.42%(d),(e) | (0.49%) | 86% | $49,179 |
| Advisor Class |
| Year Ended 12/31/2022 | $10.46 | (33.55%) | 1.07%(c),(d) | 0.95%(c),(d),(e) | (0.33%) | 105% | $14,778 |
| Year Ended 12/31/2021 | $16.37 | 8.92% | 1.15%(d) | 1.14%(d),(e) | (0.78%) | 69% | $24,058 |
| Year Ended 12/31/2020 | $19.32 | 24.08% | 1.19% | 1.15%(e) | (0.66%) | 94% | $23,158 |
| Year Ended 12/31/2019 | $16.31 | 31.27% | 1.20%(d) | 1.16%(d),(e) | (0.18%) | 91% | $19,202 |
| Year Ended 12/31/2018 | $13.77 | (1.91%) | 1.18%(d) | 1.17%(d),(e) | (0.27%) | 86% | $14,579 |
| Class C(f) |
| Year Ended 12/31/2022 | $9.48 | (34.23%) | 2.07%(c),(d) | 1.97%(c),(d),(e) | (1.37%) | 105% | $694 |
| Year Ended 12/31/2021 | $15.03 | 7.85% | 2.15%(d) | 2.14%(d),(e) | (1.78%) | 69% | $1,809 |
| Year Ended 12/31/2020 | $18.14 | 22.79% | 2.19% | 2.15%(e) | (1.66%) | 94% | $2,658 |
| Year Ended 12/31/2019 | $16.47 | 29.93% | 2.20%(d) | 2.16%(d),(e) | (1.19%) | 91% | $3,195 |
| Year Ended 12/31/2018 | $18.07 | (2.92%) | 2.19%(d) | 2.17%(d),(e) | (1.30%) | 86% | $4,608 |
| Institutional Class |
| Year Ended 12/31/2022 | $9.43 | (33.60%) | 1.07%(c),(d) | 0.95%(c),(d),(e) | (0.33%) | 105% | $98,679 |
| Year Ended 12/31/2021 | $14.83 | 8.95% | 1.15%(d) | 1.14%(d),(e) | (0.78%) | 69% | $169,844 |
| Year Ended 12/31/2020 | $17.90 | 24.04% | 1.19% | 1.15%(e) | (0.67%) | 94% | $170,650 |
| Year Ended 12/31/2019 | $15.17 | 31.28% | 1.20%(d) | 1.16%(d),(e) | (0.18%) | 91% | $158,696 |
| Year Ended 12/31/2018 | $12.90 | (1.98%) | 1.18%(d) | 1.17%(d),(e) | (0.26%) | 86% | $149,048 |
| Institutional 2 Class |
| Year Ended 12/31/2022 | $10.60 | (33.51%) | 1.00%(c),(d) | 0.90%(c),(d) | (0.26%) | 105% | $3,148 |
| Year Ended 12/31/2021 | $16.57 | 8.99% | 1.11%(d) | 1.08%(d) | (0.71%) | 69% | $3,271 |
| Year Ended 12/31/2020 | $19.50 | 24.10% | 1.14% | 1.08% | (0.60%) | 94% | $3,344 |
| Year Ended 12/31/2019 | $16.46 | 31.41% | 1.13%(d) | 1.08%(d) | (0.09%) | 91% | $3,806 |
| Year Ended 12/31/2018 | $13.87 | (1.89%) | 1.11%(d) | 1.09%(d) | (0.19%) | 86% | $3,332 |
The accompanying Notes to Financial Statements are an integral part of this statement.
Columbia Acorn Family of Funds | Annual Report 2022
| 73 |
Financial Highlights (continued)
Columbia Acorn USA®
| | Net asset value,
beginning of
period | Net
investment
income
(loss) | Net
realized
and
unrealized
gain (loss) | Total from
investment
operations | Distributions
from net
investment
income | Distributions
from net
realized
gains | Total
distributions to
shareholders |
| Institutional 3 Class |
| Year Ended 12/31/2022 | $16.84 | (0.05) | (5.58) | (5.63) | — | (0.44) | (0.44) |
| Year Ended 12/31/2021 | $19.74 | (0.15) | 1.81 | 1.66 | (0.13) | (4.43) | (4.56) |
| Year Ended 12/31/2020 | $16.65 | (0.09) | 4.00 | 3.91 | — | (0.82) | (0.82) |
| Year Ended 12/31/2019 | $14.01 | (0.01) | 4.33 | 4.32 | (0.01) | (1.67) | (1.68) |
| Year Ended 12/31/2018 | $16.36 | (0.02) | (0.11) | (0.13) | — | (2.22) | (2.22) |
| Notes to Financial Highlights |
| (a) | Had the Investment Manager and/or Transfer Agent not waived fees and/or reimbursed a portion of expenses, total return would have been reduced. |
| (b) | In addition to the fees and expenses that the Fund bears directly, the Fund indirectly bears a pro rata share of the fees and expenses of any other funds in which it invests, if any. Such indirect expenses are not included in the Fund’s reported expense ratios. |
| (c) | Ratios include Trustees’ fees deferred during the current period as well as any gains or losses on the Trustees’ deferred compensation balances as a result of market fluctuations. If these had been excluded, expenses would have been higher by 0.04%. |
| (d) | Ratios include line of credit interest expense which is less than 0.01%. |
| (e) | The benefits derived from expense reductions had an impact of less than 0.01%. |
| (f) | Per share amounts have been adjusted on a retroactive basis to reflect a 4 to 1 reverse stock split completed after the close of business on September 11, 2020. |
| (g) | Calculation of the net gain (loss) per share (both realized and unrealized) does not correlate to the aggregate realized and unrealized gain (loss) presented in the Statement of Operations due to the timing of subscriptions and redemptions of Fund shares in relation to fluctuations in the market value of the portfolio. |
The accompanying Notes to Financial Statements are an integral part of this statement.
| 74 | Columbia Acorn Family of Funds | Annual Report 2022 |
Financial Highlights (continued)
Columbia Acorn USA®
| | Net
asset
value,
end of
period | Total
return(a) | Total gross
expense
ratio to
average
net assets(b) | Total net
expense
ratio to
average
net assets(b) | Net investment
income (loss)
ratio to
average
net assets | Portfolio
turnover | Net
assets,
end of
period
(000’s) |
| Institutional 3 Class |
| Year Ended 12/31/2022 | $10.77 | (33.56%) | 0.97%(c),(d) | 0.91%(c),(d) | (0.38%) | 105% | $12,162 |
| Year Ended 12/31/2021 | $16.84 | 9.09% | 1.05%(d) | 1.04%(d) | (0.69%) | 69% | $50,303 |
| Year Ended 12/31/2020 | $19.74 | 24.16% | 1.09% | 1.04% | (0.55%) | 94% | $77,304 |
| Year Ended 12/31/2019 | $16.65 | 31.45% | 1.08%(d) | 1.03%(d) | (0.05%) | 91% | $67,921 |
| Year Ended 12/31/2018 | $14.01 | (1.86%) | 1.06%(d) | 1.04%(d) | (0.11%) | 86% | $55,248 |
The accompanying Notes to Financial Statements are an integral part of this statement.
Columbia Acorn Family of Funds | Annual Report 2022
| 75 |
Financial Highlights
Columbia Acorn International SelectSM
| | Net asset value,
beginning of
period | Net
investment
income
(loss) | Net
realized
and
unrealized
gain (loss) | Total from
investment
operations | Distributions
from net
investment
income | Distributions
from net
realized
gains | Total
distributions to
shareholders |
| Class A |
| Year Ended 12/31/2022 | $35.43 | 0.12(c) | (13.06) | (12.94) | — | (0.92) | (0.92) |
| Year Ended 12/31/2021 | $33.67 | (0.05) | 3.50 | 3.45 | (0.28) | (1.41) | (1.69) |
| Year Ended 12/31/2020 | $28.58 | (0.03) | 5.21 | 5.18 | (0.09) | — | (0.09) |
| Year Ended 12/31/2019 | $23.44 | 0.09 | 7.67 | 7.76 | (0.28) | (2.34) | (2.62) |
| Year Ended 12/31/2018 | $28.89 | 0.06 | (3.66) | (3.60) | — | (1.85) | (1.85) |
| Advisor Class |
| Year Ended 12/31/2022 | $36.35 | 0.18(c) | (13.40) | (13.22) | — | (0.92) | (0.92) |
| Year Ended 12/31/2021 | $34.56 | 0.04 | 3.59 | 3.63 | (0.43) | (1.41) | (1.84) |
| Year Ended 12/31/2020 | $29.26 | 0.04 | 5.35 | 5.39 | (0.09) | — | (0.09) |
| Year Ended 12/31/2019 | $24.00 | 0.18 | 7.84 | 8.02 | (0.42) | (2.34) | (2.76) |
| Year Ended 12/31/2018 | $29.46 | 0.09 | (3.70) | (3.61) | — | (1.85) | (1.85) |
| Class C |
| Year Ended 12/31/2022 | $31.86 | (0.06)(c) | (11.72) | (11.78) | — | (0.92) | (0.92) |
| Year Ended 12/31/2021 | $30.40 | (0.30) | 3.17 | 2.87 | — | (1.41) | (1.41) |
| Year Ended 12/31/2020 | $26.00 | (0.23) | 4.72 | 4.49 | (0.09) | — | (0.09) |
| Year Ended 12/31/2019 | $21.48 | (0.10) | 6.99 | 6.89 | (0.03) | (2.34) | (2.37) |
| Year Ended 12/31/2018 | $26.85 | (0.12) | (3.40) | (3.52) | — | (1.85) | (1.85) |
| Institutional Class |
| Year Ended 12/31/2022 | $36.01 | 0.18(c) | (13.28) | (13.10) | — | (0.92) | (0.92) |
| Year Ended 12/31/2021 | $34.25 | 0.04 | 3.56 | 3.60 | (0.43) | (1.41) | (1.84) |
| Year Ended 12/31/2020 | $29.00 | 0.03 | 5.31 | 5.34 | (0.09) | — | (0.09) |
| Year Ended 12/31/2019 | $23.81 | 0.17 | 7.78 | 7.95 | (0.42) | (2.34) | (2.76) |
| Year Ended 12/31/2018 | $29.25 | 0.14 | (3.73) | (3.59) | — | (1.85) | (1.85) |
| Institutional 2 Class |
| Year Ended 12/31/2022 | $36.33 | 0.20(c) | (13.39) | (13.19) | — | (0.92) | (0.92) |
| Year Ended 12/31/2021 | $34.57 | 0.06 | 3.60 | 3.66 | (0.49) | (1.41) | (1.90) |
| Year Ended 12/31/2020 | $29.24 | 0.08 | 5.34 | 5.42 | (0.09) | — | (0.09) |
| Year Ended 12/31/2019 | $24.01 | 0.18 | 7.86 | 8.04 | (0.47) | (2.34) | (2.81) |
| Year Ended 12/31/2018 | $29.44 | 0.11 | (3.69) | (3.58) | — | (1.85) | (1.85) |
The accompanying Notes to Financial Statements are an integral part of this statement.
| 76 | Columbia Acorn Family of Funds | Annual Report 2022 |
Financial Highlights (continued)
Columbia Acorn International SelectSM
| | Net
asset
value,
end of
period | Total
return(a) | Total gross
expense
ratio to
average
net assets(b) | Total net
expense
ratio to
average
net assets(b) | Net investment
income (loss)
ratio to
average
net assets | Portfolio
turnover | Net
assets,
end of
period
(000’s) |
| Class A |
| Year Ended 12/31/2022 | $21.57 | (36.80%) | 1.50%(d),(e) | 1.24%(d),(e),(f) | 0.48% | 21% | $124,963 |
| Year Ended 12/31/2021 | $35.43 | 10.49% | 1.44%(e) | 1.23%(e),(f) | (0.15%) | 27% | $235,103 |
| Year Ended 12/31/2020 | $33.67 | 18.21% | 1.48% | 1.26%(f) | (0.10%) | 68% | $230,519 |
| Year Ended 12/31/2019 | $28.58 | 33.37% | 1.54%(e) | 1.35%(e),(f) | 0.34% | 46% | $37,461 |
| Year Ended 12/31/2018 | $23.44 | (12.46%) | 1.54% | 1.40%(f) | 0.20% | 48% | $26,073 |
| Advisor Class |
| Year Ended 12/31/2022 | $22.21 | (36.63%) | 1.24%(d),(e) | 0.99%(d),(e),(f) | 0.71% | 21% | $924 |
| Year Ended 12/31/2021 | $36.35 | 10.78% | 1.19%(e) | 0.98%(e),(f) | 0.11% | 27% | $2,462 |
| Year Ended 12/31/2020 | $34.56 | 18.51% | 1.23% | 1.02%(f) | 0.12% | 68% | $2,748 |
| Year Ended 12/31/2019 | $29.26 | 33.73% | 1.29%(e) | 1.10%(e),(f) | 0.63% | 46% | $2,030 |
| Year Ended 12/31/2018 | $24.00 | (12.26%) | 1.29% | 1.15%(f) | 0.31% | 48% | $1,201 |
| Class C |
| Year Ended 12/31/2022 | $19.16 | (37.29%) | 2.25%(d),(e) | 1.99%(d),(e),(f) | (0.27%) | 21% | $1,085 |
| Year Ended 12/31/2021 | $31.86 | 9.68% | 2.19%(e) | 1.98%(e),(f) | (0.93%) | 27% | $2,146 |
| Year Ended 12/31/2020 | $30.40 | 17.37% | 2.23% | 2.02%(f) | (0.88%) | 68% | $3,251 |
| Year Ended 12/31/2019 | $26.00 | 32.31% | 2.29%(e) | 2.10%(e),(f) | (0.42%) | 46% | $2,493 |
| Year Ended 12/31/2018 | $21.48 | (13.11%) | 2.28% | 2.15%(f) | (0.43%) | 48% | $2,752 |
| Institutional Class |
| Year Ended 12/31/2022 | $21.99 | (36.65%) | 1.25%(d),(e) | 0.99%(d),(e),(f) | 0.73% | 21% | $79,829 |
| Year Ended 12/31/2021 | $36.01 | 10.79% | 1.19%(e) | 0.98%(e),(f) | 0.10% | 27% | $159,876 |
| Year Ended 12/31/2020 | $34.25 | 18.50% | 1.23% | 1.02%(f) | 0.12% | 68% | $155,133 |
| Year Ended 12/31/2019 | $29.00 | 33.71% | 1.29%(e) | 1.10%(e),(f) | 0.59% | 46% | $88,922 |
| Year Ended 12/31/2018 | $23.81 | (12.28%) | 1.28% | 1.15%(f) | 0.47% | 48% | $69,413 |
| Institutional 2 Class |
| Year Ended 12/31/2022 | $22.22 | (36.57%) | 1.11%(d),(e) | 0.89%(d),(e) | 0.78% | 21% | $9,225 |
| Year Ended 12/31/2021 | $36.33 | 10.87% | 1.10%(e) | 0.89%(e) | 0.17% | 27% | $51,805 |
| Year Ended 12/31/2020 | $34.57 | 18.63% | 1.15% | 0.93% | 0.27% | 68% | $77,420 |
| Year Ended 12/31/2019 | $29.24 | 33.82% | 1.22%(e) | 1.00%(e) | 0.65% | 46% | $3,392 |
| Year Ended 12/31/2018 | $24.01 | (12.16%) | 1.21% | 1.06% | 0.36% | 48% | $1,200 |
The accompanying Notes to Financial Statements are an integral part of this statement.
Columbia Acorn Family of Funds | Annual Report 2022
| 77 |
Financial Highlights (continued)
Columbia Acorn International SelectSM
| | Net asset value,
beginning of
period | Net
investment
income
(loss) | Net
realized
and
unrealized
gain (loss) | Total from
investment
operations | Distributions
from net
investment
income | Distributions
from net
realized
gains | Total
distributions to
shareholders |
| Institutional 3 Class |
| Year Ended 12/31/2022 | $36.31 | 0.21(c) | (13.39) | (13.18) | — | (0.92) | (0.92) |
| Year Ended 12/31/2021 | $34.56 | 0.09 | 3.59 | 3.68 | (0.52) | (1.41) | (1.93) |
| Year Ended 12/31/2020 | $29.22 | 0.07 | 5.36 | 5.43 | (0.09) | — | (0.09) |
| Year Ended 12/31/2019 | $24.00 | 0.20 | 7.86 | 8.06 | (0.50) | (2.34) | (2.84) |
| Year Ended 12/31/2018 | $29.42 | 0.17 | (3.74) | (3.57) | — | (1.85) | (1.85) |
| Notes to Financial Highlights |
| (a) | Had the Investment Manager and/or Transfer Agent not waived fees and/or reimbursed a portion of expenses, total return would have been reduced. |
| (b) | In addition to the fees and expenses that the Fund bears directly, the Fund indirectly bears a pro rata share of the fees and expenses of any other funds in which it invests, if any. Such indirect expenses are not included in the Fund’s reported expense ratios. |
| (c) | Net investment income per share includes European Union tax reclaims. The effect of these reclaims amounted to $0.02 per share. |
| (d) | Ratios include Trustees’ fees deferred during the current period as well as any gains or losses on the Trustees’ deferred compensation balances as a result of market fluctuations. If these had been excluded, expenses would have been higher by 0.02%. |
| (e) | Ratios include line of credit interest expense which is less than 0.01%. |
| (f) | The benefits derived from expense reductions had an impact of less than 0.01%. |
The accompanying Notes to Financial Statements are an integral part of this statement.
| 78 | Columbia Acorn Family of Funds | Annual Report 2022 |
Financial Highlights (continued)
Columbia Acorn International SelectSM
| | Net
asset
value,
end of
period | Total
return(a) | Total gross
expense
ratio to
average
net assets(b) | Total net
expense
ratio to
average
net assets(b) | Net investment
income (loss)
ratio to
average
net assets | Portfolio
turnover | Net
assets,
end of
period
(000’s) |
| Institutional 3 Class |
| Year Ended 12/31/2022 | $22.21 | (36.56%) | 1.06%(d),(e) | 0.84%(d),(e) | 0.81% | 21% | $11,188 |
| Year Ended 12/31/2021 | $36.31 | 10.93% | 1.05%(e) | 0.84%(e) | 0.24% | 27% | $28,694 |
| Year Ended 12/31/2020 | $34.56 | 18.67% | 1.09% | 0.89% | 0.24% | 68% | $27,064 |
| Year Ended 12/31/2019 | $29.22 | 33.90% | 1.16%(e) | 0.96%(e) | 0.72% | 46% | $13,861 |
| Year Ended 12/31/2018 | $24.00 | (12.14%) | 1.14% | 1.02% | 0.58% | 48% | $8,627 |
The accompanying Notes to Financial Statements are an integral part of this statement.
Columbia Acorn Family of Funds | Annual Report 2022
| 79 |
Financial Highlights
Columbia Thermostat FundSM
| | Net asset value,
beginning of
period | Net
investment
income | Net
realized
and
unrealized
gain (loss) | Total from
investment
operations | Distributions
from net
investment
income | Distributions
from net
realized
gains | Total
distributions to
shareholders |
| Class A |
| Year Ended 12/31/2022 | $17.01 | 0.26 | (2.49) | (2.23) | (0.28) | (0.14) | (0.42) |
| Year Ended 12/31/2021 | $18.31 | 0.24 | 0.89 | 1.13 | (0.26) | (2.17) | (2.43) |
| Year Ended 12/31/2020 | $15.12 | 0.26 | 4.13 | 4.39 | (0.27) | (0.93) | (1.20) |
| Year Ended 12/31/2019 | $13.85 | 0.27 | 1.79 | 2.06 | (0.26) | (0.53) | (0.79) |
| Year Ended 12/31/2018 | $14.63 | 0.24 | (0.26) | (0.02) | (0.28) | (0.48) | (0.76) |
| Advisor Class |
| Year Ended 12/31/2022 | $16.81 | 0.29 | (2.45) | (2.16) | (0.32) | (0.14) | (0.46) |
| Year Ended 12/31/2021 | $18.12 | 0.28 | 0.88 | 1.16 | (0.30) | (2.17) | (2.47) |
| Year Ended 12/31/2020 | $14.97 | 0.36 | 4.04 | 4.40 | (0.32) | (0.93) | (1.25) |
| Year Ended 12/31/2019 | $13.72 | 0.31 | 1.77 | 2.08 | (0.30) | (0.53) | (0.83) |
| Year Ended 12/31/2018 | $14.50 | 0.28 | (0.27) | 0.01 | (0.31) | (0.48) | (0.79) |
| Class C |
| Year Ended 12/31/2022 | $17.14 | 0.14 | (2.49) | (2.35) | (0.17) | (0.14) | (0.31) |
| Year Ended 12/31/2021 | $18.43 | 0.09 | 0.90 | 0.99 | (0.11) | (2.17) | (2.28) |
| Year Ended 12/31/2020 | $15.23 | 0.12 | 4.16 | 4.28 | (0.15) | (0.93) | (1.08) |
| Year Ended 12/31/2019 | $13.96 | 0.16 | 1.79 | 1.95 | (0.15) | (0.53) | (0.68) |
| Year Ended 12/31/2018 | $14.74 | 0.13 | (0.26) | (0.13) | (0.17) | (0.48) | (0.65) |
| Institutional Class |
| Year Ended 12/31/2022 | $16.69 | 0.29 | (2.44) | (2.15) | (0.32) | (0.14) | (0.46) |
| Year Ended 12/31/2021 | $18.01 | 0.28 | 0.87 | 1.15 | (0.30) | (2.17) | (2.47) |
| Year Ended 12/31/2020 | $14.88 | 0.31 | 4.07 | 4.38 | (0.32) | (0.93) | (1.25) |
| Year Ended 12/31/2019 | $13.65 | 0.30 | 1.76 | 2.06 | (0.30) | (0.53) | (0.83) |
| Year Ended 12/31/2018 | $14.43 | 0.28 | (0.27) | 0.01 | (0.31) | (0.48) | (0.79) |
| Institutional 2 Class |
| Year Ended 12/31/2022 | $16.84 | 0.29 | (2.45) | (2.16) | (0.33) | (0.14) | (0.47) |
| Year Ended 12/31/2021 | $18.14 | 0.29 | 0.89 | 1.18 | (0.31) | (2.17) | (2.48) |
| Year Ended 12/31/2020 | $14.99 | 0.31 | 4.09 | 4.40 | (0.32) | (0.93) | (1.25) |
| Year Ended 12/31/2019 | $13.74 | 0.32 | 1.77 | 2.09 | (0.31) | (0.53) | (0.84) |
| Year Ended 12/31/2018 | $14.52 | 0.29 | (0.27) | 0.02 | (0.32) | (0.48) | (0.80) |
The accompanying Notes to Financial Statements are an integral part of this statement.
| 80 | Columbia Acorn Family of Funds | Annual Report 2022 |
Financial Highlights (continued)
Columbia Thermostat FundSM
| | Net
asset
value,
end of
period | Total
return(a) | Total gross
expense
ratio to
average
net assets(b) | Total net
expense
ratio to
average
net assets(b) | Net investment
income
ratio to
average
net assets | Portfolio
turnover | Net
assets,
end of
period
(000’s) |
| Class A |
| Year Ended 12/31/2022 | $14.36 | (13.14%) | 0.54%(c),(d) | 0.50%(c),(d),(e) | 1.70% | 88% | $450,566 |
| Year Ended 12/31/2021 | $17.01 | 6.16% | 0.54%(d) | 0.50%(d),(e) | 1.26% | 49% | $624,373 |
| Year Ended 12/31/2020 | $18.31 | 29.27% | 0.56%(d) | 0.50%(d),(e) | 1.53% | 97% | $505,238 |
| Year Ended 12/31/2019 | $15.12 | 14.94% | 0.58%(d) | 0.50%(d),(e) | 1.81% | 158% | $225,113 |
| Year Ended 12/31/2018 | $13.85 | (0.13%) | 0.56% | 0.50%(e) | 1.66% | 122% | $193,683 |
| Advisor Class |
| Year Ended 12/31/2022 | $14.19 | (12.89%) | 0.29%(c),(d) | 0.25%(c),(d),(e) | 1.88% | 88% | $76,472 |
| Year Ended 12/31/2021 | $16.81 | 6.43% | 0.29%(d) | 0.25%(d),(e) | 1.51% | 49% | $172,162 |
| Year Ended 12/31/2020 | $18.12 | 29.58% | 0.32%(d) | 0.25%(d),(e) | 2.04% | 97% | $130,921 |
| Year Ended 12/31/2019 | $14.97 | 15.21% | 0.33%(d) | 0.25%(d),(e) | 2.08% | 158% | $16,208 |
| Year Ended 12/31/2018 | $13.72 | 0.12% | 0.31% | 0.25%(e) | 1.91% | 122% | $11,816 |
| Class C |
| Year Ended 12/31/2022 | $14.48 | (13.75%) | 1.29%(c),(d) | 1.25%(c),(d),(e) | 0.93% | 88% | $126,802 |
| Year Ended 12/31/2021 | $17.14 | 5.40% | 1.29%(d) | 1.25%(d),(e) | 0.48% | 49% | $189,990 |
| Year Ended 12/31/2020 | $18.43 | 28.28% | 1.31%(d) | 1.25%(d),(e) | 0.72% | 97% | $208,937 |
| Year Ended 12/31/2019 | $15.23 | 14.02% | 1.33%(d) | 1.25%(d),(e) | 1.05% | 158% | $156,027 |
| Year Ended 12/31/2018 | $13.96 | (0.88%) | 1.31% | 1.25%(e) | 0.90% | 122% | $166,292 |
| Institutional Class |
| Year Ended 12/31/2022 | $14.08 | (12.92%) | 0.29%(c),(d) | 0.25%(c),(d),(e) | 1.93% | 88% | $600,671 |
| Year Ended 12/31/2021 | $16.69 | 6.42% | 0.29%(d) | 0.25%(d),(e) | 1.52% | 49% | $902,841 |
| Year Ended 12/31/2020 | $18.01 | 29.63% | 0.31%(d) | 0.25%(d),(e) | 1.80% | 97% | $729,119 |
| Year Ended 12/31/2019 | $14.88 | 15.14% | 0.33%(d) | 0.25%(d),(e) | 2.06% | 158% | $285,444 |
| Year Ended 12/31/2018 | $13.65 | 0.12% | 0.31% | 0.25%(e) | 1.91% | 122% | $253,123 |
| Institutional 2 Class |
| Year Ended 12/31/2022 | $14.21 | (12.88%) | 0.25%(c),(d) | 0.20%(c),(d) | 1.94% | 88% | $90,290 |
| Year Ended 12/31/2021 | $16.84 | 6.53% | 0.25%(d) | 0.20%(d) | 1.53% | 49% | $169,246 |
| Year Ended 12/31/2020 | $18.14 | 29.59% | 0.27%(d) | 0.21%(d) | 1.82% | 97% | $129,197 |
| Year Ended 12/31/2019 | $14.99 | 15.25% | 0.28%(d) | 0.21%(d) | 2.16% | 158% | $40,759 |
| Year Ended 12/31/2018 | $13.74 | 0.16% | 0.26% | 0.21% | 1.97% | 122% | $16,478 |
The accompanying Notes to Financial Statements are an integral part of this statement.
Columbia Acorn Family of Funds | Annual Report 2022
| 81 |
Financial Highlights (continued)
Columbia Thermostat FundSM
| | Net asset value,
beginning of
period | Net
investment
income | Net
realized
and
unrealized
gain (loss) | Total from
investment
operations | Distributions
from net
investment
income | Distributions
from net
realized
gains | Total
distributions to
shareholders |
| Institutional 3 Class |
| Year Ended 12/31/2022 | $16.80 | 0.31 | (2.45) | (2.14) | (0.34) | (0.14) | (0.48) |
| Year Ended 12/31/2021 | $18.11 | 0.36 | 0.82 | 1.18 | (0.32) | (2.17) | (2.49) |
| Year Ended 12/31/2020 | $14.96 | 0.33 | 4.08 | 4.41 | (0.33) | (0.93) | (1.26) |
| Year Ended 12/31/2019 | $13.72 | 0.32 | 1.76 | 2.08 | (0.31) | (0.53) | (0.84) |
| Year Ended 12/31/2018 | $14.50 | 0.30 | (0.27) | 0.03 | (0.33) | (0.48) | (0.81) |
| Notes to Financial Highlights |
| (a) | Had the Investment Manager and/or Transfer Agent not waived fees and/or reimbursed a portion of expenses, total return would have been reduced. |
| (b) | In addition to the fees and expenses that the Fund bears directly, the Fund indirectly bears a pro rata share of the fees and expenses of any other funds in which it invests, if any. Such indirect expenses are not included in the Fund’s reported expense ratios. |
| (c) | Ratios include Trustees’ fees deferred during the current period as well as any gains or losses on the Trustees’ deferred compensation balances as a result of market fluctuations. If these had been excluded, expenses would have been higher by 0.01%. |
| (d) | Ratios include line of credit interest expense which is less than 0.01%. |
| (e) | The benefits derived from expense reductions had an impact of less than 0.01%. |
The accompanying Notes to Financial Statements are an integral part of this statement.
| 82 | Columbia Acorn Family of Funds | Annual Report 2022 |
Financial Highlights (continued)
Columbia Thermostat FundSM
| | Net
asset
value,
end of
period | Total
return(a) | Total gross
expense
ratio to
average
net assets(b) | Total net
expense
ratio to
average
net assets(b) | Net investment
income
ratio to
average
net assets | Portfolio
turnover | Net
assets,
end of
period
(000’s) |
| Institutional 3 Class |
| Year Ended 12/31/2022 | $14.18 | (12.82%) | 0.21%(c),(d) | 0.16%(c),(d) | 2.04% | 88% | $10,184 |
| Year Ended 12/31/2021 | $16.80 | 6.52% | 0.21%(d) | 0.17%(d) | 1.94% | 49% | $15,581 |
| Year Ended 12/31/2020 | $18.11 | 29.69% | 0.24%(d) | 0.17%(d) | 1.89% | 97% | $2,862 |
| Year Ended 12/31/2019 | $14.96 | 15.24% | 0.25%(d) | 0.16%(d) | 2.13% | 158% | $837 |
| Year Ended 12/31/2018 | $13.72 | 0.21% | 0.22% | 0.16% | 2.04% | 122% | $461 |
The accompanying Notes to Financial Statements are an integral part of this statement.
Columbia Acorn Family of Funds | Annual Report 2022
| 83 |
Financial Highlights
Columbia Acorn European FundSM
| | Net asset value,
beginning of
period | Net
investment
income
(loss) | Net
realized
and
unrealized
gain (loss) | Total from
investment
operations | Distributions
from net
investment
income | Total
distributions to
shareholders |
| Class A |
| Year Ended 12/31/2022 | $33.33 | 0.06(c) | (12.78) | (12.72) | — | — |
| Year Ended 12/31/2021 | $27.49 | (0.14) | 6.04 | 5.90 | (0.06) | (0.06) |
| Year Ended 12/31/2020 | $22.52 | (0.12) | 5.22 | 5.10 | (0.13) | (0.13) |
| Year Ended 12/31/2019 | $15.56 | 0.06 | 7.09 | 7.15 | (0.19) | (0.19) |
| Year Ended 12/31/2018 | $19.27 | 0.11 | (3.70) | (3.59) | (0.12) | (0.12) |
| Advisor Class |
| Year Ended 12/31/2022 | $33.68 | 0.11(c) | (12.92) | (12.81) | — | — |
| Year Ended 12/31/2021 | $27.78 | (0.10) | 6.13 | 6.03 | (0.13) | (0.13) |
| Year Ended 12/31/2020 | $22.70 | (0.06) | 5.27 | 5.21 | (0.13) | (0.13) |
| Year Ended 12/31/2019 | $15.68 | 0.12 | 7.13 | 7.25 | (0.23) | (0.23) |
| Year Ended 12/31/2018 | $19.36 | 0.19 | (3.75) | (3.56) | (0.12) | (0.12) |
| Class C |
| Year Ended 12/31/2022 | $32.35 | (0.10)(c) | (12.40) | (12.50) | — | — |
| Year Ended 12/31/2021 | $26.83 | (0.36) | 5.88 | 5.52 | — | — |
| Year Ended 12/31/2020 | $22.15 | (0.27) | 5.08 | 4.81 | (0.13) | (0.13) |
| Year Ended 12/31/2019 | $15.33 | (0.06) | 6.93 | 6.87 | (0.05) | (0.05) |
| Year Ended 12/31/2018 | $19.12 | (0.02) | (3.65) | (3.67) | (0.12) | (0.12) |
| Institutional Class |
| Year Ended 12/31/2022 | $33.51 | 0.11(c) | (12.85) | (12.74) | — | — |
| Year Ended 12/31/2021 | $27.64 | (0.06) | 6.06 | 6.00 | (0.13) | (0.13) |
| Year Ended 12/31/2020 | $22.59 | (0.06) | 5.24 | 5.18 | (0.13) | (0.13) |
| Year Ended 12/31/2019 | $15.60 | 0.12 | 7.10 | 7.22 | (0.23) | (0.23) |
| Year Ended 12/31/2018 | $19.27 | 0.15 | (3.70) | (3.55) | (0.12) | (0.12) |
| Institutional 2 Class |
| Year Ended 12/31/2022 | $33.92 | 0.12(c) | (13.00) | (12.88) | — | — |
| Year Ended 12/31/2021 | $27.98 | (0.12) | 6.21 | 6.09 | (0.15) | (0.15) |
| Year Ended 12/31/2020 | $22.84 | (0.05) | 5.32 | 5.27 | (0.13) | (0.13) |
| Year Ended 12/31/2019 | $15.78 | 0.14 | 7.17 | 7.31 | (0.25) | (0.25) |
| Year Ended 12/31/2018 | $19.46 | 0.19 | (3.75) | (3.56) | (0.12) | (0.12) |
The accompanying Notes to Financial Statements are an integral part of this statement.
| 84 | Columbia Acorn Family of Funds | Annual Report 2022 |
Financial Highlights (continued)
Columbia Acorn European FundSM
| | Net
asset
value,
end of
period | Total
return(a) | Total gross
expense
ratio to
average
net assets(b) | Total net
expense
ratio to
average
net assets(b) | Net investment
income (loss)
ratio to
average
net assets | Portfolio
turnover | Net
assets,
end of
period
(000’s) |
| Class A |
| Year Ended 12/31/2022 | $20.61 | (38.16%) | 1.80%(d),(e) | 1.45%(d),(e),(f) | 0.25% | 31% | $28,892 |
| Year Ended 12/31/2021 | $33.33 | 21.47% | 1.63%(e) | 1.44%(e),(f) | (0.45%) | 21% | $66,374 |
| Year Ended 12/31/2020 | $27.49 | 22.80% | 1.86%(e) | 1.45%(e) | (0.54%) | 45% | $42,059 |
| Year Ended 12/31/2019 | $22.52 | 45.96% | 1.88% | 1.44% | 0.33% | 30% | $33,361 |
| Year Ended 12/31/2018 | $15.56 | (18.78%) | 1.81%(e) | 1.45%(e) | 0.57% | 39% | $22,870 |
| Advisor Class |
| Year Ended 12/31/2022 | $20.87 | (38.03%) | 1.55%(d),(e) | 1.20%(d),(e),(f) | 0.47% | 31% | $1,161 |
| Year Ended 12/31/2021 | $33.68 | 21.75% | 1.37%(e) | 1.19%(e),(f) | (0.32%) | 21% | $3,083 |
| Year Ended 12/31/2020 | $27.78 | 23.10% | 1.61%(e) | 1.20%(e) | (0.29%) | 45% | $1,781 |
| Year Ended 12/31/2019 | $22.70 | 46.30% | 1.63% | 1.19% | 0.60% | 30% | $1,906 |
| Year Ended 12/31/2018 | $15.68 | (18.53%) | 1.55%(e) | 1.19%(e) | 0.97% | 39% | $1,496 |
| Class C |
| Year Ended 12/31/2022 | $19.85 | (38.64%) | 2.54%(d),(e) | 2.20%(d),(e),(f) | (0.47%) | 31% | $2,372 |
| Year Ended 12/31/2021 | $32.35 | 20.57% | 2.39%(e) | 2.19%(e),(f) | (1.20%) | 21% | $7,078 |
| Year Ended 12/31/2020 | $26.83 | 21.87% | 2.61%(e) | 2.20%(e) | (1.27%) | 45% | $5,705 |
| Year Ended 12/31/2019 | $22.15 | 44.79% | 2.64% | 2.19% | (0.30%) | 30% | $6,186 |
| Year Ended 12/31/2018 | $15.33 | (19.34%) | 2.56%(e) | 2.20%(e) | (0.12%) | 39% | $8,770 |
| Institutional Class |
| Year Ended 12/31/2022 | $20.77 | (38.02%) | 1.54%(d),(e) | 1.20%(d),(e),(f) | 0.46% | 31% | $38,307 |
| Year Ended 12/31/2021 | $33.51 | 21.76% | 1.38%(e) | 1.19%(e),(f) | (0.21%) | 21% | $111,462 |
| Year Ended 12/31/2020 | $27.64 | 23.08% | 1.61%(e) | 1.20%(e) | (0.29%) | 45% | $55,171 |
| Year Ended 12/31/2019 | $22.59 | 46.35% | 1.63% | 1.19% | 0.64% | 30% | $49,616 |
| Year Ended 12/31/2018 | $15.60 | (18.57%) | 1.56%(e) | 1.20%(e) | 0.80% | 39% | $32,813 |
| Institutional 2 Class |
| Year Ended 12/31/2022 | $21.04 | (37.97%) | 1.40%(d),(e) | 1.14%(d),(e) | 0.48% | 31% | $2,863 |
| Year Ended 12/31/2021 | $33.92 | 21.80% | 1.32%(e) | 1.14%(e) | (0.38%) | 21% | $25,882 |
| Year Ended 12/31/2020 | $27.98 | 23.23% | 1.58%(e) | 1.14%(e) | (0.24%) | 45% | $3,855 |
| Year Ended 12/31/2019 | $22.84 | 46.33% | 1.60% | 1.13% | 0.73% | 30% | $2,175 |
| Year Ended 12/31/2018 | $15.78 | (18.44%) | 1.50%(e) | 1.13%(e) | 0.96% | 39% | $2,554 |
The accompanying Notes to Financial Statements are an integral part of this statement.
Columbia Acorn Family of Funds | Annual Report 2022
| 85 |
Financial Highlights (continued)
Columbia Acorn European FundSM
| | Net asset value,
beginning of
period | Net
investment
income
(loss) | Net
realized
and
unrealized
gain (loss) | Total from
investment
operations | Distributions
from net
investment
income | Total
distributions to
shareholders |
| Institutional 3 Class |
| Year Ended 12/31/2022 | $33.38 | 0.13(c) | (12.80) | (12.67) | — | — |
| Year Ended 12/31/2021 | $27.54 | (0.05) | 6.05 | 6.00 | (0.16) | (0.16) |
| Year Ended 12/31/2020 | $22.48 | (0.02) | 5.21 | 5.19 | (0.13) | (0.13) |
| Year Ended 12/31/2019 | $15.53 | 0.14 | 7.06 | 7.20 | (0.25) | (0.25) |
| Year Ended 12/31/2018 | $19.17 | (0.04) | (3.48) | (3.52) | (0.12) | (0.12) |
| Notes to Financial Highlights |
| (a) | Had the Investment Manager and/or Transfer Agent not waived fees and/or reimbursed a portion of expenses, total return would have been reduced. |
| (b) | In addition to the fees and expenses that the Fund bears directly, the Fund indirectly bears a pro rata share of the fees and expenses of any other funds in which it invests, if any. Such indirect expenses are not included in the Fund’s reported expense ratios. |
| (c) | Net investment income per share includes special dividends. The effect of these dividends amounted to $0.01 per share. |
| (d) | Ratios include Trustees’ fees deferred during the current period as well as any gains or losses on the Trustees’ deferred compensation balances as a result of market fluctuations. If these had been excluded, expenses would have been higher by 0.01%. |
| (e) | Ratios include line of credit interest expense which is less than 0.01%. |
| (f) | The benefits derived from expense reductions had an impact of less than 0.01%. |
The accompanying Notes to Financial Statements are an integral part of this statement.
| 86 | Columbia Acorn Family of Funds | Annual Report 2022 |
Financial Highlights (continued)
Columbia Acorn European FundSM
| | Net
asset
value,
end of
period | Total
return(a) | Total gross
expense
ratio to
average
net assets(b) | Total net
expense
ratio to
average
net assets(b) | Net investment
income (loss)
ratio to
average
net assets | Portfolio
turnover | Net
assets,
end of
period
(000’s) |
| Institutional 3 Class |
| Year Ended 12/31/2022 | $20.71 | (37.96%) | 1.47%(d),(e) | 1.11%(d),(e) | 0.56% | 31% | $41 |
| Year Ended 12/31/2021 | $33.38 | 21.83% | 1.32%(e) | 1.10%(e) | (0.15%) | 21% | $60 |
| Year Ended 12/31/2020 | $27.54 | 23.24% | 1.52%(e) | 1.10%(e) | (0.08%) | 45% | $69 |
| Year Ended 12/31/2019 | $22.48 | 46.42% | 1.54% | 1.09% | 0.74% | 30% | $19 |
| Year Ended 12/31/2018 | $15.53 | (18.51%) | 1.41%(e) | 1.08%(e) | (0.21%) | 39% | $3 |
The accompanying Notes to Financial Statements are an integral part of this statement.
Columbia Acorn Family of Funds | Annual Report 2022
| 87 |
Notes to Financial Statements
December 31, 2022
Note 1. Organization
Columbia Acorn® Fund, Columbia Acorn International®, Columbia Acorn USA®, Columbia Acorn International SelectSM, Columbia Thermostat FundSM and Columbia Acorn European FundSM (each a Fund and collectively, the Funds) are each a series of Columbia Acorn Trust (the Trust). The Trust is registered under the Investment Company Act of 1940, as amended (the 1940 Act), as an open-end management investment company organized as a Massachusetts business trust. The investment objective of each Fund is to seek long-term capital appreciation.
Columbia Thermostat FundSM pursues its investment objective by investing in shares of other mutual funds and exchange-traded funds (ETFs). As a “fund of funds”, under normal circumstances, the Fund allocates at least 95% of its net assets among a selected group of affiliated funds (underlying funds) according to the current level of the Standard & Poor’s (S&P) 500 Index in relation to predetermined ranges set by Columbia Wanger Asset Management, LLC (the Investment Manager or CWAM). The Fund may invest up to 5% of its net assets plus any cash received that day in cash, repurchase agreements, high quality short-term paper and government securities. For information on the investment strategies, operations and risks of the underlying funds, please refer to the Fund’s current prospectus as well as the prospectuses and shareholder reports of the underlying funds, which are available from the Securities and Exchange Commission website at www.sec.gov or on the Funds’ website at columbiathreadneedleus.com/investor/.
Fund shares
The Trust and each Fund may issue an unlimited number of shares (without par value). Each Fund currently offers each of the share classes listed in the Statement of Assets and Liabilities.
Although all share classes generally have identical voting, dividend and liquidation rights, each share class votes separately when required by the Trust’s organizational documents or by law. Different share classes pay shareholders different distribution amounts to the extent the expenses of the share classes differ, and the amount of distributions in the event of a Fund’s liquidation will be proportional to the net asset value of each share class of the Fund. Each share class has its own fees (sales charges), expenses and other features. These, together with information about certain conflicts of interest associated with the fees and expenses paid by certain share classes, are discussed fully in each Fund’s prospectus and Statement of Additional Information (SAI).
As described in each Fund’s prospectus, Class A and Class C shares are available to all investors. Class C shares generally automatically convert to Class A shares of the same Fund 8 years after the Class C shares’ purchase date. Advisor Class, Institutional Class, Institutional 2 Class and Institutional 3 Class are available through authorized investment professionals to retirement plans and to certain other institutional investors described in each Fund’s prospectus. Class R shares are available to retirement and health savings plans and other institutional investors.
Investment income, realized and unrealized gains and losses, and certain fund-level expenses are allocated pro rata on the basis of the relative net assets of all classes, except that each class bears certain expenses specific to that class such as distribution services, transfer agent fees, and certain other class specific expenses. Differences in class expenses may result in payment of different dividend distributions for each class. All of the Funds’ share classes have equal rights with respect to voting, subject to Fund or class-specific matters.
Note 2. Summary of significant accounting policies
Basis of preparation
Each Fund is an investment company that applies the accounting and reporting guidance in the Financial Accounting Standards Board (FASB) Accounting Standards Codification Topic 946, Financial Services - Investment Companies (ASC 946). The financial statements are prepared in accordance with U.S. generally accepted accounting principles (GAAP), which requires management to make certain estimates and assumptions that affect the reported amounts of assets and liabilities, the disclosure of contingent assets and liabilities at the date of the financial statements and the reported amounts of income and expenses during the reporting period. Actual results could differ from those estimates.
The following is a summary of significant accounting policies followed by the Funds in the preparation of their financial statements.
| 88 | Columbia Acorn Family of Funds | Annual Report 2022 |
Notes to Financial Statements (continued)
December 31, 2022
Security valuation
Securities of the Funds are valued at market value or, if a market quotation for a security is not readily available or is deemed not to be reliable because of events or circumstances that have occurred between the market quotation and the time as of which the security is to be valued, the security is valued at a fair value determined in good faith under consistently applied procedures approved by the Board of Trustees. Equity securities listed on an exchange are valued at the closing price or last trade on their primary exchange at the close of business of the New York Stock Exchange. Securities with a closing price not readily available or not listed on any exchange are valued at the mean between the closing bid and ask prices. Listed preferred stocks convertible into common stocks are valued using an evaluated price from a pricing service.
Foreign equity securities are valued based on the closing price or last trade on their primary exchange at the close of business of the New York Stock Exchange. Foreign currency exchange rates are determined at the scheduled closing time of the New York Stock Exchange. Many securities markets and exchanges outside the U.S. close prior to the close of the New York Stock Exchange; therefore, the closing prices for securities in such markets or on such exchanges may not fully reflect events that occur after such close but before the close of the New York Stock Exchange. In situations where foreign markets are closed, where a significant event has occurred after the foreign exchange closes but before the time at which the Fund’s share price is calculated, and in the event of significant movement in the trigger index for the statistical fair valuation process approved by the Board of Trustees, foreign securities will be fair valued pursuant to a policy approved by the Board of Trustees. Under the policy, the Fund may use an independent statistical fair value pricing service that employs a systematic methodology to assist in the fair valuation process for securities principally traded in a foreign market in order to adjust for possible changes in value that may occur between the close of the foreign market and the time as of which the securities are to be valued. If a security is valued at a fair value, that value may be different from the last quoted market price for the security.
Investments in open-end investment companies (other than exchange-traded funds (ETFs)), are valued at the latest net asset value reported by those companies as of the valuation time.
Foreign currency transactions and translations
Values of investments denominated in foreign currencies are converted into U.S. dollars using the New York spot market rate of exchange at the time of valuation. Purchases and sales of investments and dividend and interest income are translated into U.S. dollars using the spot market rate of exchange prevailing on the respective dates of such transactions. The gain or loss resulting from changes in foreign exchange rates is included with net realized and unrealized gain or loss from investments, as appropriate.
Derivative instruments
Certain Funds invest in certain derivative instruments, as detailed below, in seeking to meet its investment objectives. Derivatives are instruments whose values depend on, or are derived from, in whole or in part, the value of one or more securities, currencies, commodities, indices, or other assets or instruments. Derivatives may be used to increase investment flexibility (including to maintain cash reserves while maintaining desired exposure to certain assets), for risk management (hedging) purposes, to facilitate trading, to reduce transaction costs and to pursue higher investment returns. The Fund may also use derivative instruments to mitigate certain investment risks, such as foreign currency exchange rate risk, interest rate risk and credit risk. Derivatives may involve various risks, including the potential inability of the counterparty to fulfill its obligations under the terms of the contract, the potential for an illiquid secondary market (making it difficult for the Fund to sell or terminate, including at favorable prices) and the potential for market movements which may expose the Fund to gains or losses in excess of the amount shown in the Statement of Assets and Liabilities. The notional amounts of derivative instruments, if applicable, are not recorded in the financial statements.
A derivative instrument may suffer a marked-to-market loss if the value of the contract decreases due to an unfavorable change in the market rates or values of the underlying instrument. Losses can also occur if the counterparty does not perform its obligations under the contract. The Fund’s risk of loss from counterparty credit risk on over-the-counter derivatives is generally limited to the aggregate unrealized gain netted against any collateral held by the Fund and the amount of any variation margin held by the counterparty, plus any replacement costs or related amounts. With exchange-traded or centrally cleared derivatives, there is reduced counterparty credit risk to the Fund since the clearinghouse or central counterparty (CCP) provides some protection in the case of clearing member default. The clearinghouse or CCP stands between the buyer
Columbia Acorn Family of Funds | Annual Report 2022
| 89 |
Notes to Financial Statements (continued)
December 31, 2022
and the seller of the contract; therefore, failure of the clearinghouse or CCP may pose additional counterparty credit risk. However, credit risk still exists in exchange-traded or centrally cleared derivatives with respect to initial and variation margin that is held in a broker’s customer account. While clearing brokers are required to segregate customer margin from their own assets, in the event that a clearing broker becomes insolvent or goes into bankruptcy and at that time there is a shortfall in the aggregate amount of margin held by the clearing broker for all its clients and such shortfall is remedied by the CCP or otherwise, U.S. bankruptcy laws will typically allocate that shortfall on a pro-rata basis across all the clearing broker’s customers (including the Fund), potentially resulting in losses to the Fund.
In order to better define its contractual rights and to secure rights that will help the Fund mitigate its counterparty risk, the Fund may enter into an International Swaps and Derivatives Association, Inc. Master Agreement (ISDA Master Agreement) or similar agreement with its derivatives counterparties. An ISDA Master Agreement is an agreement between the Fund and a counterparty that governs over-the-counter derivatives and foreign exchange forward contracts and contains, among other things, collateral posting terms and netting provisions in the event of a default and/or termination event. Under an ISDA Master Agreement, the Fund may, under certain circumstances, offset with the counterparty certain derivative instruments’ payables and/or receivables with collateral held and/or posted and create one single net payment. The provisions of the ISDA Master Agreement typically permit a single net payment in the event of default (close-out netting), including the bankruptcy or insolvency of the counterparty. Note, however, that bankruptcy or insolvency laws of a particular jurisdiction may impose restrictions on or prohibitions against the right of offset or netting in bankruptcy, insolvency or other events.
Collateral (margin) requirements differ by type of derivative. Margin requirements are established by the clearinghouse or CCP for exchange-traded and centrally cleared derivatives. Brokers can ask for margin in excess of the minimum in certain circumstances. Collateral terms for most over-the-counter derivatives are subject to regulatory requirements to exchange variation margin with trading counterparties and may have contract specific margin terms as well. For over-the-counter derivatives traded under an ISDA Master Agreement, the collateral requirements are typically calculated by netting the marked-to-market amount for each transaction under such agreement and comparing that amount to the value of any variation margin currently pledged by the Fund and/or the counterparty. Generally, the amount of collateral due from or to a party has to exceed a minimum transfer amount threshold (e.g., $250,000) before a transfer has to be made. To the extent amounts due to the Fund from its counterparties are not fully collateralized, contractually or otherwise, the Fund bears the risk of loss from counterparty nonperformance. The Fund may also pay interest expense on cash collateral received from the broker. Any interest expense paid by the Fund is shown in the Statement of Operations. The Fund attempts to mitigate counterparty risk by only entering into agreements with counterparties that it believes have the financial resources to honor their obligations and by monitoring the financial stability of those counterparties.
Certain ISDA Master Agreements allow counterparties of over-the-counter derivatives transactions to terminate derivatives contracts prior to maturity in the event the Fund’s net asset value declines by a stated percentage over a specified time period or if the Fund fails to meet certain terms of the ISDA Master Agreement, which would cause the Fund to accelerate payment of any net liability owed to the counterparty. The Fund also has termination rights if the counterparty fails to meet certain terms of the ISDA Master Agreement. In determining whether to exercise such termination rights, the Fund would consider, in addition to counterparty credit risk, whether termination would result in a net liability owed from the counterparty.
For financial reporting purposes, the Fund does not offset derivative assets and derivative liabilities that are subject to netting arrangements in the Statement of Assets and Liabilities.
Futures contracts
Futures contracts are exchange-traded and represent commitments for the future purchase or sale of an asset at a specified price on a specified date. Columbia Acorn International® bought and sold futures contracts during the year ended December 31, 2022 to maintain appropriate equity market exposure while keeping sufficient cash to accommodate daily operations. These instruments may be used for other purposes in future periods. Upon entering into futures contracts, a Fund bears risks that it may not achieve the anticipated benefits of the futures contracts and may realize a loss. Additional risks include counterparty credit risk, the possibility of an illiquid market, and that a change in the value of the contract or option may not correlate with changes in the value of the underlying asset.
| 90 | Columbia Acorn Family of Funds | Annual Report 2022 |
Notes to Financial Statements (continued)
December 31, 2022
Upon entering into a futures contract, the Fund deposits cash or securities with the broker, known as a futures commission merchant (FCM), in an amount sufficient to meet the initial margin requirement. The initial margin deposit must be maintained at an established level over the life of the contract. Cash deposited as initial margin is recorded in the Statement of Assets and Liabilities as margin deposits. Securities deposited as initial margin are designated in the Portfolio of Investments. Subsequent payments (variation margin) are made or received by the Fund each day. The variation margin payments are equal to the daily change in the contract value and are recorded as variation margin receivable or payable and are offset in unrealized gains or losses. The Fund generally expects to earn interest income on its margin deposits. The Fund recognizes a realized gain or loss when the contract is closed or expires. Futures contracts involve, to varying degrees, risk of loss in excess of the variation margin disclosed in the Statement of Assets and Liabilities.
Effects of derivative transactions in the financial statements
The following tables are intended to provide additional information about the effect of derivatives on the financial statements of Columbia Acorn International® including: the fair value of derivatives by risk category and the location of those fair values in the Statement of Assets and Liabilities; and the impact of derivative transactions over the period in the Statement of Operations, including realized gains or losses and unrealized gains or losses. The derivative schedules following the Portfolio of Investments present additional information regarding derivative instruments outstanding at the end of the period, if any.
Columbia Acorn International®
At December 31, 2022, the Fund had no outstanding derivatives.
The following table indicates the effect of derivative instruments (not considered to be hedging instruments for accounting disclosure purposes) in the Statement of Operations for the year ended December 31, 2022:
| Amount of realized gain (loss) on derivatives recognized in income |
| Risk exposure category | Futures
contracts
($) |
| Equity risk | (5,769,485) |
The following table is a summary of the average outstanding volume by derivative instrument for the year ended December 31, 2022:
| Derivative instrument | Average notional
amounts ($)* |
| Futures contracts — long | 13,204,593 |
| * | Based on the ending quarterly outstanding amounts for the year ended December 31, 2022. |
Security transactions and investment income
Security transactions, investment income and shareholder fund transactions are accounted for on the trade date (date the order to buy or sell is executed) and dividend income and realized gain distributions from other funds are recorded on the ex-dividend date, except that certain dividends from foreign securities are recorded as soon as the information is available to the Funds. Interest income is recorded on the accrual basis and includes amortization of discounts on debt obligations when required for federal income tax purposes. Realized gains and losses from security transactions are recorded on an identified cost basis.
Awards, if any, from class action litigation related to securities owned may be recorded as a reduction of cost of those securities. If the applicable securities are no longer owned, the proceeds are recorded as realized gains.
The Funds may receive distributions from holdings in exchange-traded funds (ETFs), limited partnerships (LPs), other regulated investment companies (RICs), and real estate investment trusts (REITs), which report information as to the character of their distributions annually. These distributions are allocated to dividend income, capital gain and return of capital based on actual information reported. To the extent actual information has not yet been reported by the REITs, estimates for return of capital may be made by the Funds’ management. Return of capital is recorded as a reduction of the
Columbia Acorn Family of Funds | Annual Report 2022
| 91 |
Notes to Financial Statements (continued)
December 31, 2022
cost basis of securities held. If the Funds no longer own the applicable securities, return of capital is recorded as a realized gain. Management’s estimates are subsequently adjusted when the actual character of the distributions is disclosed by the REITs, which could result in a proportionate change in return of capital to shareholders. No estimates are made for ETFs and RICs.
Fund share valuation
Fund shares are sold and redeemed on a daily basis at net asset value, subject to any applicable sales charge. Net asset value per share is determined daily as of the close of trading on the New York Stock Exchange (NYSE) on each day the NYSE is open for trading. Generally, income, expenses and realized and unrealized gain/(losses) of a Fund are allocated to each class proportionately on a daily basis for purposes of determining the net asset value of each class. The distribution and service fees and transfer agent fees are charged to each specific class as expenses are incurred. Redemption fees are accounted for as an addition to paid in capital for purposes of determining the net asset value of each class.
Securities lending
Each Fund, except Columbia Thermostat FundSM, may lend securities up to one-third of the value of its total assets to certain approved brokers, dealers, banks and or other institutional borrowers of securities that the Funds’ securities lending agent has determined are credit worthy under guidelines established by the Board of Trustees, to earn additional income. The Funds retain the benefits of owning the securities, including the economic equivalent of dividends or interest generated by the security. The Funds also receive a fee for the loan. The Funds have the ability to recall the loans at any time and could do so in order to vote proxies or to sell the loaned securities. Each loan is collateralized by cash that exceeds the value of the securities on loan. The market value of the loaned securities is determined daily at the close of business of a Fund and any additional required collateral is delivered to the Fund on the next business day. The Funds have elected to invest the cash collateral in the Dreyfus Government Cash Management Fund, a third-party institutional government money market fund in accordance with investment guidelines contained in the securities lending agreement and approved by the Board of Trustees. The income earned from the securities lending program is paid to each Fund, net of any fees remitted to Goldman Sachs Agency Lending, the Funds’ lending agent, and net of any borrower rebates. The Investment Manager does not retain any fees earned by the lending program. Generally, in the event of borrower default, a Fund has the right to use the collateral to offset any losses incurred. In the event a Fund is delayed or prevented from exercising its right to dispose of the collateral, there may be a potential loss to the Fund. Some of these losses may be indemnified by the lending agent. The Funds bear the risk of loss with respect to the investment of collateral. The net securities lending income earned as of December 31, 2022 by each Fund is included in the Statement of Operations.
Offsetting of assets and liabilities
The following table presents the Funds’ gross and net amount of assets and liabilities available for offset under netting agreements and under a securities lending agreement as well as the related collateral received by each Fund with securities on loan as of December 31, 2022:
| | Columbia Acorn
International® | Columbia
Acorn USA® | Columbia Acorn
European FundSM |
| | Goldman
Sachs ($) | Goldman
Sachs ($) | Goldman
Sachs ($) |
| Liabilities | | | |
| Collateral on Securities Loaned | 17,725,620 | 493,800 | 365,056 |
| Total Liabilities | 17,725,620 | 493,800 | 365,056 |
| Total Financial and Derivative Net Assets | (17,725,620) | (493,800) | (365,056) |
| Financial Instruments | 16,762,998 | 461,096 | 343,744 |
| Net Amount (a) | (962,622) | (32,704) | (21,312) |
| (a) | Represents the net amount due from/(to) counterparties in the event of default. |
| 92 | Columbia Acorn Family of Funds | Annual Report 2022 |
Notes to Financial Statements (continued)
December 31, 2022
Securities lending transactions
The following table indicates the total amount of securities loaned by type, reconciled to gross liability payable upon return of the securities loaned by the Funds as of December 31, 2022:
| | Overnight and
continuous | Up to
30 days | 30-90
days | Greater than
90 days | Total |
| Columbia Acorn International® | | | | | |
| Securities lending transactions | | | | | |
| Equity securities | $16,762,998 | $— | $— | $— | $16,762,998 |
| Gross amount of recognized liabilities for securities lending (collateral received) | | | | | 17,725,620 |
| Amounts due to counterparty in the event of default | | | | | $962,622 |
| Columbia Acorn USA® | | | | | |
| Securities lending transactions | | | | | |
| Equity securities | $461,096 | $— | $— | $— | $461,096 |
| Gross amount of recognized liabilities for securities lending (collateral received) | | | | | 493,800 |
| Amounts due to counterparty in the event of default | | | | | $32,704 |
| Columbia Acorn European FundSM | | | | | |
| Securities lending transactions | | | | | |
| Equity securities | $343,744 | $— | $— | $— | $343,744 |
| Gross amount of recognized liabilities for securities lending (collateral received) | | | | | 365,056 |
| Amounts due to counterparty in the event of default | | | | | $21,312 |
Federal income tax status
It is each Fund’s policy to comply with the provisions of the Internal Revenue Code available to regulated investment companies and, in the manner provided therein, distribute substantially all their taxable income, as well as any net realized gain on sales of investments and foreign currency transactions reportable for federal income tax purposes. Columbia Thermostat FundSM distributes all of its taxable income, as well as any net realized gain on sales of portfolio fund shares and any distributions of net realized gains received by the Fund from its portfolio funds, reportable for federal income tax purposes. Accordingly, the Funds paid no federal income taxes and no federal income tax provision was required.
Foreign taxes
The Funds may be subject to foreign taxes on income, gains on investments or currency repatriation, a portion of which may be recoverable. The Fund will accrue such taxes and recoveries, as applicable, based upon its current interpretation of tax rules and regulations that exist in the markets in which it invests.
Realized gains in certain countries may be subject to foreign taxes at the Fund level, based on statutory rates. The Fund accrues for such foreign taxes on realized and unrealized gains at the appropriate rate for each jurisdiction, as applicable. The amount, if any, is disclosed as a liability in the Statement of Assets and Liabilities.
The Fund may file withholding tax reclaims in certain European Union countries to recover a portion of foreign taxes previously withheld on dividends earned, which may be reclaimable based upon certain provisions in the Treaty on the Functioning of the European Union (EU) and subsequent rulings by the European Court of Justice. The Fund may record a reclaim receivable when the amount is known, the Fund has received notice of a pending refund, and there are no significant uncertainties on collectability. Income received from EU reclaims is included in the Statement of Operations.
Distributions to shareholders
Distributions to shareholders are recorded on the ex-dividend date.
Columbia Acorn Family of Funds | Annual Report 2022
| 93 |
Notes to Financial Statements (continued)
December 31, 2022
Guarantees and indemnification
In the normal course of business, the Trust on behalf of the Funds enters into contracts that contain a variety of representations and warranties and that provide general indemnities. A Fund’s maximum exposure under these arrangements is unknown, as this would involve future claims against the Fund. Also, under the Trust’s organizational documents, the trustees and officers of the Trust are indemnified against certain liabilities that may arise out of their duties to the Trust. However, based on experience, the Funds expect the risk of loss due to these warranties and indemnities to be remote.
Recent accounting pronouncement
Tailored Shareholder Reports
In October 2022, the Securities and Exchange Commission (SEC) adopted a final rule relating to Tailored Shareholder Reports for Mutual Funds and Exchange-Traded Funds; Fee Information in Investment Company Advertisements. The rule and form amendments will, among other things, require the Funds to transmit concise and visually engaging shareholder reports that highlight key information. The amendments will require that funds tag information in a structured data format and that certain more in-depth information be made available online and available for delivery free of charge to investors on request. The amendments became effective January 24, 2023. There is an 18-month transition period after the effective date of the amendment.
Note 3. Fees and other transactions with affiliates
Investment management fees
CWAM is a wholly-owned subsidiary of Columbia Management Investment Advisers, LLC (Columbia Management), which is a wholly-owned subsidiary of Ameriprise Financial, Inc. (Ameriprise Financial). CWAM furnishes continuing investment supervision to the Funds and is responsible for the overall management of the Funds’ business affairs.
CWAM receives a monthly advisory fee based on each Fund’s daily net assets at the following annual rates:
| Columbia Acorn® Fund |
| Average daily net assets | Annual
fee rate |
| Up to $700 million | 0.74% |
| $700 million to $2 billion | 0.69% |
| $2 billion to $6 billion | 0.64% |
| $6 billion and over | 0.63% |
| Columbia Acorn International® |
| Average daily net assets | Annual
fee rate |
| Up to $100 million | 1.19% |
| $100 million to $500 million | 0.94% |
| $500 million and over | 0.74% |
| Columbia Acorn USA® |
| Average daily net assets | Annual
fee rate |
| Up to $700 million | 0.74% |
| $700 million to $2 billion | 0.69% |
| $2 billion to $6 billion | 0.64% |
| $6 billion and over | 0.63% |
| 94 | Columbia Acorn Family of Funds | Annual Report 2022 |
Notes to Financial Statements (continued)
December 31, 2022
| Columbia Acorn International SelectSM |
| Average daily net assets | Annual
fee rate |
| Up to $500 million | 0.89% |
| $500 million and over | 0.85% |
| Columbia Thermostat FundSM |
| | Annual
fee rate |
| All average daily net assets | 0.10% |
| Columbia Acorn European FundSM |
| Average daily net assets | Annual
fee rate |
| Up to $100 million | 1.19% |
| $100 million to $500 million | 0.94% |
| $500 million and over | 0.74% |
In February 2022, the Board approved a reduction in the advisory fee rates payable to the Investment Manager by Columbia Acorn USA®. The new advisory fee, which became effective May 1, 2022, is included in the table above. Prior to May 1, 2022, the advisory fee was equal to a percentage of average daily net assets of Columbia Acorn USA®, equal to 0.94% on the first $200 million, 0.89% from $200 million to $500 million, 0.84% from $500 million to $2 billion, 0.80% from $2 billion to $3 billion and 0.70% for $3 billion and over.
For the year ended December 31, 2022, the effective investment advisory fee rates were as follows:
| Fund | Effective investment advisory fee rate (%) |
| Columbia Acorn® Fund | 0.68 |
| Columbia Acorn International® | 0.82 |
| Columbia Acorn USA® | 0.82 |
| Columbia Acorn International SelectSM | 0.89 |
| Columbia Thermostat FundSM | 0.10 |
| Columbia Acorn European FundSM | 1.14 |
Advisory Affiliates
The Investment Manager and its investment advisory affiliates, including Columbia Management (Affiliates), may coordinate in providing services to their clients. These Affiliates, like the Investment Manager, are direct or indirect subsidiaries of Ameriprise Financial and are registered with the appropriate respective regulators and, where required, the Securities and Exchange Commission and the Commodity Futures Trading Commission in the United States. From time to time, the Investment Manager may engage employees of Affiliates to provide portfolio management services to certain accounts managed by the Investment Manager. These employees provide services to the Investment Manager pursuant to personnel-sharing agreements or other inter-company arrangements and the Funds pay no additional fees and expenses as a result of any such arrangements.
Pursuant to such arrangements, employees of Affiliates, including Columbia Management, may serve as “associated persons” of the Investment Manager and, in this capacity, may provide portfolio management services to a Fund on behalf of the Investment Manager subject to the oversight and supervision of the Investment Manager and the Funds’ Chief Compliance Officer, consistent with the investment objectives, policies and limitations set forth in the Fund’s prospectus and SAI, and the Investment Manager’s and the Funds’ compliance policies and procedures.
Columbia Acorn Family of Funds | Annual Report 2022
| 95 |
Notes to Financial Statements (continued)
December 31, 2022
Administration fees
CWAM provides administrative services and receives an administration fee from the Funds at the following annual rates:
| Columbia Acorn Trust |
Aggregate average daily
net assets of the trust | Annual
fee rate |
| Up to $8 billion | 0.050% |
| $8 billion to $16 billion | 0.040% |
| $16 billion to $35 billion | 0.030% |
| $35 billion to $45 billion | 0.025% |
| $45 billion and over | 0.015% |
For the year ended December 31, 2022, the effective administration fee rate was 0.050% of each Fund’s average daily net assets. CWAM has contractually delegated to Columbia Management responsibility to provide certain sub-administrative services to the Funds.
Compensation of board members
Members of the Board of Trustees who are not officers or employees of the Investment Manager or Ameriprise Financial are compensated for their services to the Funds as disclosed in the Statement of Operations. Under a Deferred Compensation Plan (the Deferred Plan), these members of the Board of Trustees may elect to defer payment of up to 100% of their compensation. Deferred amounts are treated as though equivalent dollar amounts had been invested in shares of certain funds managed by the Investment Manager. Each Fund’s liability for these amounts is adjusted for market value changes and remains in the Funds until distributed in accordance with the Deferred Plan. All amounts payable under the Deferred Plan constitute a general unsecured obligation of the Funds. The expense for the Deferred Plan, which includes Trustees’ fees deferred during the current period as well as any gains or losses on the Trustees’ deferred compensation balances as a result of market fluctuations, is included in "Trustees’ fees" in the Statement of Operations.
Compensation of Chief Compliance Officer
The Board of Trustees has appointed a Chief Compliance Officer for the Funds in accordance with federal securities regulations. As disclosed in the Statement of Operations, a portion of the Chief Compliance Officer’s total compensation is allocated to the Funds, along with other allocations to affiliated registered investment companies managed by the Investment Manager and its affiliates, based on relative net assets.
Transfer agency fees
Under a Transfer, Dividend Disbursing and Shareholders’ Servicing Agent Agreement, Columbia Management Investment Services Corp. (the Transfer Agent), an affiliate of the Investment Manager and a wholly-owned subsidiary of Ameriprise Financial, is responsible for providing transfer agency, dividend disbursing and shareholder services to the Funds for which the Funds pay transfer agency fees. The Transfer Agent has contracted with SS&C GIDS, Inc. (SS&C GIDS) to provide certain services and assist the Transfer Agent carrying out its duties. Prior to January 1, 2023, SS&C GIDS was known as DST Asset Manager Solutions, Inc. The Transfer Agent pays the fees of SS&C GIDS for its services and SS&C GIDS is not entitled to reimbursement for such fees from the Fund (with the exception of out-of-pocket fees). In addition, the Transfer Agent enters into agreements with various financial intermediaries through which investors may hold Fund shares, including Ameriprise Financial and its affiliates. These intermediaries also may provide shareholder services (Additional Shareholder Services) for which they are compensated by the Transfer Agent, which is in turn compensated by the Funds. Additional Shareholder Services may include sub-accounting, sub-transfer agency, participant recordkeeping, shareholder or participant reporting, shareholder or participant transaction processing, shareholder or participant tax monitoring and reporting and/or the provision of call center support and other customer services.
| 96 | Columbia Acorn Family of Funds | Annual Report 2022 |
Notes to Financial Statements (continued)
December 31, 2022
The Funds pay the Transfer Agent a monthly transfer agency fee that varies by account type (on a per account or asset-based basis) based on the cost of servicing the Funds. In addition, subject to certain limitations described in the Funds’ prospectuses and except with respect to Institutional 3 Class shares, the Funds pay a fee to the Transfer Agent for the Additional Shareholder Services provided by financial intermediaries who maintain shares through omnibus or networked accounts in amounts that vary by share class and with the distribution channel, type of intermediary and type of services provided.
The Funds compensate the Transfer Agent for certain out-of-pocket expenses as approved by the Board of Trustees from time to time. Such out-of-pocket expenses may include networking account fees paid to dealer firms by the Transfer Agent with respect to shareholder accounts established or maintained pursuant to the National Securities Clearing Corporation’s (NSCC) networking system. A significant portion of such networking account fees are paid by the Transfer Agent to dealer firms affiliated with Ameriprise Financial and its affiliates.
The Transfer Agent also receives compensation from the Funds for various shareholder services and reimbursements for certain out-of-pocket fees. Total transfer agency fees for Institutional 2 Class and Institutional 3 Class shares are subject to an annual limitation of not more than 0.07% and 0.02%, respectively, of the average daily net assets attributable to each share class.
Please see Expenses waived/reimbursed by the Investment Manager and its affiliates below for information about the Transfer Agent’s contractual agreements to limit the fees payable to it by certain share classes of the Funds.
For the year ended December 31, 2022, the Funds’ effective transfer agency fee rates, which reflect the contractual limitations described below in Expenses waived/reimbursed by the Investment Manager, as a percentage of average daily net assets of each class were as follows:
| Fund | Class A
(%) | Advisor
Class (%) | Class C
(%) | Institutional
Class (%) | Institutional 2
Class (%) | Institutional 3
Class (%) | Class R
(%) |
| Columbia Acorn® Fund | 0.08 | 0.09 | 0.08 | 0.08 | 0.05 | 0.01 | — |
| Columbia Acorn International® | 0.11 | 0.11 | 0.11 | 0.11 | 0.04 | 0.00 | 0.11 |
| Columbia Acorn USA® | 0.09 | 0.09 | 0.09 | 0.09 | 0.05 | 0.00 | — |
| Columbia Acorn International SelectSM | 0.19 | 0.19 | 0.19 | 0.19 | 0.06 | 0.01 | — |
| Columbia Thermostat FundSM | 0.09 | 0.09 | 0.09 | 0.09 | 0.05 | 0.01 | — |
| Columbia Acorn European FundSM | 0.11 | 0.11 | 0.11 | 0.11 | 0.04 | 0.00 | — |
An annual minimum account balance fee of $20 may apply to certain accounts with a value below the applicable share class’s initial minimum investment requirements to reduce the impact of small accounts on transfer agency fees. These minimum account balance fees are remitted to the Funds and recorded as part of expense reductions in the Statement of Operations.
For the year ended December 31, 2022, these minimum account balance fees reduced total expenses as follows:
| Fund | Amount ($) |
| Columbia Acorn® Fund | 7,579 |
| Columbia Acorn International® | 7,775 |
| Columbia Acorn USA® | 1,300 |
| Columbia Acorn International SelectSM | 11,529 |
| Columbia Thermostat FundSM | 280 |
| Columbia Acorn European FundSM | 160 |
Distribution and service fees
Columbia Management Investment Distributors, Inc. (CMID), a wholly owned subsidiary of Ameriprise Financial, is the distributor of the Funds. Each Fund has adopted a distribution and service plan which requires it to pay CMID a monthly service fee equal to 0.25% annually of the average daily net assets attributable to Class A and Class C shares and a monthly
Columbia Acorn Family of Funds | Annual Report 2022
| 97 |
Notes to Financial Statements (continued)
December 31, 2022
distribution fee equal to 0.75% and 0.50%, annually, of the average daily net assets attributable to Class C and Class R shares, respectively. CMID receives no compensation with respect to Advisor Class, Institutional Class, Institutional 2 Class and Institutional 3 Class shares.
Sales charges (unaudited)
Sales charges, including front-end charges and contingent deferred sales charges (CDSCs), received by the Distributor for distributing Fund shares for the year ended December 31, 2022, if any, are listed below:
| | Front End (%) | CDSC (%) | Amount ($) |
| Fund | Class A | Class C | Class A | Class C | Class A | Class C |
| Columbia Acorn® Fund | 5.75 | — | 0.50 - 1.00(a) | 1.00(b) | 93,350 | 763 |
| Columbia Acorn International® | 5.75 | — | 0.50 - 1.00(a) | 1.00(b) | 40,541 | 513 |
| Columbia Acorn USA® | 5.75 | — | 0.50 - 1.00(a) | 1.00(b) | 12,371 | 130 |
| Columbia Acorn International SelectSM | 5.75 | — | 0.50 - 1.00(a) | 1.00(b) | 21,817 | 15 |
| Columbia Thermostat FundSM | 5.75 | — | 0.50 - 1.00(a) | 1.00(b) | 428,371 | 35,844 |
| Columbia Acorn European FundSM | 5.75 | — | 0.50 - 1.00(a) | 1.00(b) | 31,003 | 546 |
| (a) | This charge is imposed on certain investments of between $1 million and $50 million redeemed within 18 months after purchase, as follows: 1.00% if redeemed within 12 months after purchase, and 0.50% if redeemed more than 12, but less than 18, months after purchase, with certain limited exceptions. |
| (b) | This charge applies to redemptions within 12 months after purchase, with certain limited exceptions. |
The Funds’ other share classes are not subject to sales charges.
Expenses waived/reimbursed by the Investment Manager and its affiliates
Columbia Acorn® Fund
Effective May 1, 2022 through April 30, 2023, CWAM has contractually agreed to waive fees and/or reimburse expenses so that ordinary operating expenses (excluding transaction costs and certain other investment-related expenses, interest and fees on borrowing and expenses associated with the Fund’s investment in other investment companies, if any) paid by Columbia Acorn® Fund do not exceed the following annual rates as a percentage of the classes’ average daily net assets:
| Fund | Class A | Advisor
Class | Class C | Institutional
Class | Institutional 2
Class | Institutional 3
Class | |
| Columbia Acorn®Fund | 1.11% | 0.86% | 1.86% | 0.86% | 0.84% | 0.79% | |
This agreement may not be modified or terminated, without approval from the Fund’s Board of Trustees and CWAM. There is no guarantee that the agreement will continue after April 30, 2023.
Prior to May 1, 2022, CWAM contractually waived fees and/or reimbursed expenses so that ordinary operating expenses (excluding transaction costs and certain other investment-related expenses, interest and fees on borrowings, if any) paid by Columbia Acorn® Fund did not exceed the annual rates of 1.11% for Class A shares, 0.86% for Advisor Class shares, 1.86% for Class C shares, 0.86% for Institutional Class shares, 0.83% for Institutional 2 Class shares and 0.79% for Institutional 3 Class shares.
With respect to Columbia Acorn® Fund, the Transfer Agent contractually agreed to waive a portion of the fees payable by the Fund such that through April 30, 2022, fees paid by the Fund to the Transfer Agent did not exceed the annual rate of 0.05% of the average daily net assets of Institutional 2 Class shares of the Fund.
| 98 | Columbia Acorn Family of Funds | Annual Report 2022 |
Notes to Financial Statements (continued)
December 31, 2022
Columbia Acorn International®
Effective May 1, 2022 through April 30, 2023, CWAM has contractually agreed to waive fees and/or reimburse expenses so that ordinary operating expenses (excluding transaction costs and certain other investment-related expenses, interest and fees on borrowing and expenses associated with the Fund’s investment in other investment companies, if any) paid by Columbia Acorn International® do not exceed the following annual rates as a percentage of the classes’ average daily net assets:
| Fund | Class A | Advisor
Class | Class C | Institutional
Class | Institutional 2
Class | Institutional 3
Class | Class R |
| Columbia Acorn International® | 1.23% | 0.98% | 1.98% | 0.98% | 0.92% | 0.88% | 1.48% |
This agreement may not be modified or terminated, without approval from the Fund’s Board of Trustees and CWAM. There is no guarantee that the agreement will continue after April 30, 2023.
Prior to May 1, 2022, CWAM contractually waived fees and/or reimbursed expenses so that ordinary operating expenses (excluding transaction costs and certain other investment-related expenses, interest and fees on borrowings, if any) paid by Columbia Acorn International® did not exceed the annual rates of 1.24% for Class A shares, 0.99% for Advisor Class shares, 1.99% for Class C shares, 0.99% for Institutional Class shares, 0.92% for Institutional 2 Class shares, 0.88% for Institutional 3 Class shares and 1.49% for Class R shares.
With respect to Columbia Acorn International®, the Transfer Agent contractually agreed to waive a portion of the fees payable by the Fund such that through April 30, 2023, unless sooner terminated at the sole discretion of the Fund’s Board of Trustees, fees paid by the Fund to the Transfer Agent do not exceed the annual rate of (i) 0.04% of the average daily net assets of Institutional 2 Class shares of the Fund and (ii) 0.00% of the average daily net assets of Institutional 3 Class shares of the Fund. The Transfer Agent’s agreement is an extension of the arrangement that was previously in place through April 30, 2022.
Columbia Acorn USA®
Effective May 1, 2022 through April 30, 2023, CWAM has contractually agreed to waive fees and/or reimburse expenses so that ordinary operating expenses (excluding transaction costs and certain other investment-related expenses, interest and fees on borrowings and expenses associated with the Fund’s investments in other investment companies, if any) paid by Columbia Acorn USA® do not exceed the following annual rates as a percentage of the classes’ average daily net assets:
| Fund | Class A | Advisor
Class | Class C | Institutional
Class | Institutional 2
Class | Institutional 3
Class | |
| Columbia Acorn USA® | 1.08% | 0.83% | 1.83% | 0.83% | 0.81% | 0.76% | |
This agreement may not be modified or terminated, without approval from the Fund’s Board of Trustees and CWAM. There is no guarantee that the agreement will continue after April 30, 2023.
Prior to May 1, 2022, CWAM contractually waived fees and/or reimbursed expenses so that ordinary operating expenses (excluding transaction costs and certain other investment-related expenses, interest and fees on borrowing and expenses associated with the Fund’s investment in other investment companies, if any) paid by Columbia Acorn USA® did not exceed the annual rates of 1.40% for Class A shares, 1.15% for Advisor Class shares, 2.15% for Class C shares, 1.15% for Institutional Class shares, 1.08% for Institutional 2 Class shares and 1.04% for Institutional 3 Class shares. Prior to May 1, 2022, Columbia Acorn USA® paid advisory fees at higher rates.
With respect to Columbia Acorn USA®, the Transfer Agent contractually agreed, effective May 1, 2022, to waive a portion of the fees payable by the Fund such that through April 30, 2023, unless sooner terminated at the sole discretion of the Fund ’s Board of Trustees, fees paid by the Fund to the Transfer Agent do not exceed the annual rate of 0.08% of the average daily net assets of Class A, Advisor Class, Class C and Institutional Class shares of the Fund. Prior to May 1, 2022, the Transfer Agent contractually agreed to waive a portion of the fees payable by the Fund such that through April 30, 2022, fees paid by the Fund to the Transfer Agent did not exceed the annual rate of (i) 0.04% of the average daily net assets of Institutional 2 Class shares of the Fund and (ii) 0.00% of the average daily net assets of Institutional 3 Class shares of the Fund.
Columbia Acorn Family of Funds | Annual Report 2022
| 99 |
Notes to Financial Statements (continued)
December 31, 2022
Columbia Acorn International SelectSM
Through April 30, 2023, CWAM contractually agreed to waive fees and/or reimburse expenses so that ordinary operating expenses (excluding any transaction costs and certain other investment-related expenses, interest and fees on borrowings and expenses associated with the Fund’s investments in other investment companies, if any) paid by Columbia Acorn International SelectSM do not exceed the following annual rates as a percentage of the classes’ average daily net assets:
| Fund | Class A | Advisor
Class | Class C | Institutional
Class | Institutional 2
Class | Institutional 3
Class | |
| Columbia Acorn International SelectSM | 1.24% | 0.99% | 1.99% | 0.99% | 0.89% | 0.84% | |
This agreement is an extension of the arrangement that was previously in place through April 30, 2022. It may not be modified or terminated, without approval from the Fund’s Board of Trustees and CWAM. There is no guarantee that the agreement will continue after April 30, 2023.
Columbia Thermostat FundSM
Effective May 1, 2022 through April 30, 2023, CWAM has contractually agreed to waive fees and/or reimburse expenses so that ordinary operating expenses (excluding transaction costs and certain other investment-related expenses, interest and fees on borrowings and expenses associated with the Fund’s investments in its underlying portfolio funds) paid by Columbia Thermostat FundSM do not exceed the following annual rates as a percentage of the classes’ average daily net assets:
| Fund | Class A | Advisor
Class | Class C | Institutional
Class | Institutional 2
Class | Institutional 3
Class | |
| Columbia Thermostat FundSM | 0.50% | 0.25% | 1.25% | 0.25% | 0.20% | 0.16% | |
This agreement may not be modified or terminated, without approval from the Fund’s Board of Trustees and CWAM. There is no guarantee that the agreement will continue after April 30, 2023.
Prior to May 1, 2022, CWAM contractually waived fees and/or reimbursed expenses so that ordinary operating expenses (excluding transaction costs and certain other investment-related expenses, interest and fees on borrowing and expenses associated with the Fund’s investment in its underlying portfolio funds, if any) paid by Columbia Thermostat FundSM did not exceed the annual rates of 0.50% for Class A shares, 0.25% for Advisor Class shares, 1.25% for Class C shares, 0.25% for Institutional Class shares, 0.21% for Institutional 2 Class shares and 0.17% for Institutional 3 Class shares.
Columbia Acorn European FundSM
Effective May 1, 2022 through April 30, 2023, CWAM has contractually agreed to waive fees and/or reimburse expenses so that ordinary operating expenses (excluding transaction costs and certain other investment-related expenses, interest and fees on borrowings and expenses associated with the Fund’s investments in other investment companies, if any) paid by Columbia Acorn European FundSM do not exceed the following annual rates as a percentage of the classes’ average daily net assets:
| Fund | Class A | Advisor
Class | Class C | Institutional
Class | Institutional 2
Class | Institutional 3
Class | |
| Columbia Acorn European FundSM | 1.45% | 1.20% | 2.20% | 1.20% | 1.14% | 1.11% | |
This agreement may not be modified or terminated, without approval from the Fund’s Board of Trustees and CWAM. There is no guarantee that the agreement will continue after April 30, 2023.
Prior to May 1, 2022, CWAM contractually waived fees and/or reimbursed expenses so that ordinary operating expenses (excluding transaction costs and certain other investment-related expenses, interest and fees on borrowing and expenses associated with the Fund’s investment in other investment companies, if any) paid by Columbia Acorn European FundSM did not exceed the annual rates of 1.45% for Class A shares, 1.20% for Advisor Class shares, 2.20% for Class C shares, 1.20% for Institutional Class shares, 1.14% for Institutional 2 Class shares and 1.10% for Institutional 3 Class shares.
| 100 | Columbia Acorn Family of Funds | Annual Report 2022 |
Notes to Financial Statements (continued)
December 31, 2022
With respect to Columbia Acorn European FundSM, the Transfer Agent contractually agreed, effective May 1, 2022, to waive a portion of the fees payable by the Fund such that through April 30, 2023, unless sooner terminated at the sole discretion of the Fund’s Board of Trustees, fees paid by the Fund to the Transfer Agent do not exceed the annual rate of (i) 0.03% of the average daily net assets of Institutional 2 Class shares of the Fund and (ii) 0.00% of the average daily net assets of Institutional 3 Class shares of the Fund. Prior to May 1, 2022, the Transfer Agent contractually agreed to limit the total fees payable to it by Columbia Acorn European FundSM for Institutional 2 Class and Institutional 3 Class shares of the Fund to not more than 0.04% and 0.00%, respectively, of the average daily net assets attributable to each share class.
Note 4. Federal tax information
The timing and character of income and capital gain distributions are determined in accordance with income tax regulations, which may differ from GAAP because of temporary or permanent book to tax differences.
At December, 31, 2022, these differences were primarily due to differing treatment for deferral/reversal of wash sale losses, foreign currency transactions, passive foreign investment company (pfic) holdings, post-October capital losses, capital loss carryforwards, trustees’ deferred compensation, net operating loss reclassification, re-characterization of distributions for investments, distribution reclassifications, excess distributions, investments in partnerships and/or grantor trusts and miscellaneous adjustments. To the extent these differences were permanent, reclassifications were made among the components of the Fund’s net assets. Temporary differences do not require reclassifications.
The following reclassifications were made:
| Fund | Undistributed net
investment
income ($) | Accumulated
net realized
gain (loss) ($) | Paid in capital
decrease ($) |
| Columbia Acorn® Fund | 11,900,608 | (52,906) | (11,847,702) |
| Columbia Acorn International® | 918,865 | 1,000,656 | (1,919,521) |
| Columbia Acorn USA® | 893,386 | 1,005,135 | (1,898,521) |
| Columbia Acorn International SelectSM | 3,848,511 | 172,190 | (4,020,701) |
| Columbia Thermostat FundSM | 950,198 | (950,197) | (1) |
| Columbia Acorn European FundSM | 1,364,702 | 134,265 | (1,498,967) |
Net investment income (loss) and net realized gains (losses), as disclosed in the Statement of Operations, and net assets were not affected by these reclassifications.
The tax character of distributions paid during the years indicated was as follows:
| | Year Ended December 31, 2022 | Year Ended December 31, 2021 |
| Fund | Ordinary
income ($) | Long-term
capital gains ($) | Total ($) | Ordinary
income ($) | Long-term
capital gains ($) | Total ($) |
| Columbia Acorn® Fund | 22,200,389 | 132,000,400 | 154,200,789 | 78,584,909 | 984,296,937 | 1,062,881,846 |
| Columbia Acorn International® | — | 44,899,689 | 44,899,689 | 40,477,298 | 303,672,612 | 344,149,910 |
| Columbia Acorn USA® | 207,105 | 7,928,545 | 8,135,650 | 6,190,063 | 69,974,033 | 76,164,096 |
| Columbia Acorn International SelectSM | — | 11,260,250 | 11,260,250 | 4,850,979 | 18,438,724 | 23,289,703 |
| Columbia Thermostat FundSM | 31,126,013 | 12,725,392 | 43,851,405 | 100,826,478 | 172,798,104 | 273,624,582 |
| Columbia Acorn European FundSM | — | — | — | 691,232 | — | 691,232 |
Short-term capital gain distributions, if any, are considered ordinary income distributions for tax purposes.
Columbia Acorn Family of Funds | Annual Report 2022
| 101 |
Notes to Financial Statements (continued)
December 31, 2022
At December 31, 2022, the components of distributable earnings on a tax basis were as follows:
| Fund | Undistributed
ordinary
income ($) | Undistributed
long-term
capital gains ($) | Capital loss
carryforwards ($) | Net unrealized
appreciation
(depreciation) ($) |
| Columbia Acorn® Fund | — | — | (554,398,601) | (30,159,909) |
| Columbia Acorn International® | — | — | (114,341,355) | 163,095,811 |
| Columbia Acorn USA® | — | — | (32,951,654) | (2,905,632) |
| Columbia Acorn International SelectSM | — | — | (26,189,404) | 969,156 |
| Columbia Thermostat FundSM | 2,117,771 | — | (109,247,022) | (156,711,730) |
| Columbia Acorn European FundSM | — | — | (17,812,649) | 9,512,145 |
At December 31, 2022, the cost of all investments for federal income tax purposes along with the aggregate gross unrealized appreciation and depreciation based on that cost was:
| Fund | Tax cost ($) | Gross
unrealized
appreciation ($) | Gross
unrealized
(depreciation) ($) | Net unrealized
appreciation
(depreciation) ($) |
| Columbia Acorn® Fund | 2,524,174,409 | 320,565,748 | (350,725,657) | (30,159,909) |
| Columbia Acorn International® | 1,135,175,015 | 272,605,417 | (109,509,606) | 163,095,811 |
| Columbia Acorn USA® | 161,752,597 | 18,997,477 | (21,903,109) | (2,905,632) |
| Columbia Acorn International SelectSM | 225,647,666 | 34,722,120 | (33,752,964) | 969,156 |
| Columbia Thermostat FundSM | 1,513,510,034 | 12,788,282 | (169,500,012) | (156,711,730) |
| Columbia Acorn European FundSM | 64,376,179 | 18,767,151 | (9,255,006) | 9,512,145 |
Tax cost of investments and unrealized appreciation/(depreciation) may also include timing differences that do not constitute adjustments to tax basis.
The following capital loss carryforwards, determined at December 31, 2022, may be available to reduce future net realized gains on investments, if any, to the extent permitted by the Internal Revenue Code. In addition, for the year ended December 31, 2022, capital loss carryforwards utilized, if any, were as follows:
| Fund | No expiration
short-term ($) | No expiration
long-term ($) | Total ($) | Utilized ($) |
| Columbia Acorn® Fund | (554,398,601) | — | (554,398,601) | — |
| Columbia Acorn International® | (88,072,256) | (26,269,099) | (114,341,355) | — |
| Columbia Acorn USA® | (32,951,654) | — | (32,951,654) | — |
| Columbia Acorn International SelectSM | (9,822,688) | (16,366,716) | (26,189,404) | — |
| Columbia Thermostat FundSM | (45,168,210) | (64,078,812) | (109,247,022) | — |
| Columbia Acorn European FundSM | (17,634,463) | (178,186) | (17,812,649) | — |
Under current tax rules, regulated investment companies can elect to treat certain late-year ordinary losses incurred and post-October capital losses (capital losses realized after October 31) as arising on the first day of the following taxable year. As of December 31, 2022, the Funds will elect to treat the following late-year ordinary losses and post-October capital losses as arising on January 1, 2023.
| Fund | Late year
ordinary losses ($) | Post-October
capital losses ($) |
| Columbia Acorn International® | — | 19,857,848 |
Management of the Funds has concluded that there are no significant uncertain tax positions in the Funds that would require recognition in the financial statements. However, management’s conclusion may be subject to review and adjustment at a later date based on factors including, but not limited to, new tax laws, regulations, and administrative interpretations (including relevant court decisions). Generally, the Funds’ federal tax returns for the prior three fiscal years remain subject to examination by the Internal Revenue Service.
| 102 | Columbia Acorn Family of Funds | Annual Report 2022 |
Notes to Financial Statements (continued)
December 31, 2022
Note 5. Portfolio information
For the year ended December 31, 2022, the cost of purchases and proceeds from sales of securities, excluding short-term investments and derivatives, if any, for each Fund aggregated to:
| | Purchases
($) | Proceeds
from sales
($) |
| Columbia Acorn® Fund | 1,963,272,553 | 2,528,015,634 |
| Columbia Acorn International® | 457,685,287 | 715,863,840 |
| Columbia Acorn USA® | 201,844,356 | 248,290,863 |
| Columbia Acorn International SelectSM | 64,065,707 | 144,593,469 |
| Columbia Thermostat FundSM | 1,463,893,730 | 1,875,346,942 |
| Columbia Acorn European FundSM | 35,367,745 | 97,735,770 |
The amount of purchase and sales activity impacts the portfolio turnover rate reported in the Financial Highlights.
Note 6. Affiliated money market fund
Each Fund may invest in Columbia Short-Term Cash Fund, an affiliated money market fund established for the exclusive use by each Fund and other affiliated funds (the Affiliated MMF). The income earned by the Funds from such investments is included as Dividends - affiliated issuers in the Statement of Operations. As an investing fund, each Fund indirectly bears its proportionate share of the expenses of the Affiliated MMF. The Affiliated MMF prices its shares with a floating net asset value. In addition, the Board of Trustees of the Affiliated MMF may impose a fee on redemptions (sometimes referred to as a liquidity fee) or temporarily suspend redemptions (sometimes referred to as imposing a redemption gate) in the event its liquidity falls below regulatory limits.
Note 7. Line of credit
Each Fund has access to a revolving credit facility with a syndicate of banks led by JPMorgan Chase Bank, N.A., Citibank, N.A. and Wells Fargo Bank, N.A. whereby the Fund may borrow for the temporary funding of shareholder redemptions or for other temporary or emergency purposes. Pursuant to an October 27, 2022 amendment and restatement, the credit facility, which is an agreement between the Fund and certain other funds managed by the Investment Manager or an affiliated investment manager, severally and not jointly, permits aggregate borrowings up to $950 million. Interest is currently charged to each participating fund based on its borrowings at a rate equal to the higher of (i) the federal funds effective rate, (ii) the secured overnight financing rate plus 0.10% and (iii) the overnight bank funding rate, plus in each case, 1.00%. Each borrowing under the credit facility matures no later than 60 days after the date of borrowing. The Fund also pays a commitment fee equal to its pro rata share of the unused amount of the credit facility at a rate of 0.15% per annum. The commitment fee is included in other expenses in the Statement of Operations. This agreement expires annually in October unless extended or renewed. Prior to the October 27, 2022 amendment and restatement, the Fund had access to a revolving credit facility with a syndicate of banks led by JPMorgan Chase Bank, N.A., Citibank, N.A. and Wells Fargo Bank, N.A. which permitted collective borrowings up to $950 million. Interest was charged to each participating fund based on its borrowings at a rate equal to the higher of (i) the federal funds effective rate, (ii) the secured overnight financing rate plus 0.11448% and (iii) the overnight bank funding rate, plus in each case, 1.00%.
During the year ended December 31, 2022, the following fund(s) had borrowings:
| Fund | Average loan
balance ($) | Weighted average
interest rate (%) | Days
outstanding |
| Columbia Acorn International® | 1,300,000 | 1.16 | 1 |
| Columbia Acorn USA® | 14,700,000 | 1.16 | 1 |
| Columbia Acorn International SelectSM | 1,675,000 | 2.47 | 4 |
| Columbia Thermostat FundSM | 2,642,857 | 2.23 | 21 |
| Columbia Acorn European FundSM | 3,270,000 | 2.48 | 20 |
Columbia Acorn Family of Funds | Annual Report 2022
| 103 |
Notes to Financial Statements (continued)
December 31, 2022
Interest expense incurred by the Funds is recorded as a line of credit interest expense in the Statement of Operations. The Funds had no outstanding borrowings at December 31, 2022.
Note 8. Significant risks
Foreign securities and emerging market countries risk
Investing in foreign securities may involve heightened risks relative to investments in U.S. securities. Investing in foreign securities subjects the Funds to the risks associated with the issuer’s country of organization and places of business operations, including risks associated with political, regulatory, economic, social, diplomatic and other conditions or events occurring in the country or region, which may result in significant market volatility. In addition, certain foreign securities may be more volatile and less liquid than U.S. securities. Investing in emerging markets may increase these risks and expose the Funds to elevated risks associated with increased inflation, deflation or currency devaluation. To the extent that Columbia Acorn International®, Columbia Acorn International SelectSM and Columbia Acorn European FundSM concentrate their investment exposure to any one or a few specific countries, the Funds will be particularly susceptible to the risks associated with the conditions, events or other factors impacting those countries or regions and may, therefore, have a greater risk than that of a fund that is more geographically diversified. The financial information and disclosure made available by issuers of emerging market securities may be considerably less reliable than publicly available information about other foreign securities. The Public Company Accounting Oversight Board, which regulates auditors of U.S. public companies, is unable to inspect audit work papers in certain foreign countries. Investors in foreign countries often have limited rights and few practical remedies to pursue shareholder claims, including class actions or fraud claims, and the ability of the U.S. Securities and Exchange Commission, the U.S. Department of Justice and other authorities to bring and enforce actions against foreign issuers or foreign persons is limited.
Geographic focus risk
Columbia Acorn International®, Columbia Acorn International SelectSM and Columbia Acorn European FundSM may be particularly susceptible to risks related to economic, political, regulatory or other events or conditions affecting issuers and countries within the specific geographic regions in which the Funds invests. The Funds’ net asset value may be more volatile than the net asset value of a more geographically diversified fund.
Asia Pacific Region. Columbia Acorn International® and Columbia Acorn International SelectSM are particularly susceptible to economic, political, regulatory or other events or conditions affecting issuers and countries in the Asia Pacific region. Many of the countries in the region are considered underdeveloped or developing, including from a political, economic and/or social perspective, and may have relatively unstable governments and economies based on limited business, industries and/or natural resources or commodities. Events in any one country within the region may impact other countries in the region or the region as a whole. As a result, events in the region will generally have a greater effect on the Funds than if the Funds were more geographically diversified. This could result in increased volatility in the value of the Funds’ investments and losses for the Funds. Also, securities of some companies in the region can be less liquid than U.S. or other foreign securities, potentially making it difficult for the Funds to sell such securities at a desirable time and price.
Europe. Columbia Acorn International®, Columbia Acorn International SelectSM and Columbia Acorn European FundSM are particularly susceptible to risks related to economic, political, regulatory or other events or conditions, including acts of war or other conflicts in the region, affecting issuers and countries in Europe. Countries in Europe are often closely connected and interdependent, and events in one European country can have an adverse impact on, and potentially spread to, other European countries. In addition, whether in the public or private sector, significant debt problems of a single European Union (EU) country can pose economic risks to the EU as a whole. As a result, the Funds’ net asset value may be more volatile than the net asset value of a more geographically diversified fund. If securities of issuers in Europe fall out of favor, it may cause the Funds to underperform other funds that do not focus their investments in this region of the world. The departure of the United Kingdom (UK) from the EU single market became effective January 1, 2021 with the end of the Brexit transition period and the post-Brexit trade deal between the UK and EU taking effect on December 31, 2020. The impact of Brexit on the UK and European economies and the broader global economy could be significant, resulting in negative impacts on currency and financial markets generally, such as increased volatility and illiquidity, and potentially lower economic growth in markets in Europe, which may adversely affect the value of your investments in the Funds.
| 104 | Columbia Acorn Family of Funds | Annual Report 2022 |
Notes to Financial Statements (continued)
December 31, 2022
Industrial sector risk
Columbia Acorn® Fund, Columbia Acorn International®, Columbia Acorn USA®, Columbia Acorn International SelectSM and Columbia Acorn European FundSM are more susceptible to the particular risks that may affect companies in the industrials sector than if they were invested in a wider variety of companies in unrelated sectors. Companies in the industrials sector are subject to certain risks, including changes in supply and demand for their specific product or service and for industrial sector products in general, including decline in demand for such products due to rapid technological developments and frequent new product introduction. Performance of such companies may be affected by factors including government regulation, world events and economic conditions and risks for environmental damage and product liability claims.
Information technology sector risk
Columbia Acorn International®, Columbia Acorn International SelectSM and Columbia Acorn European FundSM are more susceptible to the particular risks that may affect companies in the information technology sector than if they were invested in a wider variety of companies in unrelated sectors. Companies in the information technology sector are subject to certain risks, including the risk that new services, equipment or technologies will not be accepted by consumers and businesses or will become rapidly obsolete. Performance of such companies may be affected by factors including obtaining and protecting patents (or the failure to do so) and significant competitive pressures, including aggressive pricing of their products or services, new market entrants, competition for market share and short product cycles due to an accelerated rate of technological developments. Such competitive pressures may lead to limited earnings and/or falling profit margins. As a result, the value of their securities may fall or fail to rise. In addition, many information technology sector companies have limited operating histories and prices of these companies’ securities historically have been more volatile than other securities, especially over the short term. Some companies in the information technology sector are facing increased government and regulatory scrutiny and may be subject to adverse government or regulatory action, which could negatively impact the value of their securities.
Market risk
The Funds may incur losses due to declines in the value of one or more securities in which they invest. These declines may be due to factors affecting a particular issuer, or the result of, among other things, political, regulatory, market, economic or social developments affecting the relevant market(s) more generally. In addition, turbulence in financial markets and reduced liquidity in equity, credit and/or fixed income markets may negatively affect many issuers, which could adversely affect the Funds’ ability to price or value hard-to-value assets in thinly traded and closed markets and could cause significant redemptions and operational challenges. Global economies and financial markets are increasingly interconnected, and conditions and events in one country, region or financial market may adversely impact issuers in a different country, region or financial market. These risks may be magnified if certain events or developments adversely interrupt the global supply chain; in these and other circumstances, such risks might affect companies worldwide. As a result, local, regional or global events such as terrorism, war, natural disasters, disease/virus outbreaks and epidemics or other public health issues, recessions, depressions or other events – or the potential for such events – could have a significant negative impact on global economic and market conditions.
The large-scale invasion of Ukraine by Russia in February 2022 has resulted in sanctions and market disruptions, including declines in regional and global stock markets, unusual volatility in global commodity markets and significant devaluations of Russian currency. The extent and duration of the military action are impossible to predict but could be significant. Market disruption caused by the Russian military action, and any counter-measures or responses thereto (including international sanctions, a downgrade in a country’s credit rating, purchasing and financing restrictions, boycotts, tariffs, changes in consumer or purchaser preferences, cyberattacks and espionage) could have severe adverse impacts on regional and/or global securities and commodities markets, including markets for oil and natural gas. These impacts may include reduced market liquidity, distress in credit markets, further disruption of global supply chains, increased risk of inflation, and limited access to investments in certain international markets and/or issuers. These developments and other related events could negatively impact Fund performance.
The pandemic caused by coronavirus disease 2019 and its variants (COVID-19) has resulted in, and may continue to result in, significant global economic and societal disruption and market volatility due to disruptions in market access, resource availability, facilities operations, imposition of tariffs, export controls and supply chain disruption, among others. Such
Columbia Acorn Family of Funds | Annual Report 2022
| 105 |
Notes to Financial Statements (continued)
December 31, 2022
disruptions may be caused, or exacerbated by, quarantines and travel restrictions, workforce displacement and loss in human and other resources. The uncertainty surrounding the magnitude, duration, reach, costs and effects of the global pandemic, as well as actions that have been or could be taken by governmental authorities or other third parties, present unknowns that are yet to unfold. The impacts, as well as the uncertainty over impacts to come, of COVID-19 – and any other infectious illness outbreaks, epidemics and pandemics that may arise in the future – could negatively affect global economies and markets in ways that cannot necessarily be foreseen. In addition, the impact of infectious illness outbreaks and epidemics in emerging market countries may be greater due to generally less established healthcare systems, governments and financial markets. Public health crises caused by the COVID-19 outbreak may exacerbate other pre-existing political, social and economic risks in certain countries or globally. The disruptions caused by COVID-19 could prevent the Funds from executing advantageous investment decisions in a timely manner and negatively impact the Funds’ ability to achieve their investment objective. Any such events could have a significant adverse impact on the value and risk profile of the Funds.
Shareholder concentration risk
At December 31, 2022, the table below details the affiliated and significant unaffiliated shareholder account ownership of outstanding shares of each Fund. The Funds have no knowledge about whether any portion of these unaffiliated shares were owned beneficially. Subscription and redemption activity of these accounts may have a significant effect on the operations of the Funds.
| Fund | Number of
unaffiliated
accounts | Percentage of
shares
outstanding
held —
unaffiliated (%) | Percentage of
shares
outstanding
held —
affiliated (%) |
| Columbia Acorn® Fund | — | — | — |
| Columbia Acorn International® | 2 | 21.6 | — |
| Columbia Acorn USA® | 1 | 10.1 | — |
| Columbia Acorn International SelectSM | — | — | 26.4 |
| Columbia Thermostat FundSM | 2 | 23.2 | 23.5 |
| Columbia Acorn European FundSM | 2 | 30.9 | 28.1 |
Small- and mid-cap company risk
Columbia Acorn® Fund, Columbia Acorn International®, Columbia Acorn USA®, Columbia Acorn International SelectSM and Columbia Acorn European FundSM investments in small- and mid-capitalization companies (small- and mid-cap companies) often involve greater risks than investments in larger, more established companies (larger companies) because small- and mid-cap companies tend to have less predictable earnings and may lack the management experience, financial resources, product diversification and competitive strengths of larger companies. Securities of small- and mid-cap companies may be less liquid and more volatile than the securities of larger companies.
Note 9. Subsequent events
Management has evaluated the events and transactions that have occurred through the date the financial statements were issued. Other than as noted below, there were no items requiring adjustment of the financial statements or additional disclosure.
In December 2022, the Board of Trustees approved an Agreement and Plan of Reorganization to reorganize Columbia Acorn USA® with and into Columbia Acorn® Fund. Pursuant to applicable law (including the 1940 Act) the reorganization will be implemented without shareholder approval. The reorganization is expected to occur in the second quarter of 2023 and is expected to be a tax-free reorganization for U.S. federal income tax purposes.
| 106 | Columbia Acorn Family of Funds | Annual Report 2022 |
Notes to Financial Statements (continued)
December 31, 2022
Note 10. Information regarding pending and settled legal proceedings
Ameriprise Financial and certain of its affiliates are involved in the normal course of business in legal proceedings which include regulatory inquiries, arbitration and litigation, including class actions concerning matters arising in connection with the conduct of its activities as a diversified financial services firm. Ameriprise Financial believes that the Funds are not currently the subject of, and that neither Ameriprise Financial nor any of its affiliates are the subject of, any pending legal, arbitration or regulatory proceedings that are likely to have a material adverse effect on the Funds or the ability of Ameriprise Financial or its affiliates to perform under their contracts with the Funds. Ameriprise Financial is required to make quarterly (10-Q), annual (10-K) and, as necessary, 8-K filings with the Securities and Exchange Commission (SEC) on legal and regulatory matters that relate to Ameriprise Financial and its affiliates. Copies of these filings may be obtained by accessing the SEC website at www.sec.gov.
There can be no assurance that these matters, or the adverse publicity associated with them, will not result in increased Fund redemptions, reduced sale of Fund shares or other adverse consequences to the Funds. Further, although we believe proceedings are not likely to have a material adverse effect on the Funds or the ability of Ameriprise Financial or its affiliates to perform under their contracts with the Funds, these proceedings are subject to uncertainties and, as such, we are unable to estimate the possible loss or range of loss that may result. An adverse outcome in one or more of these proceedings could result in adverse judgments, settlements, fines, penalties or other relief that could have a material adverse effect on the consolidated financial condition or results of operations of Ameriprise Financial or one or more of its affiliates that provides services to the Funds.
Columbia Acorn Family of Funds | Annual Report 2022
| 107 |
Report of Independent Registered Public Accounting Firm
To the Board of Trustees of Columbia Acorn Trust and Shareholders of Columbia Acorn® Fund, Columbia Acorn International®, Columbia Acorn USA®, Columbia Acorn International SelectSM, Columbia Thermostat FundSM and Columbia Acorn European FundSM
Opinions on the Financial Statements
We have audited the accompanying statements of assets and liabilities, including the portfolios of investments, of Columbia Acorn® Fund, Columbia Acorn International®, Columbia Acorn USA®, Columbia Acorn International SelectSM, Columbia Thermostat FundSM and Columbia Acorn European FundSM (six of the funds constituting Columbia Acorn Trust, hereafter collectively referred to as the "Funds") as of December 31, 2022, the related statements of operations for the year ended December 31, 2022, the statements of changes in net assets for each of the two years in the period ended December 31, 2022, including the related notes, and the financial highlights for each of the five years in the period ended December 31, 2022 (collectively referred to as the "financial statements"). In our opinion, the financial statements present fairly, in all material respects, the financial position of each of the Funds as of December 31, 2022, the results of each of their operations for the year then ended, the changes in each of their net assets for each of the two years in the period ended December 31, 2022 and each of the financial highlights for each of the five years in the period ended December 31, 2022 in conformity with accounting principles generally accepted in the United States of America.
Basis for Opinions
These financial statements are the responsibility of the Funds’ management. Our responsibility is to express an opinion on the Funds’ financial statements based on our audits. We are a public accounting firm registered with the Public Company Accounting Oversight Board (United States) (PCAOB) and are required to be independent with respect to the Funds in accordance with the U.S. federal securities laws and the applicable rules and regulations of the Securities and Exchange Commission and the PCAOB.
We conducted our audits of these financial statements in accordance with the standards of the PCAOB. Those standards require that we plan and perform the audit to obtain reasonable assurance about whether the financial statements are free of material misstatement, whether due to error or fraud.
Our audits included performing procedures to assess the risks of material misstatement of the financial statements, whether due to error or fraud, and performing procedures that respond to those risks. Such procedures included examining, on a test basis, evidence regarding the amounts and disclosures in the financial statements. Our audits also included evaluating the accounting principles used and significant estimates made by management, as well as evaluating the overall presentation of the financial statements. Our procedures included confirmation of securities owned as of December 31, 2022 by correspondence with the custodian, transfer agent and broker; when replies were not received from the broker, we performed other auditing procedures. We believe that our audits provide a reasonable basis for our opinions.
/s/PricewaterhouseCoopers LLP
Minneapolis, Minnesota
February 22, 2023
We have served as the auditor of one or more investment companies in the Columbia Acorn Trust since 2004.
| 108 | Columbia Acorn Family of Funds | Annual Report 2022 |
Federal Income Tax Information
(Unaudited)
The Funds hereby designate the following tax attributes for the fiscal year ended December 31, 2022. Shareholders were notified in early 2023 of the amounts for use in preparing 2022 income tax returns.
| | Qualified
dividend
income | Dividends
received
deduction | Section
199A
dividends | Foreign
taxes paid
to foreign
countries | Foreign
taxes paid
per share
to foreign
countries | Foreign
source
income | Foreign
source
income
per share |
| Columbia Acorn® Fund | 26.32% | 26.05% | 0.00% | $0 | $0.0000 | $0 | $0.0000 |
| Columbia Acorn International® | 100.00% | 0.00% | 0.00% | $1,381,065 | $0.0231 | $29,536,706 | $0.4938 |
| Columbia Acorn USA® | 37.70% | 37.05% | 0.00% | $0 | $0.0000 | $0 | $0.0000 |
| Columbia Acorn International SelectSM | 100.00% | 0.00% | 0.00% | $295,683 | $0.0283 | $5,478,279 | $0.5247 |
| Columbia Thermostat FundSM | 7.80% | 7.75% | 0.16% | $149,461 | $0.0016 | $364,248 | $0.0038 |
| Columbia Acorn European FundSM | 100.00% | 0.00% | 0.00% | $141,174 | $0.0397 | $1,820,281 | $0.5114 |
Qualified dividend income. For taxable, non-corporate shareholders, the percentage of ordinary income distributed during the fiscal year that represents qualified dividend income subject to reduced tax rates.
Dividends received deduction. The percentage of ordinary income distributed during the fiscal year that qualifies for the corporate dividends received deduction.
Section 199A dividends. For taxable, non-corporate shareholders, the percentage of ordinary income distributed during the fiscal year that represents Section 199A dividends potentially eligible for a 20% deduction.
Foreign taxes. The Fund makes the election to pass through to shareholders the foreign taxes paid. Eligible shareholders may claim a foreign tax credit. These taxes, and the corresponding foreign source income, are provided in the table above.
Columbia Acorn Family of Funds | Annual Report 2022
| 109 |
Board of Trustees and Management of the Columbia Acorn Family of Funds
(Unaudited)
Each trustee may serve a term of unlimited duration. The Trust’s Bylaws generally require that a trustee retire at the end of the calendar year in which the trustee attains the age of 75 years. The trustees appoint their own successors, provided that at least two-thirds of the trustees, after such appointment, have been elected by shareholders. Shareholders may remove a trustee, with or without cause, upon the vote of two-thirds of the Trust’s outstanding shares at any meeting called for that purpose. A trustee may be removed, with or without cause, upon the vote of a majority of the trustees. The names of the trustees and officers of the Trust, the date each was first elected or appointed to office and the principal business occupations of each during at least the last five years, and for the trustees, the number of portfolios in the fund complex they oversee and other directorships they hold, are shown below. Each trustee and officer serves in such capacity for each of the six series of Columbia Acorn Trust and for each of the three series of Wanger Advisors Trust.
The address for the trustees and officers of the Trust is Columbia Wanger Asset Management, LLC, 71 S Wacker Drive, 25th Floor, Chicago, Illinois 60606. The Funds’ Statement of Additional Information includes additional information about the Funds’ trustees and officers. You may obtain a free copy of the Statement of Additional Information by writing or calling toll-free:
Columbia Wanger Asset Management, LLC
Shareholder Services Group
71 S Wacker Drive, 25th Floor
Chicago, IL 60606
800.922.6769
Independent trustees
Name and age at
December 31, 2022 | Year first appointed or elected to a Board in the Columbia Funds Complex | Principal occupation(s)
during the past five years | Number of
Funds in the
Columbia
Funds
Complex
overseen (1) | Other directorships
held by the Trustee
during the past five years
in addition to
Columbia Acorn Trust and
Wanger Advisors Trust |
| Maureen M. Culhane, 74 | 2007 | Retired. Formerly, Vice President, Goldman Sachs Asset Management, L.P. (investment adviser), 2005-2007; Vice President (Consultant) – Strategic Relationship Management, Goldman, Sachs & Co., 1999-2005. | 9 | None. |
| Margaret M. Eisen, 69 | 2002 | Trustee, Smith College, 2012-2016; Chief Investment Officer, EAM International LLC (corporate finance and asset management), 2003-2013; Managing Director, CFA Institute, 2005-2008. | 9 | Chair, RMB Investors Trust (6 series). |
| John C. Heaton, 63 | 2010 | Joseph L. Gidwitz Professor of Finance, University of Chicago Booth School of Business since 2000; Deputy Dean for Faculty, University of Chicago Booth School of Business, 2012-2019. | 9 | None. |
| Dianne F. Lob, 68 | 2021 | Retired. Formerly, Senior Vice President and Senior Managing Director, Global Head of Business and Product Development, AllianceBernstein Holding L.P. (asset management), 2014-2020; Chairman, Private Client Investment Policy Group, Alliance Bernstein Holding L.P., 2005-2014. | 9 | None. |
| Charles R. Phillips, 66 | 2015 | Retired. Formerly, Vice Chairman, J.P. Morgan Private Bank, 2011-2014; Managing Director, J.P. Morgan Private Bank, 2001-2011. | 9 | None. |
| 110 | Columbia Acorn Family of Funds | Annual Report 2022 |
Board of Trustees and Management of the Columbia Acorn Family of Funds (continued)
(Unaudited)
Independent trustees (continued)
Name and age at
December 31, 2022 | Year first appointed or elected to a Board in the Columbia Funds Complex | Principal occupation(s)
during the past five years | Number of
Funds in the
Columbia
Funds
Complex
overseen (1) | Other directorships
held by the Trustee
during the past five years
in addition to
Columbia Acorn Trust and
Wanger Advisors Trust |
David J. Rudis, 69,
Chair | 2010 | Chief Executive Officer, Finger Rock, LLC (strategic consulting business). Formerly, National Checking and Debit Executive, and Illinois President, Bank of America, 2007-2009; President, Consumer Banking Group, LaSalle National Bank, 2004-2007. | 9 | None. |
Trustee Emeritus
Name and age at
December 31, 2022 | Year first
appointed or
elected to a
Board in the
Columbia
Funds
Complex | Principal occupation(s)
during the past five years | Number of
Funds in the
Columbia
Funds
Complex
overseen (1) | Other directorships
held by the Trustee
during the past five years
in addition to
Columbia Acorn Trust and
Wanger Advisors Trust |
| Ralph Wanger, 88 (2) | 1970 (3) | Founder, CWAM. Formerly, President, Chief Investment Officer and portfolio manager, CWAM or its predecessors, July 1992-September 2003; Director, Wanger Investment Company PLC; Consultant, CWAM or its predecessors, September 2003-September 2005. | 9 | None. |
| (1) | The Trustees oversee the series of Wanger Advisors Trust and Columbia Acorn Trust. |
| (2) | As permitted under the Trust’s Bylaws, Mr. Wanger serves as a non-voting Trustee Emeritus of Columbia Acorn Trust and Wanger Advisors Trust. Prior to September 2009, Mr. Wanger served as an “interested” trustee of the Columbia Acorn Trust and Wanger Advisors Trust. Mr. Wanger was considered an “interested person” of the Trusts and of CWAM within the meaning of the 1940 Act because of certain ownership interests. |
| (3) | Dates prior to April 1992 correspond to the date first elected as a director of The Acorn Fund, Inc., the predecessor to Columbia Acorn Trust. |
Fund officers
Name and age at
December 31, 2022 | Position
held with
Columbia
Acorn
Trust and
Wanger
Advisors Trust | Year first
appointed
or elected
to office | Principal occupation(s) during
the past five years |
| Daniel Beckman, 61 | Co-President and Principal Executive Officer | 2021 | Vice President, Head of North America Product, Columbia Management Investment Advisers, LLC since April 2015; Trustee, President and Principal Executive Officer of the Columbia Funds since June 2021; officer of Columbia Funds and affiliated funds, 2020-2021; Board of Governors, CWAM since January 2022; Director, Ameriprise Trust Company since October 2016; Director, Columbia Management Investment Distributors, Inc. since November 2018. |
| Joseph Beranek, 57 | Assistant Treasurer | 2022 | Vice President - Mutual Fund Accounting and Financial Reporting, Columbia Management, since December 2018 and March 2017, respectively (previously Vice President - Pricing and Corporate Actions, May 2010-March 2017); Treasurer and Chief Accounting Officer of Columbia Funds since 2019. |
| James Chapman, 52 | Vice President | 2021 | Portfolio manager and/or analyst, CWAM since 2018; partner, TDKY Advisors, September 2017-July 2018; portfolio manager and analyst, GMO LLC, November 2009-June 2017. |
Columbia Acorn Family of Funds | Annual Report 2022
| 111 |
Board of Trustees and Management of the Columbia Acorn Family of Funds (continued)
(Unaudited)
Fund officers (continued)
Name and age at
December 31, 2022 | Position
held with
Columbia
Acorn
Trust and
Wanger
Advisors Trust | Year first
appointed
or elected
to office | Principal occupation(s) during
the past five years |
| Michael G. Clarke, 52 | Treasurer and Principal Accounting and Financial Officer | 2004 | Senior Vice President - Head of Global Operations since February 2022, Vice President - Co-Head of Global Operations from June 2019 to January 2022, Vice President - Mutual Fund Accounting & Administration Services, Columbia Management from May 2010 to May 2019; Assistant Treasurer, Columbia Acorn Trust and Wanger Advisors Trust from 2004 to 2021; senior officer of Columbia Funds and affiliated funds since 2002. |
| John L. Emerson, 47 | Vice President | 2020 | Portfolio manager and/or analyst, CWAM since 2003. |
| Tae Han (Simon) Kim, 42 | Vice President | 2018 | Director of International Research, CWAM since 2020; portfolio manager and/or analyst, CWAM since 2011. |
| Stephen Kusmierczak, 55 | Co-President | 2011 | Internaional Team Head, CWAM since 2020; portfolio manager and/or analyst, CWAM or its predecessors since 2001; President, Columbia Acorn Trust and Wanger Advisors Trust, April 2021-July 2022 and Co-President, Columbia Acorn Trust and Wanger Advisors Trust, September 2020-April 2021; Vice President, Columbia Acorn Trust and Wanger Advisors Trust, 2011 - 2020. |
| Joseph C. LaPalm, 52 | Vice President | 2006 | Chief Compliance Officer, CWAM since 2005. |
| Ryan C. Larrenaga, 51 | Assistant Secretary and Chief Legal Officer | 2015 | Vice President and Chief Counsel, Ameriprise Financial, Inc. since August 2018 (previously, Vice President and Group Counsel, August 2011-August 2018); Senior Vice President and Chief Legal Officer since 2017, and Secretary, Columbia Funds since 2015; officer of Columbia Funds and affiliated funds since 2005. |
| Erika K. Maschmeyer, 41 | Vice President | 2020 | Director of Research (U.S.), CWAM since April 2021; portfolio manager and/or analyst, CWAM since 2016. |
| Thomas P. McGuire, 49 | Chief Compliance Officer | 2015 | Senior Vice President and Chief Compliance Officer of the Columbia Funds since 2012; Vice President – Asset Management Compliance, Ameriprise Financial, Inc., since May 2010; Chief Compliance Officer, Ameriprise Certificate Company, September 2010-September 2020. |
| Sebastien Pigeon, 50 | Vice President | 2021 | Portfolio manager and/or analyst, CWAM since 2015. |
| Marybeth Pilat, 53 | Assistant Treasurer | 2022 | Vice President - Product Pricing and Administration, Columbia Management since May 2017; Director - Fund Administration, Calvert Investments, August 2015-March 2017. |
| Julian Quero, 55 | Assistant Treasurer | 2015 | Vice President – Tax, Columbia Management Investment Advisers, LLC since 2009. |
| Martha A. Skinner, 47 | Assistant Treasurer | 2016 | Vice President of Financial Reporting and Administration, Columbia Management since November 2015. |
| Hans F. Stege, 38 | Vice President | 2020 | Portfolio manager and/or analyst, CWAM since 2017; prior thereto, analyst, Copia Capital. |
| Zoe Tan, 37 | Vice President | 2021 | Portfolio manager and/or analyst, CWAM, since 2018; senior analyst, Driehaus Capital Management, January 2014-June 2017. |
| Linda Roth, 52 | Secretary | 2006 | Business support analyst, CWAM since April 2007; Assistant Secretary, Columbia Acorn Trust and Wanger Advisors Trust, 2011-2020. |
| 112 | Columbia Acorn Family of Funds | Annual Report 2022 |
If you elect to receive the shareholder report for the Funds in paper, mailed to you, the Funds mail one shareholder report to each shareholder address, unless such shareholder elects to receive shareholder reports from the Funds electronically via e-mail or by having a paper notice mailed to you (Postcard Notice) that your Funds’ shareholder report is available at the Funds’ website (columbiathreadneedleus.com/investor/). If you would like more than one report in paper to be mailed to you, or would like to elect to receive reports via e-mail or access them through Postcard Notice, please call shareholder services at 800.345.6611 and additional reports will be sent to you.
Proxy voting policies and procedures
The policy of the Board of Trustees is to vote the proxies of the companies in which the Funds hold investments consistent with the procedures as stated in the Statement of Additional Information (SAI). You may obtain a copy of the SAI without charge by calling 800.345.6611; contacting your financial intermediary; visiting columbiathreadneedleus.com/investor/; or searching the website of the Securities and Exchange Commission (SEC) at sec.gov. Information regarding how the Funds voted proxies relating to portfolio securities is filed with the SEC by August 31st for the most recent 12-month period ending June 30th of that year, and is available without charge by visiting columbiathreadneedleus.com/investor/, or searching the website of the SEC at sec.gov.
Quarterly schedule of investments
The Funds file a complete schedule of portfolio holdings with the SEC for the first and third quarters of each fiscal year on Form N-PORT. The Funds’ Form N-PORT filings are available on the SEC’s website at sec.gov. The Funds’ complete schedule of portfolio holdings, as filed on Form N-PORT, is available on columbiathreadneedleus.com/investor/ or can also be obtained without charge, upon request, by calling 800.345.6611.
Additional Fund information
For more information about the Funds, please visit columbiathreadneedleus.com/investor/ or call 800.345.6611. Customer Service Representatives are available to answer your questions Monday through Friday from 8 a.m. to 7 p.m. Eastern time.
Fund investment manager
Columbia Wanger Asset Management, LLC
71 S. Wacker Drive, Suite 2500
Chicago, IL 60606
888.4.WANGER
(888.492.6437)
Fund distributor
Columbia Management Investment Distributors, Inc.
290 Congress Street
Boston, MA 02210
Fund transfer agent
Columbia Management Investment Services Corp.
P.O. Box 219104
Kansas City, MO 64121-9104
Columbia Acorn Family of Funds | Annual Report 2022
| 113 |
[THIS PAGE INTENTIONALLY LEFT BLANK]
[THIS PAGE INTENTIONALLY LEFT BLANK]
Columbia Acorn Family of Funds
P.O. Box 219104
Kansas City, MO 64121-9104
Please read and consider the investment objectives, risks, charges and expenses for any fund carefully before investing. For a prospectus and summary prospectus, which contains this and other important information about the Funds, go to columbiathreadneedleus.com/investor/. The Funds are distributed by Columbia Management Investment Distributors, Inc., member FINRA, and managed by Columbia Wanger Asset Management, LLC.
Columbia Threadneedle Investments (Columbia Threadneedle) is the global brand name of the Columbia and Threadneedle group of companies. All rights reserved. Columbia Management Investment Distributors, Inc., 290 Congress Street, Boston, MA 02210.
© 2023 Columbia Management Investment Advisers, LLC.
columbiathreadneedleus.com/investor/
Item 2. Code of Ethics.
(a)The registrant has adopted a code of ethics that applies to the registrant's prin cipal executive officer, principal financial officer, principal accounting officer or controller, or persons performing similar functions, regardless of whether these individuals are employed by the registrant or a third party.
(b)During the period covered by this report, there were not any amendments to a provision of the code of ethics that applies to the registrant's principal executive officer, principal financial officer, principal accounting officer or controller, or persons performing similar functions, regardless of whether these individuals are employed by the registrant or a third party, and that relates to any element of the code of ethics definition enumerated in paragraph (b) of this Item.
(c)During the period covered by this report, there were no waivers, including any implicit waivers, from a provision of the code of ethics to the registrant's principal executive officer, principal financial officer, principal accounting officer or controller, or persons performing similar functions, regardless of whether these individuals are employed by the registrant or a third party that relates to one or more of the items set forth in paragraph (b) of this Item.
Item 3. Audit Committee Financial Expert.
The registrant's Board of Trustees has determined that Maureen Culhane and Dianne Lob, members of the registrant's Board of Trustees and Audit Committee, qualify as audit committee financial experts. Ms. Culhane and Ms. Lob are independent trustees, as defined in paragraph (a)(2) of this item's instructions
Item 4. Principal Accountant Fees and Services.
Fee information below is disclosed for the six series of the registrant whose reports to stockholders are included in this annual filing.
(a)Audit Fees. Aggregate Audit Fees billed by the principal accountant for professional services rendered during the fiscal years ended December 31, 2022 and December 31,
2021 are approximately as follows:
Audit Fees include amounts related to the audit of the registrant's annual financial statements or services that are normally provided by the accountant in connection with statutory and regulatory filings or engagements for those fiscal years.
(b)Audit-Related Fees. Aggregate Audit-Related Fees billed to the registrant by the principal accountant for professional services rendered during the fiscal years ended December 31, 2022 and December 31, 2021 are approximately as follows:
Audit-Related Fees, if any, include amounts for assurance and related services by the principal accountant that are reasonably related to the performance of the audit of the registrant's financial statements and are not reported in Audit Fees above. In both fiscal years 2022 and 2021, Audit-Related Fees consist of agreed-upon procedures performed for other audit-related additional testing.
During the fiscal years ended December 31, 2022 and December 31, 2021, there were no Audit-Related Fees billed by the registrant's principal accountant to the registrant's investment adviser (not including any sub-adviser whose role is primarily portfolio management and is subcontracted with or overseen by another investment adviser) and any entity controlling, controlled by, or under common control with the adviser that provides ongoing services to the registrant for an engagement that related directly to the operations and financial reporting of the registrant.
(c)Tax Fees. Aggregate Tax Fees billed by the principal accountant to the registrant for professional services rendered during the fiscal years ended December 31, 2022 and December 31, 2021 are approximately as follows:
Tax Fees incurred in both fiscal years 2022 and 2021 relate to the review of annual tax returns, the review of required shareholder distribution calculations and include amounts for professional services by the principal accountant for tax compliance, tax advice and tax planning. Fiscal year 2021 and 2022 also include Tax Fees for foreign tax filings.
During the fiscal years ended December 31, 2022 and December 31, 2021, there were no Tax Fees billed by the registrant's principal accountant to the registrant's investment adviser (not including any sub-adviser whose role is primarily portfolio management and is subcontracted with or overseen by another investment adviser) and any entity controlling, controlled by, or under common control with the adviser that provides ongoing services to the registrant for an engagement that related directly to the operations and financial reporting of the registrant.
(d)All Other Fees. Aggregate All Other Fees billed by the principal accountant to the registrant for professional services rendered during the fiscal years ended December 31,
2022 and December 31, 2021 are as follows:
All Other Fees, if any, include amounts for products and services provided by the principal accountant, other than the services reported in paragraphs (a) throu gh (c) above. Aggregate All Other Fees billed by the registrant's principal accountant to the registrant's investment adviser (not including any sub-adviser whose role is primarily portfolio management and is subcontracted with or overseen by another investment adviser) and any entity controlling, controlled by, or under common control with the adviser that provides ongoing services to the registrant for an engagement that related directly to the operations and financial reporting of the registrant during the fiscal years ended December 31, 2022 and December 31, 2021 are approximately as follows:
In both fiscal years 2022 and 2021, All Other Fees primarily consist of professional services rendered for internal control reviews.
(e)(1) Audit Committee Pre-Approval Policies and Procedures
The policy of the registrant's Audit Committee is to specifically pre-approve (i) all audit and non-audit (including audit related, tax and all other) services provided by the registrant's independent auditor to the registrant and individual funds (collectively "Fund Services") and (ii) all non-audit services provided by the registrant's independent auditor to the funds' adviser or a control affiliate of the adviser, that relate directly to the funds' operations and financial reporting (collectively "Fund-related Adviser Services"). A "control affiliate" is an entity controlling, controlled by, or under common control with the adviser that provides ongoing services to the funds, and the term "adviser" is deemed to exclude any unaffiliated sub-adviser whose role is primarily portfolio management and is sub-contracted or overseen by another investment adviser.
If such Fund Services or Fund-related Adviser Services are required during the period
between the Audit Committee's regularly scheduled meetings, the Chairma n of the Audit Committee has the authority to pre-approve the service, with reporting to the full Audit Committee at the next regularly scheduled meeting.
The Audit Committee will waive pre-approval of Fund Services or Fund-related Adviser Services provided that the requirements under paragraph (c)(7)(i)(C) of Rule 2-01 of Regulation S-X are met.
(e)(2) None, or 0%, of the Audit-Related Fees, Tax Fees and All Other Fees paid by the Fund or affiliated entities relating directly to the operations and financial reporting of the Registrant disclosed above were approved by the audit committee pursuant to paragraphs (c)(7)(i)(C) of Rule 2-01 of Regulation S-X (which permits audit committee approval after the start of the engagement with respect to services other than audit, review or attest services, if certain conditions are satisfied).
(f)Not applicable.
(g)The aggregate non-audit fees billed by the registrant's accountant for services rendered to the registrant, and rendered to the registrant's investment adviser (not including any sub-adviser whose role is primarily portfolio management and is subcontracted with or overseen by another investment adviser), and any entity controlling, controlled by, or under common control with the adviser that provides ongoing services to the registrant for the fiscal years ended December 31, 2022 and December 31, 2021 are approximately as follows:
(h)The registrant's Audit Committee of the Board of Directors has considered whether the provision of non-audit services that were rendered to the registrant's adviser (not including any sub-adviser whose role is primarily portfolio management and is subcontracted with or overseen by another investment adviser), and any entity controlling, controlled by, or under common control with the investment adviser that provides ongoing services to the registrant that were not pre-approved pursuant to paragraph (c)(7)(ii) of Rule 2-01 of Regulation S-X, is compatible with maintaining the principal accountant's independence.
Item 5. Audit Committee of Listed Registrants.
Not applicable.
Item 6. Investments
(a)The registrant's "Schedule I – Investments in securities of unaffiliated issuers" (as set forth in 17 CFR 210.12-12) is included in Item 1 of this Form N-CSR.
(b)Not applicable
Item 7. Disclosure of Proxy Voting Policies and Procedures for Closed-End Management Investment Companies.
Not applicable.
Item 8. Portfolio Managers of Closed-End Management Investment Companies.
Not applicable.
Item 9. Purchases of Equity Securities by Closed-End Management Investment Company and Affiliated Purchasers.
Not applicable.
SIGNATURES
Pursuant to the requirements of the Securities Exchange Act of 1934 and the Investment Company Act of 1940, the registrant has duly caused this report to be signed on its behalf by the undersigned, thereunto duly authorized.
(registrant) | Columbia Acorn Trust |
| |
By (Signature and Title) | /s/ Daniel J. Beckman |
| Daniel J. Beckman, Co-President and Principal Executive Officer |
| |
Date | February 22, 2023 |
| |
| |
Pursuant to the requirements of the Securities Exchange Act of 1934 and the Investment Company Act of 1940, this report has been signed below by the following persons on behalf of the registrant and in the capacities and on the dates indicated.
By (Signature and Title) | /s/ Daniel J. Beckman |
| Daniel J. Beckman, Co-President and Principal Executive Officer |
| |
Date | February 22, 2023 |
By (Signature and Title) | /s/ Michael G. Clarke |
| Michael G. Clarke, Treasurer and Principal Accounting |
| and Financial Officer |
| |
Date | February 22, 2023 |