UNITED STATES
SECURITIES AND EXCHANGE COMMISSION
FORM N-CSR
CERTIFIED SHAREHOLDER REPORT OF REGISTERED MANAGEMENT INVESTMENT COMPANIES
Investment Company Act file number811-01829
Columbia Acorn Trust
(Exact name of registrant as specified in charter)
71 S Wacker Dr.
Suite 2500
Chicago, IL 60606, USA
(Address of principal executive offices) (Zip code)
Ryan C. Larrenaga
c/o Columbia Management
Investment Advisers, LLC
225 Franklin Street
Boston, MA 02110
Matthew Litfin
Columbia Acorn Trust
71 S Wacker Dr.
Suite 2500
Chicago, IL 60606, USA
Mary C. Moynihan
Perkins Coie LLP
700 13th Street, NW
Suite 800
Washington, DC 20005
(Name and address of agent for service)
Registrant's telephone number, including area code: (312) 634-9200
Date of fiscal year end: December 31
Date of reporting period: December 31, 2020
Form N-CSR is to be used by management investment companies to file reports with the Commission not later than 10 days after the transmission to stockholders of any report that is required to be transmitted to stockholders under Rule 30e-1 under the Investment Company Act of 1940 (17 CFR 270.30e-1). The Commission may use the information provided on Form N-CSR in its regulatory, disclosure review, inspection, and policymaking roles.
A registrant is required to disclose the information specified by Form N-CSR, and the Commission will make this information public. A registrant is not required to respond to the collection of information contained in Form N-CSR unless the Form displays a currently valid Office of Management and Budget ("OMB") control number. Please direct comments concerning the accuracy of the information collection burden estimate and any suggestions for reducing the burden to Secretary, Securities and Exchange Commission, 100 F Street, NE, Washington, DC 20549. The OMB has reviewed this collection of information under the clearance requirements of 44 U.S.C. § 3507.
Item 1. Reports to Stockholders.

Annual Report
December 31, 2020
Columbia
Acorn® Fund
Columbia
Acorn International®
Columbia
Acorn USA®
Columbia
Acorn International SelectSM
Columbia
Thermostat FundSM
Columbia
Acorn European FundSM
Beginning on January 1, 2021, as permitted by regulations adopted by the Securities and Exchange Commission, paper copies of the Funds’ annual and semiannual shareholder reports are no longer sent by mail, unless you specifically request paper copies of the reports. Instead, the reports are made available on the Funds’ website (columbiathreadneedleus.com/investor/), and each time a report is posted you will be notified by mail and provided with a website address to access the report.
If you have already elected to receive shareholder reports electronically, you will not be affected by this change and you need not take any action. You may elect to receive shareholder reports and other communications from the Funds electronically at any time by contacting your financial intermediary (such as a broker-dealer or bank) or, for Fund shares held directly with the Funds, by calling 800.345.6611 or by enrolling in “eDelivery” by logging into your account at columbiathreadneedleus.com/investor/.
You may elect to receive all future shareholder reports in paper free of charge. If you invest through a financial intermediary, you can contact your financial intermediary to request that you continue receiving paper copies of your shareholder reports. If you invest directly with the Funds, you can call 800.345.6611 to let the Funds know you wish to continue receiving paper copies of your shareholder reports. Your election to receive paper reports will apply to all Columbia Funds, including the Columbia Acorn Funds, held in your account if you invest through a financial intermediary or all Columbia Funds, including the Columbia Acorn Funds, held with the fund complex if you invest directly with the Funds.
Not Federally Insured • No Financial Institution Guarantee • May Lose Value
| 3 |
| 5 |
| 7 |
| 9 |
| 11 |
| 13 |
| 15 |
| 17 |
| 19 |
| 21 |
| 23 |
| 25 |
| 27 |
| 30 |
| 53 |
| 57 |
| 59 |
| 66 |
| 90 |
| 111 |
| 112 |
| 113 |
| 116 |
Columbia Acorn Family of Funds | Annual Report 2020
Fund at a glance
Columbia Acorn® Fund
Investment objective
Columbia Acorn® Fund (the Fund) seeks long-term capital appreciation.
Portfolio management
Matthew A. Litfin, CFA
Lead Portfolio Manager or Co-Portfolio Manager since 2016
Service with Fund since 2015
Erika K. Maschmeyer, CFA
Co-Portfolio Manager since 2019
Service with Fund since 2016
Richard Watson, CFA
Co-Portfolio Manager since 2019
Service with Fund since 2006
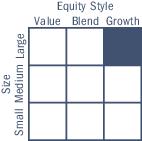
Morningstar style boxTM
The Morningstar Style Box is based on a fund’s portfolio holdings. For equity funds, the vertical axis shows the market capitalization of the stocks owned, and the horizontal axis shows investment style (value, blend, or growth). Information shown is based on the most recent data provided by Morningstar.
© 2021 Morningstar, Inc. All rights reserved. The Morningstar information contained herein: (1) is proprietary to Morningstar and/or its content providers; (2) may not be copied or distributed; and (3) is not warranted to be accurate, complete or timely. Neither Morningstar nor its content providers are responsible for any damages or losses arising from any use of this information.
| Average annual total returns (%) (for the period ended December 31, 2020) |
| | | Inception | 1 Year | 5 Years | 10 Years | Life of Fund |
| Class A | Excluding sales charges | 10/16/00 | 29.18 | 16.26 | 11.83 | 14.08 |
| | Including sales charges | | 21.80 | 14.89 | 11.17 | 13.94 |
| Advisor Class | 11/08/12 | 29.44 | 16.54 | 12.10 | 14.43 |
| Class C | Excluding sales charges | 10/16/00 | 28.27 | 15.39 | 11.01 | 13.21 |
| | Including sales charges | | 27.30 | 15.39 | 11.01 | 13.21 |
| Institutional Class | 06/10/70 | 29.51 | 16.56 | 12.14 | 14.44 |
| Institutional 2 Class | 11/08/12 | 29.50 | 16.59 | 12.16 | 14.44 |
| Institutional 3 Class | 11/08/12 | 29.54 | 16.65 | 12.21 | 14.45 |
| Russell 2500 Growth Index | | 40.47 | 18.68 | 15.00 | - |
Performance numbers reflect all Fund expenses. Returns for Class A shares are shown with and without the maximum initial sales charge of 5.75%. Returns for Class C shares are shown with and without the maximum contingent deferred sales charge of 1.00% for the first year after purchase. The Fund’s other share classes are not subject to sales charges, but may be subject to other fees and expenses, and have limited eligibility. Please see the Fund’s prospectus for details. Performance for different share classes will vary based on differences in sales charges and certain fees and expenses associated with each share class.
As stated in the May 1, 2020 prospectus (as supplemented), the Fund’s annual operating expense ratio is 0.86% for Institutional Class shares and 1.11% for Class A shares.
All results shown assume reinvestment of distributions during the period. Returns do not reflect the deduction of taxes that a shareholder may pay on Fund distributions or on the redemption of Fund shares. Performance results reflect the effect of fee waivers or reimbursements of Fund expenses by the investment manager and/or its affiliates. Absent these fee waivers and/or expense reimbursement arrangements, performance results may have been lower.
The performance information shown represents past performance and is not a guarantee of future results. The investment return and principal value of your investment will fluctuate so that shares, when redeemed, may be worth more or less than their original cost. Current performance may be lower or higher than the performance data shown. You may obtain performance information current to the most recent month-end by contacting your financial intermediary, visiting columbiathreadneedleus.com/investor/ or calling 800.922.6769.
The returns shown for periods prior to the share class inception date (including returns for the Life of the Fund, if shown, which are since Fund inception) include the returns of the Fund’s oldest share class. These returns are adjusted to reflect any higher class-related operating expenses of the newer share classes, as applicable. Please visit columbiathreadneedleus.com/investor/investment-products/mutual-funds/appended-performance for more information.
The Russell 2500 Growth Index measures the performance of those Russell 2500 companies with higher price-to-book ratios and higher forecasted growth values.
Unlike mutual funds, indexes are not managed and do not incur fees or expenses. It is not possible to invest directly in an index.
The COVID-19 pandemic has adversely impacted economies and capital markets around the world in ways that will likely continue and may change in unforeseen ways for an indeterminate period. The COVID-19 pandemic may exacerbate pre-existing political, social and economic risks in certain countries and globally. Fund performance may be significantly negatively impacted by the economic impact of the COVID-19 pandemic.
Columbia Acorn Family of Funds | Annual Report 2020
| 3 |
Fund at a glance (continued)
Columbia Acorn® Fund
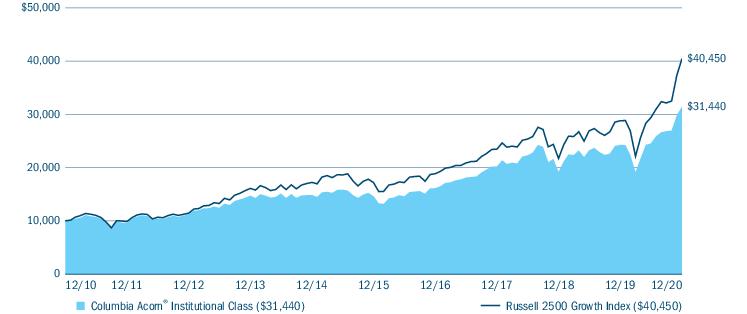
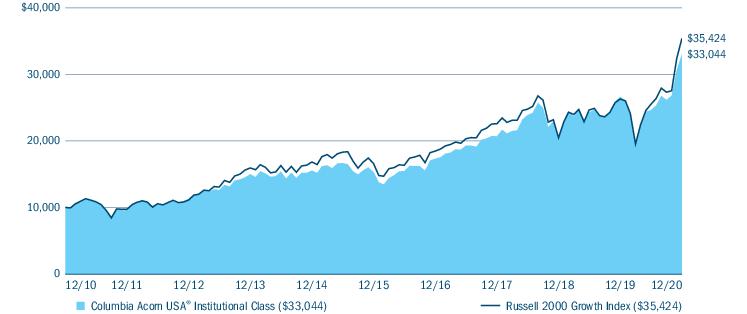
The Growth of a $10,000 Investment in Columbia Acorn® Fund Institutional Class Shares
December 31, 2010 through December 31, 2020
This chart shows the change in value of a hypothetical $10,000 investment in Institutional Class shares of the Fund during the stated time period. Although the index is provided for use in assessing the Fund’s performance, the Fund’s holdings may differ significantly from those in an index. Performance numbers reflect all Fund expenses.
| Portfolio breakdown (%) (at December 31, 2020) |
| Common Stocks | 95.9 |
| Limited Partnerships | 0.5 |
| Money Market Funds | 0.8 |
| Securities Lending Collateral | 2.8 |
| Total | 100.0 |
Percentages indicated are based upon total investments excluding investments in derivatives, if any. The Fund’s portfolio composition is subject to change.
| Equity sector breakdown (%) (at December 31, 2020) |
| Communication Services | 2.4 |
| Consumer Discretionary | 14.8 |
| Consumer Staples | 2.2 |
| Financials | 4.1 |
| Health Care | 31.7 |
| Industrials | 13.4 |
| Information Technology | 26.1 |
| Materials | 3.4 |
| Real Estate | 1.9 |
| Total | 100.0 |
Percentages indicated are based upon total equity investments. The Fund’s portfolio composition is subject to change.
| 4 | Columbia Acorn Family of Funds | Annual Report 2020 |
Manager Discussion of Fund Performance
Columbia Acorn® Fund
Columbia Acorn® Fund Institutional Class shares returned 29.51% for the 12-month period ended December 31, 2020, underperforming the 40.47% return of its primary benchmark, the Russell 2500 Growth Index.
Market overview
U.S. equity markets put together an encore performance of strength in 2020 despite a precipitous drop early in the year, as the rapidly spreading COVID-19 pandemic led to drastic declines in estimates for earnings and growth in the first quarter. The subsequent response by the Federal Reserve to put forth unprecedented stimulus measures proved invaluable as reassured investors returned to the markets in a strong way. Shifting into the back-half of the year, the 2020 U.S. Presidential election took a temporary backseat to encouraging vaccine clinical trial results reported by drug development companies Pfizer and Moderna which provided an optimistic glimpse of a potential end to the ongoing global pandemic. Equity markets cheered the Food & Drug Administration’s (FDA’)s approval of the two vaccines for emergency use in December, furthering the very strong returns experienced across U.S. equity markets and leading indices to some of their best annual returns on record.
In a year of extremes, the U.S. equity markets were supportive of volatile, speculative stocks which drove extraordinary returns, leading the benchmark index to one of the best-performing years in its history. Unprofitable companies (a segment of the Russell indices that has been increasing in size lately) substantially outperformed those that were profitable.
We are encouraged by the strong absolute results generated by the Fund for our investors. Well managed small- and mid-cap companies offer exciting opportunities for growth and innovation, and our investors experienced the value-creating benefits of those absolute returns throughout the year. Smaller companies handily outperformed the general stock market exposure of the S&P 500 Index over the course of 2020.
Contributors and detractors
Health care holding Livongo Health represented the Fund’s top contributor to absolute returns as employers increasingly acknowledged the value proposition of the company’s remote monitoring platform and widely adopted the solution. Ultimately, telehealth peer Teladoc also acknowledged Livongo’s compelling solutions and proposed a merger at a significant stock price premium for Livongo.
Zscaler, Inc., a provider of cloud-based security solutions, performed well as its offerings have been well-positioned to address companies’ ongoing need to secure a much more expansive remote workforce. This development has only accelerated the already ongoing shift away from conventional perimeter-centric protection.
Immunomedics, a developer of cancer therapies, benefitted from the FDA’s approval of its breast cancer treatment midway through the year, followed by the company’s acquisition by industry behemoth Gilead Sciences at a significant premium.
Walker and Dunlap, a lender to operators of apartment buildings and complexes, encountered challenges during the period. As business closures placed substantial pressure on employment, the potential for landlords – which borrow from Walker & Dunlop – to experience financial distress due to uncollectable rents gave investors pause.
Billboard operator Lamar Advertising struggled to gain its footing as concerns arose around the specter of meaningful cuts in the advertising budgets of the company’s end customers. These concerns were particularly noteworthy as a material portion of Lamar’s customer base is represented by smaller businesses with more modest resources that are ultimately more sensitive to budget shocks.
Reata Pharmaceuticals, Inc. is a biotechnology firm involved in the development of treatments for acute inflammatory conditions. The company endured a setback as a request was received from the FDA for additional data regarding two of its promising drug candidates. delays which were largely unexpected.
Fund positioning
We ended 2020 with some optimism given vaccine developments which, as they are administered worldwide, may help the world’s economic growth and reinstate a sense of well-being and normalcy. However, with valuations now at historically extreme levels, the hurdle for further overall stock market gains is high. The incoming Biden administration is expected to quickly propose further fiscal stimulus, which could strengthen markets, but higher tax rates, which could have a dampening
Columbia Acorn Family of Funds | Annual Report 2020
| 5 |
Manager Discussion of Fund Performance (continued)
Columbia Acorn® Fund
effect, have been a major aspect of the administration’s platform. The Federal Reserve has remained extremely accommodative, but any whiffs of budding inflation likely could cause this well-accepted narrative to come into question, thereby increasing the probability of higher interest rates, which in the long-term would be a headwind for equity valuations.
In this uncertain and “expensive” market environment, the Fund continues to own what we believe to be strong companies with above-average growth prospects, and are run by experienced and savvy management teams. We have developed a differentiated investment thesis for every stock we own, pursuing companies that we believe can successfully navigate the market uncertainty, but also perform well and take market share as global demand returns and economies recover from the current pandemic-affected business landscape. Our team remains confident in the diligent and disciplined approach of the Fund’s strategy to provide compelling performance and results for shareholders over the long-term.
In 2021, we are enthusiastic about continuing to identify and tap into some of the best and fastest growing investment opportunities in the United States, in companies that we believe can relatively outperform in a variety of economic environments.
Market risk may affect a single issuer, sector of the economy, industry or the market as a whole. Investments in small- and mid-capcompanies involve risks and volatility and possible illiquidity greater than investments in larger, more established companies. Foreign investments subject the Fund to political, economic, market, social and other risks within a particular country, as well as to potential currency instabilities and less stringent financial and accounting standards generally applicable to U.S. issuers. Risks are enhanced for emerging market issuers. The Fund may invest significantly in issuers within a particular sector, which may be negatively affected by market, economic or other conditions, making the Fund more vulnerable to unfavorable developments in the sector. See the Fund’s prospectus for more information on these and other risks.
The views expressed in this report reflect the current views of the respective parties. These views are not guarantees of future performance and involve certain risks, uncertainties and assumptions that are difficult to predict, so actual outcomes and results may differ significantly from the views expressed. These views are subject to change at any time based upon economic, market or other conditions and the respective parties disclaim any responsibility to update such views. These views may not be relied on as investment advice and, because investment decisions for a Columbia Acorn Fund are based on numerous factors, may not be relied on as an indication of trading intent on behalf of any particular Columbia Acorn Fund. References to specific securities should not be construed as a recommendation or investment advice.
| 6 | Columbia Acorn Family of Funds | Annual Report 2020 |
Fund at a glance
Columbia Acorn International®
Investment objective
Columbia Acorn International® (the Fund) seeks long-term capital appreciation.
Portfolio management
Tae Han (Simon) Kim, CFA
Co-Portfolio Manager since 2017
Service with Fund since 2011
Hans F. Stege
Co-Portfolio Manager since July 2020
Service with Fund since 2017
Morningstar style boxTM
The Morningstar Style Box is based on a fund’s portfolio holdings. For equity funds, the vertical axis shows the market capitalization of the stocks owned, and the horizontal axis shows investment style (value, blend, or growth). Information shown is based on the most recent data provided by Morningstar.
© 2021 Morningstar, Inc. All rights reserved. The Morningstar information contained herein: (1) is proprietary to Morningstar and/or its content providers; (2) may not be copied or distributed; and (3) is not warranted to be accurate, complete or timely. Neither Morningstar nor its content providers are responsible for any damages or losses arising from any use of this information.
| Average annual total returns (%) (for the period ended December 31, 2020) |
| | | Inception | 1 Year | 5 Years | 10 Years | Life of Fund |
| Class A | Excluding sales charges | 10/16/00 | 14.68 | 9.89 | 6.66 | 9.91 |
| | Including sales charges | | 8.08 | 8.60 | 6.03 | 9.68 |
| Advisor Class | 11/08/12 | 14.98 | 10.15 | 6.93 | 10.28 |
| Class C | Excluding sales charges | 10/16/00 | 13.82 | 9.07 | 5.86 | 9.09 |
| | Including sales charges | | 12.84 | 9.07 | 5.86 | 9.09 |
| Institutional Class | 09/23/92 | 14.99 | 10.17 | 6.96 | 10.30 |
| Institutional 2 Class | 08/02/11 | 15.06 | 10.23 | 7.00 | 10.30 |
| Institutional 3 Class | 11/08/12 | 15.10 | 10.28 | 7.04 | 10.33 |
| Class R | 08/02/11 | 14.40 | 9.60 | 6.33 | 9.62 |
| MSCI ACWI ex USA SMID Cap Growth Index (Net) | | 19.88 | 10.43 | 6.57 | - |
| MSCI ACWI ex USA SMID Cap Index (Net) | | 12.01 | 8.94 | 5.61 | - |
Performance numbers reflect all Fund expenses. Returns for Class A shares are shown with and without the maximum initial sales charge of 5.75%. Returns for Class C shares are shown with and without the maximum contingent deferred sales charge of 1.00% for the first year after purchase. The Fund’s other share classes are not subject to sales charges, but may be subject to other fees and expenses, and have limited eligibility. Please see the Fund’s prospectus for details. Performance for different share classes will vary based on differences in sales charges and certain fees and expenses associated with each share class.
As stated in the May 1, 2020 prospectus (as supplemented), the Fund’s annual operating expense ratio is 0.99% for Institutional Class shares and 1.24% for Class A shares.
All results shown assume reinvestment of distributions during the period. Returns do not reflect the deduction of taxes that a shareholder may pay on Fund distributions or on the redemption of Fund shares. Performance results reflect the effect of fee waivers or reimbursements of Fund expenses by the investment manager and/or its affiliates. Absent these fee waivers and/or expense reimbursement arrangements, performance results may have been lower.
The performance information shown represents past performance and is not a guarantee of future results. The investment return and principal value of your investment will fluctuate so that shares, when redeemed, may be worth more or less than their original cost. Current performance may be lower or higher than the performance data shown. You may obtain performance information current to the most recent month-end by contacting your financial intermediary, visiting columbiathreadneedleus.com/investor/ or calling 800.922.6769.
The returns shown for periods prior to the share class inception date (including returns for the Life of the Fund, if shown, which are since Fund inception) include the returns of the Fund’s oldest share class. These returns are adjusted to reflect any higher class-related operating expenses of the newer share classes, as applicable. Please visit columbiathreadneedleus.com/investor/investment-products/mutual-funds/appended-performance for more information.
The MSCI ACWI ex USA SMID Cap Growth Index (Net) captures a mid- and small-cap representation across 22 developed market countries and 27 emerging markets countries.
The MSCI ACWI ex USA SMID Cap Index (Net) captures a mid- and small-cap representation across 22 of 23 developed market countries (excluding the United States) and 27 emerging market countries. The index covers approximately 28% of the free float-adjusted market capitalization in each country.
Unlike mutual funds, indexes are not managed and do not incur fees or expenses. It is not possible to invest directly in an index.
The COVID-19 pandemic has adversely impacted economies and capital markets around the world in ways that will likely continue and may change in unforeseen ways for an indeterminate period. The COVID-19 pandemic may exacerbate pre-existing political, social and economic risks in certain countries and globally.Fund performance may be significantly negatively impacted by the economic impact of the COVID-19 pandemic.
Columbia Acorn Family of Funds | Annual Report 2020
| 7 |
Fund at a glance (continued)
Columbia Acorn International®
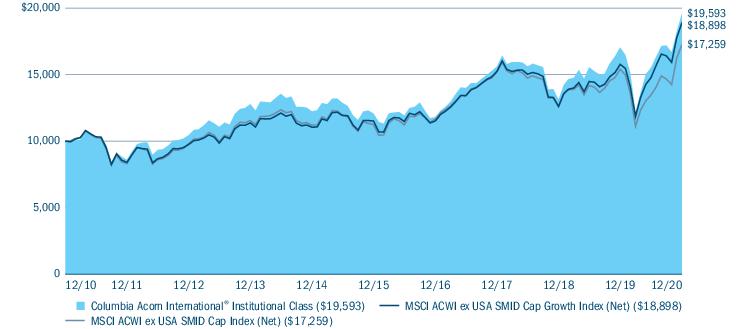
The Growth of a $10,000 Investment in Columbia Acorn International® Institutional Class Shares
December 31, 2010 through December 31, 2020
This chart shows the change in value of a hypothetical $10,000 investment in Institutional Class shares of the Fund during the stated time period. Although the indexes are provided for use in assessing the Fund’s performance, the Fund’s holdings may differ significantly from those in an index. Performance numbers reflect all Fund expenses.
| Equity sector breakdown (%) (at December 31, 2020) |
| Communication Services | 4.6 |
| Consumer Discretionary | 13.3 |
| Consumer Staples | 2.7 |
| Energy | 0.6 |
| Financials | 8.1 |
| Health Care | 15.6 |
| Industrials | 19.0 |
| Information Technology | 25.5 |
| Materials | 5.7 |
| Real Estate | 4.9 |
| Total | 100.0 |
Percentages indicated are based upon total equity investments. The Fund’s portfolio composition is subject to change.
| Country breakdown (%) (at December 31, 2020) |
| Australia | 4.4 |
| Austria | 0.8 |
| Brazil | 2.5 |
| Cambodia | 1.1 |
| Canada | 2.5 |
| China | 3.6 |
| Cyprus | 0.7 |
| Denmark | 2.9 |
| France | 0.6 |
| Country breakdown (%) (at December 31, 2020) |
| Germany | 6.9 |
| Greece | 0.4 |
| Hong Kong | 0.9 |
| Ireland | 1.0 |
| Italy | 2.8 |
| Japan | 18.7 |
| Malta | 1.5 |
| Mexico | 0.6 |
| Netherlands | 4.2 |
| New Zealand | 1.9 |
| Singapore | 2.4 |
| South Korea | 3.4 |
| Spain | 2.6 |
| Sweden | 9.9 |
| Switzerland | 3.0 |
| Taiwan | 2.8 |
| Thailand | 0.8 |
| United Kingdom | 12.8 |
| United States(a) | 4.3 |
| Total | 100.0 |
| (a) | Includes investments in Money Market Funds. |
Country breakdown is based primarily on issuer’s place of organization/incorporation. Percentages indicated are based upon total investments excluding investments in derivatives, if any. The Fund’s portfolio composition is subject to change.
| 8 | Columbia Acorn Family of Funds | Annual Report 2020 |
Manager Discussion of Fund Performance
Columbia Acorn International®
Columbia Acorn International® Institutional Class shares returned 14.99% for the 12-month period ended December 31, 2020, underperforming the 19.88% return for its primary benchmark, the MSCI ACWI ex USA SMID Cap Growth Index (Net). The Fund’s secondary benchmark, the MSCI ACWI ex USA SMID Cap Index (Net), ended the 12-month period with a return of 12.01%.
Market overview
International equity markets trended higher in 2020 despite a precipitous drop early in the year, as the rapidly spreading COVID-19 pandemic led to drastic declines in estimates for earnings and growth in the first quarter. The subsequent response by global central banks to put forth stimulus measures proved invaluable as reassured investors returned to the markets in a strong way. Global equity markets rose in the fourth quarter as positive clinical trial results and the start of vaccinations provided investors with an optimistic glimpse of a potential end to the ongoing global pandemic. Investors cheered approval of the first vaccines toward the end of 2020, with more approvals poised to follow early in 2021. As such, we would expect this to help accelerate the rate of global vaccinations moving forward. In a year of extremes, the positive vaccination news gave a jolt to volatile stocks in beaten-up sectors, despite significant unknowns in the pace and shape of recovery in travel, energy and other disrupted sectors.
We are encouraged by the solid absolute results generated by the Fund for our investors, despite underperforming strong benchmark performance that was driven by the success of more speculative companies with no clear path to positive earnings. Well-managed global small- and mid-cap companies offer some very exciting opportunities for growth and innovation, and our investors experienced the value-creating benefits of those absolute returns over the course of 2020.
Contributors and detractors
Among individual stocks, Lasertec Corp. was the leading contributor to absolute Fund performance. Lasertec is a Japanese company that produces next-generation inspection and measurement equipment used in semiconductor production. The firm’s near monopolistic position in a niche area of extreme ultraviolet (eUV) production has resulted in robust growth as innovation in the semiconductor industry drives chipmakers to produce smaller, more complex chipsets.
Hypoport SE is a fast-growing and profitable mortgage platform provider for German banks. The firm’s product suite helps its customers reduce IT costs as the competitive landscape intensifies in the mortgage sector. Hypoport’s compelling value proposition to its customers and alignment with favorable trends toward digitalization has enabled the firm to take market share, which was rewarded by investors over the course of the period.
Argenx SE is a biotech company with a primary focus on developing drug therapies to treat autoimmune diseases as well as for cancer symptoms. Shares rose as the firm published positive phase-3 clinical trial results assessing its treatment candidate for a neuromuscular disorder that causes sudden weakness in the body’s core skeletal muscles. The drug’s compelling efficacy and safety profile relative to competing products were well-received by investors during the period.
On the negative side, WH Smith, which operates duty-free retail stores in airports, train stations and other travel centers, saw revenues pressured as sudden travel restrictions and shutdowns at high street stores curbed results during the period. With subdued travel activity expected to place sustained pressure on foot traffic in the medium term, the Fund closed its position in the holding.
CAE, Inc is a Canada-based leading manufacturer of flight simulator systems for applications across the aviation industry. As the airline industry continues to grapple with an ever-evolving new normal of depressed flight activity and flight personnel needs in the near- to medium-term, subsequent demand for CAE’s simulation systems encountered pressure during the period. Despite the firm’s enviable positioning as the market share leader in the space, the Fund closed its position in light of what is likely to be an extended period of subdued growth.
MTU Aero Engines is a provider of systems and components as well as maintenance and repair services to the airline industry. Drastic reductions in global flight volumes led to less wear-and-tear on airplanes during the period. This development substantially reduced demand for MTU’s products and services, leading shares lower. The Fund closed its position in the period as we believed MTU’s growth trajectory would likely remain depressed given the expected slow recovery in air travel activity.
Columbia Acorn Family of Funds | Annual Report 2020
| 9 |
Manager Discussion of Fund Performance (continued)
Columbia Acorn International®
Fund positioning
We ended 2020 with optimism given vaccine developments that should help the world’s economic growth and reinstate a sense of well-being and normalcy. Global central banks remain largely accommodative, but we continue to monitor for signs of budding inflation that could cause this well-accepted narrative to come into question. In the event this occurs, the probability of higher interest rates would rise with the potential to create headwinds for equity valuations in the longer term.
In this uncertain market environment, the Fund continues to own what we believe to be strong companies with attractive growth prospects, led by prudent management teams. We believe these companies are well-positioned to successfully navigate the market uncertainty, but also take market share from competitors as global demand returns and economies recover. Our team remains confident in the diligent and disciplined approach of the Fund’s strategy to provide compelling performance and results for shareholders over the long-term.
In 2021, we are enthusiastic about continuing to identify and tap into some of the best and fastest growing investment opportunities across the globe, in companies that can execute and perform well in a variety of market environments.
Market risk may affect a single issuer, sector of the economy, industry or the market as a whole. International investing involves certain risks and volatility due to potential political, economic or currency instabilities and different, potentially less stringent, financial and accounting standards than those generally applicable to U.S. issuers. Risks are enhanced for emerging market issuers. Investments in small- and mid-cap companies involve risks and volatility and possible illiquidity greater than investments in larger, more established companies. The Fund may invest significantly in issuers within a particular sector, which may be negatively affected by market, economic or other conditions, making the Fund more vulnerable to unfavorable developments in the sector. See the Fund’s prospectus for more information on these and other risks.
The views expressed in this report reflect the current views of the respective parties. These views are not guarantees of future performance and involve certain risks, uncertainties and assumptions that are difficult to predict, so actual outcomes and results may differ significantly from the views expressed. These views are subject to change at any time based upon economic, market or other conditions and the respective parties disclaim any responsibility to update such views. These views may not be relied on as investment advice and, because investment decisions for a Columbia Acorn Fund are based on numerous factors, may not be relied on as an indication of trading intent on behalf of any particular Columbia Acorn Fund. References to specific securities should not be construed as a recommendation or investment advice.
| 10 | Columbia Acorn Family of Funds | Annual Report 2020 |
Fund at a glance
Columbia Acorn USA®
Investment objective
Columbia Acorn USA® (the Fund) seeks long-term capital appreciation.
Portfolio management
Matthew A. Litfin, CFA
Lead Portfolio Manager since 2016
Service with Fund since 2015
Richard Watson, CFA
Co-Portfolio Manager since 2017
Service with Fund since 2006
Morningstar style boxTM
The Morningstar Style Box is based on a fund’s portfolio holdings. For equity funds, the vertical axis shows the market capitalization of the stocks owned, and the horizontal axis shows investment style (value, blend, or growth). Information shown is based on the most recent data provided by Morningstar.
© 2021 Morningstar, Inc. All rights reserved. The Morningstar information contained herein: (1) is proprietary to Morningstar and/or its content providers; (2) may not be copied or distributed; and (3) is not warranted to be accurate, complete or timely. Neither Morningstar nor its content providers are responsible for any damages or losses arising from any use of this information.
| Average annual total returns (%) (for the period ended December 31, 2020) |
| | | Inception | 1 Year | 5 Years | 10 Years | Life of Fund |
| Class A | Excluding sales charges | 10/16/00 | 23.70 | 16.29 | 12.41 | 11.09 |
| | Including sales charges | | 16.62 | 14.92 | 11.74 | 10.82 |
| Advisor Class | 11/08/12 | 24.08 | 16.59 | 12.70 | 11.44 |
| Class C | Excluding sales charges | 10/16/00 | 22.79 | 15.45 | 11.60 | 10.28 |
| | Including sales charges | | 21.79 | 15.45 | 11.60 | 10.28 |
| Institutional Class | 09/04/96 | 24.04 | 16.59 | 12.70 | 11.44 |
| Institutional 2 Class | 11/08/12 | 24.10 | 16.69 | 12.77 | 11.47 |
| Institutional 3 Class | 11/08/12 | 24.16 | 16.74 | 12.81 | 11.49 |
| Russell 2000 Growth Index | | 34.63 | 16.36 | 13.48 | - |
Performance numbers reflect all Fund expenses. Returns for Class A shares are shown with and without the maximum initial sales charge of 5.75%. Returns for Class C shares are shown with and without the maximum contingent deferred sales charge of 1.00% for the first year after purchase. The Fund’s other share classes are not subject to sales charges, but may be subject to other fees and expenses, and have limited eligibility. Please see the Fund’s prospectus for details. Performance for different share classes will vary based on differences in sales charges and certain fees and expenses associated with each share class.
As stated in the May 1, 2020 prospectus (as supplemented), the Fund’s annual operating expense ratio is 1.16% for Institutional Class shares and 1.41% for Class A shares.
All results shown assume reinvestment of distributions during the period. Returns do not reflect the deduction of taxes that a shareholder may pay on Fund distributions or on the redemption of Fund shares. Performance results reflect the effect of fee waivers or reimbursements of Fund expenses by the investment manager and/or its affiliates. Absent these fee waivers and/or expense reimbursement arrangements, performance results may have been lower.
The performance information shown represents past performance and is not a guarantee of future results. The investment return and principal value of your investment will fluctuate so that shares, when redeemed, may be worth more or less than their original cost. Current performance may be lower or higher than the performance data shown. You may obtain performance information current to the most recent month-end by contacting your financial intermediary, visiting columbiathreadneedleus.com/investor/ or calling 800.922.6769.
The returns shown for periods prior to the share class inception date (including returns for the Life of the Fund, if shown, which are since Fund inception) include the returns of the Fund’s oldest share class. These returns are adjusted to reflect any higher class-related operating expenses of the newer share classes, as applicable. Please visit columbiathreadneedleus.com/investor/investment-products/mutual-funds/appended-performance for more information.
The Russell 2000 Growth Index, an unmanaged index, measures the performance of those Russell 2000 Index companies with higher price-to-book ratios and higher forecasted growth values.
Unlike mutual funds, indexes are not managed and do not incur fees or expenses. It is not possible to invest directly in an index.
The COVID-19 pandemic has adversely impacted economies and capital markets around the world in ways that will likely continue and may change in unforeseen ways for an indeterminate period. The COVID-19 pandemic may exacerbate pre-existing political, social and economic risks in certain countries and globally.Fund performance may be significantly negatively impacted by the economic impact of the COVID-19 pandemic.
Columbia Acorn Family of Funds | Annual Report 2020
| 11 |
Fund at a glance (continued)
Columbia Acorn USA®
The Growth of a $10,000 Investment in Columbia Acorn USA® Institutional Class Shares
December 31, 2010 through December 31, 2020
This chart shows the change in value of a hypothetical $10,000 investment in Institutional Class shares of the Fund during the stated time period. Although the index is provided for use in assessing the Fund’s performance, the Fund’s holdings may differ significantly from those in an index. Performance numbers reflect all Fund expenses.
| Portfolio breakdown (%) (at December 31, 2020) |
| Common Stocks | 96.1 |
| Limited Partnerships | 0.6 |
| Money Market Funds | 1.0 |
| Securities Lending Collateral | 2.3 |
| Total | 100.0 |
Percentages indicated are based upon total investments excluding investments in derivatives, if any. The Fund’s portfolio composition is subject to change.
| Equity sector breakdown (%) (at December 31, 2020) |
| Consumer Discretionary | 14.4 |
| Consumer Staples | 3.1 |
| Financials | 5.5 |
| Health Care | 38.2 |
| Industrials | 15.5 |
| Information Technology | 18.9 |
| Materials | 1.6 |
| Real Estate | 2.8 |
| Total | 100.0 |
Percentages indicated are based upon total equity investments. The Fund’s portfolio composition is subject to change.
| 12 | Columbia Acorn Family of Funds | Annual Report 2020 |
Manager Discussion of Fund Performance
Columbia Acorn USA®
Columbia Acorn USA® Institutional Class shares returned 24.04% for the 12-month period ended December 31, 2020, trailing the 34.63% return of the Fund’s primary benchmark, the Russell 2000 Growth Index.
Market overview
U.S. equity markets put together an encore performance of strength in 2020 despite a precipitous drop early in the year, as the rapidly spreading COVID-19 pandemic led to drastic declines in estimates for earnings and growth in the first quarter. The subsequent response by the Federal Reserve to put forth unprecedented stimulus measures proved invaluable as reassured investors returned to the markets in a strong way. Shifting into the back-half of the year, the 2020 U.S. Presidential election took a temporary backseat to encouraging vaccine clinical trial results reported by drug development companies Pfizer and Moderna that provided an optimistic glimpse of a potential end to the ongoing global pandemic. Equity markets cheered the Food & Drug Administration’s (FDA’s) approval of the two vaccines for emergency use in December, furthering the very strong returns experienced across U.S. equity markets and leading indices to some of their best annual returns on record.
In a year of extremes, the U.S. equity markets were supportive of volatile, speculative stocks which drove extraordinary returns, leading the benchmark index to one of the best-performing years in its history. Unprofitable companies (a segment of the Russell indices that has been increasing in size lately) substantially outperformed those that were profitable.
We are encouraged by the strong absolute results generated by the Fund for our investors. Well managed small-cap companies offer exciting opportunities for growth and innovation, and our investors experienced the value-creating benefits of those absolute returns throughout the year. Smaller companies handily outperformed the general stock market exposure of the S&P 500 Index over the course of 2020.
Contributors and detractors
Health care holding Livongo Health represented the Fund’s top contributor to absolute returns as employers increasingly acknowledged the value proposition of the company’s remote monitoring platform and widely adopted the solution. Ultimately, telehealth peer Teladoc also acknowledged Livongo’s compelling solutions and proposed a merger at a significant stock price premium for Livongo.
Natera, Inc. is a genetic diagnostics testing company that provides screening and testing for prenatal and cancer patients. Natera has developed less-invasive prenatal screening products that are increasingly used in the broader “average risk” pregnancy segment, while the firm’s tumor testing segment saw greater-than-expected traction in the sizable cancer treatment market during the period.
Fate Therapeutics, Inc., a biotech firm developing a broad array of cancer therapies using gene therapy, was also among the largest contributors to the Fund’s absolute performance. The firm reported encouraging interim clinical trial data for its lymphoma drug candidate towards the end of the period, which led shares substantially higher.
Walker and Dunlap, a lender to operators of apartment buildings and complexes, encountered challenges during the period. As business closures placed substantial pressure on employment, the potential for landlords – which borrow from Walker & Dunlop – to experience financial distress due to uncollectable rents gave investors pause.
Intercept Pharmaceuticals, Inc. shares were weak during the period, as the company encountered hurdles related to its drug therapy for the treatment of liver-based non-alcoholic steatohepatitis (NASH). The FDA requested additional safety-related information from Intercept to move forward in the approval process for that indication. While disappointing in the near-term, we remain encouraged by the company’s opportunity given the sizable liver disease market, and we are optimistic that Intercept’s drug will be approved upon resubmission to the FDA, which we estimate will occur in the first half of 2021.
Cash management services provider Brink’s Company also detracted from the Fund’s absolute and relative performance in the period. Shares declined as the combination of broad-based closures of the firm’s retail customer base led to subdued transaction activity in the near-term, while a sizable acquisition recently closed by Brink’s placed additional pressure on the firm’s balance sheet and ultimately, the stock.
Columbia Acorn Family of Funds | Annual Report 2020
| 13 |
Manager Discussion of Fund Performance (continued)
Columbia Acorn USA®
Fund positioning
We ended 2020 with some optimism given vaccine developments which, as they are administered worldwide, can help the world’s economic growth and reinstate a sense of well-being and normalcy. However, with valuations now at historically extreme levels, the hurdle for further overall stock market gains is high. The incoming Biden administration is expected to quickly propose further fiscal stimulus, which could strengthen markets, but higher tax rates, which could have a dampening effect, have been a major aspect of the administration’s platform. The Federal Reserve remains extremely accommodative, but any whiffs of budding inflation likely would cause this well-accepted narrative to come into question, thereby increasing the probability of higher interest rates, which in the long-term would be a headwind for equity valuations.
In this uncertain and “expensive” market environment, the Fund continues to own what we believe to be strong companies with above-average growth prospects, and are run by experienced and savvy management teams. We have developed a differentiated investment thesis for every stock we own, pursuing companies that we believe can successfully navigate the market uncertainty, but also perform well and take market share as global demand returns and economies recover from the current pandemic-affected business landscape. Our team remains confident in the diligent and disciplined approach of the Fund’s strategy to provide compelling performance and results for our shareholders over the long-term.
In 2021, we are enthusiastic about continuing to identify and tap into some of the best and fastest growing investment opportunities in the United States, in companies that we believe can relatively outperform in a variety of economic environments.
Market risk may affect a single issuer, sector of the economy, industry or the market as a whole. Investments in small- and mid-cap companies involve risks and volatility greater than investments in larger, more established companies. The Fund may invest significantly in issuers within a particular sector, which may be negatively affected by market, economic or other conditions, making the fund more vulnerable to unfavorable developments in the sector. See the Fund’s prospectus for more information on these and other risks.
The views expressed in this report reflect the current views of the respective parties. These views are not guarantees of future performance and involve certain risks, uncertainties and assumptions that are difficult to predict, so actual outcomes and results may differ significantly from the views expressed. These views are subject to change at any time based upon economic, market or other conditions and the respective parties disclaim any responsibility to update such views. These views may not be relied on as investment advice and, because investment decisions for a Columbia Acorn Fund are based on numerous factors, may not be relied on as an indication of trading intent on behalf of any particular Columbia Acorn Fund. References to specific securities should not be construed as a recommendation or investment advice.
| 14 | Columbia Acorn Family of Funds | Annual Report 2020 |
Fund at a glance
Columbia Acorn International SelectSM
Investment objective
Columbia Acorn International SelectSM (the Fund) seeks long-term capital appreciation.
Portfolio management
Stephen Kusmierczak, CFA
Lead Portfolio Manager or Co-Portfolio Manager since 2016
Service with Fund since 2001
Hans F. Stege
Co-Portfolio Manager since 2019
Service with Fund since 2017
Morningstar style boxTM
The Morningstar Style Box is based on a fund’s portfolio holdings. For equity funds, the vertical axis shows the market capitalization of the stocks owned, and the horizontal axis shows investment style (value, blend, or growth). Information shown is based on the most recent data provided by Morningstar.
© 2021 Morningstar, Inc. All rights reserved. The Morningstar information contained herein: (1) is proprietary to Morningstar and/or its content providers; (2) may not be copied or distributed; and (3) is not warranted to be accurate, complete or timely. Neither Morningstar nor its content providers are responsible for any damages or losses arising from any use of this information.
| Average annual total returns (%) (for the period ended December 31, 2020) |
| | | Inception | 1 Year | 5 Years | 10 Years | Life of Fund |
| Class A | Excluding sales charges | 10/16/00 | 18.21 | 13.51 | 8.06 | 9.10 |
| | Including sales charges | | 11.43 | 12.17 | 7.42 | 8.81 |
| Advisor Class | 11/08/12 | 18.51 | 13.80 | 8.35 | 9.43 |
| Class C | Excluding sales charges | 10/16/00 | 17.37 | 12.66 | 7.23 | 8.28 |
| | Including sales charges | | 16.37 | 12.66 | 7.23 | 8.28 |
| Institutional Class | 11/23/98 | 18.50 | 13.80 | 8.36 | 9.44 |
| Institutional 2 Class | 11/08/12 | 18.63 | 13.89 | 8.42 | 9.46 |
| Institutional 3 Class | 11/08/12 | 18.67 | 13.94 | 8.46 | 9.48 |
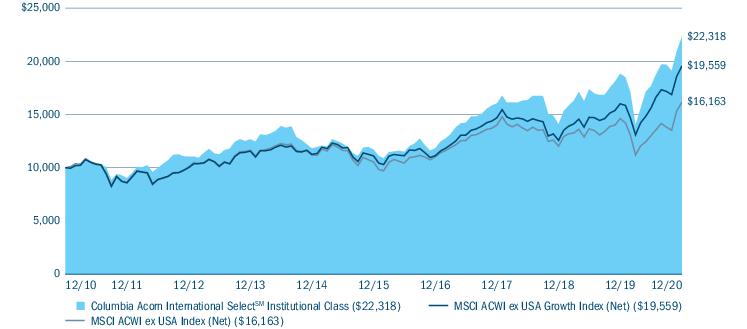
| MSCI ACWI ex USA Growth Index (Net) | | 22.20 | 11.97 | 6.94 | - |
| MSCI ACWI ex USA Index (Net) | | 10.65 | 8.93 | 4.92 | - |
Performance numbers reflect all Fund expenses. Returns for Class A shares are shown with and without the maximum initial sales charge of 5.75%. Returns for Class C shares are shown with and without the maximum contingent deferred sales charge of 1.00% for the first year after purchase. The Fund’s other share classes are not subject to sales charges, but may be subject to other fees and expenses, and have limited eligibility. Please see the Fund’s prospectus for details. Performance for different share classes will vary based on differences in sales charges and certain fees and expenses associated with each share class.
As stated in the May 1, 2020 prospectus (as supplemented), the Fund’s annual operating expense ratio is 1.03% for Institutional Class shares and 1.28% for Class A shares.
All results shown assume reinvestment of distributions during the period. Returns do not reflect the deduction of taxes that a shareholder may pay on Fund distributions or on the redemption of Fund shares. Performance results reflect the effect of fee waivers or reimbursements of Fund expenses by the investment manager and/or its affiliates. Absent these fee waivers and/or expense reimbursement arrangements, performance results may have been lower.
The performance information shown represents past performance and is not a guarantee of future results. The investment return and principal value of your investment will fluctuate so that shares, when redeemed, may be worth more or less than their original cost. Current performance may be lower or higher than the performance data shown. You may obtain performance information current to the most recent month-end by contacting your financial intermediary, visiting columbiathreadneedleus.com/investor/ or calling 800.922.6769.
The returns shown for periods prior to the share class inception date (including returns for the Life of the Fund, if shown, which are since Fund inception) include the returns of the Fund’s oldest share class. These returns are adjusted to reflect any higher class-related operating expenses of the newer share classes, as applicable. Please visit columbiathreadneedleus.com/investor/investment-products/mutual-funds/appended-performance for more information.
The MSCI ACWI ex USA Growth Index (Net) captures a large- and mid-cap representation across 22 developed market countries and 27 emerging market countries.
The MSCI ACWI ex USA Index (Net) captures a large- and mid-cap representation across 22 of 23 developed market countries (excluding the United States) and 27 emerging market countries. The index covers approximately 85% of the global equity opportunity set outside the United States.
Unlike mutual funds, indexes are not managed and do not incur fees or expenses. It is not possible to invest directly in an index.
The COVID-19 pandemic has adversely impacted economies and capital markets around the world in ways that will likely continue and may change in unforeseen ways for an indeterminate period. The COVID-19 pandemic may exacerbate pre-existing political, social and economic risks in certain countries and globally.Fund performance may be significantly negatively impacted by the economic impact of the COVID-19 pandemic.
Columbia Acorn Family of Funds | Annual Report 2020
| 15 |
Fund at a glance (continued)
Columbia Acorn International SelectSM
The Growth of a $10,000 Investment in Columbia Acorn International SelectSM Institutional Class Shares
December 31, 2010 through December 31, 2020
This chart shows the change in value of a hypothetical $10,000 investment in Institutional Class shares of the Fund during the stated time period. Although the indexes are provided for use in assessing the Fund’s performance, the Fund’s holdings may differ significantly from those in an index. Performance numbers reflect all Fund expenses.
| Equity sector breakdown (%) (at December 31, 2020) |
| Communication Services | 10.0 |
| Consumer Discretionary | 14.7 |
| Financials | 7.7 |
| Health Care | 16.8 |
| Industrials | 18.5 |
| Information Technology | 27.5 |
| Materials | 2.7 |
| Real Estate | 2.1 |
| Total | 100.0 |
Percentages indicated are based upon total equity investments. The Fund’s portfolio composition is subject to change.
| Country breakdown (%) (at December 31, 2020) |
| Australia | 2.3 |
| Brazil | 2.0 |
| Canada | 2.7 |
| China | 12.5 |
| Denmark | 2.7 |
| Germany | 4.4 |
| Country breakdown (%) (at December 31, 2020) |
| Italy | 4.0 |
| Japan | 16.4 |
| Malta | 0.0(a) |
| Netherlands | 5.8 |
| New Zealand | 3.0 |
| Singapore | 2.1 |
| South Korea | 5.7 |
| Sweden | 13.0 |
| Switzerland | 7.1 |
| Taiwan | 2.3 |
| United Kingdom | 13.3 |
| United States(b) | 0.7 |
| Total | 100.0 |
| (a) | Rounds to zero. |
| (b) | Includes investments in Money Market Funds. |
Country breakdown is based primarily on issuer’s place of organization/incorporation. Percentages indicated are based upon total investments excluding investments in derivatives, if any. The Fund’s portfolio composition is subject to change.
| 16 | Columbia Acorn Family of Funds | Annual Report 2020 |
Manager Discussion of Fund Performance
Columbia Acorn International SelectSM
Columbia Acorn International SelectSM Institutional Class shares returned 18.50% for the 12-month period ended December 31, 2020, outpaced by the 22.20% return of its primary benchmark, the MSCI ACWI ex USA Growth Index (Net). The Fund’s secondary benchmark, the MSCI ACWI ex USA Index (Net), ended the 12-month period with a return of 10.65%.
Market overview
International equity markets trended higher in 2020 despite a precipitous drop early in the year, as the rapidly spreading COVID-19 pandemic led to drastic declines in estimates for earnings and growth in the first quarter. The subsequent response by global central banks to put forth stimulus measures proved invaluable as reassured investors returned to the markets in a strong way. Shifting into the back half of the year, positive clinical trial results and the start of vaccinations provided investors with an optimistic glimpse of a potential end to the current global pandemic. Investors cheered approval of the first vaccines toward the end of 2020, with more approvals poised to follow early in 2021. As such, we would expect this to help accelerate the rate of global vaccinations moving forward. In a year of extremes, the positive vaccination news gave a jolt to volatile stocks in beaten-up sectors, despite significant unknowns in the pace and shape of recovery in travel, energy and other disrupted sectors.
Contributors and detractors
Despite generating solid absolute performance, the Fund was outpaced by the strong results of its primary benchmark over the course of 2020. Underperformance within the industrials and consumer discretionary sectors weighed most notably on the Fund’s relative returns, while, to a lesser extent, relative weakness within the materials sector also contributed to the Fund’s below-benchmark results. Positive relative returns within the consumer staples and health care sectors combined to somewhat offset the Fund’s broader underperformance over the course of 2020. At the geographic level, the Fund encountered stock-selection challenges within the Asia ex Japan and North America & AustalAsia regions; however, it did perform well on a relative basis within continental Europe, which helped to temper the Fund’s negative relative returns.
The Fund’s position in Sectra AB contributed most notably to the Fund’s absolute returns in 2020. Sectra is a provider of digital imaging, archive and communication systems used by hospitals, clinics and radiology centers across the health care industry. The firm has benefitted from strong positioning in its core markets while gaining share in less-penetrated markets as customers increasingly acknowledge the differentiation of Sectra’s offerings over legacy competitors.
Lasertec Corp. represented another meaningful contributor to Fund performance. Lasertec is a Japanese company that produces next-generation inspection and measurement equipment used in semiconductor production. The firm’s near monopolistic position in a niche area of extreme ultraviolet (eUV) production has resulted in robust growth as innovation in the semiconductor industry drives chipmakers to produce smaller, more complex chipsets.
Swedish engineering consultancy firm Sweco AB performed well during the period, contributing significantly to the Fund’s performance. The firm has continued to benefit from increasing environmental/resource efficiency infrastructure initiatives in its core end markets, as well as stability from its large public sector client base in an uncertain economic environment.
MTU Aero Engines is a provider of systems and components as well as maintenance and repair services for the airline industry. Drastic reductions in global flight volumes led to less wear-and-tear on airplanes during the period. This development substantially reduced demand for MTU’s products and services, leading shares lower. The Fund closed the position in the period as we believed MTU’s growth trajectory would likely remain depressed given the expected slow recovery in air travel activity.
Cholamandalam Investment and Finance is a diversified financial institution with a primary focus on vehicle and home equity lending across semi-urban and rural regions in India. The firm saw loan activity wane during the period as consumers paused material purchases given the economic uncertainty brought on by the pandemic.
Star Entertainment is an Australia-based gaming & entertainment company with key properties located in Australia’s important cities of Sydney and Brisbane as well as the highly-touristed Gold Coast. Expectations for the company’s growth became clouded as substantial renovations of key properties combined with pandemic-induced declines in visitation numbers weighed on shares of Star Entertainment during the period.
Columbia Acorn Family of Funds | Annual Report 2020
| 17 |
Manager Discussion of Fund Performance (continued)
Columbia Acorn International SelectSM
Fund positioning
We ended 2020 with optimism given vaccine developments that should help the world’s economic growth and reinstate a sense of well-being and normalcy. Global central banks remain largely accommodative, but we continue to monitor for signs of budding inflation that could cause this well-accepted narrative to come into question. In the event this occurs, the probability of higher interest rates would rise with the potential to create headwinds for equity valuations in the longer term.
In this uncertain market environment, the Fund continues to own what we believe to be strong companies with attractive growth prospects, led by prudent management teams. We believe these companies are well-positioned to successfully navigate the market uncertainty, but also to take market share from competitors as global demand returns and economies recover. Our team remains confident in the diligent and disciplined approach of the Fund’s strategy to provide compelling performance and results for shareholders over the long-term.
In 2021, we are enthusiastic about continuing to identify and tap into some of the best and fastest growing investment opportunities across the globe, in companies that can execute and perform well in a variety of market environments.
Market risk may affect a single issuer, sector of the economy, industry or the market as a whole. Foreign investments subject the Fund to political, economic, market, social and other risks within a particular country, as well as to potential currency instabilities and less stringent financial and accounting standards generally applicable to U.S. issuers. Risks are enhanced for emerging market issuers. Investments in small- and mid-cap companies involve risks and volatility and possible illiquidity greater than investments in larger, more established companies. The Fund may invest significantly in issuers within a particular sector, which may be negatively affected by market, economic or other conditions, making the Fund more vulnerable to unfavorable developments in the sector. See the Fund’s prospectus for more information on these and other risks.
The views expressed in this report reflect the current views of the respective parties. These views are not guarantees of future performance and involve certain risks, uncertainties and assumptions that are difficult to predict, so actual outcomes and results may differ significantly from the views expressed. These views are subject to change at any time based upon economic, market or other conditions and the respective parties disclaim any responsibility to update such views. These views may not be relied on as investment advice and, because investment decisions for a Columbia Acorn Fund are based on numerous factors, may not be relied on as an indication of trading intent on behalf of any particular Columbia Acorn Fund. References to specific securities should not be construed as a recommendation or investment advice.
| 18 | Columbia Acorn Family of Funds | Annual Report 2020 |
Fund at a glance
Columbia Thermostat FundSM
Investment objective
Columbia Thermostat FundSM (the Fund) seeks long-term capital appreciation.
Portfolio management
Anwiti Bahuguna, Ph.D.
Co-Portfolio Manager since 2018
Service with Fund since 2018
Joshua Kutin, CFA
Co-Portfolio Manager since 2018
Service with Fund since 2018
| Average annual total returns (%) (for the period ended December 31, 2020) |
| | | Inception | 1 Year | 5 Years | 10 Years | Life of Fund |
| Class A | Excluding sales charges | 03/03/03 | 29.27 | 10.27 | 8.31 | 7.97 |
| | Including sales charges | | 21.86 | 8.98 | 7.67 | 7.62 |
| Advisor Class | 11/08/12 | 29.58 | 10.55 | 8.58 | 8.24 |
| Class C | Excluding sales charges | 03/03/03 | 28.28 | 9.45 | 7.50 | 7.17 |
| | Including sales charges | | 27.28 | 9.45 | 7.50 | 7.17 |
| Institutional Class | 09/25/02 | 29.63 | 10.55 | 8.59 | 8.25 |
| Institutional 2 Class | 11/08/12 | 29.59 | 10.58 | 8.61 | 8.26 |
| Institutional 3 Class | 11/08/12 | 29.69 | 10.64 | 8.65 | 8.28 |
| Blended Benchmark | | 13.66 | 10.03 | 9.02 | - |
| S&P 500® Index | | 18.40 | 15.22 | 13.88 | - |
| Bloomberg Barclays U.S. Aggregate Bond Index | | 7.51 | 4.44 | 3.84 | - |
Performance numbers reflect all Fund expenses. Returns for Class A shares are shown with and without the maximum initial sales charge of 5.75%. Returns for Class C shares are shown with and without the maximum contingent deferred sales charge of 1.00% for the first year after purchase. The Fund’s other share classes are not subject to sales charges, but may be subject to other fees and expenses, and have limited eligibility. Please see the Fund’s prospectus for details. Performance for different share classes will vary based on differences in sales charges and certain fees and expenses associated with each share class.
As stated in the May 1, 2020 prospectus (as supplemented), the Fund’s annual operating expense ratio is 0.64% for Institutional Class shares and 0.89% for Class A shares.
All results shown assume reinvestment of distributions during the period. Returns do not reflect the deduction of taxes that a shareholder may pay on Fund distributions or on the redemption of Fund shares. Performance results reflect the effect of fee waivers or reimbursements of Fund expenses by the investment manager and/or its affiliates. Absent these fee waivers and/or expense reimbursement arrangements, performance results may have been lower.
The performance information shown represents past performance and is not a guarantee of future results. The investment return and principal value of your investment will fluctuate so that shares, when redeemed, may be worth more or less than their original cost. Current performance may be lower or higher than the performance data shown. You may obtain performance information current to the most recent month-end by contacting your financial intermediary, visiting columbiathreadneedleus.com/investor/ or calling 800.922.6769.
The returns shown for periods prior to the share class inception date (including returns for the Life of the Fund, if shown, which are since Fund inception) include the returns of the Fund’s oldest share class. These returns are adjusted to reflect any higher class-related operating expenses of the newer share classes, as applicable. Please visit columbiathreadneedleus.com/investor/investment-products/mutual-funds/appended-performance for more information.
The Fund’s performance prior to May 1, 2018 reflects returns achieved following a principal investment strategy pursuant to which day-to-day investment decisions for the Fund were made according to only one potential form of predetermined asset allocation table. Effective May 1, 2018, the Fund follows a principal investment strategy that calls for the Investment Manager, on at least an annual basis, to determine whether the Fund’s assets should be allocated according to one of two different forms of allocation table based on the Investment Manager’s assessment of the equity market. Through April 2020, the asset allocation table in place reflected the Investment Manager’s determination that the equity market was “expensive”. During the most recent annual review, the Fund’s portfolio managers determined the market to be “normal” and therefore, on May 1, 2020, the Fund switched to the "normal" equity market table with a 50% equity floor.
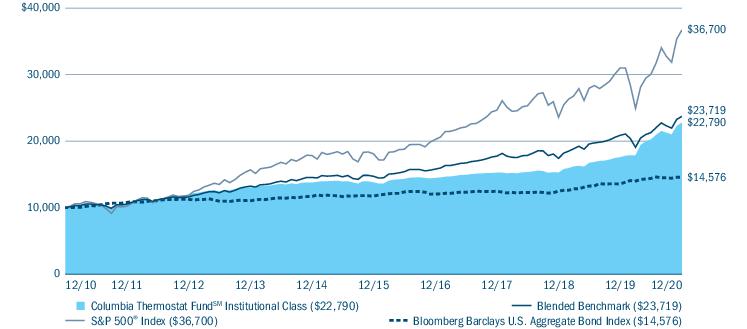
The Blended Benchmark, established by the Fund’s investment manager, is an equally weighted custom composite of Columbia Thermostat Fund’s primary equity and primary debt benchmarks, the S&P 500® Index and the Bloomberg Barclays U.S. Aggregate Bond Index, respectively. The percentage of the Fund’s assets allocated to underlying stock and bond portfolio funds will vary, and accordingly the composition of the Fund’s portfolio will not always reflect the composition of the Blended Benchmark.
The S&P 500® Index tracks the performance of 500 widely held, large-capitalization U.S. stocks.
The Bloomberg Barclays U.S. Aggregate Bond Index is a market value-weighted index that tracks the daily price, coupon, pay-downs and total return performance of fixed-rate, publicly placed, dollar-denominated and non-convertible investment-grade debt issues with at least $250 million par amount outstanding and with at least one year to final maturity.
Columbia Acorn Family of Funds | Annual Report 2020
| 19 |
Fund at a glance (continued)
Columbia Thermostat FundSM
Unlike mutual funds, indexes are not managed and do not incur fees or expenses. It is not possible to invest directly in an index.
The COVID-19 pandemic has adversely impacted economies and capital markets around the world in ways that will likely continue and may change in unforeseen ways for an indeterminate period. The COVID-19 pandemic may exacerbate pre-existing political, social and economic risks in certain countries and globally. Fund performance may be significantly negatively impacted by the economic impact of the COVID-19 pandemic.
The Growth of a $10,000 Investment in Columbia Thermostat FundSM Institutional Class Shares
December 31, 2010 through December 31, 2020
This chart shows the change in value of a hypothetical $10,000 investment in Institutional Class shares of the Fund during the stated time period. Although the indexes are provided for use in assessing the Fund’s performance, the Fund’s holdings may differ significantly from those in an index. Performance numbers reflect all Fund expenses.
| Portfolio breakdown (%) (at December 31, 2020) |
| Equity Funds | 45.0 |
| Exchange-Traded Equity Funds | 4.9 |
| Exchange-Traded Fixed Income Funds | 5.0 |
| Fixed Income Funds | 44.7 |
| Money Market Funds | 0.4 |
| Total | 100.0 |
Percentages indicated are based upon total investments excluding investments in derivatives, if any. The Fund’s portfolio composition is subject to change.
| 20 | Columbia Acorn Family of Funds | Annual Report 2020 |
Manager Discussion of Fund Performance
Columbia Thermostat FundSM
Columbia Thermostat FundSM Institutional Class shares gained 29.63% for the 12-month period ended December 31, 2020. During the same time period, the Fund’s primary equity benchmark, the S&P 500® Index, returned 18.40%, and the Fund’s primary debt benchmark, the Bloomberg Barclays U.S. Aggregate Bond Index, returned 7.51%. The Fund also significantly outperformed its custom Blended Benchmark, which returned 13.66% during 2020. The Fund’s performance in 2020 was driven by a higher allocation to equities during a period in which equities performed well.
Market overview
Equities finished 2020 with robust gains, although the journey was anything but smooth. After a benign start to the year, markets plunged beginning in mid-February amid mounting concerns about the impact of COVID-19 on the economy. Central banks and governments around the world announced huge and unprecedented policy measures to support business and households and reduce borrowing costs. Stocks began to rebound in late March as a result, and the rally more or less continued through year-end with some spikes in volatility on headlines around increasing coronavirus cases and stalled talks on further stimulus. News in November that a number of COVID-19 vaccines had proven effective against the virus led global equities to finish the year strong.
For the annual period as a whole, interest rates fell precipitously, especially at the short-term end of the U.S. Treasury yield curve, or spectrum of maturities. Federal Reserve policy was the main driver behind the drop in short-term interest rates. The decrease in economic growth and inflation expectations drove much of the decrease in longer term yields, although inflation expectations moved dramatically higher during the fourth quarter of 2020. The U.S. Treasury yield, in turn, steepened during the annual period overall, especially in the fourth quarter when the differential in yields between two-year U.S. Treasuries and 30-year U.S. Treasuries reached its highest levels since May 2017. With the significant drop in U.S. Treasury yields, duration-sensitive sectors performed well during the annual period overall. Credit sectors recovered more than many had anticipated, with most sectors of the fixed-income universe posting positive returns for the annual period. The best performing credit sector for the annual period was high-yield corporate bonds, followed by asset-backed securities. The weakest performing credit sector was emerging markets debt.
Contributors and detractors
The Fund’s equity portfolio had a weighted average return of 19.09% in 2020. All eight underlying equity funds posted positive returns for the period. Columbia Acorn® Fund was the equity portfolio’s top performer, returning 29.54% for the year. Columbia Select Mid Cap Value Fund was the equity portfolio’s worst performer, with a return of 6.96% for the year.
The Fund’s bond portfolio ended the year with a weighted average gain of 8.17%. Of the six underlying funds in the bond portfolio, Columbia Total Return Bond Fund was the strongest performer, returning 12.40% for the year. Columbia Short Term Bond Fund was the worst performer in the bond portfolio, returning 3.66% for the year.
Portfolio reallocations
There were eight reallocation triggers of the Fund’s assets driven by movement in the S&P 500® Index in 2020 following the Fund’s prospectus allocation table. Each reallocation was consistent with the S&P 500® Index levels reflected in the prospectus stock/bond allocation table in place at the time.
The Fund’s investments in the underlying funds may present certain risks, including the following: Market risk may affect a single issuer, sector of the economy, industry or the market as a whole. The Fund’s investment in other funds subjects it to the investment performance (positive or negative), risks and expenses of these underlying funds. Investments in small- and mid-cap companies involve risks and volatility and possible illiquidity greater than ininvestments in larger, more established companies. There are risks associated with fixed-income investments, including credit risk, market risk, interest rate risk and prepayment and extension risk. In general, bond prices fall when interest rates rise and vice versa. This effect is more pronounced for longer term securities. Non-investment-grade(high-yield or junk) securities present greater price volatility and more risk to principal and income than higher rated securities. Foreign investments subject the Fund to political, economic, market, social and other risks within a particular country, as well as to potential currency instabilities and less stringent financial and accounting standards generally applicable to U.S. issuers. Risks are enhanced for emerging market issuers. See the Fund’s prospectus for more information on these and other risks.
Columbia Acorn Family of Funds | Annual Report 2020
| 21 |
Manager Discussion of Fund Performance (continued)
Columbia Thermostat FundSM
The views expressed in this report reflect the current views of the respective parties. These views are not guarantees of future performance and involve certain risks, uncertainties and assumptions that are difficult to predict, so actual outcomes and results may differ significantly from the views expressed. These views are subject to change at any time based upon economic, market or other conditions and the respective parties disclaim any responsibility to update such views. These views may not be relied on as investment advice and, because investment decisions for a Columbia Acorn Fund are based on numerous factors, may not be relied on as an indication of trading intent on behalf of any particular Columbia Acorn Fund. References to specific securities should not be construed as a recommendation or investment advice.
The value of an investment in the Fund is based primarily on the performance of the underlying funds in which it invests. The Fund is subject to the risk that the investment manager’s decisions regarding asset classes and underlying funds will not anticipate market trends successfully, resulting in a failure to reserve capital or lower total return. The Investment Manager may select an underlying fund in the Columbia Acorn Family of Funds or broader Columbia Funds complex over alternative investments. There can be no assurance that the Columbia Acorn Funds will outperform similar funds managed by the Investment Manager’s affiliates. This is not an offer of the shares of any other mutual fund mentioned herein.
| 22 | Columbia Acorn Family of Funds | Annual Report 2020 |
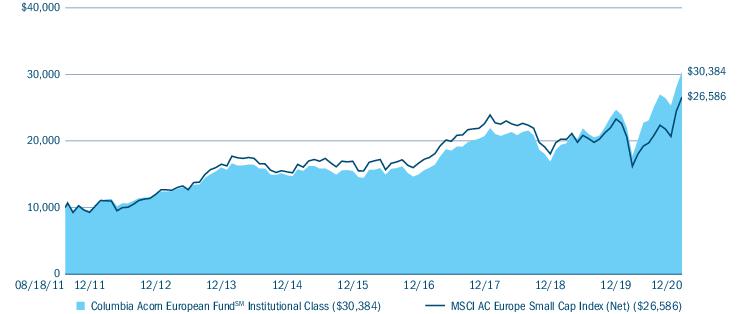
Fund at a glance
Columbia Acorn European FundSM
Investment objective
Columbia Acorn European FundSM (the Fund) seeks long-term capital appreciation.
Portfolio management
Stephen Kusmierczak, CFA
Portfolio Manager or Co-Portfolio Manager since 2011
Service with Fund since 2011
Morningstar style boxTM
The Morningstar Style Box is based on a fund’s portfolio holdings. For equity funds, the vertical axis shows the market capitalization of the stocks owned, and the horizontal axis shows investment style (value, blend, or growth). Information shown is based on the most recent data provided by Morningstar.
© 2021 Morningstar, Inc. All rights reserved. The Morningstar information contained herein: (1) is proprietary to Morningstar and/or its content providers; (2) may not be copied or distributed; and (3) is not warranted to be accurate, complete or timely. Neither Morningstar nor its content providers are responsible for any damages or losses arising from any use of this information.
| Average annual total returns (%) (for the period ended December 31, 2020) |
| | | Inception | 1 Year | 5 Years | Life of Fund |
| Class A | Excluding sales charges | 08/19/11 | 22.80 | 14.15 | 12.31 |
| | Including sales charges | | 15.76 | 12.80 | 11.60 |
| Advisor Class | 06/25/14 | 23.10 | 14.44 | 12.60 |
| Class C | Excluding sales charges | 08/19/11 | 21.87 | 13.30 | 11.48 |
| | Including sales charges | | 20.87 | 13.30 | 11.48 |
| Institutional Class | 08/19/11 | 23.08 | 14.44 | 12.59 |
| Institutional 2 Class | 11/08/12 | 23.23 | 14.51 | 12.63 |
| Institutional 3 Class | 03/01/17 | 23.24 | 14.51 | 12.63 |
| MSCI AC Europe Small Cap Index (Net) | | 14.11 | 9.43 | 11.00 |
Performance numbers reflect all Fund expenses. Returns for Class A shares are shown with and without the maximum initial sales charge of 5.75%. Returns for Class C shares are shown with and without the maximum contingent deferred sales charge of 1.00% for the first year after purchase. The Fund’s other share classes are not subject to sales charges, but may be subject to other fees and expenses, and have limited eligibility. Please see the Fund’s prospectus for details. Performance for different share classes will vary based on differences in sales charges and certain fees and expenses associated with each share class.
As stated in the May 1, 2020 prospectus (as supplemented), the Fund’s annual operating expense ratio is 1.20% for Institutional Class shares and 1.45% for Class A shares.
All results shown assume reinvestment of distributions during the period. Returns do not reflect the deduction of taxes that a shareholder may pay on Fund distributions or on the redemption of Fund shares. Performance results reflect the effect of fee waivers or reimbursements of Fund expenses by the investment manager and/or its affiliates. Absent these fee waivers and/or expense reimbursement arrangements, performance results may have been lower.
The performance information shown represents past performance and is not a guarantee of future results. The investment return and principal value of your investment will fluctuate so that shares, when redeemed, may be worth more or less than their original cost. Current performance may be lower or higher than the performance data shown. You may obtain performance information current to the most recent month-end by contacting your financial intermediary, visiting columbiathreadneedleus.com/investor/ or calling 800.922.6769.
The returns shown for periods prior to the share class inception date (including returns for the Life of the Fund, if shown, which are since Fund inception) include the returns of the Fund’s oldest share class. These returns are adjusted to reflect any higher class-related operating expenses of the newer share classes, as applicable. Please visit columbiathreadneedleus.com/investor/investment-products/mutual-funds/appended-performance for more information.
The MSCI AC Europe Small Cap Index (Net) captures a small-cap representation across 21 markets in Europe. The index covers approximately 14% of the free float-adjusted market capitalization across each market country in Europe.
Unlike mutual funds, indexes are not managed and do not incur fees or expenses. It is not possible to invest directly in an index.
The COVID-19 pandemic has adversely impacted economies and capital markets around the world in ways that will likely continue and may change in unforeseen ways for an indeterminate period. The COVID-19 pandemic may exacerbate pre-existing political, social and economic risks in certain countries and globally. Fund performance may be significantly negatively impacted by the economic impact of the COVID-19 pandemic.
Columbia Acorn Family of Funds | Annual Report 2020
| 23 |
Fund at a glance (continued)
Columbia Acorn European FundSM
The Growth of a $10,000 Investment in Columbia Acorn European FundSM Institutional Class Shares
August 19, 2011 (Fund inception) through December 31, 2020
This chart shows the change in value of a hypothetical $10,000 investment in Institutional Class shares of the Fund during the stated time period. Although the index is provided for use in assessing the Fund’s performance, the Fund’s holdings may differ significantly from those in an index. Performance numbers reflect all Fund expenses.
| Equity sector breakdown (%) (at December 31, 2020) |
| Communication Services | 3.8 |
| Consumer Discretionary | 5.3 |
| Consumer Staples | 1.9 |
| Financials | 7.6 |
| Health Care | 20.5 |
| Industrials | 30.5 |
| Information Technology | 23.7 |
| Materials | 5.5 |
| Real Estate | 1.2 |
| Total | 100.0 |
Percentages indicated are based upon total equity investments. The Fund’s portfolio composition is subject to change.
| Country breakdown (%) (at December 31, 2020) |
| Austria | 1.5 |
| Denmark | 5.2 |
| France | 2.0 |
| Germany | 12.9 |
| Greece | 0.8 |
| Ireland | 1.7 |
| Italy | 6.8 |
| Malta | 1.5 |
| Netherlands | 5.5 |
| Spain | 4.2 |
| Sweden | 22.9 |
| Switzerland | 7.4 |
| United Kingdom | 23.0 |
| United States(a) | 4.6 |
| Total | 100.0 |
| (a) | Includes investments in Money Market Funds. |
Country breakdown is based primarily on issuer’s place of organization/incorporation. Percentages indicated are based upon total investments excluding investments in derivatives, if any. The Fund’s portfolio composition is subject to change.
| 24 | Columbia Acorn Family of Funds | Annual Report 2020 |
Manager Discussion of Fund Performance
Columbia Acorn European FundSM
Columbia Acorn European FundSM Institutional Class Shares returned 23.08% in the 12-month period ended December 31, 2020, substantially outperforming the 14.11% return of the primary benchmark, the MSCI AC Europe Small Cap Index (Net).
Market overview
The European equity market trended higher in 2020 despite a precipitous drop early in the year, as the rapidly spreading COVID-19 pandemic led to drastic declines in estimates for earnings and growth in the first quarter. The subsequent response by the European Central Bank (ECB) to put forth stimulus measures proved invaluable as reassured investors returned to the markets in a strong way. Shifting into the back half of the year, positive clinical trial results and the start of vaccinations provided investors with an optimistic glimpse of a potential end to the current global pandemic. Investors cheered approval of the first vaccines toward the end of 2020, with more approvals poised to follow early in 2021. As such, we would expect this to help accelerate the rate of global vaccinations moving forward.
The Fund exceeded the return of the benchmark by a wide margin in 2020, marking three consecutive calendar years of outperformance while adding to its longer term advantage over the primary benchmark. The Columbia Acorn European FundSM team has continued to demonstrate the success of its bottom-up strategy that relies on intensive fundamental research and disciplined valuation techniques.
Contributors and detractors
On a sector basis, the Fund generated the widest margin of relative outperformance within industrials, information technology and health care which combined to drive the Fund’s compelling relative results. At the geographic level, the Fund produced the best relative performance in the Nordic and United Kingdom regions where strong stock selection drove outperformance over the course of 2020.
The Fund’s position in Sectra AB contributed most notably to the Fund’s absolute returns in 2020. Sectra is a provider of digital imaging, archive and communication systems used by hospitals, clinics and radiology centers across the health care industry. The firm has benefitted from strong positioning in its core markets while gaining share in less-penetrated markets as customers increasingly acknowledge the differentiation of Sectra’s offerings over legacy competitors.
Swedish engineering consultancy firm Sweco AB performed well during the period, contributing significantly to the Fund’s performance. The firm has been well-aligned with increasing environmental/resource efficiency infrastructure initiatives occurring within its core end markets, as well as stability from their large public sector client base in an uncertain economic environment.
Munters Group AB is a leading provider of stand-alone dehumidification and air treatment solutions for the food, pharma, agriculture and electronics industries and commercial buildings. Shares of Munters rose as the firm’s key AirTech and FoodTech business segments performed well in the period, while ongoing innovation through new product launches should help to provide additional upside moving forward.
MTU Aero Engines is a provider of systems and components as well as maintenance and repair services to the airline industry. Drastic reductions in global flight volumes led to less wear-and-tear on airplanes during the period. This development substantially reduced demand for MTU’s products and services, leading shares lower. The Fund closed the position in the period as we believe MTU’s growth trajectory is likely to remain depressed given the expected gradual recovery in air travel activity.
AKKA Technologies SE is an outsourced research and development (R&D) provider focused on transportation, with a strong focus on electro-mechanic, autonomous driving and digitizing production processes. The firm’s automotive and aerospace end markets have struggled to find their footing amid the ongoing pandemic, which has depressed production. The Fund closed its position given the lack of visibility over the near- to mid-term timeframe, especially for aerospace manufacturers.
Rational AG is a Germany-based producer of commercial ovens used in catering, hospitality and chain restaurant kitchen environments. Abrupt, pandemic-induced declines in demand from the firm’s customer base weighed meaningfully on Rational’s results and subsequently, its stock price. With growth prospects tempered and persisting headwinds in the space, the Fund closed its position in the stock.
Columbia Acorn Family of Funds | Annual Report 2020
| 25 |
Manager Discussion of Fund Performance (continued)
Columbia Acorn European FundSM
Fund positioning
We ended 2020 with optimism given vaccine developments that should help the world’s economic growth and reinstate a sense of well-being and normalcy. Currently the ECB remains largely accommodative, but we continue to monitor for signs of budding inflation which could cause this well-accepted narrative to come into question. In the event this occurs, the probability of higher interest rates would rise with the potential to create headwinds for equity valuations in the longer term.
In this uncertain market environment, the Fund continues to own what we believe to be strong companies with attractive growth prospects, led by prudent management teams. We believe these companies are well-positioned to successfully navigate the market uncertainty, but also to take market share from competitors as global demand returns and economies recover. Our team remains confident in the diligent and disciplined approach of the Fund’s strategy to provide compelling performance and results for shareholders over the long-term.
In 2021, we are enthusiastic about continuing to identify and tap into some of the best and fastest growing investment opportunities across Europe, in companies that can execute and perform well in a variety of market environments.
Market risk may affect a single issuer, sector of the economy, industry or the market as a whole. International investing involves certain risks and volatility due to potential political, economic or currency instabilities and different, potentially less stringent, financial and accounting standards than those generally applicable to U.S. issuers. Investments in small- and mid-cap companies involve risks and volatility and possible illiquidity greater than investments in larger, more established companies. See the Fund’s prospectus for more information on these and other risks.
The views expressed in this report reflect the current views of the respective parties. These views are not guarantees of future performance and involve certain risks, uncertainties and assumptions that are difficult to predict, so actual outcomes and results may differ significantly from the views expressed. These views are subject to change at any time based upon economic, market or other conditions and the respective parties disclaim any responsibility to update such views. These views may not be relied on as investment advice and, because investment decisions for a Columbia Acorn Fund are based on numerous factors, may not be relied on as an indication of trading intent on behalf of any particular Columbia Acorn Fund. References to specific securities should not be construed as a recommendation or investment advice.
| 26 | Columbia Acorn Family of Funds | Annual Report 2020 |
Understanding Your Fund’s Expenses
(Unaudited)
As a shareholder, you incur two types of costs. There are shareholder transaction costs, which generally include sales charges on purchases and may include redemption fees. There are also ongoing fund costs, which generally include investment advisory fees, distribution and service (Rule 12b-1) fees, and other Fund expenses. The following information is intended to help you understand your ongoing costs (in dollars) of investing in the Fund and to help you compare these costs with the ongoing costs of investing in other mutual funds.
Analyzing your Fund’s expenses
To illustrate these ongoing costs, we have provided examples and calculated the expenses paid by investors in each share class of the Funds during the period. The actual and hypothetical information in the tables is based on an initial investment of $1,000 at the beginning of the period indicated and held for the entire period. Expense information is calculated two ways and each method provides you with different information. The amount listed in the “Actual” column is calculated using the Funds’ actual operating expenses and total return for the period. You may use the Actual information, together with the amount invested, to estimate the expenses that you paid over the period. Simply divide your account value by $1,000 (for example, an $8,600 account value divided by $1,000 = 8.6), then multiply the results by the expenses paid during the period under the Actual column. The amount listed in the “Hypothetical” column assumes a 5% annual rate of return before expenses (which is not the Funds’ actual return) and then applies the Funds’ actual expense ratio for the period to the hypothetical return. You should not use the hypothetical account values and expenses to estimate either your actual account balance at the end of the period or the expenses you paid during the period. See “Compare with other funds” below for details on how to use the hypothetical data.
In addition to the ongoing expenses which the Funds bear directly, Columbia Thermostat Fund’s shareholders indirectly bear the Fund’s allocable share of the costs and expenses of each underlying fund in which the Fund invests. You can also estimate the effective expenses paid during the period, which includes the indirect fees associated with investing in the underlying funds, by using the amounts listed in the effective expenses paid during the period column in the “Fund of Funds” table.
Compare with other funds
Since all mutual funds are required to include the same hypothetical calculations about expenses in shareholder reports, you can use this information to compare the ongoing cost of investing in the Funds with other funds. To do so, compare the hypothetical example with the 5% hypothetical examples that appear in the shareholder reports of other funds. As you compare hypothetical examples of other funds, it is important to note that hypothetical examples are meant to highlight the ongoing costs of investing in a fund only and do not reflect any transaction costs, such as sales charges, or redemption or exchange fees. Therefore, the hypothetical calculations are useful in comparing ongoing costs only, and will not help you determine the relative total costs of owning different funds. If transaction costs were included in these calculations, your costs would be higher.
| July 1, 2020 — December 31, 2020 |
| | Account value at the
beginning of the
period ($) | Account value at the
end of the
period ($) | Expenses paid during
the period ($) | Fund’s annualized
expense ratio (%) |
| | Actual | Hypothetical | Actual | Hypothetical | Actual | Hypothetical | Actual |
| Columbia Acorn® Fund |
| Class A | 1,000.00 | 1,000.00 | 1,279.90 | 1,019.61 | 6.30 | 5.58 | 1.10 |
| Advisor Class | 1,000.00 | 1,000.00 | 1,281.20 | 1,020.86 | 4.87 | 4.32 | 0.85 |
| Class C | 1,000.00 | 1,000.00 | 1,273.90 | 1,015.84 | 10.57 | 9.37 | 1.85 |
| Institutional Class | 1,000.00 | 1,000.00 | 1,282.10 | 1,020.86 | 4.88 | 4.32 | 0.85 |
| Institutional 2 Class | 1,000.00 | 1,000.00 | 1,282.00 | 1,021.01 | 4.70 | 4.17 | 0.82 |
| Institutional 3 Class | 1,000.00 | 1,000.00 | 1,281.80 | 1,021.22 | 4.47 | 3.96 | 0.78 |
Columbia Acorn Family of Funds | Annual Report 2020
| 27 |
Understanding Your Fund’s Expenses (continued)
(Unaudited)
| July 1, 2020 — December 31, 2020 |
| | Account value at the
beginning of the
period ($) | Account value at the
end of the
period ($) | Expenses paid during
the period ($) | Fund’s annualized
expense ratio (%) |
| | Actual | Hypothetical | Actual | Hypothetical | Actual | Hypothetical | Actual |
| Columbia Acorn International® |
| Class A | 1,000.00 | 1,000.00 | 1,261.90 | 1,018.90 | 7.05 | 6.29 | 1.24 |
| Advisor Class | 1,000.00 | 1,000.00 | 1,263.40 | 1,020.16 | 5.63 | 5.03 | 0.99 |
| Class C | 1,000.00 | 1,000.00 | 1,257.10 | 1,015.13 | 11.29 | 10.08 | 1.99 |
| Institutional Class | 1,000.00 | 1,000.00 | 1,263.40 | 1,020.16 | 5.63 | 5.03 | 0.99 |
| Institutional 2 Class | 1,000.00 | 1,000.00 | 1,264.00 | 1,020.51 | 5.24 | 4.67 | 0.92 |
| Institutional 3 Class | 1,000.00 | 1,000.00 | 1,263.90 | 1,020.71 | 5.01 | 4.47 | 0.88 |
| Class R | 1,000.00 | 1,000.00 | 1,259.90 | 1,017.65 | 8.46 | 7.56 | 1.49 |
| Columbia Acorn USA® |
| Class A | 1,000.00 | 1,000.00 | 1,339.60 | 1,018.10 | 8.23 | 7.10 | 1.40 |
| Advisor Class | 1,000.00 | 1,000.00 | 1,341.60 | 1,019.36 | 6.77 | 5.84 | 1.15 |
| Class C | 1,000.00 | 1,000.00 | 1,336.90 | 1,014.33 | 12.63 | 10.89 | 2.15 |
| Institutional Class | 1,000.00 | 1,000.00 | 1,341.70 | 1,019.36 | 6.77 | 5.84 | 1.15 |
| Institutional 2 Class | 1,000.00 | 1,000.00 | 1,342.60 | 1,019.71 | 6.36 | 5.48 | 1.08 |
| Institutional 3 Class | 1,000.00 | 1,000.00 | 1,342.00 | 1,019.91 | 6.12 | 5.28 | 1.04 |
| Columbia Acorn International SelectSM |
| Class A | 1,000.00 | 1,000.00 | 1,261.50 | 1,018.85 | 7.11 | 6.34 | 1.25 |
| Advisor Class | 1,000.00 | 1,000.00 | 1,263.20 | 1,020.06 | 5.75 | 5.13 | 1.01 |
| Class C | 1,000.00 | 1,000.00 | 1,256.70 | 1,015.03 | 11.40 | 10.18 | 2.01 |
| Institutional Class | 1,000.00 | 1,000.00 | 1,262.90 | 1,020.06 | 5.75 | 5.13 | 1.01 |
| Institutional 2 Class | 1,000.00 | 1,000.00 | 1,263.50 | 1,020.56 | 5.18 | 4.62 | 0.91 |
| Institutional 3 Class | 1,000.00 | 1,000.00 | 1,264.10 | 1,020.81 | 4.89 | 4.37 | 0.86 |
| Columbia Acorn European FundSM |
| Class A | 1,000.00 | 1,000.00 | 1,313.40 | 1,017.85 | 8.43 | 7.35 | 1.45 |
| Advisor Class | 1,000.00 | 1,000.00 | 1,315.30 | 1,019.10 | 6.98 | 6.09 | 1.20 |
| Class C | 1,000.00 | 1,000.00 | 1,308.80 | 1,014.08 | 12.77 | 11.14 | 2.20 |
| Institutional Class | 1,000.00 | 1,000.00 | 1,315.60 | 1,019.10 | 6.98 | 6.09 | 1.20 |
| Institutional 2 Class | 1,000.00 | 1,000.00 | 1,316.10 | 1,019.41 | 6.64 | 5.79 | 1.14 |
| Institutional 3 Class | 1,000.00 | 1,000.00 | 1,316.40 | 1,019.61 | 6.40 | 5.58 | 1.10 |
Fund of Funds—Columbia Thermostat Fund
| July 1, 2020 — December 31, 2020 |
| | Account value at the
beginning of the
period ($) | Account value at the
end of the
period ($) | Expenses paid during
the period ($) | Fund’s annualized
expense ratio (%) | Effective expenses
paid during the
period ($) | Fund’s effective
annualized
expense ratio (%) |
| | Actual | Hypothetical | Actual | Hypothetical | Actual | Hypothetical | Actual | Actual | Hypothetical | Actual |
| Class A | 1,000.00 | 1,000.00 | 1,123.90 | 1,022.62 | 2.67 | 2.54 | 0.50 | 4.86 | 4.63 | 0.91 |
| Advisor Class | 1,000.00 | 1,000.00 | 1,125.10 | 1,023.88 | 1.34 | 1.27 | 0.25 | 3.53 | 3.36 | 0.66 |
| Class C | 1,000.00 | 1,000.00 | 1,119.50 | 1,018.85 | 6.66 | 6.34 | 1.25 | 8.84 | 8.42 | 1.66 |
| Institutional Class | 1,000.00 | 1,000.00 | 1,125.30 | 1,023.88 | 1.34 | 1.27 | 0.25 | 3.53 | 3.36 | 0.66 |
| Institutional 2 Class | 1,000.00 | 1,000.00 | 1,124.70 | 1,024.08 | 1.12 | 1.07 | 0.21 | 3.31 | 3.15 | 0.62 |
| Institutional 3 Class | 1,000.00 | 1,000.00 | 1,125.30 | 1,024.28 | 0.91 | 0.87 | 0.17 | 3.10 | 2.95 | 0.58 |
Expenses paid during the period are equal to the annualized expense ratio, multiplied by the average account value over the period and then multiplied by the number of days in the Fund’s most recent fiscal half year and divided by 366.
Except with respect to Columbia Thermostat Fund, expenses do not include any fees and expenses incurred indirectly by a Fund from the underlying funds in which the Fund may invest (also referred to as “acquired funds”), including affiliated and non-affiliated pooled investments vehicles (including mutual funds and exchange traded funds).
| 28 | Columbia Acorn Family of Funds | Annual Report 2020 |
Understanding Your Fund’s Expenses (continued)
(Unaudited)
In the case of Columbia Thermostat Fund, effective expenses paid during the period and the Fund’s effective annualized expense ratio include expenses borne directly by the class plus the Fund’s pro rata portion of the ongoing expenses charged by the underlying funds in which it invests using the expense ratio of each class of each underlying fund as of the underlying fund’s most recent shareholder report.
Had the investment manager and/or certain of its affiliates not waived/reimbursed certain fees and expenses for the Funds, account value at the end of the period would have been reduced.
Columbia Acorn Family of Funds | Annual Report 2020
| 29 |
Portfolio of Investments
Columbia Acorn® Fund, December 31, 2020
(Percentages represent value of investments compared to net assets)
Investments in securities
| Common Stocks 98.8% |
| Issuer | Shares | Value ($) |
| Communication Services 2.3% |
| Entertainment 2.3% |
| Take-Two Interactive Software, Inc.(a) | 211,000 | 43,843,690 |
| Zynga, Inc., Class A(a) | 7,153,599 | 70,606,022 |
| Total | | 114,449,712 |
| Total Communication Services | 114,449,712 |
| Consumer Discretionary 14.2% |
| Auto Components 0.7% |
| Visteon Corp.(a) | 281,454 | 35,328,106 |
| Diversified Consumer Services 1.8% |
| Chegg, Inc.(a) | 552,043 | 49,866,044 |
| Grand Canyon Education, Inc.(a) | 388,887 | 36,209,269 |
| Total | | 86,075,313 |
| Hotels, Restaurants & Leisure 3.8% |
| Churchill Downs, Inc. | 227,000 | 44,217,330 |
| DraftKings, Inc., Class A(a) | 812,500 | 37,830,000 |
| Planet Fitness, Inc., Class A(a) | 958,817 | 74,432,964 |
| Wingstop, Inc. | 209,304 | 27,743,245 |
| Total | | 184,223,539 |
| Household Durables 2.7% |
| Helen of Troy Ltd.(a) | 206,897 | 45,970,444 |
| NVR, Inc.(a) | 12,000 | 48,958,320 |
| Skyline Champion Corp.(a) | 1,240,905 | 38,393,601 |
| Total | | 133,322,365 |
| Internet & Direct Marketing Retail 1.4% |
| Etsy, Inc.(a) | 390,800 | 69,527,228 |
| Specialty Retail 3.8% |
| Five Below, Inc.(a) | 355,000 | 62,117,900 |
| Floor & Decor Holdings, Inc.(a) | 518,000 | 48,096,300 |
| Tractor Supply Co. | 132,773 | 18,665,228 |
| Vroom, Inc.(a) | 780,807 | 31,989,663 |
| Williams-Sonoma, Inc. | 230,000 | 23,423,200 |
| Total | | 184,292,291 |
| Total Consumer Discretionary | 692,768,842 |
| Common Stocks (continued) |
| Issuer | Shares | Value ($) |
| Consumer Staples 2.2% |
| Food & Staples Retailing 0.6% |
| BJ’s Wholesale Club Holdings, Inc.(a) | 824,000 | 30,718,720 |
| Food Products 0.7% |
| Beyond Meat, Inc.(a),(b) | 252,000 | 31,500,000 |
| Household Products 0.9% |
| WD-40 Co. | 171,759 | 45,632,931 |
| Total Consumer Staples | 107,851,651 |
| Financials 4.1% |
| Banks 1.1% |
| Lakeland Financial Corp. | 426,821 | 22,869,069 |
| SVB Financial Group(a) | 81,084 | 31,446,808 |
| Total | | 54,315,877 |
| Capital Markets 3.0% |
| Ares Management Corp., Class A | 1,876,790 | 88,302,969 |
| GCM Grosvenor, Inc., Class A(a),(b) | 2,226,000 | 29,650,320 |
| Hamilton Lane, Inc., Class A | 343,000 | 26,771,150 |
| Total | | 144,724,439 |
| Total Financials | 199,040,316 |
| Health Care 31.5% |
| Biotechnology 13.3% |
| ACADIA Pharmaceuticals, Inc.(a) | 851,490 | 45,520,656 |
| Acceleron Pharma, Inc.(a) | 385,693 | 49,345,563 |
| Anika Therapeutics, Inc.(a) | 648,943 | 29,371,160 |
| Arcus Biosciences, Inc.(a) | 1,072,015 | 27,829,510 |
| Argenx SE, ADR(a) | 172,201 | 50,642,592 |
| BioMarin Pharmaceutical, Inc.(a) | 340,000 | 29,814,600 |
| CRISPR Therapeutics AG(a) | 340,199 | 52,087,869 |
| Exact Sciences Corp.(a) | 494,400 | 65,503,056 |
| Insmed, Inc.(a) | 1,350,721 | 44,965,502 |
| Intercept Pharmaceuticals, Inc.(a) | 852,000 | 21,044,400 |
| Kiniksa Pharmaceuticals Ltd., Class A(a),(c) | 1,593,917 | 28,164,513 |
| Kura Oncology, Inc.(a) | 809,000 | 26,421,940 |
| Mirati Therapeutics, Inc.(a) | 187,230 | 41,123,197 |
The accompanying Notes to Financial Statements are an integral part of this statement.
| 30 | Columbia Acorn Family of Funds | Annual Report 2020 |
Portfolio of Investments (continued)
Columbia Acorn® Fund, December 31, 2020
| Common Stocks (continued) |
| Issuer | Shares | Value ($) |
| Natera, Inc.(a) | 667,000 | 66,379,840 |
| Sarepta Therapeutics, Inc.(a) | 397,117 | 67,704,477 |
| Total | | 645,918,875 |
| Health Care Equipment & Supplies 6.5% |
| Eargo, Inc.(a) | 630,706 | 28,268,243 |
| Globus Medical, Inc., Class A(a) | 1,221,000 | 79,633,620 |
| Haemonetics Corp.(a) | 428,000 | 50,825,000 |
| Masimo Corp.(a) | 312,900 | 83,976,102 |
| Penumbra, Inc.(a),(b) | 296,747 | 51,930,725 |
| West Pharmaceutical Services, Inc. | 82,694 | 23,428,037 |
| Total | | 318,061,727 |
| Health Care Providers & Services 4.1% |
| Amedisys, Inc.(a) | 187,300 | 54,940,709 |
| Chemed Corp. | 135,196 | 72,006,742 |
| Encompass Health Corp. | 840,663 | 69,514,423 |
| Total | | 196,461,874 |
| Health Care Technology 0.5% |
| American Well Corp., Class A(a),(b) | 1,027,000 | 26,013,910 |
| Life Sciences Tools & Services 6.1% |
| 10X Genomics, Inc., Class A(a) | 325,453 | 46,084,145 |
| Bio-Rad Laboratories, Inc., Class A(a) | 82,000 | 47,801,080 |
| Bio-Techne Corp. | 231,502 | 73,513,460 |
| Pacific Biosciences of California, Inc.(a) | 1,800,000 | 46,692,000 |
| Pra Health Sciences, Inc.(a) | 322,941 | 40,509,719 |
| Repligen Corp.(a) | 218,000 | 41,775,340 |
| Total | | 296,375,744 |
| Pharmaceuticals 1.0% |
| Horizon Therapeutics PLC(a) | 681,589 | 49,858,235 |
| Total Health Care | 1,532,690,365 |
| Industrials 13.3% |
| Aerospace & Defense 0.9% |
| BWX Technologies, Inc. | 747,700 | 45,071,356 |
| Commercial Services & Supplies 1.7% |
| Copart, Inc.(a) | 221,000 | 28,122,250 |
| Unifirst Corp. | 250,000 | 52,922,500 |
| Total | | 81,044,750 |
| Common Stocks (continued) |
| Issuer | Shares | Value ($) |
| Construction & Engineering 0.5% |
| Comfort Systems U.S.A., Inc. | 421,000 | 22,169,860 |
| Electrical Equipment 1.8% |
| Atkore International Group, Inc.(a),(c) | 667,000 | 27,420,370 |
| Generac Holdings, Inc.(a) | 271,300 | 61,696,333 |
| Total | | 89,116,703 |
| Machinery 5.5% |
| Donaldson Co., Inc. | 550,000 | 30,734,000 |
| IDEX Corp. | 225,000 | 44,820,000 |
| ITT, Inc. | 440,311 | 33,912,753 |
| Nordson Corp. | 225,000 | 45,213,750 |
| SPX Corp.(a) | 742,866 | 40,515,912 |
| Toro Co. (The) | 486,010 | 46,093,188 |
| Watts Water Technologies, Inc., Class A | 222,400 | 27,066,080 |
| Total | | 268,355,683 |
| Professional Services 1.4% |
| Exponent, Inc. | 396,300 | 35,678,889 |
| ICF International, Inc. | 441,000 | 32,779,530 |
| Total | | 68,458,419 |
| Road & Rail 0.6% |
| Old Dominion Freight Line, Inc. | 156,310 | 30,508,586 |
| Trading Companies & Distributors 0.9% |
| Watsco, Inc. | 185,652 | 42,059,461 |
| Total Industrials | 646,784,818 |
| Information Technology 25.9% |
| Electronic Equipment, Instruments & Components 3.5% |
| CDW Corp. | 530,772 | 69,950,442 |
| Dolby Laboratories, Inc., Class A | 637,000 | 61,871,810 |
| ePlus, Inc.(a) | 424,122 | 37,301,530 |
| Total | | 169,123,782 |
| IT Services 5.6% |
| Booz Allen Hamilton Holdings Corp. | 588,785 | 51,330,276 |
| Endava PLC, ADR(a) | 345,100 | 26,486,425 |
| EPAM Systems, Inc.(a) | 82,012 | 29,389,000 |
| GoDaddy, Inc., Class A(a) | 815,347 | 67,633,034 |
| Jack Henry & Associates, Inc. | 210,900 | 34,163,691 |
The accompanying Notes to Financial Statements are an integral part of this statement.
Columbia Acorn Family of Funds | Annual Report 2020
| 31 |
Portfolio of Investments (continued)
Columbia Acorn® Fund, December 31, 2020
| Common Stocks (continued) |
| Issuer | Shares | Value ($) |
| VeriSign, Inc.(a) | 133,000 | 28,781,200 |
| Wix.com Ltd.(a) | 142,725 | 35,675,541 |
| Total | | 273,459,167 |
| Semiconductors & Semiconductor Equipment 3.4% |
| SolarEdge Technologies, Inc.(a) | 246,519 | 78,669,143 |
| Teradyne, Inc. | 750,261 | 89,948,791 |
| Total | | 168,617,934 |
| Software 13.4% |
| Alteryx, Inc., Class A(a) | 305,597 | 37,218,659 |
| Anaplan, Inc.(a) | 637,000 | 45,768,450 |
| Cadence Design Systems, Inc.(a) | 343,871 | 46,914,320 |
| ContextLogic, Inc., Class A(a),(b) | 1,270,000 | 23,164,800 |
| CyberArk Software Ltd.(a) | 216,638 | 35,006,534 |
| Elastic NV(a) | 388,000 | 56,698,440 |
| j2 Global, Inc.(a) | 384,000 | 37,512,960 |
| JFrog Ltd.(a),(b) | 535,319 | 33,634,093 |
| Manhattan Associates, Inc.(a) | 589,760 | 62,030,957 |
| Mimecast Ltd.(a) | 1,511,795 | 85,930,428 |
| Qualys, Inc.(a) | 330,800 | 40,314,596 |
| Sprout Social, Inc., Class A(a) | 468,870 | 21,291,387 |
| Zendesk, Inc.(a) | 461,400 | 66,035,568 |
| Zscaler, Inc.(a) | 298,076 | 59,528,758 |
| Total | | 651,049,950 |
| Total Information Technology | 1,262,250,833 |
| Materials 3.4% |
| Chemicals 1.7% |
| Avient Corp. | 958,000 | 38,588,240 |
| Celanese Corp., Class A | 356,000 | 46,258,640 |
| Total | | 84,846,880 |
| Containers & Packaging 1.7% |
| Avery Dennison Corp. | 520,221 | 80,691,479 |
| Total Materials | 165,538,359 |
| Common Stocks (continued) |
| Issuer | Shares | Value ($) |
| Real Estate 1.9% |
| Equity Real Estate Investment Trusts (REITS) 0.7% |
| Americold Realty Trust | 891,532 | 33,280,890 |
| Real Estate Management & Development 1.2% |
| Colliers International Group, Inc. | 453,617 | 40,430,883 |
| FirstService Corp. | 132,500 | 18,120,700 |
| Total | | 58,551,583 |
| Total Real Estate | 91,832,473 |
Total Common Stocks
(Cost $3,290,105,651) | 4,813,207,369 |
|
| Limited Partnerships 0.5% |
| | |
| Consumer Discretionary 0.5% |
| Hotels, Restaurants & Leisure 0.5% |
| Cedar Fair LP | 623,000 | 24,508,820 |
| Total Consumer Discretionary | 24,508,820 |
Total Limited Partnerships
(Cost $22,095,257) | 24,508,820 |
|
| Securities Lending Collateral 3.0% |
| | |
| Dreyfus Government Cash Management Fund, Instutional Shares, 0.030%(d),(e) | 143,378,229 | 143,378,229 |
Total Securities Lending Collateral
(Cost $143,378,229) | 143,378,229 |
|
| Money Market Funds 0.8% |
| | Shares | Value ($) |
| Columbia Short-Term Cash Fund, 0.107%(c),(d) | 39,799,697 | 39,795,717 |
Total Money Market Funds
(Cost $39,790,513) | 39,795,717 |
Total Investments in Securities
(Cost: $3,495,369,650) | 5,020,890,135 |
| Obligation to Return Collateral for Securities Loaned | | (143,378,229) |
| Other Assets & Liabilities, Net | | (7,671,336) |
| Net Assets | 4,869,840,570 |
The accompanying Notes to Financial Statements are an integral part of this statement.
| 32 | Columbia Acorn Family of Funds | Annual Report 2020 |
Portfolio of Investments (continued)
Columbia Acorn® Fund, December 31, 2020
Notes to Portfolio of Investments
| (a) | Non-income producing investment. |
| (b) | All or a portion of this security was on loan at December 31, 2020. The total market value of securities on loan at December 31, 2020 was $138,033,364. |
| (c) | As defined in the Investment Company Act of 1940, an affiliated company is one in which the Fund owns 5% or more of the company’s outstanding voting securities, or a company which is under common ownership or control with the Fund. The value of the holdings and transactions in these affiliated companies during the year ended December 31, 2020 are as follows: |
| Affiliated issuers | Beginning
of period($) | Purchases($) | Sales($) | Net change in
unrealized
appreciation
(depreciation)($) | End of
period($) | Realized gain
(loss)($) | Dividends($) | End of
period shares |
| Atkore International Group, Inc.‡,†,* |
| | — | 81,482,771 | (78,450,102) | — | — | (21,491,745) | — | — |
| CF Finance Acquisition CL A‡,†,* |
| | — | 23,302,361 | (23,302,361) | — | — | — | — | — |
| Columbia Short-Term Cash Fund, 0.107% |
| | 57,990,784 | 1,617,608,265 | (1,635,808,536) | 5,204 | 39,795,717 | (58,648) | 529,252 | 39,799,697 |
| Kiniksa Pharmaceuticals Ltd., Class A‡ |
| | — | 31,166,939 | — | (3,002,426) | 28,164,513 | — | — | 1,593,917 |
| Total | 57,990,784 | | | (2,997,222) | 67,960,230 | (21,550,393) | 529,252 | |
| ‡ | Issuer was not an affiliate at the beginning of period. |
| † | Issuer was not an affiliate at the end of period. |
| * | Includes the effect of underlying fund reorganization. |
| (d) | The rate shown is the seven-day current annualized yield at December 31, 2020. |
| (e) | Investment made with cash collateral received from securities lending activity. |
Abbreviation Legend
| ADR | American Depositary Receipt |
Fair value measurements
Various inputs are used in determining the value of the Fund’s investments, following the input prioritization hierarchy established by accounting principles generally accepted in the United States of America (GAAP). These inputs are summarized in the three broad levels listed below:
| ■ | Level 1 – quoted prices in active markets for identical securities |
| ■ | Level 2 – prices determined using other significant observable inputs (including quoted prices for similar securities, interest rates, prepayment speeds, credit risk and others) |
| ■ | Level 3 – prices determined using significant unobservable inputs where quoted prices or observable inputs are unavailable or less reliable (including management’s own assumptions about the factors market participants would use in pricing an investment) |
The inputs or methodology used for valuing securities are not necessarily an indication of the risk associated with investing in those securities.
Examples of the types of securities in which the Fund would typically invest and how they are classified within this hierarchy are as follows. Typical Level 1 securities include exchange traded domestic equities, mutual funds whose net asset values are published each day and exchange traded foreign equities that are not typically statistically fair valued. Typical Level 2 securities include exchange traded foreign equities that are traded in the European region or Asia Pacific region time zones which are typically statistically fair valued, forward foreign currency exchange contracts and short-term investments valued at amortized cost. Additionally, securities fair valued by Columbia Wanger Asset Management’s Valuation Committee (the Committee) that rely on significant observable inputs are also included in Level 2. Typical Level 3 securities include any security fair valued by the Committee that relies on significant unobservable inputs.
The Committee is responsible for applying the Columbia Acorn Trust Portfolio Pricing Policy and the Columbia Wanger Asset Management pricing procedures (the Policies), which are approved by and subject to the oversight of the Board of Trustees.
The Committee meets as necessary, and no less frequently than quarterly, to determine fair values for securities for which market quotations are not readily available or for which Columbia Wanger Asset Management believes that available market quotations are unreliable. The Committee also reviews the continuing appropriateness of the Policies. In circumstances where a security has been fair valued, the Committee will also review the continuing appropriateness of the current value of the security. The Policies address, among other things: circumstances under which market quotations will be deemed readily available; selection of third party pricing vendors; appropriate pricing methodologies; events that require fair valuation and fair value techniques; circumstances under which securities will be deemed to pose a potential for stale pricing, including when securities are illiquid, restricted, or in default; and certain delegations of authority to determine fair values to the Fund’s investment manager. The Committee may also meet to discuss additional valuation matters, which may include review of back-testing results, review of time-sensitive information or approval of other valuation related actions, and to review the appropriateness of the Policies.
The accompanying Notes to Financial Statements are an integral part of this statement.
Columbia Acorn Family of Funds | Annual Report 2020
| 33 |
Portfolio of Investments (continued)
Columbia Acorn® Fund, December 31, 2020
Fair value measurements (continued)
The following table is a summary of the inputs used to value the Fund’s investments at December 31, 2020:
| | Level 1 ($) | Level 2 ($) | Level 3 ($) | Total ($) |
| Investments in Securities | | | | |
| Common Stocks | | | | |
| Communication Services | 114,449,712 | — | — | 114,449,712 |
| Consumer Discretionary | 692,768,842 | — | — | 692,768,842 |
| Consumer Staples | 107,851,651 | — | — | 107,851,651 |
| Financials | 199,040,316 | — | — | 199,040,316 |
| Health Care | 1,532,690,365 | — | — | 1,532,690,365 |
| Industrials | 646,784,818 | — | — | 646,784,818 |
| Information Technology | 1,262,250,833 | — | — | 1,262,250,833 |
| Materials | 165,538,359 | — | — | 165,538,359 |
| Real Estate | 91,832,473 | — | — | 91,832,473 |
| Total Common Stocks | 4,813,207,369 | — | — | 4,813,207,369 |
| Limited Partnerships | | | | |
| Consumer Discretionary | 24,508,820 | — | — | 24,508,820 |
| Total Limited Partnerships | 24,508,820 | — | — | 24,508,820 |
| Securities Lending Collateral | 143,378,229 | — | — | 143,378,229 |
| Money Market Funds | 39,795,717 | — | — | 39,795,717 |
| Total Investments in Securities | 5,020,890,135 | — | — | 5,020,890,135 |
See the Portfolio of Investments for all investment classifications not indicated in the table.
The accompanying Notes to Financial Statements are an integral part of this statement.
| 34 | Columbia Acorn Family of Funds | Annual Report 2020 |
Portfolio of Investments
Columbia Acorn International®, December 31, 2020
(Percentages represent value of investments compared to net assets)
Investments in securities
| Common Stocks 96.7% |
| Issuer | Shares | Value ($) |
| Australia 4.4% |
| Bapcor Ltd. | 5,031,000 | 30,254,582 |
| carsales.com Ltd. | 2,523,977 | 38,985,355 |
| Evolution Mining Ltd. | 3,232,513 | 12,439,897 |
| Technology One Ltd. | 2,904,116 | 18,381,795 |
| Temple & Webster Group Ltd.(a) | 1,148,109 | 9,829,135 |
| Total | 109,890,764 |
| Austria 0.8% |
| S&T AG(a) | 855,700 | 20,192,322 |
| Brazil 2.5% |
| Notre Dame Intermedica Participacoes SA | 2,323,600 | 35,045,016 |
| TOTVS SA | 4,881,300 | 26,989,900 |
| Total | 62,034,916 |
| Cambodia 1.1% |
| NagaCorp Ltd. | 20,161,000 | 26,480,298 |
| Canada 2.5% |
| CCL Industries, Inc. | 399,673 | 18,145,261 |
| Osisko Gold Royalties Ltd. | 2,455,317 | 31,113,413 |
| Parex Resources, Inc.(a) | 1,006,070 | 13,847,393 |
| Total | 63,106,067 |
| China 3.6% |
| A-Living Smart City Services Co., Ltd. | 5,100,750 | 22,639,910 |
| Shenzhou International Group Holdings Ltd. | 1,288,100 | 25,244,507 |
| Silergy Corp. | 474,000 | 40,793,239 |
| Total | 88,677,656 |
| Cyprus 0.7% |
| TCS Group Holding PLC, GDR(b) | 564,034 | 18,557,540 |
| Denmark 2.9% |
| ALK-Abello AS(a) | 60,000 | 24,714,354 |
| SimCorp AS | 318,967 | 47,422,832 |
| Total | 72,137,186 |
| France 0.6% |
| Robertet SA | 13,120 | 14,505,385 |
| Common Stocks (continued) |
| Issuer | Shares | Value ($) |
| Germany 6.8% |
| Eckert & Ziegler Strahlen- und Medizintechnik AG | 478,281 | 26,199,654 |
| Hypoport SE(a) | 78,979 | 50,189,479 |
| Jenoptik AG | 668,000 | 20,404,073 |
| Nemetschek SE | 396,847 | 29,493,024 |
| TeamViewer AG(a) | 825,280 | 44,331,907 |
| Total | 170,618,137 |
| Greece 0.4% |
| JUMBO SA | 610,544 | 10,528,837 |
| Hong Kong 0.9% |
| Vitasoy International Holdings Ltd. | 5,666,000 | 22,070,042 |
| Ireland 1.0% |
| UDG Healthcare PLC | 2,427,523 | 25,911,198 |
| Italy 2.8% |
| Amplifon SpA(a) | 614,628 | 25,547,740 |
| GVS SpA(a) | 1,238,790 | 23,078,860 |
| Nexi SpA(a) | 1,028,739 | 20,470,993 |
| Total | 69,097,593 |
| Japan 18.5% |
| Aica Kogyo Co., Ltd. | 185,600 | 6,424,677 |
| Aruhi Corp.(c) | 994,500 | 17,472,778 |
| Azbil Corp. | 237,540 | 12,993,942 |
| Daifuku Co., Ltd. | 159,600 | 19,749,795 |
| Daiseki Co., Ltd. | 818,133 | 24,022,515 |
| Daiwa Securities Living Investments Corp. | 6,135 | 5,695,263 |
| Disco Corp. | 57,500 | 19,379,394 |
| Elecom Co., Ltd. | 384,300 | 19,845,937 |
| Fuso Chemical Co., Ltd. | 414,600 | 14,950,071 |
| Glory Ltd. | 325,900 | 6,581,800 |
| Hikari Tsushin, Inc. | 278,728 | 65,399,080 |
| Invesco Office J-REIT, Inc. | 140,671 | 20,646,694 |
| Lasertec Corp. | 233,600 | 27,418,321 |
| Nihon M&A Center, Inc. | 409,300 | 27,371,217 |
| Nihon Unisys Ltd. | 1,005,200 | 39,399,679 |
| NSD Co., Ltd. | 731,900 | 15,789,329 |
| Seiren Co., Ltd. | 929,900 | 14,080,950 |
The accompanying Notes to Financial Statements are an integral part of this statement.
Columbia Acorn Family of Funds | Annual Report 2020
| 35 |
Portfolio of Investments (continued)
Columbia Acorn International®, December 31, 2020
| Common Stocks (continued) |
| Issuer | Shares | Value ($) |
| Sekisui Chemical Co., Ltd. | 3,105,200 | 58,878,710 |
| Seria Co., Ltd. | 466,691 | 17,132,393 |
| Solasto Corp. | 1,354,800 | 20,999,829 |
| Valqua Ltd. | 440,100 | 8,768,099 |
| Total | 463,000,473 |
| Malta 1.4% |
| Kindred Group PLC(a) | 3,697,935 | 36,181,867 |
| Mexico 0.6% |
| Corporación Inmobiliaria Vesta SAB de CV | 7,519,000 | 14,736,099 |
| Netherlands 4.2% |
| Argenx SE, ADR(a) | 123,933 | 36,447,456 |
| BE Semiconductor Industries NV | 313,560 | 18,829,699 |
| IMCD NV | 391,434 | 49,821,728 |
| Total | 105,098,883 |
| New Zealand 1.9% |
| Fisher & Paykel Healthcare Corp., Ltd. | 2,013,595 | 47,820,345 |
| Singapore 2.4% |
| Mapletree Commercial Trust | 18,056,300 | 29,106,247 |
| Mapletree Logistics Trust | 19,842,744 | 30,199,978 |
| Total | 59,306,225 |
| South Korea 3.4% |
| Koh Young Technology, Inc.(a) | 376,801 | 36,456,372 |
| Korea Investment Holdings Co., Ltd.(a) | 661,699 | 48,216,913 |
| Total | 84,673,285 |
| Spain 2.5% |
| Befesa SA | 601,467 | 37,936,652 |
| Vidrala SA | 219,159 | 25,408,109 |
| Total | 63,344,761 |
| Sweden 9.8% |
| AddTech AB, B Shares | 2,727,260 | 36,243,904 |
| Dometic Group AB(a) | 2,028,960 | 26,907,134 |
| Hexagon AB, Class B | 659,512 | 60,465,407 |
| Munters Group AB(a) | 3,393,226 | 34,230,852 |
| Sectra AB, Class B(a) | 252,016 | 22,312,625 |
| Sweco AB, Class B | 1,834,118 | 33,661,313 |
| Trelleborg AB, Class B(a) | 1,413,641 | 31,399,809 |
| Total | 245,221,044 |
| Common Stocks (continued) |
| Issuer | Shares | Value ($) |
| Switzerland 3.0% |
| Belimo Holding AG, Registered Shares | 3,584 | 31,136,034 |
| Gurit Holding AG | 4,564 | 12,857,098 |
| Inficon Holding AG | 33,679 | 30,851,256 |
| Total | 74,844,388 |
| Taiwan 2.8% |
| Parade Technologies Ltd. | 417,000 | 16,509,573 |
| Sinbon Electronics Co., Ltd. | 3,344,000 | 25,778,847 |
| Voltronic Power Technology Corp. | 663,408 | 26,508,163 |
| Total | 68,796,583 |
| Thailand 0.8% |
| Muangthai Capital PCL, Foreign Registered Shares | 9,594,300 | 18,842,849 |
| United Kingdom 12.7% |
| Abcam PLC | 1,280,332 | 27,138,252 |
| Auto Trader Group PLC | 3,922,473 | 31,927,919 |
| Dechra Pharmaceuticals PLC | 906,087 | 42,673,746 |
| Diploma PLC | 656,106 | 19,618,089 |
| Genus PLC | 341,944 | 19,566,020 |
| Halma PLC | 697,883 | 23,372,305 |
| Intermediate Capital Group PLC | 1,771,553 | 41,684,811 |
| Rentokil Initial PLC(a) | 4,699,905 | 32,768,569 |
| Rightmove PLC(a) | 4,514,214 | 40,107,810 |
| Safestore Holdings PLC | 1,705,112 | 18,224,317 |
| Spirax-Sarco Engineering PLC | 128,788 | 19,880,226 |
| Total | 316,962,064 |
| United States 1.7% |
| Inter Parfums, Inc. | 713,595 | 43,165,362 |
Total Common Stocks
(Cost $1,497,906,677) | 2,415,802,169 |
|
| Securities Lending Collateral 0.0% |
| | |
| Dreyfus Government Cash Management Fund, Instutional Shares, 0.030%(d),(e) | 259,440 | 259,440 |
Total Securities Lending Collateral
(Cost $259,440) | 259,440 |
|
The accompanying Notes to Financial Statements are an integral part of this statement.
| 36 | Columbia Acorn Family of Funds | Annual Report 2020 |
Portfolio of Investments (continued)
Columbia Acorn International®, December 31, 2020
| Money Market Funds 2.5% |
| | Shares | Value ($) |
| Columbia Short-Term Cash Fund, 0.107%(d),(f) | 61,940,708 | 61,934,514 |
Total Money Market Funds
(Cost $61,934,514) | 61,934,514 |
Total Investments in Securities
(Cost $1,560,100,631) | 2,477,996,123 |
| Obligation to Return Collateral for Securities Loaned | | (259,440) |
| Other Assets & Liabilities, Net | | 19,803,943 |
| Net Assets | $2,497,540,626 |
At December 31, 2020, securities and/or cash totaling $3,987,630 were pledged as collateral.
| Long futures contracts |
| Description | Number of
contracts | Expiration
date | Trading
currency | Notional
amount | Value/Unrealized
appreciation ($) | Value/Unrealized
depreciation ($) |
| Mini MSCI EAFE Index | 215 | 03/2021 | USD | 22,906,100 | 219,057 | — |
| Mini MSCI Emerging Markets Index | 479 | 03/2021 | USD | 30,852,390 | 923,452 | — |
| Total | | | | | 1,142,509 | — |
Notes to Portfolio of Investments
| (a) | Non-income producing investment. |
| (b) | Represents privately placed and other securities and instruments exempt from Securities and Exchange Commission registration (collectively, private placements), such as Section 4(a)(2) and Rule 144A eligible securities, which are often sold only to qualified institutional buyers. At December 31, 2020, the total value of these securities amounted to $18,557,540, which represents 0.74% of total net assets. |
| (c) | All or a portion of this security was on loan at December 31, 2020. The total market value of securities on loan at December 31, 2020 was $247,052. |
| (d) | The rate shown is the seven-day current annualized yield at December 31, 2020. |
| (e) | Investment made with cash collateral received from securities lending activity. |
| (f) | As defined in the Investment Company Act of 1940, an affiliated company is one in which the Fund owns 5% or more of the company’s outstanding voting securities, or a company which is under common ownership or control with the Fund. The value of the holdings and transactions in these affiliated companies during the year ended December 31, 2020 are as follows: |
| Affiliated issuers | Beginning
of period($) | Purchases($) | Sales($) | Net change in
unrealized
appreciation
(depreciation)($) | End of
period($) | Realized gain
(loss)($) | Dividends($) | End of
period shares |
| Columbia Short-Term Cash Fund, 0.107% |
| | 55,980,746 | 833,754,905 | (827,801,137) | — | 61,934,514 | 1,777 | 360,888 | 61,940,708 |
Abbreviation Legend
| ADR | American Depositary Receipt |
| GDR | Global Depositary Receipt |
Currency Legend
Fair value measurements
Various inputs are used in determining the value of the Fund’s investments, following the input prioritization hierarchy established by accounting principles generally accepted in the United States of America (GAAP). These inputs are summarized in the three broad levels listed below:
| ■ | Level 1 – quoted prices in active markets for identical securities |
The accompanying Notes to Financial Statements are an integral part of this statement.
Columbia Acorn Family of Funds | Annual Report 2020
| 37 |
Portfolio of Investments (continued)
Columbia Acorn International®, December 31, 2020
Fair value measurements (continued)
| ■ | Level 2 – prices determined using other significant observable inputs (including quoted prices for similar securities, interest rates, prepayment speeds, credit risk and others) |
| ■ | Level 3 – prices determined using significant unobservable inputs where quoted prices or observable inputs are unavailable or less reliable (including management’s own assumptions about the factors market participants would use in pricing an investment) |
The inputs or methodology used for valuing securities are not necessarily an indication of the risk associated with investing in those securities.
Examples of the types of securities in which the Fund would typically invest and how they are classified within this hierarchy are as follows. Typical Level 1 securities include exchange traded domestic equities, mutual funds whose net asset values are published each day and exchange traded foreign equities that are not typically statistically fair valued. Typical Level 2 securities include exchange traded foreign equities that are traded in the European region or Asia Pacific region time zones which are typically statistically fair valued, forward foreign currency exchange contracts and short-term investments valued at amortized cost. Additionally, securities fair valued by Columbia Wanger Asset Management’s Valuation Committee (the Committee) that rely on significant observable inputs are also included in Level 2. Typical Level 3 securities include any security fair valued by the Committee that relies on significant unobservable inputs.
The Committee is responsible for applying the Columbia Acorn Trust Portfolio Pricing Policy and the Columbia Wanger Asset Management pricing procedures (the Policies), which are approved by and subject to the oversight of the Board of Trustees.
The Committee meets as necessary, and no less frequently than quarterly, to determine fair values for securities for which market quotations are not readily available or for which Columbia Wanger Asset Management believes that available market quotations are unreliable. The Committee also reviews the continuing appropriateness of the Policies. In circumstances where a security has been fair valued, the Committee will also review the continuing appropriateness of the current value of the security. The Policies address, among other things: circumstances under which market quotations will be deemed readily available; selection of third party pricing vendors; appropriate pricing methodologies; events that require fair valuation and fair value techniques; circumstances under which securities will be deemed to pose a potential for stale pricing, including when securities are illiquid, restricted, or in default; and certain delegations of authority to determine fair values to the Fund’s investment manager. The Committee may also meet to discuss additional valuation matters, which may include review of back-testing results, review of time-sensitive information or approval of other valuation related actions, and to review the appropriateness of the Policies.
The following table is a summary of the inputs used to value the Fund’s investments at December 31, 2020:
| | Level 1 ($) | Level 2 ($) | Level 3 ($) | Total ($) |
| Investments in Securities | | | | |
| Common Stocks | | | | |
| Australia | — | 109,890,764 | — | 109,890,764 |
| Austria | — | 20,192,322 | — | 20,192,322 |
| Brazil | 62,034,916 | — | — | 62,034,916 |
| Cambodia | — | 26,480,298 | — | 26,480,298 |
| Canada | 63,106,067 | — | — | 63,106,067 |
| China | — | 88,677,656 | — | 88,677,656 |
| Cyprus | — | 18,557,540 | — | 18,557,540 |
| Denmark | — | 72,137,186 | — | 72,137,186 |
| France | — | 14,505,385 | — | 14,505,385 |
| Germany | — | 170,618,137 | — | 170,618,137 |
| Greece | — | 10,528,837 | — | 10,528,837 |
| Hong Kong | — | 22,070,042 | — | 22,070,042 |
| Ireland | — | 25,911,198 | — | 25,911,198 |
| Italy | — | 69,097,593 | — | 69,097,593 |
| Japan | — | 463,000,473 | — | 463,000,473 |
| Malta | — | 36,181,867 | — | 36,181,867 |
| Mexico | 14,736,099 | — | — | 14,736,099 |
| Netherlands | 36,447,456 | 68,651,427 | — | 105,098,883 |
| New Zealand | — | 47,820,345 | — | 47,820,345 |
| Singapore | — | 59,306,225 | — | 59,306,225 |
| South Korea | — | 84,673,285 | — | 84,673,285 |
| Spain | — | 63,344,761 | — | 63,344,761 |
| Sweden | — | 245,221,044 | — | 245,221,044 |
| Switzerland | — | 74,844,388 | — | 74,844,388 |
| Taiwan | — | 68,796,583 | — | 68,796,583 |
| Thailand | — | 18,842,849 | — | 18,842,849 |
| United Kingdom | — | 316,962,064 | — | 316,962,064 |
| United States | 43,165,362 | — | — | 43,165,362 |
| Total Common Stocks | 219,489,900 | 2,196,312,269 | — | 2,415,802,169 |
| Securities Lending Collateral | 259,440 | — | — | 259,440 |
| Money Market Funds | 61,934,514 | — | — | 61,934,514 |
| Total Investments in Securities | 281,683,854 | 2,196,312,269 | — | 2,477,996,123 |
| Investments in Derivatives | | | | |
The accompanying Notes to Financial Statements are an integral part of this statement.
| 38 | Columbia Acorn Family of Funds | Annual Report 2020 |
Portfolio of Investments (continued)
Columbia Acorn International®, December 31, 2020
Fair value measurements (continued)
| | Level 1 ($) | Level 2 ($) | Level 3 ($) | Total ($) |
| Asset | | | | |
| Futures Contracts | 1,142,509 | — | — | 1,142,509 |
| Total | 282,826,363 | 2,196,312,269 | — | 2,479,138,632 |
See the Portfolio of Investments for all investment classifications not indicated in the table.
The Fund’s assets assigned to the Level 2 input category are generally valued using a market approach, in which a security’s value is determined through its correlation to prices and information from observable market transactions for similar or identical assets. Foreign equities are generally valued at the last sale price on the foreign exchange or market on which they trade. The Fund may use a statistical fair valuation model, in accordance with the policy adopted by the Board of Trustees, provided by an independent third party to value securities principally traded in foreign markets in order to adjust for possible stale pricing that may occur between the close of the foreign exchanges and the time for valuation. These models take into account available market data including intraday index, ADR, and ETF movements.
Derivative instruments are valued at unrealized appreciation (depreciation).
The accompanying Notes to Financial Statements are an integral part of this statement.
Columbia Acorn Family of Funds | Annual Report 2020
| 39 |
Portfolio of Investments
Columbia Acorn USA®, December 31, 2020
(Percentages represent value of investments compared to net assets)
Investments in securities
| Common Stocks 98.3% |
| Issuer | Shares | Value ($) |
| Consumer Discretionary 13.6% |
| Auto Components 1.7% |
| Dorman Products, Inc.(a) | 27,500 | 2,387,550 |
| LCI Industries | 24,700 | 3,203,096 |
| Total | | 5,590,646 |
| Diversified Consumer Services 0.8% |
| Grand Canyon Education, Inc.(a) | 28,594 | 2,662,387 |
| Hotels, Restaurants & Leisure 4.4% |
| Choice Hotels International, Inc. | 25,783 | 2,751,819 |
| Churchill Downs, Inc. | 22,182 | 4,320,832 |
| Planet Fitness, Inc., Class A(a) | 36,200 | 2,810,206 |
| Wendy’s Co. (The) | 99,000 | 2,170,080 |
| Wingstop, Inc. | 20,900 | 2,770,295 |
| Total | | 14,823,232 |
| Household Durables 2.3% |
| Helen of Troy Ltd.(a) | 14,827 | 3,294,411 |
| Skyline Champion Corp.(a) | 147,481 | 4,563,062 |
| Total | | 7,857,473 |
| Leisure Products 1.3% |
| Brunswick Corp. | 56,906 | 4,338,514 |
| Specialty Retail 3.1% |
| Boot Barn Holdings, Inc.(a) | 94,190 | 4,084,078 |
| Five Below, Inc.(a) | 24,814 | 4,341,954 |
| Vroom, Inc.(a) | 48,737 | 1,996,755 |
| Total | | 10,422,787 |
| Total Consumer Discretionary | 45,695,039 |
| Consumer Staples 3.1% |
| Food & Staples Retailing 0.9% |
| BJ’s Wholesale Club Holdings, Inc.(a) | 83,401 | 3,109,189 |
| Household Products 1.0% |
| WD-40 Co. | 12,296 | 3,266,801 |
| Personal Products 1.2% |
| Inter Parfums, Inc. | 67,338 | 4,073,276 |
| Total Consumer Staples | 10,449,266 |
| Common Stocks (continued) |
| Issuer | Shares | Value ($) |
| Financials 5.4% |
| Banks 1.0% |
| Lakeland Financial Corp. | 59,365 | 3,180,777 |
| Capital Markets 2.5% |
| GCM Grosvenor, Inc., Class A(a),(b) | 158,000 | 2,104,560 |
| Hamilton Lane, Inc., Class A | 29,601 | 2,310,358 |
| Houlihan Lokey, Inc. | 61,530 | 4,136,662 |
| Total | | 8,551,580 |
| Consumer Finance 0.8% |
| FirstCash, Inc. | 40,452 | 2,833,258 |
| Thrifts & Mortgage Finance 1.1% |
| Merchants Bancorp | 131,252 | 3,626,493 |
| Total Financials | 18,192,108 |
| Health Care 37.8% |
| Biotechnology 17.3% |
| ACADIA Pharmaceuticals, Inc.(a) | 36,989 | 1,977,432 |
| Acceleron Pharma, Inc.(a) | 41,692 | 5,334,074 |
| Anika Therapeutics, Inc.(a) | 89,694 | 4,059,550 |
| Arcus Biosciences, Inc.(a) | 96,284 | 2,499,533 |
| CRISPR Therapeutics AG(a) | 24,042 | 3,681,071 |
| Fate Therapeutics, Inc.(a) | 76,109 | 6,920,591 |
| Immunogen, Inc.(a) | 588,000 | 3,792,600 |
| Insmed, Inc.(a) | 168,010 | 5,593,053 |
| Intercept Pharmaceuticals, Inc.(a) | 88,378 | 2,182,937 |
| Kiniksa Pharmaceuticals Ltd., Class A(a) | 238,096 | 4,207,156 |
| Kura Oncology, Inc.(a) | 78,847 | 2,575,143 |
| Mirati Therapeutics, Inc.(a) | 21,034 | 4,619,908 |
| Natera, Inc.(a) | 85,805 | 8,539,314 |
| Ultragenyx Pharmaceutical, Inc.(a) | 16,200 | 2,242,566 |
| Total | | 58,224,928 |
The accompanying Notes to Financial Statements are an integral part of this statement.
| 40 | Columbia Acorn Family of Funds | Annual Report 2020 |
Portfolio of Investments (continued)
Columbia Acorn USA®, December 31, 2020
| Common Stocks (continued) |
| Issuer | Shares | Value ($) |
| Health Care Equipment & Supplies 6.0% |
| Atrion Corp. | 4,453 | 2,859,895 |
| Eargo, Inc.(a),(b) | 65,037 | 2,914,958 |
| Globus Medical, Inc., Class A(a) | 91,326 | 5,956,282 |
| Haemonetics Corp.(a) | 30,267 | 3,594,206 |
| SI-BONE, Inc.(a) | 168,284 | 5,031,692 |
| Total | | 20,357,033 |
| Health Care Providers & Services 8.3% |
| Amedisys, Inc.(a) | 20,229 | 5,933,773 |
| Chemed Corp. | 10,612 | 5,652,057 |
| Corvel Corp.(a) | 40,895 | 4,334,870 |
| HealthEquity, Inc.(a) | 48,500 | 3,380,935 |
| LHC Group, Inc.(a) | 20,525 | 4,378,393 |
| National Research Corp., Class A | 95,966 | 4,102,546 |
| Total | | 27,782,574 |
| Health Care Technology 0.9% |
| American Well Corp., Class A(a),(b) | 120,400 | 3,049,732 |
| Life Sciences Tools & Services 3.8% |
| NanoString Technologies, Inc.(a) | 58,167 | 3,890,209 |
| Pacific Biosciences of California, Inc.(a) | 165,000 | 4,280,100 |
| Repligen Corp.(a) | 23,740 | 4,549,296 |
| Total | | 12,719,605 |
| Pharmaceuticals 1.5% |
| Reata Pharmaceuticals, Inc., Class A(a) | 24,500 | 3,028,690 |
| Theravance Biopharma, Inc.(a) | 105,821 | 1,880,439 |
| Total | | 4,909,129 |
| Total Health Care | 127,043,001 |
| Industrials 15.4% |
| Aerospace & Defense 2.0% |
| BWX Technologies, Inc. | 60,974 | 3,675,513 |
| Curtiss-Wright Corp. | 27,241 | 3,169,490 |
| Total | | 6,845,003 |
| Commercial Services & Supplies 0.8% |
| Unifirst Corp. | 11,788 | 2,495,402 |
| Construction & Engineering 1.5% |
| Comfort Systems U.S.A., Inc. | 92,527 | 4,872,472 |
| Common Stocks (continued) |
| Issuer | Shares | Value ($) |
| Electrical Equipment 2.5% |
| Atkore International Group, Inc.(a) | 120,921 | 4,971,062 |
| Plug Power, Inc.(a) | 96,500 | 3,272,315 |
| Total | | 8,243,377 |
| Machinery 3.5% |
| ITT, Inc. | 56,948 | 4,386,135 |
| SPX Corp.(a) | 57,155 | 3,117,234 |
| Watts Water Technologies, Inc., Class A | 36,171 | 4,402,010 |
| Total | | 11,905,379 |
| Professional Services 2.8% |
| Exponent, Inc. | 73,090 | 6,580,293 |
| ICF International, Inc. | 39,936 | 2,968,443 |
| Total | | 9,548,736 |
| Road & Rail 1.2% |
| Saia, Inc.(a) | 22,226 | 4,018,461 |
| Trading Companies & Distributors 1.1% |
| SiteOne Landscape Supply, Inc.(a) | 23,843 | 3,782,215 |
| Total Industrials | 51,711,045 |
| Information Technology 18.6% |
| Electronic Equipment, Instruments & Components 2.7% |
| Badger Meter, Inc. | 43,615 | 4,102,427 |
| ePlus, Inc.(a) | 55,368 | 4,869,615 |
| Total | | 8,972,042 |
| IT Services 1.4% |
| Endava PLC, ADR(a) | 35,024 | 2,688,092 |
| LiveRamp Holdings, Inc.(a) | 28,070 | 2,054,443 |
| Total | | 4,742,535 |
| Semiconductors & Semiconductor Equipment 2.2% |
| Advanced Energy Industries, Inc.(a) | 48,186 | 4,672,597 |
| Inphi Corp.(a) | 18,079 | 2,901,137 |
| Total | | 7,573,734 |
| Software 12.3% |
| Blackline, Inc.(a) | 30,576 | 4,078,227 |
| CyberArk Software Ltd.(a) | 23,818 | 3,848,751 |
| Elastic NV(a) | 19,023 | 2,779,831 |
| j2 Global, Inc.(a) | 32,059 | 3,131,844 |
| JFrog Ltd.(a),(b) | 41,296 | 2,594,628 |
The accompanying Notes to Financial Statements are an integral part of this statement.
Columbia Acorn Family of Funds | Annual Report 2020
| 41 |
Portfolio of Investments (continued)
Columbia Acorn USA®, December 31, 2020
| Common Stocks (continued) |
| Issuer | Shares | Value ($) |
| Manhattan Associates, Inc.(a) | 56,440 | 5,936,359 |
| Mimecast Ltd.(a) | 75,564 | 4,295,058 |
| Qualys, Inc.(a) | 42,059 | 5,125,730 |
| Sprout Social, Inc., Class A(a) | 119,108 | 5,408,694 |
| Upstart Holdings, Inc.(a) | 103,518 | 4,218,358 |
| Total | | 41,417,480 |
| Total Information Technology | 62,705,791 |
| Materials 1.6% |
| Chemicals 1.6% |
| Avient Corp. | 130,388 | 5,252,029 |
| Total Materials | 5,252,029 |
| Real Estate 2.8% |
| Equity Real Estate Investment Trusts (REITS) 0.2% |
| UMH Properties, Inc. | 34,701 | 513,922 |
| Real Estate Management & Development 2.6% |
| Colliers International Group, Inc. | 36,100 | 3,217,593 |
| FirstService Corp. | 14,395 | 1,968,660 |
| Redfin Corp.(a) | 53,122 | 3,645,763 |
| Total | | 8,832,016 |
| Total Real Estate | 9,345,938 |
Total Common Stocks
(Cost $221,391,978) | 330,394,217 |
|
| Limited Partnerships 0.7% |
| Issuer | Shares | Value ($) |
| Consumer Discretionary 0.7% |
| Hotels, Restaurants & Leisure 0.7% |
| Cedar Fair LP | 56,500 | 2,222,710 |
| Total Consumer Discretionary | 2,222,710 |
Total Limited Partnerships
(Cost $1,481,370) | 2,222,710 |
|
| Securities Lending Collateral 2.3% |
| | |
| Dreyfus Government Cash Management Fund, Instutional Shares, 0.030%(c),(d) | 7,793,305 | 7,793,305 |
Total Securities Lending Collateral
(Cost $7,793,305) | 7,793,305 |
|
| Money Market Funds 1.0% |
| | Shares | Value ($) |
| Columbia Short-Term Cash Fund, 0.107%(c),(e) | 3,541,168 | 3,540,814 |
Total Money Market Funds
(Cost $3,539,991) | 3,540,814 |
Total Investments in Securities
(Cost: $234,206,644) | 343,951,046 |
| Obligation to Return Collateral for Securities Loaned | | (7,793,305) |
| Other Assets & Liabilities, Net | | 5,254 |
| Net Assets | 336,162,995 |
Notes to Portfolio of Investments
| (a) | Non-income producing investment. |
| (b) | All or a portion of this security was on loan at December 31, 2020. The total market value of securities on loan at December 31, 2020 was $7,268,332. |
| (c) | The rate shown is the seven-day current annualized yield at December 31, 2020. |
| (d) | Investment made with cash collateral received from securities lending activity. |
| (e) | As defined in the Investment Company Act of 1940, an affiliated company is one in which the Fund owns 5% or more of the company’s outstanding voting securities, or a company which is under common ownership or control with the Fund. The value of the holdings and transactions in these affiliated companies during the year ended December 31, 2020 are as follows: |
| Affiliated issuers | Beginning
of period($) | Purchases($) | Sales($) | Net change in
unrealized
appreciation
(depreciation)($) | End of
period($) | Realized gain
(loss)($) | Dividends($) | End of
period shares |
| Columbia Short-Term Cash Fund, 0.107% |
| | 13,292,093 | 155,600,619 | (165,352,721) | 823 | 3,540,814 | (3,923) | 75,196 | 3,541,168 |
Abbreviation Legend
| ADR | American Depositary Receipt |
The accompanying Notes to Financial Statements are an integral part of this statement.
| 42 | Columbia Acorn Family of Funds | Annual Report 2020 |
Portfolio of Investments (continued)
Columbia Acorn USA®, December 31, 2020
Fair value measurements
Various inputs are used in determining the value of the Fund’s investments, following the input prioritization hierarchy established by accounting principles generally accepted in the United States of America (GAAP). These inputs are summarized in the three broad levels listed below:
| ■ | Level 1 – quoted prices in active markets for identical securities |
| ■ | Level 2 – prices determined using other significant observable inputs (including quoted prices for similar securities, interest rates, prepayment speeds, credit risk and others) |
| ■ | Level 3 – prices determined using significant unobservable inputs where quoted prices or observable inputs are unavailable or less reliable (including management’s own assumptions about the factors market participants would use in pricing an investment) |
The inputs or methodology used for valuing securities are not necessarily an indication of the risk associated with investing in those securities.
Examples of the types of securities in which the Fund would typically invest and how they are classified within this hierarchy are as follows. Typical Level 1 securities include exchange traded domestic equities, mutual funds whose net asset values are published each day and exchange traded foreign equities that are not typically statistically fair valued. Typical Level 2 securities include exchange traded foreign equities that are traded in the European region or Asia Pacific region time zones which are typically statistically fair valued, forward foreign currency exchange contracts and short-term investments valued at amortized cost. Additionally, securities fair valued by Columbia Wanger Asset Management’s Valuation Committee (the Committee) that rely on significant observable inputs are also included in Level 2. Typical Level 3 securities include any security fair valued by the Committee that relies on significant unobservable inputs.
The Committee is responsible for applying the Columbia Acorn Trust Portfolio Pricing Policy and the Columbia Wanger Asset Management pricing procedures (the Policies), which are approved by and subject to the oversight of the Board of Trustees.
The Committee meets as necessary, and no less frequently than quarterly, to determine fair values for securities for which market quotations are not readily available or for which Columbia Wanger Asset Management believes that available market quotations are unreliable. The Committee also reviews the continuing appropriateness of the Policies. In circumstances where a security has been fair valued, the Committee will also review the continuing appropriateness of the current value of the security. The Policies address, among other things: circumstances under which market quotations will be deemed readily available; selection of third party pricing vendors; appropriate pricing methodologies; events that require fair valuation and fair value techniques; circumstances under which securities will be deemed to pose a potential for stale pricing, including when securities are illiquid, restricted, or in default; and certain delegations of authority to determine fair values to the Fund’s investment manager. The Committee may also meet to discuss additional valuation matters, which may include review of back-testing results, review of time-sensitive information or approval of other valuation related actions, and to review the appropriateness of the Policies.
The following table is a summary of the inputs used to value the Fund’s investments at December 31, 2020:
| | Level 1 ($) | Level 2 ($) | Level 3 ($) | Total ($) |
| Investments in Securities | | | | |
| Common Stocks | | | | |
| Consumer Discretionary | 45,695,039 | — | — | 45,695,039 |
| Consumer Staples | 10,449,266 | — | — | 10,449,266 |
| Financials | 18,192,108 | — | — | 18,192,108 |
| Health Care | 127,043,001 | — | — | 127,043,001 |
| Industrials | 51,711,045 | — | — | 51,711,045 |
| Information Technology | 62,705,791 | — | — | 62,705,791 |
| Materials | 5,252,029 | — | — | 5,252,029 |
| Real Estate | 9,345,938 | — | — | 9,345,938 |
| Total Common Stocks | 330,394,217 | — | — | 330,394,217 |
| Limited Partnerships | | | | |
| Consumer Discretionary | 2,222,710 | — | — | 2,222,710 |
| Total Limited Partnerships | 2,222,710 | — | — | 2,222,710 |
| Securities Lending Collateral | 7,793,305 | — | — | 7,793,305 |
| Money Market Funds | 3,540,814 | — | — | 3,540,814 |
| Total Investments in Securities | 343,951,046 | — | — | 343,951,046 |
See the Portfolio of Investments for all investment classifications not indicated in the table.
The accompanying Notes to Financial Statements are an integral part of this statement.
Columbia Acorn Family of Funds | Annual Report 2020
| 43 |
Portfolio of Investments
Columbia Acorn International SelectSM, December 31, 2020
(Percentages represent value of investments compared to net assets)
Investments in securities
| Common Stocks 98.9% |
| Issuer | Shares | Value ($) |
| Australia 2.3% |
| carsales.com Ltd. | 729,442 | 11,266,963 |
| Brazil 2.0% |
| TOTVS SA | 1,758,700 | 9,724,282 |
| Canada 2.7% |
| CCL Industries, Inc. | 297,220 | 13,493,867 |
| China 12.5% |
| NetEase, Inc., ADR | 158,741 | 15,202,626 |
| New Oriental Education & Technology Group, Inc., ADR(a) | 104,477 | 19,412,871 |
| Shenzhou International Group Holdings Ltd. | 906,500 | 17,765,814 |
| Silergy Corp. | 112,000 | 9,638,909 |
| Total | 62,020,220 |
| Denmark 2.6% |
| SimCorp AS | 88,434 | 13,148,040 |
| Germany 4.4% |
| Nemetschek SE | 143,348 | 10,653,391 |
| TeamViewer AG(a) | 207,309 | 11,136,103 |
| Total | 21,789,494 |
| Italy 4.0% |
| Amplifon SpA(a) | 242,619 | 10,084,745 |
| Nexi SpA(a) | 481,575 | 9,582,915 |
| Total | 19,667,660 |
| Japan 16.4% |
| Hikari Tsushin, Inc. | 77,400 | 18,160,675 |
| Lasertec Corp. | 88,900 | 10,434,455 |
| Nihon Unisys Ltd. | 359,800 | 14,102,671 |
| Obic Co., Ltd. | 47,900 | 9,626,838 |
| Recruit Holdings Co., Ltd. | 293,900 | 12,344,669 |
| Sekisui Chemical Co., Ltd. | 879,900 | 16,684,071 |
| Total | 81,353,379 |
| Malta 0.0% |
| BGP Holdings PLC(a),(b),(c) | 2,232,232 | 3 |
| Common Stocks (continued) |
| Issuer | Shares | Value ($) |
| Netherlands 5.8% |
| IMCD NV | 100,318 | 12,768,477 |
| Koninklijke Philips NV(a) | 298,829 | 16,097,186 |
| Total | 28,865,663 |
| New Zealand 3.0% |
| Fisher & Paykel Healthcare Corp., Ltd. | 620,507 | 14,736,260 |
| Singapore 2.0% |
| Mapletree Logistics Trust | 6,704,000 | 10,203,259 |
| South Korea 5.7% |
| Koh Young Technology, Inc.(a) | 129,161 | 12,496,627 |
| Korea Investment Holdings Co., Ltd.(a) | 216,130 | 15,749,036 |
| Total | 28,245,663 |
| Sweden 13.0% |
| Hexagon AB, Class B | 264,975 | 24,293,449 |
| Sectra AB, Class B(a) | 189,568 | 16,783,695 |
| Sweco AB, Class B | 659,267 | 12,099,436 |
| Trelleborg AB, Class B(a) | 507,423 | 11,270,885 |
| Total | 64,447,465 |
| Switzerland 7.0% |
| Belimo Holding AG, Registered Shares | 1,451 | 12,605,576 |
| Lonza Group AG, Registered Shares | 18,255 | 11,759,265 |
| Partners Group Holding AG | 9,044 | 10,627,080 |
| Total | 34,991,921 |
| Taiwan 2.3% |
| Voltronic Power Technology Corp. | 281,852 | 11,262,117 |
| United Kingdom 13.2% |
| Auto Trader Group PLC | 1,194,903 | 9,726,203 |
| Dechra Pharmaceuticals PLC | 280,725 | 13,221,233 |
| Intermediate Capital Group PLC | 477,435 | 11,234,091 |
| Rentokil Initial PLC(a) | 1,277,712 | 8,908,434 |
| Rightmove PLC(a) | 1,474,133 | 13,097,351 |
| Spirax-Sarco Engineering PLC | 60,850 | 9,393,047 |
| Total | 65,580,359 |
Total Common Stocks
(Cost $359,980,426) | 490,796,615 |
|
The accompanying Notes to Financial Statements are an integral part of this statement.
| 44 | Columbia Acorn Family of Funds | Annual Report 2020 |
Portfolio of Investments (continued)
Columbia Acorn International SelectSM, December 31, 2020
| Money Market Funds 0.7% |
| | Shares | Value ($) |
| Columbia Short-Term Cash Fund, 0.107%(d),(e) | 3,595,338 | 3,594,978 |
Total Money Market Funds
(Cost $3,594,978) | 3,594,978 |
Total Investments in Securities
(Cost $363,575,404) | 494,391,593 |
| Other Assets & Liabilities, Net | | 1,742,950 |
| Net Assets | $496,134,543 |
Notes to Portfolio of Investments
| (a) | Non-income producing investment. |
| (b) | Represents fair value as determined in good faith under procedures approved by the Board of Trustees. At December 31, 2020, the total value of these securities amounted to $3, which represents less than 0.01% of total net assets. |
| (c) | Valuation based on significant unobservable inputs. |
| (d) | The rate shown is the seven-day current annualized yield at December 31, 2020. |
| (e) | As defined in the Investment Company Act of 1940, an affiliated company is one in which the Fund owns 5% or more of the company’s outstanding voting securities, or a company which is under common ownership or control with the Fund. The value of the holdings and transactions in these affiliated companies during the year ended December 31, 2020 are as follows: |
| Affiliated issuers | Beginning
of period($) | Purchases($) | Sales($) | Net change in
unrealized
appreciation
(depreciation)($) | End of
period($) | Realized gain
(loss)($) | Dividends($) | End of
period shares |
| Columbia Short-Term Cash Fund, 0.107% |
| | 1,151,541 | 137,927,461 | (135,484,024) | — | 3,594,978 | (2,877) | 32,847 | 3,595,338 |
Abbreviation Legend
| ADR | American Depositary Receipt |
Fair value measurements
Various inputs are used in determining the value of the Fund’s investments, following the input prioritization hierarchy established by accounting principles generally accepted in the United States of America (GAAP). These inputs are summarized in the three broad levels listed below:
| ■ | Level 1 – quoted prices in active markets for identical securities |
| ■ | Level 2 – prices determined using other significant observable inputs (including quoted prices for similar securities, interest rates, prepayment speeds, credit risk and others) |
| ■ | Level 3 – prices determined using significant unobservable inputs where quoted prices or observable inputs are unavailable or less reliable (including management’s own assumptions about the factors market participants would use in pricing an investment) |
The inputs or methodology used for valuing securities are not necessarily an indication of the risk associated with investing in those securities.
Examples of the types of securities in which the Fund would typically invest and how they are classified within this hierarchy are as follows. Typical Level 1 securities include exchange traded domestic equities, mutual funds whose net asset values are published each day and exchange traded foreign equities that are not typically statistically fair valued. Typical Level 2 securities include exchange traded foreign equities that are traded in the European region or Asia Pacific region time zones which are typically statistically fair valued, forward foreign currency exchange contracts and short-term investments valued at amortized cost. Additionally, securities fair valued by Columbia Wanger Asset Management’s Valuation Committee (the Committee) that rely on significant observable inputs are also included in Level 2. Typical Level 3 securities include any security fair valued by the Committee that relies on significant unobservable inputs.
The Committee is responsible for applying the Columbia Acorn Trust Portfolio Pricing Policy and the Columbia Wanger Asset Management pricing procedures (the Policies), which are approved by and subject to the oversight of the Board of Trustees.
The Committee meets as necessary, and no less frequently than quarterly, to determine fair values for securities for which market quotations are not readily available or for which Columbia Wanger Asset Management believes that available market quotations are unreliable. The Committee also reviews the continuing appropriateness of the Policies. In circumstances where a security has been fair valued, the Committee will also review the continuing appropriateness of the current value of the security. The Policies address, among other things: circumstances under which market quotations will be deemed readily available; selection of third party pricing vendors; appropriate pricing methodologies; events that require fair valuation and fair value techniques; circumstances under which securities will be deemed to pose a potential for stale pricing, including when securities are illiquid, restricted, or in default; and certain delegations of authority to determine fair values to the Fund’s investment manager. The Committee may also meet to discuss additional valuation matters, which may include review of back-testing results, review of time-sensitive information or approval of other valuation related actions, and to review the appropriateness of the Policies.
The accompanying Notes to Financial Statements are an integral part of this statement.
Columbia Acorn Family of Funds | Annual Report 2020
| 45 |
Portfolio of Investments (continued)
Columbia Acorn International SelectSM, December 31, 2020
Fair value measurements (continued)
The following table is a summary of the inputs used to value the Fund’s investments at December 31, 2020:
| | Level 1 ($) | Level 2 ($) | Level 3 ($) | Total ($) |
| Investments in Securities | | | | |
| Common Stocks | | | | |
| Australia | — | 11,266,963 | — | 11,266,963 |
| Brazil | 9,724,282 | — | — | 9,724,282 |
| Canada | 13,493,867 | — | — | 13,493,867 |
| China | 34,615,497 | 27,404,723 | — | 62,020,220 |
| Denmark | — | 13,148,040 | — | 13,148,040 |
| Germany | — | 21,789,494 | — | 21,789,494 |
| Italy | — | 19,667,660 | — | 19,667,660 |
| Japan | — | 81,353,379 | — | 81,353,379 |
| Malta | — | — | 3 | 3 |
| Netherlands | — | 28,865,663 | — | 28,865,663 |
| New Zealand | — | 14,736,260 | — | 14,736,260 |
| Singapore | — | 10,203,259 | — | 10,203,259 |
| South Korea | — | 28,245,663 | — | 28,245,663 |
| Sweden | — | 64,447,465 | — | 64,447,465 |
| Switzerland | — | 34,991,921 | — | 34,991,921 |
| Taiwan | — | 11,262,117 | — | 11,262,117 |
| United Kingdom | — | 65,580,359 | — | 65,580,359 |
| Total Common Stocks | 57,833,646 | 432,962,966 | 3 | 490,796,615 |
| Money Market Funds | 3,594,978 | — | — | 3,594,978 |
| Total Investments in Securities | 61,428,624 | 432,962,966 | 3 | 494,391,593 |
See the Portfolio of Investments for all investment classifications not indicated in the table.
The Fund’s assets assigned to the Level 2 input category are generally valued using a market approach, in which a security’s value is determined through its correlation to prices and information from observable market transactions for similar or identical assets. Foreign equities are generally valued at the last sale price on the foreign exchange or market on which they trade. The Fund may use a statistical fair valuation model, in accordance with the policy adopted by the Board of Trustees, provided by an independent third party to value securities principally traded in foreign markets in order to adjust for possible stale pricing that may occur between the close of the foreign exchanges and the time for valuation. These models take into account available market data including intraday index, ADR, and ETF movements.
The Fund does not hold any significant investments (greater than one percent of net assets) categorized as Level 3.
The accompanying Notes to Financial Statements are an integral part of this statement.
| 46 | Columbia Acorn Family of Funds | Annual Report 2020 |
Portfolio of Investments
Columbia Thermostat FundSM, December 31, 2020
(Percentages represent value of investments compared to net assets)
Investments in securities
| Equity Funds 44.9% |
| | Shares | Value ($) |
| Dividend Income 4.9% |
| Columbia Dividend Income Fund, Institutional 3 Class(a) | 3,195,219 | 83,970,346 |
| International Small Mid Cap 5.1% |
| Columbia Acorn International®, Institutional 3 Class(a) | 2,460,313 | 86,086,340 |
| U.S. Large Cap 24.8% |
| Columbia Contrarian Core Fund, Institutional 3 Class(a) | 2,735,145 | 85,172,403 |
| Columbia Large Cap Enhanced Core Fund, Institutional 3 Class(a) | 3,136,625 | 84,343,847 |
| Columbia Large Cap Index Fund, Institutional 3 Class(a) | 4,577,815 | 254,114,521 |
| Total | 423,630,771 |
| U.S. Mid Cap 5.1% |
| Columbia Select Mid Cap Value Fund, Institutional 3 Class(a) | 7,580,779 | 87,709,618 |
| U.S. Small Mid Cap 5.0% |
| Columbia Acorn® Fund, Institutional 3 Class(a),(b) | 4,677,248 | 84,751,736 |
Total Equity Funds
(Cost $595,511,631) | 766,148,811 |
|
| Exchange-Traded Equity Funds 4.9% |
| | |
| U.S. Large Cap 4.9% |
| Columbia Research Enhanced Core ETF(a) | 3,382,155 | 83,125,929 |
Total Exchange-Traded Equity Funds
(Cost $66,922,896) | 83,125,929 |
|
| Exchange-Traded Fixed Income Funds 4.9% |
| | Shares | Value ($) |
| Multisector 4.9% |
| Columbia Diversified Fixed Income Allocation ETF(a) | 3,822,732 | 84,444,150 |
Total Exchange-Traded Fixed Income Funds
(Cost $78,259,124) | 84,444,150 |
|
| Fixed Income Funds 44.6% |
| | |
| Investment Grade 44.6% |
| Columbia Corporate Income Fund, Institutional 3 Class(a) | 7,564,342 | 84,644,993 |
| Columbia Quality Income Fund, Institutional 3 Class(a) | 7,516,902 | 169,430,970 |
| Columbia Short Term Bond Fund, Institutional 3 Class(a) | 12,542,953 | 126,683,822 |
| Columbia Total Return Bond Fund, Institutional 3 Class(a) | 2,204,312 | 84,645,589 |
| Columbia U.S. Treasury Index Fund, Institutional 3 Class(a) | 24,496,004 | 295,666,771 |
| Total | 761,072,145 |
Total Fixed Income Funds
(Cost $747,938,384) | 761,072,145 |
|
| Money Market Funds 0.4% |
| | |
| Columbia Short-Term Cash Fund, 0.107%(a),(c) | 6,901,721 | 6,901,030 |
Total Money Market Funds
(Cost $6,901,028) | 6,901,030 |
Total Investments in Securities
(Cost: $1,495,533,063) | 1,701,692,065 |
| Other Assets & Liabilities, Net | | 4,581,828 |
| Net Assets | 1,706,273,893 |
Notes to Portfolio of Investments
| (a) | As defined in the Investment Company Act of 1940, an affiliated company is one in which the Fund owns 5% or more of the company’s outstanding voting securities, or a company which is under common ownership or control with the Fund. The value of the holdings and transactions in these affiliated companies during the year ended December 31, 2020 are as follows: |
| Affiliated issuers | Beginning
of period($) | Purchases($) | Sales($) | Net change in
unrealized
appreciation
(depreciation)($) | End of
period($) | Capital gain
distributions($) | Realized gain
(loss)($) | Dividends —
affiliated
issuers ($) | End of
period shares |
| Columbia Acorn International®, Institutional 3 Class |
| | 14,336,928 | 87,609,263 | (32,216,193) | 16,356,342 | 86,086,340 | 8,828,609 | 1,124,582 | 328,362 | 2,460,313 |
| Columbia Acorn SelectSM, Institutional 3 Class |
| | 14,215,080 | 44,681,686 | (57,267,750) | (1,629,016) | — | 1,414,804 | 10,745,116 | 322,525 | — |
The accompanying Notes to Financial Statements are an integral part of this statement.
Columbia Acorn Family of Funds | Annual Report 2020
| 47 |
Portfolio of Investments (continued)
Columbia Thermostat FundSM, December 31, 2020
Notes to Portfolio of Investments (continued)
| Affiliated issuers | Beginning
of period($) | Purchases($) | Sales($) | Net change in
unrealized
appreciation
(depreciation)($) | End of
period($) | Capital gain
distributions($) | Realized gain
(loss)($) | Dividends —
affiliated
issuers ($) | End of
period shares |
| Columbia Acorn® Fund, Institutional 3 Class |
| | 14,254,256 | 83,528,847 | (32,270,245) | 19,238,878 | 84,751,736 | 8,760,167 | 2,658,707 | — | 4,677,248 |
| Columbia Contrarian Core Fund, Institutional 3 Class |
| | 14,273,333 | 85,618,649 | (30,211,479) | 15,491,900 | 85,172,403 | 5,352,003 | 3,893,355 | 689,266 | 2,735,145 |
| Columbia Corporate Income Fund, Institutional 3 Class |
| | 57,276,785 | 82,037,105 | (54,636,521) | (32,376) | 84,644,993 | 3,269,427 | (994,680) | 1,655,558 | 7,564,342 |
| Columbia Diversified Fixed Income Allocation ETF |
| | 57,229,227 | 77,832,280 | (53,885,292) | 3,267,935 | 84,444,150 | — | (2,879,267) | 1,675,131 | 3,822,732 |
| Columbia Dividend Income Fund, Institutional 3 Class |
| | 14,264,391 | 86,719,825 | (31,497,062) | 14,483,192 | 83,970,346 | — | 2,668,584 | 1,266,559 | 3,195,219 |
| Columbia Inflation Protected Securities Fund |
| | 57,184,897 | 9,333,718 | (64,547,102) | (1,971,513) | — | — | 1,550,026 | — | — |
| Columbia Large Cap Enhanced Core Fund, Institutional 3 Class |
| | 14,253,804 | 86,735,124 | (30,710,810) | 14,065,729 | 84,343,847 | 3,747,344 | 3,446,431 | 1,054,184 | 3,136,625 |
| Columbia Large Cap Index Fund, Institutional 3 Class |
| | 57,074,167 | 306,193,398 | (155,409,624) | 46,256,580 | 254,114,521 | 11,985,901 | 13,800,420 | 3,763,552 | 4,577,815 |
| Columbia Quality Income Fund, Institutional 3 Class |
| | 114,706,732 | 166,127,389 | (113,264,781) | 1,861,630 | 169,430,970 | 1,897,643 | 2,349,289 | 4,189,528 | 7,516,902 |
| Columbia Research Enhanced Core ETF |
| | — | 95,476,685 | (28,553,789) | 16,203,033 | 83,125,929 | — | 391,836 | 902,580 | 3,382,155 |
| Columbia Select Mid Cap Value Fund, Institutional 3 Class |
| | — | 67,096,572 | — | 20,613,046 | 87,709,618 | 1,587,312 | — | 503,180 | 7,580,779 |
| Columbia Short Term Bond Fund, Institutional 3 Class |
| | 86,093,014 | 122,981,213 | (86,247,331) | 3,856,926 | 126,683,822 | — | (1,859,247) | 2,209,786 | 12,542,953 |
| Columbia Short-Term Cash Fund, 0.107% |
| | 6,263,184 | 452,493,844 | (451,856,000) | 2 | 6,901,030 | — | 146 | 42,089 | 6,901,721 |
| Columbia Total Return Bond Fund, Institutional 3 Class |
| | — | 155,076,617 | (71,794,838) | 1,363,810 | 84,645,589 | 3,784,222 | 719,524 | 1,416,004 | 2,204,312 |
| Columbia U.S. Treasury Index Fund, Institutional 3 Class |
| | 200,147,836 | 300,181,101 | (197,601,763) | (7,060,403) | 295,666,771 | 1,610,700 | 16,080,412 | 3,261,279 | 24,496,004 |
| Total | 721,573,634 | | | 162,365,695 | 1,701,692,065 | 52,238,132 | 53,695,234 | 23,279,583 | |
| (b) | Non-income producing investment. |
| (c) | The rate shown is the seven-day current annualized yield at December 31, 2020. |
Fair value measurements
Various inputs are used in determining the value of the Fund’s investments, following the input prioritization hierarchy established by accounting principles generally accepted in the United States of America (GAAP). These inputs are summarized in the three broad levels listed below:
| ■ | Level 1 – quoted prices in active markets for identical securities |
| ■ | Level 2 – prices determined using other significant observable inputs (including quoted prices for similar securities, interest rates, prepayment speeds, credit risk and others) |
| ■ | Level 3 – prices determined using significant unobservable inputs where quoted prices or observable inputs are unavailable or less reliable (including management’s own assumptions about the factors market participants would use in pricing an investment) |
The inputs or methodology used for valuing securities are not necessarily an indication of the risk associated with investing in those securities.
Examples of the types of securities in which the Fund would typically invest and how they are classified within this hierarchy are as follows. Typical Level 1 securities include mutual funds whose net asset values are published each day.
The accompanying Notes to Financial Statements are an integral part of this statement.
| 48 | Columbia Acorn Family of Funds | Annual Report 2020 |
Portfolio of Investments (continued)
Columbia Thermostat FundSM, December 31, 2020
Fair value measurements (continued)
The Committee is responsible for applying the Columbia Acorn Trust Portfolio Pricing Policy and the Columbia Wanger Asset Management pricing procedures (the Policies), which are approved by and subject to the oversight of the Board of Trustees.
The Committee meets as necessary, and no less frequently than quarterly, to determine fair values for securities for which market quotations are not readily available or for which Columbia Wanger Asset Management believes that available market quotations are unreliable. The Committee also reviews the continuing appropriateness of the Policies. In circumstances where a security has been fair valued, the Committee will also review the continuing appropriateness of the current value of the security. The Policies address, among other things: circumstances under which market quotations will be deemed readily available; selection of third party pricing vendors; appropriate pricing methodologies; events that require fair valuation and fair value techniques; circumstances under which securities will be deemed to pose a potential for stale pricing, including when securities are illiquid, restricted, or in default; and certain delegations of authority to determine fair values to the Fund’s investment manager. The Committee may also meet to discuss additional valuation matters, which may include review of back-testing results, review of time-sensitive information or approval of other valuation related actions, and to review the appropriateness of the Policies.
The following table is a summary of the inputs used to value the Fund’s investments at December 31, 2020:
| | Level 1 ($) | Level 2 ($) | Level 3 ($) | Total ($) |
| Investments in Securities | | | | |
| Equity Funds | 766,148,811 | — | — | 766,148,811 |
| Exchange-Traded Equity Funds | 83,125,929 | — | — | 83,125,929 |
| Exchange-Traded Fixed Income Funds | 84,444,150 | — | — | 84,444,150 |
| Fixed Income Funds | 761,072,145 | — | — | 761,072,145 |
| Money Market Funds | 6,901,030 | — | — | 6,901,030 |
| Total Investments in Securities | 1,701,692,065 | — | — | 1,701,692,065 |
See the Portfolio of Investments for all investment classifications not indicated in the table.
The accompanying Notes to Financial Statements are an integral part of this statement.
Columbia Acorn Family of Funds | Annual Report 2020
| 49 |
Portfolio of Investments
Columbia Acorn European FundSM, December 31, 2020
(Percentages represent value of investments compared to net assets)
Investments in securities
| Common Stocks 96.9% |
| Issuer | Shares | Value ($) |
| Austria 1.4% |
| S&T AG(a) | 66,900 | 1,578,668 |
| Denmark 5.2% |
| ALK-Abello AS(a) | 5,757 | 2,371,342 |
| SimCorp AS | 21,892 | 3,254,822 |
| Total | 5,626,164 |
| France 2.0% |
| Robertet SA | 1,957 | 2,163,646 |
| Germany 12.8% |
| Deutsche Beteiligungs AG | 25,555 | 1,033,358 |
| Eckert & Ziegler Strahlen- und Medizintechnik AG | 34,566 | 1,893,484 |
| Exasol AG(a) | 31,254 | 1,063,735 |
| Hypoport SE(a) | 5,308 | 3,373,121 |
| Jenoptik AG | 52,200 | 1,594,450 |
| Nemetschek SE | 27,035 | 2,009,197 |
| TeamViewer AG(a) | 34,538 | 1,855,292 |
| Washtec AG(a) | 21,109 | 1,136,733 |
| Total | 13,959,370 |
| Greece 0.8% |
| JUMBO SA | 52,245 | 900,965 |
| Ireland 1.7% |
| UDG Healthcare PLC | 174,139 | 1,858,746 |
| Italy 6.8% |
| Amplifon SpA(a) | 42,715 | 1,775,499 |
| Carel Industries SpA | 98,151 | 2,299,801 |
| GVS SpA(a) | 103,821 | 1,934,202 |
| Nexi SpA(a) | 70,479 | 1,402,470 |
| Total | 7,411,972 |
| Malta 1.4% |
| Kindred Group PLC(a) | 160,295 | 1,568,381 |
| Netherlands 5.5% |
| Argenx SE(a) | 3,935 | 1,159,570 |
| BE Semiconductor Industries NV | 27,842 | 1,671,949 |
| IMCD NV | 24,325 | 3,096,087 |
| Total | 5,927,606 |
| Common Stocks (continued) |
| Issuer | Shares | Value ($) |
| Spain 4.2% |
| Befesa SA | 36,034 | 2,272,792 |
| Vidrala SA | 19,382 | 2,247,044 |
| Total | 4,519,836 |
| Sweden 22.9% |
| AddTech AB, B Shares | 231,739 | 3,079,694 |
| Dometic Group AB(a) | 134,466 | 1,783,226 |
| Dustin Group AB | 168,551 | 1,317,130 |
| Hexagon AB, Class B | 43,672 | 4,003,938 |
| Munters Group AB(a) | 373,373 | 3,766,585 |
| Sectra AB, Class B(a) | 61,901 | 5,480,500 |
| Sweco AB, Class B | 174,060 | 3,194,499 |
| Trelleborg AB, Class B(a) | 99,389 | 2,207,630 |
| Total | 24,833,202 |
| Switzerland 7.4% |
| Belimo Holding AG, Registered Shares | 246 | 2,137,128 |
| Gurit Holding AG | 499 | 1,405,717 |
| Inficon Holding AG | 2,301 | 2,107,804 |
| Kardex Energy AG | 5,800 | 1,278,144 |
| Partners Group Holding AG | 928 | 1,090,439 |
| Total | 8,019,232 |
| United Kingdom 22.9% |
| Abcam PLC | 54,262 | 1,150,152 |
| Auto Trader Group PLC | 228,647 | 1,861,128 |
| Dechra Pharmaceuticals PLC | 61,591 | 2,900,735 |
| Diploma PLC | 91,461 | 2,734,756 |
| Genus PLC | 18,100 | 1,035,681 |
| Halma PLC | 63,394 | 2,123,083 |
| Intermediate Capital Group PLC | 108,337 | 2,549,180 |
| Rentokil Initial PLC(a) | 443,866 | 3,094,712 |
| Rightmove PLC(a) | 240,962 | 2,140,895 |
| RWS Holdings PLC | 124,820 | 914,440 |
| Safestore Holdings PLC | 115,461 | 1,234,053 |
| Spirax-Sarco Engineering PLC | 20,361 | 3,143,005 |
| Total | 24,881,820 |
The accompanying Notes to Financial Statements are an integral part of this statement.
| 50 | Columbia Acorn Family of Funds | Annual Report 2020 |
Portfolio of Investments (continued)
Columbia Acorn European FundSM, December 31, 2020
| Common Stocks (continued) |
| Issuer | Shares | Value ($) |
| United States 1.9% |
| Inter Parfums, Inc. | 33,377 | 2,018,975 |
Total Common Stocks
(Cost $62,654,576) | 105,268,583 |
|
| Money Market Funds 2.7% |
| | Shares | Value ($) |
| Columbia Short-Term Cash Fund, 0.107%(b),(c) | 2,989,901 | 2,989,602 |
Total Money Market Funds
(Cost $2,989,602) | 2,989,602 |
Total Investments in Securities
(Cost $65,644,178) | 108,258,185 |
| Other Assets & Liabilities, Net | | 381,008 |
| Net Assets | $108,639,193 |
Notes to Portfolio of Investments
| (a) | Non-income producing investment. |
| (b) | The rate shown is the seven-day current annualized yield at December 31, 2020. |
| (c) | As defined in the Investment Company Act of 1940, an affiliated company is one in which the Fund owns 5% or more of the company’s outstanding voting securities, or a company which is under common ownership or control with the Fund. The value of the holdings and transactions in these affiliated companies during the year ended December 31, 2020 are as follows: |
| Affiliated issuers | Beginning
of period($) | Purchases($) | Sales($) | Net change in
unrealized
appreciation
(depreciation)($) | End of
period($) | Realized gain
(loss)($) | Dividends($) | End of
period shares |
| Columbia Short-Term Cash Fund, 0.122% |
| | 3,469,112 | 42,003,534 | (42,483,044) | — | 2,989,602 | (913) | 12,063 | 2,989,901 |
Fair value measurements
Various inputs are used in determining the value of the Fund’s investments, following the input prioritization hierarchy established by accounting principles generally accepted in the United States of America (GAAP). These inputs are summarized in the three broad levels listed below:
| ■ | Level 1 – quoted prices in active markets for identical securities |
| ■ | Level 2 – prices determined using other significant observable inputs (including quoted prices for similar securities, interest rates, prepayment speeds, credit risk and others) |
| ■ | Level 3 – prices determined using significant unobservable inputs where quoted prices or observable inputs are unavailable or less reliable (including management’s own assumptions about the factors market participants would use in pricing an investment) |
The inputs or methodology used for valuing securities are not necessarily an indication of the risk associated with investing in those securities.
Examples of the types of securities in which the Fund would typically invest and how they are classified within this hierarchy are as follows. Typical Level 1 securities include exchange traded domestic equities, mutual funds whose net asset values are published each day and exchange traded foreign equities that are not typically statistically fair valued. Typical Level 2 securities include exchange traded foreign equities that are traded in the European region or Asia Pacific region time zones which are typically statistically fair valued, forward foreign currency exchange contracts and short-term investments valued at amortized cost. Additionally, securities fair valued by Columbia Wanger Asset Management’s Valuation Committee (the Committee) that rely on significant observable inputs are also included in Level 2. Typical Level 3 securities include any security fair valued by the Committee that relies on significant unobservable inputs.
The Committee is responsible for applying the Columbia Acorn Trust Portfolio Pricing Policy and the Columbia Wanger Asset Management pricing procedures (the Policies), which are approved by and subject to the oversight of the Board of Trustees.
The Committee meets as necessary, and no less frequently than quarterly, to determine fair values for securities for which market quotations are not readily available or for which Columbia Wanger Asset Management believes that available market quotations are unreliable. The Committee also reviews the continuing appropriateness of the Policies. In circumstances where a security has been fair valued, the Committee will also review the continuing appropriateness of the current value of the security. The Policies address, among other things: circumstances under which market quotations will be deemed readily available; selection of third party pricing vendors; appropriate pricing methodologies; events that
The accompanying Notes to Financial Statements are an integral part of this statement.
Columbia Acorn Family of Funds | Annual Report 2020
| 51 |
Portfolio of Investments (continued)
Columbia Acorn European FundSM, December 31, 2020
Fair value measurements (continued)
require fair valuation and fair value techniques; circumstances under which securities will be deemed to pose a potential for stale pricing, including when securities are illiquid, restricted, or in default; and certain delegations of authority to determine fair values to the Fund’s investment manager. The Committee may also meet to discuss additional valuation matters, which may include review of back-testing results, review of time-sensitive information or approval of other valuation related actions, and to review the appropriateness of the Policies.
The following table is a summary of the inputs used to value the Fund’s investments at December 31, 2020:
| | Level 1 ($) | Level 2 ($) | Level 3 ($) | Total ($) |
| Investments in Securities | | | | |
| Common Stocks | | | | |
| Austria | — | 1,578,668 | — | 1,578,668 |
| Denmark | — | 5,626,164 | — | 5,626,164 |
| France | — | 2,163,646 | — | 2,163,646 |
| Germany | — | 13,959,370 | — | 13,959,370 |
| Greece | — | 900,965 | — | 900,965 |
| Ireland | — | 1,858,746 | — | 1,858,746 |
| Italy | — | 7,411,972 | — | 7,411,972 |
| Malta | — | 1,568,381 | — | 1,568,381 |
| Netherlands | — | 5,927,606 | — | 5,927,606 |
| Spain | — | 4,519,836 | — | 4,519,836 |
| Sweden | — | 24,833,202 | — | 24,833,202 |
| Switzerland | — | 8,019,232 | — | 8,019,232 |
| United Kingdom | — | 24,881,820 | — | 24,881,820 |
| United States | 2,018,975 | — | — | 2,018,975 |
| Total Common Stocks | 2,018,975 | 103,249,608 | — | 105,268,583 |
| Money Market Funds | 2,989,602 | — | — | 2,989,602 |
| Total Investments in Securities | 5,008,577 | 103,249,608 | — | 108,258,185 |
See the Portfolio of Investments for all investment classifications not indicated in the table.
The Fund’s assets assigned to the Level 2 input category are generally valued using a market approach, in which a security’s value is determined through its correlation to prices and information from observable market transactions for similar or identical assets. Foreign equities are generally valued at the last sale price on the foreign exchange or market on which they trade. The Fund may use a statistical fair valuation model, in accordance with the policy adopted by the Board of Trustees, provided by an independent third party to value securities principally traded in foreign markets in order to adjust for possible stale pricing that may occur between the close of the foreign exchanges and the time for valuation. These models take into account available market data including intraday index, ADR, and ETF movements.
The accompanying Notes to Financial Statements are an integral part of this statement.
| 52 | Columbia Acorn Family of Funds | Annual Report 2020 |
Statement of Assets and Liabilities
December 31, 2020
| | Columbia
Acorn®
Fund | Columbia
Acorn
International® | Columbia
Acorn
USA® |
| Assets | | | |
| Investments in securities, at value* | | | |
| Unaffiliated issuers (cost $3,424,412,198, $1,498,166,117, $230,666,653, respectively) | $4,952,929,905 | $2,416,061,609 | $340,410,232 |
| Affiliated issuers (cost $70,957,452, $61,934,514, $3,539,991, respectively) | 67,960,230 | 61,934,514 | 3,540,814 |
| Foreign currency (cost $—, $110,020, $—, respectively) | — | 110,836 | — |
| Margin deposits on: | | | |
| Futures contracts | — | 3,987,630 | — |
| Receivable for: | | | |
| Investments sold | — | 14,161,121 | 406,617 |
| Capital shares sold | 526,247 | 587,905 | 90,120 |
| Dividends | 1,323,169 | 3,140,994 | 74,151 |
| Securities lending income | 246,350 | 3,663 | 22,185 |
| Foreign tax reclaims | 4,454 | 1,997,202 | 418 |
| Expense reimbursement due from Investment Manager | — | 789 | — |
| Prepaid expenses | 115,437 | 63,652 | 7,192 |
| Trustees’ deferred compensation plan | 4,451,066 | 2,266,398 | 391,437 |
| Total assets | 5,027,556,858 | 2,504,316,313 | 344,943,166 |
| Liabilities | | | |
| Due to custodian | — | 8,854 | — |
| Due upon return of securities on loan | 143,378,229 | 259,440 | 7,793,305 |
| Payable for: | | | |
| Investments purchased | — | 1,877,832 | — |
| Capital shares purchased | 9,170,044 | 1,581,904 | 519,632 |
| Variation margin for futures contracts | — | 235,195 | — |
| Investment advisory fee | 89,300 | 53,978 | 8,486 |
| Distribution and/or service fees | 8,306 | 2,532 | 478 |
| Transfer agent fees | 399,421 | 199,444 | 27,833 |
| Administration fees | 6,417 | 3,278 | 443 |
| Trustees’ fees | 6,039 | 54,295 | 367 |
| Compensation of chief compliance officer | 8,681 | 4,864 | 560 |
| Other expenses | 198,785 | 227,673 | 37,630 |
| Trustees’ deferred compensation plan | 4,451,066 | 2,266,398 | 391,437 |
| Total liabilities | 157,716,288 | 6,775,687 | 8,780,171 |
| Net assets applicable to outstanding capital stock | $4,869,840,570 | $2,497,540,626 | $336,162,995 |
| Represented by | | | |
| Paid in capital | 3,143,806,241 | 1,605,558,728 | 222,188,736 |
| Total distributable earnings (loss) | 1,726,034,329 | 891,981,898 | 113,974,259 |
| Total - representing net assets applicable to outstanding capital stock | $4,869,840,570 | $2,497,540,626 | $336,162,995 |
| * Includes the value of securities on loan | 138,033,364 | 247,052 | 7,268,332 |
The accompanying Notes to Financial Statements are an integral part of this statement.
Columbia Acorn Family of Funds | Annual Report 2020
| 53 |
Statement of Assets and Liabilities (continued)
December 31, 2020
| | Columbia
Acorn®
Fund | Columbia
Acorn
International® | Columbia
Acorn
USA® |
| Class A | | | |
| Net assets | $983,708,699 | $283,477,871 | $59,049,654 |
| Shares outstanding | 77,521,539 | 8,261,596 | 4,347,560 |
| Net asset value per share(a) | $12.69 | $34.31 | $13.58 |
| Maximum sales charge | 5.75% | 5.75% | 5.75% |
| Maximum offering price per share(b) (calculated by dividing the net asset value per share by 1.0 minus the maximum sales charge for Class A shares) | $13.46 | $36.40 | $14.41 |
| Advisor Class | | | |
| Net assets | $44,138,706 | $22,548,891 | $23,157,764 |
| Shares outstanding | 2,500,338 | 645,210 | 1,198,907 |
| Net asset value per share(c) | $17.65 | $34.95 | $19.32 |
| Class C | | | |
| Net assets | $55,861,299 | $19,998,074 | $2,658,057 |
| Shares outstanding | 3,460,619 | 636,333 | 146,551 |
| Net asset value per share(a) | $16.14 | $31.43 | $18.14 |
| Institutional Class | | | |
| Net assets | $3,569,793,847 | $1,760,927,289 | $170,649,846 |
| Shares outstanding | 215,069,131 | 51,091,575 | 9,533,249 |
| Net asset value per share(c) | $16.60 | $34.47 | $17.90 |
| Institutional 2 Class | | | |
| Net assets | $61,000,489 | $129,575,886 | $3,344,003 |
| Shares outstanding | 3,411,715 | 3,760,398 | 171,510 |
| Net asset value per share(c) | $17.88 | $34.46 | $19.50 |
| Institutional 3 Class | | | |
| Net assets | $155,337,530 | $277,614,466 | $77,303,671 |
| Shares outstanding | 8,570,463 | 7,934,661 | 3,915,310 |
| Net asset value per share(c) | $18.12 | $34.99 | $19.74 |
| Class R | | | |
| Net assets | $— | $3,398,149 | $— |
| Shares outstanding | — | 99,241 | — |
| Net asset value per share(c) | $— | $34.24 | $— |
| (a) | Redemption price per share is equal to net asset value less any applicable contingent deferred sales charge. |
| (b) | On sales of $50,000 or more the offering price is reduced. |
| (c) | Redemption price per share is equal to net asset value. |
The accompanying Notes to Financial Statements are an integral part of this statement.
| 54 | Columbia Acorn Family of Funds | Annual Report 2020 |
Statement of Assets and Liabilities (continued)
December 31, 2020
| | Columbia
Acorn
International
SelectSM | Columbia
Thermostat
FundSM | Columbia
Acorn
European
FundSM |
| Assets | | | |
| Investments in securities, at value | | | |
| Unaffiliated issuers (cost $359,980,426, $—, $62,654,576, respectively) | $490,796,615 | $— | $105,268,583 |
| Affiliated issuers (cost $3,594,978, $1,495,533,063, $2,989,602, respectively) | 3,594,978 | 1,701,692,065 | 2,989,602 |
| Cash | — | 12,400 | — |
| Foreign currency (cost $106,606, $—, $16,027, respectively) | 107,126 | — | 16,126 |
| Receivable for: | | | |
| Investments sold | 745,271 | — | — |
| Capital shares sold | 146,086 | 6,504,990 | 529,894 |
| Dividends | 740,276 | 1,848,177 | 68,992 |
| Securities lending income | 1,340 | — | 202 |
| Foreign tax reclaims | 619,865 | — | 174,739 |
| Expense reimbursement due from Investment Manager | 2,690 | 3,124 | 937 |
| Prepaid expenses | 12,999 | 39,605 | 2,524 |
| Total assets | 496,767,246 | 1,710,100,361 | 109,051,599 |
| Liabilities | | | |
| Due to custodian | 200 | — | — |
| Payable for: | | | |
| Investments purchased | — | 1,847,289 | — |
| Capital shares purchased | 152,975 | 1,431,554 | 345,847 |
| Investment advisory fee | 12,059 | 4,639 | 3,487 |
| Distribution and/or service fees | 1,662 | 9,123 | 446 |
| Transfer agent fees | 43,846 | 144,421 | 9,268 |
| Administration fees | 650 | 2,225 | 143 |
| Trustees’ fees | 351,749 | 304,560 | 20,626 |
| Compensation of chief compliance officer | 824 | 2,627 | 163 |
| Other expenses | 68,738 | 80,030 | 32,426 |
| Total liabilities | 632,703 | 3,826,468 | 412,406 |
| Net assets applicable to outstanding capital stock | $496,134,543 | $1,706,273,893 | $108,639,193 |
| Represented by | | | |
| Paid in capital | 370,855,403 | 1,475,594,906 | 70,547,977 |
| Total distributable earnings (loss) | 125,279,140 | 230,678,987 | 38,091,216 |
| Total - representing net assets applicable to outstanding capital stock | $496,134,543 | $1,706,273,893 | $108,639,193 |
The accompanying Notes to Financial Statements are an integral part of this statement.
Columbia Acorn Family of Funds | Annual Report 2020
| 55 |
Statement of Assets and Liabilities (continued)
December 31, 2020
| | Columbia
Acorn
International
SelectSM | Columbia
Thermostat
FundSM | Columbia
Acorn
European
FundSM |
| Class A | | | |
| Net assets | $230,518,582 | $505,237,612 | $42,058,594 |
| Shares outstanding | 6,846,928 | 27,601,028 | 1,529,725 |
| Net asset value per share(a) | $33.67 | $18.31 | $27.49 |
| Maximum sales charge | 5.75% | 5.75% | 5.75% |
| Maximum offering price per share(b) (calculated by dividing the net asset value per share by 1.0 minus the maximum sales charge for Class A shares) | $35.72 | $19.43 | $29.17 |
| Advisor Class | | | |
| Net assets | $2,747,569 | $130,921,104 | $1,781,434 |
| Shares outstanding | 79,499 | 7,225,110 | 64,125 |
| Net asset value per share(c) | $34.56 | $18.12 | $27.78 |
| Class C | | | |
| Net assets | $3,250,699 | $208,937,451 | $5,705,241 |
| Shares outstanding | 106,942 | 11,336,914 | 212,605 |
| Net asset value per share(a) | $30.40 | $18.43 | $26.83 |
| Institutional Class | | | |
| Net assets | $155,133,320 | $729,118,856 | $55,170,732 |
| Shares outstanding | 4,528,825 | 40,494,959 | 1,995,913 |
| Net asset value per share(c) | $34.25 | $18.01 | $27.64 |
| Institutional 2 Class | | | |
| Net assets | $77,420,026 | $129,197,137 | $3,854,519 |
| Shares outstanding | 2,239,367 | 7,121,059 | 137,778 |
| Net asset value per share(c) | $34.57 | $18.14 | $27.98 |
| Institutional 3 Class | | | |
| Net assets | $27,064,347 | $2,861,733 | $68,673 |
| Shares outstanding | 783,182 | 157,997 | 2,494 |
| Net asset value per share(c) | $34.56 | $18.11 | $27.54 |
| (a) | Redemption price per share is equal to net asset value less any applicable contingent deferred sales charge. |
| (b) | On sales of $50,000 or more the offering price is reduced. |
| (c) | Redemption price per share is equal to net asset value. |
The accompanying Notes to Financial Statements are an integral part of this statement.
| 56 | Columbia Acorn Family of Funds | Annual Report 2020 |
Statement of Operations
Year Ended December 31, 2020
| | Columbia
Acorn®
Fund | Columbia
Acorn
International® | Columbia
Acorn
USA® |
| Net investment income | | | |
| Income: | | | |
| Dividends — unaffiliated issuers | $21,547,824 | $35,848,378 | $1,245,312 |
| Dividends — affiliated issuers | 529,252 | 360,888 | 75,196 |
| Income from securities lending — net | 462,100 | 887,939 | 40,800 |
| Foreign taxes withheld | (36,464) | (3,150,201) | (7,665) |
| Total income | 22,502,712 | 33,947,004 | 1,353,643 |
| Expenses: | | | |
| Investment advisory fee | 27,510,670 | 18,520,125 | 2,571,334 |
| Distribution and/or service fees | | | |
| Class A | 2,026,552 | 633,994 | 124,356 |
| Class C | 567,348 | 168,116 | 26,145 |
| Class R | — | 14,823 | — |
| Transfer agent fees | | | |
| Class A | 697,212 | 276,231 | 57,371 |
| Advisor Class | 34,687 | 22,560 | 20,740 |
| Class C | 49,154 | 18,211 | 3,033 |
| Institutional Class | 2,604,152 | 1,806,253 | 164,180 |
| Institutional 2 Class | 29,467 | 83,445 | 1,675 |
| Institutional 3 Class | 7,424 | 16,236 | 4,309 |
| Class R | — | 3,231 | — |
| Administration fees | 2,013,589 | 1,150,836 | 136,880 |
| Trustees’ fees | 474,755 | 286,157 | 32,612 |
| Custodian fees | 23,737 | 403,494 | 9,402 |
| Printing and postage fees | 156,321 | 148,757 | 31,268 |
| Registration fees | 108,582 | 109,517 | 94,223 |
| Audit fees | 36,863 | 102,797 | 34,128 |
| Legal fees | 882,490 | 517,208 | 60,254 |
| Line of credit interest | — | 86 | — |
| Compensation of chief compliance officer | 17,088 | 10,445 | 1,193 |
| Other | 249,894 | 168,437 | 23,720 |
| Total expenses | 37,489,985 | 24,460,959 | 3,396,823 |
| Fees waived or expenses reimbursed by Investment Manager and its affiliates | (3,090) | (894,866) | (113,004) |
| Fees waived by transfer agent | | | |
| Institutional 2 Class | (2,205) | (16,079) | (596) |
| Institutional 3 Class | — | (11,038) | (4,309) |
| Expense reduction | (6,726) | (6,632) | (1,080) |
| Total net expenses | 37,477,964 | 23,532,344 | 3,277,834 |
| Net investment income (loss) | (14,975,252) | 10,414,660 | (1,924,191) |
| Realized and unrealized gain (loss) — net | | | |
| Net realized gain (loss) on: | | | |
| Investments — unaffiliated issuers | 701,856,947 | 249,417,964 | 14,290,968 |
| Investments — affiliated issuers | (21,550,393) | 1,777 | (3,923) |
| Foreign currency translations | — | (128,203) | — |
| Futures contracts | 278,742 | 21,979,409 | 3,013,592 |
| Net realized gain | 680,585,296 | 271,270,947 | 17,300,637 |
| Net change in unrealized appreciation (depreciation) on: | | | |
| Investments — unaffiliated issuers | 468,100,275 | 21,576,120 | 47,281,739 |
| Investments — affiliated issuers | (2,997,222) | — | 823 |
| Foreign currency translations | — | 160,265 | — |
| Futures contracts | — | 1,009,673 | — |
| Net change in unrealized appreciation (depreciation) | 465,103,053 | 22,746,058 | 47,282,562 |
| Net realized and unrealized gain | 1,145,688,349 | 294,017,005 | 64,583,199 |
| Net increase in net assets resulting from operations | $1,130,713,097 | $304,431,665 | $62,659,008 |
The accompanying Notes to Financial Statements are an integral part of this statement.
Columbia Acorn Family of Funds | Annual Report 2020
| 57 |
Statement of Operations (continued)
Year Ended December 31, 2020
| | Columbia
Acorn
International
SelectSM | Columbia
Thermostat
FundSM | Columbia
Acorn
European
FundSM |
| Net investment income | | | |
| Income: | | | |
| Dividends — unaffiliated issuers | $3,760,980 | $— | $794,375 |
| Dividends — affiliated issuers | 32,847 | 23,279,583 | 12,063 |
| Other Income | — | 6 | — |
| Income from securities lending — net | 12,876 | — | 25,080 |
| Foreign taxes withheld | (409,927) | — | (83,499) |
| Total income | 3,396,776 | 23,279,589 | 748,019 |
| Expenses: | | | |
| Investment advisory fee | 2,613,625 | 1,141,494 | 978,881 |
| Distribution and/or service fees | | | |
| Class A | 267,833 | 871,193 | 77,498 |
| Class C | 23,256 | 1,781,122 | 52,000 |
| Transfer agent fees | | | |
| Class A | 169,834 | 343,660 | 32,946 |
| Advisor Class | 3,140 | 54,040 | 1,558 |
| Class C | 3,491 | 175,279 | 5,585 |
| Institutional Class | 162,740 | 469,322 | 44,322 |
| Institutional 2 Class | 31,605 | 47,988 | 1,751 |
| Institutional 3 Class | 1,506 | 367 | 4 |
| Administration fees | 143,124 | 561,618 | 40,553 |
| Trustees’ fees | 77,307 | 156,726 | 12,147 |
| Custodian fees | 59,960 | 2,495 | 30,673 |
| Printing and postage fees | 42,170 | 95,830 | 19,901 |
| Registration fees | 95,185 | 186,560 | 92,089 |
| Audit fees | 38,405 | 15,198 | 33,883 |
| Legal fees | 57,982 | 229,459 | 18,020 |
| Line of credit interest | — | 322 | 207 |
| Compensation of chief compliance officer | 1,106 | 4,161 | 371 |
| Other | 29,516 | 58,496 | 14,241 |
| Total expenses | 3,821,785 | 6,195,330 | 1,456,630 |
| Fees waived or expenses reimbursed by Investment Manager and its affiliates | (616,055) | (740,077) | (340,414) |
| Fees waived by transfer agent | | | |
| Institutional 2 Class | (2,267) | — | (536) |
| Institutional 3 Class | (692) | — | (4) |
| Expense reduction | (9,771) | (160) | — |
| Total net expenses | 3,193,000 | 5,455,093 | 1,115,676 |
| Net investment income (loss) | 203,776 | 17,824,496 | (367,657) |
| Realized and unrealized gain (loss) — net | | | |
| Net realized gain (loss) on: | | | |
| Investments — unaffiliated issuers | (2,943,460) | — | 3,858,453 |
| Investments — affiliated issuers | (2,877) | 53,695,234 | (913) |
| Capital gain distributions from underlying affiliated funds | — | 52,238,132 | — |
| Foreign currency translations | (62,851) | — | (26,795) |
| Net realized gain (loss) | (3,009,188) | 105,933,366 | 3,830,745 |
| Net change in unrealized appreciation (depreciation) on: | | | |
| Investments — unaffiliated issuers | 82,947,678 | — | 11,480,859 |
| Investments — affiliated issuers | — | 162,365,695 | — |
| Foreign currency translations | 48,659 | — | 13,886 |
| Net change in unrealized appreciation (depreciation) | 82,996,337 | 162,365,695 | 11,494,745 |
| Net realized and unrealized gain | 79,987,149 | 268,299,061 | 15,325,490 |
| Net increase in net assets resulting from operations | $80,190,925 | $286,123,557 | $14,957,833 |
The accompanying Notes to Financial Statements are an integral part of this statement.
| 58 | Columbia Acorn Family of Funds | Annual Report 2020 |
Statement of Changes in Net Assets
| | Columbia
Acorn® Fund | Columbia Acorn
International® |
| | Year Ended
December 31, 2020 | Year Ended
December 31, 2019 | Year Ended
December 31, 2020 | Year Ended
December 31, 2019 |
| Operations | | | | |
| Net investment income (loss) | $(14,975,252) | $(5,038,865) | $10,414,660 | $26,459,641 |
| Net realized gain | 680,585,296 | 537,959,386 | 271,270,947 | 189,362,155 |
| Net change in unrealized appreciation (depreciation) | 465,103,053 | 439,927,446 | 22,746,058 | 485,609,937 |
| Net increase in net assets resulting from operations | 1,130,713,097 | 972,847,967 | 304,431,665 | 701,431,733 |
| Distributions to shareholders | | | | |
| Net investment income and net realized gains | | | | |
| Class A | (150,373,734) | (110,582,346) | (34,334,393) | (33,066,056) |
| Advisor Class | (5,281,322) | (4,615,704) | (2,890,397) | (1,425,903) |
| Class C | (14,567,713) | (24,489,308) | (2,457,496) | (2,146,649) |
| Institutional Class | (438,953,007) | (344,231,371) | (221,646,811) | (213,404,097) |
| Institutional 2 Class | (6,996,582) | (5,227,592) | (18,032,639) | (21,058,497) |
| Institutional 3 Class | (16,279,584) | (7,796,098) | (33,290,405) | (27,606,607) |
| Class R | — | — | (402,136) | (374,176) |
| Total distributions to shareholders | (632,451,942) | (496,942,419) | (313,054,277) | (299,081,985) |
| Increase (decrease) in net assets from capital stock activity | 212,416,503 | (115,107,691) | (208,084,940) | (213,532,913) |
| Total increase (decrease) in net assets | 710,677,658 | 360,797,857 | (216,707,552) | 188,816,835 |
| Net assets at beginning of year | 4,159,162,912 | 3,798,365,055 | 2,714,248,178 | 2,525,431,343 |
| Net assets at end of year | $4,869,840,570 | $4,159,162,912 | $2,497,540,626 | $2,714,248,178 |
The accompanying Notes to Financial Statements are an integral part of this statement.
Columbia Acorn Family of Funds | Annual Report 2020
| 59 |
Statement of Changes in Net Assets (continued)
| | Columbia
Acorn USA® | Columbia Acorn
International SelectSM |
| | Year Ended
December 31, 2020 | Year Ended
December 31, 2019 | Year Ended
December 31, 2020 | Year Ended
December 31, 2019 |
| Operations | | | | |
| Net investment income (loss) | $(1,924,191) | $(644,036) | $203,776 | $698,274 |
| Net realized gain (loss) | 17,300,637 | 31,861,458 | (3,009,188) | 9,151,599 |
| Net change in unrealized appreciation (depreciation) | 47,282,562 | 49,992,890 | 82,996,337 | 27,625,785 |
| Net increase in net assets resulting from operations | 62,659,008 | 81,210,312 | 80,190,925 | 37,475,658 |
| Distributions to shareholders | | | | |
| Net investment income and net realized gains | | | | |
| Class A | (3,334,546) | (7,620,982) | (137,241) | (3,162,237) |
| Advisor Class | (927,003) | (1,842,281) | (6,211) | (194,771) |
| Class C | (298,962) | (1,208,980) | (6,451) | (214,120) |
| Institutional Class | (7,684,936) | (16,965,767) | (262,018) | (7,922,245) |
| Institutional 2 Class | (135,059) | (383,196) | (225,716) | (289,819) |
| Institutional 3 Class | (3,102,308) | (6,484,915) | (53,063) | (1,214,883) |
| Total distributions to shareholders | (15,482,814) | (34,506,121) | (690,700) | (12,998,075) |
| Increase (decrease) in net assets from capital stock activity | (20,411,506) | (13,299,648) | 268,475,687 | 14,414,867 |
| Total increase in net assets | 26,764,688 | 33,404,543 | 347,975,912 | 38,892,450 |
| Net assets at beginning of year | 309,398,307 | 275,993,764 | 148,158,631 | 109,266,181 |
| Net assets at end of year | $336,162,995 | $309,398,307 | $496,134,543 | $148,158,631 |
The accompanying Notes to Financial Statements are an integral part of this statement.
| 60 | Columbia Acorn Family of Funds | Annual Report 2020 |
Statement of Changes in Net Assets (continued)
| | Columbia
Thermostat FundSM | Columbia Acorn
European FundSM |
| | Year Ended
December 31, 2020 | Year Ended
December 31, 2019 | Year Ended
December 31, 2020 | Year Ended
December 31, 2019 |
| Operations | | | | |
| Net investment income (loss) | $17,824,496 | $12,117,664 | $(367,657) | $354,347 |
| Net realized gain | 105,933,366 | 35,238,644 | 3,830,745 | 1,654,113 |
| Net change in unrealized appreciation (depreciation) | 162,365,695 | 47,454,371 | 11,494,745 | 27,314,511 |
| Net increase in net assets resulting from operations | 286,123,557 | 94,810,679 | 14,957,833 | 29,322,971 |
| Distributions to shareholders | | | | |
| Net investment income and net realized gains | | | | |
| Class A | (29,853,089) | (11,138,390) | (160,959) | (264,373) |
| Advisor Class | (7,487,768) | (822,651) | (7,030) | (18,540) |
| Class C | (11,618,991) | (6,895,240) | (30,429) | (12,781) |
| Institutional Class | (44,952,118) | (15,210,441) | (199,953) | (509,487) |
| Institutional 2 Class | (7,900,364) | (2,004,840) | (22,104) | (20,361) |
| Institutional 3 Class | (182,364) | (45,752) | (21) | (218) |
| Total distributions to shareholders | (101,994,694) | (36,117,314) | (420,496) | (825,760) |
| Increase (decrease) in net assets from capital stock activity | 797,756,258 | 23,842,525 | 839,659 | (3,740,595) |
| Total increase in net assets | 981,885,121 | 82,535,890 | 15,376,996 | 24,756,616 |
| Net assets at beginning of year | 724,388,772 | 641,852,882 | 93,262,197 | 68,505,581 |
| Net assets at end of year | $1,706,273,893 | $724,388,772 | $108,639,193 | $93,262,197 |
The accompanying Notes to Financial Statements are an integral part of this statement.
Columbia Acorn Family of Funds | Annual Report 2020
| 61 |
Statement of Changes in Net Assets (continued)
| | Columbia
Acorn® Fund | Columbia Acorn
International® |
| | Year Ended | Year Ended | Year Ended | Year Ended |
| | December 31, 2020 | December 31, 2019 | December 31, 2020 | December 31, 2019 |
| | Shares(a) | Dollars ($) | Shares(a) | Dollars ($) | Shares | Dollars ($) | Shares | Dollars ($) |
| Capital stock activity |
| Class A | | | | | | | | |
| Subscriptions | 4,688,264 | 54,407,624 | 4,133,500 | 49,889,518 | 435,640 | 13,349,899 | 677,087 | 22,088,511 |
| Fund reorganization | 7,633,122 | 86,559,646 | — | — | 401,457 | 12,160,120 | — | — |
| Distributions reinvested | 11,451,072 | 137,106,865 | 8,657,230 | 101,720,934 | 1,022,070 | 32,891,134 | 970,899 | 31,720,047 |
| Redemptions | (15,492,356) | (179,323,557) | (15,689,169) | (189,802,211) | (2,598,676) | (79,701,674) | (2,698,710) | (88,374,572) |
| Net increase (decrease) | 8,280,102 | 98,750,578 | (2,898,439) | (38,191,759) | (739,509) | (21,300,521) | (1,050,724) | (34,566,014) |
| Advisor Class | | | | | | | | |
| Subscriptions | 462,475 | 7,310,751 | 634,032 | 9,825,645 | 505,382 | 16,108,591 | 208,923 | 6,902,364 |
| Fund reorganization | 86,140 | 1,315,365 | — | — | 10,583 | 325,654 | — | — |
| Distributions reinvested | 279,871 | 4,586,563 | 267,774 | 4,133,765 | 88,709 | 2,890,336 | 42,987 | 1,423,610 |
| Redemptions | (1,179,579) | (18,249,135) | (1,016,953) | (15,975,063) | (326,695) | (10,135,796) | (311,685) | (10,230,546) |
| Net increase (decrease) | (351,093) | (5,036,456) | (115,147) | (2,015,653) | 277,979 | 9,188,785 | (59,775) | (1,904,572) |
| Class C | | | | | | | | |
| Subscriptions | 202,898 | 2,992,920 | 279,956 | 5,491,211 | 21,414 | 615,973 | 29,066 | 886,533 |
| Fund reorganization | 139,092 | 1,964,002 | — | — | 206,250 | 5,785,299 | — | — |
| Distributions reinvested | 965,200 | 14,020,819 | 1,312,812 | 23,102,168 | 81,909 | 2,439,825 | 68,676 | 2,086,897 |
| Redemptions | (2,038,003) | (30,727,957) | (1,730,252) | (34,594,301) | (260,624) | (7,549,238) | (336,100) | (10,292,732) |
| Net increase (decrease) | (730,813) | (11,750,216) | (137,484) | (6,000,922) | 48,949 | 1,291,859 | (238,358) | (7,319,302) |
| Institutional Class | | | | | | | | |
| Subscriptions | 4,362,457 | 64,578,049 | 5,282,488 | 78,653,539 | 2,231,454 | 67,688,698 | 3,027,722 | 97,126,882 |
| Fund reorganization | 8,169,626 | 117,887,709 | — | — | 435,556 | 13,232,202 | — | — |
| Distributions reinvested | 26,042,782 | 403,676,921 | 21,464,688 | 314,291,159 | 5,578,841 | 180,071,314 | 5,165,099 | 169,181,217 |
| Redemptions | (35,542,945) | (518,688,814) | (31,681,570) | (472,045,610) | (14,024,302) | (429,532,164) | (13,128,298) | (430,557,597) |
| Net increase (decrease) | 3,031,920 | 67,453,865 | (4,934,394) | (79,100,912) | (5,778,451) | (168,539,950) | (4,935,477) | (164,249,498) |
| Institutional 2 Class | | | | | | | | |
| Subscriptions | 817,139 | 12,495,019 | 1,259,715 | 19,821,837 | 642,789 | 20,785,644 | 1,727,791 | 55,959,823 |
| Fund reorganization | 204,341 | 3,157,067 | — | — | 8,252 | 250,540 | — | — |
| Distributions reinvested | 420,207 | 6,994,417 | 335,376 | 5,227,592 | 265,894 | 8,594,008 | 291,169 | 9,522,689 |
| Redemptions | (1,318,362) | (20,493,897) | (1,005,277) | (15,963,671) | (2,525,963) | (80,967,049) | (2,091,836) | (68,276,761) |
| Net increase (decrease) | 123,325 | 2,152,606 | 589,814 | 9,085,758 | (1,609,028) | (51,336,857) | (72,876) | (2,794,249) |
| Institutional 3 Class | | | | | | | | |
| Subscriptions | 6,783,381 | 92,424,393 | 3,890,545 | 60,686,076 | 3,467,150 | 93,267,502 | 2,923,055 | 94,591,351 |
| Fund reorganization | 367,453 | 5,746,856 | — | — | 20,109 | 619,153 | — | — |
| Distributions reinvested | 956,314 | 16,224,539 | 493,331 | 7,781,931 | 775,293 | 25,432,820 | 612,009 | 20,271,580 |
| Redemptions | (3,659,083) | (53,549,662) | (4,198,217) | (67,352,210) | (3,234,167) | (96,540,634) | (3,297,334) | (110,042,832) |
| Net increase | 4,448,065 | 60,846,126 | 185,659 | 1,115,797 | 1,028,385 | 22,778,841 | 237,730 | 4,820,099 |
| Class R | | | | | | | | |
| Subscriptions | — | — | — | — | 12,442 | 384,006 | 30,713 | 995,788 |
| Distributions reinvested | — | — | — | — | 12,421 | 399,796 | 10,724 | 350,523 |
| Redemptions | — | — | — | — | (33,602) | (950,899) | (274,820) | (8,865,688) |
| Net decrease | — | — | — | — | (8,739) | (167,097) | (233,383) | (7,519,377) |
| Total net increase (decrease) | 14,801,506 | 212,416,503 | (7,309,991) | (115,107,691) | (6,780,414) | (208,084,940) | (6,352,863) | (213,532,913) |
| (a) | Share activity for Class C has been adjusted on a retroactive basis to reflect a 4 to 1 reverse stock split completed after the close of business on September 11, 2020. |
The accompanying Notes to Financial Statements are an integral part of this statement.
| 62 | Columbia Acorn Family of Funds | Annual Report 2020 |
Statement of Changes in Net Assets (continued)
| | Columbia
Acorn USA® | Columbia Acorn
International SelectSM |
| | Year Ended | Year Ended | Year Ended | Year Ended |
| | December 31, 2020 | December 31, 2019 | December 31, 2020 | December 31, 2019 |
| | Shares(a) | Dollars ($) | Shares(a) | Dollars ($) | Shares | Dollars ($) | Shares | Dollars ($) |
| Capital stock activity |
| Class A | | | | | | | | |
| Subscriptions | 346,060 | 3,817,424 | 491,865 | 5,786,792 | 628,129 | 16,436,706 | 347,272 | 9,462,114 |
| Fund reorganization | — | — | — | — | 5,674,674 | 165,360,417 | — | — |
| Distributions reinvested | 266,526 | 3,190,992 | 634,698 | 7,303,655 | 5,030 | 134,560 | 109,077 | 3,076,483 |
| Redemptions | (1,104,170) | (11,907,742) | (1,072,140) | (12,603,235) | (771,815) | (20,777,304) | (257,870) | (7,091,324) |
| Net increase (decrease) | (491,584) | (4,899,326) | 54,423 | 487,212 | 5,536,018 | 161,154,379 | 198,479 | 5,447,273 |
| Advisor Class | | | | | | | | |
| Subscriptions | 219,087 | 3,501,300 | 120,871 | 1,933,694 | 34,327 | 949,659 | 79,526 | 2,161,624 |
| Fund reorganization | — | — | — | — | 13,886 | 415,049 | — | — |
| Distributions reinvested | 54,222 | 927,003 | 115,785 | 1,842,281 | 226 | 6,202 | 6,747 | 194,489 |
| Redemptions | (251,565) | (3,745,560) | (117,952) | (1,888,811) | (38,301) | (1,005,492) | (66,954) | (1,894,157) |
| Net increase | 21,744 | 682,743 | 118,704 | 1,887,164 | 10,138 | 365,418 | 19,319 | 461,956 |
| Class C | | | | | | | | |
| Subscriptions | 20,827 | 297,879 | 23,201 | 473,031 | 11,506 | 302,527 | 15,892 | 397,853 |
| Fund reorganization | — | — | — | — | 51,121 | 1,349,083 | — | — |
| Distributions reinvested | 19,743 | 289,386 | 68,702 | 1,182,883 | 265 | 6,424 | 8,233 | 211,391 |
| Redemptions | (87,933) | (1,291,382) | (153,029) | (2,976,839) | (51,813) | (1,235,107) | (56,413) | (1,390,018) |
| Net increase (decrease) | (47,363) | (704,117) | (61,126) | (1,320,925) | 11,079 | 422,927 | (32,288) | (780,774) |
| Institutional Class | | | | | | | | |
| Subscriptions | 310,344 | 4,280,049 | 675,875 | 10,092,246 | 550,028 | 15,266,316 | 722,561 | 20,085,054 |
| Fund reorganization | — | — | — | — | 2,384,285 | 70,622,469 | — | — |
| Distributions reinvested | 466,504 | 7,368,960 | 1,087,911 | 16,120,066 | 8,639 | 234,705 | 249,415 | 7,131,691 |
| Redemptions | (1,704,651) | (24,375,489) | (2,853,692) | (42,620,474) | (1,480,207) | (42,408,722) | (820,978) | (22,993,971) |
| Net increase (decrease) | (927,803) | (12,726,480) | (1,089,906) | (16,408,162) | 1,462,745 | 43,714,768 | 150,998 | 4,222,774 |
| Institutional 2 Class | | | | | | | | |
| Subscriptions | 50,915 | 759,419 | 70,285 | 1,123,435 | 2,597,666 | 67,295,084 | 69,064 | 1,956,202 |
| Fund reorganization | — | — | — | — | 27,450 | 820,474 | — | — |
| Distributions reinvested | 7,827 | 135,002 | 23,915 | 383,079 | 8,235 | 225,716 | 10,034 | 289,564 |
| Redemptions | (118,538) | (1,926,685) | (103,044) | (1,613,701) | (509,998) | (14,522,127) | (13,076) | (375,971) |
| Net increase (decrease) | (59,796) | (1,032,264) | (8,844) | (107,187) | 2,123,353 | 53,819,147 | 66,022 | 1,869,795 |
| Institutional 3 Class | | | | | | | | |
| Subscriptions | 462,738 | 7,546,284 | 548,567 | 8,889,451 | 437,355 | 12,374,906 | 215,978 | 6,017,663 |
| Fund reorganization | — | — | — | — | 152,649 | 4,559,646 | — | — |
| Distributions reinvested | 177,436 | 3,099,067 | 399,438 | 6,478,123 | 1,931 | 52,896 | 42,076 | 1,212,536 |
| Redemptions | (804,052) | (12,377,413) | (810,994) | (13,205,324) | (283,180) | (7,988,400) | (143,101) | (4,036,356) |
| Net increase (decrease) | (163,878) | (1,732,062) | 137,011 | 2,162,250 | 308,755 | 8,999,048 | 114,953 | 3,193,843 |
| Total net increase (decrease) | (1,668,680) | (20,411,506) | (849,738) | (13,299,648) | 9,452,088 | 268,475,687 | 517,483 | 14,414,867 |
| (a) | Share activity for Class C has been adjusted on a retroactive basis to reflect a 4 to 1 reverse stock split completed after the close of business on September 11, 2020. |
The accompanying Notes to Financial Statements are an integral part of this statement.
Columbia Acorn Family of Funds | Annual Report 2020
| 63 |
Statement of Changes in Net Assets (continued)
| | Columbia
Thermostat FundSM | Columbia Acorn
European FundSM |
| | Year Ended | Year Ended | Year Ended | Year Ended |
| | December 31, 2020 | December 31, 2019 | December 31, 2020 | December 31, 2019 |
| | Shares | Dollars ($) | Shares | Dollars ($) | Shares | Dollars ($) | Shares | Dollars ($) |
| Capital stock activity |
| Class A | | | | | | | | |
| Subscriptions | 17,213,419 | 298,463,150 | 3,581,278 | 53,531,987 | 753,063 | 17,268,947 | 588,163 | 11,883,992 |
| Distributions reinvested | 1,520,872 | 27,445,861 | 696,942 | 10,498,008 | 7,687 | 160,744 | 11,556 | 254,820 |
| Redemptions | (6,025,996) | (102,931,026) | (3,367,020) | (50,214,156) | (712,243) | (14,706,843) | (587,839) | (10,901,694) |
| Net increase | 12,708,295 | 222,977,985 | 911,200 | 13,815,839 | 48,507 | 2,722,848 | 11,880 | 1,237,118 |
| Advisor Class | | | | | | | | |
| Subscriptions | 6,863,588 | 119,997,025 | 973,291 | 13,978,579 | 20,311 | 460,105 | 45,419 | 904,047 |
| Distributions reinvested | 415,096 | 7,440,017 | 55,095 | 821,970 | 332 | 7,010 | 833 | 18,503 |
| Redemptions | (1,136,463) | (18,534,553) | (806,540) | (11,813,803) | (40,465) | (719,702) | (57,731) | (1,073,237) |
| Net increase (decrease) | 6,142,221 | 108,902,489 | 221,846 | 2,986,746 | (19,822) | (252,587) | (11,479) | (150,687) |
| Class C | | | | | | | | |
| Subscriptions | 4,134,190 | 72,312,804 | 832,275 | 12,480,689 | 10,212 | 224,937 | 21,243 | 401,532 |
| Distributions reinvested | 597,023 | 10,828,046 | 370,397 | 5,611,576 | 1,483 | 30,396 | 589 | 12,768 |
| Redemptions | (3,641,561) | (62,976,289) | (2,871,430) | (42,896,426) | (78,350) | (1,572,649) | (314,829) | (5,716,994) |
| Net increase (decrease) | 1,089,652 | 20,164,561 | (1,668,758) | (24,804,161) | (66,655) | (1,317,316) | (292,997) | (5,302,694) |
| Institutional Class | | | | | | | | |
| Subscriptions | 26,620,852 | 453,014,337 | 5,266,201 | 76,965,586 | 810,554 | 18,752,767 | 792,207 | 14,929,566 |
| Distributions reinvested | 2,026,638 | 36,002,075 | 778,189 | 11,538,524 | 9,440 | 198,135 | 22,896 | 506,245 |
| Redemptions | (7,335,717) | (120,216,003) | (5,410,758) | (79,342,105) | (1,020,779) | (19,997,548) | (721,406) | (13,775,797) |
| Net increase (decrease) | 21,311,773 | 368,800,409 | 633,632 | 9,162,005 | (200,785) | (1,046,646) | 93,697 | 1,660,014 |
| Institutional 2 Class | | | | | | | | |
| Subscriptions | 6,788,489 | 114,076,072 | 2,180,445 | 32,262,973 | 221,913 | 4,629,697 | 42,517 | 875,563 |
| Distributions reinvested | 441,392 | 7,900,050 | 134,270 | 2,004,839 | 1,040 | 22,084 | 909 | 20,321 |
| Redemptions | (2,828,659) | (46,801,458) | (794,328) | (11,886,178) | (180,402) | (3,964,044) | (110,095) | (2,092,686) |
| Net increase (decrease) | 4,401,222 | 75,174,664 | 1,520,387 | 22,381,634 | 42,551 | 687,737 | (66,669) | (1,196,802) |
| Institutional 3 Class | | | | | | | | |
| Subscriptions | 118,904 | 2,017,296 | 58,523 | 828,161 | 2,370 | 58,624 | 773 | 13,848 |
| Distributions reinvested | 10,200 | 182,140 | 3,059 | 45,602 | — | — | 8 | 176 |
| Redemptions | (27,055) | (463,286) | (39,256) | (573,301) | (742) | (13,001) | (81) | (1,568) |
| Net increase | 102,049 | 1,736,150 | 22,326 | 300,462 | 1,628 | 45,623 | 700 | 12,456 |
| Total net increase (decrease) | 45,755,212 | 797,756,258 | 1,640,633 | 23,842,525 | (194,576) | 839,659 | (264,868) | (3,740,595) |
The accompanying Notes to Financial Statements are an integral part of this statement.
| 64 | Columbia Acorn Family of Funds | Annual Report 2020 |
[THIS PAGE INTENTIONALLY LEFT BLANK]
Columbia Acorn Family of Funds | Annual Report 2020
| 65 |
Financial Highlights
Columbia Acorn® Fund
The following tables are intended to help you understand the Funds’ financial performance. Certain information reflects financial results for a single share of a class held for the periods shown. Per share net investment income (loss) amounts are calculated based on average shares outstanding during the period. Total return assumes reinvestment of all dividends and distributions, if any. Total return does not reflect payment of sales charges, if any. Total return and portfolio turnover are not annualized for periods of less than one year. The portfolio turnover rate is calculated without regard to purchase and sales transactions of short-term instruments and certain derivatives, if any. If such transactions were included, a Fund’s portfolio turnover rate may be higher.
| | Net asset value,
beginning of
period | Net
investment
income
(loss) | Net
realized
and
unrealized
gain (loss) | Total from
investment
operations | Distributions
from net
realized
gains | Total
distributions to
shareholders |
| Class A |
| Year Ended 12/31/2020 | $11.71 | (0.06) | 3.24 | 3.18 | (2.20) | (2.20) |
| Year Ended 12/31/2019 | $10.65 | (0.04) | 2.78 | 2.74 | (1.68) | (1.68) |
| Year Ended 12/31/2018 | $12.92 | (0.03) | (0.48) | (0.51) | (1.76) | (1.76) |
| Year Ended 12/31/2017 | $13.35 | (0.02) | 3.23 | 3.21 | (3.64) | (3.64) |
| Year Ended 12/31/2016 | $17.63 | (0.03) | 1.73 | 1.70 | (5.98) | (5.98) |
| Advisor Class |
| Year Ended 12/31/2020 | $15.52 | (0.05) | 4.38 | 4.33 | (2.20) | (2.20) |
| Year Ended 12/31/2019 | $13.63 | (0.01) | 3.58 | 3.57 | (1.68) | (1.68) |
| Year Ended 12/31/2018 | $16.06 | 0.01 | (0.64) | (0.63) | (1.80) | (1.80) |
| Year Ended 12/31/2017 | $15.83 | 0.02 | 3.85 | 3.87 | (3.64) | (3.64) |
| Year Ended 12/31/2016 | $19.84 | 0.00(e) | 1.97 | 1.97 | (5.98) | (5.98) |
| Class C(f) |
| Year Ended 12/31/2020 | $16.57 | (0.20) | 4.08 | 3.88 | (4.31) | (4.31) |
| Year Ended 12/31/2019 | $18.75 | (0.20) | 4.74 | 4.54 | (6.72) | (6.72) |
| Year Ended 12/31/2018 | $26.34 | (0.24) | (0.71) | (0.95) | (6.64) | (6.64) |
| Year Ended 12/31/2017 | $33.36 | (0.32) | 7.86 | 7.54 | (14.56) | (14.56) |
| Year Ended 12/31/2016 | $52.63 | (0.44) | 5.09 | 4.65 | (23.92) | (23.92) |
| Institutional Class |
| Year Ended 12/31/2020 | $14.70 | (0.04) | 4.14 | 4.10 | (2.20) | (2.20) |
| Year Ended 12/31/2019 | $12.98 | (0.01) | 3.41 | 3.40 | (1.68) | (1.68) |
| Year Ended 12/31/2018 | $15.39 | 0.01 | (0.62) | (0.61) | (1.80) | (1.80) |
| Year Ended 12/31/2017 | $15.29 | 0.02 | 3.72 | 3.74 | (3.64) | (3.64) |
| Year Ended 12/31/2016 | $19.34 | 0.01 | 1.92 | 1.93 | (5.98) | (5.98) |
| Institutional 2 Class |
| Year Ended 12/31/2020 | $15.69 | (0.04) | 4.43 | 4.39 | (2.20) | (2.20) |
| Year Ended 12/31/2019 | $13.76 | (0.00)(e) | 3.61 | 3.61 | (1.68) | (1.68) |
| Year Ended 12/31/2018 | $16.20 | 0.01 | (0.65) | (0.64) | (1.80) | (1.80) |
| Year Ended 12/31/2017 | $15.94 | 0.02 | 3.88 | 3.90 | (3.64) | (3.64) |
| Year Ended 12/31/2016 | $19.92 | 0.01 | 1.99 | 2.00 | (5.98) | (5.98) |
The accompanying Notes to Financial Statements are an integral part of this statement.
| 66 | Columbia Acorn Family of Funds | Annual Report 2020 |
Financial Highlights (continued)
Columbia Acorn® Fund
| | Net
asset
value,
end of
period | Total
return | Total gross
expense
ratio to
average
net assets(a) | Total net
expense
ratio to
average
net assets(a) | Net investment
income (loss)
ratio to
average
net assets | Portfolio
turnover | Net
assets,
end of
period
(000’s) |
| Class A |
| Year Ended 12/31/2020 | $12.69 | 29.18%(b) | 1.11% | 1.11%(c) | (0.56%) | 86% | $983,709 |
| Year Ended 12/31/2019 | $11.71 | 26.21%(b) | 1.11% | 1.10%(c) | (0.30%) | 101% | $810,966 |
| Year Ended 12/31/2018 | $10.65 | (5.22%)(b) | 1.10% | 1.08%(c) | (0.20%) | 66% | $768,031 |
| Year Ended 12/31/2017 | $12.92 | 24.91% | 1.09% | 1.08%(c) | (0.13%) | 72% | $830,454 |
| Year Ended 12/31/2016 | $13.35 | 10.06% | 1.10%(d) | 1.10%(d) | (0.21%) | 85% | $931,460 |
| Advisor Class |
| Year Ended 12/31/2020 | $17.65 | 29.44%(b) | 0.86% | 0.86%(c) | (0.30%) | 86% | $44,139 |
| Year Ended 12/31/2019 | $15.52 | 26.58%(b) | 0.86% | 0.85%(c) | (0.05%) | 101% | $44,248 |
| Year Ended 12/31/2018 | $13.63 | (5.00%)(b) | 0.85% | 0.83%(c) | 0.05% | 66% | $40,425 |
| Year Ended 12/31/2017 | $16.06 | 25.19% | 0.84% | 0.83%(c) | 0.12% | 72% | $38,588 |
| Year Ended 12/31/2016 | $15.83 | 10.32% | 0.89%(d) | 0.89%(d) | 0.00%(e) | 85% | $33,378 |
| Class C(f) |
| Year Ended 12/31/2020 | $16.14 | 28.27%(b) | 1.86% | 1.86%(c) | (1.30%) | 86% | $55,861 |
| Year Ended 12/31/2019 | $16.57 | 25.12%(b) | 1.86% | 1.85%(c) | (1.05%) | 101% | $69,471 |
| Year Ended 12/31/2018 | $18.75 | (5.86%)(b) | 1.85% | 1.82%(c) | (0.94%) | 66% | $81,149 |
| Year Ended 12/31/2017 | $26.34 | 23.88% | 1.84% | 1.83%(c) | (0.88%) | 72% | $246,450 |
| Year Ended 12/31/2016 | $33.36 | 9.29% | 1.84%(d) | 1.84%(d) | (0.95%) | 85% | $302,119 |
| Institutional Class |
| Year Ended 12/31/2020 | $16.60 | 29.51%(b) | 0.86% | 0.86%(c) | (0.30%) | 86% | $3,569,794 |
| Year Ended 12/31/2019 | $14.70 | 26.60%(b) | 0.86% | 0.85%(c) | (0.05%) | 101% | $3,117,486 |
| Year Ended 12/31/2018 | $12.98 | (5.09%)(b) | 0.85% | 0.83%(c) | 0.05% | 66% | $2,816,948 |
| Year Ended 12/31/2017 | $15.39 | 25.24% | 0.84% | 0.83%(c) | 0.12% | 72% | $3,407,214 |
| Year Ended 12/31/2016 | $15.29 | 10.39% | 0.82%(d) | 0.82%(d) | 0.07% | 85% | $3,425,935 |
| Institutional 2 Class |
| Year Ended 12/31/2020 | $17.88 | 29.50%(b) | 0.83% | 0.82% | (0.27%) | 86% | $61,000 |
| Year Ended 12/31/2019 | $15.69 | 26.63%(b) | 0.83% | 0.82% | (0.02%) | 101% | $51,584 |
| Year Ended 12/31/2018 | $13.76 | (5.00%)(b) | 0.81% | 0.80% | 0.08% | 66% | $37,124 |
| Year Ended 12/31/2017 | $16.20 | 25.21% | 0.82% | 0.81% | 0.14% | 72% | $67,932 |
| Year Ended 12/31/2016 | $15.94 | 10.43% | 0.81%(d) | 0.81%(d) | 0.08% | 85% | $45,475 |
The accompanying Notes to Financial Statements are an integral part of this statement.
Columbia Acorn Family of Funds | Annual Report 2020
| 67 |
Financial Highlights (continued)
Columbia Acorn® Fund
| | Net asset value,
beginning of
period | Net
investment
income
(loss) | Net
realized
and
unrealized
gain (loss) | Total from
investment
operations | Distributions
from net
realized
gains | Total
distributions to
shareholders |
| Institutional 3 Class |
| Year Ended 12/31/2020 | $15.87 | (0.04) | 4.49 | 4.45 | (2.20) | (2.20) |
| Year Ended 12/31/2019 | $13.89 | 0.00(e) | 3.66 | 3.66 | (1.68) | (1.68) |
| Year Ended 12/31/2018 | $16.34 | 0.02 | (0.66) | (0.64) | (1.81) | (1.81) |
| Year Ended 12/31/2017 | $16.04 | 0.03 | 3.91 | 3.94 | (3.64) | (3.64) |
| Year Ended 12/31/2016 | $20.00 | 0.02 | 2.00 | 2.02 | (5.98) | (5.98) |
| Notes to Financial Highlights |
| (a) | In addition to the fees and expenses that the Fund bears directly, the Fund indirectly bears a pro rata share of the fees and expenses of any other funds in which it invests, if any. Such indirect expenses are not included in the Fund’s reported expense ratios. |
| (b) | Had the Investment Manager and/or Transfer Agent not waived fees and/or reimbursed a portion of expenses, total return would have been reduced. |
| (c) | The benefits derived from expense reductions had an impact of less than 0.01%. |
| (d) | Ratios include line of credit interest expense which is less than 0.01%. |
| (e) | Rounds to zero. |
| (f) | Per share amounts have been adjusted on a retroactive basis to reflect a 4 to 1 reverse stock split completed after the close of business on September 11, 2020. |
The accompanying Notes to Financial Statements are an integral part of this statement.
| 68 | Columbia Acorn Family of Funds | Annual Report 2020 |
Financial Highlights (continued)
Columbia Acorn® Fund
| | Net
asset
value,
end of
period | Total
return | Total gross
expense
ratio to
average
net assets(a) | Total net
expense
ratio to
average
net assets(a) | Net investment
income (loss)
ratio to
average
net assets | Portfolio
turnover | Net
assets,
end of
period
(000’s) |
| Institutional 3 Class |
| Year Ended 12/31/2020 | $18.12 | 29.54%(b) | 0.78% | 0.78% | (0.25%) | 86% | $155,338 |
| Year Ended 12/31/2019 | $15.87 | 26.74%(b) | 0.78% | 0.77% | 0.03% | 101% | $65,408 |
| Year Ended 12/31/2018 | $13.89 | (4.98%)(b) | 0.76% | 0.76% | 0.13% | 66% | $54,688 |
| Year Ended 12/31/2017 | $16.34 | 25.31% | 0.76% | 0.76% | 0.19% | 72% | $47,536 |
| Year Ended 12/31/2016 | $16.04 | 10.50% | 0.76%(d) | 0.76%(d) | 0.12% | 85% | $79,518 |
The accompanying Notes to Financial Statements are an integral part of this statement.
Columbia Acorn Family of Funds | Annual Report 2020
| 69 |
Financial Highlights
Columbia Acorn International®
| | Net asset value,
beginning of
period | Net
investment
income
(loss) | Net
realized
and
unrealized
gain (loss) | Total from
investment
operations | Distributions
from net
investment
income | Distributions
from net
realized
gains | Total
distributions to
shareholders |
| Class A |
| Year Ended 12/31/2020 | $34.20 | 0.06 | 4.51 | 4.57 | (0.20) | (4.26) | (4.46) |
| Year Ended 12/31/2019 | $29.48 | 0.25 | 8.19 | 8.44 | (0.65) | (3.07) | (3.72) |
| Year Ended 12/31/2018 | $46.51 | 0.23 | (7.41) | (7.18) | (0.29) | (9.56) | (9.85) |
| Year Ended 12/31/2017 | $37.71 | 0.25 | 11.71 | 11.96 | (0.67) | (2.49) | (3.16) |
| Year Ended 12/31/2016 | $39.08 | 0.35 | (1.31) | (0.96) | (0.15) | (0.26) | (0.41) |
| Advisor Class |
| Year Ended 12/31/2020 | $34.67 | 0.16 | 4.58 | 4.74 | (0.20) | (4.26) | (4.46) |
| Year Ended 12/31/2019 | $29.84 | 0.33 | 8.30 | 8.63 | (0.73) | (3.07) | (3.80) |
| Year Ended 12/31/2018 | $46.95 | 0.46 | (7.61) | (7.15) | (0.40) | (9.56) | (9.96) |
| Year Ended 12/31/2017 | $38.03 | 0.36 | 11.82 | 12.18 | (0.77) | (2.49) | (3.26) |
| Year Ended 12/31/2016 | $39.41 | 0.48 | (1.38) | (0.90) | (0.22) | (0.26) | (0.48) |
| Class C |
| Year Ended 12/31/2020 | $31.92 | (0.17) | 4.14 | 3.97 | (0.20) | (4.26) | (4.46) |
| Year Ended 12/31/2019 | $27.63 | 0.00(e) | 7.65 | 7.65 | (0.29) | (3.07) | (3.36) |
| Year Ended 12/31/2018 | $44.57 | (0.05) | (7.09) | (7.14) | (0.24) | (9.56) | (9.80) |
| Year Ended 12/31/2017 | $36.18 | (0.06) | 11.20 | 11.14 | (0.26) | (2.49) | (2.75) |
| Year Ended 12/31/2016 | $37.65 | 0.05 | (1.26) | (1.21) | — | (0.26) | (0.26) |
| Institutional Class |
| Year Ended 12/31/2020 | $34.25 | 0.14 | 4.54 | 4.68 | (0.20) | (4.26) | (4.46) |
| Year Ended 12/31/2019 | $29.51 | 0.33 | 8.21 | 8.54 | (0.73) | (3.07) | (3.80) |
| Year Ended 12/31/2018 | $46.57 | 0.34 | (7.44) | (7.10) | (0.40) | (9.56) | (9.96) |
| Year Ended 12/31/2017 | $37.74 | 0.37 | 11.73 | 12.10 | (0.78) | (2.49) | (3.27) |
| Year Ended 12/31/2016 | $39.12 | 0.44 | (1.32) | (0.88) | (0.24) | (0.26) | (0.50) |
| Institutional 2 Class |
| Year Ended 12/31/2020 | $34.22 | 0.16 | 4.54 | 4.70 | (0.20) | (4.26) | (4.46) |
| Year Ended 12/31/2019 | $29.49 | 0.35 | 8.20 | 8.55 | (0.75) | (3.07) | (3.82) |
| Year Ended 12/31/2018 | $46.54 | 0.37 | (7.43) | (7.06) | (0.43) | (9.56) | (9.99) |
| Year Ended 12/31/2017 | $37.72 | 0.38 | 11.72 | 12.10 | (0.79) | (2.49) | (3.28) |
| Year Ended 12/31/2016 | $39.10 | 0.44 | (1.30) | (0.86) | (0.26) | (0.26) | (0.52) |
| Institutional 3 Class |
| Year Ended 12/31/2020 | $34.67 | 0.19 | 4.59 | 4.78 | (0.20) | (4.26) | (4.46) |
| Year Ended 12/31/2019 | $29.83 | 0.37 | 8.30 | 8.67 | (0.76) | (3.07) | (3.83) |
| Year Ended 12/31/2018 | $46.95 | 0.51 | (7.62) | (7.11) | (0.45) | (9.56) | (10.01) |
| Year Ended 12/31/2017 | $38.02 | 0.40 | 11.83 | 12.23 | (0.81) | (2.49) | (3.30) |
| Year Ended 12/31/2016 | $39.41 | 0.47 | (1.32) | (0.85) | (0.28) | (0.26) | (0.54) |
The accompanying Notes to Financial Statements are an integral part of this statement.
| 70 | Columbia Acorn Family of Funds | Annual Report 2020 |
Financial Highlights (continued)
Columbia Acorn International®
| | Net
asset
value,
end of
period | Total
return | Total gross
expense
ratio to
average
net assets(a) | Total net
expense
ratio to
average
net assets(a) | Net investment
income (loss)
ratio to
average
net assets | Portfolio
turnover | Net
assets,
end of
period
(000’s) |
| Class A |
| Year Ended 12/31/2020 | $34.31 | 14.68%(b) | 1.28%(c) | 1.24%(c),(d) | 0.21% | 55% | $283,478 |
| Year Ended 12/31/2019 | $34.20 | 29.56%(b) | 1.27%(c) | 1.24%(c),(d) | 0.76% | 32% | $307,872 |
| Year Ended 12/31/2018 | $29.48 | (16.13%)(b) | 1.25%(c) | 1.24%(c),(d) | 0.51% | 32% | $296,349 |
| Year Ended 12/31/2017 | $46.51 | 31.91% | 1.23% | 1.20%(d) | 0.56% | 37% | $465,830 |
| Year Ended 12/31/2016 | $37.71 | (2.51%) | 1.27% | 1.23% | 0.90% | 46% | $576,235 |
| Advisor Class |
| Year Ended 12/31/2020 | $34.95 | 14.98%(b) | 1.03%(c) | 0.99%(c),(d) | 0.52% | 55% | $22,549 |
| Year Ended 12/31/2019 | $34.67 | 29.86%(b) | 1.02%(c) | 0.99%(c),(d) | 1.00% | 32% | $12,733 |
| Year Ended 12/31/2018 | $29.84 | (15.90%)(b) | 1.00%(c) | 0.99%(c),(d) | 0.97% | 32% | $12,740 |
| Year Ended 12/31/2017 | $46.95 | 32.21% | 0.98% | 0.98%(d) | 0.81% | 37% | $99,578 |
| Year Ended 12/31/2016 | $38.03 | (2.32%) | 1.05% | 1.05% | 1.22% | 46% | $101,988 |
| Class C |
| Year Ended 12/31/2020 | $31.43 | 13.82%(b) | 2.02%(c) | 1.99%(c),(d) | (0.57%) | 55% | $19,998 |
| Year Ended 12/31/2019 | $31.92 | 28.61%(b) | 2.02%(c) | 2.00%(c),(d) | 0.01% | 32% | $18,749 |
| Year Ended 12/31/2018 | $27.63 | (16.76%)(b) | 2.00%(c) | 1.99%(c),(d) | (0.11%) | 32% | $22,817 |
| Year Ended 12/31/2017 | $44.57 | 30.93% | 1.98% | 1.97%(d) | (0.15%) | 37% | $63,787 |
| Year Ended 12/31/2016 | $36.18 | (3.26%) | 2.01% | 1.99% | 0.13% | 46% | $64,548 |
| Institutional Class |
| Year Ended 12/31/2020 | $34.47 | 14.99%(b) | 1.03%(c) | 0.99%(c),(d) | 0.46% | 55% | $1,760,927 |
| Year Ended 12/31/2019 | $34.25 | 29.89%(b) | 1.02%(c) | 0.99%(c),(d) | 1.01% | 32% | $1,947,995 |
| Year Ended 12/31/2018 | $29.51 | (15.93%)(b) | 1.00%(c) | 0.99%(c),(d) | 0.76% | 32% | $1,824,055 |
| Year Ended 12/31/2017 | $46.57 | 32.24% | 0.98% | 0.98%(d) | 0.85% | 37% | $3,116,383 |
| Year Ended 12/31/2016 | $37.74 | (2.28%) | 0.98% | 0.98% | 1.13% | 46% | $3,356,348 |
| Institutional 2 Class |
| Year Ended 12/31/2020 | $34.46 | 15.06%(b) | 0.97%(c) | 0.92%(c) | 0.53% | 55% | $129,576 |
| Year Ended 12/31/2019 | $34.22 | 29.95%(b) | 0.97%(c) | 0.93%(c) | 1.06% | 32% | $183,763 |
| Year Ended 12/31/2018 | $29.49 | (15.85%)(b) | 0.93%(c) | 0.93%(c) | 0.81% | 32% | $160,488 |
| Year Ended 12/31/2017 | $46.54 | 32.27% | 0.93% | 0.93% | 0.87% | 37% | $422,916 |
| Year Ended 12/31/2016 | $37.72 | (2.23%) | 0.93% | 0.93% | 1.15% | 46% | $286,786 |
| Institutional 3 Class |
| Year Ended 12/31/2020 | $34.99 | 15.10%(b) | 0.93%(c) | 0.88%(c) | 0.60% | 55% | $277,614 |
| Year Ended 12/31/2019 | $34.67 | 30.04%(b) | 0.92%(c) | 0.89%(c) | 1.12% | 32% | $239,441 |
| Year Ended 12/31/2018 | $29.83 | (15.82%)(b) | 0.88%(c) | 0.88%(c) | 1.10% | 32% | $198,933 |
| Year Ended 12/31/2017 | $46.95 | 32.36% | 0.88% | 0.88% | 0.89% | 37% | $725,247 |
| Year Ended 12/31/2016 | $38.02 | (2.19%) | 0.88% | 0.88% | 1.20% | 46% | $239,733 |
The accompanying Notes to Financial Statements are an integral part of this statement.
Columbia Acorn Family of Funds | Annual Report 2020
| 71 |
Financial Highlights (continued)
Columbia Acorn International®
| | Net asset value,
beginning of
period | Net
investment
income
(loss) | Net
realized
and
unrealized
gain (loss) | Total from
investment
operations | Distributions
from net
investment
income | Distributions
from net
realized
gains | Total
distributions to
shareholders |
| Class R |
| Year Ended 12/31/2020 | $34.22 | (0.01) | 4.49 | 4.48 | (0.20) | (4.26) | (4.46) |
| Year Ended 12/31/2019 | $29.44 | 0.06 | 8.27 | 8.33 | (0.48) | (3.07) | (3.55) |
| Year Ended 12/31/2018 | $46.51 | 0.12 | (7.39) | (7.27) | (0.24) | (9.56) | (9.80) |
| Year Ended 12/31/2017 | $37.71 | 0.21 | 11.63 | 11.84 | (0.55) | (2.49) | (3.04) |
| Year Ended 12/31/2016 | $39.07 | 0.21 | (1.30) | (1.09) | (0.01) | (0.26) | (0.27) |
| Notes to Financial Highlights |
| (a) | In addition to the fees and expenses that the Fund bears directly, the Fund indirectly bears a pro rata share of the fees and expenses of any other funds in which it invests, if any. Such indirect expenses are not included in the Fund’s reported expense ratios. |
| (b) | Had the Investment Manager and/or Transfer Agent not waived fees and/or reimbursed a portion of expenses, total return would have been reduced. |
| (c) | Ratios include line of credit interest expense which is less than 0.01%. |
| (d) | The benefits derived from expense reductions had an impact of less than 0.01%. |
| (e) | Rounds to zero. |
The accompanying Notes to Financial Statements are an integral part of this statement.
| 72 | Columbia Acorn Family of Funds | Annual Report 2020 |
Financial Highlights (continued)
Columbia Acorn International®
| | Net
asset
value,
end of
period | Total
return | Total gross
expense
ratio to
average
net assets(a) | Total net
expense
ratio to
average
net assets(a) | Net investment
income (loss)
ratio to
average
net assets | Portfolio
turnover | Net
assets,
end of
period
(000’s) |
| Class R |
| Year Ended 12/31/2020 | $34.24 | 14.40%(b) | 1.53%(c) | 1.49%(c),(d) | (0.04%) | 55% | $3,398 |
| Year Ended 12/31/2019 | $34.22 | 29.21%(b) | 1.52%(c) | 1.50%(c),(d) | 0.19% | 32% | $3,696 |
| Year Ended 12/31/2018 | $29.44 | (16.32%)(b) | 1.50%(c) | 1.49%(c),(d) | 0.26% | 32% | $10,049 |
| Year Ended 12/31/2017 | $46.51 | 31.58% | 1.49% | 1.48%(d) | 0.46% | 37% | $13,218 |
| Year Ended 12/31/2016 | $37.71 | (2.82%) | 1.55% | 1.55% | 0.55% | 46% | $4,637 |
The accompanying Notes to Financial Statements are an integral part of this statement.
Columbia Acorn Family of Funds | Annual Report 2020
| 73 |
Financial Highlights
Columbia Acorn USA®
| | Net asset value,
beginning of
period | Net
investment
income
(loss) | Net
realized
and
unrealized
gain (loss) | Total from
investment
operations | Distributions
from net
investment
income | Distributions
from net
realized
gains | Total
distributions to
shareholders |
| Class A |
| Year Ended 12/31/2020 | $11.69 | (0.10) | 2.76 | 2.66 | — | (0.77) | (0.77) |
| Year Ended 12/31/2019 | $10.28 | (0.05) | 3.14 | 3.09 | (0.01) | (1.67) | (1.68) |
| Year Ended 12/31/2018 | $12.48 | (0.07) | (0.04) | (0.11) | — | (2.09) | (2.09) |
| Year Ended 12/31/2017 | $14.95 | (0.09) | 2.84 | 2.75 | — | (5.22) | (5.22) |
| Year Ended 12/31/2016 | $20.25 | (0.11) | 2.43 | 2.32 | — | (7.62) | (7.62) |
| Advisor Class |
| Year Ended 12/31/2020 | $16.31 | (0.10) | 3.91 | 3.81 | — | (0.80) | (0.80) |
| Year Ended 12/31/2019 | $13.77 | (0.03) | 4.25 | 4.22 | (0.01) | (1.67) | (1.68) |
| Year Ended 12/31/2018 | $16.08 | (0.05) | (0.09) | (0.14) | — | (2.17) | (2.17) |
| Year Ended 12/31/2017 | $17.93 | (0.06) | 3.43 | 3.37 | — | (5.22) | (5.22) |
| Year Ended 12/31/2016 | $22.85 | (0.07) | 2.77 | 2.70 | — | (7.62) | (7.62) |
| Class C(e) |
| Year Ended 12/31/2020 | $16.47 | (0.25) | 3.60 | 3.35 | — | (1.68) | (1.68) |
| Year Ended 12/31/2019 | $18.07 | (0.24) | 5.32 | 5.08 | — | (6.68) | (6.68) |
| Year Ended 12/31/2018 | $26.22 | (0.36) | 0.17(f) | (0.19) | — | (7.96) | (7.96) |
| Year Ended 12/31/2017 | $40.19 | (0.52) | 7.43 | 6.91 | — | (20.88) | (20.88) |
| Year Ended 12/31/2016 | $64.00 | (0.72) | 7.39 | 6.67 | — | (30.48) | (30.48) |
| Institutional Class |
| Year Ended 12/31/2020 | $15.17 | (0.10) | 3.63 | 3.53 | — | (0.80) | (0.80) |
| Year Ended 12/31/2019 | $12.90 | (0.03) | 3.98 | 3.95 | (0.01) | (1.67) | (1.68) |
| Year Ended 12/31/2018 | $15.21 | (0.04) | (0.09) | (0.13) | — | (2.18) | (2.18) |
| Year Ended 12/31/2017 | $17.20 | (0.05) | 3.28 | 3.23 | — | (5.22) | (5.22) |
| Year Ended 12/31/2016 | $22.19 | (0.07) | 2.70 | 2.63 | — | (7.62) | (7.62) |
| Institutional 2 Class |
| Year Ended 12/31/2020 | $16.46 | (0.10) | 3.95 | 3.85 | — | (0.81) | (0.81) |
| Year Ended 12/31/2019 | $13.87 | (0.01) | 4.28 | 4.27 | (0.01) | (1.67) | (1.68) |
| Year Ended 12/31/2018 | $16.21 | (0.03) | (0.11) | (0.14) | — | (2.20) | (2.20) |
| Year Ended 12/31/2017 | $18.02 | (0.03) | 3.44 | 3.41 | — | (5.22) | (5.22) |
| Year Ended 12/31/2016 | $22.90 | (0.06) | 2.80 | 2.74 | — | (7.62) | (7.62) |
The accompanying Notes to Financial Statements are an integral part of this statement.
| 74 | Columbia Acorn Family of Funds | Annual Report 2020 |
Financial Highlights (continued)
Columbia Acorn USA®
| | Net
asset
value,
end of
period | Total
return | Total gross
expense
ratio to
average
net assets(a) | Total net
expense
ratio to
average
net assets(a) | Net investment
income (loss)
ratio to
average
net assets | Portfolio
turnover | Net
assets,
end of
period
(000’s) |
| Class A |
| Year Ended 12/31/2020 | $13.58 | 23.70%(b) | 1.44% | 1.40%(c) | (0.91%) | 94% | $59,050 |
| Year Ended 12/31/2019 | $11.69 | 30.88%(b) | 1.45%(d) | 1.41%(c),(d) | (0.43%) | 91% | $56,578 |
| Year Ended 12/31/2018 | $10.28 | (2.15%)(b) | 1.44%(d) | 1.42%(c),(d) | (0.49%) | 86% | $49,179 |
| Year Ended 12/31/2017 | $12.48 | 19.14%(b) | 1.44% | 1.43%(c) | (0.55%) | 84% | $47,960 |
| Year Ended 12/31/2016 | $14.95 | 12.70% | 1.41% | 1.41% | (0.58%) | 98% | $80,721 |
| Advisor Class |
| Year Ended 12/31/2020 | $19.32 | 24.08%(b) | 1.19% | 1.15%(c) | (0.66%) | 94% | $23,158 |
| Year Ended 12/31/2019 | $16.31 | 31.27%(b) | 1.20%(d) | 1.16%(c),(d) | (0.18%) | 91% | $19,202 |
| Year Ended 12/31/2018 | $13.77 | (1.91%)(b) | 1.18%(d) | 1.17%(c),(d) | (0.27%) | 86% | $14,579 |
| Year Ended 12/31/2017 | $16.08 | 19.42%(b) | 1.21% | 1.20%(c) | (0.31%) | 84% | $16,355 |
| Year Ended 12/31/2016 | $17.93 | 12.93% | 1.18% | 1.18% | (0.35%) | 98% | $6,172 |
| Class C(e) |
| Year Ended 12/31/2020 | $18.14 | 22.79%(b) | 2.19% | 2.15%(c) | (1.66%) | 94% | $2,658 |
| Year Ended 12/31/2019 | $16.47 | 29.93%(b) | 2.20%(d) | 2.16%(c),(d) | (1.19%) | 91% | $3,195 |
| Year Ended 12/31/2018 | $18.07 | (2.92%)(b) | 2.19%(d) | 2.17%(c),(d) | (1.30%) | 86% | $4,608 |
| Year Ended 12/31/2017 | $26.22 | 18.30%(b) | 2.19% | 2.19%(c) | (1.31%) | 84% | $9,802 |
| Year Ended 12/31/2016 | $40.19 | 11.92% | 2.13% | 2.13% | (1.31%) | 98% | $12,088 |
| Institutional Class |
| Year Ended 12/31/2020 | $17.90 | 24.04%(b) | 1.19% | 1.15%(c) | (0.67%) | 94% | $170,650 |
| Year Ended 12/31/2019 | $15.17 | 31.28%(b) | 1.20%(d) | 1.16%(c),(d) | (0.18%) | 91% | $158,696 |
| Year Ended 12/31/2018 | $12.90 | (1.98%)(b) | 1.18%(d) | 1.17%(c),(d) | (0.26%) | 86% | $149,048 |
| Year Ended 12/31/2017 | $15.21 | 19.44%(b) | 1.16% | 1.16%(c) | (0.27%) | 84% | $189,408 |
| Year Ended 12/31/2016 | $17.20 | 13.00% | 1.16% | 1.16% | (0.34%) | 98% | $492,739 |
| Institutional 2 Class |
| Year Ended 12/31/2020 | $19.50 | 24.10%(b) | 1.14% | 1.08% | (0.60%) | 94% | $3,344 |
| Year Ended 12/31/2019 | $16.46 | 31.41%(b) | 1.13%(d) | 1.08%(d) | (0.09%) | 91% | $3,806 |
| Year Ended 12/31/2018 | $13.87 | (1.89%)(b) | 1.11%(d) | 1.09%(d) | (0.19%) | 86% | $3,332 |
| Year Ended 12/31/2017 | $16.21 | 19.56%(b) | 1.08% | 1.08% | (0.17%) | 84% | $10,133 |
| Year Ended 12/31/2016 | $18.02 | 13.09% | 1.07% | 1.07% | (0.27%) | 98% | $13,764 |
The accompanying Notes to Financial Statements are an integral part of this statement.
Columbia Acorn Family of Funds | Annual Report 2020
| 75 |
Financial Highlights (continued)
Columbia Acorn USA®
| | Net asset value,
beginning of
period | Net
investment
income
(loss) | Net
realized
and
unrealized
gain (loss) | Total from
investment
operations | Distributions
from net
investment
income | Distributions
from net
realized
gains | Total
distributions to
shareholders |
| Institutional 3 Class |
| Year Ended 12/31/2020 | $16.65 | (0.09) | 4.00 | 3.91 | — | (0.82) | (0.82) |
| Year Ended 12/31/2019 | $14.01 | (0.01) | 4.33 | 4.32 | (0.01) | (1.67) | (1.68) |
| Year Ended 12/31/2018 | $16.36 | (0.02) | (0.11) | (0.13) | — | (2.22) | (2.22) |
| Year Ended 12/31/2017 | $18.14 | (0.03) | 3.47 | 3.44 | — | (5.22) | (5.22) |
| Year Ended 12/31/2016 | $22.99 | (0.04) | 2.81 | 2.77 | — | (7.62) | (7.62) |
| Notes to Financial Highlights |
| (a) | In addition to the fees and expenses that the Fund bears directly, the Fund indirectly bears a pro rata share of the fees and expenses of any other funds in which it invests, if any. Such indirect expenses are not included in the Fund’s reported expense ratios. |
| (b) | Had the Investment Manager and/or Transfer Agent not waived fees and/or reimbursed a portion of expenses, total return would have been reduced. |
| (c) | The benefits derived from expense reductions had an impact of less than 0.01%. |
| (d) | Ratios include line of credit interest expense which is less than 0.01%. |
| (e) | Per share amounts have been adjusted on a retroactive basis to reflect a 4 to 1 reverse stock split completed after the close of business on September 11, 2020. |
| (f) | Calculation of the net gain (loss) per share (both realized and unrealized) does not correlate to the aggregate realized and unrealized gain (loss) presented in the Statement of Operations due to the timing of subscriptions and redemptions of Fund shares in relation to fluctuations in the market value of the portfolio. |
The accompanying Notes to Financial Statements are an integral part of this statement.
| 76 | Columbia Acorn Family of Funds | Annual Report 2020 |
Financial Highlights (continued)
Columbia Acorn USA®
| | Net
asset
value,
end of
period | Total
return | Total gross
expense
ratio to
average
net assets(a) | Total net
expense
ratio to
average
net assets(a) | Net investment
income (loss)
ratio to
average
net assets | Portfolio
turnover | Net
assets,
end of
period
(000’s) |
| Institutional 3 Class |
| Year Ended 12/31/2020 | $19.74 | 24.16%(b) | 1.09% | 1.04% | (0.55%) | 94% | $77,304 |
| Year Ended 12/31/2019 | $16.65 | 31.45%(b) | 1.08%(d) | 1.03%(d) | (0.05%) | 91% | $67,921 |
| Year Ended 12/31/2018 | $14.01 | (1.86%)(b) | 1.06%(d) | 1.04%(d) | (0.11%) | 86% | $55,248 |
| Year Ended 12/31/2017 | $16.36 | 19.60%(b) | 1.05% | 1.05% | (0.17%) | 84% | $49,019 |
| Year Ended 12/31/2016 | $18.14 | 13.18% | 1.01% | 1.01% | (0.18%) | 98% | $38,136 |
The accompanying Notes to Financial Statements are an integral part of this statement.
Columbia Acorn Family of Funds | Annual Report 2020
| 77 |
Financial Highlights
Columbia Acorn International SelectSM
| | Net asset value,
beginning of
period | Net
investment
income
(loss) | Net
realized
and
unrealized
gain (loss) | Total from
investment
operations | Distributions
from net
investment
income | Distributions
from net
realized
gains | Tax
return of
capital | Total
distributions to
shareholders |
| Class A |
| Year Ended 12/31/2020 | $28.58 | (0.03) | 5.21 | 5.18 | (0.09) | — | — | (0.09) |
| Year Ended 12/31/2019 | $23.44 | 0.09 | 7.67 | 7.76 | (0.28) | (2.34) | — | (2.62) |
| Year Ended 12/31/2018 | $28.89 | 0.06 | (3.66) | (3.60) | — | (1.85) | — | (1.85) |
| Year Ended 12/31/2017 | $21.36 | 0.02 | 7.52 | 7.54 | (0.01) | — | — | (0.01) |
| Year Ended 12/31/2016 | $21.33 | 0.10 | 0.09(e) | 0.19 | (0.14) | — | (0.02) | (0.16) |
| Advisor Class |
| Year Ended 12/31/2020 | $29.26 | 0.04 | 5.35 | 5.39 | (0.09) | — | — | (0.09) |
| Year Ended 12/31/2019 | $24.00 | 0.18 | 7.84 | 8.02 | (0.42) | (2.34) | — | (2.76) |
| Year Ended 12/31/2018 | $29.46 | 0.09 | (3.70) | (3.61) | — | (1.85) | — | (1.85) |
| Year Ended 12/31/2017 | $21.77 | 0.08 | 7.68 | 7.76 | (0.07) | — | — | (0.07) |
| Year Ended 12/31/2016 | $21.74 | 0.17 | 0.08(e) | 0.25 | (0.20) | — | (0.02) | (0.22) |
| Class C |
| Year Ended 12/31/2020 | $26.00 | (0.23) | 4.72 | 4.49 | (0.09) | — | — | (0.09) |
| Year Ended 12/31/2019 | $21.48 | (0.10) | 6.99 | 6.89 | (0.03) | (2.34) | — | (2.37) |
| Year Ended 12/31/2018 | $26.85 | (0.12) | (3.40) | (3.52) | — | (1.85) | — | (1.85) |
| Year Ended 12/31/2017 | $19.99 | (0.15) | 7.01 | 6.86 | — | — | — | — |
| Year Ended 12/31/2016 | $19.96 | (0.06) | 0.09(e) | 0.03 | — | — | — | — |
| Institutional Class |
| Year Ended 12/31/2020 | $29.00 | 0.03 | 5.31 | 5.34 | (0.09) | — | — | (0.09) |
| Year Ended 12/31/2019 | $23.81 | 0.17 | 7.78 | 7.95 | (0.42) | (2.34) | — | (2.76) |
| Year Ended 12/31/2018 | $29.25 | 0.14 | (3.73) | (3.59) | — | (1.85) | — | (1.85) |
| Year Ended 12/31/2017 | $21.61 | 0.09 | 7.62 | 7.71 | (0.07) | — | — | (0.07) |
| Year Ended 12/31/2016 | $21.58 | 0.16 | 0.09(e) | 0.25 | (0.20) | — | (0.02) | (0.22) |
| Institutional 2 Class |
| Year Ended 12/31/2020 | $29.24 | 0.08 | 5.34 | 5.42 | (0.09) | — | — | (0.09) |
| Year Ended 12/31/2019 | $24.01 | 0.18 | 7.86 | 8.04 | (0.47) | (2.34) | — | (2.81) |
| Year Ended 12/31/2018 | $29.44 | 0.11 | (3.69) | (3.58) | — | (1.85) | — | (1.85) |
| Year Ended 12/31/2017 | $21.76 | 0.11 | 7.66 | 7.77 | (0.09) | — | — | (0.09) |
| Year Ended 12/31/2016 | $21.72 | 0.16 | 0.11(e) | 0.27 | (0.21) | — | (0.02) | (0.23) |
The accompanying Notes to Financial Statements are an integral part of this statement.
| 78 | Columbia Acorn Family of Funds | Annual Report 2020 |
Financial Highlights (continued)
Columbia Acorn International SelectSM
| | Net
asset
value,
end of
period | Total
return(a) | Total gross
expense
ratio to
average
net assets(b) | Total net
expense
ratio to
average
net assets(b) | Net investment
income (loss)
ratio to
average
net assets | Portfolio
turnover | Net
assets,
end of
period
(000’s) |
| Class A |
| Year Ended 12/31/2020 | $33.67 | 18.21% | 1.48% | 1.26%(c) | (0.10%) | 68% | $230,519 |
| Year Ended 12/31/2019 | $28.58 | 33.37% | 1.54%(d) | 1.35%(c),(d) | 0.34% | 46% | $37,461 |
| Year Ended 12/31/2018 | $23.44 | (12.46%) | 1.54% | 1.40%(c) | 0.20% | 48% | $26,073 |
| Year Ended 12/31/2017 | $28.89 | 35.30% | 1.54% | 1.40%(c) | 0.07% | 49% | $26,336 |
| Year Ended 12/31/2016 | $21.36 | 0.90% | 1.55%(f) | 1.48%(f) | 0.49% | 49% | $20,165 |
| Advisor Class |
| Year Ended 12/31/2020 | $34.56 | 18.51% | 1.23% | 1.02%(c) | 0.12% | 68% | $2,748 |
| Year Ended 12/31/2019 | $29.26 | 33.73% | 1.29%(d) | 1.10%(c),(d) | 0.63% | 46% | $2,030 |
| Year Ended 12/31/2018 | $24.00 | (12.26%) | 1.29% | 1.15%(c) | 0.31% | 48% | $1,201 |
| Year Ended 12/31/2017 | $29.46 | 35.67% | 1.29% | 1.15%(c) | 0.30% | 49% | $1,820 |
| Year Ended 12/31/2016 | $21.77 | 1.15% | 1.29%(f) | 1.21%(f) | 0.77% | 49% | $1,106 |
| Class C |
| Year Ended 12/31/2020 | $30.40 | 17.37% | 2.23% | 2.02%(c) | (0.88%) | 68% | $3,251 |
| Year Ended 12/31/2019 | $26.00 | 32.31% | 2.29%(d) | 2.10%(c),(d) | (0.42%) | 46% | $2,493 |
| Year Ended 12/31/2018 | $21.48 | (13.11%) | 2.28% | 2.15%(c) | (0.43%) | 48% | $2,752 |
| Year Ended 12/31/2017 | $26.85 | 34.32% | 2.29% | 2.15%(c) | (0.64%) | 49% | $5,027 |
| Year Ended 12/31/2016 | $19.99 | 0.15% | 2.31%(f) | 2.23%(f) | (0.29%) | 49% | $4,346 |
| Institutional Class |
| Year Ended 12/31/2020 | $34.25 | 18.50% | 1.23% | 1.02%(c) | 0.12% | 68% | $155,133 |
| Year Ended 12/31/2019 | $29.00 | 33.71% | 1.29%(d) | 1.10%(c),(d) | 0.59% | 46% | $88,922 |
| Year Ended 12/31/2018 | $23.81 | (12.28%) | 1.28% | 1.15%(c) | 0.47% | 48% | $69,413 |
| Year Ended 12/31/2017 | $29.25 | 35.70% | 1.29% | 1.15%(c) | 0.36% | 49% | $89,266 |
| Year Ended 12/31/2016 | $21.61 | 1.18% | 1.26%(f) | 1.19%(f) | 0.74% | 49% | $73,631 |
| Institutional 2 Class |
| Year Ended 12/31/2020 | $34.57 | 18.63% | 1.15% | 0.93% | 0.27% | 68% | $77,420 |
| Year Ended 12/31/2019 | $29.24 | 33.82% | 1.22%(d) | 1.00%(d) | 0.65% | 46% | $3,392 |
| Year Ended 12/31/2018 | $24.01 | (12.16%) | 1.21% | 1.06% | 0.36% | 48% | $1,200 |
| Year Ended 12/31/2017 | $29.44 | 35.72% | 1.22% | 1.08% | 0.41% | 49% | $614 |
| Year Ended 12/31/2016 | $21.76 | 1.25% | 1.23%(f) | 1.19%(f) | 0.76% | 49% | $440 |
The accompanying Notes to Financial Statements are an integral part of this statement.
Columbia Acorn Family of Funds | Annual Report 2020
| 79 |
Financial Highlights (continued)
Columbia Acorn International SelectSM
| | Net asset value,
beginning of
period | Net
investment
income
(loss) | Net
realized
and
unrealized
gain (loss) | Total from
investment
operations | Distributions
from net
investment
income | Distributions
from net
realized
gains | Tax
return of
capital | Total
distributions to
shareholders |
| Institutional 3 Class |
| Year Ended 12/31/2020 | $29.22 | 0.07 | 5.36 | 5.43 | (0.09) | — | — | (0.09) |
| Year Ended 12/31/2019 | $24.00 | 0.20 | 7.86 | 8.06 | (0.50) | (2.34) | — | (2.84) |
| Year Ended 12/31/2018 | $29.42 | 0.17 | (3.74) | (3.57) | — | (1.85) | — | (1.85) |
| Year Ended 12/31/2017 | $21.74 | (0.07) | 7.86 | 7.79 | (0.11) | — | — | (0.11) |
| Year Ended 12/31/2016 | $21.71 | 0.16 | 0.12(e) | 0.28 | (0.23) | — | (0.02) | (0.25) |
| Notes to Financial Highlights |
| (a) | Had the Investment Manager and/or Transfer Agent not waived fees and/or reimbursed a portion of expenses, total return would have been reduced. |
| (b) | In addition to the fees and expenses that the Fund bears directly, the Fund indirectly bears a pro rata share of the fees and expenses of any other funds in which it invests, if any. Such indirect expenses are not included in the Fund’s reported expense ratios. |
| (c) | The benefits derived from expense reductions had an impact of less than 0.01%. |
| (d) | Ratios include line of credit interest expense which is less than 0.01%. |
| (e) | Calculation of the net gain (loss) per share (both realized and unrealized) does not correlate to the aggregate realized and unrealized gain (loss) presented in the Statement of Operations due to the timing of subscriptions and redemptions of Fund shares in relation to fluctuations in the market value of the portfolio. |
| (f) | Expenses have been reduced due to a reimbursement of expenses overbilled by a third party. If the reimbursement had been excluded, the expense ratios would have been higher by the percentages shown for each class in the table below. All fee waivers and expense reimbursements by the Investment Manager and its affiliates were applied before giving effect to this third party reimbursement. |
| Year Ended | Class A | Advisor
Class | Class C | Institutional
Class | Institutional 2
Class | Institutional 3
Class |
| 12/31/2016 | 0.06% | 0.06% | 0.06% | 0.06% | 0.04% | 0.09% |
The accompanying Notes to Financial Statements are an integral part of this statement.
| 80 | Columbia Acorn Family of Funds | Annual Report 2020 |
Financial Highlights (continued)
Columbia Acorn International SelectSM
| | Net
asset
value,
end of
period | Total
return(a) | Total gross
expense
ratio to
average
net assets(b) | Total net
expense
ratio to
average
net assets(b) | Net investment
income (loss)
ratio to
average
net assets | Portfolio
turnover | Net
assets,
end of
period
(000’s) |
| Institutional 3 Class |
| Year Ended 12/31/2020 | $34.56 | 18.67% | 1.09% | 0.89% | 0.24% | 68% | $27,064 |
| Year Ended 12/31/2019 | $29.22 | 33.90% | 1.16%(d) | 0.96%(d) | 0.72% | 46% | $13,861 |
| Year Ended 12/31/2018 | $24.00 | (12.14%) | 1.14% | 1.02% | 0.58% | 48% | $8,627 |
| Year Ended 12/31/2017 | $29.42 | 35.81% | 1.17% | 1.03% | (0.24%) | 49% | $7,732 |
| Year Ended 12/31/2016 | $21.74 | 1.29% | 1.12%(f) | 1.04%(f) | 0.74% | 49% | $322 |
The accompanying Notes to Financial Statements are an integral part of this statement.
Columbia Acorn Family of Funds | Annual Report 2020
| 81 |
Financial Highlights
Columbia Thermostat FundSM
| | Net asset value,
beginning of
period | Net
investment
income | Net
realized
and
unrealized
gain (loss) | Total from
investment
operations | Distributions
from net
investment
income | Distributions
from net
realized
gains | Total
distributions to
shareholders |
| Class A |
| Year Ended 12/31/2020 | $15.12 | 0.26 | 4.13 | 4.39 | (0.27) | (0.93) | (1.20) |
| Year Ended 12/31/2019 | $13.85 | 0.27 | 1.79 | 2.06 | (0.26) | (0.53) | (0.79) |
| Year Ended 12/31/2018 | $14.63 | 0.24 | (0.26) | (0.02) | (0.28) | (0.48) | (0.76) |
| Year Ended 12/31/2017 | $14.60 | 0.25 | 0.50 | 0.75 | (0.50) | (0.22) | (0.72) |
| Year Ended 12/31/2016 | $14.31 | 0.20 | 0.44 | 0.64 | (0.08) | (0.27) | (0.35) |
| Advisor Class |
| Year Ended 12/31/2020 | $14.97 | 0.36 | 4.04 | 4.40 | (0.32) | (0.93) | (1.25) |
| Year Ended 12/31/2019 | $13.72 | 0.31 | 1.77 | 2.08 | (0.30) | (0.53) | (0.83) |
| Year Ended 12/31/2018 | $14.50 | 0.28 | (0.27) | 0.01 | (0.31) | (0.48) | (0.79) |
| Year Ended 12/31/2017 | $14.47 | 0.29 | 0.50 | 0.79 | (0.54) | (0.22) | (0.76) |
| Year Ended 12/31/2016 | $14.19 | 0.24 | 0.42 | 0.66 | (0.11) | (0.27) | (0.38) |
| Class C |
| Year Ended 12/31/2020 | $15.23 | 0.12 | 4.16 | 4.28 | (0.15) | (0.93) | (1.08) |
| Year Ended 12/31/2019 | $13.96 | 0.16 | 1.79 | 1.95 | (0.15) | (0.53) | (0.68) |
| Year Ended 12/31/2018 | $14.74 | 0.13 | (0.26) | (0.13) | (0.17) | (0.48) | (0.65) |
| Year Ended 12/31/2017 | $14.62 | 0.14 | 0.51 | 0.65 | (0.31) | (0.22) | (0.53) |
| Year Ended 12/31/2016 | $14.41 | 0.09 | 0.44 | 0.53 | (0.05) | (0.27) | (0.32) |
| Institutional Class |
| Year Ended 12/31/2020 | $14.88 | 0.31 | 4.07 | 4.38 | (0.32) | (0.93) | (1.25) |
| Year Ended 12/31/2019 | $13.65 | 0.30 | 1.76 | 2.06 | (0.30) | (0.53) | (0.83) |
| Year Ended 12/31/2018 | $14.43 | 0.28 | (0.27) | 0.01 | (0.31) | (0.48) | (0.79) |
| Year Ended 12/31/2017 | $14.40 | 0.29 | 0.50 | 0.79 | (0.54) | (0.22) | (0.76) |
| Year Ended 12/31/2016 | $14.12 | 0.23 | 0.43 | 0.66 | (0.11) | (0.27) | (0.38) |
| Institutional 2 Class |
| Year Ended 12/31/2020 | $14.99 | 0.31 | 4.09 | 4.40 | (0.32) | (0.93) | (1.25) |
| Year Ended 12/31/2019 | $13.74 | 0.32 | 1.77 | 2.09 | (0.31) | (0.53) | (0.84) |
| Year Ended 12/31/2018 | $14.52 | 0.29 | (0.27) | 0.02 | (0.32) | (0.48) | (0.80) |
| Year Ended 12/31/2017 | $14.49 | 0.29 | 0.50 | 0.79 | (0.54) | (0.22) | (0.76) |
| Year Ended 12/31/2016 | $14.20 | 0.24 | 0.43 | 0.67 | (0.11) | (0.27) | (0.38) |
The accompanying Notes to Financial Statements are an integral part of this statement.
| 82 | Columbia Acorn Family of Funds | Annual Report 2020 |
Financial Highlights (continued)
Columbia Thermostat FundSM
| | Net
asset
value,
end of
period | Total
return(a) | Total gross
expense
ratio to
average
net assets(b) | Total net
expense
ratio to
average
net assets(b) | Net investment
income
ratio to
average
net assets | Portfolio
turnover | Net
assets,
end of
period
(000’s) |
| Class A |
| Year Ended 12/31/2020 | $18.31 | 29.27% | 0.56%(c) | 0.50%(c),(d) | 1.53% | 97% | $505,238 |
| Year Ended 12/31/2019 | $15.12 | 14.94% | 0.58%(c) | 0.50%(c),(d) | 1.81% | 158% | $225,113 |
| Year Ended 12/31/2018 | $13.85 | (0.13%) | 0.56% | 0.50%(d) | 1.66% | 122% | $193,683 |
| Year Ended 12/31/2017 | $14.63 | 5.19% | 0.54% | 0.50%(d) | 1.70% | 33% | $257,752 |
| Year Ended 12/31/2016 | $14.60 | 4.47% | 0.54% | 0.50% | 1.39% | 95% | $398,781 |
| Advisor Class |
| Year Ended 12/31/2020 | $18.12 | 29.58% | 0.32%(c) | 0.25%(c),(d) | 2.04% | 97% | $130,921 |
| Year Ended 12/31/2019 | $14.97 | 15.21% | 0.33%(c) | 0.25%(c),(d) | 2.08% | 158% | $16,208 |
| Year Ended 12/31/2018 | $13.72 | 0.12% | 0.31% | 0.25%(d) | 1.91% | 122% | $11,816 |
| Year Ended 12/31/2017 | $14.50 | 5.49% | 0.29% | 0.25%(d) | 1.98% | 33% | $16,227 |
| Year Ended 12/31/2016 | $14.47 | 4.69% | 0.30% | 0.25% | 1.64% | 95% | $15,664 |
| Class C |
| Year Ended 12/31/2020 | $18.43 | 28.28% | 1.31%(c) | 1.25%(c),(d) | 0.72% | 97% | $208,937 |
| Year Ended 12/31/2019 | $15.23 | 14.02% | 1.33%(c) | 1.25%(c),(d) | 1.05% | 158% | $156,027 |
| Year Ended 12/31/2018 | $13.96 | (0.88%) | 1.31% | 1.25%(d) | 0.90% | 122% | $166,292 |
| Year Ended 12/31/2017 | $14.74 | 4.48% | 1.29% | 1.25%(d) | 0.96% | 33% | $250,784 |
| Year Ended 12/31/2016 | $14.62 | 3.69% | 1.28% | 1.25% | 0.63% | 95% | $338,930 |
| Institutional Class |
| Year Ended 12/31/2020 | $18.01 | 29.63% | 0.31%(c) | 0.25%(c),(d) | 1.80% | 97% | $729,119 |
| Year Ended 12/31/2019 | $14.88 | 15.14% | 0.33%(c) | 0.25%(c),(d) | 2.06% | 158% | $285,444 |
| Year Ended 12/31/2018 | $13.65 | 0.12% | 0.31% | 0.25%(d) | 1.91% | 122% | $253,123 |
| Year Ended 12/31/2017 | $14.43 | 5.52% | 0.29% | 0.25%(d) | 1.97% | 33% | $320,483 |
| Year Ended 12/31/2016 | $14.40 | 4.72% | 0.28% | 0.25% | 1.64% | 95% | $341,629 |
| Institutional 2 Class |
| Year Ended 12/31/2020 | $18.14 | 29.59% | 0.27%(c) | 0.21%(c) | 1.82% | 97% | $129,197 |
| Year Ended 12/31/2019 | $14.99 | 15.25% | 0.28%(c) | 0.21%(c) | 2.16% | 158% | $40,759 |
| Year Ended 12/31/2018 | $13.74 | 0.16% | 0.26% | 0.21% | 1.97% | 122% | $16,478 |
| Year Ended 12/31/2017 | $14.52 | 5.51% | 0.26% | 0.23% | 1.97% | 33% | $13,464 |
| Year Ended 12/31/2016 | $14.49 | 4.77% | 0.27% | 0.24% | 1.66% | 95% | $12,024 |
The accompanying Notes to Financial Statements are an integral part of this statement.
Columbia Acorn Family of Funds | Annual Report 2020
| 83 |
Financial Highlights (continued)
Columbia Thermostat FundSM
| | Net asset value,
beginning of
period | Net
investment
income | Net
realized
and
unrealized
gain (loss) | Total from
investment
operations | Distributions
from net
investment
income | Distributions
from net
realized
gains | Total
distributions to
shareholders |
| Institutional 3 Class |
| Year Ended 12/31/2020 | $14.96 | 0.33 | 4.08 | 4.41 | (0.33) | (0.93) | (1.26) |
| Year Ended 12/31/2019 | $13.72 | 0.32 | 1.76 | 2.08 | (0.31) | (0.53) | (0.84) |
| Year Ended 12/31/2018 | $14.50 | 0.30 | (0.27) | 0.03 | (0.33) | (0.48) | (0.81) |
| Year Ended 12/31/2017 | $14.46 | 0.30 | 0.51 | 0.81 | (0.55) | (0.22) | (0.77) |
| Year Ended 12/31/2016 | $14.18 | 0.25 | 0.42 | 0.67 | (0.12) | (0.27) | (0.39) |
| Notes to Financial Highlights |
| (a) | Had the Investment Manager and/or Transfer Agent not waived fees and/or reimbursed a portion of expenses, total return would have been reduced. |
| (b) | In addition to the fees and expenses that the Fund bears directly, the Fund indirectly bears a pro rata share of the fees and expenses of any other funds in which it invests, if any. Such indirect expenses are not included in the Fund’s reported expense ratios. |
| (c) | Ratios include line of credit interest expense which is less than 0.01%. |
| (d) | The benefits derived from expense reductions had an impact of less than 0.01%. |
The accompanying Notes to Financial Statements are an integral part of this statement.
| 84 | Columbia Acorn Family of Funds | Annual Report 2020 |
Financial Highlights (continued)
Columbia Thermostat FundSM
| | Net
asset
value,
end of
period | Total
return(a) | Total gross
expense
ratio to
average
net assets(b) | Total net
expense
ratio to
average
net assets(b) | Net investment
income
ratio to
average
net assets | Portfolio
turnover | Net
assets,
end of
period
(000’s) |
| Institutional 3 Class |
| Year Ended 12/31/2020 | $18.11 | 29.69% | 0.24%(c) | 0.17%(c) | 1.89% | 97% | $2,862 |
| Year Ended 12/31/2019 | $14.96 | 15.24% | 0.25%(c) | 0.16%(c) | 2.13% | 158% | $837 |
| Year Ended 12/31/2018 | $13.72 | 0.21% | 0.22% | 0.16% | 2.04% | 122% | $461 |
| Year Ended 12/31/2017 | $14.50 | 5.64% | 0.21% | 0.18% | 2.04% | 33% | $521 |
| Year Ended 12/31/2016 | $14.46 | 4.76% | 0.21% | 0.19% | 1.71% | 95% | $399 |
The accompanying Notes to Financial Statements are an integral part of this statement.
Columbia Acorn Family of Funds | Annual Report 2020
| 85 |
Financial Highlights
Columbia Acorn European FundSM
| | Net asset value,
beginning of
period | Net
investment
income
(loss) | Net
realized
and
unrealized
gain (loss) | Total from
investment
operations | Distributions
from net
investment
income | Total
distributions to
shareholders |
| Class A |
| Year Ended 12/31/2020 | $22.52 | (0.12) | 5.22 | 5.10 | (0.13) | (0.13) |
| Year Ended 12/31/2019 | $15.56 | 0.06 | 7.09 | 7.15 | (0.19) | (0.19) |
| Year Ended 12/31/2018 | $19.27 | 0.11 | (3.70) | (3.59) | (0.12) | (0.12) |
| Year Ended 12/31/2017 | $14.12 | 0.06 | 5.28 | 5.34 | (0.19) | (0.19) |
| Year Ended 12/31/2016 | $14.75 | 0.16 | (0.67) | (0.51) | (0.12) | (0.12) |
| Advisor Class |
| Year Ended 12/31/2020 | $22.70 | (0.06) | 5.27 | 5.21 | (0.13) | (0.13) |
| Year Ended 12/31/2019 | $15.68 | 0.12 | 7.13 | 7.25 | (0.23) | (0.23) |
| Year Ended 12/31/2018 | $19.36 | 0.19 | (3.75) | (3.56) | (0.12) | (0.12) |
| Year Ended 12/31/2017 | $14.18 | 0.10 | 5.32 | 5.42 | (0.24) | (0.24) |
| Year Ended 12/31/2016 | $14.82 | 0.17 | (0.65) | (0.48) | (0.16) | (0.16) |
| Class C |
| Year Ended 12/31/2020 | $22.15 | (0.27) | 5.08 | 4.81 | (0.13) | (0.13) |
| Year Ended 12/31/2019 | $15.33 | (0.06) | 6.93 | 6.87 | (0.05) | (0.05) |
| Year Ended 12/31/2018 | $19.12 | (0.02) | (3.65) | (3.67) | (0.12) | (0.12) |
| Year Ended 12/31/2017 | $13.99 | (0.04) | 5.21 | 5.17 | (0.04) | (0.04) |
| Year Ended 12/31/2016 | $14.63 | 0.03 | (0.64) | (0.61) | (0.03) | (0.03) |
| Institutional Class |
| Year Ended 12/31/2020 | $22.59 | (0.06) | 5.24 | 5.18 | (0.13) | (0.13) |
| Year Ended 12/31/2019 | $15.60 | 0.12 | 7.10 | 7.22 | (0.23) | (0.23) |
| Year Ended 12/31/2018 | $19.27 | 0.15 | (3.70) | (3.55) | (0.12) | (0.12) |
| Year Ended 12/31/2017 | $14.11 | 0.14 | 5.26 | 5.40 | (0.24) | (0.24) |
| Year Ended 12/31/2016 | $14.75 | 0.19 | (0.67) | (0.48) | (0.16) | (0.16) |
| Institutional 2 Class |
| Year Ended 12/31/2020 | $22.84 | (0.05) | 5.32 | 5.27 | (0.13) | (0.13) |
| Year Ended 12/31/2019 | $15.78 | 0.14 | 7.17 | 7.31 | (0.25) | (0.25) |
| Year Ended 12/31/2018 | $19.46 | 0.19 | (3.75) | (3.56) | (0.12) | (0.12) |
| Year Ended 12/31/2017 | $14.25 | 0.20 | 5.25 | 5.45 | (0.24) | (0.24) |
| Year Ended 12/31/2016 | $14.89 | 0.18 | (0.66) | (0.48) | (0.16) | (0.16) |
The accompanying Notes to Financial Statements are an integral part of this statement.
| 86 | Columbia Acorn Family of Funds | Annual Report 2020 |
Financial Highlights (continued)
Columbia Acorn European FundSM
| | Net
asset
value,
end of
period | Total
return(a) | Total gross
expense
ratio to
average
net assets(b) | Total net
expense
ratio to
average
net assets(b) | Net investment
income (loss)
ratio to
average
net assets | Portfolio
turnover | Net
assets,
end of
period
(000’s) |
| Class A |
| Year Ended 12/31/2020 | $27.49 | 22.80% | 1.86%(c) | 1.45%(c) | (0.54%) | 45% | $42,059 |
| Year Ended 12/31/2019 | $22.52 | 45.96% | 1.88% | 1.44% | 0.33% | 30% | $33,361 |
| Year Ended 12/31/2018 | $15.56 | (18.78%) | 1.81%(c) | 1.45%(c) | 0.57% | 39% | $22,870 |
| Year Ended 12/31/2017 | $19.27 | 37.89% | 1.94% | 1.58%(d) | 0.33% | 34% | $32,487 |
| Year Ended 12/31/2016 | $14.12 | (3.47%) | 2.00% | 1.75% | 1.07% | 40% | $26,269 |
| Advisor Class |
| Year Ended 12/31/2020 | $27.78 | 23.10% | 1.61%(c) | 1.20%(c) | (0.29%) | 45% | $1,781 |
| Year Ended 12/31/2019 | $22.70 | 46.30% | 1.63% | 1.19% | 0.60% | 30% | $1,906 |
| Year Ended 12/31/2018 | $15.68 | (18.53%) | 1.55%(c) | 1.19%(c) | 0.97% | 39% | $1,496 |
| Year Ended 12/31/2017 | $19.36 | 38.29% | 1.71% | 1.28%(d) | 0.55% | 34% | $2,942 |
| Year Ended 12/31/2016 | $14.18 | (3.27%) | 1.79% | 1.50% | 1.15% | 40% | $362 |
| Class C |
| Year Ended 12/31/2020 | $26.83 | 21.87% | 2.61%(c) | 2.20%(c) | (1.27%) | 45% | $5,705 |
| Year Ended 12/31/2019 | $22.15 | 44.79% | 2.64% | 2.19% | (0.30%) | 30% | $6,186 |
| Year Ended 12/31/2018 | $15.33 | (19.34%) | 2.56%(c) | 2.20%(c) | (0.12%) | 39% | $8,770 |
| Year Ended 12/31/2017 | $19.12 | 36.95% | 2.69% | 2.31%(d) | (0.25%) | 34% | $13,965 |
| Year Ended 12/31/2016 | $13.99 | (4.21%) | 2.75% | 2.50% | 0.18% | 40% | $7,112 |
| Institutional Class |
| Year Ended 12/31/2020 | $27.64 | 23.08% | 1.61%(c) | 1.20%(c) | (0.29%) | 45% | $55,171 |
| Year Ended 12/31/2019 | $22.59 | 46.35% | 1.63% | 1.19% | 0.64% | 30% | $49,616 |
| Year Ended 12/31/2018 | $15.60 | (18.57%) | 1.56%(c) | 1.20%(c) | 0.80% | 39% | $32,813 |
| Year Ended 12/31/2017 | $19.27 | 38.35% | 1.69% | 1.29%(d) | 0.77% | 34% | $48,965 |
| Year Ended 12/31/2016 | $14.11 | (3.29%) | 1.73% | 1.50% | 1.29% | 40% | $11,345 |
| Institutional 2 Class |
| Year Ended 12/31/2020 | $27.98 | 23.23% | 1.58%(c) | 1.14%(c) | (0.24%) | 45% | $3,855 |
| Year Ended 12/31/2019 | $22.84 | 46.33% | 1.60% | 1.13% | 0.73% | 30% | $2,175 |
| Year Ended 12/31/2018 | $15.78 | (18.44%) | 1.50%(c) | 1.13%(c) | 0.96% | 39% | $2,554 |
| Year Ended 12/31/2017 | $19.46 | 38.32% | 1.64% | 1.28% | 1.14% | 34% | $3,988 |
| Year Ended 12/31/2016 | $14.25 | (3.23%) | 1.68% | 1.47% | 1.26% | 40% | $1,262 |
The accompanying Notes to Financial Statements are an integral part of this statement.
Columbia Acorn Family of Funds | Annual Report 2020
| 87 |
Financial Highlights (continued)
Columbia Acorn European FundSM
| | Net asset value,
beginning of
period | Net
investment
income
(loss) | Net
realized
and
unrealized
gain (loss) | Total from
investment
operations | Distributions
from net
investment
income | Total
distributions to
shareholders |
| Institutional 3 Class |
| Year Ended 12/31/2020 | $22.48 | (0.02) | 5.21 | 5.19 | (0.13) | (0.13) |
| Year Ended 12/31/2019 | $15.53 | 0.14 | 7.06 | 7.20 | (0.25) | (0.25) |
| Year Ended 12/31/2018 | $19.17 | (0.04) | (3.48) | (3.52) | (0.12) | (0.12) |
| Year Ended 12/31/2017(e) | $15.02 | 0.03 | 4.40 | 4.43 | (0.28) | (0.28) |
| Notes to Financial Highlights |
| (a) | Had the Investment Manager and/or Transfer Agent not waived fees and/or reimbursed a portion of expenses, total return would have been reduced. |
| (b) | In addition to the fees and expenses that the Fund bears directly, the Fund indirectly bears a pro rata share of the fees and expenses of any other funds in which it invests, if any. Such indirect expenses are not included in the Fund’s reported expense ratios. |
| (c) | Ratios include line of credit interest expense which is less than 0.01%. |
| (d) | The benefits derived from expense reductions had an impact of less than 0.01%. |
| (e) | Institutional 3 Class shares commenced operations on March 1, 2017. Per share data and total return reflect activity from that date. |
| (f) | Annualized. |
The accompanying Notes to Financial Statements are an integral part of this statement.
| 88 | Columbia Acorn Family of Funds | Annual Report 2020 |
Financial Highlights (continued)
Columbia Acorn European FundSM
| | Net
asset
value,
end of
period | Total
return(a) | Total gross
expense
ratio to
average
net assets(b) | Total net
expense
ratio to
average
net assets(b) | Net investment
income (loss)
ratio to
average
net assets | Portfolio
turnover | Net
assets,
end of
period
(000’s) |
| Institutional 3 Class |
| Year Ended 12/31/2020 | $27.54 | 23.24% | 1.52%(c) | 1.10%(c) | (0.08%) | 45% | $69 |
| Year Ended 12/31/2019 | $22.48 | 46.42% | 1.54% | 1.09% | 0.74% | 30% | $19 |
| Year Ended 12/31/2018 | $15.53 | (18.51%) | 1.41%(c) | 1.08%(c) | (0.21%) | 39% | $3 |
| Year Ended 12/31/2017(e) | $19.17 | 29.55% | 1.58%(f) | 1.09%(f) | 0.17%(f) | 34% | $210 |
The accompanying Notes to Financial Statements are an integral part of this statement.
Columbia Acorn Family of Funds | Annual Report 2020
| 89 |
Notes to Financial Statements
December 31, 2020
Note 1. Organization
Columbia Acorn® Fund, Columbia Acorn International®, Columbia Acorn USA®, Columbia Acorn International SelectSM, Columbia Thermostat FundSM and Columbia Acorn European FundSM (each a Fund and collectively, the Funds) are each a series of Columbia Acorn Trust (the Trust). The Trust is registered under the Investment Company Act of 1940, as amended (the 1940 Act), as an open-end management investment company organized as a Massachusetts business trust. The investment objective of each Fund is to seek long-term capital appreciation.
Columbia Thermostat FundSM pursues its investment objective by investing in shares of other mutual funds and exchange-traded funds (ETFs). As a “fund of funds”, under normal circumstances, the Fund allocates at least 95% of its net assets among a selected group of affiliated funds (underlying funds) according to the current level of the Standard & Poor’s (S&P) 500 Index in relation to predetermined ranges set by Columbia Wanger Asset Management, LLC (the Investment Manager or CWAM). The Fund may invest up to 5% of its net assets plus any cash received that day in cash, repurchase agreements, high quality short-term paper and government securities.
The Funds’ Board of Trustees approved reverse stock splits of the issued and outstanding Class C shares of Columbia Acorn® Fund and Columbia Acorn USA® (the Reverse Stock Split). The Reverse Stock Split was completed after the close of business on September 11, 2020. The impact of the Reverse Stock Split was to decrease the number of Class C shares outstanding and increase the net asset value per share by the ratio of 4 to 1, resulting in no effect on the net assets or the value of each affected shareholder’s investment in Class C shares. Capital stock share activity reflected in the Statement of Changes in Net Assets and per share data in the Financial Highlights have been adjusted on a retroactive basis to reflect the impact of the Reverse Stock Split.
Fund shares
The Trust and each Fund may issue an unlimited number of shares (without par value). Each Fund currently offers each of the share classes listed in the Statement of Assets and Liabilities.
Although all share classes generally have identical voting, dividend and liquidation rights, each share class votes separately when required by the Trust’s organizational documents or by law. Different share classes pay shareholders different distribution amounts to the extent the expenses of the share classes differ, and the amount of distributions in the event of a Fund’s liquidation will be proportional to the net asset value of each share class of the Fund. Each share class has its own fees (sales charges), expenses and other features. These, together with information about certain conflicts of interest associated with the fees and expenses paid by certain share classes, are discussed fully in each Fund’s prospectus and Statement of Additional Information (SAI).
As described in each Fund’s prospectus, Class A and Class C shares are available to all investors. Effective April 1, 2021, Class C shares generally automatically convert to Class A shares of the same Fund in the month of or the month following the 8-year anniversary of the Class C shares purchase date. Prior to April 1, 2021, Class C shares generally automatically converted to Class A shares of the same Fund in the month of or the month following the 10-year anniversary of the Class C shares purchase date. Advisor Class, Institutional Class, Institutional 2 Class and Institutional 3 Class are available through authorized investment professionals to retirement plans and to certain other institutional investors described in each Fund’s prospectus. Class R shares are available to retirement and health savings plans and other institutional investors. Effective April 1, 2021, Class C shares will automatically convert to Class A shares after 8 years.
Investment income, realized and unrealized gains and losses, and certain fund-level expenses are allocated pro rata on the basis of the relative net assets of all classes, except that each class bears certain expenses specific to that class such as distribution services, transfer agent fees, and certain other class specific expenses. Differences in class expenses may result in payment of different dividend distributions for each class. All of the Funds’ share classes have equal rights with respect to voting, subject to Fund or class-specific matters.
| 90 | Columbia Acorn Family of Funds | Annual Report 2020 |
Notes to Financial Statements (continued)
December 31, 2020
Note 2. Summary of significant accounting policies
Basis of preparation
Each Fund is an investment company that applies the accounting and reporting guidance in the Financial Accounting Standards Board (FASB) Accounting Standards Codification Topic 946, Financial Services - Investment Companies (ASC 946). The financial statements are prepared in accordance with U.S. generally accepted accounting principles (GAAP), which requires management to make certain estimates and assumptions that affect the reported amounts of assets and liabilities, the disclosure of contingent assets and liabilities at the date of the financial statements and the reported amounts of income and expenses during the reporting period. Actual results could differ from those estimates.
The following is a summary of significant accounting policies followed by the Funds in the preparation of their financial statements.
Security valuation
Securities of the Funds are valued at market value or, if a market quotation for a security is not readily available or is deemed not to be reliable because of events or circumstances that have occurred between the market quotation and the time as of which the security is to be valued, the security is valued at a fair value determined in good faith under consistently applied procedures established by the Board of Trustees. Equity securities listed on an exchange are valued at the closing price or last trade on their primary exchange at the close of business of the New York Stock Exchange. Securities with a closing price not readily available or not listed on any exchange are valued at the mean between the closing bid and asked prices. Listed preferred stocks convertible into common stocks are valued using an evaluated price from a pricing service.
Foreign equity securities are valued based on the closing price or last trade on their primary exchange at the close of business of the New York Stock Exchange. Foreign currency exchange rates are determined at the scheduled closing time of the New York Stock Exchange. Many securities markets and exchanges outside the U.S. close prior to the close of the New York Stock Exchange; therefore, the closing prices for securities in such markets or on such exchanges may not fully reflect events that occur after such close but before the close of the New York Stock Exchange. In situations where foreign markets are closed, where a significant event has occurred after the foreign exchange closes but before the time at which the Fund’s share price is calculated, and in the event of significant movement in the trigger index for the statistical fair valuation process established by the Board of Trustees, foreign securities will be fair valued pursuant to a policy adopted by the Board of Trustees. Under the policy, the Fund may use an independent statistical fair value pricing service that employs a systematic methodology to assist in the fair valuation process for securities principally traded in a foreign market in order to adjust for possible changes in value that may occur between the close of the foreign market and the time as of which the securities are to be valued. If a security is valued at a fair value, that value may be different from the last quoted market price for the security.
Investments in open-end investment companies (other than exchange-traded funds (ETFs)), are valued at the latest net asset value reported by those companies as of the valuation time.
Futures contracts are valued based upon the settlement price at the close of regular trading on their principal exchanges or, in the absence of a settlement price, at the mean of the latest quoted bid and ask prices.
Foreign currency transactions and translations
Values of investments denominated in foreign currencies are converted into U.S. dollars using the New York spot market rate of exchange at the time of valuation. Purchases and sales of investments and dividend and interest income are translated into U.S. dollars using the spot market rate of exchange prevailing on the respective dates of such transactions. The gain or loss resulting from changes in foreign exchange rates is included with net realized and unrealized gain or loss from investments, as appropriate.
Columbia Acorn Family of Funds | Annual Report 2020
| 91 |
Notes to Financial Statements (continued)
December 31, 2020
Derivative instruments
Derivatives may involve various risks, including the potential inability of the counterparty to fulfill its obligation under the terms of the contract, the potential for an illiquid secondary market (making it difficult for the Fund to sell, including at favorable prices) and the potential for market movements which may expose the Fund to gains or losses in excess of the amount shown in the Statements of Assets and Liabilities.
For financial reporting purposes, the Funds do not offset derivative assets and derivative liabilities that are subject to contractual netting arrangements in the Statements of Assets and Liabilities.
Futures contracts
Futures contracts are exchange-traded and represent commitments for the future purchase or sale of an asset at a specified price on a specified date. Columbia Acorn® Fund, Columbia Acorn International® and Columbia Acorn USA® bought and sold futures contracts during the year ended December 31, 2020 to maintain appropriate equity market exposure while keeping sufficient cash to accommodate daily operations. These instruments may be used for other purposes in future periods. Upon entering into futures contracts, a Fund bears risks that it may not achieve the anticipated benefits of the futures contracts and may realize a loss. Additional risks include counterparty credit risk, the possibility of an illiquid market, and that a change in the value of the contract or option may not correlate with changes in the value of the underlying asset.
Upon entering into a futures contract, the Fund deposits cash or securities with the broker, known as a futures commission merchant (FCM), in an amount sufficient to meet the initial margin requirement. The initial margin deposit must be maintained at an established level over the life of the contract. Cash deposited as initial margin is recorded in the Statement of Assets and Liabilities as margin deposits. Securities deposited as initial margin are designated in the Portfolio of Investments. Subsequent payments (variation margin) are made or received by the Fund each day. The variation margin payments are equal to the daily change in the contract value and are recorded as variation margin receivable or payable and are offset in unrealized gains or losses. The Fund expects to earn interest income on its margin deposits. The Fund recognizes a realized gain or loss when the contract is closed or expires. Futures contracts involve, to varying degrees, risk of loss in excess of the variation margin disclosed in the Statement of Assets and Liabilities.
Effects of derivative transactions in the financial statements
The following tables are intended to provide additional information about the effect of derivatives on the financial statements of Columbia Acorn® Fund, Columbia Acorn International® and Columbia Acorn USA® including: the fair value of derivatives by risk category and the location of those fair values in the Statements of Assets and Liabilities; and the impact of derivative transactions over the period in the Statements of Operations, including realized gains or losses and unrealized gains or losses. The derivative schedules following the Portfolio of Investments present additional information regarding derivative instruments outstanding at the end of the period, if any.
Columbia Acorn® Fund
At December 31, 2020, the Fund had no outstanding derivatives.
The following table indicates the effect of derivative instruments (not considered to be hedging instruments for accounting disclosure purposes) in the Statement of Operations for the year ended December 31, 2020:
| Amount of realized gain (loss) on derivatives recognized in income |
| Risk exposure category | Futures
contracts
($) |
| Equity risk | 278,742 |
| 92 | Columbia Acorn Family of Funds | Annual Report 2020 |
Notes to Financial Statements (continued)
December 31, 2020
The following table is a summary of the average outstanding volume by derivative instrument for the year ended December 31, 2020:
| Derivative instrument | Average notional
amounts ($)* |
| Futures contracts — long | 483,363 |
| * | Based on the ending daily outstanding amounts for the year ended December 31, 2020. |
Columbia Acorn International®
The following table is a summary of the fair value of derivative instruments (not considered to be hedging instruments for accounting disclosure purposes) at December 31, 2020:
| | Asset derivatives | |
Risk exposure
category | Statement
of assets and liabilities
location | Fair value ($) |
| Equity risk | Component of total distributable earnings (loss) — unrealized appreciation on futures contracts | 1,142,509* |
| * | Includes cumulative appreciation (depreciation) as reported in the tables following the Portfolio of Investments. Only the current day’s variation margin is reported in receivables or payables in the Statement of Assets and Liabilities. |
The following table indicates the effect of derivative instruments (not considered to be hedging instruments for accounting disclosure purposes) in the Statement of Operations for the year ended December 31, 2020:
| Amount of realized gain (loss) on derivatives recognized in income |
| Risk exposure category | Futures
contracts
($) |
| Equity risk | 21,979,409 |
| |
| Change in unrealized appreciation (depreciation) on derivatives recognized in income |
| Risk exposure category | Futures
contracts
($) |
| Equity risk | 1,009,673 |
The following table is a summary of the average outstanding volume by derivative instrument for the year ended December 31, 2020:
| Derivative instrument | Average notional
amounts ($)* |
| Futures contracts — long | 72,311,064 |
| * | Based on the ending quarterly outstanding amounts for the year ended December 31, 2020. |
Columbia Acorn USA®
At December 31, 2020, the Fund had no outstanding derivatives.
The following table indicates the effect of derivative instruments (not considered to be hedging instruments for accounting disclosure purposes) in the Statement of Operations for the year ended December 31, 2020:
| Amount of realized gain (loss) on derivatives recognized in income |
| Risk exposure category | Futures
contracts
($) |
| Equity risk | 3,013,592 |
Columbia Acorn Family of Funds | Annual Report 2020
| 93 |
Notes to Financial Statements (continued)
December 31, 2020
The following table is a summary of the average outstanding volume by derivative instrument for the year ended December 31, 2020:
| Derivative instrument | Average notional
amounts ($)* |
| Futures contracts — long | 4,893,915 |
| * | Based on the ending quarterly outstanding amounts for the year ended December 31, 2020. |
Security transactions and investment income
Security transactions, investment income and shareholder fund transactions are accounted for on the trade date (date the order to buy or sell is executed) and dividend income and realized gain distributions from other funds are recorded on the ex-dividend date, except that certain dividends from foreign securities are recorded as soon as the information is available to the Funds. Interest income is recorded on the accrual basis and includes amortization of discounts on debt obligations when required for federal income tax purposes. Realized gains and losses from security transactions are recorded on an identified cost basis.
Awards, if any, from class action litigation related to securities owned may be recorded as a reduction of cost of those securities. If the applicable securities are no longer owned, the proceeds are recorded as realized gains.
The Funds may receive distributions from holdings in exchange-traded funds (ETFs), limited partnerships (LPs), other regulated investment companies (RICs), and real estate investment trusts (REITs), which report information as to the character of their distributions annually. These distributions are allocated to dividend income, capital gain and return of capital based on actual information reported. To the extent actual information has not yet been reported by the REITs, estimates for return of capital may be made by the Funds’ management. Return of capital is recorded as a reduction of the cost basis of securities held. If the Funds no longer own the applicable securities, return of capital is recorded as a realized gain. Management’s estimates are subsequently adjusted when the actual character of the distributions is disclosed by the REITs, which could result in a proportionate change in return of capital to shareholders. No estimates are made for ETFs and RICs.
Fund share valuation
Fund shares are sold and redeemed on a daily basis at net asset value, subject to any applicable sales charge. Net asset value per share is determined daily as of the close of trading on the New York Stock Exchange (NYSE) on each day the NYSE is open for trading. Generally, income, expenses and realized and unrealized gain/(losses) of a Fund are allocated to each class proportionately on a daily basis for purposes of determining the net asset value of each class. The distribution and service fees and transfer agent fees are charged to each specific class as expenses are incurred. Redemption fees are accounted for as an addition to paid in capital for purposes of determining the net asset value of each class.
Securities lending
Each Fund, except Columbia Thermostat FundSM, may lend securities up to one-third of the value of its total assets to certain approved brokers, dealers, banks and or other institutional borrowers of securities that the Funds’ securities lending agent has determined are credit worthy under guidelines established by the Board of Trustees, to earn additional income. The Funds retain the benefits of owning the securities, including the economic equivalent of dividends or interest generated by the security. The Funds also receive a fee for the loan. The Funds have the ability to recall the loans at any time and could do so in order to vote proxies or to sell the loaned securities. Each loan is collateralized by cash that exceeds the value of the securities on loan. The market value of the loaned securities is determined daily at the close of business of a Fund and any additional required collateral is delivered to the Fund on the next business day. The Funds have elected to invest the cash collateral in the Dreyfus Government Cash Management Fund, a third-party institutional government money market fund in accordance with investment guidelines contained in the securities lending agreement and approved by the Board of Trustees. The income earned from the securities lending program is paid to each Fund, net of any fees remitted to Goldman Sachs Agency Lending, the Funds’ lending agent, and net of any borrower rebates. The Investment Manager does not retain any fees earned by the lending program. Generally, in the event of borrower default, a Fund has the right to use the collateral to offset any losses incurred. In the event a Fund is delayed or prevented from exercising its right to dispose of the collateral,
| 94 | Columbia Acorn Family of Funds | Annual Report 2020 |
Notes to Financial Statements (continued)
December 31, 2020
there may be a potential loss to the Fund. Some of these losses may be indemnified by the lending agent. The Funds bear the risk of loss with respect to the investment of collateral. The net securities lending income earned as of December 31, 2020 by each Fund is included in the Statements of Operations.
Offsetting of assets and liabilities
The following table presents the Funds’ gross and net amount of assets and liabilities available for offset under netting agreements and under a securities lending agreement as well as the related collateral received by each Fund with securities on loan as of December 31, 2020:
| | Columbia
Acorn® Fund | Columbia Acorn
International® | Columbia
Acorn USA® |
| | Goldman
Sachs ($) | Goldman
Sachs ($) | Goldman
Sachs ($) |
| Liabilities | | | |
| Collateral on Securities Loaned | 143,378,229 | 259,440 | 7,793,305 |
| Total Liabilities | 143,378,229 | 259,440 | 7,793,305 |
| Total Financial and Derivative Net Assets | (143,378,229) | (259,440) | (7,793,305) |
| Financial Instruments | 138,033,364 | 247,052 | 7,268,332 |
| Net Amount (a) | (5,344,865) | (12,388) | (524,973) |
| (a) | Represents the net amount due from/(to) counterparties in the event of default. |
Securities lending transactions
The following table indicates the total amount of securities loaned by type, reconciled to gross liability payable upon return of the securities loaned by the Funds as of December 31, 2020:
| | Overnight and
continuous | Up to
30 days | 30-90
days | Greater than
90 days | Total |
| Columbia Acorn® Fund | | | | | |
| Securities lending transactions | | | | | |
| Equity securities | $138,033,364 | $— | $— | $— | $138,033,364 |
| Gross amount of recognized liabilities for securities lending (collateral received) | | | | | 143,378,229 |
| Amounts due to counterparty in the event of default | | | | | $5,344,865 |
| Columbia Acorn International® | | | | | |
| Securities lending transactions | | | | | |
| Equity securities | $247,052 | $— | $— | $— | $247,052 |
| Gross amount of recognized liabilities for securities lending (collateral received) | | | | | 259,440 |
| Amounts due to counterparty in the event of default | | | | | $12,388 |
| Columbia Acorn USA® | | | | | |
| Securities lending transactions | | | | | |
| Equity securities | $7,268,332 | $— | $— | $— | $7,268,332 |
| Gross amount of recognized liabilities for securities lending (collateral received) | | | | | 7,793,305 |
| Amounts due to counterparty in the event of default | | | | | $524,973 |
Federal income tax status
It is each Fund’s policy to comply with the provisions of the Internal Revenue Code available to regulated investment companies and, in the manner provided therein, distribute substantially all their taxable income, as well as any net realized gain on sales of investments and foreign currency transactions reportable for federal income tax purposes. Columbia Thermostat FundSM distributes all of its taxable income, as well as any net realized gain on sales of portfolio fund shares and any distributions of net realized gains received by the Fund from its portfolio funds, reportable for federal income tax purposes. Accordingly, the Funds paid no federal income taxes and no federal income tax provision was required.
Columbia Acorn Family of Funds | Annual Report 2020
| 95 |
Notes to Financial Statements (continued)
December 31, 2020
Foreign taxes
Realized gains in certain countries may be subject to foreign taxes at the fund level. The Funds accrue for such foreign taxes on realized and unrealized gains at the appropriate rate for each jurisdiction. The amount, if any, is disclosed as a liability on the Statements of Assets and Liabilities.
Distributions to shareholders
Distributions to shareholders are recorded on the ex-dividend date.
Guarantees and indemnification
In the normal course of business, the Trust on behalf of the Funds enters into contracts that contain a variety of representations and warranties and that provide general indemnities. A Fund’s maximum exposure under these arrangements is unknown, as this would involve future claims against the Fund. Also, under the Trust’s organizational documents, the trustees and officers of the Trust are indemnified against certain liabilities that may arise out of their duties to the Trust. However, based on experience, the Funds expect the risk of loss due to these warranties and indemnities to be remote.
Note 3. Fees and other transactions with affiliates
Investment management fees
CWAM is a wholly-owned subsidiary of Columbia Management Investment Advisers, LLC (Columbia Management), which is a wholly-owned subsidiary of Ameriprise Financial, Inc. (Ameriprise Financial). CWAM furnishes continuing investment supervision to the Funds and is responsible for the overall management of the Funds’ business affairs.
CWAM receives a monthly advisory fee based on each Fund’s daily net assets at the following annual rates:
| Columbia Acorn® Fund |
| Average daily net assets | Annual
fee rate |
| Up to $700 million | 0.74% |
| $700 million to $2 billion | 0.69% |
| $2 billion to $6 billion | 0.64% |
| $6 billion and over | 0.63% |
| Columbia Acorn International® |
| Average daily net assets | Annual
fee rate |
| Up to $100 million | 1.19% |
| $100 million to $500 million | 0.94% |
| $500 million and over | 0.74% |
| Columbia Acorn USA® |
| Average daily net assets | Annual
fee rate |
| Up to $200 million | 0.94% |
| $200 million to $500 million | 0.89% |
| $500 million to $2 billion | 0.84% |
| $2 billion to $3 billion | 0.80% |
| $3 billion and over | 0.70% |
| Columbia Acorn International SelectSM |
| Average daily net assets | Annual
fee rate |
| Up to $500 million | 0.89% |
| $500 million and over | 0.85% |
| 96 | Columbia Acorn Family of Funds | Annual Report 2020 |
Notes to Financial Statements (continued)
December 31, 2020
| Columbia Thermostat FundSM |
| | Annual
fee rate |
| All average daily net assets | 0.10% |
| Columbia Acorn European FundSM |
| Average daily net assets | Annual
fee rate |
| Up to $100 million | 1.19% |
| $100 million to $500 million | 0.94% |
| $500 million and over | 0.74% |
For the year ended December 31, 2020, the effective investment advisory fee rates were as follows:
| Fund | Effective investment advisory fee rate (%) |
| Columbia Acorn® Fund | 0.67 |
| Columbia Acorn International® | 0.79 |
| Columbia Acorn USA® | 0.93 |
| Columbia Acorn International SelectSM | 0.89 |
| Columbia Thermostat FundSM | 0.10 |
| Columbia Acorn European FundSM | 1.19 |
Advisory Affiliates
The Investment Manager and its investment advisory affiliates, including Columbia Management (Affiliates), may coordinate in providing services to their clients. These Affiliates, like the Investment Manager, are direct or indirect subsidiaries of Ameriprise Financial and are registered with the appropriate respective regulators and, where required, the Securities and Exchange Commission and the Commodity Futures Trading Commission in the United States. From time to time, the Investment Manager may engage employees of Affiliates to provide portfolio management services to certain accounts managed by the Investment Manager, including Columbia Thermostat FundSM. These employees provide services to the Investment Manager pursuant to personnel-sharing agreements or other inter-company arrangements and the Funds pay no additional fees and expenses as a result of any such arrangements.
Pursuant to such arrangements, employees of Affiliates, including Columbia Management, may serve as “associated persons” of the Investment Manager and, in this capacity, may provide portfolio management services to a Fund on behalf of the Investment Manager subject to the oversight and supervision of the Investment Manager and the Funds’ Chief Compliance Officer, consistent with the investment objectives, policies and limitations set forth in the Fund’s prospectus and SAI, and the Investment Manager’s and the Funds’ compliance policies and procedures.
Administration fees
CWAM provides administrative services and receives an administration fee from the Funds at the following annual rates:
| Columbia Acorn Trust |
Aggregate average daily
net assets of the trust | Annual
fee rate |
| Up to $8 billion | 0.050% |
| $8 billion to $16 billion | 0.040% |
| $16 billion to $35 billion | 0.030% |
| $35 billion to $45 billion | 0.025% |
| $45 billion and over | 0.015% |
For the year ended December 31, 2020, the effective administration fee rate was 0.049% of each Fund’s average daily net assets. CWAM has contractually delegated to Columbia Management responsibility to provide certain sub-administrative services to the Funds.
Columbia Acorn Family of Funds | Annual Report 2020
| 97 |
Notes to Financial Statements (continued)
December 31, 2020
Compensation of board members
Certain officers and trustees of the Trust are also officers of CWAM and/or Columbia Management. The Trust makes no direct payments to its officers and trustees who are affiliated with CWAM or Columbia Management. The Trust offers a Deferred Compensation Plan (the Deferred Plan) for its independent trustees. Under the Deferred Plan, a trustee may elect to defer all or a portion of his or her compensation. Amounts deferred are retained by the Trust and may represent an unfunded obligation of the Trust. The value of amounts deferred is determined by reference to the change in value of Institutional Class shares of one or more series of Columbia Acorn Trust or a money market fund as specified by the trustee. Benefits under the Deferred Plan are payable in accordance with the Deferred Plan.
Compensation of Chief Compliance Officer
The Board of Trustees has appointed a Chief Compliance Officer for the Funds in accordance with federal securities regulations. As disclosed in the Statement of Operations, a portion of the Chief Compliance Officer’s total compensation is allocated to the Funds, along with other allocations to affiliated registered investment companies managed by the Investment Manager and its affiliates, based on relative net assets.
Transfer agency fees
Under a Transfer, Dividend Disbursing and Shareholders’ Servicing Agent Agreement, Columbia Management Investment Services Corp. (the Transfer Agent), an affiliate of the Investment Manager and a wholly-owned subsidiary of Ameriprise Financial, is responsible for providing transfer agency, dividend disbursing and shareholder services to the Funds for which the Funds pay transfer agency fees. The Transfer Agent has contracted with DST Asset Manager Solutions, Inc. (DST) to provide certain services and assist the Transfer Agent carrying out its duties. The Transfer Agent pays the fees of DST for its services and DST is not entitled to reimbursement for such fees from the Fund (with the exception of out-of-pocket fees). In addition, the Transfer Agent enters into agreements with various financial intermediaries through which investors may hold Fund shares, including Ameriprise Financial and its affiliates. These intermediaries also may provide shareholder services (Additional Shareholder Services) for which they are compensated by the Transfer Agent, which is in turn compensated by the Funds. Additional Shareholder Services may include sub-accounting, sub-transfer agency, participant recordkeeping, shareholder or participant reporting, shareholder or participant transaction processing, shareholder or participant tax monitoring and reporting and/or the provision of call center support and other customer services.
The Funds pay the Transfer Agent a monthly transfer agency fee that varies by account type (on a per account or asset-based basis) based on the cost of servicing the Funds. In addition, subject to certain limitations described in the Funds’ prospectuses and except with respect to Institutional 3 Class shares, the Funds pay a fee to the Transfer Agent for the Additional Shareholder Services provided by financial intermediaries who maintain shares through omnibus or networked accounts in amounts that vary by share class and with the distribution channel, type of intermediary and type of services provided.
The Funds compensate the Transfer Agent for certain out-of-pocket expenses as approved by the Board of Trustees from time to time. Such out-of-pocket expenses may include networking account fees paid to dealer firms by the Transfer Agent with respect to shareholder accounts established or maintained pursuant to the National Securities Clearing Corporation’s (NSCC) networking system. A significant portion of such networking account fees are paid by the Transfer Agent to dealer firms affiliated with Ameriprise Financial and its affiliates.
The Transfer Agent also receives compensation from the Funds for various shareholder services and reimbursements for certain out-of-pocket fees. Total transfer agency fees for Institutional 2 Class and Institutional 3 Class shares are subject to an annual limitation of not more than 0.07% and 0.02%, respectively, of the average daily net assets attributable to each share class.
Please see Expenses waived/reimbursed by the Investment Manager and its affiliates below for information about the Transfer Agent’s contractual agreements to limit the fees payable to it by certain share classes of the Funds.
| 98 | Columbia Acorn Family of Funds | Annual Report 2020 |
Notes to Financial Statements (continued)
December 31, 2020
For the year ended December 31, 2020, the Funds’ effective transfer agency fee rates, which reflect the contractual limitations described below in Expenses waived/reimbursed by the Investment Manager, as a percentage of average daily net assets of each class were as follows:
| Fund | Class A
(%) | Advisor
Class (%) | Class C
(%) | Institutional
Class (%) | Institutional 2
Class (%) | Institutional 3
Class (%) | Class R
(%) |
| Columbia Acorn® Fund | 0.09 | 0.09 | 0.09 | 0.09 | 0.05 | 0.01 | — |
| Columbia Acorn International® | 0.11 | 0.11 | 0.11 | 0.11 | 0.05 | 0.00 | 0.11 |
| Columbia Acorn USA® | 0.12 | 0.12 | 0.12 | 0.12 | 0.04 | 0.00 | — |
| Columbia Acorn International SelectSM | 0.16 | 0.15 | 0.15 | 0.15 | 0.05 | 0.00 | — |
| Columbia Thermostat FundSM | 0.10 | 0.10 | 0.10 | 0.10 | 0.06 | 0.02 | — |
| Columbia Acorn European FundSM | 0.11 | 0.11 | 0.11 | 0.11 | 0.04 | 0.00 | — |
An annual minimum account balance fee of $20 may apply to certain accounts with a value below the applicable share class’s initial minimum investment requirements to reduce the impact of small accounts on transfer agency fees. These minimum account balance fees are remitted to the Funds and recorded as part of expense reductions in the Statement of Operations.
For the year ended December 31, 2020, these minimum account balance fees reduced total expenses as follows:
| Fund | Amount ($) |
| Columbia Acorn® Fund | 6,726 |
| Columbia Acorn International® | 6,632 |
| Columbia Acorn USA® | 1,080 |
| Columbia Acorn International SelectSM | 9,771 |
| Columbia Thermostat FundSM | 160 |
| Columbia Acorn European FundSM | — |
Distribution and service fees
Columbia Management Investment Distributors, Inc. (CMID), a wholly owned subsidiary of Ameriprise Financial, is the distributor of the Funds. Each Fund has adopted a distribution and service plan which requires it to pay CMID a monthly service fee equal to 0.25% annually of the average daily net assets attributable to Class A and Class C shares and a monthly distribution fee equal to 0.75% and 0.50%, annually, of the average daily net assets attributable to Class C and Class R shares, respectively. CMID receives no compensation with respect to Advisor Class, Institutional Class, Institutional 2 Class and Institutional 3 Class shares.
Sales charges (unaudited)
Sales charges, including front-end charges and contingent deferred sales charges (CDSCs), received by the Distributor for distributing Fund shares for the year ended December 31, 2020, if any, are listed below:
| | Front End (%) | CDSC (%) | Amount ($) |
| Fund | Class A | Class C | Class A | Class C | Class A | Class C |
| Columbia Acorn® Fund | 5.75 | — | 0.50 - 1.00(a) | 1.00(b) | 183,359 | 1,738 |
| Columbia Acorn International® | 5.75 | — | 0.50 - 1.00(a) | 1.00(b) | 53,821 | 79 |
| Columbia Acorn USA® | 5.75 | — | 0.50 - 1.00(a) | 1.00(b) | 19,070 | — |
| Columbia Acorn International SelectSM | 5.75 | — | 0.50 - 1.00(a) | 1.00(b) | 45,534 | 293 |
| Columbia Thermostat FundSM | 5.75 | — | 0.50 - 1.00(a) | 1.00(b) | 1,597,730 | 6,286 |
| Columbia Acorn European FundSM | 5.75 | — | 0.50 - 1.00(a) | 1.00(b) | 56,793 | 956 |
| (a) | This charge is imposed on certain investments of between $1 million and $50 million redeemed within 18 months after purchase, as follows: 1.00% if redeemed within 12 months after purchase, and 0.50% if redeemed more than 12, but less than 18, months after purchase, with certain limited exceptions. |
| (b) | This charge applies to redemptions within 12 months after purchase, with certain limited exceptions. |
The Fund’s other share classes are not subject to sales charges.
Columbia Acorn Family of Funds | Annual Report 2020
| 99 |
Notes to Financial Statements (continued)
December 31, 2020
Expenses waived/reimbursed by the Investment Manager and its affiliates
Effective May 1, 2020 through April 30, 2021, CWAM has contractually agreed to waive fees and/or reimburse expenses so that ordinary operating expenses (excluding transaction costs and certain other investment-related expenses, interest and fees on borrowing, expenses associated with the Fund’s investment in other investment companies as well as any reorganization costs allocated to the Fund, if any) paid by Columbia Acorn® Fund do not exceed the following annual rates as a percentage of each class’ average daily net assets:
| Fund | Class A | Advisor | Class C | Institutional Class | Institutional 2 Class | Institutional 3 Class |
| Columbia Acorn®Fund | 1.11% | 0.86% | 1.86% | 0.86% | 0.82% | 0.78% |
This agreement may not be modified or terminated, without approval from the Fund’s Board of Trustees and CWAM. There is no guarantee that the agreement will continue after April 30, 2021.
Prior to May 1, 2020, CWAM contractually waived fees and/or reimbursed expenses so that ordinary operating expenses (excluding transaction costs and certain other investment-related expenses, interest and fees on borrowings, if any) paid by Columbia Acorn® Fund did not exceed the annual rates of 1.11% for Class A shares, 0.86% for Adviser Class shares, 1.86% for Class C shares, 0.86% for Institutional Class shares, 0.82% for Institutional Class 2 shares and 0.78% for Institutional Class 3 shares.
With respect to Columbia Acorn® Fund, the Transfer Agent has contractually agreed, effective May 1, 2020, to waive a portion of the fees payable by the Fund such that through April 30, 2022, fees paid by the Fund to the Transfer Agent do not exceed 0.05% of the average daily net assets of Institutional 2 Class shares of the Fund.
Effective May 1, 2020 through April 30, 2021, CWAM contractually agreed to waive fees and/or reimburse expenses so that ordinary operating expenses (excluding transaction costs and certain other investment-related expenses, interest and fees on borrowing, expenses associated with the Fund’s investment in other investment companies as well as any reorganization costs allocated to the Fund, if any) paid by Columbia Acorn International® do not exceed the following annual rates as a percentage of each class’ average daily net assets:
| Fund | Class A | Advisor | Class C | Institutional Class | Institutional 2 Class | Institutional 3 Class | Class R |
| Columbia Acorn International® | 1.24% | 0.99% | 1.99% | 0.99% | 0.92% | 0.88% | 1.49% |
This agreement may not be modified or terminated, without approval from the Fund’s Board of Trustees and CWAM. There is no guarantee that the agreement will continue after April 30, 2021.
Prior to May 1, 2020, CWAM contractually waived fees and/or reimbursed expenses so that ordinary operating expenses (excluding transaction costs and certain other investment-related expenses, interest and fees on borrowings, if any) paid by Columbia Acorn International® did not exceed the annual rates of 1.24% for Class A shares, 0.99% for Advisor Class shares, 1.99% for Class C shares, 0.99% for Institutional Class shares, 0.92% for Institutional Class 2 shares, 0.88% for Institutional Class 3 shares and 1.49% for Class R shares.
With respect to Columbia Acorn International®, the Transfer Agent contractually agreed, effective May 1, 2020, to waive a portion of the fees payable by the Fund such that through April 30, 2021, fees paid by the Fund to the Transfer Agent do not exceed (i) 0.04% of the average daily net assets of Institutional 2 Class shares of the Fund and (ii) 0.00% of the average daily net assets of Institutional 3 Class shares of the Fund.
Effective May 1, 2020 through April 30, 2021, CWAM has contractually agreed to waive fees and/or reimburse expenses so that ordinary operating expenses (excluding transaction costs and certain other investment-related expenses, interest and fees on borrowings and expenses associated with the Fund’s investments in other investment companies, if any) paid by Columbia Acorn USA®do not exceed the following annual rates as a percentage of each class’ average daily net assets:
| Fund | Class A | Advisor | Class C | Institutional Class | Institutional 2 Class | Institutional 3 Class |
| Columbia Acorn USA® | 1.41% | 1.16% | 2.16% | 1.16% | 1.08% | 1.04% |
| 100 | Columbia Acorn Family of Funds | Annual Report 2020 |
Notes to Financial Statements (continued)
December 31, 2020
This agreement may not be modified or terminated, without approval from the Fund’s Board of Trustees and CWAM. There is no guarantee that the agreement will continue after April 30, 2021.
Prior to May 1, 2020, CWAM contractually waived fees and/or reimbursed expenses so that ordinary operating expenses (excluding transaction costs and certain other investment-related expenses, interest and fees on borrowing and expenses associated with the Fund’s investment in other investment companies, if any) paid by Columbia Acorn USA® did not exceed the annual rates of 1.42% for Class A shares, 1.17% for Adviser Class shares, 2.17% for Class C shares, 1.17% for Institutional Class shares, 1.08% for Institutional Class 2 shares and 1.04% for Institutional Class 3 shares.
With respect to Columbia Acorn USA®, the Transfer Agent has contractually agreed, effective May 1, 2020, to waive a portion of the fees payable by the Fund such that through April 30, 2021, fees paid by the Fund to the Transfer Agent do not exceed (i) 0.04% of the average daily net assets of Institutional 2 Class shares of the Fund and (ii) 0.00% of the average daily net assets of Institutional 3 Class shares of the Fund. Prior to May 1, 2020, the Transfer Agent contractually agreed to limit the total fees payable to it by Columbia Acorn USA® for Institutional 2 Class and Institutional 3 Class shares of the Fund to not more than 0.04% and 0.00%, respectively, of the average daily net assets attributable to each share class.
Effective May 1, 2020, through August 7, 2020, CWAM has contractually agreed to waive fees and/or reimburse expenses so that ordinary operating expenses (excluding any transaction costs and certain other investment-related expenses, interest and fees on borrowings, expenses associated with the Fund’s investments in other investment companies as well as any reorganization costs allocated to the Fund, if any) paid by Columbia Acorn International SelectSM did not exceed the following annual rates as a percentage of each class’ average daily net assets:
| Fund | Class A | Advisor | Class C | Institutional Class | Institutional 2 Class | Institutional 3 Class |
| Columbia Acorn International SelectSM | 1.28% | 1.03% | 2.03% | 1.03% | 0.96% | 0.91% |
Effective August 8, 2020 through April 30, 2022, CWAM contractually agreed to waive fees and/or reimburse expenses so that ordinary operating expenses (excluding any transaction costs and certain other investment-related expenses, interest and fees on borrowings and expenses associated with each Fund’s investments in other investment companies, if any) paid by Columbia Acorn International SelectSM do not exceed the following annual rates as a percentage of each class’ average daily net assets:
| Fund | Class A | Advisor | Class C | Institutional Class | Institutional 2 Class | Institutional 3 Class |
| Columbia Acorn International SelectSM | 1.28% | 1.03% | 2.03% | 1.03% | 0.90% | 0.85% |
This agreement may not be modified or terminated, without approval from the Fund’s Board of Trustees and CWAM. There is no guarantee that the agreement will continue after April 30, 2022.
Prior to May 1, 2020, CWAM contractually waived fees and/or reimbursed expenses so that ordinary operating expenses (excluding transaction costs and certain other investment-related expenses, interest and fees on borrowings and expenses associated with the Fund’s investments in other investment companies, if any) paid by Columbia Acorn International SelectSM did not exceed the annual rates of 1.31% for Class A shares, 1.06% for Adviser Class shares, 2.06% for Class C shares, 1.06% for Institutional Class shares, 0.97% for Institutional Class 2 shares and 0.92% for Institutional Class 3 shares.
With respect to Columbia Acorn International SelectSM, the Transfer Agent contractually agreed to waive a portion of the fees payable by the Fund such that through June 30, 2020, fees paid by the Fund to the Transfer Agent did not exceed (i) 0.05% of the average daily net assets of Institutional 2 Class shares of the Fund and (ii) 0.00% of the average daily net assets of Institutional 3 Class shares of the Fund.
Effective May 1, 2020 through April 30, 2021, CWAM has contractually agreed to waive fees and/or reimburse expenses so that ordinary operating expenses (excluding transaction costs and certain other investment-related expenses, interest and fees on borrowings and expenses associated with the Fund’s investments in its underlying portfolio funds) paid by Columbia Thermostat FundSM do not exceed the following annual rates as a percentage of each class’ average daily net assets:
| Fund | Class A | Advisor | Class C | Institutional Class | Institutional 2 Class | Institutional 3 Class |
| Columbia Thermostat FundSM | 0.50% | 0.25% | 1.25% | 0.25% | 0.21% | 0.17% |
Columbia Acorn Family of Funds | Annual Report 2020
| 101 |
Notes to Financial Statements (continued)
December 31, 2020
This agreement may not be modified or terminated, without approval from the Fund’s Board of Trustees and CWAM. There is no guarantee that the agreement will continue after April 30, 2021.
Prior to May 1, 2020, CWAM contractually waived fees and/or reimbursed expenses so that ordinary operating expenses (excluding transaction costs and certain other investment-related expenses, interest and fees on borrowings and expenses associated with the Fund’s investments in its underlying portfolio funds) paid by Columbia Thermostat FundSM did not exceed the annual rates of 0.50% for Class A shares, 0.25% for Adviser Class shares, 1.25% for Class C shares, 0.25% for Institutional Class shares, 0.21% for Institutional Class 2 shares and 0.17% for Institutional Class 3 shares.
Effective May 1, 2020 through April 30, 2021, CWAM has contractually agreed to waive fees and/or reimburse expenses so that ordinary operating expenses (excluding transaction costs and certain other investment-related expenses, interest and fees on borrowings and expenses associated with the Fund’s investments in other investment companies, if any) paid by Columbia Acorn European FundSM do not exceed the following annual rates as a percentage of each class’ average daily net assets:
| Fund | Class A | Advisor | Class C | Institutional Class | Institutional 2 Class | Institutional 3 Class |
| Columbia Acorn European FundSM | 1.45% | 1.20% | 2.20% | 1.20% | 1.14% | 1.10% |
This agreement may not be modified or terminated, without approval from the Fund’s Board of Trustees and CWAM. There is no guarantee that the agreement will continue after April 30, 2021.
Prior to May 1, 2020, CWAM contractually waived fees and/or reimbursed expenses so that ordinary operating expenses (excluding transaction costs and certain other investment-related expenses, interest and fees on borrowings and expenses associated with the Fund’s investments in other investment companies, if any) paid by Columbia Acorn European FundSM did not exceed the annual rates of 1.45% for Class A shares, 1.20% for Adviser Class shares, 2.20% for Class C shares, 1.20% for Institutional Class shares, 1.14% for Institutional Class 2 shares and 1.09% for Institutional Class 3 shares.
With respect to Columbia Acorn European FundSM, the Transfer Agent has contractually agreed, effective May 1, 2020, to waive a portion of the fees payable by the Fund such that through April 30, 2021, fees paid by the Fund to the Transfer Agent do not exceed (i) 0.04% of the average daily net assets of Institutional 2 Class shares of the Fund and (ii) 0.00% of the average daily net assets of Institutional 3 Class shares of the Fund. Prior to May 1, 2020, the Transfer Agent contractually agreed to limit the total fees payable to it by Columbia Acorn European FundSM to not more than 0.05% and 0.00%, respectively, for Institutional 2 Class shares and Institutional 3 Class shares.
In addition to these contractual agreements, CWAM has voluntarily agreed to waive fees and/or reimburse Fund expenses (excluding transaction costs and certain other investment-related expenses, interest and fees on borrowings and expenses associated with the Fund’s investments in other investment companies, if any) so that Columbia Acorn USA® and Columbia Acorn International SelectSM Fund level expenses (expenses directly attributable to the Fund and not to a specific share class) are waived proportionately across all share classes.
Any fees waived and/or expenses reimbursed under the fee waiver/expense reimbursement arrangements described above are not recoverable by the Investment Manager or its affiliates in future periods.
Note 4. Federal tax information
The timing and character of income and capital gain distributions are determined in accordance with income tax regulations, which may differ from GAAP because of temporary or permanent book to tax differences.
At December 31, 2020, these differences were primarily due to differing treatment for deferral/reversal of wash sale losses, trustees’ deferred compensation, capital loss carryforward, derivative investments, re-characterization of distributions for investments, distribution reclassifications, earnings and profits distributed to shareholders on the redemption of shares, excess distributions, foreign currency transactions, net operating loss reclassification, investments in partnerships, former PFIC holdings and passive foreign investment company (PFIC) holdings. To the extent these differences were permanent, reclassifications were made among the components of the Fund’s net assets. Temporary differences do not require reclassifications.
| 102 | Columbia Acorn Family of Funds | Annual Report 2020 |
Notes to Financial Statements (continued)
December 31, 2020
The following reclassifications were made:
| Fund | Undistributed
(excess of distributions over)
net investment income ($) | Accumulated
net realized
gain (loss) ($) | Paid in capital
increase
(decrease) ($) |
| Columbia Acorn® Fund | 13,857,527 | (42,910,250) | 29,052,723 |
| Columbia Acorn International® | 8,547,919 | (82,791,572) | 74,243,653 |
| Columbia Acorn USA® | 684,040 | (815,749) | 131,709 |
| Columbia Acorn International SelectSM | (327,097) | (124,025) | 451,122 |
| Columbia Thermostat FundSM | 7,317,510 | (15,010,903) | 7,693,393 |
| Columbia Acorn European FundSM | 172,864 | 23,887 | (196,751) |
Net investment income (loss) and net realized gains (losses), as disclosed in the Statement of Operations, and net assets were not affected by these reclassifications.
The tax character of distributions paid during the years indicated was as follows:
| | Year Ended December 31, 2020 | Year Ended December 31, 2019 |
| Fund | Ordinary
income ($) | Long-term
capital gains ($) | Total ($) | Ordinary
income ($) | Long-term
capital gains ($) | Total ($) |
| Columbia Acorn® Fund | — | 632,451,942 | 632,451,942 | — | 496,942,419 | 496,942,419 |
| Columbia Acorn International® | 14,685,330 | 298,368,947 | 313,054,277 | 55,821,641 | 243,260,344 | 299,081,985 |
| Columbia Acorn USA® | 2,090,215 | 13,392,599 | 15,482,814 | 2,301,803 | 32,204,318 | 34,506,121 |
| Columbia Acorn International SelectSM | 690,700 | — | 690,700 | 2,144,105 | 10,853,970 | 12,998,075 |
| Columbia Thermostat FundSM | 64,049,306 | 37,945,388 | 101,994,694 | 20,939,965 | 15,177,349 | 36,117,314 |
| Columbia Acorn European FundSM | 420,496 | — | 420,496 | 825,760 | — | 825,760 |
Short-term capital gain distributions, if any, are considered ordinary income distributions for tax purposes.
At December 31, 2020, the components of distributable earnings on a tax basis were as follows:
| Fund | Undistributed
ordinary
income ($) | Undistributed
long-term
capital gains ($) | Capital loss
carryforwards ($) | Net unrealized
appreciation ($) |
| Columbia Acorn® Fund | 20,907,010 | 183,827,243 | — | 1,525,228,250 |
| Columbia Acorn International® | 11,317,813 | 66,362,958 | (74,033,761) | 890,200,446 |
| Columbia Acorn USA® | 1,618,543 | 5,325,475 | — | 107,379,515 |
| Columbia Acorn International SelectSM | 2,508,329 | — | (3,759,384) | 126,831,882 |
| Columbia Thermostat FundSM | 3,213,852 | 23,657,582 | — | 204,110,474 |
| Columbia Acorn European FundSM | — | — | (2,973,064) | 41,073,235 |
At December 31, 2020, the cost of all investments for federal income tax purposes along with the aggregate gross unrealized appreciation and depreciation based on that cost was:
| Fund | Tax cost ($) | Gross
unrealized
appreciation ($) | Gross
unrealized
(depreciation) ($) | Net unrealized
appreciation ($) |
| Columbia Acorn® Fund | 3,495,661,885 | 1,575,526,189 | (50,297,939) | 1,525,228,250 |
| Columbia Acorn International® | 1,588,938,186 | 894,424,100 | (4,223,654) | 890,200,446 |
| Columbia Acorn USA® | 236,571,531 | 112,529,109 | (5,149,594) | 107,379,515 |
| Columbia Acorn International SelectSM | 367,559,711 | 126,831,882 | — | 126,831,882 |
| Columbia Thermostat FundSM | 1,497,581,591 | 205,034,079 | (923,605) | 204,110,474 |
| Columbia Acorn European FundSM | 67,184,950 | 41,188,690 | (115,455) | 41,073,235 |
Tax cost of investments and unrealized appreciation/(depreciation) may also include timing differences that do not constitute adjustments to tax basis.
Columbia Acorn Family of Funds | Annual Report 2020
| 103 |
Notes to Financial Statements (continued)
December 31, 2020
The following capital loss carryforwards, determined at December 31, 2020, may be available to reduce future net realized gains on investments, if any, to the extent permitted by the Internal Revenue Code. In addition, for the year ended December 31, 2020, capital loss carryforwards utilized, if any, were as follows:
| Fund | No expiration
short-term ($) | No expiration
long-term ($) | Total ($) | Utilized ($) |
| Columbia Acorn International® | (47,764,662) | (26,269,099) | (74,033,761) | 134,193 |
| Columbia Acorn International SelectSM | (3,759,384) | — | (3,759,384) | — |
| Columbia Acorn European FundSM | (2,973,064) | — | (2,973,064) | 4,025,137 |
Management of the Funds has concluded that there are no significant uncertain tax positions in the Funds that would require recognition in the financial statements. However, management’s conclusion may be subject to review and adjustment at a later date based on factors including, but not limited to, new tax laws, regulations, and administrative interpretations (including relevant court decisions). Generally, the Funds’ federal tax returns for the prior three fiscal years remain subject to examination by the Internal Revenue Service.
Columbia Acorn International® acquired $74,167,954 of capital loss carryforward in connection with the Columbia Acorn Emerging Markets FundSM merger (Note 11). In addition to the acquired capital loss carryforward, Columbia Acorn International® also acquired unrealized capital gains as a result of the merger. The yearly utilization of the acquired capital loss carryforward may be limited by the Internal Revenue Code.
Note 5. Portfolio information
The aggregate cost of purchases and proceeds from sales, other than short-term obligations, for the year ended December 31, 2020, were:
| | Purchases
($) | Proceeds
from sales
($) |
| Columbia Acorn® Fund | 3,445,254,321 | 4,045,532,182 |
| Columbia Acorn International® | 1,237,736,704 | 1,760,750,576 |
| Columbia Acorn USA® | 251,255,498 | 275,863,215 |
| Columbia Acorn International SelectSM | 206,407,578 | 191,736,502 |
| Columbia Thermostat FundSM | 1,857,229,472 | 1,093,809,668 |
| Columbia Acorn European FundSM | 37,218,433 | 36,647,431 |
Transactions to realign the portfolio for Columbia Acorn® Fund following the reorganization as described in Note 10 are excluded for purposes of calculating the Fund’s portfolio turnover rate. These realignment transactions amounted to cost of purchases and proceeds from sales of $194,307,994 and $221,715,351, respectively.
Transactions to realign the portfolio for Columbia Acorn International® following the reorganization as described in Note 11 are excluded for purposes of calculating the Fund’s portfolio turnover rate. These realignment transactions amounted to cost of purchases and proceeds from sales of $0 and $7,561,386, respectively.
Transactions to realign the portfolio for Columbia Acorn International SelectSM following the reorganization as described in Note 12 are excluded for purposes of calculating the Fund’s portfolio turnover rate. These realignment transactions amounted to cost of purchases and proceeds from sales of $28,386,000 and $17,936,760, respectively.
Note 6. Line of credit
Each Fund has access to a revolving credit facility with a syndicate of banks led by Citibank, N.A., Wells Fargo Bank, N.A. and JPMorgan Chase Bank, N.A. whereby the Funds may borrow for the temporary funding of shareholder redemptions or for other temporary or emergency purposes. Pursuant to a December 1, 2020 amendment, the credit facility, which is a collective agreement between the Fund and certain other funds managed by the Investment Manager or an affiliated investment manager, severally and not jointly, permits collective borrowings up to $950 million. Interest is charged to each participating fund based on its borrowings at a rate equal to the higher of (i) the federal funds effective rate, (ii) the one-month LIBOR rate
| 104 | Columbia Acorn Family of Funds | Annual Report 2020 |
Notes to Financial Statements (continued)
December 31, 2020
and (iii) the overnight bank funding rate, plus in each case, 1.25%. Each borrowing under the credit facility matures no later than 60 days after the date of borrowing. The Fund also pays a commitment fee equal to its pro rata share of the unused amount of the credit facility at a rate of 0.15% per annum. The commitment fee is included in other expenses in the Statement of Operations. This agreement expires annually in December unless extended or renewed. Prior to the December 1, 2020 amendment, the Funds had access to a revolving credit facility with a syndicate of banks led by Citibank, N.A., HSBC Bank USA, N.A. and JPMorgan Chase Bank, N.A. which permitted collective borrowings up to $1 billion. Interest was charged to each participating fund based on its borrowings at a rate equal to the higher of (i) the federal funds effective rate, (ii) the one-month LIBOR rate and (iii) the overnight bank funding rate, plus in each case, 1.00%.
During the year ended December 31, 2020, the following fund(s) had borrowings:
| Fund | Average loan
balance ($) | Weighted average
interest rate (%) | Days
outstanding |
| Columbia Acorn International® | 2,700,000 | 1.15 | 1 |
| Columbia Thermostat FundSM | 3,050,000 | 1.85 | 2 |
| Columbia Acorn European FundSM | 512,500 | 1.87 | 8 |
Interest expense incurred by the Funds is recorded as a line of credit interest expense in the Statement of Operations. The Funds had no outstanding borrowings at December 31, 2020.
Note 7. Significant risks
Foreign securities and emerging market countries risk
Investing in foreign securities may involve certain risks not typically associated with investing in U.S. securities, such as increased currency volatility and risks associated with political, regulatory, economic, social, diplomatic and other conditions or events (Including, for example, military confrontations, war, terrorism, natural disasters and disease pandemics) occurring in the country or region, which may result in significant market volatility. In addition, certain foreign securities may not be as liquid as U.S. securities. Investing in emerging markets may increase these risks and expose the Funds to elevated risks associated with increased inflation, deflation or currency devaluation. To the extent that Columbia Acorn International® , Columbia Acorn International SelectSM and Columbia Acorn European FundSM concentrate their investment exposure to any one or a few specific countries, the Funds will be particularly susceptible to the risks associated with the conditions, events or other factors impacting those countries or regions and may, therefore, have a greater risk than that of a fund that is more geographically diversified. The financial information and disclosure made available by issuers of emerging market securities may be considerably less reliable than publicly available information about other foreign securities. The Public Company Accounting Oversight Board, which regulates auditors of U.S. public companies, is unable to inspect audit work papers in certain foreign companies. Investors in foreign countries often have limited rights and few practical remedies to pursue shareholder claims, including class actions or fraud claims, and the ability of the U.S. Securities and Exchange Commission, the U.S. Department of Justice and other authorities to bring and enforce actions against foreign issuers or foreign persons is limited.
Asia Pacific Region. Columbia Acorn International® and Columbia Acorn International SelectSM are particularly susceptible to economic, political, regulatory or other events or conditions affecting issuers and countries in the Asia Pacific region. Many of the countries in the region are considered underdeveloped or developing, including from a political, economic and/or social perspective, and may have relatively unstable governments and economies based on limited business, industries and/or natural resources or commodities. Events in any one country within the region may impact other countries in the region or the region as a whole. As a result, events in the region will generally have a greater effect on the Funds than if the Funds were more geographically diversified. This could result in increased volatility in the value of the Funds’ investments and losses for the Funds. Also, securities of some companies in the region can be less liquid than U.S. or other foreign securities, potentially making it difficult for the Funds to sell such securities at a desirable time and price.
Europe. Columbia Acorn International®, Columbia Acorn International SelectSM and Columbia Acorn European FundSM are particularly susceptible to economic, political, regulatory or other events or conditions affecting issuers and countries in Europe. In addition, the private and public sectors’ debt problems of a single European Union (EU) country can pose significant economic risks to the EU as a whole. As a result, the Funds’ NAV may be more volatile than the NAV of a more
Columbia Acorn Family of Funds | Annual Report 2020
| 105 |
Notes to Financial Statements (continued)
December 31, 2020
geographically diversified fund. If securities of issuers in Europe fall out of favor, it may cause the Funds to underperform other funds that do not focus their investments in this region of the world. The UK’s departure from the EU single market became effective January 1, 2021 with the end of the Brexit transition period and the post-Brexit trade deal between the UK and EU taking effect on December 31, 2020. There is a significant degree of uncertainty as to the outcome of these negotiations and the future and full impact of Brexit remain uncertain and could have additional adverse effects on economies, financial markets, currencies and asset valuations around the world. During this period and beyond, the impact of Brexit on the UK and European economies and the broader global economy could be significant, resulting in negative impacts on currency and financial markets generally, such as increased volatility and illiquidity, and potentially lower economic growth in markets in Europe, which may adversely affect the value of your investment in the Funds.
Health care sector risk
Columbia Acorn® Fund, Columbia Acorn USA® and Columbia Acorn European FundSM may be more susceptible to the particular risks that may affect companies in the health care sector than if they were invested in a wider variety of companies in unrelated sectors. Companies in the health care sector are subject to certain risks, including restrictions on government reimbursement for medical expenses, government approval of medical products and services, competitive pricing pressures, and the rising cost of medical products and services (especially for companies dependent upon a relatively limited number of products or services). Performance of such companies may be affected by factors including government regulation, obtaining and protecting patents (or the failure to do so), product liability and other similar litigation as well as product obsolescence.
Industrial sector risk
Columbia Acorn European FundSM may be more susceptible to the particular risks that may affect companies in the industrials sector than if it were invested in a wider variety of companies in unrelated sectors. Companies in the industrials sector are subject to certain risks, including changes in supply and demand for their specific product or service and for industrial sector products in general, including decline in demand for such products due to rapid technological developments and frequent new product introduction. Performance of such companies may be affected by factors including government regulation, world events and economic conditions and risks for environmental damage and product liability claims.
Information technology sector risk
Columbia Acorn® Fund, Columbia Acorn International®, Columbia Acorn International SelectSM and Columbia Acorn European FundSM may be more susceptible to the particular risks that may affect companies in the information technology sector than if they were invested in a wider variety of companies in unrelated sectors. Companies in the information technology sectors are subject to certain risks, including the risk that new services, equipment or technologies will not be accepted by consumers and businesses or will become rapidly obsolete. Performance of such companies may be affected by factors including obtaining and protecting patents (or the failure to do so) and significant competitive pressures, including aggressive pricing of their products or services, new market entrants, competition for market share and short product cycles due to an accelerated rate of technological developments. Such competitive pressures may lead to limited earnings and/or falling profit margins. As a result, the value of their securities may fall or fail to rise. In addition, many information technology sector companies have limited operating histories and prices of these companies’ securities historically have been more volatile than other securities, especially over the short term.
Market and environment risk
The Funds may incur losses due to declines in the value of one or more securities in which they invest. These declines may be due to factors affecting a particular issuer, or the result of, among other things, political, regulatory, market, economic or social developments affecting the relevant market(s) more generally. In addition, turbulence in financial markets and reduced liquidity in equity, credit and/or fixed income markets may negatively affect many issuers, which could adversely affect the Funds, including causing difficulty in assigning prices to hard-to-value assets in thinly traded and closed markets, significant redemptions and operational challenges. Global economies and financial markets are increasingly interconnected, and conditions and events in one country, region or financial market may adversely impact issuers in a different country, region or financial market. These risks may be magnified if certain events or developments adversely interrupt the global supply chain; in these and other circumstances, such risks might affect companies worldwide. As a result, local, regional or global events
| 106 | Columbia Acorn Family of Funds | Annual Report 2020 |
Notes to Financial Statements (continued)
December 31, 2020
such as terrorism, war, natural disasters, disease/virus outbreaks and epidemics or other public health issues, recessions, depressions or other events – or the potential for such events – could have a significant negative impact on global economic and market conditions.
The Funds performance may also be significantly negatively impacted by the economic impact of the coronavirus disease 2019 (COVID-19) pandemic. The COVID-19 public health crisis has become a pandemic that has resulted in, and may continue to result in, significant global economic and societal disruption and market volatility due to disruptions in market access, resource availability, facilities operations, imposition of tariffs, export controls and supply chain disruption, among others. Such disruptions may be caused, or exacerbated by, quarantines and travel restrictions, workforce displacement and loss in human and other resources. The uncertainty surrounding the magnitude, duration, reach, costs and effects of the global pandemic, as well as actions that have been or could be taken by governmental authorities or other third parties, present unknowns that are yet to unfold. The impacts, as well as the uncertainty over impacts to come, of COVID-19 – and any other infectious illness outbreaks, epidemics and pandemics that may arise in the future – could negatively affect global economies and markets in ways that cannot necessarily be foreseen. In addition, the impact of infectious illness outbreaks and epidemics in emerging market countries may be greater due to generally less established healthcare systems, governments and financial markets. Public health crises caused by the COVID-19 outbreak may exacerbate other pre-existing political, social and economic risks in certain countries or globally. The disruptions caused by COVID-19 could prevent the Funds from executing advantageous investment decisions in a timely manner and negatively impact the Funds’ ability to achieve their investment objectives. Any such event(s) could have a significant adverse impact on the value and risk profile of the Funds.
The Investment Manager and its affiliates have systematically implemented strategies to address the operating environment spurred by the COVID-19 pandemic. To promote the safety and security of our employees and to assure the continuity of our business operations, we have implemented a work from home protocol for virtually all of our employee population, restricted business travel, and provided resources for complying with the guidance from the World Health Organization, the U.S. Centers for Disease Control and governments. Our operations teams seek to operate without significant disruptions in service. Our pandemic strategy takes into consideration that a pandemic could be widespread and may occur in multiple waves, affecting different communities at different times with varying levels of severity. We cannot, however, predict the impact that natural or man-made disasters, including the COVID-19 pandemic, may have on the ability of our employees and third-party service providers to continue ordinary business operations and technology functions over near- or longer-term periods.
Shareholder concentration risk
At December 31, 2020, the table below details the affiliated and significant unaffiliated shareholder account ownership of outstanding shares of each Fund. The Funds have no knowledge about whether any portion of these unaffiliated shares were owned beneficially. Subscription and redemption activity of these accounts may have a significant effect on the operations of the Funds.
| Fund | Number of
unaffiliated
accounts | Percentage of
shares
outstanding
held —
unaffiliated (%) | Percentage of
shares
outstanding
held —
affiliated (%) |
| Columbia Acorn® Fund | — | — | — |
| Columbia Acorn International® | 1 | 11.9 | 10.1 |
| Columbia Acorn USA® | 1 | 25.4 | — |
| Columbia Acorn International SelectSM | 1 | 20.4 | 24.0 |
| Columbia Thermostat FundSM | 2 | 26.7 | 19.9 |
| Columbia Acorn European FundSM | 5 | 54.9 | 27.3 |
Small- and mid-cap company risk
Columbia Acorn® Fund, Columbia Acorn International®, Columbia Acorn USA®, Columbia Acorn International SelectSM, and Columbia Acorn European FundSM investments in small- and mid-capitalization companies (small- and mid-cap companies) often involve greater risks than investments in larger, more established companies (larger companies) because small- and
Columbia Acorn Family of Funds | Annual Report 2020
| 107 |
Notes to Financial Statements (continued)
December 31, 2020
mid-cap companies tend to have less predictable earnings and may lack the management experience, financial resources, product diversification and competitive strengths of larger companies. Securities of small- and mid-cap companies may be less liquid and more volatile than the securities of larger companies.
Note 8. Subsequent events
Management has evaluated the events and transactions that have occurred through the date the financial statements were issued. Other than as noted in Note 1 above, there were no items requiring adjustment of the financial statements or additional disclosure.
Note 9. Information regarding pending and settled legal proceedings
Ameriprise Financial and certain of its affiliates have historically been involved in a number of legal, arbitration and regulatory proceedings, including routine litigation, class actions, and governmental actions, concerning matters arising in connection with the conduct of their business activities. Ameriprise Financial believes that the Funds are not currently the subject of, and that neither Ameriprise Financial nor any of its affiliates are the subject of, any pending legal, arbitration or regulatory proceedings that are likely to have a material adverse effect on the Funds or the ability of Ameriprise Financial or its affiliates to perform under their contracts with the Funds. Ameriprise Financial is required to make quarterly (10-Q), annual (10-K) and, as necessary, 8-K filings with the Securities and Exchange Commission (SEC) on legal and regulatory matters that relate to Ameriprise Financial and its affiliates. Copies of these filings may be obtained by accessing the SEC website at www.sec.gov.
There can be no assurance that these matters, or the adverse publicity associated with them, will not result in increased Fund redemptions, reduced sale of Fund shares or other adverse consequences to the Funds. Further, although we believe proceedings are not likely to have a material adverse effect on the Funds or the ability of Ameriprise Financial or its affiliates to perform under their contracts with the Funds, these proceedings are subject to uncertainties and, as such, we are unable to estimate the possible loss or range of loss that may result. An adverse outcome in one or more of these proceedings could result in adverse judgments, settlements, fines, penalties or other relief that could have a material adverse effect on the consolidated financial condition or results of operations of Ameriprise Financial or one or more of its affiliates that provides services to the Funds.
Note 10. Fund reorganization for Columbia Acorn® Fund
At the close of business on July 10, 2020, Columbia Acorn® Fund acquired the assets and assumed the identified liabilities of Columbia Acorn SelectSM (the Acquired Fund), a series of Columbia Acorn Trust. The reorganization was completed after the Board of Trustees of the Acquired Fund approved a plan of reorganization at a meeting held in February 2020. The purpose of the transaction was to combine two funds managed by the Investment Manager with comparable investment objectives and strategies.
The aggregate net assets of Columbia Acorn® Fund immediately before the reorganization were $3,945,929,243 and the combined net assets immediately after the reorganization were $4,162,559,888.
The reorganization was accomplished by a tax-free exchange of 17,982,620 shares of the Acquired Fund valued at $216,630,645 (including $45,240,007 of unrealized appreciation/(depreciation)).
In exchange for the Acquired Fund’s shares, Columbia Acorn® Fund issued the following number of shares:
| | Shares |
| Class A | 7,633,122 |
| Advisor Class | 86,140 |
| Class C | 139,092(a) |
| Institutional Class | 8,169,626 |
| Institutional 2 Class | 204,341 |
| Institutional 3 Class | 367,453 |
| (a) | Share activity for Class C has been adjusted on a retroactive basis to reflect a 4 to 1 reverse stock split completed after the close of business on September 11, 2020. |
| 108 | Columbia Acorn Family of Funds | Annual Report 2020 |
Notes to Financial Statements (continued)
December 31, 2020
For financial reporting purposes, net assets received and shares issued by Columbia Acorn® Fund were recorded at fair value; however, the Acquired Fund’s cost of investments was carried forward.
Columbia Acorn® Fund’s financial statements reflect both the operations of the Fund for the period prior to the reorganization and the combined Fund for the period subsequent to the reorganization. Because the combined investment portfolios have been managed as a single integrated portfolio since the reorganization was completed, it is not practicable to separate the amounts of revenue and earnings of the Acquired Fund that have been included in the combined Fund’s Statement of Operations since the reorganization was completed.
Assuming the reorganization had been completed on January 1, 2020, Columbia Acorn® Fund’s pro-forma results of operations for the year ended December 31, 2020 would have been approximately:
| | ($) |
| Net investment loss | (13,866,000) |
| Net realized gain | 692,024,000 |
| Net change in unrealized appreciation | 463,288,000 |
| Net increase in net asset from operations | 1,141,446,000 |
Note 11. Fund reorganization for Columbia Acorn International®
At the close of business on July 10, 2020, Columbia Acorn International® acquired the assets and assumed the identified liabilities of Columbia Acorn Emerging Markets FundSM (the Acquired Fund), a series of Columbia Acorn Trust. The reorganization was completed after the Board of Trustees of the Acquired Fund approved a plan of reorganization at a meeting held in February 2020. The purpose of the transaction was to combine two funds managed by the Investment Manager with comparable investment objectives and strategies.
The aggregate net assets of Columbia Acorn International® immediately before the reorganization were $2,289,446,759 and the combined net assets immediately after the reorganization were $2,321,819,727.
The reorganization was accomplished by a tax-free exchange of 2,827,715 shares of the Acquired Fund valued at $32,372,968 (including $3,368,388 of unrealized appreciation/(depreciation)).
In exchange for the Acquired Fund’s shares, Columbia Acorn International® issued the following number of shares:
| | Shares |
| Class A | 401,457 |
| Advisor Class | 10,583 |
| Class C | 206,250 |
| Institutional Class | 435,556 |
| Institutional 2 Class | 8,252 |
| Institutional 3 Class | 20,109 |
For financial reporting purposes, net assets received and shares issued by Columbia Acorn International® were recorded at fair value; however, the Acquired Fund’s cost of investments was carried forward.
Columbia Acorn International®’s financial statements reflect both the operations of the Fund for the period prior to the reorganization and the combined Fund for the period subsequent to the reorganization. Because the combined investment portfolios have been managed as a single integrated portfolio since the reorganization was completed, it is not practicable to separate the amounts of revenue and earnings of the Acquired Fund that have been included in the combined Fund’s Statement of Operations since the reorganization was completed.
Columbia Acorn Family of Funds | Annual Report 2020
| 109 |
Notes to Financial Statements (continued)
December 31, 2020
Assuming the reorganization had been completed on January 1, 2020, Columbia Acorn International®’s pro-forma results of operations for the year ended December 31, 2020 would have been approximately:
| | ($) |
| Net investment income | 10,398,000 |
| Net realized gain | 271,863,000 |
| Net change in unrealized appreciation | 13,902,000 |
| Net increase in net asset from operations | 296,163,000 |
Note 12. Fund reorganization for Columbia Acorn International SelectSM
At the close of business on August 7, 2020, Columbia Acorn International SelectSM acquired the assets and assumed the identified liabilities of Columbia Select International Equity Fund (the Acquired Fund), a series of Columbia Funds Series Trust. The reorganization was completed after the Board of Trustees of the Acquired Fund approved a plan of reorganization at a meeting held in June 2020. The purpose of the transaction was to combine two funds managed by the Investment Manager and its affiliates with comparable investment objectives and strategies.
The aggregate net assets of Columbia Acorn International SelectSM immediately before the reorganization were $221,813,610 and the combined net assets immediately after the reorganization were $464,940,748.
The reorganization was accomplished by a tax-free exchange of 18,460,726 shares of the Acquired Fund valued at $243,127,138 (including $9,281,109 of unrealized appreciation/(depreciation)).
In exchange for the Acquired Fund’s shares, Columbia Acorn International SelectSM issued the following number of shares:
| | Shares |
| Class A | 5,674,674(a) |
| Advisor Class | 13,886 |
| Class C | 51,121 |
| Institutional Class | 2,384,285 |
| Institutional 2 Class | 27,450 |
| Institutional 3 Class | 152,649 |
| (a) | 20,130 shares of Class A were issued in exchange of Class R shares of the Acquired fund. |
For financial reporting purposes, net assets received and shares issued by Columbia Acorn International SelectSM were recorded at fair value; however, the Acquired Fund’s cost of investments was carried forward.
Columbia Acorn International SelectSM’s financial statements reflect both the operations of the Fund for the period prior to the reorganization and the combined Fund for the period subsequent to the reorganization. Because the combined investment portfolios have been managed as a single integrated portfolio since the reorganization was completed, it is not practicable to separate the amounts of revenue and earnings of the Acquired Fund that have been included in the combined Fund’s Statement of Operations since the reorganization was completed.
Assuming the reorganization had been completed on January 1, 2020, Columbia Acorn International SelectSM’s pro-forma results of operations for the year ended December 31, 2020 would have been approximately:
| | ($) |
| Net investment income | 1,375,000 |
| Net realized gain | 35,106,000 |
| Net change in unrealized appreciation | 38,903,000 |
| Net increase in net asset from operations | 75,384,000 |
| 110 | Columbia Acorn Family of Funds | Annual Report 2020 |
Report of Independent Registered Public Accounting Firm
To the Board of Trustees of Columbia Acorn Trust and Shareholders of Columbia Acorn® Fund, Columbia Acorn International®, Columbia Acorn USA®, Columbia Acorn International SelectSM, Columbia Thermostat FundSM, and Columbia Acorn European FundSM
Opinions on the Financial Statements
We have audited the accompanying statements of assets and liabilities, including the portfolios of investments, of Columbia Acorn® Fund, Columbia Acorn International®, Columbia Acorn USA®, Columbia Acorn International SelectSM, Columbia Thermostat FundSM, and Columbia Acorn European FundSM (six of the funds constituting Columbia Acorn Trust, hereafter collectively referred to as the "Funds") as of December 31, 2020, the related statements of operations for the year ended December 31, 2020, the statements of changes in net assets for each of the two years in the period ended December 31, 2020, including the related notes, and the financial highlights for each of the periods indicated therein (collectively referred to as the "financial statements"). In our opinion, the financial statements present fairly, in all material respects, the financial position of each of the Funds as of December 31, 2020, the results of each of their operations for the year then ended, the changes in each of their net assets for each of the two years in the period ended December 31, 2020 and each of the financial highlights for each of the periods indicated therein in conformity with accounting principles generally accepted in the United States of America.
Basis for Opinions
These financial statements are the responsibility of the Funds’ management. Our responsibility is to express an opinion on the Funds’ financial statements based on our audits. We are a public accounting firm registered with the Public Company Accounting Oversight Board (United States) (PCAOB) and are required to be independent with respect to the Funds in accordance with the U.S. federal securities laws and the applicable rules and regulations of the Securities and Exchange Commission and the PCAOB.
We conducted our audits of these financial statements in accordance with the standards of the PCAOB. Those standards require that we plan and perform the audit to obtain reasonable assurance about whether the financial statements are free of material misstatement, whether due to error or fraud.
Our audits included performing procedures to assess the risks of material misstatement of the financial statements, whether due to error or fraud, and performing procedures that respond to those risks. Such procedures included examining, on a test basis, evidence regarding the amounts and disclosures in the financial statements. Our audits also included evaluating the accounting principles used and significant estimates made by management, as well as evaluating the overall presentation of the financial statements. Our procedures included confirmation of securities owned as of December 31, 2020 by correspondence with the custodian, transfer agent and brokers; when replies were not received from brokers, we performed other auditing procedures. We believe that our audits provide a reasonable basis for our opinions.
/s/PricewaterhouseCoopers LLP
Minneapolis, Minnesota
February 22, 2021
We have served as the auditor of one or more investment companies within the Columbia Acorn Trust since 2004.
Columbia Acorn Family of Funds | Annual Report 2020
| 111 |
Federal Income Tax Information
(Unaudited)
The Funds hereby designate the following tax attributes for the fiscal year ended December 31, 2020. Shareholders were notified in early 2021 of the amounts for use in preparing 2020 income tax returns.
| | Qualified
dividend
income | Dividends
received
deduction | Section
199A
dividends | Capital
gain
dividend | Foreign
taxes paid
to foreign
countries | Foreign
taxes paid
per share
to foreign
countries | Foreign
source
income | Foreign
source
income per
share |
| Columbia Acorn® Fund | 0.00% | 0.00% | 0.00% | $673,772,049 | $0 | $0.0000 | $0 | $0.00 |
| Columbia Acorn International® | 0.00% | 0.00% | 0.00% | $277,605,750 | $2,932,206 | $0.0405 | $34,940,429 | $0.48 |
| Columbia Acorn USA® | 55.66% | 53.20% | 0.00% | $12,798,267 | $0 | $0.0000 | $0 | $0.00 |
| Columbia Acorn International SelectSM | 15.25% | 0.00% | 0.00% | $0 | $370,602 | $0.0254 | $3,511,553 | $0.24 |
| Columbia Thermostat FundSM | 13.34% | 13.20% | 0.18% | $65,747,606 | $69,165 | $0.0007 | $307,640 | $0.00 |
| Columbia Acorn European FundSM | 74.12% | 0.00% | 0.00% | $0 | $73,565 | $0.0187 | $763,564 | $0.19 |
Qualified dividend income. For taxable, non-corporate shareholders, the percentage of ordinary income distributed during the fiscal year that represents qualified dividend income subject to reduced tax rates.
Dividends received deduction. The percentage of ordinary income distributed during the fiscal year that qualifies for the corporate dividends received deduction.
Section 199A dividends. For taxable, non-corporate shareholders, the percentage of ordinary income distributed during the fiscal year that represents Section 199A dividends potentially eligible for a 20% deduction.
Capital gain dividend. The Fund designates as a capital gain dividend the amount reflected above, or if subsequently determined to be different, the net capital gain of such fiscal period.
Foreign taxes. The Fund makes the election to pass through to shareholders the foreign taxes paid. Eligible shareholders may claim a foreign tax credit. These taxes, and the corresponding foreign source income, are provided.
| 112 | Columbia Acorn Family of Funds | Annual Report 2020 |
Board of Trustees and Management of the Columbia Acorn Family of Funds
Each trustee may serve a term of unlimited duration. The Trust’s Bylaws generally require that a trustee retire at the end of the calendar year in which the trustee attains the age of 75 years. The trustees appoint their own successors, provided that at least two-thirds of the trustees, after such appointment, have been elected by shareholders. Shareholders may remove a trustee, with or without cause, upon the vote of two-thirds of the Trust’s outstanding shares at any meeting called for that purpose. A trustee may be removed, with or without cause, upon the vote of a majority of the trustees. The names of the trustees and officers of the Trust, the date each was first elected or appointed to office and the principal business occupations of each during at least the last five years, and for the trustees, the number of portfolios in the fund complex they oversee and other directorships they hold, are shown below. Each trustee and officer serves in such capacity for each of the six series of Columbia Acorn Trust and for each of the three series of Wanger Advisors Trust.
The address for the trustees and officers of the Trust is Columbia Wanger Asset Management, LLC, 71 S Wacker Drive, Suite 2500, Chicago, Illinois 60606. The Funds’ Statement of Additional Information includes additional information about the Funds’ trustees and officers. You may obtain a free copy of the Statement of Additional Information by writing or calling toll-free:
Columbia Wanger Asset Management, LLC
Shareholder Services Group
71 S Wacker Drive, Suite 2500
Chicago, IL 60606
800.922.6769
Independent trustees
Name and age at
December 31, 2020 | Year first appointed or elected to a Board in the Columbia Funds Complex | Principal occupation(s)
during the past five years | Number of
Funds in the
Columbia
Funds
Complex
overseen (1) | Other directorships
held by the Trustee
during the past five years
in addition to
Columbia Acorn Trust and
Wanger Advisors Trust |
Laura M. Born, 55,
Chair* | 2007 | Adjunct Professor of Finance, University of Chicago Booth School of Business since 2007; Advisory Board Member, Driehaus Capital Management since 2018; Director and Audit Committee Chair, Carlson Inc. (private global travel company) since 2015; Managing Director – Investment Banking, JP Morgan Chase & Co. (broker-dealer) 2002-2007. | 9 | None. |
| Maureen M. Culhane, 72 | 2007 | Retired. Formerly, Vice President, Goldman Sachs Asset Management, L.P. (investment adviser), 2005-2007; Vice President (Consultant) – Strategic Relationship Management, Goldman, Sachs & Co., 1999-2005. | 9 | None. |
| Margaret M. Eisen, 67 | 2002 | Trustee, Smith College, 2012-2016; Chief Investment Officer, EAM International LLC (corporate finance and asset management), 2003-2013; Managing Director, CFA Institute, 2005-2008. | 9 | Chair, RMB Investors Trust (9 series). |
| John C. Heaton, 61 | 2010 | Joseph L. Gidwitz Professor of Finance, University of Chicago Booth School of Business since July 2000; Deputy Dean for Faculty, University of Chicago Booth School of Business, 2012-2019. | 9 | None. |
| Charles R. Phillips, 64 | 2015 | Retired. Formerly, Vice Chairman, J.P. Morgan Private Bank, 2011-2014; Managing Director, J.P. Morgan Private Bank, 2001-2011; Managing Director, J.P. Morgan Private Bank, 2001-2011. | 9 | None. |
Columbia Acorn Family of Funds | Annual Report 2020
| 113 |
Board of Trustees and Management of the Columbia Acorn Family of Funds (continued)
Independent trustees (continued)
Name and age at
December 31, 2020 | Year first appointed or elected to a Board in the Columbia Funds Complex | Principal occupation(s)
during the past five years | Number of
Funds in the
Columbia
Funds
Complex
overseen (1) | Other directorships
held by the Trustee
during the past five years
in addition to
Columbia Acorn Trust and
Wanger Advisors Trust |
David J. Rudis, 67,
Vice Chair* | 2010 | Chief Executive Officer, Finger Rock, LLC (strategic consulting business). Formerly, National Checking and Debit Executive, and Illinois President, Bank of America, 2007-2009; President, Consumer Banking Group, LaSalle National Bank, 2004-2007. | 9 | None. |
Trustee Emeritus
Name and age at
December 31, 2020 | Year first
appointed or
elected to a
Board in the
Columbia
Funds
Complex | Principal occupation(s)
during the past five years | Number of
Funds in the
Columbia
Funds
Complex
overseen (1) | Other directorships
held by the Trustee
during the past five years
in addition to
Columbia Acorn Trust and
Wanger Advisors Trust |
| Ralph Wanger, 86 (2) | 1970 (3) | Founder, CWAM. Formerly, President, Chief Investment Officer and portfolio manager, CWAM or its predecessors, July 1992-September 2003; Director, Wanger Investment Company PLC; Consultant, CWAM or its predecessors, September 2003-September 2005. | 9 | None. |
| * | On December 10, 2020, the Board of Trustees appointed Mr. Rudis as Chair, effective January 1, 2021. |
| (1) | The Trustees oversee the series of Wanger Advisors Trust and Columbia Acorn Trust. |
| (2) | As permitted under the Trust’s Bylaws, Mr. Wanger serves as a non-voting Trustee Emeritus of Columbia Acorn Trust and Wanger Advisors Trust. Prior to September 2009, Mr. Wanger served as an “interested” trustee of the Columbia Acorn Trust and Wanger Advisors Trust. Mr. Wanger was considered an “interested person” of the Trusts and of CWAM within the meaning of the 1940 Act because of certain ownership interests. |
| (3) | Dates prior to April 1992 correspond to the date first elected as a director of The Acorn Fund, Inc., the Trust’s predecessor. |
Fund officers
Name and age at
December 31, 2020 | Position
held with
Columbia
Acorn
Trust and
Wanger
Advisors Trust | Year first
appointed
or elected
to office | Principal occupation(s) during
the past five years |
| Michael G. Clarke, 50 | Assistant Treasurer* | 2004 | Vice President, Head of North American Operations, and Tax Co-Head of Global Operations, Columbia Management since June 2019 (previously Vice President, Accounting and Tax, May 2010-May 2019); senior officer of Columbia Funds and affiliated funds since 2002. |
| John L. Emerson, 45 | Vice President | 2020 | Portfolio manager and/or analyst, CWAM or its predecessors since 2003. |
| Paul B. Goucher, 51 | Assistant Secretary | 2015 | Senior Vice President and Assistant General Counsel, Ameriprise Financial, Inc. since January 2017 (previously Vice President and Lead Chief Counsel, November 2008 - January 2017 and January 2013 - January 2017, respectively); Vice President, Chief Legal Officer and Assistant Secretary, Columbia Management Investment Advisers, LLC since March 2015. |
| Tae Han (Simon) Kim, 39 | Vice President | 2018 | Portfolio manager and/or analyst, CWAM since 2011. |
| 114 | Columbia Acorn Family of Funds | Annual Report 2020 |
Board of Trustees and Management of the Columbia Acorn Family of Funds (continued)
Fund officers (continued)
Name and age at
December 31, 2020 | Position
held with
Columbia
Acorn
Trust and
Wanger
Advisors Trust | Year first
appointed
or elected
to office | Principal occupation(s) during
the past five years |
| Stephen Kusmierczak, 53 | Co-President | 2011 | Portfolio manager and/or analyst, CWAM or its predecessors since 2001. Vice President, Columbia Acorn Trust and Wanger Advisors Trust, 2011 - 2020. |
| Joseph C. LaPalm, 50 | Vice President | 2006 | Chief Compliance Officer, CWAM since 2005. |
| Ryan C. Larrenaga, 49 | Chief Legal Officer and Assistant Secretary | 2015 | Vice President and Chief Counsel, Ameriprise Financial, Inc. since August 2018 (previously, Vice President and Group Counsel, August 2011 - August 2018); officer of Columbia Funds and affiliated funds since 2005. |
| Matthew A. Litfin, 48 | Co-President | 2019 | Director of Research (U.S.) and portfolio manager, CWAM since December 2015; Vice President, Columbia Acorn Trust and Wanger Advisors Trust, 2016 - March 2019; formerly, portfolio manager, William Blair & Company 1993-2015. |
| Erika K. Maschmeyer, 39 | Vice President | 2020 | Portfolio manager and/or analyst, CWAM or its predecessors since 2016. |
| Thomas P. McGuire, 47 | Chief Compliance Officer | 2015 | Senior Vice President and Chief Compliance Officer of the Columbia Funds since 2012; Vice President – Asset Management Compliance, Ameriprise Financial, Inc., since May 2010; Chief Compliance Officer, Ameriprise Certificate Company since September 2010. |
| Julian Quero, 53 | Assistant Treasurer | 2015 | Vice President – Tax, Columbia Management Investment Advisers, LLC since 2009. |
| Martha A. Skinner, 45 | Assistant Treasurer | 2016 | Vice President of Financial Reporting and Administration, Columbia Management since November 2015; Director of Financial Reporting, Columbia Management, April 2013-November 2015. |
| Hans F. Stege, 36 | Vice President | 2020 | Portfolio manager and/or analyst, CWAM or its predecessors since 2017. |
| Richard Watson, 51 | Vice President | 2018 | Portfolio manager and/or analyst, CWAM or its predecessors since 2006. |
| Linda Roth-Wiszowaty, 50 | Secretary | 2006 | Business support analyst, CWAM since April 2007. |
| * | On December 10, 2020, the Board of Trustees appointed Mr. Clarke as the Treasurer and Principal Accounting and Financial Officer of the Trust, effective January 1, 2021. |
Columbia Acorn Family of Funds | Annual Report 2020
| 115 |
If you elect to receive shareholder reports for the Funds in paper, mailed to you, the Funds mail one shareholder report to each shareholder address, unless such shareholder elects to receive shareholder reports from the Funds electronically via e-mail or by having a paper notice mailed to you (Postcard Notice) that the Funds’ shareholder report is available at the Columbia Funds’ website (columbiathreadneedleus.com/investor/). If you would like more than one report in paper to be mailed to you, or would like to elect to receive reports via e-mail or access them through Postcard Notice, please call shareholder services at 800.345.6611 and additional reports will be sent to you.
Proxy voting policies and procedures
The policy of the Board of Trustees is to vote the proxies of the companies in which the Funds hold investments consistent with the procedures as stated in the Statement of Additional Information (SAI). You may obtain a copy of the SAI without charge by calling 800.345.6611; contacting your financial intermediary; visiting columbiathreadneedleus.com/investor/; or searching the website of the Securities and Exchange Commission (SEC) at sec.gov. Information regarding how the Funds voted proxies relating to portfolio securities is filed with the SEC by August 31st for the most recent 12-month period ending June 30th of that year, and is available without charge by visiting columbiathreadneedleus.com/investor/, or searching the website of the SEC at sec.gov.
Quarterly schedule of investments
The Funds file a complete schedule of portfolio holdings with the SEC for the first and third quarters of each fiscal year on Form N-PORT. The Funds’ Form N-PORT is available on the SEC’s website atsec.gov. The Funds’ complete schedule of portfolio holdings, as filed on Form N-PORT, can also be obtained without charge, upon request, by calling 800.345.6611.
Additional Fund information
For more information about the Funds, please visit columbiathreadneedleus.com/investor/ or call 800.345.6611. Customer Service Representatives are available to answer your questions Monday through Friday from 8 a.m. to 7 p.m. Eastern time.
Fund investment manager
Columbia Wanger Asset Management, LLC (Investment Manager)
71 S Wacker Drive, Suite 2500
Chicago, IL 60606
888.4.WANGER
(888.492.6437)
Fund distributor
Columbia Management Investment Distributors, Inc.
225 Franklin Street
Boston, MA 02110
Fund transfer agent
Columbia Management Investment Services Corp.
P.O. Box 219104
Kansas City, MO 64121-9104
| 116 | Columbia Acorn Family of Funds | Annual Report 2020 |
[THIS PAGE INTENTIONALLY LEFT BLANK]
[THIS PAGE INTENTIONALLY LEFT BLANK]
[THIS PAGE INTENTIONALLY LEFT BLANK]
Columbia Acorn Family of Funds
P.O. Box 219104
Kansas City, MO 64121-9104
Please read and consider the investment objectives, risks, charges and expenses for any fund carefully before investing. For a prospectus and summary prospectus, which contains this and other important information about the Funds, go to columbiathreadneedleus.com/investor/. The Funds are distributed by Columbia Management Investment Distributors, Inc., member FINRA, and managed by Columbia Wanger Asset Management, LLC.
Columbia Threadneedle Investments (Columbia Threadneedle) is the global brand name of the Columbia and Threadneedle group of companies. All rights reserved. Columbia Management Investment Distributors, Inc., 225 Franklin Street, Boston, MA 02110-2804
© 2021 Columbia Management Investment Advisers, LLC.
columbiathreadneedleus.com/investor/
Item 2. Code of Ethics.
(a)The registrant has adopted a code of ethics that applies to the registrant's principal executive officer, principal financial officer, principal accounting officer or controller, or persons performing similar functions, regardless of whether these individuals are employed by the registrant or a third party.
(b)During the period covered by this report, there were not any amendments to a provision of the code of ethics that applies to the registrant's principal executive officer, principal financial officer, principal accounting officer or controller, or persons performing similar functions, regardless of whether these individuals are employed by the registrant or a third party, and that relates to any element of the code of ethics definition enumerated in paragraph (b) of this Item.
(c)During the period covered by this report, there were no waivers, including any implicit waivers, from a provision of the code of ethics to the registrant's principal executive officer, principal financial officer, principal accounting officer or controller, or persons performing similar functions, regardless of whether these individuals are employed by the registrant or a third party that relates to one or more of the items set forth in paragraph (b) of this Item.
Item 3. Audit Committee Financial Expert.
The registrant's Board of Trustees has determined that Maureen Culhane, a member of the registrant's Board of Trustees and Audit Committee, qualifies as an audit committee financial expert. Ms. Culhane is an independent trustee, as defined in paragraph (a)(2) of this item's instructions
Item 4. Principal Accountant Fees and Services.
Fee information below is disclosed for the six series of the registrant whose reports to stockholders are included in this annual filing.
(a)Audit Fees. Aggregate Audit Fees billed by the principal accountant for professional services rendered during the fiscal years ended December 31, 2020 and December 31,
2019 are approximately as follows:
Audit Fees include amounts related to the audit of the registrant's annual financial statements or services that are normally provided by the accountant in connection with statutory and regulatory filings or engagements for those fiscal years.
(b)Audit-Related Fees. Aggregate Audit-Related Fees billed to the registrant by the principal accountant for professional services rendered during the fiscal years ended December 31, 2020 and December 31, 2019 are approximately as follows:
Audit-Related Fees include amounts for assurance and related services by the principal accountant that are reasonably related to the performance of the audit of the registrant's financial statements and are not reported in Audit Fees above. In both fiscal years 2020 and 2019, Audit-Related Fees consist of agreed-upon procedures performed for other audit-related additional testing.
During the fiscal years ended December 31, 2020 and December 31, 2019, there were no Audit-Related Fees billed by the registrant's principal accountant to the registrant's investment adviser (not including any sub-adviser whose role is primarily portfolio management and is subcontracted with or overseen by another investment adviser) and any entity controlling, controlled by, or under common control with the adviser that provides ongoing services to the registrant for an engagement that related directly to the operations and financial reporting of the registrant.
(c)Tax Fees. Aggregate Tax Fees billed by the principal accountant to the registrant for professional services rendered during the fiscal years ended December 31, 2020 and December 31, 2019 are approximately as follows:
Tax Fees incurred in both fiscal years 2020 and 2019 relate to the review of annual tax returns, the review of required shareholder distribution calculations and include amounts for professional services by the principal accountant for tax compliance, tax advice and tax planning. Fiscal year 2019 also includes Tax Fees for foreign tax filings.
During the fiscal years ended December 31, 2020 and December 31, 2019, there were no Tax Fees billed by the registrant's principal accountant to the registrant's investment adviser (not including any sub-adviser whose role is primarily portfolio management and is subcontracted with or overseen by another investment adviser) and any entity controlling, controlled by, or under common control with the adviser that provides ongoing services to the registrant for an engagement that related directly to the operations and financial reporting of the registrant.
(d)All Other Fees. Aggregate All Other Fees billed by the principal accountant to the registrant for professional services rendered during the fiscal years ended December 31,
2020 and December 31, 2019 are as follows:
All Other Fees include amounts for products and services provided by the principal accountant, other than the services reported in paragraphs (a) through (c) above. Aggregate All Other Fees billed by the registrant's principal accountant to the registrant's investment adviser (not including any sub-adviser whose role is primarily portfolio management and is subcontracted with or overseen by another investment adviser) and any entity controlling, controlled by, or under common control with the adviser that provides ongoing services to the registrant for an engagement that related directly to the operations and financial reporting of the registrant during the fiscal years ended December 31, 2020 and December 31, 2019 are approximately as follows:
In both fiscal years 2020 and 2019, All Other Fees primarily consist of professional services rendered for internal control reviews.
(e)(1) Audit Committee Pre-Approval Policies and Procedures
The policy of the registrant's Audit Committee is to specifically pre-approve (i) all audit and non-audit (including audit related, tax and all other) services provided by the registrant's independent auditor to the registrant and individual funds (collectively "Fund Services") and (ii) all non-audit services provided by the registrant's independent auditor to the funds' adviser or a control affiliate of the adviser, that relate directly to the funds' operations and financial reporting (collectively "Fund-related Adviser Services"). A "control affiliate" is an entity controlling, controlled by, or under common control with the adviser that provides ongoing services to the funds, and the term "adviser" is deemed to exclude any unaffiliated sub-adviser whose role is primarily portfolio management and is sub-contracted or overseen by another investment adviser.
If such Fund Services or Fund-related Adviser Services are required during the period between the Audit Committee's regularly scheduled meetings, the Chairman of the Audit Committee has the authority to pre-approve the service, with reporting to the full Audit Committee at the next regularly scheduled meeting.
The Audit Committee will waive pre-approval of Fund Services or Fund-related Adviser Services provided that the requirements under paragraph (c)(7)(i)(C) of Rule 2-01 of Regulation S-X are met.
(e)(2) None, or 0%, of the Audit-Related Fees, Tax Fees and All Other Fees paid by the Fund or affiliated entities relating directly to the operations and financial reporting of the Registrant disclosed above were approved by the audit committee pursuant to paragraphs (c)(7)(i)(C) of Rule 2-01 of Regulation S-X (which permits audit committee approval after the start of the engagement with respect to services other than audit, review or attest services, if certain conditions are satisfied).
(f)Not applicable.
(g)The aggregate non-audit fees billed by the registrant's accountant for services rendered to the registrant, and rendered to the registrant's investment adviser (not including any sub-adviser whose role is primarily portfolio management and is subcontracted with or overseen by another investment adviser), and any entity controlling, controlled by, or under common control with the adviser that provides ongoing services to the registrant for the fiscal years ended December 31, 2020 and December 31, 2019 are approximately as follows:
(h)The registrant's Audit Committee of the Board of Directors has considered whether the provision of non-audit services that were rendered to the registrant's adviser (not including any sub-adviser whose role is primarily portfolio management and is subcontracted with or overseen by another investment adviser), and any entity controlling, controlled by, or under common control with the investment adviser that provides ongoing services to the registrant that were not pre-approved pursuant to paragraph (c)(7)(ii) of Rule 2-01 of Regulation S-X, is compatible with maintaining the principal accountant's independence.
Item 5. Audit Committee of Listed Registrants.
Not applicable.
Item 6. Investments
(a)The registrant's "Schedule I – Investments in securities of unaffiliated issuers" (as set forth in 17 CFR 210.12-12) is included in Item 1 of this Form N-CSR.
(b)Not applicable
Item 7. Disclosure of Proxy Voting Policies and Procedures for Closed-End Management Investment Companies.
Not applicable.
Item 8. Portfolio Managers of Closed-End Management Investment Companies.
Not applicable.
Item 9. Purchases of Equity Securities by Closed-End Management Investment Company and Affiliated Purchasers.
Not applicable.
SIGNATURES
Pursuant to the requirements of the Securities Exchange Act of 1934 and the Investment Company Act of 1940, the registrant has duly caused this report to be signed on its behalf by the undersigned, thereunto duly authorized.
(registrant) | | Columbia Acorn Trust | |
By (Signature and Title) | /s/ Matthew A. Litfin | _______ |
| | | | Matthew A. Litfin, Co-President and Principal Executive Officer |
Date | | February 22, 2021 | |
Pursuant to the requirements of the Securities Exchange Act of 1934 and the Investment Company Act of 1940, this report has been signed below by the following persons on behalf of the registrant and in the capacities and on the dates indicated.
| | | | | |
By (Signature and Title) | /s/ Matthew A. Litfin |
| | | Matthew A. Litfin, Co-President and Principal Executive Officer | |
Date | | February 22, 2021 | |
By (Signature and Title) | /s/ Michael G. Clarke |
| | | Michael G. Clarke, Treasurer and Principal Accounting and Financial Officer |
Date | | February 22, 2021 | |