UNITED STATES
SECURITIES AND EXCHANGE COMMISSION
Washington, D.C. 20549
FORM N-CSR
CERTIFIED SHAREHOLDER REPORT OF REGISTERED
MANAGEMENT INVESTMENT COMPANIES
Investment Company Act file number 811-01829
Columbia Acorn Trust
(Exact name of registrant as specified in charter)
227 W. Monroe Street
Suite 3000
Chicago, IL 60606
(Address of principal executive offices) (Zip code)
Mary C. Moynihan
Perkins Coie LLP
700 13th Street, NW
Suite 600
Washington, DC 20005
Paul B. Goucher, Esq.
Columbia Management Investment Advisers, LLC
100 Park Avenue
New York, New York 10017
P. Zachary Egan
Columbia Acorn Trust
227 West Monroe Street, Suite 3000
Chicago, Illinois 60606
(Name and address of agent for service)
Registrant’s telephone number, including area code: (312) 634-9200
Date of fiscal year end: December 31
Date of reporting period: December 31, 2017
Form N-CSR is to be used by management investment companies to file reports with the Commission not later than 10 days after the transmission to stockholders of any report that is required to be transmitted to stockholders under Rule 30e-1 under the Investment Company Act of 1940 (17 CFR 270.30e-1). The Commission may use the information provided on Form N-CSR in its regulatory, disclosure review, inspection, and policymaking roles.
A registrant is required to disclose the information specified by Form N-CSR, and the Commission will make this information public. A registrant is not required to respond to the collection of information contained in Form N-CSR unless the Form displays a currently valid Office of Management and Budget (“OMB”) control number. Please direct comments concerning the accuracy of the information collection burden estimate and any suggestions for reducing the burden to Secretary, Securities and Exchange Commission, 450 Fifth Street, NW, Washington, DC 20549-0609. The OMB has reviewed this collection of information under the clearance requirements of 44 U.S.C. § 3507.
Item 1. Reports to Stockholders.

Annual Report
December 31, 2017
Columbia Acorn® Fund
Columbia Acorn International®
Columbia Acorn USA®
Columbia Acorn International SelectSM
Columbia Acorn SelectSM
Columbia Thermostat FundSM
Columbia Acorn Emerging Markets FundSM
Columbia Acorn European FundSM
Not FDIC Insured • No bank guarantee • May lose value
| 3 |
| 6 |
| 8 |
| 11 |
| 13 |
| 15 |
| 17 |
| 20 |
| 22 |
| 24 |
| 26 |
| 28 |
| 30 |
| 33 |
| 35 |
| 38 |
| 40 |
| 42 |
| 45 |
| 84 |
| 88 |
| 92 |
| 102 |
| 130 |
| 148 |
| 149 |
| 150 |
| 154 |
| 155 |
Columbia Acorn Family of Funds | Annual Report 2017
Fund at a glance
Columbia Acorn® Fund
Investment objective
Columbia Acorn® Fund (the Fund) seeks long-term capital appreciation.
Portfolio management
P. Zachary Egan, CFA
Co-Portfolio Manager
Managed Fund since 2015
Matthew A. Litfin, CFA
Co-Portfolio Manager
Managed Fund since 2016
Morningstar style boxTM
The Morningstar Style Box is based on a fund’s portfolio holdings. For equity funds, the vertical axis shows the market capitalization of the stocks owned, and the horizontal axis shows investment style (value, blend, or growth). Information shown is based on the most recent data provided by Morningstar.
© 2018 Morningstar, Inc. All rights reserved. The Morningstar information contained herein: (1) is proprietary to Morningstar and/or its content providers; (2) may not be copied or distributed; and (3) is not warranted to be accurate, complete or timely. Neither Morningstar nor its content providers are responsible for any damages or losses arising from any use of this information.
| Average annual total returns (%) (for the period ended December 31, 2017) |
| | | Inception | 1 Year | 5 Years | 10 Years | Life |
| Class A | Excluding sales charges | 10/16/00 | 24.91 | 12.10 | 7.82 | 13.98 |
| | Including sales charges | | 17.77 | 10.78 | 7.18 | 13.84 |
| Advisor Class | 11/08/12 | 25.19 | 12.35 | 8.09 | 14.34 |
| Class C | Excluding sales charges | 10/16/00 | 23.88 | 11.28 | 7.00 | 13.12 |
| | Including sales charges | | 23.10 | 11.28 | 7.00 | 13.12 |
| Institutional Class | 06/10/70 | 25.24 | 12.42 | 8.13 | 14.35 |
| Institutional 2 Class | 11/08/12 | 25.21 | 12.44 | 8.14 | 14.35 |
| Institutional 3 Class | 11/08/12 | 25.31 | 12.51 | 8.17 | 14.36 |
| Russell 2500 Growth Index | | 24.46 | 15.47 | 9.62 | - |
Performance numbers reflect all Fund expenses. Returns for Class A shares are shown with and without the maximum initial sales charge of 5.75%. Returns for Class C shares are shown with and without the maximum contingent deferred sales charge of 1.00% for the first year after purchase. Effective November 1, 2017, Class R4, Class R5, Class Y and Class Z shares were renamed Advisor Class, Institutional 2 Class, Institutional 3 Class and Institutional Class shares, respectively. The Fund’s other classes are not subject to sales charges, but may be subject to other fees and expenses, and have limited eligibility. Please see the Fund’s prospectus for details. Performance for different share classes will vary based on differences in sales charges and certain fees and expenses associated with each class.
As stated in the May 1, 2017, prospectus, the Fund’s annual operating expense ratio is 0.86% for Institutional Class shares and 1.11% for Class A shares.
All results shown assume reinvestment of distributions during the period. Returns do not reflect the deduction of taxes that a shareholder may pay on Fund distributions or on the redemption of Fund shares. Performance results may reflect the effect of any fee waivers or reimbursements of Fund expenses by the investment manager and/or any of its affiliates. Absent these fee waivers and/or expense reimbursement arrangements, performance results may have been lower.
The performance information shown represents past performance and is not a guarantee of future results. The investment return and principal value of your investment will fluctuate so that shares, when redeemed, may be worth more or less than their original cost. Current performance may be lower or higher than the performance data shown. You may obtain performance information current to the most recent month-end by contacting your financial intermediary, visiting investor.columbiathreadneedleus.com or calling 800.922.6769.
The returns shown for periods prior to the share class inception date (including returns for the Life of the Fund, which are since Fund inception) include the returns of the Fund’s oldest share class. These returns are adjusted to reflect any higher class-related operating expenses of the newer share classes, as applicable. Please visit investor.columbiathreadneedleus.com/investment-products/mutual-funds/appended-performance for more information.
Effective May 1, 2017, the Fund compares its performance to that of the Russell 2500 Growth Index. Prior to this date, the Fund compared its performance to that of the Russell 2500 Index. The Investment Manager believes that the Fund’s portfolio will generally be more closely aligned with the Russell 2500 Growth Index than with the former core benchmark from an investment style perspective. Information on the Russell 2500 Index will be included for a one-year transition period.
The Russell 2500 Growth Index measures the performance of those Russell 2500 companies with higher price-to-book ratios and higher forecasted growth values.
The Russell 2500 Index measures the performance of the 2,500 smallest companies in the Russell 3000 Index, which represents approximately 17% of the total market capitalization of the Russell 3000 Index.
Unlike mutual funds, indexes are not managed and do not incur fees or expenses. It is not possible to invest directly in an index.
Columbia Acorn Family of Funds | Annual Report 2017
| 3 |
Fund at a glance (continued)
Columbia Acorn® Fund
The Growth of a $10,000 Investment in Columbia Acorn® Fund Institutional Class Shares
December 31, 2007 through December 31, 2017
This chart shows the change in value of a hypothetical $10,000 investment in Institutional Class (formerly Class Z) shares of the Fund during the stated time period. Although the indexes are provided for use in assessing the Fund’s performance, the Fund’s holdings may differ significantly from those in an index. Performance numbers reflect all Fund expenses.
| Top ten holdings (%) (at December 31, 2017) | |
Pra Health Sciences, Inc.
Global contract research organization | 1.7 |
Masimo Corp.
Medical signal processing and sensor technology for non-invasive monitoring of physiological parameters | 1.6 |
Old Dominion Freight Line, Inc.
Inter-regional and multi-regional motor carrier | 1.5 |
ANSYS, Inc.
Software solutions for design analysis and optimization | 1.5 |
HealthSouth Corp.
Inpatient rehabilitative healthcare services | 1.5 |
IPG Photonics Corp.
High-power fiber lasers and amplifiers | 1.5 |
WABCO Holdings, Inc.
Electronic braking, stability, suspension, and transmission control systems commercial vehicles | 1.4 |
TransUnion
Offers consumer reports, risk scores, analytical services, and decisioning capabilities to businesses | 1.3 |
CDW Corp.
IT products and services | 1.3 |
Lazard Ltd., Class A
Corporate Advisory & Asset Management | 1.3 |
Percentages indicated are based upon total investments (excluding Money Market Funds and Securities Lending Collateral).
For further detail about these holdings, please refer to the section entitled “Portfolio of Investments."
Fund holdings are as of the date given, are subject to change at any time, and are not recommendations to buy or sell any security.
| 4 | Columbia Acorn Family of Funds | Annual Report 2017 |
Fund at a glance (continued)
Columbia Acorn® Fund
| Portfolio breakdown (%) (at December 31, 2017) |
| Common Stocks | 98.2 |
| Limited Partnerships | 0.4 |
| Money Market Funds | 0.6 |
| Securities Lending Collateral | 0.8 |
| Total | 100.0 |
Percentages indicated are based upon total investments. The Fund’s portfolio composition is subject to change.
| Equity sector breakdown (%) (at December 31, 2017) |
| Consumer Discretionary | 19.0 |
| Consumer Staples | 1.7 |
| Energy | 0.9 |
| Financials | 9.0 |
| Health Care | 22.8 |
| Industrials | 17.4 |
| Information Technology | 23.3 |
| Materials | 2.4 |
| Real Estate | 2.6 |
| Telecommunication Services | 0.9 |
| Total | 100.0 |
Percentages indicated are based upon total equity investments. The Fund’s portfolio composition is subject to change.
Columbia Acorn Family of Funds | Annual Report 2017
| 5 |
Manager Discussion of Fund Performance
Columbia Acorn® Fund
P. Zachary Egan, CFA
Co-Portfolio Manager
Matthew A. Litfin, CFA
Co-Portfolio Manager
Columbia Acorn® Fund Institutional Class (formerly Class Z) shares gained 25.24% in 2017. The Fund outperformed its primary benchmark, the Russell 2500 Growth Index, which gained 24.46%.
Although it was a tumultuous year in U.S. politics and global tensions remained high, investors banked on stronger economic growth and lower taxes, which helped drive the financial markets higher in 2017. Economic growth picked up as the year progressed, with gross domestic product (GDP) expanding at over 3.0% in back-to-back quarters for the first time in three years. Even though jobs were lost as a result of hurricane disruptions during the third quarter, the unemployment rate fell to 4.1%, a rate regarded as full employment and a 17-year low. Congress passed a major tax overhaul in late December, which lowered statutory corporate tax rates from 35% to 21%.
In 2017, corporate profits were much stronger than expected, helped by robust manufacturing activity, higher consumer spending and rising business confidence. Improved global economic growth and a weaker U.S. dollar boosted exports, and expectations for less stringent regulation in certain industries also supported investor confidence. Against this improved backdrop, the Federal Reserve raised the target range on a key short-term interest rate three times.
For the calendar year 2017, equity returns were especially strong. Eight of the eleven sectors that make up the Russell 2500 Growth Index returned 20%+, led by health care and information technology. Energy was the bottom performer and the only sector to lose ground for the year. Growth stocks outpaced value stocks by a significant margin.
The Fund’s outperformance over its primary benchmark in 2017 was generally the result of stock selection. A larger-cap bias within the Russell 2500 Growth Index’s capitalization range also had a small favorable impact on relative returns. The Fund’s relative performance was positive in all sectors except energy, real estate and industrials. Health care was the Fund’s top contributor, driven by solid stock selection, led by Align Technologies, which more than doubled for the year, and Kite Pharma. Align Technologies makes the Invisalign system of plastic teeth aligners, which have been taking market share from traditional wire braces used by dentists. Kite Pharma is a biotech company developing novel cancer drugs. The company’s stock increased throughout the year and particularly in the third quarter, on continued positive data for its drug Axi-Cel, culminating with a proposal by Gilead to acquire Kite at a significant premium. (The acquisition of Kite by Gilead was completed in October 2017.) Health care also produced the Fund’s largest detractor for the period: Evolent Health, a health care services company positioned to benefit from the transition from fee-for-service to value-based care, in which providers are compensated for the quality of outcomes. The company came under pressure, as investors reacted with skepticism to recent strategic maneuvers. However, we remain positive on the longer term outlook for Evolent, on the belief that the company is a leader in the shift to value-based care, a market we believe has good secular growth characteristics.
In the technology sector, IPG Photonics, the global leader in fiber laser technology, also gained significant ground for the Fund. IPG Photonics shares were driven higher by strong results that demonstrate an ongoing displacement of traditional machine cutting and welding tools within global manufacturing.
Stock selection for the Fund in the materials sector was also positive relative to the benchmark. An overweight in the energy sector was the Fund’s largest sector detractor from relative return, with Carrizo Oil & Gas the single biggest detractor from Fund results in 2017.
After rewarding investors in 2017 with strong performance, global stock markets were trading at elevated valuations at the end of the year. We are mindful of the risks posed by the potential reversal of key factors that helped guide this market ascent: low short-term interest rates, low inflation and low market volatility. In this environment, we continued to position the Fund toward higher quality and structural growth as measured across several metrics, including return on invested capital, revenue and earnings growth and superior debt ratios.
| 6 | Columbia Acorn Family of Funds | Annual Report 2017 |
Manager Discussion of Fund Performance (continued)
Columbia Acorn® Fund
Columbia Wanger has specialized in investing in small and mid-cap stocks since 1970. While cognizant of macroeconomic trends, our investment process takes a bottom-up approach, relying on intensive fundamental research and disciplined valuation techniques. We are focused on companies with sustainable competitive advantages, entrepreneurial management and the potential to gain market share. Our team will continue to employ our time-tested process.
Market risk may affect a single issuer, sector of the economy, industry or the market as a whole. Investments in small- and mid-cap companies involve risks and volatility and possible illiquidity greater than investments in larger, more established companies. Foreign investments subject the Fund to political, economic, market, social and other risks within a particular country, as well as to potential currency instabilities and less stringent financial and accounting standards generally applicable to U.S. issuers. Risks are enhanced for emerging market issuers. The Fund may invest significantly in issuers within a particular sector, which may be negatively affected by market, economic or other conditions, making the Fund more vulnerable to unfavorable developments in the sector. See the Fund’s prospectus for more information on these and other risks.
The views expressed in this report reflect the current views of the respective parties. These views are not guarantees of future performance and involve certain risks, uncertainties and assumptions that are difficult to predict, so actual outcomes and results may differ significantly from the views expressed. These views are subject to change at any time based upon economic, market or other conditions and the respective parties disclaim any responsibility to update such views. These views may not be relied on as investment advice and, because investment decisions for a Columbia Acorn Fund are based on numerous factors, may not be relied on as an indication of trading intent on behalf of any particular Columbia Acorn Fund. References to specific securities should not be construed as a recommendation or investment advice.
Columbia Acorn Family of Funds | Annual Report 2017
| 7 |
Fund at a glance
Columbia Acorn International®
Investment objective
Columbia Acorn International® (the Fund) seeks long-term capital appreciation.
Portfolio management
P. Zachary Egan, CFA
Co-Portfolio Manager
Managed Fund since 2003
Louis J. Mendes, CFA
Co-Portfolio Manager
Managed Fund since 2003
Tae Han (Simon) Kim, CFA
Co-Portfolio Manager
Managed Fund since December 2017
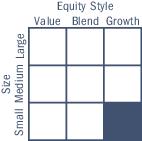
Morningstar style boxTM
The Morningstar Style Box is based on a fund’s portfolio holdings. For equity funds, the vertical axis shows the market capitalization of the stocks owned, and the horizontal axis shows investment style (value, blend, or growth). Information shown is based on the most recent data provided by Morningstar.
© 2018 Morningstar, Inc. All rights reserved. The Morningstar information contained herein: (1) is proprietary to Morningstar and/or its content providers; (2) may not be copied or distributed; and (3) is not warranted to be accurate, complete or timely. Neither Morningstar nor its content providers are responsible for any damages or losses arising from any use of this information.
| Average annual total returns (%) (for the period ended December 31, 2017) |
| | | Inception | 1 Year | 5 Years | 10 Years | Life |
| Class A | Excluding sales charges | 10/16/00 | 31.91 | 8.06 | 4.25 | 10.18 |
| | Including sales charges | | 24.33 | 6.78 | 3.63 | 9.92 |
| Advisor Class | 11/08/12 | 32.21 | 8.29 | 4.54 | 10.57 |
| Class C | Excluding sales charges | 10/16/00 | 30.93 | 7.25 | 3.45 | 9.37 |
| | Including sales charges | | 29.93 | 7.25 | 3.45 | 9.37 |
| Institutional Class | 09/23/92 | 32.24 | 8.35 | 4.57 | 10.58 |
| Institutional 2 Class | 08/02/11 | 32.27 | 8.39 | 4.59 | 10.59 |
| Institutional 3 Class | 11/08/12 | 32.36 | 8.44 | 4.62 | 10.60 |
| Class R | 08/02/11 | 31.58 | 7.68 | 3.92 | 9.89 |
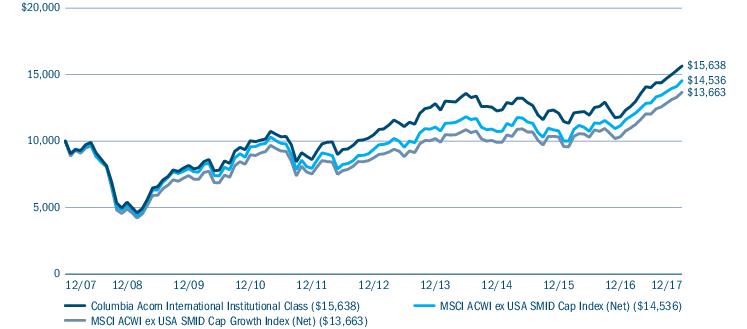
| MSCI ACWI ex USA SMID Cap Index (Net) | | 30.35 | 9.14 | 3.81 | - |
| MSCI ACWI ex USA SMID Cap Growth Index (Net) | | 32.40 | 9.35 | 3.17 | - |
Performance numbers reflect all Fund expenses. Returns for Class A shares are shown with and without the maximum initial sales charge of 5.75%. Returns for Class C shares are shown with and without the maximum contingent deferred sales charge of 1.00% for the first year after purchase. Effective November 1, 2017, Class R4, Class R5, Class Y and Class Z shares were renamed Advisor Class, Institutional 2 Class, Institutional 3 Class and Institutional Class shares, respectively. The Fund’s other classes are not subject to sales charges, but may be subject to other fees and expenses, and have limited eligibility. Please see the Fund’s prospectus for details. Performance for different share classes will vary based on differences in sales charges and certain fees and expenses associated with each class.
As stated in the May 1, 2017, prospectus, the Fund’s annual operating expense ratio is 1.01% for Institutional Class shares and 1.26% for Class A shares.
All results shown assume reinvestment of distributions during the period. Returns do not reflect the deduction of taxes that a shareholder may pay on Fund distributions or on the redemption of Fund shares. Performance results may reflect the effect of any fee waivers or reimbursements of Fund expenses by the investment manager and/or any of its affiliates. Absent these fee waivers and/or expense reimbursement arrangements, performance results may have been lower.
The performance information shown represents past performance and is not a guarantee of future results. The investment return and principal value of your investment will fluctuate so that shares, when redeemed, may be worth more or less than their original cost. Current performance may be lower or higher than the performance data shown. You may obtain performance information current to the most recent month-end by contacting your financial intermediary, visiting investor.columbiathreadneedleus.com or calling 800.922.6769.
The returns shown for periods prior to the share class inception date (including returns for the Life of the Fund, which are since Fund inception) include the returns of the Fund’s oldest share class. These returns are adjusted to reflect any higher class-related operating expenses of the newer share classes, as applicable. Please visit investor.columbiathreadneedleus.com/investment-products/mutual-funds/appended-performance for more information.
The MSCI ACWI ex USA SMID Cap Index (Net) captures a mid- and small-cap representation across 22 of 23 developed market countries (excluding the U.S.) and 24 emerging market countries. The index covers approximately 28% of the free float-adjusted market capitalization in each country.
The MSCI ACWI ex USA SMID Cap Growth Index (Net) captures mid-and small cap representation across 22 developed markets countries and 24 emerging markets countries.
Unlike mutual funds, indexes are not managed and do not incur fees or expenses. It is not possible to invest directly in an index.
| 8 | Columbia Acorn Family of Funds | Annual Report 2017 |
Fund at a glance (continued)
Columbia Acorn International®
The Growth of a $10,000 Investment in Columbia Acorn International® Institutional Class Shares
December 31, 2007 through December 31, 2017
This chart shows the change in value of a hypothetical $10,000 investment in Institutional Class (formerly Class Z) shares of the Fund during the stated time period. Although the indexes are provided for use in assessing the Fund’s performance, the Fund’s holdings may differ significantly from those in an index. Performance numbers reflect all Fund expenses.
| Top ten holdings (%) (at December 31, 2017) | |
Hexagon AB, Class B (Sweden)
Design, measurement and visualisation technologies | 2.7 |
Partners Group Holding AG (Switzerland)
Global private markets asset management firm | 2.6 |
CCL Industries, Inc. (Canada)
Manufacturing services and specialty packaging products for the non-durable consumer products market | 2.6 |
Kindred Group PLC (Malta)
Online gambling services | 2.2 |
FamilyMart UNY Holdings Co., Ltd. (Japan)
Chain of convenience stores | 2.0 |
Wirecard AG (Germany)
Internet payment and processing services | 1.9 |
Halma PLC (United Kingdom)
Products that detect hazards and protect assets and people in public and commercial buildings | 1.9 |
Brembo SpA (Italy)
Braking systems and components | 1.7 |
Novozymes AS, Class B (Denmark)
Enzymes for industrial use | 1.7 |
MTU Aero Engines AG (Germany)
Develops and manufactures engines and offers commercial engine services and support | 1.7 |
Percentages indicated are based upon total investments (excluding Money Market Funds and Securities Lending Collateral).
For further detail about these holdings, please refer to the section entitled “Portfolio of Investments."
Fund holdings are as of the date given, are subject to change at any time, and are not recommendations to buy or sell any security.
Columbia Acorn Family of Funds | Annual Report 2017
| 9 |
Fund at a glance (continued)
Columbia Acorn International®
| Equity sector breakdown (%) (at December 31, 2017) |
| Consumer Discretionary | 24.0 |
| Consumer Staples | 5.8 |
| Energy | 0.5 |
| Financials | 10.0 |
| Health Care | 8.0 |
| Industrials | 21.3 |
| Information Technology | 18.2 |
| Materials | 9.5 |
| Real Estate | 2.7 |
| Total | 100.0 |
Percentages indicated are based upon total equity investments. The Fund’s portfolio composition is subject to change.
| Country breakdown (%) (at December 31, 2017) |
| Australia | 0.9 |
| Brazil | 1.6 |
| Cambodia | 0.2 |
| Canada | 5.0 |
| Cayman Islands | 1.6 |
| China | 5.2 |
| Denmark | 3.5 |
| France | 1.1 |
| Germany | 9.9 |
| Hong Kong | 0.7 |
| India | 2.8 |
| Indonesia | 0.8 |
| Ireland | 0.9 |
| Italy | 2.1 |
| Japan | 23.3 |
| Malta | 2.1 |
| Mexico | 1.4 |
| Netherlands | 1.2 |
| New Zealand | 0.5 |
| Philippines | 0.5 |
| Singapore | 1.5 |
| South Africa | 1.7 |
| South Korea | 3.5 |
| Spain | 0.8 |
| Sweden | 4.6 |
| Switzerland | 2.5 |
| Taiwan | 1.4 |
| Thailand | 1.4 |
| United Kingdom | 12.0 |
| United States(a) | 5.3 |
| Total | 100.0 |
| (a) | Includes investments in Money Market Funds. |
Country breakdown is based primarily on issuer’s place of organization/incorporation. Percentages indicated are based upon total investments. The Fund’s portfolio composition is subject to change.
| 10 | Columbia Acorn Family of Funds | Annual Report 2017 |
Manager Discussion of Fund Performance
Columbia Acorn International®
P. Zachary Egan, CFA
Co-Portfolio Manager
Louis J. Mendes, CFA
Co-Portfolio Manager
Tae Han (Simon) Kim, CFA
Co-Portfolio Manager
Columbia Acorn International® Institutional Class (formerly Class Z) shares returned 32.24% in 2017, outperforming the Fund’s primary benchmark, the MSCI ACWI ex USA SMID Cap Index (Net), which returned 30.35% for the same time period.
International equities demonstrated strong performance in 2017 as investors responded favorably to a broad-based acceleration of global growth. The improvement in the world economy translated to positive corporate results, highlighted by rising revenues, rapid earnings growth and strengthening balance sheets. These factors fed through to market performance, with significant gains across major regions. The advance in most foreign currencies versus the U.S. dollar provided an additional boost to returns for U.S. investors.
The supportive market environment fueled investors’ risk appetites and led to outperformance for small- and mid-cap stocks relative to larger companies, and for the growth style compared to value. Both of these trends created a tailwind for the Fund’s results given the nature of our approach.
The Fund’s sector allocations also aided returns, led by an overweight in information technology and an underweight in energy. Stock selection was an additional contributor to relative performance, with positive results in Japan and Europe offsetting the Fund’s weaker showing in Australia and Canada. At the sector level, our stock selection added the most value in financials and industrials.
Among individual stocks, the German company Wirecard AG, a global leader in providing online merchants with solutions for electronic payment transactions, was the top contributor to performance. Wirecard, whose business is correlated with trends in online commerce and cashless transactions, reported increased revenues on continued growth in its end markets. The Swiss private equity firm Partners Group Holding AG, which benefited from asset growth and a favorable exit environment, helped the Fund’s performance in financials. TVS Motor Company Limited, an India-based producer of two-wheel motorized vehicles, also rallied behind better-than-expected sales and robust export growth. Hexagon AB, a Swedish provider of measurement technologies, and New Oriental Education & Technology Group Inc., China’s leader in after-school tutoring, test preparation and online education, were additional contributors of note.
On the negative side, the Canada-based silver-mining company Tahoe Resources Inc. was the Fund’s most significant detractor. Tahoe was forced to suspend production at its primary mine after a ruling by Guatemala’s Supreme Court, and we exited the position during the year in response to the political uncertainty. PT Matahari Department Store Tbk, the leading department store chain serving middle-class consumers in Indonesia, was another key detractor. Matahari suffered from slower-than-expected fourth-quarter sales stemming from soft consumer spending and merchandise assortment issues among its consignment vendors. Believing the risk/reward profile in the stock remained attractive, we took advantage of the selloff by adding to the position. Ultragenyx Pharmaceutical, Inc., Domino’s Pizza Enterprises Ltd. (based in Australia) and the British retailer Next PLC were also meaningful detractors in the annual period.
Entering 2018, we are monitoring risks such as less accommodative monetary policy, the inflation implications of tighter labor markets and the potential for market volatility to revert to more normal levels. We continue to emphasize higher-quality companies with robust structural growth, as measured by metrics such as return on invested capital, revenue and earnings growth, and superior debt ratios. More specifically, we are focused on companies with sustainable competitive advantages, entrepreneurial management and the ability to gain market share. We believe companies with these characteristics can perform well even if rising interest rates begin to fuel higher volatility. While we are mindful of valuations following the rally of the past year, we would also note that the international markets still trade at a discount relative to the United States.
We continue to identify what we believe are compelling investment ideas across regions. Niche companies in Europe that address changing circumstances in their end markets caused by technology, aging populations, tight labor markets or environmental and safety regulation can serve as a source of
Columbia Acorn Family of Funds | Annual Report 2017
| 11 |
Manager Discussion of Fund Performance (continued)
Columbia Acorn International®
opportunity. In Japan, companies that are embracing corporate governance changes and improving capital efficiency can offer above-average growth potential. We are also finding the emerging markets to be fertile ground for attractive growth companies due to the combination of healthy demographic trends (such as rapid population growth and increasing middle-class consumption) and compelling valuations relative to the developed world. More broadly speaking, we believe international markets provide an abundance of fast-growing small- and mid-sized companies whose positive attributes have not yet been reflected in their valuations.
Market risk may affect a single issuer, sector of the economy, industry or the market as a whole. International investing involves certain risks and volatility due to potential political, economic or currency instabilities and different, potentially less stringent, financial and accounting standards than those generally applicable to U.S. issuers. Risks are enhanced for emerging market issuers. Investments in small- and mid-cap companies involve risks and volatility and possible illiquidity greater than investments in larger, more established companies. See the Fund’s prospectus for more information on these and other risks.
The views expressed in this report reflect the current views of the respective parties. These views are not guarantees of future performance and involve certain risks, uncertainties and assumptions that are difficult to predict, so actual outcomes and results may differ significantly from the views expressed. These views are subject to change at any time based upon economic, market or other conditions and the respective parties disclaim any responsibility to update such views. These views may not be relied on as investment advice and, because investment decisions for a Columbia Acorn Fund are based on numerous factors, may not be relied on as an indication of trading intent on behalf of any particular Columbia Acorn Fund. References to specific securities should not be construed as a recommendation or investment advice.
| 12 | Columbia Acorn Family of Funds | Annual Report 2017 |
Fund at a glance
Columbia Acorn USA®
Investment objective
Columbia Acorn USA® (the Fund) seeks long-term capital appreciation.
Portfolio management
Matthew A. Litfin, CFA
Lead Portfolio Manager
Managed Fund since 2015
Richard Watson, CFA
Co-Portfolio Manager
Managed Fund since November 2017
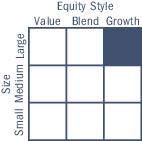
Morningstar style boxTM
The Morningstar Style Box is based on a fund’s portfolio holdings. For equity funds, the vertical axis shows the market capitalization of the stocks owned, and the horizontal axis shows investment style (value, blend, or growth). Information shown is based on the most recent data provided by Morningstar.
© 2018 Morningstar, Inc. All rights reserved. The Morningstar information contained herein: (1) is proprietary to Morningstar and/or its content providers; (2) may not be copied or distributed; and (3) is not warranted to be accurate, complete or timely. Neither Morningstar nor its content providers are responsible for any damages or losses arising from any use of this information.
| Average annual total returns (%) (for the period ended December 31, 2017) |
| | | Inception | 1 Year | 5 Years | 10 Years | Life |
| Class A | Excluding sales charges | 10/16/00 | 19.14 | 12.56 | 7.88 | 10.34 |
| | Including sales charges | | 12.30 | 11.24 | 7.24 | 10.03 |
| Advisor Class | 11/08/12 | 19.42 | 12.85 | 8.16 | 10.70 |
| Class C | Excluding sales charges | 10/16/00 | 18.30 | 11.80 | 7.10 | 9.54 |
| | Including sales charges | | 17.65 | 11.80 | 7.10 | 9.54 |
| Institutional Class | 09/04/96 | 19.44 | 12.85 | 8.17 | 10.70 |
| Institutional 2 Class | 11/08/12 | 19.56 | 12.96 | 8.22 | 10.72 |
| Institutional 3 Class | 11/08/12 | 19.60 | 13.02 | 8.24 | 10.74 |
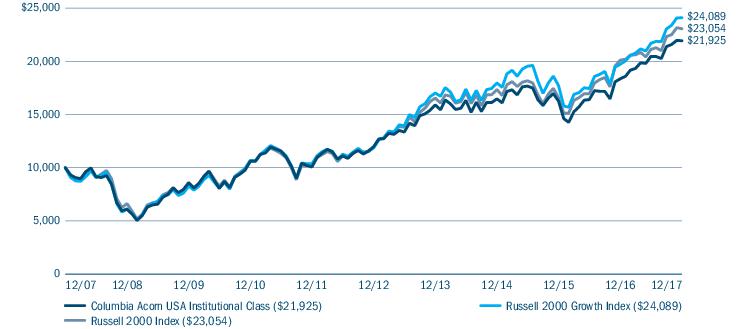
| Russell 2000 Growth Index | | 22.17 | 15.21 | 9.19 | - |
Performance numbers reflect all Fund expenses. Returns for Class A shares are shown with and without the maximum initial sales charge of 5.75%. Returns for Class C shares are shown with and without the maximum contingent deferred sales charge of 1.00% for the first year after purchase. Effective November 1, 2017, Class R4, Class R5, Class Y and Class Z shares were renamed Advisor Class, Institutional 2 Class, Institutional 3 Class and Institutional Class shares, respectively. The Fund’s other classes are not subject to sales charges, but may be subject to other fees and expenses, and have limited eligibility. Please see the Fund’s prospectus for details. Performance for different share classes will vary based on differences in sales charges and certain fees and expenses associated with each class.
As stated in the May 1, 2017, prospectus, the Fund’s annual operating expense ratio is 1.17% for Institutional Class shares and 1.42% for Class A shares.
All results shown assume reinvestment of distributions during the period. Returns do not reflect the deduction of taxes that a shareholder may pay on Fund distributions or on the redemption of Fund shares. Performance results may reflect the effect of any fee waivers or reimbursements of Fund expenses by the investment manager and/or any of its affiliates. Absent these fee waivers and/or expense reimbursement arrangements, performance results may have been lower.
The performance information shown represents past performance and is not a guarantee of future results. The investment return and principal value of your investment will fluctuate so that shares, when redeemed, may be worth more or less than their original cost. Current performance may be lower or higher than the performance data shown. You may obtain performance information current to the most recent month-end by contacting your financial intermediary, visiting investor.columbiathreadneedleus.com or calling 800.922.6769.
The returns shown for periods prior to the share class inception date (including returns for the Life of the Fund, if shown, which are since Fund inception) include the returns of the Fund’s oldest share class. These returns are adjusted to reflect any higher class-related operating expenses of the newer share classes, as applicable. Please visit investor.columbiathreadneedleus.com/investment-products/mutual-funds/appended-performance for more information.
Effective May 1, 2017, the Fund compares its performance to that of the Russell 2000 Growth Index. Prior to this date, the Fund compared its performance to that of the Russell 2000 Index. The Investment Manager believes that the Fund’s portfolio will generally be more closely aligned with the Russell 2000 Growth Index than with the former core benchmark from an investment style perspective. Information on the Russell 2000 Index will be included for a one-year transition period.
The Russell 2000 Growth Index, an unmanaged index, measures the performance of those Russell 2000 Index companies with higher price-to-book ratios and higher forecasted growth values.
The Russell 2000 Index measures the performance of the 2,000 smallest companies in the Russell 3000 Index, which represents approximately 10% of the total market capitalization of the Russell 3000 Index. The Russell 3000 Index, an unmanaged index, measures the performance of the 3,000 largest U.S. companies based on total market capitalization, which represents approximately 98% of the investable U.S. equity market.
Unlike mutual funds, indexes are not managed and do not incur fees or expenses. It is not possible to invest directly in an index.
Columbia Acorn Family of Funds | Annual Report 2017
| 13 |
Fund at a glance (continued)
Columbia Acorn USA®
The Growth of a $10,000 Investment in Columbia Acorn USA® Institutional Class Shares
December 31, 2007 through December 31, 2017
This chart shows the change in value of a hypothetical $10,000 investment in Institutional Class (formerly Class Z) shares of the Fund during the stated time period. Although the indexes are provided for use in assessing the Fund’s performance, the Fund’s holdings may differ significantly from those in an index. Performance numbers reflect all Fund expenses.
| Top ten holdings (%) (at December 31, 2017) | |
HealthSouth Corp.
Inpatient rehabilitative healthcare services | 2.0 |
Extended Stay America, Inc.
Hotels and motels | 1.8 |
AMN Healthcare Services, Inc.
Temporary healthcare staffing | 1.6 |
Houlihan Lokey, Inc.
Investment bank | 1.6 |
Dave & Buster’s Entertainment, Inc.
Venues that combine dining and entertainment for adults and families | 1.6 |
Monolithic Power Systems, Inc.
Power management solutions | 1.5 |
Brink’s Co. (The)
Provides security services globally | 1.5 |
First Busey Corp.
Multi-bank holding company | 1.5 |
OM Asset Management PLC
Domestic and international equities, fixed income, and alternative investments | 1.4 |
Texas Roadhouse, Inc.
Moderately priced, full service restaurant chain | 1.4 |
Percentages indicated are based upon total investments (excluding Money Market Funds and Securities Lending Collateral).
For further detail about these holdings, please refer to the section entitled “Portfolio of Investments."
Fund holdings are as of the date given, are subject to change at any time, and are not recommendations to buy or sell any security.
| Portfolio breakdown (%) (at December 31, 2017) |
| Common Stocks | 98.7 |
| Money Market Funds | 0.3 |
| Securities Lending Collateral | 1.0 |
| Total | 100.0 |
Percentages indicated are based upon total investments. The Fund’s portfolio composition is subject to change.
| Equity sector breakdown (%) (at December 31, 2017) |
| Consumer Discretionary | 19.8 |
| Consumer Staples | 3.4 |
| Energy | 1.4 |
| Financials | 12.8 |
| Health Care | 28.1 |
| Industrials | 10.7 |
| Information Technology | 20.0 |
| Materials | 1.7 |
| Real Estate | 2.1 |
| Total | 100.0 |
Percentages indicated are based upon total equity investments. The Fund’s portfolio composition is subject to change.
| 14 | Columbia Acorn Family of Funds | Annual Report 2017 |
Manager Discussion of Fund Performance
Columbia Acorn USA®
Matthew A. Litfin, CFA
Lead Portfolio Manager
Richard Watson, CFA
Co-Portfolio Manager
Columbia Acorn USA® Institutional Class (formerly Class Z) shares gained 19.44% in 2017. The Fund underperformed its primary benchmark, the Russell 2000 Growth Index, which gained 22.17% for the same time period.
Although it was a tumultuous year in U.S. politics and global tensions remained high, investors banked on stronger economic growth and lower taxes, which helped drive the financial markets higher in 2017. Economic growth picked up as the year progressed, with gross domestic product (GDP) expanding at over 3.0% in back-to-back quarters for the first time in three years. Even though jobs were lost as a result of hurricane disruptions during the third quarter, the unemployment rate fell to 4.1%, a rate regarded as full employment and a 17-year low. Congress passed a major tax overhaul in late December, which lowered statutory corporate tax rates from 35% to 21%.
In 2017, corporate profits were much stronger than expected, helped by robust manufacturing activity, higher consumer spending and rising business confidence. Improved global economic growth and a weaker dollar boosted exports, and expectations for less stringent regulation in certain industries also supported investor confidence. Against this improved backdrop, the Federal Reserve raised the target range on a key short-term interest rate three times.
For the calendar year 2017, equity returns were especially strong. Ten of the eleven sectors that make up the Russell 2000 Growth Index returned 10%+, led by health care and telecommunication services. Energy was the bottom performer and the only sector to lose ground for the year. Growth stocks outpaced value stocks by a significant margin.
A combination of stock selection and industry/sector allocation accounted for the Fund’s shortfall relative to its primary benchmark. The Fund was underweight the pharmaceuticals, biotechnology and life sciences industry within the health care sector, which detracted from relative results as it was a strong performer in 2017. However, three of the four top contributors to Fund returns were health care stocks: Exact Sciences, Kite Pharma and iRhythm Technologies. Exact’s stock more than doubled in the first half of the year, driven by the strength of Cologuard, a screen for the early detection of colon cancer that we believe strikes a balance of accuracy, cost-effectiveness and convenience. We took advantage of the stock’s strength to trim our position, and then fully exited our position in Exact during the second half of the year. Kite Pharma is a biotech company developing novel cancer drugs. The company’s stock increased throughout the year and particularly in the third quarter on continued positive data for its drug Axi-Cel, culminating with a proposal by Gilead to acquire Kite at a significant premium. (The acquisition of Kite by Gilead was completed in October 2017.) iRhythm Technologies makes a lightweight, easy-to-wear digital heart monitor for the detection of cardiac arrhythmias. We believe the company is strongly positioned to take significant market share by displacing traditional monitors that have lower detection rates, are less cost-effective and suffer from poor patient compliance.
Stock selection in information technology and in the consumer discretionary sector aided relative performance for the year. In technology, Qualys made a significant contribution to Fund results. Qualys is a leader in enterprise solutions for security and vulnerability management. Qualys shares were driven higher by faster-than-expected growth in recently launched solutions and good cost discipline. We believe that a higher percentage of sales coming from newer solutions has the potential to continue to drive revenue and sales growth. In the consumer discretionary sector, a position in iRobot, a global leader in household robotics, also aided Fund returns. The company enjoyed a technology lead over its competition because of more robust research and development efforts, a growing marketplace for its core products and expansion into other areas that offer the potential for market leadership.
An overweight in energy and in banks in the financials sector detracted from relative results. The Fund’s biggest individual detractor in 2017 was energy exploration and production company Carrizo Oil & Gas. Weak crude oil prices weighed on its shares in the first half of the year, and we sold the stock.
Columbia Acorn Family of Funds | Annual Report 2017
| 15 |
Manager Discussion of Fund Performance (continued)
Columbia Acorn USA®
Shares of Papa John’s International pulled back on disappointing same-store restaurant sales in the third quarter. Even though Papa John’s increased its market share in the fragmented U.S. pizza industry, its NFL-oriented marketing strategy was challenged with lower NFL viewership, and the company lost ground to a leading rival in the competitive pizza delivery sector.
Optimism and the potential for inflationary pressures appear to be increasing at a time when stocks are trading at elevated valuations, which have been supported by low interest rates. As we move into 2018, we are monitoring risks such as a less accommodative Federal Reserve, the inflation implications of tighter labor markets and the potential for normalizing volatility. We continued to position the portfolio toward companies that exhibit higher quality and structural growth as measured across several metrics, including return on invested capital, revenue and earnings growth and superior debt ratios.
Columbia Wanger has specialized in investing in small and mid-cap equities since 1970. Columbia Acorn USA® focuses specifically on small-cap stocks. While cognizant of macroeconomic trends, our investment process takes a bottom-up approach, relying on intensive fundamental research and disciplined valuation techniques. We are seeking out companies with sustainable competitive advantages, entrepreneurial management and the potential to gain market share. Our team will continue to employ our time-tested process to look for opportunities for investors to benefit from growth in small-cap businesses.
Market risk may affect a single issuer, sector of the economy, industry or the market as a whole. Investments in small- and mid-cap companies involve risks and volatility greater than investments in larger, more established companies. The Fund may invest significantly in issuers within a particular sector, which may be negatively affected by market, economic or other conditions, making the fund more vulnerable to unfavorable developments in the sector. See the Fund’s prospectus for more information on these and other risks.
The views expressed in this report reflect the current views of the respective parties. These views are not guarantees of future performance and involve certain risks, uncertainties and assumptions that are difficult to predict, so actual outcomes and results may differ significantly from the views expressed. These views are subject to change at any time based upon economic, market or other conditions and the respective parties disclaim any responsibility to update such views. These views may not be relied on as investment advice and, because investment decisions for a Columbia Acorn Fund are based on numerous factors, may not be relied on as an indication of trading intent on behalf of any particular Columbia Acorn Fund. References to specific securities should not be construed as a recommendation or investment advice.
| 16 | Columbia Acorn Family of Funds | Annual Report 2017 |
Fund at a glance
Columbia Acorn International SelectSM
Investment objective
Columbia Acorn International SelectSM (the Fund) seeks long-term capital appreciation.
Portfolio management
Stephen Kusmierczak, CFA
Portfolio Manager
Managed Fund since 2016
Morningstar style boxTM
The Morningstar Style Box is based on a fund’s portfolio holdings. For equity funds, the vertical axis shows the market capitalization of the stocks owned, and the horizontal axis shows investment style (value, blend, or growth). Information shown is based on the most recent data provided by Morningstar.
© 2018 Morningstar, Inc. All rights reserved. The Morningstar information contained herein: (1) is proprietary to Morningstar and/or its content providers; (2) may not be copied or distributed; and (3) is not warranted to be accurate, complete or timely. Neither Morningstar nor its content providers are responsible for any damages or losses arising from any use of this information.
| Average annual total returns (%) (for the period ended December 31, 2017) |
| | | Inception | 1 Year | 5 Years | 10 Years | Life |
| Class A | Excluding sales charges | 10/16/00 | 35.30 | 7.46 | 3.74 | 8.75 |
| | Including sales charges | | 27.54 | 6.20 | 3.12 | 8.42 |
| Advisor Class | 11/08/12 | 35.67 | 7.74 | 4.06 | 9.09 |
| Class C | Excluding sales charges | 10/16/00 | 34.32 | 6.64 | 2.93 | 7.93 |
| | Including sales charges | | 33.32 | 6.64 | 2.93 | 7.93 |
| Institutional Class | 11/23/98 | 35.70 | 7.77 | 4.07 | 9.10 |
| Institutional 2 Class | 11/08/12 | 35.72 | 7.82 | 4.09 | 9.11 |
| Institutional 3 Class | 11/08/12 | 35.81 | 7.87 | 4.12 | 9.13 |
| MSCI ACWI ex USA Index (Net) | | 27.19 | 6.80 | 1.84 | - |
| MSCI ACWI ex USA Growth Index (Net) | | 32.01 | 7.97 | 2.40 | - |
Performance numbers reflect all Fund expenses. Returns for Class A shares are shown with and without the maximum initial sales charge of 5.75%. Returns for Class C shares are shown with and without the maximum contingent deferred sales charge of 1.00% for the first year after purchase. Effective November 1, 2017, Class R4, Class R5, Class Y and Class Z shares were renamed Advisor Class, Institutional 2 Class, Institutional 3 Class and Institutional Class shares, respectively. The Fund’s other classes are not subject to sales charges, but may be subject to other fees and expenses, and have limited eligibility. Please see the Fund’s prospectus for details. Performance for different share classes will vary based on differences in sales charges and certain fees and expenses associated with each class.
As stated in the May 1, 2017, prospectus, the Fund’s annual operating expense ratio is 1.15% for Institutional Class shares and 1.40% for Class A shares.
All results shown assume reinvestment of distributions during the period. Returns do not reflect the deduction of taxes that a shareholder may pay on Fund distributions or on the redemption of Fund shares. Performance results may reflect the effect of any fee waivers or reimbursements of Fund expenses by the investment manager and/or any of its affiliates. Absent these fee waivers and/or expense reimbursement arrangements, performance results may have been lower.
The performance information shown represents past performance and is not a guarantee of future results. The investment return and principal value of your investment will fluctuate so that shares, when redeemed, may be worth more or less than their original cost. Current performance may be lower or higher than the performance data shown. You may obtain performance information current to the most recent month-end by contacting your financial intermediary, visiting investor.columbiathreadneedleus.com or calling 800.922.6769.
The returns shown for periods prior to the share class inception date (including returns for the Life of the Fund, if shown, which are since Fund inception) include the returns of the Fund’s oldest share class. These returns are adjusted to reflect any higher class-related operating expenses of the newer share classes, as applicable. Please visit investor.columbiathreadneedleus.com/investment-products/mutual-funds/appended-performance for more information.
The MSCI ACWI ex USA Index (Net) captures a large- and mid-cap representation across 22 of 23 developed market countries (excluding the U.S.) and 24 emerging market countries. The index covers approximately 85% of the global equity opportunity set outside the United States.
The MSCI ACWI ex USA Growth Index (Net) captures large-and mid-cap representation across 22 developed markets countries and 24 emerging markets countries.
Unlike mutual funds, indexes are not managed and do not incur fees or expenses. It is not possible to invest directly in an index.
Columbia Acorn Family of Funds | Annual Report 2017
| 17 |
Fund at a glance (continued)
Columbia Acorn International SelectSM
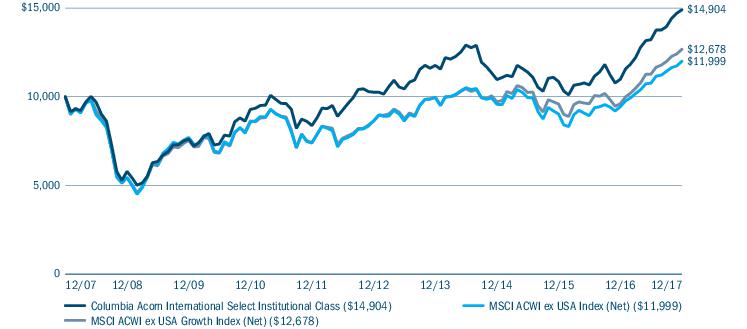
The Growth of a $10,000 Investment in Columbia Acorn International SelectSM Institutional Class Shares
December 31, 2007 through December 31, 2017
This chart shows the change in value of a hypothetical $10,000 investment in Institutional Class (formerly Class Z) shares of the Fund during the stated time period. Although the indexes are provided for use in assessing the Fund’s performance, the Fund’s holdings may differ significantly from those in an index. Performance numbers reflect all Fund expenses.
| Top ten holdings (%) (at December 31, 2017) | |
Partners Group Holding AG (Switzerland)
Global private markets asset management firm | 5.0 |
Hexagon AB, Class B (Sweden)
Design, measurement and visualisation technologies | 4.8 |
MTU Aero Engines AG (Germany)
Develops and manufactures engines and offers commercial engine services and support | 4.8 |
Naspers Ltd., Class N (South Africa)
Electronic and print media industries | 4.7 |
CCL Industries, Inc. (Canada)
Manufacturing services and specialty packaging products for the non-durable consumer products market | 4.5 |
FamilyMart UNY Holdings Co., Ltd. (Japan)
Chain of convenience stores | 4.4 |
Wirecard AG (Germany)
Internet payment and processing services | 4.3 |
NetEase, Inc., ADR (China)
Internet technology company that develops applications, services and Internet technologies | 4.3 |
Novozymes AS, Class B (Denmark)
Enzymes for industrial use | 4.1 |
Zee Entertainment Enterprises Ltd. (India)
Hindi films, serials, game shows and children’s programs | 3.3 |
Percentages indicated are based upon total investments (excluding Money Market Funds and Securities Lending Collateral).
For further detail about these holdings, please refer to the section entitled “Portfolio of Investments."
Fund holdings are as of the date given, are subject to change at any time, and are not recommendations to buy or sell any security.
| 18 | Columbia Acorn Family of Funds | Annual Report 2017 |
Fund at a glance (continued)
Columbia Acorn International SelectSM
| Equity sector breakdown (%) (at December 31, 2017) |
| Consumer Discretionary | 18.6 |
| Consumer Staples | 4.4 |
| Financials | 8.1 |
| Health Care | 12.5 |
| Industrials | 21.2 |
| Information Technology | 21.7 |
| Materials | 10.7 |
| Real Estate | 2.8 |
| Total | 100.0 |
Percentages indicated are based upon total equity investments. The Fund’s portfolio composition is subject to change.
| Country breakdown (%) (at December 31, 2017) |
| Australia | 1.9 |
| Canada | 4.1 |
| China | 8.0 |
| Denmark | 3.8 |
| France | 3.5 |
| Germany | 10.1 |
| India | 3.0 |
| Ireland | 1.5 |
| Italy | 1.6 |
| Japan | 16.7 |
| Mexico | 1.9 |
| Netherlands | 2.8 |
| South Africa | 4.3 |
| South Korea | 2.0 |
| Sweden | 6.2 |
| Switzerland | 4.5 |
| Taiwan | 2.1 |
| United Kingdom | 13.8 |
| United States(a) | 8.2 |
| Total | 100.0 |
| (a) | Includes investments in Money Market Funds. |
Country breakdown is based primarily on issuer’s place of organization/incorporation. Percentages indicated are based upon total investments. The Fund’s portfolio composition is subject to change.
Columbia Acorn Family of Funds | Annual Report 2017
| 19 |
Manager Discussion of Fund Performance
Columbia Acorn International SelectSM
Stephen Kusmierczak, CFA
Portfolio Manager
Columbia Acorn International SelectSM Institutional Class (formerly Class Z) shares returned 35.70% in 2017, outperforming the Fund’s primary benchmark, the MSCI ACWI ex USA Index (Net), which returned 27.19% for the same time period.
The global equity markets staged a robust rally in 2017, reflecting the steady increase in investors’ appetite for risk. Market sentiment was fueled by the combination of a broad-based strengthening of economic conditions, favorable outcomes in the European elections and growth in corporate earnings. This highly supportive backdrop led to sizable outperformance for the growth style relative to value, and for small-cap stocks in relation to larger companies. Both of these trends worked in the Fund’s favor given the nature of our investment approach.
Several aspects of the Fund’s positioning contributed to its return in 2017. In terms of sector allocations, the Fund benefited from an overweight in information technology (the strongest performing area of the market for the year) as well as holding no banks during the year. Stock selection was also strong, highlighted by favorable results in developed Europe, Latin America, the Europe/Middle East/Africa category within the emerging markets, and Japan. At the sector level, the Fund outperformed the corresponding benchmark components in seven of the eleven major sectors, it is important to remember that the Fund’s holdings and position sizes are determined through fundamental equity analysis, not top-down allocations to geographies and sectors. While these allocations can have a varying impact on the Fund over time, our larger goal is to outperform the benchmark by focusing on company fundamentals and valuations.
Among individual stocks, Wirecard AG, a global leader in providing online merchants with outsourcing solutions for electronic payment transactions, was the top contributor to performance during 2017. The German company, whose growth is correlated with trends in online commerce and cashless transactions, reported increased revenues on continued strength in its end markets. The South African holding company Naspers Ltd. was the second largest contributor. The company has a large stake in the Chinese internet giant Tencent Co. Ltd. Naspers largely followed Tencent’s rapid rise during the year. Partners Group Holding AG, a Swiss private equity firm, also delivered a substantial gain thanks to its robust asset growth and a favorable exit environment. MTU Aero Engines AG (Germany) and Novozymes AB (Sweden) were additional contributors in the annual period.
The U.K.-based retailer NEXT PLC was the largest detractor from returns in 2017. NEXT continued to struggle in a changing retail environment where its middle-of-the-road value proposition is suffering from online competition and shifting consumer preferences. U.K. retailer Kingfisher PLC also detracted from the Fund’s returns after the company was impacted by a weakening U.K. housing market. We exited both positions during the period. Similarly, we elected to sell our position in Vermilion Energy Inc. in 2017 based on worries about medium-term energy demand. Domino’s Pizza Enterprises Ltd. became a key performance detractor in 2017 following allegations of wage fraud. The company experienced another downturn in August after it missed earnings estimates and reduced its forward guidance. We continued to maintain the Fund’s position at year end due to Domino’s European expansion strategy and a seemingly attractive valuation.
Optimism, company earnings and the potential for inflationary pressures appear to be increasing at a time when stocks are trading at elevated valuations. We believed during 2017 that higher valuations were partly a response to historically low and in some cases, negative interest rates. We are monitoring risks such as less accommodative monetary policy, the inflation implications of tighter labor markets and the potential for normalizing volatility. During 2017, we continued to position the Fund toward companies that exhibit higher quality and structural growth as measured across several metrics such as return on invested capital, revenue and earnings growth, superior debt ratios, and proven management teams.
| 20 | Columbia Acorn Family of Funds | Annual Report 2017 |
Manager Discussion of Fund Performance (continued)
Columbia Acorn International SelectSM
Columbia Acorn International SelectSM is a concentrated portfolio that typically holds between 30 and 40 stocks. This strategy results in a diversified mix of high-conviction positions, which we believe can maximize the impact of our individual stock selections over time.
Market risk may affect a single issuer, sector of the economy, industry or the market as a whole. Foreign investments subject the Fund to political, economic, market, social and other risks within a particular country, as well as to potential currency instabilities and less stringent financial and accounting standards generally applicable to U.S. issuers. Risks are enhanced for emerging market issuers. Investments in small- and mid-cap companies involve risks and volatility and possible illiquidity greater than investments in larger, more established companies. The Fund may invest significantly in issuers within a particular sector, which may be negatively affected by market, economic or other conditions, making the Fund more vulnerable to unfavorable developments in the sector. See the Fund’s prospectus for more information on these and other risks.
The views expressed in this report reflect the current views of the respective parties. These views are not guarantees of future performance and involve certain risks, uncertainties and assumptions that are difficult to predict, so actual outcomes and results may differ significantly from the views expressed. These views are subject to change at any time based upon economic, market or other conditions and the respective parties disclaim any responsibility to update such views. These views may not be relied on as investment advice and, because investment decisions for a Columbia Acorn Fund are based on numerous factors, may not be relied on as an indication of trading intent on behalf of any particular Columbia Acorn Fund. References to specific securities should not be construed as a recommendation or investment advice.
Columbia Acorn Family of Funds | Annual Report 2017
| 21 |
Fund at a glance
Columbia Acorn SelectSM
Investment objective
Columbia Acorn SelectSM (the Fund) seeks long-term capital appreciation.
Portfolio management
David L. Frank, CFA
Co-Portfolio Manager
Managed Fund since 2015
Matthew S. Szafranski, CFA
Co-Portfolio Manager
Managed Fund since 2015
Morningstar style boxTM
The Morningstar Style Box is based on a fund’s portfolio holdings. For equity funds, the vertical axis shows the market capitalization of the stocks owned, and the horizontal axis shows investment style (value, blend, or growth). Information shown is based on the most recent data provided by Morningstar.
© 2018 Morningstar, Inc. All rights reserved. The Morningstar information contained herein: (1) is proprietary to Morningstar and/or its content providers; (2) may not be copied or distributed; and (3) is not warranted to be accurate, complete or timely. Neither Morningstar nor its content providers are responsible for any damages or losses arising from any use of this information.
| Average annual total returns (%) (for the period ended December 31, 2017) |
| | | Inception | 1 Year | 5 Years | 10 Years | Life |
| Class A | Excluding sales charges | 10/16/00 | 26.42 | 13.85 | 6.72 | 10.24 |
| | Including sales charges | | 19.16 | 12.51 | 6.09 | 9.89 |
| Advisor Class | 11/08/12 | 26.71 | 14.13 | 7.01 | 10.57 |
| Class C | Excluding sales charges | 10/16/00 | 25.40 | 13.01 | 5.90 | 9.41 |
| | Including sales charges | | 24.40 | 13.01 | 5.90 | 9.41 |
| Institutional Class | 11/23/98 | 26.59 | 14.16 | 7.02 | 10.57 |
| Institutional 2 Class | 11/08/12 | 26.72 | 14.21 | 7.05 | 10.59 |
| Institutional 3 Class | 11/08/12 | 26.79 | 14.27 | 7.07 | 10.60 |
| Russell 2500 Growth Index | | 24.46 | 15.47 | 9.62 | - |
Performance numbers reflect all Fund expenses. Returns for Class A shares are shown with and without the maximum initial sales charge of 5.75%. Returns for Class C shares are shown with and without the maximum contingent deferred sales charge of 1.00% for the first year after purchase. Effective November 1, 2017, Class R4, Class R5, Class Y and Class Z shares were renamed Advisor Class, Institutional 2 Class, Institutional 3 Class and Institutional Class shares, respectively. The Fund’s other classes are not subject to sales charges, but may be subject to other fees and expenses, and have limited eligibility. Please see the Fund’s prospectus for details. Performance for different share classes will vary based on differences in sales charges and certain fees and expenses associated with each class.
As stated in the May 1, 2017, prospectus, the Fund’s annual operating expense ratio is 0.93% for Institutional Class shares and 1.18% for Class A shares.
All results shown assume reinvestment of distributions during the period. Returns do not reflect the deduction of taxes that a shareholder may pay on Fund distributions or on the redemption of Fund shares. Performance results may reflect the effect of any fee waivers or reimbursements of Fund expenses by the investment manager and/or any of its affiliates. Absent these fee waivers and/or expense reimbursement arrangements, performance results may have been lower.
The performance information shown represents past performance and is not a guarantee of future results. The investment return and principal value of your investment will fluctuate so that shares, when redeemed, may be worth more or less than their original cost. Current performance may be lower or higher than the performance data shown. You may obtain performance information current to the most recent month-end by contacting your financial intermediary, visiting investor.columbiathreadneedleus.com or calling 800.922.6769.
The returns shown for periods prior to the share class inception date (including returns for the Life of the Fund, if shown, which are since Fund inception) include the returns of the Fund’s oldest share class. These returns are adjusted to reflect any higher class-related operating expenses of the newer share classes, as applicable. Please visit investor.columbiathreadneedleus.com/investment-products/mutual-funds/appended-performance for more information.
Effective May 1, 2017, the Fund compares its performance to that of the Russell 2500 Growth Index. Prior to this date, the Fund compared its performance to that of the S&P MidCap 400® Index. The Investment Manager believes that the Fund’s portfolio will generally be more closely aligned with the Russell 2500 Growth Index than with the former core benchmark from an investment style perspective. Information on the S&P MidCap 400® Index will be included for a one-year transition period.
The Russell 2500 Growth Index measures the performance of those Russell 2500 companies with higher price-to-book ratios and higher forecasted growth values.
The S&P MidCap 400® Index is a market value-weighted index that tracks the performance of 400 mid-cap U.S. companies.
Unlike mutual funds, indexes are not managed and do not incur fees or expenses. It is not possible to invest directly in an index.
| 22 | Columbia Acorn Family of Funds | Annual Report 2017 |
Fund at a glance (continued)
Columbia Acorn SelectSM
The Growth of a $10,000 Investment in Columbia Acorn SelectSM Institutional Class Shares
December 31, 2007 through December 31, 2017
This chart shows the change in value of a hypothetical $10,000 investment in Institutional Class (formerly Class Z) shares of the Fund during the stated time period. Although the indexes are provided for use in assessing the Fund’s performance, the Fund’s holdings may differ significantly from those in an index. Performance numbers reflect all Fund expenses.
| Top ten holdings (%) (at December 31, 2017) | |
SVB Financial Group
Holding company for Silicon Valley Bank | 5.8 |
HealthSouth Corp.
Inpatient rehabilitative healthcare services | 5.5 |
Middleby Corp. (The)
Equipment for use in cooking and preparing food | 5.2 |
LCI Industries
Recreational vehicles and equipment | 5.1 |
GoDaddy, Inc., Class A
Cloud-based web platform for small businesses, web design professionals and individuals | 5.1 |
Oshkosh Corp.
Fire and emergency apparatuses and specialty commercial, and military trucks | 5.1 |
Snap-On, Inc.
Tool and equipment solutions | 4.8 |
LKQ Corp.
Automotive products and services | 4.7 |
Vail Resorts, Inc.
Operates resorts globally | 4.7 |
VeriSign, Inc.
Domain names and Internet security services | 4.5 |
Percentages indicated are based upon total investments (excluding Money Market Funds).
For further detail about these holdings, please refer to the section entitled “Portfolio of Investments."
Fund holdings are as of the date given, are subject to change at any time, and are not recommendations to buy or sell any security.
| Portfolio breakdown (%) (at December 31, 2017) |
| Common Stocks | 98.6 |
| Money Market Funds | 1.4 |
| Total | 100.0 |
Percentages indicated are based upon total investments. The Fund’s portfolio composition is subject to change.
| Equity sector breakdown (%) (at December 31, 2017) |
| Consumer Discretionary | 19.8 |
| Financials | 15.7 |
| Health Care | 17.6 |
| Industrials | 25.0 |
| Information Technology | 16.1 |
| Materials | 3.0 |
| Real Estate | 2.8 |
| Total | 100.0 |
Percentages indicated are based upon total equity investments. The Fund’s portfolio composition is subject to change.
Columbia Acorn Family of Funds | Annual Report 2017
| 23 |
Manager Discussion of Fund Performance
Columbia Acorn SelectSM
David L. Frank, CFA
Co-Portfolio Manager
Matthew S. Szafranski, CFA
Co-Portfolio Manager
Columbia Acorn SelectSM Institutional Class (formerly Class Z) shares returned 26.59% in 2017, outperforming the Fund’s primary benchmark, the Russell 2500 Growth Index, which returned 24.46% for the same time period.
The year 2017 was characterized by an improving economic environment and strong momentum for the stock market. The U.S. economy accelerated during the year, showing some of the strongest GDP growth in three years and with data consistently coming in ahead of expectations across a broad range of measures. Corporations benefited in kind, with rising revenues and profit growth that comfortably exceeded the estimates that were in place when the year began. Stocks were further boosted by the passage of a tax-cut package that included a reduction in the corporate tax rate to 21% from 35%. Volatility continued to be conspicuously absent despite political tensions in Washington and abroad. In fact, the broad market, as measured by the S&P 500 Total Return, underwent its longest streak without a 3% correction in the history of the index.
Small- and mid-cap stocks performed particularly well in 2017. The market backdrop also worked strongly in favor of the growth style, especially stocks in the technology sector. Given the nature of the Fund’s investment approach, these two trends combined to create a robust tailwind for performance.
Stock selection also made a substantial contribution to the Fund’s returns. The Fund generated the best results in health care, led by a position in Align Technology, Inc. The stock rose during the year as the company reported better-than-expected profits thanks to the rising adoption of its Invisalign system of plastic teeth aligners, which have been taking market share from traditional wire braces. LivaNova PLC, a medical technology company with a focus on cardiac care, was the second-largest contributor in the sector. The company received product approvals from the Food and Drug Administration and exceeded earnings estimates in each of its four quarterly reports, boosting its stock price.
The consumer sector was an additional area of strength for the Fund. The recreational-vehicle components maker LCI Industries, which experienced rising sales amid accelerating demand in its end market, performed very well, as did Vail Resorts, Inc. As one of the leading operators of world-class ski destinations in North America, Vail Resort’s season sales continue to benefit from the inclusion of prime property acquisitions made over the last few years.
Outside of these two sectors, GoDaddy, Inc., which operates a cloud-based web platform for small businesses, web design professionals and individuals, moved steadily higher and made a sizable contribution to performance. The company reported increases in both total customers and average revenue per user, which translated to accelerating revenues. In addition, investors grew more optimistic about the outlook for small-business spending in anticipation of the reduction in the corporate tax rate.
On the negative side, Papa John’s International, Inc. pulled back due to disappointing same-store sales in the third quarter. In addition, the company was pressured by concerns about adverse developments in its NFL-oriented marketing strategy and the subsequent resignation of its chief executive officer. SPS Commerce, Inc., a provider of a software platform for consumer-products companies to communicate with their retailer customers, was an additional detractor. The company’s stock underperformed during the year because its sales growth ebbed and initial revenue growth guidance for 2018 was below investor expectations. In addition, traditional retailers slowed many information technology initiatives while they struggled to devise strategies to combat Amazon.com. We maintained the position in the belief that the slowdown is transitory. Education Realty Trust, Inc., the rail-components producer Wabtec Corp. and the rare disease-focused biotechnology company Ultragenyx Pharmaceutical, Inc. were also notable detractors in the annual period.
At year’s end, optimism and the potential for inflationary pressures appeared to be increasing at a time when stocks were trading at elevated absolute valuations. These higher valuations have been supported by the lower interest rate environment. As we move into 2018, we are monitoring risks such as a less accommodative Federal Reserve, the inflation implications of tighter labor markets and the
| 24 | Columbia Acorn Family of Funds | Annual Report 2017 |
Manager Discussion of Fund Performance (continued)
Columbia Acorn SelectSM
potential for normalizing volatility. We continue to position the Fund toward higher quality and structural growth as measured across several metrics such as return on invested capital, revenue and earnings growth as well as superior debt ratios.
Market risk may affect a single issuer, sector of the economy, industry or the market as a whole. Investments in small- and mid-cap companies involve risks and volatility and possible illiquidity greater than investments in larger, more established companies. Foreign investments subject the Fund to risks, including political, economic, market, social and other risks, within a particular country, as well as to potential currency instabilities and less stringent financial and accounting standards generally applicable to U.S. issuers. Risks are enhanced for emerging market issuers. The Fund may invest significantly in issuers within a particular sector, which may be negatively affected by market, economic or other conditions, making the Fund more vulnerable to unfavorable developments in the sector. See the Fund’s prospectus for more information on these and other risks.
The views expressed in this report reflect the current views of the respective parties. These views are not guarantees of future performance and involve certain risks, uncertainties and assumptions that are difficult to predict, so actual outcomes and results may differ significantly from the views expressed. These views are subject to change at any time based upon economic, market or other conditions and the respective parties disclaim any responsibility to update such views. These views may not be relied on as investment advice and, because investment decisions for a Columbia Acorn Fund are based on numerous factors, may not be relied on as an indication of trading intent on behalf of any particular Columbia Acorn Fund. References to specific securities should not be construed as a recommendation or investment advice.
Columbia Acorn Family of Funds | Annual Report 2017
| 25 |
Fund at a glance
Columbia Thermostat FundSM
Investment objective
Columbia Thermostat FundSM (the Fund) seeks long-term capital appreciation.
Portfolio management
David L. Frank, CFA
Portfolio Manager
Managed Fund since 2016
| Average annual total returns (%) (for the period ended December 31, 2017) |
| | | Inception | 1 Year | 5 Years | 10 Years | Life |
| Class A | Excluding sales charges | 03/03/03 | 5.19 | 4.78 | 4.86 | 6.82 |
| | Including sales charges | | -0.86 | 3.55 | 4.24 | 6.40 |
| Advisor Class | 11/08/12 | 5.49 | 5.04 | 5.12 | 7.09 |
| Class C | Excluding sales charges | 03/03/03 | 4.48 | 4.00 | 4.08 | 6.03 |
| | Including sales charges | | 3.48 | 4.00 | 4.08 | 6.03 |
| Institutional Class | 09/25/02 | 5.52 | 5.05 | 5.12 | 7.09 |
| Institutional 2 Class | 11/08/12 | 5.51 | 5.08 | 5.13 | 7.10 |
| Institutional 3 Class | 11/08/12 | 5.64 | 5.13 | 5.16 | 7.11 |
| S&P 500 Index | | 21.83 | 15.79 | 8.50 | - |
| Bloomberg Barclays U.S. Aggregate Bond Index | | 3.54 | 2.10 | 4.01 | - |
| Blended Benchmark | | 12.37 | 8.88 | 6.54 | - |
Performance numbers reflect all Fund expenses. Returns for Class A shares are shown with and without the maximum initial sales charge of 5.75%. Returns for Class C shares are shown with and without the maximum contingent deferred sales charge of 1.00% for the first year after purchase. Effective November 1, 2017, Class R4, Class R5, Class Y and Class Z shares were renamed Advisor Class, Institutional 2 Class, Institutional 3 Class and Institutional Class shares, respectively. The Fund’s other classes are not subject to sales charges, but may be subject to other fees and expenses, and have limited eligibility. Please see the Fund’s prospectus for details. Performance for different share classes will vary based on differences in sales charges and certain fees and expenses associated with each class.
As stated in the May 1, 2017 prospectus, the Fund’s annual operating expense ratio is 0.76% for Institutional Class shares and 1.01% for Class A shares.
All results shown assume reinvestment of distributions during the period. Returns do not reflect the deduction of taxes that a shareholder may pay on Fund distributions or on the redemption of Fund shares. Performance results may reflect the effect of any fee waivers or reimbursements of Fund expenses by the investment manager and/or any of its affiliates. Absent these fee waivers and/or expense reimbursement arrangements, performance results may have been lower.
The performance information shown represents past performance and is not a guarantee of future results. The investment return and principal value of your investment will fluctuate so that shares, when redeemed, may be worth more or less than their original cost. Current performance may be lower or higher than the performance data shown. You may obtain performance information current to the most recent month-end by contacting your financial intermediary, visiting investor.columbiathreadneedleus.com or calling 800.922.6769.
The returns shown for periods prior to the share class inception date (including returns for the Life of the Fund, if shown, which are since Fund inception) include the returns of the Fund’s oldest share class. These returns are adjusted to reflect any higher class-related operating expenses of the newer share classes, as applicable. Please visit investor.columbiathreadneedleus.com/investment-products/mutual-funds/appended-performance for more information.
The Standard & Poor’s (S&P) 500® Index tracks the performance of 500 widely held, large-capitalization U.S. stocks.
The Bloomberg Barclays U.S. Aggregate Bond Index is a market value-weighted index that tracks the daily price, coupon, pay-downs and total return performance of fixed-rate, publicly placed, dollar-denominated and non-convertible investment-grade debt issues with at least $250 million par amount outstanding and with at least one year to final maturity.
The Blended Benchmark, established by the Fund’s investment manager, is an equally weighted custom composite of Columbia Thermostat Fund’s primary equity and primary debt benchmarks, the S&P 500® Index and the Bloomberg Barclays U.S. Aggregate Bond Index, respectively. The percentage of the Fund’s assets allocated to underlying stock and bond portfolio funds will vary, and accordingly the composition of the Fund’s portfolio will not always reflect the composition of the Blended Benchmark.
Unlike mutual funds, indexes are not managed and do not incur fees or expenses. It is not possible to invest directly in an index.
| 26 | Columbia Acorn Family of Funds | Annual Report 2017 |
Fund at a glance (continued)
Columbia Thermostat FundSM
The Growth of a $10,000 Investment in Columbia Thermostat FundSM Institutional Class Shares
December 31, 2007 through December 31, 2017
This chart shows the change in value of a hypothetical $10,000 investment in Institutional Class (formerly Class Z) shares of the Fund during the stated time period. Although the indexes are provided for use in assessing the Fund’s performance, the Fund’s holdings may differ significantly from those in an index. Performance numbers reflect all Fund expenses.
| Portfolio breakdown (%) (at December 31, 2017) |
| Equity Funds | 9.9 |
| Fixed-Income Funds | 89.9 |
| Money Market Funds | 0.2 |
| Total | 100.0 |
Percentages indicated are based upon total investments. The Fund’s portfolio composition is subject to change.
Columbia Acorn Family of Funds | Annual Report 2017
| 27 |
Manager Discussion of Fund Performance
Columbia Thermostat FundSM
David L. Frank, CFA
Portfolio Manager
Columbia Thermostat Fund Institutional Class (formerly Class Z) shares returned 5.52% in 2017, which compared to a 12.37% gain for the Blended Benchmark. As designed, the Fund produced a return between those of stocks and bonds. Its primary equity benchmark, the S&P 500 Index, rose 21.83% in 2017, while its primary debt benchmark, the Bloomberg Barclays U.S. Aggregate Bond Index, returned 3.54%.
The Fund’s equity portfolio had a weighted average gain of 26.46% in 2017, which compared favorably with the equity benchmark. The underlying equity funds generated gains between 20% to 36%. The two leading performers were Columbia Select Large Cap Growth Fund, which returned 35.54%, and Columbia Acorn International, which gained 32.36%. Consistent with the broader market environment, our positions in underlying funds that invest in small-cap stocks, international equities and/or the growth style delivered the strongest returns.
The Fund’s bond portfolio generated a weighted average gain of 2.76% for the year, with all underlying funds finishing in positive territory. Columbia Income Opportunities Fund provided the best results with a gain of 6.45%, while Columbia Short Term Bond Fund posted the smallest advance with a return of 1.18%.
There were four reallocation triggers in 2017. After opening the year with an allocation of 10% in stocks and 90% in bonds, the Fund moved to stock/bond weightings of 25%/75% in May 2017 after the adoption of a new allocation table on May 1, 2017. The Fund subsequently shifted to a 20%/80% allocation in June, 15%/85% in September, and 10%/90% in December. The rotation toward bonds in the second half of the year reflects the increase in valuations that occurred as stock prices climbed steadily higher.
Columbia Thermostat Fund’s cyclically adjusted price-to-earnings valuation indicators continued to signal that the U.S. equity market was expensive at the close of the year. As a result, our formula-derived allocation table continued to favor bonds. Within the bond portfolio, we had a 40% allocation to short-duration fixed-income instruments with low credit risk. While these aspects of our strategy prevented the Fund from fully benefiting from the strong returns of the global financial markets in 2017, we believe that when stock volatility and higher rates eventually return the Fund will be well positioned to benefit.
Results of the Funds Owned in Columbia Thermostat Fund as of December 31, 2017
| Fund | Weightings
in category | 4th quarter
performance | 1 year
performance |
| Columbia Acorn International, Institutional 3 Class (formerly Class Y) | 20% | 6.37% | 32.36% |
| Columbia Dividend Income Fund, Institutional 3 Class (formerly Class Y) | 20% | 6.95% | 20.95% |
| Columbia Large Cap Enhanced Core Fund, Institutional 3 Class (formerly Class Y) | 10% | 7.64% | 24.53% |
| Columbia Select Large Cap Growth Fund, Institutional 3 Class (formerly Class Y) | 10% | 5.27% | 35.54% |
| Columbia Contrarian Core Fund, Institutional 3 Class (formerly Class Y) | 10% | 5.41% | 21.89% |
| Columbia Select Large Cap Equity Fund, Institutional 3 Class (formerly Class Y) | 10% | 6.42% | 24.70% |
| Columbia Acorn Fund, Institutional 3 Class (formerly Class Y) | 10% | 6.03% | 25.31% |
| Columbia Acorn Select, Institutional 3 Class (formerly Class Y) | 10% | 7.95% | 26.79% |
| Weighted Average Equity Gain/Loss | 100% | 6.54% | 26.46% |
| Fund | Weightings
in category | 4th quarter
performance | 1 year
performance |
| Columbia Short Term Bond Fund, Institutional 3 Class (formerly Class Y) | 40% | -0.01% | 1.18% |
| Columbia Total Return Bond Fund, Institutional 3 Class (formerly Class Y) | 20% | 0.15% | 3.95% |
| Columbia U.S. Government Mortgage Fund, Institutional 3 Class (formerly Class Y) | 20% | 0.15% | 3.37% |
| Columbia U.S. Treasury Index Fund, Institutional 3 Class (formerly Class Y) | 10% | -0.04% | 2.10% |
| Columbia Income Opportunities Fund, Institutional 3 Class (formerly Class Y) | 10% | 0.00% | 6.45% |
| Weighted Average Income Gain/Loss | 100% | 0.05% | 2.76% |
| 28 | Columbia Acorn Family of Funds | Annual Report 2017 |
Manager Discussion of Fund Performance (continued)
Columbia Thermostat FundSM
Columbia Thermostat Fund Rebalancing in the Second Half
September 13, 2017: 15% Stocks, 85% Bonds
November 9, 2017: 10% Stocks, 90% Bonds
A “fund of fund” bears its allocable share of the costs and expenses of the underlying funds in which it invests. Such funds are thus subject to two levels of fees and potentially higher expense ratios than would be associated with a fund that invests and trades directly in financial instruments under the direction of a single manager.
The Fund’s investments in the underlying funds may present certain risks, including the following. Market risk may affect a single issuer, sector of the economy, industry or the market as a whole. The Fund’s investment in other funds subjects it to the investment performance (positive or negative), risks and expenses of these underlying funds. Investments in small- and mid-cap companies involve risks and volatility and possible illiquidity greater than in investments in larger, more established companies. There are risks associated with fixed-income investments, including credit risk, market risk, interest rate risk and prepayment and extension risk. In general, bond prices fall when interest rates rise and vice versa. This effect is more pronounced for longer term securities. Non-investment-grade (high-yield or junk) securities present greater price volatility and more risk to principal and income than higher rated securities. Foreign investments subject the Fund to political, economic, market, social and other risks within a particular country, as well as to potential currency instabilities and less stringent financial and accounting standards generally applicable to U.S. issuers. Risks are enhanced for emerging market issuers. See the Fund’s prospectus for more information on these and other risks.
The views expressed in this report reflect the current views of the respective parties. These views are not guarantees of future performance and involve certain risks, uncertainties and assumptions that are difficult to predict, so actual outcomes and results may differ significantly from the views expressed. These views are subject to change at any time based upon economic, market or other conditions and the respective parties disclaim any responsibility to update such views. These views may not be relied on as investment advice and, because investment decisions for a Columbia Acorn Fund are based on numerous factors, may not be relied on as an indication of trading intent on behalf of any particular Columbia Acorn Fund. References to specific securities should not be construed as a recommendation or investment advice.
The value of an investment in the Fund is based primarily on the performance of the underlying funds in which it invests. The Fund is subject to the risk that the investment manager’s decisions regarding asset classes and underlying funds will not anticipate market trends successfully, resulting in a failure to reserve capital or lower total return. The Investment Manager may prefer an underlying fund in the Columbia Acorn Family of Funds over alternative investments. There can be no assurance that the Columbia Acorn Funds will outperform similar funds managed by the Investment Manager’s affiliates. This is not an offer of the shares of any other mutual fund mentioned herein.
Columbia Acorn Family of Funds | Annual Report 2017
| 29 |
Fund at a glance
Columbia Acorn Emerging Markets FundSM
Investment objective
Columbia Acorn Emerging Markets FundSM (the Fund) seeks long-term capital appreciation.
Portfolio management
Satoshi Matsunaga, CFA
Co-Portfolio Manager
Managed Fund since 2015
Charles C. Young
Co-Portfolio Manager
Managed Fund since November 2017
Morningstar style boxTM
The Morningstar Style Box is based on a fund’s portfolio holdings. For equity funds, the vertical axis shows the market capitalization of the stocks owned, and the horizontal axis shows investment style (value, blend, or growth). Information shown is based on the most recent data provided by Morningstar.
© 2018 Morningstar, Inc. All rights reserved. The Morningstar information contained herein: (1) is proprietary to Morningstar and/or its content providers; (2) may not be copied or distributed; and (3) is not warranted to be accurate, complete or timely. Neither Morningstar nor its content providers are responsible for any damages or losses arising from any use of this information.
| Average annual total returns (%) (for the period ended December 31, 2017) |
| | | Inception | 1 Year | 5 Years | Life |
| Class A | Excluding sales charges | 08/19/11 | 34.55 | 2.63 | 5.18 |
| | Including sales charges | | 26.82 | 1.43 | 4.21 |
| Advisor Class | 11/08/12 | 34.88 | 2.92 | 5.51 |
| Class C | Excluding sales charges | 08/19/11 | 33.57 | 1.87 | 4.43 |
| | Including sales charges | | 32.57 | 1.87 | 4.43 |
| Institutional Class | 08/19/11 | 34.92 | 2.86 | 5.47 |
| Institutional 2 Class | 11/08/12 | 35.02 | 2.96 | 5.55 |
| Institutional 3 Class | 06/13/13 | 35.13 | 3.00 | 5.58 |
| MSCI Emerging Markets SMID Cap Index (Net) | | 34.53 | 4.21 | - |
Performance numbers reflect all Fund expenses. Returns for Class A shares are shown with and without the maximum initial sales charge of 5.75%. Returns for Class C shares are shown with and without the maximum contingent deferred sales charge of 1.00% for the first year after purchase. Effective November 1, 2017, Class R4, Class R5, Class Y and Class Z shares were renamed Advisor Class, Institutional 2 Class, Institutional 3 Class and Institutional Class shares, respectively. The Fund’s other classes are not subject to sales charges, but may be subject to other fees and expenses, and have limited eligibility. Please see the Fund’s prospectus for details. Performance for different share classes will vary based on differences in sales charges and certain fees and expenses associated with each class.
As stated in the May 1, 2017 prospectus, as supplemented July 7, 2017, the Fund’s annual operating expense ratio is 1.31% for Institutional Class shares and 1.56% for Class A shares.
All results shown assume reinvestment of distributions during the period. Returns do not reflect the deduction of taxes that a shareholder may pay on Fund distributions or on the redemption of Fund shares. Performance results may reflect the effect of any fee waivers or reimbursements of Fund expenses by the investment manager and/or any of its affiliates. Absent these fee waivers and/or expense reimbursement arrangements, performance results may have been lower.
The performance information shown represents past performance and is not a guarantee of future results. The investment return and principal value of your investment will fluctuate so that shares, when redeemed, may be worth more or less than their original cost. Current performance may be lower or higher than the performance data shown. You may obtain performance information current to the most recent month-end by contacting your financial intermediary, visiting investor.columbiathreadneedleus.com or calling 800.922.6769.
The returns shown for periods prior to the share class inception date (including returns for the Life of the Fund, if shown, which are since Fund inception) include the returns of the Fund’s oldest share class. These returns are adjusted to reflect any higher class-related operating expenses of the newer share classes, as applicable. Please visit investor.columbiathreadneedleus.com/investment-products/mutual-funds/appended-performance for more information.
The MSCI Emerging Markets SMID Cap Index (Net) captures a mid- and small-cap representation across 24 emerging market countries. The index covers approximately 29% of the free float-adjusted market capitalization in each country.
Unlike mutual funds, indexes are not managed and do not incur fees or expenses. It is not possible to invest directly in an index.
| 30 | Columbia Acorn Family of Funds | Annual Report 2017 |
Fund at a glance (continued)
Columbia Acorn Emerging Markets FundSM
The Growth of a $10,000 Investment in Columbia Acorn Emerging Markets FundSM Institutional Class Shares
August 19, 2011 (Fund inception) through December 31, 2017
This chart shows the change in value of a hypothetical $10,000 investment in Institutional Class (formerly Class Z) shares of the Fund during the stated time period. Although the indexes are provided for use in assessing the Fund’s performance, the Fund’s holdings may differ significantly from those in an index. Performance numbers reflect all Fund expenses.
| Top ten holdings (%) (at December 31, 2017) | |
Care Ratings Ltd. (India)
Credit rating services | 3.5 |
NagaCorp Ltd. (Cambodia)
Leisure and tourism company | 3.4 |
GRUH Finance Ltd. (India)
Provides a range of home loans as well as insurance products | 3.3 |
Vitasoy International Holdings Ltd. (Hong Kong)
Food and beverages | 3.1 |
New Oriental Education & Technology Group, Inc., ADR (China)
Educational services | 3.0 |
Raia Drogasil SA (Brazil)
Chain of pharmaceutical stores | 2.9 |
Silergy Corp. (Taiwan)
High performance analog integrated circuits | 2.9 |
Zee Entertainment Enterprises Ltd. (India)
Hindi films, serials, game shows and children’s programs | 2.9 |
TravelSky Technology Ltd., Class H (China)
IT solutions for China’s air travel and tourism industries | 2.8 |
Modetour Network, Inc. (South Korea)
Travel services | 2.8 |
Percentages indicated are based upon total investments (excluding Money Market Funds).
For further detail about these holdings, please refer to the section entitled “Portfolio of Investments."
Fund holdings are as of the date given, are subject to change at any time, and are not recommendations to buy or sell any security.
| Equity sector breakdown (%) (at December 31, 2017) |
| Consumer Discretionary | 29.2 |
| Consumer Staples | 10.9 |
| Financials | 20.4 |
| Health Care | 4.5 |
| Industrials | 7.9 |
| Information Technology | 18.8 |
| Materials | 3.5 |
| Real Estate | 1.4 |
| Telecommunication Services | 3.4 |
| Total | 100.0 |
Percentages indicated are based upon total equity investments. The Fund’s portfolio composition is subject to change.
Columbia Acorn Family of Funds | Annual Report 2017
| 31 |
Fund at a glance (continued)
Columbia Acorn Emerging Markets FundSM
| Country breakdown (%) (at December 31, 2017) |
| Brazil | 5.3 |
| Cambodia | 3.2 |
| Cayman Islands | 9.8 |
| China | 11.4 |
| Egypt | 1.0 |
| Hong Kong | 5.3 |
| India | 12.5 |
| Indonesia | 5.7 |
| Mexico | 4.6 |
| Philippines | 1.4 |
| Russian Federation | 1.2 |
| South Africa | 7.0 |
| South Korea | 11.8 |
| Taiwan | 7.1 |
| Thailand | 5.5 |
| Turkey | 2.6 |
| United States(a) | 4.6 |
| Total | 100.0 |
| (a) | Includes investments in Money Market Funds. |
Country breakdown is based primarily on issuer’s place of organization/incorporation. Percentages indicated are based upon total investments. The Fund’s portfolio composition is subject to change.
| 32 | Columbia Acorn Family of Funds | Annual Report 2017 |
Manager Discussion of Fund Performance
Columbia Acorn Emerging Markets FundSM
Satoshi Matsunaga, CFA
Co-Portfolio Manager
Charles C. Young
Co-Portfolio Manager
Columbia Acorn Emerging Markets FundSM Institutional Class (formerly Class Z) shares returned 34.92% in 2017, which compared with a return of 34.53% for the Fund’s primary benchmark, the MSCI Emerging Markets SMID Cap Index (Net).
Emerging market stocks delivered a robust gain and comfortably beat both U.S. and developed market international equities in 2017. The asset class gained a significant boost from the emergence of synchronized economic growth across regions, which contributed to rising exports and stronger domestic consumption for emerging-market nations. Higher commodity prices were an additional positive for resource-heavy economies. Together, these factors led to strong gains in corporate earnings and supported a general improvement in company fundamentals. Emerging market equities were further aided by investors’ hearty appetite for risk and the resulting surge in investment inflows into the category. While the growth style performed particularly well in this environment, benefiting the Fund, large-cap stocks outperformed small-caps within the growth style, offsetting the tailwind effect.
The Fund’s relative performance was helped by strong stock selection in South Korea and Greater China, but this was offset to some extent by less favorable selection in Central Eastern Europe, the Middle East & Africa and South Asia. At the sector level, we added value to the Fund through positive selection in industrials, consumer discretionary and financials, but selection in materials and real estate detracted.
Among individual stocks, Koh Young Technology, Inc., a maker of inspection systems for computing-related hardware, was the top contributor to Fund performance in 2017. Koh Young rallied on the expansion of digitalization in various industries, such as autos and medical devices, which caused inspection needs to rise. The company also capitalized on the growing automation of inspection, which tends to be an expensive, labor-intensive portion of manufacturing. Modetour Network, Inc., a Korea-based provider of tour packages that outperformed on the strength of rising tour bookings and improved guidance, was an additional contributor. Although Modetour shares weakened in the latter half of the period, we believe the company’s longer-term fundamentals remain robust. New Oriental Education & Technology Group Inc., a Chinese after-school tutoring, test preparation and online education company, also added to results. In addition to increasing its efficiency and expanding its K-12 after-school tutoring service, the company benefited from both favorable domestic trends and a resumption of growth in its overseas markets. TVS Motor Company Limited, an India-based producer of two-wheel motorized vehicles, and Korea Investment Holdings Co., Ltd., the second-largest broker and asset manager in South Korea, were further contributors to the Fund’s 12-month results.
PT Matahari Department Store Tbk, a department store chain serving middle-class consumers in Indonesia, was the most significant individual detractor in 2017. The company suffered from slower-than-expected sales growth due to soft consumer spending as a result of a series of tightening policies in Indonesia, including subsidy cuts. Famous Brands Ltd., a South African quick-service restaurant and café, also hurt Fund performance as losses related to its recent acquisitions drove down its share price. Netshoes Cayman Ltd., a leading e-commerce platform focused on selling sports and lifestyle shoes and apparel in Latin America, was an additional detractor. Netshoes missed earnings expectations and failed to provide future guidance, sparking a sell-off in the stock. We retained the investment for the Fund on the belief that the company is well positioned to benefit from growth in e-commerce and online retailing, which is less widely adopted in Latin America than in the developed markets. PChome Online, Inc., a Taiwanese on-line retailer, and RYB Education, Inc., a Chinese education company, were also among the Fund’s largest detractors for the period. We subsequently exited our position in PChome Online in 2017.
Even after their strong performance in 2017, emerging market stocks finished the year with more attractive valuations than most developed regions. Additionally, demographic trends, including growing populations and increasing middle-class consumption, are important long-term tailwinds. Believing China’s transition to a more consumer-based economy represents an important long-term theme, we
Columbia Acorn Family of Funds | Annual Report 2017
| 33 |
Manager Discussion of Fund Performance (continued)
Columbia Acorn Emerging Markets FundSM
continued to look for companies that can benefit from this trend. We believe that India also remains a source of compelling investment ideas for the Fund amid ongoing government reform, rising infrastructure spending and the prospects for a recovery in capital expenditures.
With this as the backdrop, we continued to find ample opportunities for the Fund in 2017 at the individual company level. We believe emerging markets offer unique opportunities to discover small and mid-cap companies in the early phases of market development and capital formation. However, we are also realistic about the potential risks following a year of hearty performance for global equities, especially in light of the volatility inherent in the emerging markets. Accordingly, we maintained an emphasis on higher quality companies with robust structural growth, as measured by metrics such as return on invested capital, revenue and earnings growth as well as superior debt ratios. We continue to see attractive potential in small-cap growth companies, which can trade at highly undervalued levels due to the lower efficiency in the emerging markets.
Market risk may affect a single issuer, sector of the economy, industry or the market as a whole. International investing involves certain risks and volatility due to potential political, economic or currency instabilities and different, potentially less stringent, financial and accounting standards than those generally applicable to U.S. issuers. Risks are enhanced for emerging and frontier market issuers. Investments in small- and mid-cap companies involve risks and volatility and possible illiquidity greater than investments in larger, more established companies. See the Fund’s prospectus for more information on these and other risks.
The views expressed in this report reflect the current views of the respective parties. These views are not guarantees of future performance and involve certain risks, uncertainties and assumptions that are difficult to predict, so actual outcomes and results may differ significantly from the views expressed. These views are subject to change at any time based upon economic, market or other conditions and the respective parties disclaim any responsibility to update such views. These views may not be relied on as investment advice and, because investment decisions for a Columbia Acorn Fund are based on numerous factors, may not be relied on as an indication of trading intent on behalf of any particular Columbia Acorn Fund. References to specific securities should not be construed as a recommendation or investment advice.
| 34 | Columbia Acorn Family of Funds | Annual Report 2017 |
Fund at a glance
Columbia Acorn European FundSM
Investment objective
Columbia Acorn European FundSM (the Fund) seeks long-term capital appreciation.
Portfolio management
Stephen Kusmierczak, CFA
Portfolio Manager
Managed Fund since 2011
Morningstar style boxTM
The Morningstar Style Box is based on a fund’s portfolio holdings. For equity funds, the vertical axis shows the market capitalization of the stocks owned, and the horizontal axis shows investment style (value, blend, or growth). Information shown is based on the most recent data provided by Morningstar.
© 2018 Morningstar, Inc. All rights reserved. The Morningstar information contained herein: (1) is proprietary to Morningstar and/or its content providers; (2) may not be copied or distributed; and (3) is not warranted to be accurate, complete or timely. Neither Morningstar nor its content providers are responsible for any damages or losses arising from any use of this information.
| Average annual total returns (%) (for the period ended December 31, 2017) |
| | | Inception | 1 Year | 5 Years | Life |
| Class A | Excluding sales charges | 08/19/11 | 37.89 | 11.31 | 11.82 |
| | Including sales charges | | 29.98 | 10.00 | 10.79 |
| Advisor Class | 06/25/14 | 38.29 | 11.61 | 12.12 |
| Class C | Excluding sales charges | 08/19/11 | 36.95 | 10.50 | 11.01 |
| | Including sales charges | | 35.95 | 10.50 | 11.01 |
| Institutional Class | 08/19/11 | 38.35 | 11.60 | 12.11 |
| Institutional 2 Class | 11/08/12 | 38.32 | 11.61 | 12.12 |
| Institutional 3 Class | 03/01/17 | 38.46 | 11.62 | 12.13 |
| MSCI AC Europe Small Cap Index (Net) | | 35.50 | 13.58 | - |
Returns for Class A shares are shown with and without the maximum initial sales charge of 5.75%. Returns for Class C shares are shown with and without the maximum contingent deferred sales charge of 1.00% for the first year after purchase. Effective November 1, 2017, Class R4, Class R5, Class Y and Class Z shares were renamed Advisor Class, Institutional 2 Class, Institutional 3 Class and Institutional Class shares, respectively. The Fund’s other classes are not subject to sales charges, but may be subject to other fees and expenses, and have limited eligibility. Please see the Fund’s prospectus for details. Performance for different share classes will vary based on differences in sales charges and certain fees and expenses associated with each class.
As stated in the May 1, 2017 prospectus, as supplemented July 7, 2017, the Fund’s annual operating expense ratio is 1.20% for Institutional Class shares and 1.45% for Class A shares.
Performance numbers reflect all Fund expenses. All results shown assume reinvestment of distributions during the period. Returns do not reflect the deduction of taxes that a shareholder may pay on Fund distributions or on the redemption of Fund shares. Performance results may reflect the effect of any fee waivers or reimbursements of Fund expenses by the investment manager and/or any of its affiliates. Absent these fee waivers and/or expense reimbursement arrangements, performance results may have been lower.
The performance information shown represents past performance and is not a guarantee of future results. The investment return and principal value of your investment will fluctuate so that shares, when redeemed, may be worth more or less than their original cost. Current performance may be lower or higher than the performance data shown. You may obtain performance information current to the most recent month-end by contacting your financial intermediary, visiting investor.columbiathreadneedleus.com or calling 800.922.6769.
The returns shown for periods prior to the share class inception date (including returns for the Life of the Fund, if shown, which are since Fund inception) include the returns of the Fund’s oldest share class. These returns are adjusted to reflect any higher class-related operating expenses of the newer share classes, as applicable. Please visit investor.columbiathreadneedleus.com/investment-products/mutual-funds/appended-performance for more information.
The MSCI AC Europe Small Cap Index (Net) captures a small-cap representation across 21 markets in Europe. The index covers approximately 14% of the free float-adjusted market capitalization across each market country in Europe.
Unlike mutual funds, indexes are not managed and do not incur fees or expenses. It is not possible to invest directly in an index.
Columbia Acorn Family of Funds | Annual Report 2017
| 35 |
Fund at a glance (continued)
Columbia Acorn European FundSM
The Growth of a $10,000 Investment in Columbia Acorn European FundSM Institutional Class Shares
August 19, 2011 (Fund inception) through December 31, 2017
This chart shows the change in value of a hypothetical $10,000 investment in Institutional Class (formerly Class Z) shares of the Fund during the stated time period. Although the indexes are provided for use in assessing the Fund’s performance, the Fund’s holdings may differ significantly from those in an index. Performance numbers reflect all Fund expenses.
| Top ten holdings (%) (at December 31, 2017) | |
Kindred Group PLC (Malta)
Online gambling services | 3.9 |
Wirecard AG (Germany)
Internet payment and processing services | 3.6 |
Nemetschek SE (Germany)
Standard software for designing, constructing and managing buildings and real estate | 3.6 |
Halma PLC (United Kingdom)
Products that detect hazards and protect assets and people in public and commercial buildings | 3.6 |
MTU Aero Engines AG (Germany)
Develops and manufactures engines and offers commercial engine services and support | 3.1 |
WH Smith PLC (United Kingdom)
Retails books, magazines, newspapers, and periodicals | 2.9 |
Stroeer SE & Co. KGaA (Germany)
Digital multi-channel media company | 2.8 |
eDreams ODIGEO SA (Luxembourg)
Online travel company | 2.7 |
Partners Group Holding AG (Switzerland)
Global private markets asset management firm | 2.6 |
Brembo SpA (Italy)
Braking systems and components | 2.5 |
Percentages indicated are based upon total investments (excluding Money Market Funds and Securities Lending Collateral).
For further detail about these holdings, please refer to the section entitled “Portfolio of Investments."
Fund holdings are as of the date given, are subject to change at any time, and are not recommendations to buy or sell any security.
| Equity sector breakdown (%) (at December 31, 2017) |
| Consumer Discretionary | 28.6 |
| Financials | 7.5 |
| Health Care | 10.0 |
| Industrials | 21.9 |
| Information Technology | 24.2 |
| Materials | 5.1 |
| Real Estate | 2.7 |
| Total | 100.0 |
Percentages indicated are based upon total equity investments. The Fund’s portfolio composition is subject to change.
| 36 | Columbia Acorn Family of Funds | Annual Report 2017 |
Fund at a glance (continued)
Columbia Acorn European FundSM
| Country breakdown (%) (at December 31, 2017) |
| Australia | 0.9 |
| Belgium | 1.1 |
| Denmark | 4.5 |
| Finland | 3.0 |
| France | 3.0 |
| Germany | 24.9 |
| Ireland | 1.8 |
| Italy | 3.8 |
| Luxembourg | 2.5 |
| Malta | 3.6 |
| Netherlands | 1.8 |
| Norway | 2.6 |
| Spain | 1.4 |
| Sweden | 9.1 |
| Switzerland | 4.5 |
| Turkey | 1.5 |
| United Kingdom | 22.4 |
| United States(a) | 7.6 |
| Total | 100.0 |
| (a) | Includes investments in Money Market Funds. |
Country breakdown is based primarily on issuer’s place of organization/incorporation. Percentages indicated are based upon total investments. The Fund’s portfolio composition is subject to change.
Columbia Acorn Family of Funds | Annual Report 2017
| 37 |
Manager Discussion of Fund Performance
Columbia Acorn European FundSM
Stephen Kusmierczak, CFA
Portfolio Manager
Columbia Acorn European FundSM Institutional Class (formerly Class Z) shares returned 38.35% in 2017, outperforming the 35.50% return of the Fund’s primary benchmark, the MSCI AC Europe Small Cap Index (Net).
The annual period was characterized by positive momentum for global equities and improving economic conditions in Europe. Stronger growth, in turn, translated to better-than-expected corporate earnings across the region. In combination with favorable election outcomes and the accommodative monetary policy of the European Central Bank, these developments enhanced investor sentiment and led to a broad-based rally in equities. Small-cap stocks performed particularly well in this environment, as did the growth style, two trends that created a tailwind for the Fund. The strength in European currencies relative to the U.S. dollar provided an added boost to returns for U.S. investors.
Both sector allocations and individual security selection contributed to Fund performance in 2017. The Fund was helped by its overweight position in information technology, the leading performer among the 11 major sectors in 2017, as well as not holding any securities in the energy sector, the weakest performer. Stock selection also added value for the Fund across multiple sectors, with the largest contribution coming from industrials.
At the individual stock level, Wirecard AG, a global leader in providing online merchants with outsourcing solutions for electronic payment transactions, was the top contributor to performance. The German company, whose growth is correlated with trends in online commerce and cashless transactions, reported increased revenues on continued strength in its end markets. French engineering company Akka Technologies SA also made a sizable contribution to results. Akka provides services to the automotive industry, mainly in France and Germany. Through a series of judicious acquisitions, the company positioned itself as a key provider of technical skills in man/machine interfaces and autonomous driving. The Swiss private equity firm Partners Group Holding AG, which benefited from asset growth and a favorable exit environment, was an additional contributor of note. Halma PLC, a U.K. provider of technology-based safety solutions, and Kindred Group PLC, an online gaming operator based in Sweden, also added value for the Fund in 2017.
NetEnt AB was the largest individual detractor for the Fund in 2017. Shares of the Sweden-based developer of online casino games declined on concerns that the company would not meet revenue expectations in the second half of the year. We believe that more jurisdictions will legalize online gaming to boost tax revenues and address issues of money laundering and problem gambling. We believe that NetEnt, as a publicly-listed gaming provider with a record of solid corporate governance and innovative games development, should be a beneficiary of the long-term legalization trend. Connect Group PLC, a U.K.-based distributor of newspapers, books and magazines, was another detractor of note. While the company’s restructuring efforts have weighed on the stock in recent years, we believe the new structure is likely to fuel accelerating top-line growth and create benefits from rising capacity utilization and increased customer acceptance.
Columbia Wanger has specialized in investing in small- and mid-cap stocks since 1970. Our investment process, while cognizant of macroeconomic trends, uses a bottom-up approach that relies on intensive fundamental research and a disciplined analysis of valuation. We are focused on companies with sustainable competitive advantages, entrepreneurial management and the potential to gain market share. Our team continues to employ a rigorous, bottom-up process to identify opportunities in European small- and mid-cap growth companies.
Market risk may affect a single issuer, sector of the economy, industry or the market as a whole. International investing involves certain risks and volatility due to potential political, economic or currency instabilities and different, potentially less stringent, financial and accounting standards than those generally applicable to U.S. issuers. Investments in small- and mid-cap companies involve risks and volatility and possible illiquidity greater than investments in larger, more established companies. See the Fund’s prospectus for more information on these and other risks.
| 38 | Columbia Acorn Family of Funds | Annual Report 2017 |
Manager Discussion of Fund Performance (continued)
Columbia Acorn European FundSM
The views expressed in this report reflect the current views of the respective parties. These views are not guarantees of future performance and involve certain risks, uncertainties and assumptions that are difficult to predict, so actual outcomes and results may differ significantly from the views expressed. These views are subject to change at any time based upon economic, market or other conditions and the respective parties disclaim any responsibility to update such views. These views may not be relied on as investment advice and, because investment decisions for a Columbia Acorn Fund are based on numerous factors, may not be relied on as an indication of trading intent on behalf of any particular Columbia Acorn Fund. References to specific securities should not be construed as a recommendation or investment advice.
Columbia Acorn Family of Funds | Annual Report 2017
| 39 |
2017 Year-End Distributions
The following table details the year-end distributions for the Columbia Acorn Funds. The information is provided on a per share basis for each share class of the Funds.
| Fund | Ordinary
income | Short-term
capital
gain | Long-term
capital
gain | Record
date | Ex-dividend
date | Payable
date |
| Columbia Acorn® Fund | | | | | | |
| Class A | None | 0.38952 | 2.68178 | 12/4/2017 | 12/5/2017 | 12/5/2017 |
| Advisor Class (formerly Class R4) | None | 0.38952 | 2.68178 | 12/4/2017 | 12/5/2017 | 12/5/2017 |
| Class C | None | 0.38952 | 2.68178 | 12/4/2017 | 12/5/2017 | 12/5/2017 |
| Institutional Class (formerly Class Z) | None | 0.38952 | 2.68178 | 12/4/2017 | 12/5/2017 | 12/5/2017 |
| Institutional 2 Class (formerly Class R5) | None | 0.38952 | 2.68178 | 12/4/2017 | 12/5/2017 | 12/5/2017 |
| Institutional 3 Class (formerly Class Y) | None | 0.38952 | 2.68178 | 12/4/2017 | 12/5/2017 | 12/5/2017 |
| Columbia Acorn International® | | | | | | |
| Class A | 0.28989 | None | 2.49062 | 12/15/2017 | 12/18/2017 | 12/18/2017 |
| Advisor Class (formerly Class R4) | 0.38650 | None | 2.49062 | 12/15/2017 | 12/18/2017 | 12/18/2017 |
| Class C | 0.00000 | None | 2.49062 | 12/15/2017 | 12/18/2017 | 12/18/2017 |
| Institutional Class (formerly Class Z) | 0.39089 | None | 2.49062 | 12/15/2017 | 12/18/2017 | 12/18/2017 |
| Institutional 2 Class (formerly Class R5) | 0.40845 | None | 2.49062 | 12/15/2017 | 12/18/2017 | 12/18/2017 |
| Institutional 3 Class (formerly Class Y) | 0.42601 | None | 2.49062 | 12/15/2017 | 12/18/2017 | 12/18/2017 |
| Class R | 0.16695 | None | 2.49062 | 12/15/2017 | 12/18/2017 | 12/18/2017 |
| Columbia Acorn USA® | | | | | | |
| Class A | None | 0.83234 | 3.82978 | 12/4/2017 | 12/5/2017 | 12/5/2017 |
| Advisor Class (formerly Class R4) | None | 0.83234 | 3.82978 | 12/4/2017 | 12/5/2017 | 12/5/2017 |
| Class C | None | 0.83234 | 3.82978 | 12/4/2017 | 12/5/2017 | 12/5/2017 |
| Institutional Class (formerly Class Z) | None | 0.83234 | 3.82978 | 12/4/2017 | 12/5/2017 | 12/5/2017 |
| Institutional 2 Class (formerly Class R5) | None | 0.83234 | 3.82978 | 12/4/2017 | 12/5/2017 | 12/5/2017 |
| Institutional 3 Class (formerly Class Y) | None | 0.83234 | 3.82978 | 12/4/2017 | 12/5/2017 | 12/5/2017 |
| Columbia Acorn International SelectSM | | | | | | |
| Class A | 0.01057 | None | None | 12/15/2017 | 12/18/2017 | 12/18/2017 |
| Advisor Class (formerly Class R4) | 0.07464 | None | None | 12/15/2017 | 12/18/2017 | 12/18/2017 |
| Class C | 0.00000 | None | None | 12/15/2017 | 12/18/2017 | 12/18/2017 |
| Institutional Class (formerly Class Z) | 0.07464 | None | None | 12/15/2017 | 12/18/2017 | 12/18/2017 |
| Institutional 2 Class (formerly Class R5) | 0.09257 | None | None | 12/15/2017 | 12/18/2017 | 12/18/2017 |
| Institutional 3 Class (formerly Class Y) | 0.10539 | None | None | 12/15/2017 | 12/18/2017 | 12/18/2017 |
| Columbia Acorn SelectSM | | | | | | |
| Class A | None | None | 0.61565 | 12/4/2017 | 12/5/2017 | 12/5/2017 |
| Advisor Class (formerly Class R4) | None | None | 0.61565 | 12/4/2017 | 12/5/2017 | 12/5/2017 |
| Class C | None | None | 0.61565 | 12/4/2017 | 12/5/2017 | 12/5/2017 |
| Institutional Class (formerly Class Z) | None | None | 0.61565 | 12/4/2017 | 12/5/2017 | 12/5/2017 |
| Institutional 2 Class (formerly Class R5) | None | None | 0.61565 | 12/4/2017 | 12/5/2017 | 12/5/2017 |
| Institutional 3 Class (formerly Class Y) | None | None | 0.61565 | 12/4/2017 | 12/5/2017 | 12/5/2017 |
| Columbia Thermostat FundSM | | | | | | |
| Class A | 0.26917 | 0.02953 | 0.12837 | 12/20/2017 | 12/21/2017 | 12/21/2017 |
| Advisor Class (formerly Class R4) | 0.30614 | 0.02953 | 0.12837 | 12/20/2017 | 12/21/2017 | 12/21/2017 |
| Class C | 0.15826 | 0.02953 | 0.12837 | 12/20/2017 | 12/21/2017 | 12/21/2017 |
| Institutional Class (formerly Class Z) | 0.30614 | 0.02953 | 0.12837 | 12/20/2017 | 12/21/2017 | 12/21/2017 |
| Institutional 2 Class (formerly Class R5) | 0.30910 | 0.02953 | 0.12837 | 12/20/2017 | 12/21/2017 | 12/21/2017 |
| Institutional 3 Class (formerly Class Y) | 0.31649 | 0.02953 | 0.12837 | 12/20/2017 | 12/21/2017 | 12/21/2017 |
| 40 | Columbia Acorn Family of Funds | Annual Report 2017 |
2017 Year-End Distributions (continued)
| Fund | Ordinary
income | Short-term
capital
gain | Long-term
capital
gain | Record
date | Ex-dividend
date | Payable
date |
| Columbia Acorn Emerging Markets FundSM | | | | | | |
| Class A | None | None | None | 12/15/2017 | 12/18/2017 | 12/18/2017 |
| Advisor Class (formerly Class R4) | None | None | None | 12/15/2017 | 12/18/2017 | 12/18/2017 |
| Class C | None | None | None | 12/15/2017 | 12/18/2017 | 12/18/2017 |
| Institutional Class (formerly Class Z) | None | None | None | 12/15/2017 | 12/18/2017 | 12/18/2017 |
| Institutional 2 Class (formerly Class R5) | None | None | None | 12/15/2017 | 12/18/2017 | 12/18/2017 |
| Institutional 3 Class (formerly Class Y) | None | None | None | 12/15/2017 | 12/18/2017 | 12/18/2017 |
| Columbia Acorn European FundSM | | | | | | |
| Class A | 0.13417 | None | None | 12/15/2017 | 12/18/2017 | 12/18/2017 |
| Advisor Class (formerly Class R4) | 0.18177 | None | None | 12/15/2017 | 12/18/2017 | 12/18/2017 |
| Class C | 0.00835 | None | None | 12/15/2017 | 12/18/2017 | 12/18/2017 |
| Institutional Class (formerly Class Z) | 0.18347 | None | None | 12/15/2017 | 12/18/2017 | 12/18/2017 |
| Institutional 2 Class (formerly Class R5) | 0.18347 | None | None | 12/15/2017 | 12/18/2017 | 12/18/2017 |
| Institutional 3 Class (formerly Class Y) | 0.22088 | None | None | 12/15/2017 | 12/18/2017 | 12/18/2017 |
Columbia Acorn Family of Funds | Annual Report 2017
| 41 |
Understanding Your Fund’s Expenses
(Unaudited)
As a shareholder, you incur two types of costs. There are transaction costs, which generally include sales charges on purchases and may include redemption fees. There are also ongoing costs, which generally include management fees, distribution and service (Rule 12b-1) fees, and other Fund expenses. The following information is intended to help you understand your ongoing costs (in dollars) of investing in the Fund and to help you compare these costs with the ongoing costs of investing in other mutual funds.
Analyzing your Fund’s expenses
To illustrate these ongoing costs, we have provided examples and calculated the expenses paid by investors in each share class of the Funds during the period. The actual and hypothetical information in the tables is based on an initial investment of $1,000 at the beginning of the period indicated and held for the entire period. Expense information is calculated two ways and each method provides you with different information. The amount listed in the “Actual” column is calculated using the Funds’ actual operating expenses and total return for the period. You may use the Actual information, together with the amount invested, to estimate the expenses that you paid over the period. Simply divide your account value by $1,000 (for example, an $8,600 account value divided by $1,000 = 8.6), then multiply the results by the expenses paid during the period under the Actual column. The amount listed in the “Hypothetical” column assumes a 5% annual rate of return before expenses (which is not the Funds’ actual return) and then applies the Funds’ actual expense ratio for the period to the hypothetical return. You should not use the hypothetical account values and expenses to estimate either your actual account balance at the end of the period or the expenses you paid during the period. See “Compare with other funds” below for details on how to use the hypothetical data.
In addition to the ongoing expenses which the Funds bear directly, Columbia Thermostat Fund’s shareholders indirectly bear the Fund’s allocable share of the costs and expenses of each underlying fund in which the Fund invests. You can also estimate the effective expenses paid during the period, which includes the indirect fees associated with investing in the underlying funds, by using the amounts listed in the effective expenses paid during the period column in the “Fund of Funds” table.
Compare with other funds
Since all mutual funds are required to include the same hypothetical calculations about expenses in shareholder reports, you can use this information to compare the ongoing cost of investing in the Funds with other funds. To do so, compare the hypothetical example with the 5% hypothetical examples that appear in the shareholder reports of other funds. As you compare hypothetical examples of other funds, it is important to note that hypothetical examples are meant to highlight the ongoing costs of investing in a fund only and do not reflect any transaction costs, such as sales charges, or redemption or exchange fees. Therefore, the hypothetical calculations are useful in comparing ongoing costs only, and will not help you determine the relative total costs of owning different funds. If transaction costs were included in these calculations, your costs would be higher.
| July 1, 2017 — December 31, 2017 |
| | Account value at the
beginning of the
period ($) | Account value at the
end of the
period ($) | Expenses paid during
the period ($) | Fund’s annualized
expense ratio (%) |
| | Actual | Hypothetical | Actual | Hypothetical | Actual | Hypothetical | Actual |
| Columbia Acorn® Fund |
| Class A | 1,000.00 | 1,000.00 | 1,112.70 | 1,019.55 | 5.69 | 5.44 | 1.08 |
| Advisor Class (formerly Class R4) | 1,000.00 | 1,000.00 | 1,114.20 | 1,020.79 | 4.37 | 4.18 | 0.83 |
| Class C | 1,000.00 | 1,000.00 | 1,107.70 | 1,015.81 | 9.62 | 9.20 | 1.83 |
| Institutional Class (formerly Class Z) | 1,000.00 | 1,000.00 | 1,114.80 | 1,020.79 | 4.38 | 4.18 | 0.83 |
| Institutional 2 Class (formerly Class R5) | 1,000.00 | 1,000.00 | 1,114.50 | 1,020.89 | 4.27 | 4.08 | 0.81 |
| Institutional 3 Class (formerly Class Y) | 1,000.00 | 1,000.00 | 1,115.60 | 1,021.14 | 4.01 | 3.83 | 0.76 |
| 42 | Columbia Acorn Family of Funds | Annual Report 2017 |
Understanding Your Fund’s Expenses (continued)
(Unaudited)
| July 1, 2017 — December 31, 2017 |
| | Account value at the
beginning of the
period ($) | Account value at the
end of the
period ($) | Expenses paid during
the period ($) | Fund’s annualized
expense ratio (%) |
| | Actual | Hypothetical | Actual | Hypothetical | Actual | Hypothetical | Actual |
| Columbia Acorn International® |
| Class A | 1,000.00 | 1,000.00 | 1,113.80 | 1,018.75 | 6.53 | 6.24 | 1.24 |
| Advisor Class (formerly Class R4) | 1,000.00 | 1,000.00 | 1,115.10 | 1,020.00 | 5.22 | 4.99 | 0.99 |
| Class C | 1,000.00 | 1,000.00 | 1,109.50 | 1,015.01 | 10.47 | 10.00 | 1.99 |
| Institutional Class (formerly Class Z) | 1,000.00 | 1,000.00 | 1,115.20 | 1,020.00 | 5.22 | 4.99 | 0.99 |
| Institutional 2 Class (formerly Class R5) | 1,000.00 | 1,000.00 | 1,115.40 | 1,020.29 | 4.90 | 4.68 | 0.93 |
| Institutional 3 Class (formerly Class Y) | 1,000.00 | 1,000.00 | 1,115.80 | 1,020.54 | 4.64 | 4.43 | 0.88 |
| Class R | 1,000.00 | 1,000.00 | 1,112.30 | 1,017.50 | 7.85 | 7.49 | 1.49 |
| Columbia Acorn USA® |
| Class A | 1,000.00 | 1,000.00 | 1,070.70 | 1,017.55 | 7.64 | 7.44 | 1.48 |
| Advisor Class (formerly Class R4) | 1,000.00 | 1,000.00 | 1,071.40 | 1,018.80 | 6.35 | 6.19 | 1.23 |
| Class C | 1,000.00 | 1,000.00 | 1,066.80 | 1,013.81 | 11.49 | 11.20 | 2.23 |
| Institutional Class (formerly Class Z) | 1,000.00 | 1,000.00 | 1,071.90 | 1,018.95 | 6.20 | 6.04 | 1.20 |
| Institutional 2 Class (formerly Class R5) | 1,000.00 | 1,000.00 | 1,072.70 | 1,019.15 | 5.99 | 5.84 | 1.16 |
| Institutional 3 Class (formerly Class Y) | 1,000.00 | 1,000.00 | 1,072.70 | 1,019.50 | 5.63 | 5.49 | 1.09 |
| Columbia Acorn International SelectSM |
| Class A | 1,000.00 | 1,000.00 | 1,126.30 | 1,017.95 | 7.42 | 7.04 | 1.40 |
| Advisor Class (formerly Class R4) | 1,000.00 | 1,000.00 | 1,127.70 | 1,019.20 | 6.10 | 5.79 | 1.15 |
| Class C | 1,000.00 | 1,000.00 | 1,122.00 | 1,014.21 | 11.37 | 10.80 | 2.15 |
| Institutional Class (formerly Class Z) | 1,000.00 | 1,000.00 | 1,127.90 | 1,019.20 | 6.10 | 5.79 | 1.15 |
| Institutional 2 Class (formerly Class R5) | 1,000.00 | 1,000.00 | 1,127.60 | 1,019.55 | 5.73 | 5.44 | 1.08 |
| Institutional 3 Class (formerly Class Y) | 1,000.00 | 1,000.00 | 1,128.20 | 1,019.80 | 5.47 | 5.19 | 1.03 |
| Columbia Acorn SelectSM |
| Class A | 1,000.00 | 1,000.00 | 1,132.20 | 1,019.15 | 6.17 | 5.84 | 1.16 |
| Advisor Class (formerly Class R4) | 1,000.00 | 1,000.00 | 1,133.60 | 1,020.34 | 4.89 | 4.63 | 0.92 |
| Class C | 1,000.00 | 1,000.00 | 1,126.80 | 1,015.41 | 10.13 | 9.60 | 1.91 |
| Institutional Class (formerly Class Z) | 1,000.00 | 1,000.00 | 1,132.60 | 1,020.39 | 4.84 | 4.58 | 0.91 |
| Institutional 2 Class (formerly Class R5) | 1,000.00 | 1,000.00 | 1,133.60 | 1,020.69 | 4.52 | 4.28 | 0.85 |
| Institutional 3 Class (formerly Class Y) | 1,000.00 | 1,000.00 | 1,133.70 | 1,020.94 | 4.26 | 4.03 | 0.80 |
| Columbia Acorn Emerging Markets FundSM |
| Class A | 1,000.00 | 1,000.00 | 1,119.20 | 1,017.35 | 8.03 | 7.64 | 1.52 |
| Advisor Class (formerly Class R4) | 1,000.00 | 1,000.00 | 1,120.60 | 1,018.60 | 6.71 | 6.39 | 1.27 |
| Class C | 1,000.00 | 1,000.00 | 1,115.00 | 1,013.61 | 11.97 | 11.40 | 2.27 |
| Institutional Class (formerly Class Z) | 1,000.00 | 1,000.00 | 1,120.60 | 1,018.60 | 6.71 | 6.39 | 1.27 |
| Institutional 2 Class (formerly Class R5) | 1,000.00 | 1,000.00 | 1,120.60 | 1,019.00 | 6.29 | 5.99 | 1.19 |
| Institutional 3 Class (formerly Class Y) | 1,000.00 | 1,000.00 | 1,120.80 | 1,019.25 | 6.03 | 5.74 | 1.14 |
| Columbia Acorn European FundSM |
| Class A | 1,000.00 | 1,000.00 | 1,116.60 | 1,017.75 | 7.60 | 7.24 | 1.44 |
| Advisor Class (formerly Class R4) | 1,000.00 | 1,000.00 | 1,117.50 | 1,018.95 | 6.34 | 6.04 | 1.20 |
| Class C | 1,000.00 | 1,000.00 | 1,112.10 | 1,014.01 | 11.53 | 11.00 | 2.19 |
| Institutional Class (formerly Class Z) | 1,000.00 | 1,000.00 | 1,117.50 | 1,019.00 | 6.28 | 5.99 | 1.19 |
| Institutional 2 Class (formerly Class R5) | 1,000.00 | 1,000.00 | 1,118.20 | 1,019.30 | 5.97 | 5.69 | 1.13 |
| Institutional 3 Class (formerly Class Y) | 1,000.00 | 1,000.00 | 1,118.40 | 1,019.55 | 5.70 | 5.44 | 1.08 |
Columbia Acorn Family of Funds | Annual Report 2017
| 43 |
Understanding Your Fund’s Expenses (continued)
(Unaudited)
Fund of Funds—Columbia Thermostat Fund
| July 1, 2017 — December 31, 2017 |
| | Account value at the
beginning of the
period ($) | Account value at the
end of the
period ($) | Expenses paid during
the period ($) | Fund’s annualized
expense ratio (%) | Effective expenses
paid during the
period ($) | Fund’s effective
annualized
expense ratio (%) |
| | Actual | Hypothetical | Actual | Hypothetical | Actual | Hypothetical | Actual | Actual | Hypothetical | Actual |
| Class A | 1,000.00 | 1,000.00 | 1,020.20 | 1,022.44 | 2.52 | 2.52 | 0.50 | 4.99 | 4.99 | 0.99 |
| Advisor Class (formerly Class R4) | 1,000.00 | 1,000.00 | 1,021.50 | 1,023.68 | 1.26 | 1.26 | 0.25 | 3.73 | 3.73 | 0.74 |
| Class C | 1,000.00 | 1,000.00 | 1,017.40 | 1,018.70 | 6.29 | 6.29 | 1.25 | 8.75 | 8.76 | 1.74 |
| Institutional Class (formerly Class Z) | 1,000.00 | 1,000.00 | 1,022.30 | 1,023.68 | 1.26 | 1.26 | 0.25 | 3.73 | 3.73 | 0.74 |
| Institutional 2 Class (formerly Class R5) | 1,000.00 | 1,000.00 | 1,022.40 | 1,023.78 | 1.16 | 1.16 | 0.23 | 3.63 | 3.63 | 0.72 |
| Institutional 3 Class (formerly Class Y) | 1,000.00 | 1,000.00 | 1,022.90 | 1,024.03 | 0.91 | 0.91 | 0.18 | 3.38 | 3.38 | 0.67 |
Expenses paid during the period are equal to the annualized expense ratio, multiplied by the average account value over the period and then multiplied by the number of days in the Fund’s most recent fiscal half year and divided by 365.
Except with respect to Columbia Thermostat Fund, expenses do not include any fees and expenses incurred indirectly by a Fund from the underlying funds in which the Fund may invest (also referred to as “acquired funds”), including affiliated and non-affiliated pooled investments vehicles (including mutual funds and exchange traded funds).
In the case of Columbia Thermostat Fund, effective expenses paid during the period and the Fund’s effective annualized expense ratio include expenses borne directly by the class plus the Fund’s pro rata portion of the ongoing expenses charged by the underlying funds in which it invests using the expense ratio of each class of each underlying fund as of the underlying fund’s most recent shareholder report.
Had the investment manager and/or certain of its affiliates not waived/reimbursed certain fees and expenses for the Funds, account value at the end of the period would have been reduced.
| 44 | Columbia Acorn Family of Funds | Annual Report 2017 |
Portfolio of Investments
Columbia Acorn® Fund, December 31, 2017
(Percentages represent value of investments compared to net assets)
| Common Stocks 98.9% |
| Issuer | Shares | Value ($) |
| Consumer Discretionary 18.4% |
| Auto Components 2.7% |
Cooper-Standard Holding, Inc.(a)
Sealing, fuel and brake delivery, fluid transfer systems, anti-vibration systems components, subsystems, and modules | 381,375 | 46,718,437 |
Gentex Corp.
Products that use electro-optic technology | 985,983 | 20,656,344 |
LCI Industries
Recreational vehicles and equipment | 238,881 | 31,054,530 |
Tenneco, Inc.
Emission control and ride control products and systems | 457,483 | 26,781,055 |
| Total | | 125,210,366 |
| Distributors 1.6% |
LKQ Corp.(a)
Automotive products and services | 593,633 | 24,143,054 |
Pool Corp.
Swimming pool supplies, equipment and leisure products | 404,067 | 52,387,287 |
| Total | | 76,530,341 |
| Diversified Consumer Services 2.4% |
Adtalem Global Education, Inc.(a)
Higher education institutions | 969,394 | 40,763,018 |
Bright Horizons Family Solutions, Inc.(a)
Child care and early education services | 385,295 | 36,217,730 |
Grand Canyon Education, Inc.(a)
Online post secondary education | 398,464 | 35,674,482 |
| Total | | 112,655,230 |
| Hotels, Restaurants & Leisure 6.0% |
Dave & Buster’s Entertainment, Inc.(a)
Venues that combine dining and entertainment for adults and families | 766,997 | 42,315,225 |
Domino’s Pizza, Inc.
Network of company-owned and franchise Domino’s Pizza stores | 137,833 | 26,044,924 |
Dunkin’ Brands Group, Inc.
Quick service restaurants serving hot and cold coffee and baked goods | 580,202 | 37,405,623 |
Extended Stay America, Inc.
Hotels and motels | 2,683,657 | 50,989,483 |
Papa John’s International, Inc.
Pizza delivery and carry-out restaurants | 385,186 | 21,612,786 |
Texas Roadhouse, Inc.
Moderately priced, full service restaurant chain | 885,011 | 46,622,379 |
| Common Stocks (continued) |
| Issuer | Shares | Value ($) |
Vail Resorts, Inc.
Operates resorts globally | 94,762 | 20,134,082 |
Wingstop, Inc.
Cooked-to-order chicken wings | 843,639 | 32,885,048 |
| Total | | 278,009,550 |
| Household Durables 2.0% |
Cavco Industries, Inc.(a)
Designs and manufactures systems-built structures | 139,806 | 21,334,396 |
iRobot Corp.(a),(b)
Manufactures robots for cleaning | 376,562 | 28,882,305 |
Leggett & Platt, Inc.
Manufactures a wide range of engineered products | 404,053 | 19,285,450 |
NVR, Inc.(a)
Builds and markets homes and conducts mortgage banking activities | 6,100 | 21,400,142 |
| Total | | 90,902,293 |
| Internet & Direct Marketing Retail 0.7% |
Wayfair, Inc., Class A(a)
Retails household goods online | 378,419 | 30,375,693 |
| Leisure Products 0.4% |
Brunswick Corp.
Consumer products serving the outdoor and indoor active recreation markets | 334,352 | 18,462,917 |
| Specialty Retail 2.6% |
Camping World Holdings, Inc., Class A
Recreational vehicles and accessories | 536,203 | 23,984,360 |
Five Below, Inc.(a)
Specialty value retailer | 419,361 | 27,812,022 |
Monro, Inc.
Automotive undercar repair and tire services | 362,003 | 20,616,071 |
Tractor Supply Co.
Retail farm store chain | 391,354 | 29,253,711 |
Ulta Beauty, Inc.(a)
Chain of beauty stores | 94,556 | 21,148,395 |
| Total | | 122,814,559 |
| Total Consumer Discretionary | 854,960,949 |
| Consumer Staples 1.7% |
| Food & Staples Retailing 0.8% |
U.S. Foods Holding Corp.(a)
Catering services | 1,056,033 | 33,719,134 |
The accompanying Notes to Financial Statements are an integral part of this statement.
Columbia Acorn Family of Funds | Annual Report 2017
| 45 |
Portfolio of Investments (continued)
Columbia Acorn® Fund, December 31, 2017
| Common Stocks (continued) |
| Issuer | Shares | Value ($) |
| Household Products 0.9% |
Spectrum Brands Holdings, Inc.
Global and diversified consumer products company | 209,467 | 23,544,091 |
WD-40 Co.
Multi-purpose lubricant products and heavy-duty hand cleaners | 164,398 | 19,398,964 |
| Total | | 42,943,055 |
| Total Consumer Staples | 76,662,189 |
| Energy 0.9% |
| Oil, Gas & Consumable Fuels 0.9% |
Cimarex Energy Co.
Crude oil and natural gas | 147,390 | 17,983,054 |
Diamondback Energy, Inc.(a)
Independent oil and natural gas company | 199,534 | 25,191,167 |
| Total | | 43,174,221 |
| Total Energy | 43,174,221 |
| Financials 9.0% |
| Banks 1.6% |
BOK Financial Corp.
Multi-bank holding company | 250,194 | 23,097,910 |
MB Financial, Inc.
Holding company for MB Financial Bank, N.A. | 390,269 | 17,374,776 |
SVB Financial Group(a)
Holding company for Silicon Valley Bank | 148,227 | 34,651,026 |
| Total | | 75,123,712 |
| Capital Markets 6.6% |
Ares Capital Corp.
Management investment company | 2,549,524 | 40,078,517 |
Cboe Global Markets, Inc.
Marketplace for the trading of standardized and listed options on equity securities | 159,000 | 19,809,810 |
Eaton Vance Corp.
Creates, markets, and manages mutual funds | 943,078 | 53,180,168 |
Factset Research Systems, Inc.
Global economic and financial data to analysts, investment bankers, and financial professionals | 164,763 | 31,759,716 |
Houlihan Lokey, Inc.
Investment bank | 624,963 | 28,392,069 |
Lazard Ltd., Class A
Corporate Advisory & Asset Management | 1,121,299 | 58,868,198 |
| Common Stocks (continued) |
| Issuer | Shares | Value ($) |
MarketAxess Holdings, Inc.
Electronic, multi-dealer to client platform for bond trading | 160,939 | 32,469,443 |
Raymond James Financial, Inc.
Financial services to individuals, corporations, and municipalities | 446,709 | 39,891,114 |
| Total | | 304,449,035 |
| Consumer Finance 0.8% |
Credit Acceptance Corp.(a),(b)
Funding, receivables management, collection, sales training, and related services to automobile dealers | 109,411 | 35,392,270 |
| Total Financials | 414,965,017 |
| Health Care 22.7% |
| Biotechnology 6.5% |
Agios Pharmaceuticals, Inc.(a)
Therapeutics in the field of cancer metabolism | 491,259 | 28,085,277 |
Alkermes PLC(a)
Develops treatments for central nervous system disorders | 460,000 | 25,175,800 |
Bioverativ, Inc.(a)
Innovative therapies for the treatment of blood disorders | 1,032,033 | 55,647,219 |
Celldex Therapeutics, Inc.(a),(c)
Uses applications of immunology to prevent and treat diseases | 8,126,489 | 23,079,229 |
Clovis Oncology, Inc.(a)
Pre-commercial Biotech Company | 376,339 | 25,591,052 |
Genomic Health, Inc.(a)
Development and commercialization of genomic-based clinical diagnostic tests for cancer | 1,028,735 | 35,182,737 |
Ligand Pharmaceuticals, Inc.(a)
Drugs that regulate hormone activated intracellular receptors | 190,332 | 26,062,161 |
Loxo Oncology, Inc.(a)
Researches and develops cancer drugs | 342,419 | 28,824,831 |
Seattle Genetics, Inc.(a)
Monoclonal antibody-based drugs to treat cancer and related diseases | 522,621 | 27,960,224 |
Ultragenyx Pharmaceutical, Inc.(a)
Therapeutics and sialic acid for treating metabolic, body myopathy, glucuronidase, and rare genetic diseases | 537,651 | 24,936,253 |
| Total | | 300,544,783 |
The accompanying Notes to Financial Statements are an integral part of this statement.
| 46 | Columbia Acorn Family of Funds | Annual Report 2017 |
Portfolio of Investments (continued)
Columbia Acorn® Fund, December 31, 2017
| Common Stocks (continued) |
| Issuer | Shares | Value ($) |
| Health Care Equipment & Supplies 8.3% |
Align Technology, Inc.(a)
Designs, manufactures, and markets the Invisalign System | 221,309 | 49,172,647 |
Endologix, Inc.(a)
Minimally invasive treatments for vascular diseases | 3,386,649 | 18,118,572 |
Haemonetics Corp.(a)
Automated blood processing systems | 641,870 | 37,279,810 |
IDEXX Laboratories, Inc.(a)
Diagnostic, detection, and information systems for veterinary, food, and water testing applications | 120,199 | 18,796,720 |
iRhythm Technologies, Inc.(a)
Medical instruments | 526,673 | 29,520,022 |
LivaNova PLC(a)
Medical technology focusing on neuromodulation, cardiac surgery and rhythm management | 257,621 | 20,589,070 |
Masimo Corp.(a)
Medical signal processing and sensor technology for non-invasive monitoring of physiological parameters | 864,552 | 73,314,010 |
Natus Medical, Inc.(a)
Medical device company that develops, manufactures, and markets screening products | 522,886 | 19,974,245 |
ResMed, Inc.
Medical equipment for the treatment of sleep disordered breathing | 338,935 | 28,704,405 |
Varex Imaging Corp.(a)
X-ray imaging components | 1,159,355 | 46,571,290 |
Varian Medical Systems, Inc.(a)
Medical equipment | 182,447 | 20,278,984 |
West Pharmaceutical Services, Inc.
Drug therapies and healthcare products | 244,984 | 24,172,571 |
| Total | | 386,492,346 |
| Health Care Providers & Services 2.8% |
Amedisys, Inc.(a)
Provider of alternate-site health care services | 521,678 | 27,497,647 |
AMN Healthcare Services, Inc.(a)
Temporary healthcare staffing | 504,424 | 24,842,881 |
Chemed Corp.
Hospice and palliative care services | 27,212 | 6,613,060 |
HealthSouth Corp.
Inpatient rehabilitative healthcare services | 1,380,629 | 68,216,879 |
| Total | | 127,170,467 |
| Common Stocks (continued) |
| Issuer | Shares | Value ($) |
| Health Care Technology 1.5% |
Evolent Health, Inc., Class A(a),(b)
Purpose-built platform enables providers to migrate their payment models | 1,716,517 | 21,113,159 |
Veeva Systems Inc., Class A(a)
Cloud-based business services | 908,078 | 50,198,552 |
| Total | | 71,311,711 |
| Life Sciences Tools & Services 3.6% |
Bio-Techne Corp.
Biotechnology products and clinical diagnostic controls | 208,002 | 26,946,659 |
Cambrex Corp.(a)
Products, services, and technologies for the Life Sciences and fine chemicals industry | 897,649 | 43,087,152 |
Mettler-Toledo International, Inc.(a)
Weighing instruments for use in laboratory, industrial, and food retailing applications | 30,543 | 18,922,000 |
Pra Health Sciences, Inc.(a)
Global contract research organization | 851,276 | 77,525,705 |
| Total | | 166,481,516 |
| Total Health Care | 1,052,000,823 |
| Industrials 17.3% |
| Aerospace & Defense 0.6% |
HEICO Corp., Class A
Aerospace products and services | 358,269 | 28,321,164 |
| Air Freight & Logistics 0.5% |
Expeditors International of Washington, Inc.
Global logistics company | 330,439 | 21,376,099 |
| Building Products 0.4% |
JELD-WEN Holding, Inc.(a)
Interior and exterior doors, wood, vinyl and aluminum windows | 500,000 | 19,685,000 |
| Commercial Services & Supplies 2.7% |
Brink’s Co. (The)
Provides security services globally | 355,358 | 27,966,675 |
Cintas Corp.
Corporate identity uniform programs | 161,422 | 25,154,390 |
Copart, Inc.(a)
Services to process and sell salvage vehicles through auctions | 995,276 | 42,985,970 |
Unifirst Corp.
Workplace uniforms and protective clothing | 176,205 | 29,056,205 |
| Total | | 125,163,240 |
The accompanying Notes to Financial Statements are an integral part of this statement.
Columbia Acorn Family of Funds | Annual Report 2017
| 47 |
Portfolio of Investments (continued)
Columbia Acorn® Fund, December 31, 2017
| Common Stocks (continued) |
| Issuer | Shares | Value ($) |
| Industrial Conglomerates 0.5% |
Carlisle Companies, Inc.
Construction materials, transportation products, and general industry products | 188,663 | 21,441,550 |
| Machinery 7.0% |
Graco, Inc.
Technology for the management of fluids in industrial and commercial applications | 1,079,634 | 48,821,049 |
Middleby Corp. (The)(a)
Equipment for use in cooking and preparing food | 157,562 | 21,262,992 |
Nordson Corp.
Systems that apply adhesives, sealants, and coatings to products during manufacturing | 258,744 | 37,880,122 |
Oshkosh Corp.
Fire and emergency apparatuses and specialty commercial, and military trucks | 229,462 | 20,855,801 |
REV Group, Inc.
Specialty vehicles and related aftermarket parts and services | 722,347 | 23,497,948 |
Snap-On, Inc.
Tool and equipment solutions | 266,187 | 46,396,394 |
Toro Co. (The)
Turf equipment | 735,938 | 48,005,236 |
WABCO Holdings, Inc.(a)
Electronic braking, stability, suspension, and transmission control systems commercial vehicles | 454,678 | 65,246,293 |
Woodward, Inc.
Energy control systems and components for aircraft, industrial engines and turbines | 172,500 | 13,203,150 |
| Total | | 325,168,985 |
| Professional Services 3.0% |
ManpowerGroup, Inc.
Non-governmental employment services | 320,437 | 40,410,310 |
Robert Half International, Inc.
Temporary and permanent staffing services | 679,220 | 37,723,879 |
TransUnion (a)
Offers consumer reports, risk scores, analytical services, and decisioning capabilities to businesses | 1,117,020 | 61,391,419 |
| Total | | 139,525,608 |
| Road & Rail 2.0% |
JB Hunt Transport Services, Inc.
Logistics services | 212,566 | 24,440,839 |
Old Dominion Freight Line, Inc.
Inter-regional and multi-regional motor carrier | 534,818 | 70,355,308 |
| Total | | 94,796,147 |
| Common Stocks (continued) |
| Issuer | Shares | Value ($) |
| Trading Companies & Distributors 0.6% |
Watsco, Inc.
Air conditioning, heating, and refrigeration equipment | 166,128 | 28,248,405 |
| Total Industrials | 803,726,198 |
| Information Technology 23.1% |
| Electronic Equipment, Instruments & Components 4.5% |
CDW Corp.
IT products and services | 848,075 | 58,932,732 |
Cognex Corp.
Machine vision systems | 822,000 | 50,273,520 |
II-VI, Inc.(a)
Optical and optoelectronic devices | 700,550 | 32,890,822 |
IPG Photonics Corp.(a)
High-power fiber lasers and amplifiers | 318,098 | 68,114,325 |
| Total | | 210,211,399 |
| Internet Software & Services 3.9% |
Alteryx, Inc., Class A(a)
Data storage, retrieval, management, reporting, and analytics solutions | 983,198 | 24,845,414 |
CoStar Group, Inc.(a)
Provides building-specific information to the United States commercial real estate industry and related industries | 61,466 | 18,252,329 |
GoDaddy, Inc., Class A(a)
Cloud-based web platform for small businesses, web design professionals and individuals | 588,811 | 29,605,417 |
Mimecast Ltd.(a)
Cloud security and risk management services for corporate information and email | 632,000 | 18,119,440 |
MINDBODY, Inc., Class A(a)
Business management software | 554,360 | 16,880,262 |
Nutanix, Inc., Class A(a)
Enterprise cloud platforms | 508,253 | 17,931,166 |
Q2 Holdings, Inc.(a)
Secure, cloud-based virtual banking solutions | 483,131 | 17,803,377 |
Quotient Technology, Inc.(a)
Operates a promotion platform | 1,281,599 | 15,058,788 |
VeriSign, Inc.(a)
Domain names and Internet security services | 177,571 | 20,321,225 |
| Total | | 178,817,418 |
The accompanying Notes to Financial Statements are an integral part of this statement.
| 48 | Columbia Acorn Family of Funds | Annual Report 2017 |
Portfolio of Investments (continued)
Columbia Acorn® Fund, December 31, 2017
| Common Stocks (continued) |
| Issuer | Shares | Value ($) |
| IT Services 3.7% |
Black Knight, Inc.(a)
Integrated technology, work flow automation, data and analytic solutions | 427,215 | 18,861,542 |
Booz Allen Hamilton Holdings Corp.
Technology consulting services to the U.S. government in the defense, intelligence, and civil markets | 929,903 | 35,457,201 |
Broadridge Financial Solutions, Inc.
Technology-based outsourcing solutions to the financial services industry | 294,817 | 26,704,524 |
CoreLogic, Inc.(a)
Consumer, financial and property information, analytics and services to business and government | 397,760 | 18,380,490 |
Euronet Worldwide, Inc.(a)
Electronic financial transaction solutions | 301,683 | 25,422,826 |
Gartner, Inc.(a)
Research and analysis on computer hardware, software, communications, and information technology | 192,622 | 23,721,399 |
WNS Holdings Ltd., ADR(a)
Business process outsourcing services | 545,490 | 21,890,514 |
| Total | | 170,438,496 |
| Semiconductors & Semiconductor Equipment 5.4% |
Advanced Energy Industries, Inc.(a)
Engineered precision power conversion, measurement and control solutions | 762,638 | 51,462,812 |
Ambarella, Inc.(a)
High definition video compression and image processing semiconductors | 323,500 | 19,005,625 |
Brooks Automation, Inc.
Automation solutions for the global semiconductor and related industries | 708,474 | 16,897,105 |
Inphi Corp.(a),(b)
Analog semiconductor solutions | 724,916 | 26,531,926 |
MKS Instruments, Inc.
Instruments and components used to control and analyze gases in semiconductor manufacturing | 329,284 | 31,117,338 |
Monolithic Power Systems, Inc.
Power management solutions | 294,141 | 33,049,683 |
Semtech Corp.(a)
Analog and mixed-signal semiconductors | 621,391 | 21,251,572 |
Teradyne, Inc.
Semiconductor test products and services | 1,253,396 | 52,479,690 |
| Total | | 251,795,751 |
| Common Stocks (continued) |
| Issuer | Shares | Value ($) |
| Software 5.6% |
ANSYS, Inc.(a)
Software solutions for design analysis and optimization | 462,531 | 68,264,950 |
Blackline, Inc.(a)
Develops and markets enterprise software | 672,040 | 22,042,912 |
Cadence Design Systems, Inc.(a)
Software technology, design and consulting services and technology | 1,138,503 | 47,612,196 |
CyberArk Software Ltd.(a)
IT security solutions | 423,051 | 17,510,081 |
Guidewire Software, Inc.(a)
Enterprise software for the property and casualty insurance industry | 226,040 | 16,785,730 |
Qualys, Inc.(a)
Information technology security risk and compliance management solutions | 743,451 | 44,123,817 |
Synopsys, Inc.(a)
Electronic design automation solutions | 294,590 | 25,110,852 |
Ultimate Software Group, Inc. (The)(a)
Software solutions | 89,935 | 19,626,515 |
| Total | | 261,077,053 |
| Total Information Technology | 1,072,340,117 |
| Materials 2.3% |
| Chemicals 1.1% |
Celanese Corp., Class A
Global integrated producer of chemicals and advanced materials | 271,263 | 29,046,842 |
Quaker Chemical Corp.
Custom-formulated chemical specialty products | 151,400 | 22,829,606 |
| Total | | 51,876,448 |
| Containers & Packaging 1.2% |
Avery Dennison Corp.
Pressure-sensitive materials and a variety of tickets, tags and labels | 279,691 | 32,125,308 |
Sealed Air Corp.
Packaging and performance-based materials and equipment | 482,600 | 23,792,180 |
| Total | | 55,917,488 |
| Total Materials | 107,793,936 |
The accompanying Notes to Financial Statements are an integral part of this statement.
Columbia Acorn Family of Funds | Annual Report 2017
| 49 |
Portfolio of Investments (continued)
Columbia Acorn® Fund, December 31, 2017
| Common Stocks (continued) |
| Issuer | Shares | Value ($) |
| Real Estate 2.6% |
| Equity Real Estate Investment Trusts (REITS) 1.9% |
CoreCivic, Inc.
Detention and corrections services | 1,255,108 | 28,239,930 |
Education Realty Trust, Inc.
Self-managed and self-advised real estate investment trust | 514,492 | 17,966,061 |
Equity LifeStyle Properties, Inc.
Acquires properties such as camping grounds and seasonal resort communities | 205,266 | 18,272,779 |
Lamar Advertising Co., Class A
Outdoor advertising structures | 333,833 | 24,783,762 |
| Total | | 89,262,532 |
| Real Estate Management & Development 0.7% |
Jones Lang LaSalle, Inc.
Real estate and investment management services | 210,632 | 31,369,424 |
| Total Real Estate | 120,631,956 |
| Telecommunication Services 0.9% |
| Diversified Telecommunication Services 0.4% |
Zayo Group Holdings, Inc.(a)
Global provider of bandwidth infrastructure services | 547,191 | 20,136,629 |
| Wireless Telecommunication Services 0.5% |
Boingo Wireless, Inc.(a)
Mobile internet services | 965,652 | 21,727,170 |
| Total Telecommunication Services | 41,863,799 |
Total Common Stocks
(Cost: $3,282,735,192) | 4,588,119,205 |
|
| Limited Partnerships 0.5% |
| Issuer | Shares | Value ($) |
| Consumer Discretionary 0.5% |
| Hotels, Restaurants & Leisure 0.5% |
Cedar Fair LP
Owns and operates amusement parks | 328,546 | 21,352,205 |
| Total Consumer Discretionary | 21,352,205 |
Total Limited Partnerships
(Cost: $21,857,117) | 21,352,205 |
|
| Securities Lending Collateral 0.8% |
| | Shares | Value ($) |
Dreyfus Government Cash Management Fund, Institutional Shares, 1.190%(d),(e)
| 37,208,360 | 37,208,360 |
Total Securities Lending Collateral
(Cost: $37,208,360) | 37,208,360 |
|
| Money Market Funds 0.6% |
| | |
| JPMorgan U.S. Government Money Market Fund, IM Shares, 1.192%(d) | 26,619,576 | 26,619,576 |
Total Money Market Funds
(Cost: $26,619,576) | 26,619,576 |
Total Investments
(Cost $3,368,420,245) | 4,673,299,346 |
| Obligation to Return Collateral for Securities Loaned | | (37,208,360) |
| Other Assets & Liabilities, Net | | 2,082,730 |
| Net Assets | $4,638,173,716 |
Notes to Portfolio of Investments
| (a) | Non-income producing security. |
| (b) | All or a portion of this security was on loan at December 31, 2017. The total market value of securities on loan at December 31, 2017 was $35,927,492. |
| (c) | An affiliated person of the Fund, as defined in the Investment Company Act of 1940, may include any company in which the Fund owns five percent or more of its outstanding voting shares. Holdings and transactions in these affiliated companies during the year ended ended December 31, 2017, are as follows. The aggregate cost and value of these companies at December 31, 2017, was $24,580,987 and $23,079,229, respectively. Investments in affiliated companies represented 0.05% of the Fund’s total net assets at December 31, 2017. |
| Issuer | Beginning
shares | Shares
purchased | Shares
sold | Ending
shares | Realized gain
(loss) —
affiliated
issuers ($) | Net change in
unrealized
appreciation
(depreciation) —
affiliated
issuers ($) | Dividend —
affiliated issuers
($) | Value —
affiliated
issuers
at end of
period ($) |
| Alteryx, Inc., Class A † |
| | — | 1,165,000 | (181,802) | 983,198 | 555,557 | — | — | — |
| Boingo Wireless, Inc. † |
| | 2,180,974 | 84,481 | (1,299,803) | 965,652 | 13,458,610 | (9,612,747) | — | — |
The accompanying Notes to Financial Statements are an integral part of this statement.
| 50 | Columbia Acorn Family of Funds | Annual Report 2017 |
Portfolio of Investments (continued)
Columbia Acorn® Fund, December 31, 2017
Notes to Portfolio of Investments (continued)
| Issuer | Beginning
shares | Shares
purchased | Shares
sold | Ending
shares | Realized gain
(loss) —
affiliated
issuers ($) | Net change in
unrealized
appreciation
(depreciation) —
affiliated
issuers ($) | Dividend —
affiliated issuers
($) | Value —
affiliated
issuers
at end of
period ($) |
| Celldex Therapeutics, Inc. |
| | 6,019,590 | 5,350,481 | (3,243,582) | 8,126,489 | (5,653,863) | (385,498) | — | 23,079,229 |
| Endologix, Inc. † |
| | 4,661,700 | 1,457,196 | (2,732,247) | 3,386,649 | (8,376,418) | 7,567,388 | — | — |
| Nutanix, Inc., Class A † |
| | 898,090 | 510,829 | (900,666) | 508,253 | (986,045) | (816,261) | — | — |
| Total of Affiliated Transactions | | | | | (1,002,159) | (3,247,118) | — | 23,079,229 |
| † | Issuer was not an affiliate at the end of period. |
| (d) | The rate shown is the seven-day current annualized yield at December 31, 2017. |
| (e) | Investment made with cash collateral received from securities lending activity. |
Abbreviation Legend
| ADR | American Depositary Receipt |
Fair value measurements
Various inputs are used in determining the value of the Fund’s investments, following the input prioritization hierarchy established by accounting principles generally accepted in the United States of America (GAAP). These inputs are summarized in the three broad levels listed below:
| ¦ | Level 1 – quoted prices in active markets for identical securities |
| ¦ | Level 2 – prices determined using other significant observable inputs (including quoted prices for similar securities, interest rates, prepayment speeds, credit risk and others) |
| ¦ | Level 3 – prices determined using significant unobservable inputs where quoted prices or observable inputs are unavailable or less reliable (including management’s own assumptions about the factors market participants would use in pricing an investment) |
The inputs or methodology used for valuing securities are not necessarily an indication of the risk associated with investing in those securities.
Examples of the types of securities in which the Fund would typically invest and how they are classified within this hierarchy are as follows. Typical Level 1 securities include exchange traded domestic equities, mutual funds whose net asset values are published each day and exchange traded foreign equities that are not statistically fair valued. Typical Level 2 securities include exchange traded foreign equities that are statistically fair valued, forward foreign currency exchange contracts and short-term investments valued at amortized cost. Additionally, securities fair valued by Columbia Wanger Asset Management’s Valuation Committee (the Committee) that rely on significant observable inputs are also included in Level 2. Typical Level 3 securities include any security fair valued by the Committee that relies on significant unobservable inputs.
The Committee is responsible for applying the Columbia Acorn Trust Portfolio Pricing Policy and the Columbia Wanger Asset Management pricing procedures (the Policies), which are approved by and subject to the oversight of the Board of Trustees.
The Committee meets as necessary, and no less frequently than quarterly, to determine fair values for securities for which market quotations are not readily available or for which Columbia Wanger Asset Management believes that available market quotations are unreliable. The Committee also reviews the continuing appropriateness of the Policies. In circumstances where a security has been fair valued, the Committee will also review the continuing appropriateness of the current value of the security. The Policies address, among other things: circumstances under which market quotations will be deemed readily available; selection of third party pricing vendors; appropriate pricing methodologies; events that require fair valuation and fair value techniques; circumstances under which securities will be deemed to pose a potential for stale pricing, including when securities are illiquid, restricted, or in default; and certain delegations of authority to determine fair values to the Fund’s investment manager. The Committee may also meet to discuss additional valuation matters, which may include review of back-testing results, review of time-sensitive information or approval of other valuation related actions, and to review the appropriateness of the Policies.
For investments categorized as Level 3, the significant unobservable inputs used in the fair value measurement of the Fund’s securities may include: (i) data specific to the issuer or comparable issuers, (ii) general market or specific sector news and (iii) quoted prices and specific or similar security transactions. The Committee considers this data and any changes from prior periods in order to assess the reasonableness of observable and unobservable inputs, any assumptions or internal models used to value those securities and changes in fair value. Significant changes in any of these factors could result in lower or higher fair value measurements. Various factors impact the frequency of monitoring (which may occur as often as daily), however the Committee may determine that changes to inputs, assumptions and models are not required with the same frequency.
The accompanying Notes to Financial Statements are an integral part of this statement.
Columbia Acorn Family of Funds | Annual Report 2017
| 51 |
Portfolio of Investments (continued)
Columbia Acorn® Fund, December 31, 2017
Fair value measurements (continued)
The following table is a summary of the inputs used to value the Fund’s investments at December 31, 2017:
| | Level 1
quoted prices in active
markets for identical
assets ($) | Level 2
other significant
observable inputs ($) | Level 3
significant
unobservable inputs ($) | Total ($) |
| Investments | | | | |
| Common Stocks | | | | |
| Consumer Discretionary | 854,960,949 | — | — | 854,960,949 |
| Consumer Staples | 76,662,189 | — | — | 76,662,189 |
| Energy | 43,174,221 | — | — | 43,174,221 |
| Financials | 414,965,017 | — | — | 414,965,017 |
| Health Care | 1,052,000,823 | — | — | 1,052,000,823 |
| Industrials | 803,726,198 | — | — | 803,726,198 |
| Information Technology | 1,072,340,117 | — | — | 1,072,340,117 |
| Materials | 107,793,936 | — | — | 107,793,936 |
| Real Estate | 120,631,956 | — | — | 120,631,956 |
| Telecommunication Services | 41,863,799 | — | — | 41,863,799 |
| Total Common Stocks | 4,588,119,205 | — | — | 4,588,119,205 |
| Limited Partnerships | | | | |
| Consumer Discretionary | 21,352,205 | — | — | 21,352,205 |
| Total Limited Partnerships | 21,352,205 | — | — | 21,352,205 |
| Securities Lending Collateral | 37,208,360 | — | — | 37,208,360 |
| Money Market Funds | 26,619,576 | — | — | 26,619,576 |
| Total Investments | 4,673,299,346 | — | — | 4,673,299,346 |
There were no transfers of financial assets between levels during the period.
The accompanying Notes to Financial Statements are an integral part of this statement.
| 52 | Columbia Acorn Family of Funds | Annual Report 2017 |
Portfolio of Investments
Columbia Acorn International®, December 31, 2017
(Percentages represent value of investments compared to net assets)
| Common Stocks 97.1% |
| Issuer | Shares | Value ($) |
| Australia 1.0% |
Domino’s Pizza Enterprises Ltd.
Pizza delivery stores | 1,300,000 | 47,249,768 |
| Brazil 1.6% |
Odontoprev SA
Dental benefits company | 3,543,000 | 16,993,497 |
Qualicorp SA
Insurance and benefits packages | 3,046,000 | 28,466,431 |
Raia Drogasil SA
Chain of pharmaceutical stores | 1,266,000 | 35,036,267 |
| Total | 80,496,195 |
| Cambodia 0.2% |
NagaCorp Ltd.
Leisure and tourism company | 12,508,000 | 9,660,165 |
| Canada 5.2% |
Boardwalk Real Estate Investment Trust(a)
Real estate company | 1,053,355 | 36,109,043 |
CAE, Inc.
Training solutions based on simulation technology and integrated training services | 2,499,934 | 46,438,710 |
CCL Industries, Inc.
Manufacturing services and specialty packaging products for the non-durable consumer products market | 2,711,220 | 125,272,600 |
ShawCor Ltd.
Energy services company | 1,082,367 | 23,610,583 |
Winpak Ltd.
Packaging materials and machines for the protection of perishables | 608,000 | 22,636,754 |
| Total | 254,067,690 |
| Cayman Islands 1.6% |
Parade Technologies Ltd.
Fabless semiconductor company | 2,225,000 | 43,871,705 |
Silicon Motion Technology Corp., ADR
Semiconductor products | 658,000 | 34,847,680 |
| Total | 78,719,385 |
| Common Stocks (continued) |
| Issuer | Shares | Value ($) |
| China 5.3% |
51job, Inc., ADR(b)
Integrated human resource services | 404,000 | 24,583,400 |
58.Com, Inc., ADR(b)
Local life service platform | 518,107 | 37,080,918 |
China Medical System Holdings Ltd.
Pharmaceutical and medical products | 25,777,000 | 60,003,485 |
New Oriental Education & Technology Group, Inc., ADR
Educational services | 770,864 | 72,461,216 |
Shenzhou International Group Holdings Ltd.
Manufactures and processes textiles | 3,618,000 | 34,453,394 |
TravelSky Technology Ltd., Class H
IT solutions for China’s air travel and tourism industries | 10,956,000 | 32,750,413 |
| Total | 261,332,826 |
| Denmark 3.6% |
Novozymes AS, Class B
Enzymes for industrial use | 1,453,477 | 83,043,112 |
SimCorp AS
Global provider of highly specialised software for the investment management industry | 838,367 | 47,737,209 |
William Demant Holding AS(b)
Hearing aids, audiometers, tympanometers, diagnostic instruments, and wireless communication equipment | 1,648,031 | 46,083,353 |
| Total | 176,863,674 |
| France 1.2% |
Elior Group SA
Provides catering, cleaning, and facility management services | 1,208,500 | 24,976,558 |
Ipsen SA
Medical drugs for targeted disease areas | 273,000 | 32,615,035 |
| Total | 57,591,593 |
| Germany 9.4% |
AURELIUS Equity Opportunities SE & Co. KGaA(a)
Loans to distressed companies | 196,793 | 13,420,135 |
CTS Eventim AG & Co. KGaA
Online ticket sales | 570,000 | 26,500,231 |
Fielmann AG
Prescription eyeglasses, specialty glasses, sunglasses, contact lenses, and optical supplies | 655,000 | 57,695,000 |
KION Group AG
Material handling solutions | 316,000 | 27,201,679 |
The accompanying Notes to Financial Statements are an integral part of this statement.
Columbia Acorn Family of Funds | Annual Report 2017
| 53 |
Portfolio of Investments (continued)
Columbia Acorn International®, December 31, 2017
| Common Stocks (continued) |
| Issuer | Shares | Value ($) |
MTU Aero Engines AG
Develops and manufactures engines and offers commercial engine services and support | 445,000 | 79,519,176 |
Nemetschek SE
Standard software for designing, constructing and managing buildings and real estate | 191,000 | 17,086,877 |
Rational AG
Food preparation appliances/processors and kitchen accessories | 74,335 | 47,820,968 |
Stroeer SE & Co. KGaA
Digital multi-channel media company | 884,049 | 65,140,269 |
Wirecard AG
Internet payment and processing services | 815,000 | 90,581,048 |
Zalando SE(b)
Online sale of fashion accessories | 714,116 | 37,653,769 |
| Total | 462,619,152 |
| Hong Kong 0.7% |
Value Partners Group Ltd.
Independent, value oriented asset management group | 33,644,000 | 35,661,934 |
| India 2.9% |
Havells India Ltd
Manufactures electrical products | 3,083,000 | 27,111,284 |
TVS Motor Co., Ltd.
Motorcycles, mopeds and scooters | 4,754,373 | 57,344,158 |
Zee Entertainment Enterprises Ltd.
Hindi films, serials, game shows and children’s programs | 6,306,681 | 57,417,149 |
| Total | 141,872,591 |
| Indonesia 0.8% |
PT Matahari Department Store Tbk
Retail clothes, accessories, bags, shoes, cosmetics, household appliances, and management consulting services. | 52,107,800 | 38,280,155 |
| Ireland 1.0% |
UDG Healthcare PLC
Commercialisation solutions for health care companies | 4,148,000 | 47,224,088 |
| Italy 2.2% |
Brembo SpA
Braking systems and components | 5,509,337 | 83,753,440 |
Industria Macchine Automatiche SpA
Packaging machinery for the food, pharmaceuticals, and cosmetics industries | 290,000 | 23,591,437 |
| Total | 107,344,877 |
| Common Stocks (continued) |
| Issuer | Shares | Value ($) |
| Japan 23.9% |
Aeon Credit Service Co., Ltd.
Credit card company | 1,602,000 | 37,232,025 |
Aeon Mall Co., Ltd.
Large-scale shopping malls | 2,856,500 | 55,789,424 |
Aica Kogyo Co., Ltd.
Manufactures adhesives, melamine boards, and housing materials | 764,100 | 28,326,277 |
Asahi Intecc Co., Ltd.
Manufactures medical tools and stainless wire rope | 1,103,400 | 37,817,005 |
Bandai Namco Holdings, Inc.
Manufactures toys, stuffed animals, character goods, video games, commercial- and home-use game equipment and software | 1,324,400 | 43,228,046 |
CyberAgent, Inc.
Operates websites, internet advertising agency and creates PC and mobile contents | 750,300 | 29,241,201 |
Daiseki Co., Ltd.
Waste Disposal & Recycling | 538,500 | 14,972,034 |
Disco Corp.
Abrasive and precision industrial machinery for cutting and grinding purposes | 164,300 | 36,415,376 |
FamilyMart UNY Holdings Co., Ltd.
Chain of convenience stores | 1,365,300 | 95,623,134 |
Fuji Oil Holdings, Inc.
Specialty vegetable oils and fats | 956,000 | 27,911,190 |
Glory Ltd.
Vending machines, coin-operated lockers, money handling machines, and data processing terminals | 1,032,900 | 38,934,407 |
Hikari Tsushin, Inc.
Distribution network, telecommunication, office automation equipment, in-house products and individual insurance plans | 449,428 | 64,526,446 |
Kansai Paint
Paints and related products | 1,050,000 | 27,246,712 |
Mandom Corp.
Cosmetic products for men and women | 393,300 | 12,869,797 |
Miura Co., Ltd.
Industrial boilers and related equipment | 960,400 | 25,783,365 |
MonotaRO Co., Ltd(a)
Machine tools, engine parts, and factory consumable goods | 1,307,800 | 41,679,371 |
Nabtesco Corp.
Aircraft and hydraulic products | 640,000 | 24,455,510 |
NGK Insulators Ltd.
Electrical insulators, industrial ceramic products, environmental systems and electronic parts | 1,375,200 | 25,904,709 |
The accompanying Notes to Financial Statements are an integral part of this statement.
| 54 | Columbia Acorn Family of Funds | Annual Report 2017 |
Portfolio of Investments (continued)
Columbia Acorn International®, December 31, 2017
| Common Stocks (continued) |
| Issuer | Shares | Value ($) |
NGK Spark Plug Co., Ltd.
Spark plugs for automobiles, motorcycles, agricultural machinery, ships, and aircrafts | 1,528,900 | 37,056,463 |
Nihon M&A Center, Inc.
Provides M&A advisory services to small and medium-sized enterprises | 178,500 | 8,498,497 |
Nissan Chemical Industries Ltd.
Variety of chemical products | 902,000 | 35,930,903 |
NOF Corp.
Diversified chemical producer | 1,138,400 | 30,491,280 |
Obic Co., Ltd.
Computer system integration, office automation, consultation, and system support services | 402,100 | 29,533,186 |
Omron Corp.
Electronic components, equipment and systems used for factory automation | 432,200 | 25,706,805 |
OSG Corp.
Manufactures machine tool equipment | 1,128,300 | 24,373,510 |
Otsuka Corp.
Computer information system and software | 696,500 | 53,341,756 |
Persol Holdings Co., Ltd.
Human resource solutions | 1,440,000 | 36,052,380 |
Santen Pharmaceutical Co., Ltd.
Ophthalmic medicine | 1,902,000 | 29,786,014 |
Sekisui Chemical Co., Ltd.
Unit residential houses in addition to parcels of land | 3,137,500 | 62,813,745 |
Seven Bank Ltd.
Banking services through Automated Teller Machine (ATM) | 8,453,100 | 28,868,841 |
Sohgo Security Services Co., Ltd.
Around the clock security services | 787,400 | 42,795,629 |
Sony Financial Holdings, Inc.
Financial holding company | 1,870,000 | 33,049,655 |
Ushio, Inc.
Lamps and optical equipment | 1,750,100 | 24,964,068 |
| Total | 1,171,218,761 |
| Malta 2.1% |
Kindred Group PLC
Online gambling services | 7,374,685 | 105,544,004 |
| Mexico 1.4% |
Grupo Aeroportuario del Sureste SAB de CV, ADR
Operates airports in Mexico | 384,900 | 70,248,099 |
| Netherlands 1.2% |
Aalberts Industries NV
Industrial services and flow control systems | 1,183,797 | 60,216,925 |
| Common Stocks (continued) |
| Issuer | Shares | Value ($) |
| New Zealand 0.5% |
Auckland International Airport Ltd.
Owns and operates the Auckland International Airport | 5,805,568 | 26,649,194 |
| Philippines 0.5% |
Universal Robina Corp.
Branded consumer foods | 8,800,000 | 26,618,590 |
| Singapore 1.5% |
Mapletree Commercial Trust
Singapore-focused real estate investment trust | 32,720,300 | 39,632,798 |
Singapore Exchange
Singapore’s Securities and derivatives exchange and clearing houses | 6,123,200 | 34,001,430 |
| Total | 73,634,228 |
| South Africa 1.8% |
Clicks Group Ltd.
Owns and operates chains of retail stores | 2,212,748 | 32,394,023 |
PSG Group Ltd.
Diversified financial services | 937,000 | 20,447,767 |
Rand Merchant Investment Holdings Ltd.
Investment holding company | 9,400,384 | 34,803,514 |
| Total | 87,645,304 |
| South Korea 3.6% |
GS Retail Co., Ltd.
Chain of retail stores | 1,222,700 | 45,997,238 |
Koh Young Technology, Inc.
3D measurement and inspection equipment for testing various machineries | 231,000 | 17,801,597 |
Korea Investment Holdings Co., Ltd.
Financial holding company | 787,000 | 50,673,030 |
Korea Zinc Co. Ltd.
Non-ferrous metal smelting | 114,000 | 52,498,249 |
Modetour Network, Inc.
Travel services | 403,445 | 11,494,160 |
| Total | 178,464,274 |
| Spain 0.8% |
Prosegur Cia de Seguridad SA, Registered Shares
Security and transportation services | 5,000,000 | 39,295,064 |
The accompanying Notes to Financial Statements are an integral part of this statement.
Columbia Acorn Family of Funds | Annual Report 2017
| 55 |
Portfolio of Investments (continued)
Columbia Acorn International®, December 31, 2017
| Common Stocks (continued) |
| Issuer | Shares | Value ($) |
| Sweden 4.7% |
Hexagon AB, Class B
Design, measurement and visualisation technologies | 2,548,121 | 127,637,469 |
NetEnt AB
Computer gaming software | 3,854,000 | 26,544,965 |
Sweco AB, Class B
Consulting company specializing in engineering, environmental technology, and architecture | 1,008,443 | 22,349,470 |
Trelleborg AB, Class B
Manufactures and distributes industrial products | 2,296,587 | 53,193,491 |
| Total | 229,725,395 |
| Switzerland 2.6% |
Partners Group Holding AG(a)
Global private markets asset management firm | 185,000 | 126,820,258 |
| Taiwan 1.4% |
Largan Precision Co., Ltd.
Optical lens modules and optoelectronic components | 174,000 | 23,356,262 |
Silergy Corp.
High performance analog integrated circuits | 1,946,000 | 44,467,295 |
| Total | 67,823,557 |
| Thailand 1.5% |
Home Product Center PCL, Foreign Registered Shares
Building materials and home improvement products | 90,670,700 | 35,611,690 |
Tisco Financial Group PCL
Bank holding company | 13,401,000 | 36,391,178 |
| Total | 72,002,868 |
| United Kingdom 12.3% |
Ascential PLC
Media and consultancy services | 3,537,056 | 18,344,508 |
Croda International PLC
Chemicals and chemical products | 691,401 | 41,216,266 |
Domino’s Pizza Group PLC
Pizza delivery stores | 11,592,000 | 54,105,328 |
DS Smith PLC
Provides corrugated packaging services | 5,532,000 | 38,560,764 |
Halma PLC
Products that detect hazards and protect assets and people in public and commercial buildings | 5,294,688 | 89,962,908 |
Intermediate Capital Group PLC
Private equity firm | 1,957,000 | 30,217,786 |
| Common Stocks (continued) |
| Issuer | Shares | Value ($) |
LivaNova PLC(b)
Medical technology focusing on neuromodulation, cardiac surgery and rhythm management | 280,000 | 22,377,600 |
Micro Focus International PLC
Enterprise application management solutions | 1,045,454 | 35,531,646 |
Rentokil Initial PLC
Fully integrated facilities management and essential support services | 18,062,410 | 77,382,367 |
Rightmove PLC
Website that lists properties across Britain | 944,752 | 57,332,967 |
Spirax-Sarco Engineering PLC
Consultation, service and products for the control and efficient management of steam and industrial fluids | 802,262 | 60,654,807 |
WH Smith PLC
Retails books, magazines, newspapers, and periodicals | 2,401,564 | 76,100,855 |
| Total | 601,787,802 |
| United States 0.6% |
Ultragenyx Pharmaceutical, Inc.(b)
Therapeutics and sialic acid for treating metabolic, body myopathy, glucuronidase, and rare genetic diseases | 590,087 | 27,368,235 |
Total Common Stocks
(Cost: $3,019,363,709) | 4,764,046,651 |
| Preferred Stocks 0.7% |
| Issuer | Coupon
Rate | Shares | Value ($) |
| Germany 0.7% |
Sartorius AG
Precision electronic equipment and components | — | 360,000 | 34,197,222 |
Total Preferred Stocks
(Cost: $35,652,950) | 34,197,222 |
| Securities Lending Collateral 2.7% |
| | Shares | Value ($) |
Dreyfus Government Cash Management Fund, Institutional Shares, 1.190%(c),(d)
| 131,643,758 | 131,643,758 |
Total Securities Lending Collateral
(Cost: $131,643,758) | 131,643,758 |
|
The accompanying Notes to Financial Statements are an integral part of this statement.
| 56 | Columbia Acorn Family of Funds | Annual Report 2017 |
Portfolio of Investments (continued)
Columbia Acorn International®, December 31, 2017
| Money Market Funds 2.1% |
| | Shares | Value ($) |
JPMorgan U.S. Government Money Market Fund, IM Shares, 1.192%(c)
| 105,414,690 | 105,414,690 |
Total Money Market Funds
(Cost: $105,414,690) | 105,414,690 |
Total Investments
(Cost: $3,292,075,107) | 5,035,302,321 |
| Obligation to Return Collateral for Securities Loaned | | (131,643,758) |
| Other Assets & Liabilities, Net | | 3,301,440 |
| Net Assets | $4,906,960,003 |
Notes to Portfolio of Investments
| (a) | All or a portion of this security was on loan at December 31, 2017. The total market value of securities on loan at December 31, 2017 was $125,615,479. |
| (b) | Non-income producing security. |
| (c) | The rate shown is the seven-day current annualized yield at December 31, 2017. |
| (d) | Investment made with cash collateral received from securities lending activity. |
Abbreviation Legend
| ADR | American Depositary Receipt |
Fair value measurements
Various inputs are used in determining the value of the Fund’s investments, following the input prioritization hierarchy established by accounting principles generally accepted in the United States of America (GAAP). These inputs are summarized in the three broad levels listed below:
| ¦ | Level 1 – quoted prices in active markets for identical securities |
| ¦ | Level 2 – prices determined using other significant observable inputs (including quoted prices for similar securities, interest rates, prepayment speeds, credit risk and others) |
| ¦ | Level 3 – prices determined using significant unobservable inputs where quoted prices or observable inputs are unavailable or less reliable (including management’s own assumptions about the factors market participants would use in pricing an investment) |
The inputs or methodology used for valuing securities are not necessarily an indication of the risk associated with investing in those securities.
Examples of the types of securities in which the Fund would typically invest and how they are classified within this hierarchy are as follows. Typical Level 1 securities include exchange traded domestic equities, mutual funds whose net asset values are published each day and exchange traded foreign equities that are not statistically fair valued. Typical Level 2 securities include exchange traded foreign equities that are statistically fair valued, forward foreign currency exchange contracts and short-term investments valued at amortized cost. Additionally, securities fair valued by Columbia Wanger Asset Management’s Valuation Committee (the Committee) that rely on significant observable inputs are also included in Level 2. Typical Level 3 securities include any security fair valued by the Committee that relies on significant unobservable inputs.
The Committee is responsible for applying the Columbia Acorn Trust Portfolio Pricing Policy and the Columbia Wanger Asset Management pricing procedures (the Policies), which are approved by and subject to the oversight of the Board of Trustees.
The Committee meets as necessary, and no less frequently than quarterly, to determine fair values for securities for which market quotations are not readily available or for which Columbia Wanger Asset Management believes that available market quotations are unreliable. The Committee also reviews the continuing appropriateness of the Policies. In circumstances where a security has been fair valued, the Committee will also review the continuing appropriateness of the current value of the security. The Policies address, among other things: circumstances under which market quotations will be deemed readily available; selection of third party pricing vendors; appropriate pricing methodologies; events that require fair valuation and fair value techniques; circumstances under which securities will be deemed to pose a potential for stale pricing, including when securities are illiquid, restricted, or in default; and certain delegations of authority to determine fair values to the Fund’s investment manager. The Committee may also meet to discuss additional valuation matters, which may include review of back-testing results, review of time-sensitive information or approval of other valuation related actions, and to review the appropriateness of the Policies.
For investments categorized as Level 3, the significant unobservable inputs used in the fair value measurement of the Fund’s securities may include: (i) data specific to the issuer or comparable issuers, (ii) general market or specific sector news and (iii) quoted prices and specific or similar security transactions. The Committee considers this data and any changes from prior periods in order to assess the reasonableness of observable and unobservable inputs, any assumptions or internal models used to value those securities and changes in fair value. Significant changes in any of these factors could result in lower or higher fair value measurements. Various factors impact the frequency of monitoring (which may occur as often as daily), however the Committee may determine that changes to inputs, assumptions and models are not required with the same frequency.
The accompanying Notes to Financial Statements are an integral part of this statement.
Columbia Acorn Family of Funds | Annual Report 2017
| 57 |
Portfolio of Investments (continued)
Columbia Acorn International®, December 31, 2017
Fair value measurements (continued)
The following table is a summary of the inputs used to value the Fund’s investments at December 31, 2017:
| | Level 1
quoted prices in active
markets for identical
assets ($) | Level 2
other significant
observable inputs ($) | Level 3
significant
unobservable inputs ($) | Total ($) |
| Investments | | | | |
| Common Stocks | | | | |
| Australia | — | 47,249,768 | — | 47,249,768 |
| Brazil | 80,496,195 | — | — | 80,496,195 |
| Cambodia | — | 9,660,165 | — | 9,660,165 |
| Canada | 254,067,690 | — | — | 254,067,690 |
| Cayman Islands | 34,847,680 | 43,871,705 | — | 78,719,385 |
| China | 134,125,534 | 127,207,292 | — | 261,332,826 |
| Denmark | — | 176,863,674 | — | 176,863,674 |
| France | — | 57,591,593 | — | 57,591,593 |
| Germany | — | 462,619,152 | — | 462,619,152 |
| Hong Kong | — | 35,661,934 | — | 35,661,934 |
| India | — | 141,872,591 | — | 141,872,591 |
| Indonesia | — | 38,280,155 | — | 38,280,155 |
| Ireland | — | 47,224,088 | — | 47,224,088 |
| Italy | — | 107,344,877 | — | 107,344,877 |
| Japan | — | 1,171,218,761 | — | 1,171,218,761 |
| Malta | — | 105,544,004 | — | 105,544,004 |
| Mexico | 70,248,099 | — | — | 70,248,099 |
| Netherlands | — | 60,216,925 | — | 60,216,925 |
| New Zealand | — | 26,649,194 | — | 26,649,194 |
| Philippines | — | 26,618,590 | — | 26,618,590 |
| Singapore | — | 73,634,228 | — | 73,634,228 |
| South Africa | — | 87,645,304 | — | 87,645,304 |
| South Korea | — | 178,464,274 | — | 178,464,274 |
| Spain | — | 39,295,064 | — | 39,295,064 |
| Sweden | — | 229,725,395 | — | 229,725,395 |
| Switzerland | — | 126,820,258 | — | 126,820,258 |
| Taiwan | — | 67,823,557 | — | 67,823,557 |
| Thailand | — | 72,002,868 | — | 72,002,868 |
| United Kingdom | 22,377,600 | 579,410,202 | — | 601,787,802 |
| United States | 27,368,235 | — | — | 27,368,235 |
| Total Common Stocks | 623,531,033 | 4,140,515,618 | — | 4,764,046,651 |
| Preferred Stocks | | | | |
| Germany | — | 34,197,222 | — | 34,197,222 |
| Total Preferred Stocks | — | 34,197,222 | — | 34,197,222 |
| Securities Lending Collateral | 131,643,758 | — | — | 131,643,758 |
| Money Market Funds | 105,414,690 | — | — | 105,414,690 |
| Total Investments | 860,589,481 | 4,174,712,840 | — | 5,035,302,321 |
The Fund’s assets assigned to the Level 2 input category are generally valued using a market approach, in which a security’s value is determined through its correlation to prices and information from observable market transactions for similar or identical assets. Foreign equities are generally valued at the last sale price on the foreign exchange or market on which they trade. The Fund may use a statistical fair valuation model, in accordance with the policy adopted by the Board of Trustees, provided by an independent third party to value securities principally traded in foreign markets in order to adjust for possible stale pricing that may occur between the close of the foreign exchanges and the time for valuation. These models take into account available market data including intraday index, ADR, and ETF movements.
There were no transfers of financial assets between levels during the period.
The accompanying Notes to Financial Statements are an integral part of this statement.
| 58 | Columbia Acorn Family of Funds | Annual Report 2017 |
Portfolio of Investments
Columbia Acorn USA®, December 31, 2017
(Percentages represent value of investments compared to net assets)
| Common Stocks 101.0% |
| Issuer | Shares | Value ($) |
| Consumer Discretionary 20.0% |
| Auto Components 3.7% |
Cooper-Standard Holding, Inc.(a)
Sealing, fuel and brake delivery, fluid transfer systems, anti-vibration systems components, subsystems, and modules | 24,959 | 3,057,478 |
Dorman Products, Inc.(a)
Automotive products and home hardware | 51,832 | 3,169,008 |
LCI Industries
Recreational vehicles and equipment | 23,201 | 3,016,130 |
Tenneco, Inc.
Emission control and ride control products and systems | 45,179 | 2,644,779 |
| Total | | 11,887,395 |
| Distributors 0.7% |
Pool Corp.
Swimming pool supplies, equipment and leisure products | 15,931 | 2,065,454 |
| Diversified Consumer Services 2.6% |
Adtalem Global Education, Inc.(a)
Higher education institutions | 85,398 | 3,590,986 |
Bright Horizons Family Solutions, Inc.(a)
Child care and early education services | 30,934 | 2,907,796 |
Laureate Education, Inc., Class A(a)
Provides educational services | 140,926 | 1,910,956 |
| Total | | 8,409,738 |
| Hotels, Restaurants & Leisure 6.7% |
Dave & Buster’s Entertainment, Inc.(a)
Venues that combine dining and entertainment for adults and families | 92,965 | 5,128,879 |
Extended Stay America, Inc.
Hotels and motels | 304,253 | 5,780,807 |
Papa John’s International, Inc.
Pizza delivery and carry-out restaurants | 39,937 | 2,240,865 |
Red Robin Gourmet Burgers, Inc.(a)
Chain of specialty restaurants | 34,869 | 1,966,612 |
Texas Roadhouse, Inc.
Moderately priced, full service restaurant chain | 83,666 | 4,407,525 |
Wingstop, Inc.
Cooked-to-order chicken wings | 54,300 | 2,116,614 |
| Total | | 21,641,302 |
| Common Stocks (continued) |
| Issuer | Shares | Value ($) |
| Household Durables 1.8% |
Cavco Industries, Inc.(a)
Designs and manufactures systems-built structures | 11,017 | 1,681,194 |
iRobot Corp.(a)
Manufactures robots for cleaning | 55,269 | 4,239,132 |
| Total | | 5,920,326 |
| Leisure Products 1.7% |
Brunswick Corp.
Consumer products serving the outdoor and indoor active recreation markets | 67,690 | 3,737,842 |
MCBC Holdings, Inc.(a)
Sport boats | 83,598 | 1,857,547 |
| Total | | 5,595,389 |
| Specialty Retail 2.8% |
Camping World Holdings, Inc., Class A
Recreational vehicles and accessories | 63,651 | 2,847,109 |
Five Below, Inc.(a)
Specialty value retailer | 61,828 | 4,100,433 |
Monro, Inc.
Automotive undercar repair and tire services | 36,131 | 2,057,661 |
| Total | | 9,005,203 |
| Total Consumer Discretionary | 64,524,807 |
| Consumer Staples 3.4% |
| Beverages 0.7% |
MGP Ingredients, Inc.
Distillery ingredients and products | 29,324 | 2,254,429 |
| Food Products 0.8% |
Hostess Brands, Inc.(a)
Packaged baked sweet goods | 168,259 | 2,491,916 |
| Household Products 0.9% |
WD-40 Co.
Multi-purpose lubricant products and heavy-duty hand cleaners | 26,367 | 3,111,306 |
| Personal Products 1.0% |
Inter Parfums, Inc.
Fragrances and related products | 73,756 | 3,204,698 |
| Total Consumer Staples | 11,062,349 |
| Energy 1.5% |
| Energy Equipment & Services 0.8% |
Core Laboratories NV(b)
Reservoir description, production enhancement, and reservoir management services | 23,516 | 2,576,178 |
The accompanying Notes to Financial Statements are an integral part of this statement.
Columbia Acorn Family of Funds | Annual Report 2017
| 59 |
Portfolio of Investments (continued)
Columbia Acorn USA®, December 31, 2017
| Common Stocks (continued) |
| Issuer | Shares | Value ($) |
| Oil, Gas & Consumable Fuels 0.7% |
PDC Energy, Inc.(a)
Petroleum products | 40,872 | 2,106,543 |
| Total Energy | 4,682,721 |
| Financials 12.9% |
| Banks 6.2% |
First Busey Corp.
Multi-bank holding company | 158,100 | 4,733,514 |
Great Southern Bancorp, Inc.
Real estate, commercial real estate, commercial business, consumer, and construction loans | 52,254 | 2,698,919 |
Lakeland Financial Corp.
Bank holding company | 83,474 | 4,047,654 |
LegacyTexas Financial Group, Inc.
Bank holding company | 47,712 | 2,013,924 |
Sandy Spring Bancorp, Inc.
Holding company for Sandy Spring Bank | 83,758 | 3,268,237 |
Trico Bancshares
Holding company for Tri Counties Bank | 84,461 | 3,197,693 |
| Total | | 19,959,941 |
| Capital Markets 4.2% |
Hamilton Lane, Inc., Class A
Private market investment solutions | 112,404 | 3,977,978 |
Houlihan Lokey, Inc.
Investment bank | 115,338 | 5,239,805 |
OM Asset Management PLC
Domestic and international equities, fixed income, and alternative investments | 264,261 | 4,426,372 |
| Total | | 13,644,155 |
| Consumer Finance 1.0% |
FirstCash, Inc.
Owns and operates pawn stores | 48,623 | 3,279,621 |
| Thrifts & Mortgage Finance 1.5% |
OceanFirst Financial Corp.
New Jersey banks | 105,024 | 2,756,880 |
Walker & Dunlop, Inc.(a)
Commercial real estate financial services | 40,979 | 1,946,503 |
| Total | | 4,703,383 |
| Total Financials | 41,587,100 |
| Common Stocks (continued) |
| Issuer | Shares | Value ($) |
| Health Care 28.3% |
| Biotechnology 7.3% |
Agios Pharmaceuticals, Inc.(a)
Therapeutics in the field of cancer metabolism | 71,982 | 4,115,211 |
Celldex Therapeutics, Inc.(a)
Uses applications of immunology to prevent and treat diseases | 708,320 | 2,011,629 |
Clovis Oncology, Inc.(a)
Pre-commercial Biotech Company | 37,123 | 2,524,364 |
Genomic Health, Inc.(a)
Development and commercialization of genomic-based clinical diagnostic tests for cancer | 80,229 | 2,743,832 |
Intercept Pharmaceuticals, Inc.(a),(b)
biopharmaceutical products | 31,439 | 1,836,666 |
Ligand Pharmaceuticals, Inc.(a)
Drugs that regulate hormone activated intracellular receptors | 31,748 | 4,347,254 |
Loxo Oncology, Inc.(a)
Researches and develops cancer drugs | 30,273 | 2,548,381 |
MacroGenics, Inc.(a)
Treatments for autoimmune disorders, cancer and infectious diseases | 109,771 | 2,085,649 |
Ultragenyx Pharmaceutical, Inc.(a)
Therapeutics and sialic acid for treating metabolic, body myopathy, glucuronidase, and rare genetic diseases | 29,473 | 1,366,958 |
| Total | | 23,579,944 |
| Health Care Equipment & Supplies 10.8% |
Anika Therapeutics, Inc.(a)
Integrated orthopedic medicines company | 63,338 | 3,414,552 |
Atrion Corp.
Medical products and components | 6,749 | 4,255,920 |
AxoGen, Inc.(a)
Technologies for peripheral nerve reconstruction and regeneration | 91,387 | 2,586,252 |
Entellus Medical, Inc.(a)
Therapeutic solutions and medical devices | 107,500 | 2,621,925 |
Haemonetics Corp.(a)
Automated blood processing systems | 70,814 | 4,112,877 |
iRhythm Technologies, Inc.(a)
Medical instruments | 75,460 | 4,229,533 |
LeMaitre Vascular, Inc.
Medical devices for vascular surgeons and interventionists | 64,474 | 2,052,852 |
Masimo Corp.(a)
Medical signal processing and sensor technology for non-invasive monitoring of physiological parameters | 45,010 | 3,816,848 |
The accompanying Notes to Financial Statements are an integral part of this statement.
| 60 | Columbia Acorn Family of Funds | Annual Report 2017 |
Portfolio of Investments (continued)
Columbia Acorn USA®, December 31, 2017
| Common Stocks (continued) |
| Issuer | Shares | Value ($) |
Natus Medical, Inc.(a)
Medical device company that develops, manufactures, and markets screening products | 49,662 | 1,897,088 |
OraSure Technologies, Inc.(a)
Medical devices and diagnostic products | 100,714 | 1,899,466 |
Sientra, Inc.(a)
Plastic surgery implantable devices | 126,252 | 1,775,103 |
Varex Imaging Corp.(a)
X-ray imaging components | 55,500 | 2,229,435 |
| Total | | 34,891,851 |
| Health Care Providers & Services 6.5% |
Amedisys, Inc.(a)
Provider of alternate-site health care services | 37,017 | 1,951,166 |
AMN Healthcare Services, Inc.(a)
Temporary healthcare staffing | 108,470 | 5,342,147 |
Chemed Corp.
Hospice and palliative care services | 2,398 | 582,762 |
HealthEquity, Inc.(a)
Technology-enabled services platforms for consumers to make healthcare saving and spending decisions | 77,415 | 3,612,184 |
HealthSouth Corp.
Inpatient rehabilitative healthcare services | 133,146 | 6,578,744 |
Tivity Health, Inc.(a)
Health fitness solutions | 82,371 | 3,010,660 |
| Total | | 21,077,663 |
| Health Care Technology 1.0% |
Evolent Health, Inc., Class A(a),(b)
Purpose-built platform enables providers to migrate their payment models | 147,478 | 1,813,979 |
Medidata Solutions, Inc.(a)
Hosted clinical development solutions | 24,846 | 1,574,491 |
| Total | | 3,388,470 |
| Life Sciences Tools & Services 2.0% |
Bio-Techne Corp.
Biotechnology products and clinical diagnostic controls | 15,231 | 1,973,176 |
Cambrex Corp.(a)
Products, services, and technologies for the Life Sciences and fine chemicals industry | 90,067 | 4,323,216 |
| Total | | 6,296,392 |
| Pharmaceuticals 0.7% |
Optinose, Inc.(a)
Health care services | 114,183 | 2,158,059 |
| Total Health Care | 91,392,379 |
| Common Stocks (continued) |
| Issuer | Shares | Value ($) |
| Industrials 10.9% |
| Building Products 0.8% |
American Woodmark Corp.(a)
Kitchen cabinets and vanities | 19,391 | 2,525,678 |
| Commercial Services & Supplies 3.6% |
Brink’s Co. (The)
Provides security services globally | 62,255 | 4,899,469 |
Healthcare Services Group, Inc.
Housekeeping, laundry, linen, facility maintenance, and food services | 41,925 | 2,210,286 |
Knoll, Inc.
Branded office furniture products and textiles | 102,008 | 2,350,264 |
Unifirst Corp.
Workplace uniforms and protective clothing | 13,947 | 2,299,860 |
| Total | | 11,759,879 |
| Machinery 3.5% |
Barnes Group, Inc.
International industrial and aerospace manufacturer and service provider | 59,966 | 3,794,049 |
ESCO Technologies, Inc.
Engineered products and solutions | 40,939 | 2,466,575 |
REV Group, Inc.
Specialty vehicles and related aftermarket parts and services | 68,936 | 2,242,488 |
Toro Co. (The)
Turf equipment | 40,574 | 2,646,642 |
| Total | | 11,149,754 |
| Professional Services 1.7% |
ICF International, Inc.(a)
Management, technology, policy consulting, and implementation services | 53,183 | 2,792,107 |
Wageworks, Inc.(a)
Tax-advantaged programs for consumer-directed health, commuter, and other employee spending account benefits | 43,115 | 2,673,130 |
| Total | | 5,465,237 |
| Road & Rail 0.7% |
Saia, Inc.(a)
Trucking transportation | 29,967 | 2,120,165 |
| Trading Companies & Distributors 0.6% |
SiteOne Landscape Supply, Inc.(a)
Landscape supplies | 25,180 | 1,931,306 |
| Total Industrials | 34,952,019 |
The accompanying Notes to Financial Statements are an integral part of this statement.
Columbia Acorn Family of Funds | Annual Report 2017
| 61 |
Portfolio of Investments (continued)
Columbia Acorn USA®, December 31, 2017
| Common Stocks (continued) |
| Issuer | Shares | Value ($) |
| Information Technology 20.2% |
| Electronic Equipment, Instruments & Components 1.0% |
II-VI, Inc.(a)
Optical and optoelectronic devices | 69,183 | 3,248,142 |
| Internet Software & Services 5.3% |
Alarm.com Holdings, Inc.(a)
Interactive security solutions | 42,400 | 1,600,600 |
Alteryx, Inc., Class A(a)
Data storage, retrieval, management, reporting, and analytics solutions | 154,980 | 3,916,345 |
Apptio, Inc., Class A(a)
Cloud-based business management solutions | 97,414 | 2,291,177 |
LogMeIn, Inc.
Remote connectivity services | 24,532 | 2,808,914 |
Mimecast Ltd.(a)
Cloud security and risk management services for corporate information and email | 116,768 | 3,347,738 |
MINDBODY, Inc., Class A(a)
Business management software | 49,300 | 1,501,185 |
Q2 Holdings, Inc.(a)
Secure, cloud-based virtual banking solutions | 46,334 | 1,707,408 |
| Total | | 17,173,367 |
| IT Services 4.0% |
CoreLogic, Inc.(a)
Consumer, financial and property information, analytics and services to business and government | 39,658 | 1,832,596 |
Euronet Worldwide, Inc.(a)
Electronic financial transaction solutions | 42,644 | 3,593,610 |
MAXIMUS, Inc.
Program management and consulting services to state and local governments | 60,664 | 4,342,329 |
WNS Holdings Ltd., ADR(a)
Business process outsourcing services | 77,423 | 3,106,985 |
| Total | | 12,875,520 |
| Semiconductors & Semiconductor Equipment 6.2% |
Advanced Energy Industries, Inc.(a)
Engineered precision power conversion, measurement and control solutions | 34,921 | 2,356,469 |
Ambarella, Inc.(a)
High definition video compression and image processing semiconductors | 56,660 | 3,328,775 |
Brooks Automation, Inc.
Automation solutions for the global semiconductor and related industries | 70,570 | 1,683,095 |
Cabot Microelectronics Corp.
slurries used in chemical mechanical planarization | 38,692 | 3,640,143 |
| Common Stocks (continued) |
| Issuer | Shares | Value ($) |
Inphi Corp.(a),(b)
Analog semiconductor solutions | 51,863 | 1,898,186 |
Monolithic Power Systems, Inc.
Power management solutions | 44,058 | 4,950,357 |
Semtech Corp.(a)
Analog and mixed-signal semiconductors | 60,321 | 2,062,978 |
| Total | | 19,920,003 |
| Software 3.7% |
Aspen Technology, Inc.(a)
Process optimization software, products and services | 63,317 | 4,191,585 |
Blackline, Inc.(a)
Develops and markets enterprise software | 68,381 | 2,242,897 |
CyberArk Software Ltd.(a)
IT security solutions | 35,526 | 1,470,421 |
Qualys, Inc.(a)
Information technology security risk and compliance management solutions | 69,811 | 4,143,283 |
| Total | | 12,048,186 |
| Total Information Technology | 65,265,218 |
| Materials 1.7% |
| Chemicals 1.7% |
Orion Engineered Carbons SA
Global supplier of Carbon Black | 130,987 | 3,353,267 |
Quaker Chemical Corp.
Custom-formulated chemical specialty products | 14,017 | 2,113,624 |
| Total | | 5,466,891 |
| Total Materials | 5,466,891 |
| Real Estate 2.1% |
| Equity Real Estate Investment Trusts (REITS) 1.4% |
CoreCivic, Inc.
Detention and corrections services | 105,070 | 2,364,075 |
UMH Properties, Inc.
Real estate investment trust | 139,316 | 2,075,809 |
| Total | | 4,439,884 |
| Real Estate Management & Development 0.7% |
Colliers International Group, Inc.
Commercial real estate, residential property management and property services | 38,700 | 2,335,545 |
| Total Real Estate | 6,775,429 |
Total Common Stocks
(Cost: $259,537,701) | 325,708,913 |
|
The accompanying Notes to Financial Statements are an integral part of this statement.
| 62 | Columbia Acorn Family of Funds | Annual Report 2017 |
Portfolio of Investments (continued)
Columbia Acorn USA®, December 31, 2017
| Securities Lending Collateral 1.0% |
| | Shares | Value ($) |
Dreyfus Government Cash Management Fund, Institutional Shares, 1.190%(c),(d)
| 3,283,375 | 3,283,375 |
Total Securities Lending Collateral
(Cost: $3,283,375) | 3,283,375 |
|
| Money Market Funds 0.3% |
| | |
| JPMorgan U.S. Government Money Market Fund, Agency Shares, 1.090%(c) | 1,029,679 | 1,029,679 |
Total Money Market Funds
(Cost: $1,029,679) | 1,029,679 |
Total Investments
(Cost $263,850,755) | 330,021,967 |
| Obligation to Return Collateral for Securities Loaned | | (3,283,375) |
| Other Assets & Liabilities, Net | | (4,060,994) |
| Net Assets | $322,677,598 |
Notes to Portfolio of Investments
| (a) | Non-income producing security. |
| (b) | All or a portion of this security was on loan at December 31, 2017. The total market value of securities on loan at December 31, 2017 was $3,128,036. |
| (c) | The rate shown is the seven-day current annualized yield at December 31, 2017. |
| (d) | Investment made with cash collateral received from securities lending activity. |
Abbreviation Legend
| ADR | American Depositary Receipt |
Fair value measurements
Various inputs are used in determining the value of the Fund’s investments, following the input prioritization hierarchy established by accounting principles generally accepted in the United States of America (GAAP). These inputs are summarized in the three broad levels listed below:
| ¦ | Level 1 – quoted prices in active markets for identical securities |
| ¦ | Level 2 – prices determined using other significant observable inputs (including quoted prices for similar securities, interest rates, prepayment speeds, credit risk and others) |
| ¦ | Level 3 – prices determined using significant unobservable inputs where quoted prices or observable inputs are unavailable or less reliable (including management’s own assumptions about the factors market participants would use in pricing an investment) |
The inputs or methodology used for valuing securities are not necessarily an indication of the risk associated with investing in those securities.
Examples of the types of securities in which the Fund would typically invest and how they are classified within this hierarchy are as follows. Typical Level 1 securities include exchange traded domestic equities, mutual funds whose net asset values are published each day and exchange traded foreign equities that are not statistically fair valued. Typical Level 2 securities include exchange traded foreign equities that are statistically fair valued, forward foreign currency exchange contracts and short-term investments valued at amortized cost. Additionally, securities fair valued by Columbia Wanger Asset Management’s Valuation Committee (the Committee) that rely on significant observable inputs are also included in Level 2. Typical Level 3 securities include any security fair valued by the Committee that relies on significant unobservable inputs.
The Committee is responsible for applying the Columbia Acorn Trust Portfolio Pricing Policy and the Columbia Wanger Asset Management pricing procedures (the Policies), which are approved by and subject to the oversight of the Board of Trustees.
The Committee meets as necessary, and no less frequently than quarterly, to determine fair values for securities for which market quotations are not readily available or for which Columbia Wanger Asset Management believes that available market quotations are unreliable. The Committee also reviews the continuing appropriateness of the Policies. In circumstances where a security has been fair valued, the Committee will also review the continuing appropriateness of the current value of the security. The Policies address, among other things: circumstances under which market quotations will be deemed readily available; selection of third party pricing vendors; appropriate pricing methodologies; events that require fair valuation and fair value techniques; circumstances under which securities will be deemed to pose a potential for stale pricing, including when securities are illiquid, restricted, or in default; and certain delegations of authority to determine fair values to the Fund’s investment manager. The Committee may also meet to discuss additional valuation matters, which may include review of back-testing results, review of time-sensitive information or approval of other valuation related actions, and to review the appropriateness of the Policies.
The accompanying Notes to Financial Statements are an integral part of this statement.
Columbia Acorn Family of Funds | Annual Report 2017
| 63 |
Portfolio of Investments (continued)
Columbia Acorn USA®, December 31, 2017
Fair value measurements (continued)
For investments categorized as Level 3, the significant unobservable inputs used in the fair value measurement of the Fund’s securities may include: (i) data specific to the issuer or comparable issuers, (ii) general market or specific sector news and (iii) quoted prices and specific or similar security transactions. The Committee considers this data and any changes from prior periods in order to assess the reasonableness of observable and unobservable inputs, any assumptions or internal models used to value those securities and changes in fair value. Significant changes in any of these factors could result in lower or higher fair value measurements. Various factors impact the frequency of monitoring (which may occur as often as daily), however the Committee may determine that changes to inputs, assumptions and models are not required with the same frequency.
The following table is a summary of the inputs used to value the Fund’s investments at December 31, 2017:
| | Level 1
quoted prices in active
markets for identical
assets ($) | Level 2
other significant
observable inputs ($) | Level 3
significant
unobservable inputs ($) | Total ($) |
| Investments | | | | |
| Common Stocks | | | | |
| Consumer Discretionary | 64,524,807 | — | — | 64,524,807 |
| Consumer Staples | 11,062,349 | — | — | 11,062,349 |
| Energy | 4,682,721 | — | — | 4,682,721 |
| Financials | 41,587,100 | — | — | 41,587,100 |
| Health Care | 91,392,379 | — | — | 91,392,379 |
| Industrials | 34,952,019 | — | — | 34,952,019 |
| Information Technology | 65,265,218 | — | — | 65,265,218 |
| Materials | 5,466,891 | — | — | 5,466,891 |
| Real Estate | 6,775,429 | — | — | 6,775,429 |
| Total Common Stocks | 325,708,913 | — | — | 325,708,913 |
| Securities Lending Collateral | 3,283,375 | — | — | 3,283,375 |
| Money Market Funds | 1,029,679 | — | — | 1,029,679 |
| Total Investments | 330,021,967 | — | — | 330,021,967 |
There were no transfers of financial assets between levels during the period.
The accompanying Notes to Financial Statements are an integral part of this statement.
| 64 | Columbia Acorn Family of Funds | Annual Report 2017 |
Portfolio of Investments
Columbia Acorn International SelectSM, December 31, 2017
(Percentages represent value of investments compared to net assets)
| Common Stocks 94.0% |
| Issuer | Shares | Value ($) |
| Australia 1.9% |
Domino’s Pizza Enterprises Ltd.(a)
Pizza delivery stores | 70,000 | 2,544,218 |
| Canada 4.3% |
CCL Industries, Inc.
Manufacturing services and specialty packaging products for the non-durable consumer products market | 121,000 | 5,590,835 |
| China 8.4% |
China Medical System Holdings Ltd.
Pharmaceutical and medical products | 1,151,000 | 2,679,288 |
NetEase, Inc., ADR
Internet technology company that develops applications, services and Internet technologies | 15,600 | 5,383,092 |
New Oriental Education & Technology Group, Inc., ADR
Educational services | 30,600 | 2,876,400 |
| Total | 10,938,780 |
| Denmark 3.9% |
Novozymes AS, Class B
Enzymes for industrial use | 89,955 | 5,139,499 |
| France 3.7% |
Ipsen SA
Medical drugs for targeted disease areas | 18,000 | 2,150,442 |
Legrand SA
Products and systems for electrical installations and information networks | 35,000 | 2,695,641 |
| Total | 4,846,083 |
| Germany 8.7% |
MTU Aero Engines AG
Develops and manufactures engines and offers commercial engine services and support | 33,500 | 5,986,275 |
Wirecard AG
Internet payment and processing services | 48,800 | 5,423,749 |
| Total | 11,410,024 |
| India 3.1% |
Zee Entertainment Enterprises Ltd.
Hindi films, serials, game shows and children’s programs | 452,000 | 4,115,089 |
| Ireland 1.6% |
Ryanair Holdings PLC(b)
Low fare passenger airline services | 115,000 | 2,060,244 |
| Italy 1.7% |
Brembo SpA
Braking systems and components | 147,000 | 2,234,707 |
| Common Stocks (continued) |
| Issuer | Shares | Value ($) |
| Japan 17.4% |
Aeon Mall Co., Ltd.
Large-scale shopping malls | 178,600 | 3,488,182 |
FamilyMart UNY Holdings Co., Ltd.
Chain of convenience stores | 78,000 | 5,462,978 |
Hoya Corp.
Electro-optics products | 46,000 | 2,290,947 |
Recruit Holdings Co., Ltd.
Information providing services in human resource, housing, bridal, travel, restaurants, beauty, automobiles, and education and more | 104,200 | 2,587,282 |
Santen Pharmaceutical Co., Ltd.
Ophthalmic medicine | 151,200 | 2,367,847 |
Sekisui Chemical Co., Ltd.
Unit residential houses in addition to parcels of land | 129,000 | 2,582,621 |
Sony Financial Holdings, Inc.
Financial holding company | 224,500 | 3,967,726 |
| Total | 22,747,583 |
| Mexico 2.0% |
Grupo Aeroportuario del Sureste SAB de CV, ADR
Operates airports in Mexico | 14,000 | 2,555,140 |
| Netherlands 2.9% |
Koninklijke Philips NV
Health technology focused on improving people’s health | 100,000 | 3,784,325 |
| South Africa 4.5% |
Naspers Ltd., Class N
Electronic and print media industries | 21,300 | 5,901,236 |
| South Korea 2.1% |
Korea Zinc Co. Ltd.
Non-ferrous metal smelting | 5,900 | 2,717,015 |
| Sweden 6.5% |
Hexagon AB, Class B
Design, measurement and visualisation technologies | 120,000 | 6,010,898 |
Trelleborg AB, Class B
Manufactures and distributes industrial products | 106,000 | 2,455,170 |
| Total | 8,466,068 |
| Switzerland 4.7% |
Partners Group Holding AG(a)
Global private markets asset management firm | 9,060 | 6,210,765 |
| Taiwan 2.2% |
Largan Precision Co., Ltd.
Optical lens modules and optoelectronic components | 21,000 | 2,818,859 |
The accompanying Notes to Financial Statements are an integral part of this statement.
Columbia Acorn Family of Funds | Annual Report 2017
| 65 |
Portfolio of Investments (continued)
Columbia Acorn International SelectSM, December 31, 2017
| Common Stocks (continued) |
| Issuer | Shares | Value ($) |
| United Kingdom 14.4% |
Ferguson PLC
Bathroom materials, heating and plumbing supplies, and industrial pipes, valves, and fittings | 50,000 | 3,588,198 |
Halma PLC
Products that detect hazards and protect assets and people in public and commercial buildings | 164,286 | 2,791,410 |
Micro Focus International PLC
Enterprise application management solutions | 62,988 | 2,140,761 |
Rentokil Initial PLC
Fully integrated facilities management and essential support services | 593,000 | 2,540,511 |
Rightmove PLC
Website that lists properties across Britain | 43,800 | 2,658,035 |
Spirax-Sarco Engineering PLC
Consultation, service and products for the control and efficient management of steam and industrial fluids | 28,000 | 2,116,933 |
WH Smith PLC
Retails books, magazines, newspapers, and periodicals | 93,930 | 2,976,457 |
| Total | 18,812,305 |
Total Common Stocks
(Cost: $81,187,112) | 122,892,775 |
| Preferred Stocks 1.8% |
| Issuer | Coupon
Rate | Shares | Value ($) |
| Germany 1.8% |
Sartorius AG
Precision electronic equipment and components | — | 25,000 | 2,374,807 |
Total Preferred Stocks
(Cost: $2,475,897) | 2,374,807 |
| Securities Lending Collateral 4.5% |
| | Shares | Value ($) |
Dreyfus Government Cash Management Fund, Institutional Shares, 1.190%(c),(d)
| 5,961,556 | 5,961,556 |
Total Securities Lending Collateral
(Cost: $5,961,556) | 5,961,556 |
|
| Money Market Funds 4.0% |
| | |
JPMorgan U.S. Government Money Market Fund, IM Shares, 1.192%(c)
| 5,227,646 | 5,227,646 |
Total Money Market Funds
(Cost: $5,227,646) | 5,227,646 |
Total Investments
(Cost: $94,852,211) | 136,456,784 |
| Obligation to Return Collateral for Securities Loaned | | (5,961,556) |
| Other Assets & Liabilities, Net | | 299,576 |
| Net Assets | $130,794,804 |
Notes to Portfolio of Investments
| (a) | All or a portion of this security was on loan at December 31, 2017. The total market value of securities on loan at December 31, 2017 was $5,681,155. |
| (b) | Non-income producing security. |
| (c) | The rate shown is the seven-day current annualized yield at December 31, 2017. |
| (d) | Investment made with cash collateral received from securities lending activity. |
Abbreviation Legend
| ADR | American Depositary Receipt |
Fair value measurements
Various inputs are used in determining the value of the Fund’s investments, following the input prioritization hierarchy established by accounting principles generally accepted in the United States of America (GAAP). These inputs are summarized in the three broad levels listed below:
| ¦ | Level 1 – quoted prices in active markets for identical securities |
The accompanying Notes to Financial Statements are an integral part of this statement.
| 66 | Columbia Acorn Family of Funds | Annual Report 2017 |
Portfolio of Investments (continued)
Columbia Acorn International SelectSM, December 31, 2017
Fair value measurements (continued)
¦
Level 2 – prices determined using other significant observable inputs (including quoted prices for similar securities, interest rates, prepayment speeds, credit risk and others)
| ¦ | Level 3 – prices determined using significant unobservable inputs where quoted prices or observable inputs are unavailable or less reliable (including management’s own assumptions about the factors market participants would use in pricing an investment) |
The inputs or methodology used for valuing securities are not necessarily an indication of the risk associated with investing in those securities.
Examples of the types of securities in which the Fund would typically invest and how they are classified within this hierarchy are as follows. Typical Level 1 securities include exchange traded domestic equities, mutual funds whose net asset values are published each day and exchange traded foreign equities that are not statistically fair valued. Typical Level 2 securities include exchange traded foreign equities that are statistically fair valued, forward foreign currency exchange contracts and short-term investments valued at amortized cost. Additionally, securities fair valued by Columbia Wanger Asset Management’s Valuation Committee (the Committee) that rely on significant observable inputs are also included in Level 2. Typical Level 3 securities include any security fair valued by the Committee that relies on significant unobservable inputs.
The Committee is responsible for applying the Columbia Acorn Trust Portfolio Pricing Policy and the Columbia Wanger Asset Management pricing procedures (the Policies), which are approved by and subject to the oversight of the Board of Trustees.
The Committee meets as necessary, and no less frequently than quarterly, to determine fair values for securities for which market quotations are not readily available or for which Columbia Wanger Asset Management believes that available market quotations are unreliable. The Committee also reviews the continuing appropriateness of the Policies. In circumstances where a security has been fair valued, the Committee will also review the continuing appropriateness of the current value of the security. The Policies address, among other things: circumstances under which market quotations will be deemed readily available; selection of third party pricing vendors; appropriate pricing methodologies; events that require fair valuation and fair value techniques; circumstances under which securities will be deemed to pose a potential for stale pricing, including when securities are illiquid, restricted, or in default; and certain delegations of authority to determine fair values to the Fund’s investment manager. The Committee may also meet to discuss additional valuation matters, which may include review of back-testing results, review of time-sensitive information or approval of other valuation related actions, and to review the appropriateness of the Policies.
For investments categorized as Level 3, the significant unobservable inputs used in the fair value measurement of the Fund’s securities may include: (i) data specific to the issuer or comparable issuers, (ii) general market or specific sector news and (iii) quoted prices and specific or similar security transactions. The Committee considers this data and any changes from prior periods in order to assess the reasonableness of observable and unobservable inputs, any assumptions or internal models used to value those securities and changes in fair value. Significant changes in any of these factors could result in lower or higher fair value measurements. Various factors impact the frequency of monitoring (which may occur as often as daily), however the Committee may determine that changes to inputs, assumptions and models are not required with the same frequency.
The following table is a summary of the inputs used to value the Fund’s investments at December 31, 2017:
| | Level 1
quoted prices in active
markets for identical
assets ($) | Level 2
other significant
observable inputs ($) | Level 3
significant
unobservable inputs ($) | Total ($) |
| Investments | | | | |
| Common Stocks | | | | |
| Australia | — | 2,544,218 | — | 2,544,218 |
| Canada | 5,590,835 | — | — | 5,590,835 |
| China | 8,259,492 | 2,679,288 | — | 10,938,780 |
| Denmark | — | 5,139,499 | — | 5,139,499 |
| France | — | 4,846,083 | — | 4,846,083 |
| Germany | — | 11,410,024 | — | 11,410,024 |
| India | — | 4,115,089 | — | 4,115,089 |
| Ireland | — | 2,060,244 | — | 2,060,244 |
| Italy | — | 2,234,707 | — | 2,234,707 |
| Japan | — | 22,747,583 | — | 22,747,583 |
| Mexico | 2,555,140 | — | — | 2,555,140 |
| Netherlands | — | 3,784,325 | — | 3,784,325 |
| South Africa | — | 5,901,236 | — | 5,901,236 |
| South Korea | — | 2,717,015 | — | 2,717,015 |
| Sweden | — | 8,466,068 | — | 8,466,068 |
| Switzerland | — | 6,210,765 | — | 6,210,765 |
| Taiwan | — | 2,818,859 | — | 2,818,859 |
| United Kingdom | — | 18,812,305 | — | 18,812,305 |
| Total Common Stocks | 16,405,467 | 106,487,308 | — | 122,892,775 |
| Preferred Stocks | | | | |
| Germany | — | 2,374,807 | — | 2,374,807 |
| Total Preferred Stocks | — | 2,374,807 | — | 2,374,807 |
| Securities Lending Collateral | 5,961,556 | — | — | 5,961,556 |
| Money Market Funds | 5,227,646 | — | — | 5,227,646 |
| Total Investments | 27,594,669 | 108,862,115 | — | 136,456,784 |
The accompanying Notes to Financial Statements are an integral part of this statement.
Columbia Acorn Family of Funds | Annual Report 2017
| 67 |
Portfolio of Investments (continued)
Columbia Acorn International SelectSM, December 31, 2017
Fair value measurements (continued)
The Fund’s assets assigned to the Level 2 input category are generally valued using a market approach, in which a security’s value is determined through its correlation to prices and information from observable market transactions for similar or identical assets. Foreign equities are generally valued at the last sale price on the foreign exchange or market on which they trade. The Fund may use a statistical fair valuation model, in accordance with the policy adopted by the Board of Trustees, provided by an independent third party to value securities principally traded in foreign markets in order to adjust for possible stale pricing that may occur between the close of the foreign exchanges and the time for valuation. These models take into account available market data including intraday index, ADR, and ETF movements.
There were no transfers of financial assets between levels during the period.
The accompanying Notes to Financial Statements are an integral part of this statement.
| 68 | Columbia Acorn Family of Funds | Annual Report 2017 |
Portfolio of Investments
Columbia Acorn SelectSM, December 31, 2017
(Percentages represent value of investments compared to net assets)
| Common Stocks 98.3% |
| Issuer | Shares | Value ($) |
| Consumer Discretionary 19.5% |
| Auto Components 5.0% |
LCI Industries
Recreational vehicles and equipment | 119,566 | 15,543,580 |
| Distributors 4.6% |
LKQ Corp.(a)
Automotive products and services | 351,942 | 14,313,481 |
| Hotels, Restaurants & Leisure 7.0% |
Papa John’s International, Inc.
Pizza delivery and carry-out restaurants | 128,246 | 7,195,883 |
Vail Resorts, Inc.
Operates resorts globally | 67,242 | 14,286,908 |
| Total | | 21,482,791 |
| Media 2.9% |
Liberty Global PLC, Class A(a)
Broadband, distribution, and content companies | 250,140 | 8,965,018 |
| Total Consumer Discretionary | 60,304,870 |
| Financials 15.4% |
| Banks 5.6% |
SVB Financial Group(a)
Holding company for Silicon Valley Bank | 74,744 | 17,472,905 |
| Capital Markets 6.9% |
Eaton Vance Corp.
Creates, markets, and manages mutual funds | 230,547 | 13,000,545 |
Lazard Ltd., Class A
Corporate Advisory & Asset Management | 159,877 | 8,393,543 |
| Total | | 21,394,088 |
| Consumer Finance 2.9% |
FirstCash, Inc.
Owns and operates pawn stores | 131,448 | 8,866,167 |
| Total Financials | 47,733,160 |
| Health Care 17.3% |
| Biotechnology 2.5% |
Genomic Health, Inc.(a)
Development and commercialization of genomic-based clinical diagnostic tests for cancer | 179,278 | 6,131,308 |
Ultragenyx Pharmaceutical, Inc.(a)
Therapeutics and sialic acid for treating metabolic, body myopathy, glucuronidase, and rare genetic diseases | 34,290 | 1,590,370 |
| Total | | 7,721,678 |
| Common Stocks (continued) |
| Issuer | Shares | Value ($) |
| Health Care Equipment & Supplies 9.4% |
Align Technology, Inc.(a)
Designs, manufactures, and markets the Invisalign System | 31,403 | 6,977,433 |
Masimo Corp.(a)
Medical signal processing and sensor technology for non-invasive monitoring of physiological parameters | 124,500 | 10,557,600 |
Natus Medical, Inc.(a)
Medical device company that develops, manufactures, and markets screening products | 303,132 | 11,579,642 |
| Total | | 29,114,675 |
| Health Care Providers & Services 5.4% |
HealthSouth Corp.
Inpatient rehabilitative healthcare services | 337,823 | 16,691,834 |
| Total Health Care | 53,528,187 |
| Industrials 24.6% |
| Machinery 17.5% |
Middleby Corp. (The)(a)
Equipment for use in cooking and preparing food | 117,463 | 15,851,632 |
Nordson Corp.
Systems that apply adhesives, sealants, and coatings to products during manufacturing | 54,714 | 8,010,130 |
Oshkosh Corp.
Fire and emergency apparatuses and specialty commercial, and military trucks | 169,942 | 15,446,028 |
Snap-On, Inc.
Tool and equipment solutions | 84,463 | 14,721,901 |
| Total | | 54,029,691 |
| Road & Rail 7.1% |
AMERCO
Rental of trucks, trailers, and self storage space, as well as property and casualty and life insurance products | 22,480 | 8,495,417 |
JB Hunt Transport Services, Inc.
Logistics services | 116,635 | 13,410,692 |
| Total | | 21,906,109 |
| Total Industrials | 75,935,800 |
The accompanying Notes to Financial Statements are an integral part of this statement.
Columbia Acorn Family of Funds | Annual Report 2017
| 69 |
Portfolio of Investments (continued)
Columbia Acorn SelectSM, December 31, 2017
| Common Stocks (continued) |
| Issuer | Shares | Value ($) |
| Information Technology 15.8% |
| Internet Software & Services 11.9% |
GoDaddy, Inc., Class A(a)
Cloud-based web platform for small businesses, web design professionals and individuals | 307,794 | 15,475,883 |
SPS Commerce, Inc.(a)
On-demand supply chain management solutions through an online hosted software suite | 157,214 | 7,639,028 |
VeriSign, Inc.(a)
Domain names and Internet security services | 120,009 | 13,733,830 |
| Total | | 36,848,741 |
| Software 3.9% |
ANSYS, Inc.(a)
Software solutions for design analysis and optimization | 80,999 | 11,954,642 |
| Total Information Technology | 48,803,383 |
| Materials 2.9% |
| Chemicals 2.9% |
Celanese Corp., Class A
Global integrated producer of chemicals and advanced materials | 83,799 | 8,973,197 |
| Total Materials | 8,973,197 |
| Common Stocks (continued) |
| Issuer | Shares | Value ($) |
| Real Estate 2.8% |
| Equity Real Estate Investment Trusts (REITS) 2.8% |
Education Realty Trust, Inc.
Self-managed and self-advised real estate investment trust | 244,432 | 8,535,565 |
| Total Real Estate | 8,535,565 |
Total Common Stocks
(Cost: $221,147,909) | 303,814,162 |
|
| Money Market Funds 1.4% |
| | Shares | Value ($) |
| JPMorgan U.S. Government Money Market Fund, Agency Shares, 1.090%(b) | 4,278,755 | 4,278,755 |
Total Money Market Funds
(Cost: $4,278,755) | 4,278,755 |
Total Investments
(Cost $225,426,664) | 308,092,917 |
| Other Assets & Liabilities, Net | | 785,019 |
| Net Assets | $308,877,936 |
Notes to Portfolio of Investments
| (a) | Non-income producing security. |
| (b) | The rate shown is the seven-day current annualized yield at December 31, 2017. |
Fair value measurements
Various inputs are used in determining the value of the Fund’s investments, following the input prioritization hierarchy established by accounting principles generally accepted in the United States of America (GAAP). These inputs are summarized in the three broad levels listed below:
| ¦ | Level 1 – quoted prices in active markets for identical securities |
| ¦ | Level 2 – prices determined using other significant observable inputs (including quoted prices for similar securities, interest rates, prepayment speeds, credit risk and others) |
| ¦ | Level 3 – prices determined using significant unobservable inputs where quoted prices or observable inputs are unavailable or less reliable (including management’s own assumptions about the factors market participants would use in pricing an investment) |
The inputs or methodology used for valuing securities are not necessarily an indication of the risk associated with investing in those securities.
Examples of the types of securities in which the Fund would typically invest and how they are classified within this hierarchy are as follows. Typical Level 1 securities include exchange traded domestic equities, mutual funds whose net asset values are published each day and exchange traded foreign equities that are not statistically fair valued. Typical Level 2 securities include exchange traded foreign equities that are statistically fair valued, forward foreign currency exchange contracts and short-term investments valued at amortized cost. Additionally, securities fair valued by Columbia Wanger Asset Management’s Valuation Committee (the Committee) that rely on significant observable inputs are also included in Level 2. Typical Level 3 securities include any security fair valued by the Committee that relies on significant unobservable inputs.
The Committee is responsible for applying the Columbia Acorn Trust Portfolio Pricing Policy and the Columbia Wanger Asset Management pricing procedures (the Policies), which are approved by and subject to the oversight of the Board of Trustees.
The Committee meets as necessary, and no less frequently than quarterly, to determine fair values for securities for which market quotations are not readily available or for which Columbia Wanger Asset Management believes that available market quotations are unreliable. The Committee also reviews the continuing appropriateness of the Policies. In circumstances where a security has been fair valued, the Committee will also review the continuing appropriateness of the current value of the security. The Policies address, among other things: circumstances under which market quotations will be deemed readily available; selection of third party pricing vendors; appropriate pricing methodologies; events that
The accompanying Notes to Financial Statements are an integral part of this statement.
| 70 | Columbia Acorn Family of Funds | Annual Report 2017 |
Portfolio of Investments (continued)
Columbia Acorn SelectSM, December 31, 2017
Fair value measurements (continued)
require fair valuation and fair value techniques; circumstances under which securities will be deemed to pose a potential for stale pricing, including when securities are illiquid, restricted, or in default; and certain delegations of authority to determine fair values to the Fund’s investment manager. The Committee may also meet to discuss additional valuation matters, which may include review of back-testing results, review of time-sensitive information or approval of other valuation related actions, and to review the appropriateness of the Policies.
For investments categorized as Level 3, the significant unobservable inputs used in the fair value measurement of the Fund’s securities may include: (i) data specific to the issuer or comparable issuers, (ii) general market or specific sector news and (iii) quoted prices and specific or similar security transactions. The Committee considers this data and any changes from prior periods in order to assess the reasonableness of observable and unobservable inputs, any assumptions or internal models used to value those securities and changes in fair value. Significant changes in any of these factors could result in lower or higher fair value measurements. Various factors impact the frequency of monitoring (which may occur as often as daily), however the Committee may determine that changes to inputs, assumptions and models are not required with the same frequency.
The following table is a summary of the inputs used to value the Fund’s investments at December 31, 2017:
| | Level 1
quoted prices in active
markets for identical
assets ($) | Level 2
other significant
observable inputs ($) | Level 3
significant
unobservable inputs ($) | Total ($) |
| Investments | | | | |
| Common Stocks | | | | |
| Consumer Discretionary | 60,304,870 | — | — | 60,304,870 |
| Financials | 47,733,160 | — | — | 47,733,160 |
| Health Care | 53,528,187 | — | — | 53,528,187 |
| Industrials | 75,935,800 | — | — | 75,935,800 |
| Information Technology | 48,803,383 | — | — | 48,803,383 |
| Materials | 8,973,197 | — | — | 8,973,197 |
| Real Estate | 8,535,565 | — | — | 8,535,565 |
| Total Common Stocks | 303,814,162 | — | — | 303,814,162 |
| Money Market Funds | 4,278,755 | — | — | 4,278,755 |
| Total Investments | 308,092,917 | — | — | 308,092,917 |
There were no transfers of financial assets between levels during the period.
The accompanying Notes to Financial Statements are an integral part of this statement.
Columbia Acorn Family of Funds | Annual Report 2017
| 71 |
Portfolio of Investments
Columbia Thermostat FundSM, December 31, 2017
(Percentages represent value of investments compared to net assets)
| Equity Funds 9.9% |
| Issuer | Shares | Value ($) |
| Dividend Income 2.0% |
Columbia Dividend Income Fund, Institutional 3 Class(a)
| 759,793 | 17,034,557 |
| Total Dividend Income | 17,034,557 |
| International Small Mid Cap 2.0% |
Columbia Acorn International, Institutional 3 Class(a)
| 364,288 | 17,103,315 |
| Total International Small Mid Cap | 17,103,315 |
| U.S. Large Cap 3.9% |
Columbia Contrarian Core Fund, Institutional 3 Class(a)
| 323,920 | 8,512,622 |
Columbia Large Cap Enhanced Core Fund, Institutional 3 Class(a)
| 345,654 | 8,506,542 |
Columbia Select Large Cap Equity Fund, Institutional 3 Class(a)
| 595,505 | 8,509,761 |
Columbia Select Large Cap Growth Fund, Institutional 3 Class(a),(b)
| 492,597 | 8,502,217 |
| Total U.S. Large Cap | 34,031,142 |
| U.S. Mid Cap 1.0% |
Columbia Acorn Select, Institutional 3 Class(a),(b)
| 487,249 | 8,492,758 |
| Total U.S. Mid Cap | 8,492,758 |
| U.S. Small Mid Cap 1.0% |
Columbia Acorn Fund, Institutional 3 Class(a),(b)
| 519,202 | 8,483,765 |
| Total U.S. Small Mid Cap | 8,483,765 |
Total Equity Funds
(Cost: $58,776,497) | 85,145,537 |
|
| Fixed-Income Funds 89.8% |
| Issuer | Shares | Value ($) |
| High Yield 9.0% |
Columbia Income Opportunities Fund, Institutional 3 Class(a)
| 7,774,323 | 77,276,769 |
| Total High Yield | 77,276,769 |
| Investment Grade 80.8% |
Columbia Short Term Bond Fund, Institutional 3 Class(a)
| 31,104,620 | 308,557,829 |
Columbia Total Return Bond Fund, Institutional 3 Class(a)
| 17,065,809 | 154,274,918 |
Columbia U.S. Government Mortgage Fund, Institutional 3 Class(a)
| 28,648,549 | 154,415,678 |
Columbia U.S. Treasury Index Fund, Institutional 3 Class(a)
| 6,949,835 | 77,143,166 |
| Total Investment Grades | 694,391,591 |
Total Fixed-Income Funds
(Cost: $769,274,585) | 771,668,360 |
|
| Money Market Funds 0.2% |
| | Shares | Value ($) |
| JPMorgan U.S. Government Money Market Fund, Agency Shares, 1.090%(c) | 1,910,983 | 1,910,983 |
Total Money Market Funds
(Cost: $1,910,983) | 1,910,983 |
Total Investments
(Cost $829,962,065) | 858,724,880 |
| Other Assets & Liabilities, Net | | 506,166 |
| Net Assets | $859,231,046 |
The accompanying Notes to Financial Statements are an integral part of this statement.
| 72 | Columbia Acorn Family of Funds | Annual Report 2017 |
Portfolio of Investments (continued)
Columbia Thermostat FundSM, December 31, 2017
Notes to Portfolio of Investments
| (a) | An affiliated person of the Fund, as defined in the Investment Company Act of 1940, may include any company in which the Fund owns five percent or more of its outstanding voting shares. Holdings and transactions in these affiliated companies during the year ended ended December 31, 2017, are as follows. The aggregate cost and value of these companies at December 31, 2017, was $828,051,082 and $856,813,897, respectively. Investments in affiliated companies represented 99.72% of the Fund’s total net assets at December 31, 2017. |
| Issuer | Beginning
shares | Shares
purchased | Shares
sold | Ending
shares | Realized gain
(loss) —
affiliated
issuers ($) | Net change in
unrealized
appreciation
(depreciation) —
affiliated
issuers ($) | Dividend —
affiliated
issuers ($) | Capital gain
distributions —
affiliated
issuers ($) | Value —
affiliated
issuers
at end of
period ($) |
| Columbia Acorn Fund, Class I Shares |
| | 704,294 | — | (704,294) 1 | — | (25,299) | 615,947 | — | — | — |
| Columbia Acorn Fund, Institutional 3 Class |
| | — | 1,589,226 1 | (1,070,024) | 519,202 | 492,242 | (215,764) | — | 2,179,061 | 8,483,765 |
| Columbia Acorn International, Class I Shares |
| | 587,054 | — | (587,054) 1 | — | 393,821 | (3,095,669) | — | — | — |
| Columbia Acorn International, Institutional 3 Class |
| | — | 1,214,232 1 | (849,944) | 364,288 | 3,245,980 | 5,736,859 | 568,852 | 888,555 | 17,103,315 |
| Columbia Acorn Select, Class I Shares |
| | 738,151 | — | (738,151) 1 | — | 94,331 | (881,292) | — | — | — |
| Columbia Acorn Select, Institutional 3 Class |
| | — | 1,669,063 1 | (1,181,814) | 487,249 | 370,313 | 1,528,227 | — | 2,039,185 | 8,492,758 |
| Columbia Contrarian Core Fund, Class I Shares |
| | 966,230 | — | (966,230) 1 | — | 428,650 | (5,344,696) | — | — | — |
| Columbia Contrarian Core Fund, Institutional 3 Class |
| | — | 1,060,193 1 | (736,273) | 323,920 | 3,575,513 | 4,406,187 | 90,131 | 406,133 | 8,512,622 |
| Columbia Dividend Income Fund, Class I Shares |
| | 1,141,969 | 5,458 | (1,147,427) 1 | — | 347,840 | (5,811,199) | 109,213 | — | — |
| Columbia Dividend Income Fund, Institutional 3 Class |
| | — | 2,520,730 1 | (1,760,937) | 759,793 | 2,485,043 | 7,258,830 | 402,219 | 453,609 | 17,034,557 |
| Columbia Income Opportunities Fund, Class I Shares |
| | 10,148,993 | 79,762 | (10,228,755) 1 | — | 125,579 | (3,520,955) | 1,094,168 | — | — |
| Columbia Income Opportunities Fund, Institutional 3 Class |
| | — | 11,195,847 1 | (3,421,524) | 7,774,323 | 966,822 | 3,913,900 | 2,948,826 | — | 77,276,769 |
| Columbia Large Cap Enhanced Core Fund, Class I Shares |
| | 483,277 | — | (483,277) 1 | — | 295,597 | (5,100,344) | — | — | — |
| Columbia Large Cap Enhanced Core Fund, Institutional 3 Class |
| | — | 1,118,253 1 | (772,599) | 345,654 | 1,196,864 | 5,134,763 | 164,898 | 1,358,999 | 8,506,542 |
| Columbia Select Large Cap Equity Fund, Institutional 3 Class |
| | — | 1,932,751 | (1,337,246) | 595,505 | 905,477 | 595,150 | 92,919 | 515,791 | 8,509,761 |
| Columbia Select Large Cap Growth Fund, Class I Shares |
| | 788,763 | — | (788,763) 1 | — | 285,040 | (633,937) | — | — | — |
| Columbia Select Large Cap Growth Fund, Institutional 3 Class |
| | — | 1,609,785 1 | (1,117,188) | 492,597 | 1,030,048 | 1,924,787 | — | 1,590,732 | 8,502,217 |
| Columbia Short Term Bond Fund, Class I Shares |
| | 39,832,272 | 90,204 | (39,922,476) 1 | — | (44,802) | (278,925) | 1,260,302 | — | — |
| Columbia Short Term Bond Fund, Institutional 3 Class |
| | — | 43,265,618 1 | (12,160,998) | 31,104,620 | (187,385) | (600,796) | 3,953,466 | — | 308,557,829 |
The accompanying Notes to Financial Statements are an integral part of this statement.
Columbia Acorn Family of Funds | Annual Report 2017
| 73 |
Portfolio of Investments (continued)
Columbia Thermostat FundSM, December 31, 2017
Notes to Portfolio of Investments (continued)
| Issuer | Beginning
shares | Shares
purchased | Shares
sold | Ending
shares | Realized gain
(loss) —
affiliated
issuers ($) | Net change in
unrealized
appreciation
(depreciation) —
affiliated
issuers ($) | Dividend —
affiliated
issuers ($) | Capital gain
distributions —
affiliated
issuers ($) | Value —
affiliated
issuers
at end of
period ($) |
| Columbia Total Return Bond Fund, Class I Shares |
| | 22,201,461 | 102,335 | (22,303,796) 1 | — | (228,265) | 1,313,626 | 1,254,651 | — | — |
| Columbia Total Return Bond Fund, Institutional 3 Class |
| | — | 24,102,846 1 | (7,037,037) | 17,065,809 | (240,036) | 854,368 | 3,507,781 | — | 154,274,918 |
| Columbia U.S. Government Mortgage Fund, Class I Shares |
| | 36,866,439 | 145,269 | (37,011,708) 1 | — | (294,353) | 1,942,555 | 1,096,479 | — | — |
| Columbia U.S. Government Mortgage Fund, Institutional 3 Class |
| | — | 40,303,717 1 | (11,655,168) | 28,648,549 | (190,063) | (578,083) | 3,758,157 | — | 154,415,678 |
| Columbia U.S. Treasury Index Fund, Class I Shares |
| | 9,050,066 | 21,032 | (9,071,098) 1 | — | (216,893) | 2,482,972 | 324,653 | — | — |
| Columbia U.S. Treasury Index Fund, Institutional 3 Class |
| | — | 9,726,791 1 | (2,776,956) | 6,949,835 | (590,056) | (1,195,614) | 950,267 | — | 77,143,166 |
| Total of Affiliated Transactions | | | | | 14,222,008 | 10,450,897 | 21,576,982 | 9,432,065 | 856,813,897 |
| 1 | Includes the effect of underlying share class exchange. |
| (b) | Non-income producing security. |
| (c) | The rate shown is the seven-day current annualized yield at December 31, 2017. |
Fair value measurements
Various inputs are used in determining the value of the Fund’s investments, following the input prioritization hierarchy established by accounting principles generally accepted in the United States of America (GAAP). These inputs are summarized in the three broad levels listed below:
| ¦ | Level 1 – quoted prices in active markets for identical securities |
| ¦ | Level 2 – prices determined using other significant observable inputs (including quoted prices for similar securities, interest rates, prepayment speeds, credit risk and others) |
| ¦ | Level 3 – prices determined using significant unobservable inputs where quoted prices or observable inputs are unavailable or less reliable (including management’s own assumptions about the factors market participants would use in pricing an investment) |
The inputs or methodology used for valuing securities are not necessarily an indication of the risk associated with investing in those securities.
Examples of the types of securities in which the Fund would typically invest and how they are classified within this hierarchy are as follows. Typical Level 1 securities include mutual funds whose net asset values are published each day.
The Committee is responsible for applying the Columbia Acorn Trust Portfolio Pricing Policy and the Columbia Wanger Asset Management pricing procedures (the Policies), which are approved by and subject to the oversight of the Board of Trustees.
The Committee meets as necessary, and no less frequently than quarterly, to determine fair values for securities for which market quotations are not readily available or for which Columbia Wanger Asset Management believes that available market quotations are unreliable. The Committee also reviews the continuing appropriateness of the Policies. In circumstances where a security has been fair valued, the Committee will also review the continuing appropriateness of the current value of the security. The Policies address, among other things: circumstances under which market quotations will be deemed readily available; selection of third party pricing vendors; appropriate pricing methodologies; events that require fair valuation and fair value techniques; circumstances under which securities will be deemed to pose a potential for stale pricing, including when securities are illiquid, restricted, or in default; and certain delegations of authority to determine fair values to the Fund’s investment manager. The Committee may also meet to discuss additional valuation matters, which may include review of back-testing results, review of time-sensitive information or approval of other valuation related actions, and to review the appropriateness of the Policies.
For investments categorized as Level 3, the significant unobservable inputs used in the fair value measurement of the Fund’s securities may include: (i) data specific to the issuer or comparable issuers, (ii) general market or specific sector news and (iii) quoted prices and specific or similar security transactions. The Committee considers this data and any changes from prior periods in order to assess the reasonableness of observable and unobservable inputs, any assumptions or internal models used to value those securities and changes in fair value. Significant changes in any of these factors could result in lower or higher fair value measurements. Various factors impact the frequency of monitoring (which may occur as often as daily), however the Committee may determine that changes to inputs, assumptions and models are not required with the same frequency.
The accompanying Notes to Financial Statements are an integral part of this statement.
| 74 | Columbia Acorn Family of Funds | Annual Report 2017 |
Portfolio of Investments (continued)
Columbia Thermostat FundSM, December 31, 2017
Fair value measurements (continued)
The following table is a summary of the inputs used to value the Fund’s investments at December 31, 2017:
| | Level 1
quoted prices in active
markets for identical
assets ($) | Level 2
other significant
observable inputs ($) | Level 3
significant
unobservable inputs ($) | Total ($) |
| Investments | | | | |
| Equity Funds | 85,145,537 | — | — | 85,145,537 |
| Fixed-Income Funds | 771,668,360 | — | — | 771,668,360 |
| Money Market Funds | 1,910,983 | — | — | 1,910,983 |
| Total Investments | 858,724,880 | — | — | 858,724,880 |
There were no transfers of financial assets between levels during the period.
The accompanying Notes to Financial Statements are an integral part of this statement.
Columbia Acorn Family of Funds | Annual Report 2017
| 75 |
Portfolio of Investments
Columbia Acorn Emerging Markets FundSM, December 31, 2017
(Percentages represent value of investments compared to net assets)
| Common Stocks 96.8% |
| Issuer | Shares | Value ($) |
| Brazil 5.4% |
Odontoprev SA
Dental benefits company | 407,000 | 1,952,118 |
Qualicorp SA
Insurance and benefits packages | 85,000 | 794,368 |
Raia Drogasil SA
Chain of pharmaceutical stores | 109,000 | 3,016,551 |
| Total | 5,763,037 |
| Cambodia 3.3% |
NagaCorp Ltd.
Leisure and tourism company | 4,514,000 | 3,486,248 |
| Cayman Islands 9.9% |
China Lodging Group Ltd.
Chain of hotels | 18,000 | 2,599,740 |
Netshoes Cayman Ltd.(a),(b)
Online sports goods and apparel | 78,358 | 619,028 |
Parade Technologies Ltd.
Fabless semiconductor company | 133,000 | 2,622,443 |
RYB Education, Inc., ADR(a),(b)
Operates kindergarten and pre-schools | 50,050 | 844,844 |
Silicon Motion Technology Corp., ADR
Semiconductor products | 41,799 | 2,213,675 |
Xiabuxiabu Catering Management China Holdings Co., Ltd.
Chain of restaurants in China | 814,000 | 1,639,909 |
| Total | 10,539,639 |
| China 11.6% |
51job, Inc., ADR(a)
Integrated human resource services | 41,912 | 2,550,345 |
58.Com, Inc., ADR(a)
Local life service platform | 25,893 | 1,853,162 |
China Medical System Holdings Ltd.
Pharmaceutical and medical products | 808,000 | 1,880,856 |
New Oriental Education & Technology Group, Inc., ADR
Educational services | 33,000 | 3,102,000 |
TravelSky Technology Ltd., Class H
IT solutions for China’s air travel and tourism industries | 970,000 | 2,899,589 |
| Total | 12,285,952 |
| Egypt 1.0% |
Commercial International Bank of Egypt
Provides a range of financial services | 237,000 | 1,031,434 |
| Common Stocks (continued) |
| Issuer | Shares | Value ($) |
| Hong Kong 5.4% |
Value Partners Group Ltd.
Independent, value oriented asset management group | 2,382,000 | 2,524,870 |
Vitasoy International Holdings Ltd.
Food and beverages | 1,261,000 | 3,224,328 |
| Total | 5,749,198 |
| India 12.7% |
Care Ratings Ltd.
Credit rating services | 171,000 | 3,568,953 |
GRUH Finance Ltd.
Provides a range of home loans as well as insurance products | 428,074 | 3,368,124 |
Havells India Ltd
Manufactures electrical products | 129,000 | 1,134,400 |
TVS Motor Co., Ltd.
Motorcycles, mopeds and scooters | 198,523 | 2,394,455 |
Zee Entertainment Enterprises Ltd.
Hindi films, serials, game shows and children’s programs | 329,472 | 2,999,572 |
| Total | 13,465,504 |
| Indonesia 5.8% |
PT Link Net Tbk
High-speed internet connection through fiber optic lines | 4,150,000 | 1,683,892 |
PT Matahari Department Store Tbk
Retail clothes, accessories, bags, shoes, cosmetics, household appliances, and management consulting services. | 2,400,000 | 1,763,121 |
PT Media Nusantara Citra Tbk
Integrated media company in Southeast Asia | 10,000,000 | 947,116 |
PT Tower Bersama Infrastructure Tbk
Telecommunication infrastructure services to Indonesian wireless carriers | 3,800,000 | 1,795,574 |
| Total | 6,189,703 |
| Mexico 4.7% |
Grupo Aeroportuario del Centro Norte SAB de CV
Operates international airports in the northern and central regions of Mexico | 223,000 | 1,155,801 |
Grupo Aeroportuario del Sureste SAB de CV, ADR
Operates airports in Mexico | 7,000 | 1,277,570 |
Qualitas Controladora SAB de CV
Insurance holding company | 1,390,000 | 2,566,861 |
| Total | 5,000,232 |
The accompanying Notes to Financial Statements are an integral part of this statement.
| 76 | Columbia Acorn Family of Funds | Annual Report 2017 |
Portfolio of Investments (continued)
Columbia Acorn Emerging Markets FundSM, December 31, 2017
| Common Stocks (continued) |
| Issuer | Shares | Value ($) |
| Philippines 1.4% |
D&L Industries, Inc.
Customized raw materials | 6,700,000 | 1,484,415 |
| Russian Federation 1.2% |
X5 Retail Group NV GDR, Registered Shares(a)
Food retailer company | 33,000 | 1,246,410 |
| South Africa 7.1% |
Clicks Group Ltd.
Owns and operates chains of retail stores | 93,687 | 1,371,552 |
Famous Brands Ltd.(a),(b)
Food and beverage company | 305,936 | 2,546,644 |
PSG Group Ltd.
Diversified financial services | 55,000 | 1,200,242 |
Rand Merchant Investment Holdings Ltd.
Investment holding company | 654,511 | 2,423,229 |
| Total | 7,541,667 |
| South Korea 11.9% |
GS Retail Co., Ltd.
Chain of retail stores | 63,100 | 2,373,784 |
Koh Young Technology, Inc.
3D measurement and inspection equipment for testing various machineries | 34,515 | 2,659,836 |
Korea Investment Holdings Co., Ltd.
Financial holding company | 42,676 | 2,747,805 |
Korea Zinc Co. Ltd.
Non-ferrous metal smelting | 4,500 | 2,072,299 |
Modetour Network, Inc.
Travel services | 99,518 | 2,835,271 |
| Total | 12,688,995 |
| Taiwan 7.2% |
Basso Industry Corp.
Pneumatic nailers and staplers | 568,000 | 1,269,732 |
Largan Precision Co., Ltd.
Optical lens modules and optoelectronic components | 10,000 | 1,342,314 |
Silergy Corp.
High performance analog integrated circuits | 132,000 | 3,016,281 |
Voltronic Power Technology Corp.
Uninterruptible power supply products, inverters, multiple surface mounted devices and other power products | 116,000 | 2,007,494 |
| Total | 7,635,821 |
| Common Stocks (continued) |
| Issuer | Shares | Value ($) |
| Thailand 5.6% |
Beauty Community PCL
Cosmetic and beauty products | 2,760,000 | 1,761,522 |
Home Product Center PCL, Foreign Registered Shares
Building materials and home improvement products | 3,197,000 | 1,255,649 |
Samui Airport Property Fund Leasehold
Closed-end property fund incorporated in Thailand | 2,092,100 | 1,476,475 |
Tisco Financial Group PCL
Bank holding company | 550,000 | 1,493,556 |
| Total | 5,987,202 |
| Turkey 2.6% |
Logo Yazilim Sanayi Ve Ticaret AS(a)
Enterprise resource planning software | 178,000 | 2,758,871 |
Total Common Stocks
(Cost: $78,018,490) | 102,854,328 |
|
| Securities Lending Collateral 1.4% |
| | Shares | Value ($) |
Dreyfus Government Cash Management Fund, Institutional Shares, 1.190%(c),(d)
| 1,505,875 | 1,505,875 |
Total Securities Lending Collateral
(Cost: $1,505,875) | 1,505,875 |
|
| Money Market Funds 3.3% |
| | |
JPMorgan U.S. Government Money Market Fund, IM Shares, 1.192%(c)
| 3,458,712 | 3,458,712 |
Total Money Market Funds
(Cost: $3,458,712) | 3,458,712 |
Total Investments
(Cost: $82,983,077) | 107,818,915 |
| Obligation to Return Collateral for Securities Loaned | | (1,505,875) |
| Other Assets & Liabilities, Net | | (90,805) |
| Net Assets | $106,222,235 |
The accompanying Notes to Financial Statements are an integral part of this statement.
Columbia Acorn Family of Funds | Annual Report 2017
| 77 |
Portfolio of Investments (continued)
Columbia Acorn Emerging Markets FundSM, December 31, 2017
Notes to Portfolio of Investments
| (a) | Non-income producing security. |
| (b) | All or a portion of this security was on loan at December 31, 2017. The total market value of securities on loan at December 31, 2017 was $1,444,123. |
| (c) | The rate shown is the seven-day current annualized yield at December 31, 2017. |
| (d) | Investment made with cash collateral received from securities lending activity. |
Abbreviation Legend
| ADR | American Depositary Receipt |
| GDR | Global Depositary Receipt |
Fair value measurements
Various inputs are used in determining the value of the Fund’s investments, following the input prioritization hierarchy established by accounting principles generally accepted in the United States of America (GAAP). These inputs are summarized in the three broad levels listed below:
| ¦ | Level 1 – quoted prices in active markets for identical securities |
| ¦ | Level 2 – prices determined using other significant observable inputs (including quoted prices for similar securities, interest rates, prepayment speeds, credit risk and others) |
| ¦ | Level 3 – prices determined using significant unobservable inputs where quoted prices or observable inputs are unavailable or less reliable (including management’s own assumptions about the factors market participants would use in pricing an investment) |
The inputs or methodology used for valuing securities are not necessarily an indication of the risk associated with investing in those securities.
Examples of the types of securities in which the Fund would typically invest and how they are classified within this hierarchy are as follows. Typical Level 1 securities include exchange traded domestic equities, mutual funds whose net asset values are published each day and exchange traded foreign equities that are not statistically fair valued. Typical Level 2 securities include exchange traded foreign equities that are statistically fair valued, forward foreign currency exchange contracts and short-term investments valued at amortized cost. Additionally, securities fair valued by Columbia Wanger Asset Management’s Valuation Committee (the Committee) that rely on significant observable inputs are also included in Level 2. Typical Level 3 securities include any security fair valued by the Committee that relies on significant unobservable inputs.
The Committee is responsible for applying the Columbia Acorn Trust Portfolio Pricing Policy and the Columbia Wanger Asset Management pricing procedures (the Policies), which are approved by and subject to the oversight of the Board of Trustees.
The Committee meets as necessary, and no less frequently than quarterly, to determine fair values for securities for which market quotations are not readily available or for which Columbia Wanger Asset Management believes that available market quotations are unreliable. The Committee also reviews the continuing appropriateness of the Policies. In circumstances where a security has been fair valued, the Committee will also review the continuing appropriateness of the current value of the security. The Policies address, among other things: circumstances under which market quotations will be deemed readily available; selection of third party pricing vendors; appropriate pricing methodologies; events that require fair valuation and fair value techniques; circumstances under which securities will be deemed to pose a potential for stale pricing, including when securities are illiquid, restricted, or in default; and certain delegations of authority to determine fair values to the Fund’s investment manager. The Committee may also meet to discuss additional valuation matters, which may include review of back-testing results, review of time-sensitive information or approval of other valuation related actions, and to review the appropriateness of the Policies.
For investments categorized as Level 3, the significant unobservable inputs used in the fair value measurement of the Fund’s securities may include: (i) data specific to the issuer or comparable issuers, (ii) general market or specific sector news and (iii) quoted prices and specific or similar security transactions. The Committee considers this data and any changes from prior periods in order to assess the reasonableness of observable and unobservable inputs, any assumptions or internal models used to value those securities and changes in fair value. Significant changes in any of these factors could result in lower or higher fair value measurements. Various factors impact the frequency of monitoring (which may occur as often as daily), however the Committee may determine that changes to inputs, assumptions and models are not required with the same frequency.
The following table is a summary of the inputs used to value the Fund’s investments at December 31, 2017:
| | Level 1
quoted prices in active
markets for identical
assets ($) | Level 2
other significant
observable inputs ($) | Level 3
significant
unobservable inputs ($) | Total ($) |
| Investments | | | | |
| Common Stocks | | | | |
| Brazil | 5,763,037 | — | — | 5,763,037 |
| Cambodia | — | 3,486,248 | — | 3,486,248 |
| Cayman Islands | 6,277,287 | 4,262,352 | — | 10,539,639 |
| China | 7,505,507 | 4,780,445 | — | 12,285,952 |
| Egypt | — | 1,031,434 | — | 1,031,434 |
| Hong Kong | — | 5,749,198 | — | 5,749,198 |
| India | — | 13,465,504 | — | 13,465,504 |
| Indonesia | — | 6,189,703 | — | 6,189,703 |
| Mexico | 5,000,232 | — | — | 5,000,232 |
| Philippines | — | 1,484,415 | — | 1,484,415 |
| Russian Federation | — | 1,246,410 | — | 1,246,410 |
The accompanying Notes to Financial Statements are an integral part of this statement.
| 78 | Columbia Acorn Family of Funds | Annual Report 2017 |
Portfolio of Investments (continued)
Columbia Acorn Emerging Markets FundSM, December 31, 2017
Fair value measurements (continued)
| | Level 1
quoted prices in active
markets for identical
assets ($) | Level 2
other significant
observable inputs ($) | Level 3
significant
unobservable inputs ($) | Total ($) |
| South Africa | — | 7,541,667 | — | 7,541,667 |
| South Korea | — | 12,688,995 | — | 12,688,995 |
| Taiwan | — | 7,635,821 | — | 7,635,821 |
| Thailand | — | 5,987,202 | — | 5,987,202 |
| Turkey | — | 2,758,871 | — | 2,758,871 |
| Total Common Stocks | 24,546,063 | 78,308,265 | — | 102,854,328 |
| Securities Lending Collateral | 1,505,875 | — | — | 1,505,875 |
| Money Market Funds | 3,458,712 | — | — | 3,458,712 |
| Total Investments | 29,510,650 | 78,308,265 | — | 107,818,915 |
The Fund’s assets assigned to the Level 2 input category are generally valued using a market approach, in which a security’s value is determined through its correlation to prices and information from observable market transactions for similar or identical assets. Foreign equities are generally valued at the last sale price on the foreign exchange or market on which they trade. The Fund may use a statistical fair valuation model, in accordance with the policy adopted by the Board of Trustees, provided by an independent third party to value securities principally traded in foreign markets in order to adjust for possible stale pricing that may occur between the close of the foreign exchanges and the time for valuation. These models take into account available market data including intraday index, ADR, and ETF movements.
There were no transfers of financial assets between levels during the period.
The accompanying Notes to Financial Statements are an integral part of this statement.
Columbia Acorn Family of Funds | Annual Report 2017
| 79 |
Portfolio of Investments
Columbia Acorn European FundSM, December 31, 2017
(Percentages represent value of investments compared to net assets)
| Common Stocks 94.9% |
| Issuer | Shares | Value ($) |
| Australia 0.9% |
Domino’s Pizza Enterprises Ltd.
Pizza delivery stores | 26,236 | 953,573 |
| Belgium 1.1% |
Melexis NV
Advanced integrated semiconductors, sensor ICs, and programmable sensor IC systems | 11,328 | 1,146,748 |
| Denmark 4.7% |
ALK-Abello AS
Pharmaceuticals for allergy vaccinations | 8,000 | 954,115 |
SimCorp AS
Global provider of highly specialised software for the investment management industry | 40,716 | 2,318,398 |
William Demant Holding AS(a)
Hearing aids, audiometers, tympanometers, diagnostic instruments, and wireless communication equipment | 56,417 | 1,577,570 |
| Total | 4,850,083 |
| Finland 3.1% |
Ahlstrom-Munksjo Oyj
Industrial paper | 66,959 | 1,459,791 |
Ahlstrom-Munksjo Oyj(b)
Industrial paper | 81,220 | 1,755,471 |
| Total | 3,215,262 |
| France 3.1% |
Akka Technologies
High-technology engineering consulting services | 28,468 | 1,581,484 |
Elior Group SA
Provides catering, cleaning, and facility management services | 38,012 | 785,609 |
Korian SA
Healthcare facilities & medical establishments | 22,124 | 781,631 |
| Total | 3,148,724 |
| Germany 24.7% |
AURELIUS Equity Opportunities SE & Co. KGaA
Loans to distressed companies | 17,182 | 1,171,712 |
CTS Eventim AG & Co. KGaA
Online ticket sales | 50,642 | 2,354,429 |
Deutsche Beteiligungs AG
Private equity company, investing in domestic medium-sized companies | 19,672 | 1,108,116 |
Fielmann AG
Prescription eyeglasses, specialty glasses, sunglasses, contact lenses, and optical supplies | 21,878 | 1,927,101 |
| Common Stocks (continued) |
| Issuer | Shares | Value ($) |
MTU Aero Engines AG
Develops and manufactures engines and offers commercial engine services and support | 17,396 | 3,108,574 |
Nemetschek SE
Standard software for designing, constructing and managing buildings and real estate | 39,719 | 3,553,265 |
Norma Group SE
Plastic and metal-based components and systems in connecting technology | 20,772 | 1,390,801 |
Rational AG
Food preparation appliances/processors and kitchen accessories | 3,563 | 2,292,139 |
Stroeer SE & Co. KGaA
Digital multi-channel media company | 37,274 | 2,746,498 |
Vapiano SE(a),(c)
Chain of restaurants | 70,299 | 2,045,444 |
Wirecard AG
Internet payment and processing services | 32,300 | 3,589,899 |
| Total | 25,287,978 |
| Ireland 1.9% |
UDG Healthcare PLC
Commercialisation solutions for health care companies | 167,169 | 1,903,183 |
| Italy 3.9% |
Brembo SpA
Braking systems and components | 164,845 | 2,505,989 |
Industria Macchine Automatiche SpA
Packaging machinery for the food, pharmaceuticals, and cosmetics industries | 18,549 | 1,508,957 |
| Total | 4,014,946 |
| Luxembourg 2.6% |
eDreams ODIGEO SA(a)
Online travel company | 460,388 | 2,634,930 |
| Malta 3.7% |
Kindred Group PLC
Online gambling services | 267,905 | 3,834,166 |
| Netherlands 1.9% |
Aalberts Industries NV
Industrial services and flow control systems | 37,735 | 1,919,489 |
| Norway 2.7% |
Atea ASA
Nordic and Baltic supplier of IT infrastructure | 160,172 | 2,253,169 |
XXL ASA
Multi-sports retail store | 49,387 | 511,277 |
| Total | 2,764,446 |
The accompanying Notes to Financial Statements are an integral part of this statement.
| 80 | Columbia Acorn Family of Funds | Annual Report 2017 |
Portfolio of Investments (continued)
Columbia Acorn European FundSM, December 31, 2017
| Common Stocks (continued) |
| Issuer | Shares | Value ($) |
| Spain 1.5% |
Prosegur Cia de Seguridad SA, Registered Shares
Security and transportation services | 192,983 | 1,516,656 |
| Sweden 9.5% |
Byggmax Group AB
Discount provider of building materials | 169,627 | 1,137,312 |
NetEnt AB
Computer gaming software | 251,342 | 1,731,153 |
Recipharm AB, B Shares(c)
Contract development and manufacture of pharmaceuticals | 87,952 | 1,058,778 |
Sectra AB, B Shares
Medical and communication systems | 109,397 | 2,293,802 |
Sweco AB, Class B
Consulting company specializing in engineering, environmental technology, and architecture | 64,982 | 1,440,154 |
Trelleborg AB, Class B
Manufactures and distributes industrial products | 90,761 | 2,102,204 |
| Total | 9,763,403 |
| Switzerland 4.7% |
Inficon Holding AG
Vacuum instruments used to monitor and control production processes | 3,625 | 2,263,649 |
Partners Group Holding AG(c)
Global private markets asset management firm | 3,779 | 2,590,561 |
| Total | 4,854,210 |
| Turkey 1.6% |
Logo Yazilim Sanayi Ve Ticaret AS(a)
Enterprise resource planning software | 105,919 | 1,641,668 |
| United Kingdom 23.3% |
Ascential PLC
Media and consultancy services | 294,357 | 1,526,646 |
Assura PLC
Primary healthcare property group | 1,564,565 | 1,349,823 |
Big Yellow Group PLC
Self-storage company | 111,007 | 1,303,173 |
Connect Group PLC
Distribution of newspapers and magazines, and books | 197,388 | 298,484 |
Croda International PLC
Chemicals and chemical products | 17,712 | 1,055,860 |
Domino’s Pizza Group PLC
Pizza delivery stores | 450,122 | 2,100,932 |
DS Smith PLC
Provides corrugated packaging services | 108,743 | 757,992 |
| Common Stocks (continued) |
| Issuer | Shares | Value ($) |
Halma PLC
Products that detect hazards and protect assets and people in public and commercial buildings | 207,214 | 3,520,807 |
Hastings Group Holdings PLC
General insurance services to the automobile and home insurance products | 307,577 | 1,328,881 |
Intermediate Capital Group PLC
Private equity firm | 75,792 | 1,170,295 |
Polypipe Group PLC
Plastic piping systems | 191,479 | 1,016,522 |
Rentokil Initial PLC
Fully integrated facilities management and essential support services | 562,861 | 2,411,390 |
Rightmove PLC
Website that lists properties across Britain | 29,893 | 1,814,079 |
Spirax-Sarco Engineering PLC
Consultation, service and products for the control and efficient management of steam and industrial fluids | 17,832 | 1,348,184 |
WH Smith PLC
Retails books, magazines, newspapers, and periodicals | 90,889 | 2,880,094 |
| Total | 23,883,162 |
Total Common Stocks
(Cost: $74,521,269) | 97,332,627 |
| Preferred Stocks 1.3% |
| Issuer | Coupon
Rate | Shares | Value ($) |
| Germany 1.3% |
Sartorius AG
Precision electronic equipment and components | — | 14,034 | 1,333,122 |
Total Preferred Stocks
(Cost: $1,384,144) | 1,333,122 |
| Securities Lending Collateral 2.8% |
| | Shares | Value ($) |
Dreyfus Government Cash Management Fund, Institutional Shares, 1.190%(d),(e)
| 2,892,531 | 2,892,531 |
Total Securities Lending Collateral
(Cost: $2,892,531) | 2,892,531 |
|
The accompanying Notes to Financial Statements are an integral part of this statement.
Columbia Acorn Family of Funds | Annual Report 2017
| 81 |
Portfolio of Investments (continued)
Columbia Acorn European FundSM, December 31, 2017
| Money Market Funds 5.2% |
| | Shares | Value ($) |
JPMorgan U.S. Government Money Market Fund, IM Shares, 1.192%(d)
| 5,272,202 | 5,272,202 |
Total Money Market Funds
(Cost: $5,272,202) | 5,272,202 |
Total Investments
(Cost: $84,070,146) | 106,830,482 |
| Obligation to Return Collateral for Securities Loaned | | (2,892,531) |
| Other Assets & Liabilities, Net | | (1,380,528) |
| Net Assets | $102,557,423 |
Notes to Portfolio of Investments
| (a) | Non-income producing security. |
| (b) | Security is traded on a Swedish exchange. |
| (c) | All or a portion of this security was on loan at December 31, 2017. The total market value of securities on loan at December 31, 2017 was $2,762,415. |
| (d) | The rate shown is the seven-day current annualized yield at December 31, 2017. |
| (e) | Investment made with cash collateral received from securities lending activity. |
Fair value measurements
Various inputs are used in determining the value of the Fund’s investments, following the input prioritization hierarchy established by accounting principles generally accepted in the United States of America (GAAP). These inputs are summarized in the three broad levels listed below:
| ¦ | Level 1 – quoted prices in active markets for identical securities |
| ¦ | Level 2 – prices determined using other significant observable inputs (including quoted prices for similar securities, interest rates, prepayment speeds, credit risk and others) |
| ¦ | Level 3 – prices determined using significant unobservable inputs where quoted prices or observable inputs are unavailable or less reliable (including management’s own assumptions about the factors market participants would use in pricing an investment) |
The inputs or methodology used for valuing securities are not necessarily an indication of the risk associated with investing in those securities.
Examples of the types of securities in which the Fund would typically invest and how they are classified within this hierarchy are as follows. Typical Level 1 securities include exchange traded domestic equities, mutual funds whose net asset values are published each day and exchange traded foreign equities that are not statistically fair valued. Typical Level 2 securities include exchange traded foreign equities that are statistically fair valued, forward foreign currency exchange contracts and short-term investments valued at amortized cost. Additionally, securities fair valued by Columbia Wanger Asset Management’s Valuation Committee (the Committee) that rely on significant observable inputs are also included in Level 2. Typical Level 3 securities include any security fair valued by the Committee that relies on significant unobservable inputs.
The Committee is responsible for applying the Columbia Acorn Trust Portfolio Pricing Policy and the Columbia Wanger Asset Management pricing procedures (the Policies), which are approved by and subject to the oversight of the Board of Trustees.
The Committee meets as necessary, and no less frequently than quarterly, to determine fair values for securities for which market quotations are not readily available or for which Columbia Wanger Asset Management believes that available market quotations are unreliable. The Committee also reviews the continuing appropriateness of the Policies. In circumstances where a security has been fair valued, the Committee will also review the continuing appropriateness of the current value of the security. The Policies address, among other things: circumstances under which market quotations will be deemed readily available; selection of third party pricing vendors; appropriate pricing methodologies; events that require fair valuation and fair value techniques; circumstances under which securities will be deemed to pose a potential for stale pricing, including when securities are illiquid, restricted, or in default; and certain delegations of authority to determine fair values to the Fund’s investment manager. The Committee may also meet to discuss additional valuation matters, which may include review of back-testing results, review of time-sensitive information or approval of other valuation related actions, and to review the appropriateness of the Policies.
For investments categorized as Level 3, the significant unobservable inputs used in the fair value measurement of the Fund’s securities may include: (i) data specific to the issuer or comparable issuers, (ii) general market or specific sector news and (iii) quoted prices and specific or similar security transactions. The Committee considers this data and any changes from prior periods in order to assess the reasonableness of observable and unobservable inputs, any assumptions or internal models used to value those securities and changes in fair value. Significant changes in any of these factors could result in lower or higher fair value measurements. Various factors impact the frequency of monitoring (which may occur as often as daily), however the Committee may determine that changes to inputs, assumptions and models are not required with the same frequency.
The accompanying Notes to Financial Statements are an integral part of this statement.
| 82 | Columbia Acorn Family of Funds | Annual Report 2017 |
Portfolio of Investments (continued)
Columbia Acorn European FundSM, December 31, 2017
Fair value measurements (continued)
The following table is a summary of the inputs used to value the Fund’s investments at December 31, 2017:
| | Level 1
quoted prices in active
markets for identical
assets ($) | Level 2
other significant
observable inputs ($) | Level 3
significant
unobservable inputs ($) | Total ($) |
| Investments | | | | |
| Common Stocks | | | | |
| Australia | — | 953,573 | — | 953,573 |
| Belgium | — | 1,146,748 | — | 1,146,748 |
| Denmark | — | 4,850,083 | — | 4,850,083 |
| Finland | — | 3,215,262 | — | 3,215,262 |
| France | — | 3,148,724 | — | 3,148,724 |
| Germany | — | 25,287,978 | — | 25,287,978 |
| Ireland | — | 1,903,183 | — | 1,903,183 |
| Italy | — | 4,014,946 | — | 4,014,946 |
| Luxembourg | — | 2,634,930 | — | 2,634,930 |
| Malta | — | 3,834,166 | — | 3,834,166 |
| Netherlands | — | 1,919,489 | — | 1,919,489 |
| Norway | — | 2,764,446 | — | 2,764,446 |
| Spain | — | 1,516,656 | — | 1,516,656 |
| Sweden | — | 9,763,403 | — | 9,763,403 |
| Switzerland | — | 4,854,210 | — | 4,854,210 |
| Turkey | — | 1,641,668 | — | 1,641,668 |
| United Kingdom | — | 23,883,162 | — | 23,883,162 |
| Total Common Stocks | — | 97,332,627 | — | 97,332,627 |
| Preferred Stocks | | | | |
| Germany | — | 1,333,122 | — | 1,333,122 |
| Total Preferred Stocks | — | 1,333,122 | — | 1,333,122 |
| Securities Lending Collateral | 2,892,531 | — | — | 2,892,531 |
| Money Market Funds | 5,272,202 | — | — | 5,272,202 |
| Total Investments | 8,164,733 | 98,665,749 | — | 106,830,482 |
The Fund’s assets assigned to the Level 2 input category are generally valued using a market approach, in which a security’s value is determined through its correlation to prices and information from observable market transactions for similar or identical assets. Foreign equities are generally valued at the last sale price on the foreign exchange or market on which they trade. The Fund may use a statistical fair valuation model, in accordance with the policy adopted by the Board of Trustees, provided by an independent third party to value securities principally traded in foreign markets in order to adjust for possible stale pricing that may occur between the close of the foreign exchanges and the time for valuation. These models take into account available market data including intraday index, ADR, and ETF movements.
There were no transfers of financial assets between levels during the period.
The accompanying Notes to Financial Statements are an integral part of this statement.
Columbia Acorn Family of Funds | Annual Report 2017
| 83 |
Statement of Assets and Liabilities
December 31, 2017
| | Columbia
Acorn®
Fund | Columbia
Acorn
International® | Columbia
Acorn
USA® | Columbia
Acorn
International
SelectSM |
| Assets | | | | |
| Investments in unaffiliated issuers, at cost | $3,343,839,258 | $3,292,075,107 | $263,850,755 | $94,852,211 |
| Investments in affiliated issuers, at cost | 24,580,987 | — | — | — |
| Investments in unaffiliated issuers, at value (including securities on loan: $35,927,492, 125,615,479, 3,128,036 and 5,681,155, respectively) | 4,650,220,117 | 5,035,302,321 | 330,021,967 | 136,456,784 |
| Investments in affiliated issuers, at value | 23,079,229 | — | — | — |
| Receivable for: | | | | |
| Investments sold | 21,590,773 | 3,398,701 | 864,280 | — |
| Capital shares sold | 1,504,375 | 4,838,289 | 149,393 | 329,478 |
| Regulatory settlements (Note 7) | — | — | — | 33,279 |
| Dividends | 1,892,550 | 5,070,556 | 151,971 | 49,205 |
| Securities lending income | 25,078 | 24,368 | 2,475 | 224 |
| Foreign tax reclaims | — | 2,980,068 | 193 | 65,904 |
| Expense reimbursement due from Investment Manager | — | — | — | 474 |
| Prepaid expenses | 94,491 | 98,727 | 6,686 | 2,453 |
| Trustees’ deferred compensation plan | 3,203,749 | 1,577,980 | 311,456 | — |
| Total assets | 4,701,610,362 | 5,053,291,010 | 331,508,421 | 136,937,801 |
| Liabilities | | | | |
| Due to custodian | 277,081 | — | — | — |
| Due upon return of securities on loan | 37,208,360 | 131,643,758 | 3,283,375 | 5,961,556 |
| Payable for: | | | | |
| Investments purchased | 9,918,141 | 3,549,268 | 40,227 | — |
| Capital shares purchased | 11,907,502 | 8,358,000 | 5,095,481 | 54,818 |
| Foreign capital gains taxes deferred | — | — | — | 14,814 |
| Investment advisory fee | 85,941 | 103,083 | 8,346 | 3,186 |
| Distribution and/or service fees | 12,601 | 5,147 | 606 | 317 |
| Transfer agent fees | 423,757 | 471,114 | 28,368 | 11,810 |
| Administration fees | 6,038 | 6,328 | 426 | 168 |
| Trustees’ fees | 12,331 | 12,510 | 1,924 | 53,867 |
| Compensation of chief compliance officer | 7,229 | 7,506 | 801 | 174 |
| Other expenses | 373,916 | 574,912 | 59,813 | 42,287 |
| Trustees’ deferred compensation plan | 3,203,749 | 1,577,980 | 311,456 | — |
| Other liabilities | — | 21,401 | — | — |
| Total liabilities | 63,436,646 | 146,331,007 | 8,830,823 | 6,142,997 |
| Net assets applicable to outstanding capital stock | $4,638,173,716 | $4,906,960,003 | $322,677,598 | $130,794,804 |
| Represented by | | | | |
| Paid in capital | 3,137,690,010 | 3,041,875,892 | 246,699,051 | 95,755,312 |
| Undistributed (excess of distributions over) net investment income | (2,220,754) | 4,411,242 | (254,453) | (53,622) |
| Accumulated net realized gain (loss) | 197,825,359 | 117,314,526 | 10,061,788 | (6,500,696) |
| Unrealized appreciation (depreciation) on: | | | | |
| Investments - unaffiliated issuers | 1,306,380,859 | 1,743,227,214 | 66,171,212 | 41,604,573 |
| Investments - affiliated issuers | (1,501,758) | — | — | — |
| Foreign currency translations | — | 131,129 | — | 4,051 |
| Foreign capital gains tax | — | — | — | (14,814) |
| Total - representing net assets applicable to outstanding capital stock | $4,638,173,716 | $4,906,960,003 | $322,677,598 | $130,794,804 |
The accompanying Notes to Financial Statements are an integral part of this statement.
| 84 | Columbia Acorn Family of Funds | Annual Report 2017 |
Statement of Assets and Liabilities (continued)
December 31, 2017
| | Columbia
Acorn®
Fund | Columbia
Acorn
International® | Columbia
Acorn
USA® | Columbia
Acorn
International
SelectSM |
| Class A | | | | |
| Net assets | $830,453,904 | $465,829,790 | $47,959,906 | $26,335,763 |
| Shares outstanding | 64,264,622 | 10,016,089 | 3,842,664 | 911,546 |
| Net asset value per share(a) | $12.92 | $46.51 | $12.48 | $28.89 |
| Maximum offering price per share(b) | $13.71 | $49.35 | $13.24 | $30.65 |
| Advisor Class(c) | | | | |
| Net assets | $38,587,545 | $99,578,069 | $16,354,747 | $1,820,332 |
| Shares outstanding | 2,402,202 | 2,120,998 | 1,016,837 | 61,790 |
| Net asset value per share(d) | $16.06 | $46.95 | $16.08 | $29.46 |
| Class C | | | | |
| Net assets | $246,449,676 | $63,787,452 | $9,802,468 | $5,026,983 |
| Shares outstanding | 37,432,288 | 1,431,137 | 1,495,177 | 187,235 |
| Net asset value per share(a) | $6.58 | $44.57 | $6.56 | $26.85 |
| Institutional Class(e) | | | | |
| Net assets | $3,407,214,054 | $3,116,383,483 | $189,408,217 | $89,266,371 |
| Shares outstanding | 221,458,807 | 66,925,208 | 12,455,486 | 3,052,280 |
| Net asset value per share(d) | $15.39 | $46.57 | $15.21 | $29.25 |
| Institutional 2 Class(f) | | | | |
| Net assets | $67,932,344 | $422,916,456 | $10,132,867 | $613,805 |
| Shares outstanding | 4,193,532 | 9,086,725 | 625,210 | 20,846 |
| Net asset value per share(d) | $16.20 | $46.54 | $16.21 | $29.44 |
| Institutional 3 Class(g) | | | | |
| Net assets | $47,536,193 | $725,247,067 | $49,019,393 | $7,731,550 |
| Shares outstanding | 2,909,525 | 15,446,492 | 2,997,137 | 262,788 |
| Net asset value per share(d) | $16.34 | $46.95 | $16.36 | $29.42 |
| Class R | | | | |
| Net assets | $— | $13,217,686 | $— | $— |
| Shares outstanding | — | 284,187 | — | — |
| Net asset value per share(d) | $— | $46.51 | $— | $— |
| (a) | Redemption price per share is equal to net asset value less any applicable contingent deferred sales charge. |
| (b) | On sales of $50,000 or more the offering price is reduced. |
| (c) | Prior to November 1, 2017, Advisor Class shares were known as Class R4 shares. |
| (d) | Redemption price per share is equal to net asset value. |
| (e) | Prior to November 1, 2017, Institutional Class shares were known as Class Z shares. |
| (f) | Prior to November 1, 2017, Institutional 2 Class shares were known as Class R5 shares. |
| (g) | Prior to November 1, 2017, Institutional 3 Class shares were known as Class Y shares. |
The accompanying Notes to Financial Statements are an integral part of this statement.
Columbia Acorn Family of Funds | Annual Report 2017
| 85 |
Statement of Assets and Liabilities (continued)
December 31, 2017
| | Columbia
Acorn
SelectSM | Columbia
Thermostat
FundSM | Columbia
Acorn
Emerging Markets
FundSM | Columbia
Acorn
European
FundSM |
| Assets | | | | |
| Investments in unaffiliated issuers, at cost | $225,426,664 | $1,910,983 | $82,983,077 | $84,070,146 |
| Investments in affiliated issuers, at cost | — | 828,051,082 | — | — |
| Investments in unaffiliated issuers, at value (including securities on loan: $—, —, 1,444,123 and 2,762,415, respectively) | 308,092,917 | 1,910,983 | 107,818,915 | 106,830,482 |
| Investments in affiliated issuers, at value | — | 856,813,897 | — | — |
| Receivable for: | | | | |
| Investments sold | 1,262,926 | 2,391,940 | 13 | 58,802 |
| Capital shares sold | 131,377 | 968,787 | 44,473 | 612,894 |
| Dividends | 184,971 | 1,638,418 | 180,675 | 59,462 |
| Securities lending income | — | — | 4,755 | 4,626 |
| Foreign tax reclaims | — | — | 10,776 | 80,242 |
| Expense reimbursement due from Investment Manager | — | 136 | 786 | 1,134 |
| Prepaid expenses | 6,163 | 18,312 | 2,027 | 1,703 |
| Trustees’ deferred compensation plan | 260,013 | — | — | — |
| Other assets | — | — | — | 2,739 |
| Total assets | 309,938,367 | 863,742,473 | 108,062,420 | 107,652,084 |
| Liabilities | | | | |
| Due upon return of securities on loan | — | — | 1,505,875 | 2,892,531 |
| Payable for: | | | | |
| Investments purchased | — | 1,638,418 | 31,867 | 1,989,431 |
| Capital shares purchased | 706,046 | 2,529,778 | 166,346 | 153,284 |
| Foreign capital gains taxes deferred | — | — | 33,847 | — |
| Investment advisory fee | 5,560 | 2,360 | 3,587 | 3,309 |
| Distribution and/or service fees | 1,354 | 8,657 | 657 | 603 |
| Transfer agent fees | 30,591 | 76,379 | 12,363 | 8,511 |
| Administration fees | 402 | 1,109 | 136 | 131 |
| Trustees’ fees | 811 | 171,456 | 34,560 | 8,180 |
| Compensation of chief compliance officer | 473 | 1,514 | 158 | 94 |
| Other expenses | 55,181 | 81,756 | 48,843 | 38,587 |
| Trustees’ deferred compensation plan | 260,013 | — | — | — |
| Other liabilities | — | — | 1,946 | — |
| Total liabilities | 1,060,431 | 4,511,427 | 1,840,185 | 5,094,661 |
| Net assets applicable to outstanding capital stock | $308,877,936 | $859,231,046 | $106,222,235 | $102,557,423 |
| Represented by | | | | |
| Paid in capital | 203,204,712 | 821,658,915 | 163,858,627 | 88,174,431 |
| Undistributed (excess of distributions over) net investment income | (231,199) | 731,622 | (572,645) | (202,643) |
| Accumulated net realized gain (loss) | 23,238,170 | 8,077,694 | (81,866,145) | (8,177,711) |
| Unrealized appreciation (depreciation) on: | | | | |
| Investments - unaffiliated issuers | 82,666,253 | — | 24,835,838 | 22,760,336 |
| Investments - affiliated issuers | — | 28,762,815 | — | — |
| Foreign currency translations | — | — | 407 | 3,010 |
| Foreign capital gains tax | — | — | (33,847) | — |
| Total - representing net assets applicable to outstanding capital stock | $308,877,936 | $859,231,046 | $106,222,235 | $102,557,423 |
The accompanying Notes to Financial Statements are an integral part of this statement.
| 86 | Columbia Acorn Family of Funds | Annual Report 2017 |
Statement of Assets and Liabilities (continued)
December 31, 2017
| | Columbia
Acorn
SelectSM | Columbia
Thermostat
FundSM | Columbia
Acorn
Emerging Markets
FundSM | Columbia
Acorn
European
FundSM |
| Class A | | | | |
| Net assets | $106,329,974 | $257,752,361 | $33,982,215 | $32,486,521 |
| Shares outstanding | 7,275,357 | 17,614,443 | 2,566,875 | 1,685,907 |
| Net asset value per share(a) | $14.62 | $14.63 | $13.24 | $19.27 |
| Maximum offering price per share(b) | $15.51 | $15.52 | $14.05 | $20.45 |
| Advisor Class(c) | | | | |
| Net assets | $5,589,599 | $16,226,545 | $1,336,981 | $2,942,394 |
| Shares outstanding | 325,249 | 1,118,814 | 99,932 | 151,958 |
| Net asset value per share(d) | $17.19 | $14.50 | $13.38 | $19.36 |
| Class C | | | | |
| Net assets | $22,558,622 | $250,783,960 | $15,545,602 | $13,965,075 |
| Shares outstanding | 2,351,967 | 17,019,023 | 1,187,827 | 730,421 |
| Net asset value per share(a) | $9.59 | $14.74 | $13.09 | $19.12 |
| Institutional Class(e) | | | | |
| Net assets | $157,663,840 | $320,483,190 | $53,415,034 | $48,965,011 |
| Shares outstanding | 9,530,372 | 22,215,139 | 4,017,934 | 2,541,227 |
| Net asset value per share(d) | $16.54 | $14.43 | $13.29 | $19.27 |
| Institutional 2 Class(f) | | | | |
| Net assets | $1,734,914 | $13,464,394 | $1,030,171 | $3,988,146 |
| Shares outstanding | 100,420 | 927,432 | 76,965 | 204,890 |
| Net asset value per share(d) | $17.28 | $14.52 | $13.38 | $19.46 |
| Institutional 3 Class(g) | | | | |
| Net assets | $15,000,987 | $520,596 | $912,232 | $210,276 |
| Shares outstanding | 860,446 | 35,914 | 68,726 | 10,970 |
| Net asset value per share(d) | $17.43 | $14.50 | $13.27 | $19.17 |
| (a) | Redemption price per share is equal to net asset value less any applicable contingent deferred sales charge. |
| (b) | On sales of $50,000 or more the offering price is reduced. |
| (c) | Prior to November 1, 2017, Advisor Class shares were known as Class R4 shares. |
| (d) | Redemption price per share is equal to net asset value. |
| (e) | Prior to November 1, 2017, Institutional Class shares were known as Class Z shares. |
| (f) | Prior to November 1, 2017, Institutional 2 Class shares were known as Class R5 shares. |
| (g) | Prior to November 1, 2017, Institutional 3 Class shares were known as Class Y shares. |
The accompanying Notes to Financial Statements are an integral part of this statement.
Columbia Acorn Family of Funds | Annual Report 2017
| 87 |
Statement of Operations
Year Ended December 31, 2017
| | Columbia
Acorn®
Fund | Columbia
Acorn
International® | Columbia
Acorn
USA® | Columbia
Acorn
International
SelectSM |
| Net investment income | | | | |
| Income: | | | | |
| Dividends — unaffiliated issuers | $42,132,788 | $96,832,015 | $3,973,872 | $1,919,026 |
| Income from securities lending — net | 3,183,634 | 1,619,814 | 452,239 | 30,101 |
| Foreign taxes withheld | (38,556) | (9,208,984) | (30,468) | (216,850) |
| Total income | 45,277,866 | 89,242,845 | 4,395,643 | 1,732,277 |
| Expenses: | | | | |
| Investment advisory fee | 31,741,253 | 37,729,491 | 4,463,500 | 1,035,732 |
| Distribution and/or service fees | | | | |
| Class A | 2,162,306 | 1,265,450 | 149,631 | 55,225 |
| Class B(a) | — | 1,526 | — | — |
| Class C | 2,729,135 | 642,236 | 111,462 | 46,893 |
| Class R | — | 53,251 | — | — |
| Transfer agent fees | | | | |
| Class A | 691,048 | 533,170 | 86,521 | 29,491 |
| Advisor Class(b) | 29,223 | 105,644 | 18,885 | 1,953 |
| Class B(a) | — | 211 | — | — |
| Class C | 216,635 | 66,069 | 16,241 | 6,243 |
| Institutional Class(c) | 2,769,995 | 3,571,183 | 504,951 | 114,128 |
| Institutional 2 Class(d) | 30,615 | 207,834 | 4,558 | 318 |
| Institutional 3 Class(e) | 68 | 240 | 19 | 12 |
| Class R | — | 11,213 | — | — |
| Administration fees | 2,222,205 | 2,306,975 | 231,229 | 54,465 |
| Trustees’ fees | 456,449 | 469,502 | 53,543 | 10,557 |
| Custodian fees | 43,104 | 763,192 | 14,100 | 22,244 |
| Printing and postage fees | 339,797 | 432,591 | 51,437 | 30,411 |
| Registration fees | 114,121 | 145,350 | 90,801 | 90,337 |
| Audit fees | 124,798 | 177,306 | 42,158 | 55,237 |
| Legal fees | 875,736 | 898,537 | 97,685 | 21,333 |
| Compensation of chief compliance officer | 14,750 | 14,432 | 1,838 | 321 |
| Other | 255,539 | 331,837 | 46,942 | 25,670 |
| Total expenses | 44,816,777 | 49,727,240 | 5,985,501 | 1,600,570 |
| Fees waived or expenses reimbursed by Investment Manager and its affiliates | — | — | — | (165,619) |
| Fees waived by transfer agent | | | | |
| Class A | (103,938) | (141,368) | (3,418) | — |
| Advisor Class(b) | (4,529) | (4,348) | (1,276) | — |
| Class B(a) | — | (211) | — | — |
| Class C | (31,581) | (9,193) | (751) | — |
| Institutional Class(c) | (422,922) | (151,535) | (8,865) | — |
| Institutional 2 Class(d) | (4,859) | (17,538) | (120) | (56) |
| Institutional 3 Class(e) | (68) | (240) | (19) | (12) |
| Class R | — | (515) | — | — |
| Expense reduction | (10,206) | (10,492) | (1,720) | (816) |
| Total net expenses | 44,238,674 | 49,391,800 | 5,969,332 | 1,434,067 |
| Net investment income (loss) | 1,039,192 | 39,851,045 | (1,573,689) | 298,210 |
The accompanying Notes to Financial Statements are an integral part of this statement.
| 88 | Columbia Acorn Family of Funds | Annual Report 2017 |
Statement of Operations (continued)
Year Ended December 31, 2017
| | Columbia
Acorn®
Fund | Columbia
Acorn
International® | Columbia
Acorn
USA® | Columbia
Acorn
International
SelectSM |
| Realized and unrealized gain (loss) — net | | | | |
| Net realized gain (loss) on: | | | | |
| Investments — unaffiliated issuers | $1,178,101,659 | $452,786,613 | $212,473,392 | $8,209,957 |
| Investments — affiliated issuers | (1,002,159) | — | — | — |
| Foreign currency translations | 5,907 | (897,730) | — | (17,399) |
| Futures contracts | (846,958) | — | (111,277) | — |
| Net realized gain | 1,176,258,449 | 451,888,883 | 212,362,115 | 8,192,558 |
| Net change in unrealized appreciation (depreciation) on: | | | | |
| Investments — unaffiliated issuers | (106,824,734) | 879,901,697 | (119,147,241) | 26,154,093 |
| Investments — affiliated issuers | (3,247,118) | — | — | — |
| Foreign currency translations | — | 446,749 | — | 10,577 |
| Foreign capital gains tax | — | — | — | (3,652) |
| Net change in unrealized appreciation (depreciation) | (110,071,852) | 880,348,446 | (119,147,241) | 26,161,018 |
| Net realized and unrealized gain | 1,066,186,597 | 1,332,237,329 | 93,214,874 | 34,353,576 |
| Net increase in net assets resulting from operations | $1,067,225,789 | $1,372,088,374 | $91,641,185 | $34,651,786 |
| (a) | Effective July 17, 2017, Class B shares were automatically converted to Class A shares. |
| (b) | Prior to November 1, 2017, Advisor Class shares were known as Class R4 shares. |
| (c) | Prior to November 1, 2017, Institutional Class shares were known as Class Z shares. |
| (d) | Prior to November 1, 2017, Institutional 2 Class shares were known as Class R5 shares. |
| (e) | Prior to November 1, 2017, Institutional 3 Class shares were known as Class Y shares. |
The accompanying Notes to Financial Statements are an integral part of this statement.
Columbia Acorn Family of Funds | Annual Report 2017
| 89 |
Statement of Operations (continued)
Year Ended December 31, 2017
| | Columbia
Acorn
SelectSM | Columbia
Thermostat
FundSM | Columbia
Acorn
Emerging Markets
FundSM | Columbia
Acorn
European
FundSM(a) |
| Net investment income | | | | |
| Income: | | | | |
| Dividends — unaffiliated issuers | $2,954,990 | $16,841 | $1,860,453 | $1,431,772 |
| Dividends — affiliated issuers | — | 21,576,982 | — | — |
| Interest | — | — | — | 167 |
| Income from securities lending — net | 5,639 | — | 13,164 | 52,695 |
| Foreign taxes withheld | — | — | (165,183) | (127,115) |
| Total income | 2,960,629 | 21,593,823 | 1,708,434 | 1,357,519 |
| Expenses: | | | | |
| Investment advisory fee | 2,640,268 | 977,373 | 1,288,662 | 800,001 |
| Distribution and/or service fees | | | | |
| Class A | 274,273 | 770,365 | 89,673 | 58,156 |
| Class C | 241,033 | 2,944,899 | 155,232 | 101,990 |
| Transfer agent fees | | | | |
| Class A | 137,636 | 247,759 | 51,008 | 25,912 |
| Advisor Class(b) | 2,738 | 12,303 | 1,704 | 999 |
| Class C | 30,029 | 238,192 | 21,913 | 11,281 |
| Institutional Class(c) | 195,117 | 283,129 | 70,476 | 33,801 |
| Institutional 2 Class(d) | 789 | 7,052 | 567 | 1,389 |
| Institutional 3 Class(e) | 10 | 28 | 13 | 15 |
| Administration fees | 145,346 | 457,272 | 48,634 | 31,480 |
| Trustees’ fees | 30,017 | 98,928 | 9,991 | 5,394 |
| Custodian fees | 4,238 | 2,652 | 80,656 | 37,385 |
| Printing and postage fees | 57,676 | 97,569 | 28,663 | 20,436 |
| Registration fees | 88,630 | 110,901 | 88,190 | 82,208 |
| Audit fees | 41,801 | 23,768 | 60,559 | 40,820 |
| Legal fees | 58,111 | 187,361 | 18,698 | 11,602 |
| Compensation of chief compliance officer | 950 | 3,180 | 313 | 161 |
| Other | 34,837 | 62,668 | 32,490 | 33,574 |
| Total expenses | 3,983,499 | 6,525,399 | 2,047,442 | 1,296,604 |
| Fees waived or expenses reimbursed by Investment Manager and its affiliates | (621,240) | (367,668) | (314,962) | (257,322) |
| Fees waived by transfer agent | | | | |
| Class A | (16,920) | — | — | — |
| Advisor Class(b) | (437) | — | — | — |
| Class C | (3,522) | — | — | — |
| Institutional Class(c) | (25,172) | — | — | — |
| Institutional 2 Class(d) | (114) | (778) | (99) | (197) |
| Institutional 3 Class(e) | (10) | (28) | (13) | (15) |
| Expense reduction | (1,847) | (680) | (80) | (20) |
| Total net expenses | 3,314,237 | 6,156,245 | 1,732,288 | 1,039,050 |
| Net investment income (loss) | (353,608) | 15,437,578 | (23,854) | 318,469 |
The accompanying Notes to Financial Statements are an integral part of this statement.
| 90 | Columbia Acorn Family of Funds | Annual Report 2017 |
Statement of Operations (continued)
Year Ended December 31, 2017
| | Columbia
Acorn
SelectSM | Columbia
Thermostat
FundSM | Columbia
Acorn
Emerging Markets
FundSM | Columbia
Acorn
European
FundSM(a) |
| Realized and unrealized gain (loss) — net | | | | |
| Net realized gain (loss) on: | | | | |
| Investments — unaffiliated issuers | $40,516,594 | $— | $5,008,488 | $2,108,520 |
| Investments — affiliated issuers | — | 14,222,008 | — | — |
| Capital gain distributions from underlying affiliated funds | — | 9,432,065 | — | — |
| Foreign currency translations | — | — | (49,155) | 4,917 |
| Net realized gain | 40,516,594 | 23,654,073 | 4,959,333 | 2,113,437 |
| Net change in unrealized appreciation (depreciation) on: | | | | |
| Investments — unaffiliated issuers | 32,742,921 | — | 26,106,868 | 17,434,649 |
| Investments — affiliated issuers | — | 10,450,897 | — | — |
| Foreign currency translations | — | — | 106 | 8,899 |
| Foreign capital gains tax | — | — | (25,658) | — |
| Net change in unrealized appreciation (depreciation) | 32,742,921 | 10,450,897 | 26,081,316 | 17,443,548 |
| Net realized and unrealized gain | 73,259,515 | 34,104,970 | 31,040,649 | 19,556,985 |
| Net increase in net assets resulting from operations | $72,905,907 | $49,542,548 | $31,016,795 | $19,875,454 |
| (a) | Institutional 3 Class shares are based on operations from March 1, 2017 (commencement of operations) through the stated period end. |
| (b) | Prior to November 1, 2017, Advisor Class shares were known as Class R4 shares. |
| (c) | Prior to November 1, 2017, Institutional Class shares were known as Class Z shares. |
| (d) | Prior to November 1, 2017, Institutional 2 Class shares were known as Class R5 shares. |
| (e) | Prior to November 1, 2017, Institutional 3 Class shares were known as Class Y shares. |
The accompanying Notes to Financial Statements are an integral part of this statement.
Columbia Acorn Family of Funds | Annual Report 2017
| 91 |
Statement of Changes in Net Assets
| | Columbia
Acorn® Fund | Columbia Acorn
International® |
| | Year Ended
December 31, 2017 | Year Ended
December 31, 2016 | Year Ended
December 31, 2017 | Year Ended
December 31, 2016 |
| Operations | | | | |
| Net investment income (loss) | $1,039,192 | $(2,693,471) | $39,851,045 | $63,212,029 |
| Net realized gain (loss) | 1,176,258,449 | 1,510,848,459 | 451,888,883 | (14,787,593) |
| Net change in unrealized appreciation (depreciation) | (110,071,852) | (1,031,158,606) | 880,348,446 | (171,914,114) |
| Net increase (decrease) in net assets resulting from operations | 1,067,225,789 | 476,996,382 | 1,372,088,374 | (123,489,678) |
| Distributions to shareholders | | | | |
| Net investment income | | | | |
| Class A | — | — | (7,118,778) | (2,294,349) |
| Advisor Class(a) | — | — | (1,687,012) | (643,271) |
| Class B(b) | — | — | (2,069) | — |
| Class C | — | — | (387,660) | — |
| Class I(c) | — | — | — | (250,719) |
| Institutional Class(d) | — | — | (57,030,081) | (22,632,732) |
| Institutional 2 Class(e) | — | — | (7,070,007) | (2,042,254) |
| Institutional 3 Class(f) | — | — | (8,860,457) | (1,616,789) |
| Class R | — | — | (149,105) | (1,758) |
| Net realized gains | | | | |
| Class A | (198,597,993) | (355,213,879) | (23,914,812) | (4,791,671) |
| Advisor Class(a) | (7,546,403) | (10,648,130) | (5,256,918) | (3,192,056) |
| Class B(b) | — | — | — | (6,422) |
| Class C | (98,221,494) | (162,765,900) | (3,412,394) | (553,766) |
| Class I(c) | — | (6,394,000) | — | (367,390) |
| Institutional Class(d) | (708,224,553) | (1,202,301,687) | (160,560,346) | (27,548,483) |
| Institutional 2 Class(e) | (13,004,610) | (15,236,759) | (21,942,004) | (2,010,528) |
| Institutional 3 Class(f) | (11,007,435) | (25,706,160) | (35,892,439) | (1,662,627) |
| Class R | — | — | (676,321) | (30,861) |
| Total distributions to shareholders | (1,036,602,488) | (1,778,266,515) | (333,960,403) | (69,645,676) |
| Decrease in net assets from capital stock activity | (221,183,341) | (1,063,279,983) | (784,106,134) | (1,887,104,246) |
| Total increase (decrease) in net assets | (190,560,040) | (2,364,550,116) | 254,021,837 | (2,080,239,600) |
| Net assets at beginning of year | 4,828,733,756 | 7,193,283,872 | 4,652,938,166 | 6,733,177,766 |
| Net assets at end of year | $4,638,173,716 | $4,828,733,756 | $4,906,960,003 | $4,652,938,166 |
| Undistributed (excess of distributions over) net investment income | $(2,220,754) | $(3,783,993) | $4,411,242 | $30,644,829 |
| (a) | Prior to November 1, 2017, Advisor Class shares were known as Class R4 shares. |
| (b) | Effective July 17, 2017, Class B shares were automatically converted to Class A shares. |
| (c) | Effective March 27, 2017, Class I shares were redeemed or exchanged for Institutional 3 Class shares. |
| (d) | Prior to November 1, 2017, Institutional Class shares were known as Class Z shares. |
| (e) | Prior to November 1, 2017, Institutional 2 Class shares were known as Class R5 shares. |
| (f) | Prior to November 1, 2017, Institutional 3 Class shares were known as Class Y shares. |
The accompanying Notes to Financial Statements are an integral part of this statement.
| 92 | Columbia Acorn Family of Funds | Annual Report 2017 |
Statement of Changes in Net Assets (continued)
| | Columbia
Acorn USA® | Columbia Acorn
International SelectSM |
| | Year Ended
December 31, 2017 | Year Ended
December 31, 2016 | Year Ended
December 31, 2017 | Year Ended
December 31, 2016 |
| Operations | | | | |
| Net investment income (loss) | $(1,573,689) | $(2,585,435) | $298,210 | $727,712 |
| Net realized gain | 212,362,115 | 173,306,331 | 8,192,558 | 406,852 |
| Net change in unrealized appreciation (depreciation) | (119,147,241) | (116,920,216) | 26,161,018 | (727,228) |
| Net increase in net assets resulting from operations | 91,641,185 | 53,800,680 | 34,651,786 | 407,336 |
| Distributions to shareholders | | | | |
| Net investment income | | | | |
| Class A | — | — | (9,521) | (128,440) |
| Advisor Class(a) | — | — | (4,562) | (10,361) |
| Class I(b) | — | — | — | (21) |
| Institutional Class(c) | — | — | (228,058) | (688,337) |
| Institutional 2 Class(d) | — | — | (1,921) | (4,257) |
| Institutional 3 Class(e) | — | — | (26,734) | (3,239) |
| Net realized gains | | | | |
| Class A | (15,531,538) | (32,380,146) | — | — |
| Advisor Class(a) | (4,118,797) | (2,636,761) | — | — |
| Class C | (4,827,537) | (6,855,670) | — | — |
| Class I(b) | — | (535) | — | — |
| Institutional Class(c) | (61,910,319) | (176,812,357) | — | — |
| Institutional 2 Class(d) | (3,183,971) | (6,082,950) | — | — |
| Institutional 3 Class(e) | (12,346,845) | (13,772,136) | — | — |
| Return of capital | | | | |
| Class A | — | — | — | (21,491) |
| Advisor Class(a) | — | — | — | (1,231) |
| Class I(b) | — | — | — | (2) |
| Institutional Class(c) | — | — | — | (79,155) |
| Institutional 2 Class(d) | — | — | — | (474) |
| Institutional 3 Class(e) | — | — | — | (333) |
| Total distributions to shareholders | (101,919,007) | (238,540,555) | (270,796) | (937,341) |
| Decrease in net assets from capital stock activity | (310,665,005) | (129,621,627) | (3,597,759) | (38,779,298) |
| Total increase (decrease) in net assets | (320,942,827) | (314,361,502) | 30,783,231 | (39,309,303) |
| Net assets at beginning of year | 643,620,425 | 957,981,927 | 100,011,573 | 139,320,876 |
| Net assets at end of year | $322,677,598 | $643,620,425 | $130,794,804 | $100,011,573 |
| Excess of distributions over net investment income | $(254,453) | $(324,258) | $(53,622) | $(76,287) |
| (a) | Prior to November 1, 2017, Advisor Class shares were known as Class R4 shares. |
| (b) | Effective March 27, 2017, Class I shares were redeemed or exchanged for Institutional 3 Class shares. |
| (c) | Prior to November 1, 2017, Institutional Class shares were known as Class Z shares. |
| (d) | Prior to November 1, 2017, Institutional 2 Class shares were known as Class R5 shares. |
| (e) | Prior to November 1, 2017, Institutional 3 Class shares were known as Class Y shares. |
The accompanying Notes to Financial Statements are an integral part of this statement.
Columbia Acorn Family of Funds | Annual Report 2017
| 93 |
Statement of Changes in Net Assets (continued)
| | Columbia
Acorn SelectSM | Columbia
Thermostat FundSM |
| | Year Ended
December 31, 2017 | Year Ended
December 31, 2016 | Year Ended
December 31, 2017 | Year Ended
December 31, 2016 |
| Operations | | | | |
| Net investment income (loss) | $(353,608) | $(636,264) | $15,437,578 | $13,815,474 |
| Net realized gain | 40,516,594 | 51,359,334 | 23,654,073 | 6,455,376 |
| Net change in unrealized appreciation (depreciation) | 32,742,921 | (13,696,714) | 10,450,897 | 27,501,996 |
| Net increase in net assets resulting from operations | 72,905,907 | 37,026,356 | 49,542,548 | 47,772,846 |
| Distributions to shareholders | | | | |
| Net investment income | | | | |
| Class A | — | — | (9,278,829) | (2,065,216) |
| Advisor Class(a) | — | — | (559,209) | (116,893) |
| Class C | — | — | (5,769,999) | (1,254,586) |
| Institutional Class(b) | — | — | (12,343,315) | (2,661,104) |
| Institutional 2 Class(c) | — | — | (468,756) | (93,729) |
| Institutional 3 Class(d) | — | — | (17,424) | (3,227) |
| Net realized gains | | | | |
| Class A | (13,531,635) | (20,956,929) | (3,927,704) | (7,330,165) |
| Advisor Class(a) | (268,631) | (137,648) | (231,441) | (270,622) |
| Class C | (4,068,306) | (6,613,573) | (3,875,776) | (6,807,442) |
| Class I(e) | — | (3,413,863) | — | — |
| Institutional Class(b) | (17,384,449) | (23,230,145) | (4,913,074) | (6,421,250) |
| Institutional 2 Class(c) | (135,711) | (169,378) | (192,959) | (227,023) |
| Institutional 3 Class(d) | (2,568,205) | (675,691) | (7,159) | (6,939) |
| Total distributions to shareholders | (37,956,937) | (55,197,227) | (41,585,645) | (27,258,196) |
| Decrease in net assets from capital stock activity | (34,460,018) | (72,642,815) | (256,152,474) | (15,113,859) |
| Total increase (decrease) in net assets | 488,952 | (90,813,686) | (248,195,571) | 5,400,791 |
| Net assets at beginning of year | 308,388,984 | 399,202,670 | 1,107,426,617 | 1,102,025,826 |
| Net assets at end of year | $308,877,936 | $308,388,984 | $859,231,046 | $1,107,426,617 |
| Undistributed (excess of distributions over) net investment income | $(231,199) | $(319,341) | $731,622 | $13,506,415 |
| (a) | Prior to November 1, 2017, Advisor Class shares were known as Class R4 shares. |
| (b) | Prior to November 1, 2017, Institutional Class shares were known as Class Z shares. |
| (c) | Prior to November 1, 2017, Institutional 2 Class shares were known as Class R5 shares. |
| (d) | Prior to November 1, 2017, Institutional 3 Class shares were known as Class Y shares. |
| (e) | Effective March 27, 2017, Class I shares were redeemed or exchanged for Institutional 3 Class shares. |
The accompanying Notes to Financial Statements are an integral part of this statement.
| 94 | Columbia Acorn Family of Funds | Annual Report 2017 |
Statement of Changes in Net Assets (continued)
| | Columbia Acorn
Emerging Markets FundSM | Columbia Acorn
European FundSM |
| | Year Ended
December 31, 2017 | Year Ended
December 31, 2016 | Year Ended
December 31, 2017 (a) | Year Ended
December 31, 2016 |
| Operations | | | | |
| Net investment income (loss) | $(23,854) | $(284,926) | $318,469 | $590,637 |
| Net realized gain (loss) | 4,959,333 | (45,598,080) | 2,113,437 | (4,579,308) |
| Net change in unrealized appreciation (depreciation) | 26,081,316 | 36,302,688 | 17,443,548 | 1,960,685 |
| Net increase (decrease) in net assets resulting from operations | 31,016,795 | (9,580,318) | 19,875,454 | (2,027,986) |
| Distributions to shareholders | | | | |
| Net investment income | | | | |
| Class A | — | (194,500) | (276,319) | (259,174) |
| Advisor Class(b) | — | (9,157) | (26,878) | (4,237) |
| Class C | — | — | (21,994) | (14,070) |
| Class I(c) | — | (15) | — | (29) |
| Institutional Class(d) | — | (333,824) | (555,415) | (127,499) |
| Institutional 2 Class(e) | — | (6,632) | (51,520) | (14,327) |
| Institutional 3 Class(f) | — | (14) | (2,414) | — |
| Return of capital | | | | |
| Class A | — | (199,268) | — | — |
| Advisor Class(b) | — | (5,302) | — | — |
| Class I(c) | — | (8) | — | — |
| Institutional Class(d) | — | (196,472) | — | — |
| Institutional 2 Class(e) | — | (3,262) | — | — |
| Institutional 3 Class(f) | — | (7) | — | — |
| Total distributions to shareholders | — | (948,461) | (934,540) | (419,336) |
| Increase (decrease) in net assets from capital stock activity | (30,554,959) | (159,031,334) | 37,264,196 | (13,086,756) |
| Total increase (decrease) in net assets | 461,836 | (169,560,113) | 56,205,110 | (15,534,078) |
| Net assets at beginning of year | 105,760,399 | 275,320,512 | 46,352,313 | 61,886,391 |
| Net assets at end of year | $106,222,235 | $105,760,399 | $102,557,423 | $46,352,313 |
| Undistributed (excess of distributions over) net investment income | $(572,645) | $(1,216,803) | $(202,643) | $55,698 |
| (a) | Institutional 3 Class shares are based on operations from March 1, 2017 (commencement of operations) through the stated period end. |
| (b) | Prior to November 1, 2017, Advisor Class shares were known as Class R4 shares. |
| (c) | Effective March 27, 2017, Class I shares were redeemed or exchanged for Institutional 3 Class shares. |
| (d) | Prior to November 1, 2017, Institutional Class shares were known as Class Z shares. |
| (e) | Prior to November 1, 2017, Institutional 2 Class shares were known as Class R5 shares. |
| (f) | Prior to November 1, 2017, Institutional 3 Class shares were known as Class Y shares. |
The accompanying Notes to Financial Statements are an integral part of this statement.
Columbia Acorn Family of Funds | Annual Report 2017
| 95 |
Statement of Changes in Net Assets (continued)
| | Columbia
Acorn® Fund | Columbia Acorn
International® |
| | Year Ended | Year Ended | Year Ended | Year Ended |
| | December 31, 2017 | December 31, 2016 | December 31, 2017 | December 31, 2016 |
| | Shares | Dollars ($) | Shares | Dollars ($) | Shares | Dollars ($) | Shares | Dollars ($) |
| Capital stock activity |
| Class A(a) | | | | | | | | |
| Subscriptions | 5,214,954 | 73,286,260 | 4,853,520 | 75,803,085 | 1,610,233 | 69,246,137 | 1,974,708 | 75,655,038 |
| Distributions reinvested | 13,895,471 | 179,901,741 | 22,814,791 | 328,819,766 | 650,590 | 29,823,976 | 175,532 | 6,887,710 |
| Redemptions | (24,594,980) | (349,452,663) | (36,704,218) | (594,559,320) | (7,526,663) | (320,009,215) | (7,659,549) | (295,352,503) |
| Net decrease | (5,484,555) | (96,264,662) | (9,035,907) | (189,936,469) | (5,265,840) | (220,939,102) | (5,509,309) | (212,809,755) |
| Advisor Class(b) | | | | | | | | |
| Subscriptions | 1,188,440 | 20,475,315 | 495,492 | 9,093,680 | 507,657 | 22,001,991 | 2,310,115 | 89,193,756 |
| Distributions reinvested | 404,423 | 6,463,098 | 568,047 | 9,572,736 | 149,964 | 6,941,523 | 95,799 | 3,833,333 |
| Redemptions | (1,298,639) | (22,111,783) | (1,492,520) | (27,409,512) | (1,218,557) | (52,979,195) | (12,076,499) | (488,580,771) |
| Net increase (decrease) | 294,224 | 4,826,630 | (428,981) | (8,743,096) | (560,936) | (24,035,681) | (9,670,585) | (395,553,682) |
| Class B(a) | | | | | | | | |
| Distributions reinvested | — | — | — | — | 48 | 2,052 | 166 | 6,407 |
| Redemptions | — | — | (93,870) | (1,194,420) | (13,438) | (556,263) | (29,829) | (1,084,349) |
| Net decrease | — | — | (93,870) | (1,194,420) | (13,390) | (554,211) | (29,663) | (1,077,942) |
| Class C | | | | | | | | |
| Subscriptions | 1,151,804 | 9,081,597 | 2,850,481 | 28,830,261 | 90,241 | 3,793,139 | 88,146 | 3,250,023 |
| Distributions reinvested | 14,018,509 | 94,772,247 | 15,224,608 | 142,292,662 | 83,543 | 3,674,876 | 12,938 | 497,985 |
| Redemptions | (13,966,397) | (120,313,372) | (16,527,105) | (189,293,788) | (526,608) | (21,906,351) | (670,819) | (24,917,914) |
| Net increase (decrease) | 1,203,916 | (16,459,528) | 1,547,984 | (18,170,865) | (352,824) | (14,438,336) | (569,735) | (21,169,906) |
| Class I(c) | | | | | | | | |
| Subscriptions | — | — | 2,241,456 | 40,012,558 | — | — | 2,023,643 | 76,814,214 |
| Distributions reinvested | — | — | 384,162 | 6,393,601 | — | — | 15,790 | 618,080 |
| Redemptions | (704,360) | (11,413,339) | (3,318,699) | (60,309,700) | (587,108) | (24,144,151) | (2,841,410) | (108,946,434) |
| Net decrease | (704,360) | (11,413,339) | (693,081) | (13,903,541) | (587,108) | (24,144,151) | (801,977) | (31,514,140) |
| Institutional Class(d) | | | | | | | | |
| Subscriptions | 11,660,704 | 189,841,275 | 12,510,656 | 225,203,283 | 7,013,514 | 296,426,276 | 10,938,039 | 423,737,709 |
| Distributions reinvested | 41,736,204 | 640,071,038 | 65,323,103 | 1,066,953,832 | 3,676,468 | 168,682,272 | 1,012,550 | 39,453,071 |
| Redemptions | (55,995,598) | (919,152,154) | (115,579,393) | (2,071,442,868) | (32,696,730) | (1,462,774,955) | (41,785,744) | (1,603,157,736) |
| Net decrease | (2,598,690) | (89,239,841) | (37,745,634) | (779,285,753) | (22,006,748) | (997,666,407) | (29,835,155) | (1,139,966,956) |
| Institutional 2 Class(e) | | | | | | | | |
| Subscriptions | 1,892,132 | 34,420,349 | 904,623 | 16,475,579 | 4,209,934 | 183,599,629 | 2,366,752 | 90,215,384 |
| Distributions reinvested | 809,341 | 13,002,370 | 896,900 | 15,226,488 | 525,236 | 24,092,915 | 103,055 | 4,001,510 |
| Redemptions | (1,361,035) | (23,541,410) | (2,784,189) | (50,798,909) | (3,251,747) | (145,206,557) | (3,057,775) | (116,417,523) |
| Net increase (decrease) | 1,340,438 | 23,881,309 | (982,666) | (19,096,842) | 1,483,423 | 62,485,987 | (587,968) | (22,200,629) |
| Institutional 3 Class(c),(f) | | | | | | | | |
| Subscriptions | 3,152,141 | 55,149,044 | 631,619 | 11,532,036 | 14,596,689 | 678,353,931 | 1,867,415 | 72,910,693 |
| Distributions reinvested | 669,887 | 11,007,435 | 1,502,317 | 25,706,160 | 964,050 | 44,705,035 | 83,697 | 3,278,372 |
| Redemptions | (5,871,346) | (102,670,389) | (3,702,598) | (70,187,193) | (6,419,328) | (294,475,318) | (3,723,583) | (138,860,801) |
| Net increase (decrease) | (2,049,318) | (36,513,910) | (1,568,662) | (32,948,997) | 9,141,411 | 428,583,648 | (1,772,471) | (62,671,736) |
| Class R | | | | | | | | |
| Subscriptions | — | — | — | — | 247,904 | 10,356,515 | 42,672 | 1,642,911 |
| Distributions reinvested | — | — | — | — | 17,022 | 780,530 | 704 | 28,080 |
| Redemptions | — | — | — | — | (103,693) | (4,534,926) | (46,971) | (1,810,491) |
| Net increase (decrease) | — | — | — | — | 161,233 | 6,602,119 | (3,595) | (139,500) |
| Total net decrease | (7,998,345) | (221,183,341) | (49,000,817) | (1,063,279,983) | (18,000,779) | (784,106,134) | (48,780,458) | (1,887,104,246) |
The accompanying Notes to Financial Statements are an integral part of this statement.
| 96 | Columbia Acorn Family of Funds | Annual Report 2017 |
Statement of Changes in Net Assets (continued)
| (a) | Effective July 17, 2017, Class B shares were automatically converted to Class A shares. |
| (b) | Prior to November 1, 2017, Advisor Class shares were known as Class R4 shares. |
| (c) | Effective March 27, 2017, Class I shares were redeemed or exchanged for Institutional 3 Class shares. |
| (d) | Prior to November 1, 2017, Institutional Class shares were known as Class Z shares. |
| (e) | Prior to November 1, 2017, Institutional 2 Class shares were known as Class R5 shares. |
| (f) | Prior to November 1, 2017, Institutional 3 Class shares were known as Class Y shares. |
The accompanying Notes to Financial Statements are an integral part of this statement.
Columbia Acorn Family of Funds | Annual Report 2017
| 97 |
Statement of Changes in Net Assets (continued)
| | Columbia
Acorn USA® | Columbia Acorn
International SelectSM |
| | Year Ended | Year Ended | Year Ended | Year Ended |
| | December 31, 2017 | December 31, 2016 | December 31, 2017 | December 31, 2016 |
| | Shares | Dollars ($) | Shares | Dollars ($) | Shares | Dollars ($) | Shares | Dollars ($) |
| Capital stock activity |
| Class A | | | | | | | | |
| Subscriptions | 488,025 | 7,442,932 | 570,239 | 10,137,511 | 433,475 | 11,022,848 | 144,898 | 3,073,366 |
| Distributions reinvested | 1,137,099 | 14,397,674 | 1,919,989 | 30,640,598 | 318 | 9,147 | 6,931 | 145,542 |
| Redemptions | (3,181,282) | (49,739,118) | (1,785,208) | (32,134,125) | (466,338) | (11,345,132) | (791,209) | (16,621,178) |
| Net increase (decrease) | (1,556,158) | (27,898,512) | 705,020 | 8,643,984 | (32,545) | (313,137) | (639,380) | (13,402,270) |
| Advisor Class(a) | | | | | | | | |
| Subscriptions | 591,993 | 11,469,434 | 182,950 | 4,045,095 | 22,202 | 594,789 | 37,828 | 786,212 |
| Distributions reinvested | 255,091 | 4,118,796 | 139,452 | 2,636,761 | 156 | 4,554 | 541 | 11,569 |
| Redemptions | (174,410) | (3,344,051) | (338,183) | (6,985,619) | (11,360) | (303,363) | (28,908) | (628,248) |
| Net increase (decrease) | 672,674 | 12,244,179 | (15,781) | (303,763) | 10,998 | 295,980 | 9,461 | 169,533 |
| Class B | | | | | | | | |
| Redemptions | — | — | (1,541) | (21,538) | — | — | (984) | (18,165) |
| Net decrease | — | — | (1,541) | (21,538) | — | — | (984) | (18,165) |
| Class C | | | | | | | | |
| Subscriptions | 99,275 | 974,077 | 117,283 | 1,391,102 | 27,511 | 676,101 | 14,021 | 278,937 |
| Distributions reinvested | 703,494 | 4,761,201 | 573,317 | 6,404,572 | — | — | — | — |
| Redemptions | (510,499) | (5,076,159) | (566,118) | (7,483,741) | (57,659) | (1,371,955) | (66,643) | (1,312,570) |
| Net increase (decrease) | 292,270 | 659,119 | 124,482 | 311,933 | (30,148) | (695,854) | (52,622) | (1,033,633) |
| Class I(b) | | | | | | | | |
| Redemptions | (70) | (1,266) | — | — | (92) | (2,211) | — | — |
| Net decrease | (70) | (1,266) | — | — | (92) | (2,211) | — | — |
| Institutional Class(c) | | | | | | | | |
| Subscriptions | 1,272,209 | 22,899,278 | 2,044,441 | 42,076,329 | 632,322 | 15,614,831 | 496,718 | 10,632,273 |
| Distributions reinvested | 3,701,495 | 58,121,333 | 9,206,155 | 166,971,786 | 5,869 | 170,675 | 25,779 | 547,806 |
| Redemptions | (21,166,533) | (389,628,621) | (17,240,685) | (343,518,307) | (992,393) | (25,627,432) | (1,578,100) | (33,618,763) |
| Net decrease | (16,192,829) | (308,608,010) | (5,990,089) | (134,470,192) | (354,202) | (9,841,926) | (1,055,603) | (22,438,684) |
| Institutional 2 Class(d) | | | | | | | | |
| Subscriptions | 494,678 | 10,218,003 | 204,798 | 4,201,531 | 6,125 | 155,951 | 6,007 | 129,000 |
| Distributions reinvested | 194,941 | 3,183,608 | 314,491 | 6,082,419 | 65 | 1,913 | 220 | 4,710 |
| Redemptions | (828,227) | (15,512,332) | (939,630) | (19,229,210) | (5,576) | (139,156) | (90,410) | (1,874,479) |
| Net increase (decrease) | (138,608) | (2,110,721) | (420,341) | (8,945,260) | 614 | 18,708 | (84,183) | (1,740,769) |
| Institutional 3 Class(b),(e) | | | | | | | | |
| Subscriptions | 540,484 | 10,276,457 | 160,115 | 3,363,597 | 268,318 | 7,467,361 | 9,194 | 207,948 |
| Distributions reinvested | 694,408 | 11,402,230 | 722,739 | 13,771,606 | 914 | 26,725 | 166 | 3,550 |
| Redemptions | (340,563) | (6,628,481) | (591,947) | (11,971,994) | (21,261) | (553,405) | (24,953) | (526,808) |
| Net increase (decrease) | 894,329 | 15,050,206 | 290,907 | 5,163,209 | 247,971 | 6,940,681 | (15,593) | (315,310) |
| Total net decrease | (16,028,392) | (310,665,005) | (5,307,343) | (129,621,627) | (157,404) | (3,597,759) | (1,838,904) | (38,779,298) |
| (a) | Prior to November 1, 2017, Advisor Class shares were known as Class R4 shares. |
| (b) | Effective March 27, 2017, Class I shares were redeemed or exchanged for Institutional 3 Class shares. |
| (c) | Prior to November 1, 2017, Institutional Class shares were known as Class Z shares. |
| (d) | Prior to November 1, 2017, Institutional 2 Class shares were known as Class R5 shares. |
| (e) | Prior to November 1, 2017, Institutional 3 Class shares were known as Class Y shares. |
The accompanying Notes to Financial Statements are an integral part of this statement.
| 98 | Columbia Acorn Family of Funds | Annual Report 2017 |
Statement of Changes in Net Assets (continued)
| | Columbia
Acorn SelectSM | Columbia
Thermostat FundSM |
| | Year Ended | Year Ended | Year Ended | Year Ended |
| | December 31, 2017 | December 31, 2016 | December 31, 2017 | December 31, 2016 |
| | Shares | Dollars ($) | Shares | Dollars ($) | Shares | Dollars ($) | Shares | Dollars ($) |
| Capital stock activity |
| Class A | | | | | | | | |
| Subscriptions | 831,684 | 11,552,003 | 504,342 | 6,690,492 | 1,609,689 | 23,841,063 | 8,041,017 | 116,448,340 |
| Distributions reinvested | 859,784 | 11,678,407 | 1,437,616 | 19,010,001 | 840,860 | 12,338,875 | 598,148 | 8,686,416 |
| Redemptions | (3,504,699) | (48,437,824) | (3,388,242) | (45,317,466) | (12,154,415) | (179,914,818) | (8,433,395) | (122,528,839) |
| Net increase (decrease) | (1,813,231) | (25,207,414) | (1,446,284) | (19,616,973) | (9,703,866) | (143,734,880) | 205,770 | 2,605,917 |
| Advisor Class(a) | | | | | | | | |
| Subscriptions | 297,546 | 4,898,165 | 20,875 | 314,488 | 565,162 | 8,354,290 | 628,375 | 9,077,683 |
| Distributions reinvested | 16,388 | 268,631 | 9,104 | 137,648 | 54,380 | 790,505 | 26,865 | 387,442 |
| Redemptions | (45,047) | (730,797) | (32,975) | (491,350) | (582,985) | (8,576,681) | (803,020) | (11,457,488) |
| Net increase (decrease) | 268,887 | 4,435,999 | (2,996) | (39,214) | 36,557 | 568,114 | (147,780) | (1,992,363) |
| Class B | | | | | | | | |
| Redemptions | — | — | (26,947) | (277,346) | — | — | (20,546) | (294,082) |
| Net decrease | — | — | (26,947) | (277,346) | — | — | (20,546) | (294,082) |
| Class C | | | | | | | | |
| Subscriptions | 86,931 | 825,976 | 247,884 | 2,349,868 | 1,107,876 | 16,440,929 | 3,516,437 | 51,108,804 |
| Distributions reinvested | 428,882 | 3,895,445 | 573,270 | 5,430,627 | 536,248 | 7,916,684 | 433,622 | 6,322,208 |
| Redemptions | (1,148,372) | (11,025,586) | (1,129,045) | (11,022,448) | (7,807,143) | (116,029,441) | (6,071,444) | (88,504,045) |
| Net decrease | (632,559) | (6,304,165) | (307,891) | (3,241,953) | (6,163,019) | (91,671,828) | (2,121,385) | (31,073,033) |
| Class I(b) | | | | | | | | |
| Subscriptions | — | — | 2,747,662 | 39,487,939 | — | — | — | — |
| Distributions reinvested | — | — | 231,745 | 3,413,645 | — | — | — | — |
| Redemptions | (738,244) | (11,402,065) | (3,993,682) | (59,895,103) | — | — | — | — |
| Net decrease | (738,244) | (11,402,065) | (1,014,275) | (16,993,519) | — | — | — | — |
| Institutional Class(c) | | | | | | | | |
| Subscriptions | 1,381,191 | 21,252,498 | 573,558 | 8,420,465 | 8,573,428 | 125,070,056 | 7,615,049 | 109,081,660 |
| Distributions reinvested | 1,040,184 | 15,939,038 | 1,406,945 | 20,616,589 | 844,055 | 12,217,159 | 426,415 | 6,116,187 |
| Redemptions | (2,758,485) | (43,032,113) | (4,164,970) | (61,166,990) | (10,927,093) | (160,162,349) | (7,344,820) | (105,190,921) |
| Net increase (decrease) | (337,110) | (5,840,577) | (2,184,467) | (32,129,936) | (1,509,610) | (22,875,134) | 696,644 | 10,006,926 |
| Institutional 2 Class(d) | | | | | | | | |
| Subscriptions | 61,419 | 987,353 | 34,905 | 518,997 | 385,136 | 5,673,263 | 641,667 | 9,116,272 |
| Distributions reinvested | 8,423 | 135,545 | 11,146 | 169,161 | 45,470 | 661,715 | 22,173 | 319,988 |
| Redemptions | (37,575) | (614,799) | (35,794) | (532,564) | (333,143) | (4,893,764) | (264,332) | (3,843,375) |
| Net increase | 32,267 | 508,099 | 10,257 | 155,594 | 97,463 | 1,441,214 | 399,508 | 5,592,885 |
| Institutional 3 Class(b),(e) | | | | | | | | |
| Subscriptions | 1,808,898 | 29,600,372 | 86,025 | 1,305,072 | 36,425 | 537,605 | 4,847 | 70,136 |
| Distributions reinvested | 161,019 | 2,568,039 | 44,223 | 675,474 | 1,683 | 24,446 | 701 | 10,096 |
| Redemptions | (1,396,136) | (22,818,306) | (162,905) | (2,480,014) | (29,767) | (442,011) | (2,796) | (40,341) |
| Net increase (decrease) | 573,781 | 9,350,105 | (32,657) | (499,468) | 8,341 | 120,040 | 2,752 | 39,891 |
| Total net decrease | (2,646,209) | (34,460,018) | (5,005,260) | (72,642,815) | (17,234,134) | (256,152,474) | (985,037) | (15,113,859) |
| (a) | Prior to November 1, 2017, Advisor Class shares were known as Class R4 shares. |
| (b) | Effective March 27, 2017, Class I shares were redeemed or exchanged for Institutional 3 Class shares. |
| (c) | Prior to November 1, 2017, Institutional Class shares were known as Class Z shares. |
| (d) | Prior to November 1, 2017, Institutional 2 Class shares were known as Class R5 shares. |
| (e) | Prior to November 1, 2017, Institutional 3 Class shares were known as Class Y shares. |
The accompanying Notes to Financial Statements are an integral part of this statement.
Columbia Acorn Family of Funds | Annual Report 2017
| 99 |
Statement of Changes in Net Assets (continued)
| | Columbia Acorn
Emerging Markets FundSM | Columbia Acorn
European FundSM |
| | Year Ended | Year Ended | Year Ended | Year Ended |
| | December 31, 2017 | December 31, 2016 | December 31, 2017 (a) | December 31, 2016 |
| | Shares | Dollars ($) | Shares | Dollars ($) | Shares | Dollars ($) | Shares | Dollars ($) |
| Capital stock activity |
| Class A | | | | | | | | |
| Subscriptions | 441,162 | 5,127,794 | 511,014 | 5,151,768 | 1,140,391 | 20,187,059 | 614,988 | 8,800,628 |
| Distributions reinvested | — | — | 38,980 | 390,579 | 14,776 | 276,319 | 18,095 | 259,128 |
| Redemptions | (2,868,148) | (31,102,071) | (4,201,955) | (43,044,856) | (1,330,219) | (21,179,443) | (1,508,418) | (21,629,960) |
| Net decrease | (2,426,986) | (25,974,277) | (3,651,961) | (37,502,509) | (175,052) | (716,065) | (875,335) | (12,570,204) |
| Advisor Class(b) | | | | | | | | |
| Subscriptions | 47,248 | 568,561 | 48,605 | 497,849 | 126,977 | 2,378,990 | 6,570 | 97,107 |
| Distributions reinvested | — | — | 1,429 | 14,438 | 1,412 | 26,840 | 296 | 4,213 |
| Redemptions | (78,974) | (905,107) | (253,438) | (2,611,137) | (1,986) | (33,180) | (8,873) | (126,268) |
| Net increase (decrease) | (31,726) | (336,546) | (203,404) | (2,098,850) | 126,403 | 2,372,650 | (2,007) | (24,948) |
| Class C | | | | | | | | |
| Subscriptions | 86,043 | 990,408 | 87,820 | 876,756 | 337,990 | 5,828,257 | 189,633 | 2,692,628 |
| Distributions reinvested | — | — | — | — | 1,230 | 21,994 | 926 | 14,070 |
| Redemptions | (483,515) | (5,492,520) | (752,453) | (7,590,091) | (117,103) | (1,947,925) | (175,620) | (2,481,569) |
| Net increase (decrease) | (397,472) | (4,502,112) | (664,633) | (6,713,335) | 222,117 | 3,902,326 | 14,939 | 225,129 |
| Class I(c) | | | | | | | | |
| Distributions reinvested | — | — | 2 | 23 | — | — | 2 | 29 |
| Redemptions | (205) | (2,252) | — | — | (173) | (2,700) | — | — |
| Net increase (decrease) | (205) | (2,252) | 2 | 23 | (173) | (2,700) | 2 | 29 |
| Institutional Class(d) | | | | | | | | |
| Subscriptions | 2,164,060 | 23,600,425 | 1,761,120 | 18,169,951 | 2,162,206 | 36,835,519 | 767,402 | 10,950,673 |
| Distributions reinvested | — | — | 50,737 | 508,887 | 29,529 | 554,395 | 8,898 | 126,581 |
| Redemptions | (2,100,848) | (24,137,744) | (12,253,429) | (119,474,532) | (454,340) | (7,965,911) | (770,123) | (10,997,473) |
| Net increase (decrease) | 63,212 | (537,319) | (10,441,572) | (100,795,694) | 1,737,395 | 29,424,003 | 6,177 | 79,781 |
| Institutional 2 Class(e) | | | | | | | | |
| Subscriptions | 34,601 | 400,968 | 79,534 | 799,097 | 283,318 | 5,035,710 | 13,780 | 200,355 |
| Distributions reinvested | — | — | 966 | 9,749 | 2,733 | 51,481 | 997 | 14,301 |
| Redemptions | (38,991) | (455,733) | (1,224,039) | (12,729,815) | (169,753) | (2,999,705) | (68,695) | (1,011,199) |
| Net increase (decrease) | (4,390) | (54,765) | (1,143,539) | (11,920,969) | 116,298 | 2,087,486 | (53,918) | (796,543) |
| Institutional 3 Class(f) | | | | | | | | |
| Subscriptions | 72,757 | 905,959 | — | — | 11,313 | 202,597 | — | — |
| Distributions reinvested | — | — | — | — | 126 | 2,367 | — | — |
| Redemptions | (4,221) | (53,647) | — | — | (469) | (8,468) | — | — |
| Net increase | 68,536 | 852,312 | — | — | 10,970 | 196,496 | — | — |
| Total net increase (decrease) | (2,729,031) | (30,554,959) | (16,105,107) | (159,031,334) | 2,037,958 | 37,264,196 | (910,142) | (13,086,756) |
| (a) | Institutional 3 Class shares are based on operations from March 1, 2017 (commencement of operations) through the stated period end. |
| (b) | Prior to November 1, 2017, Advisor Class shares were known as Class R4 shares. |
| (c) | Effective March 27, 2017, Class I shares were redeemed or exchanged for Institutional 3 Class shares. |
| (d) | Prior to November 1, 2017, Institutional Class shares were known as Class Z shares. |
| (e) | Prior to November 1, 2017, Institutional 2 Class shares were known as Class R5 shares. |
| (f) | Prior to November 1, 2017, Institutional 3 Class shares were known as Class Y shares. |
The accompanying Notes to Financial Statements are an integral part of this statement.
| 100 | Columbia Acorn Family of Funds | Annual Report 2017 |
[THIS PAGE INTENTIONALLY LEFT BLANK]
Columbia Acorn Family of Funds | Annual Report 2017
| 101 |
Financial Highlights
Columbia Acorn® Fund
The following tables are intended to help you understand the Fund’s financial performance. Certain information reflects financial results for a single share of a class held for the periods shown. Per share net investment income (loss) amounts are calculated based on average shares outstanding during the period. Total return assumes reinvestment of all dividends and distributions, if any. Total return does not reflect payment of sales charges, if any. Total return and portfolio turnover are not annualized for periods of less than one year. The portfolio turnover rate is calculated without regard to purchase and sales transactions of short-term instruments and certain derivatives, if any. If such transactions were included, the Fund’s portfolio turnover rate may be higher.
| Year Ended | Net asset value,
beginning of
period | Net
investment
income
(loss) | Net
realized
and
unrealized
gain (loss) | Total from
investment
operations | Distributions
from net
investment
income | Distributions
from net
realized
gains |
| Class A |
| 12/31/2017 | $13.35 | (0.02) | 3.23 | 3.21 | — | (3.64) |
| 12/31/2016 | $17.63 | (0.03) | 1.73 | 1.70 | — | (5.98) |
| 12/31/2015 | $30.30 | (0.12) | (0.27) (d) | (0.39) | — | (12.28) |
| 12/31/2014 | $35.78 | (0.08) | 0.21 | 0.13 | — | (5.61) |
| 12/31/2013 | $29.36 | (0.06) | 8.84 | 8.78 | (0.04) | (2.32) |
| Advisor Class(e) |
| 12/31/2017 | $15.83 | 0.02 | 3.85 | 3.87 | — | (3.64) |
| 12/31/2016 | $19.84 | 0.00 (f) | 1.97 | 1.97 | — | (5.98) |
| 12/31/2015 | $32.51 | (0.07) | (0.32) (d) | (0.39) | — | (12.28) |
| 12/31/2014 | $37.88 | 0.02 | 0.22 | 0.24 | — | (5.61) |
| 12/31/2013 | $30.90 | 0.06 | 9.29 | 9.35 | (0.05) | (2.32) |
| Class C |
| 12/31/2017 | $8.34 | (0.08) | 1.96 | 1.88 | — | (3.64) |
| 12/31/2016 | $13.16 | (0.11) | 1.27 | 1.16 | — | (5.98) |
| 12/31/2015 | $25.92 | (0.27) | (0.21) (d) | (0.48) | — | (12.28) |
| 12/31/2014 | $31.64 | (0.28) | 0.17 | (0.11) | — | (5.61) |
| 12/31/2013 | $26.34 | (0.26) | 7.88 | 7.62 | — | (2.32) |
| Institutional Class(g) |
| 12/31/2017 | $15.29 | 0.02 | 3.72 | 3.74 | — | (3.64) |
| 12/31/2016 | $19.34 | 0.01 | 1.92 | 1.93 | — | (5.98) |
| 12/31/2015 | $31.95 | (0.04) | (0.29) (d) | (0.33) | — | (12.28) |
| 12/31/2014 | $37.32 | 0.02 | 0.22 | 0.24 | — | (5.61) |
| 12/31/2013 | $30.45 | 0.04 | 9.19 | 9.23 | (0.04) | (2.32) |
| Institutional 2 Class(h) |
| 12/31/2017 | $15.94 | 0.02 | 3.88 | 3.90 | — | (3.64) |
| 12/31/2016 | $19.92 | 0.01 | 1.99 | 2.00 | — | (5.98) |
| 12/31/2015 | $32.55 | (0.04) | (0.31) (d) | (0.35) | — | (12.28) |
| 12/31/2014 | $37.89 | 0.04 | 0.23 | 0.27 | — | (5.61) |
| 12/31/2013 | $30.88 | 0.07 | 9.30 | 9.37 | (0.04) | (2.32) |
The accompanying Notes to Financial Statements are an integral part of this statement.
| 102 | Columbia Acorn Family of Funds | Annual Report 2017 |
Total
distributions to
shareholders | Net
asset
value,
end of
period | Total
return | Total gross
expense
ratio to
average
net assets(a) | Total net
expense
ratio to
average
net assets(a) | Net investment
income (loss)
ratio to
average
net assets | Portfolio
turnover | Net
assets,
end of
period
(000’s) |
| |
| (3.64) | $12.92 | 24.91% | 1.09% | 1.08% (b) | (0.13%) | 72% | $830,454 |
| (5.98) | $13.35 | 10.06% | 1.10% (c) | 1.10% (c) | (0.21%) | 85% | $931,460 |
| (12.28) | $17.63 | (1.87%) | 1.08% | 1.08% | (0.39%) | 21% | $1,388,893 |
| (5.61) | $30.30 | 0.55% | 1.08% | 1.08% | (0.22%) | 17% | $2,694,610 |
| (2.36) | $35.78 | 30.53% | 1.07% | 1.07% | (0.17%) | 18% | $3,869,734 |
| |
| (3.64) | $16.06 | 25.19% | 0.84% | 0.83% (b) | 0.12% | 72% | $38,588 |
| (5.98) | $15.83 | 10.32% | 0.89% (c) | 0.89% (c) | — | 85% | $33,378 |
| (12.28) | $19.84 | (1.75%) | 0.89% | 0.89% | (0.23%) | 21% | $50,335 |
| (5.61) | $32.51 | 0.81% | 0.84% | 0.84% | 0.05% | 17% | $250,457 |
| (2.37) | $37.88 | 30.85% | 0.80% | 0.80% | 0.16% | 18% | $74,188 |
| |
| (3.64) | $6.58 | 23.88% | 1.84% | 1.83% (b) | (0.88%) | 72% | $246,450 |
| (5.98) | $8.34 | 9.29% | 1.84% (c) | 1.84% (c) | (0.95%) | 85% | $302,119 |
| (12.28) | $13.16 | (2.57%) | 1.80% | 1.80% | (1.11%) | 21% | $456,348 |
| (5.61) | $25.92 | (0.16%) | 1.77% | 1.77% | (0.92%) | 17% | $776,370 |
| (2.32) | $31.64 | 29.58% | 1.78% | 1.78% | (0.88%) | 18% | $938,644 |
| |
| (3.64) | $15.39 | 25.24% | 0.84% | 0.83% (b) | 0.12% | 72% | $3,407,214 |
| (5.98) | $15.29 | 10.39% | 0.82% (c) | 0.82% (c) | 0.07% | 85% | $3,425,935 |
| (12.28) | $19.34 | (1.57%) | 0.80% | 0.80% | (0.11%) | 21% | $5,062,313 |
| (5.61) | $31.95 | 0.82% | 0.79% | 0.79% | 0.07% | 17% | $11,340,770 |
| (2.36) | $37.32 | 30.90% | 0.78% | 0.78% | 0.12% | 18% | $14,703,948 |
| |
| (3.64) | $16.20 | 25.21% | 0.82% | 0.81% | 0.14% | 72% | $67,932 |
| (5.98) | $15.94 | 10.43% | 0.81% (c) | 0.81% (c) | 0.08% | 85% | $45,475 |
| (12.28) | $19.92 | (1.60%) | 0.77% | 0.77% | (0.11%) | 21% | $76,412 |
| (5.61) | $32.55 | 0.89% | 0.76% | 0.76% | 0.10% | 17% | $458,223 |
| (2.36) | $37.89 | 30.94% | 0.75% | 0.75% | 0.20% | 18% | $496,906 |
Columbia Acorn Family of Funds | Annual Report 2017
| 103 |
Financial Highlights (continued)
Columbia Acorn® Fund
| Year Ended | Net asset value,
beginning of
period | Net
investment
income
(loss) | Net
realized
and
unrealized
gain (loss) | Total from
investment
operations | Distributions
from net
investment
income | Distributions
from net
realized
gains |
| Institutional 3 Class(i) |
| 12/31/2017 | $16.04 | 0.03 | 3.91 | 3.94 | — | (3.64) |
| 12/31/2016 | $20.00 | 0.02 | 2.00 | 2.02 | — | (5.98) |
| 12/31/2015 | $32.61 | (0.02) | (0.31) (d) | (0.33) | — | (12.28) |
| 12/31/2014 | $37.93 | 0.05 | 0.24 | 0.29 | — | (5.61) |
| 12/31/2013 | $30.90 | 0.09 | 9.31 | 9.40 | (0.05) | (2.32) |
| Notes to Financial Highlights |
| (a) | In addition to the fees and expenses that the Fund bears directly, the Fund indirectly bears a pro rata share of the fees and expenses of any other funds in which it invests, if any. Such indirect expenses are not included in the Fund’s reported expense ratios. |
| (b) | The benefits derived from expense reductions had an impact of less than 0.01%. |
| (c) | Ratios include line of credit interest expense which is less than 0.01%. |
| (d) | Calculation of the net gain (loss) per share (both realized and unrealized) does not correlate to the aggregate realized and unrealized gain (loss) presented in the Statements of Operations due to the timing of subscriptions and redemptions of Fund shares in relation to fluctuations in the market value of the portfolio. |
| (e) | Prior to November 1, 2017, Advisor Class shares were known as Class R4 shares. |
| (f) | Rounds to zero. |
| (g) | Prior to November 1, 2017, Institutional Class shares were known as Class Z shares. |
| (h) | Prior to November 1, 2017, Institutional 2 Class shares were known as Class R5 shares. |
| (i) | Prior to November 1, 2017, Institutional 3 Class shares were known as Class Y shares. |
The accompanying Notes to Financial Statements are an integral part of this statement.
| 104 | Columbia Acorn Family of Funds | Annual Report 2017 |
Total
distributions to
shareholders | Net
asset
value,
end of
period | Total
return | Total gross
expense
ratio to
average
net assets(a) | Total net
expense
ratio to
average
net assets(a) | Net investment
income (loss)
ratio to
average
net assets | Portfolio
turnover | Net
assets,
end of
period
(000’s) |
| |
| (3.64) | $16.34 | 25.31% | 0.76% | 0.76% | 0.19% | 72% | $47,536 |
| (5.98) | $16.04 | 10.50% | 0.76% (c) | 0.76% (c) | 0.12% | 85% | $79,518 |
| (12.28) | $20.00 | (1.54%) | 0.73% | 0.73% | (0.06%) | 21% | $130,546 |
| (5.61) | $32.61 | 0.94% | 0.70% | 0.70% | 0.13% | 17% | $378,780 |
| (2.37) | $37.93 | 30.99% | 0.70% | 0.70% | 0.26% | 18% | $1,227,891 |
Columbia Acorn Family of Funds | Annual Report 2017
| 105 |
Financial Highlights
Columbia Acorn International®
| Year ended | Net asset value,
beginning of
period | Net
investment
income
(loss) | Net
realized
and
unrealized
gain (loss) | Total from
investment
operations | Distributions
from net
investment
income | Distributions
from net
realized
gains |
| Class A |
| 12/31/2017 | $37.71 | 0.25 | 11.71 | 11.96 | (0.67) | (2.49) |
| 12/31/2016 | $39.08 | 0.35 | (1.31) | (0.96) | (0.15) | (0.26) |
| 12/31/2015 | $41.68 | 0.39 | (1.02) | (0.63) | (0.40) | (1.57) |
| 12/31/2014 | $46.63 | 0.42 | (2.51) | (2.09) | (0.55) | (2.31) |
| 12/31/2013 | $40.79 | 0.45 | 8.37 | 8.82 | (1.05) | (1.93) |
| Advisor Class(d) |
| 12/31/2017 | $38.03 | 0.36 | 11.82 | 12.18 | (0.77) | (2.49) |
| 12/31/2016 | $39.41 | 0.48 | (1.38) | (0.90) | (0.22) | (0.26) |
| 12/31/2015 | $42.02 | 0.47 | (1.03) | (0.56) | (0.48) | (1.57) |
| 12/31/2014 | $46.99 | 0.50 | (2.52) | (2.02) | (0.64) | (2.31) |
| 12/31/2013 | $41.08 | 0.34 | 8.67 | 9.01 | (1.17) | (1.93) |
| Class C |
| 12/31/2017 | $36.18 | (0.06) | 11.20 | 11.14 | (0.26) | (2.49) |
| 12/31/2016 | $37.65 | 0.05 | (1.26) | (1.21) | — | (0.26) |
| 12/31/2015 | $40.20 | 0.07 | (0.97) | (0.90) | (0.08) | (1.57) |
| 12/31/2014 | $45.04 | 0.07 | (2.40) | (2.33) | (0.20) | (2.31) |
| 12/31/2013 | $39.50 | 0.10 | 8.08 | 8.18 | (0.71) | (1.93) |
| Institutional Class(e) |
| 12/31/2017 | $37.74 | 0.37 | 11.73 | 12.10 | (0.78) | (2.49) |
| 12/31/2016 | $39.12 | 0.44 | (1.32) | (0.88) | (0.24) | (0.26) |
| 12/31/2015 | $41.73 | 0.51 | (1.03) | (0.52) | (0.52) | (1.57) |
| 12/31/2014 | $46.68 | 0.56 | (2.51) | (1.95) | (0.69) | (2.31) |
| 12/31/2013 | $40.84 | 0.58 | 8.38 | 8.96 | (1.19) | (1.93) |
| Institutional 2 Class(f) |
| 12/31/2017 | $37.72 | 0.38 | 11.72 | 12.10 | (0.79) | (2.49) |
| 12/31/2016 | $39.10 | 0.44 | (1.30) | (0.86) | (0.26) | (0.26) |
| 12/31/2015 | $41.71 | 0.54 | (1.05) | (0.51) | (0.53) | (1.57) |
| 12/31/2014 | $46.66 | 0.57 | (2.51) | (1.94) | (0.70) | (2.31) |
| 12/31/2013 | $40.81 | 0.63 | 8.34 | 8.97 | (1.19) | (1.93) |
| Institutional 3 Class(g) |
| 12/31/2017 | $38.02 | 0.40 | 11.83 | 12.23 | (0.81) | (2.49) |
| 12/31/2016 | $39.41 | 0.47 | (1.32) | (0.85) | (0.28) | (0.26) |
| 12/31/2015 | $42.02 | 0.53 | (1.01) | (0.48) | (0.56) | (1.57) |
| 12/31/2014 | $46.99 | 0.58 | (2.52) | (1.94) | (0.72) | (2.31) |
| 12/31/2013 | $41.08 | 0.57 | 8.48 | 9.05 | (1.21) | (1.93) |
The accompanying Notes to Financial Statements are an integral part of this statement.
| 106 | Columbia Acorn Family of Funds | Annual Report 2017 |
Total
distributions to
shareholders | Proceeds from
regulatory
settlements | Net
asset
value,
end of
period | Total
return | Total gross
expense
ratio to
average
net assets(a) | Total net
expense
ratio to
average
net assets(a) | Net investment
income (loss)
ratio to
average
net assets | Portfolio
turnover | Net
assets,
end of
period
(000’s) |
| |
| (3.16) | — | $46.51 | 31.91% (b) | 1.23% | 1.20% (c) | 0.56% | 37% | $465,830 |
| (0.41) | — | $37.71 | (2.51%) (b) | 1.27% | 1.23% | 0.90% | 46% | $576,235 |
| (1.97) | — | $39.08 | (1.59%) (b) | 1.28% | 1.24% | 0.93% | 50% | $812,479 |
| (2.86) | — | $41.68 | (4.58%) (b) | 1.26% | 1.22% | 0.91% | 28% | $946,553 |
| (2.98) | — | $46.63 | 22.00% (b) | 1.27% | 1.23% | 1.02% | 45% | $1,089,263 |
| |
| (3.26) | — | $46.95 | 32.21% | 0.98% | 0.98% (c) | 0.81% | 37% | $99,578 |
| (0.48) | — | $38.03 | (2.32%) | 1.05% | 1.05% | 1.22% | 46% | $101,988 |
| (2.05) | — | $39.41 | (1.41%) | 1.06% | 1.06% | 1.10% | 50% | $486,763 |
| (2.95) | — | $42.02 | (4.39%) | 1.04% | 1.04% | 1.07% | 28% | $424,425 |
| (3.10) | — | $46.99 | 22.32% | 1.03% | 1.03% | 0.73% | 45% | $355,616 |
| |
| (2.75) | — | $44.57 | 30.93% (b) | 1.98% | 1.97% (c) | (0.15%) | 37% | $63,787 |
| (0.26) | — | $36.18 | (3.26%) (b) | 2.01% | 1.99% | 0.13% | 46% | $64,548 |
| (1.65) | — | $37.65 | (2.33%) (b) | 2.01% | 1.99% | 0.18% | 50% | $88,606 |
| (2.51) | — | $40.20 | (5.27%) (b) | 1.99% | 1.97% | 0.16% | 28% | $103,691 |
| (2.64) | — | $45.04 | 21.07% (b) | 2.01% | 1.99% | 0.23% | 45% | $110,875 |
| |
| (3.27) | — | $46.57 | 32.24% | 0.98% | 0.98% (c) | 0.85% | 37% | $3,116,383 |
| (0.50) | — | $37.74 | (2.28%) | 0.98% | 0.98% | 1.13% | 46% | $3,356,348 |
| (2.09) | — | $39.12 | (1.33%) | 0.97% | 0.97% | 1.21% | 50% | $4,645,797 |
| (3.00) | — | $41.73 | (4.28%) | 0.93% | 0.93% | 1.20% | 28% | $5,585,035 |
| (3.12) | — | $46.68 | 22.33% | 0.93% | 0.93% | 1.30% | 45% | $6,293,552 |
| |
| (3.28) | — | $46.54 | 32.27% | 0.93% | 0.93% | 0.87% | 37% | $422,916 |
| (0.52) | — | $37.72 | (2.23%) | 0.93% | 0.93% | 1.15% | 46% | $286,786 |
| (2.10) | — | $39.10 | (1.29%) | 0.92% | 0.92% | 1.26% | 50% | $320,252 |
| (3.01) | — | $41.71 | (4.25%) | 0.90% | 0.90% | 1.23% | 28% | $397,882 |
| (3.12) | — | $46.66 | 22.38% | 0.91% | 0.91% | 1.40% | 45% | $274,415 |
| |
| (3.30) | — | $46.95 | 32.36% | 0.88% | 0.88% | 0.89% | 37% | $725,247 |
| (0.54) | — | $38.02 | (2.19%) | 0.88% | 0.88% | 1.20% | 46% | $239,733 |
| (2.13) | — | $39.41 | (1.23%) | 0.88% | 0.88% | 1.26% | 50% | $318,326 |
| (3.03) | — | $42.02 | (4.21%) | 0.85% | 0.85% | 1.25% | 28% | $225,012 |
| (3.14) | — | $46.99 | 22.44% | 0.86% | 0.86% | 1.26% | 45% | $155,140 |
Columbia Acorn Family of Funds | Annual Report 2017
| 107 |
Financial Highlights (continued)
Columbia Acorn International®
| Year ended | Net asset value,
beginning of
period | Net
investment
income
(loss) | Net
realized
and
unrealized
gain (loss) | Total from
investment
operations | Distributions
from net
investment
income | Distributions
from net
realized
gains |
| Class R |
| 12/31/2017 | $37.71 | 0.21 | 11.63 | 11.84 | (0.55) | (2.49) |
| 12/31/2016 | $39.07 | 0.21 | (1.30) | (1.09) | (0.01) | (0.26) |
| 12/31/2015 | $41.67 | 0.23 | (1.02) | (0.79) | (0.24) | (1.57) |
| 12/31/2014 | $46.60 | 0.24 | (2.50) | (2.26) | (0.36) | (2.31) |
| 12/31/2013 | $40.79 | 0.26 | 8.36 | 8.62 | (0.88) | (1.93) |
| Notes to Financial Highlights |
| (a) | In addition to the fees and expenses that the Fund bears directly, the Fund indirectly bears a pro rata share of the fees and expenses of any other funds in which it invests, if any. Such indirect expenses are not included in the Fund’s reported expense ratios. |
| (b) | Had the Investment Manager and/or Transfer Agent not waived fees and/or reimbursed a portion of expenses, total return would have been reduced. |
| (c) | The benefits derived from expense reductions had an impact of less than 0.01%. |
| (d) | Prior to November 1, 2017, Advisor Class shares were known as Class R4 shares. |
| (e) | Prior to November 1, 2017, Institutional Class shares were known as Class Z shares. |
| (f) | Prior to November 1, 2017, Institutional 2 Class shares were known as Class R5 shares. |
| (g) | Prior to November 1, 2017, Institutional 3 Class shares were known as Class Y shares. |
The accompanying Notes to Financial Statements are an integral part of this statement.
| 108 | Columbia Acorn Family of Funds | Annual Report 2017 |
Total
distributions to
shareholders | Proceeds from
regulatory
settlements | Net
asset
value,
end of
period | Total
return | Total gross
expense
ratio to
average
net assets(a) | Total net
expense
ratio to
average
net assets(a) | Net investment
income (loss)
ratio to
average
net assets | Portfolio
turnover | Net
assets,
end of
period
(000’s) |
| |
| (3.04) | — | $46.51 | 31.58% | 1.49% | 1.48% (c) | 0.46% | 37% | $13,218 |
| (0.27) | — | $37.71 | (2.82%) | 1.55% | 1.55% | 0.55% | 46% | $4,637 |
| (1.81) | — | $39.07 | (1.98%) | 1.62% | 1.62% | 0.54% | 50% | $4,945 |
| (2.67) | — | $41.67 | (4.95%) | 1.63% | 1.63% | 0.52% | 28% | $5,560 |
| (2.81) | — | $46.60 | 21.50% | 1.63% | 1.63% | 0.58% | 45% | $5,822 |
Columbia Acorn Family of Funds | Annual Report 2017
| 109 |
Financial Highlights
Columbia Acorn USA®
| Year Ended | Net asset value,
beginning of
period | Net
investment
income
(loss) | Net
realized
and
unrealized
gain (loss) | Total from
investment
operations | Distributions
from net
realized
gains |
| Class A |
| 12/31/2017 | $14.95 | (0.09) | 2.84 | 2.75 | (5.22) |
| 12/31/2016 | $20.25 | (0.11) | 2.43 | 2.32 | (7.62) |
| 12/31/2015 | $29.13 | (0.18) | (0.18) (d) | (0.36) | (8.52) |
| 12/31/2014 | $34.15 | (0.20) | 1.22 | 1.02 | (6.04) |
| 12/31/2013 | $28.21 | (0.15) | 9.09 | 8.94 | (3.00) |
| Advisor Class(e) |
| 12/31/2017 | $17.93 | (0.06) | 3.43 | 3.37 | (5.22) |
| 12/31/2016 | $22.85 | (0.07) | 2.77 | 2.70 | (7.62) |
| 12/31/2015 | $31.70 | (0.13) | (0.20) (d) | (0.33) | (8.52) |
| 12/31/2014 | $36.55 | (0.11) | 1.30 | 1.19 | (6.04) |
| 12/31/2013 | $29.92 | 0.00 (f) | 9.63 | 9.63 | (3.00) |
| Class C |
| 12/31/2017 | $10.05 | (0.13) | 1.86 | 1.73 | (5.22) |
| 12/31/2016 | $16.00 | (0.18) | 1.85 | 1.67 | (7.62) |
| 12/31/2015 | $24.98 | (0.33) | (0.13) (d) | (0.46) | (8.52) |
| 12/31/2014 | $30.33 | (0.37) | 1.06 | 0.69 | (6.04) |
| 12/31/2013 | $25.49 | (0.33) | 8.17 | 7.84 | (3.00) |
| Institutional Class(g) |
| 12/31/2017 | $17.20 | (0.05) | 3.28 | 3.23 | (5.22) |
| 12/31/2016 | $22.19 | (0.07) | 2.70 | 2.63 | (7.62) |
| 12/31/2015 | $31.03 | (0.12) | (0.20) (d) | (0.32) | (8.52) |
| 12/31/2014 | $35.90 | (0.12) | 1.29 | 1.17 | (6.04) |
| 12/31/2013 | $29.45 | (0.07) | 9.52 | 9.45 | (3.00) |
| Institutional 2 Class(h) |
| 12/31/2017 | $18.02 | (0.03) | 3.44 | 3.41 | (5.22) |
| 12/31/2016 | $22.90 | (0.06) | 2.80 | 2.74 | (7.62) |
| 12/31/2015 | $31.71 | (0.10) | (0.19) (d) | (0.29) | (8.52) |
| 12/31/2014 | $36.53 | (0.06) | 1.28 | 1.22 | (6.04) |
| 12/31/2013 | $29.90 | 0.02 | 9.61 | 9.63 | (3.00) |
The accompanying Notes to Financial Statements are an integral part of this statement.
| 110 | Columbia Acorn Family of Funds | Annual Report 2017 |
Total
distributions to
shareholders | Net
asset
value,
end of
period | Total
return | Total gross
expense
ratio to
average
net assets(a) | Total net
expense
ratio to
average
net assets(a) | Net investment
income (loss)
ratio to
average
net assets | Portfolio
turnover | Net
assets,
end of
period
(000’s) |
| |
| (5.22) | $12.48 | 19.14% (b) | 1.44% | 1.43% (c) | (0.55%) | 84% | $47,960 |
| (7.62) | $14.95 | 12.70% | 1.41% | 1.41% | (0.58%) | 98% | $80,721 |
| (8.52) | $20.25 | (1.60%) | 1.34% | 1.34% | (0.63%) | 35% | $95,048 |
| (6.04) | $29.13 | 3.35% | 1.33% | 1.33% | (0.60%) | 12% | $148,089 |
| (3.00) | $34.15 | 32.34% | 1.32% | 1.32% | (0.46%) | 17% | $201,559 |
| |
| (5.22) | $16.08 | 19.42% (b) | 1.21% | 1.20% (c) | (0.31%) | 84% | $16,355 |
| (7.62) | $17.93 | 12.93% | 1.18% | 1.18% | (0.35%) | 98% | $6,172 |
| (8.52) | $22.85 | (1.36%) | 1.12% | 1.12% | (0.40%) | 35% | $8,224 |
| (6.04) | $31.70 | 3.60% | 1.07% | 1.07% | (0.32%) | 12% | $7,952 |
| (3.00) | $36.55 | 32.80% | 1.00% | 1.00% | 0.01% | 17% | $6,441 |
| |
| (5.22) | $6.56 | 18.30% (b) | 2.19% | 2.19% (c) | (1.31%) | 84% | $9,802 |
| (7.62) | $10.05 | 11.92% | 2.13% | 2.13% | (1.31%) | 98% | $12,088 |
| (8.52) | $16.00 | (2.28%) | 2.02% | 2.02% | (1.32%) | 35% | $17,255 |
| (6.04) | $24.98 | 2.67% | 2.00% | 2.00% | (1.26%) | 12% | $36,476 |
| (3.00) | $30.33 | 31.47% | 2.00% | 2.00% | (1.14%) | 17% | $40,395 |
| |
| (5.22) | $15.21 | 19.44% (b) | 1.16% | 1.16% (c) | (0.27%) | 84% | $189,408 |
| (7.62) | $17.20 | 13.00% | 1.16% | 1.16% | (0.34%) | 98% | $492,739 |
| (8.52) | $22.19 | (1.36%) | 1.10% | 1.10% | (0.40%) | 35% | $768,658 |
| (6.04) | $31.03 | 3.61% | 1.08% | 1.08% | (0.34%) | 12% | $1,132,223 |
| (3.00) | $35.90 | 32.72% | 1.06% | 1.06% | (0.20%) | 17% | $1,496,775 |
| |
| (5.22) | $16.21 | 19.56% (b) | 1.08% | 1.08% | (0.17%) | 84% | $10,133 |
| (7.62) | $18.02 | 13.09% | 1.07% | 1.07% | (0.27%) | 98% | $13,764 |
| (8.52) | $22.90 | (1.23%) | 1.01% | 1.01% | (0.30%) | 35% | $27,112 |
| (6.04) | $31.71 | 3.68% | 0.99% | 0.99% | (0.17%) | 12% | $36,689 |
| (3.00) | $36.53 | 32.83% | 0.97% | 0.97% | 0.06% | 17% | $6,068 |
Columbia Acorn Family of Funds | Annual Report 2017
| 111 |
Financial Highlights (continued)
Columbia Acorn USA®
| Year Ended | Net asset value,
beginning of
period | Net
investment
income
(loss) | Net
realized
and
unrealized
gain (loss) | Total from
investment
operations | Distributions
from net
realized
gains |
| Institutional 3 Class(i) |
| 12/31/2017 | $18.14 | (0.03) | 3.47 | 3.44 | (5.22) |
| 12/31/2016 | $22.99 | (0.04) | 2.81 | 2.77 | (7.62) |
| 12/31/2015 | $31.80 | (0.08) | (0.21) (d) | (0.29) | (8.52) |
| 12/31/2014 | $36.59 | (0.07) | 1.32 | 1.25 | (6.04) |
| 12/31/2013 | $29.93 | 0.02 | 9.64 | 9.66 | (3.00) |
| Notes to Financial Highlights |
| (a) | In addition to the fees and expenses that the Fund bears directly, the Fund indirectly bears a pro rata share of the fees and expenses of any other funds in which it invests, if any. Such indirect expenses are not included in the Fund’s reported expense ratios. |
| (b) | Had the Investment Manager and/or Transfer Agent not waived fees and/or reimbursed a portion of expenses, total return would have been reduced. |
| (c) | The benefits derived from expense reductions had an impact of less than 0.01%. |
| (d) | Calculation of the net gain (loss) per share (both realized and unrealized) does not correlate to the aggregate realized and unrealized gain (loss) presented in the Statements of Operations due to the timing of subscriptions and redemptions of Fund shares in relation to fluctuations in the market value of the portfolio. |
| (e) | Prior to November 1, 2017, Advisor Class shares were known as Class R4 shares. |
| (f) | Rounds to zero. |
| (g) | Prior to November 1, 2017, Institutional Class shares were known as Class Z shares. |
| (h) | Prior to November 1, 2017, Institutional 2 Class shares were known as Class R5 shares. |
| (i) | Prior to November 1, 2017, Institutional 3 Class shares were known as Class Y shares. |
The accompanying Notes to Financial Statements are an integral part of this statement.
| 112 | Columbia Acorn Family of Funds | Annual Report 2017 |
Total
distributions to
shareholders | Net
asset
value,
end of
period | Total
return | Total gross
expense
ratio to
average
net assets(a) | Total net
expense
ratio to
average
net assets(a) | Net investment
income (loss)
ratio to
average
net assets | Portfolio
turnover | Net
assets,
end of
period
(000’s) |
| |
| (5.22) | $16.36 | 19.60% (b) | 1.05% | 1.05% | (0.17%) | 84% | $49,019 |
| (7.62) | $18.14 | 13.18% | 1.01% | 1.01% | (0.18%) | 98% | $38,136 |
| (8.52) | $22.99 | (1.23%) | 0.97% | 0.97% | (0.25%) | 35% | $41,658 |
| (6.04) | $31.80 | 3.76% | 0.93% | 0.93% | (0.19%) | 12% | $35,551 |
| (3.00) | $36.59 | 32.89% | 0.93% | 0.93% | 0.07% | 17% | $48,479 |
Columbia Acorn Family of Funds | Annual Report 2017
| 113 |
Financial Highlights
Columbia Acorn International SelectSM
| Year Ended | Net asset value,
beginning of
period | Net
investment
income
(loss) | Net
realized
and
unrealized
gain (loss) | Total from
investment
operations | Distributions
from net
investment
income | Distributions
from net
realized
gains | Tax
return of
capital |
| Class A |
| 12/31/2017 | $21.36 | 0.02 | 7.52 | 7.54 | (0.01) | — | — |
| 12/31/2016 | $21.33 | 0.10 | 0.09 (d) | 0.19 | (0.14) | — | (0.02) |
| 12/31/2015 | $22.04 | 0.17 | (0.45) | (0.28) | (0.42) | — | (0.01) |
| 12/31/2014 | $26.91 | 0.29 | (2.17) | (1.88) | (0.10) | (2.89) | — |
| 12/31/2013 | $25.61 | 0.29 | 3.29 | 3.58 | (0.37) | (1.91) | — |
| Advisor Class(h) |
| 12/31/2017 | $21.77 | 0.08 | 7.68 | 7.76 | (0.07) | — | — |
| 12/31/2016 | $21.74 | 0.17 | 0.08 (d) | 0.25 | (0.20) | — | (0.02) |
| 12/31/2015 | $22.45 | 0.22 | (0.44) | (0.22) | (0.48) | — | (0.01) |
| 12/31/2014 | $27.36 | 0.37 | (2.22) | (1.85) | (0.17) | (2.89) | — |
| 12/31/2013 | $25.99 | 0.29 | 3.42 | 3.71 | (0.43) | (1.91) | — |
| Class C |
| 12/31/2017 | $19.99 | (0.15) | 7.01 | 6.86 | — | — | — |
| 12/31/2016 | $19.96 | (0.06) | 0.09 (d) | 0.03 | — | — | — |
| 12/31/2015 | $20.54 | (0.01) | (0.41) | (0.42) | (0.15) | — | (0.01) |
| 12/31/2014 | $25.39 | 0.07 | (2.03) | (1.96) | — | (2.89) | — |
| 12/31/2013 | $24.28 | 0.08 | 3.10 | 3.18 | (0.16) | (1.91) | — |
| Institutional Class(i) |
| 12/31/2017 | $21.61 | 0.09 | 7.62 | 7.71 | (0.07) | — | — |
| 12/31/2016 | $21.58 | 0.16 | 0.09 (d) | 0.25 | (0.20) | — | (0.02) |
| 12/31/2015 | $22.30 | 0.24 | (0.46) | (0.22) | (0.49) | — | (0.01) |
| 12/31/2014 | $27.20 | 0.38 | (2.21) | (1.83) | (0.18) | (2.89) | — |
| 12/31/2013 | $25.86 | 0.37 | 3.33 | 3.70 | (0.45) | (1.91) | — |
| Institutional 2 Class(j) |
| 12/31/2017 | $21.76 | 0.11 | 7.66 | 7.77 | (0.09) | — | — |
| 12/31/2016 | $21.72 | 0.16 | 0.11 (d) | 0.27 | (0.21) | — | (0.02) |
| 12/31/2015 | $22.43 | 0.22 | (0.42) | (0.20) | (0.50) | — | (0.01) |
| 12/31/2014 | $27.34 | 0.36 | (2.19) | (1.83) | (0.19) | (2.89) | — |
| 12/31/2013 | $25.98 | 0.38 | 3.35 | 3.73 | (0.46) | (1.91) | — |
The accompanying Notes to Financial Statements are an integral part of this statement.
| 114 | Columbia Acorn Family of Funds | Annual Report 2017 |
Total
distributions to
shareholders | Proceeds from
regulatory
settlements | Net
asset
value,
end of
period | Total
return | Total gross
expense
ratio to
average
net assets(a) | Total net
expense
ratio to
average
net assets(a) | Net investment
income (loss)
ratio to
average
net assets | Portfolio
turnover | Net
assets,
end of
period
(000’s) |
| |
| (0.01) | — | $28.89 | 35.30% (b) | 1.54% | 1.40% (c) | 0.07% | 49% | $26,336 |
| (0.16) | — | $21.36 | 0.90% (b) | 1.55% (e) | 1.48% (e) | 0.49% | 49% | $20,165 |
| (0.43) | 0.00 (f) | $21.33 | (1.30%) (g) | 1.55% | 1.55% | 0.74% | 59% | $33,772 |
| (2.99) | — | $22.04 | (7.06%) | 1.47% | 1.47% | 1.05% | 58% | $53,419 |
| (2.28) | — | $26.91 | 14.42% | 1.47% | 1.47% | 1.08% | 72% | $73,911 |
| |
| (0.07) | — | $29.46 | 35.67% (b) | 1.29% | 1.15% (c) | 0.30% | 49% | $1,820 |
| (0.22) | — | $21.77 | 1.15% (b) | 1.29% (e) | 1.21% (e) | 0.77% | 49% | $1,106 |
| (0.49) | 0.00 (f) | $21.74 | (1.00%) (g) | 1.27% | 1.27% | 0.97% | 59% | $898 |
| (3.06) | — | $22.45 | (6.83%) | 1.21% | 1.21% | 1.33% | 58% | $974 |
| (2.34) | — | $27.36 | 14.72% | 1.24% | 1.24% | 1.06% | 72% | $417 |
| |
| — | — | $26.85 | 34.32% (b) | 2.29% | 2.15% (c) | (0.64%) | 49% | $5,027 |
| — | — | $19.99 | 0.15% (b) | 2.31% (e) | 2.23% (e) | (0.29%) | 49% | $4,346 |
| (0.16) | 0.00 (f) | $19.96 | (2.05%) (g) | 2.32% | 2.32% | (0.06%) | 59% | $5,390 |
| (2.89) | — | $20.54 | (7.80%) | 2.23% | 2.23% | 0.29% | 58% | $8,057 |
| (2.07) | — | $25.39 | 13.52% | 2.26% | 2.26% | 0.32% | 72% | $10,311 |
| |
| (0.07) | — | $29.25 | 35.70% (b) | 1.29% | 1.15% (c) | 0.36% | 49% | $89,266 |
| (0.22) | — | $21.61 | 1.18% (b) | 1.26% (e) | 1.19% (e) | 0.74% | 49% | $73,631 |
| (0.50) | 0.00 (f) | $21.58 | (1.03%) (g) | 1.24% | 1.24% | 1.05% | 59% | $96,311 |
| (3.07) | — | $22.30 | (6.79%) | 1.17% | 1.17% | 1.36% | 58% | $175,764 |
| (2.36) | — | $27.20 | 14.75% | 1.19% | 1.19% | 1.37% | 72% | $256,100 |
| |
| (0.09) | — | $29.44 | 35.72% (b) | 1.22% | 1.08% | 0.41% | 49% | $614 |
| (0.23) | — | $21.76 | 1.25% (b) | 1.23% (e) | 1.19% (e) | 0.76% | 49% | $440 |
| (0.51) | 0.00 (f) | $21.72 | (0.94%) (g) | 1.21% | 1.21% | 0.96% | 59% | $2,268 |
| (3.08) | — | $22.43 | (6.77%) | 1.15% | 1.15% | 1.30% | 58% | $2,593 |
| (2.37) | — | $27.34 | 14.80% (b) | 1.15% | 1.15% | 1.40% | 72% | $956 |
Columbia Acorn Family of Funds | Annual Report 2017
| 115 |
Financial Highlights (continued)
Columbia Acorn International SelectSM
| Year Ended | Net asset value,
beginning of
period | Net
investment
income
(loss) | Net
realized
and
unrealized
gain (loss) | Total from
investment
operations | Distributions
from net
investment
income | Distributions
from net
realized
gains | Tax
return of
capital |
| Institutional 3 Class(k) |
| 12/31/2017 | $21.74 | (0.07) | 7.86 | 7.79 | (0.11) | — | — |
| 12/31/2016 | $21.71 | 0.16 | 0.12 (d) | 0.28 | (0.23) | — | (0.02) |
| 12/31/2015 | $22.42 | 0.28 | (0.47) | (0.19) | (0.51) | — | (0.01) |
| 12/31/2014 | $27.33 | 0.40 | (2.21) | (1.81) | (0.21) | (2.89) | — |
| 12/31/2013 | $25.98 | 0.11 | 3.62 | 3.73 | (0.47) | (1.91) | — |
| Notes to Financial Highlights |
| (a) | In addition to the fees and expenses that the Fund bears directly, the Fund indirectly bears a pro rata share of the fees and expenses of any other funds in which it invests, if any. Such indirect expenses are not included in the Fund’s reported expense ratios. |
| (b) | Had the Investment Manager and/or Transfer Agent not waived fees and/or reimbursed a portion of expenses, total return would have been reduced. |
| (c) | The benefits derived from expense reductions had an impact of less than 0.01%. |
| (d) | Calculation of the net gain (loss) per share (both realized and unrealized) does not correlate to the aggregate realized and unrealized gain (loss) presented in the Statements of Operations due to the timing of subscriptions and redemptions of Fund shares in relation to fluctuations in the market value of the portfolio. |
| (e) | Expenses have been reduced due to a reimbursement of expenses overbilled by a third party. If the reimbursement had been excluded, the expense ratios would have been higher by the percentages shown for each class in the table below. All fee waivers and expense reimbursements by the Investment Manager and its affiliates were applied before giving effect to this third party reimbursement. |
| | Class A | Advisor
Class | Class C | Institutional
Class | Institutional 2
Class | Institutional 3
Class |
| 12/31/2016 | 0.06 % | 0.06 % | 0.06 % | 0.06 % | 0.04 % | 0.09 % |
| (f) | Rounds to zero. |
| (g) | The Fund received proceeds from regulatory settlements. Had the Fund not received these proceeds, the total return would have been lower by 0.02%. |
| (h) | Prior to November 1, 2017, Advisor Class shares were known as Class R4 shares. |
| (i) | Prior to November 1, 2017, Institutional Class shares were known as Class Z shares. |
| (j) | Prior to November 1, 2017, Institutional 2 Class shares were known as Class R5 shares. |
| (k) | Prior to November 1, 2017, Institutional 3 Class shares were known as Class Y shares. |
The accompanying Notes to Financial Statements are an integral part of this statement.
| 116 | Columbia Acorn Family of Funds | Annual Report 2017 |
Total
distributions to
shareholders | Proceeds from
regulatory
settlements | Net
asset
value,
end of
period | Total
return | Total gross
expense
ratio to
average
net assets(a) | Total net
expense
ratio to
average
net assets(a) | Net investment
income (loss)
ratio to
average
net assets | Portfolio
turnover | Net
assets,
end of
period
(000’s) |
| |
| (0.11) | — | $29.42 | 35.81% (b) | 1.17% | 1.03% | (0.24%) | 49% | $7,732 |
| (0.25) | — | $21.74 | 1.29% (b) | 1.12% (e) | 1.04% (e) | 0.74% | 49% | $322 |
| (0.52) | 0.00 (f) | $21.71 | (0.89%) (g) | 1.14% | 1.14% | 1.21% | 59% | $660 |
| (3.10) | — | $22.42 | (6.71%) | 1.09% | 1.09% | 1.43% | 58% | $11,755 |
| (2.38) | — | $27.33 | 14.82% | 1.09% | 1.09% | 0.40% | 72% | $13,318 |
Columbia Acorn Family of Funds | Annual Report 2017
| 117 |
Financial Highlights
Columbia Acorn SelectSM
| Year ended | Net asset value,
beginning of
period | Net
investment
income
(loss) | Net
realized
and
unrealized
gain | Total from
investment
operations | Distributions
from net
investment
income | Distributions
from net
realized
gains |
| Class A |
| 12/31/2017 | $13.13 | (0.03) | 3.31 | 3.28 | — | (1.79) |
| 12/31/2016 | $13.94 | (0.04) | 1.56 | 1.52 | — | (2.33) |
| 12/31/2015 | $21.03 | (0.09) | 0.14 | 0.05 | — | (7.14) |
| 12/31/2014 | $25.57 | (0.14) | 0.64 | 0.50 | — | (5.04) |
| 12/31/2013 | $24.72 | (0.15) | 7.92 | 7.77 | (0.07) | (6.85) |
| Advisor Class(e) |
| 12/31/2017 | $15.13 | 0.01 | 3.84 | 3.85 | — | (1.79) |
| 12/31/2016 | $15.69 | (0.00) (f) | 1.77 | 1.77 | — | (2.33) |
| 12/31/2015 | $22.75 | (0.04) | 0.12 | 0.08 | — | (7.14) |
| 12/31/2014 | $27.20 | (0.10) | 0.69 | 0.59 | — | (5.04) |
| 12/31/2013 | $25.92 | (0.06) | 8.32 | 8.26 | (0.13) | (6.85) |
| Class C |
| 12/31/2017 | $9.22 | (0.09) | 2.25 | 2.16 | — | (1.79) |
| 12/31/2016 | $10.51 | (0.10) | 1.14 | 1.04 | — | (2.33) |
| 12/31/2015 | $17.69 | (0.19) | 0.15 | (0.04) | — | (7.14) |
| 12/31/2014 | $22.46 | (0.28) | 0.55 | 0.27 | — | (5.04) |
| 12/31/2013 | $22.48 | (0.32) | 7.15 | 6.83 | — | (6.85) |
| Institutional Class(g) |
| 12/31/2017 | $14.63 | 0.01 | 3.69 | 3.70 | — | (1.79) |
| 12/31/2016 | $15.24 | (0.00) (f) | 1.72 | 1.72 | — | (2.33) |
| 12/31/2015 | $22.28 | (0.03) | 0.13 | 0.10 | — | (7.14) |
| 12/31/2014 | $26.72 | (0.08) | 0.68 | 0.60 | — | (5.04) |
| 12/31/2013 | $25.57 | (0.07) | 8.21 | 8.14 | (0.14) | (6.85) |
| Institutional 2 Class(h) |
| 12/31/2017 | $15.20 | 0.02 | 3.85 | 3.87 | — | (1.79) |
| 12/31/2016 | $15.74 | 0.01 | 1.78 | 1.79 | — | (2.33) |
| 12/31/2015 | $22.78 | (0.08) | 0.18 | 0.10 | — | (7.14) |
| 12/31/2014 | $27.20 | (0.07) | 0.69 | 0.62 | — | (5.04) |
| 12/31/2013 | $25.93 | (0.04) | 8.31 | 8.27 | (0.15) | (6.85) |
The accompanying Notes to Financial Statements are an integral part of this statement.
| 118 | Columbia Acorn Family of Funds | Annual Report 2017 |
Total
distributions to
shareholders | Net
asset
value,
end of
period | Total
return | Total gross
expense
ratio to
average
net assets(a) | Total net
expense
ratio to
average
net assets(a) | Net investment
income (loss)
ratio to
average
net assets | Portfolio
turnover | Net
assets,
end of
period
(000’s) |
| |
| (1.79) | $14.62 | 26.42% (b) | 1.37% | 1.16% (c) | (0.20%) | 41% | $106,330 |
| (2.33) | $13.13 | 11.54% (b) | 1.37% | 1.17% | (0.27%) | 75% | $119,364 |
| (7.14) | $13.94 | (0.73%) (b) | 1.35% (d) | 1.22% (d) | (0.42%) | 55% | $146,864 |
| (5.04) | $21.03 | 2.17% | 1.32% | 1.32% | (0.58%) | 17% | $264,234 |
| (6.92) | $25.57 | 33.77% | 1.31% (d) | 1.31% (d) | (0.54%) | 20% | $333,193 |
| |
| (1.79) | $17.19 | 26.71% (b) | 1.14% | 0.91% (c) | 0.05% | 41% | $5,590 |
| (2.33) | $15.13 | 11.86% (b) | 1.13% | 0.93% | (0.02%) | 75% | $853 |
| (7.14) | $15.69 | (0.53%) (b) | 1.12% (d) | 0.99% (d) | (0.18%) | 55% | $932 |
| (5.04) | $22.75 | 2.39% | 1.12% | 1.12% | (0.37%) | 17% | $1,193 |
| (6.98) | $27.20 | 34.16% | 1.02% (d) | 1.02% (d) | (0.20%) | 20% | $1,383 |
| |
| (1.79) | $9.59 | 25.40% (b) | 2.12% | 1.91% (c) | (0.95%) | 41% | $22,559 |
| (2.33) | $9.22 | 10.67% (b) | 2.11% | 1.91% | (1.01%) | 75% | $27,524 |
| (7.14) | $10.51 | (1.41%) (b) | 2.08% (d) | 1.95% (d) | (1.15%) | 55% | $34,589 |
| (5.04) | $17.69 | 1.42% | 2.04% | 2.04% | (1.30%) | 17% | $48,591 |
| (6.85) | $22.46 | 32.85% | 2.04% (d) | 2.04% (d) | (1.28%) | 20% | $61,537 |
| |
| (1.79) | $16.54 | 26.59% (b) | 1.13% | 0.91% (c) | 0.04% | 41% | $157,664 |
| (2.33) | $14.63 | 11.88% (b) | 1.10% | 0.90% | (0.02%) | 75% | $144,313 |
| (7.14) | $15.24 | (0.44%) (b) | 1.07% (d) | 0.95% (d) | (0.15%) | 55% | $183,642 |
| (5.04) | $22.28 | 2.47% | 1.04% | 1.04% | (0.30%) | 17% | $318,487 |
| (6.99) | $26.72 | 34.16% | 1.02% (d) | 1.02% (d) | (0.26%) | 20% | $431,990 |
| |
| (1.79) | $17.28 | 26.72% (b) | 1.06% | 0.85% | 0.11% | 41% | $1,735 |
| (2.33) | $15.20 | 11.96% (b) | 1.05% | 0.85% | 0.07% | 75% | $1,036 |
| (7.14) | $15.74 | (0.44%) (b) | 1.02% (d) | 0.95% (d) | (0.33%) | 55% | $911 |
| (5.04) | $22.78 | 2.50% | 1.00% | 1.00% | (0.26%) | 17% | $10,697 |
| (7.00) | $27.20 | 34.21% | 0.97% (d) | 0.97% (d) | (0.13%) | 20% | $11,996 |
Columbia Acorn Family of Funds | Annual Report 2017
| 119 |
Financial Highlights (continued)
Columbia Acorn SelectSM
| Year ended | Net asset value,
beginning of
period | Net
investment
income
(loss) | Net
realized
and
unrealized
gain | Total from
investment
operations | Distributions
from net
investment
income | Distributions
from net
realized
gains |
| Institutional 3 Class(i) |
| 12/31/2017 | $15.31 | 0.02 | 3.89 | 3.91 | — | (1.79) |
| 12/31/2016 | $15.83 | 0.02 | 1.79 | 1.81 | — | (2.33) |
| 12/31/2015 | $22.86 | 0.00 (f) | 0.11 | 0.11 | — | (7.14) |
| 12/31/2014 | $27.27 | (0.06) | 0.69 | 0.63 | — | (5.04) |
| 12/31/2013 | $25.98 | (0.03) | 8.34 | 8.31 | (0.17) | (6.85) |
| Notes to Financial Highlights |
| (a) | In addition to the fees and expenses that the Fund bears directly, the Fund indirectly bears a pro rata share of the fees and expenses of any other funds in which it invests, if any. Such indirect expenses are not included in the Fund’s reported expense ratios. |
| (b) | Had the Investment Manager and/or Transfer Agent not waived fees and/or reimbursed a portion of expenses, total return would have been reduced. |
| (c) | The benefits derived from expense reductions had an impact of less than 0.01%. |
| (d) | Ratios include line of credit interest expense which is less than 0.01%. |
| (e) | Prior to November 1, 2017, Advisor Class shares were known as Class R4 shares. |
| (f) | Rounds to zero. |
| (g) | Prior to November 1, 2017, Institutional Class shares were known as Class Z shares. |
| (h) | Prior to November 1, 2017, Institutional 2 Class shares were known as Class R5 shares. |
| (i) | Prior to November 1, 2017, Institutional 3 Class shares were known as Class Y shares. |
The accompanying Notes to Financial Statements are an integral part of this statement.
| 120 | Columbia Acorn Family of Funds | Annual Report 2017 |
Total
distributions to
shareholders | Net
asset
value,
end of
period | Total
return | Total gross
expense
ratio to
average
net assets(a) | Total net
expense
ratio to
average
net assets(a) | Net investment
income (loss)
ratio to
average
net assets | Portfolio
turnover | Net
assets,
end of
period
(000’s) |
| |
| (1.79) | $17.43 | 26.79% (b) | 1.00% | 0.80% | 0.15% | 41% | $15,001 |
| (2.33) | $15.31 | 12.02% (b) | 1.00% | 0.80% | 0.10% | 75% | $4,389 |
| (7.14) | $15.83 | (0.39%) (b) | 0.98% (d) | 0.85% (d) | 0.02% | 55% | $5,056 |
| (5.04) | $22.86 | 2.53% | 0.95% | 0.95% | (0.22%) | 17% | $3,644 |
| (7.02) | $27.27 | 34.30% | 0.93% (d) | 0.93% (d) | (0.09%) | 20% | $4,847 |
Columbia Acorn Family of Funds | Annual Report 2017
| 121 |
Financial Highlights
Columbia Thermostat FundSM
| Year Ended | Net asset value,
beginning of
period | Net
investment
income | Net
realized
and
unrealized
gain (loss) | Total from
investment
operations | Distributions
from net
investment
income | Distributions
from net
realized
gains |
| Class A |
| 12/31/2017 | $14.60 | 0.25 | 0.50 | 0.75 | (0.50) | (0.22) |
| 12/31/2016 | $14.31 | 0.20 | 0.44 | 0.64 | (0.08) | (0.27) |
| 12/31/2015 | $14.86 | 0.27 | (0.26) | 0.01 | (0.28) | (0.28) |
| 12/31/2014 | $14.58 | 0.28 | 0.49 | 0.77 | (0.28) | (0.21) |
| 12/31/2013 | $14.29 | 0.29 | 1.00 | 1.29 | (0.25) | (0.75) |
| Advisor Class(d) |
| 12/31/2017 | $14.47 | 0.29 | 0.50 | 0.79 | (0.54) | (0.22) |
| 12/31/2016 | $14.19 | 0.24 | 0.42 | 0.66 | (0.11) | (0.27) |
| 12/31/2015 | $14.74 | 0.30 | (0.25) | 0.05 | (0.32) | (0.28) |
| 12/31/2014 | $14.46 | 0.32 | 0.49 | 0.81 | (0.32) | (0.21) |
| 12/31/2013 | $14.19 | 0.36 | 0.95 | 1.31 | (0.29) | (0.75) |
| Class C |
| 12/31/2017 | $14.62 | 0.14 | 0.51 | 0.65 | (0.31) | (0.22) |
| 12/31/2016 | $14.41 | 0.09 | 0.44 | 0.53 | (0.05) | (0.27) |
| 12/31/2015 | $14.96 | 0.16 | (0.26) | (0.10) | (0.17) | (0.28) |
| 12/31/2014 | $14.68 | 0.17 | 0.49 | 0.66 | (0.17) | (0.21) |
| 12/31/2013 | $14.39 | 0.18 | 1.00 | 1.18 | (0.14) | (0.75) |
| Institutional Class(e) |
| 12/31/2017 | $14.40 | 0.29 | 0.50 | 0.79 | (0.54) | (0.22) |
| 12/31/2016 | $14.12 | 0.23 | 0.43 | 0.66 | (0.11) | (0.27) |
| 12/31/2015 | $14.67 | 0.31 | (0.26) | 0.05 | (0.32) | (0.28) |
| 12/31/2014 | $14.40 | 0.32 | 0.48 | 0.80 | (0.32) | (0.21) |
| 12/31/2013 | $14.13 | 0.32 | 0.99 | 1.31 | (0.29) | (0.75) |
| Institutional 2 Class(f) |
| 12/31/2017 | $14.49 | 0.29 | 0.50 | 0.79 | (0.54) | (0.22) |
| 12/31/2016 | $14.20 | 0.24 | 0.43 | 0.67 | (0.11) | (0.27) |
| 12/31/2015 | $14.75 | 0.31 | (0.26) | 0.05 | (0.32) | (0.28) |
| 12/31/2014 | $14.47 | 0.31 | 0.50 | 0.81 | (0.32) | (0.21) |
| 12/31/2013 | $14.19 | 0.37 | 0.96 | 1.33 | (0.30) | (0.75) |
| Institutional 3 Class(g) |
| 12/31/2017 | $14.46 | 0.30 | 0.51 | 0.81 | (0.55) | (0.22) |
| 12/31/2016 | $14.18 | 0.25 | 0.42 | 0.67 | (0.12) | (0.27) |
| 12/31/2015 | $14.74 | 0.31 | (0.26) | 0.05 | (0.33) | (0.28) |
| 12/31/2014 | $14.46 | 0.32 | 0.50 | 0.82 | (0.33) | (0.21) |
| 12/31/2013 | $14.18 | 0.33 | 1.01 | 1.34 | (0.31) | (0.75) |
| Notes to Financial Highlights |
| (a) | Had the Investment Manager and/or Transfer Agent not waived fees and/or reimbursed a portion of expenses, total return would have been reduced. |
| (b) | In addition to the fees and expenses that the Fund bears directly, the Fund indirectly bears a pro rata share of the fees and expenses of any other funds in which it invests, if any. Such indirect expenses are not included in the Fund’s reported expense ratios. |
| (c) | The benefits derived from expense reductions had an impact of less than 0.01%. |
| (d) | Prior to November 1, 2017, Advisor Class shares were known as Class R4 shares. |
| (e) | Prior to November 1, 2017, Institutional Class shares were known as Class Z shares. |
| (f) | Prior to November 1, 2017, Institutional 2 Class shares were known as Class R5 shares. |
| (g) | Prior to November 1, 2017, Institutional 3 Class shares were known as Class Y shares. |
The accompanying Notes to Financial Statements are an integral part of this statement.
| 122 | Columbia Acorn Family of Funds | Annual Report 2017 |
Total
distributions to
shareholders | Net
asset
value,
end of
period | Total
return(a) | Total gross
expense
ratio to
average
net assets(b) | Total net
expense
ratio to
average
net assets(b) | Net investment
income
ratio to
average
net assets | Portfolio
turnover | Net
assets,
end of
period
(000’s) |
| |
| (0.72) | $14.63 | 5.19% | 0.54% | 0.50% (c) | 1.70% | 33% | $257,752 |
| (0.35) | $14.60 | 4.47% | 0.54% | 0.50% | 1.39% | 95% | $398,781 |
| (0.56) | $14.31 | 0.07% | 0.52% | 0.50% | 1.82% | 69% | $387,967 |
| (0.49) | $14.86 | 5.30% | 0.51% | 0.50% | 1.88% | 95% | $450,258 |
| (1.00) | $14.58 | 9.07% | 0.52% | 0.50% | 1.91% | 92% | $513,293 |
| |
| (0.76) | $14.50 | 5.49% | 0.29% | 0.25% (c) | 1.98% | 33% | $16,227 |
| (0.38) | $14.47 | 4.69% | 0.30% | 0.25% | 1.64% | 95% | $15,664 |
| (0.60) | $14.19 | 0.33% | 0.28% | 0.25% | 2.06% | 69% | $17,453 |
| (0.53) | $14.74 | 5.61% | 0.26% | 0.25% | 2.14% | 95% | $23,412 |
| (1.04) | $14.46 | 9.26% | 0.28% | 0.25% | 2.39% | 92% | $14,651 |
| |
| (0.53) | $14.74 | 4.48% | 1.29% | 1.25% (c) | 0.96% | 33% | $250,784 |
| (0.32) | $14.62 | 3.69% | 1.28% | 1.25% | 0.63% | 95% | $338,930 |
| (0.45) | $14.41 | (0.68%) | 1.27% | 1.25% | 1.08% | 69% | $364,684 |
| (0.38) | $14.96 | 4.50% | 1.26% | 1.25% | 1.14% | 95% | $404,456 |
| (0.89) | $14.68 | 8.23% | 1.27% | 1.25% | 1.16% | 92% | $430,173 |
| |
| (0.76) | $14.43 | 5.52% | 0.29% | 0.25% (c) | 1.97% | 33% | $320,483 |
| (0.38) | $14.40 | 4.72% | 0.28% | 0.25% | 1.64% | 95% | $341,629 |
| (0.60) | $14.12 | 0.33% | 0.26% | 0.25% | 2.08% | 69% | $325,159 |
| (0.53) | $14.67 | 5.57% | 0.25% | 0.24% | 2.16% | 95% | $377,119 |
| (1.04) | $14.40 | 9.30% | 0.26% | 0.25% | 2.14% | 92% | $375,444 |
| |
| (0.76) | $14.52 | 5.51% | 0.26% | 0.23% | 1.97% | 33% | $13,464 |
| (0.38) | $14.49 | 4.77% | 0.27% | 0.24% | 1.66% | 95% | $12,024 |
| (0.60) | $14.20 | 0.33% | 0.25% | 0.24% | 2.14% | 69% | $6,114 |
| (0.53) | $14.75 | 5.62% | 0.24% | 0.23% | 2.11% | 95% | $3,536 |
| (1.05) | $14.47 | 9.35% | 0.25% | 0.23% | 2.44% | 92% | $979 |
| |
| (0.77) | $14.50 | 5.64% | 0.21% | 0.18% | 2.04% | 33% | $521 |
| (0.39) | $14.46 | 4.76% | 0.21% | 0.19% | 1.71% | 95% | $399 |
| (0.61) | $14.18 | 0.32% | 0.20% | 0.19% | 2.08% | 69% | $352 |
| (0.54) | $14.74 | 5.68% | 0.19% | 0.18% | 2.19% | 95% | $401 |
| (1.06) | $14.46 | 9.46% | 0.14% | 0.14% | 2.23% | 92% | $3 |
Columbia Acorn Family of Funds | Annual Report 2017
| 123 |
Financial Highlights
Columbia Acorn Emerging Markets FundSM
| Year ended | Net asset value,
beginning of
period | Net
investment
income
(loss) | Net
realized
and
unrealized
gain (loss) | Total from
investment
operations | Distributions
from net
investment
income | Tax
return of
capital |
| Class A |
| 12/31/2017 | $9.84 | (0.02) | 3.42 | 3.40 | — | — |
| 12/31/2016 | $10.24 | (0.01) | (0.32) | (0.33) | (0.03) | (0.04) |
| 12/31/2015 | $12.72 | 0.10 | (2.42) | (2.32) | (0.15) | (0.01) |
| 12/31/2014 | $13.37 | 0.06 | (0.63) | (0.57) | (0.08) | — |
| 12/31/2013 | $12.04 | 0.07 | 1.34 | 1.41 | (0.08) | — |
| Advisor Class(e) |
| 12/31/2017 | $9.92 | 0.02 | 3.44 | 3.46 | — | — |
| 12/31/2016 | $10.32 | 0.01 | (0.31) | (0.30) | (0.06) | (0.04) |
| 12/31/2015 | $12.83 | 0.17 | (2.49) | (2.32) | (0.18) | (0.01) |
| 12/31/2014 | $13.49 | 0.09 | (0.63) | (0.54) | (0.12) | — |
| 12/31/2013 | $12.14 | 0.12 | 1.35 | 1.47 | (0.12) | — |
| Class C |
| 12/31/2017 | $9.80 | (0.09) | 3.38 | 3.29 | — | — |
| 12/31/2016 | $10.20 | (0.09) | (0.31) | (0.40) | — | — |
| 12/31/2015 | $12.65 | 0.01 | (2.39) | (2.38) | (0.06) | (0.01) |
| 12/31/2014 | $13.32 | (0.05) | (0.62) | (0.67) | — | — |
| 12/31/2013 | $12.01 | (0.03) | 1.34 | 1.31 | — | — |
| Institutional Class(f) |
| 12/31/2017 | $9.85 | 0.03 | 3.41 | 3.44 | — | — |
| 12/31/2016 | $10.26 | (0.00) (g) | (0.31) | (0.31) | (0.06) | (0.04) |
| 12/31/2015 | $12.74 | 0.13 | (2.42) | (2.29) | (0.18) | (0.01) |
| 12/31/2014 | $13.40 | 0.08 | (0.63) | (0.55) | (0.11) | — |
| 12/31/2013 | $12.07 | 0.11 | 1.33 | 1.44 | (0.11) | — |
| Institutional 2 Class(h) |
| 12/31/2017 | $9.91 | 0.04 | 3.43 | 3.47 | — | — |
| 12/31/2016 | $10.32 | (0.02) | (0.28) | (0.30) | (0.07) | (0.04) |
| 12/31/2015 | $12.82 | 0.15 | (2.45) | (2.30) | (0.19) | (0.01) |
| 12/31/2014 | $13.48 | 0.10 | (0.64) | (0.54) | (0.12) | — |
| 12/31/2013 | $12.14 | 0.12 | 1.34 | 1.46 | (0.12) | — |
The accompanying Notes to Financial Statements are an integral part of this statement.
| 124 | Columbia Acorn Family of Funds | Annual Report 2017 |
Total
distributions to
shareholders | Net
asset
value,
end of
period | Total
return | Total gross
expense
ratio to
average
net assets(a) | Total net
expense
ratio to
average
net assets(a) | Net investment
income (loss)
ratio to
average
net assets | Portfolio
turnover | Net
assets,
end of
period
(000’s) |
| |
| — | $13.24 | 34.55% (b) | 1.98% | 1.70% (c) | (0.14%) | 47% | $33,982 |
| (0.07) | $9.84 | (3.20%) (b) | 1.84% (d) | 1.84% (d) | (0.11%) | 43% | $49,141 |
| (0.16) | $10.24 | (18.25%) | 1.67% | 1.67% | 0.88% | 58% | $88,574 |
| (0.08) | $12.72 | (4.28%) | 1.56% | 1.56% | 0.42% | 45% | $160,969 |
| (0.08) | $13.37 | 11.73% (b) | 1.80% | 1.76% | 0.52% | 36% | $177,158 |
| |
| — | $13.38 | 34.88% (b) | 1.73% | 1.43% (c) | 0.19% | 47% | $1,337 |
| (0.10) | $9.92 | (2.91%) | 1.57% (d) | 1.57% (d) | 0.09% | 43% | $1,306 |
| (0.19) | $10.32 | (18.04%) | 1.36% | 1.36% | 1.37% | 58% | $3,459 |
| (0.12) | $12.83 | (4.03%) | 1.28% | 1.28% | 0.66% | 45% | $15,467 |
| (0.12) | $13.49 | 12.13% (b) | 1.44% | 1.44% | 0.92% | 36% | $13,583 |
| |
| — | $13.09 | 33.57% (b) | 2.74% | 2.43% (c) | (0.78%) | 47% | $15,546 |
| — | $9.80 | (3.92%) (b) | 2.60% (d) | 2.59% (d) | (0.87%) | 43% | $15,534 |
| (0.07) | $10.20 | (18.83%) | 2.42% | 2.42% | 0.12% | 58% | $22,953 |
| — | $12.65 | (5.03%) | 2.33% | 2.33% | (0.36%) | 45% | $41,208 |
| — | $13.32 | 10.91% (b) | 2.55% | 2.51% | (0.23%) | 36% | $32,636 |
| |
| — | $13.29 | 34.92% (b) | 1.74% | 1.42% (c) | 0.28% | 47% | $53,415 |
| (0.10) | $9.85 | (3.04%) (b) | 1.59% (d) | 1.58% (d) | (0.04%) | 43% | $38,969 |
| (0.19) | $10.26 | (17.98%) | 1.42% | 1.42% | 1.12% | 58% | $147,688 |
| (0.11) | $12.74 | (4.12%) | 1.33% | 1.33% | 0.62% | 45% | $245,053 |
| (0.11) | $13.40 | 11.92% (b) | 1.58% | 1.54% | 0.89% | 36% | $177,693 |
| |
| — | $13.38 | 35.02% (b) | 1.65% | 1.33% | 0.33% | 47% | $1,030 |
| (0.11) | $9.91 | (2.90%) | 1.46% (d) | 1.46% (d) | (0.23%) | 43% | $806 |
| (0.20) | $10.32 | (17.96%) | 1.34% | 1.34% | 1.22% | 58% | $12,643 |
| (0.12) | $12.82 | (4.02%) | 1.26% | 1.26% | 0.72% | 45% | $19,632 |
| (0.12) | $13.48 | 12.07% (b) | 1.42% | 1.42% | 0.94% | 36% | $13,625 |
Columbia Acorn Family of Funds | Annual Report 2017
| 125 |
Financial Highlights (continued)
Columbia Acorn Emerging Markets FundSM
| Year ended | Net asset value,
beginning of
period | Net
investment
income
(loss) | Net
realized
and
unrealized
gain (loss) | Total from
investment
operations | Distributions
from net
investment
income | Tax
return of
capital |
| Institutional 3 Class(i) |
| 12/31/2017 | $9.82 | 0.02 | 3.43 | 3.45 | — | — |
| 12/31/2016 | $10.23 | 0.03 | (0.33) | (0.30) | (0.07) | (0.04) |
| 12/31/2015 | $12.71 | 0.15 | (2.43) | (2.28) | (0.19) | (0.01) |
| 12/31/2014 | $13.36 | 0.09 | (0.62) | (0.53) | (0.12) | — |
| 12/31/2013 (j) | $12.22 | 0.07 | 1.20 | 1.27 | (0.13) | — |
| Notes to Financial Highlights |
| (a) | In addition to the fees and expenses that the Fund bears directly, the Fund indirectly bears a pro rata share of the fees and expenses of any other funds in which it invests, if any. Such indirect expenses are not included in the Fund’s reported expense ratios. |
| (b) | Had the Investment Manager and/or Transfer Agent not waived fees and/or reimbursed a portion of expenses, total return would have been reduced. |
| (c) | The benefits derived from expense reductions had an impact of less than 0.01%. |
| (d) | Ratios include line of credit interest expense which is less than 0.01%. |
| (e) | Prior to November 1, 2017, Advisor Class shares were known as Class R4 shares. |
| (f) | Prior to November 1, 2017, Institutional Class shares were known as Class Z shares. |
| (g) | Rounds to zero. |
| (h) | Prior to November 1, 2017, Institutional 2 Class shares were known as Class R5 shares. |
| (i) | Prior to November 1, 2017, Institutional 3 Class shares were known as Class Y shares. |
| (j) | Institutional 3 Class shares commenced operations on June 13, 2013. Per share data and total return reflect activity from that date. |
| (k) | Annualized. |
The accompanying Notes to Financial Statements are an integral part of this statement.
| 126 | Columbia Acorn Family of Funds | Annual Report 2017 |
Total
distributions to
shareholders | Net
asset
value,
end of
period | Total
return | Total gross
expense
ratio to
average
net assets(a) | Total net
expense
ratio to
average
net assets(a) | Net investment
income (loss)
ratio to
average
net assets | Portfolio
turnover | Net
assets,
end of
period
(000’s) |
| |
| — | $13.27 | 35.13% (b) | 1.59% | 1.14% | 0.16% | 47% | $912 |
| (0.11) | $9.82 | (2.92%) (b) | 1.45% | 1.45% | 0.29% | 43% | $2 |
| (0.20) | $10.23 | (17.90%) | 1.27% | 1.27% | 1.24% | 58% | $2 |
| (0.12) | $12.71 | (3.95%) | 1.22% | 1.22% | 0.68% | 45% | $2 |
| (0.13) | $13.36 | 10.43% (b) | 1.36% (k) | 1.36% (k) | 0.97% (k) | 36% | $3 |
Columbia Acorn Family of Funds | Annual Report 2017
| 127 |
Financial Highlights
Columbia Acorn European FundSM
| Year ended | Net asset value,
beginning of
period | Net
investment
income
(loss) | Net
realized
and
unrealized
gain (loss) | Total from
investment
operations | Distributions
from net
investment
income | Distributions
from net
realized
gains |
| Class A |
| 12/31/2017 | $14.12 | 0.06 | 5.28 | 5.34 | (0.19) | — |
| 12/31/2016 | $14.75 | 0.16 | (0.67) | (0.51) | (0.12) | — |
| 12/31/2015 | $14.34 | 0.10 | 0.50 | 0.60 | (0.19) | — |
| 12/31/2014 | $15.68 | 0.13 | (1.34) | (1.21) | (0.05) | (0.08) |
| 12/31/2013 | $11.76 | (0.02) | 3.97 | 3.95 | (0.01) | (0.02) |
| Advisor Class(d) |
| 12/31/2017 | $14.18 | 0.10 | 5.32 | 5.42 | (0.24) | — |
| 12/31/2016 | $14.82 | 0.17 | (0.65) | (0.48) | (0.16) | — |
| 12/31/2015 | $14.40 | 0.24 | 0.41 | 0.65 | (0.23) | — |
| 12/31/2014 (e) | $15.85 | (0.02) | (1.34) | (1.36) | (0.09) | — |
| Class C |
| 12/31/2017 | $13.99 | (0.04) | 5.21 | 5.17 | (0.04) | — |
| 12/31/2016 | $14.63 | 0.03 | (0.64) | (0.61) | (0.03) | — |
| 12/31/2015 | $14.16 | (0.00) (g) | 0.48 | 0.48 | (0.01) | — |
| 12/31/2014 | $15.54 | (0.01) | (1.29) | (1.30) | — | (0.08) |
| 12/31/2013 | $11.73 | (0.15) | 3.98 | 3.83 | — | (0.02) |
| Institutional Class(h) |
| 12/31/2017 | $14.11 | 0.14 | 5.26 | 5.40 | (0.24) | — |
| 12/31/2016 | $14.75 | 0.19 | (0.67) | (0.48) | (0.16) | — |
| 12/31/2015 | $14.34 | 0.15 | 0.49 | 0.64 | (0.23) | — |
| 12/31/2014 | $15.68 | 0.15 | (1.32) | (1.17) | (0.09) | (0.08) |
| 12/31/2013 | $11.76 | 0.11 | 3.88 | 3.99 | (0.05) | (0.02) |
| Institutional 2 Class(i) |
| 12/31/2017 | $14.25 | 0.20 | 5.25 | 5.45 | (0.24) | — |
| 12/31/2016 | $14.89 | 0.18 | (0.66) | (0.48) | (0.16) | — |
| 12/31/2015 | $14.47 | 0.15 | 0.50 | 0.65 | (0.23) | — |
| 12/31/2014 | $15.82 | 0.14 | (1.32) | (1.18) | (0.09) | (0.08) |
| 12/31/2013 | $11.86 | (0.04) | 4.06 | 4.02 | (0.04) | (0.02) |
| Institutional 3 Class(j) |
| 12/31/2017 (k) | $15.02 | 0.03 | 4.40 | 4.43 | (0.28) | — |
| Notes to Financial Highlights |
| (a) | Had the Investment Manager and/or Transfer Agent not waived fees and/or reimbursed a portion of expenses, total return would have been reduced. |
| (b) | In addition to the fees and expenses that the Fund bears directly, the Fund indirectly bears a pro rata share of the fees and expenses of any other funds in which it invests, if any. Such indirect expenses are not included in the Fund’s reported expense ratios. |
| (c) | The benefits derived from expense reductions had an impact of less than 0.01%. |
| (d) | Prior to November 1, 2017, Advisor Class shares were known as Class R4 shares. |
| (e) | Advisor Class shares commenced operations on June 25, 2014. Per share data and total return reflect activity from that date. |
| (f) | Annualized. |
| (g) | Rounds to zero. |
| (h) | Prior to November 1, 2017, Institutional Class shares were known as Class Z shares. |
| (i) | Prior to November 1, 2017, Institutional 2 Class shares were known as Class R5 shares. |
| (j) | Prior to November 1, 2017, Institutional 3 Class shares were known as Class Y shares. |
| (k) | Institutional 3 Class shares commenced operations on March 1, 2017. Per share data and total return reflect activity from that date. |
The accompanying Notes to Financial Statements are an integral part of this statement.
| 128 | Columbia Acorn Family of Funds | Annual Report 2017 |
Total
distributions to
shareholders | Net
asset
value,
end of
period | Total
return(a) | Total gross
expense
ratio to
average
net assets(b) | Total net
expense
ratio to
average
net assets(b) | Net investment
income (loss)
ratio to
average
net assets | Portfolio
turnover | Net
assets,
end of
period
(000’s) |
| |
| (0.19) | $19.27 | 37.89% | 1.94% | 1.58% (c) | 0.33% | 34% | $32,487 |
| (0.12) | $14.12 | (3.47%) | 2.00% | 1.75% | 1.07% | 40% | $26,269 |
| (0.19) | $14.75 | 4.17% | 2.06% | 1.75% | 0.67% | 37% | $40,368 |
| (0.13) | $14.34 | (7.77%) | 2.05% | 1.75% | 0.86% | 74% | $21,101 |
| (0.03) | $15.68 | 33.64% | 3.33% | 1.74% | (0.11%) | 42% | $19,078 |
| |
| (0.24) | $19.36 | 38.29% | 1.71% | 1.28% (c) | 0.55% | 34% | $2,942 |
| (0.16) | $14.18 | (3.27%) | 1.79% | 1.50% | 1.15% | 40% | $362 |
| (0.23) | $14.82 | 4.48% | 1.81% | 1.50% | 1.59% | 37% | $408 |
| (0.09) | $14.40 | (8.60%) | 1.87% (f) | 1.50% (f) | (0.30%) (f) | 74% | $302 |
| |
| (0.04) | $19.12 | 36.95% | 2.69% | 2.31% (c) | (0.25%) | 34% | $13,965 |
| (0.03) | $13.99 | (4.21%) | 2.75% | 2.50% | 0.18% | 40% | $7,112 |
| (0.01) | $14.63 | 3.41% | 2.82% | 2.50% | (0.02%) | 37% | $7,220 |
| (0.08) | $14.16 | (8.44%) | 2.84% | 2.50% | (0.10%) | 74% | $5,096 |
| (0.02) | $15.54 | 32.63% | 4.19% | 2.50% | (1.10%) | 42% | $1,400 |
| |
| (0.24) | $19.27 | 38.35% | 1.69% | 1.29% (c) | 0.77% | 34% | $48,965 |
| (0.16) | $14.11 | (3.29%) | 1.73% | 1.50% | 1.29% | 40% | $11,345 |
| (0.23) | $14.75 | 4.43% | 1.78% | 1.50% | 1.01% | 37% | $11,766 |
| (0.17) | $14.34 | (7.52%) | 1.79% | 1.50% | 0.97% | 74% | $8,499 |
| (0.07) | $15.68 | 33.98% | 3.98% | 1.45% | 0.83% | 42% | $4,407 |
| |
| (0.24) | $19.46 | 38.32% | 1.64% | 1.28% | 1.14% | 34% | $3,988 |
| (0.16) | $14.25 | (3.23%) | 1.68% | 1.47% | 1.26% | 40% | $1,262 |
| (0.23) | $14.89 | 4.48% | 1.75% | 1.48% | 0.98% | 37% | $2,122 |
| (0.17) | $14.47 | (7.54%) | 1.75% | 1.52% | 0.92% | 74% | $1,633 |
| (0.06) | $15.82 | 33.97% | 2.76% | 1.51% | (0.29%) | 42% | $1,891 |
| |
| (0.28) | $19.17 | 29.55% | 1.58% (f) | 1.09% (f) | 0.17% (f) | 34% | $210 |
Columbia Acorn Family of Funds | Annual Report 2017
| 129 |
Notes to Financial Statements
December 31, 2017
Note 1. Organization
Columbia Acorn® Fund, Columbia Acorn International®, Columbia Acorn USA®, Columbia Acorn International SelectSM, Columbia Acorn SelectSM, Columbia Thermostat FundSM, Columbia Acorn Emerging Markets FundSM and Columbia Acorn European FundSM (each a Fund and collectively, the Funds) are each a series of Columbia Acorn Trust (the Trust). The Trust is registered under the Investment Company Act of 1940, as amended (the 1940 Act), as an open-end management investment company organized as a Massachusetts business trust. The investment objective of each Fund is to seek long-term capital appreciation.
Columbia Thermostat FundSM pursues its investment objective by investing in shares of other mutual funds. As a “fund of funds”, under normal circumstances, the Fund allocates at least 95% of its net assets among a selected group of affiliated stock and bond mutual funds (underlying funds) according to the current level of the Standard & Poor’s (S&P) 500 Index in relation to predetermined ranges set by Columbia Wanger Asset Management, LLC (the Investment Manager or CWAM). The Fund may invest up to 5% of its net assets plus any cash received that day in cash, repurchase agreements, high quality short-term paper and government securities.
Fund shares
Each Fund may issue an unlimited number of shares. Columbia Acorn® Fund, Columbia Acorn USA®, Columbia Acorn International SelectSM, Columbia Acorn SelectSM, Columbia Thermostat FundSM, Columbia Acorn Emerging Markets FundSM and Columbia Acorn European FundSM each currently offers Class A, Advisor Class, Class C, Institutional Class, Institutional 2 Class and Institutional 3 Class shares. Columbia Acorn International® currently offers Class A, Advisor Class, Class C, Class R, Institutional Class, Institutional 2 Class and Institutional 3 Class shares. Effective March 27, 2017, Class I shares were no longer offered by Columbia Acorn® Fund, Columbia Acorn Emerging Markets FundSM, Columbia Acorn European FundSM, Columbia Acorn International®, Columbia Acorn International SelectSM, Columbia Acorn SelectSM and Columbia Acorn USA®. Effective July 17, 2017, Class B shares were no longer offered by Columbia Acorn International®.
Class A shares are sold with a front-end sales charge. Class A shares bought without an initial sales charge in accounts aggregating $1 million to $50 million at the time of purchase are subject to a 1.00% contingent deferred sales charge (CDSC) if the shares are redeemed within 12 months after purchase, and a 0.50% CDSC if the shares are redeemed more than 12, but less than 18, months after purchase, with certain limited exceptions.
Advisor Class shares are offered at net asset value. There are certain restrictions on who may purchase these shares. Prior to November 1, 2017, Advisor Class shares were known as Class R4 shares.
When available, Class B shares were subject to maximum CDSC of 5.00%, based upon the holding period after purchase. Effective July 17, 2017, Class B shares were automatically converted to Class A shares without a CDSC. On August 4, 2017, the capital owned by Columbia Management Investment Advisers, LLC in Class B shares was redeemed without a CDSC.
Class C shares are offered at net asset value but are subject to a CDSC on redemptions made within one year after purchase.
Class I shares are no longer offered for sale. When available, Class I shares were not subject to sales charges or distribution and service (12b-1) fees, and were made only to the Columbia Family of Funds. On March 27, 2017, Class I shares were redeemed or exchanged for Institutional 3 Class shares of the applicable Fund in a tax free transaction that had no impact on the fees and expenses paid by shareholders.
Institutional Class shares are offered at net asset value. There are certain restrictions on who may purchase Institutional Class shares. Generally, Institutional Class shares of a Fund may be exchanged for shares of another fund distributed by Columbia Management Investment Distributors, Inc. (CMID) at no additional charge. Prior to November 1, 2017, Institutional Class shares were known as Class Z shares.
Institutional 2 Class shares are offered at net asset value. There are certain restrictions on who may purchase these shares. Prior to November 1, 2017, Institutional 2 Class shares were known as Class R5 shares.
| 130 | Columbia Acorn Family of Funds | Annual Report 2017 |
Notes to Financial Statements (continued)
December 31, 2017
Institutional 3 Class shares are offered at net asset value. There are certain restrictions on who may purchase these shares. Prior to November 1, 2017, Institutional 3 Class shares were known as Class Y shares.
Investment income, realized and unrealized gains and losses, and certain fund-level expenses are allocated pro rata on the basis of the relative net assets of all classes, except that each class bears certain expenses specific to that class such as distribution services, transfer agent fees, and certain other class specific expenses. Differences in class expenses may result in payment of different dividend distributions for each class. All of the Funds’ share classes have equal rights with respect to voting, subject to Fund or class-specific matters.
Note 2. Summary of significant accounting policies
Basis of preparation
Each Fund is an investment company that applies the accounting and reporting guidance in the Financial Accounting Standards Board (FASB) Accounting Standards Codification Topic 946, Financial Services - Investment Companies (ASC 946). The financial statements are prepared in accordance with U.S. generally accepted accounting principles (GAAP), which requires management to make certain estimates and assumptions that affect the reported amounts of assets and liabilities, the disclosure of contingent assets and liabilities at the date of the financial statements and the reported amounts of income and expenses during the reporting period. Actual results could differ from those estimates.
The following is a summary of significant accounting policies followed by the Funds in the preparation of their financial statements.
Security valuation
Securities of the Funds are valued at market value or, if a market quotation for a security is not readily available or is deemed not to be reliable because of events or circumstances that have occurred between the market quotation and the time as of which the security is to be valued, the security is valued at a fair value determined in good faith under consistently applied procedures established by the Board of Trustees. With respect to Columbia Thermostat FundSM, investments in underlying funds are valued at their net asset values as reported by the underlying funds. A security traded on a securities exchange or in an over-the-counter market in which transaction prices are reported is valued at the last sales price at the time of valuation. A security traded principally on NASDAQ is valued at the NASDAQ official closing price. Exchange traded funds are valued at their closing net asset value as reported on the applicable exchange. A security for which there is no reported sale on the valuation date is valued by comparison of the mean of the latest bid and ask quotations.
Foreign equity securities are generally valued based on the closing price on the foreign exchange in which such securities are primarily traded. If any foreign equity security closing prices are not readily available, the securities are valued at the mean of the latest quoted bid and ask prices on such exchanges or markets. Foreign currency exchange rates are generally determined at 4:00 p.m. Eastern (U.S.) time. Many securities markets and exchanges outside the U.S. close prior to the close of the New York Stock Exchange; therefore, the closing prices for securities in such markets or on such exchanges may not fully reflect events that occur after such close but before the close of the New York Stock Exchange. In situations where foreign markets are closed, where a significant event has occurred after the foreign exchange closes but before the time at which the Fund’s share price is calculated, and in the event of significant movement in the trigger index for the statistical fair valuation process established by the Board of Trustees, foreign securities will be fair valued pursuant to a policy adopted by the Board of Trustees. The Trust has retained an independent statistical fair value pricing service that employs a systematic methodology to assist in the fair valuation process for securities principally traded in a foreign market in order to adjust for possible changes in value that may occur between the close of the foreign market and the time as of which the securities are to be valued. If a security is valued at a fair value, that value may be different from the last quoted market price for the security.
Short-term investments maturing in 60 days or less are valued at amortized cost, which approximates market value.
The Trust has retained an independent statistical fair value pricing service that employs a systematic methodology to assist in the fair valuation process for securities principally traded in a foreign market in order to adjust for possible changes in value that may occur between the close of the foreign exchange and the time as of which the securities are to be valued. If a security is valued at fair value, that value may be different from the last quoted market price for the security.
Columbia Acorn Family of Funds | Annual Report 2017
| 131 |
Notes to Financial Statements (continued)
December 31, 2017
Foreign currency transactions and translations
Values of investments denominated in foreign currencies are converted into U.S. dollars using the New York spot market rate of exchange at the time of valuation. Purchases and sales of investments and dividend and interest income are translated into U.S. dollars using the spot market rate of exchange prevailing on the respective dates of such transactions. The gain or loss resulting from changes in foreign exchange rates is included with net realized and unrealized gain or loss from investments, as appropriate.
Derivative instruments
Columbia Acorn® Fund and Columbia Acorn USA® invested in futures contracts on a limited basis during the year ended December 31, 2017, as detailed below. Derivatives may involve various risks, including the potential inability of the counterparty to fulfill its obligation under the terms of the contract, the potential for an illiquid secondary market (making it difficult for the Fund to sell, including at favorable prices) and the potential for market movements which may expose the Fund to gains or losses in excess of the amount shown in the Statements of Assets and Liabilities.
For financial reporting purposes, the Funds do not offset derivative assets and derivative liabilities that are subject to netting arrangements in the Statements of Assets and Liabilities.
Futures contracts
Futures contracts are exchange-traded and represent commitments for the future purchase or sale of an asset at a specified price on a specified date. Columbia Acorn® Fund and Columbia Acorn USA® bought and sold futures contracts to maintain appropriate equity market exposure while keeping sufficient cash to accommodate daily redemptions. These instruments may be used for other purposes in future periods. Upon entering into futures contracts, the Fund bears risks that it may not achieve the anticipated benefits of the futures contracts and may realize a loss. Additional risks include counterparty credit risk, the possibility of an illiquid market, and that a change in the value of the contract or option may not correlate with changes in the value of the underlying asset.
Upon entering into a futures contract, the Fund deposits cash or securities with the broker, known as a futures commission merchant (FCM), in an amount sufficient to meet the initial margin requirement. The initial margin deposit must be maintained at an established level over the life of the contract. Cash deposited as initial margin is recorded in the Statement of Assets and Liabilities as margin deposits. Securities deposited as initial margin are designated in the Portfolio of Investments. Subsequent payments (variation margin) are made or received by the Fund each day. The variation margin payments are equal to the daily change in the contract value and are recorded as variation margin receivable or payable and are offset in unrealized gains or losses. The Fund recognizes a realized gain or loss when the contract is closed or expires. Futures contracts involve, to varying degrees, risk of loss in excess of the variation margin disclosed in the Statement of Assets and Liabilities.
Effects of derivative transactions in the financial statements
The following tables are intended to provide additional information about the effect of derivatives on the financial statements of Columbia Acorn® Fund and Columbia Acorn USA® including: the fair value of derivatives by risk category and the location of those fair values in the Statements of Assets and Liabilities; and the impact of derivative transactions over the period in the Statements of Operations, including realized gains or losses and unrealized gains or losses. The derivative schedules following the Portfolio of Investments present additional information regarding derivative instruments outstanding at the end of the period, if any.
Columbia Acorn® Fund
At December 31, 2017, the Fund had no outstanding derivatives.
| Amount of realized gain (loss) on derivatives recognized in income |
| Risk exposure category | Futures
contracts
($) |
| Equity risk | (846,958) |
| 132 | Columbia Acorn Family of Funds | Annual Report 2017 |
Notes to Financial Statements (continued)
December 31, 2017
| Derivative instrument | Average notional
amounts ($)** |
| Futures contracts — long | 1,543,835 |
| ** | Based on the ending daily outstanding amounts for the entire year ended December 31, 2017, however actual investments in futures were made only between November 29, 2017 and December 5, 2017. |
Columbia Acorn USA®
At December 31, 2017, the Fund had no outstanding derivatives.
| Amount of realized gain (loss) on derivatives recognized in income |
| Risk exposure category | Futures
contracts
($) |
| Equity risk | (111,277) |
| Derivative instrument | Average notional
amounts ($)** |
| Futures contracts — long | 150,447 |
| ** | Based on the ending daily outstanding amounts for the entire year ended December 31, 2017, however actual investments in futures were made only between November 29, 2017 and December 5, 2017. |
Security transactions and investment income
Security transactions, investment income and shareholder fund transactions are accounted for on the trade date (date the order to buy or sell is executed) and dividend income and realized gain distributions from other funds are recorded on the ex-dividend date, except that certain dividends from foreign securities are recorded as soon as the information is available to the Funds. Interest income is recorded on the accrual basis and includes amortization of discounts on debt obligations when required for federal income tax purposes. Realized gains and losses from security transactions are recorded on an identified cost basis.
Awards, if any, from class action litigation related to securities owned may be recorded as a reduction of cost of those securities. If the applicable securities are no longer owned, the proceeds are recorded as realized gains.
The Funds may receive distributions from holdings in exchange-traded funds (ETFs), limited partnerships (LPs), other regulated investment companies (RICs), and real estate investment trusts (REITs), which report information on the character of their distributions annually. These distributions are allocated to dividend income, capital gain and return of capital based on actual information reported. To the extent actual information has not yet been reported by the REITs, estimates for return of capital may be made by the Funds’ management. Return of capital is recorded as a reduction of the cost basis of securities held. If the Funds no longer own the applicable securities, return of capital is recorded as a realized gain. Management’s estimates are subsequently adjusted when the actual character of the distributions is disclosed by the REITs, which could result in a proportionate change in return of capital to shareholders. No estimates are made for ETFs and RICs.
Fund share valuation
Fund shares are sold and redeemed on a daily basis at net asset value, subject to any applicable sales charge. Net asset value per share is determined daily as of the close of trading on the New York Stock Exchange (NYSE) on each day the NYSE is open for trading. Generally, income, expenses and realized and unrealized gain/(losses) of a Fund are allocated to each class proportionately on a daily basis for purposes of determining the net asset value of each class. The distribution and service fees and transfer agent fees are charged to each specific class as expenses are incurred. Redemption fees are accounted for as an addition to paid in capital for purposes of determining the net asset value of each class.
Securities lending
Each Fund, except Columbia Thermostat FundSM, may lend securities up to one-third of the value of its total assets to certain approved brokers, dealers and other financial institutions to earn additional income. The Funds retain the benefits of owning the securities, including the economic equivalent of dividends or interest generated by the security. The Funds also receive a
Columbia Acorn Family of Funds | Annual Report 2017
| 133 |
Notes to Financial Statements (continued)
December 31, 2017
fee for the loan. The Funds have the ability to recall the loans at any time and could do so in order to vote proxies or to sell the loaned securities. Each loan is collateralized by cash that exceeds the value of the securities on loan. The market value of the loaned securities is determined daily at the close of business of a Fund and any additional required collateral is delivered to the Fund on the next business day. The Funds have elected to invest the cash collateral in the Dreyfus Government Cash Management Fund. The income earned from the securities lending program is paid to each Fund, net of any fees remitted to Goldman Sachs Agency Lending, the Funds’ lending agent, and net of any borrower rebates. The Investment Manager does not retain any fees earned by the lending program. Generally, in the event of borrower default, a Fund has the right to use the collateral to offset any losses incurred. In the event a Fund is delayed or prevented from exercising its right to dispose of the collateral, there may be a potential loss to the Fund. Some of these losses may be indemnified by the lending agent. The Funds bear the risk of loss with respect to the investment of collateral. The net securities lending income earned as of December 31, 2017 by each Fund is included in the Statements of Operations.
Offsetting of assets and liabilities
The following table presents each Fund’s gross and net amount of assets and liabilities available for offset under netting agreements and under a securities lending agreement as well as the related collateral received by each Fund as of December 31, 2017:
| | Columbia Acorn
Fund® | Columbia Acorn
International® | Columbia Acorn
USA® | Columbia Acorn
International SelectSM | Columbia Acorn
Emerging Markets FundSM | Columbia Acorn
European FundSM | | |
| | Goldman
Sachs ($) | Goldman
Sachs ($) | Goldman
Sachs ($) | Goldman
Sachs ($) | Goldman
Sachs ($) | Goldman
Sachs ($) | | |
| Liabilities | | | | | | | | |
| Collateral on Securities loaned | 37,208,360 | 131,643,758 | 3,283,375 | 5,961,556 | 1,505,875 | 2,892,531 | | |
| Total Liabilities | 37,208,360 | 131,643,758 | 3,283,375 | 5,961,556 | 1,505,875 | 2,892,531 | | |
| Total Financial and Derivative Net Assets | (37,208,360) | (131,643,758) | (3,283,375) | (5,961,556) | (1,505,875) | (2,892,531) | | |
| Financial Instruments | 35,927,492 | 125,615,479 | 3,128,036 | 5,681,155 | 1,444,123 | 2,762,415 | | |
| Net Amount (a) | (1,280,868) | (6,028,279) | (155,339) | (280,401) | (61,752) | (130,116) | | |
| (a) | Represents the net amount due from/(to) counterparties in the event of default. |
Securities lending transactions
The following table indicates the total amount of securities loaned by type, reconciled to gross liability payable upon return of the securities loaned by the Fund as of December 31, 2017:
| | Overnight and
continuous | Up to
30 days | 30-90
days | Greater than
90 days | Total |
| Columbia Acorn® Fund | | | | | |
| Securities lending transactions | | | | | |
| Equity securities | $35,927,492 | $— | $— | $— | $35,927,492 |
| Gross amount of recognized liabilities for securities lending (collateral received) | | | | | 37,208,360 |
| Amounts due to counterparty in the event of default | | | | | $1,280,868 |
| Columbia Acorn International® | | | | | |
| Securities lending transactions | | | | | |
| Equity securities | $125,615,479 | $— | $— | $— | $125,615,479 |
| Gross amount of recognized liabilities for securities lending (collateral received) | | | | | 131,643,758 |
| Amounts due to counterparty in the event of default | | | | | $6,028,279 |
| 134 | Columbia Acorn Family of Funds | Annual Report 2017 |
Notes to Financial Statements (continued)
December 31, 2017
| | Overnight and
continuous | Up to
30 days | 30-90
days | Greater than
90 days | Total |
| Columbia Acorn USA® | | | | | |
| Securities lending transactions | | | | | |
| Equity securities | $3,128,036 | $— | $— | $— | $3,128,036 |
| Gross amount of recognized liabilities for securities lending (collateral received) | | | | | 3,283,375 |
| Amounts due to counterparty in the event of default | | | | | $155,339 |
| Columbia Acorn International SelectSM | | | | | |
| Securities lending transactions | | | | | |
| Equity securities | $5,681,155 | $— | $— | $— | $5,681,155 |
| Gross amount of recognized liabilities for securities lending (collateral received) | | | | | 5,961,556 |
| Amounts due to counterparty in the event of default | | | | | $280,401 |
| Columbia Acorn Emerging Markets FundSM | | | | | |
| Securities lending transactions | | | | | |
| Equity securities | $1,444,123 | $— | $— | $— | $1,444,123 |
| Gross amount of recognized liabilities for securities lending (collateral received) | | | | | 1,505,875 |
| Amounts due to counterparty in the event of default | | | | | $61,752 |
| Columbia Acorn European FundSM | | | | | |
| Securities lending transactions | | | | | |
| Equity securities | $2,762,415 | $— | $— | $— | $2,762,415 |
| Gross amount of recognized liabilities for securities lending (collateral received) | | | | | 2,892,531 |
| Amounts due to counterparty in the event of default | | | | | $130,116 |
Federal income tax status
It is each Fund’s policy to comply with the provisions of the Internal Revenue Code available to regulated investment companies and, in the manner provided therein, distribute substantially all their taxable income, as well as any net realized gain on sales of investments and foreign currency transactions reportable for federal income tax purposes. Columbia Thermostat FundSM distributes all of its taxable income, as well as any net realized gain on sales of portfolio fund shares and any distributions of net realized gains received by the Fund from its portfolio funds, reportable for federal income tax purposes. Accordingly, the Funds paid no federal income taxes and no federal income tax provision was required.
Foreign taxes
Realized gains in certain countries may be subject to foreign taxes at the fund level. The Funds accrue for such foreign taxes on realized and unrealized gains at the appropriate rate for each jurisdiction. The amount, if any, is disclosed as a liability on the Statements of Assets and Liabilities.
Distributions to shareholders
Distributions to shareholders are recorded on the ex-dividend date.
Guarantees and indemnification
In the normal course of business, the Trust on behalf of the Funds enters into contracts that contain a variety of representations and warranties and that provide general indemnities. A Fund’s maximum exposure under these arrangements is unknown, as this would involve future claims against the Fund. Also, under the Trust’s organizational documents, the trustees and officers of the Trust are indemnified against certain liabilities that may arise out of their duties to the Trust. However, based on experience, the Funds expect the risk of loss due to these warranties and indemnities to be remote.
Recent accounting pronouncement
Accounting Standards Update 2017-08 Premium Amortization on Purchased Callable Debt Securities
In March 2017, the Financial Accounting Standards Board issued Accounting Standards Update (ASU) No. 2017-08 Premium Amortization on Purchased Callable Debt Securities. ASU No. 2017-08 updates the accounting standards to shorten the amortization period for certain purchased callable debt securities, held at a premium, to be amortized to the earliest call date.
Columbia Acorn Family of Funds | Annual Report 2017
| 135 |
Notes to Financial Statements (continued)
December 31, 2017
The update applies to securities with explicit, noncontingent call features that are callable at fixed prices and on preset dates. The standard is effective for annual periods beginning after December 15, 2018 and interim periods within those fiscal years. At this time, management is evaluating the implication of this guidance and the impact it will have on the financial statement amounts and footnote disclosures, if any.
Note 3. Fees and other transactions with affiliates
Investment management fees
CWAM is a wholly-owned subsidiary of Columbia Management Investment Advisers, LLC (Columbia Management), which is a wholly-owned subsidiary of Ameriprise Financial, Inc. (Ameriprise Financial). CWAM furnishes continuing investment supervision to the Funds and is responsible for the overall management of the Funds’ business affairs.
CWAM receives a monthly advisory fee based on each Fund’s daily net assets at the following annual rates:
| Columbia Acorn® Fund |
| Average daily net assets | Annual
fee rate |
| Up to $700 million | 0.74% |
| $700 million to $2 billion | 0.69% |
| $2 billion to $6 billion | 0.64% |
| $6 billion and over | 0.63% |
| Columbia Acorn International® |
| Average daily net assets | Annual
fee rate |
| Up to $100 million | 1.19% |
| $100 million to $500 million | 0.94% |
| $500 million and over | 0.74% |
| Columbia Acorn USA® |
| Average daily net assets | Annual
fee rate |
| Up to $200 million | 0.94% |
| $200 million to $500 million | 0.89% |
| $500 million to $2 billion | 0.84% |
| $2 billion to $3 billion | 0.80% |
| $3 billion and over | 0.70% |
| Columbia Acorn International SelectSM |
| Average daily net assets | Annual
fee rate |
| Up to $500 million | 0.89% |
| $500 million and over | 0.85% |
| Columbia Acorn SelectSM |
| Average daily net assets | Annual
fee rate |
| Up to $700 million | 0.85% |
| $700 million to $2 billion | 0.80% |
| $2 billion to $3 billion | 0.75% |
| $3 billion and over | 0.70% |
| Columbia Thermostat FundSM |
| | Annual
fee rate |
| All Average Daily Net Assets | 0.10% |
| 136 | Columbia Acorn Family of Funds | Annual Report 2017 |
Notes to Financial Statements (continued)
December 31, 2017
| Columbia Acorn Emerging Markets FundSM |
| Average daily net assets | Annual
fee rate |
| Up to $100 million | 1.25% |
| $100 million to $500 million | 1.00% |
| $500 million and over | 0.80% |
| Columbia Acorn European FundSM |
| Average daily net assets | Annual
fee rate |
| Up to $100 million | 1.19% |
| $100 million to $500 million | 0.94% |
| $500 million and over | 0.74% |
Through April 30, 2018, CWAM has contractually agreed to waive 0.20% of the advisory fee otherwise payable to it by Columbia Acorn Select. When determining whether the Fund’s total expenses exceed the voluntary expense cap described below, the Fund’s net advisory fee, reflecting application of the 0.20% waiver, will be used to calculate the Fund’s total expenses. This arrangement may be modified or amended with approval from all parties to the arrangement, including the Fund and CWAM.
For the year ended December 31, 2017, the effective investment advisory fee rates (net of the advisory fee waiver for Columbia Acorn SelectSM) were as follows:
| Fund | Effective investment advisory fee rate (%) |
| Columbia Acorn® Fund | 0.67 |
| Columbia Acorn International® | 0.77 |
| Columbia Acorn USA® | 0.90 |
| Columbia Acorn International SelectSM | 0.89 |
| Columbia Acorn SelectSM | 0.65 |
| Columbia Thermostat FundSM | 0.10 |
| Columbia Acorn Emerging Markets FundSM | 1.24 |
| Columbia Acorn European FundSM | 1.19 |
Administration fees
CWAM provides administrative services and receives an administration fee from the Funds at the following annual rates:
| Columbia Acorn Trust |
Aggregate average daily
net assets of the trust | Annual
fee rate |
| Up to $8 billion | 0.050% |
| $8 billion to $16 billion | 0.040% |
| $16 billion to $35 billion | 0.030% |
| $35 billion to $45 billion | 0.025% |
| $45 billion and over | 0.015% |
For the year ended December 31, 2017, the effective administration fee rate was 0.047% of each Fund’s average daily net assets. CWAM has delegated to Columbia Management responsibility to provide certain sub-administrative services to the Funds.
Compensation of board members
Certain officers and trustees of the Trust are also officers of CWAM or Columbia Management. The Trust makes no direct payments to its officers and trustees who are affiliated with CWAM or Columbia Management. The Trust offers a deferred compensation plan for its independent trustees. Under that plan, a trustee may elect to defer all or a portion of his or her compensation. Amounts deferred are retained by the Trust and may represent an unfunded obligation of the Trust. The value
Columbia Acorn Family of Funds | Annual Report 2017
| 137 |
Notes to Financial Statements (continued)
December 31, 2017
of amounts deferred is determined by reference to the change in value of Institutional Class shares of one or more series of Columbia Acorn Trust or a money market fund as specified by the trustee. Benefits under the deferred compensation plan are payable in accordance with the plan.
Compensation of Chief Compliance Officer
The Board of Trustees has appointed a Chief Compliance Officer of the Funds in accordance with federal securities regulations. A portion of the Chief Compliance Officer’s total compensation is allocated to the Funds, along with other affiliated funds governed by the Board, based on relative net assets. The total amount allocated to all affiliated funds governed by the Board will not exceed $40,000 annually.
Transactions with affiliates
An affiliated person of a Fund may include any company in which a Fund owns five percent or more of its outstanding voting shares during the year. On December 31, 2017, Columbia Thermostat FundSM and Columbia Acorn® Fund held five percent or more of the outstanding voting securities of one or more companies or a company which is under common ownership or control with the Funds. Details of investments in those affiliated companies are presented in the Notes to Portfolio of Investments of each Fund listed above.
For the year ended December 31, 2017, the Funds engaged in purchase and sales transactions with funds that have a common investment manager (or affiliated investment managers), common directors/trustees, and/or common officers. Those transactions complied with Rule 17a-7 under the 1940 Act and totaled as follows.
| Fund | Purchases ($) | Sales ($) | Realized
gain/(loss)
from sale
transactions ($) |
| Columbia Acorn International® | — | 762,759 | 354,209 |
Transfer agency fees
Under a Transfer, Dividend Disbursing and Shareholders’ Servicing Agent Agreement, Columbia Management Investment Services Corp. (the Transfer Agent), an affiliate of the Investment Manager and a wholly-owned subsidiary of Ameriprise Financial, is responsible for providing transfer agency, dividend disbursing and shareholder services to the Funds for which the Funds pay transfer agency fees. The Transfer Agent has contracted with DST Asset Manager Solutions, Inc. (DST) to provide certain services and assist the Transfer Agent carrying out its duties. The Transfer Agent pays the fees of DST for its services and DST is not entitled to reimbursement for such fees from the Fund (with the exception of out-of-pocket fees). In addition, the Transfer Agent enters into agreements with various financial intermediaries through which investors may hold Fund shares, including Ameriprise Financial and its affiliates. These intermediaries also may provide shareholder services (Additional Shareholder Services) for which they are compensated by the Transfer Agent, which is in turn compensated by the Funds. Additional Shareholder Services may include sub-accounting, sub-transfer agency, participant recordkeeping, shareholder or participant reporting, shareholder or participant transaction processing, shareholder or participant tax monitoring and reporting and/or the provision of call center support and other customer services.
The Fund pays the Transfer Agent a monthly transfer agency fee that varies by account type (on a per account or asset-based basis) based on the cost of servicing the Funds. In addition, subject to certain limitations described in the Funds’ prospectuses and except with respect to Institutional 3 Class shares, the Funds pay a fee to the Transfer Agent for the Additional Shareholder Services provided by financial intermediaries who maintain shares through omnibus or networked accounts in amounts that vary by share class and with the distribution channel, type of intermediary and type of services provided.
The Funds compensate the Transfer Agent for certain out-of-pocket expenses as approved by the Board from time to time. Such out-of-pocket expenses may include networking account fees paid to dealer firms by the Transfer Agent with respect to shareholder accounts established or maintained pursuant to the National Securities Clearing Corporation’s (NSCC) networking system. A significant portion of such networking account fees are paid by the Transfer Agent to dealer firms affiliated with Ameriprise Financial and its affiliates.
| 138 | Columbia Acorn Family of Funds | Annual Report 2017 |
Notes to Financial Statements (continued)
December 31, 2017
Effective July 1, 2017 total fees payable to the Transfer Agent by Institutional 2 Class (formerly Class R5 shares) and Institutional 3 Class (formerly Class Y) shares of the Funds are subject to an annual limitation of not more than 0.07% and 0.02%, respectively, of the average daily net assets attributable to each share class. In addition, effective July 1, 2017 through June 30, 2019, CMIS has contractually agreed to limit the total fees payable to it by Institutional 2 Class and Institutional 3 Class shares of the Funds to not more than 0.05% and 0.00%, respectively, of the average daily net assets attributable to each share class. Prior to July 1, 2017, total fees payable to CMIS by Institutional 2 Class shares, were subject to an annual limitation of not more than 0.05% of the average daily net assets attributable to Institutional 2 Class shares and Institutional 3 Class did not pay any fees to CMIS.
Effective July 1, 2017 through June 30, 2019, the Transfer Agent has contractually agreed to limit the total fees payable to it by Columbia Acorn® Fund to an annual rate of not more than 0.07% for all share classes of the Fund other than Institutional 2 Class and Institutional 3 Class unless sooner terminated at the sole discretion of the Board of Trustees.
Effective July 1, 2017 through June 30, 2019, the Transfer Agent has contractually agreed to limit the total fees payable to it by Columbia Acorn International® to an annual rate of not more than 0.11% for all share classes of the Fund other than Institutional 2 Class and Institutional 3 Class unless sooner terminated at the sole discretion of the Board of Trustees.
Effective July 1, 2017 through June 30, 2019, the Transfer Agent has contractually agreed to limit the total fees payable to it by Columbia Acorn SelectSM to an annual rate of not more than 0.11% for all share classes of the Fund other than Institutional 2 Class and Institutional 3 Class unless sooner terminated at the sole discretion of the Board of Trustees.
Effective July 1, 2017 through June 30, 2019, the Transfer Agent has contractually agreed to limit the total fees payable to it by Columbia Acorn USA® to an annual rate of not more than 0.14% for all share classes of the Fund other than Institutional 2 Class and Institutional 3 Class unless sooner terminated at the sole discretion of the Board of Trustees.
For the year ended December 31, 2017, the Funds’ effective transfer agency fee rates, excluding any voluntary transfer agency fee waivers, as a percentage of average daily net assets of each class were as follows:
| Fund | Class A
(%) | Advisor
Class (%) | Class B
(%) | Class C
(%) | Institutional
Class (%) | Institutional 2
Class (%) | Institutional 3
Class (%) | Class R
(%) |
| Columbia Acorn® Fund | 0.07 | 0.07 | — | 0.07 | 0.07 | 0.05 | — | — |
| Columbia Acorn International® | 0.10 | 0.10 | — | 0.10 | 0.10 | 0.05 | — | 0.10 |
| Columbia Acorn USA® | 0.14 | 0.14 | — | 0.14 | 0.14 | 0.05 | — | — |
| Columbia Acorn International SelectSM | 0.13 | 0.13 | — | 0.13 | 0.13 | 0.05 | — | — |
| Columbia Acorn SelectSM | 0.11 | 0.11 | — | 0.11 | 0.11 | 0.05 | — | — |
| Columbia Thermostat FundSM | 0.08 | 0.08 | — | 0.08 | 0.08 | 0.05 | — | — |
| Columbia Acorn Emerging Markets FundSM | 0.14 | 0.14 | — | 0.14 | 0.14 | 0.05 | — | — |
| Columbia Acorn European FundSM | 0.11 | 0.11 | — | 0.11 | 0.11 | 0.05 | — | — |
Columbia Acorn International® and certain other associated investment companies, have severally, but not jointly, guaranteed the performance and observance of all the terms and conditions of a lease entered into by Seligman Data Corp. (SDC), the former transfer agent to certain associated investment companies, including the payment of rent by SDC (the Guaranty). The lease and the Guaranty expire in January 2019. At December 31, 2017, Columbia Acorn International®’s total potential future obligation over the life of the Guaranty is $22,116. The liability remaining at December 31, 2017 for non-recurring charges associated with the lease amounted to $16,715 and is included within the payable for other liabilities in the Statements of Assets and Liabilities.
An annual minimum account balance fee of $20 may apply to certain accounts with a value below the applicable share class’s initial minimum investment requirements to reduce the impact of small accounts on transfer agency fees. These minimum account balance fees are remitted to the Funds and recorded as part of expense reductions in the Statement of Operations.
Columbia Acorn Family of Funds | Annual Report 2017
| 139 |
Notes to Financial Statements (continued)
December 31, 2017
For the year ended December 31, 2017, these minimum account balance fees reduced total expenses as follows:
| Fund | Amount ($) |
| Columbia Acorn® Fund | 10,206 |
| Columbia Acorn International® | 10,492 |
| Columbia Acorn USA® | 1,720 |
| Columbia Acorn International SelectSM | 816 |
| Columbia Acorn SelectSM | 1,847 |
| Columbia Thermostat FundSM | 680 |
| Columbia Acorn Emerging Markets FundSM | 80 |
| Columbia Acorn European FundSM | 20 |
The Transfer Agent had contractually agreed to waive transfer agency fees payable by Class B shares of Columbia Acorn International® through the conversion of Class B to Class A shares. This fee waiver was in effect through August 4, 2017.
Prior to July 1, 2017, the Transfer Agent had voluntarily agreed to waive a portion of the total annual Fund operating expenses attributable to transfer agency fees incurred by Class A and Class C shares of Columbia Acorn International® such that the Fund’s total annual Fund operating expenses would be reduced by 0.04% and 0.02% for Class A and Class C shares of the Fund, respectively.
Distribution and service fees
CMID, a wholly owned subsidiary of Ameriprise Financial, is the distributor of the Funds. Each Fund has adopted a distribution and service plan which requires it to pay CMID a monthly service fee equal to 0.25% annually of the average daily net assets attributable to Class A, Class B and Class C shares and a monthly distribution fee equal to 0.50%, 0.75% and 0.50%, annually, of the average daily net assets attributable to Class B, Class C and Class R shares, respectively. CMID receives no compensation with respect to Advisor Class, Institutional Class, Institutional 2 Class and Institutional 3 Class shares. As a result of all Class B shares of the applicable Funds being redeemed or converted to Class A shares, August 4, 2017 was the last day the Funds paid a distribution fee for Class B shares.
Sales charges (unaudited)
Sales charges, including front-end charges and CDSCs, received by the Distributor for distributing Fund shares for the year ended December 31, 2017, if any, are listed below:
| | Underwriting discounts ($) | | CDSCs ($) | |
| Fund | Class A | Class A | Class B | Class C |
| Columbia Acorn® Fund | 306,791 | 231 | — | 4,135 |
| Columbia Acorn International® | 241,989 | 131 | — | 1,311 |
| Columbia Acorn USA® | 33,124 | 21 | — | 172 |
| Columbia Acorn International SelectSM | 53,340 | — | — | 303 |
| Columbia Acorn SelectSM | 34,325 | 17 | — | 83 |
| Columbia Thermostat FundSM | 286,559 | 355 | — | 37,402 |
| Columbia Acorn Emerging Markets FundSM | 32,427 | 63 | — | 444 |
| Columbia Acorn European FundSM | 120,775 | — | — | 766 |
Expenses waived/reimbursed by the Investment Manager and its affiliates
Effective July 1, 2017, CWAM has contractually agreed to waive fees and/or reimburse expenses through June 30, 2019 so that the Funds’ ordinary operating expenses (excluding transaction costs and certain other investment-related expenses, interest and fees on borrowings and expenses associated with the Fund’s investments in other investment companies, if any) do not exceed the following annual rates as a percentage of each class’ average daily net assets:
| Fund | Class A | Advisor Class | Class C | Institutional Class | Institutional 2 Class | Institutional 3 Class |
| Columbia Acorn Emerging Markets Fund | 1.55% | 1.30% | 2.30% | 1.30% | 1.19% | 1.14% |
| Columbia Acorn European Fund | 1.45% | 1.20% | 2.20% | 1.20% | 1.13% | 1.08% |
| 140 | Columbia Acorn Family of Funds | Annual Report 2017 |
Notes to Financial Statements (continued)
December 31, 2017
This arrangement may not be modified or terminated, except by a vote of the Fund’s Board and CWAM.
From May 1, 2017 through June 30, 2017, CWAM contractually agreed to waive fees and/or reimburse expenses so that the Funds’ ordinary operating expenses (excluding transaction costs and certain other investment-related expenses, interest and fees on borrowings and expenses associated with the Fund’s investments in other investment companies, if any) did not exceed the following annual rates as a percentage of each class’ average daily net assets:
| Fund | Class A | Advisor Class | Class C | Institutional Class | Institutional 2 Class | Institutional 3 Class |
| Columbia Acorn Emerging Markets Fund | 1.85% | 1.60% | 2.60% | 1.60% | 1.49% | 1.44% |
| Columbia Acorn European Fund | 1.75% | 1.50% | 2.50% | 1.50% | 1.43% | 1.38% |
Effective May 1, 2017, CWAM has voluntarily agreed to reimburse expenses so that the Fund’s ordinary operating expenses (excluding transaction costs and certain other investment-related expenses, interest and fees on borrowings and expenses associated with each Fund’s investments in other investment companies, if any) after giving effect to any balance credits or overdraft charges from the Funds’ custodian, do not exceed the following annual rates as a percentage of each class’ average daily net assets:
| Fund | Class A | Advisor Class | Class C | Institutional Class | Institutional 2 Class | Institutional 3 Class |
| Columbia Acorn Select | 1.60% | 1.35% | 2.35% | 1.35% | 1.29% | 1.24% |
This arrangement may be modified or terminated by either the Fund or CWAM on 30 days notice.
Effective May 1, 2017, CWAM has contractually agreed to waive fees and/or reimburse expenses through April 30, 2018, so that the Funds’ ordinary operating expenses (excluding transaction costs and certain other investment-related expenses, interest and fees on borrowings and expenses associated with each Fund’s investments in other investment companies, if any, and in the case of Columbia Thermostat FundSM its underlying portfolio funds), do not exceed the following annual rates as a percentage of each class’ average daily net assets:
| Fund | Class A | Advisor Class | Class C | Institutional Class | Institutional 2 Class | Institutional 3 Class |
| Columbia Acorn International Select | 1.40% | 1.15% | 2.15% | 1.15% | 1.08% | 1.03% |
| Columbia Thermostat Fund | 0.50% | 0.25% | 1.25% | 0.25% | 0.23% | 0.18% |
There is no guarantee that these agreements will continue thereafter.
Prior to May 1, 2017, CWAM voluntarily agreed to reimburse expenses so that the Funds’ ordinary operating expenses (excluding transaction costs and certain other investment-related expenses, interest and fees on borrowings and expenses associated with each Fund’s investments in other investment companies, if any) after giving effect to any balance credits or overdraft charges from the Funds’ custodian, did not exceed the following annual rates as a percentage of each class’ average daily net assets:
| Fund | Class A | Advisor Class | Class C | Institutional Class | Institutional 2 Class | Institutional 3 Class |
| Columbia Acorn Select | 1.60% | 1.35% | 2.35% | 1.35% | 1.30% | 1.25% |
Prior to May 1, 2017, CWAM contractually waived fees and/or reimburse expenses so that the Funds’ ordinary operating expenses (excluding transaction costs and certain other investment-related expenses, interest and fees on borrowings and expenses associated with each Fund’s investments in other investment companies, if any, and in the case of Columbia Thermostat FundSM its underlying portfolio funds), did not exceed the following annual rates as a percentage of each class’ average daily net assets:
| Fund | Class A | Advisor Class | Class C | Institutional Class | Institutional 2 Class | Institutional 3 Class |
| Columbia Acorn International Select | 1.40% | 1.15% | 2.15% | 1.15% | 1.07% | 1.02% |
| Columbia Thermostat Fund | 0.50% | 0.25% | 1.25% | 0.25% | 0.24% | 0.19% |
| Columbia Acorn Emerging Markets Fund | 1.85% | 1.60% | 2.60% | 1.60% | 1.50% | 1.45% |
| Columbia Acorn European Fund | 1.75% | 1.50% | 2.50% | 1.50% | 1.47% | 1.42% |
Columbia Acorn Family of Funds | Annual Report 2017
| 141 |
Notes to Financial Statements (continued)
December 31, 2017
In addition to the contractual agreement, CWAM has voluntarily agreed to waive fees and/or reimburse Fund expenses (excluding certain fees and expenses described above) so that Columbia Acorn Emerging Markets FundSM and Columbia Acorn European FundSM Fund level expenses (expenses directly attributable to the Fund and not to a specific share class) are waived proportionately across all share classes, but each Fund’s net operating expenses shall not exceed the contractual annual rates listed in the table above. This arrangement may be revised or discontinued at any time.
Expenses waived and/or reimbursed by CWAM and its affiliates for the year ended December 31, 2017, were as follows:
| Fund | Expenses waived and/or
reimbursed ($) |
| Columbia Acorn® Fund | 567,897 |
| Columbia Acorn International® | 324,948 |
| Columbia Acorn USA® | 14,449 |
| Columbia Acorn International SelectSM | 165,687 |
| Columbia Acorn SelectSM | 667,415 |
| Columbia Thermostat FundSM | 368,474 |
| Columbia Acorn Emerging Markets FundSM | 315,074 |
| Columbia Acorn European FundSM | 257,534 |
Prior to July 1, 2017, CWAM was contractually entitled to recoup from each of Columbia Acorn Emerging Markets FundSM and Columbia Acorn European FundSM any fees waived and/or expenses reimbursed with respect to any share class offered by Columbia Acorn Emerging Markets FundSM and Columbia Acorn European FundSM for a one year period following the date of such fee waiver and/or reimbursement, if such recovery did not cause the ordinary operating expenses of the Fund (excluding transaction costs and certain other investment-related expenses, interest and fees on borrowings and expenses associated with the Fund’s investment in other investment companies, if any) to exceed the annual rates set forth above, or to exceed such annual rate as was in place at the time of the recoupment, whichever was less. For the year ended December 31, 2017, there was no recoupment of fees.
Note 4. Federal tax information
The timing and character of income and capital gain distributions are determined in accordance with income tax regulations, which may differ from GAAP because of temporary or permanent book to tax differences.
At December 31, 2017, these differences were primarily due to differing treatment for deferral/reversal of wash sale losses, passive foreign investment company (PFIC) holdings, re-characterization of distributions for investments, derivative investments, late-year ordinary losses, capital loss carryforwards, trustees’ deferred compensation, foreign currency transactions, net operating loss reclassification, reversal of capital gains (losses) on a redemption-in-kind, earnings and profits distributed to shareholders on the redemption of shares, investments in partnerships, former PFIC holdings, excess distributions and foreign capital gains tax. To the extent these differences were permanent, reclassifications were made among the components of the Fund’s net assets in the Statement of Assets and Liabilities. Temporary differences do not require reclassifications.
In the Statement of Assets and Liabilities the following reclassifications were made:
| Fund | Undistributed
(excess of distributions over)
net investment income ($) | Accumulated
net realized
gain (loss) ($) | Paid in capital
increase
(decrease) ($) |
| Columbia Acorn® Fund | 524,047 | (100,822,335) | 100,298,288 |
| Columbia Acorn International® | 16,220,537 | (16,220,537) | — |
| Columbia Acorn USA® | 1,643,494 | (118,042,167) | 116,398,673 |
| Columbia Acorn International SelectSM | (4,749) | 17,400 | (12,651) |
| Columbia Acorn SelectSM | 441,750 | (4,473,546) | 4,031,796 |
| Columbia Thermostat FundSM | 225,161 | (3,317,437) | 3,092,276 |
| Columbia Acorn Emerging Markets FundSM | 668,012 | (322,791) | (345,221) |
| Columbia Acorn European FundSM | 357,730 | (357,730) | — |
| 142 | Columbia Acorn Family of Funds | Annual Report 2017 |
Notes to Financial Statements (continued)
December 31, 2017
Net investment income (loss) and net realized gains (losses), as disclosed in the Statement of Operations, and net assets were not affected by these reclassifications.
The tax character of distributions paid during the years indicated was as follows:
| | Year Ended December 31, 2017 | Year Ended December 31, 2016 |
| Fund | Ordinary
income ($) | Long-term
capital gains ($) | Total ($) | Ordinary
income ($) | Long-term
capital gains ($) | Tax return
of capital ($) | Total ($) |
| Columbia Acorn® Fund | 131,865,579 | 904,736,909 | 1,036,602,488 | — | 1,778,266,515 | — | 1,778,266,515 |
| Columbia Acorn International® | 82,305,169 | 251,655,234 | 333,960,403 | 29,981,674 | 39,664,002 | — | 69,645,676 |
| Columbia Acorn USA® | 14,725,782 | 87,193,225 | 101,919,007 | — | 238,540,555 | — | 238,540,555 |
| Columbia Acorn International SelectSM | 270,796 | — | 270,796 | 834,655 | — | 102,686 | 937,341 |
| Columbia Acorn SelectSM | — | 37,956,937 | 37,956,937 | — | 55,197,227 | — | 55,197,227 |
| Columbia Thermostat FundSM | 30,150,540 | 11,435,105 | 41,585,645 | 6,194,754 | 21,063,441 | — | 27,258,195 |
| Columbia Acorn Emerging Markets FundSM | — | — | — | 544,142 | — | 404,319 | 948,461 |
| Columbia Acorn European FundSM | 934,540 | — | 934,540 | 419,336 | — | — | 419,336 |
Short-term capital gain distributions, if any, are considered ordinary income distributions for tax purposes.
At December 31, 2017, the components of distributable earnings on a tax basis were as follows:
| Fund | Undistributed
ordinary
income ($) | Undistributed
long-term
capital gains ($) | Capital loss
carryforwards ($) | Net unrealized
appreciation ($) |
| Columbia Acorn® Fund | 38,036,318 | 169,873,329 | — | 1,295,387,341 |
| Columbia Acorn International® | 20,627,781 | 120,661,915 | — | 1,725,147,024 |
| Columbia Acorn USA® | 2,284,574 | 8,423,546 | — | 65,524,880 |
| Columbia Acorn International SelectSM | — | — | (6,453,644) | 41,557,521 |
| Columbia Acorn SelectSM | 5,760,563 | 17,604,720 | — | 82,539,140 |
| Columbia Thermostat FundSM | 2,427,872 | 8,008,823 | — | 27,303,976 |
| Columbia Acorn Emerging Markets FundSM | — | — | (81,214,778) | 23,703,831 |
| Columbia Acorn European FundSM | 676,746 | — | (7,749,232) | 21,460,585 |
At December 31, 2017, the cost of all investments for federal income tax purposes along with the aggregate gross unrealized appreciation and depreciation based on that cost was:
| Fund | Tax cost ($) | Gross
unrealized
appreciation ($) | Gross
unrealized
(depreciation) ($) | Net unrealized
appreciation ($) |
| Columbia Acorn® Fund | 3,377,912,005 | 1,395,238,534 | (99,851,193) | 1,295,387,341 |
| Columbia Acorn International® | 3,310,286,427 | 1,804,820,370 | (79,673,346) | 1,725,147,024 |
| Columbia Acorn USA® | 264,497,087 | 72,790,218 | (7,265,338) | 65,524,880 |
| Columbia Acorn International SelectSM | 94,899,263 | 43,000,275 | (1,442,754) | 41,557,521 |
| Columbia Acorn SelectSM | 225,553,777 | 85,031,740 | (2,492,600) | 82,539,140 |
| Columbia Thermostat FundSM | 831,420,904 | 29,894,232 | (2,590,256) | 27,303,976 |
| Columbia Acorn Emerging Markets FundSM | 84,115,084 | 32,071,817 | (8,367,986) | 23,703,831 |
| Columbia Acorn European FundSM | 85,369,896 | 22,127,907 | (667,322) | 21,460,585 |
Tax cost of investments and unrealized appreciation/(depreciation) may also include timing differences that do not constitute adjustments to tax basis.
The following capital loss carryforwards, determined at December 31, 2017, may be available to reduce taxable income arising from future net realized gains on investments, if any, to the extent permitted by the Internal Revenue Code. Capital loss carryforwards with no expiration are required to be utilized prior to any capital losses which carry an expiration date. As a
Columbia Acorn Family of Funds | Annual Report 2017
| 143 |
Notes to Financial Statements (continued)
December 31, 2017
result of this ordering rule, capital loss carryforwards which carry an expiration date may be more likely to expire unused. In addition, for the year ended December 31, 2017, capital loss carryforwards utilized, expired unused and permanently lost, if any, were as follows:
| Fund | 2018 ($) | 2019 ($) | No expiration
short-term ($) | No expiration
long-term ($) | Total ($) | Utilized ($) | Expired ($) | Permanently
lost ($) |
| Columbia Acorn International® | — | — | — | — | — | 46,821,711 | — | — |
| Columbia Acorn International SelectSM | — | — | 6,453,644 | — | 6,453,644 | 8,208,369 | — | — |
| Columbia Acorn Emerging Markets FundSM | — | — | 44,045,008 | 37,169,770 | 81,214,778 | 4,484,740 | — | — |
| Columbia Acorn European FundSM | — | — | 5,685,111 | 2,064,121 | 7,749,232 | 1,694,612 | — | — |
Under current tax rules, regulated investment companies can elect to treat certain late-year ordinary losses incurred and post-October capital losses (capital losses realized after October 31) as arising on the first day of the following taxable year. As of December 31, 2017, the Funds will elect to treat the following late-year ordinary losses and post-October capital losses as arising on January 1, 2018.
| Fund | Late year
ordinary losses ($) | Post-October
capital losses ($) |
| Columbia Acorn Emerging Markets FundSM | 57,729 | — |
Management of the Funds has concluded that there are no significant uncertain tax positions in the Funds that would require recognition in the financial statements. However, management’s conclusion may be subject to review and adjustment at a later date based on factors including, but not limited to, new tax laws, regulations, and administrative interpretations (including relevant court decisions). Generally, the Funds’ federal tax returns for the prior three fiscal years remain subject to examination by the Internal Revenue Service.
Note 5. Line of credit
Effective April 25, 2017, each Fund has access to a revolving credit facility with a syndicate of banks led by Citibank, N.A., HSBC Bank USA, N.A. and JPMorgan Chase Bank, N.A. whereby each Fund may borrow for the temporary funding of shareholder redemptions or for other temporary or emergency purposes. The credit facility, which is a collective agreement between each Fund and other participating Funds, including other funds managed by another affiliated investment manager, severally and not jointly, permits collective borrowings up to $1 billion. Interest is charged to each participating fund based on its borrowings at a rate equal to the higher of (i) the overnight federal funds rate plus 1.00% or (ii) the one-month LIBOR rate plus 1.00%. Each borrowing under the credit facility matures no later than 60 days after the date of borrowing. Each Fund also pays a commitment fee equal to its pro rata share of the amount of the credit facility at a rate of 0.15% per annum. Prior to April 25, 2017, the Trust participated together with Wanger Advisors Trust, another trust managed by the Investment Manager, in a revolving credit facility in the amount of $200 million with a syndicate of banks led by JPMorgan Chase Bank, N.A. Under this facility, interest was charged to each participating fund based on its borrowings at a rate per annum equal to the higher of (i) the overnight federal funds rate plus 1.00% or (ii) the one-month LIBOR rate plus 1.00%. In addition, a commitment fee of 0.15% per annum of the unutilized line of credit was accrued and apportioned among the participating funds based on their relative net assets. The commitment fee is disclosed as a part of other expenses in the Statement of Operations.
No Fund had borrowings during the year ended December 31, 2017.
| 144 | Columbia Acorn Family of Funds | Annual Report 2017 |
Notes to Financial Statements (continued)
December 31, 2017
Note 6. Portfolio information
The aggregate cost of purchases and proceeds from sales, other than short-term obligations, for the year ended December 31, 2017, were:
| | Purchases
($) | Proceeds
from sales
($) |
| Columbia Acorn® Fund | 3,389,510,036 | 4,630,139,508 |
| Columbia Acorn International® | 1,791,982,692 | 2,905,225,970 |
| Columbia Acorn USA® | 410,000,080 | 816,946,812 |
| Columbia Acorn International SelectSM | 55,314,810 | 60,880,744 |
| Columbia Acorn SelectSM | 124,277,914 | 197,374,630 |
| Columbia Thermostat FundSM | 317,957,548 | 597,053,567 |
| Columbia Acorn Emerging Markets FundSM | 47,868,156 | 76,032,702 |
| Columbia Acorn European FundSM | 56,095,853 | 22,081,087 |
The amount of purchase and sales activity impacts the portfolio turnover rate reported in the Financial Highlights.
Redemption-in-kind
Proceeds from the sales of securities for Columbia Acorn USA® include the value of securities delivered through an in-kind redemption of certain fund shares. During the year ended December 31, 2017, securities and other assets with a value of $299,386,352 were distributed to shareholders to satisfy their redemption requests. The net realized gain on these securities was $74,684,958, which is not taxable to remaining shareholders in the Fund.
Note 7. Regulatory settlements
During the year ended December 31, 2015, Columbia Acorn International SelectSM recorded a receivable of $33,279 as a result of a regulatory settlement proceeding brought by the Securities and Exchange Commission against a third party relating to market timing and/or late trading of mutual funds. This amount represented the Fund’s portion of the proceeds from the settlement (neither the Fund nor the Investment Manager were a party to the proceeding) and is disclosed as a receivable on the Statement of Assets and Liabilities.
Note 8. Significant risks
Consumer discretionary sector risk
Columbia Acorn International®, Columbia Acorn Emerging Markets FundSM and Columbia Acorn European FundSM may be more susceptible to the particular risks that may affect companies in the consumer discretionary sector than if it were invested in a wider variety of companies in unrelated sectors. Companies in the discretionary sector are subject to certain risks, including fluctuations in the performance of the overall domestic and international economy, interest rate changes, increased competition and consumer confidence. Performance of such companies may be affected by factors including reduced disposable household income, reduced consumer spending, changing demographics and consumer tastes.
Financial sector risk
Columbia Acorn Emerging Markets FundSM may be more susceptible to the particular risks that may affect companies in the financial services sector than if it were invested in a wider variety of companies in unrelated sectors. Companies in the financial services sector are subject to certain risks, including the risk of regulatory change, decreased liquidity in credit markets and unstable interest rates. Such companies may have concentrated portfolios, such as a high level of loans to real estate developers, which makes them vulnerable to economic conditions that affect that industry. Performance of such companies may be affected by competitive pressures and exposure to investments or agreements that, under certain circumstances, may lead to losses (e.g., subprime loans). Companies in the financial services sector are subject to extensive governmental regulation that may limit the amount and types of loans and other financial commitments they can make, and interest rates and fees that they may charge. In addition, profitability of such companies is largely dependent upon the availability and the cost of capital.
Columbia Acorn Family of Funds | Annual Report 2017
| 145 |
Notes to Financial Statements (continued)
December 31, 2017
Foreign securities and emerging market countries risk
Investing in foreign securities may include certain risks and considerations not typically associated with investing in U.S. securities, such as fluctuating currency values and changing local and regional economic, political and social conditions, which may result in greater market volatility. In addition, certain foreign securities may not be as liquid as U.S. securities. Investing in emerging markets may accentuate these risks. These countries are also more likely to experience high levels of inflation, deflation or currency devaluation which could hurt their economies and securities markets. To the extent that Columbia Acorn International® , Columbia Acorn International SelectSM, Columbia Acorn Emerging Markets FundSM and Columbia Acorn European FundSM concentrates their investment exposure to any one or a few specific countries, the Funds will be particularly susceptible to the various conditions, events or other factors impacting those countries and may, therefore, have a greater risk than that of a fund which is more geographically diversified.
Health care sector risk
Columbia Acorn® Fund and Columbia Acorn USA® may be more susceptible to the particular risks that may affect companies in the health care sector than if it were invested in a wider variety of companies in unrelated sectors. Companies in the health care sector are subject to certain risks, including restrictions on government reimbursement for medical expenses, government approval of medical products and services, competitive pricing pressures, and the rising cost of medical products and services (especially for companies dependent upon a relatively limited number of products or services). Performance of such companies may be affected by factors including, government regulation, obtaining and protecting patents (or the failure to do so), product liability and other similar litigation as well as product obsolescence.
Industrial sector risk
Columbia Acorn International®, Columbia Acorn International SelectSM, Columbia Acorn SelectSM and Columbia Acorn European FundSM may be more susceptible to the particular risks that may affect companies in the industrials sector than if it were invested in a wider variety of companies in unrelated sectors. Companies in the industrials sector are subject to certain risks, including changes in supply and demand for their specific product or service and for industrial sector products in general, including decline in demand for such products due to rapid technological developments and frequent new product introduction. Performance of such companies may be affected by factors including government regulation, world events and economic conditions and risks for environmental damage and product liability claims.
Shareholder concentration risk
At December 31, 2017, the table below details the affiliated and significant unaffiliated shareholder account ownership of outstanding shares of each Fund. The Funds have no knowledge about whether any portion of these unaffiliated shares were owned beneficially. Subscription and redemption activity of these accounts may have a significant effect on the operations of the Funds.
| Fund | Number of
unaffiliated
accounts | Percentage of
shares
outstanding
held —
unaffiliated (%) | Percentage of
shares
outstanding
held —
affiliated (%) |
| Columbia Acorn® Fund | 1 | 10.4 | — |
| Columbia Acorn International® | 2 | 27.9 | — |
| Columbia Acorn USA® | 1 | 26.3 | — |
| Columbia Acorn International SelectSM | 2 | 27.9 | 14.8 |
| Columbia Acorn SelectSM | 1 | 19.7 | 11.9 |
| Columbia Thermostat FundSM | 1 | 17.6 | 25.1 |
| Columbia Acorn Emerging Markets FundSM | 2 | 23.9 | 29.4 |
| Columbia Acorn European FundSM | 2 | 23.1 | 30.4 |
| 146 | Columbia Acorn Family of Funds | Annual Report 2017 |
Notes to Financial Statements (continued)
December 31, 2017
Technology and technology-related investment risk
Columbia Acorn® Fund, Columbia Acorn USA®, Columbia Acorn International SelectSM and Columbia Acorn European FundSM may be more susceptible to the particular risks that may affect companies in the information technology sector, as well as other technology-related sectors (collectively, the technology sectors) than if it were invested in a wider variety of companies in unrelated sectors. Companies in the technology sectors are subject to certain risks, including the risk that new services, equipment or technologies will not be accepted by consumers and businesses or will become rapidly obsolete. Performance of such companies may be affected by factors including obtaining and protecting patents (or the failure to do so) and significant competitive pressures, including aggressive pricing of their products or services, new market entrants, competition for market share and short product cycles due to an accelerated rate of technological developments. Such competitive pressures may lead to limited earnings and/or falling profit margins. As a result, the value of their securities may fall or fail to rise. In addition, many technology sector companies have limited operating histories and prices of these companies’ securities historically have been more volatile than other securities, especially over the short term.
Note 9. Subsequent events
Management has evaluated the events and transactions that have occurred through the date the financial statements were issued and noted no items requiring adjustment of the financial statements or additional disclosure.
Note 10. Information regarding pending and settled legal proceedings
Ameriprise Financial and certain of its affiliates have historically been involved in a number of legal, arbitration and regulatory proceedings, including routine litigation, class actions, and governmental actions, concerning matters arising in connection with the conduct of their business activities. Ameriprise Financial believes that the Funds are not currently the subject of, and that neither Ameriprise Financial nor any of its affiliates are the subject of, any pending legal, arbitration or regulatory proceedings that are likely to have a material adverse effect on the Funds or the ability of Ameriprise Financial or its affiliates to perform under their contracts with the Funds. Ameriprise Financial is required to make quarterly (10-Q), annual (10-K) and, as necessary, 8-K filings with the Securities and Exchange Commission (SEC) on legal and regulatory matters that relate to Ameriprise Financial and its affiliates. Copies of these filings may be obtained by accessing the SEC website at www.sec.gov.
There can be no assurance that these matters, or the adverse publicity associated with them, will not result in increased Fund redemptions, reduced sale of Fund shares or other adverse consequences to the Funds. Further, although we believe proceedings are not likely to have a material adverse effect on the Funds or the ability of Ameriprise Financial or its affiliates to perform under their contracts with the Funds, these proceedings are subject to uncertainties and, as such, we are unable to estimate the possible loss or range of loss that may result. An adverse outcome in one or more of these proceedings could result in adverse judgments, settlements, fines, penalties or other relief that could have a material adverse effect on the consolidated financial condition or results of operations of Ameriprise Financial.
Columbia Acorn Family of Funds | Annual Report 2017
| 147 |
Report of Independent Registered Public Accounting Firm
To the Trustees of Columbia Acorn Trust and Shareholders of Columbia Acorn Fund, Columbia Acorn International, Columbia Acorn USA, Columbia Acorn International Select, Columbia Acorn Select, Columbia Thermostat Fund, Columbia Acorn Emerging Markets Fund and Columbia Acorn European Fund:
Opinions on the Financial Statements
We have audited the accompanying statements of assets and liabilities, including the portfolios of investments, of Columbia Acorn Fund, Columbia Acorn International, Columbia Acorn USA, Columbia Acorn International Select, Columbia Acorn Select, Columbia Thermostat Fund, Columbia Acorn Emerging Markets Fund and Columbia Acorn European Fund (constituting Columbia Acorn Trust, hereafter collectively referred to as the "Funds") as of December 31, 2017, the related statements of operations for the year ended December 31, 2017, the statements of changes in net assets for each of the two years in the period ended December 31, 2017, including the related notes, and the financial highlights for each of the periods indicated therein (collectively referred to as the “financial statements”). In our opinion, the financial statements present fairly, in all material respects, the financial position of each of the Funds as of December 31, 2017, the results of each of their operations for the year then ended, the changes in each of their net assets for each of the two years in the period ended December 31, 2017 and each of the financial highlights for each of the periods indicated therein in conformity with accounting principles generally accepted in the United States of America.
Basis for Opinions
These financial statements are the responsibility of the Funds’ management. Our responsibility is to express an opinion on the Funds’ financial statements based on our audits. We are a public accounting firm registered with the Public Company Accounting Oversight Board (United States) (“PCAOB”) and are required to be independent with respect to the Funds in accordance with the U.S. federal securities laws and the applicable rules and regulations of the Securities and Exchange Commission and the PCAOB.
We conducted our audits of these financial statements in accordance with the standards of the PCAOB. Those standards require that we plan and perform the audit to obtain reasonable assurance about whether the financial statements are free of material misstatement, whether due to error or fraud.
Our audits included performing procedures to assess the risks of material misstatement of the financial statements, whether due to error or fraud, and performing procedures that respond to those risks. Such procedures included examining, on a test basis, evidence regarding the amounts and disclosures in the financial statements. Our audits also included evaluating the accounting principles used and significant estimates made by management, as well as evaluating the overall presentation of the financial statements. Our procedures included confirmation of securities owned as of December 31, 2017 by correspondence with the custodians, transfer agents and brokers; when replies were not received from brokers, we performed other auditing procedures. We believe that our audits provide a reasonable basis for our opinions.
/s/ PricewaterhouseCoopers LLP
Chicago, Illinois
February 21, 2018
We have served as the auditor of one or more investment companies in Columbia Acorn Trust since 2004.
| 148 | Columbia Acorn Family of Funds | Annual Report 2017 |
Federal Income Tax Information
(Unaudited)
The Funds hereby designate the following tax attributes for the fiscal year ended December 31, 2017. Shareholders were notified in early 2018 of the amounts for use in preparing 2017 income tax returns.
| | Qualified
dividend
income | Dividends
received
deduction | Capital
gain
dividend | Foreign
taxes paid
to foreign
countries | Foreign
taxes paid
per share
to foreign
countries | Foreign
source
income | Foreign
source
income per
share |
| Columbia Acorn® Fund | 32.31% | 31.82% | $1,056,953,266 | $0 | $0.00 | $0 | $0.00 |
| Columbia Acorn International® | 100.00% | 0.00% | $390,933,006 | $7,856,731 | $0.07 | $88,181,220 | $0.84 |
| Columbia Acorn USA® | 22.10% | 20.40% | $115,045,515 | $0 | $0.00 | $0 | $0.00 |
| Columbia Acorn International SelectSM | 100.00% | 0.00% | $0 | $187,281 | $0.04 | $1,686,595 | $0.38 |
| Columbia Acorn SelectSM | 0.00% | 0.00% | $34,702,708 | $0 | $0.00 | $0 | $0.00 |
| Columbia Thermostat FundSM | 18.18% | 14.82% | $18,800,469 | $25,444 | $0.00 | $504,970 | $0.01 |
| Columbia Acorn Emerging Markets FundSM | 0.00% | 0.00% | $0 | $215,138 | $0.03 | $1,841,894 | $0.23 |
| Columbia Acorn European FundSM | 100.00% | 0.00% | $0 | $101,578 | $0.02 | $1,289,156 | $0.24 |
Qualified dividend income. For taxable, non-corporate shareholders, the percentage of ordinary income distributed during the fiscal year that represents qualified dividend income subject to reduced tax rates.
Dividends received deduction. The percentage of ordinary income distributed during the fiscal year that qualifies for the corporate dividends received deduction.
Capital gain dividend. The Fund designates as a capital gain dividend the amount reflected above, or if subsequently determined to be different, the net capital gain of such fiscal period.
Foreign taxes. The Fund makes the election to pass through to shareholders the foreign taxes paid. Eligible shareholders may claim a foreign tax credit. These taxes, and the corresponding foreign source income, are provided.
Columbia Acorn Family of Funds | Annual Report 2017
| 149 |
Board of Trustees and Management of the Columbia Acorn Family of Funds
Each trustee may serve a term of unlimited duration. The Trust’s Bylaws generally require that a trustee retire at the end of the calendar year in which the trustee attains the age of 75 years. The trustees appoint their own successors, provided that at least two-thirds of the trustees, after such appointment, have been elected by shareholders. Shareholders may remove a trustee, with or without cause, upon the vote of two-thirds of the Trust’s outstanding shares at any meeting called for that purpose. A trustee may be removed, with or without cause, upon the vote of a majority of the trustees. The names of the trustees and officers of the Trust, the date each was first elected or appointed to office and the principal business occupations of each during at least the last five years, and for the trustees, the number of portfolios in the fund complex they oversee and other directorships they hold, are shown below. Each trustee and officer serves in such capacity for each of the eight series of Columbia Acorn Trust and for each of the three series of Wanger Advisors Trust.
The address for the trustees and officers of the Trust is Columbia Wanger Asset Management, LLC, 227 West Monroe Street, Suite 3000, Chicago, Illinois 60606. The Funds’ Statement of Additional Information includes additional information about the Funds’ trustees and officers. You may obtain a free copy of the Statement of Additional Information by writing or calling toll-free:
Columbia Wanger Asset Management, LLC
Shareholder Services Group
227 W. Monroe, Suite 3000
800.922.6769
Independent trustees
Name and age at
December 31, 2017 | Year first appointed or elected to a Board in the Columbia Funds Complex | Principal occupation(s)
during the past five years | Number of
Funds in the
Columbia
Funds
Complex
overseen (1) | Other directorships
held by the Trustee
during the past five years
in addition to
Columbia Acorn Trust and
Wanger Advisors Trust |
Laura M. Born, 52,
Chair | 2007 | Adjunct Associate Professor of Finance, University of Chicago Booth School of Business since 2007; Director, Carlson Inc. (private global hospitalities and travel company) since 2015; Managing Director – Investment Banking, JP Morgan Chase & Co. (broker-dealer) 2002-2007. | 11 | None. |
| Maureen M. Culhane, 69 | 2007 | Retired. Formerly, Vice President, Goldman Sachs Asset Management, L.P. (investment adviser), 2005-2007; Vice President (Consultant) – Strategic Relationship Management, Goldman, Sachs & Co., 1999-2005. | 11 | None. |
| Margaret M. Eisen, 64 | 2002 | Chief Investment Officer, EAM International LLC (corporate finance and asset management), 2003-2013; Managing Director, CFA Institute, 2005-2008. | 11 | RMB Investors Trust (formerly Burnham Investors Trust) (3 series). |
| Thomas M. Goldstein, 58 | 2014 | Retired. Formerly, Chief Financial Officer, Allstate Protection Division, 2011-2014; Founding Partner, The GRG Group LLC, 2009-2011; Managing Director and Chief Financial Officer, Madison Dearborn Partners, 2007-2009. | 11 | Federal Home Loan Bank – Chicago; Federal Home Loan Mortgage Corporation; Kemper Corporation (insurance). |
| John C. Heaton, 58 | 2010 | Deputy Dean for Faculty, University of Chicago Booth School of Business; Joseph L. Gidwitz Professor of Finance, University of Chicago Booth School of Business since July 2000. | 11 | None. |
| 150 | Columbia Acorn Family of Funds | Annual Report 2017 |
Board of Trustees and Management of the Columbia Acorn Family of Funds (continued)
Independent trustees (continued)
Name and age at
December 31, 2017 | Year first appointed or elected to a Board in the Columbia Funds Complex | Principal occupation(s)
during the past five years | Number of
Funds in the
Columbia
Funds
Complex
overseen (1) | Other directorships
held by the Trustee
during the past five years
in addition to
Columbia Acorn Trust and
Wanger Advisors Trust |
| Charles R. Phillips, 61 | 2015 | Consultant, Finger Rock, LLC (strategic consulting business). Director, University of North Carolina School of Law Foundation since 2010. Formerly, Vice Chairman, J.P. Morgan Private Bank, 2011-2014; Managing Director, J.P. Morgan Private Bank, 2001-2011. | 11 | None. |
David J. Rudis, 64,
Vice Chair | 2010 | Retired. Formerly, National Checking and Debit Executive, and Illinois President, Bank of America, 2007-2009; President, Consumer Banking Group, LaSalle National Bank, 2004-2007. | 11 | None. |
Interested trustee affiliated with Investment Manager*
Name and age at
December 31, 2017 | Year first
appointed or
elected to a
Board in the
Columbia
Funds
Complex | Principal occupation(s)
during the past five years | Number of
Funds in the
Columbia
Funds
Complex
overseen (1) | Other directorships
held by the Trustee
during the past five years
in addition to
Columbia Acorn Trust and
Wanger Advisors Trust |
| P. Zachary Egan, 49 (2) | 2015 | President, CWAM and President, Columbia Acorn Trust and Wanger Advisors Trust since April 2014; Global Chief Investment Officer, CWAM since October 2015; International Chief Investment Officer, CWAM, April 2014-September 2015; Director of International Research, CWAM, December 2004-March 2014; Vice President of Columbia Acorn Trust, 2003-2014, and Wanger Advisors Trust, 2007-2014; portfolio manager and analyst, CWAM or its predecessors, since 1999. | 11 | None. |
Trustee Emeritus
Name and age at
December 31, 2017 | Year first
appointed or
elected to a
Board in the
Columbia
Funds
Complex | Principal occupation(s)
during the past five years | Number of
Funds in the
Columbia
Funds
Complex
overseen (1) | Other directorships
held by the Trustee
during the past five years
in addition to
Columbia Acorn Trust and
Wanger Advisors Trust |
| Ralph Wanger, 83 (3) | 1970 (4) | Founder, CWAM. Formerly, President, Chief Investment Officer and portfolio manager, CWAM or its predecessors, July 1992-September 2003; Director, Wanger Investment Company PLC; Consultant to CWAM or its predecessors, September 2003-September 2005. | 11 | None. |
| (1) | The Trustees oversee the series of Wanger Advisors Trust and Columbia Acorn Trust. |
| (2) | Mr. Egan is an "interested person" of Wanger Advisors Trust and Columbia Acorn Trust, and of CWAM, as defined in the 1940 Act, because he is an officer of each Trust and an employee of CWAM. |
| (3) | As permitted under the Trust’s Bylaws, Mr. Wanger serves as a non-voting Trustee Emeritus of Columbia Acorn Trust and Wanger Advisors Trust. |
Columbia Acorn Family of Funds | Annual Report 2017
| 151 |
Board of Trustees and Management of the Columbia Acorn Family of Funds (continued)
| (4) | Dates prior to 1992 relate to the Acorn Fund, Inc., the predecessor trust to Columbia Acorn Trust. |
Fund officers
Name and age at
December 31, 2017 | Position
held with
Columbia
Acorn
Trust and
Wanger
Advisors Trust | Year first
appointed
or elected
to office | Principal occupation(s) during
the past five years |
| Alan G. Berkshire, 57 | Vice President | 2015 | Chief Operating Officer, CWAM since April 2015. Formerly, Independent Director, ValueQuest India Moat Fund Limited (Mauritius), April 2014-March 2015; President – North America, Religare Global Asset Management, Inc., June 2011-November 2013; Partner, Estancia Capital Management LLC, September 2009-June 2011. |
| Michael G. Clarke, 48 | Assistant Treasurer | 2004 | Vice President – Mutual Fund Administration, Columbia Management Investment Advisers, LLC since May 2010; Managing Director of Fund Administration, Columbia Management Advisors, LLC, September 2004-April 2010; Senior officer of Columbia funds and affiliated funds since 2002. |
| P. Zachary Egan, 49 | President | 2007 | President, CWAM and President, Columbia Acorn Trust and Wanger Advisors Trust since April 2014; Global Chief Investment Officer, CWAM since October 2015; International Chief Investment Officer, CWAM, April 2014-September 2015; Director of International Research, CWAM, December 2004-March 2014; Vice President of Columbia Acorn Trust, 2003-2014, and Wanger Advisors Trust, 2007-2014; portfolio manager and analyst, CWAM or its predecessors, since 1999. |
| David L. Frank, 54 | Vice President | 2014 | Portfolio manager and/or analyst, CWAM or its predecessors since 2002; Vice President, Columbia Acorn Trust and Wanger Advisors Trust since 2014. |
| Paul B. Goucher, 49 | Assistant Secretary | 2015 | Senior Vice President and Assistant General Cousel, Ameriprise Financial, Inc. since January 2017 (previously Vice President and Lead Chief Counsel, November 2008 - January 2017 and January 2013 - January 2017, respectively, and Chief Counsel, January 2010 - January 2013); Vice President, Chief Legal Counsel and Assistant Secretary, Columbia Management Investment Advisers, LLC since May 2010. |
| John Kunka, 47 | Vice President, Treasurer and
Principal Accounting and Financial Officer | 2006 | Treasurer and Principal Accounting and Financial Officer, Columbia Acorn Trust and Wanger Advisors Trust since 2014; Vice President of Accounting and Operations, CWAM since May 2006; formerly, Assistant Treasurer, Columbia Acorn Trust and Wanger Advisors Trust 2006-2014. |
| Stephen Kusmierczak, 50 | Vice President | 2011 | Portfolio manager and/or analyst, CWAM or its predecessors since 2001; Vice President, Columbia Acorn Trust and Wanger Advisors Trust since 2011. |
| Joseph C. LaPalm, 48 | Vice President | 2006 | Chief Compliance Officer, CWAM since 2005. |
| Ryan C. Larrenaga, 47 | Assistant Secretary | 2015 | Vice President and Group Counsel, Ameriprise Financial, Inc. since August 2011 (previously, Counsel, May 2010-August 2011); Assistant General Counsel, Bank of America, 2005-April 2010; officer of Columbia funds and affiliated funds since 2005. |
| Matthew A. Litfin, 46 | Vice President | 2016 | Director of Research (U.S.) and portfolio manager, CWAM since December 2015; formerly, portfolio manager, William Blair & Company 1993-2015; Vice President, Columbia Acorn Trust and Wanger Advisors Trust since 2016. |
| Satoshi Matsunaga, 46 | Vice President | 2015 | Portfolio manager and/or analyst, CWAM or its predecessors since 2005; Vice President, Columbia Acorn Trust and Wanger Advisors Trust since 2015. |
| Thomas P. McGuire, 45 | Chief Compliance Officer | 2015 | Senior Vice President and Chief Compliance Officer of the Columbia Funds since 2012; Vice President – Asset Management Compliance, Ameriprise Financial, Inc., since May 2010; Chief Compliance Officer, Ameriprise Certificate Company since September 2010; Compliance Executive, Bank of America, 2005-April 2010. |
| 152 | Columbia Acorn Family of Funds | Annual Report 2017 |
Board of Trustees and Management of the Columbia Acorn Family of Funds (continued)
Fund officers (continued)
Name and age at
December 31, 2017 | Position
held with
Columbia
Acorn
Trust and
Wanger
Advisors Trust | Year first
appointed
or elected
to office | Principal occupation(s) during
the past five years |
| Louis J. Mendes III, 53 | Vice President | 2003 | International Director of Research, CWAM, since 2015; portfolio manager and/or analyst, CWAM or its predecessors since 2001; Vice President, Columbia Acorn Trust since 2003 and Wanger Advisors Trust since 2005. |
| Julian Quero, 50 | Assistant Treasurer | 2015 | Vice President – Tax, Columbia Management Investment Advisers, LLC since 2009. |
| Martha A. Skinner, 43 | Assistant Treasurer | 2016 | Vice President of Financial Reporting and Administration, Columbia Management since November 2015; Director of Financial Reporting, Columbia Management, April 2013-November 2015; Manager of Financial Reporting, Columbia Management, August 2010-April 2013. |
| Matthew S. Szafranski, 40 | Vice President | 2015 | Portfolio manager and/or analyst, CWAM or its predecessors since 2008; Vice President, Columbia Acorn Trust and Wanger Advisors Trust since 2015. |
| Linda Roth-Wiszowaty, 48 | Secretary | 2006 | Business support analyst, CWAM since April 2007; Secretary, Columbia Acorn Trust and Wanger Advisors Trust since 2014; Assistant Secretary, Columbia Acorn Trust and Wanger Advisors Trust, 2006-2014. |
Columbia Acorn Family of Funds | Annual Report 2017
| 153 |
Expense Information
as of December 31, 2017
| Columbia Acorn® Fund | Class A | Class ADV | Class C | Class I1 | Class I2 | Class I3 | Class R |
| Investment advisory fee | 0.67% | 0.67% | 0.67% | 0.67% | 0.67% | 0.67% | | | |
| Distribution and/or service fees | 0.25% | 0.00% | 1.00% | 0.00% | 0.00% | 0.00% | | | |
| Other expenses (a) | 0.16% | 0.16% | 0.16% | 0.16% | 0.14% | 0.09% | | | |
| Net expense ratio | 1.08% | 0.83% | 1.83% | 0.83% | 0.81% | 0.76% | | | |
| Columbia Acorn International® |
| Investment advisory fee | 0.77% | 0.77% | 0.77% | 0.77% | 0.77% | 0.77% | 0.77% | | |
| Distribution and/or service fees | 0.25% | 0.00% | 1.00% | 0.00% | 0.00% | 0.00% | 0.50% | | |
| Other expenses (a) | 0.18% | 0.21% | 0.20% | 0.21% | 0.16% | 0.11% | 0.21% | | |
| Net expense ratio | 1.20% | 0.98% | 1.97% | 0.98% | 0.93% | 0.88% | 1.48% | | |
| Columbia Acorn USA® |
| Investment advisory fee | 0.90% | 0.90% | 0.90% | 0.90% | 0.90% | 0.90% | | | |
| Distribution and/or service fees | 0.25% | 0.00% | 1.00% | 0.00% | 0.00% | 0.00% | | | |
| Other expenses (a) | 0.28% | 0.30% | 0.29% | 0.26% | 0.18% | 0.15% | | | |
| Net expense ratio | 1.43% | 1.20% | 2.19% | 1.16% | 1.08% | 1.05% | | | |
| Columbia Acorn International SelectSM |
| Investment advisory fee | 0.89% | 0.89% | 0.89% | 0.89% | 0.89% | 0.89% | | | |
| Distribution and/or service fees | 0.25% | 0.00% | 1.00% | 0.00% | 0.00% | 0.00% | | | |
| Other expenses (a) | 0.26% | 0.26% | 0.26% | 0.26% | 0.19% | 0.14% | | | |
| Net expense ratio | 1.40% | 1.15% | 2.15% | 1.15% | 1.08% | 1.03% | | | |
| Columbia Acorn SelectSM |
| Investment advisory fee | 0.65% | 0.65% | 0.65% | 0.65% | 0.65% | 0.65% | | | |
| Distribution and/or service fees | 0.25% | 0.00% | 1.00% | 0.00% | 0.00% | 0.00% | | | |
| Other expenses (a) | 0.26% | 0.26% | 0.26% | 0.26% | 0.20% | 0.15% | | | |
| Net expense ratio | 1.16% | 0.91% | 1.91% | 0.91% | 0.85% | 0.80% | | | |
| Columbia Thermostat FundSM |
| Investment advisory fee | 0.10% | 0.10% | 0.10% | 0.10% | 0.10% | 0.10% | | | |
| Distribution and/or service fees | 0.25% | 0.00% | 1.00% | 0.00% | 0.00% | 0.00% | | | |
| Other expenses (a) | 0.15% | 0.15% | 0.15% | 0.15% | 0.13% | 0.08% | | | |
| Net expense ratio (b) | 0.50% | 0.25% | 1.25% | 0.25% | 0.23% | 0.18% | | | |
| Columbia Acorn Emerging Markets FundSM |
| Investment advisory fee | 1.24% | 1.24% | 1.24% | 1.24% | 1.24% | 1.24% | | | |
| Distribution and/or service fees | 0.25% | 0.00% | 1.00% | 0.00% | 0.00% | 0.00% | | | |
| Other expenses (a) | 0.21% | 0.19% | 0.19% | 0.18% | 0.09% | -0.10% | | | |
| Net expense ratio | 1.70% | 1.43% | 2.43% | 1.42% | 1.33% | 1.14% | | | |
| Columbia Acorn European FundSM |
| Investment advisory fee | 1.19% | 1.19% | 1.19% | 1.19% | 1.19% | 1.19% | | | |
| Distribution and/or service fees | 0.25% | 0.00% | 1.00% | 0.00% | 0.00% | 0.00% | | | |
| Other expenses (a) | 0.14% | 0.09% | 0.12% | 0.10% | 0.09% | -0.10% | | | |
| Net expense ratio | 1.58% | 1.28% | 2.31% | 1.29% | 1.28% | 1.09% | | | |
See the Funds’ prospectuses for information on minimum initial investment amounts and other details of buying, selling and exchanging shares of the Funds.
Fees and expenses are for the year ended December 31, 2017. Please see Note 3, “Fees and Other Transactions With Affiliates” in the Notes to Financial Statements of this report for information on fee waivers and/or expense reimbursements in place for Columbia Acorn Fund, Columbia Acorn International, Columbia Acorn USA, Columbia Acorn International Select, Columbia Acorn Select, Columbia Acorn Emerging Markets Fund, Columbia Acorn European Fund and Columbia Thermostat Fund.
| (a) | Other expenses include certain fee waivers and/or reimbursements, if applicable, which can potentially exceed other expenses charged. |
| (b) | Does not include estimated fees and expenses of 0.49% incurred by the Fund from the underlying portfolio funds in which it invests. |
| 154 | Columbia Acorn Family of Funds | Annual Report 2017 |
The Fund mails one shareholder report to each shareholder address. If you would like more than one report, please call shareholder services at 800.345.6611 and additional reports will be sent to you.
Proxy voting policies and procedures
The policy of the Board of Trustees is to vote the proxies of the companies in which the Fund holds investments consistent with the procedures as stated in the Statement of Additional Information (SAI). You may obtain a copy of the SAI without charge by calling 800.345.6611; contacting your financial intermediary; visiting investor.columbiathreadneedleus.com; or searching the website of the Securities and Exchange Commission (SEC) at sec.gov. Information regarding how the Fund voted proxies relating to portfolio securities is filed with the SEC by August 31st for the most recent 12-month period ending June 30th of that year, and is available without charge by visiting investor.columbiathreadneedleus.com, or searching the website of the SEC at sec.gov.
Quarterly schedule of investments
The Fund files a complete schedule of portfolio holdings with the SEC for the first and third quarters of each fiscal year on Form N-Q. The Fund’s Form N-Q is available on the SEC’s website at sec.gov and may be reviewed and copied at the SEC’s Public Reference Room in Washington, D.C. Information on the operation of the Public Reference Room may be obtained by calling 800.SEC.0330. The Fund’s complete schedule of portfolio holdings, as filed on Form N-Q, can also be obtained without charge, upon request, by calling 800.345.6611.
Additional Fund information
For more information about the Fund, please visit investor.columbiathreadneedleus.com or call 800.345.6611. Customer Service Representatives are available to answer your questions Monday through Friday from 8 a.m. to 7 p.m. Eastern time.
Fund investment manager
Columbia Wanger Asset Management, LLC
227 West Monroe, Suite 3000
Chicago, IL 60606
888.4.WANGER
(888.492.6437)
Fund distributor
Columbia Management Investment Distributors, Inc.
225 Franklin Street
Boston, MA 02110
Fund transfer agent
Columbia Management Investment Services Corp.
P.O. Box 8081
Boston, MA 02266-8081
Columbia Acorn Family of Funds | Annual Report 2017
| 155 |
Columbia Acorn Family of Funds
P.O. Box 8081
Boston, MA 02266-8081
Please read and consider the investment objectives, risks, charges and expenses for any fund carefully before investing. For a prospectus and summary prospectus, which contains this and other important information about the Fund, go to
investor.columbiathreadneedleus.com. The Fund is distributed by Columbia Management Investment Distributors, Inc., member FINRA, and managed by Columbia Wanger Asset Management, LLC.
Columbia Threadneedle Investments (Columbia Threadneedle) is the global brand name of the Columbia and Threadneedle group of companies. All rights reserved. Columbia Management Investment Distributors, Inc., 225 Franklin Street, Boston, MA 02110-2804
© 2018 Columbia Management Investment Advisers, LLC.
investor.columbiathreadneedleus.com
Item 2. Code of Ethics.
| | (a) | The registrant has adopted a code of ethics that applies to the registrant’s principal executive officer, principal financial officer, principal accounting officer or controller, or persons performing similar functions, regardless of whether these individuals are employed by the registrant or a third party. |
| | (b) | During the period covered by this report, there were not any amendments to a provision of the code of ethics adopted in 2(a) above. |
| | (c) | During the period covered by this report, there were no waivers, including any implicit waivers, from a provision of the code of ethics described in 2(a) above that relates to one or more of the items set forth in paragraph (b) of this item’s instructions. |
Item 3. Audit Committee Financial Expert.
The registrant’s Board of Trustees has determined that Thomas Goldstein, a member of the registrant’s Board of Trustees and Audit Committee, qualifies as an audit committee financial expert. Mr. Goldstein is an independent trustee, as defined in paragraph (a)(2) of this item’s instructions.
Item 4. Principal Accountant Fees and Services.
Fee information below is disclosed for the eight series of the registrant whose reports to stockholders are included in this annual filing.
(a) Audit Fees. Aggregate Audit Fees billed by the principal accountant for professional services rendered during the fiscal years ended December 31, 2017 and December 31, 2016 are approximately as follows:
| | |
| 2017 | | 2016 |
$304,700 | | $295,800 |
Audit Fees include amounts related to the audit of the registrant’s annual financial statements or services that are normally provided by the accountant in connection with statutory and regulatory filings or engagements for those fiscal years.
(b) Audit-Related Fees. Aggregate Audit-Related Fees billed to the registrant by the principal accountant for professional services rendered during the fiscal years ended December 31, 2017 and December 31, 2016 are approximately as follows:
Audit-Related Fees include amounts for assurance and related services by the principal accountant that are reasonably related to the performance of the audit of the registrant’s financial statements and are not reported in Audit Fees above. In fiscal years 2017 and
2016, Audit-Related Fees consist of agreed-upon procedures performed for other audit-related additional testing.
During the fiscal years ended December 31, 2017 and December 31, 2016, there were no Audit-Related Fees billed by the registrant’s principal accountant to the registrant’s investment adviser (not including any sub-adviser whose role is primarily portfolio management and is subcontracted with or overseen by another investment adviser) and any entity controlling, controlled by, or under common control with the adviser that provides ongoing services to the registrant for an engagement that related directly to the operations and financial reporting of the registrant.
(c) Tax Fees. Aggregate Tax Fees billed by the principal accountant to the registrant for professional services rendered during the fiscal years ended December 31, 2017 and December 31, 2016 are approximately as follows:
Tax Fees incurred in both fiscal years 2017 and 2016 relate to the review of annual tax returns, the review of required shareholder distribution calculations and include amounts for professional services by the principal accountant for tax compliance, tax advice and tax planning.
During the fiscal years ended December 31, 2017 and December 31, 2016, there were no Tax Fees billed by the registrant’s principal accountant to the registrant’s investment adviser (not including any sub-adviser whose role is primarily portfolio management and is subcontracted with or overseen by another investment adviser) and any entity controlling, controlled by, or under common control with the adviser that provides ongoing services to the registrant for an engagement that related directly to the operations and financial reporting of the registrant.
(d) All Other Fees. Aggregate All Other Fees billed by the principal accountant to the registrant for professional services rendered during the fiscal years ended December 31, 2017 and December 31, 2016 are as follows:
All Other Fees include amounts for products and services provided by the principal accountant, other than the services reported in paragraphs (a) through (c) above. Aggregate All Other Fees billed by the registrant’s principal accountant to the registrant’s investment adviser (not including any sub-adviser whose role is primarily portfolio management and is subcontracted with or overseen by another investment adviser) and any entity controlling, controlled by, or under common control with the adviser that provides ongoing services to the registrant for an engagement that related directly to the
operations and financial reporting of the registrant during the fiscal years ended December 31, 2017 and December 31, 2016 are approximately as follows:
| | |
| 2017 | | 2016 |
$225,000 | | $225,000 |
In both fiscal years 2017 and 2016, All Other Fees primarily consist of professional services rendered for internal control reviews.
(e)(1) Audit Committee Pre-Approval Policies and Procedures
The policy of the registrant’s Audit Committee is to specifically pre-approve (i) all audit and non-audit (including audit related, tax and all other) services provided by the registrant’s independent auditor to the registrant and individual funds (collectively “Fund Services”) and (ii) all non-audit services provided by the registrant’s independent auditor to the funds’ adviser or a control affiliate of the adviser, that relate directly to the funds’ operations and financial reporting (collectively “Fund-related Adviser Services”). A “control affiliate” is an entity controlling, controlled by, or under common control with the adviser that provides ongoing services to the funds, and the term “adviser” is deemed to exclude any unaffiliated sub-adviser whose role is primarily portfolio management and is sub-contracted or overseen by another investment adviser.
If such Fund Services or Fund-related Adviser Services are required during the period between the Audit Committee’s regularly scheduled meetings, the Chairman of the Audit Committee has the authority to pre-approve the service, with reporting to the full Audit Committee at the next regularly scheduled meeting.
The Audit Committee will waive pre-approval of Fund Services or Fund-related Adviser Services provided that the requirements under paragraph (c)(7)(i)(C) of Rule 2-01 of Regulation S-X are met.
(e)(2) The percentage of services described in paragraphs (b) through (d) of this Item approved pursuant to the “de minimis” exception under paragraph (c)(7)(i)(C) of Rule 2-01 of Regulation S-X during both fiscal years ended December 31, 2017 and December 31, 2016 was zero.
(f) Not applicable.
(g) The aggregate non-audit fees billed by the registrant’s accountant for services rendered to the registrant, and rendered to the registrant’s investment adviser (not including any sub-adviser whose role is primarily portfolio management and is subcontracted with or overseen by another investment adviser), and any entity controlling, controlled by, or under common control with the adviser that provides ongoing services to the registrant for the fiscal years ended December 31, 2017 and December 31, 2016 are approximately as follows:
| | |
| 2017 | | 2016 |
$323,700 | | $320,800 |
(h) The registrant’s Audit Committee of the Board of Directors has considered whether the provision of non-audit services that were rendered to the registrant’s adviser (not including any sub-adviser whose role is primarily portfolio management and is subcontracted with or overseen by another investment adviser), and any entity controlling, controlled by, or under common control with the investment adviser that provides ongoing services to the registrant that were not pre-approved pursuant to paragraph (c)(7)(ii) of Rule 2-01 of Regulation S-X, is compatible with maintaining the principal accountant’s independence.
Item 5. Audit Committee of Listed Registrants.
Not applicable.
Item 6. Investments
| | (a) | The registrant’s “Schedule I – Investments in securities of unaffiliated issuers” (as set forth in 17 CFR 210.12-12) is included in Item 1 of this Form N-CSR. |
Item 7. Disclosure of Proxy Voting Policies and Procedures for Closed-End Management Investment Companies.
Not applicable.
Item 8. Portfolio Managers of Closed-End Management Investment Companies.
Not applicable.
Item 9. Purchases of Equity Securities by Closed-End Management Investment Company and Affiliated Purchasers.
Not applicable.
Item 10. Submission of Matters to a Vote of Security Holders.
There were no material changes to the procedures by which shareholders may recommend nominees to the registrant’s board of directors.
Item 11. Controls and Procedures.
| | (a) | The registrant’s principal executive officer and principal financial officer, based on their evaluation of the registrant’s disclosure controls and procedures as of a |
| | date within 90 days of the filing of this report, have concluded that such controls and procedures are adequately designed to ensure that material information required to be disclosed by the registrant in Form N-CSR is accumulated and communicated to the registrant’s management, including the principal executive officer and principal financial officer, or persons performing similar functions, as appropriate to allow timely decisions regarding required disclosure. |
| | (b) | There was no change in the registrant’s internal control over financial reporting that occurred during the registrant’s second fiscal quarter of the period covered by this report that has materially affected, or is reasonably likely to materially affect, the registrant’s internal control over financial reporting. |
Item 12. Disclosure of Securities Lending Activities for Closed-End Management Investment Companies
Not applicable.
Item 13. Exhibits.
(a)(1) Code of ethics required to be disclosed under Item 2 of Form N-CSR attached hereto as Exhibit 99.CODE ETH.
(a)(2) Certifications pursuant to Rule 30a-2(a) under the Investment Company Act of 1940 (17 CFR 270.30a-2(a)) attached hereto as Exhibit 99.CERT.
(a)(3) Not applicable.
(b) Certification pursuant to Rule 30a-2(b) under the Investment Company Act of 1940 (17 CFR 270.30a-2(b)) attached hereto as Exhibit 99.906CERT.
SIGNATURES
Pursuant to the requirements of the Securities Exchange Act of 1934 and the Investment Company Act of 1940, the registrant has duly caused this report to be signed on its behalf by the undersigned, thereunto duly authorized.
| | |
(registrant) Columbia Acorn Trust |
| | |
| By (Signature and Title) /s/ P. Zachary Egan |
| P. Zachary Egan, President and Principal Executive Officer |
Pursuant to the requirements of the Securities Exchange Act of 1934 and the Investment Company Act of 1940, this report has been signed below by the following persons on behalf of the registrant and in the capacities and on the dates indicated.
| | |
| By (Signature and Title) /s/ P. Zachary Egan |
| P. Zachary Egan, President and Principal Executive Officer |
| | |
| By (Signature and Title) /s/ John M. Kunka |
| John M. Kunka, Treasurer and Principal Accounting and Financial Officer |