UNITED STATES
SECURITIES AND EXCHANGE COMMISSION
Washington, D.C. 20549
FORM N-CSR
CERTIFIED SHAREHOLDER REPORT OF REGISTERED
MANAGEMENT INVESTMENT COMPANIES
Investment Company Act file number | 811-01829 |
|
Columbia Acorn Trust |
(Exact name of registrant as specified in charter) |
|
227 W. Monroe Street Suite 3000 Chicago, IL | | 60606 |
(Address of principal executive offices) | | (Zip code) |
|
Scott R. Plummer
Columbia Management Investment Advisers, LLC
5228 Ameriprise Financial Center
Minneapolis, MN 55474 |
|
P. Zachary Egan
Columbia Acorn Trust
227 West Monroe Street, Suite 3000
Chicago, Illinois 60606 |
|
Mary C. Moynihan Perkins Coie LLP 700 13th Street, NW Suite 600 Washington, DC 20005 |
(Name and address of agent for service) |
|
Registrant’s telephone number, including area code: | (312) 634-9200 | |
|
Date of fiscal year end: | December 31 | |
|
Date of reporting period: | December 31, 2014 | |
| | | | | | | | |
Form N-CSR is to be used by management investment companies to file reports with the Commission not later than 10 days after the transmission to stockholders of any report that is required to be transmitted to stockholders under Rule 30e-1 under the Investment Company Act of 1940 (17 CFR 270.30e-1). The Commission may use the information provided on Form N-CSR in its regulatory, disclosure review, inspection, and policymaking roles.
A registrant is required to disclose the information specified by Form N-CSR, and the Commission will make this information public. A registrant is not required to respond to the collection of information contained in Form N-CSR unless the Form displays a currently valid Office of Management and Budget (“OMB”) control number. Please direct comments concerning the accuracy of the information collection burden estimate and any suggestions for reducing the burden to Secretary, Securities and Exchange Commission, 450 Fifth Street, NW, Washington, DC 20549-0609. The OMB has reviewed this collection of information under the clearance requirements of 44 U.S.C. § 3507.
Item 1. Reports to Stockholders.

Columbia Acorn Family of Funds
Class A, B, C, I, R, R4, R5, Y and Z Shares
Managed by Columbia Wanger Asset Management, LLC

Annual Report
December 31, 2014
n Columbia
Acorn® Fund
n Columbia
Acorn International®
n Columbia
Acorn USA®
n Columbia
Acorn International SelectSM
n Columbia
Acorn SelectSM
n Columbia
Thermostat FundSM
n Columbia
Acorn Emerging Markets FundSM
n Columbia
Acorn European FundSM
Not FDIC insured • No bank guarantee • May lose value
Columbia Acorn Family of Funds
Net Asset Value Per Share as of 12/31/14
| | Columbia
Acorn® Fund | | Columbia
Acorn
International® | | Columbia
Acorn
USA® | | Columbia
Acorn
International
SelectSM | | Columbia
Acorn
SelectSM | | Columbia
Thermostat
FundSM | | Columbia
Acorn
Emerging
Markets
FundSM | | Columbia
Acorn
European
FundSM | |
Class A | | $ | 30.30 | | | $ | 41.68 | | | $ | 29.13 | | | $ | 22.04 | | | $ | 21.03 | | | $ | 14.86 | | | $ | 12.72 | | | $ | 14.34 | | |
Class B | | $ | 26.53 | | | $ | 40.38 | | | $ | 25.27 | | | $ | 20.69 | | | $ | 18.03 | | | $ | 14.97 | | | | N/A | | | | N/A | | |
Class C | | $ | 25.92 | | | $ | 40.20 | | | $ | 24.98 | | | $ | 20.54 | | | $ | 17.69 | | | $ | 14.96 | | | $ | 12.65 | | | $ | 14.16 | | |
Class I | | $ | 32.03 | | | $ | 41.76 | | | $ | 31.19 | | | $ | 22.29 | | | $ | 22.38 | | | | N/A | | | $ | 12.75 | | | $ | 14.33 | | |
Class R | | | N/A | | | $ | 41.67 | | | | N/A | | | | N/A | | | | N/A | | | | N/A | | | | N/A | | | | N/A | | |
Class R4 | | $ | 32.51 | | | $ | 42.02 | | | $ | 31.70 | | | $ | 22.45 | | | $ | 22.75 | | | $ | 14.74 | | | $ | 12.83 | | | $ | 14.40 | | |
Class R5 | | $ | 32.55 | | | $ | 41.71 | | | $ | 31.71 | | | $ | 22.43 | | | $ | 22.78 | | | $ | 14.75 | | | $ | 12.82 | | | $ | 14.47 | | |
Class Y | | $ | 32.61 | | | $ | 42.02 | | | $ | 31.80 | | | $ | 22.42 | | | $ | 22.86 | | | $ | 14.74 | | | $ | 12.71 | | | | N/A | | |
Class Z | | $ | 31.95 | | | $ | 41.73 | | | $ | 31.03 | | | $ | 22.30 | | | $ | 22.28 | | | $ | 14.67 | | | $ | 12.74 | | | $ | 14.34 | | |
Class I shares are available only to the Columbia funds, such as Columbia Thermostat Fund, and are not available to individual investors. Class R, R4, R5, Y and Z shares are sold at net asset value and have limited eligibility. Please see the Funds' prospectuses for details. The Columbia Acorn Funds offer multiple share classes, not all necessarily available through all firms, and the share class ratings may vary. Contact us for details.
The views expressed in the "Squirrel Chatter II" and "In a Nutshell" commentaries reflect the current views of the respective authors. These views are not guarantees of future performance and involve certain risks, uncertainties and assumptions that are difficult to predict so actual outcomes and results may differ significantly from the views expressed. These views are subject to change at any time based upon economic, market or other conditions and the respective authors disclaim any responsibility to update such views. These views may not be relied upon as investment advice and, because investment decisions for a Columbia Acorn Fund are based on numerous factors, may not be relied upon as an indication of trading intent on behalf of any particular Columbia Acorn Fund. References to specific company's securities should not be construed as a recommendation or investment advice and there can be no assurance that as of the date of publication of this report, the securities mentioned in each Fund's portfolio are still held or that the securities sold have not been repurchased.
Acorn®, Acorn USA® and Acorn International® are service marks owned and registered by Columbia Acorn Trust.
A Comment on Trading Volumes
Market conditions are always changing and vary by country and industry sector, and investing in international markets involves unique risks. In the wake of the 2007-2009 financial crisis, trading volumes in both emerging and developed international markets declined significantly and have stayed at generally reduced levels since then. Although it is difficult to accurately assess trends in trading volumes in foreign markets, because some amount of activity has migrated to alternative trading venues, a reduction in trading volumes poses challenges to the Funds. This is particularly so because the Funds focus on small- and mid-cap companies that usually have lower trading volumes and often take sizeable positions in portfolio companies. As a result of lower trading volumes, it may take longer to buy or sell securities, which can exacerbate a Fund's exposure to volatile markets. A Fund may also be limited in its ability to execute favorable trades in portfolio securities in response to changes in company prices and fundamentals. If a Fund is forced to sell securities to meet redemption requests or other cash needs, or in the case of an event affecting liquidity in a particular market or markets, it may be forced to dispose of those securities under disadvantageous circumstances and at a loss. As a Fund grows in size, these considerations take on increasing significance and may adversely impact performance.
Letter to Shareholders from the
Columbia Acorn Trust Board of Trustees
2014 was a difficult year for actively managed equity portfolios. Although the S&P 500, a common measure of performance for domestic securities, rose 13.7% for the year, only 20% of active U.S. equity fund managers outperformed their benchmarks.1 Commentators offer various theories for this underperformance. Some believe that active managers do best when interest rates are rising, not falling as they have recently. Others argue that "dispersion"—the difference between the best and worst performing stocks—has been low by historical standards, limiting the potential benefits of active management. Finally, few managers anticipated the precipitous drop in the price of oil, and with it the decline in price of the securities of energy related companies.
The domestic Acorn Funds have not been immune to these and other influences. While all the domestic Acorn Funds finished the year in positive territory, they underperformed their benchmarks. The international Acorn Funds faced headwinds too, losing ground for the year and falling short of their benchmarks which turned in negative or uninspiring results for the year. The only benchmark to end in the black was the S&P Emerging Markets Index, which returned 1.19%.
The Board of Trustees monitors the Funds' performance carefully. In the pages that follow, the portfolio managers offer their thoughts and observations about the characteristics and performance of their respective Funds. While remaining faithful to the time-tested investment philosophy of the Acorn Funds, these managers are working hard to reposition the portfolios, where necessary, to seek improved returns. Your Board shares their hope for better results in 2015.
While the portfolio managers continue their efforts to achieve improved performance on your behalf, the Board has been active on other fronts as well. Two new Trustees joined us, Charles Phillips and Thomas Goldstein. They each bring decades of valuable experience and wisdom to the task of overseeing the Acorn Funds and we welcome their contributions. A subject of particular interest to the Board is cyber security. The cyber-attacks on Target, JP Morgan Chase & Co., Sony Corporation and other highly publicized
incidents have prompted many financial services organizations to scrutinize closely their defenses to such attacks. The mutual fund industry, fortunately, has not yet been the victim of a large scale, successful cyber-attack. We cannot assure our shareholders that such an attack will not take place in the future, but as a Board we are doing what we can to identify and monitor cyber-security risks to the Funds.
The Acorn Funds have enjoyed a long and distinguished history of serving shareholders. We thank you for your support and continued confidence in that legacy.

Laura Born
Independent Chair, Board of Trustees,
Columbia Acorn Trust
1 Barron's, "Return of the Stockpickers" (January 12, 2015)
Columbia Acorn Family of Funds
Table of Contents
Descriptions of Indexes | | | 1 | | |
Share Class Performance | | | 2 | | |
Fund Performance vs. Benchmarks | | | 3 | | |
2014 Year-End Distributions | | | 4 | | |
Squirrel Chatter II: Communications Satellites
Past and Present | | | 6 | | |
Understanding Your Expenses | | | 9 | | |
Columbia Acorn® Fund | |
In a Nutshell | | | 12 | | |
At a Glance | | | 13 | | |
Major Portfolio Changes (Unaudited) | | | 28 | | |
Statement of Investments | | | 31 | | |
Columbia Acorn International® | |
In a Nutshell | | | 14 | | |
At a Glance | | | 15 | | |
Major Portfolio Changes (Unaudited) | | | 43 | | |
Statement of Investments | | | 45 | | |
Portfolio Diversification | | | 54 | | |
Columbia Acorn USA® | |
In a Nutshell | | | 16 | | |
At a Glance | | | 17 | | |
Major Portfolio Changes (Unaudited) | | | 55 | | |
Statement of Investments | | | 57 | | |
Columbia Acorn International SelectSM | |
In a Nutshell | | | 18 | | |
At a Glance | | | 19 | | |
Major Portfolio Changes (Unaudited) | | | 63 | | |
Statement of Investments | | | 64 | | |
Portfolio Diversification | | | 68 | | |
Columbia Acorn SelectSM | |
In a Nutshell | | | 20 | | |
At a Glance | | | 21 | | |
Major Portfolio Changes (Unaudited) | | | 69 | | |
Statement of Investments | | | 70 | | |
Columbia Thermostat FundSM | |
In a Nutshell | | | 22 | | |
At a Glance | | | 23 | | |
Statement of Investments | | | 75 | | |
Columbia Acorn Emerging Markets FundSM | |
In a Nutshell | | | 24 | | |
At a Glance | | | 25 | | |
Major Portfolio Changes (Unaudited) | | | 77 | | |
Statement of Investments | | | 79 | | |
Portfolio Diversification | | | 83 | | |
Columbia Acorn European FundSM | |
In a Nutshell | | | 26 | | |
At a Glance | | | 27 | | |
Major Portfolio Changes (Unaudited) | | | 84 | | |
Statement of Investments | | | 86 | | |
Portfolio Diversification | | | 90 | | |
Columbia Acorn Family of FundsSM | |
Statements of Assets and Liabilities | | | 92 | | |
Statements of Operations | | | 94 | | |
Statements of Changes in Net Assets | | | 96 | | |
Financial Highlights | | | 102 | | |
Notes to Financial Statements | | | 118 | | |
Report of Independent Registered
Public Accounting Firm | | | 129 | | |
Federal Income Tax Information (Unaudited) | | | 130 | | |
Board of Trustees and Management | | | 131 | | |
Expense Information | | | 137 | | |
Columbia Acorn Family of Funds
Descriptions of Indexes Included in this Report
• 50/50 Blended Benchmark, established by the Fund's investment manager, is an equally weighted custom composite of Columbia Thermostat Fund's primary equity and primary debt benchmarks, the S&P 500® Index and the Barclays U.S. Aggregate Bond Index, respectively. The percentage of the Fund's assets allocated to underlying stock and bond portfolio funds will vary, and accordingly the composition of the Fund's portfolio will not always reflect the composition of the 50/50 Blended Benchmark.
• Barclays U.S. Aggregate Bond Index is a market value-weighted index that tracks the daily price, coupon, pay-downs and total return performance of fixed-rate, publicly placed, dollar-denominated and non-convertible investment grade debt issues with at least $250 million par amount outstanding and with at least one year to final maturity.
• Euromoney Smaller European Companies (inc UK) Index is an index of smaller companies in Europe including the UK market. The Euromoney Smaller European Companies Index covers companies of small- and mid-cap market capitalization in Europe's developed markets. The index is rebalanced on a quarterly basis.
• Lipper Indexes include the largest funds tracked by Lipper, Inc. in the named category. Lipper Mid-Cap Growth Funds Index, 30 largest mid-cap growth funds, including Columbia Acorn Fund; Lipper International Small/Mid Growth Funds Index, 10 largest non-U.S. small/mid growth funds, including Columbia Acorn International; Lipper Small-Cap Growth Funds Index, 30 largest small-cap growth funds, including Columbia Acorn USA; Lipper Mid-Cap Core Funds Index, 30 largest mid-cap core funds; Lipper Flexible Portfolio Funds Index, an equal-weighted index of the 30 largest mutual funds within the Flexible Portfolio fund classification, as defined by Lipper; Lipper Emerging Markets Index, 30 largest emerging markets funds; Lipper European Region Index, 10 largest European funds.
• MSCI Europe, Australasia, Far East (EAFE) Index (Net) is a capitalization-weighted index that tracks the total return of common stocks in 22 developed-market countries within Europe, Australasia and the Far East. The returns of the MSCI EAFE Index (Net) are presented net of the withholding tax rate applicable to foreign non-resident institutional investors in the foreign companies included in the index who do not benefit from double taxation treaties.
• MSCI Emerging Markets Small Cap Index (Net), a widely recognized international benchmark, is a free float-adjusted market capitalization index that is designed to measure small-cap emerging market equity performance. The MSCI Emerging Markets Small Cap Index currently consists of the following 23 emerging market country indexes: Brazil, Chile, China, Colombia, Czech Republic, Egypt, Hungary, India, Indonesia, Korea, Malaysia, Mexico, Morocco, Peru, Philippines, Poland, Qatar, Russia, South Africa, Taiwan, Thailand, Turkey and United Arab Emirates.
• Russell 2000 Index measures the performance of the 2,000 smallest companies in the Russell 3000 Index, which represents approximately 10% of the total market capitalization of the Russell 3000 Index.
• Russell 2500 Index measures the performance of the 2,500 smallest companies in the Russell 3000 Index, which represents approximately 17% of the total market capitalization of the Russell 3000 Index.
• Standard & Poor's (S&P) 500® Index tracks the performance of 500 widely held, large-capitalization U.S. stocks.
• S&P MidCap 400® Index is a market value-weighted index that tracks the performance of 400 mid-cap U.S. companies.
• S&P Developed Ex-U.S. Between $2B and $10B® Index is a subset of the broad market selected by the index sponsor representing the mid-cap developed market, excluding the United States.
• S&P Emerging Markets Between $500M and $5B® Index represents the institutionally investable capital of emerging market countries with market caps ranging between $500 million to $5 billion, as selected by S&P. The index currently consists of the following 20 emerging market country indexes: Brazil, Chile, China, Colombia, Czech Republic, Egypt, Hungary, India, Indonesia, Malaysia, Mexico, Morocco, Peru, Philippines, Poland, Russia, South Africa, Taiwan, Thailand and Turkey.
• S&P Europe Between $500M and $5B® Index represents the institutionally investable capital of 17 European countries, as determined by S&P, with market caps ranging between $500 million to $5 billion. The index consists of the following European countries: Austria, Belgium, Denmark, Finland, France, Germany, Greece, Ireland, Italy, Luxembourg, the Netherlands, Norway, Portugal, Spain, Sweden, Switzerland and the United Kingdom.
• S&P Global Ex-U.S. SmallCap® Index consists of the bottom 20% of institutionally investable capital of developed and emerging countries, excluding the United States.
• S&P Global Ex-U.S. Between $500M and $5B® Index is a subset of the broad market selected by the index sponsor representing the mid- and small-cap developed and emerging markets, excluding the United States.
Unlike mutual funds, indexes are not managed and do not incur fees or expenses. It is not possible to invest directly in an index.
1
Columbia Acorn Family of Funds
Share Class Performance Average Annual Total Returns through 12/31/14
| | Class A | | Class B | | Class C | | Class I | | Class R | | Class R4 | | Class R5 | | Class Y | | Class Z | |
| | Without
Sales
Charge | | With
Sales
Charge | | Without
Sales
Charge | | With
Sales
Charge | | Without
Sales
Charge | | With
Sales
Charge | |
| |
| |
| |
| |
| |
| |
Columbia Acorn® Fund | |
| 1 year | | | 0.55 | % | | | -5.23 | % | | | -0.16 | % | | | -4.27 | % | | | -0.16 | % | | | -0.98 | % | | | 0.91 | % | | | N/A | | | | 0.81 | % | | | 0.89 | % | | | 0.94 | % | | | 0.82 | % | |
| 5 years | | | 13.02 | % | | | 11.69 | % | | | 12.34 | % | | | 12.08 | % | | | 12.18 | % | | | 12.18 | % | | | 13.41 | % | | | N/A | | | | 13.33 | % | | | 13.37 | % | | | 13.39 | % | | | 13.35 | % | |
| 10 years | | | 8.08 | % | | | 7.44 | % | | | 7.41 | % | | | 7.41 | % | | | 7.25 | % | | | 7.25 | % | | | 8.42 | % | | | N/A | | | | 8.38 | % | | | 8.40 | % | | | 8.41 | % | | | 8.39 | % | |
Columbia Acorn International® | |
| 1 year | | | -4.58 | % | | | -10.05 | % | | | -5.29 | % | | | -9.75 | % | | | -5.27 | % | | | -6.16 | % | | | -4.20 | % | | | -4.95 | % | | | -4.39 | % | | | -4.25 | % | | | -4.21 | % | | | -4.28 | % | |
| 5 years | | | 8.11 | % | | | 6.84 | % | | | 7.36 | % | | | 7.06 | % | | | 7.31 | % | | | 7.31 | % | | | 8.54 | % | | | 7.76 | % | | | 8.43 | % | | | 8.48 | % | | | 8.50 | % | | | 8.47 | % | |
| 10 years | | | 8.59 | % | | | 7.95 | % | | | 7.87 | % | | | 7.87 | % | | | 7.76 | % | | | 7.76 | % | | | 8.99 | % | | | 8.26 | % | | | 8.94 | % | | | 8.95 | % | | | 8.97 | % | | | 8.95 | % | |
Columbia Acorn USA® | |
| 1 year | | | 3.35 | % | | | -2.58 | % | | | 2.37 | % | | | -1.74 | % | | | 2.67 | % | | | 1.85 | % | | | 3.80 | % | | | N/A | | | | 3.60 | % | | | 3.68 | % | | | 3.76 | % | | | 3.61 | % | |
| 5 years | | | 13.57 | % | | | 12.23 | % | | | 12.75 | % | | | 12.50 | % | | | 12.76 | % | | | 12.76 | % | | | 14.00 | % | | | N/A | | | | 13.89 | % | | | 13.91 | % | | | 13.94 | % | | | 13.88 | % | |
| 10 years | | | 7.33 | % | | | 6.69 | % | | | 6.59 | % | | | 6.59 | % | | | 6.52 | % | | | 6.52 | % | | | 7.68 | % | | | N/A | | | | 7.63 | % | | | 7.64 | % | | | 7.65 | % | | | 7.62 | % | |
Columbia Acorn International SelectSM | |
| 1 year | | | -7.06 | % | | | -12.39 | % | | | -7.71 | % | | | -11.77 | % | | | -7.80 | % | | | -8.61 | % | | | -6.72 | % | | | N/A | | | | -6.83 | % | | | -6.77 | % | | | -6.71 | % | | | -6.79 | % | |
| 5 years | | | 7.21 | % | | | 5.95 | % | | | 6.52 | % | | | 6.23 | % | | | 6.37 | % | | | 6.37 | % | | | 7.63 | % | | | N/A | | | | 7.55 | % | | | 7.58 | % | | | 7.60 | % | | | 7.57 | % | |
| 10 years | | | 7.42 | % | | | 6.78 | % | | | 6.73 | % | | | 6.73 | % | | | 6.57 | % | | | 6.57 | % | | | 7.79 | % | | | N/A | | | | 7.75 | % | | | 7.77 | % | | | 7.78 | % | | | 7.76 | % | |
Columbia Acorn SelectSM | |
| 1 year | | | 2.17 | % | | | -3.70 | % | | | 1.35 | % | | | -2.60 | % | | | 1.42 | % | | | 0.63 | % | | | 2.49 | % | | | N/A | | | | 2.39 | % | | | 2.50 | % | | | 2.53 | % | | | 2.47 | % | |
| 5 years | | | 10.28 | % | | | 8.98 | % | | | 9.54 | % | | | 9.30 | % | | | 9.45 | % | | | 9.45 | % | | | 10.69 | % | | | N/A | | | | 10.58 | % | | | 10.62 | % | | | 10.64 | % | | | 10.60 | % | |
| 10 years | | | 7.02 | % | | | 6.39 | % | | | 6.31 | % | | | 6.31 | % | | | 6.19 | % | | | 6.19 | % | | | 7.38 | % | | | N/A | | | | 7.32 | % | | | 7.34 | % | | | 7.35 | % | | | 7.33 | % | |
Columbia Thermostat FundSM | |
| 1 year | | | 5.30 | % | | | -0.75 | % | | | 4.83 | % | | | -0.17 | % | | | 4.50 | % | | | 3.50 | % | | | N/A | | | | N/A | | | | 5.61 | % | | | 5.62 | % | | | 5.68 | % | | | 5.57 | % | |
| 5 years | | | 9.82 | % | | | 8.54 | % | | | 9.28 | % | | | 9.00 | % | | | 9.00 | % | | | 9.00 | % | | | N/A | | | | N/A | | | | 10.09 | % | | | 10.11 | % | | | 10.14 | % | | | 10.09 | % | |
| 10 years | | | 6.29 | % | | | 5.66 | % | | | 5.73 | % | | | 5.73 | % | | | 5.49 | % | | | 5.49 | % | | | N/A | | | | N/A | | | | 6.55 | % | | | 6.56 | % | | | 6.57 | % | | | 6.55 | % | |
Columbia Acorn Emerging Markets FundSM | |
| 1 year | | | -4.28 | % | | | -9.81 | % | | | N/A | | | | N/A | | | | -5.03 | % | | | -5.98 | % | | | -4.01 | % | | | N/A | | | | -4.03 | % | | | -4.02 | % | | | -3.95 | % | | | -4.12 | % | |
Life of Fund | | | 8.00 | % | | | 6.12 | % | | | N/A | | | | N/A | | | | 7.22 | % | | | 7.22 | % | | | 8.42 | % | | | N/A | | | | 8.38 | % | | | 8.39 | % | | | 8.40 | % | | | 8.29 | % | |
Columbia Acorn European FundSM | |
| 1 year | | | -7.77 | % | | | -13.09 | % | | | N/A | | | | N/A | | | | -8.44 | % | | | -9.35 | % | | | -7.49 | % | | | N/A | | | | -7.49 | % | | | -7.54 | % | | | N/A | | | | -7.52 | % | |
Life of Fund | | | 12.10 | % | | | 10.15 | % | | | N/A | | | | N/A | | | | 11.28 | % | | | 11.28 | % | | | 12.43 | % | | | N/A | | | | 12.41 | % | | | 12.39 | % | | | N/A | | | | 12.40 | % | |
Returns for Class A shares are shown with and without the maximum initial sales charge of 5.75%. Returns for Class B shares are shown with and without the applicable contingent deferred sales charge (CDSC) of 5.00% in the first year, declining to 1.00% in the sixth year and eliminated thereafter. Returns for Class C shares are shown with and without the maximum CDSC of 1.00% for the first year after purchase. The Funds' other classes are not subject to sales charges and have limited eligibility. Please see the Funds' prospectuses for details. Performance for different share classes will vary based on differences in sales charges and certain fees associated with each class.
All results shown assume reinvestment of distributions during the period. Returns do not reflect the deduction of taxes that a shareholder may pay on Fund distributions or on the redemption of Fund shares. Performance results may reflect the effect of any fee waivers or reimbursements of Fund expenses by the investment manager and/or any of its affiliates. Absent these fee waivers and/or expense reimbursement arrangements, performance results may have been lower. Please see Page 137 of this report for information on contractual fee waiver and expense reimbursement agreements in place on December 31, 2014, for Columbia Thermostat Fund, Columbia Acorn Emerging Markets Fund and Columbia Acorn European Fund and voluntary fee waiver and expense reimbursement arrangements in place for Columbia Acorn International, Columbia Acorn International Select and Columbia Acorn Select.
The performance information shown represents past performance and is not a guarantee of future results. The investment return and principal value of your investment will fluctuate so that shares, when redeemed, may be worth more or less than their original cost. Current performance may be lower or higher than the performance data shown. You may obtain performance information current to the most recent month-end by contacting your financial intermediary, visiting columbiamanagement.com or calling 800.922.6769.
The returns shown include the returns of each Fund's Class Z shares, each Fund's oldest share class, in cases where the inception date of the Fund is earlier than the inception date of the particular share class or where a period shown dates to before the inception date of the share class. These returns are adjusted to reflect any higher class-related operating expenses of the newer share classes, as applicable. Please visit columbiamanagement.com/mutual-funds/appended-performance for more information.
Continued on Page 3.
2
Fund Performance vs. Benchmarks Class Z Average Annual Total Returns through 12/31/14
Class Z Shares | | 4th
quarter* | | 1 year | | 5 years | | 10 years | | Life of
Fund | |
| Columbia Acorn® Fund (ACRNX) (6/10/70) | | | 3.88 | % | | | 0.82 | % | | | 13.35 | % | | | 8.39 | % | | | 14.59 | % | |
Russell 2500 Index | | | 6.77 | % | | | 7.07 | % | | | 16.36 | % | | | 8.72 | % | | | N/A | | |
S&P 500 Index** | | | 4.93 | % | | | 13.69 | % | | | 15.45 | % | | | 7.67 | % | | | 11.05 | % | |
Russell 2000 Index | | | 9.73 | % | | | 4.89 | % | | | 15.55 | % | | | 7.77 | % | | | N/A | | |
Lipper Mid-Cap Growth Funds Index | | | 5.82 | % | | | 7.91 | % | | | 14.72 | % | | | 8.88 | % | | | N/A | | |
| Columbia Acorn International® (ACINX) (9/23/92) | | | -2.60 | % | | | -4.28 | % | | | 8.47 | % | | | 8.95 | % | | | 10.88 | % | |
S&P Global Ex-U.S. Between $500M and $5B Index | | | -3.48 | % | | | -1.76 | % | | | 7.14 | % | | | 7.65 | % | | | 8.31 | % | |
S&P Global Ex-U.S. SmallCap Index | | | -3.31 | % | | | -3.11 | % | | | 7.41 | % | | | 7.27 | % | | | 7.76 | % | |
MSCI EAFE Index (Net) | | | -3.57 | % | | | -4.90 | % | | | 5.33 | % | | | 4.43 | % | | | 5.97 | % | |
Lipper International Small/Mid Growth Funds Index | | | -2.88 | % | | | -5.65 | % | | | 9.55 | % | | | 8.27 | % | | | N/A | | |
| Columbia Acorn USA® (AUSAX) (9/4/96) | | | 7.73 | % | | | 3.61 | % | | | 13.88 | % | | | 7.62 | % | | | 10.81 | % | |
Russell 2000 Index | | | 9.73 | % | | | 4.89 | % | | | 15.55 | % | | | 7.77 | % | | | 8.69 | % | |
Lipper Small-Cap Growth Funds Index | | | 7.82 | % | | | 1.98 | % | | | 15.01 | % | | | 7.38 | % | | | 7.22 | % | |
| Columbia Acorn Int'l SelectSM (ACFFX) (11/23/98) | | | -8.23 | % | | | -6.79 | % | | | 7.57 | % | | | 7.76 | % | | | 8.79 | % | |
S&P Developed Ex-U.S. Between $2B and $10B Index | | | -2.45 | % | | | -2.10 | % | | | 7.53 | % | | | 6.25 | % | | | 7.41 | % | |
MSCI EAFE Index (Net) | | | -3.57 | % | | | -4.90 | % | | | 5.33 | % | | | 4.43 | % | | | 4.15 | % | |
Lipper International Small/Mid Growth Funds Index | | | -2.88 | % | | | -5.65 | % | | | 9.55 | % | | | 8.27 | % | | | 10.03 | % | |
| Columbia Acorn SelectSM (ACTWX) (11/23/98) | | | 2.90 | % | | | 2.47 | % | | | 10.60 | % | | | 7.33 | % | | | 10.28 | % | |
S&P MidCap 400 Index | | | 6.35 | % | | | 9.77 | % | | | 16.54 | % | | | 9.71 | % | | | 10.61 | % | |
S&P 500 Index** | | | 4.93 | % | | | 13.69 | % | | | 15.45 | % | | | 7.67 | % | | | 5.55 | % | |
Lipper Mid-Cap Core Funds Index | | | 5.22 | % | | | 8.89 | % | | | 14.87 | % | | | 8.50 | % | | | 9.21 | % | |
| Columbia Thermostat FundSM (COTZX) (9/25/02) | | | 1.78 | % | | | 5.57 | % | | | 10.09 | % | | | 6.55 | % | | | 7.99 | % | |
S&P 500 Index | | | 4.93 | % | | | 13.69 | % | | | 15.45 | % | | | 7.67 | % | | | 10.02 | % | |
Barclays U.S. Aggregate Bond Index | | | 1.79 | % | | | 5.97 | % | | | 4.45 | % | | | 4.71 | % | | | 4.67 | % | |
Lipper Flexible Portfolio Funds Index | | | 0.26 | % | | | 4.31 | % | | | 8.80 | % | | | 6.11 | % | | | 8.03 | % | |
50/50 Blended Benchmark | | | 3.36 | % | | | 9.85 | % | | | 10.09 | % | | | 6.48 | % | | | 7.60 | % | |
| Columbia Acorn Emerging Markets FundSM (CEFZX) (8/19/11) | | | -2.36 | % | | | -4.12 | % | | | — | | | | — | | | | 8.29 | % | |
S&P Emerging Markets Between $500M and $5B Index | | | -3.32 | % | | | 1.90 | % | | | — | | | | — | | | | 3.31 | % | |
MSCI Emerging Markets Small Cap Index (Net) | | | -6.02 | % | | | 1.01 | % | | | — | | | | — | | | | 1.16 | % | |
Lipper Emerging Markets Index | | | -5.25 | % | | | -2.66 | % | | | — | | | | — | | | | 2.18 | % | |
| Columbia Acorn European FundSM (CAEZX) (8/19/11) | | | -0.71 | % | | | -7.52 | % | | | — | | | | — | | | | 12.40 | % | |
S&P Europe Between $500M and $5B Index | | | -1.47 | % | | | -5.35 | % | | | — | | | | — | | | | 13.80 | % | |
Euromoney Smaller European Companies (inc UK) Index | | | -3.42 | % | | | -7.67 | % | | | — | | | | — | | | | 11.72 | % | |
Lipper European Region Index | | | -2.51 | % | | | -6.46 | % | | | — | | | | — | | | | 12.10 | % | |
The inception dates for Class A, B and C shares (if offered) are as follows: Columbia Acorn Fund, Columbia Acorn International, Columbia Acorn USA, Columbia Acorn International Select and Columbia Acorn Select, 10/16/00; Columbia Thermostat Fund, 3/3/03; Columbia Acorn Emerging Markets Fund and Columbia Acorn European Fund, 8/19/11. The inception dates for Class I shares are as follows: Columbia Acorn Fund, Columbia Acorn International, Columbia Acorn USA, Columbia Acorn International Select and Columbia Acorn Select, 9/27/10; Columbia Acorn Emerging Markets Fund and Columbia Acorn European Fund, 8/19/11. The inception date for Class R shares for Columbia Acorn International is 8/2/11. The inception date for Class R4, R5 and Y shares (if offered) is as follows: Columbia Acorn Fund, Columbia Acorn USA, Columbia Acorn International Select, Columbia Acorn Select, Columbia Thermostat Fund, Columbia Acorn Emerging Markets Fund and Columbia Acorn European Fund, 11/8/12, except that Class Y shares of Columbia Acorn Emerging Markets Fund commenced operations on 6/13/13 and Class R4 shares of Columbia Acorn European Fund commenced operations on 6/25/14. The inception date for Class R5 shares of Columbia Acorn International is 8/2/11. The inception date for Class R4 and Y shares of Columbia Acorn International is 11/8/12. The inception date for Class Z shares is as follows: Columbia Acorn Fund, 6/10/70; Columbia Acorn International, 9/23/92; Columbia Acorn USA, 9/4/96; Columbia Acorn International Select and Columbia Acorn Select, 11/23/98; Columbia Thermostat Fund, 9/25/02; Columbia Acorn Emerging Markets Fund and Columbia Acorn European Fund, 8/19/11.
*Not annualized
**Although the Fund typically invests in small- and mid-sized companies, the comparison to the S&P 500® Index is presented to show performance against a widely recognized market index over the life of the Fund.
Please see Page 1 for a description of the indexes listed above.
3
Columbia Acorn Family of Funds
2014 Year-End Distributions
The following table details the year-end distributions for the Columbia Acorn Funds. For all Funds except Columbia Thermostat Fund, the record date was December 8, 2014, and the ex-dividend and payable date was December 9, 2014. For Columbia Thermostat Fund, the record date was December 19, 2014, and the ex-dividend and payable date was December 22, 2014.
| Fund | | Short-term
Capital
Gain | | Long-term
Capital
Gain | | Ordinary
Income | | Reinvestment
Price | |
Columbia Acorn® Fund | |
Class A | | | None | | | $ | 4.83826 | | | | None | | | $ | 30.00 | | |
Class B | | | None | | | $ | 4.83826 | | | | None | | | $ | 26.28 | | |
Class C | | | None | | | $ | 4.83826 | | | | None | | | $ | 25.67 | | |
Class I | | | None | | | $ | 4.83826 | | | | None | | | $ | 31.70 | | |
Class R4 | | | None | | | $ | 4.83826 | | | | None | | | $ | 32.18 | | |
Class R5 | | | None | | | $ | 4.83826 | | | | None | | | $ | 32.22 | | |
Class Y | | | None | | | $ | 4.83826 | | | | None | | | $ | 32.28 | | |
Class Z | | | None | | | $ | 4.83826 | | | | None | | | $ | 31.63 | | |
Columbia Acorn International® | |
Class A | | | None | | | $ | 1.80082 | | | $ | 0.53711 | | | $ | 41.74 | | |
Class B | | | None | | | $ | 1.80082 | | | $ | 0.19085 | | | $ | 40.46 | | |
Class C | | | None | | | $ | 1.80082 | | | $ | 0.19085 | | | $ | 40.27 | | |
Class I | | | None | | | $ | 1.80082 | | | $ | 0.70556 | | | $ | 41.81 | | |
Class R | | | None | | | $ | 1.80082 | | | $ | 0.34527 | | | $ | 41.74 | | |
Class R4 | | | None | | | $ | 1.80082 | | | $ | 0.62602 | | | $ | 42.07 | | |
Class R5 | | | None | | | $ | 1.80082 | | | $ | 0.68685 | | | $ | 41.75 | | |
Class Y | | | None | | | $ | 1.80082 | | | $ | 0.71024 | | | $ | 42.07 | | |
Class Z | | | None | | | $ | 1.80082 | | | $ | 0.67281 | | | $ | 41.78 | | |
Columbia Acorn USA® | |
Class A | | | None | | | $ | 5.56080 | | | | None | | | $ | 28.65 | | |
Class B | | | None | | | $ | 5.56080 | | | | None | | | $ | 24.87 | | |
Class C | | | None | | | $ | 5.56080 | | | | None | | | $ | 24.58 | | |
Class I | | | None | | | $ | 5.56080 | | | | None | | | $ | 30.67 | | |
Class R4 | | | None | | | $ | 5.56080 | | | | None | | | $ | 31.18 | | |
Class R5 | | | None | | | $ | 5.56080 | | | | None | | | $ | 31.19 | | |
Class Y | | | None | | | $ | 5.56080 | | | | None | | | $ | 31.27 | | |
Class Z | | | None | | | $ | 5.56080 | | | | None | | | $ | 30.52 | | |
Columbia Acorn International SelectSM | |
Class A | | | None | | | $ | 2.78219 | | | $ | 0.09894 | | | $ | 22.10 | | |
Class B | | | None | | | $ | 2.78219 | | | $ | 0.00000 | | | $ | 20.76 | | |
Class C | | | None | | | $ | 2.78219 | | | $ | 0.00000 | | | $ | 20.61 | | |
Class I | | | None | | | $ | 2.78219 | | | $ | 0.19978 | | | $ | 22.35 | | |
Class R4 | | | None | | | $ | 2.78219 | | | $ | 0.16897 | | | $ | 22.51 | | |
Class R5 | | | None | | | $ | 2.78219 | | | $ | 0.18577 | | | $ | 22.49 | | |
Class Y | | | None | | | $ | 2.78219 | | | $ | 0.20258 | | | $ | 22.48 | | |
Class Z | | | None | | | $ | 2.78219 | | | $ | 0.18017 | | | $ | 22.36 | | |
4
| Fund | | Short-term
Capital
Gain | | Long-term
Capital
Gain | | Ordinary
Income | | Reinvestment
Price | |
Columbia Acorn SelectSM | |
Class A | | | None | | | $ | 3.74246 | | | | None | | | $ | 20.92 | | |
Class B | | | None | | | $ | 3.74246 | | | | None | | | $ | 17.94 | | |
Class C | | | None | | | $ | 3.74246 | | | | None | | | $ | 17.60 | | |
Class I | | | None | | | $ | 3.74246 | | | | None | | | $ | 22.26 | | |
Class R4 | | | None | | | $ | 3.74246 | | | | None | | | $ | 22.62 | | |
Class R5 | | | None | | | $ | 3.74246 | | | | None | | | $ | 22.65 | | |
Class Y | | | None | | | $ | 3.74246 | | | | None | | | $ | 22.73 | | |
Class Z | | | None | | | $ | 3.74246 | | | | None | | | $ | 22.15 | | |
Columbia Thermostat FundSM | |
Class A | | $ | 0.09300 | | | $ | 0.05196 | | | $ | 0.27078 | | | $ | 14.86 | | |
Class B | | $ | 0.09300 | | | $ | 0.05196 | | | $ | 0.19612 | | | $ | 14.97 | | |
Class C | | $ | 0.09300 | | | $ | 0.05196 | | | $ | 0.15879 | | | $ | 14.96 | | |
Class R4 | | $ | 0.09300 | | | $ | 0.05196 | | | $ | 0.30811 | | | $ | 14.74 | | |
Class R5 | | $ | 0.09300 | | | $ | 0.05196 | | | $ | 0.31110 | | | $ | 14.75 | | |
Class Y | | $ | 0.09300 | | | $ | 0.05196 | | | $ | 0.31857 | | | $ | 14.73 | | |
Class Z | | $ | 0.09300 | | | $ | 0.05196 | | | $ | 0.30961 | | | $ | 14.67 | | |
Columbia Acorn Emerging Markets FundSM | |
Class A | | | None | | | | None | | | $ | 0.06967 | | | $ | 12.64 | | |
Class C | | | None | | | | None | | | $ | 0.00000 | | | $ | 12.58 | | |
Class I | | | None | | | | None | | | $ | 0.11366 | | | $ | 12.67 | | |
Class R4 | | | None | | | | None | | | $ | 0.10700 | | | $ | 12.74 | | |
Class R5 | | | None | | | | None | | | $ | 0.10966 | | | $ | 12.73 | | |
Class Y | | | None | | | | None | | | $ | 0.11366 | | | $ | 12.62 | | |
Class Z | | | None | | | | None | | | $ | 0.09900 | | | $ | 12.66 | | |
Columbia Acorn European FundSM | |
Class A | | | None | | | | None | | | $ | 0.04887 | | | $ | 14.47 | | |
Class C | | | None | | | | None | | | $ | 0.00000 | | | $ | 14.30 | | |
Class I | | | None | | | | None | | | $ | 0.09354 | | | $ | 14.46 | | |
Class R4 | | | None | | | | None | | | $ | 0.08738 | | | $ | 14.53 | | |
Class R5 | | | None | | | | None | | | $ | 0.08430 | | | $ | 14.60 | | |
Class Z | | | None | | | | None | | | $ | 0.08738 | | | $ | 14.47 | | |
5
Squirrel Chatter II: Communications Satellites Past and Present

The Soviet Union launched Sputnik, mankind's first satellite, in October 1957. This 184-pound satellite was a 23-inch sphere with four antennas. It transmitted a "beep beep" signal over ham radio frequencies accessible by many around the globe, and its surface was polished so it was visible as it orbited the Earth.1 Sputnik was a propaganda tool that woke up the world.
Prior to the launch of Sputnik, satellites had been theorized for a long time. In the 17th century, Sir Isaac Newton developed his theory of gravitation. In it he stated that a projectile launched at the correct angle at a speed of 17,000 miles per hour would orbit the Earth.2 In 1945, science fiction writer Arthur C. Clarke introduced the concept of geostationary orbit: a satellite orbiting above the Earth's equator at an altitude of about 22,200 miles elevation would remain over the same position, appearing stationary to people on Earth. Clarke thought that within 50 years, there could be three equally spaced geostationary satellites communicating to virtually the whole planet.3
The United States launched its first satellite, Explorer 1, in January 1958. This satellite discovered the Van Allen radiation belts around Earth. In December 1958, the United States launched its first communications satellite, SCORE, which broadcast a tape-recorded holiday message from President Eisenhower.4
Many experiments and innovations in satellites followed. Perhaps the oddest was Echo-1, which inflated into a 100-foot diameter sphere coated in aluminum, enabling it to reflect radio waves.5 This passive communications satellite reflected about one ten-millionth of originating signal sent toward it.6
Telstar-1, launched in 1962, provided the first live TV broadcast from space, as well as the first phone conversation transmitted by satellite. Rather than being a passive reflector like Echo-1, Telstar-1 had an active transponder that received, amplified and re-sent signals. It could communicate a total of one black and white TV channel along with 600 telephone conversations.7
The first satellites achieved low or medium Earth orbits, far below Arthur C. Clarke's geostationary orbit, and transmitted at low power. As a result, ground antennas
needed to be huge, initially 100 feet wide,8 and had to rotate in order to remain pointed at a moving satellite.9 Furthermore, such satellites are in view of the ground antennas for short periods of time; a low Earth orbit satellite 500 miles up is in touch for 12 minutes per orbit, while a medium Earth satellite 5,000 miles up is in view for 30 minutes.10
The first successful geostationary communications satellite, Syncom 3, launched in August 196411 and was stationed over the Pacific Ocean.12 As planned, it remained in constant contact with fixed-position Earth stations within its coverage area. Also, since geostationary satellites are rarely in Earth's shadow, it was primarily powered by solar cells.13 But with a transmitter output of two watts,14 large Earth stations were needed to communicate with it. Other geostationary satellites followed shortly thereafter. In July 1969, Intelsat, a leading provider of satellite services worldwide, had three geostationary satellites covering nearly the entire Earth, fulfilling Clarke's concept some 25 years earlier than he had imagined.
Early communications satellites, continuing to transmit just one TV channel each,15 enabled much of the world to witness milestone events, which in turn drove demand for more communications satellites. Syncom satellites carried the 1964 Tokyo Olympics, while Intelsat allowed much of the world to witness Neil Armstrong walking on the moon.16 Nearly a billion people worldwide watched the 1972 Summer Olympics held in Munich, Germany.
Additional and more powerful communications satellites were launched shortly thereafter, along with improved and less expensive 16- to 33-foot ground antennas. New businesses were created and existing business models were altered. WESTAR I launched in April 1974 and provided fledgling cable TV programmer Home Box Office the opportunity to broadcast live Muhammad Ali's "Thrilla in Manila" fight in 1975.
When entrepreneur Ted Turner learned that he could broadcast his Atlanta WTCG TV station via satellite everywhere in the country, he signed a million-dollar-a-year contract to do so, and in 1976 reached homes in over 27 states via local cable television (CATV) systems.17 Turner subsequently launched CNN in 1980, creating the first
6
24-hour news channel. Numerous other CATV channels followed. Satellites enabled cable TV operators to offer additional content, which eventually ended the dominance of the three major U.S. television networks.
As demand for satellite communications rose, the International Telecommunications Union awarded additional radio bandwidth and orbital slots to industry participants. Current communications satellites have far better circuitry, software and solar power, along with innovations such as spot beams, data compression algorithms and fuel-saving electrical propulsion systems. Rather than being simple "bent pipe" mechanisms receiving and transmitting the same signal, today's satellites enhance signals and allocate bandwidth more efficiently.
New satellites continue to be larger, and are broadcasting at higher power and at higher frequencies. Early "C-band" satellite TV signals were transmitted at 10 to 17 watts, while current "Ku-band" satellite TV signals are transmitted at 100 to 200 watts.18 Higher power and higher frequencies, coupled with improved electronics, facilitate still smaller and cheaper ground station equipment. Neiman Marcus offered a 20-foot satellite TV dish in 1979 for $36,500,19 capable of receiving only HBO; today, direct-to-home receivers cost below $100 and can receive hundreds of channels using dishes as small as 18 inches across.20
Satellite technology has extended beyond broadcasting TV signals. The Global Positioning System (GPS) was introduced by the U.S. military in 1978, currently consists of 24 satellites in orbit,21 and has been made available for civilian use.22 These satellites transmit precise time signals along with their exact positions. A GPS receiver measures the range from three or four satellites and uses simultaneous equations to calculate its position. Vehicle and handheld GPS navigation systems combine position information with map data, and then provide locations and directions to users. It seems that the smallest satellite receivers may currently be GPS wristwatches!
Internet connection for fixed locations in densely populated areas is dominated by cable, telephone and cell phone service providers. Satellite data cannot compete economically with these technologies, where they are available. However, satellites provide data and Internet access elsewhere, in remote areas, on the oceans and in airplanes. These applications have also benefited from
improved satellite technology. For example, satellite data speeds have hit 30 megabits per second per aircraft, up 70-fold from prior generation satellite equipment.23
The next generation high-throughput satellites, utilizing even higher power and more frequencies, and providing more spot beams, are launching through 2017. Combined, these satellites will increase bandwidth in the sky by a factor of eight to ten,24 and promise to deliver more data, more quickly, to ever more users.
As much as satellite technology has changed the world, investments in satellite companies have had mixed results. We at Columbia Acorn Funds tended to shy away from start-up satellite companies that needed to make large up-front investments before earning highly uncertain revenues. That bias proved correct long ago when satellite phone provider Iridium filed for bankruptcy shortly after launch, citing initial subscriber counts dramatically lower than expected.
Instead, we opted to invest either downstream from satellite technology or in proven satellite service providers. Long ago, domestic Acorn Funds benefited substantially from investments in cable TV channel companies and, more recently, a company providing mapping data. The Funds currently have investments in a company utilizing GPS signals for engineering and construction, and Columbia Acorn Fund owns shares in a satellite service provider that we believe possesses valuable radio spectrum. Other investments include companies utilizing satellite transmitted data to provide Internet connectivity on airplanes. International Acorn Funds have benefited from satellite service providers possessing visible revenue streams within a more consolidated industry.

Charles P. McQuaid
Portfolio Manager, Analyst and Advisor
Columbia Wanger Asset Management, LLC
The information and data provided in this analysis are derived from sources that we deem to be reliable and accurate. These views are not guarantees of future performance and involve certain risks, uncertainties and assumptions that are difficult to predict so actual outcomes and results may differ significantly from the views expressed. The views/opinions expressed here are those of the author and not of the Columbia Acorn Trust Board, are subject to change at any time based upon economic, market or other conditions, may differ from views expressed by other Columbia Management associates and the respective parties
7
disclaim any responsibility to update such views. These views may not be relied on as investment advice and, because investment decisions for a Columbia Acorn Fund are based on numerous factors, may not be relied on as an indication of trading intent on behalf of any particular Columbia Acorn Fund.
1 Virgil S. Labrador and Peter I. Galace, Heavens Fill with Commerce: A Brief History of the Communications Satellite Industry (Sonoma, California, SATNEWS PUBLISHERS, 2005), p. 23.
2 Ibid., p. 15.
3 Ibid., p. 21.
4 Ibid., p. 36.
5 Ibid., p. 39.
6 Steve Ford, The ARRL Satellite Handbook (ARRL, The National Association for Amateur Radio, 2008-2013), appendix B, p. 5.
7 Labrador, op. cit., p. 42.
8 Bruce Elbert, The Satellite Communication Ground Segment and Earth Station Handbook, Second Edition (Norwood, Massachusetts, Artech House, 2014) p. 10.
9 Labrador, op. cit., p. 43.
10 Elbert, op. cit., p. 77.
11 Labrador, op. cit., p. 46.
12 NASA Technical Report, R-252, Syncom Engineering Report, Volume II, By Syncom Projects Office, Goddard Space Flight Center, Greenbelt, Maryland, April 1967, p. 3.
13 Ibid., p. 10.
14 Ibid., p. 8.
15 Labrador, op. cit., p. 115.
16 Ibid., p. 58.
17 Ibid., p. 119.
18 Ibid., p. 133.
19 Ray B. Browne and Pat Browne, The Guide to United States Popular Culture (Madison, Wisconsin, Popular Press 3, 2001), p. 706.
20 Elbert, op. cit., p. 304.
21 Madhavendra Richharia, Mobile Satellite Communications: Principles and Trends, Second Edition (West Sussex, United Kingdom, John Wiley & Sons, Ltd, 2014), p. 30.
22 Ford, op. cit., p. 5-14.
23 First Edition, The Anatomy of Inflight Connectivity: An Inside Look at What it Takes to Bring Connectivity to Aircraft Around the World (Gogo LLC, an aero-communications service provider, 2014) p. 41.
24 Anne Wainscott-Sargent, "Ground Players Tackle Bandwidth Optimization in an HTS World," Via Satellite, January 2015, p. 16.
8
Understanding Your Expenses
As a shareholder, you incur two types of costs. There are transaction costs, which generally include sales charges on purchases and may include redemption fees. There are also ongoing costs, which generally include management fees, distribution and service (Rule 12b-1) fees, and other Fund expenses. The following information is intended to help you understand your ongoing costs (in dollars) of investing in the Fund and to help you compare these costs with the ongoing costs of investing in other mutual funds.
Analyzing Your Fund's Expenses
To illustrate these ongoing costs, we have provided examples and calculated the expenses paid by investors in Class A, B, C, I, R, R4, R5, Y and Z shares of the Funds during the period. The actual and hypothetical information in the tables is based on an initial investment of $1,000 at the beginning of the period indicated and held for the entire period. Expense information is calculated two ways and each method provides you with different information. The amount listed in the "Actual" column is calculated using the Funds' actual operating expenses and total return for the period. You may use the Actual information, together with the amount invested, to estimate the expenses that you paid over the period. Simply divide your account value by $1,000 (for example, an $8,600 account value divided by $1,000 = 8.6), then multiply the results by the expenses paid during the period under the Actual column. The amount listed in the "Hypothetical" column assumes a 5% annual rate of return before expenses (which is not the Funds' actual return) and then applies the Funds' actual expense ratio for the period to the hypothetical return. You should not use the hypothetical account values and expenses to estimate either your actual account balance at the end of the period or the expenses you paid during the period. See "Compare With Other Funds" below for details on how to use the hypothetical data.
In addition to the ongoing expenses which the Funds bear directly, Columbia Thermostat Fund's shareholders indirectly bear the Fund's allocable share of the costs and expenses of each underlying fund in which the Fund invests. You can also estimate the effective expenses paid during the period, which includes the indirect fees associated with investing in the underlying funds, by using the amounts listed in the effective expenses paid during the period column in the "Fund of Funds" table.
Compare With Other Funds
Since all mutual funds are required to include the same hypothetical calculations about expenses in shareholder reports, you can use this information to compare the ongoing cost of investing in the Funds with other funds. To do so, compare the hypothetical example with the 5% hypothetical examples that appear in the shareholder reports of other funds. As you compare hypothetical examples of other funds, it is important to note that hypothetical examples are meant to highlight the ongoing costs of investing in a fund only and do not reflect any transaction costs, such as sales charges, or redemption or exchange fees. Therefore, the hypothetical calculations are useful in comparing ongoing costs only, and will not help you determine the relative total costs of owning different funds. If transaction costs were included in these calculations, your costs would be higher.
July 1, 2014 – December 31, 2014
| | Account value at
the beginning of
the period ($) | | Account value at
the end of
the period ($) | | Expenses paid
during the period ($) | | Fund's
annualized
expense
ratio (%) | |
| | Actual | | Hypothetical | | Actual | | Hypothetical | | Actual | | Hypothetical | | Actual | |
Columbia Acorn® Fund | |
Class A | | | 1,000.00 | | | | 1,000.00 | | | | 981.20 | | | | 1,019.76 | | | | 5.39 | | | | 5.50 | | | | 1.08 | | |
Class B | | | 1,000.00 | | | | 1,000.00 | | | | 977.40 | | | | 1,016.18 | | | | 8.92 | | | | 9.10 | | | | 1.79 | | |
Class C | | | 1,000.00 | | | | 1,000.00 | | | | 977.60 | | | | 1,016.23 | | | | 8.87 | | | | 9.05 | | | | 1.78 | | |
Class I | | | 1,000.00 | | | | 1,000.00 | | | | 982.90 | | | | 1,021.63 | | | | 3.55 | | | | 3.62 | | | | 0.71 | | |
Class R4 | | | 1,000.00 | | | | 1,000.00 | | | | 982.30 | | | | 1,020.87 | | | | 4.30 | | | | 4.38 | | | | 0.86 | | |
Class R5 | | | 1,000.00 | | | | 1,000.00 | | | | 982.90 | | | | 1,021.37 | | | | 3.80 | | | | 3.87 | | | | 0.76 | | |
Class Y | | | 1,000.00 | | | | 1,000.00 | | | | 982.90 | | | | 1,021.68 | | | | 3.50 | | | | 3.57 | | | | 0.70 | | |
Class Z | | | 1,000.00 | | | | 1,000.00 | | | | 982.30 | | | | 1,021.22 | | | | 3.95 | | | | 4.02 | | | | 0.79 | | |
9
Understanding Your Expenses, continued
| | Account value at
the beginning of
the period ($) | | Account value at
the end of
the period ($) | | Expenses paid
during the period ($) | | Fund's
annualized
expense
ratio (%) | |
| | Actual | | Hypothetical | | Actual | | Hypothetical | | Actual | | Hypothetical | | Actual | |
Columbia Acorn International® | |
Class A | | | 1,000.00 | | | | 1,000.00 | | | | 901.60 | | | | 1,019.00 | | | | 5.90 | | | | 6.26 | | | | 1.23 | | |
Class B | | | 1,000.00 | | | | 1,000.00 | | | | 898.20 | | | | 1,015.17 | | | | 9.52 | | | | 10.11 | | | | 1.99 | | |
Class C | | | 1,000.00 | | | | 1,000.00 | | | | 898.40 | | | | 1,015.27 | | | | 9.43 | | | | 10.01 | | | | 1.97 | | |
Class I | | | 1,000.00 | | | | 1,000.00 | | | | 903.50 | | | | 1,020.92 | | | | 4.08 | | | | 4.33 | | | | 0.85 | | |
Class R | | | 1,000.00 | | | | 1,000.00 | | | | 899.80 | | | | 1,016.99 | | | | 7.81 | | | | 8.29 | | | | 1.63 | | |
Class R4 | | | 1,000.00 | | | | 1,000.00 | | | | 902.60 | | | | 1,019.96 | | | | 4.99 | | | | 5.30 | | | | 1.04 | | |
Class R5 | | | 1,000.00 | | | | 1,000.00 | | | | 903.20 | | | | 1,020.62 | | | | 4.37 | | | | 4.63 | | | | 0.91 | | |
Class Y | | | 1,000.00 | | | | 1,000.00 | | | | 903.40 | | | | 1,020.87 | | | | 4.13 | | | | 4.38 | | | | 0.86 | | |
Class Z | | | 1,000.00 | | | | 1,000.00 | | | | 903.00 | | | | 1,020.47 | | | | 4.51 | | | | 4.79 | | | | 0.94 | | |
Columbia Acorn USA® | |
Class A | | | 1,000.00 | | | | 1,000.00 | | | | 1,007.60 | | | | 1,018.45 | | | | 6.78 | | | | 6.82 | | | | 1.34 | | |
Class B | | | 1,000.00 | | | | 1,000.00 | | | | 1,002.60 | | | | 1,013.51 | | | | 11.71 | | | | 11.77 | | | | 2.32 | | |
Class C | | | 1,000.00 | | | | 1,000.00 | | | | 1,004.30 | | | | 1,015.12 | | | | 10.10 | | | | 10.16 | | | | 2.00 | | |
Class I | | | 1,000.00 | | | | 1,000.00 | | | | 1,009.70 | | | | 1,020.77 | | | | 4.46 | | | | 4.48 | | | | 0.88 | | |
Class R4 | | | 1,000.00 | | | | 1,000.00 | | | | 1,008.70 | | | | 1,019.71 | | | | 5.52 | | | | 5.55 | | | | 1.09 | | |
Class R5 | | | 1,000.00 | | | | 1,000.00 | | | | 1,009.00 | | | | 1,020.21 | | | | 5.01 | | | | 5.04 | | | | 0.99 | | |
Class Y | | | 1,000.00 | | | | 1,000.00 | | | | 1,009.60 | | | | 1,020.47 | | | | 4.76 | | | | 4.79 | | | | 0.94 | | |
Class Z | | | 1,000.00 | | | | 1,000.00 | | | | 1,008.90 | | | | 1,019.76 | | | | 5.47 | | | | 5.50 | | | | 1.08 | | |
Columbia Acorn International SelectSM | |
Class A | | | 1,000.00 | | | | 1,000.00 | | | | 848.30 | | | | 1,017.80 | | | | 6.85 | | | | 7.48 | | | | 1.47 | | |
Class B | | | 1,000.00 | | | | 1,000.00 | | | | 844.90 | | | | 1,014.42 | | | | 9.95 | | | | 10.87 | | | | 2.14 | | |
Class C | | | 1,000.00 | | | | 1,000.00 | | | | 844.70 | | | | 1,013.91 | | | | 10.42 | | | | 11.37 | | | | 2.24 | | |
Class I | | | 1,000.00 | | | | 1,000.00 | | | | 849.50 | | | | 1,019.56 | | | | 5.22 | | | | 5.70 | | | | 1.12 | | |
Class R4 | | | 1,000.00 | | | | 1,000.00 | | | | 849.30 | | | | 1,019.16 | | | | 5.59 | | | | 6.11 | | | | 1.20 | | |
Class R5 | | | 1,000.00 | | | | 1,000.00 | | | | 849.40 | | | | 1,019.41 | | | | 5.36 | | | | 5.85 | | | | 1.15 | | |
Class Y | | | 1,000.00 | | | | 1,000.00 | | | | 849.70 | | | | 1,019.66 | | | | 5.13 | | | | 5.60 | | | | 1.10 | | |
Class Z | | | 1,000.00 | | | | 1,000.00 | | | | 849.50 | | | | 1,019.26 | | | | 5.50 | | | | 6.01 | | | | 1.18 | | |
Columbia Acorn SelectSM | |
Class A | | | 1,000.00 | | | | 1,000.00 | | | | 1,009.50 | | | | 1,018.55 | | | | 6.69 | | | | 6.72 | | | | 1.32 | | |
Class B | | | 1,000.00 | | | | 1,000.00 | | | | 1,005.10 | | | | 1,014.62 | | | | 10.61 | | | | 10.66 | | | | 2.10 | | |
Class C | | | 1,000.00 | | | | 1,000.00 | | | | 1,005.70 | | | | 1,014.92 | | | | 10.31 | | | | 10.36 | | | | 2.04 | | |
Class I | | | 1,000.00 | | | | 1,000.00 | | | | 1,010.90 | | | | 1,020.47 | | | | 4.76 | | | | 4.79 | | | | 0.94 | | |
Class R4 | | | 1,000.00 | | | | 1,000.00 | | | | 1,010.40 | | | | 1,019.66 | | | | 5.57 | | | | 5.60 | | | | 1.10 | | |
Class R5 | | | 1,000.00 | | | | 1,000.00 | | | | 1,011.20 | | | | 1,020.16 | | | | 5.07 | | | | 5.09 | | | | 1.00 | | |
Class Y | | | 1,000.00 | | | | 1,000.00 | | | | 1,011.20 | | | | 1,020.42 | | | | 4.82 | | | | 4.84 | | | | 0.95 | | |
Class Z | | | 1,000.00 | | | | 1,000.00 | | | | 1,011.00 | | | | 1,020.01 | | | | 5.22 | | | | 5.24 | | | | 1.03 | | |
10
| | Account value at
the beginning of
the period ($) | | Account value at
the end of
the period ($) | | Expenses paid
during the period ($) | | Fund's
annualized
expense
ratio (%) | |
| | Actual | | Hypothetical | | Actual | | Hypothetical | | Actual | | Hypothetical | | Actual | |
Columbia Acorn Emerging Markets FundSM | |
Class A | | | 1,000.00 | | | | 1,000.00 | | | | 926.80 | | | | 1,017.39 | | | | 7.53 | | | | 7.88 | | | | 1.55 | | |
Class C | | | 1,000.00 | | | | 1,000.00 | | | | 923.40 | | | | 1,013.51 | | | | 11.25 | | | | 11.77 | | | | 2.32 | | |
Class I | | | 1,000.00 | | | | 1,000.00 | | | | 928.20 | | | | 1,019.00 | | | | 5.98 | | | | 6.26 | | | | 1.23 | | |
Class R4 | | | 1,000.00 | | | | 1,000.00 | | | | 928.10 | | | | 1,018.75 | | | | 6.22 | | | | 6.51 | | | | 1.28 | | |
Class R5 | | | 1,000.00 | | | | 1,000.00 | | | | 928.20 | | | | 1,018.90 | | | | 6.08 | | | | 6.36 | | | | 1.25 | | |
Class Y | | | 1,000.00 | | | | 1,000.00 | | | | 928.60 | | | | 1,019.11 | | | | 5.88 | | | | 6.16 | | | | 1.21 | | |
Class Z | | | 1,000.00 | | | | 1,000.00 | | | | 927.70 | | | | 1,018.55 | | | | 6.41 | | | | 6.72 | | | | 1.32 | | |
Columbia Acorn European FundSM | |
Class A | | | 1,000.00 | | | | 1,000.00 | | | | 901.50 | | | | 1,016.38 | | | | 8.39 | | | | 8.89 | | | | 1.75 | | |
Class C | | | 1,000.00 | | | | 1,000.00 | | | | 897.90 | | | | 1,012.60 | | | | 11.96 | | | | 12.68 | | | | 2.50 | | |
Class I | | | 1,000.00 | | | | 1,000.00 | | | | 903.10 | | | | 1,017.80 | | | | 7.05 | | | | 7.48 | | | | 1.47 | | |
Class R4 | | | 1,000.00 | | | | 1,000.00 | | | | 903.20 | | | | 1,017.64 | | | | 7.20 | | | | 7.63 | | | | 1.50 | | |
Class R5 | | | 1,000.00 | | | | 1,000.00 | | | | 902.80 | | | | 1,017.54 | | | | 7.29 | | | | 7.73 | | | | 1.52 | | |
Class Z | | | 1,000.00 | | | | 1,000.00 | | | | 902.80 | | | | 1,017.64 | | | | 7.19 | | | | 7.63 | | | | 1.50 | | |
Fund of Funds—Columbia Thermostat Fund
July 1, 2014 – December 31, 2014
| | Account value at
the beginning of
the period ($) | | Account value at
the end of
the period ($) | | Expenses paid
during the period ($) | | Fund's
annualized
expense
ratio (%) | | Effective
expenses
paid during
the period ($) | | Fund's
effective
annualized
expense
ratio (%) | |
| | Actual | | Hypothetical | | Actual | | Hypothetical | | Actual | | Hypothetical | | Actual | | Actual | | Hypothetical | | Actual | |
Columbia Thermostat FundSM | |
Class A | | | 1,000.00 | | | | 1,000.00 | | | | 1,013.70 | | | | 1,022.68 | | | | 2.54 | | | | 2.55 | | | | 0.50 | | | | 5.18 | | | | 5.20 | | | | 1.02 | | |
Class B | | | 1,000.00 | | | | 1,000.00 | | | | 1,011.30 | | | | 1,020.16 | | | | 5.07 | | | | 5.09 | | | | 1.00 | | | | 7.71 | | | | 7.74 | | | | 1.52 | | |
Class C | | | 1,000.00 | | | | 1,000.00 | | | | 1,009.50 | | | | 1,018.90 | | | | 6.33 | | | | 6.36 | | | | 1.25 | | | | 8.97 | | | | 9.01 | | | | 1.77 | | |
Class R4 | | | 1,000.00 | | | | 1,000.00 | | | | 1,014.90 | | | | 1,023.95 | | | | 1.27 | | | | 1.28 | | | | 0.25 | | | | 3.91 | | | | 3.93 | | | | 0.77 | | |
Class R5 | | | 1,000.00 | | | | 1,000.00 | | | | 1,014.40 | | | | 1,024.05 | | | | 1.17 | | | | 1.17 | | | | 0.23 | | | | 3.81 | | | | 3.83 | | | | 0.75 | | |
Class Y | | | 1,000.00 | | | | 1,000.00 | | | | 1,014.90 | | | | 1,024.30 | | | | 0.91 | | | | 0.92 | | | | 0.18 | | | | 3.56 | | | | 3.57 | | | | 0.70 | | |
Class Z | | | 1,000.00 | | | | 1,000.00 | | | | 1,014.40 | | | | 1,024.05 | | | | 1.17 | | | | 1.17 | | | | 0.23 | | | | 3.81 | | | | 3.83 | | | | 0.75 | | |
Expenses paid during the period are equal to the annualized expense ratio, multiplied by the average account value over the period and then multiplied by the number of days in the Fund's most recent fiscal half year and divided by 365.
Except with respect to Columbia Thermostat Fund, expenses do not include any fees and expenses incurred indirectly by a Fund from the underlying funds in which the Fund may invest (also referred to as "acquired funds"), including affiliated and non-affiliated pooled investments vehicles (including mutual funds and exchange traded funds).
In the case of Columbia Thermostat Fund, effective expenses paid during the period and the Fund's effective annualized expense ratio include expenses borne directly by the class plus the Fund's pro rata portion of the ongoing expenses charged by the underlying funds in which it invests using the expense ratio of each class of each underlying fund as of the underlying fund's most recent shareholder report.
Had the investment manager and/or certain of its affiliates not waived/reimbursed certain fees and expenses for Columbia Acorn International, Columbia Acorn Select, Columbia Thermostat Fund and Columbia Acorn European Fund, account value at the end of the period would have been reduced.
11
Columbia Acorn® Fund
In a Nutshell

| | 
| |
Robert A. Mohn
Lead Portfolio Manager | | David L. Frank
Co-Portfolio Manager | |
Performance data shown represents past performance and is not a guarantee of future results. The investment return and principal value will fluctuate so that shares, when redeemed, may be worth more or less than the original cost. Current performance may be lower or higher than the performance data shown. Please visit columbiamanagement.com for daily and most recent month-end performance updates.
Stocks of small- and mid-cap companies pose special risks, including possible illiquidity and greater price volatility than stocks of larger, more established companies. International investing involves special risks, including foreign taxation, currency risks, risks associated with possible differences in financial standards, operational and settlement risks and other risks associated with future political and economic developments.
Columbia Acorn Fund Class Z shares gained 3.88% in the fourth quarter of 2014, while the Fund's primary benchmark, the Russell 2500 Index, rose 6.77%. For the annual period ended December 31, 2014, the Fund was up 0.82% versus a 7.07% gain for the benchmark. The performance for both periods was impacted by declines in the international portion of the Fund. International stocks in the portfolio fell 17.43% in 2014, while domestic returns were up 2.91%. We have been consciously decreasing the Fund's exposure to international stocks, ending the year with a 4.2% weight in foreign names, down three percentage points from the Fund's weighting at the end of 2013. We anticipate international exposure within the Fund will continue to be reduced going forward.
While energy price declines were a positive for some Fund holdings, they were a negative for many others. The drop in oil prices from $100 to $50 a barrel damaged the Fund's direct energy names, as well as several industrial companies exposed to energy end markets. Our direct energy investments averaged 5.6% of Fund assets for the year, matching the weight of the energy sector in the benchmark. Oil and gas producers Rosetta Resources and SM Energy saw their stocks drop more than 50% for both the quarter and annual period. Chart Industries and Chicago Bridge & Iron both have business tied to liquefied natural gas manufacturing plant construction. Their stocks fell 64% and 49%, respectively, for the year with Chart Industries falling 44% in the fourth quarter and Chicago Bridge & Iron dropping 27%.
For the annual period, losses in several Fund retail stocks were also a drag on performance. Down 43%, home furnishings retailer Pier 1 Imports suffered from weakening same-store sales. We exited this stock in the fourth quarter. Groupon, an online global marketplace for deals, fell 29% for the annual period as its transition away from a deal-of-the-day email blaster significantly increased operating costs. GNC Holdings, a specialty retailer for health and wellness products, ended the year down 19%, as sales disappointed.
Top contributors for the year and the fourth quarter fell largely into two groups. The first was biotech and biotech-related stocks. Synageva BioPharma, a biotech focused on orphan diseases, initiated a new trial for a drug to treat a rare neurological disease called Sanfilippo syndrome. Its stock rose 35% in the fourth quarter and ended the year up 44%. Cepheid, a molecular diagnostics company, saw its installed base of automated genetic testing instruments grow 47% year-over-year. Its stock gained 23% in the fourth quarter and was up 16% for the year. Laboratory equipment manufacturer Mettler-Toledo International's sales growth reached a two-year high, driving fourth quarter gains of 18% and an annual return of 25%.
The second winning group was comprised of companies aided by the drop in energy prices. HEICO, a manufacturer of aircraft replacement parts, benefited as lower oil prices made older aircraft more competitive. HEICO rose 18% in the fourth quarter and ended the year up 13%. Casey's General Stores, an owner/operator of convenience stores and gas stations, benefited from lower gasoline prices, which boosted its fuel margins. For the quarter, its stock gained 26% and rose 30% for the year.
Outside of these groups, the Fund's largest contributor to performance for the year was car rental company Avis Budget Group. Benefiting from improved volume and pricing, its stock gained 21% in the fourth quarter and ended the year up over 63%. tw telecom, a provider of fiber optic telephone and data services, was acquired by Level 3 Communications and left the Fund with a 31% gain for the year.
Due to our high quality, growth strategy and long-term horizon, Columbia Acorn Fund has historically underweighted utilities and most types of REITs, which together constitute about 15% of the Russell 2500 Index. Both sectors offer high dividend yields but their shares face structural impediments to compounding consistently at high rates of return, either from regulation or an inability to retain capital. Unfortunately, our positioning has generally hurt performance in the past few years since dividend paying stocks like these have become popular as bond substitutes in a very low interest rate environment. Going forward, however, we believe that rates cannot move much lower and will likely increase, eliminating the "search for yield" headwind we faced in 2014. We are not deviating from our growth-at-a-reasonable-price philosophy of owning well-managed companies with unique products and a long runway for expansion.
Fund's Positions in Mentioned Holdings
As a percentage of net assets, as of 12/31/14
Mettler-Toledo International | | | 2.2 | % | |
Cepheid | | | 1.8 | | |
Avis Budget Group | | | 1.5 | | |
Synageva BioPharma | | | 1.4 | | |
HEICO | | | 1.1 | | |
Casey's General Stores | | | 0.6 | | |
Chicago Bridge & Iron | | | 0.3 | | |
Rosetta Resources | | | 0.3 | | |
Chart Industries | | | 0.2 | | |
SM Energy | | | 0.2 | | |
GNC Holdings | | | 0.1 | | |
Groupon | | | 0.1 | | |
Fund holdings are as of the date given, are subject to change at any time, and are not recommendations to buy or sell any security. Top holdings exclude short-term holdings and cash, if applicable.
12
Columbia Acorn® Fund
At a Glance
Total Net Assets of the Fund:
$15.9 billion
Performance data shown in the table and graph below represent past performance, do not guarantee future results, assume reinvestment of dividends and distributions and do not reflect the deduction of taxes that a shareholder may pay on Fund distributions or the redemption of Fund shares. The investment return and principal value of an investment will fluctuate so that shares, when redeemed, may be worth more or less than their original cost. Current performance may be lower or higher than the performance data shown. Performance data reflect fee waivers or reimbursements of Fund expenses, if any; in their absence, performance results would have been lower. Indexes are unmanaged; their results do not reflect the effect of expenses or sales charges. Securities in the Fund may not match those in an index. Please visit columbiamanagement.com for performance data current to the most recent month-end.
The Growth of a $10,000 Investment in Columbia Acorn® Fund Class Z Shares
June 10, 1970 (Fund inception) through December 31, 2014
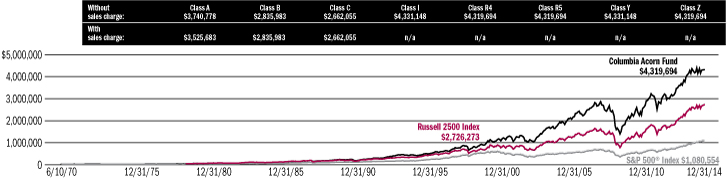
This chart shows the change in value of a hypothetical $10,000 investment in Class Z shares of the Fund during the stated time period. A $10,000 investment in Columbia Acorn Fund at inception appreciated to $31,777 on December 31, 1978, the inception date of the Russell 2500 Index. For comparison with the Russell 2500 Index, we assigned the index the same value as the Fund at index inception. Although the Fund typically invests in small- and mid-sized companies, the comparison to the S&P 500 Index is presented to show performance against a widely recognized market index over the life of the Fund.
Average Annual Total Returns for period ended December 31, 2014
| | | 4th quarter | | 1 year | | 5 years | | 10 years | | Life of Fund | |
| Class Z (6/10/70 inception) | | | 3.88 | % | | | 0.82 | % | | | 13.35 | % | | | 8.39 | % | | | 14.59 | % | |
| Class A (10/16/00 inception) | |
without sales charge | | | 3.83 | | | | 0.55 | | | | 13.02 | | | | 8.08 | | | | 14.22 | | |
with sales charge | | | -2.15 | | | | -5.23 | | | | 11.69 | | | | 7.44 | | | | 14.07 | | |
Russell 2500 Index* | | | 6.77 | | | | 7.07 | | | | 16.36 | | | | 8.72 | | | | N/A | | |
Results for other share classes can be found on Page 2.
*The Fund's primary benchmark. Please see Page 1 for index descriptions.
Returns for Class A shown with and without the maximum initial sales charge of 5.75%. As stated in the May 1, 2014, prospectus, the Fund's annual operating expense ratio is 0.79% for Class Z shares and 1.08% for Class A shares. The returns shown for periods prior to the inception of the Fund's Class A shares append the returns of the Fund's Class Z shares, the Fund's oldest share class. These returns are adjusted to reflect any higher class-related operating expenses of the newer share classes, as applicable. Please visit columbiamanagement.com/mutual-funds/ appended-performance for more information.
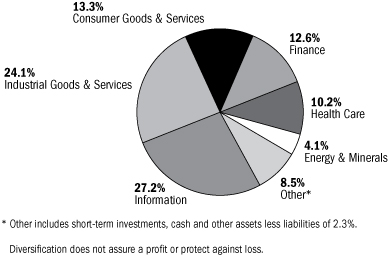
Portfolio Diversification
as a percentage of net assets, as of 12/31/14
Top 10 Holdings
as a percentage of net assets, as of 12/31/14
1. | | Ametek
Aerospace/Industrial Instruments | | | 2.4
| % | |
2. | | Mettler-Toledo International
Laboratory Equipment | | | 2.2
| % | |
3. | | Donaldson
Industrial Air Filtration | | | 1.9
| % | |
4. | | SEI Investments
Mutual Fund Administration & Investment
Management | | | 1.9
| % | |
5. | | Amphenol
Electronic Connectors | | | 1.8
| % | |
6. | | Cepheid
Molecular Diagnostics | | | 1.8
| % | |
7. | | Avis Budget Group
Car Rental Company | | | 1.5
| % | |
8. | | Nordson
Dispensing Systems for Adhesives & Coatings | | | 1.5
| % | |
9. | | Synageva BioPharma
Biotech Focused on Orphan Diseases | | | 1.4
| % | |
10. | | Ansys
Simulation Software for Engineers & Designers | | | 1.3
| % | |
The Fund's top 10 holdings and portfolio diversification vary with changes in portfolio investments. See the Statement of Investments for a complete list of the Fund's holdings.
13
Columbia Acorn International®
In a Nutshell

| | 
| |
P. Zachary Egan
Co-Portfolio Manager | | Louis J. Mendes III
Co-Portfolio Manager | |
Performance data shown represents past performance and is not a guarantee of future results. The investment return and principal value will fluctuate so that shares, when redeemed, may be worth more or less than the original cost. Current performance may be lower or higher than the performance data shown. Please visit columbiamanagement.com for daily and most recent month-end performance updates.
International investing involves special risks, including foreign taxation, currency risks, risks associated with possible differences in financial standards, operational and settlement risks and other risks associated with future political and economic developments. Stocks of small- and mid-cap companies pose special risks, including illiquidity and greater price volatility than stocks of larger, more established companies. Investing in emerging markets may involve greater risks than investing in more developed countries. In addition, concentration of investments in a single region may result in greater volatility. Please also see "A Comment on Trading Volumes" on the inside front cover of this report.
Columbia Acorn International Class Z shares declined 2.60% in the fourth quarter of 2014, performing better than the Fund's primary benchmark, the S&P Global Ex-U.S. Between $500M and $5B Index, which fell 3.48%. For the full year, the Fund was down 4.28%, lagging the 1.76% decline of the benchmark. For comparison, the large-cap, developed market MSCI EAFE Index (Net) declined 3.57% in the fourth quarter and 4.90% during the year.
After a strong return in 2013, international markets struggled to provide positive U.S. dollar returns due to a number of factors. First and foremost was the strong U.S. dollar against nearly all world currencies. The combination of a recovering U.S. economy and increasing economic and political risk in Eastern Europe and the Middle East sent many investors fleeing to the security of the U.S. dollar. The euro fell over 11% and the British pound fell over 6% to the dollar. In Japan, Abenomics' continued easy money policies helped drive the yen down over 13% versus the dollar. It is not our practice to hedge currency exposures in the Fund in order to express a view on direction. This introduces some volatility to U.S. dollar returns, but we believe it lowers costs in the long term, and also provides shareholders with the benefit of currency diversification when exchange rates move in the other direction.
The second major factor impacting international markets for the year was the rising specter of global deflation, most notably felt in the declining price of most commodities, particularly oil. While oil's dramatic fall in price has triggered debate over whether its cause is U.S.-led supply or declining global growth, there is considerable consensus that slow growth is driving the fall in other commodities, such as iron ore and copper. The flight to safety, as reflected in the roughly 0.85% drop in U.S. Treasury 10-year bond yields, only further reinforces the notion of little inflation in an increasingly hostile world outside the United States. It is notable that the 10-year yield, which has stayed under 2% for most of January 2015, implies a negative real return, assuming the Federal Reserve meets its long-term inflation target of 2%.
For the fourth quarter, top contributions to Fund returns came from a country that is often forgotten in global market discussions: South Africa. This country represented about 2.5% of the Fund's benchmark, but over 5% of Fund assets. Three of the Fund's largest positions—Coronation Fund Managers, Naspers and Rand Merchant Insurance—are based in the country and generated strong returns of 18%, 17% and 14%, respectively, in the quarter. For the full year, these three positions were up 36%, 24% and 38%, respectively, in a market that rose less than 7% in U.S. dollar terms in the benchmark. One factor that these
companies all have in common is excellent management that has allowed them to expand overseas into other markets. Coronation Fund Managers is leveraging off a successful domestic operation to expand into the international fund management business, opening up new avenues of growth. While operating a pay-television franchise in sub-Saharan Africa, Naspers generates the bulk of its value from its investment in Hong Kong-based Tencent, an Internet software/mobile application business. Rand Merchant Insurance is growing through its Australian car insurance operations. Finding overlooked gems in often under-covered markets has been a hallmark of the Acorn style and has yielded strong returns in South Africa.
The quarter's largest detractor in absolute terms was not a particular stock but rather the energy sector in its entirety. Oil prices fell from approximately $100 per barrel to about $50 in the quarter. The ramifications for many small- to mid-sized oil service providers are significant as the major oil companies are expected to cancel many exploration and production projects that no longer make economic sense. The Fund's energy positions on average fell 30% in the fourth quarter and over 38% for the full year.
For the year, Macau casino operator Melco Crown Entertainment fell 35% on negative sentiment, as the industry came under greater scrutiny from mainland China. Neopost, a French provider of postage meter machines, declined 22% during the year on poor contract renewals with the French public sector. While 2014 was a disappointing year, both Melco Crown Entertainment and Neopost have been long-term winners for the Fund's shareholders.
As we look ahead to 2015, international markets remain out of favor as market pundits continue to champion U.S. economic growth and currency strength as a reason for keeping more assets stateside than abroad. While no one knows the future direction of markets, as dedicated international investors, we will continue to seek out the best opportunities we can find for shareholders.
Fund's Positions in Mentioned Holdings
As a percentage of net assets, as of 12/31/14
Coronation Fund Managers | | | 1.8 | % | |
Naspers | | | 1.3 | | |
Neopost | | | 1.0 | | |
Rand Merchant Insurance | | | 0.9 | | |
Melco Crown Entertainment | | | 0.6 | | |
Fund holdings are as of the date given, are subject to change at any time, and are not recommendations to buy or sell any security. Top holdings exclude short-term holdings and cash, if applicable.
14
Columbia Acorn International®
At a Glance
Total Net Assets of the Fund:
$7.7 billion
Performance data shown in the table and graph below represents past performance, does not guarantee future results, assumes reinvestment of dividends and distributions and does not reflect the deduction of taxes that a shareholder may pay on Fund distributions or the redemption of Fund shares. The investment return and principal value of an investment will fluctuate so that shares, when redeemed, may be worth more or less than their original cost. Current performance may be lower or higher than the performance data shown. Performance data reflects fee waivers or reimbursements of Fund expenses, if any; in their absence, performance results would have been lower. Indexes are unmanaged; their results do not reflect the effect of expenses or sales charges. Securities in the Fund may not match those in an index. Please visit columbiamanagement.com for performance data current to the most recent month-end.
The Growth of a $10,000 Investment in Columbia Acorn International® Class Z Shares
September 23, 1992 (Fund inception) through December 31, 2014

This chart shows the change in value of a hypothetical $10,000 investment in Class Z shares of the Fund during the stated time period.
Average Annual Total Returns for period ended December 31, 2014
| | | 4th quarter | | 1 year | | 5 years | | 10 years | | Life of Fund | |
| Class Z (9/23/92 inception) | | | -2.60 | % | | | -4.28 | % | | | 8.47 | % | | | 8.95 | % | | | 10.88 | % | |
| Class A (10/16/00 inception) | |
without sales charge | | | -2.69 | | | | -4.58 | | | | 8.11 | | | | 8.59 | | | | 10.46 | | |
with sales charge | | | -8.28 | | | | -10.05 | | | | 6.84 | | | | 7.95 | | | | 10.16 | | |
S&P Global Ex-U.S. Between
$500M® and $5B* | | | -3.48 | | | | -1.76 | | | | 7.14 | | | | 7.65 | | | | 8.31 | | |
Results for other share classes can be found on Page 2.
*The Fund's primary benchmark. Please see Page 1 for index descriptions.
Returns for Class A shown with and without the maximum initial sales charge of 5.75%. As stated in the May 1, 2014, prospectus, the Fund's annual operating expense ratio is 0.94% for Class Z shares and 1.29% for Class A shares. The returns shown for periods prior to the inception of the Fund's Class A shares append the returns of the Fund's Class Z shares, the Fund's oldest share class. These returns are adjusted to reflect any higher class-related operating expenses of the newer share classes, as applicable. Please visit columbiamanagement.com/mutual-funds/
appended-performance for more information.
Portfolio Diversification
as a percentage of net assets, as of 12/31/14
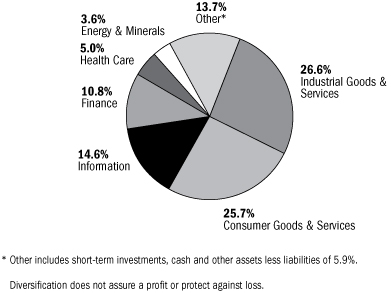
Top 10 Holdings
as a percentage of net assets, as of 12/31/14
1. | | Coronation Fund Managers (South Africa)
South African Fund Manager | | | 1.8
| % | |
2. | | Naspers (South Africa)
Media in Africa, China, Russia & other Emerging Markets | | | 1.3
| % | |
| 3. | | CCL Industries (Canada)
Global Label Converter | | | 1.2
| % | |
| 4. | | WuXi PharmaTech - ADR (China)
Contract Research Organization Business in China | | | 1.1
| % | |
5. | | Zee Entertainment Enterprises (India)
Programmer of Pay Television Content | | | 1.0
| % | |
6. | | Neopost (France)
Postage Meter Machines | | | 1.0
| % | |
| 7. | | Partners Group (Switzerland)
Private Markets Asset Management | | | 1.0
| % | |
8. | | Amcor (Australia)
Global Leader in Flexible & Rigid Packaging | | | 1.0
| % | |
9. | | Aalberts Industries (Netherlands)
Flow Control & Heat Treatment | | | 1.0
| % | |
| | | 10. Wirecard (Germany)
Online Payment Processing & Risk Management | | | 0.9
| % | |
The Fund's top 10 holdings and portfolio diversification vary with changes in portfolio investments. See the Statement of Investments for a complete list of the Fund's holdings.
15
Columbia Acorn USA®
In a Nutshell

| | 
| |
Robert A. Mohn
Lead Portfolio Manager | | William J. Doyle
Co-Portfolio Manager | |
Performance data shown represents past performance and is not a guarantee of future results. The investment return and principal value will fluctuate so that shares, when redeemed, may be worth more or less than the original cost. Current performance may be lower or higher than the performance data shown. Please visit columbiamanagement.com for daily and most recent month-end performance updates.
Stocks of small- and mid-cap companies pose special risks, including possible illiquidity and greater price volatility than stocks of larger, more established companies.
Columbia Acorn USA Class Z shares ended the fourth quarter up 7.73%. This compares to the 9.73% return for the Fund's primary benchmark, the Russell 2000 Index. For the annual period ended December 31, 2014, the Fund was up 3.61% versus a 4.89% gain for the benchmark. One area that hurt Fund relative performance versus the benchmark, especially for the annual period, was the information technology sector. Our weighting in this group was in line with the benchmark, but our technology stocks failed to keep up with the index's tech stocks. The Fund's performance was also impacted by the dramatic decline in energy prices, which hurt the Fund's energy and energy-related stocks.
The biggest detractors for the annual period in the information technology sector were CalAmp and Ultratech. CalAmp, a provider of machine-to-machine communications systems, was down 35% for the year but rebounded a bit in the fourth quarter, gaining 4%. The company's stock declined on disappointing earnings growth. Ultratech, a manufacturer of semiconductor equipment, ended the year down 39%, as orders for its equipment fell below expectations. We opted to sell this position in the fourth quarter.
Turning to top contributors in the fourth quarter and annual period, car rental company Avis Budget Group continued to provide strong performance through year end. The company has benefited from improved volume and pricing within the industry, and its stock ended the year up 63% and the quarter up 21%. Enjoying strong sales growth and interest from investors looking for a yield substitute in a low-rate environment, self-storage facility owner Extra Space Storage gained 44% in 2014 and 15% in the fourth quarter.
Other winners included several health care-related stocks. Synageva BioPharma, a biotech focused on orphan diseases, initiated a new trial for a drug to treat a rare neurological disease called Sanfilippo syndrome. Its stock rose 35% in the fourth quarter and ended the year up 44%. Cepheid, a molecular diagnostics company, saw its installed base of automated genetic testing instruments grow 47% year-over-year. Its stock gained 23% in the fourth quarter and was up 16% for the year. Laboratory equipment manufacturer Mettler-Toledo International's sales growth reached a two-year high, driving fourth quarter gains of 18% and an annual return of 25%. Akorn, a developer, manufacturer and distributor of specialty generic drugs, doubled its revenues over the prior year, aided by an acquisition and drug price increases. Its stock
was up 48% for the year but cooled in the fourth quarter, gaining just 0.2%.
In addition to the information technology stocks noted above, the other laggards for the year and quarter were not surprisingly energy related. The Fund's average weight in the energy sector was 4.7% of Fund assets in 2014, slightly below the benchmark weight of 5.4%. The drop in oil prices from $100 to $50 a barrel hurt both oil and gas producers, as well as oil service providers. Four of the energy stocks in Columbia Acorn USA had their stock prices fall about 50% in the fourth quarter, roughly in line with the 50% drop in oil in the second half of 2014.
The U.S. economy increasingly appears to be mending itself and moving in a positive direction. U.S. job growth seems relatively healthier than it has been in the recent past. At year end, the S&P 500 Index, a U.S. large-cap stock index, was up 13.69%, while the small-cap Russell 2000 Index lagged behind, rising 4.89% for the year. We believe both small-cap and large-cap stocks should continue to benefit from a strong U.S. economy. We remain optimistic that a growing U.S. economy and accelerating merger and acquisition activity will create a more positive environment for Columbia Acorn USA's small-cap stocks. As growth-at-a-reasonable-price investors, we remain focused on owning well-managed, niche companies that have room to grow.
Fund's Positions in Mentioned Holdings
As a percentage of net assets, as of 12/31/14
Avis Budget Group | | | 3.8 | % | |
Extra Space Storage | | | 3.5 | | |
Mettler-Toledo International | | | 3.4 | | |
Cepheid | | | 2.2 | | |
Synageva BioPharma | | | 2.1 | | |
Akorn | | | 1.7 | | |
CalAmp | | | 0.4 | | |
Fund holdings are as of the date given, are subject to change at any time, and are not recommendations to buy or sell any security. Top holdings exclude short-term holdings and cash, if applicable.
16
Columbia Acorn USA®
At a Glance
Total Net Assets of the Fund:
$1.3 billion
Performance data shown in the table and graph below represents past performance, does not guarantee future results, assumes reinvestment of dividends and distributions and does not reflect the deduction of taxes that a shareholder may pay on Fund distributions or the redemption of Fund shares. The investment return and principal value of an investment will fluctuate so that shares, when redeemed, may be worth more or less than their original cost. Current performance may be lower or higher than the performance data shown. Performance data reflects fee waivers or reimbursements of Fund expenses, if any; in their absence, performance results would have been lower. Indexes are unmanaged; their results do not reflect the effect of expenses or sales charges. Securities in the Fund may not match those in an index. Please visit columbiamanagement.com for performance data current to the most recent month-end.
The Growth of a $10,000 Investment in Columbia Acorn USA® Class Z Shares
September 4, 1996 (Fund inception) through December 31, 2014

This chart shows the change in value of a hypothetical $10,000 investment in Class Z shares of the Fund during the stated time period.
Average Annual Total Returns for period ended December 31, 2014
| | | 4th quarter | | 1 year | | 5 years | | 10 years | | Life of Fund | |
| Class Z (9/4/96 inception) | | | 7.73 | % | | | 3.61 | % | | | 13.88 | % | | | 7.62 | % | | | 10.81 | % | |
| Class A (10/16/00 inception) | |
without sales charge | | | 7.69 | | | | 3.35 | | | | 13.57 | | | | 7.33 | | | | 10.44 | | |
with sales charge | | | 1.50 | | | | -2.58 | | | | 12.23 | | | | 6.69 | | | | 10.08 | | |
Russell 2000 Index* | | | 9.73 | | | | 4.89 | | | | 15.55 | | | | 7.77 | | | | 8.69 | | |
Results for other share classes can be found on Page 2.
*The Fund's primary benchmark. Please see Page 1 for index descriptions.
Returns for Class A shown with and without the maximum initial sales charge of 5.75%. As stated in the May 1, 2014, prospectus, the Fund's annual operating expense ratio is 1.07% for Class Z shares and 1.33% for Class A shares. The returns shown for periods prior to the inception of the Fund's Class A shares append the returns of the Fund's Class Z shares, the Fund's oldest share class. These returns are adjusted to reflect any higher class-related operating expenses of the newer share classes, as applicable. Please visit columbiamanagement.com/mutual-funds/
appended-performance for more information.
Portfolio Diversification
as a percentage of net assets, as of 12/31/14
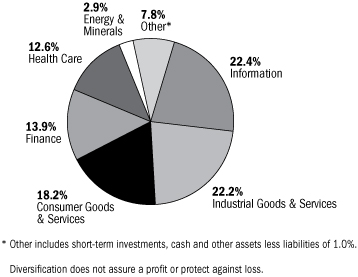
Top 10 Holdings
as a percentage of net assets, as of 12/31/14
1. | | Avis Budget Group
Car Rental Company | | | 3.8
| % | |
2. | | Extra Space Storage
Self Storage Facilities | | | 3.5
| % | |
3. | | Mettler-Toledo International
Laboratory Equipment | | | 3.4
| % | |
4. | | Ametek
Aerospace/Industrial Instruments | | | 3.0
| % | |
5. | | Nordson
Dispensing Systems for Adhesives & Coatings | | | 2.9
| % | |
6. | | HEICO
FAA-approved Aircraft Replacement Parts | | | 2.5
| % | |
7. | | Donaldson
Industrial Air Filtration | | | 2.4
| % | |
8. | | IPG Photonics
Fiber Lasers | | | 2.3
| % | |
9. | | Cepheid
Molecular Diagnostics | | | 2.2
| % | |
10. | | Synageva BioPharma
Biotech Focused on Orphan Diseases | | | 2.1
| % | |
The Fund's top 10 holdings and portfolio diversification vary with changes in portfolio investments. See the Statement of Investments for a complete list of the Fund's holdings.
17
Columbia Acorn International SelectSM
In a Nutshell

| |
Christopher J. Olson
Portfolio Manager | |
Performance data shown represents past performance and is not a guarantee of future results. The investment return and principal value will fluctuate so that shares, when redeemed, may be worth more or less than the original cost. Current performance may be lower or higher than the performance data shown. Please visit columbiamanagement.com for daily and most recent month-end performance updates.
International investing involves special risks, including foreign taxation, currency risks, risks associated with possible differences in financial standards, operational and settlement risks and other risks associated with future political and economic developments. Due to the Fund's concentration in a limited number of stocks, the Fund's portfolio will tend to diverge significantly from benchmark weightings and may therefore pose greater risk and volatility relative to its benchmark, or in comparison to other Columbia Acorn Fund portfolios. Stocks of small- and mid-cap companies pose special risks, including illiquidity and greater price volatility than stocks of larger, more established companies. Investing in emerging markets may involve greater risks than investing in more developed countries. Please also see "A Comment on Trading Volumes" on the inside front cover of this report.
Columbia Acorn International Select Class Z shares ended the fourth quarter of 2014 down 8.23%. This compares to a 2.45% drop in the Fund's primary benchmark, the S&P Developed Ex-U.S. Between $2B and $10B® Index. For the annual period ended December 31, 2014, the Fund was down 6.79% versus a 2.10% decline for its benchmark.
Pummeled by falling oil prices, energy stocks were the biggest detractor from returns for both the quarter and year. The global oil market has been thrown into severe turmoil on concerns about excess supply while, at the same time, demand is weak due to slowing global growth. Canadian oil and gas producer Baytex and U.S.-listed Denbury Resources, an oil producer using Co2 injection, both fell 58% for the year and dropped 56% and 47%, respectively, in the fourth quarter. We opted to sell the Fund's position in Denbury Resources in the quarter.
The Fund's overweight position in materials stocks continued to be a drag on returns. Brazilian gold miner Beadell Resources dropped 49% in the fourth quarter and ended the year down 75%. Falling gold prices and poor weather hampered its mining operations. Tahoe Resources, a silver miner operating in Guatemala, fell 32% in the quarter and 16% for the year as silver prices dropped along with most other commodities and the Guatemalan government doubled its royalty take. Canadian gold miner Goldcorp ended the year down 13% and fell 19% in the fourth quarter, also on a drop in commodity prices.
Up 47%, Canada's CCL Industries, a global label converter, was the top contributor to gains for the year and was also strong in the fourth quarter, gaining 9%. The company made a well-timed and well-priced acquisition that drove strong performance throughout the year. CJ Corp, a holding company of Korean consumer conglomerates, had an annual gain of 27% but cooled in the fourth quarter, falling 15%. The market looked favorably on company moves to lower operating costs to drive up margins, but the stock gave back some of its gains in the fourth quarter. In Japan, auto parts manufacturer NGK Spark Plug ended the annual period up 31% and the fourth quarter up 4%, benefiting from strong earnings growth in 2014 assisted by a weaker yen. Naspers, a provider of media to emerging markets, was the top contributor to gains in the fourth quarter, returning 18%, and ended the year with a 25% return. Chinese Internet company Tencent is Naspers' primary investment and it continued to report robust revenue and earnings gains.
The Fund's overweight position in financials versus its benchmark was a positive for the year and quarter. Coronation Fund Managers, a South African fund manager, ended the year up 34% and gained 18% in the fourth quarter. Coronation's strong fund inflows from retail and
international investors drove continued growth in assets under management and net fees. Ascendas REIT, an industrial property landlord in Singapore, gained 9% in 2014 and finished the fourth quarter up 5% on steady results and the continued search, on the part of investors, for yield. Partners Group, a Swiss private markets asset manager, was up roughly 11% for the quarter and year. The company continued to report robust increases in assets under management.
International equity and currency markets have seen their share of volatility over the past several years, a trend that is likely to continue given uncertain global growth, government intervention and ongoing geopolitical concerns. We, however, remain consistent in our search for strong, underappreciated businesses that can operate successfully in and through such environments.
Fund's Positions in Mentioned Holdings
As a percentage of net assets, as of 12/31/14
Ascendas REIT | | | 5.6 | % | |
CCL Industries | | | 3.3 | | |
Tahoe Resources | | | 3.2 | | |
NGK Spark Plug | | | 3.2 | | |
Partners Group | | | 3.1 | | |
Baytex | | | 2.4 | | |
Goldcorp | | | 2.2 | | |
Naspers | | | 2.1 | | |
CJ Corp | | | 2.1 | | |
Coronation Fund Managers | | | 1.5 | | |
Beadell Resources | | | 0.9 | | |
Fund holdings are as of the date given, are subject to change at any time, and are not recommendations to buy or sell any security. Top holdings exclude short-term holdings and cash, if applicable.
18
Columbia Acorn International SelectSM
At a Glance
Total Net Assets of the Fund:
$252.9 million
Performance data shown in the table and graph below represents past performance, does not guarantee future results, assumes reinvestment of dividends and distributions and does not reflect the deduction of taxes that a shareholder may pay on Fund distributions or the redemption of Fund shares. The investment return and principal value of an investment will fluctuate so that shares, when redeemed, may be worth more or less than their original cost. Current performance may be lower or higher than the performance data shown. Performance data reflects fee waivers or reimbursements of Fund expenses, if any; in their absence, performance results would have been lower. Indexes are unmanaged; their results do not reflect the effect of expenses or sales charges. Securities in the Fund may not match those in an index. Please visit columbiamanagement.com for performance data current to the most recent month-end.
The Growth of a $10,000 Investment in Columbia Acorn International SelectSM Class Z Shares
November 23, 1998 (Fund inception) through December 31, 2014
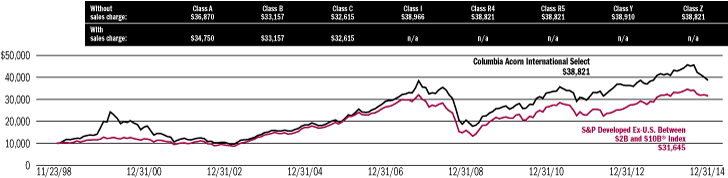
This chart shows the change in value of a hypothetical $10,000 investment in Class Z shares of the Fund during the stated time period.
Average Annual Total Returns for period ended December 31, 2014
| | | 4th quarter | | 1 year | | 5 years | | 10 years | | Life of Fund | |
| Class Z (11/23/98 inception) | | | -8.23 | % | | | -6.79 | % | | | 7.57 | % | | | 7.76 | % | | | 8.79 | % | |
| Class A (10/16/00 inception) | |
without sales charge | | | -8.27 | | | | -7.06 | | | | 7.21 | | | | 7.42 | | | | 8.44 | | |
with sales charge | | | -13.56 | | | | -12.39 | | | | 5.95 | | | | 6.78 | | | | 8.04 | | |
S&P Developed Ex-U.S. Between
$2B and $10B® Index* | | | -2.45 | | | | -2.10 | | | | 7.53 | | | | 6.25 | | | | 7.41 | | |
Results for other share classes can be found on Page 2.
*The Fund's primary benchmark. Please see Page 1 for index descriptions.
Returns for Class A shown with and without the maximum initial sales charge of 5.75%. As stated in the May 1, 2014, prospectus, the Fund's annual operating expense ratio is 1.21% for Class Z shares and 1.49% for Class A shares. The returns shown for periods prior to the inception of the Fund's Class A shares append the returns of the Fund's Class Z shares, the Fund's oldest share class. These returns are adjusted to reflect any higher class-related operating expenses of the newer share classes, as applicable. Please visit columbiamanagement.com/mutual-funds/
appended-performance for more information.
Portfolio Diversification
as a percentage of net assets, as of 12/31/14
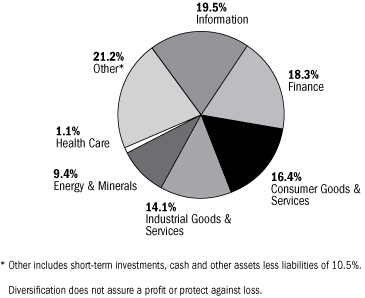
Top 10 Holdings
as a percentage of net assets, as of 12/31/14
1. | | Ascendas REIT (Singapore)
Industrial Property Landlord | | | 5.6
| % | |
2. | | Singapore Exchange (Singapore)
Singapore Equity & Derivatives Market Operator | | | 4.7
| % | |
| 3. | | Challenger Financial (Australia)
Annuity Provider in Australia | | | 4.5
| % | |
| 4. | | Babcock International (United Kingdom)
Public Sector Outsourcer | | | 3.6
| % | |
| 5. | | CCL Industries (Canada)
Global Label Converter | | | 3.3
| % | |
| 6. | | Tahoe Resources (Guatemala)
Silver Project in Guatemala | | | 3.2
| % | |
| 7. | | NGK Spark Plug (Japan)
Automobile Parts | | | 3.2
| % | |
| 8. | | Swedish Match (Sweden)
Swedish Snus | | | 3.1
| % | |
| 9. | | Partners Group (Switzerland)
Private Markets Asset Management | | | 3.1
| % | |
| 10. | | KDDI (Japan)
Mobile & Fixed Line Communication Service
Provider in Japan | | | 3.0
| % | |
The Fund's top 10 holdings and portfolio diversification vary with changes in portfolio investments. See the Statement of Investments for a complete list of the Fund's holdings.
19
Columbia Acorn SelectSM
In a Nutshell

| |
Robert A. Chalupnik
Portfolio Manager | |
Performance data shown represents past performance and is not a guarantee of future results. The investment return and principal value will fluctuate so that shares, when redeemed, may be worth more or less than the original cost. Current performance may be lower or higher than the performance data shown. Please visit columbiamanagement.com for daily and most recent month-end performance updates.
Risks include stock market fluctuations due to economic and business developments. The Fund also has potentially greater price volatility due to the Fund's concentration in a limited number of stocks of mid-size companies. International investing involves special risks, including foreign taxation, currency risks, risks associated with possible differences in financial standards, operational and settlement risks and other risks associated with future political and economic developments.
Columbia Acorn Select Class Z shares ended the fourth quarter of 2014 up 2.90%, falling short of the 6.35% gain of the Fund's primary benchmark, the S&P MidCap 400 Index. For the annual period ended December 31, 2014, the Fund gained 2.47% versus a 9.77% gain for the benchmark.
Energy holdings were the largest detractor from performance for both periods. Our energy strategy includes holding a basket of small exploration and production companies, many of which have operations outside of the United States in areas that the large-cap energy companies have mostly ignored. Unfortunately, the recent decline in oil prices caused investors to flee this space and the Fund's energy holdings were hit particularly hard. Fund energy stocks and energy-exposed industrial holdings accounted for over half the Fund's underperformance in both the fourth quarter and the year.
Looking at what helped in both the quarter and annual period, Mettler-Toledo International, a manufacturer of laboratory equipment, rose 18% in the quarter and ended the year up 25%. The company enjoyed accelerated growth in both laboratory and industrial products due to market share gains. Management also raised 2014 guidance and provided a solid outlook for 2015. Cepheid, a molecular diagnostics company, saw its installed base of automated genetic testing instruments grow 47% year-over-year. Its stock gained 23% in the fourth quarter and was up 16% for the year. Pall, a provider of life science, water and industrial filtration equipment, was up 21% in the quarter and 20% for the year. Pall enjoyed growth in both its life science and industrial segments. Improved margins have also fueled strong earnings growth.
As noted above, the Fund's underperformers were largely energy names or industrials with significant exposure to the energy sector. The Fund's energy investments averaged 5.6% of Fund assets for the year, in line with the 5.3% energy weight of the benchmark. Canacol, an oil producer in South America, saw its stock drop 55% in the fourth quarter and 68% for the year. Quanta Services provides electrical transmission and pipeline contracting services and is classified as an industrial company. However, nearly 30% of its revenues come from oil and gas pipeline construction projects so its stock fell with energy prices, declining 22% in the fourth quarter and 10% for the year.
During the fourth quarter, we sold out of three stocks and added three new names to the portfolio. Budget hotel brand Choice Hotels was sold when its stock met our price target. We also exited the Fund's positions in oil and gas producers Clayton Williams and Antero Resources to swap into Core Labs, an oil and gas reservoir consulting company. The other two new names are biotech-related companies. VWR is a distributor of lab supplies with leading market share in Europe and a number two market-share position in
the United States. We believe the company should benefit from accelerating spending by well-funded biopharmaceutical companies. Intercept Pharmaceuticals is a biotech firm developing drugs for several diseases. In public clinical trials, its lead drug, OCA, has shown strong efficacy in a liver disease known as NASH, which has no approved treatment.
At the writing of this report, oil prices were just below $50 per barrel versus the $100 mark where they hovered for most of the past five years. Certainly the additional supply of oil from U.S. shale formations is a major contributor to the price decline, but weaker economies in Europe and China are also a factor. Fortunately, the U.S. economy continues to be relatively strong. We remain bullish on the prospects for U.S. mid-cap companies.
Fund's Positions in Mentioned Holdings
As a percentage of net assets, as of 12/31/14
Mettler-Toledo International | | | 3.8 | % | |
Pall | | | 2.7 | | |
Cepheid | | | 2.6 | | |
Quanta Services | | | 2.2 | | |
VWR | | | 1.3 | | |
Canacol | | | 0.5 | | |
Core Labs | | | 0.5 | | |
Intercept Pharmaceuticals | | | 0.4 | | |
Fund holdings are as of the date given, are subject to change at any time, and are not recommendations to buy or sell any security. Top holdings exclude short-term holdings and cash, if applicable.
20
Columbia Acorn SelectSM
At a Glance
Total Net Assets of the Fund:
$666.5 million
Performance data shown in the table and graph below represents past performance, does not guarantee future results, assumes reinvestment of dividends and distributions and does not reflect the deduction of taxes that a shareholder may pay on Fund distributions or the redemption of Fund shares. The investment return and principal value of an investment will fluctuate so that shares, when redeemed, may be worth more or less than their original cost. Current performance may be lower or higher than the performance data shown. Performance data reflects fee waivers or reimbursements of Fund expenses, if any; in their absence, performance results would have been lower. Indexes are unmanaged; their results do not reflect the effect of expenses or sales charges. Securities in the Fund may not match those in an index. Please visit columbiamanagement.com for performance data current to the most recent month-end.
The Growth of a $10,000 Investment in Columbia Acorn SelectSM Class Z Shares
November 23, 1998 (Fund inception) through December 31, 2014
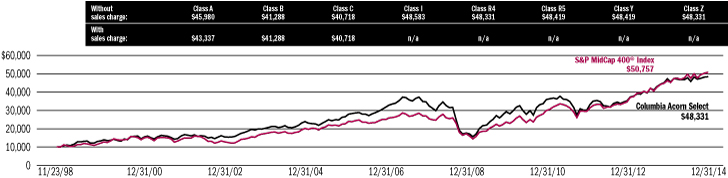
This chart shows the change in value of a hypothetical $10,000 investment in Class Z shares of the Fund during the stated time period.
Average Annual Total Returns for period ended December 31, 2014
| | | 4th quarter | | 1 year | | 5 years | | 10 years | | Life of Fund | |
| Class Z (11/23/98 inception) | | | 2.90 | % | | | 2.47 | % | | | 10.60 | % | | | 7.33 | % | | | 10.28 | % | |
Class A (10/16/00 inception) | |
without sales charge | | | 2.79 | | | | 2.17 | | | | 10.28 | | | | 7.02 | | | | 9.93 | | |
with sales charge | | | -3.12 | | | | -3.70 | | | | 8.98 | | | | 6.39 | | | | 9.53 | | |
S&P MidCap 400® Index* | | | 6.35 | | | | 9.77 | | | | 16.54 | | | | 9.71 | | | | 10.61 | | |
Results for other share classes can be found on Page 2.
*The Fund's primary benchmark. Please see Page 1 for index descriptions.
Returns for Class A shown with and without the maximum initial sales charge of 5.75%. As stated in the May 1, 2014, prospectus, the Fund's annual operating expense ratio is 1.03% for Class Z shares and 1.31% for Class A shares. The returns shown for periods prior to the inception of the Fund's Class A shares append the returns of the Fund's Class Z shares, the Fund's oldest share class. These returns are adjusted to reflect any higher class-related operating expenses of the newer share classes, as applicable. Please visit columbiamanagement.com/mutual-funds/
appended-performance for more information.
Portfolio Diversification
as a percentage of net assets, as of 12/31/14

Top 10 Holdings
as a percentage of net assets, as of 12/31/14
1. | | Ametek
Aerospace/Industrial Instruments | | | 6.2
| % | |
2. | | Donaldson
Industrial Air Filtration | | | 4.4
| % | |
3. | | Amphenol
Electronic Connectors | | | 4.3
| % | |
4. | | WNS - ADR (India)
Offshore Business Process Outsourcing Services | | | 3.9
| % | |
5. | | Mettler-Toledo International
Laboratory Equipment | | | 3.8
| % | |
6. | | SEI Investments
Mutual Fund Administration & Investment Management | | | 3.7
| % | |
7. | | F5 Network
Internet Traffic Management Equipment | | | 3.7
| % | |
8. | | LKQ
Alternative Auto Parts Distribution | | | 3.3
| % | |
9. | | CNO Financial Group
Life, Long-term Care & Medical Supplement Insurance | | | 3.3
| % | |
10. | | Nordson
Dispensing Systems for Adhesives & Coatings | | | 3.2
| % | |
The Fund's top 10 holdings and portfolio diversification vary with changes in portfolio investments. See the Statement of Investments for a complete list of the Fund's holdings.
21
Columbia Thermostat FundSM
In a Nutshell

| | 
| |
Charles P. McQuaid
Lead Portfolio Manager | | Christopher J. Olson
Co-Portfolio Manager | |
Performance data shown represents past performance and is not a guarantee of future results. The investment return and principal value will fluctuate so that shares, when redeemed, may be worth more or less than the original cost. Current performance may be lower or higher than the performance data shown. Please visit columbiamanagement.com for daily and most recent month-end performance updates.
A "fund of fund" bears its allocable share of the costs and expenses of the underlying funds in which it invests. Such funds are thus subject to two levels of fees and potentially higher expense ratios than would be associated with a fund that invests and trades directly in financial instruments under the direction of a single manager.
Columbia Thermostat Fund Class Z shares ended the fourth quarter of 2014 up 1.78%. This compares to a 4.93% quarterly gain of the Fund's primary equity benchmark, the S&P 500 Index. The Fund's primary debt benchmark, the Barclays U.S. Aggregate Bond Index, rose 1.79% in the quarter, and the 50/50 Blended Benchmark gained 3.36% for the same period. For the annual period, the Fund gained 5.57%, while the S&P 500 rose 13.69%, the Barclays U.S. Aggregate Bond Index rose 5.97% and the 50/50 Blended Benchmark gained 9.85%.
The weighted average gain for the Fund's equity portfolio was 2.93% for the fourth quarter and 6.40% for the annual period. Columbia Large Cap Enhanced Core Fund led gains for both periods, rising 5.25% in the fourth quarter and ending the year up 15.41%.
The bond portion of the Fund had a weighted average gain of 0.78% for the fourth quarter and rose 3.64% for the annual period. Columbia U.S. Government Mortgage Fund outperformed during the fourth quarter, increasing 2.15%, and rose 3.41% from May 1, 2014, when it was added to the Fund, through the end of the year.
Fund performance fell below the benchmarks for both the fourth quarter and the year. This was disappointing as our goal for Columbia Thermostat Fund is to provide performance that falls between its bond and equity benchmarks. This lag can be attributed largely to the Fund's relatively conservative bond investments, which are intended to serve as cash substitutes. Within the equities, domestic large-cap stocks outperformed, and Columbia Thermostat's smaller cap and foreign exposure hurt performance somewhat. We believe the Fund's smaller cap and foreign exposure should serve shareholders well over the long term.
The Fund hit four reallocation triggers in the fourth quarter. The Fund's equity exposure was increased twice in October, reduced in November and increased again in December. The Fund's allocation in November fell to its minimum 10% after the S&P 500 surpassed the 2,020 level, and then increased to 15% in December as the market fell. As of the writing of this report, stock market
volatility has increased. Columbia Thermostat Fund is poised to buy equities should the stock market decline.
Results of the Funds Owned in Columbia Thermostat Fund
as of December 31, 2014
Stock Funds
Fund | | Weightings
in category | | 4th
quarter | | 1 year | |
Columbia Acorn
International, Class I | | | 20 | % | | | -2.59 | % | | | -4.20 | % | |
Columbia Dividend Income
Fund, Class I | | | 20 | % | | | 4.66 | % | | | 12.94 | % | |
Columbia Acorn Fund, Class I | | | 15 | % | | | 3.91 | % | | | 0.91 | % | |
Columbia Contrarian Core
Fund, Class I | | | 15 | % | | | 4.73 | % | | | 13.12 | % | |
Columbia Acorn Select, Class I | | | 10 | % | | | 2.88 | % | | | 2.49 | % | |
Columbia Large Cap Enhanced
Core Fund, Class I | | | 10 | % | | | 5.25 | % | | | 15.41 | % | |
Columbia Select Large Cap
Growth Fund, Class I | | | 10 | % | | | 4.26 | % | | | 8.68 | % | |
Weighted Average
Equity Gain/Loss | | | 100 | % | | | 2.93 | % | | | 6.40 | % | |
Bond Funds
Fund | | Weightings
in category | | 4th
quarter | | 1 year | |
Columbia Short Term Bond
Fund, Class I | | | 40 | % | | | 0.13 | % | | | 0.97 | % | |
Columbia Intermediate Bond
Fund, Class I | | | 25 | % | | | 0.95 | % | | | 5.57 | % | |
Columbia Income Opportunities
Fund, Class I | | | 20 | % | | | 0.85 | % | | | 4.15 | % | |
Columbia U.S. Government
Mortgage Fund, Class I | | | 15 | % | | | 2.15 | % | | | 5.92 | % | |
Weighted Average
Income Gain/Loss | | | 100 | % | | | 0.78 | % | | | 3.64 | % | |
Columbia Thermostat Fund Rebalancing in the Fourth Quarter
October 3, 2014 | | 20% stocks, 80% bonds | |
October 14, 2014 | | 25% stocks, 75% bonds | |
November 14, 2014 | | 10% stocks, 90% bonds | |
December 15, 2014 | | 15% stocks, 85% bonds | |
The value of an investment in the Fund is based primarily on the performance of the underlying funds in which it invests. The Fund is subject to the risk that the investment manager's decisions regarding asset classes and underlying funds will not anticipate market trends successfully, resulting in a failure to preserve capital or lower total return.
The Fund's investments in the underlying funds may also present certain risks, including the following. Investments made by underlying funds in foreign securities, particularly those in emerging markets countries, are subject to special risks, including but not limited to a greater degree of social, political and economic volatility than is associated with domestic investments, as well as the risks associated with any differences in financial standards, including foreign taxation. Investments by the underlying funds in small- and mid-cap companies, as well as in restricted securities, pose special risks, including potential illiquidity and price volatility. Underlying funds that concentrate their investments in a single industry sector, such as technology or healthcare, are subject to the risk that companies in the same sector may be similarly affected by economic or market downturns. Risks associated with investments in bond funds include credit risk, interest rate risk, and prepayment and extension risk. Debt securities with the lowest investment grade ratings and unrated securities of comparable quality are more speculative than securities with higher ratings and may experience greater price fluctuations. These securities also tend to be more sensitive to credit risk than higher-rated securities. This is not an offer of the shares of any other mutual fund mentioned herein.
22
Columbia Thermostat FundSM
At a Glance
Total Net Assets of the Fund:
$1.2 billion
Performance data shown in the table and graph below represents past performance, does not guarantee future results, assumes reinvestment of dividends and distributions and does not reflect the deduction of taxes that a shareholder may pay on Fund distributions or the redemption of Fund shares. The investment return and principal value of an investment will fluctuate so that shares, when redeemed, may be worth more or less than their original cost. Current performance may be lower or higher than the performance data shown. Performance data reflects fee waivers or reimbursements of Fund expenses, if any; in their absence, performance results would have been lower. Indexes are unmanaged; their results do not reflect the effect of expenses or sales charges. Securities in the Fund may not match those in an index. Please visit columbiamanagement.com for performance data current to the most recent month-end.
The Growth of a $10,000 Investment in Columbia Thermostat FundSM Class Z Shares
September 25, 2002 (Fund inception) through December 31, 2014

This chart shows the change in value of a hypothetical $10,000 investment in Class Z shares of the Fund during the stated time period.
Average Annual Total Returns for period ended December 31, 2014
| | | 4th quarter | | 1 year | | 5 years | | 10 years | | Life of Fund | |
| Class Z (9/25/02 inception) | | | 1.78 | % | | | 5.57 | % | | | 10.09 | % | | | 6.55 | % | | | 7.99 | % | |
| Class A (3/3/03 inception) | |
without sales charge | | | 1.77 | | | | 5.30 | | | | 9.82 | | | | 6.29 | | | | 7.72 | | |
with sales charge | | | -4.11 | | | | -0.75 | | | | 8.54 | | | | 5.66 | | | | 7.20 | | |
S&P 500® Index* | | | 4.93 | | | | 13.69 | | | | 15.45 | | | | 7.67 | | | | 10.02 | | |
Barclays U.S. Aggregate Bond Index* | | | 1.79 | | | | 5.97 | | | | 4.45 | | | | 4.71 | | | | 4.67 | | |
Results for other share classes can be found on Page 2.
*The Fund's primary benchmarks. Please see Page 1 for index descriptions.
Returns for Class A shown with and without the maximum initial sales charge of 5.75%. As stated in the May 1, 2014, prospectus, the Fund's annual operating expense ratio is 0.80% for Class Z shares and 1.05% for Class A shares. The returns shown for periods prior to the inception of the Fund's Class A shares append the returns of the Fund's Class Z shares, the Fund's oldest share class. These returns are adjusted to reflect any higher class-related operating expenses of the newer share classes, as applicable. Please visit columbiamanagement.com/mutual-funds/
appended-performance for more information.
Asset Allocation
as a percentage of net assets, as of 12/31/14
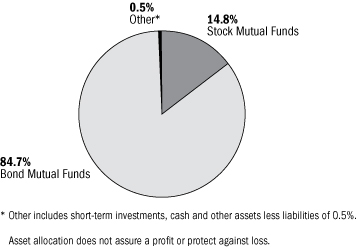
Portfolio Weightings
as a percentage of assets in each investment category, as of 12/31/14
Stock Mutual Funds
Columbia Acorn International, Class I | | | 20 | % | |
Columbia Dividend Income Fund, Class I | | | 20 | % | |
Columbia Acorn Fund, Class I | | | 15 | % | |
Columbia Contrarian Core Fund, Class I | | | 15 | % | |
Columbia Acorn Select, Class I | | | 10 | % | |
Columbia Large Cap Enhanced Core Fund,
Class I | | | 10 | % | |
Columbia Select Large Cap Growth Fund,
Class I | | | 10 | % | |
Bond Mutual Funds
Columbia Short Term Bond Fund, Class I | | | 40 | % | |
Columbia Intermediate Bond Fund, Class I | | | 25 | % | |
Columbia Income Opportunities Fund, Class I | | | 20 | % | |
Columbia U.S. Government Fund, Class I | | | 15 | % | |
23
Columbia Acorn Emerging Markets FundSM
In a Nutshell

| | 
| |
Fritz Kaegi
Lead Portfolio Manager | | Stephen Kusmierczak
Lead Portfolio Manager | |

| | 
| |
P. Zachary Egan
Co-Portfolio Manager | | Louis J. Mendes III
Co-Portfolio Manager | |
Performance data shown represents past performance and is not a guarantee of future results. The investment return and principal value will fluctuate so that shares, when redeemed, may be worth more or less than the original cost. Current performance may be lower or higher than the performance data shown. Please visit columbiamanagement.com for daily and most recent month-end performance updates.
International investing involves special risks, including foreign taxation, currency risks, risks associated with possible differences in financial standards, operational and settlement risks and other risks associated with future political and economic developments. Stocks of small- and mid-cap companies pose special risks, including illiquidity and greater price volatility than stocks of larger, more established companies. Investing in emerging markets may involve greater risks than investing in more developed countries. Please also see "A Comment on Trading Volumes" on the inside front cover of this report.
Columbia Acorn Emerging Markets Fund Class Z shares declined 2.36% in the final quarter of 2014, somewhat less than the Fund's primary benchmark, the S&P Emerging Markets Between $500M and $5B Index®, which fell 3.32%. For the full year, the Fund lost 4.12% compared to the benchmark gain of 1.90%. This underperformance was very disappointing, and represents the Fund's first year of underperformance versus the benchmark since inception. Losses in Fund health care and consumer discretionary stocks caused the most harm. Both of these sectors were outperformers last year and, since inception, our consumer discretionary stocks have been the single largest contributor to Fund outperformance. The Fund's annualized gain of 8.29% since its inception is well ahead of the benchmark's 3.31% return for the same period.
The biggest detractor in U.S. dollar terms for the fourth quarter was Kazakhstan retail bank and insurer Halyk Savings Bank of Kazakhstan, which dropped 26% in sympathy with lower oil prices and the potential devaluation of the Kazakh tenge following the Russian ruble's 30% devaluation. We believe that Halyk will emerge comfortably from this volatility, given its cheap valuation multiple, its dividend yield of over 5%, its robust capitalization and the perception within Kazakhstan of Halyk being the safest destination for deposits. Down 24% for the quarter, St. Shine Optical, a disposable contact lens manufacturer in Taiwan with most of its sales to Japan, faced increasing competition, causing its growth to flatten. Several Korean consumer discretionary holdings were also significant performance detractors in the quarter. Korean and Chinese fashion retailer The Basic House fell 39% in the fourth quarter as Korean sales remained slack after the Sewol ferry tragedy earlier in the year. Two gaming companies, Grand Korea Leisure and Paradise, fell 27% and 35%, respectively, following a corruption clampdown by Chinese authorities. Both casinos mainly serve Chinese gamers.
For the year, the biggest performance detractor was also a gaming company. Macau casino operator Melco International dropped 40%. Prior to this year, Melco International and Fund investments in gaming were consistent outperformers. We continue to hold these positions because we believe these highly cash generative businesses will eventually improve as mid-market growth offsets the decline in less-profitable VIP and junket businesses.
The two top performance contributors for the quarter also provided the biggest gains for the full year. Korean company Koh Young Technology provides inspection systems for printed circuit boards and was up 44% in the quarter and 126% for the year. The company is experiencing accelerating growth in its new 3D product and is growing penetration in China and in the automotive
industry. South African investment manager Coronation Fund Managers gained 18% for the quarter and 36% for the year, despite a 10% currency depreciation. The company continues to take savings product market share from banks and insurance companies, and is also growing its international business. Companies based in India were the best performing stocks in the emerging markets for the quarter and the year, gaining 16% and 51%, respectively. This rally was driven by expectations that the new Prime Minister Narendra Modi will be able to implement fundamental economic reforms. This improving country sentiment helped lift two of our best-performing holdings. Zee Entertainment is the leading programmer of pay television content in India, and gained 18% in the quarter and 28% for the year. Auto parts supplier Bosch is a subsidiary of its eponymous German parent, and returned 28% in the quarter and 92% for the year.
Following this year of underperformance, shareholders should rightfully question what we missed and whether we've changed how we invest your capital. First, we were slow in responding to the new anti-corruption policies in China. Similar efforts have been launched before, but not as effectively. Second, when we introduced the Fund, we expected that rising incomes and wealth, increasing labor participation and better education would drive strong spending growth by emerging market consumers, and that there would be companies that would capitalize on this development. While some markets are facing headwinds that are impacting growth, we believe the positive trends will return and be durable. Finally, while we are displeased by this year's underperformance, repeating prior years' outsized gains was unlikely. We are long-term investors and strive to invest in companies whose business models will enable outperformance over many years, not just a quarter or two. We believe this strategy should benefit patient investors and expect that you will watch our performance closely in 2015.
Please note that effective July 11, 2014, Columbia Acorn Emerging Markets Fund is closed to new investors and new accounts with certain exceptions. Refer to the Fund's prospectus dated May 1, 2014, as supplemented June 12, 2014, for details.
Fund's Positions in Mentioned Holdings
As a percentage of net assets, as of 12/31/14
Coronation Fund Managers | | | 4.1 | % | |
Zee Entertainment | | | 3.0 | | |
Koh Young Technology | | | 2.4 | | |
Melco International | | | 2.4 | | |
Halyk Savings Bank of Kazakhstan | | | 2.2 | | |
St. Shine Optical | | | 1.4 | | |
Bosch | | | 1.1 | | |
The Basic House | | | 1.0 | | |
Grand Korea Leisure | | | 0.8 | | |
Paradise | | | 0.5 | | |
Fund holdings are as of the date given, are subject to change at any time, and are not recommendations to buy or sell any security. Top holdings exclude short-term holdings and cash, if applicable.
24
Columbia Acorn Emerging Markets FundSM
At a Glance
Total Net Assets of the Fund:
$482.3 million
Performance data shown in the table and graph below represents past performance, does not guarantee future results, assumes reinvestment of dividends and distributions and does not reflect the deduction of taxes that a shareholder may pay on Fund distributions or the redemption of Fund shares. The investment return and principal value of an investment will fluctuate so that shares, when redeemed, may be worth more or less than their original cost. Current performance may be lower or higher than the performance data shown. Performance data reflects fee waivers or reimbursements of Fund expenses, if any; in their absence, performance results would have been lower. Indexes are unmanaged; their results do not reflect the effect of expenses or sales charges. Securities in the Fund may not match those in an index. Please visit columbiamanagement.com for performance data current to the most recent month-end.
The Growth of a $10,000 Investment in Columbia Acorn Emerging Markets FundSM Class Z Shares
August 19, 2011 (Fund inception) through December 31, 2014

This chart shows the change in value of a hypothetical $10,000 investment in Class Z shares of the Fund during the stated time period.
Average Annual Total Returns for period ended December 31, 2014
| | | 4th quarter | | 1 year | | Life of Fund | |
| Class Z (8/19/11 inception) | | | -2.36 | % | | | -4.12 | % | | | 8.29 | % | |
| Class A (8/19/11 inception) | | | | | | | |
without sales charge | | | -2.37 | | | | -4.28 | | | | 8.00 | | |
with sales charge | | | -7.98 | | | | -9.81 | | | | 6.12 | | |
S&P Emerging Markets Between $500M and $5B® Index* | | | -3.32 | | | | 1.90 | | | | 3.31 | | |
Results for other share classes can be found on Page 2.
*The Fund's primary benchmark. Please see Page 1 for index descriptions.
Returns for Class A shown with and without the maximum initial sales charge of 5.75%. As stated in the May 1, 2014, prospectus, the Fund's annual operating expense ratio is 1.59% for Class Z shares and 1.81% for Class A shares.
Portfolio Diversification
as a percentage of net assets, as of 12/31/14
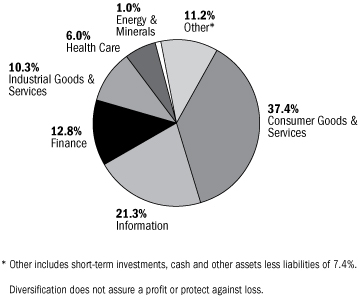
Top 10 Holdings
as a percentage of net assets, as of 12/31/14
1. | | Coronation Fund Managers (South Africa)
South African Fund Manager | | | 4.1
| % | |
| 2. | | Zee Entertainment Enterprises (India)
Programmer of Pay Television Content | | | 3.0
| % | |
3. | | AMVIG Holdings (China)
Chinese Tobacco Packaging Material Supplier | | | 2.8
| % | |
4. | | Melco Crown Resorts (Philippines)
Integrated Resort Operator in Manila | | | 2.5
| % | |
5. | | Koh Young Technology (Korea)
Inspection Systems for Printed Circuit Boards | | | 2.4
| % | |
6. | | Melco International (Hong Kong)
Macau Casino Operator | | | 2.4
| % | |
| 7. | | Halyk Savings Bank of
Kazakhstan - GDR (Kazakhstan)
Retail Bank & Insurer in Kazakhstan | | | 2.2
| % | |
8. | | WuXi PharmaTech - ADR (China)
Contract Research Organization Business in China | | | 2.1
| % | |
9. | | Rand Merchant Insurance (South Africa)
Directly Sold Property & Casualty Insurance;
Holdings in other Insurers | | | 2.1
| % | |
10. | | Nagacorp (Cambodia)
Casino & Entertainment Complex in Cambodia | | | 2.0
| % | |
The Fund's top 10 holdings and portfolio diversification vary with changes in portfolio investments. See the Statement of Investments for a complete list of the Fund's holdings.
25
Columbia Acorn European FundSM
In a Nutshell

| | 
| |
Andreas Waldburg-Wolfegg
Lead Portfolio Manager | | Stephen
Kusmierczak
Co-Portfolio Manager | |
Performance data shown represents past performance and is not a guarantee of future results. The investment return and principal value will fluctuate so that shares, when redeemed, may be worth more or less than the original cost. Current performance may be lower or higher than the performance data shown. Please visit columbiamanagement.com for daily and most recent month-end performance updates.
International investing involves special risks, including foreign taxation, currency risks, risks associated with possible differences in financial standards, operational and settlement risks and other risks associated with future political and economic developments. Stocks of small- and mid-cap companies pose special risks, including illiquidity and greater price volatility than stocks of larger, more established companies. Investing in emerging markets may involve greater risks than investing in more developed countries. Please also see "A Comment on Trading Volumes" on the inside front cover of this report.
For the year ended December 31, 2014, Columbia Acorn European Fund Class Z shares fell 7.52%. This compares to a 5.35% decline in the Fund's primary benchmark, the S&P Europe Between $500M and $5B® Index. For the fourth quarter, the Fund outperformed the benchmark with a 0.71% decline versus the benchmark's 1.47% drop.
To provide a more meaningful analysis in this report of the Fund, we divided Europe into what we consider to be homogenous sub-regions, as follows:
Mediterranean: France, Greece, Italy, Portugal and Spain
Nordic: Denmark, Finland, Norway and Sweden
Northern and Central Europe: Austria, Belgium, Germany, Luxembourg, the Netherlands and Switzerland
United Kingdom and Ireland
Other: All other countries, including Central Eastern and Southeastern Europe
The largest average geographical region weight within the Fund over 2014 was the United Kingdom and Ireland at 34%, followed by Northern and Central Europe (24%), the Mediterranean (20%), and the Nordic countries (19%). "Other" represented 1.7% of the Fund.
The largest contributor to annual performance relative to the benchmark was the Mediterranean region (up 130 basis points*), followed by the Nordic region (up 84 basis points). Chief detractors to the Fund's annual performance were Russian stocks, which were off benchmark and caused significant damage in the first quarter, though they were strong contributors in 2013. Performance was further impacted by stock picks in the Netherlands and Belgium. In the Netherlands, the Fund was hurt by its exposure to oil sector stock Core Labs at a time when oil prices dropped dramatically. In Belgium, digital live mobile production software and systems developer EVS Broadcast Equipment suffered declining revenues as a result of reduced spending by U.S. broadcasters. The Netherlands and Belgium are part of the Northern and Central Europe region, which was up 3.5% in local currency in the Fund relative to the benchmark's 8.1% local currency gain for the year.
Looking at the fourth quarter, the Fund lost only a little of its third quarter outperformance. Several of the individual contributors and detractors from last quarter remained the same but three holdings went from being top contributors to Fund performance to being detractors from it. Among them, French postage meter machines supplier
Neopost dropped at the beginning of November when the company announced that the French government had reduced the scope of its contract renewal, thereby impacting revenues for the current and next year. The shares fell back to the mid-$50 range, below levels we experienced in January 2014 when we first increased the position size. We've opted to hold the stock based on our confidence that the high yield compensates the Fund while the company diversifies into postal lockers and shipping solutions.
Many factors are currently impacting the performance of the European economies. We believe that an acceleration of reforms in France and in Italy may help performance, and the final introduction of quantitative easing sometime in the first half of this current year may also benefit the European economies. While we believe the euro's weakness against the U.S. dollar foreshadowed this widely anticipated event, we also believe that quantitative easing by the European Central Bank should allow exporters in the region to position themselves more aggressively in the global marketplace. It is also uncertain how recent events in France and the increasing reality of terrorist threats will impact European economies. In the meantime, there's much to do for the stock picker in a region that is among the most attractively valued worldwide.
Fund's Positions in Mentioned Holdings
As a percentage of net assets, as of 12/31/14
Neopost | | | 2.6 | % | |
EVS Broadcast Equipment | | | 1.1 | | |
Core Labs | | | 0.6 | | |
Fund holdings are as of the date given, are subject to change at any time, and are not recommendations to buy or sell any security. Top holdings exclude short-term holdings and cash, if applicable.
* A basis point is 1/100th of a percent.
26
Columbia Acorn
European FundSM
At a Glance
Total Net Assets of the Fund:
$36.6 million
Performance data shown in the table and graph below represents past performance, does not guarantee future results, assumes reinvestment of dividends and distributions and does not reflect the deduction of taxes that a shareholder may pay on Fund distributions or the redemption of Fund shares. The investment return and principal value of an investment will fluctuate so that shares, when redeemed, may be worth more or less than their original cost. Current performance may be lower or higher than the performance data shown. Performance data reflects fee waivers or reimbursements of Fund expenses, if any; in their absence, performance results would have been lower. Indexes are unmanaged; their results do not reflect the effect of expenses or sales charges. Securities in the Fund may not match those in an index. Please visit columbiamanagement.com for performance data current to the most recent month-end.
The Growth of a $10,000 Investment in Columbia Acorn European FundSM Class Z Shares
August 19, 2011 (Fund inception) through December 31, 2014
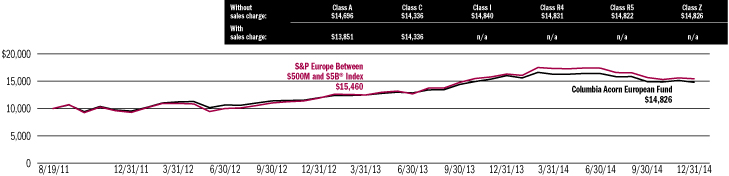
This chart shows the change in value of a hypothetical $10,000 investment in Class Z shares of the Fund during the stated time period.
Average Annual Total Returns for period ended December 31, 2014
| | | 4th quarter | | 1 year | | Life of Fund | |
| Class Z (8/19/11 inception) | | | -0.71 | % | | | -7.52 | % | | | 12.40 | % | |
| Class A (8/19/11 inception) | | | | | | | |
without sales charge | | | -0.77 | | | | -7.77 | | | | 12.10 | | |
with sales charge | | | -6.45 | | | | -13.09 | | | | 10.15 | | |
S&P Europe Between $500M and $5B® Index* | | | -1.47 | | | | -5.35 | | | | 13.80 | | |
Results for other share classes can be found on Page 2.
*The Fund's primary benchmark. Please see Page 1 for index descriptions.
Returns for Class A shown with and without the maximum initial sales charge of 5.75%. As stated in the May 1, 2014, prospectus, the Fund's annual operating expense ratio is 1.51% for Class Z shares and 1.76% for Class A shares.
Portfolio Diversification
as a percentage of net assets, as of 12/31/14
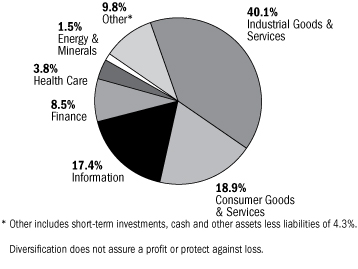
Top 10 Holdings
as a percentage of net assets, as of 12/31/14
| 1. | | Assura (United Kingdom)
Primary Health Care Property Developer | | | 3.2
| % | |
2. | | Partners Group (Switzerland)
Private Markets Asset Management | | | 2.8
| % | |
3. | | Neopost (France)
Postage Meter Machines | | | 2.6
| % | |
4. | | Spirax Sarco (United Kingdom)
Steam Systems for Manufacturing &
Processing Industries | | | 2.6
| % | |
5. | | Aurelius (Germany)
European Turnaround Investor | | | 2.3
| % | |
6. | | DIA (Spain)
Discount Retailer in Spain & Latin America | | | 2.3
| % | |
7. | | NORMA Group (Germany)
Clamps for Automotive & Industrial Applications | | | 2.2
| % | |
8. | | Aalberts Industries (Netherlands)
Flow Control & Heat Treatment | | | 2.2
| % | |
9. | | Geberit (Switzerland)
Plumbing Supplies | | | 2.1
| % | |
10. | | Babcock International (United Kingdom)
Public Sector Outsourcer | | | 2.0
| % | |
The Fund's top 10 holdings and portfolio diversification vary with changes in portfolio investments. See the Statement of Investments for a complete list of the Fund's holdings.
27
Columbia Acorn® Fund
Major Portfolio Changes in the Fourth Quarter (Unaudited)
| | | Number of Shares | |
| | | 9/30/14 | | 12/31/14 | |
Purchases | |
Information | |
Amber Road | | | 1,046,288 | | | | 2,000,000 | | |
Audience | | | 1,753,625 | | | | 2,150,000 | | |
Bankrate | | | 4,800,000 | | | | 6,300,300 | | |
Cadence Design Systems | | | 0 | | | | 2,000,000 | | |
DemandWare | | | 1,000,000 | | | | 1,152,000 | | |
E2Open | | | 2,225,000 | | | | 2,575,000 | | |
Fleetmatics | | | 0 | | | | 698,269 | | |
FLIR Systems | | | 876,000 | | | | 1,383,000 | | |
Global Eagle Entertainment | | | 0 | | | | 1,000,000 | | |
Globalstar | | | 26,000,000 | | | | 31,000,000 | | |
GTT Communications | | | 1,430,000 | | | | 1,950,000 | | |
Liquidity Services | | | 1,300,000 | | | | 1,600,000 | | |
Navigant Consulting | | | 4,075,000 | | | | 4,128,523 | | |
NetSuite | | | 550,000 | | | | 640,000 | | |
SPS Commerce | | | 1,035,000 | | | | 1,330,000 | | |
Textura | | | 589,372 | | | | 800,283 | | |
VeriFone Holdings | | | 539,000 | | | | 849,000 | | |
Verint Systems | | | 0 | | | | 365,000 | | |
Verisign | | | 0 | | | | 350,000 | | |
Vonage | | | 12,165,736 | | | | 14,044,775 | | |
Workiva | | | 0 | | | | 826,390 | | |
Zayo Group Holdings | | | 0 | | | | 925,000 | | |
Industrial Goods & Services | |
Allegion | | | 0 | | | | 188,400 | | |
Fortune Brands Home & Security | | | 930,000 | | | | 1,050,000 | | |
Lindsay | | | 0 | | | | 93,147 | | |
LKQ | | | 5,148,000 | | | | 5,423,000 | | |
Lumber Liquidators | | | 400,000 | | | | 500,000 | | |
Oshkosh Corporation | | | 1,724,000 | | | | 2,100,000 | | |
Quanta Services | | | 3,000,000 | | | | 3,309,894 | | |
Thermon | | | 1,827,007 | | | | 1,940,094 | | |
Consumer Goods & Services | |
Buffalo Wild Wings | | | 0 | | | | 157,000 | | |
Fox Factory Holding | | | 52,654 | | | | 537,804 | | |
Freshpet | | | 0 | | | | 243,000 | | |
Gentex | | | 653,000 | | | | 913,000 | | |
Hertz | | | 3,000,000 | | | | 3,300,000 | | |
Wayfair | | | 0 | | | | 433,000 | | |
Zulily | | | 1,170,000 | | | | 1,350,000 | | |
Finance | |
Eaton Vance | | | 3,052,000 | | | | 3,283,508 | | |
Leucadia National | | | 2,820,000 | | | | 3,552,000 | | |
Liberty Tax | | | 400,000 | | | | 472,000 | | |
WEX | | | 670,000 | | | | 720,000 | | |
| | | Number of Shares | |
| | | 9/30/14 | | 12/31/14 | |
Health Care | |
Abaxis | | | 506,020 | | | | 752,000 | | |
Align Technology | | | 0 | | | | 448,000 | | |
Bio-Techne | | | 1,040,000 | | | | 1,169,200 | | |
Intercept Pharmaceuticals | | | 153,000 | | | | 319,200 | | |
Medidata Solutions | | | 1,384,000 | | | | 1,549,500 | | |
VWR | | | 0 | | | | 1,375,400 | | |
Wright Medical Group | | | 647,000 | | | | 1,255,500 | | |
Other Industries | |
Amerco | | | 150,000 | | | | 170,000 | | |
Genesee & Wyoming | | | 300,000 | | | | 380,000 | | |
Heartland Express | | | 400,000 | | | | 496,024 | | |
Kirby | | | 530,000 | | | | 730,000 | | |
Energy & Minerals | |
Allied Nevada Gold | | | 3,650,000 | | | | 7,103,513 | | |
Bonanza Creek Energy | | | 0 | | | | 203,000 | | |
Core Labs (Netherlands) | | | 492,000 | | | | 505,000 | | |
Kirkland Lake Gold (Canada) | | | 5,500,000 | | | | 6,347,100 | | |
PDC Energy | | | 262,000 | | | | 501,000 | | |
Petromanas (Canada) | | | 64,685,000 | | | | 67,500,000 | | |
RGS Energy | | | 4,699,210 | | | | 5,000,000 | | |
ShaMaran Petroleum (Iraq) | | | 28,700,000 | | | | 28,962,000 | | |
Silvercrest Mines | | | 0 | | | | 3,412,300 | | |
US Silica | | | 503,000 | | | | 599,000 | | |
See accompanying notes to financial statements.
28
| | | Number of Shares | |
| | | 9/30/14 | | 12/31/14 | |
Sales | |
Information | |
Atmel | | | 5,390,000 | | | | 4,717,000 | | |
Amphenol | | | 6,312,000 | | | | 5,416,000 | | |
Avnet | | | 2,738,000 | | | | 1,887,000 | | |
Belden | | | 507,000 | | | | 475,000 | | |
Commvault Systems | | | 550,000 | | | | 0 | | |
Concur Technologies | | | 260,000 | | | | 0 | | |
Crown Castle International | | | 940,000 | | | | 800,000 | | |
Exa | | | 699,967 | | | | 554,391 | | |
Genpact | | | 1,983,000 | | | | 1,405,000 | | |
Hackett Group | | | 3,274,000 | | | | 2,903,719 | | |
Hexagon (Sweden) | | | 2,693,000 | | | | 1,622,000 | | |
iGATE | | | 3,775,000 | | | | 3,600,000 | | |
II-VI | | | 1,604,000 | | | | 0 | | |
Infinera | | | 2,983,000 | | | | 2,711,000 | | |
IPG Photonics | | | 1,620,000 | | | | 1,504,000 | | |
Ixia | | | 1,040,000 | | | | 1,006,000 | | |
Mettler-Toledo International | | | 1,351,638 | | | | 1,162,000 | | |
Monolithic Power Systems | | | 699,000 | | | | 427,000 | | |
Pandora Media | | | 3,456,000 | | | | 2,843,000 | | |
Plexus | | | 684,918 | | | | 451,458 | | |
RealPage | | | 1,050,000 | | | | 0 | | |
RetailMeNot | | | 2,199,707 | | | | 1,112,930 | | |
Rightmove (United Kingdom) | | | 257,000 | | | | 155,205 | | |
Rogers | | | 624,000 | | | | 569,000 | | |
Sanmina | | | 3,800,000 | | | | 3,200,000 | | |
SBA Communications | | | 2,360,000 | | | | 1,600,000 | | |
Semtech | | | 560,000 | | | | 0 | | |
Solera Holdings | | | 1,176,000 | | | | 989,000 | | |
Stratasys | | | 395,000 | | | | 371,000 | | |
Syntel | | | 746,000 | | | | 497,000 | | |
Tangoe | | | 1,750,000 | | | | 641,952 | | |
Trimble Navigation | | | 4,362,000 | | | | 3,651,000 | | |
TripAdvisor | | | 625,000 | | | | 0 | | |
Tyler Technologies | | | 500,000 | | | | 470,000 | | |
Ultratech | | | 615,000 | | | | 0 | | |
Virtusa | | | 1,835,000 | | | | 1,658,000 | | |
WNS - ADR (India) | | | 2,112,805 | | | | 2,025,000 | | |
Zebra Technologies | | | 803,000 | | | | 501,000 | | |
Industrial Goods & Services | |
Aalberts Industries (Netherlands) | | | 2,321,000 | | | | 2,189,385 | | |
Acuity Brands | | | 1,209,000 | | | | 960,000 | | |
Airgas | | | 930,000 | | | | 880,000 | | |
Ametek | | | 7,996,000 | | | | 7,130,000 | | |
Boise Cascade | | | 883,000 | | | | 600,000 | | |
CAE (Canada) | | | 1,894,000 | | | | 0 | | |
Chicago Bridge & Iron | | | 1,631,000 | | | | 1,299,000 | | |
Donaldson | | | 8,400,000 | | | | 7,952,000 | | |
Dorman Products | | | 881,086 | | | | 867,721 | | |
Drew Industries | | | 1,680,000 | | | | 1,610,000 | | |
| | | Number of Shares | |
| | | 9/30/14 | | 12/31/14 | |
ESCO Technologies | | | 2,185,000 | | | | 1,948,000 | | |
FMC Corporation | | | 350,000 | | | | 0 | | |
Generac | | | 4,000,000 | | | | 3,632,000 | | |
HEICO | | | 3,828,750 | | | | 3,626,750 | | |
Insperity | | | 822,000 | | | | 715,000 | | |
KAR Auction Services | | | 1,375,000 | | | | 1,316,000 | | |
Kennametal | | | 3,182,000 | | | | 2,674,000 | | |
Marel (Iceland) | | | 10,000,000 | | | | 0 | | |
Middleby | | | 1,081,200 | | | | 1,050,200 | | |
Mobile Mini | | | 1,250,000 | | | | 900,000 | | |
Moog | | | 2,974,827 | | | | 2,456,000 | | |
Nordson | | | 3,400,000 | | | | 3,130,000 | | |
Novozymes (Denmark) | | | 1,090,000 | | | | 907,458 | | |
PolyOne | | | 700,000 | | | | 0 | | |
Sociedad Quimica y Minera
de Chile - ADR (Chile) | | | 917,486 | | | | 0 | | |
Toro | | | 1,529,000 | | | | 1,486,000 | | |
Ushio (Japan) | | | 1,500,000 | | | | 0 | | |
Valmont Industries | | | 225,000 | | | | 0 | | |
WABCO Holdings | | | 1,210,000 | | | | 1,176,000 | | |
Wabtec | | | 1,083,000 | | | | 1,053,000 | | |
Waste Connections | | | 1,500,000 | | | | 1,100,000 | | |
WESCO International | | | 1,687,000 | | | | 1,553,000 | | |
Consumer Goods & Services | |
Avis Budget Group | | | 3,950,000 | | | | 3,700,000 | | |
B&G Foods | | | 1,029,000 | | | | 591,000 | | |
Blackhawk Network | | | 900,000 | | | | 700,000 | | |
Boulder Brands | | | 3,947,000 | | | | 3,484,000 | | |
Burlington Stores | | | 1,381,000 | | | | 786,900 | | |
Caesarstone (Israel) | | | 812,360 | | | | 630,000 | | |
Casey's General Stores | | | 1,475,839 | | | | 1,027,709 | | |
Choice Hotels | | | 849,483 | | | | 754,483 | | |
DeVry | | | 1,075,000 | | | | 800,000 | | |
DIA (Spain) | | | 2,557,000 | | | | 837,052 | | |
Domino's Pizza | | | 719,000 | | | | 489,000 | | |
DSW | | | 945,000 | | | | 533,500 | | |
Expedia | | | 1,050,000 | | | | 0 | | |
Fiesta Restaurant Group | | | 1,001,000 | | | | 878,000 | | |
Fossil | | | 646,845 | | | | 362,145 | | |
GNC Holdings | | | 819,000 | | | | 478,000 | | |
Groupon | | | 4,972,000 | | | | 2,010,000 | | |
Herman Miller | | | 916,000 | | | | 0 | | |
Interface | | | 2,920,000 | | | | 2,758,000 | | |
Kate Spade & Company | | | 2,366,000 | | | | 1,796,000 | | |
Knoll | | | 3,669,000 | | | | 3,366,000 | | |
KT&G (Korea) | | | 229,000 | | | | 0 | | |
Massmart Holdings (South Africa) | | | 852,000 | | | | 0 | | |
Melco Crown Entertainment - ADR
(Hong Kong) | | | 900,000 | | | | 0 | | |
Michaels Stores | | | 1,238,262 | | | | 1,162,000 | | |
See accompanying notes to financial statements.
29
Columbia Acorn® Fund
Major Portfolio Changes in the Fourth Quarter (Unaudited), continued
| | | Number of Shares | |
| | | 9/30/14 | | 12/31/14 | |
Sales (continued) | |
Consumer Goods & Services—continued | |
Papa John's International | | | 492,000 | | | | 478,000 | | |
Pier 1 Imports | | | 1,762,555 | | | | 0 | | |
Pool | | | 1,818,000 | | | | 1,565,000 | | |
Popeyes Louisiana Kitchen | | | 1,350,000 | | | | 700,000 | | |
PVH | | | 793,000 | | | | 456,000 | | |
Shutterfly | | | 1,660,000 | | | | 970,000 | | |
The Chefs' Warehouse | | | 900,000 | | | | 875,000 | | |
The Fresh Market | | | 1,535,000 | | | | 1,492,000 | | |
ULTA | | | 1,044,000 | | | | 613,000 | | |
United Natural Foods | | | 1,340,000 | | | | 1,303,000 | | |
Urban Outfitters | | | 900,000 | | | | 508,000 | | |
Vail Resorts | | | 1,430,000 | | | | 1,268,600 | | |
Williams-Sonoma | | | 1,508,000 | | | | 874,200 | | |
Finance | |
Alliance Data Systems | | | 490,000 | | | | 360,000 | | |
Brown & Brown | | | 1,650,000 | | | | 0 | | |
CNO Financial Group | | | 8,800,000 | | | | 7,600,000 | | |
Enstar Group | | | 250,000 | | | | 185,000 | | |
First Busey | | | 4,841,882 | | | | 4,328,500 | | |
Hudson Valley | | | 843,000 | | | | 0 | | |
MB Financial | | | 2,860,000 | | | | 2,580,000 | | |
McGrath Rentcorp | | | 2,000,000 | | | | 1,580,000 | | |
Rand Merchant Insurance
(South Africa) | | | 10,837,000 | | | | 8,658,000 | | |
Selective Insurance Group | | | 2,625,000 | | | | 714,574 | | |
Sprott (Canada) | | | 11,436,300 | | | | 11,000,000 | | |
TCF Financial | | | 950,000 | | | | 0 | | |
Valley National Bancorp | | | 3,323,500 | | | | 1,573,000 | | |
Wisdom Tree | | | 1,000,000 | | | | 500,000 | | |
Heath Care | |
Akorn | | | 5,089,000 | | | | 4,845,000 | | |
Allscripts Healthcare Solutions | | | 6,724,600 | | | | 2,746,200 | | |
Alnylam Pharmaceuticals | | | 423,400 | | | | 362,300 | | |
BioMarin Pharmaceutical | | | 737,000 | | | | 320,200 | | |
Castlight Health | | | 890,000 | | | | 863,500 | | |
Celldex Therapeutics | | | 2,750,000 | | | | 2,401,400 | | |
Cepheid | | | 5,836,000 | | | | 5,350,800 | | |
Envision Healthcare Holdings | | | 1,277,000 | | | | 1,239,000 | | |
HealthSouth | | | 2,100,000 | | | | 1,666,323 | | |
Henry Schein | | | 687,000 | | | | 291,100 | | |
NPS Pharmaceuticals | | | 963,000 | | | | 934,400 | | |
Revance Therapeutics | | | 476,000 | | | | 0 | | |
Sarepta Therapeutics | | | 2,552,000 | | | | 2,523,900 | | |
Seattle Genetics | | | 4,001,000 | | | | 3,398,400 | | |
Sirona Dental Systems | | | 833,000 | | | | 460,900 | | |
Synageva BioPharma | | | 2,493,309 | | | | 2,419,209 | | |
Ultragenyx Pharmaceutical | | | 1,624,689 | | | | 1,164,974 | | |
| | | Number of Shares | |
| | | 9/30/14 | | 12/31/14 | |
Other Industries | |
Coresite Realty | | | 880,000 | | | | 0 | | |
Deltic Timber | | | 90,000 | | | | 39,381 | | |
Extra Space Storage | | | 2,100,000 | | | | 2,000,000 | | |
Hudson Pacific Properties | | | 975,000 | | | | 0 | | |
JB Hunt Transport Services | | | 1,000,000 | | | | 940,000 | | |
Kite Realty Group | | | 1,172,500 | | | | 0 | | |
Mapletree Commercial Trust
(Singapore) | | | 20,282,089 | | | | 0 | | |
Northeast Utilities | | | 1,900,000 | | | | 1,600,000 | | |
Orix JREIT (Japan) | | | 10,362 | | | | 0 | | |
Rush Enterprises, Class A | | | 2,704,100 | | | | 2,650,000 | | |
St. Joe | | | 1,800,000 | | | | 872,926 | | |
Wisconsin Energy | | | 650,000 | | | | 500,000 | | |
Energy & Minerals | |
Alamos Gold (Canada) | | | 4,000,000 | | | | 3,500,000 | | |
Bill Barrett Corporation | | | 770,000 | | | | 0 | | |
Black Diamond Group (Canada) | | | 463,863 | | | | 214,100 | | |
Duluth Metals (Canada) | | | 5,544,000 | | | | 0 | | |
FMC Technologies | | | 3,858,000 | | | | 370,000 | | |
Laredo Petroleum | | | 928,000 | | | | 0 | | |
Pacific Rubiales Energy
(Colombia) | | | 2,200,000 | | | | 1,800,000 | | |
Parsley Energy | | | 891,000 | | | | 0 | | |
Rice Energy | | | 570,000 | | | | 0 | | |
Rosetta Resources | | | 2,322,600 | | | | 1,849,600 | | |
WPX Energy | | | 1,358,000 | | | | 1,210,000 | | |
See accompanying notes to financial statements.
30
Columbia Acorn® Fund
Statement of Investments, December 31, 2014
Number of Shares | | | | Value | |
| | | | | | | Equities: 97.7% | |
Information 27.2% | | | |
| | | > Business Software 6.9% | |
| | 2,500,000 | | | Ansys (a) | | $ | 205,000,000 | | |
| | | | | Simulation Software for
Engineers & Designers | | | | | |
| | 5,200,000 | | | Informatica (a) | | | 198,302,000 | | |
| | | | | Enterprise Data Integration
Software | | | | | |
| | 1,330,000 | | | SPS Commerce (a)(b) | | | 75,317,900 | | |
| | | | | Supply Chain Management
Software Delivered via the Web | | | | | |
| | 640,000 | | | NetSuite (a) | | | 69,868,800 | | |
| | | | | End-to-end IT Systems Solution
Delivered via the Web | | | | | |
| | 1,152,000 | | | DemandWare (a) | | | 66,286,080 | | |
| | | | | E-Commerce Website Platform for
Retailers & Apparel Manufacturers | | | | | |
| | 450,000 | | | Ultimate Software (a) | | | 66,066,750 | | |
| | | | | Human Capital Management
Systems | | | | | |
| | 470,000 | | | Tyler Technologies (a) | | | 51,436,800 | | |
| | | | | Financial, Tax, Court & Document
Management Systems for Local
Governments | | | | | |
| | 989,000 | | | Solera Holdings | | | 50,617,020 | | |
| | | | | Software for Automotive
Insurance Claims Processing | | | | | |
| | 1,622,000 | | | Hexagon (Sweden) | | | 50,037,952 | | |
| | | | | Design, Measurement &
Visualization Software &
Equipment | | | | | |
| | 2,000,000 | | | Cadence Design Systems (a) | | | 37,940,000 | | |
| | | | | Electronic Design Automation
Software | | | | | |
| | 3,741,000 | | | InContact (a)(b) | | | 32,883,390 | | |
| | | | | Call Center Systems Delivered
via the Web & Telco Services | | | | | |
| | 610,000 | | | Envestnet (a) | | | 29,975,400 | | |
| | | | | Technology Platform for
Investment Advisors | | | | | |
| | 698,269 | | | Fleetmatics (a) | | | 24,781,567 | | |
| | | | | Fleet Management Software | | | | | |
| | 2,575,000 | | | E2Open (a)(b)(c) | | | 24,745,750 | | |
| | | | | Supply Chain Management
Software & Supplier/Partner
Network | | | | | |
| | 800,283 | | | Textura (a)(c) | | | 22,784,057 | | |
| | | | | Construction Vendor Management
Software | | | | | |
| | 365,000 | | | Verint Systems (a) | | | 21,272,200 | | |
| | | | | Contact Center & Security Software | | | | | |
| | 2,000,000 | | | Amber Road (a)(b) | | | 20,440,000 | | |
| | | | | Global Trade Management
Software Delivered via the Web | | | | | |
| | 708,300 | | | Kinaxis (Canada) (a) | | | 11,278,662 | | |
| | | | | Supply Chain Planning &
Analytics Software | | | | | |
| | 826,390 | | | Workiva (a) | | | 11,073,626 | | |
| | | | | Software Platform for Report
Creation | | | | | |
| | 641,952 | | | Tangoe (a) | | | 8,364,635 | | |
| | | | | Software Solution for Managing
Communication Expense & Devices | | | | | |
Number of Shares | | | | Value | |
| | 1,728,000 | | | Five9 (a)(c) | | $ | 7,741,440 | | |
| | | | | Call Center Software | | | | | |
| | 554,391 | | | Exa (a) | | | 6,530,726 | | |
| | | | | Simulation Software | | | | | |
| | 540,000 | | | Covisint (a) | | | 1,431,000 | | |
| | | | | Collaboration Software
Platform Provider | | | | | |
| | | | 1,094,175,755 | | |
| | | > Instrumentation 3.8% | |
| | 1,162,000 | | | Mettler-Toledo
International (a) | | | 351,458,520 | | |
| | | | | Laboratory Equipment | | | | | |
| | 1,504,000 | | | IPG Photonics (a)(c) | | | 112,679,680 | | |
| | | | | Fiber Lasers | | | | | |
| | 3,651,000 | | | Trimble Navigation (a) | | | 96,897,540 | | |
| | | | | GPS-based Instruments | | | | | |
| | 1,383,000 | | | FLIR Systems | | | 44,684,730 | | |
| | | | | Infrared Cameras | | | | | |
| | | | 605,720,470 | | |
| | | > Computer Hardware & Related
Equipment 3.0% | |
| | 5,416,000 | | | Amphenol | | | 291,434,960 | | |
| | | | | Electronic Connectors | | | | | |
| | 569,000 | | | Rogers (a) | | | 46,339,360 | | |
| | | | | Printed Circuit Materials &
High-performance Foams | | | | | |
| | 501,000 | | | Zebra Technologies (a) | | | 38,782,410 | | |
| | | | | Bar Code Printers | | | | | |
| | 475,000 | | | Belden | | | 37,434,750 | | |
| | | | | Specialty Cable | | | | | |
| | 849,000 | | | VeriFone Holdings (a) | | | 31,582,800 | | |
| | | | | Point of Sale Systems | | | | | |
| | 371,000 | | | Stratasys (a)(c) | | | 30,833,810 | | |
| | | | | Rapid Prototyping & Direct
Digital Manufacturing Systems | | | | | |
| | | | 476,408,090 | | |
| | | > Mobile Communications 2.4% | |
| | 1,600,000 | | | SBA Communications (a) | | | 177,216,000 | | |
| | | | | Communications Towers | | | | | |
| | 31,000,000 | | | Globalstar (a)(c) | | | 85,250,000 | | |
| | | | | Satellite Mobile Voice &
Data Carrier | | | | | |
| | 800,000 | | | Crown Castle International | | | 62,960,000 | | |
| | | | | Communications Towers | | | | | |
| | 2,000,000 | | | Gogo (a)(c) | | | 33,060,000 | | |
| | | | | Provider of Wi-Fi on Airplanes | | | | | |
| | 1,000,000 | | | Global Eagle
Entertainment (a) | | | 13,610,000 | | |
| | | | | Provider of Entertainment &
Wi-Fi on Airplanes | | | | | |
| | 2,150,000 | | | Audience (a)(b)(c) | | | 9,460,000 | | |
| | | | | Improving Voice Quality for
Mobile Devices | | | | | |
| | | | 381,556,000 | | |
| | | > Computer Services 2.3% | |
| | 3,600,000 | | | iGATE (a) | | | 142,128,000 | | |
| | | | | IT & Business Process
Outsourcing Services | | | | | |
See accompanying notes to financial statements.
31
Columbia Acorn® Fund
Statement of Investments, continued
Number of Shares | | | | Value | |
| | | > Computer Services—continued | |
| | 1,658,000 | | | Virtusa (a)(b) | | $ | 69,088,860 | | |
| | | | | Offshore IT Outsourcing | | | | | |
| | 2,025,000 | | | WNS - ADR (India) (a) | | | 41,836,500 | | |
| | | | | Offshore Business Process
Outsourcing Services | | | | | |
| | 1,407,000 | | | ExlService Holdings (a) | | | 40,394,970 | | |
| | | | | Business Process Outsourcing | | | | | |
| | 1,405,000 | | | Genpact (a) | | | 26,596,650 | | |
| | | | | Business Process Outsourcing | | | | | |
| | 2,903,719 | | | Hackett Group (b) | | | 25,523,690 | | |
| | | | | IT Integration & Best Practice
Research | | | | | |
| | 497,000 | | | Syntel (a) | | | 22,355,060 | | |
| | | | | Offshore IT Services | | | | | |
| | | | 367,923,730 | | |
| | | > Business Information &
Marketing Services 1.9% | |
| | 1,900,000 | | | Verisk Analytics (a) | | | 121,695,000 | | |
| | | | | Risk & Decision Analytics | | | | | |
| | 6,300,300 | | | Bankrate (a)(b) | | | 78,312,729 | | |
| | | | | Internet Advertising for the
Insurance, Credit Card &
Banking Markets | | | | | |
| | 4,128,523 | | | Navigant Consulting (a)(b) | | | 63,455,399 | | |
| | | | | Financial Consulting Firm | | | | | |
| | 2,570,000 | | | RPX (a) | | | 35,414,600 | | |
| | | | | Patent Aggregation & Defensive
Patent Consulting | | | | | |
| | | | 298,877,728 | | |
| | | > Telephone & Data Services 1.0% | |
| | 2,200,000 | | | Cogent Communications | | | 77,858,000 | | |
| | | | | Internet Data Pipelines | | | | | |
| | 925,000 | | | Zayo Group Holdings (a)(c) | | | 28,277,250 | | |
| | | | | Fiber Optic Data Communications | | | | | |
| | 1,950,000 | | | GTT Communications (a)(b) | | | 25,798,500 | | |
| | | | | Provider of High Capacity
Data Transit | | | | | |
| | 2,800,000 | | | Boingo Wireless (a)(b) | | | 21,476,000 | | |
| | | | | Wholesale & Retail Wi-Fi Networks | | | | | |
| | 4,000,000 | | | Towerstream (a)(b)(c) | | | 7,400,000 | | |
| | | | | High Speed Wireless, Rooftop
Antenna Space & Wi-Fi Offload | | | | | |
| | | | 160,809,750 | | |
| | | > Financial Processors 0.9% | |
| | 1,700,000 | | | Global Payments | | | 137,241,000 | | |
| | | | | Credit Card Processor | | | | | |
| | 1,600,000 | | | Liquidity Services (a)(b) | | | 13,072,000 | | |
| | | | | E-Auctions for Surplus &
Salvage Goods | | | | | |
| | | | 150,313,000 | | |
| | | > Telecommunications Equipment 0.9% | |
| | 582,000 | | | F5 Networks (a) | | | 75,930,630 | | |
| | | | | Internet Traffic Management
Equipment | | | | | |
| | 2,711,000 | | | Infinera (a) | | | 39,905,920 | | |
| | | | | Optical Networking Equipment | | | | | |
Number of Shares | | | | Value | |
| | 1,118,000 | | | CalAmp (a) | | $ | 20,459,400 | | |
| | | | | Machine-to-machine
Communications | | | | | |
| | 1,006,000 | | | Ixia (a) | | | 11,317,500 | | |
| | | | | Telecom Network Test Equipment | | | | | |
| | | | 147,613,450 | | |
| | | > Internet Related 0.9% | |
| | 14,044,775 | | | Vonage (a)(b) | | | 53,510,593 | | |
| | | | | Business & Consumer Internet
Telephony | | | | | |
| | 2,843,000 | | | Pandora Media (a) | | | 50,690,690 | | |
| | | | | Streaming Music | | | | | |
| | 350,000 | | | Verisign (a) | | | 19,950,000 | | |
| | | | | Internet Domain Registry
for .com/.net | | | | | |
| | 1,112,930 | | | RetailMeNot (a)(c) | | | 16,271,036 | | |
| | | | | Digital Coupon Marketplace | | | | | |
| | 155,205 | | | Rightmove (United Kingdom) | | | 5,412,491 | | |
| | | | | Internet Real Estate Listings | | | | | |
| | | | 145,834,810 | | |
| | | > Semiconductors &
Related Equipment 0.7% | |
| | 4,717,000 | | | Atmel (a) | | | 39,599,215 | | |
| | | | | Microcontrollers, Radio
Frequency & Memory
Semiconductors | | | | | |
| | 367,000 | | | Littelfuse | | | 35,477,890 | | |
| | | | | Little Fuses | | | | | |
| | 427,000 | | | Monolithic Power Systems | | | 21,238,980 | | |
| | | | | High Performance Analog &
Mixed Signal Integrated Circuits | | | | | |
| | 2,500,000 | | | Rubicon Technology (a)(b)(c) | | | 11,425,000 | | |
| | | | | Producer of Sapphire for
the Lighting, Electronics &
Automotive Industries | | | | | |
| | | | 107,741,085 | | |
| | | > Cable TV 0.6% | |
| | 800,000 | | | Liberty Global Series A (a) | | | 40,164,000 | | |
| | 800,000 | | | Liberty Global Series C (a) | | | 38,648,000 | | |
| | | | | Cable TV Franchises
Outside the U.S. | | | | | |
| | 670,000 | | | Discovery Series C (a) | | | 22,592,400 | | |
| | | | | Cable TV Programming | | | | | |
| | | | 101,404,400 | | |
| | | > Contract Manufacturing 0.6% | |
| | 3,200,000 | | | Sanmina (a) | | | 75,296,000 | | |
| | | | | Electronic Manufacturing Services | | | | | |
| | 451,458 | | | Plexus (a) | | | 18,604,584 | | |
| | | | | Electronic Manufacturing Services | | | | | |
| | | | 93,900,584 | | |
| | | > Electronics Distribution 0.5% | |
| | 1,887,000 | | | Avnet | | | 81,178,740 | | |
| | | | | Electronic Components Distribution | | | | | |
| | | > Entertainment Programming 0.5% | |
| | 1,250,000 | | | IMAX (Canada) (a)(c) | | | 38,625,000 | | |
| | | | | IMAX Movies, Theatre Equipment &
Theatre Joint Ventures | | | | | |
See accompanying notes to financial statements.
32
Number of Shares | | | | Value | |
| | | > Entertainment Programming—continued | |
| | 5,500,000 | | | Zee Entertainment
Enterprises (India) | | $ | 33,037,929 | | |
| | | | | Programmer of Pay Television
Content | | | | | |
| | | | 71,662,929 | | |
| | | > Advertising 0.3% | |
| | 1,000,000 | | | Lamar Advertising | | | 53,640,000 | | |
| | | | | Outdoor Advertising | | | | | |
Information: Total | | | 4,338,760,521 | | |
Industrial Goods & Services 24.1% | | | |
| | | > Machinery 14.7% | |
| | 7,130,000 | | | Ametek | | | 375,251,900 | | |
| | | | | Aerospace/Industrial Instruments | | | | | |
| | 7,952,000 | | | Donaldson (b) | | | 307,185,760 | | |
| | | | | Industrial Air Filtration | | | | | |
| | 3,130,000 | | | Nordson (b) | | | 244,014,800 | | |
| | | | | Dispensing Systems for
Adhesives & Coatings | | | | | |
| | 2,456,000 | | | Moog (a)(b) | | | 181,817,680 | | |
| | | | | Motion Control Products for
Aerospace, Defense & Industrial
Markets | | | | | |
| | 3,626,750 | | | HEICO (b) | | | 171,762,880 | | |
| | | | | FAA-approved Aircraft
Replacement Parts | | | | | |
| | 3,632,000 | | | Generac (a)(b)(c) | | | 169,832,320 | | |
| | | | | Standby Power Generators | | | | | |
| | 1,176,000 | | | WABCO Holdings (a) | | | 123,221,280 | | |
| | | | | Truck & Bus Component Supplier | | | | | |
| | 1,100,000 | | | Pall | | | 111,331,000 | | |
| | | | | Life Science, Water & Industrial
Filtration | | | | | |
| | 1,050,200 | | | Middleby (a) | | | 104,074,820 | | |
| | | | | Manufacturer of Cooking
Equipment | | | | | |
| | 2,100,000 | | | Oshkosh Corporation | | | 102,165,000 | | |
| | | | | Specialty Truck Manufacturer | | | | | |
| | 2,674,000 | | | Kennametal | | | 95,702,460 | | |
| | | | | Consumable Cutting Tools | | | | | |
| | 1,486,000 | | | Toro | | | 94,821,660 | | |
| | | | | Turf Maintenance Equipment | | | | | |
| | 1,053,000 | | | Wabtec | | | 91,495,170 | | |
| | | | | Freight & Transit Component
Supplier | | | | | |
| | 1,948,000 | | | ESCO Technologies (b) | | | 71,881,200 | | |
| | | | | Industrial Filtration & Advanced
Measurement Equipment | | | | | |
| | 867,721 | | | Dorman Products (a)(c) | | | 41,884,893 | | |
| | | | | Aftermarket Auto Parts Distributor | | | | | |
| | 664,400 | | | Neopost (France) | | | 37,902,569 | | |
| | | | | Postage Meter Machines | | | | | |
| | 705,000 | | | Rexnord (a) | | | 19,888,050 | | |
| | | | | Manufacturer of Mechanical Power
Transmission Parts & Water
Mgmt. Equipment | | | | | |
| | | | 2,344,233,442 | | |
Number of Shares | | | | Value | |
| | | > Other Industrial Services 2.4% | |
| | 5,423,000 | | | LKQ (a) | | $ | 152,494,760 | | |
| | | | | Alternative Auto Parts Distribution | | | | | |
| | 1,800,000 | | | Expeditors International of
Washington | | | 80,298,000 | | |
| | | | | International Freight Forwarder | | | | | |
| | 1,500,000 | | | Forward Air | | | 75,555,000 | | |
| | | | | Freight Transportation between
Airports | | | | | |
| | 1,316,000 | | | KAR Auction Services | | | 45,599,400 | | |
| | | | | Auto Auctions | | | | | |
| | 900,000 | | | Mobile Mini | | | 36,459,000 | | |
| | | | | Portable Storage Units Leasing | | | | | |
| | | | 390,406,160 | | |
| | | > Construction 1.9% | |
| | 90,000 | | | NVR (a) | | | 114,779,700 | | |
| | | | | Homebuilder | | | | | |
| | 1,299,000 | | | Chicago Bridge & Iron | | | 54,532,020 | | |
| | | | | Engineering & Construction
for Liquefied Natural Gas &
Petrochemicals | | | | | |
| | 1,050,000 | | | Fortune Brands Home &
Security | | | 47,533,500 | | |
| | | | | Home Building Supplies &
Small Locks | | | | | |
| | 3,592,200 | | | PGT (a)(b) | | | 34,592,886 | | |
| | | | | Wind Resistant Windows & Doors | | | | | |
| | 500,000 | | | Lumber Liquidators (a)(c) | | | 33,155,000 | | |
| | | | | Hardwood Flooring Retailer | | | | | |
| | 188,400 | | | Allegion | | | 10,448,664 | | |
| | | | | Mechanical & Electronic Security
Systems | | | | | |
| | | | 295,041,770 | | |
| | | > Industrial Distribution 1.7% | |
| | 1,553,000 | | | WESCO International (a) | | | 118,354,130 | | |
| | | | | Industrial Distributor | | | | | |
| | 880,000 | | | Airgas | | | 101,358,400 | | |
| | | | | Industrial Gas Distributor | | | | | |
| | 1,545,000 | | | MRC Global (a) | | | 23,406,750 | | |
| | | | | Industrial Distributor | | | | | |
| | 600,000 | | | Boise Cascade (a) | | | 22,290,000 | | |
| | | | | Wood Products Manufacturer &
Distributor | | | | | |
| | | | 265,409,280 | | |
| | | > Electrical Components 1.1% | |
| | 960,000 | | | Acuity Brands | | | 134,467,200 | | |
| | | | | Commercial Lighting Fixtures | | | | | |
| | 1,940,094 | | | Thermon (a)(b) | | | 46,930,874 | | |
| | | | | Global Engineered Thermal
Solutions | | | | | |
| | | | 181,398,074 | | |
| | | > Industrial Materials &
Specialty Chemicals 0.8% | |
| | 1,610,000 | | | Drew Industries (a)(b) | | | 82,222,700 | | |
| | | | | RV & Manufactured Home
Components | | | | | |
| | 907,458 | | | Novozymes (Denmark) | | | 38,198,138 | | |
| | | | | Industrial Enzymes | | | | | |
| | | | 120,420,838 | | |
See accompanying notes to financial statements.
33
Columbia Acorn® Fund
Statement of Investments, continued
Number of Shares | | | | Value | |
| | | > Outsourcing Services 0.7% | |
| | 3,309,894 | | | Quanta Services (a) | | $ | 93,967,890 | | |
| | | | | Electrical Transmission &
Pipeline Contracting Services | | | | | |
| | 715,000 | | | Insperity | | | 24,231,350 | | |
| | | | | Professional Employer
Organization | | | | | |
| | | | 118,199,240 | | |
| | | > Conglomerates 0.4% | |
| | 2,189,385 | | | Aalberts Industries
(Netherlands) | | | 64,567,253 | | |
| | | | | Flow Control & Heat Treatment | | | | | |
| | | > Waste Management 0.3% | |
| | 1,100,000 | | | Waste Connections | | | 48,389,000 | | |
| | | | | Solid Waste Management | | | | | |
| | | > Water 0.1% | |
| | 93,147 | | | Lindsay (c) | | | 7,986,424 | | |
| | | | | Center Pivot Irrigation Systems
for Farmland & Highway
Infrastructure | | | | | |
Industrial Goods & Services: Total | | | 3,836,051,481 | | |
Consumer Goods & Services 13.3% | | | |
| | | > Retail 3.7% | |
| | 1,027,709 | | | Casey's General Stores | | | 92,822,677 | | |
| | | | | Owner/Operator of Convenience
Stores | | | | | |
| | 613,000 | | | ULTA (a) | | | 78,365,920 | | |
| | | | | Specialty Beauty Product Retailer | | | | | |
| | 874,200 | | | Williams-Sonoma | | | 66,159,456 | | |
| | | | | Home Goods & Furnishing Retailer | | | | | |
| | 1,492,000 | | | The Fresh Market (a)(c) | | | 61,470,400 | | |
| | | | | Specialty Food Retailer | | | | | |
| | 1,796,000 | | | Kate Spade & Company (a) | | | 57,489,960 | | |
| | | | | Global Lifestyle Brand | | | | | |
| | 970,000 | | | Shutterfly (a) | | | 40,444,150 | | |
| | | | | Internet Photo-centric Retailer | | | | | |
| | 362,145 | | | Fossil (a) | | | 40,103,937 | | |
| | | | | Watch Designer & Retailer | | | | | |
| | 786,900 | | | Burlington Stores (a) | | | 37,188,894 | | |
| | | | | Off-price Apparel Retailer | | | | | |
| | 1,350,000 | | | Zulily (a)(c) | | | 31,590,000 | | |
| | | | | E-Commerce Retailer Offering
Flash Sale Events | | | | | |
| | 1,162,000 | | | Michaels Stores (a) | | | 28,736,260 | | |
| | | | | Craft & Hobby Specialty Retailer | | | | | |
| | 533,500 | | | DSW | | | 19,899,550 | | |
| | | | | Branded Footwear Retailer | | | | | |
| | 508,000 | | | Urban Outfitters (a) | | | 17,846,040 | | |
| | | | | Multi-channel Apparel &
Accessory Retailer | | | | | |
| | 2,100,000 | | | Gaiam (a)(b) | | | 14,973,000 | | |
| | | | | Promoter of Healthy Living
through Catalogs, E-Commerce &
Gaiam TV | | | | | |
| | 837,052 | | | DIA (Spain) | | | 5,671,933 | | |
| | | | | Discount Retailer in Spain &
Latin America | | | | | |
| | | | 592,762,177 | | |
Number of Shares | | | | Value | |
| | | > Travel 3.5% | |
| | 3,700,000 | | | Avis Budget Group (a) | | $ | 245,421,000 | | |
| | | | | Car Rental Company | | | | | |
| | 1,268,600 | | | Vail Resorts | | | 115,607,518 | | |
| | | | | Ski Resort Operator & Developer | | | | | |
| | 3,300,000 | | | Hertz (a) | | | 82,302,000 | | |
| | | | | U.S. Rental Car Operator | | | | | |
| | 2,142,000 | | | HomeAway (a) | | | 63,788,760 | | |
| | | | | Vacation Rental Online
Marketplace | | | | | |
| | 754,483 | | | Choice Hotels | | | 42,266,137 | | |
| | | | | Franchisor of Budget
Hotel Brands | | | | | |
| | | | 549,385,415 | | |
| | | > Consumer Goods Distribution 1.6% | |
| | 1,303,000 | | | United Natural Foods (a) | | | 100,754,475 | | |
| | | | | Distributor of Natural/Organic
Foods to Grocery Stores | | | | | |
| | 1,565,000 | | | Pool | | | 99,283,600 | | |
| | | | | Swimming Pool Supplies &
Equipment Distributor | | | | | |
| | 478,000 | | | GNC Holdings | | | 22,446,880 | | |
| | | | | Specialty Retailer of Health &
Wellness Products | | | | | |
| | 875,000 | | | The Chefs' Warehouse (a) | | | 20,160,000 | | |
| | | | | Distributor of Specialty Foods to
Fine Dining Restaurants | | | | | |
| | 2,010,000 | | | Groupon (a) | | | 16,602,600 | | |
| | | | | Global Marketplace for Deals | | | | | |
| | | | 259,247,555 | | |
| | | > Restaurants 1.2% | |
| | 878,000 | | | Fiesta Restaurant Group (a) | | | 53,382,400 | | |
| | | | | Owns/Operates Two Restaurant
Chains: Pollo Tropical &
Taco Cabana | | | | | |
| | 489,000 | | | Domino's Pizza | | | 46,049,130 | | |
| | | | | Franchisor of Pizza Restaurants | | | | | |
| | 700,000 | | | Popeyes Louisiana
Kitchen (a) | | | 39,389,000 | | |
| | | | | Popeyes Restaurants | | | | | |
| | 157,000 | | | Buffalo Wild Wings (a) | | | 28,319,660 | | |
| | | | | Restaurants | | | | | |
| | 478,000 | | | Papa John's International | | | 26,672,400 | | |
| | | | | Franchisor of Pizza Restaurants | | | | | |
| | | | 193,812,590 | | |
| | | > Furniture & Textiles 1.1% | |
| | 3,366,000 | | | Knoll (b) | | | 71,258,220 | | |
| | | | | Office Furniture | | | | | |
| | 2,758,000 | | | Interface | | | 45,424,260 | | |
| | | | | Modular Carpet | | | | | |
| | 630,000 | | | Caesarstone (Israel) | | | 37,686,600 | | |
| | | | | Quartz Countertops | | | | | |
| | 700,000 | | | La-Z-Boy | | | 18,788,000 | | |
| | | | | Upholstery Giant | | | | | |
| | 433,000 | | | Wayfair (a)(c) | | | 8,595,050 | | |
| | | | | Online Retailer of Home
Furnishings | | | | | |
| | | | 181,752,130 | | |
See accompanying notes to financial statements.
34
Number of Shares | | | | Value | |
| | | > Other Durable Goods 0.8% | |
| | 1,900,000 | | | Select Comfort (a) | | $ | 51,357,000 | | |
| | | | | Specialty Mattresses | | | | | |
| | 500,000 | | | Cavco Industries (a)(b) | | | 39,635,000 | | |
| | | | | Manufactured Homes | | | | | |
| | 913,000 | | | Gentex | | | 32,986,690 | | |
| | | | | Manufacturer of Auto Parts | | | | | |
| | | | 123,978,690 | | |
| | | > Food & Beverage 0.4% | |
| | 3,484,000 | | | Boulder Brands (a)(b) | | | 38,533,040 | | |
| | | | | Healthy Food Products | | | | | |
| | 591,000 | | | B&G Foods | | | 17,670,900 | | |
| | | | | Acquirer of Small Food Brands | | | | | |
| | 243,000 | | | Freshpet (a)(c) | | | 4,145,580 | | |
| | | | | Fresh Pet Food Manufacturer &
Marketer | | | | | |
| | 1,665,270 | | | GLG Life Tech (Canada) (a) | | | 458,673 | | |
| | | | | Producer of an All-natural
Sweetener Extracted from
the Stevia Plant | | | | | |
| | | | 60,808,193 | | |
| | | > Apparel 0.4% | |
| | 456,000 | | | PVH | | | 58,445,520 | | |
| | | | | Apparel Wholesaler & Retailer | | | | | |
| | | > Educational Services 0.2% | |
| | 800,000 | | | DeVry | | | 37,976,000 | | |
| | | | | Postsecondary Degree Services | | | | | |
| | | > Other Consumer Services 0.2% | |
| | 700,000 | | | Blackhawk Network (a) | | | 26,383,000 | | |
| | | | | Third-party Distributer of
Prepaid Content, Mostly
Gift Cards | | | | | |
| | | > Nondurables 0.1% | |
| | 611,000 | | | Prestige Brands Holdings (a) | | | 21,213,920 | | |
| | | | | Household & Personal Care
Products | | | | | |
| | | > Leisure Products 0.1% | |
| | 641,000 | | | Performance Sports Group (a) | | | 11,531,590 | | |
| | | | | Sporting Goods Manufacturer | | | | | |
| | 537,804 | | | Fox Factory Holding (a) | | | 8,728,559 | | |
| | | | | High Performance Suspension
Systems for Leisure Market | | | | | |
| | | | 20,260,149 | | |
Consumer Goods & Services: Total | | | 2,126,025,339 | | |
Finance 12.6% | | | |
| | | > Banks 4.3% | |
| | 9,000,000 | | | Associated Banc-Corp (b) | | | 167,670,000 | | |
| | | | | Midwest Bank | | | | | |
| | 1,800,000 | | | BOK Financial | | | 108,072,000 | | |
| | | | | Tulsa-based Southwest Bank | | | | | |
| | 840,000 | | | SVB Financial Group (a) | | | 97,498,800 | | |
| | | | | Bank to Venture Capitalists | | | | | |
| | 2,580,000 | | | MB Financial | | | 84,778,800 | | |
| | | | | Chicago Bank | | | | | |
| | 940,000 | | | City National | | | 75,961,400 | | |
| | | | | Bank & Asset Manager | | | | | |
| | 1,900,000 | | | Hancock Holding | | | 58,330,000 | | |
| | | | | Gulf Coast Bank | | | | | |
Number of Shares | | | | Value | |
| | 1,162,000 | | | Sandy Spring Bancorp | | $ | 30,304,960 | | |
| | | | | Baltimore & Washington,
D.C. Bank | | | | | |
| | 4,328,500 | | | First Busey | | | 28,178,535 | | |
| | | | | Illinois Bank | | | | | |
| | 2,136,500 | | | TrustCo Bank | | | 15,510,990 | | |
| | | | | New York State Bank | | | | | |
| | 1,573,000 | | | Valley National Bancorp | | | 15,273,830 | | |
| | | | | New Jersey/New York Bank | | | | | |
| | 2,004,600 | | | Cascade Bancorp (a) | | | 10,403,874 | | |
| | | | | Central Oregon & Idaho Bank | | | | | |
| | | | 691,983,189 | | |
| | | > Brokerage & Money
Management 3.0% | |
| | 7,368,774 | | | SEI Investments | | | 295,045,711 | | |
| | | | | Mutual Fund Administration &
Investment Management | | | | | |
| | 3,283,508 | | | Eaton Vance | | | 134,393,982 | | |
| | | | | Specialty Mutual Funds | | | | | |
| | 11,000,000 | | | Sprott (Canada) (c) | | | 23,102,083 | | |
| | | | | Asset Manager Focused on
Resources, Particularly
Gold & Silver | | | | | |
| | 1,356,758 | | | Coronation Fund Managers
(South Africa) | | | 13,426,993 | | |
| | | | | South African Fund Manager | | | | | |
| | 500,000 | | | Wisdom Tree | | | 7,837,500 | | |
| | | | | Fund Manager with ETF
Specialty | | | | | |
| | | | 473,806,269 | | |
| | | > Insurance 2.5% | |
| | 7,600,000 | | | CNO Financial Group | | | 130,872,000 | | |
| | | | | Life, Long-term Care & Medical
Supplement Insurance | | | | | |
| | 2,275,000 | | | Allied World Assurance
Company Holdings | | | 86,268,000 | | |
| | | | | Commercial Lines Insurance/
Reinsurance | | | | | |
| | 1,100,000 | | | HCC Insurance Holdings | | | 58,872,000 | | |
| | | | | Specialty Insurance | | | | | |
| | 800,000 | | | RLI | | | 39,520,000 | | |
| | | | | Specialty Insurance | | | | | |
| | 8,658,000 | | | Rand Merchant Insurance
(South Africa) | | | 30,582,082 | | |
| | | | | Directly Sold Property &
Casualty Insurance; Holdings in
other Insurers | | | | | |
| | 185,000 | | | Enstar Group (a) | | | 28,284,650 | | |
| | | | | Insurance/Reinsurance &
Related Services | | | | | |
| | 714,574 | | | Selective Insurance Group | | | 19,414,976 | | |
| | | | | Commercial & Personal Lines
Insurance | | | | | |
| | | | 393,813,708 | | |
| | | > Finance Companies 1.1% | |
| | 808,343 | | | World Acceptance (a)(b)(c) | | | 64,222,852 | | |
| | | | | Personal Loans | | | | | |
| | 1,580,000 | | | McGrath Rentcorp (b) | | | 56,658,800 | | |
| | | | | Mini Rental Conglomerate | | | | | |
See accompanying notes to financial statements.
35
Columbia Acorn® Fund
Statement of Investments, continued
Number of Shares | | | | Value | |
| | | > Finance Companies—continued | |
| | 1,500,000 | | | CAI International (a)(b) | | $ | 34,800,000 | | |
| | | | | International Container Leasing | | | | | |
| | 902,210 | | | Marlin Business Services (b) | | | 18,522,371 | | |
| | | | | Small Equipment Leasing | | | | | |
| | | | 174,204,023 | | |
| | | > Credit Cards 1.1% | |
| | 360,000 | | | Alliance Data Systems (a) | | | 102,978,000 | | |
| | | | | Diversified Credit Card Provider | | | | | |
| | 720,000 | | | WEX (a) | | | 71,222,400 | | |
| | | | | Card Processor | | | | | |
| | | | 174,200,400 | | |
| | | > Diversified Financial
Companies 0.6% | |
| | 3,552,000 | | | Leucadia National | | | 79,635,840 | | |
| | | | | Holding Company | | | | | |
| | 472,000 | | | Liberty Tax (a) | | | 16,869,280 | | |
| | | | | Tax Preparation Company | | | | | |
| | | | 96,505,120 | | |
Finance: Total | | | 2,004,512,709 | | |
Health Care 10.2% | | | |
| | | > Biotechnology & Drug
Delivery 3.8% | |
| | 2,419,209 | | | Synageva BioPharma (a)(b)(c) | | | 224,478,403 | | |
| | | | | Biotech Focused on Orphan
Diseases | | | | | |
| | 3,398,400 | | | Seattle Genetics (a)(c) | | | 109,190,592 | | |
| | | | | Antibody-based Therapies for
Cancer | | | | | |
| | 1,164,974 | | | Ultragenyx Pharmaceutical (a) | | | 51,119,059 | | |
| | | | | Biotech Focused on "Ultra-Orphan"
Drugs | | | | | |
| | 319,200 | | | Intercept Pharmaceuticals (a)(c) | | | 49,795,200 | | |
| | | | | Biotech Developing Drugs for
Several Diseases | | | | | |
| | 2,401,400 | | | Celldex Therapeutics (a)(c) | | | 43,825,550 | | |
| | | | | Biotech Developing Drugs for Cancer | | | | | |
| | 2,523,900 | | | Sarepta Therapeutics (a)(b)(c) | | | 36,520,833 | | |
| | | | | Biotech Focused on Rare Diseases | | | | | |
| | 362,300 | | | Alnylam Pharmaceuticals (a) | | | 35,143,100 | | |
| | | | | Biotech Developing Drugs for
Rare Diseases | | | | | |
| | 934,400 | | | NPS Pharmaceuticals (a) | | | 33,423,488 | | |
| | | | | Orphan Drugs & Healthy Royalties | | | | | |
| | 320,200 | | | BioMarin Pharmaceutical (a) | | | 28,946,080 | | |
| | | | | Biotech Focused on Orphan Diseases | | | | | |
| | 359,944 | | | MicroDose Therapeutx
Contingent Value
Rights (a)(d)(e) | | | 529,118 | | |
| | | | | Drug Inhaler Development | | | | | |
| | | | 612,971,423 | | |
| | | > Medical Supplies 3.0% | |
| | 5,350,800 | | | Cepheid (a)(b) | | | 289,692,312 | | |
| | | | | Molecular Diagnostics | | | | | |
| | 1,169,200 | | | Bio-Techne | | | 108,034,080 | | |
| | | | | Cytokines, Antibodies & other
Reagents for Life Science | | | | | |
Number of Shares | | | | Value | |
| | 291,100 | | | Henry Schein (a) | | $ | 39,633,265 | | |
| | | | | Large Distributor of Dental,
Vet & Medical Products | | | | | |
| | 1,375,400 | | | VWR (a)(c) | | | 35,581,598 | | |
| | | | | Distributor of Lab Supplies | | | | | |
| | | | 472,941,255 | | |
| | | > Health Care Services 1.4% | |
| | 1,549,500 | | | Medidata Solutions (a) | | | 73,988,625 | | |
| | | | | Cloud-based Software for Drug
Studies | | | | | |
| | 1,666,323 | | | HealthSouth | | | 64,086,783 | | |
| | | | | Inpatient Rehabilitation Facilities | | | | | |
| | 1,239,000 | | | Envision Healthcare
Holdings (a) | | | 42,980,910 | | |
| | | | | Provider of Health Care
Outsourcing Services | | | | | |
| | 2,746,200 | | | Allscripts Healthcare
Solutions (a) | | | 35,068,974 | | |
| | | | | Health Care IT | | | | | |
| | 863,500 | | | Castlight Health (a)(c) | | | 10,102,950 | | |
| | | | | Provider of Cloud-based Software
for Managing Health Care Costs | | | | | |
| | | | 226,228,242 | | |
| | | > Pharmaceuticals 1.1% | |
| | 4,845,000 | | | Akorn (a) | | | 175,389,000 | | |
| | | | | Developer, Manufacturer &
Distributor of Specialty
Generic Drugs | | | | | |
| | | > Medical Equipment &
Devices 0.9% | |
| | 752,000 | | | Abaxis | | | 42,736,160 | | |
| | | | | Instruments & Tests for Vet &
Medical Markets | | | | | |
| | 460,900 | | | Sirona Dental Systems (a) | | | 40,268,833 | | |
| | | | | Manufacturer of Dental Equipment | | | | | |
| | 1,255,500 | | | Wright Medical Group (a) | | | 33,735,285 | | |
| | | | | Leader in Foot & Ankle Replacement | | | | | |
| | 448,000 | | | Align Technology (a) | | | 25,047,680 | | |
| | | | | Invisalign System to Correct
Malocclusion (Crooked Teeth) | | | | | |
| | | | 141,787,958 | | |
Health Care: Total | | | 1,629,317,878 | | |
Other Industries 6.2% | | | |
| | | > Real Estate 3.7% | |
| | 2,000,000 | | | Extra Space Storage | | | 117,280,000 | | |
| | | | | Self Storage Facilities | | | | | |
| | 750,000 | | | Federal Realty | | | 100,095,000 | �� | |
| | | | | Shopping Centers | | | | | |
| | 2,450,000 | | | EdR (b) | | | 89,645,500 | | |
| | | | | Student Housing | | | | | |
| | 1,320,000 | | | Post Properties | | | 77,576,400 | | |
| | | | | Multifamily Properties | | | | | |
| | 325,000 | | | Jones Lang LaSalle | | | 48,727,250 | | |
| | | | | Real Estate Services | | | | | |
| | 170,000 | | | Amerco | | | 48,324,200 | | |
| | | | | North American Moving &
Storage King | | | | | |
| | 1,293,750 | | | DCT Industrial Trust | | | 46,135,125 | | |
| | | | | Industrial Properties | | | |
See accompanying notes to financial statements.
36
Number of Shares | | | | Value | |
| | | > Real Estate—continued | |
| | 2,150,000 | | | Terreno Realty (b) | | $ | 44,354,500 | | |
| | | | | Industrial Properties | | | | | |
| | 872,926 | | | St. Joe (a) | | | 16,053,109 | | |
| | | | | Florida Panhandle Landowner | | | | | |
| | 39,381 | | | Deltic Timber | | | 2,693,661 | | |
| | | | | Arkansas Land & Timber | | | | | |
| | | | 590,884,745 | | |
| | | > Transportation 1.8% | |
| | 2,650,000 | | | Rush Enterprises,
Class A (a)(b) | | | 84,932,500 | | |
| | 550,000 | | | Rush Enterprises,
Class B (a)(b) | | | 15,488,000 | | |
| | | | | Truck Sales & Service | | | | | |
| | 940,000 | | | JB Hunt Transport Services | | | 79,195,000 | | |
| | | | | Truck & Intermodal Carrier | | | | | |
| | 730,000 | | | Kirby (a) | | | 58,940,200 | | |
| | | | | Operator of U.S. (Jones Act)
Liquid Tank Barges | | | | | |
| | 380,000 | | | Genesee & Wyoming (a) | | | 34,169,600 | | |
| | | | | Short-line Operator | | | | | |
| | 496,024 | | | Heartland Express | | | 13,397,608 | | |
| | | | | Regional Trucker | | | | | |
| | | | 286,122,908 | | |
| | | > Regulated Utilities 0.7% | |
| | 1,600,000 | | | Northeast Utilities | | | 85,632,000 | | |
| | | | | Regulated Electric Utility | | | | | |
| | 500,000 | | | Wisconsin Energy | | | 26,370,000 | | |
| | | | | Wisconsin Utility | | | | | |
| | | | 112,002,000 | | |
Other Industries: Total | | | 989,009,653 | | |
Energy & Minerals 4.1% | | | |
| | | > Oil & Gas Producers 1.8% | |
| | 717,000 | | | Energen Corporation | | | 45,715,920 | | |
| | | | | Oil & Gas Producer with
Natural Gas Utility | | | | | |
| | 1,849,600 | | | Rosetta Resources (a) | | | 41,264,576 | | |
| | | | | Oil & Gas Producer Exploring
in Texas | | | | | |
| | 926,000 | | | Carrizo Oil & Gas (a) | | | 38,521,600 | | |
| | | | | Oil & Gas Producer | | | | | |
| | 632,000 | | | Range Resources | | | 33,780,400 | | |
| | | | | Oil & Gas Producer | | | | | |
| | 778,000 | | | SM Energy | | | 30,015,240 | | |
| | | | | Oil & Gas Producer | | | | | |
| | 501,000 | | | PDC Energy (a) | | | 20,676,270 | | |
| | | | | Oil & Gas Producer in the U.S. | | | | | |
| | 281,000 | | | Clayton Williams (a) | | | 17,927,800 | | |
| | | | | Oil & Gas Producer | | | | | |
| | 1,210,000 | | | WPX Energy (a) | | | 14,072,300 | | |
| | | | | Oil & Gas Produced in
the U.S. & Argentina | | | | | |
| | 1,800,000 | | | Pacific Rubiales Energy
(Colombia) (c) | | | 11,139,611 | | |
| | | | | Oil Production & Exploration
in Colombia | | | | | |
| | 1,400,000 | | | DeeThree Exploration
(Canada) (a) | | | 6,157,686 | | |
| | | | | Canadian Oil & Gas Producer | | | | | |
Number of Shares | | | | Value | |
| | 42,000,000 | | | Petroamerica Oil
(Colombia) (a) | | $ | 5,061,112 | | |
| | | | | Oil Exploration & Production
in Colombia | | | | | |
| | 203,000 | | | Bonanza Creek Energy (a) | | | 4,872,000 | | |
| | | | | Oil & Gas Producer in Western U.S. | | | | | |
| | 67,500,000 | | | Petromanas
(Canada) (a)(b)(c) | | | 3,485,970 | | |
| | | | | Exploring for Oil in Albania | | | | | |
| | 24,115,500 | | | Canadian Overseas
Petroleum (Canada) (a)(b) | | | 2,075,702 | | |
| | 8,400,000 | | | Canadian Overseas
Petroleum (Canada) (a)(b)(d) | | | 686,865 | | |
| | | | | Oil & Gas Exploration Offshore
West Africa | | | | | |
| | 28,962,000 | | | ShaMaran Petroleum
(Iraq) (a) | | | 2,742,142 | | |
| | | | | Oil Exploration & Production
in Kurdistan | | | | | |
| | 2,600,000 | | | Petrodorado Energy
(Colombia) (a)(b) | | | 302,117 | | |
| | | | | Oil & Gas Exploration &
Production in Colombia, Peru &
Paraguay | | | | | |
| | | | 278,497,311 | | |
| | | > Oil Services 1.3% | |
| | 1,797,579 | | | ShawCor (Canada) | | | 65,602,814 | | |
| | | | | Oil & Gas Pipeline Products | | | | | |
| | 1,613,000 | | | Hornbeck Offshore (a) | | | 40,276,610 | | |
| | | | | Supply Vessel Operator in
U.S. Gulf of Mexico | | | | | |
| | 964,000 | | | Chart Industries (a) | | | 32,968,800 | | |
| | | | | Manufacturer of Natural Gas
Processing/Storage Equipment | | | | | |
| | 780,000 | | | Gulfport Energy (a) | | | 32,557,200 | | |
| | | | | Oil & Gas Producer Focused on
Utica Shale in Ohio | | | | | |
| | 370,000 | | | FMC Technologies (a) | | | 17,330,800 | | |
| | | | | Oil & Gas Well Head Manufacturer | | | | | |
| | 289,000 | | | Rowan | | | 6,739,480 | | |
| | | | | Contract Offshore Driller | | | | | |
| | 2,601,900 | | | Horizon North Logistics
(Canada) (c) | | | 5,912,391 | | |
| | | | | Provider of Diversified Oil
Services in Northern Canada | | | | | |
| | 214,100 | | | Black Diamond Group
(Canada) | | | 2,347,766 | | |
| | | | | Provider of Accommodations/
Equipment for Oil Sands
Development | | | | | |
| | | | 203,735,861 | | |
| | | > Mining 0.9% | |
| | 505,000 | | | Core Labs (Netherlands) (c) | | | 60,771,700 | | |
| | | | | Oil & Gas Reservoir Consulting | | | | | |
| | 3,500,000 | | | Alamos Gold (Canada) | | | 25,004,304 | | |
| | | | | Gold Mining | | | | | |
| | 6,347,100 | | | Kirkland Lake Gold
(Canada) (a)(b)(c) | | | 18,301,588 | | |
| | | | | Gold Mining | | | | | |
See accompanying notes to financial statements.
37
Columbia Acorn® Fund
Statement of Investments, continued
Number of Shares | | | | Value | |
| | | > Mining—continued | |
| | 599,000 | | | US Silica (c) | | $ | 15,388,310 | | |
| | | | | Provider of Frac Sand &
Industrial Sand in U.S. | | | | | |
| | 9,014,700 | | | Argonaut Gold
(Canada) (a)(b)(c) | | | 14,199,433 | | |
| | | | | Gold & Silver Mining | | | | | |
| | 7,103,513 | | | Allied Nevada Gold (a)(b)(c) | | | 6,180,056 | | |
| | | | | Gold & Silver Mining | | | | | |
| | 3,412,300 | | | Silvercrest Mines (a) | | | 4,170,654 | | |
| | | | | Gold & Silver Mining | | | | | |
| | 3,000,000 | | | Kaminak Gold (a) | | | 1,988,294 | | |
| | | | | Exploration Stage Canadian
Gold Miner | | | | | |
| | 2,800,000 | | | Alexco Resource (a) | | | 1,454,880 | | |
| | | | | Mining, Exploration &
Environmental Services | | | | | |
| | | | 147,459,219 | | |
| | | > Agricultural Commodities 0.1% | |
| | 1,306,818 | | | Union Agriculture Group
(Uruguay) (a)(d)(e) | | | 11,931,248 | | |
| | | | | Farmland Operator in Uruguay | | | | | |
| | | > Alternative Energy —% | |
| | 5,000,000 | | | RGS Energy (a)(b)(c) | | | 2,415,500 | | |
| | | | | U.S. Residential & Commercial
Solar Systems Installer | | | | | |
| | 1,000,000 | | | Synthesis Energy Systems
(China) (a) | | | 947,000 | | |
| | | | | Owner/Operator of Gasification
Plants/Technology Licenses | | | | | |
| | | | 3,362,500 | | |
Energy & Minerals: Total | | | 644,986,139 | | |
Total Equities: 97.7%
(Cost: $8,478,158,225) | | | 15,568,663,720 | (f) | |
Number of Shares | | | | Value | |
Short-Term Investments 2.5% | | | |
| | 280,000,000 | | | JPMorgan U.S. Government
Money Market Fund,
IM Shares (7 day yield
of 0.01%) | | $ | 280,000,000 | | |
| | 128,802,371 | | | JPMorgan U.S. Government
Money Market Fund,
Agency Shares (7 day yield
of 0.01%) | | | 128,802,371 | | |
Total Short-Term Investments: 2.5%
(Cost: $408,802,371) | | | 408,802,371 | | |
Securities Lending Collateral 3.4% | | | |
| | 534,041,419 | | | Dreyfus Government Cash
Management Fund,
Institutional Shares
(7 day yield of 0.01%) (g) | | | 534,041,419 | | |
Total Securities Lending Collateral: 3.4%
(Cost: $534,041,419) | | | 534,041,419 | | |
Total Investments: 103.6%
(Cost: $9,421,002,015)(h) | | | 16,511,507,510 | | |
Obligation to Return Collateral for
Securities Loaned: (3.4)% | | | (534,041,419 | ) | |
Cash and Other Assets Less
Liabilities: (0.2)% | | | (42,890,066 | ) | |
Net Assets: 100.0% | | $ | 15,934,576,025 | | |
ADR - American Depositary Receipts
> Notes to Statement of Investments
(a) Non-income producing security.
(b) An affiliated person of the Fund, as defined in the Investment Company Act of 1940, may include any company in which the Fund owns five percent or more of its outstanding voting shares. Holdings and transactions in these affiliated companies during the year ended December 31, 2014, are as follows:
Security | | Balance of
Shares Held
12/31/13 | | Purchases/
Additions | | Sales/
Reductions | | Balance of
Shares Held
12/31/14 | | Value | | Dividend | |
Mettler-Toledo International (1) | | | 1,475,000 | | | | - | | | | 313,000 | | | | 1,162,000 | | | $ | 351,458,520 | | | $ | - | | |
Donaldson | | | 8,400,000 | | | | - | | | | 448,000 | | | | 7,952,000 | | | | 307,185,760 | | | | 5,304,300 | | |
Cepheid | | | 6,170,000 | | | | 246,000 | | | | 1,065,200 | | | | 5,350,800 | | | | 289,692,312 | | | | - | | |
Nordson | | | 3,400,000 | | | | - | | | | 270,000 | | | | 3,130,000 | | | | 244,014,800 | | | | 2,680,180 | | |
Synageva BioPharma | | | 2,392,000 | | | | 181,000 | | | | 153,791 | | | | 2,419,209 | | | | 224,478,403 | | | | - | | |
Informatica (1) | | | 5,500,000 | | | | 550,000 | | | | 850,000 | | | | 5,200,000 | | | | 198,302,000 | | | | - | | |
Moog | | | 3,230,000 | | | | - | | | | 774,000 | | | | 2,456,000 | | | | 181,817,680 | | | | - | | |
Akorn (1) | | | 5,417,981 | | | | 881,485 | | | | 1,454,466 | | | | 4,845,000 | | | | 175,389,000 | | | | - | | |
HEICO | | | 3,828,750 | | | | - | | | | 202,000 | | | | 3,626,750 | | | | 171,762,880 | | | | 483,598 | | |
Generac | | | 3,113,000 | | | | 887,000 | | | | 368,000 | | | | 3,632,000 | | | | 169,832,320 | | | | - | | |
Associated Banc-Corp | | | 9,000,000 | | | | - | | | | - | | | | 9,000,000 | | | | 167,670,000 | | | | 3,330,000 | | |
iGATE (1) | | | 4,150,000 | | | | 15,083 | | | | 565,083 | | | | 3,600,000 | | | | 142,128,000 | | | | - | | |
See accompanying notes to financial statements.
38
> Notes to Statement of Investments
Security | | Balance of
Shares Held
12/31/13 | | Purchases/
Additions | | Sales/
Reductions | | Balance of
Shares Held
12/31/14 | | Value | | Dividend | |
Rush Enterprises | | | 3,650,000 | | | | - | | | | 450,000 | | | | 3,200,000 | | | $ | 100,420,500 | | | $ | - | | |
EdR (2) | | | 2,450,000 | | | | - | | | | - | | | | 2,450,000 | | | | 89,645,500 | | | | 2,665,110 | | |
Globalstar (1) | | | 25,500,000 | | | | 7,150,000 | | | | 1,650,000 | | | | 31,000,000 | | | | 85,250,000 | | | | - | | |
MB Financial (1) | | | 2,860,000 | | | | - | | | | 280,000 | | | | 2,580,000 | | | | 84,778,800 | | | | 1,448,000 | | |
Drew Industries | | | 1,780,000 | | | | - | | | | 170,000 | | | | 1,610,000 | | | | 82,222,700 | | | | - | | |
Bankrate | | | 200,000 | | | | 6,100,300 | | | | - | | | | 6,300,300 | | | | 78,312,729 | | | | - | | |
SPS Commerce | | | 900,000 | | | | 580,000 | | | | 150,000 | | | | 1,330,000 | | | | 75,317,900 | | | | - | | |
ESCO Technologies | | | 2,300,000 | | | | - | | | | 352,000 | | | | 1,948,000 | | | | 71,881,200 | | | | 698,640 | | |
Knoll | | | 3,669,000 | | | | - | | | | 303,000 | | | | 3,366,000 | | | | 71,258,220 | | | | 1,724,760 | | |
Virtusa | | | 1,985,000 | | | | - | | | | 327,000 | | | | 1,658,000 | | | | 69,088,860 | | | | - | | |
World Acceptance | | | 850,000 | | | | - | | | | 41,657 | | | | 808,343 | | | | 64,222,852 | | | | - | | |
Navigant Consulting | | | 4,025,000 | | | | 103,523 | | | | - | | | | 4,128,523 | | | | 63,455,399 | | | | - | | |
McGrath Rentcorp | | | 2,150,000 | | | | - | | | | 570,000 | | | | 1,580,000 | | | | 56,658,800 | | | | 2,022,750 | | |
Vonage | | | - | | | | 14,044,775 | | | | - | | | | 14,044,775 | | | | 53,510,593 | | | | - | | |
Ultragenyx Pharmaceutical (1)(2) | | | 1,151,982 | | | | 472,707 | | | | 459,715 | | | | 1,164,974 | | | | 51,119,059 | | | | 253,930 | | |
Thermon | | | 1,065,000 | | | | 875,094 | | | | - | | | | 1,940,094 | | | | 46,930,874 | | | | - | | |
Terreno Realty | | | 2,020,931 | | | | 129,069 | | | | - | | | | 2,150,000 | | | | 44,354,500 | | | | 1,225,500 | | |
Cavco Industries | | | 460,000 | | | | 40,000 | | | | - | | | | 500,000 | | | | 39,635,000 | | | | - | | |
Popeyes Louisiana Kitchen (1) | | | 2,000,000 | | | | - | | | | 1,300,000 | | | | 700,000 | | | | 39,389,000 | | | | - | | |
Boulder Brands | | | 2,886,552 | | | | 1,500,000 | | | | 902,552 | | | | 3,484,000 | | | | 38,533,040 | | | | - | | |
Sarepta Therapeutics | | | 2,050,000 | | | | 887,000 | | | | 413,100 | | | | 2,523,900 | | | | 36,520,833 | | | | - | | |
Allscripts Healthcare Solutions (1) | | | 9,905,000 | | | | - | | | | 7,158,800 | | | | 2,746,200 | | | | 35,068,974 | | | | - | | |
CAI International | | | 1,500,000 | | | | - | | | | - | | | | 1,500,000 | | | | 34,800,000 | | | | - | | |
PGT | | | 738,564 | | | | 2,853,636 | | | | - | | | | 3,592,200 | | | | 34,592,886 | | | | - | | |
InContact | | | 3,740,596 | | | | 404 | | | | - | | | | 3,741,000 | | | | 32,883,390 | | | | - | | |
First Busey (1) | | | 4,841,882 | | | | - | | | | 513,382 | | | | 4,328,500 | | | | 28,178,535 | | | | 919,958 | | |
Blackhawk Network (1) | | | 900,000 | | | | - | | | | 200,000 | | | | 700,000 | | | | 26,383,000 | | | | - | | |
GTT Communications | | | - | | | | 1,950,000 | | | | - | | | | 1,950,000 | | | | 25,798,500 | | | | - | | |
Hackett Group | | | 3,274,000 | | | | - | | | | 370,281 | | | | 2,903,719 | | | | 25,523,690 | | | | 369,754 | | |
E2Open | | | 610,000 | | | | 1,965,000 | | | | - | | | | 2,575,000 | | | | 24,745,750 | | | | - | | |
Insperity (1) | | | 1,400,000 | | | | - | | | | 685,000 | | | | 715,000 | | | | 24,231,350 | | | | 2,288,240 | | |
Boingo Wireless | | | 2,500,000 | | | | 300,000 | | | | - | | | | 2,800,000 | | | | 21,476,000 | | | | - | | |
Amber Road | | | - | | | | 2,000,000 | | | | - | | | | 2,000,000 | | | | 20,440,000 | | | | - | | |
Marlin Business Services | | | 1,091,000 | | | | - | | | | 188,790 | | | | 902,210 | | | | 18,522,371 | | | | 489,171 | | |
Kirkland Lake Gold | | | 4,900,000 | | | | 1,447,100 | | | | - | | | | 6,347,100 | | | | 18,301,588 | | | | - | | |
Gaiam | | | 1,500,000 | | | | 600,000 | | | | - | | | | 2,100,000 | | | | 14,973,000 | | | | - | | |
Argonaut Gold | | | - | | | | 9,014,700 | | | | - | | | | 9,014,700 | | | | 14,199,433 | | | | - | | |
Liquidity Services | | | 900,000 | | | | 700,000 | | | | - | | | | 1,600,000 | | | | 13,072,000 | | | | - | | |
Rubicon Technology | | | - | | | | 2,500,000 | | | | - | | | | 2,500,000 | | | | 11,425,000 | | | | - | | |
Audience | | | - | | | | 2,150,000 | | | | - | | | | 2,150,000 | | | | 9,460,000 | | | | - | | |
Tangoe (1) | | | 2,100,000 | | | | - | | | | 1,458,048 | | | | 641,952 | | | | 8,364,635 | | | | - | | |
Towerstream | | | 3,319,900 | | | | 680,100 | | | | - | | | | 4,000,000 | | | | 7,400,000 | | | | - | | |
Exa (1) | | | 1,000,000 | | | | - | | | | 445,609 | | | | 554,391 | | | | 6,530,726 | | | | - | | |
Allied Nevada Gold | | | 2,000,000 | | | | 5,103,513 | | | | - | | | | 7,103,513 | | | | 6,180,056 | | | | - | | |
Petroamerica Oil (1) | | | 35,000,000 | | | | 7,000,000 | | | | - | | | | 42,000,000 | | | | 5,061,112 | | | | - | | |
Petromanas | | | 51,359,500 | | | | 16,140,500 | | | | - | | | | 67,500,000 | | | | 3,485,970 | | | | - | | |
Canadian Overseas Petroleum | | | 19,471,000 | | | | 13,044,500 | | | | - | | | | 32,515,500 | | | | 2,762,567 | | | | - | | |
RGS Energy | | | 2,600,000 | | | | 2,400,000 | | | | - | | | | 5,000,000 | | | | 2,415,500 | | | | - | | |
GLG Life Tech (1) | | | 1,665,270 | | | | - | | | | - | | | | 1,665,270 | | | | 458,673 | | | | - | | |
Petrodorado Energy (2) | | | 2,600,000 | | | | - | | | | - | | | | 2,600,000 | | | | 302,117 | | | | - | | |
Acorn Energy (1) | | | 1,161,957 | | | | - | | | | 1,161,957 | | | | - | | | | - | | | | - | | |
Alimera Sciences (1) | | | 2,040,000 | | | | - | | | | 2,040,000 | | | | - | | | | - | | | | - | | |
Bally Technologies (1) | | | 3,105,000 | | | | - | | | | 3,105,000 | | | | - | | | | - | | | | - | | |
Coresite Realty (1) | | | 1,170,000 | | | | - | | | | 1,170,000 | | | | - | | | | - | | | | 1,139,962 | | |
Duluth Metals (1) | | | 7,025,500 | | | | - | | | | 7,025,500 | | | | - | | | | - | | | | - | | |
Dupont Fabros Technology (1) | | | 3,625,000 | | | | - | | | | 3,625,000 | | | | - | | | | - | | | | 1,128,750 | | |
H & E Equipment Services (1) | | | 2,508,816 | | | | - | | | | 2,508,816 | | | | - | | | | - | | | | - | | |
II-VI (1) | | | 3,640,000 | | | | - | | | | 3,640,000 | | | | - | | | | - | | | | - | | |
See accompanying notes to financial statements.
39
Columbia Acorn® Fund
Statement of Investments, continued
> Notes to Statement of Investments
Security | | Balance of
Shares Held
12/31/13 | | Purchases/
Additions | | Sales/
Reductions | | Balance of
Shares Held
12/31/14 | | Value | | Dividend | |
Pier 1 Imports (1) | | | 7,185,000 | | | | - | | | | 7,185,000 | | | | - | | | $ | - | | | $ | 939,780 | | |
Simplicity Bancorp (1) | | | 452,146 | | | | - | | | | 452,146 | | | | - | | | | - | | | | 72,577 | | |
tw telecom (1) | | | 9,500,000 | | | | - | | | | 9,500,000 | | | | - | | | | - | | | | - | | |
Total of Affiliated Transactions | | | 320,360,327 | | | | 104,492,489 | | | | 66,265,893 | | | | 358,586,923 | | | $ | 4,443,274,857 | | | $ | 29,184,960 | | |
(1) At December 31, 2014, the Fund owned less than five percent of the company's outstanding voting shares.
(2) Includes the effects of a stock split.
The aggregate cost and value of these companies at December 31, 2014, was $1,936,450,819 and $3,181,183,473, respectively. Investments in affiliated companies represented 19.96% of the Fund's total net assets at December 31, 2014.
(c) All or a portion of this security was on loan at December 31, 2014. The total market value of securities on loan at December 31, 2014 was $517,888,630.
(d) Denotes a restricted security, which is subject to restrictions on resale under federal securities laws. These securities are valued at fair value determined in good faith under consistently applied procedures established by the Fund's Board of Trustees. At December 31, 2014, the market value of these securities amounted to $13,147,231, which represented 0.08% of total net assets. Additional information on these securities is as follows:
Security | | Acquisition
Dates | | Shares/Units | | Cost | | Value | |
Union Agriculture Group | | 12/8/10-6/27/12 | | | 1,306,818 | | | $ | 15,000,000 | | | $ | 11,931,248 | | |
Canadian Overseas Petroleum | | 11/24/10 | | | 8,400,000 | | | | 3,591,152 | | | | 686,865 | | |
MicroDose Therapeutx Contingent Value Rights | | 8/14/13 | | | 359,944 | | | | - | | | | 529,118 | | |
| | | | | | | $ | 18,591,152 | | | $ | 13,147,231 | | |
(e) Illiquid security.
(f) On December 31, 2014, the market value of foreign securities represented 4.20% of total net assets. The Fund's foreign portfolio was diversified as follows:
Country | | Value | | Percentage
of Net Assets | |
Canada | | $ | 217,238,937 | | | | 1.36 | | |
Netherlands | | | 125,338,953 | | | | 0.79 | | |
India | | | 74,874,429 | | | | 0.47 | | |
Sweden | | | 50,037,952 | | | | 0.31 | | |
South Africa | | | 44,009,075 | | | | 0.28 | | |
Denmark | | | 38,198,138 | | | | 0.24 | | |
France | | | 37,902,569 | | | | 0.24 | | |
Israel | | | 37,686,600 | | | | 0.24 | | |
Colombia | | | 16,502,840 | | | | 0.10 | | |
Uruguay | | | 11,931,248 | | | | 0.07 | | |
Spain | | | 5,671,933 | | | | 0.04 | | |
United Kingdom | | | 5,412,491 | | | | 0.03 | | |
Iraq | | | 2,742,142 | | | | 0.02 | | |
China | | | 947,000 | | | | 0.01 | | |
Total Foreign Portfolio | | $ | 668,494,307 | | | | 4.20 | | |
(g) Investment made with cash collateral received from securities lending activity.
(h) At December 31, 2014, for federal income tax purposes, the cost of investments was $9,429,781,549 and net unrealized appreciation was $7,081,725,961 consisting of gross unrealized appreciation of $7,688,655,656 and gross unrealized depreciation of $606,929,695.
Fair Value Measurements
Various inputs are used in determining the value of the Fund's investments, following the input prioritization hierarchy established by accounting principles generally accepted in the United States of America (GAAP). These inputs are summarized in the three broad levels listed below:
• Level 1 – quoted prices in active markets for identical securities
• Level 2 – prices determined using other significant observable inputs (including quoted prices for similar securities, interest rates, prepayment speeds, credit risk and others)
• Level 3 – prices determined using significant unobservable inputs where quoted prices or observable inputs are unavailable or less reliable (including management's own assumptions about the factors market participants would use in pricing an investment)
The inputs or methodology used for valuing securities are not necessarily an indication of the risk associated with investing in those securities.
See accompanying notes to financial statements.
40
> Notes to Statement of Investments
Examples of the types of securities in which the Fund would typically invest and how they are classified within this hierarchy are as follows. Typical Level 1 securities include exchange traded domestic equities, mutual funds whose NAVs are published each day and exchange traded foreign equities that are not statistically fair valued. Typical Level 2 securities include exchange traded foreign equities that are statistically fair valued, forward foreign currency exchange contracts and short-term investments valued at amortized cost. Additionally, securities fair valued by the Valuation Committee (the Committee) of the Fund's Board of Trustees (the Board) that rely on significant observable inputs are also included in Level 2. Typical Level 3 securities include any security fair valued by the Committee that relies on significant unobservable inputs.
Under the direction of the Board, the Committee is responsible for overseeing the valuation procedures approved by the Board.
The Committee meets as necessary, and no less frequently than quarterly, to determine fair values for securities for which market quotations are not readily available or for which the investment manager believes that available market quotations are unreliable, to review the appropriateness of the Trust's Portfolio Pricing Policy and the pricing procedures of the investment manager (the Policies), and to review the continuing appropriateness of the current value of any security subject to the Policies. The Policies address, among other things: circumstances under which market quotations will be deemed readily available; selection of third party pricing vendors; appropriate pricing methodologies; events that require fair valuation and fair value techniques; circumstances under which securities will be deemed to pose a potential for stale pricing, including when securities are illiquid, restricted, or in default; and certain delegations of authority to determine fair values to the Fund's investment manager. The Committee may also meet to discuss additional valuation matters, which may include review of back-testing results, review of time-sensitive information or approval of other valuation related actions, and to review the appropriateness of the Policies.
For investments categorized as Level 3, the significant unobservable inputs used in the fair value measurement of the Funds' securities may include: (i) data specific to the issuer or comparable issuers, (ii) general market or specific sector news and (iii) quoted prices and specific or similar security transactions. The Committee considers this data and any changes from prior periods in order to assess the reasonableness of observable and unobservable inputs, any assumptions or internal models used to value those securities and changes in fair value. Significant changes in any of these factors could result in lower or higher fair value measurements. Various factors impact the frequency of monitoring (which may occur as often as daily), however the Committee may determine that changes to inputs, assumptions and models are not required with the same frequency.
The following table summarizes the inputs used, as of December 31, 2014, in valuing the Fund's assets:
Investment Type | | Quoted Prices
(Level 1) | | Other
Significant
Observable
Inputs
(Level 2) | | Significant
Unobservable
Inputs
(Level 3) | | Total | |
Equities | |
Information | | $ | 4,250,272,149 | | | $ | 88,488,372 | | | $ | - | | | $ | 4,338,760,521 | | |
Industrial Goods & Services | | | 3,695,383,521 | | | | 140,667,960 | | | | - | | | | 3,836,051,481 | | |
Consumer Goods & Services | | | 2,120,353,406 | | | | 5,671,933 | | | | - | | | | 2,126,025,339 | | |
Finance | | | 1,960,503,634 | | | | 44,009,075 | | | | - | | | | 2,004,512,709 | | |
Health Care | | | 1,628,788,760 | | | | - | | | | 529,118 | | | | 1,629,317,878 | | |
Other Industries | | | 989,009,653 | | | | - | | | | - | | | | 989,009,653 | | |
Energy & Minerals | | | 632,368,026 | | | | 686,865 | | | | 11,931,248 | | | | 644,986,139 | | |
Total Equities | | | 15,276,679,149 | | | | 279,524,205 | | | | 12,460,366 | | | | 15,568,663,720 | | |
Total Short-Term Investments | | | 408,802,371 | | | | - | | | | - | | | | 408,802,371 | | |
Total Securities Lending Collateral | | | 534,041,419 | | | | - | | | | - | | | | 534,041,419 | | |
Total Investments | | $ | 16,219,522,939 | | | $ | 279,524,205 | | | $ | 12,460,366 | | | $ | 16,511,507,510 | | |
The Fund's assets assigned to the Level 2 input category are generally valued using a market approach, in which a security's value is determined through its correlation to prices and information from observable market transactions for similar or identical assets. Foreign equities are generally valued at the last sale price on the foreign exchange or market on which they trade. The Fund may use a statistical fair valuation model, in accordance with the policy adopted by the Board, provided by an independent third party to value securities principally traded in foreign markets in order to adjust for possible stale pricing that may occur between the close of the foreign exchanges and the time for valuation. These models take into account available market data including intraday index, ADR, and ETF movements. Securities acquired via private placement that have a holding period or an extended settlement period are valued at a discount to the same shares that are trading freely on the market. These discounts are determined by the investment manager's experience with similar securities or situations. Factors may include, but are not limited to, trade volume, shares outstanding and stock price.
The following table shows transfers between Level 1 and Level 3 of the fair value hierarchy:
Transfers In | | Transfers Out | |
| Level 1 | | Level 3 | | Level 1 | | Level 3 | |
| $ | 14,371,342 | | | $ | - | | | $ | - | | | $ | 14,371,342 | | |
There were no transfers of financial assets between levels 1 and 2 during the period. Transfers in and/or out of Level 3 are determined based on the fair value at the beginning of the period for security positions held throughout the period.
Financial assets were transferred from Level 3 to Level 1 as resale restrictions no longer apply.
See accompanying notes to financial statements.
41
Columbia Acorn® Fund
Statement of Investments, continued
> Notes to Statement of Investments
The Fund does not hold any significant investments (greater than one percent of net assets) categorized as Level 3.
Certain securities classified as Level 3 are valued at fair value, using a market approach, as determined in good faith under consistently applied procedures established by and under the general supervision of the Board. To determine fair value for these securities, for which no market exists, the Committee utilizes the valuation technique it deems most appropriate in the circumstances, using some unobservable inputs, which may include, but are not limited to estimated earnings of the company and the position of the security within the company's capital structure. The Committee also may use some observable inputs, which may include, but are not limited to, trades of similar securities and market multiples derived from a set of comparable companies. Significant increases or decreases to any of these inputs could result in a significantly lower or higher fair value measurement.
See accompanying notes to financial statements.
42
Columbia Acorn International®
Major Portfolio Changes in the Fourth Quarter (Unaudited)
| | | Number of Shares | |
| | | 9/30/14 | | 12/31/14 | |
Purchases | |
Asia | |
| > Japan | |
Benesse | | | 1,105,800 | | | | 1,301,200 | | |
Ezaki Glico | | | 269,000 | | | | 746,500 | | |
Hamamatsu Photonics | | | 527,500 | | | | 650,800 | | |
NGK Insulators | | | 1,200,000 | | | | 1,600,000 | | |
NGK Spark Plug | | | 1,010,000 | | | | 1,170,000 | | |
Nippon Kayaku | | | 3,196,000 | | | | 3,260,000 | | |
Otsuka | | | 0 | | | | 419,300 | | |
Rohto Pharmaceutical | | | 1,668,900 | | | | 1,942,000 | | |
Ushio | | | 2,900,000 | | | | 3,850,800 | | |
| > Taiwan | |
Advantech | | | 3,078,687 | | | | 3,118,686 | | |
Largan Precision | | | 336,000 | | | | 364,000 | | |
PChome Online | | | 2,139,680 | | | | 2,300,000 | | |
President Chain Store | | | 5,250,000 | | | | 7,306,000 | | |
St. Shine Optical | | | 2,001,000 | | | | 2,081,000 | | |
Vanguard International
Semiconductor | | | 3,927,000 | | | | 14,329,000 | | |
| > Korea | |
Cheil Industries | | | 0 | | | | 122,726 | | |
Cheil Worldwide | | | 0 | | | | 1,187,900 | | |
Nongshim | | | 0 | | | | 94,000 | | |
| > China | |
NewOcean Energy | | | 29,072,000 | | | | 32,790,000 | | |
| > Singapore | |
Mapletree Commercial Trust | | | 40,564,179 | | | | 53,724,268 | | |
Mapletree Logistics Trust | | | 19,349,750 | | | | 20,865,750 | | |
Singapore Exchange | | | 5,803,000 | | | | 6,596,000 | | |
| > Hong Kong | |
Lifestyle International | | | 10,000,000 | | | | 13,120,000 | | |
Mapletree Greater China
Commercial Trust | | | 50,000,000 | | | | 52,849,000 | | |
| > Indonesia | |
Link Net | | | 0 | | | | 37,000,000 | | |
| > Philippines | |
Puregold Price Club | | | 32,706,600 | | | | 35,000,000 | | |
Europe | |
| > United Kingdom | |
Aggreko | | | 975,602 | | | | 1,300,000 | | |
Assura | | | 20,900,000 | | | | 32,700,000 | | |
Babcock International | | | 3,590,000 | | | | 4,000,000 | | |
Connect Group | | | 11,184,000 | | | | 14,379,428 | | |
Halma | | | 2,483,322 | | | | 2,725,000 | | |
Rightmove | | | 1,134,000 | | | | 1,338,000 | | |
| | | Number of Shares | |
| | | 9/30/14 | | 12/31/14 | |
| > Germany | |
Elringklinger | | | 595,000 | | | | 745,000 | | |
MTU Aero Engines | | | 365,000 | | | | 465,000 | | |
| > France | |
Eutelsat | | | 767,000 | | | | 798,001 | | |
| > Netherlands | |
Brunel | | | 764,253 | | | | 1,140,000 | | |
| > Spain | |
Prosegur | | | 5,042,000 | | | | 6,564,000 | | |
| > Italy | |
Pirelli | | | 1,959,000 | | | | 2,787,000 | | |
Other Countries | |
| > Australia | |
Challenger Financial | | | 11,515,000 | | | | 12,550,000 | | |
Estia Health | | | 0 | | | | 5,000,000 | | |
Spotless | | | 37,550,000 | | | | 42,700,000 | | |
| > Canada | |
Rona | | | 1,656,569 | | | | 2,108,517 | | |
| > New Zealand | |
Ryman Healthcare | | | 3,738,000 | | | | 4,011,000 | | |
Latin America | |
| > Mexico | |
Grupo Aeroportuario del
Sureste - ADR | | | 200,000 | | | | 252,000 | | |
| > Brazil | |
Odontoprev | | | 6,000,000 | | | | 6,487,000 | | |
See accompanying notes to financial statements.
43
Columbia Acorn International®
Major Portfolio Changes in the Fourth Quarter (Unaudited), continued
| | | Number of Shares | |
| | | 9/30/14 | | 12/31/14 | |
Sales | |
Asia | |
| > Japan | |
Aeon Mall | | | 2,255,000 | | | | 2,004,900 | | |
Aica Kogyo | | | 1,538,500 | | | | 1,246,000 | | |
Asahi Diamond Industrial | | | 2,100,000 | | | | 1,914,500 | | |
Glory | | | 1,555,000 | | | | 1,430,000 | | |
Hoshizaki Electric | | | 500,000 | | | | 420,000 | | |
Japan Airport Terminal | | | 1,090,000 | | | | 960,000 | | |
Kansai Paint | | | 4,784,600 | | | | 2,978,600 | | |
Lifenet Insurance | | | 1,191,200 | | | | 488,700 | | |
Makita | | | 630,000 | | | | 600,000 | | |
Nabtesco | | | 1,440,000 | | | | 1,110,000 | | |
Nihon Parkerizing | | | 1,222,080 | | | | 1,104,980 | | |
OBIC | | | 838,000 | | | | 688,000 | | |
Omron | | | 603,000 | | | | 462,000 | | |
Rinnai | | | 355,000 | | | | 309,000 | | |
Suruga Bank | | | 1,560,000 | | | | 1,470,000 | | |
Wacom | | | 3,885,400 | | | | 0 | | |
| > Taiwan | |
Delta Electronics | | | 6,729,000 | | | | 3,761,000 | | |
Hermes Microvision | | | 349,750 | | | | 174,750 | | |
Lite-On Technology | | | 11,470,881 | | | | 5,594,881 | | |
| > Korea | |
CJ Corp | | | 316,943 | | | | 245,944 | | |
KEPCO Plant Service &
Engineering | | | 294,940 | | | | 0 | | |
KT&G | | | 507,000 | | | | 349,317 | | |
Soulbrain | | | 279,090 | | | | 86,274 | | |
| > China | |
Biostime | | | 3,850,000 | | | | 0 | | |
Jumei International - ADR | | | 580,600 | | | | 0 | | |
| > Singapore | |
CDL Hospitality Trust | | | 20,000,000 | | | | 17,742,000 | | |
Petra Foods | | | 8,900,000 | | | | 8,500,000 | | |
Super Group | | | 3,802,000 | | | | 0 | | |
| > Hong Kong | |
Kingboard Chemicals | | | 5,175,500 | | | | 4,358,000 | | |
Melco Crown
Entertainment - ADR | | | 2,178,000 | | | | 1,800,000 | | |
Melco International | | | 16,798,000 | | | | 15,000,000 | | |
MGM China Holdings | | | 8,320,000 | | | | 7,247,000 | | |
Sa Sa International | | | 47,509,000 | | | | 33,757,000 | | |
Vitasoy International | | | 10,000,000 | | | | 5,818,000 | | |
| > Indonesia | |
Ace Indonesia | | | 400,000,000 | | | | 324,290,001 | | |
Archipelago Resources | | | 31,764,600 | | | | 0 | | |
Matahari Department Store | | | 20,000,000 | | | | 19,000,000 | | |
Surya Citra Media | | | 74,536,300 | | | | 54,535,800 | | |
| | | Number of Shares | |
| | | 9/30/14 | | 12/31/14 | |
| > Philippines | |
Security Bank | | | 5,555,150 | | | | 5,000,000 | | |
Universal Robina | | | 3,743,130 | | | | 2,114,550 | | |
| > Thailand | |
Robinson Department Store | | | 15,703,000 | | | | 14,485,000 | | |
| > Malaysia | |
Aeon | | | 24,006,700 | | | | 22,609,800 | | |
7-Eleven Malaysia Holdings | | | 51,801,200 | | | | 46,980,000 | | |
Europe | |
| > United Kingdom | |
Jardine Lloyd Thompson Group | | | 4,365,635 | | | | 3,950,000 | | |
Shaftesbury | | | 3,066,000 | | | | 1,480,000 | | |
Telecity | | | 2,210,000 | | | | 0 | | |
Whitbread | | | 606,940 | | | | 470,940 | | |
| > Germany | |
TAG Immobilien | | | 406,158 | | | | 0 | | |
| > Sweden | |
Hexagon | | | 2,308,522 | | | | 2,168,522 | | |
| > Netherlands | |
Core Labs | | | 143,395 | | | | 114,395 | | |
| > Switzerland | |
Sika | | | 16,300 | | | | 0 | | |
| > Finland | |
Vacon | | | 1,226,866 | | | | 0 | | |
| > Iceland | |
Marel | | | 35,982,499 | | | | 0 | | |
Other Countries | |
| > South Africa | |
Coronation Fund Managers | | | 14,021,217 | | | | 13,858,792 | | |
Massmart Holdings | | | 2,230,504 | | | | 0 | | |
| > Australia | |
Amcor | | | 7,030,000 | | | | 6,725,000 | | |
Domino's Pizza Enterprises | | | 3,500,000 | | | | 2,978,993 | | |
IAG | | | 14,000,000 | | | | 10,600,000 | | |
MMA Offshore | | | 12,820,287 | | | | 10,912,000 | | |
SAI Global | | | 3,900,000 | | | | 0 | | |
| > United States | |
FMC Technologies | | | 601,213 | | | | 168,213 | | |
Latin America | |
| > Mexico | |
Genomma Lab International | | | 15,347,000 | | | | 10,184,000 | | |
| > Brazil | |
Beadell Resources | | | 58,937,078 | | | | 37,336,982 | | |
Localiza Rent A Car | | | 4,000,000 | | | | 2,802,000 | | |
See accompanying notes to financial statements.
44
Columbia Acorn International®
Statement of Investments, December 31, 2014
Number of Shares | | | | Value | |
| | | | | | | Equities: 94.1% | |
Asia 42.8% | | | |
| | | > Japan 19.3% | |
| | 2,978,600 | | | Kansai Paint | | $ | 46,144,399 | | |
| | | | | Paint Producer in Japan, India,
China & Southeast Asia | | | | | |
| | 30,000 | | | Orix JREIT | | | 42,188,637 | | |
| | | | | Diversified REIT | | | | | |
| | 3,260,000 | | | Nippon Kayaku | | | 40,543,242 | | |
| | | | | Functional Chemicals,
Pharmaceuticals & Auto Safety
Systems | | | | | |
| | 3,850,800 | | | Ushio | | | 40,102,439 | | |
| | | | | Industrial Light Sources | | | | | |
| | 1,050,000 | | | FamilyMart | | | 39,547,023 | | |
| | | | | Convenience Store Operator | | | | | |
| | 1,301,200 | | | Benesse | | | 38,610,435 | | |
| | | | | Education Service Provider | | | | | |
| | 1,430,000 | | | Glory | | | 38,525,770 | | |
| | | | | Currency Handling Systems &
Related Equipment | | | | | |
| | 960,000 | | | Japan Airport Terminal | | | 37,751,039 | | |
| | | | | Airport Terminal Operator
at Haneda | | | | | |
| | 1,170,000 | | | NGK Spark Plug | | | 35,550,945 | | |
| | | | | Automobile Parts | | | | | |
| | 2,004,900 | | | Aeon Mall | | | 35,528,774 | | |
| | | | | Suburban Shopping Mall
Developer, Owner & Operator | | | | | |
| | 6,149 | | | Kenedix Office Investment | | | 34,804,239 | | |
| | | | | Tokyo Mid-size Office REIT | | | | | |
| | 434,400 | | | Disco | | | 34,744,418 | | |
| | | | | Semiconductor Dicing &
Grinding Equipment | | | | | |
| | 1,600,000 | | | NGK Insulators | | | 32,797,283 | | |
| | | | | Ceramic Products for Auto,
Power & Electronics | | | | | |
| | 960,000 | | | Misumi Group | | | 31,656,187 | | |
| | | | | Industrial Components Distributor | | | | | |
| | 2,150,000 | | | Park24 | | | 31,650,928 | | |
| | | | | Parking Lot Operator | | | | | |
| | 650,800 | | | Hamamatsu Photonics | | | 30,980,048 | | |
| | | | | Optical Sensors for Medical &
Industrial Applications | | | | | |
| | 4,872,000 | | | NOF | | | 30,785,305 | | |
| | | | | Specialty Chemicals, Life
Science & Rocket Fuels | | | | | |
| | 264,400 | | | Hirose Electric | | | 30,676,490 | | |
| | | | | Electrical Connectors | | | | | |
| | 750,000 | | | Kintetsu World Express | | | 28,778,874 | | |
| | | | | Airfreight Logistics | | | | | |
| | 970,000 | | | Nippon Paint Holdings | | | 28,108,662 | | |
| | | | | Paints for Automotive,
Decorative & Industrial Usage | | | | | |
| | 1,402,000 | | | Tamron (a) | | | 27,797,869 | | |
| | | | | Camera Lenses | | | | | |
| | 1,129,000 | | | Ariake Japan | | | 27,452,191 | | |
| | | | | Commercial Soup & Sauce
Extracts | | | | | |
| | 1,580,000 | | | Daiseki | | | 27,297,290 | | |
| | | | | Waste Disposal & Recycling | | | | | |
Number of Shares | | | | Value | |
| | 643,000 | | | Nakanishi | | $ | 27,297,114 | | |
| | | | | Dental Tools & Machinery | | | | | |
| | 600,000 | | | Makita | | | 27,037,193 | | |
| | | | | Power Tools | | | | | |
| | 1,470,000 | | | Suruga Bank | | | 27,014,176 | | |
| | | | | Regional Bank | | | | | |
| | 208,000 | | | Shimano | | | 26,940,511 | | |
| | | | | Manufacturer of Bicycle
Components & Fishing Tackle | | | | | |
| | 1,110,000 | | | Nabtesco | | | 26,827,201 | | |
| | | | | Machinery Components | | | | | |
| | 486,600 | | | Santen Pharmaceutical | | | 26,196,007 | | |
| | | | | Specialty Pharma (Ophthalmic
Medicine) | | | | | |
| | 746,500 | | | Ezaki Glico | | | 26,095,707 | | |
| | | | | Confectionary, Ice Cream &
Dairy Products | | | | | |
| | 1,600,000 | | | OSG | | | 25,819,113 | | |
| | | | | Consumable Cutting Tools | | | | | |
| | 8,340,000 | | | Aozora Bank | | | 25,816,838 | | |
| | | | | Commercial Bank | | | | | |
| | 1,246,000 | | | Aica Kogyo | | | 25,731,219 | | |
| | | | | Laminated Sheets, Building
Materials & Chemical Adhesives | | | | | |
| | 792,900 | | | Toyo Suisan Kaisha | | | 25,530,504 | | |
| | | | | Instant Noodles & Processed Foods | | | | | |
| | 2,736,000 | | | Moshi Moshi Hotline | | | 25,252,086 | | |
| | | | | Call Center Operator | | | | | |
| | 1,104,980 | | | Nihon Parkerizing | | | 25,210,166 | | |
| | | | | Metal Surface Treatment
Chemicals & Processing Service | | | | | |
| | 1,942,000 | | | Rohto Pharmaceutical | | | 24,263,266 | | |
| | | | | Pharmaceutical, Health &
Beauty Products | | | | | |
| | 1,107,000 | | | Stanley Electric | | | 23,903,959 | | |
| | | | | Automobile Lighting & LED
Equipment | | | | | |
| | 1,205,000 | | | Aeon Financial Service | | | 23,799,858 | | |
| | | | | Diversified Consumer-related
Finance Company in Japan | | | | | |
| | 2,000,000 | | | Toto | | | 23,265,410 | | |
| | | | | Toilets & Bathroom Fittings | | | | | |
| | 930,000 | | | JIN (b) | | | 23,236,639 | | |
| | | | | Eyeglasses Retailer | | | | | |
| | 1,600,000 | | | Doshisha | | | 22,592,036 | | |
| | | | | Consumer Goods Wholesaler | | | | | |
| | 688,000 | | | OBIC | | | 22,325,402 | | |
| | | | | Computer Software | | | | | |
| | 4,800 | | | Industrial & Infrastructure
Fund | | | 22,205,532 | | |
| | | | | Industrial REIT in Japan | | | | | |
| | 309,000 | | | Rinnai | | | 20,762,389 | | |
| | | | | Gas Appliances for Home &
Commercial Use | | | | | |
| | 462,000 | | | Omron | | | 20,667,797 | | |
| | | | | Electric Components for Factory
Automation | | | | | |
| | 420,000 | | | Hoshizaki Electric | | | 20,238,938 | | |
| | | | | Commercial Kitchen Equipment | | | | | |
| | 835,000 | | | Icom (a) | | | 20,090,612 | | |
| | | | | Two-way Radio Communication
Equipment | | | | | |
See accompanying notes to financial statements.
45
Columbia Acorn International®
Statement of Investments, continued
Number of Shares | | | | Value | |
| | | > Japan—continued | |
| | 1,914,500 | | | Asahi Diamond Industrial | | $ | 20,016,215 | | |
| | | | | Consumable Diamond Tools | | | | | |
| | 8,150 | | | Japan Retail Fund | | | 17,223,263 | | |
| | | | | Retail REIT in Japan | | | | | |
| | 255,800 | | | Hikari Tsushin | | | 15,558,892 | | |
| | | | | Office IT/Mobiles/Insurance
Distribution | | | | | |
| | 571,080 | | | Milbon | | | 15,546,925 | | |
| | | | | Hair Products for Salons | | | | | |
| | 419,300 | | | Otsuka | | | 13,295,353 | | |
| | | | | One-stop IT Services & Office
Supplies Provider | | | | | |
| | 575,600 | | | MonotaRO (b) | | | 11,597,760 | | |
| | | | | Online Maintenance, Repair
and Operations Goods
Distributor in Japan | | | | | |
| | 488,700 | | | Lifenet Insurance (b)(c) | | | 1,324,310 | | |
| | | | | Online Life Insurance Company
in Japan | | | | | |
| | | | 1,494,704,878 | | |
| | | > Taiwan 4.2% | |
| | 7,306,000 | | | President Chain Store | | | 56,430,258 | | |
| | | | | Taiwanese Convenience Chain
Store Operator | | | | | |
| | 2,081,000 | | | St. Shine Optical | | | 33,950,792 | | |
| | | | | Disposable Contact Lens Original
Equipment Manufacturer | | | | | |
| | 5,410,000 | | | Novatek Microelectronics | | | 30,231,615 | | |
| | | | | Display Related Integrated
Circuit Designer | | | | | |
| | 12,570,000 | | | Far EasTone Telecom | | | 28,958,139 | | |
| | | | | Taiwanese Mobile Operator | | | | | |
| | 364,000 | | | Largan Precision | | | 27,247,682 | | |
| | | | | Mobile Device Camera Lenses &
Modules | | | | | |
| | 2,300,000 | | | PChome Online | | | 24,692,759 | | |
| | | | | Taiwanese Internet Retail
Company | | | | | |
| | 14,329,000 | | | Vanguard International
Semiconductor | | | 23,447,165 | | |
| | | | | Semiconductor Foundry | | | | | |
| | 3,118,686 | | | Advantech | | | 22,895,443 | | |
| | | | | Industrial PC & Components | | | | | |
| | 3,761,000 | | | Delta Electronics | | | 22,224,640 | | |
| | | | | Industrial Automation, Switching
Power Supplies & Passive
Components | | | | | |
| | 1,925,000 | | | Ginko International | | | 20,314,145 | | |
| | | | | Contact Lens Maker in China | | | | | |
| | 6,427,000 | | | Chroma Ate | | | 16,621,061 | | |
| | | | | Automatic Test Systems, Testing &
Measurement Instruments | | | | | |
| | 174,750 | | | Hermes Microvision | | | 8,739,363 | | |
| | | | | E-beam Inspection Systems for
Semiconductor Integrated
Circuits | | | | | |
| | 5,594,881 | | | Lite-On Technology | | | 6,391,478 | | |
| | | | | Mobile Device, LED & PC Server
Component Supplier | | | | | |
| | | | 322,144,540 | | |
Number of Shares | | | | Value | |
| | | > Korea 3.1% | |
| | 245,944 | | | CJ Corp | | $ | 34,821,021 | | |
| | | | | Holding Company of Korean
Consumer Conglomerate | | | | | |
| | 631,865 | | | LS Industrial Systems | | | 34,313,078 | | |
| | | | | Electrical & Automation Equipment | | | | | |
| | 349,317 | | | KT&G | | | 24,254,255 | | |
| | | | | Tobacco & Ginseng Products | | | | | |
| | 295,580 | | | Coway | | | 22,538,457 | | |
| | | | | Household Appliance Rentals | | | | | |
| | 94,000 | | | Nongshim | | | 21,564,561 | | |
| | | | | Instant Noodles, Snacks &
Bottled Water | | | | | |
| | 974,261 | | | Paradise | | | 20,767,504 | | |
| | | | | Korean Casino Operator | | | | | |
| | 758,028 | | | LF Corp | | | 20,540,920 | | |
| | | | | Apparel Design & Retail | | | | | |
| | 1,187,900 | | | Cheil Worldwide (c) | | | 18,588,800 | | |
| | | | | Advertising | | | | | |
| | 122,726 | | | Cheil Industries (c) | | | 17,641,548 | | |
| | | | | Holding Company of Samsung
Group | | | | | |
| | 591,876 | | | Grand Korea Leisure | | | 17,202,215 | | |
| | | | | 'Foreigner Only' Casino Group
in Korea | | | | | |
| | 86,274 | | | Soulbrain | | | 2,509,312 | | |
| | | | | Electronic Chemical Producer | | | | | |
| | | | 234,741,671 | | |
| | | > India 3.0% | |
| | 13,478,000 | | | Zee Entertainment
Enterprises | | | 80,960,947 | | |
| | | | | Programmer of Pay Television
Content | | | | | |
| | 3,423,265 | | | Asian Paints | | | 40,577,153 | | |
| | | | | Paint Company | | | | | |
| | 6,095,000 | | | Adani Ports & Special
Economic Zone | | | 30,679,178 | | |
| | | | | Indian West Coast Shipping Port | | | | | |
| | 90,000 | | | Bosch | | | 27,794,506 | | |
| | | | | Automotive Parts | | | | | |
| | 2,085,000 | | | United Breweries | | | 27,486,487 | | |
| | | | | Brewer | | | | | |
| | 920,000 | | | Colgate Palmolive India | | | 25,983,244 | | |
| | | | | Consumer Products in Oral Care | | | | | |
| | | | 233,481,515 | | |
| | | > China 2.7% | |
| | 2,500,000 | | | WuXi PharmaTech - ADR (c) | | | 84,175,000 | | |
| | | | | Contract Research Organization
Business in China | | | | | |
| | 83,100,000 | | | Sihuan Pharmaceuticals | | | 55,274,689 | | |
| | | | | Chinese Generic Drug
Manufacturer | | | | | |
| | 407,570 | | | BitAuto - ADR (b)(c) | | | 28,697,004 | | |
| | | | | Automotive Information Website
for Buyers & Dealers | | | | | |
| | 35,119,000 | | | AMVIG Holdings | | | 15,171,368 | | |
| | | | | Chinese Tobacco Packaging
Material Supplier | | | | | |
| | 17,890,000 | | | CIMC Enric | | | 14,115,824 | | |
| | | | | Produces Tanks & Equipment to
Supply Natural Gas & Liquefied
Natural Gas | | | | | |
See accompanying notes to financial statements.
46
Number of Shares | | | | Value | |
| | | > China—continued | |
| | 32,790,000 | | | NewOcean Energy (b) | | $ | 12,589,624 | | |
| | | | | Southern China Liquefied
Petroleum Gas Distributor | | | | | |
| | | | 210,023,509 | | |
| | | > Singapore 2.6% | |
| | 53,724,268 | | | Mapletree Commercial Trust | | | 57,171,925 | | |
| | | | | Retail & Office Property Landlord | | | | | |
| | 6,596,000 | | | Singapore Exchange | | | 38,778,644 | | |
| | | | | Singapore Equity & Derivatives
Market Operator | | | | | |
| | 8,500,000 | | | Petra Foods | | | 24,360,487 | | |
| | | | | Chocolate Manufacturer in
South East Asia | | | | | |
| | 13,500,000 | | | Ascendas REIT | | | 24,215,667 | | |
| | | | | Industrial Property Landlord | | | | | |
| | 17,742,000 | | | CDL Hospitality Trust | | | 23,305,084 | | |
| | | | | Hotel Owner Operator | | | | | |
| | 20,865,750 | | | Mapletree Logistics Trust | | | 18,630,540 | | |
| | | | | Industrial Property Landlord | | | | | |
| | 15,000,000 | | | Mapletree Industrial Trust | | | 16,783,128 | | |
| | | | | Industrial Property Landlord | | | | | |
| | | | 203,245,475 | | |
| | | > Hong Kong 2.6% | |
| | 1,800,000 | | | Melco Crown
Entertainment - ADR | | | 45,720,000 | | |
| | | | | Macau Casino Operator | | | | | |
| | 52,849,000 | | | Mapletree Greater China
Commercial Trust | | | 37,823,829 | | |
| | | | | Retail & Office Property Landlord | | | | | |
| | 15,000,000 | | | Melco International | | | 32,836,786 | | |
| | | | | Macau Casino Operator | | | | | |
| | 13,120,000 | | | Lifestyle International | | | 27,611,614 | | |
| | | | | Mid- to High-end Department
Store Operator in Hong Kong &
China | | | | | |
| | 33,757,000 | | | Sa Sa International (b) | | | 23,549,236 | | |
| | | | | Cosmetics Retailer | | | | | |
| | 7,247,000 | | | MGM China Holdings | | | 18,298,055 | | |
| | | | | Macau Casino Operator | | | | | |
| | 5,818,000 | | | Vitasoy International | | | 8,413,794 | | |
| | | | | Hong Kong Soy Food Brand | | | | | |
| | 4,358,000 | | | Kingboard Chemicals | | | 7,317,616 | | |
| | | | | Paper & Glass Laminates, PCB,
Specialty Chemicals & Properties | | | | | |
| | | | 201,570,930 | | |
| | | > Indonesia 1.7% | |
| | 33,000,000 | | | Tower Bersama
Infrastructure | | | 25,809,845 | | |
| | | | | Communications Towers | | | | | |
| | 19,000,000 | | | Matahari Department Store | | | 22,894,258 | | |
| | | | | Department Store Chain in
Indonesia | | | | | |
| | 324,290,000 | | | Ace Indonesia | | | 20,501,327 | | |
| | | | | Home Improvement Retailer | | | | | |
| | 220,150,800 | | | Arwana Citramulia | | | 15,391,849 | | |
| | | | | Ceramic Tiles for Home
Decoration | | | | | |
Number of Shares | | | | Value | |
| | 54,535,800 | | | Surya Citra Media | | $ | 15,390,151 | | |
| | | | | Free to Air TV Station in
Indonesia | | | | | |
| | 37,000,000 | | | Link Net (c) | | | 14,698,426 | | |
| | | | | Fixed Broadband & CATV
Service Provider | | | | | |
| | 5,600,000 | | | Mayora Indah | | | 9,448,261 | | |
| | | | | Consumer Branded Food
Manufacturer | | | | | |
| | 49,000,000 | | | MNC Skyvision | | | 6,330,238 | | |
| | | | | Satellite Pay TV Operator in
Indonesia | | | | | |
| | | | 130,464,355 | | |
| | | > Philippines 1.4% | |
| | 35,000,000 | | | Puregold Price Club | | | 29,981,495 | | |
| | | | | Supermarket Operator in the
Philippines | | | | | |
| | 17,000,000 | | | Robinsons Retail Holdings | | | 28,768,792 | | |
| | | | | Multi-format Retailer in the
Philippines | | | | | |
| | 78,170,000 | | | Melco Crown (Philippines)
Resorts (c) | | | 23,642,949 | | |
| | | | | Integrated Resort Operator in
Manila | | | | | |
| | 5,000,000 | | | Security Bank | | | 16,936,167 | | |
| | | | | Commercial Bank in
the Philippines | | | | | |
| | 2,114,550 | | | Universal Robina | | | 9,219,198 | | |
| | | | | Branded Consumer Food
Manufacturer in the Philippines | | | | | |
| | | | 108,548,601 | | |
| | | > Thailand 1.1% | |
| | 4,360,000 | | | Airports of Thailand | | | 37,146,292 | | |
| | | | | Airport Operator of Thailand | | | | | |
| | 107,731,500 | | | Home Product Center | | | 26,961,612 | | |
| | | | | Home Improvement Retailer | | | | | |
| | 14,485,000 | | | Robinson Department Store | | | 19,716,276 | | |
| | | | | Department Store Operator in
Thailand | | | | | |
| | | | 83,824,180 | | |
| | | > Cambodia 0.6% | |
| | 60,000,000 | | | Nagacorp | | | 48,894,346 | | |
| | | | | Casino & Entertainment
Complex in Cambodia | | | | | |
| | | > Malaysia 0.5% | |
| | 22,609,800 | | | Aeon | | | 20,307,312 | | |
| | | | | Shopping Center & Department
Store Operator | | | | | |
| | 46,980,000 | | | 7-Eleven Malaysia
Holdings (c) | | | 20,154,440 | | |
| | | | | Exclusive 7-Eleven Franchisor
for Malaysia | | | | | |
| | | | 40,461,752 | | |
Asia: Total | | | 3,312,105,752 | | |
See accompanying notes to financial statements.
47
Columbia Acorn International®
Statement of Investments, continued
Number of Shares | | | | Value | |
Europe 30.1% | | | |
| | | > United Kingdom 9.8% | |
| | 4,000,000 | | | Babcock International | | $ | 65,529,106 | | |
| | | | | Public Sector Outsourcer | | | | | |
| | 1,300,000 | | | Spirax Sarco | | | 57,871,906 | | |
| | | | | Steam Systems for
Manufacturing & Processing
Industries | | | | | |
| | 3,950,000 | | | Jardine Lloyd Thompson
Group | | | 55,162,009 | | |
| | | | | International Business Insurance
Broker | | | | | |
| | 2,430,000 | | | WH Smith | | | 50,815,383 | | |
| | | | | Newsprint, Books & General
Stationery Retailer | | | | | |
| | 1,338,000 | | | Rightmove | | | 46,660,306 | | |
| | | | | Internet Real Estate Listings | | | | | |
| | 958,646 | | | Fidessa Group | | | 35,710,105 | | |
| | | | | Software for Financial Trading
Systems | | | | | |
| | 470,940 | | | Whitbread | | | 34,852,503 | | |
| | | | | UK Hotelier & Coffee Shop | | | | | |
| | 14,379,428 | | | Connect Group (a) | | | 34,322,292 | | |
| | | | | Newspaper & Magazine
Distributor | | | | | |
| | 4,550,000 | | | Abcam | | | 33,029,289 | | |
| | | | | Online Sales of Antibodies | | | | | |
| | 1,300,000 | | | Aggreko | | | 30,315,995 | | |
| | | | | Temporary Power & Temperature
Control Services | | | | | |
| | 4,712,000 | | | Ocado (b)(c) | | | 29,166,860 | | |
| | | | | Online Grocery Retailer | | | | | |
| | 2,660,000 | | | Domino's Pizza UK & Ireland | | | 29,042,901 | | |
| | | | | Pizza Delivery in the UK,
Ireland & Germany | | | | | |
| | 2,725,000 | | | Halma | | | 29,026,522 | | |
| | | | | Health & Safety Sensor Technology | | | | | |
| | 1,510,000 | | | Smith and Nephew | | | 27,229,143 | | |
| | | | | Medical Equipment & Supplies | | | | | |
| | 35,245,747 | | | Cable and Wireless | | | 27,091,940 | | |
| | | | | Telecommunications Services
Provider in the Caribbean | | | | | |
| | 32,700,000 | | | Assura | | | 25,992,790 | | |
| | | | | Primary Health Care Property
Developer | | | | | |
| | 6,534,800 | | | Polypipe | | | 25,003,689 | | |
| | | | | Manufacturer of Plastic Piping &
Fittings | | | | | |
| | 3,277,885 | | | Halfords | | | 23,919,695 | | |
| | | | | UK Retailer for Leisure Goods &
Auto Parts | | | | | |
| | 5,650,001 | | | Elementis | | | 22,902,088 | | |
| | | | | Specialty Chemicals | | | | | |
| | 2,834,000 | | | PureCircle (c) | | | 22,689,046 | | |
| | | | | Natural Sweeteners | | | | | |
| | 5,800,000 | | | RPS Group | | | 18,902,402 | | |
| | | | | Consultant Specializing in
Energy, Water, Urban Planning,
Health & Safety | | | | | |
Number of Shares | | | | Value | |
| | 908,500 | | | AVEVA | | $ | 18,606,096 | | |
| | | | | Engineering Software | | | | | |
| | 1,480,000 | | | Shaftesbury | | | 17,909,543 | | |
| | | | | London Prime Retail REIT | | | | | |
| | | | 761,751,609 | | |
| | | > Germany 3.2% | |
| | 1,663,000 | | | Wirecard | | | 72,513,646 | | |
| | | | | Online Payment Processing &
Risk Management | | | | | |
| | 130,000 | | | Rational | | | 40,733,523 | | |
| | | | | Commercial Ovens | | | | | |
| | 465,000 | | | MTU Aero Engines | | | 40,411,136 | | |
| | | | | Airplane Engine Components &
Services | | | | | |
| | 795,000 | | | NORMA Group | | | 37,946,095 | | |
| | | | | Clamps for Automotive &
Industrial Applications | | | | | |
| | 795,000 | | | Aurelius | | | 30,087,698 | | |
| | | | | European Turnaround Investor | | | | | |
| | 745,000 | | | Elringklinger (b) | | | 25,758,832 | | |
| | | | | Automobile Components | | | | | |
| | | | 247,450,930 | | |
| | | > Sweden 3.1% | |
| | 2,168,522 | | | Hexagon | | | 66,897,903 | | |
| | | | | Design, Measurement &
Visualization Software &
Equipment | | | | | |
| | 818,422 | | | Unibet | | | 51,705,503 | | |
| | | | | European Online Gaming Operator | | | | | |
| | 1,580,000 | | | Swedish Match | | | 49,508,540 | | |
| | | | | Swedish Snus | | | | | |
| | 3,255,024 | | | Sweco | | | 44,260,193 | | |
| | | | | Engineering Consultants | | | | | |
| | 1,044,000 | | | Mekonomen | | | 27,237,837 | | |
| | | | | Nordic Integrated Wholesaler/
Retailer of Automotive Parts &
Service | | | | | |
| | | | 239,609,976 | | |
| | | > France 2.5% | |
| | 1,350,000 | | | Neopost | | | 77,014,552 | | |
| | | | | Postage Meter Machines | | | | | |
| | 146,000 | | | Eurofins Scientific | | | 37,266,825 | | |
| | | | | Food, Pharmaceuticals &
Materials Screening & Testing | | | | | |
| | 798,001 | | | Eutelsat | | | 25,807,075 | | |
| | | | | Fixed Satellite Services | | | | | |
| | 163,400 | | | Norbert Dentressangle | | | 24,084,705 | | |
| | | | | European Logistics & Transport
Group | | | | | |
| | 729,096 | | | Saft | | | 22,115,064 | | |
| | | | | Niche Battery Manufacturer | | | | | |
| | 1,831,204 | | | Hi-Media (b)(c) | | | 5,494,680 | | |
| | | | | Online Advertiser in Europe | | | | | |
| | | | 191,782,901 | | |
| | | > Netherlands 2.2% | |
| | 2,491,770 | | | Aalberts Industries | | | 73,484,903 | | |
| | | | | Flow Control & Heat Treatment | | | | | |
| | 790,670 | | | Arcadis | | | 23,714,268 | | |
| | | | | Engineering Consultants | | | | | |
See accompanying notes to financial statements.
48
Number of Shares | | | | Value | |
| | | > Netherlands—continued | |
| | 404,124 | | | Vopak | | $ | 20,966,753 | | |
| | | | | Operator of Petroleum & Chemical
Storage Terminals | | | | | |
| | 237,700 | | | Gemalto | | | 19,399,284 | | |
| | | | | Digital Security Solutions | | | | | |
| | 1,140,000 | | | Brunel | | | 18,667,725 | | |
| | | | | Temporary Specialist & Energy
Staffing | | | | | |
| | 114,395 | | | Core Labs (b) | | | 13,766,294 | | |
| | | | | Oil & Gas Reservoir Consulting | | | | | |
| | | | 169,999,227 | | |
| | | > Spain 2.1% | |
| | 7,828,000 | | | DIA | | | 53,043,165 | | |
| | | | | Discount Retailer in Spain &
Latin America | | | | | |
| | 794,000 | | | Viscofan | | | 42,126,681 | | |
| | | | | Sausage Casings Maker | | | | | |
| | 6,564,000 | | | Prosegur | | | 37,396,926 | | |
| | | | | Security Guards | | | | | |
| | 830,000 | | | Bolsas y Mercados
Españoles | | | 32,146,208 | | |
| | | | | Spanish Stock Markets | | | | | |
| | | | 164,712,980 | | |
| | | > Switzerland 2.1% | |
| | 263,500 | | | Partners Group | | | 76,661,973 | | |
| | | | | Private Markets Asset Management | | | | | |
| | 179,000 | | | Geberit | | | 60,556,212 | | |
| | | | | Plumbing Supplies | | | | | |
| | 72,500 | | | INFICON | | | 22,478,500 | | |
| | | | | Gas Detection Instruments | | | | | |
| | | | 159,696,685 | | |
| | | > Denmark 1.8% | |
| | 1,315,800 | | | Novozymes | | | 55,386,707 | | |
| | | | | Industrial Enzymes | | | | | |
| | 1,932,063 | | | SimCorp | | | 51,011,579 | | |
| | | | | Software for Investment Managers | | | | | |
| | 709,000 | | | Jyske Bank (c) | | | 35,837,383 | | |
| | | | | Danish Bank | | | | | |
| | | | 142,235,669 | | |
| | | > Finland 1.1% | |
| | 7,766,000 | | | Sponda | | | 33,804,172 | | |
| | | | | Office, Retail & Logistics Properties | | | | | |
| | 1,669,000 | | | Tikkurila | | | 29,149,797 | | |
| | | | | Decorative & Industrial Paint in
Scandinavia & Central &
Eastern Europe | | | | | |
| | 711,000 | | | Konecranes | | | 20,331,177 | | |
| | | | | Manufacture & Service of
Industrial Cranes & Port
Handling Equipment | | | | | |
| | | | 83,285,146 | | |
| | | > Norway 0.9% | |
| | 2,613,864 | | | Atea | | | 27,004,901 | | |
| | | | | Nordic IT Hardware/Software
Reseller & Installation Company | | | | | |
Number of Shares | | | | Value | |
| | 3,784,000 | | | Orkla | | $ | 25,759,456 | | |
| | | | | Food & Brands, Aluminum,
Chemicals Conglomerate | | | | | |
| | 1,321,000 | | | Subsea 7 | | | 13,517,662 | | |
| | | | | Offshore Subsea Contractor | | | | | |
| | | | 66,282,019 | | |
| | | > Kazakhstan 0.6% | |
| | 5,143,000 | | | Halyk Savings Bank of
Kazakhstan - GDR | | | 43,715,500 | | |
| | | | | Retail Bank & Insurer in
Kazakhstan | | | | | |
| | | > Italy 0.5% | |
| | 2,787,000 | | | Pirelli | | | 37,589,393 | | |
| | | | | Global Tire Supplier | | | | | |
| | | > Belgium 0.2% | |
| | 516,965 | | | EVS Broadcast Equipment | | | 18,665,061 | | |
| | | | | Digital Live Mobile Production
Software & Systems | | | | | |
Europe: Total | | | 2,326,777,096 | | |
Other Countries 17.6% | | | |
| | | > South Africa 5.0% | |
| | 13,858,792 | | | Coronation Fund Managers | | | 137,151,874 | | |
| | | | | South African Fund Manager | | | | | |
| | 777,188 | | | Naspers | | | 100,533,337 | | |
| | | | | Media in Africa, China, Russia &
other Emerging Markets | | | | | |
| | 20,179,300 | | | Rand Merchant Insurance | | | 71,278,010 | | |
| | | | | Directly Sold Property & Casualty
Insurance; Holdings in other
Insurers | | | | | |
| | 2,644,083 | | | Mr. Price | | | 53,486,851 | | |
| | | | | South African Retailer of Apparel,
Household & Sporting Goods | | | | | |
| | 8,679,940 | | | Northam Platinum (c) | | | 27,360,931 | | |
| | | | | Platinum Mining in South Africa | | | | | |
| | | | 389,811,003 | | |
| | | > Australia 4.8% | |
| | 6,725,000 | | | Amcor | | | 73,990,708 | | |
| | | | | Global Leader in Flexible &
Rigid Packaging | | | | | |
| | 12,550,000 | | | Challenger Financial | | | 66,295,863 | | |
| | | | | Annuity Provider in Australia | | | | | |
| | 42,700,000 | | | Spotless (c) | | | 66,143,743 | | |
| | | | | Facility Management & Catering
Company | | | | | |
| | 2,978,993 | | | Domino's Pizza Enterprises | | | 60,655,383 | | |
| | | | | Domino's Pizza Operator in
Australia & New Zealand | | | | | |
| | 10,600,000 | | | IAG | | | 53,821,673 | | |
| | | | | General Insurance Provider | | | | | |
| | 5,000,000 | | | Estia Health (c) | | | 19,348,676 | | |
| | | | | Residential Aged Care Operator | | | | | |
| | 2,196,850 | | | Austbrokers | | | 18,204,106 | | |
| | | | | Local Australian Small Business
Insurance Broker | | | | | |
| | 10,912,000 | | | MMA Offshore | | | 10,939,429 | | |
| | | | | Support Vessels for Offshore
Oil/Gas Industry | | | | | |
| | | | 369,399,581 | | |
See accompanying notes to financial statements.
49
Columbia Acorn International®
Statement of Investments, continued
Number of Shares | | | | Value | |
| | | > Canada 4.2% | |
| | 862,772 | | | CCL Industries | | $ | 93,473,155 | | |
| | | | | Global Label Converter | | | | | |
| | 3,188,000 | | | CAE | | | 41,379,790 | | |
| | | | | Flight Simulator Equipment &
Training Centers | | | | | |
| | 1,067,730 | | | ShawCor | | | 38,966,907 | | |
| | | | | Oil & Gas Pipeline Products | | | | | |
| | 490,200 | | | Onex Capital | | | 28,463,498 | | |
| | | | | Private Equity | | | | | |
| | 525,260 | | | Ag Growth | | | 25,548,668 | | |
| | | | | Manufacturer of Augers & Grain
Handling Equipment | | | | | |
| | 2,108,517 | | | Rona | | | 25,135,962 | | |
| | | | | Canadian Home Improvement
Retailer | | | | | |
| | 3,622,000 | | | Canadian Energy Services &
Technology (b) | | | 19,796,609 | | |
| | | | | North American Drilling Fluids &
Chemicals | | | | | |
| | 1,108,857 | | | Baytex (b) | | | 18,439,591 | | |
| | | | | Oil & Gas Producer in Canada | | | | | |
| | 2,168,377 | | | DeeThree Exploration (c) | | | 9,537,275 | | |
| | 1,130,000 | | | DeeThree Exploration (c)(d) | | | 4,870,730 | | |
| | | | | Canadian Oil & Gas Producer | | | | | |
| | 551,976 | | | Black Diamond Group | | | 6,052,827 | | |
| | | | | Provider of Accommodations/
Equipment for Oil Sands
Development | | | | | |
| | 766,000 | | | Trilogy Energy | | | 5,215,235 | | |
| | | | | Oil & Gas Producer in Canada | | | | | |
| | 1,901,514 | | | Horizon North Logistics (b) | | | 4,320,879 | | |
| | | | | Provider of Diversified Oil
Services in Northern Canada | | | | | |
| | | | 321,201,126 | | |
| | | > United States 1.9% | |
| | 1,272,297 | | | Textainer Group Holdings (b) | | | 43,665,233 | | |
| | | | | Top International Container Leaser | | | | | |
| | 350,000 | | | Synageva BioPharma (b)(c) | | | 32,476,500 | | |
| | | | | Biotech Focused on Orphan
Diseases | | | | | |
| | 912,000 | | | Bladex | | | 27,451,200 | | |
| | | | | Latin American Trade Financing
House | | | | | |
| | 685,900 | | | Rowan | | | 15,995,188 | | |
| | | | | Contract Offshore Driller | | | | | |
| | 634,500 | | | Hornbeck Offshore (c) | | | 15,843,465 | | |
| | | | | Supply Vessel Operator in U.S.
Gulf of Mexico | | | | | |
| | 168,213 | | | FMC Technologies (c) | | | 7,879,097 | | |
| | | | | Oil & Gas Well Head
Manufacturer | | | | | |
| | 225,000 | | | Chart Industries (c) | | | 7,695,000 | | |
| | | | | Manufacturer of Natural Gas
Processing/Storage Equipment | | | | | |
| | | | 151,005,683 | | |
Number of Shares | | | | Value | |
| | | > New Zealand 1.1% | |
| | 10,800,000 | | | Auckland International
Airport | | $ | 35,536,052 | | |
| | | | | Auckland Airport Operator | | | | | |
| | 4,011,000 | | | Ryman Healthcare | | | 26,606,179 | | |
| | | | | Retirement Village Operator | | | | | |
| | 8,000,000 | | | Sky City Entertainment | | | 24,169,714 | | |
| | | | | Casino & Entertainment Complex | | | | | |
| | | | 86,311,945 | | |
| | | > Israel 0.6% | |
| | 791,000 | | | Caesarstone | | | 47,317,620 | | |
| | | | | Quartz Countertops | | | | | |
Other Countries: Total | | | 1,365,046,958 | | |
Latin America 3.6% | | | |
| | | > Mexico 1.3% | |
| | 252,000 | | | Grupo Aeroportuario del
Sureste - ADR | | | 33,223,680 | | |
| | | | | Mexican Airport Operator | | | | | |
| | 12,339,000 | | | Qualitas | | | 25,541,511 | | |
| | | | | Auto Insurer in Mexico &
Central America | | | | | |
| | 2,200,000 | | | Gruma | | | 23,458,714 | | |
| | | | | Tortilla Producer & Distributor | | | | | |
| | 10,184,000 | | | Genomma Lab
International (c) | | | 19,368,841 | | |
| | | | | Developer, Marketer &
Distributor of Consumer Products | | | | | |
| | | | 101,592,746 | | |
| | | > Brazil 1.2% | |
| | 2,802,000 | | | Localiza Rent A Car | | | 37,641,795 | | |
| | | | | Car Rental | | | | | |
| | 6,487,000 | | | Odontoprev | | | 24,062,080 | | |
| | | | | Dental Insurance | | | | | |
| | 1,184,000 | | | Linx | | | 22,493,417 | | |
| | | | | Retail Management Software
in Brazil | | | | | |
| | 37,336,982 | | | Beadell Resources (b)(c) | | | 6,762,258 | | |
| | | | | Gold Mining in Brazil | | | | | |
| | | | 90,959,550 | | |
| | | > Colombia 0.4% | |
| | 23,377,000 | | | Isagen | | | 29,165,918 | | |
| | | | | Colombian Electricity Provider | | | | | |
| | | > Guatemala 0.3% | |
| | 1,626,600 | | | Tahoe Resources | | | 22,611,112 | | |
| | | | | Silver Project in Guatemala | | | | | |
| | | > Chile 0.3% | |
| | 921,000 | | | Sociedad Quimica y Minera
de Chile - ADR | | | 21,993,480 | | |
| | | | | Producer of Specialty Fertilizers,
Lithium & Iodine | | | | | |
| | | > Uruguay 0.1% | |
| | 1,306,818 | | | Union Agriculture
Group (c)(d)(e) | | | 11,931,248 | | |
| | | | | Farmland Operator in Uruguay | | | | | |
Latin America: Total | | | 278,254,054 | | |
Total Equities: 94.1%
(Cost: $5,764,507,118) | | | 7,282,183,860 | (f) | |
See accompanying notes to financial statements.
50
Number of Shares | | | | Value | |
Short-Term Investments 5.2% | |
| | 220,000,000 | | | JPMorgan U.S. Government
Money Market Fund,
IM Shares (7 day yield
of 0.01%) | | $ | 220,000,000 | | |
| | 180,694,890 | | | JPMorgan U.S. Government
Money Market Fund,
Agency Shares (7 day yield
of 0.01%) | | | 180,694,890 | | |
Total Short-Term Investments: 5.2%
(Cost: $400,694,890) | | | 400,694,890 | | |
Number of Shares | | | | Value | |
Securities Lending Collateral 1.4% | |
| | 105,532,274 | | | Dreyfus Government Cash
Management Fund,
Institutional Shares
(7 day yield of 0.01%) (g) | | $ | 105,532,274 | | |
Total Securities Lending Collateral: 1.4%
(Cost: $105,532,274) | | | 105,532,274 | | |
Total Investments: 100.7%
(Cost: $6,270,734,282)(h) | | | 7,788,411,024 | | |
Obligation to Return Collateral for
Securities Loaned: (1.4)% | | | (105,532,274 | ) | |
Cash and Other Assets Less Liabilities: 0.7% | | | 50,599,385 | | |
Net Assets: 100.0% | | $ | 7,733,478,135 | | |
ADR - American Depositary Receipts
GDR - Global Depositary Receipts
REIT - Real Estate Investment Trust
> Notes to Statement of Investments
(a) An affiliated person of the Fund, as defined in the Investment Company Act of 1940, may include any company in which the Fund owns five percent or more of its outstanding voting shares. Holdings and transactions in these affiliated companies during the year ended December 31, 2014, are as follows:
Security | | Balance of
Shares Held
12/31/13 | | Purchases/
Additions | | Sales/
Reductions | | Balance of
Shares Held
12/31/14 | | Value | | Dividend | |
Connect Group | | | 10,944,000 | | | | 4,353,749 | | | | 918,321 | | | | 14,379,428 | | | $ | 34,322,292 | | | $ | 1,907,037 | | |
Icom | | | 835,000 | | | | - | | | | - | | | | 835,000 | | | | 20,090,612 | | | | 237,621 | | |
Tamron | | | 573,700 | | | | 828,300 | | | | - | | | | 1,402,000 | | | | 27,797,869 | | | | 572,199 | | |
Beadell Resources (1) | | | 58,937,078 | | | | - | | | | 21,600,096 | | | | 37,336,982 | | | | 6,762,258 | | | | - | | |
Archipelago Resources (1) | | | 31,764,600 | | | | - | | | | 31,764,600 | | | | - | | | | - | | | | - | | |
Empresas Hites (1) | | | 23,162,664 | | | | - | | | | 23,162,664 | | | | - | | | | - | | | | - | | |
Total of Affiliated Transactions | | | 126,217,042 | | | | 5,182,049 | | | | 77,445,681 | | | | 53,953,410 | | | $ | 88,973,031 | | | $ | 2,716,857 | | |
(1) At December 31, 2014, the Fund owned less than five percent of the company's outstanding voting shares.
The aggregate cost and value of these companies at December 31, 2014, was $89,062,228 and $82,210,773, respectively. Investments in affiliated companies represented 1.06% of the Fund's total net assets at December 31, 2014.
(b) All or a portion of this security was on loan at December 31, 2014. The total market value of securities on loan at December 31, 2014 was $101,872,493.
(c) Non-income producing security.
(d) Denotes a restricted security, which is subject to restrictions on resale under federal securities laws. These securities are valued at fair value determined in good faith under consistently applied procedures established by the Fund's Board of Trustees. At December 31, 2014, the market value of these securities amounted to $16,801,978, which represented 0.22% of total net assets. Additional information on these securities is as follows:
Security | | Acquisition
Dates | | Shares/Units | | Cost | | Value | |
Union Agriculture Group | | 12/8/10-6/27/12 | | | 1,306,818 | | | $ | 15,000,000 | | | $ | 11,931,248 | | |
DeeThree Exploration | | 9/7/10 | | | 1,130,000 | | | | 2,950,812 | | | | 4,870,730 | | |
| | | | | | | $ | 17,950,812 | | | $ | 16,801,978 | | |
(e) Illiquid security.
See accompanying notes to financial statements.
51
Columbia Acorn International®
Statement of Investments, continued
> Notes to Statement of Investments
(f) On December 31, 2014, the Fund's total equity investments were denominated in currencies as follows:
Currency | | Value | | Percentage
of Net Assets | |
Japanese Yen | | $ | 1,494,704,878 | | | | 19.3 | | |
Euro | | | 899,719,343 | | | | 11.6 | | |
British Pound | | | 761,751,609 | | | | 9.8 | | |
U.S. Dollar | | | 481,545,509 | | | | 6.2 | | |
South African Rand | | | 389,811,004 | | | | 5.1 | | |
Other currencies less
than 5% of total net assets | | | 3,254,651,517 | | | | 42.1 | | |
Total Equities | | $ | 7,282,183,860 | | | | 94.1 | | |
(g) Investment made with cash collateral received from securities lending activity.
(h) At December 31, 2014, for federal income tax purposes, the cost of investments was $6,372,747,494 and net unrealized appreciation was $1,415,663,530 consisting of gross unrealized appreciation of $1,932,627,003 and gross unrealized depreciation of $516,963,473.
Fair Value Measurements
Various inputs are used in determining the value of the Fund's investments, following the input prioritization hierarchy established by accounting principles generally accepted in the United States of America (GAAP). These inputs are summarized in the three broad levels listed below:
• Level 1 – quoted prices in active markets for identical securities
• Level 2 – prices determined using other significant observable inputs (including quoted prices for similar securities, interest rates, prepayment speeds, credit risk and others)
• Level 3 – prices determined using significant unobservable inputs where quoted prices or observable inputs are unavailable or less reliable (including management's own assumptions about the factors market participants would use in pricing an investment)
The inputs or methodology used for valuing securities are not necessarily an indication of the risk associated with investing in those securities.
Examples of the types of securities in which the Fund would typically invest and how they are classified within this hierarchy are as follows. Typical Level 1 securities include exchange traded domestic equities, mutual funds whose NAVs are published each day and exchange traded foreign equities that are not statistically fair valued. Typical Level 2 securities include exchange traded foreign equities that are statistically fair valued, forward foreign currency exchange contracts and short-term investments valued at amortized cost. Additionally, securities fair valued by the Valuation Committee (the Committee) of the Fund's Board of Trustees (the Board) that rely on significant observable inputs are also included in Level 2. Typical Level 3 securities include any security fair valued by the Committee that relies on significant unobservable inputs.
Under the direction of the Board, the Committee is responsible for overseeing the valuation procedures approved by the Board.
The Committee meets as necessary, and no less frequently than quarterly, to determine fair values for securities for which market quotations are not readily available or for which the investment manager believes that available market quotations are unreliable, to review the appropriateness of the Trust's Portfolio Pricing Policy and the pricing procedures of the investment manager (the Policies), and to review the continuing appropriateness of the current value of any security subject to the Policies. The Policies address, among other things: circumstances under which market quotations will be deemed readily available; selection of third party pricing vendors; appropriate pricing methodologies; events that require fair valuation and fair value techniques; circumstances under which securities will be deemed to pose a potential for stale pricing, including when securities are illiquid, restricted, or in default; and certain delegations of authority to determine fair values to the Fund's investment manager. The Committee may also meet to discuss additional valuation matters, which may include review of back-testing results, review of time-sensitive information or approval of other valuation related actions, and to review the appropriateness of the Policies.
For investments categorized as Level 3, the significant unobservable inputs used in the fair value measurement of the Funds' securities may include: (i) data specific to the issuer or comparable issuers, (ii) general market or specific sector news and (iii) quoted prices and specific or similar security transactions. The Committee considers this data and any changes from prior periods in order to assess the reasonableness of observable and unobservable inputs, any assumptions or internal models used to value those securities and changes in fair value. Significant changes in any of these factors could result in lower or higher fair value measurements. Various factors impact the frequency of monitoring (which may occur as often as daily), however the Committee may determine that changes to inputs, assumptions and models are not required with the same frequency.
See accompanying notes to financial statements.
52
> Notes to Statement of Investments
The following table summarizes the inputs used, as of December 31, 2014, in valuing the Fund's assets:
Investment Type | | Quoted Prices
(Level 1) | | Other
Significant
Observable
Inputs
(Level 2) | | Significant
Unobservable
Inputs
(Level 3) | | Total | |
Equities | |
Asia | | $ | 158,592,004 | | | $ | 3,153,513,748 | | | $ | - | | | $ | 3,312,105,752 | | |
Europe | | | 13,766,294 | | | | 2,313,010,802 | | | | - | | | | 2,326,777,096 | | |
Other Countries | | | 514,653,699 | | | | 850,393,259 | | | | - | | | | 1,365,046,958 | | |
Latin America | | | 259,560,548 | | | | 6,762,258 | | | | 11,931,248 | | | | 278,254,054 | | |
Total Equities | | | 946,572,545 | | | | 6,323,680,067 | | | | 11,931,248 | | | | 7,282,183,860 | | |
Total Short-Term Investments | | | 400,694,890 | | | | - | | | | - | | | | 400,694,890 | | |
Total Securities Lending Collateral | | | 105,532,274 | | | | - | | | | - | | | | 105,532,274 | | |
Total Investments | | $ | 1,452,799,709 | | | $ | 6,323,680,067 | | | $ | 11,931,248 | | | $ | 7,788,411,024 | | |
The Fund's assets assigned to the Level 2 input category are generally valued using a market approach, in which a security's value is determined through its correlation to prices and information from observable market transactions for similar or identical assets. Foreign equities are generally valued at the last sale price on the foreign exchange or market on which they trade. The Fund may use a statistical fair valuation model, in accordance with the policy adopted by the Board, provided by an independent third party to value securities principally traded in foreign markets in order to adjust for possible stale pricing that may occur between the close of the foreign exchanges and the time for valuation. These models take into account available market data including intraday index, ADR, and ETF movements. Securities acquired via private placement that have a holding period or an extended settlement period are valued at a discount to the same shares that are trading freely on the market. These discounts are determined by the investment manager's experience with similar securities or situations. Factors may include, but are not limited to, trade volume, shares outstanding and stock price.
There were no transfers of financial assets between levels during the period.
The Fund does not hold any significant investments (greater than one percent of net assets) categorized as Level 3.
Certain securities classified as Level 3 are valued at fair value, using a market approach, as determined in good faith under consistently applied procedures established by and under the general supervision of the Board. To determine fair value for these securities, for which no market exists, the Committee utilizes the valuation technique it deems most appropriate in the circumstances, using some unobservable inputs, which may include, but are not limited to estimated earnings of the company and the position of the security within the company's capital structure. The Committee also may use some observable inputs, which may include, but are not limited to, trades of similar securities and market multiples derived from a set of comparable companies. Significant increases or decreases to any of these inputs could result in a significantly lower or higher fair value measurement.
See accompanying notes to financial statements.
53
Columbia Acorn International®
Portfolio Diversification
At December 31, 2014, the Fund's portfolio investments as a percentage of net assets were diversified as follows:
| | | Value | | Percentage
of Net Assets | |
| > Industrial Goods & Services | |
Industrial Materials & Specialty
Chemicals | | $ | 506,671,903 | | | | 6.6 | | |
Machinery | | | 482,299,182 | | | | 6.2 | | |
Other Industrial Services | | | 420,517,905 | | | | 5.4 | | |
Outsourcing Services | | | 187,737,500 | | | | 2.4 | | |
Conglomerates | | | 181,794,626 | | | | 2.4 | | |
Electrical Components | | | 180,672,150 | | | | 2.3 | | |
Construction | | | 85,559,900 | | | | 1.1 | | |
Industrial Distribution | | | 11,597,760 | | | | 0.2 | | |
| | | | 2,056,850,926 | | | | 26.6 | | |
| > Consumer Goods & Services | |
Retail | | | 619,547,181 | | | | 8.0 | | |
Food & Beverage | | | 317,354,170 | | | | 4.1 | | |
Casinos & Gaming | | | 283,237,071 | | | | 3.7 | | |
Nondurables | | | 176,906,442 | | | | 2.3 | | |
Other Durable Goods | | | 144,747,198 | | | | 1.9 | | |
Restaurants | | | 124,550,787 | | | | 1.6 | | |
Consumer Goods Distribution | | | 98,456,464 | | | | 1.3 | | |
Other Consumer Services | | | 50,150,071 | | | | 0.6 | | |
Furniture & Textiles | | | 47,317,620 | | | | 0.6 | | |
Educational Services | | | 38,610,435 | | | | 0.5 | | |
Travel | | | 37,641,795 | | | | 0.5 | | |
Consumer Electronics | | | 27,797,869 | | | | 0.3 | | |
Apparel | | | 20,540,920 | | | | 0.3 | | |
| | | | 1,986,858,023 | | | | 25.7 | | |
| > Information | |
Business Software | | | 217,044,503 | | | | 2.8 | | |
Internet Related | | | 175,890,647 | | | | 2.3 | | |
Financial Processors | | | 111,292,290 | | | | 1.4 | | |
Semiconductors & Related
Equipment | | | 97,162,560 | | | | 1.3 | | |
Computer Hardware & Related
Equipment | | | 89,575,906 | | | | 1.2 | | |
Entertainment Programming | | | 80,960,947 | | | | 1.0 | | |
Instrumentation | | | 76,627,631 | | | | 1.0 | | |
Mobile Communications | | | 74,858,596 | | | | 1.0 | | |
Computer Services | | | 40,300,254 | | | | 0.5 | | |
Satellite Broadcasting & Services | | | 32,137,313 | | | | 0.4 | | |
Telecommunications Equipment | | | 27,247,682 | | | | 0.4 | | |
Telephone & Data Services | | | 27,091,940 | | | | 0.3 | | |
Business Information & Marketing
Services | | | 25,252,086 | | | | 0.3 | | |
Advertising | | | 24,083,480 | | | | 0.3 | | |
TV Broadcasting | | | 15,390,151 | | | | 0.2 | | |
Cable TV | | | 14,698,426 | | | | 0.2 | | |
| | | | 1,129,614,412 | | | | 14.6 | | |
| | | Value | | Percentage
of Net Assets | |
| > Finance | |
Insurance | | $ | 315,689,561 | | | | 4.1 | | |
Brokerage & Money
Management | | | 213,813,848 | | | | 2.8 | | |
Banks | | | 200,571,122 | | | | 2.6 | | |
Finance Companies | | | 72,128,731 | | | | 0.9 | | |
Financial Processors | | | 32,146,208 | | | | 0.4 | | |
| | | | 834,349,470 | | | | 10.8 | | |
| > Other Industries | |
Real Estate | | | 407,587,124 | | | | 5.3 | | |
Transportation | | | 167,741,768 | | | | 2.1 | | |
Regulated Utilities | | | 29,165,918 | | | | 0.4 | | |
| | | | 604,494,810 | | | | 7.8 | | |
| > Health Care | |
Pharmaceuticals | | | 165,645,696 | | | | 2.2 | | |
Medical Supplies | | | 87,294,226 | | | | 1.1 | | |
Medical Equipment & Devices | | | 54,526,257 | | | | 0.7 | | |
Health Care Services | | | 45,954,855 | | | | 0.6 | | |
Biotechnology & Drug Delivery | | | 32,476,500 | | | | 0.4 | | |
| | | | 385,897,534 | | | | 5.0 | | |
| > Energy & Minerals | |
Oil Services | | | 130,067,633 | | | | 1.7 | | |
Mining | | | 70,500,595 | | | | 0.9 | | |
Oil & Gas Producers | | | 38,062,832 | | | | 0.5 | | |
Oil Refining, Marketing &
Distribution | | | 33,556,377 | | | | 0.4 | | |
Agricultural Commodities | | | 11,931,248 | | | | 0.1 | | |
| | | | 284,118,685 | | | | 3.6 | | |
Total Equities: | | | 7,282,183,860 | | | | 94.1 | | |
Short-Term Investments: | | | 400,694,890 | | | | 5.2 | | |
Securities Lending Collateral: | | | 105,532,274 | | | | 1.4 | | |
Total Investments: | | | 7,788,411,024 | | | | 100.7 | | |
Obligation to Return
Collateral for Securities
Loaned: | | | (105,532,274 | ) | | | (1.4 | ) | |
Cash and Other Assets
Less Liabilities: | | | 50,599,385 | | | | 0.7 | | |
Net Assets: | | $ | 7,733,478,135 | | | | 100.0 | | |
See accompanying notes to financial statements.
54
Columbia Acorn USA®
Major Portfolio Changes in the Fourth Quarter (Unaudited)
| | | Number of Shares | |
| | | 9/30/14 | | 12/31/14 | |
Purchases | |
Information | |
Fleetmatics | | | 0 | | | | 96,949 | | |
SPS Commerce | | | 265,000 | | | | 290,000 | | |
Textura | | | 94,954 | | | | 128,934 | | |
Virtusa | | | 212,821 | | | | 227,000 | | |
Consumer Goods & Services | |
Buffalo Wild Wings | | | 0 | | | | 18,500 | | |
Fox Factory Holding | | | 10,005 | | | | 102,184 | | |
Gentex | | | 104,000 | | | | 148,000 | | |
Michaels Stores | | | 251,733 | | | | 368,564 | | |
Finance | |
ViewPoint Financial | | | 0 | | | | 373,487 | | |
Health Care | |
Abaxis | | | 40,482 | | | | 61,200 | | |
Medidata Solutions | | | 171,000 | | | | 184,500 | | |
Sarepta Therapeutics | | | 314,000 | | | | 338,500 | | |
VWR | | | 0 | | | | 86,300 | | |
Wright Medical Group | | | 106,000 | | | | 200,300 | | |
Energy & Minerals | |
Bonanza Creek Energy | | | 0 | | | | 47,000 | | |
US Silica | | | 0 | | | | 49,000 | | |
| | | Number of Shares | |
| | | 9/30/14 | | 12/31/14 | |
Sales | |
Information | |
Ansys | | | 343,000 | | | | 330,000 | | |
Commvault Systems | | | 50,000 | | | | 0 | | |
Concur Technologies | | | 54,000 | | | | 0 | | |
Monolithic Power Systems | | | 255,000 | | | | 152,000 | | |
Plexus | | | 215,000 | | | | 0 | | |
RCM Technologies | | | 582,000 | | | | 302,000 | | |
RealPage | | | 275,000 | | | | 0 | | |
SBA Communications | | | 48,000 | | | | 23,000 | | |
Ultratech | | | 238,000 | | | | 0 | | |
Industrial Goods & Services | |
HEICO | | | 757,500 | | | | 725,500 | | |
Kennametal | | | 264,000 | | | | 239,000 | | |
Moog | | | 368,610 | | | | 312,000 | | |
Nordson | | | 590,000 | | | | 515,000 | | |
PolyOne | | | 73,000 | | | | 0 | | |
Consumer Goods & Services | |
Avis Budget Group | | | 887,950 | | | | 791,950 | | |
Caesarstone (Israel) | | | 333,814 | | | | 225,187 | | |
Casey's General Stores | | | 204,931 | | | | 130,279 | | |
Fiesta Restaurant Group | | | 112,000 | | | | 68,000 | | |
Interface | | | 688,000 | | | | 502,000 | | |
Pier 1 Imports | | | 243,023 | | | | 0 | | |
Pool | | | 275,000 | | | | 260,000 | | |
Finance | |
Hudson Valley | | | 89,700 | | | | 0 | | |
MB Financial | | | 801,000 | | | | 733,000 | | |
TCF Financial | | | 487,000 | | | | 0 | | |
Textainer Group Holdings | | | 218,788 | | | | 83,000 | | |
ViewPoint Financial | | | 373,487 | | | | 0 | | |
Heath Care | |
Akorn | | | 694,200 | | | | 657,117 | | |
Allscripts Healthcare Solutions | | | 724,900 | | | | 581,600 | | |
Cepheid | | | 581,600 | | | | 558,500 | | |
Seattle Genetics | | | 414,000 | | | | 380,800 | | |
Other Industries | |
Coresite Realty | | | 223,000 | | | | 0 | | |
Hudson Pacific Properties | | | 116,000 | | | | 0 | | |
Kite Realty Group | | | 313,750 | | | | 0 | | |
St. Joe | | | 356,000 | | | | 153,098 | | |
See accompanying notes to financial statements.
55
Columbia Acorn USA®
Major Portfolio Changes in the Fourth Quarter (Unaudited), continued
| | | Number of Shares | |
| | | 9/30/14 | | 12/31/14 | |
Sales (continued) | |
Energy & Minerals | |
Bill Barrett Corporation | | | 120,000 | | | | 0 | | |
Carrizo Oil & Gas | | | 135,000 | | | | 120,000 | | |
Core Labs (Netherlands) | | | 70,000 | | | | 55,000 | | |
Hornbeck Offshore | | | 224,000 | | | | 198,000 | | |
Laredo Petroleum | | | 159,000 | | | | 0 | | |
Parsley Energy | | | 143,000 | | | | 0 | | |
Rice Energy | | | 45,000 | | | | 0 | | |
Rosetta Resources | | | 237,000 | | | | 159,000 | | |
See accompanying notes to financial statements.
56
Columbia Acorn USA®
Statement of Investments, December 31, 2014
Number of Shares | | | | Value | |
| | | | | | | Equities: 99.0% | |
Information 22.4% | | | |
| | | > Business Software 7.9% | |
| | 330,000 | | | Ansys (a) | | $ | 27,060,000 | | |
| | | | | Simulation Software for Engineers &
Designers | | | | | |
| | 633,000 | | | Informatica (a) | | | 24,139,455 | | |
| | | | | Enterprise Data Integration Software | | | | | |
| | 290,000 | | | SPS Commerce (a) | | | 16,422,700 | | |
| | | | | Supply Chain Management Software
Delivered via the Web | | | | | |
| | 134,000 | | | NetSuite (a) | | | 14,628,780 | | |
| | | | | End-to-end IT Systems Solution
Delivered via the Web | | | | | |
| | 119,000 | | | DemandWare (a) | | | 6,847,260 | | |
| | | | | E-Commerce Website Platform for
Retailers & Apparel Manufacturers | | | | | |
| | 82,000 | | | Envestnet (a) | | | 4,029,480 | | |
| | | | | Technology Platform for Investment
Advisors | | | | | |
| | 128,934 | | | Textura (a)(b) | | | 3,670,751 | | |
| | | | | Construction Vendor Management
Software | | | | | |
| | 394,187 | | | InContact (a) | | | 3,464,904 | | |
| | | | | Call Center Systems Delivered via the
Web & Telco Services | | | | | |
| | 96,949 | | | Fleetmatics (a) | | | 3,440,720 | | |
| | | | | Fleet Management Software | | | | | |
| | 171,861 | | | Exa (a) | | | 2,024,523 | | |
| | | | | Simulation Software | | | | | |
| | 196,000 | | | E2Open (a)(b) | | | 1,883,560 | | |
| | | | | Supply Chain Management Software &
Supplier/Partner Network | | | | | |
| | 315,000 | | | Five9 (a)(b) | | | 1,411,200 | | |
| | | | | Call Center Software | | | | | |
| | 64,563 | | | Workiva (a) | | | 865,144 | | |
| | | | | Software Platform for Report Creation | | | | | |
| | 95,950 | | | Covisint (a) | | | 254,267 | | |
| | | | | Collaboration Software Platform Provider | | | | | |
| | | | 110,142,744 | | |
| | | > Instrumentation 6.2% | |
| | 157,000 | | | Mettler-Toledo International (a) | | | 47,486,220 | | |
| | | | | Laboratory Equipment | | | | | |
| | 427,000 | | | IPG Photonics (a)(b) | | | 31,990,840 | | |
| | | | | Fiber Lasers | | | | | |
| | 274,000 | | | Trimble Navigation (a) | | | 7,271,960 | | |
| | | | | GPS-based Instruments | | | | | |
| | | | 86,749,020 | | |
| | | > Computer Services 2.7% | |
| | 506,000 | | | ExlService Holdings (a) | | | 14,527,260 | | |
| | | | | Business Process Outsourcing | | | | | |
| | 227,000 | | | Virtusa (a) | | | 9,459,090 | | |
| | | | | Offshore IT Outsourcing | | | | | |
| | 327,000 | | | WNS - ADR (India) (a) | | | 6,755,820 | | |
| | | | | Offshore Business Process
Outsourcing Services | | | | | |
| | 465,262 | | | Hackett Group | | | 4,089,653 | | |
| | | | | IT Integration & Best Practice Research | | | | | |
| | 302,000 | | | RCM Technologies | | | 2,114,000 | | |
| | | | | Technology & Engineering Services | | | | | |
| | | | 36,945,823 | | |
Number of Shares | | | | Value | |
| | | > Telecommunications Equipment 1.4% | |
| | 710,278 | | | Infinera (a) | | $ | 10,455,292 | | |
| | | | | Optical Networking Equipment | | | | | |
| | 281,000 | | | CalAmp (a) | | | 5,142,300 | | |
| | | | | Machine-to-machine Communications | | | | | |
| | 369,000 | | | Ixia (a) | | | 4,151,250 | | |
| | | | | Telecom Network Test Equipment | | | | | |
| | | | 19,748,842 | | |
| | | > Semiconductors & Related
Equipment 1.1% | |
| | 970,000 | | | Atmel (a) | | | 8,143,150 | | |
| | | | | Microcontrollers, Radio Frequency &
Memory Semiconductors | | | | | |
| | 152,000 | | | Monolithic Power Systems | | | 7,560,480 | | |
| | | | | High Performance Analog & Mixed
Signal Integrated Circuits | | | | | |
| | 50,657 | | | Rubicon Technology (a) | | | 231,503 | | |
| | | | | Producer of Sapphire for the Lighting,
Electronics & Automotive Industries | | | | | |
| | | | 15,935,133 | | |
| | | > Computer Hardware &
Related Equipment 1.0% | |
| | 101,000 | | | Rogers (a) | | | 8,225,440 | | |
| | | | | Printed Circuit Materials &
High-performance Foams | | | | | |
| | 78,000 | | | Belden | | | 6,147,180 | | |
| | | | | Specialty Cable | | | | | |
| | | | 14,372,620 | | |
| | | > Financial Processors 0.6% | |
| | 95,000 | | | Global Payments | | | 7,669,350 | | |
| | | | | Credit Card Processor | | | | | |
| | 153,000 | | | Liquidity Services (a) | | | 1,250,010 | | |
| | | | | E-Auctions for Surplus & Salvage Goods | | | | | |
| | | | 8,919,360 | | |
| | | > Internet Related 0.6% | |
| | 280,831 | | | RetailMeNot (a)(b) | | | 4,105,749 | | |
| | | | | Digital Coupon Marketplace | | | | | |
| | 951,000 | | | Vonage (a) | | | 3,623,310 | | |
| | | | | Business & Consumer Internet Telephony | | | | | |
| | | | 7,729,059 | | |
| | | > Business Information &
Marketing Services 0.4% | |
| | 211,000 | | | RPX (a) | | | 2,907,580 | | |
| | | | | Patent Aggregation & Defensive Patent
Consulting | | | | | |
| | 218,000 | | | Bankrate (a) | | | 2,709,740 | | |
| | | | | Internet Advertising for the Insurance,
Credit Card & Banking Markets | | | | | |
| | | | 5,617,320 | | |
| | | > Telephone & Data Services 0.3% | |
| | 621,000 | | | Boingo Wireless (a) | | | 4,763,070 | | |
| | | | | Wholesale & Retail Wi-Fi Networks | | | | | |
| | | > Mobile Communications 0.2% | |
| | 23,000 | | | SBA Communications (a) | | | 2,547,480 | | |
| | | | | Communications Towers | | | | | |
Information: Total | | | 313,470,471 | | |
See accompanying notes to financial statements.
57
Columbia Acorn USA®
Statement of Investments, continued
Number of Shares | | | | Value | |
Industrial Goods & Services 22.2% | | | |
| | | > Machinery 17.4% | |
| | 793,000 | | | Ametek | | $ | 41,735,590 | | |
| | | | | Aerospace/Industrial Instruments | | | | | |
| | 515,000 | | | Nordson | | | 40,149,400 | | |
| | | | | Dispensing Systems for Adhesives &
Coatings | | | | | |
| | 725,500 | | | HEICO | | | 34,359,680 | | |
| | | | | FAA-approved Aircraft Replacement
Parts | | | | | |
| | 855,000 | | | Donaldson | | | 33,028,650 | | |
| | | | | Industrial Air Filtration | | | | | |
| | 312,000 | | | Moog (a) | | | 23,097,360 | | |
| | | | | Motion Control Products for Aerospace,
Defense & Industrial Markets | | | | | |
| | 317,000 | | | Generac (a)(b) | | | 14,822,920 | | |
| | | | | Standby Power Generators | | | | | |
| | 222,000 | | | Toro | | | 14,165,820 | | |
| | | | | Turf Maintenance Equipment | | | | | |
| | 129,000 | | | Middleby (a) | | | 12,783,900 | | |
| | | | | Manufacturer of Cooking Equipment | | | | | |
| | 320,000 | | | ESCO Technologies | | | 11,808,000 | | |
| | | | | Industrial Filtration & Advanced
Measurement Equipment | | | | | |
| | 239,000 | | | Kennametal | | | 8,553,810 | | |
| | | | | Consumable Cutting Tools | | | | | |
| | 149,293 | | | Dorman Products (a)(b) | | | 7,206,373 | | |
| | | | | Aftermarket Auto Parts Distributor | | | | | |
| | 64,000 | | | Graham | | | 1,841,280 | | |
| | | | | Designer & Builder of Vacuum & Heat
Transfer Equipment for Process Industries | | | | | |
| | | | 243,552,783 | | |
| | | > Industrial Materials &
Specialty Chemicals 2.0% | |
| | 539,000 | | | Drew Industries (a) | | | 27,526,730 | | |
| | | | | RV & Manufactured Home Components | | | | | |
| | | > Electrical Components 1.6% | |
| | 106,000 | | | Acuity Brands | | | 14,847,420 | | |
| | | | | Commercial Lighting Fixtures | | | | | |
| | 312,013 | | | Thermon (a) | | | 7,547,595 | | |
| | | | | Global Engineered Thermal Solutions | | | | | |
| | | | 22,395,015 | | |
| | | > Industrial Distribution 0.5% | |
| | 90,000 | | | WESCO International (a) | | | 6,858,900 | | |
| | | | | Industrial Distributor | | | | | |
| | | > Other Industrial Services 0.4% | |
| | 151,000 | | | KAR Auction Services | | | 5,232,150 | | |
| | | | | Auto Auctions | | | | | |
| | | > Construction 0.3% | |
| | 449,000 | | | PGT (a) | | | 4,323,870 | | |
| | | | | Wind Resistant Windows & Doors | | | | | |
Industrial Goods & Services: Total | | | 309,889,448 | | |
Consumer Goods & Services 18.2% | | | |
| | | > Travel 5.7% | |
| | 791,950 | | | Avis Budget Group (a) | | | 52,530,044 | | |
| | | | | Car Rental Company | | | | | |
| | 469,000 | | | Hertz (a) | | | 11,696,860 | | |
| | | | | U.S. Rental Car Operator | | | | | |
Number of Shares | | | | Value | |
| | 281,000 | | | HomeAway (a) | | $ | 8,368,180 | | |
| | | | | Vacation Rental Online Marketplace | | | | | |
| | 89,666 | | | Choice Hotels | | | 5,023,089 | | |
| | | | | Franchisor of Budget Hotel Brands | | | | | |
| | 29,000 | | | Vail Resorts | | | 2,642,770 | | |
| | | | | Ski Resort Operator & Developer | | | | | |
| | | | 80,260,943 | | |
| | | > Retail 3.6% | |
| | 130,279 | | | Casey's General Stores | | | 11,766,799 | | |
| | | | | Owner/Operator of Convenience Stores | | | | | |
| | 207,500 | | | Burlington Stores (a) | | | 9,806,450 | | |
| | | | | Off-price Apparel Retailer | | | | | |
| | 368,564 | | | Michaels Stores (a) | | | 9,114,588 | | |
| | | | | Craft & Hobby Specialty Retailer | | | | | |
| | 185,991 | | | Shutterfly (a) | | | 7,754,895 | | |
| | | | | Internet Photo-centric Retailer | | | | | |
| | 184,000 | | | The Fresh Market (a)(b) | | | 7,580,800 | | |
| | | | | Specialty Food Retailer | | | | | |
| | 135,000 | | | Kate Spade & Company (a) | | | 4,321,350 | | |
| | | | | Global Lifestyle Brand | | | | | |
| | | | 50,344,882 | | |
| | | > Consumer Goods Distribution 2.4% | |
| | 260,000 | | | Pool | | | 16,494,400 | | |
| | | | | Swimming Pool Supplies &
Equipment Distributor | | | | | |
| | 134,000 | | | United Natural Foods (a) | | | 10,361,550 | | |
| | | | | Distributor of Natural/Organic
Foods to Grocery Stores | | | | | |
| | 279,000 | | | The Chefs' Warehouse (a) | | | 6,428,160 | | |
| | | | | Distributor of Specialty Foods to Fine
Dining Restaurants | | | | | |
| | | | 33,284,110 | | |
| | | > Furniture & Textiles 2.2% | |
| | 225,187 | | | Caesarstone (Israel) | | | 13,470,686 | | |
| | | | | Quartz Countertops | | | | | |
| | 408,000 | | | Knoll | | | 8,637,360 | | |
| | | | | Office Furniture | | | | | |
| | 502,000 | | | Interface | | | 8,267,940 | | |
| | | | | Modular Carpet | | | | | |
| | 8,750 | | | Wayfair (a)(b) | | | 173,688 | | |
| | | | | Online Retailer of Home Furnishings | | | | | |
| | | | 30,549,674 | | |
| | | > Other Durable Goods 2.0% | |
| | 187,000 | | | Cavco Industries (a) | | | 14,823,490 | | |
| | | | | Manufactured Homes | | | | | |
| | 297,000 | | | Select Comfort (a) | | | 8,027,910 | | |
| | | | | Specialty Mattresses | | | | | |
| | 148,000 | | | Gentex | | | 5,347,240 | | |
| | | | | Manufacturer of Auto Parts | | | | | |
| | | | 28,198,640 | | |
| | | > Restaurants 0.9% | |
| | 79,000 | | | Papa John's International | | | 4,408,200 | | |
| | | | | Franchisor of Pizza Restaurants | | | | | |
| | 68,000 | | | Fiesta Restaurant Group (a) | | | 4,134,400 | | |
| | | | | Owns/Operates Two Restaurant
Chains: Pollo Tropical & Taco Cabana | | | | | |
| | 18,500 | | | Buffalo Wild Wings (a) | | | 3,337,030 | | |
| | | | | Restaurants | | | | | |
| | | | 11,879,630 | | |
See accompanying notes to financial statements.
58
Number of Shares | | | | Value | |
| | | > Other Consumer Services 0.7% | |
| | 252,000 | | | Blackhawk Network (a) | | $ | 9,497,880 | | |
| | | | | Third-party Distributer of Prepaid
Content, Mostly Gift Cards | | | | | |
| | | > Food & Beverage 0.6% | |
| | 612,705 | | | Boulder Brands (a) | | | 6,776,517 | | |
| | | | | Healthy Food Products | | | | | |
| | 65,000 | | | B&G Foods | | | 1,943,500 | | |
| | | | | Acquirer of Small Food Brands | | | | | |
| | 15,000 | | | Freshpet (a)(b) | | | 255,900 | | |
| | | | | Fresh Pet Food Manufacturer & Marketer | | | | | |
| | | | 8,975,917 | | |
| | | > Leisure Products 0.1% | |
| | 102,184 | | | Fox Factory Holding (a) | | | 1,658,446 | | |
| | | | | High Performance Suspension
Systems for Leisure Market | | | | | |
Consumer Goods & Services: Total | | | 254,650,122 | | |
Finance 13.9% | | | |
| | | > Banks 8.9% | |
| | 733,000 | | | MB Financial | | | 24,086,380 | | |
| | | | | Chicago Bank | | | | | |
| | 993,000 | | | Associated Banc-Corp | | | 18,499,590 | | |
| | | | | Midwest Bank | | | | | |
| | 392,597 | | | Lakeland Financial | | | 17,066,192 | | |
| | | | | Indiana Bank | | | | | |
| | 140,000 | | | SVB Financial Group (a) | | | 16,249,800 | | |
| | | | | Bank to Venture Capitalists | | | | | |
| | 130,000 | | | City National | | | 10,505,300 | | |
| | | | | Bank & Asset Manager | | | | | |
| | 1,489,731 | | | First Busey | | | 9,698,149 | | |
| | | | | Illinois Bank | | | | | |
| | 228,000 | | | Hancock Holding | | | 6,999,600 | | |
| | | | | Gulf Coast Bank | | | | | |
| | 546,750 | | | Valley National Bancorp (b) | | | 5,308,942 | | |
| | | | | New Jersey/New York Bank | | | | | |
| | 695,000 | | | TrustCo Bank | | | 5,045,700 | | |
| | | | | New York State Bank | | | | | |
| | 171,826 | | | Sandy Spring Bancorp | | | 4,481,222 | | |
| | | | | Baltimore & Washington, D.C. Bank | | | | | |
| | 379,000 | | | First Commonwealth | | | 3,494,380 | | |
| | | | | Western Pennsylvania Bank | | | | | |
| | 154,849 | | | Guaranty Bancorp | | | 2,236,019 | | |
| | | | | Colorado Bank | | | | | |
| | | | 123,671,274 | | |
| | | > Finance Companies 3.3% | |
| | 673,208 | | | CAI International (a) | | | 15,618,426 | | |
| | | | | International Container Leasing | | | | | |
| | 180,689 | | | World Acceptance (a)(b) | | | 14,355,741 | | |
| | | | | Personal Loans | | | | | |
| | 315,000 | | | McGrath Rentcorp | | | 11,295,900 | | |
| | | | | Mini Rental Conglomerate | | | | | |
| | 83,000 | | | Textainer Group Holdings (b) | | | 2,848,560 | | |
| | | | | Top International Container Leaser | | | | | |
| | 91,000 | | | Marlin Business Services | | | 1,868,230 | | |
| | | | | Small Equipment Leasing | | | | | |
| | | | 45,986,857 | | |
Number of Shares | | | | Value | |
| | | > Insurance 0.7% | |
| | 33,728 | | | Enstar Group (a) | | $ | 5,156,674 | | |
| | | | | Insurance/Reinsurance & Related
Services | | | | | |
| | 135,000 | | | Allied World Assurance
Company Holdings | | | 5,119,200 | | |
| | | | | Commercial Lines Insurance/
Reinsurance | | | | | |
| | | | 10,275,874 | | |
| | | > Savings & Loans 0.6% | |
| | 373,487 | | | ViewPoint Financial | | | 8,907,665 | | |
| | | | | Texas Thrift | | | | | |
| | | > Brokerage & Money Management 0.4% | |
| | 139,000 | | | SEI Investments | | | 5,565,560 | | |
| | | | | Mutual Fund Administration &
Investment Management | | | | | |
Finance: Total | | | 194,407,230 | | |
Health Care 12.6% | | | |
| | | > Biotechnology & Drug Delivery 5.2% | |
| | 317,200 | | | Synageva BioPharma (a)(b) | | | 29,432,988 | | |
| | | | | Biotech Focused on Orphan Diseases | | | | | |
| | 380,800 | | | Seattle Genetics (a) | | | 12,235,104 | | |
| | | | | Antibody-based Therapies for Cancer | | | | | |
| | 349,300 | | | Celldex Therapeutics (a)(b) | | | 6,374,725 | | |
| | | | | Biotech Developing Drugs for Cancer | | | | | |
| | 177,200 | | | NPS Pharmaceuticals (a) | | | 6,338,444 | | |
| | | | | Orphan Drugs & Healthy Royalties | | | | | |
| | 338,500 | | | Sarepta Therapeutics (a)(b) | | | 4,898,095 | | |
| | | | | Biotech Focused on Rare Diseases | | | | | |
| | 46,100 | | | Alnylam Pharmaceuticals (a) | | | 4,471,700 | | |
| | | | | Biotech Developing Drugs for Rare
Diseases | | | | | |
| | 33,600 | | | BioMarin Pharmaceutical (a) | | | 3,037,440 | | |
| | | | | Biotech Focused on Orphan Diseases | | | | | |
| | 17,800 | | | Intercept Pharmaceuticals (a)(b) | | | 2,776,800 | | |
| | | | | Biotech Developing Drugs for Several
Diseases | | | | | |
| | 60,385 | | | Ultragenyx Pharmaceutical (a) | | | 2,649,694 | | |
| | | | | Biotech Focused on "Ultra-Orphan"
Drugs | | | | | |
| | | | 72,214,990 | | |
| | | > Medical Supplies 3.2% | |
| | 558,500 | | | Cepheid (a) | | | 30,237,190 | | |
| | | | | Molecular Diagnostics | | | | | |
| | 135,200 | | | Bio-Techne | | | 12,492,480 | | |
| | | | | Cytokines, Antibodies & other
Reagents for Life Science | | | | | |
| | 86,300 | | | VWR (a)(b) | | | 2,232,581 | | |
| | | | | Distributor of Lab Supplies | | | | | |
| | | | 44,962,251 | | |
| | | > Health Care Services 1.9% | |
| | 184,500 | | | Medidata Solutions (a) | | | 8,809,875 | | |
| | | | | Cloud-based Software for Drug Studies | | | | | |
| | 581,600 | | | Allscripts Healthcare
Solutions (a) | | | 7,427,032 | | |
| | | | | Health Care IT | | | | | |
| | 124,200 | | | HealthSouth | | | 4,776,732 | | |
| | | | | Inpatient Rehabilitation Facilities | | | | | |
See accompanying notes to financial statements.
59
Columbia Acorn USA®
Statement of Investments, continued
Number of Shares | | | | Value | |
| | | > Health Care Services—continued | |
| | 110,500 | | | Envision Healthcare
Holdings (a) | | $ | 3,833,245 | | |
| | | | | Provider of Health Care
Outsourcing Services | | | | | |
| | 81,900 | | | Castlight Health (a)(b) | | | 958,230 | | |
| | | | | Provider of Cloud-based Software for
Managing Health Care Costs | | | | | |
| | | | 25,805,114 | | |
| | | > Pharmaceuticals 1.7% | |
| | 657,117 | | | Akorn (a) | | | 23,787,635 | | |
| | | | | Developer, Manufacturer & Distributor
of Specialty Generic Drugs | | | | | |
| | | > Medical Equipment & Devices 0.6% | |
| | 200,300 | | | Wright Medical Group (a) | | | 5,382,061 | | |
| | | | | Leader in Foot & Ankle Replacement | | | | | |
| | 61,200 | | | Abaxis | | | 3,477,996 | | |
| | | | | Instruments & Tests for Vet &
Medical Markets | | | | | |
| | | | 8,860,057 | | |
Health Care: Total | | | 175,630,047 | | |
Other Industries 6.8% | | | |
| | | > Real Estate 5.5% | |
| | 832,000 | | | Extra Space Storage | | | 48,788,480 | | |
| | | | | Self Storage Facilities | | | | | |
| | 328,933 | | | EdR | | | 12,035,659 | | |
| | | | | Student Housing | | | | | |
| | 217,750 | | | DCT Industrial Trust | | | 7,764,965 | | |
| | | | | Industrial Properties | | | | | |
| | 91,000 | | | Post Properties | | | 5,348,070 | | |
| | | | | Multifamily Properties | | | | | |
| | 153,098 | | | St. Joe (a) | | | 2,815,472 | | |
| | | | | Florida Panhandle Landowner | | | | | |
| | | | 76,752,646 | | |
| | | > Transportation 1.3% | |
| | 468,091 | | | Rush Enterprises, Class A (a) | | | 15,002,316 | | |
| | 105,000 | | | Rush Enterprises, Class B (a) | | | 2,956,800 | | |
| | | | | Truck Sales & Service | | | | | |
| | | | 17,959,116 | | |
Other Industries: Total | | | 94,711,762 | | |
Energy & Minerals 2.9% | | | |
| | | > Oil & Gas Producers 1.6% | |
| | 120,000 | | | Carrizo Oil & Gas (a) | | | 4,992,000 | | |
| | | | | Oil & Gas Producer | | | | | |
| | 77,000 | | | Clayton Williams (a) | | | 4,912,600 | | |
| | | | | Oil & Gas Producer | | | | | |
| | 159,000 | | | Rosetta Resources (a) | | | 3,547,290 | | |
| | | | | Oil & Gas Producer Exploring
in Texas | | | | | |
| | 89,000 | | | SM Energy | | | 3,433,620 | | |
| | | | | Oil & Gas Producer | | | | | |
| | 83,000 | | | PDC Energy (a) | | | 3,425,410 | | |
| | | | | Oil & Gas Producer in the U.S. | | | | | |
| | 129,000 | | | WPX Energy (a) | | | 1,500,270 | | |
| | | | | Oil & Gas Produced in the U.S. &
Argentina | | | | | |
Number of Shares | | | | Value | |
| | 47,000 | | | Bonanza Creek Energy (a) | | $ | 1,128,000 | | |
| | | | | Oil & Gas Producer in Western U.S. | | | | | |
| | | | 22,939,190 | | |
| | | > Oil Services 0.7% | |
| | 198,000 | | | Hornbeck Offshore (a) | | | 4,944,060 | | |
| | | | | Supply Vessel Operator in U.S.
Gulf of Mexico | | | | | |
| | 84,000 | | | Chart Industries (a) | | | 2,872,800 | | |
| | | | | Manufacturer of Natural Gas
Processing/Storage Equipment | | | | | |
| | 51,000 | | | Gulfport Energy (a) | | | 2,128,740 | | |
| | | | | Oil & Gas Producer Focused on
Utica Shale in Ohio | | | | | |
| | | | 9,945,600 | | |
| | | > Mining 0.6% | |
| | 55,000 | | | Core Labs (Netherlands) (b) | | | 6,618,700 | | |
| | | | | Oil & Gas Reservoir Consulting | | | | | |
| | 49,000 | | | US Silica (b) | | | 1,258,810 | | |
| | | | | Provider of Frac Sand &
Industrial Sand in U.S. | | | | | |
| | | | 7,877,510 | | |
Energy & Minerals: Total | | | 40,762,300 | | |
Total Equities: 99.0%
(Cost: $732,454,361) | | | 1,383,521,380 | (c) | |
Short-Term Investments 1.4% | | | |
| | 19,527,766 | | | JPMorgan U.S. Government
Money Market Fund,
Agency Shares
(7 day yield of 0.01%) | | | 19,527,766 | | |
Total Short-Term Investments: 1.4%
(Cost: $19,527,766) | | | 19,527,766 | | |
Securities Lending Collateral 5.6% | | | |
| | 78,364,950 | | | Dreyfus Government Cash
Management Fund,
Institutional Shares
(7 day yield of 0.01%) (d) | | | 78,364,950 | | |
Total Securities Lending Collateral: 5.6%
(Cost: $78,364,950) | | | 78,364,950 | | |
Total Investments: 106.0%
(Cost: $830,347,077)(e) | | | 1,481,414,096 | | |
Obligation to Return Collateral for
Securities Loaned: (5.6)% | | | (78,364,950 | ) | |
Cash and Other Assets Less
Liabilities: (0.4)% | | | (5,832,859 | ) | |
Net Assets: 100.0% | | $ | 1,397,216,287 | | |
ADR - American Depositary Receipts
See accompanying notes to financial statements.
60
> Notes to Statement of Investments
(a) Non-income producing security.
(b) All or a portion of this security was on loan at December 31, 2014. The total market value of securities on loan at December 31, 2014 was $76,216,239.
(c) On December 31, 2014, the market value of foreign securities represented 1.92% of total net assets. The Fund's foreign portfolio was diversified as follows:
Country | | Value | | Percentage of
Net Assets | |
Israel | | $ | 13,470,686 | | | | 0.97 | | |
India | | | 6,755,820 | | | | 0.48 | | |
Netherlands | | | 6,618,700 | | | | 0.47 | | |
Total Foreign Portfolio | | $ | 26,845,206 | | | | 1.92 | | |
(d) Investment made with cash collateral received from securities lending activity.
(e) At December 31, 2014, for federal income tax purposes, the cost of investments was $830,856,619 and net unrealized appreciation was $650,557,477 consisting of gross unrealized appreciation of $693,589,171 and gross unrealized depreciation of $43,031,694.
Fair Value Measurements
Various inputs are used in determining the value of the Fund's investments, following the input prioritization hierarchy established by accounting principles generally accepted in the United States of America (GAAP). These inputs are summarized in the three broad levels listed below:
• Level 1 – quoted prices in active markets for identical securities
• Level 2 – prices determined using other significant observable inputs (including quoted prices for similar securities, interest rates, prepayment speeds, credit risk and others)
• Level 3 – prices determined using significant unobservable inputs where quoted prices or observable inputs are unavailable or less reliable (including management's own assumptions about the factors market participants would use in pricing an investment)
The inputs or methodology used for valuing securities are not necessarily an indication of the risk associated with investing in those securities.
Examples of the types of securities in which the Fund would typically invest and how they are classified within this hierarchy are as follows. Typical Level 1 securities include exchange traded domestic equities, mutual funds whose NAVs are published each day and exchange traded foreign equities that are not statistically fair valued. Typical Level 2 securities include exchange traded foreign equities that are statistically fair valued, forward foreign currency exchange contracts and short-term investments valued at amortized cost. Additionally, securities fair valued by the Valuation Committee (the Committee) of the Fund's Board of Trustees (the Board) that rely on significant observable inputs are also included in Level 2. Typical Level 3 securities include any security fair valued by the Committee that relies on significant unobservable inputs.
Under the direction of the Board, the Committee is responsible for overseeing the valuation procedures approved by the Board.
The Committee meets as necessary, and no less frequently than quarterly, to determine fair values for securities for which market quotations are not readily available or for which the investment manager believes that available market quotations are unreliable, to review the appropriateness of the Trust's Portfolio Pricing Policy and the pricing procedures of the investment manager (the Policies), and to review the continuing appropriateness of the current value of any security subject to the Policies. The Policies address, among other things: circumstances under which market quotations will be deemed readily available; selection of third party pricing vendors; appropriate pricing methodologies; events that require fair valuation and fair value techniques; circumstances under which securities will be deemed to pose a potential for stale pricing, including when securities are illiquid, restricted, or in default; and certain delegations of authority to determine fair values to the Fund's investment manager. The Committee may also meet to discuss additional valuation matters, which may include review of back-testing results, review of time-sensitive information or approval of other valuation related actions, and to review the appropriateness of the Policies.
For investments categorized as Level 3, the significant unobservable inputs used in the fair value measurement of the Funds' securities may include: (i) data specific to the issuer or comparable issuers, (ii) general market or specific sector news and (iii) quoted prices and specific or similar security transactions. The Committee considers this data and any changes from prior periods in order to assess the reasonableness of observable and unobservable inputs, any assumptions or internal models used to value those securities and changes in fair value. Significant changes in any of these factors could result in lower or higher fair value measurements. Various factors impact the frequency of monitoring (which may occur as often as daily), however the Committee may determine that changes to inputs, assumptions and models are not required with the same frequency.
See accompanying notes to financial statements.
61
Columbia Acorn USA®
Statement of Investments, continued
> Notes to Statement of Investments
The following table summarizes the inputs used, as of December 31, 2014, in valuing the Fund's assets:
Investment Type | | Quoted Prices
(Level 1) | | Other
Significant
Observable
Inputs
(Level 2) | | Significant
Unobservable
Inputs
(Level 3) | | Total | |
Equities | |
Information | | $ | 313,470,471 | | | $ | - | | | $ | - | | | $ | 313,470,471 | | |
Industrial Goods & Services | | | 309,889,448 | | | | - | | | | - | | | | 309,889,448 | | |
Consumer Goods & Services | | | 254,650,122 | | | | - | | | | - | | | | 254,650,122 | | |
Finance | | | 194,407,230 | | | | - | | | | - | | | | 194,407,230 | | |
Health Care | | | 175,630,047 | | | | - | | | | - | | | | 175,630,047 | | |
Other Industries | | | 94,711,762 | | | | - | | | | - | | | | 94,711,762 | | |
Energy & Minerals | | | 40,762,300 | | | | - | | | | - | | | | 40,762,300 | | |
Total Equities | | | 1,383,521,380 | | | | - | | | | - | | | | 1,383,521,380 | | |
Total Short-Term Investments | | | 19,527,766 | | | | - | | | | - | | | | 19,527,766 | | |
Total Securities Lending Collateral | | | 78,364,950 | | | | - | | | | - | | | | 78,364,950 | | |
Total Investments | | $ | 1,481,414,096 | | | $ | - | | | $ | - | | | $ | 1,481,414,096 | | |
The following table shows transfers between Level 1 and Level 3 of the fair value hierarchy:
Transfers In | | Transfers Out | |
| Level 1 | | Level 3 | | Level 1 | | Level 3 | |
| $ | 970 | | | $ | - | | | $ | - | | | $ | 970 | | |
There were no transfers of financial assets between levels 1 and 2 during the period. Transfers in and/or out of Level 3 are determined based on the fair value at the beginning of the period for security positions held throughout the period.
Financial assets were transferred from Level 3 to Level 1 as stock resumed trading on an exchange.
See accompanying notes to financial statements.
62
Columbia Acorn International SelectSM
Major Portfolio Changes in the Fourth Quarter (Unaudited)
| | | Number of Shares | |
| | | 9/30/14 | | 12/31/14 | |
Purchases | |
Asia | |
| > Japan | |
KDDI | | | 0 | | | | 120,000 | | |
Recruit Holdings | | | 0 | | | | 222,500 | | |
Secom | | | 88,300 | | | | 108,000 | | |
| > Singapore | |
Singapore Exchange | | | 1,210,000 | | | | 2,036,000 | | |
| > Korea | |
Samsung Fire and Marine | | | 0 | | | | 23,200 | | |
Europe | |
| > United Kingdom | |
Babcock International | | | 479,000 | | | | 556,000 | | |
| > Germany | |
Telefonica Deutschland | | | 1,293,500 | | | | 1,305,500 | | |
| > France | |
Eutelsat | | | 0 | | | | 105,081 | | |
Other Countries | |
| > Australia | |
Challenger Financial | | | 2,080,000 | | | | 2,156,000 | | |
| > Canada | |
Goldcorp | | | 256,000 | | | | 295,000 | | |
| | | Number of Shares | |
| | | 9/30/14 | | 12/31/14 | |
Sales | |
Asia | |
| > Japan | |
Benesse | | | 88,900 | | | | 0 | | |
Dentsu | | | 86,700 | | | | 0 | | |
Japan Tobacco | | | 212,000 | | | | 190,000 | | |
Makita | | | 60,000 | | | | 0 | | |
NGK Spark Plug | | | 285,000 | | | | 264,000 | | |
Park24 | | | 218,000 | | | | 212,000 | | |
Rinnai | | | 57,000 | | | | 38,200 | | |
Seven Bank | | | 965,000 | | | | 777,000 | | |
Toyo Suisan Kaisha | | | 60,000 | | | | 0 | | |
| > Singapore | |
Ascendas REIT | | | 9,514,001 | | | | 7,916,000 | | |
Mapletree Logistics Trust | | | 7,600,000 | | | | 0 | | |
| > Korea | |
CJ Corp | | | 57,600 | | | | 37,000 | | |
KT&G | | | 140,000 | | | | 34,400 | | |
| > Indonesia | |
Archipelago Resources | | | 11,903,000 | | | | 0 | | |
Europe | |
| > United Kingdom | |
Jardine Lloyd Thompson Group | | | 454,285 | | | | 290,000 | | |
Smith and Nephew | | | 200,000 | | | | 151,000 | | |
Whitbread | | | 70,442 | | | | 47,442 | | |
| > Sweden | |
Swedish Match | | | 307,000 | | | | 248,000 | | |
| > Switzerland | |
Swatch | | | 30,000 | | | | 0 | | |
Other Countries | |
| > Australia | |
IAG | | | 2,486,000 | | | | 1,300,000 | | |
| > Canada | |
Baytex | | | 404,000 | | | | 370,000 | | |
CCL Industries | | | 107,000 | | | | 78,000 | | |
| > United States | |
Denbury Resources | | | 758,000 | | | | 0 | | |
See accompanying notes to financial statements.
63
Columbia Acorn International SelectSM
Statement of Investments, December 31, 2014
Number of Shares | | | | Value | |
| | | | | | | Equities: 89.5% | |
Asia 37.5% | | | |
| | | > Japan 21.8% | |
| | 264,000 | | | NGK Spark Plug | | $ | 8,021,752 | | |
| | | | | Automobile Parts | | | | | |
| | 120,000 | | | KDDI | | | 7,538,886 | | |
| | | | | Mobile & Fixed Line Communication
Service Provider in Japan | | | | | |
| | 222,500 | | | Recruit Holdings (a) | | | 6,390,048 | | |
| | | | | Recruitment & Media Services | | | | | |
| | 108,000 | | | Secom | | | 6,205,098 | | |
| | | | | Security Services | | | | | |
| | 2,560 | | | Nippon Prologis REIT | | | 5,558,413 | | |
| | | | | Logistics REIT in Japan | | | | | |
| | 190,000 | | | Japan Tobacco | | | 5,229,329 | | |
| | | | | Cigarettes | | | | | |
| | 3,205 | | | Orix JREIT | | | 4,507,153 | | |
| | | | | Diversified REIT | | | | | |
| | 777,000 | | | Seven Bank | | | 3,261,448 | | |
| | | | | ATM Processing Services | | | | | |
| | 212,000 | | | Park24 | | | 3,120,929 | | |
| | | | | Parking Lot Operator | | | | | |
| | 1,300 | | | Japan Retail Fund | | | 2,747,269 | | |
| | | | | Retail REIT in Japan | | | | | |
| | 38,200 | | | Rinnai | | | 2,566,742 | | |
| | | | | Gas Appliances for Home &
Commercial Use | | | | | |
| | | | 55,147,067 | | |
| | | > Singapore 10.3% | |
| | 7,916,000 | | | Ascendas REIT | | | 14,199,349 | | |
| | | | | Industrial Property Landlord | | | | | |
| | 2,036,000 | | | Singapore Exchange | | | 11,969,879 | | |
| | | | | Singapore Equity & Derivatives
Market Operator | | | | | |
| | | | 26,169,228 | | |
| | | > Korea 5.4% | |
| | 23,200 | | | Samsung Fire and Marine | | | 5,962,789 | | |
| | | | | Non-life Insurance | | | | | |
| | 37,000 | | | CJ Corp | | | 5,238,501 | | |
| | | | | Holding Company of Korean
Consumer Conglomerate | | | | | |
| | 34,400 | | | KT&G | | | 2,388,508 | | |
| | | | | Tobacco & Ginseng Products | | | | | |
| | | | 13,589,798 | | |
Asia: Total | | | 94,906,093 | | |
Europe 26.4% | | | |
| | | > United Kingdom 7.7% | |
| | 556,000 | | | Babcock International | | | 9,108,546 | | |
| | | | | Public Sector Outsourcer | | | | | |
| | 290,000 | | | Jardine Lloyd Thompson Group | | | 4,049,869 | | |
| | | | | International Business Insurance
Broker | | | | | |
| | 47,442 | | | Whitbread | | | 3,511,004 | | |
| | | | | UK Hotelier & Coffee Shop | | | | | |
| | 151,000 | | | Smith and Nephew | | | 2,722,914 | | |
| | | | | Medical Equipment & Supplies | | | | | |
| | | | 19,392,333 | | |
Number of Shares | | | | Value | |
| | | > Germany 4.6% | |
| | 1,305,500 | | | Telefonica Deutschland | | $ | 6,918,953 | | |
| | | | | Mobile & Fixed-line
Communications in Germany | | | | | |
| | 107,400 | | | Wirecard | | | 4,683,082 | | |
| | | | | Online Payment Processing &
Risk Management | | | | | |
| | | | 11,602,035 | | |
| | | > Sweden 4.2% | |
| | 248,000 | | | Swedish Match | | | 7,770,961 | | |
| | | | | Swedish Snus | | | | | |
| | 97,000 | | | Hexagon | | | 2,992,405 | | |
| | | | | Design, Measurement &
Visualization Software & Equipment | | | | | |
| | | | 10,763,366 | | |
| | | > Switzerland 3.1% | |
| | 26,680 | | | Partners Group | | | 7,762,207 | | |
| | | | | Private Markets Asset Management | | | | | |
| | | > Denmark 2.5% | |
| | 67,300 | | | Jyske Bank (a) | | | 3,401,771 | | |
| | | | | Danish Bank | | | | | |
| | 71,500 | | | Novozymes | | | 3,009,690 | | |
| | | | | Industrial Enzymes | | | | | |
| | | | 6,411,461 | | |
| | | > Norway 1.6% | |
| | 579,000 | | | Orkla | | | 3,941,524 | | |
| | | | | Food & Brands, Aluminum,
Chemicals Conglomerate | | | | | |
| | | > Spain 1.4% | |
| | 66,000 | | | Viscofan | | | 3,501,714 | | |
| | | | | Sausage Casings Maker | | | | | |
| | | > France 1.3% | |
| | 105,081 | | | Eutelsat | | | 3,398,283 | | |
| | | | | Fixed Satellite Services | | | | | |
Europe: Total | | | 66,772,923 | | |
Other Countries 20.8% | | | |
| | | > Australia 9.2% | |
| | 2,156,000 | | | Challenger Financial | | | 11,389,154 | | |
| | | | | Annuity Provider in Australia | | | | | |
| | 1,300,000 | | | IAG | | | 6,600,771 | | |
| | | | | General Insurance Provider | | | | | |
| | 470,000 | | | Amcor | | | 5,171,098 | | |
| | | | | Global Leader in Flexible &
Rigid Packaging | | | | | |
| | | | 23,161,023 | | |
| | | > Canada 7.9% | |
| | 78,000 | | | CCL Industries | | | 8,450,559 | | |
| | | | | Global Label Converter | | | | | |
| | 370,000 | | | Baytex (b) | | | 6,152,866 | | |
| | | | | Oil & Gas Producer in Canada | | | | | |
| | 295,000 | | | Goldcorp | | | 5,463,400 | | |
| | | | | Gold Mining | | | | | |
| | | | 20,066,825 | | |
See accompanying notes to financial statements.
64
Number of Shares | | | | Value | |
| | | > South Africa 3.7% | |
| | 42,000 | | | Naspers | | $ | 5,432,920 | | |
| | | | | Media in Africa, China, Russia &
other Emerging Markets | | | | | |
| | 390,000 | | | Coronation Fund Managers | | | 3,859,588 | | |
| | | | | South African Fund Manager | | | | | |
| | | | 9,292,508 | | |
Other Countries: Total | | | 52,520,356 | | |
Latin America 4.8% | | | |
| | | > Guatemala 3.2% | |
| | 588,000 | | | Tahoe Resources | | | 8,173,696 | | |
| | | | | Silver Project in Guatemala | | | | | |
| | | > Brazil 0.9% | |
| | 12,057,582 | | | Beadell Resources (a)(b) | | | 2,183,800 | | |
| | | | | Gold Mining in Brazil | | | | | |
| | | > Uruguay 0.7% | |
| | 191,666 | | | Union Agriculture
Group (a)(c)(d) | | | 1,749,910 | | |
| | | | | Farmland Operator in Uruguay | | | | | |
Latin America: Total | | | 12,107,406 | | |
Total Equities: 89.5%
(Cost: $205,508,509) | | | 226,306,778 | (e) | |
Number of Shares | | | | Value | |
Short-Term Investments 6.2% | |
| | 15,728,035 | | | JPMorgan U.S. Government
Money Market Fund, IM
Shares (7 day yield of 0.01%) | | $ | 15,728,035 | | |
Total Short-Term Investments: 6.2%
(Cost: $15,728,035) | | | 15,728,035 | | |
Securities Lending Collateral 2.2% | |
| | 5,507,307 | | | Dreyfus Government Cash
Management Fund,
Institutional Shares
(7 day yield of 0.01%) (f) | | | 5,507,307 | | |
Total Securities Lending Collateral: 2.2%
(Cost: $5,507,307) | | | 5,507,307 | | |
Total Investments: 97.9%
(Cost: $226,743,851)(g) | | | 247,542,120 | | |
Obligation to Return Collateral for
Securities Loaned: (2.2)% | | | (5,507,307 | ) | |
Cash and Other Assets Less
Liabilities: 4.3% | | | 10,884,887 | | |
Net Assets: 100.0% | | $ | 252,919,700 | | |
REIT - Real Estate Investment Trust
> Notes to Statement of Investments
(a) Non-income producing security.
(b) All or a portion of this security was on loan at December 31, 2014. The total market value of securities on loan at December 31, 2014 was $5,229,212.
(c) Illiquid security.
(d) Denotes a restricted security, which is subject to restrictions on resale under federal securities laws. This security is valued at fair value determined in good faith under consistently applied procedures established by the Fund's Board of Trustees. At December 31, 2014, the market value of this security amounted to $1,749,910, which represented 0.69% of total net assets. Additional information on this security is as follows:
Security | | Acquisition
Dates | | Shares/Units | | Cost | | Value | |
Union Agriculture Group | | 12/8/10-6/27/12 | | | 191,666 | | | $ | 2,200,000 | | | $ | 1,749,910 | | |
(e) On December 31, 2014, the Fund's total equity investments were denominated in currencies as follows:
Currency | | Value | | Percentage
of Net Assets | |
Japanese Yen | | $ | 55,147,067 | | | | 21.8 | | |
Singapore Dollar | | | 26,169,228 | | | | 10.3 | | |
Australian Dollar | | | 25,344,822 | | | | 10.0 | | |
Canadian Dollar | | | 22,777,122 | | | | 9.0 | | |
British Pound | | | 19,392,333 | | | | 7.7 | | |
Euro | | | 18,502,032 | | | | 7.3 | | |
South Korean Won | | | 13,589,798 | | | | 5.4 | | |
Other currencies less
than 5% of total net assets | | | 45,384,376 | | | | 18.0 | | |
Total Equities | | $ | 226,306,778 | | | | 89.5 | | |
(f) Investment made with cash collateral received from securities lending activity.
See accompanying notes to financial statements.
65
Columbia Acorn International SelectSM
Statement of Investments, continued
> Notes to Statement of Investments
(g) At December 31, 2014, for federal income tax purposes, the cost of investments was $234,189,129 and net unrealized appreciation was $13,352,991 consisting of gross unrealized appreciation of $39,595,587 and gross unrealized depreciation of $26,242,596.
At December 31, 2014, the Fund had entered into the following forward foreign currency exchange contracts:
Forward Foreign
Currency Exchange
Contracts to Buy | | Forward Foreign
Currency Exchange
Contracts to Sell | | Principal Amount
in Foreign Currency | | Principal Amount
in U.S. Dollar | | Settlement
Date | | Unrealized
Appreciation
(Depreciation) | |
USD | | | | ZAR | | | | | 105,407,100 | | | $ | 9,000,000 | | | 1/15/15 | | $ | (97,181 | ) | |
The counterparty for all forward foreign currency exchange contracts is Morgan Stanley.
USD - United States Dollar
ZAR - South African Rand
Fair Value Measurements
Various inputs are used in determining the value of the Fund's investments, following the input prioritization hierarchy established by accounting principles generally accepted in the United States of America (GAAP). These inputs are summarized in the three broad levels listed below:
• Level 1 – quoted prices in active markets for identical securities
• Level 2 – prices determined using other significant observable inputs (including quoted prices for similar securities, interest rates, prepayment speeds, credit risk and others)
• Level 3 – prices determined using significant unobservable inputs where quoted prices or observable inputs are unavailable or less reliable (including management's own assumptions about the factors market participants would use in pricing an investment)
The inputs or methodology used for valuing securities are not necessarily an indication of the risk associated with investing in those securities.
Examples of the types of securities in which the Fund would typically invest and how they are classified within this hierarchy are as follows. Typical Level 1 securities include exchange traded domestic equities, mutual funds whose NAVs are published each day and exchange traded foreign equities that are not statistically fair valued. Typical Level 2 securities include exchange traded foreign equities that are statistically fair valued, forward foreign currency exchange contracts and short-term investments valued at amortized cost. Additionally, securities fair valued by the Valuation Committee (the Committee) of the Fund's Board of Trustees (the Board) that rely on significant observable inputs are also included in Level 2. Typical Level 3 securities include any security fair valued by the Committee that relies on significant unobservable inputs.
Under the direction of the Board, the Committee is responsible for overseeing the valuation procedures approved by the Board.
The Committee meets as necessary, and no less frequently than quarterly, to determine fair values for securities for which market quotations are not readily available or for which the investment manager believes that available market quotations are unreliable, to review the appropriateness of the Trust's Portfolio Pricing Policy and the pricing procedures of the investment manager (the Policies), and to review the continuing appropriateness of the current value of any security subject to the Policies. The Policies address, among other things: circumstances under which market quotations will be deemed readily available; selection of third party pricing vendors; appropriate pricing methodologies; events that require fair valuation and fair value techniques; circumstances under which securities will be deemed to pose a potential for stale pricing, including when securities are illiquid, restricted, or in default; and certain delegations of authority to determine fair values to the Fund's investment manager. The Committee may also meet to discuss additional valuation matters, which may include review of back-testing results, review of time-sensitive information or approval of other valuation related actions, and to review the appropriateness of the Policies.
For investments and derivatives categorized as Level 3, the significant unobservable inputs used in the fair value measurement of the Funds' securities may include: (i) data specific to the issuer or comparable issuers, (ii) general market or specific sector news and (iii) quoted prices and specific or similar security transactions. The Committee considers this data and any changes from prior periods in order to assess the reasonableness of observable and unobservable inputs, any assumptions or internal models used to value those securities and changes in fair value. Significant changes in any of these factors could result in lower or higher fair value measurements. Various factors impact the frequency of monitoring (which may occur as often as daily), however the Committee may determine that changes to inputs, assumptions and models are not required with the same frequency.
See accompanying notes to financial statements.
66
> Notes to Statement of Investments
The following table summarizes the inputs used, as of December 31, 2014, in valuing the Fund's assets:
Investment Type | | Quoted Prices
(Level 1) | | Other
Significant
Observable
Inputs
(Level 2) | | Significant
Unobservable
Inputs
(Level 3) | | Total | |
Equities | |
Asia | | $ | - | | | $ | 94,906,093 | | | $ | - | | | $ | 94,906,093 | | |
Europe | | | - | | | | 66,772,923 | | | | - | | | | 66,772,923 | | |
Other Countries | | | 20,066,825 | | | | 32,453,531 | | | | - | | | | 52,520,356 | | |
Latin America | | | 8,173,696 | | | | 2,183,800 | | | | 1,749,910 | | | | 12,107,406 | | |
Total Equities | | | 28,240,521 | | | | 196,316,347 | | | | 1,749,910 | | | | 226,306,778 | | |
Total Short-Term Investments | | | 15,728,035 | | | | - | | | | - | | | | 15,728,035 | | |
Total Securities Lending Collateral | | | 5,507,307 | | | | - | | | | - | | | | 5,507,307 | | |
Total Investments | | $ | 49,475,863 | | | $ | 196,316,347 | | | $ | 1,749,910 | | | $ | 247,542,120 | | |
Unrealized Depreciation on: | |
Forward Foreign Currency Exchange Contracts | | | - | | | | (97,181 | ) | | | - | | | | (97,181 | ) | |
Total | | $ | 49,475,863 | | | $ | 196,219,166 | | | $ | 1,749,910 | | | $ | 247,444,939 | | |
The Fund's assets assigned to the Level 2 input category are generally valued using a market approach, in which a security's value is determined through its correlation to prices and information from observable market transactions for similar or identical assets. Foreign equities are generally valued at the last sale price on the foreign exchange or market on which they trade. The Fund may use a statistical fair valuation model, in accordance with the policy adopted by the Board, provided by an independent third party to value securities principally traded in foreign markets in order to adjust for possible stale pricing that may occur between the close of the foreign exchanges and the time for valuation. These models take into account available market data including intraday index, ADR, and ETF movements. Forward foreign currency exchange contracts are valued at the prevailing forward exchange rate of the underlying currencies.
There were no transfers of financial assets between levels during the period.
The following table reconciles asset balances for the period ending December 31, 2014, in which significant observable and/or unobservable inputs (Level 3) were used in determining value:
Investments in Securities | | Balance as
of December 31,
2013 | | Realized
Gain/(Loss) | | Change in
Unrealized
Appreciation
(Depreciation) | | Purchases | | Sales | | Transfers
into
Level 3 | | Transfers
out of
Level 3 | | Balance as
of December 31,
2014 | |
Equities | |
Asia | | $ | 10,249,601 | | | $ | (1,522,004 | ) | | $ | 1,817,376 | | | $ | - | | | $ | (10,544,973 | ) | | $ | - | | | $ | - | | | $ | - | | |
Latin America | | | 2,048,910 | | | | - | | | | (299,000 | ) | | | - | | | | - | | | | - | | | | - | | | | 1,749,910 | | |
Options | |
Asia | | | 985,539 | | | | - | | | | (985,539 | ) | | | - | | | | - | | | | - | | | | - | | | | - | | |
| | | $ | 13,284,050 | | | $ | (1,522,004 | ) | | $ | 532,837 | | | $ | - | | | $ | (10,544,973 | ) | | $ | - | | | $ | - | | | $ | 1,749.910 | | |
The information in the above reconciliation table represents fiscal year to date activity for any securities identified as using Level 3 inputs at either the beginning or the end of the current fiscal period.
The change in unrealized depreciation attributed to securities owned at December 31, 2014, which were valued using significant unobservable inputs (Level 3), amounted to $299,000.
Quantitative information pertaining to Level 3 unobservable fair value measurements
| | | Fair Value at
12/31/14 | | Valuation Technique(s) | | Unobservable Input(s) | | Range (Weighted
Average) | |
Equities | |
Latin America | | $ | 1,749,910 | | | Market comparable companies | | Discount for lack of marketability | | | 8 | % to 23% | |
Certain securities classified as Level 3 are valued at fair value, using a market approach, as determined in good faith under consistently applied procedures established by and under the general supervision of the Board. To determine fair value for these securities, for which no market exists, the Committee utilizes the valuation technique it deems most appropriate in the circumstances, using some unobservable inputs, which may include, but are not limited to estimated earnings of the company and the position of the security within the company's capital structure. The Committee also may use some observable inputs, which may include, but are not limited to, trades of similar securities and market multiples derived from a set of comparable companies. Significant increases or decreases to any of these inputs could result in a significantly lower or higher fair value measurement.
See accompanying notes to financial statements.
67
Columbia Acorn International SelectSM
Portfolio Diversification
At December 31, 2014, the Fund's portfolio investments as a percentage of net assets were diversified as follows:
| | | Value | | Percentage
of Net Assets | |
| > Information | |
Financial Processors | | $ | 16,652,961 | | | | 6.6 | | |
Mobile Communications | | | 7,538,886 | | | | 3.0 | | |
Telephone & Data Services | | | 6,918,953 | | | | 2.7 | | |
Advertising | | | 6,390,048 | | | | 2.5 | | |
Internet Related | | | 5,432,920 | | | | 2.1 | | |
Satellite Broadcasting & Services | | | 3,398,283 | | | | 1.4 | | |
Business Software | | | 2,992,405 | | | | 1.2 | | |
| | | | 49,324,456 | | | | 19.5 | | |
| > Finance | |
Insurance | | | 28,002,584 | | | | 11.1 | | |
Brokerage & Money Management | | | 11,621,795 | | | | 4.6 | | |
Banks | | | 6,663,219 | | | | 2.6 | | |
| | | | 46,287,598 | | | | 18.3 | | |
| > Consumer Goods & Services | |
Nondurables | | | 16,068,397 | | | | 6.3 | | |
Food & Beverage | | | 11,272,675 | | | | 4.5 | | |
Other Durable Goods | | | 10,588,494 | | | | 4.2 | | |
Restaurants | | | 3,511,004 | | | | 1.4 | | |
| | | | 41,440,570 | | | | 16.4 | | |
| > Industrial Goods & Services | |
Other Industrial Services | | | 9,326,027 | | | | 3.7 | | |
Conglomerates | | | 9,180,024 | | | | 3.6 | | |
Outsourcing Services | | | 9,108,546 | | | | 3.6 | | |
Industrial Materials & Specialty
Chemicals | | | 8,180,787 | | | | 3.2 | | |
| | | | 35,795,384 | | | | 14.1 | | |
| > Other Industries | |
Real Estate | | | 27,012,184 | | | | 10.7 | | |
| | | | 27,012,184 | | | | 10.7 | | |
| > Energy & Minerals | |
Mining | | | 15,820,895 | | | | 6.3 | | |
Oil & Gas Producers | | | 6,152,866 | | | | 2.4 | | |
Agricultural Commodities | | | 1,749,911 | | | | 0.7 | | |
| | | | 23,723,672 | | | | 9.4 | | |
| | | Value | | Percentage
of Net Assets | |
| > Health Care | |
Medical Equipment & Devices | | $ | 2,722,914 | | | | 1.1 | | |
| | | | 2,722,914 | | | | 1.1 | | |
Total Equities: | | | 226,306,778 | | | | 89.5 | | |
Short-Term Investments: | | | 15,728,035 | | | | 6.2 | | |
Securities Lending Collateral: | | | 5,507,307 | | | | 2.2 | | |
Total Investments: | | | 247,542,120 | | | | 97.9 | | |
Obligation to Return
Collateral for Securities
Loaned: | | | (5,507,307 | ) | | | (2.2 | ) | |
Cash and Other Assets
Less Liabilities: | | | 10,884,887 | | | | 4.3 | | |
Net Assets: | | $ | 252,919,700 | | | | 100.0 | | |
See accompanying notes to financial statements.
68
Columbia Acorn SelectSM
Major Portfolio Changes in the Fourth Quarter (Unaudited)
| | | Number of Shares | |
| | | 9/30/14 | | 12/31/14 | |
Purchases | |
Health Care | |
Intercept Pharmaceuticals | | | 0 | | | | 18,000 | | |
VWR | | | 0 | | | | 325,000 | | |
Energy & Minerals | |
Core Labs (Netherlands) | | | 0 | | | | 27,000 | | |
Petromanas (Canada) | | | 15,399,500 | | | | 16,000,000 | | |
| | | Number of Shares | |
| | | 9/30/14 | | 12/31/14 | |
Sales | |
Industrial Goods & Services | |
Ametek | | | 865,000 | | | | 779,000 | | |
Donaldson | | | 800,000 | | | | 764,000 | | |
Kennametal | | | 355,000 | | | | 280,000 | | |
Nordson | | | 300,000 | | | | 272,000 | | |
Quanta Services | | | 570,000 | | | | 525,000 | | |
Information | |
SBA Communications | | | 114,300 | | | | 83,000 | | |
WNS - ADR (India) | | | 1,395,000 | | | | 1,245,493 | | |
Finance | |
CNO Financial Group | | | 1,830,000 | | | | 1,270,000 | | |
Discover Financial Services | | | 390,000 | | | | 319,000 | | |
SEI Investments | | | 645,000 | | | | 610,000 | | |
Consumer Goods & Services | |
Choice Hotels | | | 100,000 | | | | 0 | | |
Hertz | | | 380,000 | | | | 138,000 | | |
Heath Care | |
Henry Schein | | | 110,000 | | | | 41,000 | | |
Other Industries | |
Post Properties | | | 367,000 | | | | 355,000 | | |
Energy & Minerals | |
Antero Resources | | | 58,300 | | | | 0 | | |
Canacol (Colombia) | | | 1,880,000 | | | | 1,654,000 | | |
Clayton Williams | | | 28,000 | | | | 0 | | |
ShaMaran Petroleum (Iraq) | | | 20,600,000 | | | | 20,290,500 | | |
Synthesis Energy Systems
(China) | | | 2,000,000 | | | | 882,000 | | |
See accompanying notes to financial statements.
69
Columbia Acorn SelectSM
Statement of Investments, December 31, 2014
Number of Shares | | | | Value | |
| | | | | | | Equities: 99.1% | |
Industrial Goods & Services 26.5% | | | |
| | | > Machinery 18.0% | |
| | 779,000 | | | Ametek | | $ | 40,998,770 | | |
| | | | | Aerospace/Industrial Instruments | | | | | |
| | 764,000 | | | Donaldson | | | 29,513,320 | | |
| | | | | Industrial Air Filtration | | | | | |
| | 272,000 | | | Nordson | | | 21,205,120 | | |
| | | | | Dispensing Systems for Adhesives &
Coatings | | | | | |
| | 177,000 | | | Pall | | | 17,914,170 | | |
| | | | | Life Science, Water & Industrial
Filtration | | | | | |
| | 280,000 | | | Kennametal | | | 10,021,200 | | |
| | | | | Consumable Cutting Tools | | | | | |
| | | | 119,652,580 | | |
| | | > Other Industrial Services 3.3% | |
| | 780,000 | | | LKQ (a) | | | 21,933,600 | | |
| | | | | Alternative Auto Parts Distribution | | | | | |
| | | > Industrial Distribution 3.0% | |
| | 175,000 | | | Airgas | | | 20,156,500 | | |
| | | | | Industrial Gas Distributor | | | | | |
| | | > Outsourcing Services 2.2% | |
| | 525,000 | | | Quanta Services (a) | | | 14,904,750 | | |
| | | | | Electrical Transmission & Pipeline
Contracting Services | | | | | |
Industrial Goods & Services: Total | | | 176,647,430 | | |
Information 24.5% | | | |
| | | > Instrumentation 5.9% | |
| | 84,500 | | | Mettler-Toledo International (a) | | | 25,557,870 | | |
| | | | | Laboratory Equipment | | | | | |
| | 525,000 | | | Trimble Navigation (a) | | | 13,933,500 | | |
| | | | | GPS-based Instruments | | | | | |
| | | | 39,491,370 | | |
| | | > Computer Hardware &
Related Equipment 4.3% | |
| | 534,000 | | | Amphenol | | | 28,734,540 | | |
| | | | | Electronic Connectors | | | | | |
| | | > Computer Services 3.9% | |
| | 1,245,493 | | | WNS - ADR (India) (a) | | | 25,731,885 | | |
| | | | | Offshore Business Process
Outsourcing Services | | | | | |
| | | > Business Software 3.7% | |
| | 190,000 | | | Ansys (a) | | | 15,580,000 | | |
| | | | | Simulation Software for
Engineers & Designers | | | | | |
| | 241,000 | | | Informatica (a) | | | 9,190,535 | | |
| | | | | Enterprise Data Integration
Software | | | | | |
| | | | 24,770,535 | | |
| | | > Telecommunications Equipment 3.7% | |
| | 187,000 | | | F5 Networks (a) | | | 24,396,955 | | |
| | | | | Internet Traffic Management
Equipment | | | | | |
Number of Shares | | | | Value | |
| | | > Mobile Communications 1.4% | |
| | 83,000 | | | SBA Communications (a) | | $ | 9,193,080 | | |
| | | | | Communications Towers | | | | | |
| | | > Internet Related 0.9% | |
| | 1,635,000 | | | Vonage (a) | | | 6,229,350 | | |
| | | | | Business & Consumer Internet
Telephony | | | | | |
| | | > Semiconductors &
Related Equipment 0.7% | |
| | 535,000 | | | Atmel (a) | | | 4,491,325 | | |
| | | | | Microcontrollers, Radio
Frequency & Memory
Semiconductors | | | | | |
Information: Total | | | 163,039,040 | | |
Finance 14.3% | | | |
| | | > Banks 4.2% | |
| | 200,000 | | | City National | | | 16,162,000 | | |
| | | | | Bank & Asset Manager | | | | | |
| | 635,000 | | | Associated Banc-Corp | | | 11,830,050 | | |
| | | | | Midwest Bank | | | | | |
| | | | 27,992,050 | | |
| | | > Brokerage & Money Management 3.7% | |
| | 610,000 | | | SEI Investments | | | 24,424,400 | | |
| | | | | Mutual Fund Administration &
Investment Management | | | | | |
| | | > Insurance 3.3% | |
| | 1,270,000 | | | CNO Financial Group | | | 21,869,400 | | |
| | | | | Life, Long-term Care & Medical
Supplement Insurance | | | | | |
| | | > Credit Cards 3.1% | |
| | 319,000 | | | Discover Financial Services | | | 20,891,310 | | |
| | | | | Credit Card Company | | | | | |
Finance: Total | | | 95,177,160 | | |
Consumer Goods & Services 14.2% | | | |
| | | > Retail 6.0% | |
| | 440,000 | | | The Fresh Market (a)(b) | | | 18,128,000 | | |
| | | | | Specialty Food Retailer | | | | | |
| | 109,000 | | | ULTA (a) | | | 13,934,560 | | |
| | | | | Specialty Beauty Product Retailer | | | | | |
| | 86,875 | | | Casey's General Stores | | | 7,846,550 | | |
| | | | | Owner/Operator of Convenience
Stores | | | | | |
| | | | 39,909,110 | | |
| | | > Travel 3.4% | |
| | 210,000 | | | Vail Resorts | | | 19,137,300 | | |
| | | | | Ski Resort Operator & Developer | | | | | |
| | 138,000 | | | Hertz (a) | | | 3,441,720 | | |
| | | | | U.S. Rental Car Operator | | | | | |
| | | | 22,579,020 | | |
| | | > Other Consumer Services 1.6% | |
| | 294,000 | | | Blackhawk Network (a) | | | 11,080,860 | | |
| | | | | Third-party Distributer of
Prepaid Content, Mostly Gift Cards | | | | | |
| | | > Apparel 1.6% | |
| | 83,000 | | | PVH | | | 10,638,110 | | |
| | | | | Apparel Wholesaler & Retailer | | | | | |
See accompanying notes to financial statements.
70
Number of Shares | | | | Value | |
| | | > Consumer Goods Distribution 1.5% | |
| | 134,000 | | | United Natural Foods (a) | | $ | 10,361,550 | | |
| | | | | Distributor of Natural/Organic
Foods to Grocery Stores | | | | | |
| | | > Food & Beverage 0.1% | |
| | 1,500,000 | | | GLG Life Tech (Canada) (a) | | | 413,152 | | |
| | | | | Producer of an All-natural
Sweetener Extracted from the
Stevia Plant | | | | | |
Consumer Goods & Services: Total | | | 94,981,802 | | |
Health Care 7.7% | | | |
| | | > Medical Supplies 4.7% | |
| | 322,500 | | | Cepheid (a) | | | 17,460,150 | | |
| | | | | Molecular Diagnostics | | | | | |
| | 325,000 | | | VWR (a)(b) | | | 8,407,750 | | |
| | | | | Distributor of Lab Supplies | | | | | |
| | 41,000 | | | Henry Schein (a) | | | 5,582,150 | | |
| | | | | Large Distributor of Dental, Vet &
Medical Products | | | | | |
| | | | 31,450,050 | | |
| | | > Biotechnology & Drug Delivery 3.0% | |
| | 131,000 | | | Synageva BioPharma (a)(b) | | | 12,155,490 | | |
| | | | | Biotech Focused on Orphan
Diseases | | | | | |
| | 148,000 | | | Seattle Genetics (a) | | | 4,755,240 | | |
| | | | | Antibody-based Therapies for
Cancer | | | | | |
| | 18,000 | | | Intercept
Pharmaceuticals (a)(b) | | | 2,808,000 | | |
| | | | | Biotech Developing Drugs for
Several Diseases | | | | | |
| | | | 19,718,730 | | |
Health Care: Total | | | 51,168,780 | | |
Other Industries 7.0% | | | |
| | | > Real Estate 7.0% | |
| | 355,000 | | | Post Properties | | | 20,863,350 | | |
| | | | | Multifamily Properties | | | | | |
| | 230,000 | | | Extra Space Storage | | | 13,487,200 | | |
| | | | | Self Storage Facilities | | | | | |
| | 341,666 | | | EdR | | | 12,501,559 | | |
| | | | | Student Housing | | | | | |
| | | | 46,852,109 | | |
Other Industries: Total | | | 46,852,109 | | |
Energy & Minerals 4.9% | | | |
| | | > Agricultural Commodities 2.4% | |
| | 1,742,424 | | | Union Agriculture Group
(Uruguay) (a)(c)(d) | | | 15,908,331 | | |
| | | | | Farmland Operator in Uruguay | | | | | |
| | | > Oil & Gas Producers 1.3% | |
| | 1,654,000 | | | Canacol (Colombia) (a) | | | 3,530,659 | | |
| | | | | Oil Producer in South America | | | | | |
| | 20,290,500 | | | ShaMaran Petroleum (Iraq) (a) | | | 1,921,118 | | |
| | | | | Oil Exploration & Production in
Kurdistan | | | | | |
Number of Shares | | | | Value | |
| | 22,500,000 | | | Canadian Overseas
Petroleum (Canada) (a)(c)(e) | | $ | 1,839,818 | | |
| | | | | Oil & Gas Exploration Offshore
West Africa | | | | | |
| | 16,000,000 | | | Petromanas (Canada) (a)(b) | | | 826,304 | | |
| | | | | Exploring for Oil in Albania | | | | | |
| | 3,370,000 | | | Petrodorado Energy
(Colombia) (a)(e) | | | 391,591 | | |
| | | | | Oil & Gas Exploration &
Production in Colombia, Peru &
Paraguay | | | | | |
| | | | 8,509,490 | | |
| | | > Oil Services 0.6% | |
| | 173,000 | | | Rowan | | | 4,034,360 | | |
| | | | | Contract Offshore Driller | | | | | |
| | | > Mining 0.5% | |
| | 27,000 | | | Core Labs (Netherlands) (b) | | | 3,249,180 | | |
| | | | | Oil & Gas Reservoir Consulting | | | | | |
| | | > Alternative Energy 0.1% | |
| | 882,000 | | | Synthesis Energy Systems
(China) (a)(b) | | | 835,254 | | |
| | | | | Owner/Operator of Gasification
Plants/Technology Licenses | | | | | |
Energy & Minerals: Total | | | 32,536,615 | | |
Total Equities: 99.1%
(Cost: $453,984,082) | | | 660,402,936 | (f) | |
Short-Term Investments 1.3% | | | |
| | 8,870,699 | | | JPMorgan U.S. Government
Money Market Fund, Agency
Shares (7 day yield of 0.01%) | | | 8,870,699 | | |
Total Short-Term Investments: 1.3%
(Cost: $8,870,699) | | | 8,870,699 | | |
Securities Lending Collateral 3.8% | | | |
| | 25,598,975 | | | Dreyfus Government Cash
Management Fund,
Institutional Shares
(7 day yield of 0.01%) (g) | | | 25,598,975 | | |
Total Securities Lending Collateral: 3.8%
(Cost: $25,598,975) | | | 25,598,975 | | |
Total Investments: 104.2%
(Cost: $488,453,756)(h) | | | 694,872,610 | | |
Obligation to Return Collateral for
Securities Loaned: (3.8)% | | | (25,598,975 | ) | |
Cash and Other Assets Less
Liabilities: (0.4)% | | | (2,696,849 | ) | |
Net Assets: 100.0% | | $ | 666,576,786 | | |
ADR - American Depositary Receipts
See accompanying notes to financial statements.
71
Columbia Acorn SelectSM
Statement of Investments, continued
> Notes to Statement of Investments
(a) Non-income producing security.
(b) All or a portion of this security was on loan at December 31, 2014. The total market value of securities on loan at December 31, 2014 was $25,021,001.
(c) Denotes a restricted security, which is subject to restrictions on resale under federal securities laws. These securities are valued at fair value determined in good faith under consistently applied procedures established by the Fund's Board of Trustees. At December 31, 2014, the market value of these securities amounted to $17,748,149, which represented 2.66% of total net assets. Additional information on these securities is as follows:
Security | | Acquisition
Dates | | Shares/Units | | Cost | | Value | |
Union Agriculture Group | | 12/8/10-6/27/12 | | | 1,742,424 | | | $ | 20,000,000 | | | $ | 15,908,331 | | |
Canadian Overseas Petroleum | | 11/24/10 | | | 22,500,000 | | | | 9,596,330 | | | | 1,839,818 | | |
| | | | | | | $ | 29,596,330 | | | $ | 17,748,149 | | |
(d) Illiquid security.
(e) An affiliated person of the Fund, as defined in the Investment Company Act of 1940, may include any company in which the Fund owns five percent or more of its outstanding voting shares. Holdings and transactions in these affiliated companies during the year ended December 31, 2014, are as follows:
Security | | Balance of
Shares Held
12/31/13 | | Purchases/
Additions | | Sales/
Reductions | | Balance of
Shares Held
12/31/14 | | Value | | Dividend | |
Canadian Overseas Petroleum | | | 24,000,000 | | | | - | | | | 1,500,000 | | | | 22,500,000 | | | $ | 1,839,818 | | | $ | - | | |
Petrodorado Energy (1) | | | 3,370,000 | | | | - | | | | - | | | | 3,370,000 | | | | 391,591 | | | | - | | |
IFM Investments
(Century 21 China RE) - ADR (2) | | | 898,852 | | | | - | | | | 898,852 | | | | - | | | | - | | | | - | | |
Total of Affiliated Transactions | | | 28,268,852 | | | | - | | | | 2,398,852 | | | | 25,870,000 | | | $ | 2,231,409 | | | $ | - | | |
(1) Includes the effects of a stock split.
(2) At December 31, 2014, the Fund owned less than five percent of the company's outstanding voting shares.
The aggregate cost and value of these companies at December 31, 2014, was $23,207,419 and $2,231,409, respectively. Investments in affiliated companies represented 0.33% of the Fund's total net assets at December 31, 2014.
(f) On December 31, 2014, the market value of foreign securities represented 8.20% of total net assets. The Fund's foreign portfolio was diversified as follows:
Country | | Value | | Percentage
of Net Assets | |
India | | $ | 25,731,885 | | | | 3.86 | | |
Uruguay | | | 15,908,331 | | | | 2.39 | | |
Colombia | | | 3,922,250 | | | | 0.59 | | |
Netherlands | | | 3,249,180 | | | | 0.49 | | |
Canada | | | 3,079,274 | | | | 0.46 | | |
Iraq | | | 1,921,118 | | | | 0.29 | | |
China | | | 835,254 | | | | 0.12 | | |
Total Foreign Portfolio | | $ | 54,647,292 | | | | 8.20 | | |
(g) Investment made with cash collateral received from securities lending activity.
(h) At December 31, 2014, for federal income tax purposes, the cost of investments was $488,469,458 and net unrealized appreciation was $206,403,152 consisting of gross unrealized appreciation of $258,900,776 and gross unrealized depreciation of $52,497,624.
Fair Value Measurements
Various inputs are used in determining the value of the Fund's investments, following the input prioritization hierarchy established by accounting principles generally accepted in the United States of America (GAAP). These inputs are summarized in the three broad levels listed below:
• Level 1 – quoted prices in active markets for identical securities
• Level 2 – prices determined using other significant observable inputs (including quoted prices for similar securities, interest rates, prepayment speeds, credit risk and others)
• Level 3 – prices determined using significant unobservable inputs where quoted prices or observable inputs are unavailable or less reliable (including management's own assumptions about the factors market participants would use in pricing an investment)
The inputs or methodology used for valuing securities are not necessarily an indication of the risk associated with investing in those securities.
Examples of the types of securities in which the Fund would typically invest and how they are classified within this hierarchy are as follows. Typical Level 1 securities include exchange traded domestic equities, mutual funds whose NAVs are published each day and exchange traded foreign equities that are not statistically fair valued. Typical
See accompanying notes to financial statements.
72
> Notes to Statement of Investments
Level 2 securities include exchange traded foreign equities that are statistically fair valued, forward foreign currency exchange contracts and short-term investments valued at amortized cost. Additionally, securities fair valued by the Valuation Committee (the Committee) of the Fund's Board of Trustees (the Board) that rely on significant observable inputs are also included in Level 2. Typical Level 3 securities include any security fair valued by the Committee that relies on significant unobservable inputs.
Under the direction of the Board, the Committee is responsible for overseeing the valuation procedures approved by the Board.
The Committee meets as necessary, and no less frequently than quarterly, to determine fair values for securities for which market quotations are not readily available or for which the investment manager believes that available market quotations are unreliable, to review the appropriateness of the Trust's Portfolio Pricing Policy and the pricing procedures of the investment manager (the Policies), and to review the continuing appropriateness of the current value of any security subject to the Policies. The Policies address, among other things: circumstances under which market quotations will be deemed readily available; selection of third party pricing vendors; appropriate pricing methodologies; events that require fair valuation and fair value techniques; circumstances under which securities will be deemed to pose a potential for stale pricing, including when securities are illiquid, restricted, or in default; and certain delegations of authority to determine fair values to the Fund's investment manager. The Committee may also meet to discuss additional valuation matters, which may include review of back-testing results, review of time-sensitive information or approval of other valuation related actions, and to review the appropriateness of the Policies.
For investments categorized as Level 3, the significant unobservable inputs used in the fair value measurement of the Funds' securities may include: (i) data specific to the issuer or comparable issuers, (ii) general market or specific sector news and (iii) quoted prices and specific or similar security transactions. The Committee considers this data and any changes from prior periods in order to assess the reasonableness of observable and unobservable inputs, any assumptions or internal models used to value those securities and changes in fair value. Significant changes in any of these factors could result in lower or higher fair value measurements. Various factors impact the frequency of monitoring (which may occur as often as daily), however the Committee may determine that changes to inputs, assumptions and models are not required with the same frequency.
The following table summarizes the inputs used, as of December 31, 2014, in valuing the Fund's assets:
Investment Type | | Quoted Prices
(Level 1) | | Other
Significant
Observable
Inputs
(Level 2) | | Significant
Unobservable
Inputs
(Level 3) | | Total | |
Equities | |
Industrial Goods & Services | | $ | 176,647,430 | | | $ | - | | | $ | - | | | $ | 176,647,430 | | |
Information | | | 163,039,040 | | | | - | | | | - | | | | 163,039,040 | | |
Finance | | | 95,177,160 | | | | - | | | | - | | | | 95,177,160 | | |
Consumer Goods & Services | | | 94,981,802 | | | | - | | | | - | | | | 94,981,802 | | |
Health Care | | | 51,168,780 | | | | - | | | | - | | | | 51,168,780 | | |
Other Industries | | | 46,852,109 | | | | - | | | | - | | | | 46,852,109 | | |
Energy & Minerals | | | 14,788,466 | | | | 1,839,818 | | | | 15,908,331 | | | | 32,536,615 | | |
Total Equities | | | 642,654,787 | | | | 1,839,818 | | | | 15,908,331 | | | | 660,402,936 | | |
Total Short-Term Investments | | | 8,870,699 | | | | - | | | | - | | | | 8,870,699 | | |
Total Securities Lending Collateral | | | 25,598,975 | | | | - | | | | - | | | | 25,598,975 | | |
Total Investments | | $ | 677,124,461 | | | $ | 1,839,818 | | | $ | 15,908,331 | | | $ | 694,872,610 | | |
The Fund's assets assigned to the Level 2 input category are generally valued using a market approach, in which a security's value is determined through its correlation to prices and information from observable market transactions for similar or identical assets. Securities acquired via private placement that have a holding period or an extended settlement period are valued at a discount to the same shares that are trading freely on the market. These discounts are determined by the investment manager's experience with similar securities or situations. Factors may include, but are not limited to, trade volume, shares outstanding and stock price.
There were no transfers of financial assets between levels during the period.
See accompanying notes to financial statements.
73
Columbia Acorn SelectSM
Statement of Investments, continued
> Notes to Statement of Investments
The following table reconciles asset balances for the period ending December 31, 2014, in which significant observable and/or unobservable inputs (Level 3) were used in determining value:
Investments in Securities | | Balance as
of December 31,
2013 | | Realized
Gain/(Loss) | | Change in
Unrealized
Appreciation
(Depreciation) | | Purchases | | Sales | | Transfers
into
Level 3 | | Transfers
out of
Level 3 | | Balance as
of December 31,
2014 | |
Equities | |
Energy & Minerals | | $ | 18,626,513 | | | $ | - | | | $ | (2,718,182 | ) | | $ | - | | | $ | - | | | $ | - | | | $ | - | | | $ | 15,908,331 | | |
The information in the above reconciliation table represents fiscal year to date activity for any securities identified as using Level 3 inputs at either the beginning or the end of the current fiscal period.
The change in unrealized depreciation attributed to securities owned at December 31, 2014, which were valued using significant unobservable inputs (Level 3), amounted to $2,718,182.
Quantitative information pertaining to Level 3 unobservable fair value measurements
| | | Fair Value at
12/31/14 | | Valuation Technique(s) | | Unobservable Input(s) | | Range (Weighted
Average) | |
Equities | |
Energy & Minerals | | $ | 15,908,331 | | | Market comparable companies | | Discount for lack of marketability | | | 8 | % to 23% | |
Certain securities classified as Level 3 are valued at fair value, using a market approach, as determined in good faith under consistently applied procedures established by and under the general supervision of the Board. To determine fair value for these securities, for which no market exists, the Committee utilizes the valuation technique it deems most appropriate in the circumstances, using some unobservable inputs, which may include, but are not limited to estimated earnings of the company and the position of the security within the company's capital structure. The Committee also may use some observable inputs, which may include, but are not limited to, trades of similar securities and market multiples derived from a set of comparable companies. Significant increases or decreases to any of these inputs could result in a significantly lower or higher fair value measurement.
See accompanying notes to financial statements.
74
Columbia Thermostat FundSM
Statement of Investments, December 31, 2014
Number of Shares | | | | Value | |
| | | > Affiliated Bond Funds 84.7% | |
| | 42,849,246 | | | Columbia Short Term Bond
Fund, Class I (a) | | $ | 425,493,009 | | |
| | 28,994,280 | | | Columbia Intermediate Bond
Fund, Class I (a) | | | 266,747,380 | | |
| | 21,780,174 | | | Columbia Income Opportunities
Fund, Class I (a) | | | 215,841,525 | | |
| | 28,883,507 | | | Columbia U.S. Government
Mortgage Fund, Class I (a) | | | 159,436,960 | | |
Total Affiliated Bond Funds:
(Cost: $1,062,552,282) | | | 1,067,518,874 | | |
| | | > Affiliated Stock Funds 14.8% | |
| | 898,450 | | | Columbia Acorn International,
Class I (a) | | | 37,519,294 | | |
| | 1,962,468 | | | Columbia Dividend Income
Fund, Class I (a) | | | 37,228,026 | | |
| | 879,308 | | | Columbia Acorn Fund,
Class I (a)(b) | | | 28,164,234 | | |
| | 1,291,662 | | | Columbia Contrarian Core
Fund, Class I (a) | | | 27,938,640 | | |
| | 836,113 | | | Columbia Acorn
Select, Class I (a)(b) | | | 18,712,209 | | |
| | 870,296 | | | Columbia Large Cap
Enhanced Core Fund,
Class I (a) | | | 18,554,702 | | |
| | 1,023,561 | | | Columbia Select Large Cap
Growth Fund, Class I (a)(b) | | | 18,403,623 | | |
Total Affiliated Stock Funds:
(Cost: $155,181,763) | | | 186,520,728 | | |
Number of Shares | | | | Value | |
| | | > Short-Term Investments 0.5% | |
| | 5,937,697 | | | JPMorgan U.S. Government
Money Market Fund, Agency
Shares (7 day yield of 0.01%) | | $ | 5,937,697 | | |
Total Short-Term Investments:
(Cost: $5,937,697) | | | 5,937,697 | | |
Total Investments: 100.0%
(Cost: $1,223,671,742)(c) | | | 1,259,977,299 | | |
Cash and Other Assets Less Liabilities: —% | | | 435,762 | | |
Net Assets: 100.0% | | $ | 1,260,413,061 | | |
> Notes to Statement of Investments
(a) An affiliated person of the Fund, as defined in the Investment Company Act of 1940, may include any company in which the Fund owns five percent or more of its outstanding voting shares. Holdings and transactions in these affiliated companies during the year ended December 31, 2014, are as follows:
Security | | Balance of
Shares Held
12/31/13 | | Purchases/
Additions | | Sales/
Reductions | | Balance of
Shares Held
12/31/14 | | Value | | Dividend | |
Columbia Short Term Bond Fund, Class I | | | 47,811,438 | | | | 21,001,259 | | | | 25,963,451 | | | | 42,849,246 | | | $ | 425,493,009 | | | $ | 5,476,282 | | |
Columbia Intermediate Bond Fund, Class I | | | 39,903,530 | | | | 15,023,663 | | | | 25,932,913 | | | | 28,994,280 | | | | 266,747,380 | | | | 8,059,718 | | |
Columbia Income Opportunities Fund,
Class I | | | 35,741,824 | | | | 10,185,702 | | | | 24,147,352 | | | | 21,780,174 | | | | 215,841,525 | | | | 12,782,472 | | |
Columbia U.S. Government Mortgage Fund,
Class I | | | - | | | | 40,544,101 | | | | 11,660,594 | | | | 28,883,507 | | | | 159,436,960 | | | | 2,938,266 | | |
Columbia Acorn International, Class I | | | 583,352 | | | | 2,407,588 | | | | 2,092,490 | | | | 898,450 | | | | 37,519,294 | | | | 410,826 | | |
Columbia Dividend Income Fund, Class I | | | 1,469,969 | | | | 5,839,015 | | | | 5,346,516 | | | | 1,962,468 | | | | 37,228,026 | | | | 837,639 | | |
Columbia Acorn Fund, Class I | | | 545,386 | | | | 2,488,426 | | | | 2,154,504 | | | | 879,308 | | | | 28,164,234 | | | | - | | |
Columbia Contrarian Core Fund, Class I | | | 984,664 | | | | 3,880,700 | | | | 3,573,702 | | | | 1,291,662 | | | | 27,938,640 | | | | 159,958 | | |
Columbia Acorn Select, Class I | | | 509,430 | | | | 2,321,133 | | | | 1,994,450 | | | | 836,113 | | | | 18,712,209 | | | | - | | |
Columbia Large Cap Enhanced Core Fund,
Class I | | | 720,935 | | | | 2,745,450 | | | | 2,596,089 | | | | 870,296 | | | | 18,554,702 | | | | 183,662 | | |
Columbia Select Large Cap Growth Fund,
Class I | | | 700,545 | | | | 3,134,121 | | | | 2,811,105 | | | | 1,023,561 | | | | 18,403,623 | | | | - | | |
Total of Affiliated Transactions | | | 128,971,073 | | | | 109,571,158 | | | | 108,273,166 | | | | 130,269,065 | | | $ | 1,254,039,602 | | | $ | 30,848,823 | | |
The aggregate cost and value of these companies at December 31, 2014, was $1,217,734,045 and $1,254,039,602, respectively. Investments in affiliated companies represented 99.49% of the Fund's total net assets at December 31, 2014.
See accompanying notes to financial statements.
75
Columbia Thermostat FundSM
Statement of Investments, continued
> Notes to Statement of Investments
(b) Non-income producing security.
(c) At December 31, 2014, for federal income tax purposes, the cost of investments was $1,227,297,910 and net unrealized appreciation was $32,679,389 consisting of gross unrealized appreciation of $34,614,963 and gross unrealized depreciation of $1,935,574.
Fair Value Measurements
Various inputs are used in determining the value of the Fund's investments, following the input prioritization hierarchy established by accounting principles generally accepted in the United States of America (GAAP). These inputs are summarized in the three broad levels listed below:
• Level 1 – quoted prices in active markets for identical securities
• Level 2 – prices determined using other significant observable inputs (including quoted prices for similar securities, interest rates, prepayment speeds, credit risk and others)
• Level 3 – prices determined using significant unobservable inputs where quoted prices or observable inputs are unavailable or less reliable (including management's own assumptions about the factors market participants would use in pricing an investment)
The inputs or methodology used for valuing securities are not necessarily an indication of the risk associated with investing in those securities.
Examples of the types of securities in which the Fund would typically invest and how they are classified within this hierarchy are as follows. Typical Level 1 securities include mutual funds whose NAVs are published each day.
Under the direction of the Board, the Committee is responsible for overseeing the valuation procedures approved by the Board.
The Committee meets as necessary, and no less frequently than quarterly, to determine fair values for securities for which market quotations are not readily available or for which the investment manager believes that available market quotations are unreliable, to review the appropriateness of the Trust's Portfolio Pricing Policy and the pricing procedures of the investment manager (the Policies), and to review the continuing appropriateness of the current value of any security subject to the Policies. The Policies address, among other things: circumstances under which market quotations will be deemed readily available; selection of third party pricing vendors; appropriate pricing methodologies; events that require fair valuation and fair value techniques; circumstances under which securities will be deemed to pose a potential for stale pricing, including when securities are illiquid, restricted, or in default; and certain delegations of authority to determine fair values to the Fund's investment manager. The Committee may also meet to discuss additional valuation matters, which may include review of back-testing results, review of time-sensitive information or approval of other valuation related actions, and to review the appropriateness of the Policies.
For investments categorized as Level 3, the significant unobservable inputs used in the fair value measurement of the Funds' securities may include: (i) data specific to the issuer or comparable issuers, (ii) general market or specific sector news and (iii) quoted prices and specific or similar security transactions. The Committee considers this data and any changes from prior periods in order to assess the reasonableness of observable and unobservable inputs, any assumptions or internal models used to value those securities and changes in fair value. Significant changes in any of these factors could result in lower or higher fair value measurements. Various factors impact the frequency of monitoring (which may occur as often as daily), however the Committee may determine that changes to inputs, assumptions and models are not required with the same frequency.
The following table summarizes the inputs used, as of December 31, 2014, in valuing the Fund's assets:
Investment Type | | Quoted Prices
(Level 1) | | Other
Significant
Observable
Inputs
(Level 2) | | Significant
Unobservable
Inputs
(Level 3) | | Total | |
Total Affiliated Bond Funds | | $ | 1,067,518,874 | | | $ | - | | | $ | - | | | $ | 1,067,518,874 | | |
Total Affiliated Stock Funds | | | 186,520,728 | | | | - | | | | - | | | | 186,520,728 | | |
Total Short-Term Investments | | | 5,937,697 | | | | - | | | | - | | | | 5,937,697 | | |
Total Investments | | $ | 1,259,977,299 | | | $ | - | | | $ | - | | | $ | 1,259,977,299 | | |
There were no transfers of financial assets between levels during the period.
See accompanying notes to financial statements.
76
Columbia Acorn Emerging Markets FundSM
Major Portfolio Changes in the Fourth Quarter (Unaudited)
| | | Number of Shares | |
| | | 9/30/14 | | 12/31/14 | |
Purchases | |
Asia | |
| > Taiwan | |
Ginko International | | | 324,500 | | | | 360,000 | | |
President Chain Store | | | 742,000 | | | | 1,058,000 | | |
St. Shine Optical | | | 377,000 | | | | 420,000 | | |
Vanguard International
Semiconductor | | | 951,000 | | | | 3,461,000 | | |
| > China | |
AMVIG Holdings | | | 13,822,000 | | | | 30,774,000 | | |
Phoenix New Media - ADR | | | 0 | | | | 257,000 | | |
| > Indonesia | |
Link Net | | | 0 | | | | 11,800,000 | | |
| > Philippines | |
Puregold Price Club | | | 7,193,200 | | | | 8,198,200 | | |
| > Korea | |
The Basic House | | | 0 | | | | 358,365 | | |
Europe | |
| > United Kingdom | |
Cable and Wireless | | | 9,054,086 | | | | 10,175,965 | | |
PureCircle | | | 22,341 | | | | 544,900 | | |
| > Spain | |
Prosegur | | | 840,828 | | | | 1,148,390 | | |
| > Italy | |
Pirelli | | | 324,156 | | | | 393,882 | | |
| > Turkey | |
Aviva | | | 0 | | | | 54,624 | | |
Latin America | |
| > Brazil | |
Odontoprev | | | 1,275,100 | | | | 1,430,100 | | |
| > Mexico | |
Genomma Lab International | | | 2,180,100 | | | | 2,278,100 | | |
| > Chile | |
Forus | | | 1,258,078 | | | | 1,943,078 | | |
| > Colombia | |
Isagen | | | 5,842,782 | | | | 6,047,782 | | |
| | | Number of Shares | |
| | | 9/30/14 | | 12/31/14 | |
Sales | |
Asia | |
| > Taiwan | |
Advantech | | | 724,988 | | | | 720,988 | | |
Chroma Ate | | | 2,086,990 | | | | 2,050,990 | | |
Delta Electronics | | | 833,000 | | | | 0 | | |
Far EasTone Telecom | | | 1,738,000 | | | | 0 | | |
Lite-On Technology | | | 3,087,291 | | | | 0 | | |
PChome Online | | | 765,302 | | | | 570,000 | | |
| > China | |
Biostime | | | 830,000 | | | | 0 | | |
Jumei International - ADR | | | 212,636 | | | | 0 | | |
Sihuan Pharmaceuticals | | | 13,900,000 | | | | 11,951,000 | | |
WuXi PharmaTech - ADR | | | 313,642 | | | | 307,909 | | |
| > Indonesia | |
Archipelago Resources | | | 1,591,929 | | | | 0 | | |
Matahari Department Store | | | 7,426,700 | | | | 6,909,600 | | |
MNC Skyvision | | | 62,000,000 | | | | 61,966,600 | | |
Surya Citra Media | | | 17,095,479 | | | | 0 | | |
Tower Bersama Infrastructure | | | 9,010,709 | | | | 6,744,300 | | |
| > India | |
Adani Ports & Special
Economic Zone | | | 1,808,593 | | | | 1,737,269 | | |
Bosch | | | 37,774 | | | | 17,632 | | |
Colgate Palmolive India | | | 222,910 | | | | 190,350 | | |
United Breweries | | | 445,596 | | | | 419,349 | | |
| > Philippines | |
Melco Crown (Philippines)
Resorts | | | 55,239,300 | | | | 39,172,300 | | |
Robinsons Retail Holdings | | | 4,498,580 | | | | 3,814,910 | | |
Security Bank | | | 1,882,390 | | | | 1,601,770 | | |
| > Korea | |
Koh Young Technology | | | 373,088 | | | | 295,533 | | |
| > Hong Kong | |
Sa Sa International | | | 15,134,799 | | | | 7,471,799 | | |
Vitasoy International | | | 3,920,000 | | | | 3,698,000 | | |
| > Thailand | |
Samui Airport Property Fund | | | 10,340,200 | | | | 10,016,800 | | |
| > Singapore | |
Super Group | | | 1,079,000 | | | | 0 | | |
| > Japan | |
Kansai Paint | | | 447,760 | | | | 310,760 | | |
See accompanying notes to financial statements.
77
Columbia Acorn Emerging Markets FundSM
Major Portfolio Changes in the Fourth Quarter (Unaudited), continued
| | | Number of Shares | |
| | | 9/30/14 | | 12/31/14 | |
Sales (continued) | |
Europe | |
| > Sweden | |
Hexagon | | | 347,064 | | | | 288,064 | | |
| > France | |
Eutelsat | | | 163,000 | | | | 161,154 | | |
| > Finland | |
Vacon | | | 265,727 | | | | 0 | | |
Latin America | |
| > Brazil | |
Beadell Resources | | | 11,145,526 | | | | 3,663,018 | | |
Localiza Rent A Car | | | 718,970 | | | | 557,970 | | |
| > Mexico | |
Gruma | | | 652,200 | | | | 0 | | |
Grupo Aeroportuario del
Sureste - ADR | | | 42,927 | | | | 40,525 | | |
Other Countries | |
| > South Africa | |
Coronation Fund Managers | | | 2,048,460 | | | | 2,003,746 | | |
Massmart Holdings | | | 463,782 | | | | 0 | | |
Mr. Price | | | 399,378 | | | | 288,041 | | |
Rand Merchant Insurance | | | 4,343,702 | | | | 2,851,148 | | |
| > United States | |
Bladex | | | 196,000 | | | | 171,094 | | |
Textainer Group Holdings | | | 153,472 | | | | 0 | | |
| > Morocco | |
Holcim Maroc | | | 9,302 | | | | 4,273 | | |
Lafarge Maroc | | | 3,000 | | | | 0 | | |
| > Canada | |
CAE | | | 507,892 | | | | 0 | | |
See accompanying notes to financial statements.
78
Columbia Acorn Emerging Markets FundSM
Statement of Investments, December 31, 2014
Number of Shares | | | | Value | |
| | | | | | | Equities: 92.6% | |
Asia 61.7% | | | |
| | | > Taiwan 9.6% | |
| | 1,058,000 | | | President Chain Store | | $ | 8,171,806 | | |
| | | | | Taiwanese Convenience Chain
Store Operator | | | | | |
| | 420,000 | | | St. Shine Optical | | | 6,852,154 | | |
| | | | | Disposable Contact Lens
Original Equipment Manufacturer | | | | | |
| | 570,000 | | | PChome Online | | | 6,119,510 | | |
| | | | | Taiwanese Internet Retail Company | | | | | |
| | 3,461,000 | | | Vanguard International
Semiconductor | | | 5,663,384 | | |
| | | | | Semiconductor Foundry | | | | | |
| | 71,000 | | | Largan Precision | | | 5,314,795 | | |
| | | | | Mobile Device Camera
Lenses & Modules | | | | | |
| | 2,050,990 | | | Chroma Ate | | | 5,304,128 | | |
| | | | | Automatic Test Systems,
Testing & Measurement Instruments | | | | | |
| | 720,988 | | | Advantech | | | 5,293,043 | | |
| | | | | Industrial PC & Components | | | | | |
| | 360,000 | | | Ginko International | | | 3,799,009 | | |
| | | | | Contact Lens Maker in China | | | | | |
| | | | 46,517,829 | | |
| | | > China 9.6% | |
| | 30,774,000 | | | AMVIG Holdings | | | 13,294,333 | | |
| | | | | Chinese Tobacco Packaging
Material Supplier | | | | | |
| | 307,909 | | | WuXi PharmaTech - ADR (a) | | | 10,367,296 | | |
| | | | | Contract Research Organization
Business in China | | | | | |
| | 114,558 | | | BitAuto - ADR (a) | | | 8,066,029 | | |
| | | | | Automotive Information Website for
Buyers & Dealers | | | | | |
| | 11,951,000 | | | Sihuan Pharmaceuticals | | | 7,949,312 | | |
| | | | | Chinese Generic Drug Manufacturer | | | | | |
| | 11,330,000 | | | NewOcean Energy | | | 4,350,120 | | |
| | | | | Southern China Liquefied Petroleum
Gas Distributor | | | | | |
| | 257,000 | | | Phoenix New Media - ADR (a) | | | 2,135,670 | | |
| | | | | Internet Advertising | | | | | |
| | | | 46,162,760 | | |
| | | > Indonesia 8.3% | |
| | 6,909,600 | | | Matahari Department Store | | | 8,325,798 | | |
| | | | | Department Store Chain in Indonesia | | | | | |
| | 61,966,600 | | | MNC Skyvision | | | 8,005,374 | | |
| | | | | Satellite Pay TV Operator in Indonesia | | | | | |
| | 6,744,300 | | | Tower Bersama Infrastructure | | | 5,274,829 | | |
| | | | | Communications Towers | | | | | |
| | 82,889,190 | | | Ace Indonesia | | | 5,240,181 | | |
| | | | | Home Improvement Retailer | | | | | |
| | 11,800,000 | | | Link Net (a) | | | 4,687,606 | | |
| | | | | Fixed Broadband & CATV
Service Provider | | | | | |
| | 66,827,700 | | | Arwana Citramulia | | | 4,672,260 | | |
| | | | | Ceramic Tiles for Home Decoration | | | | | |
| | 2,183,600 | | | Mayora Indah | | | 3,684,147 | | |
| | | | | Consumer Branded Food Manufacturer | | | | | |
| | | | 39,890,195 | | |
Number of Shares | | | | Value | |
| | | > India 8.2% | |
| | 2,422,982 | | | Zee Entertainment
Enterprises | | $ | 14,554,601 | | |
| | | | | Programmer of Pay Television
Content | | | | | |
| | 1,737,269 | | | Adani Ports & Special
Economic Zone | | | 8,744,542 | | |
| | | | | Indian West Coast Shipping Port | | | | | |
| | 419,349 | | | United Breweries | | | 5,528,264 | | |
| | | | | Brewer | | | | | |
| | 17,632 | | | Bosch | | | 5,445,253 | | |
| | | | | Automotive Parts | | | | | |
| | 190,350 | | | Colgate Palmolive India | | | 5,375,990 | | |
| | | | | Consumer Products in Oral Care | | | | | |
| | | | 39,648,650 | | |
| | | > Philippines 7.7% | |
| | 39,172,300 | | | Melco Crown (Philippines)
Resorts (a)(b) | | | 11,847,879 | | |
| | | | | Integrated Resort Operator in Manila | | | | | |
| | 8,198,200 | | | Puregold Price Club | | | 7,022,694 | | |
| | | | | Supermarket Operator in the Philippines | | | | | |
| | 3,814,910 | | | Robinsons Retail Holdings | | | 6,455,903 | | |
| | | | | Multi-format Retailer in the Philippines | | | | | |
| | 56,400,000 | | | RFM Corporation | | | 6,312,286 | | |
| | | | | Flour, Bread, Pasta & Ice Cream Manufacturer/Distributor
in the Philippines | | | | | |
| | 1,601,770 | | | Security Bank | | | 5,425,569 | | |
| | | | | Commercial Bank in the Philippines | | | | | |
| | | | 37,064,331 | | |
| | | > Korea 4.7% | |
| | 295,533 | | | Koh Young Technology | | | 11,460,489 | | |
| | | | | Inspection Systems for Printed
Circuit Boards | | | | | |
| | 358,365 | | | The Basic House | | | 4,749,783 | | |
| | | | | Casual & Formal Apparel in China | | | | | |
| | 132,149 | | | Grand Korea Leisure | | | 3,840,763 | | |
| | | | | 'Foreigner Only' Casino Group in Korea | | | | | |
| | 121,818 | | | Paradise | | | 2,596,692 | | |
| | | | | Korean Casino Operator | | | | | |
| | | | 22,647,727 | | |
| | | > Hong Kong 4.5% | |
| | 5,181,000 | | | Melco International | | | 11,341,826 | | |
| | | | | Macau Casino Operator | | | | | |
| | 3,698,000 | | | Vitasoy International | | | 5,347,922 | | |
| | | | | Hong Kong Soy Food Brand | | | | | |
| | 7,471,799 | | | Sa Sa International (b) | | | 5,212,405 | | |
| | | | | Cosmetics Retailer | | | | | |
| | | | 21,902,153 | | |
| | | > Thailand 3.2% | |
| | 21,126,235 | | | Home Product Center | | | 5,287,194 | | |
| | | | | Home Improvement Retailer | | | | | |
| | 10,016,800 | | | Samui Airport Property Fund | | | 5,267,193 | | |
| | | | | Thai Airport Operator | | | | | |
| | 3,737,700 | | | Robinson Department Store | | | 5,087,575 | | |
| | | | | Department Store Operator in Thailand | | | | | |
| | | | 15,641,962 | | |
See accompanying notes to financial statements.
79
Columbia Acorn Emerging Markets FundSM
Statement of Investments, continued
Number of Shares | | | | Value | |
| | | > Cambodia 2.0% | |
| | 11,570,000 | | | Nagacorp | | $ | 9,428,460 | | |
| | | | | Casino & Entertainment Complex
in Cambodia | | | | | |
| | | > Malaysia 1.8% | |
| | 10,810,900 | | | 7-Eleven Malaysia Holdings (a) | | | 4,637,881 | | |
| | | | | Exclusive 7-Eleven Franchisor for
Malaysia | | | | | |
| | 4,592,100 | | | Aeon | | | 4,124,459 | | |
| | | | | Shopping Center & Department
Store Operator | | | | | |
| | | | 8,762,340 | | |
| | | > Singapore 1.1% | |
| | 1,829,000 | | | Petra Foods | | | 5,241,804 | | |
| | | | | Chocolate Manufacturer in
South East Asia | | | | | |
| | | > Japan 1.0% | |
| | 310,760 | | | Kansai Paint | | | 4,814,286 | | |
| | | | | Paint Producer in Japan, India,
China & Southeast Asia | | | | | |
Asia: Total | | | 297,722,497 | | |
Europe 11.4% | | | |
| | | > United Kingdom 2.5% | |
| | 10,175,965 | | | Cable and Wireless | | | 7,821,841 | | |
| | | | | Telecommunications Services
Provider in the Caribbean | | | | | |
| | 544,900 | | | PureCircle (a) | | | 4,362,477 | | |
| | | | | Natural Sweeteners | | | | | |
| | | | 12,184,318 | | |
| | | > Kazakhstan 2.2% | |
| | 1,268,483 | | | Halyk Savings Bank of
Kazakhstan - GDR | | | 10,782,106 | | |
| | | | | Retail Bank & Insurer
in Kazakhstan | | | | | |
| | | > Sweden 1.8% | |
| | 288,064 | | | Hexagon | | | 8,886,642 | | |
| | | | | Design, Measurement &
Visualization Software & Equipment | | | | | |
| | | > Spain 1.4% | |
| | 1,148,390 | | | Prosegur | | | 6,542,696 | | |
| | | | | Security Guards | | | | | |
| | | > Italy 1.1% | |
| | 393,882 | | | Pirelli | | | 5,312,445 | | |
| | | | | Global Tire Supplier | | | | | |
| | | > France 1.1% | |
| | 161,154 | | | Eutelsat | | | 5,211,664 | | |
| | | | | Fixed Satellite Services | | | | | |
| | | > Finland 1.1% | |
| | 290,000 | | | Tikkurila | | | 5,064,974 | | |
| | | | | Decorative & Industrial Paint in
Scandinavia & Central &
Eastern Europe | | | | | |
Number of Shares | | | | Value | |
| | | > Turkey 0.2% | |
| | 54,624 | | | Aviva (a) | | $ | 1,047,064 | | |
| | | | | Private Pension & Life
Insurance Provider | | | | | |
Europe: Total | | | 55,031,909 | | |
Latin America 10.8% | | | |
| | | > Brazil 3.8% | |
| | 557,970 | | | Localiza Rent A Car | | | 7,495,715 | | |
| | | | | Car Rental | | | | | |
| | 1,430,100 | | | Odontoprev | | | 5,304,637 | | |
| | | | | Dental Insurance | | | | | |
| | 255,000 | | | Linx | | | 4,844,443 | | |
| | | | | Retail Management Software
in Brazil | | | | | |
| | 3,663,018 | | | Beadell Resources (a) | | | 663,425 | | |
| | | | | Gold Mining in Brazil | | | | | |
| | | | 18,308,220 | | |
| | | > Mexico 3.8% | |
| | 40,525 | | | Grupo Aeroportuario del
Sureste - ADR | | | 5,342,816 | | |
| | | | | Mexican Airport Operator | | | | | |
| | 2,747,000 | | | Hoteles City Express (a) | | | 4,334,502 | | |
| | | | | Budget Hotel Operator in Mexico | | | | | |
| | 2,278,100 | | | Genomma Lab
International (a) | | | 4,332,694 | | |
| | | | | Developer, Marketer & Distributor
of Consumer Products | | | | | |
| | 2,069,000 | | | Qualitas | | | 4,282,793 | | |
| | | | | Auto Insurer in Mexico &
Central America | | | | | |
| | | | 18,292,805 | | |
| | | > Chile 1.6% | |
| | 1,943,078 | | | Forus | | | 7,941,359 | | |
| | | | | Multi-brand Latin American
Wholesaler & Retailer | | | | | |
| | | > Colombia 1.6% | |
| | 6,047,782 | | | Isagen | | | 7,545,413 | | |
| | | | | Colombian Electricity Provider | | | | | |
Latin America: Total | | | 52,087,797 | | |
Other Countries 8.7% | | | |
| | | > South Africa 7.4% | |
| | 2,003,746 | | | Coronation Fund Managers | | | 19,829,832 | | |
| | | | | South African Fund Manager | | | | | |
| | 2,851,148 | | | Rand Merchant Insurance | | | 10,070,922 | | |
| | | | | Directly Sold Property &
Casualty Insurance; Holdings
in other Insurers | | | | | |
| | 288,041 | | | Mr. Price | | | 5,826,748 | | |
| | | | | South African Retailer of Apparel,
Household & Sporting Goods | | | | | |
| | | | 35,727,502 | | |
| | | > United States 1.1% | |
| | 171,094 | | | Bladex | | | 5,149,929 | | |
| | | | | Latin American Trade
Financing House | | | | | |
See accompanying notes to financial statements.
80
Number of Shares | | | | Value | |
| | | > Morocco 0.2% | |
| | 4,273 | | | Holcim Maroc | | $ | 897,347 | | |
| | | Cement Player in Morocco | | | | | |
Other Countries: Total | | | 41,774,778 | | |
Total Equities: 92.6%
(Cost: $429,069,885) | | | 446,616,981 | (c) | |
Short-Term Investments 6.3% | |
| | 30,382,894 | | | JPMorgan U.S. Government
Money Market Fund, IM
Shares (7 day yield of 0.01%) | | | 30,382,894 | | |
Total Short-Term Investments: 6.3%
(Cost: $30,382,894) | | | 30,382,894 | | |
Number of Shares | | | | Value | |
Securities Lending Collateral 0.7% | |
| | 3,292,000 | | | Dreyfus Government Cash
Management Fund,
Institutional Shares
(7 day yield of 0.01%) (d) | | $ | 3,292,000 | | |
Total Securities Lending Collateral: 0.7%
(Cost: $3,292,000) | | | 3,292,000 | | |
Total Investments: 99.6%
(Cost: $462,744,779)(e) | | | 480,291,875 | | |
Obligation to Return Collateral for
Securities Loaned: (0.7)% | | | (3,292,000 | ) | |
Cash and Other Assets Less Liabilities: 1.1% | | | 5,335,232 | | |
Net Assets: 100.0% | | $ | 482,335,107 | | |
ADR - American Depositary Receipts
GDR - Global Depositary Receipts
> Notes to Statement of Investments
(a) Non-income producing security.
(b) All or a portion of this security was on loan at December 31, 2014. The total market value of securities on loan at December 31, 2014 was $3,111,617.
(c) On December 31, 2014, the Fund's total equity investments were denominated in currencies as follows:
Currency | | Value | | Percentage
of Net Assets | |
Hong Kong Dollar | | $ | 56,924,376 | | | | 11.8 | | |
Taiwan Dollar | | | 46,517,830 | | | | 9.6 | | |
U.S. Dollar | | | 41,843,846 | | | | 8.7 | | |
Indonesian Rupiah | | | 39,890,195 | | | | 8.3 | | |
Indian Rupee | | | 39,648,650 | | | | 8.2 | | |
Philippine Peso | | | 37,064,331 | | | | 7.7 | | |
South African Rand | | | 35,727,503 | | | | 7.4 | | |
Other currencies less
than 5% of total net assets | | | 149,000,250 | | | | 30.9 | | |
Total Equities | | $ | 446,616,981 | | | | 92.6 | | |
(d) Investment made with cash collateral received from securities lending activity.
(e) At December 31, 2014, for federal income tax purposes, the cost of investments was $465,233,774 and net unrealized appreciation was $15,058,101 consisting of gross unrealized appreciation of $54,270,589 and gross unrealized depreciation of $39,212,488.
Fair Value Measurements
Various inputs are used in determining the value of the Fund's investments, following the input prioritization hierarchy established by accounting principles generally accepted in the United States of America (GAAP). These inputs are summarized in the three broad levels listed below:
• Level 1 – quoted prices in active markets for identical securities
• Level 2 – prices determined using other significant observable inputs (including quoted prices for similar securities, interest rates, prepayment speeds, credit risk and others)
• Level 3 – prices determined using significant unobservable inputs where quoted prices or observable inputs are unavailable or less reliable (including management's own assumptions about the factors market participants would use in pricing an investment)
The inputs or methodology used for valuing securities are not necessarily an indication of the risk associated with investing in those securities.
Examples of the types of securities in which the Fund would typically invest and how they are classified within this hierarchy are as follows. Typical Level 1 securities include exchange traded domestic equities, mutual funds whose NAVs are published each day and exchange traded foreign equities that are not statistically fair valued. Typical Level 2 securities include exchange traded foreign equities that are statistically fair valued, forward foreign currency exchange contracts and short-term investments valued at
See accompanying notes to financial statements.
81
Columbia Acorn Emerging Markets FundSM
Statement of Investments, continued
> Notes to Statement of Investments
amortized cost. Additionally, securities fair valued by the Valuation Committee (the Committee) of the Fund's Board of Trustees (the Board) that rely on significant observable inputs are also included in Level 2. Typical Level 3 securities include any security fair valued by the Committee that relies on significant unobservable inputs.
Under the direction of the Board, the Committee is responsible for overseeing the valuation procedures approved by the Board.
The Committee meets as necessary, and no less frequently than quarterly, to determine fair values for securities for which market quotations are not readily available or for which the investment manager believes that available market quotations are unreliable, to review the appropriateness of the Trust's Portfolio Pricing Policy and the pricing procedures of the investment manager (the Policies), and to review the continuing appropriateness of the current value of any security subject to the Policies. The Policies address, among other things: circumstances under which market quotations will be deemed readily available; selection of third party pricing vendors; appropriate pricing methodologies; events that require fair valuation and fair value techniques; circumstances under which securities will be deemed to pose a potential for stale pricing, including when securities are illiquid, restricted, or in default; and certain delegations of authority to determine fair values to the Fund's investment manager. The Committee may also meet to discuss additional valuation matters, which may include review of back-testing results, review of time-sensitive information or approval of other valuation related actions, and to review the appropriateness of the Policies.
For investments categorized as Level 3, the significant unobservable inputs used in the fair value measurement of the Funds' securities may include: (i) data specific to the issuer or comparable issuers, (ii) general market or specific sector news and (iii) quoted prices and specific or similar security transactions. The Committee considers this data and any changes from prior periods in order to assess the reasonableness of observable and unobservable inputs, any assumptions or internal models used to value those securities and changes in fair value. Significant changes in any of these factors could result in lower or higher fair value measurements. Various factors impact the frequency of monitoring (which may occur as often as daily), however the Committee may determine that changes to inputs, assumptions and models are not required with the same frequency.
The following table summarizes the inputs used, as of December 31, 2014, in valuing the Fund's assets:
Investment Type | | Quoted Prices
(Level 1) | | Other
Significant
Observable
Inputs
(Level 2) | | Significant
Unobservable
Inputs
(Level 3) | | Total | |
Equities | |
Asia | | $ | 20,568,995 | | | $ | 277,153,502 | | | $ | - | | | $ | 297,722,497 | | |
Europe | | | - | | | | 55,031,909 | | | | - | | | | 55,031,909 | | |
Latin America | | | 51,424,372 | | | | 663,425 | | | | - | | | | 52,087,797 | | |
Other Countries | | | 5,149,929 | | | | 36,624,849 | | | | - | | | | 41,774,778 | | |
Total Equities | | | 77,143,296 | | | | 369,473,685 | | | | - | | | | 446,616,981 | | |
Total Short-Term Investments | | | 30,382,894 | | | | - | | | | - | | | | 30,382,894 | | |
Total Securities Lending Collateral | | | 3,292,000 | | | | - | | | | - | | | | 3,292,000 | | |
Total Investments | | $ | 110,818,190 | | | $ | 369,473,685 | | | $ | - | | | $ | 480,291,875 | | |
The Fund's assets assigned to the Level 2 input category are generally valued using a market approach, in which a security's value is determined through its correlation to prices and information from observable market transactions for similar or identical assets. Foreign equities are generally valued at the last sale price on the foreign exchange or market on which they trade. The Fund may use a statistical fair valuation model, in accordance with the policy adopted by the Board, provided by an independent third party to value securities principally traded in foreign markets in order to adjust for possible stale pricing that may occur between the close of the foreign exchanges and the time for valuation. These models take into account available market data including intraday index, ADR, and ETF movements.
There were no transfers of financial assets between levels during the period.
See accompanying notes to financial statements.
82
Columbia Acorn Emerging Markets FundSM
Portfolio Diversification
At December 31, 2014, the Fund's portfolio investments as a percentage of net assets were diversified as follows:
| | | Value | | Percentage
of Net Assets | |
| > Consumer Goods & Services | |
Retail | | $ | 79,453,513 | | | | 16.5 | | |
Casinos & Gaming | | | 39,055,619 | | | | 8.1 | | |
Food & Beverage | | | 30,476,900 | | | | 6.3 | | |
Travel | | | 11,830,217 | | | | 2.4 | | |
Consumer Goods Distribution | | | 5,375,990 | | | | 1.1 | | |
Other Durable Goods | | | 5,312,446 | | | | 1.1 | | |
Apparel | | | 4,749,782 | | | | 1.0 | | |
Nondurables | | | 4,332,694 | | | | 0.9 | | |
| | | | 180,587,161 | | | | 37.4 | | |
| > Information | |
Instrumentation | | | 16,764,617 | | | | 3.5 | | |
Entertainment Programming | | | 14,554,601 | | | | 3.0 | | |
Business Software | | | 13,731,085 | | | | 2.8 | | |
Satellite Broadcasting & Services | | | 13,217,039 | | | | 2.8 | | |
Internet Related | | | 10,201,699 | | | | 2.1 | | |
Telephone & Data Services | | | 7,821,841 | | | | 1.6 | | |
Semiconductors & Related Equipment | | | 5,663,384 | | | | 1.2 | | |
Telecommunications Equipment | | | 5,314,795 | | | | 1.1 | | |
Computer Hardware & Related
Equipment | | | 5,293,043 | | | | 1.1 | | |
Mobile Communications | | | 5,274,828 | | | | 1.1 | | |
Cable TV | | | 4,687,606 | | | | 1.0 | | |
| | | | 102,524,538 | | | | 21.3 | | |
| > Finance | |
Banks | | | 21,357,604 | | | | 4.4 | | |
Brokerage & Money Management | | | 19,829,832 | | | | 4.1 | | |
Insurance | | | 19,658,352 | | | | 4.1 | | |
Diversified Financial Companies | | | 1,047,065 | | | | 0.2 | | |
| | | | 61,892,853 | | | | 12.8 | | |
| > Industrial Goods & Services | |
Industrial Materials & Specialty
Chemicals | | | 28,743,200 | | | | 6.0 | | |
Other Industrial Services | | | 8,744,542 | | | | 1.8 | | |
Outsourcing Services | | | 6,542,696 | | | | 1.4 | | |
Machinery | | | 5,445,253 | | | | 1.1 | | |
| | | | 49,475,691 | | | | 10.3 | | |
| > Health Care | |
Pharmaceuticals | | | 18,316,608 | | | | 3.8 | | |
Medical Supplies | | | 10,651,163 | | | | 2.2 | | |
| | | | 28,967,771 | | | | 6.0 | | |
| | | Value | | Percentage
of Net Assets | |
| > Other Industries | |
Transportation | | $ | 10,610,009 | | | | 2.2 | | |
Regulated Utilities | | | 7,545,413 | | | | 1.6 | | |
| | | | 18,155,422 | | | | 3.8 | | |
| > Energy & Minerals | |
Oil Refining, Marketing &
Distribution | | | 4,350,120 | | | | 0.9 | | |
Mining | | | 663,425 | | | | 0.1 | | |
| | | | 5,013,545 | | | | 1.0 | | |
Total Equities: | | | 446,616,981 | | | | 92.6 | | |
Short-Term Investments: | | | 30,382,894 | | | | 6.3 | | |
Securities Lending Collateral: | | | 3,292,000 | | | | 0.7 | | |
Total Investments: | | | 480,291,875 | | | | 99.6 | | |
Obligation to Return
Collateral for Securities
Loaned: | | | (3,292,000 | ) | | | (0.7 | ) | |
Cash and Other Assets
Less Liabilities: | | | 5,335,232 | | | | 1.1 | | |
Net Assets: | | $ | 482,335,107 | | | | 100.0 | | |
See accompanying notes to financial statements.
83
Columbia Acorn European FundSM
Major Portfolio Changes in the Fourth Quarter (Unaudited)
| | | Number of Shares | |
| | | 9/30/14 | | 12/31/14 | |
Purchases | |
Europe | |
| > United Kingdom | |
PureCircle | | | 2,222 | | | | 42,232 | | |
| | | Number of Shares | |
| | | 9/30/14 | | 12/31/14 | |
Sales | |
Europe | |
| > United Kingdom | |
Abcam | | | 101,510 | | | | 61,730 | | |
Aggreko | | | 22,503 | | | | 16,633 | | |
Assura | | | 1,933,560 | | | | 1,460,625 | | |
AVEVA | | | 19,210 | | | | 16,930 | | |
Babcock International | | | 58,070 | | | | 45,240 | | |
Cable and Wireless | | | 726,213 | | | | 505,313 | | |
Cambian | | | 196,680 | | | | 145,820 | | |
Charles Taylor | | | 240,940 | | | | 188,030 | | |
Connect Group | | | 277,770 | | | | 225,231 | | |
Dialight | | | 40,510 | | | | 31,910 | | |
Domino's Pizza UK & Ireland | | | 59,400 | | | | 37,830 | | |
Elementis | | | 133,120 | | | | 89,680 | | |
Fidessa Group | | | 15,610 | | | | 10,300 | | |
Halfords | | | 73,060 | | | | 49,530 | | |
Halma | | | 59,235 | | | | 38,985 | | |
Jardine Lloyd Thompson Group | | | 70,133 | | | | 40,000 | | |
Ocado | | | 110,390 | | | | 92,240 | | |
Polypipe | | | 141,240 | | | | 100,890 | | |
Rightmove | | | 14,880 | | | | 11,210 | | |
| RPS Group | | | 128,860 | | | | 101,810 | | |
Shaftesbury | | | 54,000 | | | | 0 | | |
Spirax Sarco | | | 30,750 | | | | 21,120 | | |
WH Smith | | | 47,530 | | | | 32,210 | | |
Whitbread | | | 8,325 | | | | 5,575 | | |
| > France | |
AKKA Technologies | | | 16,283 | | | | 11,883 | | |
Bonduelle | | | 21,430 | | | | 15,320 | | |
Cegedim | | | 21,040 | | | | 14,480 | | |
Eurofins Scientific | | | 3,230 | | | | 2,390 | | |
Eutelsat | | | 17,160 | | | | 12,505 | | |
Hi-Media | | | 170,400 | | | | 123,020 | | |
Neopost | | | 23,030 | | | | 16,720 | | |
Norbert Dentressangle | | | 3,740 | | | | 2,690 | | |
Saft | | | 16,651 | | | | 12,681 | | |
| > Germany | |
Aurelius | | | 32,530 | | | | 22,450 | | |
Elringklinger | | | 19,110 | | | | 12,580 | | |
MTU Aero Engines | | | 6,950 | | | | 4,410 | | |
NORMA Group | | | 27,290 | | | | 16,790 | | |
Rational | | | 1,910 | | | | 1,240 | | |
TAG Immobilien | | | 9,829 | | | | 0 | | |
Telefonica Deutschland | | | 112,250 | | | | 80,330 | | |
Wirecard | | | 20,890 | | | | 14,240 | | |
See accompanying notes to financial statements.
84
| | | Number of Shares | |
| | | 9/30/14 | | 12/31/14 | |
Sales (continued) | |
Europe—continued | |
| > Sweden | |
Hexagon | | | 29,450 | | | | 18,910 | | |
Mekonomen | | | 21,070 | | | | 16,400 | | |
Recipharm | | | 40,490 | | | | 28,950 | | |
Sweco | | | 43,610 | | | | 31,870 | | |
Swedish Match | | | 25,880 | | | | 19,320 | | |
Unibet | | | 11,111 | | | | 7,351 | | |
| > Spain | |
Bolsas y Mercados Españoles | | | 14,590 | | | | 10,370 | | |
DIA | | | 145,730 | | | | 123,060 | | |
Prosegur | | | 109,520 | | | | 100,660 | | |
Viscofan | | | 15,040 | | | | 10,000 | | |
| > Switzerland | |
Geberit | | | 3,480 | | | | 2,290 | | |
INFICON | | | 1,820 | | | | 1,250 | | |
Partners Group | | | 4,280 | | | | 3,570 | | |
Sika | | | 160 | | | | 0 | | |
| > Netherlands | |
Aalberts Industries | | | 35,710 | | | | 26,960 | | |
Arcadis | | | 14,179 | | | | 11,819 | | |
Brunel | | | 18,101 | | | | 16,071 | | |
Core Labs | | | 3,610 | | | | 1,960 | | |
Gemalto | | | 6,180 | | | | 4,760 | | |
| > Finland | |
Konecranes | | | 16,520 | | | | 12,580 | | |
Munksjo | | | 70,810 | | | | 63,850 | | |
Sponda | | | 131,300 | | | | 101,200 | | |
Tikkurila | | | 31,721 | | | | 25,341 | | |
| > Norway | |
Atea | | | 42,030 | | | | 32,400 | | |
Orkla | | | 67,850 | | | | 58,530 | | |
Subsea 7 | | | 38,130 | | | | 33,440 | | |
| > Italy | |
IMA | | | 16,450 | | | | 10,240 | | |
Pirelli | | | 39,720 | | | | 29,520 | | |
| > Denmark | |
Jyske Bank | | | 9,790 | | | | 7,260 | | |
SimCorp | | | 22,580 | | | | 15,490 | | |
| > Belgium | |
EVS Broadcast Equipment | | | 12,520 | | | | 10,920 | | |
| > Austria | |
Schoeller-Bleckmann | | | 5,770 | | | | 0 | | |
| | | Number of Shares | |
| | | 9/30/14 | | 12/31/14 | |
Other Countries | |
| > United States | |
Gulfmark Offshore | | | 1,637 | | | | 0 | | |
See accompanying notes to financial statements.
85
Columbia Acorn European FundSM
Statement of Investments, December 31, 2014
Number of Shares | | | | Value | |
| | | | | | | Equities: 95.7% | |
Europe 95.7% | | | |
| | | > United Kingdom 33.2% | |
| | 1,460,625 | | | Assura | | $ | 1,161,031 | | |
| | | | | Primary Health Care
Property Developer | | | | | |
| | 21,120 | | | Spirax Sarco | | | 940,196 | | |
| | | | | Steam Systems for Manufacturing &
Processing Industries | | | | | |
| | 45,240 | | | Babcock International | | | 741,134 | | |
| | | | | Public Sector Outsourcer | | | | | |
| | 188,030 | | | Charles Taylor | | | 732,659 | | |
| | | | | Insurance Services | | | | | |
| | 32,210 | | | WH Smith | | | 673,565 | | |
| | | | | Newsprint, Books & General
Stationery Retailer | | | | | |
| | 92,240 | | | Ocado (a)(b) | | | 570,957 | | |
| | | | | Online Grocery Retailer | | | | | |
| | 40,000 | | | Jardine Lloyd Thompson Group | | | 558,603 | | |
| | | | | International Business
Insurance Broker | | | | | |
| | 225,231 | | | Connect Group | | | 537,604 | | |
| | | | | Newspaper & Magazine Distributor | | | | | |
| | 145,820 | | | Cambian (a) | | | 462,874 | | |
| | | | | Mental Health Facilities & Programs | | | | | |
| | 61,730 | | | Abcam | | | 448,109 | | |
| | | | | Online Sales of Antibodies | | | | | |
| | 38,985 | | | Halma | | | 415,266 | | |
| | | | | Health & Safety Sensor Technology | | | | | |
| | 37,830 | | | Domino's Pizza UK & Ireland | | | 413,043 | | |
| | | | | Pizza Delivery in the UK,
Ireland & Germany | | | | | |
| | 5,575 | | | Whitbread | | | 412,585 | | |
| | | | | UK Hotelier & Coffee Shop | | | | | |
| | 31,910 | | | Dialight | | | 402,853 | | |
| | | | | LED Products for Hazardous &
Industrial Environments | | | | | |
| | 11,210 | | | Rightmove | | | 390,928 | | |
| | | | | Internet Real Estate Listings | | | | | |
| | 505,313 | | | Cable and Wireless | | | 388,413 | | |
| | | | | Telecommunications Services
Provider in the Caribbean | | | | | |
| | 16,633 | | | Aggreko | | | 387,882 | | |
| | | | | Temporary Power & Temperature
Control Services | | | | | |
| | 100,890 | | | Polypipe | | | 386,029 | | |
| | | | | Manufacturer of Plastic
Piping & Fittings | | | | | |
| | 10,300 | | | Fidessa Group | | | 383,681 | | |
| | | | | Software for Financial
Trading Systems | | | | | |
| | 89,680 | | | Elementis | | | 363,515 | | |
| | | | | Specialty Chemicals | | | | | |
| | 49,530 | | | Halfords | | | 361,435 | | |
| | | | | UK Retailer for Leisure Goods &
Auto Parts | | | | | |
| | 16,930 | | | AVEVA | | | 346,727 | | |
| | | | | Engineering Software | | | | | |
| | 42,232 | | | PureCircle (a) | | | 338,110 | | |
| | | | | Natural Sweeteners | | | | | |
Number of Shares | | | | Value | |
| | 101,810 | | | RPS Group | | $ | 331,802 | | |
| | | | | Consultant Specializing in Energy,
Water, Urban Planning, Health & Safety | | | | | |
| | | | 12,149,001 | | |
| | | > France 12.0% | |
| | 16,720 | | | Neopost | | | 953,839 | | |
| | | | | Postage Meter Machines | | | | | |
| | 2,390 | | | Eurofins Scientific | | | 610,053 | | |
| | | | | Food, Pharmaceuticals & Materials
Screening & Testing | | | | | |
| | 14,480 | | | Cegedim (a) | | | 511,278 | | |
| | | | | Medical Market Research/IT Services | | | | | |
| | 11,883 | | | AKKA Technologies | | | 416,417 | | |
| | | | | Engineering Consultancy | | | | | |
| | 12,505 | | | Eutelsat | | | 404,407 | | |
| | | | | Fixed Satellite Services | | | | | |
| | 2,690 | | | Norbert Dentressangle | | | 396,499 | | |
| | | | | European Logistics & Transport Group | | | | | |
| | 12,681 | | | Saft | | | 384,642 | | |
| | | | | Niche Battery Manufacturer | | | | | |
| | 15,320 | | | Bonduelle | | | 371,040 | | |
| | | | | Producer of Canned, Deep-frozen &
Fresh Vegetables | | | | | |
| | 123,020 | | | Hi-Media (a) | | | 369,132 | | |
| | | | | Online Advertiser in Europe | | | | | |
| | | | 4,417,307 | | |
| | | > Germany 10.6% | |
| | 22,450 | | | Aurelius | | | 849,646 | | |
| | | | | European Turnaround Investor | | | | | |
| | 16,790 | | | NORMA Group | | | 801,403 | | |
| | | | | Clamps for Automotive &
Industrial Applications | | | | | |
| | 14,240 | | | Wirecard | | | 620,923 | | |
| | | | | Online Payment Processing &
Risk Management | | | | | |
| | 12,580 | | | Elringklinger | | | 434,961 | | |
| | | | | Automobile Components | | | | | |
| | 80,330 | | | Telefonica Deutschland | | | 425,737 | | |
| | | | | Mobile & Fixed-line Communications
in Germany | | | | | |
| | 1,240 | | | Rational | | | 388,535 | | |
| | | | | Commercial Ovens | | | | | |
| | 4,410 | | | MTU Aero Engines | | | 383,254 | | |
| | | | | Airplane Engine Components & Services | | | | | |
| | | | 3,904,459 | | |
| | | > Sweden 8.2% | |
| | 19,320 | | | Swedish Match | | | 605,383 | | |
| | | | | Swedish Snus | | | | | |
| | 18,910 | | | Hexagon | | | 583,365 | | |
| | | | | Design, Measurement & Visualization
Software & Equipment | | | | | |
| | 28,950 | | | Recipharm (a) | | | 499,487 | | |
| | | | | Contract Development
Manufacturing Organization | | | | | |
| | 7,351 | | | Unibet | | | 464,415 | | |
| | | | | European Online Gaming Operator | | | | | |
| | 31,870 | | | Sweco | | | 433,352 | | |
| | | | | Engineering Consultants | | | | | |
See accompanying notes to financial statements.
86
Number of Shares | | | | Value | |
| | | > Sweden—continued | |
| | 16,400 | | | Mekonomen | | $ | 427,874 | | |
| | | | | Nordic Integrated Wholesaler/Retailer
of Automotive Parts & Service | | | | | |
| | | | 3,013,876 | | |
| | | > Spain 6.4% | |
| | 123,060 | | | DIA | | | 833,864 | | |
| | | | | Discount Retailer in Spain &
Latin America | | | | | |
| | 100,660 | | | Prosegur | | | 573,488 | | |
| | | | | Security Guards | | | | | |
| | 10,000 | | | Viscofan | | | 530,563 | | |
| | | | | Sausage Casings Maker | | | | | |
| | 10,370 | | | Bolsas y Mercados Españoles | | | 401,634 | | |
| | | | | Spanish Stock Markets | | | | | |
| | | | 2,339,549 | | |
| | | > Switzerland 6.0% | |
| | 3,570 | | | Partners Group | | | 1,038,646 | | |
| | | | | Private Markets Asset Management | | | | | |
| | 2,290 | | | Geberit | | | 774,714 | | |
| | | | | Plumbing Supplies | | | | | |
| | 1,250 | | | INFICON | | | 387,560 | | |
| | | | | Gas Detection Instruments | | | | | |
| | | | 2,200,920 | | |
| | | > Netherlands 5.6% | |
| | 26,960 | | | Aalberts Industries | | | 795,079 | | |
| | | | | Flow Control & Heat Treatment | | | | | |
| | 4,760 | | | Gemalto | | | 388,475 | | |
| | | | | Digital Security Solutions | | | | | |
| | 11,819 | | | Arcadis | | | 354,483 | | |
| | | | | Engineering Consultants | | | | | |
| | 16,071 | | | Brunel | | | 263,166 | | |
| | | | | Temporary Specialist & Energy Staffing | | | | | |
| | 1,960 | | | Core Labs (b) | | | 235,866 | | |
| | | | | Oil & Gas Reservoir Consulting | | | | | |
| | | | 2,037,069 | | |
| | | > Finland 5.3% | |
| | 54,850 | | | Munksjo (a)(b) | | | 594,023 | | |
| | 9,000 | | | Munksjo (a)(c) | | | 98,710 | | |
| | | | | Specialty Paper Maker | | | | | |
| | 25,341 | | | Tikkurila | | | 442,591 | | |
| | | | | Decorative & Industrial Paint in
Scandinavia & Central &
Eastern Europe | | | | | |
| | 101,200 | | | Sponda | | | 440,508 | | |
| | | | | Office, Retail & Logistics Properties | | | | | |
| | 12,580 | | | Konecranes | | | 359,727 | | |
| | | | | Manufacture & Service of Industrial
Cranes & Port Handling Equipment | | | | | |
| | | | 1,935,559 | | |
| | | > Norway 2.9% | |
| | 58,530 | | | Orkla | | | 398,441 | | |
| | | | | Food & Brands, Aluminum,
Chemicals Conglomerate | | | | | |
Number of Shares | | | | Value | |
| | 33,440 | | | Subsea 7 | | $ | 342,188 | | |
| | | | | Offshore Subsea Contractor | | | | | |
| | 32,400 | | | Atea | | | 334,738 | | |
| | | | | Nordic IT Hardware/Software
Reseller & Installation Company | | | | | |
| | | | 1,075,367 | | |
| | | > Italy 2.3% | |
| | 10,240 | | | IMA | | | 447,502 | | |
| | | | | Food & Drugs
Packaging & Machinery | | | | | |
| | 29,520 | | | Pirelli | | | 398,148 | | |
| | | | | Global Tire Supplier | | | | | |
| | | | 845,650 | | |
| | | > Denmark 2.1% | |
| | 15,490 | | | SimCorp | | | 408,977 | | |
| | | | | Software for Investment Managers | | | | | |
| | 7,260 | | | Jyske Bank (a) | | | 366,967 | | |
| | | | | Danish Bank | | | | | |
| | | | 775,944 | | |
| | | > Belgium 1.1% | |
| | 10,920 | | | EVS Broadcast Equipment | | | 394,267 | | |
| | | | | Digital Live Mobile Production
Software & Systems | | | | | |
Europe: Total | | | 35,088,968 | | |
Total Equities: 95.7%
(Cost: $34,661,015) | | | 35,088,968 | (d) | |
Short-Term Investments 5.6% | | | |
| | 2,049,263 | | | JPMorgan U.S. Government
Money Market Fund, IM
Shares (7 day yield of 0.01%) | | | 2,049,263 | | |
Total Short-Term Investments: 5.6%
(Cost: $2,049,263) | | | 2,049,263 | | |
Securities Lending Collateral 2.6% | | | |
| | 940,969 | | | Dreyfus Government Cash
Management Fund,
Institutional Shares
(7 day yield of 0.01%) (e) | | | 940,969 | | |
Total Securities Lending Collateral: 2.6%
(Cost: $940,969) | | | 940,969 | | |
Total Investments: 103.9%
(Cost: $37,651,247)(f) | | | 38,079,200 | | |
Obligation to Return Collateral for
Securities Loaned: (2.6)% | | | (940,969 | ) | |
Cash and Other Assets Less Liabilities: (1.3)% | | | (505,423 | ) | |
Net Assets: 100.0% | | $ | 36,632,808 | | |
See accompanying notes to financial statements.
87
Columbia Acorn European FundSM
Statement of Investments, continued
> Notes to Statement of Investments
(a) Non-income producing security.
(b) All or a portion of this security was on loan at December 31, 2014. The total market value of securities on loan at December 31, 2014 was $899,714.
(c) Security is traded on a Swedish exchange.
(d) On December 31, 2014, the Fund's total equity investments were denominated in currencies as follows:
Currency | | Value | | Percentage
of Net Assets | |
Euro | | $ | 15,539,284 | | | | 42.3 | | |
British Pound | | | 12,149,001 | | | | 33.2 | | |
Swedish Krona | | | 3,112,586 | | | | 8.5 | | |
Swiss Franc | | | 2,200,920 | | | | 6.0 | | |
Other currencies less
than 5% of total net assets | | | 2,087,177 | | | | 5.7 | | |
Total Equities | | $ | 35,088,968 | | | | 95.7 | | |
(e) Investment made with cash collateral received from securities lending activity.
(f) At December 31, 2014, for federal income tax purposes, the cost of investments was $38,033,522 and net unrealized appreciation was $45,678 consisting of gross unrealized appreciation of $2,648,480 and gross unrealized depreciation of $2,602,802.
Fair Value Measurements
Various inputs are used in determining the value of the Fund's investments, following the input prioritization hierarchy established by accounting principles generally accepted in the United States of America (GAAP). These inputs are summarized in the three broad levels listed below:
• Level 1 – quoted prices in active markets for identical securities
• Level 2 – prices determined using other significant observable inputs (including quoted prices for similar securities, interest rates, prepayment speeds, credit risk and others)
• Level 3 – prices determined using significant unobservable inputs where quoted prices or observable inputs are unavailable or less reliable (including management's own assumptions about the factors market participants would use in pricing an investment)
The inputs or methodology used for valuing securities are not necessarily an indication of the risk associated with investing in those securities.
Examples of the types of securities in which the Fund would typically invest and how they are classified within this hierarchy are as follows. Typical Level 1 securities include exchange traded domestic equities, mutual funds whose NAVs are published each day and exchange traded foreign equities that are not statistically fair valued. Typical Level 2 securities include exchange traded foreign equities that are statistically fair valued, forward foreign currency exchange contracts and short-term investments valued at amortized cost. Additionally, securities fair valued by the Valuation Committee (the Committee) of the Fund's Board of Trustees (the Board) that rely on significant observable inputs are also included in Level 2. Typical Level 3 securities include any security fair valued by the Committee that relies on significant unobservable inputs.
Under the direction of the Board, the Committee is responsible for overseeing the valuation procedures approved by the Board.
The Committee meets as necessary, and no less frequently than quarterly, to determine fair values for securities for which market quotations are not readily available or for which the investment manager believes that available market quotations are unreliable, to review the appropriateness of the Trust's Portfolio Pricing Policy and the pricing procedures of the investment manager (the Policies), and to review the continuing appropriateness of the current value of any security subject to the Policies. The Policies address, among other things: circumstances under which market quotations will be deemed readily available; selection of third party pricing vendors; appropriate pricing methodologies; events that require fair valuation and fair value techniques; circumstances under which securities will be deemed to pose a potential for stale pricing, including when securities are illiquid, restricted, or in default; and certain delegations of authority to determine fair values to the Fund's investment manager. The Committee may also meet to discuss additional valuation matters, which may include review of back-testing results, review of time-sensitive information or approval of other valuation related actions, and to review the appropriateness of the Policies.
For investments categorized as Level 3, the significant unobservable inputs used in the fair value measurement of the Funds' securities may include: (i) data specific to the issuer or comparable issuers, (ii) general market or specific sector news and (iii) quoted prices and specific or similar security transactions. The Committee considers this data and any changes from prior periods in order to assess the reasonableness of observable and unobservable inputs, any assumptions or internal models used to value those securities and changes in fair value. Significant changes in any of these factors could result in lower or higher fair value measurements. Various factors impact the frequency of monitoring (which may occur as often as daily), however the Committee may determine that changes to inputs, assumptions and models are not required with the same frequency.
See accompanying notes to financial statements.
88
> Notes to Statement of Investments
The following table summarizes the inputs used, as of December 31, 2014, in valuing the Fund's assets:
Investment Type | | Quoted Prices
(Level 1) | | Other
Significant
Observable
Inputs
(Level 2) | | Significant
Unobservable
Inputs
(Level 3) | | Total | |
Equities | |
Europe | | $ | 235,866 | | | $ | 34,853,102 | | | $ | - | | | $ | 35,088,968 | | |
Total Equities | | | 235,866 | | | | 34,853,102 | | | | - | | | | 35,088,968 | | |
Total Short-Term Investments | | | 2,049,263 | | | | - | | | | - | | | | 2,049,263 | | |
Total Securities Lending Collateral | | | 940,969 | | | | - | | | | - | | | | 940,969 | | |
Total Investments | | $ | 3,226,098 | | | $ | 34,853,102 | | | $ | - | | | $ | 38,079,200 | | |
The Fund's assets assigned to the Level 2 input category are generally valued using a market approach, in which a security's value is determined through its correlation to prices and information from observable market transactions for similar or identical assets. Foreign equities are generally valued at the last sale price on the foreign exchange or market on which they trade. The Fund may use a statistical fair valuation model, in accordance with the policy adopted by the Board, provided by an independent third party to value securities principally traded in foreign markets in order to adjust for possible stale pricing that may occur between the close of the foreign exchanges and the time for valuation. These models take into account available market data including intraday index, ADR, and ETF movements.
There were no transfers of financial assets between levels during the period.
See accompanying notes to financial statements.
89
Columbia Acorn European FundSM
Portfolio Diversification
At December 31, 2014, the Fund's portfolio investments as a percentage of net assets were diversified as follows:
| | | Value | | Percentage
of Net Assets | |
| > Industrial Goods & Services | |
Machinery | | $ | 4,278,763 | | | | 11.7 | | |
Other Industrial Services | | | 2,500,826 | | | | 6.8 | | |
Conglomerates | | | 2,043,166 | | | | 5.6 | | |
Outsourcing Services | | | 1,994,205 | | | | 5.4 | | |
Industrial Materials & Specialty
Chemicals | | | 1,933,800 | | | | 5.3 | | |
Construction | | | 1,160,743 | | | | 3.2 | | |
Electrical Components | | | 787,495 | | | | 2.1 | | |
| | | | 14,698,998 | | | | 40.1 | | |
| > Consumer Goods & Services | |
Retail | | | 2,867,696 | | | | 7.8 | | |
Food & Beverage | | | 1,845,096 | | | | 5.0 | | |
Restaurants | | | 825,627 | | | | 2.2 | | |
Consumer Goods Distribution | | | 537,604 | | | | 1.5 | | |
Casinos & Gaming | | | 464,415 | | | | 1.3 | | |
Other Durable Goods | | | 398,148 | | | | 1.1 | | |
| | | | 6,938,586 | | | | 18.9 | | |
| > Information | |
Business Software | | | 1,722,749 | | | | 4.7 | | |
Computer Services | | | 846,016 | | | | 2.3 | | |
Telephone & Data Services | | | 814,150 | | | | 2.2 | | |
Computer Hardware & Related
Equipment | | | 782,743 | | | | 2.2 | | |
Financial Processors | | | 620,923 | | | | 1.7 | | |
Instrumentation | | | 415,266 | | | | 1.1 | | |
Satellite Broadcasting & Services | | | 404,407 | | | | 1.1 | | |
Internet Related | | | 390,928 | | | | 1.1 | | |
Advertising | | | 369,132 | | | | 1.0 | | |
| | | | 6,366,314 | | | | 17.4 | | |
| > Finance | |
Insurance | | | 1,291,262 | | | | 3.5 | | |
Brokerage & Money Management | | | 1,038,646 | | | | 2.9 | | |
Financial Processors | | | 401,634 | | | | 1.1 | | |
Banks | | | 366,967 | | | | 1.0 | | |
| | | | 3,098,509 | | | | 8.5 | | |
| > Other Industries | |
Real Estate | | | 1,601,539 | | | | 4.4 | | |
Transportation | | | 396,498 | | | | 1.1 | | |
| | | | 1,998,037 | | | | 5.5 | | |
| > Health Care | |
Pharmaceuticals | | | 499,487 | | | | 1.3 | | |
Health Care Services | | | 462,874 | | | | 1.3 | | |
Medical Supplies | | | 448,109 | | | | 1.2 | | |
| | | | 1,410,470 | | | | 3.8 | | |
| | | Value | | Percentage
of Net Assets | |
| > Energy & Minerals | |
Oil Services | | $ | 342,188 | | | | 0.9 | | |
Mining | | | 235,866 | | | | 0.6 | | |
| | | | 578,054 | | | | 1.5 | | |
Total Equities: | | | 35,088,968 | | | | 95.7 | | |
Short-Term Investments: | | | 2,049,263 | | | | 5.6 | | |
Securities Lending Collateral: | | | 940,969 | | | | 2.6 | | |
Total Investments: | | | 38,079,200 | | | | 103.9 | | |
Obligation to Return
Collateral for Securities
Loaned: | | | (940,969 | ) | | | (2.6 | ) | |
Cash and Other Assets
Less Liabilities: | | | (505,423 | ) | | | (1.3 | ) | |
Net Assets: | | $ | 36,632,808 | | | | 100.0 | | |
See accompanying notes to financial statements.
90
This page intentionally left blank.
91
Columbia Acorn Family of Funds
Statements of Assets and Liabilities
December 31, 2014 | | Columbia
Acorn®
Fund | | Columbia
Acorn
International® | | Columbia
Acorn
USA® | | Columbia
Acorn
International
SelectSM | |
Assets: | |
Unaffiliated investments, at cost | | $ | 7,484,551,196 | | | $ | 6,181,672,054 | | | $ | 830,347,077 | | | $ | 226,743,851 | | |
Affiliated investments, at cost | | | 1,936,450,819 | | | | 89,062,228 | | | | — | | | | — | | |
Unaffiliated investments, at value (including securities on loan: Columbia Acorn Fund $517,888,630;
Columbia Acorn International $101,872,493; Columbia Acorn USA $76,216,239; Columbia
Acorn International Select $5,229,212; Columbia Acorn Select $25,021,001; Columbia
Thermostat Fund $—; Columbia Acorn Emerging Markets Fund $3,111,617; Columbia Acorn
European Fund $899,714) | | $ | 13,330,324,037 | | | $ | 7,706,200,251 | | | $ | 1,481,414,096 | | | $ | 247,542,120 | | |
Affiliated investments, at value | | | 3,181,183,473 | | | | 82,210,773 | | | | — | | | | — | | |
Foreign currency (cost: Columbia Acorn Fund $—; Columbia Acorn International $60,590;
Columbia Acorn USA $—; Columbia Acorn International Select $207; Columbia Acorn
Select $—; Columbia Thermostat Fund $—; Columbia Acorn Emerging Markets Fund $8,175;
Columbia Acorn European Fund $—) | | | — | | | | 60,626 | | | | — | | | | 194 | | |
Receivable for: | |
Investments sold | | | 85,134,157 | | | | 10,721,096 | | | | 5,422,076 | | | | — | | |
Investments sold on a delayed delivery basis | | | — | | | | 28,140,540 | | | | — | | | | 10,544,973 | | |
Fund shares sold | | | 6,362,703 | | | | 11,502,927 | | | | 595,653 | | | | 1,297,160 | | |
Dividends | | | 9,179,988 | | | | 8,261,684 | | | | 663,335 | | | | 476,654 | | |
Interest | | | — | | | | 422,108 | | | | — | | | | 158,175 | | |
Securities lending income | | | 733,110 | | | | 92,922 | | | | 42,518 | | | | 2,959 | | |
Foreign tax reclaims | | | 80,119 | | | | 5,793,287 | | | | — | | | | 202,691 | | |
Expense reimbursement due from Investment Manager | | | — | | | | 1,105 | | | | — | | | | — | | |
Trustees' deferred compensation plan | | | 3,633,077 | | | | 1,162,700 | | | | 311,353 | | | | — | | |
Prepaid expenses | | | 178,504 | | | | 78,612 | | | | 14,603 | | | | 3,123 | | |
Other assets | | | — | | | | — | | | | — | | | | 39 | | |
Total Assets | | | 16,616,809,168 | | | | 7,854,648,631 | | | | 1,488,463,634 | | | | 260,228,088 | | |
Liabilities: | |
Collateral on securities loaned | | | 534,041,419 | | | | 105,532,274 | | | | 78,364,950 | | | | 5,507,307 | | |
Unrealized depreciation on forward foreign currency exchange contracts | | | — | | | | — | | | | — | | | | 97,181 | | |
Payable for: | |
Investments purchased | | | 13,139,136 | | | | 1,485 | | | | 20,461 | | | | — | | |
Fund shares redeemed | | | 126,071,938 | | | | 11,472,191 | | | | 12,027,290 | | | | 1,511,773 | | |
Investment advisory fee | | | 285,004 | | | | 160,731 | | | | 33,671 | | | | 6,576 | | |
Administration fee | | | 17,109 | | | | 8,193 | | | | 1,501 | | | | 270 | | |
12b-1 Service and Distribution fees | | | 40,545 | | | | 9,574 | | | | 2,081 | | | | 602 | | |
Reports to shareholders | | | 522,549 | | | | 371,066 | | | | 57,308 | | | | 23,093 | | |
Transfer agent fees | | | 2,795,822 | | | | 940,762 | | | | 350,629 | | | | 31,788 | | |
Trustees' fees | | | 6,459 | | | | 3,535 | | | | 315 | | | | 58,916 | | |
Custody fees | | | 75,578 | | | | 446,078 | | | | 3,972 | | | | 15,091 | | |
Professional fee | | | 279,984 | | | | 172,371 | | | | 60,976 | | | | 49,286 | | |
Chief compliance officer expenses | | | 67,227 | | | | 29,269 | | | | 5,346 | | | | 1,209 | | |
Deferred foreign capital gains tax payable | | | 1,217,682 | | | | 771,879 | | | | — | | | | — | | |
Trustees' deferred compensation plan | | | 3,633,077 | | | | 1,162,700 | | | | 311,353 | | | | — | | |
Other liabilities | | | 39,614 | | | | 88,388 | | | | 7,494 | | | | 5,296 | | |
Total Liabilities | | | 682,233,143 | | | | 121,170,496 | | | | 91,247,347 | | | | 7,308,388 | | |
Net Assets | | $ | 15,934,576,025 | | | $ | 7,733,478,135 | | | $ | 1,397,216,287 | | | $ | 252,919,700 | | |
Composition of Net Assets: | |
Paid-in capital | | $ | 8,251,610,741 | | | $ | 6,284,036,774 | | | $ | 713,240,383 | | | $ | 247,521,085 | | |
Undistributed (Overdistributed) net investment income (loss) | | | (3,615,764 | ) | | | (92,376,083 | ) | | | (312,115 | ) | | | (6,492,720 | ) | |
Accumulated net realized gain (loss) | | | 597,304,435 | | | | 25,535,899 | | | | 33,221,000 | | | | (8,784,944 | ) | |
Net unrealized appreciation (depreciation) on: | |
Unaffiliated investments | | | 5,845,772,841 | | | | 1,524,528,197 | | | | 651,067,019 | | | | 20,798,269 | | |
Affiliated investments | | | 1,244,732,654 | | | | (6,851,455 | ) | | | — | | | | — | | |
Foreign currency translations | | | (11,200 | ) | | | (623,318 | ) | | | — | | | | (24,809 | ) | |
Forward foreign currency exchange contracts | | | — | | | | — | | | | — | | | | (97,181 | ) | |
Foreign capital gains tax | | | (1,217,682 | ) | | | (771,879 | ) | | | — | | | | — | | |
Net Assets | | $ | 15,934,576,025 | | | $ | 7,733,478,135 | | | $ | 1,397,216,287 | | | $ | 252,919,700 | | |
Net asset value per share – Class A (a) | | $ | 30.30 | | | $ | 41.68 | | | $ | 29.13 | | | $ | 22.04 | | |
(Net assets/shares)
| | ($ | 2,694,610,293/
88,936,087) | | | ($ | 946,553,332/
22,709,158) | | | ($ | 148,089,203/
5,084,062) | | | ($ | 53,419,289/
2,424,210) | | |
Maximum offering price per share – Class A (b) | | $ | 32.15 | | | $ | 44.22 | | | $ | 30.91 | | | $ | 23.38 | | |
(Net asset value per share/front-end sales charge) | | | ($30.30/0.9425) | | | | ($41.68/0.9425) | | | | ($29.13/0.9425) | | | | ($22.04/0.9425) | | |
Net asset value and offering price per share – Class B (a) | | $ | 26.53 | | | $ | 40.38 | | | $ | 25.27 | | | $ | 20.69 | | |
(Net assets/shares)
| | ($ | 7,201,444/
271,438) | | | ($ | 6,515,645/
161,339) | | | ($ | 233,839/
9,255) | | | ($ | 355,261/
17,168) | | |
Net asset value and offering price per share – Class C (a) | | $ | 25.92 | | | $ | 40.20 | | | $ | 24.98 | | | $ | 20.54 | | |
(Net assets/shares)
| | ($ | 776,369,920/
29,952,465) | | | ($ | 103,691,126/
2,579,547) | | | ($ | 36,475,846/
1,460,419) | | | ($ | 8,057,482/
392,206) | | |
Net asset value and offering price per share – Class I (c) | | $ | 32.03 | | | $ | 41.76 | | | $ | 31.19 | (d) | | $ | 22.29 | (d) | |
(Net assets/shares)
| | ($ | 28,164,333/
879,375) | | | ($ | 38,804,103/
929,209) | | | | ($2,190/70)
| | | | ($2,054/92)
| | |
Net asset value and offering price per share – Class R (c) | | $ | — | | | $ | 41.67 | | | $ | — | | | $ | — | | |
(Net assets/shares)
| | ($ | —/—
| ) | | ($ | 5,560,256/
133,428) | | | ($ | —/—
| ) | | ($ | —/—
| ) | |
Net asset value and offering price per share – Class R4 (c) | | $ | 32.51 | | | $ | 42.02 | | | $ | 31.70 | | | $ | 22.45 | | |
(Net assets/shares)
| | ($ | 250,456,683/
7,704,621) | | | ($ | 424,424,543/
10,100,805) | | | ($ | 7,951,752/
250,822) | | | ($ | 973,923/
43,382) | | |
Net asset value and offering price per share – Class R5 (c) | | $ | 32.55 | | | $ | 41.71 | | | $ | 31.71 | | | $ | 22.43 | | |
(Net assets/shares)
| | ($ | 458,223,180/
14,079,444) | | | ($ | 397,881,832/
9,540,352) | | | ($ | 36,689,268/
1,156,852) | | | ($ | 2,592,742/
115,594) | | |
Net asset value and offering price per share – Class Y (c) | | $ | 32.61 | | | $ | 42.02 | | | $ | 31.80 | | | $ | 22.42 | | |
(Net assets/shares)
| | ($ | 378,779,713/
11,616,665) | | | ($ | 225,012,495/
5,354,548) | | | ($ | 35,550,879/
1,118,012) | | | ($ | 11,755,060/
524,405) | | |
Net asset value and offering price per share – Class Z (c) | | $ | 31.95 | | | $ | 41.73 | | | $ | 31.03 | | | $ | 22.30 | | |
(Net assets/shares)
| | ($ | 11,340,770,459/
354,923,558) | | | ($ | 5,585,034,803/
133,844,433) | | | ($ | 1,132,223,310/
36,489,177) | | | ($ | 175,763,889/
7,883,319) | | |
(a) Redemption price per share is equal to net asset value less any applicable contingent deferred sales charge.
(b) On sales of $50,000 or more the offering price is reduced.
(c) Redemption price per share is equal to net asset value.
(d) Net asset value per share rounds to this amount due to fractional shares outstanding.
See accompanying notes to financial statements.
92
December 31, 2014 | | Columbia
Acorn
SelectSM | | Columbia
Thermostat
FundSM | | Columbia
Acorn
Emerging Markets
FundSM | | Columbia
Acorn
European
FundSM | |
Assets: | |
Unaffiliated investments, at cost | | $ | 465,246,337 | | | $ | 5,937,697 | | | $ | 462,744,779 | | | $ | 37,651,247 | | |
Affiliated investments, at cost | | | 23,207,419 | | | | 1,217,734,045 | | | | — | | | | — | | |
Unaffiliated investments, at value (including securities on loan: Columbia Acorn Fund $517,888,630;
Columbia Acorn International $101,872,493; Columbia Acorn USA $76,216,239; Columbia
Acorn International Select $5,229,212; Columbia Acorn Select $25,021,001; Columbia
Thermostat Fund $—; Columbia Acorn Emerging Markets Fund $3,111,617; Columbia Acorn
European Fund $899,714) | | $ | 692,641,201 | | | $ | 5,937,697 | | | $ | 480,291,875 | | | $ | 38,079,200 | | |
Affiliated investments, at value | | | 2,231,409 | | | | 1,254,039,602 | | | | — | | | | — | | |
Foreign currency (cost: Columbia Acorn Fund $—; Columbia Acorn International $60,590;
Columbia Acorn USA $—; Columbia Acorn International Select $207; Columbia Acorn
Select $—; Columbia Thermostat Fund $—; Columbia Acorn Emerging Markets Fund $8,175;
Columbia Acorn European Fund $—) | | | — | | | | — | | | | 8,175 | | | | — | | |
Receivable for: | |
Investments sold | | | 2,733,151 | | | | — | | | | 5,671,005 | | | | — | | |
Investments sold on a delayed delivery basis | | | — | | | | — | | | | 1,410,304 | | | | — | | |
Fund shares sold | | | 327,811 | | | | 3,252,825 | | | | 502,063 | | | | 106,968 | | |
Dividends | | | 505,390 | | | | 2,517,967 | | | | 381,411 | | | | 19,807 | | |
Interest | | | — | | | | — | | | | 21,155 | | | | — | | |
Securities lending income | | | 5,915 | | | | — | | | | 4,273 | | | | 258 | | |
Foreign tax reclaims | | | — | | | | — | | | | 16,018 | | | | 29,146 | | |
Expense reimbursement due from Investment Manager | | | 5 | | | | 272 | | | | — | | | | 361 | | |
Trustees' deferred compensation plan | | | 327,425 | | | | — | | | | — | | | | — | | |
Prepaid expenses | | | 6,689 | | | | 11,441 | | | | 5,396 | | | | 604 | | |
Other assets | | | — | | | | — | | | | — | | | | 6,700 | | |
Total Assets | | | 698,778,996 | | | | 1,265,759,804 | | | | 488,311,675 | | | | 38,243,044 | | |
Liabilities: | |
Collateral on securities loaned | | | 25,598,975 | | | | — | | | | 3,292,000 | | | | 940,969 | | |
Unrealized depreciation on forward foreign currency exchange contracts | | | — | | | | — | | | | — | | | | — | | |
Payable for: | |
Investments purchased | | | — | | | | 2,517,967 | | | | 392,506 | | | | — | | |
Fund shares redeemed | | | 6,049,874 | | | | 2,509,156 | | | | 1,341,057 | | | | 594,520 | | |
Investment advisory fee | | | 15,817 | | | | 3,456 | | | | 13,868 | | | | 1,213 | | |
Administration fee | | | 717 | | | | 1,332 | | | | 508 | | | | 39 | | |
12b-1 Service and Distribution fees | | | 3,202 | | | | 14,207 | | | | 2,227 | | | | 287 | | |
Reports to shareholders | | | 51,558 | | | | 60,626 | | | | 35,164 | | | | 9,851 | | |
Transfer agent fees | | | 89,370 | | | | 123,723 | | | | 87,433 | | | | 4,879 | | |
Trustees' fees | | | 115 | | | | 68,313 | | | | 13,396 | | | | 2,030 | | |
Custody fees | | | 2,661 | | | | 772 | | | | 67,822 | | | | 8,105 | | |
Professional fee | | | 53,695 | | | | 36,711 | | | | 51,847 | | | | 44,953 | | |
Chief compliance officer expenses | | | 2,553 | | | | 4,188 | | | | 1,920 | | | | 230 | | |
Deferred foreign capital gains tax payable | | | — | | | | — | | | | 670,775 | | | | — | | |
Trustees' deferred compensation plan | | | 327,425 | | | | — | | | | — | | | | — | | |
Other liabilities | | | 6,248 | | | | 6,292 | | | | 6,045 | | | | 3,160 | | |
Total Liabilities | | | 32,202,210 | | | | 5,346,743 | | | | 5,976,568 | | | | 1,610,236 | | |
Net Assets | | $ | 666,576,786 | | | $ | 1,260,413,061 | | | $ | 482,335,107 | | | $ | 36,632,808 | | |
Composition of Net Assets: | |
Paid-in capital | | $ | 412,071,005 | | | $ | 1,203,792,209 | | | $ | 483,175,584 | | | $ | 38,729,584 | | |
Undistributed (Overdistributed) net investment income (loss) | | | (325,960 | ) | | | 1,675,197 | | | | (2,486,157 | ) | | | 199,170 | | |
Accumulated net realized gain (loss) | | | 48,412,887 | | | | 18,640,098 | | | | (15,220,290 | ) | | | (2,720,678 | ) | |
Net unrealized appreciation (depreciation) on: | |
Unaffiliated investments | | | 227,394,864 | | | | — | | | | 17,547,096 | | | | 427,953 | | |
Affiliated investments | | | (20,976,010 | ) | | | 36,305,557 | | | | — | | | | — | | |
Foreign currency translations | | | — | | | | — | | | | (10,351 | ) | | | (3,221 | ) | |
Forward foreign currency exchange contracts | | | — | | | | — | | | | — | | | | — | | |
Foreign capital gains tax | | | — | | | | — | | | | (670,775 | ) | | | — | | |
Net Assets | | $ | 666,576,786 | | | $ | 1,260,413,061 | | | $ | 482,335,107 | | | $ | 36,632,808 | | |
Net asset value per share – Class A (a) | | $ | 21.03 | | | $ | 14.86 | | | $ | 12.72 | | | $ | 14.34 | | |
(Net assets/shares)
| | ($ | 264,233,793/
12,564,179) | | | ($ | 450,258,215/
30,296,730) | | | ($ | 160,969,366/
12,653,450) | | | ($ | 21,100,546/
1,471,542) | | |
Maximum offering price per share – Class A (b) | | $ | 22.31 | | | $ | 15.77 | | | $ | 13.50 | | | $ | 15.21 | | |
(Net asset value per share/front-end sales charge) | | | ($21.03/0.9425) | | | | ($14.86/0.9425) | | | | ($12.72/0.9425) | | | | ($14.34/0.9425) | | |
Net asset value and offering price per share – Class B (a) | | $ | 18.03 | | | $ | 14.97 | | | $ | — | | | $ | — | | |
(Net assets/shares)
| | ($ | 1,013,740/
56,223) | | | ($ | 1,230,725/
82,215) | | | ($ | —/—
| ) | | ($ | —/—
| ) | |
Net asset value and offering price per share – Class C (a) | | $ | 17.69 | | | $ | 14.96 | | | $ | 12.65 | | | $ | 14.16 | | |
(Net assets/shares)
| | ($ | 48,590,843/
2,746,875) | | | ($ | 404,455,852/
27,029,504) | | | ($ | 41,207,804/
3,256,664) | | | ($ | 5,095,696/
359,769) | | |
Net asset value and offering price per share – Class I (c) | | $ | 22.38 | | | $ | — | | | $ | 12.75 | | | $ | 14.33 | (d) | |
(Net assets/shares)
| | ($ | 18,718,451/
836,207) | | | ($ | —/—
| ) | | | ($2,537/199)
| | | | ($2,405/168)
| | |
Net asset value and offering price per share – Class R (c) | | $ | — | | | $ | — | | | $ | — | | | $ | — | | |
(Net assets/shares)
| | ($ | —/—
| ) | | ($ | —/—
| ) | | ($ | —/—
| ) | | ($ | —/—
| ) | |
Net asset value and offering price per share – Class R4 (c) | | $ | 22.75 | | | $ | 14.74 | | | $ | 12.83 | | | $ | 14.40 | | |
(Net assets/shares)
| | ($ | 1,192,845/
52,437) | | | ($ | 23,412,262/
1,588,161) | | | ($ | 15,467,392/
1,205,718) | | | ($ | 302,200/
20,989) | | |
Net asset value and offering price per share – Class R5 (c) | | $ | 22.78 | | | $ | 14.75 | | | $ | 12.82 | | | $ | 14.47 | | |
(Net assets/shares)
| | ($ | 10,696,533/
469,631) | | | ($ | 3,535,754/
239,636) | | | ($ | 19,632,386/
1,531,295) | | | ($ | 1,632,907/
112,858) | | |
Net asset value and offering price per share – Class Y (c) | | $ | 22.86 | | | $ | 14.74 | | | $ | 12.71 | (d) | | $ | — | | |
(Net assets/shares)
| | ($ | 3,643,794/
159,383) | | | ($ | 401,249/
27,225) | | | ($2,409/190)
| | ($ | —/—
| ) | |
Net asset value and offering price per share – Class Z (c) | | $ | 22.28 | | | $ | 14.67 | | | $ | 12.74 | | | $ | 14.34 | | |
(Net assets/shares)
| | ($ | 318,486,787/
14,295,229) | | | ($ | 377,119,004/
25,702,685) | | | ($ | 245,053,213/
19,227,983) | | | ($ | 8,499,054/
592,721) | | |
See accompanying notes to financial statements.
93
Columbia Acorn Family of Funds
Statements of Operations For the Year Ended December 31, 2014
| | | Columbia
Acorn®
Fund | | Columbia
Acorn
International® | | Columbia
Acorn
USA® | | Columbia
Acorn
International
SelectSM | |
Investment Income: | |
Dividends | | $ | 130,103,964 | | | $ | 193,185,949 | | | $ | 10,988,172 | | | $ | 9,293,543 | | |
Dividends from affiliates | | | 29,184,960 | | | | 2,716,857 | | | | — | | | | — | | |
Dividends from affiliated investment company shares | | | — | | | | — | | | | — | | | | — | | |
Interest | | | 28 | | | | 422,120 | | | | — | | | | 159,496 | | |
Income from securities lending – net | | | 8,813,015 | | | | 2,698,509 | | | | 695,151 | | | | 82,125 | | |
| | | 168,101,967 | | | | 199,023,435 | | | | 11,683,323 | | | | 9,535,164 | | |
Foreign taxes withheld | | | (3,690,111 | ) | | | (21,512,877 | ) | | | (48,111 | ) | | | (983,827 | ) | |
Total Investment Income | | | 164,411,856 | | | | 177,510,558 | | | | 11,635,212 | | | | 8,551,337 | | |
Expenses: | |
Investment advisory fee | | | 123,279,339 | | | | 62,943,042 | | | | 13,670,928 | | | | 3,181,739 | | |
Administration fee | | | 7,213,744 | | | | 3,125,021 | | | | 594,093 | | | | 126,805 | | |
12b-1 Service and Distribution fees: | |
Class A | | | 8,592,952 | | | | 2,667,608 | | | | 449,365 | | | | 175,936 | | |
Class B | | | 90,223 | | | | 72,788 | | | | 2,594 | | | | 4,608 | | |
Class C | | | 8,701,253 | | | | 1,126,925 | | | | 380,797 | | | | 100,087 | | |
Class R | | | — | | | | 31,579 | | | | — | | | | — | | |
Transfer agent fees: | |
Class A | | | 4,155,458 | | | | 1,720,019 | | | | 261,824 | | | | 87,589 | | |
Class B | | | 35,903 | | | | 38,766 | | | | 1,980 | | | | 1,679 | | |
Class C | | | 600,799 | | | | 149,726 | | | | 22,804 | | | | 13,942 | | |
Class R | | | — | | | | 17,366 | | | | — | | | | — | | |
Class R4 | | | 141,867 | | | | 727,781 | | | | 9,607 | | | | 1,027 | | |
Class R5 | | | 270,303 | | | | 180,234 | | | | 12,947 | | | | 1,140 | | |
Class Z | | | 10,876,663 | | | | 4,859,090 | | | | 1,792,440 | | | | 189,839 | | |
Trustees' fees | | | 783,134 | | | | 331,507 | | | | 64,051 | | | | 18,370 | | |
Custody fees | | | 286,646 | | | | 1,627,706 | | | | 18,109 | | | | 53,691 | | |
Registration and blue sky fees | | | 161,921 | | | | 208,490 | | | | 101,054 | | | | 96,305 | | |
Reports to shareholders | | | 1,709,475 | | | | 1,468,212 | | | | 189,682 | | | | 93,133 | | |
Audit fees | | | 128,015 | | | | 186,886 | | | | 47,454 | | | | 67,565 | | |
Legal fees | | | 954,344 | | | | 411,735 | | | | 77,560 | | | | 16,867 | | |
Chief compliance officer expenses | | | 832,923 | | | | 349,613 | | | | 67,861 | | | | 14,459 | | |
Other expenses | | | 500,991 | | | | 432,540 | | | | 52,183 | | | | 29,423 | | |
Total Expenses | | | 169,315,953 | | | | 82,676,634 | | | | 17,817,333 | | | | 4,274,204 | | |
Less reimbursement of expenses by Investment Manager | | | — | | | | (452,267 | ) | | | — | | | | — | | |
Net Expenses | | | 169,315,953 | | | | 82,224,367 | | | | 17,817,333 | | | | 4,274,204 | | |
Net Investment Income (Loss) | | | (4,904,097 | ) | | | 95,286,191 | | | | (6,182,121 | ) | | | 4,277,133 | | |
Net Realized and Unrealized Gain (Loss) on Investments: | |
Net realized gain (loss) on: | |
Unaffiliated investments | | | 2,437,002,117 | | | | 484,607,306 | | | | 257,777,850 | | | | 26,013,036 | | |
Affiliated investments | | | 821,706,250 | | | | (17,504,372 | ) | | | — | | | | — | | |
Distributions from affiliated investment company shares | | | — | | | | — | | | | — | | | | — | | |
Foreign currency translations | | | (364,125 | ) | | | (3,712,183 | ) | | | — | | | | (216,519 | ) | |
Forward foreign currency exchange contracts | | | — | | | | — | | | | — | | | | 469,034 | | |
Net realized gain (loss) | | | 3,258,344,242 | | | | 463,390,751 | | | | 257,777,850 | | | | 26,265,551 | | |
Net change in net unrealized appreciation (depreciation) on: | |
Unaffiliated investments | | | (2,177,683,907 | ) | | | (907,336,120 | ) | | | (207,204,706 | ) | | | (49,975,163 | ) | |
Affiliated investments | | | (983,776,070 | ) | | | (8,117,487 | ) | | | — | | | | — | | |
Foreign currency translations | | | (52,735 | ) | | | (768,255 | ) | | | — | | | | (22,087 | ) | |
Forward foreign currency exchange contracts | | | — | | | | — | | | | — | | | | (162,999 | ) | |
Unaffiliated options | | | — | | | | — | | | | — | | | | (985,539 | ) | |
Affiliated options | | | — | | | | (2,630,029 | ) | | | — | | | | — | | |
Foreign capital gains tax | | | (1,217,682 | ) | | | (771,879 | ) | | | — | | | | — | | |
Net change in unrealized appreciation (depreciation) | | | (3,162,730,394 | ) | | | (919,623,770 | ) | | | (207,204,706 | ) | | | (51,145,788 | ) | |
Net realized and unrealized gain (loss) | | | 95,613,848 | | | | (456,233,019 | ) | | | 50,573,144 | | | | (24,880,237 | ) | |
Net Increase (Decrease) in Net Assets from Operations | | $ | 90,709,751 | | | $ | (360,946,828 | ) | | $ | 44,391,023 | | | $ | (20,603,104 | ) | |
(a) Class R4 shares reflect activity for the period from June 25, 2014 (commencement of operations) through December 31, 2014.
See accompanying notes to financial statements.
94
| | | Columbia
Acorn
SelectSM | | Columbia
Thermostat
FundSM | | Columbia
Acorn
Emerging Markets
FundSM | | Columbia
Acorn
European
FundSM | |
Investment Income: | |
Dividends | | $ | 5,569,610 | | | $ | 383 | | | $ | 11,155,771 | | | $ | 1,403,275 | | |
Dividends from affiliates | | | — | | | | — | | | | — | | | | — | | |
Dividends from affiliated investment company shares | | | — | | | | 30,848,823 | | | | — | | | | — | | |
Interest | | | — | | | | — | | | | 21,163 | | | | 17 | | |
Income from securities lending – net | | | 48,463 | | | | — | | | | 147,926 | | | | 7,066 | | |
| | | 5,618,073 | | | | 30,849,206 | | | | 11,324,860 | | | | 1,410,358 | | |
Foreign taxes withheld | | | (10,148 | ) | | | — | | | | (1,119,841 | ) | | | (148,567 | ) | |
Total Investment Income | | | 5,607,925 | | | | 30,849,206 | | | | 10,205,019 | | | | 1,261,791 | | |
Expenses: | |
Investment advisory fee | | | 6,450,443 | | | | 1,290,957 | | | | 5,370,711 | | | | 590,149 | | |
Administration fee | | | 285,780 | | | | 483,999 | | | | 194,491 | | | | 18,574 | | |
12b-1 Service and Distribution fees: | |
Class A | | | 737,403 | | | | 1,212,958 | | | | 516,453 | | | | 71,873 | | |
Class B | | | 13,589 | | | | 12,184 | | | | — | | | | — | | |
Class C | | | 554,669 | | | | 4,156,486 | | | | 414,504 | | | | 40,802 | | |
Class R | | | — | | | | — | | | | — | | | | — | | |
Transfer agent fees: | |
Class A | | | 353,825 | | | | 358,522 | | | | 225,183 | | | | 30,394 | | |
Class B | | | 8,093 | | | | 3,500 | | | | — | | | | — | | |
Class C | | | 51,781 | | | | 305,697 | | | | 49,236 | | | | 5,171 | | |
Class R | | | — | | | | — | | | | — | | | | — | | |
Class R4 | | | 2,424 | | | | 13,427 | | | | 10,924 | | | | 136 | (a) | |
Class R5 | | | 5,531 | | | | 1,132 | | | | 10,150 | | | | 944 | | |
Class Z | | | 329,934 | | | | 220,537 | | | | 283,809 | | | | 15,080 | | |
Trustees' fees | | | 32,033 | | | | 52,035 | | | | 24,337 | | | | 3,067 | | |
Custody fees | | | 8,718 | | | | 1,735 | | | | 245,329 | | | | 52,875 | | |
Registration and blue sky fees | | | 100,823 | | | | 143,059 | | | | 105,558 | | | | 81,031 | | |
Reports to shareholders | | | 169,234 | | | | 255,154 | | | | 148,357 | | | | 36,112 | | |
Audit fees | | | 47,454 | | | | 35,914 | | | | 69,614 | | | | 36,644 | | |
Legal fees | | | 36,715 | | | | 62,378 | | | | 29,416 | | | | 3,019 | | |
Chief compliance officer expenses | | | 32,246 | | | | 53,583 | | | | 21,819 | | | | 2,257 | | |
Other expenses | | | 60,146 | | | | 44,174 | | | | 55,010 | | | | 16,407 | | |
Total Expenses | | | 9,280,841 | | | | 8,707,431 | | | | 7,774,901 | | | | 1,004,535 | | |
Less reimbursement of expenses by Investment Manager | | | (854 | ) | | | (135,531 | ) | | | — | | | | (147,638 | ) | |
Net Expenses | | | 9,279,987 | | | | 8,571,900 | | | | 7,774,901 | | | | 856,897 | | |
Net Investment Income (Loss) | | | (3,672,062 | ) | | | 22,277,306 | | | | 2,430,118 | | | | 404,894 | | |
Net Realized and Unrealized Gain (Loss) on Investments: | |
Net realized gain (loss) on: | |
Unaffiliated investments | | | 158,812,494 | | | | 35 | | | | (9,031,194 | ) | | | (2,662,856 | ) | |
Affiliated investments | | | (5,568,755 | ) | | | 22,954,871 | | | | — | | | | — | | |
Distributions from affiliated investment company shares | | | — | | | | 15,223,291 | | | | — | | | | — | | |
Foreign currency translations | | | (10,222 | ) | | | — | | | | (198,212 | ) | | | (50,072 | ) | |
Forward foreign currency exchange contracts | | | — | | | | — | | | | — | | | | — | | |
Net realized gain (loss) | | | 153,233,517 | | | | 38,178,197 | | | | (9,229,406 | ) | | | (2,712,928 | ) | |
Net change in net unrealized appreciation (depreciation) on: | |
Unaffiliated investments | | | (133,989,051 | ) | | | — | | | | (13,842,360 | ) | | | (3,112,977 | ) | |
Affiliated investments | | | 854,842 | | | | 4,982,086 | | | | — | | | | — | | |
Foreign currency translations | | | — | | | | — | | | | 4,051 | | | | (3,732 | ) | |
Forward foreign currency exchange contracts | | | — | | | | — | | | | — | | | | — | | |
Unaffiliated options | | | — | | | | — | | | | (131,808 | ) | | | — | | |
Affiliated options | | | — | | | | — | | | | — | | | | — | | |
Foreign capital gains tax | | | — | | | | — | | | | (670,775 | ) | | | — | | |
Net change in unrealized appreciation (depreciation) | | | (133,134,209 | ) | | | 4,982,086 | | | | (14,640,892 | ) | | | (3,116,709 | ) | |
Net realized and unrealized gain (loss) | | | 20,099,308 | | | | 43,160,283 | | | | (23,870,298 | ) | | | (5,829,637 | ) | |
Net Increase (Decrease) in Net Assets from Operations | | $ | 16,427,246 | | | $ | 65,437,589 | | | $ | (21,440,180 | ) | | $ | (5,424,743 | ) | |
See accompanying notes to financial statements.
95
Columbia Acorn Family of Funds
Statements of Changes in Net Assets
| | | Columbia
Acorn® Fund | | Columbia Acorn
International® | | Columbia
Acorn USA® | | Columbia Acorn
International SelectSM | |
Increase (Decrease) in Net Assets | | Year ended December 31, | | Year ended December 31, | | Year ended December 31, | | Year ended December 31, | |
| | | 2014 | | 2013 | | 2014 | | 2013 | | 2014 | | 2013 | | 2014 | | 2013 | |
Operations: | |
Net investment income (loss) | | $ | (4,904,097 | ) | | $ | 5,803,936 | | | $ | 95,286,191 | | | $ | 94,506,163 | | | $ | (6,182,121 | ) | | $ | (4,042,574 | ) | | $ | 4,277,133 | | | $ | 4,636,217 | | |
Net realized gain (loss) on investments, foreign
currency translations, forward foreign currency
exchange contracts and foreign capital gains tax | | | 2,436,637,992 | | | | 1,401,573,106 | | | | 480,895,123 | | | | 523,273,919 | | | | 257,777,850 | | | | 160,973,633 | | | | 26,265,551 | | | | 29,669,962 | | |
Net realized gain (loss) on affiliated investments and
distributions from affiliated investment company shares | | | 821,706,250 | | | | 222,109,404 | | | | (17,504,372 | ) | | | 76,804,823 | | | | — | | | | — | | | | — | | | | — | | |
Net change in net unrealized appreciation (depreciation)
on investments, foreign currency translations, forward
foreign currency exchange contracts, options and
foreign capital gains tax | | | (2,178,954,324 | ) | | | 2,882,264,973 | | | | (908,876,254 | ) | | | 906,950,318 | | | | (207,204,706 | ) | | | 306,146,936 | | | | (51,145,788 | ) | | | 13,943,403 | | |
Net change in net unrealized appreciation (depreciation)
on affiliated investments, affiliated options and affiliated
investment company shares | | | (983,776,070 | ) | | | 742,076,449 | | | | (10,747,516 | ) | | | (67,324,444 | ) | | | — | | | | 392,095 | | | | — | | | | — | | |
Net Increase (Decrease) in Net Assets from Operations | | | 90,709,751 | | | | 5,253,827,868 | | | | (360,946,828 | ) | | | 1,534,210,779 | | | | 44,391,023 | | | | 463,470,090 | | | | (20,603,104 | ) | | | 48,249,582 | | |
Distributions to Shareholders From: | |
Net investment income – Class A | | | — | | | | (4,469,883 | ) | | | (11,982,984 | ) | | | (25,492,504 | ) | | | — | | | | — | | | | (224,613 | ) | | | (995,831 | ) | |
Net realized gain – Class A | | | (486,737,575 | ) | | | (242,979,462 | ) | | | (51,297,757 | ) | | | (42,739,072 | ) | | | (28,022,455 | ) | | | (16,332,703 | ) | | | (6,609,718 | ) | | | (5,217,634 | ) | |
Net investment income – Class B | | | — | | | | — | | | | (33,111 | ) | | | (249,782 | ) | | | — | | | | — | | | | — | | | | (6,430 | ) | |
Net realized gain – Class B | | | (1,499,818 | ) | | | (1,474,831 | ) | | | (404,076 | ) | | | (556,329 | ) | | | (50,293 | ) | | | (57,712 | ) | | | (51,627 | ) | | | (67,482 | ) | |
Net investment income – Class C | | | — | | | | — | | | | (500,190 | ) | | | (1,667,787 | ) | | | — | | | | — | | | | — | | | | (60,907 | ) | |
Net realized gain – Class C | | | (148,638,681 | ) | | | (65,282,509 | ) | | | (5,765,804 | ) | | | (4,540,816 | ) | | | (7,386,824 | ) | | | (3,645,977 | ) | | | (1,052,637 | ) | | | (740,564 | ) | |
Net investment income – Class I | | | — | | | | (44,509 | ) | | | (432,624 | ) | | | (1,200,147 | ) | | | — | | | | — | | | | (19 | ) | | | (44 | ) | |
Net realized gain – Class I | | | (3,521,541 | ) | | | (1,462,421 | ) | | | (1,776,863 | ) | | | (1,173,000 | ) | | | (424 | ) | | | (310 | ) | | | (267 | ) | | | (183 | ) | |
Net investment income – Class R | | | — | | | | — | | | | (45,702 | ) | | | (88,738 | ) | | | — | | | | — | | | | — | | | | — | | |
Net realized gain – Class R | | | — | | | | — | | | | (308,877 | ) | | | (220,182 | ) | | | — | | | | — | | | | — | | | | — | | |
Net investment income – Class R4 | | | — | | | | (39,853 | ) | | | (5,947,002 | ) | | | (5,132,184 | ) | | | — | | | | — | | | | (7,289 | ) | | | (6,112 | ) | |
Net realized gain – Class R4 | | | (21,919,022 | ) | | | (3,609,537 | ) | | | (21,064,501 | ) | | | (13,386,984 | ) | | | (1,294,173 | ) | | | (464,529 | ) | | | (123,308 | ) | | | (20,623 | ) | |
Net investment income – Class R5 | | | — | | | | (132,214 | ) | | | (6,469,747 | ) | | | (6,226,444 | ) | | | — | | | | — | | | | (19,269 | ) | | | (15,307 | ) | |
Net realized gain – Class R5 | | | (83,114,711 | ) | | | (24,670,758 | ) | | | (20,627,952 | ) | | | (11,061,862 | ) | | | (5,923,118 | ) | | | (450,508 | ) | | | (294,842 | ) | | | (50,485 | ) | |
Net investment income – Class Y | | | — | | | | (1,014,881 | ) | | | (3,631,416 | ) | | | (3,420,841 | ) | | | — | | | | — | | | | (94,386 | ) | | | (202,646 | ) | |
Net realized gain – Class Y | | | (70,995,899 | ) | | | (67,636,681 | ) | | | (11,216,211 | ) | | | (7,136,853 | ) | | | (5,748,134 | ) | | | (2,875,291 | ) | | | (1,353,410 | ) | | | (590,564 | ) | |
Net investment income – Class Z | | | — | | | | (15,891,591 | ) | | | (88,209,132 | ) | | | (155,452,351 | ) | | | — | | | | — | | | | (1,436,806 | ) | | | (4,109,073 | ) | |
Net realized gain – Class Z | | | (1,866,279,508 | ) | | | (900,665,248 | ) | | | (300,186,783 | ) | | | (249,192,931 | ) | | | (197,817,289 | ) | | | (117,566,025 | ) | | | (23,156,256 | ) | | | (18,050,611 | ) | |
Total Distributions to Shareholders | | | (2,682,706,755 | ) | | | (1,329,374,378 | ) | | | (529,900,732 | ) | | | (528,938,807 | ) | | | (246,242,710 | ) | | | (141,393,055 | ) | | | (34,424,447 | ) | | | (30,134,496 | ) | |
Share Transactions: | |
Subscriptions – Class A | | | 387,297,277 | | | | 557,145,668 | | | | 235,302,578 | | | | 388,100,963 | | | | 25,880,527 | | | | 45,008,746 | | | | 17,687,288 | | | | 25,343,455 | | |
Distributions reinvested – Class A | | | 458,120,888 | | | | 233,381,519 | | | | 61,324,199 | | | | 65,876,765 | | | | 25,490,248 | | | | 15,114,156 | | | | 6,671,741 | | | | 6,095,501 | | |
Redemptions – Class A | | | (1,539,008,962 | ) | | | (858,688,706 | ) | | | (328,383,569 | ) | | | (530,170,862 | ) | | | (81,566,768 | ) | | | (44,053,671 | ) | | | (33,811,493 | ) | | | (35,337,785 | ) | |
Net Increase (Decrease) – Class A | | | (693,590,797 | ) | | | (68,161,519 | ) | | | (31,756,792 | ) | | | (76,193,134 | ) | | | (30,195,993 | ) | | | 16,069,231 | | | | (9,452,464 | ) | | | (3,898,829 | ) | |
Distributions reinvested – Class B | | | 1,459,028 | | | | 1,460,482 | | | | 428,823 | | | | 818,689 | | | | 50,412 | | | | 57,565 | | | | 51,402 | | | | 73,716 | | |
Redemptions – Class B | | | (11,842,669 | ) | | | (21,005,008 | ) | | | (6,307,820 | ) | | | (7,611,506 | ) | | | (333,713 | ) | | | (704,340 | ) | | | (493,902 | ) | | | (502,159 | ) | |
Net Increase (Decrease) – Class B | | | (10,383,641 | ) | | | (19,544,526 | ) | | | (5,878,997 | ) | | | (6,792,817 | ) | | | (283,301 | ) | | | (646,775 | ) | | | (442,500 | ) | | | (428,443 | ) | |
Subscriptions – Class C | | | 69,519,166 | | | | 102,078,253 | | | | 20,327,395 | | | | 18,300,360 | | | | 2,990,564 | | | | 3,731,266 | | | | 1,124,408 | | | | 2,209,150 | | |
Distributions reinvested – Class C | | | 124,358,458 | | | | 53,482,078 | | | | 5,543,900 | | | | 5,389,019 | | | | 7,016,021 | | | | 3,400,514 | | | | 965,830 | | | | 731,141 | | |
Redemptions – Class C | | | (204,072,123 | ) | | | (127,416,912 | ) | | | (20,718,133 | ) | | | (18,680,336 | ) | | | (7,454,664 | ) | | | (4,271,383 | ) | | | (2,579,871 | ) | | | (2,895,556 | ) | |
Net Increase (Decrease) – Class C | | | (10,194,499 | ) | | | 28,143,419 | | | | 5,153,162 | | | | 5,009,043 | | | | 2,551,921 | | | | 2,860,397 | | | | (489,633 | ) | | | 44,735 | | |
Subscriptions – Class I | | | 82,894,450 | | | | 62,857,281 | | | | 106,632,159 | | | | 88,004,757 | | | | — | | | | — | | | | — | | | | — | | |
Distributions reinvested – Class I | | | 3,521,166 | | | | 1,506,709 | | | | 2,209,323 | | | | 2,371,517 | | | | — | | | | — | | | | — | | | | — | | |
Redemptions – Class I | | | (79,941,110 | ) | | | (116,462,027 | ) | | | (98,916,651 | ) | | | (175,245,774 | ) | | | (1,200 | ) | | | — | | | | (100 | ) | | | — | | |
Net Increase (Decrease) – Class I | | | 6,474,506 | | | | (52,098,037 | ) | | | 9,924,831 | | | | (84,869,500 | ) | | | (1,200 | ) | | | — | | | | (100 | ) | | | — | | |
Subscriptions – Class R | | | — | | | | — | | | | 3,552,904 | | | | 3,579,789 | | | | — | | | | — | | | | — | | | | — | | |
Distributions reinvested – Class R | | | — | | | | — | | | | 324,934 | | | | 280,476 | | | | — | | | | — | | | | — | | | | — | | |
Redemptions – Class R | | | — | | | | — | | | | (3,574,734 | ) | | | (1,384,671 | ) | | | — | | | | — | | | | — | | | | — | | |
Net Increase – Class R | | | — | | | | — | | | | 303,104 | | | | 2,475,594 | | | | — | | | | — | | | | — | | | | — | | |
(a) Class Y shares reflect activity for the period from June 13, 2013 (commencement of operations) through December 31, 2013.
(b) Class R4 shares reflect activity for the period from June 25, 2014 (commencement of operations) through December 31, 2014.
See accompanying notes to financial statements.
96
| | | Columbia
Acorn SelectSM | | Columbia
Thermostat FundSM | | Columbia Acorn
Emerging Markets FundSM | | Columbia Acorn
European FundSM | |
Increase (Decrease) in Net Assets | | Year ended December 31, | | Year ended December 31, | | Year ended December 31, | | Year ended December 31, | |
| | | 2014 | | 2013 | | 2014 | | 2013 | | 2014 | | 2013 (a) | | 2014 (b) | | 2013 | |
Operations: | |
Net investment income (loss) | | $ | (3,672,062 | ) | | $ | (3,787,764 | ) | | $ | 22,277,306 | | | $ | 21,177,510 | | | $ | 2,430,118 | | | $ | 1,192,356 | | | $ | 404,894 | | | $ | 16,515 | | |
Net realized gain (loss) on investments, foreign
currency translations, forward foreign currency
exchange contracts and foreign capital gains tax | | | 158,802,272 | | | | 199,126,634 | | | | 35 | | | | — | | | | (9,229,406 | ) | | | (5,903,007 | ) | | | (2,712,928 | ) | | | 290,295 | | |
Net realized gain (loss) on affiliated investments and
distributions from affiliated investment company shares | | | (5,568,755 | ) | | | 1,096,550 | | | | 38,178,162 | | | | 87,967,259 | | | | — | | | | — | | | | — | | | | — | | |
Net change in net unrealized appreciation (depreciation)
on investments, foreign currency translations, forward
foreign currency exchange contracts, options and
foreign capital gains tax | | | (133,989,051 | ) | | | 59,584,538 | | | | — | | | | — | | | | (14,640,892 | ) | | | 30,064,776 | | | | (3,116,709 | ) | | | 3,148,647 | | |
Net change in net unrealized appreciation (depreciation)
on affiliated investments, affiliated options and affiliated
investment company shares | | | 854,842 | | | | 7,543,133 | | | | 4,982,086 | | | | (12,732,372 | ) | | | — | | | | — | | | | — | | | | — | | |
Net Increase (Decrease) in Net Assets from Operations | | | 16,427,246 | | | | 263,563,091 | | | | 65,437,589 | | | | 96,412,397 | | | | (21,440,180 | ) | | | 25,354,125 | | | | (5,424,743 | ) | | | 3,455,457 | | |
Distributions to Shareholders From: | |
Net investment income – Class A | | | — | | | | (779,067 | ) | | | (8,397,874 | ) | | | (8,405,645 | ) | | | (1,094,797 | ) | | | (982,830 | ) | | | (84,996 | ) | | | (19,726 | ) | |
Net realized gain – Class A | | | (56,636,824 | ) | | | (74,628,738 | ) | | | (6,398,591 | ) | | | (24,911,710 | ) | | | — | | | | — | | | | (169,484 | ) | | | (17,284 | ) | |
Net investment income – Class B | | | — | | | | — | | | | (17,083 | ) | | | (26,642 | ) | | | — | | | | — | | | | — | | | | — | | |
Net realized gain – Class B | | | (297,506 | ) | | | (860,295 | ) | | | (18,454 | ) | | | (109,193 | ) | | | — | | | | — | | | | — | | | | — | | |
Net investment income – Class C | | | — | | | | — | | | | (4,546,957 | ) | | | (3,912,583 | ) | | | — | | | | — | | | | — | | | | — | | |
Net realized gain – Class C | | | (12,212,259 | ) | | | (15,474,668 | ) | | | (5,614,280 | ) | | | (20,870,877 | ) | | | — | | | | — | | | | (21,837 | ) | | | (1,176 | ) | |
Net investment income – Class I | | | — | | | | (134,582 | ) | | | — | | | | — | | | | (25 | ) | | | (63 | ) | | | (17 | ) | | | (31 | ) | |
Net realized gain – Class I | | | (3,400,475 | ) | | | (3,544,269 | ) | | | — | | | | — | | | | — | | | | — | | | | (13 | ) | | | (8 | ) | |
Net investment income – Class R | | | — | | | | — | | | | — | | | | — | | | | — | | | | — | | | | — | | | | — | | |
Net realized gain – Class R | | | — | | | | — | | | | — | | | | — | | | | — | | | | — | | | | — | | | | — | | |
Net investment income – Class R4 | | | — | | | | (361 | ) | | | (496,795 | ) | | | (279,538 | ) | | | (139,747 | ) | | | (121,494 | ) | | | (1,628 | ) | | | — | | |
Net realized gain – Class R4 | | | (246,466 | ) | | | (146,391 | ) | | | (305,871 | ) | | | (732,207 | ) | | | — | | | | — | | | | — | | | | — | | |
Net investment income – Class R5 | | | — | | | | (2,205 | ) | | | (65,599 | ) | | | (17,560 | ) | | | (184,675 | ) | | | (121,239 | ) | | | (11,230 | ) | | | (5,749 | ) | |
Net realized gain – Class R5 | | | (2,042,106 | ) | | | (2,031,137 | ) | | | (42,379 | ) | | | (45,621 | ) | | | — | | | | — | | | | (14,316 | ) | | | (1,913 | ) | |
Net investment income – Class Y | | | — | | | | (184 | ) | | | (8,730 | ) | | | (55 | ) | | | (23 | ) | | | (27 | ) | | | — | | | | — | | |
Net realized gain – Class Y | | | (715,032 | ) | | | (819,712 | ) | | | (5,549 | ) | | | (133 | ) | | | — | | | | — | | | | — | | | | — | | |
Net investment income – Class Z | | | — | | | | (2,355,271 | ) | | | (8,020,198 | ) | | | (7,145,972 | ) | | | (2,086,821 | ) | | | (1,332,785 | ) | | | (58,745 | ) | | | (15,666 | ) | |
Net realized gain – Class Z | | | (67,822,345 | ) | | | (101,354,640 | ) | | | (5,142,454 | ) | | | (18,354,791 | ) | | | — | | | | — | | | | (81,656 | ) | | | (4,486 | ) | |
Total Distributions to Shareholders | | | (143,373,013 | ) | | | (202,131,520 | ) | | | (39,080,814 | ) | | | (84,812,527 | ) | | | (3,506,088 | ) | | | (2,558,438 | ) | | | (443,922 | ) | | | (66,039 | ) | |
Share Transactions: | |
Subscriptions – Class A | | | 23,903,410 | | | | 65,389,229 | | | | 109,228,793 | | | | 269,301,297 | | | | 111,765,309 | | | | 179,677,591 | | | | 30,709,434 | | | | 19,592,036 | | |
Distributions reinvested – Class A | | | 52,931,442 | | | | 70,987,772 | | | | 13,288,881 | | | | 30,672,808 | | | | 1,088,373 | | | | 978,630 | | | | 251,848 | | | | 31,783 | | |
Redemptions – Class A | | | (94,474,957 | ) | | | (88,198,756 | ) | | | (196,252,756 | ) | | | (113,768,855 | ) | | | (122,334,919 | ) | | | (16,017,690 | ) | | | (25,970,474 | ) | | | (3,060,376 | ) | |
Net Increase (Decrease) – Class A | | | (17,640,105 | ) | | | 48,178,245 | | | | (73,735,082 | ) | | | 186,205,250 | | | | (9,481,237 | ) | | | 164,638,531 | | | | 4,990,808 | | | | 16,563,443 | | |
Distributions reinvested – Class B | | | 295,790 | | | | 857,139 | | | | 35,043 | | | | 134,520 | | | | — | | | | — | | | | — | | | | — | | |
Redemptions – Class B | | | (1,910,917 | ) | | | (8,581,439 | ) | | | (1,111,595 | ) | | | (2,504,093 | ) | | | — | | | | — | | | | — | | | | — | | |
Net Increase (Decrease) – Class B | | | (1,615,127 | ) | | | (7,724,300 | ) | | | (1,076,552 | ) | | | (2,369,573 | ) | | | — | | | | — | | | | — | | | | — | | |
Subscriptions – Class C | | | 3,943,141 | | | | 4,254,216 | | | | 71,129,998 | | | | 215,445,550 | | | | 16,317,984 | | | | 30,902,660 | | | | 5,134,061 | | | | 1,250,413 | | |
Distributions reinvested – Class C | | | 10,065,907 | | | | 12,694,116 | | | | 7,780,938 | | | | 18,856,243 | | | | — | | | | — | | | | 21,837 | | | | 1,175 | | |
Redemptions – Class C | | | (15,355,912 | ) | | | (14,117,603 | ) | | | (113,101,789 | ) | | | (60,357,649 | ) | | | (5,604,206 | ) | | | (732,599 | ) | | | (974,284 | ) | | | (56,761 | ) | |
Net Increase (Decrease) – Class C | | | (1,346,864 | ) | | | 2,830,729 | | | | (34,190,853 | ) | | | 173,944,144 | | | | 10,713,778 | | | | 30,170,061 | | | | 4,181,614 | | | | 1,194,827 | | |
Subscriptions – Class I | | | 54,126,443 | | | | 41,439,706 | | | | — | | | | — | | | | — | | | | — | | | | — | | | | — | | |
Distributions reinvested – Class I | | | 3,400,003 | | | | 3,678,143 | | | | — | | | | — | | | | 24 | | | | 63 | | | | 29 | | | | 39 | | |
Redemptions – Class I | | | (52,140,680 | ) | | | (77,746,294 | ) | | | — | | | | — | | | | (4,200 | ) | | | — | | | | (5,500 | ) | | | — | | |
Net Increase (Decrease) – Class I | | | 5,385,766 | | | | (32,628,445 | ) | | | — | | | | — | | | | (4,176 | ) | | | 63 | | | | (5,471 | ) | | | 39 | | |
Subscriptions – Class R | | | — | | | | — | | | | — | | | | — | | | | — | | | | — | | | | — | | | | — | | |
Distributions reinvested – Class R | | | — | | | | — | | | | — | | | | — | | | | — | | | | — | | | | — | | | | — | | |
Redemptions – Class R | | | — | | | | — | | | | — | | | | — | | | | — | | | | — | | | | — | | | | — | | |
Net Increase – Class R | | | — | | | | — | | | | — | | | | — | | | | — | | | | — | | | | — | | | | — | | |
See accompanying notes to financial statements.
97
Columbia Acorn Family of Funds
Statements of Changes in Net Assets, continued
| | | Columbia
Acorn® Fund | | Columbia Acorn
International® | | Columbia
Acorn USA® | | Columbia Acorn
International SelectSM | |
Increase (Decrease) in Net Assets | | Year ended December 31, | | Year ended December 31, | | Year ended December 31, | | Year ended December 31, | |
| | | 2014 | | 2013 | | 2014 | | 2013 | | 2014 | | 2013 | | 2014 | | 2013 | |
Subscriptions – Class R4 | | | 207,170,623 | | | | 70,679,921 | | | | 175,589,777 | | | | 346,765,044 | | | | 2,470,102 | | | | 6,157,899 | | | | 1,034,431 | | | | 383,885 | | |
Distributions reinvested – Class R4 | | | 21,432,710 | | | | 3,598,586 | | | | 26,888,828 | | | | 18,510,730 | | | | 1,284,629 | | | | 463,030 | | | | 130,285 | | | | 25,563 | | |
Redemptions – Class R4 | | | (32,595,900 | ) | | | (5,189,707 | ) | | | (86,239,207 | ) | | | (7,666,126 | ) | | | (1,252,295 | ) | | | (397,344 | ) | | | (342,802 | ) | | | (158 | ) | |
Net Increase – Class R4 | | | 196,007,433 | | | | 69,088,800 | | | | 116,239,398 | | | | 357,609,648 | | | | 2,502,436 | | | | 6,223,585 | | | | 821,914 | | | | 409,290 | | |
Subscriptions – Class R5 | | | 195,425,964 | | | | 491,001,376 | | | | 247,362,038 | | | | 285,865,026 | | | | 37,680,269 | | | | 5,875,204 | | | | 3,308,092 | | | | 959,653 | | |
Distributions reinvested – Class R5 | | | 82,145,922 | | | | 24,452,455 | | | | 27,089,438 | | | | 17,278,109 | | | | 5,922,697 | | | | 450,258 | | | | 313,832 | | | | 65,594 | | |
Redemptions – Class R5 | | | (237,599,243 | ) | | | (47,781,358 | ) | | | (105,520,799 | ) | | | (47,512,031 | ) | | | (8,503,850 | ) | | | (553,703 | ) | | | (1,308,702 | ) | | | (79,732 | ) | |
Net Increase (Decrease) – Class R5 | | | 39,972,643 | | | | 467,672,473 | | | | 168,930,677 | | | | 255,631,104 | | | | 35,099,116 | | | | 5,771,759 | | | | 2,313,222 | | | | 945,515 | | |
Subscriptions – Class Y | | | 199,351,710 | | | | 1,048,816,289 | | | | 103,024,265 | | | | 165,373,208 | | | | 36,144,225 | | | | 44,461,461 | | | | 2,689,199 | | | | 13,106,279 | | |
Distributions reinvested – Class Y | | | 70,995,899 | | | | 68,651,368 | | | | 14,847,627 | | | | 8,485,714 | | | | 5,747,713 | | | | 2,875,042 | | | | 1,447,516 | | | | 793,011 | | |
Redemptions – Class Y | | | (1,053,713,427 | ) | | | (76,908,863 | ) | | | (21,611,148 | ) | | | (60,678,159 | ) | | | (48,745,200 | ) | | | (321,655 | ) | | | (3,306,180 | ) | | | (353,711 | ) | |
Net Increase (Decrease) – Class Y | | | (783,365,818 | ) | | | 1,040,558,794 | | | | 96,260,744 | | | | 113,180,763 | | | | (6,853,262 | ) | | | 47,014,848 | | | | 830,535 | | | | 13,545,579 | | |
Subscriptions – Class Z | | | 982,362,041 | | | | 1,365,381,996 | | | | 856,537,476 | | | | 952,243,095 | | | | 102,940,940 | | | | 192,666,998 | | | | 43,516,847 | | | | 56,693,525 | | |
Distributions reinvested – Class Z | | | 1,619,840,849 | | | | 797,203,097 | | | | 294,475,850 | | | | 317,702,278 | | | | 173,222,058 | | | | 102,958,421 | | | | 14,556,758 | | | | 12,763,349 | | |
Redemptions – Class Z | | | (4,171,520,886 | ) | | | (3,725,592,700 | ) | | | (1,213,184,358 | ) | | | (1,257,745,052 | ) | | | (480,201,144 | ) | | | (494,803,769 | ) | | | (99,596,462 | ) | | | (122,754,727 | ) | |
Net Increase (Decrease) – Class Z | | | (1,569,317,996 | ) | | | (1,563,007,607 | ) | | | (62,171,032 | ) | | | 12,200,321 | | | | (204,038,146 | ) | | | (199,178,350 | ) | | | (41,522,857 | ) | | | (53,297,853 | ) | |
Net Increase (Decrease) from Share Transactions | | | (2,824,398,169 | ) | | | (97,348,203 | ) | | | 297,005,095 | | | | 578,251,022 | | | | (201,218,429 | ) | | | (121,885,305 | ) | | | (47,941,883 | ) | | | (42,680,006 | ) | |
Total Increase (Decrease) in Net Assets | | | (5,416,395,173 | ) | | | 3,827,105,287 | | | | (593,842,465 | ) | | | 1,583,522,994 | | | | (403,070,116 | ) | | | 200,191,730 | | | | (102,969,434 | ) | | | (24,564,920 | ) | |
Net Assets: | |
Beginning of period | | | 21,350,971,198 | | | | 17,523,865,911 | | | | 8,327,320,600 | | | | 6,743,797,606 | | | | 1,800,286,403 | | | | 1,600,094,673 | | | | 355,889,134 | | | | 380,454,054 | | |
End of period | | $ | 15,934,576,025 | | | $ | 21,350,971,198 | | | $ | 7,733,478,135 | | | $ | 8,327,320,600 | | | $ | 1,397,216,287 | | | $ | 1,800,286,403 | | | $ | 252,919,700 | | | $ | 355,889,134 | | |
Undistributed (Overdistributed) net investment income (loss) | | $ | (3,615,764 | ) | | $ | (36,590,606 | ) | | $ | (92,376,083 | ) | | $ | (119,307,605 | ) | | $ | (312,115 | ) | | $ | (286,857 | ) | | $ | (6,492,720 | ) | | $ | (12,664,698 | ) | |
(a) Class Y shares reflect activity for the period from June 13, 2013 (commencement of operations) through December 31, 2013.
(b) Class R4 shares reflect activity for the period from June 25, 2014 (commencement of operations) through December 31, 2014.
See accompanying notes to financial statements.
98
| | | Columbia
Acorn SelectSM | | Columbia
Thermostat FundSM | | Columbia Acorn
Emerging Markets FundSM | | Columbia Acorn
European FundSM | |
Increase (Decrease) in Net Assets | | Year ended December 31, | | Year ended December 31, | | Year ended December 31, | | Year ended December 31, | |
| | | 2014 | | 2013 | | 2014 | | 2013 | | 2014 | | 2013 (a) | | 2014 (b) | | 2013 | |
Subscriptions – Class R4 | | | 533,691 | | | | 1,409,186 | | | | 12,515,863 | | | | 16,841,816 | | | | 6,532,869 | | | | 13,932,169 | | | | 325,474 | | | | — | | |
Distributions reinvested – Class R4 | | | 246,466 | | | | 142,707 | | | | 802,565 | | | | 1,010,634 | | | | 139,724 | | | | 121,336 | | | | 1,614 | | | | — | | |
Redemptions – Class R4 | | | (753,003 | ) | | | (144,546 | ) | | | (4,731,799 | ) | | | (2,678,147 | ) | | | (3,899,691 | ) | | | (1,223,601 | ) | | | (93 | ) | | | — | | |
Net Increase – Class R4 | | | 27,154 | | | | 1,407,347 | | | | 8,586,629 | | | | 15,174,303 | | | | 2,772,902 | | | | 12,829,904 | | | | 326,995 | | | | — | | |
Subscriptions – Class R5 | | | 2,302,873 | | | | 10,681,076 | | | | 3,265,267 | | | | 1,172,670 | | | | 13,884,224 | | | | 13,005,283 | | | | 3,323,523 | | | | 1,696,121 | | |
Distributions reinvested – Class R5 | | | 2,041,638 | | | | 2,032,665 | | | | 106,949 | | | | 62,995 | | | | 184,675 | | | | 121,213 | | | | 25,520 | | | | 7,648 | | |
Redemptions – Class R5 | | | (3,845,123 | ) | | | (532,781 | ) | | | (815,418 | ) | | | (221,359 | ) | | | (7,252,982 | ) | | | (155,394 | ) | | | (3,409,088 | ) | | | (51,126 | ) | |
Net Increase (Decrease) – Class R5 | | | 499,388 | | | | 12,180,960 | | | | 2,556,798 | | | | 1,014,306 | | | | 6,815,917 | | | | 12,971,102 | | | | (60,045 | ) | | | 1,652,643 | | |
Subscriptions – Class Y | | | 538,245 | | | | 4,652,097 | | | | 435,256 | | | | — | | | | — | | | | 2,500 | | | | — | | | | — | | |
Distributions reinvested – Class Y | | | 714,565 | | | | 819,220 | | | | 14,183 | | | | — | | | | — | | | | — | | | | — | | | | — | | |
Redemptions – Class Y | | | (1,818,170 | ) | | | (557,993 | ) | | | (53,320 | ) | | | — | | | | (200 | ) | | | — | | | | — | | | | — | | |
Net Increase (Decrease) – Class Y | | | (565,360 | ) | | | 4,913,324 | | | | 396,119 | | | | — | | | | (200 | ) | | | 2,500 | | | | — | | | | — | | |
Subscriptions – Class Z | | | 41,269,615 | | | | 46,215,005 | | | | 158,234,941 | | | | 241,074,077 | | | | 181,236,447 | | | | 173,769,882 | | | | 21,621,093 | | | | 1,188,594 | | |
Distributions reinvested – Class Z | | | 52,107,171 | | | | 71,082,424 | | | | 8,772,626 | | | | 15,861,661 | | | | 2,002,496 | | | | 1,254,500 | | | | 139,509 | | | | 19,797 | | |
Redemptions – Class Z | | | (146,142,628 | ) | | | (311,970,231 | ) | | | (172,293,477 | ) | | | (180,321,598 | ) | | | (101,479,206 | ) | | | (14,317,387 | ) | | | (15,477,555 | ) | | | (502,271 | ) | |
Net Increase (Decrease) – Class Z | | | (52,765,842 | ) | | | (194,672,802 | ) | | | (5,285,910 | ) | | | 76,614,140 | | | | 81,759,737 | | | | 160,706,995 | | | | 6,283,047 | | | | 706,120 | | |
Net Increase (Decrease) from Share Transactions | | | (68,020,990 | ) | | | (165,514,942 | ) | | | (102,748,851 | ) | | | 450,582,570 | | | | 92,576,721 | | | | 381,319,156 | | | | 15,716,948 | | | | 20,117,072 | | |
Total Increase (Decrease) in Net Assets | | | (194,966,757 | ) | | | (104,083,371 | ) | | | (76,392,076 | ) | | | 462,182,440 | | | | 67,630,453 | | | | 404,114,843 | | | | 9,848,283 | | | | 23,506,490 | | |
Net Assets: | |
Beginning of period | | | 861,543,543 | | | | 965,626,914 | | | | 1,336,805,137 | | | | 874,622,697 | | | | 414,704,654 | | | | 10,589,811 | | | | 26,784,525 | | | | 3,278,035 | | |
End of period | | $ | 666,576,786 | | | $ | 861,543,543 | | | $ | 1,260,413,061 | | | $ | 1,336,805,137 | | | $ | 482,335,107 | | | $ | 414,704,654 | | | $ | 36,632,808 | | | $ | 26,784,525 | | |
Undistributed (Overdistributed) net investment income (loss) | | $ | (325,960 | ) | | $ | (450,627 | ) | | $ | 1,675,197 | | | $ | 720,757 | | | $ | (2,486,157 | ) | | $ | (1,371,231 | ) | | $ | 199,170 | | | $ | (26,208 | ) | |
See accompanying notes to financial statements.
99
Columbia Acorn Family of Funds
Statements of Changes in Net Assets, continued
| | | Columbia
Acorn® Fund | | Columbia Acorn
International® | | Columbia
Acorn USA® | | Columbia Acorn
International SelectSM | |
Changes in Shares of Beneficial Interest: | | Year ended December 31, | | Year ended December 31, | | Year ended December 31, | | Year ended December 31, | |
| | | 2014 | | 2013 | | 2014 | | 2013 | | 2014 | | 2013 | | 2014 | | 2013 | |
Subscriptions – Class A | | | 11,177,523 | | | | 16,772,784 | | | | 5,069,057 | | | | 8,721,860 | | | | 786,132 | | | | 1,394,169 | | | | 638,165 | | | | 953,061 | | |
Shares issued in reinvestment and capital gains – Class A | | | 14,955,024 | | | | 6,939,430 | | | | 1,433,668 | | | | 1,475,191 | | | | 878,620 | | | | 468,483 | | | | 298,993 | | | | 233,959 | | |
Less shares redeemed – Class A | | | (45,358,767 | ) | | | (25,665,267 | ) | | | (7,155,380 | ) | | | (11,526,833 | ) | | | (2,482,524 | ) | | | (1,355,276 | ) | | | (1,259,425 | ) | | | (1,336,213 | ) | |
Net Increase (Decrease) – Class A | | | (19,226,220 | ) | | | (1,953,053 | ) | | | (652,655 | ) | | | (1,329,782 | ) | | | (817,772 | ) | | | 507,376 | | | | (322,267 | ) | | | (149,193 | ) | |
Shares issued in reinvestment and capital gains – Class B | | | 53,837 | | | | 48,181 | | | | 10,251 | | | | 18,918 | | | | 1,994 | | | | 1,984 | | | | 2,445 | | | | 2,974 | | |
Less shares redeemed – Class B | | | (380,244 | ) | | | (705,007 | ) | | | (141,082 | ) | | | (178,171 | ) | | | (11,206 | ) | | | (24,425 | ) | | | (19,481 | ) | | | (20,013 | ) | |
Net Increase (Decrease) – Class B | | | (326,407 | ) | | | (656,826 | ) | | | (130,831 | ) | | | (159,253 | ) | | | (9,212 | ) | | | (22,441 | ) | | | (17,036 | ) | | | (17,039 | ) | |
Subscriptions – Class C | | | 2,380,665 | | | | 3,426,567 | | | | 455,251 | | | | 425,390 | | | | 106,036 | | | | 128,459 | | | | 43,902 | | | | 88,935 | | |
Shares issued in reinvestment and capital gains – Class C | | | 4,736,715 | | | | 1,792,288 | | | | 134,128 | | | | 124,854 | | | | 281,787 | | | | 118,609 | | | | 46,423 | | | | 29,744 | | |
Less shares redeemed – Class C | | | (6,832,781 | ) | | | (4,279,659 | ) | | | (471,635 | ) | | | (436,255 | ) | | | (259,303 | ) | | | (147,379 | ) | | | (104,212 | ) | | | (115,611 | ) | |
Net Increase (Decrease) – Class C | | | 284,599 | | | | 939,196 | | | | 117,744 | | | | 113,989 | | | | 128,520 | | | | 99,689 | | | | (13,887 | ) | | | 3,068 | | |
Subscriptions – Class I | | | 2,381,215 | | | | 1,885,590 | | | | 2,360,586 | | | | 2,038,998 | | | | — | | | | — | | | | — | | | | — | | |
Shares issued in reinvestment and capital gains – Class I | | | 107,212 | | | | 43,283 | | | | 50,640 | | | | 53,236 | | | | — | | | | — | | | | — | | | | — | | |
Less shares redeemed – Class I | | | (2,154,531 | ) | | | (3,308,111 | ) | | | (2,111,846 | ) | | | (3,848,404 | ) | | | (33 | ) | | | — | | | | (4 | ) | | | — | | |
Net Increase (Decrease) – Class I | | | 333,896 | | | | (1,379,238 | ) | | | 299,380 | | | | (1,756,170 | ) | | | (33 | ) | | | — | | | | (4 | ) | | | — | | |
Subscriptions – Class R | | | — | | | | — | | | | 77,000 | | | | 81,299 | | | | — | | | | — | | | | — | | | | — | | |
Shares issued in reinvestment and capital gains – Class R | | | — | | | | — | | | | 7,564 | | | | 6,268 | | | | — | | | | — | | | | — | | | | — | | |
Less shares redeemed – Class R | | | — | | | | — | | | | (76,075 | ) | | | (31,263 | ) | | | — | | | | — | | | | — | | | | — | | |
Net Increase – Class R | | | — | | | | — | | | | 8,489 | | | | 56,304 | | | | — | | | | — | | | | — | | | | — | | |
Subscriptions – Class R4 | | | 5,988,744 | | | | 1,998,028 | | | | 3,770,182 | | | | 7,323,105 | | | | 69,547 | | | | 173,989 | | | | 36,025 | | | | 13,801 | | |
Shares issued in reinvestment and capital gains – Class R4 | | | 658,166 | | | | 100,520 | | | | 626,322 | | | | 408,790 | | | | 40,840 | | | | 13,409 | | | | 5,756 | | | | 962 | | |
Less shares redeemed – Class R4 | | | (900,585 | ) | | | (140,805 | ) | | | (1,864,318 | ) | | | (163,652 | ) | | | (35,802 | ) | | | (11,660 | ) | | | (13,656 | ) | | | (6 | ) | |
Net Increase – Class R4 | | | 5,746,325 | | | | 1,957,743 | | | | 2,532,186 | | | | 7,568,243 | | | | 74,585 | | | | 175,738 | | | | 28,125 | | | | 14,757 | | |
Subscriptions – Class R5 | | | 5,371,622 | | | | 13,752,426 | | | | 5,374,903 | | | | 6,528,156 | | | | 1,039,918 | | | | 167,928 | | | | 113,565 | | | | 35,393 | | |
Shares issued in reinvestment and capital gains – Class R5 | | | 2,508,272 | | | | 680,831 | | | | 636,802 | | | | 385,664 | | | | 188,407 | | | | 13,045 | | | | 13,893 | | | | 2,472 | | |
Less shares redeemed – Class R5 | | | (6,914,002 | ) | | | (1,319,787 | ) | | | (2,352,664 | ) | | | (1,038,451 | ) | | | (237,562 | ) | | | (14,967 | ) | | | (46,841 | ) | | | (2,971 | ) | |
Net Increase (Decrease) – Class R5 | | | 965,892 | | | | 13,113,470 | | | | 3,659,041 | | | | 5,875,369 | | | | 990,763 | | | | 166,006 | | | | 80,617 | | | | 34,894 | | |
Subscriptions – Class Y | | | 5,405,607 | | | | 30,418,210 | | | | 2,180,767 | | | | 3,692,396 | | | | 989,024 | | | | 1,250,341 | | | | 95,911 | | | | 470,106 | | |
Shares issued in reinvestment and capital gains – Class Y | | | 2,114,206 | | | | 1,921,971 | | | | 346,391 | | | | 187,806 | | | | 182,296 | | | | 83,147 | | | | 63,827 | | | | 29,869 | | |
Less shares redeemed – Class Y | | | (28,273,237 | ) | | | (2,138,695 | ) | | | (474,107 | ) | | | (1,329,828 | ) | | | (1,378,135 | ) | | | (8,744 | ) | | | (122,660 | ) | | | (12,731 | ) | |
Net Increase (Decrease) – Class Y | | | (20,753,424 | ) | | | 30,201,486 | | | | 2,053,051 | | | | 2,550,374 | | | | (206,815 | ) | | | 1,324,744 | | | | 37,078 | | | | 487,244 | | |
Subscriptions – Class Z | | | 27,275,542 | | | | 39,991,834 | | | | 18,575,064 | | | | 21,587,060 | | | | 2,943,870 | | | | 5,769,866 | | | | 1,572,550 | | | | 2,139,566 | | |
Shares issued in reinvestment and capital gains – Class Z | | | 50,258,476 | | | | 22,754,352 | | | | 6,885,453 | | | | 7,096,454 | | | | 5,614,121 | | | | 3,036,499 | | | | 645,241 | | | | 484,755 | | |
Less shares redeemed – Class Z | | | (116,645,260 | ) | | | (107,868,830 | ) | | | (26,436,650 | ) | | | (28,414,984 | ) | | | (13,762,562 | ) | | | (15,174,383 | ) | | | (3,750,710 | ) | | | (4,625,116 | ) | |
Net Increase (Decrease) – Class Z | | | (39,111,242 | ) | | | (45,122,644 | ) | | | (976,133 | ) | | | 268,530 | | | | (5,204,571 | ) | | | (6,368,018 | ) | | | (1,532,919 | ) | | | (2,000,795 | ) | |
Net Increase (Decrease) in Shares of Beneficial Interest | | | (72,086,581 | ) | | | (2,899,866 | ) | | | 6,910,272 | | | | 13,187,604 | | | | (5,044,535 | ) | | | (4,116,906 | ) | | | (1,740,293 | ) | | | (1,627,064 | ) | |
(a) Class Y shares reflect activity for the period from June 13, 2013 (commencement of operations) through December 31, 2013.
(b) Class R4 shares reflect activity for the period from June 25, 2014 (commencement of operations) through December 31, 2014.
See accompanying notes to financial statements.
100
| | | Columbia
Acorn SelectSM | | Columbia
Thermostat FundSM | | Columbia Acorn
Emerging Markets FundSM | | Columbia Acorn
European FundSM | |
Changes in Shares of Beneficial Interest: | | Year ended December 31, | | Year ended December 31, | | Year ended December 31, | | Year ended December 31, | |
| | | 2014 | | 2013 | | 2014 | | 2013 | | 2014 | | 2013 (a) | | 2014 (b) | | 2013 | |
Subscriptions – Class A | | | 999,673 | | | | 2,409,551 | | | | 7,304,585 | | | | 17,981,201 | | | | 8,480,721 | | | | 14,185,095 | | | | 1,976,901 | | | | 1,389,036 | | |
Shares issued in reinvestment and capital gains – Class A | | | 2,437,585 | | | | 2,880,725 | | | | 893,241 | | | | 2,106,160 | | | | 85,241 | | | | 75,048 | | | | 16,205 | | | | 2,142 | | |
Less shares redeemed – Class A | | | (3,902,541 | ) | | | (3,250,484 | ) | | | (13,113,073 | ) | | | (7,527,423 | ) | | | (9,160,435 | ) | | | (1,269,880 | ) | | | (1,738,341 | ) | | | (212,961 | ) | |
Net Increase (Decrease) – Class A | | | (465,283 | ) | | | 2,039,792 | | | | (4,915,247 | ) | | | 12,559,938 | | | | (594,473 | ) | | | 12,990,263 | | | | 254,765 | | | | 1,178,217 | | |
Shares issued in reinvestment and capital gains – Class B | | | 15,514 | | | | 38,348 | | | | 2,338 | | | | 9,173 | | | | — | | | | — | | | | — | | | | — | | |
Less shares redeemed – Class B | | | (88,114 | ) | | | (346,271 | ) | | | (74,245 | ) | | | (166,345 | ) | | | — | | | | — | | | | — | | | | — | | |
Net Increase (Decrease) – Class B | | | (72,600 | ) | | | (307,923 | ) | | | (71,907 | ) | | | (157,172 | ) | | | — | | | | — | | | | — | | | | — | | |
Subscriptions – Class C | | | 200,609 | | | | 184,785 | | | | 4,743,432 | | | | 14,371,325 | | | | 1,237,012 | | | | 2,457,588 | | | | 335,241 | | | | 86,894 | | |
Shares issued in reinvestment and capital gains – Class C | | | 546,759 | | | | 583,469 | | | | 519,687 | | | | 1,285,939 | | | | — | | | | — | | | | 1,380 | | | | 80 | | |
Less shares redeemed – Class C | | | (740,621 | ) | | | (577,080 | ) | | | (7,542,466 | ) | | | (3,977,289 | ) | | | (430,442 | ) | | | (58,728 | ) | | | (66,938 | ) | | | (4,470 | ) | |
Net Increase (Decrease) – Class C | | | 6,747 | | | | 191,174 | | | | (2,279,347 | ) | | | 11,679,975 | | | | 806,570 | | | | 2,398,860 | | | | 269,683 | | | | 82,504 | | |
Subscriptions – Class I | | | 2,177,235 | | | | 1,503,059 | | | | — | | | | — | | | | — | | | | — | | | | — | | | | — | | |
Shares issued in reinvestment and capital gains – Class I | | | 143,898 | | | | 141,436 | | | | — | | | | — | | | | 2 | | | | 5 | | | | 2 | | | | 3 | | |
Less shares redeemed – Class I | | | (1,994,457 | ) | | | (2,658,803 | ) | | | — | | | | — | | | | (313 | ) | | | — | | | | (346 | ) | | | — | | |
Net Increase (Decrease) – Class I | | | 326,676 | | | | (1,014,308 | ) | | | — | | | | — | | | | (311 | ) | | | 5 | | | | (344 | ) | | | 3 | | |
Subscriptions – Class R | | | — | | | | — | | | | — | | | | — | | | | — | | | | — | | | | — | | | | — | | |
Shares issued in reinvestment and capital gains – Class R | | | — | | | | — | | | | — | | | | — | | | | — | | | | — | | | | — | | | | — | | |
Less shares redeemed – Class R | | | — | | | | — | | | | — | | | | — | | | | — | | | | — | | | | — | | | | — | | |
Net Increase – Class R | | | — | | | | — | | | | — | | | | — | | | | — | | | | — | | | | — | | | | — | | |
Subscriptions – Class R4 | | | 20,220 | | | | 49,613 | | | | 838,999 | | | | 1,120,984 | | | | 479,110 | | | | 1,090,642 | | | | 20,884 | | | | — | | |
Shares issued in reinvestment and capital gains – Class R4 | | | 10,486 | | | | 5,524 | | | | 54,396 | | | | 69,981 | | | | 10,917 | | | | 9,227 | | | | 111 | | | | — | | |
Less shares redeemed – Class R4 | | | (29,113 | ) | | | (4,872 | ) | | | (318,210 | ) | | | (179,054 | ) | | | (291,550 | ) | | | (93,939 | ) | | | (6 | ) | | | — | | |
Net Increase – Class R4 | | | 1,593 | | | | 50,265 | | | | 575,185 | | | | 1,011,911 | | | | 198,477 | | | | 1,005,930 | | | | 20,989 | | | | — | | |
Subscriptions – Class R5 | | | 87,557 | | | | 381,566 | | | | 219,576 | | | | 77,722 | | | | 1,041,821 | | | | 1,013,748 | | | | 208,383 | | | | 122,328 | | |
Shares issued in reinvestment and capital gains – Class R5 | | | 87,341 | | | | 78,762 | | | | 7,242 | | | | 4,359 | | | | 14,425 | | | | 9,225 | | | | 1,646 | | | | 511 | | |
Less shares redeemed – Class R5 | | | (146,321 | ) | | | (19,370 | ) | | | (54,794 | ) | | | (14,647 | ) | | | (536,066 | ) | | | (12,077 | ) | | | (216,692 | ) | | | (3,541 | ) | |
Net Increase (Decrease) – Class R5 | | | 28,577 | | | | 440,958 | | | | 172,024 | | | | 67,434 | | | | 520,180 | | | | 1,010,896 | | | | (6,663 | ) | | | 119,298 | | |
Subscriptions – Class Y | | | 20,305 | | | | 164,585 | | | | 29,656 | | | | — | | | | — | | | | 205 | | | | — | | | | — | | |
Shares issued in reinvestment and capital gains – Class Y | | | 30,390 | | | | 31,675 | | | | 962 | | | | — | | | | — | | | | — | | | | — | | | | — | | |
Less shares redeemed – Class Y | | | (69,067 | ) | | | (18,601 | ) | | | (3,571 | ) | | | — | | | | (15 | ) | | | — | | | | — | | | | — | | |
Net Increase (Decrease) – Class Y | | | (18,372 | ) | | | 177,659 | | | | 27,047 | | | | — | | | | (15 | ) | | | 205 | | | | — | | | | — | | |
Subscriptions – Class Z | | | 1,616,671 | | | | 1,677,809 | | | | 10,700,096 | | | | 16,316,167 | | | | 13,528,786 | | | | 13,732,748 | | | | 1,375,486 | | | | 85,515 | | |
Shares issued in reinvestment and capital gains – Class Z | | | 2,273,717 | | | | 2,759,330 | | | | 597,366 | | | | 1,102,717 | | | | 157,433 | | | | 96,057 | | | | 9,056 | | | | 1,334 | | |
Less shares redeemed – Class Z | | | (5,760,728 | ) | | | (11,254,870 | ) | | | (11,671,258 | ) | | | (12,064,146 | ) | | | (7,722,797 | ) | | | (1,131,598 | ) | | | (1,072,883 | ) | | | (37,709 | ) | |
Net Increase (Decrease) – Class Z | | | (1,870,340 | ) | | | (6,817,731 | ) | | | (373,796 | ) | | | 5,354,738 | | | | 5,963,422 | | | | 12,697,207 | | | | 311,659 | | | | 49,140 | | |
Net Increase (Decrease) in Shares of Beneficial Interest | | | (2,063,002 | ) | | | (5,240,114 | ) | | | (6,866,041 | ) | | | 30,516,824 | | | | 6,893,850 | | | | 30,103,366 | | | | 850,089 | | | | 1,429,162 | | |
See accompanying notes to financial statements.
101
Columbia Acorn Family of Funds
Financial Highlights
The following tables are intended to help you understand the Fund's financial performance. Certain information reflects financial results for a single share of a class held for the periods shown. Per share net investment income (loss) amounts are calculated based on average shares outstanding during the period. Total return assumes reinvestment of all dividends and distributions, if any. Total return does not reflect payment of sales charges, if any. Total return and portfolio turnover are not annualized for periods of less than one year. The portfolio turnover rate is calculated without regard to purchase and sales transactions of short-term instruments and certain derivatives, if any. If such transactions were included, the Fund's portfolio turnover rate may be higher.
Columbia Acorn® Fund
| | | | | Income from Investment Operations | | | | Less Distributions to Shareholders | | | | | |
(Selected data for a share outstanding
throughout each period) | | Net Asset
Value,
Beginning of
Period | | Net
investment
income (loss) | | Net realized
and
unrealized
gain (loss) | | Total from
investment
operations | | Net
investment
income | | Net
realized gains | | Total
Distributions to
Shareholders | | Increase from
regulatory
settlements | |
Class A | |
Year Ended December 31, 2014 | | $ | 35.78 | | | | (0.08 | ) | | | 0.21 | | | | 0.13 | | | | — | | | | (5.61 | ) | | | (5.61 | ) | | | — | | |
Year Ended December 31, 2013 | | $ | 29.36 | | | | (0.06 | ) | | | 8.84 | | | | 8.78 | | | | (0.04 | ) | | | (2.32 | ) | | | (2.36 | ) | | | — | | |
Year Ended December 31, 2012 | | $ | 26.63 | | | | 0.08 | | | | 4.53 | | | | 4.61 | | | | (0.06 | ) | | | (1.82 | ) | | | (1.88 | ) | | | — | | |
Year Ended December 31, 2011 | | $ | 29.24 | | | | (0.10 | ) | | | (1.30 | ) | | | (1.40 | ) | | | (0.02 | ) | | | (1.19 | ) | | | (1.21 | ) | | | — | | |
Year Ended December 31, 2010 | | $ | 23.98 | | | | (0.06 | ) | | | 6.18 | | | | 6.12 | | | | (0.02 | ) | | | (0.84 | ) | | | (0.86 | ) | | | 0.00 | (c) | |
Class B | |
Year Ended December 31, 2014 | | $ | 32.25 | | | | (0.29 | ) | | | 0.18 | | | | (0.11 | ) | | | — | | | | (5.61 | ) | | | (5.61 | ) | | | — | | |
Year Ended December 31, 2013 | | $ | 26.80 | | | | (0.25 | ) | | | 8.02 | | | | 7.77 | | | | — | | | | (2.32 | ) | | | (2.32 | ) | | | — | | |
Year Ended December 31, 2012 | | $ | 24.53 | | | | (0.11 | ) | | | 4.20 | | | | 4.09 | | | | — | | | | (1.82 | ) | | | (1.82 | ) | | | — | | |
Year Ended December 31, 2011 | | $ | 27.14 | | | | (0.27 | ) | | | (1.15 | ) | | | (1.42 | ) | | | — | | | | (1.19 | ) | | | (1.19 | ) | | | — | | |
Year Ended December 31, 2010 | | $ | 22.43 | | | | (0.21 | ) | | | 5.76 | | | | 5.55 | | | | — | | | | (0.84 | ) | | | (0.84 | ) | | | 0.00 | (c) | |
Class C | |
Year Ended December 31, 2014 | | $ | 31.64 | | | | (0.28 | ) | | | 0.17 | | | | (0.11 | ) | | | — | | | | (5.61 | ) | | | (5.61 | ) | | | — | | |
Year Ended December 31, 2013 | | $ | 26.34 | | | | (0.26 | ) | | | 7.88 | | | | 7.62 | | | | — | | | | (2.32 | ) | | | (2.32 | ) | | | — | | |
Year Ended December 31, 2012 | | $ | 24.18 | | | | (0.12 | ) | | | 4.10 | | | | 3.98 | | | | — | | | | (1.82 | ) | | | (1.82 | ) | | | — | | |
Year Ended December 31, 2011 | | $ | 26.85 | | | | (0.29 | ) | | | (1.19 | ) | | | (1.48 | ) | | | — | | | | (1.19 | ) | | | (1.19 | ) | | | — | | |
Year Ended December 31, 2010 | | $ | 22.23 | | | | (0.24 | ) | | | 5.70 | | | | 5.46 | | | | — | | | | (0.84 | ) | | | (0.84 | ) | | | 0.00 | (c) | |
Class I | |
Year Ended December 31, 2014 | | $ | 37.37 | | | | 0.05 | | | | 0.22 | | | | 0.27 | | | | — | | | | (5.61 | ) | | | (5.61 | ) | | | — | | |
Year Ended December 31, 2013 | | $ | 30.47 | | | | 0.06 | | | | 9.20 | | | | 9.26 | | | | (0.04 | ) | | | (2.32 | ) | | | (2.36 | ) | | | — | | |
Year Ended December 31, 2012 | | $ | 27.57 | | | | 0.26 | | | | 4.62 | | | | 4.88 | | | | (0.16 | ) | | | (1.82 | ) | | | (1.98 | ) | | | — | | |
Year Ended December 31, 2011 | | $ | 30.19 | | | | 0.01 | | | | (1.35 | ) | | | (1.34 | ) | | | (0.09 | ) | | | (1.19 | ) | | | (1.28 | ) | | | — | | |
Year Ended December 31, 2010 (d) | | $ | 26.80 | | | | (0.01 | ) | | | 4.26 | | | | 4.25 | | | | (0.02 | ) | | | (0.84 | ) | | | (0.86 | ) | | | — | | |
Class R4 | |
Year Ended December 31, 2014 | | $ | 37.88 | | | | 0.02 | | | | 0.22 | | | | 0.24 | | | | — | | | | (5.61 | ) | | | (5.61 | ) | | | — | | |
Year Ended December 31, 2013 | | $ | 30.90 | | | | 0.06 | | | | 9.29 | | | | 9.35 | | | | (0.05 | ) | | | (2.32 | ) | | | (2.37 | ) | | | — | | |
Year Ended December 31, 2012 (f) | | $ | 30.59 | | | | 0.05 | | | | 1.84 | | | | 1.89 | | | | (0.12 | ) | | | (1.46 | ) | | | (1.58 | ) | | | — | | |
Class R5 | |
Year Ended December 31, 2014 | | $ | 37.89 | | | | 0.04 | | | | 0.23 | | | | 0.27 | | | | — | | | | (5.61 | ) | | | (5.61 | ) | | | — | | |
Year Ended December 31, 2013 | | $ | 30.88 | | | | 0.07 | | | | 9.30 | | | | 9.37 | | | | (0.04 | ) | | | (2.32 | ) | | | (2.36 | ) | | | — | | |
Year Ended December 31, 2012 (g) | | $ | 30.59 | | | | 0.06 | | | | 1.83 | | | | 1.89 | | | | (0.14 | ) | | | (1.46 | ) | | | (1.60 | ) | | | — | | |
Class Y | |
Year Ended December 31, 2014 | | $ | 37.93 | | | | 0.05 | | | | 0.24 | | | | 0.29 | | | | — | | | | (5.61 | ) | | | (5.61 | ) | | | — | | |
Year Ended December 31, 2013 | | $ | 30.90 | | | | 0.09 | | | | 9.31 | | | | 9.40 | | | | (0.05 | ) | | | (2.32 | ) | | | (2.37 | ) | | | — | | |
Year Ended December 31, 2012 (h) | | $ | 30.62 | | | | 0.09 | | | | 1.80 | | | | 1.89 | | | | (0.15 | ) | | | (1.46 | ) | | | (1.61 | ) | | | — | | |
Class Z | |
Year Ended December 31, 2014 | | $ | 37.32 | | | | 0.02 | | | | 0.22 | | | | 0.24 | | | | — | | | | (5.61 | ) | | | (5.61 | ) | | | — | | |
Year Ended December 31, 2013 | | $ | 30.45 | | | | 0.04 | | | | 9.19 | | | | 9.23 | | | | (0.04 | ) | | | (2.32 | ) | | | (2.36 | ) | | | — | | |
Year Ended December 31, 2012 | | $ | 27.56 | | | | 0.17 | | | | 4.69 | | | | 4.86 | | | | (0.15 | ) | | | (1.82 | ) | | | (1.97 | ) | | | — | | |
Year Ended December 31, 2011 | | $ | 30.19 | | | | (0.01 | ) | | | (1.34 | ) | | | (1.35 | ) | | | (0.09 | ) | | | (1.19 | ) | | | (1.28 | ) | | | — | | |
Year Ended December 31, 2010 | | $ | 24.68 | | | | 0.02 | | | | 6.37 | | | | 6.39 | | | | (0.04 | ) | | | (0.84 | ) | | | (0.88 | ) | | | 0.00 | (c) | |
Notes to Financial Highlights
(a) In addition to the fees and expenses that the Fund bears directly, the Fund indirectly bears a pro rata share of the fees and expenses of any other funds in which it invests, if any. Such indirect expenses are not included in the Fund's reported expense ratios.
(b) The benefits derived from custody fees paid indirectly had an impact of less than 0.01%.
(c) Rounds to zero.
(d) Class I shares commenced operations on September 27, 2010. Per share data and total return reflect activity from that date.
(e) Annualized.
(f) Class R4 shares commenced operations on November 8, 2012. Per share data and total return reflect activity from that date.
(g) Class R5 shares commenced operations on November 8, 2012. Per share data and total return reflect activity from that date.
(h) Class Y shares commenced operations on November 8, 2012. Per share data and total return reflect activity from that date.
See accompanying notes to financial statements.
102
| | | | | | | Ratio to Average Net Assets | | Supplemental Data | |
(Selected data for a share outstanding
throughout each period) | | Net Asset
Value, End of
Period | | Total Return | | Total gross
expenses
(a) | | Total net
expenses
(a) | | Net
investment
income (loss) | | Portfolio
turnover rate | | Net assets,
end of period
(000s) | |
Class A | |
Year Ended December 31, 2014 | | $ | 30.30 | | | | 0.55 | % | | | 1.08 | % | | | 1.08 | % | | | (0.22 | )% | | | 17 | % | | $ | 2,694,610 | | |
Year Ended December 31, 2013 | | $ | 35.78 | | | | 30.53 | % | | | 1.07 | % | | | 1.07 | % | | | (0.17 | )% | | | 18 | % | | $ | 3,869,734 | | |
Year Ended December 31, 2012 | | $ | 29.36 | | | | 17.62 | % | | | 1.06 | % | | | 1.06 | %(b) | | | 0.27 | % | | | 16 | % | | $ | 3,233,494 | | |
Year Ended December 31, 2011 | | $ | 26.63 | | | | (4.91 | )% | | | 1.06 | % | | | 1.06 | %(b) | | | (0.33 | )% | | | 18 | % | | $ | 3,246,833 | | |
Year Ended December 31, 2010 | | $ | 29.24 | | | | 25.61 | % | | | 1.07 | % | | | 1.07 | %(b) | | | (0.22 | )% | | | 28 | % | | $ | 3,639,788 | | |
Class B | |
Year Ended December 31, 2014 | | $ | 26.53 | | | | (0.16 | )% | | | 1.75 | % | | | 1.75 | % | | | (0.91 | )% | | | 17 | % | | $ | 7,201 | | |
Year Ended December 31, 2013 | | $ | 32.25 | | | | 29.63 | % | | | 1.73 | % | | | 1.73 | % | | | (0.84 | )% | | | 18 | % | | $ | 19,278 | | |
Year Ended December 31, 2012 | | $ | 26.80 | | | | 16.98 | % | | | 1.65 | % | | | 1.64 | %(b) | | | (0.42 | )% | | | 16 | % | | $ | 33,623 | | |
Year Ended December 31, 2011 | | $ | 24.53 | | | | (5.34 | )% | | | 1.67 | % | | | 1.67 | %(b) | | | (0.98 | )% | | | 18 | % | | $ | 67,153 | | |
Year Ended December 31, 2010 | | $ | 27.14 | | | | 24.81 | % | | | 1.69 | % | | | 1.69 | %(b) | | | (0.88 | )% | | | 28 | % | | $ | 287,650 | | |
Class C | |
Year Ended December 31, 2014 | | $ | 25.92 | | | | (0.16 | )% | | | 1.77 | % | | | 1.77 | % | | | (0.92 | )% | | | 17 | % | | $ | 776,370 | | |
Year Ended December 31, 2013 | | $ | 31.64 | | | | 29.58 | % | | | 1.78 | % | | | 1.78 | % | | | (0.88 | )% | | | 18 | % | | $ | 938,644 | | |
Year Ended December 31, 2012 | | $ | 26.34 | | | | 16.77 | % | | | 1.80 | % | | | 1.80 | %(b) | | | (0.46 | )% | | | 16 | % | | $ | 756,709 | | |
Year Ended December 31, 2011 | | $ | 24.18 | | | | (5.63 | )% | | | 1.82 | % | | | 1.82 | %(b) | | | (1.10 | )% | | | 18 | % | | $ | 721,446 | | |
Year Ended December 31, 2010 | | $ | 26.85 | | | | 24.63 | % | | | 1.85 | % | | | 1.85 | %(b) | | | (1.00 | )% | | | 28 | % | | $ | 829,181 | | |
Class I | |
Year Ended December 31, 2014 | | $ | 32.03 | | | | 0.91 | % | | | 0.70 | % | | | 0.70 | % | | | 0.14 | % | | | 17 | % | | $ | 28,164 | | |
Year Ended December 31, 2013 | | $ | 37.37 | | | | 30.99 | % | | | 0.70 | % | | | 0.70 | % | | | 0.16 | % | | | 18 | % | | $ | 20,383 | | |
Year Ended December 31, 2012 | | $ | 30.47 | | | | 18.02 | % | | | 0.72 | % | | | 0.72 | %(b) | | | 0.86 | % | | | 16 | % | | $ | 58,652 | | |
Year Ended December 31, 2011 | | $ | 27.57 | | | | (4.57 | )% | | | 0.72 | % | | | 0.72 | %(b) | | | 0.02 | % | | | 18 | % | | $ | 16,397 | | |
Year Ended December 31, 2010 (d) | | $ | 30.19 | | | | 15.94 | % | | | 0.71 | %(e) | | | 0.71 | %(b)(e) | | | (0.13 | )%(e) | | | 28 | % | | $ | 11,627 | | |
Class R4 | |
Year Ended December 31, 2014 | | $ | 32.51 | | | | 0.81 | % | | | 0.84 | % | | | 0.84 | % | | | 0.05 | % | | | 17 | % | | $ | 250,457 | | |
Year Ended December 31, 2013 | | $ | 37.88 | | | | 30.85 | % | | | 0.80 | % | | | 0.80 | % | | | 0.16 | % | | | 18 | % | | $ | 74,188 | | |
Year Ended December 31, 2012 (f) | | $ | 30.90 | | | | 6.31 | % | | | 0.87 | %(e) | | | 0.86 | %(b)(e) | | | 1.24 | %(e) | | | 16 | % | | $ | 17 | | |
Class R5 | |
Year Ended December 31, 2014 | | $ | 32.55 | | | | 0.89 | % | | | 0.76 | % | | | 0.76 | % | | | 0.10 | % | | | 17 | % | | $ | 458,223 | | |
Year Ended December 31, 2013 | | $ | 37.89 | | | | 30.94 | % | | | 0.75 | % | | | 0.75 | % | | | 0.20 | % | | | 18 | % | | $ | 496,906 | | |
Year Ended December 31, 2012 (g) | | $ | 30.88 | | | | 6.33 | % | | | 0.82 | %(e) | | | 0.81 | %(b)(e) | | | 1.29 | %(e) | | | 16 | % | | $ | 3 | | |
Class Y | |
Year Ended December 31, 2014 | | $ | 32.61 | | | | 0.94 | % | | | 0.70 | % | | | 0.70 | % | | | 0.13 | % | | | 17 | % | | $ | 378,780 | | |
Year Ended December 31, 2013 | | $ | 37.93 | | | | 30.99 | % | | | 0.70 | % | | | 0.70 | % | | | 0.26 | % | | | 18 | % | | $ | 1,227,891 | | |
Year Ended December 31, 2012 (h) | | $ | 30.90 | | | | 6.34 | % | | | 0.75 | %(e) | | | 0.75 | %(b)(e) | | | 2.21 | %(e) | | | 16 | % | | $ | 67,012 | | |
Class Z | |
Year Ended December 31, 2014 | | $ | 31.95 | | | | 0.82 | % | | | 0.79 | % | | | 0.79 | % | | | 0.07 | % | | | 17 | % | | $ | 11,340,770 | | |
Year Ended December 31, 2013 | | $ | 37.32 | | | | 30.90 | % | | | 0.78 | % | | | 0.78 | % | | | 0.12 | % | | | 18 | % | | $ | 14,703,948 | | |
Year Ended December 31, 2012 | | $ | 30.45 | | | | 17.93 | % | | | 0.78 | % | | | 0.78 | %(b) | | | 0.57 | % | | | 16 | % | | $ | 13,374,355 | | |
Year Ended December 31, 2011 | | $ | 27.56 | | | | (4.61 | )% | | | 0.76 | % | | | 0.76 | %(b) | | | (0.03 | )% | | | 18 | % | | $ | 12,284,748 | | |
Year Ended December 31, 2010 | | $ | 30.19 | | | | 26.00 | % | | | 0.76 | % | | | 0.76 | %(b) | | | 0.09 | % | | | 28 | % | | $ | 13,330,466 | | |
See accompanying notes to financial statements.
103
Columbia Acorn Family of Funds
Financial Highlights, continued
Columbia Acorn International®
| | | | | Income from Investment Operations | | | | Less Distributions to Shareholders | | | | | |
(Selected data for a share outstanding
throughout each period) | | Net Asset
Value,
Beginning of
Period | | Net
investment
income (loss) | | Net realized
and
unrealized
gain (loss) | | Reimbursement
from
affiliate | | Total from
investment
operations | | Net
investment
income | | Net
realized gains | | Total
Distributions to
Shareholders | | Redemption
fees added
to paid in
capital | |
Class A | |
Year Ended December 31, 2014 | | $ | 46.63 | | | | 0.42 | | | | (2.51 | ) | | | — | | | | (2.09 | ) | | | (0.55 | ) | | | (2.31 | ) | | | (2.86 | ) | | | — | | |
Year Ended December 31, 2013 | | $ | 40.79 | | | | 0.45 | | | | 8.37 | | | | — | | | | 8.82 | | | | (1.05 | ) | | | (1.93 | ) | | | (2.98 | ) | | | — | | |
Year Ended December 31, 2012 | | $ | 34.15 | | | | 0.47 | | | | 6.75 | | | | — | | | | 7.22 | | | | (0.58 | ) | | | — | | | | (0.58 | ) | | | — | | |
Year Ended December 31, 2011 | | $ | 40.87 | | | | 0.32 | | | | (6.02 | ) | | | 0.00 | (c) | | | (5.70 | ) | | | (1.02 | ) | | | — | | | | (1.02 | ) | | | — | | |
Year Ended December 31, 2010 | | $ | 34.13 | | | | 0.22 | | | | 7.21 | | | | — | | | | 7.43 | | | | (0.69 | ) | | | — | | | | (0.69 | ) | | | 0.00 | (c) | |
Class B | |
Year Ended December 31, 2014 | | $ | 45.24 | | | | 0.07 | | | | (2.42 | ) | | | — | | | | (2.35 | ) | | | (0.20 | ) | | | (2.31 | ) | | | (2.51 | ) | | | — | | |
Year Ended December 31, 2013 | | $ | 39.67 | | | | 0.12 | | | | 8.10 | | | | — | | | | 8.22 | | | | (0.72 | ) | | | (1.93 | ) | | | (2.65 | ) | | | — | | |
Year Ended December 31, 2012 | | $ | 33.17 | | | | 0.19 | | | | 6.55 | | | | — | | | | 6.74 | | | | (0.24 | ) | | | — | | | | (0.24 | ) | | | — | | |
Year Ended December 31, 2011 | | $ | 39.96 | | | | 0.06 | | | | (5.85 | ) | | | 0.00 | (c) | | | (5.79 | ) | | | (1.00 | ) | | | — | | | | (1.00 | ) | | | — | | |
Year Ended December 31, 2010 | | $ | 33.22 | | | | 0.03 | | | | 7.02 | | | | — | | | | 7.05 | | | | (0.31 | ) | | | — | | | | (0.31 | ) | | | 0.00 | (c) | |
Class C | |
Year Ended December 31, 2014 | | $ | 45.04 | | | | 0.07 | | | | (2.40 | ) | | | — | | | | (2.33 | ) | | | (0.20 | ) | | | (2.31 | ) | | | (2.51 | ) | | | — | | |
Year Ended December 31, 2013 | | $ | 39.50 | | | | 0.10 | | | | 8.08 | | | | — | | | | 8.18 | | | | (0.71 | ) | | | (1.93 | ) | | | (2.64 | ) | | | — | | |
Year Ended December 31, 2012 | | $ | 33.03 | | | | 0.18 | | | | 6.52 | | | | — | | | | 6.70 | | | | (0.23 | ) | | | — | | | | (0.23 | ) | | | — | | |
Year Ended December 31, 2011 | | $ | 39.79 | | | | 0.04 | | | | (5.86 | ) | | | 0.00 | (c) | | | (5.82 | ) | | | (0.94 | ) | | | — | | | | (0.94 | ) | | | — | | |
Year Ended December 31, 2010 | | $ | 33.08 | | | | (0.05 | ) | | | 7.03 | | | | — | | | | 6.98 | | | | (0.27 | ) | | | — | | | | (0.27 | ) | | | 0.00 | (c) | |
Class I | |
Year Ended December 31, 2014 | | $ | 46.71 | | | | 0.59 | | | | (2.51 | ) | | | — | | | | (1.92 | ) | | | (0.72 | ) | | | (2.31 | ) | | | (3.03 | ) | | | — | | |
Year Ended December 31, 2013 | | $ | 40.86 | | | | 0.66 | | | | 8.34 | | | | — | | | | 9.00 | | | | (1.22 | ) | | | (1.93 | ) | | | (3.15 | ) | | | — | | |
Year Ended December 31, 2012 | | $ | 34.33 | | | | 0.57 | | | | 6.83 | | | | — | | | | 7.40 | | | | (0.87 | ) | | | — | | | | (0.87 | ) | | | — | | |
Year Ended December 31, 2011 | | $ | 40.92 | | | | 0.37 | | | | (5.94 | ) | | | 0.00 | (c) | | | (5.57 | ) | | | (1.02 | ) | | | — | | | | (1.02 | ) | | | — | | |
Year Ended December 31, 2010 (f) | | $ | 37.69 | | | | 0.08 | | | | 3.49 | | | | — | | | | 3.57 | | | | (0.34 | ) | | | — | | | | (0.34 | ) | | | 0.00 | (c) | |
Class R | |
Year Ended December 31, 2014 | | $ | 46.60 | | | | 0.24 | | | | (2.50 | ) | | | — | | | | (2.26 | ) | | | (0.36 | ) | | | (2.31 | ) | | | (2.67 | ) | | | — | | |
Year Ended December 31, 2013 | | $ | 40.79 | | | | 0.26 | | | | 8.36 | | | | — | | | | 8.62 | | | | (0.88 | ) | | | (1.93 | ) | | | (2.81 | ) | | | — | | |
Year Ended December 31, 2012 | | $ | 34.11 | | | | 0.21 | | | | 6.89 | | | | — | | | | 7.10 | | | | (0.42 | ) | | | — | | | | (0.42 | ) | | | — | | |
Year Ended December 31, 2011 (h) | | $ | 40.11 | | | | (0.00 | )(c) | | | (6.00 | ) | | | 0.00 | (c) | | | (6.00 | ) | | | — | | | | — | | | | — | | | | — | | |
Class R4 | |
Year Ended December 31, 2014 | | $ | 46.99 | | | | 0.50 | | | | (2.52 | ) | | | — | | | | (2.02 | ) | | | (0.64 | ) | | | (2.31 | ) | | | (2.95 | ) | | | — | | |
Year Ended December 31, 2013 | | $ | 41.08 | | | | 0.34 | | | | 8.67 | | | | — | | | | 9.01 | | | | (1.17 | ) | | | (1.93 | ) | | | (3.10 | ) | | | — | | |
Year Ended December 31, 2012 (i) | | $ | 39.86 | | | | (0.00 | )(c) | | | 1.81 | | | | — | | | | 1.81 | | | | (0.59 | ) | | | — | | | | (0.59 | ) | | | — | | |
Class R5 | |
Year Ended December 31, 2014 | | $ | 46.66 | | | | 0.57 | | | | (2.51 | ) | | | — | | | | (1.94 | ) | | | (0.70 | ) | | | (2.31 | ) | | | (3.01 | ) | | | — | | |
Year Ended December 31, 2013 | | $ | 40.81 | | | | 0.63 | | | | 8.34 | | | | — | | | | 8.97 | | | | (1.19 | ) | | | (1.93 | ) | | | (3.12 | ) | | | — | | |
Year Ended December 31, 2012 | | $ | 34.31 | | | | 0.75 | | | | 6.62 | | | | — | | | | 7.37 | | | | (0.87 | ) | | | — | | | | (0.87 | ) | | | — | | |
Year Ended December 31, 2011 (j) | | $ | 40.24 | | | | 0.09 | | | | (6.02 | ) | | | 0.00 | (c) | | | (5.93 | ) | | | — | | | | — | | | | — | | | | — | | |
Class Y | |
Year Ended December 31, 2014 | | $ | 46.99 | | | | 0.58 | | | | (2.52 | ) | | | — | | | | (1.94 | ) | | | (0.72 | ) | | | (2.31 | ) | | | (3.03 | ) | | | — | | |
Year Ended December 31, 2013 | | $ | 41.08 | | | | 0.57 | | | | 8.48 | | | | — | | | | 9.05 | | | | (1.21 | ) | | | (1.93 | ) | | | (3.14 | ) | | | — | | |
Year Ended December 31, 2012 (k) | | $ | 39.90 | | | | 0.04 | | | | 1.78 | | | | — | | | | 1.82 | | | | (0.64 | ) | | | — | | | | (0.64 | ) | | | — | | |
Class Z | |
Year Ended December 31, 2014 | | $ | 46.68 | | | | 0.56 | | | | (2.51 | ) | | | — | | | | (1.95 | ) | | | (0.69 | ) | | | (2.31 | ) | | | (3.00 | ) | | | — | | |
Year Ended December 31, 2013 | | $ | 40.84 | | | | 0.58 | | | | 8.38 | | | | — | | | | 8.96 | | | | (1.19 | ) | | | (1.93 | ) | | | (3.12 | ) | | | — | | |
Year Ended December 31, 2012 | | $ | 34.31 | | | | 0.59 | | | | 6.78 | | | | — | | | | 7.37 | | | | (0.84 | ) | | | — | | | | (0.84 | ) | | | — | | |
Year Ended December 31, 2011 | | $ | 40.92 | | | | 0.48 | | | | (6.07 | ) | | | 0.00 | (c) | | | (5.59 | ) | | | (1.02 | ) | | | — | | | | (1.02 | ) | | | — | | |
Year Ended December 31, 2010 | | $ | 34.26 | | | | 0.35 | | | | 7.23 | | | | — | | | | 7.58 | | | | (0.92 | ) | | | — | | | | (0.92 | ) | | | 0.00 | (c) | |
Notes to Financial Highlights
(a) In addition to the fees and expenses that the Fund bears directly, the Fund indirectly bears a pro rata share of the fees and expenses of any other funds in which it invests, if any. Such indirect expenses are not included in the Fund's reported expense ratios.
(b) Had the Investment Manager and/or its affiliates not waived fees and/or reimbursed a portion of expenses, total return would have been reduced.
(c) Rounds to zero.
(d) The benefits derived from custody fees paid indirectly had an impact of 0.01%.
(e) During the year ended December 31, 2011, Columbia Management reimbursed the Fund for a loss on a trading error. Had the Fund not received this reimbursement, total return would have been lower by less than 0.01%.
(f) Class I shares commenced operations on September 27, 2010. Per share data and total return reflect activity from that date.
(g) Annualized.
(h) Class R shares commenced operations on August 2, 2011. Per share data and total return reflect activity from that date.
(i) Class R4 shares commenced operations on November 8, 2012. Per share data and total return reflect activity from that date.
(j) Class R5 shares commenced operations on August 2, 2011. Per share data and total return reflect activity from that date.
(k) Class Y shares commenced operations on November 8, 2012. Per share data and total return reflect activity from that date.
See accompanying notes to financial statements.
104
| | | | | | | | | Ratio to Average Net Assets | | Supplemental Data | |
(Selected data for a share outstanding
throughout each period) | | Increase from
regulatory
settlements | | Net Asset
Value, End of
Period | | Total Return | | Total gross
expenses
(a) | | Total net
expenses
(a) | | Net
investment
income (loss) | | Portfolio
turnover rate | | Net assets,
end of period
(000s) | |
Class A | |
Year Ended December 31, 2014 | | | — | | | $ | 41.68 | | | | (4.58 | )%(b) | | | 1.26 | % | | | 1.22 | % | | | 0.91 | % | | | 28 | % | | $ | 946,553 | | |
Year Ended December 31, 2013 | | | — | | | $ | 46.63 | | | | 22.00 | %(b) | | | 1.27 | % | | | 1.23 | % | | | 1.02 | % | | | 45 | % | | $ | 1,089,263 | | |
Year Ended December 31, 2012 | | | 0.00 | (c) | | $ | 40.79 | | | | 21.21 | %(b) | | | 1.28 | % | | | 1.24 | %(d) | | | 1.22 | % | | | 33 | % | | $ | 1,007,236 | | |
Year Ended December 31, 2011 | | | 0.00 | (c) | | $ | 34.15 | | | | (14.37 | )%(b)(e) | | | 1.32 | % | | | 1.30 | %(d) | | | 0.84 | % | | | 32 | % | | $ | 918,112 | | |
Year Ended December 31, 2010 | | | 0.00 | (c) | | $ | 40.87 | | | | 22.23 | % | | | 1.35 | % | | | 1.35 | %(d) | | | 0.62 | % | | | 25 | % | | $ | 810,603 | | |
Class B | |
Year Ended December 31, 2014 | | | — | | | $ | 40.38 | | | | (5.29 | )%(b) | | | 2.00 | % | | | 1.97 | % | | | 0.16 | % | | | 28 | % | | $ | 6,516 | | |
Year Ended December 31, 2013 | | | — | | | $ | 45.24 | | | | 21.08 | %(b) | | | 2.00 | % | | | 1.97 | % | | | 0.27 | % | | | 45 | % | | $ | 13,218 | | |
Year Ended December 31, 2012 | | | 0.00 | (c) | | $ | 39.67 | | | | 20.33 | %(b) | | | 2.00 | % | | | 1.97 | %(d) | | | 0.51 | % | | | 33 | % | | $ | 17,910 | | |
Year Ended December 31, 2011 | | | 0.00 | (c) | | $ | 33.17 | | | | (14.92 | )%(b)(e) | | | 1.98 | % | | | 1.96 | %(d) | | | 0.15 | % | | | 32 | % | | $ | 24,510 | | |
Year Ended December 31, 2010 | | | 0.00 | (c) | | $ | 39.96 | | | | 21.49 | % | | | 1.96 | % | | | 1.96 | %(d) | | | 0.08 | % | | | 25 | % | | $ | 29,368 | | |
Class C | |
Year Ended December 31, 2014 | | | — | | | $ | 40.20 | | | | (5.27 | )%(b) | | | 1.99 | % | | | 1.97 | % | | | 0.16 | % | | | 28 | % | | $ | 103,691 | | |
Year Ended December 31, 2013 | | | — | | | $ | 45.04 | | | | 21.07 | %(b) | | | 2.01 | % | | | 1.99 | % | | | 0.23 | % | | | 45 | % | | $ | 110,875 | | |
Year Ended December 31, 2012 | | | 0.00 | (c) | | $ | 39.50 | | | | 20.31 | %(b) | | | 2.02 | % | | | 2.00 | %(d) | | | 0.48 | % | | | 33 | % | | $ | 92,748 | | |
Year Ended December 31, 2011 | | | 0.00 | (c) | | $ | 33.03 | | | | (15.02 | )%(b)(e) | | | 2.07 | % | | | 2.06 | %(d) | | | 0.10 | % | | | 32 | % | | $ | 97,328 | | |
Year Ended December 31, 2010 | | | 0.00 | (c) | | $ | 39.79 | | | | 21.34 | % | | | 2.11 | % | | | 2.11 | %(d) | | | (0.13 | )% | | | 25 | % | | $ | 110,931 | | |
Class I | |
Year Ended December 31, 2014 | | | — | | | $ | 41.76 | | | | (4.20 | )% | | | 0.85 | % | | | 0.85 | % | | | 1.26 | % | | | 28 | % | | $ | 38,804 | | |
Year Ended December 31, 2013 | | | — | | | $ | 46.71 | | | | 22.43 | % | | | 0.85 | % | | | 0.85 | % | | | 1.49 | % | | | 45 | % | | $ | 29,418 | | |
Year Ended December 31, 2012 | | | 0.00 | (c) | | $ | 40.86 | | | | 21.69 | % | | | 0.88 | % | | | 0.88 | %(d) | | | 1.48 | % | | | 33 | % | | $ | 97,484 | | |
Year Ended December 31, 2011 | | | 0.00 | (c) | | $ | 34.33 | | | | (14.02 | )%(e) | | | 0.91 | % | | | 0.91 | %(d) | | | 0.99 | % | | | 32 | % | | $ | 50,335 | | |
Year Ended December 31, 2010 (f) | | | — | | | $ | 40.92 | | | | 9.50 | % | | | 0.94 | %(g) | | | 0.94 | %(d)(g) | | | 0.77 | %(g) | | | 25 | % | | $ | 66,581 | | |
Class R | |
Year Ended December 31, 2014 | | | — | | | $ | 41.67 | | | | (4.95 | )% | | | 1.63 | % | | | 1.63 | % | | | 0.52 | % | | | 28 | % | | $ | 5,560 | | |
Year Ended December 31, 2013 | | | — | | | $ | 46.60 | | | | 21.50 | % | | | 1.63 | % | | | 1.63 | % | | | 0.58 | % | | | 45 | % | | $ | 5,822 | | |
Year Ended December 31, 2012 | | | 0.00 | (c) | | $ | 40.79 | | | | 20.83 | % | | | 1.52 | % | | | 1.51 | %(d) | | | 0.54 | % | | | 33 | % | | $ | 2,799 | | |
Year Ended December 31, 2011 (h) | | | 0.00 | (c) | | $ | 34.11 | | | | (14.96 | )% | | | 1.59 | %(g) | | | 1.59 | %(d)(g) | | | (0.02 | )%(g) | | | 32 | % | | $ | 2,130 | | |
Class R4 | |
Year Ended December 31, 2014 | | | — | | | $ | 42.02 | | | | (4.39 | )% | | | 1.04 | % | | | 1.04 | % | | | 1.07 | % | | | 28 | % | | $ | 424,425 | | |
Year Ended December 31, 2013 | | | — | | | $ | 46.99 | | | | 22.32 | % | | | 1.03 | % | | | 1.03 | % | | | 0.73 | % | | | 45 | % | | $ | 355,616 | | |
Year Ended December 31, 2012 (i) | | | — | | | $ | 41.08 | | | | 4.57 | % | | | 1.03 | %(g) | | | 1.02 | %(d)(g) | | | (0.02 | )%(g) | | | 33 | % | | $ | 15 | | |
Class R5 | |
Year Ended December 31, 2014 | | | — | | | $ | 41.71 | | | | (4.25 | )% | | | 0.90 | % | | | 0.90 | % | | | 1.23 | % | | | 28 | % | | $ | 397,882 | | |
Year Ended December 31, 2013 | | | — | | | $ | 46.66 | | | | 22.38 | % | | | 0.91 | % | | | 0.91 | % | | | 1.40 | % | | | 45 | % | | $ | 274,415 | | |
Year Ended December 31, 2012 | | | 0.00 | (c) | | $ | 40.81 | | | | 21.61 | % | | | 0.89 | % | | | 0.89 | %(d) | | | 1.99 | % | | | 33 | % | | $ | 242 | | |
Year Ended December 31, 2011 (j) | | | 0.00 | (c) | | $ | 34.31 | | | | (14.74 | )% | | | 0.91 | %(g) | | | 0.91 | %(d)(g) | | | 0.65 | %(g) | | | 32 | % | | $ | 2,038 | | |
Class Y | |
Year Ended December 31, 2014 | | | — | | | $ | 42.02 | | | | (4.21 | )% | | | 0.85 | % | | | 0.85 | % | | | 1.25 | % | | | 28 | % | | $ | 225,012 | | |
Year Ended December 31, 2013 | | | — | | | $ | 46.99 | | | | 22.44 | % | | | 0.86 | % | | | 0.86 | % | | | 1.26 | % | | | 45 | % | | $ | 155,140 | | |
Year Ended December 31, 2012 (k) | | | — | | | $ | 41.08 | | | | 4.59 | % | | | 0.91 | %(g) | | | 0.90 | %(d)(g) | | | 0.75 | %(g) | | | 33 | % | | $ | 30,856 | | |
Class Z | |
Year Ended December 31, 2014 | | | — | | | $ | 41.73 | | | | (4.28 | )% | | | 0.93 | % | | | 0.93 | % | | | 1.20 | % | | | 28 | % | | $ | 5,585,035 | | |
Year Ended December 31, 2013 | | | — | | | $ | 46.68 | | | | 22.33 | % | | | 0.93 | % | | | 0.93 | % | | | 1.30 | % | | | 45 | % | | $ | 6,293,552 | | |
Year Ended December 31, 2012 | | | 0.00 | (c) | | $ | 40.84 | | | | 21.60 | % | | | 0.93 | % | | | 0.93 | %(d) | | | 1.53 | % | | | 33 | % | | $ | 5,494,506 | | |
Year Ended December 31, 2011 | | | 0.00 | (c) | | $ | 34.31 | | | | (14.06 | )%(e) | | | 0.95 | % | | | 0.95 | %(d) | | | 1.24 | % | | | 32 | % | | $ | 4,322,500 | | |
Year Ended December 31, 2010 | | | 0.00 | (c) | | $ | 40.92 | | | | 22.70 | % | | | 0.97 | % | | | 0.97 | %(d) | | | 0.99 | % | | | 25 | % | | $ | 5,107,580 | | |
See accompanying notes to financial statements.
105
Columbia Acorn Family of Funds
Financial Highlights, continued
Columbia Acorn USA®
| | | | | Income from Investment Operations | | | | Less Distributions to Shareholders | | | |
(Selected data for a share outstanding
throughout each period) | | Net Asset
Value,
Beginning of
Period | | Net
investment
income (loss) | | Net realized
and
unrealized
gain (loss) | | Total from
investment
operations | | Net
investment
income | | Net
realized gains | | Total
Distributions to
Shareholders | |
Class A | |
Year Ended December 31, 2014 | | $ | 34.15 | | | | (0.20 | ) | | | 1.22 | | | | 1.02 | | | | — | | | | (6.04 | ) | | | (6.04 | ) | |
Year Ended December 31, 2013 | | $ | 28.21 | | | | (0.15 | ) | | | 9.09 | | | | 8.94 | | | | — | | | | (3.00 | ) | | | (3.00 | ) | |
Year Ended December 31, 2012 | | $ | 25.94 | | | | 0.02 | | | | 4.73 | | | | 4.75 | | | | (0.11 | ) | | | (2.37 | ) | | | (2.48 | ) | |
Year Ended December 31, 2011 | | $ | 27.54 | | | | (0.22 | ) | | | (1.21 | ) | | | (1.43 | ) | | | — | | | | (0.17 | ) | | | (0.17 | ) | |
Year Ended December 31, 2010 | | $ | 22.43 | | | | (0.15 | ) | | | 5.26 | | | | 5.11 | | | | — | | | | — | | | | — | | |
Class B | |
Year Ended December 31, 2014 | | $ | 30.70 | | | | (0.46 | ) | | | 1.07 | | | | 0.61 | | | | — | | | | (6.04 | ) | | | (6.04 | ) | |
Year Ended December 31, 2013 | | $ | 25.81 | | | | (0.39 | ) | | | 8.28 | | | | 7.89 | | | | — | | | | (3.00 | ) | | | (3.00 | ) | |
Year Ended December 31, 2012 | | $ | 23.98 | | | | (0.19 | ) | | | 4.39 | | | | 4.20 | | | | — | | | | (2.37 | ) | | | (2.37 | ) | |
Year Ended December 31, 2011 | | $ | 25.60 | | | | (0.37 | ) | | | (1.08 | ) | | | (1.45 | ) | | | — | | | | (0.17 | ) | | | (0.17 | ) | |
Year Ended December 31, 2010 | | $ | 20.99 | | | | (0.30 | ) | | | 4.91 | | | | 4.61 | | | | — | | | | — | | | | — | | |
Class C | |
Year Ended December 31, 2014 | | $ | 30.33 | | | | (0.37 | ) | | | 1.06 | | | | 0.69 | | | | — | | | | (6.04 | ) | | | (6.04 | ) | |
Year Ended December 31, 2013 | | $ | 25.49 | | | | (0.33 | ) | | | 8.17 | | | | 7.84 | | | | — | | | | (3.00 | ) | | | (3.00 | ) | |
Year Ended December 31, 2012 | | $ | 23.72 | | | | (0.16 | ) | | | 4.30 | | | | 4.14 | | | | — | | | | (2.37 | ) | | | (2.37 | ) | |
Year Ended December 31, 2011 | | $ | 25.39 | | | | (0.39 | ) | | | (1.11 | ) | | | (1.50 | ) | | | — | | | | (0.17 | ) | | | (0.17 | ) | |
Year Ended December 31, 2010 | | $ | 20.84 | | | | (0.31 | ) | | | 4.86 | | | | 4.55 | | | | — | | | | — | | | | — | | |
Class I | |
Year Ended December 31, 2014 | | $ | 35.99 | | | | (0.06 | ) | | | 1.30 | | | | 1.24 | | | | — | | | | (6.04 | ) | | | (6.04 | ) | |
Year Ended December 31, 2013 | | $ | 29.47 | | | | (0.02 | ) | | | 9.54 | | | | 9.52 | | | | — | | | | (3.00 | ) | | | (3.00 | ) | |
Year Ended December 31, 2012 | | $ | 27.00 | | | | (0.10 | ) | | | 5.16 | | | | 5.06 | | | | (0.22 | ) | | | (2.37 | ) | | | (2.59 | ) | |
Year Ended December 31, 2011 | | $ | 28.56 | | | | (0.14 | ) | | | (1.25 | ) | | | (1.39 | ) | | | — | | | | (0.17 | ) | | | (0.17 | ) | |
Year Ended December 31, 2010 (d) | | $ | 24.24 | | | | (0.03 | ) | | | 4.35 | | | | 4.32 | | | | — | | | | — | | | | — | | |
Class R4 | |
Year Ended December 31, 2014 | | $ | 36.55 | | | | (0.11 | ) | | | 1.30 | | | | 1.19 | | | | — | | | | (6.04 | ) | | | (6.04 | ) | |
Year Ended December 31, 2013 | | $ | 29.92 | | | | 0.00 | (f) | | | 9.63 | | | | 9.63 | | | | — | | | | (3.00 | ) | | | (3.00 | ) | |
Year Ended December 31, 2012 (g) | | $ | 30.06 | | | | 0.06 | | | | 2.28 | | | | 2.34 | | | | (0.16 | ) | | | (2.32 | ) | | | (2.48 | ) | |
Class R5 | |
Year Ended December 31, 2014 | | $ | 36.53 | | | | (0.06 | ) | | | 1.28 | | | | 1.22 | | | | — | | | | (6.04 | ) | | | (6.04 | ) | |
Year Ended December 31, 2013 | | $ | 29.90 | | | | 0.02 | | | | 9.61 | | | | 9.63 | | | | — | | | | (3.00 | ) | | | (3.00 | ) | |
Year Ended December 31, 2012 (h) | | $ | 30.06 | | | | 0.07 | | | | 2.27 | | | | 2.34 | | | | (0.18 | ) | | | (2.32 | ) | | | (2.50 | ) | |
Class Y | |
Year Ended December 31, 2014 | | $ | 36.59 | | | | (0.07 | ) | | | 1.32 | | | | 1.25 | | | | — | | | | (6.04 | ) | | | (6.04 | ) | |
Year Ended December 31, 2013 | | $ | 29.93 | | | | 0.02 | | | | 9.64 | | | | 9.66 | | | | — | | | | (3.00 | ) | | | (3.00 | ) | |
Year Ended December 31, 2012 (i) | | $ | 30.10 | | | | 0.07 | | | | 2.27 | | | | 2.34 | | | | (0.19 | ) | | | (2.32 | ) | | | (2.51 | ) | |
Class Z | |
Year Ended December 31, 2014 | | $ | 35.90 | | | | (0.12 | ) | | | 1.29 | | | | 1.17 | | | | — | | | | (6.04 | ) | | | (6.04 | ) | |
Year Ended December 31, 2013 | | $ | 29.45 | | | | (0.07 | ) | | | 9.52 | | | | 9.45 | | | | — | | | | (3.00 | ) | | | (3.00 | ) | |
Year Ended December 31, 2012 | | $ | 26.98 | | | | 0.11 | | | | 4.92 | | | | 5.03 | | | | (0.19 | ) | | | (2.37 | ) | | | (2.56 | ) | |
Year Ended December 31, 2011 | | $ | 28.56 | | | | (0.14 | ) | | | (1.27 | ) | | | (1.41 | ) | | | — | | | | (0.17 | ) | | | (0.17 | ) | |
Year Ended December 31, 2010 | | $ | 23.19 | | | | (0.08 | ) | | | 5.45 | | | | 5.37 | | | | — | | | | — | | | | — | | |
Notes to Financial Highlights
(a) In addition to the fees and expenses that the Fund bears directly, the Fund indirectly bears a pro rata share of the fees and expenses of any other funds in which it invests, if any. Such indirect expenses are not included in the Fund's reported expense ratios.
(b) Ratios include line of credit interest expense which is less than 0.01%.
(c) The benefits derived from custody fees paid indirectly had an impact of less than 0.01%.
(d) Class I shares commenced operations on September 27, 2010. Per share data and total return reflect activity from that date.
(e) Annualized.
(f) Rounds to zero.
(g) Class R4 shares commenced operations on November 8, 2012. Per share data and total return reflect activity from that date.
(h) Class R5 shares commenced operations on November 8, 2012. Per share data and total return reflect activity from that date.
(i) Class Y shares commenced operations on November 8, 2012. Per share data and total return reflect activity from that date.
See accompanying notes to financial statements.
106
| | | | | | | Ratio to Average Net Assets | | Supplemental Data | |
(Selected data for a share outstanding
throughout each period) | | Net Asset
Value, End of
Period | | Total Return | | Total gross
expenses
(a) | | Total net
expenses
(a) | | Net
investment
income (loss) | | Portfolio
turnover rate | | Net assets,
end of period
(000s) | |
Class A | |
Year Ended December 31, 2014 | | $ | 29.13 | | | | 3.35 | % | | | 1.33 | % | | | 1.33 | % | | | (0.60 | )% | | | 12 | % | | $ | 148,089 | | |
Year Ended December 31, 2013 | | $ | 34.15 | | | | 32.34 | % | | | 1.32 | % | | | 1.32 | % | | | (0.46 | )% | | | 17 | % | | $ | 201,559 | | |
Year Ended December 31, 2012 | | $ | 28.21 | | | | 18.67 | % | | | 1.32 | %(b) | | | 1.32 | %(b)(c) | | | 0.08 | % | | | 14 | % | | $ | 152,164 | | |
Year Ended December 31, 2011 | | $ | 25.94 | | | | (5.21 | )% | | | 1.30 | % | | | 1.30 | %(c) | | | (0.78 | )% | | | 20 | % | | $ | 167,038 | | |
Year Ended December 31, 2010 | | $ | 27.54 | | | | 22.78 | % | | | 1.30 | % | | | 1.30 | %(c) | | | (0.64 | )% | | | 32 | % | | $ | 214,097 | | |
Class B | |
Year Ended December 31, 2014 | | $ | 25.27 | | | | 2.37 | % | | | 2.26 | % | | | 2.26 | % | | | (1.55 | )% | | | 12 | % | | $ | 234 | | |
Year Ended December 31, 2013 | | $ | 30.70 | | | | 31.28 | % | | | 2.15 | % | | | 2.15 | % | | | (1.33 | )% | | | 17 | % | | $ | 567 | | |
Year Ended December 31, 2012 | | $ | 25.81 | | | | 17.87 | % | | | 1.99 | %(b) | | | 1.99 | %(b)(c) | | | (0.71 | )% | | | 14 | % | | $ | 1,056 | | |
Year Ended December 31, 2011 | | $ | 23.98 | | | | (5.68 | )% | | | 1.92 | % | | | 1.92 | %(c) | | | (1.42 | )% | | | 20 | % | | $ | 2,253 | | |
Year Ended December 31, 2010 | | $ | 25.60 | | | | 21.96 | % | | | 1.98 | % | | | 1.98 | %(c) | | | (1.37 | )% | | | 32 | % | | $ | 9,222 | | |
Class C | |
Year Ended December 31, 2014 | | $ | 24.98 | | | | 2.67 | % | | | 2.00 | % | | | 2.00 | % | | | (1.26 | )% | | | 12 | % | | $ | 36,476 | | |
Year Ended December 31, 2013 | | $ | 30.33 | | | | 31.47 | % | | | 2.00 | % | | | 2.00 | % | | | (1.14 | )% | | | 17 | % | | $ | 40,395 | | |
Year Ended December 31, 2012 | | $ | 25.49 | | | | 17.82 | % | | | 2.05 | %(b) | | | 2.05 | %(b)(c) | | | (0.61 | )% | | | 14 | % | | $ | 31,410 | | |
Year Ended December 31, 2011 | | $ | 23.72 | | | | (5.92 | )% | | | 2.05 | % | | | 2.05 | %(c) | | | (1.53 | )% | | | 20 | % | | $ | 30,584 | | |
Year Ended December 31, 2010 | | $ | 25.39 | | | | 21.83 | % | | | 2.08 | % | | | 2.08 | %(c) | | | (1.41 | )% | | | 32 | % | | $ | 36,101 | | |
Class I | |
Year Ended December 31, 2014 | | $ | 31.19 | | | | 3.80 | % | | | 0.88 | % | | | 0.88 | % | | | (0.17 | )% | | | 12 | % | | $ | 2 | | |
Year Ended December 31, 2013 | | $ | 35.99 | | | | 32.93 | % | | | 0.90 | % | | | 0.90 | % | | | (0.04 | )% | | | 17 | % | | $ | 4 | | |
Year Ended December 31, 2012 | | $ | 29.47 | | | | 19.10 | % | | | 0.96 | % | | | 0.96 | %(c) | | | (0.33 | )% | | | 14 | % | | $ | 3 | | |
Year Ended December 31, 2011 | | $ | 27.00 | | | | (4.88 | )% | | | 0.94 | % | | | 0.94 | %(c) | | | (0.47 | )% | | | 20 | % | | $ | 2,635 | | |
Year Ended December 31, 2010 (d) | | $ | 28.56 | | | | 17.82 | % | | | 0.94 | %(e) | | | 0.94 | %(c)(e) | | | (0.35 | )%(e) | | | 32 | % | | $ | 28,993 | | |
Class R4 | |
Year Ended December 31, 2014 | | $ | 31.70 | | | | 3.60 | % | | | 1.07 | % | | | 1.07 | % | | | (0.32 | )% | | | 12 | % | | $ | 7,952 | | |
Year Ended December 31, 2013 | | $ | 36.55 | | | | 32.80 | % | | | 1.00 | % | | | 1.00 | % | | | 0.01 | % | | | 17 | % | | $ | 6,441 | | |
Year Ended December 31, 2012 (g) | | $ | 29.92 | | | | 8.06 | % | | | 1.14 | %(b)(e) | | | 1.14 | %(b)(c)(e) | | | 1.51 | %(e) | | | 14 | % | | $ | 15 | | |
Class R5 | |
Year Ended December 31, 2014 | | $ | 31.71 | | | | 3.68 | % | | | 0.99 | % | | | 0.99 | % | | | (0.17 | )% | | | 12 | % | | $ | 36,689 | | |
Year Ended December 31, 2013 | | $ | 36.53 | | | | 32.83 | % | | | 0.97 | % | | | 0.97 | % | | | 0.06 | % | | | 17 | % | | $ | 6,068 | | |
Year Ended December 31, 2012 (h) | | $ | 29.90 | | | | 8.06 | % | | | 1.12 | %(e) | | | 1.12 | %(c)(e) | | | 1.53 | %(e) | | | 14 | % | | $ | 2 | | |
Class Y | |
Year Ended December 31, 2014 | | $ | 31.80 | | | | 3.76 | % | | | 0.93 | % | | | 0.93 | % | | | (0.19 | )% | | | 12 | % | | $ | 35,551 | | |
Year Ended December 31, 2013 | | $ | 36.59 | | | | 32.89 | % | | | 0.93 | % | | | 0.93 | % | | | 0.07 | % | | | 17 | % | | $ | 48,479 | | |
Year Ended December 31, 2012 (i) | | $ | 29.93 | | | | 8.07 | % | | | 1.04 | %(e) | | | 1.04 | %(c)(e) | | | 1.62 | %(e) | | | 14 | % | | $ | 2 | | |
Class Z | |
Year Ended December 31, 2014 | | $ | 31.03 | | | | 3.61 | % | | | 1.08 | % | | | 1.08 | % | | | (0.34 | )% | | | 12 | % | | $ | 1,132,223 | | |
Year Ended December 31, 2013 | | $ | 35.90 | | | | 32.72 | % | | | 1.06 | % | | | 1.06 | % | | | (0.20 | )% | | | 17 | % | | $ | 1,496,775 | | |
Year Ended December 31, 2012 | | $ | 29.45 | | | | 18.98 | % | | | 1.07 | %(b) | | | 1.07 | %(b)(c) | | | 0.36 | % | | | 14 | % | | $ | 1,415,442 | | |
Year Ended December 31, 2011 | | $ | 26.98 | | | | (4.95 | )% | | | 1.00 | % | | | 1.00 | %(c) | | | (0.48 | )% | | | 20 | % | | $ | 1,355,934 | | |
Year Ended December 31, 2010 | | $ | 28.56 | | | | 23.16 | % | | | 1.01 | % | | | 1.01 | %(c) | | | (0.34 | )% | | | 32 | % | | $ | 1,410,133 | | |
See accompanying notes to financial statements.
107
Columbia Acorn Family of Funds
Financial Highlights, continued
Columbia Acorn International SelectSM
| | | | | Income from Investment Operations | | | | Less Distributions to Shareholders | | | | | |
(Selected data for a share outstanding
throughout each period) | | Net Asset
Value,
Beginning of
Period | | Net
investment
income (loss) | | Net realized
and
unrealized
gain (loss) | | Total from
investment
operations | | Net
investment
income | | Net
realized gains | | Total
Distributions to
Shareholders | | Redemption
fees added
to paid in
capital | |
Class A | |
Year Ended December 31, 2014 | | $ | 26.91 | | | | 0.29 | | | | (2.17 | ) | | | (1.88 | ) | | | (0.10 | ) | | | (2.89 | ) | | | (2.99 | ) | | | — | | |
Year Ended December 31, 2013 | | $ | 25.61 | | | | 0.29 | | | | 3.29 | | | | 3.58 | | | | (0.37 | ) | | | (1.91 | ) | | | (2.28 | ) | | | — | | |
Year Ended December 31, 2012 | | $ | 24.26 | | | | 0.39 | | | | 4.92 | | | | 5.31 | | | | (1.75 | ) | | | (2.21 | ) | | | (3.96 | ) | | | — | | |
Year Ended December 31, 2011 | | $ | 28.01 | | | | 0.18 | | | | (2.95 | ) | | | (2.77 | ) | | | (0.59 | ) | | | (0.39 | ) | | | (0.98 | ) | | | — | | |
Year Ended December 31, 2010 | | $ | 23.39 | | | | 0.08 | | | | 4.84 | | | | 4.92 | | | | (0.30 | ) | | | — | | | | (0.30 | ) | | | 0.00 | (e) | |
Class B | |
Year Ended December 31, 2014 | | $ | 25.53 | | | | 0.10 | | | | (2.05 | ) | | | (1.95 | ) | | | — | | | | (2.89 | ) | | | (2.89 | ) | | | — | | |
Year Ended December 31, 2013 | | $ | 24.40 | | | | 0.11 | | | | 3.12 | | | | 3.23 | | | | (0.19 | ) | | | (1.91 | ) | | | (2.10 | ) | | | — | | |
Year Ended December 31, 2012 | | $ | 23.27 | | | | 0.23 | | | | 4.69 | | | | 4.92 | | | | (1.58 | ) | | | (2.21 | ) | | | (3.79 | ) | | | — | | |
Year Ended December 31, 2011 | | $ | 26.72 | | | | 0.01 | | | | (2.82 | ) | | | (2.81 | ) | | | (0.25 | ) | | | (0.39 | ) | | | (0.64 | ) | | | — | | |
Year Ended December 31, 2010 | | $ | 22.34 | | | | (0.06 | ) | | | 4.62 | | | | 4.56 | | | | (0.18 | ) | | | — | | | | (0.18 | ) | | | 0.00 | (e) | |
Class C | |
Year Ended December 31, 2014 | | $ | 25.39 | | | | 0.07 | | | | (2.03 | ) | | | (1.96 | ) | | | — | | | | (2.89 | ) | | | (2.89 | ) | | | — | | |
Year Ended December 31, 2013 | | $ | 24.28 | | | | 0.08 | | | | 3.10 | | | | 3.18 | | | | (0.16 | ) | | | (1.91 | ) | | | (2.07 | ) | | | — | | |
Year Ended December 31, 2012 | | $ | 23.17 | | | | 0.18 | | | | 4.67 | | | | 4.85 | | | | (1.53 | ) | | | (2.21 | ) | | | (3.74 | ) | | | — | | |
Year Ended December 31, 2011 | | $ | 26.58 | | | | (0.04 | ) | | | (2.81 | ) | | | (2.85 | ) | | | (0.17 | ) | | | (0.39 | ) | | | (0.56 | ) | | | — | | |
Year Ended December 31, 2010 | | $ | 22.21 | | | | (0.10 | ) | | | 4.60 | | | | 4.50 | | | | (0.13 | ) | | | — | | | | (0.13 | ) | | | 0.00 | (e) | |
Class I | |
Year Ended December 31, 2014 | | $ | 27.19 | | | | 0.39 | | | | (2.20 | ) | | | (1.81 | ) | | | (0.20 | ) | | | (2.89 | ) | | | (3.09 | ) | | | — | | |
Year Ended December 31, 2013 | | $ | 25.85 | | | | 0.39 | | | | 3.32 | | | | 3.71 | | | | (0.46 | ) | | | (1.91 | ) | | | (2.37 | ) | | | — | | |
Year Ended December 31, 2012 | | $ | 24.45 | | | | 0.51 | | | | 4.94 | | | | 5.45 | | | | (1.84 | ) | | | (2.21 | ) | | | (4.05 | ) | | | — | | |
Year Ended December 31, 2011 | | $ | 28.33 | | | | 0.31 | | | | (2.97 | ) | | | (2.66 | ) | | | (0.83 | ) | | | (0.39 | ) | | | (1.22 | ) | | | — | | |
Year Ended December 31, 2010 (g) | | $ | 26.11 | | | | 0.03 | | | | 2.19 | | | | 2.22 | | | | — | | | | — | | | | — | | | | — | | |
Class R4 | |
Year Ended December 31, 2014 | | $ | 27.36 | | | | 0.37 | | | | (2.22 | ) | | | (1.85 | ) | | | (0.17 | ) | | | (2.89 | ) | | | (3.06 | ) | | | — | | |
Year Ended December 31, 2013 | | $ | 25.99 | | | | 0.29 | | | | 3.42 | | | | 3.71 | | | | (0.43 | ) | | | (1.91 | ) | | | (2.34 | ) | | | — | | |
Year Ended December 31, 2012 (i) | | $ | 29.98 | | | | (0.02 | ) | | | (0.09 | )(j) | | | (0.11 | ) | | | (1.79 | ) | | | (2.09 | ) | | | (3.88 | ) | | | — | | |
Class R5 | |
Year Ended December 31, 2014 | | $ | 27.34 | | | | 0.36 | | | | (2.19 | ) | | | (1.83 | ) | | | (0.19 | ) | | | (2.89 | ) | | | (3.08 | ) | | | — | | |
Year Ended December 31, 2013 | | $ | 25.98 | | | | 0.38 | | | | 3.35 | | | | 3.73 | | | | (0.46 | ) | | | (1.91 | ) | | | (2.37 | ) | | | — | | |
Year Ended December 31, 2012 (k) | | $ | 29.98 | | | | (0.02 | ) | | | (0.09 | )(j) | | | (0.11 | ) | | | (1.80 | ) | | | (2.09 | ) | | | (3.89 | ) | | | — | | |
Class Y | |
Year Ended December 31, 2014 | | $ | 27.33 | | | | 0.40 | | | | (2.21 | ) | | | (1.81 | ) | | | (0.21 | ) | | | (2.89 | ) | | | (3.10 | ) | | | — | | |
Year Ended December 31, 2013 | | $ | 25.98 | | | | 0.11 | | | | 3.62 | | | | 3.73 | | | | (0.47 | ) | | | (1.91 | ) | | | (2.38 | ) | | | — | | |
Year Ended December 31, 2012 (l) | | $ | 29.99 | | | | (0.02 | ) | | | (0.09 | )(j) | | | (0.11 | ) | | | (1.81 | ) | | | (2.09 | ) | | | (3.90 | ) | | | — | | |
Class Z | |
Year Ended December 31, 2014 | | $ | 27.20 | | | | 0.38 | | | | (2.21 | ) | | | (1.83 | ) | | | (0.18 | ) | | | (2.89 | ) | | | (3.07 | ) | | | — | | |
Year Ended December 31, 2013 | | $ | 25.86 | | | | 0.37 | | | | 3.33 | | | | 3.70 | | | | (0.45 | ) | | | (1.91 | ) | | | (2.36 | ) | | | — | | |
Year Ended December 31, 2012 | | $ | 24.46 | | | | 0.49 | | | | 4.95 | | | | 5.44 | | | | (1.83 | ) | | | (2.21 | ) | | | (4.04 | ) | | | — | | |
Year Ended December 31, 2011 | | $ | 28.33 | | | | 0.29 | | | | (2.98 | ) | | | (2.69 | ) | | | (0.79 | ) | | | (0.39 | ) | | | (1.18 | ) | | | — | | |
Year Ended December 31, 2010 | | $ | 23.64 | | | | 0.18 | | | | 4.89 | | | | 5.07 | | | | (0.38 | ) | | | — | | | | (0.38 | ) | | | 0.00 | (e) | |
Notes to Financial Highlights
(a) In addition to the fees and expenses that the Fund bears directly, the Fund indirectly bears a pro rata share of the fees and expenses of any other funds in which it invests, if any. Such indirect expenses are not included in the Fund's reported expense ratios.
(b) Ratios include line of credit interest expense which is less than 0.01%.
(c) The benefits derived from custody fees paid indirectly had an impact of 0.01%.
(d) The benefits derived from custody fees paid indirectly had an impact of less than 0.01%.
(e) Rounds to zero.
(f) Had the Investment Manager and/or its affiliates not waived fees and/or reimbursed a portion of expenses, total return would have been reduced.
(g) Class I shares commenced operations on September 27, 2010. Per share data and total return reflect activity from that date.
(h) Annualized.
(i) Class R4 shares commenced operations on November 8, 2012. Per share data and total return reflect activity from that date.
(j) Calculation of the net gain (loss) per share (both realized and unrealized) does not correlate to the aggregate realized and unrealized gain (loss) presented in the Statements of Operations due to the timing of subscriptions and redemptions of Fund shares in relation to fluctuations in the market value of the portfolio.
(k) Class R5 shares commenced operations on November 8, 2012. Per share data and total return reflect activity from that date.
(l) Class Y shares commenced operations on November 8, 2012. Per share data and total return reflect activity from that date.
See accompanying notes to financial statements.
108
| | | | | | | | | Ratio to Average Net Assets | | Supplemental Data | |
(Selected data for a share outstanding
throughout each period) | | Increase from
regulatory
settlements | | Net Asset
Value, End of
Period | | Total Return | | Total gross
expenses
(a) | | Total net
expenses
(a) | | Net
investment
income (loss) | | Portfolio
turnover rate | | Net assets,
end of period
(000s) | |
Class A | |
Year Ended December 31, 2014 | | | — | | | $ | 22.04 | | | | (7.06 | )% | | | 1.47 | % | | | 1.47 | % | | | 1.05 | % | | | 58 | % | | $ | 53,419 | | |
Year Ended December 31, 2013 | | | — | | | $ | 26.91 | | | | 14.42 | % | | | 1.47 | % | | | 1.47 | % | | | 1.08 | % | | | 72 | % | | $ | 73,911 | | |
Year Ended December 31, 2012 | | | — | | | $ | 25.61 | | | | 22.05 | % | | | 1.49 | %(b) | | | 1.49 | %(b)(c) | | | 1.43 | % | | | 63 | % | | $ | 74,167 | | |
Year Ended December 31, 2011 | | | — | | | $ | 24.26 | | | | (10.11 | )% | | | 1.51 | % | | | 1.51 | %(d) | | | 0.66 | % | | | 44 | % | | $ | 56,350 | | |
Year Ended December 31, 2010 | | | 0.00 | (e) | | $ | 28.01 | | | | 21.41 | % | | | 1.56 | % | | | 1.56 | %(d) | | | 0.33 | % | | | 42 | % | | $ | 71,668 | | |
Class B | |
Year Ended December 31, 2014 | | | — | | | $ | 20.69 | | | | (7.71 | )% | | | 2.11 | % | | | 2.11 | % | | | 0.39 | % | | | 58 | % | | $ | 355 | | |
Year Ended December 31, 2013 | | | — | | | $ | 25.53 | | | | 13.67 | % | | | 2.14 | % | | | 2.14 | % | | | 0.43 | % | | | 72 | % | | $ | 873 | | |
Year Ended December 31, 2012 | | | — | | | $ | 24.40 | | | | 21.29 | % | | | 2.11 | %(b) | | | 2.10 | %(b)(c) | | | 0.87 | % | | | 63 | % | | $ | 1,250 | | |
Year Ended December 31, 2011 | | | — | | | $ | 23.27 | | | | (10.64 | )% | | | 2.14 | % | | | 2.14 | %(d) | | | 0.04 | % | | | 44 | % | | $ | 1,774 | | |
Year Ended December 31, 2010 | | | 0.00 | (e) | | $ | 26.72 | | | | 20.63 | %(f) | | | 2.24 | % | | | 2.20 | %(d) | | | (0.27 | )% | | | 42 | % | | $ | 3,030 | | |
Class C | |
Year Ended December 31, 2014 | | | — | | | $ | 20.54 | | | | (7.80 | )% | | | 2.23 | % | | | 2.23 | % | | | 0.29 | % | | | 58 | % | | $ | 8,057 | | |
Year Ended December 31, 2013 | | | — | | | $ | 25.39 | | | | 13.52 | % | | | 2.26 | % | | | 2.26 | % | | | 0.32 | % | | | 72 | % | | $ | 10,311 | | |
Year Ended December 31, 2012 | | | — | | | $ | 24.28 | | | | 21.10 | % | | | 2.28 | %(b) | | | 2.27 | %(b)(c) | | | 0.67 | % | | | 63 | % | | $ | 9,786 | | |
Year Ended December 31, 2011 | | | — | | | $ | 23.17 | | | | (10.81 | )% | | | 2.31 | % | | | 2.31 | %(d) | | | (0.14 | )% | | | 44 | % | | $ | 8,704 | | |
Year Ended December 31, 2010 | | | 0.00 | (e) | | $ | 26.58 | | | | 20.45 | % | | | 2.36 | % | | | 2.36 | %(d) | | | (0.45 | )% | | | 42 | % | | $ | 11,885 | | |
Class I | |
Year Ended December 31, 2014 | | | — | | | $ | 22.29 | | | | (6.72 | )% | | | 1.11 | % | | | 1.11 | % | | | 1.41 | % | | | 58 | % | | $ | 2 | | |
Year Ended December 31, 2013 | | | — | | | $ | 27.19 | | | | 14.82 | % | | | 1.13 | % | | | 1.13 | % | | | 1.43 | % | | | 72 | % | | $ | 3 | | |
Year Ended December 31, 2012 | | | — | | | $ | 25.85 | | | | 22.48 | % | | | 1.15 | % | | | 1.14 | %(c) | | | 1.84 | % | | | 63 | % | | $ | 2 | | |
Year Ended December 31, 2011 | | | — | | | $ | 24.45 | | | | (9.68 | )% | | | 1.04 | % | | | 1.04 | %(d) | | | 1.12 | % | | | 44 | % | | $ | 2 | | |
Year Ended December 31, 2010 (g) | | | — | | | $ | 28.33 | | | | 8.50 | % | | | 1.14 | %(h) | | | 1.14 | %(d)(h) | | | 0.44 | %(h) | | | 42 | % | | $ | 3 | | |
Class R4 | |
Year Ended December 31, 2014 | | | — | | | $ | 22.45 | | | | (6.83 | )% | | | 1.21 | % | | | 1.21 | % | | | 1.33 | % | | | 58 | % | | $ | 974 | | |
Year Ended December 31, 2013 | | | — | | | $ | 27.36 | | | | 14.72 | % | | | 1.24 | % | | | 1.24 | % | | | 1.06 | % | | | 72 | % | | $ | 417 | | |
Year Ended December 31, 2012 (i) | | | — | | | $ | 25.99 | | | | (0.27 | )% | | | 1.30 | %(b)(h) | | | 1.30 | %(b)(c)(h) | | | (0.55 | )%(h) | | | 63 | % | | $ | 13 | | |
Class R5 | |
Year Ended December 31, 2014 | | | — | | | $ | 22.43 | | | | (6.77 | )% | | | 1.15 | % | | | 1.15 | % | | | 1.30 | % | | | 58 | % | | $ | 2,593 | | |
Year Ended December 31, 2013 | | | — | | | $ | 27.34 | | | | 14.80 | %(f) | | | 1.15 | % | | | 1.15 | % | | | 1.40 | % | | | 72 | % | | $ | 956 | | |
Year Ended December 31, 2012 (k) | | | — | | | $ | 25.98 | | | | (0.27 | )% | | | 1.29 | %(h) | | | 1.28 | %(c)(h) | | | (0.55 | )%(h) | | | 63 | % | | $ | 2 | | |
Class Y | |
Year Ended December 31, 2014 | | | — | | | $ | 22.42 | | | | (6.71 | )% | | | 1.09 | % | | | 1.09 | % | | | 1.43 | % | | | 58 | % | | $ | 11,755 | | |
Year Ended December 31, 2013 | | | — | | | $ | 27.33 | | | | 14.82 | % | | | 1.09 | % | | | 1.09 | % | | | 0.40 | % | | | 72 | % | | $ | 13,318 | | |
Year Ended December 31, 2012 (l) | | | — | | | $ | 25.98 | | | | (0.25 | )% | | | 1.21 | %(h) | | | 1.20 | %(c)(h) | | | (0.48 | )%(h) | | | 63 | % | | $ | 2 | | |
Class Z | |
Year Ended December 31, 2014 | | | — | | | $ | 22.30 | | | | (6.79 | )% | | | 1.17 | % | | | 1.17 | % | | | 1.36 | % | | | 58 | % | | $ | 175,764 | | |
Year Ended December 31, 2013 | | | — | | | $ | 27.20 | | | | 14.75 | % | | | 1.19 | % | | | 1.19 | % | | | 1.37 | % | | | 72 | % | | $ | 256,100 | | |
Year Ended December 31, 2012 | | | — | | | $ | 25.86 | | | | 22.42 | % | | | 1.20 | %(b) | | | 1.19 | %(b)(c) | | | 1.77 | % | | | 63 | % | | $ | 295,231 | | |
Year Ended December 31, 2011 | | | — | | | $ | 24.46 | | | | (9.76 | )% | | | 1.14 | % | | | 1.14 | %(d) | | | 1.03 | % | | | 44 | % | | $ | 259,553 | | |
Year Ended December 31, 2010 | | | 0.00 | (e) | | $ | 28.33 | | | | 21.89 | % | | | 1.16 | % | | | 1.16 | %(d) | | | 0.75 | % | | | 42 | % | | $ | 366,081 | | |
See accompanying notes to financial statements.
109
Columbia Acorn Family of Funds
Financial Highlights, continued
Columbia Acorn SelectSM
| | | | | Income from Investment Operations | | | | Less Distributions to Shareholders | | | |
(Selected data for a share outstanding
throughout each period) | | Net Asset
Value,
Beginning of
Period | | Net
investment
income (loss) | | Net realized
and
unrealized
gain (loss) | | Reimbursement
from
affiliate | | Total from
investment
operations | | Net
investment
income | | Net
realized gains | | Total
Distributions to
Shareholders | |
Class A | |
Year Ended December 31, 2014 | | $ | 25.57 | | | | (0.14 | ) | | | 0.64 | | | | — | | | | 0.50 | | | | — | | | | (5.04 | ) | | | (5.04 | ) | |
Year Ended December 31, 2013 | | $ | 24.72 | | | | (0.15 | ) | | | 7.92 | | | | — | | | | 7.77 | | | | (0.07 | ) | | | (6.85 | ) | | | (6.92 | ) | |
Year Ended December 31, 2012 | | $ | 22.95 | | | | 0.03 | | | | 3.78 | | | | — | | | | 3.81 | | | | — | | | | (2.04 | ) | | | (2.04 | ) | |
Year Ended December 31, 2011 | | $ | 27.94 | | | | (0.15 | ) | | | (4.46 | ) | | | — | | | | (4.61 | ) | | | (0.38 | ) | | | — | | | | (0.38 | ) | |
Year Ended December 31, 2010 | | $ | 22.81 | | | | (0.18 | ) | | | 5.31 | | | | — | | | | 5.13 | | | | — | | | | — | | | | — | | |
Class B | |
Year Ended December 31, 2014 | | $ | 22.81 | | | | (0.31 | ) | | | 0.57 | | | | — | | | | 0.26 | | | | — | | | | (5.04 | ) | | | (5.04 | ) | |
Year Ended December 31, 2013 | | $ | 22.75 | | | | (0.33 | ) | | | 7.24 | | | | — | | | | 6.91 | | | | — | | | | (6.85 | ) | | | (6.85 | ) | |
Year Ended December 31, 2012 | | $ | 21.40 | | | | (0.15 | ) | | | 3.54 | | | | — | | | | 3.39 | | | | — | | | | (2.04 | ) | | | (2.04 | ) | |
Year Ended December 31, 2011 | | $ | 26.06 | | | | (0.30 | ) | | | (4.13 | ) | | | — | | | | (4.43 | ) | | | (0.23 | ) | | | — | | | | (0.23 | ) | |
Year Ended December 31, 2010 | | $ | 21.41 | | | | (0.31 | ) | | | 4.96 | | | | — | | | | 4.65 | | | | — | | | | — | | | | — | | |
Class C | |
Year Ended December 31, 2014 | | $ | 22.46 | | | | (0.28 | ) | | | 0.55 | | | | — | | | | 0.27 | | | | — | | | | (5.04 | ) | | | (5.04 | ) | |
Year Ended December 31, 2013 | | $ | 22.48 | | | | (0.32 | ) | | | 7.15 | | | | — | | | | 6.83 | | | | — | | | | (6.85 | ) | | | (6.85 | ) | |
Year Ended December 31, 2012 | | $ | 21.20 | | | | (0.14 | ) | | | 3.46 | | | | — | | | | 3.32 | | | | — | | | | (2.04 | ) | | | (2.04 | ) | |
Year Ended December 31, 2011 | | $ | 25.83 | | | | (0.32 | ) | | | (4.12 | ) | | | — | | | | (4.44 | ) | | | (0.19 | ) | | | — | | | | (0.19 | ) | |
Year Ended December 31, 2010 | | $ | 21.25 | | | | (0.34 | ) | | | 4.92 | | | | — | | | | 4.58 | | | | — | | | | — | | | | — | | |
Class I | |
Year Ended December 31, 2014 | | $ | 26.81 | | | | (0.05 | ) | | | 0.66 | | | | — | | | | 0.61 | | | | — | | | | (5.04 | ) | | | (5.04 | ) | |
Year Ended December 31, 2013 | | $ | 25.63 | | | | (0.06 | ) | | | 8.25 | | | | — | | | | 8.19 | | | | (0.16 | ) | | | (6.85 | ) | | | (7.01 | ) | |
Year Ended December 31, 2012 | | $ | 23.65 | | | | 0.23 | | | | 3.79 | | | | — | | | | 4.02 | | | | — | | | | (2.04 | ) | | | (2.04 | ) | |
Year Ended December 31, 2011 | | $ | 28.74 | | | | (0.03 | ) | | | (4.59 | ) | | | — | | | | (4.62 | ) | | | (0.47 | ) | | | — | | | | (0.47 | ) | |
Year Ended December 31, 2010 (e) | | $ | 24.74 | | | | 0.01 | | | | 3.99 | | | | — | | | | 4.00 | | | | — | | | | — | | | | — | | |
Class R4 | |
Year Ended December 31, 2014 | | $ | 27.20 | | | | (0.10 | ) | | | 0.69 | | | | — | | | | 0.59 | | | | — | | | | (5.04 | ) | | | (5.04 | ) | |
Year Ended December 31, 2013 | | $ | 25.92 | | | | (0.06 | ) | | | 8.32 | | | | — | | | | 8.26 | | | | (0.13 | ) | | | (6.85 | ) | | | (6.98 | ) | |
Year Ended December 31, 2012 (g) | | $ | 25.91 | | | | 0.00 | (h) | | | 1.52 | | | | — | | | | 1.52 | | | | — | | | | (1.51 | ) | | | (1.51 | ) | |
Class R5 | |
Year Ended December 31, 2014 | | $ | 27.20 | | | | (0.07 | ) | | | 0.69 | | | | — | | | | 0.62 | | | | — | | | | (5.04 | ) | | | (5.04 | ) | |
Year Ended December 31, 2013 | | $ | 25.93 | | | | (0.04 | ) | | | 8.31 | | | | — | | | | 8.27 | | | | (0.15 | ) | | | (6.85 | ) | | | (7.00 | ) | |
Year Ended December 31, 2012 (i) | | $ | 25.91 | | | | 0.00 | (h) | | | 1.53 | | | | — | | | | 1.53 | | | | — | | | | (1.51 | ) | | | (1.51 | ) | |
Class Y | |
Year Ended December 31, 2014 | | $ | 27.27 | | | | (0.06 | ) | | | 0.69 | | | | — | | | | 0.63 | | | | — | | | | (5.04 | ) | | | (5.04 | ) | |
Year Ended December 31, 2013 | | $ | 25.98 | | | | (0.03 | ) | | | 8.34 | | | | — | | | | 8.31 | | | | (0.17 | ) | | | (6.85 | ) | | | (7.02 | ) | |
Year Ended December 31, 2012 (j) | | $ | 25.96 | | | | 0.01 | | | | 1.52 | | | | — | | | | 1.53 | | | | — | | | | (1.51 | ) | | | (1.51 | ) | |
Class Z | |
Year Ended December 31, 2014 | | $ | 26.72 | | | | (0.08 | ) | | | 0.68 | | | | — | | | | 0.60 | | | | — | | | | (5.04 | ) | | | (5.04 | ) | |
Year Ended December 31, 2013 | | $ | 25.57 | | | | (0.07 | ) | | | 8.21 | | | | — | | | | 8.14 | | | | (0.14 | ) | | | (6.85 | ) | | | (6.99 | ) | |
Year Ended December 31, 2012 | | $ | 23.62 | | | | 0.11 | | | | 3.88 | | | | — | | | | 3.99 | | | | — | | | | (2.04 | ) | | | (2.04 | ) | |
Year Ended December 31, 2011 | | $ | 28.73 | | | | (0.07 | ) | | | (4.58 | ) | | | 0.00 | (h) | | | (4.65 | ) | | | (0.46 | ) | | | — | | | | (0.46 | ) | |
Year Ended December 31, 2010 | | $ | 23.38 | | | | (0.10 | ) | | | 5.45 | | | | — | | | | 5.35 | | | | — | | | | — | | | | — | | |
Notes to Financial Highlights
(a) In addition to the fees and expenses that the Fund bears directly, the Fund indirectly bears a pro rata share of the fees and expenses of any other funds in which it invests, if any. Such indirect expenses are not included in the Fund's reported expense ratios.
(b) Ratios include line of credit interest expense which is less than 0.01%.
(c) The benefits derived from custody fees paid indirectly had an impact of less than 0.01%.
(d) Had the Investment Manager and/or its affiliates not waived fees and/or reimbursed a portion of expenses, total return would have been reduced.
(e) Class I shares commenced operations on September 27, 2010. Per share data and total return reflect activity from that date.
(f) Annualized.
(g) Class R4 shares commenced operations on November 8, 2012. Per share data and total return reflect activity from that date.
(h) Rounds to zero.
(i) Class R5 shares commenced operations on November 8, 2012. Per share data and total return reflect activity from that date.
(j) Class Y shares commenced operations on November 8, 2012. Per share data and total return reflect activity from that date.
(k) During the year ended December 31, 2011, the Fund received a reimbursement from an affiliate. Had the Fund not received this payment, the total return would have been lower by 0.01%.
See accompanying notes to financial statements.
110
| | | | | | | Ratio to Average Net Assets | | Supplemental Data | |
(Selected data for a share outstanding
throughout each period) | | Net Asset
Value, End of
Period | | Total Return | | Total gross
expenses
(a) | | Total net
expenses
(a) | | Net
investment
income (loss) | | Portfolio
turnover rate | | Net assets,
end of period
(000s) | |
Class A | |
Year Ended December 31, 2014 | | $ | 21.03 | | | | 2.17 | % | | | 1.32 | % | | | 1.32 | % | | | (0.58 | )% | | | 17 | % | | $ | 264,234 | | |
Year Ended December 31, 2013 | | $ | 25.57 | | | | 33.77 | % | | | 1.31 | %(b) | | | 1.31 | %(b) | | | (0.54 | )% | | | 20 | % | | $ | 333,193 | | |
Year Ended December 31, 2012 | | $ | 24.72 | | | | 16.87 | % | | | 1.31 | %(b) | | | 1.31 | %(b)(c) | | | 0.13 | % | | | 15 | % | | $ | 271,628 | | |
Year Ended December 31, 2011 | | $ | 22.95 | | | | (16.65 | )% | | | 1.28 | % | | | 1.28 | %(c) | | | (0.57 | )% | | | 21 | % | | $ | 340,325 | | |
Year Ended December 31, 2010 | | $ | 27.94 | | | | 22.49 | % | | | 1.28 | % | | | 1.28 | %(c) | | | (0.73 | )% | | | 28 | % | | $ | 555,263 | | |
Class B | |
Year Ended December 31, 2014 | | $ | 18.03 | | | | 1.35 | %(d) | | | 2.14 | % | | | 2.10 | % | | | (1.40 | )% | | | 17 | % | | $ | 1,014 | | |
Year Ended December 31, 2013 | | $ | 22.81 | | | | 32.81 | %(d) | | | 2.05 | %(b) | | | 2.03 | %(b) | | | (1.32 | )% | | | 20 | % | | $ | 2,938 | | |
Year Ended December 31, 2012 | | $ | 22.75 | | | | 16.11 | % | | | 1.91 | %(b) | | | 1.90 | %(b)(c) | | | (0.62 | )% | | | 15 | % | | $ | 9,938 | | |
Year Ended December 31, 2011 | | $ | 21.40 | | | | (17.11 | )% | | | 1.88 | % | | | 1.88 | %(c) | | | (1.21 | )% | | | 21 | % | | $ | 26,126 | | |
Year Ended December 31, 2010 | | $ | 26.06 | | | | 21.72 | % | | | 1.92 | % | | | 1.92 | %(c) | | | (1.39 | )% | | | 28 | % | | $ | 72,203 | | |
Class C | |
Year Ended December 31, 2014 | | $ | 17.69 | | | | 1.42 | % | | | 2.04 | % | | | 2.04 | % | | | (1.30 | )% | | | 17 | % | | $ | 48,591 | | |
Year Ended December 31, 2013 | | $ | 22.46 | | | | 32.85 | % | | | 2.04 | %(b) | | | 2.04 | %(b) | | | (1.28 | )% | | | 20 | % | | $ | 61,537 | | |
Year Ended December 31, 2012 | | $ | 22.48 | | | | 15.93 | % | | | 2.07 | %(b) | | | 2.06 | %(b)(c) | | | (0.59 | )% | | | 15 | % | | $ | 57,309 | | |
Year Ended December 31, 2011 | | $ | 21.20 | | | | (17.27 | )% | | | 2.05 | % | | | 2.05 | %(c) | | | (1.34 | )% | | | 21 | % | | $ | 62,887 | | |
Year Ended December 31, 2010 | | $ | 25.83 | | | | 21.55 | % | | | 2.07 | % | | | 2.07 | %(c) | | | (1.52 | )% | | | 28 | % | | $ | 98,445 | | |
Class I | |
Year Ended December 31, 2014 | | $ | 22.38 | | | | 2.49 | % | | | 0.94 | % | | | 0.94 | % | | | (0.20 | )% | | | 17 | % | | $ | 18,718 | | |
Year Ended December 31, 2013 | | $ | 26.81 | | | | 34.31 | % | | | 0.94 | %(b) | | | 0.94 | %(b) | | | (0.21 | )% | | | 20 | % | | $ | 13,660 | | |
Year Ended December 31, 2012 | | $ | 25.63 | | | | 17.26 | % | | | 0.96 | %(b) | | | 0.95 | %(b)(c) | | | 0.89 | % | | | 15 | % | | $ | 39,054 | | |
Year Ended December 31, 2011 | | $ | 23.65 | | | | (16.25 | )% | | | 0.92 | % | | | 0.92 | %(c) | | | (0.12 | )% | | | 21 | % | | $ | 10,944 | | |
Year Ended December 31, 2010 (e) | | $ | 28.74 | | | | 16.17 | % | | | 0.91 | %(f) | | | 0.91 | %(c)(f) | | | 0.18 | %(f) | | | 28 | % | | $ | 7,832 | | |
Class R4 | |
Year Ended December 31, 2014 | | $ | 22.75 | | | | 2.39 | % | | | 1.12 | % | | | 1.12 | % | | | (0.37 | )% | | | 17 | % | | $ | 1,193 | | |
Year Ended December 31, 2013 | | $ | 27.20 | | | | 34.16 | % | | | 1.02 | %(b) | | | 1.02 | %(b) | | | (0.20 | )% | | | 20 | % | | $ | 1,383 | | |
Year Ended December 31, 2012 (g) | | $ | 25.92 | | | | 5.92 | % | | | 1.07 | %(f) | | | 1.06 | %(c)(f) | | | 0.02 | %(f) | | | 15 | % | | $ | 15 | | |
Class R5 | |
Year Ended December 31, 2014 | | $ | 22.78 | | | | 2.50 | % | | | 1.00 | % | | | 1.00 | % | | | (0.26 | )% | | | 17 | % | | $ | 10,697 | | |
Year Ended December 31, 2013 | | $ | 27.20 | | | | 34.21 | % | | | 0.97 | %(b) | | | 0.97 | %(b) | | | (0.13 | )% | | | 20 | % | | $ | 11,996 | | |
Year Ended December 31, 2012 (i) | | $ | 25.93 | | | | 5.96 | % | | | 0.99 | %(f) | | | 0.99 | %(c)(f) | | | 0.08 | %(f) | | | 15 | % | | $ | 3 | | |
Class Y | |
Year Ended December 31, 2014 | | $ | 22.86 | | | | 2.53 | % | | | 0.95 | % | | | 0.95 | % | | | (0.22 | )% | | | 17 | % | | $ | 3,644 | | |
Year Ended December 31, 2013 | | $ | 27.27 | | | | 34.30 | % | | | 0.93 | %(b) | | | 0.93 | %(b) | | | (0.09 | )% | | | 20 | % | | $ | 4,847 | | |
Year Ended December 31, 2012 (j) | | $ | 25.98 | | | | 5.94 | % | | | 0.92 | %(f) | | | 0.92 | %(c)(f) | | | 0.15 | %(f) | | | 15 | % | | $ | 3 | | |
Class Z | |
Year Ended December 31, 2014 | | $ | 22.28 | | | | 2.47 | % | | | 1.04 | % | | | 1.04 | % | | | (0.30 | )% | | | 17 | % | | $ | 318,487 | | |
Year Ended December 31, 2013 | | $ | 26.72 | | | | 34.16 | % | | | 1.02 | %(b) | | | 1.02 | %(b) | | | (0.26 | )% | | | 20 | % | | $ | 431,990 | | |
Year Ended December 31, 2012 | | $ | 25.57 | | | | 17.15 | % | | | 1.03 | %(b) | | | 1.03 | %(b)(c) | | | 0.40 | % | | | 15 | % | | $ | 587,678 | | |
Year Ended December 31, 2011 | | $ | 23.62 | | | | (16.37 | )%(k) | | | 0.97 | % | | | 0.97 | %(c) | | | (0.28 | )% | | | 21 | % | | $ | 850,338 | | |
Year Ended December 31, 2010 | | $ | 28.73 | | | | 22.88 | % | | | 0.97 | % | | | 0.97 | %(c) | | | (0.41 | )% | | | 28 | % | | $ | 1,549,112 | | |
See accompanying notes to financial statements.
111
Columbia Acorn Family of Funds
Financial Highlights, continued
Columbia Thermostat FundSM
| | | | | Income from Investment Operations | | | | Less Distributions to Shareholders | | | |
(Selected data for a share outstanding
throughout each period) | | Net Asset
Value,
Beginning of
Period | | Net
investment
income | | Net realized
and
unrealized
gain | | Total from
investment
operations | | Net
investment
income | | Net
realized gains | | Total
Distributions to
Shareholders | |
Class A | |
Year Ended December 31, 2014 | | $ | 14.58 | | | | 0.28 | | | | 0.49 | | | | 0.77 | | | | (0.28 | ) | | | (0.21 | ) | | | (0.49 | ) | |
Year Ended December 31, 2013 | | $ | 14.29 | | | | 0.29 | | | | 1.00 | | | | 1.29 | | | | (0.25 | ) | | | (0.75 | ) | | | (1.00 | ) | |
Year Ended December 31, 2012 | | $ | 12.82 | | | | 0.32 | | | | 1.39 | | | | 1.71 | | | | (0.24 | ) | | | — | | | | (0.24 | ) | |
Year Ended December 31, 2011 | | $ | 12.58 | | | | 0.28 | | | | 0.30 | | | | 0.58 | | | | (0.34 | ) | | | — | | | | (0.34 | ) | |
Year Ended December 31, 2010 | | $ | 10.90 | | | | 0.19 | | | | 1.67 | | | | 1.86 | | | | (0.18 | ) | | | — | | | | (0.18 | ) | |
Class B | |
Year Ended December 31, 2014 | | $ | 14.68 | | | | 0.21 | | | | 0.50 | | | | 0.71 | | | | (0.21 | ) | | | (0.21 | ) | | | (0.42 | ) | |
Year Ended December 31, 2013 | | $ | 14.39 | | | | 0.19 | | | | 1.03 | | | | 1.22 | | | | (0.18 | ) | | | (0.75 | ) | | | (0.93 | ) | |
Year Ended December 31, 2012 | | $ | 12.91 | | | | 0.20 | | | | 1.45 | | | | 1.65 | | | | (0.17 | ) | | | — | | | | (0.17 | ) | |
Year Ended December 31, 2011 | | $ | 12.64 | | | | 0.15 | | | | 0.38 | | | | 0.53 | | | | (0.26 | ) | | | — | | | | (0.26 | ) | |
Year Ended December 31, 2010 | | $ | 10.93 | | | | 0.13 | | | | 1.67 | | | | 1.80 | | | | (0.09 | ) | | | — | | | | (0.09 | ) | |
Class C | |
Year Ended December 31, 2014 | | $ | 14.68 | | | | 0.17 | | | | 0.49 | | | | 0.66 | | | | (0.17 | ) | | | (0.21 | ) | | | (0.38 | ) | |
Year Ended December 31, 2013 | | $ | 14.39 | | | | 0.18 | | | | 1.00 | | | | 1.18 | | | | (0.14 | ) | | | (0.75 | ) | | | (0.89 | ) | |
Year Ended December 31, 2012 | | $ | 12.91 | | | | 0.22 | | | | 1.39 | | | | 1.61 | | | | (0.13 | ) | | | — | | | | (0.13 | ) | |
Year Ended December 31, 2011 | | $ | 12.62 | | | | 0.18 | | | | 0.31 | | | | 0.49 | | | | (0.20 | ) | | | — | | | | (0.20 | ) | |
Year Ended December 31, 2010 | | $ | 10.91 | | | | 0.10 | | | | 1.68 | | | | 1.78 | | | | (0.07 | ) | | | — | | | | (0.07 | ) | |
Class R4 | |
Year Ended December 31, 2014 | | $ | 14.46 | | | | 0.32 | | | | 0.49 | | | | 0.81 | | | | (0.32 | ) | | | (0.21 | ) | | | (0.53 | ) | |
Year Ended December 31, 2013 | | $ | 14.19 | | | | 0.36 | | | | 0.95 | | | | 1.31 | | | | (0.29 | ) | | | (0.75 | ) | | | (1.04 | ) | |
Year Ended December 31, 2012 (d) | | $ | 14.08 | | | | 0.09 | | | | 0.28 | | | | 0.37 | | | | (0.26 | ) | | | — | | | | (0.26 | ) | |
Class R5 | |
Year Ended December 31, 2014 | | $ | 14.47 | | | | 0.31 | | | | 0.50 | | | | 0.81 | | | | (0.32 | ) | | | (0.21 | ) | | | (0.53 | ) | |
Year Ended December 31, 2013 | | $ | 14.19 | | | | 0.37 | | | | 0.96 | | | | 1.33 | | | | (0.30 | ) | | | (0.75 | ) | | | (1.05 | ) | |
Year Ended December 31, 2012 (f) | | $ | 14.08 | | | | 0.09 | | | | 0.27 | | | | 0.36 | | | | (0.25 | ) | | | — | | | | (0.25 | ) | |
Class Y | |
Year Ended December 31, 2014 | | $ | 14.46 | | | | 0.32 | | | | 0.50 | | | | 0.82 | | | | (0.33 | ) | | | (0.21 | ) | | | (0.54 | ) | |
Year Ended December 31, 2013 | | $ | 14.18 | | | | 0.33 | | | | 1.01 | | | | 1.34 | | | | (0.31 | ) | | | (0.75 | ) | | | (1.06 | ) | |
Year Ended December 31, 2012 (g) | | $ | 14.08 | | | | 0.09 | | | | 0.27 | | | | 0.36 | | | | (0.26 | ) | | | — | | | | (0.26 | ) | |
Class Z | |
Year Ended December 31, 2014 | | $ | 14.40 | | | | 0.32 | | | | 0.48 | | | | 0.80 | | | | (0.32 | ) | | | (0.21 | ) | | | (0.53 | ) | |
Year Ended December 31, 2013 | | $ | 14.13 | | | | 0.32 | | | | 0.99 | | | | 1.31 | | | | (0.29 | ) | | | (0.75 | ) | | | (1.04 | ) | |
Year Ended December 31, 2012 | | $ | 12.67 | | | | 0.34 | | | | 1.39 | | | | 1.73 | | | | (0.27 | ) | | | — | | | | (0.27 | ) | |
Year Ended December 31, 2011 | | $ | 12.44 | | | | 0.31 | | | | 0.29 | | | | 0.60 | | | | (0.37 | ) | | | — | | | | (0.37 | ) | |
Year Ended December 31, 2010 | | $ | 10.80 | | | | 0.21 | | | | 1.66 | | | | 1.87 | | | | (0.23 | ) | | | — | | | | (0.23 | ) | |
Notes to Financial Highlights
(a) Had the Investment Manager and/or its affiliates not waived fees and/or reimbursed a portion of expenses, total return would have been reduced.
(b) In addition to the fees and expenses that the Fund bears directly, the Fund indirectly bears a pro rata share of the fees and expenses of the underlying funds in which the Fund invests, if any. Such indirect expenses are not included in the Fund's reported expense ratios.
(c) The benefits derived from custody fees paid indirectly had an impact of less than 0.01%.
(d) Class R4 shares commenced operations on November 8, 2012. Per share data and total return reflect activity from that date.
(e) Annualized.
(f) Class R5 shares commenced operations on November 8, 2012. Per share data and total return reflect activity from that date.
(g) Class Y shares commenced operations on November 8, 2012. Per share data and total return reflect activity from that date.
See accompanying notes to financial statements.
112
| | | | | | | Ratio to Average Net Assets | | Supplemental Data | |
(Selected data for a share outstanding
throughout each period) | | Net Asset
Value, End of
Period | | Total Return
(a) | | Total gross
expenses
(b) | | Total net
expenses
(b) | | Net
investment
income | | Portfolio
turnover rate | | Net assets,
end of period
(000s) | |
Class A | |
Year Ended December 31, 2014 | | $ | 14.86 | | | | 5.30 | % | | | 0.51 | % | | | 0.50 | % | | | 1.88 | % | | | 95 | % | | $ | 450,258 | | |
Year Ended December 31, 2013 | | $ | 14.58 | | | | 9.07 | % | | | 0.52 | % | | | 0.50 | % | | | 1.91 | % | | | 92 | % | | $ | 513,293 | | |
Year Ended December 31, 2012 | | $ | 14.29 | | | | 13.34 | % | | | 0.58 | % | | | 0.50 | %(c) | | | 2.28 | % | | | 109 | % | | $ | 323,750 | | |
Year Ended December 31, 2011 | | $ | 12.82 | | | | 4.62 | % | | | 0.67 | % | | | 0.50 | %(c) | | | 2.17 | % | | | 130 | % | | $ | 79,744 | | |
Year Ended December 31, 2010 | | $ | 12.58 | | | | 17.28 | % | | | 0.72 | % | | | 0.50 | %(c) | | | 1.64 | % | | | 118 | % | | $ | 44,527 | | |
Class B | |
Year Ended December 31, 2014 | | $ | 14.97 | | | | 4.83 | % | | | 1.15 | % | | | 1.00 | % | | | 1.39 | % | | | 95 | % | | $ | 1,231 | | |
Year Ended December 31, 2013 | | $ | 14.68 | | | | 8.49 | % | | | 1.15 | % | | | 1.00 | % | | | 1.29 | % | | | 92 | % | | $ | 2,263 | | |
Year Ended December 31, 2012 | | $ | 14.39 | | | | 12.78 | % | | | 1.16 | % | | | 1.00 | %(c) | | | 1.47 | % | | | 109 | % | | $ | 4,480 | | |
Year Ended December 31, 2011 | | $ | 12.91 | | | | 4.19 | % | | | 1.23 | % | | | 1.00 | %(c) | | | 1.18 | % | | | 130 | % | | $ | 11,318 | | |
Year Ended December 31, 2010 | | $ | 12.64 | | | | 16.64 | % | | | 1.28 | % | | | 1.00 | %(c) | | | 1.10 | % | | | 118 | % | | $ | 28,752 | | |
Class C | |
Year Ended December 31, 2014 | | $ | 14.96 | | | | 4.50 | % | | | 1.26 | % | | | 1.25 | % | | | 1.14 | % | | | 95 | % | | $ | 404,456 | | |
Year Ended December 31, 2013 | | $ | 14.68 | | | | 8.23 | % | | | 1.27 | % | | | 1.25 | % | | | 1.16 | % | | | 92 | % | | $ | 430,173 | | |
Year Ended December 31, 2012 | | $ | 14.39 | | | | 12.52 | % | | | 1.32 | % | | | 1.25 | %(c) | | | 1.56 | % | | | 109 | % | | $ | 253,641 | | |
Year Ended December 31, 2011 | | $ | 12.91 | | | | 3.87 | % | | | 1.43 | % | | | 1.25 | %(c) | | | 1.40 | % | | | 130 | % | | $ | 33,378 | | |
Year Ended December 31, 2010 | | $ | 12.62 | | | | 16.43 | % | | | 1.49 | % | | | 1.25 | %(c) | | | 0.88 | % | | | 118 | % | | $ | 21,866 | | |
Class R4 | |
Year Ended December 31, 2014 | | $ | 14.74 | | | | 5.61 | % | | | 0.26 | % | | | 0.25 | % | | | 2.14 | % | | | 95 | % | | $ | 23,412 | | |
Year Ended December 31, 2013 | | $ | 14.46 | | | | 9.26 | % | | | 0.28 | % | | | 0.25 | % | | | 2.39 | % | | | 92 | % | | $ | 14,651 | | |
Year Ended December 31, 2012 (d) | | $ | 14.19 | | | | 2.60 | % | | | 0.42 | %(e) | | | 0.25 | %(c)(e) | | | 4.59 | %(e) | | | 109 | % | | $ | 15 | | |
Class R5 | |
Year Ended December 31, 2014 | | $ | 14.75 | | | | 5.62 | % | | | 0.24 | % | | | 0.23 | % | | | 2.11 | % | | | 95 | % | | $ | 3,536 | | |
Year Ended December 31, 2013 | | $ | 14.47 | | | | 9.35 | % | | | 0.25 | % | | | 0.23 | % | | | 2.44 | % | | | 92 | % | | $ | 979 | | |
Year Ended December 31, 2012 (f) | | $ | 14.19 | | | | 2.58 | % | | | 0.35 | %(e) | | | 0.27 | %(c)(e) | | | 4.60 | %(e) | | | 109 | % | | $ | 3 | | |
Class Y | |
Year Ended December 31, 2014 | | $ | 14.74 | | | | 5.68 | % | | | 0.19 | % | | | 0.18 | % | | | 2.19 | % | | | 95 | % | | $ | 401 | | |
Year Ended December 31, 2013 | | $ | 14.46 | | | | 9.46 | % | | | 0.14 | % | | | 0.14 | % | | | 2.23 | % | | | 92 | % | | $ | 3 | | |
Year Ended December 31, 2012 (g) | | $ | 14.18 | | | | 2.55 | % | | | 0.30 | %(e) | | | 0.22 | %(c)(e) | | | 4.63 | %(e) | | | 109 | % | | $ | 3 | | |
Class Z | |
Year Ended December 31, 2014 | | $ | 14.67 | | | | 5.57 | % | | | 0.25 | % | | | 0.24 | % | | | 2.16 | % | | | 95 | % | | $ | 377,119 | | |
Year Ended December 31, 2013 | | $ | 14.40 | | | | 9.30 | % | | | 0.26 | % | | | 0.25 | % | | | 2.14 | % | | | 92 | % | | $ | 375,444 | | |
Year Ended December 31, 2012 | | $ | 14.13 | | | | 13.69 | % | | | 0.30 | % | | | 0.25 | %(c) | | | 2.48 | % | | | 109 | % | | $ | 292,732 | | |
Year Ended December 31, 2011 | | $ | 12.67 | | | | 4.85 | % | | | 0.34 | % | | | 0.25 | %(c) | | | 2.43 | % | | | 130 | % | | $ | 65,167 | | |
Year Ended December 31, 2010 | | $ | 12.44 | | | | 17.58 | % | | | 0.37 | % | | | 0.25 | %(c) | | | 1.87 | % | | | 118 | % | | $ | 36,130 | | |
See accompanying notes to financial statements.
113
Columbia Acorn Family of Funds
Financial Highlights, continued
Columbia Acorn Emerging Markets FundSM
| | | | | Income from Investment Operations | | | | Less Distributions to
Shareholders | | | | | |
(Selected data for a share outstanding
throughout each period) | | Net Asset
Value,
Beginning of
Period | | Net
investment
income (loss) | | Net realized
and
unrealized
gain (loss) | | Total from
investment
operations | | Net
investment
income | | Total
Distributions to
Shareholders | | Net Asset
Value, End of
Period | |
Class A | |
Year Ended December 31, 2014 | | $ | 13.37 | | | | 0.06 | | | | (0.63 | ) | | | (0.57 | ) | | | (0.08 | ) | | | (0.08 | ) | | $ | 12.72 | | |
Year Ended December 31, 2013 | | $ | 12.04 | | | | 0.07 | | | | 1.34 | | | | 1.41 | | | | (0.08 | ) | | | (0.08 | ) | | $ | 13.37 | | |
Year Ended December 31, 2012 | | $ | 9.26 | | | | 0.08 | | | | 2.78 | | | | 2.86 | | | | (0.08 | ) | | | (0.08 | ) | | $ | 12.04 | | |
Year Ended December 31, 2011 (d) | | $ | 10.00 | | | | (0.00 | )(e) | | | (0.74 | ) | | | (0.74 | ) | | | — | | | | — | | | $ | 9.26 | | |
Class C | |
Year Ended December 31, 2014 | | $ | 13.32 | | | | (0.05 | ) | | | (0.62 | ) | | | (0.67 | ) | | | — | | | | — | | | $ | 12.65 | | |
Year Ended December 31, 2013 | | $ | 12.01 | | | | (0.03 | ) | | | 1.34 | | | | 1.31 | | | | — | | | | — | | | $ | 13.32 | | |
Year Ended December 31, 2012 | | $ | 9.24 | | | | (0.02 | ) | | | 2.79 | | | | 2.77 | | | | — | | | | — | | | $ | 12.01 | | |
Year Ended December 31, 2011 (h) | | $ | 10.00 | | | | (0.02 | ) | | | (0.74 | ) | | | (0.76 | ) | | | — | | | | — | | | $ | 9.24 | | |
Class I | |
Year Ended December 31, 2014 | | $ | 13.41 | | | | 0.06 | | | | (0.60 | ) | | | (0.54 | ) | | | (0.12 | ) | | | (0.12 | ) | | $ | 12.75 | | |
Year Ended December 31, 2013 | | $ | 12.08 | | | | 0.08 | | | | 1.37 | | | | 1.45 | | | | (0.12 | ) | | | (0.12 | ) | | $ | 13.41 | | |
Year Ended December 31, 2012 | | $ | 9.29 | | | | 0.11 | | | | 2.80 | | | | 2.91 | | | | (0.12 | ) | | | (0.12 | ) | | $ | 12.08 | | |
Year Ended December 31, 2011 (i) | | $ | 10.00 | | | | 0.01 | | | | (0.72 | ) | | | (0.71 | ) | | | — | | | | — | | | $ | 9.29 | | |
Class R4 | |
Year Ended December 31, 2014 | | $ | 13.49 | | | | 0.09 | | | | (0.63 | ) | | | (0.54 | ) | | | (0.12 | ) | | | (0.12 | ) | | $ | 12.83 | | |
Year Ended December 31, 2013 | | $ | 12.14 | | | | 0.12 | | | | 1.35 | | | | 1.47 | | | | (0.12 | ) | | | (0.12 | ) | | $ | 13.49 | | |
Year Ended December 31, 2012 (j) | | $ | 11.44 | | | | (0.01 | ) | | | 0.81 | | | | 0.80 | | | | (0.10 | ) | | | (0.10 | ) | | $ | 12.14 | | |
Class R5 | |
Year Ended December 31, 2014 | | $ | 13.48 | | | | 0.10 | | | | (0.64 | ) | | | (0.54 | ) | | | (0.12 | ) | | | (0.12 | ) | | $ | 12.82 | | |
Year Ended December 31, 2013 | | $ | 12.14 | | | | 0.12 | | | | 1.34 | | | | 1.46 | | | | (0.12 | ) | | | (0.12 | ) | | $ | 13.48 | | |
Year Ended December 31, 2012 (k) | | $ | 11.44 | | | | (0.00 | )(e) | | | 0.81 | | | | 0.81 | | | | (0.11 | ) | | | (0.11 | ) | | $ | 12.14 | | |
Class Y | |
Year Ended December 31, 2014 | | $ | 13.36 | | | | 0.09 | | | | (0.62 | ) | | | (0.53 | ) | | | (0.12 | ) | | | (0.12 | ) | | $ | 12.71 | | |
Year Ended December 31, 2013 (l) | | $ | 12.22 | | | | 0.07 | | | | 1.20 | | | | 1.27 | | | | (0.13 | ) | | | (0.13 | ) | | $ | 13.36 | | |
Class Z | |
Year Ended December 31, 2014 | | $ | 13.40 | | | | 0.08 | | | | (0.63 | ) | | | (0.55 | ) | | | (0.11 | ) | | | (0.11 | ) | | $ | 12.74 | | |
Year Ended December 31, 2013 | | $ | 12.07 | | | | 0.11 | | | | 1.33 | | | | 1.44 | | | | (0.11 | ) | | | (0.11 | ) | | $ | 13.40 | | |
Year Ended December 31, 2012 | | $ | 9.28 | | | | 0.12 | | | | 2.79 | | | | 2.91 | | | | (0.12 | ) | | | (0.12 | ) | | $ | 12.07 | | |
Year Ended December 31, 2011 (m) | | $ | 10.00 | | | | 0.01 | | | | (0.73 | ) | | | (0.72 | ) | | | — | | | | — | | | $ | 9.28 | | |
Notes to Financial Highlights
(a) In addition to the fees and expenses that the Fund bears directly, the Fund indirectly bears a pro rata share of the fees and expenses of any other funds in which it invests, if any. Such indirect expenses are not included in the Fund's reported expense ratios.
(b) Had the Investment Manager and/or its affiliates not waived fees and/or reimbursed a portion of expenses, total return would have been reduced.
(c) The benefits derived from custody fees paid indirectly had an impact of 0.01%.
(d) Class A shares commenced operations on August 19, 2011. Per share data and total return reflect activity from that date.
(e) Rounds to zero.
(f) Annualized.
(g) The benefits derived from custody fees paid indirectly had an impact of less than 0.01%.
(h) Class C shares commenced operations on August 19, 2011. Per share data and total return reflect activity from that date.
(i) Class I shares commenced operations on August 19, 2011. Per share data and total return reflect activity from that date.
(j) Class R4 shares commenced operations on November 8, 2012. Per share data and total return reflect activity from that date.
(k) Class R5 shares commenced operations on November 8, 2012. Per share data and total return reflect activity from that date.
(l) Class Y shares commenced operations on June 13, 2013. Per share data and total return reflect activity from that date.
(m) Class Z shares commenced operations on August 19, 2011. Per share data and total return reflect activity from that date.
See accompanying notes to financial statements.
114
| | | | | Ratio to Average Net Assets | | Supplemental Data | |
(Selected data for a share outstanding
throughout each period) | | Total Return | | Total gross
expenses | | Total net
expenses | | Net
investment
income (loss) | | Portfolio
turnover rate | | Net assets,
end of period
(000s) | |
Class A | |
Year Ended December 31, 2014 | | | (4.28 | )% | | | 1.56 | %(a) | | | 1.56 | %(a) | | | 0.42 | % | | | 45 | % | | $ | 160,969 | | |
Year Ended December 31, 2013 | | | 11.73 | %(b) | | | 1.80 | %(a) | | | 1.76 | %(a) | | | 0.52 | % | | | 36 | % | | $ | 177,158 | | |
Year Ended December 31, 2012 | | | 30.86 | %(b) | | | 6.42 | %(a) | | | 1.77 | %(a)(c) | | | 0.77 | % | | | 30 | % | | $ | 3,103 | | |
Year Ended December 31, 2011 (d) | | | (7.40 | )%(b) | | | 20.13 | %(f) | | | 1.85 | %(f)(g) | | | (0.01 | )%(f) | | | 9 | % | | $ | 332 | | |
Class C | |
Year Ended December 31, 2014 | | | (5.03 | )% | | | 2.33 | %(a) | | | 2.33 | %(a) | | | (0.36 | )% | | | 45 | % | | $ | 41,208 | | |
Year Ended December 31, 2013 | | | 10.91 | %(b) | | | 2.55 | %(a) | | | 2.51 | %(a) | | | (0.23 | )% | | | 36 | % | | $ | 32,636 | | |
Year Ended December 31, 2012 | | | 29.98 | %(b) | | | 7.18 | %(a) | | | 2.56 | %(a)(c) | | | (0.15 | )% | | | 30 | % | | $ | 615 | | |
Year Ended December 31, 2011 (h) | | | (7.60 | )%(b) | | | 25.06 | %(f) | | | 2.60 | %(f)(g) | | | (0.68 | )%(f) | | | 9 | % | | $ | 127 | | |
Class I | |
Year Ended December 31, 2014 | | | (4.01 | )% | | | 1.22 | %(a) | | | 1.22 | %(a) | | | 0.44 | % | | | 45 | % | | $ | 3 | | |
Year Ended December 31, 2013 | | | 12.06 | %(b) | | | 1.73 | %(a) | | | 1.39 | %(a) | | | 0.65 | % | | | 36 | % | | $ | 7 | | |
Year Ended December 31, 2012 | | | 31.39 | %(b) | | | 6.18 | %(a) | | | 1.41 | %(a)(c) | | | 1.05 | % | | | 30 | % | | $ | 6 | | |
Year Ended December 31, 2011 (i) | | | (7.10 | )%(b) | | | 19.31 | %(f) | | | 1.41 | %(f)(g) | | | 0.17 | %(f) | | | 9 | % | | $ | 5 | | |
Class R4 | |
Year Ended December 31, 2014 | | | (4.03 | )% | | | 1.28 | %(a) | | | 1.28 | %(a) | | | 0.66 | % | | | 45 | % | | $ | 15,467 | | |
Year Ended December 31, 2013 | | | 12.13 | %(b) | | | 1.44 | %(a) | | | 1.44 | %(a) | | | 0.92 | % | | | 36 | % | | $ | 13,583 | | |
Year Ended December 31, 2012 (j) | | | 7.04 | %(b) | | | 5.86 | %(a)(f) | | | 1.54 | %(a)(c)(f) | | | (0.31 | )%(f) | | | 30 | % | | $ | 16 | | |
Class R5 | |
Year Ended December 31, 2014 | | | (4.02 | )% | | | 1.26 | %(a) | | | 1.26 | %(a) | | | 0.72 | % | | | 45 | % | | $ | 19,632 | | |
Year Ended December 31, 2013 | | | 12.07 | %(b) | | | 1.42 | %(a) | | | 1.42 | %(a) | | | 0.94 | % | | | 36 | % | | $ | 13,625 | | |
Year Ended December 31, 2012 (k) | | | 7.11 | %(b) | | | 5.81 | %(a)(f) | | | 1.46 | %(a)(c)(f) | | | (0.22 | )%(f) | | | 30 | % | | $ | 3 | | |
Class Y | |
Year Ended December 31, 2014 | | | (3.95 | )% | | | 1.22 | %(a) | | | 1.22 | %(a) | | | 0.68 | % | | | 45 | % | | $ | 2 | | |
Year Ended December 31, 2013 (l) | | | 10.43 | %(b) | | | 1.36 | %(a)(f) | | | 1.36 | %(a)(f) | | | 0.97 | %(f) | | | 36 | % | | $ | 3 | | |
Class Z | |
Year Ended December 31, 2014 | | | (4.12 | )% | | | 1.33 | %(a) | | | 1.33 | %(a) | | | 0.62 | % | | | 45 | % | | $ | 245,053 | | |
Year Ended December 31, 2013 | | | 11.92 | %(b) | | | 1.58 | %(a) | | | 1.54 | %(a) | | | 0.89 | % | | | 36 | % | | $ | 177,693 | | |
Year Ended December 31, 2012 | | | 31.35 | %(b) | | | 6.15 | %(a) | | | 1.46 | %(a)(c) | | | 1.07 | % | | | 30 | % | | $ | 6,846 | | |
Year Ended December 31, 2011 (m) | | | (7.20 | )%(b) | | | 19.52 | %(f) | | | 1.46 | %(f)(g) | | | 0.15 | %(f) | | | 9 | % | | $ | 2,765 | | |
See accompanying notes to financial statements.
115
Columbia Acorn Family of Funds
Financial Highlights, continued
Columbia Acorn European FundSM
| | | | | Income from Investment Operations | | | | Less Distributions to Shareholders | | | |
(Selected data for a share outstanding
throughout each period) | | Net Asset
Value,
Beginning of
Period | | Net
investment
income (loss) | | Net realized
and
unrealized
gain (loss) | | Total from
investment
operations | | Net
investment
income | | Net
realized gains | | Total
Distributions to
Shareholders | |
Class A | |
Year Ended December 31, 2014 | | $ | 15.68 | | | | 0.13 | | | | (1.34 | ) | | | (1.21 | ) | | | (0.05 | ) | | | (0.08 | ) | | | (0.13 | ) | |
Year Ended December 31, 2013 | | $ | 11.76 | | | | (0.02 | ) | | | 3.97 | | | | 3.95 | | | | (0.01 | ) | | | (0.02 | ) | | | (0.03 | ) | |
Year Ended December 31, 2012 | | $ | 9.43 | | | | 0.03 | | | | 2.37 | | | | 2.40 | | | | (0.07 | ) | | | (0.00 | )(c) | | | (0.07 | ) | |
Year Ended December 31, 2011 (e) | | $ | 10.00 | | | | (0.03 | ) | | | (0.46 | ) | | | (0.49 | ) | | | (0.06 | ) | | | (0.02 | ) | | | (0.08 | ) | |
Class C | |
Year Ended December 31, 2014 | | $ | 15.54 | | | | (0.01 | ) | | | (1.29 | ) | | | (1.30 | ) | | | — | | | | (0.08 | ) | | | (0.08 | ) | |
Year Ended December 31, 2013 | | $ | 11.73 | | | | (0.15 | ) | | | 3.98 | | | | 3.83 | | | | — | | | | (0.02 | ) | | | (0.02 | ) | |
Year Ended December 31, 2012 | | $ | 9.44 | | | | (0.15 | ) | | | 2.46 | | | | 2.31 | | | | (0.02 | ) | | | (0.00 | )(c) | | | (0.02 | ) | |
Year Ended December 31, 2011 (h) | | $ | 10.00 | | | | (0.06 | ) | | | (0.45 | ) | | | (0.51 | ) | | | (0.03 | ) | | | (0.02 | ) | | | (0.05 | ) | |
Class I | |
Year Ended December 31, 2014 | | $ | 15.67 | | | | 0.11 | | | | (1.27 | ) | | | (1.16 | ) | | | (0.10 | ) | | | (0.08 | ) | | | (0.18 | ) | |
Year Ended December 31, 2013 | | $ | 11.75 | | | | 0.12 | | | | 3.88 | | | | 4.00 | | | | (0.06 | ) | | | (0.02 | ) | | | (0.08 | ) | |
Year Ended December 31, 2012 | | $ | 9.43 | | | | 0.10 | | | | 2.32 | | | | 2.42 | | | | (0.10 | ) | | | (0.00 | )(c) | | | (0.10 | ) | |
Year Ended December 31, 2011 (i) | | $ | 10.00 | | | | (0.02 | ) | | | (0.46 | ) | | | (0.48 | ) | | | (0.07 | ) | | | (0.02 | ) | | | (0.09 | ) | |
Class R4 | |
Year Ended December 31, 2014 (j) | | $ | 15.85 | | | | (0.02 | ) | | | (1.34 | ) | | | (1.36 | ) | | | (0.09 | ) | | | — | | | | (0.09 | ) | |
Class R5 | |
Year Ended December 31, 2014 | | $ | 15.82 | | | | 0.14 | | | | (1.32 | ) | | | (1.18 | ) | | | (0.09 | ) | | | (0.08 | ) | | | (0.17 | ) | |
Year Ended December 31, 2013 | | $ | 11.86 | | | | (0.04 | ) | | | 4.06 | | | | 4.02 | | | | (0.04 | ) | | | (0.02 | ) | | | (0.06 | ) | |
Year Ended December 31, 2012 (k) | | $ | 11.19 | | | | (0.02 | ) | | | 0.77 | | | | 0.75 | | | | (0.08 | ) | | | — | | | | (0.08 | ) | |
Class Z | |
Year Ended December 31, 2014 | | $ | 15.68 | | | | 0.15 | | | | (1.32 | ) | | | (1.17 | ) | | | (0.09 | ) | | | (0.08 | ) | | | (0.17 | ) | |
Year Ended December 31, 2013 | | $ | 11.76 | | | | 0.11 | | | | 3.88 | | | | 3.99 | | | | (0.05 | ) | | | (0.02 | ) | | | (0.07 | ) | |
Year Ended December 31, 2012 | | $ | 9.44 | | | | 0.08 | | | | 2.34 | | | | 2.42 | | | | (0.10 | ) | | | (0.00 | )(c) | | | (0.10 | ) | |
Year Ended December 31, 2011 (l) | | $ | 10.00 | | | | (0.02 | ) | | | (0.46 | ) | | | (0.48 | ) | | | (0.06 | ) | | | (0.02 | ) | | | (0.08 | ) | |
Notes to Financial Highlights
(a) Had the Investment Manager and/or its affiliates not waived fees and/or reimbursed a portion of expenses, total return would have been reduced.
(b) In addition to the fees and expenses that the Fund bears directly, the Fund indirectly bears a pro rata share of the fees and expenses of any other funds in which it invests, if any. Such indirect expenses are not included in the Fund's reported expense ratios.
(c) Rounds to zero.
(d) The benefits derived from custody fees paid indirectly had an impact of 0.01%.
(e) Class A shares commenced operations on August 19, 2011. Per share data and total return reflect activity from that date.
(f) Annualized.
(g) The benefits derived from custody fees paid indirectly had an impact of 0.02%.
(h) Class C shares commenced operations on August 19, 2011. Per share data and total return reflect activity from that date.
(i) Class I shares commenced operations on August 19, 2011. Per share data and total return reflect activity from that date.
(j) Class R4 shares commenced operations on June 25, 2014. Per share data and total return reflect activity from that date.
(k) Class R5 shares commenced operations on November 8, 2012. Per share data and total return reflect activity from that date.
(l) Class Z shares commenced operations on August 19, 2011. Per share data and total return reflect activity from that date.
See accompanying notes to financial statements.
116
| | | | | | Ratio to Average Net Assets | | Supplemental Data | |
(Selected data for a share outstanding
throughout each period) | | Net Asset
Value, End of
Period | | Total Return
(a) | | Total gross
expenses | | Total net
expenses | | Net
investment
income (loss) | | Portfolio
turnover rate | | Net assets,
end of period
(000s) | |
Class A | |
Year Ended December 31, 2014 | | $ | 14.34 | | | | (7.77 | )% | | | 2.05 | %(b) | | | 1.75 | %(b) | | | 0.86 | % | | | 74 | % | | $ | 21,101 | | |
Year Ended December 31, 2013 | | $ | 15.68 | | | | 33.64 | % | | | 3.33 | %(b) | | | 1.74 | %(b) | | | (0.11 | )% | | | 42 | % | | $ | 19,078 | | |
Year Ended December 31, 2012 | | $ | 11.76 | | | | 25.46 | % | | | 12.35 | %(b) | | | 1.61 | %(b)(d) | | | 0.23 | % | | | 37 | % | | $ | 453 | | |
Year Ended December 31, 2011 (e) | | $ | 9.43 | | | | (4.97 | )% | | | 33.59 | %(f) | | | 1.75 | %(f)(g) | | | (0.84 | )%(f) | | | 17 | % | | $ | 154 | | |
Class C | |
Year Ended December 31, 2014 | | $ | 14.16 | | | | (8.44 | )% | | | 2.84 | %(b) | | | 2.50 | %(b) | | | (0.10 | )% | | | 74 | % | | $ | 5,096 | | |
Year Ended December 31, 2013 | | $ | 15.54 | | | | 32.63 | % | | | 4.19 | %(b) | | | 2.50 | %(b) | | | (1.10 | )% | | | 42 | % | | $ | 1,400 | | |
Year Ended December 31, 2012 | | $ | 11.73 | | | | 24.46 | % | | | 12.83 | %(b) | | | 2.32 | %(b)(d) | | | (1.33 | )% | | | 37 | % | | $ | 89 | | |
Year Ended December 31, 2011 (h) | | $ | 9.44 | | | | (5.14 | )% | | | 35.79 | %(f) | | | 2.50 | %(f)(g) | | | (1.66 | )%(f) | | | 17 | % | | $ | 5 | | |
Class I | |
Year Ended December 31, 2014 | | $ | 14.33 | | | | (7.49 | )% | | | 1.71 | %(b) | | | 1.46 | %(b) | | | 0.74 | % | | | 74 | % | | $ | 2 | | |
Year Ended December 31, 2013 | | $ | 15.67 | | | | 34.06 | % | | | 3.99 | %(b) | | | 1.41 | %(b) | | | 0.88 | % | | | 42 | % | | $ | 8 | | |
Year Ended December 31, 2012 | | $ | 11.75 | | | | 25.71 | % | | | 12.05 | %(b) | | | 1.31 | %(b)(d) | | | 0.94 | % | | | 37 | % | | $ | 6 | | |
Year Ended December 31, 2011 (i) | | $ | 9.43 | | | | (4.81 | )% | | | 30.00 | %(f) | | | 1.31 | %(f)(g) | | | (0.47 | )%(f) | | | 17 | % | | $ | 5 | | |
Class R4 | |
Year Ended December 31, 2014 (j) | | $ | 14.40 | | | | (8.60 | )% | | | 1.87 | %(b)(f) | | | 1.50 | %(b)(f) | | | (0.30 | )%(f) | | | 74 | % | | $ | 302 | | |
Class R5 | |
Year Ended December 31, 2014 | | $ | 14.47 | | | | (7.54 | )% | | | 1.75 | %(b) | | | 1.52 | %(b) | | | 0.92 | % | | | 74 | % | | $ | 1,633 | | |
Year Ended December 31, 2013 | | $ | 15.82 | | | | 33.97 | % | | | 2.76 | %(b) | | | 1.51 | %(b) | | | (0.29 | )% | | | 42 | % | | $ | 1,891 | | |
Year Ended December 31, 2012 (k) | | $ | 11.86 | | | | 6.70 | % | | | 14.07 | %(b)(f) | | | 1.36 | %(b)(d)(f) | | | (1.07 | )%(f) | | | 37 | % | | $ | 3 | | |
Class Z | |
Year Ended December 31, 2014 | | $ | 14.34 | | | | (7.52 | )% | | | 1.79 | %(b) | | | 1.50 | %(b) | | | 0.97 | % | | | 74 | % | | $ | 8,499 | | |
Year Ended December 31, 2013 | | $ | 15.68 | | | | 33.98 | % | | | 3.98 | %(b) | | | 1.45 | %(b) | | | 0.83 | % | | | 42 | % | | $ | 4,407 | | |
Year Ended December 31, 2012 | | $ | 11.76 | | | | 25.66 | % | | | 12.07 | %(b) | | | 1.33 | %(b)(d) | | | 0.76 | % | | | 37 | % | | $ | 2,727 | | |
Year Ended December 31, 2011 (l) | | $ | 9.44 | | | | (4.78 | )% | | | 30.26 | %(f) | | | 1.37 | %(f)(g) | | | (0.52 | )%(f) | | | 17 | % | | $ | 1,516 | | |
See accompanying notes to financial statements.
117
Columbia Acorn Family of Funds
Notes to Financial Statements
1. Nature of Operations
Columbia Acorn Fund, Columbia Acorn International, Columbia Acorn USA, Columbia Acorn International Select, Columbia Acorn Select, Columbia Thermostat Fund, Columbia Acorn Emerging Markets Fund and Columbia Acorn European Fund (each a Fund and collectively, the Funds) are each a series of Columbia Acorn Trust (the Trust). The Trust is registered under the Investment Company Act of 1940, as amended (the 1940 Act), as an open-end management investment company organized as a Massachusetts business trust. The investment objective of each Fund is to seek long-term capital appreciation.
Columbia Thermostat Fund pursues its investment objective by investing in shares of other mutual funds. As a "fund of funds" under normal circumstances, the Fund allocates at least 95% of its net assets among a selected group of affiliated stock and bond mutual funds (underlying funds) according to the current level of the Standard & Poor's (S&P) 500 Index in relation to predetermined ranges set by Columbia Wanger Asset Management, LLC (the Investment Manager or CWAM). The Fund may invest up to 5% of its net assets plus any cash received that day in cash, repurchase agreements, high quality short-term paper and government securities.
Each Fund may issue an unlimited number of shares. Columbia Acorn Fund, Columbia Acorn USA, Columbia Acorn International Select and Columbia Acorn Select each currently offers Class A, Class B, Class C, Class I, Class R4, Class R5, Class Y and Class Z shares. Columbia Acorn International currently offers Class A, Class B, Class C, Class I, Class R, Class R4, Class R5, Class Y and Class Z shares. Columbia Thermostat Fund currently offers Class A, Class B, Class C, Class R4, Class R5, Class Y and Class Z shares. Columbia Acorn Emerging Markets Fund currently offers Class A, Class C, Class I, Class R4, Class R5, Class Y and Class Z shares. Columbia Acorn European Fund currently offers Class A, Class C, Class I, Class R4, Class R5 and Class Z shares. Effective July 11, 2014, Columbia Acorn Emerging Markets Fund is closed to new investors and new accounts, except as described in the Fund's prospectus, dated May 1, 2014, as supplemented June 12, 2014. Effective February 29, 2008, the Funds generally no longer accept investments by new or existing investors in the Funds' Class B shares, except in connection with the reinvestment of any dividend and/or capital gain distributions in Class B shares of the Funds and exchanges by existing Class B shareholders of certain other funds within the Columbia Acorn Family of Funds.
Class A shares are sold with a front-end sales charge. Class A shares bought without an initial sales charge in accounts aggregating $1 million to $50 million at the time of purchase are subject to a 1.00% contingent deferred sales charge (CDSC) if the shares are redeemed within 12 months of purchase, and a 0.50% CDSC if the shares are redeemed more than 12, but less than 18, months after purchase, with certain limited exceptions.
Class B shares are subject to CDSC if redeemed within six years of purchase. Class B shares will convert to Class A shares automatically eight years after purchase.
Class C shares are offered at net asset value but are subject to a CDSC on redemptions made within one year after purchase.
Class I, Class R, Class R4, Class R5 and Class Y shares are offered at net asset value. There are certain restrictions on who may purchase these share classes.
Class Z shares are offered at net asset value. There are certain restrictions on who may purchase Class Z shares. Generally, Class Z shares of a Fund may be exchanged for shares of another fund distributed by Columbia Management Investment Distributors, Inc. (CMID) at no additional charge.
Investment income, realized and unrealized gains and losses, and certain fund-level expenses are allocated pro rata on the basis of the relative net assets of all classes, except that each class bears certain expenses specific to that class such as distribution services, transfer agent fees, and certain other class specific expenses. Differences in class expenses may result in payment of different dividend distributions for each class. All of the Funds' share classes have equal rights with respect to voting, subject to Fund or class specific matters.
2. Summary of Significant Accounting Policies
>Basis of Preparation
Each Fund is an investment company that applies the accounting and reporting guidance in the Financial Accounting Standards Board (FASB) Accounting Standards Codification Topic 946, Financial Services – Investment Companies (ASC 946). The financial statements are prepared in accordance with U.S. generally accepted accounting principles (GAAP) which requires management to make certain estimates and assumptions that affect the reported amounts of assets and liabilities, the disclosure of contingent assets and liabilities at the date of the financial statements and the reported amounts of income and expenses during the reporting period. Actual results could differ from those estimates.
118
The following is a summary of significant accounting policies followed by the Funds in the preparation of their financial statements.
>Security valuation
Securities of the Funds are valued at market value or, if a market quotation for a security is not readily available or is deemed not to be reliable because of events or circumstances that have occurred between the market quotation and the time as of which the security is to be valued, the security is valued at a fair value determined in good faith under consistently applied procedures established by the Board of Trustees (the Board). With respect to Columbia Thermostat Fund, investments in underlying funds are valued at their net asset values as reported by the underlying funds. A security traded on a securities exchange or in an over-the-counter market in which transaction prices are reported is valued at the last sales price at the time of valuation. A security traded principally on NASDAQ is valued at the NASDAQ official closing price. Exchange traded funds are valued at their closing net asset value as reported on the applicable exchange.
Short-term investments maturing in 60 days or less are valued at amortized cost, which approximates market value.
Forward foreign currency exchange contracts are marked-to-market based upon foreign currency exchange rates provided by a pricing service.
The Trust has retained an independent statistical fair value pricing service that employs a systematic methodology to assist in the fair valuation process for securities principally traded in a foreign market in order to adjust for possible changes in value that may occur between the close of the foreign exchange and the time as of which the securities are to be valued. If a security is valued at fair value, that value may be different from the last quoted market price for the security. A security for which there is no reported sale on the valuation date is valued at the mean of the latest bid and ask quotations.
>Foreign currency translations
Values of investments denominated in foreign currencies are converted into U.S. dollars using the New York spot market rate of exchange at the time of valuation. Purchases and sales of investments and dividend and interest income are translated into U.S. dollars using the spot market rate of exchange prevailing on the respective dates of such transactions. The gain or loss resulting from changes in foreign exchange rates is included with net realized and unrealized gain or loss from investments, as appropriate.
>Restricted securities
Restricted securities are securities that may only be resold upon registration under federal securities laws or in transactions exempt from registration. In some cases, the issuer of restricted securities has agreed to register such securities for resale at the issuer's expense either upon demand by the Fund or in connection with another registered offering of the securities. Many restricted securities may be resold in the secondary market in transactions exempt from registration. Such restricted securities may be determined to be liquid under criteria established by the Board.
>Derivative instruments
Columbia Acorn International Select invests in forward foreign currency exchange contracts on a limited basis, as detailed below. Forward foreign currency exchange contracts are derivative instruments whose values depend on, or are derived from, in whole or in part, the value of one or more other assets, in this case, currencies. Derivatives may involve various risks, including the potential inability of the counterparty to fulfill its obligation under the terms of the contract, the potential for an illiquid secondary market (making it difficult for the Fund to sell, including at favorable prices) and the potential for market movements which may expose the Fund to gains or losses in excess of the amount shown in the Statements of Assets and Liabilities.
Columbia Acorn International, Columbia Acorn International Select and Columbia Acorn Emerging Markets Fund each held a put option in 2014, which was acquired through a transaction between the Funds and PT Rajawali Corpora (Indonesia), in connection with the delisting of the shares of Archipelago Resources in 2013. A put option is often held to decrease exposure to an underlying stock. However, in this case, the put option related to the proposed restructuring of Archipelago Resources and provided the Funds with the ability to sell its shares back to PT Rajawali Corpora (Indonesia) at an agreed upon price or to convert the shares held in Archipelago Resources into shares of the newly restructured company based upon the terms of the put option agreement between the Funds and PT Rajawali Corpora (Indonesia). During 2014, the Funds opted to exercise the put option and sell its shares back to PT Rajawali Corpora (Indonesia) with the exercise delivery expected in the first quarter of 2015. The proceeds from the exercising of the put option are included in "Receivable for Investments sold on a delayed delivery basis" in the Statements of Assets and Liabilities.
119
Columbia Acorn Family of Funds
Notes to Financial Statements, continued
For financial reporting purposes, the Funds do not offset derivative assets and derivative liabilities that are subject to netting arrangements in the Statements of Assets and Liabilities.
>Forward foreign currency exchange contracts
Forward foreign currency exchange contracts are agreements between two parties to buy and sell a currency at a set price on a future date. Columbia Acorn International Select utilized forward foreign currency exchange contracts to hedge the currency exposure associated with some or all of the Fund's securities. These instruments may be used for other purposes in future periods. The Fund's use of forward foreign currency exchange contracts was not material to the net assets of the Fund.
The values of forward foreign currency exchange contracts fluctuate with changes in foreign currency exchange rates. Changes in the value of these contracts are recorded as unrealized appreciation or depreciation until the contract is exercised or has expired. The Fund will realize a gain or loss when the forward foreign currency exchange contract is closed or expires.
The use of forward foreign currency exchange contracts does not eliminate fluctuations in the prices of the Fund's portfolio securities. The risks of forward foreign currency exchange contracts include movement in the values of the foreign currencies relative to the U.S. dollar (or other foreign currencies) and the possibility that counterparties will not complete their contractual obligations, which may be in excess of the amount reflected, if any, in the Statements of Assets and Liabilities.
>Offsetting of derivative assets and derivative liabilities
The following table presents the gross and net amount of assets and liabilities of Columbia Acorn International Select, available for offset under netting arrangements as well as any related collateral received or pledged by the Fund as of December 31, 2014:
| | | | | | | | Gross Amounts Not Offset in
the Statements of Assets and Liabilities | | | |
| | Gross
Amounts of
Recognized
Liabilities | | Gross Amounts
Offset in the
Statements of
Assets and Liabilities | | Net Amounts of Liabilities
Presented in the
Statements of
Assets and Liabilities | | Financial
Instruments(a) | | Cash
Collateral
Pledged | | Securities
Collateral
Pledged | | Net
Amount(b) | |
Liability Derivatives: | |
Forward Foreign Currency
Exchange Contracts | | $ | 97,181 | | | $ | — | | | $ | 97,181 | | | $ | — | | | $ | — | | | $ | — | | | $ | 97,181 | | |
(a) Represents the amount of liabilities that could be offset by assets with the same counterparty under master netting or similar agreements that management elects not to offset on the Statements of Assets and Liabilities.
(b) Represents the net amount due to counterparties in the event of default.
>Effects of derivative transactions in the financial statements
The following tables are intended to provide additional information about the effect of derivatives on the financial statements of Columbia Acorn International, Columbia Acorn International Select and Columbia Acorn Emerging Markets Fund, including: the the fair value of derivatives by risk category and the location of those fair values in the Statements of Assets and Liabilities; and the impact of derivative transactions over the period in the Statements of Operations, including realized gains or losses and unrealized gains or losses. The derivative schedules following the Statements of Investments present additional information regarding derivative instruments outstanding at the end of the period, if any.
Columbia Acorn International
At December 31, 2014, the Fund had no outstanding derivatives.
The following table indicates the effect of derivative instruments (not considered to be hedging instruments for accounting disclosure purposes) in the Statements of Operations for the year ended December 31, 2014:
Change in Unrealized Appreciation (Depreciation)
on Derivatives Recognized in Income
Risk Exposure Category | | Options Contracts | |
Equity risk | | $ | (2,630,029 | ) | |
The following table is a summary of the average outstanding volume by derivative instrument for the year ended December 31, 2014:
Derivative Instrument | | Average market value* | |
Options contracts | | $ | 787,040 | | |
* Based on the ending quarterly outstanding amounts for the year ended December 31, 2014.
120
Columbia Acorn International Select
The following table is a summary of the fair value of derivative instruments (not considered to be hedging instruments for accounting disclosure purposes) at December 31, 2014:
| | | Liability Derivatives | |
Risk Exposure
Category | | Statements of Assets
and Liabilities Location | | Fair
Value | |
Foreign exchange risk
| | Unrealized depreciation on
forward foreign currency
exchange contracts | | $ | 97,181 | | |
The following table indicates the effect of derivative instruments (not considered to be hedging instruments for accounting disclosure purposes) in the Statements of Operations for the year ended December 31, 2014:
Amount of Realized Gain (Loss) on
Derivatives Recognized in Income
Risk Exposure Category | | Forward
Foreign Currency
Exchange Contracts | |
Foreign exchange risk | | $ | 469,034 | | |
Change in Unrealized Appreciation (Depreciation)
on Derivatives Recognized in Income
Risk Exposure Category | | Forward
Foreign Currency
Exchange Contracts | | Options
Contracts | | Total | |
Equity risk | | $ | — | | | $ | (985,539 | ) | | $ | (985,539 | ) | |
Foreign exchange risk | | | (162,999 | ) | | | — | | | | (162,999 | ) | |
Total | | $ | (162,999 | ) | | $ | (985,539 | ) | | $ | (1,148,538 | ) | |
The following table is a summary of the average outstanding volume by derivative instrument for the year ended December 31, 2014:
Derivative Instrument | | Average market value* | |
Options contracts | | $ | 294,924 | | |
Derivative Instrument | | Average unrealized
appreciation* | | Average unrealized
depreciation* | |
Forward foreign currency
exchange contracts | | $ | 54,284 | | | $ | (89,471 | ) | |
* Based on the ending quarterly outstanding amounts for the year ended December 31, 2014.
Columbia Acorn Emerging Markets Fund
At December 31, 2014, the Fund had no outstanding derivatives.
The following table indicates the effect of derivative instruments (not considered to be hedging instruments for accounting disclosure purposes) in the Statements of Operations for the year ended December 31, 2014:
Change in Unrealized Appreciation (Depreciation) on Derivatives Recognized in Income
Risk Exposure Category | | Options Contracts | |
Equity risk | | $ | (131,808 | ) | |
The following table is a summary of the average outstanding volume by derivative instrument for the year ended December 31, 2014:
Derivative Instrument | | Average market value* | |
Options contracts | | $ | 39,444 | | |
* Based on the ending quarterly outstanding amounts for the year ended December 31, 2014.
>Security transactions and investment income
Security transactions, investment income and shareholder fund transactions are accounted for on the trade date (date the order to buy or sell is executed) and dividend income and realized gain distributions from other funds are recorded on the ex-dividend date, except that certain dividends from foreign securities are recorded as soon as the information is available to the Funds. Interest income is recorded on the accrual basis and includes amortization of discounts on debt obligations when required for federal income tax purposes. Realized gains and losses from security transactions are recorded on an identified cost basis.
Awards, if any, from class action litigation related to securities owned may be recorded as a reduction of cost of those securities. If the applicable securities are no longer owned, the proceeds are recorded as realized gains.
The Funds may receive distributions from holdings in exchange-traded funds (ETFs), other regulated investment companies (RICs), and real estate investment trusts (REITs), which report information on the character of their distributions annually. These distributions are allocated to dividend income, capital gain and return of capital based on actual information reported. To the extent actual information has not yet been reported by the REITs, estimates for return of capital may be made by the Funds' management. Return of capital is recorded as a reduction of the cost basis of securities held. If the Funds no longer own the applicable securities, return of capital is recorded as a realized gain. Management's estimates are subsequently adjusted when the actual character of the distributions is disclosed by the REITs, which could result in a proportionate change in return of capital to shareholders. No estimates are made for ETFs and RICs.
>Fund share valuation
Fund shares are sold and redeemed on a daily basis at net asset value, subject to any applicable sales charge. Net asset value per share is determined daily as of the close of trading on the New York Stock Exchange (NYSE) on each day the NYSE is open for trading. Generally, income, expenses and realized and unrealized gain/(losses) of a Fund are allocated to each class proportionately on a daily basis for purposes of determining the net asset value of each class. The distribution
121
Columbia Acorn Family of Funds
Notes to Financial Statements, continued
and service fees and transfer agent fees are charged to each specific class as expenses are incurred. Redemption fees are accounted for as an addition to paid in capital for purposes of determining the net asset value of each class.
>Securities lending
Each Fund, except Columbia Thermostat Fund, may lend securities up to one-third of the value of its total assets to certain approved brokers, dealers and other financial institutions to earn additional income. The Funds retain the benefits of owning the securities, including the economic equivalent of dividends or interest generated by the security. The Funds also receive a fee for the loan. The Funds have the ability to recall the loans at any time and could do so in order to vote proxies or to sell the loaned securities. Each loan is collateralized by cash that exceeds the value of the securities on loan. The market value of the loaned securities is determined daily at the close of business of a Fund
and any additional required collateral is delivered to the Fund on the next business day. The Funds have elected to invest the cash collateral in the Dreyfus Government Cash Management Fund. The income earned from the securities lending program is paid to each Fund, net of any fees remitted to Goldman Sachs Agency Lending, the Funds' lending agent, and net of any borrower rebates. The Investment Manager does not retain any fees earned by the lending program. Generally, in the event of borrower default, a Fund has the right to use the collateral to offset any losses incurred. In the event a Fund is delayed or prevented from exercising its right to dispose of the collateral, there may be a potential loss to the Fund. Some of these losses may be indemnified by the lending agent. The Funds bear the risk of loss with respect to the investment of collateral. The net securities lending income earned as of December 31, 2014 by each Fund is included in the Statements of Operations.
>Offsetting of Financial Assets
The following table presents each Fund's gross and net amount of assets available for offset under a securities lending agreement as well as the related collateral received by the Fund as of December 31, 2014:
| | | | | | | | | Gross Amounts Not Offset in
the Statements of Assets and Liabilities | | | |
| | | Gross
Amounts of
Recognized
Assets | | Gross Amounts
Offset in the
Statements of
Assets and Liabilities | | Net Amounts of Assets
Presented in the
Statements of
Assets and Liabilities | | Financial
Instruments(a) | | Cash
Collateral
Received | | Securities
Collateral
Received | | Net
Amount(b) | |
Securities Loaned | |
Columbia Acorn Fund | | $ | 517,888,630 | | | $ | — | | | $ | 517,888,630 | | | $ | — | | | $ | 517,888,630 | | | $ | — | | | $ | — | | |
Columbia Acorn
International | | | 101,872,493 | | | | — | | | | 101,872,493 | | | | — | | | | 101,872,493 | | | | — | | | | — | | |
Columbia Acorn USA | | | 76,216,239 | | | | — | | | | 76,216,239 | | | | — | | | | 76,216,239 | | | | — | | | | — | | |
Columbia Acorn
International Select | | | 5,229,212 | | | | — | | | | 5,229,212 | | | | — | | | | 5,229,212 | | | | — | | | | — | | |
Columbia Acorn Select | | | 25,021,001 | | | | — | | | | 25,021,001 | | | | — | | | | 25,021,001 | | | | — | | | | — | | |
Columbia Acorn
Emerging Markets Fund | | | 3,111,617 | | | | — | | | | 3,111,617 | | | | — | | | | 3,111,617 | | | | — | | | | — | | |
Columbia Acorn
European Fund | | | 899,714 | | | | — | | | | 899,714 | | | | — | | | | 899,714 | | | | — | | | | — | | |
(a) Represents the amount of assets that could be offset by liabilities with the same counterparty under master netting or similar agreements that management elects not to offset on the Statements of Assets and Liabilities.
(b) Represents the net amount due from counterparties in the event of default.
>Federal income taxes
It is each Fund's policy to comply with the provisions of the Internal Revenue Code available to regulated investment companies and, in the manner provided therein, distribute substantially all their taxable income, as well as any net realized gain on sales of investments and foreign currency transactions reportable for federal income tax purposes. Columbia Thermostat Fund distributes all of its taxable income, as well as any net realized gain on sales of portfolio fund shares and any distributions of net realized gains received by the Fund from its portfolio funds, reportable for federal income
tax purposes. Accordingly, the Funds paid no federal income taxes and no federal income tax provision was required.
>Foreign capital gains taxes
Realized gains in certain countries may be subject to foreign taxes at the fund level. The Funds accrue for such foreign taxes on realized and unrealized gains at the appropriate rate for each jurisdiction. The amount, if any, is disclosed as a liability on the Statements of Assets and Liabilities.
>Distributions to shareholders
Distributions to shareholders are recorded on the ex-dividend date.
122
>Indemnification
In the normal course of business, the Trust on behalf of the Funds enters into contracts that contain a variety of representations and warranties and that provide general indemnities. A Fund's maximum exposure under these arrangements is unknown, as this would involve future claims against the Fund. Also, under the Trust's organizational documents, the trustees and officers of the Trust are indemnified against certain liabilities that may arise out of their duties to the Trust. However, based on experience, the Funds expect the risk of loss due to these warranties and indemnities to be remote.
>Recent Accounting Pronouncement
Transfers and Servicing (Topic 860), Repurchase-to-Maturity Transactions, Repurchase Financings, and Disclosures
In June 2014, the Financial Accounting Standards Board (FASB) issued Accounting Standards Update (ASU) No. 2014-11, Transfers and Servicing (Topic 860), Repurchase-to-Maturity Transactions, Repurchase Financings, and Disclosures. ASU No. 2014-11 changes the accounting for transactions accounted for as secured borrowings and expands disclosure requirements related to securities lending and similar transactions. The disclosure requirements are effective for interim and annual periods beginning after December 15, 2014. At this time, management is evaluating the implications of this guidance and the impact it will have on the financial statement amounts and footnote disclosures, if any.
3. Federal Tax Information
The timing and character of income and capital gain distributions are determined in accordance with income tax regulations, which may differ from GAAP. Reclassifications are made
to the Funds' capital accounts for permanent tax differences to reflect income and gains available for distribution (or available capital loss carryforwards) under income tax regulations.
For the year ended December 31, 2014, permanent book and tax basis differences resulting primarily from foreign currency transactions, passive foreign investment company (PFIC) holdings, re-characterization of distributions from investments, net operating loss reclassification, distribution reclassifications and earnings and profits distributed to shareholders on the redemption of shares, were identified and reclassified among the components of each Fund's net assets as follows:
| | | Undistributed/
(Overdistributed) or
Accumulated
Net Investment
Income (Loss) | | Accumulated
Net Realized
Gain/(Loss) | | Paid-In
Capital | |
Columbia Acorn Fund | | $ | 37,878,939 | | | $ | (391,692,152 | ) | | $ | 353,813,213 | | |
Columbia Acorn
International | | | 48,897,239 | | | | (48,897,240 | ) | | | 1 | | |
Columbia Acorn USA | | | 6,156,863 | | | | 273,193 | | | | (6,430,056 | ) | |
Columbia Acorn
International Select | | | 3,677,227 | | | | (3,677,227 | ) | | | — | | |
Columbia Acorn
Select | | | 3,796,729 | | | | 124,894 | | | | (3,921,623 | ) | |
Columbia
Thermostat Fund | | | 230,370 | | | | (3,701,459 | ) | | | 3,471,089 | | |
Columbia Acorn
Emerging
Markets Fund | | | (38,956 | ) | | | 38,957 | | | | (1 | ) | |
Columbia Acorn
European Fund | | | (22,900 | ) | | | 22,900 | | | | — | | |
Net investment income (loss) and net realized gains (losses), as disclosed on the Statements of Operations, and net assets were not affected by this reclassification.
The tax character of distributions paid during the years ended December 31, 2014 and December 31, 2013 was as follows:
| | | December 31, 2014 | | December 31, 2013 | |
Fund | | Ordinary
Income* | | Long-Term
Capital Gains | | Ordinary
Income* | | Long-Term
Capital Gains | |
Columbia Acorn Fund | | $ | — | | | $ | 2,682,706,755 | | | $ | 21,340,532 | | | $ | 1,308,033,846 | | |
Columbia Acorn International | | | 116,690,475 | | | | 413,210,257 | | | | 198,930,778 | | | | 330,008,029 | | |
Columbia Acorn USA | | | — | | | | 246,242,710 | | | | — | | | | 141,393,055 | | |
Columbia Acorn International Select | | | 2,302,638 | | | | 32,121,809 | | | | 5,084,134 | | | | 25,050,362 | | |
Columbia Acorn Select | | | — | | | | 143,373,013 | | | | 3,241,093 | | | | 198,890,427 | | |
Columbia Thermostat Fund | | | 29,624,764 | | | | 9,456,050 | | | | 32,251,737 | | | | 52,560,790 | | |
Columbia Acorn Emerging Markets Fund | | | 3,506,088 | | | | — | | | | 2,558,438 | | | | — | | |
Columbia Acorn European Fund | | | 353,305 | | | | 90,617 | | | | 41,172 | | | | 24,867 | | |
* For tax purposes short-term capital gain distributions, if any, are considered ordinary income distributions.
123
Columbia Acorn Family of Funds
Notes to Financial Statements, continued
As of December 31, 2014, the components of distributable earnings on a tax basis were as follows:
Fund | | Undistributed
Ordinary
Income | | Undistributed
Long-Term
Capital
Gains | | Capital Loss
Carryforwards | | Net
Unrealized
Appreciation
(Depreciation)* | |
Columbia Acorn Fund | | $ | — | | | $ | 606,933,438 | | | $ | — | | | $ | 7,081,725,961 | | |
Columbia Acorn International | | | — | | | | 69,311,634 | | | | (32,978,592 | ) | | | 1,415,663,530 | | |
Columbia Acorn USA | | | — | | | | 33,730,542 | | | | — | | | | 650,557,477 | | |
Columbia Acorn International Select | | | 896,977 | | | | — | | | | — | | | | 13,352,991 | | |
Columbia Acorn Select | | | — | | | | 48,428,589 | | | | — | | | | 206,403,152 | | |
Columbia Thermostat Fund | | | 10,966,888 | | | | 13,043,172 | | | | — | | | | 32,679,389 | | |
Columbia Acorn Emerging Markets Fund | | | — | | | | — | | | | (14,671,234 | ) | | | 15,058,101 | | |
Columbia Acorn European Fund | | | 200,929 | | | | — | | | | (2,338,404 | ) | | | 45,678 | | |
* The differences between book-basis and tax-basis net unrealized appreciation (depreciation) are primarily due to deferral of losses from wash sales and PFIC adjustments.
The following capital loss carryforwards, determined as of December 31, 2014, may be available to reduce taxable income arising from future net realized gains on investments, if any, to the extent permitted by the Internal Revenue Code:
| | | Year of Expiration | | | | | |
| | | 2015 | | 2016 | | No
Expiration
Short-Term | | Total | |
Columbia Acorn International | | $ | 2,521,892 | | | $ | 30,456,700 | | | $ | — | | | $ | 32,978,592 | | |
Columbia Acorn Emerging Markets Fund | | | — | | | | — | | | | 14,671,234 | | | | 14,671,234 | | |
Columbia Acorn European Fund | | | — | | | | — | | | | 2,338,404 | | | | 2,338,404 | | |
The value of capital loss carryforwards that were utilized, expired and permanently lost for the Funds during the year ended December 31, 2014, were as follows:
| | | Utilized | | Expired | | Lost | |
Columbia Acorn International | | $ | 18,996,063 | | | $ | — | | | $ | — | | |
Under current tax rules, Regulated Investment Companies can elect to treat certain late-year ordinary losses incurred and post-October capital losses (capital losses realized after October 31) as arising on the first day of the following taxable year. As of December 31, 2014, the Funds will elect to treat the following late-year ordinary losses and post-October capital losses as arising on January 1, 2015:
Fund | | Late-Year
Ordinary
Losses | | Post-October
Capital
Losses | |
Columbia Acorn International
Select | | $ | — | | | $ | 8,767,586 | | |
Columbia Acorn Emerging
Markets Fund | | | 533,398 | | | | — | | |
Management of the Funds has concluded that there are no significant uncertain tax positions in any Fund that would require recognition in the financial statements. However, management's conclusion may be subject to review and adjustment at a later date based on factors including, but not limited to, new tax laws, regulations, and administrative interpretations (including relevant court decisions). Generally, the Funds' federal tax returns for the prior three fiscal years remain subject to examination by the Internal Revenue Service.
4. Transactions with Affiliates
CWAM is a wholly-owned subsidiary of Columbia Management Investment Advisers, LLC (Columbia Management), which is a
wholly-owned subsidiary of Ameriprise Financial, Inc. (Ameriprise Financial). CWAM furnishes continuing investment supervision to the Funds and is responsible for the overall management of the Funds' business affairs.
CWAM receives a monthly advisory fee based on each Fund's average daily net assets at the following annual rates:
Columbia Acorn Fund
Average Daily Net Assets | | Annual
Fee Rate | |
Up to $700 million | | | 0.74 | % | |
$700 million to $2 billion | | | 0.69 | % | |
$2 billion to $6 billion | | | 0.64 | % | |
| $6 billion and over | | | 0.63 | % | |
Columbia Acorn International
Average Daily Net Assets | | Annual
Fee Rate | |
Up to $100 million | | | 1.19 | % | |
$100 million to $500 million | | | 0.94 | % | |
| $500 million and over | | | 0.74 | % | |
Columbia Acorn USA
Average Daily Net Assets | | Annual
Fee Rate | |
Up to $200 million | | | 0.94 | % | |
$200 million to $500 million | | | 0.89 | % | |
$500 million to $2 billion | | | 0.84 | % | |
$2 billion to $3 billion | | | 0.80 | % | |
| $3 billion and over | | | 0.70 | % | |
Columbia Acorn International Select
Average Daily Net Assets | | Annual
Fee Rate | |
Up to $500 million | | | 0.94 | % | |
| $500 million and over | | | 0.90 | % | |
124
Columbia Acorn Select
Average Daily Net Assets | | Annual
Fee Rate | |
Up to $700 million | | | 0.85 | % | |
$700 million to $2 billion | | | 0.80 | % | |
$2 billion to $3 billion | | | 0.75 | % | |
| $3 billion and over | | | 0.70 | % | |
Columbia Thermostat Fund
| | | Annual
Fee Rate | |
All Average Daily Net Assets | | | 0.10 | % | |
Columbia Acorn Emerging Markets Fund
Average Daily Net Assets | | Annual
Fee Rate | |
Up to $100 million | | | 1.25 | % | |
$100 million to $500 million | | | 1.00 | % | |
| $500 million and over | | | 0.80 | % | |
Columbia Acorn European Fund
Average Daily Net Assets | | Annual
Fee Rate | |
Up to $100 million | | | 1.19 | % | |
$100 million to $500 million | | | 0.94 | % | |
| $500 million and over | | | 0.74 | % | |
For the year ended December 31, 2014, the effective investment advisory fee rates were as follows:
Fund | |
Columbia Acorn Fund | | | 0.64 | % | |
Columbia Acorn International | | | 0.75 | % | |
Columbia Acorn USA | | | 0.86 | % | |
Columbia Acorn International Select | | | 0.94 | % | |
Columbia Acorn Select | | | 0.85 | % | |
Columbia Thermostat Fund | | | 0.10 | % | |
Columbia Acorn Emerging Markets Fund | | | 1.04 | % | |
Columbia Acorn European Fund | | | 1.19 | % | |
>Expense limits
Columbia Management Investment Services Corp. (CMIS), a wholly owned subsidiary of Ameriprise Financial, has voluntarily agreed to waive a portion of the total annual Fund operating expenses attributable to transfer agency fees incurred by Class A, Class B and Class C shares of Columbia Acorn International such that the Fund's total annual Fund operating expenses will be reduced by 0.04%, 0.03% and 0.02% for Class A, Class B and Class C shares of the Fund, respectively.
Effective May 1, 2014, CWAM has voluntarily agreed to reimburse expenses so that the Funds' ordinary operating expenses (excluding transaction costs and certain other investment-related expenses, interest and fees on borrowings and expenses associated with each Fund's investments in other investment companies, if any) after giving effect to any balance credits or overdraft charges from the Funds' custodian, do not exceed annually the average daily net assets of each class as follows:
Fund | | Class A | | Class B | | Class C | | Class I | | Class R4 | | Class R5 | | Class Y | | Class Z | |
Columbia Acorn International Select | | | 1.70 | % | | | 2.20 | % | | | 2.45 | % | | | 1.37 | % | | | 1.45 | % | | | 1.42 | % | | | 1.37 | % | | | 1.45 | % | |
Columbia Acorn Select | | | 1.60 | % | | | 2.10 | % | | | 2.35 | % | | | 1.22 | % | | | 1.35 | % | | | 1.27 | % | | | 1.22 | % | | | 1.35 | % | |
These arrangements may be modified or terminated by either the Funds or CWAM on 30 days notice.
Through April 30, 2014, CWAM voluntarily reimbursed expenses so that the Funds' ordinary operating expenses (excluding transaction costs and certain other investment-related expenses, interest and fees on borrowings and expenses associated with each Fund's investments in other investment companies, if any) after giving effect to any balance credits or overdraft charges from the Funds' custodian, did not exceed annually the average daily net assets of each class as follows:
Fund | | Class A | | Class B | | Class C | | Class I | | Class R4 | | Class R5 | | Class Y | | Class Z | |
Columbia Acorn International Select | | | 1.70 | % | | | 2.20 | % | | | 2.45 | % | | | 1.31 | % | | | 1.45 | % | | | 1.36 | % | | | 1.31 | % | | | 1.45 | % | |
Columbia Acorn Select | | | 1.60 | % | | | 2.10 | % | | | 2.35 | % | | | 1.23 | % | | | 1.35 | % | | | 1.28 | % | | | 1.23 | % | | | 1.35 | % | |
Effective May 1, 2014, CWAM has contractually agreed to waive fees and/or reimburse expenses through April 30, 2015, so that the Funds' ordinary operating expenses (excluding transaction costs and certain other investment-related expenses, interest and fees on borrowings and expenses associated with each Fund's investments in other investment companies, if any, and in the
125
Columbia Acorn Family of Funds
Notes to Financial Statements, continued
case of Columbia Thermostat Fund its underlying portfolio funds), do not exceed annually the average daily net assets of each class as follows:
Fund | | Class A | | Class B | | Class C | | Class I | | Class R4 | | Class R5 | | Class Y | | Class Z | |
Columbia Thermostat Fund | | | 0.50 | % | | | 1.00 | % | | | 1.25 | % | | | — | % | | | 0.25 | % | | | 0.23 | % | | | 0.18 | % | | | 0.25 | % | |
Columbia Acorn Emerging Markets Fund | | | 1.85 | % | | | — | % | | | 2.60 | % | | | 1.46 | % | | | 1.60 | % | | | 1.51 | % | | | 1.46 | % | | | 1.60 | % | |
Columbia Acorn European Fund | | | 1.75 | % | | | — | % | | | 2.50 | % | | | 1.47 | % | | | 1.50 | %* | | | 1.52 | % | | | — | % | | | 1.50 | % | |
* Effective June 25, 2014 (the commencement of operations of Columbia Acorn European Fund Class R4 shares) through April 30, 2015.
There is no guarantee that these agreements will continue thereafter.
Through April 30, 2014, CWAM contractually waived fees and/or reimburse expenses so that the Funds' ordinary operating expenses (excluding transaction costs and certain other investment-related expenses, interest and fees on borrowings and expenses associated with each Fund's investments in other investment companies, if any, and in the case of Columbia Thermostat Fund its underlying portfolio funds), did not exceed annually the average daily net assets of each class as follows:
Fund | | Class A | | Class B | | Class C | | Class I | | Class R4 | | Class R5 | | Class Y | | Class Z | |
Columbia Thermostat Fund | | | 0.50 | % | | | 1.00 | % | | | 1.25 | % | | | — | % | | | 0.25 | % | | | 0.23 | % | | | 0.18 | % | | | 0.25 | % | |
Columbia Acorn Emerging Markets Fund | | | 1.85 | % | | | — | % | | | 2.60 | % | | | 1.54 | % | | | 1.60 | % | | | 1.59 | % | | | 1.54 | % | | | 1.60 | % | |
Columbia Acorn European Fund | | | 1.75 | % | | | — | % | | | 2.50 | % | | | 1.46 | % | | | — | % | | | 1.51 | % | | | — | % | | | 1.50 | % | |
Expenses reimbursed by CWAM and its affiliates for the year ended December 31, 2014, were as follows:
Fund | | Expenses
Reimbursed | |
Columbia Acorn International | | $ | 452,267 | | |
Columbia Acorn Select | | | 854 | | |
Columbia Thermostat Fund | | | 135,531 | | |
Columbia Acorn European Fund | | | 147,638 | | |
CWAM is contractually entitled to recoup from each of Columbia Acorn Emerging Markets Fund and Columbia Acorn European Fund any fees waived and/or expenses reimbursed with respect to any share class offered by Columbia Acorn Emerging Markets Fund and Columbia Acorn European Fund for a one year period following the date of such fee waiver and/or reimbursement, if such recovery does not cause the ordinary operating expenses of the Fund (excluding transaction costs and certain other investment-related expenses, interest and fees on borrowings and expenses associated with the Fund's investment in other investment companies, if any) to exceed the annual rates set forth above, or to exceed such annual rate as may be in place at the time of the recoupment, whichever is less.
CWAM provides administrative services and receives an administration fee from the Funds at the following annual rates:
Columbia Acorn Trust
Aggregate Average Daily
Net Assets of the Trust | | Annual
Fee Rate | |
Up to $8 billion | | | 0.050 | % | |
$8 billion to $16 billion | | | 0.040 | % | |
$16 billion to $35 billion | | | 0.030 | % | |
$35 billion to $45 billion | | | 0.025 | % | |
| $45 billion and over | | | 0.015 | % | |
For the year ended December 31, 2014, the effective administration fee rate was 0.04% of each Fund's average daily net assets. CWAM has delegated to Columbia Management responsibility to provide certain sub-administrative services to the Funds.
CMID, a wholly owned subsidiary of Ameriprise Financial, is the distributor of the Funds.
Sales charges, including front-end and CDSCs, received by the Distributor for distributing each Fund's shares for the year ended December 31, 2014 are as follows:
| | | Underwriting
Discounts | | CDSCs | |
(Unaudited) | | Class A | | Class A | | Class B | | Class C | |
Columbia Acorn Fund | | $ | 1,435,758 | | | $ | 12,592 | | | $ | 438 | | | $ | 31,848 | | |
Columbia Acorn
International | | | 592,622 | | | | 6,544 | | | | 1,004 | | | | 7,646 | | |
Columbia Acorn USA | | | 85,622 | | | | 1,772 | | | | — | | | | 2,679 | | |
Columbia Acorn
International Select | | | 49,250 | | | | 1 | | | | — | | | | 865 | | |
Columbia Acorn Select | | | 50,998 | | | | 21 | | | | 194 | | | | 1,816 | | |
Columbia
Thermostat Fund | | | 1,181,699 | | | | 21,521 | | | | 53 | | | | 74,964 | | |
Columbia Acorn
Emerging Markets Fund | | | 314,720 | | | | 5,137 | | | | — | | | | 8,322 | | |
Columbia Acorn
European Fund | | | 81,450 | | | | 30 | | | | — | | | | 1,175 | | |
Each Fund has adopted a distribution and service plan which requires it to pay CMID a monthly service fee equal to 0.25% annually of the average daily net assets attributable to Class A, Class B and Class C shares and a monthly distribution fee equal to 0.50%, 0.75% and 0.50%, annually, of the average daily net assets attributable to Class B, Class C and Class R
126
shares, respectively. CMID receives no compensation with respect to Class R4, Class R5, Class Y and Class Z shares.
CMIS is the transfer agent of the Funds. CMIS receives monthly account-based service fees based on the number of open Fund accounts. Each Fund pays CMIS a monthly fee at the annual rate of $20.00 per open account. Subject to certain limitations, the Funds reimburse payments made by CMIS to financial intermediaries for the shareholder services that the intermediaries
provide, in amounts that vary by share class and with the type of intermediary and type of shareholder services provided.
The Transfer Agent also receives compensation from fees for various shareholder services and reimbursements for certain out-of-pocket fees. Total transfer agent fees for Class R5 shares are subject to an annual limitation of not more than 0.05% of the average daily net assets attributable to Class R5 shares. Class I shares and Class Y shares do not pay transfer agency fees.
For the year ended December 31, 2014, the Funds' effective transfer agent fee rates as a percentage of average daily net assets of each class were as follows:
Fund | | Class A | | Class B | | Class C | | Class R | | Class R4 | | Class R5 | | Class Z | |
Columbia Acorn Fund | | | 0.12 | % | | | 0.30 | % | | | 0.07 | % | | | — | % | | | 0.13 | % | | | 0.05 | % | | | 0.08 | % | |
Columbia Acorn International | | | 0.16 | % | | | 0.40 | % | | | 0.13 | % | | | 0.27 | % | | | 0.18 | % | | | 0.05 | % | | | 0.08 | % | |
Columbia Acorn USA | | | 0.15 | % | | | 0.57 | % | | | 0.06 | % | | | — | % | | | 0.13 | % | | | 0.05 | % | | | 0.14 | % | |
Columbia Acorn International Select | | | 0.12 | % | | | 0.27 | % | | | 0.14 | % | | | — | % | | | 0.11 | % | | | 0.05 | % | | | 0.08 | % | |
Columbia Acorn Select | | | 0.12 | % | | | 0.45 | % | | | 0.09 | % | | | — | % | | | 0.17 | % | | | 0.05 | % | | | 0.09 | % | |
Columbia Thermostat Fund | | | 0.07 | % | | | 0.22 | % | | | 0.07 | % | | | — | % | | | 0.07 | % | | | 0.05 | % | | | 0.06 | % | |
Columbia Acorn Emerging Markets Fund | | | 0.11 | % | | | — | % | | | 0.12 | % | | | — | % | | | 0.07 | % | | | 0.05 | % | | | 0.12 | % | |
Columbia Acorn European Fund | | | 0.11 | % | | | — | % | | | 0.13 | % | | | — | % | | | 0.12 | % | | | 0.05 | % | | | 0.10 | % | |
Columbia Acorn International and certain other associated investment companies, have severally, but not jointly, guaranteed the performance and observance of all the terms and conditions of a lease entered into by Seligman Data Corp. (SDC), the former transfer agent to certain associated investment companies, including the payment of rent by SDC (the Guaranty). The lease and the Guaranty expire in January 2019. At December 31, 2014, Columbia Acorn International's total potential future obligation over the life of the Guaranty is $83,362. The liability remaining at December 31, 2014 for non-recurring charges associated with the lease amounted to $53,685 and is included within the "Payable for Other liabilities" in the Statements of Assets and Liabilities.
Certain officers and trustees of the Trust are also officers of CWAM. The Trust makes no direct payments to its officers and trustees who are affiliated with CWAM.
The Board has appointed a Chief Compliance Officer of the Trust in accordance with federal securities regulations. The Funds, along with other affiliated funds, pay their pro-rata share of the expenses associated with the Office of the Chief Compliance Officer.
The Trust offers a deferred compensation plan for its independent trustees. Under that plan, a trustee may elect to defer all or a portion of his or her compensation. Amounts deferred are retained by the Trust and may represent an unfunded obligation of the Trust. The value of amounts deferred is
determined by reference to the change in value of Class Z shares of one or more series of the Trust or a money market fund as specified by the trustee. Benefits under the deferred compensation plan are payable in accordance with the plan.
An affiliated person of a Fund may include any company in which a Fund owns five percent or more of its outstanding voting shares during the year. On December 31, 2014, Columbia Acorn Fund, Columbia Acorn International, Columbia Acorn Select and Columbia Thermostat Fund each held five percent or more of the outstanding voting securities of one or more companies or a company which is under common ownership or control with the Funds. Details of investments in those affiliated companies are presented in the Notes to Statement of Investments of each Fund listed above.
For the year ended December 31, 2014, the Funds engaged in purchase and sales transactions with funds that have a common investment manager (or affiliated investment managers), common directors/trustees, and/or common officers. Those transactions complied with Rule 17a-7 under the Investment Company Act of 1940 and totaled as follows:
| | | Purchases | | Sales | |
Columbia Acorn Fund | | $ | — | | | $ | 42,246,098 | | |
Columbia Acorn International | | | 39,818,858 | | | | — | | |
Columbia Acorn International
Select | | | — | | | | 2,898,140 | | |
Columbia Acorn European Fund | | | 59,702 | | | | 970,001 | | |
127
Columbia Acorn Family of Funds
Notes to Financial Statements, continued
5. Borrowing Arrangements
During the year ended December 31, 2014, the Trust participated in a credit facility with JPMorgan Chase Bank, N.A., along with Wanger Advisors Trust, another trust managed by CWAM, in the amount of $150 million. The credit facility was entered into to facilitate portfolio liquidity. Under the facility, interest is charged to each participating fund based on its borrowings at a rate per annum equal to the Federal Funds Rate plus 1.00%. In addition, a commitment fee of 0.08% per annum of the unutilized line of credit is accrued and apportioned among the participating funds based on their relative net assets. The commitment fee is disclosed as a part of "Other expenses" in the Statements of Operations. The Trust expects to renew this line of credit for one year durations each July at then current market rates and terms.
No amounts were borrowed for the benefit of a Fund under the line of credit during the year ended December 31, 2014.
6. Investment Transactions
The aggregate cost of purchases and proceeds from sales, other than short-term obligations, for the year ended December 31, 2014, were:
| | | Purchases | | Proceeds from
Sales | |
Columbia Acorn Fund | | $ | 3,275,347,007 | | | $ | 8,592,258,057 | | |
Columbia Acorn
International | | | 2,237,161,643 | | | | 2,573,022,536 | | |
Columbia Acorn USA | | | 189,636,474 | | | | 622,182,315 | | |
Columbia Acorn
International Select | | | 183,138,204 | | | | 273,542,036 | | |
Columbia Acorn Select | | | 131,244,205 | | | | 341,575,769 | | |
Columbia
Thermostat Fund | | | 1,225,640,896 | | | | 1,327,359,510 | | |
Columbia Acorn Emerging
Markets Fund | | | 297,006,975 | | | | 220,140,785 | | |
Columbia Acorn
European Fund | | | 50,568,798 | | | | 34,379,689 | | |
The amount of purchase and sales activity impacts the portfolio turnover rate reported in the Financial Highlights.
7. Shareholder Concentration
At December 31, 2014, the table below details the affiliated and significant unaffiliated shareholder account ownership of outstanding shares of each Fund. The Funds have no knowledge about whether any portion of these unaffiliated shares were owned beneficially. Subscription and redemption activity of these accounts may have a significant effect on the operations of the Funds.
Fund | | Number of
unaffiliated
accounts | | Percentage of
shares
outstanding
held –
unaffiliated | | Percentage of
shares
outstanding
held –
affiliated | |
Columbia Acorn Fund | | | 1 | | | | 15.3 | % | | | — | % | |
Columbia Acorn International | | | 2 | | | | 27.6 | % | | | — | % | |
Columbia Acorn USA | | | 3 | | | | 51.1 | % | | | — | % | |
Columbia Acorn
International Select | | | 2 | | | | 38.8 | % | | | 10.9 | % | |
Columbia Acorn Select | | | 2 | | | | 34.2 | % | | | 12.5 | % | |
Columbia Thermostat Fund | | | 1 | | | | 20.6 | % | | | 23.9 | % | |
Columbia Acorn Emerging
Markets Fund | | | 3 | | | | 45.7 | % | | | 23.3 | % | |
Columbia Acorn European Fund | | | — | | | | — | % | | | 57.8 | % | |
8. Subsequent Events
Management has evaluated the events and transactions that have occurred through the date the financial statements were issued and noted no items requiring adjustment of the financial statements or additional disclosure.
9. Information Regarding Pending and Settled Legal Proceedings
Ameriprise Financial and certain of its affiliates have historically been involved in a number of legal, arbitration and regulatory proceedings, including routine litigation, class actions, and governmental actions, concerning matters arising in connection with the conduct of their business activities. Ameriprise Financial believes that the Funds are not currently the subject of, and that neither Ameriprise Financial nor any of its affiliates are the subject of, any pending legal, arbitration or regulatory proceedings that are likely to have a material adverse effect on the Funds or the ability of Ameriprise Financial or its affiliates to perform under their contracts with the Funds. Ameriprise Financial is required to make quarterly (10-Q), annual (10-K) and, as necessary, 8-K filings with the Securities and Exchange Commission on legal and regulatory matters that relate to Ameriprise Financial and its affiliates. Copies of these filings may be obtained by accessing the SEC website at www.sec.gov.
There can be no assurance that these matters, or the adverse publicity associated with them, will not result in increased fund redemptions, reduced sale of fund shares or other adverse consequences to the Funds. Further, although we believe proceedings are not likely to have a material adverse effect on the Funds or the ability of Ameriprise Financial or its affiliates to perform under their contracts with the Funds, these proceedings are subject to uncertainties and, as such, we are unable to estimate the possible loss or range of loss that may result. An adverse outcome in one or more of these proceedings could result in adverse judgments, settlements, fines, penalties or other relief that could have a material adverse effect on the consolidated financial condition or results of operations of Ameriprise Financial.
128
Report of Independent Registered Public Accounting Firm
To the Board of Trustees and Shareholders of
Columbia Acorn Trust:
In our opinion, the accompanying statements of assets and liabilities, including the statements of investments, and the related statements of operations and of changes in net assets and the financial highlights present fairly, in all material respects, the financial position of Columbia Acorn Fund, Columbia Acorn International, Columbia Acorn USA, Columbia Acorn International Select, Columbia Acorn Select, Columbia Thermostat Fund, Columbia Acorn Emerging Markets Fund and Columbia Acorn European Fund (each a series of the Columbia Acorn Trust, hereinafter referred to as the "Funds") at December 31, 2014, the results of each of their operations for the year then ended, the changes in each of their net assets for each of the two years in the period then ended and the financial highlights for each of the periods presented, in conformity with accounting principles generally accepted in the United States of America. These financial statements and financial highlights (hereafter referred to as "financial statements")
are the responsibility of the Funds' management; our responsibility is to express an opinion on these financial statements based on our audits. We conducted our audits of these financial statements in accordance with the standards of the Public Company Accounting Oversight Board (United States). Those standards require that we plan and perform the audit to obtain reasonable assurance about whether the financial statements are free of material misstatement. An audit includes examining, on a test basis, evidence supporting the amounts and disclosures in the financial statements, assessing the accounting principles used and significant estimates made by management, and evaluating the overall financial statement presentation. We believe that our audits, which included confirmation of securities at December 31, 2014 by correspondence with the custodian and brokers, provide a reasonable basis for our opinion.
PricewaterhouseCoopers LLP
Chicago, Illinois
February 19, 2015
129
Columbia Acorn Family of Funds
Federal Income Tax Information (Unaudited)
The Funds hereby designate the following tax attributes for the fiscal year ended December 31, 2014.
| | | Qualified
Dividend
Income | | Dividends
Received
Deduction | | Capital Gain
Dividend | | Foreign
Taxes Paid | | Foreign
Taxes Paid
Per Share | | Foreign
Source
Income | | Foreign
Source
Income
Per Share | |
Columbia Acorn Fund | | | — | % | | | — | % | | $ | 3,388,331,689 | | | $ | — | | | $ | — | | | $ | — | | | $ | — | | |
Columbia Acorn International | | | 98.68 | % | | | — | % | | $ | 410,719,781 | | | $ | 17,276,766 | | | $ | 0.09 | | | $ | 185,883,142 | | | $ | 1.00 | | |
Columbia Acorn USA | | | — | % | | | — | % | | $ | 270,758,416 | | | $ | — | | | $ | — | | | $ | — | | | $ | — | | |
Columbia Acorn International
Select | | | 100.00 | % | | | 3.92 | % | | $ | 32,336,116 | | | $ | 639,342 | | | $ | 0.06 | | | $ | 9,200,048 | | | $ | 0.81 | | |
Columbia Acorn Select | | | — | % | | | — | % | | $ | 159,598,820 | | | $ | — | | | $ | — | | | $ | — | | | $ | — | | |
Columbia Thermostat Fund | | | 6.08 | % | | | 4.64 | % | | $ | 20,250,975 | | | $ | 51,990 | | | $ | — | | | $ | 373,276 | | | $ | — | | |
Columbia Acorn Emerging
Markets Fund | | | 100.00 | % | | | — | % | | $ | — | | | $ | 1,078,712 | | | $ | 0.03 | | | $ | 11,153,698 | | | $ | 0.29 | | |
Columbia Acorn European
Fund | | | 100.00 | % | | | 0.69 | % | | $ | — | | | $ | 95,533 | | | $ | 0.04 | | | $ | 1,289,056 | | | $ | 0.50 | | |
The following Funds hereby designate additional tax attributes for the fiscal year ended December 31, 2013.
| | | Foreign
Taxes Paid | | Foreign
Taxes Paid
Per Share | |
Columbia Acorn International Select | | $ | 168,503 | | | $ | 0.01 | | |
Columbia Thermostat Fund | | $ | 20,604 | | | $ | — | | |
Columbia Acorn European Fund | | $ | 812 | | | $ | — | | |
Qualified Dividend Income. For taxable, non-corporate shareholders, the percentage of ordinary income distributed during the fiscal year that represents qualified dividend income subject to reduced tax rates.
Dividends Received Deduction. The percentage of ordinary income distributed during the fiscal year that qualifies for the corporate dividends received deduction.
Capital Gain Dividend. The Fund designates as a capital gain dividend the amount reflected above, or if subsequently determined to be different, the net capital gain of such fiscal period.
Foreign Taxes. The Fund makes the election to pass through to shareholders the foreign taxes paid. Eligible shareholders may claim a foreign tax credit. These taxes, and the corresponding foreign source income, are provided.
130
Board of Trustees and Management of
Columbia Acorn Family of Funds
Each trustee may serve a term of unlimited duration. The Trust's By-laws generally require that a trustee retire at the end of the calendar year in which the trustee attains the age of 75 years. The trustees appoint their own successors, provided that at least two-thirds of the trustees, after such appointment, have been elected by shareholders. Shareholders may remove a trustee, with or without cause, upon the vote of two-thirds of the Trust's outstanding shares at any meeting called for that purpose. A trustee may be removed, with or without cause, upon the vote of a majority of the trustees. The names of the trustees and officers of the Trust, the date each was first elected or appointed to office, their principal business occupations during at least the last five years, the number of portfolios in the fund complex they oversee, and other directorships they hold, are shown below. Each trustee serves in such capacity for each of the eight series of Columbia Acorn Trust and for each of the four series of Wanger Advisors Trust.
The address for the trustees and officers of the Trust is Columbia Wanger Asset Management, LLC, 227 West Monroe Street, Suite 3000, Chicago, Illinois 60606. The Funds' Statement of Additional Information includes additional information about the Funds' trustees and officers. You may obtain a free copy of the Statement of Additional Information by writing or calling toll-free:
Columbia Wanger Asset Management, LLC
Shareholder Services Group
227 W. Monroe, Suite 3000
Chicago IL 60606
1-800-922-6769
Name, Position
Held with
Columbia Acorn
Trust and Age at
December 31, 2014 | | Year First
Appointed or
Elected to a
Board in the
Columbia
Funds
Complex* | | Principal Occupation(s)
during the Past Five Years | | Number of
Funds in the
Columbia
Funds
Complex
Overseen | | Other
Directorships
in addition to
Columbia Acorn Trust | |
Trustees who are not interested persons of Columbia Acorn Trust:(1) | | | |
Laura M. Born, 49,
Trustee and Chair | | | 2007 | | | Adjunct Associate Professor of Finance, University of Chicago Booth School of Business; Managing Director – Investment Banking, J.P. Morgan Chase & Co. (broker-dealer), 2002-2007. | | | 12 | | | Wanger Advisors Trust. | |
Maureen M. Culhane, 66,
Trustee | | | 2007 | | | Retired. Formerly, Vice President, Goldman Sachs Asset Management, L.P. (investment adviser), 2005-2007; Vice President (Consultant) – Strategic Relationship Management, Goldman, Sachs & Co., 1999-2005. | | | 12 | | | Wanger Advisors Trust. | |
Margaret M. Eisen, 61,
Trustee | | | 2002 | | | Chief Investment Officer, EAM International LLC (corporate finance and asset management), 2003-2013; Managing Director, CFA Institute, 2005-2008. | | | 12 | | | Wanger Advisors Trust; Burnham Investors Trust. | |
Thomas M. Goldstein, 55,
Trustee | | | 2014 | | | Retired. Formerly, Chief Financial Officer, Allstate Protection Division, 2011-2014; Founding Partner, The GRG Group LLC, 2009-2011; Managing Director and Chief Financial Officer, Madison Dearborn Partners, 2007-2009. | | | 12 | | | Wanger Advisors Trust; Federal Home Loan Bank – Chicago; Federal Home Loan Mortgage Corporation. | |
John C. Heaton, 55,
Trustee | | | 2010 | | | Deputy Dean for Faculty, University of Chicago Booth School of Business; Joseph L. Gidwitz Professor of Finance, University of Chicago Booth School of Business since 2000. | | | 12 | | | Wanger Advisors Trust. | |
Steven N. Kaplan, 55,
Trustee and Vice Chair | | | 1999 | | | Neubauer Family Distinguished Service Professor of Entrepreneurship and Finance, University of Chicago Booth School of Business; faculty member of the University of Chicago Booth School of Business since 1988. | | | 12 | | | Wanger Advisors Trust; Accretive Health, Inc. (healthcare management services provider); Morningstar, Inc. (provider of independent investment research). | |
David J. Rudis, 61,
Trustee | | | 2010 | | | Retired. Formerly, National Checking and Debit Executive, and Illinois President, Bank of America, 2007-2009; President, Consumer Banking Group, LaSalle National Bank, 2004-2007. | | | 12 | | | Wanger Advisors Trust. | |
David B. Small, 58,
Trustee(2) | | | 2010 | | | Managing Director, Grosvenor Capital Management, L.P. (investment adviser) since 1994; Adjunct Associate Professor of Finance, University of Chicago Booth School of Business. | | | 12 | | | Wanger Advisors Trust. | |
131
Name, Position
Held with
Columbia Acorn
Trust and Age at
December 31, 2014 | | Year First
Appointed or
Elected to a
Board in the
Columbia
Funds
Complex* | | Principal Occupation(s)
during the Past Five Years | | Number of
Funds in the
Columbia
Funds
Complex
Overseen | | Other
Directorships
in addition to
Columbia Acorn Trust | |
Trustees who are interested persons of Columbia Acorn Trust: | | | |
Charles P. McQuaid, 61,
Trustee and Vice President(3) | | | 1992 | | | Portfolio manager and/or analyst, CWAM or its predecessors since 1978; Vice President of Columbia Acorn Trust and Wanger Advisors Trust since April 2014; formerly, President and Chief Investment Officer, CWAM or its predecessors, October 2003-March 2014, and President of Columbia Acorn Trust and Wanger Advisors Trust, October 2003-March 2014. | | | 12 | | | Wanger Advisors Trust. | |
Ralph Wanger, 80,
Trustee Emeritus(4) | | | 1970 | | | Founder, CWAM. Formerly, President, Chief Investment Officer and portfolio manager, CWAM or its predecessors, July 1992 – September 2003; Director, Wanger Investment Company PLC; Consultant to CWAM or its predecessors, September 2003 – September 2005. | | | 12 | | | Wanger Advisors Trust. | |
Officers of Columbia Acorn Trust: | | | |
Robert A. Chalupnik, 49,
Vice President | | | 2011 | | | Portfolio manager and/or analyst, CWAM or its predecessors since 2000; Vice President Columbia Acorn Trust and Wanger Advisors Trust since 2011. | | | N/A | | | N/A | |
Michael G. Clarke, 45,
Assistant Treasurer | | | 2004 | | | Vice President – Mutual Fund Treasurer, Columbia Management Investment Advisers, LLC since May 2010; Managing Director of Fund Administration, Columbia Management Advisors, LLC, September 2004-April 2010; Senior officer, Columbia Funds and affiliated funds since 2002. | | | N/A | | | N/A | |
Joseph F. DiMaria, 46,
Assistant Treasurer | | | 2010 | | | Vice President – Mutual Fund Administration, Columbia Management Investment Advisers, LLC since May 2010; Director of Fund Administration, Columbia Management Advisors, LLC, January 2006-April 2010. | | | N/A | | | N/A | |
William J. Doyle, 50,
Vice President | | | 2014 | | | Portfolio manager and/or analyst, CWAM or its predecessors since 2006; Vice President, Columbia Acorn Trust and Wanger Advisors Trust since 2014. | | | N/A | | | N/A | |
P. Zachary Egan, 46,
President | | | 2014 | | | President and International Chief Investment Officer, CWAM since April 2014; portfolio manager and/or analyst, CWAM or its predecessors since 1999; formerly, Director of International Research, CWAM December 2004-March 2014, and Vice President, Columbia Acorn Trust, 2003-2014, and Wanger Advisors Trust, 2007-2014. | | | N/A | | | N/A | |
David L. Frank, 51,
Vice President | | | 2014 | | | Portfolio manager and/or analyst, CWAM or its predecessors since 2002; Vice President, Columbia Acorn Trust and Wanger Advisors Trust since 2014. | | | N/A | | | N/A | |
Fritz Kaegi, 43,
Vice President | | | 2011 | | | Portfolio manager and/or analyst, CWAM or its predecessors since 2004; Vice President, Columbia Acorn Trust and Wanger Advisors Trust since 2011. | | | N/A | | | N/A | |
John M. Kunka, 44,
Treasurer | | | 2006 | | | Treasurer and Principal Accounting and Financial Officer, Columbia Acorn Trust and Wanger Advisors Trust since 2014; Director of Accounting and Operations, CWAM since May 2006; formerly, Assistant Treasurer, Columbia Acorn Trust and Wanger Advisors Trust 2006-2014. | | | N/A | | | N/A | |
132
Name, Position
Held with
Columbia Acorn
Trust and Age at
December 31, 2014 | | Year First
Appointed or
Elected to a
Board in the
Columbia
Funds
Complex* | | Principal Occupation(s)
during the Past Five Years | | Number of
Funds in the
Columbia
Funds
Complex
Overseen | | Other
Directorships
in addition to
Columbia Acorn Trust | |
Officers of Columbia Acorn Trust: (continued) | | | |
Stephen Kusmierczak, 47,
Vice President | | | 2011 | | | Portfolio manager and/or analyst, CWAM or its predecessors since 2001; Vice President, Columbia Acorn Trust and Wanger Advisors Trust since 2011. | | | N/A | | | | N/A | | |
Joseph C. LaPalm, 45,
Vice President | | | 2006 | | | Chief Compliance Officer, CWAM since 2005. | | | N/A | | | | N/A | | |
Charles P. McQuaid, 61,
Vice President | | | 1992 | | | Portfolio manager and/or analyst, CWAM or its predecessors since 1978; Vice President of Columbia Acorn Trust and Wanger Advisors Trust since April 2014; formerly, President and Chief Investment Officer, CWAM or its predecessors, October 2003-March 2014, and President of Columbia Acorn Trust and Wanger Advisors Trust, October 2003-March 2014. | | | N/A | | | | N/A | | |
Louis J. Mendes III, 50,
Vice President | | | 2003 | | | Portfolio manager and/or analyst, CWAM or its predecessors since 2001; Vice President, Columbia Acorn Trust since 2003 and Wanger Advisors Trust since 2005. | | | N/A | | | | N/A | | |
Robert A. Mohn, 53,
Vice President | | | 1997 | | | Domestic Chief Investment Officer, CWAM since April 2014; Vice President, Columbia Acorn Trust and Wanger Advisors Trust since 1997; portfolio manager and/or analyst, CWAM or its predecessors since 1992; formerly, Director of Domestic Research, CWAM or its predecessors, March 2004-March 2014. Mr. Mohn served as Principal Executive Officer of the Funds during Mr. McQuaid's sabbatical from January 14 through March 31, 2011. | | | N/A | | | | N/A | | |
Christopher J. Olson, 50,
Vice President | | | 2001 | | | Portfolio manager and/or analyst, CWAM or its predecessors since January 2001; Vice President, Columbia Acorn Trust and Wanger Advisors Trust since 2001. | | | N/A | | | | N/A | | |
Christopher O. Petersen, 44,
Assistant Secretary | | | 2010 | | | Vice President and Lead Chief Counsel, Ameriprise Financial, Inc. since January 2015 (previously, Vice President and Chief Counsel, January 2010-December 2014 and Vice President and Group Counsel or Counsel, 2004-2010); officer, Columbia Funds and affiliated funds since 2007. | | | N/A | | | | N/A | | |
133
Name, Position
Held with
Columbia Acorn
Trust and Age at
December 31, 2014 | | Year First
Appointed or
Elected to a
Board in the
Columbia
Funds
Complex* | | Principal Occupation(s)
during the Past Five Years | | Number of
Funds in the
Columbia
Funds
Complex
Overseen | | Other
Directorships
in addition to
Columbia Acorn Trust | |
Officers of Columbia Acorn Trust: (continued) | | | |
Scott R. Plummer, 55,
Assistant Secretary | | | 2010 | | | Senior Vice President, Assistant General Counsel and Head of Global Asset Management, Ameriprise Financial, Inc. since February 2014 (previously, Senior Vice President and Lead Chief Counsel – Asset Management, January 2012-February 2014; Vice President and Lead Chief Counsel – Asset Management, 2010-2012; and Vice President and Chief Counsel – Asset Management, 2005-2010); Senior Vice President and Assistant Secretary, Columbia Management Investment Advisers, LLC since June 2005 (previously, Chief Legal Officer, Columbia Management Investment Advisers, LLC, June 2005-January 2015); Vice President, Chief Counsel and Assistant Secretary, Columbia Management Investment Distributors, Inc. since 2008; Vice President, General Counsel and Secretary, Ameriprise Certificate Company since 2005; Chief Counsel, RiverSource Distributors, Inc. since 2006; senior officer of Columbia Funds and affiliated funds 2006-2014. | | | N/A | | | | N/A | | |
Robert P. Scales, 62,
Chief Compliance Officer, Chief Legal Officer, Senior Vice President and General Counsel | | | 2004 | | | Chief Compliance Officer, Chief Legal Officer, Senior Vice President and General Counsel, Columbia Acorn Trust and Wanger Advisors Trust since 2004. | | | N/A | | | | N/A | | |
Andreas Waldburg-Wolfegg, 49,
Vice President | | | 2011 | | | Portfolio manager and/or analyst, CWAM or its predecessors since 2002; Vice President, Columbia Acorn Trust and Wanger Advisors Trust since 2011. | | | N/A | | | | N/A | | |
Linda Roth-Wiszowaty, 45,
Secretary | | | 2006 | | | Secretary, Columbia Acorn Trust and Wanger Advisors Trust since 2014; Assistant Secretary, Columbia Acorn Trust and Wanger Advisors Trust, 2006-2014; Business support analyst, CWAM since April 2007. | | | N/A | | | | N/A | | |
* Dates prior to April 1992 correspond to the date first elected or appointed as a director or officer of The Acorn Fund Inc., the predecessor to Columbia Acorn Trust.
(1) In addition to the trustees listed below, the Board appointed Charles R. Phillips as a trustee effective January 1, 2015.
(2) Mr. Small resigned from the Board effective December 31, 2014.
(3) Mr. McQuaid is an "interested person" of the Trust and of CWAM, as defined in the 1940 Act, because he is an officer of the Trust and an employee of CWAM.
(4) As permitted under the Trust's Bylaws, Mr. Wanger serves as a non-voting Trustee Emeritus of the Trust.
134
This page intentionally left blank.
135
This page intentionally left blank.
136
Columbia Acorn Family of Funds Expense Information
as of 12/31/14
Columbia Acorn® Fund | | Class A | | Class B(a) | | Class C | | Class I | | Class R | | Class R4 | | Class R5 | | Class Y | | Class Z | |
Management Fees | | | 0.64 | % | | | 0.64 | % | | | 0.64 | % | | | 0.64 | % | | | | | 0.64 | % | | | 0.64 | % | | | 0.64 | % | | | 0.64 | % | |
Distribution and Service (12b-1) Fees | | | 0.25 | % | | | 0.75 | % | | | 1.00 | % | | | 0.00 | % | | | | | 0.00 | % | | | 0.00 | % | | | 0.00 | % | | | 0.00 | % | |
Other Expenses | | | 0.19 | % | | | 0.36 | % | | | 0.13 | % | | | 0.06 | % | | | | | 0.20 | % | | | 0.12 | % | | | 0.06 | % | | | 0.15 | % | |
Net Expense Ratio | | | 1.08 | % | | | 1.75 | % | | | 1.77 | % | | | 0.70 | % | | | | | 0.84 | % | | | 0.76 | % | | | 0.70 | % | | | 0.79 | % | |
Columbia Acorn International® | |
Management Fees | | | 0.75 | % | | | 0.75 | % | | | 0.75 | % | | | 0.75 | % | | | 0.75 | % | | | 0.75 | % | | | 0.75 | % | | | 0.75 | % | | | 0.75 | % | |
Distribution and Service (12b-1) Fees | | | 0.25 | % | | | 0.75 | % | | | 1.00 | % | | | 0.00 | % | | | 0.50 | % | | | 0.00 | % | | | 0.00 | % | | | 0.00 | % | | | 0.00 | % | |
Other Expenses | | | 0.22 | % | | | 0.47 | % | | | 0.22 | % | | | 0.10 | % | | | 0.38 | % | | | 0.29 | % | | | 0.15 | % | | | 0.10 | % | | | 0.18 | % | |
Net Expense Ratio | | | 1.22 | % | | | 1.97 | % | | | 1.97 | % | | | 0.85 | % | | | 1.63 | % | | | 1.04 | % | | | 0.90 | % | | | 0.85 | % | | | 0.93 | % | |
Columbia Acorn USA® | |
Management Fees | | | 0.86 | % | | | 0.86 | % | | | 0.86 | % | | | 0.86 | % | | | | | 0.86 | % | | | 0.86 | % | | | 0.86 | % | | | 0.86 | % | |
Distribution and Service (12b-1) Fees | | | 0.25 | % | | | 0.75 | % | | | 1.00 | % | | | 0.00 | % | | | | | 0.00 | % | | | 0.00 | % | | | 0.00 | % | | | 0.00 | % | |
Other Expenses | | | 0.22 | % | | | 0.65 | % | | | 0.14 | % | | | 0.02 | % | | | | | 0.21 | % | | | 0.13 | % | | | 0.07 | % | | | 0.22 | % | |
Net Expense Ratio | | | 1.33 | % | | | 2.26 | % | | | 2.00 | % | | | 0.88 | % | | | | | 1.07 | % | | | 0.99 | % | | | 0.93 | % | | | 1.08 | % | |
Columbia Acorn International SelectSM | |
Management Fees | | | 0.94 | % | | | 0.94 | % | | | 0.94 | % | | | 0.94 | % | | | | | 0.94 | % | | | 0.94 | % | | | 0.94 | % | | | 0.94 | % | |
Distribution and Service (12b-1) Fees | | | 0.25 | % | | | 0.75 | % | | | 1.00 | % | | | 0.00 | % | | | | | 0.00 | % | | | 0.00 | % | | | 0.00 | % | | | 0.00 | % | |
Other Expenses | | | 0.28 | % | | | 0.42 | % | | | 0.29 | % | | | 0.17 | % | | | | | 0.27 | % | | | 0.21 | % | | | 0.15 | % | | | 0.23 | % | |
Net Expense Ratio | | | 1.47 | % | | | 2.11 | % | | | 2.23 | % | | | 1.11 | % | | | | | 1.21 | % | | | 1.15 | % | | | 1.09 | % | | | 1.17 | % | |
Columbia Acorn SelectSM | |
Management Fees | | | 0.85 | % | | | 0.85 | % | | | 0.85 | % | | | 0.85 | % | | | | | 0.85 | % | | | 0.85 | % | | | 0.85 | % | | | 0.85 | % | |
Distribution and Service (12b-1) Fees | | | 0.25 | % | | | 0.75 | % | | | 1.00 | % | | | 0.00 | % | | | | | 0.00 | % | | | 0.00 | % | | | 0.00 | % | | | 0.00 | % | |
Other Expenses | | | 0.22 | % | | | 0.50 | % | | | 0.19 | % | | | 0.09 | % | | | | | 0.27 | % | | | 0.15 | % | | | 0.10 | % | | | 0.19 | % | |
Net Expense Ratio | | | 1.32 | % | | | 2.10 | % | | | 2.04 | % | | | 0.94 | % | | | | | 1.12 | % | | | 1.00 | % | | | 0.95 | % | | | 1.04 | % | |
Columbia Thermostat FundSM | |
Management Fees | | | 0.10 | % | | | 0.10 | % | | | 0.10 | % | | | | | | | 0.10 | % | | | 0.10 | % | | | 0.10 | % | | | 0.10 | % | |
Distribution and Service (12b-1) Fees | | | 0.25 | % | | | 0.75 | % | | | 1.00 | % | | | | | | | 0.00 | % | | | 0.00 | % | | | 0.00 | % | | | 0.00 | % | |
Other Expenses | | | 0.15 | % | | | 0.15 | % | | | 0.15 | % | | | | | | | 0.15 | % | | | 0.13 | % | | | 0.08 | % | | | 0.14 | % | |
Net Expense Ratio(b) | | | 0.50 | % | | | 1.00 | % | | | 1.25 | % | | | | | | | 0.25 | % | | | 0.23 | % | | | 0.18 | % | | | 0.24 | % | |
Columbia Acorn Emerging Markets FundSM(c) | |
Management Fees | | | 1.04 | % | | | | | 1.04 | % | | | 1.04 | % | | | | | 1.04 | % | | | 1.04 | % | | | 1.04 | % | | | 1.04 | % | |
Distribution and Service (12b-1) Fees | | | 0.25 | % | | | | | 1.00 | % | | | 0.00 | % | | | | | 0.00 | % | | | 0.00 | % | | | 0.00 | % | | | 0.00 | % | |
Other Expenses | | | 0.27 | % | | | | | 0.29 | % | | | 0.18 | % | | | | | 0.24 | % | | | 0.22 | % | | | 0.18 | % | | | 0.29 | % | |
Net Expense Ratio | | | 1.56 | % | | | | | 2.33 | % | | | 1.22 | % | | | | | 1.28 | % | | | 1.26 | % | | | 1.22 | % | | | 1.33 | % | |
Columbia Acorn European FundSM | |
Management Fees | | | 1.19 | % | | | | | 1.19 | % | | | 1.19 | % | | | | | 1.19 | % | | | 1.19 | % | | | | | 1.19 | % | |
Distribution and Service (12b-1) Fees | | | 0.25 | % | | | | | 1.00 | % | | | 0.00 | % | | | | | 0.00 | % | | | 0.00 | % | | | | | 0.00 | % | |
Other Expenses | | | 0.31 | % | | | | | 0.31 | % | | | 0.27 | % | | | | | 0.31 | % | | | 0.33 | % | | | | | 0.31 | % | |
Net Expense Ratio | | | 1.75 | % | | | | | 2.50 | % | | | 1.46 | % | | | | | 1.50 | % | | | 1.52 | % | | | | | 1.50 | % | |
See the Funds' prospectuses for information on minimum initial investment amounts and other details of buying, selling and exchanging shares of the Funds.
Fees and expenses are for the year ended December 31, 2014. The fees and expenses of Columbia Acorn International Select and Columbia Acorn Select include the effect of the voluntary undertaking by Columbia Wanger Asset Management, LLC (CWAM) to reimburse each Fund so that the ordinary operating expenses (excluding transaction costs and certain other investment-related expenses, interest and fees on borrowings and expenses associated with the Fund's investment in other investment companies, if any), after giving effect to any balance credits or overdraft charges from the Fund's custodian, do not exceed annually each class' average daily net assets as follows:
Fund | | Class A | | Class B | | Class C | | Class I | | Class R4 | | Class R5 | | Class Y | | Class Z | |
Columbia Acorn International Select | | | 1.70 | % | | | 2.20 | % | | | 2.45 | % | | | 1.37 | % | | | 1.45 | % | | | 1.42 | % | | | 1.37 | % | | | 1.45 | % | |
Columbia Acorn Select | | | 1.60 | % | | | 2.10 | % | | | 2.35 | % | | | 1.22 | % | | | 1.35 | % | | | 1.27 | % | | | 1.22 | % | | | 1.35 | % | |
These arrangements may be modified or terminated by either the Funds or CWAM on 30 days' notice.
The fees and expenses of Columbia Thermostat Fund include the effect of CWAM's contractual undertaking to waive fees and/or reimburse expenses of the Fund so that the ordinary operating expenses (excluding transaction costs and certain other investment-related expenses, interest and fees on borrowings and expenses associated with the Fund's investment in underlying portfolio funds), do not exceed annually the rates of 0.50%, 1.00%, 1.25%, 0.25%, 0.23%, 0.18% and 0.25% of the Fund's average daily net assets attributable to Class A, Class B, Class C, Class R4, Class R5, Class Y and Class Z shares, respectively, through April 30, 2015. There is no guarantee that this agreement will continue thereafter.
The fees and expenses of Columbia Acorn Emerging Markets Fund and Columbia Acorn European Fund include the effect of CWAM's contractual undertaking to waive fees and/or reimburse expenses of each Fund so that the ordinary operating expenses (excluding transaction costs and certain other investment-related expenses, interest and fees on borrowings and expenses associated with the Fund's investment in other investment companies, if any), of each Fund's Class A, Class C, Class I, Class R4, Class R5, Class Y (if offered) and Class Z shares through April 30, 2015, do not exceed annually each class' average daily net assets as follows:
Fund | | Class A | | Class C | | Class I | | Class R4 | | Class R5 | | Class Y | | Class Z | |
Columbia Acorn Emerging Markets Fund | | | 1.85 | % | | | 2.60 | % | | | 1.46 | % | | | 1.60 | % | | | 1.51 | % | | | 1.46 | % | | | 1.60 | % | |
Columbia Acorn European Fund | | | 1.75 | % | | | 2.50 | % | | | 1.47 | % | | | 1.50 | %(d) | | | 1.52 | % | | | — | | | | 1.50 | % | |
There is no guarantee that these arrangements will continue thereafter.
The fees and expenses of Columbia Acorn International include the effect of the voluntary undertaking by CMIS to waive a portion of total annual Fund operating expenses attributable to transfer agency expenses incurred by Class A, Class B and Class C shares of Columbia Acorn International such that the Fund's total annual Fund operating expenses will be reduced by 0.04%, 0.03% and 0.02% for Class A, Class B and Class C shares of the Fund, respectively.
(a) The Funds generally no longer accept investments by new or existing investors in Class B shares, except in connection with the reinvestment of any dividend and/or capital gain distributions in Class B shares of the Funds and exchanges by existing Class B shareholders of certain other funds within the Columbia Acorn Family of Funds.
(b) Does not include estimated fees and expenses of 0.52% incurred by the Fund from the underlying portfolio funds in which it invests.
(c) Effective July 11, 2014, Columbia Acorn Emerging Markets Fund is closed to new investors and new accounts, except as described in the Fund's prospectus, dated May 1, 2014, as supplemented June 12, 2014.
(d) Effective June 25, 2014 (commencement of operations) through April 30, 2015.
137
Columbia Acorn Family of Funds
Trustees
Laura M. Born
Chair of the Board
Steven N. Kaplan
Vice Chair of the Board
Maureen M. Culhane
Margaret M. Eisen
Thomas M. Goldstein
John C. Heaton
Charles P. McQuaid
David J. Rudis
David B. Small*
Ralph Wanger (Trustee Emeritus)
Officers
P. Zachary Egan
President
Robert A. Chalupnik
Vice President
Michael G. Clarke
Assistant Treasurer
Joseph F. DiMaria
Assistant Treasurer
William J. Doyle
Vice President
David L. Frank
Vice President
Fritz Kaegi
Vice President
John M. Kunka
Treasurer and Principal Accounting and Financial Officer
Stephen Kusmierczak
Vice President
Joseph C. LaPalm
Vice President
Charles P. McQuaid
Vice President
Louis J. Mendes III
Vice President
Robert A. Mohn
Vice President
Christopher J. Olson
Vice President
Christopher O. Petersen
Assistant Secretary
Scott R. Plummer
Assistant Secretary
Robert P. Scales
Chief Compliance Officer, Chief Legal Officer,
Senior Vice President and General Counsel
Andreas Waldburg-Wolfegg
Vice President
Linda K. Roth-Wiszowaty
Secretary
* Mr. Small resigned from the Board effective December 31, 2014.
Investment Manager
Columbia Wanger Asset Management, LLC
227 West Monroe Street, Suite 3000
Chicago, Illinois 60606
1-800-922-6769
Distributor
Columbia Management Investment Distributors, Inc.
225 Franklin Street
Boston, Massachusetts 02110
Transfer Agent, Dividend Disbursing Agent
Columbia Management Investment Services Corp.
P. O. Box 8081
Boston, Massachusetts 02266-8081
1-800-345-6611
Legal Counsel to the Funds
Perkins Coie LLP
Washington, DC
Legal Counsel to the Independent Trustees
Drinker Biddle & Reath LLP
Philadelphia, Pennsylvania
Independent Registered Public Accounting Firm
PricewaterhouseCoopers LLP
Chicago, Illinois
This report, including the schedules of investments, is submitted for the general information of the shareholders of Columbia Acorn Trust.
A description of the policies and procedures that the Funds use to determine how to vote proxies and a copy of the Funds' voting record are available (i) without charge, upon request, by calling 800-922-6769 and (ii) on the Securities and Exchange Commission's website at www.sec.gov. Information regarding how the Funds voted proxies relating to portfolio securities during the 12-month period ended June 30, is available from the SEC's website. Information regarding how the Funds voted proxies relating to portfolio securities is also available at www.columbiamanagement.com under "About Us." From there, click on "Disclosures."
The Funds file a complete schedule of portfolio holdings with the SEC for the first and third quarters of each fiscal year on Form N-Q. The Funds' Form N-Q is available on the SEC's website at www.sec.gov and may be reviewed and copied at the SEC's Public Reference Room in Washington, D.C. Information on the operation of the Public Reference Room may be obtained by calling 1-800-SEC-0330. The Funds' complete portfolio holdings are disclosed at www.columbiamanagement.com approximately 30 to 40 days after each month-end.
Investors should consider the investment objectives, risks, charges and expenses of a mutual fund carefully before investing. For a free prospectus and, if available, a summary prospectus, which contains this and other important information about the funds, visit www.columbiamanagement.com. Read the prospectus carefully before investing.
Columbia Acorn Family of Funds are distributed by Columbia Management Investment Distributors, Inc., member FINRA and managed by Columbia Wanger Asset Management, LLC.
Find out what's new – visit our web site at:
www.columbiamanagement.com
Our e-mail address is:
ServiceInquiries@ColumbiaManagement.com
Shareholders should not include personal information such as account numbers, Social Security numbers or taxpayer identification numbers in e-mail. We are unable to accept account transactions sent via e-mail.
138
This document contains Global Industry Classification Standard data. The Global Industry Classification Standard ("GICS") was developed by and is the exclusive property and a service mark of MSCI Inc. ("MSCI") and Standard & Poor's Financial Services LLC ("S&P") and is licensed for use by Columbia Wanger Asset Management, LLC. Neither MSCI, S&P, nor any other party involved in making or compiling the GICS or any GICS classifications makes any express or implied warranties or representations with respect to such standard or classification (or the results to be obtained by the use thereof), and all such parties hereby expressly disclaim all warranties of originality, accuracy, completeness, merchantability and fitness for a particular purpose with respect to any of such standard or classification. Without limiting any of the foregoing, in no event shall MSCI, S&P, any of their affiliates or any third party involved in making or compiling the GICS or any GICS classifications have any liability for any direct, indirect, special, punitive, consequential or any other damages (including lost profits) even if notified of the possibility of such damages.
Columbia Management®
Columbia Acorn Family of Funds
Class A, B, C, I, R, R4, R5, Y and Z Shares
Annual Report, December 31, 2014
For More Information
You'll find more information about the Columbia Acorn Family of Funds in the documents described below. Contact Columbia Funds as follows to obtain these documents free of charge:
By Mail: Columbia Funds
c/o Columbia Management Investment Services Corp.
P.O. Box 8081
Boston, MA 02266-8081
By Telephone: 800.345.6611
Online: www.columbiamanagement.com
Shareholder Communications with the Board
The Funds' Board of Trustees has adopted procedures by which shareholders may communicate with the Board. Shareholders who wish to communicate with the Board should send their written communications to the Board by mail, c/o Columbia Wanger Asset Management, LLC, 227 West Monroe Street, Suite 3000, Chicago, Illinois 60606, Attention: Secretary. Shareholder communications must (i) be in writing, (ii) identify the Columbia Acorn Fund to which the communication relates and (iii) state the particular class of shares and number of shares held by the communicating shareholder.
Prospectuses and the Statement of Additional Information (SAI)
The prospectuses and the SAI provide more detailed information about the Funds and their policies. The SAI is legally part of each prospectus (it's incorporated by reference). A copy of each has been filed with the SEC.
Information Provided by the SEC
You can review and copy information about the Funds (including their prospectuses, the SAI and shareholder reports) at the SEC's Public Reference Room in Washington, DC. To find out more about the operation of the Public Reference Room, call the SEC at 202.551.8090. Reports and other information about the Fund are also available in the EDGAR Database on the SEC's website at http://www.sec.gov, or you can receive copies of this information, for a fee, by electronic request at the following e-mail address: publicinfo@sec.gov. You can also obtain copies of this information by writing the Public Reference Section, Securities and Exchange Commission, Washington, DC 20549-0102.
The investment company registration number of Columbia Acorn Trust, of which each of these Funds is a series, is 811-01829.
© 2015 Columbia Management Investment Advisers, LLC. All rights reserved.
225 Franklin Street, Boston, MA 02110
800.345.6611 www.columbiamanagement.com
ANN110_12_E01_(02/15) 1122099
Item 2. Code of Ethics.
(a) The registrant has adopted a code of ethics that applies to the registrant’s principal executive officer, principal financial officer, principal accounting officer or controller, or persons performing similar functions, regardless of whether these individuals are employed by the registrant or a third party.
(b) During the period covered by this report, there were not any amendments to a provision of the code of ethics adopted in 2(a) above.
(c) During the period covered by this report, there were no waivers, including any implicit waivers, from a provision of the code of ethics described in 2(a) above that relates to one or more of the items set forth in paragraph (b) of this item’s instructions.
Item 3. Audit Committee Financial Expert.
The registrant’s Board of Trustees has determined that Thomas Goldstein, a member of the registrant’s Board of Trustees and Audit Committee, qualifies as an audit committee financial expert. Mr. Goldstein is an independent trustee, as defined in paragraph (a)(2) of this item’s instructions.
Item 4. Principal Accountant Fees and Services.
(a) Audit Fees. Aggregate Audit Fees billed by the principal accountant for professional services rendered during the fiscal years ended December 31, 2014 and December 31, 2013 are approximately as follows:
2014 | | 2013 | |
$ | 319,100 | | $ | 304,800 | |
| | | | | |
Audit Fees include amounts related to the audit of the registrant’s annual financial statements or services that are normally provided by the accountant in connection with statutory and regulatory filings or engagements for those fiscal years.
(b) Audit-Related Fees. Aggregate Audit-Related Fees billed to the registrant by the principal accountant for professional services rendered during the fiscal years ended December 31, 2014 and December 31, 2013 are approximately as follows:
2014 | | 2013 | |
$ | 57,200 | | $ | 46,000 | |
| | | | | |
Audit-Related Fees include amounts for assurance and related services by the principal accountant that are reasonably related to the performance of the audit of the registrant’s financial statements and are not reported in Audit Fees above. In fiscal years 2014 and 2013, Audit-Related Fees consist of agreed-upon procedures performed for other audit-related additional testing.
During the fiscal years ended December 31, 2014 and December 31, 2013, there were no Audit-Related Fees billed by the registrant’s principal accountant to the registrant’s investment adviser (not including any sub-adviser whose role is primarily portfolio management and is subcontracted with or overseen by another investment adviser) and any entity controlling, controlled by, or under common control with the adviser that provides ongoing services to the registrant for an engagement that related directly to the operations and financial reporting of the registrant.
(c) Tax Fees. Aggregate Tax Fees billed by the principal accountant to the registrant for professional services rendered during the fiscal years ended December 31, 2014 and December 31, 2013 are approximately as follows:
2014 | | 2013 | |
$ | 62,900 | | $ | 59,300 | |
| | | | | |
Tax Fees incurred in both fiscal years 2014 and 2013 relate to the review of annual tax returns, the review of required shareholder distribution calculations and include amounts for professional services by the principal accountant for tax compliance, tax advice and tax planning.
During the fiscal years ended December 31, 2014 and December 31, 2013, there were no Tax Fees billed by the registrant’s principal accountant to the registrant’s investment adviser (not including any sub-adviser whose role is primarily portfolio management and is subcontracted with or overseen by another investment adviser) and any entity controlling, controlled by, or under common control with the adviser that provides ongoing services to the registrant for an engagement that related directly to the operations and financial reporting of the registrant.
(d) All Other Fees. Aggregate All Other Fees billed by the principal accountant to the registrant for professional services rendered during the fiscal years ended December 31, 2014 and December 31, 2013 are as follows:
All Other Fees include amounts for products and services provided by the principal accountant, other than the services reported in paragraphs (a) through (c) above.
Aggregate All Other Fees billed by the registrant’s principal accountant to the registrant’s investment adviser (not including any sub-adviser whose role is primarily portfolio management and is subcontracted with or overseen by another investment adviser) and any entity controlling, controlled by, or under common control with the adviser that provides ongoing services to the registrant for an engagement that related directly to the operations and financial reporting of the registrant during the fiscal years ended December 31, 2014 and December 31, 2013 are approximately as follows:
2014 | | 2013 | |
$ | 325,000 | | $ | 135,000 | |
| | | | | |
In both fiscal years 2014 and 2013, All Other Fees primarily consist of professional services rendered for internal control reviews.
(e)(1) Audit Committee Pre-Approval Policies and Procedures
The policy of the registrant’s Audit Committee is to specifically pre-approve (i) all audit and non-audit (including audit related, tax and all other) services provided by the registrant’s independent auditor to the registrant and individual funds (collectively “Fund Services”) and (ii) all non-audit services provided by the registrant’s independent auditor to the funds’ adviser or a control affiliate of the adviser, that relate directly to the funds’ operations and financial reporting (collectively “Fund-related Adviser Services”). A “control affiliate” is an entity controlling, controlled by, or under common control with the adviser that provides ongoing services to the funds, and the term “adviser” is deemed to exclude any unaffiliated sub-adviser whose role is primarily portfolio management and is sub-contracted or overseen by another investment adviser.
If such Fund Services or Fund-related Adviser Services are required during the period between the Audit Committee’s regularly scheduled meetings, the Chairman of the Audit Committee has the authority to pre-approve the service, with reporting to the full Audit Committee at the next regularly scheduled meeting.
The Audit Committee will waive pre-approval of Fund Services or Fund-related Adviser Services provided that the requirements under paragraph (c)(7)(i)(C) of Rule 2-01 of Regulation S-X are met.
(e)(2) The percentage of services described in paragraphs (b) through (d) of this Item approved pursuant to the “de minimis” exception under paragraph (c)(7)(i)(C) of Rule 2-01 of Regulation S-X during both fiscal years ended December 31, 2014 and December 31, 2013 was zero.
(f) Not applicable.
(g) The aggregate non-audit fees billed by the registrant’s accountant for services rendered to the registrant, and rendered to the registrant’s investment adviser (not including any sub-adviser whose role is primarily portfolio management and is
subcontracted with or overseen by another investment adviser), and any entity controlling, controlled by, or under common control with the adviser that provides ongoing services to the registrant for the fiscal years ended December 31, 2014 and December 31, 2013 are approximately as follows:
2014 | | 2013 | |
$ | 445,100 | | $ | 240,300 | |
| | | | | |
(h) The registrant’s Audit Committee of the Board of Directors has considered whether the provision of non-audit services that were rendered to the registrant’s adviser (not including any sub-adviser whose role is primarily portfolio management and is subcontracted with or overseen by another investment adviser), and any entity controlling, controlled by, or under common control with the investment adviser that provides ongoing services to the registrant that were not pre-approved pursuant to paragraph (c)(7)(ii) of Rule 2-01 of Regulation S-X, is compatible with maintaining the principal accountant’s independence.
Item 5. Audit Committee of Listed Registrants.
Not applicable.
Item 6. Investments
(a) The registrant’s “Schedule I — Investments in securities of unaffiliated issuers” (as set forth in 17 CFR 210.12-12) is included in Item 1 of this Form N-CSR.
(b) Not applicable
Item 7. Disclosure of Proxy Voting Policies and Procedures for Closed-End Management Investment Companies.
Not applicable.
Item 8. Portfolio Managers of Closed-End Management Investment Companies.
Not applicable.
Item 9. Purchases of Equity Securities by Closed-End Management Investment Company and Affiliated Purchasers.
Not applicable.
Item 10. Submission of Matters to a Vote of Security Holders.
There were no material changes to the procedures by which shareholders may recommend nominees to the registrant’s board of directors.
Item 11. Controls and Procedures.
(a) The registrant’s principal executive officer and principal financial officers, based on their evaluation of the registrant’s disclosure controls and procedures as of a date within 90 days of the filing of this report, have concluded that such controls and procedures are adequately designed to ensure that material information required to be disclosed by the registrant in Form N-CSR is accumulated and communicated to the registrant’s management, including the principal executive officer and principal financial officer, or persons performing similar functions, as appropriate to allow timely decisions regarding required disclosure.
(b) There was no change in the registrant’s internal control over financial reporting that occurred during the registrant’s second fiscal quarter of the period covered by this report that has materially affected, or is reasonably likely to materially affect, the registrant’s internal control over financial reporting.
Item 12. Exhibits.
(a)(1) Code of ethics required to be disclosed under Item 2 of Form N-CSR attached hereto as Exhibit 99.CODE ETH.
(a)(2) Certifications pursuant to Rule 30a-2(a) under the Investment Company Act of 1940 (17 CFR 270.30a-2(a)) attached hereto as Exhibit 99.CERT.
(a)(3) Not applicable.
(b) Certification pursuant to Rule 30a-2(b) under the Investment Company Act of 1940 (17 CFR 270.30a-2(b)) attached hereto as Exhibit 99.906CERT.
SIGNATURES
Pursuant to the requirements of the Securities Exchange Act of 1934 and the Investment Company Act of 1940, the registrant has duly caused this report to be signed on its behalf by the undersigned, thereunto duly authorized.
(registrant) | | Columbia Acorn Trust | |
| | |
| | |
By (Signature and Title) | | /s/ P. Zachary Egan | |
| P. Zachary Egan, President |
| | |
| | |
Date | | February 19, 2015 | |
| | | | | |
Pursuant to the requirements of the Securities Exchange Act of 1934 and the Investment Company Act of 1940, this report has been signed below by the following persons on behalf of the registrant and in the capacities and on the dates indicated.
By (Signature and Title) | | /s/ P. Zachary Egan | |
| P. Zachary Egan, President |
| | |
| | |
Date | | February 19, 2015 | |
| | |
| | |
By (Signature and Title) | | /s/ John M. Kunka | |
| John M. Kunka, Treasurer |
| | |
| | |
Date | | February 19, 2015 | |
| | | | |