UNITED STATES
SECURITIES AND EXCHANGE COMMISSION
Washington, D.C. 20549
FORM N-CSR
CERTIFIED SHAREHOLDER REPORT OF REGISTERED
MANAGEMENT INVESTMENT COMPANIES
Investment Company Act file number | 811-01829 | |||||||
| ||||||||
Columbia Acorn Trust | ||||||||
(Exact name of registrant as specified in charter) | ||||||||
| ||||||||
225 Franklin Street, Boston, Massachusetts |
| 02110 | ||||||
(Address of principal executive offices) |
| (Zip code) | ||||||
| ||||||||
Scott R. Plummer 5228 Ameriprise Financial Center Minneapolis, MN 55474 | ||||||||
(Name and address of agent for service) | ||||||||
| ||||||||
Registrant’s telephone number, including area code: | 1-612-671-1947 |
| ||||||
| ||||||||
Date of fiscal year end: | December 31 |
| ||||||
| ||||||||
Date of reporting period: | December 31, 2012 |
| ||||||
Form N-CSR is to be used by management investment companies to file reports with the Commission not later than 10 days after the transmission to stockholders of any report that is required to be transmitted to stockholders under Rule 30e-1 under the Investment Company Act of 1940 (17 CFR 270.30e-1). The Commission may use the information provided on Form N-CSR in its regulatory, disclosure review, inspection, and policymaking roles.
A registrant is required to disclose the information specified by Form N-CSR, and the Commission will make this information public. A registrant is not required to respond to the collection of information contained in Form N-CSR unless the Form displays a currently valid Office of Management and Budget (“OMB”) control number. Please direct comments concerning the accuracy of the information collection burden estimate and any suggestions for reducing the burden to Secretary, Securities and Exchange Commission, 450 Fifth Street, NW, Washington, DC 20549-0609. The OMB has reviewed this collection of information under the clearance requirements of 44 U.S.C. § 3507.
Item 1. Reports to Stockholders.
Q4 2012

Columbia Acorn Family of Funds
Class A, B, C, I, R, R4, R5, Y and Z Shares
Managed by Columbia Wanger Asset Management, LLC
Annual Report
December 31, 2012
n Columbia
Acorn® Fund
n Columbia
Acorn International®
n Columbia
Acorn USA®
n Columbia
Acorn International SelectSM
n Columbia
Acorn SelectSM
n Columbia
Thermostat FundSM
n Columbia
Acorn Emerging Markets FundSM
n Columbia
Acorn European FundSM
Not FDIC insured • No bank guarantee • May lose value
Columbia Acorn Family of Funds
Net Asset Value Per Share as of 12/31/12
| Columbia Acorn Fund | Columbia Acorn International | Columbia Acorn USA | Columbia Acorn International Select | Columbia Acorn Select | Columbia Thermostat Fund | Columbia Acorn Emerging Markets Fund | Columbia Acorn European Fund | ||||||||||||||||||||||||||||
Class A | $ | 29.36 | $ | 40.79 | $ | 28.21 | $ | 25.61 | $ | 24.72 | $ | 14.29 | $ | 12.04 | $ | 11.76 | |||||||||||||||||||
Class B | $ | 26.80 | $ | 39.67 | $ | 25.81 | $ | 24.40 | $ | 22.75 | $ | 14.39 | NA | NA | |||||||||||||||||||||
Class C | $ | 26.34 | $ | 39.50 | $ | 25.49 | $ | 24.28 | $ | 22.48 | $ | 14.39 | $ | 12.01 | $ | 11.73 | |||||||||||||||||||
Class I | $ | 30.47 | $ | 40.86 | $ | 29.47 | $ | 25.85 | $ | 25.63 | NA | $ | 12.08 | $ | 11.75 | ||||||||||||||||||||
Class R | NA | $ | 40.79 | NA | NA | NA | NA | NA | NA | ||||||||||||||||||||||||||
Class R4 | $ | 30.90 | $ | 41.08 | $ | 29.92 | $ | 25.99 | $ | 25.92 | $ | 14.19 | $ | 12.14 | NA | ||||||||||||||||||||
Class R5 | $ | 30.88 | $ | 40.81 | $ | 29.90 | $ | 25.98 | $ | 25.93 | $ | 14.19 | $ | 12.14 | $ | 11.86 | |||||||||||||||||||
Class Y | $ | 30.90 | $ | 41.08 | $ | 29.93 | $ | 25.98 | $ | 25.98 | $ | 14.18 | NA | NA | |||||||||||||||||||||
Class Z | $ | 30.45 | $ | 40.84 | $ | 29.45 | $ | 25.86 | $ | 25.57 | $ | 14.13 | $ | 12.07 | $ | 11.76 | |||||||||||||||||||
The views expressed in the "Squirrel Chatter II" and "In a Nutshell" commentaries reflect the current views of the respective authors. These views are not guarantees of future performance and involve certain risks, uncertainties and assumptions that are difficult to predict so actual outcomes and results may differ significantly from the views expressed. These views are subject to change at any time based upon economic, market or other conditions and the respective authors disclaim any responsibility to update such views. These views may not be relied upon as investment advice and, because investment decisions for a Columbia Acorn Fund are based on numerous factors, may not be relied upon as an indication of trading intent on behalf of any particular Columbia Acorn Fund. References to specific company's securities should not be construed as a recommendation or investment advice and there can be no assurance that as of the date of publication of this report, the securities mentioned in each Fund's portfolio are still held or that the securities sold have not been repurchased.
Acorn®, Acorn USA® and Acorn International® are service marks owned and registered by Columbia Acorn Trust. ColumbiaSM, Columbia Management®, and the Columbia Management Logo® are service marks owned and/or registered by Ameriprise Financial, Inc.
Letter to Shareholders from the
Columbia Acorn Board of Trustees
Dear Shareholder,
In 2012, the domestic equity market suffered its sixth consecutive year of outflows. According to Morningstar, U.S. stock funds experienced outflows of $105 billion while taxable bond funds enjoyed inflows of $266 billion in 2012. Even as investors pulled out of equities, however, the Russell 2500 Index, the primary benchmark for Columbia Acorn Fund, gained 17.88% and the S&P 500 Index gained 16.00% for the year.
The Columbia Acorn Funds are not immune to the sometimes sudden reversals in investor attitudes toward equity markets. Our flagship fund, Columbia Acorn Fund, essentially matched its benchmark in 2012 but nonetheless had redemptions of approximately 10% of its average assets over the year. These redemptions are modest in comparison to the approximately 60% of U.S. equity funds that experienced redemptions in 2012, as reported by Morningstar, with an average outflow of 22% of assets. However, redemptions have not altered the Funds' commitment to their guiding principles. What this means is that your portfolio managers continue to apply the "growth at reasonable price" discipline that has been the hallmark of the Funds, and that they continue to invest and hold stocks that they believe will provide investment returns over the long term.
In addition, the portfolio turnover rate for Columbia Acorn Fund last year was only 16%, in keeping with its historically low rate. The turnover rate reflects the velocity with which the portfolio manager is buying and selling securities. A high percentage, for example 100%, suggests that many of a fund's holdings are being sold and new ones bought during the year. A low turnover rate also minimizes commission costs. Although a low turnover rate alone does not result in fund outperformance, it reflects an important element of investment process and, in fact, Columbia Acorn Fund has delivered outstanding long-term performance. According to Morningstar, Columbia Acorn Fund's annualized return for the past 15 years trumps 93% of its U.S. mid-cap growth category peers and tops its benchmark by nearly 3%,1 an extraordinary accomplishment.
Investors did not abandon all equities: sentiment favored international equities, which Morningstar reports
enjoyed inflows of $20 billion across the industry. In keeping with this trend, our international funds collectively experienced net inflows. They have performed well too, with Columbia Acorn International and Columbia Acorn International Select outperforming their benchmarks in 2012. Launched in August 2011, Columbia Acorn Emerging Markets Fund and Columbia Acorn European Fund have had promising starts. Both enjoyed modest inflows during 2012 and both delivered impressive annual results. Columbia Acorn Emerging Markets Fund returned 31.35%, well ahead of its benchmark, while Columbia Acorn European Fund delivered a strong absolute return, up 25.66%, though it lagged its benchmark, which increased 28.24%.
The investment results from 2012 suggest that investors may benefit from a focus on the long term and by resisting dramatic swings in sentiment. The Board of Trustees remains confident in the established philosophy and management principles that guide the Funds. Thank you for your continued investment in the Funds.

Laura M. Born
Independent Chair of the Board of Trustees
Columbia Acorn Trust
Fund performance data cited is for Class Z shares. Past performance does not guarantee future results. For more detailed performance comparisons, including standard performance data for the Columbia Acorn Funds, please see Pages 2 and 3 of this report.
Information concerning investment flows provided above is derived from Morningstar Direct. ©2013 Morningstar, Inc. All rights reserved. Morningstar is an independent provider of financial information. The Morningstar information contained herein: (1) is proprietary to Morningstar and/or its content providers; (2) may not be copied or distributed; and (3) is not warranted to be accurate, complete or timely. Neither Morningstar nor its content providers are responsible for any damages or losses arising from any use of this information.
1 According to Morningstar, Columbia Acorn Fund Class Z ranked 14 of 198 U.S. mid-cap growth equity funds for the 15-year period ended December 31, 2012. Morningstar percentile rankings are based on the average annual total returns of the funds in the category for the period stated and do not include any sales charges or redemption fees, but do include 12b-1 fees and the reinvestment of dividends and capital gains distributions. The highest (or most favorable) percentile rank is 1 and the lowest (or least favorable) percentile rank is 100. Rankings for each share class will vary due to different expenses. Columbia Acorn Fund Class Z gained 10.21% for the 15-year period, compared to a 7.43% return for the Russell 2500 Index, its primary benchmark.
Columbia Acorn Family of Funds
Table of Contents
Descriptions of Indexes | 1 | ||||||
Share Class Performance | 2 | ||||||
Fund Performance vs. Benchmarks | 3 | ||||||
2012 Year-End Distributions | 4 | ||||||
Squirrel Chatter II: Photovoltaic Energy | 6 | ||||||
Understanding Your Expenses | 9 | ||||||
Columbia Acorn Fund | |||||||
In a Nutshell | 12 | ||||||
At a Glance | 13 | ||||||
Major Portfolio Changes | 28 | ||||||
Statement of Investments | 30 | ||||||
Columbia Acorn International | |||||||
In a Nutshell | 14 | ||||||
At a Glance | 15 | ||||||
Major Portfolio Changes | 43 | ||||||
Statement of Investments | 45 | ||||||
Portfolio Diversification | 54 | ||||||
Columbia Acorn USA | |||||||
In a Nutshell | 16 | ||||||
At a Glance | 17 | ||||||
Major Portfolio Changes | 55 | ||||||
Statement of Investments | 56 | ||||||
Columbia Acorn International Select | |||||||
In a Nutshell | 18 | ||||||
At a Glance | 19 | ||||||
Major Portfolio Changes | 63 | ||||||
Statement of Investments | 64 | ||||||
Portfolio Diversification | 68 | ||||||
Columbia Acorn Select | |||||||
In a Nutshell | 20 | ||||||
At a Glance | 21 | ||||||
Major Portfolio Changes | 69 | ||||||
Statement of Investments | 70 | ||||||
Columbia Thermostat Fund | |||||||
In a Nutshell | 22 | ||||||
At a Glance | 23 | ||||||
Statement of Investments | 75 | ||||||
Columbia Acorn Emerging Markets Fund | |||||||
In a Nutshell | 24 | ||||||
At a Glance | 25 | ||||||
Major Portfolio Changes | 77 | ||||||
Statement of Investments | 79 | ||||||
Portfolio Diversification | 83 | ||||||
Columbia Acorn European Fund | |||||||
In a Nutshell | 26 | ||||||
At a Glance | 27 | ||||||
Major Portfolio Changes | 84 | ||||||
Statement of Investments | 85 | ||||||
Portfolio Diversification | 89 | ||||||
Columbia Acorn Family of Funds | |||||||
Statements of Assets and Liabilities | 90 | ||||||
Statements of Operations | 92 | ||||||
Statements of Changes in Net Assets | 94 | ||||||
Financial Highlights | 100 | ||||||
Notes to Financial Statements | 114 | ||||||
| Report of Independent Registered Public Accounting Firm | 125 | ||||||
Federal Income Tax Information | 126 | ||||||
Board of Trustees and Management | 127 | ||||||
Expense Information | 130 | ||||||
Columbia Acorn Family of Funds
Descriptions of Indexes Included in this Report
• 50/50 Blended Benchmark, established by the Fund's investment manager, is an equally weighted custom composite of Columbia Thermostat Fund's primary equity and primary debt benchmarks, the S&P 500 Index and the Barclays U.S. Aggregate Bond Index, respectively. The percentage of the Fund's assets allocated to underlying stock and bond portfolio funds will vary, and accordingly the composition of the Fund's portfolio will not always reflect the composition of the 50/50 Blended Benchmark.
• Barclays U.S. Aggregate Bond Index is a market value-weighted index that tracks the daily price, coupon, pay-downs and total return performance of fixed-rate, publicly placed, dollar-denominated and non-convertible investment grade debt issues with at least $250 million par amount outstanding and with at least one year to final maturity.
• HSBC Smaller European Companies (inc UK) Index is a weighted combination of two indexes: the HSBC Smaller Europe (ex UK) Index and the HSBC Smaller UK Index. The index is rebalanced on a quarterly basis.
• Lipper Indexes include the largest funds tracked by Lipper, Inc. in the named category. Lipper Mid-Cap Growth Funds Index, 30 largest mid-cap growth funds, including Columbia Acorn Fund; Lipper International Small/Mid Growth Funds Index, 10 largest non-U.S. small/mid growth funds, including Columbia Acorn International; Lipper Small-Cap Growth Funds Index, 30 largest small-cap growth funds, including Columbia Acorn USA; Lipper Mid-Cap Core Funds Index, 30 largest mid-cap core funds; Lipper Flexible Portfolio Funds Index, an equal-weighted index of the 30 largest mutual funds within the Flexible Portfolio fund classification, as defined by Lipper. Lipper Emerging Markets Index, 30 largest emerging markets funds; Lipper European Region Index, 10 largest European funds.
• MSCI Europe, Australasia, Far East (EAFE) Index (Net) is a capitalization-weighted index that tracks the total return of common stocks in 22 developed-market countries within Europe, Australasia and the Far East. The returns of the MSCI EAFE Index (Net) are presented net of the withholding tax rate applicable to foreign non-resident institutional investors in the foreign companies included in the index who do not benefit from double taxation treaties.
• MSCI Emerging Markets Small Cap Index, a widely recognized international benchmark, is a free float-adjusted market capitalization index that is designed to measure small-cap emerging market equity performance. The MSCI Emerging Markets Small Cap Index currently consists of the following 21 emerging market country indexes: Brazil, Chile, China, Colombia, Czech Republic, Egypt, Hungary, India, Indonesia, Korea, Malaysia, Mexico, Morocco, Peru, Philippines, Poland, Russia, South Africa, Taiwan, Thailand and Turkey.
• Russell 2000 Index measures the performance of the 2,000 smallest companies in the Russell 3000 Index, which represents approximately 10% of the total market capitalization of the Russell 3000 Index.
• Russell 2500 Index measures the performance of the 2,500 smallest companies in the Russell 3000 Index, which represents approximately 17% of the total market capitalization of the Russell 3000 Index.
• Standard & Poor's (S&P) 500 Index tracks the performance of 500 widely held, large-capitalization U.S. stocks.
• Standard & Poor's (S&P) MidCap 400 Index is a market value-weighted index that tracks the performance of 400 mid-cap U.S. companies.
• S&P Developed Ex-U.S. Between $2B and $10B Index is a subset of the broad market selected by the index sponsor representing the mid-cap developed market, excluding the United States.
• S&P Emerging Markets Between $500M and $5B Index represents the institutionally investable capital of emerging market countries with market caps ranging between $500 million to $5 billion, as selected by S&P. The index currently consists of the following 21 emerging market country indexes: Brazil, Chile, China, Colombia, Czech Republic, Egypt, Hungary, India, Indonesia, Korea, Malaysia, Mexico, Morocco, Peru, Philippines, Poland, Russia, South Africa, Taiwan, Thailand and Turkey.
• S&P Europe Between $500M and $5B Index represents the institutionally investable capital of European countries with market caps ranging between $500 million to $5 billion, as selected by S&P. The index currently consists of the following 17 developed market country indexes: Austria, Belgium, Denmark, Finland, France, Germany, Greece, Ireland, Italy, Luxembourg, the Netherlands, Norway, Portugal, Spain, Sweden, Switzerland and the United Kingdom.
• S&P Global Ex-U.S. SmallCap Index consists of the bottom 20% of institutionally investable capital of developed and emerging countries, excluding the United States.
• S&P Global Ex-U.S. Between $500M and $5B Index is a subset of the broad market selected by the index sponsor representing the mid- and small-cap developed and emerging markets, excluding the United States.
Unlike mutual funds, indexes are not managed and do not incur fees or expenses. It is not possible to invest directly in an index.
1
Columbia Acorn Family of Funds
Share Class Performance Average Annual Total Returns through 12/31/12
Class A | Class B | Class C | Class I | Class R | Class R4 | Class R5 | Class Y | Class Z | |||||||||||||||||||||||||||||||||||||||||||
| Without Sales Charge | With Sales Charge | Without Sales Charge | With Sales Charge | Without Sales Charge | With Sales Charge | ||||||||||||||||||||||||||||||||||||||||||||||
Columbia Acorn Fund | |||||||||||||||||||||||||||||||||||||||||||||||||||
| 1 year | 17.62 | % | 10.87 | % | 16.98 | % | 11.98 | % | 16.77 | % | 15.77 | % | 18.02 | % | NA | 17.93 | % | 17.95 | % | 17.96 | % | 17.93 | % | ||||||||||||||||||||||||||||
| 5 years | 3.69 | % | 2.47 | % | 3.09 | % | 2.75 | % | 2.89 | % | 2.89 | % | 4.03 | % | NA | 4.00 | % | 4.00 | % | 4.00 | % | 4.00 | % | ||||||||||||||||||||||||||||
| 10 years | 11.25 | % | 10.59 | % | 10.57 | % | 10.57 | % | 10.41 | % | 10.41 | % | 11.64 | % | NA | 11.62 | % | 11.62 | % | 11.62 | % | 11.62 | % | ||||||||||||||||||||||||||||
Columbia Acorn International | |||||||||||||||||||||||||||||||||||||||||||||||||||
| 1 year | 21.21 | % | 14.25 | % | 20.33 | % | 15.33 | % | 20.31 | % | 19.31 | % | 21.69 | % | 20.83 | % | 21.57 | % | 21.61 | % | 21.58 | % | 21.60 | % | |||||||||||||||||||||||||||
| 5 years | 0.57 | % | -0.62 | % | -0.09 | % | -0.47 | % | -0.21 | % | -0.21 | % | 0.96 | % | 0.30 | % | 0.93 | % | 0.92 | % | 0.93 | % | 0.93 | % | |||||||||||||||||||||||||||
| 10 years | 14.01 | % | 13.34 | % | 13.26 | % | 13.26 | % | 13.16 | % | 13.16 | % | 14.46 | % | 13.72 | % | 14.44 | % | 14.43 | % | 14.44 | % | 14.44 | % | |||||||||||||||||||||||||||
Columbia Acorn USA | |||||||||||||||||||||||||||||||||||||||||||||||||||
| 1 year | 18.67 | % | 11.86 | % | 17.87 | % | 12.87 | % | 17.82 | % | 16.82 | % | 19.10 | % | NA | 18.97 | % | 18.97 | % | 18.97 | % | 18.98 | % | ||||||||||||||||||||||||||||
| 5 years | 3.39 | % | 2.17 | % | 2.74 | % | 2.38 | % | 2.59 | % | 2.59 | % | 3.71 | % | NA | 3.67 | % | 3.67 | % | 3.67 | % | 3.67 | % | ||||||||||||||||||||||||||||
| 10 years | 10.05 | % | 9.39 | % | 9.33 | % | 9.33 | % | 9.22 | % | 9.22 | % | 10.42 | % | NA | 10.40 | % | 10.40 | % | 10.40 | % | 10.40 | % | ||||||||||||||||||||||||||||
Columbia Acorn International Select | |||||||||||||||||||||||||||||||||||||||||||||||||||
| 1 year | 22.05 | % | 15.03 | % | 21.29 | % | 16.29 | % | 21.10 | % | 20.10 | % | 22.48 | % | NA | 22.38 | % | 22.39 | % | 22.40 | % | 22.42 | % | ||||||||||||||||||||||||||||
| 5 years | 0.14 | % | -1.04 | % | -0.49 | % | -0.82 | % | -0.65 | % | -0.65 | % | 0.53 | % | NA | 0.50 | % | 0.50 | % | 0.50 | % | 0.50 | % | ||||||||||||||||||||||||||||
| 10 years | 12.88 | % | 12.22 | % | 12.15 | % | 12.15 | % | 12.01 | % | 12.01 | % | 13.28 | % | NA | 13.26 | % | 13.27 | % | 13.27 | % | 13.27 | % | ||||||||||||||||||||||||||||
Columbia Acorn Select | |||||||||||||||||||||||||||||||||||||||||||||||||||
| 1 year | 16.87 | % | 10.15 | % | 16.11 | % | 11.11 | % | 15.93 | % | 14.93 | % | 17.26 | % | NA | 17.11 | % | 17.15 | % | 17.14 | % | 17.15 | % | ||||||||||||||||||||||||||||
| 5 years | 0.04 | % | -1.14 | % | -0.60 | % | -0.95 | % | -0.76 | % | -0.76 | % | 0.39 | % | NA | 0.32 | % | 0.33 | % | 0.33 | % | 0.33 | % | ||||||||||||||||||||||||||||
| 10 years | 8.28 | % | 7.64 | % | 7.57 | % | 7.57 | % | 7.44 | % | 7.44 | % | 8.65 | % | NA | 8.61 | % | 8.62 | % | 8.62 | % | 8.62 | % | ||||||||||||||||||||||||||||
Columbia Thermostat Fund | |||||||||||||||||||||||||||||||||||||||||||||||||||
| 1 year | 13.34 | % | 6.84 | % | 12.78 | % | 7.78 | % | 12.52 | % | 11.52 | % | NA | NA | 13.68 | % | 13.66 | % | 13.63 | % | 13.69 | % | |||||||||||||||||||||||||||||
| 5 years | 4.94 | % | 3.70 | % | 4.41 | % | 4.07 | % | 4.16 | % | 4.16 | % | NA | NA | 5.19 | % | 5.19 | % | 5.18 | % | 5.19 | % | |||||||||||||||||||||||||||||
| 10 years | 7.61 | % | 6.97 | % | 7.03 | % | 7.03 | % | 6.82 | % | 6.82 | % | NA | NA | 7.89 | % | 7.89 | % | 7.89 | % | 7.89 | % | |||||||||||||||||||||||||||||
Columbia Acorn Emerging Markets Fund | |||||||||||||||||||||||||||||||||||||||||||||||||||
| 1 year | 30.86 | % | 23.40 | % | NA | NA | 29.98 | % | 28.98 | % | 31.39 | % | NA | 30.97 | % | 31.05 | % | NA | 31.35 | % | |||||||||||||||||||||||||||||||
Life of Fund | 15.05 | % | 10.19 | % | NA | NA | 14.31 | % | 14.31 | % | 15.66 | % | NA | 15.12 | % | 15.17 | % | NA | 15.55 | % | |||||||||||||||||||||||||||||||
Columbia Acorn European Fund | |||||||||||||||||||||||||||||||||||||||||||||||||||
| 1 year | 25.46 | % | 18.19 | % | NA | NA | 24.46 | % | 23.46 | % | 25.71 | % | NA | NA | 25.46 | % | NA | 25.66 | % | ||||||||||||||||||||||||||||||||
Life of Fund | 13.70 | % | 8.89 | % | NA | NA | 12.89 | % | 12.89 | % | 14.00 | % | NA | NA | 13.70 | % | NA | 14.00 | % | ||||||||||||||||||||||||||||||||
Returns for Class A shares are shown with and without the maximum initial sales charge of 5.75%. Returns for Class B shares are shown with and without the applicable contingent deferred sales charge (CDSC) of 5.00% in the first year, declining to 1.00% in the sixth year and eliminated thereafter. Returns for Class C shares are shown with and without the maximum CDSC of 1.00% for the first year after purchase. The Funds' other classes are not subject to sales charges and have limited eligibility. Please see the Funds' prospectuses for details. Performance for different share classes will vary based on differences in sales charges and certain fees associated with each class.
All results shown assume reinvestment of distributions during the period. Returns do not reflect the deduction of taxes that a shareholder may pay on Fund distributions or on the redemption of Fund shares. Performance results may reflect the effect of any fee waivers or reimbursements of Fund expenses by the investment manager and/or any of its affiliates. Absent these fee waivers and/or expense reimbursement arrangements, performance results would have been lower. Please see Page 130 of this report for information on fee waiver and expense reimbursement arrangements in place for Columbia Acorn International, Columbia Thermostat Fund, Columbia Acorn Emerging Markets Fund and Columbia Acorn European Fund.
The performance information shown represents past performance and is not a guarantee of future results. The investment return and principal value of your investment will fluctuate so that shares, when redeemed, may be worth more or less than their original cost. Current performance may be lower or higher than the performance data shown. You may obtain performance information current to the most recent month-end by contacting your financial intermediary, visiting columbiamanagement.com or calling 800.922.6769.
The returns shown include the returns of each Fund's Class Z shares, each Fund's oldest share class, in cases where the inception date of the Fund is earlier than the inception date of the particular share class or where a period shown dates to before the inception date of the share class. These returns are adjusted to reflect any higher class-related operating expenses of the newer share classes, as applicable. Please visit columbiamanagement.com/mutual-funds/appended-performance for more information.
Continued on Page 3.
2
Fund Performance vs. Benchmarks Class Z Average Annual Total Returns through 12/31/12
Class Z Shares | 4th quarter* | 1 year | 5 years | 10 years | Life of Fund | ||||||||||||||||||
| Columbia Acorn Fund (ACRNX) (6/10/70) | 3.01 | % | 17.93 | % | 4.00 | % | 11.62 | % | 14.58 | % | |||||||||||||
Russell 2500 Index | 3.10 | % | 17.88 | % | 4.34 | % | 10.49 | % | NA | ||||||||||||||
S&P 500 Index** | -0.38 | % | 16.00 | % | 1.66 | % | 7.10 | % | 10.56 | % | |||||||||||||
Russell 2000 Index | 1.85 | % | 16.35 | % | 3.56 | % | 9.72 | % | NA | ||||||||||||||
Lipper Mid-Cap Growth Funds Index | 0.80 | % | 13.36 | % | 1.49 | % | 9.40 | % | NA | ||||||||||||||
| Columbia Acorn International (ACINX) (9/23/92) | 4.23 | % | 21.60 | % | 0.93 | % | 14.44 | % | 11.14 | % | |||||||||||||
S&P Global Ex-U.S. Between $500M and $5B Index | 5.66 | % | 19.17 | % | -0.04 | % | 13.92 | % | 8.43 | % | |||||||||||||
S&P Global Ex-U.S. SmallCap Index | 5.82 | % | 20.35 | % | -0.78 | % | 13.20 | % | 7.72 | % | |||||||||||||
MSCI EAFE Index (Net) | 6.57 | % | 17.32 | % | -3.69 | % | 8.21 | % | 5.77 | % | |||||||||||||
Lipper International Small/Mid Growth Funds Index | 5.19 | % | 23.38 | % | -0.05 | % | 13.19 | % | NA | ||||||||||||||
| Columbia Acorn USA (AUSAX) (9/4/96) | 3.17 | % | 18.98 | % | 3.67 | % | 10.40 | % | 10.05 | % | |||||||||||||
Russell 2000 Index | 1.85 | % | 16.35 | % | 3.56 | % | 9.72 | % | 7.31 | % | |||||||||||||
Lipper Small-Cap Growth Funds Index | 0.12 | % | 14.95 | % | 2.09 | % | 8.56 | % | 5.78 | % | |||||||||||||
| Columbia Acorn International Select (ACFFX) (11/23/98) | -1.49 | % | 22.42 | % | 0.50 | % | 13.27 | % | 9.58 | % | |||||||||||||
S&P Developed Ex-U.S. Between $2B and $10B Index | 5.35 | % | 16.78 | % | -1.86 | % | 11.17 | % | 7.17 | % | |||||||||||||
MSCI EAFE Index (Net) | 6.57 | % | 17.32 | % | -3.69 | % | 8.21 | % | 3.61 | % | |||||||||||||
Lipper International Small/Mid Growth Funds Index | 5.19 | % | 23.38 | % | -0.05 | % | 13.19 | % | 10.10 | % | |||||||||||||
| Columbia Acorn Select (ACTWX) (11/23/98) | 2.04 | % | 17.15 | % | 0.33 | % | 8.62 | % | 9.33 | % | |||||||||||||
S&P MidCap 400 Index | 3.61 | % | 17.88 | % | 5.15 | % | 10.53 | % | 9.21 | % | |||||||||||||
S&P 500 Index** | -0.38 | % | 16.00 | % | 1.66 | % | 7.10 | % | 3.33 | % | |||||||||||||
Lipper Mid-Cap Core Funds Index | 3.28 | % | 16.27 | % | 3.11 | % | 9.27 | % | 7.70 | % | |||||||||||||
| Columbia Thermostat Fund (COTZX) (9/25/02) | 1.52 | % | 13.69 | % | 5.19 | % | 7.89 | % | 8.10 | % | |||||||||||||
S&P 500 Index | -0.38 | % | 16.00 | % | 1.66 | % | 7.10 | % | 7.71 | % | |||||||||||||
Barclays U.S. Aggregate Bond Index | 0.22 | % | 4.22 | % | 5.95 | % | 5.18 | % | 5.22 | % | |||||||||||||
Lipper Flexible Portfolio Funds Index | 1.54 | % | 13.34 | % | 2.72 | % | 7.31 | % | 7.70 | % | |||||||||||||
50/50 Blended Benchmark | -0.07 | % | 10.13 | % | 4.26 | % | 6.44 | % | 6.78 | % | |||||||||||||
| Columbia Acorn Emerging Markets Fund (CEFZX) (8/19/11) | 9.08 | % | 31.35 | % | — | — | 15.55 | % | |||||||||||||||
S&P Emerging Markets Between $500M and $5B Index | 7.07 | % | 25.71 | % | — | — | 6.34 | % | |||||||||||||||
MSCI Emerging Markets Small Cap Index | 5.10 | % | 22.22 | % | — | — | 1.36 | % | |||||||||||||||
Lipper Emerging Markets Index | 6.28 | % | 20.08 | % | — | — | 8.55 | % | |||||||||||||||
| Columbia Acorn European Fund (CAEZX) (8/19/11) | 5.08 | % | 25.66 | % | — | — | 14.00 | % | |||||||||||||||
S&P Europe Between $500M and $5B Index | 8.01 | % | 28.24 | % | — | — | 13.57 | % | |||||||||||||||
HSBC Smaller European Companies Index | 8.53 | % | 25.89 | % | — | — | 9.96 | % | |||||||||||||||
Lipper European Region Index | 7.17 | % | 22.07 | % | — | — | 14.62 | % | |||||||||||||||
The inception dates for Class A, B and C shares (if offered) are as follows: Columbia Acorn Fund, Columbia Acorn International, Columbia Acorn USA, Columbia Acorn International Select and Columbia Acorn Select, 10/16/00; Columbia Thermostat Fund, 3/3/03; Columbia Acorn Emerging Markets Fund and Columbia Acorn European Fund, 8/19/11. The inception dates for Class I Shares are as follows: Columbia Acorn Fund, Columbia Acorn International, Columbia Acorn USA, Columbia Acorn International Select and Columbia Acorn Select, 9/27/10; Columbia Acorn Emerging Markets Fund and Columbia Acorn European Fund, 8/19/11. The inception date for Class R Shares for Columbia Acorn International is 8/15/11. The inception date for Class R4, R5 and Y shares (if offered) is as follows: Columbia Acorn Fund, Columbia Acorn USA, Columbia Acorn International Select, Columbia Acorn Select, Columbia Thermostat Fund, Columbia Acorn Emerging Markets Fund and Columbia Acorn European Fund, 11/8/12. The inception date for Class R5 shares of Columbia Acorn International is 8/15/11. The inception date for Class R4 and Class Y shares of Columbia Acorn International is 11/8/12. The inception date for Class Z shares is as follows: Columbia Acorn Fund, 6/10/70; Columbia Acorn International, 9/23/92; Columbia Acorn USA, 9/4/96; Columbia Acorn International Select and Columbia Acorn Select, 11/23/98; Columbia Thermostat Fund, 9/25/02; Columbia Acorn Emerging Markets Fund and Columbia Acorn European Fund, 8/19/11.
*Not annualized
**Although the Fund typically invests in small- and mid-sized companies, the comparison to the S&P 500 Index is presented to show performance against a widely recognized market index over the life of the Fund.
Please see Page 1 for a description of the indexes listed above.
3
Columbia Acorn Family of Funds
2012 Year-End Distributions
The following table details the year-end distributions for the Columbia Acorn Family of Funds. For all Funds except for Columbia Thermostat Fund, the record date was December 5, 2012, and the ex-dividend and payable date was December 6, 2012. For Columbia Thermostat Fund, the record date was December 20, 2012, and the ex-dividend and payable date was December 21, 2012. Additionally, Columbia Acorn International and Columbia Acorn USA paid additional dividends with a record date of December 26, 2012, and an ex-dividend and payable date of December 27, 2012. In the chart below, the ordinary income shown is the sum of these two distributions.
| Short-term Capital Gains | Long-term Capital Gains | Ordinary Income | Reinvestment Price | ||||||||||||||||
Columbia Acorn Fund | |||||||||||||||||||
Class A | None | $ | 1.46206 | $ | 0.06234 | $ | 28.54 | ||||||||||||
Class B | None | $ | 1.46206 | None | $ | 26.05 | |||||||||||||
Class C | None | $ | 1.46206 | None | $ | 25.61 | |||||||||||||
Class I | None | $ | 1.46206 | $ | 0.16459 | $ | 29.61 | ||||||||||||
Class R4 | None | $ | 1.46206 | $ | 0.11346 | $ | 30.03 | ||||||||||||
Class R5 | None | $ | 1.46206 | $ | 0.13752 | $ | 30.00 | ||||||||||||
Class Y | None | $ | 1.46206 | $ | 0.15256 | $ | 30.03 | ||||||||||||
Class Z | None | $ | 1.46206 | $ | 0.14955 | $ | 29.59 | ||||||||||||
Columbia Acorn International | |||||||||||||||||||
Class A | None | None | $ | 0.52359 | $ | 40.08/$40.57 | * | ||||||||||||
Class B | None | None | $ | 0.24101 | $ | 39.00/$39.46 | * | ||||||||||||
Class C | None | None | $ | 0.23337 | $ | 38.83/$39.30 | * | ||||||||||||
Class I | None | None | $ | 0.66106 | $ | 40.13/$40.64 | * | ||||||||||||
Class R | None | None | $ | 0.41667 | $ | 40.08/$40.57 | * | ||||||||||||
Class R4 | None | None | $ | 0.59232 | $ | 40.36/$40.86 | * | ||||||||||||
Class R5 | None | None | $ | 0.65724 | $ | 40.09/$40.59 | * | ||||||||||||
Class Y | None | None | $ | 0.63815 | $ | 40.35/$40.86 | * | ||||||||||||
Class Z | None | None | $ | 0.64197 | $ | 40.11/$40.62 | * | ||||||||||||
Columbia Acorn USA | |||||||||||||||||||
Class A | None | $ | 2.31906 | $ | 0.11399 | $ | 27.32/$27.86 | * | |||||||||||
Class B | None | $ | 2.31906 | None | $ | 24.94 | |||||||||||||
Class C | None | $ | 2.31906 | None | $ | 24.63 | |||||||||||||
Class I | None | $ | 2.31906 | $ | 0.22168 | $ | 28.53/$29.11 | * | |||||||||||
Class R4 | None | $ | 2.31906 | $ | 0.15886 | $ | 28.97/$29.55 | * | |||||||||||
Class R5 | None | $ | 2.31906 | $ | 0.17681 | $ | 28.94/$29.53 | * | |||||||||||
Class Y | None | $ | 2.31906 | $ | 0.19177 | $ | 28.98/$29.56 | * | |||||||||||
Class Z | None | $ | 2.31906 | $ | 0.18878 | $ | 28.52/$29.09 | * | |||||||||||
* The first price is the reinvestment price on 12/6/12. The second price is the reinvestment price on 12/27/12.
4
| Short-term Capital Gains | Long-term Capital Gains | Ordinary Income | Reinvestment Price | ||||||||||||||||
Columbia Acorn International Select | |||||||||||||||||||
Class A | None | $ | 2.09423 | $ | 1.74324 | $ | 25.44 | ||||||||||||
Class B | None | $ | 2.09423 | $ | 1.57167 | $ | 24.25 | ||||||||||||
Class C | None | $ | 2.09423 | $ | 1.52739 | $ | 24.13 | ||||||||||||
Class I | None | $ | 2.09423 | $ | 1.84009 | $ | 25.67 | ||||||||||||
Class R4 | None | $ | 2.09423 | $ | 1.78751 | $ | 25.81 | ||||||||||||
Class R5 | None | $ | 2.09423 | $ | 1.79858 | $ | 25.80 | ||||||||||||
Class Y | None | $ | 2.09423 | $ | 1.81242 | $ | 25.80 | ||||||||||||
Class Z | None | $ | 2.09423 | $ | 1.82625 | $ | 25.68 | ||||||||||||
Columbia Acorn Select | |||||||||||||||||||
Class A | None | $ | 1.50555 | None | $ | 24.44 | |||||||||||||
Class B | None | $ | 1.50555 | None | $ | 22.51 | |||||||||||||
Class C | None | $ | 1.50555 | None | $ | 22.24 | |||||||||||||
Class I | None | $ | 1.50555 | None | $ | 25.34 | |||||||||||||
Class R4 | None | $ | 1.50555 | None | $ | 25.63 | |||||||||||||
Class R5 | None | $ | 1.50555 | None | $ | 25.63 | |||||||||||||
Class Y | None | $ | 1.50555 | None | $ | 25.68 | |||||||||||||
Class Z | None | $ | 1.50555 | None | $ | 25.28 | |||||||||||||
Columbia Thermostat Fund | |||||||||||||||||||
Class A | None | None | $ | 0.22082 | $ | 14.29 | |||||||||||||
Class B | None | None | $ | 0.15159 | $ | 14.39 | |||||||||||||
Class C | None | None | $ | 0.11698 | $ | 14.39 | |||||||||||||
Class R4 | None | None | $ | 0.25543 | $ | 14.18 | |||||||||||||
Class R5 | None | None | $ | 0.25266 | $ | 14.18 | |||||||||||||
Class Y | None | None | $ | 0.25958 | $ | 14.18 | |||||||||||||
Class Z | None | None | $ | 0.25543 | $ | 14.12 | |||||||||||||
Columbia Acorn Emerging Markets Fund | |||||||||||||||||||
Class A | None | None | $ | 0.07638 | $ | 11.79 | |||||||||||||
Class C | None | None | None | NA | |||||||||||||||
Class I | None | None | $ | 0.11580 | $ | 11.82 | |||||||||||||
Class R4 | None | None | $ | 0.10301 | $ | 11.89 | |||||||||||||
Class R5 | None | None | $ | 0.11047 | $ | 11.88 | |||||||||||||
Class Z | None | None | $ | 0.11154 | $ | 11.81 | |||||||||||||
Columbia Acorn European Fund | |||||||||||||||||||
Class A | None | None | $ | 0.05024 | $ | 11.39 | |||||||||||||
Class C | None | None | None | NA | |||||||||||||||
Class I | None | None | $ | 0.08251 | $ | 11.39 | |||||||||||||
Class R5 | None | None | $ | 0.07713 | $ | 11.49 | |||||||||||||
Class Z | None | None | $ | 0.08035 | $ | 11.39 | |||||||||||||
5
Squirrel Chatter II: Photovoltaic Electricity
 When the sun is directly overhead on a clear day, it casts about 1,000 watts of energy per square meter. Across the earth, in about one hour the sun provides as much energy as mankind uses from all sources during an entire year.
Photovoltaic (PV) energy, electricity generated directly from sunlight, was discovered in 1839 by Edmund Becquerel. In 1873, Willoughby Smith observed that selenium became conductive when exposed to light.1 Selenium photovoltaic cells, which convert sunlight directly into electricity, were first made in the 1870s and were later used as light meters for photography.2 But selenium cells converted at best 1% of sun power into electricity and were expensive, so their uses were limited.3
In the 1950s, Bell Laboratories began developing silicon photovoltaic cells, and succeeded in creating cells capable of converting 6% of solar power into energy. Cells were combined together into PV modules, and were originally used to recharge batteries that powered remote transmitters. PV modules using more expensive and efficient gallium arsenide were also invented, and almost immediately began to be used in space. The Vanguard I satellite in 1958 had solar capacity well under a watt.4 Capacity on satellites grew rapidly, to 1962's Telstar at 14 watts, to the early 1970's Skylab at 16,000 watts, and to today's International Space Station at more than 100,000 watts.5
In 1960, silicon solar modules were handmade and cost about $1,000 per peak watt.6 The cost of modules has declined in accordance with learning curve theory. For each doubling of cumulative production, prices generally dropped about 20% through the year 2000. The price fell to about $300 per peak watt in 1970, and then to about $3.50 in 2000.7 Module costs fell as sunlight conversion efficiency was enhanced, materials requirements were reduced and manufacturing processes were mechanized and streamlined. Other costs of PV systems, including electronics, cabling, racks, mounting hardware and installation expenses, have also been dropping, but not as quickly.
As prices fell, mass market applications developed. In the 1980s, PV systems were most often used to provide power to areas without electrical infrastructure to run irrigation pumps, illuminate schools and refrigerate medicine, for example.8 In the 1990s, PV systems began to be connected to electric grids in the developed world in order to utilize essentially pollution-free energy.9 Governments created incentives for installing and producing PV electricity in order to reduce carbon dioxide emissions and slow global warming.
In 2000, Germany passed legislation that guarantees high, 20-year payments to producers for PV-produced electricity. Payment rates on new projects decline along with the costs of photovoltaic systems. Utilities in Germany currently pay about $0.35 per kilowatt hour (kWh) for home roof-top produced PV electricity.10 As of the end of 2011, Germany was the world leader in PV energy investment with 24.8 billion peak watts of installed PV capacity, about 35% of the world total.11 Italy, which also adopted high payments for PV electricity, was second, at about 17% of world PV capacity.12 The United States, in comparison, accounted for only 5% of installed worldwide PV capacity.
As a result of the incentives in Germany and Italy, demand for photovoltaic systems surged. A shortage of polysilicon, the primary raw material for silicon solar cells, also developed. Module prices were stuck between $3 and $4 from 2000 until the second half of 2008, and profits boomed for both solar module and polysilicon makers. Manufacturing capacity consequently jumped, boosted at first by attractive profits and then by Chinese efforts to dominate world PV module production. Module prices then fell to $2 in 200913 and collapsed to as low as $0.70 by September 2012, when global manufacturing capacity equaled nearly double worldwide demand.14 Extremely competitive pricing, plus the lack of apparent technology or cost advantages, have caused losses, an industry shakeout, and poor stock performance for PV module producers.
According to the World Research Institute, by 2011 the average installed price for complete photovoltaic systems fell to $4.75 per peak watt of energy generated.
6
Meanwhile, the price of utility-generated electricity has been rising. According to the U.S. Energy Information Administration, the average residential electricity price in the United States rose from $0.02 per kWh in 1970 to $0.08 in the year 2000 and $0.12 in 2011. The falling price of PV systems and the rising price of electricity have made PV electricity more competitive.
In the United States, 44 states have adopted net metering policies. These policies make it possible for consumers to buy PV systems, produce their own PV electricity by day and provide what they don't use into the electric grid. By night, they get electricity from the grid. Consumers are generally billed for the net amount they use. Given that solar electric production varies by hour of the day and cloud cover, and utilities need reliable supplies, utility obligations to purchase such power are capped state by state. PV electricity production, however, tends to match peak load needs, so utilities are generally buying what would otherwise be expensive peak-load power and selling cheaper off-peak power to owners of PV systems at average retail rates.
PV electricity is now competitive in areas with high electric rates, especially in places with lots of sunshine. Household electricity rates vary tremendously by location. As examples, Honolulu rates recently hit $0.34 per kWh, and the New York City area, $0.20. Worldwide electric rates vary tremendously as well, with Denmark at nearly $0.40 and Italy at about $0.30 per kWh. These prices contrast to electric rates ranging from $0.05 to $0.10 per kWh in some energy-rich states and countries.15
Peak sunshine varies by location; solar modules in Honolulu receive an average of 5.7 hours of peak sunshine per day, so each peak watt of installed solar module would generate about 1.87 kWh yearly.16 Assuming that a PV system costs $4.75 per peak watt installed, it would pay for itself in about 7.5 years based on Honolulu's electricity rates. Utilizing the current 30% federal tax credit reduces the payback period to 5.2 years.17 After the PV system pays for itself, it should provide more than 20 years of nearly free energy to its owner, as modules are designed to last 30 years, though electronics associated with them will likely need to be replaced once or twice during that period.
Honolulu is an extreme example in the United States because of its high electricity costs and its abundant sunshine. Tucson receives even more sunshine, but with approximately $0.10 kWh power prices, PV systems there have after-tax credit paybacks of nearly 16 years. New York receives about one-third less sunshine than Tucson, but due to its higher power rates, PV systems there have about 11 year paybacks.18
As of early 2012, 30 states had renewable portfolio standards, which mandate certain percentages of electricity production to be from renewable sources such as PV. Solar renewable energy credits and tax credits have also incentivized purchases of PV systems in many of those states.19 As a result, large, non-residential PV installations jumped, and recently accounted for 84% of nationwide PV capacity.20 Total new installations in the United States surged over 15-fold from 2007 to 2012, to about 3.2 billion peak watts.21
Although PV installations in the United States are rising sharply, relatively low net metered electricity prices in most of the United States makes PV electricity less competitive compared to high payment rates in other countries. Abundant and cheap shale natural gas in the United States will likely keep domestic electric rates low. With these factors in mind, despite tax incentives and renewable portfolio standards, the United States seems unlikely to become the world leader in PV electricity production.
Photovoltaic electricity production is instead more economically attractive in areas with high electricity costs. PV electricity should displace a lot of the 5% of worldwide electricity that is generated by burning costly petroleum. Also, the World Bank estimates that 1.4 billion people do not have access to electricity, and is funding billions of dollars to provide electricity to them.22 PV electricity seems like a good choice to provide power to third world locations currently lacking electricity.
Usage of photovoltaic electricity is growing rapidly from a very low base. Worldwide PV power production jumped about 86% in 2012, but accounted for just 0.25% of electric power.23 As photovoltaic costs continue to drop, fossil fuel prices rise, and concerns about carbon emissions grow, PV seems poised to achieve substantially
7
greater shares of electricity production, helping to change the world in a favorable way.

Charles P. McQuaid
President and Chief Investment Officer
Columbia Wanger Asset Management, LLC
The information and data provided in this analysis are derived from sources that we deem to be reliable and accurate. These views are not guarantees of future performance and involve certain risks, uncertainties and assumptions that are difficult to predict so actual outcomes and results may differ significantly from the views expressed. The views/opinions expressed here are those of the author and not of the Columbia Acorn Trust Board, are subject to change at any time based upon economic, market or other conditions, may differ from views expressed by other Columbia Management associates and the respective parties disclaim any responsibility to update such views. These views may not be relied on as investment advice and, because investment decisions for a Columbia Acorn Fund are based on numerous factors, may not be relied on as an indication of trading intent on behalf of any particular Columbia Acorn Fund.
1 Dunlop, James P., Photovoltaic Systems, Second Edition, (Orland Park, Illinois, American Technical Publishers, Inc., 2010), p. 5.
2 Lynn, Paul A., Electricity from Sunlight, An Introduction to Photovoltaics, (West Sussex, United Kingdom, John Wiley & Sons, Ltd, 2010), p. 13.
3 Dunlop, James P., op. cit., p. 6.
4 Ibid., p. 7.
5 Lynn, Paul A., op. cit., p. 14 and p. 168.
6 Dunlop, James P., op. cit., p. 7. Peak watts are the amount of electricity produced by photovoltaic modules when the sun is directly overhead and unobstructed.
7 Lynn, Paul A., op. cit., p. 14-16.
8 Dunlop, James P., op. cit., p. 7.
9 Lynn, Paul A., op. cit., p. 19.
10 German Feed-in Tariffs 2012, posted on the German Energy Blog. http://www.germanenergyblog.de/?page_id=8617. Accessed January 21, 2013.
11 Barua, Priya and Tawney, Letha and Weischer, Lutz, "Delivering on the Clean Energy Economy: The Role of Policy in Developing Successful Domestic Solar and Wind Industries," a Working Paper published by the World Resources Institute, November 2012, p. 16, http://www.wri.org/publication/delivering-on-the-clean-energy-economy. Accessed February 4, 2013.
12 Kaften, Cheryl, "IEA: Renewables to Rival Coal by 2035," PV Magazine.com, November 14, 2012, http://www.pv-magazine.com/news/details/beitrag/iea--renewables-to-rival-coal-by-2035_100009194/#axzz2JxkjpuqF. Accessed January 18, 2013.
13 Bazilian, Morgan, et al., "Reconsidering the Economics of Photovoltaic Power," a Working Paper published May 17, 2012, p. 3, http://www.ourenergypolicy.org/wp-content/uploads/2012/05/BNEF_re_considering_the_economics_of_photovoltaic_power.pdf. Accessed February 4, 2013.
14 "U.S. Solar Market Insight Report, Q3 2012, Executive Summary," Copyright 2012, SEIA (Solar Energy Industries Association)/GTM Research, p. 11, http://www.seia.org/research-resources/us-solar-market-insight. Accessed February 4, 2013.
15 U.S. Energy Information Administration website, http://www.eia.gov/electricity/state/. Accessed January 7, 2013.
16 Assumes 10% electricity loss from line losses and conversion from direct current to alternating current.
17 $4.75 average included commercial systems; residential system costs averaged $5.21 per watt, as stated in the "U.S. Solar Market Insight Report, Q3 2012, Executive Summary," p. 10. See footnote 14.
18 Paybacks calculated by author utilizing recently published electric rates as mentioned in essay, hours of peak sunshine per Dunlop book, 10% line and conversion losses, and the current 30% federal tax credit. Readers are advised to update data and do own calculations prior to purchasing PV systems.
19 U.S. Energy Information Administration website, http://www.eia.gov/todayinenergy/detail.cfm?id=4850. Accessed February 4, 2013.
20 Sherwood, Larry, "U.S. Solar Market Trends 2011," IREC (Interstate Renewable Energy Council, Inc.), August 2012, p. 7, http://www.irecusa.org/wp-content/uploads/IRECSolarMarketTrends-2012-Web-8-28-12.pdf. Accessed February 4, 2013.
21 "U.S. Solar Market Insight Report," op. cit., p. 2.
22 The world bank website, http://web.worldbank.org/WBSITE/EXTERNAL/TOPICS/EXTENERGY2/0,,contentMDK:22855502~pagePK:210058~piPK:210062~theSitePK:4114200,00.html. Accessed February 4, 2013.
23 Carr, Geoffrey, "Science and Technology: Sunny Uplands," The Economist, November 13, 2012, 2:22, http://www.economist.com/news/21566414-alternative-energy-will-no-longer-be-alternative-sunny-uplands. Accessed February 4, 2013.
8
Understanding Your Expenses
As a shareholder, you incur two types of costs. There are transaction costs, which generally include sales charges on purchases and may include redemption fees. There are also ongoing costs, which generally include management fees, distribution and service (Rule 12b-1) fees, and other Fund expenses. The following information is intended to help you understand your ongoing costs (in dollars) of investing in the Fund and to help you compare these costs with the ongoing costs of investing in other mutual funds.
Analyzing Your Fund's Expenses
To illustrate these ongoing costs, we have provided examples and calculated the expenses paid by investors in Class A, B, C, I, R, R4, R5, Y and Z shares of the Funds during the period. The actual and hypothetical information in the tables is based on an initial investment of $1,000 at the beginning of the period indicated and held for the entire period. Expense information is calculated two ways and each method provides you with different information. The amount listed in the "Actual" column is calculated using the Funds' actual operating expenses and total return for the period. You may use the Actual information, together with the amount invested, to estimate the expenses that you paid over the period. Simply divide your account value by $1,000 (for example, an $8,600 account value divided by $1,000 = 8.6), then multiply the results by the expenses paid during the period under the Actual column. The amount listed in the "Hypothetical" column assumes a 5% annual rate of return before expenses (which is not the Funds' actual return) and then applies the Funds' actual expense ratio for the period to the hypothetical return. You should not use the hypothetical account values and expenses to estimate either your actual account balance at the end of the period or the expenses you paid during the period. See "Compare With Other Funds" below for details on how to use the hypothetical data.
In addition to the ongoing expenses which the Funds bear directly, Columbia Thermostat Fund's shareholders indirectly bear the Fund's allocable share of the costs and expenses of each underlying fund in which the Fund invests. You can also estimate the effective expenses paid during the period, which includes the indirect fees associated with investing in the underlying funds, by using the amounts listed in the effective expenses paid during the period column in the "Fund of Funds" table.
Compare With Other Funds
Since all mutual funds are required to include the same hypothetical calculations about expenses in shareholder reports, you can use this information to compare the ongoing cost of investing in the Funds with other funds. To do so, compare the hypothetical example with the 5% hypothetical examples that appear in the shareholder reports of other funds. As you compare hypothetical examples of other funds, it is important to note that hypothetical examples are meant to highlight the ongoing costs of investing in a fund only and do not reflect any transaction costs, such as sales charges, or redemption or exchange fees. Therefore, the hypothetical calculations are useful in comparing ongoing costs only, and will not help you determine the relative total costs of owning different funds. If transaction costs were included in these calculations, your costs would be higher.
July 1, 2012 – December 31, 2012
| Account value at the beginning of the period ($) | Account value at the end of the period ($) | Expenses paid during the period ($) | Fund's annualized expense ratio (%) | ||||||||||||||||||||||||||||
Actual | Hypothetical | Actual | Hypothetical | Actual | Hypothetical | Actual | |||||||||||||||||||||||||
Columbia Acorn Fund | |||||||||||||||||||||||||||||||
Class A | 1,000.00 | 1,000.00 | 1,078.00 | 1,019.86 | 5.62 | 5.46 | 1.07 | ||||||||||||||||||||||||
Class B | 1,000.00 | 1,000.00 | 1,075.40 | 1,017.03 | 8.55 | 8.31 | 1.63 | ||||||||||||||||||||||||
Class C | 1,000.00 | 1,000.00 | 1,074.20 | 1,016.17 | 9.44 | 9.17 | 1.80 | ||||||||||||||||||||||||
Class I | 1,000.00 | 1,000.00 | 1,080.10 | 1,021.63 | 3.79 | 3.68 | 0.72 | ||||||||||||||||||||||||
Class R4* | 1,000.00 | 1,000.00 | 1,063.10 | 1,020.93 | 1.26 | 4.39 | 0.86 | ||||||||||||||||||||||||
Class R5* | 1,000.00 | 1,000.00 | 1,063.30 | 1,021.18 | 1.19 | 4.14 | 0.81 | ||||||||||||||||||||||||
Class Y* | 1,000.00 | 1,000.00 | 1,063.40 | 1,021.48 | 1.10 | 3.83 | 0.75 | ||||||||||||||||||||||||
Class Z | 1,000.00 | 1,000.00 | 1,079.60 | 1,021.28 | 4.15 | 4.04 | 0.79 | ||||||||||||||||||||||||
9
Understanding Your Expenses, continued
| Account value at the beginning of the period ($) | Account value at the end of the period ($) | Expenses paid during the period ($) | Fund's annualized expense ratio (%) | ||||||||||||||||||||||||||||
Actual | Hypothetical | Actual | Hypothetical | Actual | Hypothetical | Actual | |||||||||||||||||||||||||
Columbia Acorn International | |||||||||||||||||||||||||||||||
Class A | 1,000.00 | 1,000.00 | 1,116.50 | 1,019.01 | 6.63 | 6.33 | 1.24 | ||||||||||||||||||||||||
Class B | 1,000.00 | 1,000.00 | 1,112.50 | 1,015.47 | 10.36 | 9.88 | 1.94 | ||||||||||||||||||||||||
Class C | 1,000.00 | 1,000.00 | 1,112.20 | 1,015.16 | 10.68 | 10.19 | 2.00 | ||||||||||||||||||||||||
Class I | 1,000.00 | 1,000.00 | 1,118.60 | 1,020.83 | 4.71 | 4.49 | 0.88 | ||||||||||||||||||||||||
Class R | 1,000.00 | 1,000.00 | 1,114.80 | 1,017.54 | 8.18 | 7.80 | 1.53 | ||||||||||||||||||||||||
Class R4* | 1,000.00 | 1,000.00 | 1,045.70 | 1,020.12 | 1.48 | 5.21 | 1.02 | ||||||||||||||||||||||||
Class R5 | 1,000.00 | 1,000.00 | 1,118.00 | 1,020.72 | 4.82 | 4.60 | 0.90 | ||||||||||||||||||||||||
Class Y* | 1,000.00 | 1,000.00 | 1,045.90 | 1,020.72 | 1.31 | 4.60 | 0.90 | ||||||||||||||||||||||||
Class Z | 1,000.00 | 1,000.00 | 1,118.40 | 1,020.52 | 5.03 | 4.80 | 0.94 | ||||||||||||||||||||||||
Columbia Acorn USA | |||||||||||||||||||||||||||||||
Class A | 1,000.00 | 1,000.00 | 1,077.40 | 1,018.60 | 6.93 | 6.73 | 1.32 | ||||||||||||||||||||||||
Class B | 1,000.00 | 1,000.00 | 1,073.80 | 1,015.37 | 10.27 | 9.98 | 1.96 | ||||||||||||||||||||||||
Class C | 1,000.00 | 1,000.00 | 1,073.10 | 1,014.91 | 10.74 | 10.44 | 2.05 | ||||||||||||||||||||||||
Class I | 1,000.00 | 1,000.00 | 1,079.00 | 1,020.57 | 4.89 | 4.75 | 0.93 | ||||||||||||||||||||||||
Class R4* | 1,000.00 | 1,000.00 | 1,080.60 | 1,019.51 | 1.68 | 5.82 | 1.14 | ||||||||||||||||||||||||
Class R5* | 1,000.00 | 1,000.00 | 1,080.60 | 1,019.61 | 1.66 | 5.72 | 1.12 | ||||||||||||||||||||||||
Class Y* | 1,000.00 | 1,000.00 | 1,080.70 | 1,020.02 | 1.54 | 5.31 | 1.04 | ||||||||||||||||||||||||
Class Z | 1,000.00 | 1,000.00 | 1,078.20 | 1,019.66 | 5.83 | 5.67 | 1.11 | ||||||||||||||||||||||||
Columbia Acorn International Select | |||||||||||||||||||||||||||||||
Class A | 1,000.00 | 1,000.00 | 1,107.20 | 1,017.84 | 7.83 | 7.50 | 1.47 | ||||||||||||||||||||||||
Class B | 1,000.00 | 1,000.00 | 1,103.70 | 1,014.71 | 11.11 | 10.64 | 2.09 | ||||||||||||||||||||||||
Class C | 1,000.00 | 1,000.00 | 1,102.80 | 1,013.85 | 12.01 | 11.50 | 2.26 | ||||||||||||||||||||||||
Class I | 1,000.00 | 1,000.00 | 1,109.10 | 1,019.51 | 6.08 | 5.82 | 1.14 | ||||||||||||||||||||||||
Class R4* | 1,000.00 | 1,000.00 | 997.30 | 1,018.70 | 1.84 | 6.63 | 1.30 | ||||||||||||||||||||||||
Class R5* | 1,000.00 | 1,000.00 | 997.30 | 1,018.80 | 1.82 | 6.53 | 1.28 | ||||||||||||||||||||||||
Class Y* | 1,000.00 | 1,000.00 | 997.50 | 1,019.21 | 1.70 | 6.12 | 1.20 | ||||||||||||||||||||||||
Class Z | 1,000.00 | 1,000.00 | 1,108.90 | 1,019.21 | 6.40 | 6.12 | 1.20 | ||||||||||||||||||||||||
Columbia Acorn Select | |||||||||||||||||||||||||||||||
Class A | 1,000.00 | 1,000.00 | 1,085.80 | 1,018.70 | 6.85 | 6.63 | 1.30 | ||||||||||||||||||||||||
Class B | 1,000.00 | 1,000.00 | 1,082.10 | 1,015.62 | 10.05 | 9.73 | 1.91 | ||||||||||||||||||||||||
Class C | 1,000.00 | 1,000.00 | 1,081.20 | 1,014.86 | 10.84 | 10.49 | 2.06 | ||||||||||||||||||||||||
Class I | 1,000.00 | 1,000.00 | 1,087.90 | 1,020.47 | 5.01 | 4.85 | 0.95 | ||||||||||||||||||||||||
Class R4* | 1,000.00 | 1,000.00 | 1,059.20 | 1,019.92 | 1.55 | 5.41 | 1.06 | ||||||||||||||||||||||||
Class R5* | 1,000.00 | 1,000.00 | 1,059.60 | 1,020.27 | 1.45 | 5.05 | 0.99 | ||||||||||||||||||||||||
Class Y* | 1,000.00 | 1,000.00 | 1,059.40 | 1,020.62 | 1.35 | 4.70 | 0.92 | ||||||||||||||||||||||||
Class Z | 1,000.00 | 1,000.00 | 1,087.20 | 1,020.02 | 5.49 | 5.31 | 1.04 | ||||||||||||||||||||||||
10
| Account value at the beginning of the period ($) | Account value at the end of the period ($) | Expenses paid during the period ($) | Fund's annualized expense ratio (%) | ||||||||||||||||||||||||||||
Actual | Hypothetical | Actual | Hypothetical | Actual | Hypothetical | Actual | |||||||||||||||||||||||||
Columbia Acorn Emerging Markets Fund | |||||||||||||||||||||||||||||||
Class A | 1,000.00 | 1,000.00 | 1,193.90 | 1,016.33 | 9.81 | 9.02 | 1.77 | ||||||||||||||||||||||||
Class C | 1,000.00 | 1,000.00 | 1,189.10 | 1,012.33 | 14.16 | 13.02 | 2.56 | ||||||||||||||||||||||||
Class I | 1,000.00 | 1,000.00 | 1,197.10 | 1,018.15 | 7.83 | 7.19 | 1.41 | ||||||||||||||||||||||||
Class R4* | 1,000.00 | 1,000.00 | 1,070.40 | 1,017.49 | 2.26 | 7.85 | 1.54 | ||||||||||||||||||||||||
Class R5* | 1,000.00 | 1,000.00 | 1,071.10 | 1,017.89 | 2.15 | 7.45 | 1.46 | ||||||||||||||||||||||||
Class Z | 1,000.00 | 1,000.00 | 1,195.70 | 1,017.84 | 8.16 | 7.50 | 1.47 | ||||||||||||||||||||||||
Columbia Acorn European Fund | |||||||||||||||||||||||||||||||
Class A | 1,000.00 | 1,000.00 | 1,124.90 | 1,017.08 | 8.70 | 8.26 | 1.62 | ||||||||||||||||||||||||
Class C | 1,000.00 | 1,000.00 | 1,121.40 | 1,013.65 | 12.33 | 11.71 | 2.30 | ||||||||||||||||||||||||
Class I | 1,000.00 | 1,000.00 | 1,126.10 | 1,018.65 | 7.04 | 6.68 | 1.31 | ||||||||||||||||||||||||
Class R5* | 1,000.00 | 1,000.00 | 1,067.00 | 1,018.40 | 2.00 | 6.94 | 1.36 | ||||||||||||||||||||||||
Class Z | 1,000.00 | 1,000.00 | 1,125.80 | 1,018.50 | 7.20 | 6.84 | 1.34 | ||||||||||||||||||||||||
Fund of Funds—Columbia Thermostat Fund
July 1, 2012 – December 31, 2012
| Account value at the beginning of the period ($) | Account value at the end of the period ($) | Expenses paid during the period ($) | Fund's annualized expense ratio (%) | Effective expenses paid during the period ($) | Fund's effective annualized expense ratio (%) | ||||||||||||||||||||||||||||||||||||||
Actual | Hypothetical | Actual | Hypothetical | Actual | Hypothetical | Actual | Actual | Hypothetical | Actual | ||||||||||||||||||||||||||||||||||
Columbia Thermostat Fund | |||||||||||||||||||||||||||||||||||||||||||
Class A | 1,000.00 | 1,000.00 | 1,063.10 | 1,022.75 | 2.61 | 2.56 | 0.50 | 5.74 | 5.62 | 1.10 | |||||||||||||||||||||||||||||||||
Class B | 1,000.00 | 1,000.00 | 1,060.70 | 1,020.22 | 5.21 | 5.11 | 1.00 | 8.33 | 8.17 | 1.60 | |||||||||||||||||||||||||||||||||
Class C | 1,000.00 | 1,000.00 | 1,059.70 | 1,018.95 | 6.51 | 6.38 | 1.25 | 9.63 | 9.44 | 1.85 | |||||||||||||||||||||||||||||||||
Class R4* | 1,000.00 | 1,000.00 | 1,026.00 | 1,024.01 | 0.36 | 1.28 | 0.25 | 1.22 | 4.35 | 0.85 | |||||||||||||||||||||||||||||||||
Class R5* | 1,000.00 | 1,000.00 | 1,025.80 | 1,023.91 | 0.39 | 1.38 | 0.27 | 1.25 | 4.45 | 0.87 | |||||||||||||||||||||||||||||||||
Class Y* | 1,000.00 | 1,000.00 | 1,025.50 | 1,024.16 | 0.32 | 1.13 | 0.22 | 1.18 | 4.19 | 0.82 | |||||||||||||||||||||||||||||||||
Class Z | 1,000.00 | 1,000.00 | 1,064.80 | 1,024.01 | 1.30 | 1.28 | 0.25 | 4.44 | 4.35 | 0.85 | |||||||||||||||||||||||||||||||||
Expenses paid during the period are equal to the annualized expense ratio, multiplied by the average account value over the period and then multiplied by the number of days in the Fund's most recent fiscal half year and divided by 366.
Except with respect to Columbia Thermostat Fund, expenses do not include any fees and expenses incurred indirectly by a Fund from the underlying funds in which the Fund may invest (also referred to as "acquired funds"), including affiliated and non-affiliated pooled investments vehicles (including mutual funds and exchange traded funds).
In the case of Columbia Thermostat Fund, effective expenses paid during the period and the Fund's effective annualized expense ratio include expenses borne directly by the class plus the Fund's pro rata portion of the ongoing expenses charged by the underlying funds using the expense ratio of each class of the underlying funds as of the underlying fund's most recent shareholder report.
Had the investment manager and/or certain of its affiliates not waived/reimbursed certain fees and expenses for Columbia Acorn International, Columbia Thermostat Fund, Columbia Acorn Emerging Markets Fund and Columbia Acorn European Fund, account value at the end of the period would have been reduced.
* For the period from November 8, 2012 (commencement of operations) through December 31, 2012.
11
Columbia Acorn Fund
In a Nutshell
|
| ||||||
| Charles P. McQuaid Lead Portfolio Manager | Robert A. Mohn Co-Portfolio Manager | ||||||


Performance data shown represents past performance and is not a guarantee of future results. The investment return and principal value will fluctuate so that shares, when redeemed, may be worth more or less than the original cost. Current performance may be lower or higher than the performance data shown. Please visit columbiamanagement.com for most recent month-end performance updates.
Including a 3.01% gain in the fourth quarter, Columbia Acorn Fund (Class Z shares) rose 17.93% in 2012. Both gains about matched the Fund's primary benchmark, the Russell 2500 Index, and were moderately ahead of the Lipper Mid-Cap Growth Index and the large-cap S&P 500 Index.
The technology hardware group did well during both periods. Fiber optic laser equipment provider IPG Photonics lit up performance, rising 17% in the quarter and nearly doubling for the year. Earnings beat expectations and fears of a slowdown did not materialize. Swedish measurement equipment and software company Hexagon rose 18% in the quarter and jumped over 70% during the year on fine earnings and margin gains. Trimble Navigation, a producer of global positioning equipment for engineering and agriculture, grew 25% in the quarter and 38% in the year, also on excellent earnings and margin gains. Electronics connector maker Amphenol rose 10% in the quarter and 44% in the year, as it won additional business and grew nicely.
Communications stocks also performed well. Tower companies were the highest performers. Both SBA Communications and Crown Castle International rose 13% in the quarter; SBA edged out Crown for the year with a 65% rise versus 61%. Both companies are benefiting from buildouts of new generation cellular technology, as well as reportedly improved outlooks for some of its cell phone provider customers. Voice and data provider tw telecom rose 31% in 2012 on continued growth and consolidation within the industry.
Consumer discretionary stocks rounded out the winner's circle. Premium active apparel retailer lululemon athletica jumped 64% during the year as it proved the naysayers wrong. It was the Fund's largest dollar winner. Ryman Hospitality Properties, formerly Gaylord Entertainment, rose 19% in the quarter and surged 95% in the year on its conversion to real estate investment trust status. PVH, the owner of most of the Calvin Klein brand, agreed to buy Warnaco Group, the owner of Calvin Klein underwear and international rights. Warnaco rose 38% in the quarter and 43% during the year. However, Deckers Outdoor, the wholesaler of UGG fashion footwear, had a disappointing year due to higher costs and unfavorable weather. Its stock stumbled 47% during the year.
Health care stocks were generally disappointing. During the quarter, Auxilium Pharmaceuticals fell 24% on increased competition and Isis Pharmaceuticals fell 33% on poor drug development. During the year, health care information technology provider Quality Systems fell 52% on disappointing earnings. Chelsea Therapeutics International plunged 86%, and Anthera Pharmaceuticals 86%, both on poor drug development results. On the bright side, BioMarin Pharmaceutical rose 43% for the year as it made progress developing orphan drugs. Alexion Pharmaceuticals appreciated 30% on continued earnings growth, though it did fall 19% in the quarter. We opted to sell the Fund's positions in Isis Pharmaceuticals and Anthera Pharmaceuticals.
Columbia Acorn Fund's international stocks fell 0.16% in the quarter and were up only 13.73% in the year.* While Hexagon, as mentioned above, performed well, Canadian mining company Kirkland Lake Gold dropped 61% and Mongolian copper miner Turquoise Hill Resources fell 53% during the year. Foreign stocks accounted for 8.3% of the Fund's assets at year end, down from 9.2% at the beginning of year and 8.7% at the beginning of the quarter.
Stocks did quite well in 2012 despite mediocre economic growth. Small and mid caps were helped by takeovers. Seventeen takeovers of Columbia Acorn Fund portfolio companies were announced during the year. Given low interest rates on bonds and inflated prices of some real assets, such as precious metals and farmland, we believe stocks may continue to do relatively well in 2013. In the current environment, the takeover trend could also persist, further benefiting small and mid caps.
* These returns are not comparable to mutual fund returns, as they are gross of fees and other expenses and do not portray the cash effects incurred by actual mutual funds. Columbia Acorn Fund's foreign stockholdings were not purchased as a balanced, stand-alone portfolio.
Stocks of small- and mid-cap companies pose special risks, including possible illiquidity and greater price volatility than stocks of larger, more established companies. International investing involves special risks, including foreign taxation, currency risks, risks associated with possible differences in financial standards, operational and settlement risks and other risks associated with future political and economic developments.
Portfolio holdings are subject to change periodically and may not be representative of current holdings.
Fund Positions in Mentioned Holdings
As a percentage of net assets, as of 12/31/12
Crown Castle International | 1.7 | % | |||||
lululemon athletica | 1.6 | ||||||
tw telecom | 1.4 | ||||||
SBA Communications | 1.4 | ||||||
Amphenol | 1.3 | ||||||
IPG Photonics | 1.1 | ||||||
PVH | 1.1 | ||||||
BioMarin Pharmaceutical | 1.0 | ||||||
Ryman Hospitality Properties | 1.0 | ||||||
Hexagon | 0.8 | ||||||
Trimble Navigation | 0.7 | ||||||
Alexion Pharmaceuticals | 0.4 | ||||||
Warnaco Group | 0.3 | ||||||
Deckers Outdoor | 0.2 | ||||||
Auxilium Pharmaceuticals | 0.2 | ||||||
Quality Systems | 0.1 | ||||||
Kirkland Lake Gold | 0.1 | ||||||
Turquoise Hill Resources | 0.1 | ||||||
Chelsea Therapeutics International | 0.0 | * | |||||
*Rounds to less than 0.1%.
12
Columbia Acorn Fund
At a Glance
Performance data shown represents past performance and is not a guarantee of future results. The investment return and principal value of an investment will fluctuate so that shares, when redeemed, may be worth more or less than their original cost. Current performance may be lower or higher than the performance data shown. Performance results reflect any fee waivers or reimbursements of Fund expenses by the investment manager and/or any of its affiliates. Absent these fee waivers and/or expense reimbursement arrangements, performance results would have been lower. Please visit columbiamanagement.com for performance data current to the most recent month-end. Market indexes are unmanaged; their results do not reflect the effect of expenses or sales charges. Securities in the Fund may not match those in an index.
Average Annual Total Returns for period ended December 31, 2012
4th quarter | 1 year | 5 years | 10 years | Life of Fund | |||||||||||||||||||
| Class Z (06/10/70 inception) | 3.01 | % | 17.93 | % | 4.00 | % | 11.62 | % | 14.58 | % | |||||||||||||
| Class A (10/16/00 inception) | |||||||||||||||||||||||
without sales charge | 2.92 | 17.62 | 3.69 | 11.25 | 14.20 | ||||||||||||||||||
with sales charge | -2.99 | 10.87 | 2.47 | 10.59 | 14.04 | ||||||||||||||||||
Russell 2500 Index* | 3.10 | 17.88 | 4.34 | 10.49 | NA | ||||||||||||||||||
Results for other share classes can be found on Page 2.
*The Fund's primary benchmark. Please see Page 1 for index definitions.
All results shown assume reinvestment of distributions. The Fund's Class Z share annual operating expense ratio, as stated in the May 1, 2012, prospectus, is 0.77% and the Class A share expense ratio is 1.11%. Class Z shares are sold at NAV, have limited eligibility and the investment minimum requirement may vary. Only eligible investors may purchase Class Z shares of the Fund, directly or by exchange. Please see the Fund's prospectuses for eligibility and other details. Returns for Class A shares are shown with and without the maximum initial sales charge of 5.75%. The returns shown for periods prior to the inception of the Fund's Class A shares may append the returns of the Fund's Class Z shares, the Fund's oldest share class. These returns are adjusted to reflect any higher class-related operating expenses of the newer share classes, as applicable. Please visit columbiamanagement.com/mutual-funds/appended-performance for more information.
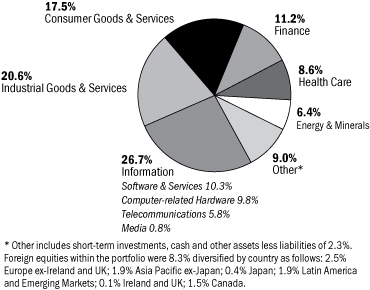
Portfolio Diversification
as a percentage of net assets, as of 12/31/12
Top 10 Holdings
as a percentage of net assets, as of 12/31/12
1. | Ametek Aerospace/Industrial Instruments | 2.2 | % | ||||||||
2. | Mettler-Toledo International Laboratory Equipment | 1.8 | % | ||||||||
3. | Crown Castle International Communications Towers | 1.7 | % | ||||||||
4. | lululemon athletica Premium Active Apparel Retailer | 1.6 | % | ||||||||
5. | Donaldson Industrial Air Filtration | 1.6 | % | ||||||||
6. | tw telecom Fiber Optic Telephone/Data Services | 1.4 | % | ||||||||
7. | SBA Communications Communications Towers | 1.4 | % | ||||||||
8. | Amphenol Electronic Connectors | 1.3 | % | ||||||||
9. | FMC Technologies Oil & Gas Well Head Manufacturer | 1.1 | % | ||||||||
10. | Nordson Dispensing Systems for Adhesives & Coatings | 1.1 | % | ||||||||
The Fund's top 10 holdings and portfolio diversification vary with changes in portfolio investments. See the Statement of Investments for a complete list of the Fund's holdings.
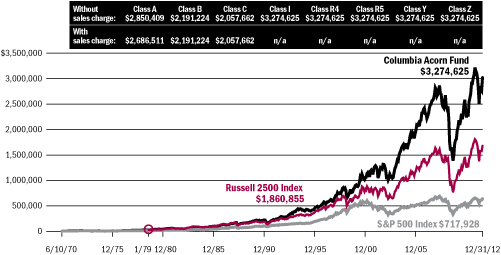
The Growth of a $10,000 Investment in Columbia Acorn Fund Class Z Shares
June 10, 1970 (Fund inception) through December 31, 2012
The chart shows the change in value of a hypothetical $10,000 investment in Class Z shares of the Fund during the stated time period, and does not reflect the deduction of taxes that a shareholder may pay on Fund distributions or on the redemption of Fund shares. A $10,000 investment in Columbia Acorn Fund at inception appreciated to $31,777 on December 31, 1978, the inception date of the Russell 2500 Index. For comparison with the Russell 2500 Index, we assigned the index the same value as the Fund at index inception. Although the Fund typically invests in small- and mid-sized companies, the comparison to the S&P 500 Index is presented to show performance against a widely recognized market index over the life of the Fund.
Total Net Assets of the Fund: $17.5 billion
13
Columbia Acorn International
In a Nutshell
|
| ||||||
| P. Zachary Egan Co-Portfolio Manager | Louis J. Mendes III Co-Portfolio Manager | ||||||


Performance data shown represents past performance and is not a guarantee of future results. The investment return and principal value will fluctuate so that shares, when redeemed, may be worth more or less than the original cost. Current performance may be lower or higher than the performance data shown. Please visit columbiamanagement.com for most recent month-end performance updates.
Columbia Acorn International (Class Z shares) returned 4.23% in the fourth quarter, 1.43% behind the 5.66% return of its primary benchmark, the S&P Global Ex-U.S. between $500M and $5B Index. For 2012, the Fund's annual return was 21.60%, 2.43% ahead of its benchmark, up 19.17%. International small-cap stocks outperformed larger caps as measured by the large-cap developed market MSCI EAFE Index, which rose 17.32% during the year.
Recall that in 2011, fears of a renewed global recession dragged down equity markets just about everywhere, with those in Europe, Asia excluding Japan, and Latin America particularly hard hit. Early concerns over inflation in China, India and Brazil abated as 2011 progressed. They were replaced that year by the far greater concerns of a renewed credit crunch triggered by potential European debt defaults and even the possible demise of the European single currency. In 2012, concerns over the eurozone abated, and market participants preoccupied themselves with the scarcity of growth and the real risk of a prolonged deflation, despite the best efforts of many governments to keep the liquidity spigot open via low interest rates and deficit spending. The result was a bifurcated market where conservative, high-yielding assets in mature markets (for example, real estate investment trusts or REITs) and high-growth assets in the few remaining growth markets around (especially emerging markets) rallied, while global cyclicals, particularly commodities, generally rose only modestly.
This is evidenced in the Fund by the fact that nine of the top 15 performers were emerging market companies with returns ranging from 75% to 160%. Asian gaming stocks continued to move higher with Cambodia-based Nagacorp rising 160% and Macau-based Melco Crown Entertainment appreciating over 75%. We expect rising regional wealth and increased opportunities and desire for leisure travel to continue to drive growth in this sector. In India, rising affluence within a sizable and expanding middle class continued to drive expectations for consumer stocks higher. United Breweries, India's leading brewer, for example, was up 137% in the year. In Indonesia, continued penetration of cellular phones increased the demand for requisite cellular tower infrastructure, propelling Tower Bersama Infrastructure up over 128%. In South Africa, wealth effects across the population helped drive earnings for fund management company Coronation Fund Managers, sending the stock up 77% in the year.
The strong performance in many high-growth emerging market companies contrasts sharply with comparatively weak economic trends in developed markets and the inability of most western governments to confront fiscal imbalances with solutions rather than rhetoric and continued large deficits.
The concerns of a "fiscal cliff" in the United States and little growth in Japan and Europe continued to weigh heavily on commodity-related stocks. In particular, Japan continued to suffer the consequences of deflation and economic stagnation, accounting for eight of the 15 worst performers in the Fund. Japanese consumer and Internet stocks suffered with online apparel retailer Start Today down nearly 60% on weak earnings, social networker Gree down 25% on lower expectations, and Sanrio, owner of the "Hello Kitty" brand, down over 23%. We sold the Fund's position in Gree.
As we enter 2013, the outlook appears more positive than one year ago. Elections in the United States and changes in leadership in China have taken place without hanging chads or revolution. European policymakers are regarded as more credible on the common currency than was previously the case. Even Japan has embarked on a more aggressive reflationary stance to end over 20 years of deflation. Emerging markets appear stable and poised for continued economic growth that is well above global averages. Unfortunately, after a strong performance in 2012, equity markets may no longer appear as attractive as they did one year ago, and have been invigorated by nominal interest rates at record lows in many countries. We believe that for equities to continue to perform, they will need to demonstrate solid ongoing growth in quality earnings, as this is what present valuations appear to discount. As always, we will continue to work hard to identify investments in dynamic, emerging growth companies for shareholders, while remaining attentive to the downside risks.
International investing involves special risks, including foreign taxation, currency risks, risks associated with possible differences in financial standards, operational and settlement risks and other risks associated with future political and economic developments. Stocks of small- and mid-cap companies pose special risks, including possible illiquidity and greater price volatility than stocks of larger, more established companies. Investing in emerging markets may involve greater risks than investing in more developed countries. In addition, concentration of investments in a single region may result in greater volatility.
Portfolio holdings are subject to change periodically and may not be representative of current holdings.
Fund's Positions in Mentioned Holdings
As a percentage of net assets, as of 12/31/12
Melco Crown Entertainment | 1.6 | % | |||||
Coronation Fund Managers | 0.8 | ||||||
United Breweries | 0.6 | ||||||
Nagacorp | 0.5 | ||||||
Tower Bersama Infrastructure | 0.5 | ||||||
Sanrio | 0.5 | ||||||
Start Today | 0.4 | ||||||
14
Columbia Acorn International
At a Glance
Performance data shown represents past performance and is not a guarantee of future results. The investment return and principal value of an investment will fluctuate so that shares, when redeemed, may be worth more or less than their original cost. Current performance may be lower or higher than the performance data shown. Performance results reflect any fee waivers or reimbursements of Fund expenses by the investment manager and/or any of its affiliates. Absent these fee waivers and/or expense reimbursement arrangements, performance results would have been lower. Please visit columbiamanagement.com for performance data current to the most recent month-end. Market indexes are unmanaged; their results do not reflect the effect of expenses or sales charges. Securities in the Fund may not match those in an index.
Average Annual Total Returns for period ended December 31, 2012
4th quarter | 1 year | 5 years | 10 years | Life of Fund | |||||||||||||||||||
| Class Z (9/23/92 inception) | 4.23 | % | 21.60 | % | 0.93 | % | 14.44 | % | 11.14 | % | |||||||||||||
| Class A (10/16/00 inception) | |||||||||||||||||||||||
without sales charge | 4.14 | 21.21 | 0.57 | 14.01 | 10.71 | ||||||||||||||||||
with sales charge | -1.85 | 14.25 | -0.62 | 13.34 | 10.39 | ||||||||||||||||||
| S&P Global Ex-U.S. Between $500M and $5B* | 5.66 | 19.17 | -0.04 | 13.92 | 8.43 | ||||||||||||||||||
Results for other share classes can be found on Page 2.
*The Fund's primary benchmark. Please see Page 1 for index definitions.
All results shown assume reinvestment of distributions. The Fund's Class Z share annual operating expense ratio, as stated in the May 1, 2012, prospectus, is 0.98% and the Class A share expense ratio is 1.35%. Class Z shares are sold at NAV, have limited eligibility and the investment minimum requirement may vary. Only eligible investors may purchase Class Z shares of the Fund, directly or by exchange. Please see the Fund's prospectuses for eligibility and other details. Returns for Class A shares are shown with and without the maximum initial sales charge of 5.75%. The returns shown for periods prior to the inception of the Fund's Class A shares may append the returns of the Fund's Class Z shares, the Fund's oldest share class. These returns are adjusted to reflect any higher class-related operating expenses of the newer share classes, as applicable. Please visit columbiamanagement.com/mutual-funds/appended-performance for more information.
Portfolio Diversification
as a percentage of net assets, as of 12/31/12
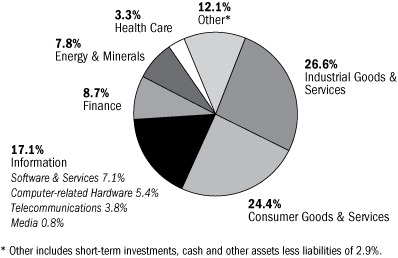
Top 10 Holdings
as a percentage of net assets, as of 12/31/12
| 1. | Melco Crown Entertainment (Hong Kong) Macau Casino Operator | 1.6 | % | ||||||||
| 2. | Far EasTone Telecom (Taiwan) Taiwan's Third Largest Mobile Operator | 1.5 | % | ||||||||
| 3. | Hexagon (Sweden) Design, Measurement & Visualization Software & Equipment | 1.5 | % | ||||||||
| 4. | Eurofins Scientific (France) Food, Pharmaceuticals & Materials Screening & Testing | 1.3 | % | ||||||||
| 5. | Naspers (South Africa) Media in Africa, China, Russia & Other Emerging Markets | 1.1 | % | ||||||||
| 6. | Grupo Aeroportuario del Sureste (Mexico) Mexican Airport Operator | 1.0 | % | ||||||||
| 7. | Localiza Rent A Car (Brazil) Car Rental | 1.0 | % | ||||||||
| 8. | Gemalto (France) Digital Security Solutions | 1.0 | % | ||||||||
| 9. | Partners Group (Switzerland) Private Markets Asset Management | 1.0 | % | ||||||||
| 10. | Taiwan Mobile (Taiwan) Taiwan's Second Largest Mobile Operator | 0.9 | % | ||||||||
The Fund's top 10 holdings and portfolio diversification vary with changes in portfolio investments. See the Statement of Investments for a complete list of the Fund's holdings.
The Growth of a $10,000 Investment in Columbia Acorn International Class Z Shares
September 23, 1992 (Fund inception) through December 31, 2012
This chart shows the change in value of a hypothetical $10,000 investment in Class Z shares of the Fund during the stated time period, and does not reflect the deduction of taxes that a shareholder may pay on Fund distributions or on the redemption of Fund shares.
Total Net Assets of the Fund: $6.7 billion
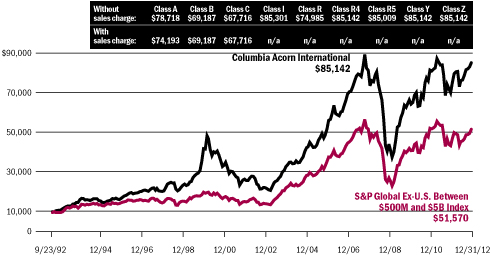
15
Columbia Acorn USA
In a Nutshell
| |||
| Robert A. Mohn Lead Portfolio Manager | |||

Performance data shown represents past performance and is not a guarantee of future results. The investment return and principal value will fluctuate so that shares, when redeemed, may be worth more or less than the original cost. Current performance may be lower or higher than the performance data shown. Please visit columbiamanagement.com for daily and most recent month-end performance updates.
Columbia Acorn USA (Class Z shares) ended the fourth quarter of 2012 up 3.17%, outperforming the 1.85% gain of its primary benchmark, the Russell 2000 Index. For the annual period, the Fund also topped the benchmark with an 18.98% gain versus a 16.35% return for the Russell 2000 Index.
The top contributor to performance in the fourth quarter came from teen apparel retailer Abercrombie & Fitch, up 42% on improved U.S. earnings results, a reduction in excess inventory and a large share buy-back executed in the quarter. Global branded apparel manufacturer Warnaco Group also had a strong quarter, gaining 38% after announcing that it was to be acquired by PVH Corp. The Fund also profited from the other side of the deal table, as casino operator Pinnacle Entertainment gained 29% in the quarter on news it would acquire Ameristar Casinos.
Car rental company Avis Budget Group was up 29% in the fourth quarter and ended the year up 85%, benefiting from high fleet utilization and what we believe could be a new trend of positive rental car pricing in the industry. IPG Photonics rose 17% in the fourth quarter and was up 99% for the year. Revenue growth was strong as IPG's fiber laser technology continued to gain acceptance across a wide range of new applications. Convention hotel operator Ryman Hospitality Properties issued a large special dividend in advance of its conversion to a real estate investment trust. The stock rose 19% in the fourth quarter and was up 95% for the year.
The top contributor to Fund performance for the year was premium active apparel retailer lululemon atheletica, up 63% as growing brand awareness continued to fuel earnings growth. Industrial companies Nordson and Ametek had annual gains of 55% and 34%, respectively. Nordson's dispensing systems for adhesives and coatings are in high demand from a wide spectrum of product manufacturers, including, of particular note, smartphone and tablet producers. Ametek, a maker of aerospace and industrial instruments, continued to take market share, which propelled earnings nearly 20% higher year-to-date through September.
Several technology stocks detracted from Fund performance. Micros Systems, a developer of information systems used by the hospitality industry, fell 14% in the quarter and 9% for the year. Data integration software developer Informatica was off 13% for the quarter and 18% for the year. Both fell on disappointing sales results. Atmel, a manufacturer of microcontrollers, ended the year on a strong note with a fourth quarter gain of 25%, but it was not enough to offset earlier losses. For the year, Atmel's stock was down 19%, beset by declining revenues and a lost contract bid.
Biotechnology stocks also marred performance. In the fourth quarter, Isis Pharmaceuticals, Auxilium Pharmaceuticals and ARIAD Pharmaceuticals had losses ranging from 21% to 34%. Isis and ARIAD both had drugs that were approved by the FDA, but Isis received negative callouts from the FDA panel and ARIAD was required to add a warning label to its product. We sold the Fund's position in Isis. Sales of Auxilium's drug came in short of expectations. For the annual period, Chelsea Therapeutics International fell 85% as data presented to the FDA failed to warrant a reversal of a prior rejection of Chelsea's drug for hypo-tension.
On the first trading day of the New Year, small-cap stock indexes hit all-time record highs to very little fanfare. It's as though we're stuck in a stealth bull market that few feel comfortable acknowledging. Traumatized by the market's plunge four long years ago, investors have in general remained suspicious and skeptical about stocks (with the notable exception of their crush on Apple). We believe this is not at all a bad thing, for bull markets typically keep grinding higher until sometime after the crowd's skepticism twists into enthusiasm, and we hope the current one will do the same.
Stocks of small- and mid-cap companies pose special risks, including possible illiquidity and greater price volatility than stocks of larger, more established companies.
Portfolio holdings are subject to change periodically and may not be representative of current holdings.
Fund's Positions in Mentioned Holdings
As a percentage of net assets, as of 12/31/12
Nordson | 2.9 | % | |||||
Ametek | 2.5 | ||||||
lululemon atheletica | 2.5 | ||||||
Ryman Hospitality Properties | 2.4 | ||||||
IPG Photonics | 2.2 | ||||||
Informatica | 1.7 | ||||||
Micros Systems | 1.7 | ||||||
Avis Budget Group | 1.6 | ||||||
Abercrombie & Fitch | 1.4 | ||||||
Pinnacle Entertainment | 0.7 | ||||||
ARIAD Pharmaceuticals | 0.6 | ||||||
Atmel | 0.5 | ||||||
Auxilium Pharmaceuticals | 0.1 | ||||||
Chelsea Therapeutics International | 0.0 | * | |||||
* Rounds to less than 0.1%.
16
Columbia Acorn USA
At a Glance
Performance data shown represents past performance and is not a guarantee of future results. The investment return and principal value of an investment will fluctuate so that shares, when redeemed, may be worth more or less than their original cost. Current performance may be lower or higher than the performance data shown. Performance results reflect any fee waivers or reimbursements of Fund expenses by the investment manager and/or any of its affiliates. Absent these fee waivers and/or expense reimbursement arrangements, performance results would have been lower. Please visit columbiamanagement.com for performance data current to the most recent month-end. Market indexes are unmanaged; their results do not reflect the effect of expenses or sales charges. Securities in the Fund may not match those in an index.
Average Annual Total Returns for period ended December 31, 2012
4th quarter | 1 year | 5 years | 10 years | Life of Fund | |||||||||||||||||||
| Class Z (9/4/96 inception) | 3.17 | % | 18.98 | % | 3.67 | % | 10.40 | % | 10.05 | % | |||||||||||||
| Class A (10/16/00 inception) | |||||||||||||||||||||||
without sales charge | 3.11 | 18.67 | 3.39 | 10.05 | 9.67 | ||||||||||||||||||
with sales charge | -2.82 | 11.86 | 2.17 | 9.39 | 9.27 | ||||||||||||||||||
Russell 2000 Index* | 1.85 | 16.35 | 3.56 | 9.72 | 7.31 | ||||||||||||||||||
Results for other share classes can be found on Page 2.
*The Fund's primary benchmark. Please see Page 1 for index definitions.
All results shown assume reinvestment of distributions. The Fund's Class Z share annual operating expense ratio, as stated in the May 1, 2012, prospectus, is 1.05% and the Class A share expense ratio is 1.33%. Class Z shares are sold at NAV, have limited eligibility and the investment minimum requirement may vary. Only eligible investors may purchase Class Z shares of the Fund, directly or by exchange. Please see the Fund's prospectuses for eligibility and other details. Returns for Class A shares are shown with and without the maximum initial sales charge of 5.75%. The returns shown for periods prior to the inception of the Fund's Class A shares may append the returns of the Fund's Class Z shares, the Fund's oldest share class. These returns are adjusted to reflect any higher class-related operating expenses of the newer share classes, as applicable. Please visit columbiamanagement.com/mutual-funds/appended-performance for more information.
Portfolio Diversification
as a percentage of net assets, as of 12/31/12
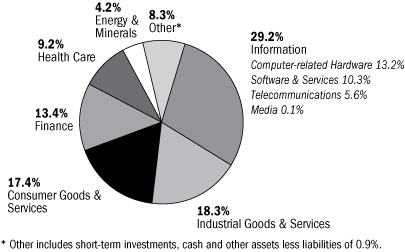
Top 10 Holdings
as a percentage of net assets, as of 12/31/12
| 1. | Nordson Dispensing Systems for Adhesives & Coatings | 2.9 | % | ||||||||
| 2. | Ametek Aerospace/Industrial Instruments | 2.5 | % | ||||||||
| 3. | lululemon athletica Premium Active Apparel Retailer | 2.5 | % | ||||||||
| 4. | Ryman Hospitality Properties Convention Hotels | 2.4 | % | ||||||||
| 5. | tw telecom Fiber Optic Telephone/Data Services | 2.3 | % | ||||||||
| 6. | IPG Photonics Fiber Lasers | 2.2 | % | ||||||||
| 7. | Mettler-Toledo International Laboratory Equipment | 2.2 | % | ||||||||
| 8. | Extra Space Storage Self Storage Facilities | 2.1 | % | ||||||||
| 9. | Atwood Oceanics Offshore Drilling Contractor | 2.1 | % | ||||||||
| 10. | ESCO Technologies Automatic Electric Meter Readers | 2.0 | % | ||||||||
The Fund's top 10 holdings and portfolio diversification vary with changes in portfolio investments. See the Statement of Investments for a complete list of the Fund's holdings.
The Growth of a $10,000 Investment in Columbia Acorn USA Class Z Shares
September 4, 1996 (Fund inception) through December 31, 2012
This chart shows the change in value of a hypothetical $10,000 investment in Class Z shares of the Fund during the stated time period, and does not reflect the deduction of taxes that a shareholder may pay on Fund distributions or on the redemption of Fund shares.
Total Net Assets of the Fund: $1.6 billion
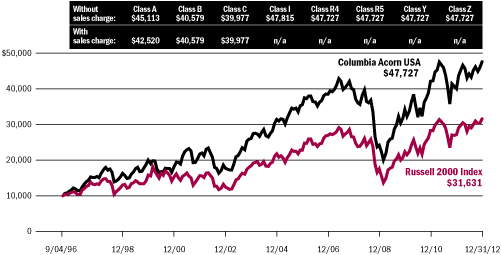
17
Columbia Acorn International Select
In a Nutshell
| |||
| Christopher J. Olson Lead Portfolio Manager | |||

Performance data shown represents past performance and is not a guarantee of future results. The investment return and principal value will fluctuate so that shares, when redeemed, may be worth more or less than the original cost. Current performance may be lower or higher than the performance data shown. Please visit columbiamanagement.com for daily and most recent month-end performance updates.
Columbia Acorn International Select (Class Z shares) ended the fourth quarter of 2012 down 1.49%, underperforming the 5.35% gain of its primary benchmark, the S&P Developed Ex-U.S. Between $2B and $10B Index. Even with the lag in the fourth quarter, the Fund's annual gain remained well ahead of its benchmark, up 22.42% versus the benchmark's 16.78% return. As I have mentioned in previous reports, Columbia Acorn International Select is managed with a preference for quality, high cash flow and dividend yield, strong balance sheet, and less cyclical businesses. This style generally does well in more difficult or lower growth periods but can lag when the market takes a euphoric turn either due to unexpectedly loose monetary policy or strong economic growth. The fourth quarter was certainly one of those times. Investors globally became more optimistic about economic growth as the market felt the effect of significant monetary stimulus in the United States and Japan. As a result, investors switched their attention to more cyclical companies, an area where the Fund is significantly underweight. In addition, the Fund's hedge in gold and silver mining stocks, which were very successful in the third quarter, reversed their gains.
Jupiter Telecommunications, the largest cable service provider in Japan, was the top contributor to Fund performance in the fourth quarter, up 28%, and its stock was up nearly 30% for the year. We opted to sell the Fund's position as the gain was driven by the decision of the two largest shareholders to purchase the company and take it private. Far EasTone Telecom, a Taiwanese mobile device operator, had a 3% gain in the fourth quarter and was up 41% for the annual period. The company continued to benefit from growing smartphone sales and data usage. Hexagon, a Swedish software developer, gained 18% in the quarter and ended the year up 70% thanks to its continued investment in higher quality and automated manufacturing. German online payment processor Wirecard's 7% fourth quarter gain added to the stock's 54% annual return. Stock gains were driven by a continuation of strong online payment growth as consumers became more comfortable doing business over the Internet.
Singaporean industrial property landlords Ascendas REIT, Mapletree Industrial Trust and Mapletree Logistics Trust ended the year with annual gains ranging from 44% to 53%. In the fourth quarter, Mapletree Logistics Trust gained 5%, Ascendas REIT rose 1% and Mapletree Industrial Trust fell 1%. While these stocks cooled at year end due to investor preference for more cyclical stocks, the strong economic outlook for Singapore and the real estate investment trust's (REIT) high dividend yields drove interest in these stocks throughout the year.
The Fund's largest detractor from performance was Japanese online apparel retailer Start Today, off 35% in the quarter and 40% for the year. The stock fell on a slowdown in revenue growth. Adcock Ingram Holdings was also down for both the quarter and annual periods, off 15% and 19%, respectively. This South African manufacturer of pharmaceuticals and medical supplies suffered from increasing price competition and we elected to sell the stock out of the portfolio.
The Fund saw a reversal in the performance of its mining stocks in the fourth quarter. Allied Nevada Gold and Alamos Gold were added to the Fund in the quarter, but ended the period down 23% and 13%, respectively. Canada-listed Goldcorp fell 20% and China's Zhaojin Mining Industry was down 12%. For the year, Goldcorp and Zhaojin were up only slightly. We opted to sell the Fund's position in Zhaojin and reallocate the funds to better quality ideas.
We believe that the main question going into 2013 is the sustainability of the current rally. Have we sufficiently solved many of our economic and financial problems? Is it enough to get the global economy back on the track of sustainable growth? While I remain skeptical, these are questions that bear further serious consideration and I will continue to reassess the Fund's current positioning to determine whether or not changes to the portfolio are warranted.
International investing involves special risks, including foreign taxation, currency risks, risks associated with possible differences in financial standards, operational and settlement risks and other risks associated with future political and economic developments. Stocks of small- and mid-cap companies pose special risks, including possible illiquidity and greater price volatility than stocks of larger, more established companies. Investing in emerging markets may involve greater risks than investing in more developed countries.
Portfolio holdings are subject to change periodically and may not be representative of current holdings.
Fund's Positions in Mentioned Holdings
As a percentage of net assets, as of 12/31/12
Far EasTone Telecom | 7.5 | % | |||||
Ascendas REIT | 6.8 | ||||||
Goldcorp | 4.8 | ||||||
Mapletree Industrial Trust | 4.7 | ||||||
Mapletree Logistics Trust | 3.5 | ||||||
Alamos Gold | 3.0 | ||||||
Wirecard | 2.3 | ||||||
Allied Nevada Gold | 2.2 | ||||||
Start Today | 2.1 | ||||||
Hexagon | 1.3 | ||||||
18
Columbia Acorn International Select
At a Glance
Performance data shown represents past performance and is not a guarantee of future results. The investment return and principal value of an investment will fluctuate so that shares, when redeemed, may be worth more or less than their original cost. Current performance may be lower or higher than the performance data shown. Performance results reflect any fee waivers or reimbursements of Fund expenses by the investment manager and/or any of its affiliates. Absent these fee waivers and/or expense reimbursement arrangements, performance results would have been lower. Please visit columbiamanagement.com for performance data current to the most recent month-end. Market indexes are unmanaged; their results do not reflect the effect of expenses or sales charges. Securities in the Fund may not match those in an index.
Average Annual Total Returns for period ended December 31, 2012
4th quarter | 1 year | 5 years | 10 years | Life of Fund | |||||||||||||||||||
| Class Z (11/23/98 inception) | -1.49 | % | 22.42 | % | 0.50 | % | 13.27 | % | 9.58 | % | |||||||||||||
| Class A (10/16/00 inception) | |||||||||||||||||||||||
without sales charge | -1.56 | 22.05 | 0.14 | 12.88 | 9.21 | ||||||||||||||||||
with sales charge | -7.23 | 15.03 | -1.04 | 12.22 | 8.76 | ||||||||||||||||||
| S&P Developed Ex-U.S. Between $2B and $10B Index* | 5.35 | 16.78 | -1.86 | 11.17 | 7.17 | ||||||||||||||||||
Results for other share classes can be found on Page 2.
*The Fund's primary benchmark. Please see Page 1 for index definitions.
All results shown assume reinvestment of distributions. The Fund's Class Z share annual operating expense ratio, as stated in the May 1, 2012, prospectus, is 1.25% and the Class A share expense ratio is 1.62%. Class Z shares are sold at NAV, have limited eligibility and the investment minimum requirement may vary. Only eligible investors may purchase Class Z shares of the Fund, directly or by exchange. Please see the Fund's prospectuses for eligibility and other details. Returns for Class A shares are shown with and without the maximum initial sales charge of 5.75%. The returns shown for periods prior to the inception of the Fund's Class A shares may append the returns of the Fund's Class Z shares, the Fund's oldest share class. These returns are adjusted to reflect any higher class-related operating expenses of the newer share classes, as applicable. Please visit columbiamanagement.com/mutual-funds/appended-performance for more information.
Portfolio Diversification
as a percentage of net assets, as of 12/31/12
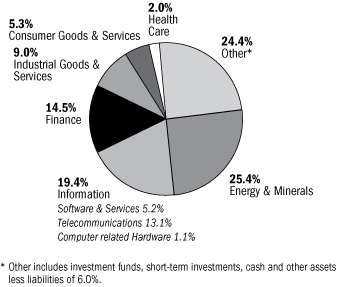
Top 10 Holdings
as a percentage of net assets, as of 12/31/12
| 1. | Far EasTone Telecom (Taiwan) Taiwan's Third Largest Mobile Operator | 7.5 | % | ||||||||
| 2. | Ascendas REIT (Singapore) Industrial Property Landlord | 6.8 | % | ||||||||
| 3. | Fresnillo (Mexico) Silver & Metal Byproduct Mining in Mexico | 6.0 | % | ||||||||
| 4. | Goldcorp (Canada) Gold Mining | 4.8 | % | ||||||||
| 5. | Mapletree Industrial Trust (Singapore) Industrial Property Landlord | 4.7 | % | ||||||||
| 6. | Taiwan Mobile (Taiwan) Taiwan's Second Largest Mobile Operator | 4.7 | % | ||||||||
| 7. | Challenger Financial (Australia) Largest Annuity Provider | 4.1 | % | ||||||||
| 8. | Seven Bank (Japan) ATM Processing Services | 3.8 | % | ||||||||
| 9. | Mapletree Logistics Trust (Singapore) Industrial Property Landlord | 3.5 | % | ||||||||
| 10. | Commonwealth Property Office Fund (Australia) Australia Prime Office REIT | 3.4 | % | ||||||||
The Fund's top 10 holdings and portfolio diversification vary with changes in portfolio investments. See the Statement of Investments for a complete list of the Fund's holdings.
The Growth of a $10,000 Investment in Columbia Acorn International Select Class Z Shares
November 23, 1998 (Fund inception) through December 31, 2012
This chart shows the change in value of a hypothetical $10,000 investment in Class Z shares of the Fund during the stated time period, and does not reflect the deduction of taxes that a shareholder may pay on Fund distributions or on the redemption of Fund shares.
Total Net Assets of the Fund: $380.4 million
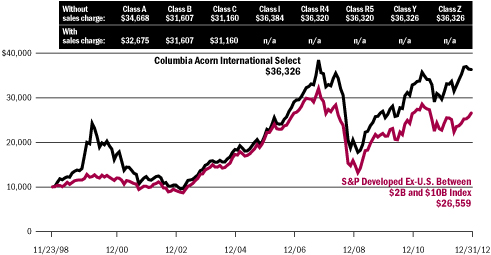
19
Columbia Acorn Select
In a Nutshell
|
| ||||||
| Ben Andrews Lead Portfolio Manager | Robert A. Chalupnik Co-Portfolio Manager | ||||||


Performance data shown represents past performance and is not a guarantee of future results. The investment return and principal value will fluctuate so that shares, when redeemed, may be worth more or less than the original cost. Current performance may be lower or higher than the performance data shown. Please visit columbiamanagement.com for most recent month-end performance updates.
Columbia Acorn Select (Class Z shares) gained 2.04% in the fourth quarter of 2012, underperforming the S&P MidCap 400 Index, the Fund's primary benchmark, which was up 3.61%. The large-cap S&P 500 Index lost 0.38% in the fourth quarter. For the year, Columbia Acorn Select was up 17.15%, the S&P Midcap 400 Index gained 17.88%, and the S&P 500 Index was up 16.00%.
We've mentioned previously the repositioning of the Fund into more core growth companies. We believe this repositioning contributed to the solid returns that we experienced this year, as most of the Fund's core growth stocks outperformed its riskier opportunistic holdings (which usually have turnaround characteristics). Though such opportunistic holdings cost the Fund some performance in 2012, we still believe in using this strategy within the Fund, but to a lesser degree. When the Fund makes investments in opportunistic stocks, we have typically sought to purchase the stocks at historic low valuations, such as on a multiple of revenue or cash on their balance sheet. If the turnaround took longer than we anticipated or if we were wrong and it never happened, the already low valuation could serve to lower the risk that the Fund would experience a substantial principal loss from the investment. We believe the risk of principal loss has increased, however, since the end of 2009, as the economy has grown slowly and money flows into the equity market have been continuously negative. In particular, with money continuing to flow out of stocks, we have seen valuation compression in the Fund's opportunistic stocks in cases where we believe the market was less certain of their future turnaround. As a result, we lost capital in opportunistic stocks where our analysis or timing was incorrect. Therefore, it is particularly crucial that we are correct in our analysis and timing before making an investment in an opportunistic stock in today's market environment.
Co-portfolio manager Rob Chalupnik has played a key role in the repositioning of the Fund into more core growth names. Two stocks that Rob selected for the Fund's portfolio were top contributors to performance for the year. Ryman Hospitality Properties and Ametek combined added over 3.5% of portfolio annual performance. Ryman Hospitality Properties, formerly Gaylord Entertainment, runs convention hotel properties and was up 95% in the year as travel picked up in the United States and as a result of its conversion to a real estate investment trust. Ametek, a global manufacturer of aerospace and industrial instruments, gained market share in a soft economy and added over 1.5% to portfolio performance for the year with its 34% gain.
Financials were also a strong driver of portfolio performance in 2012. Discover Financial Services, which offers the Discover Card, and CNO Financial Group, a provider of life, long-term care and medical supplemental insurance, were up 62% and 49%, respectively, for the year and added over 5% of portfolio performance.
Energy stocks detracted from the Fund's annual performance, with six energy names costing the Fund 3.3% of performance for the year. Colombian oil exploration companies Canacol and Houston American Energy, down 58% and 98%, respectively, cost the Fund roughly 2%. Both had disappointing exploration results. Houston American Energy drilled three wells in Colombia and all three were dry holes, leaving the company low on funds and with a questionable future. We opted to sell the Fund's position in the stock.
During the fourth quarter, we purchased Airgas, the United States' largest distributor of industrial, medical, and specialty gases. We also added Choice Hotels, owner of the Comfort Inn, Clarion, and Quality Inn hotel brands, among others, to the portfolio.
We sold out of business software company Concur Technologies. Though its sales have been growing, we felt its valuation was high and that operating margins may compress, leaving the company with flat year-over-year earnings. We also exited luxury goods retailer Tiffany & Co. as we believe its near-term sales growth data is murky and that we can find other ideas with more top-line visibility. We swapped out of Expeditors International of Washington in favor of Forward Air, a provider of time-definite surface transportation and logistics to the North American air freight market. We believe domestic transportation is growing faster than trans-Pacific (which Expeditors International caters to), and domestic is not suffering from the overcapacity that exists in ocean freight (which is one of Expeditors International's strong suits). In addition, Forward Air is increasing its pickup and delivery business of goods it handles.
Risks include stock market fluctuations due to economic and business developments. The Fund also has potentially greater price volatility due to the Fund's concentration in a limited number of stocks of mid-size companies. International investing involves special risks, including foreign taxation, currency risks, risks associated with possible differences in financial standards, operational and settlement risks and other risks associated with future political and economic developments.
Portfolio holdings are subject to change periodically and may not be representative of current holdings.
Fund's Positions in Mentioned Holdings
As a percentage of net assets, as of 12/31/12
Ametek | 6.0 | % | |||||
Discover Financial Services | 5.6 | ||||||
CNO Financial Group | 5.4 | ||||||
Ryman Hospitality Properties | 4.1 | ||||||
Canacol | 1.0 | ||||||
Airgas | 0.7 | ||||||
Forward Air | 0.4 | ||||||
Choice Hotels | 0.3 | ||||||
20
Columbia Acorn Select
At a Glance
Performance data shown represents past performance and is not a guarantee of future results. The investment return and principal value of an investment will fluctuate so that shares, when redeemed, may be worth more or less than their original cost. Current performance may be lower or higher than the performance data shown. Performance results reflect any fee waivers or reimbursements of Fund expenses by the investment manager and/or any of its affiliates. Absent these fee waivers and/or expense reimbursement arrangements, performance results would have been lower. Please visit columbiamanagement.com for performance data current to the most recent month-end. Market indexes are unmanaged; their results do not reflect the effect of expenses or sales charges. Securities in the Fund may not match those in an index.
Average Annual Total Returns for period ended December 31, 2012
4th quarter | 1 year | 5 years | 10 years | Life of Fund | |||||||||||||||||||
| Class Z (11/23/98 inception) | 2.04 | % | 17.15 | % | 0.33 | % | 8.62 | % | 9.33 | % | |||||||||||||
| Class A (10/16/00 inception) | |||||||||||||||||||||||
without sales charge | 1.99 | 16.87 | 0.04 | 8.28 | 8.98 | ||||||||||||||||||
with sales charge | -3.87 | 10.15 | -1.14 | 7.64 | 8.52 | ||||||||||||||||||
S&P MidCap 400 Index* | 3.61 | 17.88 | 5.15 | 10.53 | 9.21 | ||||||||||||||||||
Results for other share classes can be found on Page 2.
*The Fund's primary benchmark. Please see Page 1 for index definitions.
All results shown assume reinvestment of distributions. The Fund's Class Z share annual operating expense ratio, as stated in the May 1, 2012, prospectus, is 1.00% and the Class A share expense ratio is 1.35%. Class Z shares are sold at NAV, have limited eligibility and the investment minimum requirement may vary. Only eligible investors may purchase Class Z shares of the Fund, directly or by exchange. Please see the Fund's prospectuses for eligibility and other details. Returns for Class A shares are shown with and without the maximum initial sales charge of 5.75%. The returns shown for periods prior to the inception of the Fund's Class A shares may append the returns of the Fund's Class Z shares, the Fund's oldest share class. These returns are adjusted to reflect any higher class-related operating expenses of the newer share classes, as applicable. Please visit columbiamanagement.com/mutual-funds/appended-performance for more information.
Portfolio Diversification
as a percentage of net assets, as of 12/31/12
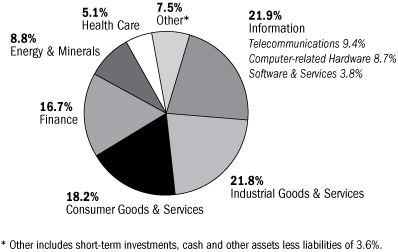
Top 10 Holdings
as a percentage of net assets, as of 12/31/12
| 1. | Ametek Aerospace/Industrial Instruments | 6.0 | % | ||||||||
| 2. | Discover Financial Services Credit Card Company | 5.6 | % | ||||||||
| 3. | CNO Financial Group Life, Long-term Care & Medical Supplement Insurance | 5.4 | % | ||||||||
| 4. | Hertz Largest US Rental Car Operator | 5.0 | % | ||||||||
| 5. | Crown Castle International Communications Towers | 4.2 | % | ||||||||
| 6. | Ryman Hospitality Properties Convention Hotels | 4.1 | % | ||||||||
| 7. | Donaldson Industrial Air Filtration | 3.6 | % | ||||||||
| 8. | Amphenol Electronic Connectors | 3.4 | % | ||||||||
| 9. | WNS (India) Offshore BPO (Business Process Outsourcing) Services | 3.3 | % | ||||||||
| 10. | SBA Communications Communications Towers | 3.2 | % | ||||||||
The Fund's top 10 holdings and portfolio diversification vary with changes in portfolio investments. See the Statement of Investments for a complete list of the Fund's holdings.
The Growth of a $10,000 Investment in Columbia Acorn Select Class Z Shares
November 23, 1998 (Fund inception) through December 31, 2012
This chart shows the change in value of a hypothetical $10,000 investment in Class Z shares of the Fund during the stated time period, and does not reflect the deduction of taxes that a shareholder may pay on Fund distributions or on the redemption of Fund shares.
Total Net Assets of the Fund: $965.6 million
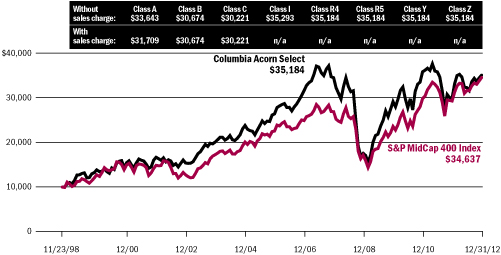
21
Columbia Thermostat Fund
In a Nutshell
| |||
| Charles P. McQuaid Lead Portfolio Manager | |||

Performance data shown represents past performance and is not a guarantee of future results. The investment return and principal value will fluctuate so that shares, when redeemed, may be worth more or less than the original cost. Current performance may be lower or higher than the performance data shown. Please visit columbiamanagement.com for daily and most recent month-end performance updates.
A "fund of fund" bears its allocable share of the costs and expenses of the underlying funds in which it invests. Such funds are thus subject to two levels of fees and potentially higher expense ratios than would be associated with a fund that invests and trades directly in financial instruments under the direction of a single manager.
Columbia Thermostat Fund (Class Z shares) ended the fourth quarter up 1.52%. This compares to a 0.38% drop of the Fund's primary equity benchmark, the S&P 500 Index, and a 0.22% gain of its primary debt benchmark, the Barclays U.S. Aggregate Bond Index. Weighted returns for the equity and income portions of the Fund were up 1.09% and 1.60%, respectively. The equity portion's tilt toward international and small- and mid-caps helped that portion to beat the S&P 500 Index, and the bond portion's tilt toward higher yields contributed to its outperformance of the bond index.
For the year, the Fund was up 13.69%, the S&P 500 Index gained 16.00% and the Barclays U.S. Aggregate Bond Index rose 4.22%. The equity portion of the Fund had a 17.14% weighted average gain with top underlying fund performance coming from Columbia Acorn International, up 21.69% (Class I shares). On the income side of the Fund, the annual weighted average gain was 8.59% with the higher yielding Columbia Income Opportunities Fund's 14.55% gain contributing heavily to that number.
The Fund hit three reallocation triggers during the fourth quarter, increasing stock exposure in October and November and reducing it in December. At the end of the period, the Fund had a 45% weighting in its underlying stock funds and a 55% weighting in its bond funds.
As a result of the periodic review of underlying funds called for by Columbia Thermostat Fund's prospectus, effective December 10, 2012, the following changes were made to the Fund's fixed income allocation:
• The weighting of Columbia Intermediate Bond Fund was reduced from 50% to 30%.
• Columbia Short Term Bond Fund, which provides exposure to the shorter duration investment-grade debt style, was added to the Fund's portfolio with a weighting of 40%.
• Columbia U.S. Treasury Index Fund was removed from the portfolio.
These changes were driven by a concern over the possibility of rising interest rates in the future, given the current low rate environment, expansionary monetary policy and government budget deficits. The average duration of the bond funds within Columbia Thermostat
Fund was reduced as a result of these changes, lowering the Fund's interest rate risk.
Results of the Funds Owned in Columbia Thermostat Fund
as of December 31, 2012
Stock Funds
| Fund | Weightings in category | 4th quarter | 1 year | ||||||||||||
| Columbia Acorn International, Class I | 20 | % | 4.25 | % | 21.69 | % | |||||||||
| Columbia Dividend Income Fund, Class I | 20 | % | -1.37 | % | 11.30 | % | |||||||||
Columbia Acorn Fund, Class I | 15 | % | 3.03 | % | 18.02 | % | |||||||||
| Columbia Select Large Cap Growth Fund, Class I | 10 | % | -0.92 | % | 15.51 | % | |||||||||
| Columbia Acorn Select, Class I | 10 | % | 2.08 | % | 17.26 | % | |||||||||
| Columbia Contrarian Core Fund, Class I | 15 | % | 0.51 | % | 18.92 | % | |||||||||
| Columbia Large Cap Enhanced Core Fund, Class I | 10 | % | -1.28 | % | 16.17 | % | |||||||||
Weighted Average Equity Gain | 100 | % | 1.09 | % | 17.14 | % | |||||||||
Bond Funds
| Fund | Weightings in category | 4th quarter | 1 year | ||||||||||||
| Columbia Short Term Bond Fund, Class I* | 40 | % | 0.33 | % | 2.99 | % | |||||||||
| Columbia Intermediate Bond Fund, Class I | 30 | % | 1.06 | % | 7.57 | % | |||||||||
| Columbia Income Opportunities Fund, Class I | 30 | % | 3.27 | % | 14.55 | % | |||||||||
Weighted Average Income Gain | 100 | % | 1.60 | % | 8.59 | % | |||||||||
*Replaced Columbia U.S. Treasury Index Fund effective December 10, 2012. Weighted average income returns through year-end reflect linked returns between the previous Fund holding and Columbia Short Term Bond Fund.
Columbia Thermostat Fund Rebalancing in the Fourth Quarter
October 15, 2012 | 45% stocks, 55% bonds | ||||||
November 8, 2012 | 50% stocks, 50% bonds | ||||||
December 10, 2012 | 45% stocks, 55% bonds | ||||||
The value of an investment in the Fund is based primarily on the performance of the underlying funds in which its invests. The Fund is subject to the risk that the investment manager's decisions regarding asset classes and underlying funds will not anticipate market trends successfully, resulting in a failure to preserve capital or lower total return.
The Fund's investments in the underlying funds may also present certain risks, including the following. Investments made by underlying funds in foreign securities, particularly those in emerging markets countries, are subject to special risks, including but not limited to a greater degree of social, political and economic volatility than is associated with domestic investments, as well as the risks associated with any differences in financial standards, including foreign taxation. Investments by the underlying funds in small- and mid-cap companies, as well as in restricted securities, pose special risks, including potential illiquidity and price volatility. Underlying funds that concentrate their investments in a single industry sector, such as technology or healthcare, are subject to the risk that companies in the same sector may be similarly affected by economic or market downturns. Risks associated with investments in bond funds include credit risk, interest rate risk, and prepayment and extension risk. Debt securities with the lowest investment grade ratings and unrated securities of comparable quality are more speculative than securities with higher ratings and may experience greater price fluctuations. These securities also tend to be more sensitive to credit risk than higher-rated securities. This is not an offer of the shares of any other mutual fund mentioned herein.
22
Columbia Thermostat Fund
At a Glance
Performance data shown represents past performance and is not a guarantee of future results. The investment return and principal value of an investment will fluctuate so that shares, when redeemed, may be worth more or less than their original cost. Current performance may be lower or higher than the performance data shown. Performance results reflect any fee waivers or reimbursements of Fund expenses by the investment manager and/or any of its affiliates. Absent these fee waivers and/or expense reimbursement arrangements, performance results would have been lower. Please visit columbiamanagement.com for performance data current to the most recent month-end. Market indexes are unmanaged; their results do not reflect the effect of expenses or sales charges. Securities in the Fund may not match those in an index.
Average Annual Total Returns for period ended December 31, 2012
4th quarter | 1 year | 5 years | 10 years | Life of Fund | |||||||||||||||||||
| Class Z (9/25/02 inception) | 1.52 | % | 13.69 | % | 5.19 | % | 7.89 | % | 8.10 | % | |||||||||||||
| Class A (3/3/03 inception) | |||||||||||||||||||||||
without sales charge | 1.47 | 13.34 | 4.94 | 7.61 | 7.82 | ||||||||||||||||||
with sales charge | -4.35 | 6.84 | 3.70 | 6.97 | 7.20 | ||||||||||||||||||
S&P 500 Index* | -0.38 | 16.00 | 1.66 | 7.10 | 7.71 | ||||||||||||||||||
| Barclays U.S. Aggregate Bond Index* | 0.22 | 4.22 | 5.95 | 5.18 | 5.22 | ||||||||||||||||||
Results for other share classes can be found on Page 2.
*The Fund's primary stock and bond benchmarks, respectively. Please see Page 1 for index definitions.
All results shown assume reinvestment of distributions. The Fund's Class Z share annual operating expense ratio, as stated in the May 1, 2012, prospectus, is 0.90% and the Class A share expense ratio is 1.15%. Class Z shares are sold at NAV, have limited eligibility and the investment minimum requirement may vary. Only eligible investors may purchase Class Z shares of the Fund, directly or by exchange. Please see the Fund's prospectuses for eligibility and other details. Returns for Class A shares are shown with and without the maximum initial sales charge of 5.75%. The returns shown for periods prior to the inception of the Fund's Class A shares may append the returns of the Fund's Class Z shares, the Fund's oldest share class. These returns are adjusted to reflect any higher class-related operating expenses of the newer share classes, as applicable. Please visit columbiamanagement.com/mutual-funds/appended-performance for more information.
Asset Allocation
as a percentage of net assets, as of 12/31/12
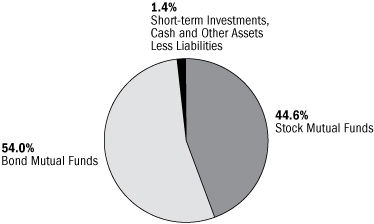
Portfolio Weightings
as a percentage of assets in each investment category, as of 12/31/12
Stock Mutual Funds
Columbia Acorn International, Class I | 20 | % | |||||
Columbia Dividend Income Fund, Class I | 20 | % | |||||
Columbia Acorn Fund, Class I | 15 | % | |||||
Columbia Contrarian Core Fund, Class I | 15 | % | |||||
Columbia Acorn Select, Class I | 10 | % | |||||
Columbia Large Cap Enhanced Core Fund, Class I | 10 | % | |||||
Columbia Select Large Cap Growth Fund, Class I | 10 | % | |||||
Bond Mutual Funds
Columbia Short Term Bond Fund, Class I | 40 | %* | |||||
Columbia Intermediate Bond Fund, Class I | 30 | % | |||||
Columbia Income Opportunities Fund, Class I | 30 | % | |||||
*Replaced Columbia U.S. Treasury Index Fund effective December 10, 2012.
The Growth of a $10,000 Investment in Columbia Thermostat Fund Class Z Shares
September 25, 2002 (Fund inception) through December 31, 2012
This chart shows the change in value of a hypothetical $10,000 investment in Class Z shares of the Fund during the stated time period, and does not reflect the deduction of taxes that a shareholder may pay on Fund distributions or on the redemption of Fund shares.
Total Net Assets of the Fund: $874.6 million
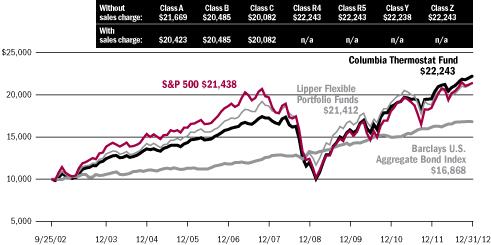
23
Columbia Acorn Emerging Markets Fund
In a Nutshell
|
| ||||||
| Fritz Kaegi Lead Portfolio Manager | Stephen Kusmierczak Lead Portfolio Manager | ||||||
|
| ||||||
| P. Zachary Egan Co-Portfolio Manager | Louis J. Mendes III Co-Portfolio Manager | ||||||


Performance data shown represents past performance and is not a guarantee of future results. The investment return and principal value will fluctuate so that shares, when redeemed, may be worth more or less than the original cost. Current performance may be lower or higher than the performance data shown. Please visit columbiamanagement.com for most recent month-end performance updates.
Columbia Acorn Emerging Markets Fund (Class Z shares) gained 9.08% in the fourth quarter of 2012, outperforming the 7.07% increase in the Fund's primary benchmark, the S&P Emerging Markets Between $500M and $5B Index. For the year, the Fund returned 31.35%, substantially beating the benchmark result of 25.71%. Since inception in August 2011, the Fund's 15.55% annualized advance was more than double the benchmark gain of 6.34%.
Emerging markets' equity returns were up solidly in 2012, and admittedly we have been somewhat surprised by the Fund's strong outperformance in these markets. Our strategy has been to position the Fund conservatively, with the expectation that performance might lag the benchmark in strongly rising markets. The Fund did decline less than the benchmark during the negative second quarter of 2012, so the limited record so far is that the Fund has outperformed in both falling and rising markets.
Energy companies Americas Petrogas and Madalena Ventures were the best performers in the fourth quarter, up 60% and 54%, respectively. Both companies announced successful new well developments, while sentiment towards their key market, Argentina, improved somewhat. Yet for the year, Madalena Ventures was down 65% as Argentina's nationalization of another energy company crushed industry valuations and made it the worst performing holding in 2012. Two consumer staples companies contributed strongly in the fourth quarter. A new idea in the second quarter, Petra Foods jumped 42% following the announcement that Barry Callebaut was buying its cocoa business at a large premium. United Breweries, an Indian brewer, gained 38% in the quarter after its inclusion in the MSCI India Index. The stock rose 135% in 2012 on solid earnings gains, making it the Fund's second best performer for the year. German automotive paint equipment manufacturer Dürr, with a strong position in emerging markets, advanced 36% in the fourth quarter and 113% for the year on consistent revenue and margin growth.
The biggest decliner in the fourth quarter was Arcos Dorados, the largest McDonald's franchise operator in Latin America. Its shares dropped 22% following weak growth in its key Brazilian operations. Taiwanese Internet retailer PC Home fell 18% in the quarter as low utilization in its new warehouse depressed operating margins. NetEase.com, a Chinese online gaming company, experienced a sharp slowdown in revenues during the second and third quarters, and the stock declined 18% on
the news in the fourth quarter. We opted to exit the name. Leading Taiwanese battery pack manufacturer Simplo Technology slid 16% on continued weakness in the PC and notebook markets.
When we introduced Columbia Acorn Emerging Markets Fund in 2011, we believed that the rising consumer class was one of the key themes recommending investing in emerging markets. Through a thoroughly bottom-up process, the Fund's positioning reflects this conviction. The Fund's sizeable overweight in consumer discretionary and staples has widened in 2012 from 28% to roughly 40% of the portfolio. This group also includes four of the Fund's top 10 contributors. On balance, our Columbia Wanger Asset Management analysts appear to have rightly sized their best ideas, meaning that five of the Fund's largest holdings were top 10 performers for the year. An example is Cambodian casino operator Nagacorp, which was the Fund's largest contributor in 2012, up 159%, and also its third largest position.
While the opportunities in many emerging markets' consumer retail stocks are less attractive after big gains, our analysts continue to identify new ideas that should benefit from supportive trends like urbanization, better education, productivity increases following new infrastructure investment, and the emergence of a sizeable middle class.
International investing involves special risks, including foreign taxation, currency risks, risks associated with possible differences in financial standards, operational and settlement risks and other risks associated with future political and economic developments. Stocks of small- and mid-cap companies pose special risks, including possible illiquidity and greater price volatility than stocks of larger, more established companies. Investing in emerging markets may involve greater risks than investing in more developed countries.
Portfolio holdings are subject to change periodically and may not be representative of current holdings.
Fund's Positions in Mentioned Holdings
As a percentage of net assets, as of 12/31/12
Nagacorp | 2.8 | % | |||||
United Breweries | 2.1 | ||||||
PC Home | 2.0 | ||||||
Arcos Dorados | 1.1 | ||||||
Petra Foods | 1.1 | ||||||
Americas Petrogas | 1.0 | ||||||
Dürr | 0.9 | ||||||
Simplo Technology | 0.8 | ||||||
Madalena Ventures | 0.4 | ||||||
24
Columbia Acorn Emerging Markets Fund
At a Glance
Performance data shown represents past performance and is not a guarantee of future results. The investment return and principal value of an investment will fluctuate so that shares, when redeemed, may be worth more or less than their original cost. Current performance may be lower or higher than the performance data shown. Performance results reflect any fee waivers or reimbursements of Fund expenses by the investment manager and/or any of its affiliates. Absent these fee waivers and/or expense reimbursement arrangements, performance results would have been lower. Please visit columbiamanagement.com for performance data current to the most recent month-end. Market indexes are unmanaged; their results do not reflect the effect of expenses or sales charges. Securities in the Fund may not match those in an index.
Average Annual Total Returns for period ended December 31, 2012
4th quarter | 1 year | Life of Fund | |||||||||||||
| Class Z (8/19/11 inception) | 9.08 | % | 31.35 | % | 15.55 | % | |||||||||
| Class A (8/19/11 inception) | |||||||||||||||
without sales charge | 8.88 | 30.86 | 15.05 | ||||||||||||
with sales charge | 2.61 | 23.40 | 10.19 | ||||||||||||
S&P Emerging Markets Between $500M and $5B Index* | 7.07 | 25.71 | 6.34 | ||||||||||||
Results for other share classes can be found on Page 2.
*The Fund's primary benchmark. Please see Page 1 for index definitions.
All results shown assume reinvestment of distributions. The Fund's Class Z share annual operating expense ratio, as stated in the May 1, 2012, prospectus, is 1.60% and the Class A share expense ratio is 1.85%. Class Z shares are sold at NAV, have limited eligibility and the investment minimum requirement may vary. Only eligible investors may purchase Class Z shares of the Fund, directly or by exchange. Please see the Fund's prospectuses for eligibility and other details. Returns for Class A shares are shown with and without the maximum initial sales charge of 5.75%. For purposes of the Fund's principal investment strategies, CWAM generally determines which countries are emerging market countries by reference to the countries included in the S&P Emerging Markets Broad Market Index.
Portfolio Diversification
as a percentage of net assets, as of 12/31/12
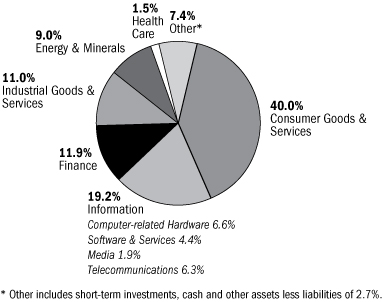
Top 10 Holdings
as a percentage of net assets, as of 12/31/12
| 1. | Far EasTone Telecom (Taiwan) Taiwan's Third Largest Mobile Operator | 3.3 | % | ||||||||
| 2. | Tower Bersama Infrastructure (Indonesia) Communications Towers | 3.0 | % | ||||||||
| 3. | Nagacorp (Cambodia) Casino/Entertainment Complex in Cambodia | 2.8 | % | ||||||||
| 4. | Halyk Savings Bank of Kazakhstan (Kazakhstan) Largest Retail Bank & Insurer in Kazakhstan | 2.7 | % | ||||||||
| 5. | Ace Indonesia (Indonesia) Home Improvement Retailer | 2.5 | % | ||||||||
| 6. | Hexagon (Sweden) Design, Measurement & Visualization Software & Equipment | 2.5 | % | ||||||||
| 7. | Coronation Fund Managers (South Africa) South African Fund Manager | 2.4 | % | ||||||||
| 8. | Archipelago Resources (Indonesia) Gold Mining Projects in Indonesia, Vietnam & the Philippines | 2.4 | % | ||||||||
| 9. | Dufry Group (Switzerland) Operates Airport Duty Free & Duty Paid Shops | 2.3 | % | ||||||||
| 10. | Melco International (Hong Kong) Macau Casino Operator | 2.2 | % | ||||||||
The Fund's top 10 holdings and portfolio diversification vary with changes in portfolio investments. See the Statement of Investments for a complete list of the Fund's holdings.
The Growth of a $10,000 Investment in Columbia Acorn Emerging Markets Fund Class Z Shares
August 19, 2011 (Fund inception) through December 31, 2012
This chart shows the change in value of a hypothetical $10,000 investment in Class Z shares of the Fund during the stated time period, and does not reflect the deduction of taxes that a shareholder may pay on Fund distributions or on the redemption of Fund shares.
Total Net Assets of the Fund: $10.5 million
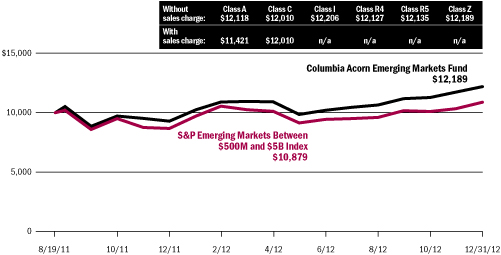
25
Columbia Acorn European Fund
In a Nutshell
|
| ||||||
| Andreas Waldburg-Wolfegg Lead Portfolio Manager | Stephen Kusmierczak Co-Portfolio Manager | ||||||


Performance data shown represents past performance and is not a guarantee of future results. The investment return and principal value will fluctuate so that shares, when redeemed, may be worth more or less than the original cost. Current performance may be lower or higher than the performance data shown. Please visit columbiamanagement.com for daily and most recent month-end performance updates.
For 2012, Columbia Acorn European Fund (Class Z shares) returned 25.66% versus its primary benchmark, the S&P Europe Between $500M and $5B Index, up 28.24%. Following strong outperformance in the first half of the year, the Fund lagged the benchmark in the second half. For the fourth quarter, the Fund posted a 5.08% gain while its benchmark rose 8.01%.
Several of the Fund's strongest contributors to annual performance were Eurofins Scientific, Gemalto, GlobeOp Financial Services and Wirecard. French testing company Eurofins Scientific, up 126% for the year, reported strong improvements in operating margins following the consolidation and restructuring of smaller, less efficient laboratories. French digital security solutions provider Gemalto, up 86%, is reaping the benefits of investing heavily in a new product line-up for mobile telephones, secure transactions and access control. Wirecard, up 54%, is a German online payment processor and risk manager. The company consistently reported good operating statistics throughout the year. Finally GlobeOp Financial Services, a U.K. hedge fund administrator, became the object of a takeover battle early in the year, providing the Fund with a 60% gain before its first quarter exit from the portfolio.
The main detractors from performance for the year were Velti, a U.S.-based provider of mobile marketing software, Alliance Grain Traders, a Canada-listed processor of lentils and peas (pulses) with more than half of its sales in Turkey, and CIR, an Italian holding company.
We had bought Velti to diversify our bet on mobile marketing in Europe, where Velti had 60% of its sales. However, the company was unable to get its considerable working capital issues under control and, in the third quarter of 2012, sold a large portion of its European activities to local management. Our investment case, which was premised on the business both remaining mainly European and controlling its working capital, was disproven and we sold the position. The stock had a fourth quarter decline of 57% and was off 48% for the year.
Alliance Grain Traders was off 34% for the year with 9% of the decline coming in the fourth quarter. The company's Middle Eastern clients suffered from a liquidity squeeze in the wake of political turmoil and devaluing currencies in the first quarter. The situation and the stock remained volatile for the rest of the year. With its short-term outlook unclear, this kind of volatility will persist, yet management has delivered on its promises in this tough environment, and we believe the long-term outlook for pulses as a cheap source of protein and fiber remains very strong.
CIR, the holding company of the de Benedetti family, has been suffering from a difficult operating environment in Italian electricity generation and there seems to be no catalyst in sight for either its electricity generation arm or for its health care arm. Its shares fell 7% in the fourth quarter and were down 32% for the year.
Velti and Alliance Grain Traders were significant detractors from performance in the fourth quarter as was FX Energy, an oil and gas exploration company operating in Poland and the United States. The company reported cautious updates for two of its core wells in Poland, depressing the share price more than 40% from the date of the announcement in early October to the end of November. Given the number of projects in Poland that the company is active in and the size of the opportunity, we believe the investment still has long-term value.
Major contributors in the fourth quarter were, again, Eurofins Scientific, up 14%, followed by German automotive plant engineer Dürr, up 34% on consistent revenue and margin growth. German automotive engineer Bertrandt was also strong in the quarter, gaining 36%.
International investing involves special risks, including foreign taxation, currency risks, risks associated with possible differences in financial standards, operational and settlement risks and other risks associated with future political and economic developments. Stocks of small- and mid-cap companies pose special risks, including possible illiquidity and greater price volatility than stocks of larger, more established companies. Investing in emerging markets may involve greater risks than investing in more developed countries.
Portfolio holdings are subject to change periodically and may not be representative of current holdings.
Fund's Positions in Mentioned Holdings
As a percentage of net assets, as of 12/31/12
Eurofins Scientific | 2.8 | % | |||||
Gemalto | 2.5 | ||||||
Wirecard | 2.2 | ||||||
Alliance Grain Traders | 1.3 | ||||||
Bertrandt | 1.3 | ||||||
Dürr | 1.0 | ||||||
FX Energy | 0.5 | ||||||
CIR | 0.2 | ||||||
26
Columbia Acorn European Fund
At a Glance
Performance data shown represents past performance and is not a guarantee of future results. The investment return and principal value of an investment will fluctuate so that shares, when redeemed, may be worth more or less than their original cost. Current performance may be lower or higher than the performance data shown. Performance results reflect any fee waivers or reimbursements of Fund expenses by the investment manager and/or any of its affiliates. Absent these fee waivers and/or expense reimbursement arrangements, performance results would have been lower. Please visit columbiamanagement.com for performance data current to the most recent month-end. Market indexes are unmanaged; their results do not reflect the effect of expenses or sales charges. Securities in the Fund may not match those in an index.
Average Annual Total Returns for period ended December 31, 2012
4th quarter | 1 year | Life of Fund | |||||||||||||
| Class Z (8/19/11 inception) | 5.08 | % | 25.66 | % | 14.00 | % | |||||||||
| Class A (8/19/11 inception) | |||||||||||||||
without sales charge | 4.99 | 25.46 | 13.70 | ||||||||||||
with sales charge | -1.07 | 18.19 | 8.89 | ||||||||||||
S&P Europe Between $500M and $5B Index* | 8.01 | 28.24 | 13.57 | ||||||||||||
Results for other share classes can be found on Page 2.
*The Fund's primary benchmark. Please see Page 1 for index definitions.
All results shown assume reinvestment of distributions. The Fund's Class Z share annual operating expense ratio, as stated in the May 1, 2012, prospectus, is 1.50% and the Class A share expense ratio is 1.75%. Class Z shares are sold at NAV, have limited eligibility and the investment minimum requirement may vary. Only eligible investors may purchase Class Z shares of the Fund, directly or by exchange. Please see the Fund's prospectuses for eligibility and other details. Returns for Class A shares are shown with and without the maximum initial sales charge of 5.75%.
Portfolio Diversification
as a percentage of net assets, as of 12/31/12
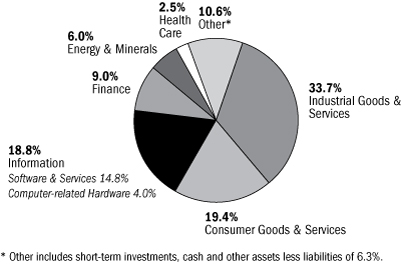
Top 10 Holdings
as a percentage of net assets, as of 12/31/12
| 1. | Eurofins Scientific (France) Food, Pharmaceuticals & Materials Screening & Testing | 2.8 | % | ||||||||
| 2. | Geberit (Switzerland) Plumbing Supplies | 2.8 | % | ||||||||
| 3. | 1000 Interactive Advertising and Marketingmercis (France) | 2.7 | % | ||||||||
| 4. | Partners Group (Switzerland) Private Markets Asset Management | 2.7 | % | ||||||||
| 5. | Hexagon (Sweden) Design, Measurement & Visualization Software & Equipment | 2.6 | % | ||||||||
| 6. | Dufry Group (Switzerland) Operates Airport Duty Free & Duty Paid Shops | 2.6 | % | ||||||||
| 7. | Gemalto (France) Digital Security Solutions | 2.5 | % | ||||||||
| 8. | Archipelago Resources (Indonesia) Gold Mining Projects in Indonesia, Vietnam & the Philippines | 2.5 | % | ||||||||
| 9. | Charles Taylor (United Kingdom) Insurance Services | 2.3 | % | ||||||||
| 10. | Aalberts Industries (Netherlands) Flow Control & Heat Treatment | 2.3 | % | ||||||||
The Fund's top 10 holdings and portfolio diversification vary with changes in portfolio investments. See the Statement of Investments for a complete list of the Fund's holdings.
The Growth of a $10,000 Investment in Columbia Acorn European Fund Class Z Shares
August 19, 2011 (Fund inception) through December 31, 2012
This chart shows the change in value of a hypothetical $10,000 investment in Class Z shares of the Fund during the stated time period, and does not reflect the deduction of taxes that a shareholder may pay on Fund distributions or on the redemption of Fund shares.
Total Net Assets of the Fund: $3.2 million
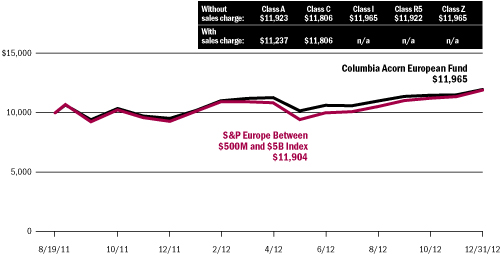
27
Columbia Acorn Fund
Major Portfolio Changes in the Fourth Quarter (Unaudited)
Number of Shares | |||||||||||
9/30/12 | 12/31/12 | ||||||||||
Purchases | |||||||||||
Information | |||||||||||
Bazaarvoice | 141,923 | 1,700,000 | |||||||||
Blackbaud | 368,889 | 900,000 | |||||||||
Cree | 560,000 | 720,000 | |||||||||
Exa | 102,593 | 872,060 | |||||||||
iGATE | 3,400,000 | 3,700,000 | |||||||||
InContact | 2,110,000 | 2,200,000 | |||||||||
Liquidity Services | 100,000 | 250,000 | |||||||||
Monolithic Power Systems | 1,165,000 | 1,415,000 | |||||||||
Navigant Consulting | 3,500,000 | 3,704,600 | |||||||||
RealPage | 0 | 1,219,511 | |||||||||
Rogers | 0 | 35,816 | |||||||||
Semtech | 0 | 650,000 | |||||||||
Solera Holdings | 55,000 | 155,000 | |||||||||
Windstream | 0 | 2,000,000 | |||||||||
Industrial Goods & Services | |||||||||||
| Aalberts Industries (Netherlands) | 2,472,255 | 2,695,419 | |||||||||
Airgas | 0 | 294,180 | |||||||||
Albemarle | 1,580,000 | 1,730,000 | |||||||||
Ashland | 800,000 | 1,100,000 | |||||||||
Forward Air | 1,400,000 | 1,500,000 | |||||||||
Imtech (Netherlands) | 1,300,000 | 1,948,368 | |||||||||
Insperity | 1,546,000 | 1,800,000 | |||||||||
Moog | 3,000,000 | 3,230,000 | |||||||||
Polyone | 0 | 1,200,000 | |||||||||
Polypore International | 1,557,553 | 1,600,000 | |||||||||
Thermon | 0 | 1,065,000 | |||||||||
WESCO International | 157,843 | 1,200,000 | |||||||||
Consumer Goods & Services | |||||||||||
American Eagle Outfitters | 1,575,000 | 1,925,000 | |||||||||
B&G Foods | 0 | 700,000 | |||||||||
Boulder Brands Inc | 0 | 1,675,000 | |||||||||
Casey's General Stores | 0 | 500,000 | |||||||||
Choice Hotels | 1,100,000 | 1,337,338 | |||||||||
DeVry | 600,000 | 1,300,000 | |||||||||
Domino's Pizza | 0 | 370,000 | |||||||||
Fossil | 527,845 | 822,845 | |||||||||
Lifetime Fitness | 2,190,000 | 2,280,000 | |||||||||
| Massmart Holdings (South Africa) | 388,220 | 852,000 | |||||||||
Pier 1 Imports | 6,600,000 | 7,185,000 | |||||||||
Ryman Hospitality Properties | 3,850,000 | 4,520,690 | |||||||||
ULTA | 0 | 640,000 | |||||||||
Williams-Sonoma | 415,000 | 1,375,000 | |||||||||
Number of Shares | |||||||||||
9/30/12 | 12/31/12 | ||||||||||
Finance | |||||||||||
Associated Banc-Corp | 6,956,800 | 7,756,800 | |||||||||
Brown & Brown | 900,000 | 1,500,000 | |||||||||
CAI International | 1,123,400 | 1,397,834 | |||||||||
Oriental Financial Group | 0 | 500,000 | |||||||||
SEI Investments | 6,654,000 | 7,100,000 | |||||||||
Selective Insurance Group | 2,050,000 | 2,625,000 | |||||||||
The Hanover Insurance Group | 1,120,000 | 1,400,000 | |||||||||
Tower Group | 2,764,000 | 3,300,000 | |||||||||
Health Care | |||||||||||
DENTSPLY International | 1,550,000 | 1,950,000 | |||||||||
Orthofix International | 570,000 | 725,000 | |||||||||
PerkinElmer Inc. | 950,000 | 1,475,000 | |||||||||
Sarepta Therapeutics | 0 | 955,000 | |||||||||
Seattle Genetics | 6,153,000 | 6,550,000 | |||||||||
Synageva Biopharma | 735,000 | 1,165,000 | |||||||||
Ultragenyx | 0 | 3,610,890 | |||||||||
Other Industries | |||||||||||
EdR | 3,000,000 | 5,744,300 | |||||||||
Hudson Pacific Properties | 0 | 544,330 | |||||||||
Kirby | 350,000 | 602,000 | |||||||||
Kite Realty Group | 3,500,000 | 4,000,000 | |||||||||
| Mapletree Commercial Trust (Singapore) | 8,845,000 | 10,000,000 | |||||||||
Pepco Holdings | 0 | 2,200,000 | |||||||||
Post Properties | 975,000 | 1,435,000 | |||||||||
Summit Hotel Properties | 2,476,000 | 2,850,000 | |||||||||
Terreno Realty | 0 | 358,151 | |||||||||
Energy & Minerals | |||||||||||
Alamos Gold (Canada) | 0 | 1,600,000 | |||||||||
Allied Nevada Gold | 0 | 1,150,000 | |||||||||
Chart Industries | 0 | 226,889 | |||||||||
Dresser-Rand Group | 0 | 400,000 | |||||||||
Gulfmark Offshore | 0 | 150,000 | |||||||||
Kirkland Lake Gold (Canada) | 1,400,000 | 1,900,000 | |||||||||
Regis Resources (Australia) | 217,283 | 1,282,902 | |||||||||
See accompanying notes to financial statements.
28
Number of Shares | |||||||||||
9/30/12 | 12/31/12 | ||||||||||
Sales | |||||||||||
Information | |||||||||||
Ansys | 2,550,000 | 2,350,000 | |||||||||
Ariba | 300,000 | 0 | |||||||||
Atmel | 11,562,000 | 7,976,000 | |||||||||
Concur Technologies | 1,400,000 | 1,130,000 | |||||||||
Crown Castle International | 4,465,000 | 4,200,000 | |||||||||
Discovery Series C | 900,000 | 720,000 | |||||||||
Eloqua | 130,881 | 0 | |||||||||
Equinix | 450,000 | 300,000 | |||||||||
IXYS | 1,900,000 | 850,000 | |||||||||
Kenexa | 925,000 | 0 | |||||||||
Lamar Advertising | 1,700,000 | 1,200,000 | |||||||||
NetEase.com - ADR (China) | 222,400 | 0 | |||||||||
Quality Systems | 2,350,000 | 1,500,000 | |||||||||
SABA | 2,000,000 | 148,664 | |||||||||
Stratasys | 480,000 | 310,000 | |||||||||
Syntel | 680,000 | 616,029 | |||||||||
WMS Industries | 1,530,000 | 600,000 | |||||||||
Industrial Goods & Services | |||||||||||
Albany International | 600,000 | 0 | |||||||||
Clarcor | 2,213,551 | 1,750,000 | |||||||||
Clean Harbors | 560,000 | 400,000 | |||||||||
| Expeditors International of Washington | 2,900,000 | 2,600,000 | |||||||||
FMC Corporation | 1,520,000 | 1,050,000 | |||||||||
Fortune Brands Home & Security | 1,350,000 | 1,050,000 | |||||||||
GrafTech International | 2,221,812 | 0 | |||||||||
Novozymes (Denmark) | 1,525,000 | 1,000,000 | |||||||||
Oshkosh Corporation | 2,675,000 | 2,400,000 | |||||||||
Pall | 1,800,000 | 1,660,000 | |||||||||
Pentair | 1,250,000 | 0 | |||||||||
WABCO Holdings | 950,000 | 750,000 | |||||||||
Consumer Goods & Services | |||||||||||
Abercrombie & Fitch | 2,601,000 | 2,431,000 | |||||||||
Annie's | 45,500 | 0 | |||||||||
Cheesecake Factory | 450,000 | 370,000 | |||||||||
Coach | 2,100,000 | 1,500,000 | |||||||||
Deckers Outdoor | 1,310,000 | 1,060,000 | |||||||||
Expedia | 1,225,000 | 1,100,000 | |||||||||
Jarden | 1,500,000 | 595,000 | |||||||||
lululemon athletica | 4,505,000 | 3,761,540 | |||||||||
Monster Beverage | 1,700,000 | 600,000 | |||||||||
Olam International (Singapore) | 32,000,000 | 20,000,000 | |||||||||
Saks | 4,425,000 | 4,100,000 | |||||||||
Skullcandy | 1,290,000 | 975,386 | |||||||||
Teavana | 971,500 | 0 | |||||||||
The Fresh Market | 66,000 | 0 | |||||||||
True Religion Apparel | 182,866 | 0 | |||||||||
Warnaco Group | 1,460,000 | 762,000 | |||||||||
Number of Shares | |||||||||||
9/30/12 | 12/31/12 | ||||||||||
Finance | |||||||||||
Eaton Vance | 4,036,000 | 3,052,000 | |||||||||
Willis Group | 832,000 | 0 | |||||||||
Health Care | |||||||||||
| Adcock Ingram Holdings (South Africa) | 2,606,333 | 0 | |||||||||
Alexion Pharmaceuticals | 1,215,000 | 800,000 | |||||||||
Auxilium Pharmaceuticals | 3,250,000 | 2,202,196 | |||||||||
BioMarin Pharmaceutical | 3,875,000 | 3,617,000 | |||||||||
Hill-Rom Holdings | 925,000 | 0 | |||||||||
Horizon Pharma | 1,095,000 | 0 | |||||||||
Isis Pharmaceuticals | 3,430,000 | 0 | |||||||||
Patterson Companies | 2,126,000 | 1,676,000 | |||||||||
Other Industries | |||||||||||
Allete | 500,000 | 0 | |||||||||
Associated Estates Realty | 3,700,000 | 3,000,000 | |||||||||
Dupont Fabros Technology | 3,700,000 | 3,625,000 | |||||||||
Heartland Express | 2,400,000 | 1,773,000 | |||||||||
Kilroy Realty | 770,000 | 0 | |||||||||
Wisconsin Energy | 1,660,000 | 700,000 | |||||||||
Energy & Minerals | |||||||||||
Approach Resources | 200,000 | 0 | |||||||||
Black Diamond Group (Canada) | 893,600 | 847,600 | |||||||||
Celtic Exploration (Canada) | 718,000 | 0 | |||||||||
Denbury Resources | 2,700,000 | 1,477,000 | |||||||||
FMC Technologies | 5,150,000 | 4,635,000 | |||||||||
| Horizon North Logistics (Canada) | 2,890,900 | 2,631,339 | |||||||||
Hornbeck Offshore | 884,000 | 499,000 | |||||||||
Kodiak Oil and Gas | 1,100,000 | 0 | |||||||||
Oil States International | 513,000 | 191,000 | |||||||||
| Pacific Rubiales Energy (Colombia) | 3,500,000 | 2,700,000 | |||||||||
Rosetta Resources | 974,000 | 722,000 | |||||||||
ShawCor (Canada) | 1,670,000 | 1,334,000 | |||||||||
SM Energy | 703,000 | 590,000 | |||||||||
Tullow Oil (United Kingdom) | 1,050,000 | 850,000 | |||||||||
Vopak (Netherlands) | 218,000 | 0 | |||||||||
See accompanying notes to financial statements.
29
Columbia Acorn Fund
Statement of Investments, December 31, 2012
Number of Shares | Value | ||||||||||
Equities: 97.7% | |||||||||||
Information 26.7% | |||||||||||
| > Business Software 5.9% | |||||||||||
2,350,000 | Ansys (a) | $ | 158,249,000 | ||||||||
| Simulation Software for Engineers & Designers | |||||||||||
5,000,000 | Informatica (a) | 151,600,000 | |||||||||
Enterprise Data Integration Software | |||||||||||
5,450,000 | Hexagon (Sweden) | 137,820,900 | |||||||||
| Design, Measurement & Visualization Software & Equipment | |||||||||||
2,700,000 | Micros Systems (a) | 114,588,000 | |||||||||
| Information Systems for Hotels, Restaurants & Retailers | |||||||||||
1,130,000 | Concur Technologies (a) | 76,297,600 | |||||||||
| Web Enabled Cost & Expense Management Software | |||||||||||
700,000 | NetSuite (a) | 47,110,000 | |||||||||
| End-to-end IT Systems Solutions Delivered Over the Web | |||||||||||
900,000 | Tyler Technologies (a) | 43,596,000 | |||||||||
| Financial, Tax, Court & Document Management Systems for Local Governments | |||||||||||
700,000 | Red Hat (a) | 37,072,000 | |||||||||
| Maintenance & Support for Opensource Operating System & Middleware | |||||||||||
900,000 | SPS Commerce (a)(b) | 33,543,000 | |||||||||
| Supply Chain Management Software Delivered via the Web | |||||||||||
1,450,000 | TIBCO (a) | 31,914,500 | |||||||||
Datacenter Software | |||||||||||
750,000 | Jack Henry & Associates | 29,445,000 | |||||||||
| IT Systems & Outsourced IT Solutions for Financial Institutions | |||||||||||
1,219,511 | RealPage (a) | 26,304,852 | |||||||||
| Software for Managing Rental Properties Delivered Via the Web | |||||||||||
1,500,000 | Quality Systems | 26,040,000 | |||||||||
| IT Systems for Medical Groups & Ambulatory Care Centers | |||||||||||
900,000 | Blackbaud | 20,547,000 | |||||||||
Software & Services for Non-profits | |||||||||||
1,200,000 | Constant Contact (a) | 17,052,000 | |||||||||
| Email & Other Marketing Campaign Management Systems Delivered Over Web | |||||||||||
1,700,000 | Bazaarvoice (a)(c) | 15,895,000 | |||||||||
| Platform for Managing Consumer Interaction Via the Web | |||||||||||
500,000 | DemandWare (a) | 13,660,000 | |||||||||
| eCommerce Website Solutions for Retailers & Apparel Manufacturers | |||||||||||
2,700,000 | Velti (a)(c) | 12,150,000 | |||||||||
Mobile Marketing Software Platform | |||||||||||
2,200,000 | InContact (a) | 11,396,000 | |||||||||
| Call Center Systems Delivered Via the Web & Telco Services | |||||||||||
872,060 | Exa (a)(b) | 8,485,144 | |||||||||
Simulation Software | |||||||||||
155,000 | Solera Holdings | 8,287,850 | |||||||||
| Software for Automotive Insurance Claims Processing | |||||||||||
Number of Shares | Value | ||||||||||
900,000 | Active Network (a) | $ | 4,419,000 | ||||||||
| Web-delivered Software Solutions for Managing Events & Activities | |||||||||||
148,664 | SABA (a) | 1,299,323 | |||||||||
Learning Management Systems | |||||||||||
1,026,772,169 | |||||||||||
| > Instrumentation 3.5% | |||||||||||
1,600,000 | Mettler-Toledo International (a)(b) | 309,280,000 | |||||||||
Laboratory Equipment | |||||||||||
2,780,000 | IPG Photonics (b)(c) | 185,287,000 | |||||||||
Fiber Lasers | |||||||||||
2,035,000 | Trimble Navigation (a) | 121,652,300 | |||||||||
GPS-based Instruments | |||||||||||
616,219,300 | |||||||||||
| > Mobile Communications 3.1% | |||||||||||
4,200,000 | Crown Castle International (a) | 303,072,000 | |||||||||
Communications Towers | |||||||||||
3,400,000 | SBA Communications (a) | 241,468,000 | |||||||||
Communications Towers | |||||||||||
1,200,000 | Globalstar (a)(c) | 366,000 | |||||||||
Satellite Mobile Voice & Data Carrier | |||||||||||
544,906,000 | |||||||||||
| > Computer Hardware & Related Equipment 2.7% | |||||||||||
3,415,000 | Amphenol | 220,950,500 | |||||||||
Electronic Connectors | |||||||||||
4,550,000 | II-VI (a)(b) | 83,128,500 | |||||||||
Laser Optics & Specialty Materials | |||||||||||
1,365,000 | Zebra Technologies (a) | 53,617,200 | |||||||||
Bar Code Printers | |||||||||||
900,000 | Netgear (a) | 35,478,000 | |||||||||
| Networking Products for Small Business & Home | |||||||||||
800,000 | Nice Systems - ADR (Israel) (a) | 26,784,000 | |||||||||
Audio & Video Recording Solutions | |||||||||||
310,000 | Stratasys (a)(c) | 24,846,500 | |||||||||
Rapid Prototyping Systems | |||||||||||
250,000 | Gemalto (France) | 22,566,209 | |||||||||
Digital Security Solutions | |||||||||||
35,816 | Rogers (a) | 1,778,623 | |||||||||
| Printed Circuit Materials & High-performance Foams | |||||||||||
469,149,532 | |||||||||||
| > Semiconductors & Related Equipment 2.2% | |||||||||||
7,932,000 | ON Semiconductor (a) | 55,920,600 | |||||||||
| Mixed Signal & Power Management Semiconductors | |||||||||||
7,976,000 | Atmel (a) | 52,242,800 | |||||||||
| Microcontrollers, Radio Frequency & Memory Semiconductors | |||||||||||
5,000,000 | Entegris (a) | 45,900,000 | |||||||||
| Semiconductor Materials Management Products | |||||||||||
2,160,000 | Microsemi (a) | 45,446,400 | |||||||||
Analog/Mixed Signal Semiconductors | |||||||||||
1,415,000 | Monolithic Power Systems | 31,526,200 | |||||||||
| High Performance Analog & Mixed Signal Integrated Circuits | |||||||||||
See accompanying notes to financial statements.
30
Number of Shares | Value | ||||||||||
| > Semiconductors & Related Equipment—continued | |||||||||||
420,000 | Littelfuse | $ | 25,918,200 | ||||||||
Little Fuses | |||||||||||
400,000 | Hittite Microwave (a) | 24,840,000 | |||||||||
| Radio Frequency, Microwave & Millimeterwave Semiconductors | |||||||||||
720,000 | Cree (a)(c) | 24,465,600 | |||||||||
LED Lighting, Components & Chips | |||||||||||
615,000 | Ultratech (a) | 22,939,500 | |||||||||
Semiconductor Equipment | |||||||||||
650,000 | Semtech (a) | 18,817,500 | |||||||||
Analog Semiconductors | |||||||||||
1,765,000 | Pericom Semiconductor (a)(b) | 14,172,950 | |||||||||
| Interface Integrated Circuits & Frequency Control Products | |||||||||||
2,290,000 | TriQuint Semiconductor (a) | 11,083,600 | |||||||||
Radio Frequency Semiconductors | |||||||||||
850,000 | IXYS | 7,769,000 | |||||||||
Power Semiconductors | |||||||||||
381,042,350 | |||||||||||
| > Telephone & Data Services 1.9% | |||||||||||
9,500,000 | tw telecom (a)(b) | 241,965,000 | |||||||||
Fiber Optic Telephone/Data Services | |||||||||||
2,200,000 | Cogent Communications | 49,808,000 | |||||||||
Internet Data Pipelines | |||||||||||
2,000,000 | Windstream (c) | 16,560,000 | |||||||||
Business & Rural Telecom Services | |||||||||||
1,500,000 | General Communications (a) | 14,385,000 | |||||||||
| Commercial Communications & Consumer CATV, Web & Phone in Alaska | |||||||||||
1,900,000 | Boingo Wireless (a)(b)(c) | 14,345,000 | |||||||||
Wholesale & Retail WiFi Networks | |||||||||||
337,063,000 | |||||||||||
| > Computer Services 1.3% | |||||||||||
3,700,000 | iGATE (a)(b) | 58,349,000 | |||||||||
| IT & Business Process Outsourcing Services | |||||||||||
1,618,000 | ExlService Holdings (a)(b) | 42,877,000 | |||||||||
Business Process Outsourcing | |||||||||||
2,125,000 | Virtusa (a)(b) | 34,913,750 | |||||||||
Offshore IT Outsourcing | |||||||||||
616,029 | Syntel | 33,012,994 | |||||||||
Offshore IT Services | |||||||||||
1,705,000 | Genpact | 26,427,500 | |||||||||
Business Process Outsourcing | |||||||||||
3,849,207 | Hackett Group (b) | 16,474,606 | |||||||||
IT Integration & Best Practice Research | |||||||||||
1,491,353 | WNS - ADR (India) (a) | 15,539,898 | |||||||||
| Offshore BPO (Business Process Outsourcing) Services | |||||||||||
227,594,748 | |||||||||||
| > Gaming Equipment & Services 1.0% | |||||||||||
3,725,000 | Bally Technologies (a)(b) | 166,544,750 | |||||||||
Slot Machines & Software | |||||||||||
600,000 | WMS Industries (a) | 10,500,000 | |||||||||
Slot Machine Provider | |||||||||||
177,044,750 | |||||||||||
Number of Shares | Value | ||||||||||
| > Internet Related 0.8% | |||||||||||
300,000 | Equinix (a) | $ | 61,860,000 | ||||||||
Network Neutral Data Centers | |||||||||||
1,325,000 | TripAdvisor (a) | 55,597,000 | |||||||||
Online Travel Research | |||||||||||
727,000 | Yandex (Russia) (a) | 15,681,390 | |||||||||
| Search Engine for Russian & Turkish Languages | |||||||||||
900,000 | Angie's List (a)(c) | 10,791,000 | |||||||||
| Consumer Subscription & Internet Advertising | |||||||||||
86,700 | Trulia (a)(c) | 1,408,008 | |||||||||
| Real Estate Broker Subscription & Advertising | |||||||||||
145,337,398 | |||||||||||
| > Business Information & Marketing Services 0.8% | |||||||||||
1,900,000 | Verisk Analytics (a) | 96,900,000 | |||||||||
Risk & Decision Analytics | |||||||||||
3,704,600 | Navigant Consulting (a)(b) | 41,343,336 | |||||||||
Financial Consulting Firm | |||||||||||
505,000 | RPX (a) | 4,565,200 | |||||||||
| Patent Aggregation & Defensive Patent Consulting | |||||||||||
142,808,536 | |||||||||||
| > Telecommunications Equipment 0.7% | |||||||||||
640,000 | F5 Networks (a) | 62,176,000 | |||||||||
Internet Traffic Management Equipment | |||||||||||
1,730,000 | Ixia (a) | 29,375,400 | |||||||||
Telecom Network Test Equipment | |||||||||||
1,675,000 | Finisar (a) | 27,302,500 | |||||||||
Optical Subsystems & Components | |||||||||||
1,925,000 | Infinera (a)(c) | 11,184,250 | |||||||||
Optical Networking Equipment | |||||||||||
130,038,150 | |||||||||||
| > Financial Processors 0.7% | |||||||||||
1,700,000 | Global Payments | 77,010,000 | |||||||||
Credit Card Processor | |||||||||||
5,000,000 | Singapore Exchange (Singapore) | 29,055,467 | |||||||||
| Singapore Equity & Derivatives Market Operator | |||||||||||
250,000 | Liquidity Services (a) | 10,215,000 | |||||||||
E-Auctions for Surplus & Salvage Goods | |||||||||||
116,280,467 | |||||||||||
| > CATV 0.7% | |||||||||||
800,000 | Liberty Global Series A (a) | 50,392,000 | |||||||||
Cable TV Franchises Outside the US | |||||||||||
720,000 | Discovery Series C (a) | 42,120,000 | |||||||||
Cable TV Programming | |||||||||||
18,000 | Jupiter Telecommunications (Japan) | 22,418,191 | |||||||||
Largest Cable Service Provider in Japan | |||||||||||
114,930,191 | |||||||||||
| > Electronics Distribution 0.6% | |||||||||||
3,125,000 | Avnet (a) | 95,656,250 | |||||||||
Electronic Components Distribution | |||||||||||
95,656,250 | |||||||||||
See accompanying notes to financial statements.
31
Columbia Acorn Fund
Statement of Investments, continued
Number of Shares | Value | ||||||||||
| > Contract Manufacturing 0.4% | |||||||||||
3,800,000 | Sanmina-SCI (a) | $ | 42,066,000 | ||||||||
Electronic Manufacturing Services | |||||||||||
960,000 | Plexus (a) | 24,768,000 | |||||||||
Electronic Manufacturing Services | |||||||||||
66,834,000 | |||||||||||
| > Advertising 0.3% | |||||||||||
1,200,000 | Lamar Advertising (a) | 46,500,000 | |||||||||
Outdoor Advertising | |||||||||||
46,500,000 | |||||||||||
| > Entertainment Programming 0.1% | |||||||||||
1,100,000 | IMAX (Canada) (a)(c) | 24,728,000 | |||||||||
| IMAX Movies, Theatre Equipment & Theatre Joint Ventures | |||||||||||
24,728,000 | |||||||||||
| > TV Broadcasting —% | |||||||||||
2,500,000 | Entravision Communications | 4,150,000 | |||||||||
| Spanish Language TV & Radio Stations | |||||||||||
1,750,000 | Gray Television (a) | 3,850,000 | |||||||||
Mid-market Affiliated TV Stations | |||||||||||
8,000,000 | |||||||||||
| > Consumer Software —% | |||||||||||
273,500 | Carbonite (a)(c) | 2,529,875 | |||||||||
Online Data Storage | |||||||||||
2,529,875 | |||||||||||
Information: Total | 4,673,434,716 | ||||||||||
Industrial Goods & Services 20.6% | |||||||||||
| > Machinery 11.6% | |||||||||||
10,125,000 | Ametek | 380,396,250 | |||||||||
Aerospace/Industrial Instruments | |||||||||||
8,400,000 | Donaldson (b) | 275,856,000 | |||||||||
Industrial Air Filtration | |||||||||||
3,125,000 | Nordson | 197,250,000 | |||||||||
| Dispensing Systems for Adhesives & Coatings | |||||||||||
3,725,000 | Kennametal | 149,000,000 | |||||||||
Consumable Cutting Tools | |||||||||||
3,230,000 | Moog (a)(b) | 132,526,900 | |||||||||
| Motion Control Products for Aerospace, Defense & Industrial Markets | |||||||||||
1,660,000 | Pall | 100,031,600 | |||||||||
Life Science, Water & Industrial Filtration | |||||||||||
3,063,000 | HEICO (b) | 97,954,740 | |||||||||
| FAA Approved Aircraft Replacement Parts | |||||||||||
2,725,000 | Generac | 93,494,750 | |||||||||
Standby Power Generators | |||||||||||
1,750,000 | Clarcor | 83,615,000 | |||||||||
Mobile Equipment & Industrial Filters | |||||||||||
2,200,000 | ESCO Technologies (b) | 82,302,000 | |||||||||
Automatic Electric Meter Readers | |||||||||||
1,600,000 | Polypore International (a)(c) | 74,400,000 | |||||||||
Battery Separators & Filtration Media | |||||||||||
2,400,000 | Oshkosh Corporation (a) | 71,160,000 | |||||||||
Specialty Truck Manufacturer | |||||||||||
Number of Shares | Value | ||||||||||
1,610,000 | Toro | $ | 69,197,800 | ||||||||
Turf Maintenance Equipment | |||||||||||
435,000 | Valmont Industries | 59,399,250 | |||||||||
| Center Pivot Irrigation Systems & Utility Poles | |||||||||||
600,000 | Wabtec | 52,524,000 | |||||||||
Freight & Transit Component Supplier | |||||||||||
750,000 | WABCO Holdings (a) | 48,892,500 | |||||||||
Truck & Bus Component Supplier | |||||||||||
170,000 | Middleby (a) | 21,795,700 | |||||||||
Manufacturer of Cooking Equipment | |||||||||||
400,000 | Neopost (France) (c) | 21,212,712 | |||||||||
Postage Meter Machines | |||||||||||
10,000,000 | Marel (Iceland) | 11,025,103 | |||||||||
| Largest Manufacturer of Poultry & Fish Processing Equipment | |||||||||||
1,000,000 | Spartan Motors | 4,930,000 | |||||||||
Specialty Truck & Chassis Manufacturer | |||||||||||
2,026,964,305 | |||||||||||
| > Industrial Materials & Specialty Chemicals 2.5% | |||||||||||
1,730,000 | Albemarle | 107,467,600 | |||||||||
| Specialty Chemicals for Refineries, Plastics, Pharma, Food | |||||||||||
1,100,000 | Ashland | 88,451,000 | |||||||||
Diversified Chemicals Company | |||||||||||
1,050,000 | FMC Corporation | 61,446,000 | |||||||||
Niche Specialty Chemicals | |||||||||||
1,880,000 | Drew Industries (b) | 60,630,000 | |||||||||
| RV & Manufactured Home Components | |||||||||||
673,000 | Sociedad Quimica y Minera de Chile - ADR (Chile) | 38,791,720 | |||||||||
| Producer of Specialty Fertilizers, Lithium & Iodine | |||||||||||
1,000,000 | Novozymes (Denmark) | 28,386,637 | |||||||||
Industrial Enzymes | |||||||||||
1,200,000 | Polyone | 24,504,000 | |||||||||
Intermediate Stage Chemicals Producer | |||||||||||
2,218,700 | Kansai Paint (Japan) | 23,910,669 | |||||||||
| Paint Producer in Japan, India, China & Southeast Asia | |||||||||||
200,000 | Silgan Holdings | 8,318,000 | |||||||||
Metal & Plastic Packaging | |||||||||||
441,905,626 | |||||||||||
| > Other Industrial Services 1.8% | |||||||||||
2,600,000 | Expeditors International of Washington | 102,830,000 | |||||||||
International Freight Forwarder | |||||||||||
2,700,000 | LKQ (a) | 56,970,000 | |||||||||
Alternative Auto Parts Distribution | |||||||||||
1,500,000 | Forward Air (b) | 52,515,000 | |||||||||
Freight Transportation Between Airports | |||||||||||
1,948,368 | Imtech (Netherlands) | 45,254,792 | |||||||||
Technical Installation & Maintenance | |||||||||||
1,600,000 | Mobile Mini (a) | 33,328,000 | |||||||||
Portable Storage Units Leasing | |||||||||||
1,512,352 | Acorn Energy (b)(c) | 11,811,469 | |||||||||
| Frac Well Exploration/Monitoring Device, Sonar Security, Electric Grid Monitoring | |||||||||||
See accompanying notes to financial statements.
32
Number of Shares | Value | ||||||||||
| > Other Industrial Services—continued | |||||||||||
500,000 | UTI Worldwide | $ | 6,700,000 | ||||||||
Freight Forwarding & Logistics | |||||||||||
309,409,261 | |||||||||||
| > Construction 1.5% | |||||||||||
2,850,000 | Chicago Bridge & Iron | 132,097,500 | |||||||||
| Engineering & Construction for Liquefied Natural Gas & Petrochemicals | |||||||||||
72,000 | NVR (a) | 66,240,000 | |||||||||
DC Homebuilder | |||||||||||
1,050,000 | Fortune Brands Home & Security (a) | 30,681,000 | |||||||||
Home Building Supplies & Small Locks | |||||||||||
1,800,000 | Mills Estruturas e Servicos de Engenharia (Brazil) | 29,890,110 | |||||||||
Civil Engineering & Construction | |||||||||||
258,908,610 | |||||||||||
| > Electrical Components 1.0% | |||||||||||
1,765,000 | Acuity Brands | 119,543,450 | |||||||||
Commercial Lighting Fixtures | |||||||||||
1,065,000 | Thermon (a) | 23,994,450 | |||||||||
Global Engineered Thermal Solutions | |||||||||||
1,500,000 | Ushio (Japan) | 16,448,568 | |||||||||
Industrial Light Sources | |||||||||||
351,000 | Saft (France) | 8,260,374 | |||||||||
Niche Battery Manufacturer | |||||||||||
168,246,842 | |||||||||||
| > Outsourcing Services 0.8% | |||||||||||
2,800,000 | Quanta Services (a) | 76,412,000 | |||||||||
Electrical & Telecom Construction Services | |||||||||||
1,800,000 | Insperity (b) | 58,608,000 | |||||||||
Professional Employer Organization | |||||||||||
600,000 | GP Strategies (a) | 12,390,000 | |||||||||
Outsourced Training Services | |||||||||||
147,410,000 | |||||||||||
| > Industrial Distribution 0.6% | |||||||||||
1,200,000 | WESCO International (a) | 80,916,000 | |||||||||
Industrial Distribution | |||||||||||
294,180 | Airgas | 26,855,692 | |||||||||
Industrial Gas Distributor | |||||||||||
107,771,692 | |||||||||||
| > Waste Management 0.5% | |||||||||||
2,050,000 | Waste Connections | 69,269,500 | |||||||||
Solid Waste Management | |||||||||||
400,000 | Clean Harbors (a) | 22,004,000 | |||||||||
Hazardous Waste Services & Disposal | |||||||||||
91,273,500 | |||||||||||
| > Conglomerates 0.3% | |||||||||||
2,695,419 | Aalberts Industries (Netherlands) | 56,431,490 | |||||||||
Flow Control & Heat Treatment | |||||||||||
56,431,490 | |||||||||||
Industrial Goods & Services: Total | 3,608,321,326 | ||||||||||
Number of Shares | Value | ||||||||||
Consumer Goods & Services 17.5% | |||||||||||
| > Retail 5.7% | |||||||||||
3,761,540 | lululemon athletica (a) | $ | 286,742,194 | ||||||||
Premium Active Apparel Retailer | |||||||||||
7,185,000 | Pier 1 Imports (b) | 143,700,000 | |||||||||
Home Furnishing Retailer | |||||||||||
2,431,000 | Abercrombie & Fitch | 116,615,070 | |||||||||
Teen Apparel Retailer | �� | ||||||||||
2,835,000 | Shutterfly (a)(b) | 84,681,450 | |||||||||
Internet Photo-centric Retailer | |||||||||||
822,845 | Fossil (a) | 76,606,870 | |||||||||
Watch Designer & Retailer | |||||||||||
640,000 | ULTA | 62,886,400 | |||||||||
Specialty Beauty Product Retailer | |||||||||||
1,375,000 | Williams-Sonoma | 60,183,750 | |||||||||
Home Goods & Furnishing Retailer | |||||||||||
4,100,000 | Saks (a)(c) | 43,091,000 | |||||||||
Luxury Department Store Retailer | |||||||||||
1,925,000 | American Eagle Outfitters | 39,481,750 | |||||||||
Teen Apparel Retailer | |||||||||||
525,000 | DSW | 34,487,250 | |||||||||
Branded Footwear Retailer | |||||||||||
500,000 | Casey's General Stores | 26,550,000 | |||||||||
Owner/Operator of Convenience Stores | |||||||||||
852,000 | Massmart Holdings (South Africa) | 19,317,084 | |||||||||
| General Merchandise, Food & Home Improvement Stores; Wal-Mart Subsidiary | |||||||||||
1,371,366 | Gaiam (a)(b) | 4,333,517 | |||||||||
| Healthy Living Catalogs & E-Commerce, Non-theatrical Media | |||||||||||
998,676,335 | |||||||||||
| > Travel 3.3% | |||||||||||
4,520,690 | Ryman Hospitality Properties (b)(c) | 173,865,737 | |||||||||
Convention Hotels | |||||||||||
4,400,000 | Avis Budget Group (a) | 87,208,000 | |||||||||
Second Largest Car Rental Company | |||||||||||
1,430,000 | Vail Resorts | 77,348,700 | |||||||||
Ski Resort Operator & Developer | |||||||||||
1,100,000 | Expedia | 67,595,000 | |||||||||
Online Travel Services Company | |||||||||||
3,750,000 | Hertz (a) | 61,012,500 | |||||||||
Largest US Rental Car Operator | |||||||||||
1,337,338 | Choice Hotels | 44,961,304 | |||||||||
Franchisor of Budget Hotel Brands | |||||||||||
2,000,000 | Localiza Rent A Car (Brazil) | 36,630,037 | |||||||||
Car Rental | |||||||||||
1,600,000 | HomeAway (a)(c) | 35,200,000 | |||||||||
Vacation Rental Online Marketplace | |||||||||||
583,821,278 | |||||||||||
| > Apparel 2.2% | |||||||||||
1,660,000 | PVH | 184,276,600 | |||||||||
Apparel Wholesaler & Retailer | |||||||||||
1,500,000 | Coach | 83,265,000 | |||||||||
| Designer & Retailer of Branded Leather Accessories | |||||||||||
762,000 | Warnaco Group (a) | 54,536,340 | |||||||||
Global Branded Apparel Manufacturer | |||||||||||
See accompanying notes to financial statements.
33
Columbia Acorn Fund
Statement of Investments, continued
Number of Shares | Value | ||||||||||
| > Apparel—continued | |||||||||||
1,060,000 | Deckers Outdoor (a)(c) | $ | 42,686,200 | ||||||||
Fashion Footwear Wholesaler | |||||||||||
600,000 | Steven Madden (a) | 25,362,000 | |||||||||
Wholesaler/Retailer of Fashion Footwear | |||||||||||
390,126,140 | |||||||||||
| > Consumer Goods Distribution 1.0% | |||||||||||
2,015,000 | Pool | 85,274,800 | |||||||||
| Distributor of Swimming Pool Supplies & Equipment | |||||||||||
2,305,000 | GNC Holdings | 76,710,400 | |||||||||
| Specialty Retailer of Health & Wellness Products | |||||||||||
625,000 | United Stationers | 19,368,750 | |||||||||
Wholesale Distributor of Business Products | |||||||||||
181,353,950 | |||||||||||
| > Casinos & Gaming 1.0% | |||||||||||
3,950,000 | Pinnacle Entertainment (a)(b) | 62,528,500 | |||||||||
Regional Casino Operator | |||||||||||
3,000,000 | Melco Crown Entertainment - ADR (Hong Kong) (a) | 50,520,000 | |||||||||
Macau Casino Operator | |||||||||||
850,000 | Penn National Gaming (a) | 41,743,500 | |||||||||
Regional Casino Operator | |||||||||||
12,000,000 | MGM China Holdings (Hong Kong) | 22,102,000 | |||||||||
Macau Casino Operator | |||||||||||
176,894,000 | |||||||||||
| > Other Consumer Services 0.9% | |||||||||||
2,280,000 | Lifetime Fitness (a)(b) | 112,198,800 | |||||||||
Sport & Fitness Club Operator | |||||||||||
17,000,000 | Lifestyle International (Hong Kong) | 42,052,554 | |||||||||
| Mid- to High-end Department Store Operator in Hong Kong & China | |||||||||||
1,062,500 | Move (a) | 8,064,375 | |||||||||
Real Estate Internet Websites | |||||||||||
450,000 | IFM Investments (Century 21 China RE) - ADR (China) (a) | 823,500 | |||||||||
Provide Real Estate Services in China | |||||||||||
163,139,229 | |||||||||||
| > Furniture & Textiles 0.9% | |||||||||||
4,200,000 | Knoll (b) | 64,512,000 | |||||||||
Office Furniture | |||||||||||
2,250,000 | Herman Miller | 48,195,000 | |||||||||
Office Furniture | |||||||||||
2,325,000 | Interface | 37,386,000 | |||||||||
Modular Carpet | |||||||||||
215,000 | Caesarstone (Israel) (a) | 3,472,250 | |||||||||
Quartz Countertops | |||||||||||
153,565,250 | |||||||||||
| > Food & Beverage 0.7% | |||||||||||
600,000 | Monster Beverage (a) | 31,728,000 | |||||||||
Alternative Beverages | |||||||||||
20,000,000 | Olam International (Singapore) (c) | 25,690,573 | |||||||||
| 6,260,000 | Olam International - Rights (Singapore) (a)(d) | 1,482,136 | |||||||||
Agriculture Supply Chain Manager | |||||||||||
1,675,000 | Boulder Brands Inc (a) | 21,607,500 | |||||||||
Healthy Food Products | |||||||||||
Number of Shares | Value | ||||||||||
1,800,000 | Arcos Dorados (Brazil) (c) | $ | 21,528,000 | ||||||||
| McDonald's Master Franchise for Latin America | |||||||||||
700,000 | B&G Foods | 19,817,000 | |||||||||
Acquiror of Small Food Brands | |||||||||||
| 1,665,270 | GLG Life Tech (Canada) (a)(b)(d) | 434,636 | |||||||||
| Produces an All-natural Sweetener Extracted from the Stevia Plant | |||||||||||
122,287,845 | |||||||||||
| > Restaurants 0.5% | |||||||||||
2,000,000 | AFC Enterprises (a)(b) | 52,260,000 | |||||||||
Popeye's Restaurants | |||||||||||
370,000 | Domino's Pizza | 16,113,500 | |||||||||
Franchisor of Pizza Restaurants | |||||||||||
370,000 | Cheesecake Factory | 12,106,400 | |||||||||
Casual Dining Restaurants | |||||||||||
675,000 | Bravo Brio Restaurant Group (a) | 9,065,250 | |||||||||
Upscale Casual Italian Restaurants | |||||||||||
89,545,150 | |||||||||||
| > Other Durable Goods 0.5% | |||||||||||
595,000 | Jarden | 30,761,500 | |||||||||
Branded Household Products | |||||||||||
850,000 | Tesla Motors (a)(c) | 28,789,500 | |||||||||
| Design, Manufacture & Sell High Performance Electric Vehicles | |||||||||||
460,000 | Cavco Industries (a)(b) | 22,990,800 | |||||||||
Manufactured Homes | |||||||||||
82,541,800 | |||||||||||
| > Educational Services 0.3% | |||||||||||
1,300,000 | DeVry | 30,849,000 | |||||||||
Postsecondary Degree Services | |||||||||||
800,000 | New Oriental Education & Technology - ADR (China) (c) | 15,544,000 | |||||||||
Education Service Provider | |||||||||||
500,000 | ITT Educational Services (a)(c) | 8,655,000 | |||||||||
Postsecondary Degree Services | |||||||||||
2,000,000 | Voyager Learning - Contingent Value Rights (a)(d)(e) | 220,000 | |||||||||
Education Services for the K-12 Market | |||||||||||
55,268,000 | |||||||||||
| > Nondurables 0.3% | |||||||||||
1,600,000 | Helen of Troy (a)(b) | 53,424,000 | |||||||||
| Personal Care, Housewares, Healthcare & Home Environment Products | |||||||||||
53,424,000 | |||||||||||
| > Other Entertainment 0.1% | |||||||||||
265,000 | CTS Eventim (Germany) | 9,337,630 | |||||||||
Event Ticket Sales | |||||||||||
9,337,630 | |||||||||||
| > Leisure Products 0.1% | |||||||||||
975,386 | Skullcandy (a)(c) | 7,598,257 | |||||||||
Lifestyle Branded Headphones | |||||||||||
7,598,257 | |||||||||||
Consumer Goods & Services: Total | 3,067,578,864 | ||||||||||
See accompanying notes to financial statements.
34
Number of Shares | Value | ||||||||||
Finance 11.2% | |||||||||||
| > Banks 4.3% | |||||||||||
2,638,000 | BOK Financial | $ | 143,665,480 | ||||||||
Tulsa-based S.W. Bank | |||||||||||
7,756,800 | Associated Banc-Corp | 101,769,216 | |||||||||
Midwest Bank | |||||||||||
2,337,313 | Hancock Holding | 74,186,315 | |||||||||
Gulf Coast Bank | |||||||||||
1,348,000 | City National | 66,752,960 | |||||||||
Bank & Asset Manager | |||||||||||
2,860,000 | MB Financial (b) | 56,485,000 | |||||||||
Chicago Bank | |||||||||||
985,000 | SVB Financial Group (a) | 55,130,450 | |||||||||
Bank to Venture Capitalists | |||||||||||
5,323,500 | Valley National Bancorp (c) | 49,508,550 | |||||||||
New Jersey/New York Bank | |||||||||||
3,000,000 | CVB Financial | 31,200,000 | |||||||||
Inland Empire Business Bank | |||||||||||
2,200,000 | TCF Financial | 26,730,000 | |||||||||
Great Lakes Bank | |||||||||||
1,350,000 | TriCo Bancshares (b) | 22,612,500 | |||||||||
California Central Valley Bank | |||||||||||
1,162,000 | Sandy Spring Bancorp | 22,566,040 | |||||||||
Baltimore, D.C. Bank | |||||||||||
550,000 | Wintrust Financial | 20,185,000 | |||||||||
Chicago & Milwaukee Full Service Bank | |||||||||||
4,299,507 | First Busey | 19,992,707 | |||||||||
Illinois Bank | |||||||||||
2,500,000 | First Commonwealth | 17,050,000 | |||||||||
Western Pennsylvania Bank | |||||||||||
705,072 | Eagle Bancorp (a) | 14,080,288 | |||||||||
Metro D.C. Bank | |||||||||||
811,295 | Hudson Valley | 12,631,863 | |||||||||
Metro New York City Bank | |||||||||||
2,136,500 | TrustCo Bank | 11,280,720 | |||||||||
New York State Bank | |||||||||||
500,000 | Oriental Financial Group (c) | 6,675,000 | |||||||||
Puerto Rican Bank | |||||||||||
752,502,089 | |||||||||||
| > Insurance 2.5% | |||||||||||
8,900,000 | CNO Financial Group | 83,037,000 | |||||||||
| Life, Long-term Care & Medical Supplement Insurance | |||||||||||
833,000 | Allied World Holdings | 65,640,400 | |||||||||
Commerical Lines Insurance/Reinsurance | |||||||||||
3,300,000 | Tower Group (b) | 58,641,000 | |||||||||
Commercial & Personal Lines Insurance | |||||||||||
1,400,000 | The Hanover Insurance Group | 54,236,000 | |||||||||
| Commercial & Personal Lines Insurance | |||||||||||
2,625,000 | Selective Insurance Group | 50,583,750 | |||||||||
Commercial & Personal Lines Insurance | |||||||||||
1,100,000 | HCC Insurance Holdings | 40,931,000 | |||||||||
Specialty Insurance | |||||||||||
1,500,000 | Brown & Brown | 38,190,000 | |||||||||
Insurance Broker | |||||||||||
250,000 | Enstar Group (a) | 27,995,000 | |||||||||
| Insurance/Reinsurance & Related Services | |||||||||||
Number of Shares | Value | ||||||||||
925,000 | Kemper | $ | 27,287,500 | ||||||||
Multi Line Insurance | |||||||||||
446,541,650 | |||||||||||
| > Finance Companies 1.7% | |||||||||||
1,285,000 | World Acceptance (a)(b) | 95,809,600 | |||||||||
Personal Loans | |||||||||||
2,150,000 | McGrath Rentcorp (b) | 62,393,000 | |||||||||
Temporary Space & IT Rentals | |||||||||||
3,400,000 | H & E Equipment Services (b) | 51,238,000 | |||||||||
Heavy Equipment Leasing | |||||||||||
1,397,834 | CAI International (a)(b) | 30,682,456 | |||||||||
International Container Leasing | |||||||||||
1,091,000 | Marlin Business Services (b) | 21,885,460 | |||||||||
Small Equipment Leasing | |||||||||||
450,000 | Onex Capital (Canada) | 18,941,892 | |||||||||
Private Equity | |||||||||||
228,500 | Textainer Group Holdings | 7,188,610 | |||||||||
Top International Container Leasor | |||||||||||
291,231 | Regional Management (a)(c) | 4,819,873 | |||||||||
Consumer Loans | |||||||||||
292,958,891 | |||||||||||
| > Brokerage & Money Management 1.5% | |||||||||||
7,100,000 | SEI Investments | 165,714,000 | |||||||||
| Mutual Fund Administration & Investment Management | |||||||||||
3,052,000 | Eaton Vance | 97,206,200 | |||||||||
Specialty Mutual Funds | |||||||||||
1,000,000 | Artio Global Investors | 1,900,000 | |||||||||
International Asset Manager | |||||||||||
264,820,200 | |||||||||||
| > Credit Cards 0.6% | |||||||||||
550,000 | Alliance Data Systems (a) | 79,618,000 | |||||||||
Diversified Credit Card Provider | |||||||||||
350,000 | Wright Express (a) | 26,379,500 | |||||||||
Pay Card Processor | |||||||||||
105,997,500 | |||||||||||
| > Diversified Financial Companies 0.4% | |||||||||||
2,820,000 | Leucadia National | 67,087,800 | |||||||||
Holding Company | |||||||||||
67,087,800 | |||||||||||
| > Savings & Loans 0.2% | |||||||||||
400,000 | Financial Engines (a) | 11,100,000 | |||||||||
Asset Management for 401k Plans | |||||||||||
470,000 | ViewPoint Financial | 9,841,800 | |||||||||
Texas Thrift | |||||||||||
1,010,000 | Provident New York Bancorp | 9,403,100 | |||||||||
New York State Thrift | |||||||||||
452,146 | Simplicity Bancorp (b) | 6,759,583 | |||||||||
Los Angeles Savings & Loan | |||||||||||
65,991 | Berkshire Hills Bancorp | 1,574,545 | |||||||||
Northeast Thrift | |||||||||||
38,679,028 | |||||||||||
Finance: Total | 1,968,587,158 | ||||||||||
See accompanying notes to financial statements.
35
Columbia Acorn Fund
Statement of Investments, continued
Number of Shares | Value | ||||||||||
Health Care 8.6% | |||||||||||
| > Biotechnology & Drug Delivery 4.4% | |||||||||||
3,617,000 | BioMarin Pharmaceutical (a) | $ | 178,137,250 | ||||||||
Biotech Focused on Orphan Diseases | |||||||||||
6,550,000 | Seattle Genetics (a)(b)(c) | 151,960,000 | |||||||||
Antibody-based Therapies for Cancer | |||||||||||
800,000 | Alexion Pharmaceuticals (a) | 75,048,000 | |||||||||
Biotech Focused on Orphan Diseases | |||||||||||
3,600,000 | ARIAD Pharmaceuticals (a) | 69,048,000 | |||||||||
Biotech Focused on Cancer | |||||||||||
870,000 | Onyx Pharmaceuticals (a) | 65,711,100 | |||||||||
| Commercial-stage Biotech Focused on Cancer | |||||||||||
6,000,000 | NPS Pharmaceuticals (a)(b) | 54,600,000 | |||||||||
Orphan Drugs & Healthy Royalties | |||||||||||
1,165,000 | Synageva Biopharma (a) | 53,927,850 | |||||||||
Biotech Focused on Orphan Diseases | |||||||||||
2,202,196 | Auxilium Pharmaceuticals (a) | 40,806,692 | |||||||||
| Biotech Focused on Niche Disease Areas | |||||||||||
955,000 | Sarepta Therapeutics (a)(c) | 24,639,000 | |||||||||
Biotech Focused On Rare Diseases | |||||||||||
2,025,000 | InterMune (a)(c) | 19,622,250 | |||||||||
| Drugs for Pulmonary Fibrosis & Hepatitis C | |||||||||||
3,000,000 | Raptor Pharmaceutical (a)(b)(c) | 17,550,000 | |||||||||
Orphan Drug Company | |||||||||||
3,610,890 | Ultragenyx (a)(d)(e) | 9,999,999 | |||||||||
| Biotech Focused On "Ultra-Orphan" Drugs | |||||||||||
4,949,000 | Chelsea Therapeutics International (a)(b)(c) | 3,761,240 | |||||||||
Biotech Focused on Rare Diseases | |||||||||||
359,944 | MicroDose Therapeutx (a)(d)(e) | 61,190 | |||||||||
Drug Inhaler Development | |||||||||||
764,872,571 | |||||||||||
| > Medical Supplies 2.3% | |||||||||||
4,970,000 | Cepheid (a)(b) | 168,035,700 | |||||||||
Molecular Diagnostics | |||||||||||
1,950,000 | DENTSPLY International | 77,239,500 | |||||||||
Leading Dental Supplies Manufacturer | |||||||||||
950,000 | Henry Schein (a) | 76,437,000 | |||||||||
Largest Distributor of Healthcare Products | |||||||||||
1,676,000 | Patterson Companies | 57,369,480 | |||||||||
Dental/Vet/Med Distributor | |||||||||||
375,000 | Techne | 25,627,500 | |||||||||
| Cytokines, Antibodies & Other Reagents for Life Science | |||||||||||
404,709,180 | |||||||||||
| > Medical Equipment & Devices 1.1% | |||||||||||
1,024,683 | Sirona Dental Systems (a) | 66,051,066 | |||||||||
Manufacturer of Dental Equipment | |||||||||||
1,475,000 | PerkinElmer Inc. | 46,816,500 | |||||||||
Analytical Instruments for Life Sciences | |||||||||||
1,100,000 | Haemonetics (a) | 44,924,000 | |||||||||
Blood & Plasma Collection Equipment | |||||||||||
725,000 | Orthofix International (a) | 28,514,250 | |||||||||
Bone Fixation & Stimulation Devices | |||||||||||
186,305,816 | |||||||||||
Number of Shares | Value | ||||||||||
| > Health Care Services 0.5% | |||||||||||
665,000 | Mednax (a) | $ | 52,880,800 | ||||||||
| Physician Management for Pediatric & Anesthesia Practices | |||||||||||
1,875,000 | Health Management Associates (a) | 17,475,000 | |||||||||
Non-urban Hospitals | |||||||||||
825,000 | HealthSouth (a) | 17,415,750 | |||||||||
Inpatient Rehabalitation Facilities | |||||||||||
87,771,550 | |||||||||||
| > Pharmaceuticals 0.3% | |||||||||||
4,000,000 | Akorn (a) | 53,440,000 | |||||||||
| Develops, Manufactures & Sells Specialty Generic Drugs | |||||||||||
2,040,000 | Alimera Sciences (a)(b) | 3,202,800 | |||||||||
| Ophthalmology-focused Pharmaceutical Company | |||||||||||
56,642,800 | |||||||||||
Health Care: Total | 1,500,301,917 | ||||||||||
Other Industries 6.7% | |||||||||||
| > Real Estate 4.5% | |||||||||||
3,625,000 | Dupont Fabros Technology (b) | 87,580,000 | |||||||||
Technology-focused Office Buildings | |||||||||||
750,000 | Federal Realty | 78,015,000 | |||||||||
Shopping Centers | |||||||||||
1,435,000 | Post Properties | 71,678,250 | |||||||||
Multifamily Properties | |||||||||||
1,850,000 | Extra Space Storage | 67,321,500 | |||||||||
Self Storage Facilities | |||||||||||
5,744,300 | EdR (b) | 61,119,352 | |||||||||
Student Housing | |||||||||||
720,000 | Digital Realty Trust | 48,880,800 | |||||||||
Technology-focused Office Buildings | |||||||||||
3,000,000 | Associated Estates Realty (b) | 48,360,000 | |||||||||
Multifamily Properties | |||||||||||
2,450,000 | Biomed Realty Trust | 47,358,500 | |||||||||
Life Science-focused Office Buildings | |||||||||||
50,000,000 | Mapletree Logistics Trust (Singapore) | 47,057,100 | |||||||||
Industrial Property Landlord | |||||||||||
22,000,000 | Ascendas REIT (Singapore) | 43,052,265 | |||||||||
Industrial Property Landlord | |||||||||||
1,300,000 | St. Joe (a)(c) | 30,004,000 | |||||||||
Florida Panhandle Landowner | |||||||||||
325,000 | Jones Lang LaSalle | 27,280,500 | |||||||||
Real Estate Services | |||||||||||
2,850,000 | Summit Hotel Properties (b) | 27,075,000 | |||||||||
Owner of Select Service Hotels | |||||||||||
3,750,000 | DCT Industrial Trust | 24,337,500 | |||||||||
Industrial Properties | |||||||||||
4,000,000 | Kite Realty Group (b) | 22,360,000 | |||||||||
Community Shopping Centers | |||||||||||
2,800 | Orix JREIT (Japan) | 13,809,474 | |||||||||
Diversified REIT | |||||||||||
544,330 | Hudson Pacific Properties | 11,463,590 | |||||||||
| West Coast Office Buildings & Production Studios | |||||||||||
See accompanying notes to financial statements.
36
Number of Shares | Value | ||||||||||
| > Real Estate—continued | |||||||||||
10,000,000 | Mapletree Industrial Trust (Singapore) | $ | 11,165,904 | ||||||||
Industrial Property Landlord | |||||||||||
10,000,000 | Mapletree Commercial Trust (Singapore) | 9,995,931 | |||||||||
Retail & Office Property Landlord | |||||||||||
358,151 | Terreno Realty | 5,529,851 | |||||||||
Industrial Properties | |||||||||||
783,444,517 | |||||||||||
| > Transportation 1.4% | |||||||||||
| 3,100,000 | Rush Enterprises, Class A (a)(b) | 64,077,000 | |||||||||
| 550,000 | Rush Enterprises, Class B (a)(b) | 9,520,500 | |||||||||
Truck Sales & Service | |||||||||||
| 1,155,000 | JB Hunt Transport Services | 68,965,050 | |||||||||
Truck & Intermodal Carrier | |||||||||||
602,000 | Kirby (a) | 37,257,780 | |||||||||
| Largest Operator of US (Jones Act) Liquid Tank Barges | |||||||||||
627,000 | World Fuel Services | 25,813,590 | |||||||||
Global Fuel Broker | |||||||||||
1,773,000 | Heartland Express | 23,173,110 | |||||||||
Regional Trucker | |||||||||||
300,000 | Genesee & Wyoming (a) | 22,824,000 | |||||||||
Short-line Operator | |||||||||||
251,631,030 | |||||||||||
| > Regulated Utilities 0.8% | |||||||||||
2,000,000 | Northeast Utilities | 78,160,000 | |||||||||
Regulated Electric Utility | |||||||||||
2,200,000 | Pepco Holdings (c) | 43,142,000 | |||||||||
Regulated Utility | |||||||||||
700,000 | Wisconsin Energy | 25,795,000 | |||||||||
Wisconsin Utility | |||||||||||
147,097,000 | |||||||||||
Other Industries: Total | 1,182,172,547 | ||||||||||
Energy & Minerals 6.4% | |||||||||||
| > Oil Services 3.1% | |||||||||||
4,635,000 | FMC Technologies (a) | 198,517,050 | |||||||||
Oil & Gas Well Head Manufacturer | |||||||||||
2,114,000 | Atwood Oceanics (a) | 96,800,060 | |||||||||
Offshore Drilling Contractor | |||||||||||
1,031,106 | Fugro (Netherlands) | 61,183,604 | |||||||||
Subsea Oilfield Services | |||||||||||
1,334,000 | ShawCor (Canada) | 52,289,796 | |||||||||
Oil & Gas Pipeline Products | |||||||||||
400,000 | Dresser-Rand Group (a) | 22,456,000 | |||||||||
Manufactures & Services Compressors | |||||||||||
585,000 | Rowan (a) | 18,292,950 | |||||||||
Contract Offshore Driller | |||||||||||
2,631,339 | Horizon North Logistics (Canada) | 18,173,619 | |||||||||
| Provides Diversified Oil Service Offering in Northern Canada | |||||||||||
499,000 | Hornbeck Offshore (a) | 17,135,660 | |||||||||
| Supply Vessel Operator in US Gulf of Mexico | |||||||||||
Number of Shares | Value | ||||||||||
847,600 | Black Diamond Group (Canada) | $ | 17,084,930 | ||||||||
| Provides Accommodations/ Equipment for Oil Sands Development | |||||||||||
226,889 | Chart Industries (a) | 15,126,690 | |||||||||
| Manufacturer of Natural Gas Processing/Storage Equipment | |||||||||||
191,000 | Oil States International (a) | 13,664,140 | |||||||||
| Diversified North American Oil Service Provider | |||||||||||
150,000 | Gulfmark Offshore | 5,167,500 | |||||||||
Operator of Offshore Supply Vessels | |||||||||||
4,025,000 | Tuscany International Drilling (Colombia) (a) | 930,683 | |||||||||
| South America Based Drilling Rig Contractor | |||||||||||
536,822,682 | |||||||||||
| > Oil & Gas Producers 1.9% | |||||||||||
2,700,000 | Pacific Rubiales Energy (Colombia) (c) | 62,729,466 | |||||||||
| Oil Production & Exploration in Colombia | |||||||||||
695,000 | Range Resources | 43,666,850 | |||||||||
Oil & Gas Producer | |||||||||||
722,000 | Rosetta Resources (a) | 32,749,920 | |||||||||
| Oil & Gas Producer Exploring in South Texas & Montana | |||||||||||
590,000 | SM Energy | 30,803,900 | |||||||||
Oil & Gas Producer | |||||||||||
1,477,000 | Denbury Resources (a) | 23,927,400 | |||||||||
| Oil Producer Using Carbon Dioxide Injection | |||||||||||
443,000 | Cabot Oil and Gas | 22,034,820 | |||||||||
| Large Natural Gas Producer in Appalachia & Gulf Coast | |||||||||||
1,159,000 | Laredo Petroleum (a) | 21,047,440 | |||||||||
Permian Basin Oil Producer | |||||||||||
850,000 | Tullow Oil (United Kingdom) | 17,720,305 | |||||||||
Oil & Gas Producer | |||||||||||
361,000 | Baytex (Canada) (c) | 15,558,530 | |||||||||
Oil & Gas Producer in Canada | |||||||||||
340,000 | PDC Energy (a) | 11,291,400 | |||||||||
Oil & Gas Producer in US | |||||||||||
27,000,000 | Shamaran Petroleum (Iraq) (a) | 10,586,106 | |||||||||
Oil Exploration in Kurdistan | |||||||||||
25,000,000 | Petroamerica Oil (Colombia) (a)(c) | 8,796,622 | |||||||||
| Oil Exploration & Production in Colombia | |||||||||||
750,000 | Athabasca Oil Sands (Canada) (a) | 7,879,260 | |||||||||
| Oil Sands & Unconventional Oil Development | |||||||||||
37,500,000 | Petromanas (Canada) (a)(b) | 6,597,467 | |||||||||
Exploring for Oil in Albania | |||||||||||
1,198,100 | Pan Orient (Canada) (a) | 3,529,137 | |||||||||
Asian Oil & Gas Explorer | |||||||||||
493,000 | Crew Energy (Canada) (a) | 3,216,618 | |||||||||
Canadian Oil & Gas Producer | |||||||||||
26,000,000 | Petrodorado Energy (Colombia) (a)(b) | 3,136,624 | |||||||||
| Oil & Gas Exploration & Production in Colombia, Peru & Paraguay | |||||||||||
See accompanying notes to financial statements.
37
Columbia Acorn Fund
Statement of Investments, continued
Number of Shares | Value | ||||||||||
| > Oil & Gas Producers—continued | |||||||||||
511,600 | Canacol (Colombia) (a) | $ | 1,640,700 | ||||||||
Oil Producer in South America | |||||||||||
8,400,000 | Canadian Overseas Petroleum (United Kingdom) (a)(e) | 1,459,254 | |||||||||
| 4,200,000 | Canadian Overseas Petroleum - Warrants (United Kingdom) (a)(d)(e) | 65,109 | |||||||||
| Oil & Gas Exploration/Production in the North Sea | |||||||||||
50,000,000 | Gulf United Energy (Colombia) (a)(b) | 390,000 | |||||||||
| Prospecting for Oil Alongside Large Producers in Colombia | |||||||||||
4,110,000 | Santa Maria Petroleum (Colombia) (a)(b)(e) | 337,163 | |||||||||
| 890,000 | Santa Maria Petroleum (Colombia) (a)(b) | 76,053 | |||||||||
Explores for Oil & Gas in Latin America | |||||||||||
393,600 | Houston American Energy (a)(c) | 86,592 | |||||||||
| Oil & Gas Exploration/ Production in Colombia | |||||||||||
329,326,736 | |||||||||||
| > Mining 1.3% | |||||||||||
387,000 | Core Labs (Netherlands) | 42,302,970 | |||||||||
Oil & Gas Reservoir Consulting | |||||||||||
1,000,000 | Silver Wheaton (Canada) | 36,080,000 | |||||||||
Silver Mining Royalty Company | |||||||||||
1,150,000 | Allied Nevada Gold (a) | 34,649,500 | |||||||||
Gold & Silver Mining | |||||||||||
1,600,000 | Alamos Gold (Canada) | 28,068,764 | |||||||||
Gold Mining | |||||||||||
4,432,000 | Northam Platinum (South Africa) | 20,060,723 | |||||||||
Platinum Mining in South Africa | |||||||||||
7,500,000 | Duluth Metals (Canada) (a)(b) | 18,623,706 | |||||||||
| 500,000 | Duluth Exploration - Special Warrants (Canada) (a)(d)(e) | 25,133 | |||||||||
Copper & Nickel Miner | |||||||||||
1,900,000 | Kirkland Lake Gold (Canada) (a) | 11,174,223 | |||||||||
Gold Mining | |||||||||||
1,150,000 | Turquoise Hill Resources (Mongolia) (a) | 8,786,569 | |||||||||
Copper Mine Project in Mongolia | |||||||||||
16,000,000 | Mongolian Mining (Mongolia) (a) | 7,929,331 | |||||||||
Coking Coal Mining in Mongolia | |||||||||||
2,050,000 | Alexco Resource (a) | 7,318,500 | |||||||||
| Mining, Exploration & Environmental Services | |||||||||||
1,282,902 | Regis Resources (Australia) (a) | 6,884,619 | |||||||||
Gold Mining in Australia | |||||||||||
3,000,000 | Kaminak Gold (a)(c) | 4,976,375 | |||||||||
| Exploration Stage Canadian Gold Miner | |||||||||||
800,000 | Augusta Resource (a)(c) | 1,960,000 | |||||||||
US Copper/Molybdenum | |||||||||||
Number of Shares | Value | ||||||||||
4,000,000 | Wolverine Minerals (Canada) (a)(b)(e) | $ | 135,116 | ||||||||
Gold Mining | |||||||||||
228,975,529 | |||||||||||
| > Agricultural Commodities 0.1% | |||||||||||
1,306,818 | Union Agriculture Group (Uruguay) (a)(d)(e) | 13,381,816 | |||||||||
Farmland Operator in Uruguay | |||||||||||
13,381,816 | |||||||||||
| > Alternative Energy —% | |||||||||||
2,000,000 | GT Advanced Technologies (a)(c) | 6,040,000 | |||||||||
| Largest Manufacturer of Furnaces & Reactors to Produce & Cast Polysilicon | |||||||||||
1,210,300 | Synthesis Energy Systems (China) (a) | 1,295,021 | |||||||||
Owner/Operator of Gasification Plants | |||||||||||
7,335,021 | |||||||||||
Energy & Minerals: Total | 1,115,841,784 | ||||||||||
| Total Equities: 97.7% (Cost: $10,488,578,720) | 17,116,238,312 | (f) | |||||||||
Short-Term Investments: 2.3% | |||||||||||
280,000,000 | J.P. Morgan U.S. Government Money Market Fund - Capital Shares (7 day yield of 0.01%) | 280,000,000 | |||||||||
117,232,736 | J.P. Morgan U.S. Government Money Market Fund - Agency Shares (7 day yield of 0.01%) | 117,232,736 | |||||||||
| Total Short-Term Investments: 2.3% (Cost: $397,232,736) | 397,232,736 | ||||||||||
Securities Lending Collateral 2.1% | |||||||||||
371,676,935 | Dreyfus Government Cash Management Fund (7 day yield of 0.01%) (g) | 371,676,935 | |||||||||
| Total Securities Lending Collateral: (Cost: $371,676,935) | 371,676,935 | ||||||||||
| Total Investments: 102.1% (Cost: $11,257,488,391)(h) | 17,885,147,983 | ||||||||||
| Obligation to Return Collateral for Securities Loaned: (2.1)% | (371,676,935 | ) | |||||||||
Cash and Other Assets Less Liabilities: 0.0% | 10,394,863 | ||||||||||
Net Assets: 100.0% | $ | 17,523,865,911 | |||||||||
ADR - American Depositary Receipts
REIT - Real Estate Investment Trust
(a) Non-income producing security.
(b) An affiliated person of the Fund may include any company in which the Fund owns five percent or more of its outstanding voting shares. Holdings and transactions in
See accompanying notes to financial statements.
38
> Notes to Statement of Investments
these affiliated companies during the year ended December 31, 2012, are as follows:
Security | Balance of Shares Held 12/31/11 | Purchases/ Additions | Sales/ Reductions | Balance of Shares Held 12/31/12 | Value | Dividend | |||||||||||||||||||||
AboveNet (1) | 1,400,000 | - | 1,400,000 | - | $ | - | $ | - | |||||||||||||||||||
Acorn Energy | 1,500,000 | 12,352 | - | 1,512,352 | 11,811,469 | 210,184 | |||||||||||||||||||||
AFC Enterprises | 2,000,000 | - | - | 2,000,000 | 52,260,000 | - | |||||||||||||||||||||
Alimera Sciences | 2,040,000 | - | - | 2,040,000 | 3,202,800 | - | |||||||||||||||||||||
Associated Estates Realty | 3,700,000 | - | 700,000 | 3,000,000 | 48,360,000 | 2,568,931 | |||||||||||||||||||||
Auxilium Pharmaceuticals (1) | 3,033,715 | 216,285 | 1,047,804 | 2,202,196 | 40,806,692 | - | |||||||||||||||||||||
Bally Technologies | 3,725,000 | - | - | 3,725,000 | 166,544,750 | - | |||||||||||||||||||||
Boingo Wireless | 1,500,000 | 400,000 | - | 1,900,000 | 14,345,000 | - | |||||||||||||||||||||
CAI International | 1,123,400 | 274,434 | - | 1,397,834 | 30,682,456 | - | |||||||||||||||||||||
Cavco Industries | 460,000 | - | - | 460,000 | 22,990,800 | - | |||||||||||||||||||||
Cepheid | 3,200,000 | 1,770,000 | - | 4,970,000 | 168,035,700 | - | |||||||||||||||||||||
Chelsea Therapeutics International | 4,550,000 | 1,200,000 | 801,000 | 4,949,000 | 3,761,240 | - | |||||||||||||||||||||
Cogent Communications (1) | 2,520,000 | - | 320,000 | 2,200,000 | 49,808,000 | 462,000 | |||||||||||||||||||||
Constant Contact (1) | 2,350,000 | - | 1,150,000 | 1,200,000 | 17,052,000 | - | |||||||||||||||||||||
Donaldson (2) | 4,200,000 | 4,200,000 | - | 8,400,000 | 275,856,000 | 2,940,000 | |||||||||||||||||||||
Drew Industries | 1,500,000 | 380,000 | - | 1,880,000 | 60,630,000 | 3,760,000 | |||||||||||||||||||||
Duluth Metals | 7,500,000 | - | - | 7,500,000 | 18,623,706 | - | |||||||||||||||||||||
Dupont Fabros Technology | 3,350,000 | 765,000 | 490,000 | 3,625,000 | 87,580,000 | 2,295,710 | |||||||||||||||||||||
EdR | 3,000,000 | 2,744,300 | - | 5,744,300 | 61,119,352 | 1,120,000 | |||||||||||||||||||||
eResearch Technology (1) | 4,900,000 | - | 4,900,000 | - | - | - | |||||||||||||||||||||
ESCO Technologies | 2,200,000 | - | - | 2,200,000 | 82,302,000 | 704,000 | |||||||||||||||||||||
Exa | - | 872,060 | 872,060 | 8,485,144 | - | ||||||||||||||||||||||
ExlService Holdings | 1,145,000 | 473,000 | - | 1,618,000 | 42,877,000 | - | |||||||||||||||||||||
Forward Air | 1,300,000 | 200,000 | - | 1,500,000 | 52,515,000 | 472,000 | |||||||||||||||||||||
Gaiam | 1,371,366 | - | - | 1,371,366 | 4,333,517 | - | |||||||||||||||||||||
GLG Life Tech | 1,750,000 | - | 84,730 | 1,665,270 | 434,636 | - | |||||||||||||||||||||
Gulf United Energy | - | 50,000,000 | - | 50,000,000 | 390,000 | - | |||||||||||||||||||||
H & E Equipment Services | 3,400,000 | - | - | 3,400,000 | 51,238,000 | 4,514,860 | |||||||||||||||||||||
Hackett Group (3) | 4,500,000 | - | 650,793 | 3,849,207 | 16,474,606 | 384,921 | |||||||||||||||||||||
HEICO (2) | 2,250,000 | 813,000 | - | 3,063,000 | 97,954,740 | 7,057,380 | |||||||||||||||||||||
Helen of Troy | 1,600,000 | - | - | 1,600,000 | 53,424,000 | - | |||||||||||||||||||||
Horizon Pharma (1) | 1,095,000 | - | 1,095,000 | - | - | - | |||||||||||||||||||||
iGATE | 3,400,000 | 300,000 | - | 3,700,000 | 58,349,000 | - | |||||||||||||||||||||
II-VI | 4,550,000 | - | - | 4,550,000 | 83,128,500 | - | |||||||||||||||||||||
Insperity | 1,210,000 | 590,000 | - | 1,800,000 | 58,608,000 | 2,681,215 | |||||||||||||||||||||
Interline Brands (1) | 2,600,000 | - | 2,600,000 | - | - | - | |||||||||||||||||||||
IPG Photonics | 2,780,000 | - | - | 2,780,000 | 185,287,000 | 1,807,000 | |||||||||||||||||||||
IXYS (1) | 1,900,000 | - | 1,050,000 | 850,000 | 7,769,000 | 49,409 | |||||||||||||||||||||
Kenexa (1) | 1,700,000 | - | 1,700,000 | - | - | - | |||||||||||||||||||||
Kite Realty Group | 3,500,000 | 500,000 | - | 4,000,000 | 22,360,000 | 840,000 | |||||||||||||||||||||
Knoll | 4,200,000 | - | - | 4,200,000 | 64,512,000 | 1,848,000 | |||||||||||||||||||||
Lifetime Fitness | 2,190,000 | 90,000 | - | 2,280,000 | 112,198,800 | - | |||||||||||||||||||||
lululemon athletica (1) | 5,740,000 | - | 1,978,460 | 3,761,540 | 286,742,194 | - | |||||||||||||||||||||
Marlin Business Services | 1,091,000 | - | - | 1,091,000 | 21,885,460 | 305,480 | |||||||||||||||||||||
MB Financial | 2,360,000 | 500,000 | - | 2,860,000 | 56,485,000 | 369,300 | |||||||||||||||||||||
McGrath Rentcorp | 2,150,000 | - | - | 2,150,000 | 62,393,000 | 2,010,250 | |||||||||||||||||||||
Mettler-Toledo International | 1,600,000 | - | - | 1,600,000 | 309,280,000 | - | |||||||||||||||||||||
Micromet (1) | 6,702,347 | 64,547 | 6,766,894 | - | - | - | |||||||||||||||||||||
Moog | 2,775,000 | 455,000 | - | 3,230,000 | 132,526,900 | - | |||||||||||||||||||||
Navigant Consulting | 2,800,000 | 904,600 | - | 3,704,600 | 41,343,336 | - | |||||||||||||||||||||
NPS Pharmaceuticals | 6,000,000 | - | - | 6,000,000 | 54,600,000 | - | |||||||||||||||||||||
Pericom Semiconductor | 1,765,000 | - | - | 1,765,000 | 14,172,950 | - | |||||||||||||||||||||
Petroamerica Oil (1) | 30,275,000 | - | 5,275,000 | 25,000,000 | 8,796,622 | - | |||||||||||||||||||||
Petrodorado Energy | 26,000,000 | - | - | 26,000,000 | 3,136,624 | - | |||||||||||||||||||||
PetroMagdalena Energy (1) | 7,582,928 | - | 7,582,928 | - | - | - | |||||||||||||||||||||
Petromanas | 37,500,000 | - | - | 37,500,000 | 6,597,467 | - | |||||||||||||||||||||
Pier 1 Imports | 5,600,000 | 1,585,000 | - | 7,185,000 | 143,700,000 | 752,000 | |||||||||||||||||||||
Pinnacle Entertainment | 3,950,000 | - | - | 3,950,000 | 62,528,500 | - | |||||||||||||||||||||
Raptor Pharmaceutical | 3,455,000 | 745,000 | 1,200,000 | 3,000,000 | 17,550,000 | - | |||||||||||||||||||||
Rush Enterprises | 3,350,000 | 300,000 | - | 3,650,000 | 73,597,500 | - | |||||||||||||||||||||
See accompanying notes to financial statements.
39
Columbia Acorn Fund
Statement of Investments, continued
> Notes to Statement of Investments
Security | Balance of Shares Held 12/31/11 | Purchases/ Additions | Sales/ Reductions | Balance of Shares Held 12/31/12 | Value | Dividend | |||||||||||||||||||||
Ryman Hospitality Properties | 3,850,000 | 670,690 | - | 4,520,690 | $ | 173,865,737 | $ | 24,418,477 | |||||||||||||||||||
Salem Communications (1) | 1,527,700 | - | 1,527,700 | - | - | - | |||||||||||||||||||||
Santa Maria Petroleum (2) | 50,000,000 | - | 45,000,000 | 5,000,000 | 413,216 | - | |||||||||||||||||||||
Seattle Genetics | 6,153,000 | 397,000 | - | 6,550,000 | 151,960,000 | - | |||||||||||||||||||||
Shutterfly | 3,070,000 | 300,000 | 535,000 | 2,835,000 | 84,681,450 | - | |||||||||||||||||||||
Simplicity Bancorp | 452,146 | - | - | 452,146 | 6,759,583 | 135,644 | |||||||||||||||||||||
SPS Commerce | 900,000 | - | - | 900,000 | 33,543,000 | - | |||||||||||||||||||||
Summit Hotel Properties | 1,500,000 | 1,350,000 | - | 2,850,000 | 27,075,000 | 916,969 | |||||||||||||||||||||
Tower Group | 1,675,000 | 1,625,000 | - | 3,300,000 | 58,641,000 | 2,173,500 | |||||||||||||||||||||
TriCo Bancshares | 1,350,000 | - | - | 1,350,000 | 22,612,500 | 486,000 | |||||||||||||||||||||
True Religion Apparel (1) | 1,507,000 | - | 1,507,000 | - | - | 92,581 | |||||||||||||||||||||
tw telecom | 9,500,000 | - | - | 9,500,000 | 241,965,000 | - | |||||||||||||||||||||
Tyler Technologies (1) | 1,700,000 | - | 800,000 | 900,000 | 43,596,000 | - | |||||||||||||||||||||
Virtusa | 2,125,000 | - | - | 2,125,000 | 34,913,750 | - | |||||||||||||||||||||
Warnaco Group (1) | 2,190,000 | - | 1,428,000 | 762,000 | 54,536,340 | - | |||||||||||||||||||||
Wolverine Minerals | 4,000,000 | - | - | 4,000,000 | 135,116 | - | |||||||||||||||||||||
World Acceptance | 1,505,202 | - | 220,202 | 1,285,000 | 95,809,600 | - | |||||||||||||||||||||
Total of Affiliated Transactions | 349,894,804 | 74,697,268 | 91,810,511 | 332,781,561 | $ | 4,461,953,753 | $ | 65,375,811 | |||||||||||||||||||
(1) At December 31, 2012, the Fund owned less than five percent of the company's outstanding voting shares.
(2) Includes the effects of a stock split.
(3) Includes the effects of a corporate action.
The aggregate cost and value of these companies at December 31, 2012, were $2,466,414,630 and $3,952,846,905, respectively. Investments in affiliated companies represented 22.56% of the Fund's total net assets at December 31, 2012.
(c) All or a portion of this security was on loan at December 31, 2012. The total market value of securities on loan at December 31, 2012 was $368,048,192.
(d) Illiquid security.
(e) Denotes a restricted security, which is subject to restrictions on resale under federal securities laws. These securities are valued at fair value determined in good faith under consistently applied procedures established by the Board of Trustees. At December 31, 2012, the market value of these securities amounted to $25,684,780, which represented 0.15% of total net assets. Additional information on these securities is as follows:
Security | Acquisition Dates | Shares | Cost | Value | |||||||||||||||
Union Agriculture Group | 12/8/10-6/27/12 | 1,306,818 | $ | 15,000,000 | $ | 13,381,816 | |||||||||||||
Ultragenyx | 12/19/12 | 3,610,890 | 9,999,999 | 9,999,999 | |||||||||||||||
Canadian Overseas Petroleum | 11/24/10 | 8,400,000 | 3,591,152 | 1,459,254 | |||||||||||||||
Santa Maria Petroleum | 1/14/11 | 4,110,000 | 5,193,292 | 337,163 | |||||||||||||||
Voyager Learning - Contingent Value Rights | 12/24/09 | 2,000,000 | - | 220,000 | |||||||||||||||
Wolverine Minerals | 6/3/11 | 4,000,000 | 2,004,903 | 135,116 | |||||||||||||||
Canadian Overseas Petroleum - Warrants | 11/24/10 | 4,200,000 | 525,688 | 65,109 | |||||||||||||||
MicroDose Therapeutx | 11/24/00 | 359,944 | 2,004,000 | 61,190 | |||||||||||||||
Duluth Exploration - Special Warrants | 8/19/11 | 500,000 | - | 25,133 | |||||||||||||||
$ | 38,319,034 | $ | 25,684,780 | ||||||||||||||||
(f) On December 31, 2012, the market value of foreign securities represented 8.30% of total net assets. The Fund's foreign portfolio was diversified as follows:
Country | Value | Percentage of Net Assets | |||||||||
Canada | $ | 262,540,827 | 1.50 | ||||||||
Netherlands | 205,172,856 | 1.17 | |||||||||
Singapore | 167,499,376 | 0.95 | |||||||||
Sweden | 137,820,900 | 0.79 | |||||||||
Hong Kong | 114,674,554 | 0.65 | |||||||||
Brazil | 88,048,147 | 0.50 | |||||||||
Colombia | 78,037,311 | 0.45 | |||||||||
Japan | 76,586,902 | 0.44 | |||||||||
France | 52,039,295 | 0.30 | |||||||||
South Africa | 39,377,807 | 0.22 | |||||||||
Chile | 38,791,720 | 0.22 | |||||||||
Israel | 30,256,250 | 0.17 | |||||||||
Country | Value | Percentage of Net Assets | |||||||||
Denmark | $ | 28,386,637 | 0.16 | ||||||||
United Kingdom | 19,244,668 | 0.11 | |||||||||
China | 17,662,521 | 0.10 | |||||||||
Mongolia | 16,715,900 | 0.10 | |||||||||
Russia | 15,681,390 | 0.09 | |||||||||
India | 15,539,898 | 0.09 | |||||||||
Uruguay | 13,381,816 | 0.08 | |||||||||
Iceland | 11,025,103 | 0.06 | |||||||||
Iraq | 10,586,106 | 0.06 | |||||||||
Germany | 9,337,630 | 0.05 | |||||||||
Australia | 6,884,619 | 0.04 | |||||||||
Total Foreign Portfolio | $ | 1,455,292,233 | 8.30 | ||||||||
See accompanying notes to financial statements.
40
> Notes to Statement of Investments
(g) Investment made with cash collateral received from securities lending activity.
(h) At December 31, 2012, for federal income tax purposes, the cost of investments was $11,326,139,898 and net unrealized appreciation was $6,559,008,085 consisting of gross unrealized appreciation of $7,244,753,464 and gross unrealized depreciation of $685,745,379.
Fair Value Measurements
Various inputs are used in determining the value of the Fund's investments, following the input prioritization hierarchy established by accounting principles generally accepted in the United States of America (GAAP). These inputs are summarized in the three broad levels listed below:
• Level 1 - quoted prices in active markets for identical securities
• Level 2 - prices determined using other significant observable inputs (including quoted prices for similar securities, interest rates, prepayment speeds, credit risk and others)
• Level 3 - prices determined using significant unobservable inputs where quoted prices or observable inputs are unavailable or less reliable (including management's own assumptions about the factors market participants would use in pricing an investment)
The inputs or methodology used for valuing securities are not necessarily an indication of the risk associated with investing in those securities.
Examples of the types of securities in which the Fund would typically invest and how they are classified within this hierarchy are as follows. Typical Level 1 securities include exchange traded domestic equities, mutual funds whose NAVs are published each day and exchange traded foreign equities that are not statistically fair valued. Typical Level 2 securities include exchange traded foreign equities that are statistically fair valued, forward foreign currency exchange contracts and short-term investments valued at amortized cost. Additionally, securities fair valued by the Valuation Committee (the Committee) of the Fund's Board of Trustees (the Board) that rely on significant observable inputs are also included in Level 2. Typical Level 3 securities include any security fair valued by the Committee that relies on significant unobservable inputs.
Under the direction of the Board, the Committee is responsible for carrying out the valuation procedures approved by the Board.
The Committee meets as necessary, and no less frequently than quarterly, to determine fair values for securities for which market quotations are not readily available or for which the investment manager believes that available market quotations are unreliable, to review the appropriateness of the Trust's Portfolio Pricing Policy and the pricing procedures of the investment manager (the Policies), and to review the continuing appropriateness of the current value of any security subject to the Policies. The Policies address, among other things: circumstances under which market quotations will be deemed readily available; selection of third party pricing vendors; appropriate pricing methodologies; events that require fair valuation and fair value techniques; and circumstances under which securities will be deemed to pose a potential for stale pricing, including when securities are illiquid, restricted, or in default. The Committee may also meet to discuss additional valuation matters, which may include review of back-testing results, review of time-sensitive information or approval of other valuation related actions, and to review the appropriateness of the Policies.
For investments categorized as Level 3, the significant unobservable inputs used in the fair value measurement of the Funds' securities may include: (i) data specific to the issuer or comparable issuers, (ii) general market or specific sector news and (iii) quoted prices and specific or similar security transactions. The Committee considers this data and any changes from prior periods in order to assess the reasonableness of observable and unobservable inputs, any assumptions or internal models used to value those securities and changes in fair value. Significant changes in any of these factors could result in lower or higher fair value measurements. Various factors impact the frequency of monitoring (which may occur as often as daily), however the Committee may determine that changes to inputs, assumptions and models are not required with the same frequency.
The following table summarizes the inputs used, as of December 31, 2012, in valuing the Fund's assets:
Investment Type | Quoted Prices (Level 1) | Other Significant Observable Inputs (Level 2) | Significant Unobservable Inputs (Level 3) | Total | |||||||||||||||
Equities | |||||||||||||||||||
Information | $ | 4,461,573,949 | $ | 211,860,767 | $ | - | $ | 4,673,434,716 | |||||||||||
Industrial Goods & Services | 3,397,390,981 | 210,930,345 | - | 3,608,321,326 | |||||||||||||||
Consumer Goods & Services | 2,946,942,251 | 120,416,613 | 220,000 | 3,067,578,864 | |||||||||||||||
Finance | 1,968,587,158 | - | - | 1,968,587,158 | |||||||||||||||
Health Care | 1,490,240,728 | - | 10,061,189 | 1,500,301,917 | |||||||||||||||
Other Industries | 1,057,091,873 | 125,080,674 | - | 1,182,172,547 | |||||||||||||||
Energy & Minerals | 986,659,611 | 115,775,224 | 13,406,949 | 1,115,841,784 | |||||||||||||||
Total Equities | 16,308,486,551 | 784,063,623 | 23,688,138 | 17,116,238,312 | |||||||||||||||
Total Short-Term Investments | 397,232,736 | - | - | 397,232,736 | |||||||||||||||
Total Securities Lending Collateral | 371,676,935 | - | - | 371,676,935 | |||||||||||||||
Total Investments | $ | 17,077,396,222 | $ | 784,063,623 | $ | 23,688,138 | $ | 17,885,147,983 | |||||||||||
The Fund's assets assigned to the Level 2 input category are generally valued using a market approach, in which a security's value is determined through its correlation to prices and information from observable market transactions for similar or identical assets. Foreign equities are generally valued at the last sale price on the foreign exchange or market on which they trade. The Fund may use a statistical fair valuation model, in accordance with the policy adopted by the Board, provided by an independent third party to value securities principally traded in foreign markets in order to adjust for possible stale pricing that may occur between the close of the foreign exchanges and the time for valuation. These models take into account available market data including intraday index, ADR, and ETF movements. Securities acquired via private placement that have a holding period or an extended settlement period are valued at a discount to the same shares that are trading freely on the market. These discounts are determined by the
See accompanying notes to financial statements.
41
Columbia Acorn Fund
Statement of Investments, continued
> Notes to Statement of Investments
investment manager's experience with similar securities or situations. Factors may include, but are not limited to, trade volume, shares outstanding and stock price. Warrants which do not trade are valued as a percentage of the actively trading common stock using a model, based on Black Scholes. Securities which have halted or temporarily stopped trading are valued at the last sale and adjusted by a premium or a discount to account for the anticipated re-opening price. These adjustments are determined by the investment manager's experience with similar securities or situations.
The following table shows transfers between Level 1 and Level 2 of the fair value hierarchy:
Transfers In | Transfers Out | ||||||||||||||
| Level 1 | Level 2 | Level 1 | Level 2 | ||||||||||||
| $ | - | $ | 1,575,000 | $ | 1,575,000 | $ | - | ||||||||
Financial assets were transferred from Level 1 to Level 2 as trading halted during the period.
The Fund does not hold any significant investments categorized as Level 3.
Certain common stock classified as Level 3 are valued at fair value, using a market approach, as determined in good faith under consistently applied procedures established by and under the general supervision of the Board. To determine fair value for these securities, for which no market exists, the Committee utilizes the valuation technique it deems most appropriate in the circumstances, using some unobservable inputs, which may include but are not limited to trades of similar securities, estimated earnings of the company, market multiples derived from a set of comparable companies, and the position of the security within the company's capital structure. Significant increases or decreases to any of these inputs could result in a significantly lower or higher fair value measurement.
See accompanying notes to financial statements.
42
Columbia Acorn International
Major Portfolio Changes in the Fourth Quarter (Unaudited)
Number of Shares | |||||||||||
9/30/12 | 12/31/12 | ||||||||||
Purchases | |||||||||||
Asia | |||||||||||
| > Japan | |||||||||||
Benesse | 0 | 453,000 | |||||||||
Hamamatsu Photonics | 423,900 | 609,900 | |||||||||
Horiba | 711,100 | 765,000 | |||||||||
Itochu Techno-Science | 249,100 | 406,000 | |||||||||
Lifenet Insurance | 813,400 | 1,575,000 | |||||||||
Miraca Holdings | 816,456 | 862,706 | |||||||||
Nippon Paint | 0 | 1,586,000 | |||||||||
Rinnai | 0 | 40,300 | |||||||||
Shimano | 0 | 64,400 | |||||||||
| > Taiwan | |||||||||||
Chipbond | 37,000 | 689,000 | |||||||||
Far EasTone Telecom | 36,606,000 | 39,592,000 | |||||||||
Flexium Interconnect | 0 | 5,891,000 | |||||||||
Lung Yen | 3,835,000 | 6,173,000 | |||||||||
PC Home | 3,000,141 | 3,101,000 | |||||||||
Taiwan Mobile | 16,410,000 | 17,000,000 | |||||||||
| > Hong Kong | |||||||||||
Melco International | 8,000,000 | 12,000,000 | |||||||||
Vitasoy International | 9,557,900 | 11,473,900 | |||||||||
| > Singapore | |||||||||||
Mapletree Commercial Trust | 39,467,000 | 40,000,000 | |||||||||
| > Korea | |||||||||||
BS Financial Group | 1,208,000 | 1,726,000 | |||||||||
Hite Jinro | 138,990 | 751,390 | |||||||||
iMarketKorea | 724,727 | 806,004 | |||||||||
KCC | 0 | 74,400 | |||||||||
Lotte Chilsung Beverage | 0 | 14,540 | |||||||||
Nexen Tire | 0 | 660,140 | |||||||||
Paradise Co | 0 | 567,986 | |||||||||
Samsung Engineering | 57,000 | 132,000 | |||||||||
| > India | |||||||||||
Bharti Infratel | 0 | 5,200,000 | |||||||||
Bosch | 0 | 60,000 | |||||||||
TTK Prestige | 63,000 | 95,000 | |||||||||
Yes Bank | 0 | 2,765,000 | |||||||||
| > Thailand | |||||||||||
Samui Airport Property Fund | 699,700 | 2,680,100 | |||||||||
Siam Makro | 0 | 1,343,600 | |||||||||
Europe | |||||||||||
| > United Kingdom | |||||||||||
Abcam | 2,855,000 | 3,486,700 | |||||||||
Elementis | 4,999,847 | 6,960,000 | |||||||||
Greggs | 2,300,000 | 2,843,000 | |||||||||
JLT Group | 2,281,600 | 3,254,000 | |||||||||
Spirax Sarco | 655,000 | 819,974 | |||||||||
Number of Shares | |||||||||||
9/30/12 | 12/31/12 | ||||||||||
| > Netherlands | |||||||||||
Aalberts Industries | 2,742,165 | 2,915,700 | |||||||||
Imtech | 1,515,723 | 2,114,073 | |||||||||
| > Germany | |||||||||||
Pfeiffer Vacuum | 130,050 | 200,000 | |||||||||
| > Switzerland | |||||||||||
Dufry Group | 375,000 | 408,000 | |||||||||
Partners Group | 260,000 | 282,000 | |||||||||
Zehnder | 330,000 | 380,000 | |||||||||
| > France | |||||||||||
Norbert Dentressangle | 285,704 | 308,400 | |||||||||
| > Italy | |||||||||||
Geox | 7,706,873 | 8,501,000 | |||||||||
| > Finland | |||||||||||
Vacon | 0 | 401,000 | |||||||||
| > Kazakhstan | |||||||||||
| Halyk Savings Bank of Kazakhstan - GDR | 4,506,259 | 5,143,000 | |||||||||
| > Turkey | |||||||||||
Bizim Toptan | 0 | 543,494 | |||||||||
Other Countries | |||||||||||
| > South Africa | |||||||||||
Coronation Fund Managers | 11,763,907 | 11,920,964 | |||||||||
Massmart Holdings | 1,574,575 | 2,230,504 | |||||||||
| > Australia | |||||||||||
Challenger Financial | 14,652,712 | 15,000,000 | |||||||||
| Commonwealth Property Office Fund | 49,017,000 | 52,500,000 | |||||||||
Regis Resources | 311,805 | 1,840,985 | |||||||||
SAI Global | 3,338,561 | 5,640,000 | |||||||||
| > United States | |||||||||||
Textainer Group Holdings | 1,103,297 | 1,272,297 | |||||||||
| > New Zealand | |||||||||||
Telecom NZ | 3,598,749 | 10,879,000 | |||||||||
Latin America | |||||||||||
| > Brazil | |||||||||||
Arcos Dorados | 1,730,000 | 1,800,000 | |||||||||
Beadell Resources | 0 | 17,793,303 | |||||||||
| > Chile | |||||||||||
Viña Concha y Toro | 10,115,274 | 12,956,011 | |||||||||
See accompanying notes to financial statements.
43
Columbia Acorn International
Major Portfolio Changes in the Fourth Quarter (Unaudited), continued
Number of Shares | |||||||||||
9/30/12 | 12/31/12 | ||||||||||
Sales | |||||||||||
Asia | |||||||||||
| > Japan | |||||||||||
Aeon Delight | 1,221,938 | 964,000 | |||||||||
Ain Pharmaciez | 300,792 | 50,292 | |||||||||
Disco | 480,000 | 396,000 | |||||||||
Miura | 202,150 | 0 | |||||||||
Park24 | 2,719,900 | 2,545,200 | |||||||||
Torishima Pump Manufacturing | 1,069,963 | 302,263 | |||||||||
| > Taiwan | |||||||||||
Chroma Ate | 11,794,000 | 10,520,000 | |||||||||
Radiant Opto-Electronics | 4,564,960 | 2,577,960 | |||||||||
Simplo Technology | 6,334,713 | 5,159,713 | |||||||||
Tripod Technologies | 8,012,470 | 5,625,135 | |||||||||
| > Hong Kong | |||||||||||
AAC Technologies | 10,038,000 | 8,518,000 | |||||||||
| > Singapore | |||||||||||
Mapletree Industrial Trust | 33,000,000 | 30,000,000 | |||||||||
Olam International | 25,000,000 | 15,000,000 | |||||||||
| > Korea | |||||||||||
Grand Korea Leisure | 852,150 | 0 | |||||||||
| > India | |||||||||||
Jain Irrigation Systems | 1,426,549 | 0 | |||||||||
REI Agro | 27,212,878 | 10,823,473 | |||||||||
Shriram Transport Finance | 1,550,000 | 0 | |||||||||
| > China | |||||||||||
51 | job - ADR | 427,814 | 328,779 | ||||||||
NetEase.com - ADR | 419,323 | 0 | |||||||||
RexLot Holdings | 260,000,000 | 200,000,000 | |||||||||
Europe | |||||||||||
| > United Kingdom | |||||||||||
Asos | 646,000 | 485,000 | |||||||||
Premier Oil | 1,907,154 | 1,403,932 | |||||||||
Rotork | 517,000 | 63,577 | |||||||||
| > Netherlands | |||||||||||
BinckBank | 449,113 | 0 | |||||||||
Koninklijke TenCate | 821,137 | 0 | |||||||||
Vopak | 317,424 | 266,124 | |||||||||
Number of Shares | |||||||||||
9/30/12 | 12/31/12 | ||||||||||
| > Germany | |||||||||||
Dürr | 440,000 | 285,000 | |||||||||
| > France | |||||||||||
| Compagnie Française de l'Afrique Occidentale | 377,000 | 0 | |||||||||
| > Italy | |||||||||||
CIR | 7,248,893 | 4,842,819 | |||||||||
Fiat | 3,791,000 | 0 | |||||||||
Tod's | 224,200 | 168,200 | |||||||||
| > Denmark | |||||||||||
Novozymes | 1,648,800 | 1,049,800 | |||||||||
| > Finland | |||||||||||
Stockmann | 1,430,429 | 1,168,630 | |||||||||
| > Ireland | |||||||||||
Paddy Power | 74,637 | 0 | |||||||||
Other Countries | |||||||||||
| > South Africa | |||||||||||
Adcock Ingram Holdings | 3,938,965 | 0 | |||||||||
| > Australia | |||||||||||
UGL | 3,973,200 | 3,557,000 | |||||||||
| > Canada | |||||||||||
Black Diamond Group | 770,576 | 709,576 | |||||||||
Horizon North Logistics | 2,096,514 | 1,921,379 | |||||||||
ShawCor | 1,212,597 | 1,084,597 | |||||||||
| > United States | |||||||||||
BioMarin Pharmaceutical | 1,044,000 | 928,000 | |||||||||
FMC Technologies | 669,213 | 601,213 | |||||||||
| > Senegal | |||||||||||
Sonatel | 31,200 | 0 | |||||||||
Latin America | |||||||||||
| > Brazil | |||||||||||
| Mills Estruturas e Servicos de Engenharia | 1,880,200 | 1,800,000 | |||||||||
MRV Engenharia | 3,577,000 | 0 | |||||||||
| > Colombia | |||||||||||
Gulf United Energy | 22,525,000 | 19,893,109 | |||||||||
See accompanying notes to financial statements.
44
Columbia Acorn International
Statement of Investments, December 31, 2012
Number of Shares | Value | ||||||||||
Equities: 97.1% | |||||||||||
Asia 44.5% | |||||||||||
| > Japan 16.0% | |||||||||||
5,582,600 | Kansai Paint | $ | 60,163,024 | ||||||||
| Paint Producer in Japan, India, China & Southeast Asia | |||||||||||
21,500 | Wacom (a) | 56,604,038 | |||||||||
Computer Graphic Illustration Devices | |||||||||||
20,227,000 | Seven Bank | 53,354,600 | |||||||||
ATM Processing Services | |||||||||||
1,817,562 | Glory | 42,122,862 | |||||||||
| Currency Handling Systems & Related Equipment | |||||||||||
1,582,200 | Hoshizaki Electric | 42,069,705 | |||||||||
Commercial Kitchen Equipment | |||||||||||
2,545,200 | Park24 | 40,196,188 | |||||||||
Parking Lot Operator | |||||||||||
2,981,100 | Kuraray | 39,079,727 | |||||||||
| Special Resin, Fine Chemical, Fibers & Textures | |||||||||||
7,780 | Orix JREIT | 38,370,609 | |||||||||
Diversified REIT | |||||||||||
30,500 | Jupiter Telecommunications | 37,986,380 | |||||||||
| Largest Cable Service Provider in Japan | |||||||||||
862,706 | Miraca Holdings | 34,784,977 | |||||||||
| Outsourced Lab Testing, Diagnostic Equipment & Reagents | |||||||||||
937,651 | Kintetsu World Express | 31,355,399 | |||||||||
Airfreight Logistics | |||||||||||
960,000 | Sanrio (b) | 30,627,735 | |||||||||
Character Goods & Licensing | |||||||||||
2,552,000 | NGK Insulators | 30,273,569 | |||||||||
| Ceramic Products for Auto, Power & Electronics | |||||||||||
295,762 | Nakanishi | 29,464,651 | |||||||||
Dental Tools & Machinery | |||||||||||
2,892,724 | Start Today (b) | 26,778,607 | |||||||||
Online Japanese Apparel Retailer | |||||||||||
7,620 | Kenedix Realty Investment | 26,563,778 | |||||||||
Tokyo Mid-size Office REIT | |||||||||||
4,900 | Mori Hills REIT Investment | 26,299,325 | |||||||||
Tokyo Centric Diversified REIT | |||||||||||
2,380,000 | Japan Airport Terminal | 24,569,722 | |||||||||
Airport Terminal Operator at Haneda | |||||||||||
345,000 | FP Corporation | 22,951,390 | |||||||||
Disposable Food Trays & Containers | |||||||||||
1,613,429 | Daiseki | 22,315,284 | |||||||||
Waste Disposal & Recycling | |||||||||||
765,000 | Horiba | 22,187,152 | |||||||||
Test & Measurement Instruments | |||||||||||
609,900 | Hamamatsu Photonics | 22,175,238 | |||||||||
| Optical Sensors for Medical & Industrial Applications | |||||||||||
838,000 | Doshisha | 21,948,807 | |||||||||
Wholesaler | |||||||||||
772,000 | Misumi Group | 21,098,587 | |||||||||
Industrial Components Distributor | |||||||||||
396,000 | Disco | 20,642,364 | |||||||||
| Semiconductor Dicing & Grinding Equipment | |||||||||||
Number of Shares | Value | ||||||||||
9,700 | Advance Residence Investment | $ | 19,881,813 | ||||||||
Residential REIT | |||||||||||
790,000 | Aeon Mall | 19,434,841 | |||||||||
| Suburban Shopping Mall Developer, Owner & Operator | |||||||||||
964,000 | Aeon Delight | 18,870,214 | |||||||||
Facility Maintenance & Management | |||||||||||
453,000 | Benesse | 18,852,223 | |||||||||
Education Service Provider | |||||||||||
1,885,600 | Asahi Diamond Industrial | 18,659,274 | |||||||||
Consumable Diamond Tools | |||||||||||
3,000 | Global One Real Estate | 17,876,022 | |||||||||
Office REIT | |||||||||||
1,233,080 | Nihon Parkerizing | 17,737,580 | |||||||||
| Metal Surface Treatment Agents & Processing | |||||||||||
406,000 | Itochu Techno-Science | 16,718,418 | |||||||||
| IT Network Equipment Sales & Services | |||||||||||
732,108 | Icom | 16,347,318 | |||||||||
| Two Way Radio Communication Equipment | |||||||||||
1,940,200 | Sintokogio | 15,429,277 | |||||||||
| Automated Casting Machines, Surface Treatment System & Consumables | |||||||||||
1,405,739 | Ushio | 15,414,929 | |||||||||
Industrial Light Sources | |||||||||||
672,000 | Nabtesco | 15,009,968 | |||||||||
Machinery Components | |||||||||||
1,586,000 | Nippon Paint | 13,641,864 | |||||||||
| Paints for Automotive, Decorative & Industrial Usage | |||||||||||
1,575,000 | Lifenet Insurance (b)(c) | 13,483,021 | |||||||||
| Online Life Insurance Company in Japan | |||||||||||
64,400 | Shimano | 4,123,731 | |||||||||
Bicycle Components & Fishing Tackle | |||||||||||
5,230 | GLP J-REIT (c) | 3,996,376 | |||||||||
Logistics REIT in Japan | |||||||||||
50,292 | Ain Pharmaciez | 2,751,043 | |||||||||
| Dispensing Pharmacy/ Drugstore Operator | |||||||||||
40,300 | Rinnai | 2,738,139 | |||||||||
| Gas Appliances for Household & Commercial Use | |||||||||||
302,263 | Torishima Pump Manufacturing | 2,434,562 | |||||||||
| Industrial Pump for Power Generation & Water Supply Systems | |||||||||||
11,500 | MonotaRO | 370,509 | |||||||||
| Online MRO Goods Distributor in Japan | |||||||||||
1,077,754,840 | |||||||||||
| > Taiwan 6.4% | |||||||||||
39,592,000 | Far EasTone Telecom | 101,093,360 | |||||||||
| Taiwan's Third Largest Mobile Operator | |||||||||||
17,000,000 | Taiwan Mobile | 62,824,429 | |||||||||
| Taiwan's Second Largest Mobile Operator | |||||||||||
See accompanying notes to financial statements.
45
Columbia Acorn International
Statement of Investments, continued
Number of Shares | Value | ||||||||||
| > Taiwan—continued | |||||||||||
20,120,000 | CTCI Corp | $ | 39,971,832 | ||||||||
International Engineering Firm | |||||||||||
2,035,000 | St. Shine Optical | 31,124,567 | |||||||||
| World's Leading Disposable Contact Lens Original Equipment Manufacturer | |||||||||||
6,607,000 | Advantech | 27,997,696 | |||||||||
Industrial PC & Components | |||||||||||
5,159,713 | Simplo Technology | 26,226,350 | |||||||||
| Battery Packs for Notebook & Tablet PCs | |||||||||||
11,200,000 | Taiwan Hon Chuan | 24,644,221 | |||||||||
| Beverage Packaging (Bottles, Caps, Labels) Manufacturer | |||||||||||
10,520,000 | Chroma Ate | 23,546,438 | |||||||||
| Automatic Test Systems, Testing & Measurement Instruments | |||||||||||
5,891,000 | Flexium Interconnect | 20,876,932 | |||||||||
| Flexible Printed Circuit for Mobile Electronics | |||||||||||
6,173,000 | Lung Yen | 19,968,575 | |||||||||
Funeral Services & Columbaria | |||||||||||
3,181,000 | President Chain Store | 17,067,196 | |||||||||
| Taiwanese Convenience Chain Store Operator | |||||||||||
3,101,000 | PC Home | 14,473,838 | |||||||||
Taiwanese Internet Retail Company | |||||||||||
5,625,135 | Tripod Technologies | 12,161,109 | |||||||||
Printed Circuit Boards (PCB) | |||||||||||
2,577,960 | Radiant Opto-Electronics | 10,705,050 | |||||||||
LCD Back Light Units & Modules | |||||||||||
689,000 | Chipbond | 1,360,486 | |||||||||
| Semiconductor Back-end Packaging Services | |||||||||||
434,042,079 | |||||||||||
| > Hong Kong 4.7% | |||||||||||
6,500,000 | Melco Crown Entertainment - ADR (b)(c) | 109,460,000 | |||||||||
Macau Casino Operator | |||||||||||
22,000,000 | Lifestyle International | 54,420,953 | |||||||||
| Mid- to High-end Department Store Operator in Hong Kong & China | |||||||||||
15,625,000 | L'Occitane International | 49,997,402 | |||||||||
Skin Care & Cosmetics Producer | |||||||||||
8,518,000 | AAC Technologies | 30,203,290 | |||||||||
Miniature Acoustic Components | |||||||||||
30,000,000 | Sa Sa International | 24,911,234 | |||||||||
Cosmetics Retailer | |||||||||||
10,000,000 | MGM China Holdings | 18,418,333 | |||||||||
Macau Casino Operator | |||||||||||
12,000,000 | Melco International | 14,246,925 | |||||||||
Macau Casino Operator | |||||||||||
11,473,900 | Vitasoy International | 11,805,188 | |||||||||
Hong Kong Soy Food Brand | |||||||||||
313,463,325 | |||||||||||
Number of Shares | Value | ||||||||||
| > Singapore 3.9% | |||||||||||
22,000,000 | Ascendas REIT | $ | 43,052,265 | ||||||||
Industrial Property Landlord | |||||||||||
40,000,000 | Mapletree Commercial Trust | 39,983,726 | |||||||||
Retail & Office Property Landlord | |||||||||||
40,000,000 | Mapletree Logistics Trust | 37,645,680 | |||||||||
Industrial Property Landlord | |||||||||||
30,000,000 | Mapletree Industrial Trust | 33,497,712 | |||||||||
Industrial Property Landlord | |||||||||||
20,000,000 | CDL Hospitality Trust | 30,908,452 | |||||||||
Hotel Owner/Operator | |||||||||||
15,000,000 | Goodpack Limited | 22,697,675 | |||||||||
International Bulk Container Leasing | |||||||||||
| 15,000,000 | Olam International (b) | 19,267,930 | |||||||||
| 4,695,000 | Olam International - Rights (c)(d) | 1,111,602 | |||||||||
Agriculture Supply Chain Manager | |||||||||||
3,500,000 | Singapore Exchange | 20,338,826 | |||||||||
| Singapore Equity & Derivatives Market Operator | |||||||||||
| 4,772,000 | Petra Foods | 13,461,904 | |||||||||
| Cocoa Processor & Chocolate Manufacturer | |||||||||||
261,965,772 | |||||||||||
| > Korea 3.2% | |||||||||||
623,120 | Woongjin Coway | 25,347,945 | |||||||||
| Household Appliance Rental Service Provider | |||||||||||
806,004 | iMarketKorea | 21,472,051 | |||||||||
| Procurement, Distribution of MRO (Maintenance, Repair, Operations) Goods | |||||||||||
1,726,000 | BS Financial Group | 21,401,560 | |||||||||
| Regional Bank in Busan (Korea's Second Largest City) | |||||||||||
751,390 | Hite Jinro (c) | 21,331,271 | |||||||||
Beer & Spirits Manufacturer | |||||||||||
74,400 | KCC | 20,792,755 | |||||||||
Paint & Housing Material Manufacturer | |||||||||||
14,540 | Lotte Chilsung Beverage | 20,582,981 | |||||||||
Beverages & Liquor Manufacturer | |||||||||||
132,000 | Samsung Engineering | 20,565,259 | |||||||||
| Global Engineering, Procurement & Construction (EPC) Firm | |||||||||||
305,540 | Kepco Plant Service & Engineering | 17,435,434 | |||||||||
Power Plant & Grid Maintenance | |||||||||||
624,441 | Handsome | 17,228,710 | |||||||||
High-end Apparel Company | |||||||||||
182,000 | Hana Tour Service | 10,433,840 | |||||||||
Wholesale Package Tour Provider | |||||||||||
660,140 | Nexen Tire | 9,923,118 | |||||||||
Korean Tire Manufacturer | |||||||||||
567,986 | Paradise Co | 9,189,084 | |||||||||
| Korean 'Foreigner Only' Casino Operator | |||||||||||
215,704,008 | |||||||||||
See accompanying notes to financial statements.
46
Number of Shares | Value | ||||||||||
| > India 2.9% | |||||||||||
2,262,300 | United Breweries | $ | 38,785,528 | ||||||||
India's Largest Brewer | |||||||||||
341,652 | Asian Paints | 27,828,983 | |||||||||
India's Largest Paint Company | |||||||||||
2,765,000 | Yes Bank | 23,549,408 | |||||||||
Commercial Banking in India | |||||||||||
8,945,000 | Adani Ports & Special Economic Zone | 22,228,970 | |||||||||
Indian West Coast Shipping Port | |||||||||||
13,195,000 | Redington India | 20,998,407 | |||||||||
| Supply Chain Solutions for IT & Mobile Handsets in Emerging Markets | |||||||||||
5,200,000 | Bharti Infratel (c)(e) | 18,383,647 | |||||||||
Communication Towers | |||||||||||
545,000 | Colgate Palmolive India | 15,731,036 | |||||||||
Consumer Products in Oral Care | |||||||||||
60,000 | Bosch | 10,503,093 | |||||||||
Automotive Parts | |||||||||||
1,600,000 | Titan Industries | 8,386,444 | |||||||||
Jewlery, Watches, Eyeglasses | |||||||||||
95,000 | TTK Prestige | 5,902,783 | |||||||||
Branded Cooking Equipment | |||||||||||
1,650,000 | SKIL Ports and Logistics (c) | 2,827,761 | |||||||||
Indian Container Port Project | |||||||||||
10,823,473 | REI Agro | 2,113,728 | |||||||||
Basmati Rice Processing | |||||||||||
197,239,788 | |||||||||||
| > China 2.2% | |||||||||||
22,168,300 | Digital China | 38,335,261 | |||||||||
| IT Distribution & Systems Integration Services | |||||||||||
24,290,000 | Want Want | 34,040,150 | |||||||||
| Chinese Branded Consumer Food Company | |||||||||||
1,000,000 | New Oriental Education & Technology - ADR (b) | 19,430,000 | |||||||||
Education Service Provider | |||||||||||
328,779 | 51 | job - ADR (c) | 15,370,418 | ||||||||
Integrated Human Resource Services | |||||||||||
200,000,000 | RexLot Holdings | 15,343,762 | |||||||||
Lottery Equipment Supplier in China | |||||||||||
9,306,554 | Zhaojin Mining Industry | 14,895,917 | |||||||||
Gold Mining & Refining in China | |||||||||||
30,000,000 | AMVIG Holdings | 10,953,638 | |||||||||
| Chinese Tobacco Packaging Material Supplier | |||||||||||
148,369,146 | |||||||||||
| > Indonesia 1.9% | |||||||||||
60,516,300 | Tower Bersama Infrastructure (c) | 35,822,064 | |||||||||
Communications Towers | |||||||||||
31,764,600 | Archipelago Resources (a)(c) | 30,960,001 | |||||||||
| Gold Mining Projects in Indonesia, Vietnam & the Philippines | |||||||||||
250,000,000 | Ace Indonesia | 21,383,607 | |||||||||
Home Improvement Retailer | |||||||||||
40,047,000 | MNC Skyvision (c) | 9,972,794 | |||||||||
| Largest Satellite Pay TV Operator in Indonesia | |||||||||||
Number of Shares | Value | ||||||||||
4,326,000 | Mayora Indah | $ | 9,010,277 | ||||||||
| Consumer Branded Food Manufacturer | |||||||||||
38,065,000 | Surya Citra Media | 8,886,771 | |||||||||
Free to Air TV in Indonesia | |||||||||||
12,488,000 | Mitra Adiperkasa | 8,630,935 | |||||||||
| Operator of Department Store & Specialty Retail Stores | |||||||||||
6,217,500 | Southern Arc Minerals (a)(c) | 1,593,910 | |||||||||
| Gold & Copper Exploration in Indonesia | |||||||||||
126,260,359 | |||||||||||
| > Thailand 1.1% | |||||||||||
130,000,000 | Home Product Center | 54,052,147 | |||||||||
Home Improvement Retailer | |||||||||||
1,343,600 | Siam Makro | 19,651,046 | |||||||||
| General Merchadise Wholesaler in Thailand | |||||||||||
2,680,100 | Samui Airport Property Fund | 1,471,908 | |||||||||
Thai Airport Operator | |||||||||||
75,175,101 | |||||||||||
| > Philippines 0.9% | |||||||||||
73,221,250 | SM Prime Holdings | 29,515,107 | |||||||||
Shopping Mall Operator | |||||||||||
19,454,700 | Manila Water Company | 15,194,696 | |||||||||
| Water Utility Company in Philippines | |||||||||||
7,931,700 | Int'l Container Terminal | 14,329,326 | |||||||||
| Container Handling Terminals & Port Management | |||||||||||
59,039,129 | |||||||||||
| > Mongolia 0.8% | |||||||||||
74,865,700 | Mongolian Mining (c) | 37,102,183 | |||||||||
Coking Coal Mining in Mongolia | |||||||||||
1,049,943 | Turquoise Hill Resources (c) | 8,022,084 | |||||||||
914,678 | Turquoise Hill Resources (c)(f) | 6,960,699 | |||||||||
Copper Mine Project in Mongolia | |||||||||||
52,084,966 | |||||||||||
| > Cambodia 0.5% | |||||||||||
60,000,000 | Nagacorp | 36,656,769 | |||||||||
| Casino/Entertainment Complex in Cambodia | |||||||||||
36,656,769 | |||||||||||
Asia: Total | 2,997,755,282 | ||||||||||
Europe 30.2% | |||||||||||
| > United Kingdom 6.2% | |||||||||||
935,000 | Intertek Group | 47,494,916 | |||||||||
| Testing, Inspection, Certification Services | |||||||||||
3,254,000 | JLT Group | 42,140,366 | |||||||||
| International Business Insurance Broker | |||||||||||
8,785,000 | BBA Aviation | 32,058,608 | |||||||||
Aviation Support Services | |||||||||||
See accompanying notes to financial statements.
47
Columbia Acorn International
Statement of Investments, continued
Number of Shares | Value | ||||||||||
| > United Kingdom—continued | |||||||||||
3,789,000 | Domino's Pizza UK & Ireland | $ | 30,930,846 | ||||||||
| Pizza Delivery in UK, Ireland & Germany | |||||||||||
819,974 | Spirax Sarco | 30,702,717 | |||||||||
| Steam Systems for Manufacturing & Process Industries | |||||||||||
6,960,000 | Elementis | 26,574,986 | |||||||||
Clay-based Additives | |||||||||||
2,321,211 | WH Smith | 25,404,201 | |||||||||
| Newsprint, Books & General Stationery Retailer | |||||||||||
875,000 | Aggreko | 24,971,247 | |||||||||
| Temporary Power & Temperature Control Services | |||||||||||
998,000 | Rightmove | 23,462,631 | |||||||||
Internet Real Estate Listings | |||||||||||
3,486,700 | Abcam | 21,820,443 | |||||||||
Online Sales of Antibodies | |||||||||||
485,000 | Asos (c) | 21,392,481 | |||||||||
| Internet-based Retailer to Hipsters Up to Age 35 | |||||||||||
2,843,000 | Greggs | 21,208,037 | |||||||||
Bakery | |||||||||||
1,761,742 | Smith and Nephew | 19,474,113 | |||||||||
Medical Equipment & Supplies | |||||||||||
1,773,408 | Shaftesbury | 16,313,883 | |||||||||
London Prime Retail REIT | |||||||||||
4,163,948 | PureCircle (b)(c) | 16,030,976 | |||||||||
Natural Sweeteners | |||||||||||
382,581 | Tullow Oil | 7,975,826 | |||||||||
Oil & Gas Producer | |||||||||||
1,403,932 | Premier Oil (c) | 7,768,633 | |||||||||
| Oil & Gas Producer in Europe, Pakistan & Asia | |||||||||||
63,577 | Rotork | 2,653,925 | |||||||||
| Valve Actuators for Oil & Water Pipelines | |||||||||||
2,272,000 | Sterling Resources (b)(c) | 1,713,079 | |||||||||
Oil & Gas Exploration - Europe | |||||||||||
420,091,914 | |||||||||||
| > Netherlands 4.0% | |||||||||||
2,915,700 | Aalberts Industries | 61,043,309 | |||||||||
Flow Control & Heat Treatment | |||||||||||
2,114,073 | Imtech | 49,103,626 | |||||||||
Technical Installation & Maintenance | |||||||||||
1,574,145 | UNIT4 (a) | 47,517,926 | |||||||||
Business Software Development | |||||||||||
1,252,514 | Arcadis | 29,738,991 | |||||||||
Engineering Consultants | |||||||||||
1,118,268 | TKH Group | 28,945,194 | |||||||||
Dutch Industrial Conglomerate | |||||||||||
368,000 | Fugro | 21,836,326 | |||||||||
Subsea Oilfield Services | |||||||||||
266,124 | Vopak | 18,811,675 | |||||||||
| World's Largest Operator of Petroleum & Chemical Storage Terminals | |||||||||||
143,395 | Core Labs | 15,674,508 | |||||||||
Oil & Gas Reservoir Consulting | |||||||||||
272,671,555 | |||||||||||
Number of Shares | Value | ||||||||||
| > Germany 3.8% | |||||||||||
2,000,000 | Wirecard | $ | 49,374,898 | ||||||||
| Online Payment Processing & Risk Management | |||||||||||
148,295 | Rational | 42,837,140 | |||||||||
Commercial Ovens | |||||||||||
1,050,000 | NORMA Group | 29,104,915 | |||||||||
| Clamps for Automotive & Industrial Applications | |||||||||||
285,000 | Dürr | 25,538,317 | |||||||||
| Automotive Plant Engineering & Associated Capital Equipment | |||||||||||
200,000 | Pfeiffer Vacuum | 24,372,438 | |||||||||
Vacuum Pumps | |||||||||||
1,865,000 | TAG Immobilien (b) | 23,373,920 | |||||||||
| Owner of Residential Properties in Germany | |||||||||||
625,000 | CTS Eventim | 22,022,711 | |||||||||
Event Ticket Sales | |||||||||||
165,400 | Bertrandt | 16,606,222 | |||||||||
Outsourced Engineering | |||||||||||
333,000 | Elringklinger | 11,294,005 | |||||||||
Automobile Components | |||||||||||
338,886 | Deutsche Beteiligungs | 8,750,900 | |||||||||
Private Equity Investment Management | |||||||||||
253,275,466 | |||||||||||
| > Switzerland 3.7% | |||||||||||
282,000 | Partners Group | 65,192,651 | |||||||||
Private Markets Asset Management | |||||||||||
255,000 | Geberit (c) | 56,527,204 | |||||||||
Plumbing Supplies | |||||||||||
408,000 | Dufry Group (c) | 53,950,668 | |||||||||
| Operates Airport Duty Free & Duty Paid Shops | |||||||||||
15,500 | Sika | 35,850,662 | |||||||||
| Chemicals for Construction & Industrial Applications | |||||||||||
170,000 | Kuehne & Nagel | 20,495,059 | |||||||||
Freight Forwarding/Logistics | |||||||||||
380,000 | Zehnder | 18,375,117 | |||||||||
| Radiators & Heat Recovery Ventilation Systems | |||||||||||
250,391,361 | |||||||||||
| > France 3.7% | |||||||||||
553,000 | Eurofins Scientific | 89,954,447 | |||||||||
| Food, Pharmaceuticals & Materials Screening & Testing | |||||||||||
729,700 | Gemalto | 65,866,252 | |||||||||
Digital Security Solutions | |||||||||||
770,000 | Neopost (b) | 40,834,470 | |||||||||
Postage Meter Machines | |||||||||||
308,400 | Norbert Dentressangle | 23,793,407 | |||||||||
| Leading European Logistics & Transport Group | |||||||||||
971,800 | Saft | 22,870,175 | |||||||||
Niche Battery Manufacturer | |||||||||||
1,831,204 | Hi-Media (b)(c) | 5,042,671 | |||||||||
Online Advertiser in Europe | |||||||||||
248,361,422 | |||||||||||
See accompanying notes to financial statements.
48
Number of Shares | Value | ||||||||||
| > Sweden 2.5% | |||||||||||
3,957,522 | Hexagon | $ | 100,078,760 | ||||||||
| Design, Measurement & Visualization Software & Equipment | |||||||||||
4,150,024 | Sweco (a) | 46,585,386 | |||||||||
Engineering Consultants | |||||||||||
666,777 | Unibet | 21,346,699 | |||||||||
European Online Gaming Operator | |||||||||||
168,010,845 | |||||||||||
| > Italy 1.3% | |||||||||||
3,245,000 | Pirelli (b) | 37,387,904 | |||||||||
Global Tire Supplier | |||||||||||
8,501,000 | Geox | 24,672,810 | |||||||||
Apparel & Shoe Maker | |||||||||||
168,200 | Tod's (b) | 21,356,306 | |||||||||
Leather Shoes & Bags | |||||||||||
4,842,819 | CIR | 5,105,689 | |||||||||
Italian Holding Company | |||||||||||
88,522,709 | |||||||||||
| > Denmark 1.1% | |||||||||||
168,042 | SimCorp | 37,578,523 | |||||||||
Software for Investment Managers | |||||||||||
1,049,800 | Novozymes | 29,800,291 | |||||||||
Industrial Enzymes | |||||||||||
207,968 | Solar | 9,523,454 | |||||||||
| Technical Wholesaler of Electrical, Plumbing & HVAC Equipment | |||||||||||
76,902,268 | |||||||||||
| > Finland 0.6% | |||||||||||
401,000 | Vacon | 21,277,871 | |||||||||
| Leading Independent Manufacturer of Variable Speed Alternating Current Drives | |||||||||||
1,168,630 | Stockmann | 20,990,713 | |||||||||
| Department Store & Fashion Retailer in Scandinavia & Russia | |||||||||||
42,268,584 | |||||||||||
| > Kazakhstan 0.6% | |||||||||||
5,143,000 | Halyk Savings Bank of Kazakhstan - GDR (c) | 42,172,600 | |||||||||
| Largest Retail Bank & Insurer in Kazakhstan | |||||||||||
42,172,600 | |||||||||||
| > Norway 0.5% | |||||||||||
3,281,864 | Atea | 35,112,424 | |||||||||
| Leading Nordic IT Hardware/ Software Reseller & Installation Company | |||||||||||
35,112,424 | |||||||||||
| > Iceland 0.5% | |||||||||||
28,312,499 | Marel (g) | 22,314,448 | |||||||||
7,670,000 | Marel (g) | 8,456,254 | |||||||||
| Largest Manufacturer of Poultry & Fish Processing Equipment | |||||||||||
30,770,702 | |||||||||||
Number of Shares | Value | ||||||||||
| > Czech Republic 0.4% | |||||||||||
130,682 | Komercni Banka | $ | 27,625,776 | ||||||||
Leading Czech Universal Bank | |||||||||||
27,625,776 | |||||||||||
| > Belgium 0.4% | |||||||||||
438,880 | EVS Broadcast Equipment | 25,805,303 | |||||||||
| Digital Live Mobile Production Software & Systems | |||||||||||
25,805,303 | |||||||||||
| > Russia 0.4% | |||||||||||
1,167,000 | Yandex (c) | 25,172,190 | |||||||||
| Search Engine for Russian & Turkish Languages | |||||||||||
25,172,190 | |||||||||||
| > Portugal 0.4% | |||||||||||
8,635,000 | Redes Energéticas Nacionais | 23,422,428 | |||||||||
| Portuguese Power Transmission & Gas Transportation | |||||||||||
23,422,428 | |||||||||||
| > Turkey 0.1% | |||||||||||
543,494 | Bizim Toptan | 8,492,943 | |||||||||
Cash & Carry Stores in Turkey | |||||||||||
8,492,943 | |||||||||||
Europe: Total | 2,039,070,490 | ||||||||||
Other Countries 17.1% | |||||||||||
| > South Africa 4.6% | |||||||||||
1,170,188 | Naspers | 75,583,404 | |||||||||
| Media in Africa, China, Russia & Other Emerging Markets | |||||||||||
11,920,964 | Coronation Fund Managers | 55,812,561 | |||||||||
South African Fund Manager | |||||||||||
2,230,504 | Massmart Holdings | 50,571,401 | |||||||||
| General Merchandise, Food & Home Improvement Stores; Wal-Mart Subsidiary | |||||||||||
19,098,300 | Rand Merchant Insurance | 46,833,805 | |||||||||
| Directly Sold Property & Casualty Insurance; Holdings in Other Insurers | |||||||||||
2,644,083 | Mr. Price | 43,820,805 | |||||||||
| South African Retailer of Apparel, Household & Sporting Goods | |||||||||||
8,679,940 | Northam Platinum | 39,288,328 | |||||||||
Platinum Mining in South Africa | |||||||||||
311,910,304 | |||||||||||
| > Australia 4.3% | |||||||||||
52,500,000 | Commonwealth Property Office Fund | 55,930,038 | |||||||||
Australia Prime Office REIT | |||||||||||
15,000,000 | Challenger Financial | 55,891,572 | |||||||||
Largest Annuity Provider | |||||||||||
498,560 | Cochlear | 41,330,407 | |||||||||
Cochlear Implants | |||||||||||
3,557,000 | UGL | 40,604,617 | |||||||||
Engineering & Facilities Management | |||||||||||
7,059,010 | IAG | 34,768,051 | |||||||||
General Insurance Provider | |||||||||||
See accompanying notes to financial statements.
49
Columbia Acorn International
Statement of Investments, continued
Number of Shares | Value | ||||||||||
| > Australia—continued | |||||||||||
2,500,000 | Domino's Pizza Enterprises | $ | 27,403,603 | ||||||||
| Domino's Pizza Operator in Australia/New Zealand & France/Benelux | |||||||||||
5,640,000 | SAI Global | 25,056,754 | |||||||||
| Publishing, Certification, Compliance Services | |||||||||||
1,840,985 | Regis Resources (c) | 9,879,539 | |||||||||
Gold Mining in Australia | |||||||||||
290,864,581 | |||||||||||
| > Canada 4.1% | |||||||||||
1,403,772 | CCL Industries | 60,669,708 | |||||||||
Leading Global Label Manufacturer | |||||||||||
1,084,597 | ShawCor | 42,513,760 | |||||||||
Oil & Gas Pipeline Products | |||||||||||
3,047,000 | CAE (b) | 30,846,778 | |||||||||
| Flight Simulator Equipment & Training Centers | |||||||||||
653,200 | Onex Capital | 27,495,208 | |||||||||
Private Equity | |||||||||||
582,942 | AG Growth (b) | 18,378,467 | |||||||||
| Leading Manufacturer of Augers & Grain Handling Equipment | |||||||||||
709,576 | Black Diamond Group | 14,302,804 | |||||||||
| Provides Accommodations/ Equipment for Oil Sands Development | |||||||||||
1,921,379 | Horizon North Logistics | 13,270,206 | |||||||||
| Provides Diversified Oil Service Offering in Northern Canada | |||||||||||
984,500 | Alliance Grain Traders (b) | 12,926,078 | |||||||||
| Global Leader in Pulse Processing & Distribution | |||||||||||
454,000 | Celtic Exploration (c) | 11,999,256 | |||||||||
Canadian Oil & Gas Producer | |||||||||||
263,857 | Baytex (b) | 11,371,820 | |||||||||
Oil & Gas Producer in Canada | |||||||||||
1,142,377 | DeeThree Exploration (c) | 7,476,500 | |||||||||
1,130,000 | DeeThree Exploration (c)(h) | 7,358,519 | |||||||||
Canadian Oil & Gas Producer | |||||||||||
1,611,000 | Americas Petrogas (c) | 4,858,751 | |||||||||
| Oil & Gas Exploration in Argentina, Potash in Peru | |||||||||||
1,607,306 | Pan Orient (c) | 4,734,499 | |||||||||
Asian Oil & Gas Explorer | |||||||||||
450,000 | Athabasca Oil Sands (c) | 4,727,556 | |||||||||
| Oil Sands & Unconventional Oil Development | |||||||||||
332,700 | Crew Energy (c) | 2,170,728 | |||||||||
Canadian Oil & Gas Producer | |||||||||||
275,100,638 | |||||||||||
| > United States 3.1% | |||||||||||
928,000 | BioMarin Pharmaceutical (c) | 45,704,000 | |||||||||
Biotech Focused on Orphan Diseases | |||||||||||
952,080 | Atwood Oceanics (c) | 43,595,743 | |||||||||
Offshore Drilling Contractor | |||||||||||
1,272,297 | Textainer Group Holdings (b) | 40,026,463 | |||||||||
Top International Container Leasor | |||||||||||
601,213 | FMC Technologies (c) | 25,749,953 | |||||||||
Oil & Gas Well Head Manufacturer | |||||||||||
Number of Shares | Value | ||||||||||
428,228 | World Fuel Services | $ | 17,630,147 | ||||||||
Global Fuel Broker | |||||||||||
548,900 | Rowan (c) | 17,164,103 | |||||||||
Contract Offshore Driller | |||||||||||
439,500 | Hornbeck Offshore (c) | 15,092,430 | |||||||||
| Supply Vessel Operator in US Gulf of Mexico | |||||||||||
204,962,839 | |||||||||||
| > Israel 0.7% | |||||||||||
3,145,527 | Israel Chemicals | 37,882,033 | |||||||||
| Producer of Potash, Phosphates, Bromine & Specialty Chemicals | |||||||||||
625,000 | Caesarstone (c) | 10,093,750 | |||||||||
Quartz Countertops | |||||||||||
47,975,783 | |||||||||||
| > New Zealand 0.3% | |||||||||||
10,879,000 | Telecom NZ | 20,591,900 | |||||||||
Primary Telecom Operator | |||||||||||
20,591,900 | |||||||||||
Other Countries: Total | 1,151,406,045 | ||||||||||
Latin America 5.3% | |||||||||||
| > Brazil 2.8% | |||||||||||
3,700,000 | Localiza Rent A Car | 67,765,568 | |||||||||
Car Rental | |||||||||||
1,800,000 | Mills Estruturas e Servicos de Engenharia | 29,890,110 | |||||||||
Civil Engineering & Construction | |||||||||||
1,200,000 | Multiplus | 27,967,765 | |||||||||
Loyalty Program Operator in Brazil | |||||||||||
5,000,000 | Odontoprev | 26,202,686 | |||||||||
Dental Insurance | |||||||||||
1,800,000 | Arcos Dorados (b) | 21,528,000 | |||||||||
| McDonald's Master Franchise for Latin America | |||||||||||
17,793,303 | Beadell Resources (c) | 18,384,027 | |||||||||
Gold Mining in Brazil | |||||||||||
191,738,156 | |||||||||||
| > Mexico 1.5% | |||||||||||
600,000 | Grupo Aeroportuario del Sureste - ADR | 68,400,000 | |||||||||
Mexican Airport Operator | |||||||||||
11,945,000 | Genomma Lab International (c) | 24,543,698 | |||||||||
| Develops, Markets & Distributes Consumer Products | |||||||||||
1,728,500 | Herdez | 5,314,018 | |||||||||
Processed Foods Producer & Distributor | |||||||||||
98,257,716 | |||||||||||
| > Guatemala 0.4% | |||||||||||
1,434,600 | Tahoe Resources (c) | 26,248,839 | |||||||||
Silver Project in Guatemala | |||||||||||
26,248,839 | |||||||||||
| > Chile 0.4% | |||||||||||
12,956,011 | Viña Concha y Toro | 25,237,904 | |||||||||
Global Branded Wine Manufacturer | |||||||||||
25,237,904 | |||||||||||
See accompanying notes to financial statements.
50
Number of Shares | Value | ||||||||||
| > Uruguay 0.2% | |||||||||||
1,306,818 | Union Agriculture Group (c)(d)(h) | $ | 13,381,816 | ||||||||
Farmland Operator in Uruguay | |||||||||||
13,381,816 | |||||||||||
| > Argentina —% | |||||||||||
7,425,000 | Madalena Ventures (c) | 2,873,856 | |||||||||
Oil & Gas Exploration in Argentina | |||||||||||
2,873,856 | |||||||||||
| > Colombia —% | |||||||||||
785,077 | Canacol (c) | 2,517,740 | |||||||||
Oil Producer in South America | |||||||||||
19,893,109 | Gulf United Energy (c) | 155,166 | |||||||||
| Prospecting for Oil Alongside Large Producers in Colombia | |||||||||||
2,672,906 | |||||||||||
Latin America: Total | 360,411,193 | ||||||||||
| Total Equities: 97.1% (Cost: $4,951,432,379) | 6,548,643,010 | (i) | |||||||||
Short-Term Investments: 2.7% | |||||||||||
180,857,939 | J.P. Morgan U.S. Government Money Market Fund - Capital Shares (7 day yield of 0.01%) | 180,857,939 | |||||||||
| Total Short-Term Investments: 2.7% (Cost: $180,857,939) | 180,857,939 | ||||||||||
Number of Shares | Value | ||||||||||
Securities Lending Collateral 1.9% | |||||||||||
131,072,367 | Dreyfus Government Cash Management Fund (7 day yield of 0.01%) (j) | $ | 131,072,367 | ||||||||
| Total Securities Lending Collateral: (Cost: $131,072,367) | 131,072,367 | ||||||||||
| Total Investments: 101.7% (Cost: $5,263,362,685)(k) | 6,860,573,316 | ||||||||||
| Obligation to Return Collateral for Securities Loaned: (1.9)% | (131,072,367 | ) | |||||||||
Cash and Other Assets Less Liabilities: 0.2% | 14,296,657 | ||||||||||
Net Assets: 100.0% | $ | 6,743,797,606 | |||||||||
ADR - American Depositary Receipts
GDR - Global Depositary Receipts
REIT - Real Estate Investment Trust
> Notes to Statement of Investments
(a) An affiliated person of the Fund may include any company in which the Fund owns five percent or more of its outstanding voting shares. Holdings and transactions in these affiliated companies during the year ended December 31, 2012, are as follows:
Security | Balance of Shares Held 12/31/11 | Purchases/ Additions | Sales/ Reductions | Balance of Shares Held 12/31/12 | Value | Dividend | |||||||||||||||||||||
Archipelago Resources | 29,063,787 | 2,700,813 | - | 31,764,600 | $ | 30,960,001 | $ | - | |||||||||||||||||||
DeeThree Exploration (1) | 4,061,377 | - | 1,789,000 | 2,272,377 | 14,835,019 | - | |||||||||||||||||||||
Gulf United Energy (1) | 22,525,000 | - | 2,631,891 | 19,893,109 | 155,166 | - | |||||||||||||||||||||
Koninklijke TenCate (1) | 1,371,573 | 53,685 | 1,425,258 | - | - | 1,476,185 | |||||||||||||||||||||
Southern Arc Minerals | 6,217,500 | - | - | 6,217,500 | 1,593,910 | - | |||||||||||||||||||||
Sweco | 4,150,024 | - | - | 4,150,024 | 46,585,386 | 1,845,111 | |||||||||||||||||||||
UNIT4 | 1,591,702 | - | 17,557 | 1,574,145 | 47,517,926 | 796,615 | |||||||||||||||||||||
United Drug (1) | 9,074,112 | - | 9,074,112 | - | - | 196,099 | |||||||||||||||||||||
Wacom | 23,790 | 1,404 | 3,694 | 21,500 | 56,604,038 | 807,532 | |||||||||||||||||||||
Workspace Group (1) | 8,000,000 | - | 8,000,000 | - | - | 359,171 | |||||||||||||||||||||
Total of Affiliated Transactions | 86,078,865 | 2,755,902 | 22,941,512 | 65,893,255 | $ | 198,251,446 | $ | 5,480,713 | |||||||||||||||||||
(1) At December 31, 2012, the Fund owned less than five percent of the company's outstanding voting shares.
The aggregate cost and value of these companies at December 31, 2012, was $112,040,756 and $183,261,261, respectively. Investments in affiliated companies represented 2.72% of the Fund's total net assets at December 31, 2012.
(b) All or a portion of this security was on loan at December 31, 2012. The total market value of securities on loan at December 31, 2012 was $125,494,564.
(c) Non-income producing security.
(d) Illiquid security.
(e) A portion of this security is to be delivered on a delayed basis.
(f) Security is traded on a U.S. exchange.
See accompanying notes to financial statements.
51
Columbia Acorn International
Statement of Investments, continued
> Notes to Statement of Investments
(g) The common stock equity holdings of Marel are stated separately on the Statements of Investments due to the application of the onshore or offshore foreign currency exchange rate. The appropriate exchange rate is applied to each purchased security lot based on the applicable registration obtained from Marel's regulatory governing body, the Icelandic Central Bank.
(h) Denotes a restricted security, which is subject to restrictions on resale under federal securities laws. These securities are valued at fair value determined in good faith under consistently applied procedures established by the Board of Trustees. At December 31, 2012, the market value of these securities amounted to $20,740,335, which represented 0.31% of total net assets. Additional information on these securities is as follows:
Security | Acquisition Dates | Shares | Cost | Value | |||||||||||||||
Union Agriculture Group | 12/8/10-6/27/12 | 1,306,818 | $ | 15,000,000 | $ | 13,381,816 | |||||||||||||
DeeThree Exploration | 9/7/10 | 1,130,000 | 2,950,812 | 7,358,519 | |||||||||||||||
$ | 17,950,812 | $ | 20,740,335 | ||||||||||||||||
(i) On December 31, 2012, the Fund's total investments were denominated in currencies as follows:
Currency | Value | Percentage of Net Assets | |||||||||
Japanese Yen | $ | 1,077,754,840 | 16.0 | ||||||||
Euro | 938,652,959 | 13.9 | |||||||||
United States Dollar | 553,873,590 | 8.2 | |||||||||
British Pound | 452,166,597 | 6.7 | |||||||||
Taiwan Dollar | 434,042,080 | 6.4 | |||||||||
Hong Kong Dollar | 391,331,005 | 5.8 | |||||||||
| Other currencies less than 5% of total net assets | 2,700,821,939 | 40.1 | |||||||||
Total Equities | $ | 6,548,643,010 | 97.1 | ||||||||
(j) Investment made with cash collateral received from securities lending activity.
(k) At December 31, 2012, for federal income tax purposes, the cost of investments was $5,426,082,628 and net unrealized appreciation was $1,434,490,688 consisting of gross unrealized appreciation of $1,728,170,866 and gross unrealized depreciation of $293,680,178.
Fair Value Measurements
Various inputs are used in determining the value of the Fund's investments, following the input prioritization hierarchy established by accounting principles generally accepted in the United States of America (GAAP). These inputs are summarized in the three broad levels listed below:
• Level 1 – quoted prices in active markets for identical securities
• Level 2 – prices determined using other significant observable inputs (including quoted prices for similar securities, interest rates, prepayment speeds, credit risk and others)
• Level 3 – prices determined using significant unobservable inputs where quoted prices or observable inputs are unavailable or less reliable (including management's own assumptions about the factors market participants would use in pricing an investment)
The inputs or methodology used for valuing securities are not necessarily an indication of the risk associated with investing in those securities.
Examples of the types of securities in which the Fund would typically invest and how they are classified within this hierarchy are as follows. Typical Level 1 securities include exchange traded domestic equities, mutual funds whose NAVs are published each day and exchange traded foreign equities that are not statistically fair valued. Typical Level 2 securities include exchange traded foreign equities that are statistically fair valued, forward foreign currency exchange contracts and short-term investments valued at amortized cost. Additionally, securities fair valued by the Valuation Committee (the Committee) of the Fund's Board of Trustees (the Board) that rely on significant observable inputs are also included in Level 2. Typical Level 3 securities include any security fair valued by the Committee that relies on significant unobservable inputs.
Under the direction of the Board, the Committee is responsible for carrying out the valuation procedures approved by the Board.
The Committee meets as necessary, and no less frequently than quarterly, to determine fair values for securities for which market quotations are not readily available or for which the investment manager believes that available market quotations are unreliable, to review the appropriateness of the Trust's Portfolio Pricing Policy and the pricing procedures of the investment manager (the Policies), and to review the continuing appropriateness of the current value of any security subject to the Policies. The Policies address, among other things: circumstances under which market quotations will be deemed readily available; selection of third party pricing vendors; appropriate pricing methodologies; events that require fair valuation and fair value techniques; and circumstances under which securities will be deemed to pose a potential for stale pricing, including when securities are illiquid, restricted, or in default. The Committee may also meet to discuss additional valuation matters, which may include review of back-testing results, review of time-sensitive information or approval of other valuation related actions, and to review the appropriateness of the Policies.
For investments categorized as Level 3, the significant unobservable inputs used in the fair value measurement of the Funds' securities may include: (i) data specific to the issuer or comparable issuers, (ii) general market or specific sector news and (iii) quoted prices and specific or similar security transactions. The Committee considers this data and any changes from prior periods in order to assess the reasonableness of observable and unobservable inputs, any assumptions or internal models used to value those securities and changes in fair value. Significant changes in any of these factors could result in lower or higher fair value measurements. Various factors impact the frequency of monitoring (which may occur as often as daily), however the Committee may determine that changes to inputs, assumptions and models are not required with the same frequency.
See accompanying notes to financial statements.
52
> Notes to Statement of Investments
The following table summarizes the inputs used, as of December 31, 2012, in valuing the Fund's assets:
Investment Type | Quoted Prices (Level 1) | Other Significant Observable Inputs (Level 2) | Significant Unobservable Inputs (Level 3) | Total | |||||||||||||||
Equities | |||||||||||||||||||
Asia | $ | 160,837,111 | $ | 2,836,918,171 | $ | - | $ | 2,997,755,282 | |||||||||||
Europe | 42,559,777 | 1,996,510,713 | - | 2,039,070,490 | |||||||||||||||
Other Countries | 482,798,708 | 668,607,337 | - | 1,151,406,045 | |||||||||||||||
Latin America | 328,645,350 | 18,384,027 | 13,381,816 | 360,411,193 | |||||||||||||||
Total Equities | 1,014,840,946 | 5,520,420,248 | 13,381,816 | 6,548,643,010 | |||||||||||||||
Total Short-Term Investments | 180,857,939 | - | - | 180,857,939 | |||||||||||||||
Total Securities Lending Collateral | 131,072,367 | - | - | 131,072,367 | |||||||||||||||
Total Investments | $ | 1,326,771,252 | $ | 5,520,420,248 | $ | 13,381,816 | $ | 6,860,573,316 | |||||||||||
The Fund's assets assigned to the Level 2 input category are generally valued using a market approach, in which a security's value is determined through its correlation to prices and information from observable market transactions for similar or identical assets. Foreign equities are generally valued at the last sale price on the foreign exchange or market on which they trade. The Fund may use a statistical fair valuation model, in accordance with the policy adopted by the Board, provided by an independent third party to value securities principally traded in foreign markets in order to adjust for possible stale pricing that may occur between the close of the foreign exchanges and the time for valuation. These models take into account available market data including intraday index, ADR, and ETF movements. Securities acquired via private placement that have a holding period or an extended settlement period are valued at a discount to the same shares that are trading freely on the market. These discounts are determined by the investment manager's experience with similar securities or situations. Factors may include, but are not limited to, trade volume, shares outstanding and stock price.
The following table shows transfers between Level 1 and Level 2 of the fair value hierarchy:
Transfers In | Transfers Out | ||||||||||||||
| Level 1 | Level 2 | Level 1 | Level 2 | ||||||||||||
| $ | 15,784,552 | $ | - | $ | - | $ | 15,784,552 | ||||||||
Financial assets were transferred from Level 2 to Level 1 as resale restrictions no longer apply.
The fund does not hold any significant investments categorized as Level 3.
Certain common stock classified as Level 3 are valued at fair value, using a market approach, as determined in good faith under consistently applied procedures established by and under the general supervision of the Board. To determine fair value for these securities, for which no market exists, the Committee utilizes the valuation technique it deems most appropriate in the circumstances, using some unobservable inputs, which may include but are not limited to trades of similar securities, estimated earnings of the company, market multiples derived from a set of comparable companies, and the position of the security within the company's capital structure. Significant increases or decreases to any of these inputs could result in a significantly lower or higher fair value measurement.
See accompanying notes to financial statements.
53
Columbia Acorn International
Portfolio Diversification
At December 31, 2012, the Fund's portfolio investments as a percentage of net assets were diversified as follows:
Value | Percentage of Net Assets | ||||||||||
| > Industrial Goods & Services | |||||||||||
Other Industrial Services | $ | 610,132,159 | 9.0 | ||||||||
Machinery | 391,421,832 | 5.8 | |||||||||
| Industrial Materials & Specialty Chemicals | 379,195,160 | 5.6 | |||||||||
Construction | 146,954,404 | 2.2 | |||||||||
Conglomerates | 95,094,193 | 1.4 | |||||||||
Electrical Components | 89,836,544 | 1.3 | |||||||||
Industrial Distribution | 54,063,689 | 0.8 | |||||||||
Outsourcing Services | 34,041,656 | 0.5 | |||||||||
1,800,739,637 | 26.6 | ||||||||||
| > Consumer Goods & Services | |||||||||||
Retail | 430,388,693 | 6.4 | |||||||||
Food & Beverage | 288,797,260 | 4.3 | |||||||||
Casinos & Gaming | 224,661,571 | 3.3 | |||||||||
Nondurables | 156,567,113 | 2.3 | |||||||||
Other Consumer Services | 115,107,890 | 1.7 | |||||||||
Consumer Goods Distribution | 80,070,730 | 1.2 | |||||||||
Other Durable Goods | 78,450,790 | 1.2 | |||||||||
Travel | 78,199,408 | 1.2 | |||||||||
Apparel | 62,892,232 | 0.9 | |||||||||
Restaurants | 58,334,450 | 0.9 | |||||||||
Educational Services | 38,282,223 | 0.6 | |||||||||
Other Entertainment | 22,022,712 | 0.3 | |||||||||
Furniture & Textiles | 10,093,750 | 0.1 | |||||||||
1,643,868,822 | 24.4 | ||||||||||
| > Information | |||||||||||
| Computer Hardware & Related Equipment | 255,569,089 | 3.8 | |||||||||
Mobile Communications | 234,470,818 | 3.5 | |||||||||
Business Software | 185,175,209 | 2.7 | |||||||||
Internet Related | 124,218,225 | 1.8 | |||||||||
Financial Processors | 69,713,724 | 1.0 | |||||||||
Instrumentation | 67,908,828 | 1.0 | |||||||||
Computer Services | 51,830,841 | 0.8 | |||||||||
| Semiconductors & Related Equipment | 42,879,782 | 0.6 | |||||||||
Electronics Distribution | 38,335,261 | 0.6 | |||||||||
CATV | 37,986,380 | 0.6 | |||||||||
Telephone & Data Services | 20,591,900 | 0.3 | |||||||||
Satellite Broadcasting & Services | 9,972,794 | 0.2 | |||||||||
TV Broadcasting | 8,886,770 | 0.1 | |||||||||
Advertising | 5,042,671 | 0.1 | |||||||||
1,152,582,292 | 17.1 | ||||||||||
Value | Percentage of Net Assets | ||||||||||
| > Other Industries | |||||||||||
Real Estate | $ | 443,208,704 | 6.6 | ||||||||
Transportation | 135,865,184 | 2.0 | |||||||||
Regulated Utilities | 38,617,124 | 0.6 | |||||||||
617,691,012 | 9.2 | ||||||||||
| > Finance | |||||||||||
Insurance | 219,319,501 | 3.3 | |||||||||
Banks | 168,103,945 | 2.5 | |||||||||
Brokerage & Money Management | 129,756,113 | 1.9 | |||||||||
Finance Companies | 67,521,672 | 1.0 | |||||||||
584,701,231 | 8.7 | ||||||||||
| > Energy & Minerals | |||||||||||
Mining | 209,010,035 | 3.1 | |||||||||
Oil Services | 193,525,324 | 2.9 | |||||||||
Oil & Gas Producers | 77,701,929 | 1.1 | |||||||||
Agricultural Commodities | 26,307,895 | 0.4 | |||||||||
Oil Refining, Marketing & Distribution | 18,811,675 | 0.3 | |||||||||
525,356,858 | 7.8 | ||||||||||
| > Health Care | |||||||||||
Medical Equipment & Devices | 90,269,171 | 1.3 | |||||||||
Medical Supplies | 52,945,010 | 0.8 | |||||||||
Biotechnology & Drug Delivery | 45,704,000 | 0.7 | |||||||||
Health Care Services | 34,784,977 | 0.5 | |||||||||
223,703,158 | 3.3 | ||||||||||
Total Equities: | 6,548,643,010 | 97.1 | |||||||||
Short-Term Investments: | 180,857,939 | 2.7 | |||||||||
Securities Lending Collateral: | 131,072,367 | 1.9 | |||||||||
Total Investments: | 6,860,573,316 | 101.7 | |||||||||
| Obligation to Return Collateral for Securities Loaned: | (131,072,367 | ) | (1.9 | ) | |||||||
| Cash and Other Assets Less Liabilities: | 14,296,657 | 0.2 | |||||||||
Net Assets: | $ | 6,743,797,606 | 100.0 | ||||||||
See accompanying notes to financial statements.
54
Columbia Acorn USA Fund
Major Portfolio Changes in the Fourth Quarter (Unaudited)
Number of Shares | |||||||||||
9/30/12 | 12/31/12 | ||||||||||
Purchases | |||||||||||
Information | |||||||||||
Exa | 31,804 | 270,337 | |||||||||
Liquidity Services | 0 | 81,000 | |||||||||
RealPage | 0 | 125,442 | |||||||||
Semtech | 0 | 130,000 | |||||||||
Industrial Goods & Services | |||||||||||
Dorman Products | 0 | 97,000 | |||||||||
Drew Industries | 496,000 | 539,000 | |||||||||
Forward Air | 109,000 | 207,000 | |||||||||
Generac | 155,000 | 183,963 | |||||||||
Polyone | 0 | 180,000 | |||||||||
Thermon | 0 | 260,000 | |||||||||
Consumer Goods & Services | |||||||||||
Boulder Brands Inc | 0 | 149,000 | |||||||||
Casey's General Stores | 0 | 63,000 | |||||||||
Choice Hotels | 75,000 | 173,000 | |||||||||
Ryman Hospitality Properties | 849,700 | 997,722 | |||||||||
Finance | |||||||||||
CAI International | 415,208 | 542,055 | |||||||||
SEI Investments | 0 | 139,000 | |||||||||
Health Care | |||||||||||
Sarepta Therapeutics | 0 | 179,000 | |||||||||
Techne | 53,000 | 96,000 | |||||||||
Other Industries | |||||||||||
EdR | 783,000 | 1,084,800 | |||||||||
Energy & Minerals | |||||||||||
Chart Industries | 0 | 27,050 | |||||||||
Number of Shares | |||||||||||
9/30/12 | 12/31/12 | ||||||||||
Sales | |||||||||||
Information | |||||||||||
Ansys | 375,000 | 329,000 | |||||||||
Atmel | 1,958,000 | 1,307,000 | |||||||||
Concur Technologies | 243,000 | 196,000 | |||||||||
Micros Systems | 698,000 | 633,000 | |||||||||
SABA | 337,000 | 25,050 | |||||||||
Syntel | 97,000 | 87,000 | |||||||||
WMS Industries | 167,000 | 83,500 | |||||||||
Industrial Goods & Services | |||||||||||
Acorn Energy | 600,919 | 542,836 | |||||||||
Ametek | 1,264,000 | 1,082,000 | |||||||||
Clean Harbors | 50,000 | 0 | |||||||||
GrafTech International | 413,634 | 0 | |||||||||
Oshkosh Corporation | 146,000 | 76,000 | |||||||||
TrueBlue | 240,000 | 0 | |||||||||
Consumer Goods & Services | |||||||||||
Deckers Outdoor | 73,000 | 0 | |||||||||
Herman Miller | 148,000 | 78,000 | |||||||||
lululemon athletica | 565,000 | 522,000 | |||||||||
Pool | 429,000 | 393,000 | |||||||||
Skullcandy | 230,000 | 213,494 | |||||||||
Teavana | 120,000 | 0 | |||||||||
Vail Resorts | 64,000 | 32,000 | |||||||||
Warnaco Group | 222,000 | 0 | |||||||||
Finance | |||||||||||
City National | 211,000 | 190,000 | |||||||||
Eaton Vance | 306,500 | 203,500 | |||||||||
Pacific Continental Bank | 217,117 | 0 | |||||||||
Health Care | |||||||||||
Alexion Pharmaceuticals | 75,000 | 63,000 | |||||||||
Auxilium Pharmaceuticals | 421,000 | 103,527 | |||||||||
BioMarin Pharmaceutical | 415,000 | 381,000 | |||||||||
Hill-Rom Holdings | 268,000 | 0 | |||||||||
Isis Pharmaceuticals | 643,000 | 0 | |||||||||
Other Industries | |||||||||||
Dupont Fabros Technology | 625,000 | 499,100 | |||||||||
Energy & Minerals | |||||||||||
Hornbeck Offshore | 125,000 | 0 | |||||||||
Rosetta Resources | 129,000 | 93,000 | |||||||||
SM Energy | 133,000 | 99,000 | |||||||||
See accompanying notes to financial statements.
55
Columbia Acorn USA
Statement of Investments, December 31, 2012
Number of Shares | Value | ||||||||||
Equities: 99.1% | |||||||||||
Information 29.2% | |||||||||||
| > Business Software 7.6% | |||||||||||
910,000 | Informatica (a) | $ | 27,591,200 | ||||||||
Enterprise Data Integration Software | |||||||||||
633,000 | Micros Systems (a) | 26,864,520 | |||||||||
| Information Systems for Hotels, Restaurants & Retailers | |||||||||||
329,000 | Ansys (a) | 22,154,860 | |||||||||
| Simulation Software for Engineers & Designers | |||||||||||
197,000 | NetSuite (a) | 13,258,100 | |||||||||
| End-to-end IT Systems Solutions Delivered Over the Web | |||||||||||
196,000 | Concur Technologies (a) | 13,233,920 | |||||||||
| Web Enabled Cost & Expense Management Software | |||||||||||
290,000 | SPS Commerce (a) | 10,808,300 | |||||||||
| Supply Chain Management Software Delivered via the Web | |||||||||||
125,442 | RealPage (a)(b) | 2,705,784 | |||||||||
| Software for Managing Rental Properties Delivered Via the Web | |||||||||||
270,337 | Exa (a) | 2,630,379 | |||||||||
Simulation Software | |||||||||||
400,000 | Velti (a)(b) | 1,800,000 | |||||||||
Mobile Marketing Software Platform | |||||||||||
25,050 | SABA (a) | 218,937 | |||||||||
Learning Management Systems | |||||||||||
121,266,000 | |||||||||||
| > Instrumentation 4.9% | |||||||||||
525,000 | IPG Photonics (b) | 34,991,250 | |||||||||
Fiber Lasers | |||||||||||
180,000 | Mettler-Toledo International (a) | 34,794,000 | |||||||||
Laboratory Equipment | |||||||||||
151,000 | Trimble Navigation (a) | 9,026,780 | |||||||||
GPS-based Instruments | |||||||||||
78,812,030 | |||||||||||
| > Semiconductors & Related Equipment 3.9% | |||||||||||
690,000 | Microsemi (a) | 14,517,600 | |||||||||
Analog/Mixed Signal Semiconductors | |||||||||||
262,000 | Ultratech (a) | 9,772,600 | |||||||||
Semiconductor Equipment | |||||||||||
1,307,000 | Atmel (a) | 8,560,850 | |||||||||
| Microcontrollers, Radio Frequency & Memory Semiconductors | |||||||||||
366,000 | Monolithic Power Systems | 8,154,480 | |||||||||
| High Performance Analog & Mixed Signal Integrated Circuits | |||||||||||
961,000 | ON Semiconductor (a) | 6,775,050 | |||||||||
| Mixed Signal & Power Management Semiconductors | |||||||||||
1,075,000 | TriQuint Semiconductor (a) | 5,203,000 | |||||||||
Radio Frequency Semiconductors | |||||||||||
130,000 | Semtech (a) | 3,763,500 | |||||||||
Analog Semiconductors | |||||||||||
390,000 | Pericom Semiconductor (a) | 3,131,700 | |||||||||
| Interface Integrated Circuits & Frequency Control Products | |||||||||||
Number of Shares | Value | ||||||||||
50,000 | Hittite Microwave (a) | $ | 3,105,000 | ||||||||
| Radio Frequency, Microwave & Millimeterwave Semiconductors | |||||||||||
62,983,780 | |||||||||||
| > Telephone & Data Services 2.5% | |||||||||||
1,457,000 | tw telecom (a) | 37,109,790 | |||||||||
Fiber Optic Telephone/Data Services | |||||||||||
400,000 | Boingo Wireless (a)(b) | 3,020,000 | |||||||||
Wholesale & Retail WiFi Networks | |||||||||||
40,129,790 | |||||||||||
| > Computer Hardware & Related Equipment 2.1% | |||||||||||
1,317,000 | II-VI (a) | 24,061,590 | |||||||||
Laser Optics & Specialty Materials | |||||||||||
160,000 | Nice Systems - ADR (Israel) (a) | 5,356,800 | |||||||||
Audio & Video Recording Solutions | |||||||||||
97,000 | Netgear (a) | 3,823,740 | |||||||||
| Networking Products for Small Business & Home | |||||||||||
4,558 | Rogers (a) | 226,350 | |||||||||
| Printed Circuit Materials & High-performance Foams | |||||||||||
33,468,480 | |||||||||||
| > Computer Services 2.1% | |||||||||||
556,000 | ExlService Holdings (a) | 14,734,000 | |||||||||
Business Process Outsourcing | |||||||||||
87,000 | Syntel | 4,662,330 | |||||||||
Offshore IT Services | |||||||||||
359,000 | WNS - ADR (India) (a) | 3,740,780 | |||||||||
| Offshore BPO (Business Process Outsourcing) Services | |||||||||||
776,766 | Hackett Group | 3,324,559 | |||||||||
IT Integration & Best Practice Research | |||||||||||
640,000 | RCM Technologies (c) | 3,232,000 | |||||||||
Technology & Engineering Services | |||||||||||
192,000 | Virtusa (a) | 3,154,560 | |||||||||
Offshore IT Outsourcing | |||||||||||
32,848,229 | |||||||||||
| > Gaming Equipment & Services 1.9% | |||||||||||
660,000 | Bally Technologies (a) | 29,508,600 | |||||||||
Slot Machines & Software | |||||||||||
83,500 | WMS Industries (a) | 1,461,250 | |||||||||
Slot Machine Provider | |||||||||||
30,969,850 | |||||||||||
| > Telecommunications Equipment 1.7% | |||||||||||
813,000 | Ixia (a) | 13,804,740 | |||||||||
Telecom Network Test Equipment | |||||||||||
732,000 | Finisar (a) | 11,931,600 | |||||||||
Optical Subsystems & Components | |||||||||||
323,278 | Infinera (a)(b) | 1,878,245 | |||||||||
Optical Networking Equipment | |||||||||||
27,614,585 | |||||||||||
| > Mobile Communications 1.3% | |||||||||||
300,000 | SBA Communications (a) | 21,306,000 | |||||||||
Communications Towers | |||||||||||
21,306,000 | |||||||||||
See accompanying notes to financial statements.
56
Number of Shares | Value | ||||||||||
| > Financial Processors 0.7% | |||||||||||
153,000 | Global Payments | $ | 6,930,900 | ||||||||
Credit Card Processor | |||||||||||
81,000 | Liquidity Services (a) | 3,309,660 | |||||||||
E-Auctions for Surplus & Salvage Goods | |||||||||||
10,240,560 | |||||||||||
| > Contract Manufacturing 0.4% | |||||||||||
236,000 | Plexus (a) | 6,088,800 | |||||||||
Electronic Manufacturing Services | |||||||||||
6,088,800 | |||||||||||
| > TV Broadcasting 0.1% | |||||||||||
875,000 | Entravision Communications | 1,452,500 | |||||||||
Spanish Language TV & Radio Stations | |||||||||||
1,452,500 | |||||||||||
Information: Total | 467,180,604 | ||||||||||
Industrial Goods & Services 18.3% | |||||||||||
| > Machinery 14.5% | |||||||||||
747,200 | Nordson | 47,163,264 | |||||||||
| Dispensing Systems for Adhesives & Coatings | |||||||||||
1,082,000 | Ametek | 40,650,740 | |||||||||
Aerospace/Industrial Instruments | |||||||||||
835,000 | ESCO Technologies | 31,237,350 | |||||||||
Automatic Electric Meter Readers | |||||||||||
890,000 | Donaldson | 29,227,600 | |||||||||
Industrial Air Filtration | |||||||||||
631,000 | HEICO | 20,179,380 | |||||||||
FAA Approved Aircraft Replacement Parts | |||||||||||
436,000 | Moog (a) | 17,889,080 | |||||||||
| Motion Control Products for Aerospace, Defense & Industrial Markets | |||||||||||
260,000 | Toro | 11,174,800 | |||||||||
Turf Maintenance Equipment | |||||||||||
227,000 | Polypore International (a)(b) | 10,555,500 | |||||||||
Battery Separators & Filtration Media | |||||||||||
204,000 | Kennametal | 8,160,000 | |||||||||
Consumable Cutting Tools | |||||||||||
183,963 | Generac | 6,311,771 | |||||||||
Standby Power Generators | |||||||||||
97,000 | Dorman Products | 3,427,980 | |||||||||
Aftermarket Auto Parts Distributor | |||||||||||
26,000 | Middleby (a) | 3,333,460 | |||||||||
Manufacturer of Cooking Equipment | |||||||||||
76,000 | Oshkosh Corporation (a) | 2,253,400 | |||||||||
Specialty Truck Manufacturer | |||||||||||
231,564,325 | |||||||||||
| > Industrial Materials & Specialty Chemicals 1.3% | |||||||||||
539,000 | Drew Industries | 17,382,750 | |||||||||
RV & Manufactured Home Components | |||||||||||
180,000 | Polyone | 3,675,600 | |||||||||
Intermediate Stage Chemicals Producer | |||||||||||
21,058,350 | |||||||||||
Number of Shares | Value | ||||||||||
| > Electrical Components 1.3% | |||||||||||
209,000 | Acuity Brands | $ | 14,155,570 | ||||||||
Commercial Lighting Fixtures | |||||||||||
260,000 | Thermon (a) | 5,857,800 | |||||||||
Global Engineered Thermal Solutions | |||||||||||
20,013,370 | |||||||||||
| > Other Industrial Services 0.7% | |||||||||||
207,000 | Forward Air | 7,247,070 | |||||||||
Freight Transportation Between Airports | |||||||||||
542,836 | Acorn Energy (b) | 4,239,549 | |||||||||
| Frac Well Exploration/Monitoring Device, Sonar Security, Electric Grid Monitoring | |||||||||||
11,486,619 | |||||||||||
| > Construction 0.3% | |||||||||||
180,000 | Fortune Brands Home & Security (a) | 5,259,600 | |||||||||
Home Building Supplies & Small Locks | |||||||||||
5,259,600 | |||||||||||
| > Waste Management 0.2% | |||||||||||
90,000 | Waste Connections | 3,041,100 | |||||||||
Solid Waste Management | |||||||||||
3,041,100 | |||||||||||
Industrial Goods & Services: Total | 292,423,364 | ||||||||||
Consumer Goods & Services 17.4% | |||||||||||
| > Retail 6.2% | |||||||||||
522,000 | lululemon athletica (a) | 39,792,060 | |||||||||
Premium Active Apparel Retailer | |||||||||||
468,500 | Abercrombie & Fitch | 22,473,945 | |||||||||
Teen Apparel Retailer | |||||||||||
805,000 | Pier 1 Imports | 16,100,000 | |||||||||
Home Furnishing Retailer | |||||||||||
356,000 | Shutterfly (a) | 10,633,720 | |||||||||
Internet Photo-centric Retailer | |||||||||||
715,000 | Saks (a)(b) | 7,514,650 | |||||||||
Luxury Department Store Retailer | |||||||||||
63,000 | Casey's General Stores | 3,345,300 | |||||||||
Owner/Operator of Convenience Stores | |||||||||||
99,859,675 | |||||||||||
| > Travel 5.4% | |||||||||||
997,722 | Ryman Hospitality Properties | 38,372,388 | |||||||||
Convention Hotels | |||||||||||
1,300,950 | Avis Budget Group (a) | 25,784,829 | |||||||||
Second Largest Car Rental Company | |||||||||||
675,000 | Hertz (a) | 10,982,250 | |||||||||
Largest US Rental Car Operator | |||||||||||
173,000 | Choice Hotels | 5,816,260 | |||||||||
Franchisor of Budget Hotel Brands | |||||||||||
140,000 | HomeAway (a)(b) | 3,080,000 | |||||||||
Vacation Rental Online Marketplace | |||||||||||
32,000 | Vail Resorts | 1,730,880 | |||||||||
Ski Resort Operator & Developer | |||||||||||
85,766,607 | |||||||||||
See accompanying notes to financial statements.
57
Columbia Acorn USA
Statement of Investments, continued
Number of Shares | Value | ||||||||||
| > Furniture & Textiles 1.9% | |||||||||||
880,000 | Knoll | $ | 13,516,800 | ||||||||
Office Furniture | |||||||||||
756,000 | Interface | 12,156,480 | |||||||||
Modular Carpet | |||||||||||
200,000 | Caesarstone (Israel) (a) | 3,230,000 | |||||||||
Quartz Countertops | |||||||||||
78,000 | Herman Miller | 1,670,760 | |||||||||
Office Furniture | |||||||||||
30,574,040 | |||||||||||
| > Consumer Goods Distribution 1.0% | |||||||||||
393,000 | Pool | 16,631,760 | |||||||||
| Distributor of Swimming Pool Supplies & Equipment | |||||||||||
16,631,760 | |||||||||||
| > Other Consumer Services 0.7% | |||||||||||
233,000 | Lifetime Fitness (a) | 11,465,930 | |||||||||
Sport & Fitness Club Operator | |||||||||||
11,465,930 | |||||||||||
| > Casinos & Gaming 0.7% | |||||||||||
698,000 | Pinnacle Entertainment (a) | 11,049,340 | |||||||||
Regional Casino Operator | |||||||||||
11,049,340 | |||||||||||
| > Other Durable Goods 0.7% | |||||||||||
206,000 | Cavco Industries (a) | 10,295,880 | |||||||||
Manufactured Homes | |||||||||||
10,295,880 | |||||||||||
| > Nondurables 0.6% | |||||||||||
262,000 | Helen of Troy (a) | 8,748,180 | |||||||||
| Personal Care, Housewares, Healthcare & Home Environment Products | |||||||||||
8,748,180 | |||||||||||
| > Food & Beverage 0.1% | |||||||||||
149,000 | Boulder Brands Inc (a) | 1,922,100 | |||||||||
Healthy Food Products | |||||||||||
1,922,100 | |||||||||||
| > Leisure Products 0.1% | |||||||||||
213,494 | Skullcandy (a)(b) | 1,663,118 | |||||||||
Lifestyle Branded Headphones | |||||||||||
1,663,118 | |||||||||||
| > Educational Services —% | |||||||||||
37,350 | ITT Educational Services (a) | 646,529 | |||||||||
Postsecondary Degree Services | |||||||||||
646,529 | |||||||||||
Consumer Goods & Services: Total | 278,623,159 | ||||||||||
Finance 13.4% | |||||||||||
| > Banks 7.0% | |||||||||||
833,000 | MB Financial | 16,451,750 | |||||||||
Chicago Bank | |||||||||||
1,053,000 | Associated Banc-Corp | 13,815,360 | |||||||||
Midwest Bank | |||||||||||
431,597 | Lakeland Financial | 11,152,466 | |||||||||
Indiana Bank | |||||||||||
170,000 | SVB Financial Group (a) | 9,514,900 | |||||||||
Bank to Venture Capitalists | |||||||||||
Number of Shares | Value | ||||||||||
190,000 | City National | $ | 9,408,800 | ||||||||
Bank & Asset Manager | |||||||||||
251,000 | Hancock Holding | 7,966,740 | |||||||||
Gulf Coast Bank | |||||||||||
1,478,200 | First Busey | 6,873,630 | |||||||||
Illinois Bank | |||||||||||
535,000 | TCF Financial | 6,500,250 | |||||||||
Great Lakes Bank | |||||||||||
641,750 | Valley National Bancorp (b) | 5,968,275 | |||||||||
New Jersey/New York Bank | |||||||||||
834,000 | First Commonwealth | 5,687,880 | |||||||||
Western Pennsylvania Bank | |||||||||||
242,000 | Eagle Bancorp (a) | 4,832,740 | |||||||||
Metro D.C. Bank | |||||||||||
764,000 | TrustCo Bank | 4,033,920 | |||||||||
New York State Bank | |||||||||||
178,826 | Sandy Spring Bancorp | 3,472,801 | |||||||||
Baltimore, D.C. Bank | |||||||||||
210,000 | CVB Financial | 2,184,000 | |||||||||
Inland Empire Business Bank | |||||||||||
851,247 | Guaranty Bancorp (a) | 1,659,932 | |||||||||
Colorado Bank | |||||||||||
105,700 | Hudson Valley | 1,645,749 | |||||||||
Metro New York City Bank | |||||||||||
90,000 | TriCo Bancshares | 1,507,500 | |||||||||
California Central Valley Bank | |||||||||||
112,676,693 | |||||||||||
| > Finance Companies 4.1% | |||||||||||
315,000 | World Acceptance (a) | 23,486,400 | |||||||||
Personal Loans | |||||||||||
389,000 | Textainer Group Holdings | 12,237,940 | |||||||||
Top International Container Leasor | |||||||||||
542,055 | CAI International (a) | 11,898,107 | |||||||||
International Container Leasing | |||||||||||
346,000 | McGrath Rentcorp | 10,040,920 | |||||||||
Temporary Space & IT Rentals | |||||||||||
357,861 | H & E Equipment Services | 5,392,966 | |||||||||
Heavy Equipment Leasing | |||||||||||
100,000 | Marlin Business Services | 2,006,000 | |||||||||
Small Equipment Leasing | |||||||||||
32,071 | Regional Management (a)(b) | 530,775 | |||||||||
Consumer Loans | |||||||||||
65,593,108 | |||||||||||
| > Savings & Loans 1.2% | |||||||||||
602,487 | ViewPoint Financial | 12,616,078 | |||||||||
Texas Thrift | |||||||||||
144,000 | Berkshire Hills Bancorp | 3,435,840 | |||||||||
Northeast Thrift | |||||||||||
173,073 | Simplicity Bancorp | 2,587,441 | |||||||||
Los Angeles Savings & Loan | |||||||||||
18,639,359 | |||||||||||
| > Brokerage & Money Management 0.6% | |||||||||||
203,500 | Eaton Vance | 6,481,475 | |||||||||
Specialty Mutual Funds | |||||||||||
139,000 | SEI Investments | 3,244,260 | |||||||||
| Mutual Fund Administration & Investment Management | |||||||||||
9,725,735 | |||||||||||
See accompanying notes to financial statements.
58
Number of Shares | Value | ||||||||||
| > Insurance 0.5% | |||||||||||
39,000 | Enstar Group (a) | $ | 4,367,220 | ||||||||
Insurance/Reinsurance & Related Services | |||||||||||
50,000 | Allied World Holdings | 3,940,000 | |||||||||
Commerical Lines Insurance/Reinsurance | |||||||||||
8,307,220 | |||||||||||
Finance: Total | 214,942,115 | ||||||||||
Health Care 9.2% | |||||||||||
| > Biotechnology & Drug Delivery 5.6% | |||||||||||
381,000 | BioMarin Pharmaceutical (a) | 18,764,250 | |||||||||
Biotech Focused on Orphan Diseases | |||||||||||
696,000 | Seattle Genetics (a)(b) | 16,147,200 | |||||||||
Antibody-based Therapies for Cancer | |||||||||||
1,196,450 | NPS Pharmaceuticals (a) | 10,887,695 | |||||||||
Orphan Drugs & Healthy Royalties | |||||||||||
197,000 | Synageva Biopharma (a) | 9,119,130 | |||||||||
Biotech Focused on Orphan Diseases | |||||||||||
466,000 | ARIAD Pharmaceuticals (a) | 8,937,880 | |||||||||
Biotech Focused on Cancer | |||||||||||
100,000 | Onyx Pharmaceuticals (a) | 7,553,000 | |||||||||
Commercial-stage Biotech Focused on Cancer | |||||||||||
63,000 | Alexion Pharmaceuticals (a) | 5,910,030 | |||||||||
Biotech Focused on Orphan Diseases | |||||||||||
179,000 | Sarepta Therapeutics (a)(b) | 4,618,200 | |||||||||
Biotech Focused On Rare Diseases | |||||||||||
400,000 | InterMune (a)(b) | 3,876,000 | |||||||||
Drugs for Pulmonary Fibrosis & Hepatitis C | |||||||||||
103,527 | Auxilium Pharmaceuticals (a) | 1,918,355 | |||||||||
Biotech Focused on Niche Disease Areas | |||||||||||
259,000 | Raptor Pharmaceutical (a)(b) | 1,515,150 | |||||||||
Orphan Drug Company | |||||||||||
815,900 | Chelsea Therapeutics International (a)(b) | 620,084 | |||||||||
Biotech Focused on Rare Diseases | |||||||||||
18,181 | Metabolex (a)(d)(e) | 3,636 | |||||||||
Diabetes Drug Development | |||||||||||
89,870,610 | |||||||||||
| > Medical Supplies 1.7% | |||||||||||
587,600 | Cepheid (a) | 19,866,756 | |||||||||
Molecular Diagnostics | |||||||||||
96,000 | Techne | 6,560,640 | |||||||||
| Cytokines, Antibodies & Other Reagents for Life Science | |||||||||||
26,427,396 | |||||||||||
| > Medical Equipment & Devices 1.0% | |||||||||||
246,012 | Sirona Dental Systems (a) | 15,857,934 | |||||||||
Manufacturer of Dental Equipment | |||||||||||
15,857,934 | |||||||||||
| > Pharmaceuticals 0.5% | |||||||||||
642,000 | Akorn (a) | 8,577,120 | |||||||||
| Develops, Manufactures & Sells Specialty Generic Drugs | |||||||||||
133,180 | Alimera Sciences (a) | 209,093 | |||||||||
| Ophthalmology-focused Pharmaceutical Company | |||||||||||
8,786,213 | |||||||||||
Number of Shares | Value | ||||||||||
| > Health Care Services 0.4% | |||||||||||
664,900 | Health Management Associates (a) | $ | 6,196,868 | ||||||||
Non-urban Hospitals | |||||||||||
6,196,868 | |||||||||||
Health Care: Total | 147,139,021 | ||||||||||
Other Industries 7.4% | |||||||||||
| > Real Estate 6.3% | |||||||||||
915,000 | Extra Space Storage | 33,296,850 | |||||||||
Self Storage Facilities | |||||||||||
499,100 | Dupont Fabros Technology | 12,058,256 | |||||||||
Technology-focused Office Buildings | |||||||||||
1,084,800 | EdR | 11,542,272 | |||||||||
Student Housing | |||||||||||
561,200 | Biomed Realty Trust | 10,847,996 | |||||||||
Life Science-focused Office Buildings | |||||||||||
540,000 | Associated Estates Realty | 8,704,800 | |||||||||
Multifamily Properties | |||||||||||
1,380,000 | Kite Realty Group | 7,714,200 | |||||||||
Community Shopping Centers | |||||||||||
958,000 | DCT Industrial Trust | 6,217,420 | |||||||||
Industrial Properties | |||||||||||
100,000 | Post Properties | 4,995,000 | |||||||||
Multifamily Properties | |||||||||||
200,000 | St. Joe (a)(b) | 4,616,000 | |||||||||
Florida Panhandle Landowner | |||||||||||
99,992,794 | |||||||||||
| > Transportation 1.1% | |||||||||||
515,091 | Rush Enterprises, Class A (a) | 10,646,931 | |||||||||
| 115,000 | Rush Enterprises, Class B (a) | 1,990,650 | |||||||||
Truck Sales & Service | |||||||||||
128,000 | World Fuel Services | 5,269,760 | |||||||||
Global Fuel Broker | |||||||||||
17,907,341 | |||||||||||
Other Industries: Total | 117,900,135 | ||||||||||
Energy & Minerals 4.2% | |||||||||||
| > Oil Services 2.2% | |||||||||||
725,000 | Atwood Oceanics (a) | 33,197,750 | |||||||||
Offshore Drilling Contractor | |||||||||||
27,050 | Chart Industries (a) | 1,803,423 | |||||||||
| Manufacturer of Natural Gas Processing/Storage Equipment | |||||||||||
35,001,173 | |||||||||||
| > Oil & Gas Producers 1.3% | |||||||||||
182,000 | PDC Energy (a) | 6,044,220 | |||||||||
Oil & Gas Producer in US | |||||||||||
99,000 | SM Energy | 5,168,790 | |||||||||
Oil & Gas Producer | |||||||||||
174,000 | Approach Resources (a) | 4,351,740 | |||||||||
Oil & Gas Producer in West Texas Permian | |||||||||||
93,000 | Rosetta Resources (a) | 4,218,480 | |||||||||
| Oil & Gas Producer Exploring in South Texas & Montana | |||||||||||
See accompanying notes to financial statements.
59
Columbia Acorn USA
Statement of Investments, continued
Number of Shares | Value | ||||||||||
| > Oil & Gas Producers—continued | |||||||||||
510,000 | Quicksilver Resources (a) | $ | 1,458,600 | ||||||||
Natural Gas & Coal Seam Gas Producer | |||||||||||
262,200 | Houston American Energy (a)(b) | 57,684 | |||||||||
Oil & Gas Exploration/Production in Colombia | |||||||||||
21,299,514 | |||||||||||
| > Mining 0.7% | |||||||||||
77,000 | Core Labs (Netherlands) | 8,416,870 | |||||||||
Oil & Gas Reservoir Consulting | |||||||||||
600,000 | Alexco Resource (a) | 2,142,000 | |||||||||
Mining, Exploration & Environmental Services | |||||||||||
180,000 | Augusta Resource (a)(b) | 441,000 | |||||||||
US Copper/Molybdenum Mine | |||||||||||
10,999,870 | |||||||||||
Energy & Minerals: Total | 67,300,557 | ||||||||||
| Total Equities: 99.1% (Cost: $1,033,776,261) | 1,585,508,955 | (f) | |||||||||
Short-Term Investments: 0.6% | |||||||||||
10,223,537 | J.P. Morgan U.S. Government Money Market Fund - Agency Shares (7 day yield of 0.01%) | 10,223,537 | |||||||||
| Total Short-Term Investments: 0.6% (Cost: $10,223,537) | 10,223,537 | ||||||||||
Number of Shares | Value | ||||||||||
Securities Lending Collateral 3.2% | |||||||||||
51,263,955 | Dreyfus Government Cash Management Fund (7 day yield of 0.01%) (g) | $ | 51,263,955 | ||||||||
| Total Securities Lending Collateral: (Cost: $51,263,955) | 51,263,955 | ||||||||||
| Total Investments: 102.9% (Cost: $1,095,263,753)(h) | 1,646,996,447 | ||||||||||
| Obligation to Return Collateral for Securities Loaned: (3.2)% | (51,263,955 | ) | |||||||||
Cash and Other Assets Less Liabilities: 0.3% | 4,362,181 | ||||||||||
Net Assets: 100.0% | $ | 1,600,094,673 | |||||||||
ADR - American Depositary Receipts
> Notes to Statement of Investments
(a) Non-income producing security.
(b) All or a portion of this security was on loan at December 31, 2012. The total market value of securities on loan at December 31, 2012 was $50,627,612.
(c) An affiliated person of the Fund may include any company in which the Fund owns five percent or more of its outstanding voting shares. Holdings and transactions in this affiliated company during the year ended December 31, 2012, are as follows:
Security | Balance of Shares Held 12/31/11 | Purchases/ Additions | Sales/ Reductions | Balance of Shares Held 12/31/12 | Value | Dividend | |||||||||||||||||||||
RCM Technologies | 640,000 | - | - | 640,000 | $ | 3,232,000 | $ | 640,000 | |||||||||||||||||||
Total of Affiliated Transactions | 640,000 | - | - | 640,000 | $ | 3,232,000 | $ | 640,000 | |||||||||||||||||||
The aggregate cost and value of these companies at December 31, 2012, were $3,624,095 and $3,232,000, respectively. Investments in affiliated companies represented 0.20% of the Fund's total net assets at December 31, 2012.
(d) Denotes a restricted security, which is subject to restrictions on resale under federal securities laws. This security is valued at fair value determined in good faith under consistently applied procedures established by the Board of Trustees. At December 31, 2012, the market value of this security amounted to $3,636, which represented less than 0.01% of total net assets. Additional information on this security is as follows:
Security | Acquisition Dates | Shares | Cost | Value | |||||||||||||||
Metabolex | 2/11/00 | 18,181 | $ | 1,999,910 | $ | 3,636 | |||||||||||||
$ | 1,999,910 | $ | 3,636 | ||||||||||||||||
(e) Illiquid security.
See accompanying notes to financial statements.
60
> Notes to Statement of Investments
(f) At December 31, 2012, the market value of foreign securities represented 1.30% of total net assets. The Fund's foreign portfolio was diversified as follows:
| Country | Value | Percentage of Net Assets | |||||||||
Israel | $ | 8,586,800 | 0.54 | ||||||||
Netherlands | 8,416,870 | 0.53 | |||||||||
India | 3,740,780 | 0.23 | |||||||||
Total Foreign Portfolio | $ | 20,744,450 | 1.30 | ||||||||
(g) Investment made with cash collateral received from securities lending activity.
(h) At December 31, 2012, for federal income tax purposes, the cost of investments was $1,099,408,351 and net unrealized appreciation was $547,588,096 consisting of gross unrealized appreciation of $626,018,281 and gross unrealized depreciation of $78,430,185.
Fair Value Measurements
Various inputs are used in determining the value of the Fund's investments, following the input prioritization hierarchy established by accounting principles generally accepted in the United States of America (GAAP). These inputs are summarized in the three broad levels listed below:
• Level 1 – quoted prices in active markets for identical securities
• Level 2 – prices determined using other significant observable inputs (including quoted prices for similar securities, interest rates, prepayment speeds, credit risk and others)
• Level 3 – prices determined using significant unobservable inputs where quoted prices or observable inputs are unavailable or less reliable (including management's own assumptions about the factors market participants would use in pricing an investment)
The inputs or methodology used for valuing securities are not necessarily an indication of the risk associated with investing in those securities.
Examples of the types of securities in which the Fund would typically invest and how they are classified within this hierarchy are as follows. Typical Level 1 securities include exchange traded domestic equities, mutual funds whose NAVs are published each day and exchange traded foreign equities that are not statistically fair valued. Typical Level 2 securities include exchange traded foreign equities that are statistically fair valued, forward foreign currency exchange contracts and short-term investments valued at amortized cost. Additionally, securities fair valued by the Valuation Committee (the Committee) of the Fund's Board of Trustees (the Board) that rely on significant observable inputs are also included in Level 2. Typical Level 3 securities include any security fair valued by the Committee that relies on significant unobservable inputs.
Under the direction of the Board, the Committee is responsible for carrying out the valuation procedures approved by the Board.
The Committee meets as necessary, and no less frequently than quarterly, to determine fair values for securities for which market quotations are not readily available or for which the investment manager believes that available market quotations are unreliable, to review the appropriateness of the Trust's Portfolio Pricing Policy and the pricing procedures of the investment manager (the Policies), and to review the continuing appropriateness of the current value of any security subject to the Policies. The Policies address, among other things: circumstances under which market quotations will be deemed readily available; selection of third party pricing vendors; appropriate pricing methodologies; events that require fair valuation and fair value techniques; and circumstances under which securities will be deemed to pose a potential for stale pricing, including when securities are illiquid, restricted, or in default. The Committee may also meet to discuss additional valuation matters, which may include review of back-testing results, review of time-sensitive information or approval of other valuation related actions, and to review the appropriateness of the Policies.
For investments categorized as Level 3, the significant unobservable inputs used in the fair value measurement of the Funds' securities may include: (i) data specific to the issuer or comparable issuers, (ii) general market or specific sector news and (iii) quoted prices and specific or similar security transactions. The Committee considers this data and any changes from prior periods in order to assess the reasonableness of observable and unobservable inputs, any assumptions or internal models used to value those securities and changes in fair value. Significant changes in any of these factors could result in lower or higher fair value measurements. Various factors impact the frequency of monitoring (which may occur as often as daily), however the Committee may determine that changes to inputs, assumptions and models are not required with the same frequency.
See accompanying notes to financial statements.
61
Columbia Acorn USA
Statement of Investments, continued
> Notes to Statement of Investments
The following table summarizes the inputs used, as of December 31, 2012, in valuing the Fund's assets:
Investment Type | Quoted Prices (Level 1) | Other Significant Observable Inputs (Level 2) | Significant Unobservable Inputs (Level 3) | Total | |||||||||||||||
Equities | |||||||||||||||||||
Information | $ | 467,180,604 | $ | - | $ | - | $ | 467,180,604 | |||||||||||
Industrial Goods & Services | 292,423,364 | - | - | 292,423,364 | |||||||||||||||
Consumer Goods & Services | 278,623,159 | - | - | 278,623,159 | |||||||||||||||
Finance | 214,942,115 | - | - | 214,942,115 | |||||||||||||||
Health Care | 147,135,385 | - | 3,636 | 147,139,021 | |||||||||||||||
Other Industries | 117,900,135 | - | - | 117,900,135 | |||||||||||||||
Energy & Minerals | 67,300,557 | - | - | 67,300,557 | |||||||||||||||
Total Equities | 1,585,505,319 | - | 3,636 | 1,585,508,955 | |||||||||||||||
Total Short-Term Investments | 10,223,537 | - | - | 10,223,537 | |||||||||||||||
Total Securities Lending Collateral | 51,263,955 | - | - | 51,263,955 | |||||||||||||||
Total Investments | $ | 1,646,992,811 | $ | - | $ | 3,636 | $ | 1,646,996,447 | |||||||||||
There were no transfers of financial assets between levels 1 and 2 during the period.
The Fund does not hold any significant investments categorized as Level 3.
Certain common stock classified as Level 3 are valued at fair value, using a market approach, as determined in good faith under consistently applied procedures established by and under the general supervision of the Board. To determine fair value for these securities, for which no market exists, the Committee utilizes the valuation technique it deems most appropriate in the circumstances, using some unobservable inputs, which may include but are not limited to trades of similar securities, estimated earnings of the company, market multiples derived from a set of comparable companies, and the position of the security within the company's capital structure. Significant increases or decreases to any of these inputs could result in a significantly lower or higher fair value measurement.
See accompanying notes to financial statements.
62
Columbia Acorn International Select
Major Portfolio Changes in the Fourth Quarter (Unaudited)
Number of Shares | |||||||||||
9/30/12 | 12/31/12 | ||||||||||
Purchases | |||||||||||
Asia | |||||||||||
| > Singapore | |||||||||||
Mapletree Logistics Trust | 11,142,000 | 14,162,000 | |||||||||
| > Taiwan | |||||||||||
Taiwan Mobile | 3,810,000 | 4,810,000 | |||||||||
| > Japan | |||||||||||
FP Corporation | 0 | 55,400 | |||||||||
Miraca Holdings | 0 | 187,000 | |||||||||
Park24 | 0 | 110,400 | |||||||||
| > Korea | |||||||||||
Hite Jinro | 28,690 | 156,680 | |||||||||
Other Countries | |||||||||||
| > Australia | |||||||||||
Challenger Financial | 3,461,296 | 4,170,000 | |||||||||
| Commonwealth Property Office Fund | 11,089,000 | 12,057,000 | |||||||||
Regis Resources | 95,201 | 562,088 | |||||||||
| > Canada | |||||||||||
Alamos Gold | 0 | 643,000 | |||||||||
Central Fund of Canada | 213,503 | 263,000 | |||||||||
Goldcorp | 464,000 | 500,000 | |||||||||
| > United States | |||||||||||
Allied Nevada Gold | 0 | 277,000 | |||||||||
| > New Zealand | |||||||||||
Telecom NZ | 744,857 | 1,980,000 | |||||||||
Europe | |||||||||||
| > United Kingdom | |||||||||||
JLT Group | 296,000 | 501,000 | |||||||||
| > Netherlands | |||||||||||
Imtech | 123,416 | 184,186 | |||||||||
| > France | |||||||||||
Gemalto | 7,031 | 45,000 | |||||||||
Latin America | |||||||||||
| > Guatemala | |||||||||||
Tahoe Resources | 401,000 | 588,000 | |||||||||
| > Brazil | |||||||||||
Beadell Resources | 0 | 2,755,603 | |||||||||
Number of Shares | |||||||||||
9/30/12 | 12/31/12 | ||||||||||
Sales | |||||||||||
Asia | |||||||||||
> Singapore | |||||||||||
Mapletree Industrial Trust | 20,395,000 | 16,000,000 | |||||||||
> Taiwan | |||||||||||
CTCI Corp | 3,920,000 | 3,750,000 | |||||||||
> Japan | |||||||||||
Jupiter Telecommunications | 13,964 | 0 | |||||||||
Seven Bank | 5,750,000 | 5,421,000 | |||||||||
> China | |||||||||||
Zhaojin Mining Industry | 2,839,000 | 0 | |||||||||
Other Countries | |||||||||||
> Australia | |||||||||||
IAG | 1,652,046 | 1,335,000 | |||||||||
UGL | 1,058,050 | 498,000 | |||||||||
> Canada | |||||||||||
Kirkland Lake Gold | 290,000 | 0 | |||||||||
> United States | |||||||||||
Atwood Oceanics | 94,000 | 82,000 | |||||||||
> South Africa | |||||||||||
Adcock Ingram Holdings | 1,001,517 | 0 | |||||||||
Rand Merchant Insurance | 4,798,015 | 3,106,606 | |||||||||
> Israel | |||||||||||
Israel Chemicals | 349,000 | 307,000 | |||||||||
Europe | |||||||||||
> United Kingdom | |||||||||||
Intertek Group | 79,000 | 75,000 | |||||||||
> Germany | |||||||||||
Wirecard | 538,000 | 355,000 | |||||||||
> Iceland | |||||||||||
Marel | 3,958,835 | 3,488,000 | |||||||||
> Denmark | |||||||||||
Novozymes | 125,000 | 0 | |||||||||
See accompanying notes to financial statements.
63
Columbia Acorn International Select
Statement of Investments, December 31, 2012
Number of Shares | Value | ||||||||||
Equities: 94.0% | |||||||||||
Asia 43.4% | |||||||||||
| > Singapore 14.9% | |||||||||||
13,130,000 | Ascendas REIT | $ | 25,694,375 | ||||||||
Industrial Property Landlord | |||||||||||
16,000,000 | Mapletree Industrial Trust | 17,865,446 | |||||||||
Industrial Property Landlord | |||||||||||
14,162,000 | Mapletree Logistics Trust | 13,328,453 | |||||||||
Industrial Property Landlord | |||||||||||
56,888,274 | |||||||||||
| > Taiwan 14.1% | |||||||||||
11,103,000 | Far EasTone Telecom | 28,350,161 | |||||||||
| Taiwan's Third Largest Mobile Operator | |||||||||||
4,810,000 | Taiwan Mobile | 17,775,618 | |||||||||
| Taiwan's Second Largest Mobile Operator | |||||||||||
3,750,000 | CTCI Corp | 7,450,018 | |||||||||
International Engineering Firm | |||||||||||
53,575,797 | |||||||||||
| > Japan 9.4% | |||||||||||
5,421,000 | Seven Bank | 14,299,466 | |||||||||
ATM Processing Services | |||||||||||
869,000 | Start Today (a) | 8,044,532 | |||||||||
Online Japanese Apparel Retailer | |||||||||||
187,000 | Miraca Holdings | 7,539,985 | |||||||||
| Outsourced Lab Testing, Diagnostic Equipment & Reagents | |||||||||||
55,400 | FP Corporation | 3,685,528 | |||||||||
Disposable Food Trays & Containers | |||||||||||
110,400 | Park24 | 1,743,540 | |||||||||
Parking Lot Operator | |||||||||||
390 | GLP J-REIT (b) | 298,009 | |||||||||
Logistics REIT in Japan | |||||||||||
35,611,060 | |||||||||||
| > Indonesia 2.8% | |||||||||||
11,136,600 | Archipelago Resources (a)(b) | 10,854,509 | |||||||||
| Gold Mining Projects in Indonesia, Vietnam & the Philippines | |||||||||||
10,854,509 | |||||||||||
| > Korea 1.2% | |||||||||||
156,680 | Hite Jinro (b) | 4,448,001 | |||||||||
Beer & Spirits Manufacturer | |||||||||||
4,448,001 | |||||||||||
| > China 1.0% | |||||||||||
2,770,000 | Want Want | 3,881,894 | |||||||||
| Chinese Branded Consumer Food Company | |||||||||||
3,881,894 | |||||||||||
Asia: Total | 165,259,535 | ||||||||||
Other Countries 29.7% | |||||||||||
| > Australia 11.5% | |||||||||||
4,170,000 | Challenger Financial | 15,537,857 | |||||||||
Largest Annuity Provider | |||||||||||
Number of Shares | Value | ||||||||||
12,057,000 | Commonwealth Property Office Fund | $ | 12,844,733 | ||||||||
Australia Prime Office REIT | |||||||||||
1,335,000 | IAG | 6,575,334 | |||||||||
General Insurance Provider | |||||||||||
498,000 | UGL | 5,684,875 | |||||||||
Engineering & Facilities Management | |||||||||||
562,088 | Regis Resources (b) | 3,016,412 | |||||||||
Gold Mining in Australia | |||||||||||
43,659,211 | |||||||||||
| > Canada 8.8% | |||||||||||
500,000 | Goldcorp | 18,350,000 | |||||||||
Gold Mining | |||||||||||
643,000 | Alamos Gold | 11,280,135 | |||||||||
Gold Mining | |||||||||||
| 91,400 | CCL Industries | 3,950,222 | |||||||||
Leading Global Label Manufacturer | |||||||||||
33,580,357 | |||||||||||
| > United States 3.9% | |||||||||||
277,000 | Allied Nevada Gold (b) | 8,346,010 | |||||||||
Gold & Silver Mining | |||||||||||
82,000 | Atwood Oceanics (b) | 3,754,780 | |||||||||
Offshore Drilling Contractor | |||||||||||
52,000 | SM Energy | 2,714,920 | |||||||||
Oil & Gas Producer | |||||||||||
14,815,710 | |||||||||||
| > South Africa 3.6% | |||||||||||
3,106,606 | Rand Merchant Insurance | 7,618,174 | |||||||||
| Directly Sold Property & Casualty Insurance; Holdings in Other Insurers | |||||||||||
95,700 | Naspers | 6,181,342 | |||||||||
| Media in Africa, China, Russia & Other Emerging Markets | |||||||||||
13,799,516 | |||||||||||
| > New Zealand 1.0% | |||||||||||
1,980,000 | Telecom NZ | 3,747,767 | |||||||||
Primary Telecom Operator | |||||||||||
3,747,767 | |||||||||||
| > Israel 0.9% | |||||||||||
307,000 | Israel Chemicals | 3,697,245 | |||||||||
| Producer of Potash, Phosphates, Bromine & Specialty Chemicals | |||||||||||
3,697,245 | |||||||||||
Other Countries: Total | 113,299,806 | ||||||||||
Europe 10.7% | |||||||||||
| > United Kingdom 2.7% | |||||||||||
501,000 | JLT Group | 6,488,114 | |||||||||
International Business Insurance Broker | |||||||||||
75,000 | Intertek Group | 3,809,753 | |||||||||
Testing, Inspection, Certification Services | |||||||||||
10,297,867 | |||||||||||
See accompanying notes to financial statements.
64
Number of Shares | Value | ||||||||||
| > Germany 2.3% | |||||||||||
355,000 | Wirecard | $ | 8,764,044 | ||||||||
| Online Payment Processing & Risk Management | |||||||||||
8,764,044 | |||||||||||
| > Sweden 1.3% | |||||||||||
192,000 | Hexagon | 4,855,342 | |||||||||
| Design, Measurement & Visualization Software & Equipment | |||||||||||
4,855,342 | |||||||||||
| > Switzerland 1.2% | |||||||||||
19,800 | Partners Group | 4,577,356 | |||||||||
Private Markets Asset Management | |||||||||||
4,577,356 | |||||||||||
| > Netherlands 1.1% | |||||||||||
184,186 | Imtech | 4,278,093 | |||||||||
Technical Installation & Maintenance | |||||||||||
4,278,093 | |||||||||||
| > France 1.1% | |||||||||||
45,000 | Gemalto | 4,061,918 | |||||||||
Digital Security Solutions | |||||||||||
4,061,918 | |||||||||||
| > Iceland 1.0% | |||||||||||
3,488,000 | Marel | 3,845,556 | |||||||||
| Largest Manufacturer of Poultry & Fish Processing Equipment | |||||||||||
3,845,556 | |||||||||||
Europe: Total | 40,680,176 | ||||||||||
Latin America 10.2% | |||||||||||
| > Mexico 6.0% | |||||||||||
745,000 | Fresnillo | 22,850,303 | |||||||||
| Silver & Metal Byproduct Mining in Mexico | |||||||||||
22,850,303 | |||||||||||
| > Guatemala 2.8% | |||||||||||
588,000 | Tahoe Resources (b) | 10,758,621 | |||||||||
Silver Project in Guatemala | |||||||||||
10,758,621 | |||||||||||
| > Brazil 0.8% | |||||||||||
2,755,603 | Beadell Resources (b) | 2,847,087 | |||||||||
Gold Mining in Brazil | |||||||||||
2,847,087 | |||||||||||
| > Uruguay 0.5% | |||||||||||
191,666 | Union Agriculture Group (b)(c)(d) | 1,962,660 | |||||||||
Farmland Operator in Uruguay | |||||||||||
1,962,660 | |||||||||||
Number of Shares | Value | ||||||||||
| > Colombia 0.1% | |||||||||||
1,880,000 | Santa Maria Petroleum (b)(d) | $ | 154,225 | ||||||||
| Explores for Oil & Gas in Latin America | |||||||||||
154,225 | |||||||||||
Latin America: Total | 38,572,896 | ||||||||||
| Total Equities: 94.0% (Cost: $298,860,688) | 357,812,413 | (e) | |||||||||
Investment Funds 1.4% | |||||||||||
Other Countries 1.4% | |||||||||||
| > Canada 1.4% | |||||||||||
| 263,000 | Central Fund of Canada | 5,530,890 | |||||||||
| Allocated Gold & Silver Closed End Fund | |||||||||||
Other Countries: Total | 5,530,890 | ||||||||||
| Total Investment Funds: 1.4% (Cost: $6,183,324) | 5,530,890 | ||||||||||
Short-Term Investments: 4.3% | |||||||||||
16,208,432 | J.P. Morgan U.S. Government Money Market Fund - Agency Shares (7 day yield of 0.01%) | 16,208,432 | |||||||||
| Total Short-Term Investments: 4.3% (Cost: $16,208,432) | 16,208,432 | ||||||||||
Securities Lending Collateral 1.7% | |||||||||||
6,389,590 | Dreyfus Government Cash Management Fund (7 day yield of 0.01%) (f) | 6,389,590 | |||||||||
| Total Securities Lending Collateral: (Cost: $6,389,590) | 6,389,590 | ||||||||||
| Total Investments: 101.4% (Cost: $327,642,034)(g) | 385,941,325 | ||||||||||
| Obligation to Return Collateral for Securities Loaned: (1.7)% | (6,389,590 | ) | |||||||||
Cash and Other Assets Less Liabilities: 0.3% | 902,319 | ||||||||||
Net Assets: 100.0% | $ | 380,454,054 | |||||||||
REIT - Real Estate Investment Trust
See accompanying notes to financial statements.
65
Columbia Acorn International Select
Statement of Investments, continued
> Notes to Statement of Investments
(a) All or a portion of this security was on loan at December 31, 2012. The total market value of securities on loan at December 31, 2012 was $6,077,787.
(b) Non-income producing security.
(c) Illiquid security.
(d) Denotes a restricted security, which is subject to restrictions on resale under federal securities laws. These securities are valued at fair value determined in good faith under consistently applied procedures established by the Board of Trustees. At December 31, 2012, the market value of these securities amounted to $2,116,885, which represented 0.56% of total net assets. Additional information on these securities is as follows:
Security | Acquisition Dates | Shares | Cost | Value | |||||||||||||||
Union Agriculture Group | 12/8/10-6/27/12 | 191,666 | $ | 2,200,000 | $ | 1,962,660 | |||||||||||||
Santa Maria Petroleum | 1/14/11 | 1,880,000 | 2,375,897 | 154,225 | |||||||||||||||
$ | 4,575,897 | $ | 2,116,885 | ||||||||||||||||
(e) On December 31, 2012, the Fund's total investments were denominated in currencies as follows:
Currency | Value | Percentage of Net Assets | |||||||||
Singapore Dollar | $ | 56,888,274 | 14.9 | ||||||||
Taiwan Dollar | 53,575,797 | 14.1 | |||||||||
Australian Dollar | 46,506,298 | 12.2 | |||||||||
British Pound | 44,002,679 | 11.6 | |||||||||
United States Dollar | 40,659,260 | 10.7 | |||||||||
Japanese Yen | 35,611,060 | 9.4 | |||||||||
Canadian Dollar | 20,612,313 | 5.4 | |||||||||
| Other currencies less than 5% of total net assets | 59,956,732 | 15.7 | |||||||||
Total Equities | $ | 357,812,413 | 94.0 | ||||||||
(f) Investment made with cash collateral received from securities lending activity.
(g) At December 31, 2012, for federal income tax purposes, the cost of investments was $347,187,320 and net unrealized appreciation was $38,754,005 consisting of gross unrealized appreciation of $53,206,551 and gross unrealized depreciation of $14,452,546.
At December 31, 2012, the Fund had entered into the following forward foreign currency exchange contract:
Forward Foreign Currency Exchange Contracts to Buy | Forward Foreign Currency Exchange Contracts to Sell | Principal Amount in Foreign Currency | Principal Amount in U.S. Dollar | Settlement Date | Unrealized Appreciation (Depreciation) | ||||||||||||||||||||||
USD | ZAR | 173,346,000 | $ | 20,000,000 | 1/15/13 | $ | (411,753 | ) | |||||||||||||||||||
The counterparty for all forward foreign currency exchange contracts is State Street Bank and Trust Company.
USD - United States Dollar
ZAR - South African Rand
Fair Value Measurements
Various inputs are used in determining the value of the Fund's investments, following the input prioritization hierarchy established by accounting principles generally accepted in the United States of America (GAAP). These inputs are summarized in the three broad levels listed below:
• Level 1 – quoted prices in active markets for identical securities
• Level 2 – prices determined using other significant observable inputs (including quoted prices for similar securities, interest rates, prepayment speeds, credit risk and others)
• Level 3 – prices determined using significant unobservable inputs where quoted prices or observable inputs are unavailable or less reliable (including management's own assumptions about the factors market participants would use in pricing an investment)
The inputs or methodology used for valuing securities are not necessarily an indication of the risk associated with investing in those securities.
Examples of the types of securities in which the Fund would typically invest and how they are classified within this hierarchy are as follows. Typical Level 1 securities include exchange traded domestic equities, mutual funds whose NAVs are published each day and exchange traded foreign equities that are not statistically fair valued. Typical Level 2 securities include exchange traded foreign equities that are statistically fair valued, forward foreign currency exchange contracts and short-term investments valued at amortized cost. Additionally, securities fair valued by the Valuation Committee (the Committee) of the Fund's Board of Trustees (the Board) that rely on significant observable inputs are also included in Level 2. Typical Level 3 securities include any security fair valued by the Committee that relies on significant unobservable inputs.
Under the direction of the Board, the Committee is responsible for carrying out the valuation procedures approved by the Board.
See accompanying notes to financial statements.
66
> Notes to Statement of Investments
The Committee meets as necessary, and no less frequently than quarterly, to determine fair values for securities for which market quotations are not readily available or for which the investment manager believes that available market quotations are unreliable, to review the appropriateness of the Trust's Portfolio Pricing Policy and the pricing procedures of the investment manager (the Policies), and to review the continuing appropriateness of the current value of any security subject to the Policies. The Policies address, among other things: circumstances under which market quotations will be deemed readily available; selection of third party pricing vendors; appropriate pricing methodologies; events that require fair valuation and fair value techniques; and circumstances under which securities will be deemed to pose a potential for stale pricing, including when securities are illiquid, restricted, or in default. The Committee may also meet to discuss additional valuation matters, which may include review of back-testing results, review of time-sensitive information or approval of other valuation related actions, and to review the appropriateness of the Policies.
For investments categorized as Level 3, the significant unobservable inputs used in the fair value measurement of the Funds' securities may include: (i) data specific to the issuer or comparable issuers, (ii) general market or specific sector news and (iii) quoted prices and specific or similar security transactions. The Committee considers this data and any changes from prior periods in order to assess the reasonableness of observable and unobservable inputs, any assumptions or internal models used to value those securities and changes in fair value. Significant changes in any of these factors could result in lower or higher fair value measurements. Various factors impact the frequency of monitoring (which may occur as often as daily), however the Committee may determine that changes to inputs, assumptions and models are not required with the same frequency.
The following table summarizes the inputs used, as of December 31, 2012, in valuing the Fund's assets:
Investment Type | (Level 1) | Other Significant Observable Quoted Prices (Level 2) | Significant Unobservable Inputs (Level 3) | Inputs Total | |||||||||||||||
Equities | |||||||||||||||||||
Asia | $ | - | $ | 165,259,535 | $ | - | $ | 165,259,535 | |||||||||||
Other Countries | 48,396,067 | 64,903,739 | - | 113,299,806 | |||||||||||||||
Europe | - | 40,680,176 | - | 40,680,176 | |||||||||||||||
Latin America | 10,758,621 | 25,851,615 | 1,962,660 | 38,572,896 | |||||||||||||||
Total Equities | 59,154,688 | 296,695,065 | 1,962,660 | 357,812,413 | |||||||||||||||
Investment Funds | |||||||||||||||||||
Other Countries | 5,530,890 | - | - | 5,530,890 | |||||||||||||||
Total Short-Term Investments | 16,208,432 | - | - | 16,208,432 | |||||||||||||||
Total Securities Lending Collateral | 6,389,590 | - | - | 6,389,590 | |||||||||||||||
Total Investments | $ | 87,283,600 | $ | 296,695,065 | $ | 1,962,660 | $ | 385,941,325 | |||||||||||
| Unrealized Depreciation on Forward Foreign Currency Exchange Contracts | - | (411,753 | ) | - | (411,753 | ) | |||||||||||||
Total Investments | $ | 87,283,600 | $ | 296,283,312 | $ | 1,962,660 | $ | 385,529,572 | |||||||||||
The Fund's assets assigned to the Level 2 input category are generally valued using a market approach, in which a security's value is determined through its correlation to prices and information from observable market transactions for similar or identical assets. Foreign equities are generally valued at the last sale price on the foreign exchange or market on which they trade. The Fund may use a statistical fair valuation model, in accordance with the policy adopted by the Board, provided by an independent third party to value securities principally traded in foreign markets in order to adjust for possible stale pricing that may occur between the close of the foreign exchanges and the time for valuation. These models take into account available market data including intraday index, ADR, and ETF movements. Forward foreign currency exchange contracts are valued at the prevailing forward exchange rate of the underlying currencies. Securities acquired via private placement that have a holding period or an extended settlement period are valued at a discount to the same shares that are trading freely on the market. These discounts are determined by the investment manager's experience with similar securities or situations. Factors may include, but are not limited to, trade volume, shares outstanding and stock price.
There were no transfers of financial assets between levels 1 and 2 during the period.
The Fund does not hold any significant investments categorized as Level 3.
Certain common stock classified as Level 3 are valued at fair value, using a market approach, as determined in good faith under consistently applied procedures established by and under the general supervision of the Board. To determine fair value for these securities, for which no market exists, the Committee utilizes the valuation technique it deems most appropriate in the circumstances, using some unobservable inputs, which may include but are not limited to trades of similar securities, estimated earnings of the company, market multiples derived from a set of comparable companies, and the position of the security within the company's capital structure. Significant increases or decreases to any of these inputs could result in a significantly lower or higher fair value measurement.
See accompanying notes to financial statements.
67
Columbia Acorn International Select
Portfolio Diversification
At December 31, 2012, the Fund's portfolio investments as a percentage of net assets were diversified as follows:
Value | Percentage of Net Assets | ||||||||||
| > Energy & Minerals | |||||||||||
Mining | $ | 88,303,077 | 23.2 | ||||||||
Oil Services | 3,754,780 | 1.0 | |||||||||
Oil & Gas Producers | 2,869,145 | 0.7 | |||||||||
Agricultural Commodities | 1,962,660 | 0.5 | |||||||||
96,889,662 | 25.4 | ||||||||||
| > Information | |||||||||||
Mobile Communications | 46,125,779 | 12.1 | |||||||||
Financial Processors | 8,764,044 | 2.3 | |||||||||
Internet Related | 6,181,342 | 1.6 | |||||||||
Business Software | 4,855,342 | 1.3 | |||||||||
| Computer Hardware & Related Equipment | 4,061,918 | 1.1 | |||||||||
Telephone & Data Services | 3,747,767 | 1.0 | |||||||||
73,736,192 | 19.4 | ||||||||||
| > Other Industries | |||||||||||
Real Estate | 70,031,015 | 18.4 | |||||||||
70,031,015 | 18.4 | ||||||||||
| > Finance | |||||||||||
Insurance | 36,219,479 | 9.5 | |||||||||
Banks | 14,299,466 | 3.8 | |||||||||
| Brokerage & Money Management | 4,577,356 | 1.2 | |||||||||
55,096,301 | 14.5 | ||||||||||
| > Industrial Goods & Services | |||||||||||
Other Industrial Services | 15,516,261 | 4.1 | |||||||||
Construction | 7,450,018 | 2.0 | |||||||||
| Industrial Materials & Specialty Chemicals | 7,382,773 | 1.9 | |||||||||
Machinery | 3,845,556 | 1.0 | |||||||||
34,194,608 | 9.0 | ||||||||||
Value | Percentage of Net Assets | ||||||||||
| > Consumer Goods & Services | |||||||||||
Food & Beverage | $ | 8,329,896 | 2.2 | ||||||||
Retail | 8,044,532 | 2.1 | |||||||||
Nondurables | 3,950,222 | 1.0 | |||||||||
20,324,650 | 5.3 | ||||||||||
| > Health Care | |||||||||||
Health Care Services | 7,539,985 | 2.0 | |||||||||
7,539,985 | 2.0 | ||||||||||
Total Equities: | 357,812,413 | 94.0 | |||||||||
Total Investment Funds: | 5,530,890 | 1.4 | |||||||||
| Total Short-Term Investments: | 16,208,432 | 4.3 | |||||||||
Securities Lending Collateral: | 6,389,590 | 1.7 | |||||||||
Total Investments: | 385,941,325 | 101.4 | |||||||||
| Obligation to Return Collateral for Securities Loaned: | (6,389,590 | ) | (1.7 | ) | |||||||
| Cash and Other Assets Less Liabilities: | 902,319 | 0.3 | |||||||||
Net Assets: | $ | 380,454,054 | 100.0 | ||||||||
See accompanying notes to financial statements.
68
Columbia Acorn Select Fund
Major Portfolio Changes in the Fourth Quarter (Unaudited)
Number of Shares | |||||||||||
9/30/12 | 12/31/12 | ||||||||||
Purchases | |||||||||||
Information | |||||||||||
F5 Networks | 80,000 | 140,000 | |||||||||
Industrial Goods & Services | |||||||||||
Airgas | 0 | 74,233 | |||||||||
Forward Air | 0 | 106,509 | |||||||||
Consumer Goods & Services | |||||||||||
Choice Hotels | 0 | 87,591 | |||||||||
Ryman Hospitality Properties | 900,000 | 1,020,783 | |||||||||
Energy & Minerals | |||||||||||
Kirkland Lake Gold (Canada) | 925,000 | 1,200,000 | |||||||||
Number of Shares | |||||||||||
9/30/12 | 12/31/12 | ||||||||||
Sales | |||||||||||
Information | |||||||||||
Amphenol | 540,000 | 510,000 | |||||||||
Ansys | 95,000 | 74,000 | |||||||||
Concur Technologies | 167,000 | 0 | |||||||||
Crown Castle International | 680,000 | 566,000 | |||||||||
Sanmina-SCI | 2,415,000 | 1,990,000 | |||||||||
SBA Communications | 455,000 | 431,000 | |||||||||
WNS - ADR (India) | 3,300,000 | 3,034,100 | |||||||||
Industrial Goods & Services | |||||||||||
Ametek | 1,860,000 | 1,533,000 | |||||||||
Donaldson | 1,110,000 | 1,065,000 | |||||||||
| Expeditors International of Washington | 230,000 | 0 | |||||||||
Kennametal | 835,000 | 713,000 | |||||||||
Pall | 605,000 | 426,000 | |||||||||
Consumer Goods & Services | |||||||||||
Abercrombie & Fitch | 455,000 | 445,000 | |||||||||
Coach | 515,000 | 285,000 | |||||||||
Hertz | 4,020,000 | 2,976,000 | |||||||||
lululemon athletica | 288,000 | 209,000 | |||||||||
RexLot Holdings (China) | 208,000,000 | 187,475,000 | |||||||||
Tiffany & Co. | 149,000 | 0 | |||||||||
Vail Resorts | 235,000 | 205,000 | |||||||||
Finance | |||||||||||
City National | 520,000 | 496,000 | |||||||||
CNO Financial Group | 6,315,000 | 5,539,000 | |||||||||
Discover Financial Services | 1,700,000 | 1,412,000 | |||||||||
Energy & Minerals | |||||||||||
Houston American Energy | 1,455,000 | 0 | |||||||||
| Pacific Rubiales Energy (Colombia) | 1,035,000 | 757,000 | |||||||||
Shamaran Petroleum (Iraq) | 27,100,000 | 26,965,500 | |||||||||
Health Care | |||||||||||
NPS Pharmaceuticals | 1,875,000 | 1,444,255 | |||||||||
Other Industries | |||||||||||
Biomed Realty Trust | 1,375,000 | 954,000 | |||||||||
Wisconsin Energy | 316,000 | 220,000 | |||||||||
See accompanying notes to financial statements.
69
Columbia Acorn Select
Statement of Investments, December 31, 2012
Number of Shares | Value | ||||||||||
Equities: 96.4% | |||||||||||
Information 21.9% | |||||||||||
| > Mobile Communications 8.0% | |||||||||||
566,000 | Crown Castle International (a) | $ | 40,842,560 | ||||||||
Communications Towers | |||||||||||
431,000 | SBA Communications (a) | 30,609,620 | |||||||||
Communications Towers | |||||||||||
19,000,000 | Globalstar (a)(b)(c) | 5,795,000 | |||||||||
Satellite Mobile Voice & Data Carrier | |||||||||||
77,247,180 | |||||||||||
| > Computer Hardware & Related Equipment 3.4% | |||||||||||
510,000 | Amphenol | 32,997,000 | |||||||||
Electronic Connectors | |||||||||||
32,997,000 | |||||||||||
| > Computer Services 3.3% | |||||||||||
3,034,100 | WNS - ADR (India) (a)(b) | 31,615,322 | |||||||||
| Offshore BPO (Business Process Outsourcing) Services | |||||||||||
31,615,322 | |||||||||||
| > Contract Manufacturing 2.3% | |||||||||||
1,990,000 | Sanmina-SCI (a) | 22,029,300 | |||||||||
Electronic Manufacturing Services | |||||||||||
22,029,300 | |||||||||||
| > Instrumentation 2.2% | |||||||||||
111,000 | Mettler-Toledo International (a) | 21,456,300 | |||||||||
Laboratory Equipment | |||||||||||
21,456,300 | |||||||||||
| > Telecommunications Equipment 1.4% | |||||||||||
140,000 | F5 Networks (a) | 13,601,000 | |||||||||
Internet Traffic Management Equipment | |||||||||||
13,601,000 | |||||||||||
| > Semiconductors & Related Equipment 0.8% | |||||||||||
1,140,000 | Atmel (a) | 7,467,000 | |||||||||
| Microcontrollers, Radio Frequency & Memory Semiconductors | |||||||||||
7,467,000 | |||||||||||
| > Business Software 0.5% | |||||||||||
74,000 | Ansys (a) | 4,983,160 | |||||||||
Simulation Software for Engineers & Designers | |||||||||||
4,983,160 | |||||||||||
Information: Total | 211,396,262 | ||||||||||
Industrial Goods & Services 21.8% | |||||||||||
| > Machinery 16.6% | |||||||||||
1,533,000 | Ametek | 57,594,810 | |||||||||
Aerospace/Industrial Instruments | |||||||||||
1,065,000 | Donaldson | 34,974,600 | |||||||||
Industrial Air Filtration | |||||||||||
713,000 | Kennametal | 28,520,000 | |||||||||
Consumable Cutting Tools | |||||||||||
426,000 | Pall | 25,670,760 | |||||||||
Life Science, Water & Industrial Filtration | |||||||||||
214,000 | Nordson | 13,507,680 | |||||||||
Dispensing Systems for Adhesives & Coatings | |||||||||||
160,267,850 | |||||||||||
Number of Shares | Value | ||||||||||
| > Outsourcing Services 2.4% | |||||||||||
865,000 | Quanta Services (a) | $ | 23,605,850 | ||||||||
Electrical & Telecom Construction Services | |||||||||||
23,605,850 | |||||||||||
| > Industrial Materials & Specialty Chemicals 1.7% | |||||||||||
273,000 | FMC Corporation | 15,975,960 | |||||||||
Niche Specialty Chemicals | |||||||||||
15,975,960 | |||||||||||
| > Industrial Distribution 0.7% | |||||||||||
74,233 | Airgas | 6,776,731 | |||||||||
Industrial Gas Distributor | |||||||||||
6,776,731 | |||||||||||
| > Other Industrial Services 0.4% | |||||||||||
106,509 | Forward Air | 3,728,880 | |||||||||
Freight Transportation Between Airports | |||||||||||
3,728,880 | |||||||||||
Industrial Goods & Services: Total | 210,355,271 | ||||||||||
Consumer Goods & Services 18.2% | |||||||||||
| > Travel 10.5% | |||||||||||
2,976,000 | Hertz (a) | 48,419,520 | |||||||||
Largest US Rental Car Operator | |||||||||||
1,020,783 | Ryman Hospitality Properties | 39,259,314 | |||||||||
Convention Hotels | |||||||||||
205,000 | Vail Resorts | 11,088,450 | |||||||||
Ski Resort Operator & Developer | |||||||||||
87,591 | Choice Hotels | 2,944,810 | |||||||||
Franchisor of Budget Hotel Brands | |||||||||||
101,712,094 | |||||||||||
| > Retail 3.9% | |||||||||||
445,000 | Abercrombie & Fitch | 21,346,650 | |||||||||
Teen Apparel Retailer | |||||||||||
209,000 | lululemon athletica (a) | 15,932,070 | |||||||||
Premium Active Apparel Retailer | |||||||||||
37,278,720 | |||||||||||
| > Apparel 1.6% | |||||||||||
285,000 | Coach | 15,820,350 | |||||||||
| Designer & Retailer of Branded Leather Accessories | |||||||||||
15,820,350 | |||||||||||
| > Casinos & Gaming 1.5% | |||||||||||
187,475,000 | RexLot Holdings (China) | 14,382,858 | |||||||||
Lottery Equipment Supplier in China | |||||||||||
14,382,858 | |||||||||||
| > Educational Services 0.4% | |||||||||||
223,000 | ITT Educational Services (a)(c) | 3,860,130 | |||||||||
Postsecondary Degree Services | |||||||||||
3,860,130 | |||||||||||
| > Other Consumer Services 0.3% | |||||||||||
1,300,000 | IFM Investments (Century 21 China RE) - ADR (China) (a)(b) | 2,379,000 | |||||||||
Provide Real Estate Services in China | |||||||||||
2,379,000 | |||||||||||
See accompanying notes to financial statements.
70
Number of Shares | Value | ||||||||||
| > Food & Beverage —% | |||||||||||
1,500,000 | GLG Life Tech (Canada) (a)(d) | $ | 391,500 | ||||||||
| Produces an All-natural Sweetener Extracted from the Stevia Plant | |||||||||||
391,500 | |||||||||||
Consumer Goods & Services: Total | 175,824,652 | ||||||||||
Finance 16.7% | |||||||||||
| > Credit Cards 5.6% | |||||||||||
1,412,000 | Discover Financial Services | 54,432,600 | |||||||||
Credit Card Company | |||||||||||
54,432,600 | |||||||||||
| > Insurance 5.3% | |||||||||||
5,539,000 | CNO Financial Group | 51,678,870 | |||||||||
| Life, Long-term Care & Medical Supplement Insurance | |||||||||||
51,678,870 | |||||||||||
| > Banks 4.0% | |||||||||||
496,000 | City National | 24,561,920 | |||||||||
Bank & Asset Manager | |||||||||||
1,075,000 | Associated Banc-Corp | 14,104,000 | |||||||||
Midwest Bank | |||||||||||
38,665,920 | |||||||||||
| > Brokerage & Money Management 1.8% | |||||||||||
731,000 | SEI Investments | 17,061,540 | |||||||||
| Mutual Fund Administration & Investment Management | |||||||||||
17,061,540 | |||||||||||
Finance: Total | 161,838,930 | ||||||||||
Energy & Minerals 8.8% | |||||||||||
| > Oil & Gas Producers 5.1% | |||||||||||
757,000 | Pacific Rubiales Energy (Colombia) (c) | 17,587,483 | |||||||||
Oil Production & Exploration in Colombia | |||||||||||
26,965,500 | Shamaran Petroleum (Iraq) (a) | 10,572,580 | |||||||||
Oil Exploration in Kurdistan | |||||||||||
2,918,740 | Canacol (Colombia) (a) | 9,360,391 | |||||||||
Oil Producer in South America | |||||||||||
24,000,000 | Canadian Overseas Petroleum (United Kingdom) (a)(b)(e) | 4,169,297 | |||||||||
| 12,000,000 | Canadian Overseas Petroleum - Warrants (United Kingdom) (a)(d)(e) | 186,026 | |||||||||
| Oil & Gas Exploration/Production in the North Sea | |||||||||||
33,700,000 | Petrodorado Energy (Colombia) (a)(b) | 4,065,547 | |||||||||
| Oil & Gas Exploration & Production in Colombia, Peru & Paraguay | |||||||||||
17,575,000 | Petromanas (Canada) (a) | 3,092,013 | |||||||||
Exploring for Oil in Albania | |||||||||||
49,033,337 | |||||||||||
| > Agricultural Commodities 1.8% | |||||||||||
1,742,424 | Union Agriculture Group (Uruguay) (a)(d)(e) | 17,842,422 | |||||||||
Farmland Operator in Uruguay | |||||||||||
17,842,422 | |||||||||||
Number of Shares | Value | ||||||||||
| > Alternative Energy 0.9% | |||||||||||
1,500,000 | Canadian Solar (China) (a)(c) | $ | 5,100,000 | ||||||||
Solar Cell & Module Manufacturer | |||||||||||
2,200,000 | Synthesis Energy Systems (China) (a) | 2,354,000 | |||||||||
Owner/Operator of Gasification Plants | |||||||||||
1,165,000 | Real Goods Solar (a) | 873,750 | |||||||||
Residential Solar Energy Installer | |||||||||||
8,327,750 | |||||||||||
| > Mining 0.7% | |||||||||||
1,200,000 | Kirkland Lake Gold (Canada) (a)(c) | 7,057,404 | |||||||||
Gold Mining | |||||||||||
7,057,404 | |||||||||||
| > Oil Services 0.3% | |||||||||||
10,559,800 | Tuscany International Drilling (Colombia) (a)(c) | 2,441,695 | |||||||||
| South America Based Drilling Rig Contractor | |||||||||||
2,441,695 | |||||||||||
Energy & Minerals: Total | 84,702,608 | ||||||||||
Health Care 5.1% | |||||||||||
| > Medical Supplies 2.6% | |||||||||||
176,000 | Henry Schein (a) | 14,160,960 | |||||||||
Largest Distributor of Healthcare Products | |||||||||||
320,000 | Cepheid (a) | 10,819,200 | |||||||||
Molecular Diagnostics | |||||||||||
24,980,160 | |||||||||||
| > Biotechnology & Drug Delivery 2.5% | |||||||||||
1,444,255 | NPS Pharmaceuticals (a) | 13,142,720 | |||||||||
Orphan Drugs & Healthy Royalties | |||||||||||
468,000 | Seattle Genetics (a)(c) | 10,857,600 | |||||||||
Antibody-based Therapies for Cancer | |||||||||||
24,000,320 | |||||||||||
Health Care: Total | 48,980,480 | ||||||||||
Other Industries 3.9% | |||||||||||
| > Real Estate 3.1% | |||||||||||
954,000 | Biomed Realty Trust | 18,440,820 | |||||||||
Life Science-focused Office Buildings | |||||||||||
466,196 | Dupont Fabros Technology | 11,263,295 | |||||||||
Technology-focused Office Buildings | |||||||||||
29,704,115 | |||||||||||
| > Regulated Utilities 0.8% | |||||||||||
220,000 | Wisconsin Energy | 8,107,000 | |||||||||
Wisconsin Utility | |||||||||||
8,107,000 | |||||||||||
Other Industries: Total | 37,811,115 | ||||||||||
| Total Equities: 96.4% (Cost: $658,483,772) | 930,909,318 | (f) | |||||||||
See accompanying notes to financial statements.
71
Columbia Acorn Select
Statement of Investments, continued
Number of Shares | Value | ||||||||||
Short-Term Investments: 0.3% | |||||||||||
2,654,408 | J.P. Morgan U.S. Government Money Market Fund - Capital Shares (7 day yield of 0.01%) | $ | 2,654,408 | ||||||||
| Total Short-Term Investments: 0.3% (Cost: $2,654,408) | 2,654,408 | ||||||||||
Securities Lending Collateral 1.2% | |||||||||||
11,106,378 | Dreyfus Government Cash Management Fund (7 day yield of 0.01%) (g) | 11,106,378 | |||||||||
| Total Securities Lending Collateral: (Cost: $11,106,378) | 11,106,378 | ||||||||||
| Total Investments: 97.9% (Cost: $672,244,558)(h) | 944,670,104 | ||||||||||
| Obligation to Return Collateral for Securities Loaned: (1.2)% | (11,106,378 | ) | |||||||||
Cash and Other Assets Less Liabilities: 3.3% | 32,063,188 | ||||||||||
Net Assets: 100.0% | $ | 965,626,914 | |||||||||
ADR - American Depositary Receipts
> Notes to Statement of Investments
(a) Non-income producing security.
(b) An affiliated person of the Fund may include any company in which the Fund owns five percent or more of its outstanding voting shares. Holdings and transactions in these affiliated companies during the year ended December 31, 2012, are as follows:
Security | Balance of Shares Held 12/31/11 | Purchases/ Additions | Sales/ Reductions | Balance of Shares Held 12/31/12 | Value | Dividend | |||||||||||||||||||||
Canacol (1)(2) | 31,372,300 | - | 28,453,560 | 2,918,740 | $ | 9,360,391 | $ | - | |||||||||||||||||||
Canadian Overseas Petroleum | 24,000,000 | - | - | 24,000,000 | 4,169,297 | - | |||||||||||||||||||||
Canadian Solar (1) | 2,700,000 | 601,200 | 1,801,200 | 1,500,000 | 5,100,000 | - | |||||||||||||||||||||
Eacom Timber (1) | 36,000,000 | - | 36,000,000 | - | - | - | |||||||||||||||||||||
GLG Life Tech (1) | 1,850,000 | - | 350,000 | 1,500,000 | 391,500 | - | |||||||||||||||||||||
Globalstar | 13,184,322 | 10,815,678 | 5,000,000 | 19,000,000 | 5,795,000 | - | |||||||||||||||||||||
| IFM Investments (Century 21 China RE) - ADR (2) | 3,430,000 | 302,000 | 2,432,000 | 1,300,000 | 2,379,000 | - | |||||||||||||||||||||
Petrodorado Energy | 34,700,000 | - | 1,000,000 | 33,700,000 | 4,065,547 | - | |||||||||||||||||||||
Real Goods Solar (1) | 1,500,000 | - | 335,000 | 1,165,000 | 873,750 | - | |||||||||||||||||||||
Sanmina-SCI (1) | 6,100,000 | - | 4,110,000 | 1,990,000 | 22,029,300 | - | |||||||||||||||||||||
Synthesis Energy Systems (1) | 2,950,372 | - | 750,372 | 2,200,000 | 2,354,000 | - | |||||||||||||||||||||
VisionChina Media - ADR (1) | 7,000,000 | - | 7,000,000 | - | - | - | |||||||||||||||||||||
WNS - ADR | 4,254,230 | - | 1,220,130 | 3,034,100 | 31,615,322 | - | |||||||||||||||||||||
Total of Affiliated Transactions | 169,041,224 | 11,718,878 | 88,452,262 | 92,307,840 | $ | 88,133,107 | $ | - | |||||||||||||||||||
(1) At December 31, 2012, the Fund owned less than five percent of the company's outstanding voting shares.
(2) Includes the effects of a stock split.
The aggregate cost and value of these companies at December 31, 2012, were $77,398,151 and $48,024,166, respectively. Investments in affiliated companies represented 4.97% of the Fund's total net assets at December 31, 2012.
See accompanying notes to financial statements.
72
> Notes to Statement of Investments
(c) All or a portion of this security was on loan at December 31, 2012. The total market value of securities on loan at December 31, 2012 was $10,135,994.
(d) Illiquid security.
(e) Denotes a restricted security, which is subject to restrictions on resale under federal securities laws. These securities are valued at fair value determined in good faith under consistently applied procedures established by the Board of Trustees. At December 31, 2012, the market value of these securities amounted to $22,197,745, which represented 2.30% of total net assets. Additional information on these securities is as follows:
Security | Acquisition Dates | Shares | Cost | Value | |||||||||||||||
Union Agriculture Group | 12/8/10-6/27/12 | 1,742,424 | $ | 20,000,000 | $ | 17,842,422 | |||||||||||||
Canadian Overseas Petroleum | 11/24/10 | 24,000,000 | 10,260,435 | 4,169,297 | |||||||||||||||
Canadian Overseas Petroleum - Warrants | 11/24/10 | 12,000,000 | 1,501,964 | 186,026 | |||||||||||||||
$ | 31,762,399 | $ | 22,197,745 | ||||||||||||||||
(f) On December 31, 2012, the market value of foreign securities represented 13.73% of total net assets. The Fund's foreign portfolio was diversified as follows:
Country | Value | Percentage of Net Assets | |||||||||
Colombia | $ | 33,455,116 | 3.47 | ||||||||
India | 31,615,322 | 3.27 | |||||||||
China | 24,215,858 | 2.51 | |||||||||
Uruguay | 17,842,422 | 1.85 | |||||||||
Iraq | 10,572,580 | 1.09 | |||||||||
Canada | 10,540,917 | 1.09 | |||||||||
United Kingdom | 4,355,323 | 0.45 | |||||||||
Total Foreign Portfolio | $ | 132,597,538 | 13.73 | ||||||||
(g) Investment made with cash collateral received from securities lending activity.
(h) At December 31, 2012, for federal income tax purposes, the cost of investments was $682,147,469 and net unrealized appreciation was $262,522,635 consisting of gross unrealized appreciation of $359,494,803 and gross unrealized depreciation of $96,972,168.
Fair Value Measurements
Various inputs are used in determining the value of the Fund's investments, following the input prioritization hierarchy established by accounting principles generally accepted in the United States of America (GAAP). These inputs are summarized in the three broad levels listed below:
• Level 1 – quoted prices in active markets for identical securities
• Level 2 – prices determined using other significant observable inputs (including quoted prices for similar securities, interest rates, prepayment speeds, credit risk and others)
• Level 3 – prices determined using significant unobservable inputs where quoted prices or observable inputs are unavailable or less reliable (including management's own assumptions about the factors market participants would use in pricing an investment)
The inputs or methodology used for valuing securities are not necessarily an indication of the risk associated with investing in those securities.
Examples of the types of securities in which the Fund would typically invest and how they are classified within this hierarchy are as follows. Typical Level 1 securities include exchange traded domestic equities, mutual funds whose NAVs are published each day and exchange traded foreign equities that are not statistically fair valued. Typical Level 2 securities include exchange traded foreign equities that are statistically fair valued, forward foreign currency exchange contracts and short-term investments valued at amortized cost. Additionally, securities fair valued by the Valuation Committee (the Committee) of the Fund's Board of Trustees (the Board) that rely on significant observable inputs are also included in Level 2. Typical Level 3 securities include any security fair valued by the Committee that relies on significant unobservable inputs.
Under the direction of the Board, the Committee is responsible for carrying out the valuation procedures approved by the Board.
The Committee meets as necessary, and no less frequently than quarterly, to determine fair values for securities for which market quotations are not readily available or for which the investment manager believes that available market quotations are unreliable, to review the appropriateness of the Trust's Portfolio Pricing Policy and the pricing procedures of the investment manager (the Policies), and to review the continuing appropriateness of the current value of any security subject to the Policies. The Policies address, among other things: circumstances under which market quotations will be deemed readily available; selection of third party pricing vendors; appropriate pricing methodologies; events that require fair valuation and fair value techniques; and circumstances under which securities will be deemed to pose a potential for stale pricing, including when securities are illiquid, restricted, or in default. The Committee may also meet to discuss additional valuation matters, which may include review of back-testing results, review of time-sensitive information or approval of other valuation related actions, and to review the appropriateness of the Policies.
For investments categorized as Level 3, the significant unobservable inputs used in the fair value measurement of the Funds' securities may include: (i) data specific to the issuer or comparable issuers, (ii) general market or specific sector news and (iii) quoted prices and specific or similar security transactions. The Committee considers this data and any changes from prior periods in order to assess the reasonableness of observable and unobservable inputs, any assumptions or internal models used to value those securities and changes in fair value. Significant changes in any of these factors could result in lower or higher fair value measurements. Various factors impact the frequency of monitoring (which may occur as often as daily), however the Committee may determine that changes to inputs, assumptions and models are not required with the same frequency.
See accompanying notes to financial statements.
73
Columbia Acorn Select
Statement of Investments, continued
> Notes to Statement of Investments
The following table summarizes the inputs used, as of December 31, 2012, in valuing the Fund's assets:
Investment Type | Quoted Prices (Level 1) | Other Significant Observable Inputs (Level 2) | Significant Unobservable Inputs (Level 3) | Total | |||||||||||||||
Equities | |||||||||||||||||||
Information | $ | 211,396,262 | $ | - | $ | - | $ | 211,396,262 | |||||||||||
Industrial Goods & Services | 210,355,271 | - | - | 210,355,271 | |||||||||||||||
Consumer Goods & Services | 161,050,294 | 14,774,358 | - | 175,824,652 | |||||||||||||||
Finance | 161,838,930 | - | - | 161,838,930 | |||||||||||||||
Energy & Minerals | 62,504,863 | 4,355,323 | 17,842,422 | 84,702,608 | |||||||||||||||
Health Care | 48,980,480 | - | - | 48,980,480 | |||||||||||||||
Other Industries | 37,811,115 | - | - | 37,811,115 | |||||||||||||||
Total Equities | 893,937,215 | 19,129,681 | 17,842,422 | 930,909,318 | |||||||||||||||
Total Short-Term Investments | 2,654,408 | - | - | 2,654,408 | |||||||||||||||
Total Securities Lending Collateral | 11,106,378 | - | - | 11,106,378 | |||||||||||||||
Total Investments | $ | 907,698,001 | $ | 19,129,681 | $ | 17,842,422 | $ | 944,670,104 | |||||||||||
The Fund's assets assigned to the Level 2 input category are generally valued using a market approach, in which a security's value is determined through its correlation to prices and information from observable market transactions for similar or identical assets. Foreign equities are generally valued at the last sale price on the foreign exchange or market on which they trade. The Fund may use a statistical fair valuation model, in accordance with the policy adopted by the Board, provided by an independent third party to value securities principally traded in foreign markets in order to adjust for possible stale pricing that may occur between the close of the foreign exchanges and the time for valuation. These models take into account available market data including intraday index, ADR, and ETF movements. Securities acquired via private placement that have a holding period or an extended settlement period are valued at a discount to the same shares that are trading freely on the market. These discounts are determined by the investment manager's experience with similar securities or situations. Factors may include, but are not limited to, trade volume, shares outstanding and stock price. Warrants which do not trade are valued as a percentage of the actively trading common stock using a model, based on Black Scholes. Securities which have halted or temporarily stopped trading are valued at the last sale and adjusted by a premium or a discount to account for the anticipated re-opening price. These adjustments are determined by the investment manager's experience with similar securities or situations.
The following table shows transfers between Level 1 and Level 2 of the fair value hierarchy:
Transfers In | Transfers Out | ||||||||||||||
| Level 1 | Level 2 | Level 1 | Level 2 | ||||||||||||
| $ | - | $ | 1,665,000 | $ | 1,665,000 | $ | - | ||||||||
Financial assets were transferred from Level 1 to Level 2 as trading halted during the period.
| Fair Value at 12/31/12 | Valuation Technique(s) | Unobservable Input(s) | Range (Weighted Average) | ||||||||||||||||
Equities | $ | 17,842,422 | Market comparable companies | Discount for lack of marketability | -2 | % to 3% (-8%) | |||||||||||||
Certain common stock classified as Level 3 are valued at fair value, using a market approach, as determined in good faith under consistently applied procedures established by and under the general supervision of the Board. To determine fair value for these securities, for which no market exists, the Committee utilizes the valuation technique it deems most appropriate in the circumstances, using some unobservable inputs, which may include but are not limited to trades of similar securities, estimated earnings of the company, market multiples derived from a set of comparable companies, and the position of the security within the company's capital structure. Significant increases or decreases to any of these inputs could result in a significantly lower or higher fair value measurement.
See accompanying notes to financial statements.
74
Columbia Thermostat Fund
Statement of Investments, December 31, 2012
Number of Shares | Value | ||||||||||
| > Affiliated Bond Funds: 54.0% | |||||||||||
18,877,615 | Columbia Short Term Bond Fund, Class I | $ | 188,776,150 | ||||||||
14,098,807 | Columbia Income Opportunities Fund, Class I | 141,974,994 | |||||||||
14,950,850 | Columbia Intermediate Bond Fund, Class I | 141,734,058 | |||||||||
Total Bond Funds: (Cost: $464,614,483) | 472,485,202 | ||||||||||
| > Affiliated Stock Funds: 44.6% | |||||||||||
5,273,173 | Columbia Dividend Income Fund, Class I | 77,832,029 | |||||||||
1,899,103 | Columbia Acorn International, Class I | 77,597,366 | |||||||||
1,924,624 | Columbia Acorn Fund, Class I | 58,643,291 | |||||||||
3,628,435 | Columbia Contrarian Core Fund, Class I | 58,599,226 | |||||||||
2,813,972 | Columbia Select Large Cap Growth Fund, Class I (a) | 39,198,626 | |||||||||
2,773,358 | Columbia Large Cap Enhanced Core Fund, Class I | 39,076,617 | |||||||||
1,523,738 | Columbia Acorn Select, Class I (a) | 39,053,399 | |||||||||
Total Stock Funds: (Cost: $353,815,430) | 390,000,554 | ||||||||||
Number of Shares | Value | ||||||||||
| > Short-Term Investments 0.7% | |||||||||||
5,795,466 | J.P. Morgan U.S. Government Money Market Fund - Agency Shares (7 day yield of 0.01%) | $ | 5,795,466 | ||||||||
| Total Short-Term Investments: (Cost: $5,795,466) | 5,795,466 | ||||||||||
| Total Investments: 99.3% (Cost: $824,225,379)(b) | 868,281,222 | ||||||||||
Cash and Other Assets Less Liabilities: 0.7% | 6,341,475 | ||||||||||
Net Assets: 100.0% | $ | 874,622,697 | |||||||||
> Notes to Statement of Investments
(a) Non-income producing security.
(b) At December 31, 2012, for federal income tax purposes, the cost of investments was $829,003,500 and net unrealized appreciation was $39,277,722 consisting of gross unrealized appreciation of $40,011,973 and gross unrealized depreciation of $734,251.
Fair Value Measurements
Various inputs are used in determining the value of the Fund's investments, following the input prioritization hierarchy established by accounting principles generally accepted in the United States of America (GAAP). These inputs are summarized in the three broad levels listed below:
• Level 1 – quoted prices in active markets for identical securities
• Level 2 – prices determined using other significant observable inputs (including quoted prices for similar securities, interest rates, prepayment speeds, credit risk and others)
• Level 3 – prices determined using significant unobservable inputs where quoted prices or observable inputs are unavailable or less reliable (including management's own assumptions about the factors market participants would use in pricing an investment)
The inputs or methodology used for valuing securities are not necessarily an indication of the risk associated with investing in those securities.
Examples of the types of securities in which the Fund would typically invest and how they are classified within this hierarchy are as follows. Typical Level 1 securities include mutual funds whose NAVs are published each day. Typical Level 2 securities include short-term investments valued at amortized cost.
Under the direction of the Board, the Committee is responsible for carrying out the valuation procedures approved by the Board.
The Committee meets as necessary, and no less frequently than quarterly, to determine fair values for securities for which market quotations are not readily available or for which the investment manager believes that available market quotations are unreliable, to review the appropriateness of the Trust's Portfolio Pricing Policy and the pricing procedures of the investment manager (the Policies), and to review the continuing appropriateness of the current value of any security subject to the Policies. The Policies address, among other things: circumstances under which market quotations will be deemed readily available; selection of third party pricing vendors; appropriate pricing methodologies; events that require fair valuation and fair value techniques; and circumstances under which securities will be deemed to pose a potential for stale pricing, including when securities are illiquid, restricted, or in default. The Committee may also meet to discuss additional valuation matters, which may include review of back-testing results, review of time-sensitive information or approval of other valuation related actions, and to review the appropriateness of the Policies.
For investments categorized as Level 3, the significant unobservable inputs used in the fair value measurement of the Funds' securities may include: (i) data specific to the issuer or comparable issuers, (ii) general market or specific sector news and (iii) quoted prices and specific or similar security transactions. The Committee considers this data and any changes from prior periods in order to assess the reasonableness of observable and unobservable inputs, any assumptions or internal models used to value those securities and changes in fair value. Significant changes in any of these factors could result in lower or higher fair value measurements. Various factors impact the frequency of monitoring (which may occur as often as daily), however the Committee may determine that changes to inputs, assumptions and models are not required with the same frequency.
See accompanying notes to financial statements.
75
Columbia Thermostat Fund
Statement of Investments, continued
> Notes to Statement of Investments
The following table summarizes the inputs used, as of December 31, 2012, in valuing the Fund's assets:
Investment Type | Quoted Prices (Level 1) | Other Significant Observable Inputs (Level 2) | Significant Unobservable Inputs (Level 3) | Total | |||||||||||||||
Total Bond Funds | $ | 472,485,202 | $ | - | $ | - | $ | 472,485,202 | |||||||||||
Total Stock Funds | 390,000,554 | - | - | 390,000,554 | |||||||||||||||
Total Short-Term Investments | 5,795,466 | - | - | 5,795,466 | |||||||||||||||
Total Investments | $ | 868,281,222 | $ | - | $ | - | $ | 868,281,222 | |||||||||||
There were no transfers of financial assets between levels 1 and 2 during the period.
See accompanying notes to financial statements.
76
Columbia Acorn Emerging Markets Fund
Major Portfolio Changes in the Fourth Quarter (Unaudited)
Number of Shares | |||||||||||
9/30/12 | 12/31/12 | ||||||||||
Purchases | |||||||||||
Asia | |||||||||||
| > Taiwan | |||||||||||
Advantech | 22,169 | 32,169 | |||||||||
CTCI Corp | 81,762 | 99,762 | |||||||||
Far Eastone Telecom | 74,126 | 137,000 | |||||||||
Flexium Interconnect | 0 | 38,000 | |||||||||
Lung Yen | 20,500 | 30,500 | |||||||||
PC Home | 19,307 | 46,000 | |||||||||
St. Shine Optical | 8,000 | 11,000 | |||||||||
Taiwan Hon Chuan | 29,689 | 68,000 | |||||||||
| > Indonesia | |||||||||||
Ace Indonesia | 2,790,190 | 3,078,690 | |||||||||
Archipelago Resources | 191,539 | 255,898 | |||||||||
Mayora Indah | 28,000 | 48,500 | |||||||||
MNC Skyvision | 364,000 | 389,500 | |||||||||
Surya Citra Media | 373,516 | 428,440 | |||||||||
| > India | |||||||||||
| Adani Ports & Special Economic Zone | 46,045 | 59,839 | |||||||||
Bosch | 0 | 597 | |||||||||
Colgate Palmolive (India) | 0 | 3,580 | |||||||||
Redington India | 61,400 | 74,582 | |||||||||
Titan Industries | 16,080 | 19,309 | |||||||||
TTK Prestige | 1,005 | 1,627 | |||||||||
United Breweries | 12,216 | 12,844 | |||||||||
Yes Bank | 0 | 11,731 | |||||||||
| > Hong Kong | |||||||||||
AAC Technologies | 31,027 | 46,027 | |||||||||
Lifestyle International | 56,589 | 71,589 | |||||||||
Melco Crown Entertainment - ADR | 8,650 | 9,081 | |||||||||
Melco International | 128,862 | 200,000 | |||||||||
Sa Sa International | 99,799 | 121,799 | |||||||||
| > Thailand | |||||||||||
Home Product Center | 372,000 | 472,000 | |||||||||
Samui Airport Property Fund | 7,700 | 180,800 | |||||||||
Siam Makro | 0 | 6,400 | |||||||||
| > China | |||||||||||
AMVIG Holdings | 212,000 | 312,000 | |||||||||
Digital China | 61,151 | 115,151 | |||||||||
| > Cambodia | |||||||||||
Nagacorp | 420,000 | 482,000 | |||||||||
| > Philippines | |||||||||||
Manila Water Company | 109,465 | 127,365 | |||||||||
SM Prime Holdings | 195,818 | 242,518 | |||||||||
| > Mongolia | |||||||||||
Mongolian Mining | 255,100 | 345,100 | |||||||||
| > Japan | |||||||||||
Kansai Paint | 5,760 | 13,760 | |||||||||
Number of Shares | |||||||||||
9/30/12 | 12/31/12 | ||||||||||
| > Singapore | |||||||||||
Petra Foods | 32,000 | 40,000 | |||||||||
| > Korea | |||||||||||
Paradise Co | 0 | 6,500 | |||||||||
Europe | |||||||||||
| > Kazakhstan | |||||||||||
| Halyk Savings Bank of Kazakhstan - GDR | 23,202 | 35,257 | |||||||||
| > Sweden | |||||||||||
Hexagon | 8,731 | 10,359 | |||||||||
| > Switzerland | |||||||||||
Dufry Group | 1,320 | 1,866 | |||||||||
| > Italy | |||||||||||
Pirelli | 7,631 | 13,812 | |||||||||
| > Finland | |||||||||||
Vacon | 0 | 2,220 | |||||||||
| > Germany | |||||||||||
Dürr | 962 | 1,119 | |||||||||
| > Turkey | |||||||||||
Bizim Toptan | 0 | 2,496 | |||||||||
Other Countries | |||||||||||
| > South Africa | |||||||||||
Coronation Fund Managers | 47,172 | 55,348 | |||||||||
Massmart Holdings | 5,847 | 8,306 | |||||||||
Mr. Price | 5,897 | 6,722 | |||||||||
| > United States | |||||||||||
Atwood Oceanics | 952 | 3,076 | |||||||||
Textainer Group Holdings | 4,404 | 5,419 | |||||||||
| > Canada | |||||||||||
Alliance Grain Traders | 7,801 | 9,973 | |||||||||
Latin America | |||||||||||
| > Brazil | |||||||||||
Arcos Dorados | 4,622 | 9,977 | |||||||||
Beadell Resources | 0 | 101,706 | |||||||||
Localiza Rent A Car | 8,000 | 10,700 | |||||||||
Multiplus | 4,200 | 6,300 | |||||||||
Odontoprev | 0 | 18,500 | |||||||||
| > Mexico | |||||||||||
Genomma Lab International | 38,000 | 48,300 | |||||||||
| > Chile | |||||||||||
Viña Concha y Toro | 34,333 | 44,806 | |||||||||
| > Argentina | |||||||||||
Madalena Ventures | 81,500 | 106,000 | |||||||||
See accompanying notes to financial statements.
77
Columbia Acorn Emerging Markets Fund
Major Portfolio Changes in the Fourth Quarter (Unaudited), continued
Number of Shares | |||||||||||
9/30/12 | 12/31/12 | ||||||||||
Sales | |||||||||||
Asia | |||||||||||
| > Taiwan | |||||||||||
Radiant Opto-Electronics | 15,735 | 10,735 | |||||||||
Tripod Technologies | 28,300 | 20,248 | |||||||||
| > China | |||||||||||
NetEase.com - ADR | 1,549 | 0 | |||||||||
RexLot Holdings | 1,575,000 | 0 | |||||||||
Europe | |||||||||||
| > France | |||||||||||
| Compagnie Française de l'Afrique Occidentale | 1,333 | 0 | |||||||||
Other Countries | |||||||||||
| > South Africa | |||||||||||
Adcock Ingram Holdings | 10,076 | 0 | |||||||||
Northam Platinum | 10,854 | 0 | |||||||||
Latin America | |||||||||||
| > Brazil | |||||||||||
MRV Engenharia | 12,425 | 0 | |||||||||
See accompanying notes to financial statements.
78
Columbia Acorn Emerging Markets Fund
Statement of Investments, December 31, 2012
Number of Shares | Value | ||||||||||
Equities: 97.3% | |||||||||||
Asia 61.8% | |||||||||||
| > Taiwan 16.3% | |||||||||||
137,000 | Far EasTone Telecom | $ | 349,813 | ||||||||
Taiwan's Third Largest Mobile Operator | |||||||||||
46,000 | PC Home | 214,704 | |||||||||
Taiwanese Internet Retail Company | |||||||||||
99,762 | CTCI Corp | 198,194 | |||||||||
International Engineering Firm | |||||||||||
11,000 | St. Shine Optical | 168,241 | |||||||||
| World's Leading Disposable Contact Lens Original Equipment Manufacturer | |||||||||||
68,000 | Taiwan Hon Chuan | 149,626 | |||||||||
| Beverage Packaging (Bottles, Caps, Labels) Manufacturer | |||||||||||
32,169 | Advantech | 136,319 | |||||||||
Industrial PC & Components | |||||||||||
38,000 | Flexium Interconnect | 134,667 | |||||||||
Flexible Printed Circuit for Mobile Electronics | |||||||||||
30,500 | Lung Yen | 98,662 | |||||||||
Funeral Services & Columbaria | |||||||||||
42,990 | Chroma Ate | 96,222 | |||||||||
| Automatic Test Systems, Testing & Measurement Instruments | |||||||||||
17,576 | Simplo Technology | 89,337 | |||||||||
Battery Packs for Notebook & Tablet PCs | |||||||||||
10,735 | Radiant Opto-Electronics | 44,577 | |||||||||
LCD Back Light Units & Modules | |||||||||||
20,248 | Tripod Technologies | 43,775 | |||||||||
Printed Circuit Boards (PCB) | |||||||||||
1,724,137 | |||||||||||
| > Indonesia 10.7% | |||||||||||
537,609 | Tower Bersama Infrastructure (a) | 318,233 | |||||||||
Communications Towers | |||||||||||
3,078,691 | Ace Indonesia | 263,334 | |||||||||
Home Improvement Retailer | |||||||||||
255,898 | Archipelago Resources (a) | 249,416 | |||||||||
| Gold Mining Projects in Indonesia, Vietnam & the Philippines | |||||||||||
48,500 | Mayora Indah | 101,017 | |||||||||
Consumer Branded Food Manufacturer | |||||||||||
428,440 | Surya Citra Media | 100,025 | |||||||||
Free to Air TV in Indonesia | |||||||||||
389,500 | MNC Skyvision (a) | 96,996 | |||||||||
| Largest Satellite Pay TV Operator in Indonesia | |||||||||||
1,129,021 | |||||||||||
| > India 9.4% | |||||||||||
12,844 | United Breweries | 220,201 | |||||||||
India's Largest Brewer | |||||||||||
59,839 | Adani Ports & Special Economic Zone | 148,704 | |||||||||
Indian West Coast Shipping Port | |||||||||||
74,582 | Redington India | 118,689 | |||||||||
| Supply Chain Solutions for IT & Mobile Handsets in Emerging Markets | |||||||||||
597 | Bosch | 104,506 | |||||||||
Automotive Parts | |||||||||||
3,580 | Colgate Palmolive India | 103,334 | |||||||||
Consumer Products in Oral Care | |||||||||||
Number of Shares | Value | ||||||||||
19,309 | Titan Industries | $ | 101,209 | ||||||||
Jewlery, Watches, Eyeglasses | |||||||||||
1,627 | TTK Prestige | 101,093 | |||||||||
Branded Cooking Equipment | |||||||||||
11,731 | Yes Bank | 99,913 | |||||||||
Commercial Banking in India | |||||||||||
997,649 | |||||||||||
| > Hong Kong 7.8% | |||||||||||
200,000 | Melco International | 237,449 | |||||||||
Macau Casino Operator | |||||||||||
71,589 | Lifestyle International | 177,088 | |||||||||
| Mid- to High-end Department Store Operator in Hong Kong & China | |||||||||||
46,027 | AAC Technologies | 163,203 | |||||||||
Miniature Acoustic Components | |||||||||||
9,081 | Melco Crown Entertainment - ADR (a) | 152,924 | |||||||||
Macau Casino Operator | |||||||||||
121,799 | Sa Sa International | 101,139 | |||||||||
Cosmetics Retailer | |||||||||||
831,803 | |||||||||||
| > Thailand 3.7% | |||||||||||
472,000 | Home Product Center | 196,251 | |||||||||
Home Improvement Retailer | |||||||||||
180,800 | Samui Airport Property Fund | 99,295 | |||||||||
Thai Airport Operator | |||||||||||
6,400 | Siam Makro | 93,604 | |||||||||
General Merchadise Wholesaler in Thailand | |||||||||||
389,150 | |||||||||||
| > China 3.4% | |||||||||||
115,151 | Digital China | 199,128 | |||||||||
| IT Distribution & Systems Integration Services | |||||||||||
312,000 | AMVIG Holdings | 113,918 | |||||||||
| Chinese Tobacco Packaging Material Supplier | |||||||||||
1,057 | 51 | job - ADR (a) | 49,415 | ||||||||
Integrated Human Resource Services | |||||||||||
362,461 | |||||||||||
| > Cambodia 2.8% | |||||||||||
482,000 | Nagacorp | 294,476 | |||||||||
| Casino/Entertainment Complex in Cambodia | |||||||||||
294,476 | |||||||||||
| > Philippines 2.6% | |||||||||||
127,365 | Manila Water Company | 99,476 | |||||||||
Water Utility Company in Philippines | |||||||||||
242,518 | SM Prime Holdings | 97,757 | |||||||||
Shopping Mall Operator | |||||||||||
44,487 | Int'l Container Terminal | 80,370 | |||||||||
| Container Handling Terminals & Port Management | |||||||||||
277,603 | |||||||||||
| > Mongolia 1.6% | |||||||||||
345,100 | Mongolian Mining (a) | 171,026 | |||||||||
Coking Coal Mining in Mongolia | |||||||||||
171,026 | |||||||||||
See accompanying notes to financial statements.
79
Columbia Acorn Emerging Markets Fund
Statement of Investments, continued
Number of Shares | Value | ||||||||||
| > Japan 1.4% | |||||||||||
13,760 | Kansai Paint | $ | 148,290 | ||||||||
| Paint Producer in Japan, India, China & Southeast Asia | |||||||||||
148,290 | |||||||||||
| > Singapore 1.1% | |||||||||||
40,000 | Petra Foods | 112,841 | |||||||||
Cocoa Processor & Chocolate Manufacturer | |||||||||||
112,841 | |||||||||||
| > Korea 1.0% | |||||||||||
6,500 | Paradise Co | 105,160 | |||||||||
Korean 'Foreigner Only' Casino Operator | |||||||||||
105,160 | |||||||||||
Asia: Total | 6,543,617 | ||||||||||
Europe 12.8% | |||||||||||
| > Kazakhstan 2.7% | |||||||||||
35,257 | Halyk Savings Bank of Kazakhstan - GDR (a) | 289,107 | |||||||||
| Largest Retail Bank & Insurer in Kazakhstan | |||||||||||
289,107 | |||||||||||
| > Sweden 2.5% | |||||||||||
10,359 | Hexagon | 261,961 | |||||||||
| Design, Measurement & Visualization Software & Equipment | |||||||||||
261,961 | |||||||||||
| > Switzerland 2.3% | |||||||||||
1,866 | Dufry Group (a) | 246,745 | |||||||||
| Operates Airport Duty Free & Duty Paid Shops | |||||||||||
246,745 | |||||||||||
| > Italy 1.5% | |||||||||||
13,812 | Pirelli | 159,138 | |||||||||
Global Tire Supplier | |||||||||||
159,138 | |||||||||||
| > Czech Republic 1.3% | |||||||||||
665 | Komercni Banka | 140,579 | |||||||||
Leading Czech Universal Bank | |||||||||||
140,579 | |||||||||||
| > Finland 1.1% | |||||||||||
2,220 | Vacon | 117,798 | |||||||||
| Leading Independent Manufacturer of Variable Speed Alternating Current Drives | |||||||||||
117,798 | |||||||||||
| > Germany 1.0% | |||||||||||
1,119 | Dürr | 100,271 | |||||||||
| Automotive Plant Engineering & Associated Capital Equipment | |||||||||||
100,271 | |||||||||||
| > Turkey 0.4% | |||||||||||
2,496 | Bizim Toptan | 39,004 | |||||||||
Cash & Carry Stores in Turkey | |||||||||||
39,004 | |||||||||||
Europe: Total | 1,354,603 | ||||||||||
Number of Shares | Value | ||||||||||
Other Countries 12.4% | |||||||||||
| > South Africa 7.2% | |||||||||||
55,348 | Coronation Fund Managers | $ | 259,133 | ||||||||
South African Fund Manager | |||||||||||
81,332 | Rand Merchant Insurance | 199,446 | |||||||||
| Directly Sold Property & Casualty Insurance; Holdings in Other Insurers | |||||||||||
8,306 | Massmart Holdings | 188,319 | |||||||||
| General Merchandise, Food & Home Improvement Stores; Wal-Mart Subsidiary | |||||||||||
6,722 | Mr. Price | 111,405 | |||||||||
| South African Retailer of Apparel, Household & Sporting Goods | |||||||||||
758,303 | |||||||||||
| > United States 2.9% | |||||||||||
5,419 | Textainer Group Holdings (b) | 170,482 | |||||||||
Top International Container Leasor | |||||||||||
3,076 | Atwood Oceanics (a) | 140,850 | |||||||||
Offshore Drilling Contractor | |||||||||||
311,332 | |||||||||||
| > Canada 2.3% | |||||||||||
9,973 | Alliance Grain Traders | 130,941 | |||||||||
| Global Leader in Pulse Processing & Distribution | |||||||||||
36,607 | Americas Petrogas (a) | 110,406 | |||||||||
| Oil & Gas Exploration in Argentina, Potash in Peru | |||||||||||
241,347 | |||||||||||
Other Countries: Total | 1,310,982 | ||||||||||
Latin America 10.3% | |||||||||||
| > Brazil 6.2% | |||||||||||
10,700 | Localiza Rent A Car | 195,971 | |||||||||
Car Rental | |||||||||||
6,300 | Multiplus | 146,831 | |||||||||
Loyalty Program Operator in Brazil | |||||||||||
9,977 | Arcos Dorados (b) | 119,325 | |||||||||
| McDonald's Master Franchise for Latin America | |||||||||||
101,706 | Beadell Resources (a) | 105,082 | |||||||||
Gold Mining in Brazil | |||||||||||
18,500 | Odontoprev | 96,950 | |||||||||
Dental Insurance | |||||||||||
664,159 | |||||||||||
| > Mexico 2.9% | |||||||||||
1,808 | Grupo Aeroportuario del Sureste - ADR | 206,112 | |||||||||
Mexican Airport Operator | |||||||||||
48,300 | Genomma Lab International (a) | 99,243 | |||||||||
| Develops, Markets & Distributes Consumer Products | |||||||||||
305,355 | |||||||||||
| > Chile 0.8% | |||||||||||
44,806 | Viña Concha y Toro | 87,281 | |||||||||
Global Branded Wine Manufacturer | |||||||||||
87,281 | |||||||||||
See accompanying notes to financial statements.
80
Number of Shares | Value | ||||||||||
| > Argentina 0.4% | |||||||||||
106,000 | Madalena Ventures (a) | $ | 41,027 | ||||||||
Oil & Gas Exploration in Argentina | |||||||||||
41,027 | |||||||||||
Latin America: Total | 1,097,822 | ||||||||||
| Total Equities: 97.3% (Cost: $8,851,918) | 10,307,024 | (c) | |||||||||
Short-Term Investments: 9.0% | |||||||||||
952,603 | J.P. Morgan U.S. Government Money Market Fund - Capital Shares (7 day yield of 0.01%) | 952,603 | |||||||||
| Total Short-Term Investments: 9.0% (Cost: $952,603) | 952,603 | ||||||||||
Number of Shares | Value | ||||||||||
Securities Lending Collateral 0.8% | |||||||||||
86,100 | Dreyfus Government Cash Management Fund (7 day yield of 0.01%) (d) | $ | 86,100 | ||||||||
| Total Securities Lending Collateral: (Cost: $86,100) | 86,100 | ||||||||||
| Total Investments: 107.1% (Cost: $9,890,621)(e) | 11,345,727 | ||||||||||
| Obligation to Return Collateral for Securities Loaned: (0.8)% | (86,100 | ) | |||||||||
Cash and Other Assets Less Liabilities: (6.3)% | (669,816 | ) | |||||||||
Net Assets: 100.0% | $ | 10,589,811 | |||||||||
ADR - American Depositary Receipts
GDR - Global Depositary Receipts
See accompanying notes to financial statements.
> Notes to Statement of Investments
(a) Non-income producing security.
(b) All or a portion of this security was on loan at December 31, 2012. The total market value of securities on loan at December 31, 2012 was $84,708.
(c) On December 31, 2012, the Fund's total investments were denominated in currencies as follows:
Currency | Value | Percentage of Net Assets | |||||||||
Taiwan Dollar | $ | 1,724,137 | 16.3 | ||||||||
Hong Kong Dollar | 1,457,427 | 13.8 | |||||||||
United States Dollar | 1,128,215 | 10.7 | |||||||||
Indian Rupee | 997,649 | 9.4 | |||||||||
Indonesian Rupiah | 879,604 | 8.3 | |||||||||
South African Rand | 758,303 | 7.2 | |||||||||
| Other currencies less than 5% of total net assets | 3,361,689 | 31.6 | |||||||||
Total Equities | $ | 10,307,024 | 97.3 | ||||||||
(d) Investment made with cash collateral received from securities lending activity.
(e) At December 31, 2012, for federal income tax purposes, the cost of investments was $9,916,215 and net unrealized appreciation was $1,429,512 consisting of gross unrealized appreciation of $1,673,371 and gross unrealized depreciation of $243,859.
Fair Value Measurements
Various inputs are used in determining the value of the Fund's investments, following the input prioritization hierarchy established by accounting principles generally accepted in the United States of America (GAAP). These inputs are summarized in the three broad levels listed below:
• Level 1 – quoted prices in active markets for identical securities
• Level 2 – prices determined using other significant observable inputs (including quoted prices for similar securities, interest rates, prepayment speeds, credit risk and others)
• Level 3 – prices determined using significant unobservable inputs where quoted prices or observable inputs are unavailable or less reliable (including management's own assumptions about the factors market participants would use in pricing an investment)
The inputs or methodology used for valuing securities are not necessarily an indication of the risk associated with investing in those securities.
Examples of the types of securities in which the Fund would typically invest and how they are classified within this hierarchy are as follows. Typical Level 1 securities include exchange traded domestic equities, mutual funds whose NAVs are published each day and exchange traded foreign equities that are not statistically fair valued. Typical Level 2 securities include exchange traded foreign equities that are statistically fair valued, forward foreign currency exchange contracts and short-term investments valued at amortized cost. Additionally, securities fair valued by the Valuation Committee (the Committee) of the Fund's Board of Trustees (the Board) that rely on significant observable inputs are also included in Level 2. Typical Level 3 securities include any security fair valued by the Committee that relies on significant unobservable inputs.
Under the direction of the Board, the Committee is responsible for carrying out the valuation procedures approved by the Board.
81
Columbia Acorn Emerging Markets Fund
Statement of Investments, continued
> Notes to Statement of Investments
The Committee meets as necessary, and no less frequently than quarterly, to determine fair values for securities for which market quotations are not readily available or for which the investment manager believes that available market quotations are unreliable, to review the appropriateness of the Trust's Portfolio Pricing Policy and the pricing procedures of the investment manager (the Policies), and to review the continuing appropriateness of the current value of any security subject to the Policies. The Policies address, among other things: circumstances under which market quotations will be deemed readily available; selection of third party pricing vendors; appropriate pricing methodologies; events that require fair valuation and fair value techniques; and circumstances under which securities will be deemed to pose a potential for stale pricing, including when securities are illiquid, restricted, or in default. The Committee may also meet to discuss additional valuation matters, which may include review of back-testing results, review of time-sensitive information or approval of other valuation related actions, and to review the appropriateness of the Policies.
For investments categorized as Level 3, the significant unobservable inputs used in the fair value measurement of the Funds' securities may include: (i) data specific to the issuer or comparable issuers, (ii) general market or specific sector news and (iii) quoted prices and specific or similar security transactions. The Committee considers this data and any changes from prior periods in order to assess the reasonableness of observable and unobservable inputs, any assumptions or internal models used to value those securities and changes in fair value. Significant changes in any of these factors could result in lower or higher fair value measurements. Various factors impact the frequency of monitoring (which may occur as often as daily), however the Committee may determine that changes to inputs, assumptions and models are not required with the same frequency.
The following table summarizes the inputs used, as of December 31, 2012, in valuing the Fund's assets:
Investment Type | Quoted Prices (Level 1) | Other Significant Observable Inputs (Level 2) | Significant Unobservable Inputs (Level 3) | Total | |||||||||||||||
Equities | |||||||||||||||||||
Asia | $ | 202,339 | $ | 6,341,278 | $ | - | $ | 6,543,617 | |||||||||||
Europe | - | 1,354,603 | - | 1,354,603 | |||||||||||||||
Other Countries | 552,679 | 758,303 | - | 1,310,982 | |||||||||||||||
Latin America | 992,740 | 105,082 | - | 1,097,822 | |||||||||||||||
Total Equities | 1,747,758 | 8,559,266 | - | 10,307,024 | |||||||||||||||
Total Short-Term Investments | 952,603 | - | - | 952,603 | |||||||||||||||
Total Securities Lending Collateral | 86,100 | - | - | 86,100 | |||||||||||||||
Total Investments | $ | 2,786,461 | $ | 8,559,266 | $ | - | $ | 11,345,727 | |||||||||||
The Fund's assets assigned to the Level 2 input category are generally valued using a market approach, in which a security's value is determined through its correlation to prices and information from observable market transactions for similar or identical assets. Foreign equities are generally valued at the last sale price on the foreign exchange or market on which they trade. The Fund may use a statistical fair valuation model, in accordance with the policy adopted by the Board, provided by an independent third party to value securities principally traded in foreign markets in order to adjust for possible stale pricing that may occur between the close of the foreign exchanges and the time for valuation. These models take into account available market data including intraday index, ADR, and ETF movements.
There were no transfers of financial assets between levels 1 and 2 during the period.
See accompanying notes to financial statements.
82
Columbia Acorn Emerging Markets Fund
Portfolio Diversification
At December 31, 2012, the Fund's portfolio investments as a percentage of net assets were diversified as follows:
Value | Percentage of Net Assets | ||||||||||
| > Consumer Goods & Services | |||||||||||
Retail | $ | 1,555,713 | 14.7 | ||||||||
Casinos & Gaming | 790,008 | 7.5 | |||||||||
Food & Beverage | 787,495 | 7.4 | |||||||||
Other Consumer Services | 325,165 | 3.1 | |||||||||
Other Durable Goods | 260,231 | 2.5 | |||||||||
Consumer Goods Distribution | 222,023 | 2.1 | |||||||||
Travel | 195,971 | 1.8 | |||||||||
Nondurables | 99,243 | 0.9 | |||||||||
4,235,849 | 40.0 | ||||||||||
| > Information | |||||||||||
Mobile Communications | 668,046 | 6.3 | |||||||||
| Computer Hardware & Related Equipment | 477,211 | 4.5 | |||||||||
Business Software | 261,961 | 2.5 | |||||||||
Electronics Distribution | 199,129 | 1.9 | |||||||||
Semiconductors & Related Equipment | 134,667 | 1.3 | |||||||||
TV Broadcasting | 100,025 | 0.9 | |||||||||
Satellite Broadcasting & Services | 96,996 | 0.9 | |||||||||
Instrumentation | 96,223 | 0.9 | |||||||||
2,034,258 | 19.2 | ||||||||||
| > Finance | |||||||||||
Banks | 529,599 | 5.0 | |||||||||
Insurance | 296,396 | 2.8 | |||||||||
Brokerage & Money Management | 259,133 | 2.5 | |||||||||
Finance Companies | 170,482 | 1.6 | |||||||||
1,255,610 | 11.9 | ||||||||||
| > Industrial Goods & Services | |||||||||||
| Industrial Materials & Specialty Chemicals | 411,834 | 3.9 | |||||||||
Other Industrial Services | 229,074 | 2.2 | |||||||||
Machinery | 204,777 | 1.9 | |||||||||
Construction | 198,194 | 1.9 | |||||||||
Electrical Components | 117,797 | 1.1 | |||||||||
1,161,676 | 11.0 | ||||||||||
| > Energy & Minerals | |||||||||||
Mining | 525,524 | 5.0 | |||||||||
Oil & Gas Producers | 151,434 | 1.4 | |||||||||
Oil Services | 140,850 | 1.3 | |||||||||
Agricultural Commodities | 130,941 | 1.3 | |||||||||
948,749 | 9.0 | ||||||||||
| > Other Industries | |||||||||||
Transportation | 305,407 | 2.9 | |||||||||
Regulated Utilities | 99,476 | 0.9 | |||||||||
Real Estate | 97,758 | 0.9 | |||||||||
502,641 | 4.7 | ||||||||||
Value | Percentage of Net Assets | ||||||||||
| > Health Care | |||||||||||
Medical Supplies | $ | 168,241 | 1.5 | ||||||||
168,241 | 1.5 | ||||||||||
Total Equities: | 10,307,024 | 97.3 | |||||||||
Short-Term Investments: | 952,603 | 9.0 | |||||||||
Securities Lending Collateral: | 86,100 | 0.8 | |||||||||
Total Investments: | 11,345,727 | 107.1 | |||||||||
| Obligation to Return Collateral for Securities Loaned: | (86,100 | ) | (0.8 | ) | |||||||
| Cash and Other Assets Less Liabilities: | (669,816 | ) | (6.3 | ) | |||||||
Net Assets: | $ | 10,589,811 | 100.0 | ||||||||
See accompanying notes to financial statements.
83
Columbia Acorn European Fund
Major Portfolio Changes in the Fourth Quarter (Unaudited)
Number of Shares | |||||||||||
9/30/12 | 12/31/12 | ||||||||||
Purchases | |||||||||||
Europe | |||||||||||
| > United Kingdom | |||||||||||
Abcam | 3,190 | 5,300 | |||||||||
BBA Aviation | 7,480 | 9,339 | |||||||||
Charles Taylor | 22,220 | 28,000 | |||||||||
Elementis | 5,768 | 8,300 | |||||||||
Greggs | 3,200 | 5,000 | |||||||||
IG Group | 0 | 4,000 | |||||||||
Intertek Group | 500 | 660 | |||||||||
JLT Group | 1,827 | 5,500 | |||||||||
Ocado | 25,000 | 31,000 | |||||||||
WH Smith | 3,500 | 4,300 | |||||||||
| > France | |||||||||||
Neopost | 600 | 900 | |||||||||
Saft | 1,300 | 1,829 | |||||||||
| > Germany | |||||||||||
CTS Eventim | 590 | 882 | |||||||||
Stratec Biomedical Systems | 500 | 965 | |||||||||
TAG Immobilien | �� | 0 | 2,500 | ||||||||
| > Switzerland | |||||||||||
Dufry Group | 480 | 638 | |||||||||
| > Netherlands | |||||||||||
Aalberts Industries | 3,400 | 3,573 | |||||||||
Imtech | 1,499 | 2,575 | |||||||||
| > Sweden | |||||||||||
Sweco | 4,570 | 5,745 | |||||||||
| > Italy | |||||||||||
Geox | 13,500 | 17,223 | |||||||||
| > Finland | |||||||||||
Vacon | 0 | 1,000 | |||||||||
| > Norway | |||||||||||
Atea | 5,310 | 6,044 | |||||||||
| > Belgium | |||||||||||
EVS Broadcast Equipment | 630 | 830 | |||||||||
| > Turkey | |||||||||||
Bizim Toptan | 0 | 761 | |||||||||
Asia | |||||||||||
| > Indonesia | |||||||||||
Archipelago Resources | 0 | 83,300 | |||||||||
| > Hong Kong | |||||||||||
L'Occitane International | 13,000 | 18,000 | |||||||||
Number of Shares | |||||||||||
9/30/12 | 12/31/12 | ||||||||||
Sales | |||||||||||
Europe | |||||||||||
| > United Kingdom | |||||||||||
Premier Oil | 2,315 | 0 | |||||||||
Rotork | 660 | 95 | |||||||||
| > Netherlands | |||||||||||
Koninklijke TenCate | 975 | 0 | |||||||||
| > Italy | |||||||||||
Fiat | 4,400 | 0 | |||||||||
Other Countries | |||||||||||
| > United States | |||||||||||
Velti | 2,550 | 0 | |||||||||
See accompanying notes to financial statements.
84
Columbia Acorn European Fund
Statement of Investments, December 31, 2012
Number of Shares | Value | ||||||||||
Equities: 93.7% | |||||||||||
Europe 88.2% | |||||||||||
| > United Kingdom 21.5% | |||||||||||
28,000 | Charles Taylor | $ | 76,642 | ||||||||
Insurance Services | |||||||||||
5,500 | JLT Group | 71,227 | |||||||||
International Business Insurance Broker | |||||||||||
8,500 | Domino's Pizza UK & Ireland | 69,388 | |||||||||
Pizza Delivery in UK, Ireland & Germany | |||||||||||
2,470 | Rightmove | 58,069 | |||||||||
Internet Real Estate Listings | |||||||||||
4,300 | WH Smith | 47,061 | |||||||||
Newsprint, Books & General Stationery Retailer | |||||||||||
31,000 | Ocado (a) | 44,285 | |||||||||
Leading Online Grocery Retailer | |||||||||||
1,000 | Asos (a) | 44,108 | |||||||||
| Internet-based Retailer to Hipsters Up to Age 35 | |||||||||||
5,000 | Greggs | 37,299 | |||||||||
Bakery | |||||||||||
9,339 | BBA Aviation | 34,080 | |||||||||
Aviation Support Services | |||||||||||
660 | Intertek Group | 33,526 | |||||||||
Testing, Inspection, Certification Services | |||||||||||
886 | Spirax Sarco | 33,175 | |||||||||
| Steam Systems for Manufacturing & Process Industries | |||||||||||
5,300 | Abcam | 33,168 | |||||||||
Online Sales of Antibodies | |||||||||||
8,300 | Elementis | 31,691 | |||||||||
Clay-based Additives | |||||||||||
3,408 | Shaftesbury | 31,351 | |||||||||
London Prime Retail REIT | |||||||||||
4,000 | IG Group | 29,439 | |||||||||
On-line Retail Spread Betting Platform | |||||||||||
877 | Aggreko | 25,028 | |||||||||
Temporary Power & Temperature Control Services | |||||||||||
95 | Rotork | 3,966 | |||||||||
Valve Actuators for Oil & Water Pipelines | |||||||||||
703,503 | |||||||||||
| > France 13.1% | |||||||||||
570 | Eurofins Scientific | 92,720 | |||||||||
| Food, Pharmaceuticals & Materials Screening & Testing | |||||||||||
1,650 | 1000 | mercis | 89,077 | ||||||||
Interactive Advertising & Marketing | |||||||||||
900 | Gemalto | 81,238 | |||||||||
Digital Security Solutions | |||||||||||
900 | Neopost | 47,729 | |||||||||
Postage Meter Machines | |||||||||||
1,829 | Saft | 43,043 | |||||||||
Niche Battery Manufacturer | |||||||||||
556 | Norbert Dentressangle | 42,896 | |||||||||
Leading European Logistics & Transport Group | |||||||||||
12,000 | Hi-Media (a) | 33,045 | |||||||||
Online Advertiser in Europe | |||||||||||
429,748 | |||||||||||
Number of Shares | Value | ||||||||||
| > Germany 11.7% | |||||||||||
2,906 | Wirecard | $ | 71,742 | ||||||||
Online Payment Processing & Risk Management | |||||||||||
233 | Rational | 67,306 | |||||||||
Commercial Ovens | |||||||||||
965 | Stratec Biomedical Systems | 48,141 | |||||||||
Diagnostic Instrumentation | |||||||||||
420 | Bertrandt | 42,168 | |||||||||
Outsourced Engineering | |||||||||||
1,166 | NORMA Group | 32,320 | |||||||||
Clamps for Automotive & Industrial Applications | |||||||||||
360 | Dürr | 32,259 | |||||||||
| Automotive Plant Engineering & Associated Capital Equipment | |||||||||||
2,500 | TAG Immobilien | 31,332 | |||||||||
Owner of Residential Properties in Germany | |||||||||||
882 | CTS Eventim | 31,079 | |||||||||
Event Ticket Sales | |||||||||||
230 | Pfeiffer Vacuum | 28,028 | |||||||||
Vacuum Pumps | |||||||||||
384,375 | |||||||||||
| > Switzerland 10.4% | |||||||||||
414 | Geberit (a) | 91,773 | |||||||||
Plumbing Supplies | |||||||||||
384 | Partners Group | 88,773 | |||||||||
Private Markets Asset Management | |||||||||||
638 | Dufry Group (a) | 84,364 | |||||||||
Operates Airport Duty Free & Duty Paid Shops | |||||||||||
20 | Sika | 46,259 | |||||||||
| Chemicals for Construction & Industrial Applications | |||||||||||
643 | Zehnder | 31,093 | |||||||||
Radiators & Heat Recovery Ventilation Systems | |||||||||||
342,262 | |||||||||||
| > Netherlands 10.2% | |||||||||||
3,573 | Aalberts Industries | 74,805 | |||||||||
Flow Control & Heat Treatment | |||||||||||
2,011 | UNIT4 | 60,705 | |||||||||
Business Software Development | |||||||||||
2,575 | Imtech | 59,810 | |||||||||
Technical Installation & Maintenance | |||||||||||
1,577 | TKH Group | 40,819 | |||||||||
Dutch Industrial Conglomerate | |||||||||||
1,680 | Arcadis | 39,889 | |||||||||
Engineering Consultants | |||||||||||
263 | Core Labs | 28,748 | |||||||||
Oil & Gas Reservoir Consulting | |||||||||||
402 | Vopak | 28,416 | |||||||||
| World's Largest Operator of Petroleum & Chemical Storage Terminals | |||||||||||
333,192 | |||||||||||
| > Sweden 5.7% | |||||||||||
3,370 | Hexagon | 85,221 | |||||||||
| Design, Measurement & Visualization Software & Equipment | |||||||||||
5,745 | Sweco | 64,490 | |||||||||
Engineering Consultants | |||||||||||
See accompanying notes to financial statements.
85
Columbia Acorn European Fund
Statement of Investments, continued
Number of Shares | Value | ||||||||||
| > Sweden—continued | |||||||||||
1,211 | Unibet | $ | 38,770 | ||||||||
European Online Gaming Operator | |||||||||||
188,481 | |||||||||||
| > Italy 3.8% | |||||||||||
17,223 | Geox | 49,987 | |||||||||
Apparel & Shoe Maker | |||||||||||
300 | Tod's | 38,091 | |||||||||
Leather Shoes & Bags | |||||||||||
2,800 | Pirelli | 32,261 | |||||||||
Global Tire Supplier | |||||||||||
5,391 | CIR | 5,683 | |||||||||
Italian Holding Company | |||||||||||
126,022 | |||||||||||
| > Finland 2.2% | |||||||||||
1,000 | Vacon | 53,062 | |||||||||
| Leading Independent Manufacturer of Variable Speed Alternating Current Drives | |||||||||||
1,063 | Stockmann | 19,093 | |||||||||
| Department Store & Fashion Retailer in Scandinavia & Russia | |||||||||||
72,155 | |||||||||||
| > Norway 2.0% | |||||||||||
6,044 | Atea | 64,664 | |||||||||
| Leading Nordic IT Hardware/Software Reseller & Installation Company | |||||||||||
64,664 | |||||||||||
| > Belgium 1.5% | |||||||||||
830 | EVS Broadcast Equipment | 48,802 | |||||||||
| Digital Live Mobile Production Software & Systems | |||||||||||
48,802 | |||||||||||
| > Iceland 1.5% | |||||||||||
43,750 | Marel | 48,235 | |||||||||
| Largest Manufacturer of Poultry & Fish Processing Equipment | |||||||||||
48,235 | |||||||||||
| > Portugal 1.1% | |||||||||||
13,480 | Redes Energéticas Nacionais | 36,565 | |||||||||
| Portuguese Power Transmission & Gas Transportation | |||||||||||
36,565 | |||||||||||
| > Denmark 1.0% | |||||||||||
700 | Solar | 32,055 | |||||||||
| Technical Wholesaler of Electrical, Plumbing & HVAC Equipment | |||||||||||
32,055 | |||||||||||
| > Czech Republic 0.9% | |||||||||||
140 | Komercni Banka | 29,596 | |||||||||
Leading Czech Universal Bank | |||||||||||
29,596 | |||||||||||
| > Russia 0.7% | |||||||||||
1,049 | Yandex (a) | 22,627 | |||||||||
Search Engine for Russian & Turkish Languages | |||||||||||
22,627 | |||||||||||
Number of Shares | Value | ||||||||||
| > Poland 0.5% | |||||||||||
4,000 | FX Energy (a) | $ | 16,440 | ||||||||
Oil & Gas Producer in Poland | |||||||||||
16,440 | |||||||||||
| > Turkey 0.4% | |||||||||||
761 | Bizim Toptan (a) | 11,892 | |||||||||
Cash & Carry Stores in Turkey | |||||||||||
11,892 | |||||||||||
Europe: Total | 2,890,614 | ||||||||||
Asia 4.2% | |||||||||||
| > Indonesia 2.5% | |||||||||||
83,300 | Archipelago Resources (a) | 81,190 | |||||||||
| Gold Mining Projects in Indonesia, Vietnam & the Philippines | |||||||||||
81,190 | |||||||||||
| > Hong Kong 1.7% | |||||||||||
18,000 | L'Occitane International | 57,597 | |||||||||
Skin Care & Cosmetics Producer | |||||||||||
57,597 | |||||||||||
Asia: Total | 138,787 | ||||||||||
Other Countries 1.3% | |||||||||||
| > Canada 1.3% | |||||||||||
3,270 | Alliance Grain Traders | 42,934 | |||||||||
| Global Leader in Pulse Processing & Distribution | |||||||||||
42,934 | |||||||||||
Other Countries: Total | 42,934 | ||||||||||
| Total Equities: 93.7% (Cost: $2,679,610) | 3,072,335 | (b) | |||||||||
Short-Term Investments: 8.2% | |||||||||||
269,451 | J.P. Morgan U.S. Government Money Market Fund - Agency Shares (7 day yield of 0.01%) | 269,451 | |||||||||
| Total Short-Term Investments: 8.2% (Cost: $269,451) | 269,451 | ||||||||||
| Total Investments: 101.9% (Cost: $2,949,061)(c) | 3,341,786 | ||||||||||
Cash and Other Assets Less Liabilities: (1.9)% | (63,751 | ) | |||||||||
Net Assets: 100.0% | $ | 3,278,035 | |||||||||
REIT - Real Estate Investment Trust
See accompanying notes to financial statements.
86
> Notes to Statement of Investments
(a) Non-income producing security.
(b) On December 31, 2012, the Fund's total investments were denominated in currencies as follows:
Currency | Value | Percentage of Net Assets | |||||||||
Euro | $ | 1,402,111 | 42.8 | ||||||||
British Pound | 784,693 | 23.9 | |||||||||
Swiss Franc | 342,262 | 10.4 | |||||||||
Swedish Krona | 188,481 | 5.8 | |||||||||
| Other currencies less than 5% of total net assets | 354,788 | 10.8 | |||||||||
Total Equities | $ | 3,072,335 | 93.7 | ||||||||
(c) At December 31, 2012, for federal income tax purposes, the cost of investments was $2,957,119 and net unrealized appreciation was $384,667 consisting of gross unrealized appreciation of $452,659 and gross unrealized depreciation of $67,992.
Fair Value Measurements
Various inputs are used in determining the value of the Fund's investments, following the input prioritization hierarchy established by accounting principles generally accepted in the United States of America (GAAP). These inputs are summarized in the three broad levels listed below:
• Level 1 – quoted prices in active markets for identical securities
• Level 2 – prices determined using other significant observable inputs (including quoted prices for similar securities, interest rates, prepayment speeds, credit risk and others)
• Level 3 – prices determined using significant unobservable inputs where quoted prices or observable inputs are unavailable or less reliable (including management's own assumptions about the factors market participants would use in pricing an investment)
The inputs or methodology used for valuing securities are not necessarily an indication of the risk associated with investing in those securities.
Examples of the types of securities in which the Fund would typically invest and how they are classified within this hierarchy are as follows. Typical Level 1 securities include exchange traded domestic equities, mutual funds whose NAVs are published each day and exchange traded foreign equities that are not statistically fair valued. Typical Level 2 securities include exchange traded foreign equities that are statistically fair valued, forward foreign currency exchange contracts and short-term investments valued at amortized cost. Additionally, securities fair valued by the Valuation Committee (the Committee) of the Fund's Board of Trustees (the Board) that rely on significant observable inputs are also included in Level 2. Typical Level 3 securities include any security fair valued by the Committee that relies on significant unobservable inputs.
Under the direction of the Board, the Committee is responsible for carrying out the valuation procedures approved by the Board.
The Committee meets as necessary, and no less frequently than quarterly, to determine fair values for securities for which market quotations are not readily available or for which the investment manager believes that available market quotations are unreliable, to review the appropriateness of the Trust's Portfolio Pricing Policy and the pricing procedures of the investment manager (the Policies), and to review the continuing appropriateness of the current value of any security subject to the Policies. The Policies address, among other things: circumstances under which market quotations will be deemed readily available; selection of third party pricing vendors; appropriate pricing methodologies; events that require fair valuation and fair value techniques; and circumstances under which securities will be deemed to pose a potential for stale pricing, including when securities are illiquid, restricted, or in default. The Committee may also meet to discuss additional valuation matters, which may include review of back-testing results, review of time-sensitive information or approval of other valuation related actions, and to review the appropriateness of the Policies.
For investments categorized as Level 3, the significant unobservable inputs used in the fair value measurement of the Funds' securities may include: (i) data specific to the issuer or comparable issuers, (ii) general market or specific sector news and (iii) quoted prices and specific or similar security transactions. The Committee considers this data and any changes from prior periods in order to assess the reasonableness of observable and unobservable inputs, any assumptions or internal models used to value those securities and changes in fair value. Significant changes in any of these factors could result in lower or higher fair value measurements. Various factors impact the frequency of monitoring (which may occur as often as daily), however the Committee may determine that changes to inputs, assumptions and models are not required with the same frequency.
The following table summarizes the inputs used, as of December 31, 2012, in valuing the Fund's assets:
Investment Type | Quoted Prices (Level 1) | Other Significant Observable Inputs (Level 2) | Significant Unobservable Inputs (Level 3) | Total | |||||||||||||||
Equities | |||||||||||||||||||
Europe | $ | 67,815 | $ | 2,822,799 | $ | - | $ | 2,890,614 | |||||||||||
Asia | - | 138,787 | - | 138,787 | |||||||||||||||
Other Countries | 42,934 | - | - | 42,934 | |||||||||||||||
Total Equities | 110,749 | 2,961,586 | - | 3,072,335 | |||||||||||||||
Total Short-Term Investments | 269,451 | - | - | 269,451 | |||||||||||||||
Total Investments | $ | 380,200 | $ | 2,961,586 | $ | - | $ | 3,341,786 | |||||||||||
See accompanying notes to financial statements.
87
Columbia Acorn European Fund
Statement of Investments, continued
> Notes to Statement of Investments
The Fund's assets assigned to the Level 2 input category are generally valued using a market approach, in which a security's value is determined through its correlation to prices and information from observable market transactions for similar or identical assets. Foreign equities are generally valued at the last sale price on the foreign exchange or market on which they trade. The Fund may use a statistical fair valuation model, in accordance with the policy adopted by the Board, provided by an independent third party to value securities principally traded in foreign markets in order to adjust for possible stale pricing that may occur between the close of the foreign exchanges and the time for valuation. These models take into account available market data including intraday index, ADR, and ETF movements.
There were no transfers of financial assets between levels 1 and 2 during the period.
See accompanying notes to financial statements.
88
Columbia Acorn European Fund
Portfolio Diversification
At December 31, 2012, the Fund's portfolio investments as a percentage of net assets were diversified as follows:
Value | Percentage of Net Assets | ||||||||||
| > Industrial Goods & Services | |||||||||||
Other Industrial Services | $ | 349,542 | 10.7 | ||||||||
Machinery | 293,017 | 8.9 | |||||||||
Conglomerates | 121,307 | 3.7 | |||||||||
Electrical Components | 96,106 | 2.9 | |||||||||
Construction | 91,774 | 2.8 | |||||||||
| Industrial Materials & Specialty Chemicals | 77,950 | 2.4 | |||||||||
Outsourcing Services | 42,168 | 1.3 | |||||||||
Industrial Distribution | 32,055 | 1.0 | |||||||||
1,103,919 | 33.7 | ||||||||||
| > Consumer Goods & Services | |||||||||||
Retail | 187,602 | 5.7 | |||||||||
Nondurables | 95,688 | 2.9 | |||||||||
Restaurants | 69,388 | 2.1 | |||||||||
Apparel | 69,080 | 2.1 | |||||||||
Other Durable Goods | 63,353 | 1.9 | |||||||||
Consumer Goods Distribution | 44,108 | 1.4 | |||||||||
Casinos & Gaming | 38,770 | 1.2 | |||||||||
Food & Beverage | 37,299 | 1.1 | |||||||||
Other Entertainment | 31,079 | 1.0 | |||||||||
636,367 | 19.4 | ||||||||||
| > Information | |||||||||||
Business Software | 145,926 | 4.4 | |||||||||
| Computer Hardware & Related Equipment | 130,041 | 4.0 | |||||||||
| Business Information & Marketing Services | 89,077 | 2.7 | |||||||||
Internet Related | 80,696 | 2.5 | |||||||||
Financial Processors | 71,742 | 2.2 | |||||||||
Computer Services | 64,664 | 2.0 | |||||||||
Advertising | 33,045 | 1.0 | |||||||||
615,191 | 18.8 | ||||||||||
| > Finance | |||||||||||
Insurance | 147,868 | 4.5 | |||||||||
Brokerage & Money Management | 118,212 | 3.6 | |||||||||
Banks | 29,596 | 0.9 | |||||||||
295,676 | 9.0 | ||||||||||
| > Energy & Minerals | |||||||||||
Mining | 109,939 | 3.3 | |||||||||
Agricultural Commodities | 42,934 | 1.3 | |||||||||
Oil Refining, Marketing & Distribution | 28,416 | 0.9 | |||||||||
Oil & Gas Producers | 16,440 | 0.5 | |||||||||
197,729 | 6.0 | ||||||||||
Value | Percentage of Net Assets | ||||||||||
| > Other Industries | |||||||||||
Real Estate | $ | 62,683 | 1.9 | ||||||||
Transportation | 42,896 | 1.3 | |||||||||
Regulated Utilities | 36,564 | 1.1 | |||||||||
142,143 | 4.3 | ||||||||||
| > Health Care | |||||||||||
Medical Equipment & Devices | 48,141 | 1.5 | |||||||||
Medical Supplies | 33,169 | 1.0 | |||||||||
81,310 | 2.5 | ||||||||||
Total Equities: | 3,072,335 | 93.7 | |||||||||
Short-Term Investments: | 269,451 | 8.2 | |||||||||
Total Investments: | 3,341,786 | 101.9 | |||||||||
| Cash and Other Assets Less Liabilities: | (63,751 | ) | (1.9 | ) | |||||||
Net Assets: | $ | 3,278,035 | 100.0 | ||||||||
See accompanying notes to financial statements.
89
Columbia Acorn Family of Funds
Statements of Assets and Liabilities
December 31, 2012 | Columbia Acorn Fund | Columbia Acorn International | Columbia Acorn USA | Columbia Acorn International Select | |||||||||||||||
Assets: | |||||||||||||||||||
Unaffiliated investments, at cost | $ | 8,791,073,761 | $ | 5,151,321,929 | $ | 1,091,639,658 | $ | 327,642,034 | |||||||||||
Affiliated investments, at cost (See Note 4) | 2,466,414,630 | 112,040,756 | 3,624,095 | — | |||||||||||||||
| Unaffiliated investments, at value (including securities on loan: Columbia Acorn Fund $368,048,192; Columbia Acorn International $125,494,564; Columbia Acorn USA $50,627,612; Columbia Acorn International Select $6,077,787; Columbia Acorn Select $10,135,994; Columbia Thermostat Fund $—; Columbia Acorn Emerging Markets Fund $84,708; Columbia Acorn European Fund $—) | $ | 13,932,301,078 | $ | 6,677,312,055 | $ | 1,643,764,447 | $ | 385,941,325 | |||||||||||
Affiliated investments, at value (See Note 4) | 3,952,846,905 | 183,261,261 | 3,232,000 | — | |||||||||||||||
Cash | — | — | — | — | |||||||||||||||
| Foreign currency (cost: Columbia Acorn Fund $—; Columbia Acorn International $6,525,747; Columbia Acorn USA $—; Columbia Acorn International Select $61; Columbia Acorn Select $—; Columbia Thermostat Fund $—; Columbia Acorn Emerging Markets Fund $1,168; Columbia Acorn European Fund $—) | — | 6,750,603 | — | 62 | |||||||||||||||
Receivable for: | |||||||||||||||||||
Investments sold | 16,286,994 | 7,267,659 | 3,338,740 | — | |||||||||||||||
Fund shares sold | 68,211,999 | 13,794,588 | 6,833,315 | 2,634,979 | |||||||||||||||
Dividends and interest | 7,537,489 | 5,054,931 | 613,603 | 280,461 | |||||||||||||||
Securities lending income | 1,529,160 | 215,947 | 169,559 | 7,005 | |||||||||||||||
Foreign tax reclaims | 234,119 | 4,031,568 | — | 214,919 | |||||||||||||||
Expense reimbursement due from Adviser | — | 3,472 | — | — | |||||||||||||||
Trustees' deferred compensation investments | 2,668,496 | 774,532 | 228,226 | — | |||||||||||||||
Other assets | 279,704 | 70,654 | 18,384 | 3,883 | |||||||||||||||
Total Assets | 17,981,895,944 | 6,898,537,270 | 1,658,198,274 | 389,082,634 | |||||||||||||||
Liabilities: | |||||||||||||||||||
Payable to custodian bank | 218,390 | — | 11,582 | — | |||||||||||||||
Collateral on securities loaned | 371,676,935 | 131,072,367 | 51,263,955 | 6,389,590 | |||||||||||||||
Unrealized depreciation on forward foreign currency exchange contracts | — | — | — | 411,753 | |||||||||||||||
Payable for: | |||||||||||||||||||
Investments purchased | 20,285,925 | 10,036,277 | 4,251,671 | 588,894 | |||||||||||||||
Fund shares redeemed | 58,768,193 | 10,080,883 | 1,713,554 | 1,036,400 | |||||||||||||||
Management fee | 907,328 | 415,756 | 110,751 | 28,942 | |||||||||||||||
Administration fee | 54,690 | 21,182 | 4,964 | 1,190 | |||||||||||||||
12b-1 Service and Distribution fees | 128,684 | 29,239 | 5,657 | 2,376 | |||||||||||||||
Reports to shareholders | 898,725 | 444,010 | 161,450 | 37,735 | |||||||||||||||
Deferred Trustees' fees | 2,668,496 | 774,532 | 228,226 | — | |||||||||||||||
Transfer agent fees | 1,996,074 | 506,158 | 255,326 | 28,746 | |||||||||||||||
Trustees' fees | 16,852 | 19,641 | 1,579 | 35,622 | |||||||||||||||
Custody fees | 930 | 279,308 | 2,155 | 16,290 | |||||||||||||||
Professional fee | 292,774 | 128,924 | 50,264 | 32,041 | |||||||||||||||
Chief compliance officer expenses | 19,744 | 5,464 | 1,980 | 253 | |||||||||||||||
Deferred foreign capital gains tax payable | — | 779,466 | — | — | |||||||||||||||
Other liabilities | 96,293 | 146,457 | 40,487 | 18,748 | |||||||||||||||
Total Liabilities | 458,030,033 | 154,739,664 | 58,103,601 | 8,628,580 | |||||||||||||||
Net Assets | $ | 17,523,865,911 | $ | 6,743,797,606 | $ | 1,600,094,673 | $ | 380,454,054 | |||||||||||
Composition of Net Assets: | |||||||||||||||||||
Paid-in capital | $ | 10,730,224,359 | $ | 5,408,888,462 | $ | 1,050,613,572 | $ | 338,142,976 | |||||||||||
Undistributed (Overdistributed) net investment income | (27,792,423 | ) | (74,303,358 | ) | (4,074,947 | ) | (22,556,622 | ) | |||||||||||
Accumulated net realized gain (loss) | 193,768,390 | (187,066,939 | ) | 1,823,354 | 6,989,036 | ||||||||||||||
Net unrealized appreciation (depreciation) on: | |||||||||||||||||||
Unaffiliated investments | 5,141,227,317 | 1,525,990,126 | 552,124,789 | 58,299,291 | |||||||||||||||
Affiliated investments (See Note 4) | 1,486,432,275 | 71,220,505 | (392,095 | ) | — | ||||||||||||||
Foreign currency translations | 5,993 | (151,724 | ) | — | (8,874 | ) | |||||||||||||
Forward foreign currency exchange contracts | — | — | — | (411,753 | ) | ||||||||||||||
Foreign capital gains tax | — | (779,466 | ) | — | — | ||||||||||||||
Net Assets | $ | 17,523,865,911 | $ | 6,743,797,606 | $ | 1,600,094,673 | $ | 380,454,054 | |||||||||||
Net asset value per share – Class A (a) | $ | 29.36 | $ | 40.79 | $ | 28.21 | $ | 25.61 | |||||||||||
| (Net assets/shares) | ($ | 3,233,494,173/ 110,115,360) | ($ | 1,007,236,229/ 24,691,595) | ($ | 152,163,790/ 5,394,458) | ($ | 74,166,705/ 2,895,670) | |||||||||||
Maximum offering price per share – Class A (b) | $ | 31.15 | $ | 43.28 | $ | 29.93 | $ | 27.17 | |||||||||||
(Net asset value per share/front-end sales charge) | ($29.36/0.9425) | ($40.79/0.9425) | ($28.21/0.9425) | ($25.61/0.9425) | |||||||||||||||
Net asset value and offering price per share – Class B (a) | $ | 26.80 | $ | 39.67 | $ | 25.81 | $ | 24.40 | |||||||||||
(Net assets/shares) | ($ | 33,623,177/ 1,254,671) | ($ | 17,909,992/ 451,423) | ($ | 1,055,794/ 40,908) | ($ | 1,250,387/ 51,243) | |||||||||||
Net asset value and offering price per share – Class C (a) | $ | 26.34 | $ | 39.50 | $ | 25.49 | $ | 24.28 | |||||||||||
(Net assets/shares) | ($ | 756,709,209/ 28,728,670) | ($ | 92,747,897/ 2,347,814) | ($ | 31,410,280/ 1,232,210) | ($ | 9,785,692/ 403,025) | |||||||||||
Net asset value and offering price per share – Class I (c) | $ | 30.47 | $ | 40.86 | $ | 29.47 | (d) | $ | 25.85 | (d) | |||||||||
(Net assets/shares) | ($ | 58,652,328/ 1,924,717) | ($ | 97,483,849/ 2,385,999) | ($3,039/103) | ($2,475/96) | |||||||||||||
Net asset value and offering price per share – Class R (c) | $ | — | $ | 40.79 | $ | — | $ | — | |||||||||||
(Net assets/shares) | ($ | —/— | ) | ($2,799,425/68,635) | ($ | —/— | ) | ($ | —/— | ) | |||||||||
Net asset value and offering price per share – Class R4 (c) | $ | 30.90 | (e) | $ | 41.08 | (d)(e) | $ | 29.92 | (e) | $ | 25.99 | (d)(e) | |||||||
(Net assets/shares) | ($17,087/553) | ($15,459/376) | ($14,930/499) | ($13,006/500) | |||||||||||||||
Net asset value and offering price per share – Class R5 (c) | $ | 30.88 | (d)(e) | $ | 40.81 | $ | 29.90 | (d)(e) | $ | 25.98 | (d)(e) | ||||||||
(Net assets/shares) | ($2,524/82) | ($242,486/5,942) | ($2,487/83) | ($2,167/83) | |||||||||||||||
Net asset value and offering price per share – Class Y (c) | $ | 30.90 | (e) | $ | 41.08 | (e) | $ | 29.93 | (d)(e) | $ | 25.98 | (d)(e) | |||||||
(Net assets/shares) | ($ | 67,012,003/ 2,168,603) | ($ | 30,856,334/ 751,123) | ($2,486/83) | ($2,166/83) | |||||||||||||
Net asset value and offering price per share – Class Z (c) | $ | 30.45 | $ | 40.84 | $ | 29.45 | $ | 25.86 | |||||||||||
(Net assets/shares) | ($ | 13,374,355,410/ 439,157,444) | ($ | 5,494,505,935/ 134,552,036) | ($ | 1,415,441,867/ 48,061,766) | ($ | 295,231,456/ 11,417,033) | |||||||||||
(a) Redemption price per share is equal to net asset value less any applicable contingent deferred sales charge.
(b) On sales of $50,000 or more the offering price is reduced.
(c) Redemption price per share is equal to net asset value.
(d) Net asset value per share rounds to this amount due to fractional shares outstanding.
(e) Shares commenced operations on November 8, 2012.
See accompanying notes to financial statements.
90
December 31, 2012 | Columbia Acorn Select | Columbia Thermostat Fund | Columbia Acorn Emerging Markets Fund | Columbia Acorn European Fund | |||||||||||||||
Assets: | |||||||||||||||||||
Unaffiliated investments, at cost | $ | 594,846,407 | $ | — | $ | 9,890,621 | $ | 2,949,061 | |||||||||||
Affiliated investments, at cost (See Note 4) | 77,398,151 | 824,225,379 | — | — | |||||||||||||||
| Unaffiliated investments, at value (including securities on loan: Columbia Acorn Fund $368,048,192; Columbia Acorn International $125,494,564; Columbia Acorn USA $50,627,612; Columbia Acorn International Select $6,077,787; Columbia Acorn Select $10,135,994; Columbia Thermostat Fund $—; Columbia Acorn Emerging Markets Fund $84,708; Columbia Acorn European Fund $—) | $ | 896,645,938 | $ | — | $ | 11,345,727 | $ | 3,341,786 | |||||||||||
Affiliated investments, at value (See Note 4) | 48,024,166 | 868,281,222 | — | — | |||||||||||||||
Cash | 68,495 | — | — | — | |||||||||||||||
| Foreign currency (cost: Columbia Acorn Fund $—; Columbia Acorn International $6,525,747; Columbia Acorn USA $—; Columbia Acorn International Select $61; Columbia Acorn Select $—; Columbia Thermostat Fund $—; Columbia Acorn Emerging Markets Fund $1,168; Columbia Acorn European Fund $—) | — | — | 1,168 | — | |||||||||||||||
Receivable for: | |||||||||||||||||||
Investments sold | 46,942,769 | — | — | 1,690 | |||||||||||||||
Fund shares sold | 1,001,128 | 8,844,857 | 113,273 | 10,066 | |||||||||||||||
Dividends and interest | 687,570 | 1,134,771 | 1,128 | 370 | |||||||||||||||
Securities lending income | 35,665 | — | 49 | 1 | |||||||||||||||
Foreign tax reclaims | 10,340 | — | 1,842 | 2,410 | |||||||||||||||
Expense reimbursement due from Adviser | — | 7,003 | 3,306 | 2,953 | |||||||||||||||
Trustees' deferred compensation investments | 270,217 | — | — | — | |||||||||||||||
Other assets | 12,031 | 5,478 | 70 | 26 | |||||||||||||||
Total Assets | 993,698,319 | 878,273,331 | 11,466,563 | 3,359,302 | |||||||||||||||
Liabilities: | |||||||||||||||||||
Payable to custodian bank | — | — | — | — | |||||||||||||||
Collateral on securities loaned | 11,106,378 | — | 86,100 | — | |||||||||||||||
Unrealized depreciation on forward foreign currency exchange contracts | — | — | — | — | |||||||||||||||
Payable for: | |||||||||||||||||||
Investments purchased | 1,776,748 | 2,587,560 | 703,201 | 790 | |||||||||||||||
Fund shares redeemed | 14,494,223 | 862,727 | 14,518 | 23,910 | |||||||||||||||
Management fee | 66,113 | 7,087 | 1,058 | 318 | |||||||||||||||
Administration fee | 3,056 | 2,740 | 33 | 10 | |||||||||||||||
12b-1 Service and Distribution fees | 10,743 | 27,362 | 107 | 18 | |||||||||||||||
Reports to shareholders | 146,424 | 34,613 | 10,890 | 10,900 | |||||||||||||||
Deferred Trustees' fees | 270,217 | — | — | — | |||||||||||||||
Transfer agent fees | 121,709 | 48,342 | 459 | 66 | |||||||||||||||
Trustees' fees | 1,078 | 20,647 | 468 | 334 | |||||||||||||||
Custody fees | 1,813 | 834 | 7,253 | 5,090 | |||||||||||||||
Professional fee | 42,013 | 20,398 | 25,195 | 25,137 | |||||||||||||||
Chief compliance officer expenses | 1,432 | 1,233 | 3 | 1 | |||||||||||||||
Deferred foreign capital gains tax payable | — | — | 12,859 | — | |||||||||||||||
Other liabilities | 29,458 | 37,091 | 14,608 | 14,693 | |||||||||||||||
Total Liabilities | 28,071,405 | 3,650,634 | 876,752 | 81,267 | |||||||||||||||
Net Assets | $ | 965,626,914 | $ | 874,622,697 | $ | 10,589,811 | $ | 3,278,035 | |||||||||||
Composition of Net Assets: | |||||||||||||||||||
Paid-in capital | $ | 658,289,312 | $ | 843,632,414 | $ | 9,279,708 | $ | 2,895,563 | |||||||||||
Undistributed (Overdistributed) net investment income | 2,866,367 | 650,727 | (17,167 | ) | (8,259 | ) | |||||||||||||
Accumulated net realized gain (loss) | 32,045,843 | (13,716,287 | ) | (114,816 | ) | (2,063 | ) | ||||||||||||
Net unrealized appreciation (depreciation) on: | |||||||||||||||||||
Unaffiliated investments | 301,799,531 | — | 1,455,106 | 392,725 | |||||||||||||||
Affiliated investments (See Note 4) | (29,373,985 | ) | 44,055,843 | — | — | ||||||||||||||
Foreign currency translations | (154 | ) | — | (161 | ) | 69 | |||||||||||||
Forward foreign currency exchange contracts | — | — | — | — | |||||||||||||||
Foreign capital gains tax | — | — | (12,859 | ) | — | ||||||||||||||
Net Assets | $ | 965,626,914 | $ | 874,622,697 | $ | 10,589,811 | $ | 3,278,035 | |||||||||||
Net asset value per share – Class A (a) | $ | 24.72 | $ | 14.29 | $ | 12.04 | $ | 11.76 | |||||||||||
| (Net assets/shares) | ($ | 271,628,345/ 10,989,670) | ($ | 323,749,858/ 22,652,039) | ($ | 3,103,467/ 257,660) | ($ | 453,307/ 38,560) | |||||||||||
Maximum offering price per share – Class A (b) | $ | 26.23 | $ | 15.16 | $ | 12.77 | $ | 12.48 | |||||||||||
(Net asset value per share/front-end sales charge) | ($24.72/0.9425) | ($14.29/0.9425) | ($12.04/0.9425) | ($11.76/0.9425) | |||||||||||||||
Net asset value and offering price per share – Class B (a) | $ | 22.75 | $ | 14.39 | $ | — | $ | — | |||||||||||
(Net assets/shares) | ($ | 9,937,628/ 436,746) | ($ | 4,479,695/ 311,294) | ($ | —/— | ) | ($ | —/— | ) | |||||||||
Net asset value and offering price per share – Class C (a) | $ | 22.48 | $ | 14.39 | $ | 12.01 | $ | 11.73 | |||||||||||
(Net assets/shares) | ($ | 57,308,635/ 2,548,954) | ($ | 253,640,911/ 17,628,876) | ($ | 615,451/ 51,234) | ($ | 88,963/ 7,582) | |||||||||||
Net asset value and offering price per share – Class I (c) | $ | 25.63 | $ | — | $ | 12.08 | $ | 11.75 | (d) | ||||||||||
(Net assets/shares) | ($ | 39,053,882/ 1,523,839) | ($ | —/— | ) | ($6,101/505) | ($5,985/509) | ||||||||||||
Net asset value and offering price per share – Class R (c) | $ | — | $ | — | $ | — | $ | — | |||||||||||
(Net assets/shares) | ($ | —/— | ) | ($ | —/— | ) | ($ | —/— | ) | ($ | —/— | ) | |||||||
Net asset value and offering price per share – Class R4 (c) | $ | 25.92 | (e) | $ | 14.19 | (e) | $ | 12.14 | (d)(e) | $ | — | ||||||||
(Net assets/shares) | ($15,008/579) | ($15,114/1,065) | ($15,924/1,311) | ($ | —/— | ) | |||||||||||||
Net asset value and offering price per share – Class R5 (c) | $ | 25.93 | (d)(e) | $ | 14.19 | (d)(e) | $ | 12.14 | (d)(e) | $ | 11.86 | (d)(e) | |||||||
(Net assets/shares) | ($2,501/96) | ($2,520/178) | ($2,653/219) | ($2,650/223) | |||||||||||||||
Net asset value and offering price per share – Class Y (c) | $ | 25.98 | (d)(e) | $ | 14.18 | (d)(e) | $ | — | $ | — | |||||||||
(Net assets/shares) | ($2,502/96) | ($2,518/178) | ($ | —/— | ) | ($ | —/— | ) | |||||||||||
Net asset value and offering price per share – Class Z (c) | $ | 25.57 | $ | 14.13 | $ | 12.07 | $ | 11.76 | |||||||||||
(Net assets/shares) | ($ | 587,678,413/ 22,983,300) | ($ | 292,732,081/ 20,721,743) | ($ | 6,846,215/ 567,354) | ($ | 2,727,130/ 231,922) | |||||||||||
See accompanying notes to financial statements.
91
Columbia Acorn Family of Funds
Statements of Operations For the Year Ended December 31, 2012
| Columbia Acorn Fund | Columbia Acorn International | Columbia Acorn USA | Columbia Acorn International Select | ||||||||||||||||
Investment Income: | |||||||||||||||||||
Dividend income | $ | 159,371,982 | $ | 163,085,641 | $ | 20,822,554 | $ | 11,895,529 | |||||||||||
Dividend income from affiliates (See Note 4) | 64,771,821 | 3,449,258 | 640,000 | — | |||||||||||||||
Dividends from affiliated investment company shares (See Note 4) | — | — | — | — | |||||||||||||||
Interest income | 80 | 39,718 | — | 3,706 | |||||||||||||||
Securities lending income, net | 13,829,543 | 1,953,896 | 1,754,009 | 38,971 | |||||||||||||||
237,973,426 | 168,528,513 | 23,216,563 | 11,938,206 | ||||||||||||||||
Foreign taxes withheld | (2,724,315 | ) | (15,916,807 | ) | (13,608 | ) | (1,238,581 | ) | |||||||||||
Total Investment Income | 235,249,111 | 152,611,706 | 23,202,955 | 10,699,625 | |||||||||||||||
Expenses: | |||||||||||||||||||
Management fee | 112,165,480 | 47,191,198 | 14,027,089 | 3,407,749 | |||||||||||||||
Administration fee | 6,786,725 | 2,408,151 | 631,621 | 140,638 | |||||||||||||||
12b-1 Service and Distribution fees: | |||||||||||||||||||
Class A | 8,411,136 | 2,428,249 | 404,377 | 156,318 | |||||||||||||||
Class B | 369,947 | 159,618 | 12,846 | 11,380 | |||||||||||||||
Class C | 7,641,208 | 964,952 | 320,406 | 91,391 | |||||||||||||||
Class R | — | 6,596 | — | — | |||||||||||||||
Transfer agent fees: | |||||||||||||||||||
Class A | 3,092,580 | 1,518,464 | 161,367 | 72,453 | |||||||||||||||
Class B | 86,533 | 80,272 | 4,728 | 3,578 | |||||||||||||||
Class C | 628,306 | 138,828 | 25,903 | 13,840 | |||||||||||||||
Class R | — | 1,940 | — | — | |||||||||||||||
Class R4 | 3 | 3 | 3 | 3 | |||||||||||||||
Class R5 | — | 353 | — | — | |||||||||||||||
Class Z | 7,557,416 | 2,732,248 | 1,510,571 | 199,463 | |||||||||||||||
Trustees' fees | 970,891 | 336,803 | 92,597 | 27,839 | |||||||||||||||
Custody fees | 762,741 | 1,675,551 | 20,961 | 115,015 | |||||||||||||||
Registration and blue sky fees | 252,212 | 214,331 | 150,912 | 146,958 | |||||||||||||||
Reports to shareholders | 2,480,740 | 1,393,048 | 522,940 | 142,414 | |||||||||||||||
Audit fees | 98,941 | 154,323 | 45,526 | 46,202 | |||||||||||||||
Legal fees | 1,636,932 | 576,736 | 155,016 | 33,150 | |||||||||||||||
Interest expense (See Note 5) | — | — | 742 | 247 | |||||||||||||||
Chief compliance officer expenses (See Note 4) | 479,405 | 168,581 | 44,835 | 8,809 | |||||||||||||||
Organizational expenses (See Note 4) | — | — | — | — | |||||||||||||||
Other expenses | 779,409 | 448,035 | 80,017 | 20,227 | |||||||||||||||
Total Expenses | 154,200,605 | 62,598,280 | 18,212,457 | 4,637,674 | |||||||||||||||
Less custody earnings credit | (762,741 | ) | (323,112 | ) | (10,325 | ) | (27,768 | ) | |||||||||||
Less reimbursement of expenses by Investment Manager (See Note 4) | — | (414,204 | ) | — | — | ||||||||||||||
Net Expenses | 153,437,864 | 61,860,964 | 18,202,132 | 4,609,906 | |||||||||||||||
Net Investment Income | 81,811,247 | 90,750,742 | 5,000,823 | 6,089,719 | |||||||||||||||
Net Realized and Unrealized Gain (Loss) on Portfolio Positions: | |||||||||||||||||||
Net realized gain (loss) on: | |||||||||||||||||||
Unaffiliated investments | 1,113,526,734 | 141,080,163 | 120,638,007 | 37,862,228 | |||||||||||||||
Affiliated investments (See Note 4) | 4,469,667 | (103,501 | ) | — | — | ||||||||||||||
Foreign currency transactions | (251,943 | ) | (2,522,072 | ) | — | (133,506 | ) | ||||||||||||
Forward foreign currency exchange contracts | — | 5,422,582 | — | (324,460 | ) | ||||||||||||||
Distributions from affiliated investment company shares | — | — | — | — | |||||||||||||||
Net realized gain (loss) | 1,117,744,458 | 143,877,172 | 120,638,007 | 37,404,262 | |||||||||||||||
Net change in net unrealized appreciation (depreciation) on: | |||||||||||||||||||
Unaffiliated investments | 1,224,609,167 | 923,634,193 | 149,564,276 | 26,469,865 | |||||||||||||||
Affiliated investments (See Note 4) | 408,220,687 | 31,907,664 | (83,200 | ) | — | ||||||||||||||
Foreign currency translations | 18,321 | (71,882 | ) | — | 3,771 | ||||||||||||||
Forward foreign currency exchange contracts | — | (4,539,004 | ) | — | 536,271 | ||||||||||||||
Foreign capital gains tax | — | 1,541,277 | — | — | |||||||||||||||
Net change in unrealized appreciation (depreciation) | 1,632,848,175 | 952,472,248 | 149,481,076 | 27,009,907 | |||||||||||||||
Net realized and unrealized gain | 2,750,592,633 | 1,096,349,420 | 270,119,083 | 64,414,169 | |||||||||||||||
Net Increase in Net Assets from Operations | $ | 2,832,403,880 | $ | 1,187,100,162 | $ | 275,119,906 | $ | 70,503,888 | |||||||||||
See accompanying notes to financial statements.
92
| Columbia Acorn Select | Columbia Thermostat Fund | Columbia Acorn Emerging Markets Fund | Columbia Acorn European Fund | ||||||||||||||||
Investment Income: | |||||||||||||||||||
Dividend income | $ | 15,090,039 | $ | — | $ | 172,638 | $ | 52,254 | |||||||||||
Dividend income from affiliates (See Note 4) | — | — | — | — | |||||||||||||||
Dividends from affiliated investment company shares (See Note 4) | — | 13,324,451 | — | — | |||||||||||||||
Interest income | — | — | 3 | 11 | |||||||||||||||
Securities lending income, net | 2,022,571 | — | 340 | 167 | |||||||||||||||
17,112,610 | 13,324,451 | 172,981 | 52,432 | ||||||||||||||||
Foreign taxes withheld | (80,355 | ) | — | (15,229 | ) | (6,061 | ) | ||||||||||||
Total Investment Income | 17,032,255 | 13,324,451 | 157,752 | 46,371 | |||||||||||||||
Expenses: | |||||||||||||||||||
Management fee | 9,810,516 | 482,102 | 78,222 | 26,888 | |||||||||||||||
Administration fee | 458,713 | 186,962 | 2,427 | 876 | |||||||||||||||
12b-1 Service and Distribution fees: | |||||||||||||||||||
Class A | 796,812 | 455,829 | 3,350 | 572 | |||||||||||||||
Class B | 130,133 | 50,533 | — | — | |||||||||||||||
Class C | 630,190 | 1,232,329 | 2,606 | 369 | |||||||||||||||
Class R | — | — | — | — | |||||||||||||||
Transfer agent fees: | |||||||||||||||||||
Class A | 342,668 | 154,868 | 1,534 | 124 | |||||||||||||||
Class B | 35,367 | 11,640 | — | — | |||||||||||||||
Class C | 69,251 | 101,936 | 381 | 2 | |||||||||||||||
Class R | — | — | — | — | |||||||||||||||
Class R4 | 3 | 3 | 3 | — | |||||||||||||||
Class R5 | — | — | — | — | |||||||||||||||
Class Z | 573,742 | 104,168 | 2,190 | 446 | |||||||||||||||
Trustees' fees | 71,690 | 23,389 | 558 | 331 | |||||||||||||||
Custody fees | 36,722 | 9,384 | 46,534 | 17,572 | |||||||||||||||
Registration and blue sky fees | 139,093 | 195,995 | 119,534 | 106,557 | |||||||||||||||
Reports to shareholders | 390,663 | 170,911 | 38,338 | 37,432 | |||||||||||||||
Audit fees | 45,366 | 24,255 | 62,868 | 53,960 | |||||||||||||||
Legal fees | 109,566 | 37,009 | 489 | 164 | |||||||||||||||
Interest expense (See Note 5) | 1,408 | — | — | — | |||||||||||||||
Chief compliance officer expenses (See Note 4) | 29,484 | 13,837 | 159 | 41 | |||||||||||||||
Organizational expenses (See Note 4) | — | — | 26,291 | 24,026 | |||||||||||||||
Other expenses | 194,700 | 15,093 | 5,461 | 4,284 | |||||||||||||||
Total Expenses | 13,866,087 | 3,270,243 | 390,945 | 273,644 | |||||||||||||||
Less custody earnings credit | (33,584 | ) | (4,387 | ) | (398 | ) | (207 | ) | |||||||||||
Less reimbursement of expenses by Investment Manager (See Note 4) | — | (321,910 | ) | (292,249 | ) | (242,324 | ) | ||||||||||||
Net Expenses | 13,832,503 | 2,943,946 | 98,298 | 31,113 | |||||||||||||||
Net Investment Income | 3,199,752 | 10,380,505 | 59,454 | 15,258 | |||||||||||||||
Net Realized and Unrealized Gain (Loss) on Portfolio Positions: | |||||||||||||||||||
Net realized gain (loss) on: | |||||||||||||||||||
Unaffiliated investments | 146,050,604 | — | (60,595 | ) | 9,793 | ||||||||||||||
Affiliated investments (See Note 4) | (32,861,769 | ) | (680,088 | ) | — | — | |||||||||||||
Foreign currency transactions | (9,264 | ) | — | (678 | ) | (1,082 | ) | ||||||||||||
Forward foreign currency exchange contracts | — | — | — | — | |||||||||||||||
Distributions from affiliated investment company shares | — | 10,645,025 | — | — | |||||||||||||||
Net realized gain (loss) | 113,179,571 | 9,964,937 | (61,273 | ) | 8,711 | ||||||||||||||
Net change in net unrealized appreciation (depreciation) on: | |||||||||||||||||||
Unaffiliated investments | 9,007,034 | — | 1,589,015 | 478,541 | |||||||||||||||
Affiliated investments (See Note 4) | 76,071,172 | 30,128,824 | — | — | |||||||||||||||
Foreign currency translations | (154 | ) | — | (160 | ) | 107 | |||||||||||||
Forward foreign currency exchange contracts | — | — | — | — | |||||||||||||||
Foreign capital gains tax | — | — | (11,580 | ) | — | ||||||||||||||
Net change in unrealized appreciation (depreciation) | 85,078,052 | 30,128,824 | 1,577,275 | 478,648 | |||||||||||||||
Net realized and unrealized gain | 198,257,623 | 40,093,761 | 1,516,002 | 487,359 | |||||||||||||||
Net Increase in Net Assets from Operations | $ | 201,457,375 | $ | 50,474,266 | $ | 1,575,456 | $ | 502,617 | |||||||||||
See accompanying notes to financial statements.
93
Columbia Acorn Family of Funds
Statements of Changes in Net Assets
| Columbia Acorn Fund | Columbia Acorn International | Columbia Acorn USA | Columbia Acorn International Select | ||||||||||||||||||||||||||||||||
Increase (Decrease) in Net Assets | Year ended December 31, | Year ended December 31, | Year ended December 31, | Year ended December 31, | |||||||||||||||||||||||||||||||
2012 (a)(b)(c) | 2011 | 2012 (a)(c) | 2011 (d) | 2012 (a)(b)(c) | 2011 | 2012 (a)(b)(c) | 2011 | ||||||||||||||||||||||||||||
Operations: | |||||||||||||||||||||||||||||||||||
Net investment income (loss) | $ | 81,811,247 | $ | (26,857,762 | ) | $ | 90,750,742 | $ | 70,395,348 | $ | 5,000,823 | $ | (9,383,201 | ) | $ | 6,089,719 | $ | 3,857,076 | |||||||||||||||||
| Net realized gain (loss) on investments, foreign currency transactions, forward foreign currency exchange contracts and foreign capital gains tax | 1,113,274,791 | 756,713,680 | 143,980,673 | 226,123,538 | 120,638,007 | 41,208,252 | 37,404,262 | 45,952,002 | |||||||||||||||||||||||||||
| Net realized gain (loss) on affiliated investments and distributions from affiliated investment companies and affiliated investment company shares | 4,469,667 | (10,816,845 | ) | (103,501 | ) | (3,603,000 | ) | — | (511,503 | ) | — | — | |||||||||||||||||||||||
Reimbursement from affiliate (See Note 4) | — | — | — | 174,055 | — | — | — | — | |||||||||||||||||||||||||||
| Net change in net unrealized appreciation (depreciation) on investments, foreign currency translations, forward foreign currency exchange contracts and foreign capital gains tax | 1,224,627,488 | (1,530,795,009 | ) | 920,564,584 | (1,230,964,786 | ) | 149,564,276 | (112,789,973 | ) | 27,009,907 | (89,001,498 | ) | |||||||||||||||||||||||
| Net change in net unrealized appreciation (depreciation) on affiliated investment companies and affiliated investment company shares | 408,220,687 | (43,543,412 | ) | 31,907,664 | 22,439,508 | (83,200 | ) | 875,717 | — | — | |||||||||||||||||||||||||
Net Increase (Decrease) in Net Assets from Operations | 2,832,403,880 | (855,299,348 | ) | 1,187,100,162 | (915,435,337 | ) | 275,119,906 | (80,600,708 | ) | 70,503,888 | (39,192,420 | ) | |||||||||||||||||||||||
Distributions to Shareholders From: | |||||||||||||||||||||||||||||||||||
Net investment income – Class A | (6,663,987 | ) | (2,049,259 | ) | (14,411,473 | ) | (21,972,254 | ) | (599,485 | ) | — | (4,362,966 | ) | (1,392,316 | ) | ||||||||||||||||||||
Net realized gain – Class A | (197,512,972 | ) | (144,445,416 | ) | — | — | (11,879,641 | ) | (1,096,345 | ) | (5,497,945 | ) | (901,438 | ) | |||||||||||||||||||||
Net investment income – Class B | — | — | (110,407 | ) | (600,382 | ) | — | — | (72,287 | ) | (22,776 | ) | |||||||||||||||||||||||
Net realized gain – Class B | (2,528,156 | ) | (4,964,015 | ) | — | — | (115,000 | ) | (20,402 | ) | (103,484 | ) | (30,723 | ) | |||||||||||||||||||||
Net investment income – Class C | — | — | (564,735 | ) | (2,368,917 | ) | — | — | (545,569 | ) | (70,087 | ) | |||||||||||||||||||||||
Net realized gain – Class C | (50,561,092 | ) | (35,290,933 | ) | — | — | (2,747,308 | ) | (216,751 | ) | (788,458 | ) | (150,074 | ) | |||||||||||||||||||||
Net investment income – Class I | (314,994 | ) | (33,681 | ) | (2,000,370 | ) | (675,509 | ) | (23 | ) | — | (176 | ) | (79 | ) | ||||||||||||||||||||
Net realized gain – Class I | (3,228,769 | ) | (670,263 | ) | — | — | (1,468 | ) | (16,297 | ) | (212 | ) | (38 | ) | |||||||||||||||||||||
Net investment income – Class R | — | — | (25,256 | ) | — | — | — | — | — | ||||||||||||||||||||||||||
Net investment income – Class R4 | (56 | ) | — | (223 | ) | — | (79 | ) | — | (894 | ) | — | |||||||||||||||||||||||
Net realized gain – Class R4 | (717 | ) | — | — | — | (1,157 | ) | — | (1,048 | ) | — | ||||||||||||||||||||||||
Net investment income – Class R5 | (11 | ) | — | (16,524 | ) | — | (15 | ) | — | (150 | ) | — | |||||||||||||||||||||||
Net realized gain – Class R5 | (119 | ) | — | — | — | (193 | ) | — | (175 | ) | — | ||||||||||||||||||||||||
Net investment income – Class Y | (88,761 | ) | — | (19,488 | ) | — | (16 | ) | — | (151 | ) | — | |||||||||||||||||||||||
Net realized gain – Class Y | (850,641 | ) | — | — | — | (193 | ) | — | (174 | ) | — | ||||||||||||||||||||||||
Net investment income – Class Z | (63,442,374 | ) | (36,822,645 | ) | (111,633,313 | ) | (131,454,754 | ) | (8,664,877 | ) | — | (19,872,784 | ) | (9,039,073 | ) | ||||||||||||||||||||
Net realized gain – Class Z | (774,147,758 | ) | (521,914,461 | ) | — | — | (105,839,468 | ) | (8,480,983 | ) | (23,989,252 | ) | (4,185,448 | ) | |||||||||||||||||||||
Total Distributions to Shareholders | (1,099,340,407 | ) | (746,190,673 | ) | (128,781,789 | ) | (157,071,816 | ) | (129,848,923 | ) | (9,830,778 | ) | (55,235,725 | ) | (15,792,052 | ) | |||||||||||||||||||
Share Transactions: | |||||||||||||||||||||||||||||||||||
Subscriptions – Class A | 504,132,337 | 881,347,513 | 192,174,434 | 302,658,475 | 23,184,962 | 41,839,313 | 28,487,144 | 18,154,050 | |||||||||||||||||||||||||||
Distributions reinvested – Class A | 192,504,936 | 134,124,557 | 13,849,288 | 18,983,083 | 11,472,496 | 993,440 | 9,540,300 | 2,039,159 | |||||||||||||||||||||||||||
| Net assets of shares issued in connection with Merger – Class A | — | — | — | 204,929,893 | — | — | — | — | |||||||||||||||||||||||||||
Redemptions – Class A | (1,043,161,042 | ) | (1,072,697,473 | ) | (288,655,100 | ) | (251,676,760 | ) | (65,386,017 | ) | (80,479,403 | ) | (22,115,770 | ) | (26,421,899 | ) | |||||||||||||||||||
Net Increase (Decrease) – Class A | (346,523,769 | ) | (57,225,403 | ) | (82,631,378 | ) | 274,894,691 | (30,728,559 | ) | (37,646,650 | ) | 15,911,674 | (6,228,690 | ) | |||||||||||||||||||||
Distributions reinvested – Class B (f) | 2,488,680 | 4,776,785 | 109,244 | 558,478 | 112,821 | 26,565 | 171,043 | 51,060 | |||||||||||||||||||||||||||
| Net assets of shares issued in connection with Merger – Class B | — | — | — | 12,516,646 | — | — | — | — | |||||||||||||||||||||||||||
Redemptions – Class B | (42,408,789 | ) | (215,635,845 | ) | (10,614,723 | ) | (13,183,025 | ) | (1,506,892 | ) | (6,779,156 | ) | (821,529 | ) | (1,017,074 | ) | |||||||||||||||||||
Net Increase (Decrease) – Class B | (39,920,109 | ) | (210,859,060 | ) | (10,505,479 | ) | (107,901 | ) | (1,394,071 | ) | (6,752,591 | ) | (650,486 | ) | (966,014 | ) | |||||||||||||||||||
Subscriptions – Class C | 75,456,034 | 101,180,823 | 9,589,255 | 19,818,591 | 1,894,599 | 2,254,840 | 1,909,549 | 966,467 | |||||||||||||||||||||||||||
Distributions reinvested – Class C | 41,007,235 | 27,312,778 | 462,763 | 1,844,621 | 2,504,682 | 193,429 | 1,184,774 | 188,226 | |||||||||||||||||||||||||||
| Net assets of shares issued in connection with Merger – Class C | — | — | — | 25,563,134 | — | — | — | — | |||||||||||||||||||||||||||
Redemptions – Class C | (147,063,884 | ) | (154,449,467 | ) | (31,713,431 | ) | (42,186,965 | ) | (6,051,022 | ) | (5,936,913 | ) | (2,386,931 | ) | (2,975,326 | ) | |||||||||||||||||||
Net Increase (Decrease) – Class C | (30,600,615 | ) | (25,955,866 | ) | (21,661,413 | ) | 5,039,381 | (1,651,741 | ) | (3,488,644 | ) | 707,392 | (1,820,633 | ) | |||||||||||||||||||||
(a) Class R4 shares reflect activity for the period from November 8, 2012 (commencement of operations) through December 31, 2012.
(b) Class R5 shares reflect activity for the period from November 8, 2012 (commencement of operations) through December 31, 2012.
(c) Class Y shares reflect activity for the period from November 8, 2012 (commencement of operations) through December 31, 2012.
(d) Class R and Class R5 shares reflect activity for the period from August 15, 2011 (commencement of operations) through December 31, 2011.
(e) For the period from August 19, 2011 (commencement of operations) to December 31, 2011.
(f) Presentation for fiscal year 2011 has been changed to conform to that of the current year.
See accompanying notes to financial statements.
94
| Columbia Acorn Select | Columbia Thermostat Fund | Columbia Acorn Emerging Markets Fund | Columbia Acorn European Fund | ||||||||||||||||||||||||||||||||
Increase (Decrease) in Net Assets | Year ended December 31, | Year ended December 31, | Year ended December 31, | Year ended December 31, | |||||||||||||||||||||||||||||||
2012 (a)(b)(c) | 2011 | 2012 (a)(b)(c) | 2011 | 2012 (a)(b) | 2011 (e) | 2012 (b) | 2011 (e) | ||||||||||||||||||||||||||||
Operations: | |||||||||||||||||||||||||||||||||||
Net investment income (loss) | $ | 3,199,752 | $ | (7,973,307 | ) | $ | 10,380,505 | $ | 2,784,210 | $ | 59,454 | $ | 1,307 | $ | 15,258 | $ | (3,253 | ) | |||||||||||||||||
| Net realized gain (loss) on investments, foreign currency transactions, forward foreign currency exchange contracts and foreign capital gains tax | 146,041,340 | 209,797,019 | — | — | (61,273 | ) | (57,599 | ) | 8,711 | 5,764 | |||||||||||||||||||||||||
| Net realized gain (loss) on affiliated investments and distributions from affiliated investment companies and affiliated investment company shares | (32,861,769 | ) | (66,391,196 | ) | 9,964,937 | 8,878,053 | — | — | — | — | |||||||||||||||||||||||||
Reimbursement from affiliate (See Note 4) | — | — | — | — | — | — | — | — | |||||||||||||||||||||||||||
| Net change in net unrealized appreciation (depreciation) on investments, foreign currency translations, forward foreign currency exchange contracts and foreign capital gains tax | 9,006,880 | (347,747,328 | ) | — | — | 1,577,275 | (135,189 | ) | 478,648 | (85,854 | ) | ||||||||||||||||||||||||
| Net change in net unrealized appreciation (depreciation) on affiliated investment companies and affiliated investment company shares | 76,071,172 | (112,603,396 | ) | 30,128,824 | (4,865,908 | ) | — | — | — | — | |||||||||||||||||||||||||
Net Increase (Decrease) in Net Assets from Operations | 201,457,375 | (324,918,208 | ) | 50,474,266 | 6,796,355 | 1,575,456 | (191,481 | ) | 502,617 | (83,343 | ) | ||||||||||||||||||||||||
Distributions to Shareholders From: | |||||||||||||||||||||||||||||||||||
Net investment income – Class A | — | (7,161,966 | ) | (5,054,209 | ) | (1,706,583 | ) | (15,490 | ) | — | (1,646 | ) | (796 | ) | |||||||||||||||||||||
Net realized gain – Class A | (22,932,516 | ) | — | — | — | — | — | (87 | ) | (207 | ) | ||||||||||||||||||||||||
Net investment income – Class B | — | (499,744 | ) | (54,808 | ) | (351,024 | ) | — | — | — | — | ||||||||||||||||||||||||
Net realized gain – Class B | (1,087,328 | ) | — | — | — | — | — | — | — | ||||||||||||||||||||||||||
Net investment income – Class C | — | (672,184 | ) | (2,121,887 | ) | (405,817 | ) | — | — | (20 | ) | (16 | ) | ||||||||||||||||||||||
Net realized gain – Class C | (5,136,384 | ) | — | — | — | — | — | (8 | ) | (8 | ) | ||||||||||||||||||||||||
Net investment income – Class I | — | (140,882 | ) | — | — | (61 | ) | — | (48 | ) | (38 | ) | |||||||||||||||||||||||
Net realized gain – Class I | (2,740,487 | ) | — | — | — | — | — | (2 | ) | (8 | ) | ||||||||||||||||||||||||
Net investment income – Class R | — | — | — | — | — | — | — | — | |||||||||||||||||||||||||||
Net investment income – Class R4 | — | — | (272 | ) | — | (135 | ) | — | — | — | |||||||||||||||||||||||||
Net realized gain – Class R4 | (872 | ) | — | — | — | — | — | — | — | ||||||||||||||||||||||||||
Net investment income – Class R5 | — | — | (45 | ) | — | (24 | ) | — | (17 | ) | — | ||||||||||||||||||||||||
Net realized gain – Class R5 | (145 | ) | — | — | — | — | — | — | — | ||||||||||||||||||||||||||
Net investment income – Class Y | — | — | (46 | ) | — | — | — | — | — | ||||||||||||||||||||||||||
Net realized gain – Class Y | (145 | ) | — | — | — | — | — | — | — | ||||||||||||||||||||||||||
Net investment income – Class Z | — | (22,715,133 | ) | (5,300,668 | ) | (1,460,001 | ) | (60,520 | ) | — | (20,402 | ) | (10,925 | ) | |||||||||||||||||||||
Net realized gain – Class Z | (51,934,084 | ) | — | — | — | — | — | (815 | ) | (2,458 | ) | ||||||||||||||||||||||||
Total Distributions to Shareholders | (83,831,961 | ) | (31,189,909 | ) | (12,531,935 | ) | (3,923,425 | ) | (76,230 | ) | — | (23,045 | ) | (14,456 | ) | ||||||||||||||||||||
Share Transactions: | |||||||||||||||||||||||||||||||||||
Subscriptions – Class A | 40,027,597 | 72,440,740 | 273,105,947 | 44,384,781 | 2,701,324 | 351,565 | 295,687 | 163,602 | |||||||||||||||||||||||||||
Distributions reinvested – Class A | 21,373,765 | 6,306,938 | 4,549,410 | 1,390,763 | 15,419 | — | 1,697 | 1,003 | |||||||||||||||||||||||||||
| Net assets of shares issued in connection with Merger – Class A | — | — | — | — | — | — | — | — | |||||||||||||||||||||||||||
Redemptions – Class A | (159,108,074 | ) | (203,498,579 | ) | (48,212,223 | ) | (11,538,308 | ) | (234,401 | ) | (12,847 | ) | (46,529 | ) | — | ||||||||||||||||||||
Net Increase (Decrease) – Class A | (97,706,712 | ) | (124,750,901 | ) | 229,443,134 | 34,237,236 | 2,482,342 | 338,718 | 250,855 | 164,605 | |||||||||||||||||||||||||
Distributions reinvested – Class B (f) | 1,050,259 | 464,296 | 52,935 | 381,262 | — | — | — | — | |||||||||||||||||||||||||||
| Net assets of shares issued in connection with Merger – Class B | — | — | — | — | — | — | — | — | |||||||||||||||||||||||||||
Redemptions – Class B | (19,619,654 | ) | (37,412,784 | ) | (7,803,976 | ) | (18,369,136 | ) | — | — | — | — | |||||||||||||||||||||||
Net Increase (Decrease) – Class B | (18,569,395 | ) | (36,948,488 | ) | (7,751,041 | ) | (17,987,874 | ) | — | — | — | — | |||||||||||||||||||||||
Subscriptions – Class C | 3,033,655 | 3,602,724 | 220,660,384 | 15,268,427 | 479,073 | 137,805 | 102,697 | 5,000 | |||||||||||||||||||||||||||
Distributions reinvested – Class C | 4,111,417 | 494,683 | 1,498,365 | 312,780 | — | — | 28 | 23 | |||||||||||||||||||||||||||
| Net assets of shares issued in connection with Merger – Class C | — | — | — | — | — | — | — | — | |||||||||||||||||||||||||||
Redemptions – Class C | (17,080,513 | ) | (23,948,063 | ) | (11,490,278 | ) | (4,725,014 | ) | (62,650 | ) | (10,000 | ) | (23,910 | ) | — | ||||||||||||||||||||
Net Increase (Decrease) – Class C | (9,935,441 | ) | (19,850,656 | ) | 210,668,471 | 10,856,193 | 416,423 | 127,805 | 78,815 | 5,023 | |||||||||||||||||||||||||
See accompanying notes to financial statements.
95
Columbia Acorn Family of Funds
Statements of Changes in Net Assets, continued
| Columbia Acorn Fund | Columbia Acorn International | Columbia Acorn USA | Columbia Acorn International Select | ||||||||||||||||||||||||||||||||
Increase (Decrease) in Net Assets | Year ended December 31, | Year ended December 31, | Year ended December 31, | Year ended December 31, | |||||||||||||||||||||||||||||||
2012 (a)(b)(c) | 2011 | 2012 (a)(c) | 2011 (d) | 2012 (a)(b)(c) | 2011 | 2012 (a)(b)(c) | 2011 | ||||||||||||||||||||||||||||
Subscriptions – Class I | 67,198,938 | 17,610,293 | 89,544,891 | 27,930,224 | 2,149,882 | 11,069,761 | — | — | |||||||||||||||||||||||||||
Distributions reinvested – Class I | 3,543,577 | 703,825 | 1,999,919 | 675,441 | 1,223 | 16,280 | — | — | |||||||||||||||||||||||||||
| Net assets of shares issued in connection with Merger – Class I | — | — | — | 152,987,093 | — | — | — | — | |||||||||||||||||||||||||||
Redemptions – Class I | (30,814,450 | ) | (13,595,009 | ) | (56,555,211 | ) | (184,759,915 | ) | (4,920,409 | ) | (38,709,258 | ) | — | — | |||||||||||||||||||||
Net Increase (Decrease) – Class I | 39,928,065 | 4,719,109 | 34,989,599 | (3,167,157 | ) | (2,769,304 | ) | (27,623,217 | ) | — | — | ||||||||||||||||||||||||
Subscriptions – Class R | — | — | 4,849,766 | 369,489 | — | — | — | — | |||||||||||||||||||||||||||
Distributions reinvested – Class R | — | — | 20,880 | — | — | — | — | — | |||||||||||||||||||||||||||
| Net assets of shares issued in connection with Merger – Class R | — | — | — | 2,027,456 | — | — | — | — | |||||||||||||||||||||||||||
Redemptions – Class R | — | — | (4,484,989 | ) | (76,789 | ) | — | — | — | — | |||||||||||||||||||||||||
Net Increase – Class R | — | — | 385,657 | 2,320,156 | — | — | — | — | |||||||||||||||||||||||||||
Subscriptions – Class R4 | 16,900 | — | 15,000 | — | 15,000 | — | 15,000 | — | |||||||||||||||||||||||||||
Net Increase – Class R4 | 16,900 | — | 15,000 | — | 15,000 | — | 15,000 | — | |||||||||||||||||||||||||||
Subscriptions – Class R5 | 2,500 | — | 445 | 2,624 | 2,500 | — | 2,500 | — | |||||||||||||||||||||||||||
Distributions reinvested – Class R5 | — | — | 5,613 | — | — | — | — | — | |||||||||||||||||||||||||||
| Net assets of shares issued in connection with Merger – Class R5 | — | — | — | 2,232,537 | — | — | — | — | |||||||||||||||||||||||||||
Redemptions – Class R5 | — | — | (2,089,711 | ) | (7 | ) | — | — | — | — | |||||||||||||||||||||||||
Net Increase (Decrease) – Class R5 | 2,500 | — | (2,083,653 | ) | 2,235,154 | 2,500 | — | 2,500 | — | ||||||||||||||||||||||||||
Subscriptions – Class Y | 66,583,143 | — | 30,626,355 | — | 2,500 | — | 2,500 | — | |||||||||||||||||||||||||||
Distributions reinvested – Class Y | 939,270 | — | 19,448 | — | — | — | — | — | |||||||||||||||||||||||||||
Redemptions – Class Y | (326,942 | ) | — | — | — | — | — | — | — | ||||||||||||||||||||||||||
Net Increase – Class Y | 67,195,471 | — | 30,645,803 | — | 2,500 | — | 2,500 | — | |||||||||||||||||||||||||||
Subscriptions – Class Z | 1,687,350,294 | 2,172,346,851 | 1,168,999,243 | 965,616,527 | 222,245,731 | 349,840,792 | 86,732,266 | 45,935,610 | |||||||||||||||||||||||||||
Distributions reinvested – Class Z | 734,024,683 | 471,639,563 | 86,747,474 | 91,323,594 | 102,214,147 | 7,533,719 | 21,542,287 | 5,069,068 | |||||||||||||||||||||||||||
Redemptions – Class Z | (2,657,246,336 | ) | (2,515,311,322 | ) | (936,482,410 | ) | (973,864,897 | ) | (391,557,641 | ) | (331,532,754 | ) | (85,460,095 | ) | (113,289,031 | ) | |||||||||||||||||||
Net Increase (Decrease) – Class Z | (235,871,359 | ) | 128,675,092 | 319,264,307 | 83,075,224 | (67,097,763 | ) | 25,841,757 | 22,814,458 | (62,284,353 | ) | ||||||||||||||||||||||||
Net Increase (Decrease) from Share Transactions | (545,772,916 | ) | (160,646,128 | ) | 268,418,443 | 364,289,548 | (103,621,438 | ) | (49,669,345 | ) | 38,803,038 | (71,299,690 | ) | ||||||||||||||||||||||
Increase from regulatory settlements (See Note 7) | — | — | 107,802 | 107,617 | — | — | — | — | |||||||||||||||||||||||||||
Increase from contribution from affiliate (See Note 4) | — | — | — | — | — | — | — | — | |||||||||||||||||||||||||||
Total Increase (Decrease) in Net Assets | 1,187,290,557 | (1,762,136,149 | ) | 1,326,844,618 | (708,109,988 | ) | 41,649,545 | (140,100,831 | ) | 54,071,201 | (126,284,162 | ) | |||||||||||||||||||||||
Net Assets: | |||||||||||||||||||||||||||||||||||
Beginning of period | 16,336,575,354 | 18,098,711,503 | 5,416,952,988 | 6,125,062,976 | 1,558,445,128 | 1,698,545,959 | 326,382,853 | 452,667,015 | |||||||||||||||||||||||||||
End of period | $ | 17,523,865,911 | $ | 16,336,575,354 | $ | 6,743,797,606 | $ | 5,416,952,988 | $ | 1,600,094,673 | $ | 1,558,445,128 | $ | 380,454,054 | $ | 326,382,853 | |||||||||||||||||||
Undistributed (Overdistributed) net investment income | $ | (27,792,423 | ) | $ | (32,073,997 | ) | $ | (74,303,358 | ) | $ | (60,514,153 | ) | $ | (4,074,947 | ) | $ | (167,486 | ) | $ | (22,556,622 | ) | $ | (5,294,000 | ) | |||||||||||
(a) Class R4 shares reflect activity for the period from November 8, 2012 (commencement of operations) through December 31, 2012.
(b) Class R5 shares reflect activity for the period from November 8, 2012 (commencement of operations) through December 31, 2012.
(c) Class Y shares reflect activity for the period from November 8, 2012 (commencement of operations) through December 31, 2012.
(d) Class R and Class R5 shares reflect activity for the period from August 15, 2011 (commencement of operations) through December 31, 2011.
(e) For the period from August 19, 2011 (commencement of operations) to December 31, 2011.
(f) Presentation for fiscal year 2011 has been changed to conform to that of the current year.
See accompanying notes to financial statements.
96
| Columbia Acorn Select | Columbia Thermostat Fund | Columbia Acorn Emerging Markets Fund | Columbia Acorn European Fund | ||||||||||||||||||||||||||||||||
Increase (Decrease) in Net Assets | Year ended December 31, | Year ended December 31, | Year ended December 31, | Year ended December 31, | |||||||||||||||||||||||||||||||
2012 (a)(b)(c) | 2011 | 2012 (a)(b)(c) | 2011 | 2012 (a)(b) | 2011 (e) | 2012 (b) | 2011 (e) | ||||||||||||||||||||||||||||
Subscriptions – Class I | 45,199,109 | 12,447,313 | — | — | — | 5,000 | — | 5,000 | |||||||||||||||||||||||||||
Distributions reinvested – Class I | 2,740,281 | 140,834 | — | — | 61 | — | 50 | 46 | |||||||||||||||||||||||||||
| Net assets of shares issued in connection with Merger – Class I | — | — | — | — | — | — | — | — | |||||||||||||||||||||||||||
Redemptions – Class I | (20,749,765 | ) | (8,781,953 | ) | — | — | — | — | — | — | |||||||||||||||||||||||||
Net Increase (Decrease) – Class I | 27,189,625 | 3,806,194 | — | — | 61 | 5,000 | 50 | 5,046 | |||||||||||||||||||||||||||
Subscriptions – Class R | — | — | — | — | — | — | — | — | |||||||||||||||||||||||||||
Distributions reinvested – Class R | — | — | — | — | — | — | — | — | |||||||||||||||||||||||||||
| Net assets of shares issued in connection with Merger – Class R | — | — | — | — | — | — | — | — | |||||||||||||||||||||||||||
Redemptions – Class R | — | — | — | — | — | — | — | — | |||||||||||||||||||||||||||
Net Increase – Class R | — | — | — | — | — | — | — | — | |||||||||||||||||||||||||||
Subscriptions – Class R4 | 15,000 | — | 15,000 | — | 15,000 | — | — | — | |||||||||||||||||||||||||||
Net Increase – Class R4 | 15,000 | — | 15,000 | — | 15,000 | — | — | — | |||||||||||||||||||||||||||
Subscriptions – Class R5 | 2,500 | — | 2,500 | — | 2,500 | — | 2,500 | — | |||||||||||||||||||||||||||
Distributions reinvested – Class R5 | — | — | — | — | — | — | — | — | |||||||||||||||||||||||||||
| Net assets of shares issued in connection with Merger – Class R5 | — | — | — | — | — | — | — | — | |||||||||||||||||||||||||||
Redemptions – Class R5 | — | — | — | — | — | — | — | — | |||||||||||||||||||||||||||
Net Increase (Decrease) – Class R5 | 2,500 | — | 2,500 | — | 2,500 | — | 2,500 | — | |||||||||||||||||||||||||||
Subscriptions – Class Y | 2,500 | — | 2,500 | — | — | — | — | — | |||||||||||||||||||||||||||
Distributions reinvested – Class Y | — | — | — | — | — | — | — | — | |||||||||||||||||||||||||||
Redemptions – Class Y | — | — | — | — | — | — | — | — | |||||||||||||||||||||||||||
Net Increase – Class Y | 2,500 | — | 2,500 | — | — | — | — | — | |||||||||||||||||||||||||||
Subscriptions – Class Z | 92,416,113 | 177,361,634 | 280,471,623 | 42,101,307 | 3,279,578 | 2,948,759 | 774,240 | 1,588,892 | |||||||||||||||||||||||||||
Distributions reinvested – Class Z | 40,196,957 | 17,487,932 | 3,443,888 | 1,165,088 | 58,786 | — | 20,822 | 13,383 | |||||||||||||||||||||||||||
Redemptions – Class Z | (476,230,534 | ) | (653,288,529 | ) | (69,222,297 | ) | (14,913,772 | ) | (392,871 | ) | (35 | ) | (7,954 | ) | (15 | ) | |||||||||||||||||||
Net Increase (Decrease) – Class Z | (343,617,464 | ) | (458,438,963 | ) | 214,693,214 | 28,352,623 | 2,945,493 | 2,948,724 | 787,108 | 1,602,260 | |||||||||||||||||||||||||
Net Increase (Decrease) from Share Transactions | (442,619,387 | ) | (636,182,814 | ) | 647,073,778 | 55,458,178 | 5,861,819 | 3,420,247 | 1,119,328 | 1,776,934 | |||||||||||||||||||||||||
Increase from regulatory settlements (See Note 7) | — | — | — | — | — | — | — | — | |||||||||||||||||||||||||||
Increase from contribution from affiliate (See Note 4) | — | 56,666 | — | — | — | — | — | — | |||||||||||||||||||||||||||
Total Increase (Decrease) in Net Assets | (324,993,973 | ) | (992,234,265 | ) | 685,016,109 | 58,331,108 | 7,361,045 | 3,228,766 | 1,598,900 | 1,679,135 | |||||||||||||||||||||||||
Net Assets: | |||||||||||||||||||||||||||||||||||
Beginning of period | 1,290,620,887 | 2,282,855,152 | 189,606,588 | 131,275,480 | 3,228,766 | — | 1,679,135 | — | |||||||||||||||||||||||||||
End of period | $ | 965,626,914 | $ | 1,290,620,887 | $ | 874,622,697 | $ | 189,606,588 | $ | 10,589,811 | $ | 3,228,766 | $ | 3,278,035 | $ | 1,679,135 | |||||||||||||||||||
Undistributed (Overdistributed) net investment income | $ | 2,866,367 | $ | (324,122 | ) | $ | 650,727 | $ | 470,857 | $ | (17,167 | ) | $ | (922 | ) | $ | (8,259 | ) | $ | (340 | ) | ||||||||||||||
See accompanying notes to financial statements.
97
Columbia Acorn Family of Funds
Statements of Changes in Net Assets, continued
| Columbia Acorn Fund | Columbia Acorn International | Columbia Acorn USA | Columbia Acorn International Select | ||||||||||||||||||||||||||||||||
Changes in Shares of Beneficial Interest: | Year ended December 31, | Year ended December 31, | Year ended December 31, | Year ended December 31, | |||||||||||||||||||||||||||||||
2012 (a)(b)(c) | 2011 | 2012 (a)(c) | 2011 (d) | 2012 (a)(b)(c) | 2011 | 2012 (a)(b)(c) | 2011 | ||||||||||||||||||||||||||||
Subscriptions – Class A | 17,231,624 | 30,308,575 | 5,036,565 | 7,713,244 | 809,060 | 1,506,914 | 1,023,664 | 665,384 | |||||||||||||||||||||||||||
Shares issued in reinvestment and capital gains – Class A | 6,767,946 | 4,849,511 | 349,670 | 463,002 | 419,501 | 37,645 | 374,787 | 78,166 | |||||||||||||||||||||||||||
Shares issued in connection with merger – Class A | — | — | — | 5,466,934 | — | — | — | — | |||||||||||||||||||||||||||
Less shares redeemed – Class A | (35,802,801 | ) | (37,724,697 | ) | (7,580,692 | ) | (6,592,650 | ) | (2,274,459 | ) | (2,878,665 | ) | (825,702 | ) | (979,677 | ) | |||||||||||||||||||
Net Increase (Decrease) – Class A | (11,803,231 | ) | (2,566,611 | ) | (2,194,457 | ) | 7,050,530 | (1,045,898 | ) | (1,334,106 | ) | 572,749 | (236,127 | ) | |||||||||||||||||||||
Shares issued in reinvestment and capital gains – Class B (f) | 95,443 | 184,819 | 2,774 | 13,998 | 4,518 | 1,075 | 7,046 | 2,043 | |||||||||||||||||||||||||||
Shares issued in connection with merger – Class B | — | — | — | 342,758 | — | — | — | — | |||||||||||||||||||||||||||
Less shares redeemed – Class B | (1,578,470 | ) | (8,045,886 | ) | (290,213 | ) | (352,784 | ) | (57,586 | ) | (267,391 | ) | (32,062 | ) | (39,168 | ) | |||||||||||||||||||
Net Increase (Decrease) – Class B | (1,483,027 | ) | (7,861,067 | ) | (287,439 | ) | 3,972 | (53,068 | ) | (266,316 | ) | (25,016 | ) | (37,125 | ) | ||||||||||||||||||||
Subscriptions – Class C | 2,852,549 | 3,778,865 | 259,798 | 519,373 | 72,817 | 90,021 | 71,372 | 36,299 | |||||||||||||||||||||||||||
Shares issued in reinvestment and capital gains – Class C | 1,604,270 | 1,085,991 | 11,902 | 46,324 | 101,628 | 8,013 | 49,061 | 7,679 | |||||||||||||||||||||||||||
Shares issued in connection with merger – Class C | — | — | — | 702,540 | — | — | — | — | |||||||||||||||||||||||||||
Less shares redeemed – Class C | (5,562,067 | ) | (5,913,273 | ) | (870,089 | ) | (1,110,263 | ) | (231,588 | ) | (230,475 | ) | (93,117 | ) | (115,449 | ) | |||||||||||||||||||
Net Increase (Decrease) – Class C | (1,105,248 | ) | (1,048,417 | ) | (598,389 | ) | 157,974 | (57,143 | ) | (132,441 | ) | 27,316 | (71,471 | ) | |||||||||||||||||||||
Subscriptions – Class I | 2,226,501 | 639,251 | 2,338,136 | 764,242 | 69,785 | 370,935 | — | — | |||||||||||||||||||||||||||
Shares issued in reinvestment and capital gains – Class I | 119,925 | 24,710 | 50,947 | 16,426 | 42 | 593 | — | — | |||||||||||||||||||||||||||
Shares issued in connection with merger – Class I | — | — | — | 4,062,014 | — | — | — | — | |||||||||||||||||||||||||||
Less shares redeemed – Class I | (1,016,424 | ) | (454,350 | ) | (1,469,126 | ) | (5,003,583 | ) | (167,312 | ) | (1,288,985 | ) | — | — | |||||||||||||||||||||
Net Increase (Decrease) – Class I | 1,330,002 | 209,611 | 919,957 | (160,901 | ) | (97,485 | ) | (917,457 | ) | — | — | ||||||||||||||||||||||||
Subscriptions – Class R | — | — | 123,992 | 10,551 | — | — | — | — | |||||||||||||||||||||||||||
Shares issued in reinvestment and capital gains – Class R | — | — | 521 | — | — | — | — | — | |||||||||||||||||||||||||||
Shares issued in connection with merger – Class R | — | — | — | 54,059 | — | — | — | — | |||||||||||||||||||||||||||
Less shares redeemed – Class R | — | — | (118,346 | ) | (2,142 | ) | — | — | — | — | |||||||||||||||||||||||||
Net Increase – Class R | — | — | 6,167 | 62,468 | — | — | — | — | |||||||||||||||||||||||||||
Subscriptions – Class R4 | 553 | — | 376 | — | 499 | — | 500 | — | |||||||||||||||||||||||||||
Net Increase – Class R4 | 553 | — | 376 | — | 499 | — | 500 | — | |||||||||||||||||||||||||||
Subscriptions – Class R5 | 82 | — | 8 | 66 | 83 | — | 83 | — | |||||||||||||||||||||||||||
Shares issued in reinvestment and capital gains – Class R5 | — | — | 145 | — | — | — | — | — | |||||||||||||||||||||||||||
Shares issued in connection with merger – Class R5 | — | — | — | 59,324 | — | — | — | — | |||||||||||||||||||||||||||
Less shares redeemed – Class R5 | — | — | (53,601 | ) | — | — | — | — | — | ||||||||||||||||||||||||||
Net Increase (Decrease) – Class R5 | 82 | — | (53,448 | ) | 59,390 | 83 | — | 83 | — | ||||||||||||||||||||||||||
Subscriptions – Class Y | 2,148,017 | — | 750,647 | — | 83 | — | 83 | — | |||||||||||||||||||||||||||
Shares issued in reinvestment and capital gains – Class Y | 31,278 | — | 476 | — | — | — | — | — | |||||||||||||||||||||||||||
Less shares redeemed – Class Y | (10,692 | ) | — | — | — | — | — | — | — | ||||||||||||||||||||||||||
Net Increase – Class Y | 2,168,603 | — | 751,123 | — | 83 | — | 83 | — | |||||||||||||||||||||||||||
Subscriptions – Class Z | 55,847,077 | 72,817,179 | 30,630,548 | 24,482,095 | 7,413,473 | 12,164,332 | 3,087,336 | 1,655,528 | |||||||||||||||||||||||||||
Shares issued in reinvestment and capital gains – Class Z | 24,884,327 | 16,442,041 | 2,218,261 | 2,221,985 | 3,580,586 | 274,452 | 838,401 | 192,067 | |||||||||||||||||||||||||||
Less shares redeemed – Class Z | (87,379,864 | ) | (85,040,148 | ) | (24,297,024 | ) | (25,537,246 | ) | (13,185,688 | ) | (11,564,391 | ) | (3,121,838 | ) | (4,157,219 | ) | |||||||||||||||||||
Net Increase (Decrease) – Class Z | (6,648,460 | ) | 4,219,072 | 8,551,785 | 1,166,834 | (2,191,629 | ) | 874,393 | 803,899 | (2,309,624 | ) | ||||||||||||||||||||||||
Net Increase (Decrease) in Shares of Beneficial Interest | (17,540,726 | ) | (7,047,412 | ) | 7,095,675 | 8,340,267 | (3,444,558 | ) | (1,775,927 | ) | 1,379,614 | (2,654,347 | ) | ||||||||||||||||||||||
(a) Class R4 shares reflect activity for the period from November 8, 2012 (commencement of operations) through December 31, 2012.
(b) Class R5 shares reflect activity for the period from November 8, 2012 (commencement of operations) through December 31, 2012.
(c) Class Y shares reflect activity for the period from November 8, 2012 (commencement of operations) through December 31, 2012.
(d) Class R and Class R5 shares reflect activity for the period from August 15, 2011 (commencement of operations) through December 31, 2011.
(e) For the period from August 19, 2011 (commencement of operations) to December 31, 2011.
(f) Presentation for fiscal year 2011 has been changed to conform to that of the current year.
See accompanying notes to financial statements.
98
| Columbia Acorn Select | Columbia Thermostat Fund | Columbia Acorn Emerging Markets Fund | Columbia Acorn European Fund | ||||||||||||||||||||||||||||||||
Changes in Shares of Beneficial Interest: | Year ended December 31, | Year ended December 31, | Year ended December 31, | Year ended December 31, | |||||||||||||||||||||||||||||||
2012 (a)(b)(c) | 2011 | 2012 (a)(b)(c) | 2011 | 2012 (a)(b) | 2011 (e) | 2012 (b) | 2011 (e) | ||||||||||||||||||||||||||||
Subscriptions – Class A | 1,572,755 | 2,804,118 | 19,574,784 | 3,467,554 | 242,160 | 37,163 | 26,410 | 16,225 | |||||||||||||||||||||||||||
Shares issued in reinvestment and capital gains – Class A | 878,414 | 242,109 | 319,205 | 109,048 | 1,308 | — | 152 | 104 | |||||||||||||||||||||||||||
Shares issued in connection with merger – Class A | — | — | — | — | — | — | — | — | |||||||||||||||||||||||||||
Less shares redeemed – Class A | (6,287,849 | ) | (8,092,457 | ) | (3,461,158 | ) | (898,243 | ) | (21,619 | ) | (1,352 | ) | (4,331 | ) | — | ||||||||||||||||||||
Net Increase (Decrease) – Class A | (3,836,680 | ) | (5,046,230 | ) | 16,432,831 | 2,678,359 | 221,849 | 35,811 | 22,231 | 16,329 | |||||||||||||||||||||||||
Shares issued in reinvestment and capital gains – Class B (f) | 46,775 | 19,069 | 3,716 | 29,853 | — | — | — | — | |||||||||||||||||||||||||||
Shares issued in connection with merger – Class B | — | — | — | — | — | — | — | — | |||||||||||||||||||||||||||
Less shares redeemed – Class B | (830,866 | ) | (1,568,983 | ) | (568,981 | ) | (1,427,236 | ) | — | — | — | — | |||||||||||||||||||||||
Net Increase (Decrease) – Class B | (784,091 | ) | (1,549,914 | ) | (565,265 | ) | (1,397,383 | ) | — | — | — | — | |||||||||||||||||||||||
Subscriptions – Class C | 130,998 | 145,444 | 15,757,125 | 1,195,517 | 43,007 | 14,831 | 9,113 | 500 | |||||||||||||||||||||||||||
Shares issued in reinvestment and capital gains – Class C | 185,145 | 20,476 | 104,556 | 24,387 | — | — | 3 | 2 | |||||||||||||||||||||||||||
Shares issued in connection with merger – Class C | — | — | — | — | — | — | — | — | |||||||||||||||||||||||||||
Less shares redeemed – Class C | (733,680 | ) | (1,010,864 | ) | (818,151 | ) | (367,683 | ) | (5,549 | ) | (1,055 | ) | (2,036 | ) | — | ||||||||||||||||||||
Net Increase (Decrease) – Class C | (417,537 | ) | (844,944 | ) | 15,043,530 | 852,221 | 37,458 | 13,776 | 7,080 | 502 | |||||||||||||||||||||||||
Subscriptions – Class I | 1,751,104 | 519,581 | — | — | — | 500 | — | 500 | |||||||||||||||||||||||||||
Shares issued in reinvestment and capital gains – Class I | 108,517 | 5,262 | — | — | 5 | — | 4 | 5 | |||||||||||||||||||||||||||
Shares issued in connection with merger – Class I | — | — | — | — | — | — | — | — | |||||||||||||||||||||||||||
Less shares redeemed – Class I | (798,545 | ) | (334,605 | ) | — | — | — | — | — | — | |||||||||||||||||||||||||
Net Increase (Decrease) – Class I | 1,061,076 | 190,238 | — | — | 5 | 500 | 4 | 505 | |||||||||||||||||||||||||||
Subscriptions – Class R | — | — | — | — | — | — | — | — | |||||||||||||||||||||||||||
Shares issued in reinvestment and capital gains – Class R | — | — | — | — | — | — | — | — | |||||||||||||||||||||||||||
Shares issued in connection with merger – Class R | — | — | — | — | — | — | — | — | |||||||||||||||||||||||||||
Less shares redeemed – Class R | — | — | — | — | — | — | — | — | |||||||||||||||||||||||||||
Net Increase – Class R | — | — | — | — | — | — | — | — | |||||||||||||||||||||||||||
Subscriptions – Class R4 | 579 | — | 1,065 | — | 1,311 | — | — | — | |||||||||||||||||||||||||||
Net Increase – Class R4 | 579 | — | 1,065 | — | 1,311 | — | — | — | |||||||||||||||||||||||||||
Subscriptions – Class R5 | 96 | — | 178 | — | 219 | — | 223 | — | |||||||||||||||||||||||||||
Shares issued in reinvestment and capital gains – Class R5 | — | — | — | — | — | — | — | — | |||||||||||||||||||||||||||
Shares issued in connection with merger – Class R5 | — | — | — | — | — | — | — | — | |||||||||||||||||||||||||||
Less shares redeemed – Class R5 | — | — | — | — | — | — | — | — | |||||||||||||||||||||||||||
Net Increase (Decrease) – Class R5 | 96 | — | 178 | — | 219 | — | 223 | — | |||||||||||||||||||||||||||
Subscriptions – Class Y | 96 | — | 178 | — | — | — | — | — | |||||||||||||||||||||||||||
Shares issued in reinvestment and capital gains – Class Y | — | — | — | — | — | — | — | — | |||||||||||||||||||||||||||
Less shares redeemed – Class Y | — | — | — | — | — | — | — | — | |||||||||||||||||||||||||||
Net Increase – Class Y | 96 | — | 178 | — | — | — | — | — | |||||||||||||||||||||||||||
Subscriptions – Class Z | 3,534,761 | 6,576,496 | 20,385,294 | 3,337,874 | 299,290 | 298,053 | 70,205 | 159,229 | |||||||||||||||||||||||||||
Shares issued in reinvestment and capital gains – Class Z | 1,598,571 | 653,510 | 244,437 | 92,364 | 5,008 | — | 1,859 | 1,384 | |||||||||||||||||||||||||||
Less shares redeemed – Class Z | (18,152,892 | ) | (25,141,231 | ) | (5,049,709 | ) | (1,192,353 | ) | (34,993 | ) | (4 | ) | (754 | ) | (1 | ) | |||||||||||||||||||
Net Increase (Decrease) – Class Z | (13,019,560 | ) | (17,911,225 | ) | 15,580,022 | 2,237,885 | 269,305 | 298,049 | 71,310 | 160,612 | |||||||||||||||||||||||||
Net Increase (Decrease) in Shares of Beneficial Interest | (16,996,021 | ) | (25,162,075 | ) | 46,492,539 | 4,371,082 | 530,147 | 348,136 | 100,848 | 177,948 | |||||||||||||||||||||||||
See accompanying notes to financial statements.
99
Columbia Acorn Family of Funds
Financial Highlights
The following tables are intended to help you understand the Fund's financial performance. Certain information reflects financial results for a single share of a class held for the periods shown. Per share net investment income (loss) amounts are calculated based on average shares outstanding during the period. Total return assumes reinvestment of all dividends and distributions. Total return does not reflect payment of sales charges, if any, and is not annualized for periods of less than one year.
Columbia Acorn Fund
Income from Investment Operations | Less Distributions to Shareholders | ||||||||||||||||||||||||||||||||||
| Net Asset Value, Beginning of Period | Net investment income (loss) | Net realized and unrealized gain (loss) | Total from investment operations | From net investment income | From net realized gains | Total Distributions to Shareholders | Increase from regulatory settlements | ||||||||||||||||||||||||||||
Class A | |||||||||||||||||||||||||||||||||||
Year Ended December 31, 2012 | $ | 26.63 | 0.08 | 4.53 | 4.61 | (0.06 | ) | (1.82 | ) | (1.88 | ) | — | |||||||||||||||||||||||
Year Ended December 31, 2011 | $ | 29.24 | (0.10 | ) | (1.30 | ) | (1.40 | ) | (0.02 | ) | (1.19 | ) | (1.21 | ) | — | ||||||||||||||||||||
Year Ended December 31, 2010 | $ | 23.98 | (0.06 | ) | 6.18 | 6.12 | (0.02 | ) | (0.84 | ) | (0.86 | ) | 0.00 | (d) | |||||||||||||||||||||
Year Ended December 31, 2009 | $ | 17.22 | (0.02 | ) | 6.78 | 6.76 | — | — | — | 0.00 | (d) | ||||||||||||||||||||||||
Year Ended December 31, 2008 | $ | 28.87 | (0.01 | ) | (10.98 | ) | (10.99 | ) | — | (0.66 | ) | (0.66 | ) | — | |||||||||||||||||||||
Class B | |||||||||||||||||||||||||||||||||||
Year Ended December 31, 2012 | $ | 24.53 | (0.11 | ) | 4.20 | 4.09 | — | (1.82 | ) | (1.82 | ) | — | |||||||||||||||||||||||
Year Ended December 31, 2011 | $ | 27.14 | (0.27 | ) | (1.15 | ) | (1.42 | ) | — | (1.19 | ) | (1.19 | ) | — | |||||||||||||||||||||
Year Ended December 31, 2010 | $ | 22.43 | (0.21 | ) | 5.76 | 5.55 | — | (0.84 | ) | (0.84 | ) | 0.00 | (d) | ||||||||||||||||||||||
Year Ended December 31, 2009 | $ | 16.21 | (0.14 | ) | 6.36 | 6.22 | — | — | — | 0.00 | (d) | ||||||||||||||||||||||||
Year Ended December 31, 2008 | $ | 27.39 | (0.15 | ) | (10.37 | ) | (10.52 | ) | — | (0.66 | ) | (0.66 | ) | — | |||||||||||||||||||||
Class C | |||||||||||||||||||||||||||||||||||
Year Ended December 31, 2012 | $ | 24.18 | (0.12 | ) | 4.10 | 3.98 | — | (1.82 | ) | (1.82 | ) | — | |||||||||||||||||||||||
Year Ended December 31, 2011 | $ | 26.85 | (0.29 | ) | (1.19 | ) | (1.48 | ) | — | (1.19 | ) | (1.19 | ) | — | |||||||||||||||||||||
Year Ended December 31, 2010 | $ | 22.23 | (0.24 | ) | 5.70 | 5.46 | — | (0.84 | ) | (0.84 | ) | 0.00 | (d) | ||||||||||||||||||||||
Year Ended December 31, 2009 | $ | 16.09 | (0.17 | ) | 6.31 | 6.14 | — | — | — | 0.00 | (d) | ||||||||||||||||||||||||
Year Ended December 31, 2008 | $ | 27.25 | (0.19 | ) | (10.31 | ) | (10.50 | ) | — | (0.66 | ) | (0.66 | ) | — | |||||||||||||||||||||
Class I | |||||||||||||||||||||||||||||||||||
Year Ended December 31, 2012 | $ | 27.57 | 0.26 | 4.62 | 4.88 | (0.16 | ) | (1.82 | ) | (1.98 | ) | — | |||||||||||||||||||||||
Year Ended December 31, 2011 | $ | 30.19 | 0.01 | (1.35 | ) | (1.34 | ) | (0.09 | ) | (1.19 | ) | (1.28 | ) | — | |||||||||||||||||||||
Year Ended December 31, 2010 (e) | $ | 26.80 | (0.01 | ) | 4.26 | 4.25 | (0.02 | ) | (0.84 | ) | (0.86 | ) | — | ||||||||||||||||||||||
Class R4 | |||||||||||||||||||||||||||||||||||
Year Ended December 31, 2012 (g) | $ | 30.59 | 0.05 | 1.84 | 1.89 | (0.12 | ) | (1.46 | ) | (1.58 | ) | — | |||||||||||||||||||||||
Class R5 | |||||||||||||||||||||||||||||||||||
Year Ended December 31, 2012 (h) | $ | 30.59 | 0.06 | 1.83 | 1.89 | (0.14 | ) | (1.46 | ) | (1.60 | ) | — | |||||||||||||||||||||||
Class Y | |||||||||||||||||||||||||||||||||||
Year Ended December 31, 2012 (i) | $ | 30.62 | 0.09 | 1.80 | 1.89 | (0.15 | ) | (1.46 | ) | (1.61 | ) | — | |||||||||||||||||||||||
Class Z | |||||||||||||||||||||||||||||||||||
Year Ended December 31, 2012 | $ | 27.56 | 0.17 | 4.69 | 4.86 | (0.15 | ) | (1.82 | ) | (1.97 | ) | — | |||||||||||||||||||||||
Year Ended December 31, 2011 | $ | 30.19 | (0.01 | ) | (1.34 | ) | (1.35 | ) | (0.09 | ) | (1.19 | ) | (1.28 | ) | — | ||||||||||||||||||||
Year Ended December 31, 2010 | $ | 24.68 | 0.02 | 6.37 | 6.39 | (0.04 | ) | (0.84 | ) | (0.88 | ) | 0.00 | (d) | ||||||||||||||||||||||
Year Ended December 31, 2009 | $ | 17.71 | 0.04 | 6.98 | 7.02 | (0.05 | ) | — | (0.05 | ) | 0.00 | (d) | |||||||||||||||||||||||
Year Ended December 31, 2008 | $ | 29.61 | 0.06 | (11.29 | ) | (11.23 | ) | (0.01 | ) | (0.66 | ) | (0.67 | ) | — | |||||||||||||||||||||
(a) Certain line items from prior years have been reclassified to conform to the current presentation.
(b) In addition to the fees and expenses which the Fund bears directly, the Fund indirectly bears a pro rata share of the fees and expenses of the underlying funds in which it invests. Such indirect expenses are not included in the reported expense ratios.
(c) The benefits derived from custody fees paid indirectly had an impact of less than 0.01%.
(d) Rounds to less than $0.01 per share.
(e) Class I shares commenced operations on September 27, 2010. Per share data and total return reflect activity from that date.
(f) Annualized.
(g) Class R4 shares commenced operations on November 8, 2012. Per share data and total return reflect activity from that date.
(h) Class R5 shares commenced operations on November 8, 2012. Per share data and total return reflect activity from that date.
(i) Class Y shares commenced operations on November 8, 2012. Per share data and total return reflect activity from that date.
See accompanying notes to financial statements.
100
Ratio to Average Net Assets | Supplemental Data | ||||||||||||||||||||||||||||||
| Net Asset Value, End of Period | Total Return | Total gross expenses (a) | Total net expenses (b)(c) | Net investment income (loss) | Portfolio turnover rate | Net assets, end of period (000s) | |||||||||||||||||||||||||
Class A | |||||||||||||||||||||||||||||||
Year Ended December 31, 2012 | $ | 29.36 | 17.62 | % | 1.06 | % | 1.06 | % | 0.27 | % | 16 | % | $ | 3,233,494 | |||||||||||||||||
Year Ended December 31, 2011 | $ | 26.63 | (4.91 | )% | 1.06 | % | 1.06 | % | (0.33 | )% | 18 | % | $ | 3,246,833 | |||||||||||||||||
Year Ended December 31, 2010 | $ | 29.24 | 25.61 | % | 1.07 | % | 1.07 | % | (0.22 | )% | 28 | % | $ | 3,639,788 | |||||||||||||||||
Year Ended December 31, 2009 | $ | 23.98 | 39.26 | % | 1.07 | % | 1.07 | % | (0.12 | )% | 27 | % | $ | 2,937,761 | |||||||||||||||||
Year Ended December 31, 2008 | $ | 17.22 | (38.72 | )% | 1.05 | % | 1.05 | % | (0.04 | )% | 21 | % | $ | 2,221,100 | |||||||||||||||||
Class B | |||||||||||||||||||||||||||||||
Year Ended December 31, 2012 | $ | 26.80 | 16.98 | % | 1.65 | % | 1.64 | % | (0.42 | )% | 16 | % | $ | 33,623 | |||||||||||||||||
Year Ended December 31, 2011 | $ | 24.53 | (5.34 | )% | 1.67 | % | 1.67 | % | (0.98 | )% | 18 | % | $ | 67,153 | |||||||||||||||||
Year Ended December 31, 2010 | $ | 27.14 | 24.81 | % | 1.69 | % | 1.69 | % | (0.88 | )% | 28 | % | $ | 287,650 | |||||||||||||||||
Year Ended December 31, 2009 | $ | 22.43 | 38.37 | % | 1.74 | % | 1.74 | % | (0.77 | )% | 27 | % | $ | 525,072 | |||||||||||||||||
Year Ended December 31, 2008 | $ | 16.21 | (39.11 | )% | 1.65 | % | 1.65 | % | (0.64 | )% | 21 | % | $ | 581,587 | |||||||||||||||||
Class C | |||||||||||||||||||||||||||||||
Year Ended December 31, 2012 | $ | 26.34 | 16.77 | % | 1.80 | % | 1.80 | % | (0.46 | )% | 16 | % | $ | 756,709 | |||||||||||||||||
Year Ended December 31, 2011 | $ | 24.18 | (5.63 | )% | 1.82 | % | 1.82 | % | (1.10 | )% | 18 | % | $ | 721,446 | |||||||||||||||||
Year Ended December 31, 2010 | $ | 26.85 | 24.63 | % | 1.85 | % | 1.85 | % | (1.00 | )% | 28 | % | $ | 829,181 | |||||||||||||||||
Year Ended December 31, 2009 | $ | 22.23 | 38.16 | % | 1.89 | % | 1.89 | % | (0.93 | )% | 27 | % | $ | 736,818 | |||||||||||||||||
Year Ended December 31, 2008 | $ | 16.09 | (39.23 | )% | 1.83 | % | 1.83 | % | (0.82 | )% | 21 | % | $ | 622,665 | |||||||||||||||||
Class I | |||||||||||||||||||||||||||||||
Year Ended December 31, 2012 | $ | 30.47 | 18.02 | % | 0.72 | % | 0.72 | % | 0.86 | % | 16 | % | $ | 58,652 | |||||||||||||||||
Year Ended December 31, 2011 | $ | 27.57 | (4.57 | )% | 0.72 | % | 0.72 | % | 0.02 | % | 18 | % | $ | 16,397 | |||||||||||||||||
Year Ended December 31, 2010 (e) | $ | 30.19 | 15.94 | % | 0.71 | %(f) | 0.71 | %(f) | (0.13 | )%(f) | 28 | % | $ | 11,627 | |||||||||||||||||
Class R4 | |||||||||||||||||||||||||||||||
Year Ended December 31, 2012 (g) | $ | 30.90 | 6.31 | % | 0.87 | %(f) | 0.86 | %(f) | 1.24 | %(f) | 16 | % | $ | 17 | |||||||||||||||||
Class R5 | |||||||||||||||||||||||||||||||
Year Ended December 31, 2012 (h) | $ | 30.88 | 6.33 | % | 0.82 | %(f) | 0.81 | %(f) | 1.29 | %(f) | 16 | % | $ | 3 | |||||||||||||||||
Class Y | |||||||||||||||||||||||||||||||
Year Ended December 31, 2012 (i) | $ | 30.90 | 6.34 | % | 0.75 | %(f) | 0.75 | %(f) | 2.21 | %(f) | 16 | % | $ | 67,012 | |||||||||||||||||
Class Z | |||||||||||||||||||||||||||||||
Year Ended December 31, 2012 | $ | 30.45 | 17.93 | % | 0.78 | % | 0.78 | % | 0.57 | % | 16 | % | $ | 13,374,355 | |||||||||||||||||
Year Ended December 31, 2011 | $ | 27.56 | (4.61 | )% | 0.76 | % | 0.76 | % | (0.03 | )% | 18 | % | $ | 12,284,748 | |||||||||||||||||
Year Ended December 31, 2010 | $ | 30.19 | 26.00 | % | 0.76 | % | 0.76 | % | 0.09 | % | 28 | % | $ | 13,330,466 | |||||||||||||||||
Year Ended December 31, 2009 | $ | 24.68 | 39.65 | % | 0.77 | % | 0.77 | % | 0.18 | % | 27 | % | $ | 10,527,500 | |||||||||||||||||
Year Ended December 31, 2008 | $ | 17.71 | (38.55 | )% | 0.76 | % | 0.76 | % | 0.26 | % | 21 | % | $ | 7,445,862 | |||||||||||||||||
See accompanying notes to financial statements.
101
Columbia Acorn Family of Funds
Financial Highlights, continued
Columbia Acorn International
Income from Investment Operations | Less Distributions to Shareholders | ||||||||||||||||||||||||||||||||||||||
| Net Asset Value, Beginning of Period | Net investment income (loss) | Net realized and unrealized gain (loss) | Reimbursement from affiliate | Total from investment operations | From net investment income | From net realized gains | Total Distributions to Shareholders | Redemption fees added to paid in capital | |||||||||||||||||||||||||||||||
Class A | |||||||||||||||||||||||||||||||||||||||
Year Ended December 31, 2012 | $ | 34.15 | 0.47 | 6.75 | — | 7.22 | (0.58 | ) | — | (0.58 | ) | — | |||||||||||||||||||||||||||
Year Ended December 31, 2011 | $ | 40.87 | 0.32 | (6.02 | ) | 0.00 | (c) | (5.70 | ) | (1.02 | ) | — | (1.02 | ) | — | ||||||||||||||||||||||||
Year Ended December 31, 2010 | $ | 34.13 | 0.22 | 7.21 | — | 7.43 | (0.69 | ) | — | (0.69 | ) | 0.00 | (c) | ||||||||||||||||||||||||||
Year Ended December 31, 2009 | $ | 23.03 | 0.23 | 11.27 | — | 11.50 | (0.41 | ) | — | (0.41 | ) | 0.00 | (c) | ||||||||||||||||||||||||||
Year Ended December 31, 2008 | $ | 43.42 | 0.47 | (20.20 | ) | — | (19.73 | ) | (0.06 | ) | (0.60 | ) | (0.66 | ) | 0.00 | (c) | |||||||||||||||||||||||
Class B | |||||||||||||||||||||||||||||||||||||||
Year Ended December 31, 2012 | $ | 33.17 | 0.19 | 6.55 | — | 6.74 | (0.24 | ) | — | (0.24 | ) | — | |||||||||||||||||||||||||||
Year Ended December 31, 2011 | $ | 39.96 | 0.06 | (5.85 | ) | 0.00 | (c) | (5.79 | ) | (1.00 | ) | — | (1.00 | ) | — | ||||||||||||||||||||||||
Year Ended December 31, 2010 | $ | 33.22 | 0.03 | 7.02 | — | 7.05 | (0.31 | ) | — | (0.31 | ) | 0.00 | (c) | ||||||||||||||||||||||||||
Year Ended December 31, 2009 | $ | 22.41 | 0.08 | 10.92 | — | 11.00 | (0.20 | ) | — | (0.20 | ) | 0.00 | (c) | ||||||||||||||||||||||||||
Year Ended December 31, 2008 | $ | 42.46 | 0.27 | (19.72 | ) | — | (19.45 | ) | — | (0.60 | ) | (0.60 | ) | 0.00 | (c) | ||||||||||||||||||||||||
Class C | |||||||||||||||||||||||||||||||||||||||
Year Ended December 31, 2012 | $ | 33.03 | 0.18 | 6.52 | — | 6.70 | (0.23 | ) | — | (0.23 | ) | — | |||||||||||||||||||||||||||
Year Ended December 31, 2011 | $ | 39.79 | 0.04 | (5.86 | ) | 0.00 | (c) | (5.82 | ) | (0.94 | ) | — | (0.94 | ) | — | ||||||||||||||||||||||||
Year Ended December 31, 2010 | $ | 33.08 | (0.05 | ) | 7.03 | — | 6.98 | (0.27 | ) | — | (0.27 | ) | 0.00 | (c) | |||||||||||||||||||||||||
Year Ended December 31, 2009 | $ | 22.30 | 0.02 | 10.89 | — | 10.91 | (0.14 | ) | — | (0.14 | ) | 0.00 | (c) | ||||||||||||||||||||||||||
Year Ended December 31, 2008 | $ | 42.32 | 0.21 | (19.63 | ) | — | (19.42 | ) | — | (0.60 | ) | (0.60 | ) | 0.00 | (c) | ||||||||||||||||||||||||
Class I | |||||||||||||||||||||||||||||||||||||||
Year Ended December 31, 2012 | $ | 34.33 | 0.57 | 6.83 | — | 7.40 | (0.87 | ) | — | (0.87 | ) | — | |||||||||||||||||||||||||||
Year Ended December 31, 2011 | $ | 40.92 | 0.37 | (5.94 | ) | 0.00 | (c) | (5.57 | ) | (1.02 | ) | — | (1.02 | ) | — | ||||||||||||||||||||||||
Year Ended December 31, 2010 (g) | $ | 37.69 | 0.08 | 3.49 | — | 3.57 | (0.34 | ) | — | (0.34 | ) | 0.00 | (c) | ||||||||||||||||||||||||||
Class R | |||||||||||||||||||||||||||||||||||||||
Year Ended December 31, 2012 | $ | 34.11 | 0.21 | 6.89 | — | 7.10 | (0.42 | ) | — | (0.42 | ) | — | |||||||||||||||||||||||||||
Year Ended December 31, 2011 (i) | $ | 40.11 | (0.00 | )(c) | (6.00 | ) | 0.00 | (c) | (6.00 | ) | — | — | — | — | |||||||||||||||||||||||||
Class R4 | |||||||||||||||||||||||||||||||||||||||
Year Ended December 31, 2012 (j) | $ | 39.86 | (0.00 | )(c) | 1.81 | — | 1.81 | (0.59 | ) | — | (0.59 | ) | — | ||||||||||||||||||||||||||
Class R5 | |||||||||||||||||||||||||||||||||||||||
Year Ended December 31, 2012 | $ | 34.31 | 0.75 | 6.62 | — | 7.37 | (0.87 | ) | — | (0.87 | ) | — | |||||||||||||||||||||||||||
Year Ended December 31, 2011 (k) | $ | 40.24 | 0.09 | (6.02 | ) | 0.00 | (c) | (5.93 | ) | — | — | — | — | ||||||||||||||||||||||||||
Class Y | |||||||||||||||||||||||||||||||||||||||
Year Ended December 31, 2012 (l) | $ | 39.90 | 0.04 | 1.78 | — | 1.82 | (0.64 | ) | — | (0.64 | ) | — | |||||||||||||||||||||||||||
Class Z | |||||||||||||||||||||||||||||||||||||||
Year Ended December 31, 2012 | $ | 34.31 | 0.59 | 6.78 | — | 7.37 | (0.84 | ) | — | (0.84 | ) | — | |||||||||||||||||||||||||||
Year Ended December 31, 2011 | $ | 40.92 | 0.48 | (6.07 | ) | 0.00 | (c) | (5.59 | ) | (1.02 | ) | — | (1.02 | ) | — | ||||||||||||||||||||||||
Year Ended December 31, 2010 | $ | 34.26 | 0.35 | 7.23 | — | 7.58 | (0.92 | ) | — | (0.92 | ) | 0.00 | (c) | ||||||||||||||||||||||||||
Year Ended December 31, 2009 | $ | 23.13 | 0.34 | 11.31 | — | 11.65 | (0.53 | ) | — | (0.53 | ) | 0.00 | (c) | ||||||||||||||||||||||||||
Year Ended December 31, 2008 | $ | 43.60 | 0.60 | (20.26 | ) | — | (19.66 | ) | (0.21 | ) | (0.60 | ) | (0.81 | ) | 0.00 | (c) | |||||||||||||||||||||||
(a) Certain line items from prior years have been reclassified to conform to the current presentation.
(b) The benefits derived from custody fees paid indirectly had an impact of 0.01%.
(c) Rounds to less than $0.01 per share.
(d) Had the Investment Manager and/or Transfer Agent not waived fees and/or reimbursed a portion of expenses, total return would have been reduced.
(e) In addition to the fees and expenses which the Fund bears directly, the Fund indirectly bears a pro rata share of the fees and expenses of the underlying funds in which it invests. Such indirect expenses are not included in the reported expense ratios.
(f) During the year ended December 31, 2011, Columbia Management reimbursed the Fund for a loss on a trading error. Had the Fund not received this reimbursement, total return would have been lower by less than 0.01%.
(g) Class I shares commenced operations on September 27, 2010. Per share data and total return reflect activity from that date.
(h) Annualized.
(i) Class R shares commenced operations on August 15, 2011. Per share data and total return reflect activity from that date.
(j) Class R4 shares commenced operations on November 8, 2012. Per share data and total return reflect activity from that date.
(k) Class R5 shares commenced operations on August 15, 2011. Per share data and total return reflect activity from that date.
(l) Class Y shares commenced operations on November 8, 2012. Per share data and total return reflect activity from that date.
See accompanying notes to financial statements.
102
Ratio to Average Net Assets | Supplemental Data | ||||||||||||||||||||||||||||||||||
| Increase from regulatory settlements | Net Asset Value, End of Period | Total Return | Total gross expenses (a) | Total net expenses (b) | Net investment income (loss) | Portfolio turnover rate | Net assets, end of period (000s) | ||||||||||||||||||||||||||||
Class A | |||||||||||||||||||||||||||||||||||
Year Ended December 31, 2012 | 0.00 | (c) | $ | 40.79 | 21.21 | %(d) | 1.28 | % | 1.24 | %(e) | 1.22 | % | 33 | % | $ | 1,007,236 | |||||||||||||||||||
Year Ended December 31, 2011 | 0.00 | (c) | $ | 34.15 | (14.37 | %)(d)(f) | 1.32 | % | 1.30 | %(e) | 0.84 | % | 32 | % | $ | 918,112 | |||||||||||||||||||
Year Ended December 31, 2010 | 0.00 | (c) | $ | 40.87 | 22.23 | % | 1.35 | % | 1.35 | %(e) | 0.62 | % | 25 | % | $ | 810,603 | |||||||||||||||||||
Year Ended December 31, 2009 | 0.01 | $ | 34.13 | 50.40 | % | 1.36 | % | 1.36 | %(e) | 0.85 | % | 31 | % | $ | 578,599 | ||||||||||||||||||||
Year Ended December 31, 2008 | — | $ | 23.03 | (46.09 | %) | 1.31 | % | 1.31 | % | 1.36 | % | 38 | % | $ | 366,820 | ||||||||||||||||||||
Class B | |||||||||||||||||||||||||||||||||||
Year Ended December 31, 2012 | 0.00 | (c) | $ | 39.67 | 20.33 | %(d) | 2.00 | % | 1.97 | %(e) | 0.51 | % | 33 | % | $ | 17,910 | |||||||||||||||||||
Year Ended December 31, 2011 | 0.00 | (c) | $ | 33.17 | (14.92 | %)(d)(f) | 1.98 | % | 1.96 | %(e) | 0.15 | % | 32 | % | $ | 24,510 | |||||||||||||||||||
Year Ended December 31, 2010 | 0.00 | (c) | $ | 39.96 | 21.49 | % | 1.96 | % | 1.96 | %(e) | 0.08 | % | 25 | % | $ | 29,368 | |||||||||||||||||||
Year Ended December 31, 2009 | 0.01 | $ | 33.22 | 49.36 | % | 2.03 | % | 2.03 | %(e) | 0.29 | % | 31 | % | $ | 38,835 | ||||||||||||||||||||
Year Ended December 31, 2008 | — | $ | 22.41 | (46.41 | %) | 1.90 | % | 1.90 | % | 0.77 | % | 38 | % | $ | 39,153 | ||||||||||||||||||||
Class C | |||||||||||||||||||||||||||||||||||
Year Ended December 31, 2012 | 0.00 | (c) | $ | 39.50 | 20.31 | %(d) | 2.02 | % | 2.00 | %(e) | 0.48 | % | 33 | % | $ | 92,748 | |||||||||||||||||||
Year Ended December 31, 2011 | 0.00 | (c) | $ | 33.03 | (15.02 | %)(d)(f) | 2.07 | % | 2.06 | %(e) | 0.10 | % | 32 | % | $ | 97,328 | |||||||||||||||||||
Year Ended December 31, 2010 | 0.00 | (c) | $ | 39.79 | 21.34 | % | 2.11 | % | 2.11 | %(e) | (0.13 | %) | 25 | % | $ | 110,931 | |||||||||||||||||||
Year Ended December 31, 2009 | 0.01 | $ | 33.08 | 49.12 | % | 2.17 | % | 2.17 | %(e) | 0.07 | % | 31 | % | $ | 85,625 | ||||||||||||||||||||
Year Ended December 31, 2008 | — | $ | 22.30 | (46.50 | %) | 2.08 | % | 2.08 | % | 0.60 | % | 38 | % | $ | 62,906 | ||||||||||||||||||||
Class I | |||||||||||||||||||||||||||||||||||
Year Ended December 31, 2012 | 0.00 | (c) | $ | 40.86 | 21.69 | % | 0.88 | % | 0.88 | %(e) | 1.48 | % | 33 | % | $ | 97,484 | |||||||||||||||||||
Year Ended December 31, 2011 | 0.00 | (c) | $ | 34.33 | (14.02 | %)(f) | 0.91 | % | 0.91 | %(e) | 0.99 | % | 32 | % | $ | 50,335 | |||||||||||||||||||
Year Ended December 31, 2010 (g) | — | $ | 40.92 | 9.50 | % | 0.94 | %(h) | 0.94 | %(e)(h) | 0.77 | %(h) | 25 | % | $ | 66,581 | ||||||||||||||||||||
Class R | |||||||||||||||||||||||||||||||||||
Year Ended December 31, 2012 | 0.00 | (c) | $ | 40.79 | 20.83 | % | 1.52 | % | 1.51 | %(e) | 0.54 | % | 33 | % | $ | 2,799 | |||||||||||||||||||
Year Ended December 31, 2011 (i) | 0.00 | (c) | $ | 34.11 | (14.96 | %) | 1.59 | %(h) | 1.59 | %(e)(h) | (0.02 | %)(h) | 32 | % | $ | 2,130 | |||||||||||||||||||
Class R4 | |||||||||||||||||||||||||||||||||||
Year Ended December 31, 2012 (j) | — | $ | 41.08 | 4.57 | 1.03 | %(h) | 1.02 | %(e)(h) | (0.02 | %)(h) | 33 | % | $ | 15 | |||||||||||||||||||||
Class R5 | |||||||||||||||||||||||||||||||||||
Year Ended December 31, 2012 | 0.00 | (c) | $ | 40.81 | 21.61 | % | 0.89 | % | 0.89 | %(e) | 1.99 | % | 33 | % | $ | 242 | |||||||||||||||||||
Year Ended December 31, 2011 (k) | 0.00 | (c) | $ | 34.31 | (14.74 | %) | 0.91 | %(h) | 0.91 | %(e)(h) | 0.65 | %(h) | 32 | % | $ | 2,038 | |||||||||||||||||||
Class Y | |||||||||||||||||||||||||||||||||||
Year Ended December 31, 2012 (l) | — | $ | 41.08 | 4.59 | % | 0.91 | %(h) | 0.90 | %(e)(h) | 0.75 | %(h) | 33 | % | $ | 30,856 | ||||||||||||||||||||
Class Z | |||||||||||||||||||||||||||||||||||
Year Ended December 31, 2012 | 0.00 | (c) | $ | 40.84 | 21.60 | % | 0.93 | % | 0.93 | %(e) | 1.53 | % | 33 | % | $ | 5,494,506 | |||||||||||||||||||
Year Ended December 31, 2011 | 0.00 | (c) | $ | 34.31 | (14.06 | %)(f) | 0.95 | % | 0.95 | %(e) | 1.24 | % | 32 | % | $ | 4,322,500 | |||||||||||||||||||
Year Ended December 31, 2010 | 0.00 | (c) | $ | 40.92 | 22.70 | % | 0.97 | % | 0.97 | %(e) | 0.99 | % | 25 | % | $ | 5,107,580 | |||||||||||||||||||
Year Ended December 31, 2009 | 0.01 | $ | 34.26 | 50.97 | % | 0.99 | % | 0.99 | %(e) | 1.23 | % | 31 | % | $ | 3,727,679 | ||||||||||||||||||||
Year Ended December 31, 2008 | — | $ | 23.13 | (45.89 | %) | 0.96 | % | 0.96 | % | 1.72 | % | 38 | % | $ | 2,371,688 | ||||||||||||||||||||
See accompanying notes to financial statements.
103
Columbia Acorn Family of Funds
Financial Highlights, continued
Columbia Acorn USA
Income from Investment Operations | Less Distributions to Shareholders | ||||||||||||||||||||||||||||||||||
| Net Asset Value, Beginning of Period | Net investment income (loss) | Net realized and unrealized gain (loss) | Total from investment operations | From net investment income | From net realized gains | Total Distributions to Shareholders | Increase from regulatory settlements | ||||||||||||||||||||||||||||
Class A | |||||||||||||||||||||||||||||||||||
Year Ended December 31, 2012 | $ | 25.94 | 0.02 | 4.73 | 4.75 | (0.11 | ) | (2.37 | ) | (2.48 | ) | — | |||||||||||||||||||||||
Year Ended December 31, 2011 | $ | 27.54 | (0.22 | ) | (1.21 | ) | (1.43 | ) | — | (0.17 | ) | (0.17 | ) | — | |||||||||||||||||||||
Year Ended December 31, 2010 | $ | 22.43 | (0.15 | ) | 5.26 | 5.11 | — | — | — | — | |||||||||||||||||||||||||
Year Ended December 31, 2009 | $ | 15.90 | (0.11 | ) | 6.64 | 6.53 | — | — | — | 0.00 | (e) | ||||||||||||||||||||||||
Year Ended December 31, 2008 | $ | 27.23 | (0.14 | ) | (10.23 | ) | (10.37 | ) | — | (0.96 | ) | (0.96 | ) | — | |||||||||||||||||||||
Class B | |||||||||||||||||||||||||||||||||||
Year Ended December 31, 2012 | $ | 23.98 | (0.19 | ) | 4.39 | 4.20 | — | (2.37 | ) | (2.37 | ) | — | |||||||||||||||||||||||
Year Ended December 31, 2011 | $ | 25.60 | (0.37 | ) | (1.08 | ) | (1.45 | ) | — | (0.17 | ) | (0.17 | ) | — | |||||||||||||||||||||
Year Ended December 31, 2010 | $ | 20.99 | (0.30 | ) | 4.91 | 4.61 | — | — | — | — | |||||||||||||||||||||||||
Year Ended December 31, 2009 | $ | 14.98 | (0.22 | ) | 6.23 | 6.01 | — | — | — | 0.00 | (e) | ||||||||||||||||||||||||
Year Ended December 31, 2008 | $ | 25.87 | (0.27 | ) | (9.66 | ) | (9.93 | ) | — | (0.96 | ) | (0.96 | ) | — | |||||||||||||||||||||
Class C | |||||||||||||||||||||||||||||||||||
Year Ended December 31, 2012 | $ | 23.72 | (0.16 | ) | 4.30 | 4.14 | — | (2.37 | ) | (2.37 | ) | — | |||||||||||||||||||||||
Year Ended December 31, 2011 | $ | 25.39 | (0.39 | ) | (1.11 | ) | (1.50 | ) | — | (0.17 | ) | (0.17 | ) | — | |||||||||||||||||||||
Year Ended December 31, 2010 | $ | 20.84 | (0.31 | ) | 4.86 | 4.55 | — | — | — | — | |||||||||||||||||||||||||
Year Ended December 31, 2009 | $ | 14.89 | (0.24 | ) | 6.19 | 5.95 | — | — | — | 0.00 | (e) | ||||||||||||||||||||||||
Year Ended December 31, 2008 | $ | 25.77 | (0.30 | ) | (9.62 | ) | (9.92 | ) | — | (0.96 | ) | (0.96 | ) | — | |||||||||||||||||||||
Class I | |||||||||||||||||||||||||||||||||||
Year Ended December 31, 2012 | $ | 27.00 | (0.10 | ) | 5.16 | 5.06 | (0.22 | ) | (2.37 | ) | (2.59 | ) | — | ||||||||||||||||||||||
Year Ended December 31, 2011 | $ | 28.56 | (0.14 | ) | (1.25 | ) | (1.39 | ) | — | (0.17 | ) | (0.17 | ) | — | |||||||||||||||||||||
Year Ended December 31, 2010 (f) | $ | 24.24 | (0.03 | ) | 4.35 | 4.32 | — | — | — | — | |||||||||||||||||||||||||
Class R4 | |||||||||||||||||||||||||||||||||||
Year Ended December 31, 2012 (h) | $ | 30.06 | 0.06 | 2.28 | 2.34 | (0.16 | ) | (2.32 | ) | (2.48 | ) | — | |||||||||||||||||||||||
Class R5 | |||||||||||||||||||||||||||||||||||
Year Ended December 31, 2012 (i) | $ | 30.06 | 0.07 | 2.27 | 2.34 | (0.18 | ) | (2.32 | ) | (2.50 | ) | — | |||||||||||||||||||||||
Class Y | |||||||||||||||||||||||||||||||||||
Year Ended December 31, 2012 (j) | $ | 30.10 | 0.07 | 2.27 | 2.34 | (0.19 | ) | (2.32 | ) | (2.51 | ) | — | |||||||||||||||||||||||
Class Z | |||||||||||||||||||||||||||||||||||
Year Ended December 31, 2012 | $ | 26.98 | 0.11 | 4.92 | 5.03 | (0.19 | ) | (2.37 | ) | (2.56 | ) | — | |||||||||||||||||||||||
Year Ended December 31, 2011 | $ | 28.56 | (0.14 | ) | (1.27 | ) | (1.41 | ) | — | (0.17 | ) | (0.17 | ) | — | |||||||||||||||||||||
Year Ended December 31, 2010 | $ | 23.19 | (0.08 | ) | 5.45 | 5.37 | — | — | — | — | |||||||||||||||||||||||||
Year Ended December 31, 2009 | $ | 16.39 | (0.07 | ) | 6.87 | 6.80 | — | — | — | 0.00 | (e) | ||||||||||||||||||||||||
Year Ended December 31, 2008 | $ | 27.97 | (0.07 | ) | (10.55 | ) | (10.62 | ) | — | (0.96 | ) | (0.96 | ) | — | |||||||||||||||||||||
(a) Certain line items from prior years have been reclassified to conform to the current presentation.
(b) In addition to the fees and expenses which the Fund bears directly, the Fund indirectly bears a pro rata share of the fees and expenses of the underlying funds in which it invests. Such indirect expenses are not included in the reported expense ratios.
(c) The benefits derived from custody fees paid indirectly had an impact of less than 0.01%.
(d) Includes interest expense which rounds to less than 0.01%.
(e) Rounds to less than $0.01 per share.
(f) Class I shares commenced operations on September 27, 2010. Per share data and total return reflect activity from that date.
(g) Annualized.
(h) Class R4 shares commenced operations on November 8, 2012. Per share data and total return reflect activity from that date.
(i) Class R5 shares commenced operations on November 8, 2012. Per share data and total return reflect activity from that date.
(j) Class Y shares commenced operations on November 8, 2012. Per share data and total return reflect activity from that date.
See accompanying notes to financial statements.
104
Ratio to Average Net Assets | Supplemental Data | ||||||||||||||||||||||||||||||
| Net Asset Value, End of Period | Total Return | Total gross expenses (a) | Total net expenses (b)(c) | Net investment income (loss) | Portfolio turnover rate | Net assets, end of period (000s) | |||||||||||||||||||||||||
Class A | |||||||||||||||||||||||||||||||
Year Ended December 31, 2012 | $ | 28.21 | 18.67 | % | 1.32 | %(d) | 1.32 | %(d) | 0.08 | % | 14 | % | $ | 152,164 | |||||||||||||||||
Year Ended December 31, 2011 | $ | 25.94 | (5.21 | )% | 1.30 | % | 1.30 | % | (0.78 | )% | 20 | % | $ | 167,038 | |||||||||||||||||
Year Ended December 31, 2010 | $ | 27.54 | 22.78 | % | 1.30 | % | 1.30 | % | (0.64 | )% | 32 | % | $ | 214,097 | |||||||||||||||||
Year Ended December 31, 2009 | $ | 22.43 | 41.07 | % | 1.32 | % | 1.32 | % | (0.64 | )% | 28 | % | $ | 178,605 | |||||||||||||||||
Year Ended December 31, 2008 | $ | 15.90 | (39.38 | )% | 1.29 | % | 1.29 | % | (0.60 | )% | 23 | % | $ | 136,597 | |||||||||||||||||
Class B | |||||||||||||||||||||||||||||||
Year Ended December 31, 2012 | $ | 25.81 | 17.87 | % | 1.99 | %(d) | 1.99 | %(d) | (0.71 | )% | 14 | % | $ | 1,056 | |||||||||||||||||
Year Ended December 31, 2011 | $ | 23.98 | (5.68 | )% | 1.92 | % | 1.92 | % | (1.42 | )% | 20 | % | $ | 2,253 | |||||||||||||||||
Year Ended December 31, 2010 | $ | 25.60 | 21.96 | % | 1.98 | % | 1.98 | % | (1.37 | )% | 32 | % | $ | 9,222 | |||||||||||||||||
Year Ended December 31, 2009 | $ | 20.99 | 40.12 | % | 2.02 | % | 2.02 | % | (1.33 | )% | 28 | % | $ | 20,903 | |||||||||||||||||
Year Ended December 31, 2008 | $ | 14.98 | (39.75 | )% | 1.92 | % | 1.92 | % | (1.24 | )% | 23 | % | $ | 23,633 | |||||||||||||||||
Class C | |||||||||||||||||||||||||||||||
Year Ended December 31, 2012 | $ | 25.49 | 17.82 | % | 2.05 | %(d) | 2.05 | %(d) | (0.61 | )% | 14 | % | $ | 31,410 | |||||||||||||||||
Year Ended December 31, 2011 | $ | 23.72 | (5.92 | )% | 2.05 | % | 2.05 | % | (1.53 | )% | 20 | % | $ | 30,584 | |||||||||||||||||
Year Ended December 31, 2010 | $ | 25.39 | 21.83 | % | 2.08 | % | 2.08 | % | (1.41 | )% | 32 | % | $ | 36,101 | |||||||||||||||||
Year Ended December 31, 2009 | $ | 20.84 | 39.96 | % | 2.13 | % | 2.13 | % | (1.45 | )% | 28 | % | $ | 32,508 | |||||||||||||||||
Year Ended December 31, 2008 | $ | 14.89 | (39.87 | )% | 2.08 | % | 2.08 | % | (1.39 | )% | 23 | % | $ | 25,899 | |||||||||||||||||
Class I | |||||||||||||||||||||||||||||||
Year Ended December 31, 2012 | $ | 29.47 | 19.10 | % | 0.96 | % | 0.96 | % | (0.33 | )% | 14 | % | $ | 3 | |||||||||||||||||
Year Ended December 31, 2011 | $ | 27.00 | (4.88 | )% | 0.94 | % | 0.94 | % | (0.47 | )% | 20 | % | $ | 2,635 | |||||||||||||||||
Year Ended December 31, 2010 (f) | $ | 28.56 | 17.82 | % | 0.94 | %(g) | 0.94 | %(g) | (0.35 | )%(g) | 32 | % | $ | 28,993 | |||||||||||||||||
Class R4 | |||||||||||||||||||||||||||||||
Year Ended December 31, 2012 (h) | $ | 29.92 | 8.06 | % | 1.14 | %(d)(g) | 1.14 | %(d)(g) | 1.51 | %(g) | 14 | % | $ | 15 | |||||||||||||||||
Class R5 | |||||||||||||||||||||||||||||||
Year Ended December 31, 2012 (i) | $ | 29.90 | 8.06 | % | 1.12 | %(g) | 1.12 | %(g) | 1.53 | %(g) | 14 | % | $ | 2 | |||||||||||||||||
Class Y | |||||||||||||||||||||||||||||||
Year Ended December 31, 2012 (j) | $ | 29.93 | 8.07 | % | 1.04 | %(g) | 1.04 | %(g) | 1.62 | %(g) | 14 | % | $ | 2 | |||||||||||||||||
Class Z | |||||||||||||||||||||||||||||||
Year Ended December 31, 2012 | $ | 29.45 | 18.98 | % | 1.07 | %(d) | 1.07 | %(d) | 0.36 | % | 14 | % | $ | 1,415,442 | |||||||||||||||||
Year Ended December 31, 2011 | $ | 26.98 | (4.95 | )% | 1.00 | % | 1.00 | % | (0.48 | )% | 20 | % | $ | 1,355,934 | |||||||||||||||||
Year Ended December 31, 2010 | $ | 28.56 | 23.16 | % | 1.01 | % | 1.01 | % | (0.34 | )% | 32 | % | $ | 1,410,133 | |||||||||||||||||
Year Ended December 31, 2009 | $ | 23.19 | 41.49 | % | 1.03 | % | 1.03 | % | (0.36 | )% | 28 | % | $ | 1,157,593 | |||||||||||||||||
Year Ended December 31, 2008 | $ | 16.39 | (39.22 | )% | 1.01 | % | 1.01 | % | (0.32 | )% | 23 | % | $ | 758,267 | |||||||||||||||||
See accompanying notes to financial statements.
105
Columbia Acorn Family of Funds
Financial Highlights, continued
Columbia Acorn International Select
Income from Investment Operations | Less Distributions to Shareholders | ||||||||||||||||||||||||||||||||||
| Net Asset Value, Beginning of Period | Net investment income (loss) | Net realized and unrealized gain (loss) | Total from investment operations | From net investment income | From net realized gains | Total Distributions to Shareholders | Redemption fees added to paid in capital | ||||||||||||||||||||||||||||
Class A | |||||||||||||||||||||||||||||||||||
Year Ended December 31, 2012 | $ | 24.26 | 0.39 | 4.92 | 5.31 | (1.75 | ) | (2.21 | ) | (3.96 | ) | — | |||||||||||||||||||||||
Year Ended December 31, 2011 | $ | 28.01 | 0.18 | (2.95 | ) | (2.77 | ) | (0.59 | ) | (0.39 | ) | (0.98 | ) | — | |||||||||||||||||||||
Year Ended December 31, 2010 | $ | 23.39 | 0.08 | 4.84 | 4.92 | (0.30 | ) | — | (0.30 | ) | 0.00 | (f) | |||||||||||||||||||||||
Year Ended December 31, 2009 | $ | 17.99 | 0.10 | 5.43 | 5.53 | (0.15 | ) | — | (0.15 | ) | 0.00 | (f) | |||||||||||||||||||||||
Year Ended December 31, 2008 | $ | 31.74 | 0.20 | (13.41 | ) | (13.21 | ) | — | (0.54 | ) | (0.54 | ) | 0.00 | (f) | |||||||||||||||||||||
Class B | |||||||||||||||||||||||||||||||||||
Year Ended December 31, 2012 | $ | 23.27 | 0.23 | 4.69 | 4.92 | (1.58 | ) | (2.21 | ) | (3.79 | ) | — | |||||||||||||||||||||||
Year Ended December 31, 2011 | $ | 26.72 | 0.01 | (2.82 | ) | (2.81 | ) | (0.25 | ) | (0.39 | ) | (0.64 | ) | — | |||||||||||||||||||||
Year Ended December 31, 2010 | $ | 22.34 | (0.06 | ) | 4.62 | 4.56 | (0.18 | ) | — | (0.18 | ) | 0.00 | (f) | ||||||||||||||||||||||
Year Ended December 31, 2009 | $ | 17.16 | (0.01 | ) | 5.17 | 5.16 | — | — | — | 0.00 | (f) | ||||||||||||||||||||||||
Year Ended December 31, 2008 | $ | 30.50 | 0.04 | (12.84 | ) | (12.80 | ) | — | (0.54 | ) | (0.54 | ) | 0.00 | (f) | |||||||||||||||||||||
Class C | |||||||||||||||||||||||||||||||||||
Year Ended December 31, 2012 | $ | 23.17 | 0.18 | 4.67 | 4.85 | (1.53 | ) | (2.21 | ) | (3.74 | ) | — | |||||||||||||||||||||||
Year Ended December 31, 2011 | $ | 26.58 | (0.04 | ) | (2.81 | ) | (2.85 | ) | (0.17 | ) | (0.39 | ) | (0.56 | ) | — | ||||||||||||||||||||
Year Ended December 31, 2010 | $ | 22.21 | (0.10 | ) | 4.60 | 4.50 | (0.13 | ) | — | (0.13 | ) | 0.00 | (f) | ||||||||||||||||||||||
Year Ended December 31, 2009 | $ | 17.08 | (0.06 | ) | 5.17 | 5.11 | — | — | — | 0.00 | (f) | ||||||||||||||||||||||||
Year Ended December 31, 2008 | $ | 30.42 | 0.00 | (f) | (12.80 | ) | (12.80 | ) | — | (0.54 | ) | (0.54 | ) | 0.00 | (f) | ||||||||||||||||||||
Class I | |||||||||||||||||||||||||||||||||||
Year Ended December 31, 2012 | $ | 24.45 | 0.51 | 4.94 | 5.45 | (1.84 | ) | (2.21 | ) | (4.05 | ) | — | |||||||||||||||||||||||
Year Ended December 31, 2011 | $ | 28.33 | 0.31 | (2.97 | ) | (2.66 | ) | (0.83 | ) | (0.39 | ) | (1.22 | ) | — | |||||||||||||||||||||
Year Ended December 31, 2010 (h) | $ | 26.11 | 0.03 | 2.19 | 2.22 | — | — | — | — | ||||||||||||||||||||||||||
Class R4 | |||||||||||||||||||||||||||||||||||
Year Ended December 31, 2012 (j) | $ | 29.98 | (0.02 | ) | (0.09 | )(k) | (0.11 | ) | (1.79 | ) | (2.09 | ) | (3.88 | ) | — | ||||||||||||||||||||
Class R5 | |||||||||||||||||||||||||||||||||||
Year Ended December 31, 2012 (l) | $ | 29.98 | (0.02 | ) | (0.09 | )(k) | (0.11 | ) | (1.80 | ) | (2.09 | ) | (3.89 | ) | — | ||||||||||||||||||||
Class Y | |||||||||||||||||||||||||||||||||||
Year Ended December 31, 2012 (m) | $ | 29.99 | (0.02 | ) | (0.09 | )(k) | (0.11 | ) | (1.81 | ) | (2.09 | ) | (3.90 | ) | — | ||||||||||||||||||||
Class Z | |||||||||||||||||||||||||||||||||||
Year Ended December 31, 2012 | $ | 24.46 | 0.49 | 4.95 | 5.44 | (1.83 | ) | (2.21 | ) | (4.04 | ) | — | |||||||||||||||||||||||
Year Ended December 31, 2011 | $ | 28.33 | 0.29 | (2.98 | ) | (2.69 | ) | (0.79 | ) | (0.39 | ) | (1.18 | ) | — | |||||||||||||||||||||
Year Ended December 31, 2010 | $ | 23.64 | 0.18 | 4.89 | 5.07 | (0.38 | ) | — | (0.38 | ) | 0.00 | (f) | |||||||||||||||||||||||
Year Ended December 31, 2009 | $ | 18.19 | 0.17 | 5.50 | 5.67 | (0.24 | ) | — | (0.24 | ) | 0.00 | (f) | |||||||||||||||||||||||
Year Ended December 31, 2008 | $ | 32.02 | 0.28 | (13.53 | ) | (13.25 | ) | (0.04 | ) | (0.54 | ) | (0.58 | ) | 0.00 | (f) | ||||||||||||||||||||
(a) Certain line items from prior years have been reclassified to conform to the current presentation.
(b) Includes interest expense which rounds to less than 0.01%.
(c) In addition to the fees and expenses which the Fund bears directly, the Fund indirectly bears a pro rata share of the fees and expenses of the underlying funds in which it invests. Such indirect expenses are not included in the reported expense ratios.
(d) The benefits derived from custody fees paid indirectly had an impact of 0.01%.
(e) The benefits derived from custody fees paid indirectly had an impact of less than 0.01%.
(f) Rounds to less than $0.01 per share.
(g) Had the Investment Manager and/or Transfer Agent not waived fees and/or reimbursed a portion of expenses, total return would have been reduced.
(h) Class I shares commenced operations on September 27, 2010. Per share data and total return reflect activity from that date.
(i) Annualized.
(j) Class R4 shares commenced operations on November 8, 2012. Per share data and total return reflect activity from that date.
(k) Calculation of the net gain (loss) per share (both realized and unrealized) does not correlate to the aggregate realized and unrealized gain (loss) presented in the Statements of Operations due to the timing of sales and repurchases of Fund shares in relation to fluctuations in the market value of the portfolio.
(l) Class R5 shares commenced operations on November 8, 2012. Per share data and total return reflect activity from that date.
(m) Class Y shares commenced operations on November 8, 2012. Per share data and total return reflect activity from that date.
See accompanying notes to financial statements.
106
Ratio to Average Net Assets | Supplemental Data | ||||||||||||||||||||||||||||||||||
| Increase from regulatory settlements | Net Asset Value, End of Period | Total Return | Total gross expenses (a) | Total net expenses | Net investment income (loss) | Portfolio turnover rate | Net assets, end of period (000s) | ||||||||||||||||||||||||||||
Class A | |||||||||||||||||||||||||||||||||||
Year Ended December 31, 2012 | — | $ | 25.61 | 22.05 | % | 1.49 | %(b) | 1.49 | %(b)(c)(d) | 1.43 | % | 63 | % | $ | 74,167 | ||||||||||||||||||||
Year Ended December 31, 2011 | — | $ | 24.26 | (10.11 | )% | 1.51 | % | 1.51 | %(c)(e) | 0.66 | % | 44 | % | $ | 56,350 | ||||||||||||||||||||
Year Ended December 31, 2010 | 0.00 | (f) | $ | 28.01 | 21.41 | % | 1.56 | % | 1.56 | %(c)(e) | 0.33 | % | 42 | % | $ | 71,668 | |||||||||||||||||||
Year Ended December 31, 2009 | 0.02 | $ | 23.39 | 31.01 | % | 1.56 | % | 1.56 | %(e) | 0.53 | % | 56 | % | $ | 64,664 | ||||||||||||||||||||
Year Ended December 31, 2008 | — | $ | 17.99 | (42.30 | )% | 1.54 | % | 1.54 | %(e) | 0.78 | % | 68 | % | $ | 46,522 | ||||||||||||||||||||
Class B | |||||||||||||||||||||||||||||||||||
Year Ended December 31, 2012 | — | $ | 24.40 | 21.29 | % | 2.11 | %(b) | 2.10 | %(b)(c)(d) | 0.87 | % | 63 | % | $ | 1,250 | ||||||||||||||||||||
Year Ended December 31, 2011 | — | $ | 23.27 | (10.64 | )% | 2.14 | % | 2.14 | %(c)(e) | 0.04 | % | 44 | % | $ | 1,774 | ||||||||||||||||||||
Year Ended December 31, 2010 | 0.00 | (f) | $ | 26.72 | 20.63 | %(g) | 2.24 | % | 2.20 | %(c)(e) | (0.27 | )% | 42 | % | $ | 3,030 | |||||||||||||||||||
Year Ended December 31, 2009 | 0.02 | $ | 22.34 | 30.19 | %(g) | 2.32 | % | 2.20 | %(e) | (0.05 | )% | 56 | % | $ | 3,887 | ||||||||||||||||||||
Year Ended December 31, 2008 | — | $ | 17.16 | (42.68 | )% | 2.17 | % | 2.17 | %(e) | 0.16 | % | 68 | % | $ | 4,444 | ||||||||||||||||||||
Class C | |||||||||||||||||||||||||||||||||||
Year Ended December 31, 2012 | — | $ | 24.28 | 21.10 | % | 2.28 | %(b) | 2.27 | %(b)(c)(d) | 0.67 | % | 63 | % | $ | 9,786 | ||||||||||||||||||||
Year Ended December 31, 2011 | — | $ | 23.17 | (10.81 | )% | 2.31 | % | 2.31 | %(c)(e) | (0.14 | )% | 44 | % | $ | 8,704 | ||||||||||||||||||||
Year Ended December 31, 2010 | 0.00 | (f) | $ | 26.58 | 20.45 | % | 2.36 | % | 2.36 | %(c)(e) | (0.45 | )% | 42 | % | $ | 11,885 | |||||||||||||||||||
Year Ended December 31, 2009 | 0.02 | $ | 22.21 | 30.04 | % | 2.42 | % | 2.42 | %(e) | (0.30 | )% | 56 | % | $ | 11,096 | ||||||||||||||||||||
Year Ended December 31, 2008 | — | $ | 17.08 | (42.79 | )% | 2.34 | % | 2.34 | %(e) | 0.01 | % | 68 | % | $ | 9,747 | ||||||||||||||||||||
Class I | |||||||||||||||||||||||||||||||||||
Year Ended December 31, 2012 | — | $ | 25.85 | 22.48 | % | 1.15 | % | 1.14 | %(c)(d) | 1.84 | % | 63 | % | $ | 2 | ||||||||||||||||||||
Year Ended December 31, 2011 | — | $ | 24.45 | (9.68 | )% | 1.04 | % | 1.04 | %(c)(e) | 1.12 | % | 44 | % | $ | 2 | ||||||||||||||||||||
Year Ended December 31, 2010 (h) | — | $ | 28.33 | 8.50 | % | 1.14 | %(i) | 1.14 | %(c)(e)(i) | 0.44 | %(i) | 42 | % | $ | 3 | ||||||||||||||||||||
Class R4 | |||||||||||||||||||||||||||||||||||
Year Ended December 31, 2012 (j) | — | $ | 25.99 | (0.27 | )% | 1.30 | %(b)(i) | 1.30 | %(b)(c)(d)(i) | (0.55 | )%(i) | 63 | % | $ | 13 | ||||||||||||||||||||
Class R5 | |||||||||||||||||||||||||||||||||||
Year Ended December 31, 2012 (l) | — | $ | 25.98 | (0.27 | )% | 1.29 | %(i) | 1.28 | %(c)(d)(i) | (0.55 | )%(i) | 63 | % | $ | 2 | ||||||||||||||||||||
Class Y | |||||||||||||||||||||||||||||||||||
Year Ended December 31, 2012 (m) | — | $ | 25.98 | (0.25 | )% | 1.21 | %(i) | 1.20 | %(c)(d)(i) | (0.48 | )%(i) | 63 | % | $ | 2 | ||||||||||||||||||||
Class Z | |||||||||||||||||||||||||||||||||||
Year Ended December 31, 2012 | — | $ | 25.86 | 22.42 | % | 1.20 | %(b) | 1.19 | %(b)(c)(d) | 1.77 | % | 63 | % | $ | 295,231 | ||||||||||||||||||||
Year Ended December 31, 2011 | — | $ | 24.46 | (9.76 | )% | 1.14 | % | 1.14 | %(c)(e) | 1.03 | % | 44 | % | $ | 259,553 | ||||||||||||||||||||
Year Ended December 31, 2010 | 0.00 | (f) | $ | 28.33 | 21.89 | % | 1.16 | % | 1.16 | %(c)(e) | 0.75 | % | 42 | % | $ | 366,081 | |||||||||||||||||||
Year Ended December 31, 2009 | 0.02 | $ | 23.64 | 31.52 | % | 1.20 | % | 1.20 | %(e) | 0.84 | % | 56 | % | $ | 331,027 | ||||||||||||||||||||
Year Ended December 31, 2008 | — | $ | 18.19 | (42.10 | )% | 1.21 | % | 1.21 | %(e) | 1.09 | % | 68 | % | $ | 186,194 | ||||||||||||||||||||
See accompanying notes to financial statements.
107
Columbia Acorn Family of Funds
Financial Highlights, continued
Columbia Acorn Select
Income from Investment Operations | Less Distributions to Shareholders | ||||||||||||||||||||||||||||||||||
| Net Asset Value, Beginning of Period | Net investment income (loss) | Net realized and unrealized gain (loss) | Reimbursement from affiliate | Total from investment operations | From net investment income | From net realized gains | Total Distributions to Shareholders | ||||||||||||||||||||||||||||
Class A | |||||||||||||||||||||||||||||||||||
Year Ended December 31, 2012 | $ | 22.95 | 0.03 | 3.78 | — | 3.81 | — | (2.04 | ) | (2.04 | ) | ||||||||||||||||||||||||
Year Ended December 31, 2011 | $ | 27.94 | (0.15 | ) | (4.46 | ) | — | (4.61 | ) | (0.38 | ) | — | (0.38 | ) | |||||||||||||||||||||
Year Ended December 31, 2010 | $ | 22.81 | (0.18 | ) | 5.31 | — | 5.13 | — | — | — | |||||||||||||||||||||||||
Year Ended December 31, 2009 | $ | 13.77 | (0.14 | ) | 9.18 | — | 9.04 | — | — | — | |||||||||||||||||||||||||
Year Ended December 31, 2008 | $ | 27.89 | (0.18 | ) | (13.25 | ) | — | (13.43 | ) | — | (0.69 | ) | (0.69 | ) | |||||||||||||||||||||
Class B | |||||||||||||||||||||||||||||||||||
Year Ended December 31, 2012 | $ | 21.40 | (0.15 | ) | 3.54 | — | 3.39 | — | (2.04 | ) | (2.04 | ) | |||||||||||||||||||||||
Year Ended December 31, 2011 | $ | 26.06 | (0.30 | ) | (4.13 | ) | — | (4.43 | ) | (0.23 | ) | — | (0.23 | ) | |||||||||||||||||||||
Year Ended December 31, 2010 | $ | 21.41 | (0.31 | ) | 4.96 | — | 4.65 | — | — | — | |||||||||||||||||||||||||
Year Ended December 31, 2009 | $ | 13.02 | (0.24 | ) | 8.63 | — | 8.39 | — | — | — | |||||||||||||||||||||||||
Year Ended December 31, 2008 | $ | 26.57 | (0.31 | ) | (12.55 | ) | — | (12.86 | ) | — | (0.69 | ) | (0.69 | ) | |||||||||||||||||||||
Class C | |||||||||||||||||||||||||||||||||||
Year Ended December 31, 2012 | $ | 21.20 | (0.14 | ) | 3.46 | — | 3.32 | — | (2.04 | ) | (2.04 | ) | |||||||||||||||||||||||
Year Ended December 31, 2011 | $ | 25.83 | (0.32 | ) | (4.12 | ) | — | (4.44 | ) | (0.19 | ) | — | (0.19 | ) | |||||||||||||||||||||
Year Ended December 31, 2010 | $ | 21.25 | (0.34 | ) | 4.92 | — | 4.58 | — | — | — | |||||||||||||||||||||||||
Year Ended December 31, 2009 | $ | 12.94 | (0.26 | ) | 8.57 | — | 8.31 | — | — | — | |||||||||||||||||||||||||
Year Ended December 31, 2008 | $ | 26.46 | (0.34 | ) | (12.49 | ) | — | (12.83 | ) | — | (0.69 | ) | (0.69 | ) | |||||||||||||||||||||
Class I | |||||||||||||||||||||||||||||||||||
Year Ended December 31, 2012 | $ | 23.65 | 0.23 | 3.79 | — | 4.02 | — | (2.04 | ) | (2.04 | ) | ||||||||||||||||||||||||
Year Ended December 31, 2011 | $ | 28.74 | (0.03 | ) | (4.59 | ) | — | (4.62 | ) | (0.47 | ) | — | (0.47 | ) | |||||||||||||||||||||
Year Ended December 31, 2010 (f) | $ | 24.74 | 0.01 | 3.99 | — | 4.00 | — | — | — | ||||||||||||||||||||||||||
Class R4 | |||||||||||||||||||||||||||||||||||
Year Ended December 31, 2012 (h) | $ | 25.91 | 0.00 | (i) | 1.52 | — | 1.52 | — | (1.51 | ) | (1.51 | ) | |||||||||||||||||||||||
Class R5 | |||||||||||||||||||||||||||||||||||
Year Ended December 31, 2012 (j) | $ | 25.91 | 0.00 | (i) | 1.53 | — | 1.53 | — | (1.51 | ) | (1.51 | ) | |||||||||||||||||||||||
Class Y | |||||||||||||||||||||||||||||||||||
Year Ended December 31, 2012 (k) | $ | 25.96 | 0.01 | 1.52 | — | 1.53 | — | (1.51 | ) | (1.51 | ) | ||||||||||||||||||||||||
Class Z | |||||||||||||||||||||||||||||||||||
Year Ended December 31, 2012 | $ | 23.62 | 0.11 | 3.88 | — | 3.99 | — | (2.04 | ) | (2.04 | ) | ||||||||||||||||||||||||
Year Ended December 31, 2011 | $ | 28.73 | (0.07 | ) | (4.58 | ) | 0.00 | (i) | (4.65 | ) | (0.46 | ) | — | (0.46 | ) | ||||||||||||||||||||
Year Ended December 31, 2010 | $ | 23.38 | (0.10 | ) | 5.45 | — | 5.35 | — | — | — | |||||||||||||||||||||||||
Year Ended December 31, 2009 | $ | 14.07 | (0.08 | ) | 9.39 | — | 9.31 | — | — | — | |||||||||||||||||||||||||
Year Ended December 31, 2008 | $ | 28.41 | (0.12 | ) | (13.53 | ) | — | (13.65 | ) | — | (0.69 | ) | (0.69 | ) | |||||||||||||||||||||
(a) Certain line items from prior years have been reclassified to conform to the current presentation.
(b) In addition to the fees and expenses which the Fund bears directly, the Fund indirectly bears a pro rata share of the fees and expenses of the underlying funds in which it invests. Such indirect expenses are not included in the reported expense ratios.
(c) The benefits derived from custody fees paid indirectly had an impact of less than 0.01%.
(d) Includes interest expense which rounds to less than 0.01%.
(e) Total return includes a voluntary reimbursement by the Investment Manager for a realized investment loss due to a trading error. This reimbursement increased total return and net asset value per share by 0.01% and $0.01, respectively.
(f) Class I shares commenced operations on September 27, 2010. Per share data and total return reflect activity from that date.
(g) Annualized.
(h) Class R4 shares commenced operations on November 8, 2012. Per share data and total return reflect activity from that date.
(i) Rounds to less than $0.01 per share.
(j) Class R5 shares commenced operations on November 8, 2012. Per share data and total return reflect activity from that date.
(k) Class Y shares commenced operations on November 8, 2012. Per share data and total return reflect activity from that date.
(l) During the year ended December 31, 2011, the Fund received a reimbursement by an affiliate. Had the Fund not received this payment, total return would have been lower by 0.01%.
See accompanying notes to financial statements.
108
Ratio to Average Net Assets | Supplemental Data | ||||||||||||||||||||||||||||||
| Net Asset Value, End of Period | Total Return | Total gross expenses (a) | Total net expenses (b)(c) | Net investment income (loss) | Portfolio turnover rate | Net assets, end of period (000s) | |||||||||||||||||||||||||
Class A | |||||||||||||||||||||||||||||||
Year Ended December 31, 2012 | $ | 24.72 | 16.87 | % | 1.31 | %(d) | 1.31 | %(d) | 0.13 | % | 15 | % | $ | 271,628 | |||||||||||||||||
Year Ended December 31, 2011 | $ | 22.95 | (16.65 | )% | 1.28 | % | 1.28 | % | (0.57 | )% | 21 | % | $ | 340,325 | |||||||||||||||||
Year Ended December 31, 2010 | $ | 27.94 | 22.49 | % | 1.28 | % | 1.28 | % | (0.73 | )% | 28 | % | $ | 555,263 | |||||||||||||||||
Year Ended December 31, 2009 | $ | 22.81 | 65.65 | % | 1.30 | % | 1.30 | % | (0.78 | )% | 19 | % | $ | 522,443 | |||||||||||||||||
Year Ended December 31, 2008 | $ | 13.77 | (49.31 | )%(e) | 1.24 | % | 1.24 | % | (0.80 | )% | 28 | % | $ | 395,794 | |||||||||||||||||
Class B | |||||||||||||||||||||||||||||||
Year Ended December 31, 2012 | $ | 22.75 | 16.11 | % | 1.91 | %(d) | 1.90 | %(d) | (0.62 | )% | 15 | % | $ | 9,938 | |||||||||||||||||
Year Ended December 31, 2011 | $ | 21.40 | (17.11 | )% | 1.88 | % | 1.88 | % | (1.21 | )% | 21 | % | $ | 26,126 | |||||||||||||||||
Year Ended December 31, 2010 | $ | 26.06 | 21.72 | % | 1.92 | % | 1.92 | % | (1.39 | )% | 28 | % | $ | 72,203 | |||||||||||||||||
Year Ended December 31, 2009 | $ | 21.41 | 64.44 | % | 2.01 | % | 2.01 | % | (1.49 | )% | 19 | % | $ | 88,004 | |||||||||||||||||
Year Ended December 31, 2008 | $ | 13.02 | (49.62 | )%(e) | 1.87 | % | 1.87 | % | (1.43 | )% | 28 | % | $ | 73,152 | |||||||||||||||||
Class C | |||||||||||||||||||||||||||||||
Year Ended December 31, 2012 | $ | 22.48 | 15.93 | % | 2.07 | %(d) | 2.06 | %(d) | (0.59 | )% | 15 | % | $ | 57,309 | |||||||||||||||||
Year Ended December 31, 2011 | $ | 21.20 | (17.27 | )% | 2.05 | % | 2.05 | % | (1.34 | )% | 21 | % | $ | 62,887 | |||||||||||||||||
Year Ended December 31, 2010 | $ | 25.83 | 21.55 | % | 2.07 | % | 2.07 | % | (1.52 | )% | 28 | % | $ | 98,445 | |||||||||||||||||
Year Ended December 31, 2009 | $ | 21.25 | 64.22 | % | 2.14 | % | 2.14 | % | (1.62 | )% | 19 | % | $ | 93,121 | |||||||||||||||||
Year Ended December 31, 2008 | $ | 12.94 | (49.71 | )%(e) | 2.04 | % | 2.04 | % | (1.60 | )% | 28 | % | $ | 70,962 | |||||||||||||||||
Class I | |||||||||||||||||||||||||||||||
Year Ended December 31, 2012 | $ | 25.63 | 17.26 | % | 0.96 | %(d) | 0.95 | %(d) | 0.89 | % | 15 | % | $ | 39,054 | |||||||||||||||||
Year Ended December 31, 2011 | $ | 23.65 | (16.25 | )% | 0.92 | % | 0.92 | % | (0.12 | )% | 21 | % | $ | 10,944 | |||||||||||||||||
Year Ended December 31, 2010 (f) | $ | 28.74 | 16.17 | % | 0.91 | %(g) | 0.91 | %(g) | 0.18 | %(g) | 28 | % | $ | 7,832 | |||||||||||||||||
Class R4 | |||||||||||||||||||||||||||||||
Year Ended December 31, 2012 (h) | $ | 25.92 | 5.92 | % | 1.07 | %(g) | 1.06 | %(g) | 0.02 | %(g) | 15 | % | $ | 15 | |||||||||||||||||
Class R5 | |||||||||||||||||||||||||||||||
Year Ended December 31, 2012 (j) | $ | 25.93 | 5.96 | % | 0.99 | %(g) | 0.99 | %(g) | 0.08 | %(g) | 15 | % | $ | 3 | |||||||||||||||||
Class Y | |||||||||||||||||||||||||||||||
Year Ended December 31, 2012 (k) | $ | 25.98 | 5.94 | % | 0.92 | %(g) | 0.92 | %(g) | 0.15 | %(g) | 15 | % | $ | 3 | |||||||||||||||||
Class Z | |||||||||||||||||||||||||||||||
Year Ended December 31, 2012 | $ | 25.57 | 17.15 | % | 1.03 | %(d) | 1.03 | %(d) | 0.40 | % | 15 | % | $ | 587,678 | |||||||||||||||||
Year Ended December 31, 2011 | $ | 23.62 | (16.37 | )%(l) | 0.97 | % | 0.97 | % | (0.28 | )% | 21 | % | $ | 850,338 | |||||||||||||||||
Year Ended December 31, 2010 | $ | 28.73 | 22.88 | % | 0.97 | % | 0.97 | % | (0.41 | )% | 28 | % | $ | 1,549,112 | |||||||||||||||||
Year Ended December 31, 2009 | $ | 23.38 | 66.17 | % | 0.99 | % | 0.99 | % | (0.47 | )% | 19 | % | $ | 1,241,277 | |||||||||||||||||
Year Ended December 31, 2008 | $ | 14.07 | (49.18 | )%(e) | 0.95 | % | 0.95 | % | (0.51 | )% | 28 | % | $ | 779,892 | |||||||||||||||||
See accompanying notes to financial statements.
109
Columbia Acorn Family of Funds
Financial Highlights, continued
Columbia Thermostat Fund
Income from Investment Operations | Less Distributions to Shareholders | ||||||||||||||||||||||||||||||
| Net Asset Value, Beginning of Period | Net investment income | Net realized and unrealized gain (loss) | Total from investment operations | From net investment income | From net realized gains | Total Distributions to Shareholders | |||||||||||||||||||||||||
Class A | |||||||||||||||||||||||||||||||
Year Ended December 31, 2012 | $ | 12.82 | 0.32 | 1.39 | 1.71 | (0.24 | ) | — | (0.24 | ) | |||||||||||||||||||||
Year Ended December 31, 2011 | $ | 12.58 | 0.28 | 0.30 | 0.58 | (0.34 | ) | — | (0.34 | ) | |||||||||||||||||||||
Year Ended December 31, 2010 | $ | 10.90 | 0.19 | 1.67 | 1.86 | (0.18 | ) | — | (0.18 | ) | |||||||||||||||||||||
Year Ended December 31, 2009 | $ | 8.26 | 0.11 | 2.53 | 2.64 | (0.00 | )(e) | — | (0.00 | )(e) | |||||||||||||||||||||
Year Ended December 31, 2008 | $ | 12.31 | 0.22 | (3.98 | ) | (3.76 | ) | (0.22 | ) | (0.07 | ) | (0.29 | ) | ||||||||||||||||||
Class B | |||||||||||||||||||||||||||||||
Year Ended December 31, 2012 | $ | 12.91 | 0.20 | 1.45 | 1.65 | (0.17 | ) | — | (0.17 | ) | |||||||||||||||||||||
Year Ended December 31, 2011 | $ | 12.64 | 0.15 | 0.38 | 0.53 | (0.26 | ) | — | (0.26 | ) | |||||||||||||||||||||
Year Ended December 31, 2010 | $ | 10.93 | 0.13 | 1.67 | 1.80 | (0.09 | ) | — | (0.09 | ) | |||||||||||||||||||||
Year Ended December 31, 2009 | $ | 8.32 | 0.06 | 2.55 | 2.61 | — | — | — | |||||||||||||||||||||||
Year Ended December 31, 2008 | $ | 12.38 | 0.16 | (4.00 | ) | (3.84 | ) | (0.15 | ) | (0.07 | ) | (0.22 | ) | ||||||||||||||||||
Class C | |||||||||||||||||||||||||||||||
Year Ended December 31, 2012 | $ | 12.91 | 0.22 | 1.39 | 1.61 | (0.13 | ) | — | (0.13 | ) | |||||||||||||||||||||
Year Ended December 31, 2011 | $ | 12.62 | 0.18 | 0.31 | 0.49 | (0.20 | ) | — | (0.20 | ) | |||||||||||||||||||||
Year Ended December 31, 2010 | $ | 10.91 | 0.10 | 1.68 | 1.78 | (0.07 | ) | — | (0.07 | ) | |||||||||||||||||||||
Year Ended December 31, 2009 | $ | 8.33 | 0.03 | 2.55 | 2.58 | — | — | — | |||||||||||||||||||||||
Year Ended December 31, 2008 | $ | 12.37 | 0.13 | (3.97 | ) | (3.84 | ) | (0.13 | ) | (0.07 | ) | (0.20 | ) | ||||||||||||||||||
Class R4 | |||||||||||||||||||||||||||||||
Year Ended December 31, 2012 (f) | $ | 14.08 | 0.09 | 0.28 | 0.37 | (0.26 | ) | — | (0.26 | ) | |||||||||||||||||||||
Class R5 | |||||||||||||||||||||||||||||||
Year Ended December 31, 2012 (h) | $ | 14.08 | 0.09 | 0.27 | 0.36 | (0.25 | ) | — | (0.25 | ) | |||||||||||||||||||||
Class Y | |||||||||||||||||||||||||||||||
Year Ended December 31, 2012 (i) | $ | 14.08 | 0.09 | 0.27 | 0.36 | (0.26 | ) | — | (0.26 | ) | |||||||||||||||||||||
Class Z | |||||||||||||||||||||||||||||||
Year Ended December 31, 2012 | $ | 12.67 | 0.34 | 1.39 | 1.73 | (0.27 | ) | — | (0.27 | ) | |||||||||||||||||||||
Year Ended December 31, 2011 | $ | 12.44 | 0.31 | 0.29 | 0.60 | (0.37 | ) | — | (0.37 | ) | |||||||||||||||||||||
Year Ended December 31, 2010 | $ | 10.80 | 0.21 | 1.66 | 1.87 | (0.23 | ) | — | (0.23 | ) | |||||||||||||||||||||
Year Ended December 31, 2009 | $ | 8.19 | 0.13 | 2.51 | 2.64 | (0.03 | ) | — | (0.03 | ) | |||||||||||||||||||||
Year Ended December 31, 2008 | $ | 12.26 | 0.24 | (3.96 | ) | (3.72 | ) | (0.28 | ) | (0.07 | ) | (0.35 | ) | ||||||||||||||||||
(a) Had the Investment Manager and/or Transfer Agent not waived fees and/or reimbursed a portion of expenses, total return would have been reduced.
(b) Certain line items from prior years have been reclassified to conform to the current presentation.
(c) In addition to the fees and expenses which the Fund bears directly, the Fund indirectly bears a pro rata share of the fees and expenses of the underlying funds in which it invests. Such indirect expenses are not included in the reported expense ratios.
(d) The benefits derived from custody fees paid indirectly had an impact of less than 0.01%.
(e) Rounds to less than $0.01 per share.
(f) Class R4 shares commenced operations on November 8, 2012. Per share data and total return reflect activity from that date.
(g) Annualized.
(h) Class R5 shares commenced operations on November 8, 2012. Per share data and total return reflect activity from that date.
(i) Class Y shares commenced operations on November 8, 2012. Per share data and total return reflect activity from that date.
See accompanying notes to financial statements.
110
Ratio to Average Net Assets | Supplemental Data | ||||||||||||||||||||||||||||||
| Net Asset Value, End of Period | Total Return (a) | Total gross expenses (b) | Total net expenses (c)(d) | Net investment income | Portfolio turnover rate | Net assets, end of period (000s) | |||||||||||||||||||||||||
Class A | |||||||||||||||||||||||||||||||
Year Ended December 31, 2012 | $ | 14.29 | 13.34 | % | 0.58 | % | 0.50 | % | 2.28 | % | 109 | % | $ | 323,750 | |||||||||||||||||
Year Ended December 31, 2011 | $ | 12.82 | 4.62 | % | 0.67 | % | 0.50 | % | 2.17 | % | 130 | % | $ | 79,744 | |||||||||||||||||
Year Ended December 31, 2010 | $ | 12.58 | 17.28 | % | 0.72 | % | 0.50 | % | 1.64 | % | 118 | % | $ | 44,527 | |||||||||||||||||
Year Ended December 31, 2009 | $ | 10.90 | 31.98 | % | 0.78 | % | 0.50 | % | 1.17 | % | 17 | % | $ | 42,976 | |||||||||||||||||
Year Ended December 31, 2008 | $ | 8.26 | (30.67 | )% | 0.68 | % | 0.50 | % | 1.99 | % | 130 | % | $ | 41,032 | |||||||||||||||||
Class B | |||||||||||||||||||||||||||||||
Year Ended December 31, 2012 | $ | 14.39 | 12.78 | % | 1.16 | % | 1.00 | % | 1.47 | % | 109 | % | $ | 4,480 | |||||||||||||||||
Year Ended December 31, 2011 | $ | 12.91 | 4.19 | % | 1.23 | % | 1.00 | % | 1.18 | % | 130 | % | $ | 11,318 | |||||||||||||||||
Year Ended December 31, 2010 | $ | 12.64 | 16.64 | % | 1.28 | % | 1.00 | % | 1.10 | % | 118 | % | $ | 28,752 | |||||||||||||||||
Year Ended December 31, 2009 | $ | 10.93 | 31.37 | % | 1.32 | % | 1.00 | % | 0.64 | % | 17 | % | $ | 32,758 | |||||||||||||||||
Year Ended December 31, 2008 | $ | 8.32 | (31.10 | )% | 1.20 | % | 1.00 | % | 1.45 | % | 130 | % | $ | 36,673 | |||||||||||||||||
Class C | |||||||||||||||||||||||||||||||
Year Ended December 31, 2012 | $ | 14.39 | 12.52 | % | 1.32 | % | 1.25 | % | 1.56 | % | 109 | % | $ | 253,641 | |||||||||||||||||
Year Ended December 31, 2011 | $ | 12.91 | 3.87 | % | 1.43 | % | 1.25 | % | 1.40 | % | 130 | % | $ | 33,378 | |||||||||||||||||
Year Ended December 31, 2010 | $ | 12.62 | 16.43 | % | 1.49 | % | 1.25 | % | 0.88 | % | 118 | % | $ | 21,866 | |||||||||||||||||
Year Ended December 31, 2009 | $ | 10.91 | 30.97 | % | 1.55 | % | 1.25 | % | 0.39 | % | 17 | % | $ | 21,090 | |||||||||||||||||
Year Ended December 31, 2008 | $ | 8.33 | (31.20 | )% | 1.45 | % | 1.25 | % | 1.23 | % | 130 | % | $ | 24,383 | |||||||||||||||||
Class R4 | |||||||||||||||||||||||||||||||
Year Ended December 31, 2012 (f) | $ | 14.19 | 2.60 | % | 0.42 | %(g) | 0.25 | %(g) | 4.59 | %(g) | 109 | % | $ | 15 | |||||||||||||||||
Class R5 | |||||||||||||||||||||||||||||||
Year Ended December 31, 2012 (h) | $ | 14.19 | 2.58 | % | 0.35 | %(g) | 0.27 | %(g) | 4.60 | %(g) | 109 | % | $ | 3 | |||||||||||||||||
Class Y | |||||||||||||||||||||||||||||||
Year Ended December 31, 2012 (i) | $ | 14.18 | 2.55 | % | 0.30 | %(g) | 0.22 | %(g) | 4.63 | %(g) | 109 | % | $ | 3 | |||||||||||||||||
Class Z | |||||||||||||||||||||||||||||||
Year Ended December 31, 2012 | $ | 14.13 | 13.69 | % | 0.30 | % | 0.25 | % | 2.48 | % | 109 | % | $ | 292,732 | |||||||||||||||||
Year Ended December 31, 2011 | $ | 12.67 | 4.85 | % | 0.34 | % | 0.25 | % | 2.43 | % | 130 | % | $ | 65,167 | |||||||||||||||||
Year Ended December 31, 2010 | $ | 12.44 | 17.58 | % | 0.37 | % | 0.25 | % | 1.87 | % | 118 | % | $ | 36,130 | |||||||||||||||||
Year Ended December 31, 2009 | $ | 10.80 | 32.29 | % | 0.39 | % | 0.25 | % | 1.48 | % | 17 | % | $ | 41,765 | |||||||||||||||||
Year Ended December 31, 2008 | $ | 8.19 | (30.53 | )% | 0.33 | % | 0.25 | % | 2.23 | % | 130 | % | $ | 34,985 | |||||||||||||||||
See accompanying notes to financial statements.
111
Columbia Acorn Family of Funds
Financial Highlights, continued
Columbia Acorn Emerging Markets Fund
Income from Investment Operations | Less Distributions to Shareholders | ||||||||||||||||||||||||||||||
| Net Asset Value, Beginning of Period | Net investment income (loss) | Net realized and unrealized gain (loss) | Total from investment operations | From net investment income | From net realized gains | Total Distributions to Shareholders | |||||||||||||||||||||||||
Class A | |||||||||||||||||||||||||||||||
Year Ended December 31, 2012 | $ | 9.26 | 0.08 | 2.78 | 2.86 | (0.08 | ) | — | (0.08 | ) | |||||||||||||||||||||
Year Ended December 31, 2011 (e) | $ | 10.00 | (0.00 | )(f) | (0.74 | ) | (0.74 | ) | — | — | — | ||||||||||||||||||||
Class C | |||||||||||||||||||||||||||||||
Year Ended December 31, 2012 | $ | 9.24 | (0.02 | ) | 2.79 | 2.77 | — | — | — | ||||||||||||||||||||||
Year Ended December 31, 2011 (i) | $ | 10.00 | (0.02 | ) | (0.74 | ) | (0.76 | ) | — | — | — | ||||||||||||||||||||
Class I | |||||||||||||||||||||||||||||||
Year Ended December 31, 2012 | $ | 9.29 | 0.11 | 2.80 | 2.91 | (0.12 | ) | — | (0.12 | ) | |||||||||||||||||||||
Year Ended December 31, 2011 (j) | $ | 10.00 | 0.01 | (0.72 | ) | (0.71 | ) | — | — | — | |||||||||||||||||||||
Class R4 | |||||||||||||||||||||||||||||||
Year Ended December 31, 2012 (k) | $ | 11.44 | (0.01 | ) | 0.81 | 0.80 | (0.10 | ) | — | (0.10 | ) | ||||||||||||||||||||
Class R5 | |||||||||||||||||||||||||||||||
Year Ended December 31, 2012 (l) | $ | 11.44 | (0.00 | )(f) | 0.81 | 0.81 | (0.11 | ) | — | (0.11 | ) | ||||||||||||||||||||
Class Z | |||||||||||||||||||||||||||||||
Year Ended December 31, 2012 | $ | 9.28 | 0.12 | 2.79 | 2.91 | (0.12 | ) | — | (0.12 | ) | |||||||||||||||||||||
Year Ended December 31, 2011 (m) | $ | 10.00 | 0.01 | (0.73 | ) | (0.72 | ) | — | — | — | |||||||||||||||||||||
(a) Had the Investment Manager and/or Transfer Agent not waived fees and/or reimbursed a portion of expenses, total return would have been reduced.
(b) Certain line items from prior years have been reclassified to conform to the current presentation.
(c) In addition to the fees and expenses which the Fund bears directly, the Fund indirectly bears a pro rata share of the fees and expenses of the underlying funds in which it invests. Such indirect expenses are not included in the reported expense ratios.
(d) The benefits derived from custody fees paid indirectly had an impact of 0.01%.
(e) Class A shares commenced operations on August 19, 2011. Per share data and total return reflect activity from that date.
(f) Rounds to less than $0.01 per share.
(g) Annualized.
(h) The benefits derived from custody fees paid indirectly had an impact of 0.02%.
(i) Class C shares commenced operations on August 19, 2011. Per share data and total return reflect activity from that date.
(j) Class I shares commenced operations on August 19, 2011. Per share data and total return reflect activity from that date.
(k) Class R4 shares commenced operations on November 8, 2012. Per share data and total return reflect activity from that date.
(l) Class R5 shares commenced operations on November 8, 2012. Per share data and total return reflect activity from that date.
(m) Class Z shares commenced operations on August 19, 2011. Per share data and total return reflect activity from that date.
Columbia Acorn European Fund
Income from Investment Operations | Less Distributions to Shareholders | ||||||||||||||||||||||||||||||
| Net Asset Value, Beginning of Period | Net investment income (loss) | Net realized and unrealized gain (loss) | Total from investment operations | From net investment income | From net realized gains | Total Distributions to Shareholders | |||||||||||||||||||||||||
Class A | |||||||||||||||||||||||||||||||
Year Ended December 31, 2012 | $ | 9.43 | 0.03 | 2.37 | 2.40 | (0.07 | ) | (0.00 | )(c) | (0.07 | ) | ||||||||||||||||||||
Year Ended December 31, 2011 (f) | $ | 10.00 | (0.03 | ) | (0.46 | ) | (0.49 | ) | (0.06 | ) | (0.02 | ) | (0.08 | ) | |||||||||||||||||
Class C | |||||||||||||||||||||||||||||||
Year Ended December 31, 2012 | $ | 9.44 | (0.15 | ) | 2.46 | 2.31 | (0.02 | ) | (0.00 | )(c) | (0.02 | ) | |||||||||||||||||||
Year Ended December 31, 2011 (i) | $ | 10.00 | (0.06 | ) | (0.45 | ) | (0.51 | ) | (0.03 | ) | (0.02 | ) | (0.05 | ) | |||||||||||||||||
Class I | |||||||||||||||||||||||||||||||
Year Ended December 31, 2012 | $ | 9.43 | 0.10 | 2.32 | 2.42 | (0.10 | ) | (0.00 | )(c) | (0.10 | ) | ||||||||||||||||||||
Year Ended December 31, 2011 (j) | $ | 10.00 | (0.02 | ) | (0.46 | ) | (0.48 | ) | (0.07 | ) | (0.02 | ) | (0.09 | ) | |||||||||||||||||
Class R5 | |||||||||||||||||||||||||||||||
Year Ended December 31, 2012 (k) | $ | 11.19 | (0.02 | ) | 0.77 | 0.75 | (0.08 | ) | — | (0.08 | ) | ||||||||||||||||||||
Class Z | |||||||||||||||||||||||||||||||
Year Ended December 31, 2012 | $ | 9.44 | 0.08 | 2.34 | 2.42 | (0.10 | ) | (0.00 | )(c) | (0.10 | ) | ||||||||||||||||||||
Year Ended December 31, 2011 (l) | $ | 10.00 | (0.02 | ) | (0.46 | ) | (0.48 | ) | (0.06 | ) | (0.02 | ) | (0.08 | ) | |||||||||||||||||
(a) Had the Investment Manager and/or Transfer Agent not waived fees and/or reimbursed a portion of expenses, total return would have been reduced.
(b) Certain line items from prior years have been reclassified to conform to the current presentation.
(c) Rounds to less than $0.01 per share.
(d) In addition to the fees and expenses which the Fund bears directly, the Fund indirectly bears a pro rata share of the fees and expenses of the underlying funds in which it invests. Such indirect expenses are not included in the reported expense ratios.
(e) The benefits derived from custody fees paid indirectly had an impact of 0.01%.
(f) Class A shares commenced operations on August 19, 2011. Per share data and total return reflect activity from that date.
(g) Annualized.
(h) The benefits derived from custody fees paid indirectly had an impact of 0.02%.
(i) Class C shares commenced operations on August 19, 2011. Per share data and total return reflect activity from that date.
(j) Class I shares commenced operations on August 19, 2011. Per share data and total return reflect activity from that date.
(k) Class R5 shares commenced operations on November 8, 2012. Per share data and total return reflect activity from that date.
(l) Class Z shares commenced operations on August 19, 2011. Per share data and total return reflect activity from that date.
See accompanying notes to financial statements.
112
Ratio to Average Net Assets | Supplemental Data | ||||||||||||||||||||||||||||||
| Net Asset Value, End of Period | Total Return(a) | Total gross expenses (b) | Total net expenses | Net investment income (loss) | Portfolio turnover rate | Net assets, end of period (000s) | |||||||||||||||||||||||||
Class A | |||||||||||||||||||||||||||||||
Year Ended December 31, 2012 | $ | 12.04 | 30.86 | % | 6.42 | % | 1.77 | %(c)(d) | 0.77 | % | 30 | % | $ | 3,103 | |||||||||||||||||
Year Ended December 31, 2011 (e) | $ | 9.26 | (7.40 | )% | 20.13 | %(g) | 1.85 | %(g)(h) | (0.01 | )%(g) | 9 | % | $ | 332 | |||||||||||||||||
Class C | |||||||||||||||||||||||||||||||
Year Ended December 31, 2012 | $ | 12.01 | 29.98 | % | 7.18 | % | 2.56 | %(c)(d) | (0.15 | )% | 30 | % | $ | 615 | |||||||||||||||||
Year Ended December 31, 2011 (i) | $ | 9.24 | (7.60 | )% | 25.06 | %(g) | 2.60 | %(g)(h) | (0.68 | )%(g) | 9 | % | $ | 127 | |||||||||||||||||
Class I | |||||||||||||||||||||||||||||||
Year Ended December 31, 2012 | $ | 12.08 | 31.39 | % | 6.18 | % | 1.41 | %(c)(d) | 1.05 | % | 30 | % | $ | 6 | |||||||||||||||||
Year Ended December 31, 2011 (j) | $ | 9.29 | (7.10 | )% | 19.31 | %(g) | 1.41 | %(g)(h) | 0.17 | %(g) | 9 | % | $ | 5 | |||||||||||||||||
Class R4 | |||||||||||||||||||||||||||||||
Year Ended December 31, 2012 (k) | $ | 12.14 | 7.04 | 5.86 | %(g) | 1.54 | %(c)(d)(g) | (0.31 | )%(g) | 30 | % | $ | 16 | ||||||||||||||||||
Class R5 | |||||||||||||||||||||||||||||||
Year Ended December 31, 2012 (l) | $ | 12.14 | 7.11 | % | 5.81 | %(g) | 1.46 | %(c)(d)(g) | (0.22 | )%(g) | 30 | % | $ | 3 | |||||||||||||||||
Class Z | |||||||||||||||||||||||||||||||
Year Ended December 31, 2012 | $ | 12.07 | 31.35 | % | 6.15 | % | 1.46 | %(c)(d) | 1.07 | % | 30 | % | $ | 6,846 | |||||||||||||||||
Year Ended December 31, 2011 (m) | $ | 9.28 | (7.20 | )% | 19.52 | %(g) | 1.46 | %(g)(h) | 0.15 | %(g) | 9 | % | $ | 2,765 | |||||||||||||||||
Ratio to Average Net Assets | Supplemental Data | ||||||||||||||||||||||||||||||
| Net Asset Value, End of Period | Total Return(a) | Total gross expenses (b) | Total net expenses | Net investment income (loss) | Portfolio turnover rate | Net assets, end of period (000s) | |||||||||||||||||||||||||
Class A | |||||||||||||||||||||||||||||||
Year Ended December 31, 2012 | $ | 11.76 | 25.46 | % | 12.35 | % | 1.61 | %(d)(e) | 0.23 | % | 37 | % | $ | 453 | |||||||||||||||||
Year Ended December 31, 2011 (f) | $ | 9.43 | (4.97 | )% | 33.59 | %(g) | 1.75 | %(g)(h) | (0.84 | )%(g) | 17 | % | $ | 154 | |||||||||||||||||
Class C | |||||||||||||||||||||||||||||||
Year Ended December 31, 2012 | $ | 11.73 | 24.46 | % | 12.83 | % | 2.32 | %(d)(e) | (1.33 | )% | 37 | % | $ | 89 | |||||||||||||||||
Year Ended December 31, 2011 (i) | $ | 9.44 | (5.14 | )% | 35.79 | %(g) | 2.50 | %(g)(h) | (1.66 | )%(g) | 17 | % | $ | 5 | |||||||||||||||||
Class I | |||||||||||||||||||||||||||||||
Year Ended December 31, 2012 | $ | 11.75 | 25.71 | % | 12.05 | % | 1.31 | %(d)(e) | 0.94 | % | 37 | % | $ | 6 | |||||||||||||||||
Year Ended December 31, 2011 (j) | $ | 9.43 | (4.81 | )% | 30.00 | %(g) | 1.31 | %(g)(h) | (0.47 | )%(g) | 17 | % | $ | 5 | |||||||||||||||||
Class R5 | |||||||||||||||||||||||||||||||
Year Ended December 31, 2012 (k) | $ | 11.86 | 6.70 | % | 14.07 | %(g) | 1.36 | %(d)(e)(g) | (1.07 | )%(g) | 37 | % | $ | 3 | |||||||||||||||||
Class Z | |||||||||||||||||||||||||||||||
Year Ended December 31, 2012 | $ | 11.76 | 25.66 | % | 12.07 | % | 1.33 | %(d)(e) | 0.76 | % | 37 | % | $ | 2,727 | |||||||||||||||||
Year Ended December 31, 2011 (l) | $ | 9.44 | (4.78 | )% | 30.26 | %(g) | 1.37 | %(g)(h) | (0.52 | )%(g) | 17 | % | $ | 1,516 | |||||||||||||||||
See accompanying notes to financial statements.
113
Columbia Acorn Family of Funds
Notes to Financial Statements
1. Nature of Operations
Columbia Acorn Fund, Columbia Acorn International, Columbia Acorn USA, Columbia Acorn International Select, Columbia Acorn Select, Columbia Thermostat Fund, Columbia Acorn Emerging Markets Fund and Columbia Acorn European Fund (the Funds) are each a series of Columbia Acorn Trust (the Trust). The Trust is registered under the Investment Company Act of 1940, as amended (the 1940 Act), as an open-end management investment company organized as a Massachusetts business trust. The investment objective of each Fund is to seek long-term capital appreciation.
Columbia Thermostat Fund pursues its investment objective by investing in shares of other mutual funds. As a "fund of funds" under normal circumstances, the Fund allocates at least 95% of its net assets among a selected group of affiliated stock and bond mutual funds (underlying portfolio funds) according to the current level of the Standard & Poor's (S&P) 500 Index in relation to predetermined ranges set by Columbia Wanger Asset Management, LLC (the Investment Manager). The Fund may invest up to 5% of its net assets plus any cash received that day in cash, repurchase agreements, high quality short-term paper and government securities.
Each Fund may issue an unlimited number of shares. Columbia Acorn Fund, Columbia Acorn USA, Columbia Acorn International Select and Columbia Acorn Select each currently offer Class A, Class B, Class C, Class I, Class R4, Class R5, Class Y and Class Z shares. Columbia Acorn International currently offers Class A, Class B, Class C, Class I, Class R, Class R4, Class R5, Class Y and Class Z shares. Columbia Thermostat Fund currently offers Class A, Class B, Class C, Class R4, Class R5, Class Y and Class Z shares. Columbia Acorn Emerging Markets Fund currently offers Class A, Class C, Class I, Class R4, Class R5 and Class Z shares. Columbia Acorn European Fund currently offers Class A, Class C, Class I, Class R5 and Class Z shares. Effective February 29, 2008, the Funds generally no longer accept investments by new or existing investors in the Funds' Class B shares, except in connection with the reinvestment of any dividend and/or capital gain distributions in Class B shares of the Funds and exchanges by existing Class B shareholders of certain other funds within the Columbia Family of Funds.
Class A shares are sold with a front-end sales charge. Class A shares bought without an initial sales charge in accounts aggregating $1 million to $50 million at the time of purchase are subject to a 1.00% contingent deferred sales charge (CDSC) if the shares are redeemed within 18 months of purchase.
Class B shares are subject to CDSC if redeemed within six years of purchase. Class B shares will convert to Class A shares automatically eight years after purchase.
Class C shares are offered at net asset value but are subject to a CDSC on redemptions made within one year after purchase.
Class I, Class R, Class R4, Class R5 and Class Y shares are offered at net asset value. There are certain restrictions on who may purchase these share classes. Class R4 and Class Y shares commenced operations on November 8, 2012. Class R5 shares commenced operations on November 8, 2012 for all Funds with the exception of Columbia Acorn International.
Class Z shares are offered at net asset value. There are certain restrictions on who may purchase Class Z shares. Generally, Class Z shares of a Fund may be exchanged for shares of another fund distributed by Columbia Management Investment Distributors, Inc. (CMID) at no additional charge.
Investment income, realized and unrealized gains and losses, and certain fund-level expenses are allocated pro rata on the basis of the relative net assets of all classes, except that each class bears certain expenses specific to that class such as distribution services, transfer agent fees, and certain other class specific expenses. Differences in class expenses may result in payment of different dividend distributions for each class. All of the Funds' share classes have equal rights with respect to voting, subject to Fund or class specific matters.
2. Significant Accounting Policies
The preparation of financial statements in accordance with accounting principles generally accepted in the United States of America (GAAP) requires management to make certain estimates and assumptions that affect the reported amounts of assets and liabilities, the disclosure of contingent assets and liabilities at the date of the financial statements and the reported amounts of revenue and expenses during the reporting period. Actual results could differ from those estimates.
>Security valuation
Securities of the Funds are valued at market value or, if a market quotation for a security is not readily available or is deemed not to be reliable because of events or circumstances that have occurred between the market quotation and the time as of which the security is to be valued, the security is valued at a fair value determined in good faith under consistently applied procedures established by the Board of Trustees (the Board). With respect to Columbia Thermostat Fund, investments in portfolio funds are valued at their net asset values as reported by the portfolio funds. A security traded on a securities exchange or in an over-the-counter market in which
114
transaction prices are reported is valued at the last sales price at the time of valuation. A security traded principally on NASDAQ is valued at the NASDAQ official closing price. Mutual Funds and Exchange Traded Funds are valued at their closing net asset value as reported to the applicable exchange.
Short-term investments maturing in 60 days or less are valued at amortized cost, which approximates market value.
Forward foreign currency exchange contracts are marked-to-market based upon foreign currency exchange rates provided by a pricing service.
A security for which a market quotation is not readily available and any other assets are valued at their fair value determined in good faith under consistently applied procedures established by the Board. The Trust has retained an independent statistical fair value pricing service that employs a systematic methodology to assist in the fair valuation process for securities principally traded in a foreign market in order to adjust for possible changes in value that may occur between the close of the foreign exchange and the time as of which the securities are to be valued. If a security is valued at fair value, that value may be different from the last quoted market price for the security. A security for which there is no reported sale on the valuation date is valued at the mean of the latest bid and ask quotations.
>Foreign currency translations
Values of investments denominated in foreign currencies are converted into U.S. dollars using the New York spot market rate of exchange at the time of valuation. Purchases and sales of investments and dividend and interest income are translated into U.S. dollars using the spot market rate of exchange prevailing on the respective dates of such transactions. The gain or loss resulting from changes in foreign exchange rates is included with net realized and unrealized gain or loss from investments, as appropriate.
>Restricted securities
Restricted securities are securities that may only be resold upon registration under federal securities laws or in transactions exempt from registration. In some cases, the issuer of restricted securities has agreed to register such securities for resale at the issuer's expense either upon demand by the Fund or in connection with another registered offering of the securities. Many restricted securities may be resold in the secondary market in transactions exempt from registration. Such restricted securities may be determined to be liquid under criteria established by the Board.
>Derivative instruments
Columbia Acorn International and Columbia Acorn International Select invest in certain derivative instruments as detailed below to meet their investment objectives. Derivatives are instruments whose values depend on, or are derived from, in whole or in part, the value of one or more other assets, such as securities, currencies, commodities or indices. Derivative instruments may be used to maintain cash reserves while maintaining exposure to certain other assets, to offset anticipated declines in values of investments, to facilitate trading, to reduce transaction costs and to pursue higher investment returns. The Funds may also use derivative instruments to mitigate certain investment risks, such as foreign currency exchange rate risk, interest rate risk and credit risk. Derivatives may involve various risks, including the potential inability of the counterparty to fulfill its obligation under the terms of the contract, the potential for an illiquid secondary market and the potential for market movements which may expose the Funds to gains or losses in excess of the amount shown in the Statements of Assets and Liabilities.
>Forward foreign currency exchange contracts
Forward foreign currency exchange contracts are agreements between two parties to buy and sell a currency at a set price on a future date. Columbia Acorn International and Columbia Acorn International Select utilize forward foreign currency exchange contracts to hedge the currency exposure associated with some or all of the Funds' securities.
The values of forward foreign currency exchange contracts fluctuate with changes in foreign currency exchange rates. Each Fund will record a realized gain or loss when the forward foreign currency exchange contract is closed.
The use of forward foreign currency exchange contracts does not eliminate fluctuations in the prices of the Funds' portfolio securities. The risks of forward foreign currency exchange contracts include movement in the values of the foreign currencies relative to the U.S. dollar (or other foreign currencies) and the possibility that counterparties will not complete their contractual obligations, which may be in excess of the amount reflected, if any, in the Statements of Assets and Liabilities.
>Effects of derivative transactions in the financial statements
The following tables are intended to provide additional information about the effect of derivatives on the financial statements of Columbia Acorn International and Columbia Acorn International Select including: the fair value of derivatives by risk category and the location of those fair values in the
115
Columbia Acorn Family of Funds
Notes to Financial Statements, continued
Statements of Assets and Liabilities; the impact of derivative transactions on the Funds' operations over the period including realized gains or losses and unrealized gains or losses. The derivative schedules following the Statements of Investments present additional information regarding derivative instruments outstanding at the end of the period, if any.
The effect of derivative instruments in Columbia Acorn International's Statements of Operations for the year ended December 31, 2012:
Amount of Realized Gain (Loss) on
Derivatives Recognized in Income
Risk Exposure Category | Forward Foreign Currency Exchange Contracts | ||||||
Foreign currency exchange rate | $ | 5,422,582 | |||||
Change in Unrealized Appreciation (Depreciation)
on Derivatives Recognized in Income
Risk Exposure Category | Forward Foreign Currency Exchange Contracts | ||||||
Foreign currency exchange rate | $ | (4,539,004 | ) | ||||
The following table is a summary of the volume of Columbia Acorn International's derivative instruments for the year ended December 31, 2012:
Derivative Instrument | Contracts Opened | ||||||
Forward foreign currency exchange contracts | 3 | ||||||
The following table is a summary of the fair value of Columbia Acorn International Select's derivative instruments at December 31, 2012:
Liability Derivatives | |||||||||||
| Risk Exposure Category | Statements of Assets and Liabilities Location | Fair Value | |||||||||
| Foreign currency exchange rate | Unrealized depreciation on forward foreign currency exchange contracts | $ | (411,753 | ) | |||||||
The effect of derivative instruments in Columbia Acorn International Select's Statements of Operations for the year ended December 31, 2012:
Amount of Realized Gain (Loss)
on Derivatives Recognized in Income
Risk Exposure Category | Forward Foreign Currency Exchange Contracts | ||||||
Foreign currency exchange rate | $ | (324,460 | ) | ||||
Change in Unrealized Appreciation (Depreciation)
on Derivatives Recognized in Income
Risk Exposure Category | Forward Foreign Currency Exchange Contracts | ||||||
Foreign currency exchange rate | $ | 536,271 | |||||
The following table is a summary of the volume of Columbia Acorn International Select's derivative instruments for the year ended December 31, 2012:
Derivative Instrument | Contracts Opened | ||||||
Forward foreign currency exchange contracts | 24 | ||||||
>Security transactions and investment income
Security transactions, investment income and shareholder fund transactions are accounted for on the trade date (date the order to buy or sell is executed) and dividend income and realized gain distributions from other funds are recorded on the ex-dividend date, except that certain dividends from foreign securities are recorded as soon as the information is available to the Funds. Interest income is recorded on the accrual basis and includes amortization of discounts on debt obligations when required for federal income tax purposes. Realized gains and losses from security transactions are recorded on an identified cost basis.
Awards, if any, from class action litigation related to securities owned may be recorded as a reduction of cost of those securities. If the applicable securities are no longer owned, the proceeds are recorded as realized gains.
The Funds estimate the tax character of distributions from real estate investment trusts (REITs). Distributions received in excess of income are recorded as a reduction of the cost of the related investments. If the applicable securities are no longer owned, any distributions received in excess of income are recorded as realized gains.
>Fund share valuation
Fund shares are sold and redeemed on a daily basis at net asset value, subject to any applicable sales charge. Net asset value per share is determined daily as of the close of trading on the New York Stock Exchange (NYSE) on each day the NYSE is open for trading. Generally, income, expenses and realized and unrealized gain/(losses) of a Fund are allocated to each class proportionately on a daily basis for purposes of determining the net asset value of each class. The Rule 12b-1 distribution and service fees and transfer agent fees are charged to each specific class as expenses are incurred. Redemption fees are accounted for as an addition to paid in capital for purposes of determining the net asset value of each class.
116
>Securities lending
Each Fund, except Columbia Thermostat Fund, may lend securities up to one-third of the value of its total assets to certain approved brokers, dealers and other financial institutions to earn additional income. The Fund retains the benefits of owning the securities, including receipt of dividends or interest generated by the security. Each Fund also receives a fee for the loan. Each Fund has the ability to recall the loans at any time and could do so in order to vote proxies or to sell the loaned securities. Each loan is collateralized by cash that exceeds the value of the securities on loan. The market value of the loaned securities is determined daily at the close of business of each Fund and any additional required collateral is delivered to each Fund on the next business day. Each Fund has elected to invest the cash collateral in the Dreyfus Government Cash Management Fund, and the income earned is paid to each Fund, net of any fees remitted to Goldman Sachs Agency Lending, the lending agent, and net of any borrower rebates. The Investment Manager does not retain any fees earned by the lending program. Generally, in the event of borrower default, a Fund has the right to use the collateral to offset any losses incurred. In the event a Fund is delayed or prevented from exercising its right to dispose of the collateral, there may be a potential loss to the Fund. Some of these losses may be indemnified by the lending agent. Each Fund bears the risk of loss with respect to the investment of collateral.
The net securities lending income earned as of December 31, 2012 by each Fund is included in the Statements of Operations.
>Custody fees/credits
Custody fees are reduced based on each Fund's cash balances maintained with the custodian. The amount is disclosed as a reduction of total expenses in the Statements of Operations.
>Federal income taxes
It is each Fund's policy to comply with the provisions of the Internal Revenue Code available to regulated investment companies and, in the manner provided therein, distribute substantially all their taxable income, as well as any net realized gain on sales of investments and foreign currency transactions reportable for federal income tax purposes. Columbia Thermostat Fund distributes all of its taxable income, as well as any net realized gain on sales of portfolio fund shares and any distributions of net realized gains received by the Fund from its portfolio funds, reportable for federal income
tax purposes. Accordingly, the Funds paid no federal income taxes and no federal income tax provision was required.
>Foreign capital gains taxes
Realized gains in certain countries may be subject to foreign taxes at the fund level. The Funds accrue for such foreign taxes on net realized and unrealized gains at the appropriate rate for each jurisdiction. The amount, if any, is disclosed as a liability on the Statements of Assets and Liabilities.
>Distributions to shareholders
Distributions to shareholders are recorded on the ex-dividend date.
>Indemnification
In the normal course of business, the Trust on behalf of the Funds enters into contracts that contain a variety of representations and warranties and that provide general indemnities. A Fund's maximum exposure under these arrangements is unknown, as this would involve future claims against the Fund. Also, under the Trust's organizational documents, the trustees and officers of the Trust are indemnified against certain liabilities that may arise out of their duties to the Trust. However, based on experience, the Funds expect the risk of loss due to these warranties and indemnities to be remote.
>Recent Accounting Pronouncement
Disclosures about Offsetting Assets and Liabilities
In December 2011, the Financial Accounting Standards Board (FASB) issued Accounting Standards Update (ASU) No. 2011-11, Disclosures about Offsetting Assets and Liabilities. The objective of the FASB is to enhance current disclosure requirements on offsetting of certain assets and liabilities and to enable financial statement users to compare financial statements prepared under GAAP and International Financial Reporting Standards.
Specifically, ASU No. 2011-11 requires an entity to disclose both gross and net information for derivatives and other financial instruments that are subject to a master netting arrangement or similar agreement. The standard requires disclosure of collateral received in connection with the master netting agreements or similar agreements. The effective date of ASU No. 2011-11 is for interim and annual periods beginning on or after January 1, 2013. At this time, management is evaluating the implications of this guidance and the impact it will have on the financial statement amounts and footnote disclosures, if any.
117
Columbia Acorn Family of Funds
Notes to Financial Statements, continued
3. Federal Tax Information
The timing and character of income and capital gain distributions are determined in accordance with income tax regulations, which may differ from GAAP. Reclassifications are made to the Funds' capital accounts for permanent tax differences to reflect income and gains available for distribution (or available capital loss carryforwards) under income tax regulations.
For the year ended December 31, 2012, permanent book and tax basis differences resulting primarily from capital loss carryforwards, distribution reclassifications, foreign capital gains tax, foreign currency transactions, non-deductible expenses, passive foreign investment company (PFIC) holdings, re-characterization of distributions from investments and earnings and profits distributed to shareholders on the redemption
of shares were identified and reclassified among the components of each Fund's net assets as follows:
| Undistributed/ (Overdistributed) Net Investment Income (Loss) | Accumulated Net Realized Gain (Loss) | Paid-In Capital | |||||||||||||
Columbia Acorn Fund | $ | (7,019,490 | ) | $ | (70,954,396 | ) | $ | 77,973,886 | |||||||
| Columbia Acorn International | 24,241,842 | (25,220,387 | ) | 978,545 | |||||||||||
| Columbia Acorn USA | 356,211 | (356,209 | ) | (2 | ) | ||||||||||
| Columbia Acorn International Select | 1,502,636 | (1,502,641 | ) | 5 | |||||||||||
| Columbia Acorn Select | (9,263 | ) | 9,263 | — | |||||||||||
| Columbia Thermostat Fund | 2,331,300 | (2,331,298 | ) | (2 | ) | ||||||||||
| Columbia Acorn Emerging Markets Fund | 531 | 620 | (1,151 | ) | |||||||||||
| Columbia Acorn European Fund | (1,044 | ) | 1,112 | (68 | ) | ||||||||||
Net investment income and net realized gains (losses), as disclosed on the Statements of Operations, and net assets were not affected by these reclassifications.
The tax character of distributions paid during the years ended December 31, 2012 and 2011 were as follows:
December 31, 2012 | December 31, 2011 | ||||||||||||||||||
Fund | Ordinary Income* | Long-Term Capital Gains | Ordinary Income* | Long-Term Capital Gains | |||||||||||||||
Columbia Acorn Fund | $ | 70,510,183 | $ | 1,028,830,224 | $ | 38,838,016 | $ | 707,352,658 | |||||||||||
Columbia Acorn International | 128,781,789 | — | 157,071,816 | — | |||||||||||||||
Columbia Acorn USA | 8,908,286 | 120,940,637 | — | 9,830,778 | |||||||||||||||
Columbia Acorn International Select | 24,643,601 | 30,592,124 | 10,288,242 | 5,503,810 | |||||||||||||||
Columbia Acorn Select | — | 83,831,961 | 31,147,585 | 42,324 | |||||||||||||||
Columbia Thermostat Fund | 12,531,935 | — | 3,923,425 | — | |||||||||||||||
Columbia Acorn Emerging Markets Fund | 76,230 | — | — | — | |||||||||||||||
Columbia Acorn European Fund | 22,685 | 360 | 14,455 | — | |||||||||||||||
* For tax purposes short-term capital gain distributions, if any, are considered ordinary income distributions.
As of December 31, 2012, the components of distributable earnings on a tax basis were as follows:
| Fund | Undistributed Ordinary Income | Undistributed Accumulated Long-Term Capital Gains | Accumulated Realized Loss | Unrealized Appreciation (Depreciation) | |||||||||||||||
Columbia Acorn Fund | $ | 21,250,410 | $ | 224,200,890 | $ | (8,243,176 | ) | $ | 6,559,008,085 | ||||||||||
Columbia Acorn International | 80,046,295 | — | (177,969,429 | ) | 1,434,490,688 | ||||||||||||||
Columbia Acorn USA | — | 2,115,795 | — | 547,588,096 | |||||||||||||||
Columbia Acorn International Select | — | 7,048,066 | — | 38,754,005 | |||||||||||||||
Columbia Acorn Select | 3,241,093 | 41,833,911 | — | 262,522,635 | |||||||||||||||
Columbia Thermostat Fund | 670,600 | — | (8,938,163 | ) | 39,277,722 | ||||||||||||||
Columbia Acorn Emerging Markets Fund | — | — | (106,036 | ) | 1,429,512 | ||||||||||||||
Columbia Acorn European Fund | — | — | (1,940 | ) | 384,667 | ||||||||||||||
* The differences between book-basis and tax-basis net unrealized appreciation (depreciation) are primarily due to deferral of losses from wash sales, PFIC adjustments and non-taxable distributions.
The following capital loss carryforward, determined as of December 31, 2012, may be available to reduce taxable income arising from future net realized gains on investments, if any, to the extent permitted by the Internal Revenue Code:
Year of Expiration | |||||||||||||||||||||||||||
2015 | 2016 | 2017 | 2018 | Unlimited Short-Term | Total | ||||||||||||||||||||||
Columbia Acorn International | $ | 11,884,052 | $ | 62,714,662 | $ | 102,948,489 | $ | — | $ | — | $ | 177,547,203 | |||||||||||||||
Columbia Thermostat Fund | — | — | 5,983,674 | 2,954,489 | — | 8,938,163 | |||||||||||||||||||||
Columbia Acorn Emerging Markets Fund | — | — | — | — | 86,920 | 86,920 | |||||||||||||||||||||
118
Unlimited capital loss carryforwards are required to be utilized prior to any capital losses which carry an expiration date. As a result of this ordering rule, capital loss carryforwards which carry an expiration date may be more likely to expire unused.
The value of capital loss carryforwards that were utilized and expired for the Funds during the year ended December 31, 2012, were as follows:
Utilized | Expired | ||||||||||
Columbia Acorn International | $ | 110,637,154 | $ | — | |||||||
Columbia Thermostat Fund | 11,749,824 | — | |||||||||
Under current tax rules, Regulated Investment Companies can elect to treat certain late-year ordinary losses incurred and post-October capital losses (capital losses realized after October 31) as arising on the first day of the following taxable year. As of December 31, 2012, the Funds will elect to treat the following late-year ordinary losses and post-October capital losses as arising on January 1, 2013:
| Fund | Late-Year Ordinary Losses | Post-October Capital Losses | |||||||||
Columbia Acorn Fund | $ | — | $ | 8,243,176 | |||||||
Columbia Acorn International | — | 422,226 | |||||||||
| Columbia Acorn International Select | 3,455,583 | — | |||||||||
| Columbia Acorn Emerging Markets Fund | — | 19,116 | |||||||||
Columbia Acorn European Fund | — | 1,940 | |||||||||
Management of the Funds has concluded that there are no significant uncertain tax positions that would require recognition in the financial statements. However, management's conclusion may be subject to review and adjustment at a later date based on factors including, but not limited to, new tax laws, regulations, and administrative interpretations (including relevant court decisions). Generally, the Funds' federal tax returns for the prior three fiscal years remain subject to examination by the Internal Revenue Service.
4. Transactions with Affiliates
Columbia Wanger Asset Management, LLC (CWAM) is a wholly-owned subsidiary of Columbia Management Investment Advisers, LLC (Columbia Management), which is a wholly-owned subsidiary of Ameriprise Financial, Inc. (Ameriprise Financial). CWAM furnishes continuing investment supervision to the Funds and is responsible for the overall management of the Funds' business affairs.
CWAM receives a monthly advisory fee based on each Fund's average daily net assets at the following annual rates:
Columbia Acorn Fund
Average Daily Net Assets | Annual Fee Rate | ||||||
Up to $700 million | 0.74 | % | |||||
$700 million to $2 billion | 0.69 | % | |||||
$2 billion to $6 billion | 0.64 | % | |||||
| $6 billion and over | 0.63 | % | |||||
Columbia Acorn International
Average Daily Net Assets | Annual Fee Rate | ||||||
Up to $100 million | 1.19 | % | |||||
$100 million to $500 million | 0.94 | % | |||||
| $500 million and over | 0.74 | % | |||||
Columbia Acorn USA
Average Daily Net Assets | Annual Fee Rate | ||||||
Up to $200 million | 0.94 | % | |||||
$200 million to $500 million | 0.89 | % | |||||
$500 million to $2 billion | 0.84 | % | |||||
$2 billion to $3 billion | 0.80 | % | |||||
| $3 billion and over | 0.70 | % | |||||
Columbia Acorn International Select
Average Daily Net Assets | Annual Fee Rate | ||||||
Up to $500 million | 0.94 | % | |||||
| $500 million and over | 0.90 | % | |||||
Columbia Acorn Select
Average Daily Net Assets | Annual Fee Rate | ||||||
Up to $700 million | 0.85 | % | |||||
$700 million to $2 billion | 0.80 | % | |||||
$2 billion to $3 billion | 0.75 | % | |||||
| $3 billion and over | 0.70 | % | |||||
Columbia Thermostat Fund
| Annual Fee Rate | |||||||
All Average Daily Net Assets | 0.10 | % | |||||
Columbia Acorn Emerging Markets Fund
Average Daily Net Assets | Annual Fee Rate | ||||||
Up to $100 million | 1.25 | % | |||||
$100 million to $500 million | 1.00 | % | |||||
| $500 million and over | 0.80 | % | |||||
Columbia Acorn European Fund
Average Daily Net Assets | Annual Fee Rate | ||||||
Up to $100 million | 1.19 | % | |||||
$100 million to $500 million | 0.94 | % | |||||
| $500 million and over | 0.74 | % | |||||
119
Columbia Acorn Family of Funds
Notes to Financial Statements, continued
For the year ended December 31, 2012, the effective investment advisory fee rates were as follows:
Fund | |||||||
Columbia Acorn Fund | 0.64 | % | |||||
Columbia Acorn International | 0.76 | % | |||||
Columbia Acorn USA | 0.86 | % | |||||
Fund | |||||||
Columbia Acorn International Select | 0.94 | % | |||||
Columbia Acorn Select | 0.83 | % | |||||
Columbia Thermostat Fund | 0.10 | % | |||||
Columbia Acorn Emerging Markets Fund | 1.25 | % | |||||
Columbia Acorn European Fund | 1.19 | % | |||||
>Expense limit
CWAM has voluntarily agreed to reimburse the ordinary operating expenses (exclusive of brokerage commissions, interest, taxes and extraordinary expenses, but inclusive of custodial charges relating to overdrafts, if any) exceeding annually each class' average daily net assets as follows:
Fund | Class A | Class B | Class C | Class I | Class R4 | Class R5 | Class Y | Class Z | |||||||||||||||||||||||||||
Columbia Acorn International Select | 1.70 | % | 2.20 | % | 2.45 | % | 1.28 | % | 1.45 | % | 1.33 | % | 1.28 | % | 1.45 | % | |||||||||||||||||||
Columbia Acorn Select | 1.60 | % | 2.10 | % | 2.35 | % | 1.25 | % | 1.35 | % | 1.30 | % | 1.25 | % | 1.35 | % | |||||||||||||||||||
This arrangement may be modified or terminated by either the Funds or CWAM on 30 days notice.
Effective May 1, 2012, for Class A, Class B, Class C and Class Z shares, and effective November 8, 2012 for Class R4, Class R5 and Class Y shares, CWAM has contractually agreed to waive fees and/or reimburse expenses of Columbia Thermostat Fund for one year, so that the ordinary operating expenses (exclusive of brokerage commissions, interest, taxes and extraordinary expenses, but inclusive of custodial charges relating to overdrafts, if any) do not exceed annually each class' average daily net assets as follows:
Fund | Class A | Class B | Class C | Class R4 | Class R5 | Class Y | Class Z | ||||||||||||||||||||||||
Columbia Thermostat Fund | 0.50 | % | 1.00 | % | 1.25 | % | 0.25 | % | 0.27 | % | 0.22 | % | 0.25 | % | |||||||||||||||||
There is no guarantee that this agreement will continue thereafter.
Effective May 1, 2012, for Class A, Class B, Class C and Class Z shares, and effective November 8, 2012 for Class R4 and Class R5 shares, CWAM has contractually agreed to waive fees and/or reimburse expenses of Columbia Acorn Emerging Markets Fund and Columbia Acorn European Fund for one year, so that the ordinary operating expenses (exclusive of interest and fees on borrowings and expenses associated with each Fund's investment in other investment companies, but inclusive of custodial charges relating to overdrafts, if any), do not exceed annually each class' average daily net assets as follows:
Fund | Class A | Class C | Class I | Class R4 | Class R5 | Class Z | |||||||||||||||||||||
Columbia Acorn Emerging Markets Fund | 1.85 | % | 2.60 | % | 1.41 | % | 1.60 | % | 1.46 | % | 1.60 | % | |||||||||||||||
Columbia Acorn European Fund | 1.75 | % | 2.50 | % | 1.31 | % | — | % | 1.36 | % | 1.50 | % | |||||||||||||||
There is no guarantee that this agreement will continue thereafter.
Effective August 15, 2011, CWAM and its affiliates have contractually agreed to waive a portion of total annual Fund operating expenses incurred by Class A shares, Class B shares and Class C shares of Columbia Acorn International such that the Fund's total annual Fund operating expenses will be reduced by 0.04%, 0.03% and 0.02% for Class A, Class B and Class C shares of the Fund, respectively, through August 14, 2013. There is no guarantee that this agreement will continue thereafter.
Expenses reimbursed by CWAM and its affiliates for the year ended December 31, 2012, were as follows:
Fund | Expenses Reimbursed | ||||||
Columbia Acorn International | $ | 414,204 | |||||
Columbia Thermostat Fund | 321,910 | ||||||
Columbia Acorn Emerging Markets Fund | 292,249 | ||||||
Columbia Acorn European Fund | 242,324 | ||||||
CWAM provides administrative services and receives an administration fee from the Funds at the following annual rates:
Columbia Acorn Trust
| Aggregate Average Daily Net Assets of the Trust: | Annual Fee Rate | ||||||
Up to $8 billion | 0.050 | % | |||||
$8 billion to $16 billion | 0.040 | % | |||||
$16 billion to $35 billion | 0.030 | % | |||||
$35 billion to $45 billion | 0.025 | % | |||||
| $45 billion and over | 0.015 | % | |||||
120
For the year ended December 31, 2012, the effective administration fee rate was 0.04% of each Fund's average daily net assets. CWAM has delegated to Columbia Management responsibility to provide certain sub-administrative services to the Funds.
CMID, a wholly owned subsidiary of Ameriprise Financial, is the distributor of the Funds.
For the year ended December 31, 2012, the Funds have been advised that CMID retained underwriting discounts in connection with redemptions of Class A shares and received CDSCs in connection with Class A, Class B and Class C share redemptions as follows:
| Underwriting Discounts | CDSCs | ||||||||||||||||||
(Unaudited) | Class A | Class A | Class B | Class C | |||||||||||||||
Columbia Acorn Fund | $ | 1,601,152 | $ | 4,108 | $ | 11,666 | $ | 37,327 | |||||||||||
| Columbia Acorn International | 345,764 | 917 | 19,023 | 6,027 | |||||||||||||||
Columbia Acorn USA | 50,004 | — | 544 | 1,839 | |||||||||||||||
| Columbia Acorn International Select | 80,731 | 145 | 2,427 | 415 | |||||||||||||||
| Columbia Acorn Select | 80,837 | 270 | 3,544 | 1,224 | |||||||||||||||
| Columbia Thermostat Fund | 5,056,120 | 168 | 2,401 | 36,807 | |||||||||||||||
| Columbia Acorn Emerging Markets Fund | 12,085 | — | — | — | |||||||||||||||
| Columbia Acorn European Fund | 1,374 | — | — | — | |||||||||||||||
Each Fund has adopted a Rule 12b-1 (distribution and service) plan which requires it to pay CMID a monthly service fee equal to 0.25% annually of the average daily net assets attributable to Class A, Class B and Class C shares and a monthly distribution fee equal to 0.50%, 0.75% and 0.50%,
annually, of the average daily net assets attributable to Class B, Class C and Class R shares, respectively. CMID receives no compensation with respect to Class R4, Class R5, Class Y and Class Z shares.
Columbia Management Investment Services Corp. (CMIS), a wholly owned subsidiary of Ameriprise Financial, is the transfer agent of the Funds. Effective May 1, 2012, CMIS receives monthly account-based service fees based on the number of open Fund accounts. Each Fund pays CMIS a monthly fee at the annual rate of $18.50 per open account. Prior to May 1, 2012, the annual rate was $17.00 per open account. CMIS is also reimbursed by the Funds for the fees and expenses that it pays retirement plan sponsors, defined contribution plans and 529 Plans (the Plans) or other financial intermediaries that maintain omnibus accounts with the Funds and provide record keeping services to shareholders invested through the Plans. Such fees are calculated as a percentage of the average aggregate value of each Fund's shares maintained by a Plan. CMIS is also reimbursed for the fees and expenses that it pays each fund supermarket, broker-dealer firm or other financial intermediary that maintain an omnibus account with a Fund. Such fees are based on the number of sub-accounts comprising the omnibus position.
The Transfer Agent also receives compensation from fees for various shareholder services and reimbursements for certain out-of-pocket fees. Class I shares do not pay transfer agent fees. Total transfer agent fees for Class R5 shares are subject to an annual limitation of not more than 0.05% of the average daily net assets attributable to Class R5 shares. Effective November 8, 2012, Class Y shares will not pay transfer agent fees for at least twelve months.
For the year ended December 31, 2012, the Funds' effective transfer agent fee rates as a percentage of average daily net assets of each class were as follows:
Fund | Class A | Class B | Class C | Class R | Class R4 | Class R5 | Class Z | ||||||||||||||||||||||||
Columbia Acorn Fund | 0.09 | % | 0.18 | % | 0.08 | % | — | % | 0.13 | % | 0.05 | % | 0.06 | % | |||||||||||||||||
Columbia Acorn International | 0.16 | % | 0.38 | % | 0.14 | % | 0.15 | % | 0.13 | % | 0.02 | % | 0.05 | % | |||||||||||||||||
Columbia Acorn USA | 0.10 | % | 0.28 | % | 0.08 | % | — | % | 0.13 | % | 0.05 | % | 0.11 | % | |||||||||||||||||
Columbia Acorn International Select | 0.12 | % | 0.24 | % | 0.15 | % | — | % | 0.14 | % | 0.05 | % | 0.07 | % | |||||||||||||||||
Columbia Acorn Select | 0.11 | % | 0.20 | % | 0.11 | % | — | % | 0.13 | % | 0.05 | % | 0.08 | % | |||||||||||||||||
Columbia Thermostat Fund | 0.08 | % | 0.17 | % | 0.08 | % | — | % | 0.13 | % | 0.05 | % | 0.06 | % | |||||||||||||||||
Columbia Acorn Emerging Markets Fund | 0.11 | % | — | % | 0.15 | % | — | % | 0.13 | % | 0.05 | % | 0.05 | % | |||||||||||||||||
Columbia Acorn European Fund | 0.05 | % | — | % | 0.01 | % | — | % | — | % | 0.05 | % | 0.02 | % | |||||||||||||||||
121
Columbia Acorn Family of Funds
Notes to Financial Statements, continued
In connection with the acquisition that closed August 15, 2011, Columbia Acorn International assumed the assets and obligations of RiverSource Partners International Small Cap Fund and RiverSource Partners International Select Growth Fund (See Note 8), which together with certain other associated investment companies, have severally, but not jointly, guaranteed the performance and observance of all the terms and conditions of a lease (including the payment of rent (the Guaranty)) entered into by Seligman Data Corp., the former transfer agent of Seligman Global Smaller Companies Fund and Seligman International Growth Fund, which were acquired by RiverSource Partners International Small Cap Fund and RiverSource Partners International Select Growth Fund, respectively, in previous years. The lease and the Guaranty expire in January 2019. At December 31, 2012, Columbia Acorn International's total potential future obligation over the life of the Guaranty is $121,876. The liability remaining at December 31, 2012 for non-recurring charges associated with the lease amounted to $70,651 and is included within payable for other liabilities in the Statements of Assets and Liabilities.
Certain officers and trustees of the Trust are also officers of CWAM. The Trust makes no direct payments to its officers and trustees who are affiliated with CWAM.
The Board has appointed a Chief Compliance Officer of the Trust in accordance with federal securities regulations. The Funds, along with other affiliated funds, pay their pro-rata share of the expenses associated with the Office of the Chief Compliance Officer. These expenses are disclosed separately as "Chief compliance officer expenses" in the Statements of Operations.
The Trust offers a deferred compensation plan for its independent trustees. Under that plan, a trustee may elect to defer all or a portion of his or her compensation. Amounts deferred are retained by the Trust and may represent an unfunded obligation of the Trust. The value of amounts deferred is determined by reference to the change in value of Class Z shares of one or more series of the Trust or a money market fund as specified by the trustee. Benefits under the deferred compensation plan are payable in accordance with the plan.
Organizational expenses for Columbia Acorn Emerging Markets Fund and Columbia Acorn European Fund consist of offering costs which were incurred prior to the initial public offering of shares of the Funds and include, among other things, state registration filing fees and printing costs. The offering costs were paid by CWAM as incurred. The Funds have capitalized these offering costs and are amortizing them to expense over a period of 12 months from the commencement
of the initial public offering of shares. The Funds reimburse CWAM during the 12 month period on a monthly basis an amount equal to the offering amortized to expense by each Fund during that month.
An affiliated person of a Fund may include any company in which a Fund owns five percent or more of its outstanding voting shares during the year. On December 31, 2012, Columbia Acorn Fund, Columbia Acorn International, Columbia Acorn USA, Columbia Acorn Select and Columbia Thermostat Fund each held five percent or more of the outstanding voting securities of one or more companies. Details of investments in those affiliated companies are presented on pages 39, 40, 51, 60, 72 and 75, respectively.
For the year ended December 31, 2012, the Funds engaged in purchase and sales transactions with funds that have a common investment adviser (or affiliated investment advisers), common directors/trustees, and/or common officers. Those transactions complied with Rule 17a-7 under the Investment Company Act of 1940 and were as follows:
Purchases | Sales | ||||||||||
Columbia Acorn Fund | $ | 800,000 | $ | — | |||||||
Columbia Acorn International | 3,678,950 | — | |||||||||
Columbia Acorn International Select | 711,990 | — | |||||||||
Columbia Acorn Select | — | 1,445,547 | |||||||||
| Columbia Acorn Emerging Markets Fund | 23,583 | — | |||||||||
During the year ended December 31, 2011, Columbia Management reimbursed Columbia Acorn International $174,055 for a loss on a trading error.
During the year ended December 31, 2011, Columbia Acorn Select Class Z shares received a payment of $56,666 from Columbia Management as a reimbursement for certain shareholder transactions processed at an incorrect price. The payment has been included in "Increase from contribution from affiliate" on the Statements of Changes in Net Assets.
5. Borrowing Arrangements
Effective July 23, 2012, the Trust participates in a $150 million credit facility with JPMorgan Chase Bank, N.A., along with another Trust managed by CWAM, which was entered into to facilitate portfolio liquidity. Under the facility, interest is charged to each participating fund based on its borrowings at a rate per annum equal to the Federal Funds Rate plus 1.00%. In addition, a commitment fee of 0.08% per annum of the unutilized line of credit is accrued and apportioned among the participating funds based on their relative net assets. The commitment fee is disclosed as a part of "Other expenses" in the Statements of Operations. The Trust expects to renew this line of credit for
122
one year durations annually in July at then current market rates and terms.
Prior to July 23, 2012, interest was charged at a rate per annum equal to the higher of Federal Funds Rate or Overnight LIBOR plus 1.25%. In addition, the commitment fee was 0.10% per annum of the unutilized line of credit.
Other than as noted below, no Fund had borrowings during the year ended December 31, 2012:
Fund Name | Average Daily Loan Balance Outstanding | Weighted Average Interest Rate | |||||||||
Columbia Acorn USA | $ | 7,633,333 | 1.18 | % | |||||||
| Columbia Acorn International Select | 1,900,000 | 1.18 | % | ||||||||
Columbia Acorn Select | 8,500,000 | 1.49 | % | ||||||||
Effective January 11, 2013, the committed line of credit was increased from $150 million to $200 million, under the same terms as disclosed above.
6. Investment Transactions
The aggregate cost of purchases and proceeds from sales, other than short-term obligations, for the year ended December 31, 2012, were:
Purchases | Proceeds from Sales | ||||||||||
Columbia Acorn Fund | $ | 2,773,626,402 | $ | 4,265,384,295 | |||||||
| Columbia Acorn International | 2,155,653,985 | 1,948,721,278 | |||||||||
Columbia Acorn USA | 222,195,446 | 456,536,683 | |||||||||
| Columbia Acorn International Select | 214,235,730 | 224,470,428 | |||||||||
Columbia Acorn Select | 169,709,495 | 722,275,331 | |||||||||
| Columbia Thermostat Fund | 1,167,795,401 | 517,912,342 | |||||||||
| Columbia Acorn Emerging Markets Fund | 7,743,428 | 1,827,700 | |||||||||
| Columbia Acorn European Fund | 1,763,030 | 803,138 | |||||||||
7. Regulatory Settlements with Third Parties
During the years ended December 31, 2012 and 2011, Columbia Acorn International received payments of $107,802 and $107,617, respectively, resulting from certain regulatory settlements with third parties in which the Fund had participated. The payments have been included in "Increase from regulatory settlements" in the Statements of Changes in Net Assets.
8. Fund Merger
On August 15, 2011, Columbia Acorn International acquired the assets and assumed the identified liabilities of RiverSource Partners International Select Growth Fund and RiverSource Partners International Small Cap Fund, both series of
RiverSource International Managers Series, Inc., which were sub-advised by CWAM. The reorganization was completed after shareholders approved the plan on May 11, 2011. The purpose of the transaction was to combine funds managed by CWAM with comparable investment objectives and strategies.
The aggregate net assets of Columbia Acorn International immediately before the acquisitions were $5,887,634,436 and the combined net assets immediately after the acquisitions were $6,287,891,195.
The merger was accomplished by a tax-free exchange of 48,230,699 shares of RiverSource Partners International Select Growth Fund valued at $311,482,971 (including $29,840,736 of unrealized appreciation) and 15,801,504 shares of RiverSource Partners International Small Cap Fund valued at $88,773,788 (including $6,322,097 of unrealized appreciation).
In exchange for RiverSource Partners International Select Growth Fund and RiverSource Partners International Small Cap Fund shares, Columbia Acorn International issued the following number of shares:
| RiverSource Partners International Select Growth Fund | RiverSource Partners International Small Cap Fund | ||||||||||
Class A | 3,800,227 | 1,666,707 | |||||||||
Class B | 267,259 | 75,499 | |||||||||
Class C | 183,761 | 518,779 | |||||||||
Class I | 4,010,380 | 51,634 | |||||||||
Class R | 35,341 | 48,348 | |||||||||
Class R5 | 5,711 | 23,983 | |||||||||
For financial reporting purposes, net assets received and shares issued by Columbia Acorn International were recorded at fair value; however, RiverSource Partners International Select Growth Fund and RiverSource Partners International Small Cap Fund's cost of investments was carried forward.
The financial statements reflect the operations of Columbia Acorn International for the period prior to the merger and the combined fund for the period subsequent to the merger. Because the combined investment portfolios have been managed as a single integrated portfolio since the merger was completed, it is not practicable to separate the amounts of revenue and earnings of RiverSource Partners International Select Growth Fund and RiverSource Partners International Small Cap Fund that have been included in the combined Fund's Statements of Operations since the merger was completed.
Assuming the merger had been completed on January 1, 2011, Columbia Acorn International's pro-forma net investment income, net gain on investments, net change in unrealized
123
Columbia Acorn Family of Funds
Notes to Financial Statements, continued
depreciation and net increase in net assets from operations for the year ended December 31, 2011 would have been approximately $76.7 million, $260.0 million, $(1,274.8) million and $(938.1) million, respectively.
9. Shareholder Concentration
At December 31, 2012, the table below details the affiliated and significant unaffiliated shareholder account ownership of outstanding shares of each Fund. The Funds have no knowledge about whether any portion of these unaffiliated shares were owned beneficially. Subscription and redemption activity of these accounts may have a significant effect on the operations of the Funds.
| Number of unaffiliated accounts | Percentage of shares outstanding held – unaffiliated | Percentage of shares outstanding held – affiliated | |||||||||||||
Columbia Acorn Fund | 1 | 10.9 | % | — | % | ||||||||||
Columbia Acorn International | 3 | 37.4 | % | — | % | ||||||||||
Columbia Acorn USA | 3 | 45.6 | % | — | % | ||||||||||
| Columbia Acorn International Select | 1 | 36.6 | % | — | % | ||||||||||
Columbia Acorn Select | 2 | 27.0 | % | — | % | ||||||||||
Columbia Thermostat Fund | 4 | 61.2 | % | — | % | ||||||||||
| Columbia Acorn Emerging Markets Fund | 1 | 22.4 | % | — | % | ||||||||||
Columbia Acorn European Fund | 2 | 32.8 | % | 31.4 | % | ||||||||||
10. Subsequent Events
Management has evaluated the events and transactions that have occurred through the date the financial statements were issued and noted no items requiring adjustment of the financial statements or additional disclosure other than the change in borrowing arrangements (See Note 5) and the following redemption. Between January 14, 2013 and January 15, 2013, a large investor redeemed a total of $185 million from Columbia Acorn USA.
11. Information Regarding Pending and Settled Legal Proceedings
Ameriprise Financial and certain of its affiliates have historically been involved in a number of legal, arbitration and regulatory proceedings, including routine litigation, class actions, and governmental actions, concerning matters arising in connection with the conduct of their business activities. Ameriprise Financial believes that the Funds are not currently the subject of, and that neither Ameriprise Financial nor any of its affiliates are the subject of, any pending legal, arbitration or regulatory proceedings that are likely to have a material adverse effect on the Funds or the ability of Ameriprise Financial or its affiliates to perform under their contracts with the Funds. Ameriprise Financial is required to make 10-Q, 10-K
and, as necessary, 8-K filings with the Securities and Exchange Commission on legal and regulatory matters that relate to Ameriprise Financial and its affiliates. Copies of these filings may be obtained by accessing the SEC website at www.sec.gov.
There can be no assurance that these matters, or the adverse publicity associated with them, will not result in increased fund redemptions, reduced sale of fund shares or other adverse consequences to the Funds. Further, although we believe proceedings are not likely to have a material adverse effect on the Funds or the ability of Ameriprise Financial or its affiliates to perform under their contracts with the Funds, these proceedings are subject to uncertainties and, as such, we are unable to estimate the possible loss or range of loss that may result. An adverse outcome in one or more of these proceedings could result in adverse judgments, settlements, fines, penalties or other relief that could have a material adverse effect on the consolidated financial condition or results of operations of Ameriprise Financial.
124
Report of Independent Registered Public Accounting Firm
To the Board of Trustees and Shareholders of
Columbia Acorn Trust:
In our opinion, the accompanying statement of assets and liabilities, including the statement of investments, and the related statements of operations and of changes in net assets and the financial highlights present fairly, in all material respects, the financial position of Columbia Acorn Fund, Columbia Acorn International, Columbia Acorn USA, Columbia Acorn International Select, Columbia Acorn Select, Columbia Thermostat Fund, Columbia Acorn Emerging Markets Fund, and Columbia Acorn European Fund (each a series of the Columbia Acorn Trust, hereinafter referred to as the "Funds") at December 31, 2012, the results of their operations, and the changes in their net assets and the financial highlights for the periods presented, in conformity with accounting principles generally accepted in the United States of America. These financial statements and financial highlights (hereafter referred to as "financial statements") are the responsibility of the
Funds' management; our responsibility is to express an opinion on these financial statements based on our audits. We conducted our audits of these financial statements in accordance with the standards of the Public Company Accounting Oversight Board (United States). Those standards require that we plan and perform the audit to obtain reasonable assurance about whether the financial statements are free of material misstatement. An audit includes examining, on a test basis, evidence supporting the amounts and disclosures in the financial statements, assessing the accounting principles used and significant estimates made by management, and evaluating the overall financial statement presentation. We believe that our audits, which included confirmation of securities at December 31, 2012 by correspondence with the custodian and brokers, provide a reasonable basis for our opinion.
PricewaterhouseCoopers LLP
Chicago, Illinois
February 22, 2013
125
Columbia Acorn Family of Funds
Federal Income Tax Information (Unaudited)
The Funds hereby designate the following tax attributes for the fiscal year ended December 31, 2012. Shareholders will be notified in early 2013 of the amounts for use in preparing 2012 income tax returns.
| Qualified Dividend Income | Dividends Received Deduction | Capital Gain Dividend | Foreign Taxes Paid | Foreign Source Income | |||||||||||||||||||
Columbia Acorn Fund | 100.00 | % | 100.00 | % | $ | 1,174,543,462 | $ | — | $ | — | |||||||||||||
Columbia Acorn International | 85.98 | % | — | % | — | 13,137,869 | 159,180,957 | ||||||||||||||||
Columbia Acorn USA | 100.00 | % | 100.00 | % | 126,339,955 | — | — | ||||||||||||||||
Columbia Acorn International Select | 18.07 | % | — | % | 37,965,361 | 834,503 | 11,887,752 | ||||||||||||||||
Columbia Acorn Select | — | % | — | % | 106,967,491 | — | — | ||||||||||||||||
Columbia Thermostat Fund | 34.63 | % | 22.96 | % | — | 155,528 | 1,452,097 | ||||||||||||||||
Columbia Acorn Emerging Markets Fund | 69.87 | % | — | % | — | 15,164 | 172,638 | ||||||||||||||||
Columbia Acorn European Fund | 100.00 | % | — | % | 378 | 4,833 | 50,952 | ||||||||||||||||
Qualified Dividend Income. For taxable, non-corporate shareholders, the percentage of ordinary income dividends paid during the fiscal year that represents qualified dividend income subject to reduced tax rates under the Jobs and Growth Tax Relief Reconciliation Act of 2003.
Dividends Received Deduction. The percentage of ordinary income dividends paid during the fiscal year that qualifies for the corporate dividends received deduction.
Capital Gain Dividend. The Fund designates as a capital gain dividend the amount reflected above, or if subsequently determined to be different, the net capital gain of such fiscal period. The Fund also designates as capital gain dividends, to the extent necessary to fully distribute such capital gains, earnings and profits distributed to shareholders on the redemption of shares.
Foreign Taxes Paid. The Fund makes the election to pass through to shareholders the foreign taxes paid. These taxes, and the corresponding foreign source income, are provided.
126
Board of Trustees and Management of
Columbia Acorn Family of Funds
Each trustee may serve a term of unlimited duration. The Trust's By-laws generally require that a trustee retire at the end of the calendar year in which the trustee attains the age of 75 years. The trustees appoint their own successors, provided that at least two-thirds of the trustees, after such appointment, have been elected by shareholders. Shareholders may remove a trustee, with or without cause, upon the vote of two-thirds of the Trust's outstanding shares at any meeting called for that purpose. A trustee may be removed, with or without cause, upon the vote of a majority of the trustees. The names of the trustees and officers of the Trust, the date each was first elected or appointed to office, their principal business occupations during at least the last five years, the number of portfolios in the fund complex they oversee, and other directorships they hold, are shown below. Each trustee serves in such capacity for each of the eight series of Columbia Acorn Trust and for each of the four series of Wanger Advisors Trust.
The address for the trustees and officers of the Trust is Columbia Wanger Asset Management, LLC, 227 West Monroe Street, Suite 3000, Chicago, Illinois 60606. The Funds' Statement of Additional Information includes additional information about the Funds' trustees and officers. You may obtain a free copy of the Statement of Additional Information by writing or calling toll-free:
Columbia Wanger Asset Management, LLC
Shareholder Services Group
227 W. Monroe, Suite 3000
Chicago IL 60606
1-800-922-6769
| Name, Position(s) with Columbia Acorn Trust and Age at December 31, 2012 | Year First Elected or Appointed to Office* | Principal Occupation(s) during Past Five Years | Number of Portfolios in Fund Complex Overseen by Trustee/Officer | Other Directorships in addition to Columbia Acorn Trust | |||||||||||||||
Trustees who are not interested persons of Columbia Acorn Trust: | |||||||||||||||||||
| Laura M. Born, 47, Trustee and Chair | 2007 | Adjunct Assistant Professor of Finance, University of Chicago Booth School of Business; Managing Director – Investment Banking, JP Morgan Chase & Co. (broker/dealer) 2002-2007; prior thereto, associated with JP Morgan as an investment professional since 1991. | 12 | Wanger Advisors Trust | |||||||||||||||
| Michelle L. Collins, 52, Trustee | 2008 | President, Cambium LLC (financial and business advisory firm) since 2007; Advisory Board Member, Svoboda Capital Partners LLC (private equity firm) since 2007; Managing Director, Svoboda Capital Partners LLC, 1998-2006. | 12 | Wanger Advisors Trust; Integrys Energy Group, Inc. (public utility); Molex, Inc. (electronics components manufacturer); CDW Corporation (electronics components manufacturer) until October 2007. | |||||||||||||||
| Maureen M. Culhane, 64, Trustee | 2007 | Retired. Formerly, Vice President, Goldman Sachs Asset Management, L.P. (investment adviser), 2005-2007, and Vice President (Consultant) – Strategic Relationship Management, Goldman Sachs & Co., 1999-2005. | 12 | Wanger Advisors Trust | |||||||||||||||
| Margaret M. Eisen, 59, Trustee | 2002 | Chief Investment Officer, EAM International LLC (corporate finance and asset management) since 2003; Managing Director, CFA Institute, 2005-2008. | 12 | Wanger Advisors Trust; Antigenics, Inc. (provider of technology products and services) until June 2009. | |||||||||||||||
| John C. Heaton, 53, Trustee | 2010 | Joseph L. Gidwitz Professor of Finance, University of Chicago Booth School of Business since July 2006; James H. Lorie Professor of Finance, University of Chicago Booth School of Business July 2000 – July 2006; financial consultant since 2004. | 12 | Wanger Advisors Trust | |||||||||||||||
| Steven N. Kaplan, 53, Trustee and Vice Chair | 1999 | Neubauer Family Distinguished Service Professor of Entrepreneurship and Finance, University of Chicago Booth School of Business; faculty member of the University of Chicago Booth School of Business since 1988. | 12 | Wanger Advisors Trust; Accretive Health, Inc. (healthcare management services provider); Morningstar, Inc. (provider of independent investment research). | |||||||||||||||
| David J. Rudis, 59, Trustee | 2010 | National Checking and Debit Executive, and Illinois President, Bank of America, 2007-2009; President, Consumer Banking Group, LaSalle National Bank, 2004-2007. | 12 | Wanger Advisors Trust | |||||||||||||||
| David B. Small, 56, Trustee | 2010 | Managing Director, Grosvenor Capital Management, L.P. (investment adviser) since 1994; Adjunct Associate Professor of Finance, University of Chicago Booth School of Business. | 12 | Wanger Advisors Trust | |||||||||||||||
Trustees who are interested persons of Columbia Acorn Trust: | |||||||||||||||||||
| Charles P. McQuaid, 59, Trustee and President(1) | 1992 | President and Chief Investment Officer, CWAM or its predecessors, since October 2003; associated with CWAM or its predecessors as an investment professional since 1978. | 12 | Wanger Advisors Trust | |||||||||||||||
127
| Name, Position(s) with Columbia Acorn Trust and Age at December 31, 2012 | Year First Elected or Appointed to Office* | Principal Occupation(s) during Past Five Years | Number of Portfolios in Fund Complex Overseen by Trustee/Officer | Other Directorships in addition to Columbia Acorn Trust | |||||||||||||||
Trustee Emeritus | |||||||||||||||||||
| Ralph Wanger, 78, Trustee Emeritus(2) | 1970 | Founder, CWAM. Formerly, President, Chief Investment Officer and portfolio manager, CWAM or its predecessors, July 1992 – September 2003; Director, Wanger Investment Company PLC; Consultant to CWAM or its predecessors, September 2003 – September 2005. | 12 | Wanger Advisors Trust | |||||||||||||||
Officers of Columbia Acorn Trust: | |||||||||||||||||||
| Ben Andrews, 46, Vice President | 2004 | Portfolio manager and/or analyst, CWAM or its predecessors, since 1998; Vice President, Columbia Acorn Trust and Wanger Advisors Trust since 2004. | 12 | None | |||||||||||||||
| Robert A. Chalupnik, 46, Vice President | 2011 | Portfolio manager and/or analyst, CWAM or its predecessors since 1998; Vice President Columbia Acorn Trust and Wanger Advisors Trust since May 2011. | 12 | None | |||||||||||||||
| Michael G. Clarke, 43, Assistant Treasurer | 2004 | Vice President, Columbia Management Investment Advisers, LLC since May 2010; Managing Director of Fund Administration, Columbia Management Advisors, LLC, 2004 – 2010; senior officer of Columbia Funds and affiliated funds since 2002. | 12 | None | |||||||||||||||
| Joseph F. DiMaria, 43, Assistant Treasurer | 2010 | Vice President, Mutual Fund Administration, Columbia Management Investment Advisers, LLC, since May 2010; Director of Fund Administration, Columbia Management Advisors, LLC, 2006 – 2010. | 12 | None | |||||||||||||||
| P. Zachary Egan, 43, Vice President | 2003 | Director of International Research, CWAM or its predecessors since December 2004; Vice President, Columbia Acorn Trust since 2003 and Wanger Advisors Trust since 2007; portfolio manager and/or analyst, CWAM or its predecessors since 1999. | 12 | None | |||||||||||||||
| Fritz Kaegi, 41, Vice President | 2011 | Portfolio manager and/or analyst, CWAM or its predecessors since 2004; Vice President Columbia Acorn Trust and Wanger Advisors Trust since September 2011. | 12 | None | |||||||||||||||
| John Kunka, 42, Assistant Treasurer | 2006 | Director of Accounting and Operations, CWAM since 2006. | 12 | None | |||||||||||||||
| Stephen Kusmierczak, 45, Vice President | 2011 | Portfolio manager and/or analyst, CWAM or its predecessors since 2001; Vice President Columbia Acorn Trust and Wanger Advisors Trust since September 2011. | 12 | None | |||||||||||||||
| Joseph C. LaPalm, 43, Vice President | 2006 | Chief Compliance Officer, CWAM since 2005. | 12 | None | |||||||||||||||
| Bruce H. Lauer, 55, Vice President, Secretary and Treasurer | 1995 | Chief Operating Officer, CWAM or its predecessors since April 2000; Vice President, Secretary and Treasurer, Columbia Acorn Trust and Wanger Advisors Trust since 1995; formerly, Director, Wanger Investment Company PLC; formerly, Director, Banc of America Capital Management (Ireland) Ltd.; and formerly, Director, Bank of America Global Liquidity Funds, PLC. | 12 | None | |||||||||||||||
| Louis J. Mendes III, 48, Vice President | 2003 | Portfolio manager and/or analyst, CWAM or its predecessors since 2001; Vice President, Columbia Acorn Trust since 2003 and Wanger Advisors Trust since 2005. | 12 | None | |||||||||||||||
128
| Name, Position(s) with Columbia Acorn Trust and Age at December 31, 2012 | Year First Elected or Appointed to Office* | Principal Occupation(s) during Past Five Years | Number of Portfolios in Fund Complex Overseen by Trustee/Officer | Other Directorships in addition to Columbia Acorn Trust | |||||||||||||||
Officers of Columbia Acorn Trust: (continued) | |||||||||||||||||||
| Robert A. Mohn, 51, Vice President | 1997 | Director of Domestic Research, CWAM or its predecessors since March 2004; Vice President, Columbia Acorn Trust and Wanger Advisors Trust since 1997; portfolio manager and/or analyst, CWAM or its predecessors since August 1992. | 12 | None | |||||||||||||||
| Christopher J. Olson, 48, Vice President | 2001 | Portfolio manager and/or analyst, CWAM or its predecessors since January 2001; Vice President, Columbia Acorn Trust and Wanger Advisors Trust, since 2001. | 12 | None | |||||||||||||||
| Christopher O. Petersen, 43, Assistant Secretary | 2010 | Vice President and Chief Counsel, Ameriprise Financial since January 2010 (formerly, Vice President and Group Counsel or Counsel, 2004 – 2010); Officer, Columbia Funds and affiliated funds since 2007. | 12 | None | |||||||||||||||
| Scott R. Plummer, 53, Assistant Secretary | 2010 | Senior Vice President, Chief Legal Officer and Assistant Secretary, Columbia Management Investment Advisers, LLC (or its predecessors) since June 2005; Senior Vice President and Lead Chief Counsel – Asset Management, Ameriprise Financial since February 2012 (previously, Vice President and Lead Chief Counsel – Asset Management, 2010 – 2012, and Vice President and Chief Counsel – Asset Management, 2005 – 2010); Vice President, Chief Counsel and Assistant Secretary, Columbia Management Investment Distributors, Inc. (or its predecessors) since 2008; Vice President, General Counsel and Secretary, Ameriprise Certificate Company since 2005; Chief Counsel, RiverSource Distributors, Inc., 2006 – 2010; Senior Officer, Columbia Funds and affiliated funds since 2006. | 12 | None | |||||||||||||||
| Robert P. Scales, 60, Chief Compliance Officer, Chief Legal Officer, Senior Vice President and General Counsel | 2004 | Chief Compliance Officer, Chief Legal Officer, Senior Vice President and General Counsel, Columbia Acorn Trust and Wanger Advisors Trust, since 2004. | 12 | None | |||||||||||||||
| Andreas Waldburg-Wolfegg, 46, Vice President | 2011 | Portfolio Manager and/or analyst of CWAM since 2002; Vice President Columbia Acorn Trust and Wanger Advisors Trust since September 2011 | 12 | None | |||||||||||||||
| Linda Roth-Wiszowaty, 43, Assistant Secretary | 2006 | Business support analyst, CWAM, since April 2007; prior thereto executive administrator, CWAM or its predecessors, and executive assistant to the Chief Operating Officer of CWAM or its predecessors. | 12 | None | |||||||||||||||
* Dates prior to April 1992 correspond to the date of first election or appointment as a trustee or officer of The Acorn Fund, Inc., the predecessor to Columbia Acorn Trust.
(1) Mr. McQuaid is an "interested person" of Columbia Acorn Trust and of CWAM, as defined in the Investment Company Act of 1940, because he is an officer of the Trust and of CWAM.
(2) As permitted under the Columbia Acorn Trust's By-Laws, Mr. Wanger serves as a non-voting Trustee Emeritus of the Trust.
129
Columbia Acorn Family of Funds Expense Information (Unaudited)
Columbia Acorn Fund | Class A | Class B* | Class C | Class I | Class R | Class R4† | Class R5† | Class Y† | Class Z | ||||||||||||||||||||||||||||||
Management Fees | 0.64 | % | 0.64 | % | 0.64 | % | 0.64 | % | 0.64 | % | 0.64 | % | 0.64 | % | 0.64 | % | |||||||||||||||||||||||
Distribution and Service (12b-1) Fees | 0.25 | % | 0.75 | % | 1.00 | % | 0.00 | % | 0.00 | % | 0.00 | % | 0.00 | % | 0.00 | % | |||||||||||||||||||||||
Other Expenses | 0.17 | % | 0.25 | % | 0.16 | % | 0.08 | % | 0.22 | % | 0.17 | % | 0.11 | % | 0.14 | % | |||||||||||||||||||||||
Net Expense Ratio | 1.06 | % | 1.64 | % | 1.80 | % | 0.72 | % | 0.86 | % | 0.81 | % | 0.75 | % | 0.78 | % | |||||||||||||||||||||||
Columbia Acorn International | |||||||||||||||||||||||||||||||||||||||
Management Fees | 0.76 | % | 0.76 | % | 0.76 | % | 0.76 | % | 0.76 | % | 0.76 | % | 0.76 | % | 0.76 | % | 0.76 | % | |||||||||||||||||||||
Distribution and Service (12b-1) Fees | 0.25 | % | 0.75 | % | 1.00 | % | 0.00 | % | 0.50 | % | 0.00 | % | 0.00 | % | 0.00 | % | 0.00 | % | |||||||||||||||||||||
Other Expenses | 0.23 | % | 0.46 | % | 0.24 | % | 0.12 | % | 0.25 | % | 0.26 | % | 0.13 | % | 0.14 | % | 0.17 | % | |||||||||||||||||||||
Net Expense Ratio | 1.24 | % | 1.97 | % | 2.00 | % | 0.88 | % | 1.51 | % | 1.02 | % | 0.89 | % | 0.90 | % | 0.93 | % | |||||||||||||||||||||
Columbia Acorn USA | |||||||||||||||||||||||||||||||||||||||
Management Fees | 0.86 | % | 0.86 | % | 0.86 | % | 0.86 | % | 0.86 | % | 0.86 | % | 0.86 | % | 0.86 | % | |||||||||||||||||||||||
Distribution and Service (12b-1) Fees | 0.25 | % | 0.75 | % | 1.00 | % | 0.00 | % | 0.00 | % | 0.00 | % | 0.00 | % | 0.00 | % | |||||||||||||||||||||||
Other Expenses | 0.21 | % | 0.38 | % | 0.19 | % | 0.10 | % | 0.28 | % | 0.26 | % | 0.18 | % | 0.21 | % | |||||||||||||||||||||||
Net Expense Ratio | 1.32 | % | 1.99 | % | 2.05 | % | 0.96 | % | 1.14 | % | 1.12 | % | 1.04 | % | 1.07 | % | |||||||||||||||||||||||
Columbia Acorn International Select | |||||||||||||||||||||||||||||||||||||||
Management Fees | 0.94 | % | 0.94 | % | 0.94 | % | 0.94 | % | 0.94 | % | 0.94 | % | 0.94 | % | 0.94 | % | |||||||||||||||||||||||
Distribution and Service (12b-1) Fees | 0.25 | % | 0.75 | % | 1.00 | % | 0.00 | % | 0.00 | % | 0.00 | % | 0.00 | % | 0.00 | % | |||||||||||||||||||||||
Other Expenses | 0.30 | % | 0.41 | % | 0.33 | % | 0.20 | % | 0.36 | % | 0.34 | % | 0.26 | % | 0.25 | % | |||||||||||||||||||||||
Net Expense Ratio | 1.49 | % | 2.10 | % | 2.27 | % | 1.14 | % | 1.30 | % | 1.28 | % | 1.20 | % | 1.19 | % | |||||||||||||||||||||||
Columbia Acorn Select | |||||||||||||||||||||||||||||||||||||||
Management Fees | 0.83 | % | 0.83 | % | 0.83 | % | 0.83 | % | 0.83 | % | 0.83 | % | 0.83 | % | 0.83 | % | |||||||||||||||||||||||
Distribution and Service (12b-1) Fees | 0.25 | % | 0.75 | % | 1.00 | % | 0.00 | % | 0.00 | % | 0.00 | % | 0.00 | % | 0.00 | % | |||||||||||||||||||||||
Other Expenses | 0.23 | % | 0.32 | % | 0.23 | % | 0.12 | % | 0.23 | % | 0.16 | % | 0.09 | % | 0.20 | % | |||||||||||||||||||||||
Net Expense Ratio | 1.31 | % | 1.90 | % | 2.06 | % | 0.95 | % | 1.06 | % | 0.99 | % | 0.92 | % | 1.03 | % | |||||||||||||||||||||||
Columbia Thermostat Fund | |||||||||||||||||||||||||||||||||||||||
Management Fees | 0.10 | % | 0.10 | % | 0.10 | % | 0.10 | % | 0.10 | % | 0.10 | % | 0.10 | % | |||||||||||||||||||||||||
Distribution and Service (12b-1) Fees | 0.25 | % | 0.75 | % | 1.00 | % | 0.00 | % | 0.00 | % | 0.00 | % | 0.00 | % | |||||||||||||||||||||||||
Other Expenses | 0.15 | % | 0.15 | % | 0.15 | % | 0.15 | % | 0.17 | % | 0.12 | % | 0.15 | % | |||||||||||||||||||||||||
Net Expense Ratio** | 0.50 | % | 1.00 | % | 1.25 | % | 0.25 | % | 0.27 | % | 0.22 | % | 0.25 | % | |||||||||||||||||||||||||
Columbia Acorn Emerging Markets Fund | |||||||||||||||||||||||||||||||||||||||
Management Fees | 1.25 | % | 1.25 | % | 1.25 | % | 1.25 | % | 1.25 | % | 1.25 | % | |||||||||||||||||||||||||||
Distribution and Service (12b-1) Fees | 0.25 | % | 1.00 | % | 0.00 | % | 0.00 | % | 0.00 | % | 0.00 | % | |||||||||||||||||||||||||||
Other Expenses | 0.27 | % | 0.31 | % | 0.16 | % | 0.29 | % | 0.21 | % | 0.21 | % | |||||||||||||||||||||||||||
Net Expense Ratio | 1.77 | % | 2.56 | % | 1.41 | % | 1.54 | % | 1.46 | % | 1.46 | % | |||||||||||||||||||||||||||
Columbia Acorn European Fund | |||||||||||||||||||||||||||||||||||||||
Management Fees | 1.19 | % | 1.19 | % | 1.19 | % | 1.19 | % | 1.19 | % | |||||||||||||||||||||||||||||
Distribution and Service (12b-1) Fees | 0.25 | % | 1.00 | % | 0.00 | % | 0.00 | % | 0.00 | % | |||||||||||||||||||||||||||||
Other Expenses | 0.17 | % | 0.13 | % | 0.12 | % | 0.17 | % | 0.14 | % | |||||||||||||||||||||||||||||
Net Expense Ratio | 1.61 | % | 2.32 | % | 1.31 | % | 1.36 | % | 1.33 | % | |||||||||||||||||||||||||||||
See the Funds' prospectuses for information on minimum initial investment amounts and other details of buying, selling and exchanging shares of the Funds.
Fees and expenses are as of the year ended December 31, 2012. The fees and expenses of Columbia Acorn International Select and Columbia Acorn Select include the effect of the voluntary undertaking by Columbia Wanger Asset Management, LLC (CWAM) to reimburse each Fund for the ordinary operating expenses (exclusive of brokerage commissions, interest, taxes and extraordinary expenses, but inclusive of custodial charges relating to overdrafts, if any), exceeding annually each class' average daily net assets as follows:
Fund | Class A | Class B | Class C | Class I | Class R4 | Class R5 | Class Y | Class Z | |||||||||||||||||||||||||||
Columbia Acorn International Select | 1.70 | % | 2.20 | % | 2.45 | % | 1.28 | % | 1.45 | % | 1.33 | % | 1.28 | % | 1.45 | % | |||||||||||||||||||
Columbia Acorn Select | 1.60 | % | 2.10 | % | 2.35 | % | 1.25 | % | 1.35 | % | 1.30 | % | 1.25 | % | 1.35 | % | |||||||||||||||||||
This arrangement may be modified or terminated by either the Funds or CWAM on 30 days notice.
The fees and expenses of Columbia Thermostat Fund include the effect of CWAM's contractual undertaking to waive fees and/or reimburse expenses of the Fund so that the ordinary operating expenses (exclusive of brokerage commissions, interest, taxes and extraordinary expenses, but inclusive of custodial charges relating to overdrafts, if any), do not exceed annually the rate of 0.50%, 1.00%, 1.25%, and 0.25% of the Fund's average daily net assets attributable to Class A, Class B, Class C, and Class Z shares, respectively, through April 30, 2013, and 0.25%, 0.27% and 0.22% of the Fund's average daily net assets attributable to Class R4, Class R5 and Class Y shares, respectively, through November 8, 2013. There is no guarantee that this agreement will continue thereafter.
The fees and expenses of Columbia Acorn Emerging Markets Fund and Columbia Acorn European Fund include the effect of CWAM's contractual undertaking to waive fees and/or reimburse expenses of each Fund so that the ordinary operating expenses (exclusive of interest and fees on borrowings and expenses associated with each Fund's investment in other investment companies, but inclusive of custodial charges relating to overdrafts, if any) of each Fund's Class A, Class B, Class C and Class Z shares through April 30, 2013, and each Fund's Class R4, Class R5 (if offered) and Class Y shares through November 8, 2013, do not exceed annually each class' average daily net assets as follows:
Fund | Class A | Class C | Class I | Class R4 | Class R5 | Class Z | |||||||||||||||||||||
Columbia Acorn Emerging Markets Fund | 1.85 | % | 2.60 | % | 1.41 | % | 1.60 | % | 1.46 | % | 1.60 | % | |||||||||||||||
Columbia Acorn European Fund | 1.75 | % | 2.50 | % | 1.31 | % | — | % | 1.36 | % | 1.50 | % | |||||||||||||||
There is no guarantee that this agreement will continue thereafter.
The fees and expenses of Columbia Acorn International include the effect of the contractual undertaking by CWAM and its affiliates, effective August 15, 2011, to waive a portion of total annual Fund operating expenses incurred by Class A, Class B and Class C shares of Columbia Acorn International such that the Fund's total annual Fund operating expenses will be reduced by 0.04%, 0.03% and 0.02% for Class A, Class B and Class C shares of the Fund, respectively, through August 14, 2013. There is no guarantee that this agreement will continue thereafter.
* The Funds generally no longer accept investments by new or existing investors in Class B shares, except in connection with the reinvestment of any dividend and/or capital gain distributions in Class B shares of the Funds and exchanges by existing Class B shareholders of certain other funds within the Columbia Family of Funds.
** Does not include estimated fees and expenses of 0.60% incurred by the Fund from the underlying portfolio funds in which it invests.
† With the exception of Class R5 shares of Columbia Acorn International, noted share classes commenced operations on November 8, 2012, and have limited eligibility. Please see the Funds' prospectuses for details.
130
Columbia Acorn Family of Funds
Trustees
Laura M. Born
Chair of the Board
Steven N. Kaplan
Vice Chair of the Board
Michelle L. Collins
Maureen M. Culhane
Margaret M. Eisen
John C. Heaton
Charles P. McQuaid
David J. Rudis
David B. Small
Ralph Wanger (Trustee Emeritus)
Officers
Charles P. McQuaid
President
Ben Andrews
Vice President
Robert A. Chalupnik
Vice President
Michael G. Clarke
Assistant Treasurer
Joseph F. DiMaria
Assistant Treasurer
P. Zachary Egan
Vice President
Fritz Kaegi
Vice President
John M. Kunka
Assistant Treasurer
Stephen Kusmierczak
Vice President
Joseph C. LaPalm
Vice President
Bruce H. Lauer
Vice President, Secretary and Treasurer
Louis J. Mendes III
Vice President
Robert A. Mohn
Vice President
Christopher J. Olson
Vice President
Christopher O. Petersen
Assistant Secretary
Scott R. Plummer
Assistant Secretary
Andreas Waldburg-Wolfegg
Vice President
Linda K. Roth-Wiszowaty
Assistant Secretary
Robert P. Scales
Chief Compliance Officer, Chief Legal Officer,
Senior Vice President and General Counsel
Investment Manager
Columbia Wanger Asset Management, LLC
227 West Monroe Street, Suite 3000
Chicago, Illinois 60606
1-800-922-6769
Distributor
Columbia Management Investment Distributors, Inc.
225 Franklin Street
Boston, Massachusetts 02110
Transfer Agent, Dividend Disbursing Agent
Columbia Management Investment Services Corp.
P. O. Box 8081
Boston, Massachusetts 02266-8081
1-800-345-6611
Legal Counsel to the Funds
Perkins Coie LLP
Washington, DC
Legal Counsel to the Independent Trustees
Drinker Biddle & Reath LLP
Philadelphia, Pennsylvania
Independent Registered Public Accounting Firm
PricewaterhouseCoopers LLP
Chicago, Illinois
This report, including the schedules of investments, is submitted for the general information of the shareholders of Columbia Acorn Trust.
A description of the policies and procedures that the Funds use to determine how to vote proxies and a copy of the Funds' voting record are available (i) without charge, upon request, by calling 800-922-6769 and (ii) on the Securities and Exchange Commission's website at www.sec.gov. Information regarding how the Funds voted proxies relating to portfolio securities during the 12-month period ended June 30, is available from the SEC's website. Information regarding how the Funds voted proxies relating to portfolio securities is also available at www.columbiamanagement.com under "About Us." From there, click on "Disclosures."
The Funds file a complete schedule of portfolio holdings with the SEC for the first and third quarters of each fiscal year on Form N-Q. The Funds' Form N-Q is available on the SEC's website at www.sec.gov and may be reviewed and copied at the SEC's Public Reference Room in Washington, D.C. Information on the operation of the Public Reference Room may be obtained by calling 1-800-SEC-0330. The Funds' complete portfolio holdings are disclosed at www.columbiamanagement.com approximately 30 to 40 days after each month-end.
Investors should consider the investment objectives, risks, charges and expenses of a mutual fund carefully before investing. For a free prospectus, which contains this and other important information about the funds, visit www.columbiamanagement.com. Read the prospectus carefully before investing.
Columbia Acorn Family of Funds are distributed by Columbia Management Investment Distributors, Inc., member FINRA and managed by Columbia Wanger Asset Management, LLC.
Find out what's new – visit our web site at:
www.columbiamanagement.com
Our e-mail address is:
ServiceInquiries@ColumbiaManagement.com
Shareholders should not include personal information such as account numbers, Social Security numbers or taxpayer identification numbers in e-mail. We are unable to accept account transactions sent via e-mail.
This document contains Global Industry Classification Standard data. The Global Industry Classification Standard ("GICS") was developed by and is the exclusive property and a service mark of MSCI Inc. ("MSCI") and Standard & Poor's Financial Services LLC ("S&P") and is licensed for use by Columbia Wanger Asset Management, LLC. Neither MSCI, S&P, nor any other party involved in making or compiling the GICS or any GICS classifications makes any express or implied warranties or representations with respect to such standard or classification (or the results to be obtained by the use thereof), and all such parties hereby expressly disclaim all warranties of originality, accuracy, completeness, merchantability and fitness for a particular purpose with respect to any of such standard or classification. Without limiting any of the foregoing, in no event shall MSCI, S&P, any of their affiliates or any third party involved in making or compiling the GICS or any GICS classifications have any liability for any direct, indirect, special, punitive, consequential or any other damages (including lost profits) even if notified of the possibility of such damages.
Columbia Management®
Columbia Acorn Family of Funds
Class A, B, C, I, R, R4, R5, Y and Z Shares
Annual Report, December 31, 2012
For More Information
You'll find more information about the Columbia Acorn Family of Funds in the documents described below. Contact Columbia Funds as follows to obtain these documents free of charge:
By Mail: Columbia Funds
c/o Columbia Management Investment Services Corp.
P.O. Box 8081
Boston, MA 02266-8081
By Telephone: 800.345.6611
Online: www.columbiamanagement.com
Shareholder Communications with the Board
The Funds' Board of Trustees has adopted procedures by which shareholders may communicate with the Board. Shareholders who wish to communicate with the Board should send their written communications to the Board by mail, c/o Columbia Wanger Asset Management, LLC, 227 West Monroe Street, Suite 3000, Chicago, Illinois 60606, Attention: Secretary. Shareholder communications must (i) be in writing, (ii) identify the Columbia Acorn Fund to which the communication relates and (iii) state the particular class of shares and number of shares held by the communicating shareholder.
Prospectuses and the Statement of Additional Information (SAI)
The prospectuses and the SAI provide more detailed information about the Funds and their policies. The SAI is legally part of each prospectus (it's incorporated by reference). A copy of each has been filed with the SEC.
Information Provided by the SEC
You can review and copy information about the Funds (including their prospectuses, the SAI and shareholder reports) at the SEC's Public Reference Room in Washington, DC. To find out more about the operation of the Public Reference Room, call the SEC at 202.551.8090. Reports and other information about the Fund are also available in the EDGAR Database on the SEC's website at http://www.sec.gov, or you can receive copies of this information, for a fee, by electronic request at the following e-mail address: publicinfo@sec.gov. You can also obtain copies of this information by writing the Public Reference Section, Securities and Exchange Commission, Washington, DC 20549-0102.
The investment company registration number of Columbia Acorn Trust, of which each of these Funds is a series, is 811-01829.
© 2013 Columbia Management Investment Advisers, LLC. All rights reserved.
225 Franklin Street, Boston, MA 02110
800.345.6611 www.columbiamanagement.com
C-1446 D (3/13) 152524
Item 2. Code of Ethics.
(a)�� The registrant has adopted a code of ethics that applies to the registrant’s principal executive officer, principal financial officer, principal accounting officer or controller, or persons performing similar functions, regardless of whether these individuals are employed by the registrant or a third party.
(b) During the period covered by this report, there were not any amendments to a provision of the code of ethics adopted in 2(a) above.
(c) During the period covered by this report, there were no waivers, including any implicit waivers, from a provision of the code of ethics described in 2(a) above that relates to one or more of the items set forth in paragraph (b) of this item’s instructions.
Item 3. Audit Committee Financial Expert.
The registrant’s Board of Trustees has determined that Michelle L. Collins, a member of the registrant’s Board of Trustees and Chair of the Audit Committee, qualifies as an audit committee financial expert. Ms. Collins is an independent trustee, as defined in paragraph (a)(2) of this item’s instructions.
Item 4. Principal Accountant Fees and Services.
(a) Audit Fees. Aggregate Audit Fees billed by the principal accountant for professional services rendered during the fiscal years ended December 31, 2012 and December 31, 2011 are approximately as follows:
2012 |
| 2011 |
| ||
$ | 296,000 |
| $ | 286,000 |
|
Audit Fees include amounts related to the audit of the registrant’s annual financial statements or services that are normally provided by the accountant in connection with statutory and regulatory filings or engagements for those fiscal years.
(b) Audit-Related Fees. Aggregate Audit-Related Fees billed to the registrant by the principal accountant for professional services rendered during the fiscal years ended December 31, 2012 and December 31, 2011 are approximately as follows:
2012 |
| 2011 |
| ||
$ | 44,900 |
| $ | 74,100 |
|
Audit-Related Fees include amounts for assurance and related services by the principal accountant that are reasonably related to the performance of the audit of the registrant’s financial statements and are not reported in Audit Fees above. In fiscal years 2012 and 2011, Audit-Related Fees consist of agreed-upon procedures performed for other audit-related additional testing. Fiscal year 2011 also includes Audit-Related Fees for agreed-upon procedures related to a fund merger and agreed-upon procedures for fund accounting and custody conversions.
During the fiscal years ended December 31, 2012 and December 31, 2011, there were no Audit-Related Fees billed by the registrant’s principal accountant to the registrant’s investment adviser (not including any sub-adviser whose role is primarily portfolio management and is subcontracted with or overseen by another investment adviser) and any entity controlling, controlled by, or under common control with the adviser that provides ongoing services to the registrant for an engagement that related directly to the operations and financial reporting of the registrant.
(c) Tax Fees. Aggregate Tax Fees billed by the principal accountant to the registrant for professional services rendered during the fiscal years ended December 31, 2012 and December 31, 2011 are approximately as follows:
2012 |
| 2011 |
| ||
$ | 58,200 |
| $ | 49,300 |
|
Tax Fees incurred in both fiscal years 2012 and 2011 relate to the review of annual tax returns, the review of required shareholder distribution calculations and include amounts for professional services by the principal accountant for tax compliance, tax advice and tax planning.
During the fiscal years ended December 31, 2012 and December 31, 2011, there were no Tax Fees billed by the registrant’s principal accountant to the registrant’s investment adviser (not including any sub-adviser whose role is primarily portfolio management and is subcontracted with or overseen by another investment adviser) and any entity controlling, controlled by, or under common control with the adviser that provides ongoing services to the registrant for an engagement that related directly to the operations and financial reporting of the registrant.
(d) All Other Fees. Aggregate All Other Fees billed by the principal accountant to the registrant for professional services rendered during the fiscal years ended December 31, 2012 and December 31, 2011 are approximately as follows:
2012 |
| 2011 |
| ||
$ | 0 |
| $ | 0 |
|
All Other Fees include amounts for products and services provided by the principal accountant, other than the services reported in paragraphs (a) through (c) above.
Aggregate All Other Fees billed by the registrant’s principal accountant to the registrant’s investment adviser (not including any sub-adviser whose role is primarily portfolio management and is subcontracted with or overseen by another investment adviser) and any entity controlling, controlled by, or under common control with the adviser that provides ongoing services to the registrant for an engagement that related directly to the operations and financial reporting of the registrant during the fiscal years ended December 31, 2012 and December 31, 2011 are approximately as follows:
2012 |
| 2011 |
| ||
$ | 140,000 |
| $ | 65,000 |
|
In both fiscal years 2012 and 2011, All Other Fees consist of professional services rendered for internal control reviews of the registrant’s transfer agent.
(e)(1) Audit Committee Pre-Approval Policies and Procedures
The policy of the registrant’s Audit Committee is to specifically pre-approve (i) all audit and non-audit (including audit related, tax and all other) services provided by the registrant’s independent auditor to the registrant and individual funds (collectively “Fund Services”) and (ii) all non-audit services provided by the registrant’s independent auditor to the funds’ adviser or a control affiliate of the adviser, that relate directly to the funds’ operations and financial reporting (collectively “Fund-related Adviser Services”). A “control affiliate” is an entity controlling, controlled by, or under common control with the adviser that provides ongoing services to the funds, and the term “adviser” is deemed to exclude any unaffiliated sub-adviser whose role is primarily portfolio management and is sub-contracted or overseen by another investment adviser.
If such Fund Services or Fund-related Adviser Services are required during the period between the Audit Committee’s regularly scheduled meetings, the Chairman of the Audit Committee has the authority to pre-approve the service, with reporting to the full Audit Committee at the next regularly scheduled meeting.
The Audit Committee will waive pre-approval of Fund Services or Fund-related Adviser Services provided that the requirements under paragraph (c)(7)(i)(C) of Rule 2-01 of Regulation S-X are met.
(e)(2) The percentage of services described in paragraphs (b) through (d) of this Item approved pursuant to the “de minimis” exception under paragraph (c)(7)(i)(C) of Rule 2-01 of Regulation S-X during both fiscal years ended December 31, 2012 and December 31, 2011 was zero.
(f) Not applicable.
(g) The aggregate non-audit fees billed by the registrant’s accountant for services rendered to the registrant, and rendered to the registrant’s investment adviser (not including any sub-adviser whose role is primarily portfolio management and is subcontracted with or overseen by another investment adviser), and any entity controlling, controlled by, or under common control with the adviser that provides ongoing services to the registrant for the fiscal years ended December 31, 2012 and December 31, 2011 are approximately as follows:
2012 |
| 2011 |
| ||
$ | 243,100 |
| $ | 188,400 |
|
(h) The registrant’s Audit Committee of the Board of Directors has considered whether the provision of non-audit services that were rendered to the registrant’s adviser (not including any sub-adviser whose role is primarily portfolio management and is subcontracted with or overseen by another investment adviser), and any entity controlling, controlled by, or under common control with the investment adviser that provides ongoing services to the registrant that were not pre-approved pursuant to paragraph (c)(7)(ii) of Rule 2-01 of Regulation S-X, is compatible with maintaining the principal accountant’s independence.
Item 5. Audit Committee of Listed Registrants.
Not applicable.
Item 6. Investments
(a) The registrant’s “Schedule I — Investments in securities of unaffiliated issuers” (as set forth in 17 CFR 210.12-12) is included in Item 1 of this Form N-CSR.
(b) Not applicable
Item 7. Disclosure of Proxy Voting Policies and Procedures for Closed-End Management Investment Companies.
Not applicable.
Item 8. Portfolio Managers of Closed-End Management Investment Companies.
Not applicable.
Item 9. Purchases of Equity Securities by Closed-End Management Investment Company and Affiliated Purchasers.
Not applicable.
Item 10. Submission of Matters to a Vote of Security Holders.
There were no material changes to the procedures by which shareholders may recommend nominees to the registrant’s board of directors.
Item 11. Controls and Procedures.
(a) The registrant’s principal executive officer and principal financial officers, based on their evaluation of the registrant’s disclosure controls and procedures as of a date within 90 days of the filing of this report, have concluded that such controls and procedures are adequately designed to ensure that material information required to be disclosed by the registrant in Form N-CSR is accumulated and communicated to the registrant’s management, including the principal executive officer and principal financial officer, or persons performing similar functions, as appropriate to allow timely decisions regarding required disclosure.
(b) During November 2012, the registrant enhanced internal controls over financial reporting relating to the recording of certain last day trades. These controls include (i) additional analysis of last day security purchase prices, (ii) comparisons of cost and market value for last day trades and (iii) analytical review of per share changes resulting from financial statement adjustments.
Item 12. Exhibits.
(a)(1) Code of ethics required to be disclosed under Item 2 of Form N-CSR attached hereto as Exhibit 99.CODE ETH.
(a)(2) Certifications pursuant to Rule 30a-2(a) under the Investment Company Act of 1940 (17 CFR 270.30a-2(a)) attached hereto as Exhibit 99.CERT.
(a)(3) Not applicable.
(b) Certification pursuant to Rule 30a-2(b) under the Investment Company Act of 1940 (17 CFR 270.30a-2(b)) attached hereto as Exhibit 99.906CERT.
SIGNATURES
Pursuant to the requirements of the Securities Exchange Act of 1934 and the Investment Company Act of 1940, the registrant has duly caused this report to be signed on its behalf by the undersigned, thereunto duly authorized.
(registrant) |
| Columbia Acorn Trust | ||
|
| |||
|
| |||
By (Signature and Title) |
| /s/Charles P. McQuaid | ||
|
| Charles P. McQuaid, President | ||
|
|
| ||
|
|
| ||
Date |
| February 22, 2013 | ||
Pursuant to the requirements of the Securities Exchange Act of 1934 and the Investment Company Act of 1940, this report has been signed below by the following persons on behalf of the registrant and in the capacities and on the dates indicated.
By (Signature and Title) |
| /s/Charles P. McQuaid | |
|
| Charles P. McQuaid, President | |
|
|
| |
|
|
| |
Date |
| February 22, 2013 | |
By (Signature and Title) |
| /s/Bruce H. Lauer | |
|
| Bruce H. Lauer, Treasurer | |
|
|
| |
|
|
| |
Date |
| February 22, 2013 | |