UNITED STATES
SECURITIES AND EXCHANGE COMMISSION
Washington, D.C. 20549
FORM N-CSR
CERTIFIED SHAREHOLDER REPORT OF REGISTERED
MANAGEMENT INVESTMENT COMPANIES
Investment Company Act file number | 811-01829 |
|
Columbia Acorn Trust |
(Exact name of registrant as specified in charter) |
|
227 W. Monroe Street Suite 3000 Chicago, IL | | 60606 |
(Address of principal executive offices) | | (Zip code) |
|
Mary C. Moynihan Perkins Coie LLP 700 13th Street, NW Suite 600 Washington, DC 20005 |
(Name and address of agent for service) |
|
Registrant’s telephone number, including area code: | (312) 634-9200 | |
|
Date of fiscal year end: | December 31 | |
|
Date of reporting period: | December 31, 2013 | |
| | | | | | | | |
Form N-CSR is to be used by management investment companies to file reports with the Commission not later than 10 days after the transmission to stockholders of any report that is required to be transmitted to stockholders under Rule 30e-1 under the Investment Company Act of 1940 (17 CFR 270.30e-1). The Commission may use the information provided on Form N-CSR in its regulatory, disclosure review, inspection, and policymaking roles.
A registrant is required to disclose the information specified by Form N-CSR, and the Commission will make this information public. A registrant is not required to respond to the collection of information contained in Form N-CSR unless the Form displays a currently valid Office of Management and Budget (“OMB”) control number. Please direct comments concerning the accuracy of the information collection burden estimate and any suggestions for reducing the burden to Secretary, Securities and Exchange Commission, 450 Fifth Street, NW, Washington, DC 20549-0609. The OMB has reviewed this collection of information under the clearance requirements of 44 U.S.C. § 3507.
Item 1. Reports to Stockholders.

Columbia Acorn Family of Funds
Class A, B, C, I, R, R4, R5, Y and Z Shares
Managed by Columbia Wanger Asset Management, LLC

Annual Report
December 31, 2013
n Columbia
Acorn® Fund
n Columbia
Acorn International®
n Columbia
Acorn USA®
n Columbia
Acorn International SelectSM
n Columbia
Acorn SelectSM
n Columbia
Thermostat FundSM
n Columbia
Acorn Emerging Markets FundSM
n Columbia
Acorn European FundSM
Not FDIC insured • No bank guarantee • May lose value
Columbia Acorn Family of Funds
Net Asset Value Per Share as of 12/31/13
| | Columbia
Acorn Fund | | Columbia
Acorn
International | | Columbia
Acorn
USA | | Columbia
Acorn
International
Select | | Columbia
Acorn
Select | | Columbia
Thermostat
Fund | | Columbia
Acorn
Emerging
Markets
Fund | | Columbia
Acorn
European
Fund | |
Class A | | $ | 35.78 | | | $ | 46.63 | | | $ | 34.15 | | | $ | 26.91 | | | $ | 25.57 | | | $ | 14.58 | | | $ | 13.37 | | | $ | 15.68 | | |
Class B | | $ | 32.25 | | | $ | 45.24 | | | $ | 30.70 | | | $ | 25.53 | | | $ | 22.81 | | | $ | 14.68 | | | | NA | | | | NA | | |
Class C | | $ | 31.64 | | | $ | 45.04 | | | $ | 30.33 | | | $ | 25.39 | | | $ | 22.46 | | | $ | 14.68 | | | $ | 13.32 | | | $ | 15.54 | | |
Class I | | $ | 37.37 | | | $ | 46.71 | | | $ | 35.99 | | | $ | 27.19 | | | $ | 26.81 | | | | NA | | | $ | 13.41 | | | $ | 15.67 | | |
Class R | | | NA | | | $ | 46.60 | | | | NA | | | | NA | | | | NA | | | | NA | | | | NA | | | | NA | | |
Class R4 | | $ | 37.88 | | | $ | 46.99 | | | $ | 36.55 | | | $ | 27.36 | | | $ | 27.20 | | | $ | 14.46 | | | $ | 13.49 | | | | NA | | |
Class R5 | | $ | 37.89 | | | $ | 46.66 | | | $ | 36.53 | | | $ | 27.34 | | | $ | 27.20 | | | $ | 14.47 | | | $ | 13.48 | | | $ | 15.82 | | |
Class Y | | $ | 37.93 | | | $ | 46.99 | | | $ | 36.59 | | | $ | 27.33 | | | $ | 27.27 | | | $ | 14.46 | | | $ | 13.36 | | | | NA | | |
Class Z | | $ | 37.32 | | | $ | 46.68 | | | $ | 35.90 | | | $ | 27.20 | | | $ | 26.72 | | | $ | 14.40 | | | $ | 13.40 | | | $ | 15.68 | | |
Class I shares are available only to the Columbia Funds, such as Columbia Thermostat Fund, and are not available to individual investors. Class R, R4, R5, Y and Z shares are sold at net asset value and have limited eligibility. Columbia Management offers multiple share classes, not all necessarily available through all firms, and the share class ratings may vary. Contact us for details.
A Comment on Trading Volumes
Market conditions are always changing and vary by country and industry sector, and investing in international markets involves unique risks. In the wake of the 2007-2009 financial crisis, trading volumes in both emerging and developed international markets declined significantly and have stayed at generally reduced levels since then. Although it is difficult to accurately assess trends in trading volumes in foreign markets, because some amount of activity has migrated to alternative trading venues, a reduction in trading volumes poses challenges to the Funds. This is particularly so because the Funds focus on small- and mid-cap companies that usually have lower trading volumes and often take sizeable positions in portfolio companies. As a result of lower trading volumes, it may take longer to buy or sell securities, which can exacerbate a Fund's exposure to volatile markets. A Fund may also be limited in its ability to execute favorable trades in portfolio securities in response to changes in company prices and fundamentals. If a Fund is forced to sell securities to meet redemption requests or other cash needs, or in the case of an event affecting liquidity in a particular market or markets, it may be forced to dispose of those securities under disadvantageous circumstances and at a loss. As a Fund grows in size, these considerations take on increasing significance and may adversely impact performance.
The views expressed in the "Squirrel Chatter II" and "In a Nutshell" commentaries reflect the current views of the respective authors. These views are not guarantees of future performance and involve certain risks, uncertainties and assumptions that are difficult to predict so actual outcomes and results may differ significantly from the views expressed. These views are subject to change at any time based upon economic, market or other conditions and the respective authors disclaim any responsibility to update such views. These views may not be relied upon as investment advice and, because investment decisions for a Columbia Acorn Fund are based on numerous factors, may not be relied upon as an indication of trading intent on behalf of any particular Columbia Acorn Fund. References to specific company's securities should not be construed as a recommendation or investment advice and there can be no assurance that as of the date of publication of this report, the securities mentioned in each Fund's portfolio are still held or that the securities sold have not been repurchased.
Acorn®, Acorn USA® and Acorn International® are service marks owned and registered by Columbia Acorn Trust.
Letter to Shareholders from the
Columbia Acorn Trust Board of Trustees
The unique investment process employed by the Columbia Acorn Family of Funds ("Acorn Funds") has been in place for over 40 years, and your Trustees believe the process has been responsible for the Funds' strong long-term investment results. The execution of that process requires talent and experience. This past November, we announced that Chuck McQuaid, the President and Chief Investment Officer of Columbia Wanger Asset Management ("CWAM"), is stepping down as lead portfolio manager of Columbia Acorn Fund and President and Chief Investment Officer of CWAM. He will, however, remain a valuable contributor to CWAM, and his successor on the Columbia Acorn Fund, Rob Mohn, has served the Acorn Funds, with outstanding results, for over 20 years. Your Trustees have complete confidence in Rob Mohn, and he will also become the firm's Domestic Chief Investment Officer. As a testament to the stability of the investment team at CWAM, Rob Mohn represents the third portfolio manager of the Columbia Acorn Fund in 43 years.
There are other changes at CWAM, too. Zach Egan, the co-manager of Columbia Acorn International, will be assuming the President's role in place of Chuck McQuaid, and will become the firm's International Chief Investment Officer. Other analysts and managers at CWAM—David Frank, Bill Doyle and Christopher Olson—are also assuming new and greater responsibilities. Each of them is a proven, experienced investment professional with an exceptional track record. Your Trustees recognize that all dynamic organizations must change and are confident that our shareholders will continue to be well served by the new team.
This is not the first change in leadership at CWAM. Ralph Wanger retired over ten years ago, handing the reins to Chuck McQuaid. CWAM has always fostered a strong bench of skillful managers who have adopted and excelled in applying the investment principles upon which the Acorn Funds are based. This is not an accident. An essential element of the CWAM investment process is a team-oriented approach that assigns talented individuals the task of acquiring expertise in their assigned industry or country, while learning to apply the Acorn Funds' investment philosophy and strategy. As a result, CWAM has developed a team of capable individuals who are ready and able to
assume new and greater responsibilities when the time comes, as it now has.
As we begin 2014, the Board of Trustees embarks, as it does every year, on the process of considering the renewal of the advisory agreement with CWAM. We review management fee levels, fund performance and other factors. We are attentive to ensuring that CWAM continues to have the resources necessary to deliver outstanding service to our shareholders. At the same time, the Trustees employ the renewal process to help ensure that CWAM fosters a culture that hires, trains and promotes the people who will continue the legacy of the Acorn Funds and serve our shareholders in the future. Your Trustees continue to have the highest degree of confidence in that future, and I thank you for your support of the Acorn Funds

Laura Born
Independent Chair, Board of Trustees
Columbia Acorn Trust
Columbia Acorn Family of Funds
Table of Contents
Descriptions of Indexes | | | 1 | | |
Share Class Performance | | | 2 | | |
Fund Performance vs. Benchmarks | | | 3 | | |
2013 Year-End Distributions | | | 4 | | |
Squirrel Chatter II: Containerized Cargo and
the Man Who Popularized It | | | 6 | | |
Understanding Your Expenses | | | 9 | | |
Columbia Acorn Fund | |
In a Nutshell | | | 12 | | |
At a Glance | | | 13 | | |
Major Portfolio Changes (Unaudited) | | | 28 | | |
Statement of Investments | | | 30 | | |
Columbia Acorn International | |
In a Nutshell | | | 14 | | |
At a Glance | | | 15 | | |
Major Portfolio Changes (Unaudited) | | | 42 | | |
Statement of Investments | | | 45 | | |
Portfolio Diversification | | | 54 | | |
Columbia Acorn USA | |
In a Nutshell | | | 16 | | |
At a Glance | | | 17 | | |
Major Portfolio Changes (Unaudited) | | | 55 | | |
Statement of Investments | | | 56 | | |
Columbia Acorn International Select | |
In a Nutshell | | | 18 | | |
At a Glance | | | 19 | | |
Major Portfolio Changes (Unaudited) | | | 63 | | |
Statement of Investments | | | 64 | | |
Portfolio Diversification | | | 69 | | |
Columbia Acorn Select | |
In a Nutshell | | | 20 | | |
At a Glance | | | 21 | | |
Major Portfolio Changes (Unaudited) | | | 70 | | |
Statement of Investments | | | 71 | | |
Columbia Thermostat Fund | |
In a Nutshell | | | 22 | | |
At a Glance | | | 23 | | |
Statement of Investments | | | 76 | | |
Columbia Acorn Emerging Markets Fund | |
In a Nutshell | | | 24 | | |
At a Glance | | | 25 | | |
Major Portfolio Changes (Unaudited) | | | 78 | | |
Statement of Investments | | | 80 | | |
Portfolio Diversification | | | 85 | | |
Columbia Acorn European Fund | |
In a Nutshell | | | 26 | | |
At a Glance | | | 27 | | |
Major Portfolio Changes (Unaudited) | | | 86 | | |
Statement of Investments | | | 88 | | |
Portfolio Diversification | | | 92 | | |
Columbia Acorn Family of Funds | |
Statements of Assets and Liabilities | | | 94 | | |
Statements of Operations | | | 96 | | |
Statements of Changes in Net Assets | | | 98 | | |
Financial Highlights | | | 104 | | |
Notes to Financial Statements | | | 120 | | |
Report of Independent Registered
Public Accounting Firm | | | 131 | | |
Federal Income Tax Information (Unaudited) | | | 132 | | |
Board of Trustees and Management | | | 133 | | |
Expense Information | | | 136 | | |
Columbia Acorn Family of Funds
Descriptions of Indexes Included in this Report
• 50/50 Blended Benchmark, established by the Fund's investment manager, is an equally weighted custom composite of Columbia Thermostat Fund's primary equity and primary debt benchmarks, the S&P 500 Index and the Barclays U.S. Aggregate Bond Index, respectively. The percentage of the Fund's assets allocated to underlying stock and bond portfolio funds will vary, and accordingly the composition of the Fund's portfolio will not always reflect the composition of the 50/50 Blended Benchmark.
• Barclays U.S. Aggregate Bond Index is a market value-weighted index that tracks the daily price, coupon, pay-downs and total return performance of fixed-rate, publicly placed, dollar-denominated and non-convertible investment grade debt issues with at least $250 million par amount outstanding and with at least one year to final maturity.
• Euromoney Smaller European Companies (inc UK) Index is a weighted combination of two indexes: the HSBC Smaller Europe (ex UK) Index and the HSBC Smaller UK Index. The index is rebalanced on a quarterly basis.
• Lipper Indexes include the largest funds tracked by Lipper, Inc. in the named category. Lipper Mid-Cap Growth Funds Index, 30 largest mid-cap growth funds, including Columbia Acorn Fund; Lipper International Small/Mid Growth Funds Index, 10 largest non-U.S. small/mid growth funds, including Columbia Acorn International; Lipper Small-Cap Growth Funds Index, 30 largest small-cap growth funds, including Columbia Acorn USA; Lipper Mid-Cap Core Funds Index, 30 largest mid-cap core funds; Lipper Flexible Portfolio Funds Index, an equal-weighted index of the 30 largest mutual funds within the Flexible Portfolio fund classification, as defined by Lipper. Lipper Emerging Markets Index, 30 largest emerging markets funds; Lipper European Region Index, 10 largest European funds.
• MSCI Europe, Australasia, Far East (EAFE) Index (Net) is a capitalization-weighted index that tracks the total return of common stocks in 22 developed-market countries within Europe, Australasia and the Far East. The returns of the MSCI EAFE Index (Net) are presented net of the withholding tax rate applicable to foreign non-resident institutional investors in the foreign companies included in the index who do not benefit from double taxation treaties.
• MSCI Emerging Markets Small Cap Index, a widely recognized international benchmark, is a free float-adjusted market capitalization index that is designed to measure small-cap emerging market equity performance. The MSCI Emerging Markets Small Cap Index currently consists of the following 23 emerging market country indexes: Brazil, Chile, China, Colombia, Czech Republic, Egypt, Hungary, India, Indonesia, Korea, Malaysia, Mexico, Morocco, Peru, Philippines, Poland, Qatar, Russia, South Africa, Taiwan, Thailand, Turkey and United Arab Emirates.
• Russell 2000 Index measures the performance of the 2,000 smallest companies in the Russell 3000 Index, which represents approximately 10% of the total market capitalization of the Russell 3000 Index.
• Russell 2500 Index measures the performance of the 2,500 smallest companies in the Russell 3000 Index, which represents approximately 17% of the total market capitalization of the Russell 3000 Index.
• Standard & Poor's (S&P) 500 Index tracks the performance of 500 widely held, large-capitalization U.S. stocks.
• Standard & Poor's (S&P) MidCap 400 Index is a market value-weighted index that tracks the performance of 400 mid-cap U.S. companies.
• S&P Developed Ex-U.S. Between $2B and $10B Index is a subset of the broad market selected by the index sponsor representing the mid-cap developed market, excluding the United States.
• S&P Emerging Markets Between $500M and $5B Index represents the institutionally investable capital of emerging market countries with market caps ranging between $500 million to $5 billion, as selected by S&P. The index currently consists of the following 20 emerging market country indexes: Brazil, Chile, China, Colombia, Czech Republic, Egypt, Hungary, India, Indonesia, Malaysia, Mexico, Morocco, Peru, Philippines, Poland, Russia, South Africa, Taiwan, Thailand and Turkey.
• S&P Europe Between $500M and $5B Index represents the institutionally investable capital of European countries with market caps ranging between $500 million to $5 billion, as selected by S&P. The index currently consists of the following 17 developed market country indexes: Austria, Belgium, Denmark, Finland, France, Germany, Greece, Ireland, Italy, Luxembourg, the Netherlands, Norway, Portugal, Spain, Sweden, Switzerland and the United Kingdom.
• S&P Global Ex-U.S. SmallCap Index consists of the bottom 20% of institutionally investable capital of developed and emerging countries, excluding the United States.
• S&P Global Ex-U.S. Between $500M and $5B Index is a subset of the broad market selected by the index sponsor representing the mid- and small-cap developed and emerging markets, excluding the United States.
Unlike mutual funds, indexes are not managed and do not incur fees or expenses. It is not possible to invest directly in an index.
1
Columbia Acorn Funds
Share Class Performance Average Annual Total Returns through 12/31/13
| | Class A | | Class B | | Class C | | Class I | | Class R | | Class R4 | | Class R5 | | Class Y | | Class Z | |
| | Without
Sales
Charge | | With
Sales
Charge | | Without
Sales
Charge | | With
Sales
Charge | | Without
Sales
Charge | | With
Sales
Charge | | | | | | | | | | | | | |
Columbia Acorn Fund | |
| 1 year | | | 30.53 | % | | | 23.02 | % | | | 29.63 | % | | | 24.63 | % | | | 29.58 | % | | | 28.58 | % | | | 30.99 | % | | | NA | | | | 30.85 | % | | | 30.94 | % | | | 30.99 | % | | | 30.90 | % | |
| 5 years | | | 20.62 | % | | | 19.20 | % | | | 19.91 | % | | | 19.72 | % | | | 19.71 | % | | | 19.71 | % | | | 21.03 | % | | | NA | | | | 20.97 | % | | | 20.99 | % | | | 21.00 | % | | | 20.98 | % | |
| 10 years | | | 10.10 | % | | | 9.45 | % | | | 9.42 | % | | | 9.42 | % | | | 9.26 | % | | | 9.26 | % | | | 10.46 | % | | | NA | | | | 10.43 | % | | | 10.44 | % | | | 10.44 | % | | | 10.43 | % | |
Columbia Acorn International | |
| 1 year | | | 22.00 | % | | | 14.98 | % | | | 21.08 | % | | | 16.08 | % | | | 21.07 | % | | | 20.07 | % | | | 22.43 | % | | | 21.50 | % | | | 22.32 | % | | | 22.38 | % | | | 22.44 | % | | | 22.33 | % | |
| 5 years | | | 18.41 | % | | | 17.01 | % | | | 17.60 | % | | | 17.39 | % | | | 17.50 | % | | | 17.50 | % | | | 18.87 | % | | | 18.06 | % | | | 18.81 | % | | | 18.82 | % | | | 18.83 | % | | | 18.81 | % | |
| 10 years | | | 11.91 | % | | | 11.25 | % | | | 11.16 | % | | | 11.16 | % | | | 11.06 | % | | | 11.06 | % | | | 12.32 | % | | | 11.59 | % | | | 12.29 | % | | | 12.29 | % | | | 12.30 | % | | | 12.29 | % | |
Columbia Acorn USA | |
| 1 year | | | 32.34 | % | | | 24.74 | % | | | 31.28 | % | | | 26.28 | % | | | 31.47 | % | | | 30.47 | % | | | 32.93 | % | | | NA | | | | 32.80 | % | | | 32.83 | % | | | 32.89 | % | | | 32.72 | % | |
| 5 years | | | 20.86 | % | | | 19.44 | % | | | 20.06 | % | | | 19.86 | % | | | 19.97 | % | | | 19.97 | % | | | 21.28 | % | | | NA | | | | 21.21 | % | | | 21.22 | % | | | 21.23 | % | | | 21.20 | % | |
| 10 years | | | 8.95 | % | | | 8.31 | % | | | 8.23 | % | | | 8.23 | % | | | 8.13 | % | | | 8.13 | % | | | 9.31 | % | | | NA | | | | 9.28 | % | | | 9.28 | % | | | 9.28 | % | | | 9.27 | % | |
Columbia Acorn International Select | |
| 1 year | | | 14.42 | % | | | 7.85 | % | | | 13.67 | % | | | 8.67 | % | | | 13.52 | % | | | 12.52 | % | | | 14.82 | % | | | NA | | | | 14.72 | % | | | 14.80 | % | | | 14.82 | % | | | 14.75 | % | |
| 5 years | | | 14.83 | % | | | 13.48 | % | | | 14.11 | % | | | 13.87 | % | | | 13.94 | % | | | 13.94 | % | | | 15.28 | % | | | NA | | | | 15.22 | % | | | 15.24 | % | | | 15.25 | % | | | 15.24 | % | |
| 10 years | | | 10.54 | % | | | 9.89 | % | | | 9.83 | % | | | 9.83 | % | | | 9.68 | % | | | 9.68 | % | | | 10.92 | % | | | NA | | | | 10.89 | % | | | 10.90 | % | | | 10.90 | % | | | 10.90 | % | |
Columbia Acorn Select | |
| 1 year | | | 33.77 | % | | | 26.07 | % | | | 32.81 | % | | | 27.81 | % | | | 32.85 | % | | | 31.85 | % | | | 34.31 | % | | | NA | | | | 34.16 | % | | | 34.21 | % | | | 34.30 | % | | | 34.16 | % | |
| 5 years | | | 21.46 | % | | | 20.03 | % | | | 20.67 | % | | | 20.48 | % | | | 20.52 | % | | | 20.52 | % | | | 21.92 | % | | | NA | | | | 21.82 | % | | | 21.84 | % | | | 21.85 | % | | | 21.83 | % | |
| 10 years | | | 8.59 | % | | | 7.95 | % | | | 7.87 | % | | | 7.87 | % | | | 7.74 | % | | | 7.74 | % | | | 8.95 | % | | | NA | | | | 8.91 | % | | | 8.91 | % | | | 8.92 | % | | | 8.91 | % | |
Columbia Thermostat Fund | |
| 1 year | | | 9.07 | % | | | 2.81 | % | | | 8.49 | % | | | 3.49 | % | | | 8.23 | % | | | 7.23 | % | | | NA | | | | NA | | | | 9.26 | % | | | 9.35 | % | | | 9.46 | % | | | 9.30 | % | |
| 5 years | | | 14.89 | % | | | 13.55 | % | | | 14.33 | % | | | 14.09 | % | | | 14.04 | % | | | 14.04 | % | | | NA | | | | NA | | | | 15.17 | % | | | 15.18 | % | | | 15.20 | % | | | 15.18 | % | |
| 10 years | | | 6.65 | % | | | 6.02 | % | | | 6.08 | % | | | 6.08 | % | | | 5.85 | % | | | 5.85 | % | | | NA | | | | NA | | | | 6.90 | % | | | 6.91 | % | | | 6.92 | % | | | 6.91 | % | |
Columbia Acorn Emerging Markets Fund | |
| 1 year | | | 11.73 | % | | | 5.34 | % | | | NA | | | | NA | | | | 10.91 | % | | | 9.91 | % | | | 12.06 | % | | | NA | | | | 12.13 | % | | | 12.07 | % | | | 12.08 | % | | | 11.92 | % | |
Life of Fund | | | 13.64 | % | | | 10.83 | % | | | NA | | | | NA | | | | 12.86 | % | | | 12.86 | % | | | 14.13 | % | | | NA | | | | 14.08 | % | | | 14.09 | % | | | 14.07 | % | | | 14.00 | % | |
Columbia Acorn European Fund | |
| 1 year | | | 33.64 | % | | | 25.93 | % | | | NA | | | | NA | | | | 32.63 | % | | | 31.63 | % | | | 34.06 | % | | | NA | | | | NA | | | | 33.97 | % | | | NA | | | | 33.98 | % | |
Life of Fund | | | 21.72 | % | | | 18.72 | % | | | NA | | | | NA | | | | 20.83 | % | | | 20.83 | % | | | 22.07 | % | | | NA | | | | NA | | | | 22.03 | % | | | NA | | | | 22.04 | % | |
Returns for Class A shares are shown with and without the maximum initial sales charge of 5.75%. Returns for Class B shares are shown with and without the applicable contingent deferred sales charge (CDSC) of 5.00% in the first year, declining to 1.00% in the sixth year and eliminated thereafter. Returns for Class C shares are shown with and without the maximum CDSC of 1.00% for the first year after purchase. The Funds' other classes are not subject to sales charges and have limited eligibility. Please see the Funds' prospectuses for details. Performance for different share classes will vary based on differences in sales charges and certain fees associated with each class.
All results shown assume reinvestment of distributions during the period. Returns do not reflect the deduction of taxes that a shareholder may pay on Fund distributions or on the redemption of Fund shares. Performance results may reflect the effect of any fee waivers or reimbursements of Fund expenses by the investment manager and/or any of its affiliates. Absent these fee waivers and/or expense reimbursement arrangements, performance results would have been lower. Please see Pages 126 and 127 of this report for information on contractual fee waiver and expense reimbursement agreements in place for Columbia Thermostat Fund, Columbia Acorn Emerging Markets Fund and Columbia Acorn European Fund and voluntary fee waiver and expense reimbursement arrangements in place for Columbia Acorn International, Columbia Acorn International Select and Columbia Acorn Select as of December 31, 2013.
The performance information shown represents past performance and is not a guarantee of future results. The investment return and principal value of your investment will fluctuate so that shares, when redeemed, may be worth more or less than their original cost. Current performance may be lower or higher than the performance data shown. You may obtain performance information current to the most recent month-end by contacting your financial intermediary, visiting columbiamanagement.com or calling 800.922.6769.
The returns shown include the returns of each Fund's Class Z shares, each Fund's oldest share class, in cases where the inception date of the Fund is earlier than the inception date of the particular share class or where a period shown dates to before the inception date of the share class. These returns are adjusted to reflect any higher class-related operating expenses of the newer share classes, as applicable. Please visit columbiamanagement.com/mutual-funds/appended-performance for more information.
Continued on Page 3.
2
Fund Performance vs. Benchmarks Class Z Average Annual Total Returns through 12/31/13
| Class Z Shares | | 4th
quarter* | | 1 year | | 5 years | | 10 years | | Life of
Fund | |
| Columbia Acorn Fund (ACRNX) (6/10/70) | | | 7.30 | % | | | 30.90 | % | | | 20.98 | % | | | 10.43 | % | | | 14.93 | % | |
Russell 2500 Index | | | 8.66 | % | | | 36.80 | % | | | 21.77 | % | | | 9.81 | % | | | NA | | |
S&P 500 Index** | | | 10.51 | % | | | 32.39 | % | | | 17.94 | % | | | 7.41 | % | | | 11.02 | % | |
Russell 2000 Index | | | 8.72 | % | | | 38.82 | % | | | 20.08 | % | | | 9.07 | % | | | NA | | |
Lipper Mid-Cap Growth Funds Index | | | 8.50 | % | | | 36.52 | % | | | 21.31 | % | | | 9.49 | % | | | NA | | |
| Columbia Acorn International (ACINX) (9/23/92) | | | 6.09 | % | | | 22.33 | % | | | 18.81 | % | | | 12.29 | % | | | 11.65 | % | |
S&P Global Ex-U.S. Between $500M and $5B Index | | | 4.06 | % | | | 16.77 | % | | | 17.45 | % | | | 10.62 | % | | | 8.81 | % | |
S&P Global Ex-U.S. SmallCap Index | | | 5.18 | % | | | 20.71 | % | | | 18.27 | % | | | 10.40 | % | | | 8.30 | % | |
MSCI EAFE Index (Net) | | | 5.71 | % | | | 22.78 | % | | | 12.44 | % | | | 6.91 | % | | | 6.51 | % | |
Lipper International Small/Mid Growth Funds Index | | | 6.81 | % | | | 27.72 | % | | | 20.91 | % | | | 11.23 | % | | | NA | | |
| Columbia Acorn USA (AUSAX) (9/4/96) | | | 6.82 | % | | | 32.72 | % | | | 21.20 | % | | | 9.27 | % | | | 11.24 | % | |
Russell 2000 Index | | | 8.72 | % | | | 38.82 | % | | | 20.08 | % | | | 9.07 | % | | | 8.91 | % | |
Lipper Small-Cap Growth Funds Index | | | 7.82 | % | | | 40.99 | % | | | 22.20 | % | | | 8.27 | % | | | 7.54 | % | |
| Columbia Acorn Int'l Select (ACFFX) (11/23/98) | | | 1.97 | % | | | 14.75 | % | | | 15.24 | % | | | 10.90 | % | | | 9.91 | % | |
S&P Developed Ex-U.S. Between $2B and $10B Index | | | 4.42 | % | | | 21.70 | % | | | 15.27 | % | | | 8.90 | % | | | 8.08 | % | |
MSCI EAFE Index (Net) | | | 5.71 | % | | | 22.78 | % | | | 12.44 | % | | | 6.91 | % | | | 4.78 | % | |
Lipper International Small/Mid Growth Funds Index | | | 6.81 | % | | | 27.72 | % | | | 20.91 | % | | | 11.23 | % | | | 11.16 | % | |
| Columbia Acorn Select (ACTWX) (11/23/98) | | | 9.64 | % | | | 34.16 | % | | | 21.83 | % | | | 8.91 | % | | | 10.82 | % | |
S&P MidCap 400 Index | | | 8.33 | % | | | 33.50 | % | | | 21.89 | % | | | 10.36 | % | | | 10.67 | % | |
S&P 500 Index** | | | 10.51 | % | | | 32.39 | % | | | 17.94 | % | | | 7.41 | % | | | 5.04 | % | |
Lipper Mid-Cap Core Funds Index | | | 8.69 | % | | | 35.04 | % | | | 20.68 | % | | | 9.14 | % | | | 9.24 | % | |
| Columbia Thermostat Fund (COTZX) (9/25/02) | | | 1.95 | % | | | 9.30 | % | | | 15.18 | % | | | 6.91 | % | | | 8.21 | % | |
S&P 500 Index | | | 10.51 | % | | | 32.39 | % | | | 17.94 | % | | | 7.41 | % | | | 9.70 | % | |
Barclays U.S. Aggregate Bond Index | | | -0.14 | % | | | -2.02 | % | | | 4.44 | % | | | 4.55 | % | | | 4.56 | % | |
Lipper Flexible Portfolio Funds Index | | | 5.37 | % | | | 15.55 | % | | | 13.55 | % | | | 6.63 | % | | | 8.37 | % | |
50/50 Blended Benchmark | | | 5.10 | % | | | 14.08 | % | | | 11.36 | % | | | 6.26 | % | | | 7.41 | % | |
| Columbia Acorn Emerging Markets Fund (CEFZX) (8/19/11) | | | 7.13 | % | | | 11.92 | % | | | — | | | | — | | | | 14.00 | % | |
S&P Emerging Markets Between $500M and $5B Index | | | 2.71 | % | | | 0.67 | % | | | — | | | | — | | | | 3.91 | % | |
MSCI Emering Markets Small Cap Index | | | 1.26 | % | | | 1.04 | % | | | — | | | | — | | | | 1.23 | % | |
Lipper Emerging Markets Index | | | 1.81 | % | | | -1.29 | % | | | — | | | | — | | | | 4.30 | % | |
| Columbia Acorn European Fund (CAEZX) (8/19/11) | | | 11.28 | % | | | 33.98 | % | | | — | | | | — | | | | 22.04 | % | |
S&P Europe Between $500M and $5B Index | | | 10.40 | % | | | 37.20 | % | | | — | | | | — | | | | 23.00 | % | |
Euromoney Smaller European Companies Index | | | 10.30 | % | | | 38.18 | % | | | — | | | | — | | | | 21.08 | % | |
Lipper European Region Index | | | 9.45 | % | | | 30.36 | % | | | — | | | | — | | | | 21.03 | % | |
The inception dates for Class A, B and C shares (if offered) are as follows: Columbia Acorn Fund, Columbia Acorn International, Columbia Acorn USA, Columbia Acorn International Select and Columbia Acorn Select, 10/16/00; Columbia Thermostat Fund, 3/3/03; Columbia Acorn Emerging Markets Fund and Columbia Acorn European Fund, 8/19/11. The inception dates for Class I shares are as follows: Columbia Acorn Fund, Columbia Acorn International, Columbia Acorn USA, Columbia Acorn International Select and Columbia Acorn Select, 9/27/10; Columbia Acorn Emerging Markets Fund and Columbia Acorn European Fund, 8/19/11. The inception date for Class R shares for Columbia Acorn International is 8/2/11. The inception date for Class R4, R5 and Y shares (if offered) is as follows: Columbia Acorn Fund, Columbia Acorn USA, Columbia Acorn International Select, Columbia Acorn Select, Columbia Thermostat Fund, Columbia Acorn Emerging Markets Fund and Columbia Acorn European Fund, 11/8/12, except that Class Y shares of Columbia Acorn Emerging Markets Fund commenced operations on 6/13/13. The inception date for Class R5 shares of Columbia Acorn International is 8/2/11. The inception date for Class R4 and Y shares of Columbia Acorn International is 11/8/12. The inception date for Class Z shares is as follows: Columbia Acorn Fund, 6/10/70; Columbia Acorn International, 9/23/92; Columbia Acorn USA, 9/4/96; Columbia Acorn International Select and Columbia Acorn Select, 11/23/98; Columbia Thermostat Fund, 9/25/02; Columbia Acorn Emerging Markets Fund and Columbia Acorn European Fund, 8/19/11.
*Not annualized
**Although the Fund typically invests in small- and mid-sized companies, the comparison to the S&P 500 Index is presented to show performance against a widely recognized market index over the life of the Fund.
Please see Page 1 for a description of the indexes listed above.
3
Columbia Acorn Family of Funds
2013 Year-End Distributions
The following table details the year-end distributions for the Columbia Acorn Funds. For all Funds except Columbia Thermostat Fund, the record date was December 10, 2013, and the ex-dividend and payable date was December 11, 2013. For Columbia Thermostat Fund, the record date was December 20, 2013, and the ex-dividend and payable date was December 23, 2013.
Fund | | Short-term
Capital
Gain | | Long-term
Capital
Gain | | Ordinary
Income | | Reinvestment
Price | |
Columbia Acorn Fund | |
Class A | | | None | | | $ | 1.93992 | | | | None | | | $ | 34.04 | | |
Class B | | | None | | | $ | 1.93992 | | | | None | | | $ | 30.69 | | |
Class C | | | None | | | $ | 1.93992 | | | | None | | | $ | 30.11 | | |
Class I | | | None | | | $ | 1.93992 | | | | None | | | $ | 35.55 | | |
Class R4 | | | None | | | $ | 1.93992 | | | | None | | | $ | 36.04 | | |
Class R5 | | | None | | | $ | 1.93992 | | | | None | | | $ | 36.05 | | |
Class Y | | | None | | | $ | 1.93992 | | | | None | | | $ | 36.08 | | |
Class Z | | | None | | | $ | 1.93992 | | | | None | | | $ | 35.50 | | |
Columbia Acorn International | |
Class A | | | None | | | $ | 1.92614 | | | $ | 0.57190 | | | $ | 44.96 | | |
Class B | | | None | | | $ | 1.92614 | | | $ | 0.24753 | | | $ | 43.65 | | |
Class C | | | None | | | $ | 1.92614 | | | $ | 0.23864 | | | $ | 43.45 | | |
Class I | | | None | | | $ | 1.92614 | | | $ | 0.74519 | | | $ | 45.03 | | |
Class R | | | None | | | $ | 1.92614 | | | $ | 0.40749 | | | $ | 44.95 | | |
Class R4 | | | None | | | $ | 1.92614 | | | $ | 0.69187 | | | $ | 45.31 | | |
Class R5 | | | None | | | $ | 1.92614 | | | $ | 0.71853 | | | $ | 44.99 | | |
Class Y | | | None | | | $ | 1.92614 | | | $ | 0.74075 | | | $ | 45.31 | | |
Class Z | | | None | | | $ | 1.92614 | | | $ | 0.71409 | | | $ | 45.01 | | |
Columbia Acorn USA | |
Class A | | | None | | | $ | 2.95980 | | | | None | | | $ | 32.28 | | |
Class B | | | None | | | $ | 2.95980 | | | | None | | | $ | 29.03 | | |
Class C | | | None | | | $ | 2.95980 | | | | None | | | $ | 28.68 | | |
Class I | | | None | | | $ | 2.95980 | | | | None | | | $ | 34.01 | | |
Class R4 | | | None | | | $ | 2.95980 | | | | None | | | $ | 34.54 | | |
Class R5 | | | None | | | $ | 2.95980 | | | | None | | | $ | 34.52 | | |
Class Y | | | None | | | $ | 2.95980 | | | | None | | | $ | 34.58 | | |
Class Z | | | None | | | $ | 2.95980 | | | | None | | | $ | 33.93 | | |
Columbia Acorn International Select | |
Class A | | | None | | | $ | 1.38126 | | | $ | 0.37173 | | | $ | 26.15 | | |
Class B | | | None | | | $ | 1.38126 | | | $ | 0.19141 | | | $ | 24.81 | | |
Class C | | | None | | | $ | 1.38126 | | | $ | 0.15911 | | | $ | 24.68 | | |
Class I | | | None | | | $ | 1.38126 | | | $ | 0.46324 | | | $ | 26.42 | | |
Class R4 | | | None | | | $ | 1.38126 | | | $ | 0.43094 | | | $ | 26.58 | | |
Class R5 | | | None | | | $ | 1.38126 | | | $ | 0.45785 | | | $ | 26.56 | | |
Class Y | | | None | | | $ | 1.38126 | | | $ | 0.47400 | | | $ | 26.55 | | |
Class Z | | | None | | | $ | 1.38126 | | | $ | 0.44709 | | | $ | 26.42 | | |
4
Fund | | Short-term
Capital
Gain | | Long-term
Capital
Gain | | Ordinary
Income | | Reinvestment
Price | |
Columbia Acorn Select | |
Class A | | | None | | | $ | 5.49871 | | | | None | | | $ | 24.25 | | |
Class B | | | None | | | $ | 5.49871 | | | | None | | | $ | 21.64 | | |
Class C | | | None | | | $ | 5.49871 | | | | None | | | $ | 21.31 | | |
Class I | | | None | | | $ | 5.49871 | | | | None | | | $ | 25.42 | | |
Class R4 | | | None | | | $ | 5.49871 | | | | None | | | $ | 25.80 | | |
Class R5 | | | None | | �� | $ | 5.49871 | | | | None | | | $ | 25.79 | | |
Class Y | | | None | | | $ | 5.49871 | | | | None | | | $ | 25.86 | | |
Class Z | | | None | | | $ | 5.49871 | | | | None | | | $ | 25.34 | | |
Columbia Thermostat Fund | |
Class A | | $ | 0.14390 | | | $ | 0.60684 | | | $ | 0.24510 | | | $ | 14.56 | | |
Class B | | $ | 0.14390 | | | $ | 0.60684 | | | $ | 0.16995 | | | $ | 14.66 | | |
Class C | | $ | 0.14390 | | | $ | 0.60684 | | | $ | 0.13238 | | | $ | 14.66 | | |
Class R4 | | $ | 0.14390 | | | $ | 0.60684 | | | $ | 0.28268 | | | $ | 14.44 | | |
Class R5 | | $ | 0.14390 | | | $ | 0.60684 | | | $ | 0.28568 | | | $ | 14.45 | | |
Class Y | | $ | 0.14390 | | | $ | 0.60684 | | | $ | 0.29921 | | | $ | 14.44 | | |
Class Z | | $ | 0.14390 | | | $ | 0.60684 | | | $ | 0.28268 | | | $ | 14.38 | | |
Columbia Acorn Emerging Markets Fund | |
Class A | | | None | | | | None | | | $ | 0.07987 | | | $ | 13.04 | | |
Class C | | | None | | | | None | | | $ | 0.00000 | | | $ | 13.00 | | |
Class I | | | None | | | | None | | | $ | 0.12380 | | | $ | 13.07 | | |
Class R4 | | | None | | | | None | | | $ | 0.12003 | | | $ | 13.15 | | |
Class R5 | | | None | | | | None | | | $ | 0.12254 | | | $ | 13.14 | | |
Class Y | | | None | | | | None | | | $ | 0.13133 | | | $ | 13.02 | | |
Class Z | | | None | | | | None | | | $ | 0.10623 | | | $ | 13.06 | | |
Columbia Acorn European Fund | |
Class A | | | None | | | $ | 0.01614 | | | $ | 0.01842 | | | $ | 14.84 | | |
Class C | | | None | | | $ | 0.01614 | | | $ | 0.00000 | | | $ | 14.72 | | |
Class I | | | None | | | $ | 0.01614 | | | $ | 0.06159 | | | $ | 14.83 | | |
Class R5 | | | None | | | $ | 0.01614 | | | $ | 0.04851 | | | $ | 14.98 | | |
Class Z | | | None | | | $ | 0.01614 | | | $ | 0.05636 | | | $ | 14.84 | | |
5
Squirrel Chatter II: Containerized Cargo and the Man Who Popularized It

Born in a small town in North Carolina, Malcom McLean had little formal schooling beyond grade school. He first worked as a farmer and then operated a gas station. When, in 1934, a road builder asked him where he could hire a truck and a driver, Malcom bought a used truck for $150 and signed on. Malcom went on to build McLean Trucking, one of the largest trucking firms in the country.1 The company was an early adopter of diesel engines and conveyors, and acquired other truckers in order to transport backhauls under Interstate Commerce Commission rules.2
Early in his trucking career, McLean personally had the job of delivering cotton to the port of New York and returning with a truck full of roofing material. He grew impatient waiting for the stevedores to unload and reload his truck and thought that switching full containers would save time and money.3
In 1955, McLean sold his trucking business and bought Pan-Atlantic Steamship Company for $7 million cash. He then bought Pan-Atlantic's former parent company, Waterman, in a $42 million leveraged buyout using Pan-Atlantic as collateral.4 Combined, the companies operated 37 World War II surplus C-2 cargo ships. He also bought four World War II surplus T-2 tankers and had them equipped with spar decks on top, similar to those used during the war to haul large equipment across the Atlantic.
McLean now had the opportunity to put his shipping-by-container idea to work. Until the 1950s, general ocean cargo arrived at ports in crates, boxes, bags and on pallets. It was then meticulously packed by longshoremen; a typical ship took 150 of them four days to load.5 One steamship executive said it cost more to move cargo from the street to the hold of a ship, than it did to move the cargo across the sea.6 McLean decided to save time and space by utilizing detachable truck trailers, and transporting only the container section of the trailer on the vessels.7 In April 1956, service commenced between Port Newark, New Jersey, Miami, Florida and Houston, Texas. Each of the
four ships could accommodate 58 containers that were thirty-three feet long.8
Shipping by container did cost substantially less. As an extreme example, McLean calculated that the cost of hauling bottled beer from Newark to Miami was 94% cheaper by containership than by conventional shipping. More realistically, a government-sponsored study calculated that container shipping cost 39% to 74% less.9 McLean named his intermodal operation Sea-Land Service.
Sea-Land then set about converting six of the C-2 cargo ships in its fleet into dedicated containerships. Containers were to be stacked four high in the hold and two high on the deck, resulting in a capacity of 226 containers per vessel. In order to allow stacking, frames of the containers were strengthened and twist locks were invented to hold adjacent containers in place. The first converted C-2 began hauling containers in October 1957. These containerships could be loaded by a crew of 14 during a single eight-hour shift for a cost nearly 90% less than loading a similar sized break-bulk ship, a ship with cargo loaded individually.10
Imitators soon followed. In August 1958 Matson Line began service between California and Hawaii, carrying 20 containers on deck and conventional break-bulk cargo below. In 1960, Matson began launching dedicated containerships, again converted World War II cargo ships, accommodating up to 356 containers each. In 1960, Grace Line inserted mid-sections into C-2 cargo ships and converted them to containerships capable of carrying 476 containers for shipments between the United States and Latin America. But Grace Line abandoned the service within a few years due to labor problems. McLean launched ships that could carry 476 much larger containers in 1962, and put them into service between the East and West coasts of the United States,11 as well as between the continental United States and Puerto Rico.12 On its tenth anniversary in 1966, Sea-Land had 19 containerships.13 By 1969, Sea-Land had also converted C-4s to carry 622 containers.14
McLean recognized that to achieve the full benefit of containers, the entire system of ports, labor, trucks and ships would have to change.15 Port Elizabeth, New Jersey,
6
was designed for containerships. Opening in 1962, it had a wide and deep channel and plenty of paved area shore-side for containers in transit.16 New Jersey's share of the Port of New York cargo jumped from 9% in 1956 to 63% in 1970. Around the country, the few ports that had room for containers, good road and rail connections (and a penchant for spending on infrastructure) gained share, while ports relying on piers within congested cities lost out.17 McLean also signed agreements with unions, providing regular work, safe working conditions and provisions for early retirement in exchange for fewer paid employee hours and more flexible work rules.
Trans-Atlantic container shipping started in 1966 and competition increased. McLean decided to build all-new containerships rather than convert old vessels. He specified ships for both size and speed that could carry over 1,200 containers of varying sizes.18 The ships were to steam at 33 knots, well above most others that operated at 18 to 24 knots. The new containerships cost a total of $435 million. In May of 1969, McLean orchestrated a $530 million takeover of Sea-Land by R.J. Reynolds, a cash-rich tobacco company, as Sea-Land needed investment capital and R.J. Reynolds wanted to diversify.19
The first of eight ships launched in 1972. It crossed the Atlantic in under five days and averaged 31 knots, a cargo ship record. After refinements, sister ships were able to make the crossing in under four days, beating the record of all passenger ships except for a ship named the United States.20 Six of the eight ships were eventually assigned to trans-Pacific crossings.
But fast ships use far more fuel than slower ships. Sea-Land's new containerships consumed nearly twice as much fuel per mile at 33 knots than at 24 knots, and at 24 knots consumed more fuel per container than ships that were designed for 24 knots or less. After two oil price spikes in the 1970s, the ships became unprofitable and were sold in 1981, at less than half their cost of construction, to the U.S. Navy for use as fast supply vessels.21
McLean reduced his role at Sea-Land after the fast ships launched in 1972, resigned from the R.J. Reynolds board in 1977 and sold his last shares in the company in 1980. R.J. Reynolds spun off Sea-Land in 1984; CSX bought it in 1986, and sold it to Maersk in 1999.
McLean re-entered the shipping industry by buying United States Lines from Walter Kidde in April 1978. Later that year, the company placed a record order to construct 12 new containerships, each with a capacity somewhat over 4,250 containers. These ships were 40% larger than the largest containership in existence and would provide United States Lines with the most capacity in the industry. Per container, the ships would be by far the most efficient and would cruise at a fuel-efficient 16 knots. The ships were highly automated and were able to carry nearly 50 times as much cargo per crewmember as the first dedicated cargo ships.22
Tragically for McLean and United States Lines, the price of oil then plunged, fuel efficiency mattered a lot less, and speed became more important. The ships were underpowered and had trouble keeping schedules in rough seas. They could not compete and in 1986 the company filed the biggest bankruptcy in U.S. history. The ships were sold at $0.28 on the dollar 16 months later.23 McLean was mortified by the failure, which cost thousands of jobs and millions of dollars. He died in 2001 at the age of 87, after yet another attempt to re-enter the industry.
Containerships kept getting larger and speeds gradually increased. Beginning in 2006, Maersk launched eight ships capable of carrying over 14,000 containers. Larger containerships had costs per container nearly 50% less than smaller ships.24 In 2013, Maersk launched the Mc-Kinney Moller with a capacity of 18,000 containers and had 19 more on order. These ships are longer than the height of the Empire State Building's occupied floors. Echoing McLean's 1978 order, the ships are designed to be at least 30% more fuel efficient than competitors and cruise at 16 knots.25 Worldwide containership capacity currently exceeds 17 million containers, which, if laid end-to-end, exceeds twice the circumference of the world.26
Containerships made freight transport reliable and incredibly cheap. At least three-quarters of vessels in the Far East/North America trade arrive within a day of schedule. In 2004, 4,000 video recorders could be shipped from the Far East to Europe for $0.83 each and Scotch whisky could be shipped from Europe to Japan for $0.05 per bottle.27 In 2013, it was cheaper to ship Scottish cod 10,000 miles to China for filleting and back to Scotland than to fillet it in Scotland!28
7
Containerized cargo hiked supplies and reduced prices of consumer goods, raising living standards around the world. The containership industry has high fixed costs and is very cyclical. Also, new more efficient ships increase industry capacity and depress pricing, hurting profitability of existing ships. As investors, we've found more stable opportunities in this industry by investing in adjunct businesses that benefit from increased container volumes. These include freight forwarders, which tend to benefit from declining costs or transport, and container owners, which exist today thanks to the ingenuity of Malcom McLean.

Charles P. McQuaid
President and Chief Investment Officer
Columbia Wanger Asset Management, LLC
The information and data provided in this analysis are derived from sources that we deem to be reliable and accurate. These views are not guarantees of future performance and involve certain risks, uncertainties and assumptions that are difficult to predict so actual outcomes and results may differ significantly from the views expressed. The views/opinions expressed here are those of the author and not of the Columbia Acorn Trust Board, are subject to change at any time based upon economic, market or other conditions, may differ from views expressed by other Columbia Management associates and the respective parties disclaim any responsibility to update such views. These views may not be relied on as investment advice and, because investment decisions for a Columbia Acorn Fund are based on numerous factors, may not be relied on as an indication of trading intent on behalf of any particular Columbia Acorn Fund.
1 Cudahy, Brian J., Box Boats, How Container Ships Changed the World (New York, New York, Fordham University Press, 2006) p. 21.
2 Levinson, Marc, The Box, How the Shipping Container Made the World Smaller and the World Economy Bigger (Princeton, New Jersey, Princeton University Press, 2006), p. 40-41.
3 Cudahy, Brian J., op. cit., p. 10.
4 Ibid., p. 24.
5 Ibid., p. 35.
6 Ibid., p. 9.
7 Ibid., p. 27.
8 Levinson, Marc, op. cit., p. 49, 51.
9 Ibid., p. 48, 91.
10 Cudahy, Brian J., op. cit., p. 35.
11 Ibid., p. 80.
12 Levinson, Marc, op. cit., p. 72.
13 Cudahy, Brian J., op. cit., p. 90.
14 Ibid., p. 100.
15 Levinson, Marc, op. cit., p. 53.
16 Ibid., p. 91.
17 Ibid., p. 91, 96, 193.
18 Sea-Land's initial containers were 33 and 35 feet long, while Matson Lines' were 24 feet and Grace Lines' measured 17 feet, lengths determined by ship sizes and road regulations. Going forward in this essay, capacity refers to standardized 20-foot trailer equivalent units (TEU), though most containers today are 40 feet long.
19 Levinson, Marc, op. cit., p. 216-217.
20 Cudahy, Brian J., op. cit., p. 123.
21 Ibid., p. 136-137.
22 Ibid., p. 149-150.
23 Levinson, Marc, op. cit., p. 243.
24 Stopford, Martin, Maritime Economics, Third Edition (New York, New York, Routledge, Taylor & Francis Group, 2009) p. 540.
25 Bennett, Drake, "Risk Ahoy: Maersk, Daewoo Build the World's Biggest Boat," Bloomberg Businessweek, September 5, 2013.
26 World Shipping Council website, http://www.worldshipping.org/about-the-industry/liner-ships/container-vessel-fleet.
27 Stopford, Martin, op. cit., p. 512, 522.
28 George, Rose, Ninety Percent of Everything, Inside Shipping, The Invisible Industry that Puts Clothes on Your Back, Gas in Your Car, and Food on Your Plate (New York, New York, Metropolitan Books, Henry Hold and Company, 2013), p. 18.
8
Understanding Your Expenses
As a shareholder, you incur two types of costs. There are transaction costs, which generally include sales charges on purchases and may include redemption fees. There are also ongoing costs, which generally include management fees, distribution and service (Rule 12b-1) fees, and other Fund expenses. The following information is intended to help you understand your ongoing costs (in dollars) of investing in the Fund and to help you compare these costs with the ongoing costs of investing in other mutual funds.
Analyzing Your Fund's Expenses
To illustrate these ongoing costs, we have provided examples and calculated the expenses paid by investors in Class A, B, C, I, R, R4, R5, Y and Z shares of the Funds during the period. The actual and hypothetical information in the tables is based on an initial investment of $1,000 at the beginning of the period indicated and held for the entire period. Expense information is calculated two ways and each method provides you with different information. The amount listed in the "Actual" column is calculated using the Funds' actual operating expenses and total return for the period. You may use the Actual information, together with the amount invested, to estimate the expenses that you paid over the period. Simply divide your account value by $1,000 (for example, an $8,600 account value divided by $1,000 = 8.6), then multiply the results by the expenses paid during the period under the Actual column. The amount listed in the "Hypothetical" column assumes a 5% annual rate of return before expenses (which is not the Funds' actual return) and then applies the Funds' actual expense ratio for the period to the hypothetical return. You should not use the hypothetical account values and expenses to estimate either your actual account balance at the end of the period or the expenses you paid during the period. See "Compare With Other Funds" below for details on how to use the hypothetical data.
In addition to the ongoing expenses which the Funds bear directly, Columbia Thermostat Fund's shareholders indirectly bear the Fund's allocable share of the costs and expenses of each underlying fund in which the Fund invests. You can also estimate the effective expenses paid during the period, which includes the indirect fees associated with investing in the underlying funds, by using the amounts listed in the effective expenses paid during the period column in the "Fund of Funds" table.
Compare With Other Funds
Since all mutual funds are required to include the same hypothetical calculations about expenses in shareholder reports, you can use this information to compare the ongoing cost of investing in the Funds with other funds. To do so, compare the hypothetical example with the 5% hypothetical examples that appear in the shareholder reports of other funds. As you compare hypothetical examples of other funds, it is important to note that hypothetical examples are meant to highlight the ongoing costs of investing in a fund only and do not reflect any transaction costs, such as sales charges, or redemption or exchange fees. Therefore, the hypothetical calculations are useful in comparing ongoing costs only, and will not help you determine the relative total costs of owning different funds. If transaction costs were included in these calculations, your costs would be higher.
July 1, 2013 – December 31, 2013
| | Account value at
the beginning of
the period ($) | | Account value at
the end of
the period ($) | | Expenses paid
during the period ($) | | Fund's
annualized
expense
ratio (%) | |
| | Actual | | Hypothetical | | Actual | | Hypothetical | | Actual | | Hypothetical | | Actual | |
Columbia Acorn Fund | |
Class A | | | 1,000.00 | | | | 1,000.00 | | | | 1,182.60 | | | | 1,019.98 | | | | 6.01 | | | | 5.56 | | | | 1.08 | | |
Class B | | | 1,000.00 | | | | 1,000.00 | | | | 1,178.70 | | | | 1,016.56 | | | | 9.71 | | | | 8.99 | | | | 1.75 | | |
Class C | | | 1,000.00 | | | | 1,000.00 | | | | 1,178.40 | | | | 1,016.41 | | | | 9.88 | | | | 9.15 | | | | 1.78 | | |
Class I | | | 1,000.00 | | | | 1,000.00 | | | | 1,184.90 | | | | 1,021.96 | | | | 3.84 | | | | 3.55 | | | | 0.69 | | |
Class R4 | | | 1,000.00 | | | | 1,000.00 | | | | 1,184.20 | | | | 1,021.40 | | | | 4.45 | | | | 4.12 | | | | 0.80 | | |
Class R5 | | | 1,000.00 | | | | 1,000.00 | | | | 1,184.50 | | | | 1,021.61 | | | | 4.23 | | | | 3.91 | | | | 0.76 | | |
Class Y | | | 1,000.00 | | | | 1,000.00 | | | | 1,184.60 | | | | 1,021.91 | | | | 3.90 | | | | 3.61 | | | | 0.70 | | |
Class Z | | | 1,000.00 | | | | 1,000.00 | | | | 1,184.50 | | | | 1,021.50 | | | | 4.34 | | | | 4.02 | | | | 0.78 | | |
9
Understanding Your Expenses, continued
| | Account value at
the beginning of
the period ($) | | Account value at
the end of
the period ($) | | Expenses paid
during the period ($) | | Fund's
annualized
expense
ratio (%) | |
| | Actual | | Hypothetical | | Actual | | Hypothetical | | Actual | | Hypothetical | | Actual | |
Columbia Acorn International | |
Class A | | | 1,000.00 | | | | 1,000.00 | | | | 1,154.10 | | | | 1,019.16 | | | | 6.81 | | | | 6.38 | | | | 1.24 | | |
Class B | | | 1,000.00 | | | | 1,000.00 | | | | 1,149.70 | | | | 1,015.34 | | | | 10.90 | | | | 10.22 | | | | 1.99 | | |
Class C | | | 1,000.00 | | | | 1,000.00 | | | | 1,149.60 | | | | 1,015.34 | | | | 10.90 | | | | 10.22 | | | | 1.99 | | |
Class I | | | 1,000.00 | | | | 1,000.00 | | | | 1,156.40 | | | | 1,021.15 | | | | 4.67 | | | | 4.38 | | | | 0.85 | | |
Class R | | | 1,000.00 | | | | 1,000.00 | | | | 1,151.50 | | | | 1,016.97 | | | | 9.15 | | | | 8.58 | | | | 1.67 | | |
Class R4 | | | 1,000.00 | | | | 1,000.00 | | | | 1,155.70 | | | | 1,020.18 | | | | 5.71 | | | | 5.35 | | | | 1.04 | | |
Class R5 | | | 1,000.00 | | | | 1,000.00 | | | | 1,155.90 | | | | 1,020.84 | | | | 5.00 | | | | 4.69 | | | | 0.91 | | |
Class Y | | | 1,000.00 | | | | 1,000.00 | | | | 1,156.30 | | | | 1,021.10 | | | | 4.72 | | | | 4.43 | | | | 0.86 | | |
Class Z | | | 1,000.00 | | | | 1,000.00 | | | | 1,155.70 | | | | 1,020.74 | | | | 5.11 | | | | 4.79 | | | | 0.93 | | |
Columbia Acorn USA | |
Class A | | | 1,000.00 | | | | 1,000.00 | | | | 1,188.80 | | | | 1,018.80 | | | | 7.31 | | | | 6.74 | | | | 1.31 | | |
Class B | | | 1,000.00 | | | | 1,000.00 | | | | 1,184.10 | | | | 1,014.37 | | | | 12.13 | | | | 11.19 | | | | 2.18 | | |
Class C | | | 1,000.00 | | | | 1,000.00 | | | | 1,185.30 | | | | 1,015.39 | | | | 11.02 | | | | 10.17 | | | | 1.98 | | |
Class I | | | 1,000.00 | | | | 1,000.00 | | | | 1,191.70 | | | | 1,020.89 | | | | 5.03 | | | | 4.63 | | | | 0.90 | | |
Class R4 | | | 1,000.00 | | | | 1,000.00 | | | | 1,191.30 | | | | 1,020.38 | | | | 5.58 | | | | 5.15 | | | | 1.00 | | |
Class R5 | | | 1,000.00 | | | | 1,000.00 | | | | 1,191.10 | | | | 1,020.59 | | | | 5.36 | | | | 4.94 | | | | 0.96 | | |
Class Y | | | 1,000.00 | | | | 1,000.00 | | | | 1,191.40 | | | | 1,020.74 | | | | 5.19 | | | | 4.79 | | | | 0.93 | | |
Class Z | | | 1,000.00 | | | | 1,000.00 | | | | 1,190.70 | | | | 1,020.13 | | | | 5.86 | | | | 5.40 | | | | 1.05 | | |
Columbia Acorn International Select | |
Class A | | | 1,000.00 | | | | 1,000.00 | | | | 1,124.70 | | | | 1,018.04 | | | | 7.90 | | | | 7.51 | | | | 1.46 | | |
Class B | | | 1,000.00 | | | | 1,000.00 | | | | 1,121.40 | | | | 1,014.57 | | | | 11.57 | | | | 10.98 | | | | 2.14 | | |
Class C | | | 1,000.00 | | | | 1,000.00 | | | | 1,120.20 | | | | 1,014.06 | | | | 12.10 | | | | 11.50 | | | | 2.24 | | |
Class I | | | 1,000.00 | | | | 1,000.00 | | | | 1,127.00 | | | | 1,019.87 | | | | 5.96 | | | | 5.66 | | | | 1.10 | | |
Class R4 | | | 1,000.00 | | | | 1,000.00 | | | | 1,126.20 | | | | 1,019.16 | | | | 6.72 | | | | 6.38 | | | | 1.24 | | |
Class R5 | | | 1,000.00 | | | | 1,000.00 | | | | 1,127.00 | | | | 1,019.72 | | | | 6.12 | | | | 5.82 | | | | 1.13 | | |
Class Y | | | 1,000.00 | | | | 1,000.00 | | | | 1,127.20 | | | �� | 1,019.92 | | | | 5.91 | | | | 5.61 | | | | 1.09 | | |
Class Z | | | 1,000.00 | | | | 1,000.00 | | | | 1,126.80 | | | | 1,019.52 | | | | 6.34 | | | | 6.02 | | | | 1.17 | | |
Columbia Acorn Select | |
Class A | | | 1,000.00 | | | | 1,000.00 | | | | 1,194.50 | | | | 1,018.91 | | | | 7.21 | | | | 6.64 | | | | 1.29 | | |
Class B | | | 1,000.00 | | | | 1,000.00 | | | | 1,189.40 | | | | 1,014.78 | | | | 11.71 | | | | 10.78 | | | | 2.10 | | |
Class C | | | 1,000.00 | | | | 1,000.00 | | | | 1,190.20 | | | | 1,015.19 | | | | 11.27 | | | | 10.37 | | | | 2.02 | | |
Class I | | | 1,000.00 | | | | 1,000.00 | | | | 1,196.70 | | | | 1,020.89 | | | | 5.04 | | | | 4.63 | | | | 0.90 | | |
Class R4 | | | 1,000.00 | | | | 1,000.00 | | | | 1,196.00 | | | | 1,020.33 | | | | 5.65 | | | | 5.20 | | | | 1.01 | | |
Class R5 | | | 1,000.00 | | | | 1,000.00 | | | | 1,196.50 | | | | 1,020.59 | | | | 5.37 | | | | 4.94 | | | | 0.96 | | |
Class Y | | | 1,000.00 | | | | 1,000.00 | | | | 1,196.80 | | | | 1,020.84 | | | | 5.09 | | | | 4.69 | | | | 0.91 | | |
Class Z | | | 1,000.00 | | | | 1,000.00 | | | | 1,196.00 | | | | 1,020.49 | | | | 5.48 | | | | 5.05 | | | | 0.98 | | |
10
| | Account value at
the beginning of
the period ($) | | Account value at
the end of
the period ($) | | Expenses paid
during the period ($) | | Fund's
annualized
expense
ratio (%) | |
| | Actual | | Hypothetical | | Actual | | Hypothetical | | Actual | | Hypothetical | | Actual | |
Columbia Acorn Emerging Markets Fund | |
Class A | | | 1,000.00 | | | | 1,000.00 | | | | 1,121.90 | | | | 1,016.56 | | | | 9.46 | | | | 8.99 | | | | 1.75 | | |
Class C | | | 1,000.00 | | | | 1,000.00 | | | | 1,117.40 | | | | 1,012.74 | | | | 13.49 | | | | 12.82 | | | | 2.50 | | |
Class I | | | 1,000.00 | | | | 1,000.00 | | | | 1,124.30 | | | | 1,018.70 | | | | 7.20 | | | | 6.84 | | | | 1.33 | | |
Class R4 | | | 1,000.00 | | | | 1,000.00 | | | | 1,124.10 | | | | 1,018.19 | | | | 7.74 | | | | 7.35 | | | | 1.43 | | |
Class R5 | | | 1,000.00 | | | | 1,000.00 | | | | 1,124.40 | | | | 1,018.29 | | | | 7.63 | | | | 7.25 | | | | 1.41 | | |
Class Y | | | 1,000.00 | | | | 1,000.00 | | | | 1,124.60 | | | | 1,018.65 | | | | 7.25 | | | | 6.89 | | | | 1.34 | | |
Class Z | | | 1,000.00 | | | | 1,000.00 | | | | 1,123.90 | | | | 1,017.63 | | | | 8.33 | | | | 7.92 | | | | 1.54 | | |
Columbia Acorn European Fund | |
Class A | | | 1,000.00 | | | | 1,000.00 | | | | 1,244.40 | | | | 1,016.56 | | | | 10.01 | | | | 8.99 | | | | 1.75 | | |
Class C | | | 1,000.00 | | | | 1,000.00 | | | | 1,239.60 | | | | 1,012.74 | | | | 14.27 | | | | 12.82 | | | | 2.50 | | |
Class I | | | 1,000.00 | | | | 1,000.00 | | | | 1,246.20 | | | | 1,018.04 | | | | 8.36 | | | | 7.51 | | | | 1.46 | | |
Class R5 | | | 1,000.00 | | | | 1,000.00 | | | | 1,246.10 | | | | 1,017.78 | | | | 8.64 | | | | 7.76 | | | | 1.51 | | |
Class Z | | | 1,000.00 | | | | 1,000.00 | | | | 1,246.60 | | | | 1,017.84 | | | | 8.59 | | | | 7.71 | | | | 1.50 | | |
Fund of Funds—Columbia Thermostat Fund
July 1, 2013 – December 31, 2013
| | Account value at
the beginning of
the period ($) | | Account value at
the end of
the period ($) | | Expenses paid
during the period ($) | | Fund's
annualized
expense
ratio (%) | | Effective
expenses
paid during
the period ($) | | Fund's
effective
annualized
expense
ratio (%) | |
| | Actual | | Hypothetical | | Actual | | Hypothetical | | Actual | | Hypothetical | | Actual | | Actual | | Hypothetical | | Actual | |
Columbia Thermostat Fund | |
Class A | | | 1,000.00 | | | | 1,000.00 | | | | 1,048.30 | | | | 1,022.93 | | | | 2.61 | | | | 2.58 | | | | 0.50 | | | | 5.43 | | | | 5.36 | | | | 1.04 | | |
Class B | | | 1,000.00 | | | | 1,000.00 | | | | 1,045.00 | | | | 1,020.38 | | | | 5.21 | | | | 5.15 | | | | 1.00 | | | | 8.02 | | | | 7.93 | | | | 1.54 | | |
Class C | | | 1,000.00 | | | | 1,000.00 | | | | 1,043.90 | | | | 1,019.11 | | | | 6.51 | | | | 6.43 | | | | 1.25 | | | | 9.32 | | | | 9.21 | | | | 1.79 | | |
Class R4 | | | 1,000.00 | | | | 1,000.00 | | | | 1,049.10 | | | | 1,024.21 | | | | 1.31 | | | | 1.29 | | | | 0.25 | | | | 4.12 | | | | 4.07 | | | | 0.79 | | |
Class R5 | | | 1,000.00 | | | | 1,000.00 | | | | 1,049.20 | | | | 1,024.31 | | | | 1.20 | | | | 1.19 | | | | 0.23 | | | | 4.02 | | | | 3.97 | | | | 0.77 | | |
Class Y | | | 1,000.00 | | | | 1,000.00 | | | | 1,049.50 | | | | 1,024.77 | | | | 0.73 | | | | 0.72 | | | | 0.14 | | | | 3.55 | | | | 3.51 | | | | 0.68 | | |
Class Z | | | 1,000.00 | | | | 1,000.00 | | | | 1,049.30 | | | | 1,024.21 | | | | 1.31 | | | | 1.29 | | | | 0.25 | | | | 4.12 | | | | 4.07 | | | | 0.79 | | |
Expenses paid during the period are equal to the annualized expense ratio, multiplied by the average account value over the period and then multiplied by the number of days in the Fund's most recent fiscal half year and divided by 365.
Except with respect to Columbia Thermostat Fund, expenses do not include any fees and expenses incurred indirectly by a Fund from the underlying funds in which the Fund may invest (also referred to as "acquired funds"), including affiliated and non-affiliated pooled investments vehicles (including mutual funds and exchange traded funds).
In the case of Columbia Thermostat Fund, effective expenses paid during the period and the Fund's effective annualized expense ratio include expenses borne directly by the class plus the Fund's pro rata portion of the ongoing expenses charged by the underlying funds using the expense ratio of each class of the underlying funds as of the underlying fund's most recent shareholder report.
Had the investment manager and/or certain of its affiliates not waived/reimbursed certain fees and expenses for Columbia Acorn International, Columbia Acorn International Select, Columbia Acorn Select, Columbia Thermostat Fund, Columbia Acorn Emerging Markets Fund and Columbia Acorn European Fund, account value at the end of the period would have been reduced.
11
Columbia Acorn Fund
In a Nutshell

| | 
| |
Charles P. McQuaid
Lead Portfolio Manager | | Robert A. Mohn
Co-Portfolio Manager | |

David L. Frank*
Co-Portfolio Manager
Performance data shown represents past performance and is not a guarantee of future results. The investment return and principal value will fluctuate so that shares, when redeemed, may be worth more or less than the original cost. Current performance may be lower or higher than the performance data shown. Please visit columbiamanagement.com for daily and most recent month-end performance updates.
* Effective January 1, 2014, David L. Frank was named co-portfolio manager of Columbia Acorn Fund. Mr. Frank has been an analyst with the investment manager since 2002. Performance information provided in this report is for the period ended December 31, 2013, and was achieved by the portfolio management in place through that date.
Columbia Acorn Fund Class Z shares jumped 30.90% in 2013, including a 7.30% gain in the fourth quarter. Absolute returns were excellent considering economic conditions. Relative returns were disappointing in comparison to the Fund's primary benchmark, the Russell 2500 Index, which returned 36.80% for the year and 8.66% for the quarter.
Columbia Acorn Fund's sector weightings enhanced performance for both periods. Compared to its benchmark, the Fund had above-market weights in industrial, consumer discretionary and information technology stocks, benchmark sector groups that surged between 39% and 45% during the year. The Fund was underweight in REITs and utilities, which rose just 7% and 20%, respectively, within the benchmark.
We believe the primary reason for underperformance was that the Fund's growth-at-a-reasonable-price (GARP) investment style was "out of style" in 2013. GARP stocks were the worst performing style within the Russell 2500 for the year and underperformed in the quarter.** Columbia Acorn Fund's domestic stocks did outperform the Russell 2500's GARP component for both periods, but not by enough to beat the benchmark.
Ametek, a producer of aerospace and industrial instruments, jumped 41% in the year and 15% in the quarter on fine earnings gains, and was the Fund's largest dollar winner both periods. Chicago Bridge & Iron, an engineering and construction company with strong participation in liquefied natural gas projects, surged 80% in the year and 23% in the quarter. Rental car provider Avis Budget Group had a somewhat bumpy ride in 2013, but finished the year up 104%, including a 40% gain in the fourth quarter. Generac produced an 88% gain in the year and rose 33% in the quarter as increased power outages caused by storms and aging infrastructure boosted demand for its standby generators. On the downside, a scandal-plagued Imtech plunged 75% in 2013 through the date that we exited the position in the third quarter. In total, the Fund's industrial stocks were up about 40% for the year, somewhat less than the benchmark's 45% gain in this sector.
Columbia Acorn Fund's consumer discretionary stocks provided a 38% return during the year, compared to the benchmark's 44% sector gain. Slot machine and gaming software company Bally Technologies posted a 76% win in the year and a 9% gain in the quarter on excellent earnings and a favorable acquisition. Macau casino operator Melco Crown Entertainment provided a 134% jackpot for the year and a 23% return in the quarter on strong results. In
contrast, premium active apparel retailer lululemon athletica dropped 15% in 2013 through the date that we exited the position in the third quarter, falling on product quality and management transition concerns.
Information technology (IT) and business process outsourcing services provider iGATE jumped 154% in the year and 45% in the quarter. Virtusa, a provider of offshore IT outsourcing services, surged 132% in 2013 and 31% in the quarter. Both had improved costs as a result of the drop of the rupee. iGATE had a resumption of revenue growth, while Virtusa's fine growth continued. In contrast, marketing technology provider Velti collapsed 76% in 2013 through the date that we exited the position in the third quarter, falling on disappointing sales growth and concerns about solvency. The Fund's IT stocks were up 39% in 2013, slightly more than the benchmark's tech stocks.
Columbia Acorn Fund's foreign stocks were up just 13.77% for the year and 4.98% for the quarter. At the end of the year, the Fund's foreign stocks were 7.2% of assets, down from 8.3% at the end of 2012.
Absolute returns were wonderful in 2013, but relative returns were disappointing. We don't know when GARP will be back in style, but we believe those stocks are relatively attractive, and the style has served shareholders well in the long term.
**Merrill Lynch data indicate the second highest PE quintile stocks (which we consider to be GARP stocks) were the worst performing quintile in the Russell 2500 Index, underperforming the index by 4.73% for the year and 0.79% for the fourth quarter.
Stocks of small- and mid-cap companies pose special risks, including possible illiquidity and greater price volatility than stocks of larger, more established companies. International investing involves special risks, including foreign taxation, currency risks, risks associated with possible differences in financial standards, operational and settlement risks and other risks associated with future political and economic developments.
Fund holdings are as of the date given, are subject to change at any time, and are not recommendations to buy or sell any security. Top holdings exclude short-term holdings and cash, if applicable.
Fund Positions in Mentioned Holdings
As a percentage of net assets, as of 12/31/13
Ametek | | | 2.3 | % | |
Bally Technologies | | | 1.1 | | |
Chicago Bridge & Iron | | | 0.9 | | |
Avis Budget Group` | | | 0.8 | | |
Generac | | | 0.8 | | |
iGATE | | | 0.8 | | |
Melco Crown Entertainment | | | 0.4 | | |
Virtusa | | | 0.4 | | |
12
Columbia Acorn Fund
At a Glance
Total Net Assets of the Fund:
$21.3 billion
Performance data shown in the table and graph below represent past performance, do not guarantee future results, assume reinvestment of dividends and distributions and do not reflect the deduction of taxes that a shareholder may pay on Fund distributions or the redemption of Fund shares. The investment return and principal value of an investment will fluctuate so that shares, when redeemed, may be worth more or less than their original cost. Current performance may be lower or higher than the performance data shown. Performance data reflect fee waivers or reimbursements of Fund expenses, if any; in their absence, performance results would have been lower. Indexes are unmanaged; their results do not reflect the effect of expenses or sales charges. Securities in the Fund may not match those in an index. Please visit columbiamanagement.com for performance data current to the most recent month-end.
The Growth of a $10,000 Investment in Columbia Acorn Fund Class Z Shares
June 10, 1970 (Fund inception) through December 31, 2013

This chart shows the change in value of a hypothetical $10,000 investment in Class Z shares of the Fund during the stated time period. A $10,000 investment in Columbia Acorn Fund at inception appreciated to $31,777 on December 31, 1978, the inception date of the Russell 2500 Index. For comparison with the Russell 2500 Index, we assigned the index the same value as the Fund at index inception. Although the Fund typically invests in small- and mid-sized companies, the comparison to the S&P 500 Index is presented to show performance against a widely recognized market index over the life of the Fund.
Average Annual Total Returns for period ended December 31, 2013
| | 4th quarter | | 1 year | | 5 years | | 10 years | | Life of Fund | |
| Class Z (6/10/70 inception) | | | 7.30 | % | | | 30.90 | % | | | 20.98 | % | | | 10.43 | % | | | 14.93 | % | |
| Class A (10/16/00 inception) | |
without sales charge | | | 7.23 | | | | 30.53 | | | | 20.62 | | | | 10.10 | | | | 14.55 | | |
with sales charge | | | 1.07 | | | | 23.02 | | | | 19.20 | | | | 9.45 | | | | 14.40 | | |
Russell 2500 Index* | | | 8.66 | | | | 36.80 | | | | 21.77 | | | | 9.81 | | | | N/A | | |
Results for other share classes can be found on Page 2.
*The Fund's primary benchmark. Please see Page 1 for index descriptions.
Returns for Class A shown with and without the maximum initial sales charge of 5.75%. As stated in the May 1, 2013, prospectus, the Fund's annual operating expense ratio is 0.82% for Class Z shares and 1.10% for Class A shares. The returns shown for periods prior to the inception of the Fund's Class A shares append the returns of the Fund's Class Z shares, the Fund's oldest share class. These returns are adjusted to reflect any higher class-related operating expenses of the newer share classes, as applicable. Please visit columbiamanagement.com/mutual-funds/
appended-performance for more information.
Portfolio Diversification
as a percentage of net assets, as of 12/31/13

Top 10 Holdings
as a percentage of net assets, as of 12/31/13
| 1. | | Ametek
Aerospace/Industrial Instruments | | | 2.3
| % | |
| 2. | | Donaldson
Industrial Air Filtration | | | 1.7
| % | |
| 3. | | Mettler-Toledo International
Laboratory Equipment | | | 1.7
| % | |
| 4. | | SBA Communications
Communications Towers | | | 1.4
| % | |
| 5. | | Amphenol
Electronic Connectors | | | 1.4
| % | |
| 6. | | tw telecom
Fiber Optic Telephone/Data Services | | | 1.4
| % | |
| 7. | | Cepheid
Molecular Diagnostics | | | 1.4
| % | |
| 8. | | SEI Investments
Mutual Fund Administration & Investment
Management | | | 1.2
| % | |
| 9. | | Nordson
Dispensing Systems for Adhesives & Coatings | | | 1.2
| % | |
| 10. | | Bally Technologies
Slot Machines & Software | | | 1.1
| % | |
The Fund's top 10 holdings and portfolio diversification vary with changes in portfolio investments. See the Statement of Investments for a complete list of the Fund's holdings.
13
Columbia Acorn International
In a Nutshell

| | 
| |
P. Zachary Egan
Co-Portfolio Manager | | Louis J. Mendes III
Co-Portfolio Manager | |
Performance data shown represents past performance and is not a guarantee of future results. The investment return and principal value will fluctuate so that shares, when redeemed, may be worth more or less than the original cost. Current performance may be lower or higher than the performance data shown. Please visit columbiamanagement.com for daily and most recent month-end performance updates.
Columbia Acorn International Class Z shares returned 6.09% in the fourth quarter of 2013, 2.03% better than its primary benchmark, the S&P Global Ex-U.S. Between $500M and $5B Index. The Fund's return for the full year was 22.33%, 5.56% ahead of its benchmark. For comparison, the large-cap, developed market MSCI EAFE Index (Net) rose 5.71% in the fourth quarter and 22.78% during the year.
2013 was a banner year for many equity markets in the developed world as optimism about economic recovery in Japan, Europe and the United States sent most major market indexes up more than 20%. This optimistic outlook was underpinned by the U.S. Federal Reserve Bank, which in the second quarter indicated that its bond purchase program might be wound down sooner rather than later due to the Fed's rising expectations for economic growth. The resultant jump of approximately 100 basis points in long-term government bond rates had a particularly pronounced effect on the developing world, which was already struggling with deteriorated economic outlooks. Many emerging markets posted weak local market returns, exacerbated in U.S. dollar terms by weakening currencies. The Fund's holdings in Europe and Japan returned over 35% in the year, while holdings elsewhere in Asia, Latin America and Africa averaged 13% gains.
The Fund's top percentage return for the fourth quarter and the year came from QIWI, a Russian provider of electronic payment services. Its stock rose 253% from its initial public offering in May through year end, including an 88% gain in the fourth quarter. The company has benefited from growing payment volumes, strong expected growth in Russian e-commerce, management's decision to return cash to shareholders through special dividends, and broader investor recognition of the quality of the company's business model. Hong Kong-based casino operator Melco International gained 37% in the fourth quarter and ended the year up 213%. Thanks to ongoing heavy visitation by mainland Chinese to its Macau casino, gaming revenue exceeded both management and analyst expectations. Caesarstone, an Israel-based manufacturer of quartz countertops, rose 206% for the year and was up 10% in the fourth quarter, as its innovative products increasingly gained acceptance internationally as an alternative building material in modern homes.
On the downside, Mongolian Mining, a Mongolia-based coal producer, ended the year down 68% as it struggled to make deliveries to the Chinese market on economics consistent with its original projections. In Brazil, loyalty program operator Multiplus fell 52% as management changes weighed on sentiment that was already soured by downward pressure on the value of its loyalty points from some of its business partners. We exited the Fund's position in Multiplus in the third quarter and sold out of Mongolian Mining in the fourth.
As we look ahead to 2014, many developed market companies are now trading at valuations higher than mid-term medians, as a result of two years of strong returns. However, we believe that operating fundamentals in many cases continue to show signs of a recovery, which is cause for optimism. In contrast, many emerging market companies are struggling with the twin overhang of rising interest rates and weaker domestic economic growth. Of course, these headwinds are in many cases also reflected in lower valuations, which could create opportunity. As always, we will work to identify situations where we believe that companies with good or improving fundamentals can be bought for shareholders at a reasonable price.
International investing involves special risks, including foreign taxation, currency risks, risks associated with possible differences in financial standards, operational and settlement risks and other risks associated with future political and economic developments. Stocks of small- and mid-cap companies pose special risks, including illiquidity and greater price volatility than stocks of larger, more established companies. Investing in emerging markets may involve greater risks than investing in more developed countries. In addition, concentration of investments in a single region may result in greater volatility. Please also see "A Comment on Trading Volumes" on the inside front cover of this report.
Fund holdings are as of the date given, are subject to change at any time, and are not recommendations to buy or sell any security. Top holdings exclude short-term holdings and cash, if applicable.
Fund's Positions in Mentioned Holdings
As a percentage of net assets, as of 12/31/13
Melco International | | | 0.9 | % | |
Caesarstone | | | 0.5 | | |
QIWI | | | 0.3 | | |
14
Columbia Acorn International
At a Glance
Total Net Assets of the Fund:
$8.3 billion
Performance data shown in the table and graph below represent past performance, do not guarantee future results, assume reinvestment of dividends and distributions and do not reflect the deduction of taxes that a shareholder may pay on Fund distributions or the redemption of Fund shares. The investment return and principal value of an investment will fluctuate so that shares, when redeemed, may be worth more or less than their original cost. Current performance may be lower or higher than the performance data shown. Performance data reflect fee waivers or reimbursements of Fund expenses, if any; in their absence, performance results would have been lower. Indexes are unmanaged; their results do not reflect the effect of expenses or sales charges. Securities in the Fund may not match those in an index. Please visit columbiamanagement.com for performance data current to the most recent month-end.
The Growth of a $10,000 Investment in Columbia Acorn International Class Z Shares
September 23, 1992 (Fund inception) through December 31, 2013

This chart shows the change in value of a hypothetical $10,000 investment in Class Z shares of the Fund during the stated time period.
Average Annual Total Returns for period ended December 31, 2013
| | 4th quarter | | 1 year | | 5 years | | 10 years | | Life of Fund | |
| Class Z (9/23/92 inception) | | | 6.09 | % | | | 22.33 | % | | | 18.81 | % | | | 12.29 | % | | | 11.65 | % | |
| Class A (10/16/00 inception) | |
without sales charge | | | 6.03 | | | | 22.00 | | | | 18.41 | | | | 11.91 | | | | 11.22 | | |
with sales charge | | | -0.06 | | | | 14.98 | | | | 17.01 | | | | 11.25 | | | | 10.91 | | |
S&P Global Ex-U.S.
Between $500M and $5B* | | | 4.06 | | | | 16.77 | | | | 17.45 | | | | 10.62 | | | | 8.81 | | |
Results for other share classes can be found on Page 2.
*The Fund's primary benchmark. Please see Page 1 for index descriptions.
Returns for Class A shown with and without the maximum initial sales charge of 5.75%. As stated in the May 1, 2013, prospectus, the Fund's annual operating expense ratio is 0.95% for Class Z shares and 1.31% for Class A shares. The returns shown for periods prior to the inception of the Fund's Class A shares append the returns of the Fund's Class Z shares, the Fund's oldest share class. These returns are adjusted to reflect any higher class-related operating expenses of the newer share classes, as applicable. Please visit columbiamanagement.com/mutual-funds/
appended-performance for more information.
Portfolio Diversification
as a percentage of net assets, as of 12/31/13

Top 10 Holdings
as a percentage of net assets, as of 12/31/13
| 1. | | Melco Crown Entertainment - ADR
(Hong Kong)
Macau Casino Operator | | | 1.4
| % | |
| 2. | | Coronation Fund Managers (South Africa)
South African Fund Manager | | | 1.3
| % | |
| 3. | | WuXi Pharma Tech - ADR (China)
Largest Contract Research Organization Business in
China | | | 1.1
| % | |
| 4. | | Aalberts Industries (Netherlands)
Flow Control & Heat Treatment | | | 1.1
| % | |
| 5. | | Neopost (France)
Postage Meter Machines | | | 1.0
| % | |
| 6. | | Eurofins Scientific (France)
Food, Pharmaceuticals & Materials Screening & Testing | | | 1.0
| % | |
| 7. | | Hexagon (Sweden)
Design, Measurement & Visualization Software &
Equipment | | | 1.0
| % | |
| 8. | | CCL Industries (Canada)
Leading Global Label Converter | | | 1.0
| % | |
| 9. | | Naspers (South Africa)
Media in Africa, China, Russia & Other Emerging
Markets | | | 1.0
| % | |
| 10. | | Jardine Lloyd Thompson Group
(United Kingdom)
International Business Insurance Broker | | | 0.9
| % | |
The Fund's top 10 holdings and portfolio diversification vary with changes in portfolio investments. See the Statement of Investments for a complete list of the Fund's holdings.
15
Columbia Acorn USA
In a Nutshell

| | 
| |
Robert A. Mohn
Lead Portfolio Manager | | William J. Doyle*
Co-Portfolio Manager | |
Performance data shown represents past performance and is not a guarantee of future results. The investment return and principal value will fluctuate so that shares, when redeemed, may be worth more or less than the original cost. Current performance may be lower or higher than the performance data shown. Please visit columbiamanagement.com for daily and most recent month-end performance updates.
* Effective January 1, 2014, William J. Doyle was named co-portfolio manager of Columbia Acorn USA. Mr. Doyle has been an analyst with the investment manager since 2006. Performance information provided in this report is for the period ended December 31, 2013, and was achieved by the portfolio management in place through that date.
Columbia Acorn USA Class Z shares ended the fourth quarter of 2013 up 6.82%. This compares to an 8.72% gain by the Fund's primary benchmark, the Russell 2000 Index. For the annual period, the Fund gained 32.72%, a pleasing absolute return but below the benchmark's 38.82% gain. The Fund's technology and industrials stocks lagged the performance of their respective sectors in the benchmark in 2013, while a downturn in Fund health care stocks dampened relative returns in the fourth quarter.
The Fund's top contributor in the quarter and the year was car rental company Avis Budget Group. Its stock rose 104% for the year and 40% in the fourth quarter, as the company benefited from lower fleet costs and higher pricing and utilization. Bally Technologies, a manufacturer of slot machines and gaming software, had a 75% annual gain and was up 8% in the fourth quarter. Investors responded favorably to Bally's purchase of SHFL Entertainment, an acquisition that broadens its product line. Caesarstone, a manufacturer of quartz countertops, ended the year up an impressive 208%, as sales of its products in the United States were up 50% over the prior year.
HEICO and Moog both sell into the aircraft market and both announced strong results for the year. HEICO sells FAA-approved aircraft replacement parts and Moog sells motion control products used primarily in airplanes. HEICO was up 67% for the year with 6% of the gain coming in the fourth quarter. Moog had an annual gain of 66% and a 16% fourth quarter increase.
Biotech stocks were strong contributors to the Fund for the annual period despite some fourth quarter declines. Drug developer NPS Pharmaceuticals gained 230% for the year, benefiting from the successful launch of a medication to treat short bowel syndrome. Seattle Genetics, a developer of antibody-based therapies for cancer, rose 72% in 2013 as its drug, Adcetris, gained traction as a means for treating multiple forms of cancer. Detractors in this sector included ARIAD Pharmaceuticals and Coronado Biosciences. Off roughly 70% for the quarter and the year, ARIAD's drug was placed on clinical hold by the FDA due to elevated cardiovascular risk. Coronado's drug to treat Crohn's disease failed in its FDA trials, leaving the stock with an 80% annual decline and a 74% fourth quarter
drop. We sold both positions in the fourth quarter. While off 59% in the fourth quarter and 26% for the year, we continue to hold Sarepta Therapeutics, a biotech focused on rare diseases. Its stock declined after the FDA removed its drug as a candidate for accelerated approval.
Fourth quarter winners included fiber laser manufacturer IPG Photonics, which rose 38%. The company announced revenues up 40% year-over-year in Asia, boosted by strong 57% growth in China. Cepheid services the largest installed base of molecular diagnostic systems in the world. Its revenues were up 24% versus the prior year, driving its 20% gain in the fourth quarter. Generac, a producer of standby power generators, gained 33% in the quarter as the company benefited from a surge in demand in the wake of recent storms.
In 2013, lower-quality turnarounds and momentum stocks with high price-to-earnings ratios were the big market winners. Stocks we consider more reasonably priced, quality investments generally underperformed. Our investment style has proven itself to work well in most market conditions but it was out of favor in 2013. We are uncertain how long this headwind will persist, but we believe the Fund will be well served in the long term by adhering to its historically successful strategy of investing in reasonably priced growth stocks.
Stocks of small- and mid-cap companies pose special risks, including possible illiquidity and greater price volatility than stocks of larger, more established companies.
Fund holdings are as of the date given, are subject to change at any time, and are not recommendations to buy or sell any security. Top holdings exclude short-term holdings and cash, if applicable.
Fund's Positions in Mentioned Holdings
As a percentage of net assets, as of 12/31/13
Avis Budget Group | | | 2.7 | % | |
IPG Photonics | | | 1.8 | | |
HEICO | | | 1.8 | | |
Bally Technologies | | | 1.7 | | |
Moog | | | 1.6 | | |
Cepheid | | | 1.6 | | |
Seattle Genetics | | | 1.1 | | |
Caesarstone | | | 0.9 | | |
NPS Pharmaceuticals | | | 0.8 | | |
Generac | | | 0.8 | | |
Sarepta Therapeutics | | | 0.3 | | |
16
Columbia Acorn USA
At a Glance
Total Net Assets of the Fund:
$1.8 billion
Performance data shown in the table and graph below represent past performance, do not guarantee future results, assume reinvestment of dividends and distributions and do not reflect the deduction of taxes that a shareholder may pay on Fund distributions or the redemption of Fund shares. The investment return and principal value of an investment will fluctuate so that shares, when redeemed, may be worth more or less than their original cost. Current performance may be lower or higher than the performance data shown. Performance data reflect fee waivers or reimbursements of Fund expenses, if any; in their absence, performance results would have been lower. Indexes are unmanaged; their results do not reflect the effect of expenses or sales charges. Securities in the Fund may not match those in an index. Please visit columbiamanagement.com for performance data current to the most recent month-end.
The Growth of a $10,000 Investment in Columbia Acorn USA Class Z Shares
September 4, 1996 (Fund inception) through December 31, 2013
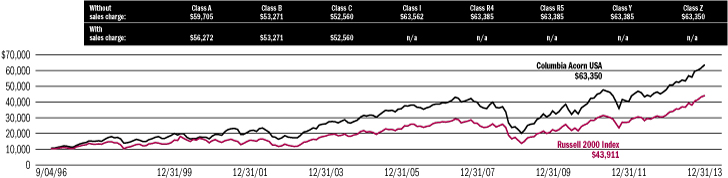
This chart shows the change in value of a hypothetical $10,000 investment in Class Z shares of the Fund during the stated time period.
Average Annual Total Returns for period ended December 31, 2013
| | 4th quarter | | 1 year | | 5 years | | 10 years | | Life of Fund | |
| Class Z (9/4/96 inception) | | | 6.82 | % | | | 32.72 | % | | | 21.20 | % | | | 9.27 | % | | | 11.24 | % | |
| Class A (10/16/00 inception) | |
without sales charge | | | 6.73 | | | | 32.34 | | | | 20.86 | | | | 8.95 | | | | 10.86 | | |
with sales charge | | | 0.60 | | | | 24.74 | | | | 19.44 | | | | 8.31 | | | | 10.49 | | |
Russell 2000 Index* | | | 8.72 | | | | 38.82 | | | | 20.08 | | | | 9.07 | | | | 8.91 | | |
Results for other share classes can be found on Page 2.
*The Fund's primary benchmark. Please see Page 1 for index descriptions.
Returns for Class A shown with and without the maximum initial sales charge of 5.75%. As stated in the May 1, 2013, prospectus, the Fund's annual operating expense ratio is 1.15% for Class Z shares and 1.38% for Class A shares. The returns shown for periods prior to the inception of the Fund's Class A shares append the returns of the Fund's Class Z shares, the Fund's oldest share class. These returns are adjusted to reflect any higher class-related operating expenses of the newer share classes, as applicable. Please visit columbiamanagement.com/mutual-funds/
appended-performance for more information.
Portfolio Diversification
as a percentage of net assets, as of 12/31/13

Top 10 Holdings
as a percentage of net assets, as of 12/31/13
| 1. | | Avis Budget Group
Second Largest Car Rental Company | | | 2.7
| % | |
| 2. | | Ametek
Aerospace/Industrial Instruments | | | 2.5
| % | |
| 3. | | Nordson
Dispensing Systems for Adhesives & Coatings | | | 2.4
| % | |
| 4. | | Mettler-Toledo International
Laboratory Equipment | | | 2.2
| % | |
| 5. | | Donaldson
Industrial Air Filtration | | | 2.1
| % | |
| 6. | | tw telecom
Fiber Optic Telephone/Data Services | | | 2.0
| % | |
| 7. | | Extra Space Storage
Self Storage Facilities | | | 1.9
| % | |
| 8. | | IPG Photonics
Fiber Lasers | | | 1.8
| % | |
| 9. | | HEICO
FAA Approved Aircraft Replacement Parts | | | 1.8
| % | |
| 10. | | Informatica
Enterprise Data Integration Software | | | 1.7
| % | |
The Fund's top 10 holdings and portfolio diversification vary with changes in portfolio investments. See the Statement of Investments for a complete list of the Fund's holdings.
17
Columbia Acorn International Select
In a Nutshell

| |
Christopher J. Olson
Portfolio Manager | |
Performance data shown represents past performance and is not a guarantee of future results. The investment return and principal value will fluctuate so that shares, when redeemed, may be worth more or less than the original cost. Current performance may be lower or higher than the performance data shown. Please visit columbiamanagement.com for daily and most recent month-end performance updates.
Columbia Acorn International Select Class Z shares ended the fourth quarter of 2013 up 1.97%. This compares to a 4.42% gain for the Fund's primary benchmark, the S&P Developed Ex-U.S. Between $2B and $10B Index. For the annual period, the Fund was up 14.75% versus a 21.70% gain for the benchmark. The Fund's underperformance relative to the benchmark for both periods was due to its more cautious positioning and an overweight position in the poorly performing commodities sector.
Investor enthusiasm for the Japanese government's new monetary and fiscal policies provided a nice tailwind for the three top annual contributors, which were all Japanese stocks. Start Today is an online apparel retailer. The company ended 2013 up a substantial 171%, driven by strong revenue growth and by global investors' enthusiasm for Internet plays. Start Today's stock did cool somewhat in the fourth quarter, falling 12%. NGK Spark Plug, a maker of automobile parts, ended the annual period up 82% with 7% coming in the fourth quarter. NGK benefited along with other exporters from the weaker yen that resulted from new government policies. Rounding out the Japanese winners, Seven Bank, a provider of ATM processing services, gained 51% for the year and was up 17% for the fourth quarter. Investors responded favorably to its expansion into the 7-Eleven store network in Japan and to its strong, defensive cash flows.
Macau casino operator Melco International was the top contributor to Fund gains in the fourth quarter, rising 37%. This added to the 133% annual gain for the stock. Gaming revenues exceeded both management and analyst expectations thanks to heavy visitation by mainland Chinese to its Macau casino. Canadian global label converter CCL Industries rose 13% in the fourth quarter, adding to its 73% annual gain. The company benefited from the acquisition of Avery's label and office product division, which it acquired at a sharp discount. The integration of that acquisition appears to be going smoothly and CCL's revenues have continued to grow at a reasonable pace.
Despite their uptick in the third quarter, materials stocks were the largest detractors to Fund performance in 2013. Mexican silver and metal byproduct miner Fresnillo fell 50% for the annual period. We sold the Fund's position in this stock in the fourth quarter. We exited the Fund's position in gold and silver miner Allied Nevada Gold in the second quarter, but its 58% decline made it a top detractor for the year. Australian gold miner Regis Resources ended the year off 49%, despite reports of positive operational results.
Materials stocks weighed down fourth quarter results as well, with Regis Resources and Brazilian gold miner Beadell Resources falling 28% and 18%, respectively, in the quarter. Taiwanese mobile operator Far EasTone Telecom had its ups and downs in 2013 but ended the year on a down note, falling 11% in the fourth quarter and declining 10% for the year. Investor concerns about the cost of acquiring bandwidth to support new 4G networks hurt mobile operators.
Surveying 2013's investment returns, those markets that had major monetary and financial policy measures did well (Japan, the United States, the United Kingdom and Europe, for example) while those that did not performed poorly (Australia, Singapore, the emerging markets). Whether or not such extraordinary policies will continue and whether they will have any sustainable impact on real economic growth remains to be seen. In the meantime, the Fund will continue to look for underappreciated stocks with good business models, sound management and what we believe are strong balance sheets, as it has done in the past.
International investing involves special risks, including foreign taxation, currency risks, risks associated with possible differences in financial standards, operational and settlement risks and other risks associated with future political and economic developments. Due to the Fund's concentration in a limited number of stocks, the Fund's portfolio will tend to diverge significantly from benchmark weightings and may therefore pose greater risk and volatility relative to its benchmark, or in comparison to other Columbia Acorn Fund portfolios that are supported by the same team of individual analysts. Stocks of small- and mid-cap companies pose special risks, including illiquidity and greater price volatility than stocks of larger, more established companies. Investing in emerging markets may involve greater risks than investing in more developed countries. Please also see "A Comment on Trading Volumes" on the inside front cover of this report.
Fund holdings are as of the date given, are subject to change at any time, and are not recommendations to buy or sell any security. Top holdings exclude short-term holdings and cash, if applicable.
Fund's Positions in Mentioned Holdings
As a percentage of net assets, as of 12/31/13
Far EasTone Telecom | | | 4.1 | % | |
NGK Spark Plug | | | 4.1 | | |
CCL Industries | | | 3.2 | | |
Melco International | | | 2.5 | | |
Seven Bank | | | 2.5 | | |
Beadell Resources | | | 2.4 | | |
Regis Resources | | | 1.3 | | |
Start Today | | | 1.0 | | |
18
Columbia Acorn International Select
At a Glance
Total Net Assets of the Fund:
$355.8 million
Performance data shown in the table and graph below represent past performance, do not guarantee future results, assume reinvestment of dividends and distributions and do not reflect the deduction of taxes that a shareholder may pay on Fund distributions or the redemption of Fund shares. The investment return and principal value of an investment will fluctuate so that shares, when redeemed, may be worth more or less than their original cost. Current performance may be lower or higher than the performance data shown. Performance data reflect fee waivers or reimbursements of Fund expenses, if any; in their absence, performance results would have been lower. Indexes are unmanaged; their results do not reflect the effect of expenses or sales charges. Securities in the Fund may not match those in an index. Please visit columbiamanagement.com for performance data current to the most recent month-end.
The Growth of a $10,000 Investment in Columbia Acorn International Select Class Z Shares
November 23, 1998 (Fund inception) through December 31, 2013

This chart shows the change in value of a hypothetical $10,000 investment in Class Z shares of the Fund during the stated time period.
Average Annual Total Returns for period ended December 31, 2013
| | 4th quarter | | 1 year | | 5 years | | 10 years | | Life of Fund | |
| Class Z (11/23/98 inception) | | | 1.97 | % | | | 14.75 | % | | | 15.24 | % | | | 10.90 | % | | | 9.91 | % | |
| Class A (10/16/00 inception) | |
without sales charge | | | 1.86 | | | | 14.42 | | | | 14.83 | | | | 10.54 | | | | 9.55 | | |
with sales charge | | | -4.00 | | | | 7.85 | | | | 13.48 | | | | 9.89 | | | | 9.12 | | |
S&P Developed Ex-U.S.
Between $2B and $10B Index* | | | 4.42 | | | | 21.70 | | | | 15.27 | | | | 8.90 | | | | 8.08 | | |
Results for other share classes can be found on Page 2.
*The Fund's primary benchmark. Please see Page 1 for index descriptions.
Returns for Class A shown with and without the maximum initial sales charge of 5.75%. As stated in the May 1, 2013, prospectus, the Fund's annual operating expense ratio is 1.26% for Class Z shares and 1.51% for Class A shares. The returns shown for periods prior to the inception of the Fund's Class A shares append the returns of the Fund's Class Z shares, the Fund's oldest share class. These returns are adjusted to reflect any higher class-related operating expenses of the newer share classes, as applicable. Please visit columbiamanagement.com/mutual-funds/
appended-performance for more information.
Portfolio Diversification
as a percentage of net assets, as of 12/31/13
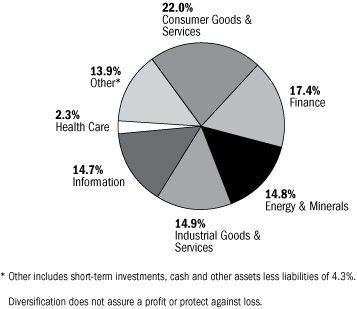
Top 10 Holdings
as a percentage of net assets, as of 12/31/13
| 1. | | Ascendas REIT (Singapore)
Industrial Property Landlord | | | 4.7
| % | |
| 2. | | Jardine Lloyd Thompson Group
(United Kingdom)
International Business Insurance Broker | | | 4.3
| % | |
| 3. | | Far EasTone Telecom (Taiwan)
Taiwan's Third Largest Mobile Operator | | | 4.1
| % | |
| 4. | | NGK Spark Plug (Japan)
Automobile Parts | | | 4.1
| % | |
| 5. | | Rinnai (Japan)
Gas Appliances for Household & Commercial Use | | | 3.6
| % | |
| 6. | | Neopost (France)
Postage Meter Machines | | | 3.3
| % | |
| 7. | | CCL Industries (Canada)
Largest Global Label Converter | | | 3.2
| % | |
| 8. | | Archipelago Resources (Indonesia)†
Gold Mining Projects in Indonesia, Vietnam &
Philippines | | | 3.2
| % | |
| 9. | | Babcock International (United Kingdom)
Public Sector Outsourcer | | | 3.0
| % | |
| 10. | | IAG (Australia)
General Insurance Provider | | | 2.9
| % | |
The Fund's top 10 holdings and portfolio diversification vary with changes in portfolio investments. See the Statement of Investments for a complete list of the Fund's holdings.
†Includes both stock and option.
19
Columbia Acorn Select
In a Nutshell

| |
Robert A. Chalupnik
Portfolio Manager | |
Performance data shown represents past performance and is not a guarantee of future results. The investment return and principal value will fluctuate so that shares, when redeemed, may be worth more or less than the original cost. Current performance may be lower or higher than the performance data shown. Please visit columbiamanagement.com for daily and most recent month-end performance updates.
Columbia Acorn Select Class Z shares outperformed for both the fourth quarter of 2013 and the year. The Fund's fourth quarter gain of 9.64% topped the 8.33% return of its primary benchmark, the S&P MidCap 400 Index. For the annual period, the Fund gained 34.16% versus a 33.50% gain for the benchmark. It is pleasing to end the year with performance above benchmark following a weak first quarter. Several holdings that underperformed in early 2013 recovered nicely as the year progressed, and some new positions in the Fund got off to a strong start, contributing to gains.
A top contributor for the year and quarter was insurance provider CNO Financial Group. Its stock was up 91% for the year and 23% in the fourth quarter. The company continued to make progress toward its goal of 9% return on equity (ROE) by the end of 2015. While up only 3% in the fourth quarter, offshore business process outsourcing services provider WNS had an annual gain of 110%, making it the best performing stock in the Fund for 2013. Its stock continues to benefit from growth in new business and price-to-earnings multiple expansion.
Rebounding from a third quarter lag, car rental company Hertz gained 29% in the fourth quarter and ended the year up 75%. Lower fleet costs and higher pricing and utilization drove earnings growth. Its stock also got a boost on the last day of the year, rising 10% after the company adopted a shareholder rights plan in response to unusual and substantial trading of its stock. We took the opportunity to capture gains during this rally and trimmed the Fund's position just after the quarter end. South American oil producer Canacol ended the year up 109%, gaining 57% in the fourth quarter, as investors responded favorably to its solid production and successful well results.
The largest detractor to returns for the year was gold miner Kirkland Lake Gold. Its stock fell along with gold prices, declining 63% for the year and 19% in the fourth quarter. We sold out of the stock in the quarter due to concerns about the impact a long period of lower gold prices could have on the company. This sale also reduced the Fund's exposure to riskier micro-cap names. We have been reducing this exposure across the portfolio since 2011. Rather than invest in such companies, we have tried to emphasize more of CWAM's "best ideas." While "best ideas" do not dominate the portfolio, they do represent a significant percentage of the Fund's holdings.
Petrodorado Energy, an oil and gas exploration and production company operating in Colombia, Peru and Paraguay, was also a detractor during 2013, as it was off 73% for the year and fell 15% in the fourth quarter. The company hit oil in Colombia, but concerns remained as to whether the well would be commercially viable.
During the fourth quarter, the Fund added three new names to the portfolio. Antero Resources is an oil and gas producer drilling in the Marcellus and Utica shale found in the Appalachian Basin states. Self storage facilities real estate investment trust (REIT) Extra Space Storage was added to replace Biomed Realty Trust, a life science-focused REIT. We view Extra Space Storage as a better-quality name with higher expected returns. The third addition was Informatica, a developer of enterprise data integration software. We consider Informatica a well-managed company positioned to benefit from increasing sources and uses of data.
In addition to Kirkland Lake Gold and Biomed Realty Trust, we sold communications towers owner Crown Castle International. Within the same industry, we prefer SBA Communications at current valuations.
The U.S. stock market, as defined by the S&P 500 Index, ended the year at an all-time high and was 18% above the prior high set on October 9, 2007. Although no one can predict how the stock market will perform in 2014, we believe there are encouraging signs that the U.S. economy could continue to improve. Also, over a longer time period, it seems likely that the U.S. manufacturing base will benefit from cheaper natural gas, reasonable electricity rates and stable unit labor rates relative to increasing unit labor rates in other regions of the world. This view is reflected in the Fund's overweight position in the industrials sector.
Risks include stock market fluctuations due to economic and business developments. The Fund also has potentially greater price volatility due to the Fund's concentration in a limited number of stocks of mid-size companies. International investing involves special risks, including foreign taxation, currency risks, risks associated with possible differences in financial standards, operational and settlement risks and other risks associated with future political and economic developments.
Fund holdings are as of the date given, are subject to change at any time, and are not recommendations to buy or sell any security. Top holdings exclude short-term holdings and cash, if applicable.
Fund's Positions in Mentioned Holdings
As a percentage of net assets, as of 12/31/13
Hertz | | | 4.7 | % | |
CNO Financial Group | | | 4.3 | | |
WNS | | | 4.0 | | |
SBA Communications | | | 3.4 | | |
Canacol | | | 2.8 | | |
Informatica | | | 1.1 | | |
Extra Space Storage | | | 1.1 | | |
Antero Resources | | | 0.4 | | |
Petrodorado Energy | | | 0.1 | | |
20
Columbia Acorn Select
At a Glance
Total Net Assets of the Fund:
$861.5 million
Performance data shown in the table and graph below represent past performance, do not guarantee future results, assume reinvestment of dividends and distributions and do not reflect the deduction of taxes that a shareholder may pay on Fund distributions or the redemption of Fund shares. The investment return and principal value of an investment will fluctuate so that shares, when redeemed, may be worth more or less than their original cost. Current performance may be lower or higher than the performance data shown. Performance data reflect fee waivers or reimbursements of Fund expenses, if any; in their absence, performance results would have been lower. Indexes are unmanaged; their results do not reflect the effect of expenses or sales charges. Securities in the Fund may not match those in an index. Please visit columbiamanagement.com for performance data current to the most recent month-end.
The Growth of a $10,000 Investment in Columbia Acorn Select Class Z Shares
November 23, 1998 (Fund inception) through December 31, 2013

This chart shows the change in value of a hypothetical $10,000 investment in Class Z shares of the Fund during the stated time period.
Average Annual Total Returns for period ended December 31, 2013
| | 4th quarter | | 1 year | | 5 years | | 10 years | | Life of Fund | |
| Class Z (11/23/98 inception) | | | 9.64 | % | | | 34.16 | % | | | 21.83 | % | | | 8.91 | % | | | 10.82 | % | |
| Class A (10/16/00 inception) | |
without sales charge | | | 9.56 | | | | 33.77 | | | | 21.46 | | | | 8.59 | | | | 10.47 | | |
with sales charge | | | 3.25 | | | | 26.07 | | | | 20.03 | | | | 7.95 | | | | 10.04 | | |
S&P MidCap 400 Index* | | | 8.33 | | | | 33.50 | | | | 21.89 | | | | 10.36 | | | | 10.67 | | |
Results for other share classes can be found on Page 2.
*The Fund's primary benchmark. Please see Page 1 for index descriptions.
Returns for Class A shown with and without the maximum initial sales charge of 5.75%. As stated in the May 1, 2013, prospectus, the Fund's annual operating expense ratio is 1.07% for Class Z shares and 1.35% for Class A shares. The returns shown for periods prior to the inception of the Fund's Class A shares append the returns of the Fund's Class Z shares, the Fund's oldest share class. These returns are adjusted to reflect any higher class-related operating expenses of the newer share classes, as applicable. Please visit columbiamanagement.com/mutual-funds/
appended-performance for more information.
Portfolio Diversification
as a percentage of net assets, as of 12/31/13

Top 10 Holdings
as a percentage of net assets, as of 12/31/13
| 1. | | Ametek
Aerospace/Industrial Instruments | | | 6.1
| % | |
| 2. | | Hertz
Largest U.S. Rental Car Operator | | | 4.7
| % | |
| 3. | | Discover Financial Services
Credit Card Company | | | 4.4
| % | |
| 4. | | CNO Financial Group
Life, Long-term Care & Medical Supplement Insurance | | | 4.3
| % | |
| 5. | | Donaldson
Industrial Air Filtration | | | 4.2
| % | |
| 6. | | WNS - ADR (India)
Offshore Business Process Outsourcing Services | | | 4.0
| % | |
| 7. | | Amphenol
Electronic Connectors | | | 3.8
| % | |
| 8. | | SBA Communications
Communications Towers | | | 3.4
| % | |
| 9. | | City National
Bank & Asset Manager | | | 3.1
| % | |
| 10. | | Kennametal
Consumable Cutting Tools | | | 3.1
| % | |
The Fund's top 10 holdings and portfolio diversification vary with changes in portfolio investments. See the Statement of Investments for a complete list of the Fund's holdings.
21
Columbia Thermostat Fund
In a Nutshell

| |
Charles P. McQuaid
Lead Portfolio Manager | |

Christopher J. Olson*
Co-Portfolio Manager
Performance data shown represents past performance and is not a guarantee of future results. The investment return and principal value will fluctuate so that shares, when redeemed, may be worth more or less than the original cost. Current performance may be lower or higher than the performance data shown. Please visit columbiamanagement.com for daily and most recent month-end performance updates.
A "fund of fund" bears its allocable share of the costs and expenses of the underlying funds in which it invests. Such funds are thus subject to two levels of fees and potentially higher expense ratios than would be associated with a fund that invests and trades directly in financial instruments under the direction of a single manager.
* Effective January 1, 2014, Christopher J. Olson was named co-portfolio manager of Columbia Thermostat Fund. Mr. Olson is also lead portfolio manager of Columbia Acorn International Select, a position he has held since 2001. Performance information provided in this report is for the period ended December 31, 2013, and was achieved by the portfolio management in place through that date.
Columbia Thermostat Fund Class Z shares ended the fourth quarter of 2013 up 1.95%. This compares to a 10.51% return for the Fund's primary equity benchmark, the S&P 500 Index, and a 0.14% decline for its primary debt benchmark, the Barclays U.S. Aggregate Bond Index. For the annual period, Columbia Thermostat Fund was up 9.30% versus a 32.39% gain for the S&P 500 Index and a fall of 2.02% in the Barclays U.S. Aggregate Bond Index. The Fund's 50/50 Blended Benchmark, which offers an equally weighted custom composite of the Fund's primary equity and primary debt benchmarks, gained 5.10% in the fourth quarter and 14.08% for the year.
The weighted average gain for the Fund's equity portfolio was 8.95% for the fourth quarter and 31.70% for the year. Columbia Large Cap Enhanced Core Fund led fourth quarter gains, rising 12.01%. Columbia Select Large Cap Growth Fund was the equity fund leader for the year, gaining 44.56%.
The bond portion of the Fund had a weighted average gain of just over 1% for both the fourth quarter and the year. Columbia Income Opportunities Fund was the strongest contributor for both periods, up 3.06% for the quarter and 5.11% for the year.
The Fund hit three reallocation triggers in October, decreasing stock fund exposure each time as the equity markets continued to surge. Columbia Thermostat Fund moved to its minimum 10% weighting in stock funds after the S&P 500 surpassed 1,750 and remained at this level through year end. The Fund is poised to buy equities should the S&P 500 close below 1,750, given its current prospectus allocation table.
As we've mentioned in recent reports, Columbia Thermostat Fund is designed to work best in a range-bound equity market, selling stock funds on strength and buying on weakness. The rally in the stock market has left the Fund dominated by bond funds. It offers good protection against a stock market correction and an automatic addition to equity holdings should a correction occur. Columbia Thermostat Fund was dominated by stock funds from October 2008 to July 2009, and maintaining the allocation table ultimately served shareholders very well. As required
by the Fund's prospectus, we are conducting the annual review of the current allocation table and, should we decide to change it based on the performance of the underlying funds, market conditions or other reasons, shareholders will be notified by a prospectus update and a discussion in the following shareholder report.
Results of the Funds Owned in Columbia Thermostat Fund
as of December 31, 2013
Stock Funds
| Fund | | Weightings
in category | | 4th
quarter | | 1 year | |
Columbia Acorn
International, Class I | | | 20 | % | | | 6.14 | % | | | 22.43 | % | |
Columbia Dividend Income
Fund, Class I | | | 20 | % | | | 9.30 | % | | | 28.86 | % | |
Columbia Acorn Fund, Class I | | | 15 | % | | | 7.32 | % | | | 30.99 | % | |
Columbia Contrarian Core
Fund, Class I | | | 15 | % | | | 10.59 | % | | | 35.99 | % | |
Columbia Acorn Select, Class I | | | 10 | % | | | 9.69 | % | | | 34.31 | % | |
Columbia Large Cap Enhanced
Core Fund, Class I | | | 10 | % | | | 12.01 | % | | | 35.26 | % | |
Columbia Select Large Cap
Growth Fund, Class I | | | 10 | % | | | 10.04 | % | | | 44.56 | % | |
Weighted Average Equity Gain | | | 100 | % | | | 8.95 | % | | | 31.70 | % | |
Bond Funds
| Fund | | Weightings
in category | | 4th
quarter | | 1 year | |
Columbia Short Term Bond
Fund, Class I | | | 40 | % | | | 0.31 | % | | | 0.63 | % | |
Columbia Intermediate Bond
Fund, Class I | | | 30 | % | | | 0.14 | % | | | -2.20 | % | |
Columbia Income Opportunities
Fund, Class I | | | 30 | % | | | 3.06 | % | | | 5.11 | % | |
Weighted Average Income Gain | | | 100 | % | | | 1.08 | % | | | 1.11 | % | |
Columbia Thermostat Fund Rebalancing in the Fourth Quarter
October 4, 2013 | | 20% stocks, 80% bonds | |
October 14, 2013 | | 15% stocks, 85% bonds | |
October 23, 2013 | | 10% stocks, 90% bonds | |
The value of an investment in the Fund is based primarily on the performance of the underlying funds in which it invests. The Fund is subject to the risk that the investment manager's decisions regarding asset classes and underlying funds will not anticipate market trends successfully, resulting in a failure to preserve capital or lower total return.
The Fund's investments in the underlying funds may also present certain risks, including the following. Investments made by underlying funds in foreign securities, particularly those in emerging markets countries, are subject to special risks, including but not limited to a greater degree of social, political and economic volatility than is associated with domestic investments, as well as the risks associated with any differences in financial standards, including foreign taxation. Investments by the underlying funds in small- and mid-cap companies, as well as in restricted securities, pose special risks, including illiquidity and price volatility. Underlying funds that concentrate their investments in a single industry sector, such as technology or healthcare, are subject to the risk that companies in the same sector may be similarly affected by economic or market downturns. Risks associated with investments in bond funds include credit risk, interest rate risk, and prepayment and extension risk. Debt securities with the lowest investment grade ratings and unrated securities of comparable quality are more speculative than securities with higher ratings and may experience greater price fluctuations. These securities also tend to be more sensitive to credit risk than higher-rated securities. This is not an offer of the shares of any other mutual fund mentioned herein.
22
Columbia Thermostat Fund
At a Glance
Total Net Assets of the Fund:
$1.3 billion
Performance data shown in the table and graph below represent past performance, do not guarantee future results, assume reinvestment of dividends and distributions and do not reflect the deduction of taxes that a shareholder may pay on Fund distributions or the redemption of Fund shares. The investment return and principal value of an investment will fluctuate so that shares, when redeemed, may be worth more or less than their original cost. Current performance may be lower or higher than the performance data shown. Performance data reflect fee waivers or reimbursements of Fund expenses, if any; in their absence, performance results would have been lower. Indexes are unmanaged; their results do not reflect the effect of expenses or sales charges. Securities in the Fund may not match those in an index. Please visit columbiamanagement.com for performance data current to the most recent month-end.
The Growth of a $10,000 Investment in Columbia Thermostat Fund Class Z Shares
September 25, 2002 (Fund inception) through December 31, 2013
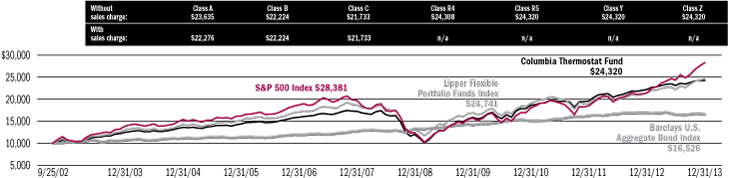
This chart shows the change in value of a hypothetical $10,000 investment in Class Z shares of the Fund during the stated time period.
Average Annual Total Returns for period ended December 31, 2013
| | 4th quarter | | 1 year | | 5 years | | 10 years | | Life of Fund | |
| Class Z (9/25/02 inception) | | | 1.95 | % | | | 9.30 | % | | | 15.18 | % | | | 6.91 | % | | | 8.21 | % | |
| Class A (3/3/03 inception) | |
without sales charge | | | 1.88 | | | | 9.07 | | | | 14.89 | | | | 6.65 | | | | 7.93 | | |
with sales charge | | | -3.96 | | | | 2.81 | | | | 13.55 | | | | 6.02 | | | | 7.37 | | |
S&P 500 Index* | | | 10.51 | | | | 32.39 | | | | 17.94 | | | | 7.41 | | | | 9.70 | | |
Barclays U.S. Aggregate Bond Index* | | | -0.14 | | | | -2.02 | | | | 4.44 | | | | 4.55 | | | | 4.56 | | |
Results for other share classes can be found on Page 2.
*The Fund's primary benchmarks. Please see Page 1 for index descriptions.
Returns for Class A shown with and without the maximum initial sales charge of 5.75%. As stated in the May 1, 2013, prospectus, the Fund's annual operating expense ratio is 0.85% for Class Z shares and 1.10% for Class A shares. The returns shown for periods prior to the inception of the Fund's Class A shares append the returns of the Fund's Class Z shares, the Fund's oldest share class. These returns are adjusted to reflect any higher class-related operating expenses of the newer share classes, as applicable. Please visit columbiamanagement.com/mutual-funds/ appended-performance for more information.
Asset Allocation
as a percentage of net assets, as of 12/31/13

Portfolio Weightings
as a percentage of assets in each investment category, as of 12/31/13
Stock Mutual Funds
Columbia Acorn International, Class I | | | 20 | % | |
Columbia Dividend Income Fund, Class I | | | 20 | % | |
Columbia Acorn Fund, Class I | | | 15 | % | |
Columbia Contrarian Core Fund, Class I | | | 15 | % | |
Columbia Acorn Select, Class I | | | 10 | % | |
Columbia Large Cap Enhanced Core Fund,
Class I | | | 10 | % | |
Columbia Select Large Cap Growth Fund,
Class I | | | 10 | % | |
Bond Mutual Funds
Columbia Short Term Bond Fund, Class I | | | 40 | % | |
Columbia Income Opportunities Fund, Class I | | | 30 | % | |
Columbia Intermediate Bond Fund, Class I | | | 30 | % | |
23
Columbia Acorn Emerging Markets Fund
In a Nutshell

| | 
| |
Fritz G. Kaegi
Lead Portfolio Manager | | Stephen Kusmierczak
Lead Portfolio Manager | |

| | 
| |
P. Zachary Egan
Co-Portfolio Manager | | Louis J. Mendes III
Co-Portfolio Manager | |
Performance data shown represents past performance and is not a guarantee of future results. The investment return and principal value will fluctuate so that shares, when redeemed, may be worth more or less than the original cost. Current performance may be lower or higher than the performance data shown. Please visit columbiamanagement.com for daily and most recent month-end performance updates.
Columbia Acorn Emerging Markets Fund Class Z shares gained 7.13% in the fourth quarter of 2013, outperforming the 2.71% gain of the Fund's primary benchmark, the S&P Emerging Markets Between $500M and $5B Index. For the year, the Fund was up 11.92%, which beat the benchmark's gain of 0.67% by a significant 1,125 basis points. In a period of increasing volatility in emerging markets stocks, the Fund has continued to widen its outperformance versus the benchmark. Since its inception in August 2011, the Fund has returned an annualized gain of 14.00% compared to the benchmark's 3.91% return, or about 10 percentage points of outperformance.
The Fund's largest gainer in percentage terms for the fourth quarter was 58.com, a Chinese online classified ad service provider similar to Craigslist. The stock was a new purchase in the quarter, and jumped 132% following strong growth in local business advertising. Building on its robust performance for the year, Russian electronic payments operator QIWI gained 85% in the quarter and 246% for the year, making it the Fund's best performer. QIWI is benefitting from growing payment volumes, expected growth in Russian e-commerce, the return of cash to shareholders through special dividends, and broader investor recognition of this quality business model. Cable and Wireless is the leading telecommunication services provider in the Caribbean. Speculation that the company may be acquired drove the stock up 49% in the fourth quarter, ending the year with a 55% gain. PC Home is a Taiwanese Internet electronics retailer. Its stock gained 41% in the fourth quarter and ended the year up 68% following regulatory changes to ease restrictions on online payment systems. Macau casino company Melco International continued to be a solid performer, up 37% this quarter and 208% for the year, making it the Fund's second largest percentage gainer in 2013.
The largest percentage detractor in the fourth quarter was South African retailer Massmart Holdings, which was down 26%. Massmart suffered from a weak retail backdrop, a depreciating rand, and especially poor execution in its general merchandise business. The stock's 44% decline in 2013 made it the third worst performer for the year. Chipbond is a Taiwanese company providing chip packaging services for the integrated circuit industry. The stock fell 24% in the fourth quarter and was off 30% for the year following aggressive pricing by a new entrant into the industry. We have since exited the position. Empresas Hites
is a mass retailer in Chile that has continued to disappoint operationally, causing a 22% decline in the quarter and a 40% drop for the year. Ace Indonesia is the leading home improvement retailer in Indonesia. The stock fell 21% in the fourth quarter on concerns over margin compression due to the weakening rupiah, as 80% of its products sold are imported. Also, a potential law would require a high level of local content in products sold, further dampening sentiment. Ace was the worst performing holding for the year, dropping 47%. Another retailer, Robinson's Department Store, rounded out the worst three performers for the year. The Thai department store fell 45% in 2013 on growing political unrest and the devaluation of the baht.
Companies and their stocks cannot be entirely insulated from the economies in which they operate. Expected monetary tightening in the United States along with rising political uncertainty in many emerging markets such as India, Thailand and Turkey has caused sharp declines in currencies and stock prices. We generally don't believe that we are better predictors of these crises than other investors, but we do try to be prepared for them in how we select companies for the portfolio. We believe that owning businesses with solid business models, robust balance sheets, debt denominated primarily in local currencies, strong free cash flows and limited or even negative working capital, should make the portfolio more resilient when macro headwinds accelerate. As we have said in earlier communications to you, our expectation is that the Fund should outperform its benchmark in declining markets. We are glad to report that we have achieved this objective so far.
International investing involves special risks, including foreign taxation, currency risks, risks associated with possible differences in financial standards, operational and settlement risks and other risks associated with future political and economic developments. Stocks of small- and mid-cap companies pose special risks, including illiquidity and greater price volatility than stocks of larger, more established companies. Investing in emerging markets may involve greater risks than investing in more developed countries. Please also see "A Comment on Trading Volumes" on the inside front cover of this report.
Fund holdings are as of the date given, are subject to change at any time, and are not recommendations to buy or sell any security. Top holdings exclude short-term holdings and cash, if applicable.
Fund's Positions in Mentioned Holdings
As a percentage of net assets, as of 12/31/13
Melco International | | | 3.0 | % | |
QIWI | | | 1.7 | | |
Cable and Wireless | | | 1.6 | | |
Robinson's Department Store | | | 1.3 | | |
Massmart Holdings | | | 1.2 | | |
PC Home | | | 1.2 | | |
Ace Indonesia | | | 1.0 | | |
Empresas Hites | | | 0.7 | | |
58.com | | | 0.6 | | |
24
Columbia Acorn Emerging Markets Fund
At a Glance
Total Net Assets of the Fund:
$414.7 million
Performance data shown in the table and graph below represent past performance, do not guarantee future results, assume reinvestment of dividends and distributions and do not reflect the deduction of taxes that a shareholder may pay on Fund distributions or the redemption of Fund shares. The investment return and principal value of an investment will fluctuate so that shares, when redeemed, may be worth more or less than their original cost. Current performance may be lower or higher than the performance data shown. Performance data reflect fee waivers or reimbursements of Fund expenses, if any; in their absence, performance results would have been lower. Indexes are unmanaged; their results do not reflect the effect of expenses or sales charges. Securities in the Fund may not match those in an index. Please visit columbiamanagement.com for performance data current to the most recent month-end.
The Growth of a $10,000 Investment in Columbia Acorn Emerging Markets Fund Class Z Shares
August 19, 2011 (Fund inception) through December 31, 2013
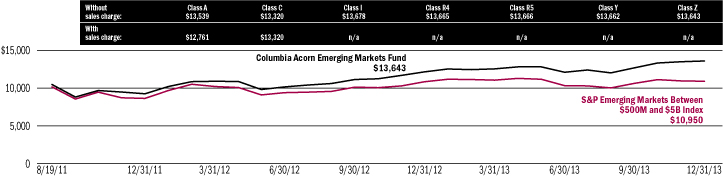
This chart shows the change in value of a hypothetical $10,000 investment in Class Z shares of the Fund during the stated time period.
Average Annual Total Returns for period ended December 31, 2013
| | 4th quarter | | 1 year | | Life of Fund | |
| Class Z (8/19/11 inception) | | | 7.13 | % | | | 11.92 | % | | | 14.00 | % | |
| Class A (8/19/11 inception) | |
without sales charge | | | 7.02 | | | | 11.73 | | | | 13.64 | | |
with sales charge | | | 0.84 | | | | 5.34 | | | | 10.83 | | |
S&P Emerging Markets Between $500M and $5B Index* | | | 2.71 | | | | 0.67 | | | | 3.91 | | |
Results for other share classes can be found on Page 2.
*The Fund's primary benchmark. Please see Page 1 for index descriptions.
Returns for Class A shown with and without the maximum initial sales charge of 5.75%. As stated in the May 1, 2013, prospectus, the Fund's annual operating expense ratio is 1.60% for Class Z shares and 1.85% for Class A shares.
Portfolio Diversification
as a percentage of net assets, as of 12/31/13

Top 10 Holdings
as a percentage of net assets, as of 12/31/13
| 1. | | Melco International (Hong Kong)
Macau Casino Operator | | | 3.0
| % | |
| 2. | | Coronation Fund Managers (South Africa)
South African Fund Manager | | | 2.7
| % | |
| 3. | | Melco Crown Resorts (Philippines)
Integrated Resort Operator in Manila | | | 2.6
| % | |
| 4. | | Halyk Savings Bank of Kazakhstan - GDR
(Kazakhstan)
Largest Retail Bank & Insurer in Kazakhstan | | | 2.2
| % | |
| 5. | | Vacon (Finland)
Leading Independent Manufacturer of Variable
Speed Alternating Current Drives | | | 2.1
| % | |
| 6. | | Yandex (Russia)
Search Engine for Russian & Turkish Languages | | | 2.0
| % | |
| 7. | | MNC Skyvision (Indonesia)
Largest Satellite Pay TV Operator in Indonesia | | | 2.0
| % | |
| 8. | | Sa Sa International (Hong Kong)
Cosmetics Retailer | | | 1.9
| % | |
| 9. | | Nagacorp (Cambodia)
Casino/Entertainment Complex in Cambodia | | | 1.9
| % | |
| 10. | | Hexagon (Sweden)
Design, Measurement & Visualization Software &
Equipment | | | 1.8
| % | |
The Fund's top 10 holdings and portfolio diversification vary with changes in portfolio investments. See the Statement of Investments for a complete list of the Fund's holdings.
25
Columbia Acorn European Fund
In a Nutshell

| | 
| |
Andreas Waldburg-Wolfegg
Lead Portfolio Manager | | Stephen
Kusmierczak
Co-Portfolio Manager | |
Performance data shown represents past performance and is not a guarantee of future results. The investment return and principal value will fluctuate so that shares, when redeemed, may be worth more or less than the original cost. Current performance may be lower or higher than the performance data shown. Please visit columbiamanagement.com for daily and most recent month-end performance updates.
Columbia Acorn European Fund Class Z shares gained 33.98% in 2013, trailing its primary benchmark, the S&P Europe Between $500M and $5B Index, by 3.22%. For the second half of the year, the Fund had a 24.66% gain versus the benchmark at 28.88%, while the fourth quarter was the strongest quarter of the year for the Fund, as it returned 11.28% versus the benchmark's 10.40% gain.
The second half of 2013 was led by further decline in interest rates in the Mediterranean, most notably in Spain and Italy, and less so in Portugal. Some progress has been made in the reduction of public debt, and most bond offerings by the Italian and Spanish governments were well subscribed, even if Greece's access to the capital markets remains shut. This notwithstanding, unemployment, especially among the young, remains stubbornly high across all four nations, while European partners continue to insist on a continuation of the region's austerity policies.
Both detractors and contributors to Fund performance can best be explained by individual stocks, but over and underweights on a sector and country basis did help overall. The best call in 2013 was made by our firm's energy analyst, Bill Doyle. He suggested that we underweight the energy sector, allocating a mere 66% of the benchmark's weight, and proceeded to pick some excellent stocks. The sector, up 2% in the benchmark, returned among the lowest in our universe, but Bill's stocks were up almost 25% in 2013 in the Fund.
In software and services, the Fund's overweight (more than three times the benchmark) wasn't the result of an individual analyst's decision, instead it resulted from strong individual stock picks by most of the analysts working on the portfolio. The leader of the segment in terms of performance was QIWI, the Russian electronic payments network, which more than tripled in the year, followed by another Russian company, search engine Yandex, which more than doubled in the course of the year. Detractors in this segment included Telecity, a UK data center provider. Its stock struggled as the UK stock market worried about overcapacity, a worry we don't share. Also among the detractors was AVEVA, a UK company that makes software for the digitalization of construction plans used mainly by the oil, gas and marine industries.
In the retailing industry, UK online grocer Ocado, up five times in the year, was all the rage on the stock market following its agreement to manage the online operations for Morrison's, the UK's third largest grocer. Ocado's
strength fueled the Fund's retail industry performance as a whole, making it the second strongest industry in the Fund for the year, though some other retail names were less successful. Listed in Hong Kong, L'Occitane International, a skin care and cosmetics manufacturer, fell 26% in 2013. Sales were weak in its key Japanese market and the company announced a drop in revenues. Against this backdrop, management's decision to continue to invest in expansion did not go over well with investors. We started selling the stock in the third quarter and exited the position completely in the fourth quarter.
2014 will no doubt bring more challenges to the macro front across Europe. News reports suggest that the French president is more interested in his personal life than in the running of his severely damaged economy, while over in the United Kingdom the former stockbroker Nigel Farage and his UK Independence Party (UKIP) have shown a meteoric rise among the electorate. The Irish Republic has been praised for the speed at which it has addressed its banking crisis. The Grand Coalition in Germany in the meantime took the better part of a quarter to negotiate its Coalition Agreement and the result has been criticized as a lukewarm, and in all likelihood ineffective, document. It's a mixed bag, economically, and we expect the fringe parties in the United Kingdom, France and Italy to show strength in the elections to the European Parliament in May. While the macroeconomic and political scene doesn't look very rosy, we are excited about continuing our search for strong companies whose stock is trading at attractive multiples.
International investing involves special risks, including foreign taxation, currency risks, risks associated with possible differences in financial standards, operational and settlement risks and other risks associated with future political and economic developments. Stocks of small- and mid-cap companies pose special risks, including illiquidity and greater price volatility than stocks of larger, more established companies. Investing in emerging markets may involve greater risks than investing in more developed countries. Please also see "A Comment on Trading Volumes" on the inside front cover of this report.
Fund holdings are as of the date given, are subject to change at any time, and are not recommendations to buy or sell any security. Top holdings exclude short-term holdings and cash, if applicable.
Fund's Positions in Mentioned Holdings
As a percentage of net assets, as of 12/31/13
Ocado | | | 2.3 | % | |
QIWI | | | 1.8 | | |
Yandex | | | 1.7 | | |
Telecity | | | 1.6 | | |
AVEVA | | | 0.9 | | |
26
Columbia Acorn
European Fund
At a Glance
Total Net Assets of the Fund:
$26.7 million
Performance data shown in the table and graph below represent past performance, do not guarantee future results, assume reinvestment of dividends and distributions and do not reflect the deduction of taxes that a shareholder may pay on Fund distributions or the redemption of Fund shares. The investment return and principal value of an investment will fluctuate so that shares, when redeemed, may be worth more or less than their original cost. Current performance may be lower or higher than the performance data shown. Performance data reflect fee waivers or reimbursements of Fund expenses, if any; in their absence, performance results would have been lower. Indexes are unmanaged; their results do not reflect the effect of expenses or sales charges. Securities in the Fund may not match those in an index. Please visit columbiamanagement.com for performance data current to the most recent month-end.
The Growth of a $10,000 Investment in Columbia Acorn European Fund Class Z Shares
August 19, 2011 (Fund inception) through December 31, 2013
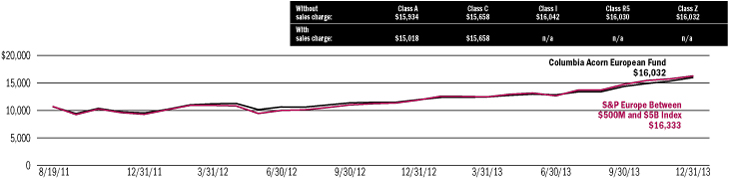
This chart shows the change in value of a hypothetical $10,000 investment in Class Z shares of the Fund during the stated time period.
Average Annual Total Returns for period ended December 31, 2013
| | 4th quarter | | 1 year | | Life of Fund | |
| Class Z (8/19/11 inception) | | | 11.28 | % | | | 33.98 | % | | | 22.04 | % | |
| Class A (8/19/11 inception) | |
without sales charge | | | 11.23 | | | | 33.64 | | | | 21.72 | | |
with sales charge | | | 4.85 | | | | 25.93 | | | | 18.72 | | |
S&P Europe Between $500M and $5B Index* | | | 10.40 | | | | 37.20 | | | | 23.00 | | |
Results for other share classes can be found on Page 2.
*The Fund's primary benchmark. Please see Page 1 for index descriptions.
Returns for Class A shown with and without the maximum initial sales charge of 5.75%. As stated in the May 1, 2013, prospectus, the Fund's annual operating expense ratio is 1.50% for Class Z shares and 1.75% for Class A shares.
Portfolio Diversification
as a percentage of net assets, as of 12/31/13
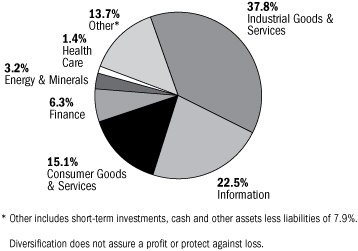
Top 10 Holdings
as a percentage of net assets, as of 12/31/13
| 1. | | Eurofins Scientific (France)
Food, Pharmaceuticals & Materials Screening & Testing | | | 2.7
| % | |
| 2. | | Gemalto (France)
Digital Security Solutions | | | 2.4
| % | |
| 3. | | Spirax Sarco (United Kingdom)
Steam Systems for Manufacturing & Process Industries | | | 2.4
| % | |
| 4. | | Jardine Lloyd Thompson Group
(United Kingdom)
International Business Insurance Broker | | | 2.3
| % | |
| 5. | | Ocado (United Kingdom)
Leading Online Grocery Retailer | | | 2.3
| % | |
| 6. | | Neopost (France)
Postage Meter Machines | | | 2.2
| % | |
| 7. | | Assura (United Kingdom)
UK Primary Health Care Property Developer | | | 2.1
| % | |
| 8. | | Vacon (Finland)
Leading Independent Manufacturer of Variable
Speed Alternating Current Drives | | | 2.0
| % | |
| 9. | | Aurelius (Germany)
European Turnaround Investor | | | 2.0
| % | |
| 10. | | Partners Group (Switzerland)
Private Markets Asset Management | | | 2.0
| % | |
The Fund's top 10 holdings and portfolio diversification vary with changes in portfolio investments. See the Statement of Investments for a complete list of the Fund's holdings.
27
Columbia Acorn Fund
Major Portfolio Changes in the Fourth Quarter (Unaudited)
| | | Number of Shares | |
| | | 9/30/13 | | 12/31/13 | |
Purchases | |
Information | |
Belden | | | 0 | | | | 370,000 | | |
Ellie Mae | | | 0 | | | | 764,495 | | |
Globalstar | | | 22,100,000 | | | | 25,500,000 | | |
InContact | | | 3,200,000 | | | | 3,740,596 | | |
Infinera | | | 1,925,000 | | | | 2,365,000 | | |
Informatica | | | 4,500,000 | | | | 5,500,000 | | |
Pandora Media | | | 2,555,000 | | | | 2,855,000 | | |
Rogers | | | 400,000 | | | | 570,000 | | |
Semtech | | | 360,000 | | | | 560,000 | | |
Solera Holdings | | | 697,000 | | | | 860,000 | | |
Tangoe | | | 1,725,971 | | | | 2,100,000 | | |
Towerstream | | | 3,000,000 | | | | 3,319,900 | | |
Industrial Goods & Services | |
Airgas | | | 405,841 | | | | 535,000 | | |
Boise Cascade | | | 0 | | | | 930,000 | | |
Dorman Products | | | 0 | | | | 550,000 | | |
Middleby | | | 247,000 | | | | 281,400 | | |
PGT | | | 0 | | | | 738,564 | | |
WABCO Holdings | | | 750,000 | | | | 1,109,000 | | |
Consumer Goods & Services | |
B&G Foods | | | 1,325,000 | | | | 1,624,000 | | |
Blackhawk Network | | | 800,000 | | | | 900,000 | | |
Burlington Stores | | | 0 | | | | 1,130,047 | | |
Casey's General Stores | | | 754,000 | | | | 1,439,000 | | |
Chegg | | | 0 | | | | 765,000 | | |
Fiesta Restaurant Group | | | 625,000 | | | | 765,000 | | |
Gaiam | | | 1,371,366 | | | | 1,500,000 | | |
Groupon | | | 0 | | | | 7,000,000 | | |
Hertz | | | 4,600,000 | | | | 4,700,000 | | |
Prestige Brands Holdings | | | 0 | | | | 1,288,000 | | |
Select Comfort | | | 1,100,000 | | | | 1,400,000 | | |
United Natural Foods | | | 250,000 | | | | 427,770 | | |
Zulily | | | 0 | | | | 146,000 | | |
Finance | |
Brown & Brown | | | 1,500,000 | | | | 1,650,000 | | |
Coronation Fund Managers | | | 0 | | | | 387,130 | | |
Hudson Valley | | | 811,295 | | | | 843,000 | | |
Protective Life | | | 0 | | | | 675,000 | | |
Health Care | |
Alnylam Pharmaceuticals | | | 908,681 | | | | 1,404,000 | | |
Celldex Therapeutics | | | 0 | | | | 1,240,000 | | |
Medidata Solutions | | | 0 | | | | 350,000 | | |
Sarepta Therapeutics | | | 1,040,000 | | | | 2,050,000 | | |
Techne | | | 383,212 | | | | 580,000 | | |
| | | Number of Shares | |
| | | 9/30/13 | | 12/31/13 | |
Energy & Minerals | |
Bill Barrett Corporation | | | 1,550,834 | | | | 1,861,000 | | |
Carrizo Oil & Gas | | | 181,160 | | | | 550,000 | | |
Chart Industries | | | 268,000 | | | | 698,000 | | |
Clayton Williams | | | 0 | | | | 141,000 | | |
DeeThree Exploration | | | 797,647 | | | | 1,400,000 | | |
Forum Energy Technology | | | 0 | | | | 530,000 | | |
Hornbeck Offshore | | | 661,000 | | | | 1,208,000 | | |
Pacific Rubiales Energy | | | 2,160,000 | | | | 2,200,000 | | |
Petroamerica Oil | | | 20,000,000 | | | | 35,000,000 | | |
Petromanas | | | 37,500,000 | | | | 51,359,500 | | |
WPX Energy | | | 0 | | | | 2,868,000 | | |
Other Industries | |
AMERCO | | | 0 | | | | 45,000 | | |
Gaming & Leisure Properties | | | 0 | | | | 407,000 | | |
Kite Realty Group | | | 4,000,000 | | | | 6,250,000 | | |
RE/MAX | | | 0 | | | | 400,000 | | |
Terreno Realty | | | 1,550,000 | | | | 2,020,931 | | |
See accompanying notes to financial statements.
28
| | | Number of Shares | |
| | | 9/30/13 | | 12/31/13 | |
Sales | |
Information | |
Bally Technologies | | | 3,537,000 | | | | 3,105,000 | | |
Bazaarvoice | | | 1,700,000 | | | | 0 | | |
Blackbaud | | | 900,000 | | | | 700,000 | | |
Concur Technologies | | | 700,000 | | | | 630,000 | | |
Constant Contact | | | 1,200,000 | | | | 0 | | |
Crown Castle International | | | 3,800,000 | | | | 1,700,000 | | |
DemandWare | | | 1,100,000 | | | | 1,000,000 | | |
Far EasTone Telecom | | | 9,662,000 | | | | 0 | | |
Finisar | | | 2,025,000 | | | | 1,538,000 | | |
Hackett Group | | | 3,849,207 | | | | 3,274,000 | | |
Hexagon | | | 4,162,000 | | | | 3,727,001 | | |
iGATE | | | 4,500,000 | | | | 4,150,000 | | |
II-VI | | | 4,550,000 | | | | 3,640,000 | | |
IMAX | | | 1,100,000 | | | | 800,000 | | |
Mettler-Toledo International | | | 1,600,000 | | | | 1,475,000 | | |
Micros Systems | | | 2,700,000 | | | | 2,530,000 | | |
Monolithic Power Systems | | | 1,240,000 | | | | 820,000 | | |
ON Semiconductor | | | 2,430,000 | | | | 0 | | |
RealPage | | | 2,000,000 | | | | 1,550,000 | | |
Stratasys | | | 310,000 | | | | 267,000 | | |
Telecity | | | 1,100,000 | | | | 0 | | |
Tree.com | | | 100,000 | | | | 0 | | |
TripAdvisor | | | 1,325,000 | | | | 1,150,000 | | |
Virtusa | | | 2,125,000 | | | | 1,985,000 | | |
Webgroup.com | | | 801,748 | | | | 0 | | |
Windstream | | | 3,500,000 | | | | 1,500,000 | | |
Zebra Technologies | | | 1,365,000 | | | | 1,105,000 | | |
Industrial Goods & Services | |
Aalberts Industries | | | 2,747,253 | | | | 2,500,000 | | |
Acorn Energy | | | 1,520,957 | | | | 1,161,957 | | |
Ametek | | | 9,900,000 | | | | 9,270,000 | | |
Chicago Bridge & Iron | | | 2,680,000 | | | | 2,400,000 | | |
Drew Industries | | | 1,880,000 | | | | 1,780,000 | | |
Generac | | | 3,200,000 | | | | 3,113,000 | | |
LKQ | | | 2,700,000 | | | | 2,405,000 | | |
Mobile Mini | | | 1,600,000 | | | | 1,400,000 | | |
Pall | | | 1,660,000 | | | | 1,405,000 | | |
TrueBlue | | | 70,313 | | | | 0 | | |
Consumer Goods & Services | |
Abercrombie & Fitch | | | 725,000 | | | | 0 | | |
Choice Hotels | | | 1,893,000 | | | | 1,840,000 | | |
Deckers Outdoor | | | 710,000 | | | | 0 | | |
Five Below | | | 450,000 | | | | 0 | | |
Helen of Troy | | | 1,170,000 | | | | 800,000 | | |
Jarden | | | 472,500 | | | | 0 | | |
Lifestyle International | | | 17,000,000 | | | | 15,354,000 | | |
Lifetime Fitness | | | 2,280,000 | | | | 1,969,000 | | |
| | | Number of Shares | |
| | | 9/30/13 | | 12/31/13 | |
Melco Crown
Entertainment - ADR | | | 2,500,000 | | | | 2,350,000 | | |
PVH | | | 1,296,000 | | | | 1,231,000 | | |
Restoration Hardware Holdings | | | 474,000 | | | | 314,000 | | |
Ryman Hospitality Properties | | | 2,030,000 | | | | 1,120,000 | | |
Shutterfly | | | 1,975,000 | | | | 1,845,498 | | |
Steven Madden | | | 600,000 | | | | 0 | | |
Tile Shop Holdings | | | 546,000 | | | | 0 | | |
ULTA | | | 1,385,000 | | | | 1,160,000 | | |
Finance | |
Alliance Data Systems | | | 550,000 | | | | 530,000 | | |
BOK Financial | | | 2,638,000 | | | | 2,470,000 | | |
City National | | | 1,348,000 | | | | 1,153,000 | | |
First Commonwealth | | | 2,500,000 | | | | 943,049 | | |
Green Dot | | | 100,000 | | | | 0 | | |
H & E Equipment Services | | | 3,382,621 | | | | 2,508,816 | | |
| SVB Financial Group | | | 985,000 | | | | 935,000 | | |
World Acceptance | | | 945,000 | | | | 850,000 | | |
Heath Care | |
Akorn | | | 6,312,644 | | | | 5,417,981 | | |
ARIAD Pharmaceuticals | | | 4,000,000 | | | | 0 | | |
BioMarin Pharmaceutical | | | 1,954,268 | | | | 1,725,000 | | |
Coronado Biosciences | | | 1,370,000 | | | | 0 | | |
Haemonetics | | | 429,290 | | | | 0 | | |
HealthSouth | | | 2,650,000 | | | | 2,100,000 | | |
Mednax | | | 1,330,000 | | | | 406,551 | | |
NPS Pharmaceuticals | | | 3,283,000 | | | | 2,635,000 | | |
Ophthotech | | | 187,909 | | | | 0 | | |
Seattle Genetics | | | 5,590,000 | | | | 4,972,000 | | |
Energy & Minerals | |
Atwood Oceanics | | | 2,400,000 | | | | 2,180,000 | | |
Duluth Metals | | | 7,500,000 | | | | 7,025,500 | | |
FMC Technologies | | | 4,635,000 | | | | 3,858,000 | | |
Fugro | | | 1,031,106 | | | | 402,555 | | |
GT Advanced Technologies | | | 2,000,000 | | | | 0 | | |
Gulfmark Offshore | | | 511,000 | | | | 88,000 | | |
Mongolian Mining | | | 13,459,000 | | | | 0 | | |
Pan Orient | | | 1,198,100 | | | | 741,089 | | |
Superior Energy Services | | | 1,150,000 | | | | 0 | | |
Tullow Oil | | | 850,000 | | | | 735,000 | | |
Turquoise Hill Resources | | | 1,150,000 | | | | 0 | | |
Other Industries | |
Associated Estates Realty | | | 3,000,000 | | | | 2,075,000 | | |
Mapletree Logistics Trust | | | 33,000,000 | | | | 24,284,000 | | |
Pepco Holdings | | | 2,200,000 | | | | 0 | | |
See accompanying notes to financial statements.
29
Columbia Acorn Fund
Statement of Investments, December 31, 2013
Number of Shares | | | | Value | |
| | | | | | | Equities: 97.4% | |
Information 26.4% | | | |
| | | > Business Software 6.4% | |
| | 5,500,000 | | | Informatica (a)(b) | | $ | 228,250,000 | | |
| | | | | Enterprise Data Integration Software | | | | | |
| | 2,350,000 | | | Ansys (a) | | | 204,920,000 | | |
| | | | | Simulation Software for
Engineers & Designers | | | | | |
| | 2,530,000 | | | Micros Systems (a) | | | 145,146,100 | | |
| | | | | Information Systems for Hotels,
Restaurants & Retailers | | | | | |
| | 3,727,001 | | | Hexagon (Sweden) | | | 117,893,422 | | |
| | | | | Design, Measurement & Visualization
Software & Equipment | | | | | |
| | 800,000 | | | Tyler Technologies (a) | | | 81,704,000 | | |
| | | | | Financial, Tax, Court & Document
Management Systems for Local
Governments | | | | | |
| | 630,000 | | | Concur Technologies (a) | | | 65,003,400 | | |
| | | | | Web Enabled Cost & Expense
Management Software | | | | | |
| | 1,000,000 | | | DemandWare (a) | | | 64,120,000 | | |
| | | | | eCommerce Website Platform for
Retailers & Apparel Manufacturers | | | | | |
| | 860,000 | | | Solera Holdings | | | 60,853,600 | | |
| | | | | Software for Automotive Insurance
Claims Processing | | | | | |
| | 900,000 | | | SPS Commerce (a)(b) | | | 58,770,000 | | |
| | | | | Supply Chain Management Software
Delivered via the Web | | | | | |
| | 550,000 | | | NetSuite (a) | | | 56,661,000 | | |
| | | | | End to End IT Systems Solution
Delivered Over the Web | | | | | |
| | 750,000 | | | Jack Henry & Associates | | | 44,407,500 | | |
| | | | | IT Systems & Outsourced IT Solutions
for Financial Institutions | | | | | |
| | 700,000 | | | Red Hat (a) | | | 39,228,000 | | |
| | | | | Maintenance & Support for Opensource
Operating System & Middleware | | | | | |
| | 2,100,000 | | | Tangoe (a)(b)(c) | | | 37,821,000 | | |
| | | | | Software Solution for Managing
Communication Expense & Devices | | | | | |
| | 1,550,000 | | | RealPage (a) | | | 36,239,000 | | |
| | | | | Software for Managing Rental
Properties Delivered via the Web | | | | | |
| | 3,740,596 | | | InContact (a)(b) | | | 29,214,055 | | |
| | | | | Call Center Systems Delivered Via
the Web & Telco Services | | | | | |
| | 700,000 | | | Blackbaud | | | 26,355,000 | | |
| | | | | Software & Services for Non-profits | | | | | |
| | 610,000 | | | Envestnet (a) | | | 24,583,000 | | |
| | | | | Technology Platform for
Investment Advisors | | | | | |
| | 764,495 | | | Ellie Mae (a) | | | 20,541,980 | | |
| | | | | Software for Managing & Network
for Facilitating Mortgage Origination | | | | | |
| | 610,000 | | | E2Open (a) | | | 14,585,100 | | |
| | | | | Supply Chain Management
Software & Supplier/Partner Network | | | | | |
| | 1,000,000 | | | Exa (a)(b) | | | 13,260,000 | | |
| | | | | Simulation Software | | | | | |
| | | | 1,369,556,157 | | |
Number of Shares | | | | Value | |
| | | > Instrumentation 2.9% | |
| | 1,475,000 | | | Mettler-Toledo
International (a) | | $ | 357,820,250 | | |
| | | | | Laboratory Equipment | | | | | |
| | 4,070,000 | | | Trimble Navigation (a) | | | 141,229,000 | | |
| | | | | GPS-based Instruments | | | | | |
| | 1,620,000 | | | IPG Photonics (a)(c) | | | 125,728,200 | | |
| | | | | Fiber Lasers | | | | | |
| | | | 624,777,450 | | |
| | | > Computer Hardware & Related
Equipment 2.7% | |
| | 3,415,000 | | | Amphenol | | | 304,549,700 | | |
| | | | | Electronic Connectors | | | | | |
| | 3,640,000 | | | II-VI (a)(b) | | | 64,064,000 | | |
| | | | | Laser Optics & Specialty Materials | | | | | |
| | 1,105,000 | | | Zebra Technologies (a) | | | 59,758,400 | | |
| | | | | Bar Code Printers | | | | | |
| | 267,000 | | | Stratasys (a) | | | 35,964,900 | | |
| | | | | Rapid Prototyping & Direct Digital
Manufacturing Systems | | | | | |
| | 570,000 | | | Rogers (a) | | | 35,055,000 | | |
| | | | | Printed Circuit Materials &
High-performance Foams | | | | | |
| | 280,000 | | | Gemalto (France) | | | 30,815,530 | | |
| | | | | Digital Security Solutions | | | | | |
| | 900,000 | | | Netgear (a) | | | 29,646,000 | | |
| | | | | Networking Products for Small
Business & Home | | | | | |
| | 370,000 | | | Belden | | | 26,066,500 | | |
| | | | | Specialty Cable | | | | | |
| | | | 585,920,030 | | |
| | | > Mobile Communications 2.2% | |
| | 3,400,000 | | | SBA Communications (a) | | | 305,456,000 | | |
| | | | | Communications Towers | | | | | |
| | 1,700,000 | | | Crown Castle International (a) | | | 124,831,000 | | |
| | | | | Communications Towers | | | | | |
| | 25,500,000 | | | Globalstar (a)(b)(c) | | | 44,625,000 | | |
| | | | | Satellite Mobile Voice & Data Carrier | | | | | |
| | | | 474,912,000 | | |
| | | > Computer Services 2.1% | |
| | 4,150,000 | | | iGATE (a)(b) | | | 166,664,000 | | |
| | | | | IT & Business Process
Outsourcing Services | | | | | |
| | 1,985,000 | | | Virtusa (a)(b) | | | 75,608,650 | | |
| | | | | Offshore IT Outsourcing | | | | | |
| | 3,419,000 | | | Genpact (a) | | | 62,807,030 | | |
| | | | | Business Process Outsourcing | | | | | |
| | 1,618,000 | | | ExlService Holdings (a) | | | 44,689,160 | | |
| | | | | Business Process Outsourcing | | | | | |
| | 2,000,000 | | | WNS - ADR (India) (a) | | | 43,820,000 | | |
| | | | | Offshore Business Process
Outsourcing Services | | | | | |
| | 373,000 | | | Syntel | | | 33,924,350 | | |
| | | | | Offshore I/T Services | | | | | |
| | 3,274,000 | | | Hackett Group (b) | | | 20,331,540 | | |
| | | | | IT Integration & Best Practice
Research | | | | | |
| | | | 447,844,730 | | |
See accompanying notes to financial statements.
30
Number of Shares | | | | Value | |
| | | > Telephone & Data Services 2.0% | |
| | 9,500,000 | | | tw telecom (a)(b) | | $ | 289,465,000 | | |
| | | | | Fiber Optic Telephone/Data Services | | | | | |
| | 2,200,000 | | | Cogent Communications | | | 88,902,000 | | |
| | | | | Internet Data Pipelines | | | | | |
| | 1,500,000 | | | General Communications (a) | | | 16,725,000 | | |
| | | | | Commercial Communication &
Consumer CATV, Web & Phone
in Alaska | | | | | |
| | 2,500,000 | | | Boingo Wireless (a)(b) | | | 16,025,000 | | |
| | | | | Wholesale & Retail Wi-Fi Networks | | | | | |
| | 1,500,000 | | | Windstream (c) | | | 11,970,000 | | |
| | | | | Business & Rural
Telecommunication Services | | | | | |
| | 3,319,900 | | | Towerstream (a)(b)(c) | | | 9,826,904 | | |
| | | | | High Speed Wireless, Rooftop
Antenna Space & Wi-Fi Offload | | | | | |
| | | | 432,913,904 | | |
| | | > Internet Related 1.3% | |
| | 1,150,000 | | | TripAdvisor (a) | | | 95,254,500 | | |
| | | | | Online Travel Research | | | | | |
| | 2,855,000 | | | Pandora Media (a) | | | 75,943,000 | | |
| | | | | Streaming Music | | | | | |
| | 1,344,707 | | | RetailMeNot (a) | | | 38,714,115 | | |
| | | | | Digital Coupon Marketplace | | | | | |
| | 727,000 | | | Yandex (Russia) (a) | | | 31,370,050 | | |
| | | | | Search Engine for Russian &
Turkish Languages | | | | | |
| | 175,000 | | | Equinix (a) | | | 31,053,750 | | |
| | | | | Network Neutral Data Centers | | | | | |
| | | | 272,335,415 | | |
| | | > Business Information & Marketing
Services 1.2% | |
| | 1,900,000 | | | Verisk Analytics (a) | | | 124,868,000 | | |
| | | | | Risk & Decision Analytics | | | | | |
| | 4,025,000 | | | Navigant Consulting (a)(b) | | | 77,280,000 | | |
| | | | | Financial Consulting Firm | | | | | |
| | 2,561,123 | | | RPX (a) | | | 43,282,979 | | |
| | | | | Patent Aggregation & Defensive
Patent Consulting | | | | | |
| | 200,000 | | | Bankrate (a) | | | 3,588,000 | | |
| | | | | Internet Advertising for the Insurance,
Credit Card & Banking Markets | | | | | |
| | | | 249,018,979 | | |
| | | > Gaming Equipment & Services 1.1% | |
| | 3,105,000 | | | Bally Technologies (a)(b) | | | 243,587,250 | | |
| | | | | Slot Machines & Software | | | | | |
| | | > Semiconductors & Related
Equipment 0.9% | |
| | 5,390,000 | | | Atmel (a) | | | 42,203,700 | | |
| | | | | Microcontrollers, Radio Frequency &
Memory Semiconductors | | | | | |
| | 420,000 | | | Littelfuse | | | 39,030,600 | | |
| | | | | Little Fuses | | | | | |
| | 469,000 | | | Cree (a) | | | 29,345,330 | | |
| | | | | LED Lighting, Components & Chips | | | | | |
| | 820,000 | | | Monolithic Power Systems (a) | | | 28,421,200 | | |
| | | | | High Performance Analog & Mixed
Signal Integrated Circuits | | | | | |
Number of Shares | | | | Value | |
| | 400,000 | | | Hittite Microwave (a) | | $ | 24,692,000 | | |
| | | | | Radio Frequency, Microwave &
Millimeterwave Semiconductors | | | | | |
| | 615,000 | | | Ultratech (a) | | | 17,835,000 | | |
| | | | | Semiconductor Equipment | | | | | |
| | 560,000 | | | Semtech (a) | | | 14,156,800 | | |
| | | | | Analog Semiconductors | | | | | |
| | | | 195,684,630 | | |
| | | > Telecommunications Equipment 0.8% | |
| | 640,000 | | | F5 Networks (a) | | | 58,150,400 | | |
| | | | | Internet Traffic Management
Equipment | | | | | |
| | 1,538,000 | | | Finisar (a) | | | 36,788,960 | | |
| | | | | Optical Subsystems & Components | | | | | |
| | 2,030,000 | | | Ixia (a) | | | 27,019,300 | | |
| | | | | Telecom Network Test Equipment | | | | | |
| | 910,000 | | | CalAmp (a) | | | 25,452,700 | | |
| | | | | Machine to Machine Communications | | | | | |
| | 2,365,000 | | | Infinera (a) | | | 23,129,700 | | |
| | | | | Optical Networking Equipment | | | | | |
| | | | 170,541,060 | | |
| | | > Financial Processors 0.8% | |
| | 1,700,000 | | | Global Payments | | | 110,483,000 | | |
| | | | | Credit Card Processor | | | | | |
| | 5,000,000 | | | Singapore Exchange
(Singapore) | | | 28,832,945 | | |
| | | | | Singapore Equity & Derivatives
Market Operator | | | | | |
| | 900,000 | | | Liquidity Services (a)(c) | | | 20,394,000 | | |
| | | | | E-Auctions for Surplus & Salvage
Goods | | | | | |
| | | | 159,709,945 | | |
| | | > Electronics Distribution 0.7% | |
| | 3,125,000 | | | Avnet | | | 137,843,750 | | |
| | | | | Electronic Components Distribution | | | | | |
| | | > Contract Manufacturing 0.5% | |
| | 3,800,000 | | | Sanmina-SCI (a) | | | 63,460,000 | | |
| | | | | Electronic Manufacturing Services | | | | | |
| | 960,000 | | | Plexus (a) | | | 41,558,400 | | |
| | | | | Electronic Manufacturing Services | | | | | |
| | | | 105,018,400 | | |
| | | > CATV 0.5% | |
| | 800,000 | | | Liberty Global Series A (a) | | | 71,192,000 | | |
| | | | | Cable TV Franchises Outside the U.S. | | | | | |
| | 400,000 | | | Discovery Series C (a) | | | 33,544,000 | | |
| | | | | Cable TV Programming | | | | | |
| | | | 104,736,000 | | |
| | | > Advertising 0.2% | |
| | 1,000,000 | | | Lamar Advertising (a) | | | 52,250,000 | | |
| | | | | Outdoor Advertising | | | | | |
| | | > Entertainment Programming 0.1% | |
| | 800,000 | | | IMAX (Canada) (a)(c) | | | 23,584,000 | | |
| | | | | IMAX Movies, Theatre Equipment &
Theatre Joint Ventures | | | | | |
Information: Total | | | 5,650,233,700 | | |
See accompanying notes to financial statements.
31
Columbia Acorn Fund
Statement of Investments, continued
Number of Shares | | | | Value | |
Industrial Goods & Services 22.2% | | | |
| | | > Machinery 13.2% | |
| | 9,270,000 | | | Ametek | | $ | 488,250,900 | | |
| | | | | Aerospace/Industrial Instruments | | | | | |
| | 8,400,000 | | | Donaldson (b) | | | 365,064,000 | | |
| | | | | Industrial Air Filtration | | | | | |
| | 3,400,000 | | | Nordson (b) | | | 252,620,000 | | |
| | | | | Dispensing Systems for Adhesives &
Coatings | | | | | |
| | 3,230,000 | | | Moog (a)(b) | | | 219,446,200 | | |
| | | | | Motion Control Products for
Aerospace, Defense & Industrial
Markets | | | | | |
| | 3,725,000 | | | Kennametal | | | 193,960,750 | | |
| | | | | Consumable Cutting Tools | | | | | |
| | 3,113,000 | | | Generac | | | 176,320,320 | | |
| | | | | Standby Power Generators | | | | | |
| | 3,828,750 | | | HEICO (b) | | | 161,266,950 | | |
| | | | | FAA Approved Aircraft
Replacement Parts | | | | | |
| | 1,405,000 | | | Pall | | | 119,916,750 | | |
| | | | | Life Science, Water & Industrial
Filtration | | | | | |
| | 2,185,000 | | | Oshkosh Corporation | | | 110,080,300 | | |
| | | | | Specialty Truck Manufacturer | | | | | |
| | 1,109,000 | | | WABCO Holdings (a) | | | 103,591,690 | | |
| | | | | Truck & Bus Component Supplier | | | | | |
| | 1,610,000 | | | Toro | | | 102,396,000 | | |
| | | | | Turf Maintenance Equipment | | | | | |
| | 1,570,000 | | | Clarcor | | | 101,029,500 | | |
| | | | | Mobile Equipment & Industrial Filters | | | | | |
| | 1,200,000 | | | Wabtec | | | 89,124,000 | | |
| | | | | Freight & Transit Component Supplier | | | | | |
| | 2,300,000 | | | ESCO Technologies (b) | | | 78,798,000 | | |
| | | | | Automatic Electric Meter Readers | | | | | |
| | 281,400 | | | Middleby (a) | | | 67,527,558 | | |
| | | | | Manufacturer of Cooking Equipment | | | | | |
| | 435,000 | | | Valmont Industries | | | 64,867,200 | | |
| | | | | Center Pivot Irrigation Systems &
Utility Poles | | | | | |
| | 604,000 | | | Neopost (France) (c) | | | 46,609,173 | | |
| | | | | Postage Meter Machines | | | | | |
| | 1,000,000 | | | Polypore International (a)(c) | | | 38,900,000 | | |
| | | | | Battery Separators & Filtration Media | | | | | |
| | 550,000 | | | Dorman Products (a) | | | 30,838,500 | | |
| | | | | Aftermarket Auto Parts Distributor | | | | | |
| | 10,000,000 | | | Marel (Iceland) | | | 11,543,636 | | |
| | | | | Largest Manufacturer of Poultry &
Fish Processing Equipment | | | | | |
| | | | 2,822,151,427 | | |
| | | > Other Industrial Services 1.8% | |
| | 1,800,000 | | | Expeditors International of
Washington | | | 79,650,000 | | |
| | | | | International Freight Forwarder | | | | | |
| | 2,405,000 | | | LKQ (a) | | | 79,124,500 | | |
| | | | | Alternative Auto Parts Distribution | | | | | |
| | 1,500,000 | | | Forward Air | | | 65,865,000 | | |
| | | | | Freight Transportation Between
Airports | | | | | |
Number of Shares | | | | Value | |
| | 1,400,000 | | | Mobile Mini (a) | | $ | 57,652,000 | | |
| | | | | Portable Storage Units Leasing | | | | | |
| | 1,375,000 | | | KAR Auction Services | | | 40,631,250 | | |
| | | | | Auto Auctions | | | | | |
| | 2,400,000 | | | CAE (Canada) | | | 30,523,888 | | |
| | | | | Flight Simulator Equipment &
Training Centers | | | | | |
| | 700,000 | | | Echo Global Logistics (a) | | | 15,036,000 | | |
| | | | | Third Party Logistics | | | | | |
| | 1,161,957 | | | Acorn Energy (b)(c) | | | 4,729,165 | | |
| | | | | Fiber Optic Oil Well Monitoring &
Evaluation | | | | | |
| | | | 373,211,803 | | |
| | | > Construction 1.7% | |
| | 2,400,000 | | | Chicago Bridge & Iron | | | 199,536,000 | | |
| | | | | Engineering & Construction for
Liquefied Natural Gas &
Petrochemicals | | | | | |
| | 99,000 | | | NVR (a) | | | 101,574,990 | | |
| | | | | Homebuilder | | | | | |
| | 930,000 | | | Fortune Brands Home &
Security | | | 42,501,000 | | |
| | | | | Home Building Supplies & Small Locks | | | | | |
| | 738,564 | | | PGT (a) | | | 7,474,268 | | |
| | | | | Wind Resistant Windows & Doors | | | | | |
| | | | 351,086,258 | | |
| | | > Industrial Materials & Specialty
Chemicals 1.5% | |
| | 1,780,000 | | | Drew Industries (b) | | | 91,136,000 | | |
| | | | | RV & Manufactured Home Components | | | | | |
| | 1,000,000 | | | FMC Corporation | | | 75,460,000 | | |
| | | | | Niche Specialty Chemicals | | | | | |
| | 1,288,000 | | | Novozymes (Denmark) | | | 54,405,429 | | |
| | | | | Industrial Enzymes | | | | | |
| | 1,200,000 | | | Polyone | | | 42,420,000 | | |
| | | | | Intermediate Stage Chemicals Producer | | | | | |
| | 2,218,700 | | | Kansai Paint (Japan) | | | 32,809,984 | | |
| | | | | Paint Producer in Japan, India,
China & Southeast Asia | | | | | |
| | 673,000 | | | Sociedad Quimica y Minera de
Chile - ADR (Chile) | | | 17,417,240 | | |
| | | | | Producer of Specialty Fertilizers,
Lithium & Iodine | | | | | |
| | 400,000 | | | Owens-Illinois (a) | | | 14,312,000 | | |
| | | | | Glass Packaging for Food & Beverages | | | | | |
| | | | 327,960,653 | | |
| | | > Industrial Distribution 1.5% | |
| | 1,620,000 | | | WESCO International (a) | | | 147,533,400 | | |
| | | | | Industrial Distributor | | | | | |
| | 2,320,000 | | | MRC Global (a) | | | 74,843,200 | | |
| | | | | Industrial Distributor | | | | | |
| | 535,000 | | | Airgas | | | 59,839,750 | | |
| | | | | Industrial Gas Distributor | | | | | |
| | 930,000 | | | Boise Cascade (a) | | | 27,416,400 | | |
| | | | | Wood Products Manufacturer &
Distributor | | | | | |
| | 965,000 | | | Titan Machinery (a)(c) | | | 17,196,300 | | |
| | | | | Agriculture & Construction Dealerships | | | | | |
| | | | 326,829,050 | | |
See accompanying notes to financial statements.
32
Number of Shares | | | | Value | |
| | | > Electrical Components 1.1% | |
| | 1,765,000 | | | Acuity Brands | | $ | 192,949,800 | | |
| | | | | Commercial Lighting Fixtures | | | | | |
| | 1,065,000 | | | Thermon (a) | | | 29,106,450 | | |
| | | | | Global Engineered Thermal
Solutions | | | | | |
| | 1,500,000 | | | Ushio (Japan) | | | 19,937,819 | | |
| | | | | Industrial Light Sources | | | | | |
| | | | 241,994,069 | | |
| | | > Outsourcing Services 0.7% | |
| | 3,000,000 | | | Quanta Services (a) | | | 94,680,000 | | |
| | | | | Electrical & Telecom Construction
Services | | | | | |
| | 1,400,000 | | | Insperity (b) | | | 50,582,000 | | |
| | | | | Professional Employer Organization | | | | | |
| | | | 145,262,000 | | |
| | | > Conglomerates 0.4% | |
| | 2,500,000 | | | Aalberts Industries
(Netherlands) | | | 79,798,673 | | |
| | | | | Flow Control & Heat Treatment | | | | | |
| | | > Waste Management 0.3% | |
| | 1,500,000 | | | Waste Connections | | | 65,445,000 | | |
| | | | | Solid Waste Management | | | | | |
Industrial Goods & Services: Total | | | 4,733,738,933 | | |
Consumer Goods & Services 15.6% | | | |
| | | > Retail 4.2% | |
| | 7,185,000 | | | Pier 1 Imports (b) | | | 165,829,800 | | |
| | | | | Home Furnishing Retailer | | | | | |
| | 1,160,000 | | | ULTA (a) | | | 111,963,200 | | |
| | | | | Specialty Beauty Product Retailer | | | | | |
| | 1,439,000 | | | Casey's General Stores | | | 101,089,750 | | |
| | | | | Owner/Operator of Convenience
Stores | | | | | |
| | 822,845 | | | Fossil (a) | | | 98,692,030 | | |
| | | | | Watch Designer & Retailer | | | | | |
| | 1,675,000 | | | Williams-Sonoma | | | 97,619,000 | | |
| | | | | Home Goods & Furnishing Retailer | | | | | |
| | 1,845,498 | | | Shutterfly (a) | | | 93,991,213 | | |
| | | | | Internet Photo-centric Retailer | | | | | |
| | 1,050,000 | | | DSW | | | 44,866,500 | | |
| | | | | Branded Footwear Retailer | | | | | |
| | 865,000 | | | GameStop | | | 42,609,900 | | |
| | | | | Video Game Specialty Retailer | | | | | |
| | 1,000,000 | | | Urban Outfitters (a) | | | 37,100,000 | | |
| | | | | Multi-channel Apparel & Accessory
Retailer | | | | | |
| | 1,130,047 | | | Burlington Stores (a) | | | 36,161,504 | | |
| | | | | Off-price Apparel Retailer | | | | | |
| | 1,000,000 | | | Fifth & Pacific Companies (a) | | | 32,070,000 | | |
| | | | | Global Lifestyle Brand | | | | | |
| | 314,000 | | | Restoration Hardware
Holdings (a) | | | 21,132,200 | | |
| | | | | Specialty Home Furnishing Retailer | | | | | |
| | 852,000 | | | Massmart Holdings
(South Africa) | | | 10,565,488 | | |
| | | | | General Merchandise, Food &
Home Improvement Stores;
Wal-Mart Subsidiary | | | | | |
Number of Shares | | | | Value | |
| | 1,500,000 | | | Gaiam (a)(b) | | $ | 9,930,000 | | |
| | | | | Healthy Living Catalogs &
eCommerce, Non-theatrical Media | | | | | |
| | 146,000 | | | Zulily (a) | | | 6,048,780 | | |
| | | | | eCommerce Retailer Offering Flash
Sale Events | | | | | |
| | | | 909,669,365 | | |
| | | > Travel 3.4% | |
| | 4,400,000 | | | Avis Budget Group (a) | | | 177,848,000 | | |
| | | | | Second Largest Car Rental Company | | | | | |
| | 4,700,000 | | | Hertz (a) | | | 134,514,000 | | |
| | | | | Largest U.S. Rental Car Operator | | | | | |
| | 1,430,000 | | | Vail Resorts | | | 107,578,900 | | |
| | | | | Ski Resort Operator & Developer | | | | | |
| | 1,840,000 | | | Choice Hotels | | | 90,362,400 | | |
| | | | | Franchisor of Budget Hotel Brands | | | | | |
| | 1,100,000 | | | Expedia | | | 76,626,000 | | |
| | | | | Online Travel Services Company | | | | | |
| | 1,600,000 | | | HomeAway (a) | | | 65,408,000 | | |
| | | | | Vacation Rental Online Marketplace | | | | | |
| | 1,120,000 | | | Ryman Hospitality
Properties (c) | | | 46,793,600 | | |
| | | | | Convention Hotels | | | | | |
| | 2,100,000 | | | Localiza Rent A Car (Brazil) | | | 29,622,973 | | |
| | | | | Car Rental | | | | | |
| | | | 728,753,873 | | |
| | | > Consumer Goods Distribution 1.7% | |
| | 2,305,000 | | | GNC Holdings | | | 134,727,250 | | |
| | | | | Specialty Retailer of Health &
Wellness Products | | | | | |
| | 2,015,000 | | | Pool | | | 117,152,100 | | |
| | | | | Swimming Pool Supplies &
Equipment Distributor | | | | | |
| | 7,000,000 | | | Groupon (a) | | | 82,390,000 | | |
| | | | | Global Marketplace for Deals | | | | | |
| | 427,770 | | | United Natural Foods (a) | | | 32,249,580 | | |
| | | | | Distributor of Natural/Organic
Foods to Grocery Stores | | | | | |
| | | | 366,518,930 | | |
| | | > Casinos & Gaming 1.3% | |
| | 2,350,000 | | | Melco Crown Entertainment -
ADR (Hong Kong) (a) | | | 92,167,000 | | |
| | | | | Macau Casino Operator | | | | | |
| | 20,000,000 | | | Melco International
(Hong Kong) | | | 73,775,345 | | |
| | | | | Macau Casino Operator | | | | | |
| | 12,000,000 | | | MGM China Holdings
(Hong Kong) | | | 51,358,442 | | |
| | | | | Macau Casino Operator | | | | | |
| | 40,000,000 | | | Nagacorp (Cambodia) | | | 42,252,799 | | |
| | | | | Casino/Entertainment Complex in
Cambodia | | | | | |
| | 850,000 | | | Penn National Gaming (a) | | | 12,180,500 | | |
| | | | | Regional Casino Operator | | | | | |
| | | | 271,734,086 | | |
| | | > Furniture & Textiles 1.0% | |
| | 3,669,000 | | | Knoll (b) | | | 67,179,390 | | |
| | | | | Office Furniture | | | | | |
See accompanying notes to financial statements.
33
Columbia Acorn Fund
Statement of Investments, continued
Number of Shares | | | | Value | |
| | | > Furniture & Textiles—continued | |
| | 1,765,000 | | | Herman Miller | | $ | 52,102,800 | | |
| | | | | Office Furniture | | | | | |
| | 2,325,000 | | | Interface | | | 51,057,000 | | |
| | | | | Modular Carpet | | | | | |
| | 812,360 | | | Caesarstone (Israel) | | | 40,349,921 | | |
| | | | | Quartz Countertops | | | | | |
| | | | 210,689,111 | | |
| | | > Apparel 0.9% | |
| | 1,231,000 | | | PVH | | | 167,440,620 | | |
| | | | | Apparel Wholesaler & Retailer | | | | | |
| | 2,620,000 | | | Quiksilver (a) | | | 22,977,400 | | |
| | | | | Action Sports Lifestyle Branded
Apparel & Footwear | | | | | |
| | | | 190,418,020 | | |
| | | > Restaurants 0.9% | |
| | 2,000,000 | | | AFC Enterprises (a)(b) | | | 77,000,000 | | |
| | | | | Popeye's Restaurants | | | | | |
| | 968,000 | | | Domino's Pizza | | | 67,421,200 | | |
| | | | | Franchisor of Pizza Restaurants | | | | | |
| | 765,000 | | | Fiesta Restaurant Group (a) | | | 39,963,600 | | |
| | | | | Owns/Operates Two Restaurant
Chains: Pollo Tropical &
Taco Cabana | | | | | |
| | | | 184,384,800 | | |
| | | > Other Consumer Services 0.7% | |
| | 1,969,000 | | | Lifetime Fitness (a) | | | 92,543,000 | | |
| | | | | Sport & Fitness Club Operator | | | | | |
| | 15,354,000 | | | Lifestyle International
(Hong Kong) | | | 28,433,700 | | |
| | | | | Mid- to High-end Department Store
Operator in Hong Kong & China | | | | | |
| | 900,000 | | | Blackhawk Network (a)(b) | | | 22,734,000 | | |
| | | | | Third Party Distributer of Prepaid
Content, Mostly Gift Cards | | | | | |
| | 450,000 | | | IFM Investments (Century 21
China RE) - ADR (China) (a) | | | 922,500 | | |
| | | | | Real Estate Services in China | | | | | |
| | | | 144,633,200 | | |
| | | > Food & Beverage 0.5% | |
| | 1,624,000 | | | B&G Foods | | | 55,069,840 | | |
| | | | | Acquirer of Small Food Brands | | | | | |
| | 2,886,552 | | | Boulder Brands Inc (a) | | | 45,780,715 | | |
| | | | | Healthy Food Products | | | | | |
| | 1,665,270 | | | GLG Life Tech (Canada) (a)(b) | | | 783,841 | | |
| | | | | Producer of an All-natural Sweetener
Extracted from the Stevia Plant | | | | | |
| | | | 101,634,396 | | |
| | | > Nondurables 0.4% | |
| | 1,288,000 | | | Prestige Brands Holdings (a) | | | 46,110,400 | | |
| | | | | Household & Personal Care Products | | | | | |
| | 800,000 | | | Helen of Troy (a) | | | 39,608,000 | | |
| | | | | Personal Care, Housewares,
Healthcare & Home Environment
Products | | | | | |
| | | | 85,718,400 | | |
| | | > Educational Services 0.3% | |
| | 1,300,000 | | | DeVry | | | 46,150,000 | | |
| | | | | Post-secondary Degree Services | | | | | |
Number of Shares | | | | Value | |
| | 500,000 | | | ITT Educational
Services (a)(c) | | $ | 16,790,000 | | |
| | | | | Post-secondary Degree Services | | | | | |
| | 765,000 | | | Chegg (a)(c) | | | 6,510,150 | | |
| | | | | Education Platform | | | | | |
| | | | 69,450,150 | | |
| | | > Other Durable Goods 0.3% | |
| | 460,000 | | | Cavco Industries (a)(b) | | | 31,602,000 | | |
| | | | | Manufactured Homes | | | | | |
| | 1,400,000 | | | Select Comfort (a) | | | 29,526,000 | | |
| | | | | Specialty Mattresses | | | | | |
| | | | 61,128,000 | | |
Consumer Goods & Services: Total | | | 3,324,732,331 | | |
Finance 11.5% | | | |
| | | > Banks 4.1% | |
| | 2,470,000 | | | BOK Financial | | | 163,810,400 | | |
| | | | | Tulsa Based Southwest. Bank | | | | | |
| | 9,000,000 | | | Associated Banc-Corp (b) | | | 156,600,000 | | |
| | | | | Midwest Bank | | | | | |
| | 935,000 | | | SVB Financial Group (a) | | | 98,044,100 | | |
| | | | | Bank to Venture Capitalists | | | | | |
| | 2,860,000 | | | MB Financial (b) | | | 91,777,400 | | |
| | | | | Chicago Bank | | | | | |
| | 1,153,000 | | | City National | | | 91,340,660 | | |
| | | | | Bank & Asset Manager | | | | | |
| | 1,900,000 | | | Hancock Holding | | | 69,692,000 | | |
| | | | | Gulf Coast Bank | | | | | |
| | 5,323,500 | | | Valley National Bancorp (c) | | | 53,873,820 | | |
| | | | | New Jersey/New York Bank | | | | | |
| | 2,200,000 | | | TCF Financial | | | 35,750,000 | | |
| | | | | Great Lakes Bank | | | | | |
| | 1,162,000 | | | Sandy Spring Bancorp | | | 32,756,780 | | |
| | | | | Baltimore & Washington, D.C. Bank | | | | | |
| | 4,841,882 | | | First Busey (b) | | | 28,082,916 | | |
| | | | | Illinois Bank | | | | | |
| | 843,000 | | | Hudson Valley | | | 17,155,050 | | |
| | | | | Metro New York City Bank | | | | | |
| | 900,000 | | | OFG Bancorp | | | 15,606,000 | | |
| | | | | Puerto Rican Bank | | | | | |
| | 2,136,500 | | | TrustCo Bank | | | 15,340,070 | | |
| | | | | New York State Bank | | | | | |
| | 943,049 | | | First Commonwealth | | | 8,317,692 | | |
| | | | | Western Pennsylvania Bank | | | | | |
| | | | 878,146,888 | | |
| | | > Insurance 2.8% | |
| | 8,900,000 | | | CNO Financial Group | | | 157,441,000 | | |
| | | | | Life, Long-term Care & Medical
Supplement Insurance | | | | | |
| | 833,000 | | | Allied World Holdings | | | 93,970,730 | | |
| | | | | Commercial Lines Insurance/
Reinsurance | | | | | |
| | 2,625,000 | | | Selective Insurance Group | | | 71,032,500 | | |
| | | | | Commercial & Personal Lines
Insurance | | | | | |
| | 1,650,000 | | | Brown & Brown | | | 51,793,500 | | |
| | | | | Insurance Broker | | | | | |
See accompanying notes to financial statements.
34
Number of Shares | | | | Value | |
| | | > Insurance—continued | |
| | 1,100,000 | | | HCC Insurance Holdings | | $ | 50,754,000 | | |
| | | | | Specialty Insurance | | | | | |
| | 400,000 | | | RLI | | | 38,952,000 | | |
| | | | | Specialty Insurance | | | | | |
| | 250,000 | | | Enstar Group (a) | | | 34,727,500 | | |
| | | | | Insurance/Reinsurance & Related
Services | | | | | |
| | 675,000 | | | Protective Life | | | 34,195,500 | | |
| | | | | Life Insurance | | | | | |
| | 500,000 | | | The Hanover Insurance Group | | | 29,855,000 | | |
| | | | | Commercial & Personal Lines Insurance | | | | | |
| | 10,837,000 | | | Rand Merchant Insurance
(South Africa) | | | 28,378,599 | | |
| | | | | Directly Sold Property & Casualty
Insurance; Holdings in Other Insurers | | | | | |
| | | | 591,100,329 | | |
| | | > Brokerage & Money Management 1.8% | |
| | 7,275,000 | | | SEI Investments | | | 252,660,750 | | |
| | | | | Mutual Fund Administration &
Investment Management | | | | | |
| | 3,052,000 | | | Eaton Vance | | | 130,595,080 | | |
| | | | | Specialty Mutual Funds | | | | | |
| | 387,130 | | | Coronation Fund Managers
(South Africa) | | | 2,954,651 | | |
| | | | | South African Fund Manager | | | | | |
| | | | 386,210,481 | | |
| | | > Finance Companies 1.5% | |
| | 2,150,000 | | | McGrath Rentcorp (b) | | | 85,570,000 | | |
| | | | | Temporary Space & IT Rentals | | | | | |
| | 850,000 | | | World Acceptance (a)(b)(c) | | | 74,400,500 | | |
| | | | | Personal Loans | | | | | |
| | 2,508,816 | | | H & E Equipment
Services (a)(b) | | | 74,336,218 | | |
| | | | | Heavy Equipment Leasing | | | | | |
| | 1,500,000 | | | CAI International (a)(b) | | | 35,355,000 | | |
| | | | | International Container Leasing | | | | | |
| | 1,091,000 | | | Marlin Business Services (b) | | | 27,493,200 | | |
| | | | | Small Equipment Leasing | | | | | |
| | 450,000 | | | Onex Capital (Canada) | | | 24,295,128 | | |
| | | | | Private Equity | | | | | |
| | | | 321,450,046 | | |
| | | > Credit Cards 0.9% | |
| | 530,000 | | | Alliance Data Systems (a) | | | 139,352,900 | | |
| | | | | Diversified Credit Card Provider | | | | | |
| | 500,000 | | | WEX (a) | | | 49,515,000 | | |
| | | | | Pay Card Processor | | | | | |
| | | | 188,867,900 | | |
| | | > Diversified Financial Companies 0.4% | |
| | 2,820,000 | | | Leucadia National | | | 79,918,800 | | |
| | | | | Holding Company | | | | | |
| | | > Savings & Loans —% | |
| | 452,146 | | | Simplicity Bancorp (b) | | | 7,306,679 | | |
| | | | | Los Angeles Savings & Loan | | | | | |
Finance: Total | | | 2,453,001,123 | | |
Number of Shares | | | | Value | |
Health Care 8.8% | | | |
| | | > Biotechnology & Drug Delivery 3.6% | |
| | 4,972,000 | | | Seattle Genetics (a) | | $ | 198,333,080 | | |
| | | | | Antibody-based Therapies for Cancer | | | | | |
| | 2,392,000 | | | Synageva Biopharma (a)(b) | | | 154,810,240 | | |
| | | | | Biotech Focused on Orphan Diseases | | | | | |
| | 1,725,000 | | | BioMarin Pharmaceutical (a) | | | 121,215,750 | | |
| | | | | Biotech Focused on Orphan Diseases | | | | | |
| | 1,404,000 | | | Alnylam Pharmaceuticals (a) | | | 90,319,320 | | |
| | | | | Biotech Developing Drugs for Rare
Diseases | | | | | |
| | 2,635,000 | | | NPS Pharmaceuticals (a) | | | 79,998,600 | | |
| | | | | Orphan Drugs & Healthy Royalties | | | | | |
| | 2,050,000 | | | Sarepta Therapeutics (a)(b)(c) | | | 41,758,500 | | |
| | | | | Biotech Focused on Rare Diseases | | | | | |
| | 1,240,000 | | | Celldex Therapeutics (a) | | | 30,020,400 | | |
| | | | | Biotech Developing Drugs for Cancer | | | | | |
| | 2,025,000 | | | InterMune (a) | | | 29,828,250 | | |
| | | | | Drugs for Pulmonary Fibrosis &
Hepatitis C | | | | | |
| | 3,610,890 | | | Ultragenyx (a)(d)(e) | | | 14,371,342 | | |
| | | | | Biotech Focused on "Ultra-Orphan"
Drugs | | | | | |
| | 359,944 | | | MicroDose Therapeutx
Contingent Value
Rights (a)(d)(e) | | | 889,062 | | |
| | | | | Drug Inhaler Development | | | | | |
| | | | 761,544,544 | | |
| | | > Medical Supplies 2.4% | |
| | 6,170,000 | | | Cepheid (a)(b) | | | 288,262,400 | | |
| | | | | Molecular Diagnostics | | | | | |
| | 950,000 | | | Henry Schein (a) | | | 108,547,000 | | |
| | | | | Largest Distributor of Healthcare
Products | | | | | |
| | 1,676,000 | | | Patterson Companies | | | 69,051,200 | | |
| | | | | Dental/Vet/Med Distributor | | | | | |
| | 580,000 | | | Techne | | | 54,908,600 | | |
| | | | | Cytokines, Antibodies & Other
Reagents for Life Science | | | | | |
| | | | 520,769,200 | | |
| | | > Health Care Services 1.4% | |
| | 9,905,000 | | | Allscripts Healthcare
Solutions (a)(b) | | | 153,131,300 | | |
| | | | | Health Care IT | | | | | |
| | 2,100,000 | | | HealthSouth | | | 69,972,000 | | |
| | | | | Inpatient Rehabilitation Facilities | | | | | |
| | 1,004,000 | | | Envision Healthcare
Holdings (a) | | | 35,662,080 | | |
| | | | | Provider of Health Care
Outsourcing Services | | | | | |
| | 406,551 | | | Mednax (a) | | | 21,701,692 | | |
| | | | | Physician Management for
Pediatric & Anesthesia Practices | | | | | |
| | 350,000 | | | Medidata Solutions (a) | | | 21,199,500 | | |
| | | | | Cloud-based Software for Drug Studies | | | | | |
| | | | 301,666,572 | | |
| | | > Medical Equipment & Devices 0.7% | |
| | 1,550,000 | | | Sirona Dental Systems (a) | | | 108,810,000 | | |
| | | | | Manufacturer of Dental Equipment | | | | | |
See accompanying notes to financial statements.
35
Columbia Acorn Fund
Statement of Investments, continued
Number of Shares | | | | Value | |
| | | > Medical Equipment & Devices—continued | |
| | 925,000 | | | PerkinElmer | | $ | 38,137,750 | | |
| | | | | Analytical Instruments for Life
Sciences | | | | | |
| | | | 146,947,750 | | |
| | | > Pharmaceuticals 0.7% | |
| | 5,417,981 | | | Akorn (a)(b) | | | 133,444,872 | | |
| | | | | Developer, Manufacturer &
Distributor of Specialty Generic
Drugs | | | | | |
| | 2,040,000 | | | Alimera Sciences (a)(b)(c) | | | 9,608,400 | | |
| | | | | Ophthalmology-focused
Pharmaceutical Company | | | | | |
| | | | 143,053,272 | | |
Health Care: Total | | | 1,873,981,338 | | |
Energy & Minerals 6.7% | | | |
| | | > Oil & Gas Producers 2.9% | |
| | 1,120,000 | | | SM Energy | | | 93,083,200 | | |
| | | | | Oil & Gas Producer | | | | | |
| | 695,000 | | | Range Resources | | | 58,595,450 | | |
| | | | | Oil & Gas Producer | | | | | |
| | 2,868,000 | | | WPX Energy (a) | | | 58,449,840 | | |
| | | | | Oil & Gas Produced in U.S. &
Argentina | | | | | |
| | 1,153,600 | | | Rosetta Resources (a) | | | 55,418,944 | | |
| | | | | Oil & Gas Producer Exploring
in Texas | | | | | |
| | 1,861,000 | | | Bill Barrett Corporation (a)(c) | | | 49,837,580 | | |
| | | | | Oil & Gas Producer in U.S. Rockies | | | | | |
| | 2,200,000 | | | Pacific Rubiales Energy
(Colombia) | | | 37,983,526 | | |
| | | | | Oil Production & Exploration
in Colombia | | | | | |
| | 886,000 | | | Cabot Oil and Gas | | | 34,341,360 | | |
| | | | | Large Natural Gas Producer in
Appalachia & Gulf Coast | | | | | |
| | 1,159,000 | | | Laredo Petroleum (a) | | | 32,092,710 | | |
| | | | | Permian Basin Oil Producer | | | | | |
| | 743,000 | | | Baytex (Canada) (c) | | | 29,125,460 | | |
| | | | | Oil & Gas Producer in Canada | | | | | |
| | 550,000 | | | Carrizo Oil & Gas (a) | | | 24,623,500 | | |
| | | | | Oil & Gas Producer | | | | | |
| | 1,477,000 | | | Denbury Resources (a) | | | 24,267,110 | | |
| | | | | Oil Producer Using Co2 Injection | | | | | |
| | 3,095,000 | | | Athabasca Oil Sands
(Canada) (a) | | | 18,880,301 | | |
| | | | | Oil Sands & Unconventional
Oil Development | | | | | |
| | 340,000 | | | PDC Energy (a) | | | 18,094,800 | | |
| | | | | Oil & Gas Producer in U.S. | | | | | |
| | 530,000 | | | Forum Energy Technology (a) | | | 14,977,800 | | |
| | | | | Oil Field Capital Equipment &
Consumables | | | | | |
| | 1,400,000 | | | DeeThree Exploration
(Canada) (a) | | | 12,612,850 | | |
| | | | | Canadian Oil & Gas Producer | | | | | |
| | 27,000,000 | | | Shamaran Petroleum
(Iraq) (a) | | | 11,692,163 | | |
| | | | | Oil Exploration & Production in
Kurdistan | | | | | |
Number of Shares | | | | Value | |
| | 141,000 | | | Clayton Williams (a) | | $ | 11,554,950 | | |
| | | | | Oil & Gas Producer | | | | | |
| | 35,000,000 | | | Petroamerica Oil
(Colombia) (a)(b) | | | 11,367,381 | | |
| | | | | Oil Exploration & Production in
Colombia | | | | | |
| | 735,000 | | | Tullow Oil (United Kingdom) | | | 10,431,556 | | |
| | | | | Oil & Gas Producer | | | | | |
| | 51,359,500 | | | Petromanas (Canada) (a)(b) | | | 7,735,957 | | |
| | | | | Exploring for Oil in Albania | | | | | |
| | 11,071,000 | | | Canadian Overseas Petroleum
(United Kingdom) (a)(b) | | | 2,761,888 | | |
| | 8,400,000 | | | Canadian Overseas Petroleum
(United Kingdom) (a)(b)(d) | | | 1,990,774 | | |
| | | | | Oil & Gas Exploration/Production
in the North Sea | | | | | |
| | 511,600 | | | Canacol (Colombia) (a) | | | 3,433,945 | | |
| | | | | Oil Producer in South America | | | | | |
| | 741,089 | | | Pan Orient (Canada) (a) | | | 1,381,366 | | |
| | | | | Growth Oriented, Return Focused
Asian Explorer | | | | | |
| | 61,091 | | | Matador Resources (a) | | | 1,138,736 | | |
| | | | | Oil & Gas Producer in Texas &
Louisiana | | | | | |
| | 26,000,000 | | | Petrodorado Energy
(Colombia) (a)(b) | | | 856,672 | | |
| | | | | Oil & Gas Exploration & Production
in Colombia, Peru & Paraguay | | | | | |
| | | | 626,729,819 | | |
| | | > Oil Services 2.9% | |
| | 3,858,000 | | | FMC Technologies (a) | | | 201,426,180 | | |
| | | | | Oil & Gas Well Head Manufacturer | | | | | |
| | 2,180,000 | | | Atwood Oceanics (a) | | | 116,390,200 | | |
| | | | | Offshore Drilling Contractor | | | | | |
| | 698,000 | | | Chart Industries (a) | | | 66,756,720 | | |
| | | | | Manufacturer of Natural Gas
Processing/Storage Equipment | | | | | |
| | 1,208,000 | | | Hornbeck Offshore (a) | | | 59,469,840 | | |
| | | | | Supply Vessel Operator in U.S.
Gulf of Mexico | | | | | |
| | 1,334,000 | | | ShawCor (Canada) | | | 53,347,442 | | |
| | | | | Oil & Gas Pipeline Products | | | | | |
| | 1,008,000 | | | Rowan (a) | | | 35,642,880 | | |
| | | | | Contract Offshore Driller | | | | | |
| | 2,601,900 | | | Horizon North Logistics
(Canada) (c) | | | 24,371,763 | | |
| | | | | Diversified Oil Service Offering in
Northern Canada | | | | | |
| | 402,555 | | | Fugro (Netherlands) | | | 24,013,033 | | |
| | | | | Subsea Oilfield Services | | | | | |
| | 400,000 | | | Dresser-Rand Group (a) | | | 23,852,000 | | |
| | | | | Manufactures & Services Compressors | | | | | |
| | 596,600 | | | Black Diamond Group
(Canada) | | | 16,849,141 | | |
| | | | | Accommodations/Equipment for
Oil Sands Development | | | | | |
| | 88,000 | | | Gulfmark Offshore | | | 4,147,440 | | |
| | | | | Operator of Offshore Supply Vessels | | | | | |
| | | | 626,266,639 | | |
See accompanying notes to financial statements.
36
Number of Shares | | | | Value | |
| | | > Mining 0.7% | |
| | 387,000 | | | Core Labs (Netherlands) | | $ | 73,897,650 | | |
| | | | | Oil & Gas Reservoir Consulting | | | | | |
| | 1,600,000 | | | Alamos Gold (Canada) | | | 19,385,267 | | |
| | 500,000 | | | Alamos Gold (Canada) (f) | | | 6,065,000 | | |
| | | | | Gold Mining | | | | | |
| | 6,044,000 | | | Northam Platinum
(South Africa) (a) | | | 24,287,049 | | |
| | | | | Platinum Mining in South Africa | | | | | |
| | 4,900,000 | | | Kirkland Lake Gold
(Canada) (a)(b)(c) | | | 11,855,025 | | |
| | | | | Gold Mining | | | | | |
| | 2,000,000 | | | Allied Nevada Gold (a)(c) | | | 7,100,000 | | |
| | | | | Gold & Silver Mining | | | | | |
| | 7,025,500 | | | Duluth Metals
(Canada) (a)(b) | | | 5,158,757 | | |
| | | | | Copper & Nickel Miner | | | | | |
| | 2,050,000 | | | Alexco Resource (a)(c) | | | 2,583,000 | | |
| | | | | Mining, Exploration &
Environmental Services | | | | | |
| | 3,000,000 | | | Kaminak Gold (a)(c) | | | 1,581,549 | | |
| | | | | Exploration Stage Canadian
Gold Miner | | | | | |
| | 2,300 | | | SilverCrest Mines (a) | | | 3,919 | | |
| | | | | Gold & Silver Mining | | | | | |
| | | | 151,917,216 | | |
| | | > Agricultural Commodities 0.1% | |
| | 1,306,818 | | | Union Agriculture Group
(Uruguay) (a)(d)(e) | | | 13,969,884 | | |
| | | | | Farmland Operator in Uruguay | | | | | |
| | | > Alternative Energy 0.1% | |
| | 2,600,000 | | | Real Goods Solar (a)(b)(c) | | | 7,852,000 | | |
| | | | | Residential Solar Energy Installer | | | | | |
| | 1,210,300 | | | Synthesis Energy Systems
(China) (a) | | | 726,180 | | |
| | | | | Owner/Operator of Gasification
Plants | | | | | |
| | | | 8,578,180 | | |
Energy & Minerals: Total | | | 1,427,461,738 | | |
Other Industries 6.2% | | | |
| | | > Real Estate 4.3% | |
| | 3,625,000 | | | Dupont Fabros
Technology (b) | | | 89,573,750 | | |
| | | | | Data Centers | | | | | |
| | 2,100,000 | | | Extra Space Storage | | | 88,473,000 | | |
| | | | | Self Storage Facilities | | | | | |
| | 1,760,000 | | | Post Properties | | | 79,604,800 | | |
| | | | | Multifamily Properties | | | | | |
| | 750,000 | | | Federal Realty | | | 76,057,500 | | |
| | | | | Shopping Centers | | | | | |
| | 7,350,000 | | | EdR (b) | | | 64,827,000 | | |
| | | | | Student Housing | | | | | |
| | 6,250,000 | | | Kite Realty Group | | | 41,062,500 | | |
| | | | | Community Shopping Centers | | | | | |
| | 1,170,000 | | | Coresite Realty (b) | | | 37,662,300 | | |
| | | | | Data Centers | | | | | |
Number of Shares | | | | Value | |
| | 2,020,931 | | | Terreno Realty (b) | | $ | 35,770,479 | | |
| | | | | Industrial Properties | | | | | |
| | 1,800,000 | | | St. Joe (a)(c) | | | 34,542,000 | | |
| | | | | Florida Panhandle Landowner | | | | | |
| | 1,900,000 | | | Biomed Realty Trust | | | 34,428,000 | | |
| | | | | Life Science-focused Office Buildings | | | | | |
| | 2,075,000 | | | Associated Estates Realty | | | 33,303,750 | | |
| | | | | Multifamily Properties | | | | | |
| | 325,000 | | | Jones Lang LaSalle | | | 33,276,750 | | |
| | | | | Real Estate Services | | | | | |
| | 17,000,000 | | | Ascendas REIT (Singapore) | | | 29,752,418 | | |
| | | | | Industrial Property Landlord | | | | | |
| | 1,300,000 | | | Hudson Pacific Properties | | | 28,431,000 | | |
| | | | | West Coast Office Buildings &
Production Studios | | | | | |
| | 3,750,000 | | | DCT Industrial Trust | | | 26,737,500 | | |
| | | | | Industrial Properties | | | | | |
| | 2,850,000 | | | Summit Hotel Properties | | | 25,650,000 | | |
| | | | | Owner of Select Service Hotels | | | | | |
| | 407,000 | | | Gaming & Leisure
Properties (a) | | | 20,679,670 | | |
| | | | | Regional Gaming REIT | | | | | |
| | 24,284,000 | | | Mapletree Logistics Trust
(Singapore) | | | 20,325,532 | | |
| | | | | Industrial Property Landlord | | | | | |
| | 20,000,000 | | | Mapletree Commercial Trust
(Singapore) | | | 18,909,513 | | |
| | | | | Retail & Office Property Landlord | | | | | |
| | 14,000 | | | Orix JREIT (Japan) | | | 17,514,732 | | |
| | | | | Diversified REIT | | | | | |
| | 24,664,000 | | | Mapletree Greater China
Commercial Trust
(Hong Kong) | | | 16,446,263 | | |
| | | | | Retail & Office Property Landlord | | | | | |
| | 950,000 | | | American Residential
Properties (a)(c) | | | 16,302,000 | | |
| | | | | Single-family Rental Properties | | | | | |
| | 12,000,000 | | | CDL Hospitality Trust
(Singapore) | | | 15,602,330 | | |
| | | | | Hotel Owner/Operator | | | | | |
| | 400,000 | | | RE/MAX (a) | | | 12,828,000 | | |
| | | | | Residential Real Estate Broker | | | | | |
| | 45,000 | | | AMERCO (a) | | | 10,702,800 | | |
| | | | | North American Moving & Storage | | | | | |
| | | | 908,463,587 | | |
| | | > Transportation 1.4% | |
| | 3,100,000 | | | Rush Enterprises,
Class A (a)(b) | | | 91,915,000 | | |
| | 550,000 | | | Rush Enterprises,
Class B (a)(b) | | | 14,025,000 | | |
| | | | | Truck Sales & Service | | | | | |
| | 1,155,000 | | | JB Hunt Transport Services | | | 89,281,500 | | |
| | | | | Truck & Intermodal Carrier | | | | | |
| | 846,000 | | | Kirby (a) | | | 83,965,500 | | |
| | | | | Largest Operator of U.S.
(Jones Act) Liquid Tank Barges | | | | | |
| | 300,000 | | | Genesee & Wyoming (a) | | | 28,815,000 | | |
| | | | | Short-line Operator | | | | | |
| | | | 308,002,000 | | |
See accompanying notes to financial statements.
37
Columbia Acorn Fund
Statement of Investments, continued
Number of Shares | | | | Value | |
| | | > Regulated Utilities 0.5% | |
| | 2,000,000 | | | Northeast Utilities | | $ | 84,780,000 | | |
| | | | | Regulated Electric Utility | | | | | |
| | 700,000 | | | Wisconsin Energy | | | 28,938,000 | | |
| | | | | Wisconsin Utility | | | | | |
| | | | 113,718,000 | | |
Other Industries: Total | | | 1,330,183,587 | | |
Total Equities: 97.4%
(Cost: $10,541,367,278) | | | 20,793,332,750 | (g) | |
Short-Term Investments: 3.5% | | | |
| | 467,563,245 | | | JPMorgan U.S. Government
Money Market Fund,
Agency Shares (7 day yield
of 0.01%) | | | 467,563,245 | | |
| | 280,000,000 | | | JPMorgan U.S. Government
Money Market Fund,
IM Shares (7 day yield
of 0.01%) | | | 280,000,000 | | |
Total Short-Term Investments: 3.5%
(Cost: $747,563,245) | | | 747,563,245 | | |
Number of Shares | | | | Value | |
Securities Lending Collateral 1.6% | |
| | 337,873,354 | | | Dreyfus Government Cash
Management Fund,
Institutional Shares
(7 day yield of 0.01%) (h) | | $ | 337,873,354 | | |
Total Securities Lending Collateral:
(Cost: $337,873,354) | | | 337,873,354 | | |
Total Investments: 102.5%
(Cost: $11,626,803,877)(i) | | | 21,878,769,349 | | |
Obligation to Return Collateral for
Securities Loaned: (1.6)% | | | (337,873,354 | ) | |
Cash and Other Assets Less
Liabilities: (0.9)% | | | (189,924,797 | ) | |
Net Assets: 100.0% | | $ | 21,350,971,198 | | |
ADR - American Depositary Receipts
REIT - Real Estate Investment Trust
> Notes to Statement of Investments
(a) Non-income producing security.
(b) An affiliated person of the Fund, as defined in the Investment Company Act of 1940, may include any company in which the Fund owns five percent or more of its outstanding voting shares. Holdings and transactions in these affiliated companies during the year ended December 31, 2013, are as follows:
Security | | Balance of
Shares Held
12/31/12 | | Purchases/
Additions | | Sales/
Reductions | | Balance of
Shares Held
12/31/13 | | Value | | Dividend | |
Donaldson | | | 8,400,000 | | | | - | | | | - | | | | 8,400,000 | | | $ | 365,064,000 | | | $ | 4,200,000 | | |
Mettler-Toledo International (1) | | | 1,600,000 | | | | - | | | | 125,000 | | | | 1,475,000 | | | | 357,820,250 | | | | - | | |
tw telecom | | | 9,500,000 | | | | - | | | | - | | | | 9,500,000 | | | | 289,465,000 | | | | - | | |
Cepheid | | | 4,970,000 | | | | 1,200,000 | | | | - | | | | 6,170,000 | | | | 288,262,400 | | | | - | | |
Nordson | | | 3,125,000 | | | | 275,000 | | | | - | | | | 3,400,000 | | | | 252,620,000 | | | | 2,202,750 | | |
Bally Technologies | | | 3,725,000 | | | | - | | | | 620,000 | | | | 3,105,000 | | | | 243,587,250 | | | | - | | |
Informatica | | | 5,000,000 | | | | 1,000,000 | | | | 500,000 | | | | 5,500,000 | | | | 228,250,000 | | | | |
Moog | | | 3,230,000 | | | | - | | | | - | | | | 3,230,000 | | | | 219,446,200 | | | | - | | |
Seattle Genetics (1) | | | 6,550,000 | | | | - | | | | 1,578,000 | | | | 4,972,000 | | | | 198,333,080 | | | | - | | |
iGATE | | | 3,700,000 | | | | 800,000 | | | | 350,000 | | | | 4,150,000 | | | | 166,664,000 | | | | - | | |
Pier 1 Imports | | | 7,185,000 | | | | - | | | | - | | | | 7,185,000 | | | | 165,829,800 | | | | 1,437,000 | | |
HEICO (2) | | | 3,828,750 | | | | - | | | | - | | | | 3,828,750 | | | | 161,266,950 | | | | 1,784,197 | | |
Associated Banc-Corp | | | 7,756,800 | | | | 1,243,200 | | | | - | | | | 9,000,000 | | | | 156,600,000 | | | | 2,868,544 | | |
Synageva Biopharma | | | 1,165,000 | | | | 1,227,000 | | | | - | | | | 2,392,000 | | | | 154,810,240 | | | | - | | |
Allscripts Healthcare Solutions | | | - | | | | 9,905,000 | | | | - | | | | 9,905,000 | | | | 153,131,300 | | | | - | | |
Akorn | | | 4,000,000 | | | | 2,313,000 | | | | 895,019 | | | | 5,417,981 | | | | 133,444,872 | | | | - | | |
IPG Photonics (1) | | | 2,780,000 | | | | - | | | | 1,160,000 | | | | 1,620,000 | | | | 125,728,200 | | | | - | | |
Rush Enterprises | | | 3,650,000 | | | | - | | | | - | | | | 3,650,000 | | | | 105,940,000 | | | | - | | |
Shutterfly (1) | | | 2,835,000 | | | | - | | | | 989,502 | | | | 1,845,498 | | | | 93,991,213 | | | | - | | |
Lifetime Fitness (1) | | | 2,280,000 | | | | - | | | | 311,000 | | | | 1,969,000 | | | | 92,543,000 | | | | - | | |
MB Financial | | | 2,860,000 | | | | - | | | | - | | | | 2,860,000 | | | | 91,777,400 | | | | 1,258,400 | | |
Drew Industries | | | 1,880,000 | | | | - | | | | 100,000 | | | | 1,780,000 | | | | 91,136,000 | | | | 3,560,000 | | |
Dupont Fabros Technology | | | 3,625,000 | | | | - | | | | - | | | | 3,625,000 | | | | 89,573,750 | | | | 3,107,058 | | |
McGrath Rentcorp | | | 2,150,000 | | | | - | | | | - | | | | 2,150,000 | | | | 85,570,000 | | | | 2,053,250 | | |
NPS Pharmaceuticals (1) | | | 6,000,000 | | | | - | | | | 3,365,000 | | | | 2,635,000 | | | | 79,998,600 | | | | - | | |
ESCO Technologies | | | 2,200,000 | | | | 100,000 | | | | - | | | | 2,300,000 | | | | 78,798,000 | | | | 904,000 | | |
Navigant Consulting | | | 3,704,600 | | | | 320,400 | | | | - | | | | 4,025,000 | | | | 77,280,000 | | | | - | | |
AFC Enterprises | | | 2,000,000 | | | | - | | | | - | | | | 2,000,000 | | | | 77,000,000 | | | | - | | |
See accompanying notes to financial statements.
38
> Notes to Statement of Investments
Security | | Balance of
Shares Held
12/31/12 | | Purchases/
Additions | | Sales/
Reductions | | Balance of
Shares Held
12/31/13 | | Value | | Dividend | |
Virtusa | | | 2,125,000 | | | | - | | | | 140,000 | | | | 1,985,000 | | | $ | 75,608,650 | | | $ | - | | |
World Acceptance | | | 1,285,000 | | | | - | | | | 435,000 | | | | 850,000 | | | | 74,400,500 | | | | - | | |
H & E Equipment Services | | | 3,400,000 | | | | 22,749 | | | | 913,933 | | | | 2,508,816 | | | | 74,336,218 | | | | - | | |
Knoll | | | 4,200,000 | | | | - | | | | 531,000 | | | | 3,669,000 | | | | 67,179,390 | | | | 1,805,417 | | |
Forward Air (1) | | | 1,500,000 | | | | - | | | | - | | | | 1,500,000 | | | | 65,865,000 | | | | 600,000 | | |
EdR | | | 5,744,300 | | | | 1,605,700 | | | | - | | | | 7,350,000 | | | | 64,827,000 | | | | 1,158,759 | | |
II-VI | | | 4,550,000 | | | | - | | | | 910,000 | | | | 3,640,000 | | | | 64,064,000 | | | | - | | |
SPS Commerce | | | 900,000 | | | | - | | | | - | | | | 900,000 | | | | 58,770,000 | | | | - | | |
Insperity | | | 1,800,000 | | | | - | | | | 400,000 | | | | 1,400,000 | | | | 50,582,000 | | | | 980,733 | | |
Ryman Hospitality Properties (1) | | | 4,520,690 | | | | - | | | | 3,400,690 | | | | 1,120,000 | | | | 46,793,600 | | | | 4,295,552 | | |
ExlService Holdings (1) | | | 1,618,000 | | | | - | | | | - | | | | 1,618,000 | | | | 44,689,160 | | | | - | | |
Globalstar | | | 1,200,000 | | | | 24,589,746 | | | | 289,746 | | | | 25,500,000 | | | | 44,625,000 | | | | - | | |
Sarepta Therapeutics | | | 955,000 | | | | 1,365,000 | | | | 270,000 | | | | 2,050,000 | | | | 41,758,500 | | | | | | |
Kite Realty Group (1) | | | 4,000,000 | | | | 2,250,000 | | | | - | | | | 6,250,000 | | | | 41,062,500 | | | | 186,176 | | |
Helen of Troy (1) | | | 1,600,000 | | | | - | | | | 800,000 | | | | 800,000 | | | | 39,608,000 | | | | - | | |
Tangoe | | | - | | | | 2,100,000 | | | | | | | | 2,100,000 | | | | 37,821,000 | | | | | | |
Coresite Realty | | | - | | | | 1,170,000 | | | | - | | | | 1,170,000 | | | | 37,662,300 | | | | 1,075,936 | | |
Terreno Realty | | | 358,151 | | | | 1,662,780 | | | | - | | | | 2,020,931 | | | | 35,770,479 | | | | 637,139 | | |
CAI International | | | 1,397,834 | | | | 102,166 | | | | - | | | | 1,500,000 | | | | 35,355,000 | | | | - | | |
Associated Estates Realty (1) | | | 3,000,000 | | | | - | | | | 925,000 | | | | 2,075,000 | | | | 33,303,750 | | | | 1,690,713 | | |
Cavco Industries | | | 460,000 | | | | - | | | | - | | | | 460,000 | | | | 31,602,000 | | | | - | | |
InContact | | | 2,200,000 | | | | 1,540,596 | | | | | | | | 3,740,596 | | | | 29,214,055 | | | | - | | |
First Busey | | | 4,299,507 | | | | 542,375 | | | | - | | | | 4,841,882 | | | | 28,082,916 | | | | 547,076 | | |
Marlin Business Services | | | 1,091,000 | | | | - | | | | - | | | | 1,091,000 | | | | 27,493,200 | | | | 2,640,220 | | |
Summit Hotel Properties (1) | | | 2,850,000 | | | | - | | | | - | | | | 2,850,000 | | | | 25,650,000 | | | | 1,282,500 | | |
Blackhawk Network | | | - | | | | 900,000 | | | | - | | | | 900,000 | | | | 22,734,000 | | | | - | | |
Hackett Group | | | 3,849,207 | | | | - | | | | 575,207 | | | | 3,274,000 | | | | 20,331,540 | | | | 327,400 | | |
Boingo Wireless | | | 1,900,000 | | | | 600,000 | | | | - | | | | 2,500,000 | | | | 16,025,000 | | | | - | | |
Exa | | | 872,060 | | | | 127,940 | | | | - | | | | 1,000,000 | | | | 13,260,000 | | | | - | | |
Kirkland Lake Gold | | | 1,900,000 | | | | 3,000,000 | | | | - | | | | 4,900,000 | | | | 11,855,025 | | | | - | | |
Petroamerica Oil | | | 25,000,000 | | | | 15,000,000 | | | | 5,000,000 | | | | 35,000,000 | | | | 11,367,381 | | | | | | |
Gaiam | | | 1,371,366 | | | | 128,634 | | | | - | | | | 1,500,000 | | | | 9,930,000 | | | | - | | |
Towerstream | | | - | | | | 3,319,900 | | | | | | | | 3,319,900 | | | | 9,826,904 | | | | | | |
Alimera Sciences | | | 2,040,000 | | | | - | | | | - | | | | 2,040,000 | | | | 9,608,400 | | | | - | | |
Real Goods Solar | | | - | | | | 2,600,000 | | | | - | | | | 2,600,000 | | | | 7,852,000 | | | | - | | |
Petromanas | | | 37,500,000 | | | | 13,859,500 | | | | - | | | | 51,359,500 | | | | 7,735,957 | | | | - | | |
Simplicity Bancorp | | | 452,146 | | | | - | | | | - | | | | 452,146 | | | | 7,306,679 | | | | 144,687 | | |
Duluth Metals | | | 7,500,000 | | | | - | | | | 474,500 | | | | 7,025,500 | | | | 5,158,757 | | | | - | | |
Canadian Overseas Petroleum | | | 8,400,000 | | | | 11,071,000 | | | | - | | | | 19,471,000 | | | | 4,752,662 | | | | | | |
Acorn Energy | | | 1,512,352 | | | | 8,605 | | | | 359,000 | | | | 1,161,957 | | | | 4,729,165 | | | | 52,932 | | |
Petrodorado Energy | | | 26,000,000 | | | | - | | | | - | | | | 26,000,000 | | | | 856,672 | | | | - | | |
GLG Life Tech | | | 1,665,270 | | | | - | | | | - | | | | 1,665,270 | | | | 783,841 | | | | - | | |
Chelsea Therapeutics International (1) | | | 4,949,000 | | | | - | | | | 4,949,000 | | | | - | | | | - | | | | - | | |
Gulf United Energy (1) | | | 50,000,000 | | | | - | | | | 50,000,000 | | | | - | | | | - | | | | - | | |
Pericom Semiconductor (1) | | | 1,765,000 | | | | - | | | | 1,765,000 | | | | - | | | | - | | | | - | | |
Pinnacle Entertainment (1) | | | 3,950,000 | | | | - | | | | 3,950,000 | | | | - | | | | - | | | | - | | |
Raptor Pharmaceutical (1) | | | 3,000,000 | | | | - | | | | 3,000,000 | | | | - | | | | - | | | | - | | |
Santa Maria Petroleum (1) | | | 5,000,000 | | | | - | | | | 5,000,000 | | | | - | | | | - | | | | - | | |
Tower Group (1)(2) | | | 3,738,900 | | | | - | | | | 3,738,900 | | | | - | | | | - | | | | 1,840,746 | | |
TriCo Bancshares (1) | | | 1,350,000 | | | | - | | | | 1,350,000 | | | | - | | | | - | | | | 270,000 | | |
Wolverine Minerals (1)(2) | | | 1,000,000 | | | | - | | | | 1,000,000 | | | | - | | | | - | | | | - | | |
Total of Affiliated Transactions | | | 359,469,933 | | | | 105,950,291 | | | | 100,170,497 | | | | 365,249,727 | | | $ | 5,964,169,706 | | | $ | 42,911,185 | | |
(1) At December 31, 2013, the Fund owned less than five percent of the company's outstanding voting shares.
(2) Includes the effects of a stock split.
The aggregate cost and value of these companies at December 31, 2013, was $2,490,274,629 and $4,718,783,353, respectively. Investments in affiliated companies represented 22.10% of the Fund's total net assets at December 31, 2013.
See accompanying notes to financial statements.
39
Columbia Acorn Fund
Statement of Investments, continued
> Notes to Statement of Investments
(c) All or a portion of this security was on loan at December 31, 2013. The total market value of securities on loan at December 31, 2013 was $325,396,020.
(d) Denotes a restricted security, which is subject to restrictions on resale under federal securities laws. These securities are valued at fair value determined in good faith under consistently applied procedures established by the Board of Trustees. At December 31, 2013, the market value of these securities amounted to $31,221,062, which represented 0.15% of total net assets. Additional information on these securities is as follows:
Security | | Acquisition
Dates | | Shares/Units | | Cost | | Value | |
Ultragenyx | | 12/19/12 | | | 3,610,890 | | | $ | 9,999,999 | | | $ | 14,371,342 | | |
Union Agriculture Group | | 12/8/10-6/27/12 | | | 1,306,818 | | | | 15,000,000 | | | | 13,969,884 | | |
Canadian Overseas Petroleum | | 11/24/10 | | | 8,400,000 | | | | 3,591,152 | | | | 1,990,774 | | |
MicroDose Therapeutx Contingent Value Rights | | 8/14/13 | | | 359,944 | | | | - | | | | 889,062 | | |
| | | | | | | $ | 28,591,151 | | | $ | 31,221,062 | | |
(e) Illiquid security.
(f) Security is traded on a U.S. exchange.
(g) On December 31, 2013, the market value of foreign securities represented 7.20% of total net assets. The Fund's foreign portfolio was diversified as follows:
Country | | Value | | Percentage
of Net Assets | |
Canada | | $ | 285,955,186 | | | | 1.34 | | |
Hong Kong | | | 262,180,750 | | | | 1.23 | | |
Netherlands | | | 177,709,356 | | | | 0.83 | | |
Sweden | | | 117,893,422 | | | | 0.55 | | |
Singapore | | | 113,422,738 | | | | 0.53 | | |
France | | | 77,424,703 | | | | 0.36 | | |
Japan | | | 70,262,535 | | | | 0.33 | | |
South Africa | | | 66,185,787 | | | | 0.31 | | |
Denmark | | | 54,405,429 | | | | 0.25 | | |
Colombia | | | 53,641,524 | | | | 0.25 | | |
India | | | 43,820,000 | | | | 0.21 | | |
Cambodia | | | 42,252,799 | | | | 0.20 | | |
Israel | | | 40,349,921 | | | | 0.19 | | |
Russia | | | 31,370,050 | | | | 0.15 | | |
Brazil | | | 29,622,973 | | | | 0.14 | | |
Chile | | | 17,417,240 | | | | 0.08 | | |
United Kingdom | | | 15,184,218 | | | | 0.07 | | |
Uruguay | | | 13,969,884 | | | | 0.07 | | |
Iraq | | | 11,692,163 | | | | 0.05 | | |
Iceland | | | 11,543,636 | | | | 0.05 | | |
China | | | 1,648,680 | | | | 0.01 | | |
Total Foreign Portfolio | | $ | 1,537,952,994 | | | | 7.20 | | |
(h) Investment made with cash collateral received from securities lending activity.
(i) At December 31, 2013, for federal income tax purposes, the cost of investments was $11,667,228,597 and net unrealized appreciation was $10,211,540,752 consisting of gross unrealized appreciation of $10,507,529,203 and gross unrealized depreciation of $295,988,451.
Fair Value Measurements
Various inputs are used in determining the value of the Fund's investments, following the input prioritization hierarchy established by accounting principles generally accepted in the United States of America (GAAP). These inputs are summarized in the three broad levels listed below:
• Level 1 – quoted prices in active markets for identical securities
• Level 2 – prices determined using other significant observable inputs (including quoted prices for similar securities, interest rates, prepayment speeds, credit risk and others)
• Level 3 – prices determined using significant unobservable inputs where quoted prices or observable inputs are unavailable or less reliable (including management's own assumptions about the factors market participants would use in pricing an investment)
The inputs or methodology used for valuing securities are not necessarily an indication of the risk associated with investing in those securities.
Examples of the types of securities in which the Fund would typically invest and how they are classified within this hierarchy are as follows. Typical Level 1 securities include exchange traded domestic equities, mutual funds whose NAVs are published each day and exchange traded foreign equities that are not statistically fair valued. Typical Level 2 securities include exchange traded foreign equities that are statistically fair valued, forward foreign currency exchange contracts and short-term investments valued at amortized cost. Additionally, securities fair valued by the Valuation Committee (the Committee) of the Fund's Board of Trustees (the Board) that rely on significant observable inputs are also included in Level 2. Typical Level 3 securities include any security fair valued by the Committee that relies on significant unobservable inputs.
See accompanying notes to financial statements.
40
> Notes to Statement of Investments
Under the direction of the Board, the Committee is responsible for overseeing the valuation procedures approved by the Board.
The Committee meets as necessary, and no less frequently than quarterly, to determine fair values for securities for which market quotations are not readily available or for which the investment manager believes that available market quotations are unreliable, to review the appropriateness of the Trust's Portfolio Pricing Policy and the pricing procedures of the investment manager (the Policies), and to review the continuing appropriateness of the current value of any security subject to the Policies. The Policies address, among other things: circumstances under which market quotations will be deemed readily available; selection of third party pricing vendors; appropriate pricing methodologies; events that require fair valuation and fair value techniques; circumstances under which securities will be deemed to pose a potential for stale pricing, including when securities are illiquid, restricted, or in default; and certain delegations of authority to determine fair values to the Fund's investment manager. The Committee may also meet to discuss additional valuation matters, which may include review of back-testing results, review of time-sensitive information or approval of other valuation related actions, and to review the appropriateness of the Policies.
For investments categorized as Level 3, the significant unobservable inputs used in the fair value measurement of the Funds' securities may include: (i) data specific to the issuer or comparable issuers, (ii) general market or specific sector news and (iii) quoted prices and specific or similar security transactions. The Committee considers this data and any changes from prior periods in order to assess the reasonableness of observable and unobservable inputs, any assumptions or internal models used to value those securities and changes in fair value. Significant changes in any of these factors could result in lower or higher fair value measurements. Various factors impact the frequency of monitoring (which may occur as often as daily), however the Committee may determine that changes to inputs, assumptions and models are not required with the same frequency.
The following table summarizes the inputs used, as of December 31, 2013, in valuing the Fund's assets:
Investment Type | | Quoted Prices
(Level 1) | | Other
Significant
Observable
Inputs
(Level 2) | | Significant
Unobservable
Inputs
(Level 3) | | Total | |
Equities | |
Information | | $ | 5,472,691,803 | | | $ | 177,541,897 | | | $ | - | | | $ | 5,650,233,700 | | |
Industrial Goods & Services | | | 4,488,634,219 | | | | 245,104,714 | | | | - | | | | 4,733,738,933 | | |
Consumer Goods & Services | | | 3,118,346,557 | | | | 206,385,774 | | | | - | | | | 3,324,732,331 | | |
Finance | | | 2,421,667,873 | | | | 31,333,250 | | | | - | | | | 2,453,001,123 | | |
Health Care | | | 1,858,720,934 | | | | - | | | | 15,260,404 | | | | 1,873,981,338 | | |
Energy & Minerals | | | 1,352,769,442 | | | | 60,722,412 | | | | 13,969,884 | | | | 1,427,461,738 | | |
Other Industries | | | 1,211,632,799 | | | | 118,550,788 | | | | - | | | | 1,330,183,587 | | |
Total Equities | | | 19,924,463,627 | | | | 839,638,835 | | | | 29,230,288 | | | | 20,793,332,750 | | |
Total Short-Term Investments | | | 747,563,245 | | | | - | | | | - | | | | 747,563,245 | | |
Total Securities Lending Collateral | | | 337,873,354 | | | | - | | | | - | | | | 337,873,354 | | |
Total Investments | | $ | 21,009,900,226 | | | $ | 839,638,835 | | | $ | 29,230,288 | | | $ | 21,878,769,349 | | |
The Fund's assets assigned to the Level 2 input category are generally valued using a market approach, in which a security's value is determined through its correlation to prices and information from observable market transactions for similar or identical assets. Foreign equities are generally valued at the last sale price on the foreign exchange or market on which they trade. The Fund may use a statistical fair valuation model, in accordance with the policy adopted by the Board, provided by an independent third party to value securities principally traded in foreign markets in order to adjust for possible stale pricing that may occur between the close of the foreign exchanges and the time for valuation. These models take into account available market data including intraday index, ADR, and ETF movements. Securities acquired via private placement that have a holding period or an extended settlement period are valued at a discount to the same shares that are trading freely on the market. These discounts are determined by the investment manager's experience with similar securities or situations. Factors may include, but are not limited to, trade volume, shares outstanding and stock price.
The following table shows transfers between Level 1 and Level 2 of the fair value hierarchy:
Transfers In | | Transfers Out | |
| Level 1 | | Level 2 | | Level 1 | | Level 2 | |
| $ | 434,636 | | | $ | - | | | $ | - | | | $ | 434,636 | | |
Financial assets were transferred from Level 2 to Level 1 as trading resumed during the period.
The Fund does not hold any significant investments categorized as Level 3.
Certain common stock classified as Level 3 are valued at fair value, using a market approach, as determined in good faith under consistently applied procedures established by and under the general supervision of the Board. To determine fair value for these securities, for which no market exists, the Committee utilizes the valuation technique it deems most appropriate in the circumstances, using some unobservable inputs, which may include, but are not limited to, estimated earnings of the company and the position of the security within the company's capital structure. The Committee also may use some observable inputs, which may include, but are not limited to, trades of similar securities and market multiples derived from a set of comparable companies. Significant increases or decreases to any of these inputs could result in a significantly lower or higher fair value measurement.
See accompanying notes to financial statements.
41
Columbia Acorn International
Major Portfolio Changes in the Fourth Quarter (Unaudited)
| | | Number of Shares | |
| | | 9/30/13 | | 12/31/13 | |
Purchases | |
Asia | |
| > Japan | |
Aica Kogyo | | | 1,401,000 | | | | 1,658,000 | | |
Aozora Bank | | | 7,210,000 | | | | 11,000,000 | | |
Benesse | | | 730,000 | | | | 959,800 | | |
Hikari Tsushin | | | 0 | | | | 255,800 | | |
Itochu Techno-Science | | | 503,000 | | | | 566,700 | | |
JIN | | | 234,400 | | | | 930,000 | | |
Kuraray | | | 2,010,100 | | | | 2,378,100 | | |
Makita | | | 0 | | | | 500,000 | | |
MonotaRO | | | 350,000 | | | | 800,000 | | |
Nabtesco | | | 1,268,000 | | | | 1,443,000 | | |
NOF | | | 926,000 | | | | 3,409,000 | | |
OBIC | | | 135,300 | | | | 755,000 | | |
Omron | | | 905,000 | | | | 1,071,000 | | |
OSG | | | 1,450,000 | | | | 1,600,000 | | |
Shimano | | | 172,000 | | | | 293,000 | | |
Tamron | | | 0 | | | | 573,700 | | |
| > Hong Kong | |
Kingboard Chemicals | | | 8,866,000 | | | | 11,287,000 | | |
| > Taiwan | |
Ginko International | | | 1,868,000 | | | | 2,100,000 | | |
Lite-On Technology | | | 14,019,253 | | | | 20,116,253 | | |
President Chain Store | | | 2,673,000 | | | | 2,930,000 | | |
St. Shine Optical | | | 2,199,000 | | | | 2,350,000 | | |
| > Korea | |
AmorePacific Group | | | 0 | | | | 17,583 | | |
| > China | |
58.com - ADR | | | 0 | | | | 239,400 | | |
Biostime | | | 4,524,000 | | | | 4,600,000 | | |
Sihuan Pharmaceuticals | | | 0 | | | | 4,864,000 | | |
SouFun - ADR | | | 0 | | | | 241,797 | | |
| > Singapore | |
CDL Hospitality Trust | | | 18,784,000 | | | | 20,000,000 | | |
Petra Foods | | | 4,772,000 | | | | 6,220,000 | | |
Super Group | | | 7,000,000 | | | | 9,780,000 | | |
| > Indonesia | |
Ace Indonesia | | | 250,000,000 | | | | 400,000,001 | | |
Arwana Citramulia | | | 69,428,000 | | | | 97,713,000 | | |
Matahari Department Store | | | 10,917,000 | | | | 14,292,500 | | |
| > Philippines | |
Puregold Price Club | | | 4,530,200 | | | | 19,000,000 | | |
Robinsons Retail Holdings | | | 0 | | | | 12,138,840 | | |
Security Bank | | | 5,831,244 | | | | 6,960,000 | | |
SM Prime Holdings | | | 42,000,000 | | | | 50,000,000 | | |
| > Malaysia | |
Aeon | | | 1,918,200 | | | | 5,000,000 | | |
| | | Number of Shares | |
| | | 9/30/13 | | 12/31/13 | |
Europe | |
| > United Kingdom | |
Aggreko | | | 875,000 | | | | 1,025,000 | | |
AVEVA | | | 584,273 | | | | 908,500 | | |
Babcock International | | | 2,257,802 | | | | 2,515,000 | | |
Fidessa Group | | | 708,000 | | | | 958,646 | | |
PureCircle | | | 3,100,000 | | | | 3,234,993 | | |
| RPS Group | | | 0 | | | | 3,676,860 | | |
Smith & Nephew | | | 2,709,000 | | | | 3,240,000 | | |
Spirax Sarco | | | 1,214,089 | | | | 1,500,000 | | |
| > Germany | |
NORMA Group | | | 727,453 | | | | 795,000 | | |
| > Switzerland | |
INFICON | | | 54,886 | | | | 72,500 | | |
| > Netherlands | |
Vopak | | | 266,124 | | | | 404,124 | | |
| > Spain | |
Prosegur | | | 0 | | | | 3,116,681 | | |
Viscofan | | | 570,000 | | | | 700,000 | | |
| > Finland | |
Tikkurila | | | 1,472,689 | | | | 1,669,000 | | |
Vacon | | | 582,500 | | | | 613,433 | | |
| > Russia | |
Moscow Exchange | | | 4,260,219 | | | | 12,636,000 | | |
QIWI - ADR | | | 400,000 | | | | 498,947 | | |
Yandex | | | 1,167,000 | | | | 1,548,874 | | |
| > Norway | |
Orkla | | | 2,876,245 | | | | 4,154,000 | | |
Other Countries | |
| > South Africa | |
Coronation Fund Managers | | | 13,888,359 | | | | 14,231,161 | | |
| > Canada | |
DeeThree Exploration | | | 2,983,324 | | | | 3,298,377 | | |
Trilogy Energy | | | 0 | | | | 766,000 | | |
| > Australia | |
Austbrokers | | | 1,166,443 | | | | 1,500,000 | | |
IAG | | | 10,200,000 | | | | 11,200,000 | | |
Orora | | | 0 | | | | 3,816,000 | | |
SAI Global | | | 9,863,787 | | | | 10,000,000 | | |
| > United States | |
Hornbeck Offshore | | | 439,500 | | | | 576,500 | | |
| > New Zealand | |
Sky City Entertainment | | | 1,622,847 | | | | 7,000,000 | | |
See accompanying notes to financial statements.
42
| | | Number of Shares | |
| | | 9/30/13 | | 12/31/13 | |
Purchases (continued) | |
Latin America | |
| > Brazil | |
Beadell Resources | | | 55,632,340 | | | | 58,937,078 | | |
Linx | | | 1,000,000 | | | | 1,500,000 | | |
| > Mexico | |
Qualitas | | | 13,782,000 | | | | 14,432,000 | | |
| | | Number of Shares | |
| | | 9/30/13 | | 12/31/13 | |
Sales | |
Asia | |
| > Japan | |
Ain Pharmaciez | | | 569,292 | | | | 473,292 | | |
Daiseki | | | 1,680,000 | | | | 1,580,000 | | |
Disco | | | 458,400 | | | | 388,400 | | |
Hirose Electric | | | 229,400 | | | | 203,400 | | |
Hoshizaki Electric | | | 1,276,300 | | | | 950,000 | | |
Japan Airport Terminal | | | 1,610,000 | | | | 1,450,000 | | |
Kintetsu World Express | | | 879,000 | | | | 816,000 | | |
Miraca Holdings | | | 603,706 | | | | 535,706 | | |
Nakanishi | | | 270,000 | | | | 220,000 | | |
NGK Insulators | | | 2,260,000 | | | | 1,295,000 | | |
NGK Spark Plug | | | 2,570,000 | | | | 1,584,000 | | |
Seven Bank | | | 10,560,000 | | | | 7,648,000 | | |
Sintokogio | | | 1,628,300 | | | | 278,300 | | |
Start Today | | | 1,480,000 | | | | 1,270,000 | | |
Toyo Suisan Kaisha | | | 1,040,900 | | | | 958,900 | | |
Wacom | | | 5,800,000 | | | | 3,388,000 | | |
| > Hong Kong | |
| ASM Pacific | | | 1,799,800 | | | | 537,900 | | |
Lifestyle International | | | 14,000,000 | | | | 12,625,500 | | |
L'Occitane International | | | 9,215,750 | | | | 0 | | |
Mapletree Greater China
Commercial Trust | | | 30,000,000 | | | | 25,000,000 | | |
| > Taiwan | |
Advantech | | | 5,219,000 | | | | 4,499,000 | | |
CHC Healthcare | | | 269,866 | | | | 0 | | |
Chipbond | | | 11,158,183 | | | | 0 | | |
CTCI Corp | | | 21,218,000 | | | | 15,370,000 | | |
Far EasTone Telecom | | | 39,877,000 | | | | 29,700,000 | | |
Flexium Interconnect | | | 6,089,262 | | | | 3,230,262 | | |
Lung Yen | | | 2,933,000 | | | | 0 | | |
Radiant Opto-Electronics | | | 4,043,000 | | | | 2,064,000 | | |
Taiwan Hon Chuan | | | 8,366,000 | | | | 0 | | |
Taiwan Mobile | | | 15,600,000 | | | | 7,320,000 | | |
| > Korea | |
Coway | | | 682,580 | | | | 497,580 | | |
Handsome | | | 563,431 | | | | 0 | | |
iMarketKorea | | | 502,644 | | | | 0 | | |
Lotte Chilsung Beverage | | | 16,200 | | | | 2,093 | | |
| > China | |
Digital China | | | 4,561,300 | | | | 0 | | |
| > Singapore | |
Goodpack Limited | | | 1,191,000 | | | | 0 | | |
Mapletree Industrial Trust | | | 20,000,000 | | | | 15,000,000 | | |
Mapletree Logistics Trust | | | 25,000,000 | | | | 19,032,000 | | |
| > Indonesia | |
Tower Bersama Infrastructure | | | 48,636,500 | | | | 48,000,000 | | |
See accompanying notes to financial statements.
43
Columbia Acorn International
Major Portfolio Changes in the Fourth Quarter (Unaudited), continued
| | | Number of Shares | |
| | | 9/30/13 | | 12/31/13 | |
Sales (continued) | |
Asia—continued | |
| > India | |
Redington India | | | 13,195,000 | | | | 12,909,000 | | |
TTK Prestige | | | 125,000 | | | | 95,500 | | |
| > Philippines | |
Int'l Container Terminal | | | 7,000,000 | | | | 3,336,920 | | |
| > Mongolia | |
Mongolian Mining | | | 62,976,200 | | | | 0 | | |
Turquoise Hill Resources | | | 1,964,621 | | | | 0 | | |
Europe | |
| > United Kingdom | |
Elementis | | | 7,760,000 | | | | 7,250,000 | | |
Halford's | | | 4,577,000 | | | | 3,218,000 | | |
Tullow Oil | | | 382,581 | | | | 283,581 | | |
WH Smith | | | 3,186,211 | | | | 2,789,621 | | |
| > France | |
Saft | | | 1,002,314 | | | | 820,000 | | |
| > Germany | |
TAG Immobilien | | | 2,580,000 | | | | 2,350,000 | | |
| > Switzerland | |
Partners Group | | | 302,300 | | | | 286,300 | | |
| > Netherlands | |
Aalberts Industries | | | 2,971,770 | | | | 2,750,770 | | |
Fugro | | | 520,900 | | | | 214,891 | | |
UNIT4 | | | 1,514,545 | | | | 0 | | |
| > Sweden | |
Hexagon | | | 2,747,522 | | | | 2,655,522 | | |
Unibet | | | 868,700 | | | | 843,196 | | |
| > Denmark | |
Jyske Bank | | | 788,000 | | | | 709,000 | | |
| > Italy | |
Geox | | | 4,567,745 | | | | 0 | | |
| > Portugal | |
Redes Energéticas Nacionais | | | 4,123,318 | | | | 0 | | |
Other Countries | |
| > Canada | |
Alliance Grain Traders | | | 858,539 | | | | 0 | | |
CCL Industries | | | 1,303,772 | | | | 1,113,772 | | |
Pan Orient | | | 1,607,306 | | | | 1,151,238 | | |
| > Australia | |
Commonwealth Property
Office Fund | | | 24,418,249 | | | | 0 | | |
| > United States | |
Atwood Oceanics | | | 952,080 | | | | 772,080 | | |
| | | Number of Shares | |
| | | 9/30/13 | | 12/31/13 | |
Latin America | |
| > Mexico | |
Bolsa Mexicana de Valores | | | 2,975,535 | | | | 0 | | |
Genomma Lab Internacional | | | 18,255,800 | | | | 15,972,815 | | |
Gruma | | | 6,090,000 | | | | 3,466,000 | | |
| > Chile | |
Empresas Hites | | | 23,280,000 | | | | 23,162,664 | | |
See accompanying notes to financial statements.
44
Columbia Acorn International
Statement of Investments, December 31, 2013
Number of Shares | | | | Value | |
| | | | | | | Equities: 96.9% | |
Asia 43.0% | | | |
| | | > Japan 20.0% | |
| | 4,784,600 | | | Kansai Paint | | $ | 70,754,339 | | |
| | | | | Paint Producer in Japan, India,
China & Southeast Asia | | | | | |
| | 1,071,000 | | | Omron | | | 47,331,010 | | |
| | | | | Electric Components for
Factory Automation | | | | | |
| | 2,300,000 | | | Park24 | | | 43,375,484 | | |
| | | | | Parking Lot Operator | | | | | |
| | 33,000 | | | Orix JREIT | | | 41,284,727 | | |
| | | | | Diversified REIT | | | | | |
| | 930,000 | | | JIN (a) | | | 39,345,055 | | |
| | | | | Eyeglasses Retailer | | | | | |
| | 501,000 | | | Rinnai | | | 39,032,009 | | |
| | | | | Gas Appliances for Household &
Commercial Use | | | | | |
| | 959,800 | | | Benesse | | | 38,559,245 | | |
| | | | | Education Service Provider | | | | | |
| | 1,584,000 | | | NGK Spark Plug | | | 37,541,789 | | |
| | | | | Automobile Parts | | | | | |
| | 1,400,000 | | | Glory | | | 36,332,783 | | |
| | | | | Currency Handling Systems &
Related Equipment | | | | | |
| | 7,651 | | | Kenedix Realty Investment (a) | | | 36,312,908 | | |
| | | | | Tokyo Mid-size Office REIT | | | | | |
| | 1,456,000 | | | Ariake Japan | | | 35,857,936 | | |
| | | | | Manufacturer of Soup/Sauce Extracts | | | | | |
| | 950,000 | | | Hoshizaki Electric | | | 33,782,667 | | |
| | | | | Commercial Kitchen Equipment | | | | | |
| | 1,443,000 | | | Nabtesco | | | 33,302,684 | | |
| | | | | Machinery Components | | | | | |
| | 2,329,000 | | | Nippon Kayaku | | | 33,120,389 | | |
| | | | | Functional Chemicals,
Pharmaceuticals & Auto
Safety Systems | | | | | |
| | 816,000 | | | Kintetsu World Express | | | 32,834,290 | | |
| | | | | Airfreight Logistics | | | | | |
| | 1,450,000 | | | Japan Airport Terminal | | | 32,815,962 | | |
| | | | | Airport Terminal Operator at Haneda | | | | | |
| | 1,658,000 | | | Aica Kogyo | | | 32,790,566 | | |
| | | | | Laminated Sheets, Building
Materials & Chemical Adhesives | | | | | |
| | 1,270,000 | | | Start Today | | | 31,579,203 | | |
| | | | | Online Japanese Apparel Retailer | | | | | |
| | 220,000 | | | Nakanishi | | | 31,433,425 | | |
| | | | | Dental Tools & Machinery | | | | | |
| | 2,350,000 | | | Ushio | | | 31,235,916 | | |
| | | | | Industrial Light Sources | | | | | |
| | 11,000,000 | | | Aozora Bank | | | 31,172,774 | | |
| | | | | Commercial Bank | | | | | |
| | 1,580,000 | | | Daiseki | | | 30,938,458 | | |
| | | | | Waste Disposal & Recycling | | | | | |
| | 3,156 | | | Nippon Prologis REIT | | | 30,231,215 | | |
| | | | | Logistics REIT in Japan | | | | | |
| | 7,648,000 | | | Seven Bank | | | 29,911,821 | | |
| | | | | ATM Processing Services | | | | | |
| | 203,400 | | | Hirose Electric | | | 28,994,927 | | |
| | | | | Electrical Connectors | | | | | |
Number of Shares | | | | Value | |
| | 958,900 | | | Toyo Suisan Kaisha | | $ | 28,806,104 | | |
| | | | | Instant Noodle Manufacturer | | | | | |
| | 709,500 | | | Hamamatsu Photonics | | | 28,390,768 | | |
| | | | | Optical Sensors for Medical &
Industrial Applications | | | | | |
| | 2,378,100 | | | Kuraray | | | 28,386,906 | | |
| | | | | Special Resin, Fine Chemical,
Fibers & Textures | | | | | |
| | 1,530,000 | | | Suruga Bank | | | 27,474,569 | | |
| | | | | Regional Bank | | | | | |
| | 1,600,000 | | | OSG | | | 27,169,988 | | |
| | | | | Consumable Cutting Tools | | | | | |
| | 581,600 | | | Santen Pharmaceutical | | | 27,098,056 | | |
| | | | | Specialty Pharma
(Ophthalmic Medicine) | | | | | |
| | 500,000 | | | Makita | | | 26,296,332 | | |
| | | | | Power Tools | | | | | |
| | 3,850 | | | Global One Real Estate | | | 26,143,082 | | |
| | | | | Office REIT | | | | | |
| | 388,400 | | | Disco | | | 25,779,306 | | |
| | | | | Semiconductor Dicing &
Grinding Equipment | | | | | |
| | 808,200 | | | Misumi Group | | | 25,410,239 | | |
| | | | | Industrial Components Distributor | | | | | |
| | 535,706 | | | Miraca Holdings | | | 25,272,626 | | |
| | | | | Outsourced Lab Testing, Diagnostic
Equipment & Reagents | | | | | |
| | 293,000 | | | Shimano | | | 25,153,813 | | |
| | | | | Manufacturer of Bicycle
Components & Fishing Tackle | | | | | |
| | 1,295,000 | | | NGK Insulators | | | 24,644,993 | | |
| | | | | Ceramic Products for Auto,
Power & Electronics | | | | | |
| | 532,000 | | | FamilyMart | | | 24,305,234 | | |
| | | | | Convenience Store Operator | | | | | |
| | 3,409,000 | | | NOF | | | 24,268,304 | | |
| | | | | Specialty Chemicals, Life Science &
Rocket Fuels | | | | | |
| | 3,388,000 | | | Wacom | | | 23,822,656 | | |
| | | | | Computer Graphic Illustration Devices | | | | | |
| | 1,122,080 | | | Nihon Parkerizing | | | 23,432,027 | | |
| | | | | Metal Surface Treatment Agents &
Processing Service | | | | | |
| | 473,292 | | | Ain Pharmaciez | | | 23,244,017 | | |
| | | | | Dispensing Pharmacy/Drugstore
Operator | | | | | |
| | 566,700 | | | Itochu Techno-Science | | | 22,970,259 | | |
| | | | | IT Network Equipment Sales & Services | | | | | |
| | 539,000 | | | Sanrio (a) | | | 22,695,820 | | |
| | | | | Character Goods & Licensing | | | | | |
| | 1,600,000 | | | Doshisha | | | 22,551,380 | | |
| | | | | Wholesaler of Household Products | | | | | |
| | 314,800 | | | FP Corporation | | | 22,445,604 | | |
| | | | | Disposable Food Trays & Containers | | | | | |
| | 571,080 | | | Milbon | | | 22,352,161 | | |
| | | | | Manufacturer of Hair Products | | | | | |
| | 755,000 | | | OBIC | | | 22,308,462 | | |
| | | | | Computer Software | | | | | |
| | 2,100,000 | | | Asahi Diamond Industrial | | | 21,599,783 | | |
| | | | | Consumable Diamond Tools | | | | | |
See accompanying notes to financial statements.
45
Columbia Acorn International
Statement of Investments, continued
Number of Shares | | | | Value | |
| | | > Japan—continued | |
| | 1,297,000 | | | Nippon Paint | | $ | 21,579,614 | | |
| | | | | Paints for Automotive, Decorative &
Industrial Usage | | | | | |
| | 2,580 | | | Industrial &
Infrastructure Fund (a) | | | 21,497,618 | | |
| | | | | Industrial REIT in Japan | | | | | |
| | 835,000 | | | Icom (b) | | | 20,148,587 | | |
| | | | | Two Way Radio
Communication Equipment | | | | | |
| | 255,800 | | | Hikari Tsushin | | | 19,296,444 | | |
| | | | | Distribution of Office
IT/Mobiles/Insurance | | | | | |
| | 800,000 | | | MonotaRO (a) | | | 16,287,463 | | |
| | | | | Online MRO (Maintenance, Repair,
Operations) Goods Distributor
in Japan | | | | | |
| | 573,700 | | | Tamron | | | 13,916,371 | | |
| | | | | Camera Lens Maker | | | | | |
| | 2,099 | | | Mori Hills REIT Investment | | | 13,909,489 | | |
| | | | | Tokyo-centric Diversified REIT | | | | | |
| | 1,575,000 | | | Lifenet Insurance (a)(c) | | | 8,160,492 | | |
| | | | | Online Life Insurance Company
in Japan | | | | | |
| | 278,300 | | | Sintokogio | | | 2,090,109 | | |
| | | | | Automated Casting Machines, Surface
Treatment System & Consumables | | | | | |
| | | | 1,668,780,258 | | |
| | | > Hong Kong 4.8% | |
| | 3,000,000 | | | Melco Crown
Entertainment - ADR (c) | | | 117,660,000 | | |
| | | | | Macau Casino Operator | | | | | |
| | 20,000,000 | | | Melco International | | | 73,775,345 | | |
| | | | | Macau Casino Operator | | | | | |
| | 10,000,000 | | | MGM China Holdings | | | 42,798,701 | | |
| | | | | Macau Casino Operator | | | | | |
| | 30,000,000 | | | Sa Sa International | | | 35,237,707 | | |
| | | | | Cosmetics Retailer | | | | | |
| | 20,000,000 | | | Vitasoy International | | | 30,838,035 | | |
| | | | | Hong Kong Soy Food Brand | | | | | |
| | 11,287,000 | | | Kingboard Chemicals | | | 29,541,683 | | |
| | | | | Paper & Glass Laminates, PCB,
Specialty Chemicals & Properties | | | | | |
| | 12,625,500 | | | Lifestyle International | | | 23,380,857 | | |
| | | | | Mid- to High-end Department Store
Operator in Hong Kong & China | | | | | |
| | 4,687,000 | | | AAC Technologies | | | 22,805,945 | | |
| | | | | Miniature Acoustic Components | | | | | |
| | 25,000,000 | | | Mapletree Greater China
Commercial Trust | | | 16,670,312 | | |
| | | | | Retail & Office Property Landlord | | | | | |
| | 537,900 | | | ASM Pacific | | | 4,501,981 | | |
| | | | | Semi Back-end & Surface
Mounting Equipment | | | | | |
| | | | 397,210,566 | | |
| | | > Taiwan 4.8% | |
| | 2,350,000 | | | St. Shine Optical | | | 67,242,092 | | |
| | | | | World's Leading Disposable Contact
Lens OEM (Original Equipment
Manufacturer) | | | | | |
Number of Shares | | | | Value | |
| | 29,700,000 | | | Far EasTone Telecom | | $ | 65,247,079 | | |
| | | | | Taiwan's Third Largest Mobile
Operator | | | | | |
| | 7,306,000 | | | Delta Electronics | | | 41,837,727 | | |
| | | | | Industrial Automation, Switching
Power Supplies & Passive
Components | | | | | |
| | 2,100,000 | | | Ginko International | | | 39,666,767 | | |
| | | | | Largest Contact Lens Maker in China | | | | | |
| | 20,116,253 | | | Lite-On Technology | | | 32,328,070 | | |
| | | | | Mobile Device, LED & PC Server
Component Supplier | | | | | |
| | 4,499,000 | | | Advantech | | | 31,213,932 | | |
| | | | | Industrial PC & Components | | | | | |
| | 15,370,000 | | | CTCI Corp | | | 24,948,358 | | |
| | | | | International Engineering Firm | | | | | |
| | 7,320,000 | | | Taiwan Mobile | | | 23,659,794 | | |
| | | | | Taiwan's Second Largest Mobile
Operator | | | | | |
| | 2,930,000 | | | President Chain Store | | | 20,343,085 | | |
| | | | | Convenience Chain Store Operator | | | | | |
| | 2,027,000 | | | PC Home | | | 16,288,099 | | |
| | | | | Taiwanese Internet Retail Company | | | | | |
| | 7,568,000 | | | Chroma Ate | | | 15,902,578 | | |
| | | | | Automatic Test Systems, Testing &
Measurement Instruments | | | | | |
| | 3,230,262 | | | Flexium Interconnect | | | 10,435,696 | | |
| | | | | Flexible Printed Circuit for Mobile
Electronics | | | | | |
| | 2,064,000 | | | Radiant Opto-Electronics | | | 7,571,233 | | |
| | | | | LCD Back Light Units & Modules | | | | | |
| | | | 396,684,510 | | |
| | | > Korea 2.7% | |
| | 1,424,261 | | | Paradise Co | | | 35,727,092 | | |
| | | | | Korean 'Foreigner Only'
Casino Operator | | | | | |
| | 74,400 | | | KCC | | | 33,083,144 | | |
| | | | | Paint & Housing Material
Manufacturer | | | | | |
| | 510,998 | | | LS Industrial Systems | | | 31,859,867 | | |
| | | | | Manufacturer of Electrical &
Automation Equipment | | | | | |
| | 497,580 | | | Coway | | | 31,346,310 | | |
| | | | | Household Appliance Rental
Service Provider | | | | | |
| | 246,300 | | | CJ Corp | | | 27,242,327 | | |
| | | | | Holding Company of Korean
Consumer Conglomerate | | | | | |
| | 465,540 | | | Kepco Plant Service &
Engineering | | | 24,186,635 | | |
| | | | | Power Plant & Grid Maintenance | | | | | |
| | 545,000 | | | Samsung Securities | | | 22,787,893 | | |
| | | | | Brokerage & Wealth Management | | | | | |
| | 704,000 | | | Nexen Tire | | | 9,729,141 | | |
| | | | | Tire Manufacturer | | | | | |
| | 17,583 | | | AmorePacific Group | | | 7,757,220 | | |
| | | | | Holding Company of Korea's
Leading Cosmetics Manufacturer | | | | | |
| | 2,093 | | | Lotte Chilsung Beverage | | | 3,024,423 | | |
| | | | | Beverages & Liquor Manufacturer | | | | | |
| | | | 226,744,052 | | |
See accompanying notes to financial statements.
46
Number of Shares | | | | Value | |
| | | > China 2.4% | |
| | 2,357,000 | | | WuXi PharmaTech - ADR (c) | | $ | 90,461,660 | | |
| | | | | Largest Contract Research
Organization Business in China | | | | | |
| | 4,600,000 | | | Biostime (a) | | | 41,082,454 | | |
| | | | | Pediatric Nutrition & Baby Care
Products Provider | | | | | |
| | 241,797 | | | SouFun - ADR (a) | | | 19,926,491 | | |
| | | | | Chinese Real Estate Internet Portal | | | | | |
| | 35,119,000 | | | AMVIG Holdings | | | 16,711,903 | | |
| | | | | Chinese Tobacco Packaging
Material Supplier | | | | | |
| | 11,020,000 | | | Want Want | | | 15,949,746 | | |
| | | | | Chinese Branded Consumer
Food Company | | | | | |
| | 239,400 | | | 58.com - ADR (a)(c) | | | 9,178,596 | | |
| | | | | Online Classified Service Provider | | | | | |
| | 4,864,000 | | | Sihuan Pharmaceuticals | | | 4,451,269 | | |
| | | | | Leading Chinese Generic
Drug Manufacturer | | | | | |
| | | | 197,762,119 | | |
| | | > Singapore 2.2% | |
| | 40,000,000 | | | Mapletree Commercial Trust | | | 37,819,026 | | |
| | | | | Retail & Office Property Landlord | | | | | |
| | 9,780,000 | | | Super Group | | | 29,527,703 | | |
| | | | | Instant Food & Beverages in
Southeast Asia | | | | | |
| | 20,000,000 | | | CDL Hospitality Trust | | | 26,003,883 | | |
| | | | | Hotel Owner/Operator | | | | | |
| | 13,500,000 | | | Ascendas REIT | | | 23,626,920 | | |
| | | | | Industrial Property Landlord | | | | | |
| | 3,800,000 | | | Singapore Exchange | | | 21,913,038 | | |
| | | | | Singapore Equity & Derivatives
Market Operator | | | | | |
| | 19,032,000 | | | Mapletree Logistics Trust | | | 15,929,646 | | |
| | | | | Industrial Property Landlord | | | | | |
| | 15,000,000 | | | Mapletree Industrial Trust | | | 15,893,724 | | |
| | | | | Industrial Property Landlord | | | | | |
| | 6,220,000 | | | Petra Foods | | | 15,870,994 | | |
| | | | | Cocoa Processor & Chocolate
Manufacturer | | | | | |
| | | | 186,584,934 | | |
| | | > India 1.5% | |
| | 3,423,265 | | | Asian Paints | | | 27,155,847 | | |
| | | | | India's Largest Paint Company | | | | | |
| | 1,655,000 | | | United Breweries | | | 20,729,353 | | |
| | | | | India's Largest Brewer | | | | | |
| | 920,000 | | | Colgate Palmolive India | | | 20,142,963 | | |
| | | | | Consumer Products in Oral Care | | | | | |
| | 7,500,000 | | | Adani Ports & Special
Economic Zone | | | 18,885,398 | | |
| | | | | Indian West Coast Shipping Port | | | | | |
| | 12,909,000 | | | Redington India | | | 15,647,874 | | |
| | | | | Supply Chain Solutions for IT &
Mobile Handsets in
Emerging Markets | | | | | |
| | 90,000 | | | Bosch | | | 14,661,019 | | |
| | | | | Automotive Parts | | | | | |
| | 95,500 | | | TTK Prestige | | | 5,376,391 | | |
| | | | | Branded Cooking Equipment | | | | | |
Number of Shares | | | | Value | |
| | 1,650,000 | | | SKIL Ports and Logistics (c) | | $ | 1,952,451 | | |
| | | | | Indian Container Port Project | | | | | |
| | | 124,551,296 | | |
| | | > Indonesia 1.4% | |
| | 31,764,600 | | | Archipelago
Resources (b)(d)(e)(f) | | | 27,352,305 | | |
| | | | | Gold Mining Projects in Indonesia,
Vietnam & Philippines | | | | | |
| | 48,000,000 | | | Tower Bersama
Infrastructure (c) | | | 22,907,640 | | |
| | | | | Communications Towers | | | | | |
| | 400,000,001 | | | Ace Indonesia | | | 19,419,094 | | |
| | | | | Home Improvement Retailer | | | | | |
| | 14,292,500 | | | Matahari Department Store (c) | | | 12,934,394 | | |
| | | | | Largest Department Store Chain
in Indonesia | | | | | |
| | 58,000,000 | | | Surya Citra Media | | | 12,514,762 | | |
| | | | | Free to Air TV Station in Indonesia | | | | | |
| | 5,600,000 | | | Mayora Indah | | | 11,993,107 | | |
| | | | | Consumer Branded Food
Manufacturer | | | | | |
| | 49,000,000 | | | MNC Skyvision | | | 8,064,617 | | |
| | | | | Largest Satellite Pay TV Operator
in Indonesia | | | | | |
| | 97,713,000 | | | Arwana Citramulia | | | 6,583,785 | | |
| | | | | Ceramic Tiles for Home Decoration | | | | | |
| | 1,721,000 | | | Mitra Adiperkasa | | | 777,773 | | |
| | | | | Operator of Department Store &
Specialty Retail Stores | | | | | |
| | | 122,547,477 | | |
| | | > Philippines 1.1% | |
| | 60,000,000 | | | Melco Crown (Philippines)
Resorts (c) | | | 18,536,302 | | |
| | | | | Integrated Resort Operator in Manila | | | | | |
| | 6,960,000 | | | Security Bank | | | 18,175,380 | | |
| | | | | Commercial Bank in Philippines | | | | | |
| | 50,000,000 | | | SM Prime Holdings | | | 16,600,302 | | |
| | | | | Shopping Mall Operator | | | | | |
| | 19,000,000 | | | Puregold Price Club | | | 16,261,682 | | |
| | | | | Supermarket Operator in Philippines | | | | | |
| | 12,138,840 | | | Robinsons Retail Holdings (c) | | | 15,097,481 | | |
| | | | | Multi-format Retailer in
Philippines | | | | | |
| | 3,336,920 | | | Int'l Container Terminal | | | 7,681,829 | | |
| | | | | Container Handling Terminals &
Port Management | | | | | |
| | | | 92,352,976 | | |
| | | > Thailand 1.0% | |
| | 116,666,667 | | | Home Product Center | | | 33,357,912 | | |
| | | | | Home Improvement Retailer | | | | | |
| | 16,000,000 | | | Robinson's Department Store | | | 23,513,026 | | |
| | | | | Department Store Operator
in Thailand | | | | | |
| | 4,500,000 | | | Airports of Thailand | | | 21,782,097 | | |
| | | | | Airport Operator of Thailand | | | | | |
| | 10,000,000 | | | Samui Airport Property Fund | | | 4,874,558 | | |
| | | | | Thai Airport Operator | | | | | |
| | | | 83,527,593 | | |
See accompanying notes to financial statements.
47
Columbia Acorn International
Statement of Investments, continued
Number of Shares | | | | Value | |
| | | > Cambodia 0.8% | |
| | 60,000,000 | | | Nagacorp | | $ | 63,379,199 | | |
| | | | | Casino/Entertainment Complex
in Cambodia | | | | | |
| | | > Malaysia 0.3% | |
| | 5,000,000 | | | Aeon | | | 21,370,783 | | |
| | | | | Shopping Center & Department
Store Operator | | | | | |
Asia: Total | | | 3,581,495,763 | | |
Europe 34.6% | | | |
| | | > United Kingdom 10.3% | |
| | 4,561,000 | | | Jardine Lloyd Thompson Group | | | 76,988,660 | | |
| | | | | International Business Insurance
Broker | | | | | |
| | 1,500,000 | | | Spirax Sarco | | | 74,446,234 | | |
| | | | | Steam Systems for Manufacturing &
Process Industries | | | | | |
| | 2,515,000 | | | Babcock International | | | 56,512,146 | | |
| | | | | Public Sector Outsourcer | | | | | |
| | 3,937,000 | | | Telecity | | | 47,361,233 | | |
| | | | | European Data Center Provider | | | | | |
| | 2,789,621 | | | WH Smith | | | 46,321,503 | | |
| | | | | Newsprint, Books & General
Stationery Retailer | | | | | |
| | 3,240,000 | | | Smith & Nephew | | | 46,275,912 | | |
| | | | | Medical Equipment & Supplies | | | | | |
| | 10,944,000 | | | Smiths News (b) | | | 42,769,609 | | |
| | | | | Newspaper & Magazine Distributor | | | | | |
| | 960,100 | | | Croda | | | 39,136,527 | | |
| | | | | Oleochemicals & Industrial
Chemicals | | | | | |
| | 3,565,000 | | | Shaftesbury | | | 37,125,216 | | |
| | | | | London Prime Retail REIT | | | | | |
| | 958,646 | | | Fidessa Group | | | 35,851,671 | | |
| | | | | Software for Financial
Trading Systems | | | | | |
| | 908,500 | | | AVEVA | | | 32,609,856 | | |
| | | | | Engineering Software | | | | | |
| | 34,752,000 | | | Cable and Wireless | | | 32,426,733 | | |
| | | | | Leading Telecoms Service Provider
in the Caribbean | | | | | |
| | 7,250,000 | | | Elementis | | | 32,369,022 | | |
| | | | | Clay-based Additives | | | | | |
| | 3,850,000 | | | Abcam | | | 31,303,249 | | |
| | | | | Online Sales of Antibodies | | | | | |
| | 3,234,993 | | | PureCircle (c) | | | 30,802,672 | | |
| | | | | Natural Sweeteners | | | | | |
| | 3,583,000 | | | Domino's Pizza UK & Ireland | | | 30,481,787 | | |
| | | | | Pizza Delivery in UK, Ireland &
Germany | | | | | |
| | 646,000 | | | Rightmove | | | 29,337,819 | | |
| | | | | Internet Real Estate Listings | | | | | |
| | 1,025,000 | | | Aggreko | | | 29,069,649 | | |
| | | | | Temporary Power & Temperature
Control Services | | | | | |
| | 464,002 | | | Whitbread | | | 28,876,875 | | |
| | | | | The UK's Leading Hotelier &
Coffee Shop | | | | | |
| | 3,218,000 | | | Halford's | | | 23,853,719 | | |
| | | | | The UK's Leading Retailer of
Leisure Goods & Auto Parts | | | | | |
Number of Shares | | | | Value | |
| | 3,676,860 | | | RPS Group | | $ | 20,450,755 | | |
| | | | | Consultant Specializing in Energy,
Water, Urban Planning,
Health & Safety | | | | | |
| | 1,864,319 | | | Ocado (c) | | | 13,673,688 | | |
| | | | | Leading Online Grocery Retailer | | | | | |
| | 160,000 | | | Intertek Group | | | 8,350,620 | | |
| | | | | Testing, Inspection, Certification
Services | | | | | |
| | 1,364,000 | | | Foxtons (c) | | | 7,562,950 | | |
| | | | | London-centric Residential Real
Estate Broker | | | | | |
| | 283,581 | | | Tullow Oil | | | 4,024,750 | | |
| | | | | Oil & Gas Producer | | | | | |
| | | | 857,982,855 | | |
| | | > France 3.6% | |
| | 1,107,000 | | | Neopost (a) | | | 85,424,428 | | |
| | | | | Postage Meter Machines | | | | | |
| | 314,000 | | | Eurofins Scientific | | | 84,987,425 | | |
| | | | | Food, Pharmaceuticals & Materials
Screening & Testing | | | | | |
| | 531,700 | | | Gemalto | | | 58,516,490 | | |
| | | | | Digital Security Solutions | | | | | |
| | 308,400 | | | Norbert Dentressangle | | | 39,668,842 | | |
| | | | | Leading European Logistics &
Transport Group | | | | | |
| | 820,000 | | | Saft | | | 28,197,966 | | |
| | | | | Niche Battery Manufacturer | | | | | |
| | 1,831,204 | | | Hi-Media (a)(c) | | | 4,711,248 | | |
| | | | | Online Advertiser in Europe | | | | | |
| | | | 301,506,399 | | |
| | | > Germany 3.1% | |
| | 1,663,000 | | | Wirecard | | | 65,825,352 | | |
| | | | | Online Payment Processing &
Risk Management | | | | | |
| | 148,295 | | | Rational | | | 49,194,138 | | |
| | | | | Commercial Ovens | | | | | |
| | 795,000 | | | NORMA Group | | | 39,521,401 | | |
| | | | | Clamps for Automotive &
Industrial Applications | | | | | |
| | 795,000 | | | Aurelius | | | 32,302,483 | | |
| | | | | European Turnaround Investor | | | | | |
| | 2,350,000 | | | TAG Immobilien | | | 28,424,835 | | |
| | | | | Owner of Residential Properties
in Germany | | | | | |
| | 595,000 | | | Elringklinger | | | 24,239,580 | | |
| | | | | Automobile Components | | | | | |
| | 90,000 | | | Bertrandt | | | 13,743,486 | | |
| | | | | Outsourced Engineering | | | | | |
| | 234,621 | | | Deutsche Beteiligungs | | | 6,692,507 | | |
| | | | | Private Equity Investment
Management | | | | | |
| | | | 259,943,782 | | |
| | | > Switzerland 2.8% | |
| | 286,300 | | | Partners Group | | | 76,353,085 | | |
| | | | | Private Markets Asset Management | | | | | |
| | 16,300 | | | Sika | | | 58,084,183 | | |
| | | | | Chemicals for Construction &
Industrial Applications | | | | | |
| | 179,000 | | | Geberit | | | 54,305,212 | | |
| | | | | Plumbing Supplies | | | | | |
See accompanying notes to financial statements.
48
Number of Shares | | | | Value | |
| | | > Switzerland—continued | |
| | 72,500 | | | INFICON | | $ | 28,003,203 | | |
| | | | | Gas Detection Instruments | | | | | |
| | 380,000 | | | Zehnder | | | 17,465,389 | | |
| | | | | Radiators & Heat Recovery
Ventilation Systems | | | | | |
| | | | 234,211,072 | | |
| | | > Netherlands 2.8% | |
| | 2,750,770 | | | Aalberts Industries | | | 87,803,119 | | |
| | | | | Flow Control & Heat Treatment | | | | | |
| | 1,178,288 | | | TKH Group | | | 41,185,967 | | |
| | | | | Dutch Industrial Conglomerate | | | | | |
| | 1,068,478 | | | Arcadis | | | 37,680,807 | | |
| | | | | Engineering Consultants | | | | | |
| | 143,395 | | | Core Labs | | | 27,381,275 | | |
| | | | | Oil & Gas Reservoir Consulting | | | | | |
| | 404,124 | | | Vopak | | | 23,658,331 | | |
| | | | | World's Largest Operator of
Petroleum & Chemical Storage
Terminals | | | | | |
| | 214,891 | | | Fugro | | | 12,818,583 | | |
| | | | | Subsea Oilfield Services | | | | | |
| | | | 230,528,082 | | |
| | | > Sweden 2.2% | |
| | 2,655,522 | | | Hexagon | | | 84,000,132 | | |
| | | | | Design, Measurement &
Visualization Software & Equipment | | | | | |
| | 3,255,024 | | | Sweco | | | 53,644,370 | | |
| | | | | Engineering Consultants | | | | | |
| | 843,196 | | | Unibet | | | 40,705,607 | | |
| | | | | European Online Gaming Operator | | | | | |
| | | | 178,350,109 | | |
| | | > Denmark 1.9% | |
| | 1,702,063 | | | SimCorp | | | 66,882,653 | | |
| | | | | Software for Investment Managers | | | | | |
| | 1,315,800 | | | Novozymes | | | 55,579,708 | | |
| | | | | Industrial Enzymes | | | | | |
| | 709,000 | | | Jyske Bank (c) | | | 38,335,246 | | |
| | | | | Danish Bank | | | | | |
| | | | 160,797,607 | | |
| | | > Spain 1.7% | |
| | 6,064,000 | | | Dia | | | 54,296,543 | | |
| | | | | Leading Hard Discounter in Spain,
Latin America & the Eastern
Mediterranean | | | | | |
| | 700,000 | | | Viscofan | | | 39,819,619 | | |
| | | | | Sausage Casings Maker | | | | | |
| | 700,745 | | | Bolsas y Mercados Españoles | | | 26,679,823 | | |
| | | | | Spanish Stock Markets | | | | | |
| | 3,116,681 | | | Prosegur | | | 21,389,862 | | |
| | | | | Security Guards | | | | | |
| | | | 142,185,847 | | |
| | | > Finland 1.5% | |
| | 613,433 | | | Vacon | | | 49,368,114 | | |
| | | | | Leading Independent Manufacturer
of Variable Speed Alternating
Current Drives | | | | | |
Number of Shares | | | | Value | |
| | 1,669,000 | | | Tikkurila | | $ | 45,691,241 | | |
| | | | | Decorative & Industrial Paint in
Scandinavia, Central &
Eastern Europe | | | | | |
| | 761,000 | | | Konecranes | | | 26,999,702 | | |
| | | | | Manufacture & Service of Industrial
Cranes & Port Handling Equipment | | | | | |
| | | | 122,059,057 | | |
| | | > Russia 1.4% | |
| | 1,548,874 | | | Yandex (c) | | | 66,833,913 | | |
| | | | | Search Engine for Russian &
Turkish Languages | | | | | |
| | 498,947 | | | QIWI - ADR | | | 27,941,032 | | |
| | | | | Electronic Payments Network
Serving Russia & the Commonwealth
of Independent States | | | | | |
| | 12,636,000 | | | Moscow Exchange | | | 24,971,567 | | |
| | | | | Russia's Main Exchange for
Stocks, Bonds, Derivatives,
Currencies & Repo | | | | | |
| | | | 119,746,512 | | |
| | | > Norway 1.1% | |
| | 4,154,000 | | | Orkla | | | 32,469,237 | | |
| | | | | Food & Brands, Aluminum,
Chemicals Conglomerate | | | | | |
| | 3,281,864 | | | Atea | | | 32,365,907 | | |
| | | | | Leading Nordic IT
Hardware/Software Reseller &
Installation Company | | | | | |
| | 1,321,000 | | | Subsea 7 | | | 25,324,747 | | |
| | | | | Offshore Subsea Contractor | | | | | |
| | | | 90,159,891 | | |
| | | > Kazakhstan 0.6% | |
| | 5,143,000 | | | Halyk Savings Bank of
Kazakhstan - GDR | | | 52,806,354 | | |
| | | | | Largest Retail Bank & Insurer
in Kazakhstan | | | | | |
| | | > Italy 0.6% | |
| | 2,984,000 | | | Pirelli | | | 51,623,574 | | |
| | | | | Global Tire Supplier | | | | | |
| | | > Iceland 0.4% | |
| | 28,312,499 | | | Marel (g) | | | 22,559,705 | | |
| | 7,670,000 | | | Marel (g) | | | 8,853,969 | | |
| | | | | Largest Manufacturer of Poultry &
Fish Processing Equipment | | | | | |
| | | | 31,413,674 | | |
| | | > Belgium 0.4% | |
| | 437,465 | | | EVS Broadcast Equipment | | | 28,332,612 | | |
| | | | | Digital Live Mobile Production
Software & Systems | | | | | |
| | | > Turkey 0.2% | |
| | 1,785,000 | | | Bizim Toptan | | | 19,644,137 | | |
| | | | | Cash & Carry Stores in Turkey | | | | | |
Europe: Total | | | 2,881,291,564 | | |
See accompanying notes to financial statements.
49
Columbia Acorn International
Statement of Investments, continued
Number of Shares | | | | Value | |
Other Countries 14.6% | | | |
| | | > South Africa 4.1% | |
| | 14,231,161 | | | Coronation Fund Managers | | $ | 108,614,952 | | |
| | | | | South African Fund Manager | | | | | |
| | 777,188 | | | Naspers | | | 81,351,751 | | |
| | | | | Media in Africa, China, Russia &
Other Emerging Markets | | | | | |
| | 19,098,300 | | | Rand Merchant Insurance | | | 50,012,272 | | |
| | | | | Directly Sold Property & Casualty
Insurance; Holdings in
Other Insurers | | | | | |
| | 2,644,083 | | | Mr. Price | | | 41,326,347 | | |
| | | | | South African Retailer of Apparel,
Household & Sporting Goods | | | | | |
| | 8,679,940 | | | Northam Platinum (c) | | | 34,879,240 | | |
| | | | | Platinum Mining in South Africa | | | | | |
| | 2,230,504 | | | Massmart Holdings | | | 27,660,051 | | |
| | | | | General Merchandise, Food &
Home Improvement Stores;
Wal-Mart Subsidiary | | | | | |
| | | | 343,844,613 | | |
| | | > Canada 3.9% | |
| | 1,113,772 | | | CCL Industries | | | 83,062,384 | | |
| | | | | Largest Global Label Converter | | | | | |
| | 1,084,597 | | | ShawCor | | | 43,373,670 | | |
| | | | | Oil & Gas Pipeline Products | | | | | |
| | 3,188,000 | | | CAE | | | 40,545,898 | | |
| | | | | Flight Simulator Equipment &
Training Centers | | | | | |
| | 653,200 | | | Onex Capital | | | 35,265,728 | | |
| | | | | Private Equity | | | | | |
| | 2,168,377 | | | DeeThree Exploration (c) | | | 19,535,296 | | |
| | 1,130,000 | | | DeeThree Exploration (c)(e) | | | 9,976,764 | | |
| | | | | Canadian Oil & Gas Producer | | | | | |
| | 609,828 | | | AG Growth (a) | | | 25,633,156 | | |
| | | | | Leading Manufacturer of Augers &
Grain Handling Equipment | | | | | |
| | 709,576 | | | Black Diamond Group | | | 20,039,802 | | |
| | | | | Accommodations/Equipment for
Oil Sands Development | | | | | |
| | 766,000 | | | Trilogy Energy (a) | | | 19,902,660 | | |
| | | | | Oil & Gas Producer in Canada | | | | | |
| | 1,901,514 | | | Horizon North Logistics (a) | | | 17,811,310 | | |
| | | | | Diversified Oil Service Offering in
Northern Canada | | | | | |
| | 263,857 | | | Baytex (a) | | | 10,343,145 | | |
| | | | | Oil & Gas Producer in Canada | | | | | |
| | 450,000 | | | Athabasca Oil Sands (c) | | | 2,745,117 | | |
| | | | | Oil Sands & Unconventional
Oil Development | | | | | |
| | 1,151,238 | | | Pan Orient (c) | | | 2,145,871 | | |
| | | | | Growth Oriented, Return Focused
Asian Explorer | | | | | |
| | | | 330,380,801 | | |
| | | > Australia 3.1% | |
| | 10,653,000 | | | Challenger Financial | | | 59,164,488 | | |
| | | | | Largest Annuity Provider | | | | | |
| | 11,200,000 | | | IAG | | | 58,314,372 | | |
| | | | | General Insurance Provider | | | | | |
Number of Shares | | | | Value | |
| | 3,500,000 | | | Domino's Pizza Enterprises | | $ | 50,565,860 | | |
| | | | | Domino's Pizza Operator in
Australia/New Zealand &
France/Benelux | | | | | |
| | 3,816,000 | | | Amcor | | | 36,045,146 | | |
| | | | | Global Leader in Flexible &
Rigid Packaging | | | | | |
| | 10,000,000 | | | SAI Global | | | 34,721,415 | | |
| | | | | Publishing, Certification,
Compliance Services | | | | | |
| | 1,500,000 | | | Austbrokers | | | 16,086,742 | | |
| | | | | Local Australian Small Business
Insurance Broker | | | | | |
| | 3,816,000 | | | Orora (c) | | | 3,952,476 | | |
| | | | | Australasia Fiber & Packaging | | | | | |
| | | | 258,850,499 | | |
| | | > United States 2.3% | |
| | 1,272,297 | | | Textainer Group Holdings (a) | | | 51,171,785 | | |
| | | | | Top International Container Leaser | | | | | |
| | 772,080 | | | Atwood Oceanics (c) | | | 41,221,351 | | |
| | | | | Offshore Drilling Contractor | | | | | |
| | 1,052,900 | | | Rowan (c) | | | 37,230,544 | | |
| | | | | Contract Offshore Driller | | | | | |
| | 601,213 | | | FMC Technologies (c) | | | 31,389,331 | | |
| | | | | Oil & Gas Well Head Manufacturer | | | | | |
| | 576,500 | | | Hornbeck Offshore (c) | | | 28,381,095 | | |
| | | | | Supply Vessel Operator
in U.S. Gulf of Mexico | | | | | |
| | | | 189,394,106 | | |
| | | > New Zealand 0.7% | |
| | 12,000,000 | | | Auckland International Airport | | | 34,850,413 | | |
| | | | | Auckland Airport Operator | | | | | |
| | 7,000,000 | | | Sky City Entertainment | | | 21,484,038 | | |
| | | | | Casino/Entertainment Complex | | | | | |
| | | | 56,334,451 | | |
| | | > Israel 0.5% | |
| | 791,000 | | | Caesarstone | | | 39,288,970 | | |
| | | | | Quartz Countertops | | | | | |
Other Countries: Total | | | 1,218,093,440 | | |
Latin America 4.7% | | | |
| | | > Brazil 1.8% | |
| | 4,000,000 | | | Localiza Rent A Car | | | 56,424,711 | | |
| | | | | Car Rental | | | | | |
| | 58,937,078 | | | Beadell Resources (b)(c) | | | 41,973,117 | | |
| | | | | Gold Mining in Brazil | | | | | |
| | 1,500,000 | | | Linx | | | 30,460,952 | | |
| | | | | Retail Management Software
in Brazil | | | | | |
| | 6,000,000 | | | Odontoprev | | | 24,999,470 | | |
| | | | | Dental Insurance | | | | | |
| | | | 153,858,250 | | |
| | | > Mexico 1.6% | |
| | 15,972,815 | | | Genomma Lab
Internacional (c) | | | 44,799,486 | | |
| | | | | Developer, Marketer & Distributor
of Consumer Products | | | | | |
| | 14,432,000 | | | Qualitas | | | 34,951,161 | | |
| | | | | Leading Auto Insurer in Mexico &
Central America | | | | | |
See accompanying notes to financial statements.
50
Number of Shares | | | | Value | |
| | | > Mexico—continued | |
| | 3,466,000 | | | Gruma (c) | | $ | 26,222,302 | | |
| | | | | Tortilla Producer & Distributor | | | | | |
| | 200,000 | | | Grupo Aeroportuario del
Sureste - ADR | | | 24,926,000 | | |
| | | | | Mexican Airport Operator | | | | | |
| | | | 130,898,949 | | |
| | | > Chile 0.5% | |
| | 814,000 | | | Sociedad Quimica y Minera
de Chile - ADR | | | 21,066,320 | | |
| | | | | Producer of Specialty Fertilizers,
Lithium & Iodine | | | | | |
| | 23,162,664 | | | Empresas Hites (b) | | | 16,318,118 | | |
| | | | | Mass Retailer for the Lower
Income Strata | | | | | |
| | | | 37,384,438 | | |
| | | > Guatemala 0.3% | |
| | 1,626,600 | | | Tahoe Resources (c) | | | 27,057,681 | | |
| | | | | Silver Project in Guatemala | | | | | |
| | | > Colombia 0.3% | |
| | 14,729,000 | | | Isagen | | | 24,802,720 | | |
| | | | | Leading Colombian Electricity
Provider | | | | | |
| | | > Uruguay 0.2% | |
| | 1,306,818 | | | Union Agriculture
Group (c)(e)(f) | | | 13,969,884 | | |
| | | | | Farmland Operator in Uruguay | | | | | |
Latin America: Total | | | 387,971,922 | | |
Total Equities: 96.9%
(Cost: $5,635,722,340) | | | 8,068,852,689 | (h) | |
Number of Shares | | | | Value | |
Short-Term Investments 2.7% | | | |
| | 220,000,000 | | | JPMorgan U.S. Government
Money Market Fund, IM
Shares (7 day yield of 0.01%) | | $ | 220,000,000 | | |
| | 5,132,860 | | | JPMorgan U.S. Government
Money Market Fund, Agency
Shares (7 day yield of 0.01%) | | | 5,132,860 | | |
Total Short-Term Investments: 2.7%
(Cost: $225,132,860) | | | 225,132,860 | | |
Securities Lending Collateral 1.4% | | | |
| | 120,006,046 | | | Dreyfus Government Cash
Management Fund,
Institutional Shares
(7 day yield of 0.01%) (i) | | | 120,006,046 | | |
Total Securities Lending Collateral:
(Cost: $120,006,046) | | | 120,006,046 | | |
Total Investments: 101.0%
(Cost: $5,980,861,246)(j) | | | 8,413,991,595 | | |
Obligation to Return Collateral for
Securities Loaned: (1.4)% | | | (120,006,046 | ) | |
Cash and Other Assets Less
Liabilities: 0.4% | | | 33,335,051 | | |
Net Assets: 100.0% | | $ | 8,327,320,600 | | |
ADR - American Depositary Receipts
GDR - Global Depositary Receipts
REIT - Real Estate Investment Trust
> Notes to Statement of Investments
(a) All or a portion of this security was on loan at December 31, 2013. The total market value of securities on loan at December 31, 2013 was $115,336,707.
(b) An affiliated person of the Fund, as defined in the Investment Company Act of 1940, may include any company in which the Fund owns five percent or more of its outstanding voting shares. Holdings and transactions in these affiliated companies during the year ended December 31, 2013, are as follows:
Security | | Balance of
Shares Held
12/31/12 | | Purchases/
Additions | | Sales/
Reductions | | Balance of
Shares Held
12/31/13 | | Value | | Dividend | |
Sweco (1) | | | 4,150,024 | | | | - | | | | 895,000 | | | | 3,255,024 | | | $ | 53,644,370 | | | $ | 2,061,880 | | |
Smiths News | | | - | | | | 10,944,000 | | | | | | 10,944,000 | | | | 42,769,609 | | | | 425,393 | | |
Beadell Resources | | | 17,793,303 | | | | 41,143,775 | | | | - | | | | 58,937,078 | | | | 41,973,117 | | | | - | | |
Archipelago Resources | | | 31,764,600 | | | | - | | | | - | | | | 31,764,600 | | | | 27,352,305 | | | | 1,518,209 | | |
Wacom (1)(2) | | | 8,600,000 | | | | 1,660,000 | | | | 6,872,000 | | | | 3,388,000 | | | | 23,822,656 | | | | 881,792 | | |
Icom | | | 732,108 | | | | 102,892 | | | | - | | | | 835,000 | | | | 20,148,587 | | | | 275,137 | | |
Empresas Hites | | | - | | | | 23,280,000 | | | | 117,336 | | | | 23,162,664 | | | | 16,318,118 | | | | 474,018 | | |
UNIT4 (1) | | | 1,574,145 | | | | - | | | | 1,574,145 | | | | - | | | | - | | | | 881,545 | | |
Southern Arc Minerals (1) | | | 6,217,500 | | | | - | | | | 6,217,500 | | | | - | | | | - | | | | - | | |
Total of Affiliated Transactions | | | 70,831,680 | | | | 77,130,667 | | | | 15,675,981 | | | | 132,286,366 | | | $ | 226,028,762 | | | $ | 6,517,974 | | |
(1) At December 31, 2013, the Fund owned less than five percent of the company's outstanding voting shares.
(2) Includes the effects of a stock split.
The aggregate cost and value of these companies at December 31, 2013, was $147,295,704 and $148,561,736, respectively. Investments in affiliated companies represented 1.78% of the Fund's total net assets at December 31, 2013.
See accompanying notes to financial statements.
51
Columbia Acorn International
Statement of Investments, continued
> Notes to Statement of Investments
(c) Non-income producing security.
(d) The Fund also received put options through a transaction related to a proposed company restructuring of Archipelago Resources. Additional information on the put options received is as follows:
Security | | Option Shares | | Exercise Price | | Expiration Date | | Value | |
Option (1) | | | 31,764,600 | | | GBP | 0.58 | | | August 13, 2014 | | $ | 2,630,029 | | |
GBP - British Pound
(1) Archipelago Resources is expected to restructure into a new company during 2014. From January 31, 2014, the option is exercisable until the earlier of (i) the date the company is restructured and prices the shares for its initial public offering or (ii) August 13, 2014, subject to extension until the date the company is restructured and prices the shares for its initial public offering (but not later than September 26, 2016). After August 13, 2014, the valuation of the option will fluctuate based upon its fair market value as determined in accordance with the put option agreement. These put options are valued at fair value determined in good faith under consistently applied procedures established by the Board of Trustees.
(e) Denotes a restricted security, which is subject to restrictions on resale under federal securities laws. These securities are valued at fair value determined in good faith under consistently applied procedures established by the Board of Trustees. At December 31, 2013, the market value of these securities amounted to $51,298,953, which represented 0.62% of total net assets. Additional information on these securities is as follows:
Security | | Acquisition
Dates | | Shares | | Cost | | Value | |
Archipelago Resources | | 2/23/10-9/26/13 | | | 31,764,600 | | | $ | 18,376,857 | | | $ | 27,352,305 | | |
Union Agriculture Group | | 12/8/10-6/27/12 | | | 1,306,818 | | | | 15,000,000 | | | | 13,969,884 | | |
DeeThree Exploration | | 9/7/10 | | | 1,130,000 | | | | 2,950,812 | | | | 9,976,764 | | |
| | | | | | | $ | 36,327,669 | | | $ | 51,298,953 | | |
(f) Illiquid security.
(g) The common stock equity holdings of Marel are stated separately on the Statement of Investments due to the application of the onshore or offshore foreign currency exchange rate. The appropriate exchange rate is applied to each purchased security lot based on the applicable registration obtained from Marel's regulatory governing body, the Icelandic Central Bank.
(h) On December 31, 2013, the Fund's total investments were denominated in currencies as follows:
Currency | | Value | | Percentage
of Net Assets | |
Japanese Yen | | $ | 1,668,780,258 | | | | 20.1 | | |
Euro | | | 1,108,798,077 | | | | 13.3 | | |
British Pound | | | 887,287,612 | | | | 10.6 | | |
United States Dollar | | | 725,806,169 | | | | 8.7 | | |
Other currencies less
than 5% of total net assets | | | 3,678,180,573 | | | | 44.2 | | |
Total Equities | | $ | 8,068,852,689 | | | | 96.9 | | |
(i) Investment made with cash collateral received from securities lending activity.
(j) At December 31, 2013, for federal income tax purposes, the cost of investments was $6,116,567,174 and net unrealized appreciation was $2,297,424,421 consisting of gross unrealized appreciation of $2,523,908,518 and gross unrealized depreciation of $226,484,097.
Fair Value Measurements
Various inputs are used in determining the value of the Fund's investments, following the input prioritization hierarchy established by accounting principles generally accepted in the United States of America (GAAP). These inputs are summarized in the three broad levels listed below:
• Level 1 – quoted prices in active markets for identical securities
• Level 2 – prices determined using other significant observable inputs (including quoted prices for similar securities, interest rates, prepayment speeds, credit risk and others)
• Level 3 – prices determined using significant unobservable inputs where quoted prices or observable inputs are unavailable or less reliable (including management's own assumptions about the factors market participants would use in pricing an investment)
The inputs or methodology used for valuing securities are not necessarily an indication of the risk associated with investing in those securities.
Examples of the types of securities in which the Fund would typically invest and how they are classified within this hierarchy are as follows. Typical Level 1 securities include exchange traded domestic equities, mutual funds whose NAVs are published each day and exchange traded foreign equities that are not statistically fair valued. Typical Level 2 securities include exchange traded foreign equities that are statistically fair valued, forward foreign currency exchange contracts and short-term investments valued at amortized cost. Additionally, securities fair valued by the Valuation Committee (the Committee) of the Fund's Board of Trustees (the Board) that rely on significant observable inputs are also included in Level 2. Typical Level 3 securities include any security fair valued by the Committee that relies on significant unobservable inputs.
See accompanying notes to financial statements.
52
> Notes to Statement of Investments
Under the direction of the Board, the Committee is responsible for overseeing the valuation procedures approved by the Board.
The Committee meets as necessary, and no less frequently than quarterly, to determine fair values for securities for which market quotations are not readily available or for which the investment manager believes that available market quotations are unreliable, to review the appropriateness of the Trust's Portfolio Pricing Policy and the pricing procedures of the investment manager (the Policies), and to review the continuing appropriateness of the current value of any security subject to the Policies. The Policies address, among other things: circumstances under which market quotations will be deemed readily available; selection of third party pricing vendors; appropriate pricing methodologies; events that require fair valuation and fair value techniques; circumstances under which securities will be deemed to pose a potential for stale pricing, including when securities are illiquid, restricted, or in default; and certain delegations of authority to determine fair values to the Fund's investment manager. The Committee may also meet to discuss additional valuation matters, which may include review of back-testing results, review of time-sensitive information or approval of other valuation related actions, and to review the appropriateness of the Policies.
For investments and derivatives categorized as Level 3, the significant unobservable inputs used in the fair value measurement of the Funds' securities may include: (i) data specific to the issuer or comparable issuers, (ii) general market or specific sector news and (iii) quoted prices and specific or similar security transactions. The Committee considers this data and any changes from prior periods in order to assess the reasonableness of observable and unobservable inputs, any assumptions or internal models used to value those securities and changes in fair value. Significant changes in any of these factors could result in lower or higher fair value measurements. Various factors impact the frequency of monitoring (which may occur as often as daily), however the Committee may determine that changes to inputs, assumptions and models are not required with the same frequency.
The following table summarizes the inputs used, as of December 31, 2013, in valuing the Fund's assets:
Investment Type | | Quoted Prices
(Level 1) | | Other
Significant
Observable
Inputs
(Level 2) | | Significant
Unobservable
Inputs
(Level 3) | | Total | |
Equities | |
Asia | | $ | 237,226,747 | | | $ | 3,316,916,711 | | | $ | 27,352,305 | | | $ | 3,581,495,763 | | |
Europe | | | 122,156,220 | | | | 2,759,135,344 | | | | - | | | | 2,881,291,564 | | |
Other Countries | | | 549,087,113 | | | | 669,006,327 | | | | - | | | | 1,218,093,440 | | |
Latin America | | | 332,028,921 | | | | 41,973,117 | | | | 13,969,884 | | | | 387,971,922 | | |
Total Equities | | | 1,240,499,001 | | | | 6,787,031,499 | | | | 41,322,189 | | | | 8,068,852,689 | | |
Total Short-Term Investments | | | 225,132,860 | | | | - | | | | - | | | | 225,132,860 | | |
Total Securities Lending Collateral | | | 120,006,046 | | | | - | | | | - | | | | 120,006,046 | | |
Total Investments | | $ | 1,585,637,907 | | | $ | 6,787,031,499 | | | $ | 41,322,189 | | | $ | 8,413,991,595 | | |
Unrealized Appreciation on Options | | | - | | | | - | | | | 2,630,029 | | | | 2,630,029 | | |
Total | | $ | 1,585,637,907 | | | $ | 6,787,031,499 | | | $ | 43,952,218 | | | $ | 8,416,621,624 | | |
The Fund's assets assigned to the Level 2 input category are generally valued using a market approach, in which a security's value is determined through its correlation to prices and information from observable market transactions for similar or identical assets. Foreign equities are generally valued at the last sale price on the foreign exchange or market on which they trade. The Fund may use a statistical fair valuation model, in accordance with the policy adopted by the Board, provided by an independent third party to value securities principally traded in foreign markets in order to adjust for possible stale pricing that may occur between the close of the foreign exchanges and the time for valuation. These models take into account available market data including intraday index, ADR, and ETF movements. Securities acquired via private placement that have a holding period or an extended settlement period are valued at a discount to the same shares that are trading freely on the market. These discounts are determined by the investment manager's experience with similar securities or situations. Factors may include, but are not limited to, trade volume, shares outstanding and stock price.
There were no transfers of financial assets between levels 1 and 2 during the period.
The Fund does not hold any significant investments categorized as Level 3.
Certain securities classified as Level 3 are valued at fair value, using a market approach, as determined in good faith under consistently applied procedures established by and under the general supervision of the Board. To determine fair value for these securities, for which no market exists, the Committee utilizes the valuation technique it deems most appropriate in the circumstances, using some unobservable inputs, which may include, but are not limited to, estimated earnings of the company and the position of the security within the company's capital structure. The Committee also may use some observable inputs, which may include, but are not limited to, trades of similar securities and market multiples derived from a set of comparable companies. Significant increases or decreases to any of these inputs could result in a significantly lower or higher fair value measurement.
See accompanying notes to financial statements.
53
Columbia Acorn International
Portfolio Diversification
At December 31, 2013, the Fund's portfolio investments as a percentage of net assets were diversified as follows:
| | | Value | | Percentage
of Net Assets | |
| > Industrial Goods & Services | |
Industrial Materials & Specialty
Chemicals | | $ | 686,018,313 | | | | 8.2 | | |
Machinery | | | 555,871,300 | | | | 6.7 | | |
Other Industrial Services | | | 470,529,088 | | | | 5.7 | | |
Electrical Components | | | 241,632,793 | | | | 2.9 | | |
Conglomerates | | | 193,760,806 | | | | 2.3 | | |
Outsourcing Services | | | 115,832,129 | | | | 1.4 | | |
Construction | | | 79,253,570 | | | | 0.9 | | |
Industrial Distribution | | | 16,287,463 | | | | 0.2 | | |
| | | | 2,359,185,462 | | | | 28.3 | | |
| > Consumer Goods & Services | |
Retail | | | 598,864,471 | | | | 7.1 | | |
Casinos & Gaming | | | 414,066,284 | | | | 4.9 | | |
Food & Beverage | | | 330,524,446 | | | | 4.0 | | |
Other Durable Goods | | | 185,922,105 | | | | 2.2 | | |
Nondurables | | | 157,971,250 | | | | 1.9 | | |
Consumer Goods Distribution | | | 120,408,271 | | | | 1.5 | | |
Restaurants | | | 109,924,522 | | | | 1.3 | | |
Other Consumer Services | | | 81,969,494 | | | | 1.0 | | |
Travel | | | 56,424,711 | | | | 0.7 | | |
Furniture & Textiles | | | 39,288,970 | | | | 0.5 | | |
Educational Services | | | 38,559,245 | | | | 0.5 | | |
Consumer Electronics | | | 13,916,371 | | | | 0.2 | | |
| | | | 2,147,840,140 | | | | 25.8 | | |
| > Information | |
Business Software | | | 272,113,726 | | | | 3.2 | | |
Computer Hardware & Related
Equipment | | | 246,428,665 | | | | 3.0 | | |
Internet Related | | | 206,628,570 | | | | 2.5 | | |
Financial Processors | | | 140,650,989 | | | | 1.7 | | |
Mobile Communications | | | 131,963,100 | | | | 1.5 | | |
Computer Services | | | 102,697,400 | | | | 1.2 | | |
Instrumentation | | | 44,293,346 | | | | 0.5 | | |
Semiconductors & Related
Equipment | | | 40,716,984 | | | | 0.5 | | |
Telephone & Data Services | | | 32,426,733 | | | | 0.4 | | |
TV Broadcasting | | | 12,514,762 | | | | 0.2 | | |
Satellite Broadcasting & Services | | | 8,064,617 | | | | 0.1 | | |
Advertising | | | 4,711,249 | | | | 0.1 | | |
| | | | 1,243,210,141 | | | | 14.9 | | |
| | | Value | | Percentage
of Net Assets | |
| > Finance | |
Insurance | | $ | 328,677,658 | | | | 3.9 | | |
Banks | | | 197,876,144 | | | | 2.4 | | |
Brokerage & Money Management | | | 191,660,544 | | | | 2.3 | | |
Finance Companies | | | 109,225,407 | | | | 1.3 | | |
Financial Processors | | | 26,679,823 | | | | 0.4 | | |
| | | | 854,119,576 | | | | 10.3 | | |
| > Other Industries | |
Real Estate | | | 395,035,853 | | | | 4.8 | | |
Transportation | | | 158,917,872 | | | | 1.9 | | |
Regulated Utilities | | | 24,802,720 | | | | 0.3 | | |
| | | | 578,756,445 | | | | 7.0 | | |
| > Energy & Minerals | |
Oil Services | | | 257,590,433 | | | | 3.1 | | |
Mining | | | 158,643,619 | | | | 1.8 | | |
Oil & Gas Producers | | | 68,673,601 | | | | 0.8 | | |
Oil Refining, Marketing & Distribution | | | 23,658,332 | | | | 0.3 | | |
Agricultural Commodities | | | 13,969,884 | | | | 0.2 | | |
| | | 522,535,869 | | | | 6.2 | | |
| > Health Care | |
Medical Supplies | | | 138,212,108 | | | | 1.7 | | |
Pharmaceuticals | | | 122,010,985 | | | | 1.5 | | |
Medical Equipment & Devices | | | 77,709,337 | | | | 0.9 | | |
Health Care Services | | | 25,272,626 | | | | 0.3 | | |
| | | | 363,205,056 | | | | 4.4 | | |
Total Equities: | | | 8,068,852,689 | | | | 96.9 | | |
Short-Term Investments: | | | 225,132,860 | | | | 2.7 | | |
Securities Lending Collateral: | | | 120,006,046 | | | | 1.4 | | |
Total Investments: | | | 8,413,991,595 | | | | 101.0 | | |
Obligation to Return
Collateral for Securities
Loaned: | | | (120,006,046 | ) | | | (1.4 | ) | |
Cash and Other Assets
Less Liabilities: | | | 33,335,051 | | | | 0.4 | | |
Net Assets: | | $ | 8,327,320,600 | | | | 100.0 | | |
See accompanying notes to financial statements.
54
Columbia Acorn USA
Major Portfolio Changes in the Fourth Quarter (Unaudited)
| | | Number of Shares | |
| | | 9/30/13 | | 12/31/13 | |
Purchases | |
Information | |
Ellie Mae | | | 0 | | | | 106,180 | | |
Infinera | | | 294,278 | | | | 464,278 | | |
Industrial Goods & Services | |
Dorman Products | | | 97,000 | | | | 134,000 | | |
Consumer Goods & Services | |
Burlington Stores | | | 0 | | | | 93,737 | | |
Casey's General Stores | | | 138,000 | | | | 184,000 | | |
Fiesta Restaurant Group | | | 92,000 | | | | 112,000 | | |
Prestige Brands Holdings | | | 0 | | | | 166,000 | | |
The Chefs' Warehouse | | | 127,000 | | | | 198,000 | | |
United Natural Foods | | | 54,000 | | | | 79,000 | | |
Heath Care | |
Alnylam Pharmaceuticals | | | 160,377 | | | | 203,000 | | |
Celldex Therapeutics | | | 0 | | | | 172,000 | | |
Medidata Solutions | | | 0 | | | | 44,000 | | |
Sarepta Therapeutics | | | 151,000 | | | | 265,000 | | |
Energy & Minerals | |
Carrizo Oil & Gas | | | 41,576 | | | | 95,000 | | |
Chart Industries | | | 0 | | | | 40,000 | | |
Clayton Williams | | | 0 | | | | 46,000 | | |
Hornbeck Offshore | | | 182,000 | | | | 251,000 | | |
WPX Energy | | | 0 | | | | 240,000 | | |
| | | Number of Shares | |
| | | 9/30/13 | | 12/31/13 | |
Sales | |
Information | |
Bally Technologies | | | 555,000 | | | | 383,000 | | |
Concur Technologies | | | 178,000 | | | | 112,000 | | |
DemandWare | | | 72,000 | | | | 60,000 | | |
Finisar | | | 666,000 | | | | 426,000 | | |
Hackett Group | | | 706,766 | | | | 591,000 | | |
II-VI | | | 1,242,000 | | | | 1,036,000 | | |
Micros Systems | | | 335,000 | | | | 310,000 | | |
Monolithic Power Systems | | | 383,000 | | | | 255,000 | | |
RealPage | | | 330,000 | | | | 275,000 | | |
tw telecom | | | 1,325,000 | | | | 1,200,000 | | |
Webgroup.com | | | 81,192 | | | | 0 | | |
Industrial Goods & Services | |
Acorn Energy | | | 496,643 | | | | 290,643 | | |
ESCO Technologies | | | 760,000 | | | | 374,730 | | |
Nordson | | | 675,200 | | | | 590,000 | | |
Polypore International | | | 65,000 | | | | 0 | | |
Thermon | | | 386,000 | | | | 239,000 | | |
Consumer Goods & Services | |
Abercrombie & Fitch | | | 145,000 | | | | 0 | | |
Ryman Hospitality Properties | | | 427,000 | | | | 236,000 | | |
Shutterfly | | | 224,000 | | | | 185,991 | | |
Finance | |
World Acceptance | | | 211,000 | | | | 190,000 | | |
Health Care | |
Akorn | | | 742,000 | | | | 704,625 | | |
ARIAD Pharmaceuticals | | | 476,000 | | | | 0 | | |
BioMarin Pharmaceutical | | | 167,338 | | | | 146,000 | | |
Coronado Biosciences | | | 250,000 | | | | 0 | | |
HealthSouth | | | 183,000 | | | | 150,000 | | |
NPS Pharmaceuticals | | | 550,000 | | | | 477,500 | | |
Seattle Genetics | | | 604,000 | | | | 516,000 | | |
Energy & Minerals | |
Approach Resources | | | 158,000 | | | | 0 | | |
Atwood Oceanics | | | 464,000 | | | | 247,000 | | |
Gulfmark Offshore | | | 153,000 | | | | 68,000 | | |
See accompanying notes to financial statements.
55
Columbia Acorn USA
Statement of Investments, December 31, 2013
Number of Shares | | | | Value | |
| | | | | | | Equities: 98.1% | |
Information 26.2% | | | |
| | | > Business Software 8.3% | |
| | 745,000 | | | Informatica (a) | | $ | 30,917,500 | | |
| | | | | Enterprise Data Integration
Software | | | | | |
| | 299,000 | | | Ansys (a) | | | 26,072,800 | | |
| | | | | Simulation Software for
Engineers & Designers | | | | | |
| | 290,000 | | | SPS Commerce (a) | | | 18,937,000 | | |
| | | | | Supply Chain Management
Software Delivered via the Web | | | | | |
| | 310,000 | | | Micros Systems (a) | | | 17,784,700 | | |
| | | | | Information Systems for Hotels,
Restaurants & Retailers | | | | | |
| | 170,000 | | | NetSuite (a) | | | 17,513,400 | | |
| | | | | End to End IT Systems Solution
Delivered Over the Web | | | | | |
| | 112,000 | | | Concur Technologies (a) | | | 11,556,160 | | |
| | | | | Web Enabled Cost & Expense
Management Software | | | | | |
| | 275,000 | | | RealPage (a)(b) | | | 6,429,500 | | |
| | | | | Software for Managing Rental
Properties Delivered via the Web | | | | | |
| | 310,000 | | | Exa (a) | | | 4,110,600 | | |
| | | | | Simulation Software | | | | | |
| | 60,000 | | | DemandWare (a) | | | 3,847,200 | | |
| | | | | eCommerce Website Platform for
Retailers & Apparel
Manufacturers | | | | | |
| | 82,000 | | | Envestnet (a) | | | 3,304,600 | | |
| | | | | Technology Platform for
Investment Advisors | | | | | |
| | 394,119 | | | InContact (a) | | | 3,078,069 | | |
| | | | | Call Center Systems Delivered
Via the Web & Telco Services | | | | | |
| | 126,000 | | | E2Open (a)(b) | | | 3,012,660 | | |
| | | | | Supply Chain Management
Software & Supplier/Partner
Network | | | | | |
| | 106,180 | | | Ellie Mae (a) | | | 2,853,057 | | |
| | | | | Software for Managing &
Network for Facilitating
Mortgage Origination | | | | | |
| | | | 149,417,246 | | |
| | | > Instrumentation 4.6% | |
| | 164,000 | | | Mettler-Toledo
International (a) | | | 39,784,760 | | |
| | | | | Laboratory Equipment | | | | | |
| | 427,000 | | | IPG Photonics (a)(b) | | | 33,139,470 | | |
| | | | | Fiber Lasers | | | | | |
| | 274,000 | | | Trimble Navigation (a) | | | 9,507,800 | | |
| | | | | GPS-based Instruments | | | | | |
| | | | 82,432,030 | | |
| | | > Telephone & Data Services 2.1% | |
| | 1,200,000 | | | tw telecom (a) | | | 36,564,000 | | |
| | | | | Fiber Optic Telephone/Data
Services | | | | | |
| | 364,000 | | | Boingo Wireless (a) | | | 2,333,240 | | |
| | | | | Wholesale & Retail Wi-Fi
Networks | | | | | |
| | | | 38,897,240 | | |
Number of Shares | | | | Value | |
| | | > Computer Services 2.0% | |
| | 506,000 | | | ExlService Holdings (a) | | $ | 13,975,720 | | |
| | | | | Business Process Outsourcing | | | | | |
| | 327,000 | | | WNS - ADR (India) (a) | | | 7,164,570 | | |
| | | | | Offshore Business Process
Outsourcing Services | | | | | |
| | 175,000 | | | Virtusa (a) | | | 6,665,750 | | |
| | | | | Offshore IT Outsourcing | | | | | |
| | 582,000 | | | RCM Technologies (a) | | | 4,062,360 | | |
| | | | | Technology & Engineering
Services | | | | | |
| | 591,000 | | | Hackett Group | | | 3,670,110 | | |
| | | | | IT Integration & Best Practice
Research | | | | | |
| | | | 35,538,510 | | |
| | | > Telecommunications Equipment 1.8% | |
| | 426,000 | | | Finisar (a) | | | 10,189,920 | | |
| | | | | Optical Subsystems & Components | | | | | |
| | 740,000 | | | Ixia (a) | | | 9,849,400 | | |
| | | | | Telecom Network Test Equipment | | | | | |
| | 281,000 | | | CalAmp (a) | | | 7,859,570 | | |
| | | | | Machine to Machine
Communications | | | | | |
| | 464,278 | | | Infinera (a) | | | 4,540,639 | | |
| | | | | Optical Networking Equipment | | | | | |
| | | | 32,439,529 | | |
| | | > Gaming Equipment & Services 1.7% | |
| | 383,000 | | | Bally Technologies (a) | | | 30,046,350 | | |
| | | | | Slot Machines & Software | | | | | |
| | | > Semiconductors & Related
Equipment 1.4% | |
| | 255,000 | | | Monolithic Power
Systems (a) | | | 8,838,300 | | |
| | | | | High Performance Analog &
Mixed Signal Integrated Circuits | | | | | |
| | 970,000 | | | Atmel (a) | | | 7,595,100 | | |
| | | | | Microcontrollers, Radio
Frequency & Memory
Semiconductors | | | | | |
| | 238,000 | | | Ultratech (a) | | | 6,902,000 | | |
| | | | | Semiconductor Equipment | | | | | |
| | 45,000 | | | Hittite Microwave (a) | | | 2,777,850 | | |
| | | | | Radio Frequency, Microwave &
Millimeterwave Semiconductors | | | | | |
| | | | 26,113,250 | | |
| | | > Mobile Communications 1.4% | |
| | 273,000 | | | SBA Communications (a) | | | 24,526,320 | | |
| | | | | Communications Towers | | | | | |
| | | > Computer Hardware & Related
Equipment 1.3% | |
| | 1,036,000 | | | II-VI (a) | | | 18,233,600 | | |
| | | | | Laser Optics & Specialty Materials | | | | | |
| | 83,000 | | | Rogers (a) | | | 5,104,500 | | |
| | | | | Printed Circuit Materials &
High-performance Foams | | | | | |
| | | | 23,338,100 | | |
| | | > Financial Processors 0.7% | |
| | 139,000 | | | Global Payments | | | 9,033,610 | | |
| | | | | Credit Card Processor | | | | | |
See accompanying notes to financial statements.
56
Number of Shares | | | | Value | |
| | | > Financial Processors—continued | |
| | 153,000 | | | Liquidity Services (a)(b) | | $ | 3,466,980 | | |
| | | | | E-Auctions for Surplus &
Salvage Goods | | | | | |
| | | | 12,500,590 | | |
| | | > Contract Manufacturing 0.5% | |
| | 215,000 | | | Plexus (a) | | | 9,307,350 | | |
| | | | | Electronic Manufacturing Services | | | | | |
| | | > Internet Related 0.2% | |
| | 141,831 | | | RetailMeNot (a) | | | 4,083,314 | | |
| | | | | Digital Coupon Marketplace | | | | | |
| | | > Business Information & Marketing
Services 0.2% | |
| | 228,294 | | | RPX (a) | | | 3,858,169 | | |
| | | | | Patent Aggregation & Defensive
Patent Consulting | | | | | |
Information: Total | | | 472,497,998 | | |
Industrial Goods & Services 20.2% | | | |
| | | > Machinery 14.6% | |
| | 871,000 | | | Ametek | | | 45,875,570 | | |
| | | | | Aerospace/Industrial Instruments | | | | | |
| | 590,000 | | | Nordson | | | 43,837,000 | | |
| | | | | Dispensing Systems for
Adhesives & Coatings | | | | | |
| | 855,000 | | | Donaldson | | | 37,158,300 | | |
| | | | | Industrial Air Filtration | | | | | |
| | 757,500 | | | HEICO | | | 31,905,900 | | |
| | | | | FAA Approved Aircraft
Replacement Parts | | | | | |
| | 436,000 | | | Moog (a) | | | 29,621,840 | | |
| | | | | Motion Control Products for
Aerospace, Defense &
Industrial Markets | | | | | |
| | 237,000 | | | Toro | | | 15,073,200 | | |
| | | | | Turf Maintenance Equipment | | | | | |
| | 245,000 | | | Generac | | | 13,876,800 | | |
| | | | | Standby Power Generators | | | | | |
| | 264,000 | | | Kennametal | | | 13,746,480 | | |
| | | | | Consumable Cutting Tools | | | | | |
| | 374,730 | | | ESCO Technologies | | | 12,838,250 | | |
| | | | | Automatic Electric Meter Readers | | | | | |
| | 46,000 | | | Middleby (a) | | | 11,038,620 | | |
| | | | | Manufacturer of Cooking
Equipment | | | | | |
| | 134,000 | | | Dorman Products (a) | | | 7,513,380 | | |
| | | | | Aftermarket Auto Parts Distributor | | | | | |
| | | | 262,485,340 | | |
| | | > Industrial Materials &
Specialty Chemicals 2.1% | |
| | 539,000 | | | Drew Industries | | | 27,596,800 | | |
| | | | | RV & Manufactured Home
Components | | | | | |
| | 290,000 | | | Polyone | | | 10,251,500 | | |
| | | | | Intermediate Stage Chemicals
Producer | | | | | |
| | | | 37,848,300 | | |
Number of Shares | | | | Value | |
| | | > Electrical Components 1.5% | |
| | 190,000 | | | Acuity Brands | | $ | 20,770,800 | | |
| | | | | Commercial Lighting Fixtures | | | | | |
| | 239,000 | | | Thermon (a) | | | 6,531,870 | | |
| | | | | Global Engineered Thermal
Solutions | | | | | |
| | | | 27,302,670 | | |
| | | > Industrial Distribution 0.8% | |
| | 90,000 | | | WESCO International (a) | | | 8,196,300 | | |
| | | | | Industrial Distributor | | | | | |
| | 217,000 | | | MRC Global (a) | | | 7,000,420 | | |
| | | | | Industrial Distributor | | | | | |
| | | | 15,196,720 | | |
| | | > Other Industrial Services 0.8% | |
| | 188,000 | | | Forward Air | | | 8,255,080 | | |
| | | | | Freight Transportation
Between Airports | | | | | |
| | 151,000 | | | KAR Auction Services | | | 4,462,050 | | |
| | | | | Auto Auctions | | | | | |
| | 290,643 | | | Acorn Energy (b) | | | 1,182,917 | | |
| | | | | Fiber Optic Oil Well
Monitoring & Evaluation | | | | | |
| | | | 13,900,047 | | |
| | | > Construction 0.2% | |
| | 86,000 | | | Fortune Brands Home &
Security | | | 3,930,200 | | |
| | | | | Home Building Supplies &
Small Locks | | | | | |
| | | > Waste Management 0.2% | |
| | 82,000 | | | Waste Connections | | | 3,577,660 | | |
| | | | | Solid Waste Management | | | | | |
Industrial Goods & Services: Total | | | 364,240,937 | | |
Consumer Goods & Services 16.2% | | | |
| | | > Travel 5.1% | |
| | 1,183,950 | | | Avis Budget Group (a) | | | 47,855,259 | | |
| | | | | Second Largest Car Rental
Company | | | | | |
| | 614,000 | | | Hertz (a) | | | 17,572,680 | | |
| | | | | Largest U.S. Rental Car Operator | | | | | |
| | 236,000 | | | Ryman Hospitality
Properties (b) | | | 9,860,080 | | |
| | | | | Convention Hotels | | | | | |
| | 172,666 | | | Choice Hotels | | | 8,479,627 | | |
| | | | | Franchisor of Budget Hotel
Brands | | | | | |
| | 135,000 | | | HomeAway (a) | | | 5,518,800 | | |
| | | | | Vacation Rental Online
Marketplace | | | | | |
| | 29,000 | | | Vail Resorts | | | 2,181,670 | | |
| | | | | Ski Resort Operator & Developer | | | | | |
| | | | 91,468,116 | | |
| | | > Retail 2.9% | |
| | 805,000 | | | Pier 1 Imports | | | 18,579,400 | | |
| | | | | Home Furnishing Retailer | | | | | |
| | 184,000 | | | Casey's General Stores | | | 12,926,000 | | |
| | | | | Owner/Operator of Convenience
Stores | | | | | |
See accompanying notes to financial statements.
57
Columbia Acorn USA
Statement of Investments, continued
Number of Shares | | | | Value | |
| | | > Retail—continued | |
| | 185,991 | | | Shutterfly (a) | | $ | 9,472,522 | | |
| | | | | Internet Photo-centric Retailer | | | | | |
| | 135,000 | | | Fifth & Pacific
Companies (a) | | | 4,329,450 | | |
| | | | | Global Lifestyle Brand | | | | | |
| | 46,400 | | | Restoration Hardware
Holdings (a) | | | 3,122,720 | | |
| | | | | Specialty Home Furnishing
Retailer | | | | | |
| | 93,737 | | | Burlington Stores (a)(b) | | | 2,999,584 | | |
| | | | | Off-price Apparel Retailer | | | | | |
| | | | 51,429,676 | | |
| | | > Furniture & Textiles 2.4% | |
| | 333,814 | | | Caesarstone (Israel) | | | 16,580,541 | | |
| | | | | Quartz Countertops | | | | | |
| | 688,000 | | | Interface | | | 15,108,480 | | |
| | | | | Modular Carpet | | | | | |
| | 657,000 | | | Knoll | | | 12,029,670 | | |
| | | | | Office Furniture | | | | | |
| | | | 43,718,691 | | |
| | | > Consumer Goods Distribution 1.8% | |
| | 358,000 | | | Pool | | | 20,814,120 | | |
| | | | | Swimming Pool Supplies &
Equipment Distributor | | | | | |
| | 79,000 | | | United Natural Foods (a) | | | 5,955,810 | | |
| | | | | Distributor of Natural/Organic
Foods to Grocery Stores | | | | | |
| | 198,000 | | | The Chefs' Warehouse (a) | | | 5,773,680 | | |
| | | | | Distributor of Specialty
Foods to Fine Dining Restaurants | | | | | |
| | | | 32,543,610 | | |
| | | > Other Consumer Services 1.1% | |
| | 293,000 | | | Lifetime Fitness (a) | | | 13,771,000 | | |
| | | | | Sport & Fitness Club Operator | | | | | |
| | 252,000 | | | Blackhawk Network (a) | | | 6,365,520 | | |
| | | | | Third Party Distributer of
Prepaid Content, Mostly Gift Cards | | | | | |
| | | | 20,136,520 | | |
| | | > Other Durable Goods 1.1% | |
| | 187,000 | | | Cavco Industries (a) | | | 12,846,900 | | |
| | | | | Manufactured Homes | | | | | |
| | 297,000 | | | Select Comfort (a) | | | 6,263,730 | | |
| | | | | Specialty Mattresses | | | | | |
| | | | 19,110,630 | | |
| | | > Nondurables 0.8% | |
| | 152,000 | | | Helen of Troy (a) | | | 7,525,520 | | |
| | | | | Personal Care, Housewares,
Healthcare & Home
Environment Products | | | | | |
| | 166,000 | | | Prestige Brands
Holdings (a) | | | 5,942,800 | | |
| | | | | Household & Personal Care
Products | | | | | |
| | | | 13,468,320 | | |
| | | > Food & Beverage 0.4% | |
| | 269,723 | | | Boulder Brands Inc (a) | | | 4,277,807 | | |
| | | | | Healthy Food Products | | | | | |
Number of Shares | | | | Value | |
| | 100,000 | | | B&G Foods | | $ | 3,391,000 | | |
| | | | | Acquirer of Small Food Brands | | | | | |
| | | | 7,668,807 | | |
| | | > Restaurants 0.3% | |
| | 112,000 | | | Fiesta Restaurant Group (a) | | | 5,850,880 | | |
| | | | | Owns/Operates Two Restaurant
Chains: Pollo Tropical & Taco
Cabana | | | | | |
| | | > Apparel 0.2% | |
| | 475,000 | | | Quiksilver (a) | | | 4,165,750 | | |
| | | | | Action Sports Lifestyle Branded
Apparel & Footwear | | | | | |
| | | > Educational Services 0.1% | |
| | 34,350 | | | ITT Educational
Services (a)(b) | | | 1,153,473 | | |
| | | | | Post-secondary Degree Services | | | | | |
Consumer Goods & Services: Total | | | 290,714,473 | | |
Finance 13.7% | | | |
| | | > Banks 7.8% | |
| | 801,000 | | | MB Financial | | | 25,704,090 | | |
| | | | | Chicago Bank | | | | | |
| | 993,000 | | | Associated Banc-Corp | | | 17,278,200 | | |
| | | | | Midwest Bank | | | | | |
| | 164,000 | | | SVB Financial Group (a) | | | 17,197,040 | | |
| | | | | Bank to Venture Capitalists | | | | | |
| | 392,597 | | | Lakeland Financial | | | 15,311,283 | | |
| | | | | Indiana Bank | | | | | |
| | 173,000 | | | City National | | | 13,705,060 | | |
| | | | | Bank & Asset Manager | | | | | |
| | 1,615,986 | | | First Busey | | | 9,372,719 | | |
| | | | | Illinois Bank | | | | | |
| | 228,000 | | | Hancock Holding | | | 8,363,040 | | |
| | | | | Gulf Coast Bank | | | | | |
| | 487,000 | | | TCF Financial | | | 7,913,750 | | |
| | | | | Great Lakes Bank | | | | | |
| | 566,750 | | | Valley National Bancorp (b) | | | 5,735,510 | | |
| | | | | New Jersey/New York Bank | | | | | |
| | 633,994 | | | First Commonwealth | | | 5,591,827 | | |
| | | | | Western Pennsylvania Bank | | | | | |
| | 695,000 | | | TrustCo Bank | | | 4,990,100 | | |
| | | | | New York State Bank | | | | | |
| | 171,826 | | | Sandy Spring Bancorp | | | 4,843,775 | | |
| | | | | Baltimore & Washington, D.C.
Bank | | | | | |
| | 154,849 | | | Guaranty Bancorp | | | 2,175,628 | | |
| | | | | Colorado Bank | | | | | |
| | 89,700 | | | Hudson Valley | | | 1,825,395 | | |
| | | | | Metro New York City Bank | | | | | |
| | | | 140,007,417 | | |
| | | > Finance Companies 3.9% | |
| | 190,000 | | | World Acceptance (a)(b) | | | 16,630,700 | | |
| | | | | Personal Loans | | | | | |
| | 673,208 | | | CAI International (a) | | | 15,867,513 | | |
| | | | | International Container Leasing | | | | | |
| | 389,000 | | | Textainer Group Holdings (b) | | | 15,645,580 | | |
| | | | | Top International Container
Leaser | | | | | |
See accompanying notes to financial statements.
58
Number of Shares | | | | Value | |
| | | > Finance Companies—continued | |
| | 315,000 | | | McGrath Rentcorp | | $ | 12,537,000 | | |
| | | | | Temporary Space & IT Rentals | | | | | |
| | 264,072 | | | H & E Equipment
Services (a) | | | 7,824,453 | | |
| | | | | Heavy Equipment Leasing | | | | | |
| | 91,000 | | | Marlin Business Services | | | 2,293,200 | | |
| | | | | Small Equipment Leasing | | | | | |
| | | | 70,798,446 | | |
| | | > Savings & Loans 0.9% | |
| | 393,487 | | | ViewPoint Financial | | | 10,801,218 | | |
| | | | | Texas Thrift | | | | | |
| | 128,000 | | | Berkshire Hills Bancorp | | | 3,490,560 | | |
| | | | | Northeast Thrift | | | | | |
| | 157,073 | | | Simplicity Bancorp | | | 2,538,300 | | |
| | | | | Los Angeles Savings & Loan | | | | | |
| | | | 16,830,078 | | |
| | | > Insurance 0.6% | |
| | 45,000 | | | Allied World Holdings | | | 5,076,450 | | |
| | | | | Commercial Lines
Insurance/Reinsurance | | | | | |
| | 35,000 | | | Enstar Group (a) | | | 4,861,850 | | |
| | | | | Insurance/Reinsurance &
Related Services | | | | | |
| | | | 9,938,300 | | |
| | | > Brokerage & Money Management 0.5% | |
| | 139,000 | | | SEI Investments | | | 4,827,470 | | |
| | | | | Mutual Fund Administration &
Investment Management | | | | | |
| | 200,000 | | | Kennedy-Wilson Holdings | | | 4,450,000 | | |
| | | | | Global Distressed Real Estate | | | | | |
| | | | 9,277,470 | | |
Finance: Total | | | 246,851,711 | | |
Health Care 10.5% | | | |
| | | > Biotechnology & Drug Delivery 5.2% | |
| | 321,100 | | | Synageva Biopharma (a) | | | 20,781,592 | | |
| | | | | Biotech Focused on Orphan
Diseases | | | | | |
| | 516,000 | | | Seattle Genetics (a) | | | 20,583,240 | | |
| | | | | Antibody-based Therapies for
Cancer | | | | | |
| | 477,500 | | | NPS Pharmaceuticals (a) | | | 14,496,900 | | |
| | | | | Orphan Drugs & Healthy
Royalties | | | | | |
| | 203,000 | | | Alnylam Pharmaceuticals (a) | | | 13,058,990 | | |
| | | | | Biotech Developing Drugs for
Rare Diseases | | | | | |
| | 146,000 | | | BioMarin Pharmaceutical (a) | | | 10,259,420 | | |
| | | | | Biotech Focused on Orphan
Diseases | | | | | |
| | 265,000 | | | Sarepta Therapeutics (a)(b) | | | 5,398,050 | | |
| | | | | Biotech Focused on Rare
Diseases | | | | | |
| | 364,000 | | | InterMune (a) | | | 5,361,720 | | |
| | | | | Drugs for Pulmonary Fibrosis &
Hepatitis C | | | | | |
| | 172,000 | | | Celldex Therapeutics (a) | | | 4,164,120 | | |
| | | | | Biotech Developing Drugs for
Cancer | | | | | |
Number of Shares | | | | Value | |
| | 228 | | | CymaBay
Therapeutics (a)(c)(d) | | $ | 970 | | |
| | | | | Diabetes Drug Development | | | | | |
| | | | 94,105,002 | | |
| | | > Medical Supplies 2.0% | |
| | 612,600 | | | Cepheid (a) | | | 28,620,672 | | |
| | | | | Molecular Diagnostics | | | | | |
| | 87,000 | | | Techne | | | 8,236,290 | | |
| | | | | Cytokines, Antibodies & Other
Reagents for Life Science | | | | | |
| | | | 36,856,962 | | |
| | | > Health Care Services 1.5% | |
| | 960,000 | | | Allscripts Healthcare
Solutions (a) | | | 14,841,600 | | |
| | | | | Health Care IT | | | | | |
| | 150,000 | | | HealthSouth | | | 4,998,000 | | |
| | | | | Inpatient Rehabilitation Facilities | | | | | |
| | 112,000 | | | Envision Healthcare
Holdings (a) | | | 3,978,240 | | |
| | | | | Provider of Health Care
Outsourcing Services | | | | | |
| | 44,000 | | | Medidata Solutions (a) | | | 2,665,080 | | |
| | | | | Cloud-based Software for
Drug Studies | | | | | |
| | | | 26,482,920 | | |
| | | > Pharmaceuticals 1.1% | |
| | 704,625 | | | Akorn (a) | | | 17,354,913 | | |
| | | | | Developer, Manufacturer &
Distributor of Specialty
Generic Drugs | | | | | |
| | 331,180 | | | Alimera Sciences (a)(b) | | | 1,559,858 | | |
| | | | | Ophthalmology-focused
Pharmaceutical Company | | | | | |
| | | | 18,914,771 | | |
| | | > Medical Equipment & Devices 0.7% | |
| | 183,000 | | | Sirona Dental Systems (a) | | | 12,846,600 | | |
| | | | | Manufacturer of Dental
Equipment | | | | | |
Health Care: Total | | | 189,206,255 | | |
Other Industries 5.9% | | | |
| | | > Real Estate 5.0% | |
| | 832,000 | | | Extra Space Storage | | | 35,052,160 | | |
| | | | | Self Storage Facilities | | | | | |
| | 986,800 | | | EdR | | | 8,703,576 | | |
| | | | | Student Housing | | | | | |
| | 1,255,000 | | | Kite Realty Group | | | 8,245,350 | | |
| | | | | Community Shopping Centers | | | | | |
| | 491,000 | | | Associated Estates Realty | | | 7,880,550 | | |
| | | | | Multifamily Properties | | | | | |
| | 223,000 | | | Coresite Realty | | | 7,178,370 | | |
| | | | | Data Centers | | | | | |
| | 356,000 | | | St. Joe (a)(b) | | | 6,831,640 | | |
| | | | | Florida Panhandle Landowner | | | | | |
| | 871,000 | | | DCT Industrial Trust | | | 6,210,230 | | |
| | | | | Industrial Properties | | | | | |
| | 91,000 | | | Post Properties | | | 4,115,930 | | |
| | | | | Multifamily Properties | | | | | |
| | 196,200 | | | Biomed Realty Trust | | | 3,555,144 | | |
| | | | | Life Science-focused Office
Buildings | | | | | |
See accompanying notes to financial statements.
59
Columbia Acorn USA
Statement of Investments, continued
Number of Shares | | | | Value | |
| | | > Real Estate—continued | |
| | 90,000 | | | American Residential
Properties (a)(b) | | $ | 1,544,400 | | |
| | | | | Single-family Rental Properties | | | | | |
| | | | 89,317,350 | | |
| | | > Transportation 0.9% | |
| | 468,091 | | | Rush Enterprises,
Class A (a) | | | 13,878,898 | | |
| | 105,000 | | | Rush Enterprises,
Class B (a) | | | 2,677,500 | | |
| | | | | Truck Sales & Service | | | | | |
| | | | 16,556,398 | | |
Other Industries: Total | | | 105,873,748 | | |
Energy & Minerals 5.4% | | | |
| | | > Oil & Gas Producers 2.8% | |
| | 116,000 | | | SM Energy | | | 9,640,760 | | |
| | | | | Oil & Gas Producer | | | | | |
| | 166,000 | | | PDC Energy (a) | | | 8,834,520 | | |
| | | | | Oil & Gas Producer in U.S. | | | | | |
| | 180,000 | | | Rosetta Resources (a) | | | 8,647,200 | | |
| | | | | Oil & Gas Producer
Exploring in Texas | | | | | |
| | 240,000 | | | WPX Energy (a) | | | 4,891,200 | | |
| | | | | Oil & Gas Produced in U.S. &
Argentina | | | | | |
| | 159,000 | | | Laredo Petroleum (a) | | | 4,402,710 | | |
| | | | | Permian Basin Oil Producer | | | | | |
| | 95,000 | | | Carrizo Oil & Gas (a) | | | 4,253,150 | | |
| | | | | Oil & Gas Producer | | | | | |
| | 157,000 | | | Bill Barrett
Corporation (a)(b) | | | 4,204,460 | | |
| | | | | Oil & Gas Producer in U.S.
Rockies | | | | | |
| | 46,000 | | | Clayton Williams (a) | | | 3,769,700 | | |
| | | | | Oil & Gas Producer | | | | | |
| | 464,000 | | | Quicksilver Resources (a)(b) | | | 1,424,480 | | |
| | | | | Natural Gas & Coal Seam Gas
Producer | | | | | |
| | 19,548 | | | Matador Resources (a) | | | 364,375 | | |
| | | | | Oil & Gas Producer in
Texas & Louisiana | | | | | |
| | | | 50,432,555 | | |
| | | > Oil Services 1.8% | |
| | 247,000 | | | Atwood Oceanics (a) | | | 13,187,330 | | |
| | | | | Offshore Drilling Contractor | | | | | |
| | 251,000 | | | Hornbeck Offshore (a) | | | 12,356,730 | | |
| | | | | Supply Vessel Operator in U.S.
Gulf of Mexico | | | | | |
| | 40,000 | | | Chart Industries (a) | | | 3,825,600 | | |
| | | | | Manufacturer of Natural Gas
Processing/Storage Equipment | | | | | |
Number of Shares | | | | Value | |
| | 68,000 | | | Gulfmark Offshore | | $ | 3,204,840 | | |
| | | | | Operator of Offshore Supply
Vessels | | | | | |
| | | | 32,574,500 | | |
| | | > Mining 0.8% | |
| | 70,000 | | | Core Labs (Netherlands) | | | 13,366,500 | | |
| | | | | Oil & Gas Reservoir Consulting | | | | | |
| | 546,000 | | | Alexco Resource (a)(b) | | | 687,960 | | |
| | | | | Mining, Exploration &
Environmental Services | | | | | |
| | | | 14,054,460 | | |
Energy & Minerals: Total | | | 97,061,515 | | |
Total Equities: 98.1%
(Cost: $908,174,912) | | | 1,766,446,637 | (e)(f) | |
Short-Term Investments: 1.8% | | | |
| | 31,294,824 | | | JPMorgan U.S.
Government Money
Market Fund,
Agency Shares
(7 day yield of 0.01%) | | | 31,294,824 | | |
Total Short-Term Investments: 1.8%
(Cost: $31,294,824) | | | 31,294,824 | | |
Securities Lending Collateral 3.2% | | | |
| | 58,504,906 | | | Dreyfus Government Cash
Management Fund,
Institutional Shares
(7 day yield of 0.01%) (g) | | | 58,504,906 | | |
Total Securities Lending Collateral:
(Cost: $58,504,906) | | | 58,504,906 | | |
Total Investments: 103.1%
(Cost: $997,974,642)(h) | | | 1,856,246,367 | | |
Obligation to Return Collateral for
Securities Loaned: (3.2)% | | | (58,504,906 | ) | |
Cash and Other Assets Less
Liabilities: 0.1% | | | 2,544,942 | | |
Net Assets: 100.0% | | $ | 1,800,286,403 | | |
ADR - American Depositary Receipts
> Notes to Statement of Investments
(a) Non-income producing security.
(b) All or a portion of this security was on loan at December 31, 2013. The total market value of securities on loan at December 31, 2013 was $56,975,550.
(c) Illiquid security.
See accompanying notes to financial statements.
60
> Notes to Statement of Investments
(d) Denotes a restricted security, which is subject to restrictions on resale under federal securities laws. This security is valued at fair value determined in good faith under consistently applied procedures established by the Board of Trustees. At December 31, 2013, the market value of this security amounted to $970, which represented less than 0.01% of total net assets. Additional information on this security is as follows:
Security | | Acquisition
Dates | | Shares/Units | | Cost | | Value | |
CymaBay Therapeutics | | 2/11/00 | | | 228 | | | $ | 1,999,910 | | | $ | 970 | | |
(e) An affiliated person of the Fund, as defined in the Investment Company Act of 1940, may include any company in which the Fund owns five percent or more of its outstanding voting shares. Holdings and transactions in these affiliated companies during the year ended December 31, 2013, are as follows:
Security | | Balance of
Shares Held
12/31/12 | | Purchases/
Additions | | Sales/
Reductions | | Balance of
Shares Held
12/31/13 | | Value | | Dividend | |
RCM Technologies (1) | | | 640,000 | | | | - | | | | 58,000 | | | | 582,000 | | | $ | 4,062,360 | | | $ | - | | |
(1) At December 31, 2013, the Fund owned less than five percent of the company's outstanding voting shares.
(f) On December 31, 2013, the market value of foreign securities represented 2.06% of total net assets. The Fund's foreign portfolio was diversified as follows:
Country | | Value | | Percentage
of Net Assets | |
Israel | | $ | 16,580,541 | | | | 0.92 | | |
Netherlands | | | 13,366,500 | | | | 0.74 | | |
India | | | 7,164,570 | | | | 0.40 | | |
Total Foreign Portfolio | | $ | 37,111,611 | | | | 2.06 | | |
(g) Investment made with cash collateral received from securities lending activity.
(h) At December 31, 2013, for federal income tax purposes, the cost of investments was $998,663,376 and net unrealized appreciation was $857,582,991 consisting of gross unrealized appreciation of $881,121,057 and gross unrealized depreciation of $23,538,066.
Fair Value Measurements
Various inputs are used in determining the value of the Fund's investments, following the input prioritization hierarchy established by accounting principles generally accepted in the United States of America (GAAP). These inputs are summarized in the three broad levels listed below:
• Level 1 – quoted prices in active markets for identical securities
• Level 2 – prices determined using other significant observable inputs (including quoted prices for similar securities, interest rates, prepayment speeds, credit risk and others)
• Level 3 – prices determined using significant unobservable inputs where quoted prices or observable inputs are unavailable or less reliable (including management's own assumptions about the factors market participants would use in pricing an investment)
The inputs or methodology used for valuing securities are not necessarily an indication of the risk associated with investing in those securities.
Examples of the types of securities in which the Fund would typically invest and how they are classified within this hierarchy are as follows. Typical Level 1 securities include exchange traded domestic equities, mutual funds whose NAVs are published each day and exchange traded foreign equities that are not statistically fair valued. Typical Level 2 securities include exchange traded foreign equities that are statistically fair valued, forward foreign currency exchange contracts and short-term investments valued at amortized cost. Additionally, securities fair valued by the Valuation Committee (the Committee) of the Fund's Board of Trustees (the Board) that rely on significant observable inputs are also included in Level 2. Typical Level 3 securities include any security fair valued by the Committee that relies on significant unobservable inputs.
Under the direction of the Board, the Committee is responsible for overseeing the valuation procedures approved by the Board.
The Committee meets as necessary, and no less frequently than quarterly, to determine fair values for securities for which market quotations are not readily available or for which the investment manager believes that available market quotations are unreliable, to review the appropriateness of the Trust's Portfolio Pricing Policy and the pricing procedures of the investment manager (the Policies), and to review the continuing appropriateness of the current value of any security subject to the Policies. The Policies address, among other things: circumstances under which market quotations will be deemed readily available; selection of third party pricing vendors; appropriate pricing methodologies; events that require fair valuation and fair value techniques; circumstances under which securities will be deemed to pose a potential for stale pricing, including when securities are illiquid, restricted, or in default; and certain delegations of authority to determine fair values to the Fund's investment manager. The Committee may also meet to discuss additional valuation matters, which may include review of back-testing results, review of time-sensitive information or approval of other valuation related actions, and to review the appropriateness of the Policies.
For investments categorized as Level 3, the significant unobservable inputs used in the fair value measurement of the Funds' securities may include: (i) data specific to the issuer or comparable issuers, (ii) general market or specific sector news and (iii) quoted prices and specific or similar security transactions. The Committee considers this data and any changes from prior periods in order to assess the reasonableness of observable and unobservable inputs, any assumptions or internal models used to value those securities and changes in fair value. Significant changes in any of these factors could result in lower or higher fair value measurements. Various factors impact the frequency of monitoring (which may occur as often as daily), however the Committee may determine that changes to inputs, assumptions and models are not required with the same frequency.
See accompanying notes to financial statements.
61
Columbia Acorn USA
Statement of Investments, continued
> Notes to Statement of Investments
The following table summarizes the inputs used, as of December 31, 2013, in valuing the Fund's assets:
Investment Type | | Quoted Prices
(Level 1) | | Other
Significant
Observable
Inputs
(Level 2) | | Significant
Unobservable
Inputs
(Level 3) | | Total | |
Equities | |
Information | | $ | 472,497,998 | | | $ | - | | | $ | - | | | $ | 472,497,998 | | |
Industrial Goods & Services | | | 364,240,937 | | | | - | | | | - | | | | 364,240,937 | | |
Consumer Goods & Services | | | 290,714,473 | | | | - | | | | - | | | | 290,714,473 | | |
Finance | | | 246,851,711 | | | | - | | | | - | | | | 246,851,711 | | |
Health Care | | | 189,205,285 | | | | - | | | | 970 | | | | 189,206,255 | | |
Other Industries | | | 105,873,748 | | | | - | | | | - | | | | 105,873,748 | | |
Energy & Minerals | | | 97,061,515 | | | | - | | | | - | | | | 97,061,515 | | |
Total Equities | | | 1,766,445,667 | | | | - | | | | 970 | | | | 1,766,446,637 | | |
Total Short-Term Investments | | | 31,294,824 | | | | - | | | | - | | | | 31,294,824 | | |
Total Securities Lending Collateral | | | 58,504,906 | | | | - | | | | - | | | | 58,504,906 | | |
Total Investments | | $ | 1,856,245,397 | | | $ | - | | | $ | 970 | | | $ | 1,856,246,367 | | |
There were no transfers of financial assets between levels 1 and 2 during the period.
The Fund does not hold any significant investments categorized as Level 3.
Certain common stock classified as Level 3 are valued at fair value, using a market approach, as determined in good faith under consistently applied procedures established by and under the general supervision of the Board. To determine fair value for these securities, for which no market exists, the Committee utilizes the valuation technique it deems most appropriate in the circumstances, using some unobservable inputs, which may include, but are not limited to, estimated earnings of the company and the position of the security within the company's capital structure. The Committee also may use some observable inputs, which may include, but are not limited to, trades of similar securities and market multiples derived from a set of comparable companies. Significant increases or decreases to any of these inputs could result in a significantly lower or higher fair value measurement.
See accompanying notes to financial statements.
62
Columbia Acorn International Select
Major Portfolio Changes in the Fourth Quarter (Unaudited)
| | | Number of Shares | |
| | | 9/30/13 | | 12/31/13 | |
Purchases | |
Asia | |
| > Japan | |
Dentsu | | | 164,000 | | | | 188,000 | | |
Makita | | | 0 | | | | 74,000 | | |
Rinnai | | | 122,000 | | | | 166,500 | | |
| > Korea | |
AmorePacific Group | | | 0 | | | | 2,631 | | |
CJ Corp | | | 38,000 | | | | 52,400 | | |
Kepco Plant Service & Engineering | | | 142,919 | | | | 174,900 | | |
Europe | |
| > United Kingdom | |
Babcock International | | | 416,504 | | | | 476,000 | | |
Smith & Nephew | | | 439,000 | | | | 580,000 | | |
| > France | |
Gemalto | | | 0 | | | | 33,000 | | |
| > Norway | |
Orkla | | | 433,032 | | | | 724,000 | | |
Subsea 7 | | | 171,000 | | | | 257,000 | | |
Other Countries | |
| > Australia | |
Crown Resorts Ltd. | | | 0 | | | | 250,000 | | |
IAG | | | 1,976,000 | | | | 2,000,000 | | |
| | | Number of Shares | |
| | | 9/30/13 | | 12/31/13 | |
Sales | |
Asia | |
| > Japan | |
NGK Spark Plug | | | 759,000 | | | | 614,000 | | |
Seven Bank | | | 2,535,000 | | | | 2,253,000 | | |
Start Today | | | 375,000 | | | | 143,700 | | |
Toyo Suisan Kaisha | | | 154,800 | | | | 0 | | |
| > Singapore | |
Mapletree Industrial Trust | | | 5,869,000 | | | | 0 | | |
Mapletree Logistics Trust | | | 10,847,000 | | | | 8,571,000 | | |
| > Taiwan | |
Far EasTone Telecom | | | 9,640,000 | | | | 6,700,000 | | |
Taiwan Mobile | | | 2,950,000 | | | | 550,000 | | |
Other Countries | |
| > Canada | |
CCL Industries | | | 202,000 | | | | 151,000 | | |
Goldcorp | | | 271,000 | | | | 159,000 | | |
| > United States | |
Atwood Oceanics | | | 82,000 | | | | 67,000 | | |
Latin America | |
| > Mexico | |
Fresnillo | | | 243,000 | | | | 0 | | |
See accompanying notes to financial statements.
63
Columbia Acorn International Select
Statement of Investments, December 31, 2013
Number of Shares | | | | Value | |
| | | | | | | Equities: 95.7% | |
Asia 42.8% | | | |
| | | > Japan 20.4% | |
| | 614,000 | | | NGK Spark Plug | | $ | 14,552,183 | | |
| | | | | Automobile Parts | | | | | |
| | 166,500 | | | Rinnai | | | 12,971,716 | | |
| | | | | Gas Appliances for Household &
Commercial Use | | | | | |
| | 2,253,000 | | | Seven Bank | | | 8,811,628 | | |
| | | | | ATM Processing Services | | | | | |
| | 188,000 | | | Dentsu | | | 7,688,943 | | |
| | | | | Advertising Agency | | | | | |
| | 658 | | | Nippon Prologis REIT | | | 6,302,959 | | |
| | | | | Logistics REIT in Japan | | | | | |
| | 91,000 | | | FamilyMart | | | 4,157,474 | | |
| | | | | Convenience Store Operator | | | | | |
| | 3,125 | | | Orix JREIT | | | 3,909,539 | | |
| | | | | Diversified REIT | | | | | |
| | 74,000 | | | Makita | | | 3,891,857 | | |
| | | | | Power Tools | | | | | |
| | 206,000 | | | Park24 | | | 3,884,935 | | |
| | | | | Parking Lot Operator | | | | | |
| | 143,700 | | | Start Today | | | 3,573,175 | | |
| | | | | Online Japanese Apparel Retailer | | | | | |
| | 414,000 | | | Wacom | | | 2,911,033 | | |
| | | | | Computer Graphic Illustration Devices | | | | | |
| | | | 72,655,442 | | |
| | | > Singapore 6.7% | |
| | 9,513,999 | | | Ascendas REIT | | | 16,650,853 | | |
| | | | | Industrial Property Landlord | | | | | |
| | 8,571,000 | | | Mapletree Logistics Trust | | | 7,173,865 | | |
| | | | | Industrial Property Landlord | | | | | |
| | | | 23,824,718 | | |
| | | > Korea 5.7% | |
| | 174,900 | | | Kepco Plant Service & Engineering | | | 9,086,744 | | |
| | | | | Power Plant & Grid Maintenance | | | | | |
| | 52,400 | | | CJ Corp | | | 5,795,769 | | |
| | | | | Holding Company of Korean
Consumer Conglomerate | | | | | |
| | 66,800 | | | Coway | | | 4,208,235 | | |
| | | | | Household Appliance Rental
Service Provider | | | | | |
| | 2,631 | | | AmorePacific Group | | | 1,160,737 | | |
| | | | | Holding Company of Korea's
Leading Cosmetics Manufacturer | | | | | |
| | | | 20,251,485 | | |
| | | > Taiwan 4.6% | |
| | 6,700,000 | | | Far EasTone Telecom | | | 14,719,038 | | |
| | | | | Taiwan's Third Largest Mobile Operator | | | | | |
| | 550,000 | | | Taiwan Mobile | | | 1,777,717 | | |
| | | | | Taiwan's Second Largest Mobile
Operator | | | | | |
| | | | 16,496,755 | | |
| | | > Indonesia 2.9% | |
| | 11,903,000 | | | Archipelago Resources (a)(b)(c) | | | 10,249,601 | | |
| | | | | Gold Mining Projects in Indonesia,
Vietnam & Philippines | | | | | |
Number of Shares | | | | Value | |
| | | > Hong Kong 2.5% | |
| | 2,391,000 | | | Melco International | | $ | 8,819,842 | | |
| | | | | Macau Casino Operator | | | | | |
Asia: Total | | | 152,297,843 | | |
Europe 28.4% | | | |
| | | > United Kingdom 11.7% | |
| | 900,000 | | | Jardine Lloyd Thompson Group | | | 15,191,799 | | |
| | | | | International Business Insurance Broker | | | | | |
| | 476,000 | | | Babcock International | | | 10,695,738 | | |
| | | | | Public Sector Outsourcer | | | | | |
| | 580,000 | | | Smith & Nephew | | | 8,283,960 | | |
| | | | | Medical Equipment & Supplies | | | | | |
| | 70,000 | | | Whitbread | | | 4,356,406 | | |
| | | | | The UK's Leading Hotelier & Coffee Shop | | | | | |
| | 270,000 | | | Telecity | | | 3,248,040 | | |
| | | | | European Data Center Provider | | | | | |
| | | | 41,775,943 | | |
| | | > France 4.4% | |
| | 153,900 | | | Neopost (d) | | | 11,876,079 | | |
| | | | | Postage Meter Machines | | | | | |
| | 33,000 | | | Gemalto | | | 3,631,830 | | |
| | | | | Digital Security Solutions | | | | | |
| | | | 15,507,909 | | |
| | | > Denmark 3.8% | |
| | 131,474 | | | SimCorp | | | 5,166,277 | | |
| | | | | Software for Investment Managers | | | | | |
| | 109,000 | | | Novozymes | | | 4,604,186 | | |
| | | | | Industrial Enzymes | | | | | |
| | 67,300 | | | Jyske Bank (e) | | | 3,638,875 | | |
| | | | | Danish Bank | | | | | |
| | | | 13,409,338 | | |
| | | > Norway 3.0% | |
| | 724,000 | | | Orkla | | | 5,659,058 | | |
| | | | | Food & Brands, Aluminum, Chemicals
Conglomerate | | | | | |
| | 257,000 | | | Subsea 7 | | | 4,926,919 | | |
| | | | | Offshore Subsea Contractor | | | | | |
| | | | 10,585,977 | | |
| | | > Switzerland 2.3% | |
| | 30,500 | | | Partners Group | | | 8,134,017 | | |
| | | | | Private Markets Asset Management | | | | | |
| | | > Germany 1.2% | |
| | 107,400 | | | Wirecard | | | 4,251,138 | | |
| | | | | Online Payment Processing &
Risk Management | | | | | |
| | | > Spain 1.0% | |
| | 66,000 | | | Viscofan | | | 3,754,421 | | |
| | | | | Sausage Casings Maker | | | | | |
| | | > Sweden 1.0% | |
| | 115,000 | | | Hexagon | | | 3,637,709 | | |
| | | | | Design, Measurement & Visualization
Software & Equipment | | | | | |
Europe: Total | | | 101,056,452 | | |
See accompanying notes to financial statements.
64
Number of Shares | | | | Value | |
Other Countries 18.8% | | | |
| | | > Australia 8.8% | |
| | 2,000,000 | | | IAG | | $ | 10,413,281 | | |
| | | | | General Insurance Provider | | | | | |
| | 1,674,000 | | | Challenger Financial | | | 9,297,039 | | |
| | | | | Largest Annuity Provider | | | | | |
| | 1,700,000 | | | Regis Resources | | | 4,461,267 | | |
| | | | | Gold Mining in Australia | | | | | |
| | 250,000 | | | Crown Resorts Ltd. | | | 3,771,940 | | |
| | | | | Australian Casino Operator | | | | | |
| | 370,000 | | | Amcor | | | 3,494,943 | | |
| | | | | Global Leader in Flexible & Rigid
Packaging | | | | | |
| | | | 31,438,470 | | |
| | | > Canada 4.1% | |
| | 151,000 | | | CCL Industries | | | 11,261,210 | | |
| | | | | Largest Global Label Converter | | | | | |
| | 159,000 | | | Goldcorp | | | 3,445,530 | | |
| | | | | Gold Mining | | | | | |
| | | | 14,706,740 | | |
| | | > South Africa 3.3% | |
| | 846,448 | | | Coronation Fund Managers | | | 6,460,253 | | |
| | | | | South African Fund Manager | | | | | |
| | 50,000 | | | Naspers | | | 5,233,724 | | |
| | | | | Media in Africa, China, Russia & Other
Emerging Markets | | | | | |
| | | | 11,693,977 | | |
| | | > United States 2.6% | |
| | 66,000 | | | SM Energy | | | 5,485,260 | | |
| | | | | Oil & Gas Producer | | | | | |
| | 67,000 | | | Atwood Oceanics (e) | | | 3,577,130 | | |
| | | | | Offshore Drilling Contractor | | | | | |
| | | | 9,062,390 | | |
Other Countries: Total | | | 66,901,577 | | |
Latin America 5.7% | | | |
| | | > Guatemala 2.7% | |
| | 588,000 | | | Tahoe Resources (e) | | | 9,781,087 | | |
| | | | | Silver Project in Guatemala | | | | | |
Number of Shares | | | | Value | |
| | | > Brazil 2.4% | |
| | 12,057,582 | | | Beadell Resources (e) | | $ | 8,587,027 | | |
| | | | | Gold Mining in Brazil | | | | | |
| | | > Uruguay 0.6% | |
| | 191,666 | | | Union Agriculture Group (a)(c)(e) | | | 2,048,910 | | |
| | | | | Farmland Operator in Uruguay | | | | | |
Latin America: Total | | | 20,417,024 | | |
Total Equities: 95.7%
(Cost: $269,899,464) | | | 340,672,896 | (f) | |
Short-Term Investments: 4.1% | | | |
| | 14,537,726 | | | JPMorgan U.S. Government
Money Market Fund, IM
Shares (7 day yield of 0.01%) | | | 14,537,726 | | |
Total Short-Term Investments: 4.1%
(Cost: $14,537,726) | | | 14,537,726 | | |
Securities Lending Collateral 0.2% | | | |
| | 662,817 | | | Dreyfus Government Cash
Management Fund, Institutional
Shares (7 day yield of 0.01%) (g) | | | 662,817 | | |
Total Securities Lending Collateral:
(Cost: $662,817) | | | 662,817 | | |
Total Investments: 100.0%
(Cost: $285,100,007)(h) | | | 355,873,439 | | |
Obligation to Return Collateral for
Securities Loaned: (0.2)% | | | (662,817 | ) | |
Cash and Other Assets Less
Liabilities: 0.2% | | | 678,512 | | |
Net Assets: 100.0% | | $ | 355,889,134 | | |
REIT - Real Estate Investment Trust
> Notes to Statement of Investments
(a) Denotes a restricted security, which is subject to restrictions on resale under federal securities laws. These securities are valued at fair value determined in good faith under consistently applied procedures established by the Board of Trustees. At December 31, 2013, the market value of these securities amounted to $12,298,511, which represented 3.46% of total net assets. Additional information on these securities is as follows:
Security | | Acquisition
Dates | | Shares/Units | | Cost | | Value | |
Archipelago Resources | | 12/20/10-9/26/13 | | | 11,903,000 | | | $ | 12,066,977 | | | $ | 10,249,601 | | |
Union Agriculture Group | | 12/8/10-6/27/12 | | | 191,666 | | | | 2,200,000 | | | | 2,048,910 | | |
| | | | | | | $ | 14,266,977 | | | $ | 12,298,511 | | |
See accompanying notes to financial statements.
65
Columbia Acorn International Select
Statement of Investments, continued
> Notes to Statement of Investments
(b) The Fund also received put options through a transaction related to a proposed company restructuring of Archipelago Resources. Additional information on the put options received is as follows:
Security | | Option Shares | | Exercise Price | | Expiration Date | | Value | |
Option (1) | | | 11,903,000 | | | GBP | 0.58 | | | August 13, 2014 | | $ | 985,539 | | |
GBP - British Pound
(1) Archipelago Resources is expected to restructure into a new company during 2014. From January 31, 2014, the option is exercisable until the earlier of (i) the date the company is restructured and prices the shares for its initial public offering or (ii) August 13, 2014, subject to extension until the date the company is restructured and prices the shares for its initial public offering (but not later than September 26, 2016). After August 13, 2014, the valuation of the option will fluctuate based upon its fair market value as determined in accordance with the put option agreement. These put options are valued at fair value determined in good faith under consistently applied procedures established by the Board of Trustees.
(c) Illiquid security.
(d) All or a portion of this security was on loan at December 31, 2013. The total market value of securities on loan at December 31, 2013 was $624,717.
(e) Non-income producing security.
(f) On December 31, 2013, the Fund's total investments were denominated in currencies as follows:
Currency | | Value | | Percentage
of Net Assets | |
Japanese Yen | | $ | 72,655,442 | | | | 20.4 | | |
British Pound | | | 52,025,543 | | | | 14.6 | | |
Australian Dollar | | | 40,025,497 | | | | 11.3 | | |
Singapore Dollar | | | 23,824,718 | | | | 6.7 | | |
Euro | | | 23,513,469 | | | | 6.6 | | |
Canadian Dollar | | | 21,042,297 | | | | 5.9 | | |
South Korean Won | | | 20,251,485 | | | | 5.7 | | |
Other currencies less
than 5% of total net assets | | | 87,334,445 | | | | 24.5 | | |
Total Equities | | $ | 340,672,896 | | | | 95.7 | | |
(g) Investment made with cash collateral received from securities lending activity.
(h) At December 31, 2013, for federal income tax purposes, the cost of investments was $295,031,767 and net unrealized appreciation was $60,841,672 consisting of gross unrealized appreciation of $71,010,395 and gross unrealized depreciation of $10,168,723.
At December 31, 2013, the Fund had entered into the following forward foreign currency exchange contracts:
Forward Foreign
Currency Exchange
Contracts to Buy | | Forward Foreign
Currency Exchange
Contracts to Sell | | Principal Amount
in Foreign Currency | | Principal Amount
in U.S. Dollar | | Settlement
Date | | Unrealized
Appreciation
(Depreciation) | |
USD | | | | ZAR | | | | | 93,885,300 | | | $ | 9,000,000 | | | 1/15/14 | | $ | 65,818 | | |
The counterparty for all forward foreign currency exchange contracts is Morgan Stanley.
USD - United States Dollar
ZAR - South African Rand
Fair Value Measurements
Various inputs are used in determining the value of the Fund's investments, following the input prioritization hierarchy established by accounting principles generally accepted in the United States of America (GAAP). These inputs are summarized in the three broad levels listed below:
• Level 1 – quoted prices in active markets for identical securities
• Level 2 – prices determined using other significant observable inputs (including quoted prices for similar securities, interest rates, prepayment speeds, credit risk and others)
• Level 3 – prices determined using significant unobservable inputs where quoted prices or observable inputs are unavailable or less reliable (including management's own assumptions about the factors market participants would use in pricing an investment)
The inputs or methodology used for valuing securities are not necessarily an indication of the risk associated with investing in those securities.
Examples of the types of securities in which the Fund would typically invest and how they are classified within this hierarchy are as follows. Typical Level 1 securities include exchange traded domestic equities, mutual funds whose NAVs are published each day and exchange traded foreign equities that are not statistically fair valued. Typical Level 2 securities include exchange traded foreign equities that are statistically fair valued, forward foreign currency exchange contracts and short-term investments valued at amortized cost. Additionally, securities fair valued by the Valuation Committee (the Committee) of the Fund's Board of Trustees (the Board) that rely on significant observable inputs are also included in Level 2. Typical Level 3 securities include any security fair valued by the Committee that relies on significant unobservable inputs.
See accompanying notes to financial statements.
66
> Notes to Statement of Investments
Under the direction of the Board, the Committee is responsible for overseeing the valuation procedures approved by the Board.
The Committee meets as necessary, and no less frequently than quarterly, to determine fair values for securities for which market quotations are not readily available or for which the investment manager believes that available market quotations are unreliable, to review the appropriateness of the Trust's Portfolio Pricing Policy and the pricing procedures of the investment manager (the Policies), and to review the continuing appropriateness of the current value of any security subject to the Policies. The Policies address, among other things: circumstances under which market quotations will be deemed readily available; selection of third party pricing vendors; appropriate pricing methodologies; events that require fair valuation and fair value techniques; circumstances under which securities will be deemed to pose a potential for stale pricing, including when securities are illiquid, restricted, or in default; and certain delegations of authority to determine fair values to the Fund's investment manager. The Committee may also meet to discuss additional valuation matters, which may include review of back-testing results, review of time-sensitive information or approval of other valuation related actions, and to review the appropriateness of the Policies.
For investments and derivatives categorized as Level 3, the significant unobservable inputs used in the fair value measurement of the Funds' securities may include: (i) data specific to the issuer or comparable issuers, (ii) general market or specific sector news and (iii) quoted prices and specific or similar security transactions. The Committee considers this data and any changes from prior periods in order to assess the reasonableness of observable and unobservable inputs, any assumptions or internal models used to value those securities and changes in fair value. Significant changes in any of these factors could result in lower or higher fair value measurements. Various factors impact the frequency of monitoring (which may occur as often as daily), however the Committee may determine that changes to inputs, assumptions and models are not required with the same frequency.
The following table summarizes the inputs used, as of December 31, 2013, in valuing the Fund's assets:
Investment Type | | Quoted Prices
(Level 1) | | Other
Significant
Observable
Inputs
(Level 2) | | Significant
Unobservable
Inputs
(Level 3) | | Total | |
Equities | |
Asia | | $ | - | | | $ | 142,048,242 | | | $ | 10,249,601 | | | $ | 152,297,843 | | |
Europe | | | - | | | | 101,056,452 | | | | - | | | | 101,056,452 | | |
Other Countries | | | 23,769,130 | | | | 43,132,447 | | | | - | | | | 66,901,577 | | |
Latin America | | | 9,781,087 | | | | 8,587,027 | | | | 2,048,910 | | | | 20,417,024 | | |
Total Equities | | | 33,550,217 | | | | 294,824,168 | | | | 12,298,511 | | | | 340,672,896 | | |
Total Short-Term Investments | | | 14,537,726 | | | | - | | | | - | | | | 14,537,726 | | |
Total Securities Lending Collateral | | | 662,817 | | | | - | | | | - | | | | 662,817 | | |
Total Investments | | $ | 48,750,760 | | | $ | 294,824,168 | | | $ | 12,298,511 | | | $ | 355,873,439 | | |
Unrealized Appreciation on: | |
| Forward Foreign Currency Exchange Contracts | | | - | | | | 65,818 | | | | - | | | | 65,818 | | |
| Options | | | - | | | | - | | | | 985,539 | | | | 985,539 | | |
Total | | $ | 48,750,760 | | | $ | 294,889,986 | | | $ | 13,284,050 | | | $ | 356,924,796 | | |
The Fund's assets assigned to the Level 2 input category are generally valued using a market approach, in which a security's value is determined through its correlation to prices and information from observable market transactions for similar or identical assets. Foreign equities are generally valued at the last sale price on the foreign exchange or market on which they trade. The Fund may use a statistical fair valuation model, in accordance with the policy adopted by the Board, provided by an independent third party to value securities principally traded in foreign markets in order to adjust for possible stale pricing that may occur between the close of the foreign exchanges and the time for valuation. These models take into account available market data including intraday index, ADR, and ETF movements. Forward foreign currency exchange contracts are valued at the prevailing forward exchange rate of the underlying currencies.
There were no transfers of financial assets between levels 1 and 2 during the period.
The following table reconciles asset balances for the period ending December 31, 2013, in which significant observable and/or unobservable inputs (Level 3) were used in determining value:
Investments in Securities | | Balance as
of December 31,
2012 | | Realized
Gain/(Loss) | | Change in
Unrealized
Appreciation
(Depreciation) | | Purchases | | Sales | | Transfers
into
Level 3 | | Transfers
out of
Level 3 | | Balance as
of December 31,
2013 | |
Equities | |
Asia | | $ | - | | | $ | - | | | $ | (1,345,999 | ) | | $ | 741,091 | | | $ | - | | | $ | 10,854,509 | | | $ | - | | | $ | 10,249,601 | | |
Latin America | | | 1,962,660 | | | | - | | | | 86,250 | | | | - | | | | - | | | | - | | | | - | | | | 2,048,910 | | |
Options | |
| Asia | | | - | | | | - | | | | 985,539 | | | | - | | | | - | | | | - | | | | - | | | | 985,539 | | |
| | | $ | 1,962,660 | | | $ | - | | | $ | (274,210 | ) | | $ | 741,091 | | | $ | - | | | $ | 10,854,509 | | | $ | - | | | $ | 13,284,050 | | |
See accompanying notes to financial statements.
67
Columbia Acorn International Select
Statement of Investments, continued
> Notes to Statement of Investments
The information in the above reconciliation table represents fiscal year to date activity for any securities identified as using Level 3 inputs at either the beginning or the end of the current fiscal period.
The change in unrealized depreciation attributed to securities owned at December 31, 2013, which were valued using significant unobservable inputs (Level 3), amounted to $(274,210).
Quantitative information pertaining to Level 3 unobservable fair value measurements
| | | Fair Value at
12/31/13 | | Valuation Technique(s) | | Unobservable Input(s) | | Range | |
Equities | |
| Asia | | $ | 10,249,601 | | | Discounted cash flow | | Enterprise valuation and illiquid discount | | | 19.5 | % to 22.7% | |
| Latin America | | $ | 2,048,910 | | | Market comparable companies | | Discount for lack of marketability | | | 8 | % to 10% | |
Options | |
| Asia | | $ | 985,539 | | | Income approach | | Illiquid discount | | | 6 | % | |
Certain securities classified as Level 3 are valued at fair value, using a market approach, as determined in good faith under consistently applied procedures established by and under the general supervision of the Board. To determine fair value for these securities, for which no market exists, the Committee utilizes the valuation technique it deems most appropriate in the circumstances, using some unobservable inputs, which may include, but are not limited to, estimated earnings of the company and the position of the security within the company's capital structure. The Committee also may use some observable inputs, which may include, but are not limited to, trades of similar securities and market multiples derived from a set of comparable companies. Significant increases or decreases to any of these inputs could result in a significantly lower or higher fair value measurement.
Transfers in and/or out of Level 3 are determined based on the fair value at the beginning of the period for security positions held throughout the period.
See accompanying notes to financial statements.
68
Columbia Acorn International Select
Portfolio Diversification
At December 31, 2013, the Fund's portfolio investments as a percentage of net assets were diversified as follows:
| | | Value | | Percentage
of Net Assets | |
| > Consumer Goods & Services | |
Other Durable Goods | | $ | 27,523,899 | | | | 7.7 | | |
Casinos & Gaming | | | 12,591,783 | | | | 3.5 | | |
Nondurables | | | 12,421,947 | | | | 3.5 | | |
Other Consumer Services | | | 10,004,004 | | | | 2.8 | | |
Retail | | | 7,730,649 | | | | 2.2 | | |
Restaurants | | | 4,356,406 | | | | 1.2 | | |
Food & Beverage | | | 3,754,421 | | | | 1.1 | | |
| | | | 78,383,109 | | | | 22.0 | | |
| > Finance | |
Insurance | | | 34,902,118 | | | | 9.8 | | |
Brokerage & Money Management | | | 14,594,271 | | | | 4.1 | | |
Banks | | | 12,450,503 | | | | 3.5 | | |
| | | | 61,946,892 | | | | 17.4 | | |
| > Industrial Goods & Services | |
Outsourcing Services | | | 19,782,482 | | | | 5.5 | | |
Machinery | | | 15,767,936 | | | | 4.4 | | |
Industrial Materials & Specialty
Chemicals | | | 8,099,129 | | | | 2.3 | | |
Conglomerates | | | 5,659,058 | | | | 1.6 | | |
Other Industrial Services | | | 3,884,935 | | | | 1.1 | | |
| | | 53,193,540 | | | | 14.9 | | |
| > Energy & Minerals | |
Mining | | | 36,524,513 | | | | 10.2 | | |
Oil Services | | | 8,504,049 | | | | 2.4 | | |
Oil & Gas Producers | | | 5,485,260 | | | | 1.6 | | |
Agricultural Commodities | | | 2,048,909 | | | | 0.6 | | |
| | | 52,562,731 | | | | 14.8 | | |
| > Information | |
Mobile Communications | | | 16,496,755 | | | | 4.6 | | |
Business Software | | | 8,803,986 | | | | 2.5 | | |
Advertising | | | 7,688,943 | | | | 2.2 | | |
Computer Hardware & Related
Equipment | | | 6,542,863 | | | | 1.8 | | |
Internet Related | | | 5,233,724 | | | | 1.5 | | |
Financial Processors | | | 4,251,138 | | | | 1.2 | | |
Computer Services | | | 3,248,040 | | | | 0.9 | | |
| | | | 52,265,449 | | | | 14.7 | | |
| > Other Industries | |
Real Estate | | | 34,037,216 | | | | 9.6 | | |
| | | | 34,037,216 | | | | 9.6 | | |
| | | Value | | Percentage
of Net Assets | |
| > Health Care | |
Medical Equipment & Devices | | $ | 8,283,959 | | | | 2.3 | | |
| | | | 8,283,959 | | | | 2.3 | | |
Total Equities: | | | 340,672,896 | | | | 95.7 | | |
Short-Term Investments: | | | 14,537,726 | | | | 4.1 | | |
Securities Lending Collateral: | | | 662,817 | | | | 0.2 | | |
Total Investments: | | | 355,873,439 | | | | 100.0 | | |
Obligation to Return
Collateral for Securities
Loaned: | | | (662,817 | ) | | | (0.2 | ) | |
Cash and Other Assets
Less Liabilities: | | | 678,512 | | | | 0.2 | | |
Net Assets: | | $ | 355,889,134 | | | | 100.0 | | |
See accompanying notes to financial statements.
69
Columbia Acorn Select
Major Portfolio Changes in the Fourth Quarter (Unaudited)
| | | Number of Shares | |
| | | 9/30/13 | | 12/31/13 | |
Purchases | |
Industrial Goods & Services | |
Airgas | | | 94,064 | | | | 117,000 | | |
Information | |
Ansys | | | 138,000 | | | | 153,000 | | |
Informatica | | | 0 | | | | 234,000 | | |
Energy & Minerals | |
Antero Resources | | | 0 | | | | 58,300 | | |
Other Industries | |
Extra Space Storage | | | 0 | | | | 230,000 | | |
| | | Number of Shares | |
| | | 9/30/13 | | 12/31/13 | |
Sales | |
Industrial Goods & Services | |
FMC Corporation | | | 265,000 | | | | 220,000 | | |
Pall | | | 375,000 | | | | 265,000 | | |
Quanta Services | | | 790,000 | | | | 760,000 | | |
Information | |
Amphenol | | | 445,000 | | | | 370,000 | | |
Atmel | | | 575,000 | | | | 360,000 | | |
Crown Castle International | | | 265,000 | | | | 0 | | |
Sanmina-SCI | | | 740,000 | | | | 440,000 | | |
SBA Communications | | | 350,000 | | | | 325,000 | | |
WNS - ADR | | | 2,055,960 | | | | 1,589,000 | | |
Consumer Goods & Services | |
Hertz | | | 1,643,000 | | | | 1,415,000 | | |
ITT Educational Services | | | 198,000 | | | | 120,000 | | |
Lifetime Fitness | | | 275,000 | | | | 250,000 | | |
ULTA | | | 129,000 | | | | 115,000 | | |
Finance | |
Associated Banc-Corp | | | 1,043,000 | | | | 860,000 | | |
City National | | | 445,000 | | | | 333,000 | | |
CNO Financial Group | | | 2,970,000 | | | | 2,085,000 | | |
Energy & Minerals | |
Kirkland Lake Gold | | | 1,550,000 | | | | 0 | | |
Heath Care | |
Cepheid | | | 464,000 | | | | 435,000 | | |
Other Industries | |
Biomed Realty Trust | | | 235,000 | | | | 0 | | |
See accompanying notes to financial statements.
70
Columbia Acorn Select
Statement of Investments, December 31, 2013
Number of Shares | | | | Value | |
| | | | | | | Equities: 98.8% | |
Industrial Goods & Services 25.2% | | | |
| | | > Machinery 18.4% | |
| | 990,000 | | | Ametek | | $ | 52,143,300 | | |
| | | | | Aerospace/Industrial Instruments | | | | | |
| | 830,000 | | | Donaldson | | | 36,071,800 | | |
| | | | | Industrial Air Filtration | | | | | |
| | 505,000 | | | Kennametal | | | 26,295,350 | | |
| | | | | Consumable Cutting Tools | | | | | |
| | 265,000 | | | Pall | | | 22,617,750 | | |
| | | | | Life Science, Water &
Industrial Filtration | | | | | |
| | 288,000 | | | Nordson | | | 21,398,400 | | |
| | | | | Dispensing Systems for
Adhesives & Coatings | | | | | |
| | | | 158,526,600 | | |
| | | > Outsourcing Services 2.8% | |
| | 760,000 | | | Quanta Services (a) | | | 23,985,600 | | |
| | | | | Electrical & Telecom
Construction Services | | | | | |
| | | > Industrial Materials & Specialty Chemicals 1.9% | |
| | 220,000 | | | FMC Corporation | | | 16,601,200 | | |
| | | | | Niche Specialty Chemicals | | | | | |
| | | > Industrial Distribution 1.5% | |
| | 117,000 | | | Airgas | | | 13,086,450 | | |
| | | | | Industrial Gas Distributor | | | | | |
| | | > Other Industrial Services 0.6% | |
| | 107,000 | | | Forward Air | | | 4,698,370 | | |
| | | | | Freight Transportation Between
Airports | | | | | |
Industrial Goods & Services: Total | | | 216,898,220 | | |
Information 21.7% | | | |
| | | > Instrumentation 4.7% | |
| | 98,000 | | | Mettler-Toledo International (a) | | | 23,773,820 | | |
| | | | | Laboratory Equipment | | | | | |
| | 490,000 | | | Trimble Navigation (a) | | | 17,003,000 | | |
| | | | | GPS-based Instruments | | | | | |
| | | | 40,776,820 | | |
| | | > Computer Services 4.0% | |
| | 1,589,000 | | | WNS - ADR (India) (a) | | | 34,814,990 | | |
| | | | | Offshore Business Process Outsourcing
Services | | | | | |
| | | > Computer Hardware & Related
Equipment 3.8% | |
| | 370,000 | | | Amphenol | | | 32,996,600 | | |
| | | | | Electronic Connectors | | | | | |
| | | > Mobile Communications 3.4% | |
| | 325,000 | | | SBA Communications (a) | | | 29,198,000 | | |
| | | | | Communications Towers | | | | | |
| | | > Business Software 2.7% | |
| | 153,000 | | | Ansys (a) | | | 13,341,600 | | |
| | | | | Simulation Software for Engineers &
Designers | | | | | |
Number of Shares | | | | Value | |
| | 234,000 | | | Informatica (a) | | $ | 9,711,000 | | |
| | | | | Enterprise Data Integration Software | | | | | |
| | | | 23,052,600 | | |
| | | > Telecommunications Equipment 1.9% | |
| | 180,000 | | | F5 Networks (a) | | | 16,354,800 | | |
| | | | | Internet Traffic Management
Equipment | | | | | |
| | | > Contract Manufacturing 0.9% | |
| | 440,000 | | | Sanmina-SCI (a) | | | 7,348,000 | | |
| | | | | Electronic Manufacturing Services | | | | | |
| | | > Semiconductors &
Related Equipment 0.3% | |
| | 360,000 | | | Atmel (a) | | | 2,818,800 | | |
| | | | | Microcontrollers, Radio Frequency &
Memory Semiconductors | | | | | |
Information: Total | | | 187,360,610 | | |
Consumer Goods & Services 16.4% | | | |
| | | > Travel 7.9% | |
| | 1,415,000 | | | Hertz (a) | | | 40,497,300 | | |
| | | | | Largest U.S. Rental Car Operator | | | | | |
| | 238,000 | | | Vail Resorts | | | 17,904,740 | | |
| | | | | Ski Resort Operator & Developer | | | | | |
| | 200,000 | | | Choice Hotels | | | 9,822,000 | | |
| | | | | Franchisor of Budget Hotel Brands | | | | | |
| | | | 68,224,040 | | |
| | | > Retail 3.7% | |
| | 184,000 | | | Casey's General Stores | | | 12,926,000 | | |
| | | | | Owner/Operator of Convenience Stores | | | | | |
| | 115,000 | | | ULTA (a) | | | 11,099,800 | | |
| | | | | Specialty Beauty Product Retailer | | | | | |
| | 195,000 | | | Best Buy | | | 7,776,600 | | |
| | | | | Consumer Electronic Specialty Retailer | | | | | |
| | | | 31,802,400 | | |
| | | > Other Consumer Services 2.8% | |
| | 250,000 | | | Lifetime Fitness (a) | | | 11,750,000 | | |
| | | | | Sport & Fitness Club Operator | | | | | |
| | 435,000 | | | Blackhawk Network (a)(b) | | | 10,988,100 | | |
| | | | | Third Party Distributer of Prepaid
Content, Mostly Gift Cards | | | | | |
| | 898,852 | | | IFM Investments
(Century 21 China RE) - ADR
(China) (a)(c) | | | 1,842,647 | | |
| | | | | Real Estate Services in China | | | | | |
| | | | 24,580,747 | | |
| | | > Apparel 1.4% | |
| | 89,000 | | | PVH | | | 12,105,780 | | |
| | | | | Apparel Wholesaler & Retailer | | | | | |
| | | > Educational Services 0.5% | |
| | 120,000 | | | ITT Educational Services (a)(b) | | | 4,029,600 | | |
| | | | | Post-secondary Degree Services | | | | | |
| | | > Food & Beverage 0.1% | |
| | 1,500,000 | | | GLG Life Tech (Canada) (a) | | | 706,048 | | |
| | | | | Producer of an All-natural Sweetener
Extracted from the Stevia Plant | | | | | |
Consumer Goods & Services: Total | | | 141,448,615 | | |
See accompanying notes to financial statements.
71
Columbia Acorn Select
Statement of Investments, continued
Number of Shares | | | | Value | |
Finance 16.4% | | | |
| | | > Banks 4.8% | |
| | 333,000 | | | City National | | $ | 26,380,260 | | |
| | | | | Bank & Asset Manager | | | | | |
| | 860,000 | | | Associated Banc-Corp | | | 14,964,000 | | |
| | | | | Midwest Bank | | | | | |
| | | | 41,344,260 | | |
| | | > Credit Cards 4.4% | |
| | 678,000 | | | Discover Financial Services | | | 37,934,100 | | |
| | | | | Credit Card Company | | | | | |
| | | > Insurance 4.3% | |
| | 2,085,000 | | | CNO Financial Group | | | 36,883,650 | | |
| | | | | Life, Long-term Care & Medical
Supplement Insurance | | | | | |
| | | > Brokerage & Money Management 2.9% | |
| | 725,000 | | | SEI Investments | | | 25,179,250 | | |
| | | | | Mutual Fund Administration &
Investment Management | | | | | |
Finance: Total | | | 141,341,260 | | |
Energy & Minerals 9.5% | | | |
| | | > Oil & Gas Producers 6.1% | |
| | 3,600,000 | | | Canacol (Colombia) (a) | | | 24,163,803 | | |
| | | | | Oil Producer in South America | | | | | |
| | 20,600,000 | | | Shamaran Petroleum (Iraq) (a) | | | 8,920,687 | | |
| | | | | Oil Exploration & Production in
Kurdistan | | | | | |
| | 410,000 | | | Pacific Rubiales
Energy (Colombia) | | | 7,078,748 | | |
| | | | | Oil Production & Exploration in
Colombia | | | | | |
| | 24,000,000 | | | Canadian Overseas Petroleum
(United Kingdom) (a)(c)(d) | | | 5,687,927 | | |
| | | | | Oil & Gas Exploration/Production
in the North Sea | | | | | |
| | 58,300 | | | Antero Resources (a) | | | 3,698,552 | | |
| | | | | Oil & Gas Exploration & Production
in Utica & Marcellus Shale | | | | | |
| | 12,000,000 | | | Petromanas (Canada) (a) | | | 1,807,484 | | |
| | | | | Exploring for Oil in Albania | | | | | |
| | 33,700,000 | | | Petrodorado Energy
(Colombia) (a)(c) | | | 1,110,379 | | |
| | | | | Oil & Gas Exploration & Production
in Colombia, Peru & Paraguay | | | | | |
| | | | 52,467,580 | | |
| | | > Agricultural Commodities 2.2% | |
| | 1,742,424 | | | Union Agriculture Group
(Uruguay) (a)(d)(e) | | | 18,626,513 | | |
| | | | | Farmland Operator in Uruguay | | | | | |
| | | > Oil Services 1.1% | |
| | 260,000 | | | Rowan (a) | | | 9,193,600 | | |
| | | | | Contract Offshore Driller | | | | | |
| | | > Alternative Energy 0.1% | |
| | 2,000,000 | | | Synthesis Energy
Systems (China) (a) | | | 1,200,000 | | |
| | | | | Owner/Operator of Gasification
Plants | | | | | |
Energy & Minerals: Total | | | 81,487,693 | | |
Number of Shares | | | | Value | |
Health Care 6.2% | | | |
| | | > Medical Supplies 4.5% | |
| | 435,000 | | | Cepheid (a) | | $ | 20,323,200 | | |
| | | | | Molecular Diagnostics | | | | | |
| | 163,000 | | | Henry Schein (a) | | | 18,624,380 | | |
| | | | | Largest Distributor of Healthcare
Products | | | | | |
| | | | 38,947,580 | | |
| | | > Biotechnology & Drug Delivery 1.7% | |
| | 363,000 | | | Seattle Genetics (a) | | | 14,480,070 | | |
| | | | | Antibody-based Therapies for
Cancer | | | | | |
Health Care: Total | | | 53,427,650 | | |
Other Industries 3.4% | | | |
| | | > Real Estate 3.4% | |
| | 430,000 | | | Post Properties | | | 19,448,900 | | |
| | | | | Multifamily Properties | | | | | |
| | 230,000 | | | Extra Space Storage | | | 9,689,900 | | |
| | | | | Self Storage Facilities | | | | | |
| | | | 29,138,800 | | |
Other Industries: Total | | | 29,138,800 | | |
Total Equities: 98.8%
(Cost: $511,549,785) | | | 851,102,848 | (f) | |
Short-Term Investments: 2.1% | | | |
| | 18,436,144 | | | JPMorgan U.S. Government
Money Market Fund, Agency
Shares (7 day yield of 0.01%) | | | 18,436,144 | | |
Total Short-Term Investments: 2.1%
(Cost: $18,436,144) | | | 18,436,144 | | |
Securities Lending Collateral 0.4% | | | |
| | 3,090,175 | | | Dreyfus Government Cash
Management Fund,
Institutional Shares
(7 day yield of 0.01%) (g) | | | 3,090,175 | | |
Total Securities Lending Collateral:
(Cost: $3,090,175) | | | 3,090,175 | | |
Total Investments: 101.3%
(Cost: $533,076,104)(h) | | | 872,629,167 | | |
Obligation to Return Collateral for
Securities Loaned: (0.4)% | | | (3,090,175 | ) | |
Cash and Other Assets Less
Liabilities: (0.9)% | | | (7,995,449 | ) | |
Net Assets: 100.0% | | $ | 861,543,543 | | |
ADR - American Depositary Receipts
See accompanying notes to financial statements.
72
> Notes to Statement of Investments
(a) Non-income producing security.
(b) All or a portion of this security was on loan at December 31, 2013. The total market value of securities on loan at December 31, 2013 was $3,049,372.
(c) An affiliated person of the Fund, as defined in the Investment Company Act of 1940, may include any company in which the Fund owns five percent or more of its outstanding voting shares. Holdings and transactions in these affiliated companies during the year ended December 31, 2013, are as follows:
Security | | Balance of
Shares Held
12/31/12 | | Purchases/
Additions | | Sales/
Reductions | | Balance of
Shares Held
12/31/13 | | Value | | Dividend | |
WNS - ADR (1) | | | 3,034,100 | | | | - | | | | 1,445,100 | | | | 1,589,000 | | | $ | 34,814,990 | | | $ | - | | |
Canadian Overseas Petroleum | | | 24,000,000 | | | | - | | | | - | | | | 24,000,000 | | | | 5,687,927 | | | | - | | |
IFM Investments
(Century 21 China RE) - ADR | | | 1,300,000 | | | | - | | | | 401,148 | | | | 898,852 | | | | 1,842,647 | | | | - | | |
Petrodorado Energy | | | 33,700,000 | | | | - | | | | - | | | | 33,700,000 | | | | 1,110,379 | | | | - | | |
Globalstar (1) | | | 19,000,000 | | | | - | | | | 19,000,000 | | | | - | | | | - | | | | - | | |
Total of Affiliated Transactions | | | 81,034,100 | | | | - | | | | 20,846,248 | | | | 60,187,852 | | | $ | 43,455,943 | | | $ | - | | |
(1) At December 31, 2013, the Fund owned less than five percent of the company's outstanding voting shares.
The aggregate cost and value of these companies at December 31, 2013, was $30,471,805 and $8,640,953, respectively. Investments in affiliated companies represented 1.00% of the Fund's total net assets at December 31, 2013.
(d) Denotes a restricted security, which is subject to restrictions on resale under federal securities laws. These securities are valued at fair value determined in good faith under consistently applied procedures established by the Board of Trustees. At December 31, 2013, the market value of these securities amounted to $24,314,440, which represented 2.82% of total net assets. Additional information on these securities is as follows:
Security | | Acquisition
Dates | | Shares/Units | | Cost | | Value | |
Union Agriculture Group | | 12/8/10-6/27/12 | | | 1,742,424 | | | $ | 20,000,000 | | | $ | 18,626,513 | | |
Canadian Overseas Petroleum | | 11/24/10 | | | 24,000,000 | | | | 10,260,435 | | | | 5,687,927 | | |
| | | | | | | $ | 30,260,435 | | | $ | 24,314,440 | | |
(e) Illiquid security.
(f) On December 31, 2013, the market value of foreign securities represented 12.30% of total net assets. The Fund's foreign portfolio was diversified as follows:
Country | | Value | | Percentage
of Net Assets | |
India | | $ | 34,814,990 | | | | 4.04 | | |
Colombia | | | 32,352,930 | | | | 3.76 | | |
Uruguay | | | 18,626,513 | | | | 2.16 | | |
Iraq | | | 8,920,687 | | | | 1.04 | | |
United Kingdom | | | 5,687,927 | | | | 0.66 | | |
China | | | 3,042,647 | | | | 0.35 | | |
Canada | | | 2,513,532 | | | | 0.29 | | |
Total Foreign Portfolio | | $ | 105,959,226 | | | | 12.30 | | |
(g) Investment made with cash collateral received from securities lending activity.
(h) At December 31, 2013, for federal income tax purposes, the cost of investments was $533,211,350 and net unrealized appreciation was $339,417,817 consisting of gross unrealized appreciation of $379,904,435 and gross unrealized depreciation of $40,486,618.
Fair Value Measurements
Various inputs are used in determining the value of the Fund's investments, following the input prioritization hierarchy established by accounting principles generally accepted in the United States of America (GAAP). These inputs are summarized in the three broad levels listed below:
• Level 1 – quoted prices in active markets for identical securities
• Level 2 – prices determined using other significant observable inputs (including quoted prices for similar securities, interest rates, prepayment speeds, credit risk and others)
• Level 3 – prices determined using significant unobservable inputs where quoted prices or observable inputs are unavailable or less reliable (including management's own assumptions about the factors market participants would use in pricing an investment)
The inputs or methodology used for valuing securities are not necessarily an indication of the risk associated with investing in those securities.
Examples of the types of securities in which the Fund would typically invest and how they are classified within this hierarchy are as follows. Typical Level 1 securities include exchange traded domestic equities, mutual funds whose NAVs are published each day and exchange traded foreign equities that are not statistically fair valued. Typical
See accompanying notes to financial statements.
73
Columbia Acorn Select
Statement of Investments, continued
> Notes to Statement of Investments
Level 2 securities include exchange traded foreign equities that are statistically fair valued, forward foreign currency exchange contracts and short-term investments valued at amortized cost. Additionally, securities fair valued by the Valuation Committee (the Committee) of the Fund's Board of Trustees (the Board) that rely on significant observable inputs are also included in Level 2. Typical Level 3 securities include any security fair valued by the Committee that relies on significant unobservable inputs.
Under the direction of the Board, the Committee is responsible for overseeing the valuation procedures approved by the Board.
The Committee meets as necessary, and no less frequently than quarterly, to determine fair values for securities for which market quotations are not readily available or for which the investment manager believes that available market quotations are unreliable, to review the appropriateness of the Trust's Portfolio Pricing Policy and the pricing procedures of the investment manager (the Policies), and to review the continuing appropriateness of the current value of any security subject to the Policies. The Policies address, among other things: circumstances under which market quotations will be deemed readily available; selection of third party pricing vendors; appropriate pricing methodologies; events that require fair valuation and fair value techniques; circumstances under which securities will be deemed to pose a potential for stale pricing, including when securities are illiquid, restricted, or in default; and certain delegations of authority to determine fair values to the Fund's investment manager. The Committee may also meet to discuss additional valuation matters, which may include review of back-testing results, review of time-sensitive information or approval of other valuation related actions, and to review the appropriateness of the Policies.
For investments categorized as Level 3, the significant unobservable inputs used in the fair value measurement of the Funds' securities may include: (i) data specific to the issuer or comparable issuers, (ii) general market or specific sector news and (iii) quoted prices and specific or similar security transactions. The Committee considers this data and any changes from prior periods in order to assess the reasonableness of observable and unobservable inputs, any assumptions or internal models used to value those securities and changes in fair value. Significant changes in any of these factors could result in lower or higher fair value measurements. Various factors impact the frequency of monitoring (which may occur as often as daily), however the Committee may determine that changes to inputs, assumptions and models are not required with the same frequency.
The following table summarizes the inputs used, as of December 31, 2013, in valuing the Fund's assets:
Investment Type | | Quoted Prices
(Level 1) | | Other
Significant
Observable
Inputs
(Level 2) | | Significant
Unobservable
Inputs
(Level 3) | | Total | |
Equities | |
Industrial Goods & Services | | $ | 216,898,220 | | | $ | - | | | $ | - | | | $ | 216,898,220 | | |
Information | | | 187,360,610 | | | | - | | | | - | | | | 187,360,610 | | |
Consumer Goods & Services | | | 141,448,615 | | | | - | | | | - | | | | 141,448,615 | | |
Finance | | | 141,341,260 | | | | - | | | | - | | | | 141,341,260 | | |
Energy & Minerals | | | 57,173,253 | | | | 5,687,927 | | | | 18,626,513 | | | | 81,487,693 | | |
Health Care | | | 53,427,650 | | | | - | | | | - | | | | 53,427,650 | | |
Other Industries | | | 29,138,800 | | | | - | | | | - | | | | 29,138,800 | | |
Total Equities | | | 826,788,408 | | | | 5,687,927 | | | | 18,626,513 | | | | 851,102,848 | | |
Total Short-Term Investments | | | 18,436,144 | | | | - | | | | - | | | | 18,436,144 | | |
Total Securities Lending Collateral | | | 3,090,175 | | | | - | | | | - | | | | 3,090,175 | | |
Total Investments | | $ | 848,314,727 | | | $ | 5,687,927 | | | $ | 18,626,513 | | | $ | 872,629,167 | | |
The Fund's assets assigned to the Level 2 input category are generally valued using a market approach, in which a security's value is determined through its correlation to prices and information from observable market transactions for similar or identical assets. Securities acquired via private placement that have a holding period or an extended settlement period are valued at a discount to the same shares that are trading freely on the market. These discounts are determined by the investment manager's experience with similar securities or situations. Factors may include, but are not limited to, trade volume, shares outstanding and stock price.
The following table shows transfers between Level 1 and Level 2 of the fair value hierarchy:
Transfers In | | Transfers Out | |
| Level 1 | | Level 2 | | Level 1 | | Level 2 | |
| $ | 391,500 | | | $ | - | | | $ | - | | | $ | 391,500 | | |
Financial assets were transferred from Level 2 to Level 1 as trading resumed during the period.
See accompanying notes to financial statements.
74
> Notes to Statement of Investments
The following table reconciles asset balances for the period ending December 31, 2013, in which significant observable and/or unobservable inputs (Level 3) were used in determining value:
Investments in Securities | | Balance as
of December 31,
2012 | | Realized
Gain/(Loss) | | Change
in Unrealized
Appreciation
(Depreciation) | | Purchases | | Sales | | Transfers
into
Level 3 | | Transfers
out of
Level 3 | | Balance as
of December 31,
2013 | |
Equities | |
Energy & Materials | | $ | 17,842,422 | | | $ | - | | | $ | 784,091 | | | $ | - | | | $ | - | | | $ | - | | | $ | - | | | $ | 18,626,513 | | |
| | | $ | 17,842,422 | | | $ | - | | | $ | 784,091 | | | $ | - | | | $ | - | | | $ | - | | | $ | - | | | $ | 18,626,513 | | |
The information in the above reconciliation table represents fiscal year to date activity for any securities identified as using Level 3 inputs at either the beginning or the end of the current fiscal period.
The change in unrealized appreciation attributed to securities owned at December 31, 2013, which were valued using significant unobservable inputs (Level 3), amounted to $784,091.
Quantitative information pertaining to Level 3 unobservable fair value measurements
| | | Fair Value at
12/31/13 | | Valuation Technique(s) | | Unobservable Input(s) | | Range | |
Equities | |
| Energy & Minerals | | $ | 18,626,513 | | | Market comparable companies | | Discount for lack of marketability | | | 8 | % to 10% | |
Certain common stock classified as Level 3 are valued at fair value, using a market approach, as determined in good faith under consistently applied procedures established by and under the general supervision of the Board. To determine fair value for these securities, for which no market exists, the Committee utilizes the valuation technique it deems most appropriate in the circumstances, using some unobservable inputs, which may include, but are not limited to, estimated earnings of the company and the position of the security within the company's capital structure. The Committee also may use some observable inputs, which may include, but are not limited to, trades of similar securities and market multiples derived from a set of comparable companies. Significant increases or decreases to any of these inputs could result in a significantly lower or higher fair value measurement.
See accompanying notes to financial statements.
75
Columbia Thermostat Fund
Statement of Investments, December 31, 2013
Number of Shares | | | | Value | |
| | | > Affiliated Bond Funds: 89.2% | |
| | 47,811,438 | | | Columbia Short Term Bond
Fund, Class I (a) | | $ | 476,201,920 | | |
| | 35,741,824 | | | Columbia Income Opportunities
Fund, Class I (a) | | | 358,490,499 | | |
| | 39,903,530 | | | Columbia Intermediate Bond
Fund, Class I (a) | | | 357,535,630 | | |
Total Affiliated Bond Funds:
(Cost: $1,199,374,387) | | | 1,192,228,049 | | |
| | | > Affiliated Stock Funds: 10.1% | |
| | 583,352 | | | Columbia Acorn International,
Class I (a) | | | 27,248,371 | | |
| | 1,469,969 | | | Columbia Dividend Income
Fund, Class I (a) | | | 26,959,238 | | |
| | 545,386 | | | Columbia Acorn Fund, Class I (a) | | | 20,381,085 | | |
| | 984,664 | | | Columbia Contrarian Core Fund,
Class I (a) | | | 20,274,222 | | |
| | 509,430 | | | Columbia Acorn Select,
Class I (a) | | | 13,657,827 | | |
| | 700,545 | | | Columbia Select Large Cap
Growth Fund, Class I (a)(b) | | | 13,576,572 | | |
| | 720,935 | | | Columbia Large Cap Enhanced
Core Fund, Class I (a) | | | 13,495,895 | | |
Total Affiliated Stock Funds:
(Cost: $97,123,401) | | | 135,593,210 | | |
Number of Shares | | | | Value | |
| | | > Short-Term Investments: 0.4% | |
| | 5,586,480 | | | JPMorgan U.S. Government
Money Market Fund, Agency
Shares (7 day yield of 0.01%) | | $ | 5,586,480 | | |
Total Short-Term Investments:
(Cost: $5,586,480) | | | 5,586,480 | | |
Total Investments: 99.7%
(Cost: $1,302,084,268)(c) | | | 1,333,407,739 | | |
Cash and Other Assets Less Liabilities: 0.3% | | | 3,397,398 | | |
Net Assets: 100.0% | | $ | 1,336,805,137 | | |
> Notes to Statement of Investments
(a) An affiliated person of the Fund, as defined in the Investment Company Act of 1940, may include any company in which the Fund owns five percent or more of its outstanding voting shares. Holdings and transactions in these affiliated companies during the year ended December 31, 2013, are as follows:
Security | | Balance of
Shares Held
12/31/12 | | Purchases/
Additions | | Sales/
Reductions | | Balance of
Shares Held
12/31/13 | | Value | | Dividend | |
Columbia Short Term Bond Fund, Class I | | | 18,877,615 | | | | 42,617,549 | | | | 13,683,726 | | | | 47,811,438 | | | $ | 476,201,920 | | | $ | 3,842,347 | | |
Columbia Income Opportunities Fund,
Class I | | | 14,098,807 | | | | 31,545,575 | | | | 9,902,558 | | | | 35,741,824 | | | | 358,490,499 | | | | 14,814,209 | | |
Columbia Intermediate Bond Fund, Class I | | | 14,950,850 | | | | 35,650,845 | | | | 10,698,165 | | | | 39,903,530 | | | | 357,535,630 | | | | 7,535,475 | | |
Columbia Acorn International, Class I | | | 1,899,103 | | | | 1,950,060 | | | | 3,265,811 | | | | 583,352 | | | | 27,248,371 | | | | 943,963 | | |
Columbia Dividend Income Fund, Class I | | | 5,273,173 | | | | 4,820,323 | | | | 8,623,527 | | | | 1,469,969 | | | | 26,959,238 | | | | 1,304,672 | | |
Columbia Acorn Fund, Class I | | | 1,924,624 | | | | 1,928,874 | | | | 3,308,112 | | | | 545,386 | | | | 20,381,085 | | | | 44,505 | | |
Columbia Contrarian Core Fund, Class I | | | 3,628,435 | | | | 3,308,115 | | | | 5,951,886 | | | | 984,664 | | | | 20,274,222 | | | | 184,143 | | |
Columbia Acorn Select, Class I | | | 1,523,738 | | | | 1,644,495 | | | | 2,658,803 | | | | 509,430 | | | | 13,657,827 | | | | 134,566 | | |
Columbia Select Large Cap Growth Fund,
Class I | | | 2,813,972 | | | | 2,656,282 | | | | 4,769,709 | | | | 700,545 | | | | 13,576,572 | | | | — | | |
Columbia Large Cap Enhanced Core Fund,
Class I | | | 2,773,358 | | | | 2,531,218 | | | | 4,583,641 | | | | 720,935 | | | | 13,495,895 | | | | 321,105 | | |
Total of Affiliated Transactions | | | 67,763,675 | | | | 128,653,336 | | | | 67,445,938 | | | | 128,971,073 | | | $ | 1,327,821,259 | | | $ | 29,124,985 | | |
The aggregate cost and value of these companies at December 31, 2013, was $1,296,497,788 and $1,327,821,259, respectively. Investments in affiliated companies represented 99.33% of the Fund's total net assets at December 31, 2013.
(b) Non-income producing security.
(c) At December 31, 2013, for federal income tax purposes, the cost of investments was $1,306,077,884 and net unrealized appreciation was $27,329,855 consisting of gross unrealized appreciation of $39,567,026 and gross unrealized depreciation of $12,237,171.
See accompanying notes to financial statements.
76
> Notes to Statement of Investments
Fair Value Measurements
Various inputs are used in determining the value of the Fund's investments, following the input prioritization hierarchy established by accounting principles generally accepted in the United States of America (GAAP). These inputs are summarized in the three broad levels listed below:
• Level 1 – quoted prices in active markets for identical securities
• Level 2 – prices determined using other significant observable inputs (including quoted prices for similar securities, interest rates, prepayment speeds, credit risk and others)
• Level 3 – prices determined using significant unobservable inputs where quoted prices or observable inputs are unavailable or less reliable (including management's own assumptions about the factors market participants would use in pricing an investment)
The inputs or methodology used for valuing securities are not necessarily an indication of the risk associated with investing in those securities.
Examples of the types of securities in which the Fund would typically invest and how they are classified within this hierarchy are as follows. Typical Level 1 securities include mutual funds whose NAVs are published each day.
Under the direction of the Board, the Committee is responsible for overseeing the valuation procedures approved by the Board.
The Committee meets as necessary, and no less frequently than quarterly, to determine fair values for securities for which market quotations are not readily available or for which the investment manager believes that available market quotations are unreliable, to review the appropriateness of the Trust's Portfolio Pricing Policy and the pricing procedures of the investment manager (the Policies), and to review the continuing appropriateness of the current value of any security subject to the Policies. The Policies address, among other things: circumstances under which market quotations will be deemed readily available; selection of third party pricing vendors; appropriate pricing methodologies; events that require fair valuation and fair value techniques; circumstances under which securities will be deemed to pose a potential for stale pricing, including when securities are illiquid, restricted, or in default; and certain delegations of authority to determine fair values to the Fund's investment manager. The Committee may also meet to discuss additional valuation matters, which may include review of back-testing results, review of time-sensitive information or approval of other valuation related actions, and to review the appropriateness of the Policies.
For investments categorized as Level 3, the significant unobservable inputs used in the fair value measurement of the Funds' securities may include: (i) data specific to the issuer or comparable issuers, (ii) general market or specific sector news and (iii) quoted prices and specific or similar security transactions. The Committee considers this data and any changes from prior periods in order to assess the reasonableness of observable and unobservable inputs, any assumptions or internal models used to value those securities and changes in fair value. Significant changes in any of these factors could result in lower or higher fair value measurements. Various factors impact the frequency of monitoring (which may occur as often as daily), however the Committee may determine that changes to inputs, assumptions and models are not required with the same frequency.
The following table summarizes the inputs used, as of December 31, 2013, in valuing the Fund's assets:
Investment Type | | Quoted Prices
(Level 1) | | Other
Significant
Observable
Inputs
(Level 2) | | Significant
Unobservable
Inputs
(Level 3) | | Total | |
Total Affiliated Bond Funds | | $ | 1,192,228,049 | | | $ | - | | | $ | - | | | $ | 1,192,228,049 | | |
Total Affiliated Stock Funds | | | 135,593,210 | | | | - | | | | - | | | | 135,593,210 | | |
Total Short-Term Investments | | | 5,586,480 | | | | - | | | | - | | | | 5,586,480 | | |
Total Investments | | $ | 1,333,407,739 | | | $ | - | | | $ | - | | | $ | 1,333,407,739 | | |
There were no transfers of financial assets between levels 1 and 2 during the period.
See accompanying notes to financial statements.
77
Columbia Acorn Emerging Markets Fund
Major Portfolio Changes in the Fourth Quarter (Unaudited)
| | | Number of Shares | |
| | | 9/30/13 | | 12/31/13 | |
Purchases | |
Asia | |
| > Taiwan | |
Advantech | | | 624,169 | | | | 729,169 | | |
Chroma Ate | | | 1,306,990 | | | | 1,937,990 | | |
Ginko International | | | 158,000 | | | | 270,000 | | |
Lite-On Technology | | | 2,186,631 | | | | 3,274,631 | | |
PC Home | | | 496,000 | | | | 596,000 | | |
St. Shine Optical | | | 146,000 | | | | 210,000 | | |
| > Indonesia | |
Ace Indonesia | | | 44,302,690 | | | | 82,889,190 | | |
Matahari Department Store | | | 3,022,500 | | | | 6,677,000 | | |
Mayora Indah | | | 1,186,500 | | | | 1,889,000 | | |
MNC Skyvision | | | 28,369,500 | | | | 49,308,500 | | |
| > Philippines | |
Melco Crown (Philippines)
Resorts | | | 23,367,600 | | | | 34,866,900 | | |
Puregold Price Club | | | 3,047,900 | | | | 4,684,900 | | |
RFM Corporation | | | 17,031,000 | | | | 31,314,400 | | |
Robinsons Retail Holdings | | | 0 | | | | 3,319,330 | | |
Security Bank | | | 1,019,472 | | | | 1,860,468 | | |
| > India | |
Bosch | | | 20,671 | | | | 34,000 | | |
Colgate Palmolive India | | | 147,861 | | | | 183,768 | | |
Redington India | | | 3,122,282 | | | | 3,819,510 | | |
TTK Prestige | | | 51,731 | | | | 71,593 | | |
United Breweries | | | 219,155 | | | | 328,926 | | |
| > Hong Kong | |
Sa Sa International | | | 5,023,799 | | | | 6,801,799 | | |
Vitasoy International | | | 2,258,000 | | | | 2,642,000 | | |
| > China | |
58.com - ADR | | | 0 | | | | 66,229 | | |
AMVIG Holdings | | | 6,386,000 | | | | 8,370,000 | | |
Biostime | | | 475,000 | | | | 557,500 | | |
SouFun - ADR | �� | | 0 | | | | 38,215 | | |
WuXi PharmaTech - ADR | | | 105,365 | | | | 116,546 | | |
| > Thailand | |
Robinson's Department Store | | | 2,674,700 | | | | 3,788,300 | | |
| > Singapore | |
Petra Foods | | | 0 | | | | 1,567,000 | | |
Super Group | | | 830,000 | | | | 2,112,000 | | |
| > Cambodia | |
Nagacorp | | | 6,436,000 | | | | 7,464,000 | | |
| > Japan | |
Kansai Paint | | | 261,760 | | | | 323,760 | | |
| > Malaysia | |
Aeon | | | 232,900 | | | | 930,800 | | |
| | | Number of Shares | |
| | | 9/30/13 | | 12/31/13 | |
Europe | |
| > Russia | |
Moscow Exchange | | | 2,185,581 | | | | 2,986,454 | | |
QIWI - ADR | | | 91,058 | | | | 127,500 | | |
Yandex | | | 102,420 | | | | 196,239 | | |
| > Finland | |
Tikkurila | | | 154,160 | | | | 217,257 | | |
Vacon | | | 65,855 | | | | 108,534 | | |
| > Kazakhstan | |
Halyk Savings Bank of
Kazakhstan - GDR | | | 698,908 | | | | 876,046 | | |
| > Sweden | |
Hexagon | | | 189,560 | | | | 236,490 | | |
| > United Kingdom | |
Cable and Wireless | | | 6,749,624 | | | | 7,303,837 | | |
| > Italy | |
Pirelli | | | 320,827 | | | | 390,418 | | |
| > Turkey | |
Bizim Toptan | | | 311,893 | | | | 344,552 | | |
| > Spain | |
Prosegur | | | 0 | | | | 468,656 | | |
Latin America | |
| > Mexico | |
Genomma Lab Internacional | | | 1,506,700 | | | | 1,979,300 | | |
Grupo Aeroportuario del
Sureste - ADR | | | 25,190 | | | | 31,754 | | |
Qualitas | | | 1,824,000 | | | | 2,539,500 | | |
| > Brazil | |
Beadell Resources | | | 3,975,346 | | | | 7,058,587 | | |
Linx | | | 172,600 | | | | 200,000 | | |
Localiza Rent A Car | | | 377,870 | | | | 504,570 | | |
Odontoprev | | | 674,200 | | | | 969,400 | | |
Other Countries | |
| > South Africa | |
Coronation Fund Managers | | | 1,156,120 | | | | 1,444,590 | | |
Massmart Holdings | | | 228,382 | | | | 417,276 | | |
Mr. Price | | | 224,031 | | | | 279,765 | | |
Rand Merchant Insurance | | | 1,927,792 | | | | 2,672,291 | | |
| > United States | |
Atwood Oceanics | | | 67,433 | | | | 97,261 | | |
Textainer Group Holdings | | | 120,163 | | | | 161,393 | | |
| > Canada | |
CAE | | | 315,195 | | | | 400,003 | | |
See accompanying notes to financial statements.
78
| | | Number of Shares | |
| | | 9/30/13 | | 12/31/13 | |
Sales | |
Asia | |
| > Taiwan | |
CHC Healthcare | | | 56,266 | | | | 0 | | |
Chipbond | | | 1,709,200 | | | | 0 | | |
Flexium Interconnect | | | 823,144 | | | | 501,144 | | |
Lung Yen | | | 93,500 | | | | 0 | | |
Radiant Opto-Electronics | | | 790,000 | | | | 525,000 | | |
Taiwan Hon Chuan | | | 1,852,000 | | | | 0 | | |
| > Philippines | |
Int'l Container Terminal | | | 1,228,597 | | | | 0 | | |
| > Hong Kong | |
| ASM Pacific | | | 350,100 | | | | 124,400 | | |
L'Occitane International | | | 979,750 | | | | 0 | | |
| > China | |
Digital China | | | 67,151 | | | | 0 | | |
| > Mongolia | |
Mongolian Mining | | | 7,747,100 | | | | 0 | | |
Latin America | |
| > Mexico | |
Bolsa Mexicana de Valores | | | 306,161 | | | | 0 | | |
| > Colombia | |
Isagen | | | 3,635,863 | | | | 2,900,000 | | |
Other Countries | |
| > Canada | |
Alliance Grain Traders | | | 153,291 | | | | 0 | | |
See accompanying notes to financial statements.
79
Columbia Acorn Emerging Markets Fund
Statement of Investments, December 31, 2013
Number of Shares | | | | Value | |
| | | | | | | Equities: 94.7% | |
Asia 54.6% | | | |
| | | > Taiwan 10.6% | |
| | 210,000 | | | St. Shine Optical | | $ | 6,008,868 | | |
| | | | | World's Leading Disposable Contact
Lens OEM (Original Equipment
Manufacturer) | | | | | |
| | 2,732,000 | | | Far EasTone Telecom | | | 6,001,853 | | |
| | | | | Taiwan's Third Largest Mobile
Operator | | | | | |
| | 3,274,631 | | | Lite-On Technology | | | 5,262,536 | | |
| | | | | Mobile Device, LED & PC Server
Component Supplier | | | | | |
| | 270,000 | | | Ginko International | | | 5,100,013 | | |
| | | | | Largest Contact Lens Maker in China | | | | | |
| | 729,169 | | | Advantech | | | 5,058,953 | | |
| | | | | Industrial PC & Components | | | | | |
| | 596,000 | | | PC Home | | | 4,789,199 | | |
| | | | | Taiwanese Internet Retail Company | | | | | |
| | 2,538,000 | | | CTCI Corp | | | 4,119,644 | | |
| | | | | International Engineering Firm | | | | | |
| | 1,937,990 | | | Chroma Ate | | | 4,072,283 | | |
| | | | | Automatic Test Systems, Testing &
Measurement Instruments | | | | | |
| | 525,000 | | | Radiant Opto-Electronics | | | 1,925,822 | | |
| | | | | LCD Back Light Units & Modules | | | | | |
| | 501,144 | | | Flexium Interconnect | | | 1,618,998 | | |
| | | | | Flexible Printed Circuit for Mobile
Electronics | | | | | |
| | | | 43,958,169 | | |
| | | > Indonesia 8.7% | |
| | 49,308,500 | | | MNC Skyvision | | | 8,115,391 | | |
| | | | | Largest Satellite Pay TV Operator in
Indonesia | | | | | |
| | 6,677,000 | | | Matahari Department Store (a) | | | 6,042,536 | | |
| | | | | Largest Department Store Chain in
Indonesia | | | | | |
| | 20,432,079 | | | Surya Citra Media | | | 4,408,666 | | |
| | | | | Free to Air TV Station in Indonesia | | | | | |
| | 8,986,109 | | | Tower Bersama Infrastructure (a) | | | 4,288,553 | | |
| | | | | Communications Towers | | | | | |
| | 1,889,000 | | | Mayora Indah | | | 4,045,532 | | |
| | | | | Consumer Branded Food
Manufacturer | | | | | |
| | 82,889,190 | | | Ace Indonesia | | | 4,024,083 | | |
| | | | | Home Improvement Retailer | | | | | |
| | 57,233,000 | | | Arwana Citramulia | | | 3,856,291 | | |
| | | | | Ceramic Tiles for Home Decoration | | | | | |
| | 1,591,929 | | | Archipelago Resources (b)(c)(d)(e) | | | 1,370,800 | | |
| | | | | Gold Mining Projects in Indonesia,
Vietnam & Philippines | | | | | |
| | | | 36,151,852 | | |
| | | > Philippines 6.7% | |
| | 34,866,900 | | | Melco Crown (Philippines)
Resorts (a) | | | 10,771,723 | | |
| | | | | Integrated Resort Operator in Manila | | | | | |
| | 1,860,468 | | | Security Bank | | | 4,858,436 | | |
| | | | | Commercial Bank in Philippines | | | | | |
| | 3,319,330 | | | Robinsons Retail Holdings (a) | | | 4,128,362 | | |
| | | | | Multi-format Retailer in Philippines | | | | | |
Number of Shares | | | | Value | |
| | 4,684,900 | | | Puregold Price Club | | $ | 4,009,703 | | |
| | | | | Supermarket Operator in Philippines | | | | | |
| | 31,314,400 | | | RFM Corporation | | | 3,926,502 | | |
| | | | | Flour, Bread, Pasta & Ice Cream
Manufacturer/Distributor in Philippines | | | | | |
| | | | 27,694,726 | | |
| | | > India 6.5% | |
| | 34,000 | | | Bosch | | | 5,538,607 | | |
| | | | | Automotive Parts | | | | | |
| | 3,819,510 | | | Redington India | | | 4,629,887 | | |
| | | | | Supply Chain Solutions for IT &
Mobile Handsets in Emerging Markets | | | | | |
| | 1,808,593 | | | Adani Ports & Special
Economic Zone | | | 4,554,133 | | |
| | | | | Indian West Coast Shipping Port | | | | | |
| | 328,926 | | | United Breweries | | | 4,119,894 | | |
| | | | | India's Largest Brewer | | | | | |
| | 71,593 | | | TTK Prestige | | | 4,030,492 | | |
| | | | | Branded Cooking Equipment | | | | | |
| | 183,768 | | | Colgate Palmolive India | | | 4,023,513 | | |
| | | | | Consumer Products in Oral Care | | | | | |
| | | | 26,896,526 | | |
| | | > Hong Kong 6.2% | |
| | 3,398,000 | | | Melco International | | | 12,534,431 | | |
| | | | | Macau Casino Operator | | | | | |
| | 6,801,799 | | | Sa Sa International | | | 7,989,327 | | |
| | | | | Cosmetics Retailer | | | | | |
| | 2,642,000 | | | Vitasoy International | | | 4,073,704 | | |
| | | | | Hong Kong Soy Food Brand | | | | | |
| | 124,400 | | | ASM Pacific | | | 1,041,172 | | |
| | | | | Semi Back-end & Surface Mounting
Equipment | | | | | |
| | | | 25,638,634 | | |
| | | > China 4.8% | |
| | 557,500 | | | Biostime | | | 4,979,015 | | |
| | | | | Pediatric Nutrition & Baby Care
Products Provider | | | | | |
| | 116,546 | | | WuXi PharmaTech - ADR (a) | | | 4,473,035 | | |
| | | | | Largest Contract Research
Organization Business in China | | | | | |
| | 8,370,000 | | | AMVIG Holdings | | | 3,982,990 | | |
| | | | | Chinese Tobacco Packaging
Material Supplier | | | | | |
| | 38,215 | | | SouFun - ADR (b) | | | 3,149,298 | | |
| | | | | Chinese Real Estate Internet Portal | | | | | |
| | 66,229 | | | 58.com - ADR (a)(b) | | | 2,539,220 | | |
| | | | | Online Classified Service Provider | | | | | |
| | 788,000 | | | Sihuan Pharmaceuticals | | | 721,135 | | |
| | | | | Leading Chinese Generic Drug
Manufacturer | | | | | |
| | | | 19,844,693 | | |
| | | > Thailand 3.6% | |
| | 19,830,683 | | | Home Product Center | | | 5,670,087 | | |
| | | | | Home Improvement Retailer | | | | | |
| | 3,788,300 | | | Robinson's Department Store | | | 5,567,150 | | |
| | | | | Department Store Operator in Thailand | | | | | |
| | 7,888,100 | | | Samui Airport Property Fund | | | 3,845,100 | | |
| | | | | Thai Airport Operator | | | | | |
| | | | 15,082,337 | | |
See accompanying notes to financial statements.
80
Number of Shares | | | | Value | |
| | | > Singapore 2.5% | |
| | 2,112,000 | | | Super Group | | $ | 6,376,534 | | |
| | | | | Instant Food & Beverages in
Southeast Asia | | | | | |
| | 1,567,000 | | | Petra Foods | | | 3,998,368 | | |
| | | | | Cocoa Processor & Chocolate
Manufacturer | | | | | |
| | | | 10,374,902 | | |
| | | > Cambodia 1.9% | |
| | 7,464,000 | | | Nagacorp | | | 7,884,372 | | |
| | | | | Casino/Entertainment Complex in
Cambodia | | | | | |
| | | > Japan 1.1% | |
| | 323,760 | | | Kansai Paint | | | 4,787,741 | | |
| | | | | Paint Producer in Japan, India,
China & Southeast Asia | | | | | |
| | | > Malaysia 1.0% | |
| | 930,800 | | | Aeon | | | 3,978,385 | | |
| | | | | Shopping Center & Department
Store Operator | | | | | |
| | | > Korea 1.0% | |
| | 158,025 | | | Paradise Co | | | 3,964,002 | | |
| | | | | Korean 'Foreigner Only' Casino
Operator | | | | | |
Asia: Total | | | 226,256,339 | | |
Europe 17.6% | | | |
| | | > Russia 5.2% | |
| | 196,239 | | | Yandex (a) | | | 8,467,713 | | |
| | | | | Search Engine for Russian &
Turkish Languages | | | | | |
| | 127,500 | | | QIWI - ADR | | | 7,140,000 | | |
| | | | | Electronic Payments Network
Serving Russia & the Commonwealth
of Independent States | | | | | |
| | 2,986,454 | | | Moscow Exchange | | | 5,901,902 | | |
| | | | | Russia's Main Exchange for Stocks,
Bonds, Derivatives, Currencies & Repo | | | | | |
| | | | 21,509,615 | | |
| | | > Finland 3.5% | |
| | 108,534 | | | Vacon | | | 8,734,644 | | |
| | | | | Leading Independent Manufacturer of
Variable Speed Alternating
Current Drives | | | | | |
| | 217,257 | | | Tikkurila | | | 5,947,718 | | |
| | | | | Decorative & Industrial Paint in
Scandinavia, Central &
Eastern Europe | | | | | |
| | | | 14,682,362 | | |
| | | > Kazakhstan 2.2% | |
| | 876,046 | | | Halyk Savings Bank of
Kazakhstan - GDR | | | 8,994,905 | | |
| | | | | Largest Retail Bank & Insurer in
Kazakhstan | | | | | |
| | | > Sweden 1.8% | |
| | 236,490 | | | Hexagon | | | 7,480,711 | | |
| | | | | Design, Measurement & Visualization
Software & Equipment | | | | | |
Number of Shares | | | | Value | |
| | | > United Kingdom 1.6% | |
| | 7,303,837 | | | Cable and Wireless | | $ | 6,815,135 | | |
| | | | | Leading Telecoms Service Provider
in the Caribbean | | | | | |
| | | > Italy 1.6% | |
| | 390,418 | | | Pirelli | | | 6,754,280 | | |
| | | | | Global Tire Supplier | | | | | |
| | | > Turkey 0.9% | |
| | 344,552 | | | Bizim Toptan | | | 3,791,836 | | |
| | | | | Cash & Carry Stores in Turkey | | | | | |
| | | > Spain 0.8% | |
| | 468,656 | | | Prosegur | | | 3,216,398 | | |
| | | | | Security Guards | | | | | |
Europe: Total | | | 73,245,242 | | |
Latin America 11.8% | | | |
| | | > Mexico 5.0% | |
| | 2,539,500 | | | Qualitas | | | 6,150,116 | | |
| | | | | Leading Auto Insurer in Mexico &
Central America | | | | | |
| | 1,979,300 | | | Genomma Lab Internacional (a) | | | 5,551,409 | | |
| | | | | Developer, Marketer & Distributor of
Consumer Products | | | | | |
| | 652,200 | | | Gruma (a) | | | 4,934,271 | | |
| | | | | Tortilla Producer & Distributor | | | | | |
| | 31,754 | | | Grupo Aeroportuario del
Sureste - ADR | | | 3,957,501 | | |
| | | | | Mexican Airport Operator | | | | | |
| | | | 20,593,297 | | |
| | | > Brazil 4.9% | |
| | 504,570 | | | Localiza Rent A Car | | | 7,117,554 | | |
| | | | | Car Rental | | | | | |
| | 7,058,587 | | | Beadell Resources (a) | | | 5,026,902 | | |
| | | | | Gold Mining in Brazil | | | | | |
| | 200,000 | | | Linx | | | 4,061,460 | | |
| | | | | Retail Management Software in Brazil | | | | | |
| | 969,400 | | | Odontoprev | | | 4,039,081 | | |
| | | | | Dental Insurance | | | | | |
| | | | 20,244,997 | | |
| | | > Colombia 1.2% | |
| | 2,900,000 | | | Isagen | | | 4,883,420 | | |
| | | | | Leading Colombian Electricity
Provider | | | | | |
| | | > Chile 0.7% | |
| | 4,342,954 | | | Empresas Hites | | | 3,059,615 | | |
| | | | | Mass Retailer for the Lower
Income Strata | | | | | |
Latin America: Total | | | 48,781,329 | | |
Other Countries 10.7% | | | |
| | | > South Africa 6.7% | |
| | 1,444,590 | | | Coronation Fund Managers | | | 11,025,388 | | |
| | | | | South African Fund Manager | | | | | |
| | 2,672,291 | | | Rand Merchant Insurance | | | 6,997,866 | | |
| | | | | Directly Sold Property & Casualty
Insurance; Holdings in Other Insurers | | | | | |
See accompanying notes to financial statements.
81
Columbia Acorn Emerging Markets Fund
Statement of Investments, continued
Number of Shares | | | | Value | |
| | | > South Africa—continued | |
| | 417,276 | | | Massmart Holdings | | $ | 5,174,559 | | |
| | | | | General Merchandise, Food &
Home Improvement Stores;
Wal-Mart Subsidiary | | | | | |
| | 279,765 | | | Mr. Price | | | 4,372,656 | | |
| | | | | South African Retailer of Apparel,
Household & Sporting Goods | | | | | |
| | | | 27,570,469 | | |
| | | > United States 2.8% | |
| | 161,393 | | | Textainer Group Holdings (b) | | | 6,491,226 | | |
| | | | | Top International Container Leaser | | | | | |
| | 97,261 | | | Atwood Oceanics (a) | | | 5,192,765 | | |
| | | | | Offshore Drilling Contractor | | | | | |
| | | | 11,683,991 | | |
| | | > Canada 1.2% | |
| | 400,003 | | | CAE | | | 5,087,353 | | |
| | | | | Flight Simulator Equipment &
Training Centers | | | | | |
Other Countries: Total | | | 44,341,813 | | |
Total Equities: 94.7%
(Cost: $361,235,267) | | 392,624,723(f) | |
Short-Term Investments 5.9% | | | |
| | 24,619,906 | | | JPMorgan U.S. Government
Money Market Fund, IM
Shares (7 day yield of 0.01%) | | | 24,619,906 | | |
Total Short-Term Investments: 5.9%
(Cost: $24,619,906) | | | 24,619,906 | | |
Number of Shares | | | | Value | |
Securities Lending Collateral 1.3% | |
| | 5,346,586 | | | Dreyfus Government Cash
Management Fund,
Institutional Shares
(7 day yield of 0.01%) (g) | | $ | 5,346,586 | | |
Total Securities Lending Collateral:
(Cost: $5,346,586) | | | 5,346,586 | | |
Total Investments: 101.9%
(Cost: $391,201,759)(h) | | | 422,591,215 | | |
Obligation to Return Collateral for
Securities Loaned: (1.3)% | | | (5,346,586 | ) | |
Cash and Other Assets Less
Liabilities: (0.6)% | | | (2,539,975 | ) | |
Net Assets: 100.0% | | $ | 414,704,654 | | |
ADR - American Depositary Receipts
GDR - Global Depositary Receipts
> Notes to Statement of Investments
(a) Non-income producing security.
(b) All or a portion of this security was on loan at December 31, 2013. The total market value of securities on loan at December 31, 2013 was $5,245,136.
(c) Denotes a restricted security, which is subject to restrictions on resale under federal securities laws. This security is valued at fair value determined in good faith under consistently applied procedures established by the Board of Trustees. At December 31, 2013, the market value of this security amounted to $1,370,800, which represented 0.33% of total net assets. Additional information on this security is as follows:
Security | | Acquisition
Dates | | Shares | | Cost | | Value | |
Archipelago Resources | | 8/19/11-9/26/13 | | | 1,591,929 | | | $ | 1,316,810 | | | $ | 1,370,800 | | |
(d) Illiquid security.
(e) The Fund also received put options through a transaction related to a proposed company restructuring of Archipelago Resources. Additional information on the put options received is as follows:
Security | | Option Shares | | Exercise Price | | Expiration Date | | Value | |
Option (1) | | | 1,591,929 | | | GBP | 0.58 | | | August 13, 2014 | | $ | 131,808 | | |
GBP - British Pound
(1) Archipelago Resources is expected to restructure into a new company during 2014. From January 31, 2014, the option is exercisable until the earlier of (i) the date the company is restructured and prices the shares for its initial public offering or (ii) August 13, 2014, subject to extension until the date the company is restructured and prices the shares for its initial public offering (but not later than September 26, 2016). After August 13, 2014, the valuation of the option will fluctuate based upon its fair market value as determined in accordance with the put option agreement. These put options are valued at fair value determined in good faith under consistently applied procedures established by the Board of Trustees.
See accompanying notes to financial statements.
82
> Notes to Statement of Investments
(f) On December 31, 2013, the Fund's total investments were denominated in currencies as follows:
Currency | | Value | | Percentage
of Net Assets | |
United States Dollar | | $ | 56,307,565 | | | | 13.6 | | |
Taiwan Dollar | | | 43,958,169 | | | | 10.6 | | |
Hong Kong Dollar | | | 43,206,146 | | | | 10.4 | | |
Indonesian Rupiah | | | 34,781,051 | | | | 8.4 | | |
Philippine Peso | | | 27,694,726 | | | | 6.7 | | |
South African Rand | | | 27,570,470 | | | | 6.6 | | |
Indian Rupee | | | 26,896,526 | | | | 6.5 | | |
Euro | | | 24,653,041 | | | | 5.9 | | |
Other currencies less
than 5% of total net assets | | | 107,557,029 | | | | 26.0 | | |
Total Equities | | $ | 392,624,723 | | | | 94.7 | | |
(g) Investment made with cash collateral received from securities lending activity.
(h) At December 31, 2013, for federal income tax purposes, the cost of investments was $393,124,874 and net unrealized appreciation was $29,466,341 consisting of gross unrealized appreciation of $46,839,585 and gross unrealized depreciation of $17,373,244.
Fair Value Measurements
Various inputs are used in determining the value of the Fund's investments, following the input prioritization hierarchy established by accounting principles generally accepted in the United States of America (GAAP). These inputs are summarized in the three broad levels listed below:
• Level 1 – quoted prices in active markets for identical securities
• Level 2 – prices determined using other significant observable inputs (including quoted prices for similar securities, interest rates, prepayment speeds, credit risk and others)
• Level 3 – prices determined using significant unobservable inputs where quoted prices or observable inputs are unavailable or less reliable (including management's own assumptions about the factors market participants would use in pricing an investment)
The inputs or methodology used for valuing securities are not necessarily an indication of the risk associated with investing in those securities.
Examples of the types of securities in which the Fund would typically invest and how they are classified within this hierarchy are as follows. Typical Level 1 securities include exchange traded domestic equities, mutual funds whose NAVs are published each day and exchange traded foreign equities that are not statistically fair valued. Typical Level 2 securities include exchange traded foreign equities that are statistically fair valued, forward foreign currency exchange contracts and short-term investments valued at amortized cost. Additionally, securities fair valued by the Valuation Committee (the Committee) of the Fund's Board of Trustees (the Board) that rely on significant observable inputs are also included in Level 2. Typical Level 3 securities include any security fair valued by the Committee that relies on significant unobservable inputs.
Under the direction of the Board, the Committee is responsible for overseeing the valuation procedures approved by the Board.
The Committee meets as necessary, and no less frequently than quarterly, to determine fair values for securities for which market quotations are not readily available or for which the investment manager believes that available market quotations are unreliable, to review the appropriateness of the Trust's Portfolio Pricing Policy and the pricing procedures of the investment manager (the Policies), and to review the continuing appropriateness of the current value of any security subject to the Policies. The Policies address, among other things: circumstances under which market quotations will be deemed readily available; selection of third party pricing vendors; appropriate pricing methodologies; events that require fair valuation and fair value techniques; circumstances under which securities will be deemed to pose a potential for stale pricing, including when securities are illiquid, restricted, or in default; and certain delegations of authority to determine fair values to the Fund's investment manager. The Committee may also meet to discuss additional valuation matters, which may include review of back-testing results, review of time-sensitive information or approval of other valuation related actions, and to review the appropriateness of the Policies.
For investments and derivatives categorized as Level 3, the significant unobservable inputs used in the fair value measurement of the Funds' securities may include: (i) data specific to the issuer or comparable issuers, (ii) general market or specific sector news and (iii) quoted prices and specific or similar security transactions. The Committee considers this data and any changes from prior periods in order to assess the reasonableness of observable and unobservable inputs, any assumptions or internal models used to value those securities and changes in fair value. Significant changes in any of these factors could result in lower or higher fair value measurements. Various factors impact the frequency of monitoring (which may occur as often as daily), however the Committee may determine that changes to inputs, assumptions and models are not required with the same frequency.
See accompanying notes to financial statements.
83
Columbia Acorn Emerging Markets Fund
Statement of Investments, continued
> Notes to Statement of Investments
The following table summarizes the inputs used, as of December 31, 2013, in valuing the Fund's assets:
Investment Type | | Quoted Prices
(Level 1) | | Other
Significant
Observable
Inputs
(Level 2) | | Significant
Unobservable
Inputs
(Level 3) | | Total | |
Equities | |
Asia | | $ | 10,161,553 | | | $ | 214,723,986 | | | $ | 1,370,800 | | | $ | 226,256,339 | | |
Europe | | | 15,607,713 | | | | 57,637,529 | | | | - | | | | 73,245,242 | | |
Latin America | | | 43,754,427 | | | | 5,026,902 | | | | - | | | | 48,781,329 | | |
Other Countries | | | 16,771,344 | | | | 27,570,469 | | | | - | | | | 44,341,813 | | |
Total Equities | | | 86,295,037 | | | | 304,958,886 | | | | 1,370,800 | | | | 392,624,723 | | |
Total Short-Term Investments | | | 24,619,906 | | | | - | | | | - | | | | 24,619,906 | | |
Total Securities Lending Collateral | | | 5,346,586 | | | | - | | | | - | | | | 5,346,586 | | |
Total Investments | | $ | 116,261,529 | | | $ | 304,958,886 | | | $ | 1,370,800 | | | $ | 422,591,215 | | |
Unrealized Appreciation on Options | | | - | | | | - | | | | 131,808 | | | | 131,808 | | |
Total | | $ | 116,261,529 | | | $ | 304,958,886 | | | $ | 1,502,608 | | | $ | 422,723,023 | | |
The Fund's assets assigned to the Level 2 input category are generally valued using a market approach, in which a security's value is determined through its correlation to prices and information from observable market transactions for similar or identical assets. Foreign equities are generally valued at the last sale price on the foreign exchange or market on which they trade. The Fund may use a statistical fair valuation model, in accordance with the policy adopted by the Board, provided by an independent third party to value securities principally traded in foreign markets in order to adjust for possible stale pricing that may occur between the close of the foreign exchanges and the time for valuation. These models take into account available market data including intraday index, ADR, and ETF movements.
There were no transfers of financial assets between levels 1 and 2 during the period.
The Fund does not hold any significant investments categorized as Level 3.
Certain securities classified as Level 3 are valued at fair value, using a market approach, as determined in good faith under consistently applied procedures established by and under the general supervision of the Board. To determine fair value for these securities, for which no market exists, the Committee utilizes the valuation technique it deems most appropriate in the circumstances, using some unobservable inputs, which may include, but are not limited to, estimated earnings of the company and the position of the security within the company's capital structure. The Committee also may use some observable inputs, which may include, but are not limited to, trades of similar securities and market multiples derived from a set of comparable companies. Significant increases or decreases to any of these inputs could result in a significantly lower or higher fair value measurement.
See accompanying notes to financial statements.
84
Columbia Acorn Emerging Markets Fund
Portfolio Diversification
At December 31, 2013, the Fund's portfolio investments as a percentage of net assets were diversified as follows:
| | | Value | | Percentage
of Net Assets | |
| > Consumer Goods & Services | |
Retail | | $ | 62,597,497 | | | | 15.1 | | |
Food & Beverage | | | 36,453,820 | | | | 8.8 | | |
Casinos & Gaming | | | 35,154,529 | | | | 8.5 | | |
Other Durable Goods | | | 10,784,772 | | | | 2.6 | | |
Consumer Goods Distribution | | | 8,653,400 | | | | 2.1 | | |
Travel | | | 7,117,554 | | | | 1.7 | | |
Nondurables | | | 5,551,409 | | | | 1.3 | | |
| | | | 166,312,981 | | | | 40.1 | | |
| > Information | |
Internet Related | | | 14,156,231 | | | | 3.4 | | |
Financial Processors | | | 13,041,902 | | | | 3.1 | | |
Computer Hardware & Related
Equipment | | | 12,247,311 | | | | 3.0 | | |
Business Software | | | 11,542,171 | | | | 2.8 | | |
Mobile Communications | | | 10,290,406 | | | | 2.5 | | |
Satellite Broadcasting & Services | | | 8,115,391 | | | | 2.0 | | |
Telephone & Data Services | | | 6,815,135 | | | | 1.6 | | |
TV Broadcasting | | | 4,408,666 | | | | 1.1 | | |
Instrumentation | | | 4,072,283 | | | | 1.0 | | |
Semiconductors & Related
Equipment | | | 2,660,170 | | | | 0.6 | | |
| | | | 87,349,666 | | | | 21.1 | | |
| > Industrial Goods & Services | |
Industrial Materials & Specialty
Chemicals | | | 18,574,740 | | | | 4.5 | | |
Other Industrial Services | | | 9,641,486 | | | | 2.3 | | |
Electrical Components | | | 8,734,644 | | | | 2.1 | | |
Machinery | | | 5,538,607 | | | | 1.3 | | |
Construction | | | 4,119,644 | | | | 1.0 | | |
Outsourcing Services | | | 3,216,398 | | | | 0.8 | | |
| | | | 49,825,519 | | | | 12.0 | | |
| > Finance | |
Insurance | | | 17,187,063 | | | | 4.1 | | |
Banks | | | 13,853,340 | | | | 3.3 | | |
Brokerage & Money Management | | | 11,025,388 | | | | 2.7 | | |
Finance Companies | | | 6,491,227 | | | | 1.6 | | |
| | | | 48,557,018 | | | | 11.7 | | |
| | | Value | | Percentage
of Net Assets | |
| > Health Care | |
Medical Supplies | | $ | 11,108,881 | | | | 2.6 | | |
Pharmaceuticals | | | 5,194,170 | | | | 1.3 | | |
| | | | 16,303,051 | | | | 3.9 | | |
| > Other Industries | |
Transportation | | | 7,802,601 | | | | 1.9 | | |
Regulated Utilities | | | 4,883,420 | | | | 1.2 | | |
| | | | 12,686,021 | | | | 3.1 | | |
| > Energy & Minerals | |
Mining | | | 6,397,702 | | | | 1.5 | | |
Oil Services | | | 5,192,765 | | | | 1.3 | | |
| | | | 11,590,467 | | | | 2.8 | | |
Total Equities: | | | 392,624,723 | | | | 94.7 | | |
Short-Term Investments: | | | 24,619,906 | | | | 5.9 | | |
Securities Lending Collateral: | | | 5,346,586 | | | | 1.3 | | |
Total Investments: | | | 422,591,215 | | | | 101.9 | | |
Obligation to Return
Collateral for Securities
Loaned: | | | (5,346,586 | ) | | | (1.3 | ) | |
Cash and Other Assets
Less Liabilities: | | | (2,539,975 | ) | | | (0.6 | ) | |
Net Assets: | | $ | 414,704,654 | | | | 100.0 | | |
See accompanying notes to financial statements.
85
Columbia Acorn European Fund
Major Portfolio Changes in the Fourth Quarter (Unaudited)
| | | Number of Shares | |
| | | 9/30/13 | | 12/31/13 | |
Purchases | |
Europe | |
| > United Kingdom | |
Abcam | | | 23,431 | | | | 45,700 | | |
Aggreko | | | 4,400 | | | | 9,900 | | |
Assura | | | 520,087 | | | | 891,300 | | |
AVEVA | | | 2,531 | | | | 6,700 | | |
Babcock International | | | 6,687 | | | | 12,100 | | |
Cable and Wireless | | | 174,450 | | | | 332,300 | | |
Charles Taylor | | | 61,500 | | | | 65,540 | | |
Croda | | | 4,400 | | | | 6,700 | | |
Domino's Pizza UK & Ireland | | | 21,262 | | | | 37,900 | | |
Elementis | | | 28,475 | | | | 62,300 | | |
Fidessa Group | | | 3,325 | | | | 7,300 | | |
Halford's | | | 21,850 | | | | 33,000 | | |
Jardine Lloyd Thompson Group | | | 22,100 | | | | 36,700 | | |
Rightmove | | | 3,075 | | | | 6,200 | | |
| RPS Group | | | 0 | | | | 50,700 | | |
Shaftesbury | | | 15,962 | | | | 31,700 | | |
Smiths News | | | 50,000 | | | | 84,100 | | |
Spirax Sarco | | | 4,984 | | | | 12,900 | | |
Telecity | | | 14,550 | | | | 35,000 | | |
WH Smith | | | 14,012 | | | | 24,900 | | |
Whitbread | | | 2,962 | | | | 4,900 | | |
| > France | |
| 1000 mercis | | | 3,212 | | | | 4,600 | | |
Bonduelle | | | 0 | | | | 10,000 | | |
Cegedim | | | 0 | | | | 9,400 | | |
Eurofins Scientific | | | 1,425 | | | | 2,700 | | |
Gemalto | | | 3,062 | | | | 5,900 | | |
Hi-Media | | | 47,637 | | | | 100,500 | | |
Neopost | | | 4,050 | | | | 7,700 | | |
Norbert Dentressangle | | | 1,762 | | | | 3,000 | | |
Saft | | | 4,912 | | | | 8,900 | | |
| > Germany | |
Bertrandt | | | 2,187 | | | | 2,900 | | |
Elringklinger | | | 4,462 | | | | 6,100 | | |
Rational | | | 430 | | | | 770 | | |
TAG Immobilien | | | 14,312 | | | | 21,700 | | |
Wirecard | | | 5,675 | | | | 8,700 | | |
| | | Number of Shares | |
| | | 9/30/13 | | 12/31/13 | |
| > Switzerland | |
Geberit | | | 957 | | | | 1,500 | | |
INFICON | | | 303 | | | | 750 | | |
Partners Group | | | 1,028 | | | | 2,000 | | |
| > Netherlands | |
Aalberts Industries | | | 9,837 | | | | 14,300 | | |
Arcadis | | | 5,787 | | | | 9,800 | | |
| > Finland | |
Konecranes | | | 4,012 | | | | 8,800 | | |
Vacon | | | 3,043 | | | | 6,700 | | |
| > Spain | |
Bolsas y Mercados Españoles | | | 3,152 | | | | 4,500 | | |
Prosegur | | | 0 | | | | 27,703 | | |
Viscofan | | | 2,700 | | | | 5,700 | | |
| > Sweden | |
Hexagon | | | 5,250 | | | | 10,070 | | |
Sweco | | | 11,512 | | | | 22,400 | | |
| > Norway | |
Atea | | | 16,962 | | | | 25,440 | | |
Orkla | | | 15,054 | | | | 42,600 | | |
Subsea 7 | | | 9,200 | | | | 18,600 | | |
| > Denmark | |
Jyske Bank | | | 2,912 | | | | 5,000 | | |
SimCorp | | | 3,962 | | | | 7,600 | | |
| > Italy | |
Pirelli | | | 9,150 | | | | 17,300 | | |
| > Belgium | |
EVS Broadcast Equipment | | | 2,687 | | | | 4,500 | | |
Other Countries | |
| > United States | |
Gulfmark Offshore | | | 2,937 | | | | 5,277 | | |
See accompanying notes to financial statements.
86
| | | Number of Shares | |
| | | 9/30/13 | | 12/31/13 | |
Sales | |
Europe | |
| > Netherlands | |
Fugro | | | 2,100 | | | | 0 | | |
UNIT4 | | | 4,562 | | | | 0 | | |
| > Sweden | |
Eniro | | | 42,000 | | | | 0 | | |
| > Italy | |
Geox | | | 16,449 | | | | 0 | | |
| > Portugal | |
Redes Energéticas Nacionais | | | 12,679 | | | | 0 | | |
Asia | |
| > Hong Kong | |
L'Occitane International | | | 45,200 | | | | 0 | | |
See accompanying notes to financial statements.
87
Columbia Acorn European Fund
Statement of Investments, December 31, 2013
Number of Shares | | | | Value | |
| | | | | | | Equities: 92.1% | |
Europe 91.2% | | | |
| | | > United Kingdom 29.7% | |
| | 12,900 | | | Spirax Sarco | | $ | 640,238 | | |
| | | | | Steam Systems for Manufacturing &
Process Industries | | | | | |
| | 36,700 | | | Jardine Lloyd Thompson Group | | | 619,488 | | |
| | | | | International Business Insurance Broker | | | | | |
| | 84,300 | | | Ocado (a) | | | 618,291 | | |
| | | | | Leading Online Grocery Retailer | | | | | |
| | 891,300 | | | Assura | | | 560,860 | | |
| | | | | UK Primary Health Care Property
Developer | | | | | |
| | 35,000 | | | Telecity | | | 421,042 | | |
| | | | | European Data Center Provider | | | | | |
| | 24,900 | | | WH Smith | | | 413,463 | | |
| | | | | Newsprint, Books & General Stationery
Retailer | | | | | |
| | 45,700 | | | Abcam | | | 371,574 | | |
| | | | | Online Sales of Antibodies | | | | | |
| | 31,700 | | | Shaftesbury | | | 330,118 | | |
| | | | | London Prime Retail REIT | | | | | |
| | 84,100 | | | Smiths News | | | 328,666 | | |
| | | | | Newspaper & Magazine Distributor | | | | | |
| | 37,900 | | | Domino's Pizza UK & Ireland | | | 322,428 | | |
| | | | | Pizza Delivery in UK, Ireland &
Germany | | | | | |
| | 332,300 | | | Cable and Wireless | | | 310,066 | | |
| | | | | Leading Telecoms Service Provider in
the Caribbean | | | | | |
| | 4,900 | | | Whitbread | | | 304,948 | | |
| | | | | The UK's Leading Hotelier & Coffee Shop | | | | | |
| | 50,700 | | | RPS Group | | | 281,994 | | |
| | | | | Consultant Specializing in Energy,
Water, Urban Planning, Health & Safety | | | | | |
| | 6,200 | | | Rightmove | | | 281,570 | | |
| | | | | Internet Real Estate Listings | | | | | |
| | 9,900 | | | Aggreko | | | 280,770 | | |
| | | | | Temporary Power & Temperature
Control Services | | | | | |
| | 62,300 | | | Elementis | | | 278,150 | | |
| | | | | Clay-based Additives | | | | | |
| | 65,540 | | | Charles Taylor | | | 274,636 | | |
| | | | | Insurance Services | | | | | |
| | 6,700 | | | Croda | | | 273,112 | | |
| | | | | Oleochemicals & Industrial Chemicals | | | | | |
| | 7,300 | | | Fidessa Group | | | 273,007 | | |
| | | | | Software for Financial Trading Systems | | | | | |
| | 12,100 | | | Babcock International | | | 271,888 | | |
| | | | | Public Sector Outsourcer | | | | | |
| | 33,000 | | | Halford's | | | 244,616 | | |
| | | | | The UK's Leading Retailer of Leisure
Goods & Auto Parts | | | | | |
| | 6,700 | | | AVEVA | | | 240,491 | | |
| | | | | Engineering Software | | | | | |
| | | | 7,941,416 | | |
| | | > France 15.2% | |
| | 2,700 | | | Eurofins Scientific | | | 730,784 | | |
| | | | | Food, Pharmaceuticals &
Materials Screening & Testing | | | | | |
Number of Shares | | | | Value | |
| | 5,900 | | | Gemalto | | $ | 649,327 | | |
| | | | | Digital Security Solutions | | | | | |
| | 7,700 | | | Neopost | | | 594,190 | | |
| | | | | Postage Meter Machines | | | | | |
| | 3,000 | | | Norbert Dentressangle | | | 385,884 | | |
| | | | | Leading European Logistics &
Transport Group | | | | | |
| | 4,600 | | | 1000 mercis (a) | | | 324,321 | | |
| | | | | Interactive Advertising & Marketing | | | | | |
| | 8,900 | | | Saft | | | 306,051 | | |
| | | | | Niche Battery Manufacturer | | | | | |
| | 9,400 | | | Cegedim (a) | | | 296,004 | | |
| | | | | Medical Market Research/IT Services | | | | | |
| | 10,000 | | | Bonduelle | | | 264,822 | | |
| | | | | Canned, Deep-frozen & Fresh Vegetables | | | | | |
| | 8,200 | | | AKKA Technologies | | | 263,631 | | |
| | | | | Engineering Consultancy | | | | | |
| | 100,500 | | | Hi-Media (a) | | | 258,562 | | |
| | | | | Online Advertiser in Europe | | | | | |
| | | | 4,073,576 | | |
| | | > Germany 9.6% | |
| | 13,200 | | | Aurelius | | | 536,343 | | |
| | | | | European Turnaround Investor | | | | | |
| | 9,600 | | | NORMA Group | | | 477,239 | | |
| | | | | Clamps for Automotive & Industrial
Applications | | | | | |
| | 2,900 | | | Bertrandt | | | 442,846 | | |
| | | | | Outsourced Engineering | | | | | |
| | 8,700 | | | Wirecard | | | 344,366 | | |
| | | | | Online Payment Processing &
Risk Management | | | | | |
| | 21,700 | | | TAG Immobilien | | | 262,476 | | |
| | | | | Owner of Residential Properties in Germany | | | | | |
| | 770 | | | Rational | | | 255,433 | | |
| | | | | Commercial Ovens | | | | | |
| | 6,100 | | | Elringklinger | | | 248,507 | | |
| | | | | Automobile Components | | | | | |
| | | | 2,567,210 | | |
| | | > Switzerland 6.1% | |
| | 2,000 | | | Partners Group | | | 533,378 | | |
| | | | | Private Markets Asset Management | | | | | |
| | 1,500 | | | Geberit | | | 455,072 | | |
| | | | | Plumbing Supplies | | | | | |
| | 100 | | | Sika | | | 356,345 | | |
| | | | | Chemicals for Construction &
Industrial Applications | | | | | |
| | 750 | | | INFICON | | | 289,688 | | |
| | | | | Gas Detection Instruments | | | | | |
| | | | 1,634,483 | | |
| | | > Netherlands 5.1% | |
| | 14,300 | | | Aalberts Industries | | | 456,448 | | |
| | | | | Flow Control & Heat Treatment | | | | | |
| | 9,800 | | | Arcadis | | | 345,606 | | |
| | | | | Engineering Consultants | | | | | |
| | 8,200 | | | TKH Group | | | 286,623 | | |
| | | | | Dutch Industrial Conglomerate | | | | | |
| | 1,400 | | | Core Labs | | | 267,330 | | |
| | | | | Oil & Gas Reservoir Consulting | | | | | |
| | | | 1,356,007 | | |
See accompanying notes to financial statements.
88
Number of Shares | | | | Value | |
| | | > Russia 4.9% | |
| | 8,500 | | | QIWI - ADR | | $ | 476,000 | | |
| | | | | Electronic Payments Network Serving
Russia & the Commonwealth of
Independent States | | | | | |
| | 10,500 | | | Yandex (a) | | | 453,075 | | |
| | | | | Search Engine for Russian &
Turkish Languages | | | | | |
| | 190,000 | | | Moscow Exchange | | | 375,483 | | |
| | | | | Russia's Main Exchange for Stocks,
Bonds, Derivatives, Currencies & Repo | | | | | |
| | | | 1,304,558 | | |
| | | > Finland 4.3% | |
| | 6,700 | | | Vacon | | | 539,206 | | |
| | | | | Leading Independent Manufacturer of
Variable Speed Alternating Current Drives | | | | | |
| | 8,800 | | | Konecranes | | | 312,217 | | |
| | | | | Manufacture & Service of Industrial
Cranes & Port Handling Equipment | | | | | |
| | 11,131 | | | Tikkurila | | | 304,727 | | |
| | | | | Decorative & Industrial Paint in
Scandinavia, Central & Eastern Europe | | | | | |
| | | | 1,156,150 | | |
| | | > Spain 3.9% | |
| | 40,100 | | | Dia | | | 359,052 | | |
| | | | | Leading Hard Discounter in Spain,
Latin America & the Eastern Mediterranean | | | | | |
| | 5,700 | | | Viscofan | | | 324,246 | | |
| | | | | Sausage Casings Maker | | | | | |
| | 27,703 | | | Prosegur | | | 190,126 | | |
| | | | | Security Guards | | | | | |
| | 4,500 | | | Bolsas y Mercados Españoles | | | 171,331 | | |
| | | | | Spanish Stock Markets | | | | | |
| | | | 1,044,755 | | |
| | | > Sweden 3.7% | |
| | 22,400 | | | Sweco | | | 369,163 | | |
| | | | | Engineering Consultants | | | | | |
| | 10,070 | | | Hexagon | | | 318,537 | | |
| | | | | Design, Measurement & Visualization
Software & Equipment | | | | | |
| | 6,400 | | | Unibet | | | 308,962 | | |
| | | | | European Online Gaming Operator | | | | | |
| | | | 996,662 | | |
| | | > Norway 3.5% | |
| | 18,600 | | | Subsea 7 | | | 356,579 | | |
| | | | | Offshore Subsea Contractor | | | | | |
| | 42,600 | | | Orkla | | | 332,978 | | |
| | | | | Food & Brands, Aluminum, Chemicals
Conglomerate | | | | | |
| | 25,440 | | | Atea | | | 250,890 | | |
| | | | | Leading Nordic IT Hardware/Software
Reseller & Installation Company | | | | | |
| | | | 940,447 | | |
Number of Shares | | | | Value | |
| | | > Denmark 2.1% | |
| | 7,600 | | | SimCorp | | $ | 298,643 | | |
| | | | | Software for Investment Managers | | | | | |
| | 5,000 | | | Jyske Bank (a) | | | 270,347 | | |
| | | | | Danish Bank | | | | | |
| | | | 568,990 | | |
| | | > Italy 1.1% | |
| | 17,300 | | | Pirelli | | | 299,292 | | |
| | | | | Global Tire Supplier | | | |
| | | > Belgium 1.1% | |
| | 4,500 | | | EVS Broadcast Equipment | | | 291,444 | | |
| | | | | Digital Live Mobile Production
Software & Systems | | | | | |
| | | > Turkey 0.9% | |
| | 22,900 | | | Bizim Toptan | | | 252,017 | | |
| | | | | Cash & Carry Stores in Turkey | | | | | |
Europe: Total | | | 24,427,007 | | |
Other Countries 0.9% | | | |
| | | > United States 0.9% | |
| | 5,277 | | | Gulfmark Offshore | | | 248,705 | | |
| | | | | Operator of Offshore Supply Vessels | | | | | |
Other Countries: Total | | $ | 248,705 | | |
Total Equities(b): 92.1%
(Cost: $21,134,782) | | | 24,675,712 | | |
Short-Term Investments 4.2% | | | |
| | 1,112,716 | | | JPMorgan U.S. Government
Money Market Fund, IM
Shares (7 day yield of 0.01%) | | | 1,112,716 | | |
Total Short-Term Investments: 4.2%
(Cost: $1,112,716) | | | 1,112,716 | | |
Total Investments: 96.3%
(Cost: $22,247,498)(c) | | | 25,788,428 | | |
Cash and Other Assets Less Liabilities: 3.7% | | | 996,097 | | |
Net Assets: 100.0% | | $ | 26,784,525 | | |
ADR - American Depositary Receipts
REIT - Real Estate Investment Trust
See accompanying notes to financial statements.
89
Columbia Acorn European Fund
Statement of Investments, continued
> Notes to Statement of Investments
(a) Non-income producing security.
(b) On December 31, 2013, the Fund's total investments were denominated in currencies as follows:
Currency | | Value | | Percentage
of Net Assets | |
Euro | | $ | 10,521,104 | | | | 39.3 | | |
British Pound | | | 7,941,416 | | | | 29.6 | | |
United States Dollar | | | 1,820,593 | | | | 6.8 | | |
Swiss Franc | | | 1,634,483 | | | | 6.1 | | |
Other currencies less
than 5% of total net assets | | | 2,758,116 | | | | 10.3 | | |
Total Equities | | $ | 24,675,712 | | | | 92.1 | | |
(c) At December 31, 2013, for federal income tax purposes, the cost of investments was $22,303,687 and net unrealized appreciation was $3,484,741 consisting of gross unrealized appreciation of $3,667,842 and gross unrealized depreciation of $183,101.
Fair Value Measurements
Various inputs are used in determining the value of the Fund's investments, following the input prioritization hierarchy established by accounting principles generally accepted in the United States of America (GAAP). These inputs are summarized in the three broad levels listed below:
• Level 1 – quoted prices in active markets for identical securities
• Level 2 – prices determined using other significant observable inputs (including quoted prices for similar securities, interest rates, prepayment speeds, credit risk and others)
• Level 3 – prices determined using significant unobservable inputs where quoted prices or observable inputs are unavailable or less reliable (including management's own assumptions about the factors market participants would use in pricing an investment)
The inputs or methodology used for valuing securities are not necessarily an indication of the risk associated with investing in those securities.
Examples of the types of securities in which the Fund would typically invest and how they are classified within this hierarchy are as follows. Typical Level 1 securities include exchange traded domestic equities, mutual funds whose NAVs are published each day and exchange traded foreign equities that are not statistically fair valued. Typical Level 2 securities include exchange traded foreign equities that are statistically fair valued, forward foreign currency exchange contracts and short-term investments valued at amortized cost. Additionally, securities fair valued by the Valuation Committee (the Committee) of the Fund's Board of Trustees (the Board) that rely on significant observable inputs are also included in Level 2. Typical Level 3 securities include any security fair valued by the Committee that relies on significant unobservable inputs.
Under the direction of the Board, the Committee is responsible for overseeing the valuation procedures approved by the Board.
The Committee meets as necessary, and no less frequently than quarterly, to determine fair values for securities for which market quotations are not readily available or for which the investment manager believes that available market quotations are unreliable, to review the appropriateness of the Trust's Portfolio Pricing Policy and the pricing procedures of the investment manager (the Policies), and to review the continuing appropriateness of the current value of any security subject to the Policies. The Policies address, among other things: circumstances under which market quotations will be deemed readily available; selection of third party pricing vendors; appropriate pricing methodologies; events that require fair valuation and fair value techniques; circumstances under which securities will be deemed to pose a potential for stale pricing, including when securities are illiquid, restricted, or in default; and certain delegations of authority to determine fair values to the Fund's investment manager. The Committee may also meet to discuss additional valuation matters, which may include review of back-testing results, review of time-sensitive information or approval of other valuation related actions, and to review the appropriateness of the Policies.
For investments categorized as Level 3, the significant unobservable inputs used in the fair value measurement of the Funds' securities may include: (i) data specific to the issuer or comparable issuers, (ii) general market or specific sector news and (iii) quoted prices and specific or similar security transactions. The Committee considers this data and any changes from prior periods in order to assess the reasonableness of observable and unobservable inputs, any assumptions or internal models used to value those securities and changes in fair value. Significant changes in any of these factors could result in lower or higher fair value measurements. Various factors impact the frequency of monitoring (which may occur as often as daily), however the Committee may determine that changes to inputs, assumptions and models are not required with the same frequency.
See accompanying notes to financial statements.
90
> Notes to Statement of Investments
The following table summarizes the inputs used, as of December 31, 2013, in valuing the Fund's assets:
Investment Type | | Quoted Prices
(Level 1) | | Other
Significant
Observable
Inputs
(Level 2) | | Significant
Unobservable
Inputs
(Level 3) | | Total | |
Equities | |
Europe | | $ | 1,196,405 | | | $ | 23,230,602 | | | $ | - | | | $ | 24,427,007 | | |
Other Countries | | | 248,705 | | | | - | | | | - | | | | 248,705 | | |
Total Equities | | | 1,445,110 | | | | 23,230,602 | | | | - | | | | 24,675,712 | | |
Total Short-Term Investments | | | 1,112,716 | | | | - | | | | - | | | | 1,112,716 | | |
Total Investments | | $ | 2,557,826 | | | $ | 23,230,602 | | | $ | - | | | $ | 25,788,428 | | |
The Fund's assets assigned to the Level 2 input category are generally valued using a market approach, in which a security's value is determined through its correlation to prices and information from observable market transactions for similar or identical assets. Foreign equities are generally valued at the last sale price on the foreign exchange or market on which they trade. The Fund may use a statistical fair valuation model, in accordance with the policy adopted by the Board, provided by an independent third party to value securities principally traded in foreign markets in order to adjust for possible stale pricing that may occur between the close of the foreign exchanges and the time for valuation. These models take into account available market data including intraday index, ADR, and ETF movements.
There were no transfers of financial assets between levels 1 and 2 during the period.
See accompanying notes to financial statements.
91
Columbia Acorn European Fund
Portfolio Diversification
At December 31, 2013, the Fund's portfolio investments as a percentage of net assets were diversified as follows:
| | | Value | | Percentage
of Net Assets | |
| > Industrial Goods & Services | |
Machinery | | $ | 2,569,006 | | | | 9.6 | | |
Other Industrial Services | | | 2,008,316 | | | | 7.5 | | |
Conglomerates | | | 1,612,393 | | | | 6.0 | | |
Industrial Materials & Specialty
Chemicals | | | 1,460,840 | | | | 5.4 | | |
Outsourcing Services | | | 1,168,490 | | | | 4.4 | | |
Electrical Components | | | 845,256 | | | | 3.2 | | |
Construction | | | 455,072 | | | | 1.7 | | |
| | | | 10,119,373 | | | | 37.8 | | |
| > Information | |
Financial Processors | | | 1,367,180 | | | | 5.1 | | |
Business Software | | | 1,130,677 | | | | 4.2 | | |
Computer Services | | | 967,937 | | | | 3.6 | | |
Computer Hardware & Related
Equipment | | | 940,772 | | | | 3.5 | | |
Internet Related | | | 734,645 | | | | 2.7 | | |
Business Information &
Marketing Services | | | 324,321 | | | | 1.2 | | |
Telephone & Data Services | | | 310,066 | | | | 1.2 | | |
Advertising | | | 258,562 | | | | 1.0 | | |
| | | | 6,034,160 | | | | 22.5 | | |
| > Consumer Goods & Services | |
Retail | | | 1,887,439 | | | | 7.1 | | |
Restaurants | | | 627,377 | | | | 2.3 | | |
Food & Beverage | | | 589,068 | | | | 2.2 | | |
Consumer Goods Distribution | | | 328,666 | | | | 1.2 | | |
Casinos & Gaming | | | 308,962 | | | | 1.2 | | |
Other Durable Goods | | | 299,292 | | | | 1.1 | | |
| | | | 4,040,804 | | | | 15.1 | | |
| | | Value | | Percentage
of Net Assets | |
| > Finance | |
Insurance | | $ | 894,124 | | | | 3.3 | | |
Brokerage & Money Management | | | 533,378 | | | | 2.0 | | |
Banks | | | 270,347 | | | | 1.0 | | |
| | | | 1,697,849 | | | | 6.3 | | |
| > Other Industries | |
Real Estate | | | 1,153,454 | | | | 4.3 | | |
Transportation | | | 385,884 | | | | 1.5 | | |
| | | | 1,539,338 | | | | 5.8 | | |
| > Energy & Minerals | |
Oil Services | | | 605,284 | | | | 2.2 | | |
Mining | | | 267,330 | | | | 1.0 | | |
| | | | 872,614 | | | | 3.2 | | |
| > Health Care | |
Medical Supplies | | | 371,574 | | | | 1.4 | | |
| | | | 371,574 | | | | 1.4 | | |
Total Equities: | | | 24,675,712 | | | | 92.1 | | |
Short-Term Investments: | | | 1,112,716 | | | | 4.2 | | |
Total Investments: | | | 25,788,428 | | | | 96.3 | | |
Cash and Other Assets
Less Liabilities: | | | 996,097 | | | | 3.7 | | |
Net Assets: | | $ | 26,784,525 | | | | 100.0 | | |
See accompanying notes to financial statements.
92
This page intentionally left blank.
93
Columbia Acorn Family of Funds
Statements of Assets and Liabilities
December 31, 2013 | | Columbia
Acorn
Fund | | Columbia
Acorn
International | | Columbia
Acorn
USA | | Columbia
Acorn
International
Select | |
Assets: | |
Unaffiliated investments, at cost | | $ | 9,136,529,248 | | | $ | 5,833,565,542 | | | $ | 997,974,642 | | | $ | 285,100,007 | | |
Affiliated investments, at cost | | | 2,490,274,629 | | | | 147,295,704 | | | | — | | | | — | | |
Unaffiliated investments, at value (including securities on loan: Columbia Acorn Fund $325,396,020;
Columbia Acorn International $115,336,707; Columbia Acorn USA $56,975,550; Columbia Acorn
International Select $624,717; Columbia Acorn Select $3,049,372; Columbia Thermostat Fund
$—; Columbia Acorn Emerging Markets Fund $5,245,136; Columbia Acorn European Fund $—) | | $ | 17,159,985,996 | | | $ | 8,265,429,859 | | | $ | 1,856,246,367 | | | $ | 355,873,439 | | |
Affiliated investments, at value | | | 4,718,783,353 | | | | 148,561,736 | | | | — | | | | — | | |
Unaffiliated options, at value | | | — | | | | — | | | | — | | | | 985,539 | | |
Affiliated options, at value | | | — | | | | 2,630,029 | | | | — | | | | — | | |
Foreign currency (cost: Columbia Acorn Fund $—; Columbia Acorn International $2,370,423;
Columbia Acorn USA $—; Columbia Acorn International Select $200; Columbia Acorn
Select $—; Columbia Thermostat Fund $—; Columbia Acorn Emerging Markets Fund $704,327;
Columbia Acorn European Fund $2,549) | | | — | | | | 2,370,423 | | | | — | | | | 205 | | |
Unrealized appreciation on forward foreign currency exchange contracts | | | — | | | | — | | | | — | | | | 65,818 | | |
Receivable for: | |
Investments sold | | | 26,973,795 | | | | 28,129,219 | | | | 791,606 | | | | 399,209 | | |
Fund shares sold | | | 21,670,797 | | | | 11,466,476 | | | | 1,126,184 | | | | 239,648 | | |
Dividends and interest | | | 17,538,699 | | | | 6,931,523 | | | | 2,242,533 | | | | 257,851 | | |
Securities lending income | | | 1,285,611 | | | | 171,478 | | | | 137,000 | | | | 296 | | |
Foreign tax reclaims | | | 870,467 | | | | 6,276,074 | | | | — | | | | 197,040 | | |
Expense reimbursement due from Investment Manager | | | — | | | | 1,263 | | | | — | | | | — | | |
Trustees' deferred compensation plan | | | 3,525,605 | | | | 1,074,888 | | | | 301,765 | | | | — | | |
Prepaid expenses | | | 231,125 | | | | 90,574 | | | | 19,079 | | | | 4,146 | | |
Other assets | | | — | | | | — | | | | — | | | | 39 | | |
Total Assets | | | 21,950,865,448 | | | | 8,473,133,542 | | | | 1,860,864,534 | | | | 358,023,230 | | |
Liabilities: | |
Collateral on securities loaned | | | 337,873,354 | | | | 120,006,046 | | | | 58,504,906 | | | | 662,817 | | |
Payable for: | |
Investments purchased | | | 12,834,499 | | | | 10,549,492 | | | | 232,484 | | | | — | | |
Fund shares redeemed | | | 241,078,532 | | | | 12,044,541 | | | | 970,009 | | | | 1,286,727 | | |
Investment advisory fee | | | 376,315 | | | | 172,061 | | | | 42,253 | | | | 9,182 | | |
Administration fee | | | 21,750 | | | | 8,417 | | | | 1,816 | | | | 361 | | |
12b-1 Service and Distribution fees | | | 52,625 | | | | 10,831 | | | | 2,494 | | | | 805 | | |
Reports to shareholders | | | 526,517 | | | | 369,358 | | | | 66,587 | | | | 22,480 | | |
Trustees' deferred compensation plan | | | 3,525,605 | | | | 1,074,888 | | | | 301,765 | | | | — | | |
Transfer agent fees | | | 3,091,992 | | | | 815,040 | | | | 390,784 | | | | 32,391 | | |
Trustees' fees | | | 21,614 | | | | 14,240 | | | | 1,765 | | | | 51,185 | | |
Custody fees | | | 110,174 | | | | 485,398 | | | | 7,496 | | | | 31,193 | | |
Professional fee | | | 266,317 | | | | 132,813 | | | | 43,743 | | | | 30,878 | | |
Chief compliance officer expenses | | | 45,868 | | | | 17,702 | | | | 3,911 | | | | 823 | | |
Other liabilities | | | 69,088 | | | | 112,115 | | | | 8,118 | | | | 5,254 | | |
Total Liabilities | | | 599,894,250 | | | | 145,812,942 | | | | 60,578,131 | | | | 2,134,096 | | |
Net Assets | | $ | 21,350,971,198 | | | $ | 8,327,320,600 | | | $ | 1,800,286,403 | | | $ | 355,889,134 | | |
Composition of Net Assets: | |
Paid-in capital | | $ | 10,722,195,697 | | | $ | 5,987,031,678 | | | $ | 920,888,868 | | | $ | 295,462,968 | | |
Undistributed (Overdistributed) net investment income (loss) | | | (36,590,606 | ) | | | (119,307,605 | ) | | | (286,857 | ) | | | (12,664,698 | ) | |
Accumulated net realized gain (loss) | | | 413,359,100 | | | | 23,691,212 | | | | 21,412,667 | | | | 1,268,797 | | |
Net unrealized appreciation (depreciation) on: | |
Unaffiliated investments | | | 8,023,456,748 | | | | 2,431,864,317 | | | | 858,271,725 | | | | 70,773,432 | | |
Affiliated investments | | | 2,228,508,724 | | | | 1,266,032 | | | | — | | | | — | | |
Foreign currency translations | | | 41,535 | | | | 144,937 | | | | — | | | | (2,722 | ) | |
Forward foreign currency exchange contracts | | | — | | | | — | | | | — | | | | 65,818 | | |
Unaffiliated options | | | — | | | | — | | | | — | | | | 985,539 | | |
Affiliated options | | | — | | | | 2,630,029 | | | | — | | | | — | | |
Net Assets | | $ | 21,350,971,198 | | | $ | 8,327,320,600 | | | $ | 1,800,286,403 | | | $ | 355,889,134 | | |
Net asset value per share – Class A (a) | | $ | 35.78 | | | $ | 46.63 | | | $ | 34.15 | | | $ | 26.91 | | |
(Net assets/shares) | | ($ | 3,869,734,415/
108,162,307) | | | ($ | 1,089,262,958/
23,361,813) | | | ($ | 201,559,321/
5,901,834) | | | ($ | 73,910,751/
2,746,477) | | |
Maximum offering price per share – Class A (b) | | $ | 37.96 | | | $ | 49.47 | | | $ | 36.23 | | | $ | 28.55 | | |
(Net asset value per share/front-end sales charge) | | ($ | 35.78/ 0.9425 | ) | | ($ | 46.63/ 0.9425 | ) | | ($ | 34.15/ 0.9425 | ) | | ($ | 26.91/ 0.9425 | ) | |
Net asset value and offering price per share – Class B (a) | | $ | 32.25 | | | $ | 45.24 | | | $ | 30.70 | | | $ | 25.53 | | |
(Net assets/shares) | | ($ | 19,277,693/
597,845) | | | ($ | 13,218,255/
292,170) | | | ($ | 566,875/
18,467) | | | ($ | 873,120/
34,204) | | |
Net asset value and offering price per share – Class C (a) | | $ | 31.64 | | | $ | 45.04 | | | $ | 30.33 | | | $ | 25.39 | | |
(Net assets/shares) | | ($ | 938,643,605/
29,667,866) | | | ($ | 110,875,117/
2,461,803) | | | ($ | 40,394,904/
1,331,899) | | | ($ | 10,311,206/
406,093) | | |
Net asset value and offering price per share – Class I (c) | | $ | 37.37 | | | $ | 46.71 | | | $ | 35.99 | (d) | | $ | 27.19 | (d) | |
(Net assets/shares) | | ($ | 20,383,139/
545,479) | | | ($ | 29,417,766/
629,829) | | | ($ | 3,712/ 103
| ) | | ($ | 2,604/ 96
| ) | |
Net asset value and offering price per share – Class R (c) | | $ | — | | | $ | 46.60 | | | $ | — | | | $ | — | | |
(Net assets/shares) | | ($ | —/—
| ) | | ($ | 5,822,265/
124,939) | | | ($ | —/— | ) | | ($ | —/— | ) | |
Net asset value and offering price per share – Class R4 (c) | | $ | 37.88 | | | $ | 46.99 | | | $ | 36.55 | | | $ | 27.36 | | |
(Net assets/shares) | | ($ | 74,187,647/
1,958,296) | | | ($ | 355,616,304/
7,568,619) | | | ($ | 6,440,603/
176,237) | | | ($ | 417,449/
15,257) | | |
Net asset value and offering price per share – Class R5 (c) | | $ | 37.89 | | | $ | 46.66 | | | $ | 36.53 | | | $ | 27.34 | | |
(Net assets/shares) | | ($ | 496,905,683/
13,113,552) | | | ($ | 274,415,306/
5,881,311) | | | ($ | 6,067,542/
166,089) | | | ($ | 956,245/
34,977) | | |
Net asset value and offering price per share – Class Y (c) | | $ | 37.93 | | | $ | 46.99 | | | $ | 36.59 | | | $ | 27.33 | | |
(Net assets/shares) | | ($ | 1,227,890,879/
32,370,089) | | | ($ | 155,140,349/
3,301,497) | | | ($ | 48,478,795/
1,324,827) | | | ($ | 13,317,940/
487,327) | | |
Net asset value and offering price per share – Class Z (c) | | $ | 37.32 | | | $ | 46.68 | | | $ | 35.90 | | | $ | 27.20 | | |
(Net assets/shares) | | ($ | 14,703,948,137/
394,034,800) | | | ($ | 6,293,552,280/
134,820,566) | | | ($ | 1,496,774,651/
41,693,748) | | | ($ | 256,099,819/
9,416,238) | | |
(a) Redemption price per share is equal to net asset value less any applicable contingent deferred sales charge.
(b) On sales of $50,000 or more the offering price is reduced.
(c) Redemption price per share is equal to net asset value.
(d) Net asset value per share rounds to this amount due to fractional shares outstanding.
See accompanying notes to financial statements.
94
December 31, 2013 | | Columbia
Acorn
Select | | Columbia
Thermostat
Fund | | Columbia
Acorn
Emerging Markets
Fund | | Columbia
Acorn
European
Fund | |
Assets: | |
Unaffiliated investments, at cost | | $ | 502,604,299 | | | $ | 5,586,480 | | | $ | 391,201,759 | | | $ | 22,247,498 | | |
Affiliated investments, at cost | | | 30,471,805 | | | | 1,296,497,788 | | | | — | | | | — | | |
Unaffiliated investments, at value (including securities on loan: Columbia Acorn Fund $325,396,020;
Columbia Acorn International $115,336,707; Columbia Acorn USA $56,975,550; Columbia Acorn
International Select $624,717; Columbia Acorn Select $3,049,372; Columbia Thermostat Fund
$—; Columbia Acorn Emerging Markets Fund $5,245,136; Columbia Acorn European Fund $—) | | $ | 863,988,214 | | | $ | 5,586,480 | | | $ | 422,591,215 | | | $ | 25,788,428 | | |
Affiliated investments, at value | | | 8,640,953 | | | | 1,327,821,259 | | | | — | | | | — | | |
Unaffiliated options, at value | | | — | | | | — | | | | 131,808 | | | | — | | |
Affiliated options, at value | | | — | | | | — | | | | — | | | | — | | |
Foreign currency (cost: Columbia Acorn Fund $—; Columbia Acorn International $2,370,423;
Columbia Acorn USA $—; Columbia Acorn International Select $200; Columbia Acorn
Select $—; Columbia Thermostat Fund $—; Columbia Acorn Emerging Markets Fund $704,327;
Columbia Acorn European Fund $2,549) | | | — | | | | — | | | | 704,327 | | | | 2,540 | | |
Unrealized appreciation on forward foreign currency exchange contracts | | | — | | | | — | | | | — | | | | — | | |
Receivable for: | |
Investments sold | | | 70,723 | | | | — | | | | 448,594 | | | | — | | |
Fund shares sold | | | 308,782 | | | | 7,093,728 | | | | 3,812,506 | | | | 1,021,164 | | |
Dividends and interest | | | 543,325 | | | | 2,972,436 | | | | 232,785 | | | | 9,794 | | |
Securities lending income | | | 7,026 | | | | — | | | | 2,747 | | | | 4 | | |
Foreign tax reclaims | | | — | | | | — | | | | 5,797 | | | | 9,150 | | |
Expense reimbursement due from Investment Manager | | | 4 | | | | 1,221 | | | | — | | | | 700 | | |
Trustees' deferred compensation plan | | | 336,369 | | | | — | | | | — | | | | — | | |
Prepaid expenses | | | 10,340 | | | | 16,106 | | | | 2,327 | | | | 105 | | |
Other assets | | | — | | | | — | | | | — | | | | — | | |
Total Assets | | | 873,905,736 | | | | 1,343,491,230 | | | | 427,932,106 | | | | 26,831,885 | | |
Liabilities: | |
Collateral on securities loaned | | | 3,090,175 | | | | — | | | | 5,346,586 | | | | — | | |
Payable for: | |
Investments purchased | | | — | | | | 2,972,436 | | | | 7,519,913 | | | | — | | |
Fund shares redeemed | | | 8,686,558 | | | | 3,442,532 | | | | 176,577 | | | | — | | |
Investment advisory fee | | | 19,882 | | | | 3,663 | | | | 11,970 | | | | 843 | | |
Administration fee | | | 874 | | | | 1,353 | | | | 417 | | | | 26 | | |
12b-1 Service and Distribution fees | | | 4,004 | | | | 15,348 | | | | 2,087 | | | | 161 | | |
Reports to shareholders | | | 68,454 | | | | 56,473 | | | | 13,450 | | | | 5,312 | | |
Trustees' deferred compensation plan | | | 336,369 | | | | — | | | | — | | | | — | | |
Transfer agent fees | | | 103,036 | | | | 106,933 | | | | 49,980 | | | | 2,446 | | |
Trustees' fees | | | 1,235 | | | | 47,098 | | | | 4,132 | | | | 715 | | |
Custody fees | | | 6,623 | | | | 1,769 | | | | 64,735 | | | | 9,494 | | |
Professional fee | | | 35,789 | | | | 29,829 | | | | 26,703 | | | | 25,502 | | |
Chief compliance officer expenses | | | 2,054 | | | | 2,989 | | | | 503 | | | | 14 | | |
Other liabilities | | | 7,140 | | | | 5,670 | | | | 10,399 | | | | 2,847 | | |
Total Liabilities | | | 12,362,193 | | | | 6,686,093 | | | | 13,227,452 | | | | 47,360 | | |
Net Assets | | $ | 861,543,543 | | | $ | 1,336,805,137 | | | $ | 414,704,654 | | | $ | 26,784,525 | | |
Composition of Net Assets: | |
Paid-in capital | | $ | 484,013,618 | | | $ | 1,303,069,971 | | | $ | 390,598,864 | | | $ | 23,012,636 | | |
Undistributed (Overdistributed) net investment income (loss) | | | (450,627 | ) | | | 720,757 | | | | (1,371,231 | ) | | | (26,208 | ) | |
Accumulated net realized gain (loss) | | | 38,427,489 | | | | 1,690,938 | | | | (6,029,841 | ) | | | 256,656 | | |
Net unrealized appreciation (depreciation) on: | |
Unaffiliated investments | | | 361,383,915 | | | | — | | | | 31,389,456 | | | | 3,540,930 | | |
Affiliated investments | | | (21,830,852 | ) | | | 31,323,471 | | | | — | | | | — | | |
Foreign currency translations | | | — | | | | — | | | | (14,402 | ) | | | 511 | | |
Forward foreign currency exchange contracts | | | — | | | | — | | | | — | | | | — | | |
Unaffiliated options | | | — | | | | — | | | | 131,808 | | | | — | | |
Affiliated options | | | — | | | | — | | | | — | | | | — | | |
Net Assets | | $ | 861,543,543 | | | $ | 1,336,805,137 | | | $ | 414,704,654 | | | $ | 26,784,525 | | |
Net asset value per share – Class A (a) | | $ | 25.57 | | | $ | 14.58 | | | $ | 13.37 | | | $ | 15.68 | | |
(Net assets/shares) | | ($ | 333,192,806/
13,029,462) | | | ($ | 513,293,435/
35,211,977) | | | ($ | 177,157,745/
13,247,923) | | | ($ | 19,077,937/
1,216,777) | | |
Maximum offering price per share – Class A (b) | | $ | 27.13 | | | $ | 15.47 | | | $ | 14.19 | | | $ | 16.64 | | |
(Net asset value per share/front-end sales charge) | | ($ | 25.57/ 0.9425 | ) | | ($ | 14.58/ 0.9425 | ) | | ($ | 13.37/ 0.9425 | ) | | ($ | 15.68/ 0.9425 | ) | |
Net asset value and offering price per share – Class B (a) | | $ | 22.81 | | | $ | 14.68 | | | $ | — | | | $ | — | | |
(Net assets/shares) | | ($ | 2,938,303/
128,823) | | | ($ | 2,262,765/
154,122) | | | ($ | —/—
| ) | | ($ | —/—
| ) | |
Net asset value and offering price per share – Class C (a) | | $ | 22.46 | | | $ | 14.68 | | | $ | 13.32 | | | $ | 15.54 | | |
(Net assets/shares) | | ($ | 61,536,690/
2,740,128) | | | ($ | 430,172,759/
29,308,851) | | | ($ | 32,636,308/
2,450,094) | | | ($ | 1,400,286/
90,086) | | |
Net asset value and offering price per share – Class I (c) | | $ | 26.81 | | | $ | — | | | $ | 13.41 | | | $ | 15.67 | | |
(Net assets/shares) | | ($ | 13,659,604/
509,531) | | | ($ | —/—
| ) | | ($ | 6,839/ 510
| ) | | ($ | 8,022/ 512
| ) | |
Net asset value and offering price per share – Class R (c) | | $ | — | | | $ | — | | | $ | — | | | $ | — | | |
(Net assets/shares) | | ($ | —/—
| ) | | ($ | —/—
| ) | | ($ | —/—
| ) | | ($ | —/—
| ) | |
Net asset value and offering price per share – Class R4 (c) | | $ | 27.20 | | | $ | 14.46 | | | $ | 13.49 | | | $ | — | | |
(Net assets/shares) | | ($ | 1,383,000/
50,844) | | | ($ | 14,650,751/
1,012,976) | | | ($ | 13,582,726/
1,007,241) | | | ($ | —/—
| ) | |
Net asset value and offering price per share – Class R5 (c) | | $ | 27.20 | | | $ | 14.47 | | | $ | 13.48 | | | $ | 15.82 | | |
(Net assets/shares) | | ($ | 11,995,820/
441,054) | | | ($ | 978,529/
67,612) | | | ($ | 13,625,062/
1,011,115) | | | ($ | 1,891,114/
119,521) | | |
Net asset value and offering price per share – Class Y (c) | | $ | 27.27 | | | $ | 14.46 | (d) | | $ | 13.36 | (d) | | $ | — | | |
(Net assets/shares) | | ($ | 4,847,090/
177,755) | | | ($ | 2,567/ 178
| ) | | ($ | 2,732/ 205
| ) | | ($ | —/—
| ) | |
Net asset value and offering price per share – Class Z (c) | | $ | 26.72 | | | $ | 14.40 | | | $ | 13.40 | | | $ | 15.68 | | |
(Net assets/shares) | | ($ | 431,990,230/
16,165,569) | | | ($ | 375,444,331/
26,076,481) | | | ($ | 177,693,242/
13,264,561) | | | ($ | 4,407,166/
281,062) | | |
See accompanying notes to financial statements.
95
Columbia Acorn Family of Funds
Statements of Operations For the Year Ended December 31, 2013
| | | Columbia
Acorn
Fund | | Columbia
Acorn
International | | Columbia
Acorn
USA | | Columbia
Acorn
International
Select | |
Investment Income: | |
Dividends | | $ | 128,897,838 | | | $ | 178,671,145 | | | $ | 13,134,825 | | | $ | 10,354,062 | | |
Dividends from affiliates | | | 42,911,185 | | | | 6,517,974 | | | | — | | | | — | | |
Dividends from affiliated investment company shares | | | — | | | | — | | | | — | | | | — | | |
Interest | | | — | | | | 446 | | | | — | | | | 135 | | |
Income from securities lending – net | | | 9,259,901 | | | | 2,586,037 | | | | 960,004 | | | | 117,852 | | |
Other income | | | 703 | | | | 373 | | | | 47 | | | | — | | |
| | | 181,069,627 | | | | 187,775,975 | | | | 14,094,876 | | | | 10,472,049 | | |
Foreign taxes withheld | | | (3,087,175 | ) | | | (18,120,284 | ) | | | (42,482 | ) | | | (1,171,917 | ) | |
Total Investment Income | | | 177,982,452 | | | | 169,655,691 | | | | 14,052,394 | | | | 9,300,132 | | |
Expenses: | |
Investment advisory fee | | | 125,835,656 | | | | 57,575,576 | | | | 14,096,687 | | | | 3,429,562 | | |
Administration fee | | | 7,394,755 | | | | 2,862,221 | | | | 615,412 | | | | 137,286 | | |
12b-1 Service and Distribution fees: | |
Class A | | | 8,975,322 | | | | 2,873,438 | | | | 445,359 | | | | 187,384 | | |
Class B | | | 189,416 | | | | 115,347 | | | | 5,899 | | | | 7,637 | | |
Class C | | | 8,485,519 | | | | 1,006,206 | | | | 358,234 | | | | 101,635 | | |
Class R | | | — | | | | 21,548 | | | | — | | | | — | | |
Transfer agent fees: | |
Class A | | | 4,249,096 | | | | 1,918,719 | | | | 244,383 | | | | 90,391 | | |
Class B | | | 69,719 | | | | 61,093 | | | | 3,645 | | | | 2,959 | | |
Class C | | | 675,978 | | | | 155,278 | | | | 24,669 | | | | 15,808 | | |
Class R | | | — | | | | 11,658 | | | | — | | | | — | | |
Class R4 | | | 31,377 | | | | 114,025 | | | | 1,903 | | | | 181 | | |
Class R5 | | | 88,494 | | | | 90,338 | | | | 1,060 | | | | 225 | | |
Class Z | | | 11,274,739 | | | | 4,153,008 | | | | 1,755,710 | | | | 242,263 | | |
Trustees' fees | | | 726,705 | | | | 284,997 | | | | 60,334 | | | | 22,745 | | |
Custody fees | | | 374,758 | | | | 1,767,715 | | | | 26,523 | | | | 128,735 | | |
Registration and blue sky fees | | | 159,209 | | | | 182,178 | | | | 77,918 | | | | 83,734 | | |
Reports to shareholders | | | 1,447,441 | | | | 1,234,035 | | | | 150,673 | | | | 102,730 | | |
Audit fees | | | 90,612 | | | | 161,192 | | | | 43,541 | | | | 51,313 | | |
Legal fees | | | 1,049,970 | | | | 415,561 | | | | 84,389 | | | | 20,282 | | |
Interest expense (Note 5) | | | — | | | | — | | | | — | | | | — | | |
Chief compliance officer expenses | | | 569,385 | | | | 223,238 | | | | 47,247 | | | | 11,027 | | |
Other expenses | | | 490,365 | | | | 406,645 | | | | 51,382 | | | | 28,021 | | |
Total Expenses | | | 172,178,516 | | | | 75,634,016 | | | | 18,094,968 | | | | 4,663,918 | | |
Less reimbursement of expenses by Investment Manager | | | — | | | | (484,488 | ) | | | — | | | | (3 | ) | |
Net Expenses | | | 172,178,516 | | | | 75,149,528 | | | | 18,094,968 | | | | 4,663,915 | | |
Net Investment Income (Loss) | | | 5,803,936 | | | | 94,506,163 | | | | (4,042,574 | ) | | | 4,636,217 | | |
Net Realized and Unrealized Gain (Loss) on Investments: | |
Net realized gain (loss) on: | |
Unaffiliated investments | | | 1,402,013,829 | | | | 530,385,232 | | | | 160,973,633 | | | | 28,213,996 | | |
Affiliated investments | | | 222,109,404 | | | | 76,804,823 | | | | — | | | | — | | |
Foreign currency translations | | | (440,723 | ) | | | (7,111,313 | ) | | | — | | | | (35,274 | ) | |
Forward foreign currency exchange contracts | | | — | | | | — | | | | — | | | | 1,491,240 | | |
Distributions from affiliated investment company shares | | | — | | | | — | | | | — | | | | — | | |
Net realized gain (loss) | | | 1,623,682,510 | | | | 600,078,742 | | | | 160,973,633 | | | | 29,669,962 | | |
Net change in net unrealized appreciation (depreciation) on: | |
Unaffiliated investments | | | 2,882,229,431 | | | | 905,874,191 | | | | 306,146,936 | | | | 12,474,141 | | |
Affiliated investments | | | 742,076,449 | | | | (69,954,473 | ) | | | 392,095 | | | | — | | |
Foreign currency translations | | | 35,542 | | | | 296,661 | | | | — | | | | 6,152 | | |
Forward foreign currency exchange contracts | | | — | | | | — | | | | — | | | | 477,571 | | |
Unaffiliated options | | | — | | | | — | | | | — | | | | 985,539 | | |
Affiliated options | | | — | | | | 2,630,029 | | | | — | | | | — | | |
Foreign capital gains tax | | | — | | | | 779,466 | | | | — | | | | — | | |
Net change in unrealized appreciation (depreciation) | | | 3,624,341,422 | | | | 839,625,874 | | | | 306,539,031 | | | | 13,943,403 | | |
Net realized and unrealized gain | | | 5,248,023,932 | | | | 1,439,704,616 | | | | 467,512,664 | | | | 43,613,365 | | |
Net Increase in Net Assets from Operations | | $ | 5,253,827,868 | | | $ | 1,534,210,779 | | | $ | 463,470,090 | | | $ | 48,249,582 | | |
See accompanying notes to financial statements.
96
| | | Columbia
Acorn
Select | | Columbia
Thermostat
Fund | | Columbia
Acorn
Emerging Markets
Fund | | Columbia
Acorn
European
Fund | |
Investment Income: | |
Dividends | | $ | 6,634,096 | | | $ | 833 | | | $ | 4,625,126 | | | $ | 199,273 | | |
Dividends from affiliates | | | — | | | | — | | | | — | | | | — | | |
Dividends from affiliated investment company shares | | | — | | | | 29,124,985 | | | | — | | | | — | | |
Interest | | | — | | | | — | | | | — | | | | 1 | | |
Income from securities lending – net | | | 197,416 | | | | — | | | | 15,889 | | | | 1,462 | | |
Other income | | | — | | | | — | | | | — | | | | — | | |
| | | 6,831,512 | | | | 29,125,818 | | | | 4,641,015 | | | | 200,736 | | |
Foreign taxes withheld | | | (48,757 | ) | | | — | | | | (436,736 | ) | | | (20,688 | ) | |
Total Investment Income | | | 6,782,755 | | | | 29,125,818 | | | | 4,204,279 | | | | 180,048 | | |
Expenses: | |
Investment advisory fee | | | 7,461,971 | | | | 1,211,226 | | | | 1,966,358 | | | | 117,559 | | |
Administration fee | | | 334,539 | | | | 455,223 | | | | 66,598 | | | | 3,693 | | |
12b-1 Service and Distribution fees: | |
Class A | | | 768,385 | | | | 1,129,819 | | | | 172,258 | | | | 14,286 | | |
Class B | | | 38,837 | | | | 23,948 | | | | — | | | | — | | |
Class C | | | 596,512 | | | | 3,772,774 | | | | 130,597 | | | | 2,798 | | |
Class R | | | — | | | | — | | | | — | | | | — | | |
Transfer agent fees: | |
Class A | | | 380,888 | | | | 360,017 | | | | 89,400 | | | | 6,992 | | |
Class B | | | 18,865 | | | | 6,714 | | | | — | | | | — | | |
Class C | | | 67,451 | | | | 308,014 | | | | 17,233 | | | | 591 | | |
Class R | | | — | | | | — | | | | — | | | | — | | |
Class R4 | | | 301 | | | | 6,201 | | | | 4,159 | | | | — | | |
Class R5 | | | 3,054 | | | | 211 | | | | 2,603 | | | | 294 | | |
Class Z | | | 416,822 | | | | 265,103 | | | | 133,419 | | | | 1,324 | | |
Trustees' fees | | | 35,000 | | | | 48,017 | | | | 5,770 | | | | 497 | | |
Custody fees | | | 22,147 | | | | 4,860 | | | | 218,256 | | | | 62,588 | | |
Registration and blue sky fees | | | 80,412 | | | | 128,145 | | | | 124,951 | | | | 53,651 | | |
Reports to shareholders | | | 161,117 | | | | 277,073 | | | | 50,934 | | | | 23,861 | | |
Audit fees | | | 43,689 | | | | 29,482 | | | | 52,485 | | | | 44,152 | | |
Legal fees | | | 46,289 | | | | 69,840 | | | | 7,002 | | | | 378 | | |
Interest expense (Note 5) | | | 371 | | | | — | | | | — | | | | — | | |
Chief compliance officer expenses | | | 26,043 | | | | 34,432 | | | | 3,861 | | | | 218 | | |
Other expenses | | | 68,744 | | | | 33,738 | | | | 27,659 | | | | 16,982 | | |
Total Expenses | | | 10,571,437 | | | | 8,164,837 | | | | 3,073,543 | | | | 349,864 | | |
Less reimbursement of expenses by Investment Manager | | | (918 | ) | | | (216,529 | ) | | | (61,620 | ) | | | (186,331 | ) | |
Net Expenses | | | 10,570,519 | | | | 7,948,308 | | | | 3,011,923 | | | | 163,533 | | |
Net Investment Income (Loss) | | | (3,787,764 | ) | | | 21,177,510 | | | | 1,192,356 | | | | 16,515 | | |
Net Realized and Unrealized Gain (Loss) on Investments: | |
Net realized gain (loss) on: | |
Unaffiliated investments | | | 199,130,702 | | | | — | | | | (5,914,357 | ) | | | 291,209 | | |
Affiliated investments | | | 1,096,550 | | | | 77,485,104 | | | | — | | | | — | | |
Foreign currency translations | | | (4,068 | ) | | | — | | | | 11,350 | | | | (914 | ) | |
Forward foreign currency exchange contracts | | | — | | | | — | | | | — | | | | — | | |
Distributions from affiliated investment company shares | | | — | | | | 10,482,155 | | | | — | | | | — | | |
Net realized gain (loss) | | | 200,223,184 | | | | 87,967,259 | | | | (5,903,007 | ) | | | 290,295 | | |
Net change in net unrealized appreciation (depreciation) on: | |
Unaffiliated investments | | | 59,584,384 | | | | — | | | | 29,934,350 | | | | 3,148,205 | | |
Affiliated investments | | | 7,543,133 | | | | (12,732,372 | ) | | | — | | | | — | | |
Foreign currency translations | | | 154 | | | | — | | | | (14,241 | ) | | | 442 | | |
Forward foreign currency exchange contracts | | | — | | | | — | | | | — | | | | — | | |
Unaffiliated options | | | — | | | | — | | | | 131,808 | | | | — | | |
Affiliated options | | | — | | | | — | | | | — | | | | — | | |
Foreign capital gains tax | | | — | | | | — | | | | 12,859 | | | | — | | |
Net change in unrealized appreciation (depreciation) | | | 67,127,671 | | | | (12,732,372 | ) | | | 30,064,776 | | | | 3,148,647 | | |
Net realized and unrealized gain | | | 267,350,855 | | | | 75,234,887 | | | | 24,161,769 | | | | 3,438,942 | | |
Net Increase in Net Assets from Operations | | $ | 263,563,091 | | | $ | 96,412,397 | | | $ | 25,354,125 | | | $ | 3,455,457 | | |
See accompanying notes to financial statements.
97
Columbia Acorn Family of Funds
Statements of Changes in Net Assets
| | | Columbia
Acorn Fund | | Columbia Acorn
International | | Columbia
Acorn USA | | Columbia Acorn
International Select | |
Increase (Decrease) in Net Assets | | Year ended December 31, | | Year ended December 31, | | Year ended December 31, | | Year ended December 31, | |
| | | 2013 | | 2012 (a)(b)(c) | | 2013 | | 2012 (a)(b)(c) | | 2013 | | 2012 (a)(b)(c) | | 2013 | | 2012 (a)(b)(c) | |
Operations: | |
Net investment income (loss) | | $ | 5,803,936 | | | $ | 81,811,247 | | | $ | 94,506,163 | | | $ | 90,750,742 | | | $ | (4,042,574 | ) | | $ | 5,000,823 | | | $ | 4,636,217 | | | $ | 6,089,719 | | |
Net realized gain (loss) on investments, foreign
currency translations, forward foreign currency
exchange contracts and foreign capital gains tax | | | 1,401,573,106 | | | | 1,113,274,791 | | | | 523,273,919 | | | | 143,980,673 | | | | 160,973,633 | | | | 120,638,007 | | | | 29,669,962 | | | | 37,404,262 | | |
Net realized gain (loss) on affiliated investments and
distributions from affiliated investment company shares | | | 222,109,404 | | | | 4,469,667 | | | | 76,804,823 | | | | (103,501 | ) | | | — | | | | — | | | | — | | | | — | | |
Net change in net unrealized appreciation on investments,
options, foreign currency translations, forward foreign
currency exchange contracts and foreign capital gains tax | | | 2,882,264,973 | | | | 1,224,627,488 | | | | 906,950,318 | | | | 920,564,584 | | | | 306,146,936 | | | | 149,564,276 | | | | 13,943,403 | | | | 27,009,907 | | |
Net change in net unrealized appreciation (depreciation)
on affiliated investments, affiliated options and affiliated
investment company shares | | | 742,076,449 | | | | 408,220,687 | | | | (67,324,444 | ) | | | 31,907,664 | | | | 392,095 | | | | (83,200 | ) | | | — | | | | — | | |
Net Increase in Net Assets from Operations | | | 5,253,827,868 | | | | 2,832,403,880 | | | | 1,534,210,779 | | | | 1,187,100,162 | | | | 463,470,090 | | | | 275,119,906 | | | | 48,249,582 | | | | 70,503,888 | | |
Distributions to Shareholders From: | |
Net investment income – Class A | | | (4,469,883 | ) | | | (6,663,987 | ) | | | (25,492,504 | ) | | | (14,411,473 | ) | | | — | | | | (599,485 | ) | | | (995,831 | ) | | | (4,362,966 | ) | |
Net realized gain – Class A | | | (242,979,462 | ) | | | (197,512,972 | ) | | | (42,739,072 | ) | | | — | | | | (16,332,703 | ) | | | (11,879,641 | ) | | | (5,217,634 | ) | | | (5,497,945 | ) | |
Net investment income – Class B | | | — | | | | — | | | | (249,782 | ) | | | (110,407 | ) | | | — | | | | — | | | | (6,430 | ) | | | (72,287 | ) | |
Net realized gain – Class B | | | (1,474,831 | ) | | | (2,528,156 | ) | | | (556,329 | ) | | | — | | | | (57,712 | ) | | | (115,000 | ) | | | (67,482 | ) | | | (103,484 | ) | |
Net investment income – Class C | | | — | | | | — | | | | (1,667,787 | ) | | | (564,735 | ) | | | — | | | | — | | | | (60,907 | ) | | | (545,569 | ) | |
Net realized gain – Class C | | | (65,282,509 | ) | | | (50,561,092 | ) | | | (4,540,816 | ) | | | — | | | | (3,645,977 | ) | | | (2,747,308 | ) | | | (740,564 | ) | | | (788,458 | ) | |
Net investment income – Class I | | | (44,509 | ) | | | (314,994 | ) | | | (1,200,147 | ) | | | (2,000,370 | ) | | | — | | | | (23 | ) | | | (44 | ) | | | (176 | ) | |
Net realized gain – Class I | | | (1,462,421 | ) | | | (3,228,769 | ) | | | (1,173,000 | ) | | | — | | | | (310 | ) | | | (1,468 | ) | | | (183 | ) | | | (212 | ) | |
Net investment income – Class R | | | — | | | | — | | | | (88,738 | ) | | | (25,256 | ) | | | — | | | | — | | | | — | | | | — | | |
Net realized gain – Class R | | | — | | | | — | | | | (220,182 | ) | | | — | | | | — | | | | — | | | | — | | | | — | | |
Net investment income – Class R4 | | | (39,853 | ) | | | (56 | ) | | | (5,132,184 | ) | | | (223 | ) | | | — | | | | (79 | ) | | | (6,112 | ) | | | (894 | ) | |
Net realized gain – Class R4 | | | (3,609,537 | ) | | | (717 | ) | | | (13,386,984 | ) | | | — | | | | (464,529 | ) | | | (1,157 | ) | | | (20,623 | ) | | | (1,048 | ) | |
Net investment income – Class R5 | | | (132,214 | ) | | | (11 | ) | | | (6,226,444 | ) | | | (16,524 | ) | | | — | | | | (15 | ) | | | (15,307 | ) | | | (150 | ) | |
Net realized gain – Class R5 | | | (24,670,758 | ) | | | (119 | ) | | | (11,061,862 | ) | | | — | | | | (450,508 | ) | | | (193 | ) | | | (50,485 | ) | | | (175 | ) | |
Net investment income – Class Y | | | (1,014,881 | ) | | | (88,761 | ) | | | (3,420,841 | ) | | | (19,488 | ) | | | — | | | | (16 | ) | | | (202,646 | ) | | | (151 | ) | |
Net realized gain – Class Y | | | (67,636,681 | ) | | | (850,641 | ) | | | (7,136,853 | ) | | | — | | | | (2,875,291 | ) | | | (193 | ) | | | (590,564 | ) | | | (174 | ) | |
Net investment income – Class Z | | | (15,891,591 | ) | | | (63,442,374 | ) | | | (155,452,351 | ) | | | (111,633,313 | ) | | | — | | | | (8,664,877 | ) | | | (4,109,073 | ) | | | (19,872,784 | ) | |
Net realized gain – Class Z | | | (900,665,248 | ) | | | (774,147,758 | ) | | | (249,192,931 | ) | | | — | | | | (117,566,025 | ) | | | (105,839,468 | ) | | | (18,050,611 | ) | | | (23,989,252 | ) | |
Total Distributions to Shareholders | | | (1,329,374,378 | ) | | | (1,099,340,407 | ) | | | (528,938,807 | ) | | | (128,781,789 | ) | | | (141,393,055 | ) | | | (129,848,923 | ) | | | (30,134,496 | ) | | | (55,235,725 | ) | |
Share Transactions: | |
Subscriptions – Class A | | | 557,145,668 | | | | 504,132,337 | | | | 388,100,963 | | | | 192,174,434 | | | | 45,008,746 | | | | 23,184,962 | | | | 25,343,455 | | | | 28,487,144 | | |
Distributions reinvested – Class A | | | 233,381,519 | | | | 192,504,936 | | | | 65,876,765 | | | | 13,849,288 | | | | 15,114,156 | | | | 11,472,496 | | | | 6,095,501 | | | | 9,540,300 | | |
Redemptions – Class A | | | (858,688,706 | ) | | | (1,043,161,042 | ) | | | (530,170,862 | ) | | | (288,655,100 | ) | | | (44,053,671 | ) | | | (65,386,017 | ) | | | (35,337,785 | ) | | | (22,115,770 | ) | |
Net Increase (Decrease) – Class A | | | (68,161,519 | ) | | | (346,523,769 | ) | | | (76,193,134 | ) | | | (82,631,378 | ) | | | 16,069,231 | | | | (30,728,559 | ) | | | (3,898,829 | ) | | | 15,911,674 | | |
Distributions reinvested – Class B | | | 1,460,482 | | | | 2,488,680 | | | | 818,689 | | | | 109,244 | | | | 57,565 | | | | 112,821 | | | | 73,716 | | | | 171,043 | | |
Redemptions – Class B | | | (21,005,008 | ) | | | (42,408,789 | ) | | | (7,611,506 | ) | | | (10,614,723 | ) | | | (704,340 | ) | | | (1,506,892 | ) | | | (502,159 | ) | | | (821,529 | ) | |
Net Increase (Decrease) – Class B | | | (19,544,526 | ) | | | (39,920,109 | ) | | | (6,792,817 | ) | | | (10,505,479 | ) | | | (646,775 | ) | | | (1,394,071 | ) | | | (428,443 | ) | | | (650,486 | ) | |
Subscriptions – Class C | | | 102,078,253 | | | | 75,456,034 | | | | 18,300,360 | | | | 9,589,255 | | | | 3,731,266 | | | | 1,894,599 | | | | 2,209,150 | | | | 1,909,549 | | |
Distributions reinvested – Class C | | | 53,482,078 | | | | 41,007,235 | | | | 5,389,019 | | | | 462,763 | | | | 3,400,514 | | | | 2,504,682 | | | | 731,141 | | | | 1,184,774 | | |
Redemptions – Class C | | | (127,416,912 | ) | | | (147,063,884 | ) | | | (18,680,336 | ) | | | (31,713,431 | ) | | | (4,271,383 | ) | | | (6,051,022 | ) | | | (2,895,556 | ) | | | (2,386,931 | ) | |
Net Increase (Decrease) – Class C | | | 28,143,419 | | | | (30,600,615 | ) | | | 5,009,043 | | | | (21,661,413 | ) | | | 2,860,397 | | | | (1,651,741 | ) | | | 44,735 | | | | 707,392 | | |
Subscriptions – Class I | | | 62,857,281 | | | | 67,198,938 | | | | 88,004,757 | | | | 89,544,891 | | | | — | | | | 2,149,882 | | | | — | | | | — | | |
Distributions reinvested – Class I | | | 1,506,709 | | | | 3,543,577 | | | | 2,371,517 | | | | 1,999,919 | | | | — | | | | 1,223 | | | | — | | | | — | | |
Redemptions – Class I | | | (116,462,027 | ) | | | (30,814,450 | ) | | | (175,245,774 | ) | | | (56,555,211 | ) | | | — | | | | (4,920,409 | ) | | | — | | | | — | | |
Net Increase (Decrease) – Class I | | | (52,098,037 | ) | | | 39,928,065 | | | | (84,869,500 | ) | | | 34,989,599 | | | | — | | | | (2,769,304 | ) | | | — | | | | — | | |
Subscriptions – Class R | | | — | | | | — | | | | 3,579,789 | | | | 4,849,766 | | | | — | | | | — | | | | — | | | | — | | |
Distributions reinvested – Class R | | | — | | | | — | | | | 280,476 | | | | 20,880 | | | | — | | | | — | | | | — | | | | — | | |
Redemptions – Class R | | | — | | | | — | | | | (1,384,671 | ) | | | (4,484,989 | ) | | | — | | | | — | | | | — | | | | — | | |
Net Increase – Class R | | | — | | | | — | | | | 2,475,594 | | | | 385,657 | | | | — | | | | — | | | | — | | | | — | | |
(a) Class R4 shares reflect activity for the period from November 8, 2012 (commencement of operations) through December 31, 2012.
(b) Class R5 shares reflect activity for the period from November 8, 2012 (commencement of operations) through December 31, 2012.
(c) Class Y shares reflect activity for the period from November 8, 2012 (commencement of operations) through December 31, 2012.
(d) Class Y shares reflect activity for the period from June 13, 2013 (commencement of operations) through December 31, 2013.
See accompanying notes to financial statements.
98
| | | Columbia
Acorn Select | | Columbia
Thermostat Fund | | Columbia Acorn
Emerging Markets Fund | | Columbia Acorn
European Fund | |
Increase (Decrease) in Net Assets | | Year ended December 31, | | Year ended December 31, | | Year ended December 31, | | Year ended December 31, | |
| | | 2013 | | 2012 (a)(b)(c) | | 2013 | | 2012 (a)(b)(c) | | 2013 (d) | | 2012 (a)(b) | | 2013 | | 2012 (b) | |
Operations: | |
Net investment income (loss) | | $ | (3,787,764 | ) | | $ | 3,199,752 | | | $ | 21,177,510 | | | $ | 10,380,505 | | | $ | 1,192,356 | | | $ | 59,454 | | | $ | 16,515 | | | $ | 15,258 | | |
Net realized gain (loss) on investments, foreign
currency translations, forward foreign currency
exchange contracts and foreign capital gains tax | | | 199,126,634 | | | | 146,041,340 | | | | — | | | | — | | | | (5,903,007 | ) | | | (61,273 | ) | | | 290,295 | | | | 8,711 | | |
Net realized gain (loss) on affiliated investments and
distributions from affiliated investment company shares | | | 1,096,550 | | | | (32,861,769 | ) | | | 87,967,259 | | | | 9,964,937 | | | | — | | | | — | | | | — | | | | — | | |
Net change in net unrealized appreciation on investments,
options, foreign currency translations, forward foreign
currency exchange contracts and foreign capital gains tax | | | 59,584,538 | | | | 9,006,880 | | | | — | | | | — | | | | 30,064,776 | | | | 1,577,275 | | | | 3,148,647 | | | | 478,648 | | |
Net change in net unrealized appreciation (depreciation)
on affiliated investments, affiliated options and affiliated
investment company shares | | | 7,543,133 | | | | 76,071,172 | | | | (12,732,372 | ) | | | 30,128,824 | | | | — | | | | — | | | | — | | | | — | | |
Net Increase in Net Assets from Operations | | | 263,563,091 | | | | 201,457,375 | | | | 96,412,397 | | | | 50,474,266 | | | | 25,354,125 | | | | 1,575,456 | | | | 3,455,457 | | | | 502,617 | | |
Distributions to Shareholders From: | |
Net investment income – Class A | | | (779,067 | ) | | | — | | | | (8,405,645 | ) | | | (5,054,209 | ) | | | (982,830 | ) | | | (15,490 | ) | | | (19,726 | ) | | | (1,646 | ) | |
Net realized gain – Class A | | | (74,628,738 | ) | | | (22,932,516 | ) | | | (24,911,710 | ) | | | — | | | | — | | | | — | | | | (17,284 | ) | | | (87 | ) | |
Net investment income – Class B | | | — | | | | — | | | | (26,642 | ) | | | (54,808 | ) | | | — | | | | — | | | | — | | | | — | | |
Net realized gain – Class B | | | (860,295 | ) | | | (1,087,328 | ) | | | (109,193 | ) | | | — | | | | — | | | | — | | | | — | | | | — | | |
Net investment income – Class C | | | — | | | | — | | | | (3,912,583 | ) | | | (2,121,887 | ) | | | — | | | | — | | | | — | | | | (20 | ) | |
Net realized gain – Class C | | | (15,474,668 | ) | | | (5,136,384 | ) | | | (20,870,877 | ) | | | — | | | | — | | | | — | | | | (1,176 | ) | | | (8 | ) | |
Net investment income – Class I | | | (134,582 | ) | | | — | | | | — | | | | — | | | | (63 | ) | | | (61 | ) | | | (31 | ) | | | (48 | ) | |
Net realized gain – Class I | | | (3,544,269 | ) | | | (2,740,487 | ) | | | — | | | | — | | | | — | | | | — | | | | (8 | ) | | | (2 | ) | |
Net investment income – Class R | | | — | | | | — | | | | — | | | | — | | | | — | | | | — | | | | — | | | | — | | |
Net realized gain – Class R | | | — | | | | — | | | | — | | | | — | | | | — | | | | — | | | | — | | | | — | | |
Net investment income – Class R4 | | | (361 | ) | | | — | | | | (279,538 | ) | | | (272 | ) | | | (121,494 | ) | | | (135 | ) | | | — | | | | — | | |
Net realized gain – Class R4 | | | (146,391 | ) | | | (872 | ) | | | (732,207 | ) | | | — | | | | — | | | | — | | | | — | | | | — | | |
Net investment income – Class R5 | | | (2,205 | ) | | | — | | | | (17,560 | ) | | | (45 | ) | | | (121,239 | ) | | | (24 | ) | | | (5,749 | ) | | | (17 | ) | |
Net realized gain – Class R5 | | | (2,031,137 | ) | | | (145 | ) | | | (45,621 | ) | | | — | | | | — | | | | — | | | | (1,913 | ) | | | — | | |
Net investment income – Class Y | | | (184 | ) | | | — | | | | (55 | ) | | | (46 | ) | | | (27 | ) | | | — | | | | — | | | | — | | |
Net realized gain – Class Y | | | (819,712 | ) | | | (145 | ) | | | (133 | ) | | | — | | | | — | | | | — | | | | — | | | | — | | |
Net investment income – Class Z | | | (2,355,271 | ) | | | — | | | | (7,145,972 | ) | | | (5,300,668 | ) | | | (1,332,785 | ) | | | (60,520 | ) | | | (15,666 | ) | | | (20,402 | ) | |
Net realized gain – Class Z | | | (101,354,640 | ) | | | (51,934,084 | ) | | | (18,354,791 | ) | | | — | | | | — | | | | — | | | | (4,486 | ) | | | (815 | ) | |
Total Distributions to Shareholders | | | (202,131,520 | ) | | | (83,831,961 | ) | | | (84,812,527 | ) | | | (12,531,935 | ) | | | (2,558,438 | ) | | | (76,230 | ) | | | (66,039 | ) | | | (23,045 | ) | |
Share Transactions: | |
Subscriptions – Class A | | | 65,389,229 | | | | 40,027,597 | | | | 269,301,297 | | | | 273,105,947 | | | | 179,677,591 | | | | 2,701,324 | | | | 19,592,036 | | | | 295,687 | | |
Distributions reinvested – Class A | | | 70,987,772 | | | | 21,373,765 | | | | 30,672,808 | | | | 4,549,410 | | | | 978,630 | | | | 15,419 | | | | 31,783 | | | | 1,697 | | |
Redemptions – Class A | | | (88,198,756 | ) | | | (159,108,074 | ) | | | (113,768,855 | ) | | | (48,212,223 | ) | | | (16,017,690 | ) | | | (234,401 | ) | | | (3,060,376 | ) | | | (46,529 | ) | |
Net Increase (Decrease) – Class A | | | 48,178,245 | | | | (97,706,712 | ) | | | 186,205,250 | | | | 229,443,134 | | | | 164,638,531 | | | | 2,482,342 | | | | 16,563,443 | | | | 250,855 | | |
Distributions reinvested – Class B | | | 857,139 | | | | 1,050,259 | | | | 134,520 | | | | 52,935 | | | | — | | | | — | | | | — | | | | — | | |
Redemptions – Class B | | | (8,581,439 | ) | | | (19,619,654 | ) | | | (2,504,093 | ) | | | (7,803,976 | ) | | | — | | | | — | | | | — | | | | — | | |
Net Increase (Decrease) – Class B | | | (7,724,300 | ) | | | (18,569,395 | ) | | | (2,369,573 | ) | | | (7,751,041 | ) | | | — | | | | — | | | | — | | | | — | | |
Subscriptions – Class C | | | 4,254,216 | | | | 3,033,655 | | | | 215,445,550 | | | | 220,660,384 | | | | 30,902,660 | | | | 479,073 | | | | 1,250,413 | | | | 102,697 | | |
Distributions reinvested – Class C | | | 12,694,116 | | | | 4,111,417 | | | | 18,856,243 | | | | 1,498,365 | | | | — | | | | — | | | | 1,175 | | | | 28 | | |
Redemptions – Class C | | | (14,117,603 | ) | | | (17,080,513 | ) | | | (60,357,649 | ) | | | (11,490,278 | ) | | | (732,599 | ) | | | (62,650 | ) | | | (56,761 | ) | | | (23,910 | ) | |
Net Increase (Decrease) – Class C | | | 2,830,729 | | | | (9,935,441 | ) | | | 173,944,144 | | | | 210,668,471 | | | | 30,170,061 | | | | 416,423 | | | | 1,194,827 | | | | 78,815 | | |
Subscriptions – Class I | | | 41,439,706 | | | | 45,199,109 | | | | — | | | | — | | | | — | | | | — | | | | — | | | | — | | |
Distributions reinvested – Class I | | | 3,678,143 | | | | 2,740,281 | | | | — | | | | — | | | | 63 | | | | 61 | | | | 39 | | | | 50 | | |
Redemptions – Class I | | | (77,746,294 | ) | | | (20,749,765 | ) | | | — | | | | — | | | | — | | | | — | | | | — | | | | — | | |
Net Increase (Decrease) – Class I | | | (32,628,445 | ) | | | 27,189,625 | | | | — | | | | — | | | | 63 | | | | 61 | | | | 39 | | | | 50 | | |
Subscriptions – Class R | | | — | | | | — | | | | — | | | | — | | | | — | | | | — | | | | — | | | | — | | |
Distributions reinvested – Class R | | | — | | | | — | | | | — | | | | — | | | | — | | | | — | | | | — | | | | — | | |
Redemptions – Class R | | | — | | | | — | | | | — | | | | — | | | | — | | | | — | | | | — | | | | — | | |
Net Increase – Class R | | | — | | | | — | | | | — | | | | — | | | | — | | | | — | | | | — | | | | — | | |
See accompanying notes to financial statements.
99
Columbia Acorn Family of Funds
Statements of Changes in Net Assets, continued
| | | Columbia
Acorn Fund | | Columbia Acorn
International | | Columbia
Acorn USA | | Columbia Acorn
International Select | |
Increase (Decrease) in Net Assets | | Year ended December 31, | | Year ended December 31, | | Year ended December 31, | | Year ended December 31, | |
| | | 2013 | | 2012 (a)(b)(c) | | 2013 | | 2012 (a)(b)(c) | | 2013 | | 2012 (a)(b)(c) | | 2013 | | 2012 (a)(b)(c) | |
Subscriptions – Class R4 | | | 70,679,921 | | | | 16,900 | | | | 346,765,044 | | | | 15,000 | | | | 6,157,899 | | | | 15,000 | | | | 383,885 | | | | 15,000 | | |
Distributions reinvested – Class R4 | | | 3,598,586 | | | | — | | | | 18,510,730 | | | | — | | | | 463,030 | | | | — | | | | 25,563 | | | | — | | |
Redemptions – Class R4 | | | (5,189,707 | ) | | | — | | | | (7,666,126 | ) | | | — | | | | (397,344 | ) | | | — | | | | (158 | ) | | | — | | |
Net Increase – Class R4 | | | 69,088,800 | | | | 16,900 | | | | 357,609,648 | | | | 15,000 | | | | 6,223,585 | | | | 15,000 | | | | 409,290 | | | | 15,000 | | |
Subscriptions – Class R5 | | | 491,001,376 | | | | 2,500 | | | | 285,865,026 | | | | 445 | | | | 5,875,204 | | | | 2,500 | | | | 959,653 | | | | 2,500 | | |
Distributions reinvested – Class R5 | | | 24,452,455 | | | | — | | | | 17,278,109 | | | | 5,613 | | | | 450,258 | | | | — | | | | 65,594 | | | | — | | |
Redemptions – Class R5 | | | (47,781,358 | ) | | | — | | | | (47,512,031 | ) | | | (2,089,711 | ) | | | (553,703 | ) | | | — | | | | (79,732 | ) | | | — | | |
Net Increase (Decrease) – Class R5 | | | 467,672,473 | | | | 2,500 | | | | 255,631,104 | | | | (2,083,653 | ) | | | 5,771,759 | | | | 2,500 | | | | 945,515 | | | | 2,500 | | |
Subscriptions – Class Y | | | 1,048,816,289 | | | | 66,583,143 | | | | 165,373,208 | | | | 30,626,355 | | | | 44,461,461 | | | | 2,500 | | | | 13,106,279 | | | | 2,500 | | |
Distributions reinvested – Class Y | | | 68,651,368 | | | | 939,270 | | | | 8,485,714 | | | | 19,448 | | | | 2,875,042 | | | | — | | | | 793,011 | | | | — | | |
Redemptions – Class Y | | | (76,908,863 | ) | | | (326,942 | ) | | | (60,678,159 | ) | | | — | | | | (321,655 | ) | | | — | | | | (353,711 | ) | | | — | | |
Net Increase – Class Y | | | 1,040,558,794 | | | | 67,195,471 | | | | 113,180,763 | | | | 30,645,803 | | | | 47,014,848 | | | | 2,500 | | | | 13,545,579 | | | | 2,500 | | |
Subscriptions – Class Z | | | 1,365,381,996 | | | | 1,687,350,294 | | | | 952,243,095 | | | | 1,168,999,243 | | | | 192,666,998 | | | | 222,245,731 | | | | 56,693,525 | | | | 86,732,266 | | |
Distributions reinvested – Class Z | | | 797,203,097 | | | | 734,024,683 | | | | 317,702,278 | | | | 86,747,474 | | | | 102,958,421 | | | | 102,214,147 | | | | 12,763,349 | | | | 21,542,287 | | |
Redemptions – Class Z | | | (3,725,592,700 | ) | | | (2,657,246,336 | ) | | | (1,257,745,052 | ) | | | (936,482,410 | ) | | | (494,803,769 | ) | | | (391,557,641 | ) | | | (122,754,727 | ) | | | (85,460,095 | ) | |
Net Increase (Decrease) – Class Z | | | (1,563,007,607 | ) | | | (235,871,359 | ) | | | 12,200,321 | | | | 319,264,307 | | | | (199,178,350 | ) | | | (67,097,763 | ) | | | (53,297,853 | ) | | | 22,814,458 | | |
Net Increase (Decrease) from Share Transactions | | | (97,348,203 | ) | | | (545,772,916 | ) | | | 578,251,022 | | | | 268,418,443 | | | | (121,885,305 | ) | | | (103,621,438 | ) | | | (42,680,006 | ) | | | 38,803,038 | | |
Increase from regulatory settlements (Note 7) | | | — | | | | — | | | | — | | | | 107,802 | | | | — | | | | — | | | | — | | | | — | | |
Total Increase (Decrease) in Net Assets | | | 3,827,105,287 | | | | 1,187,290,557 | | | | 1,583,522,994 | | | | 1,326,844,618 | | | | 200,191,730 | | | | 41,649,545 | | | | (24,564,920 | ) | | | 54,071,201 | | |
Net Assets: | |
Beginning of period | | | 17,523,865,911 | | | | 16,336,575,354 | | | | 6,743,797,606 | | | | 5,416,952,988 | | | | 1,600,094,673 | | | | 1,558,445,128 | | | | 380,454,054 | | | | 326,382,853 | | |
End of period | | $ | 21,350,971,198 | | | $ | 17,523,865,911 | | | $ | 8,327,320,600 | | | $ | 6,743,797,606 | | | $ | 1,800,286,403 | | | $ | 1,600,094,673 | | | $ | 355,889,134 | | | $ | 380,454,054 | | |
Undistributed (Overdistributed) net investment income (loss) | | $ | (36,590,606 | ) | | $ | (27,792,423 | ) | | $ | (119,307,605 | ) | | $ | (74,303,358 | ) | | $ | (286,857 | ) | | $ | (4,074,947 | ) | | $ | (12,664,698 | ) | | $ | (22,556,622 | ) | |
(a) Class R4 shares reflect activity for the period from November 8, 2012 (commencement of operations) through December 31, 2012.
(b) Class R5 shares reflect activity for the period from November 8, 2012 (commencement of operations) through December 31, 2012.
(c) Class Y shares reflect activity for the period from November 8, 2012 (commencement of operations) through December 31, 2012.
(d) Class Y shares reflect activity for the period from June 13, 2013 (commencement of operations) through December 31, 2013.
See accompanying notes to financial statements.
100
| | | Columbia
Acorn Select | | Columbia
Thermostat Fund | | Columbia Acorn
Emerging Markets Fund | | Columbia Acorn
European Fund | |
Increase (Decrease) in Net Assets | | Year ended December 31, | | Year ended December 31, | | Year ended December 31, | | Year ended December 31, | |
| | | 2013 | | 2012 (a)(b)(c) | | 2013 | | 2012 (a)(b)(c) | | 2013 (d) | | 2012 (a)(b) | | 2013 | | 2012 (b) | |
Subscriptions – Class R4 | | | 1,409,186 | | | | 15,000 | | | | 16,841,816 | | | | 15,000 | | | | 13,932,169 | | | | 15,000 | | | | — | | | | — | | |
Distributions reinvested – Class R4 | | | 142,707 | | | | — | | | | 1,010,634 | | | | — | | | | 121,336 | | | | — | | | | — | | | | — | | |
Redemptions – Class R4 | | | (144,546 | ) | | | — | | | | (2,678,147 | ) | | | — | | | | (1,223,601 | ) | | | — | | | | — | | | | — | | |
Net Increase – Class R4 | | | 1,407,347 | | | | 15,000 | | | | 15,174,303 | | | | 15,000 | | | | 12,829,904 | | | | 15,000 | | | | — | | | | — | | |
Subscriptions – Class R5 | | | 10,681,076 | | | | 2,500 | | | | 1,172,670 | | | | 2,500 | | | | 13,005,283 | | | | 2,500 | | | | 1,696,121 | | | | 2,500 | | |
Distributions reinvested – Class R5 | | | 2,032,665 | | | | — | | | | 62,995 | | | | — | | | | 121,213 | | | | — | | | | 7,648 | | | | — | | |
Redemptions – Class R5 | | | (532,781 | ) | | | — | | | | (221,359 | ) | | | — | | | | (155,394 | ) | | | — | | | | (51,126 | ) | | | — | | |
Net Increase (Decrease) – Class R5 | | | 12,180,960 | | | | 2,500 | | | | 1,014,306 | | | | 2,500 | | | | 12,971,102 | | | | 2,500 | | | | 1,652,643 | | | | 2,500 | | |
Subscriptions – Class Y | | | 4,652,097 | | | | 2,500 | | | | — | | | | 2,500 | | | | 2,500 | | | | — | | | | — | | | | — | | |
Distributions reinvested – Class Y | | | 819,220 | | | | — | | | | — | | | | — | | | | — | | | | — | | | | — | | | | — | | |
Redemptions – Class Y | | | (557,993 | ) | | | — | | | | — | | | | — | | | | — | | | | — | | | | — | | | | — | | |
Net Increase – Class Y | | | 4,913,324 | | | | 2,500 | | | | — | | | | 2,500 | | | | 2,500 | | | | — | | | | — | | | | — | | |
Subscriptions – Class Z | | | 46,215,005 | | | | 92,416,113 | | | | 241,074,077 | | | | 280,471,623 | | | | 173,769,882 | | | | 3,279,578 | | | | 1,188,594 | | | | 774,240 | | |
Distributions reinvested – Class Z | | | 71,082,424 | | | | 40,196,957 | | | | 15,861,661 | | | | 3,443,888 | | | | 1,254,500 | | | | 58,786 | | | | 19,797 | | | | 20,822 | | |
Redemptions – Class Z | | | (311,970,231 | ) | | | (476,230,534 | ) | | | (180,321,598 | ) | | | (69,222,297 | ) | | | (14,317,387 | ) | | | (392,871 | ) | | | (502,271 | ) | | | (7,954 | ) | |
Net Increase (Decrease) – Class Z | | | (194,672,802 | ) | | | (343,617,464 | ) | | | 76,614,140 | | | | 214,693,214 | | | | 160,706,995 | | | | 2,945,493 | | | | 706,120 | | | | 787,108 | | |
Net Increase (Decrease) from Share Transactions | | | (165,514,942 | ) | | | (442,619,387 | ) | | | 450,582,570 | | | | 647,073,778 | | | | 381,319,156 | | | | 5,861,819 | | | | 20,117,072 | | | | 1,119,328 | | |
Increase from regulatory settlements (Note 7) | | | — | | | | — | | | | — | | | | — | | | | — | | | | — | | | | — | | | | — | | |
Total Increase (Decrease) in Net Assets | | | (104,083,371 | ) | | | (324,993,973 | ) | | | 462,182,440 | | | | 685,016,109 | | | | 404,114,843 | | | | 7,361,045 | | | | 23,506,490 | | | | 1,598,900 | | |
Net Assets: | |
Beginning of period | | | 965,626,914 | | | | 1,290,620,887 | | | | 874,622,697 | | | | 189,606,588 | | | | 10,589,811 | | | | 3,228,766 | | | | 3,278,035 | | | | 1,679,135 | | |
End of period | | $ | 861,543,543 | | | $ | 965,626,914 | | | $ | 1,336,805,137 | | | $ | 874,622,697 | | | $ | 414,704,654 | | | $ | 10,589,811 | | | $ | 26,784,525 | | | $ | 3,278,035 | | |
Undistributed (Overdistributed) net investment income (loss) | | $ | (450,627 | ) | | $ | 2,866,367 | | | $ | 720,757 | | | $ | 650,727 | | | $ | (1,371,231 | ) | | $ | (17,167 | ) | | $ | (26,208 | ) | | $ | (8,259 | ) | |
See accompanying notes to financial statements.
101
Columbia Acorn Family of Funds
Statements of Changes in Net Assets, continued
| | | Columbia
Acorn Fund | | Columbia Acorn
International | | Columbia
Acorn USA | | Columbia Acorn
International Select | |
Changes in Shares of Beneficial Interest: | | Year ended December 31, | | Year ended December 31, | | Year ended December 31, | | Year ended December 31, | |
| | | 2013 | | 2012 (a)(b)(c) | | 2013 | | 2012 (a)(b)(c) | | 2013 | | 2012 (a)(b)(c) | | 2013 | | 2012 (a)(b)(c) | |
Subscriptions – Class A | | | 16,772,784 | | | | 17,231,624 | | | | 8,721,860 | | | | 5,036,565 | | | | 1,394,169 | | | | 809,060 | | | | 953,061 | | | | 1,023,664 | | |
Shares issued in reinvestment and capital gains – Class A | | | 6,939,430 | | | | 6,767,946 | | | | 1,475,191 | | | | 349,670 | | | | 468,483 | | | | 419,501 | | | | 233,959 | | | | 374,787 | | |
Less shares redeemed – Class A | | | (25,665,267 | ) | | | (35,802,801 | ) | | | (11,526,833 | ) | | | (7,580,692 | ) | | | (1,355,276 | ) | | | (2,274,459 | ) | | | (1,336,213 | ) | | | (825,702 | ) | |
Net Increase (Decrease) – Class A | | | (1,953,053 | ) | | | (11,803,231 | ) | | | (1,329,782 | ) | | | (2,194,457 | ) | | | 507,376 | | | | (1,045,898 | ) | | | (149,193 | ) | | | 572,749 | | |
Shares issued in reinvestment and capital gains – Class B | | | 48,181 | | | | 95,443 | | | | 18,918 | | | | 2,774 | | | | 1,984 | | | | 4,518 | | | | 2,974 | | | | 7,046 | | |
Less shares redeemed – Class B | | | (705,007 | ) | | | (1,578,470 | ) | | | (178,171 | ) | | | (290,213 | ) | | | (24,425 | ) | | | (57,586 | ) | | | (20,013 | ) | | | (32,062 | ) | |
Net Increase (Decrease) – Class B | | | (656,826 | ) | | | (1,483,027 | ) | | | (159,253 | ) | | | (287,439 | ) | | | (22,441 | ) | | | (53,068 | ) | | | (17,039 | ) | | | (25,016 | ) | |
Subscriptions – Class C | | | 3,426,567 | | | | 2,852,549 | | | | 425,390 | | | | 259,798 | | | | 128,459 | | | | 72,817 | | | | 88,935 | | | | 71,372 | | |
Shares issued in reinvestment and capital gains – Class C | | | 1,792,288 | | | | 1,604,270 | | | | 124,854 | | | | 11,902 | | | | 118,609 | | | | 101,628 | | | | 29,744 | | | | 49,061 | | |
Less shares redeemed – Class C | | | (4,279,659 | ) | | | (5,562,067 | ) | | | (436,255 | ) | | | (870,089 | ) | | | (147,379 | ) | | | (231,588 | ) | | | (115,611 | ) | | | (93,117 | ) | |
Net Increase (Decrease) – Class C | | | 939,196 | | | | (1,105,248 | ) | | | 113,989 | | | | (598,389 | ) | | | 99,689 | | | | (57,143 | ) | | | 3,068 | | | | 27,316 | | |
Subscriptions – Class I | | | 1,885,590 | | | | 2,226,501 | | | | 2,038,998 | | | | 2,338,136 | | | | — | | | | 69,785 | | | | — | | | | — | | |
Shares issued in reinvestment and capital gains – Class I | | | 43,283 | | | | 119,925 | | | | 53,236 | | | | 50,947 | | | | — | | | | 42 | | | | — | | | | — | | |
Less shares redeemed – Class I | | | (3,308,111 | ) | | | (1,016,424 | ) | | | (3,848,404 | ) | | | (1,469,126 | ) | | | — | | | | (167,312 | ) | | | — | | | | — | | |
Net Increase (Decrease) – Class I | | | (1,379,238 | ) | | | 1,330,002 | | | | (1,756,170 | ) | | | 919,957 | | | | — | | | | (97,485 | ) | | | — | | | | — | | |
Subscriptions – Class R | | | — | | | | — | | | | 81,299 | | | | 123,992 | | | | — | | | | — | | | | — | | | | — | | |
Shares issued in reinvestment and capital gains – Class R | | | — | | | | — | | | | 6,268 | | | | 521 | | | | — | | | | — | | | | — | | | | — | | |
Less shares redeemed – Class R | | | — | | | | — | | | | (31,263 | ) | | | (118,346 | ) | | | — | | | | — | | | | — | | | | — | | |
Net Increase – Class R | | | — | | | | — | | | | 56,304 | | | | 6,167 | | | | — | | | | — | | | | — | | | | — | | |
Subscriptions – Class R4 | | | 1,998,028 | | | | 553 | | | | 7,323,105 | | | | 376 | | | | 173,989 | | | | 499 | | | | 13,801 | | | | 500 | | |
Shares issued in reinvestment and capital gains – Class R4 | | | 100,520 | | | | — | | | | 408,790 | | | | — | | | | 13,409 | | | | — | | | | 962 | | | | — | | |
Less shares redeemed – Class R4 | | | (140,805 | ) | | | — | | | | (163,652 | ) | | | — | | | | (11,660 | ) | | | — | | | | (6 | ) | | | — | | |
Net Increase – Class R4 | | | 1,957,743 | | | | 553 | | | | 7,568,243 | | | | 376 | | | | 175,738 | | | | 499 | | | | 14,757 | | | | 500 | | |
Subscriptions – Class R5 | | | 13,752,426 | | | | 82 | | | | 6,528,156 | | | | 8 | | | | 167,928 | | | | 83 | | | | 35,393 | | | | 83 | | |
Shares issued in reinvestment and capital gains – Class R5 | | | 680,831 | | | | — | | | | 385,664 | | | | 145 | | | | 13,045 | | | | — | | | | 2,472 | | | | — | | |
Less shares redeemed – Class R5 | | | (1,319,787 | ) | | | — | | | | (1,038,451 | ) | | | (53,601 | ) | | | (14,967 | ) | | | — | | | | (2,971 | ) | | | — | | |
Net Increase (Decrease) – Class R5 | | | 13,113,470 | | | | 82 | | | | 5,875,369 | | | | (53,448 | ) | | | 166,006 | | | | 83 | | | | 34,894 | | | | 83 | | |
Subscriptions – Class Y | | | 30,418,210 | | | | 2,148,017 | | | | 3,692,396 | | | | 750,647 | | | | 1,250,341 | | | | 83 | | | | 470,106 | | | | 83 | | |
Shares issued in reinvestment and capital gains – Class Y | | | 1,921,971 | | | | 31,278 | | | | 187,806 | | | | 476 | | | | 83,147 | | | | — | | | | 29,869 | | | | — | | |
Less shares redeemed – Class Y | | | (2,138,695 | ) | | | (10,692 | ) | | | (1,329,828 | ) | | | — | | | | (8,744 | ) | | | — | | | | (12,731 | ) | | | — | | |
Net Increase – Class Y | | | 30,201,486 | | | | 2,168,603 | | | | 2,550,374 | | | | 751,123 | | | | 1,324,744 | | | | 83 | | | | 487,244 | | | | 83 | | |
Subscriptions – Class Z | | | 39,991,834 | | | | 55,847,077 | | | | 21,587,060 | | | | 30,630,548 | | | | 5,769,866 | | | | 7,413,473 | | | | 2,139,566 | | | | 3,087,336 | | |
Shares issued in reinvestment and capital gains – Class Z | | | 22,754,352 | | | | 24,884,327 | | | | 7,096,454 | | | | 2,218,261 | | | | 3,036,499 | | | | 3,580,586 | | | | 484,755 | | | | 838,401 | | |
Less shares redeemed – Class Z | | | (107,868,830 | ) | | | (87,379,864 | ) | | | (28,414,984 | ) | | | (24,297,024 | ) | | | (15,174,383 | ) | | | (13,185,688 | ) | | | (4,625,116 | ) | | | (3,121,838 | ) | |
Net Increase (Decrease) – Class Z | | | (45,122,644 | ) | | | (6,648,460 | ) | | | 268,530 | | | | 8,551,785 | | | | (6,368,018 | ) | | | (2,191,629 | ) | | | (2,000,795 | ) | | | 803,899 | | |
Net Increase (Decrease) in Shares of Beneficial Interest | | | (2,899,866 | ) | | | (17,540,726 | ) | | | 13,187,604 | | | | 7,095,675 | | | | (4,116,906 | ) | | | (3,444,558 | ) | | | (1,627,064 | ) | | | 1,379,614 | | |
(a) Class R4 shares reflect activity for the period from November 8, 2012 (commencement of operations) through December 31, 2012.
(b) Class R5 shares reflect activity for the period from November 8, 2012 (commencement of operations) through December 31, 2012.
(c) Class Y shares reflect activity for the period from November 8, 2012 (commencement of operations) through December 31, 2012.
(d) Class Y shares reflect activity for the period from June 13, 2013 (commencement of operations) through December 31, 2013.
See accompanying notes to financial statements.
102
| | | Columbia
Acorn Select | | Columbia
Thermostat Fund | | Columbia Acorn
Emerging Markets Fund | | Columbia Acorn
European Fund | |
Changes in Shares of Beneficial Interest: | | Year ended December 31, | | Year ended December 31, | | Year ended December 31, | | Year ended December 31, | |
| | | 2013 | | 2012 (a)(b)(c) | | 2013 | | 2012 (a)(b)(c) | | 2013 (d) | | 2012 (a)(b) | | 2013 | | 2012 (b) | |
Subscriptions – Class A | | | 2,409,551 | | | | 1,572,755 | | | | 17,981,201 | | | | 19,574,784 | | | | 14,185,095 | | | | 242,160 | | | | 1,389,036 | | | | 26,410 | | |
Shares issued in reinvestment and capital gains – Class A | | | 2,880,725 | | | | 878,414 | | | | 2,106,160 | | | | 319,205 | | | | 75,048 | | | | 1,308 | | | | 2,142 | | | | 152 | | |
Less shares redeemed – Class A | | | (3,250,484 | ) | | | (6,287,849 | ) | | | (7,527,423 | ) | | | (3,461,158 | ) | | | (1,269,880 | ) | | | (21,619 | ) | | | (212,961 | ) | | | (4,331 | ) | |
Net Increase (Decrease) – Class A | | | 2,039,792 | | | | (3,836,680 | ) | | | 12,559,938 | | | | 16,432,831 | | | | 12,990,263 | | | | 221,849 | | | | 1,178,217 | | | | 22,231 | | |
Shares issued in reinvestment and capital gains – Class B | | | 38,348 | | | | 46,775 | | | | 9,173 | | | | 3,716 | | | | — | | | | — | | | | — | | | | — | | |
Less shares redeemed – Class B | | | (346,271 | ) | | | (830,866 | ) | | | (166,345 | ) | | | (568,981 | ) | | | — | | | | — | | | | — | | | | — | | |
Net Increase (Decrease) – Class B | | | (307,923 | ) | | | (784,091 | ) | | | (157,172 | ) | | | (565,265 | ) | | | — | | | | — | | | | — | | | | — | | |
Subscriptions – Class C | | | 184,785 | | | | 130,998 | | | | 14,371,325 | | | | 15,757,125 | | | | 2,457,588 | | | | 43,007 | | | | 86,894 | | | | 9,113 | | |
Shares issued in reinvestment and capital gains – Class C | | | 583,469 | | | | 185,145 | | | | 1,285,939 | | | | 104,556 | | | | — | | | | — | | | | 80 | | | | 3 | | |
Less shares redeemed – Class C | | | (577,080 | ) | | | (733,680 | ) | | | (3,977,289 | ) | | | (818,151 | ) | | | (58,728 | ) | | | (5,549 | ) | | | (4,470 | ) | | | (2,036 | ) | |
Net Increase (Decrease) – Class C | | | 191,174 | | | | (417,537 | ) | | | 11,679,975 | | | | 15,043,530 | | | | 2,398,860 | | | | 37,458 | | | | 82,504 | | | | 7,080 | | |
Subscriptions – Class I | | | 1,503,059 | | | | 1,751,104 | | | | — | | | | — | | | | — | | | | — | | | | — | | | | — | | |
Shares issued in reinvestment and capital gains – Class I | | | 141,436 | | | | 108,517 | | | | — | | | | — | | | | 5 | | | | 5 | | | | 3 | | | | 4 | | |
Less shares redeemed – Class I | | | (2,658,803 | ) | | | (798,545 | ) | | | — | | | | — | | | | — | | | | — | | | | — | | | | — | | |
Net Increase (Decrease) – Class I | | | (1,014,308 | ) | | | 1,061,076 | | | | — | | | | — | | | | 5 | | | | 5 | | | | 3 | | | | 4 | | |
Subscriptions – Class R | | | — | | | | — | | | | — | | | | — | | | | — | | | | — | | | | — | | | | — | | |
Shares issued in reinvestment and capital gains – Class R | | | — | | | | — | | | | — | | | | — | | | | — | | | | — | | | | — | | | | — | | |
Less shares redeemed – Class R | | | — | | | | — | | | | — | | | | — | | | | — | | | | — | | | | — | | | | — | | |
Net Increase – Class R | | | — | | | | — | | | | — | | | | — | | | | — | | | | — | | | | — | | | | — | | |
Subscriptions – Class R4 | | | 49,613 | | | | 579 | | | | 1,120,984 | | | | 1,065 | | | | 1,090,642 | | | | 1,311 | | | | — | | | | — | | |
Shares issued in reinvestment and capital gains – Class R4 | | | 5,524 | | | | — | | | | 69,981 | | | | — | | | | 9,227 | | | | — | | | | — | | | | — | | |
Less shares redeemed – Class R4 | | | (4,872 | ) | | | — | | | | (179,054 | ) | | | — | | | | (93,939 | ) | | | — | | | | — | | | | — | | |
Net Increase – Class R4 | | | 50,265 | | | | 579 | | | | 1,011,911 | | | | 1,065 | | | | 1,005,930 | | | | 1,311 | | | | — | | | | — | | |
Subscriptions – Class R5 | | | 381,566 | | | | 96 | | | | 77,722 | | | | 178 | | | | 1,013,748 | | | | 219 | | | | 122,328 | | | | 223 | | |
Shares issued in reinvestment and capital gains – Class R5 | | | 78,762 | | | | — | | | | 4,359 | | | | — | | | | 9,225 | | | | — | | | | 511 | | | | — | | |
Less shares redeemed – Class R5 | | | (19,370 | ) | | | — | | | | (14,647 | ) | | | — | | | | (12,077 | ) | | | — | | | | (3,541 | ) | | | — | | |
Net Increase (Decrease) – Class R5 | | | 440,958 | | | | 96 | | | | 67,434 | | | | 178 | | | | 1,010,896 | | | | 219 | | | | 119,298 | | | | 223 | | |
Subscriptions – Class Y | | | 164,585 | | | | 96 | | | | — | | | | 178 | | | | 205 | | | | — | | | | — | | | | — | | |
Shares issued in reinvestment and capital gains – Class Y | | | 31,675 | | | | — | | | | — | | | | — | | | | — | | | | — | | | | — | | | | — | | |
Less shares redeemed – Class Y | | | (18,601 | ) | | | — | | | | — | | | | — | | | | — | | | | — | | | | — | | | | — | | |
Net Increase – Class Y | | | 177,659 | | | | 96 | | | | — | | | | 178 | | | | 205 | | | | — | | | | — | | | | — | | |
Subscriptions – Class Z | | | 1,677,809 | | | | 3,534,761 | | | | 16,316,167 | | | | 20,385,294 | | | | 13,732,748 | | | | 299,290 | | | | 85,515 | | | | 70,205 | | |
Shares issued in reinvestment and capital gains – Class Z | | | 2,759,330 | | | | 1,598,571 | | | | 1,102,717 | | | | 244,437 | | | | 96,057 | | | | 5,008 | | | | 1,334 | | | | 1,859 | | |
Less shares redeemed – Class Z | | | (11,254,870 | ) | | | (18,152,892 | ) | | | (12,064,146 | ) | | | (5,049,709 | ) | | | (1,131,598 | ) | | | (34,993 | ) | | | (37,709 | ) | | | (754 | ) | |
Net Increase (Decrease) – Class Z | | | (6,817,731 | ) | | | (13,019,560 | ) | | | 5,354,738 | | | | 15,580,022 | | | | 12,697,207 | | | | 269,305 | | | | 49,140 | | | | 71,310 | | |
Net Increase (Decrease) in Shares of Beneficial Interest | | | (5,240,114 | ) | | | (16,996,021 | ) | | | 30,516,824 | | | | 46,492,539 | | | | 30,103,366 | | | | 530,147 | | | | 1,429,162 | | | | 100,848 | | |
See accompanying notes to financial statements.
103
Columbia Acorn Family of Funds
Financial Highlights
The following tables are intended to help you understand the Fund's financial performance. Certain information reflects financial results for a single share of a class held for the periods shown. Per share net investment income (loss) amounts are calculated based on average shares outstanding during the period. Total return assumes reinvestment of all dividends and distributions, if any. Total return does not reflect payment of sales charges, if any. Total return and portfolio turnover are not annualized for periods of less than one year.
Columbia Acorn Fund
| | | | | Income from Investment Operations | | | | Less Distributions to Shareholders | | | | | |
(Selected data for a share outstanding
throughout each period) | | Net Asset
Value,
Beginning of
Period | | Net
investment
income (loss) | | Net realized
and
unrealized
gain (loss) | | Total from
investment
operations | | Net
investment
income | | Net
realized gains | | Total
Distributions to
Shareholders | | Increase from
regulatory
settlements | |
Class A | |
Year Ended December 31, 2013 | | $ | 29.36 | | | | (0.06 | ) | | | 8.84 | | | | 8.78 | | | | (0.04 | ) | | | (2.32 | ) | | | (2.36 | ) | | | — | | |
Year Ended December 31, 2012 | | $ | 26.63 | | | | 0.08 | | | | 4.53 | | | | 4.61 | | | | (0.06 | ) | | | (1.82 | ) | | | (1.88 | ) | | | — | | |
Year Ended December 31, 2011 | | $ | 29.24 | | | | (0.10 | ) | | | (1.30 | ) | | | (1.40 | ) | | | (0.02 | ) | | | (1.19 | ) | | | (1.21 | ) | | | — | | |
Year Ended December 31, 2010 | | $ | 23.98 | | | | (0.06 | ) | | | 6.18 | | | | 6.12 | | | | (0.02 | ) | | | (0.84 | ) | | | (0.86 | ) | | | 0.00 | (c) | |
Year Ended December 31, 2009 | | $ | 17.22 | | | | (0.02 | ) | | | 6.78 | | | | 6.76 | | | | — | | | | — | | | | — | | | | 0.00 | (c) | |
Class B | |
Year Ended December 31, 2013 | | $ | 26.80 | | | | (0.25 | ) | | | 8.02 | | | | 7.77 | | | | — | | | | (2.32 | ) | | | (2.32 | ) | | | — | | |
Year Ended December 31, 2012 | | $ | 24.53 | | | | (0.11 | ) | | | 4.20 | | | | 4.09 | | | | — | | | | (1.82 | ) | | | (1.82 | ) | | | — | | |
Year Ended December 31, 2011 | | $ | 27.14 | | | | (0.27 | ) | | | (1.15 | ) | | | (1.42 | ) | | | — | | | | (1.19 | ) | | | (1.19 | ) | | | — | | |
Year Ended December 31, 2010 | | $ | 22.43 | | | | (0.21 | ) | | | 5.76 | | | | 5.55 | | | | — | | | | (0.84 | ) | | | (0.84 | ) | | | 0.00 | (c) | |
Year Ended December 31, 2009 | | $ | 16.21 | | | | (0.14 | ) | | | 6.36 | | | | 6.22 | | | | — | | | | — | | | | — | | | | 0.00 | (c) | |
Class C | |
Year Ended December 31, 2013 | | $ | 26.34 | | | | (0.26 | ) | | | 7.88 | | | | 7.62 | | | | — | | | | (2.32 | ) | | | (2.32 | ) | | | — | | |
Year Ended December 31, 2012 | | $ | 24.18 | | | | (0.12 | ) | | | 4.10 | | | | 3.98 | | | | — | | | | (1.82 | ) | | | (1.82 | ) | | | — | | |
Year Ended December 31, 2011 | | $ | 26.85 | | | | (0.29 | ) | | | (1.19 | ) | | | (1.48 | ) | | | — | | | | (1.19 | ) | | | (1.19 | ) | | | — | | |
Year Ended December 31, 2010 | | $ | 22.23 | | | | (0.24 | ) | | | 5.70 | | | | 5.46 | | | | — | | | | (0.84 | ) | | | (0.84 | ) | | | 0.00 | (c) | |
Year Ended December 31, 2009 | | $ | 16.09 | | | | (0.17 | ) | | | 6.31 | | | | 6.14 | | | | — | | | | — | | | | — | | | | 0.00 | (c) | |
Class I | |
Year Ended December 31, 2013 | | $ | 30.47 | | | | 0.06 | | | | 9.20 | | | | 9.26 | | | | (0.04 | ) | | | (2.32 | ) | | | (2.36 | ) | | | — | | |
Year Ended December 31, 2012 | | $ | 27.57 | | | | 0.26 | | | | 4.62 | | | | 4.88 | | | | (0.16 | ) | | | (1.82 | ) | | | (1.98 | ) | | | — | | |
Year Ended December 31, 2011 | | $ | 30.19 | | | | 0.01 | | | | (1.35 | ) | | | (1.34 | ) | | | (0.09 | ) | | | (1.19 | ) | | | (1.28 | ) | | | — | | |
Year Ended December 31, 2010 (d) | | $ | 26.80 | | | | (0.01 | ) | | | 4.26 | | | | 4.25 | | | | (0.02 | ) | | | (0.84 | ) | | | (0.86 | ) | | | — | | |
Class R4 | |
Year Ended December 31, 2013 | | $ | 30.90 | | | | 0.06 | | | | 9.29 | | | | 9.35 | | | | (0.05 | ) | | | (2.32 | ) | | | (2.37 | ) | | | — | | |
Year Ended December 31, 2012 (f) | | $ | 30.59 | | | | 0.05 | | | | 1.84 | | | | 1.89 | | | | (0.12 | ) | | | (1.46 | ) | | | (1.58 | ) | | | — | | |
Class R5 | |
Year Ended December 31, 2013 | | $ | 30.88 | | | | 0.07 | | | | 9.30 | | | | 9.37 | | | | (0.04 | ) | | | (2.32 | ) | | | (2.36 | ) | | | — | | |
Year Ended December 31, 2012 (g) | | $ | 30.59 | | | | 0.06 | | | | 1.83 | | | | 1.89 | | | | (0.14 | ) | | | (1.46 | ) | | | (1.60 | ) | | | — | | |
Class Y | |
Year Ended December 31, 2013 | | $ | 30.90 | | | | 0.09 | | | | 9.31 | | | | 9.40 | | | | (0.05 | ) | | | (2.32 | ) | | | (2.37 | ) | | | — | | |
Year Ended December 31, 2012 (h) | | $ | 30.62 | | | | 0.09 | | | | 1.80 | | | | 1.89 | | | | (0.15 | ) | | | (1.46 | ) | | | (1.61 | ) | | | — | | |
Class Z | |
Year Ended December 31, 2013 | | $ | 30.45 | | | | 0.04 | | | | 9.19 | | | | 9.23 | | | | (0.04 | ) | | | (2.32 | ) | | | (2.36 | ) | | | — | | |
Year Ended December 31, 2012 | | $ | 27.56 | | | | 0.17 | | | | 4.69 | | | | 4.86 | | | | (0.15 | ) | | | (1.82 | ) | | | (1.97 | ) | | | — | | |
Year Ended December 31, 2011 | | $ | 30.19 | | | | (0.01 | ) | | | (1.34 | ) | | | (1.35 | ) | | | (0.09 | ) | | | (1.19 | ) | | | (1.28 | ) | | | — | | |
Year Ended December 31, 2010 | | $ | 24.68 | | | | 0.02 | | | | 6.37 | | | | 6.39 | | | | (0.04 | ) | | | (0.84 | ) | | | (0.88 | ) | | | 0.00 | (c) | |
Year Ended December 31, 2009 | | $ | 17.71 | | | | 0.04 | | | | 6.98 | | | | 7.02 | | | | (0.05 | ) | | | — | | | | (0.05 | ) | | | 0.00 | (c) | |
(a) In addition to the fees and expenses which the Fund bears directly, the Fund indirectly bears a pro rata share of the fees and expenses of the acquired funds in which it invests, if any. Such indirect expenses are not included in the reported expense ratios.
(b) The benefits derived from custody fees paid indirectly had an impact of less than 0.01%.
(c) Rounds to zero.
(d) Class I shares commenced operations on September 27, 2010. Per share data and total return reflect activity from that date.
(e) Annualized.
(f) Class R4 shares commenced operations on November 8, 2012. Per share data and total return reflect activity from that date.
(g) Class R5 shares commenced operations on November 8, 2012. Per share data and total return reflect activity from that date.
(h) Class Y shares commenced operations on November 8, 2012. Per share data and total return reflect activity from that date.
See accompanying notes to financial statements.
104
| | | | | | | Ratio to Average Net Assets | | Supplemental Data | |
(Selected data for a share outstanding
throughout each period) | | Net Asset
Value, End of
Period | | Total Return | | Total gross
expenses
(a) | | Total net
expenses
(a) | | Net
investment
income (loss) | | Portfolio
turnover rate | | Net assets,
end of period
(000s) | |
Class A | |
Year Ended December 31, 2013 | | $ | 35.78 | | | | 30.53 | % | | | 1.07 | % | | | 1.07 | % | | | (0.17 | )% | | | 18 | % | | $ | 3,869,734 | | |
Year Ended December 31, 2012 | | $ | 29.36 | | | | 17.62 | % | | | 1.06 | % | | | 1.06 | %(b) | | | 0.27 | % | | | 16 | % | | $ | 3,233,494 | | |
Year Ended December 31, 2011 | | $ | 26.63 | | | | (4.91 | )% | | | 1.06 | % | | | 1.06 | %(b) | | | (0.33 | )% | | | 18 | % | | $ | 3,246,833 | | |
Year Ended December 31, 2010 | | $ | 29.24 | | | | 25.61 | % | | | 1.07 | % | | | 1.07 | %(b) | | | (0.22 | )% | | | 28 | % | | $ | 3,639,788 | | |
Year Ended December 31, 2009 | | $ | 23.98 | | | | 39.26 | % | | | 1.07 | % | | | 1.07 | %(b) | | | (0.12 | )% | | | 27 | % | | $ | 2,937,761 | | |
Class B | |
Year Ended December 31, 2013 | | $ | 32.25 | | | | 29.63 | % | | | 1.73 | % | | | 1.73 | % | | | (0.84 | )% | | | 18 | % | | $ | 19,278 | | |
Year Ended December 31, 2012 | | $ | 26.80 | | | | 16.98 | % | | | 1.65 | % | | | 1.64 | %(b) | | | (0.42 | )% | | | 16 | % | | $ | 33,623 | | |
Year Ended December 31, 2011 | | $ | 24.53 | | | | (5.34 | )% | | | 1.67 | % | | | 1.67 | %(b) | | | (0.98 | )% | | | 18 | % | | $ | 67,153 | | |
Year Ended December 31, 2010 | | $ | 27.14 | | | | 24.81 | % | | | 1.69 | % | | | 1.69 | %(b) | | | (0.88 | )% | | | 28 | % | | $ | 287,650 | | |
Year Ended December 31, 2009 | | $ | 22.43 | | | | 38.37 | % | | | 1.74 | % | | | 1.74 | %(b) | | | (0.77 | )% | | | 27 | % | | $ | 525,072 | | |
Class C | |
Year Ended December 31, 2013 | | $ | 31.64 | | | | 29.58 | % | | | 1.78 | % | | | 1.78 | % | | | (0.88 | )% | | | 18 | % | | $ | 938,644 | | |
Year Ended December 31, 2012 | | $ | 26.34 | | | | 16.77 | % | | | 1.80 | % | | | 1.80 | %(b) | | | (0.46 | )% | | | 16 | % | | $ | 756,709 | | |
Year Ended December 31, 2011 | | $ | 24.18 | | | | (5.63 | )% | | | 1.82 | % | | | 1.82 | %(b) | | | (1.10 | )% | | | 18 | % | | $ | 721,446 | | |
Year Ended December 31, 2010 | | $ | 26.85 | | | | 24.63 | % | | | 1.85 | % | | | 1.85 | %(b) | | | (1.00 | )% | | | 28 | % | | $ | 829,181 | | |
Year Ended December 31, 2009 | | $ | 22.23 | | | | 38.16 | % | | | 1.89 | % | | | 1.89 | %(b) | | | (0.93 | )% | | | 27 | % | | $ | 736,818 | | |
Class I | |
Year Ended December 31, 2013 | | $ | 37.37 | | | | 30.99 | % | | | 0.70 | % | | | 0.70 | % | | | 0.16 | % | | | 18 | % | | $ | 20,383 | | |
Year Ended December 31, 2012 | | $ | 30.47 | | | | 18.02 | % | | | 0.72 | % | | | 0.72 | %(b) | | | 0.86 | % | | | 16 | % | | $ | 58,652 | | |
Year Ended December 31, 2011 | | $ | 27.57 | | | | (4.57 | )% | | | 0.72 | % | | | 0.72 | %(b) | | | 0.02 | % | | | 18 | % | | $ | 16,397 | | |
Year Ended December 31, 2010 (d) | | $ | 30.19 | | | | 15.94 | % | | | 0.71 | %(e) | | | 0.71 | %(b)(e) | | | (0.13 | )%(e) | | | 28 | % | | $ | 11,627 | | |
Class R4 | |
Year Ended December 31, 2013 | | $ | 37.88 | | | | 30.85 | % | | | 0.80 | % | | | 0.80 | % | | | 0.16 | % | | | 18 | % | | $ | 74,188 | | |
Year Ended December 31, 2012 (f) | | $ | 30.90 | | | | 6.31 | % | | | 0.87 | %(e) | | | 0.86 | %(b)(e) | | | 1.24 | %(e) | | | 16 | % | | $ | 17 | | |
Class R5 | |
Year Ended December 31, 2013 | | $ | 37.89 | | | | 30.94 | % | | | 0.75 | % | | | 0.75 | % | | | 0.20 | % | | | 18 | % | | $ | 496,906 | | |
Year Ended December 31, 2012 (g) | | $ | 30.88 | | | | 6.33 | % | | | 0.82 | %(e) | | | 0.81 | %(b)(e) | | | 1.29 | %(e) | | | 16 | % | | $ | 3 | | |
Class Y | |
Year Ended December 31, 2013 | | $ | 37.93 | | | | 30.99 | % | | | 0.70 | % | | | 0.70 | % | | | 0.26 | % | | | 18 | % | | $ | 1,227,891 | | |
Year Ended December 31, 2012 (h) | | $ | 30.90 | | | | 6.34 | % | | | 0.75 | %(e) | | | 0.75 | %(b)(e) | | | 2.21 | %(e) | | | 16 | % | | $ | 67,012 | | |
Class Z | |
Year Ended December 31, 2013 | | $ | 37.32 | | | | 30.90 | % | | | 0.78 | % | | | 0.78 | % | | | 0.12 | % | | | 18 | % | | $ | 14,703,948 | | |
Year Ended December 31, 2012 | | $ | 30.45 | | | | 17.93 | % | | | 0.78 | % | | | 0.78 | %(b) | | | 0.57 | % | | | 16 | % | | $ | 13,374,355 | | |
Year Ended December 31, 2011 | | $ | 27.56 | | | | (4.61 | )% | | | 0.76 | % | | | 0.76 | %(b) | | | (0.03 | )% | | | 18 | % | | $ | 12,284,748 | | |
Year Ended December 31, 2010 | | $ | 30.19 | | | | 26.00 | % | | | 0.76 | % | | | 0.76 | %(b) | | | 0.09 | % | | | 28 | % | | $ | 13,330,466 | | |
Year Ended December 31, 2009 | | $ | 24.68 | | | | 39.65 | % | | | 0.77 | % | | | 0.77 | %(b) | | | 0.18 | % | | | 27 | % | | $ | 10,527,500 | | |
See accompanying notes to financial statements.
105
Columbia Acorn Family of Funds
Financial Highlights, continued
Columbia Acorn International
| | | | | Income from Investment Operations | | | | Less Distributions to Shareholders | | | | | |
(Selected data for a share outstanding
throughout each period) | | Net Asset
Value,
Beginning of
Period | | Net
investment
income (loss) | | Net realized
and
unrealized
gain (loss) | | Reimbursement
from
affiliate | | Total from
investment
operations | | Net
investment
income | | Net
realized gains | | Total
Distributions to
Shareholders | | Redemption
fees added
to paid in
capital | |
Class A | |
Year Ended December 31, 2013 | | $ | 40.79 | | | | 0.45 | | | | 8.37 | | | | — | | | | 8.82 | | | | (1.05 | ) | | | (1.93 | ) | | | (2.98 | ) | | | — | | |
Year Ended December 31, 2012 | | $ | 34.15 | | | | 0.47 | | | | 6.75 | | | | — | | | | 7.22 | | | | (0.58 | ) | | | — | | | | (0.58 | ) | | | — | | |
Year Ended December 31, 2011 | | $ | 40.87 | | | | 0.32 | | | | (6.02 | ) | | | 0.00 | (c) | | | (5.70 | ) | | | (1.02 | ) | | | — | | | | (1.02 | ) | | | — | | |
Year Ended December 31, 2010 | | $ | 34.13 | | | | 0.22 | | | | 7.21 | | | | — | | | | 7.43 | | | | (0.69 | ) | | | — | | | | (0.69 | ) | | | 0.00 | (c) | |
Year Ended December 31, 2009 | | $ | 23.03 | | | | 0.23 | | | | 11.27 | | | | — | | | | 11.50 | | | | (0.41 | ) | | | — | | | | (0.41 | ) | | | 0.00 | (c) | |
Class B | |
Year Ended December 31, 2013 | | $ | 39.67 | | | | 0.12 | | | | 8.10 | | | | — | | | | 8.22 | | | | (0.72 | ) | | | (1.93 | ) | | | (2.65 | ) | | | — | | |
Year Ended December 31, 2012 | | $ | 33.17 | | | | 0.19 | | | | 6.55 | | | | — | | | | 6.74 | | | | (0.24 | ) | | | — | | | | (0.24 | ) | | | — | | |
Year Ended December 31, 2011 | | $ | 39.96 | | | | 0.06 | | | | (5.85 | ) | | | 0.00 | (c) | | | (5.79 | ) | | | (1.00 | ) | | | — | | | | (1.00 | ) | | | — | | |
Year Ended December 31, 2010 | | $ | 33.22 | | | | 0.03 | | | | 7.02 | | | | — | | | | 7.05 | | | | (0.31 | ) | | | — | | | | (0.31 | ) | | | 0.00 | (c) | |
Year Ended December 31, 2009 | | $ | 22.41 | | | | 0.08 | | | | 10.92 | | | | — | | | | 11.00 | | | | (0.20 | ) | | | — | | | | (0.20 | ) | | | 0.00 | (c) | |
Class C | |
Year Ended December 31, 2013 | | $ | 39.50 | | | | 0.10 | | | | 8.08 | | | | — | | | | 8.18 | | | | (0.71 | ) | | | (1.93 | ) | | | (2.64 | ) | | | — | | |
Year Ended December 31, 2012 | | $ | 33.03 | | | | 0.18 | | | | 6.52 | | | | — | | | | 6.70 | | | | (0.23 | ) | | | — | | | | (0.23 | ) | | | — | | |
Year Ended December 31, 2011 | | $ | 39.79 | | | | 0.04 | | | | (5.86 | ) | | | 0.00 | (c) | | | (5.82 | ) | | | (0.94 | ) | | | — | | | | (0.94 | ) | | | — | | |
Year Ended December 31, 2010 | | $ | 33.08 | | | | (0.05 | ) | | | 7.03 | | | | — | | | | 6.98 | | | | (0.27 | ) | | | — | | | | (0.27 | ) | | | 0.00 | (c) | |
Year Ended December 31, 2009 | | $ | 22.30 | | | | 0.02 | | | | 10.89 | | | | — | | | | 10.91 | | | | (0.14 | ) | | | — | | | | (0.14 | ) | | | 0.00 | (c) | |
Class I | |
Year Ended December 31, 2013 | | $ | 40.86 | | | | 0.66 | | | | 8.34 | | | | — | | | | 9.00 | | | | (1.22 | ) | | | (1.93 | ) | | | (3.15 | ) | | | — | | |
Year Ended December 31, 2012 | | $ | 34.33 | | | | 0.57 | | | | 6.83 | | | | — | | | | 7.40 | | | | (0.87 | ) | | | — | | | | (0.87 | ) | | | — | | |
Year Ended December 31, 2011 | | $ | 40.92 | | | | 0.37 | | | | (5.94 | ) | | | 0.00 | (c) | | | (5.57 | ) | | | (1.02 | ) | | | — | | | | (1.02 | ) | | | — | | |
Year Ended December 31, 2010 (f) | | $ | 37.69 | | | | 0.08 | | | | 3.49 | | | | — | | | | 3.57 | | | | (0.34 | ) | | | — | | | | (0.34 | ) | | | 0.00 | (c) | |
Class R | |
Year Ended December 31, 2013 | | $ | 40.79 | | | | 0.26 | | | | 8.36 | | | | — | | | | 8.62 | | | | (0.88 | ) | | | (1.93 | ) | | | (2.81 | ) | | | — | | |
Year Ended December 31, 2012 | | $ | 34.11 | | | | 0.21 | | | | 6.89 | | | | — | | | | 7.10 | | | | (0.42 | ) | | | — | | | | (0.42 | ) | | | — | | |
Year Ended December 31, 2011 (h) | | $ | 40.11 | | | | (0.00 | )(c) | | | (6.00 | ) | | | 0.00 | (c) | | | (6.00 | ) | | | — | | | | — | | | | — | | | | — | | |
Class R4 | |
Year Ended December 31, 2013 | | $ | 41.08 | | | | 0.34 | | | | 8.67 | | | | — | | | | 9.01 | | | | (1.17 | ) | | | (1.93 | ) | | | (3.10 | ) | | | — | | |
Year Ended December 31, 2012 (i) | | $ | 39.86 | | | | (0.00 | )(c) | | | 1.81 | | | | — | | | | 1.81 | | | | (0.59 | ) | | | — | | | | (0.59 | ) | | | — | | |
Class R5 | |
Year Ended December 31, 2013 | | $ | 40.81 | | | | 0.63 | | | | 8.34 | | | | — | | | | 8.97 | | | | (1.19 | ) | | | (1.93 | ) | | | (3.12 | ) | | | — | | |
Year Ended December 31, 2012 | | $ | 34.31 | | | | 0.75 | | | | 6.62 | | | | — | | | | 7.37 | | | | (0.87 | ) | | | — | | | | (0.87 | ) | | | — | | |
Year Ended December 31, 2011 (j) | | $ | 40.24 | | | | 0.09 | | | | (6.02 | ) | | | 0.00 | (c) | | | (5.93 | ) | | | — | | | | — | | | | — | | | | — | | |
Class Y | |
Year Ended December 31, 2013 | | $ | 41.08 | | | | 0.57 | | | | 8.48 | | | | — | | | | 9.05 | | | | (1.21 | ) | | | (1.93 | ) | | | (3.14 | ) | | | — | | |
Year Ended December 31, 2012 (k) | | $ | 39.90 | | | | 0.04 | | | | 1.78 | | | | — | | | | 1.82 | | | | (0.64 | ) | | | — | | | | (0.64 | ) | | | — | | |
Class Z | |
Year Ended December 31, 2013 | | $ | 40.84 | | | | 0.58 | | | | 8.38 | | | | — | | | | 8.96 | | | | (1.19 | ) | | | (1.93 | ) | | | (3.12 | ) | | | — | | |
Year Ended December 31, 2012 | | $ | 34.31 | | | | 0.59 | | | | 6.78 | | | | — | | | | 7.37 | | | | (0.84 | ) | | | — | | | | (0.84 | ) | | | — | | |
Year Ended December 31, 2011 | | $ | 40.92 | | | | 0.48 | | | | (6.07 | ) | | | 0.00 | (c) | | | (5.59 | ) | | | (1.02 | ) | | | — | | | | (1.02 | ) | | | — | | |
Year Ended December 31, 2010 | | $ | 34.26 | | | | 0.35 | | | | 7.23 | | | | — | | | | 7.58 | | | | (0.92 | ) | | | — | | | | (0.92 | ) | | | 0.00 | (c) | |
Year Ended December 31, 2009 | | $ | 23.13 | | | | 0.34 | | | | 11.31 | | | | — | | | | 11.65 | | | | (0.53 | ) | | | — | | | | (0.53 | ) | | | 0.00 | (c) | |
(a) In addition to the fees and expenses which the Fund bears directly, the Fund indirectly bears a pro rata share of the fees and expenses of the acquired funds in which it invests, if any. Such indirect expenses are not included in the reported expense ratios.
(b) Had the Investment Manager and/or Transfer Agent not waived fees and/or reimbursed a portion of expenses, total return would have been reduced.
(c) Rounds to zero.
(d) The benefits derived from custody fees paid indirectly had an impact of 0.01%.
(e) During the year ended December 31, 2011, Columbia Management reimbursed the Fund for a loss on a trading error. Had the Fund not received this reimbursement, total return would have been lower by less than 0.01%.
(f) Class I shares commenced operations on September 27, 2010. Per share data and total return reflect activity from that date.
(g) Annualized.
(h) Class R shares commenced operations on August 2, 2011. Per share data and total return reflect activity from that date.
(i) Class R4 shares commenced operations on November 8, 2012. Per share data and total return reflect activity from that date.
(j) Class R5 shares commenced operations on August 2, 2011. Per share data and total return reflect activity from that date.
(k) Class Y shares commenced operations on November 8, 2012. Per share data and total return reflect activity from that date.
See accompanying notes to financial statements.
106
| | | | | | | | | Ratio to Average Net Assets | | Supplemental Data | |
(Selected data for a share outstanding
throughout each period) | | Increase from
regulatory
settlements | | Net Asset
Value, End of
Period | | Total Return | | Total gross
expenses
(a) | | Total net
expenses
(a) | | Net
investment
income (loss) | | Portfolio
turnover rate | | Net assets,
end of period
(000s) | |
Class A | |
Year Ended December 31, 2013 | | | — | | | $ | 46.63 | | | | 22.00 | %(b) | | | 1.27 | % | | | 1.23 | % | | | 1.02 | % | | | 45 | % | | $ | 1,089,263 | | |
Year Ended December 31, 2012 | | | 0.00 | (c) | | $ | 40.79 | | | | 21.21 | %(b) | | | 1.28 | % | | | 1.24 | %(d) | | | 1.22 | % | | | 33 | % | | $ | 1,007,236 | | |
Year Ended December 31, 2011 | | | 0.00 | (c) | | $ | 34.15 | | | | (14.37 | )%(b)(e) | | | 1.32 | % | | | 1.30 | %(d) | | | 0.84 | % | | | 32 | % | | $ | 918,112 | | |
Year Ended December 31, 2010 | | | 0.00 | (c) | | $ | 40.87 | | | | 22.23 | % | | | 1.35 | % | | | 1.35 | %(d) | | | 0.62 | % | | | 25 | % | | $ | 810,603 | | |
Year Ended December 31, 2009 | | | 0.01 | | | $ | 34.13 | | | | 50.40 | % | | | 1.36 | % | | | 1.36 | %(d) | | | 0.85 | % | | | 31 | % | | $ | 578,599 | | |
Class B | |
Year Ended December 31, 2013 | | | — | | | $ | 45.24 | | | | 21.08 | %(b) | | | 2.00 | % | | | 1.97 | % | | | 0.27 | % | | | 45 | % | | $ | 13,218 | | |
Year Ended December 31, 2012 | | | 0.00 | (c) | | $ | 39.67 | | | | 20.33 | %(b) | | | 2.00 | % | | | 1.97 | %(d) | | | 0.51 | % | | | 33 | % | | $ | 17,910 | | |
Year Ended December 31, 2011 | | | 0.00 | (c) | | $ | 33.17 | | | | (14.92 | )%(b)(e) | | | 1.98 | % | | | 1.96 | %(d) | | | 0.15 | % | | | 32 | % | | $ | 24,510 | | |
Year Ended December 31, 2010 | | | 0.00 | (c) | | $ | 39.96 | | | | 21.49 | % | | | 1.96 | % | | | 1.96 | %(d) | | | 0.08 | % | | | 25 | % | | $ | 29,368 | | |
Year Ended December 31, 2009 | | | 0.01 | | | $ | 33.22 | | | | 49.36 | % | | | 2.03 | % | | | 2.03 | %(d) | | | 0.29 | % | | | 31 | % | | $ | 38,835 | | |
Class C | |
Year Ended December 31, 2013 | | | — | | | $ | 45.04 | | | | 21.07 | %(b) | | | 2.01 | % | | | 1.99 | % | | | 0.23 | % | | | 45 | % | | $ | 110,875 | | |
Year Ended December 31, 2012 | | | 0.00 | (c) | | $ | 39.50 | | | | 20.31 | %(b) | | | 2.02 | % | | | 2.00 | %(d) | | | 0.48 | % | | | 33 | % | | $ | 92,748 | | |
Year Ended December 31, 2011 | | | 0.00 | (c) | | $ | 33.03 | | | | (15.02 | )%(b)(e) | | | 2.07 | % | | | 2.06 | %(d) | | | 0.10 | % | | | 32 | % | | $ | 97,328 | | |
Year Ended December 31, 2010 | | | 0.00 | (c) | | $ | 39.79 | | | | 21.34 | % | | | 2.11 | % | | | 2.11 | %(d) | | | (0.13 | )% | | | 25 | % | | $ | 110,931 | | |
Year Ended December 31, 2009 | | | 0.01 | | | $ | 33.08 | | | | 49.12 | % | | | 2.17 | % | | | 2.17 | %(d) | | | 0.07 | % | | | 31 | % | | $ | 85,625 | | |
Class I | |
Year Ended December 31, 2013 | | | — | | | $ | 46.71 | | | | 22.43 | % | | | 0.85 | % | | | 0.85 | % | | | 1.49 | % | | | 45 | % | | $ | 29,418 | | |
Year Ended December 31, 2012 | | | 0.00 | (c) | | $ | 40.86 | | | | 21.69 | % | | | 0.88 | % | | | 0.88 | %(d) | | | 1.48 | % | | | 33 | % | | $ | 97,484 | | |
Year Ended December 31, 2011 | | | 0.00 | (c) | | $ | 34.33 | | | | (14.02 | )%(e) | | | 0.91 | % | | | 0.91 | %(d) | | | 0.99 | % | | | 32 | % | | $ | 50,335 | | |
Year Ended December 31, 2010 (f) | | | — | | | $ | 40.92 | | | | 9.50 | % | | | 0.94 | %(g) | | | 0.94 | %(d)(g) | | | 0.77 | %(g) | | | 25 | % | | $ | 66,581 | | |
Class R | |
Year Ended December 31, 2013 | | | — | | | $ | 46.60 | | | | 21.50 | % | | | 1.63 | % | | | 1.63 | % | | | 0.58 | % | | | 45 | % | | $ | 5,822 | | |
Year Ended December 31, 2012 | | | 0.00 | (c) | | $ | 40.79 | | | | 20.83 | % | | | 1.52 | % | | | 1.51 | %(d) | | | 0.54 | % | | | 33 | % | | $ | 2,799 | | |
Year Ended December 31, 2011 (h) | | | 0.00 | (c) | | $ | 34.11 | | | | (14.96 | )% | | | 1.59 | %(g) | | | 1.59 | %(d)(g) | | | (0.02 | )%(g) | | | 32 | % | | $ | 2,130 | | |
Class R4 | |
Year Ended December 31, 2013 | | | — | | | $ | 46.99 | | | | 22.32 | % | | | 1.03 | % | | | 1.03 | % | | | 0.73 | % | | | 45 | % | | $ | 355,616 | | |
Year Ended December 31, 2012 (i) | | | — | | | $ | 41.08 | | | | 4.57 | % | | | 1.03 | %(g) | | | 1.02 | %(d)(g) | | | (0.02 | )%(g) | | | 33 | % | | $ | 15 | | |
Class R5 | |
Year Ended December 31, 2013 | | | — | | | $ | 46.66 | | | | 22.38 | % | | | 0.91 | % | | | 0.91 | % | | | 1.40 | % | | | 45 | % | | $ | 274,415 | | |
Year Ended December 31, 2012 | | | 0.00 | (c) | | $ | 40.81 | | | | 21.61 | % | | | 0.89 | % | | | 0.89 | %(d) | | | 1.99 | % | | | 33 | % | | $ | 242 | | |
Year Ended December 31, 2011 (j) | | | 0.00 | (c) | | $ | 34.31 | | | | (14.74 | )% | | | 0.91 | %(g) | | | 0.91 | %(d)(g) | | | 0.65 | %(g) | | | 32 | % | | $ | 2,038 | | |
Class Y | |
Year Ended December 31, 2013 | | | — | | | $ | 46.99 | | | | 22.44 | % | | | 0.86 | % | | | 0.86 | % | | | 1.26 | % | | | 45 | % | | $ | 155,140 | | |
Year Ended December 31, 2012 (k) | | | — | | | $ | 41.08 | | | | 4.59 | % | | | 0.91 | %(g) | | | 0.90 | %(d)(g) | | | 0.75 | %(g) | | | 33 | % | | $ | 30,856 | | |
Class Z | |
Year Ended December 31, 2013 | | | — | | | $ | 46.68 | | | | 22.33 | % | | | 0.93 | % | | | 0.93 | % | | | 1.30 | % | | | 45 | % | | $ | 6,293,552 | | |
Year Ended December 31, 2012 | | | 0.00 | (c) | | $ | 40.84 | | | | 21.60 | % | | | 0.93 | % | | | 0.93 | %(d) | | | 1.53 | % | | | 33 | % | | $ | 5,494,506 | | |
Year Ended December 31, 2011 | | | 0.00 | (c) | | $ | 34.31 | | | | (14.06 | )%(e) | | | 0.95 | % | | | 0.95 | %(d) | | | 1.24 | % | | | 32 | % | | $ | 4,322,500 | | |
Year Ended December 31, 2010 | | | 0.00 | (c) | | $ | 40.92 | | | | 22.70 | % | | | 0.97 | % | | | 0.97 | %(d) | | | 0.99 | % | | | 25 | % | | $ | 5,107,580 | | |
Year Ended December 31, 2009 | | | 0.01 | | | $ | 34.26 | | | | 50.97 | % | | | 0.99 | % | | | 0.99 | %(d) | | | 1.23 | % | | | 31 | % | | $ | 3,727,679 | | |
See accompanying notes to financial statements.
107
Columbia Acorn Family of Funds
Financial Highlights, continued
Columbia Acorn USA
| | | | | Income from Investment Operations | | | | Less Distributions to Shareholders | | | | | |
(Selected data for a share outstanding
throughout each period) | | Net Asset
Value,
Beginning of
Period | | Net
investment
income (loss) | | Net realized
and
unrealized
gain (loss) | | Total from
investment
operations | | Net
investment
income | | Net
realized gains | | Total
Distributions to
Shareholders | | Increase from
regulatory
settlements | |
Class A | |
Year Ended December 31, 2013 | | $ | 28.21 | | | | (0.15 | ) | | | 9.09 | | | | 8.94 | | | | — | | | | (3.00 | ) | | | (3.00 | ) | | | — | | |
Year Ended December 31, 2012 | | $ | 25.94 | | | | 0.02 | | | | 4.73 | | | | 4.75 | | | | (0.11 | ) | | | (2.37 | ) | | | (2.48 | ) | | | — | | |
Year Ended December 31, 2011 | | $ | 27.54 | | | | (0.22 | ) | | | (1.21 | ) | | | (1.43 | ) | | | — | | | | (0.17 | ) | | | (0.17 | ) | | | — | | |
Year Ended December 31, 2010 | | $ | 22.43 | | | | (0.15 | ) | | | 5.26 | | | | 5.11 | | | | — | | | | — | | | | — | | | | — | | |
Year Ended December 31, 2009 | | $ | 15.90 | | | | (0.11 | ) | | | 6.64 | | | | 6.53 | | | | — | | | | — | | | | — | | | | 0.00 | (d) | |
Class B | |
Year Ended December 31, 2013 | | $ | 25.81 | | | | (0.39 | ) | | | 8.28 | | | | 7.89 | | | | — | | | | (3.00 | ) | | | (3.00 | ) | | | — | | |
Year Ended December 31, 2012 | | $ | 23.98 | | | | (0.19 | ) | | | 4.39 | | | | 4.20 | | | | — | | | | (2.37 | ) | | | (2.37 | ) | | | — | | |
Year Ended December 31, 2011 | | $ | 25.60 | | | | (0.37 | ) | | | (1.08 | ) | | | (1.45 | ) | | | — | | | | (0.17 | ) | | | (0.17 | ) | | | — | | |
Year Ended December 31, 2010 | | $ | 20.99 | | | | (0.30 | ) | | | 4.91 | | | | 4.61 | | | | — | | | | — | | | | — | | | | — | | |
Year Ended December 31, 2009 | | $ | 14.98 | | | | (0.22 | ) | | | 6.23 | | | | 6.01 | | | | — | | | | — | | | | — | | | | 0.00 | (d) | |
Class C | |
Year Ended December 31, 2013 | | $ | 25.49 | | | | (0.33 | ) | | | 8.17 | | | | 7.84 | | | | — | | | | (3.00 | ) | | | (3.00 | ) | | | — | | |
Year Ended December 31, 2012 | | $ | 23.72 | | | | (0.16 | ) | | | 4.30 | | | | 4.14 | | | | — | | | | (2.37 | ) | | | (2.37 | ) | | | — | | |
Year Ended December 31, 2011 | | $ | 25.39 | | | | (0.39 | ) | | | (1.11 | ) | | | (1.50 | ) | | | — | | | | (0.17 | ) | | | (0.17 | ) | | | — | | |
Year Ended December 31, 2010 | | $ | 20.84 | | | | (0.31 | ) | | | 4.86 | | | | 4.55 | | | | — | | | | — | | | | — | | | | — | | |
Year Ended December 31, 2009 | | $ | 14.89 | | | | (0.24 | ) | | | 6.19 | | | | 5.95 | | | | — | | | | — | | | | — | | | | 0.00 | (d) | |
Class I | |
Year Ended December 31, 2013 | | $ | 29.47 | | | | (0.02 | ) | | | 9.54 | | | | 9.52 | | | | — | | | | (3.00 | ) | | | (3.00 | ) | | | — | | |
Year Ended December 31, 2012 | | $ | 27.00 | | | | (0.10 | ) | | | 5.16 | | | | 5.06 | | | | (0.22 | ) | | | (2.37 | ) | | | (2.59 | ) | | | — | | |
Year Ended December 31, 2011 | | $ | 28.56 | | | | (0.14 | ) | | | (1.25 | ) | | | (1.39 | ) | | | — | | | | (0.17 | ) | | | (0.17 | ) | | | — | | |
Year Ended December 31, 2010 (e) | | $ | 24.24 | | | | (0.03 | ) | | | 4.35 | | | | 4.32 | | | | — | | | | — | | | | — | | | | — | | |
Class R4 | |
Year Ended December 31, 2013 | | $ | 29.92 | | | | 0.00 | (d) | | | 9.63 | | | | 9.63 | | | | — | | | | (3.00 | ) | | | (3.00 | ) | | | — | | |
Year Ended December 31, 2012 (g) | | $ | 30.06 | | | | 0.06 | | | | 2.28 | | | | 2.34 | | | | (0.16 | ) | | | (2.32 | ) | | | (2.48 | ) | | | — | | |
Class R5 | |
Year Ended December 31, 2013 | | $ | 29.90 | | | | 0.02 | | | | 9.61 | | | | 9.63 | | | | — | | | | (3.00 | ) | | | (3.00 | ) | | | — | | |
Year Ended December 31, 2012 (h) | | $ | 30.06 | | | | 0.07 | | | | 2.27 | | | | 2.34 | | | | (0.18 | ) | | | (2.32 | ) | | | (2.50 | ) | | | — | | |
Class Y | |
Year Ended December 31, 2013 | | $ | 29.93 | | | | 0.02 | | | | 9.64 | | | | 9.66 | | | | — | | | | (3.00 | ) | | | (3.00 | ) | | | — | | |
Year Ended December 31, 2012 (i) | | $ | 30.10 | | | | 0.07 | | | | 2.27 | | | | 2.34 | | | | (0.19 | ) | | | (2.32 | ) | | | (2.51 | ) | | | — | | |
Class Z | |
Year Ended December 31, 2013 | | $ | 29.45 | | | | (0.07 | ) | | | 9.52 | | | | 9.45 | | | | — | | | | (3.00 | ) | | | (3.00 | ) | | | — | | |
Year Ended December 31, 2012 | | $ | 26.98 | | | | 0.11 | | | | 4.92 | | | | 5.03 | | | | (0.19 | ) | | | (2.37 | ) | | | (2.56 | ) | | | — | | |
Year Ended December 31, 2011 | | $ | 28.56 | | | | (0.14 | ) | | | (1.27 | ) | | | (1.41 | ) | | | — | | | | (0.17 | ) | | | (0.17 | ) | | | — | | |
Year Ended December 31, 2010 | | $ | 23.19 | | | | (0.08 | ) | | | 5.45 | | | | 5.37 | | | | — | | | | — | | | | — | | | | — | | |
Year Ended December 31, 2009 | | $ | 16.39 | | | | (0.07 | ) | | | 6.87 | | | | 6.80 | | | | — | | | | — | | | | — | | | | 0.00 | (d) | |
(a) In addition to the fees and expenses which the Fund bears directly, the Fund indirectly bears a pro rata share of the fees and expenses of the acquired funds in which it invests, if any. Such indirect expenses are not included in the reported expense ratios.
(b) Ratios include line of credit interest expense which rounds to less than 0.01%.
(c) The benefits derived from custody fees paid indirectly had an impact of less than 0.01%.
(d) Rounds to zero.
(e) Class I shares commenced operations on September 27, 2010. Per share data and total return reflect activity from that date.
(f) Annualized.
(g) Class R4 shares commenced operations on November 8, 2012. Per share data and total return reflect activity from that date.
(h) Class R5 shares commenced operations on November 8, 2012. Per share data and total return reflect activity from that date.
(i) Class Y shares commenced operations on November 8, 2012. Per share data and total return reflect activity from that date.
See accompanying notes to financial statements.
108
| | | | | | | Ratio to Average Net Assets | | Supplemental Data | |
(Selected data for a share outstanding
throughout each period) | | Net Asset
Value, End of
Period | | Total Return | | Total gross
expenses
(a) | | Total net
expenses
(a) | | Net
investment
income (loss) | | Portfolio
turnover rate | | Net assets,
end of period
(000s) | |
Class A | |
Year Ended December 31, 2013 | | $ | 34.15 | | | | 32.34 | % | | | 1.32 | % | | | 1.32 | % | | | (0.46 | )% | | | 17 | % | | $ | 201,559 | | |
Year Ended December 31, 2012 | | $ | 28.21 | | | | 18.67 | % | | | 1.32 | %(b) | | | 1.32 | %(b)(c) | | | 0.08 | % | | | 14 | % | | $ | 152,164 | | |
Year Ended December 31, 2011 | | $ | 25.94 | | | | (5.21 | )% | | | 1.30 | % | | | 1.30 | %(c) | | | (0.78 | )% | | | 20 | % | | $ | 167,038 | | |
Year Ended December 31, 2010 | | $ | 27.54 | | | | 22.78 | % | | | 1.30 | % | | | 1.30 | %(c) | | | (0.64 | )% | | | 32 | % | | $ | 214,097 | | |
Year Ended December 31, 2009 | | $ | 22.43 | | | | 41.07 | % | | | 1.32 | % | | | 1.32 | %(c) | | | (0.64 | )% | | | 28 | % | | $ | 178,605 | | |
Class B | |
Year Ended December 31, 2013 | | $ | 30.70 | | | | 31.28 | % | | | 2.15 | % | | | 2.15 | % | | | (1.33 | )% | | | 17 | % | | $ | 567 | | |
Year Ended December 31, 2012 | | $ | 25.81 | | | | 17.87 | % | | | 1.99 | %(b) | | | 1.99 | %(b)(c) | | | (0.71 | )% | | | 14 | % | | $ | 1,056 | | |
Year Ended December 31, 2011 | | $ | 23.98 | | | | (5.68 | )% | | | 1.92 | % | | | 1.92 | %(c) | | | (1.42 | )% | | | 20 | % | | $ | 2,253 | | |
Year Ended December 31, 2010 | | $ | 25.60 | | | | 21.96 | % | | | 1.98 | % | | | 1.98 | %(c) | | | (1.37 | )% | | | 32 | % | | $ | 9,222 | | |
Year Ended December 31, 2009 | | $ | 20.99 | | | | 40.12 | % | | | 2.02 | % | | | 2.02 | %(c) | | | (1.33 | )% | | | 28 | % | | $ | 20,903 | | |
Class C | |
Year Ended December 31, 2013 | | $ | 30.33 | | | | 31.47 | % | | | 2.00 | % | | | 2.00 | % | | | (1.14 | )% | | | 17 | % | | $ | 40,395 | | |
Year Ended December 31, 2012 | | $ | 25.49 | | | | 17.82 | % | | | 2.05 | %(b) | | | 2.05 | %(b)(c) | | | (0.61 | )% | | | 14 | % | | $ | 31,410 | | |
Year Ended December 31, 2011 | | $ | 23.72 | | | | (5.92 | )% | | | 2.05 | % | | | 2.05 | %(c) | | | (1.53 | )% | | | 20 | % | | $ | 30,584 | | |
Year Ended December 31, 2010 | | $ | 25.39 | | | | 21.83 | % | | | 2.08 | % | | | 2.08 | %(c) | | | (1.41 | )% | | | 32 | % | | $ | 36,101 | | |
Year Ended December 31, 2009 | | $ | 20.84 | | | | 39.96 | % | | | 2.13 | % | | | 2.13 | %(c) | | | (1.45 | )% | | | 28 | % | | $ | 32,508 | | |
Class I | |
Year Ended December 31, 2013 | | $ | 35.99 | | | | 32.93 | % | | | 0.90 | % | | | 0.90 | % | | | (0.04 | )% | | | 17 | % | | $ | 4 | | |
Year Ended December 31, 2012 | | $ | 29.47 | | | | 19.10 | % | | | 0.96 | % | | | 0.96 | %(c) | | | (0.33 | )% | | | 14 | % | | $ | 3 | | |
Year Ended December 31, 2011 | | $ | 27.00 | | | | (4.88 | )% | | | 0.94 | % | | | 0.94 | %(c) | | | (0.47 | )% | | | 20 | % | | $ | 2,635 | | |
Year Ended December 31, 2010 (e) | | $ | 28.56 | | | | 17.82 | % | | | 0.94 | %(f) | | | 0.94 | %(c)(f) | | | (0.35 | )%(f) | | | 32 | % | | $ | 28,993 | | |
Class R4 | |
Year Ended December 31, 2013 | | $ | 36.55 | | | | 32.80 | % | | | 1.00 | % | | | 1.00 | % | | | 0.01 | % | | | 17 | % | | $ | 6,441 | | |
Year Ended December 31, 2012 (g) | | $ | 29.92 | | | | 8.06 | % | | | 1.14 | %(b)(f) | | | 1.14 | %(b)(c)(f) | | | 1.51 | %(f) | | | 14 | % | | $ | 15 | | |
Class R5 | |
Year Ended December 31, 2013 | | $ | 36.53 | | | | 32.83 | % | | | 0.97 | % | | | 0.97 | % | | | 0.06 | % | | | 17 | % | | $ | 6,068 | | |
Year Ended December 31, 2012 (h) | | $ | 29.90 | | | | 8.06 | % | | | 1.12 | %(f) | | | 1.12 | %(c)(f) | | | 1.53 | %(f) | | | 14 | % | | $ | 2 | | |
Class Y | |
Year Ended December 31, 2013 | | $ | 36.59 | | | | 32.89 | % | | | 0.93 | % | | | 0.93 | % | | | 0.07 | % | | | 17 | % | | $ | 48,479 | | |
Year Ended December 31, 2012 (i) | | $ | 29.93 | | | | 8.07 | % | | | 1.04 | %(f) | | | 1.04 | %(c)(f) | | | 1.62 | %(f) | | | 14 | % | | $ | 2 | | |
Class Z | |
Year Ended December 31, 2013 | | $ | 35.90 | | | | 32.72 | % | | | 1.06 | % | | | 1.06 | % | | | (0.20 | )% | | | 17 | % | | $ | 1,496,775 | | |
Year Ended December 31, 2012 | | $ | 29.45 | | | | 18.98 | % | | | 1.07 | %(b) | | | 1.07 | %(b)(c) | | | 0.36 | % | | | 14 | % | | $ | 1,415,442 | | |
Year Ended December 31, 2011 | | $ | 26.98 | | | | (4.95 | )% | | | 1.00 | % | | | 1.00 | %(c) | | | (0.48 | )% | | | 20 | % | | $ | 1,355,934 | | |
Year Ended December 31, 2010 | | $ | 28.56 | | | | 23.16 | % | | | 1.01 | % | | | 1.01 | %(c) | | | (0.34 | )% | | | 32 | % | | $ | 1,410,133 | | |
Year Ended December 31, 2009 | | $ | 23.19 | | | | 41.49 | % | | | 1.03 | % | | | 1.03 | %(c) | | | (0.36 | )% | | | 28 | % | | $ | 1,157,593 | | |
See accompanying notes to financial statements.
109
Columbia Acorn Family of Funds
Financial Highlights, continued
Columbia Acorn International Select
| | | | | Income from Investment Operations | | | | Less Distributions to Shareholders | | | | | |
(Selected data for a share outstanding
throughout each period) | | Net Asset
Value,
Beginning of
Period | | Net
investment
income (loss) | | Net realized
and
unrealized
gain (loss) | | Total from
investment
operations | | Net
investment
income | | Net
realized gains | | Total
Distributions to
Shareholders | | Redemption
fees added
to paid in
capital | |
Class A | |
Year Ended December 31, 2013 | | $ | 25.61 | | | | 0.29 | | | | 3.29 | | | | 3.58 | | | | (0.37 | ) | | | (1.91 | ) | | | (2.28 | ) | | | — | | |
Year Ended December 31, 2012 | | $ | 24.26 | | | | 0.39 | | | | 4.92 | | | | 5.31 | | | | (1.75 | ) | | | (2.21 | ) | | | (3.96 | ) | | | — | | |
Year Ended December 31, 2011 | | $ | 28.01 | | | | 0.18 | | | | (2.95 | ) | | | (2.77 | ) | | | (0.59 | ) | | | (0.39 | ) | | | (0.98 | ) | | | — | | |
Year Ended December 31, 2010 | | $ | 23.39 | | | | 0.08 | | | | 4.84 | | | | 4.92 | | | | (0.30 | ) | | | — | | | | (0.30 | ) | | | 0.00 | (e) | |
Year Ended December 31, 2009 | | $ | 17.99 | | | | 0.10 | | | | 5.43 | | | | 5.53 | | | | (0.15 | ) | | | — | | | | (0.15 | ) | | | 0.00 | (e) | |
Class B | |
Year Ended December 31, 2013 | | $ | 24.40 | | | | 0.11 | | | | 3.12 | | | | 3.23 | | | | (0.19 | ) | | | (1.91 | ) | | | (2.10 | ) | | | — | | |
Year Ended December 31, 2012 | | $ | 23.27 | | | | 0.23 | | | | 4.69 | | | | 4.92 | | | | (1.58 | ) | | | (2.21 | ) | | | (3.79 | ) | | | — | | |
Year Ended December 31, 2011 | | $ | 26.72 | | | | 0.01 | | | | (2.82 | ) | | | (2.81 | ) | | | (0.25 | ) | | | (0.39 | ) | | | (0.64 | ) | | | — | | |
Year Ended December 31, 2010 | | $ | 22.34 | | | | (0.06 | ) | | | 4.62 | | | | 4.56 | | | | (0.18 | ) | | | — | | | | (0.18 | ) | | | 0.00 | (e) | |
Year Ended December 31, 2009 | | $ | 17.16 | | | | (0.01 | ) | | | 5.17 | | | | 5.16 | | | | — | | | | — | | | | — | | | | 0.00 | (e) | |
Class C | |
Year Ended December 31, 2013 | | $ | 24.28 | | | | 0.08 | | | | 3.10 | | | | 3.18 | | | | (0.16 | ) | | | (1.91 | ) | | | (2.07 | ) | | | — | | |
Year Ended December 31, 2012 | | $ | 23.17 | | | | 0.18 | | | | 4.67 | | | | 4.85 | | | | (1.53 | ) | | | (2.21 | ) | | | (3.74 | ) | | | — | | |
Year Ended December 31, 2011 | | $ | 26.58 | | | | (0.04 | ) | | | (2.81 | ) | | | (2.85 | ) | | | (0.17 | ) | | | (0.39 | ) | | | (0.56 | ) | | | — | | |
Year Ended December 31, 2010 | | $ | 22.21 | | | | (0.10 | ) | | | 4.60 | | | | 4.50 | | | | (0.13 | ) | | | — | | | | (0.13 | ) | | | 0.00 | (e) | |
Year Ended December 31, 2009 | | $ | 17.08 | | | | (0.06 | ) | | | 5.17 | | | | 5.11 | | | | — | | | | — | | | | — | | | | 0.00 | (e) | |
Class I | |
Year Ended December 31, 2013 | | $ | 25.85 | | | | 0.39 | | | | 3.32 | | | | 3.71 | | | | (0.46 | ) | | | (1.91 | ) | | | (2.37 | ) | | | — | | |
Year Ended December 31, 2012 | | $ | 24.45 | | | | 0.51 | | | | 4.94 | | | | 5.45 | | | | (1.84 | ) | | | (2.21 | ) | | | (4.05 | ) | | | — | | |
Year Ended December 31, 2011 | | $ | 28.33 | | | | 0.31 | | | | (2.97 | ) | | | (2.66 | ) | | | (0.83 | ) | | | (0.39 | ) | | | (1.22 | ) | | | — | | |
Year Ended December 31, 2010 (g) | | $ | 26.11 | | | | 0.03 | | | | 2.19 | | | | 2.22 | | | | — | | | | — | | | | — | | | | — | | |
Class R4 | |
Year Ended December 31, 2013 | | $ | 25.99 | | | | 0.29 | | | | 3.42 | | | | 3.71 | | | | (0.43 | ) | | | (1.91 | ) | | | (2.34 | ) | | | — | | |
Year Ended December 31, 2012 (i) | | $ | 29.98 | | | | (0.02 | ) | | | (0.09 | )(j) | | | (0.11 | ) | | | (1.79 | ) | | | (2.09 | ) | | | (3.88 | ) | | | — | | |
Class R5 | |
Year Ended December 31, 2013 | | $ | 25.98 | | | | 0.38 | | | | 3.35 | | | | 3.73 | | | | (0.46 | ) | | | (1.91 | ) | | | (2.37 | ) | | | — | | |
Year Ended December 31, 2012 (k) | | $ | 29.98 | | | | (0.02 | ) | | | (0.09 | )(j) | | | (0.11 | ) | | | (1.80 | ) | | | (2.09 | ) | | | (3.89 | ) | | | — | | |
Class Y | |
Year Ended December 31, 2013 | | $ | 25.98 | | | | 0.11 | | | | 3.62 | | | | 3.73 | | | | (0.47 | ) | | | (1.91 | ) | | | (2.38 | ) | | | — | | |
Year Ended December 31, 2012 (l) | | $ | 29.99 | | | | (0.02 | ) | | | (0.09 | )(j) | | | (0.11 | ) | | | (1.81 | ) | | | (2.09 | ) | | | (3.90 | ) | | | — | | |
Class Z | |
Year Ended December 31, 2013 | | $ | 25.86 | | | | 0.37 | | | | 3.33 | | | | 3.70 | | | | (0.45 | ) | | | (1.91 | ) | | | (2.36 | ) | | | — | | |
Year Ended December 31, 2012 | | $ | 24.46 | | | | 0.49 | | | | 4.95 | | | | 5.44 | | | | (1.83 | ) | | | (2.21 | ) | | | (4.04 | ) | | | — | | |
Year Ended December 31, 2011 | | $ | 28.33 | | | | 0.29 | | | | (2.98 | ) | | | (2.69 | ) | | | (0.79 | ) | | | (0.39 | ) | | | (1.18 | ) | | | — | | |
Year Ended December 31, 2010 | | $ | 23.64 | | | | 0.18 | | | | 4.89 | | | | 5.07 | | | | (0.38 | ) | | | — | | | | (0.38 | ) | | | 0.00 | (e) | |
Year Ended December 31, 2009 | | $ | 18.19 | | | | 0.17 | | | | 5.50 | | | | 5.67 | | | | (0.24 | ) | | | — | | | | (0.24 | ) | | | 0.00 | (e) | |
(a) In addition to the fees and expenses which the Fund bears directly, the Fund indirectly bears a pro rata share of the fees and expenses of the acquired funds in which it invests, if any. Such indirect expenses are not included in the reported expense ratios.
(b) Ratios include line of credit interest expense which rounds to less than 0.01%.
(c) The benefits derived from custody fees paid indirectly had an impact of 0.01%.
(d) The benefits derived from custody fees paid indirectly had an impact of less than 0.01%.
(e) Rounds to zero.
(f) Had the Investment Manager and/or Transfer Agent not waived fees and/or reimbursed a portion of expenses, total return would have been reduced.
(g) Class I shares commenced operations on September 27, 2010. Per share data and total return reflect activity from that date.
(h) Annualized.
(i) Class R4 shares commenced operations on November 8, 2012. Per share data and total return reflect activity from that date.
(j) Calculation of the net gain (loss) per share (both realized and unrealized) does not correlate to the aggregate realized and unrealized gain (loss) presented in the Statements of Operations due to the timing of sales and repurchases of Fund shares in relation to fluctuations in the market value of the portfolio.
(k) Class R5 shares commenced operations on November 8, 2012. Per share data and total return reflect activity from that date.
(l) Class Y shares commenced operations on November 8, 2012. Per share data and total return reflect activity from that date.
See accompanying notes to financial statements.
110
| | | | | | | | | Ratio to Average Net Assets | | Supplemental Data | |
(Selected data for a share outstanding
throughout each period) | | Increase from
regulatory
settlements | | Net Asset
Value, End of
Period | | Total Return | | Total gross
expenses | | Total net
expenses | | Net
investment
income (loss) | | Portfolio
turnover rate | | Net assets,
end of period
(000s) | |
Class A | |
Year Ended December 31, 2013 | | | — | | | $ | 26.91 | | | | 14.42 | % | | | 1.47 | %(a) | | | 1.47 | %(a) | | | 1.08 | % | | | 72 | % | | $ | 73,911 | | |
Year Ended December 31, 2012 | | | — | | | $ | 25.61 | | | | 22.05 | % | | | 1.49 | %(a)(b) | | | 1.49 | %(a)(b)(c) | | | 1.43 | % | | | 63 | % | | $ | 74,167 | | |
Year Ended December 31, 2011 | | | — | | | $ | 24.26 | | | | (10.11 | )% | | | 1.51 | %(a) | | | 1.51 | %(a)(d) | | | 0.66 | % | | | 44 | % | | $ | 56,350 | | |
Year Ended December 31, 2010 | | | 0.00 | (e) | | $ | 28.01 | | | | 21.41 | % | | | 1.56 | %(a) | | | 1.56 | %(a)(d) | | | 0.33 | % | | | 42 | % | | $ | 71,668 | | |
Year Ended December 31, 2009 | | | 0.02 | | | $ | 23.39 | | | | 31.01 | % | | | 1.56 | % | | | 1.56 | %(d) | | | 0.53 | % | | | 56 | % | | $ | 64,664 | | |
Class B | |
Year Ended December 31, 2013 | | | — | | | $ | 25.53 | | | | 13.67 | % | | | 2.14 | %(a) | | | 2.14 | %(a) | | | 0.43 | % | | | 72 | % | | $ | 873 | | |
Year Ended December 31, 2012 | | | — | | | $ | 24.40 | | | | 21.29 | % | | | 2.11 | %(a)(b) | | | 2.10 | %(a)(b)(c) | | | 0.87 | % | | | 63 | % | | $ | 1,250 | | |
Year Ended December 31, 2011 | | | — | | | $ | 23.27 | | | | (10.64 | )% | | | 2.14 | %(a) | | | 2.14 | %(a)(d) | | | 0.04 | % | | | 44 | % | | $ | 1,774 | | |
Year Ended December 31, 2010 | | | 0.00 | (e) | | $ | 26.72 | | | | 20.63 | %(f) | | | 2.24 | %(a) | | | 2.20 | %(a)(d) | | | (0.27 | )% | | | 42 | % | | $ | 3,030 | | |
Year Ended December 31, 2009 | | | 0.02 | | | $ | 22.34 | | | | 30.19 | %(f) | | | 2.32 | % | | | 2.20 | %(d) | | | (0.05 | )% | | | 56 | % | | $ | 3,887 | | |
Class C | |
Year Ended December 31, 2013 | | | — | | | $ | 25.39 | | | | 13.52 | % | | | 2.26 | %(a) | | | 2.26 | %(a) | | | 0.32 | % | | | 72 | % | | $ | 10,311 | | |
Year Ended December 31, 2012 | | | — | | | $ | 24.28 | | | | 21.10 | % | | | 2.28 | %(a)(b) | | | 2.27 | %(a)(b)(c) | | | 0.67 | % | | | 63 | % | | $ | 9,786 | | |
Year Ended December 31, 2011 | | | — | | | $ | 23.17 | | | | (10.81 | )% | | | 2.31 | %(a) | | | 2.31 | %(a)(d) | | | (0.14 | )% | | | 44 | % | | $ | 8,704 | | |
Year Ended December 31, 2010 | | | 0.00 | (e) | | $ | 26.58 | | | | 20.45 | % | | | 2.36 | %(a) | | | 2.36 | %(a)(d) | | | (0.45 | )% | | | 42 | % | | $ | 11,885 | | |
Year Ended December 31, 2009 | | | 0.02 | | | $ | 22.21 | | | | 30.04 | % | | | 2.42 | % | | | 2.42 | %(d) | | | (0.30 | )% | | | 56 | % | | $ | 11,096 | | |
Class I | |
Year Ended December 31, 2013 | | | — | | | $ | 27.19 | | | | 14.82 | % | | | 1.13 | %(a) | | | 1.13 | %(a) | | | 1.43 | % | | | 72 | % | | $ | 3 | | |
Year Ended December 31, 2012 | | | — | | | $ | 25.85 | | | | 22.48 | % | | | 1.15 | %(a) | | | 1.14 | %(a)(c) | | | 1.84 | % | | | 63 | % | | $ | 2 | | |
Year Ended December 31, 2011 | | | — | | | $ | 24.45 | | | | (9.68 | )% | | | 1.04 | %(a) | | | 1.04 | %(a)(d) | | | 1.12 | % | | | 44 | % | | $ | 2 | | |
Year Ended December 31, 2010 (g) | | | — | | | $ | 28.33 | | | | 8.50 | % | | | 1.14 | %(a)(h) | | | 1.14 | %(a)(d)(h) | | | 0.44 | %(h) | | | 42 | % | | $ | 3 | | |
Class R4 | |
Year Ended December 31, 2013 | | | — | | | $ | 27.36 | | | | 14.72 | % | | | 1.24 | %(a) | | | 1.24 | %(a) | | | 1.06 | % | | | 72 | % | | $ | 417 | | |
Year Ended December 31, 2012 (i) | | | — | | | $ | 25.99 | | | | (0.27 | )% | | | 1.30 | %(a)(b)(h) | | | 1.30 | %(a)(b)(c)(h) | | | (0.55 | )%(h) | | | 63 | % | | $ | 13 | | |
Class R5 | |
Year Ended December 31, 2013 | | | — | | | $ | 27.34 | | | | 14.80 | %(f) | | | 1.15 | %(a) | | | 1.15 | %(a) | | | 1.40 | % | | | 72 | % | | $ | 956 | | |
Year Ended December 31, 2012 (k) | | | — | | | $ | 25.98 | | | | (0.27 | )% | | | 1.29 | %(a)(h) | | | 1.28 | %(a)(c)(h) | | | (0.55 | )%(h) | | | 63 | % | | $ | 2 | | |
Class Y | |
Year Ended December 31, 2013 | | | — | | | $ | 27.33 | | | | 14.82 | % | | | 1.09 | %(a) | | | 1.09 | %(a) | | | 0.40 | % | | | 72 | % | | $ | 13,318 | | |
Year Ended December 31, 2012 (l) | | | — | | | $ | 25.98 | | | | (0.25 | )% | | | 1.21 | %(a)(h) | | | 1.20 | %(a)(c)(h) | | | (0.48 | )%(h) | | | 63 | % | | $ | 2 | | |
Class Z | |
Year Ended December 31, 2013 | | | — | | | $ | 27.20 | | | | 14.75 | % | | | 1.19 | %(a) | | | 1.19 | %(a) | | | 1.37 | % | | | 72 | % | | $ | 256,100 | | |
Year Ended December 31, 2012 | | | — | | | $ | 25.86 | | | | 22.42 | % | | | 1.20 | %(a)(b) | | | 1.19 | %(a)(b)(c) | | | 1.77 | % | | | 63 | % | | $ | 295,231 | | |
Year Ended December 31, 2011 | | | — | | | $ | 24.46 | | | | (9.76 | )% | | | 1.14 | %(a) | | | 1.14 | %(a)(d) | | | 1.03 | % | | | 44 | % | | $ | 259,553 | | |
Year Ended December 31, 2010 | | | 0.00 | (e) | | $ | 28.33 | | | | 21.89 | % | | | 1.16 | %(a) | | | 1.16 | %(a)(d) | | | 0.75 | % | | | 42 | % | | $ | 366,081 | | |
Year Ended December 31, 2009 | | | 0.02 | | | $ | 23.64 | | | | 31.52 | % | | | 1.20 | % | | | 1.20 | %(d) | | | 0.84 | % | | | 56 | % | | $ | 331,027 | | |
See accompanying notes to financial statements.
111
Columbia Acorn Family of Funds
Financial Highlights, continued
Columbia Acorn Select
| | | | | Income from Investment Operations | | | | Less Distributions to Shareholders | | | |
(Selected data for a share outstanding
throughout each period) | | Net Asset
Value,
Beginning of
Period | | Net
investment
income (loss) | | Net realized
and
unrealized
gain (loss) | | Reimbursement
from
affiliate | | Total from
investment
operations | | Net
investment
income | | Net
realized gains | | Total
Distributions to
Shareholders | |
Class A | |
Year Ended December 31, 2013 | | $ | 24.72 | | | | (0.15 | ) | | | 7.92 | | | | — | | | | 7.77 | | | | (0.07 | ) | | | (6.85 | ) | | | (6.92 | ) | |
Year Ended December 31, 2012 | | $ | 22.95 | | | | 0.03 | | | | 3.78 | | | | — | | | | 3.81 | | | | — | | | | (2.04 | ) | | | (2.04 | ) | |
Year Ended December 31, 2011 | | $ | 27.94 | | | | (0.15 | ) | | | (4.46 | ) | | | — | | | | (4.61 | ) | | | (0.38 | ) | | | — | | | | (0.38 | ) | |
Year Ended December 31, 2010 | | $ | 22.81 | | | | (0.18 | ) | | | 5.31 | | | | — | | | | 5.13 | | | | — | | | | — | | | | — | | |
Year Ended December 31, 2009 | | $ | 13.77 | | | | (0.14 | ) | | | 9.18 | | | | — | | | | 9.04 | | | | — | | | | — | | | | — | | |
Class B | |
Year Ended December 31, 2013 | | $ | 22.75 | | | | (0.33 | ) | | | 7.24 | | | | — | | | | 6.91 | | | | — | | | | (6.85 | ) | | | (6.85 | ) | |
Year Ended December 31, 2012 | | $ | 21.40 | | | | (0.15 | ) | | | 3.54 | | | | — | | | | 3.39 | | | | — | | | | (2.04 | ) | | | (2.04 | ) | |
Year Ended December 31, 2011 | | $ | 26.06 | | | | (0.30 | ) | | | (4.13 | ) | | | — | | | | (4.43 | ) | | | (0.23 | ) | | | — | | | | (0.23 | ) | |
Year Ended December 31, 2010 | | $ | 21.41 | | | | (0.31 | ) | | | 4.96 | | | | — | | | | 4.65 | | | | — | | | | — | | | | — | | |
Year Ended December 31, 2009 | | $ | 13.02 | | | | (0.24 | ) | | | 8.63 | | | | — | | | | 8.39 | | | | — | | | | — | | | | — | | |
Class C | |
Year Ended December 31, 2013 | | $ | 22.48 | | | | (0.32 | ) | | | 7.15 | | | | — | | | | 6.83 | | | | — | | | | (6.85 | ) | | | (6.85 | ) | |
Year Ended December 31, 2012 | | $ | 21.20 | | | | (0.14 | ) | | | 3.46 | | | | — | | | | 3.32 | | | | — | | | | (2.04 | ) | | | (2.04 | ) | |
Year Ended December 31, 2011 | | $ | 25.83 | | | | (0.32 | ) | | | (4.12 | ) | | | — | | | | (4.44 | ) | | | (0.19 | ) | | | — | | | | (0.19 | ) | |
Year Ended December 31, 2010 | | $ | 21.25 | | | | (0.34 | ) | | | 4.92 | | | | — | | | | 4.58 | | | | — | | | | — | | | | — | | |
Year Ended December 31, 2009 | | $ | 12.94 | | | | (0.26 | ) | | | 8.57 | | | | — | | | | 8.31 | | | | — | | | | — | | | | — | | |
Class I | |
Year Ended December 31, 2013 | | $ | 25.63 | | | | (0.06 | ) | | | 8.25 | | | | — | | | | 8.19 | | | | (0.16 | ) | | | (6.85 | ) | | | (7.01 | ) | |
Year Ended December 31, 2012 | | $ | 23.65 | | | | 0.23 | | | | 3.79 | | | | — | | | | 4.02 | | | | — | | | | (2.04 | ) | | | (2.04 | ) | |
Year Ended December 31, 2011 | | $ | 28.74 | | | | (0.03 | ) | | | (4.59 | ) | | | — | | | | (4.62 | ) | | | (0.47 | ) | | | — | | | | (0.47 | ) | |
Year Ended December 31, 2010 (e) | | $ | 24.74 | | | | 0.01 | | | | 3.99 | | | | — | | | | 4.00 | | | | — | | | | — | | | | — | | |
Class R4 | |
Year Ended December 31, 2013 | | $ | 25.92 | | | | (0.06 | ) | | | 8.32 | | | | — | | | | 8.26 | | | | (0.13 | ) | | | (6.85 | ) | | | (6.98 | ) | |
Year Ended December 31, 2012 (g) | | $ | 25.91 | | | | (0.00 | )(h) | | | 1.52 | | | | — | | | | 1.52 | | | | — | | | | (1.51 | ) | | | (1.51 | ) | |
Class R5 | |
Year Ended December 31, 2013 | | $ | 25.93 | | | | (0.04 | ) | | | 8.31 | | | | — | | | | 8.27 | | | | (0.15 | ) | | | (6.85 | ) | | | (7.00 | ) | |
Year Ended December 31, 2012 (i) | | $ | 25.91 | | | | (0.00 | )(h) | | | 1.53 | | | | — | | | | 1.53 | | | | — | | | | (1.51 | ) | | | (1.51 | ) | |
Class Y | |
Year Ended December 31, 2013 | | $ | 25.98 | | | | (0.03 | ) | | | 8.34 | | | | — | | | | 8.31 | | | | (0.17 | ) | | | (6.85 | ) | | | (7.02 | ) | |
Year Ended December 31, 2012 (j) | | $ | 25.96 | | | | 0.01 | | | | 1.52 | | | | — | | | | 1.53 | | | | — | | | | (1.51 | ) | | | (1.51 | ) | |
Class Z | |
Year Ended December 31, 2013 | | $ | 25.57 | | | | (0.07 | ) | | | 8.21 | | | | — | | | | 8.14 | | | | (0.14 | ) | | | (6.85 | ) | | | (6.99 | ) | |
Year Ended December 31, 2012 | | $ | 23.62 | | | | 0.11 | | | | 3.88 | | | | — | | | | 3.99 | | | | — | | | | (2.04 | ) | | | (2.04 | ) | |
Year Ended December 31, 2011 | | $ | 28.73 | | | | (0.07 | ) | | | (4.58 | ) | | | 0.00 | (h) | | | (4.65 | ) | | | (0.46 | ) | | | — | | | | (0.46 | ) | |
Year Ended December 31, 2010 | | $ | 23.38 | | | | (0.10 | ) | | | 5.45 | | | | — | | | | 5.35 | | | | — | | | | — | | | | — | | |
Year Ended December 31, 2009 | | $ | 14.07 | | | | (0.08 | ) | | | 9.39 | | | | — | | | | 9.31 | | | | — | | | | — | | | | — | | |
(a) In addition to the fees and expenses which the Fund bears directly, the Fund indirectly bears a pro rata share of the fees and expenses of the acquired funds in which it invests, if any. Such indirect expenses are not included in the reported expense ratios.
(b) Ratios include line of credit interest expense which rounds to less than 0.01%.
(c) The benefits derived from custody fees paid indirectly had an impact of less than 0.01%.
(d) Had the Investment Manager and/or Transfer Agent not waived fees and/or reimbursed a portion of expenses, total return would have been reduced.
(e) Class I shares commenced operations on September 27, 2010. Per share data and total return reflect activity from that date.
(f) Annualized.
(g) Class R4 shares commenced operations on November 8, 2012. Per share data and total return reflect activity from that date.
(h) Rounds to zero.
(i) Class R5 shares commenced operations on November 8, 2012. Per share data and total return reflect activity from that date.
(j) Class Y shares commenced operations on November 8, 2012. Per share data and total return reflect activity from that date.
(k) During the year ended December 31, 2011, the Fund received a reimbursement by an affiliate. Had the Fund not received this payment, total return would have been lower by 0.01%.
See accompanying notes to financial statements.
112
| | | | | | | Ratio to Average Net Assets | | Supplemental Data | |
(Selected data for a share outstanding
throughout each period) | | Net Asset
Value, End of
Period | | Total Return | | Total gross
expenses
(a) | | Total net
expenses
(a) | | Net
investment
income (loss) | | Portfolio
turnover rate | | Net assets,
end of period
(000s) | |
Class A | |
Year Ended December 31, 2013 | | $ | 25.57 | | | | 33.77 | % | | | 1.31 | %(b) | | | 1.31 | %(b) | | | (0.54 | )% | | | 20 | % | | $ | 333,193 | | |
Year Ended December 31, 2012 | | $ | 24.72 | | | | 16.87 | % | | | 1.31 | %(b) | | | 1.31 | %(b)(c) | | | 0.13 | % | | | 15 | % | | $ | 271,628 | | |
Year Ended December 31, 2011 | | $ | 22.95 | | | | (16.65 | )% | | | 1.28 | % | | | 1.28 | %(c) | | | (0.57 | )% | | | 21 | % | | $ | 340,325 | | |
Year Ended December 31, 2010 | | $ | 27.94 | | | | 22.49 | % | | | 1.28 | % | | | 1.28 | %(c) | | | (0.73 | )% | | | 28 | % | | $ | 555,263 | | |
Year Ended December 31, 2009 | | $ | 22.81 | | | | 65.65 | % | | | 1.30 | % | | | 1.30 | %(c) | | | (0.78 | )% | | | 19 | % | | $ | 522,443 | | |
Class B | |
Year Ended December 31, 2013 | | $ | 22.81 | | | | 32.81 | %(d) | | | 2.05 | %(b) | | | 2.03 | %(b) | | | (1.32 | )% | | | 20 | % | | $ | 2,938 | | |
Year Ended December 31, 2012 | | $ | 22.75 | | | | 16.11 | % | | | 1.91 | %(b) | | | 1.90 | %(b)(c) | | | (0.62 | )% | | | 15 | % | | $ | 9,938 | | |
Year Ended December 31, 2011 | | $ | 21.40 | | | | (17.11 | )% | | | 1.88 | % | | | 1.88 | %(c) | | | (1.21 | )% | | | 21 | % | | $ | 26,126 | | |
Year Ended December 31, 2010 | | $ | 26.06 | | | | 21.72 | % | | | 1.92 | % | | | 1.92 | %(c) | | | (1.39 | )% | | | 28 | % | | $ | 72,203 | | |
Year Ended December 31, 2009 | | $ | 21.41 | | | | 64.44 | % | | | 2.01 | % | | | 2.01 | %(c) | | | (1.49 | )% | | | 19 | % | | $ | 88,004 | | |
Class C | |
Year Ended December 31, 2013 | | $ | 22.46 | | | | 32.85 | % | | | 2.04 | %(b) | | | 2.04 | %(b) | | | (1.28 | )% | | | 20 | % | | $ | 61,537 | | |
Year Ended December 31, 2012 | | $ | 22.48 | | | | 15.93 | % | | | 2.07 | %(b) | | | 2.06 | %(b)(c) | | | (0.59 | )% | | | 15 | % | | $ | 57,309 | | |
Year Ended December 31, 2011 | | $ | 21.20 | | | | (17.27 | )% | | | 2.05 | % | | | 2.05 | %(c) | | | (1.34 | )% | | | 21 | % | | $ | 62,887 | | |
Year Ended December 31, 2010 | | $ | 25.83 | | | | 21.55 | % | | | 2.07 | % | | | 2.07 | %(c) | | | (1.52 | )% | | | 28 | % | | $ | 98,445 | | |
Year Ended December 31, 2009 | | $ | 21.25 | | | | 64.22 | % | | | 2.14 | % | | | 2.14 | %(c) | | | (1.62 | )% | | | 19 | % | | $ | 93,121 | | |
Class I | |
Year Ended December 31, 2013 | | $ | 26.81 | | | | 34.31 | % | | | 0.94 | %(b) | | | 0.94 | %(b) | | | (0.21 | )% | | | 20 | % | | $ | 13,660 | | |
Year Ended December 31, 2012 | | $ | 25.63 | | | | 17.26 | % | | | 0.96 | %(b) | | | 0.95 | %(b)(c) | | | 0.89 | % | | | 15 | % | | $ | 39,054 | | |
Year Ended December 31, 2011 | | $ | 23.65 | | | | (16.25 | )% | | | 0.92 | % | | | 0.92 | %(c) | | | (0.12 | )% | | | 21 | % | | $ | 10,944 | | |
Year Ended December 31, 2010 (e) | | $ | 28.74 | | | | 16.17 | % | | | 0.91 | %(f) | | | 0.91 | %(c)(f) | | | 0.18 | %(f) | | | 28 | % | | $ | 7,832 | | |
Class R4 | |
Year Ended December 31, 2013 | | $ | 27.20 | | | | 34.16 | % | | | 1.02 | %(b) | | | 1.02 | %(b) | | | (0.20 | )% | | | 20 | % | | $ | 1,383 | | |
Year Ended December 31, 2012 (g) | | $ | 25.92 | | | | 5.92 | % | | | 1.07 | %(f) | | | 1.06 | %(c)(f) | | | 0.02 | %(f) | | | 15 | % | | $ | 15 | | |
Class R5 | |
Year Ended December 31, 2013 | | $ | 27.20 | | | | 34.21 | % | | | 0.97 | %(b) | | | 0.97 | %(b) | | | (0.13 | )% | | | 20 | % | | $ | 11,996 | | |
Year Ended December 31, 2012 (i) | | $ | 25.93 | | | | 5.96 | % | | | 0.99 | %(f) | | | 0.99 | %(c)(f) | | | 0.08 | %(f) | | | 15 | % | | $ | 3 | | |
Class Y | |
Year Ended December 31, 2013 | | $ | 27.27 | | | | 34.30 | % | | | 0.93 | %(b) | | | 0.93 | %(b) | | | (0.09 | )% | | | 20 | % | | $ | 4,847 | | |
Year Ended December 31, 2012 (j) | | $ | 25.98 | | | | 5.94 | % | | | 0.92 | %(f) | | | 0.92 | %(c)(f) | | | 0.15 | %(f) | | | 15 | % | | $ | 3 | | |
Class Z | |
Year Ended December 31, 2013 | | $ | 26.72 | | | | 34.16 | % | | | 1.02 | %(b) | | | 1.02 | %(b) | | | (0.26 | )% | | | 20 | % | | $ | 431,990 | | |
Year Ended December 31, 2012 | | $ | 25.57 | | | | 17.15 | % | | | 1.03 | %(b) | | | 1.03 | %(b)(c) | | | 0.40 | % | | | 15 | % | | $ | 587,678 | | |
Year Ended December 31, 2011 | | $ | 23.62 | | | | (16.37 | )%(k) | | | 0.97 | % | | | 0.97 | %(c) | | | (0.28 | )% | | | 21 | % | | $ | 850,338 | | |
Year Ended December 31, 2010 | | $ | 28.73 | | | | 22.88 | % | | | 0.97 | % | | | 0.97 | %(c) | | | (0.41 | )% | | | 28 | % | | $ | 1,549,112 | | |
Year Ended December 31, 2009 | | $ | 23.38 | | | | 66.17 | % | | | 0.99 | % | | | 0.99 | %(c) | | | (0.47 | )% | | | 19 | % | | $ | 1,241,277 | | |
See accompanying notes to financial statements.
113
Columbia Acorn Family of Funds
Financial Highlights, continued
Columbia Thermostat Fund
| | | | | Income from Investment Operations | | | | Less Distributions to Shareholders | | | |
(Selected data for a share outstanding
throughout each period) | | Net Asset
Value,
Beginning of
Period | | Net
investment
income | | Net realized
and
unrealized
gain | | Total from
investment
operations | | Net
investment
income | | Net
realized gains | | Total
Distributions to
Shareholders | |
Class A | |
Year Ended December 31, 2013 | | $ | 14.29 | | | | 0.29 | | | | 1.00 | | | | 1.29 | | | | (0.25 | ) | | | (0.75 | ) | | | (1.00 | ) | |
Year Ended December 31, 2012 | | $ | 12.82 | | | | 0.32 | | | | 1.39 | | | | 1.71 | | | | (0.24 | ) | | | — | | | | (0.24 | ) | |
Year Ended December 31, 2011 | | $ | 12.58 | | | | 0.28 | | | | 0.30 | | | | 0.58 | | | | (0.34 | ) | | | — | | | | (0.34 | ) | |
Year Ended December 31, 2010 | | $ | 10.90 | | | | 0.19 | | | | 1.67 | | | | 1.86 | | | | (0.18 | ) | | | — | | | | (0.18 | ) | |
Year Ended December 31, 2009 | | $ | 8.26 | | | | 0.11 | | | | 2.53 | | | | 2.64 | | | | (0.00 | )(d) | | | — | | | | (0.00 | )(d) | |
Class B | |
Year Ended December 31, 2013 | | $ | 14.39 | | | | 0.19 | | | | 1.03 | | | | 1.22 | | | | (0.18 | ) | | | (0.75 | ) | | | (0.93 | ) | |
Year Ended December 31, 2012 | | $ | 12.91 | | | | 0.20 | | | | 1.45 | | | | 1.65 | | | | (0.17 | ) | | | — | | | | (0.17 | ) | |
Year Ended December 31, 2011 | | $ | 12.64 | | | | 0.15 | | | | 0.38 | | | | 0.53 | | | | (0.26 | ) | | | — | | | | (0.26 | ) | |
Year Ended December 31, 2010 | | $ | 10.93 | | | | 0.13 | | | | 1.67 | | | | 1.80 | | | | (0.09 | ) | | | — | | | | (0.09 | ) | |
Year Ended December 31, 2009 | | $ | 8.32 | | | | 0.06 | | | | 2.55 | | | | 2.61 | | | | — | | | | — | | | | — | | |
Class C | |
Year Ended December 31, 2013 | | $ | 14.39 | | | | 0.18 | | | | 1.00 | | | | 1.18 | | | | (0.14 | ) | | | (0.75 | ) | | | (0.89 | ) | |
Year Ended December 31, 2012 | | $ | 12.91 | | | | 0.22 | | | | 1.39 | | | | 1.61 | | | | (0.13 | ) | | | — | | | | (0.13 | ) | |
Year Ended December 31, 2011 | | $ | 12.62 | | | | 0.18 | | | | 0.31 | | | | 0.49 | | | | (0.20 | ) | | | — | | | | (0.20 | ) | |
Year Ended December 31, 2010 | | $ | 10.91 | | | | 0.10 | | | | 1.68 | | | | 1.78 | | | | (0.07 | ) | | | — | | | | (0.07 | ) | |
Year Ended December 31, 2009 | | $ | 8.33 | | | | 0.03 | | | | 2.55 | | | | 2.58 | | | | — | | | | — | | | | — | | |
Class R4 | |
Year Ended December 31, 2013 | | $ | 14.19 | | | | 0.36 | | | | 0.95 | | | | 1.31 | | | | (0.29 | ) | | | (0.75 | ) | | | (1.04 | ) | |
Year Ended December 31, 2012 (e) | | $ | 14.08 | | | | 0.09 | | | | 0.28 | | | | 0.37 | | | | (0.26 | ) | | | — | | | | (0.26 | ) | |
Class R5 | |
Year Ended December 31, 2013 | | $ | 14.19 | | | | 0.37 | | | | 0.96 | | | | 1.33 | | | | (0.30 | ) | | | (0.75 | ) | | | (1.05 | ) | |
Year Ended December 31, 2012 (g) | | $ | 14.08 | | | | 0.09 | | | | 0.27 | | | | 0.36 | | | | (0.25 | ) | | | — | | | | (0.25 | ) | |
Class Y | |
Year Ended December 31, 2013 | | $ | 14.18 | | | | 0.33 | | | | 1.01 | | | | 1.34 | | | | (0.31 | ) | | | (0.75 | ) | | | (1.06 | ) | |
Year Ended December 31, 2012 (h) | | $ | 14.08 | | | | 0.09 | | | | 0.27 | | | | 0.36 | | | | (0.26 | ) | | | — | | | | (0.26 | ) | |
Class Z | |
Year Ended December 31, 2013 | | $ | 14.13 | | | | 0.32 | | | | 0.99 | | | | 1.31 | | | | (0.29 | ) | | | (0.75 | ) | | | (1.04 | ) | |
Year Ended December 31, 2012 | | $ | 12.67 | | | | 0.34 | | | | 1.39 | | | | 1.73 | | | | (0.27 | ) | | | — | | | | (0.27 | ) | |
Year Ended December 31, 2011 | | $ | 12.44 | | | | 0.31 | | | | 0.29 | | | | 0.60 | | | | (0.37 | ) | | | — | | | | (0.37 | ) | |
Year Ended December 31, 2010 | | $ | 10.80 | | | | 0.21 | | | | 1.66 | | | | 1.87 | | | | (0.23 | ) | | | — | | | | (0.23 | ) | |
Year Ended December 31, 2009 | | $ | 8.19 | | | | 0.13 | | | | 2.51 | | | | 2.64 | | | | (0.03 | ) | | | — | | | | (0.03 | ) | |
(a) Had the Investment Manager and/or Transfer Agent not waived fees and/or reimbursed a portion of expenses, total return would have been reduced.
(b) In addition to the fees and expenses which the Fund bears directly, the Fund indirectly bears a pro rata share of the fees and expenses of the underlying funds in which it invests, if any. Such indirect expenses are not included in the reported expense ratios.
(c) The benefits derived from custody fees paid indirectly had an impact of less than 0.01%.
(d) Rounds to zero.
(e) Class R4 shares commenced operations on November 8, 2012. Per share data and total return reflect activity from that date.
(f) Annualized.
(g) Class R5 shares commenced operations on November 8, 2012. Per share data and total return reflect activity from that date.
(h) Class Y shares commenced operations on November 8, 2012. Per share data and total return reflect activity from that date.
See accompanying notes to financial statements.
114
| | | | | | Ratio to Average Net Assets | | Supplemental Data | |
(Selected data for a share outstanding
throughout each period) | | Net Asset
Value, End of
Period | | Total Return
(a) | | Total gross
expenses
(b) | | Total net
expenses
(b) | | Net
investment
income | | Portfolio
turnover rate | | Net assets,
end of period
(000s) | |
Class A | |
Year Ended December 31, 2013 | | $ | 14.58 | | | | 9.07 | % | | | 0.52 | % | | | 0.50 | % | | | 1.91 | % | | | 92 | % | | $ | 513,293 | | |
Year Ended December 31, 2012 | | $ | 14.29 | | | | 13.34 | % | | | 0.58 | % | | | 0.50 | %(c) | | | 2.28 | % | | | 109 | % | | $ | 323,750 | | |
Year Ended December 31, 2011 | | $ | 12.82 | | | | 4.62 | % | | | 0.67 | % | | | 0.50 | %(c) | | | 2.17 | % | | | 130 | % | | $ | 79,744 | | |
Year Ended December 31, 2010 | | $ | 12.58 | | | | 17.28 | % | | | 0.72 | % | | | 0.50 | %(c) | | | 1.64 | % | | | 118 | % | | $ | 44,527 | | |
Year Ended December 31, 2009 | | $ | 10.90 | | | | 31.98 | % | | | 0.78 | % | | | 0.50 | %(c) | | | 1.17 | % | | | 17 | % | | $ | 42,976 | | |
Class B | |
Year Ended December 31, 2013 | | $ | 14.68 | | | | 8.49 | % | | | 1.15 | % | | | 1.00 | % | | | 1.29 | % | | | 92 | % | | $ | 2,263 | | |
Year Ended December 31, 2012 | | $ | 14.39 | | | | 12.78 | % | | | 1.16 | % | | | 1.00 | %(c) | | | 1.47 | % | | | 109 | % | | $ | 4,480 | | |
Year Ended December 31, 2011 | | $ | 12.91 | | | | 4.19 | % | | | 1.23 | % | | | 1.00 | %(c) | | | 1.18 | % | | | 130 | % | | $ | 11,318 | | |
Year Ended December 31, 2010 | | $ | 12.64 | | | | 16.64 | % | | | 1.28 | % | | | 1.00 | %(c) | | | 1.10 | % | | | 118 | % | | $ | 28,752 | | |
Year Ended December 31, 2009 | | $ | 10.93 | | | | 31.37 | % | | | 1.32 | % | | | 1.00 | %(c) | | | 0.64 | % | | | 17 | % | | $ | 32,758 | | |
Class C | |
Year Ended December 31, 2013 | | $ | 14.68 | | | | 8.23 | % | | | 1.27 | % | | | 1.25 | % | | | 1.16 | % | | | 92 | % | | $ | 430,173 | | |
Year Ended December 31, 2012 | | $ | 14.39 | | | | 12.52 | % | | | 1.32 | % | | | 1.25 | %(c) | | | 1.56 | % | | | 109 | % | | $ | 253,641 | | |
Year Ended December 31, 2011 | | $ | 12.91 | | | | 3.87 | % | | | 1.43 | % | | | 1.25 | %(c) | | | 1.40 | % | | | 130 | % | | $ | 33,378 | | |
Year Ended December 31, 2010 | | $ | 12.62 | | | | 16.43 | % | | | 1.49 | % | | | 1.25 | %(c) | | | 0.88 | % | | | 118 | % | | $ | 21,866 | | |
Year Ended December 31, 2009 | | $ | 10.91 | | | | 30.97 | % | | | 1.55 | % | | | 1.25 | %(c) | | | 0.39 | % | | | 17 | % | | $ | 21,090 | | |
Class R4 | |
Year Ended December 31, 2013 | | $ | 14.46 | | | | 9.26 | % | | | 0.28 | % | | | 0.25 | % | | | 2.39 | % | | | 92 | % | | $ | 14,651 | | |
Year Ended December 31, 2012 (e) | | $ | 14.19 | | | | 2.60 | % | | | 0.42 | %(f) | | | 0.25 | %(c)(f) | | | 4.59 | %(f) | | | 109 | % | | $ | 15 | | |
Class R5 | |
Year Ended December 31, 2013 | | $ | 14.47 | | | | 9.35 | % | | | 0.25 | % | | | 0.23 | % | | | 2.44 | % | | | 92 | % | | $ | 979 | | |
Year Ended December 31, 2012 (g) | | $ | 14.19 | | | | 2.58 | % | | | 0.35 | %(f) | | | 0.27 | %(c)(f) | | | 4.60 | %(f) | | | 109 | % | | $ | 3 | | |
Class Y | |
Year Ended December 31, 2013 | | $ | 14.46 | | | | 9.46 | % | | | 0.14 | % | | | 0.14 | % | | | 2.23 | % | | | 92 | % | | $ | 3 | | |
Year Ended December 31, 2012 (h) | | $ | 14.18 | | | | 2.55 | % | | | 0.30 | %(f) | | | 0.22 | %(c)(f) | | | 4.63 | %(f) | | | 109 | % | | $ | 3 | | |
Class Z | |
Year Ended December 31, 2013 | | $ | 14.40 | | | | 9.30 | % | | | 0.26 | % | | | 0.25 | % | | | 2.14 | % | | | 92 | % | | $ | 375,444 | | |
Year Ended December 31, 2012 | | $ | 14.13 | | | | 13.69 | % | | | 0.30 | % | | | 0.25 | %(c) | | | 2.48 | % | | | 109 | % | | $ | 292,732 | | |
Year Ended December 31, 2011 | | $ | 12.67 | | | | 4.85 | % | | | 0.34 | % | | | 0.25 | %(c) | | | 2.43 | % | | | 130 | % | | $ | 65,167 | | |
Year Ended December 31, 2010 | | $ | 12.44 | | | | 17.58 | % | | | 0.37 | % | | | 0.25 | %(c) | | | 1.87 | % | | | 118 | % | | $ | 36,130 | | |
Year Ended December 31, 2009 | | $ | 10.80 | | | | 32.29 | % | | | 0.39 | % | | | 0.25 | %(c) | | | 1.48 | % | | | 17 | % | | $ | 41,765 | | |
See accompanying notes to financial statements.
115
Columbia Acorn Family of Funds
Financial Highlights, continued
Columbia Acorn Emerging Markets Fund
| | | | | Income from Investment Operations | | | | Less Distributions to
Shareholders | | | | | |
(Selected data for a share outstanding
throughout each period) | | Net Asset
Value,
Beginning of
Period | | Net
investment
income (loss) | | Net realized
and
unrealized
gain (loss) | | Total from
investment
operations | | Net
investment
income | | Total
Distributions to
Shareholders | | Net Asset
Value, End of
Period | |
Class A | |
Year Ended December 31, 2013 | | $ | 12.04 | | | | 0.07 | | | | 1.34 | | | | 1.41 | | | | (0.08 | ) | | | (0.08 | ) | | $ | 13.37 | | |
Year Ended December 31, 2012 | | $ | 9.26 | | | | 0.08 | | | | 2.78 | | | | 2.86 | | | | (0.08 | ) | | | (0.08 | ) | | $ | 12.04 | | |
Year Ended December 31, 2011 (d) | | $ | 10.00 | | | | (0.00 | )(e) | | | (0.74 | ) | | | (0.74 | ) | | | — | | | | — | | | $ | 9.26 | | |
Class C | |
Year Ended December 31, 2013 | | $ | 12.01 | | | | (0.03 | ) | | | 1.34 | | | | 1.31 | | | | — | | | | — | | | $ | 13.32 | | |
Year Ended December 31, 2012 | | $ | 9.24 | | | | (0.02 | ) | | | 2.79 | | | | 2.77 | | | | — | | | | — | | | $ | 12.01 | | |
Year Ended December 31, 2011 (h) | | $ | 10.00 | | | | (0.02 | ) | | | (0.74 | ) | | | (0.76 | ) | | | — | | | | — | | | $ | 9.24 | | |
Class I | |
Year Ended December 31, 2013 | | $ | 12.08 | | | | 0.08 | | | | 1.37 | | | | 1.45 | | | | (0.12 | ) | | | (0.12 | ) | | $ | 13.41 | | |
Year Ended December 31, 2012 | | $ | 9.29 | | | | 0.11 | | | | 2.80 | | | | 2.91 | | | | (0.12 | ) | | | (0.12 | ) | | $ | 12.08 | | |
Year Ended December 31, 2011 (i) | | $ | 10.00 | | | | 0.01 | | | | (0.72 | ) | | | (0.71 | ) | | | — | | | | — | | | $ | 9.29 | | |
Class R4 | |
Year Ended December 31, 2013 | | $ | 12.14 | | | | 0.12 | | | | 1.35 | | | | 1.47 | | | | (0.12 | ) | | | (0.12 | ) | | $ | 13.49 | | |
Year Ended December 31, 2012 (j) | | $ | 11.44 | | | | (0.01 | ) | | | 0.81 | | | | 0.80 | | | | (0.10 | ) | | | (0.10 | ) | | $ | 12.14 | | |
Class R5 | |
Year Ended December 31, 2013 | | $ | 12.14 | | | | 0.12 | | | | 1.34 | | | | 1.46 | | | | (0.12 | ) | | | (0.12 | ) | | $ | 13.48 | | |
Year Ended December 31, 2012 (k) | | $ | 11.44 | | | | (0.00 | )(e) | | | 0.81 | | | | 0.81 | | | | (0.11 | ) | | | (0.11 | ) | | $ | 12.14 | | |
Class Y | |
Year Ended December 31, 2013 (l) | | $ | 12.22 | | | | 0.07 | | | | 1.20 | | | | 1.27 | | | | (0.13 | ) | | | (0.13 | ) | | $ | 13.36 | | |
Class Z | |
Year Ended December 31, 2013 | | $ | 12.07 | | | | 0.11 | | | | 1.33 | | | | 1.44 | | | | (0.11 | ) | | | (0.11 | ) | | $ | 13.40 | | |
Year Ended December 31, 2012 | | $ | 9.28 | | | | 0.12 | | | | 2.79 | | | | 2.91 | | | | (0.12 | ) | | | (0.12 | ) | | $ | 12.07 | | |
Year Ended December 31, 2011 (m) | | $ | 10.00 | | | | 0.01 | | | | (0.73 | ) | | | (0.72 | ) | | | — | | | | — | | | $ | 9.28 | | |
(a) Had the Investment Manager and/or Transfer Agent not waived fees and/or reimbursed a portion of expenses, total return would have been reduced.
(b) In addition to the fees and expenses which the Fund bears directly, the Fund indirectly bears a pro rata share of the fees and expenses of the acquired funds in which it invests, if any. Such indirect expenses are not included in the reported expense ratios.
(c) The benefits derived from custody fees paid indirectly had an impact of 0.01%.
(d) Class A shares commenced operations on August 19, 2011. Per share data and total return reflect activity from that date.
(e) Rounds to zero.
(f) Annualized.
(g) The benefits derived from custody fees paid indirectly had an impact of less than 0.01%.
(h) Class C shares commenced operations on August 19, 2011. Per share data and total return reflect activity from that date.
(i) Class I shares commenced operations on August 19, 2011. Per share data and total return reflect activity from that date.
(j) Class R4 shares commenced operations on November 8, 2012. Per share data and total return reflect activity from that date.
(k) Class R5 shares commenced operations on November 8, 2012. Per share data and total return reflect activity from that date.
(l) Class Y shares commenced operations on June 13, 2013. Per share data and total return reflect activity from that date.
(m) Class Z shares commenced operations on August 19, 2011. Per share data and total return reflect activity from that date.
See accompanying notes to financial statements.
116
| | | | | Ratio to Average Net Assets | | Supplemental Data | |
(Selected data for a share outstanding
throughout each period) | | Total Return
(a) | | Total gross
expenses | | Total net
expenses | | Net
investment
income (loss) | | Portfolio
turnover rate | | Net assets,
end of period
(000s) | |
Class A | |
Year Ended December 31, 2013 | | | 11.73 | % | | | 1.80 | %(b) | | | 1.76 | %(b) | | | 0.52 | % | | | 36 | % | | $ | 177,158 | | |
Year Ended December 31, 2012 | | | 30.86 | % | | | 6.42 | %(b) | | | 1.77 | %(b)(c) | | | 0.77 | % | | | 30 | % | | $ | 3,103 | | |
Year Ended December 31, 2011 (d) | | | (7.40 | )% | | | 20.13 | %(f) | | | 1.85 | %(f)(g) | | | (0.01 | )%(f) | | | 9 | % | | $ | 332 | | |
Class C | |
Year Ended December 31, 2013 | | | 10.91 | % | | | 2.55 | %(b) | | | 2.51 | %(b) | | | (0.23 | )% | | | 36 | % | | $ | 32,636 | | |
Year Ended December 31, 2012 | | | 29.98 | % | | | 7.18 | %(b) | | | 2.56 | %(b)(c) | | | (0.15 | )% | | | 30 | % | | $ | 615 | | |
Year Ended December 31, 2011 (h) | | | (7.60 | )% | | | 25.06 | %(f) | | | 2.60 | %(f)(g) | | | (0.68 | )%(f) | | | 9 | % | | $ | 127 | | |
Class I | |
Year Ended December 31, 2013 | | | 12.06 | % | | | 1.73 | %(b) | | | 1.39 | %(b) | | | 0.65 | % | | | 36 | % | | $ | 7 | | |
Year Ended December 31, 2012 | | | 31.39 | % | | | 6.18 | %(b) | | | 1.41 | %(b)(c) | | | 1.05 | % | | | 30 | % | | $ | 6 | | |
Year Ended December 31, 2011 (i) | | | (7.10 | )% | | | 19.31 | %(f) | | | 1.41 | %(f)(g) | | | 0.17 | %(f) | | | 9 | % | | $ | 5 | | |
Class R4 | |
Year Ended December 31, 2013 | | | 12.13 | % | | | 1.44 | %(b) | | | 1.44 | %(b) | | | 0.92 | % | | | 36 | % | | $ | 13,583 | | |
Year Ended December 31, 2012 (j) | | | 7.04 | % | | | 5.86 | %(b)(f) | | | 1.54 | %(b)(c)(f) | | | (0.31 | )%(f) | | | 30 | % | | $ | 16 | | |
Class R5 | |
Year Ended December 31, 2013 | | | 12.07 | % | | | 1.42 | %(b) | | | 1.42 | %(b) | | | 0.94 | % | | | 36 | % | | $ | 13,625 | | |
Year Ended December 31, 2012 (k) | | | 7.11 | % | | | 5.81 | %(b)(f) | | | 1.46 | %(b)(c)(f) | | | (0.22 | )%(f) | | | 30 | % | | $ | 3 | | |
Class Y | |
Year Ended December 31, 2013 (l) | | | 10.43 | % | | | 1.36 | %(b)(f) | | | 1.36 | %(b)(f) | | | 0.97 | %(f) | | | 36 | % | | $ | 3 | | |
Class Z | |
Year Ended December 31, 2013 | | | 11.92 | % | | | 1.58 | %(b) | | | 1.54 | %(b) | | | 0.89 | % | | | 36 | % | | $ | 177,693 | | |
Year Ended December 31, 2012 | | | 31.35 | % | | | 6.15 | %(b) | | | 1.46 | %(b)(c) | | | 1.07 | % | | | 30 | % | | $ | 6,846 | | |
Year Ended December 31, 2011 (m) | | | (7.20 | )% | | | 19.52 | %(f) | | | 1.46 | %(f)(g) | | | 0.15 | %(f) | | | 9 | % | | $ | 2,765 | | |
See accompanying notes to financial statements.
117
Columbia Acorn Family of Funds
Financial Highlights, continued
Columbia Acorn European Fund
| | | | | Income from Investment Operations | | | | Less Distributions to Shareholders | | | |
(Selected data for a share outstanding
throughout each period) | | Net Asset
Value,
Beginning of
Period | | Net
investment
income (loss) | | Net realized
and
unrealized
gain (loss) | | Total from
investment
operations | | Net
investment
income | | Net
realized gains | | Total
Distributions to
Shareholders | |
Class A | |
Year Ended December 31, 2013 | | $ | 11.76 | | | | (0.02 | ) | | | 3.97 | | | | 3.95 | | | | (0.01 | ) | | | (0.02 | ) | | | (0.03 | ) | |
Year Ended December 31, 2012 | | $ | 9.43 | | | | 0.03 | | | | 2.37 | | | | 2.40 | | | | (0.07 | ) | | | (0.00 | )(c) | | | (0.07 | ) | |
Year Ended December 31, 2011 (e) | | $ | 10.00 | | | | (0.03 | ) | | | (0.46 | ) | | | (0.49 | ) | | | (0.06 | ) | | | (0.02 | ) | | | (0.08 | ) | |
Class C | |
Year Ended December 31, 2013 | | $ | 11.73 | | | | (0.15 | ) | | | 3.98 | | | | 3.83 | | | | — | | | | (0.02 | ) | | | (0.02 | ) | |
Year Ended December 31, 2012 | | $ | 9.44 | | | | (0.15 | ) | | | 2.46 | | | | 2.31 | | | | (0.02 | ) | | | (0.00 | )(c) | | | (0.02 | ) | |
Year Ended December 31, 2011 (h) | | $ | 10.00 | | | | (0.06 | ) | | | (0.45 | ) | | | (0.51 | ) | | | (0.03 | ) | | | (0.02 | ) | | | (0.05 | ) | |
Class I | |
Year Ended December 31, 2013 | | $ | 11.75 | | | | 0.12 | | | | 3.88 | | | | 4.00 | | | | (0.06 | ) | | | (0.02 | ) | | | (0.08 | ) | |
Year Ended December 31, 2012 | | $ | 9.43 | | | | 0.10 | | | | 2.32 | | | | 2.42 | | | | (0.10 | ) | | | (0.00 | )(c) | | | (0.10 | ) | |
Year Ended December 31, 2011 (i) | | $ | 10.00 | | | | (0.02 | ) | | | (0.46 | ) | | | (0.48 | ) | | | (0.07 | ) | | | (0.02 | ) | | | (0.09 | ) | |
Class R5 | |
Year Ended December 31, 2013 | | $ | 11.86 | | | | (0.04 | ) | | | 4.06 | | | | 4.02 | | | | (0.04 | ) | | | (0.02 | ) | | | (0.06 | ) | |
Year Ended December 31, 2012 (j) | | $ | 11.19 | | | | (0.02 | ) | | | 0.77 | | | | 0.75 | | | | (0.08 | ) | | | — | | | | (0.08 | ) | |
Class Z | |
Year Ended December 31, 2013 | | $ | 11.76 | | | | 0.11 | | | | 3.88 | | | | 3.99 | | | | (0.05 | ) | | | (0.02 | ) | | | (0.07 | ) | |
Year Ended December 31, 2012 | | $ | 9.44 | | | | 0.08 | | | | 2.34 | | | | 2.42 | | | | (0.10 | ) | | | (0.00 | )(c) | | | (0.10 | ) | |
Year Ended December 31, 2011 (k) | | $ | 10.00 | | | | (0.02 | ) | | | (0.46 | ) | | | (0.48 | ) | | | (0.06 | ) | | | (0.02 | ) | | | (0.08 | ) | |
(a) Had the Investment Manager and/or Transfer Agent not waived fees and/or reimbursed a portion of expenses, total return would have been reduced.
(b) In addition to the fees and expenses which the Fund bears directly, the Fund indirectly bears a pro rata share of the fees and expenses of the acquired funds in which it invests, if any. Such indirect expenses are not included in the reported expense ratios.
(c) Rounds to zero.
(d) The benefits derived from custody fees paid indirectly had an impact of 0.01%.
(e) Class A shares commenced operations on August 19, 2011. Per share data and total return reflect activity from that date.
(f) Annualized.
(g) The benefits derived from custody fees paid indirectly had an impact of 0.02%.
(h) Class C shares commenced operations on August 19, 2011. Per share data and total return reflect activity from that date.
(i) Class I shares commenced operations on August 19, 2011. Per share data and total return reflect activity from that date.
(j) Class R5 shares commenced operations on November 8, 2012. Per share data and total return reflect activity from that date.
(k) Class Z shares commenced operations on August 19, 2011. Per share data and total return reflect activity from that date.
See accompanying notes to financial statements.
118
| | | | | | Ratio to Average Net Assets | | Supplemental Data | |
(Selected data for a share outstanding
throughout each period) | | Net Asset
Value, End of
Period | | Total Return
(a) | | Total gross
expenses | | Total net
expenses | | Net
investment
income (loss) | | Portfolio
turnover rate | | Net assets,
end of period
(000s) | |
Class A | |
Year Ended December 31, 2013 | | $ | 15.68 | | | | 33.64 | % | | | 3.33 | %(b) | | | 1.74 | %(b) | | | (0.11 | )% | | | 42 | % | | $ | 19,078 | | |
Year Ended December 31, 2012 | | $ | 11.76 | | | | 25.46 | % | | | 12.35 | %(b) | | | 1.61 | %(b)(d) | | | 0.23 | % | | | 37 | % | | $ | 453 | | |
Year Ended December 31, 2011 (e) | | $ | 9.43 | | | | (4.97 | )% | | | 33.59 | %(f) | | | 1.75 | %(f)(g) | | | (0.84 | )%(f) | | | 17 | % | | $ | 154 | | |
Class C | |
Year Ended December 31, 2013 | | $ | 15.54 | | | | 32.63 | % | | | 4.19 | %(b) | | | 2.50 | %(b) | | | (1.10 | )% | | | 42 | % | | $ | 1,400 | | |
Year Ended December 31, 2012 | | $ | 11.73 | | | | 24.46 | % | | | 12.83 | %(b) | | | 2.32 | %(b)(d) | | | (1.33 | )% | | | 37 | % | | $ | 89 | | |
Year Ended December 31, 2011 (h) | | $ | 9.44 | | | | (5.14 | )% | | | 35.79 | %(f) | | | 2.50 | %(f)(g) | | | (1.66 | )%(f) | | | 17 | % | | $ | 5 | | |
Class I | |
Year Ended December 31, 2013 | | $ | 15.67 | | | | 34.06 | % | | | 3.99 | %(b) | | | 1.41 | %(b) | | | 0.88 | % | | | 42 | % | | $ | 8 | | |
Year Ended December 31, 2012 | | $ | 11.75 | | | | 25.71 | % | | | 12.05 | %(b) | | | 1.31 | %(b)(d) | | | 0.94 | % | | | 37 | % | | $ | 6 | | |
Year Ended December 31, 2011 (i) | | $ | 9.43 | | | | (4.81 | )% | | | 30.00 | %(f) | | | 1.31 | %(f)(g) | | | (0.47 | )%(f) | | | 17 | % | | $ | 5 | | |
Class R5 | |
Year Ended December 31, 2013 | | $ | 15.82 | | | | 33.97 | % | | | 2.76 | %(b) | | | 1.51 | %(b) | | | (0.29 | )% | | | 42 | % | | $ | 1,891 | | |
Year Ended December 31, 2012 (j) | | $ | 11.86 | | | | 6.70 | % | | | 14.07 | %(b)(f) | | | 1.36 | %(b)(d)(f) | | | (1.07 | )%(f) | | | 37 | % | | $ | 3 | | |
Class Z | |
Year Ended December 31, 2013 | | $ | 15.68 | | | | 33.98 | % | | | 3.98 | %(b) | | | 1.45 | %(b) | | | 0.83 | % | | | 42 | % | | $ | 4,407 | | |
Year Ended December 31, 2012 | | $ | 11.76 | | | | 25.66 | % | | | 12.07 | %(b) | | | 1.33 | %(b)(d) | | | 0.76 | % | | | 37 | % | | $ | 2,727 | | |
Year Ended December 31, 2011 (k) | | $ | 9.44 | | | | (4.78 | )% | | | 30.26 | %(f) | | | 1.37 | %(f)(g) | | | (0.52 | )%(f) | | | 17 | % | | $ | 1,516 | | |
See accompanying notes to financial statements.
119
Columbia Acorn Family of Funds
Notes to Financial Statements
1. Nature of Operations
Columbia Acorn Fund, Columbia Acorn International, Columbia Acorn USA, Columbia Acorn International Select, Columbia Acorn Select, Columbia Thermostat Fund, Columbia Acorn Emerging Markets Fund and Columbia Acorn European Fund (the Funds) are each a series of Columbia Acorn Trust (the Trust). The Trust is registered under the Investment Company Act of 1940, as amended (the 1940 Act), as an open-end management investment company organized as a Massachusetts business trust. The investment objective of each Fund is to seek long-term capital appreciation.
Columbia Thermostat Fund pursues its investment objective by investing in shares of other mutual funds. As a "fund of funds" under normal circumstances, the Fund allocates at least 95% of its net assets among a selected group of affiliated stock and bond mutual funds (underlying portfolio funds) according to the current level of the Standard & Poor's (S&P) 500 Index in relation to predetermined ranges set by Columbia Wanger Asset Management, LLC (the Investment Manager). The Fund may invest up to 5% of its net assets plus any cash received that day in cash, repurchase agreements, high quality short-term paper and government securities.
Each Fund may issue an unlimited number of shares. Columbia Acorn Fund, Columbia Acorn USA, Columbia Acorn International Select and Columbia Acorn Select each currently offers Class A, Class B, Class C, Class I, Class R4, Class R5, Class Y and Class Z shares. Columbia Acorn International currently offers Class A, Class B, Class C, Class I, Class R, Class R4, Class R5, Class Y and Class Z shares. Columbia Thermostat Fund currently offers Class A, Class B, Class C, Class R4, Class R5, Class Y and Class Z shares. Columbia Acorn Emerging Markets Fund currently offers Class A, Class C, Class I, Class R4, Class R5, Class Y and Class Z shares. Columbia Acorn European Fund currently offers Class A, Class C, Class I, Class R5 and Class Z shares. Effective February 29, 2008, the Funds generally no longer accept investments by new or existing investors in the Funds' Class B shares, except in connection with the reinvestment of any dividend and/or capital gain distributions in Class B shares of the Funds and exchanges by existing Class B shareholders of certain other funds within the Columbia Family of Funds.
Class A shares are sold with a front-end sales charge. Class A shares bought without an initial sales charge in accounts aggregating $1 million to $50 million at the time of purchase are subject to a 1.00% contingent deferred sales charge (CDSC) if the shares are redeemed within 12 months of purchase, and a 0.50% CDSC if the shares are redeemed more than 12, but less than 18, months after purchase, with certain limited exceptions.
Class B shares are subject to CDSC if redeemed within six years of purchase. Class B shares will convert to Class A shares automatically eight years after purchase.
Class C shares are offered at net asset value but are subject to a CDSC on redemptions made within one year after purchase.
Class I, Class R, Class R4, Class R5 and Class Y shares are offered at net asset value. There are certain restrictions on who may purchase these share classes. Class Y shares commenced operations on June 13, 2013 for Columbia Acorn Emerging Markets Fund.
Class Z shares are offered at net asset value. There are certain restrictions on who may purchase Class Z shares. Generally, Class Z shares of a Fund may be exchanged for shares of another fund distributed by Columbia Management Investment Distributors, Inc. (CMID) at no additional charge.
Investment income, realized and unrealized gains and losses, and certain fund-level expenses are allocated pro rata on the basis of the relative net assets of all classes, except that each class bears certain expenses specific to that class such as distribution services, transfer agent fees, and certain other class specific expenses. Differences in class expenses may result in payment of different dividend distributions for each class. All of the Funds' share classes have equal rights with respect to voting, subject to Fund or class specific matters.
2. Significant Accounting Policies
The preparation of financial statements in accordance with accounting principles generally accepted in the United States of America (GAAP) requires management to make certain estimates and assumptions that affect the reported amounts of assets and liabilities, the disclosure of contingent assets and liabilities at the date of the financial statements and the reported amounts of revenue and expenses during the reporting period. Actual results could differ from those estimates.
>Security valuation
Securities of the Funds are valued at market value or, if a market quotation for a security is not readily available or is deemed not to be reliable because of events or circumstances that have occurred between the market quotation and the time as of which the security is to be valued, the security is valued at a fair value determined in good faith under consistently applied procedures established by the Board of Trustees (the Board). With respect to Columbia Thermostat Fund, investments in portfolio funds are valued at their net asset values as reported by the portfolio funds. A security traded on a securities exchange or in an over-the-counter market in which transaction prices are reported is valued at the last sales price at the time of valuation. A security traded principally on NASDAQ is valued at the NASDAQ official closing price. Mutual funds and exchange
120
traded funds are valued at their closing net asset value as reported to the applicable exchange.
Short-term investments maturing in 60 days or less are valued at amortized cost, which approximates market value.
Forward foreign currency exchange contracts are marked-to-market based upon foreign currency exchange rates provided by a pricing service.
A security for which a market quotation is not readily available and any other assets are valued at their fair value determined in good faith under consistently applied procedures established by the Board. The Trust has retained an independent statistical fair value pricing service that employs a systematic methodology to assist in the fair valuation process for securities principally traded in a foreign market in order to adjust for possible changes in value that may occur between the close of the foreign exchange and the time as of which the securities are to be valued. If a security is valued at fair value, that value may be different from the last quoted market price for the security. A security for which there is no reported sale on the valuation date is valued at the mean of the latest bid and ask quotations.
>Foreign currency translations
Values of investments denominated in foreign currencies are converted into U.S. dollars using the New York spot market rate of exchange at the time of valuation. Purchases and sales of investments and dividend and interest income are translated into U.S. dollars using the spot market rate of exchange prevailing on the respective dates of such transactions. The gain or loss resulting from changes in foreign exchange rates is included with net realized and unrealized gain or loss from investments, as appropriate.
>Restricted securities
Restricted securities are securities that may only be resold upon registration under federal securities laws or in transactions exempt from registration. In some cases, the issuer of restricted securities has agreed to register such securities for resale at the issuer's expense either upon demand by the Fund or in connection with another registered offering of the securities. Many restricted securities may be resold in the secondary market in transactions exempt from registration. Such restricted securities may be determined to be liquid under criteria established by the Board.
>Derivative instruments
Columbia Acorn International Select invests in forward foreign currency exchange contracts on a limited basis, as detailed below. Forward foreign currency exchange contracts are derivative instruments whose values depend on, or are derived from, in whole or in part, the value of one or more other assets, in this case, currencies. Derivatives may involve various risks,
including the potential inability of the counterparty to fulfill its obligation under the terms of the contract and the potential for market movements, which may expose the Fund to gains or losses in excess of the amount shown in the Statements of Assets and Liabilities.
The put option held at December 31, 2013 was acquired through a transaction between each of Columbia Acorn International, Columbia Acorn International Select and Columbia Acorn Emerging Markets Fund and the controlling shareholder of Archipelago Resources (the "Controlling Shareholder") in connection with the delisting of the shares of Archipelago Resources in 2013 and the anticipated restructuring of Archipelago Resources into a new company during 2014 ("New Co"). Normally, a put option would be bought to decrease a Fund's exposure to the underlying stock. However, in this case, the put option related to the proposed restructuring of Archipelago Resources provides each Fund with the ability to sell its shares back to the Controlling Shareholder at an agreed upon price or to convert the shares held in Archipelago Resources into shares of New Co based upon the terms of the put option agreement between each Fund and the Controlling Shareholder.
For financial reporting purposes, the Funds do not offset derivative assets and derivative liabilities that are subject to netting arrangements in the Statements of Assets and Liabilities.
>Forward foreign currency exchange contracts
Forward foreign currency exchange contracts are agreements between two parties to buy and sell a currency at a set price on a future date. Columbia Acorn International Select utilized forward foreign currency exchange contracts to hedge the currency exposure associated with some of the Fund's securities. The Fund's use of forward foreign currency exchange contracts was not material to the net assets of the Fund.
The values of forward foreign currency exchange contracts fluctuate with changes in foreign currency exchange rates. The Fund will record a realized gain or loss when the forward foreign currency exchange contract expires or is closed.
The use of forward foreign currency exchange contracts does not eliminate fluctuations in the prices of the Fund's portfolio securities. The risks of forward foreign currency exchange contracts include movement in the values of the foreign currencies relative to the U.S. dollar (or other foreign currencies) and the possibility that counterparties will not complete their contractual obligations, which may be in excess of the amount reflected, if any, in the Statements of Assets and Liabilities.
>Offsetting of derivative assets and derivative liabilities
The following table presents the gross and net amount of assets and liabilities of Columbia Acorn International Select
121
Columbia Acorn Family of Funds
Notes to Financial Statements, continued
available for offset under netting arrangements as well as any related collateral received or pledged by the Fund as of December 31, 2013:
| | | | | | | | Gross Amounts Not Offset in
the Statements of Assets and Liabilities | | | |
| | Gross
Amounts of
Recognized
Assets | | Gross Amounts
Offset in the
Statements of
Assets and Liabilities | | Net Amounts of Assets
Presented in the
Statements of
Assets and Liabilities | | Financial
Instruments(a) | | Cash
Collateral
Received | | Securities
Collateral
Received | | Net
Amount(b) | |
Forward foreign currency
exchange contracts | | $ | 65,818 | | | $ | — | | | $ | 65,818 | | | $ | — | | | $ | — | | | $ | — | | | $ | 65,818 | | |
(a) Represents the amount of assets that could be offset by liabilities with the same counterparty under master netting or similar agreements that management elects not to offset on the Statements of Assets and Liabilities.
(b) Represents the net amount due from counterparties in the event of default.
>Effects of derivative transactions in the financial statements
The following tables are intended to provide additional information about the effect of derivatives on the financial statements of the Funds including: the fair value of derivatives by risk category and the location of those fair values in the Statements of Assets and Liabilities; the impact of derivative transactions on each Fund's operations over the period including realized gains or losses and unrealized gains or losses. The derivative schedules following each Statement of Investments present additional information regarding derivative instruments outstanding at the end of the period, if any.
Columbia Acorn International
The following table is a summary of the fair value of derivative instruments at December 31, 2013:
| | Asset Derivatives | |
Risk Exposure
Category | | Statement of Assets
and Liabilities Location | | Fair
Value | |
Equity risk | | Affiliated options, at value | | $ | 2,630,029 | | |
The following table indicates the effect of derivative instruments in the Statement of Operations for the year ended December 31, 2013:
Change in Unrealized Appreciation (Depreciation) on
Derivatives Recognized in Income
Risk Exposure Category | | Affiliated options | |
Equity risk | | $ | 2,630,029 | | |
The following table is a summary of the volume of derivative instruments for the year ended December 31, 2013:
Derivative Instrument | | Contracts Opened | |
Option | | | 1 | | |
Columbia Acorn International Select
The following table is a summary of the fair value of derivative instruments at December 31, 2013:
| | | Asset Derivatives | |
Risk Exposure
Category | | Statements of Assets
and Liabilities Location | | Fair
Value | |
Foreign exchange risk
| | Unrealized appreciation on
forward foreign currency
exchange contracts | | $ | 65,818 | | |
Equity risk | | Unaffiliated options, | | | |
| | at value | | | 985,539 | | |
Total | | | | $ | 1,051,357 | | |
The following table indicates the effect of derivative instruments in the Statements of Operations for the year ended December 31, 2013:
Amount of Realized Gain (Loss) on
Derivatives Recognized in Income
Risk Exposure Category | | Forward
Foreign Currency
Exchange Contracts | |
Foreign exchange risk | | $ | 1,491,240 | | |
Change in Unrealized Appreciation (Depreciation)
on Derivatives Recognized in Income
Risk Exposure Category | | Forward
Foreign Currency
Exchange Contracts | |
Unaffiliated
options | | Total | |
Foreign exchange risk | | $ | 477,571 | | | $ | — | | | $ | 477,571 | | |
Equity risk | | | — | | | | 985,539 | | | | 985,539 | | |
Total | | $ | 477,571 | | | $ | 985,539 | | | $ | 1,463,110 | | |
The following table is a summary of the volume of derivative instruments for the year ended December 31, 2013:
Derivative Instrument | | Contracts Opened | |
Forward foreign currency exchange contracts | | | 27 | | |
Option | | | 1 | | |
Columbia Acorn Emerging Markets Fund
The following table is a summary of the fair value of derivative instruments at December 31, 2013:
| | Asset Derivatives | |
Risk Exposure
Category | | Statement of Assets
and Liabilities Location | | Fair
Value | |
| Equity risk | | Unaffiliated options,
at value | | $ | 131,808 | | |
122
The following table indicates the effect of derivative instruments in the Statement of Operations for the year ended December 31, 2013:
Change in Unrealized Appreciation (Depreciation) on
Derivatives Recognized in Income
Risk Exposure Category | | Unaffiliated options | |
Equity risk | | $ | 131,808 | | |
The following table is a summary of the volume of derivative instruments for the year ended December 31, 2013:
Derivative Instrument | | Contracts Opened | |
Option | | | 1 | | |
>Security transactions and investment income
Security transactions, investment income and shareholder fund transactions are accounted for on the trade date (date the order to buy or sell is executed) and dividend income and realized gain distributions from other funds are recorded on the ex-dividend date, except that certain dividends from foreign securities are recorded as soon as the information is available to the Funds. Interest income is recorded on the accrual basis and includes amortization of discounts on debt obligations when required for federal income tax purposes. Realized gains and losses from security transactions are recorded on an identified cost basis.
Awards, if any, from class action litigation related to securities owned may be recorded as a reduction of cost of those securities. If the applicable securities are no longer owned, the proceeds are recorded as realized gains.
The Funds estimate the tax character of distributions from real estate investment trusts (REITs). Distributions received in excess of income are recorded as a reduction of the cost of the related investments. If the applicable securities are no longer owned, any distributions received in excess of income are recorded as realized gains.
>Fund share valuation
Fund shares are sold and redeemed on a daily basis at net asset value, subject to any applicable sales charge. Net asset value per share is determined daily as of the close of trading
on the New York Stock Exchange (NYSE) on each day the NYSE is open for trading. Generally, income, expenses and realized and unrealized gain/(losses) of a Fund are allocated to each class proportionately on a daily basis for purposes of determining the net asset value of each class. The distribution and service fees and transfer agent fees are charged to each specific class as expenses are incurred. Redemption fees are accounted for as an addition to paid in capital for purposes of determining the net asset value of each class.
>Securities lending
Each Fund, except Columbia Thermostat Fund, may lend securities up to one-third of the value of its total assets to certain approved brokers, dealers and other financial institutions to earn additional income. The Funds retain the benefits of owning the securities, including receipt of dividends or interest generated by the security. The Funds also receive a fee for the loan. The Funds have the ability to recall the loans at any time and could do so in order to vote proxies or to sell the loaned securities. Each loan is collateralized by cash that exceeds the value of the securities on loan. The market value of the loaned securities is determined daily at the close of business of a Fund and any additional required collateral is delivered to the Fund on the next business day. The Funds have elected to invest the cash collateral in the Dreyfus Government Cash Management Fund, and the income earned is paid to each Fund, net of any fees remitted to Goldman Sachs Agency Lending, the Funds' lending agent, and net of any borrower rebates. The Investment Manager does not retain any fees earned by the lending program. Generally, in the event of borrower default, a Fund has the right to use the collateral to offset any losses incurred. In the event a Fund is delayed or prevented from exercising its right to dispose of the collateral, there may be a potential loss to the Fund. Some or all of these losses may be indemnified by the lending agent. The Funds bear the risk of loss with respect to the investment of collateral. The net securities lending income earned as of December 31, 2013 by each Fund is included in the Statements of Operations.
123
Columbia Acorn Family of Funds
Notes to Financial Statements, continued
>Offsetting of Financial Assets
The following table presents each Fund's gross and net amount of assets available for offset under a securities lending agreement as well as the related collateral received by the Fund as of December 31, 2013:
| | | | | | | | Gross Amounts Not Offset in
the Statements of Assets and Liabilities | | | |
| | Gross
Amounts of
Recognized
Assets | | Gross Amounts
Offset in the
Statements of
Assets and Liabilities | | Net Amounts of Assets
Presented in the
Statements of
Assets and Liabilities | | Financial
Instruments(a) | | Cash
Collateral
Received | | Securities
Collateral
Received | | Net
Amount(b) | |
Securities Loaned | |
Columbia Acorn Fund | | $ | 325,396,020 | | | $ | — | | | $ | 325,396,020 | | | $ | — | | | $ | 325,396,020 | | | $ | — | | | $ | — | | |
Columbia Acorn
International | | | 115,336,707 | | | | — | | | | 115,336,707 | | | | — | | | | 115,336,707 | | | | — | | | | — | | |
Columbia Acorn USA | | | 56,975,550 | | | | — | | | | 56,975,550 | | | | — | | | | 56,975,550 | | | | — | | | | — | | |
Columbia Acorn
International Select | | | 624,717 | | | | — | | | | 624,717 | | | | — | | | | 624,717 | | | | — | | | | — | | |
Columbia Acorn Select | | | 3,049,372 | | | | — | | | | 3,049,372 | | | | — | | | | 3,049,372 | | | | — | | | | — | | |
Columbia Acorn
Emerging Markets Fund | | | 5,245,136 | | | | — | | | | 5,245,136 | | | | — | | | | 5,245,136 | | | | — | | | | — | | |
(a) Represents the amount of assets that could be offset by liabilities with the same counterparty under master netting or similar agreements that management elects not to offset on the Statements of Assets and Liabilities.
(b) Represents the net amount due from counterparties in the event of default.
>Federal income taxes
It is each Fund's policy to comply with the provisions of the Internal Revenue Code available to regulated investment companies and, in the manner provided therein, distribute substantially all their taxable income, as well as any net realized gain on sales of investments and foreign currency transactions reportable for federal income tax purposes. Columbia Thermostat Fund distributes all of its taxable income, as well as any net realized gain on sales of portfolio fund shares and any distributions of net realized gains received by the Fund from its portfolio funds, reportable for federal income tax purposes. Accordingly, the Funds paid no federal income taxes and no federal income tax provision was required.
>Foreign capital gains taxes
Realized gains in certain countries may be subject to foreign taxes at the fund level. The Funds accrue for such foreign taxes on realized and unrealized gains at the appropriate rate for each jurisdiction. The amount, if any, is disclosed as a liability on the Statements of Assets and Liabilities.
>Distributions to shareholders
Distributions to shareholders are recorded on the ex-dividend date.
>Indemnification
In the normal course of business, the Trust on behalf of the Funds enters into contracts that contain a variety of representations and warranties and that provide general indemnities. A Fund's maximum exposure under these arrangements is unknown, as this would involve future claims against the Fund. Also, under the Trust's organizational documents, the trustees and officers of the Trust are indemnified against certain liabilities that may arise out of their duties to the Trust.
However, based on experience, the Funds expect the risk of loss due to these warranties and indemnities to be remote.
3. Federal Tax Information
The timing and character of income and capital gain distributions are determined in accordance with income tax regulations, which may differ from GAAP. Reclassifications are made to the Funds' capital accounts for permanent tax differences to reflect income and gains available for distribution (or available capital loss carryforwards) under income tax regulations.
For the year ended December 31, 2013, permanent book and tax basis differences resulting primarily from foreign currency transactions, passive foreign investment company (PFIC) holdings, re-characterization of distributions from investments, net operating loss reclassification, distribution reclassifications, foreign capital gains tax, earnings and profits distributed to shareholders on the redemption of shares and proceeds from regulatory settlements were identified and reclassified among the components of each Fund's net assets as follows:
| | | Undistributed/
(Overdistributed)
Net Investment
Income (Loss) | | Accumulated
Net Realized
Gain (Loss) | | Paid-In
Capital | |
Columbia Acorn Fund | | $ | 6,990,812 | | | $ | (96,310,353 | ) | | $ | 89,319,541 | | |
Columbia Acorn
International | | | 59,420,368 | | | | (59,312,562 | ) | | | (107,806 | ) | |
Columbia
Acorn USA | | | 7,830,664 | | | | 8,735 | | | | (7,839,399 | ) | |
Columbia Acorn
International Select | | | 10,652,057 | | | | (10,652,055 | ) | | | (2 | ) | |
Columbia
Acorn Select | | | 3,742,440 | | | | 5,018,312 | | | | (8,760,752 | ) | |
Columbia
Thermostat Fund | | | (1,319,485 | ) | | | (7,535,502 | ) | | | 8,854,987 | | |
Columbia Acorn
Emerging
Markets Fund | | | 12,018 | | | | (12,018 | ) | | | — | | |
Columbia Acorn
European Fund | | | 6,708 | | | | (6,709 | ) | | | 1 | | |
124
Net investment income (loss) and net realized gains (losses), as disclosed on the Statements of Operations, and net assets were not affected by these reclassifications.
The tax character of distributions paid during the years ended December 31, 2013 and December 31, 2012 was as follows:
| | | December 31, 2013 | | December 31, 2012 | |
Fund | | Ordinary
Income* | | Long-Term
Capital Gains | | Ordinary
Income* | | Long-Term
Capital Gains | |
Columbia Acorn Fund | | $ | 21,340,532 | | | $ | 1,308,033,846 | | | $ | 70,510,183 | | | $ | 1,028,830,224 | | |
Columbia Acorn International | | | 198,930,778 | | | | 330,008,029 | | | | 128,781,789 | | | | — | | |
Columbia Acorn USA | | | — | | | | 141,393,055 | | | | 8,908,286 | | | | 120,940,637 | | |
Columbia Acorn International Select | | | 5,084,134 | | | | 25,050,362 | | | | 24,643,601 | | | | 30,592,124 | | |
Columbia Acorn Select | | | 3,241,093 | | | | 198,890,427 | | | | — | | | | 83,831,961 | | |
Columbia Thermostat Fund | | | 32,251,737 | | | | 52,560,790 | | | | 15,531,935 | | | | — | | |
Columbia Acorn Emerging Markets Fund | | | 2,558,438 | | | | — | | | | 76,230 | | | | — | | |
Columbia Acorn European Fund | | | 41,172 | | | | 24,867 | | | | 22,685 | | | | 360 | | |
* For tax purposes short-term capital gain distributions, if any, are considered ordinary income distributions.
As of December 31, 2013, the components of distributable earnings on a tax basis were as follows:
Fund | | Undistributed
Ordinary
Income | | Undistributed
Accumulated
Long-Term
Gain | | Unrealized
Appreciation
(Depreciation) | |
Columbia Acorn Fund | | $ | — | | | $ | 423,534,776 | | | $ | 10,211,540,752 | | |
Columbia Acorn International | | | 1,355,464 | | | | 91,726,394 | | | | 2,297,424,421 | | |
Columbia Acorn USA | | | — | | | | 22,101,400 | | | | 857,582,991 | | |
Columbia Acorn International Select | | | — | | | | 1,339,634 | | | | 60,841,672 | | |
Columbia Acorn Select | | | — | | | | 39,802,726 | | | | 339,417,817 | | |
Columbia Thermostat Fund | | | 823,711 | | | | 5,627,379 | | | | 27,329,855 | | |
Columbia Acorn Emerging Markets Fund | | | 265,229 | | | | — | | | | 29,466,341 | | |
Columbia Acorn European Fund | | | 196,717 | | | | 90,618 | | | | 3,484,741 | | |
* The differences between book-basis and tax-basis net unrealized appreciation/(depreciation) are primarily due to deferral of losses from wash sales and PFIC adjustments.
The following capital loss carryforward, determined as of December 31, 2013, may be available to reduce taxable income arising from future net realized gains on investments, if any, to the extent permitted by the Internal Revenue Code:
| | | Year of Expiration | | | |
| | | 2015 | | 2016 | | Unlimited
Short-Term | | Total | |
Columbia Acorn
International | | $ | 7,202,972 | | | $ | 44,771,683 | | | $ | — | | | $ | 51,974,655 | | |
Columbia Acorn
Emerging
Markets Fund | | | — | | | | — | | | | 3,304,889 | | | | 3,304,889 | | |
Unlimited capital loss carryforwards are required to be utilized prior to any capital losses which carry an expiration date. As a result of this ordering rule, capital loss carryforwards which carry an expiration date may be more likely to expire unused.
The value of capital loss carryforwards that were utilized and expired for the Funds during the year ended December 31, 2013, were as follows:
| | | Utilized | | Expired | |
Columbia Acorn International | | $ | 207,136,352 | | | $ | — | | |
Columbia Thermostat Fund | | | 8,938,163 | | | | — | | |
Under current tax rules, Regulated Investment Companies can elect to treat certain late-year ordinary losses incurred and post-October capital losses (capital losses realized after October 31) as arising on the first day of the following taxable year. As of December 31, 2013, the Funds will elect to treat
the following late-year ordinary losses and post-October capital losses as arising on January 1, 2014:
Fund | | Late-Year
Ordinary
Losses | | Post-October
Capital
Losses | |
Columbia Acorn Fund | | $ | 2,167,445 | | | $ | — | | |
Columbia Acorn International
Select | | | 2,686,548 | | | | — | | |
Columbia Acorn Select | | | 15,928 | | | | 1,243,045 | | |
Columbia Acorn Emerging
Markets Fund | | | — | | | | 2,434,757 | | |
Management of the Funds has concluded that there are no significant uncertain tax positions that would require recognition in the financial statements. However, management's conclusion may be subject to review and adjustment at a later date based on factors including, but not limited to, new tax laws, regulations, and administrative interpretations (including relevant court decisions). Generally, the Funds' federal tax returns for the prior three fiscal years remain subject to examination by the Internal Revenue Service.
4. Transactions with Affiliates
Columbia Wanger Asset Management, LLC (CWAM) is a wholly-owned subsidiary of Columbia Management Investment Advisers, LLC (Columbia Management), which is a wholly-owned subsidiary of Ameriprise Financial, Inc. (Ameriprise Financial). CWAM furnishes continuing investment supervision to the
125
Columbia Acorn Family of Funds
Notes to Financial Statements, continued
Funds and is responsible for the overall management of the Funds' business affairs.
CWAM receives a monthly advisory fee based on each Fund's average daily net assets at the following annual rates:
Columbia Acorn Fund
Average Daily Net Assets | | Annual
Fee Rate | |
Up to $700 million | | | 0.74 | % | |
$700 million to $2 billion | | | 0.69 | % | |
$2 billion to $6 billion | | | 0.64 | % | |
| $6 billion and over | | | 0.63 | % | |
Columbia Acorn International
Average Daily Net Assets | | Annual
Fee Rate | |
Up to $100 million | | | 1.19 | % | |
$100 million to $500 million | | | 0.94 | % | |
| $500 million and over | | | 0.74 | % | |
Columbia Acorn USA
Average Daily Net Assets | | Annual
Fee Rate | |
Up to $200 million | | | 0.94 | % | |
$200 million to $500 million | | | 0.89 | % | |
$500 million to $2 billion | | | 0.84 | % | |
$2 billion to $3 billion | | | 0.80 | % | |
| $3 billion and over | | | 0.70 | % | |
Columbia Acorn International Select
Average Daily Net Assets | | Annual
Fee Rate | |
Up to $500 million | | | 0.94 | % | |
| $500 million and over | | | 0.90 | % | |
Columbia Acorn Select
Average Daily Net Assets | | Annual
Fee Rate | |
Up to $700 million | | | 0.85 | % | |
$700 million to $2 billion | | | 0.80 | % | |
$2 billion to $3 billion | | | 0.75 | % | |
| $3 billion and over | | | 0.70 | % | |
Columbia Thermostat Fund
| | | Annual
Fee Rate | |
All Average Daily Net Assets | | | 0.10 | % | |
Columbia Acorn Emerging Markets Fund
Average Daily Net Assets | | Annual
Fee Rate | |
Up to $100 million | | | 1.25 | % | |
$100 million to $500 million | | | 1.00 | % | |
| $500 million and over | | | 0.80 | % | |
Columbia Acorn European Fund
Average Daily Net Assets | | Annual
Fee Rate | |
Up to $100 million | | | 1.19 | % | |
$100 million to $500 million | | | 0.94 | % | |
| $500 million and over | | | 0.74 | % | |
For the year ended December 31, 2013, the effective investment advisory fee rates were as follows:
Fund | |
Columbia Acorn Fund | | | 0.64 | % | |
Columbia Acorn International | | | 0.76 | % | |
Columbia Acorn USA | | | 0.86 | % | |
Columbia Acorn International Select | | | 0.94 | % | |
Columbia Acorn Select | | | 0.84 | % | |
Columbia Thermostat Fund | | | 0.10 | % | |
Columbia Acorn Emerging Markets Fund | | | 1.10 | % | |
Columbia Acorn European Fund | | | 1.19 | % | |
>Expense limit
Effective August 15, 2013, CWAM and its affiliates voluntarily agreed to waive a portion of the total annual Fund operating expenses incurred by Class A shares, Class B shares and Class C shares of Columbia Acorn International such that the Fund's total annual Fund operating expenses will be reduced by 0.04%, 0.03% and 0.02% for Class A, Class B and Class C shares of the Fund, respectively.
Through August 14, 2013, CWAM and its affiliates contractually waived a portion of the total annual Fund operating expenses incurred by Class A shares, Class B shares and Class C shares of Columbia Acorn International such that the Fund's total annual Fund operating expenses were reduced by 0.04%, 0.03% and 0.02% for Class A, Class B and Class C shares of the Fund, respectively.
126
Effective May 1, 2013, CWAM has voluntarily agreed to reimburse expenses so that the Funds' ordinary operating expenses (exclusive of transaction costs and certain other investment-related expenses, interest and fees on borrowings and expenses associated with each Fund's investments in other investment companies, if any) after giving effect to any balance credits or overdraft charges from the Funds' custodian, do not exceed annually the average daily net assets of each class as follows:
Fund | | Class A | | Class B | | Class C | | Class I | | Class R4 | | Class R5 | | Class Y | | Class Z | |
Columbia Acorn International Select | | | 1.70 | % | | | 2.20 | % | | | 2.45 | % | | | 1.31 | % | | | 1.45 | % | | | 1.36 | % | | | 1.31 | % | | | 1.45 | % | |
Columbia Acorn Select | | | 1.60 | % | | | 2.10 | % | | | 2.35 | % | | | 1.23 | % | | | 1.35 | % | | | 1.28 | % | | | 1.23 | % | | | 1.35 | % | |
These arrangements may be modified or terminated by either the Funds or CWAM on 30 days notice.
Through April 30, 2013, CWAM voluntarily reimbursed expenses so that the Funds' ordinary operating expenses (exclusive of taxes, brokerage commissions, interest and extraordinary expenses, if any) after giving effect to any balance credits or overdraft charges from the Funds' custodian, did not exceed annually the average daily net assets of each class as follows:
Fund | | Class A | | Class B | | Class C | | Class I | | Class R4 | | Class R5 | | Class Y | | Class Z | |
Columbia Acorn International Select | | | 1.70 | % | | | 2.20 | % | | | 2.45 | % | | | 1.28 | % | | | 1.45 | % | | | 1.33 | % | | | 1.28 | % | | | 1.45 | % | |
Columbia Acorn Select | | | 1.60 | % | | | 2.10 | % | | | 2.35 | % | | | 1.25 | % | | | 1.35 | % | | | 1.30 | % | | | 1.25 | % | | | 1.35 | % | |
Effective May 1, 2013, CWAM has contractually agreed to waive fees and/or reimburse expenses through April 30, 2014, so that the Funds' ordinary operating expenses (exclusive of transaction costs and certain other investment-related expenses, interest and fees on borrowings and expenses associated with each Fund's investments in other investment companies, if any), do not exceed annually the average daily net assets of each class as follows:
Fund | | Class A | | Class B | | Class C | | Class I | | Class R4 | | Class R5 | | Class Y | | Class Z | |
Columbia Thermostat Fund | | | 0.50 | % | | | 1.00 | % | | | 1.25 | % | | | — | % | | | 0.25 | % | | | 0.23 | % | | | 0.18 | % | | | 0.25 | % | |
Columbia Acorn Emerging Markets Fund | | | 1.85 | % | | | — | % | | | 2.60 | % | | | 1.54 | % | | | 1.60 | % | | | 1.59 | % | | | 1.54 | %* | | | 1.60 | % | |
Columbia Acorn European Fund | | | 1.75 | % | | | — | % | | | 2.50 | % | | | 1.46 | % | | | — | % | | | 1.51 | % | | | — | % | | | 1.50 | % | |
* Effective June 13, 2013 (the commencement of operations of Columbia Acorn Emerging Markets Fund Class Y shares) through April 30, 2014.
There is no guarantee that these agreements will continue thereafter.
Through April 30, 2013, CWAM contractually waived fees and/or reimburse expenses so that the Funds' ordinary operating expenses (exclusive of interest and fees on borrowings and expenses associated with each Fund's investments in other investment companies, if any), did not exceed annually the average daily net assets of each class as follows:
Fund | | Class A | | Class B | | Class C | | Class I | | Class R4 | | Class R5 | | Class Y | | Class Z | |
Columbia Thermostat Fund | | | 0.50 | % | | | 1.00 | % | | | 1.25 | % | | | — | % | | | 0.25 | % | | | 0.27 | % | | | 0.22 | % | | | 0.25 | % | |
Columbia Acorn Emerging Markets Fund | | | 1.85 | % | | | — | % | | | 2.60 | % | | | 1.41 | % | | | 1.60 | % | | | 1.46 | % | | | — | % | | | 1.60 | % | |
Columbia Acorn European Fund | | | 1.75 | % | | | — | % | | | 2.50 | % | | | 1.31 | % | | | — | % | | | 1.36 | % | | | — | % | | | 1.50 | % | |
Expenses reimbursed by CWAM and its affiliates for the year ended December 31, 2013, were as follows:
Fund | | Expenses
Reimbursed | |
Columbia Acorn International | | $ | 484,488 | | |
Columbia Acorn International Select | | | 3 | | |
Columbia Acorn Select | | | 918 | | |
Columbia Thermostat Fund | | | 216,529 | | |
Columbia Acorn Emerging Markets Fund | | | 61,620 | | |
Columbia Acorn European Fund | | | 186,331 | | |
CWAM is contractually entitled to recoup from each of Columbia Acorn Emerging Markets Fund and Columbia Acorn European Fund any fees waived and/or expenses reimbursed with respect to any share class offered by Columbia Acorn Emerging Markets Fund and Columbia Acorn European Fund for a one year period following the date of such fee waiver and/or reimbursement, if such recovery does not cause the ordinary operating expenses of the Fund (excluding transaction costs and certain other investment-related expenses, interest and fees on borrowings and expenses associated with the Fund's investment in other investment companies, if any) to exceed the annual
127
Columbia Acorn Family of Funds
Notes to Financial Statements, continued
rates set forth above, or to exceed such annual rate as may be in place at the time of the recoupment, whichever is less.
CWAM provides administrative services and receives an administration fee from the Funds at the following annual rates:
Columbia Acorn Trust
Aggregate Average Daily
Net Assets of the Trust: | | Annual
Fee Rate | |
Up to $8 billion | | | 0.050 | % | |
$8 billion to $16 billion | | | 0.040 | % | |
$16 billion to $35 billion | | | 0.030 | % | |
$35 billion to $45 billion | | | 0.025 | % | |
| $45 billion and over | | | 0.015 | % | |
For the year ended December 31, 2013, the effective administration fee rate was 0.04% of each Fund's average daily net assets. CWAM has delegated to Columbia Management responsibility to provide certain sub-administrative services to the Funds.
CMID, a wholly owned subsidiary of Ameriprise Financial, is the distributor of the Funds.
Sales charges, including front-end and CDSCs, received by the Distributor for distributing each Fund's shares for the year ended December 31, 2013 are as follows:
| | | Underwriting
Discounts | | CDSCs | |
(Unaudited) | | Class A | | Class A | | Class B | | Class C | |
Columbia Acorn Fund | | $ | 2,182,506 | | | $ | 3,261 | | | $ | 2,651 | | | $ | 30,541 | | |
Columbia Acorn
International | | | 567,621 | | | | 603 | | | | 4,966 | | | | 5,707 | | |
Columbia Acorn USA | | | 104,952 | | | | — | | | | 31 | | | | 422 | | |
Columbia Acorn
International Select | | | 63,741 | | | | 33 | | | | 196 | | | | 1,605 | | |
Columbia
Acorn Select | | | 68,499 | | | | 693 | | | | 476 | | | | 605 | | |
Columbia
Thermostat Fund | | | 4,129,615 | | | | 13,950 | | | | 321 | | | | 83,670 | | |
Columbia Acorn
Emerging Markets Fund | | | 586,312 | | | | 587 | | | | — | | | | 1,482 | | |
Columbia Acorn
European Fund | | | 33,318 | | | | 2 | | | | — | | | | 148 | | |
Each Fund has adopted a distribution and service plan which requires it to pay CMID a monthly service fee equal to 0.25% annually of the average daily net assets attributable to Class A, Class B and Class C shares and a monthly distribution fee equal to 0.50%, 0.75% and 0.50%, annually, of the average daily net assets attributable to Class B, Class C and Class R shares, respectively. CMID receives no compensation with respect to Class R4, Class R5, Class Y and Class Z shares.
Columbia Management Investment Services Corp. (CMIS), a wholly owned subsidiary of Ameriprise Financial, is the transfer agent of the Funds. CMIS receives monthly account-based service fees based on the number of open Fund accounts. Effective May 1, 2013, each Fund pays CMIS a monthly fee at the annual rate of $20.00 per open account. Prior to May 1, 2013, the annual rate was $18.50 per open account. Subject to certain limitations, the Funds reimburse payments made by CMIS to financial intermediaries for the shareholder services that the intermediaries provide, in amounts that vary by share class and with the type of intermediary and type of shareholder services provided.
The Transfer Agent also receives compensation from fees for various shareholder services and reimbursements for certain out-of-pocket fees. Class I shares do not pay transfer agent fees. Total transfer agent fees for Class R5 shares are subject to an annual limitation of not more than 0.05% of the average daily net assets attributable to Class R5 shares. Class Y shares are not subject to transfer agent fees through April 30, 2014.
For the year ended December 31, 2013, the Funds' effective transfer agent fee rates as a percentage of average daily net assets of each class were as follows:
Fund | | Class A | | Class B | | Class C | | Class R | | Class R4 | | Class R5 | | Class Z | |
Columbia Acorn Fund | | | 0.12 | % | | | 0.28 | % | | | 0.08 | % | | | — | % | | | 0.09 | % | | | 0.05 | % | | | 0.08 | % | |
Columbia Acorn International | | | 0.17 | % | | | 0.40 | % | | | 0.15 | % | | | 0.27 | % | | | 0.16 | % | | | 0.05 | % | | | 0.07 | % | |
Columbia Acorn USA | | | 0.14 | % | | | 0.46 | % | | | 0.07 | % | | | — | % | | | 0.08 | % | | | 0.05 | % | | | 0.13 | % | |
Columbia Acorn International Select | | | 0.12 | % | | | 0.29 | % | | | 0.16 | % | | | — | % | | | 0.14 | % | | | 0.05 | % | | | 0.09 | % | |
Columbia Acorn Select | | | 0.12 | % | | | 0.36 | % | | | 0.11 | % | | | — | % | | | 0.10 | % | | | 0.05 | % | | | 0.09 | % | |
Columbia Thermostat Fund | | | 0.08 | % | | | 0.21 | % | | | 0.08 | % | | | — | % | | | 0.08 | % | | | 0.05 | % | | | 0.07 | % | |
Columbia Acorn Emerging Markets Fund | | | 0.13 | % | | | — | % | | | 0.13 | % | | | — | % | | | 0.07 | % | | | 0.05 | % | | | 0.16 | % | |
Columbia Acorn European Fund | | | 0.12 | % | | | — | % | | | 0.21 | % | | | — | % | | | — | % | | | 0.05 | % | | | 0.04 | % | |
128
Columbia Acorn International and certain other associated investment companies, have severally, but not jointly, guaranteed the performance and observance of all the terms and conditions of a lease entered into by Seligman Data Corp. (SDC), the former transfer agent to certain associated investment companies, including the payment of rent by SDC (the Guaranty). The lease and the Guaranty expire in January 2019. At December 31, 2013, Columbia Acorn International's total potential future obligation over the life of the Guaranty is $103,777. The liability remaining at December 31, 2013 for non-recurring charges associated with the lease amounted to $68,268 and is included within payable for other liabilities in the Statements of Assets and Liabilities.
Certain officers and trustees of the Trust are also officers of CWAM. The Trust makes no direct payments to its officers and trustees who are affiliated with CWAM.
The Board has appointed a Chief Compliance Officer of the Trust in accordance with federal securities regulations. The Funds, along with other affiliated funds, pay their pro-rata share of the expenses associated with the Office of the Chief Compliance Officer.
The Trust offers a deferred compensation plan for its independent trustees. Under that plan, a trustee may elect to defer all or a portion of his or her compensation. Amounts deferred are retained by the Trust and may represent an unfunded obligation of the Trust. The value of amounts deferred is determined by reference to the change in value of Class Z shares of one or more series of the Trust or a money market fund as specified by the trustee. Benefits under the deferred compensation plan are payable in accordance with the plan.
An affiliated person of a Fund may include any company in which a Fund owns five percent or more of its outstanding voting shares during the year. On December 31, 2013, Columbia Acorn Fund, Columbia Acorn International, Columbia Acorn Select and Columbia Thermostat Fund each held five percent or more of the outstanding voting securities of one or more companies or a company which is under common ownership or control with the Funds. Details of investments in those affiliated companies are presented on pages 38, 39, 51, 73 and 76, respectively.
For the year ended December 31, 2013, the Funds engaged in purchase and sales transactions with funds that have a common investment manager (or affiliated investment managers), common directors/trustees, and/or common
officers. Those transactions complied with Rule 17a-7 under the Investment Company Act of 1940 and totaled as follows:
| | | Purchases | | Sales | |
Columbia Acorn Fund | | $ | 11,567,570 | | | $ | — | | |
Columbia Acorn International | | | — | | | | 1,267,105 | | |
Columbia Acorn USA | | | — | | | | 846,750 | | |
Columbia Acorn Select | | | 1,112,321 | | | | 10,497,193 | | |
Columbia Acorn European Fund | | | 4,433 | | | | — | | |
5. Borrowing Arrangements
During the year ended December 31, 2013, the Trust participated in a credit facility with JPMorgan Chase Bank, N.A., along with Wanger Advisors Trust, another trust managed by CWAM, in the amount of $150 million prior to January 11, 2013, $200 million for the period January 11, 2013 through July 21, 2013, and $150 million thereafter. The credit facility was entered into to facilitate portfolio liquidity. Under the facility, interest is charged to each participating fund based on its borrowings at a rate per annum equal to the Federal Funds Rate plus 1.00%. In addition, a commitment fee of 0.08% per annum of the unutilized line of credit is accrued and apportioned among the participating funds based on their relative net assets. The commitment fee is disclosed as a part of Other expenses in the Statements of Operations. The Trust expects to renew this line of credit in July at then current market rates and terms.
For the year ended December 31, 2013, the average daily loan balance outstanding on days when borrowing existed as follows. Interest expense incurred by the Fund is recorded as Interest expense in the Statements of Operations.
Fund Name | | Average Daily
Loan Balance
Outstanding | | Weighted Average
Interest Rate | |
Columbia Acorn Select | | $ | 11,400,000 | | | | 1.17 | % | |
6. Investment Transactions
The aggregate cost of purchases and proceeds from sales, other than short-term obligations, for the year ended December 31, 2013, were:
| | | Purchases | | Proceeds from
Sales | |
Columbia Acorn Fund | | $ | 3,455,828,765 | | | $ | 5,011,492,382 | | |
Columbia Acorn
International | | | 3,352,415,329 | | | | 3,275,280,969 | | |
Columbia Acorn USA | | | 276,337,827 | | | | 561,364,926 | | |
Columbia Acorn
International Select | | | 244,886,767 | | | | 308,413,813 | | |
Columbia Acorn Select | | | 174,510,595 | | | | 521,572,706 | | |
Columbia
Thermostat Fund | | | 1,491,770,741 | | | | 1,091,187,970 | | |
Columbia Acorn
Emerging Markets Fund | | | 417,852,494 | | | | 59,559,515 | | |
Columbia Acorn
European Fund | | | 22,246,869 | | | | 4,083,719 | | |
129
Columbia Acorn Family of Funds
Notes to Financial Statements, continued
7. Regulatory Settlements with Third Parties
During the year ended December 31, 2012, Columbia Acorn International received a payment of $107,802 resulting from regulatory settlements with third parties in which the Fund had participated. The payment has been included in "Increase from regulatory settlements" in the Statements of Changes in Net Assets.
8. Shareholder Concentration
At December 31, 2013, the table below details the affiliated and significant unaffiliated shareholder account ownership of outstanding shares of each Fund. The Funds have no knowledge about whether any portion of these unaffiliated shares were owned beneficially. Subscription and redemption activity of these accounts may have a significant effect on the operations of the Funds.
| | | Number of
unaffiliated
accounts | | Percentage of
shares
outstanding
held –
unaffiliated | | Percentage of
shares
outstanding
held –
affiliated | |
Columbia Acorn Fund | | | 1 | | | | 19.4 | % | | | — | % | |
Columbia Acorn International | | | 3 | | | | 39.3 | % | | | — | % | |
Columbia Acorn USA | | | 4 | | | | 61.0 | % | | | — | % | |
Columbia Acorn
International Select | | | 2 | | | | 39.9 | % | | | — | % | |
Columbia Acorn Select | | | 2 | | | | 37.3 | % | | | 10.9 | % | |
Columbia Thermostat Fund | | | 2 | | | | 31.4 | % | | | 22.0 | % | |
Columbia Acorn Emerging
Markets Fund | | | 3 | | | | 47.0 | % | | | 21.5 | % | |
Columbia Acorn European Fund | | | 1 | | | | 24.3 | % | | | 41.9 | % | |
9. Subsequent Events
Management has evaluated the events and transactions that have occurred through the date the financial statements were issued and noted no items requiring adjustment of the financial statements or additional disclosure.
10. Information Regarding Pending and Settled Legal Proceedings
Ameriprise Financial and certain of its affiliates have historically been involved in a number of legal, arbitration and regulatory proceedings, including routine litigation, class actions, and governmental actions, concerning matters arising in connection with the conduct of their business activities. Ameriprise Financial believes that the Funds are not currently the subject of, and that neither Ameriprise Financial nor any of its affiliates are the subject of, any pending legal, arbitration or regulatory proceedings that are likely to have a material adverse effect on the Funds or the ability of Ameriprise Financial or its affiliates to perform under their contracts with the Funds. Ameriprise Financial is required to make 10-Q, 10-K and, as necessary, 8-K filings with the Securities and Exchange
Commission on legal and regulatory matters that relate to Ameriprise Financial and its affiliates. Copies of these filings may be obtained by accessing the SEC website at www.sec.gov.
There can be no assurance that these matters, or the adverse publicity associated with them, will not result in increased fund redemptions, reduced sale of fund shares or other adverse consequences to the Funds. Further, although we believe proceedings are not likely to have a material adverse effect on the Funds or the ability of Ameriprise Financial or its affiliates to perform under their contracts with the Funds, these proceedings are subject to uncertainties and, as such, we are unable to estimate the possible loss or range of loss that may result. An adverse outcome in one or more of these proceedings could result in adverse judgments, settlements, fines, penalties or other relief that could have a material adverse effect on the consolidated financial condition or results of operations of Ameriprise Financial.
130
Report of Independent Registered Public Accounting Firm
To the Board of Trustees and Shareholders of
Columbia Acorn Trust:
In our opinion, the accompanying statement of assets and liabilities, including the statement of investments, and the related statements of operations and of changes in net assets and the financial highlights present fairly, in all material respects, the financial position of Columbia Acorn Fund, Columbia Acorn International, Columbia Acorn USA, Columbia Acorn International Select, Columbia Acorn Select, Columbia Thermostat Fund, Columbia Acorn Emerging Markets Fund, and Columbia Acorn European Fund (each a series of the Columbia Acorn Trust, hereinafter referred to as the "Funds") at December 31, 2013, the results of their operations for the year then ended, and the changes in their net assets for each of the two years in the period then ended and the financial highlights for the periods presented, in conformity with accounting principles generally accepted in the United States of America. These financial statements and financial highlights (hereafter referred to as "financial statements") are the responsibility of the
Funds' management; our responsibility is to express an opinion on these financial statements based on our audits. We conducted our audits of these financial statements in accordance with the standards of the Public Company Accounting Oversight Board (United States). Those standards require that we plan and perform the audit to obtain reasonable assurance about whether the financial statements are free of material misstatement. An audit includes examining, on a test basis, evidence supporting the amounts and disclosures in the financial statements, assessing the accounting principles used and significant estimates made by management, and evaluating the overall financial statement presentation. We believe that our audits, which included confirmation of securities at December 31, 2013 by correspondence with the custodian and brokers, provide a reasonable basis for our opinion.
PricewaterhouseCoopers LLP
Chicago, Illinois
February 19, 2014
131
Columbia Acorn Family of Funds
Federal Income Tax Information (Unaudited)
The Funds hereby designate the following tax attributes for distributions paid in the fiscal year ended December 31, 2013. Shareholders will be notified in early 2014 of the amounts for use in preparing 2013 income tax returns.
| | | Qualified
Dividend
Income | | Dividends
Received
Deduction | | Capital Gain
Dividend | | Foreign
Taxes Paid | | Foreign
Source
Income | |
Columbia Acorn Fund | | | 100.00 | % | | | 100.00 | % | | $ | 1,690,456,762 | | | $ | — | | | $ | — | | |
Columbia Acorn International | | | 54.81 | % | | | 0.02 | % | | | 442,821,144 | | | | 14,124,584 | | | | 176,342,281 | | |
Columbia Acorn USA | | | — | % | | | — | % | | | 169,447,593 | | | | — | | | | — | | |
Columbia Acorn International Select | | | 72.98 | % | | | 0.11 | % | | | 20,283,996 | | | | 775,503 | | | | 10,345,088 | | |
Columbia Acorn Select | | | 100.00 | % | | | 100.00 | % | | | 206,702,205 | | | | — | | | | — | | |
Columbia Thermostat Fund | | | 6.91 | % | | | 5.41 | % | | | 67,889,817 | | | | 24,995 | | | | 464,740 | | |
Columbia Acorn Emerging Markets Fund | | | 62.59 | % | | | — | % | | | — | | | | 411,835 | | | | 4,623,855 | | |
Columbia Acorn European Fund | | | 100.00 | % | | | 3.53 | % | | | 121,259 | | | | 13,334 | | | | 194,060 | | |
Qualified Dividend Income. For taxable, non-corporate shareholders, the percentage of ordinary income dividends paid during the fiscal year that represents qualified dividend income subject to reduced tax rates under the Jobs and Growth Tax Relief Reconciliation Act of 2003.
Dividends Received Deduction. The percentage of ordinary income dividends paid during the fiscal year that qualifies for the corporate dividends received deduction.
Capital Gain Dividend. The Fund designates as a capital gain dividend the amount reflected above, or if subsequently determined to be different, the net capital gain of such fiscal period. The Fund also designates as capital gain dividends, to the extent necessary to fully distribute such capital gains, earnings and profits distributed to shareholders on the redemption of shares.
Foreign Taxes. The Fund makes the election to pass through to shareholders the foreign taxes paid. These taxes, and the corresponding foreign source income, are provided.
132
Board of Trustees and Management of
Columbia Acorn Family of Funds
Each trustee may serve a term of unlimited duration. The Trust's By-laws generally require that a trustee retire at the end of the calendar year in which the trustee attains the age of 75 years. The trustees appoint their own successors, provided that at least two-thirds of the trustees, after such appointment, have been elected by shareholders. Shareholders may remove a trustee, with or without cause, upon the vote of two-thirds of the Trust's outstanding shares at any meeting called for that purpose. A trustee may be removed, with or without cause, upon the vote of a majority of the trustees. The names of the trustees and officers of the Trust, the date each was first elected or appointed to office, their principal business occupations during at least the last five years, the number of portfolios in the fund complex they oversee, and other directorships they hold, are shown below. Each trustee serves in such capacity for each of the eight series of Columbia Acorn Trust and for each of the four series of Wanger Advisors Trust.
The address for the trustees and officers of the Trust is Columbia Wanger Asset Management, LLC, 227 West Monroe Street, Suite 3000, Chicago, Illinois 60606. The Funds' Statement of Additional Information includes additional information about the Funds' trustees and officers. You may obtain a free copy of the Statement of Additional Information by writing or calling toll-free:
Columbia Wanger Asset Management, LLC
Shareholder Services Group
227 W. Monroe, Suite 3000
Chicago IL 60606
1-800-922-6769
Name, Position(s)
with Columbia Acorn
Trust and Age at
December 31, 2013 | | Year First
Elected or
Appointed
to Office* | | Principal Occupation(s)
during
Past Five Years | | Number of
Portfolios in
Fund Complex
Overseen by
Trustee/Officer | | Other
Directorships
in addition to
Columbia Acorn Trust | |
Trustees who are not interested persons of Columbia Acorn Trust: | | | |
Laura M. Born, 48,
Trustee and Chair | | | 2007 | | | Adjunct Associate Professor of Finance, University of Chicago Booth School of Business; Managing Director – Investment Banking, JP Morgan Chase & Co. (broker/dealer) 2002-2007. | | | 12 | | | Wanger Advisors Trust; Carlson Wagonlit Travel, B.V. | |
Michelle L. Collins, 53,
Trustee | | | 2008 | | | President, Cambium LLC (financial and business advisory firm) since 2007; Advisory Board Member, Svoboda Capital Partners LLC (private equity firm) since 2007. | | | 12 | | | Wanger Advisors Trust; Integrys Energy Group, Inc. (public utility); Molex, Inc. (electronics components manufacturer) 2003-2012; Bucyrus International Inc. (manufacturer of mining equipment) 2009-2011. | |
Maureen M. Culhane, 65,
Trustee | | | 2007 | | | Retired. Formerly, Vice President, Goldman Sachs Asset Management, L.P. (investment adviser), 2005-2007, and Vice President (Consultant) – Strategic Relationship Management, Goldman Sachs & Co., 1999-2005. | | | 12 | | | Wanger Advisors Trust | |
Margaret M. Eisen, 60,
Trustee | | | 2002 | | | Chief Investment Officer, EAM International LLC (corporate finance and asset management) since 2003; Managing Director, CFA Institute, 2005-2008. | | | 12 | | | Wanger Advisors Trust; Burnham Investors Trust; Antigenics, Inc. (provider of technology products and services) 2003-2009. | |
John C. Heaton, 54,
Trustee | | | 2010 | | | Deputy Dean for Faculty, University of Chicago Booth School of Business; Joseph L. Gidwitz Professor of Finance, University of Chicago Booth School of Business since 2000. | | | 12 | | | Wanger Advisors Trust | |
Steven N. Kaplan, 54,
Trustee and Vice Chair | | | 1999 | | | Neubauer Family Distinguished Service Professor of Entrepreneurship and Finance, University of Chicago Booth School of Business; faculty member of the University of Chicago Booth School of Business since 1988. | | | 12 | | | Wanger Advisors Trust; Accretive Health, Inc. (healthcare management services provider); Morningstar, Inc. (provider of independent investment research). | |
David J. Rudis, 60,
Trustee | | | 2010 | | | Retired National Checking and Debit Executive, and Illinois President, Bank of America, 2007-2009; President, Consumer Banking Group, LaSalle National Bank, 2004-2007. | | | 12 | | | Wanger Advisors Trust | |
David B. Small, 57,
Trustee | | | 2010 | | | Managing Director, Grosvenor Capital Management, L.P. (investment adviser) since 1994; Adjunct Associate Professor of Finance, University of Chicago Booth School of Business. | | | 12 | | | Wanger Advisors Trust | |
Trustees who are interested persons of Columbia Acorn Trust: | | | |
Charles P. McQuaid, 60,
Trustee and President(1),(2) | | | 1992 | | | President and Chief Investment Officer, CWAM or its predecessors, since October 2003; associated with CWAM or its predecessors as an investment professional since 1978. | | | 12 | | | Wanger Advisors Trust | |
133
Name, Position(s)
with Columbia Acorn
Trust and Age at
December 31, 2013 | | Year First
Elected or
Appointed
to Office* | | Principal Occupation(s)
during
Past Five Years | | Number of
Portfolios in
Fund Complex
Overseen by
Trustee/Officer | | Other
Directorships
in addition to
Columbia Acorn Trust | |
Trustee Emeritus | | | |
Ralph Wanger, 79,
Trustee Emeritus(3) | | | 1970 | | | Founder, CWAM. Formerly, President, Chief Investment Officer and portfolio manager, CWAM or its predecessors, July 1992 – September 2003; Director, Wanger Investment Company PLC; Consultant to CWAM or its predecessors, September 2003 – September 2005. | | | 12 | | | Wanger Advisors Trust | |
Officers of Columbia Acorn Trust: | | | |
Robert A. Chalupnik, 47,
Vice President | | | 2011 | | | Portfolio manager and/or analyst, CWAM or its predecessors since 2000; Vice President Columbia Acorn Trust and Wanger Advisors Trust since May 2011. | | | 12 | | | | N/A | | |
Michael G. Clarke, 44,
Assistant Treasurer | | | 2004 | | | Vice President, Columbia Management Investment Advisers, LLC since May 2010; Managing Director of Fund Administration, Columbia Management Advisors, LLC, September 2004 – April 2010; Senior officer, Columbia Funds and affiliated funds since 2002. | | | 12 | | | | N/A | | |
Joseph F. DiMaria, 44,
Assistant Treasurer | | | 2010 | | | Vice President, Mutual Fund Administration, Columbia Management Investment Advisers, LLC, since May 2010; Director of Fund Administration, Columbia Management Advisors, LLC, January 2006 – April 2010. | | | 12 | | | | N/A | | |
P. Zachary Egan, 44,
Vice President(2) | | | 2003 | | | Director of International Research, CWAM or its predecessors since December 2004; Vice President, Columbia Acorn Trust since 2003 and Wanger Advisors Trust since 2007; portfolio manager and/or analyst, CWAM or its predecessors since 1999. | | | 12 | | | | N/A | | |
Fritz Kaegi, 42,
Vice President | | | 2011 | | | Portfolio manager and/or analyst, CWAM or its predecessors since 2004; Vice President Columbia Acorn Trust and Wanger Advisors Trust since September 2011. | | | 12 | | | | N/A | | |
John Kunka, 43,
Assistant Treasurer | | | 2006 | | | Director of Accounting and Operations, CWAM since 2006. | | | 12 | | | | N/A | | |
Stephen Kusmierczak, 46,
Vice President | | | 2011 | | | Portfolio manager and/or analyst, CWAM or its predecessors since 2001; Vice President Columbia Acorn Trust and Wanger Advisors Trust since September 2011. | | | 12 | | | | N/A | | |
Joseph C. LaPalm, 44,
Vice President | | | 2006 | | | Chief Compliance Officer, CWAM since 2005. | | | 12 | | | | N/A | | |
Bruce H. Lauer, 56,
Vice President, Secretary and Treasurer | | | 1995 | | | Chief Operating Officer, CWAM or its predecessors since April 2000; Vice President, Secretary and Treasurer (Chief Financial and Accounting Officer), Columbia Acorn Trust and Wanger Advisors Trust since 1995; formerly, Director, Wanger Investment Company PLC; formerly, Director, Banc of America Capital Management (Ireland) Ltd.; and formerly, Director, Bank of America Global Liquidity Funds, PLC. | | | 12 | | | | N/A | | |
Louis J. Mendes III, 49,
Vice President | | | 2003 | | | Portfolio manager and/or analyst, CWAM or its predecessors since 2001; Vice President, Columbia Acorn Trust since 2003 and Wanger Advisors Trust since 2005. | | | 12 | | | | N/A | | |
134
Name, Position(s)
with Columbia Acorn
Trust and Age at
December 31, 2013 | | Year First
Elected or
Appointed
to Office* | | Principal Occupation(s)
during
Past Five Years | | Number of
Portfolios in
Fund Complex
Overseen by
Trustee/Officer | | Other
Directorships
in addition to
Columbia Acorn Trust | |
Officers of Columbia Acorn Trust: (continued) | | | |
Robert A. Mohn, 52,
Vice President(2) | | | 1997 | | | Director of Domestic Research, CWAM or its predecessors since March 2004; Vice President, Columbia Acorn Trust and Wanger Advisors Trust since 1997; portfolio manager and/or analyst, CWAM or its predecessors since August 1992. | | | 12 | | | | N/A | | |
Christopher J. Olson, 49,
Vice President | | | 2001 | | | Portfolio manager and/or analyst, CWAM or its predecessors since January 2001; Vice President, Columbia Acorn Trust and Wanger Advisors Trust, since 2001. | | | 12 | | | | N/A | | |
Christopher O. Petersen, 44,
Assistant Secretary | | | 2010 | | | Vice President and Chief Counsel, Ameriprise Financial since January 2010 (formerly, Vice President and Group Counsel or Counsel, April 2004 – January 2010); Officer, Columbia Funds and affiliated funds since 2007. | | | 12 | | | | N/A | | |
Scott R. Plummer, 54,
Assistant Secretary | | | 2010 | | | Senior Vice President, Chief Legal Officer and Assistant Secretary, Columbia Management Investment Advisers, LLC (or its predecessors) since June 2005; Senior Vice President and Assistant General Counsel – Global Asset Management, Ameriprise Financial since February 2014 (previously, Senior Vice President and Lead Chief Counsel -- Asset Management, 2012 – February 2014, Vice President and Lead Chief Counsel – Asset Management, 2010 – 2012, and Vice President and Chief Counsel – Asset Management, 2005 – 2010); Vice President, Chief Counsel and Assistant Secretary, Columbia Management Investment Distributors, Inc. (or its predecessors) since 2008; Vice President, General Counsel and Secretary, Ameriprise Certificate Company since 2005; Chief Counsel, RiverSource Distributors, Inc., 2006 – 2010; Senior officer, Columbia Funds and affiliated funds since 2006. | | | 12 | | | | N/A | | |
Robert P. Scales, 61,
Chief Compliance Officer, Chief Legal Officer, Senior Vice President and General Counsel | | | 2004 | | | Chief Compliance Officer, Chief Legal Officer, Senior Vice President and General Counsel, Columbia Acorn Trust and Wanger Advisors Trust, since 2004. | | | 12 | | | | N/A | | |
Andreas Waldburg-Wolfegg, 47,
Vice President | | | 2011 | | | Portfolio Manager and/or analyst of CWAM since 2002; Vice President Columbia Acorn Trust and Wanger Advisors Trust since September 2011. | | | 12 | | | | N/A | | |
Linda Roth-Wiszowaty, 44,
Assistant Secretary | | | 2006 | | | Business support analyst, CWAM, since April 2007; prior thereto executive administrator, CWAM or its predecessors, and executive assistant to the Chief Operating Officer of CWAM or its predecessors. | | | 12 | | | | N/A | | |
* Dates prior to April 1992 correspond to the date of first election or appointment as a trustee or officer of The Acorn Fund, Inc., the predecessor to Columbia Acorn Trust.
(1) Mr. McQuaid is an "interested person" of Columbia Acorn Trust and of CWAM, as defined in the Investment Company Act of 1940, because he is an officer of the Trust and of CWAM.
(2) Effective March 31, 2014, Mr. McQuaid expects to step down from his current role as President and Chief Investment Officer of CWAM. Effective April 1, 2014, it is expected that Mr. Mohn will become the Domestic Chief Investment Officer of CWAM and Mr. Egan will become the President and International Investment Officer of CWAM.
(3) As permitted under the Columbia Acorn Trust's By-Laws, Mr. Wanger serves as a non-voting Trustee Emeritus of the Trust.
135
Columbia Acorn Family of Funds Expense Information (Unaudited)
as of 12/31/13
Columbia Acorn Fund | | Class A | | Class B* | | Class C | | Class I | | Class R | | Class R4† | | Class R5† | | Class Y† | | Class Z | |
Management Fees | | | 0.64 | % | | | 0.64 | % | | | 0.64 | % | | | 0.64 | % | | | | | | | 0.64 | % | | | 0.64 | % | | | 0.64 | % | | | 0.64 | % | |
Distribution and Service (12b-1) Fees | | | 0.25 | % | | | 0.75 | % | | | 1.00 | % | | | 0.00 | % | | | | | | | 0.00 | % | | | 0.00 | % | | | 0.00 | % | | | 0.00 | % | |
Other Expenses | | | 0.18 | % | | | 0.34 | % | | | 0.14 | % | | | 0.06 | % | | | | | | | 0.16 | % | | | 0.11 | % | | | 0.06 | % | | | 0.14 | % | |
Net Expense Ratio | | | 1.07 | % | | | 1.73 | % | | | 1.78 | % | | | 0.70 | % | | | | | 0.80 | % | | | 0.75 | % | | | 0.70 | % | | | 0.78 | % | |
Columbia Acorn International | |
Management Fees | | | 0.76 | % | | | 0.76 | % | | | 0.76 | % | | | 0.76 | % | | | 0.76 | % | | | 0.76 | % | | | 0.76 | % | | | 0.76 | % | | | 0.76 | % | |
Distribution and Service (12b-1) Fees | | | 0.25 | % | | | 0.75 | % | | | 1.00 | % | | | 0.00 | % | | | 0.50 | % | | | 0.00 | % | | | 0.00 | % | | | 0.00 | % | | | 0.00 | % | |
Other Expenses | | | 0.22 | % | | | 0.46 | % | | | 0.23 | % | | | 0.09 | % | | | 0.37 | % | | | 0.27 | % | | | 0.15 | % | | | 0.10 | % | | | 0.17 | % | |
Net Expense Ratio | | | 1.23 | % | | | 1.97 | % | | | 1.99 | % | | | 0.85 | % | | | 1.63 | % | | | 1.03 | % | | | 0.91 | % | | | 0.86 | % | | | 0.93 | % | |
Columbia Acorn USA | |
Management Fees | | | 0.86 | % | | | 0.86 | % | | | 0.86 | % | | | 0.86 | % | | | | | | | 0.86 | % | | | 0.86 | % | | | 0.86 | % | | | 0.86 | % | |
Distribution and Service (12b-1) Fees | | | 0.25 | % | | | 0.75 | % | | | 1.00 | % | | | 0.00 | % | | | | | | | 0.00 | % | | | 0.00 | % | | | 0.00 | % | | | 0.00 | % | |
Other Expenses | | | 0.21 | % | | | 0.54 | % | | | 0.14 | % | | | 0.04 | % | | | | | | | 0.14 | % | | | 0.11 | % | | | 0.07 | % | | | 0.20 | % | |
Net Expense Ratio | | | 1.32 | % | | | 2.15 | % | | | 2.00 | % | | | 0.90 | % | | | | | 1.00 | % | | | 0.97 | % | | | 0.93 | % | | | 1.06 | % | |
Columbia Acorn International Select | |
Management Fees | | | 0.94 | % | | | 0.94 | % | | | 0.94 | % | | | 0.94 | % | | | | | | | 0.94 | % | | | 0.94 | % | | | 0.94 | % | | | 0.94 | % | |
Distribution and Service (12b-1) Fees | | | 0.25 | % | | | 0.75 | % | | | 1.00 | % | | | 0.00 | % | | | | | | | 0.00 | % | | | 0.00 | % | | | 0.00 | % | | | 0.00 | % | |
Other Expenses | | | 0.28 | % | | | 0.45 | % | | | 0.32 | % | | | 0.19 | % | | | | | | | 0.30 | % | | | 0.21 | % | | | 0.15 | % | | | 0.25 | % | |
Net Expense Ratio | | | 1.47 | % | | | 2.14 | % | | | 2.26 | % | | | 1.13 | % | | | | | 1.24 | % | | | 1.15 | % | | | 1.09 | % | | | 1.19 | % | |
Columbia Acorn Select | |
Management Fees | | | 0.84 | % | | | 0.84 | % | | | 0.84 | % | | | 0.84 | % | | | | | | | 0.84 | % | | | 0.84 | % | | | 0.84 | % | | | 0.84 | % | |
Distribution and Service (12b-1) Fees | | | 0.25 | % | | | 0.75 | % | | | 1.00 | % | | | 0.00 | % | | | | | | | 0.00 | % | | | 0.00 | % | | | 0.00 | % | | | 0.00 | % | |
Other Expenses | | | 0.22 | % | | | 0.44 | % | | | 0.20 | % | | | 0.10 | % | | | | | | | 0.18 | % | | | 0.13 | % | | | 0.09 | % | | | 0.18 | % | |
Net Expense Ratio | | | 1.31 | % | | | 2.03 | % | | | 2.04 | % | | | 0.94 | % | | | | | 1.02 | % | | | 0.97 | % | | | 0.93 | % | | | 1.02 | % | |
Columbia Thermostat Fund | |
Management Fees | | | 0.10 | % | | | 0.10 | % | | | 0.10 | % | | | | | | | | | | | 0.10 | % | | | 0.10 | % | | | 0.10 | % | | | 0.10 | % | |
Distribution and Service (12b-1) Fees | | | 0.25 | % | | | 0.75 | % | | | 1.00 | % | | | | | | | | | | | 0.00 | % | | | 0.00 | % | | | 0.00 | % | | | 0.00 | % | |
Other Expenses | | | 0.15 | % | | | 0.15 | % | | | 0.15 | % | | | | | | | | | | | 0.15 | % | | | 0.13 | % | | | 0.04 | % | | | 0.15 | % | |
Net Expense Ratio** | | | 0.50 | % | | | 1.00 | % | | | 1.25 | % | | | | | | | 0.25 | % | | | 0.23 | % | | | 0.14 | % | | | 0.25 | % | |
Columbia Acorn Emerging Markets Fund | |
Management Fees | | | 1.10 | % | | | | | | | 1.10 | % | | | 1.10 | % | | | | | | | 1.10 | % | | | 1.10 | % | | | 1.10 | % | | | 1.10 | % | |
Distribution and Service (12b-1) Fees | | | 0.25 | % | | | | | | | 1.00 | % | | | 0.00 | % | | | | | | | 0.00 | % | | | 0.00 | % | | | 0.00 | % | | | 0.00 | % | |
Other Expenses | | | 0.41 | % | | | | | | | 0.41 | % | | | 0.29 | % | | | | | | | 0.34 | % | | | 0.32 | % | | | 0.26 | % | | | 0.44 | % | |
Net Expense Ratio | | | 1.76 | % | | | | | 2.51 | % | | | 1.39 | % | | | | | 1.44 | % | | | 1.42 | % | | | 1.36 | % | | | 1.54 | % | |
Columbia Acorn European Fund | |
Management Fees | | | 1.19 | % | | | | | 1.19 | % | | | 1.19 | % | | | | | | | | | 1.19 | % | | | | | | | 1.19 | % | |
Distribution and Service (12b-1) Fees | | | 0.25 | % | | | | | 1.00 | % | | | 0.00 | % | | | | | | | | | 0.00 | % | | | | | | | 0.00 | % | |
Other Expenses | | | 0.30 | % | | | | | 0.31 | % | | | 0.22 | % | | | | | | | | | 0.32 | % | | | | | | | 0.26 | % | |
Net Expense Ratio | | | 1.74 | % | | | | | 2.50 | % | | | 1.41 | % | | | | | | | 1.51 | % | | | | | 1.45 | % | |
See the Funds' prospectuses for information on minimum initial investment amounts and other details of buying, selling and exchanging shares of the Funds.
Fees and expenses are for the year ended December 31, 2013. The fees and expenses of Columbia Acorn International Select and Columbia Acorn Select include the effect of the voluntary undertaking by Columbia Wanger Asset Management, LLC (CWAM) to reimburse each Fund for the ordinary operating expenses (exclusive of transaction costs and certain other investment-related expenses, interest and fees on borrowings and expenses associated with the Fund's investment in other investment companies, if any), after giving effect to any balance credits or overdraft charges from the Fund's custodian, do not exceed annually each class' average daily net assets as follows:
Fund | | Class A | | Class B | | Class C | | Class I | | Class R4 | | Class R5 | | Class Y | | Class Z | |
Columbia Acorn International Select | | | 1.70 | % | | | 2.20 | % | | | 2.45 | % | | | 1.31 | % | | | 1.45 | % | | | 1.36 | % | | | 1.31 | % | | | 1.45 | % | |
Columbia Acorn Select | | | 1.60 | % | | | 2.10 | % | | | 2.35 | % | | | 1.23 | % | | | 1.35 | % | | | 1.28 | % | | | 1.23 | % | | | 1.35 | % | |
These arrangements may be modified or terminated by either the Funds or CWAM on 30 days notice.
The fees and expenses of Columbia Thermostat Fund include the effect of CWAM's contractual undertaking to waive fees and/or reimburse expenses of the Fund so that the ordinary operating expenses (exclusive of transaction costs and certain other investment-related expenses, interest and fees on borrowings and expenses associated with the Fund's investment in other investment companies, if any), do not exceed annually the rates of 0.50%, 1.00%, 1.25%, 0.25%, 0.23%, 0.18% and 0.25% of the Fund's average daily net assets attributable to Class A, Class B, Class C, Class R4, Class R5, Class Y and Class Z shares, respectively, through April 30, 2014. There is no guarantee that this agreement will continue thereafter.
The fees and expenses of Columbia Acorn Emerging Markets Fund and Columbia Acorn European Fund include the effect of CWAM's contractual undertaking to waive fees and/or reimburse expenses of each Fund so that the ordinary operating expenses (exclusive of transaction costs and certain other investment-related expenses, interest and fees on borrowings and expenses associated with the Fund's investment in other investment companies, if any), of each Fund's Class A, Class C, Class I, Class R4 (if offered), Class R5, Class Y (if offered) and Class Z shares through April 30, 2014, do not exceed annually each class' average daily net assets as follows:
Fund | | Class A | | Class C | | Class I | | Class R4 | | Class R5 | | Class Y | | Class Z | |
Columbia Acorn Emerging Markets Fund | | | 1.85 | % | | | 2.60 | % | | | 1.54 | % | | | 1.60 | % | | | 1.59 | % | | | 1.54 | % | | | 1.60 | % | |
Columbia Acorn European Fund | | | 1.75 | % | | | 2.50 | % | | | 1.46 | % | | | — | % | | | 1.51 | % | | | — | % | | | 1.50 | % | |
There is no guarantee that this agreement will continue thereafter.
The fees and expenses of Columbia Acorn International include the effect of the voluntary undertaking by CWAM and its affiliates, effective August 15, 2013, to waive a portion of total annual Fund operating expenses incurred by Class A, Class B and Class C shares of Columbia Acorn International such that the Fund's total annual Fund operating expenses will be reduced by 0.04%, 0.03% and 0.02% for Class A, Class B and Class C shares of the Fund, respectively.
* The Funds generally no longer accept investments by new or existing investors in Class B shares, except in connection with the reinvestment of any dividend and/or capital gain distributions in Class B shares of the Funds and exchanges by existing Class B shareholders of certain other funds within the Columbia Family of Funds.
** Does not include estimated fees and expenses of 0.54% incurred by the Fund from the underlying portfolio funds in which it invests.
† With the exception of Class R5 shares of Columbia Acorn International (which commenced operations on August 2, 2011) and Class Y shares of Columbia Acorn Emerging Markets Fund (which commenced operations on June 13, 2013), noted share classes commenced operations on November 8, 2012, and have limited eligibility. Please see the Funds' prospectuses for details.
136
This page intentionally left blank.
137
Columbia Acorn Family of Funds
Trustees
Laura M. Born
Chair of the Board
Steven N. Kaplan
Vice Chair of the Board
Michelle L. Collins
Maureen M. Culhane
Margaret M. Eisen
John C. Heaton
Charles P. McQuaid
David J. Rudis
David B. Small
Ralph Wanger (Trustee Emeritus)
Officers
Charles P. McQuaid
President
Robert A. Chalupnik
Vice President
Michael G. Clarke
Assistant Treasurer
Joseph F. DiMaria
Assistant Treasurer
P. Zachary Egan
Vice President
Fritz Kaegi
Vice President
John M. Kunka
Assistant Treasurer
Stephen Kusmierczak
Vice President
Joseph C. LaPalm
Vice President
Bruce H. Lauer
Vice President, Secretary and Treasurer
Louis J. Mendes III
Vice President
Robert A. Mohn
Vice President
Christopher J. Olson
Vice President
Christopher O. Petersen
Assistant Secretary
Scott R. Plummer
Assistant Secretary
Robert P. Scales
Chief Compliance Officer, Chief Legal Officer,
Senior Vice President and General Counsel
Andreas Waldburg-Wolfegg
Vice President
Linda K. Roth-Wiszowaty
Assistant Secretary
Investment Manager
Columbia Wanger Asset Management, LLC
227 West Monroe Street, Suite 3000
Chicago, Illinois 60606
1-800-922-6769
Distributor
Columbia Management Investment Distributors, Inc.
225 Franklin Street
Boston, Massachusetts 02110
Transfer Agent, Dividend Disbursing Agent
Columbia Management Investment Services Corp.
P. O. Box 8081
Boston, Massachusetts 02266-8081
1-800-345-6611
Legal Counsel to the Funds
Perkins Coie LLP
Washington, DC
Legal Counsel to the Independent Trustees
Drinker Biddle & Reath LLP
Philadelphia, Pennsylvania
Independent Registered Public Accounting Firm
PricewaterhouseCoopers LLP
Chicago, Illinois
This report, including the schedules of investments, is submitted for the general information of the shareholders of Columbia Acorn Trust.
A description of the policies and procedures that the Funds use to determine how to vote proxies and a copy of the Funds' voting record are available (i) without charge, upon request, by calling 800-922-6769 and (ii) on the Securities and Exchange Commission's website at www.sec.gov. Information regarding how the Funds voted proxies relating to portfolio securities during the 12-month period ended June 30, is available from the SEC's website. Information regarding how the Funds voted proxies relating to portfolio securities is also available at www.columbiamanagement.com under "About Us." From there, click on "Disclosures."
The Funds file a complete schedule of portfolio holdings with the SEC for the first and third quarters of each fiscal year on Form N-Q. The Funds' Form N-Q is available on the SEC's website at www.sec.gov and may be reviewed and copied at the SEC's Public Reference Room in Washington, D.C. Information on the operation of the Public Reference Room may be obtained by calling 1-800-SEC-0330. The Funds' complete portfolio holdings are disclosed at www.columbiamanagement.com approximately 30 to 40 days after each month-end.
Investors should consider the investment objectives, risks, charges and expenses of a mutual fund carefully before investing. For a free prospectus and, if available, a summary prospectus, which contains this and other important information about the funds, visit www.columbiamanagement.com. Read the prospectus carefully before investing.
Columbia Acorn Family of Funds are distributed by Columbia Management Investment Distributors, Inc., member FINRA and managed by Columbia Wanger Asset Management, LLC.
Find out what's new – visit our web site at:
www.columbiamanagement.com
Our e-mail address is:
ServiceInquiries@ColumbiaManagement.com
Shareholders should not include personal information such as account numbers, Social Security numbers or taxpayer identification numbers in e-mail. We are unable to accept account transactions sent via e-mail.
138
This document contains Global Industry Classification Standard data. The Global Industry Classification Standard ("GICS") was developed by and is the exclusive property and a service mark of MSCI Inc. ("MSCI") and Standard & Poor's Financial Services LLC ("S&P") and is licensed for use by Columbia Wanger Asset Management, LLC. Neither MSCI, S&P, nor any other party involved in making or compiling the GICS or any GICS classifications makes any express or implied warranties or representations with respect to such standard or classification (or the results to be obtained by the use thereof), and all such parties hereby expressly disclaim all warranties of originality, accuracy, completeness, merchantability and fitness for a particular purpose with respect to any of such standard or classification. Without limiting any of the foregoing, in no event shall MSCI, S&P, any of their affiliates or any third party involved in making or compiling the GICS or any GICS classifications have any liability for any direct, indirect, special, punitive, consequential or any other damages (including lost profits) even if notified of the possibility of such damages.
Columbia Management®
Columbia Acorn Family of Funds
Class A, B, C, I, R, R4, R5, Y and Z Shares
Annual Report, December 31, 2013
For More Information
You'll find more information about the Columbia Acorn Family of Funds in the documents described below. Contact Columbia Funds as follows to obtain these documents free of charge:
By Mail: Columbia Funds
c/o Columbia Management Investment Services Corp.
P.O. Box 8081
Boston, MA 02266-8081
By Telephone: 800.345.6611
Online: www.columbiamanagement.com
Shareholder Communications with the Board
The Funds' Board of Trustees has adopted procedures by which shareholders may communicate with the Board. Shareholders who wish to communicate with the Board should send their written communications to the Board by mail, c/o Columbia Wanger Asset Management, LLC, 227 West Monroe Street, Suite 3000, Chicago, Illinois 60606, Attention: Secretary. Shareholder communications must (i) be in writing, (ii) identify the Columbia Acorn Fund to which the communication relates and (iii) state the particular class of shares and number of shares held by the communicating shareholder.
Prospectuses and the Statement of Additional Information (SAI)
The prospectuses and the SAI provide more detailed information about the Funds and their policies. The SAI is legally part of each prospectus (it's incorporated by reference). A copy of each has been filed with the SEC.
Information Provided by the SEC
You can review and copy information about the Funds (including their prospectuses, the SAI and shareholder reports) at the SEC's Public Reference Room in Washington, DC. To find out more about the operation of the Public Reference Room, call the SEC at 202.551.8090. Reports and other information about the Fund are also available in the EDGAR Database on the SEC's website at http://www.sec.gov, or you can receive copies of this information, for a fee, by electronic request at the following e-mail address: publicinfo@sec.gov. You can also obtain copies of this information by writing the Public Reference Section, Securities and Exchange Commission, Washington, DC 20549-0102.
The investment company registration number of Columbia Acorn Trust, of which each of these Funds is a series, is 811-01829.
© 2014 Columbia Management Investment Advisers, LLC. All rights reserved.
225 Franklin Street, Boston, MA 02110
800.345.6611 www.columbiamanagement.com
ANN110_12_D01_(02/14) 815582
Item 2. Code of Ethics.
(a) The registrant has adopted a code of ethics that applies to the registrant’s principal executive officer, principal financial officer, principal accounting officer or controller, or persons performing similar functions, regardless of whether these individuals are employed by the registrant or a third party.
(b) During the period covered by this report, there were not any amendments to a provision of the code of ethics adopted in 2(a) above.
(c) During the period covered by this report, there were no waivers, including any implicit waivers, from a provision of the code of ethics described in 2(a) above that relates to one or more of the items set forth in paragraph (b) of this item’s instructions.
Item 3. Audit Committee Financial Expert.
The registrant’s Board of Trustees has determined that Michelle L. Collins, a member of the registrant’s Board of Trustees and Audit Committee, qualifies as an audit committee financial expert. Ms. Collins is an independent trustee, as defined in paragraph (a)(2) of this item’s instructions.
Item 4. Principal Accountant Fees and Services.
(a) Audit Fees. Aggregate Audit Fees billed by the principal accountant for professional services rendered during the fiscal years ended December 31, 2013 and December 31, 2012 are approximately as follows:
2013 | | 2012 | |
$ | 304,800 | | $ | 296,000 | |
| | | | | |
Audit Fees include amounts related to the audit of the registrant’s annual financial statements or services that are normally provided by the accountant in connection with statutory and regulatory filings or engagements for those fiscal years.
(b) Audit-Related Fees. Aggregate Audit-Related Fees billed to the registrant by the principal accountant for professional services rendered during the fiscal years ended December 31, 2013 and December 31, 2012 are approximately as follows:
2013 | | 2012 | |
$ | 46,000 | | $ | 44,900 | |
| | | | | |
Audit-Related Fees include amounts for assurance and related services by the principal accountant that are reasonably related to the performance of the audit of the registrant’s financial statements and are not reported in Audit Fees above. In fiscal years 2013 and 2012, Audit-Related Fees consist of agreed-upon procedures performed for other audit-related additional testing.
During the fiscal years ended December 31, 2013 and December 31, 2012, there were no Audit-Related Fees billed by the registrant’s principal accountant to the registrant’s investment adviser (not including any sub-adviser whose role is primarily portfolio management and is subcontracted with or overseen by another investment adviser) and any entity controlling, controlled by, or under common control with the adviser that provides ongoing services to the registrant for an engagement that related directly to the operations and financial reporting of the registrant.
(c) Tax Fees. Aggregate Tax Fees billed by the principal accountant to the registrant for professional services rendered during the fiscal years ended December 31, 2013 and December 31, 2012 are approximately as follows:
2013 | | 2012 | |
$ | 59,300 | | $ | 58,200 | |
| | | | | |
Tax Fees incurred in both fiscal years 2013 and 2012 relate to the review of annual tax returns, the review of required shareholder distribution calculations and include amounts for professional services by the principal accountant for tax compliance, tax advice and tax planning.
During the fiscal years ended December 31, 2013 and December 31, 2012, there were no Tax Fees billed by the registrant’s principal accountant to the registrant’s investment adviser (not including any sub-adviser whose role is primarily portfolio management and is subcontracted with or overseen by another investment adviser) and any entity controlling, controlled by, or under common control with the adviser that provides ongoing services to the registrant for an engagement that related directly to the operations and financial reporting of the registrant.
(d) All Other Fees. Aggregate All Other Fees billed by the principal accountant to the registrant for professional services rendered during the fiscal years ended December 31, 2013 and December 31, 2012 are as follows:
All Other Fees include amounts for products and services provided by the principal accountant, other than the services reported in paragraphs (a) through (c) above.
Aggregate All Other Fees billed by the registrant’s principal accountant to the registrant’s investment adviser (not including any sub-adviser whose role is primarily portfolio management and is subcontracted with or overseen by another investment adviser) and any entity controlling, controlled by, or under common control with the adviser that provides ongoing services to the registrant for an engagement that related directly to the operations and financial reporting of the registrant during the fiscal years ended December 31, 2013 and December 31, 2012 are approximately as follows:
2013 | | 2012 | |
$ | 135,000 | | $ | 140,000 | |
| | | | | |
In both fiscal years 2013 and 2012, All Other Fees consist of professional services rendered for internal control reviews.
(e)(1) Audit Committee Pre-Approval Policies and Procedures
The policy of the registrant’s Audit Committee is to specifically pre-approve (i) all audit and non-audit (including audit related, tax and all other) services provided by the registrant’s independent auditor to the registrant and individual funds (collectively “Fund Services”) and (ii) all non-audit services provided by the registrant’s independent auditor to the funds’ adviser or a control affiliate of the adviser, that relate directly to the funds’ operations and financial reporting (collectively “Fund-related Adviser Services”). A “control affiliate” is an entity controlling, controlled by, or under common control with the adviser that provides ongoing services to the funds, and the term “adviser” is deemed to exclude any unaffiliated sub-adviser whose role is primarily portfolio management and is sub-contracted or overseen by another investment adviser.
If such Fund Services or Fund-related Adviser Services are required during the period between the Audit Committee’s regularly scheduled meetings, the Chairman of the Audit Committee has the authority to pre-approve the service, with reporting to the full Audit Committee at the next regularly scheduled meeting.
The Audit Committee will waive pre-approval of Fund Services or Fund-related Adviser Services provided that the requirements under paragraph (c)(7)(i)(C) of Rule 2-01 of Regulation S-X are met.
(e)(2) The percentage of services described in paragraphs (b) through (d) of this Item approved pursuant to the “de minimis” exception under paragraph (c)(7)(i)(C) of Rule 2-01 of Regulation S-X during both fiscal years ended December 31, 2013 and December 31, 2012 was zero.
(f) Not applicable.
(g) The aggregate non-audit fees billed by the registrant’s accountant for services rendered to the registrant, and rendered to the registrant’s investment adviser (not including any sub-adviser whose role is primarily portfolio management and is
subcontracted with or overseen by another investment adviser), and any entity controlling, controlled by, or under common control with the adviser that provides ongoing services to the registrant for the fiscal years ended December 31, 2013 and December 31, 2012 are approximately as follows:
2013 | | 2012 | |
$ | 240,300 | | $ | 243,100 | |
| | | | | |
(h) The registrant’s Audit Committee of the Board of Directors has considered whether the provision of non-audit services that were rendered to the registrant’s adviser (not including any sub-adviser whose role is primarily portfolio management and is subcontracted with or overseen by another investment adviser), and any entity controlling, controlled by, or under common control with the investment adviser that provides ongoing services to the registrant that were not pre-approved pursuant to paragraph (c)(7)(ii) of Rule 2-01 of Regulation S-X, is compatible with maintaining the principal accountant’s independence.
Item 5. Audit Committee of Listed Registrants.
Not applicable.
Item 6. Investments
(a) The registrant’s “Schedule I — Investments in securities of unaffiliated issuers” (as set forth in 17 CFR 210.12-12) is included in Item 1 of this Form N-CSR.
(b) Not applicable
Item 7. Disclosure of Proxy Voting Policies and Procedures for Closed-End Management Investment Companies.
Not applicable.
Item 8. Portfolio Managers of Closed-End Management Investment Companies.
Not applicable.
Item 9. Purchases of Equity Securities by Closed-End Management Investment Company and Affiliated Purchasers.
Not applicable.
Item 10. Submission of Matters to a Vote of Security Holders.
There were no material changes to the procedures by which shareholders may recommend nominees to the registrant’s board of directors.
Item 11. Controls and Procedures.
(a) The registrant’s principal executive officer and principal financial officers, based on their evaluation of the registrant’s disclosure controls and procedures as of a date within 90 days of the filing of this report, have concluded that such controls and procedures are adequately designed to ensure that material information required to be disclosed by the registrant in Form N-CSR is accumulated and communicated to the registrant’s management, including the principal executive officer and principal financial officer, or persons performing similar functions, as appropriate to allow timely decisions regarding required disclosure.
(b) There was no change in the registrant’s internal control over financial reporting that occurred during the registrant’s second fiscal quarter of the period covered by this report that has materially affected, or is reasonably likely to materially affect, the registrant’s internal control over financial reporting.
Item 12. Exhibits.
(a)(1) Code of ethics required to be disclosed under Item 2 of Form N-CSR attached hereto as Exhibit 99.CODE ETH.
(a)(2) Certifications pursuant to Rule 30a-2(a) under the Investment Company Act of 1940 (17 CFR 270.30a-2(a)) attached hereto as Exhibit 99.CERT.
(a)(3) Not applicable.
(b) Certification pursuant to Rule 30a-2(b) under the Investment Company Act of 1940 (17 CFR 270.30a-2(b)) attached hereto as Exhibit 99.906CERT.
SIGNATURES
Pursuant to the requirements of the Securities Exchange Act of 1934 and the Investment Company Act of 1940, the registrant has duly caused this report to be signed on its behalf by the undersigned, thereunto duly authorized.
(registrant) | | Columbia Acorn Trust | |
|
|
By (Signature and Title) | | /s/ Charles P. McQuaid | |
| | Charles P. McQuaid, President | |
|
|
Date | | February 19, 2014 | |
| | | | | |
Pursuant to the requirements of the Securities Exchange Act of 1934 and the Investment Company Act of 1940, this report has been signed below by the following persons on behalf of the registrant and in the capacities and on the dates indicated.
By (Signature and Title) | | /s/ Charles P. McQuaid | |
| | Charles P. McQuaid, President | |
|
|
Date | | February 19, 2014 | |
|
|
By (Signature and Title) | | /s/ Bruce H. Lauer | |
| | Bruce H. Lauer, Treasurer | |
|
|
Date | | February 19, 2014 | |
| | | | |