UNITED STATES
SECURITIES AND EXCHANGE COMMISSION
Washington, D.C. 20549
FORM N-CSR
CERTIFIED SHAREHOLDER REPORT OF REGISTERED
MANAGEMENT INVESTMENT COMPANIES
Investment Company Act file number 811-01829
Columbia Acorn Trust
(Exact name of registrant as specified in charter)
227 W. Monroe Street
Suite 3000
Chicago, IL 60606
(Address of principal executive offices) (Zip code)
Mary C. Moynihan
Perkins Coie LLP
700 13th Street, NW
Suite 600
Washington, DC 20005
Paul B. Goucher, Esq.
Columbia Management Investment Advisers, LLC
100 Park Avenue
New York, New York 10017
P. Zachary Egan
Columbia Acorn Trust
227 West Monroe Street, Suite 3000
Chicago, Illinois 60606
(Name and address of agent for service)
Registrant’s telephone number, including area code: (312) 634-9200
Date of fiscal year end: December 31
Date of reporting period: December 31, 2016
Form N-CSR is to be used by management investment companies to file reports with the Commission not later than 10 days after the transmission to stockholders of any report that is required to be transmitted to stockholders under Rule 30e-1 under the Investment Company Act of 1940 (17 CFR 270.30e-1). The Commission may use the information provided on Form N-CSR in its regulatory, disclosure review, inspection, and policymaking roles.
A registrant is required to disclose the information specified by Form N-CSR, and the Commission will make this information public. A registrant is not required to respond to the collection of information contained in Form N-CSR unless the Form displays a currently valid Office of Management and Budget (“OMB”) control number. Please direct comments concerning the accuracy of the information collection burden estimate and any suggestions for reducing the burden to Secretary, Securities and Exchange Commission, 450 Fifth Street, NW, Washington, DC 20549-0609. The OMB has reviewed this collection of information under the clearance requirements of 44 U.S.C. § 3507.
Item 1. Reports to Stockholders.

Annual Report
December 31, 2016
Columbia Acorn® Fund
Columbia Acorn International®
Columbia Acorn USA®
Columbia Acorn International SelectSM
Columbia Acorn SelectSM
Columbia Thermostat FundSM
Columbia Acorn Emerging Markets FundSM
Columbia Acorn European FundSM
Not FDIC Insured • No bank guarantee • May lose value
| | |
 | | Stay informed with Columbia Threadneedle Investments Investor insight Columbia Acorn funds have moved away from producing quarterly shareholder reports and are now offering a semiannual and annual report to shareholders. To find economic and market commentary, investment videos, white papers, quarterly mutual fund commentary, distribution information and more, visit our website at investor.columbiathreadneedleus.com. Subscribe to the latest information from Columbia Threadneedle. Register your information online at investor.columbiathreadneedleus.com/subscribe and select the publications you would like to receive, including: ∎ Columbia Threadneedle Investor Newsletter, highlighting the latest macro- and micro-economic trends, investment themes, products, service changes and other items of interest to our investors ∎ White papers that delve deep into a variety of investment topics ∎ Quarterly portfolio manager commentary and fund fact sheets ∎ Perspectives blog at investor.columbiathreadneedleus.com Read timely posts by our investment team. Update your subscriptions at any time by accessing the email subscription center. Social media We offer you multiple ways to access our market commentary and investment insights. ∎ Twitter.com/CTinvest_US Follow us on Twitter for quick, up-to-the-minute comments on market news and more. ∎ Youtube.com/CTInvestUS View our commentaries on the economy, markets and current investment opportunities. ∎ Linkedin.com/company/Columbia-Threadneedle-Investments-US Connect with us on LinkedIn for updates from our thought leaders. |
Not part of the shareholder report
| 4 |
| 6 |
| 8 |
| 11 |
| 13 |
| 15 |
| 16 |
| 19 |
| 21 |
| 23 |
| 25 |
| 27 |
| 29 |
| 32 |
| 34 |
| 37 |
| 38 |
| 40 |
| 43 |
| 79 |
| 83 |
| 85 |
| 94 |
| 122 |
| 140 |
| 141 |
| 142 |
| 146 |
| 147 |
Columbia Acorn Family of Funds | Annual Report 2016
Fund at a glance
Columbia Acorn® Fund
Investment objective
The Fund seeks long-term capital appreciation.
Portfolio management
P. Zachary Egan
Co-Portfolio Manager
Fritz Kaegi
Co-Portfolio Manager
Matthew A. Litfin
Co-Portfolio Manager
Morningstar Style BoxTM
The Morningstar Style Box™ is based on a fund’s portfolio holdings. For equity funds, the vertical axis shows the market capitalization of the stocks owned, and the horizontal axis shows investment style (value, blend, or growth). Information shown is based on the most recent data provided by Morningstar.
© 2017 Morningstar, Inc. All rights reserved. The Morningstar information contained herein: (1) is proprietary to Morningstar and/or its content providers; (2) may not be copied or distributed; and (3) is not warranted to be accurate, complete or timely. Neither Morningstar nor its content providers are responsible for any damages or losses arising from any use of this information.
| Average annual total returns (%) (for the period ended December 31, 2016) |
| | | Inception | 1 Year | 5 Years | 10 Years | Life |
| Class A | Excluding sales charges | 10/16/00 | 10.06 | 10.76 | 6.20 | 13.76 |
| | Including sales charges | | 3.70 | 9.46 | 5.57 | 13.61 |
| Class C | Excluding sales charges | 10/16/00 | 9.29 | 9.98 | 5.40 | 12.89 |
| | Including sales charges | | 8.66 | 9.98 | 5.40 | 12.89 |
| Class I | 09/27/10 | 10.44 | 11.15 | 6.55 | 14.13 |
| Class R4 | 11/08/12 | 10.32 | 11.01 | 6.48 | 14.12 |
| Class R5 | 11/08/12 | 10.43 | 11.11 | 6.52 | 14.13 |
| Class Y | 11/08/12 | 10.50 | 11.16 | 6.55 | 14.13 |
| Class Z | 06/10/70 | 10.39 | 11.08 | 6.51 | 14.12 |
| Russell 2500 Index | | 17.59 | 14.54 | 7.69 | N/A |
Returns for Class A shares are shown with and without the maximum initial sales charge of 5.75%. Returns for Class C shares are shown with and without the maximum contingent deferred sales charge of 1.00% for the first year after purchase. The Fund’s other classes are not subject to sales charges, but may be subject to other fees and expenses, and have limited eligibility. Please see the Fund’s prospectus for details. Performance for different share classes will vary based on differences in sales charges and certain fees and expenses associated with each class.
As stated in the May 1, 2016, prospectus, as supplemented June 27, 2016, the Fund’s annual operating expense ratio is 0.82% for Class Z shares and 1.07% for Class A shares.
All results shown assume reinvestment of distributions during the period. Returns do not reflect the deduction of taxes that a shareholder may pay on Fund distributions or on the redemption of Fund shares. Performance results may reflect the effect of any fee waivers or reimbursements of Fund expenses by the investment manager and/or any of its affiliates. Absent these fee waivers and/or expense reimbursement arrangements, performance results may have been lower.
The performance information shown represents past performance and is not a guarantee of future results. The investment return and principal value of your investment will fluctuate so that shares, when redeemed, may be worth more or less than their original cost. Current performance may be lower or higher than the performance data shown. You may obtain performance information current to the most recent month-end by contacting your financial intermediary, visiting investor.columbiathreadneedleus.com or calling 800.922.6769.
The returns shown for periods prior to the share class inception date (including returns for the Life of the Fund, which are since Fund inception) include the returns of the Fund’s oldest share class. These returns are adjusted to reflect any higher class-related operating expenses of the newer share classes, as applicable. Please visit investor.columbiathreadneedleus.com/investment-products/mutual-funds/appended-performance for more information.
The Russell 2500 Index measures the performance of the 2,500 smallest companies in the Russell 3000 Index, which represents approximately 17% of the total market capitalization of the Russell 3000 Index.
Unlike mutual funds, indexes are not managed and do not incur fees or expenses. It is not possible to invest directly in an index.
| 4 | Columbia Acorn Family of Funds | Annual Report 2016 |
Fund at a glance (continued)
Columbia Acorn® Fund
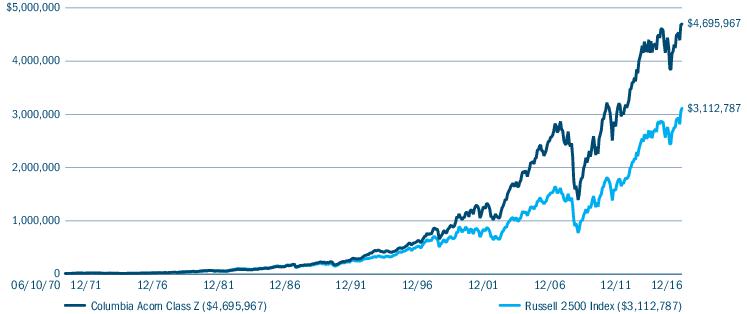
The Growth of a $10,000 Investment in Columbia Acorn® Fund Class Z Shares
June 10, 1970 (Fund inception) through December 31, 2016
This chart shows the change in value of a hypothetical $10,000 investment in Class Z shares of the Fund during the stated time period. A $10,000 investment in Columbia Acorn® Fund at inception appreciated to $31,777 on December 31, 1978, the inception date of the Russell 2500 Index. For comparison with the Russell 2500 Index, we assigned the index the same value as the Fund at index inception.
| Top ten holdings (%) (at December 31, 2016) | |
Align Technology, Inc.
Invisalign System to Correct Malocclusion (Crooked Teeth) | 2.4 |
Education Realty Trust, Inc.
Student Housing | 1.7 |
Wageworks, Inc.
Healthcare Consumer Directed Benefits & Commuter Account Management | 1.7 |
Lazard Ltd., Class A
Corporate Advisory & Asset Management | 1.6 |
Raymond James Financial, Inc.
Full Service Wealth Management | 1.6 |
HealthSouth Corp.
Inpatient Rehabilitation Facilities & Home Health Care | 1.6 |
Toro Co. (The)
Turf Maintenance Equipment | 1.5 |
Vantiv, Inc., Class A
Credit Card Processor | 1.4 |
Pra Health Sciences, Inc.
Contract Research Organization | 1.3 |
MB Financial, Inc.
Chicago Bank | 1.3 |
Percentages indicated are based upon total investments (excluding Money Market Funds and Securities Lending Collateral).
For further detail about these holdings, please refer to the section entitled “Portfolio of Investments."
Fund holdings are as of the date given, are subject to change at any time, and are not recommendations to buy or sell any security.
| Portfolio breakdown (%) (at December 31, 2016) |
| Common Stocks | 97.5 |
| Money Market Funds | 0.4 |
| Securities Lending Collateral | 2.1 |
| Total | 100.0 |
Percentages indicated are based upon total investments. The Fund’s portfolio composition is subject to change.
| Equity sector breakdown (%) (at December 31, 2016) |
| Consumer Discretionary | 14.6 |
| Consumer Staples | 2.0 |
| Energy | 3.7 |
| Financials | 17.1 |
| Health Care | 20.0 |
| Industrials | 19.5 |
| Information Technology | 15.0 |
| Materials | 1.8 |
| Real Estate | 4.7 |
| Telecommunication Services | 1.6 |
| Total | 100.0 |
Percentages indicated are based upon total equity investments. The Fund’s portfolio composition is subject to change.
Columbia Acorn Family of Funds | Annual Report 2016
| 5 |
Manager Discussion of Fund Performance
Columbia Acorn® Fund
P. Zachary Egan
Co-Portfolio Manager
Fritz Kaegi
Co-Portfolio Manager
Matthew A. Litfin
Lead Portfolio Manager
Columbia Acorn Fund Class Z shares gained 10.39% in 2016. While it had a strong absolute return, the Fund fell short of its primary benchmark, the Russell 2500 Index, which gained 17.59%. The benchmark’s more core orientation benefited from strength in value stocks throughout the year. In comparison to the Fund’s more growth-oriented Morningstar Mid-Cap Growth peer group, Columbia Acorn Fund beat the category average return of 6.03% by 436 basis points (a basis point is 1/100th of a percent). We feel 2016 was a positive year for the Fund’s small/mid-cap growth strategy and are pleased with its solid absolute return in a market that largely favored value strategies. Fund relative performance benefited from good stock selection in the consumer discretionary sector, but was dragged down by investments in the financial and information technology sectors.
The health care sector is inherently risky and often complicated by political volatility and regulatory hurdles, so it was not surprising that the sector came under pressure following the U.S. presidential election on concerns about changes proposed by the new administration. The Fund saw a significant impact from health care holdings both at the top and the bottom end of the performance scale. On the downside in the sector, Celldex Therapeutics, a biotech developing cancer drugs, fell following a failed drug trial early in the year and a lack of news flow kept the stock depressed, resulting in a 78% decline for the year. Down 37% in the Fund, orphan drug developer Ultragenyx Pharmaceutical also declined with the sector and on concerns about drug prices.
There is still a great deal of strategic interest from acquirers within the health care sector, as evidenced by Medivation, a developer and marketer of cancer drugs. Its stock rose 173% for the year, gaining on news that French drug company Sanofi wanted to acquire the company at a significant premium. Sanofi lost out to Pfizer, however, which acquired the company at a price well above Sanofi’s initial offer. Up 46%, Align Technology, the maker of the Invisalign system used to straighten teeth, gained as the company continued to take business away from traditional braces with its clear
plastic retainers.
In the real estate sector, Jones Lang LaSalle, a provider of real estate services, fell 37% in 2016. The company struggled early in the year on concerns of a decline in commercial real estate transaction and leasing volumes in China, concerns that broadened to include the United Kingdom and Europe following the Brexit vote.
Industrials benefited from the “Trump bump” following the election, particularly companies with larger U.S. tax exposure. Up 55%, Toro, a well-known name in lawn care equipment, reported strong quarterly earnings and positive initial 2017 guidance driven primarily by excellent operational execution. New to the Fund this year, WageWorks, a provider of health care consumer-directed benefits and commuter account management, falls within the industrial sector and gained 41% on news of its acquisition of ADP’s customer-directed benefits business. This acquisition is expected to have significant upside, and the company also benefited from positive 2017 enrollment trends.
Through enhancements to our long-standing, research-driven process, the number of new stock ideas added to Columbia Acorn Fund increased in 2016. The 58 new ideas that were added—which compares to 25 new ideas added in 2015—represented 38% of the Fund’s market value at year end. Looking at Fund and benchmark comparative data for earnings-per-share growth, long-term debt to capitalization and return on invested capital, the portfolio now holds higher quality and faster growing names. We believe we are offering Fund shareholders a portfolio of the best U.S. small- to mid-caps available. We do not anticipate the same level of turnover will continue in 2017, but we will continue to look for opportunities to add what we believe to be superior smaller growth names to the portfolio.
While we do not generally make large shifts in the Fund based on macroeconomic events, we did consider Fund positioning and the anticipated impact of a Trump presidency. We took advantage of the downturn in health care to increase the Fund’s overweight in the sector. We believe that there are many compelling investment areas in health care that will not be impacted significantly by the changes proposed by the new administration. While still an underweight position versus the benchmark, we did
| 6 | Columbia Acorn Family of Funds | Annual Report 2016 |
Manager Discussion of Fund Performance (continued)
Columbia Acorn® Fund
increase exposure to financials in the quarter, specifically to banks that are likely to benefit from higher interest rates. With the potential for interest rates to rise, we maintained the Fund’s large underweights in utilities and real estate, areas that are generally negatively impacted by higher rates and that also lack the growth potential that we look for in Fund holdings.
Market risk may affect a single issuer, sector of the economy, industry or the market as a whole. Investments in small- and mid-cap companies involve risks and volatility and possible illiquidity greater than investments in larger, more established companies. Foreign investments subject the Fund to political, economic, market, social and other risks within a particular country, as well as to potential currency instabilities and less stringent financial and accounting standards generally applicable to U.S. issuers. Risks are enhanced for emerging market issuers. The Fund may invest significantly in issuers within a particular sector, which may be negatively affected by market, economic or other conditions, making the Fund more vulnerable to unfavorable developments in the sector.
Columbia Acorn Family of Funds | Annual Report 2016
| 7 |
Fund at a glance
Columbia Acorn International®
Investment objective
The Fund seeks long-term capital appreciation.
Portfolio management
P. Zachary Egan
Co-Portfolio Manager
Louis J. Mendes
Co-Portfolio Manager
Morningstar Style BoxTM
The Morningstar Style Box™ is based on a fund’s portfolio holdings. For equity funds, the vertical axis shows the market capitalization of the stocks owned, and the horizontal axis shows investment style (value, blend, or growth). Information shown is based on the most recent data provided by Morningstar.
© 2017 Morningstar, Inc. All rights reserved. The Morningstar information contained herein: (1) is proprietary to Morningstar and/or its content providers; (2) may not be copied or distributed; and (3) is not warranted to be accurate, complete or timely. Neither Morningstar nor its content providers are responsible for any damages or losses arising from any use of this information.
| Average annual total returns (%) (for the period ended December 31, 2016) |
| | | Inception | 1 Year | 5 Years | 10 Years | Life |
| Class A | Excluding sales charges | 10/16/00 | -2.51 | 6.24 | 2.99 | 9.37 |
| | Including sales charges | | -8.10 | 5.00 | 2.39 | 9.10 |
| Class B | Excluding sales charges | 10/16/00 | -3.11 | 5.44 | 2.28 | 8.65 |
| | Including sales charges | | -7.93 | 5.11 | 2.28 | 8.65 |
| Class C | Excluding sales charges | 10/16/00 | -3.26 | 5.45 | 2.21 | 8.56 |
| | Including sales charges | | -4.22 | 5.45 | 2.21 | 8.56 |
| Class I | 09/27/10 | -2.18 | 6.64 | 3.38 | 9.80 |
| Class R | 08/02/11 | -2.82 | 5.86 | 2.67 | 9.08 |
| Class R4 | 11/08/12 | -2.32 | 6.48 | 3.30 | 9.76 |
| Class R5 | 08/02/11 | -2.23 | 6.58 | 3.34 | 9.77 |
| Class Y | 11/08/12 | -2.19 | 6.62 | 3.36 | 9.79 |
| Class Z | 09/23/92 | -2.28 | 6.54 | 3.33 | 9.77 |
| MSCI ACWI ex USA SMID Cap Index (Net) | | 3.57 | 6.99 | 2.18 | N/A |
| S&P Global ex-U.S. Between $500M and $5B Index | | 6.73 | 7.89 | 3.57 | 7.90 |
Returns for Class A shares are shown with and without the maximum initial sales charge of 5.75%. Returns for Class B shares are shown with and without the applicable contingent deferred sales charge (CDSC) of 5.00% in the first year, declining to 1.00% in the sixth year and eliminated thereafter. Returns for Class C shares are shown with and without the maximum CDSC of 1.00% for the first year after purchase. The Fund’s other classes are not subject to sales charges, but may be subject to other fees and expenses, and have limited eligibility. Please see the Fund’s prospectus for details. Performance for different share classes will vary based on differences in sales charges and certain fees and expenses associated with each class.
As stated in the May 1, 2016, prospectus, as supplemented June 27, 2016, the Fund’s annual operating expense ratio is 0.99% for Class Z shares and 1.24% for Class A shares.
All results shown assume reinvestment of distributions during the period. Returns do not reflect the deduction of taxes that a shareholder may pay on Fund distributions or on the redemption of Fund shares. Performance results may reflect the effect of any fee waivers or reimbursements of Fund expenses by the investment manager and/or any of its affiliates. Absent these fee waivers and/or expense reimbursement arrangements, performance results may have been lower.
The performance information shown represents past performance and is not a guarantee of future results. The investment return and principal value of your investment will fluctuate so that shares, when redeemed, may be worth more or less than their original cost. Current performance may be lower or higher than the performance data shown. You may obtain performance information current to the most recent month-end by contacting your financial intermediary, visiting investor.columbiathreadneedleus.com or calling 800.922.6769.
The returns shown for periods prior to the share class inception date (including returns for the Life of the Fund, which are since Fund inception) include the returns of the Fund’s oldest share class. These returns are adjusted to reflect any higher class-related operating expenses of the newer share classes, as applicable. Please visit investor.columbiathreadneedleus.com/investment-products/mutual-funds/appended-performance for more information.
The MSCI ACWI ex USA SMID Cap Index (Net) captures a mid- and small-cap representation across 22 of 23 developed market countries (excluding the U.S.) and 23 emerging market countries. The index covers approximately 28% of the free float-adjusted market capitalization in each country.
The S&P Global ex-U.S. Between $500M and $5B® Index is a subset of the broad market selected by the index sponsor that represents the mid- and small-cap developed and emerging markets, excluding the United States.
Unlike mutual funds, indexes are not managed and do not incur fees or expenses. It is not possible to invest directly in an index.
| 8 | Columbia Acorn Family of Funds | Annual Report 2016 |
Fund at a glance (continued)
Columbia Acorn International®
The Growth of a $10,000 Investment in Columbia Acorn International® Class Z Shares
September 23, 1992 (Fund inception) through December 31, 2016
This chart shows the change in value of a hypothetical $10,000 investment in Class Z shares of the Fund during the stated time period. A $10,000 investment in Columbia Acorn International at inception appreciated to $15,870 on May 31, 1994, the inception date of the MSCI ACWI ex USA SMID Cap Index (Net). For comparison with the MSCI ACWI ex USA SMID Cap Index (Net), we assigned the index the same value as the Fund at index inception.
| Top ten holdings (%) (at December 31, 2016) | |
CCL Industries, Inc. (Canada)
Global Label Converter | 2.4 |
Hexagon AB, Class B (Sweden)
Design, Measurement & Visualization Software & Equipment | 2.1 |
Partners Group Holding AG (Switzerland)
Private Markets Asset Management | 2.0 |
Wirecard AG (Germany)
Online Payment Processing & Risk Management | 1.8 |
Rightmove PLC (United Kingdom)
Internet Real Estate Listings | 1.8 |
Domino’s Pizza Enterprises Ltd. (Australia)
Domino’s Pizza Operator in Australia & New Zealand | 1.6 |
Kindred Group PLC (Malta)
European Online Gaming Operator | 1.5 |
Zee Entertainment Enterprises Ltd. (India)
Indian Programmer of Pay Television Content | 1.5 |
Aalberts Industries NV (Netherlands)
Flow Control & Heat Treatment | 1.5 |
MTU Aero Engines AG (Germany)
Airplane Engine Components & Services | 1.4 |
Percentages indicated are based upon total investments (excluding Money Market Funds and Securities Lending Collateral).
For further detail about these holdings, please refer to the section entitled “Portfolio of Investments."
Fund holdings are as of the date given, are subject to change at any time, and are not recommendations to buy or sell any security.
| Equity sector breakdown (%) (at December 31, 2016) |
| Consumer Discretionary | 22.5 |
| Consumer Staples | 3.2 |
| Energy | 2.7 |
| Financials | 9.0 |
| Health Care | 9.6 |
| Industrials | 23.4 |
| Information Technology | 16.4 |
| Materials | 8.1 |
| Real Estate | 3.8 |
| Telecommunication Services | 1.3 |
| Total | 100.0 |
Percentages indicated are based upon total equity investments. The Fund’s portfolio composition is subject to change.
Columbia Acorn Family of Funds | Annual Report 2016
| 9 |
Fund at a glance (continued)
Columbia Acorn International®
| Country breakdown (%) (at December 31, 2016) |
| Australia | 2.3 |
| Cambodia | 0.2 |
| Canada | 7.5 |
| China | 1.7 |
| Denmark | 3.1 |
| Finland | 0.6 |
| France | 2.8 |
| Germany | 6.1 |
| Hong Kong | 1.4 |
| India | 2.2 |
| Indonesia | 0.7 |
| Italy | 1.3 |
| Japan | 22.5 |
| Malta | 1.4 |
| Mexico | 1.1 |
| Netherlands | 2.2 |
| New Zealand | 0.6 |
| Philippines | 0.5 |
| Singapore | 1.3 |
| South Africa | 1.2 |
| South Korea | 2.6 |
| Spain | 3.0 |
| Sweden | 4.2 |
| Switzerland | 4.5 |
| Taiwan | 3.3 |
| Thailand | 1.1 |
| United Kingdom | 15.2 |
| United States(a) | 5.4 |
| Total | 100.0 |
| (a) | Includes investments in Money Market Funds. |
Country Breakdown is based primarily on issuer’s place of organization/incorporation. Percentages indicated are based upon total investments. The Fund’s portfolio composition is subject to change.
| 10 | Columbia Acorn Family of Funds | Annual Report 2016 |
Manager Discussion of Fund Performance
Columbia Acorn International®
P. Zachary Egan
Co-Portfolio Manager
Louis J. Mendes
Co-Portfolio Manager
Columbia Acorn International Class Z shares ended the year down 2.28%, underperforming the 3.57% gain of the Fund’s primary benchmark, the MSCI ACWI ex USA SMID Cap Index (Net). The relative lag was largely due to the Fund’s emphasis on secular growth businesses in a year that favored deep value cyclicals. This effect of the Fund’s investment strategy is apparent when looking at its more growth-oriented Morningstar Foreign Small/Mid Growth peer group, which had an average decline of 2.98% for the year. Materials and information technology were the most significant sectoral detractors from relative performance for the year. Regionally, the majority of the Fund’s underperformance was concentrated in Europe and the United Kingdom, and in Asia ex-Japan.
On the downside, IHI, a Japanese industrial conglomerate, was the Fund’s biggest detractor for the year. Down 49%, we sold the stock in the first quarter as word reached the market that several of its projects in shipbuilding and overseas plant construction were exceeding budget estimates, negatively impacting the company’s profitability. Based in Sweden, Kindred Group (formerly known as Unibet), a European online gaming operator, ended the year down 24%. Kindred gave back much of its 2015 gains as overall sentiment on the sector weakened and on concerns that growth would not be fast enough in newly regulated markets to offset higher taxes. We view the re-regulation of online gaming as a long-term positive development, reducing regulatory risk, raising barriers to entry and favoring highly ethical, well-invested Nordic operators like Kindred.
CCL Industries, a Canadian global label converter, ended the year up 23% and was the Fund’s top contributing stock. CCL acquired U.S.-based Checkpoint Solutions, a maker of anti-theft label systems, in 2016, raising expectations of significant cost and revenue synergies from the move. Actelion, a Swiss-based biopharmaceutical company focused on the discovery, development and commercialization of drugs for orphan diseases, was added to the Fund this year and was a top contributor to gains, increasing 53% in the Fund. A key player in the $5 billion-plus pulmonary hypertension market, Actelion is the subject of a complicated takeover bid by Johnson & Johnson, which may not ultimately result in a deal, but has put a valuation premium on its shares. Also impacted by acquisition news, U.S.-listed Cepheid, a global leader in the burgeoning molecular diagnostics space, gained 83% following the announcement that it was to be acquired by Danaher. We sold the stock on the news.
Thoughtful market commentators will pause before opining on market prospects for 2017, given the series of consequential political surprises in 2016. Western Europe, including the United Kingdom, was home to over 40% of the Fund’s capital at year end. Here we face not only uncertainties related to how the United Kingdom will extricate itself from the European Union, but also important national elections in both France and Germany, which could have implications for the future of the European integration project. On the other hand, many European corporates, with the notable exception of financials, are beneficiaries of continuing low interest rates and any potential fiscal boost. In addition, we feel many corporate valuations appear reasonable at this time.
Japan, the third largest economy in the world, contains few pockets of growth owing to adverse demographics and little immigration. However, many Japanese companies are now earnestly adopting initiatives aimed at improving returns on capital, which we believe could prove a catalyst for further stock price appreciation. The yen remains a wildcard, as earnings in Japanese exporters can be highly sensitive to foreign exchange effects. The Fund had roughly 20% of its capital deployed in Japan at
year end.
Asia ex-Japan, not a homogenous region, constituted roughly 15% of Fund assets at year end. Here we remain excited by attractive demographics, and rising productivity and prospects for the consumer and financial sectors, which flow from these. As long as regional corporates fund themselves in unhedged U.S. dollars, however, dollar strength introduces balance sheet hazards, which we will be watching closely. To the extent that companies anywhere on the globe supply the U.S. market, they could be adversely impacted by protectionist measures seemingly entailed by President Trump’s “America First!” rhetoric. The contours of any policy in this regard, however, remain highly uncertain at this time, and
Columbia Acorn Family of Funds | Annual Report 2016
| 11 |
Manager Discussion of Fund Performance (continued)
Columbia Acorn International®
policymakers may reconsider as they become sensitized to the ultimate implications of this approach for U.S. consumers and U.S. exporters. As always, we will rely heavily on indicators of business quality to sort through the opportunities.
Market risk may affect a single issuer, sector of the economy, industry or the market as a whole. International investing involves certain risks and volatility due to potential political, economic or currency instabilities and different, potentially less stringent, financial and accounting standards than those generally applicable to U.S. issuers. Risks are enhanced for emerging market issuers. Investments in small- and mid-cap companies involve risks and volatility and possible illiquidity greater than investments in larger, more established companies.
| 12 | Columbia Acorn Family of Funds | Annual Report 2016 |
Fund at a glance
Columbia Acorn USA®
Investment objective
The Fund seeks long-term capital appreciation.
Portfolio management
Matthew A. Litfin
Lead Portfolio Manager
William J. Doyle
Co-Portfolio Manager
Morningstar Style BoxTM
The Morningstar Style Box™ is based on a fund’s portfolio holdings. For equity funds, the vertical axis shows the market capitalization of the stocks owned, and the horizontal axis shows investment style (value, blend, or growth). Information shown is based on the most recent data provided by Morningstar.
© 2017 Morningstar, Inc. All rights reserved. The Morningstar information contained herein: (1) is proprietary to Morningstar and/or its content providers; (2) may not be copied or distributed; and (3) is not warranted to be accurate, complete or timely. Neither Morningstar nor its content providers are responsible for any damages or losses arising from any use of this information.
| Average annual total returns (%) (for the period ended December 31, 2016) |
| | | Inception | 1 Year | 5 Years | 10 Years | Life |
| Class A | Excluding sales charges | 10/16/00 | 12.70 | 12.48 | 6.34 | 9.92 |
| | Including sales charges | | 6.19 | 11.15 | 5.71 | 9.60 |
| Class C | Excluding sales charges | 10/16/00 | 11.92 | 11.71 | 5.56 | 9.13 |
| | Including sales charges | | 11.29 | 11.71 | 5.56 | 9.13 |
| Class I | 09/27/10 | 13.16 | 12.94 | 6.71 | 10.33 |
| Class R4 | 11/08/12 | 12.93 | 12.76 | 6.62 | 10.29 |
| Class R5 | 11/08/12 | 13.09 | 12.85 | 6.66 | 10.31 |
| Class Y | 11/08/12 | 13.18 | 12.90 | 6.69 | 10.32 |
| Class Z | 09/04/96 | 13.00 | 12.77 | 6.62 | 10.29 |
| Russell 2000 Index | | 21.31 | 14.46 | 7.07 | 8.59 |
Returns for Class A shares are shown with and without the maximum initial sales charge of 5.75%. Returns for Class C shares are shown with and without the maximum contingent deferred sales charge of 1.00% for the first year after purchase. The Fund’s other classes are not subject to sales charges, but may be subject to other fees and expenses, and have limited eligibility. Please see the Fund’s prospectus for details. Performance for different share classes will vary based on differences in sales charges and certain fees and expenses associated with each class.
As stated in the May 1, 2016, prospectus, as supplemented June 27, 2016, the Fund’s annual operating expense ratio is 1.18% for Class Z shares and 1.43% for Class A shares.
All results shown assume reinvestment of distributions during the period. Returns do not reflect the deduction of taxes that a shareholder may pay on Fund distributions or on the redemption of Fund shares. Performance results may reflect the effect of any fee waivers or reimbursements of Fund expenses by the investment manager and/or any of its affiliates. Absent these fee waivers and/or expense reimbursement arrangements, performance results may have been lower.
The performance information shown represents past performance and is not a guarantee of future results. The investment return and principal value of your investment will fluctuate so that shares, when redeemed, may be worth more or less than their original cost. Current performance may be lower or higher than the performance data shown. You may obtain performance information current to the most recent month-end by contacting your financial intermediary, visiting investor.columbiathreadneedleus.com or calling 800.922.6769.
The returns shown for periods prior to the share class inception date (including returns for the Life of the Fund, if shown, which are since Fund inception) include the returns of the Fund’s oldest share class. These returns are adjusted to reflect any higher class-related operating expenses of the newer share classes, as applicable. Please visit investor.columbiathreadneedleus.com/investment-products/mutual-funds/appended-performance for more information.
The Russell 2000 Index measures the performance of the 2,000 smallest companies in the Russell 3000 Index, which represents approximately 10% of the total market capitalization of the Russell 3000 Index.
Unlike mutual funds, indexes are not managed and do not incur fees or expenses. It is not possible to invest directly in an index.
Columbia Acorn Family of Funds | Annual Report 2016
| 13 |
Fund at a glance (continued)
Columbia Acorn USA®
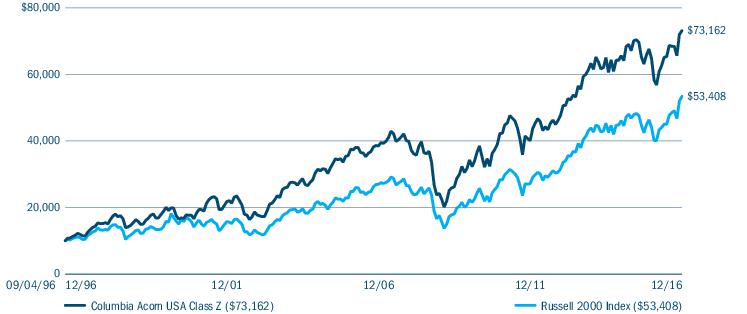
The Growth of a $10,000 Investment in Columbia Acorn USA® Class Z Shares
September 4, 1996 (Fund inception) through December 31, 2016
This chart shows the change in value of a hypothetical $10,000 investment in Class Z shares of the Fund during the stated time period.
| Top ten holdings (%) (at December 31, 2016) | |
Toro Co. (The)
Turf Maintenance Equipment | 2.2 |
LCI Industries
RV & Manufactured Home Components | 2.1 |
Camping World Holdings, Inc., Class A
RV-centric Retail Stores & Services | 2.1 |
LegacyTexas Financial Group, Inc.
Texas Thrift | 2.0 |
Dorman Products, Inc.
Aftermarket Auto Parts Distributor | 1.9 |
j2 Global, Inc.
Communication Technology & Digital Media | 1.9 |
Papa John’s International, Inc.
Franchisor of Pizza Restaurants | 1.8 |
Lakeland Financial Corp.
Indiana Bank | 1.8 |
AMN Healthcare Services, Inc.
Temporary Healthcare Staffing | 1.8 |
ANSYS, Inc.
Simulation Software for Engineers & Designers | 1.7 |
Percentages indicated are based upon total investments (excluding Money Market Funds and Securities Lending Collateral).
For further detail about these holdings, please refer to the section entitled “Portfolio of Investments."
Fund holdings are as of the date given, are subject to change at any time, and are not recommendations to buy or sell any security.
| Portfolio breakdown (%) (at December 31, 2016) |
| Common Stocks | 95.7 |
| Money Market Funds | 2.0 |
| Securities Lending Collateral | 2.3 |
| Total | 100.0 |
Percentages indicated are based upon total investments. The Fund’s portfolio composition is subject to change.
| Equity sector breakdown (%) (at December 31, 2016) |
| Consumer Discretionary | 19.5 |
| Consumer Staples | 1.4 |
| Energy | 2.5 |
| Financials | 15.3 |
| Health Care | 25.1 |
| Industrials | 16.0 |
| Information Technology | 17.9 |
| Real Estate | 2.3 |
| Total | 100.0 |
Percentages indicated are based upon total equity investments. The Fund’s portfolio composition is subject to change.
| 14 | Columbia Acorn Family of Funds | Annual Report 2016 |
Manager Discussion of Fund Performance
Columbia Acorn USA®
Matthew A. Litfin
Lead Portfolio Manager
William J. Doyle
Co-Portfolio Manager
Columbia Acorn USA Class Z shares gained 13.00% in 2016, a strong absolute return but short of the 21.31% gain of the Fund’s primary benchmark, the Russell 2000 Index. The difference was largely due to the benchmark’s exposure to value stocks, which led market performance for much of the year but aren’t a focus of the Fund’s small-cap growth strategy. Comparing to the Fund’s growth-oriented Morningstar Small Growth peer group, Columbia Acorn USA surpassed the category average return of 11.20% by 180 basis points (a basis point is 1/100th of a percent).
Health care names were prominent among the Fund’s detractors for the year. Celldex Therapeutics, a biotech developing cancer drugs, was sold in the first quarter but ranked as the Fund’s worst detractor for the annual period, falling 78% in the Fund. The company’s brain cancer drug failed a Phase III trial early in the year and the stock declined on the news. Orphan drug developer Ultragenyx Pharmaceutical and Akorn, a developer, manufacturer and distributor of specialty generic drugs, ended the year down 38% and 42%, respectively. Political uncertainty following the election brought down the sector, as did increased concerns regarding drug pricing pressures.
The top-contributing sector to Fund performance for the year was consumer discretionary. The Fund’s overweight position in the sector gained 24%, nearly doubling the benchmark’s 13% return. LCI Industries (formerly Drew Industries), a provider of recreational vehicles (RVs) and manufactured home components, was the top contributor in the Fund, gaining 78% in 2016, as the company continued to benefit from market-share gains amid robust RV end-market demand, combined with its efficient manufacturing processes. Within the same industry, we participated in the October initial public offering of Camping World, a chain of RV-centric retail stores and related services provider. The stock got off to a strong start, ending the year up 42%. The RV market is one of the bright spots in the consumer discretionary space, and we believe Camping World has solid prospects for sales growth and margin expansion. Papa John’s International, a franchisor of pizza restaurants, was also a leader for the year in the sector, gaining 56% as the company took share in the pizza industry with its effective digital platform and marketing strategy, which drove strong earnings.
Over the past year, we made significant changes to Columbia Acorn USA. We added 63 new ideas to the Fund, focusing on companies that have high and steady returns on invested capital. We also reduced the weighted average market cap of the Fund by focusing our additions to the portfolio on small-cap growth names. Overall, the Fund increased its exposure to the health care and consumer discretionary sectors in 2016 and reduced its exposure to industrials, as we gravitated to companies that we believe are less cyclical, have sustainable growth outlooks and have the ability to control their own destinies. While health care struggled late in the year, we are finding compelling valuations and investment opportunities in the sector in areas that we believe are unlikely to be greatly impacted by changes proposed by the new administration.
Going into 2017, it appears that there is significant economic momentum. U.S. gross domestic product growth looks encouraging, though it was down somewhat in the fourth quarter of 2016. Consumer spending has been strong, and the market is beginning to price in apparent optimism around potential regulatory changes. In our opinion, a more business-friendly environment should be beneficial to the high-quality, small-cap growth companies held in Columbia Acorn USA, as should a transition in equity markets from being interest-rate driven to being earnings driven.
Market risk may affect a single issuer, sector of the economy, industry or the market as a whole. Investments in small- and mid-cap companies involve risks and volatility and possible illiquidity greater than investments in larger, more established companies. The Fund may invest significantly in issuers within a particular sector, which may be negatively affected by market, economic or other conditions, making the Fund more vulnerable to unfavorable developments in the sector.
Columbia Acorn Family of Funds | Annual Report 2016
| 15 |
Fund at a glance
Columbia Acorn International SelectSM
Investment objective
The Fund seeks long-term capital appreciation.
Portfolio management
Stephen Kusmierczak
Co-Portfolio Manager
Andreas Waldburg-Wolfegg
Co-Portfolio Manager
Morningstar Style BoxTM
The Morningstar Style Box™ is based on a fund’s portfolio holdings. For equity funds, the vertical axis shows the market capitalization of the stocks owned, and the horizontal axis shows investment style (value, blend, or growth). Information shown is based on the most recent data provided by Morningstar.
© 2017 Morningstar, Inc. All rights reserved. The Morningstar information contained herein: (1) is proprietary to Morningstar and/or its content providers; (2) may not be copied or distributed; and (3) is not warranted to be accurate, complete or timely. Neither Morningstar nor its content providers are responsible for any damages or losses arising from any use of this information.
| Average annual total returns (%) (for the period ended December 31, 2016) |
| | | Inception | 1 Year | 5 Years | 10 Years | Life |
| Class A | Excluding sales charges | 10/16/00 | 0.90 | 5.27 | 2.63 | 7.45 |
| | Including sales charges | | -4.89 | 4.03 | 2.02 | 7.10 |
| Class C | Excluding sales charges | 10/16/00 | 0.15 | 4.45 | 1.82 | 6.63 |
| | Including sales charges | | -0.85 | 4.45 | 1.82 | 6.63 |
| Class I | 09/27/10 | 1.34 | 5.65 | 3.01 | 7.82 |
| Class R4 | 11/08/12 | 1.15 | 5.55 | 2.95 | 7.79 |
| Class R5 | 11/08/12 | 1.25 | 5.61 | 2.98 | 7.80 |
| Class Y | 11/08/12 | 1.29 | 5.65 | 3.00 | 7.82 |
| Class Z | 11/23/98 | 1.18 | 5.57 | 2.96 | 7.79 |
| MSCI ACWI ex USA Net (USD) | | 4.50 | 5.00 | 0.96 | N/A |
| S&P Developed Ex-U.S. Between $2B and $10B Index | | 4.32 | 8.58 | 2.60 | 7.05 |
Returns for Class A shares are shown with and without the maximum initial sales charge of 5.75%. Returns for Class C shares are shown with and without the maximum contingent deferred sales charge of 1.00% for the first year after purchase. The Fund’s other classes are not subject to sales charges, but may be subject to other fees and expenses, and have limited eligibility. Please see the Fund’s prospectus for details. Performance for different share classes will vary based on differences in sales charges and certain fees and expenses associated with each class.
As stated in the May 1, 2016, prospectus, as supplemented June 27, 2016, the Fund’s annual operating expense ratio is 1.15% for Class Z shares and 1.40% for Class A shares.
All results shown assume reinvestment of distributions during the period. Returns do not reflect the deduction of taxes that a shareholder may pay on Fund distributions or on the redemption of Fund shares. Performance results may reflect the effect of any fee waivers or reimbursements of Fund expenses by the investment manager and/or any of its affiliates. Absent these fee waivers and/or expense reimbursement arrangements, performance results may have been lower.
The performance information shown represents past performance and is not a guarantee of future results. The investment return and principal value of your investment will fluctuate so that shares, when redeemed, may be worth more or less than their original cost. Current performance may be lower or higher than the performance data shown. You may obtain performance information current to the most recent month-end by contacting your financial intermediary, visiting investor.columbiathreadneedleus.com or calling 800.922.6769.
The returns shown for periods prior to the share class inception date (including returns for the Life of the Fund, if shown, which are since Fund inception) include the returns of the Fund’s oldest share class. These returns are adjusted to reflect any higher class-related operating expenses of the newer share classes, as applicable. Please visit investor.columbiathreadneedleus.com/investment-products/mutual-funds/appended-performance for more information.
The MSCI ACWI ex USA Index (Net) captures a large- and mid-cap representation across 22 of 23 developed market countries (excluding the U.S.) and 23 emerging market countries. The index covers approximately 85% of the global equity opportunity set outside the United States.
The S&P Developed Ex-U.S. Between $2B and $10B® Index is a subset of the broad market selected by the index sponsor that represents the mid-cap developed market, excluding the United States.
Unlike mutual funds, indexes are not managed and do not incur fees or expenses. It is not possible to invest directly in an index.
| 16 | Columbia Acorn Family of Funds | Annual Report 2016 |
Fund at a glance (continued)
Columbia Acorn International SelectSM
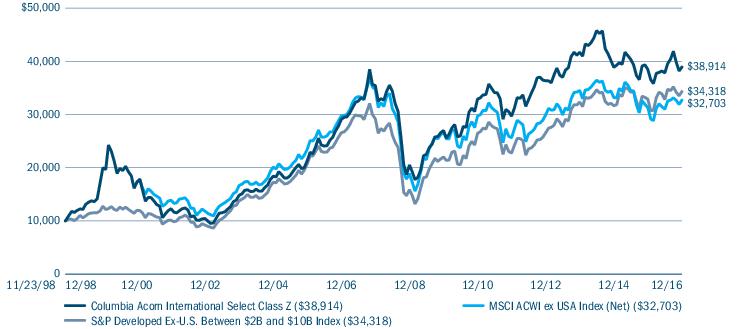
The Growth of a $10,000 Investment in Columbia Acorn International SelectSM Class Z Shares
November 23, 1998 (Fund inception) through December 31, 2016
This chart shows the change in value of a hypothetical $10,000 investment in Class Z shares of the Fund during the stated time period. A $10,000 investment in Columbia Acorn International Select at inception appreciated to $17,309 on December 31, 2000, the month-end of the inception date of the MSCI ACWI ex USA Index (Net). For comparison with the MSCI ACWI ex USA Index (Net), we assigned the index the same value as the Fund at month-end of the index inception date.
| Top ten holdings (%) (at December 31, 2016) | |
CCL Industries, Inc. (Canada)
Global Label Converter | 6.0 |
Recruit Holdings Co., Ltd. (Japan)
Recruitment & Media Services | 4.9 |
Hexagon AB, Class B (Sweden)
Design, Measurement & Visualization Software & Equipment | 4.7 |
Partners Group Holding AG (Switzerland)
Private Markets Asset Management | 4.6 |
Aeon Mall Co., Ltd. (Japan)
Suburban Shopping Mall Developer, Owner & Operator | 4.1 |
Wirecard AG (Germany)
Online Payment Processing & Risk Management | 4.0 |
MTU Aero Engines AG (Germany)
Airplane Engine Components & Services | 4.0 |
Naspers Ltd., Class N (South Africa)
Media in Africa, China, Russia & Other Emerging Markets | 3.6 |
Hoya Corp. (Japan)
Opto-electrical Components & Eyeglass Lenses | 3.6 |
Geberit AG (Switzerland)
Plumbing Systems | 3.5 |
Percentages indicated are based upon total investments (excluding Money Market Funds and Securities Lending Collateral).
For further detail about these holdings, please refer to the section entitled “Portfolio of Investments."
Fund holdings are as of the date given, are subject to change at any time, and are not recommendations to buy or sell any security.
| Equity sector breakdown (%) (at December 31, 2016) |
| Consumer Discretionary | 17.7 |
| Consumer Staples | 4.5 |
| Energy | 4.4 |
| Financials | 7.6 |
| Health Care | 8.4 |
| Industrials | 20.1 |
| Information Technology | 19.8 |
| Materials | 11.4 |
| Real Estate | 4.1 |
| Telecommunication Services | 2.0 |
| Total | 100.0 |
Percentages indicated are based upon total equity investments. The Fund’s portfolio composition is subject to change.
Columbia Acorn Family of Funds | Annual Report 2016
| 17 |
Fund at a glance (continued)
Columbia Acorn International SelectSM
| Country breakdown (%) (at December 31, 2016) |
| Australia | 2.0 |
| Canada | 7.5 |
| China | 3.0 |
| Denmark | 3.0 |
| France | 4.8 |
| Germany | 7.4 |
| India | 2.9 |
| Ireland | 2.3 |
| Japan | 20.5 |
| South Africa | 3.3 |
| Spain | 2.0 |
| Sweden | 4.3 |
| Switzerland | 7.5 |
| Taiwan | 2.7 |
| Thailand | 2.4 |
| United Kingdom | 14.5 |
| United States(a) | 9.9 |
| Total | 100.0 |
| (a) | Includes investments in Money Market Funds. |
Country Breakdown is based primarily on issuer’s place of organization/incorporation. Percentages indicated are based upon total investments. The Fund’s portfolio composition is subject to change.
| 18 | Columbia Acorn Family of Funds | Annual Report 2016 |
Manager Discussion of Fund Performance
Columbia Acorn International SelectSM
Stephen Kusmierczak
Co-Portfolio Manager
Andreas Waldburg-Wolfegg
Co-Portfolio Manager
Columbia Acorn International Select Class Z shares ended the year up 1.18%, underperforming the 4.50% gain of the Fund’s primary benchmark, the MSCI ACWI ex USA Index (Net). The relative lag was largely due to the Fund’s emphasis on growth in a year that favored deep value cyclicals. Comparing to the Fund’s more growth-oriented Morningstar Foreign Large Growth peer group, which had an average decline of 2.14% for the year, the Fund outperformed by 332 basis points (a basis point is 1/100th of a percent). Regionally, Fund underperformance was concentrated in the United Kingdom and Europe. On a sector basis, Fund performance lagged in the consumer discretionary and materials sectors.
On the downside, Novozymes, a Danish manufacturer of industrial enzymes, fell 27% on lowered guidance in the second half of the year, reversing reports made earlier in the year that the company would likely reach the higher end of its guidance range. Novozymes has been negatively impacted by weak agriculture income and low oil prices, which have depressed bioenergy. Down 38% for the year, Eutelsat, a French provider of fixed satellite services, was sold in the third quarter on concerns about future growth prospects for the company. Down 15%, Distribuidora Internacional de Alimentación, a discount retailer in Spain and Latin America, declined as quarterly earnings fell short of expectations and remained flat year-over-year. Pricing pressure in Spain and Portugal have hurt the company. Next, a UK clothes and home retailer, ended the year down 40%, also suffering from poor earnings results for the year.
The leading contributor to Fund performance in 2016 was Largan Precision, a Taiwanese maker of mobile device camera lenses and modules. Largan dominates the high-end miniature lens business and has been expanding its operating margins. Its stock gained 73% during the year. Also a leader in the year, Partners Group, a Swiss investment manager focused on private equity, infrastructure and real estate, gained 33%. The company benefited from the uptick in European financials and from fundraising from new and existing clients that exceeded expectations. Canadian global label converter CCL Industries, the Fund’s largest position at year end, was also a top contributor, gaining 22%. CCL acquired U.S.-based Checkpoint Solutions, a maker of anti-theft label systems, in 2016, raising expectations of significant cost and revenue synergies from the move.
As we move into 2017, worldwide political uncertainty is at an all-time high. President Trump’s pledge to put America first could have negative implications for international companies that draw their business from the United States. A lack of clarity around Brexit negotiations continues to worry investors, and upcoming elections in France and Germany could determine the future of the European Union. On the other hand, despite initial concerns, the resignation of Italian Prime Minister Renzi following the defeat of a controversial reform referendum had little impact on European markets late in the year. In addition, Italy began to take measures to safeguard its banking sector, a move viewed very favorably by the markets.
At the end of the year, we saw interest rates increase in the United States and we expect other countries to follow. Japanese stocks rallied at year end on positive economic data suggesting
improved growth prospects and on reduced expectations of further stimulus efforts coming from the Bank of Japan. The European Central Bank announced stimulus measures but then hinted at a
possible reversal.
Through diligent research, we will continue to focus on finding opportunities to take advantage of market conditions. Our emphasis remains on building exposure to names that have solid earnings growth and the ability to succeed long term.
Market risk may affect a single issuer, sector of the economy, industry or the market as a whole. Foreign investments subject the Fund to political, economic, market, social and other risks within a particular country, as well as to potential currency instabilities and less stringent financial and accounting standards generally applicable to U.S. issuers. Risks are enhanced for emerging market issuers. Investments in small- and mid-cap companies involve risks and volatility and possible illiquidity greater
Columbia Acorn Family of Funds | Annual Report 2016
| 19 |
Manager Discussion of Fund Performance (continued)
Columbia Acorn International SelectSM
than investments in larger, more established companies. The Fund may invest significantly in issuers within a particular sector, which may be negatively affected by market, economic or other conditions, making the Fund more vulnerable to unfavorable developments in the sector.
| 20 | Columbia Acorn Family of Funds | Annual Report 2016 |
Fund at a glance
Columbia Acorn SelectSM
Investment objective
The Fund seeks long-term capital appreciation.
Portfolio management
David L. Frank
Co-Portfolio Manager
Matthew S. Szafranski
Co-Portfolio Manager
Morningstar Style BoxTM
The Morningstar Style Box™ is based on a fund’s portfolio holdings. For equity funds, the vertical axis shows the market capitalization of the stocks owned, and the horizontal axis shows investment style (value, blend, or growth). Information shown is based on the most recent data provided by Morningstar.
© 2017 Morningstar, Inc. All rights reserved. The Morningstar information contained herein: (1) is proprietary to Morningstar and/or its content providers; (2) may not be copied or distributed; and (3) is not warranted to be accurate, complete or timely. Neither Morningstar nor its content providers are responsible for any damages or losses arising from any use of this information.
| Average annual total returns (%) (for the period ended December 31, 2016) |
| | | Inception | 1 Year | 5 Years | 10 Years | Life |
| Class A | Excluding sales charges | 10/16/00 | 11.54 | 12.08 | 5.14 | 9.40 |
| | Including sales charges | | 5.13 | 10.76 | 4.52 | 9.05 |
| Class C | Excluding sales charges | 10/16/00 | 10.67 | 11.25 | 4.34 | 8.58 |
| | Including sales charges | | 9.80 | 11.25 | 4.34 | 8.58 |
| Class I | 09/27/10 | 11.99 | 12.49 | 5.51 | 9.79 |
| Class R4 | 11/08/12 | 11.86 | 12.35 | 5.43 | 9.74 |
| Class R5 | 11/08/12 | 11.96 | 12.43 | 5.47 | 9.76 |
| Class Y | 11/08/12 | 12.02 | 12.47 | 5.49 | 9.77 |
| Class Z | 11/23/98 | 11.88 | 12.40 | 5.45 | 9.75 |
| S&P MidCap 400 Index | | 20.74 | 15.33 | 9.16 | 10.40 |
Returns for Class A shares are shown with and without the maximum initial sales charge of 5.75%. Returns for Class C shares are shown with and without the maximum contingent deferred sales charge of 1.00% for the first year after purchase. The Fund’s other classes are not subject to sales charges, but may be subject to other fees and expenses, and have limited eligibility. Please see the Fund’s prospectus for details. Performance for different share classes will vary based on differences in sales charges and certain fees and expenses associated with each class.
As stated in the May 1, 2016, prospectus, as supplemented June 27, 2016, the Fund’s annual operating expense ratio is 0.88% for Class Z shares and 1.13% for Class A shares.
All results shown assume reinvestment of distributions during the period. Returns do not reflect the deduction of taxes that a shareholder may pay on Fund distributions or on the redemption of Fund shares. Performance results may reflect the effect of any fee waivers or reimbursements of Fund expenses by the investment manager and/or any of its affiliates. Absent these fee waivers and/or expense reimbursement arrangements, performance results may have been lower.
The performance information shown represents past performance and is not a guarantee of future results. The investment return and principal value of your investment will fluctuate so that shares, when redeemed, may be worth more or less than their original cost. Current performance may be lower or higher than the performance data shown. You may obtain performance information current to the most recent month-end by contacting your financial intermediary, visiting investor.columbiathreadneedleus.com or calling 800.922.6769.
The returns shown for periods prior to the share class inception date (including returns for the Life of the Fund, if shown, which are since Fund inception) include the returns of the Fund’s oldest share class. These returns are adjusted to reflect any higher class-related operating expenses of the newer share classes, as applicable. Please visit investor.columbiathreadneedleus.com/investment-products/mutual-funds/appended-performance for more information.
The S&P MidCap 400® Index is a market value-weighted index that tracks the performance of 400 mid-cap U.S. companies.
Unlike mutual funds, indexes are not managed and do not incur fees or expenses. It is not possible to invest directly in an index.
Columbia Acorn Family of Funds | Annual Report 2016
| 21 |
Fund at a glance (continued)
Columbia Acorn SelectSM
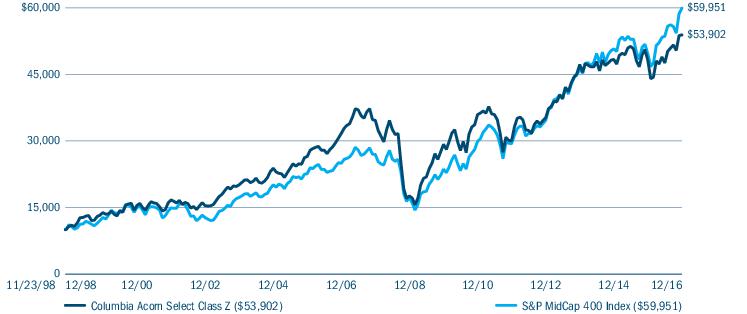
The Growth of a $10,000 Investment in Columbia Acorn SelectSM Class Z Shares
November 23, 1998 (Fund inception) through December 31, 2016
This chart shows the change in value of a hypothetical $10,000 investment in Class Z shares of the Fund during the stated time period.
| Top ten holdings (%) (at December 31, 2016) | |
HealthSouth Corp.
Inpatient Rehabilitation Facilities & Home Health Care | 4.8 |
Liberty Global PLC, Class A
Cable TV Franchises Outside of the United States | 4.7 |
JB Hunt Transport Services, Inc.
Truck & Intermodal Carrier | 4.6 |
Middleby Corp. (The)
Manufacturer of Cooking Equipment | 4.5 |
LKQ Corp.
Alternative Auto Parts Distribution | 4.4 |
Vail Resorts, Inc.
Ski Resort Operator & Developer | 4.2 |
AMERCO
North American Moving & Storage | 3.9 |
Education Realty Trust, Inc.
Student Housing | 3.8 |
Robert Half International, Inc.
Temporary & Permanent Staffing in Finance, Accounting & Other Professions | 3.7 |
Jones Lang LaSalle, Inc.
Real Estate Services | 3.7 |
Percentages indicated are based upon total investments (excluding Money Market Funds).
For further detail about these holdings, please refer to the section entitled “Portfolio of Investments."
Fund holdings are as of the date given, are subject to change at any time, and are not recommendations to buy or sell any security.
| Portfolio breakdown (%) (at December 31, 2016) |
| Common Stocks | 98.5 |
| Money Market Funds | 1.5 |
| Total | 100.0 |
Percentages indicated are based upon total investments. The Fund’s portfolio composition is subject to change.
| Equity sector breakdown (%) (at December 31, 2016) |
| Consumer Discretionary | 20.3 |
| Financials | 9.0 |
| Health Care | 16.6 |
| Industrials | 29.6 |
| Information Technology | 11.6 |
| Materials | 3.5 |
| Real Estate | 9.4 |
| Total | 100.0 |
Percentages indicated are based upon total equity investments. The Fund’s portfolio composition is subject to change.
| 22 | Columbia Acorn Family of Funds | Annual Report 2016 |
Manager Discussion of Fund Performance
Columbia Acorn SelectSM
David L. Frank
Co-Portfolio Manager
Matthew S. Szafranski
Co-Portfolio Manager
Columbia Acorn Select Class Z shares gained 11.88% in 2016, a strong absolute return but short of the Fund’s primary benchmark, the S&P MidCap 400 Index, which gained 20.74%. Throughout most of the year, strong performance among value stocks helped the benchmark’s more core orientation, but worked against the Fund’s mid-cap growth strategy. Compared to its peers, Columbia Acorn Select topped its Morningstar Mid-Cap Growth category average annual return of 6.03%.
The Fund underperformed relative to its benchmark in the information technology sector, due largely to the underperformance of two names sold in the first quarter of the year. Bankrate, a provider of Internet advertising for insurance, credit card and banking markets, left the Fund with a 33% loss for the year after declining on increased pressure from competitor Google. Blackhawk Network, a third-party distributor of prepaid content such as gift cards, declined 26% in the Fund on changes at the retail level that negatively impacted its business in the first quarter.
Within the real estate sector, Jones Lang LaSalle, a provider of commercial real estate services worldwide, struggled early in the year on concerns of a decline in commercial real estate transaction and leasing volumes in China. Following the Brexit vote, these concerns expanded to include the United Kingdom and Europe. While its stock recovered some ground in the third quarter, a downward reversal in the fourth quarter left Jones Lang LaSalle with a 16% loss for the year.
As we ended the year, the surprising outcome of the U.S. election sparked a sudden and significant change in market expectations and touched off a flood of cash into equity sectors expected to benefit from Republican policy initiatives including financials, industrials, materials and energy. Against this backdrop, Columbia Acorn Select benefited from its overweight position in the industrials sector. Nordson, a manufacturer of dispensing systems for adhesives and coatings, was mentioned at the half year as being a beneficiary of new technology that utilizes the company’s dispensing and testing technologies. This development, combined with the sector rally late in the year, led the stock to a 75% gain in the Fund.
Financials surged following the election on expectations of less onerous federal regulations for brokers, as well as benefits from higher interest rates. This rally contributed to the 74% annual gain for SVB Financial, a bank for venture capitalists that was added to the Fund this year. Among its mid-cap banking peers, we expect SVB Financial to find a higher rate environment very advantageous.
Political uncertainty following the election weighed on the health care sector in the final months of 2016, but the Fund outperformed its benchmark in the sector thanks to strong stock selection, gaining 12% versus a benchmark gain of 9%. Align Technology, the manufacturer of the Invisalign system used to straighten teeth, gained 45%, as the company has been able to take business away from traditional braces with its clear plastic retainers. The launch of a new digital scanner this year helped drive an acceleration of case volumes and, moreover, its acquisition of a minority stake in Smile Direct Club, a do-it-yourself aligner treatment for basic cases, looks promising.
We further concentrated the Fund in 2016, ending the year with 32 names. We have worked to create a portfolio of our analyst team’s top ideas, focusing on high-quality names that we believe have strong growth potential and that are available at compelling valuations. We like companies that we see as having the ability to control their own destinies and not being heavily tied to macroeconomic drivers. On a sector basis, the Fund’s largest average overweights relative to the benchmark at year end were in the industrial and consumer discretionary sectors. The adjustments that we made to the Fund were largely completed at mid-year, and we were pleased to see Columbia Acorn Select ahead of the benchmark with the Fund up 13.26% and the benchmark up 11.87% for the six months ended December 31, 2016. Going forward, we expect less turnover in the Fund, as we seek to profit from multi-year trends in our heavily researched, concentrated Fund.
Market risk may affect a single issuer, sector of the economy, industry or the market as a whole. Investments in small- and mid-cap companies involve risks and volatility and possible illiquidity greater than investments in larger, more established companies. Foreign investments subject the Fund to risks, including political, economic, market, social and other risks, within a
Columbia Acorn Family of Funds | Annual Report 2016
| 23 |
Manager Discussion of Fund Performance (continued)
Columbia Acorn SelectSM
particular country, as well as to potential currency instabilities and less stringent financial and accounting standards generally applicable to U.S. issuers. Risks are enhanced for emerging market issuers. The Fund may invest significantly in issuers within a particular sector, which may be negatively affected by market, economic or other conditions, making the Fund more vulnerable to unfavorable developments in the sector.
| 24 | Columbia Acorn Family of Funds | Annual Report 2016 |
Fund at a glance
Columbia Thermostat FundSM
Investment objective
The Fund seeks long-term capital appreciation.
Portfolio management
David L. Frank
Portfolio Manager
| Average annual total returns (%) (for the period ended December 31, 2016) |
| | | Inception | 1 Year | 5 Years | 10 Years | Life |
| Class A | Excluding sales charges | 03/03/03 | 4.47 | 6.36 | 5.15 | 6.93 |
| | Including sales charges | | -1.52 | 5.11 | 4.53 | 6.49 |
| Class C | Excluding sales charges | 03/03/03 | 3.69 | 5.56 | 4.37 | 6.14 |
| | Including sales charges | | 2.69 | 5.56 | 4.37 | 6.14 |
| Class R4 | 11/08/12 | 4.69 | 6.62 | 5.41 | 7.20 |
| Class R5 | 11/08/12 | 4.77 | 6.65 | 5.43 | 7.21 |
| Class Y | 11/08/12 | 4.76 | 6.68 | 5.44 | 7.22 |
| Class Z | 09/25/02 | 4.72 | 6.63 | 5.41 | 7.20 |
| S&P 500 Index | | 11.96 | 14.66 | 6.95 | 9.52 |
| Bloomberg Barclays U.S. Aggregate Bond Index | | 2.65 | 2.23 | 4.34 | 4.24 |
| Blended Benchmark | | 7.38 | 8.44 | 5.96 | 7.13 |
Returns for Class A shares are shown with and without the maximum initial sales charge of 5.75%. Returns for Class C shares are shown with and without the maximum contingent deferred sales charge of 1.00% for the first year after purchase. The Fund’s other classes are not subject to sales charges, but may be subject to other fees and expenses, and have limited eligibility. Please see the Fund’s prospectus for details. Performance for different share classes will vary based on differences in sales charges and certain fees and expenses associated with each class.
As stated in the May 1, 2016, prospectus, as supplemented June 27, 2016, the Fund’s annual operating expense ratio is 0.77% for Class Z shares and 1.02% for Class A shares.
All results shown assume reinvestment of distributions during the period. Returns do not reflect the deduction of taxes that a shareholder may pay on Fund distributions or on the redemption of Fund shares. Performance results may reflect the effect of any fee waivers or reimbursements of Fund expenses by the investment manager and/or any of its affiliates. Absent these fee waivers and/or expense reimbursement arrangements, performance results may have been lower.
The performance information shown represents past performance and is not a guarantee of future results. The investment return and principal value of your investment will fluctuate so that shares, when redeemed, may be worth more or less than their original cost. Current performance may be lower or higher than the performance data shown. You may obtain performance information current to the most recent month-end by contacting your financial intermediary, visiting investor.columbiathreadneedleus.com or calling 800.922.6769.
The returns shown for periods prior to the share class inception date (including returns for the Life of the Fund, if shown, which are since Fund inception) include the returns of the Fund’s oldest share class. These returns are adjusted to reflect any higher class-related operating expenses of the newer share classes, as applicable. Please visit investor.columbiathreadneedleus.com/investment-products/mutual-funds/appended-performance for more information.
The Standard & Poor’s (S&P) 500® Index tracks the performance of 500 widely held, large-capitalization U.S. stocks.
The Bloomberg Barclays U.S. Aggregate Bond Index is a market value-weighted index that tracks the daily price, coupon, pay-downs and total return performance of fixed-rate, publicly placed, dollar-denominated and non-convertible investment grade debt issues with at least $250 million par amount outstanding and with at least one year to final maturity.
The 50/50 Blended Benchmark, established by the Fund’s investment manager, is an equally weighted custom composite of Columbia Thermostat Fund’s primary equity and primary debt benchmarks, the S&P 500® Index and the Bloomberg Barclays U.S. Aggregate Bond Index, respectively. The percentage of the Fund’s assets allocated to underlying stock and bond portfolio funds will vary, and accordingly the composition of the Fund’s portfolio will not always reflect the composition of the 50/50 Blended Benchmark.
Unlike mutual funds, indexes are not managed and do not incur fees or expenses. It is not possible to invest directly in an index.
Columbia Acorn Family of Funds | Annual Report 2016
| 25 |
Fund at a glance (continued)
Columbia Thermostat FundSM
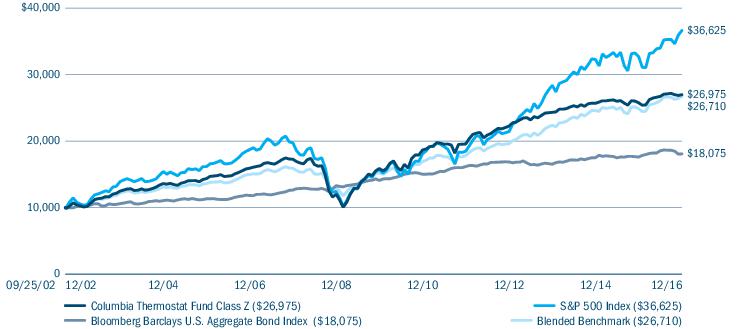
The Growth of a $10,000 Investment in Columbia Thermostat FundSM Class Z Shares
September 25, 2002 (Fund inception) through December 31, 2016
This chart shows the change in value of a hypothetical $10,000 investment in Class Z shares of the Fund during the stated time period.
| Portfolio breakdown (%) (at December 31, 2016) |
| Equity Funds | 9.9 |
| Fixed-Income Funds | 89.8 |
| Money Market Funds | 0.3 |
| Total | 100.0 |
Percentages indicated are based upon total investments. The Fund’s portfolio composition is subject to change.
| 26 | Columbia Acorn Family of Funds | Annual Report 2016 |
Manager Discussion of Fund Performance
Columbia Thermostat FundSM
David L. Frank
Portfolio Manager*
Columbia Thermostat Fund Class Z shares gained 4.72% in 2016, compared to an 11.96% gain of the Fund’s primary equity benchmark, the S&P 500 Index. Fund gains topped its primary debt benchmark, the Bloomberg Barclays U.S. Aggregate Bond Index, which ended the year up 2.65%, while the Fund’s custom 50/50 Blended Benchmark gained 7.38% for the year.
The Fund’s equity portfolio had a weighted average gain of 6.41% for the year. Columbia Dividend Income Fund led the equity portion, gaining 13.65% in 2016. Columbia Select Large Cap Growth Fund had the largest decline, falling 8.36%.
Columbia Thermostat Fund’s bond portfolio ended the year with a weighted average gain of 3.62%. Columbia Income Opportunities Fund was a standout for the year, gaining 10.66%. Columbia U.S. Treasury Index Fund had the smallest gain, increasing 0.88% for the annual period.
The Fund hit five reallocation triggers in the second half of the year and three in the fourth quarter. The Fund increased equity exposure in November and decreased exposure twice in December to end the year with a 10% weighting in stocks and a 90% weighting in bonds.
We were pleased to see the Fund perform as designed in 2016, offering shareholders a return that fell between the equity and bond markets. The Fund ended the year with its minimum exposure to stocks of 10%, as we sold equities on market strength late in the year to capture gains. This was the first time in 2016 that the S&P 500 topped the 2,250 threshold, which triggered the Fund’s move to 10% stocks. We look forward to taking advantage of future market reversals.
*Christopher Olson, former co-portfolio manager of Columbia Thermostat Fund, retired from Columbia Wanger Asset Management on December 31, 2016. David Frank will continue as the sole portfolio manager of Columbia Thermostat Fund.
Results of the Funds Owned in Columbia Thermostat Fund as of December 31, 2016
| Equity Funds | Weightings
in category | 4th quarter
performance | 1 year
performance |
| Columbia Acorn International, Class I Shares | 20% | -8.52% | -2.18% |
| Columbia Contrarian Core Fund, Class I Shares | 20% | 1.94% | 8.82% |
| Columbia Dividend Income Fund, Class I Shares | 20% | 4.76% | 13.65% |
| Columbia Acorn Fund, Class I Shares | 10% | 3.56% | 10.44% |
| Columbia Acorn Select, Class I Shares | 10% | 4.41% | 11.99% |
| Columbia Large Cap Enhanced Core Fund, Class I Shares | 10% | 3.84% | 9.99% |
| Columbia Select Large Cap Growth Fund, Class I Shares | 10% | -8.55% | -8.36% |
| Weighted Average Equity Gain/Loss | 100% | -0.11% | 6.41% |
| Fixed-Income Funds | Weightings
in category | 4th quarter
performance | 1 year
performance |
| Columbia Short Term Bond Fund, Class I Shares | 40% | -0.19% | 1.97% |
| Columbia Total Return Bond Fund, Class I Shares | 20% | -2.22% | 5.01% |
| Columbia U.S. Government Mortgage Fund, Class I Shares | 20% | -1.48% | 2.40% |
| Columbia Income Opportunities Fund, Class I Shares | 10% | 0.57% | 10.66% |
| Columbia U.S. Treasury Index Fund, Class I Shares | 10% | -3.82% | 0.88% |
| Weighted Average Income Gain/Loss | 100% | -1.14% | 3.62% |
Columbia Thermostat Fund Rebalancing in the Fourth Quarter
November 3, 2016: 25% Equity, 75% Fixed-Income
December 5, 2016: 15% Equity, 85% Fixed-Income
December 12, 2016: 10% Equity, 90% Fixed-Income
Columbia Acorn Family of Funds | Annual Report 2016
| 27 |
Manager Discussion of Fund Performance (continued)
Columbia Thermostat FundSM
A "fund of fund" bears its allocable share of the costs and expenses of the underlying funds in which it invests. Such funds are thus subject to two levels of fees and potentially higher expense ratios than would be associated with a fund that invests and trades directly in financial instruments under the direction of a single manager.
The Fund’s investments in the underlying funds may present certain risks, including the following. Market risk may affect a single issuer, sector of the economy, industry or the market as a whole. The Fund’s investment in other funds subjects it to the investment performance (positive or negative), risks and expenses of these underlying funds. Investments in small- and mid-cap companies involve risks and volatility and possible illiquidity greater than in investments in larger, more established companies. There are risks associated with fixed-income investments, including credit risk, market risk, interest rate risk and prepayment and extension risk. In general, bond prices fall when interest rates rise and vice versa. This effect is more pronounced for longer term securities. Non-investment-grade (high-yield or junk) securities present greater price volatility and more risk to principal and income than higher rated securities. Foreign investments subject the Fund to political, economic, market, social and other risks within a particular country, as well as to potential currency instabilities and less stringent financial and accounting standards generally applicable to U.S. issuers. Risks are enhanced for emerging market issuers.
The value of an investment in the Fund is based primarily on the performance of the underlying funds in which it invests. The Fund is subject to the risk that the investment manager’s decisions regarding asset classes and underlying funds will not anticipate market trends successfully, resulting in a failure to reserve capital or lower total return. The Investment Manager may prefer an underlying fund in the Columbia Acorn Family of Funds over alternative investments. There can be no assurance that the Columbia Acorn Funds will outperform similar funds managed by the Investment Manager’s affiliates. This is not an offer of the shares of any other mutual fund mentioned herein.
| 28 | Columbia Acorn Family of Funds | Annual Report 2016 |
Fund at a glance
Columbia Acorn Emerging Markets FundSM
Investment objective
The Fund seeks long-term capital appreciation.
Portfolio management
Fritz Kaegi
Co-Portfolio Manager
Stephen Kusmierczak
Co-Portfolio Manager
Louis J. Mendes
Co-Portfolio Manager
Satoshi Matsunaga
Co-Portfolio Manager
Morningstar Style BoxTM
The Morningstar Style Box™ is based on a fund’s portfolio holdings. For equity funds, the vertical axis shows the market capitalization of the stocks owned, and the horizontal axis shows investment style (value, blend, or growth). Information shown is based on the most recent data provided by Morningstar.
© 2017 Morningstar, Inc. All rights reserved. The Morningstar information contained herein: (1) is proprietary to Morningstar and/or its content providers; (2) may not be copied or distributed; and (3) is not warranted to be accurate, complete or timely. Neither Morningstar nor its content providers are responsible for any damages or losses arising from any use of this information.
| Average annual total returns (%) (for the period ended December 31, 2016) |
| | | Inception | 1 Year | 5 Years | Life |
| Class A | Excluding sales charges | 08/19/11 | -3.20 | 2.06 | 0.47 |
| | Including sales charges | | -8.73 | 0.87 | -0.63 |
| Class C | Excluding sales charges | 08/19/11 | -3.92 | 1.32 | -0.25 |
| | Including sales charges | | -4.88 | 1.32 | -0.25 |
| Class I | 08/19/11 | -2.81 | 2.42 | 0.86 |
| Class R4 | 11/08/12 | -2.91 | 2.37 | 0.80 |
| Class R5 | 11/08/12 | -2.90 | 2.40 | 0.82 |
| Class Y | 06/13/13 | -2.92 | 2.42 | 0.84 |
| Class Z | 08/19/11 | -3.04 | 2.31 | 0.74 |
| MSCI Emerging Markets SMID Cap Index (Net) | | 3.51 | 2.10 | -1.17 |
| S&P Emerging Markets Between $500M and $5B Index | | 10.58 | 4.37 | 1.30 |
Returns for Class A shares are shown with and without the maximum initial sales charge of 5.75%. Returns for Class C shares are shown with and without the maximum contingent deferred sales charge of 1.00% for the first year after purchase. The Fund’s other classes are not subject to sales charges, but may be subject to other fees and expenses, and have limited eligibility. Please see the Fund’s prospectus for details. Performance for different share classes will vary based on differences in sales charges and certain fees and expenses associated with each class.
As stated in the May 1, 2016, prospectus, as supplemented June 27, 2016, the Fund’s annual operating expense ratio is 1.55% for Class Z shares and 1.80% for Class A shares.
All results shown assume reinvestment of distributions during the period. Returns do not reflect the deduction of taxes that a shareholder may pay on Fund distributions or on the redemption of Fund shares. Performance results may reflect the effect of any fee waivers or reimbursements of Fund expenses by the investment manager and/or any of its affiliates. Absent these fee waivers and/or expense reimbursement arrangements, performance results may have been lower.
The performance information shown represents past performance and is not a guarantee of future results. The investment return and principal value of your investment will fluctuate so that shares, when redeemed, may be worth more or less than their original cost. Current performance may be lower or higher than the performance data shown. You may obtain performance information current to the most recent month-end by contacting your financial intermediary, visiting investor.columbiathreadneedleus.com or calling 800.922.6769.
The returns shown for periods prior to the share class inception date (including returns for the Life of the Fund, if shown, which are since Fund inception) include the returns of the Fund’s oldest share class. These returns are adjusted to reflect any higher class-related operating expenses of the newer share classes, as applicable. Please visit investor.columbiathreadneedleus.com/investment-products/mutual-funds/appended-performance for more information.
The MSCI Emerging Markets SMID Cap Index (Net) captures a mid- and small-cap representation across 23 emerging market countries. The index covers approximately 29% of the free float-adjusted market capitalization in each country.
The S&P Emerging Markets Between $500M and $5B® Index represents the institutionally investable capital of 22 emerging market countries, as determined by S&P, with market caps ranging between $500 million to $5 billion. The index currently consists of the following emerging market country indexes: Brazil, Chile, China, Colombia, Czech Republic, Egypt, Greece, Hungary, India, Indonesia, Malaysia, Mexico, Peru, Philippines, Poland, Qatar, Russia, South Africa, Taiwan, Thailand, Turkey and United Arab Emirates.
Unlike mutual funds, indexes are not managed and do not incur fees or expenses. It is not possible to invest directly in an index.
Columbia Acorn Family of Funds | Annual Report 2016
| 29 |
Fund at a glance (continued)
Columbia Acorn Emerging Markets FundSM
The Growth of a $10,000 Investment in Columbia Acorn Emerging Markets FundSM Class Z Shares
August 19, 2011 (Fund inception) through December 31, 2016
This chart shows the change in value of a hypothetical $10,000 investment in Class Z shares of the Fund during the stated time period.
| Top ten holdings (%) (at December 31, 2016) | |
Zee Entertainment Enterprises Ltd. (India)
Indian Programmer of Pay Television Content | 5.5 |
Vitasoy International Holdings Ltd. (Hong Kong)
Hong Kong Soy Food Brand | 4.2 |
Modetour Network, Inc. (South Korea)
Travel Services | 3.4 |
Credit Analysis & Research Ltd. (India)
Credit Rating Agency in India | 3.3 |
PT Link Net Tbk (Indonesia)
Fixed Broadband & CATV Service Provider | 3.3 |
Koh Young Technology, Inc. (South Korea)
Inspection Systems for Printed Circuit Boards | 3.3 |
Samui Airport Property Fund Leasehold (Thailand)
Thai Airport Operator | 3.1 |
Amara Raja Batteries Ltd. (India)
Indian Maker of Auto & Industrial Batteries, Mostly for the Replacement Market | 3.0 |
Silergy Corp. (Taiwan)
Chinese Provider of Analog & Mixed Digital Integrated Circuits | 2.9 |
PT Media Nusantara Citra Tbk (Indonesia)
Media Company in Indonesia | 2.9 |
Percentages indicated are based upon total investments (excluding Money Market Funds and Securities Lending Collateral).
For further detail about these holdings, please refer to the section entitled “Portfolio of Investments."
Fund holdings are as of the date given, are subject to change at any time, and are not recommendations to buy or sell any security.
| Equity sector breakdown (%) (at December 31, 2016) |
| Consumer Discretionary | 25.9 |
| Consumer Staples | 11.0 |
| Financials | 18.6 |
| Health Care | 3.9 |
| Industrials | 9.9 |
| Information Technology | 19.2 |
| Materials | 1.4 |
| Real Estate | 3.1 |
| Telecommunication Services | 7.0 |
| Total | 100.0 |
Percentages indicated are based upon total equity investments. The Fund’s portfolio composition is subject to change.
| 30 | Columbia Acorn Family of Funds | Annual Report 2016 |
Fund at a glance (continued)
Columbia Acorn Emerging Markets FundSM
| Country breakdown (%) (at December 31, 2016) |
| Cambodia | 2.2 |
| Cayman Islands | 1.0 |
| China | 4.7 |
| Finland | 1.3 |
| Hong Kong | 5.0 |
| India | 16.7 |
| Indonesia | 9.3 |
| Japan | 0.7 |
| Mexico | 6.9 |
| Panama | 2.5 |
| Philippines | 3.7 |
| Poland | 2.2 |
| South Africa | 5.8 |
| South Korea | 12.5 |
| Spain | 1.2 |
| Sweden | 1.5 |
| Taiwan | 9.6 |
| Thailand | 3.9 |
| Turkey | 2.5 |
| United States(a) | 6.8 |
| Total | 100.0 |
| (a) | Includes investments in Money Market Funds. |
Country Breakdown is based primarily on issuer’s place of organization/incorporation. Percentages indicated are based upon total investments. The Fund’s portfolio composition is subject to change.
Columbia Acorn Family of Funds | Annual Report 2016
| 31 |
Manager Discussion of Fund Performance
Columbia Acorn Emerging Markets FundSM
Fritz Kaegi
Co-Portfolio Manager
Stephen Kusmierczak
Co-Portfolio Manager
Louis J. Mendes
Co-Portfolio Manager
Satoshi Matsunaga
Co-Portfolio Manager
Columbia Acorn Emerging Markets Fund Class Z shares ended 2016 down 3.04%, underperforming the 3.51% gain of the Fund’s primary benchmark, the MSCI Emerging Markets SMID Cap Index (Net). 2016 was the Fund’s toughest year in terms of underperformance versus its primary benchmark since its launch in 2011. The Fund’s primary detractor was poor stock selection in China (including Hong Kong- and Singapore-listed stocks), which represented about two-thirds of the underperformance relative to the benchmark, with one stock—Sihuan Pharmaceutical—representing about a third of the Fund’s
total underperformance.
In an effort to improve performance, we’ve made changes to our analyst coverage in China, and we’re upgrading the quality of Fund holdings in that market. Our analyst has a strong record investing in Asian technology and select China-related stocks, and we feel he can further his stock-picking success with his coverage of the full region. We have been hurt by “value traps”—stocks that look very cheap but that have unexceptional corporate governance, business models and economic drivers—and relatively illiquid ones at that. In the meantime, because we believe high-quality ideas in Chinese small caps are scarce, we have reduced our overall exposure to China.
The second-largest negative Fund performance factor was not being present in Brazil for the full year, which accounts for about one-third of the Fund’s underperformance versus the benchmark in 2016. Entering 2016, we had some limited exposure to the market, but we saw little to be excited about in terms of Brazilian company fundamentals; further, Brazil had a 10-year bond rate of about 16%, rendering equity investments relatively unattractive because a company’s future cash flows would be heavily discounted by comparison with less-risky local bank deposits or bonds. Against this backdrop, we opted to exit the market. By the end of 2016, local bond rates fell to nearly 11%, making stocks look more attractive. At the same time, the Fund missed out on the 24% appreciation of the Brazilian Real against the U.S. dollar. We generally do not try to make bets on interest rate changes or foreign currency moves because these tend to be speculative.
In 2016, the Fund also performed poorly in some of the markets where it was overweight, most notably India and Mexico. In India, government moves hurt: in October it announced media regulations that could affect ad revenues at Zee Entertainment, an Indian programmer of pay television content and the Fund’s largest holding. Though we think the effect will be muted on Zee Entertainment’s business and that there are positive aspects of the change that could increase subscription revenues, the news hurt the stock late in the period, leaving it with a 0.98% return for the year. In November, the government caused a negative monetary shock by cancelling large-denomination cash bills. This "demonetization" caused disruption in many industries and hurt Indian stocks, as investors sought liquidity and priced in the shock’s effects. As a result, during the fourth quarter India underperformed other countries in the Fund. Nonetheless, we believe that we have a group of high quality, resilient Indian businesses that will hold up well through the “demonetization” disruption.
In Mexico, the MSCI Mexico Investable Market Index sank 8% and the peso depreciated 6% in the wake of the U.S. elections on concerns the new presidential administration will enact policies that could worsen Mexican business conditions. Airport operator Grupo Aeroportuario Centro Norte was among the Fund’s biggest detractors for the year, falling 27% on fears of lower traffic. We have followed Mexican airport operators for years and held on to the position based on our belief that we own an asset with attractive long-term growth and price dynamics, listed at a very attractive price.
On the positive side, the Fund saw strong performance from holdings in Taiwan and the Philippines during the year, and also benefited from its overweight allocation to Southeast Asia. Largan Precision (+72% for the year), Silergy (+37% for the year), and Vanguard International (+36% for the year)—all tech hardware companies—strongly outperformed Taiwan and the tech sector as a whole versus the benchmark, driven by diverse trends within their various industries. Melco Crown (Philippines) Resorts grew 57% during the year and was the leading contributor to performance, benefiting as gaming conditions improved and costs got under control, finally swinging the company to profitability after a tough opening in 2015.
| 32 | Columbia Acorn Family of Funds | Annual Report 2016 |
Manager Discussion of Fund Performance (continued)
Columbia Acorn Emerging Markets FundSM
Emerging markets face diverse economic and political challenges in 2017, arising not only from conditions internal to them but also from policy and macroeconomic volatility in the developed world. International political tension has also ratcheted higher. As we navigate these conditions—and strive to improve on our 2016 performance—remember that each of your portfolio managers are sizable investors in this Fund. Having each lived and worked in emerging markets ourselves, we know that these countries have their ups and downs, but also are at the leading edge of many global economic and demographic trends.
Market risk may affect a single issuer, sector of the economy, industry or the market as a whole. International investing involves certain risks and volatility due to potential political, economic or currency instabilities and different, potentially less stringent, financial and accounting standards than those generally applicable to U.S. issuers. Risks are enhanced for emerging and frontier market issuers. Investments in small- and mid-cap companies involve risks and volatility and possible illiquidity greater than investments in larger, more established companies.
Columbia Acorn Family of Funds | Annual Report 2016
| 33 |
Fund at a glance
Columbia Acorn European FundSM
Investment objective
The Fund seeks long-term capital appreciation.
Portfolio management
Andreas Waldburg-Wolfegg
Co-Portfolio Manager
Stephen Kusmierczak
Co-Portfolio Manager
Morningstar Style BoxTM
The Morningstar Style Box™ is based on a fund’s portfolio holdings. For equity funds, the vertical axis shows the market capitalization of the stocks owned, and the horizontal axis shows investment style (value, blend, or growth). Information shown is based on the most recent data provided by Morningstar.
© 2017 Morningstar, Inc. All rights reserved. The Morningstar information contained herein: (1) is proprietary to Morningstar and/or its content providers; (2) may not be copied or distributed; and (3) is not warranted to be accurate, complete or timely. Neither Morningstar nor its content providers are responsible for any damages or losses arising from any use of this information.
| Average annual total returns (%) (for the period ended December 31, 2016) |
| | | Inception | 1 Year | 5 Years | Life |
| Class A | Excluding sales charges | 08/19/11 | -3.47 | 9.23 | 7.54 |
| | Including sales charges | | -9.02 | 7.93 | 6.36 |
| Class C | Excluding sales charges | 08/19/11 | -4.21 | 8.40 | 6.75 |
| | Including sales charges | | -5.16 | 8.40 | 6.75 |
| Class I | 08/19/11 | -3.21 | 9.54 | 7.86 |
| Class R4 | 06/25/14 | -3.27 | 9.50 | 7.83 |
| Class R5 | 11/08/12 | -3.23 | 9.49 | 7.82 |
| Class Z | 08/19/11 | -3.29 | 9.47 | 7.81 |
| MSCI AC Europe Small Cap Index (Net) | | -1.57 | 12.50 | 9.99 |
| S&P Europe Between $500M and $5B Index | | -0.31 | 12.77 | 10.30 |
Returns for Class A shares are shown with and without the maximum initial sales charge of 5.75%. Returns for Class C shares are shown with and without the maximum contingent deferred sales charge of 1.00% for the first year after purchase. The Fund’s other classes are not subject to sales charges, but may be subject to other fees and expenses, and have limited eligibility. Please see the Fund’s prospectus for details. Performance for different share classes will vary based on differences in sales charges and certain fees and expenses associated with each class.
As stated in the May 1, 2016, prospectus, as supplemented June 27, 2016, the Fund’s annual operating expense ratio is 1.51% for Class Z shares and 1.76% for Class A shares.
All results shown assume reinvestment of distributions during the period. Returns do not reflect the deduction of taxes that a shareholder may pay on Fund distributions or on the redemption of Fund shares. Performance results may reflect the effect of any fee waivers or reimbursements of Fund expenses by the investment manager and/or any of its affiliates. Absent these fee waivers and/or expense reimbursement arrangements, performance results may have been lower.
The performance information shown represents past performance and is not a guarantee of future results. The investment return and principal value of your investment will fluctuate so that shares, when redeemed, may be worth more or less than their original cost. Current performance may be lower or higher than the performance data shown. You may obtain performance information current to the most recent month-end by contacting your financial intermediary, visiting investor.columbiathreadneedleus.com or calling 800.922.6769.
The returns shown for periods prior to the share class inception date (including returns for the Life of the Fund, if shown, which are since Fund inception) include the returns of the Fund’s oldest share class. These returns are adjusted to reflect any higher class-related operating expenses of the newer share classes, as applicable. Please visit investor.columbiathreadneedleus.com/investment-products/mutual-funds/appended-performance for more information.
The MSCI AC Europe Small Cap Index (Net) captures a small-cap representation across 21 markets in Europe. The index covers approximately 14% of the free float-adjusted market capitalization across each market country in Europe.
The S&P Europe Between $500M and $5B® Index represents the institutionally investable capital of 16 European countries, as determined by S&P, with market caps ranging between $500 million to $5 billion. The index consists of the following European countries: Austria, Belgium, Denmark, Finland, France, Germany, Ireland, Italy, Luxembourg, the Netherlands, Norway, Portugal, Spain, Sweden, Switzerland and the United Kingdom.
Unlike mutual funds, indexes are not managed and do not incur fees or expenses. It is not possible to invest directly in an index.
| 34 | Columbia Acorn Family of Funds | Annual Report 2016 |
Fund at a glance (continued)
Columbia Acorn European FundSM
The Growth of a $10,000 Investment in Columbia Acorn European FundSM Class Z Shares
August 19, 2011 (Fund inception) through December 31, 2016
This chart shows the change in value of a hypothetical $10,000 investment in Class Z shares of the Fund during the stated time period.
| Top ten holdings (%) (at December 31, 2016) | |
Kindred Group PLC (Malta)
European Online Gaming Operator | 3.9 |
Wirecard AG (Germany)
Online Payment Processing & Risk Management | 3.6 |
Partners Group Holding AG (Switzerland)
Private Markets Asset Management | 3.2 |
SimCorp AS (Denmark)
Software for Investment Managers | 3.2 |
Halma PLC (United Kingdom)
Health & Safety Sensor Technology | 3.1 |
Akka Technologies (France)
Engineering Consultancy | 3.0 |
Rightmove PLC (United Kingdom)
Internet Real Estate Listings | 2.8 |
Sweco AB, Class B (Sweden)
Engineering Consultants | 2.6 |
AURELIUS Equity Opportunities SE & Co. KGaA (Germany)
European Turnaround Investor | 2.6 |
Tikkurila OYJ (Finland)
Decorative & Industrial Paint in Scandinavia, Central & Eastern Europe | 2.5 |
Percentages indicated are based upon total investments (excluding Money Market Funds and Securities Lending Collateral).
For further detail about these holdings, please refer to the section entitled “Portfolio of Investments."
Fund holdings are as of the date given, are subject to change at any time, and are not recommendations to buy or sell any security.
| Equity sector breakdown (%) (at December 31, 2016) |
| Consumer Discretionary | 17.2 |
| Consumer Staples | 4.1 |
| Financials | 9.7 |
| Health Care | 9.4 |
| Industrials | 24.0 |
| Information Technology | 20.4 |
| Materials | 9.5 |
| Real Estate | 5.7 |
| Total | 100.0 |
Percentages indicated are based upon total equity investments. The Fund’s portfolio composition is subject to change.
Columbia Acorn Family of Funds | Annual Report 2016
| 35 |
Fund at a glance (continued)
Columbia Acorn European FundSM
| Country breakdown (%) (at December 31, 2016) |
| Belgium | 1.3 |
| Denmark | 4.8 |
| Finland | 7.5 |
| France | 6.1 |
| Germany | 13.4 |
| Italy | 3.3 |
| Malta | 3.6 |
| Netherlands | 3.6 |
| Norway | 2.2 |
| Poland | 1.6 |
| Spain | 5.1 |
| Sweden | 7.7 |
| Switzerland | 3.9 |
| Turkey | 1.1 |
| United Kingdom | 26.4 |
| United States(a) | 8.4 |
| Total | 100.0 |
| (a) | Includes investments in Money Market Funds. |
Country Breakdown is based primarily on issuer’s place of organization/incorporation. Percentages indicated are based upon total investments. The Fund’s portfolio composition is subject to change.
| 36 | Columbia Acorn Family of Funds | Annual Report 2016 |
Manager Discussion of Fund Performance
Columbia Acorn European FundSM
Andreas Waldburg-Wolfegg
Co-Portfolio Manager
Stephen Kusmierczak
Co-Portfolio Manager
Columbia Acorn European Fund Class Z shares ended the year down 3.29%, underperforming the 1.57% decline of the Fund’s primary benchmark, the MSCI AC Europe Small Cap Index (Net). The relative lag was largely due to the Fund’s emphasis on growth in a year that generally favored value. The impact of value strength on the Fund was felt strongest in the fourth quarter. Columbia Acorn European Fund’s performance was in line with its Morningstar Europe Stock peer group, which had an average decline of 1.66% in 2016. Regionally, relative underperformance was concentrated in Northern and Central Europe and in the United Kingdom. From a sector perspective, the Fund underperformed the benchmark within the consumer discretionary and information technology sectors.
Among the Fund’s detractors, Wirecard, a German online payment processing and risk management company, fell in the first quarter on questionable allegations against the company. This downturn was followed by a strong second and third quarter, but the company cooled in the fourth quarter leaving the stock with a 13% loss for the year. Ending the year down 37%, we sold the Fund’s position in Regus, a provider of rental office space in full service business centers. In light of the many newcomers in the space, we were no longer convinced that Regus could preserve its edge. Distribuidora Internacional de Alimentación, a discount retailer in Spain and Latin America, declined 16%, as earnings fell short of expectations. Pricing pressure in Spain and Portugal hurt the company.
Top contributors to Fund performance in the year included two Finnish stocks. Munksjo, a specialty paper manufacturer, gained 76% on strong results driven in part by improved market conditions that removed headwinds that were hampering stock performance. Konecranes, a manufacturer and service provider for industrial cranes and port handling equipment, rose 50% on news it would acquire U.S.-based Terex Corporation’s material handling and port solutions business. Listed in Spain, Prosegur, a provider of security guard services, ended the year up 40%, as the company showed strong organic growth and more technological innovation and service-level agreements.
As we move into 2017, Europe faces many challenges. A lack of clarity around Brexit negotiations continues to worry investors, and the upcoming elections in France and Germany could determine the future of the European Union. On the other hand, despite initial concerns, the resignation of Italian Prime Minister Renzi following the defeat of a controversial reform referendum had little impact on European markets late in the period. In addition, Italy began to take measures to safeguard its banking sector, a move viewed very favorably by the markets. During the fourth quarter, we saw interest rates increase in the United States, and we expect other countries to follow. The European Central Bank announced stimulus measures that bolstered the markets late in the year but then hinted at a
possible reversal. While we will continue to closely monitor the macroeconomic factors impacting Europe, our focus remains on owning stocks in companies with solid earnings growth and sound
long-term prospects.
Market risk may affect a single issuer, sector of the economy, industry or the market as a whole. International investing involves certain risks and volatility due to potential political, economic or currency instabilities and different, potentially less stringent, financial and accounting standards than those generally applicable to U.S. issuers. Investments in small- and mid-cap companies involve risks and volatility and possible illiquidity greater than investments in larger, more established companies.
Columbia Acorn Family of Funds | Annual Report 2016
| 37 |
A “fund of fund” bears its allocable share of the costs and expenses of the underlying funds in which it invests. Such funds are thus subject to two levels of fees and potentially higher expense ratios than would be associated with a fund that invests and trades directly in financial instruments under the direction of a single manager.
2016 Year-End Distributions
The following table details the year-end distributions for the Columbia Acorn Funds. For all Funds except Columbia Thermostat Fund, the record date was December 6, 2016, and the ex-dividend and payable date was December 7, 2016. For Columbia Thermostat Fund, the record date was December 21, 2016, and the ex-dividend and payable date was December 22, 2016.
| Fund | Ordinary
income | Short-term
capital
gain | Long-term
capital
gain |
| Columbia Acorn® Fund | | | |
| Class A | None | None | 3.92246 |
| Class C | None | None | 3.92246 |
| Class I | None | None | 3.92246 |
| Class R4 | None | None | 3.92246 |
| Class R5 | None | None | 3.92246 |
| Class Y | None | None | 3.92246 |
| Class Z | None | None | 3.92246 |
| Columbia Acorn International® | | | |
| Class A | 0.14692 | None | None |
| Class B | None | None | None |
| Class C | None | None | None |
| Class I | 0.28346 | None | None |
| Class R | 0.01428 | None | None |
| Class R4 | 0.22104 | None | None |
| Class R5 | 0.26396 | None | None |
| Class Y | 0.28346 | None | None |
| Class Z | 0.24445 | None | None |
| Columbia Acorn USA® | | | |
| Class A | None | None | 4.95032 |
| Class C | None | None | 4.95032 |
| Class I | None | None | 4.95032 |
| Class R4 | None | None | 4.95032 |
| Class R5 | None | None | 4.95032 |
| Class Y | None | None | 4.95032 |
| Class Z | None | None | 4.95032 |
| Columbia Acorn International SelectSM | | | |
| Class A | 0.15970 | None | None |
| Class C | None | None | None |
| Class I | 0.25415 | None | None |
| Class R4 | 0.21551 | None | None |
| Class R5 | 0.22839 | None | None |
| Class Y | 0.24556 | None | None |
| Class Z | 0.22195 | None | None |
| Columbia Acorn SelectSM | | | |
| Class A | None | None | 1.11394 |
| Class C | None | None | 1.11394 |
| Class I | None | None | 1.11394 |
| Class R4 | None | None | 1.11394 |
| Class R5 | None | None | 1.11394 |
| Class Y | None | None | 1.11394 |
| Class Z | None | None | 1.11394 |
| 38 | Columbia Acorn Family of Funds | Annual Report 2016 |
2016 Year-End Distributions (continued)
| Fund | Ordinary
income | Short-term
capital
gain | Long-term
capital
gain |
| Columbia Thermostat FundSM | | | |
| Class A | 0.02607 | None | None |
| Class C | None | None | None |
| Class R4 | 0.06235 | None | None |
| Class R5 | 0.06380 | None | None |
| Class Y | 0.07106 | None | None |
| Class Z | 0.06235 | None | None |
| Columbia Acorn Emerging Markets FundSM | | | |
| Class A | 0.07330 | None | None |
| Class C | None | None | None |
| Class I | 0.11353 | None | None |
| Class R4 | 0.10115 | None | None |
| Class R5 | 0.11250 | None | None |
| Class Y | 0.11353 | None | None |
| Class Z | 0.10012 | None | None |
| Columbia Acorn European FundSM | | | |
| Class A | 0.09256 | None | None |
| Class C | None | None | None |
| Class I | 0.14069 | None | None |
| Class R4 | 0.12902 | None | None |
| Class R5 | 0.13340 | None | None |
| Class Z | 0.12902 | None | None |
Columbia Acorn Family of Funds | Annual Report 2016
| 39 |
Understanding Your Fund’s Expenses
As a shareholder, you incur two types of costs. There are transaction costs, which generally include sales charges on purchases and may include redemption fees. There are also ongoing costs, which generally include management fees, distribution and service (Rule 12b-1) fees, and other Fund expenses. The following information is intended to help you understand your ongoing costs (in dollars) of investing in the Fund and to help you compare these costs with the ongoing costs of investing in other mutual funds.
Analyzing your fund’s expenses
To illustrate these ongoing costs, we have provided examples and calculated the expenses paid by investors in Class A, B, C, I, R, R4, R5, Y and Z shares of the Funds during the period. The actual and hypothetical information in the tables is based on an initial investment of $1,000 at the beginning of the period indicated and held for the entire period. Expense information is calculated two ways and each method provides you with different information. The amount listed in the “Actual” column is calculated using the Funds’ actual operating expenses and total return for the period. You may use the Actual information, together with the amount invested, to estimate the expenses that you paid over the period. Simply divide your account value by $1,000 (for example, an $8,600 account value divided by $1,000 = 8.6), then multiply the results by the expenses paid during the period under the Actual column. The amount listed in the “Hypothetical” column assumes a 5% annual rate of return before expenses (which is not the Funds’ actual return) and then applies the Funds’ actual expense ratio for the period to the hypothetical return. You should not use the hypothetical account values and expenses to estimate either your actual account balance at the end of the period or the expenses you paid during the period. See “Compare With Other Funds” below for details on how to use the hypothetical data.
In addition to the ongoing expenses which the Funds bear directly, Columbia Thermostat Fund’s shareholders indirectly bear the Fund’s allocable share of the costs and expenses of each underlying fund in which the Fund invests. You can also estimate the effective expenses paid during the period, which includes the indirect fees associated with investing in the underlying funds, by using the amounts listed in the effective expenses paid during the period column in the “Fund of Funds” table.
Compare with other funds
Since all mutual funds are required to include the same hypothetical calculations about expenses in shareholder reports, you can use this information to compare the ongoing cost of investing in the Funds with other funds. To do so, compare the hypothetical example with the 5% hypothetical examples that appear in the shareholder reports of other funds. As you compare hypothetical examples of other funds, it is important to note that hypothetical examples are meant to highlight the ongoing costs of investing in a fund only and do not reflect any transaction costs, such as sales charges, or redemption or exchange fees. Therefore, the hypothetical calculations are useful in comparing ongoing costs only, and will not help you determine the relative total costs of owning different funds. If transaction costs were included in these calculations, your costs would be higher.
| July 1, 2016 — December 31, 2016 |
| | Account value at the
beginning of the
period ($) | Account value at the
end of the
period ($) | Expenses paid during
the period ($) | Fund’s annualized
expense ratio (%) |
| | Actual | Hypothetical | Actual | Hypothetical | Actual | Hypothetical | Actual |
| Columbia Acorn® Fund |
| Class A | 1,000.00 | 1,000.00 | 1,104.70 | 1,019.65 | 5.63 | 5.40 | 1.07 |
| Class C | 1,000.00 | 1,000.00 | 1,101.10 | 1,015.90 | 9.56 | 9.17 | 1.82 |
| Class I | 1,000.00 | 1,000.00 | 1,106.50 | 1,021.20 | 4.00 | 3.84 | 0.76 |
| Class R4 | 1,000.00 | 1,000.00 | 1,105.70 | 1,020.90 | 4.32 | 4.14 | 0.82 |
| Class R5 | 1,000.00 | 1,000.00 | 1,106.30 | 1,020.95 | 4.27 | 4.09 | 0.81 |
| Class Y | 1,000.00 | 1,000.00 | 1,107.00 | 1,021.20 | 4.00 | 3.84 | 0.76 |
| Class Z | 1,000.00 | 1,000.00 | 1,105.80 | 1,020.90 | 4.32 | 4.14 | 0.82 |
| 40 | Columbia Acorn Family of Funds | Annual Report 2016 |
Understanding Your Fund’s Expenses (continued)
| July 1, 2016 — December 31, 2016 |
| | Account value at the
beginning of the
period ($) | Account value at the
end of the
period ($) | Expenses paid during
the period ($) | Fund’s annualized
expense ratio (%) |
| | Actual | Hypothetical | Actual | Hypothetical | Actual | Hypothetical | Actual |
| Columbia Acorn International® |
| Class A | 1,000.00 | 1,000.00 | 989.00 | 1,019.20 | 5.77 | 5.86 | 1.16 |
| Class B | 1,000.00 | 1,000.00 | 986.40 | 1,016.85 | 8.09 | 8.22 | 1.63 |
| Class C | 1,000.00 | 1,000.00 | 985.00 | 1,015.30 | 9.63 | 9.77 | 1.94 |
| Class I | 1,000.00 | 1,000.00 | 990.50 | 1,020.60 | 4.38 | 4.45 | 0.88 |
| Class R | 1,000.00 | 1,000.00 | 987.50 | 1,017.65 | 7.30 | 7.41 | 1.47 |
| Class R4 | 1,000.00 | 1,000.00 | 990.00 | 1,020.10 | 4.88 | 4.95 | 0.98 |
| Class R5 | 1,000.00 | 1,000.00 | 990.20 | 1,020.35 | 4.63 | 4.70 | 0.93 |
| Class Y | 1,000.00 | 1,000.00 | 990.30 | 1,020.60 | 4.38 | 4.45 | 0.88 |
| Class Z | 1,000.00 | 1,000.00 | 990.00 | 1,020.15 | 4.83 | 4.90 | 0.97 |
| Columbia Acorn USA® |
| Class A | 1,000.00 | 1,000.00 | 1,117.80 | 1,018.05 | 7.36 | 7.01 | 1.39 |
| Class C | 1,000.00 | 1,000.00 | 1,114.10 | 1,014.30 | 11.31 | 10.78 | 2.14 |
| Class I | 1,000.00 | 1,000.00 | 1,120.30 | 1,020.05 | 5.25 | 5.00 | 0.99 |
| Class R4 | 1,000.00 | 1,000.00 | 1,119.30 | 1,019.30 | 6.04 | 5.76 | 1.14 |
| Class R5 | 1,000.00 | 1,000.00 | 1,120.40 | 1,019.70 | 5.62 | 5.35 | 1.06 |
| Class Y | 1,000.00 | 1,000.00 | 1,120.30 | 1,020.00 | 5.30 | 5.05 | 1.00 |
| Class Z | 1,000.00 | 1,000.00 | 1,119.70 | 1,019.30 | 6.04 | 5.76 | 1.14 |
| Columbia Acorn International SelectSM |
| Class A | 1,000.00 | 1,000.00 | 1,028.30 | 1,018.05 | 7.05 | 7.01 | 1.39 |
| Class C | 1,000.00 | 1,000.00 | 1,024.60 | 1,014.30 | 10.83 | 10.78 | 2.14 |
| Class I | 1,000.00 | 1,000.00 | 1,030.10 | 1,019.90 | 5.18 | 5.15 | 1.02 |
| Class R4 | 1,000.00 | 1,000.00 | 1,029.50 | 1,019.30 | 5.78 | 5.76 | 1.14 |
| Class R5 | 1,000.00 | 1,000.00 | 1,030.10 | 1,019.65 | 5.43 | 5.40 | 1.07 |
| Class Y | 1,000.00 | 1,000.00 | 1,030.50 | 1,019.90 | 5.18 | 5.15 | 1.02 |
| Class Z | 1,000.00 | 1,000.00 | 1,029.50 | 1,019.30 | 5.78 | 5.76 | 1.14 |
| Columbia Acorn SelectSM |
| Class A | 1,000.00 | 1,000.00 | 1,130.40 | 1,019.25 | 6.12 | 5.81 | 1.15 |
| Class C | 1,000.00 | 1,000.00 | 1,126.70 | 1,015.50 | 10.10 | 9.57 | 1.90 |
| Class I | 1,000.00 | 1,000.00 | 1,132.80 | 1,021.05 | 4.21 | 3.99 | 0.79 |
| Class R4 | 1,000.00 | 1,000.00 | 1,131.90 | 1,020.50 | 4.80 | 4.55 | 0.90 |
| Class R5 | 1,000.00 | 1,000.00 | 1,132.80 | 1,020.80 | 4.48 | 4.24 | 0.84 |
| Class Y | 1,000.00 | 1,000.00 | 1,133.40 | 1,021.05 | 4.21 | 3.99 | 0.79 |
| Class Z | 1,000.00 | 1,000.00 | 1,132.60 | 1,020.50 | 4.80 | 4.55 | 0.90 |
| Columbia Acorn Emerging Markets FundSM |
| Class A | 1,000.00 | 1,000.00 | 956.80 | 1,015.80 | 9.00 | 9.27 | 1.84 |
| Class C | 1,000.00 | 1,000.00 | 953.30 | 1,012.05 | 12.65 | 13.03 | 2.59 |
| Class I | 1,000.00 | 1,000.00 | 957.90 | 1,017.75 | 7.10 | 7.31 | 1.45 |
| Class R4 | 1,000.00 | 1,000.00 | 957.90 | 1,017.05 | 7.78 | 8.02 | 1.59 |
| Class R5 | 1,000.00 | 1,000.00 | 958.00 | 1,017.45 | 7.39 | 7.62 | 1.51 |
| Class Y | 1,000.00 | 1,000.00 | 957.70 | 1,017.55 | 7.29 | 7.52 | 1.49 |
| Class Z | 1,000.00 | 1,000.00 | 957.50 | 1,017.05 | 7.78 | 8.02 | 1.59 |
Columbia Acorn Family of Funds | Annual Report 2016
| 41 |
Understanding Your Fund’s Expenses (continued)
| July 1, 2016 — December 31, 2016 |
| | Account value at the
beginning of the
period ($) | Account value at the
end of the
period ($) | Expenses paid during
the period ($) | Fund’s annualized
expense ratio (%) |
| | Actual | Hypothetical | Actual | Hypothetical | Actual | Hypothetical | Actual |
| Columbia Acorn European FundSM |
| Class A | 1,000.00 | 1,000.00 | 1,003.80 | 1,016.25 | 8.77 | 8.82 | 1.75 |
| Class C | 1,000.00 | 1,000.00 | 999.30 | 1,012.50 | 12.50 | 12.58 | 2.50 |
| Class I | 1,000.00 | 1,000.00 | 1,005.10 | 1,017.90 | 7.12 | 7.16 | 1.42 |
| Class R4 | 1,000.00 | 1,000.00 | 1,005.00 | 1,017.50 | 7.52 | 7.57 | 1.50 |
| Class R5 | 1,000.00 | 1,000.00 | 1,005.20 | 1,017.65 | 7.37 | 7.41 | 1.47 |
| Class Z | 1,000.00 | 1,000.00 | 1,004.30 | 1,017.50 | 7.52 | 7.57 | 1.50 |
Fund of Funds—Columbia Thermostat Fund
| July 1, 2016 — December 31, 2016 |
| | Account value at the
beginning of the
period ($) | Account value at the
end of the
period ($) | Expenses paid during
the period ($) | Fund’s annualized
expense ratio (%) | Effective expenses
paid during the
period ($) | Fund’s effective
annualized
expense ratio (%) |
| | Actual | Hypothetical | Actual | Hypothetical | Actual | Hypothetical | Actual | Actual | Hypothetical | Actual |
| Columbia Thermostat FundSM | | | | | | | | | | |
| Class A | 1,000.00 | 1,000.00 | 1,008.70 | 1,022.50 | 2.51 | 2.53 | 0.50 | 4.97 | 5.01 | 0.99 |
| Class C | 1,000.00 | 1,000.00 | 1,004.80 | 1,018.75 | 6.27 | 6.31 | 1.25 | 8.72 | 8.78 | 1.74 |
| Class R4 | 1,000.00 | 1,000.00 | 1,009.90 | 1,023.75 | 1.26 | 1.26 | 0.25 | 3.72 | 3.74 | 0.74 |
| Class R5 | 1,000.00 | 1,000.00 | 1,010.00 | 1,023.80 | 1.21 | 1.21 | 0.24 | 3.67 | 3.69 | 0.73 |
| Class Y | 1,000.00 | 1,000.00 | 1,009.80 | 1,024.05 | 0.95 | 0.96 | 0.19 | 3.42 | 3.44 | 0.68 |
| Class Z | 1,000.00 | 1,000.00 | 1,010.00 | 1,023.75 | 1.26 | 1.26 | 0.25 | 3.72 | 3.74 | 0.74 |
Expenses paid during the period are equal to the annualized expense ratio, multiplied by the average account value over the period and then multiplied by the number of days in the Fund’s most recent fiscal half year and divided by 366.
Except with respect to Columbia Thermostat Fund, expenses do not include any fees and expenses incurred indirectly by a Fund from the underlying funds in which the Fund may invest (also referred to as “acquired funds”), including affiliated and non-affiliated pooled investments vehicles (including mutual funds and exchange traded funds).
In the case of Columbia Thermostat Fund, effective expenses paid during the period and the Fund’s effective annualized expense ratio include expenses borne directly by the class plus the Fund’s pro rata portion of the ongoing expenses charged by the underlying funds in which it invests using the expense ratio of each class of each underlying fund as of the underlying fund’s most recent shareholder report.
Had the investment manager and/or certain of its affiliates not waived/reimbursed certain fees and expenses for Columbia Acorn International, Columbia Acorn International Select, Columbia Acorn Select, Columbia Thermostat Fund, Columbia Emerging Markets Fund and Columbia Acorn European Fund, account value at the end of the period would have been reduced.
| 42 | Columbia Acorn Family of Funds | Annual Report 2016 |
Portfolio of Investments
Columbia Acorn® Fund, December 31, 2016
(Percentages represent value of investments compared to net assets)
| Common Stocks 99.1% |
| Issuer | Shares | Value ($) |
| Consumer Discretionary 14.4% |
| Auto Components 3.3% |
Cooper-Standard Holding, Inc.(a)
Auto Supplier: Sealing, Fuel/Brake Delivery, Fluid Transfer, Anti-Vibrate Systems | 278,980 | 28,840,952 |
Gentex Corp.
Manufacturer of Auto Parts | 2,034,222 | 40,053,831 |
LCI Industries
RV & Manufactured Home Components | 356,099 | 38,369,667 |
Tenneco, Inc.(a)
Auto Parts for Emission Control, Suspension | 840,533 | 52,508,097 |
| Total | | 159,772,547 |
| Distributors 0.8% |
LKQ Corp.(a)
Alternative Auto Parts Distribution | 1,317,619 | 40,385,022 |
| Diversified Consumer Services 0.5% |
Bright Horizons Family Solutions, Inc.(a)
Child Care/Preschool Services | 360,017 | 25,208,390 |
| Hotels, Restaurants & Leisure 4.0% |
Domino’s Pizza, Inc.
Franchisor of Pizza Restaurants | 158,399 | 25,223,457 |
Dunkin’ Brands Group, Inc.
Franchisor of Quick Service Restaurants | 564,984 | 29,627,761 |
Papa John’s International, Inc.
Franchisor of Pizza Restaurants | 440,272 | 37,678,478 |
Popeyes Louisiana Kitchen, Inc.(a)
Popeyes Restaurants | 415,745 | 25,144,257 |
Texas Roadhouse, Inc.
Rural-focused Full Service Steakhouse | 509,339 | 24,570,513 |
Vail Resorts, Inc.
Ski Resort Operator & Developer | 304,645 | 49,142,285 |
| Total | | 191,386,751 |
| Household Durables 2.6% |
Cavco Industries, Inc.(a)
Manufactured Homes | 256,459 | 25,607,431 |
iRobot Corp.(a)
Home Robots (Vacuums, Pool Cleaners) & Battlefield Reconnaissance Robots | 667,666 | 39,025,078 |
Leggett & Platt, Inc.
Designs & Produces Diverse Products for Homes, Offices & Vehicles | 528,700 | 25,842,856 |
NVR, Inc.(a)
Homebuilder | 20,200 | 33,713,800 |
| Total | | 124,189,165 |
| Common Stocks (continued) |
| Issuer | Shares | Value ($) |
| Internet & Catalog Retail 0.3% |
Liberty TripAdvisor Holdings, Inc., Class A(a)
Holding Company for Trip Advisor | 1,029,572 | 15,495,059 |
| Leisure Products 0.5% |
Polaris Industries, Inc.(b)
Leisure Vehicles & Related Products | 304,121 | 25,056,529 |
| Specialty Retail 1.9% |
Five Below, Inc.(a)
Low-price Specialty Retailer Targeting Pre-Teens, Teens & Parents | 910,489 | 36,383,141 |
Monro Muffler Brake, Inc.
Automotive Services | 446,259 | 25,526,015 |
Ulta Salon Cosmetics & Fragrance, Inc.(a)
Specialty Beauty Product Retailer | 110,376 | 28,139,257 |
| Total | | 90,048,413 |
| Textiles, Apparel & Luxury Goods 0.5% |
Hanesbrands, Inc.
Apparel Wholesaler | 1,189,520 | 25,657,947 |
| Total Consumer Discretionary | 697,199,823 |
| Consumer Staples 1.9% |
| Food & Staples Retailing 0.5% |
US Foods Holding Corp.(a)
U.S. Food Distributor | 983,688 | 27,031,746 |
| Household Products 1.4% |
Spectrum Brands Holdings, Inc.
Household Product Brands | 307,067 | 37,563,506 |
WD-40 Co.
Manufacturer of Industrial Lubrications | 244,724 | 28,608,236 |
| Total | | 66,171,742 |
| Total Consumer Staples | 93,203,488 |
| Energy 3.7% |
| Energy Equipment & Services 1.7% |
Oil States International, Inc.(a)
Oilfield Service Provider | 589,504 | 22,990,656 |
RPC, Inc.(b)
North American Onshore Oil Service | 1,884,243 | 37,326,854 |
ShawCor Ltd.
Oil & Gas Pipeline Products | 755,788 | 20,174,611 |
| Total | | 80,492,121 |
The accompanying Notes to Portfolio of Investments are an integral part of this statement.
Columbia Acorn Family of Funds | Annual Report 2016
| 43 |
Portfolio of Investments (continued)
Columbia Acorn® Fund, December 31, 2016
| Common Stocks (continued) |
| Issuer | Shares | Value ($) |
| Oil, Gas & Consumable Fuels 2.0% |
Carrizo Oil & Gas, Inc.(a)
Oil & Gas Producer | 621,033 | 23,195,583 |
Cimarex Energy Co.
Oil & Gas Producer in Texas, New Mexico & Oklahoma | 217,317 | 29,533,380 |
Diamondback Energy, Inc.(a)
Oil & Gas Producer in Texas | 427,434 | 43,196,480 |
| Total | | 95,925,443 |
| Total Energy | 176,417,564 |
| Financials 17.0% |
| Banks 5.2% |
Associated Banc-Corp.
Midwest Bank | 2,057,675 | 50,824,572 |
BOK Financial Corp.(b)
Tulsa-based Southwest Bank | 561,417 | 46,620,068 |
First Republic Bank
San Francisco Bank to Affluent | 477,662 | 44,011,777 |
MB Financial, Inc.
Chicago Bank | 1,322,056 | 62,440,705 |
SVB Financial Group(a)
Bank to Venture Capitalists | 277,068 | 47,561,493 |
| Total | | 251,458,615 |
| Capital Markets 9.5% |
Affiliated Managers Group, Inc.(a)
Asset Manager Holding Company | 316,933 | 46,050,365 |
Ares Capital Corp.(b)
Business Development Company | 1,383,310 | 22,810,782 |
CBOE Holdings, Inc.
Marketplace for Trading Options & Futures | 619,898 | 45,804,263 |
Eaton Vance Corp.
Specialty Mutual Funds | 886,117 | 37,110,580 |
Factset Research Systems, Inc.
Securities Data Purveyor | 151,270 | 24,722,056 |
Interactive Brokers Group, Inc., Class A
Electronic Brokerage & Market Maker | 1,119,868 | 40,886,381 |
Lazard Ltd., Class A
Corporate Advisory & Asset Management | 1,887,669 | 77,564,319 |
MarketAxess Holdings, Inc.
Bond Exchange | 137,306 | 20,172,997 |
Nasdaq, Inc.
Exchange Operator & Data/Market Technology Provider | 527,700 | 35,419,224 |
| Common Stocks (continued) |
| Issuer | Shares | Value ($) |
Raymond James Financial, Inc.
Full Service Wealth Management | 1,085,796 | 75,213,089 |
SEI Investments Co.
Mutual Fund Administration & Investment Management | 687,519 | 33,935,938 |
| Total | | 459,689,994 |
| Insurance 2.3% |
Allied World Assurance Co. Holdings AG
Commercial Lines Insurance/Reinsurance | 646,232 | 34,709,121 |
CNO Financial Group, Inc.
Life, Long-term Care & Medical Supplement Insurance | 2,005,496 | 38,405,248 |
FNF Group
Title Insurance & Related Services | 1,034,935 | 35,146,393 |
| Total | | 108,260,762 |
| Total Financials | 819,409,371 |
| Health Care 19.8% |
| Biotechnology 2.8% |
Agios Pharmaceuticals, Inc.(a)
Biotech Focused on Cancer & Orphan Diseases | 406,598 | 16,967,334 |
Celldex Therapeutics, Inc.(a),(b),(c)
Biotech Developing Drugs for Cancer | 6,019,590 | 21,309,349 |
Genomic Health, Inc.(a)
Cancer Diagnostics | 913,915 | 26,859,962 |
Seattle Genetics, Inc.(a)
Antibody-based Therapies for Cancer | 618,581 | 32,642,519 |
Ultragenyx Pharmaceutical, Inc.(a)
Biotech Focused on "Ultra-Orphan" Drugs | 568,212 | 39,950,986 |
| Total | | 137,730,150 |
| Health Care Equipment & Supplies 8.3% |
ABIOMED, Inc.(a)
Medical Devices for Cardiac Conditions | 237,094 | 26,715,752 |
Align Technology, Inc.(a)
Invisalign System to Correct Malocclusion (Crooked Teeth) | 1,215,648 | 116,860,242 |
Dentsply Sirona, Inc.
Dental Supplies Manufacturer | 501,890 | 28,974,110 |
Endologix, Inc.(a),(c)
Minimally Invasive Treatment of Abdominal Aortic Aneurysm | 4,661,700 | 26,664,924 |
IDEXX Laboratories, Inc.(a)
Diagnostic Equipment & Services for Veterinarians | 178,166 | 20,893,527 |
LivaNova PLC(a)
Neuromodulation & Cardiac Devices | 742,066 | 33,370,708 |
The accompanying Notes to Portfolio of Investments are an integral part of this statement.
| 44 | Columbia Acorn Family of Funds | Annual Report 2016 |
Portfolio of Investments (continued)
Columbia Acorn® Fund, December 31, 2016
| Common Stocks (continued) |
| Issuer | Shares | Value ($) |
Masimo Corp.(a)
Pulse Oximetry Monitors (Blood Oxygen Levels) | 584,652 | 39,405,545 |
ResMed, Inc.
Medical Devices for Sleep Apnea Treatment | 666,609 | 41,363,088 |
Varian Medical Systems, Inc.(a)
Radiation Therapy Systems, Software & Services to Treat Cancer | 323,900 | 29,079,742 |
West Pharmaceutical Services, Inc.
Components & Systems for Injectable Drug Delivery | 436,061 | 36,991,055 |
| Total | | 400,318,693 |
| Health Care Providers & Services 3.7% |
Centene Corp.(a)
Managed Care Organization | 744,943 | 42,096,729 |
HealthSouth Corp.
Inpatient Rehabilitation Facilities & Home Health Care | 1,810,686 | 74,672,691 |
Mednax, Inc.(a)
Physician Management for Pediatric & Anesthesia Practices | 428,637 | 28,572,942 |
VCA, Inc.(a)
Animal Hospitals & Laboratory Services | 456,000 | 31,304,400 |
| Total | | 176,646,762 |
| Health Care Technology 0.5% |
Medidata Solutions, Inc.(a)
Cloud-based Software for Drug Studies | 520,666 | 25,861,480 |
| Life Sciences Tools & Services 4.2% |
Agilent Technologies, Inc.
Provider of Systems, Consumables & Services for Life Science Labs | 571,835 | 26,052,803 |
Bio-Techne Corp.
Maker of Consumables & Systems for the Life Science Market | 352,757 | 36,274,002 |
Mettler-Toledo International, Inc.(a)
Laboratory Equipment | 46,514 | 19,468,900 |
Pra Health Sciences, Inc.(a)
Contract Research Organization | 1,141,768 | 62,934,252 |
Quintiles IMS Holdings, Inc.(a)
Contract Research Organization | 261,273 | 19,869,812 |
VWR Corp.(a)
Distributor of Lab Supplies | 1,540,319 | 38,554,184 |
| Total | | 203,153,953 |
| Common Stocks (continued) |
| Issuer | Shares | Value ($) |
| Pharmaceuticals 0.3% |
Akorn, Inc.(a)
Developer, Manufacturer & Distributor of Specialty Generic Drugs | 656,493 | 14,331,242 |
| Total Health Care | 958,042,280 |
| Industrials 19.4% |
| Aerospace & Defense 1.1% |
HEICO Corp., Class A
FAA-Approved Aircraft Replacement Parts | 806,242 | 54,743,832 |
| Air Freight & Logistics 0.5% |
Expeditors International of Washington, Inc.
International Freight Forwarder | 451,553 | 23,914,247 |
| Commercial Services & Supplies 3.0% |
Cintas Corp.
Provider of Rental Uniforms & Floor Mats | 429,202 | 49,598,583 |
Ritchie Bros. Auctioneers, Inc.
Heavy Equipment Auctioneer | 785,300 | 26,700,200 |
Rollins, Inc.
Pest Control & Wildlife Removal Services | 734,562 | 24,813,505 |
Unifirst Corp.
Uniform Rental | 298,808 | 42,923,769 |
| Total | | 144,036,057 |
| Electrical Equipment 1.7% |
Acuity Brands, Inc.
Commercial Lighting Fixtures | 219,011 | 50,560,880 |
Generac Holdings, Inc.(a)
Standby Power Generators | 745,364 | 30,366,129 |
| Total | | 80,927,009 |
| Industrial Conglomerates 1.1% |
Carlisle Companies, Inc.
industrial Conglomerate | 466,606 | 51,461,976 |
| Machinery 5.5% |
Graco, Inc.
Manufacturer of Dispensing Equipment | 335,160 | 27,848,444 |
Middleby Corp. (The)(a)
Manufacturer of Cooking Equipment | 178,951 | 23,050,678 |
Nordson Corp.
Dispensing Systems for Adhesives & Coatings | 258,666 | 28,983,525 |
Oshkosh Corp.
Specialty Truck Manufacturer | 442,915 | 28,616,738 |
Snap-On, Inc.
Tools | 205,185 | 35,142,035 |
The accompanying Notes to Portfolio of Investments are an integral part of this statement.
Columbia Acorn Family of Funds | Annual Report 2016
| 45 |
Portfolio of Investments (continued)
Columbia Acorn® Fund, December 31, 2016
| Common Stocks (continued) |
| Issuer | Shares | Value ($) |
Toro Co. (The)
Turf Maintenance Equipment | 1,248,869 | 69,874,221 |
WABCO Holdings, Inc.(a)
Truck & Bus Component Supplier | 220,212 | 23,375,504 |
Wabtec Corp.
Freight & Transit Component Supplier | 361,756 | 30,032,983 |
| Total | | 266,924,128 |
| Professional Services 3.6% |
ManpowerGroup, Inc.
Global Temporary Staffing Provider | 263,282 | 23,397,871 |
Navigant Consulting, Inc.(a)
Financial Consulting Firm | 1,275,977 | 33,405,078 |
Robert Half International, Inc.
Temporary & Permanent Staffing in Finance, Accounting & Other Professions | 698,463 | 34,071,025 |
Wageworks, Inc.(a)
Healthcare Consumer Directed Benefits & Commuter Account Management | 1,102,275 | 79,914,938 |
| Total | | 170,788,912 |
| Road & Rail 2.2% |
AMERCO
North American Moving & Storage | 127,482 | 47,116,072 |
JB Hunt Transport Services, Inc.
Truck & Intermodal Carrier | 244,513 | 23,734,877 |
Old Dominion Freight Line, Inc.(a)
LTL Trucker | 428,717 | 36,779,632 |
| Total | | 107,630,581 |
| Trading Companies & Distributors 0.7% |
Watsco, Inc.
HVAC Distribution | 230,729 | 34,175,579 |
| Total Industrials | 934,602,321 |
| Information Technology 14.9% |
| Electronic Equipment, Instruments & Components 1.5% |
CDW Corp.
Value Added Reseller of IT Products & Services | 903,618 | 47,069,462 |
IPG Photonics Corp.(a)
Fiber Lasers | 243,502 | 24,036,082 |
| Total | | 71,105,544 |
| Common Stocks (continued) |
| Issuer | Shares | Value ($) |
| Internet Software & Services 3.8% |
GoDaddy, Inc., Class A(a)
Website Management for Small- & Medium-sized Companies | 1,392,539 | 48,669,238 |
NIC, Inc.
Government Web Portal Development & Management Outsourcing | 850,201 | 20,319,804 |
Nutanix, Inc., Class A(a),(b),(c)
Software Company Selling Hyper-converged Infrastructure Appliances | 898,090 | 23,853,270 |
Quotient Technology, Inc.(a)
Allows CPGs to Digitally Distribute Coupons, Advertising & Trade Promotion | 3,270,726 | 35,160,305 |
SPS Commerce, Inc.(a)
Supply Chain Management Software Delivered via the Web | 322,646 | 22,549,729 |
VeriSign, Inc.(a)
Internet Domain Registry for .COM/.NET | 407,370 | 30,988,636 |
| Total | | 181,540,982 |
| IT Services 4.8% |
Booz Allen Hamilton Holdings Corp.
IT Consulting for US Government | 991,752 | 35,772,495 |
Broadridge Financial Solutions, Inc.
Proxy & Mutual Fund Interim Processing & Distribution & Trade Processing | 483,155 | 32,033,176 |
CoreLogic, Inc.(a)
Data Processing Services for Real Estate, Insurance & Mortgages | 753,281 | 27,743,339 |
ExlService Holdings, Inc.(a)
Business Process Outsourcing | 544,055 | 27,442,134 |
Gartner, Inc.(a)
IT Research & Consulting Services | 209,456 | 21,169,718 |
Global Payments, Inc.
Credit Card Processor | 277,070 | 19,231,429 |
Vantiv, Inc., Class A(a)
Credit Card Processor | 1,132,668 | 67,529,666 |
| Total | | 230,921,957 |
| Semiconductors & Semiconductor Equipment 0.7% |
MACOM Technology Solutions Holdings, Inc.(a)
Radio Frequency, Microwave & Millimeterwave Semiconductors | 396,265 | 18,339,144 |
Monolithic Power Systems, Inc.
High Performance Analog & Mixed Signal Integrated Circuits | 218,097 | 17,868,687 |
| Total | | 36,207,831 |
The accompanying Notes to Portfolio of Investments are an integral part of this statement.
| 46 | Columbia Acorn Family of Funds | Annual Report 2016 |
Portfolio of Investments (continued)
Columbia Acorn® Fund, December 31, 2016
| Common Stocks (continued) |
| Issuer | Shares | Value ($) |
| Software 4.1% |
ANSYS, Inc.(a)
Simulation Software for Engineers & Designers | 497,378 | 46,002,491 |
Cadence Design Systems, Inc.(a)
Electronic Design Automation Software | 888,973 | 22,419,899 |
Manhattan Associates, Inc.(a)
Supply Chain Management Software & Services | 557,613 | 29,570,218 |
Qualys, Inc.(a)
Security Software Delivered Via the Cloud | 785,208 | 24,851,833 |
Synopsys, Inc.(a)
Software for Designing Semiconductor Chips | 580,988 | 34,196,954 |
Ultimate Software Group, Inc. (The)(a)
Human Capital Management Systems | 229,549 | 41,858,260 |
| Total | | 198,899,655 |
| Total Information Technology | 718,675,969 |
| Materials 1.8% |
| Chemicals 1.8% |
Axalta Coating Systems Ltd.(a)
Global Manufacturer of High Performance Coatings | 728,164 | 19,806,061 |
Celanese Corp., Class A
Commodity & Specialty Chemicals Provider | 494,776 | 38,958,662 |
International Flavors & Fragrances, Inc.
Flavors & Fragrances | 238,514 | 28,104,105 |
| Total | | 86,868,828 |
| Total Materials | 86,868,828 |
| Real Estate 4.6% |
| Equity Real Estate Investment Trusts (REITS) 3.4% |
Education Realty Trust, Inc.
Student Housing | 1,963,102 | 83,039,215 |
Equity LifeStyle Properties, Inc.
Manufactured Home & RV Communities | 334,424 | 24,111,970 |
Federal Realty Investment Trust
Shopping Centers & Mixed Use Projects | 133,829 | 19,018,439 |
Lamar Advertising Co., Class A
Outdoor Advertising | 582,481 | 39,166,022 |
| Total | | 165,335,646 |
| Real Estate Management & Development 1.2% |
Jones Lang LaSalle, Inc.
Real Estate Services | 569,595 | 57,551,879 |
| Total Real Estate | 222,887,525 |
| Common Stocks (continued) |
| Issuer | Shares | Value ($) |
| Telecommunication Services 1.6% |
| Diversified Telecommunication Services 1.0% |
SBA Communications Corp., Class A(a)
Communications Towers | 287,988 | 29,737,641 |
Zayo Group Holdings, Inc.(a)
Fiber Optic Data Communications | 620,864 | 20,401,591 |
| Total | | 50,139,232 |
| Wireless Telecommunication Services 0.6% |
Boingo Wireless, Inc.(a),(c)
Wi-Fi & Cellular Communications Networks | 2,180,974 | 26,586,073 |
| Total Telecommunication Services | 76,725,305 |
Total Common Stocks
(Cost: $3,369,081,521) | 4,784,032,474 |
|
| Securities Lending Collateral 2.1% |
| | Shares | Value ($) |
Dreyfus Government Cash Management Fund, Institutional Shares, (7 day yield of 0.450%)(d)
| 101,389,775 | 101,389,775 |
Total Securities Lending Collateral
(Cost: $101,389,775) | 101,389,775 |
|
| Money Market Funds 0.4% |
| | |
| JPMorgan U.S. Government Money Market Fund, IM Shares (7 day yield of 0.445%) | 18,674,370 | 18,674,369 |
Total Money Market Funds
(Cost: $18,674,369) | 18,674,369 |
Total Investments
(Cost $3,489,145,665) | 4,904,096,618 |
| Obligation to Return Collateral for Securities Loaned | | (101,389,775) |
| Other Assets & Liabilities, Net | | 26,026,913 |
| Net Assets | $4,828,733,756 |
The accompanying Notes to Portfolio of Investments are an integral part of this statement.
Columbia Acorn Family of Funds | Annual Report 2016
| 47 |
Portfolio of Investments (continued)
Columbia Acorn® Fund, December 31, 2016
Notes to portfolio of investments
| (a) | Non-income producing security. |
| (b) | All or a portion of this security was on loan at December 31, 2016. The total market value of securities on loan at December 31, 2016 was $99,397,696. |
| (c) | An affiliated person of the Fund, as defined in the Investment Company Act of 1940, may include any company in which the Fund owns five percent or more of its outstanding voting shares. Holdings and transactions in these affiliated companies during the year ended December 31, 2016, are as follows. The aggregate cost and value of these companies at December 31, 2016, was $96,668,256 and $98,413,616, respectively. Investments in affiliated companies represented 2.04% of the Fund’s total net assets at December 31, 2016. |
| Issuer | Beginning
shares | Shares
purchased | Shares
sold | Ending
shares | Value ($) | Dividend —
affiliated issuers
($) | Realized
Gain (Loss) ($) |
| Bankrate, Inc. 1 | 7,126,562 | — | 7,126,562 | — | — | — | (31,270,348) |
| Boingo Wireless, Inc. | 2,727,319 | 647,886 | 1,194,231 | 2,180,974 | 26,586,073 | — | (2,096,916) |
| Celldex Therapeutics, Inc. | 2,428,687 | 7,211,337 | 3,620,434 | 6,019,590 | 21,309,349 | — | (36,557,425) |
| Endologix, Inc. | — | 4,661,700 | — | 4,661,700 | 26,664,924 | — | — |
| Fiesta Restaurant Group, Inc. 1 | 1,453,484 | 516,572 | 1,970,056 | — | — | — | (22,872,677) |
| Gaiam, Inc. 1 | 1,893,824 | — | 1,893,824 | — | — | — | (2,811,143) |
| Hackett Group, Inc. (The) 1 | 1,899,313 | — | 1,899,313 | — | — | — | 22,429,669 |
| Kirkland Lake Gold, Inc. 1 | 5,119,843 | — | 5,119,843 | — | — | — | (3,585,606) |
| ShaMaran Petroleum Corp. 1 | 90,046,000 | — | 90,046,000 | — | — | — | (16,605,419) |
| Nutanix, Inc., Class A | — | 910,900 | 12,810 | 898,090 | 23,853,270 | — | 156,452 |
| Quotient Technology, Inc. 1 | 4,634,954 | 2,754,119 | 4,118,347 | 3,270,726 | 35,160,305 | — | 694,899 |
| Vonage Holdings Corp. 1 | 13,576,409 | — | 13,576,409 | — | — | — | 9,289,144 |
| Total of Affiliated Transactions | 130,906,395 | 16,702,514 | 130,577,829 | 17,031,080 | 133,573,921 | — | (83,229,370) |
| 1 | At December 31, 2016, the Fund owned less than five percent of the company’s outstanding voting shares. |
| (d) | Investment made with cash collateral received from securities lending activity. |
Fair value measurements
Various inputs are used in determining the value of the Fund’s investments, following the input prioritization hierarchy established by accounting principles generally accepted in the United States of America (GAAP). These inputs are summarized in the three broad levels listed below:
| • | Level 1 – quoted prices in active markets for identical securities |
| • | Level 2 – prices determined using other significant observable inputs (including quoted prices for similar securities, interest rates, prepayment speeds, credit risk and others) |
| • | Level 3 – prices determined using significant unobservable inputs where quoted prices or observable inputs are unavailable or less reliable (including management’s own assumptions about the factors market participants would use in pricing an investment) |
The inputs or methodology used for valuing securities are not necessarily an indication of the risk associated with investing in those securities.
Examples of the types of securities in which the Fund would typically invest and how they are classified within this hierarchy are as follows. Typical Level 1 securities include exchange traded domestic equities, mutual funds whose net asset values are published each day and exchange traded foreign equities that are not statistically fair valued. Typical Level 2 securities include exchange traded foreign equities that are statistically fair valued, forward foreign currency exchange contracts and short-term investments valued at amortized cost. Additionally, securities fair valued by Columbia Wanger Asset Management’s Valuation Committee (the Committee) that rely on significant observable inputs are also included in Level 2. Typical Level 3 securities include any security fair valued by the Committee that relies on significant unobservable inputs.
The Committee is responsible for applying Columbia Acorn Trust Portfolio Pricing Policy and the Columbia Wanger Asset Management pricing procedures (the Policies), which are approved by and subject to the oversight of the Board of Trustees.
The Committee meets as necessary, and no less frequently than quarterly, to determine fair values for securities for which market quotations are not readily available or for which Columbia Wanger Asset Management believes that available market quotations are unreliable. The Committee also reviews the continuing appropriateness of the Policies. In circumstances where a security has been fair valued, the Committee will also review the continuing appropriateness of the current value of the security. The Policies address, among other things: circumstances under which market quotations will be deemed readily available; selection of third party pricing vendors; appropriate pricing methodologies; events that require fair valuation and fair value techniques; circumstances under which securities will be deemed to pose a potential for stale pricing, including when securities are illiquid, restricted, or in default; and certain delegations of authority to determine fair values to the Fund’s investment manager. The Committee may also meet to discuss additional valuation matters, which may include review of back-testing results, review of time-sensitive information or approval of other valuation related actions, and to review the appropriateness of the Policies.
For investments categorized as Level 3, the significant unobservable inputs used in the fair value measurement of the Fund’s securities may include: (i) data specific to the issuer or comparable issuers, (ii) general market or specific sector news and (iii) quoted prices and specific or similar security transactions. The Committee considers this data and any changes from prior periods in order to assess the reasonableness of observable and unobservable inputs, any assumptions or internal models used to value those securities and changes in fair value. Significant changes in any of these factors could result in lower or higher fair value measurements. Various factors impact the frequency of monitoring (which may occur as often as daily), however the Committee may determine that changes to inputs, assumptions and models are not required with the same frequency.
The accompanying Notes to Portfolio of Investments are an integral part of this statement.
| 48 | Columbia Acorn Family of Funds | Annual Report 2016 |
Portfolio of Investments (continued)
Columbia Acorn® Fund, December 31, 2016
Fair value measurements (continued)
The following table is a summary of the inputs used to value the Fund’s investments at December 31, 2016:
| | Level 1
quoted prices in active
markets for identical
assets ($) | Level 2
other significant
observable inputs ($) | Level 3
significant
unobservable inputs ($) | Total ($) |
| Investments | | | | |
| Common Stocks | | | | |
| Consumer Discretionary | 697,199,823 | — | — | 697,199,823 |
| Consumer Staples | 93,203,488 | — | — | 93,203,488 |
| Energy | 176,417,564 | — | — | 176,417,564 |
| Financials | 819,409,371 | — | — | 819,409,371 |
| Health Care | 958,042,280 | — | — | 958,042,280 |
| Industrials | 934,602,321 | — | — | 934,602,321 |
| Information Technology | 718,675,969 | — | — | 718,675,969 |
| Materials | 86,868,828 | — | — | 86,868,828 |
| Real Estate | 222,887,525 | — | — | 222,887,525 |
| Telecommunication Services | 76,725,305 | — | — | 76,725,305 |
| Total Common Stocks | 4,784,032,474 | — | — | 4,784,032,474 |
| Securities Lending Collateral | 101,389,775 | — | — | 101,389,775 |
| Money Market Funds | 18,674,369 | — | — | 18,674,369 |
| Total Investments | 4,904,096,618 | — | — | 4,904,096,618 |
There were no transfers of financial assets between levels during the period.
The accompanying Notes to Portfolio of Investments are an integral part of this statement.
Columbia Acorn Family of Funds | Annual Report 2016
| 49 |
Portfolio of Investments
Columbia Acorn International®, December 31, 2016
(Percentages represent value of investments compared to net assets)
| Common Stocks 98.4% |
| Issuer | Shares | Value ($) |
| Australia 2.3% |
Amcor Ltd.
Flexible & Rigid Packaging | 2,475,208 | 26,640,219 |
Domino’s Pizza Enterprises Ltd.
Domino’s Pizza Operator in Australia & New Zealand | 1,565,257 | 73,196,564 |
Sirtex Medical Ltd.
Selective Internal Radiation Therapy Biotech Company | 891,207 | 9,084,143 |
| Total | 108,920,926 |
| Cambodia 0.2% |
NagaCorp Ltd.
Casino & Entertainment Complex in Cambodia | 19,028,000 | 10,967,291 |
| Canada 7.7% |
Boardwalk Real Estate Investment Trust(a)
Canadian Residential REIT | 1,053,355 | 38,167,594 |
CAE, Inc.
Flight Simulator Equipment & Training Centers | 2,241,934 | 31,358,523 |
CCL Industries, Inc.
Global Label Converter | 569,444 | 111,882,715 |
PrairieSky Royalty Ltd.(a)
Canadian Owner of Oil & Gas Mineral Interests | 1,929,380 | 45,897,588 |
ShawCor Ltd.
Oil & Gas Pipeline Products | 1,157,567 | 30,899,491 |
Tahoe Resources, Inc.
Silver & Gold Projects in Guatemala, Canada & Peru | 3,151,582 | 29,693,153 |
Uni-Select, Inc.
Distribution of Automotive Paint & Replacement Parts in North America | 1,131,748 | 24,857,743 |
Vermilion Energy, Inc.
Canadian Exploration & Production Company | 1,119,195 | 47,088,464 |
| Total | 359,845,271 |
| China 1.8% |
China Medical System Holdings Ltd.
Pharmaceutical & Medical Products | 18,726,000 | 29,564,301 |
Shenzhou International Group Holdings Ltd.
High-quality Apparel Manufacturer of Sportswear | 3,018,000 | 19,027,516 |
TravelSky Technology Ltd., Class H
Chinese Air Travel Transaction Processor | 16,203,000 | 33,957,955 |
Vipshop Holdings Ltd., ADR(b)
Internet Discount Retailer | 78,527 | 864,582 |
| Total | 83,414,354 |
| Common Stocks (continued) |
| Issuer | Shares | Value ($) |
| Denmark 3.2% |
Novozymes AS, Class B
Industrial Enzymes | 1,453,477 | 50,112,800 |
SimCorp AS
Software for Investment Managers | 932,367 | 45,440,102 |
William Demant Holding AS(b)
Manufacture & Distribution of Hearing Aids & Diagnostic Equipment | 2,966,887 | 51,587,076 |
| Total | 147,139,978 |
| Finland 0.7% |
Konecranes OYJ
Manufacture & Service of Industrial Cranes & Port Handling Equipment | 881,236 | 31,335,458 |
| France 2.9% |
Elior Group(c)
Contract Caterer & Travel Concessionary | 1,920,770 | 43,915,654 |
Eurofins Scientific SE
Food, Pharmaceuticals & Materials Screening & Testing | 76,908 | 32,787,681 |
Legrand SA
Electrical Components | 996,387 | 56,585,306 |
| Total | 133,288,641 |
| Germany 6.3% |
Fielmann AG
Retail Optician Chain | 621,901 | 41,040,688 |
MTU Aero Engines AG
Airplane Engine Components & Services | 551,920 | 63,663,898 |
Rational AG
Commercial Ovens | 58,610 | 26,139,621 |
Stroeer SE & Co. KGaA(a)
Out of Home & Online Advertising | 884,049 | 38,749,688 |
Wirecard AG(a)
Online Payment Processing & Risk Management | 1,968,514 | 84,464,042 |
Zalando SE(b)
Online Platform for Apparel Sales | 986,618 | 37,584,475 |
| Total | 291,642,412 |
| Hong Kong 1.4% |
Samsonite International SA
Mass Market Luggage & Travel Accessories | 12,545,600 | 35,712,039 |
Value Partners Group Ltd.
Mutual Fund Management | 37,198,000 | 29,384,688 |
| Total | 65,096,727 |
The accompanying Notes to Portfolio of Investments are an integral part of this statement.
| 50 | Columbia Acorn Family of Funds | Annual Report 2016 |
Portfolio of Investments (continued)
Columbia Acorn International®, December 31, 2016
| Common Stocks (continued) |
| Issuer | Shares | Value ($) |
| India 2.3% |
TVS Motor Co., Ltd.
Indian Maker of Scooters, Mopeds, Motorcycles & Three-wheelers | 6,268,373 | 33,192,998 |
United Breweries Ltd.
Indian Brewer | 450,000 | 5,160,170 |
Zee Entertainment Enterprises Ltd.
Indian Programmer of Pay Television Content | 10,025,681 | 66,733,383 |
| Total | 105,086,551 |
| Indonesia 0.7% |
PT Matahari Department Store Tbk
Department Store Chain in Indonesia | 30,377,500 | 34,002,861 |
| Italy 1.3% |
Brembo SpA
High Performance Auto Braking Systems Supplier | 1,024,269 | 61,996,338 |
| Japan 23.3% |
Aeon Credit Service Co., Ltd.
Diversified Consumer-related Finance Company in Japan | 2,197,900 | 38,929,506 |
Aeon Mall Co., Ltd.
Suburban Shopping Mall Developer, Owner & Operator | 4,309,000 | 60,553,580 |
Aica Kogyo Co., Ltd.
Laminated Sheets, Building Materials & Chemical Adhesives | 1,169,100 | 30,776,644 |
Asahi Intecc Co., Ltd.
Medical Guidewires for Surgery | 845,200 | 34,162,708 |
ASKUL Corp.(a)
Online & Mail Order Distribution to Businesses and Consumers | 663,500 | 22,649,453 |
Bandai Namco Holdings, Inc.
Branded Toys & Related Content | 854,800 | 23,528,334 |
CyberAgent, Inc.
Mobile Advertising, Gaming & Media | 1,269,000 | 31,244,929 |
DIP Corp.
Mobile Temporary Job Information Provider | 1,752,000 | 36,101,785 |
Disco Corp.
Semiconductor Dicing & Grinding Equipment | 370,900 | 44,842,215 |
FamilyMart UNY Holdings Co., Ltd.
Convenience Store Operator | 936,500 | 62,314,740 |
Glory Ltd.
Currency Handling Systems & Related Equipment | 1,172,300 | 36,941,903 |
Hikari Tsushin, Inc.
Office IT/Mobiles/Insurance Distribution | 577,700 | 53,777,007 |
| Common Stocks (continued) |
| Issuer | Shares | Value ($) |
Hoshizaki Corp.
Commercial Kitchen Equipment | 324,800 | 25,714,145 |
Japan Airport Terminal Co., Ltd.(a)
Airport Terminal Operator at Haneda | 554,300 | 20,029,106 |
Makita Corp.
Power Tools | 346,800 | 23,172,794 |
MonotaRO Co., Ltd(a)
Online Maintenance, Repair & Operations Goods Distributor in Japan | 1,126,400 | 22,968,915 |
NGK Insulators Ltd.
Ceramic Products for Auto, Power & Electronics | 2,150,000 | 41,617,260 |
NGK Spark Plug Co., Ltd.
Automobile Parts | 1,587,400 | 35,184,326 |
NOF Corp.
Specialty Chemicals, Life Science & Rocket Fuels | 3,467,000 | 33,258,487 |
Obic Co., Ltd.
Computer Software | 495,300 | 21,602,979 |
Omron Corp.
Electric Components for Factory Automation | 600,000 | 22,928,978 |
OSG Corp.(a)
Consumable Cutting Tools | 1,128,300 | 22,154,134 |
Otsuka Corp.
One-stop IT Services & Office Supplies Provider | 583,500 | 27,216,929 |
Recruit Holdings Co., Ltd.
Recruitment & Media Services | 754,300 | 30,229,619 |
Santen Pharmaceutical Co., Ltd.
Specialty Pharma (Ophthalmic Medicine) | 2,927,300 | 35,716,925 |
Sekisui Chemical Co., Ltd.
Housing, Infrastructure & Functional Plastics | 3,147,500 | 50,103,612 |
Seria Co., Ltd.
100 Yen Discount Stores | 189,100 | 12,844,038 |
Seven Bank Ltd.
ATM Processing Services | 11,500,000 | 32,882,817 |
Sohgo Security Services Co., Ltd.
Home & Office Security Services in Japan | 830,400 | 31,873,844 |
Sony Financial Holdings, Inc.
Life Insurance, Assurance & Internet Banking | 2,200,000 | 34,294,551 |
Suruga Bank Ltd.
Regional Bank | 1,072,900 | 23,955,174 |
Temp Holdings Co., Ltd.
Temporary Staffing & Recruiting Agency Services in Japan | 1,784,300 | 27,593,708 |
Ushio, Inc.
Industrial Light Sources | 2,613,100 | 33,235,285 |
| Total | 1,084,400,430 |
The accompanying Notes to Portfolio of Investments are an integral part of this statement.
Columbia Acorn Family of Funds | Annual Report 2016
| 51 |
Portfolio of Investments (continued)
Columbia Acorn International®, December 31, 2016
| Common Stocks (continued) |
| Issuer | Shares | Value ($) |
| Malta 1.5% |
Kindred Group PLC
European Online Gaming Operator | 7,374,685 | 69,249,479 |
| Mexico 1.2% |
Grupo Aeroportuario del Sureste SAB de CV, ADR
Mexican Airport Operator | 384,900 | 55,383,261 |
| Netherlands 2.3% |
Aalberts Industries NV
Flow Control & Heat Treatment | 2,044,797 | 66,338,707 |
Gemalto NV
Digital Security Solutions | 717,797 | 41,496,965 |
| Total | 107,835,672 |
| New Zealand 0.7% |
Auckland International Airport Ltd.
Auckland Airport Operator | 7,017,369 | 30,437,837 |
| Philippines 0.5% |
Universal Robina Corp.
Branded Consumer Food Manufacturer in the Philippines | 6,840,000 | 22,467,369 |
| Singapore 1.3% |
Mapletree Commercial Trust
Retail & Office Property Landlord | 24,421,300 | 23,524,990 |
Singapore Exchange
Singapore Equity & Derivatives Market Operator | 7,714,200 | 38,040,336 |
| Total | 61,565,326 |
| South Africa 1.2% |
Coronation Fund Managers Ltd.
South African Fund Manager | 5,340,119 | 27,314,984 |
Rand Merchant Investment Holdings Ltd.
Directly Sold Property & Casualty Insurance; Holdings in Other Insurers | 10,612,584 | 30,633,349 |
| Total | 57,948,333 |
| South Korea 2.6% |
KEPCO Plant Service & Engineering Co., Ltd.
Power Plant & Grid Maintenance | 763,018 | 34,191,244 |
Korea Investment Holdings Co., Ltd.
Brokerage & Asset Management | 1,071,000 | 37,115,399 |
Medy-Tox, Inc.
Botulinum Toxin ("Botox") & Dermal Fillers | 96,199 | 28,310,825 |
Yuhan Corp.
Pharmaceutical Manufacturing & Distribution | 141,799 | 23,398,293 |
| Total | 123,015,761 |
| Common Stocks (continued) |
| Issuer | Shares | Value ($) |
| Spain 3.1% |
Bolsas y Mercados Españoles SHMSF SA
Spanish Stock Markets | 948,207 | 27,942,663 |
Distribuidora Internacional de Alimentacion SA
Discount Retailer in Spain & Latin America | 4,972,329 | 24,417,189 |
Prosegur Cia de Seguridad SA, Registered Shares
Security Guards | 10,061,099 | 62,909,471 |
Viscofan SA
Sausage Casings Maker | 609,424 | 30,054,764 |
| Total | 145,324,087 |
| Sweden 4.3% |
Hexagon AB, Class B
Design, Measurement & Visualization Software & Equipment | 2,636,121 | 94,182,314 |
Millicom International Cellular SA, SDR
Telecoms Operator in Latin America & Africa | 826,173 | 35,302,741 |
Sweco AB, Class B
Engineering Consultants | 1,312,822 | 25,966,514 |
Trelleborg AB, Class B
Manufacturer of Sealing, Dampening & Protective Solutions for Industry | 2,296,587 | 45,197,687 |
| Total | 200,649,256 |
| Switzerland 4.7% |
Actelion Ltd., Registered Shares
Swiss Orphan Drug Company | 98,965 | 21,429,620 |
Geberit AG
Plumbing Systems | 132,852 | 53,255,609 |
Givaudan SA
Fragrances & Flavors | 27,631 | 50,632,865 |
Partners Group Holding AG(a)
Private Markets Asset Management | 199,766 | 93,624,986 |
| Total | 218,943,080 |
| Taiwan 3.4% |
Advantech Co., Ltd.
Industrial PC & Components | 2,922,686 | 23,046,818 |
Far EasTone Telecommunications Co., Ltd.
Mobile Operator in Taiwan | 10,143,000 | 22,801,917 |
Largan Precision Co., Ltd.
Mobile Device Camera Lenses & Modules | 405,000 | 47,207,368 |
PChome Online, Inc.
Taiwanese E-commerce Company | 2,319,844 | 20,305,278 |
Silergy Corp.
Chinese Provider of Analog & Mixed Digital Integrated Circuits | 1,496,000 | 20,956,368 |
The accompanying Notes to Portfolio of Investments are an integral part of this statement.
| 52 | Columbia Acorn Family of Funds | Annual Report 2016 |
Portfolio of Investments (continued)
Columbia Acorn International®, December 31, 2016
| Common Stocks (continued) |
| Issuer | Shares | Value ($) |
St. Shine Optical Co., Ltd.
Disposable Contact Lens Original Equipment Manufacturer | 388,000 | 7,406,682 |
Vanguard International Semiconductor Corp.
Semiconductor Foundry | 9,170,352 | 15,890,166 |
| Total | 157,614,597 |
| Thailand 1.1% |
Airports of Thailand PCL
Airport Operator of Thailand | 2,520,200 | 27,986,094 |
Home Product Center PCL, Foreign Registered Shares
Home Improvement Retailer | 82,081,700 | 23,327,798 |
| Total | 51,313,892 |
| United Kingdom 15.8% |
Abcam PLC
Online Sales of Antibodies | 5,818,756 | 54,935,510 |
Croda International PLC
Oleo-chemicals & Industrial Chemicals | 1,031,317 | 40,561,242 |
Domino’s Pizza Group PLC
Pizza Delivery in the UK, Ireland & Switzerland | 7,209,146 | 31,992,110 |
DS Smith PLC
Packaging | 5,663,564 | 28,440,099 |
Halma PLC
Health & Safety Sensor Technology | 5,582,860 | 61,765,872 |
Kingfisher PLC
European DIY Retailer | 9,537,000 | 41,089,099 |
LivaNova PLC(b)
Neuromodulation & Cardiac Devices | 929,961 | 41,820,346 |
Micro Focus International PLC
Legacy Software Provider | 1,019,000 | 27,366,316 |
Next PLC
Clothes & Home Retailer in the UK | 623,800 | 38,267,420 |
Ocado Group PLC(a),(b)
Online Grocery Retailer | 9,295,866 | 30,255,886 |
PureCircle Ltd.(b)
Natural Sweeteners | 641,557 | 1,976,637 |
Rentokil Initial PLC
Pest Control, Washroom & Workwear Service Provider | 20,513,830 | 56,121,344 |
Rightmove PLC
Internet Real Estate Listings | 1,685,065 | 80,944,461 |
| Common Stocks (continued) |
| Issuer | Shares | Value ($) |
Shaftesbury PLC
London Prime Retail REIT | 4,740,158 | 53,069,388 |
Smith & Nephew PLC
Medical Equipment & Supplies | 2,848,399 | 42,752,242 |
Spirax-Sarco Engineering PLC
Steam Systems & Pumps for Manufacturing & Process Industries | 588,262 | 30,274,559 |
WH Smith PLC
Newsprint, Books & General Stationery Retailer | 2,401,564 | 46,015,914 |
Wolseley PLC
Distributor of Plumbing, HVAC & Waterworks Equipment | 423,000 | 25,822,531 |
| Total | 733,470,976 |
| United States 0.6% |
Ultragenyx Pharmaceutical, Inc.(b)
Biotech Focused on "Ultra-Orphan" Drugs | 376,087 | 26,442,677 |
Total Common Stocks
(Cost: $3,715,473,324) | 4,578,798,841 |
|
| Securities Lending Collateral 3.7% |
| | Shares | Value ($) |
Dreyfus Government Cash Management Fund, Institutional Shares, (7 day yield of 0.450%)(d)
| 169,508,371 | 169,508,371 |
Total Securities Lending Collateral
(Cost: $169,508,371) | 169,508,371 |
|
| Money Market Funds 1.4% |
| | |
JPMorgan U.S. Government Money Market Fund, IM Shares (7 day yield of 0.445%)
| 66,479,974 | 66,479,974 |
Total Money Market Funds
(Cost: $66,479,974) | 66,479,974 |
Total Investments
(Cost: $3,951,461,669) | 4,814,787,186 (e) |
| Obligation to Return Collateral for Securities Loaned | | (169,508,371) |
| Other Assets & Liabilities, Net | | 7,659,351 |
| Net Assets | $4,652,938,166 |
The accompanying Notes to Portfolio of Investments are an integral part of this statement.
Columbia Acorn Family of Funds | Annual Report 2016
| 53 |
Portfolio of Investments (continued)
Columbia Acorn International®, December 31, 2016
Notes to portfolio of investments
| (a) | All or a portion of this security was on loan at December 31, 2016. The total market value of securities on loan at December 31, 2016 was $162,723,470. |
| (b) | Non-income producing security. |
| (c) | Represents privately placed and other securities and instruments exempt from SEC registration (collectively, private placements), such as Section 4(a)(2) and Rule 144A eligible securities, which are often sold only to qualified institutional buyers. The Fund may invest in private placements determined to be liquid as well as those determined to be illiquid. Private placements may be determined to be liquid under guidelines established by the Fund’s Board of Trustees. At December 31, 2016, the value of these securities amounted to $43,915,654 or 0.94% of net assets. |
| (d) | Investment made with cash collateral received from securities lending activity. |
| (e) | An affiliated person of the Fund, as defined in the Investment Company Act of 1940, may include any company in which the Fund owns five percent or more of its outstanding voting shares. Holdings and transactions in these affiliated companies during the year ended December 31, 2016, are as follows. At December 31, 2016, the Fund did not hold any investments in affiliated companies. |
| Issuer | Beginning
shares | Shares
purchased | Shares
sold | Ending
shares | Value ($) | Dividend —
affiliated issuers
($) | Realized
Gain (Loss) ($) |
| Spotless Group Holdings Ltd. 1 | 63,000,000 | — | (63,000,000) | — | — | 1,686,164 | (40,493,220) |
| 1 | At December 31, 2016, the Fund owned less than five percent of the company’s outstanding voting shares. |
Abbreviation Legend
| ADR | American Depositary Receipt |
| SDR | Swedish Depositary Receipt |
Fair value measurements
Various inputs are used in determining the value of the Fund’s investments, following the input prioritization hierarchy established by accounting principles generally accepted in the United States of America (GAAP). These inputs are summarized in the three broad levels listed below:
| • | Level 1 – quoted prices in active markets for identical securities |
| • | Level 2 – prices determined using other significant observable inputs (including quoted prices for similar securities, interest rates, prepayment speeds, credit risk and others) |
| • | Level 3 – prices determined using significant unobservable inputs where quoted prices or observable inputs are unavailable or less reliable (including management’s own assumptions about the factors market participants would use in pricing an investment) |
The inputs or methodology used for valuing securities are not necessarily an indication of the risk associated with investing in those securities.
Examples of the types of securities in which the Fund would typically invest and how they are classified within this hierarchy are as follows. Typical Level 1 securities include exchange traded domestic equities, mutual funds whose net asset values are published each day and exchange traded foreign equities that are not statistically fair valued. Typical Level 2 securities include exchange traded foreign equities that are statistically fair valued, forward foreign currency exchange contracts and short-term investments valued at amortized cost. Additionally, securities fair valued by Columbia Wanger Asset Management’s Valuation Committee (the Committee) that rely on significant observable inputs are also included in Level 2. Typical Level 3 securities include any security fair valued by the Committee that relies on significant unobservable inputs.
The Committee is responsible for applying Columbia Acorn Trust Portfolio Pricing Policy and the Columbia Wanger Asset Management pricing procedures (the Policies), which are approved by and subject to the oversight of the Board of Trustees.
The Committee meets as necessary, and no less frequently than quarterly, to determine fair values for securities for which market quotations are not readily available or for which Columbia Wanger Asset Mangement believes that available market quotations are unreliable. The Committee also reviews the continuing appropriateness of the Policies. In circumstances where a security has been fair valued, the Committee will also review the continuing appropriateness of the current value of the security. The Policies address, among other things: circumstances under which market quotations will be deemed readily available; selection of third party pricing vendors; appropriate pricing methodologies; events that require fair valuation and fair value techniques; circumstances under which securities will be deemed to pose a potential for stale pricing, including when securities are illiquid, restricted, or in default; and certain delegations of authority to determine fair values to the Fund’s investment manager. The Committee may also meet to discuss additional valuation matters, which may include review of back-testing results, review of time-sensitive information or approval of other valuation related actions, and to review the appropriateness of the Policies.
For investments categorized as Level 3, the significant unobservable inputs used in the fair value measurement of the Fund’s securities may include: (i) data specific to the issuer or comparable issuers, (ii) general market or specific sector news and (iii) quoted prices and specific or similar security transactions. The Committee considers this data and any changes from prior periods in order to assess the reasonableness of observable and unobservable inputs, any assumptions or internal models used to value those securities and changes in fair value. Significant changes in any of these factors could result in lower or higher fair value measurements. Various factors impact the frequency of monitoring (which may occur as often as daily), however the Committee may determine that changes to inputs, assumptions and models are not required with the same frequency.
The following table is a summary of the inputs used to value the Fund’s investments at December 31, 2016:
The accompanying Notes to Portfolio of Investments are an integral part of this statement.
| 54 | Columbia Acorn Family of Funds | Annual Report 2016 |
Portfolio of Investments (continued)
Columbia Acorn International®, December 31, 2016
Fair value measurements (continued)
| | Level 1
quoted prices in active
markets for identical
assets ($) | Level 2
other significant
observable inputs ($) | Level 3
significant
unobservable inputs ($) | Total ($) |
| Investments | | | | |
| Common Stocks | | | | |
| Australia | — | 108,920,926 | — | 108,920,926 |
| Cambodia | — | 10,967,291 | — | 10,967,291 |
| Canada | 359,845,271 | — | — | 359,845,271 |
| China | 864,582 | 82,549,772 | — | 83,414,354 |
| Denmark | — | 147,139,978 | — | 147,139,978 |
| Finland | — | 31,335,458 | — | 31,335,458 |
| France | — | 133,288,641 | — | 133,288,641 |
| Germany | — | 291,642,412 | — | 291,642,412 |
| Hong Kong | — | 65,096,727 | — | 65,096,727 |
| India | — | 105,086,551 | — | 105,086,551 |
| Indonesia | — | 34,002,861 | — | 34,002,861 |
| Italy | — | 61,996,338 | — | 61,996,338 |
| Japan | — | 1,084,400,430 | — | 1,084,400,430 |
| Malta | — | 69,249,479 | — | 69,249,479 |
| Mexico | 55,383,261 | — | — | 55,383,261 |
| Netherlands | — | 107,835,672 | — | 107,835,672 |
| New Zealand | — | 30,437,837 | — | 30,437,837 |
| Philippines | — | 22,467,369 | — | 22,467,369 |
| Singapore | — | 61,565,326 | — | 61,565,326 |
| South Africa | — | 57,948,333 | — | 57,948,333 |
| South Korea | — | 123,015,761 | — | 123,015,761 |
| Spain | — | 145,324,087 | — | 145,324,087 |
| Sweden | — | 200,649,256 | — | 200,649,256 |
| Switzerland | — | 218,943,080 | — | 218,943,080 |
| Taiwan | — | 157,614,597 | — | 157,614,597 |
| Thailand | — | 51,313,892 | — | 51,313,892 |
| United Kingdom | 41,820,346 | 691,650,630 | — | 733,470,976 |
| United States | 26,442,677 | — | — | 26,442,677 |
| Total Common Stocks | 484,356,137 | 4,094,442,704 | — | 4,578,798,841 |
| Securities Lending Collateral | 169,508,371 | — | — | 169,508,371 |
| Money Market Funds | 66,479,974 | — | — | 66,479,974 |
| Total Investments | 720,344,482 | 4,094,442,704 | — | 4,814,787,186 |
The Fund’s assets assigned to the Level 2 input category are generally valued using a market approach, in which a security’s value is determined through its correlation to prices and information from observable market transactions for similar or identical assets. Foreign equities are generally valued at the last sale price on the foreign exchange or market on which they trade. The Fund may use a statistical fair valuation model, in accordance with the policy adopted by the Board, provided by an independent third party to value securities principally traded in foreign markets in order to adjust for possible stale pricing that may occur between the close of the foreign exchanges and the time for valuation. These models take into account available market data including intraday index, ADR, and ETF movements.
There were no transfers of financial assets between levels during the period.
The accompanying Notes to Portfolio of Investments are an integral part of this statement.
Columbia Acorn Family of Funds | Annual Report 2016
| 55 |
Portfolio of Investments
Columbia Acorn USA®, December 31, 2016
(Percentages represent value of investments compared to net assets)
| Common Stocks 99.4% |
| Issuer | Shares | Value ($) |
| Consumer Discretionary 19.4% |
| Auto Components 4.9% |
Dorman Products, Inc.(a)
Aftermarket Auto Parts Distributor | 167,670 | 12,249,970 |
Gentex Corp.
Manufacturer of Auto Parts | 279,199 | 5,497,428 |
LCI Industries
RV & Manufactured Home Components | 127,130 | 13,698,258 |
| Total | | 31,445,656 |
| Distributors 0.9% |
Pool Corp.
Swimming Pool Supplies & Equipment Distributor | 56,906 | 5,937,572 |
| Diversified Consumer Services 1.7% |
Bright Horizons Family Solutions, Inc.(a)
Child Care/Preschool Services | 101,892 | 7,134,478 |
ServiceMaster Global Holdings, Inc.(a)
Pest & Termite Control, Home Warranty & Other Home Services | 96,785 | 3,645,891 |
| Total | | 10,780,369 |
| Hotels, Restaurants & Leisure 4.4% |
Papa John’s International, Inc.
Franchisor of Pizza Restaurants | 135,776 | 11,619,710 |
Texas Roadhouse, Inc.
Rural-focused Full Service Steakhouse | 200,365 | 9,665,608 |
Vail Resorts, Inc.
Ski Resort Operator & Developer | 20,550 | 3,314,920 |
Zoe’s Kitchen, Inc.(a),(b)
Fast, Casual Mediterranean Food | 163,866 | 3,931,145 |
| Total | | 28,531,383 |
| Household Durables 2.6% |
Cavco Industries, Inc.(a)
Manufactured Homes | 87,073 | 8,694,239 |
iRobot Corp.(a)
Home Robots (Vacuums, Pool Cleaners) & Battlefield Reconnaissance Robots | 139,940 | 8,179,493 |
| Total | | 16,873,732 |
| Leisure Products 1.6% |
Brunswick Corp.
Boats, Boat Engines, Exercise & Bowling Equipment | 184,849 | 10,081,664 |
| Common Stocks (continued) |
| Issuer | Shares | Value ($) |
| Specialty Retail 3.3% |
Camping World Holdings, Inc., Class A
RV-centric Retail Stores & Services | 405,611 | 13,218,863 |
Five Below, Inc.(a)
Low-price Specialty Retailer Targeting Pre-Teens, Teens & Parents | 106,217 | 4,244,431 |
Monro Muffler Brake, Inc.
Automotive Services | 61,769 | 3,533,187 |
| Total | | 20,996,481 |
| Total Consumer Discretionary | 124,646,857 |
| Consumer Staples 1.4% |
| Household Products 1.4% |
WD-40 Co.
Manufacturer of Industrial Lubrications | 76,187 | 8,906,260 |
| Total Consumer Staples | 8,906,260 |
| Energy 2.5% |
| Energy Equipment & Services 1.3% |
Core Laboratories NV(b)
Oil & Gas Reservoir Consulting | 41,938 | 5,034,237 |
Frank’s International NV(b)
Global Provider of Casing Running Services Post Drilling of Wells | 281,825 | 3,469,266 |
| Total | | 8,503,503 |
| Oil, Gas & Consumable Fuels 1.2% |
Carrizo Oil & Gas, Inc.(a)
Oil & Gas Producer | 94,006 | 3,511,124 |
PDC Energy, Inc.(a)
Oil & Gas Producer in the United States | 53,180 | 3,859,805 |
| Total | | 7,370,929 |
| Total Energy | 15,874,432 |
| Financials 15.2% |
| Banks 11.9% |
Associated Banc-Corp.
Midwest Bank | 322,978 | 7,977,557 |
First Busey Corp.
Illinois Bank | 326,877 | 10,061,274 |
Great Southern Bancorp, Inc.
Heartland Bank | 91,153 | 4,981,512 |
Lakeland Financial Corp.
Indiana Bank | 243,727 | 11,542,911 |
LegacyTexas Financial Group, Inc.
Texas Thrift | 289,987 | 12,486,840 |
The accompanying Notes to Portfolio of Investments are an integral part of this statement.
| 56 | Columbia Acorn Family of Funds | Annual Report 2016 |
Portfolio of Investments (continued)
Columbia Acorn USA®, December 31, 2016
| Common Stocks (continued) |
| Issuer | Shares | Value ($) |
MB Financial, Inc.
Chicago Bank | 195,273 | 9,222,744 |
Sandy Spring Bancorp, Inc.
Baltimore & Washington, D.C. Bank | 170,479 | 6,817,455 |
SVB Financial Group(a)
Bank to Venture Capitalists | 55,532 | 9,532,623 |
Trico Bancshares
California Central Valley Bank | 118,819 | 4,061,233 |
| Total | | 76,684,149 |
| Capital Markets 2.8% |
MarketAxess Holdings, Inc.
Bond Exchange | 20,869 | 3,066,074 |
OM Asset Management PLC
Asset Manager Holding Company | 658,408 | 9,546,916 |
SEI Investments Co.
Mutual Fund Administration & Investment Management | 106,295 | 5,246,721 |
| Total | | 17,859,711 |
| Insurance 0.5% |
Allied World Assurance Co. Holdings AG
Commercial Lines Insurance/Reinsurance | 59,498 | 3,195,637 |
| Total Financials | 97,739,497 |
| Health Care 24.9% |
| Biotechnology 4.6% |
Agios Pharmaceuticals, Inc.(a)
Biotech Focused on Cancer & Orphan Diseases | 92,390 | 3,855,435 |
Clovis Oncology, Inc.(a),(b)
Pre-commercial Biotech Company | 80,253 | 3,564,838 |
Exact Sciences Corp.(a),(b)
Molecular Diagnostics | 364,785 | 4,873,528 |
Genomic Health, Inc.(a)
Cancer Diagnostics | 145,693 | 4,281,917 |
Ligand Pharmaceuticals, Inc.(a)
Royalties from Licensing Drug Delivery Technology | 37,292 | 3,789,240 |
Repligen Corp.(a)
Supplier to Biopharma Industry | 123,924 | 3,819,338 |
Seattle Genetics, Inc.(a)
Antibody-based Therapies for Cancer | 52,515 | 2,771,216 |
Ultragenyx Pharmaceutical, Inc.(a)
Biotech Focused on "Ultra-Orphan" Drugs | 44,716 | 3,143,982 |
| Total | | 30,099,494 |
| Common Stocks (continued) |
| Issuer | Shares | Value ($) |
| Health Care Equipment & Supplies 7.7% |
ABIOMED, Inc.(a)
Medical Devices for Cardiac Conditions | 28,538 | 3,215,662 |
Endologix, Inc.(a)
Minimally Invasive Treatment of Abdominal Aortic Aneurysm | 644,233 | 3,685,013 |
iRhythm Technologies, Inc.(a)
Cardiac Arrhythmia Monitoring Devices & Services | 233,921 | 7,017,630 |
LeMaitre Vascular, Inc.
Medical Devices for Peripheral Vascular Disease | 387,057 | 9,808,024 |
Masimo Corp.(a)
Pulse Oximetry Monitors (Blood Oxygen Levels) | 100,954 | 6,804,300 |
Natus Medical, Inc.(a)
Neuro-diagnostic & Newborn Care Products | 249,801 | 8,693,075 |
West Pharmaceutical Services, Inc.
Components & Systems for Injectable Drug Delivery | 67,159 | 5,697,098 |
Zeltiq Aesthetics, Inc.(a)
Systems & Consumables for Aesthetics | 105,124 | 4,574,996 |
| Total | | 49,495,798 |
| Health Care Providers & Services 6.8% |
AMN Healthcare Services, Inc.(a)
Temporary Healthcare Staffing | 299,242 | 11,505,855 |
HealthSouth Corp.
Inpatient Rehabilitation Facilities & Home Health Care | 189,584 | 7,818,444 |
Mednax, Inc.(a)
Physician Management for Pediatric & Anesthesia Practices | 149,012 | 9,933,140 |
Team Health Holdings, Inc.(a)
Healthcare Professionals Outsourcing | 159,360 | 6,924,192 |
VCA, Inc.(a)
Animal Hospitals & Laboratory Services | 109,281 | 7,502,141 |
| Total | | 43,683,772 |
| Health Care Technology 2.1% |
Computer Programs & Systems, Inc.(b)
IT Systems & Services for Health Care Providers | 216,645 | 5,112,822 |
Evolent Health, Inc., Class A(a)
IT & Services Vendor for Hospitals | 194,996 | 2,885,941 |
Medidata Solutions, Inc.(a)
Cloud-based Software for Drug Studies | 109,134 | 5,420,685 |
| Total | | 13,419,448 |
The accompanying Notes to Portfolio of Investments are an integral part of this statement.
Columbia Acorn Family of Funds | Annual Report 2016
| 57 |
Portfolio of Investments (continued)
Columbia Acorn USA®, December 31, 2016
| Common Stocks (continued) |
| Issuer | Shares | Value ($) |
| Life Sciences Tools & Services 3.0% |
Bio-Techne Corp.
Maker of Consumables & Systems for the Life Science Market | 95,949 | 9,866,436 |
Cambrex Corp.(a)
Active Pharmaceutical Ingredients for Small Molecule Drugs | 113,884 | 6,144,042 |
VWR Corp.(a)
Distributor of Lab Supplies | 129,715 | 3,246,766 |
| Total | | 19,257,244 |
| Pharmaceuticals 0.7% |
Akorn, Inc.(a)
Developer, Manufacturer & Distributor of Specialty Generic Drugs | 213,702 | 4,665,115 |
| Total Health Care | 160,620,871 |
| Industrials 15.9% |
| Aerospace & Defense 2.8% |
Astronics Corp.(a)
Designer & Manufacturer of Aircraft Electrical Components & Testing Equipment | 123,496 | 4,179,104 |
Astronics Corp., Class B(a)
Designer & Manufacturer of Aircraft Electrical Components & Testing Equipment | 18,524 | 624,259 |
HEICO Corp., Class A
FAA-Approved Aircraft Replacement Parts | 103,979 | 7,060,174 |
Taser International, Inc.(a)
Manufacturer of Electrical Weapons & Body Cameras | 258,407 | 6,263,786 |
| Total | | 18,127,323 |
| Commercial Services & Supplies 4.9% |
Copart, Inc.(a)
Auto Salvage Services | 100,598 | 5,574,135 |
Healthcare Services Group, Inc.
Outsourced Services to Long-term Care Industry | 86,178 | 3,375,592 |
Knoll, Inc.
Office & Residential Furniture | 258,562 | 7,221,637 |
Ritchie Bros. Auctioneers, Inc.
Heavy Equipment Auctioneer | 148,991 | 5,065,694 |
Unifirst Corp.
Uniform Rental | 71,595 | 10,284,622 |
| Total | | 31,521,680 |
| Common Stocks (continued) |
| Issuer | Shares | Value ($) |
| Machinery 5.0% |
ESCO Technologies, Inc.
Industrial Filtration & Advanced Measurement Equipment | 63,084 | 3,573,709 |
Middleby Corp. (The)(a)
Manufacturer of Cooking Equipment | 33,768 | 4,349,656 |
Nordson Corp.
Dispensing Systems for Adhesives & Coatings | 54,032 | 6,054,285 |
Oshkosh Corp.
Specialty Truck Manufacturer | 63,377 | 4,094,788 |
Toro Co. (The)
Turf Maintenance Equipment | 250,820 | 14,033,379 |
| Total | | 32,105,817 |
| Professional Services 2.2% |
ICF International, Inc.(a)
Professional Service Company | 72,769 | 4,016,849 |
Wageworks, Inc.(a)
Healthcare Consumer Directed Benefits & Commuter Account Management | 142,534 | 10,333,715 |
| Total | | 14,350,564 |
| Trading Companies & Distributors 1.0% |
Watsco, Inc.
HVAC Distribution | 40,917 | 6,060,626 |
| Total Industrials | 102,166,010 |
| Information Technology 17.8% |
| Electronic Equipment, Instruments & Components 1.0% |
IPG Photonics Corp.(a)
Fiber Lasers | 63,554 | 6,273,415 |
| Internet Software & Services 7.0% |
CoStar Group, Inc.(a)
Commercial Real Estate Data Aggregator & Web Marketing for Retail Landlords | 55,461 | 10,453,844 |
j2 Global, Inc.
Communication Technology & Digital Media | 144,855 | 11,849,139 |
Mimecast Ltd.(a)
Cyber Security, Continuity & Archiving Software | 270,012 | 4,833,215 |
NIC, Inc.
Government Web Portal Development & Management Outsourcing | 281,595 | 6,730,120 |
Nutanix, Inc., Class A(a),(b)
Software Company Selling Hyper-converged Infrastructure Appliances | 118,000 | 3,134,080 |
The accompanying Notes to Portfolio of Investments are an integral part of this statement.
| 58 | Columbia Acorn Family of Funds | Annual Report 2016 |
Portfolio of Investments (continued)
Columbia Acorn USA®, December 31, 2016
| Common Stocks (continued) |
| Issuer | Shares | Value ($) |
Q2 Holdings, Inc.(a)
Online & Mobile Banking Software | 124,729 | 3,598,432 |
SPS Commerce, Inc.(a)
Supply Chain Management Software Delivered via the Web | 61,796 | 4,318,922 |
| Total | | 44,917,752 |
| IT Services 3.0% |
CoreLogic, Inc.(a)
Data Processing Services for Real Estate, Insurance & Mortgages | 82,298 | 3,031,036 |
ExlService Holdings, Inc.(a)
Business Process Outsourcing | 64,759 | 3,266,444 |
MAXIMUS, Inc.
Outsourcer for Government Program Administration | 153,956 | 8,589,205 |
WNS Holdings Ltd., ADR(a)
Offshore Business Process Outsourcing Services | 177,667 | 4,894,726 |
| Total | | 19,781,411 |
| Semiconductors & Semiconductor Equipment 1.2% |
Monolithic Power Systems, Inc.
High Performance Analog & Mixed Signal Integrated Circuits | 95,831 | 7,851,434 |
| Software 5.6% |
ANSYS, Inc.(a)
Simulation Software for Engineers & Designers | 117,985 | 10,912,433 |
Apptio, Inc., Class A(a)
Software for Managing IT Spending | 166,193 | 3,079,556 |
Blackline, Inc.(a)
Accounting Software | 114,385 | 3,160,458 |
Guidewire Software, Inc.(a)
Software for Global Property & Casualty Insurance Carriers | 63,894 | 3,151,891 |
Manhattan Associates, Inc.(a)
Supply Chain Management Software & Services | 114,692 | 6,082,117 |
Qualys, Inc.(a)
Security Software Delivered Via the Cloud | 200,639 | 6,350,224 |
Tyler Technologies, Inc.(a)
Financial, Tax, Court & Document Management Systems for Local Governments | 22,068 | 3,150,648 |
| Total | | 35,887,327 |
| Total Information Technology | 114,711,339 |
| Common Stocks (continued) |
| Issuer | Shares | Value ($) |
| Real Estate 2.3% |
| Equity Real Estate Investment Trusts (REITS) 0.8% |
UMH Properties, Inc.
Owner & Operator of Manufactured Home Parks | 360,973 | 5,432,644 |
| Real Estate Management & Development 1.5% |
Colliers International Group, Inc.
Real Estate Services | 120,961 | 4,445,317 |
FirstService Corp.
Residential Property Management & Housing Related Services | 104,286 | 4,951,499 |
| Total | | 9,396,816 |
| Total Real Estate | 14,829,460 |
Total Common Stocks
(Cost: $454,176,273) | 639,494,726 |
|
| Securities Lending Collateral 2.4% |
| | Shares | Value ($) |
Dreyfus Government Cash Management Fund, Institutional Shares, (7 day yield of 0.450%)(c)
| 15,336,080 | 15,336,080 |
Total Securities Lending Collateral
(Cost: $15,336,080) | 15,336,080 |
|
| Money Market Funds 2.0% |
| | |
| JPMorgan U.S. Government Money Market Fund, Agency Shares, (7 day yield of 0.345%) | 13,174,441 | 13,174,441 |
Total Money Market Funds
(Cost: $13,174,441) | 13,174,441 |
Total Investments
(Cost $482,686,794) | 668,005,247 (d) |
| Obligation to Return Collateral for Securities Loaned | | (15,336,080) |
| Other Assets & Liabilities, Net | | (9,048,742) |
| Net Assets | $643,620,425 |
Notes to portfolio of investments
| (a) | Non-income producing security. |
| (b) | All or a portion of this security was on loan at December 31, 2016. The total market value of securities on loan at December 31, 2016 was $14,865,804. |
| (c) | Investment made with cash collateral received from securities lending activity. |
The accompanying Notes to Portfolio of Investments are an integral part of this statement.
Columbia Acorn Family of Funds | Annual Report 2016
| 59 |
Portfolio of Investments (continued)
Columbia Acorn USA®, December 31, 2016
Notes to portfolio of investments (continued)
| (d) | An affiliated person of the Fund, as defined in the Investment Company Act of 1940, may include any company in which the Fund owns five percent or more of its outstanding voting shares. Holdings and transactions in these affiliated companies during the year ended December 31, 2016, are as follows. At December 31, 2016, the Fund did not hold any investments in affiliated companies. |
| Issuer | Beginning
shares | Shares
purchased | Shares
sold | Ending
shares | Value ($) | Dividend —
affiliated issuers
($) | Realized
Gain (Loss) |
| Rubicon Technology1 | 1,354,071 | — | (1,354,071) | — | — | — | (1,922,691) |
| 1 | At December 31, 2016, the Fund owned less than five percent of the company’s outstanding voting shares. |
Abbreviation Legend
| ADR | American Depositary Receipt |
Fair value measurements
Various inputs are used in determining the value of the Fund’s investments, following the input prioritization hierarchy established by accounting principles generally accepted in the United States of America (GAAP). These inputs are summarized in the three broad levels listed below:
| • | Level 1 – quoted prices in active markets for identical securities |
| • | Level 2 – prices determined using other significant observable inputs (including quoted prices for similar securities, interest rates, prepayment speeds, credit risk and others) |
| • | Level 3 – prices determined using significant unobservable inputs where quoted prices or observable inputs are unavailable or less reliable (including management’s own assumptions about the factors market participants would use in pricing an investment) |
The inputs or methodology used for valuing securities are not necessarily an indication of the risk associated with investing in those securities.
Examples of the types of securities in which the Fund would typically invest and how they are classified within this hierarchy are as follows. Typical Level 1 securities include exchange traded domestic equities, mutual funds whose net asset values are published each day and exchange traded foreign equities that are not statistically fair valued. Typical Level 2 securities include exchange traded foreign equities that are statistically fair valued, forward foreign currency exchange contracts and short-term investments valued at amortized cost. Additionally, securities fair valued by Columbia Wanger Asset Management’s Valuation Committee (the Committee) that rely on significant observable inputs are also included in Level 2. Typical Level 3 securities include any security fair valued by the Committee that relies on significant unobservable inputs.
The Committee is responsible for applying Columbia Acorn Trust Portfolio Pricing Policy and the Columbia Wanger Asset Management pricing procedures (the Policies), which are approved by and subject to the oversight of the Board of Trustees.
The Committee meets as necessary, and no less frequently than quarterly, to determine fair values for securities for which market quotations are not readily available or for which Columbia Wanger Asset Management believes that available market quotations are unreliable. The Committee also reviews the continuing appropriateness of the Policies. In circumstances where a security has been fair valued, the Committee will also review the continuing appropriateness of the current value of the security. The Policies address, among other things: circumstances under which market quotations will be deemed readily available; selection of third party pricing vendors; appropriate pricing methodologies; events that require fair valuation and fair value techniques; circumstances under which securities will be deemed to pose a potential for stale pricing, including when securities are illiquid, restricted, or in default; and certain delegations of authority to determine fair values to the Fund’s investment manager. The Committee may also meet to discuss additional valuation matters, which may include review of back-testing results, review of time-sensitive information or approval of other valuation related actions, and to review the appropriateness of the Policies.
For investments categorized as Level 3, the significant unobservable inputs used in the fair value measurement of the Fund’s securities may include: (i) data specific to the issuer or comparable issuers, (ii) general market or specific sector news and (iii) quoted prices and specific or similar security transactions. The Committee considers this data and any changes from prior periods in order to assess the reasonableness of observable and unobservable inputs, any assumptions or internal models used to value those securities and changes in fair value. Significant changes in any of these factors could result in lower or higher fair value measurements. Various factors impact the frequency of monitoring (which may occur as often as daily), however the Committee may determine that changes to inputs, assumptions and models are not required with the same frequency.
The following table is a summary of the inputs used to value the Fund’s investments at December 31, 2016:
| | Level 1
quoted prices in active
markets for identical
assets ($) | Level 2
other significant
observable inputs ($) | Level 3
significant
unobservable inputs ($) | Total ($) |
| Investments | | | | |
| Common Stocks | | | | |
| Consumer Discretionary | 124,646,857 | — | — | 124,646,857 |
| Consumer Staples | 8,906,260 | — | — | 8,906,260 |
| Energy | 15,874,432 | — | — | 15,874,432 |
| Financials | 97,739,497 | — | — | 97,739,497 |
| Health Care | 160,620,871 | — | — | 160,620,871 |
| Industrials | 102,166,010 | — | — | 102,166,010 |
The accompanying Notes to Portfolio of Investments are an integral part of this statement.
| 60 | Columbia Acorn Family of Funds | Annual Report 2016 |
Portfolio of Investments (continued)
Columbia Acorn USA®, December 31, 2016
Fair value measurements (continued)
| | Level 1
quoted prices in active
markets for identical
assets ($) | Level 2
other significant
observable inputs ($) | Level 3
significant
unobservable inputs ($) | Total ($) |
| Information Technology | 114,711,339 | — | — | 114,711,339 |
| Real Estate | 14,829,460 | — | — | 14,829,460 |
| Total Common Stocks | 639,494,726 | — | — | 639,494,726 |
| Securities Lending Collateral | 15,336,080 | — | — | 15,336,080 |
| Money Market Funds | 13,174,441 | — | — | 13,174,441 |
| Total Investments | 668,005,247 | — | — | 668,005,247 |
There were no transfers of financial assets between levels during the period.
The accompanying Notes to Portfolio of Investments are an integral part of this statement.
Columbia Acorn Family of Funds | Annual Report 2016
| 61 |
Portfolio of Investments
Columbia Acorn International SelectSM, December 31, 2016
(Percentages represent value of investments compared to net assets)
| Common Stocks 96.5% |
| Issuer | Shares | Value ($) |
| Australia 2.1% |
Amcor Ltd.
Flexible & Rigid Packaging | 193,000 | 2,077,224 |
| Canada 7.9% |
CCL Industries, Inc.
Global Label Converter | 29,641 | 5,823,778 |
Vermilion Energy, Inc.
Canadian Exploration & Production Company | 48,340 | 2,033,834 |
| Total | 7,857,612 |
| China 3.1% |
NetEase, Inc., ADR
Chinese Online Gaming Services | 14,200 | 3,057,828 |
Vipshop Holdings Ltd., ADR(a)
Internet Discount Retailer | 4,849 | 53,387 |
| Total | 3,111,215 |
| Denmark 3.1% |
Novozymes AS, Class B
Industrial Enzymes | 89,955 | 3,101,457 |
| France 5.0% |
Essilor International SA
Eyeglass Lenses | 22,000 | 2,486,044 |
Legrand SA
Electrical Components | 44,000 | 2,498,782 |
| Total | 4,984,826 |
| Germany 7.8% |
MTU Aero Engines AG
Airplane Engine Components & Services | 33,500 | 3,864,221 |
Wirecard AG(b)
Online Payment Processing & Risk Management | 91,040 | 3,906,300 |
| Total | 7,770,521 |
| India 3.1% |
Zee Entertainment Enterprises Ltd.
Indian Programmer of Pay Television Content | 463,000 | 3,081,841 |
| Ireland 2.4% |
Ryanair Holdings PLC
European Low Cost Airline | 158,000 | 2,412,454 |
| Japan 21.4% |
Aeon Mall Co., Ltd.
Suburban Shopping Mall Developer, Owner & Operator | 279,200 | 3,923,546 |
FamilyMart UNY Holdings Co., Ltd.
Convenience Store Operator | 34,300 | 2,282,323 |
| Common Stocks (continued) |
| Issuer | Shares | Value ($) |
Hoya Corp.
Opto-electrical Components & Eyeglass Lenses | 83,000 | 3,480,142 |
KDDI Corp.
Mobile & Fixed Line Communication Service Provider in Japan | 77,000 | 1,944,479 |
Recruit Holdings Co., Ltd.
Recruitment & Media Services | 117,500 | 4,708,976 |
Santen Pharmaceutical Co., Ltd.
Specialty Pharma (Ophthalmic Medicine) | 173,000 | 2,110,829 |
Sony Financial Holdings, Inc.
Life Insurance, Assurance & Internet Banking | 189,200 | 2,949,331 |
| Total | 21,399,626 |
| South Africa 3.5% |
Naspers Ltd., Class N
Media in Africa, China, Russia & Other Emerging Markets | 24,000 | 3,503,800 |
| Spain 2.1% |
Distribuidora Internacional de Alimentacion SA
Discount Retailer in Spain & Latin America | 421,000 | 2,067,369 |
| Sweden 4.5% |
Hexagon AB, Class B
Design, Measurement & Visualization Software & Equipment | 127,000 | 4,537,407 |
| Switzerland 7.8% |
Geberit AG
Plumbing Systems | 8,540 | 3,423,380 |
Partners Group Holding AG(b)
Private Markets Asset Management | 9,400 | 4,405,529 |
| Total | 7,828,909 |
| Taiwan 2.8% |
Largan Precision Co., Ltd.
Mobile Device Camera Lenses & Modules | 24,000 | 2,797,474 |
| Thailand 2.5% |
Airports of Thailand PCL
Airport Operator of Thailand | 228,000 | 2,531,874 |
| United Kingdom 15.2% |
Compass Group PLC
Catering & Support Services | 141,000 | 2,605,899 |
Halma PLC
Health & Safety Sensor Technology | 242,000 | 2,677,363 |
Kingfisher PLC
European DIY Retailer | 494,000 | 2,128,344 |
Next PLC
Clothes & Home Retailer in the UK | 50,000 | 3,067,283 |
The accompanying Notes to Portfolio of Investments are an integral part of this statement.
| 62 | Columbia Acorn Family of Funds | Annual Report 2016 |
Portfolio of Investments (continued)
Columbia Acorn International SelectSM, December 31, 2016
| Common Stocks (continued) |
| Issuer | Shares | Value ($) |
Rightmove PLC
Internet Real Estate Listings | 43,800 | 2,103,994 |
WH Smith PLC
Newsprint, Books & General Stationery Retailer | 136,930 | 2,623,690 |
| Total | 15,206,573 |
| United States 2.2% |
Anadarko Petroleum Corp.
Worldwide Production of Oil & Gas | 31,540 | 2,199,284 |
Total Common Stocks
(Cost: $81,018,986) | 96,469,466 |
|
| Securities Lending Collateral 5.4% |
| | Shares | Value ($) |
Dreyfus Government Cash Management Fund, Institutional Shares, (7 day yield of 0.450%)(c)
| 5,444,661 | 5,444,661 |
Total Securities Lending Collateral
(Cost: $5,444,661) | 5,444,661 |
|
| Money Market Funds 2.7% |
| | Shares | Value ($) |
JPMorgan U.S. Government Money Market Fund, IM Shares (7 day yield of 0.445%)
| 2,721,922 | 2,721,922 |
Total Money Market Funds
(Cost: $2,721,922) | 2,721,922 |
Total Investments
(Cost: $89,185,569) | 104,636,049 |
| Obligation to Return Collateral for Securities Loaned | | (5,444,661) |
| Other Assets & Liabilities, Net | | 820,185 |
| Net Assets | $100,011,573 |
Notes to portfolio of investments
| (a) | Non-income producing security. |
| (b) | All or a portion of this security was on loan at December 31, 2016. The total market value of securities on loan at December 31, 2016 was $5,209,652. |
| (c) | Investment made with cash collateral received from securities lending activity. |
Abbreviation Legend
| ADR | American Depositary Receipt |
Fair value measurements
Various inputs are used in determining the value of the Fund’s investments, following the input prioritization hierarchy established by accounting principles generally accepted in the United States of America (GAAP). These inputs are summarized in the three broad levels listed below:
| • | Level 1 – quoted prices in active markets for identical securities |
| • | Level 2 – prices determined using other significant observable inputs (including quoted prices for similar securities, interest rates, prepayment speeds, credit risk and others) |
| • | Level 3 – prices determined using significant unobservable inputs where quoted prices or observable inputs are unavailable or less reliable (including management’s own assumptions about the factors market participants would use in pricing an investment) |
The inputs or methodology used for valuing securities are not necessarily an indication of the risk associated with investing in those securities.
Examples of the types of securities in which the Fund would typically invest and how they are classified within this hierarchy are as follows. Typical Level 1 securities include exchange traded domestic equities, mutual funds whose net asset values are published each day and exchange traded foreign equities that are not statistically fair valued. Typical Level 2 securities include exchange traded foreign equities that are statistically fair valued, forward foreign currency exchange contracts and short-term investments valued at amortized cost. Additionally, securities fair valued by Columbia Wanger Asset Management’s Valuation Committee (the Committee) that rely on significant observable inputs are also included in Level 2. Typical Level 3 securities include any security fair valued by the Committee that relies on significant unobservable inputs.
The Committee is responsible for applying Columbia Acorn Trust Portfolio Pricing Policy and the Columbia Wanger Asset Management pricing procedures (the Policies), which are approved by and subject to the oversight of the Board of Trustees.
The Committee meets as necessary, and no less frequently than quarterly, to determine fair values for securities for which market quotations are not readily available or for which Columbia Wanger Asset Management believes that available market quotations are unreliable. The Committee also reviews the continuing appropriateness of the Policies. In circumstances where a security has been fair valued, the Committee will also review the continuing appropriateness of the current value of the security. The Policies address, among other things: circumstances under which market quotations will be deemed readily available; selection of third party pricing vendors; appropriate pricing methodologies; events that
The accompanying Notes to Portfolio of Investments are an integral part of this statement.
Columbia Acorn Family of Funds | Annual Report 2016
| 63 |
Portfolio of Investments (continued)
Columbia Acorn International SelectSM, December 31, 2016
Fair value measurements (continued)
require fair valuation and fair value techniques; circumstances under which securities will be deemed to pose a potential for stale pricing, including when securities are illiquid, restricted, or in default; and certain delegations of authority to determine fair values to the Fund’s investment manager. The Committee may also meet to discuss additional valuation matters, which may include review of back-testing results, review of time-sensitive information or approval of other valuation related actions, and to review the appropriateness of the Policies.
For investments categorized as Level 3, the significant unobservable inputs used in the fair value measurement of the Fund’s securities may include: (i) data specific to the issuer or comparable issuers, (ii) general market or specific sector news and (iii) quoted prices and specific or similar security transactions. The Committee considers this data and any changes from prior periods in order to assess the reasonableness of observable and unobservable inputs, any assumptions or internal models used to value those securities and changes in fair value. Significant changes in any of these factors could result in lower or higher fair value measurements. Various factors impact the frequency of monitoring (which may occur as often as daily), however the Committee may determine that changes to inputs, assumptions and models are not required with the same frequency.
The following table is a summary of the inputs used to value the Fund’s investments at December 31, 2016:
| | Level 1
quoted prices in active
markets for identical
assets ($) | Level 2
other significant
observable inputs ($) | Level 3
significant
unobservable inputs ($) | Total ($) |
| Investments | | | | |
| Common Stocks | | | | |
| Australia | — | 2,077,224 | — | 2,077,224 |
| Canada | 7,857,612 | — | — | 7,857,612 |
| China | 3,111,215 | — | — | 3,111,215 |
| Denmark | — | 3,101,457 | — | 3,101,457 |
| France | — | 4,984,826 | — | 4,984,826 |
| Germany | — | 7,770,521 | — | 7,770,521 |
| India | — | 3,081,841 | — | 3,081,841 |
| Ireland | — | 2,412,454 | — | 2,412,454 |
| Japan | — | 21,399,626 | — | 21,399,626 |
| South Africa | — | 3,503,800 | — | 3,503,800 |
| Spain | — | 2,067,369 | — | 2,067,369 |
| Sweden | — | 4,537,407 | — | 4,537,407 |
| Switzerland | — | 7,828,909 | — | 7,828,909 |
| Taiwan | — | 2,797,474 | — | 2,797,474 |
| Thailand | — | 2,531,874 | — | 2,531,874 |
| United Kingdom | — | 15,206,573 | — | 15,206,573 |
| United States | 2,199,284 | — | — | 2,199,284 |
| Total Common Stocks | 13,168,111 | 83,301,355 | — | 96,469,466 |
| Securities Lending Collateral | 5,444,661 | — | — | 5,444,661 |
| Money Market Funds | 2,721,922 | — | — | 2,721,922 |
| Total Investments | 21,334,694 | 83,301,355 | — | 104,636,049 |
The Fund’s assets assigned to the Level 2 input category are generally valued using a market approach, in which a security’s value is determined through its correlation to prices and information from observable market transactions for similar or identical assets. Foreign equities are generally valued at the last sale price on the foreign exchange or market on which they trade. The Fund may use a statistical fair valuation model, in accordance with the policy adopted by the Board, provided by an independent third party to value securities principally traded in foreign markets in order to adjust for possible stale pricing that may occur between the close of the foreign exchanges and the time for valuation. These models take into account available market data including intraday index, ADR, and ETF movements.
There were no transfers of financial assets between levels during the period.
The accompanying Notes to Portfolio of Investments are an integral part of this statement.
| 64 | Columbia Acorn Family of Funds | Annual Report 2016 |
Portfolio of Investments
Columbia Acorn SelectSM, December 31, 2016
(Percentages represent value of investments compared to net assets)
| Common Stocks 98.5% |
| Issuer | Shares | Value ($) |
| Consumer Discretionary 20.0% |
| Distributors 4.4% |
LKQ Corp.(a)
Alternative Auto Parts Distribution | 437,620 | 13,413,053 |
| Hotels, Restaurants & Leisure 6.1% |
Papa John’s International, Inc.
Franchisor of Pizza Restaurants | 70,600 | 6,041,948 |
Vail Resorts, Inc.
Ski Resort Operator & Developer | 79,584 | 12,837,695 |
| Total | | 18,879,643 |
| Household Durables 3.1% |
iRobot Corp.(a)
Home Robots (Vacuums, Pool Cleaners) & Battlefield Reconnaissance Robots | 166,000 | 9,702,700 |
| Media 4.6% |
Liberty Global PLC, Class A(a)
Cable TV Franchises Outside of the United States | 463,000 | 14,163,170 |
| Textiles, Apparel & Luxury Goods 1.8% |
Hanesbrands, Inc.
Apparel Wholesaler | 261,000 | 5,629,770 |
| Total Consumer Discretionary | 61,788,336 |
| Financials 8.9% |
| Banks 3.3% |
SVB Financial Group(a)
Bank to Venture Capitalists | 58,200 | 9,990,612 |
| Capital Markets 5.6% |
Eaton Vance Corp.
Specialty Mutual Funds | 156,037 | 6,534,830 |
Lazard Ltd., Class A
Corporate Advisory & Asset Management | 263,000 | 10,806,670 |
| Total | | 17,341,500 |
| Total Financials | 27,332,112 |
| Health Care 16.3% |
| Biotechnology 0.6% |
Ultragenyx Pharmaceutical, Inc.(a)
Biotech Focused on "Ultra-Orphan" Drugs | 26,186 | 1,841,138 |
| Common Stocks (continued) |
| Issuer | Shares | Value ($) |
| Health Care Equipment & Supplies 5.4% |
Align Technology, Inc.(a)
Invisalign System to Correct Malocclusion (Crooked Teeth) | 107,177 | 10,302,925 |
LivaNova PLC(a)
Neuromodulation & Cardiac Devices | 143,000 | 6,430,710 |
| Total | | 16,733,635 |
| Health Care Providers & Services 7.4% |
HealthSouth Corp.
Inpatient Rehabilitation Facilities & Home Health Care | 357,000 | 14,722,680 |
VCA, Inc.(a)
Animal Hospitals & Laboratory Services | 118,000 | 8,100,700 |
| Total | | 22,823,380 |
| Life Sciences Tools & Services 2.9% |
VWR Corp.(a)
Distributor of Lab Supplies | 356,603 | 8,925,773 |
| Total Health Care | 50,323,926 |
| Industrials 29.2% |
| Electrical Equipment 2.6% |
Generac Holdings, Inc.(a)
Standby Power Generators | 200,230 | 8,157,370 |
| Machinery 14.5% |
Middleby Corp. (The)(a)
Manufacturer of Cooking Equipment | 106,700 | 13,744,027 |
Nordson Corp.
Dispensing Systems for Adhesives & Coatings | 53,256 | 5,967,335 |
Oshkosh Corp.
Specialty Truck Manufacturer | 120,082 | 7,758,498 |
Snap-On, Inc.
Tools | 36,000 | 6,165,720 |
Wabtec Corp.
Freight & Transit Component Supplier | 133,000 | 11,041,660 |
| Total | | 44,677,240 |
| Professional Services 3.7% |
Robert Half International, Inc.
Temporary & Permanent Staffing in Finance, Accounting & Other Professions | 231,395 | 11,287,448 |
The accompanying Notes to Portfolio of Investments are an integral part of this statement.
Columbia Acorn Family of Funds | Annual Report 2016
| 65 |
Portfolio of Investments (continued)
Columbia Acorn SelectSM, December 31, 2016
| Common Stocks (continued) |
| Issuer | Shares | Value ($) |
| Road & Rail 8.4% |
AMERCO
North American Moving & Storage | 32,000 | 11,826,880 |
JB Hunt Transport Services, Inc.
Truck & Intermodal Carrier | 145,000 | 14,075,150 |
| Total | | 25,902,030 |
| Total Industrials | 90,024,088 |
| Information Technology 11.4% |
| Internet Software & Services 6.2% |
GoDaddy, Inc., Class A(a)
Website Management for Small- & Medium-sized Companies | 297,000 | 10,380,150 |
SPS Commerce, Inc.(a)
Supply Chain Management Software Delivered via the Web | 124,000 | 8,666,360 |
| Total | | 19,046,510 |
| Software 5.2% |
ANSYS, Inc.(a)
Simulation Software for Engineers & Designers | 113,158 | 10,465,983 |
Ultimate Software Group, Inc. (The)(a)
Human Capital Management Systems | 31,057 | 5,663,244 |
| Total | | 16,129,227 |
| Total Information Technology | 35,175,737 |
| Materials 3.4% |
| Chemicals 3.4% |
Axalta Coating Systems Ltd.(a)
Global Manufacturer of High Performance Coatings | 388,681 | 10,572,123 |
| Total Materials | 10,572,123 |
| Common Stocks (continued) |
| Issuer | Shares | Value ($) |
| Real Estate 9.3% |
| Equity Real Estate Investment Trusts (REITS) 5.7% |
Crown Castle International Corp.
Communications Towers | 68,161 | 5,914,330 |
Education Realty Trust, Inc.
Student Housing | 273,566 | 11,571,842 |
| Total | | 17,486,172 |
| Real Estate Management & Development 3.6% |
Jones Lang LaSalle, Inc.
Real Estate Services | 109,900 | 11,104,296 |
| Total Real Estate | 28,590,468 |
Total Common Stocks
(Cost: $253,883,458) | 303,806,790 |
|
| Money Market Funds 1.5% |
| | Shares | Value ($) |
| JPMorgan U.S. Government Money Market Fund, Agency Shares, (7 day yield of 0.345%) | 4,574,896 | 4,574,896 |
Total Money Market Funds
(Cost: $4,574,896) | 4,574,896 |
Total Investments
(Cost $258,458,354) | 308,381,686 |
| Other Assets & Liabilities, Net | | 7,298 |
| Net Assets | $308,388,984 |
Notes to portfolio of investments
| (a) | Non-income producing security. |
Fair value measurements
Various inputs are used in determining the value of the Fund’s investments, following the input prioritization hierarchy established by accounting principles generally accepted in the United States of America (GAAP). These inputs are summarized in the three broad levels listed below:
| • | Level 1 – quoted prices in active markets for identical securities |
| • | Level 2 – prices determined using other significant observable inputs (including quoted prices for similar securities, interest rates, prepayment speeds, credit risk and others) |
| • | Level 3 – prices determined using significant unobservable inputs where quoted prices or observable inputs are unavailable or less reliable (including management’s own assumptions about the factors market participants would use in pricing an investment) |
The inputs or methodology used for valuing securities are not necessarily an indication of the risk associated with investing in those securities.
Examples of the types of securities in which the Fund would typically invest and how they are classified within this hierarchy are as follows. Typical Level 1 securities include exchange traded domestic equities, mutual funds whose net asset values are published each day and exchange traded foreign equities that are not statistically fair valued. Typical Level 2 securities include exchange traded foreign equities that are statistically fair valued, forward foreign currency exchange contracts and short-term investments valued at amortized cost. Additionally, securities fair valued by Columbia Wanger Asset Management’s Valuation Committee (the Committee) that rely on significant observable inputs are also included in Level 2. Typical Level 3 securities include any security fair valued by the Committee that relies on significant unobservable inputs.
The accompanying Notes to Portfolio of Investments are an integral part of this statement.
| 66 | Columbia Acorn Family of Funds | Annual Report 2016 |
Portfolio of Investments (continued)
Columbia Acorn SelectSM, December 31, 2016
Fair value measurements (continued)
The Committee is responsible for applying Columbia Acorn Trust Portfolio Pricing Policy and the Columbia Wanger Asset Management pricing procedures (the Policies), which are approved by and subject to the oversight of the Board of Trustees.
The Committee meets as necessary, and no less frequently than quarterly, to determine fair values for securities for which market quotations are not readily available or for which Columbia Wanger Asset Management believes that available market quotations are unreliable. The Committee also reviews the continuing appropriateness of the Policies. In circumstances where a security has been fair valued, the Committee will also review the continuing appropriateness of the current value of the security. The Policies address, among other things: circumstances under which market quotations will be deemed readily available; selection of third party pricing vendors; appropriate pricing methodologies; events that require fair valuation and fair value techniques; circumstances under which securities will be deemed to pose a potential for stale pricing, including when securities are illiquid, restricted, or in default; and certain delegations of authority to determine fair values to the Fund’s investment manager. The Committee may also meet to discuss additional valuation matters, which may include review of back-testing results, review of time-sensitive information or approval of other valuation related actions, and to review the appropriateness of the Policies.
For investments categorized as Level 3, the significant unobservable inputs used in the fair value measurement of the Fund’s securities may include: (i) data specific to the issuer or comparable issuers, (ii) general market or specific sector news and (iii) quoted prices and specific or similar security transactions. The Committee considers this data and any changes from prior periods in order to assess the reasonableness of observable and unobservable inputs, any assumptions or internal models used to value those securities and changes in fair value. Significant changes in any of these factors could result in lower or higher fair value measurements. Various factors impact the frequency of monitoring (which may occur as often as daily), however the Committee may determine that changes to inputs, assumptions and models are not required with the same frequency.
The following table is a summary of the inputs used to value the Fund’s investments at December 31, 2016:
| | Level 1
quoted prices in active
markets for identical
assets ($) | Level 2
other significant
observable inputs ($) | Level 3
significant
unobservable inputs ($) | Total ($) |
| Investments | | | | |
| Common Stocks | | | | |
| Consumer Discretionary | 61,788,336 | — | — | 61,788,336 |
| Financials | 27,332,112 | — | — | 27,332,112 |
| Health Care | 50,323,926 | — | — | 50,323,926 |
| Industrials | 90,024,088 | — | — | 90,024,088 |
| Information Technology | 35,175,737 | — | — | 35,175,737 |
| Materials | 10,572,123 | — | — | 10,572,123 |
| Real Estate | 28,590,468 | — | — | 28,590,468 |
| Total Common Stocks | 303,806,790 | — | — | 303,806,790 |
| Money Market Funds | 4,574,896 | — | — | 4,574,896 |
| Total Investments | 308,381,686 | — | — | 308,381,686 |
There were no transfers of financial assets between levels during the period.
The following table reconciles asset balances for the period ending December 31, 2016, in which significant observable and/or unobservable inputs (Level 3) were used in determining value:
| Investments in Securities | Balance as
of December 31,
2015 | Realized
Gain (Loss) | Change
in Unrealized
Appreciation
(Depreciation) | Purchases | Sales | Transfers
Into
Level 3 | Transfers
out of
Level 3 | Balance as
of December 31,
2016 |
| Common Stock | | | | | | | | |
| Consumer Discretionary | $8,851,514 | $(16,166,667) | $11,148,486 | $— | $(3,833,333) | $— | $— | $— |
The information in the above reconciliation table represents fiscal year to date activity for any securities identified as using Level 3 inputs at either the beginning or the end of the current fiscal period.
The Fund does not hold any significant investments (greater than one percent of net assets) categorized as Level 3.
Certain securities classified as Level 3 are valued by the Committee at fair value, using a market approach, as determined in good faith under consistently applied procedures established by and under the general supervision of the Board. To determine fair value for these securities, for which no market exists, the Committee utilizes the valuation technique it deems most appropriate in the circumstances, using some unobservable inputs, which may include, but are not limited to estimated earnings of the company and the position of the security within the company’s capital structure. The Committee also may use some observable inputs, which may include, but are not limited to, trades of similar securities and market multiples derived from a set of comparable companies. Significant increases or decreases to any of these inputs could result in a significantly lower or higher fair value measurement.
The accompanying Notes to Portfolio of Investments are an integral part of this statement.
Columbia Acorn Family of Funds | Annual Report 2016
| 67 |
Portfolio of Investments
Columbia Thermostat FundSM, December 31, 2016
(Percentages represent value of investments compared to net assets)
| Equity Funds 9.9% |
| Issuer | Shares | Value ($) |
| Dividend Income 2.0% |
Columbia Dividend Income Fund, Class I Shares(a)
| 1,141,969 | 21,857,289 |
| Total Dividend Income | 21,857,289 |
| International Small Mid Cap 2.0% |
Columbia Acorn International, Class I Shares(a)
| 587,054 | 22,173,033 |
| Total International Small Mid Cap | 22,173,033 |
| U.S. Large Cap 3.9% |
Columbia Contrarian Core Fund, Class I Shares(a)
| 966,230 | 21,720,847 |
Columbia Large Cap Enhanced Core Fund, Class I Shares(a)
| 483,277 | 10,878,580 |
Columbia Select Large Cap Growth Fund, Class I Shares(a),(b)
| 788,763 | 10,908,591 |
| Total U.S. Large Cap | 43,508,018 |
| U.S. Mid Cap 1.0% |
Columbia Acorn Select Fund, Class I Shares(a),(b)
| 738,151 | 10,909,863 |
| Total U.S. Mid Cap | 10,909,863 |
| U.S. Small Mid Cap 1.0% |
Columbia Acorn Fund, Class I Shares(a),(b)
| 704,294 | 10,846,124 |
| Total U.S. Small Mid Cap | 10,846,124 |
Total Equity Funds
(Cost: $89,043,137) | 109,294,327 |
|
| Fixed-Income Funds 89.7% |
| Issuer | Shares | Value ($) |
| High Yield 9.0% |
Columbia Income Opportunities Fund, Class I Shares(a)
| 10,148,993 | 99,358,642 |
| Total High Yield | 99,358,642 |
| Investment Grade 80.7% |
Columbia Short Term Bond Fund, Class I Shares(a)
| 39,832,272 | 396,729,429 |
Columbia Total Return Bond Fund, Class I Shares(a)
| 22,201,461 | 198,925,088 |
Columbia U.S. Government Mortgage Fund, Class I Shares(a)
| 36,866,439 | 198,710,106 |
Columbia U.S. Treasury Index Fund, Class I Shares(a)
| 9,050,066 | 99,279,224 |
| Total Investment Grade | 893,643,847 |
Total Fixed-Income Funds
(Cost: $994,941,761) | 993,002,489 |
|
| Money Market Funds 0.3% |
| | Shares | Value ($) |
| JPMorgan U.S. Government Money Market Fund, Agency Shares, (7 day yield of 0.345%) | 3,545,380 | 3,545,380 |
Total Money Market Funds
(Cost: $3,545,380) | 3,545,380 |
Total Investments
(Cost $1,087,530,278) | 1,105,842,196 |
| Other Assets & Liabilities, Net | | 1,584,421 |
| Net Assets | $1,107,426,617 |
Notes to portfolio of investments
| (a) | An affiliated person of the Fund, as defined in the Investment Company Act of 1940, may include any company in which the Fund owns five percent or more of its outstanding voting shares. Holdings and transactions in these affiliated companies during the year ended December 31, 2016, are as follows. The aggregate cost and value of these companies at December 31, 2016, was $1,083,984,898 and $1,102,296,816, respectively. Investments in affiliated companies represented 99.60% of the Fund’s total net assets at December 31, 2016. |
| Issuer | Beginning
shares | Shares
purchased | Shares
sold | Ending
shares | Capital gain
Distributions ($) | Realized
Gain
(Loss) ($) | Dividends —
affiliated
issuers($) | Value ($) |
| Columbia Acorn Fund, Class I Shares | 1,397,374 | 2,625,618 | 3,318,698 | 704,294 | 6,393,601 | (9,183,481) | — | 10,846,124 |
| Columbia Acorn International, Class I Shares | 1,389,031 | 2,039,433 | 2,841,410 | 587,054 | 367,376 | (2,579,022) | 250,704 | 22,173,033 |
| Columbia Acorn Select Fund, Class I Shares | 1,752,426 | 2,979,407 | 3,993,682 | 738,151 | 3,413,645 | (6,097,926) | — | 10,909,863 |
| Columbia Contrarian Core Fund, Class I Shares | 2,628,205 | 3,553,715 | 5,215,690 | 966,230 | 164,463 | 5,080,294 | 229,582 | 21,720,847 |
The accompanying Notes to Portfolio of Investments are an integral part of this statement.
| 68 | Columbia Acorn Family of Funds | Annual Report 2016 |
Portfolio of Investments (continued)
Columbia Thermostat FundSM, December 31, 2016
Notes to portfolio of investments (continued)
| Issuer | Beginning
shares | Shares
purchased | Shares
sold | Ending
shares | Capital gain
Distributions ($) | Realized
Gain
(Loss) ($) | Dividends —
affiliated
issuers($) | Value ($) |
| Columbia Dividend Income Fund, Class I Shares | 3,143,436 | 3,941,800 | 5,943,267 | 1,141,969 | 504,911 | 6,276,140 | 976,288 | 21,857,289 |
| Columbia Income Opportunities Fund, Class I Shares | 17,570,413 | 7,816,796 | 15,238,216 | 10,148,993 | — | (3,348,293) | 5,669,528 | 99,358,642 |
| Columbia Large Cap Enhanced Core Fund, Class I Shares | 1,322,181 | 1,842,063 | 2,680,967 | 483,277 | — | 3,671,902 | 490,530 | 10,878,580 |
| Columbia Select Large Cap Growth Fund, Class I Shares | 1,625,974 | 3,049,934 | 3,887,145 | 788,763 | 2,051,840 | (2,497,733) | — | 10,908,591 |
| Columbia Short Term Bond Fund, Class I Shares | 33,379,127 | 23,233,899 | 16,780,754 | 39,832,272 | — | (688,378) | 3,635,669 | 396,729,429 |
| Columbia Total Return Bond Fund, Class I Shares | 18,493,046 | 13,057,342 | 9,348,927 | 22,201,461 | 2,576,077 | (525,304) | 4,952,232 | 198,925,088 |
| Columbia U.S. Government Mortgage Fund, Class I Shares | 30,509,848 | 21,973,082 | 15,616,491 | 36,866,439 | 792,017 | (45,533) | 4,195,278 | 198,710,106 |
| Columbia U.S. Treasury Index Fund, Class I Shares | — | 10,993,291 | 1,943,225 | 9,050,066 | 238,099 | (109,319) | 837,893 | 99,279,224 |
| Total of Affiliated Transactions | 113,211,061 | 97,106,380 | 86,808,472 | 123,508,969 | 16,502,029 | (10,046,653) | 21,237,704 | 1,102,296,816 |
| (b) | Non-income producing security. |
Fair value measurements
Various inputs are used in determining the value of the Fund’s investments, following the input prioritization hierarchy established by accounting principles generally accepted in the United States of America (GAAP). These inputs are summarized in the three broad levels listed below:
| • | Level 1 – quoted prices in active markets for identical securities |
| • | Level 2 – prices determined using other significant observable inputs (including quoted prices for similar securities, interest rates, prepayment speeds, credit risk and others) |
| • | Level 3 – prices determined using significant unobservable inputs where quoted prices or observable inputs are unavailable or less reliable (including management’s own assumptions about the factors market participants would use in pricing an investment) |
The inputs or methodology used for valuing securities are not necessarily an indication of the risk associated with investing in those securities.
Examples of the types of securities in which the Fund would typically invest and how they are classified within this hierarchy are as follows. Typical Level 1 securities include mutual funds whose net asset values are published each day.
The Committee is responsible for applying Columbia Acorn Trust Portfolio Pricing Policy and the Columbia Wanger Asset Management pricing procedures (the Policies), which are approved by and subject to the oversight of the Board of Trustees.
The Committee meets as necessary, and no less frequently than quarterly, to determine fair values for securities for which market quotations are not readily available or for which Columbia Wanger Asset Management believes that available market quotations are unreliable. The Committee also reviews the continuing appropriateness of the Policies. In circumstances where a security has been fair valued, the Committee will also review the continuing appropriateness of the current value of the security. The Policies address, among other things: circumstances under which market quotations will be deemed readily available; selection of third party pricing vendors; appropriate pricing methodologies; events that require fair valuation and fair value techniques; circumstances under which securities will be deemed to pose a potential for stale pricing, including when securities are illiquid, restricted, or in default; and certain delegations of authority to determine fair values to the Fund’s investment manager. The Committee may also meet to discuss additional valuation matters, which may include review of back-testing results, review of time-sensitive information or approval of other valuation related actions, and to review the appropriateness of the Policies.
For investments categorized as Level 3, the significant unobservable inputs used in the fair value measurement of the Fund’s securities may include: (i) data specific to the issuer or comparable issuers, (ii) general market or specific sector news and (iii) quoted prices and specific or similar security transactions. The Committee considers this data and any changes from prior periods in order to assess the reasonableness of observable and unobservable inputs, any assumptions or internal models used to value those securities and changes in fair value. Significant changes in any of these factors could result in lower or higher fair value measurements. Various factors impact the frequency of monitoring (which may occur as often as daily), however the Committee may determine that changes to inputs, assumptions and models are not required with the same frequency.
The accompanying Notes to Portfolio of Investments are an integral part of this statement.
Columbia Acorn Family of Funds | Annual Report 2016
| 69 |
Portfolio of Investments (continued)
Columbia Thermostat FundSM, December 31, 2016
Fair value measurements (continued)
The following table is a summary of the inputs used to value the Fund’s investments at December 31, 2016:
| | Level 1
quoted prices in active
markets for identical
assets ($) | Level 2
other significant
observable inputs ($) | Level 3
significant
unobservable inputs ($) | Total ($) |
| Investments | | | | |
| Equity Funds | 109,294,327 | — | — | 109,294,327 |
| Fixed-Income Funds | 993,002,489 | — | — | 993,002,489 |
| Money Market Funds | 3,545,380 | — | — | 3,545,380 |
| Total Investments | 1,105,842,196 | — | — | 1,105,842,196 |
There were no transfers of financial assets between levels during the period.
The accompanying Notes to Portfolio of Investments are an integral part of this statement.
| 70 | Columbia Acorn Family of Funds | Annual Report 2016 |
Portfolio of Investments
Columbia Acorn Emerging Markets FundSM, December 31, 2016
(Percentages represent value of investments compared to net assets)
| Common Stocks 94.4% |
| Issuer | Shares | Value ($) |
| Cambodia 2.2% |
NagaCorp Ltd.
Casino & Entertainment Complex in Cambodia | 4,056,000 | 2,337,783 |
| Cayman Islands 1.1% |
Bitauto Holdings Ltd., ADR(a),(b)
Automotive Information Website for Buyers & Dealers | 59,444 | 1,125,869 |
| China 4.8% |
51job, Inc., ADR(a)
Integrated Human Resource Services | 59,912 | 2,025,025 |
China Medical System Holdings Ltd.
Pharmaceutical & Medical Products | 808,000 | 1,275,657 |
TravelSky Technology Ltd., Class H
Chinese Air Travel Transaction Processor | 836,000 | 1,752,074 |
| Total | 5,052,756 |
| Finland 1.3% |
Tikkurila OYJ
Decorative & Industrial Paint in Scandinavia, Central & Eastern Europe | 68,395 | 1,354,245 |
| Hong Kong 5.0% |
Value Partners Group Ltd.
Mutual Fund Management | 1,450,000 | 1,145,432 |
Vitasoy International Holdings Ltd.
Hong Kong Soy Food Brand | 2,087,000 | 4,181,526 |
| Total | 5,326,958 |
| India 16.9% |
Amara Raja Batteries Ltd.
Indian Maker of Auto & Industrial Batteries, Mostly for the Replacement Market | 233,667 | 2,990,856 |
Credit Analysis & Research Ltd.
Credit Rating Agency in India | 171,000 | 3,285,472 |
GRUH Finance Ltd.
Rural & Small Town Mortgage & Home Equity Lending in India | 463,074 | 2,198,680 |
TVS Motor Co., Ltd.
Indian Maker of Scooters, Mopeds, Motorcycles & Three-wheelers | 449,523 | 2,380,365 |
United Breweries Ltd.
Indian Brewer | 139,000 | 1,593,919 |
Zee Entertainment Enterprises Ltd.
Indian Programmer of Pay Television Content | 821,472 | 5,467,919 |
| Total | 17,917,211 |
| Common Stocks (continued) |
| Issuer | Shares | Value ($) |
| Indonesia 9.4% |
PT Link Net Tbk
Fixed Broadband & CATV Service Provider | 8,548,000 | 3,267,560 |
PT Matahari Department Store Tbk
Department Store Chain in Indonesia | 1,500,000 | 1,679,015 |
PT Media Nusantara Citra Tbk
Media Company in Indonesia | 22,500,000 | 2,918,929 |
PT Tower Bersama Infrastructure Tbk
Communications Towers | 5,700,000 | 2,106,959 |
| Total | 9,972,463 |
| Japan 0.7% |
Yonex Co., Ltd.(b)
Branded Sporting Goods Manufacturer | 17,200 | 798,735 |
| Mexico 7.0% |
Grupo Aeroportuario del Centro Norte SAB de CV
Northern Mexican Airport Operator | 545,000 | 2,345,932 |
Hoteles City Express SAB de CV(a)
Budget Hotel Operator in Mexico | 3,134,000 | 2,585,254 |
Qualitas Controladora SAB de CV
Auto Insurer in Mexico & Central America | 1,766,300 | 2,500,809 |
| Total | 7,431,995 |
| Panama 2.5% |
Banco Latinoamericano de Comercio Exterior SA, Class E
Latin American Trade Financing House | 90,000 | 2,649,600 |
| Philippines 3.7% |
Melco Crown Philippines Resorts Corp.(a)
Integrated Resort Operator in Manila | 14,293,000 | 1,084,454 |
Puregold Price Club, Inc.
Supermarket Operator in the Philippines | 2,199,000 | 1,725,139 |
RFM Corp.
Flour, Bread, Pasta & Ice Cream Manufacturer/Distributor in the Philippines | 10,970,000 | 1,124,875 |
| Total | 3,934,468 |
| Poland 2.2% |
Wawel SA
Chocolate & Confectionery Maker in Poland | 8,800 | 2,313,216 |
The accompanying Notes to Portfolio of Investments are an integral part of this statement.
Columbia Acorn Family of Funds | Annual Report 2016
| 71 |
Portfolio of Investments (continued)
Columbia Acorn Emerging Markets FundSM, December 31, 2016
| Common Stocks (continued) |
| Issuer | Shares | Value ($) |
| South Africa 5.9% |
Coronation Fund Managers Ltd.
South African Fund Manager | 284,552 | 1,455,498 |
Famous Brands Ltd.
Quick Service Restaurant & Cafe Franchise System in Africa | 192,936 | 2,198,701 |
Rand Merchant Investment Holdings Ltd.
Directly Sold Property & Casualty Insurance; Holdings in Other Insurers | 882,911 | 2,548,533 |
| Total | 6,202,732 |
| South Korea 12.7% |
Koh Young Technology, Inc.
Inspection Systems for Printed Circuit Boards | 87,387 | 3,266,989 |
Korea Investment Holdings Co., Ltd.
Brokerage & Asset Management | 80,656 | 2,795,126 |
Medy-Tox, Inc.
Botulinum Toxin ("Botox") & Dermal Fillers | 4,442 | 1,307,255 |
Modetour Network, Inc.
Travel Services | 140,705 | 3,365,077 |
Sam Yung Trading Co., Ltd.
Ophthalmic lenses | 90,103 | 1,316,792 |
Yuhan Corp.
Pharmaceutical Manufacturing & Distribution | 8,150 | 1,344,847 |
| Total | 13,396,086 |
| Spain 1.2% |
Prosegur Cia de Seguridad SA, Registered Shares
Security Guards | 200,000 | 1,250,549 |
| Sweden 1.5% |
Millicom International Cellular SA, SDR
Telecoms Operator in Latin America & Africa | 37,336 | 1,595,384 |
| Taiwan 9.7% |
Advantech Co., Ltd.
Industrial PC & Components | 166,988 | 1,316,783 |
Largan Precision Co., Ltd.
Mobile Device Camera Lenses & Modules | 25,000 | 2,914,035 |
PChome Online, Inc.
Taiwanese E-commerce Company | 249,581 | 2,184,549 |
| Common Stocks (continued) |
| Issuer | Shares | Value ($) |
Silergy Corp.
Chinese Provider of Analog & Mixed Digital Integrated Circuits | 210,000 | 2,941,736 |
Vanguard International Semiconductor Corp.
Semiconductor Foundry | 517,000 | 895,845 |
| Total | 10,252,948 |
| Thailand 4.0% |
Home Product Center PCL, Foreign Registered Shares
Home Improvement Retailer | 3,838,000 | 1,090,768 |
Samui Airport Property Fund Leasehold
Thai Airport Operator | 4,476,100 | 3,124,852 |
| Total | 4,215,620 |
| Turkey 2.6% |
Logo Yazilim Sanayi Ve Ticaret AS(a)
Enterprise Resource Planning (ERP) Software for Small-midsized Companies | 176,662 | 2,722,385 |
Total Common Stocks
(Cost: $101,122,033) | 99,851,003 |
|
| Securities Lending Collateral 1.1% |
| | Shares | Value ($) |
Dreyfus Government Cash Management Fund, Institutional Shares, (7 day yield of 0.450%)(c)
| 1,161,570 | 1,161,570 |
Total Securities Lending Collateral
(Cost: $1,161,570) | 1,161,570 |
|
| Money Market Funds 5.8% |
| | |
JPMorgan U.S. Government Money Market Fund, IM Shares (7 day yield of 0.445%)
| 6,153,634 | 6,153,634 |
Total Money Market Funds
(Cost: $6,153,634) | 6,153,634 |
Total Investments
(Cost: $108,437,237) | 107,166,207 |
| Obligation to Return Collateral for Securities Loaned | | (1,161,570) |
| Other Assets & Liabilities, Net | | (244,238) |
| Net Assets | $105,760,399 |
Notes to portfolio of investments
| (a) | Non-income producing security. |
| (b) | All or a portion of this security was on loan at December 31, 2016. The total market value of securities on loan at December 31, 2016 was $1,122,619. |
| (c) | Investment made with cash collateral received from securities lending activity. |
The accompanying Notes to Portfolio of Investments are an integral part of this statement.
| 72 | Columbia Acorn Family of Funds | Annual Report 2016 |
Portfolio of Investments (continued)
Columbia Acorn Emerging Markets FundSM, December 31, 2016
Abbreviation Legend
| ADR | American Depositary Receipt |
| SDR | Swedish Depositary Receipt |
Fair value measurements
Various inputs are used in determining the value of the Fund’s investments, following the input prioritization hierarchy established by accounting principles generally accepted in the United States of America (GAAP). These inputs are summarized in the three broad levels listed below:
| • | Level 1 – quoted prices in active markets for identical securities |
| • | Level 2 – prices determined using other significant observable inputs (including quoted prices for similar securities, interest rates, prepayment speeds, credit risk and others) |
| • | Level 3 – prices determined using significant unobservable inputs where quoted prices or observable inputs are unavailable or less reliable (including management’s own assumptions about the factors market participants would use in pricing an investment) |
The inputs or methodology used for valuing securities are not necessarily an indication of the risk associated with investing in those securities.
Examples of the types of securities in which the Fund would typically invest and how they are classified within this hierarchy are as follows. Typical Level 1 securities include exchange traded domestic equities, mutual funds whose net asset values are published each day and exchange traded foreign equities that are not statistically fair valued. Typical Level 2 securities include exchange traded foreign equities that are statistically fair valued, forward foreign currency exchange contracts and short-term investments valued at amortized cost. Additionally, securities fair valued by Columbia Wanger Asset Management’s Valuation Committee (the Committee) that rely on significant observable inputs are also included in Level 2. Typical Level 3 securities include any security fair valued by the Committee that relies on significant unobservable inputs.
The Committee is responsible for applying Columbia Acorn Trust Portfolio Pricing Policy and the Columbia Wanger Asset Management pricing procedures (the Policies), which are approved by and subject to the oversight of the Board of Trustees.
The Committee meets as necessary, and no less frequently than quarterly, to determine fair values for securities for which market quotations are not readily available or for which Columbia Wanger Asset Management believes that available market quotations are unreliable. The Committee also reviews the continuing appropriateness of the Policies. In circumstances where a security has been fair valued, the Committee will also review the continuing appropriateness of the current value of the security. The Policies address, among other things: circumstances under which market quotations will be deemed readily available; selection of third party pricing vendors; appropriate pricing methodologies; events that require fair valuation and fair value techniques; circumstances under which securities will be deemed to pose a potential for stale pricing, including when securities are illiquid, restricted, or in default; and certain delegations of authority to determine fair values to the Fund’s investment manager. The Committee may also meet to discuss additional valuation matters, which may include review of back-testing results, review of time-sensitive information or approval of other valuation related actions, and to review the appropriateness of the Policies.
For investments categorized as Level 3, the significant unobservable inputs used in the fair value measurement of the Fund’s securities may include: (i) data specific to the issuer or comparable issuers, (ii) general market or specific sector news and (iii) quoted prices and specific or similar security transactions. The Committee considers this data and any changes from prior periods in order to assess the reasonableness of observable and unobservable inputs, any assumptions or internal models used to value those securities and changes in fair value. Significant changes in any of these factors could result in lower or higher fair value measurements. Various factors impact the frequency of monitoring (which may occur as often as daily), however the Committee may determine that changes to inputs, assumptions and models are not required with the same frequency.
The following table is a summary of the inputs used to value the Fund’s investments at December 31, 2016:
| | Level 1
quoted prices in active
markets for identical
assets ($) | Level 2
other significant
observable inputs ($) | Level 3
significant
unobservable inputs ($) | Total ($) |
| Investments | | | | |
| Common Stocks | | | | |
| Cambodia | — | 2,337,783 | — | 2,337,783 |
| Cayman Islands | 1,125,869 | — | — | 1,125,869 |
| China | 2,025,025 | 3,027,731 | — | 5,052,756 |
| Finland | — | 1,354,245 | — | 1,354,245 |
| Hong Kong | — | 5,326,958 | — | 5,326,958 |
| India | — | 17,917,211 | — | 17,917,211 |
| Indonesia | — | 9,972,463 | — | 9,972,463 |
| Japan | — | 798,735 | — | 798,735 |
| Mexico | 7,431,995 | — | — | 7,431,995 |
| Panama | 2,649,600 | — | — | 2,649,600 |
| Philippines | — | 3,934,468 | — | 3,934,468 |
| Poland | — | 2,313,216 | — | 2,313,216 |
| South Africa | — | 6,202,732 | — | 6,202,732 |
| South Korea | — | 13,396,086 | — | 13,396,086 |
| Spain | — | 1,250,549 | — | 1,250,549 |
| Sweden | — | 1,595,384 | — | 1,595,384 |
| Taiwan | — | 10,252,948 | — | 10,252,948 |
The accompanying Notes to Portfolio of Investments are an integral part of this statement.
Columbia Acorn Family of Funds | Annual Report 2016
| 73 |
Portfolio of Investments (continued)
Columbia Acorn Emerging Markets FundSM, December 31, 2016
Fair value measurements (continued)
| | Level 1
quoted prices in active
markets for identical
assets ($) | Level 2
other significant
observable inputs ($) | Level 3
significant
unobservable inputs ($) | Total ($) |
| Thailand | — | 4,215,620 | — | 4,215,620 |
| Turkey | — | 2,722,385 | — | 2,722,385 |
| Total Common Stocks | 13,232,489 | 86,618,514 | — | 99,851,003 |
| Securities Lending Collateral | 1,161,570 | — | — | 1,161,570 |
| Money Market Funds | 6,153,634 | — | — | 6,153,634 |
| Total Investments | 20,547,693 | 86,618,514 | — | 107,166,207 |
The Fund’s assets assigned to the Level 2 input category are generally valued using a market approach, in which a security’s value is determined through its correlation to prices and information from observable market transactions for similar or identical assets. Foreign equities are generally valued at the last sale price on the foreign exchange or market on which they trade. The Fund may use a statistical fair valuation model, in accordance with the policy adopted by the Board, provided by an independent third party to value securities principally traded in foreign markets in order to adjust for possible stale pricing that may occur between the close of the foreign exchanges and the time for valuation. These models take into account available market data including intraday index, ADR, and ETF movements.
There were no transfers of financial assets between levels during the period.
The following table reconciles asset balances for the period ending December 31, 2016, in which significant observable and/or unobservable inputs (Level 3) were used in determining value:
| Investments in Securities | Balance as
of December 31,
2015 | Realized
Gain (Loss) | Change
in Unrealized
Appreciation
(Depreciation) | Purchases | Sales | Transfers
Into
Level 3 | Transfers
out of
Level 3 | Balance as
of December 31,
2016 |
| Common Stocks | | | | | | | | |
| China | 4,620,853 | (3,958,938) | 1,779,426 | 630,060 | (3,071,400) | - | - | - |
The information in the above reconciliation table represents fiscal year to date activity for any securities identified as using Level 3 inputs at either the beginning or the end of the current fiscal period.
Certain securities classified as Level 3 are valued by the Committee at fair value, using a market approach, as determined in good faith under consistently applied procedures established by and under the general supervision of the Board. To determine fair value for these securities, for which no market exists, the Committee utilizes the valuation technique it deems most appropriate in the circumstances, using some unobservable inputs, which may include, but are not limited to estimated earnings of the company and the position of the security within the company’s capital structure. The Committee also may use some observable inputs, which may include, but are not limited to, trades of similar securities or indices and market multiples derived from a set of comparable companies. Significant increases or decreases to any of these inputs could result in a significantly lower or higher fair value measurement.
The accompanying Notes to Portfolio of Investments are an integral part of this statement.
| 74 | Columbia Acorn Family of Funds | Annual Report 2016 |
Portfolio of Investments
Columbia Acorn European FundSM, December 31, 2016
(Percentages represent value of investments compared to net assets)
| Common Stocks 97.3% |
| Issuer | Shares | Value ($) |
| Belgium 1.3% |
Melexis NV
Analog & Custom Integrated Circuit Designer | 9,217 | 617,550 |
| Denmark 5.0% |
SimCorp AS
Software for Investment Managers | 29,125 | 1,419,444 |
William Demant Holding AS(a)
Manufacture & Distribution of Hearing Aids & Diagnostic Equipment | 52,898 | 919,770 |
| Total | 2,339,214 |
| Finland 8.0% |
Konecranes OYJ
Manufacture & Service of Industrial Cranes & Port Handling Equipment | 13,961 | 496,433 |
Munksjo OYJ
Specialty Paper Maker | 56,522 | 940,067 |
Munksjo OYJ(b)
Specialty Paper Maker | 68,560 | 1,136,320 |
Tikkurila OYJ
Decorative & Industrial Paint in Scandinavia, Central & Eastern Europe | 57,748 | 1,143,431 |
| Total | 3,716,251 |
| France 6.4% |
Akka Technologies
Engineering Consultancy | 36,969 | 1,347,641 |
Elior Group(c)
Contract Caterer & Travel Concessionary | 39,663 | 906,838 |
Eurofins Scientific SE
Food, Pharmaceuticals & Materials Screening & Testing | 1,710 | 729,013 |
| Total | 2,983,492 |
| Germany 14.3% |
AURELIUS Equity Opportunities SE & Co. KGaA
European Turnaround Investor | 20,200 | 1,181,034 |
Deutsche Beteiligungs AG
Private Equity Investment Management | 14,500 | 469,166 |
Fielmann AG
Retail Optician Chain | 7,724 | 509,725 |
MTU Aero Engines AG
Airplane Engine Components & Services | 9,170 | 1,057,758 |
Norma Group SE
Clamps for Automotive & Industrial Applications | 18,000 | 766,738 |
Rational AG
Commercial Ovens | 1,080 | 481,672 |
Stroeer SE & Co. KGaA(d)
Out of Home & Online Advertising | 12,323 | 540,142 |
| Common Stocks (continued) |
| Issuer | Shares | Value ($) |
Wirecard AG(d)
Online Payment Processing & Risk Management | 37,435 | 1,606,243 |
| Total | 6,612,478 |
| Italy 3.5% |
Brembo SpA
High Performance Auto Braking Systems Supplier | 10,622 | 642,922 |
Industria Macchine Automatiche SpA
Food & Drugs Packaging & Machinery | 16,424 | 995,831 |
| Total | 1,638,753 |
| Malta 3.8% |
Kindred Group PLC
European Online Gaming Operator | 189,040 | 1,775,116 |
| Netherlands 3.8% |
Aalberts Industries NV
Flow Control & Heat Treatment | 30,701 | 996,023 |
Gemalto NV
Digital Security Solutions | 13,475 | 779,011 |
| Total | 1,775,034 |
| Norway 2.4% |
Atea ASA
Nordic IT Hardware/Software Reseller & Integrator | 118,307 | 1,089,175 |
| Poland 1.7% |
Wawel SA
Chocolate & Confectionery Maker in Poland | 2,919 | 767,304 |
| Spain 5.5% |
Bolsas y Mercados Españoles SHMSF SA
Spanish Stock Markets | 16,000 | 471,503 |
Distribuidora Internacional de Alimentacion SA
Discount Retailer in Spain & Latin America | 101,155 | 496,733 |
Prosegur Cia de Seguridad SA, Registered Shares
Security Guards | 156,990 | 981,619 |
Viscofan SA
Sausage Casings Maker | 11,867 | 585,241 |
| Total | 2,535,096 |
The accompanying Notes to Portfolio of Investments are an integral part of this statement.
Columbia Acorn Family of Funds | Annual Report 2016
| 75 |
Portfolio of Investments (continued)
Columbia Acorn European FundSM, December 31, 2016
| Common Stocks (continued) |
| Issuer | Shares | Value ($) |
| Sweden 8.2% |
Byggmax Group AB
Nordic Discount DIY Retail Chain | 77,000 | 532,457 |
Recipharm AB, B Shares(d)
Contract Development Manufacturing Organization | 84,554 | 1,122,981 |
Sweco AB, Class B
Engineering Consultants | 59,867 | 1,184,119 |
Trelleborg AB, Class B
Manufacturer of Sealing, Dampening & Protective Solutions for Industry | 47,952 | 943,713 |
| Total | 3,783,270 |
| Switzerland 4.2% |
Inficon Holding AG
Gas Detection Instruments | 1,339 | 482,582 |
Partners Group Holding AG(d)
Private Markets Asset Management | 3,077 | 1,442,107 |
| Total | 1,924,689 |
| Turkey 1.2% |
Logo Yazilim Sanayi Ve Ticaret AS(a)
Enterprise Resource Planning (ERP) Software for Small-midsized Companies | 35,730 | 550,604 |
| United Kingdom 28.0% |
Abcam PLC
Online Sales of Antibodies | 92,474 | 873,057 |
Assura PLC
UK Primary Health Care Property REIT | 1,039,724 | 734,144 |
Big Yellow Group PLC
UK Self Storage | 90,309 | 765,334 |
Connect Group PLC
Newspaper & Magazine Distributor | 440,355 | 828,964 |
Croda International PLC
Oleo-chemicals & Industrial Chemicals | 14,411 | 566,778 |
Domino’s Pizza Group PLC
Pizza Delivery in the UK, Ireland & Switzerland | 160,000 | 710,034 |
DS Smith PLC
Packaging | 95,000 | 477,051 |
Halma PLC
Health & Safety Sensor Technology | 126,231 | 1,396,554 |
Hastings Group Holdings PLC(c)
General Insurance Provider | 267,297 | 813,659 |
| Common Stocks (continued) |
| Issuer | Shares | Value ($) |
LivaNova PLC(a)
Neuromodulation & Cardiac Devices | 13,451 | 604,892 |
Ocado Group PLC(a),(d)
Online Grocery Retailer | 168,528 | 548,520 |
Polypipe Group PLC
Manufacturer of Plastic Piping & Fittings | 84,385 | 336,843 |
Rentokil Initial PLC
Pest Control, Washroom & Workwear Service Provider | 355,932 | 973,752 |
Rightmove PLC
Internet Real Estate Listings | 26,655 | 1,280,410 |
Shaftesbury PLC
London Prime Retail REIT | 94,669 | 1,059,886 |
Spirax-Sarco Engineering PLC
Steam Systems & Pumps for Manufacturing & Process Industries | 5,359 | 275,798 |
WH Smith PLC
Newsprint, Books & General Stationery Retailer | 39,357 | 754,112 |
| Total | 12,999,788 |
Total Common Stocks
(Cost: $39,782,127) | 45,107,814 |
|
| Securities Lending Collateral 6.8% |
| | Shares | Value ($) |
Dreyfus Government Cash Management Fund, Institutional Shares, (7 day yield of 0.450%)(e)
| 3,133,401 | 3,133,401 |
Total Securities Lending Collateral
(Cost: $3,133,401) | 3,133,401 |
|
| Money Market Funds 2.2% |
| | |
JPMorgan U.S. Government Money Market Fund, IM Shares (7 day yield of 0.445%)
| 1,010,059 | 1,010,059 |
Total Money Market Funds
(Cost: $1,010,059) | 1,010,059 |
Total Investments
(Cost: $43,925,587) | 49,251,274 |
| Obligation to Return Collateral for Securities Loaned | | (3,133,401) |
| Other Assets & Liabilities, Net | | 234,440 |
| Net Assets | $46,352,313 |
The accompanying Notes to Portfolio of Investments are an integral part of this statement.
| 76 | Columbia Acorn Family of Funds | Annual Report 2016 |
Portfolio of Investments (continued)
Columbia Acorn European FundSM, December 31, 2016
Notes to portfolio of investments
| (a) | Non-income producing security. |
| (b) | Security is traded on a Swedish exchange. |
| (c) | Represents privately placed and other securities and instruments exempt from SEC registration (collectively, private placements), such as Section 4(a)(2) and Rule 144A eligible securities, which are often sold only to qualified institutional buyers. The Fund may invest in private placements determined to be liquid as well as those determined to be illiquid. Private placements may be determined to be liquid under guidelines established by the Fund’s Board of Trustees. At December 31, 2016, the value of these securities amounted to $1,720,497 or 3.71% of net assets. |
| (d) | All or a portion of this security was on loan at December 31, 2016. The total market value of securities on loan at December 31, 2016 was $3,019,078. |
| (e) | Investment made with cash collateral received from securities lending activity. |
Fair value measurements
Various inputs are used in determining the value of the Fund’s investments, following the input prioritization hierarchy established by accounting principles generally accepted in the United States of America (GAAP). These inputs are summarized in the three broad levels listed below:
| • | Level 1 – quoted prices in active markets for identical securities |
| • | Level 2 – prices determined using other significant observable inputs (including quoted prices for similar securities, interest rates, prepayment speeds, credit risk and others) |
| • | Level 3 – prices determined using significant unobservable inputs where quoted prices or observable inputs are unavailable or less reliable (including management’s own assumptions about the factors market participants would use in pricing an investment) |
The inputs or methodology used for valuing securities are not necessarily an indication of the risk associated with investing in those securities.
Examples of the types of securities in which the Fund would typically invest and how they are classified within this hierarchy are as follows. Typical Level 1 securities include exchange traded domestic equities, mutual funds whose net asset values are published each day and exchange traded foreign equities that are not statistically fair valued. Typical Level 2 securities include exchange traded foreign equities that are statistically fair valued, forward foreign currency exchange contracts and short-term investments valued at amortized cost. Additionally, securities fair valued by Columbia Wanger Asset Management’s Valuation Committee (the Committee) that rely on significant observable inputs are also included in Level 2. Typical Level 3 securities include any security fair valued by the Committee that relies on significant unobservable inputs.
The Committee is responsible for applying Columbia Acorn Trust Portfolio Pricing Policy and the Columbia Wanger Asset Management pricing procedures (the Policies), which are approved by and subject to the oversight of the Board of Trustees.
The Committee meets as necessary, and no less frequently than quarterly, to determine fair values for securities for which market quotations are not readily available or for which Columbia Wanger Asset Management believes that available market quotations are unreliable. The Committee also reviews the continuing appropriateness of the Policies. In circumstances where a security has been fair valued, the Committee will also review the continuing appropriateness of the current value of the security. The Policies address, among other things: circumstances under which market quotations will be deemed readily available; selection of third party pricing vendors; appropriate pricing methodologies; events that require fair valuation and fair value techniques; circumstances under which securities will be deemed to pose a potential for stale pricing, including when securities are illiquid, restricted, or in default; and certain delegations of authority to determine fair values to the Fund’s investment manager. The Committee may also meet to discuss additional valuation matters, which may include review of back-testing results, review of time-sensitive information or approval of other valuation related actions, and to review the appropriateness of the Policies.
For investments categorized as Level 3, the significant unobservable inputs used in the fair value measurement of the Fund’s securities may include: (i) data specific to the issuer or comparable issuers, (ii) general market or specific sector news and (iii) quoted prices and specific or similar security transactions. The Committee considers this data and any changes from prior periods in order to assess the reasonableness of observable and unobservable inputs, any assumptions or internal models used to value those securities and changes in fair value. Significant changes in any of these factors could result in lower or higher fair value measurements. Various factors impact the frequency of monitoring (which may occur as often as daily), however the Committee may determine that changes to inputs, assumptions and models are not required with the same frequency.
The following table is a summary of the inputs used to value the Fund’s investments at December 31, 2016:
| | Level 1
quoted prices in active
markets for identical
assets ($) | Level 2
other significant
observable inputs ($) | Level 3
significant
unobservable inputs ($) | Total ($) |
| Investments | | | | |
| Common Stocks | | | | |
| Belgium | — | 617,550 | — | 617,550 |
| Denmark | — | 2,339,214 | — | 2,339,214 |
| Finland | — | 3,716,251 | — | 3,716,251 |
| France | — | 2,983,492 | — | 2,983,492 |
| Germany | — | 6,612,478 | — | 6,612,478 |
| Italy | — | 1,638,753 | — | 1,638,753 |
| Malta | — | 1,775,116 | — | 1,775,116 |
| Netherlands | — | 1,775,034 | — | 1,775,034 |
| Norway | — | 1,089,175 | — | 1,089,175 |
| Poland | — | 767,304 | — | 767,304 |
| Spain | — | 2,535,096 | — | 2,535,096 |
| Sweden | — | 3,783,270 | — | 3,783,270 |
The accompanying Notes to Portfolio of Investments are an integral part of this statement.
Columbia Acorn Family of Funds | Annual Report 2016
| 77 |
Portfolio of Investments (continued)
Columbia Acorn European FundSM, December 31, 2016
Fair value measurements (continued)
| | Level 1
quoted prices in active
markets for identical
assets ($) | Level 2
other significant
observable inputs ($) | Level 3
significant
unobservable inputs ($) | Total ($) |
| Switzerland | — | 1,924,689 | — | 1,924,689 |
| Turkey | — | 550,604 | — | 550,604 |
| United Kingdom | 604,892 | 12,394,896 | — | 12,999,788 |
| Total Common Stocks | 604,892 | 44,502,922 | — | 45,107,814 |
| Securities Lending Collateral | 3,133,401 | — | — | 3,133,401 |
| Money Market Funds | 1,010,059 | — | — | 1,010,059 |
| Total Investments | 4,748,352 | 44,502,922 | — | 49,251,274 |
The Fund’s assets assigned to the Level 2 input category are generally valued using a market approach, in which a security’s value is determined through its correlation to prices and information from observable market transactions for similar or identical assets. Foreign equities are generally valued at the last sale price on the foreign exchange or market on which they trade. The Fund may use a statistical fair valuation model, in accordance with the policy adopted by the Board, provided by an independent third party to value securities principally traded in foreign markets in order to adjust for possible stale pricing that may occur between the close of the foreign exchanges and the time for valuation. These models take into account available market data including intraday index, ADR, and ETF movements.
There were no transfers of financial assets between levels during the period.
The accompanying Notes to Portfolio of Investments are an integral part of this statement.
| 78 | Columbia Acorn Family of Funds | Annual Report 2016 |
Statement of Assets and Liabilities
December 31, 2016
| | Columbia
Acorn®
Fund | Columbia
Acorn
International® | Columbia
Acorn
USA® | Columbia
Acorn
International
SelectSM |
| Assets | | | | |
| Investments, at cost | | | | |
| Unaffiliated issuers, at cost | $3,392,477,409 | $3,951,461,669 | $482,686,794 | $89,185,569 |
| Affiliated issuers, at cost | 96,668,256 | — | — | — |
| Total investments, at cost | 3,489,145,665 | 3,951,461,669 | 482,686,794 | 89,185,569 |
| Investments, at value | | | | |
| Unaffiliated issuers, at value (including securities on loan: $99,397,696, 162,723,470, 14,865,804 and 5,209,652, respectively) | 4,805,683,002 | 4,814,787,186 | 668,005,247 | 104,636,049 |
| Affiliated issuers, at value | 98,413,616 | — | — | — |
| Total investments, at value | 4,904,096,618 | 4,814,787,186 | 668,005,247 | 104,636,049 |
| Foreign currency (identified cost $—, 291,610, — and 101, respectively) | — | 292,228 | — | 98 |
| Receivable for: | | | | |
| Investments sold | 49,264,526 | 26,436,444 | 14,859,818 | 591,987 |
| Capital shares sold | 2,815,608 | 32,272,348 | 267,305 | 346,759 |
| Dividends | 2,437,087 | 4,659,846 | 221,571 | 85,659 |
| Securities lending income | 445,518 | 179,376 | 59,527 | 1,438 |
| Foreign tax reclaims | — | 3,339,524 | 1,840 | 92,641 |
| Expense reimbursement due from Investment Manager | — | 668 | — | 1,632 |
| Prepaid expenses | 103,017 | 103,904 | 12,318 | 1,991 |
| Trustees’ deferred compensation plan | 3,719,222 | 1,502,703 | 336,601 | — |
| Total assets | 4,962,881,596 | 4,883,574,227 | 683,764,227 | 105,758,254 |
| Liabilities | | | | |
| Due upon return of securities on loan | 101,389,775 | 169,508,371 | 15,336,080 | 5,444,661 |
| Payable for: | | | | |
| Investments purchased | 7,535,033 | 2,383,263 | 19,356,443 | 741 |
| Capital shares purchased | 20,581,656 | 55,979,574 | 4,869,728 | 160,786 |
| Foreign capital gains taxes deferred | — | — | — | 11,163 |
| Investment advisory fee | 88,860 | 97,931 | 15,891 | 2,441 |
| Distribution and/or service fees | 14,773 | 5,796 | 887 | 257 |
| Transfer agent fees | 442,675 | 479,657 | 158,038 | 9,644 |
| Administration fees | 6,220 | 5,970 | 831 | 128 |
| Trustees’ fees | 18,738 | 16,132 | 2,414 | 68,780 |
| Chief compliance officer expenses | 7,442 | 7,238 | 924 | 149 |
| Other expenses | 343,446 | 649,426 | 65,965 | 47,931 |
| Trustees’ deferred compensation plan | 3,719,222 | 1,502,703 | 336,601 | — |
| Total liabilities | 134,147,840 | 230,636,061 | 40,143,802 | 5,746,681 |
| Net assets applicable to outstanding capital stock | $4,828,733,756 | $4,652,938,166 | $643,620,425 | $100,011,573 |
| Represented by | | | | |
| Paid in capital | 3,258,575,063 | 3,825,982,026 | 440,965,383 | 99,365,722 |
| Undistributed (excess of distributions over) net investment income | (3,783,993) | 30,644,829 | (324,258) | (76,287) |
| Accumulated net realized gain (loss) | 158,991,733 | (66,698,586) | 17,660,847 | (14,710,654) |
| Unrealized appreciation (depreciation) on: | | | | |
| Investments - unaffiliated issuers | 1,413,205,593 | 863,325,517 | 185,318,453 | 15,450,480 |
| Investments - affiliated issuers | 1,745,360 | — | — | — |
| Foreign currency translations | — | (315,620) | — | (6,526) |
| Foreign capital gains tax | — | — | — | (11,162) |
| Total - representing net assets applicable to outstanding capital stock | $4,828,733,756 | $4,652,938,166 | $643,620,425 | $100,011,573 |
The accompanying Notes to Financial Statements are an integral part of this statement.
Columbia Acorn Family of Funds | Annual Report 2016
| 79 |
Statement of Assets and Liabilities (continued)
December 31, 2016
| | Columbia
Acorn®
Fund | Columbia
Acorn
International® | Columbia
Acorn
USA® | Columbia
Acorn
International
SelectSM |
| Class A | | | | |
| Net assets | $931,460,422 | $576,235,048 | $80,720,701 | $20,164,911 |
| Shares outstanding | 69,749,177 | 15,281,929 | 5,398,822 | 944,091 |
| Net asset value per share(a) | $13.35 | $37.71 | $14.95 | $21.36 |
| Maximum offering price per share(b) | $14.16 | $40.01 | $15.86 | $22.66 |
| Class B | | | | |
| Net assets | $— | $487,201 | $— | $— |
| Shares outstanding | — | 13,390 | — | — |
| Net asset value per share(a) | $— | $36.38 (c) | $— | $— |
| Class C | | | | |
| Net assets | $302,119,041 | $64,547,718 | $12,087,505 | $4,345,711 |
| Shares outstanding | 36,228,372 | 1,783,961 | 1,202,907 | 217,383 |
| Net asset value per share(a) | $8.34 | $36.18 | $10.05 | $19.99 |
| Class I | | | | |
| Net assets | $10,848,523 | $22,176,859 | $1,227 | $1,991 |
| Shares outstanding | 704,360 | 587,108 | 70 | 92 |
| Net asset value per share(d) | $15.40 | $37.77 | $17.47 (c) | $21.60 (c) |
| Class R | | | | |
| Net assets | $— | $4,636,888 | $— | $— |
| Shares outstanding | — | 122,954 | — | — |
| Net asset value per share(d) | $— | $37.71 | $— | $— |
| Class R4 | | | | |
| Net assets | $33,378,072 | $101,988,046 | $6,172,231 | $1,105,881 |
| Shares outstanding | 2,107,978 | 2,681,934 | 344,163 | 50,792 |
| Net asset value per share(d) | $15.83 | $38.03 | $17.93 | $21.77 |
| Class R5 | | | | |
| Net assets | $45,474,651 | $286,786,286 | $13,763,575 | $440,246 |
| Shares outstanding | 2,853,094 | 7,603,302 | 763,818 | 20,232 |
| Net asset value per share(d) | $15.94 | $37.72 | $18.02 | $21.76 |
| Class Y | | | | |
| Net assets | $79,518,124 | $239,732,607 | $38,136,274 | $322,112 |
| Shares outstanding | 4,958,843 | 6,305,081 | 2,102,808 | 14,817 |
| Net asset value per share(d) | $16.04 | $38.02 | $18.14 | $21.74 |
| Class Z | | | | |
| Net assets | $3,425,934,923 | $3,356,347,513 | $492,738,912 | $73,630,721 |
| Shares outstanding | 224,057,497 | 88,931,956 | 28,648,315 | 3,406,482 |
| Net asset value per share(d) | $15.29 | $37.74 | $17.20 | $21.61 |
| (a) | Redemption price per share is equal to net asset value less any applicable contingent deferred sales charge. |
| (b) | On sales of $50,000 or more the offering price is reduced. |
| (c) | Net asset value per share rounds to this amount due to fractional shares outstanding. |
| (d) | Redemption price per share is equal to net asset value. |
The accompanying Notes to Financial Statements are an integral part of this statement.
| 80 | Columbia Acorn Family of Funds | Annual Report 2016 |
Statement of Assets and Liabilities (continued)
December 31, 2016
| | Columbia
Acorn
SelectSM | Columbia
Thermostat
FundSM | Columbia
Acorn
Emerging Markets
FundSM | Columbia
Acorn
European
FundSM |
| Assets | | | | |
| Investments, at cost | | | | |
| Unaffiliated issuers, at cost | $258,458,354 | $3,545,380 | $108,437,237 | $43,925,587 |
| Affiliated issuers, at cost | — | 1,083,984,898 | — | — |
| Total investments, at cost | 258,458,354 | 1,087,530,278 | 108,437,237 | 43,925,587 |
| Investments, at value | | | | |
| Unaffiliated issuers, at value (including securities on loan: $—, —, 1,122,619 and 3,019,078, respectively) | 308,381,686 | 3,545,380 | 107,166,207 | 49,251,274 |
| Affiliated issuers, at value | — | 1,102,296,816 | — | — |
| Total investments, at value | 308,381,686 | 1,105,842,196 | 107,166,207 | 49,251,274 |
| Foreign currency (identified cost $—, —, 19,437 and 1,713, respectively) | — | — | 19,417 | 1,713 |
| Receivable for: | | | | |
| Investments sold | 4,452,507 | 1,985,474 | 209,823 | 247,376 |
| Capital shares sold | 348,179 | 1,994,669 | 235,624 | 29,905 |
| Dividends | 168,302 | 1,818,936 | 124,704 | 31,005 |
| Securities lending income | — | — | 1,364 | 3,853 |
| Foreign tax reclaims | — | — | 11,641 | 53,140 |
| Expense reimbursement due from Investment Manager | — | 185 | — | 166 |
| Prepaid expenses | 6,087 | 20,866 | 2,879 | 1,058 |
| Trustees’ deferred compensation plan | 312,273 | — | — | — |
| Other assets | — | — | — | 564 |
| Total assets | 313,669,034 | 1,111,662,326 | 107,771,659 | 49,620,054 |
| Liabilities | | | | |
| Due upon return of securities on loan | — | — | 1,161,570 | 3,133,401 |
| Payable for: | | | | |
| Investments purchased | 2,312,792 | 1,818,936 | 8,928 | 2,884 |
| Capital shares purchased | 2,561,282 | 2,103,016 | 705,271 | 78,394 |
| Foreign capital gains taxes deferred | — | — | 8,189 | — |
| Investment advisory fee | 5,534 | 3,025 | 3,569 | 1,503 |
| Distribution and/or service fees | 1,585 | 11,987 | 759 | 371 |
| Transfer agent fees | 31,371 | 77,932 | 17,078 | 5,446 |
| Administration fees | 398 | 1,414 | 135 | 59 |
| Trustees’ fees | 991 | 145,059 | 33,262 | 5,892 |
| Chief compliance officer expenses | 482 | 1,647 | 198 | 73 |
| Other expenses | 53,342 | 72,693 | 72,301 | 39,718 |
| Trustees’ deferred compensation plan | 312,273 | — | — | — |
| Total liabilities | 5,280,050 | 4,235,709 | 2,011,260 | 3,267,741 |
| Net assets applicable to outstanding capital stock | $308,388,984 | $1,107,426,617 | $105,760,399 | $46,352,313 |
| Represented by | | | | |
| Paid in capital | 233,632,934 | 1,074,719,113 | 194,758,807 | 50,910,235 |
| Undistributed (excess of distributions over) net investment income | (319,341) | 13,506,415 | (1,216,803) | 55,698 |
| Accumulated net realized gain (loss) | 25,152,059 | 889,171 | (86,502,687) | (9,933,418) |
| Unrealized appreciation (depreciation) on: | | | | |
| Investments - unaffiliated issuers | 49,923,332 | — | (1,271,030) | 5,325,687 |
| Investments - affiliated issuers | — | 18,311,918 | — | — |
| Foreign currency translations | — | — | 301 | (5,889) |
| Foreign capital gains tax | — | — | (8,189) | — |
| Total - representing net assets applicable to outstanding capital stock | $308,388,984 | $1,107,426,617 | $105,760,399 | $46,352,313 |
The accompanying Notes to Financial Statements are an integral part of this statement.
Columbia Acorn Family of Funds | Annual Report 2016
| 81 |
Statement of Assets and Liabilities (continued)
December 31, 2016
| | Columbia
Acorn
SelectSM | Columbia
Thermostat
FundSM | Columbia
Acorn
Emerging Markets
FundSM | Columbia
Acorn
European
FundSM |
| Class A | | | | |
| Net assets | $119,363,900 | $398,781,216 | $49,141,319 | $26,269,210 |
| Shares outstanding | 9,088,588 | 27,318,309 | 4,993,861 | 1,860,959 |
| Net asset value per share(a) | $13.13 | $14.60 | $9.84 | $14.12 |
| Maximum offering price per share(b) | $13.93 | $15.49 | $10.44 | $14.98 |
| Class C | | | | |
| Net assets | $27,524,105 | $338,930,080 | $15,534,318 | $7,111,743 |
| Shares outstanding | 2,984,526 | 23,182,042 | 1,585,299 | 508,304 |
| Net asset value per share(a) | $9.22 | $14.62 | $9.80 | $13.99 |
| Class I | | | | |
| Net assets | $10,910,817 | $— | $2,023 | $2,434 |
| Shares outstanding | 738,244 | — | 205 | 173 |
| Net asset value per share(c) | $14.78 | $— | $9.86 (d) | $14.10 (d) |
| Class R4 | | | | |
| Net assets | $852,802 | $15,663,916 | $1,305,802 | $362,286 |
| Shares outstanding | 56,362 | 1,082,257 | 131,658 | 25,555 |
| Net asset value per share(c) | $15.13 | $14.47 | $9.92 | $14.18 |
| Class R5 | | | | |
| Net assets | $1,035,650 | $12,023,710 | $806,494 | $1,262,050 |
| Shares outstanding | 68,153 | 829,969 | 81,355 | 88,592 |
| Net asset value per share(c) | $15.20 | $14.49 | $9.91 | $14.25 |
| Class Y | | | | |
| Net assets | $4,388,668 | $398,823 | $1,863 | $— |
| Shares outstanding | 286,665 | 27,573 | 190 | — |
| Net asset value per share(c) | $15.31 | $14.46 | $9.82 (d) | $— |
| Class Z | | | | |
| Net assets | $144,313,042 | $341,628,872 | $38,968,580 | $11,344,590 |
| Shares outstanding | 9,867,482 | 23,724,749 | 3,954,722 | 803,832 |
| Net asset value per share(c) | $14.63 | $14.40 | $9.85 | $14.11 |
| (a) | Redemption price per share is equal to net asset value less any applicable contingent deferred sales charge. |
| (b) | On sales of $50,000 or more the offering price is reduced. |
| (c) | Redemption price per share is equal to net asset value. |
| (d) | Net asset value per share rounds to this amount due to fractional shares outstanding. |
The accompanying Notes to Financial Statements are an integral part of this statement.
| 82 | Columbia Acorn Family of Funds | Annual Report 2016 |
Statement of Operations
Year Ended December 31, 2016
| | Columbia
Acorn®
Fund | Columbia
Acorn
International® | Columbia
Acorn
USA® | Columbia
Acorn
International
SelectSM |
| Net investment income | | | | |
| Income: | | | | |
| Dividends — unaffiliated issuers | $49,703,992 | $125,725,867 | $5,377,935 | $2,205,449 |
| Dividends — affiliated issuers | — | 1,686,164 | — | — |
| Interest | 234 | 788 | — | 14 |
| Income from securities lending — net | 1,715,074 | 7,283,923 | 256,279 | 201,738 |
| Foreign taxes withheld | (115,876) | (12,766,598) | (45,243) | (213,970) |
| Total income | 51,303,424 | 121,930,144 | 5,588,971 | 2,193,231 |
| Expenses: | | | | |
| Investment advisory fee | 38,178,766 | 43,794,854 | 6,082,827 | 1,037,789 |
| Distribution and/or service fees | | | | |
| Class A | 2,756,099 | 1,741,815 | 209,739 | 61,049 |
| Class B | 1,617 | 7,065 | 17 | 14 |
| Class C | 3,661,493 | 779,367 | 143,160 | 47,144 |
| Class R | — | 23,533 | — | — |
| Transfer agent fees | | | | |
| Class A | 1,023,375 | 946,818 | 121,406 | 34,701 |
| Class B | 1,688 | 5,577 | 141 | 37 |
| Class C | 289,948 | 95,479 | 16,753 | 7,409 |
| Class R | — | 8,082 | — | — |
| Class R4 | 47,723 | 618,756 | 11,501 | 1,737 |
| Class R5 | 27,296 | 152,871 | 12,005 | 439 |
| Class Z | 2,490,169 | 3,840,756 | 741,274 | 91,413 |
| Administration fees | 2,629,907 | 2,626,696 | 311,930 | 51,760 |
| Trustees’ fees | 499,834 | 485,915 | 58,777 | 9,793 |
| Custodian fees | 64,606 | 962,099 | 20,319 | — |
| Printing and postage fees | 505,070 | 756,143 | 71,682 | 31,043 |
| Registration fees | 140,910 | 169,093 | 98,705 | 93,665 |
| Audit fees | 106,593 | 205,746 | 38,874 | 51,636 |
| Legal fees | 914,988 | 958,878 | 111,877 | 18,091 |
| Line of credit interest expense | 1,516 | — | — | — |
| Chief compliance officer expenses | 655,297 | 652,365 | 83,331 | 12,916 |
| Other | — | 183,394 | 40,088 | — |
| Total expenses | 53,996,895 | 59,015,302 | 8,174,406 | 1,550,636 |
| Fees waived or expenses reimbursed by Investment Manager and its affiliates | — | (297,187) | — | (85,117) |
| Total net expenses | 53,996,895 | 58,718,115 | 8,174,406 | 1,465,519 |
| Net investment income (loss) | (2,693,471) | 63,212,029 | (2,585,435) | 727,712 |
| Realized and unrealized gain (loss) — net | | | | |
| Net realized gain (loss) on: | | | | |
| Investments — unaffiliated issuers | 1,607,174,198 | 25,614,402 | 184,943,364 | 407,103 |
| Investments — affiliated issuers | (83,229,370) | (40,493,220) | (1,922,691) | — |
| Foreign currency translations | (17,346) | 91,225 | — | (251) |
| Futures contracts | (13,079,023) | — | (9,714,342) | — |
| Net realized gain (loss) | 1,510,848,459 | (14,787,593) | 173,306,331 | 406,852 |
| Net change in unrealized appreciation (depreciation) on: | | | | |
| Investments — unaffiliated issuers | (1,014,702,901) | (220,426,452) | (117,922,044) | (736,932) |
| Investments — affiliated issuers | (12,165,324) | 48,595,971 | 1,467,113 | — |
| Foreign currency translations | 2,210 | (83,633) | — | 16,479 |
| Futures contracts | (4,292,591) | — | (465,285) | — |
| Foreign capital gains tax | — | — | — | (6,775) |
| Net change in unrealized appreciation (depreciation) | (1,031,158,606) | (171,914,114) | (116,920,216) | (727,228) |
| Net realized and unrealized gain (loss) | 479,689,853 | (186,701,707) | 56,386,115 | (320,376) |
| Net increase (decrease) in net assets resulting from operations | $476,996,382 | $(123,489,678) | $53,800,680 | $407,336 |
The accompanying Notes to Financial Statements are an integral part of this statement.
Columbia Acorn Family of Funds | Annual Report 2016
| 83 |
Statement of Operations (continued)
Year Ended December 31, 2016
| | Columbia
Acorn
SelectSM | Columbia
Thermostat
FundSM | Columbia
Acorn
Emerging Markets
FundSM | Columbia
Acorn
European
FundSM |
| Net investment income | | | | |
| Income: | | | | |
| Dividends — unaffiliated issuers | $3,101,943 | $7,948 | $3,065,864 | $1,668,499 |
| Dividends — affiliated issuers | — | 21,237,704 | — | — |
| Interest | — | — | 55 | — |
| Income from securities lending — net | 5,947 | — | 23,400 | 122,374 |
| Foreign taxes withheld | (5,800) | — | (322,610) | (165,460) |
| Total income | 3,102,090 | 21,245,652 | 2,766,709 | 1,625,413 |
| Expenses: | | | | |
| Investment advisory fee | 2,950,183 | 1,125,392 | 1,943,701 | 692,765 |
| Distribution and/or service fees | | | | |
| Class A | 319,978 | 992,344 | 177,219 | 88,422 |
| Class B | 413 | 399 | — | — |
| Class C | 299,201 | 3,625,487 | 195,306 | 73,973 |
| Transfer agent fees | | | | |
| Class A | 160,214 | 292,173 | 103,623 | 41,367 |
| Class B | 508 | 248 | — | — |
| Class C | 33,954 | 254,525 | 30,077 | 8,954 |
| Class R4 | 1,183 | 13,348 | 3,098 | 648 |
| Class R5 | 546 | 5,674 | 2,205 | 786 |
| Class Z | 164,580 | 222,233 | 100,255 | 13,343 |
| Administration fees | 158,617 | 514,594 | 77,335 | 26,595 |
| Trustees’ fees | 29,085 | 89,172 | 15,937 | 4,832 |
| Custodian fees | 6,316 | 1,586 | 128,049 | 43,380 |
| Printing and postage fees | 71,488 | 142,213 | 42,085 | 27,619 |
| Registration fees | 96,358 | 132,245 | 87,893 | 75,893 |
| Audit fees | 38,874 | 22,799 | 69,295 | 38,484 |
| Legal fees | 54,669 | 178,399 | 28,047 | 10,046 |
| Line of credit interest expense | — | — | 335 | — |
| Chief compliance officer expenses | 37,793 | 112,684 | 25,146 | 6,188 |
| Other | 8,759 | 92,985 | 31,983 | 22,946 |
| Total expenses | 4,432,719 | 7,818,500 | 3,061,589 | 1,176,241 |
| Fees waived or expenses reimbursed by Investment Manager and its affiliates | (694,365) | (388,322) | (9,954) | (141,465) |
| Total net expenses | 3,738,354 | 7,430,178 | 3,051,635 | 1,034,776 |
| Net investment income (loss) | (636,264) | 13,815,474 | (284,926) | 590,637 |
| Realized and unrealized gain (loss) — net | | | | |
| Net realized gain (loss) on: | | | | |
| Investments — unaffiliated issuers | 51,362,650 | — | (47,941,233) | (4,563,222) |
| Investments — affiliated issuers | — | (10,046,653) | — | — |
| Capital gain distributions from underlying affiliated funds | — | 16,502,029 | — | — |
| Foreign currency translations | (3,316) | — | (96,973) | (16,086) |
| Futures contracts | — | — | 2,440,126 | — |
| Net realized gain (loss) | 51,359,334 | 6,455,376 | (45,598,080) | (4,579,308) |
| Net change in unrealized appreciation (depreciation) on: | | | | |
| Investments — unaffiliated issuers | (13,695,183) | — | 36,309,650 | 1,960,873 |
| Investments — affiliated issuers | — | 27,501,996 | — | — |
| Foreign currency translations | (1,531) | — | 1,227 | (188) |
| Foreign capital gains tax | — | — | (8,189) | — |
| Net change in unrealized appreciation (depreciation) | (13,696,714) | 27,501,996 | 36,302,688 | 1,960,685 |
| Net realized and unrealized gain (loss) | 37,662,620 | 33,957,372 | (9,295,392) | (2,618,623) |
| Net increase (decrease) in net assets resulting from operations | $37,026,356 | $47,772,846 | $(9,580,318) | $(2,027,986) |
The accompanying Notes to Financial Statements are an integral part of this statement.
| 84 | Columbia Acorn Family of Funds | Annual Report 2016 |
Statement of Changes in Net Assets
| | Columbia
Acorn® Fund | Columbia Acorn
International® |
| | Year Ended
December 31, 2016 | Year Ended
December 31, 2015 | Year Ended
December 31, 2016 | Year Ended
December 31, 2015 |
| Operations | | | | |
| Net investment income (loss) | $(2,693,471) | $(26,090,948) | $63,212,029 | $88,208,011 |
| Net realized gain (loss) | 1,510,848,459 | 4,728,265,616 | (14,787,593) | 303,613,317 |
| Net change in unrealized appreciation (depreciation) | (1,031,158,606) | (4,643,167,054) | (171,914,114) | (481,357,534) |
| Net increase (decrease) in net assets resulting from operations | 476,996,382 | 59,007,614 | (123,489,678) | (89,536,206) |
| Distributions to shareholders | | | | |
| Net investment income | | | | |
| Class A | — | — | (2,294,349) | (8,205,224) |
| Class B | — | — | — | (1,139) |
| Class C | — | — | — | (181,949) |
| Class I | — | — | (250,719) | (739,480) |
| Class R | — | — | (1,758) | (28,701) |
| Class R4 | — | — | (643,271) | (5,718,822) |
| Class R5 | — | — | (2,042,254) | (4,463,810) |
| Class Y | — | — | (1,616,789) | (3,895,860) |
| Class Z | — | — | (22,632,732) | (61,075,291) |
| Net realized gains | | | | |
| Class A | (355,213,879) | (686,509,674) | (4,791,671) | (33,019,639) |
| Class B | — | (1,036,254) | (6,422) | (98,847) |
| Class C | (162,765,900) | (272,289,441) | (553,766) | (3,721,075) |
| Class I | (6,394,000) | (10,763,307) | (367,390) | (1,983,081) |
| Class R | — | — | (30,861) | (184,807) |
| Class R4 | (10,648,130) | (27,922,528) | (3,192,056) | (18,460,175) |
| Class R5 | (15,236,759) | (38,850,876) | (2,010,528) | (13,614,854) |
| Class Y | (25,706,160) | (55,761,205) | (1,662,627) | (10,490,604) |
| Class Z | (1,202,301,687) | (2,491,951,313) | (27,548,483) | (189,765,735) |
| Total distributions to shareholders | (1,778,266,515) | (3,585,084,598) | (69,645,676) | (355,649,093) |
| Decrease in net assets from capital stock activity | (1,063,279,983) | (5,215,215,169) | (1,887,104,246) | (555,115,070) |
| Total decrease in net assets | (2,364,550,116) | (8,741,292,153) | (2,080,239,600) | (1,000,300,369) |
| Net assets at beginning of year | 7,193,283,872 | 15,934,576,025 | 6,733,177,766 | 7,733,478,135 |
| Net assets at end of year | $4,828,733,756 | $7,193,283,872 | $4,652,938,166 | $6,733,177,766 |
| Undistributed (excess of distributions over) net investment income | $(3,783,993) | $(3,776,255) | $30,644,829 | $(35,935,510) |
The accompanying Notes to Financial Statements are an integral part of this statement.
Columbia Acorn Family of Funds | Annual Report 2016
| 85 |
Statement of Changes in Net Assets (continued)
| | Columbia
Acorn USA® | Columbia Acorn
International SelectSM |
| | Year Ended
December 31, 2016 | Year Ended
December 31, 2015 | Year Ended
December 31, 2016 | Year Ended
December 31, 2015 |
| Operations | | | | |
| Net investment income (loss) | $(2,585,435) | $(5,534,984) | $727,712 | $2,055,038 |
| Net realized gain | 173,306,331 | 349,086,609 | 406,852 | 1,724,919 |
| Net change in unrealized appreciation (depreciation) | (116,920,216) | (348,828,350) | (727,228) | (4,516,259) |
| Net increase (decrease) in net assets resulting from operations | 53,800,680 | (5,276,725) | 407,336 | (736,302) |
| Distributions to shareholders | | | | |
| Net investment income | | | | |
| Class A | — | — | (128,440) | (736,335) |
| Class B | — | — | — | (522) |
| Class C | — | — | — | (42,697) |
| Class I | — | — | (21) | (46) |
| Class R4 | — | — | (10,361) | (20,748) |
| Class R5 | — | — | (4,257) | (80,237) |
| Class Y | — | — | (3,239) | (55,291) |
| Class Z | — | — | (688,337) | (2,757,476) |
| Net realized gains | | | | |
| Class A | (32,380,146) | (31,255,985) | — | — |
| Class B | — | (16,747) | — | — |
| Class C | (6,855,670) | (7,350,636) | — | — |
| Class I | (535) | (598) | — | — |
| Class R4 | (2,636,761) | (2,417,938) | — | — |
| Class R5 | (6,082,950) | (7,965,886) | — | — |
| Class Y | (13,772,136) | (11,343,762) | — | — |
| Class Z | (176,812,357) | (239,084,391) | — | — |
| Return of capital | | | | |
| Class A | — | — | (21,491) | (11,066) |
| Class B | — | — | — | (45) |
| Class C | — | — | — | (1,883) |
| Class I | — | — | (2) | (1) |
| Class R4 | — | — | (1,231) | (255) |
| Class R5 | — | — | (474) | (924) |
| Class Y | — | — | (333) | (2,370) |
| Class Z | — | — | (79,155) | (36,925) |
| Total distributions to shareholders | (238,540,555) | (299,435,943) | (937,341) | (3,746,821) |
| Decrease in net assets from capital stock activity | (129,621,627) | (134,521,692) | (38,779,298) | (109,148,980) |
| Proceeds from regulatory settlements | — | — | — | 33,279 |
| Total decrease in net assets | (314,361,502) | (439,234,360) | (39,309,303) | (113,598,824) |
| Net assets at beginning of year | 957,981,927 | 1,397,216,287 | 139,320,876 | 252,919,700 |
| Net assets at end of year | $643,620,425 | $957,981,927 | $100,011,573 | $139,320,876 |
| Undistributed (excess of distributions over) net investment income | $(324,258) | $2,786 | $(76,287) | $(65,144) |
The accompanying Notes to Financial Statements are an integral part of this statement.
| 86 | Columbia Acorn Family of Funds | Annual Report 2016 |
Statement of Changes in Net Assets (continued)
| | Columbia
Acorn SelectSM | Columbia
Thermostat FundSM |
| | Year Ended
December 31, 2016 | Year Ended
December 31, 2015 | Year Ended
December 31, 2016 | Year Ended
December 31, 2015 |
| Operations | | | | |
| Net investment income (loss) | $(636,264) | $(1,864,930) | $13,815,474 | $19,698,061 |
| Net realized gain | 51,359,334 | 146,992,096 | 6,455,376 | 26,208,927 |
| Net change in unrealized appreciation (depreciation) | (13,696,714) | (142,798,808) | 27,501,996 | (45,495,635) |
| Net increase in net assets resulting from operations | 37,026,356 | 2,328,358 | 47,772,846 | 411,353 |
| Distributions to shareholders | | | | |
| Net investment income | | | | |
| Class A | — | — | (2,065,216) | (7,632,819) |
| Class B | — | — | — | (5,291) |
| Class C | — | — | (1,254,586) | (4,362,350) |
| Class R4 | — | — | (116,893) | (414,095) |
| Class R5 | — | — | (93,729) | (130,360) |
| Class Y | — | — | (3,227) | (7,982) |
| Class Z | — | — | (2,661,104) | (7,332,645) |
| Net realized gains | | | | |
| Class A | (20,956,929) | (62,803,525) | (7,330,165) | (8,171,921) |
| Class B | — | (166,590) | — | (18,462) |
| Class C | (6,613,573) | (16,611,457) | (6,807,442) | (7,171,479) |
| Class I | (3,413,863) | (8,765,892) | — | — |
| Class R4 | (137,648) | (363,113) | (270,622) | (420,695) |
| Class R5 | (169,378) | (483,970) | (227,023) | (87,538) |
| Class Y | (675,691) | (1,604,075) | (6,939) | (6,396) |
| Class Z | (23,230,145) | (73,806,494) | (6,421,250) | (6,594,710) |
| Total distributions to shareholders | (55,197,227) | (164,605,116) | (27,258,196) | (42,356,743) |
| Decrease in net assets from capital stock activity | (72,642,815) | (105,097,358) | (15,113,859) | (116,441,845) |
| Total increase (decrease) in net assets | (90,813,686) | (267,374,116) | 5,400,791 | (158,387,235) |
| Net assets at beginning of year | 399,202,670 | 666,576,786 | 1,102,025,826 | 1,260,413,061 |
| Net assets at end of year | $308,388,984 | $399,202,670 | $1,107,426,617 | $1,102,025,826 |
| Undistributed (excess of distributions over) net investment income | $(319,341) | $(328,292) | $13,506,415 | $3,632,187 |
The accompanying Notes to Financial Statements are an integral part of this statement.
Columbia Acorn Family of Funds | Annual Report 2016
| 87 |
Statement of Changes in Net Assets (continued)
| | Columbia Acorn
Emerging Markets FundSM | Columbia Acorn
European FundSM |
| | Year Ended
December 31, 2016 | Year Ended
December 31, 2015 | Year Ended
December 31, 2016 | Year Ended
December 31, 2015 |
| Operations | | | | |
| Net investment income (loss) | $(284,926) | $3,811,610 | $590,637 | $361,772 |
| Net realized loss | (45,598,080) | (24,300,516) | (4,579,308) | (2,562,808) |
| Net change in unrealized appreciation (depreciation) | 36,302,688 | (54,447,576) | 1,960,685 | 2,934,381 |
| Net increase (decrease) in net assets resulting from operations | (9,580,318) | (74,936,482) | (2,027,986) | 733,345 |
| Distributions to shareholders | | | | |
| Net investment income | | | | |
| Class A | (194,500) | (1,341,423) | (259,174) | (485,566) |
| Class C | — | (140,907) | (14,070) | (6,023) |
| Class I | (15) | (39) | (29) | (41) |
| Class R4 | (9,157) | (65,129) | (4,237) | (11,283) |
| Class R5 | (6,632) | (215,834) | (14,327) | (30,715) |
| Class Y | (14) | (38) | — | — |
| Class Z | (333,824) | (2,691,733) | (127,499) | (213,540) |
| Return of capital | | | | |
| Class A | (199,268) | (67,571) | — | — |
| Class C | — | (17,434) | — | — |
| Class I | (8) | (1) | — | — |
| Class R4 | (5,302) | (5,437) | — | — |
| Class R5 | (3,262) | (8,955) | — | — |
| Class Y | (7) | (1) | — | — |
| Class Z | (196,472) | (104,559) | — | — |
| Total distributions to shareholders | (948,461) | (4,659,061) | (419,336) | (747,168) |
| Increase (decrease) in net assets from capital stock activity | (159,031,334) | (127,419,052) | (13,086,756) | 25,267,406 |
| Total increase (decrease) in net assets | (169,560,113) | (207,014,595) | (15,534,078) | 25,253,583 |
| Net assets at beginning of year | 275,320,512 | 482,335,107 | 61,886,391 | 36,632,808 |
| Net assets at end of year | $105,760,399 | $275,320,512 | $46,352,313 | $61,886,391 |
| Undistributed (excess of distributions over) net investment income | $(1,216,803) | $(322,301) | $55,698 | $(196,240) |
The accompanying Notes to Financial Statements are an integral part of this statement.
| 88 | Columbia Acorn Family of Funds | Annual Report 2016 |
Statement of Changes in Net Assets (continued)
| | Columbia
Acorn® Fund | Columbia Acorn
International® |
| | Year Ended | Year Ended | Year Ended | Year Ended |
| | December 31, 2016 | December 31, 2015 | December 31, 2016 | December 31, 2015 |
| | Shares | Dollars ($) | Shares | Dollars ($) | Shares | Dollars ($) | Shares | Dollars ($) |
| Class A | | | | | | | | |
| Subscriptions | 4,853,520 | 75,803,085 | 6,733,437 | 174,900,524 | 1,974,708 | 75,655,038 | 3,850,541 | 162,684,349 |
| Distributions reinvested | 22,814,791 | 328,819,766 | 33,406,680 | 637,395,152 | 175,532 | 6,887,710 | 997,927 | 40,031,526 |
| Redemptions | (36,704,218) | (594,559,320) | (50,291,120) | (1,430,796,125) | (7,659,549) | (295,352,503) | (6,766,388) | (282,908,269) |
| Net decrease | (9,035,907) | (189,936,469) | (10,151,003) | (618,500,449) | (5,509,309) | (212,809,755) | (1,917,920) | (80,192,394) |
| Class B | | | | | | | | |
| Distributions reinvested | — | — | 63,442 | 980,657 | 166 | 6,407 | 2,547 | 101,400 |
| Redemptions | (93,870) | (1,194,420) | (241,010) | (5,952,788) | (29,829) | (1,084,349) | (120,833) | (4,964,593) |
| Net decrease | (93,870) | (1,194,420) | (177,568) | (4,972,131) | (29,663) | (1,077,942) | (118,286) | (4,863,193) |
| Class C | | | | | | | | |
| Subscriptions | 2,850,481 | 28,830,261 | 3,327,736 | 56,969,500 | 88,146 | 3,250,023 | 262,906 | 10,738,058 |
| Distributions reinvested | 15,224,608 | 142,292,662 | 16,310,940 | 233,591,330 | 12,938 | 497,985 | 90,497 | 3,513,911 |
| Redemptions | (16,527,105) | (189,293,788) | (14,910,753) | (328,691,291) | (670,819) | (24,917,914) | (579,254) | (23,313,955) |
| Net increase (decrease) | 1,547,984 | (18,170,865) | 4,727,923 | (38,130,461) | (569,735) | (21,169,906) | (225,851) | (9,061,986) |
| Class I | | | | | | | | |
| Subscriptions | 2,241,456 | 40,012,558 | 1,198,874 | 37,441,664 | 2,023,643 | 76,814,214 | 1,994,133 | 84,152,189 |
| Distributions reinvested | 384,162 | 6,393,601 | 528,459 | 10,762,488 | 15,790 | 618,080 | 68,257 | 2,722,446 |
| Redemptions | (3,318,699) | (60,309,700) | (1,209,267) | (37,821,638) | (2,841,410) | (108,946,434) | (1,602,514) | (67,063,363) |
| Net increase (decrease) | (693,081) | (13,903,541) | 518,066 | 10,382,514 | (801,977) | (31,514,140) | 459,876 | 19,811,272 |
| Class R | | | | | | | | |
| Subscriptions | — | — | — | — | 42,672 | 1,642,911 | 42,773 | 1,781,071 |
| Distributions reinvested | — | — | — | — | 704 | 28,080 | 4,738 | 189,988 |
| Redemptions | — | — | — | — | (46,971) | (1,810,491) | (54,390) | (2,268,431) |
| Net decrease | — | — | — | — | (3,595) | (139,500) | (6,879) | (297,372) |
| Class R4 | | | | | | | | |
| Subscriptions | 495,492 | 9,093,680 | 1,294,282 | 41,454,333 | 2,310,115 | 89,193,756 | 3,958,217 | 168,556,060 |
| Distributions reinvested | 568,047 | 9,572,736 | 1,141,383 | 26,538,222 | 95,799 | 3,833,333 | 598,103 | 24,099,699 |
| Redemptions | (1,492,520) | (27,409,512) | (7,603,327) | (246,875,440) | (12,076,499) | (488,580,771) | (2,304,606) | (96,973,701) |
| Net increase (decrease) | (428,981) | (8,743,096) | (5,167,662) | (178,882,885) | (9,670,585) | (395,553,682) | 2,251,714 | 95,682,058 |
| Class R5 | | | | | | | | |
| Subscriptions | 904,623 | 16,475,579 | 1,667,147 | 54,491,036 | 2,366,752 | 90,215,384 | 2,779,508 | 117,463,579 |
| Distributions reinvested | 896,900 | 15,226,488 | 1,754,796 | 38,794,589 | 103,055 | 4,001,510 | 446,370 | 17,910,363 |
| Redemptions | (2,784,189) | (50,798,909) | (13,665,627) | (434,966,772) | (3,057,775) | (116,417,523) | (4,574,960) | (191,668,981) |
| Net decrease | (982,666) | (19,096,842) | (10,243,684) | (341,681,147) | (587,968) | (22,200,629) | (1,349,082) | (56,295,039) |
| Class Y | | | | | | | | |
| Subscriptions | 631,619 | 11,532,036 | 1,179,273 | 36,748,801 | 1,867,415 | 72,910,693 | 3,320,852 | 141,178,249 |
| Distributions reinvested | 1,502,317 | 25,706,160 | 2,581,951 | 55,761,205 | 83,697 | 3,278,372 | 358,119 | 14,382,629 |
| Redemptions | (3,702,598) | (70,187,193) | (8,850,384) | (289,533,536) | (3,723,583) | (138,860,801) | (955,967) | (40,252,596) |
| Net increase (decrease) | (1,568,662) | (32,948,997) | (5,089,160) | (197,023,530) | (1,772,471) | (62,671,736) | 2,723,004 | 115,308,282 |
| Class Z | | | | | | | | |
| Subscriptions | 12,510,656 | 225,203,283 | 18,745,346 | 544,389,234 | 10,938,039 | 423,737,709 | 12,874,531 | 545,406,592 |
| Distributions reinvested | 65,323,103 | 1,066,953,832 | 99,426,548 | 2,072,475,933 | 1,012,550 | 39,453,071 | 4,784,539 | 191,876,849 |
| Redemptions | (115,579,393) | (2,071,442,868) | (211,292,321) | (6,463,272,247) | (41,785,744) | (1,603,157,736) | (32,736,392) | (1,372,490,139) |
| Net decrease | (37,745,634) | (779,285,753) | (93,120,427) | (3,846,407,080) | (29,835,155) | (1,139,966,956) | (15,077,322) | (635,206,698) |
| Total net decrease | (49,000,817) | (1,063,279,983) | (118,703,515) | (5,215,215,169) | (48,780,458) | (1,887,104,246) | (13,260,746) | (555,115,070) |
The accompanying Notes to Financial Statements are an integral part of this statement.
Columbia Acorn Family of Funds | Annual Report 2016
| 89 |
Statement of Changes in Net Assets (continued)
| | Columbia
Acorn USA® | Columbia Acorn
International SelectSM |
| | Year Ended | Year Ended | Year Ended | Year Ended |
| | December 31, 2016 | December 31, 2015 | December 31, 2016 | December 31, 2015 |
| | Shares | Dollars ($) | Shares | Dollars ($) | Shares | Dollars ($) | Shares | Dollars ($) |
| Class A | | | | | | | | |
| Subscriptions | 570,239 | 10,137,511 | 446,799 | 12,442,691 | 144,898 | 3,073,366 | 315,553 | 7,109,433 |
| Distributions reinvested | 1,919,989 | 30,640,598 | 1,394,063 | 29,525,556 | 6,931 | 145,542 | 33,425 | 729,830 |
| Redemptions | (1,785,208) | (32,134,125) | (2,231,122) | (62,632,427) | (791,209) | (16,621,178) | (1,189,717) | (26,641,940) |
| Net increase (decrease) | 705,020 | 8,643,984 | (390,260) | (20,664,180) | (639,380) | (13,402,270) | (840,739) | (18,802,677) |
| Class B | | | | | | | | |
| Distributions reinvested | — | — | 979 | 18,478 | — | — | 145 | 3,044 |
| Redemptions | (1,541) | (21,538) | (8,693) | (214,967) | (984) | (18,165) | (16,329) | (342,841) |
| Net decrease | (1,541) | (21,538) | (7,714) | (196,489) | (984) | (18,165) | (16,184) | (339,797) |
| Class C | | | | | | | | |
| Subscriptions | 117,283 | 1,391,102 | 92,994 | 1,973,916 | 14,021 | 278,937 | 26,260 | 547,068 |
| Distributions reinvested | 573,317 | 6,404,572 | 401,417 | 6,862,553 | — | — | 2,092 | 41,842 |
| Redemptions | (566,118) | (7,483,741) | (876,405) | (20,683,050) | (66,643) | (1,312,570) | (150,553) | (3,102,184) |
| Net increase (decrease) | 124,482 | 311,933 | (381,994) | (11,846,581) | (52,622) | (1,033,633) | (122,201) | (2,513,274) |
| Class R4 | | | | | | | | |
| Subscriptions | 182,950 | 4,045,095 | 230,470 | 7,383,504 | 37,828 | 786,212 | 16,419 | 375,431 |
| Distributions reinvested | 139,452 | 2,636,761 | 101,221 | 2,417,938 | 541 | 11,569 | 945 | 20,953 |
| Redemptions | (338,183) | (6,985,619) | (222,569) | (6,906,266) | (28,908) | (628,248) | (19,415) | (437,431) |
| Net increase (decrease) | (15,781) | (303,763) | 109,122 | 2,895,176 | 9,461 | 169,533 | (2,051) | (41,047) |
| Class R5 | | | | | | | | |
| Subscriptions | 204,798 | 4,201,531 | 206,312 | 6,662,313 | 6,007 | 129,000 | 176,316 | 4,024,111 |
| Distributions reinvested | 314,491 | 6,082,419 | 332,383 | 7,965,293 | 220 | 4,710 | 3,656 | 80,764 |
| Redemptions | (939,630) | (19,229,210) | (511,388) | (16,334,571) | (90,410) | (1,874,479) | (191,151) | (4,219,124) |
| Net increase (decrease) | (420,341) | (8,945,260) | 27,307 | (1,706,965) | (84,183) | (1,740,769) | (11,179) | (114,249) |
| Class Y | | | | | | | | |
| Subscriptions | 160,115 | 3,363,597 | 386,715 | 12,436,567 | 9,194 | 207,948 | 221,884 | 5,050,810 |
| Distributions reinvested | 722,739 | 13,771,606 | 479,575 | 11,343,169 | 166 | 3,550 | 2,474 | 57,614 |
| Redemptions | (591,947) | (11,971,994) | (172,401) | (5,465,477) | (24,953) | (526,808) | (718,353) | (16,103,000) |
| Net increase (decrease) | 290,907 | 5,163,209 | 693,889 | 18,314,259 | (15,593) | (315,310) | (493,995) | (10,994,576) |
| Class Z | | | | | | | | |
| Subscriptions | 2,044,441 | 42,076,329 | 3,763,553 | 116,284,123 | 496,718 | 10,632,273 | 465,219 | 10,515,929 |
| Distributions reinvested | 9,206,155 | 166,971,786 | 9,392,001 | 216,649,809 | 25,779 | 547,806 | 76,982 | 1,699,575 |
| Redemptions | (17,240,685) | (343,518,307) | (15,006,327) | (454,250,844) | (1,578,100) | (33,618,763) | (3,963,435) | (88,558,864) |
| Net decrease | (5,990,089) | (134,470,192) | (1,850,773) | (121,316,912) | (1,055,603) | (22,438,684) | (3,421,234) | (76,343,360) |
| Total net decrease | (5,307,343) | (129,621,627) | (1,800,423) | (134,521,692) | (1,838,904) | (38,779,298) | (4,907,583) | (109,148,980) |
The accompanying Notes to Financial Statements are an integral part of this statement.
| 90 | Columbia Acorn Family of Funds | Annual Report 2016 |
Statement of Changes in Net Assets (continued)
| | Columbia
Acorn SelectSM | Columbia
Thermostat FundSM |
| | Year Ended | Year Ended | Year Ended | Year Ended |
| | December 31, 2016 | December 31, 2015 | December 31, 2016 | December 31, 2015 |
| | Shares | Dollars ($) | Shares | Dollars ($) | Shares | Dollars ($) | Shares | Dollars ($) |
| Class A | | | | | | | | |
| Subscriptions | 504,342 | 6,690,492 | 909,174 | 16,532,728 | 8,041,017 | 116,448,340 | 5,851,778 | 86,714,257 |
| Distributions reinvested | 1,437,616 | 19,010,001 | 3,674,508 | 57,876,468 | 598,148 | 8,686,416 | 982,225 | 14,298,982 |
| Redemptions | (3,388,242) | (45,317,466) | (6,612,989) | (129,581,359) | (8,433,395) | (122,528,839) | (10,018,194) | (148,233,887) |
| Net increase (decrease) | (1,446,284) | (19,616,973) | (2,029,307) | (55,172,163) | 205,770 | 2,605,917 | (3,184,191) | (47,220,648) |
| Class B | | | | | | | | |
| Distributions reinvested | — | — | 13,401 | 169,957 | — | — | 1,746 | 25,841 |
| Redemptions | (26,947) | (277,346) | (42,677) | (737,583) | (20,546) | (294,082) | (63,415) | (939,051) |
| Net decrease | (26,947) | (277,346) | (29,276) | (567,626) | (20,546) | (294,082) | (61,669) | (913,210) |
| Class C | | | | | | | | |
| Subscriptions | 247,884 | 2,349,868 | 382,060 | 4,700,279 | 3,516,437 | 51,108,804 | 4,088,021 | 60,530,214 |
| Distributions reinvested | 573,270 | 5,430,627 | 1,164,079 | 13,758,410 | 433,622 | 6,322,208 | 607,884 | 8,934,025 |
| Redemptions | (1,129,045) | (11,022,448) | (1,000,597) | (15,566,161) | (6,071,444) | (88,504,045) | (6,421,982) | (95,550,794) |
| Net increase (decrease) | (307,891) | (3,241,953) | 545,542 | 2,892,528 | (2,121,385) | (31,073,033) | (1,726,077) | (26,086,555) |
| Class I | | | | | | | | |
| Subscriptions | 2,747,662 | 39,487,939 | 2,004,428 | 43,166,378 | — | — | — | — |
| Distributions reinvested | 231,745 | 3,413,645 | 528,929 | 8,765,223 | — | — | — | — |
| Redemptions | (3,993,682) | (59,895,103) | (1,617,045) | (34,630,444) | — | — | — | — |
| Net increase (decrease) | (1,014,275) | (16,993,519) | 916,312 | 17,301,157 | — | — | — | — |
| Class R4 | | | | | | | | |
| Subscriptions | 20,875 | 314,488 | 17,318 | 391,188 | 628,375 | 9,077,683 | 658,898 | 9,737,619 |
| Distributions reinvested | 9,104 | 137,648 | 21,008 | 363,113 | 26,865 | 387,442 | 57,808 | 834,675 |
| Redemptions | (32,975) | (491,350) | (31,405) | (653,792) | (803,020) | (11,457,488) | (1,074,830) | (15,839,006) |
| Net increase (decrease) | (2,996) | (39,214) | 6,921 | 100,509 | (147,780) | (1,992,363) | (358,124) | (5,266,712) |
| Class R5 | | | | | | | | |
| Subscriptions | 34,905 | 518,997 | 59,903 | 1,367,998 | 641,667 | 9,116,272 | 247,793 | 3,638,685 |
| Distributions reinvested | 11,146 | 169,161 | 27,179 | 483,307 | 22,173 | 319,988 | 15,133 | 217,898 |
| Redemptions | (35,794) | (532,564) | (498,817) | (11,631,849) | (264,332) | (3,843,375) | (72,101) | (1,059,811) |
| Net increase (decrease) | 10,257 | 155,594 | (411,735) | (9,780,544) | 399,508 | 5,592,885 | 190,825 | 2,796,772 |
| Class Y | | | | | | | | |
| Subscriptions | 86,025 | 1,305,072 | 135,278 | 3,036,144 | 4,847 | 70,136 | 31,010 | 451,230 |
| Distributions reinvested | 44,223 | 675,474 | 94,278 | 1,603,413 | 701 | 10,096 | 991 | 14,270 |
| Redemptions | (162,905) | (2,480,014) | (69,617) | (1,511,253) | (2,796) | (40,341) | (34,405) | (504,325) |
| Net increase (decrease) | (32,657) | (499,468) | 159,939 | 3,128,304 | 2,752 | 39,891 | (2,404) | (38,825) |
| Class Z | | | | | | | | |
| Subscriptions | 573,558 | 8,420,465 | 737,164 | 14,738,554 | 7,615,049 | 109,081,660 | 6,272,816 | 91,578,896 |
| Distributions reinvested | 1,406,945 | 20,616,589 | 3,661,677 | 61,844,603 | 426,415 | 6,116,187 | 659,729 | 9,468,573 |
| Redemptions | (4,164,970) | (61,166,990) | (6,642,121) | (139,582,680) | (7,344,820) | (105,190,921) | (9,607,125) | (140,760,136) |
| Net increase (decrease) | (2,184,467) | (32,129,936) | (2,243,280) | (62,999,523) | 696,644 | 10,006,926 | (2,674,580) | (39,712,667) |
| Total net decrease | (5,005,260) | (72,642,815) | (3,084,884) | (105,097,358) | (985,037) | (15,113,859) | (7,816,220) | (116,441,845) |
The accompanying Notes to Financial Statements are an integral part of this statement.
Columbia Acorn Family of Funds | Annual Report 2016
| 91 |
Statement of Changes in Net Assets (continued)
| | Columbia Acorn
Emerging Markets FundSM | Columbia Acorn
European FundSM |
| | Year Ended | Year Ended | Year Ended | Year Ended |
| | December 31, 2016 | December 31, 2015 | December 31, 2016 | December 31, 2015 |
| | Shares | Dollars ($) | Shares | Dollars ($) | Shares | Dollars ($) | Shares | Dollars ($) |
| Class A | | | | | | | | |
| Subscriptions | 511,014 | 5,151,768 | 1,020,306 | 12,073,817 | 614,988 | 8,800,628 | 1,928,835 | 29,232,277 |
| Distributions reinvested | 38,980 | 390,579 | 137,596 | 1,402,102 | 18,095 | 259,128 | 31,377 | 477,264 |
| Redemptions | (4,201,955) | (43,044,856) | (5,165,530) | (59,731,096) | (1,508,418) | (21,629,960) | (695,460) | (10,345,904) |
| Net increase (decrease) | (3,651,961) | (37,502,509) | (4,007,628) | (46,255,177) | (875,335) | (12,570,204) | 1,264,752 | 19,363,637 |
| Class C | | | | | | | | |
| Subscriptions | 87,820 | 876,756 | 131,810 | 1,573,003 | 189,633 | 2,692,628 | 233,273 | 3,486,085 |
| Distributions reinvested | — | — | 15,055 | 152,813 | 926 | 14,070 | 407 | 6,019 |
| Redemptions | (752,453) | (7,590,091) | (1,153,597) | (13,305,273) | (175,620) | (2,481,569) | (100,084) | (1,478,139) |
| Net increase (decrease) | (664,633) | (6,713,335) | (1,006,732) | (11,579,457) | 14,939 | 225,129 | 133,596 | 2,013,965 |
| Class I | | | | | | | | |
| Distributions reinvested | 2 | 23 | 4 | 40 | 2 | 29 | 3 | 41 |
| Net increase | 2 | 23 | 4 | 40 | 2 | 29 | 3 | 41 |
| Class R4 | | | | | | | | |
| Subscriptions | 48,605 | 497,849 | 97,765 | 1,210,590 | 6,570 | 97,107 | 78,479 | 1,189,747 |
| Distributions reinvested | 1,429 | 14,438 | 6,867 | 70,526 | 296 | 4,213 | 726 | 11,246 |
| Redemptions | (253,438) | (2,611,137) | (975,288) | (11,090,725) | (8,873) | (126,268) | (72,632) | (1,109,125) |
| Net increase (decrease) | (203,404) | (2,098,850) | (870,656) | (9,809,609) | (2,007) | (24,948) | 6,573 | 91,868 |
| Class R5 | | | | | | | | |
| Subscriptions | 79,534 | 799,097 | 420,340 | 4,899,598 | 13,780 | 200,355 | 43,183 | 661,788 |
| Distributions reinvested | 966 | 9,749 | 21,708 | 222,723 | 997 | 14,301 | 2,003 | 30,678 |
| Redemptions | (1,224,039) | (12,729,815) | (748,449) | (8,484,365) | (68,695) | (1,011,199) | (15,534) | (232,666) |
| Net increase (decrease) | (1,143,539) | (11,920,969) | (306,401) | (3,362,044) | (53,918) | (796,543) | 29,652 | 459,800 |
| Class Z | | | | | | | | |
| Subscriptions | 1,761,120 | 18,169,951 | 2,978,393 | 35,528,290 | 767,402 | 10,950,673 | 595,443 | 9,065,450 |
| Distributions reinvested | 50,737 | 508,887 | 268,573 | 2,739,444 | 8,898 | 126,581 | 13,964 | 212,045 |
| Redemptions | (12,253,429) | (119,474,532) | (8,078,655) | (94,680,539) | (770,123) | (10,997,473) | (404,473) | (5,939,400) |
| Net increase (decrease) | (10,441,572) | (100,795,694) | (4,831,689) | (56,412,805) | 6,177 | 79,781 | 204,934 | 3,338,095 |
| Total net increase (decrease) | (16,105,107) | (159,031,334) | (11,023,102) | (127,419,052) | (910,142) | (13,086,756) | 1,639,510 | 25,267,406 |
The accompanying Notes to Financial Statements are an integral part of this statement.
| 92 | Columbia Acorn Family of Funds | Annual Report 2016 |
[THIS PAGE INTENTIONALLY LEFT BLANK]
Columbia Acorn Family of Funds | Annual Report 2016
| 93 |
Financial Highlights
Columbia Acorn® Fund
The following tables are intended to help you understand the Fund’s financial performance. Certain information reflects financial results for a single share of a class held for the periods shown. Per share net investment income (loss) amounts are calculated based on average shares outstanding during the period. Total return assumes reinvestment of all dividends and distributions, if any. Total return does not reflect payment of sales charges, if any. Total return and portfolio turnover are not annualized for periods of less than one year. The portfolio turnover rate is calculated without regard to purchase and sales transactions of short-term instruments and certain derivatives, if any. If such transactions were included, the Fund’s portfolio turnover rate may be higher.
| Year ended | Net asset value,
beginning of
period | Net
investment
income
(loss) | Net
realized
and
unrealized
gain (loss) | Total from
investment
operations | Distributions
from net
investment
income | Distributions
from net
realized
gains |
| Class A |
| 12/31/2016 | $17.63 | (0.03) | 1.73 | 1.70 | — | (5.98) |
| 12/31/2015 | $30.30 | (0.12) | (0.27) (c) | (0.39) | — | (12.28) |
| 12/31/2014 | $35.78 | (0.08) | 0.21 | 0.13 | — | (5.61) |
| 12/31/2013 | $29.36 | (0.06) | 8.84 | 8.78 | (0.04) | (2.32) |
| 12/31/2012 | $26.63 | 0.08 | 4.53 | 4.61 | (0.06) | (1.82) |
| Class C |
| 12/31/2016 | $13.16 | (0.11) | 1.27 | 1.16 | — | (5.98) |
| 12/31/2015 | $25.92 | (0.27) | (0.21) (c) | (0.48) | — | (12.28) |
| 12/31/2014 | $31.64 | (0.28) | 0.17 | (0.11) | — | (5.61) |
| 12/31/2013 | $26.34 | (0.26) | 7.88 | 7.62 | — | (2.32) |
| 12/31/2012 | $24.18 | (0.12) | 4.10 | 3.98 | — | (1.82) |
| Class I |
| 12/31/2016 | $19.43 | 0.02 | 1.93 | 1.95 | — | (5.98) |
| 12/31/2015 | $32.03 | (0.01) | (0.31) (c) | (0.32) | — | (12.28) |
| 12/31/2014 | $37.37 | 0.05 | 0.22 | 0.27 | — | (5.61) |
| 12/31/2013 | $30.47 | 0.06 | 9.20 | 9.26 | (0.04) | (2.32) |
| 12/31/2012 | $27.57 | 0.26 | 4.62 | 4.88 | (0.16) | (1.82) |
| Class R4 |
| 12/31/2016 | $19.84 | 0.00 | 1.97 | 1.97 | — | (5.98) |
| 12/31/2015 | $32.51 | (0.07) | (0.32) (c) | (0.39) | — | (12.28) |
| 12/31/2014 | $37.88 | 0.02 | 0.22 | 0.24 | — | (5.61) |
| 12/31/2013 | $30.90 | 0.06 | 9.29 | 9.35 | (0.05) | (2.32) |
| 12/31/2012 (e) | $30.59 | 0.05 | 1.84 | 1.89 | (0.12) | (1.46) |
| Class R5 |
| 12/31/2016 | $19.92 | 0.01 | 1.99 | 2.00 | — | (5.98) |
| 12/31/2015 | $32.55 | (0.04) | (0.31) (c) | (0.35) | — | (12.28) |
| 12/31/2014 | $37.89 | 0.04 | 0.23 | 0.27 | — | (5.61) |
| 12/31/2013 | $30.88 | 0.07 | 9.30 | 9.37 | (0.04) | (2.32) |
| 12/31/2012 (g) | $30.59 | 0.06 | 1.83 | 1.89 | (0.14) | (1.46) |
| Class Y |
| 12/31/2016 | $20.00 | 0.02 | 2.00 | 2.02 | — | (5.98) |
| 12/31/2015 | $32.61 | (0.02) | (0.31) (c) | (0.33) | — | (12.28) |
| 12/31/2014 | $37.93 | 0.05 | 0.24 | 0.29 | — | (5.61) |
| 12/31/2013 | $30.90 | 0.09 | 9.31 | 9.40 | (0.05) | (2.32) |
| 12/31/2012 (h) | $30.62 | 0.09 | 1.80 | 1.89 | (0.15) | (1.46) |
The accompanying Notes to Financial Statements are an integral part of this statement.
| 94 | Columbia Acorn Family of Funds | Annual Report 2016 |
Total
distributions to
shareholders | Net
asset
value,
end of
period | Total
return | Total gross
expense
ratio to
average
net assets(a) | Total net
expense
ratio to
average
net assets(a) | Net investment
income (loss)
ratio to
average
net assets | Portfolio
turnover | Net
assets,
end of
period
(000’s) |
| |
| (5.98) | $13.35 | 10.06% | 1.10% (b) | 1.10% (b) | (0.21%) | 85% | $931,460 |
| (12.28) | $17.63 | (1.87%) | 1.08% | 1.08% | (0.39%) | 21% | $1,388,893 |
| (5.61) | $30.30 | 0.55% | 1.08% | 1.08% | (0.22%) | 17% | $2,694,610 |
| (2.36) | $35.78 | 30.53% | 1.07% | 1.07% | (0.17%) | 18% | $3,869,734 |
| (1.88) | $29.36 | 17.62% | 1.06% | 1.06% (d) | 0.27% | 16% | $3,233,494 |
| |
| (5.98) | $8.34 | 9.29% | 1.84% (b) | 1.84% (b) | (0.95%) | 85% | $302,119 |
| (12.28) | $13.16 | (2.57%) | 1.80% | 1.80% | (1.11%) | 21% | $456,348 |
| (5.61) | $25.92 | (0.16%) | 1.77% | 1.77% | (0.92%) | 17% | $776,370 |
| (2.32) | $31.64 | 29.58% | 1.78% | 1.78% | (0.88%) | 18% | $938,644 |
| (1.82) | $26.34 | 16.77% | 1.80% | 1.80% (d) | (0.46%) | 16% | $756,709 |
| |
| (5.98) | $15.40 | 10.44% | 0.76% (b) | 0.76% (b) | 0.12% | 85% | $10,849 |
| (12.28) | $19.43 | (1.53%) | 0.73% | 0.73% | (0.02%) | 21% | $27,151 |
| (5.61) | $32.03 | 0.91% | 0.70% | 0.70% | 0.14% | 17% | $28,164 |
| (2.36) | $37.37 | 30.99% | 0.70% | 0.70% | 0.16% | 18% | $20,383 |
| (1.98) | $30.47 | 18.02% | 0.72% | 0.72% (d) | 0.86% | 16% | $58,652 |
| |
| (5.98) | $15.83 | 10.32% | 0.89% (b) | 0.89% (b) | — | 85% | $33,378 |
| (12.28) | $19.84 | (1.75%) | 0.89% | 0.89% | (0.23%) | 21% | $50,335 |
| (5.61) | $32.51 | 0.81% | 0.84% | 0.84% | 0.05% | 17% | $250,457 |
| (2.37) | $37.88 | 30.85% | 0.80% | 0.80% | 0.16% | 18% | $74,188 |
| (1.58) | $30.90 | 6.31% | 0.87% (f) | 0.86% (d),(f) | 1.24% (f) | 16% | $17 |
| |
| (5.98) | $15.94 | 10.43% | 0.81% (b) | 0.81% (b) | 0.08% | 85% | $45,475 |
| (12.28) | $19.92 | (1.60%) | 0.77% | 0.77% | (0.11%) | 21% | $76,412 |
| (5.61) | $32.55 | 0.89% | 0.76% | 0.76% | 0.10% | 17% | $458,223 |
| (2.36) | $37.89 | 30.94% | 0.75% | 0.75% | 0.20% | 18% | $496,906 |
| (1.60) | $30.88 | 6.33% | 0.82% (f) | 0.81% (d),(f) | 1.29% (f) | 16% | $3 |
| |
| (5.98) | $16.04 | 10.50% | 0.76% (b) | 0.76% (b) | 0.12% | 85% | $79,518 |
| (12.28) | $20.00 | (1.54%) | 0.73% | 0.73% | (0.06%) | 21% | $130,546 |
| (5.61) | $32.61 | 0.94% | 0.70% | 0.70% | 0.13% | 17% | $378,780 |
| (2.37) | $37.93 | 30.99% | 0.70% | 0.70% | 0.26% | 18% | $1,227,891 |
| (1.61) | $30.90 | 6.34% | 0.75% (f) | 0.75% (d),(f) | 2.21% (f) | 16% | $67,012 |
Columbia Acorn Family of Funds | Annual Report 2016
| 95 |
Financial Highlights (continued)
Columbia Acorn® Fund
| Year ended | Net asset value,
beginning of
period | Net
investment
income
(loss) | Net
realized
and
unrealized
gain (loss) | Total from
investment
operations | Distributions
from net
investment
income | Distributions
from net
realized
gains |
| Class Z |
| 12/31/2016 | $19.34 | 0.01 | 1.92 | 1.93 | — | (5.98) |
| 12/31/2015 | $31.95 | (0.04) | (0.29) (c) | (0.33) | — | (12.28) |
| 12/31/2014 | $37.32 | 0.02 | 0.22 | 0.24 | — | (5.61) |
| 12/31/2013 | $30.45 | 0.04 | 9.19 | 9.23 | (0.04) | (2.32) |
| 12/31/2012 | $27.56 | 0.17 | 4.69 | 4.86 | (0.15) | (1.82) |
| Notes to Financial Highlights |
| (a) | In addition to the fees and expenses that the Fund bears directly, the Fund indirectly bears a pro rata share of the fees and expenses of any other funds in which it invests, if any. Such indirect expenses are not included in the Fund’s reported expense ratios. |
| (b) | Ratios include line of credit interest expense which is less than 0.01%. |
| (c) | Calculation of the net gain (loss) per share (both realized and unrealized) does not correlate to the aggregate realized and unrealized gain (loss) presented in the Statements of Operations due to the timing of subscriptions and redemptions of Fund shares in relation to fluctuations in the market value of the portfolio. |
| (d) | The benefits derived from expense reductions had an impact of less than 0.01%. |
| (e) | Class R4 shares commenced operations on November 8, 2012. Per share data and total return reflect activity from that date. |
| (f) | Annualized. |
| (g) | Class R5 shares commenced operations on November 8, 2012. Per share data and total return reflect activity from that date. |
| (h) | Class Y shares commenced operations on November 8, 2012. Per share data and total return reflect activity from that date. |
The accompanying Notes to Financial Statements are an integral part of this statement.
| 96 | Columbia Acorn Family of Funds | Annual Report 2016 |
Total
distributions to
shareholders | Net
asset
value,
end of
period | Total
return | Total gross
expense
ratio to
average
net assets(a) | Total net
expense
ratio to
average
net assets(a) | Net investment
income (loss)
ratio to
average
net assets | Portfolio
turnover | Net
assets,
end of
period
(000’s) |
| |
| (5.98) | $15.29 | 10.39% | 0.82% (b) | 0.82% (b) | 0.07% | 85% | $3,425,935 |
| (12.28) | $19.34 | (1.57%) | 0.80% | 0.80% | (0.11%) | 21% | $5,062,313 |
| (5.61) | $31.95 | 0.82% | 0.79% | 0.79% | 0.07% | 17% | $11,340,770 |
| (2.36) | $37.32 | 30.90% | 0.78% | 0.78% | 0.12% | 18% | $14,703,948 |
| (1.97) | $30.45 | 17.93% | 0.78% | 0.78% (d) | 0.57% | 16% | $13,374,355 |
Columbia Acorn Family of Funds | Annual Report 2016
| 97 |
Financial Highlights
Columbia Acorn International®
| Year ended | Net asset value,
beginning of
period | Net
investment
income | Net
realized
and
unrealized
gain (loss) | Total from
investment
operations | Distributions
from net
investment
income | Distributions
from net
realized
gains |
| Class A |
| 12/31/2016 | $39.08 | 0.35 | (1.31) | (0.96) | (0.15) | (0.26) |
| 12/31/2015 | $41.68 | 0.39 | (1.02) | (0.63) | (0.40) | (1.57) |
| 12/31/2014 | $46.63 | 0.42 | (2.51) | (2.09) | (0.55) | (2.31) |
| 12/31/2013 | $40.79 | 0.45 | 8.37 | 8.82 | (1.05) | (1.93) |
| 12/31/2012 | $34.15 | 0.47 | 6.75 | 7.22 | (0.58) | — |
| Class B |
| 12/31/2016 | $37.80 | 0.07 | (1.23) | (1.16) | — | (0.26) |
| 12/31/2015 | $40.38 | 0.02 | (1.01) | (0.99) | (0.02) | (1.57) |
| 12/31/2014 | $45.24 | 0.07 | (2.42) | (2.35) | (0.20) | (2.31) |
| 12/31/2013 | $39.67 | 0.12 | 8.10 | 8.22 | (0.72) | (1.93) |
| 12/31/2012 | $33.17 | 0.19 | 6.55 | 6.74 | (0.24) | — |
| Class C |
| 12/31/2016 | $37.65 | 0.05 | (1.26) | (1.21) | — | (0.26) |
| 12/31/2015 | $40.20 | 0.07 | (0.97) | (0.90) | (0.08) | (1.57) |
| 12/31/2014 | $45.04 | 0.07 | (2.40) | (2.33) | (0.20) | (2.31) |
| 12/31/2013 | $39.50 | 0.10 | 8.08 | 8.18 | (0.71) | (1.93) |
| 12/31/2012 | $33.03 | 0.18 | 6.52 | 6.70 | (0.23) | — |
| Class I |
| 12/31/2016 | $39.15 | 0.45 | (1.29) | (0.84) | (0.28) | (0.26) |
| 12/31/2015 | $41.76 | 0.52 | (1.00) | (0.48) | (0.56) | (1.57) |
| 12/31/2014 | $46.71 | 0.59 | (2.51) | (1.92) | (0.72) | (2.31) |
| 12/31/2013 | $40.86 | 0.66 | 8.34 | 9.00 | (1.22) | (1.93) |
| 12/31/2012 | $34.33 | 0.57 | 6.83 | 7.40 | (0.87) | — |
| Class R |
| 12/31/2016 | $39.07 | 0.21 | (1.30) | (1.09) | (0.01) | (0.26) |
| 12/31/2015 | $41.67 | 0.23 | (1.02) | (0.79) | (0.24) | (1.57) |
| 12/31/2014 | $46.60 | 0.24 | (2.50) | (2.26) | (0.36) | (2.31) |
| 12/31/2013 | $40.79 | 0.26 | 8.36 | 8.62 | (0.88) | (1.93) |
| 12/31/2012 | $34.11 | 0.21 | 6.89 | 7.10 | (0.42) | — |
| Class R4 |
| 12/31/2016 | $39.41 | 0.48 | (1.38) | (0.90) | (0.22) | (0.26) |
| 12/31/2015 | $42.02 | 0.47 | (1.03) | (0.56) | (0.48) | (1.57) |
| 12/31/2014 | $46.99 | 0.50 | (2.52) | (2.02) | (0.64) | (2.31) |
| 12/31/2013 | $41.08 | 0.34 | 8.67 | 9.01 | (1.17) | (1.93) |
| 12/31/2012 (e) | $39.86 | (0.00) (c) | 1.81 | 1.81 | (0.59) | — |
| Class R5 |
| 12/31/2016 | $39.10 | 0.44 | (1.30) | (0.86) | (0.26) | (0.26) |
| 12/31/2015 | $41.71 | 0.54 | (1.05) | (0.51) | (0.53) | (1.57) |
| 12/31/2014 | $46.66 | 0.57 | (2.51) | (1.94) | (0.70) | (2.31) |
| 12/31/2013 | $40.81 | 0.63 | 8.34 | 8.97 | (1.19) | (1.93) |
| 12/31/2012 | $34.31 | 0.75 | 6.62 | 7.37 | (0.87) | — |
The accompanying Notes to Financial Statements are an integral part of this statement.
| 98 | Columbia Acorn Family of Funds | Annual Report 2016 |
Total
distributions to
shareholders | Proceeds from
regulatory
settlements | Net
asset
value,
end of
period | Total
return | Total gross
expense
ratio to
average
net assets(a) | Total net
expense
ratio to
average
net assets(a) | Net investment
income (loss)
ratio to
average
net assets | Portfolio
turnover | Net
assets,
end of
period
(000’s) |
| |
| (0.41) | — | $37.71 | (2.51%) (b) | 1.27% | 1.23% | 0.90% | 46% | $576,235 |
| (1.97) | — | $39.08 | (1.59%) (b) | 1.28% | 1.24% | 0.93% | 50% | $812,479 |
| (2.86) | — | $41.68 | (4.58%) (b) | 1.26% | 1.22% | 0.91% | 28% | $946,553 |
| (2.98) | — | $46.63 | 22.00% (b) | 1.27% | 1.23% | 1.02% | 45% | $1,089,263 |
| (0.58) | 0.00 (c) | $40.79 | 21.21% (b) | 1.28% | 1.24% (d) | 1.22% | 33% | $1,007,236 |
| |
| (0.26) | — | $36.38 | (3.11%) (b) | 2.22% | 1.91% | 0.18% | 46% | $487 |
| (1.59) | — | $37.80 | (2.53%) (b) | 2.17% | 2.14% | 0.05% | 50% | $1,628 |
| (2.51) | — | $40.38 | (5.29%) (b) | 2.00% | 1.97% | 0.16% | 28% | $6,516 |
| (2.65) | — | $45.24 | 21.08% (b) | 2.00% | 1.97% | 0.27% | 45% | $13,218 |
| (0.24) | 0.00 (c) | $39.67 | 20.33% (b) | 2.00% | 1.97% (d) | 0.51% | 33% | $17,910 |
| |
| (0.26) | — | $36.18 | (3.26%) (b) | 2.01% | 1.99% | 0.13% | 46% | $64,548 |
| (1.65) | — | $37.65 | (2.33%) (b) | 2.01% | 1.99% | 0.18% | 50% | $88,606 |
| (2.51) | — | $40.20 | (5.27%) (b) | 1.99% | 1.97% | 0.16% | 28% | $103,691 |
| (2.64) | — | $45.04 | 21.07% (b) | 2.01% | 1.99% | 0.23% | 45% | $110,875 |
| (0.23) | 0.00 (c) | $39.50 | 20.31% (b) | 2.02% | 2.00% (d) | 0.48% | 33% | $92,748 |
| |
| (0.54) | — | $37.77 | (2.18%) | 0.88% | 0.88% | 1.18% | 46% | $22,177 |
| (2.13) | — | $39.15 | (1.23%) | 0.88% | 0.88% | 1.23% | 50% | $54,382 |
| (3.03) | — | $41.76 | (4.20%) | 0.85% | 0.85% | 1.26% | 28% | $38,804 |
| (3.15) | — | $46.71 | 22.43% | 0.85% | 0.85% | 1.49% | 45% | $29,418 |
| (0.87) | 0.00 (c) | $40.86 | 21.69% | 0.88% | 0.88% (d) | 1.48% | 33% | $97,484 |
| |
| (0.27) | — | $37.71 | (2.82%) | 1.55% | 1.55% | 0.55% | 46% | $4,637 |
| (1.81) | — | $39.07 | (1.98%) | 1.62% | 1.62% | 0.54% | 50% | $4,945 |
| (2.67) | — | $41.67 | (4.95%) | 1.63% | 1.63% | 0.52% | 28% | $5,560 |
| (2.81) | — | $46.60 | 21.50% | 1.63% | 1.63% | 0.58% | 45% | $5,822 |
| (0.42) | 0.00 (c) | $40.79 | 20.83% | 1.52% | 1.51% (d) | 0.54% | 33% | $2,799 |
| |
| (0.48) | — | $38.03 | (2.32%) | 1.05% | 1.05% | 1.22% | 46% | $101,988 |
| (2.05) | — | $39.41 | (1.41%) | 1.06% | 1.06% | 1.10% | 50% | $486,763 |
| (2.95) | — | $42.02 | (4.39%) | 1.04% | 1.04% | 1.07% | 28% | $424,425 |
| (3.10) | — | $46.99 | 22.32% | 1.03% | 1.03% | 0.73% | 45% | $355,616 |
| (0.59) | — | $41.08 | 4.57% | 1.03% (f) | 1.02% (d),(f) | (0.02%) (f) | 33% | $15 |
| |
| (0.52) | — | $37.72 | (2.23%) | 0.93% | 0.93% | 1.15% | 46% | $286,786 |
| (2.10) | — | $39.10 | (1.29%) | 0.92% | 0.92% | 1.26% | 50% | $320,252 |
| (3.01) | — | $41.71 | (4.25%) | 0.90% | 0.90% | 1.23% | 28% | $397,882 |
| (3.12) | — | $46.66 | 22.38% | 0.91% | 0.91% | 1.40% | 45% | $274,415 |
| (0.87) | 0.00 (c) | $40.81 | 21.61% | 0.89% | 0.89% (d) | 1.99% | 33% | $242 |
Columbia Acorn Family of Funds | Annual Report 2016
| 99 |
Financial Highlights (continued)
Columbia Acorn International®
| Year ended | Net asset value,
beginning of
period | Net
investment
income | Net
realized
and
unrealized
gain (loss) | Total from
investment
operations | Distributions
from net
investment
income | Distributions
from net
realized
gains |
| Class Y |
| 12/31/2016 | $39.41 | 0.47 | (1.32) | (0.85) | (0.28) | (0.26) |
| 12/31/2015 | $42.02 | 0.53 | (1.01) | (0.48) | (0.56) | (1.57) |
| 12/31/2014 | $46.99 | 0.58 | (2.52) | (1.94) | (0.72) | (2.31) |
| 12/31/2013 | $41.08 | 0.57 | 8.48 | 9.05 | (1.21) | (1.93) |
| 12/31/2012 (g) | $39.90 | 0.04 | 1.78 | 1.82 | (0.64) | — |
| Class Z |
| 12/31/2016 | $39.12 | 0.44 | (1.32) | (0.88) | (0.24) | (0.26) |
| 12/31/2015 | $41.73 | 0.51 | (1.03) | (0.52) | (0.52) | (1.57) |
| 12/31/2014 | $46.68 | 0.56 | (2.51) | (1.95) | (0.69) | (2.31) |
| 12/31/2013 | $40.84 | 0.58 | 8.38 | 8.96 | (1.19) | (1.93) |
| 12/31/2012 | $34.31 | 0.59 | 6.78 | 7.37 | (0.84) | — |
| Notes to Financial Highlights |
| (a) | In addition to the fees and expenses that the Fund bears directly, the Fund indirectly bears a pro rata share of the fees and expenses of any other funds in which it invests. Such indirect expenses are not included in the Fund’s reported expense ratios. |
| (b) | Had the Investment Manager and/or its affiliates not waived a portion of expenses, total return would have been reduced. |
| (c) | Rounds to zero. |
| (d) | The benefits derived from custody fees paid indirectly had an impact of 0.01%. |
| (e) | Class R4 shares commenced operations on November 8, 2012. Per share data and total return reflect activity from that date. |
| (f) | Annualized. |
| (g) | Class Y shares commenced operations on November 8, 2012. Per share data and total return reflect activity from that date. |
The accompanying Notes to Financial Statements are an integral part of this statement.
| 100 | Columbia Acorn Family of Funds | Annual Report 2016 |
Total
distributions to
shareholders | Proceeds from
regulatory
settlements | Net
asset
value,
end of
period | Total
return | Total gross
expense
ratio to
average
net assets(a) | Total net
expense
ratio to
average
net assets(a) | Net investment
income (loss)
ratio to
average
net assets | Portfolio
turnover | Net
assets,
end of
period
(000’s) |
| |
| (0.54) | — | $38.02 | (2.19%) | 0.88% | 0.88% | 1.20% | 46% | $239,733 |
| (2.13) | — | $39.41 | (1.23%) | 0.88% | 0.88% | 1.26% | 50% | $318,326 |
| (3.03) | — | $42.02 | (4.21%) | 0.85% | 0.85% | 1.25% | 28% | $225,012 |
| (3.14) | — | $46.99 | 22.44% | 0.86% | 0.86% | 1.26% | 45% | $155,140 |
| (0.64) | — | $41.08 | 4.59% | 0.91% (f) | 0.90% (f) | 0.75% (f) | 33% | $30,856 |
| |
| (0.50) | — | $37.74 | (2.28%) | 0.98% | 0.98% | 1.13% | 46% | $3,356,348 |
| (2.09) | — | $39.12 | (1.33%) | 0.97% | 0.97% | 1.21% | 50% | $4,645,797 |
| (3.00) | — | $41.73 | (4.28%) | 0.93% | 0.93% | 1.20% | 28% | $5,585,035 |
| (3.12) | — | $46.68 | 22.33% | 0.93% | 0.93% | 1.30% | 45% | $6,293,552 |
| (0.84) | 0.00 (c) | $40.84 | 21.60% | 0.93% | 0.93% (d) | 1.53% | 33% | $5,494,506 |
Columbia Acorn Family of Funds | Annual Report 2016
| 101 |
Financial Highlights
Columbia Acorn USA®
| Year ended | Net asset value,
beginning of
period | Net
investment
income
(loss) | Net
realized
and
unrealized
gain (loss) | Total from
investment
operations | Distributions
from net
investment
income | Distributions
from net
realized
gains |
| Class A |
| 12/31/2016 | $20.25 | (0.11) | 2.43 | 2.32 | — | (7.62) |
| 12/31/2015 | $29.13 | (0.18) | (0.18) (b) | (0.36) | — | (8.52) |
| 12/31/2014 | $34.15 | (0.20) | 1.22 | 1.02 | — | (6.04) |
| 12/31/2013 | $28.21 | (0.15) | 9.09 | 8.94 | — | (3.00) |
| 12/31/2012 | $25.94 | 0.02 | 4.73 | 4.75 | (0.11) | (2.37) |
| Class C |
| 12/31/2016 | $16.00 | (0.18) | 1.85 | 1.67 | — | (7.62) |
| 12/31/2015 | $24.98 | (0.33) | (0.13) (b) | (0.46) | — | (8.52) |
| 12/31/2014 | $30.33 | (0.37) | 1.06 | 0.69 | — | (6.04) |
| 12/31/2013 | $25.49 | (0.33) | 8.17 | 7.84 | — | (3.00) |
| 12/31/2012 | $23.72 | (0.16) | 4.30 | 4.14 | — | (2.37) |
| Class I |
| 12/31/2016 | $22.40 | (0.03) | 2.72 | 2.69 | — | (7.62) |
| 12/31/2015 | $31.19 | (0.07) | (0.20) (b) | (0.27) | — | (8.52) |
| 12/31/2014 | $35.99 | (0.06) | 1.30 | 1.24 | — | (6.04) |
| 12/31/2013 | $29.47 | (0.02) | 9.54 | 9.52 | — | (3.00) |
| 12/31/2012 | $27.00 | (0.10) | 5.16 | 5.06 | (0.22) | (2.37) |
| Class R4 |
| 12/31/2016 | $22.85 | (0.07) | 2.77 | 2.70 | — | (7.62) |
| 12/31/2015 | $31.70 | (0.13) | (0.20) (b) | (0.33) | — | (8.52) |
| 12/31/2014 | $36.55 | (0.11) | 1.30 | 1.19 | — | (6.04) |
| 12/31/2013 | $29.92 | 0.00 (e) | 9.63 | 9.63 | — | (3.00) |
| 12/31/2012 (f) | $30.06 | 0.06 | 2.28 | 2.34 | (0.16) | (2.32) |
| Class R5 |
| 12/31/2016 | $22.90 | (0.06) | 2.80 | 2.74 | — | (7.62) |
| 12/31/2015 | $31.71 | (0.10) | (0.19) (b) | (0.29) | — | (8.52) |
| 12/31/2014 | $36.53 | (0.06) | 1.28 | 1.22 | — | (6.04) |
| 12/31/2013 | $29.90 | 0.02 | 9.61 | 9.63 | — | (3.00) |
| 12/31/2012 (h) | $30.06 | 0.07 | 2.27 | 2.34 | (0.18) | (2.32) |
| Class Y |
| 12/31/2016 | $22.99 | (0.04) | 2.81 | 2.77 | — | (7.62) |
| 12/31/2015 | $31.80 | (0.08) | (0.21) (b) | (0.29) | — | (8.52) |
| 12/31/2014 | $36.59 | (0.07) | 1.32 | 1.25 | — | (6.04) |
| 12/31/2013 | $29.93 | 0.02 | 9.64 | 9.66 | — | (3.00) |
| 12/31/2012 (i) | $30.10 | 0.07 | 2.27 | 2.34 | (0.19) | (2.32) |
The accompanying Notes to Financial Statements are an integral part of this statement.
| 102 | Columbia Acorn Family of Funds | Annual Report 2016 |
Total
distributions to
shareholders | Net
asset
value,
end of
period | Total
return | Total gross
expense
ratio to
average
net assets(a) | Total net
expense
ratio to
average
net assets(a) | Net investment
income (loss)
ratio to
average
net assets | Portfolio
turnover | Net
assets,
end of
period
(000’s) |
| |
| (7.62) | $14.95 | 12.70% | 1.41% | 1.41% | (0.58%) | 98% | $80,721 |
| (8.52) | $20.25 | (1.60%) | 1.34% | 1.34% | (0.63%) | 35% | $95,048 |
| (6.04) | $29.13 | 3.35% | 1.33% | 1.33% | (0.60%) | 12% | $148,089 |
| (3.00) | $34.15 | 32.34% | 1.32% | 1.32% | (0.46%) | 17% | $201,559 |
| (2.48) | $28.21 | 18.67% | 1.32% (c) | 1.32% (c),(d) | 0.08% | 14% | $152,164 |
| |
| (7.62) | $10.05 | 11.92% | 2.13% | 2.13% | (1.31%) | 98% | $12,088 |
| (8.52) | $16.00 | (2.28%) | 2.02% | 2.02% | (1.32%) | 35% | $17,255 |
| (6.04) | $24.98 | 2.67% | 2.00% | 2.00% | (1.26%) | 12% | $36,476 |
| (3.00) | $30.33 | 31.47% | 2.00% | 2.00% | (1.14%) | 17% | $40,395 |
| (2.37) | $25.49 | 17.82% | 2.05% (c) | 2.05% (c),(d) | (0.61%) | 14% | $31,410 |
| |
| (7.62) | $17.47 | 13.16% | 0.98% | 0.98% | (0.16%) | 98% | $1 |
| (8.52) | $22.40 | (1.19%) | 0.92% | 0.92% | (0.23%) | 35% | $2 |
| (6.04) | $31.19 | 3.80% | 0.88% | 0.88% | (0.17%) | 12% | $2 |
| (3.00) | $35.99 | 32.93% | 0.90% | 0.90% | (0.04%) | 17% | $4 |
| (2.59) | $29.47 | 19.10% | 0.96% | 0.96% (d) | (0.33%) | 14% | $3 |
| |
| (7.62) | $17.93 | 12.93% | 1.18% | 1.18% | (0.35%) | 98% | $6,172 |
| (8.52) | $22.85 | (1.36%) | 1.12% | 1.12% | (0.40%) | 35% | $8,224 |
| (6.04) | $31.70 | 3.60% | 1.07% | 1.07% | (0.32%) | 12% | $7,952 |
| (3.00) | $36.55 | 32.80% | 1.00% | 1.00% | 0.01% | 17% | $6,441 |
| (2.48) | $29.92 | 8.06% | 1.14% (c),(g) | 1.14% (c),(d),(g) | 1.51% (g) | 14% | $15 |
| |
| (7.62) | $18.02 | 13.09% | 1.07% | 1.07% | (0.27%) | 98% | $13,764 |
| (8.52) | $22.90 | (1.23%) | 1.01% | 1.01% | (0.30%) | 35% | $27,112 |
| (6.04) | $31.71 | 3.68% | 0.99% | 0.99% | (0.17%) | 12% | $36,689 |
| (3.00) | $36.53 | 32.83% | 0.97% | 0.97% | 0.06% | 17% | $6,068 |
| (2.50) | $29.90 | 8.06% | 1.12% (g) | 1.12% (d),(g) | 1.53% (g) | 14% | $2 |
| |
| (7.62) | $18.14 | 13.18% | 1.01% | 1.01% | (0.18%) | 98% | $38,136 |
| (8.52) | $22.99 | (1.23%) | 0.97% | 0.97% | (0.25%) | 35% | $41,658 |
| (6.04) | $31.80 | 3.76% | 0.93% | 0.93% | (0.19%) | 12% | $35,551 |
| (3.00) | $36.59 | 32.89% | 0.93% | 0.93% | 0.07% | 17% | $48,479 |
| (2.51) | $29.93 | 8.07% | 1.04% (g) | 1.04% (d),(g) | 1.62% (g) | 14% | $2 |
Columbia Acorn Family of Funds | Annual Report 2016
| 103 |
Financial Highlights (continued)
Columbia Acorn USA®
| Year ended | Net asset value,
beginning of
period | Net
investment
income
(loss) | Net
realized
and
unrealized
gain (loss) | Total from
investment
operations | Distributions
from net
investment
income | Distributions
from net
realized
gains |
| Class Z |
| 12/31/2016 | $22.19 | (0.07) | 2.70 | 2.63 | — | (7.62) |
| 12/31/2015 | $31.03 | (0.12) | (0.20) (b) | (0.32) | — | (8.52) |
| 12/31/2014 | $35.90 | (0.12) | 1.29 | 1.17 | — | (6.04) |
| 12/31/2013 | $29.45 | (0.07) | 9.52 | 9.45 | — | (3.00) |
| 12/31/2012 | $26.98 | 0.11 | 4.92 | 5.03 | (0.19) | (2.37) |
| Notes to Financial Highlights |
| (a) | In addition to the fees and expenses that the Fund bears directly, the Fund indirectly bears a pro rata share of the fees and expenses of any other funds in which it invests, if any. Such indirect expenses are not included in the Fund’s reported expense ratios. |
| (b) | Calculation of the net gain (loss) per share (both realized and unrealized) does not correlate to the aggregate realized and unrealized gain (loss) presented in the Statements of Operations due to the timing of subscriptions and redemptions of Fund shares in relation to fluctuations in the market value of the portfolio. |
| (c) | Ratios include line of credit interest expense which is less than 0.01%. |
| (d) | The benefits derived from custody fees paid indirectly had an impact of less than 0.01%. |
| (e) | Rounds to zero. |
| (f) | Class R4 shares commenced operations on November 8, 2012. Per share data and total return reflect activity from that date. |
| (g) | Annualized. |
| (h) | Class R5 shares commenced operations on November 8, 2012. Per share data and total return reflect activity from that date. |
| (i) | Class Y shares commenced operations on November 8, 2012. Per share data and total return reflect activity from that date. |
The accompanying Notes to Financial Statements are an integral part of this statement.
| 104 | Columbia Acorn Family of Funds | Annual Report 2016 |
Total
distributions to
shareholders | Net
asset
value,
end of
period | Total
return | Total gross
expense
ratio to
average
net assets(a) | Total net
expense
ratio to
average
net assets(a) | Net investment
income (loss)
ratio to
average
net assets | Portfolio
turnover | Net
assets,
end of
period
(000’s) |
| |
| (7.62) | $17.20 | 13.00% | 1.16% | 1.16% | (0.34%) | 98% | $492,739 |
| (8.52) | $22.19 | (1.36%) | 1.10% | 1.10% | (0.40%) | 35% | $768,658 |
| (6.04) | $31.03 | 3.61% | 1.08% | 1.08% | (0.34%) | 12% | $1,132,223 |
| (3.00) | $35.90 | 32.72% | 1.06% | 1.06% | (0.20%) | 17% | $1,496,775 |
| (2.56) | $29.45 | 18.98% | 1.07% (c) | 1.07% (c),(d) | 0.36% | 14% | $1,415,442 |
Columbia Acorn Family of Funds | Annual Report 2016
| 105 |
Financial Highlights
Columbia Acorn International SelectSM
| Year ended | Net asset value,
beginning of
period | Net
investment
income
(loss) | Net
realized
and
unrealized
gain (loss) | Total from
investment
operations | Distributions
from net
investment
income | Distributions
from net
realized
gains | Tax
return of
capital |
| Class A |
| 12/31/2016 | $21.33 | 0.10 | 0.09 (b) | 0.19 | (0.14) | — | (0.02) |
| 12/31/2015 | $22.04 | 0.17 | (0.45) | (0.28) | (0.42) | — | (0.01) |
| 12/31/2014 | $26.91 | 0.29 | (2.17) | (1.88) | (0.10) | (2.89) | — |
| 12/31/2013 | $25.61 | 0.29 | 3.29 | 3.58 | (0.37) | (1.91) | — |
| 12/31/2012 | $24.26 | 0.39 | 4.92 | 5.31 | (1.75) | (2.21) | — |
| Class C |
| 12/31/2016 | $19.96 | (0.06) | 0.09 (b) | 0.03 | — | — | — |
| 12/31/2015 | $20.54 | (0.01) | (0.41) | (0.42) | (0.15) | — | (0.01) |
| 12/31/2014 | $25.39 | 0.07 | (2.03) | (1.96) | — | (2.89) | — |
| 12/31/2013 | $24.28 | 0.08 | 3.10 | 3.18 | (0.16) | (1.91) | — |
| 12/31/2012 | $23.17 | 0.18 | 4.67 | 4.85 | (1.53) | (2.21) | — |
| Class I |
| 12/31/2016 | $21.57 | 0.18 | 0.10 (b) | 0.28 | (0.23) | — | (0.02) |
| 12/31/2015 | $22.29 | 0.24 | (0.45) | (0.21) | (0.50) | — | (0.01) |
| 12/31/2014 | $27.19 | 0.39 | (2.20) | (1.81) | (0.20) | (2.89) | — |
| 12/31/2013 | $25.85 | 0.39 | 3.32 | 3.71 | (0.46) | (1.91) | — |
| 12/31/2012 | $24.45 | 0.51 | 4.94 | 5.45 | (1.84) | (2.21) | — |
| Class R4 |
| 12/31/2016 | $21.74 | 0.17 | 0.08 (b) | 0.25 | (0.20) | — | (0.02) |
| 12/31/2015 | $22.45 | 0.22 | (0.44) | (0.22) | (0.48) | — | (0.01) |
| 12/31/2014 | $27.36 | 0.37 | (2.22) | (1.85) | (0.17) | (2.89) | — |
| 12/31/2013 | $25.99 | 0.29 | 3.42 | 3.71 | (0.43) | (1.91) | — |
| 12/31/2012 (l) | $29.98 | (0.02) | (0.09) (b) | (0.11) | (1.79) | (2.09) | — |
| Class R5 |
| 12/31/2016 | $21.72 | 0.16 | 0.11 (b) | 0.27 | (0.21) | — | (0.02) |
| 12/31/2015 | $22.43 | 0.22 | (0.42) | (0.20) | (0.50) | — | (0.01) |
| 12/31/2014 | $27.34 | 0.36 | (2.19) | (1.83) | (0.19) | (2.89) | — |
| 12/31/2013 | $25.98 | 0.38 | 3.35 | 3.73 | (0.46) | (1.91) | — |
| 12/31/2012 (p) | $29.98 | (0.02) | (0.09) (b) | (0.11) | (1.80) | (2.09) | — |
| Class Y |
| 12/31/2016 | $21.71 | 0.16 | 0.12 (b) | 0.28 | (0.23) | — | (0.02) |
| 12/31/2015 | $22.42 | 0.28 | (0.47) | (0.19) | (0.51) | — | (0.01) |
| 12/31/2014 | $27.33 | 0.40 | (2.21) | (1.81) | (0.21) | (2.89) | — |
| 12/31/2013 | $25.98 | 0.11 | 3.62 | 3.73 | (0.47) | (1.91) | — |
| 12/31/2012 (r) | $29.99 | (0.02) | (0.09) (b) | (0.11) | (1.81) | (2.09) | — |
The accompanying Notes to Financial Statements are an integral part of this statement.
| 106 | Columbia Acorn Family of Funds | Annual Report 2016 |
Total
distributions to
shareholders | Proceeds from
regulatory
settlements | Net
asset
value,
end of
period | Total
return | Total gross
expense
ratio to
average
net assets(a) | Total net
expense
ratio to
average
net assets(a) | Net investment
income (loss)
ratio to
average
net assets | Portfolio
turnover | Net
assets,
end of
period
(000’s) |
| |
| (0.16) | — | $21.36 | 0.90% (c) | 1.55% (d) | 1.48% (d) | 0.49% | 49% | $20,165 |
| (0.43) | 0.00 (e) | $21.33 | (1.30%) (f) | 1.55% | 1.55% | 0.74% | 59% | $33,772 |
| (2.99) | — | $22.04 | (7.06%) | 1.47% | 1.47% | 1.05% | 58% | $53,419 |
| (2.28) | — | $26.91 | 14.42% | 1.47% | 1.47% | 1.08% | 72% | $73,911 |
| (3.96) | — | $25.61 | 22.05% | 1.49% (g) | 1.49% (g),(h) | 1.43% | 63% | $74,167 |
| |
| — | — | $19.99 | 0.15% (c) | 2.31% (i) | 2.23% (i) | (0.29%) | 49% | $4,346 |
| (0.16) | 0.00 (e) | $19.96 | (2.05%) (f) | 2.32% | 2.32% | (0.06%) | 59% | $5,390 |
| (2.89) | — | $20.54 | (7.80%) | 2.23% | 2.23% | 0.29% | 58% | $8,057 |
| (2.07) | — | $25.39 | 13.52% | 2.26% | 2.26% | 0.32% | 72% | $10,311 |
| (3.74) | — | $24.28 | 21.10% | 2.28% (g) | 2.27% (g),(h) | 0.67% | 63% | $9,786 |
| |
| (0.25) | — | $21.60 | 1.34% (c) | 1.12% (j) | 1.03% (j) | 0.85% | 49% | $2 |
| (0.51) | 0.00 (e) | $21.57 | (0.97%) (f) | 1.18% | 1.18% | 1.05% | 59% | $2 |
| (3.09) | — | $22.29 | (6.72%) | 1.11% | 1.11% | 1.41% | 58% | $2 |
| (2.37) | — | $27.19 | 14.82% | 1.13% | 1.13% | 1.43% | 72% | $3 |
| (4.05) | — | $25.85 | 22.48% | 1.15% | 1.14% (h) | 1.84% | 63% | $2 |
| |
| (0.22) | — | $21.77 | 1.15% (c) | 1.29% (k) | 1.21% (k) | 0.77% | 49% | $1,106 |
| (0.49) | 0.00 (e) | $21.74 | (1.00%) (f) | 1.27% | 1.27% | 0.97% | 59% | $898 |
| (3.06) | — | $22.45 | (6.83%) | 1.21% | 1.21% | 1.33% | 58% | $974 |
| (2.34) | — | $27.36 | 14.72% | 1.24% | 1.24% | 1.06% | 72% | $417 |
| (3.88) | — | $25.99 | (0.27%) | 1.30% (g),(m) | 1.30% (g),(h),(m) | (0.55%) (m) | 63% | $13 |
| |
| (0.23) | — | $21.76 | 1.25% (c) | 1.23% (n) | 1.19% (n) | 0.76% | 49% | $440 |
| (0.51) | 0.00 (e) | $21.72 | (0.94%) (f) | 1.21% | 1.21% | 0.96% | 59% | $2,268 |
| (3.08) | — | $22.43 | (6.77%) | 1.15% | 1.15% | 1.30% | 58% | $2,593 |
| (2.37) | — | $27.34 | 14.80% (o) | 1.15% | 1.15% | 1.40% | 72% | $956 |
| (3.89) | — | $25.98 | (0.27%) | 1.29% (m) | 1.28% (h),(m) | (0.55%) (m) | 63% | $2 |
| |
| (0.25) | — | $21.74 | 1.29% (c) | 1.12% (q) | 1.04% (q) | 0.74% | 49% | $322 |
| (0.52) | 0.00 (e) | $21.71 | (0.89%) (f) | 1.14% | 1.14% | 1.21% | 59% | $660 |
| (3.10) | — | $22.42 | (6.71%) | 1.09% | 1.09% | 1.43% | 58% | $11,755 |
| (2.38) | — | $27.33 | 14.82% | 1.09% | 1.09% | 0.40% | 72% | $13,318 |
| (3.90) | — | $25.98 | (0.25%) | 1.21% (m) | 1.20% (h),(m) | (0.48%) (m) | 63% | $2 |
Columbia Acorn Family of Funds | Annual Report 2016
| 107 |
Financial Highlights (continued)
Columbia Acorn International SelectSM
| Year ended | Net asset value,
beginning of
period | Net
investment
income
(loss) | Net
realized
and
unrealized
gain (loss) | Total from
investment
operations | Distributions
from net
investment
income | Distributions
from net
realized
gains | Tax
return of
capital |
| Class Z |
| 12/31/2016 | $21.58 | 0.16 | 0.09 (b) | 0.25 | (0.20) | — | (0.02) |
| 12/31/2015 | $22.30 | 0.24 | (0.46) | (0.22) | (0.49) | — | (0.01) |
| 12/31/2014 | $27.20 | 0.38 | (2.21) | (1.83) | (0.18) | (2.89) | — |
| 12/31/2013 | $25.86 | 0.37 | 3.33 | 3.70 | (0.45) | (1.91) | — |
| 12/31/2012 | $24.46 | 0.49 | 4.95 | 5.44 | (1.83) | (2.21) | — |
| Notes to Financial Highlights |
| (a) | In addition to the fees and expenses that the Fund bears directly, the Fund indirectly bears a pro rata share of the fees and expenses of any other funds in which it invests, if any. Such indirect expenses are not included in the Fund’s reported expense ratios. |
| (b) | Calculation of the net gain (loss) per share (both realized and unrealized) does not correlate to the aggregate realized and unrealized gain (loss) presented in the Statements of Operations due to the timing of subscriptions and redemptions of Fund shares in relation to fluctuations in the market value of the portfolio. |
| (c) | Had the Investment Manager and/or its affiliates not waived a portion of expenses, total return would have been reduced. |
| (d) | Expenses have been reduced due to a reimbursement of expenses overbilled by a third party. If the reimbursement had been excluded, the expense ratios would have been higher by 0.06% for Class A. All fee waivers and expense reimbursements by the Investment Manager and its affiliates were applied before giving effect to this third party reimbursement. |
| (e) | Rounds to zero. |
| (f) | The Fund received proceeds from regulatory settlements. Had the Fund not received these proceeds, the total return would have been lower by 0.01%. |
| (g) | Ratios include line of credit interest expense which is less than 0.01%. |
| (h) | The benefits derived from custody fees paid indirectly had an impact of 0.01%. |
| (i) | Expenses have been reduced due to a reimbursement of expenses overbilled by a third party. If the reimbursement had been excluded, the expense ratios would have been higher by 0.06% for Class C. All fee waivers and expense reimbursements by the Investment Manager and its affiliates were applied before giving effect to this third party reimbursement. |
| (j) | Expenses have been reduced due to a reimbursement of expenses overbilled by a third party. If the reimbursement had been excluded, the expense ratios would have been higher by 0.07% for Class I. All fee waivers and expense reimbursements by the Investment Manager and its affiliates were applied before giving effect to this third party reimbursement. |
| (k) | Expenses have been reduced due to a reimbursement of expenses overbilled by a third party. If the reimbursement had been excluded, the expense ratios would have been higher by 0.06% for Class R4. All fee waivers and expense reimbursements by the Investment Manager and its affiliates were applied before giving effect to this third party reimbursement. |
| (l) | Class R4 shares commenced operations on November 8, 2012. Per share data and total return reflect activity from that date. |
| (m) | Annualized. |
| (n) | Expenses have been reduced due to a reimbursement of expenses overbilled by a third party. If the reimbursement had been excluded, the expense ratios would have been higher by 0.04% for Class R5. All fee waivers and expense reimbursements by the Investment Manager and its affiliates were applied before giving effect to this third party reimbursement. |
| (o) | Had the Investment Manager and/or Transfer Agent not waived fees and/or reimbursed a portion of expenses, total return would have been reduced. |
| (p) | Class R5 shares commenced operations on November 8, 2012. Per share data and total return reflect activity from that date. |
| (q) | Expenses have been reduced due to a reimbursement of expenses overbilled by a third party. If the reimbursement had been excluded, the expense ratios would have been higher by 0.09% for Class Y. All fee waivers and expense reimbursements by the Investment Manager and its affiliates were applied before giving effect to this third party reimbursement. |
| (r) | Class Y shares commenced operations on November 8, 2012. Per share data and total return reflect activity from that date. |
| (s) | Expenses have been reduced due to a reimbursement of expenses overbilled by a third party. If the reimbursement had been excluded, the expense ratios would have been higher by 0.06% for Class Z. All fee waivers and expense reimbursements by the Investment Manager and its affiliates were applied before giving effect to this third party reimbursement. |
The accompanying Notes to Financial Statements are an integral part of this statement.
| 108 | Columbia Acorn Family of Funds | Annual Report 2016 |
Total
distributions to
shareholders | Proceeds from
regulatory
settlements | Net
asset
value,
end of
period | Total
return | Total gross
expense
ratio to
average
net assets(a) | Total net
expense
ratio to
average
net assets(a) | Net investment
income (loss)
ratio to
average
net assets | Portfolio
turnover | Net
assets,
end of
period
(000’s) |
| |
| (0.22) | — | $21.61 | 1.18% (c) | 1.26% (s) | 1.19% (s) | 0.74% | 49% | $73,631 |
| (0.50) | 0.00 (e) | $21.58 | (1.03%) (f) | 1.24% | 1.24% | 1.05% | 59% | $96,311 |
| (3.07) | — | $22.30 | (6.79%) | 1.17% | 1.17% | 1.36% | 58% | $175,764 |
| (2.36) | — | $27.20 | 14.75% | 1.19% | 1.19% | 1.37% | 72% | $256,100 |
| (4.04) | — | $25.86 | 22.42% | 1.20% (g) | 1.19% (g),(h) | 1.77% | 63% | $295,231 |
Columbia Acorn Family of Funds | Annual Report 2016
| 109 |
Financial Highlights
Columbia Acorn SelectSM
| Year ended | Net asset value,
beginning of
period | Net
investment
income
(loss) | Net
realized
and
unrealized
gain | Total from
investment
operations | Distributions
from net
investment
income | Distributions
from net
realized
gains |
| Class A |
| 12/31/2016 | $13.94 | (0.04) | 1.56 | 1.52 | — | (2.33) |
| 12/31/2015 | $21.03 | (0.09) | 0.14 | 0.05 | — | (7.14) |
| 12/31/2014 | $25.57 | (0.14) | 0.64 | 0.50 | — | (5.04) |
| 12/31/2013 | $24.72 | (0.15) | 7.92 | 7.77 | (0.07) | (6.85) |
| 12/31/2012 | $22.95 | 0.03 | 3.78 | 3.81 | — | (2.04) |
| Class C |
| 12/31/2016 | $10.51 | (0.10) | 1.14 | 1.04 | — | (2.33) |
| 12/31/2015 | $17.69 | (0.19) | 0.15 | (0.04) | — | (7.14) |
| 12/31/2014 | $22.46 | (0.28) | 0.55 | 0.27 | — | (5.04) |
| 12/31/2013 | $22.48 | (0.32) | 7.15 | 6.83 | — | (6.85) |
| 12/31/2012 | $21.20 | (0.14) | 3.46 | 3.32 | — | (2.04) |
| Class I |
| 12/31/2016 | $15.36 | 0.01 | 1.74 | 1.75 | — | (2.33) |
| 12/31/2015 | $22.38 | 0.01 | 0.11 | 0.12 | — | (7.14) |
| 12/31/2014 | $26.81 | (0.05) | 0.66 | 0.61 | — | (5.04) |
| 12/31/2013 | $25.63 | (0.06) | 8.25 | 8.19 | (0.16) | (6.85) |
| 12/31/2012 | $23.65 | 0.23 | 3.79 | 4.02 | — | (2.04) |
| Class R4 |
| 12/31/2016 | $15.69 | (0.00) (e) | 1.77 | 1.77 | — | (2.33) |
| 12/31/2015 | $22.75 | (0.04) | 0.12 | 0.08 | — | (7.14) |
| 12/31/2014 | $27.20 | (0.10) | 0.69 | 0.59 | — | (5.04) |
| 12/31/2013 | $25.92 | (0.06) | 8.32 | 8.26 | (0.13) | (6.85) |
| 12/31/2012 (f) | $25.91 | 0.00 (e) | 1.52 | 1.52 | — | (1.51) |
| Class R5 |
| 12/31/2016 | $15.74 | 0.01 | 1.78 | 1.79 | — | (2.33) |
| 12/31/2015 | $22.78 | (0.08) | 0.18 | 0.10 | — | (7.14) |
| 12/31/2014 | $27.20 | (0.07) | 0.69 | 0.62 | — | (5.04) |
| 12/31/2013 | $25.93 | (0.04) | 8.31 | 8.27 | (0.15) | (6.85) |
| 12/31/2012 (h) | $25.91 | 0.00 (e) | 1.53 | 1.53 | — | (1.51) |
| Class Y |
| 12/31/2016 | $15.83 | 0.02 | 1.79 | 1.81 | — | (2.33) |
| 12/31/2015 | $22.86 | 0.00 (e) | 0.11 | 0.11 | — | (7.14) |
| 12/31/2014 | $27.27 | (0.06) | 0.69 | 0.63 | — | (5.04) |
| 12/31/2013 | $25.98 | (0.03) | 8.34 | 8.31 | (0.17) | (6.85) |
| 12/31/2012 (i) | $25.96 | 0.01 | 1.52 | 1.53 | — | (1.51) |
The accompanying Notes to Financial Statements are an integral part of this statement.
| 110 | Columbia Acorn Family of Funds | Annual Report 2016 |
Total
distributions to
shareholders | Net
asset
value,
end of
period | Total
return | Total gross
expense
ratio to
average
net assets(a) | Total net
expense
ratio to
average
net assets(a) | Net investment
income (loss)
ratio to
average
net assets | Portfolio
turnover | Net
assets,
end of
period
(000’s) |
| |
| (2.33) | $13.13 | 11.54% (b) | 1.37% | 1.17% | (0.27%) | 75% | $119,364 |
| (7.14) | $13.94 | (0.73%) (b) | 1.35% (c) | 1.22% (c) | (0.42%) | 55% | $146,864 |
| (5.04) | $21.03 | 2.17% | 1.32% | 1.32% | (0.58%) | 17% | $264,234 |
| (6.92) | $25.57 | 33.77% | 1.31% (c) | 1.31% (c) | (0.54%) | 20% | $333,193 |
| (2.04) | $24.72 | 16.87% | 1.31% (c) | 1.31% (c),(d) | 0.13% | 15% | $271,628 |
| |
| (2.33) | $9.22 | 10.67% (b) | 2.11% | 1.91% | (1.01%) | 75% | $27,524 |
| (7.14) | $10.51 | (1.41%) (b) | 2.08% (c) | 1.95% (c) | (1.15%) | 55% | $34,589 |
| (5.04) | $17.69 | 1.42% | 2.04% | 2.04% | (1.30%) | 17% | $48,591 |
| (6.85) | $22.46 | 32.85% | 2.04% (c) | 2.04% (c) | (1.28%) | 20% | $61,537 |
| (2.04) | $22.48 | 15.93% | 2.07% (c) | 2.06% (c),(d) | (0.59%) | 15% | $57,309 |
| |
| (2.33) | $14.78 | 11.99% (b) | 1.00% | 0.80% | 0.07% | 75% | $10,911 |
| (7.14) | $15.36 | (0.34%) (b) | 0.99% (c) | 0.83% (c) | 0.06% | 55% | $26,917 |
| (5.04) | $22.38 | 2.49% | 0.94% | 0.94% | (0.20%) | 17% | $18,718 |
| (7.01) | $26.81 | 34.31% | 0.94% (c) | 0.94% (c) | (0.21%) | 20% | $13,660 |
| (2.04) | $25.63 | 17.26% | 0.96% (c) | 0.95% (c),(d) | 0.89% | 15% | $39,054 |
| |
| (2.33) | $15.13 | 11.86% (b) | 1.13% | 0.93% | (0.02%) | 75% | $853 |
| (7.14) | $15.69 | (0.53%) (b) | 1.12% (c) | 0.99% (c) | (0.18%) | 55% | $932 |
| (5.04) | $22.75 | 2.39% | 1.12% | 1.12% | (0.37%) | 17% | $1,193 |
| (6.98) | $27.20 | 34.16% | 1.02% (c) | 1.02% (c) | (0.20%) | 20% | $1,383 |
| (1.51) | $25.92 | 5.92% | 1.07% (g) | 1.06% (d),(g) | 0.02% (g) | 15% | $15 |
| |
| (2.33) | $15.20 | 11.96% (b) | 1.05% | 0.85% | 0.07% | 75% | $1,036 |
| (7.14) | $15.74 | (0.44%) (b) | 1.02% (c) | 0.95% (c) | (0.33%) | 55% | $911 |
| (5.04) | $22.78 | 2.50% | 1.00% | 1.00% | (0.26%) | 17% | $10,697 |
| (7.00) | $27.20 | 34.21% | 0.97% (c) | 0.97% (c) | (0.13%) | 20% | $11,996 |
| (1.51) | $25.93 | 5.96% | 0.99% (g) | 0.99% (d),(g) | 0.08% (g) | 15% | $3 |
| |
| (2.33) | $15.31 | 12.02% (b) | 1.00% | 0.80% | 0.10% | 75% | $4,389 |
| (7.14) | $15.83 | (0.39%) (b) | 0.98% (c) | 0.85% (c) | 0.02% | 55% | $5,056 |
| (5.04) | $22.86 | 2.53% | 0.95% | 0.95% | (0.22%) | 17% | $3,644 |
| (7.02) | $27.27 | 34.30% | 0.93% (c) | 0.93% (c) | (0.09%) | 20% | $4,847 |
| (1.51) | $25.98 | 5.94% | 0.92% (g) | 0.92% (d),(g) | 0.15% (g) | 15% | $3 |
Columbia Acorn Family of Funds | Annual Report 2016
| 111 |
Financial Highlights (continued)
Columbia Acorn SelectSM
| Year ended | Net asset value,
beginning of
period | Net
investment
income
(loss) | Net
realized
and
unrealized
gain | Total from
investment
operations | Distributions
from net
investment
income | Distributions
from net
realized
gains |
| Class Z |
| 12/31/2016 | $15.24 | (0.00) (e) | 1.72 | 1.72 | — | (2.33) |
| 12/31/2015 | $22.28 | (0.03) | 0.13 | 0.10 | — | (7.14) |
| 12/31/2014 | $26.72 | (0.08) | 0.68 | 0.60 | — | (5.04) |
| 12/31/2013 | $25.57 | (0.07) | 8.21 | 8.14 | (0.14) | (6.85) |
| 12/31/2012 | $23.62 | 0.11 | 3.88 | 3.99 | — | (2.04) |
| Notes to Financial Highlights |
| (a) | In addition to the fees and expenses that the Fund bears directly, the Fund indirectly bears a pro rata share of the fees and expenses of any other funds in which it invests, if any. Such indirect expenses are not included in the Fund’s reported expense ratios. |
| (b) | Had the Investment Manager and/or Transfer Agent not waived fees and/or reimbursed a portion of expenses, total return would have been reduced. |
| (c) | Ratios include line of credit interest expense which is less than 0.01%. |
| (d) | The benefits derived from custody fees paid indirectly had an impact of less than 0.01%. |
| (e) | Rounds to zero. |
| (f) | Class R4 shares commenced operations on November 8, 2012. Per share data and total return reflect activity from that date. |
| (g) | Annualized. |
| (h) | Class R5 shares commenced operations on November 8, 2012. Per share data and total return reflect activity from that date. |
| (i) | Class Y shares commenced operations on November 8, 2012. Per share data and total return reflect activity from that date. |
The accompanying Notes to Financial Statements are an integral part of this statement.
| 112 | Columbia Acorn Family of Funds | Annual Report 2016 |
Total
distributions to
shareholders | Net
asset
value,
end of
period | Total
return | Total gross
expense
ratio to
average
net assets(a) | Total net
expense
ratio to
average
net assets(a) | Net investment
income (loss)
ratio to
average
net assets | Portfolio
turnover | Net
assets,
end of
period
(000’s) |
| |
| (2.33) | $14.63 | 11.88% (b) | 1.10% | 0.90% | (0.02%) | 75% | $144,313 |
| (7.14) | $15.24 | (0.44%) (b) | 1.07% (c) | 0.95% (c) | (0.15%) | 55% | $183,642 |
| (5.04) | $22.28 | 2.47% | 1.04% | 1.04% | (0.30%) | 17% | $318,487 |
| (6.99) | $26.72 | 34.16% | 1.02% (c) | 1.02% (c) | (0.26%) | 20% | $431,990 |
| (2.04) | $25.57 | 17.15% | 1.03% (c) | 1.03% (c),(d) | 0.40% | 15% | $587,678 |
Columbia Acorn Family of Funds | Annual Report 2016
| 113 |
Financial Highlights
Columbia Thermostat FundSM
| Year ended | Net asset value,
beginning of
period | Net
investment
income | Net
realized
and
unrealized
gain (loss) | Total from
investment
operations | Distributions
from net
investment
income | Distributions
from net
realized
gains |
| Class A |
| 12/31/2016 | $14.31 | 0.20 | 0.44 | 0.64 | (0.08) | (0.27) |
| 12/31/2015 | $14.86 | 0.27 | (0.26) | 0.01 | (0.28) | (0.28) |
| 12/31/2014 | $14.58 | 0.28 | 0.49 | 0.77 | (0.28) | (0.21) |
| 12/31/2013 | $14.29 | 0.29 | 1.00 | 1.29 | (0.25) | (0.75) |
| 12/31/2012 | $12.82 | 0.32 | 1.39 | 1.71 | (0.24) | — |
| Class C |
| 12/31/2016 | $14.41 | 0.09 | 0.44 | 0.53 | (0.05) | (0.27) |
| 12/31/2015 | $14.96 | 0.16 | (0.26) | (0.10) | (0.17) | (0.28) |
| 12/31/2014 | $14.68 | 0.17 | 0.49 | 0.66 | (0.17) | (0.21) |
| 12/31/2013 | $14.39 | 0.18 | 1.00 | 1.18 | (0.14) | (0.75) |
| 12/31/2012 | $12.91 | 0.22 | 1.39 | 1.61 | (0.13) | — |
| Class R4 |
| 12/31/2016 | $14.19 | 0.24 | 0.42 | 0.66 | (0.11) | (0.27) |
| 12/31/2015 | $14.74 | 0.30 | (0.25) | 0.05 | (0.32) | (0.28) |
| 12/31/2014 | $14.46 | 0.32 | 0.49 | 0.81 | (0.32) | (0.21) |
| 12/31/2013 | $14.19 | 0.36 | 0.95 | 1.31 | (0.29) | (0.75) |
| 12/31/2012 (d) | $14.08 | 0.09 | 0.28 | 0.37 | (0.26) | — |
| Class R5 |
| 12/31/2016 | $14.20 | 0.24 | 0.43 | 0.67 | (0.11) | (0.27) |
| 12/31/2015 | $14.75 | 0.31 | (0.26) | 0.05 | (0.32) | (0.28) |
| 12/31/2014 | $14.47 | 0.31 | 0.50 | 0.81 | (0.32) | (0.21) |
| 12/31/2013 | $14.19 | 0.37 | 0.96 | 1.33 | (0.30) | (0.75) |
| 12/31/2012 (f) | $14.08 | 0.09 | 0.27 | 0.36 | (0.25) | — |
| Class Y |
| 12/31/2016 | $14.18 | 0.25 | 0.42 | 0.67 | (0.12) | (0.27) |
| 12/31/2015 | $14.74 | 0.31 | (0.26) | 0.05 | (0.33) | (0.28) |
| 12/31/2014 | $14.46 | 0.32 | 0.50 | 0.82 | (0.33) | (0.21) |
| 12/31/2013 | $14.18 | 0.33 | 1.01 | 1.34 | (0.31) | (0.75) |
| 12/31/2012 (g) | $14.08 | 0.09 | 0.27 | 0.36 | (0.26) | — |
| Class Z |
| 12/31/2016 | $14.12 | 0.23 | 0.43 | 0.66 | (0.11) | (0.27) |
| 12/31/2015 | $14.67 | 0.31 | (0.26) | 0.05 | (0.32) | (0.28) |
| 12/31/2014 | $14.40 | 0.32 | 0.48 | 0.80 | (0.32) | (0.21) |
| 12/31/2013 | $14.13 | 0.32 | 0.99 | 1.31 | (0.29) | (0.75) |
| 12/31/2012 | $12.67 | 0.34 | 1.39 | 1.73 | (0.27) | — |
| Notes to Financial Highlights |
| (a) | Had the Investment Manager and/or Transfer Agent not waived fees and/or reimbursed a portion of expenses, total return would have been reduced. |
| (b) | In addition to the fees and expenses that the Fund bears directly, the Fund indirectly bears a pro rata share of the fees and expenses of any other funds in which it invests, if any. Such indirect expenses are not included in the Fund’s reported expense ratios. |
| (c) | The benefits derived from custody fees paid indirectly had an impact of 0.01%. |
| (d) | Class R4 shares commenced operations on November 8, 2012. Per share data and total return reflect activity from that date. |
| (e) | Annualized. |
| (f) | Class R5 shares commenced operations on November 8, 2012. Per share data and total return reflect activity from that date. |
| (g) | Class Y shares commenced operations on November 8, 2012. Per share data and total return reflect activity from that date. |
The accompanying Notes to Financial Statements are an integral part of this statement.
| 114 | Columbia Acorn Family of Funds | Annual Report 2016 |
Total
distributions to
shareholders | Net
asset
value,
end of
period | Total
return(a) | Total gross
expense
ratio to
average
net assets(b) | Total net
expense
ratio to
average
net assets(b) | Net investment
income
ratio to
average
net assets | Portfolio
turnover | Net
assets,
end of
period
(000’s) |
| |
| (0.35) | $14.60 | 4.47% | 0.54% | 0.50% | 1.39% | 95% | $398,781 |
| (0.56) | $14.31 | 0.07% | 0.52% | 0.50% | 1.82% | 69% | $387,967 |
| (0.49) | $14.86 | 5.30% | 0.51% | 0.50% | 1.88% | 95% | $450,258 |
| (1.00) | $14.58 | 9.07% | 0.52% | 0.50% | 1.91% | 92% | $513,293 |
| (0.24) | $14.29 | 13.34% | 0.58% | 0.50% (c) | 2.28% | 109% | $323,750 |
| |
| (0.32) | $14.62 | 3.69% | 1.28% | 1.25% | 0.63% | 95% | $338,930 |
| (0.45) | $14.41 | (0.68%) | 1.27% | 1.25% | 1.08% | 69% | $364,684 |
| (0.38) | $14.96 | 4.50% | 1.26% | 1.25% | 1.14% | 95% | $404,456 |
| (0.89) | $14.68 | 8.23% | 1.27% | 1.25% | 1.16% | 92% | $430,173 |
| (0.13) | $14.39 | 12.52% | 1.32% | 1.25% (c) | 1.56% | 109% | $253,641 |
| |
| (0.38) | $14.47 | 4.69% | 0.30% | 0.25% | 1.64% | 95% | $15,664 |
| (0.60) | $14.19 | 0.33% | 0.28% | 0.25% | 2.06% | 69% | $17,453 |
| (0.53) | $14.74 | 5.61% | 0.26% | 0.25% | 2.14% | 95% | $23,412 |
| (1.04) | $14.46 | 9.26% | 0.28% | 0.25% | 2.39% | 92% | $14,651 |
| (0.26) | $14.19 | 2.60% | 0.42% (e) | 0.25% (c),(e) | 4.59% (e) | 109% | $15 |
| |
| (0.38) | $14.49 | 4.77% | 0.27% | 0.24% | 1.66% | 95% | $12,024 |
| (0.60) | $14.20 | 0.33% | 0.25% | 0.24% | 2.14% | 69% | $6,114 |
| (0.53) | $14.75 | 5.62% | 0.24% | 0.23% | 2.11% | 95% | $3,536 |
| (1.05) | $14.47 | 9.35% | 0.25% | 0.23% | 2.44% | 92% | $979 |
| (0.25) | $14.19 | 2.58% | 0.35% (e) | 0.27% (c),(e) | 4.60% (e) | 109% | $3 |
| |
| (0.39) | $14.46 | 4.76% | 0.21% | 0.19% | 1.71% | 95% | $399 |
| (0.61) | $14.18 | 0.32% | 0.20% | 0.19% | 2.08% | 69% | $352 |
| (0.54) | $14.74 | 5.68% | 0.19% | 0.18% | 2.19% | 95% | $401 |
| (1.06) | $14.46 | 9.46% | 0.14% | 0.14% | 2.23% | 92% | $3 |
| (0.26) | $14.18 | 2.55% | 0.30% (e) | 0.22% (c),(e) | 4.63% (e) | 109% | $3 |
| |
| (0.38) | $14.40 | 4.72% | 0.28% | 0.25% | 1.64% | 95% | $341,629 |
| (0.60) | $14.12 | 0.33% | 0.26% | 0.25% | 2.08% | 69% | $325,159 |
| (0.53) | $14.67 | 5.57% | 0.25% | 0.24% | 2.16% | 95% | $377,119 |
| (1.04) | $14.40 | 9.30% | 0.26% | 0.25% | 2.14% | 92% | $375,444 |
| (0.27) | $14.13 | 13.69% | 0.30% | 0.25% (c) | 2.48% | 109% | $292,732 |
Columbia Acorn Family of Funds | Annual Report 2016
| 115 |
Financial Highlights
Columbia Acorn Emerging Markets FundSM
| Year ended | Net asset value,
beginning of
period | Net
investment
income
(loss) | Net
realized
and
unrealized
gain (loss) | Total from
investment
operations | Distributions
from net
investment
income | Tax
return of
capital |
| Class A |
| 12/31/2016 | $10.24 | (0.01) | (0.32) | (0.33) | (0.03) | (0.04) |
| 12/31/2015 | $12.72 | 0.10 | (2.42) | (2.32) | (0.15) | (0.01) |
| 12/31/2014 | $13.37 | 0.06 | (0.63) | (0.57) | (0.08) | — |
| 12/31/2013 | $12.04 | 0.07 | 1.34 | 1.41 | (0.08) | — |
| 12/31/2012 | $9.26 | 0.08 | 2.78 | 2.86 | (0.08) | — |
| Class C |
| 12/31/2016 | $10.20 | (0.09) | (0.31) | (0.40) | — | — |
| 12/31/2015 | $12.65 | 0.01 | (2.39) | (2.38) | (0.06) | (0.01) |
| 12/31/2014 | $13.32 | (0.05) | (0.62) | (0.67) | — | — |
| 12/31/2013 | $12.01 | (0.03) | 1.34 | 1.31 | — | — |
| 12/31/2012 | $9.24 | (0.02) | 2.79 | 2.77 | — | — |
| Class I |
| 12/31/2016 | $10.26 | 0.03 | (0.32) | (0.29) | (0.07) | (0.04) |
| 12/31/2015 | $12.75 | 0.14 | (2.43) | (2.29) | (0.19) | (0.01) |
| 12/31/2014 | $13.41 | 0.06 | (0.60) | (0.54) | (0.12) | — |
| 12/31/2013 | $12.08 | 0.08 | 1.37 | 1.45 | (0.12) | — |
| 12/31/2012 | $9.29 | 0.11 | 2.80 | 2.91 | (0.12) | — |
| Class R4 |
| 12/31/2016 | $10.32 | 0.01 | (0.31) | (0.30) | (0.06) | (0.04) |
| 12/31/2015 | $12.83 | 0.17 | (2.49) | (2.32) | (0.18) | (0.01) |
| 12/31/2014 | $13.49 | 0.09 | (0.63) | (0.54) | (0.12) | — |
| 12/31/2013 | $12.14 | 0.12 | 1.35 | 1.47 | (0.12) | — |
| 12/31/2012 (e) | $11.44 | (0.01) | 0.81 | 0.80 | (0.10) | — |
| Class R5 |
| 12/31/2016 | $10.32 | (0.02) | (0.28) | (0.30) | (0.07) | (0.04) |
| 12/31/2015 | $12.82 | 0.15 | (2.45) | (2.30) | (0.19) | (0.01) |
| 12/31/2014 | $13.48 | 0.10 | (0.64) | (0.54) | (0.12) | — |
| 12/31/2013 | $12.14 | 0.12 | 1.34 | 1.46 | (0.12) | — |
| 12/31/2012 (g) | $11.44 | (0.00) (h) | 0.81 | 0.81 | (0.11) | — |
| Class Y |
| 12/31/2016 | $10.23 | 0.03 | (0.33) | (0.30) | (0.07) | (0.04) |
| 12/31/2015 | $12.71 | 0.15 | (2.43) | (2.28) | (0.19) | (0.01) |
| 12/31/2014 | $13.36 | 0.09 | (0.62) | (0.53) | (0.12) | — |
| 12/31/2013 (i) | $12.22 | 0.07 | 1.20 | 1.27 | (0.13) | — |
The accompanying Notes to Financial Statements are an integral part of this statement.
| 116 | Columbia Acorn Family of Funds | Annual Report 2016 |
Total
distributions to
shareholders | Net
asset
value,
end of
period | Total
return | Total gross
expense
ratio to
average
net assets(a) | Total net
expense
ratio to
average
net assets(a) | Net investment
income (loss)
ratio to
average
net assets | Portfolio
turnover | Net
assets,
end of
period
(000’s) |
| |
| (0.07) | $9.84 | (3.20%) (b) | 1.84% (c) | 1.84% (c) | (0.11%) | 43% | $49,141 |
| (0.16) | $10.24 | (18.25%) | 1.67% | 1.67% | 0.88% | 58% | $88,574 |
| (0.08) | $12.72 | (4.28%) | 1.56% | 1.56% | 0.42% | 45% | $160,969 |
| (0.08) | $13.37 | 11.73% (b) | 1.80% | 1.76% | 0.52% | 36% | $177,158 |
| (0.08) | $12.04 | 30.86% (b) | 6.42% | 1.77% (d) | 0.77% | 30% | $3,103 |
| |
| — | $9.80 | (3.92%) (b) | 2.60% (c) | 2.59% (c) | (0.87%) | 43% | $15,534 |
| (0.07) | $10.20 | (18.83%) | 2.42% | 2.42% | 0.12% | 58% | $22,953 |
| — | $12.65 | (5.03%) | 2.33% | 2.33% | (0.36%) | 45% | $41,208 |
| — | $13.32 | 10.91% (b) | 2.55% | 2.51% | (0.23%) | 36% | $32,636 |
| — | $12.01 | 29.98% (b) | 7.18% | 2.56% (d) | (0.15%) | 30% | $615 |
| |
| (0.11) | $9.86 | (2.81%) (b) | 1.47% | 1.45% | 0.29% | 43% | $2 |
| (0.20) | $10.26 | (17.95%) | 1.31% | 1.31% | 1.21% | 58% | $2 |
| (0.12) | $12.75 | (4.01%) | 1.22% | 1.22% | 0.44% | 45% | $3 |
| (0.12) | $13.41 | 12.06% (b) | 1.73% | 1.39% | 0.65% | 36% | $7 |
| (0.12) | $12.08 | 31.39% (b) | 6.18% | 1.41% (d) | 1.05% | 30% | $6 |
| |
| (0.10) | $9.92 | (2.91%) | 1.57% (c) | 1.57% (c) | 0.09% | 43% | $1,306 |
| (0.19) | $10.32 | (18.04%) | 1.36% | 1.36% | 1.37% | 58% | $3,459 |
| (0.12) | $12.83 | (4.03%) | 1.28% | 1.28% | 0.66% | 45% | $15,467 |
| (0.12) | $13.49 | 12.13% (b) | 1.44% | 1.44% | 0.92% | 36% | $13,583 |
| (0.10) | $12.14 | 7.04% (b) | 5.86% (f) | 1.54% (d),(f) | (0.31%) (f) | 30% | $16 |
| |
| (0.11) | $9.91 | (2.90%) | 1.46% (c) | 1.46% (c) | (0.23%) | 43% | $806 |
| (0.20) | $10.32 | (17.96%) | 1.34% | 1.34% | 1.22% | 58% | $12,643 |
| (0.12) | $12.82 | (4.02%) | 1.26% | 1.26% | 0.72% | 45% | $19,632 |
| (0.12) | $13.48 | 12.07% (b) | 1.42% | 1.42% | 0.94% | 36% | $13,625 |
| (0.11) | $12.14 | 7.11% (b) | 5.81% (f) | 1.46% (d),(f) | (0.22%) (f) | 30% | $3 |
| |
| (0.11) | $9.82 | (2.92%) (b) | 1.45% | 1.45% | 0.29% | 43% | $2 |
| (0.20) | $10.23 | (17.90%) | 1.27% | 1.27% | 1.24% | 58% | $2 |
| (0.12) | $12.71 | (3.95%) | 1.22% | 1.22% | 0.68% | 45% | $2 |
| (0.13) | $13.36 | 10.43% (b) | 1.36% (f) | 1.36% (f) | 0.97% (f) | 36% | $3 |
Columbia Acorn Family of Funds | Annual Report 2016
| 117 |
Financial Highlights (continued)
Columbia Acorn Emerging Markets FundSM
| Year ended | Net asset value,
beginning of
period | Net
investment
income
(loss) | Net
realized
and
unrealized
gain (loss) | Total from
investment
operations | Distributions
from net
investment
income | Tax
return of
capital |
| Class Z |
| 12/31/2016 | $10.26 | (0.00) (h) | (0.31) | (0.31) | (0.06) | (0.04) |
| 12/31/2015 | $12.74 | 0.13 | (2.42) | (2.29) | (0.18) | (0.01) |
| 12/31/2014 | $13.40 | 0.08 | (0.63) | (0.55) | (0.11) | — |
| 12/31/2013 | $12.07 | 0.11 | 1.33 | 1.44 | (0.11) | — |
| 12/31/2012 | $9.28 | 0.12 | 2.79 | 2.91 | (0.12) | — |
| Notes to Financial Highlights |
| (a) | In addition to the fees and expenses that the Fund bears directly, the Fund indirectly bears a pro rata share of the fees and expenses of any other funds in which it invests, if any. Such indirect expenses are not included in the Fund’s reported expense ratios. |
| (b) | Had the Investment Manager and/or Transfer Agent not waived fees and/or reimbursed a portion of expenses, total return would have been reduced. |
| (c) | Ratios include line of credit interest expense which is less than 0.01%. |
| (d) | The benefits derived from custody fees paid indirectly had an impact of 0.01%. |
| (e) | Class R4 shares commenced operations on November 8, 2012. Per share data and total return reflect activity from that date. |
| (f) | Annualized. |
| (g) | Class R5 shares commenced operations on November 8, 2012. Per share data and total return reflect activity from that date. |
| (h) | Rounds to zero. |
| (i) | Class Y shares commenced operations on June 13, 2013. Per share data and total return reflect activity from that date. |
The accompanying Notes to Financial Statements are an integral part of this statement.
| 118 | Columbia Acorn Family of Funds | Annual Report 2016 |
Total
distributions to
shareholders | Net
asset
value,
end of
period | Total
return | Total gross
expense
ratio to
average
net assets(a) | Total net
expense
ratio to
average
net assets(a) | Net investment
income (loss)
ratio to
average
net assets | Portfolio
turnover | Net
assets,
end of
period
(000’s) |
| |
| (0.10) | $9.85 | (3.04%) (b) | 1.59% (c) | 1.58% (c) | (0.04%) | 43% | $38,969 |
| (0.19) | $10.26 | (17.98%) | 1.42% | 1.42% | 1.12% | 58% | $147,688 |
| (0.11) | $12.74 | (4.12%) | 1.33% | 1.33% | 0.62% | 45% | $245,053 |
| (0.11) | $13.40 | 11.92% (b) | 1.58% | 1.54% | 0.89% | 36% | $177,693 |
| (0.12) | $12.07 | 31.35% (b) | 6.15% | 1.46% (d) | 1.07% | 30% | $6,846 |
Columbia Acorn Family of Funds | Annual Report 2016
| 119 |
Financial Highlights
Columbia Acorn European FundSM
| Year ended | Net asset value,
beginning of
period | Net
investment
income
(loss) | Net
realized
and
unrealized
gain (loss) | Total from
investment
operations | Distributions
from net
investment
income | Distributions
from net
realized
gains |
| Class A |
| 12/31/2016 | $14.75 | 0.16 | (0.67) | (0.51) | (0.12) | — |
| 12/31/2015 | $14.34 | 0.10 | 0.50 | 0.60 | (0.19) | — |
| 12/31/2014 | $15.68 | 0.13 | (1.34) | (1.21) | (0.05) | (0.08) |
| 12/31/2013 | $11.76 | (0.02) | 3.97 | 3.95 | (0.01) | (0.02) |
| 12/31/2012 | $9.43 | 0.03 | 2.37 | 2.40 | (0.07) | (0.00) (c) |
| Class C |
| 12/31/2016 | $14.63 | 0.03 | (0.64) | (0.61) | (0.03) | — |
| 12/31/2015 | $14.16 | (0.00) (c) | 0.48 | 0.48 | (0.01) | — |
| 12/31/2014 | $15.54 | (0.01) | (1.29) | (1.30) | — | (0.08) |
| 12/31/2013 | $11.73 | (0.15) | 3.98 | 3.83 | — | (0.02) |
| 12/31/2012 | $9.44 | (0.15) | 2.46 | 2.31 | (0.02) | (0.00) (c) |
| Class I |
| 12/31/2016 | $14.74 | 0.18 | (0.65) | (0.47) | (0.17) | — |
| 12/31/2015 | $14.33 | 0.16 | 0.49 | 0.65 | (0.24) | — |
| 12/31/2014 | $15.67 | 0.11 | (1.27) | (1.16) | (0.10) | (0.08) |
| 12/31/2013 | $11.75 | 0.12 | 3.88 | 4.00 | (0.06) | (0.02) |
| 12/31/2012 | $9.43 | 0.10 | 2.32 | 2.42 | (0.10) | (0.00) (c) |
| Class R4 |
| 12/31/2016 | $14.82 | 0.17 | (0.65) | (0.48) | (0.16) | — |
| 12/31/2015 | $14.40 | 0.24 | 0.41 | 0.65 | (0.23) | — |
| 12/31/2014 (e) | $15.85 | (0.02) | (1.34) | (1.36) | (0.09) | — |
| Class R5 |
| 12/31/2016 | $14.89 | 0.18 | (0.66) | (0.48) | (0.16) | — |
| 12/31/2015 | $14.47 | 0.15 | 0.50 | 0.65 | (0.23) | — |
| 12/31/2014 | $15.82 | 0.14 | (1.32) | (1.18) | (0.09) | (0.08) |
| 12/31/2013 | $11.86 | (0.04) | 4.06 | 4.02 | (0.04) | (0.02) |
| 12/31/2012 (g) | $11.19 | (0.02) | 0.77 | 0.75 | (0.08) | — |
| Class Z |
| 12/31/2016 | $14.75 | 0.19 | (0.67) | (0.48) | (0.16) | — |
| 12/31/2015 | $14.34 | 0.15 | 0.49 | 0.64 | (0.23) | — |
| 12/31/2014 | $15.68 | 0.15 | (1.32) | (1.17) | (0.09) | (0.08) |
| 12/31/2013 | $11.76 | 0.11 | 3.88 | 3.99 | (0.05) | (0.02) |
| 12/31/2012 | $9.44 | 0.08 | 2.34 | 2.42 | (0.10) | (0.00) (c) |
| Notes to Financial Highlights |
| (a) | Had the Investment Manager and/or Transfer Agent not waived fees and/or reimbursed a portion of expenses, total return would have been reduced. |
| (b) | In addition to the fees and expenses that the Fund bears directly, the Fund indirectly bears a pro rata share of the fees and expenses of any other funds in which it invests, if any. Such indirect expenses are not included in the Fund’s reported expense ratios. |
| (c) | Rounds to zero. |
| (d) | The benefits derived from custody fees paid indirectly had an impact of 0.01%. |
| (e) | Class R4 shares commenced operations on June 25, 2014. Per share data and total return reflect activity from that date. |
| (f) | Annualized. |
| (g) | Class R5 shares commenced operations on November 8, 2012. Per share data and total return reflect activity from that date. |
The accompanying Notes to Financial Statements are an integral part of this statement.
| 120 | Columbia Acorn Family of Funds | Annual Report 2016 |
Total
distributions to
shareholders | Net
asset
value,
end of
period | Total
return(a) | Total gross
expense
ratio to
average
net assets(b) | Total net
expense
ratio to
average
net assets(b) | Net investment
income (loss)
ratio to
average
net assets | Portfolio
turnover | Net
assets,
end of
period
(000’s) |
| |
| (0.12) | $14.12 | (3.47%) | 2.00% | 1.75% | 1.07% | 40% | $26,269 |
| (0.19) | $14.75 | 4.17% | 2.06% | 1.75% | 0.67% | 37% | $40,368 |
| (0.13) | $14.34 | (7.77%) | 2.05% | 1.75% | 0.86% | 74% | $21,101 |
| (0.03) | $15.68 | 33.64% | 3.33% | 1.74% | (0.11%) | 42% | $19,078 |
| (0.07) | $11.76 | 25.46% | 12.35% | 1.61% (d) | 0.23% | 37% | $453 |
| |
| (0.03) | $13.99 | (4.21%) | 2.75% | 2.50% | 0.18% | 40% | $7,112 |
| (0.01) | $14.63 | 3.41% | 2.82% | 2.50% | (0.02%) | 37% | $7,220 |
| (0.08) | $14.16 | (8.44%) | 2.84% | 2.50% | (0.10%) | 74% | $5,096 |
| (0.02) | $15.54 | 32.63% | 4.19% | 2.50% | (1.10%) | 42% | $1,400 |
| (0.02) | $11.73 | 24.46% | 12.83% | 2.32% (d) | (1.33%) | 37% | $89 |
| |
| (0.17) | $14.10 | (3.21%) | 1.62% | 1.42% | 1.24% | 40% | $2 |
| (0.24) | $14.74 | 4.50% | 1.71% | 1.43% | 1.09% | 37% | $3 |
| (0.18) | $14.33 | (7.49%) | 1.71% | 1.46% | 0.74% | 74% | $2 |
| (0.08) | $15.67 | 34.06% | 3.99% | 1.41% | 0.88% | 42% | $8 |
| (0.10) | $11.75 | 25.71% | 12.05% | 1.31% (d) | 0.94% | 37% | $6 |
| |
| (0.16) | $14.18 | (3.27%) | 1.79% | 1.50% | 1.15% | 40% | $362 |
| (0.23) | $14.82 | 4.48% | 1.81% | 1.50% | 1.59% | 37% | $408 |
| (0.09) | $14.40 | (8.60%) | 1.87% (f) | 1.50% (f) | (0.30%) (f) | 74% | $302 |
| |
| (0.16) | $14.25 | (3.23%) | 1.68% | 1.47% | 1.26% | 40% | $1,262 |
| (0.23) | $14.89 | 4.48% | 1.75% | 1.48% | 0.98% | 37% | $2,122 |
| (0.17) | $14.47 | (7.54%) | 1.75% | 1.52% | 0.92% | 74% | $1,633 |
| (0.06) | $15.82 | 33.97% | 2.76% | 1.51% | (0.29%) | 42% | $1,891 |
| (0.08) | $11.86 | 6.70% | 14.07% (f) | 1.36% (d),(f) | (1.07%) (f) | 37% | $3 |
| |
| (0.16) | $14.11 | (3.29%) | 1.73% | 1.50% | 1.29% | 40% | $11,345 |
| (0.23) | $14.75 | 4.43% | 1.78% | 1.50% | 1.01% | 37% | $11,766 |
| (0.17) | $14.34 | (7.52%) | 1.79% | 1.50% | 0.97% | 74% | $8,499 |
| (0.07) | $15.68 | 33.98% | 3.98% | 1.45% | 0.83% | 42% | $4,407 |
| (0.10) | $11.76 | 25.66% | 12.07% | 1.33% (d) | 0.76% | 37% | $2,727 |
Columbia Acorn Family of Funds | Annual Report 2016
| 121 |
Notes to Financial Statements
December 31, 2016
Note 1. Organization
Columbia Acorn® Fund, Columbia Acorn International®, Columbia Acorn USA®, Columbia Acorn International SelectSM, Columbia Acorn SelectSM, Columbia Thermostat FundSM, Columbia Acorn Emerging Markets FundSM and Columbia Acorn European FundSM (each a Fund and collectively, the Funds) are each a series of Columbia Acorn Trust (the Trust). The Trust is registered under the Investment Company Act of 1940, as amended (the 1940 Act), as an open-end management investment company organized as a Massachusetts business trust. The investment objective of each Fund is to seek long-term capital appreciation.
Columbia Thermostat Fund pursues its investment objective by investing in shares of other mutual funds. As a “fund of funds”, under normal circumstances, the Fund allocates at least 95% of its net assets among a selected group of affiliated stock and bond mutual funds (underlying funds) according to the current level of the Standard & Poor’s (S&P) 500 Index in relation to predetermined ranges set by Columbia Wanger Asset Management, LLC (the Investment Manager or CWAM). The Fund may invest up to 5% of its net assets plus any cash received that day in cash, repurchase agreements, high quality short-term paper and government securities.
Fund shares
Each Fund may issue an unlimited number of shares. Columbia Acorn Fund, Columbia Acorn USA, Columbia Acorn International Select and Columbia Acorn Select each currently offers Class A, Class C, Class I, Class R4, Class R5, Class Y and Class Z shares. Columbia Acorn International currently offers Class A, Class B, Class C, Class I, Class R, Class R4, Class R5, Class Y and Class Z shares. Columbia Thermostat Fund currently offers Class A, Class C, Class R4, Class R5, Class Y and Class Z shares. Columbia Acorn Emerging Markets Fund currently offers Class A, Class C, Class I, Class R4, Class R5, Class Y and Class Z shares. Columbia Acorn European Fund currently offers Class A, Class C, Class I, Class R4, Class R5 and Class Z shares. Columbia Acorn International generally no longer accepts investments by new or existing investors in the Fund’s Class B shares, except in connection with the reinvestment of any dividend and/or capital gain distributions in Class B shares of the Fund. Prior to February 1, 2016, Columbia Acorn Emerging Markets Fund was closed to most new investors and new accounts with certain exceptions.
Class A shares are sold with a front-end sales charge. Class A shares bought without an initial sales charge in accounts aggregating $1 million to $50 million at the time of purchase are subject to a 1.00% contingent deferred sales charge (CDSC) if the shares are redeemed within 12 months after purchase, and a 0.50% CDSC if the shares are redeemed more than 12, but less than 18, months after purchase, with certain limited exceptions.
Class B shares are subject to CDSC if redeemed within six years after purchase. Class B shares will convert to Class A shares automatically eight years after purchase.
Class C shares are offered at net asset value but are subject to a CDSC on redemptions made within one year after purchase.
Class I, Class R, Class R4, Class R5 and Class Y shares are offered at net asset value. There are certain restrictions on who may purchase these share classes.
Class Z shares are offered at net asset value. There are certain restrictions on who may purchase Class Z shares. Generally, Class Z shares of a Fund may be exchanged for shares of another fund distributed by Columbia Management Investment Distributors, Inc. (CMID) at no additional charge.
Investment income, realized and unrealized gains and losses, and certain fund-level expenses are allocated pro rata on the basis of the relative net assets of all classes, except that each class bears certain expenses specific to that class such as distribution services, transfer agent fees, and certain other class specific expenses. Differences in class expenses may result in payment of different dividend distributions for each class. All of the Funds’ share classes have equal rights with respect to voting, subject to Fund or class-specific matters.
| 122 | Columbia Acorn Family of Funds | Annual Report 2016 |
Notes to Financial Statements (continued)
December 31, 2016
Note 2. Summary of significant accounting policies
Basis of preparation
Each Fund is an investment company that applies the accounting and reporting guidance in the Financial Accounting Standards Board (FASB) Accounting Standards Codification Topic 946, Financial Services - Investment Companies (ASC 946). The financial statements are prepared in accordance with U.S. generally accepted accounting principles (GAAP), which requires management to make certain estimates and assumptions that affect the reported amounts of assets and liabilities, the disclosure of contingent assets and liabilities at the date of the financial statements and the reported amounts of income and expenses during the reporting period. Actual results could differ from those estimates.
The following is a summary of significant accounting policies followed by the Funds in the preparation of their financial statements.
Security valuation
Securities of the Funds are valued at market value or, if a market quotation for a security is not readily available or is deemed not to be reliable because of events or circumstances that have occurred between the market quotation and the time as of which the security is to be valued, the security is valued at a fair value determined in good faith under consistently applied procedures established by the Board of Trustees. With respect to Columbia Thermostat Fund, investments in underlying funds are valued at their net asset values as reported by the underlying funds. A security traded on a securities exchange or in an over-the-counter market in which transaction prices are reported is valued at the last sales price at the time of valuation. A security traded principally on NASDAQ is valued at the NASDAQ official closing price. Exchange traded funds are valued at their closing net asset value as reported on the applicable exchange. A security for which there is no reported sale on the valuation date is valued by comparison of the mean of the latest bid and ask quotations.
Foreign equity securities are generally valued based on the closing price on the foreign exchange in which such securities are primarily traded. If any foreign equity security closing prices are not readily available, the securities are valued at the mean of the latest quoted bid and ask prices on such exchanges or markets. Foreign currency exchange rates are generally determined at 4:00 p.m. Eastern (U.S.) time. Many securities markets and exchanges outside the U.S. close prior to the close of the New York Stock Exchange; therefore, the closing prices for securities in such markets or on such exchanges may not fully reflect events that occur after such close but before the close of the New York Stock Exchange. In situations where foreign markets are closed, where a significant event has occurred after the foreign exchange closes but before the time at which the Fund’s share price is calculated, and in the event of significant movement in the trigger index for the statistical fair valuation process established by the Board of Trustees, foreign securities will be fair valued pursuant to a policy adopted by the Board of Trustees. The Trust has retained an independent statistical fair value pricing service that employs a systematic methodology to assist in the fair valuation process for securities principally traded in a foreign market in order to adjust for possible changes in value that may occur between the close of the foreign market and the time as of which the securities are to be valued. If a security is valued at a fair value, that value may be different from the last quoted market price for the security.
Short-term investments maturing in 60 days or less are valued at amortized cost, which approximates market value.
Futures contracts are valued based upon the settlement price at the close of regular trading on their principal exchanges or, in the absence of transactions, at the mean of the latest quoted bid and ask prices.
The Trust has retained an independent statistical fair value pricing service that employs a systematic methodology to assist in the fair valuation process for securities principally traded in a foreign market in order to adjust for possible changes in value that may occur between the close of the foreign exchange and the time as of which the securities are to be valued. If a security is valued at fair value, that value may be different from the last quoted market price for the security.
Columbia Acorn Family of Funds | Annual Report 2016
| 123 |
Notes to Financial Statements (continued)
December 31, 2016
Foreign currency transactions and translations
Values of investments denominated in foreign currencies are converted into U.S. dollars using the New York spot market rate of exchange at the time of valuation. Purchases and sales of investments and dividend and interest income are translated into U.S. dollars using the spot market rate of exchange prevailing on the respective dates of such transactions. The gain or loss resulting from changes in foreign exchange rates is included with net realized and unrealized gain or loss from investments, as appropriate.
Derivative instruments
Columbia Acorn® Fund, Columbia Acorn USA®, and Columbia Acorn Emerging Markets FundSM invested in futures contracts on a limited basis during the year ended December 31, 2016, as detailed below. Derivatives may involve various risks, including the potential inability of the counterparty to fulfill its obligation under the terms of the contract, the potential for an illiquid secondary market (making it difficult for the Fund to sell, including at favorable prices) and the potential for market movements which may expose the Fund to gains or losses in excess of the amount shown in the Statements of Assets and Liabilities.
For financial reporting purposes, the Funds do not offset derivative assets and derivative liabilities that are subject to netting arrangements in the Statements of Assets and Liabilities.
Futures contracts
Futures contracts are exchange-traded and represent commitments for the future purchase or sale of an asset at a specified price on a specified date. Columbia Acorn Fund, Columbia Acorn USA Fund and Columbia Acorn Emerging Markets Fund bought and sold futures contracts to maintain appropriate equity market exposure while keeping sufficient cash to accommodate daily redemptions. These instruments may be used for other purposes in future periods. Upon entering into futures contracts, the Fund bears risks that it may not achieve the anticipated benefits of the futures contracts and may realize a loss. Additional risks include counterparty credit risk, the possibility of an illiquid market, and that a change in the value of the contract or option may not correlate with changes in the value of the underlying asset.
Upon entering into a futures contract, the Fund deposits cash or securities with the broker, known as a futures commission merchant (FCM), in an amount sufficient to meet the initial margin requirement. The initial margin deposit must be maintained at an established level over the life of the contract. Cash deposited as initial margin is recorded in the Statement of Assets and Liabilities as margin deposits. Securities deposited as initial margin are designated in the Portfolio of Investments. Subsequent payments (variation margin) are made or received by the Fund each day. The variation margin payments are equal to the daily change in the contract value and are recorded as variation margin receivable or payable and are offset in unrealized gains or losses. The Fund recognizes a realized gain or loss when the contract is closed or expires. Futures contracts involve, to varying degrees, risk of loss in excess of the variation margin disclosed in the Statement of Assets and Liabilities.
Effects of derivative transactions in the financial statements
The following tables are intended to provide additional information about the effect of derivatives on the financial statements of the Funds, including: the fair value of derivatives by risk category and the location of those fair values in the Statements of Assets and Liabilities; and the impact of derivative transactions over the period in the Statements of Operations, including realized gains or losses and unrealized gains or losses. The derivative schedules following the Portfolio of Investments present additional information regarding derivative instruments outstanding at the end of the period, if any.
Columbia Acorn® Fund
At December 31, 2016, the Fund had no outstanding derivatives.
| 124 | Columbia Acorn Family of Funds | Annual Report 2016 |
Notes to Financial Statements (continued)
December 31, 2016
The following table indicates the effect of derivative instruments (not considered to be hedging instruments for accounting disclosure purposes) in the Statement of Operations for the year ended December 31, 2016:
| Amount of realized gain (loss) on derivatives recognized in income |
Risk
exposure
category | Futures
contracts
($) |
| Equity risk | (13,079,023) |
| |
| Change in unrealized appreciation (depreciation) on derivatives recognized in income |
| Risk exposure category | Futures
contracts
($) |
| Equity Risk | (4,292,591) |
The following table is a summary of the average outstanding volume by derivative instrument for the year ended December 31, 2016:
| Derivative Instrument | Average Notional
Amounts ($)** |
| Futures contracts — Long | 56,517,703 |
| ** | Based on the ending daily outstanding amounts for the year ended December 31, 2016. |
Columbia Acorn USA®
At December 31, 2016, the Fund had no outstanding derivatives.
The following table indicates the effect of derivative instruments (not considered to be hedging instruments for accounting disclosure purposes) in the Statement of Operations for the year ended December 31, 2016:
| Amount of realized gain (loss) on derivatives recognized in income |
Risk
exposure
category | Futures
contracts
($) |
| Equity risk | (9,714,342) |
| |
| Change in unrealized appreciation (depreciation) on derivatives recognized in income |
| Risk exposure category | Futures
contracts
($) |
| Equity Risk | (465,285) |
The following table is a summary of the average outstanding volume by derivative instrument for the year ended December 31, 2016:
| Derivative Instrument | Average Notional
Amounts ($)** |
| Futures contracts — Long | 7,144,960 |
| ** | Based on the ending daily outstanding amounts for the year ended December 31, 2016. |
Columbia Acorn Emerging Markets FundSM
At December 31, 2016, the Fund had no outstanding derivatives.
Columbia Acorn Family of Funds | Annual Report 2016
| 125 |
Notes to Financial Statements (continued)
December 31, 2016
The following table indicates the effect of derivative instruments (not considered to be hedging instruments for accounting disclosure purposes) in the Statement of Operations for the year ended December 31, 2016:
| Amount of realized gain (loss) on derivatives recognized in income |
Risk
exposure
category | Futures
contracts
($) |
| Equity risk | 2,440,126 |
The following table is a summary of the average outstanding volume by derivative instrument for the year ended December 31, 2016:
| Derivative Instrument | Average Notional
Amounts ($)** |
| Futures contracts — Long | 4,260,362 |
| ** | Based on the ending daily outstanding amounts for the year ended December 31, 2016. |
Security transactions and investment income
Security transactions, investment income and shareholder fund transactions are accounted for on the trade date (date the order to buy or sell is executed) and dividend income and realized gain distributions from other funds are recorded on the ex-dividend date, except that certain dividends from foreign securities are recorded as soon as the information is available to the Funds. Interest income is recorded on the accrual basis and includes amortization of discounts on debt obligations when required for federal income tax purposes. Realized gains and losses from security transactions are recorded on an identified cost basis.
Awards, if any, from class action litigation related to securities owned may be recorded as a reduction of cost of those securities. If the applicable securities are no longer owned, the proceeds are recorded as realized gains.
The Funds may receive distributions from holdings in exchange-traded funds (ETFs), other regulated investment companies (RICs), and real estate investment trusts (REITs), which report information on the character of their distributions annually. These distributions are allocated to dividend income, capital gain and return of capital based on actual information reported. To the extent actual information has not yet been reported by the REITs, estimates for return of capital may be made by the Funds’ management. Return of capital is recorded as a reduction of the cost basis of securities held. If the Funds no longer own the applicable securities, return of capital is recorded as a realized gain. Management’s estimates are subsequently adjusted when the actual character of the distributions is disclosed by the REITs, which could result in a proportionate change in return of capital to shareholders. No estimates are made for ETFs and RICs.
Fund share valuation
Fund shares are sold and redeemed on a daily basis at net asset value, subject to any applicable sales charge. Net asset value per share is determined daily as of the close of trading on the New York Stock Exchange (NYSE) on each day the NYSE is open for trading. Generally, income, expenses and realized and unrealized gain/(losses) of a Fund are allocated to each class proportionately on a daily basis for purposes of determining the net asset value of each class. The distribution and service fees and transfer agent fees are charged to each specific class as expenses are incurred. Redemption fees are accounted for as an addition to paid in capital for purposes of determining the net asset value of each class.
Securities lending
Each Fund, except Columbia Thermostat Fund, may lend securities up to one-third of the value of its total assets to certain approved brokers, dealers and other financial institutions to earn additional income. The Funds retain the benefits of owning the securities, including the economic equivalent of dividends or interest generated by the security. The Funds also receive a fee for the loan. The Funds have the ability to recall the loans at any time and could do so in order to vote proxies or to sell the loaned securities. Each loan is collateralized by cash that exceeds the value of the securities on loan. The market value of the loaned securities is determined daily at the close of business of a Fund and any additional required collateral is delivered to the Fund on the next business day. The Funds have elected to invest the cash collateral in the Dreyfus Government Cash Management Fund. The income earned from the securities lending program is paid to each Fund, net of
| 126 | Columbia Acorn Family of Funds | Annual Report 2016 |
Notes to Financial Statements (continued)
December 31, 2016
any fees remitted to Goldman Sachs Agency Lending, the Funds’ lending agent, and net of any borrower rebates. The Investment Manager does not retain any fees earned by the lending program. Generally, in the event of borrower default, a Fund has the right to use the collateral to offset any losses incurred. In the event a Fund is delayed or prevented from exercising its right to dispose of the collateral, there may be a potential loss to the Fund. Some of these losses may be indemnified by the lending agent. The Funds bear the risk of loss with respect to the investment of collateral. The net securities lending income earned as of December 31, 2016 by each Fund is included in the Statements of Operations.
Offsetting of assets and liabilities
The following table presents each Fund’s gross and net amount of assets and liabilities available for offset under netting agreements and under a securities lending agreement as well as the related collateral received by each Fund as of December 31, 2016:
| | Columbia Acorn
Fund | Columbia Acorn
International | Columbia Acorn
USA | Columbia Acorn
International Select | Columbia Acorn
Emerging Markets
Fund | Columbia Acorn
European Fund |
| | Goldman
Sachs ($) | Goldman
Sachs ($) | Goldman
Sachs ($) | Goldman
Sachs ($) | Goldman
Sachs ($) | Goldman
Sachs ($) |
| Liabilities | | | | | | |
| Collateral on Securities loaned | 101,389,775 | 169,508,371 | 15,336,080 | 5,444,661 | 1,161,570 | 3,133,401 |
| Total Liabilities | 101,389,775 | 169,508,371 | 15,336,080 | 5,444,661 | 1,161,570 | 3,133,401 |
| Total Financial and Derivative Net Assets | (101,389,775) | (169,508,371) | (15,336,080) | (5,444,661) | (1,161,570) | (3,133,401) |
| Financial Instruments | 99,397,696 | 162,723,470 | 14,865,804 | 5,209,652 | 1,122,619 | 3,019,078 |
| Net Amount (a) | (1,992,079) | (6,784,901) | (470,276) | (235,009) | (38,951) | (114,323) |
| (a) | Represents the net amount due from/(to) counterparties in the event of default. |
Securities lending transactions
The following table indicates the total amount of securities loaned by type, reconciled to gross liability payable upon return of the securities loaned by the Fund as of December 31, 2016:
| | Overnight and
continuous | Up to
30 days | 30-90
days | Greater than
90 days | Total |
| Columbia Acorn® Fund | | | | | |
| Securities lending transactions | | | | | |
| Equity securities | $99,397,696 | $— | $— | $— | $99,397,696 |
| Gross amount of recognized liabilities for securities lending (collateral received) | | | | | 101,389,775 |
| Amounts due to counterparty | | | | | $1,992,079 |
| Columbia Acorn International® | | | | | |
| Securities lending transactions | | | | | |
| Equity securities | $162,723,470 | $— | $— | $— | $162,723,470 |
| Gross amount of recognized liabilities for securities lending (collateral received) | | | | | 169,508,371 |
| Amounts due to counterparty | | | | | $6,784,901 |
| Columbia Acorn USA® | | | | | |
| Securities lending transactions | | | | | |
| Equity securities | $14,865,804 | $— | $— | $— | $14,865,804 |
| Gross amount of recognized liabilities for securities lending (collateral received) | | | | | 15,336,080 |
| Amounts due to counterparty | | | | | $470,276 |
| Columbia Acorn International SelectSM | | | | | |
| Securities lending transactions | | | | | |
| Equity securities | $5,209,652 | $— | $— | $— | $5,209,652 |
| Gross amount of recognized liabilities for securities lending (collateral received) | | | | | 5,444,661 |
| Amounts due to counterparty | | | | | $235,009 |
Columbia Acorn Family of Funds | Annual Report 2016
| 127 |
Notes to Financial Statements (continued)
December 31, 2016
| | Overnight and
continuous | Up to
30 days | 30-90
days | Greater than
90 days | Total |
| Columbia Acorn Emerging Markets FundSM | | | | | |
| Securities lending transactions | | | | | |
| Equity securities | $1,122,619 | $— | $— | $— | $1,122,619 |
| Gross amount of recognized liabilities for securities lending (collateral received) | | | | | 1,161,570 |
| Amounts due to counterparty | | | | | $38,951 |
| Columbia Acorn European FundSM | | | | | |
| Securities lending transactions | | | | | |
| Equity securities | $3,019,078 | $— | $— | $— | $3,019,078 |
| Gross amount of recognized liabilities for securities lending (collateral received) | | | | | 3,133,401 |
| Amounts due to counterparty | | | | | $114,323 |
Federal income tax status
It is each Fund’s policy to comply with the provisions of the Internal Revenue Code available to regulated investment companies and, in the manner provided therein, distribute substantially all their taxable income, as well as any net realized gain on sales of investments and foreign currency transactions reportable for federal income and federal excise tax purposes. Columbia Thermostat Fund distributes all of its taxable income, as well as any net realized gain on sales of portfolio fund shares and any distributions of net realized gains received by the Fund from its portfolio funds, reportable for federal income tax purposes. Accordingly, the Funds paid no federal income taxes or federal excise tax and no federal income or excise tax provision was required.
Foreign taxes
Realized gains in certain countries may be subject to foreign taxes at the fund level. The Funds accrue for such foreign taxes on realized and unrealized gains at the appropriate rate for each jurisdiction. The amount, if any, is disclosed as a liability on the Statements of Assets and Liabilities.
Distributions to shareholders
Distributions to shareholders are recorded on the ex-dividend date.
Guarantees and indemnification
In the normal course of business, the Trust on behalf of the Funds enters into contracts that contain a variety of representations and warranties and that provide general indemnities. A Fund’s maximum exposure under these arrangements is unknown, as this would involve future claims against the Fund. Also, under the Trust’s organizational documents, the trustees and officers of the Trust are indemnified against certain liabilities that may arise out of their duties to the Trust. However, based on experience, the Funds expect the risk of loss due to these warranties and indemnities to be remote.
Investment company reporting modernization
In October 2016, the U.S. Securities and Exchange Commission adopted new rules and forms, and amendments to certain current rules and forms, to modernize reporting and disclosure of information by registered investment companies. The amendments to Regulation S-X will require standardized, enhanced disclosure about derivatives in investment company financial statements, and will also change the rules governing the form and content of such financial statements. The amendments to Regulation S-X take effect on August 1, 2017. At this time, management is assessing the anticipated impact of these regulatory developments.
Note 3. Fees and other transactions with affiliates
Investment management fees
CWAM is a wholly-owned subsidiary of Columbia Management Investment Advisers, LLC (Columbia Management), which is a wholly-owned subsidiary of Ameriprise Financial, Inc. (Ameriprise Financial). CWAM furnishes continuing investment supervision to the Funds and is responsible for the overall management of the Funds’ business affairs.
| 128 | Columbia Acorn Family of Funds | Annual Report 2016 |
Notes to Financial Statements (continued)
December 31, 2016
CWAM receives a monthly advisory fee based on each Fund’s average daily net assets at the following annual rates:
| Columbia Acorn Fund |
| Average daily net assets | Annual
fee rate |
| Up to $700 million | 0.740% |
| $700 million to $2 billion | 0.690% |
| $2 billion to $6 billion | 0.640% |
| $6 billion and over | 0.630% |
| Columbia Acorn International |
| Average daily net assets | Annual
fee rate |
| Up to $100 million | 1.190% |
| $100 million to $500 million | 0.940% |
| $500 million and over | 0.740% |
| Columbia Acorn USA |
| Average daily net assets | Annual
fee rate |
| Up to $200 million | 0.940% |
| $200 million to $500 million | 0.890% |
| $500 million to $2 billion | 0.840% |
| $2 billion to $3 billion | 0.800% |
| $3 billion and over | 0.700% |
| Columbia Acorn International Select, prior to July 1, 2016 |
| Average daily net assets | Annual
fee rate |
| Up to $500 million | 0.940% |
| $500 million and over | 0.900% |
| Columbia Acorn International Select, effective July 1, 2016 |
| Average daily net assets | Annual
fee rate |
| Up to $500 million | 0.890% |
| $500 million and over | 0.850% |
| Columbia Acorn Select |
| Average daily net assets | Annual
fee rate |
| Up to $700 million | 0.850% |
| $700 million to $2 billion | 0.800% |
| $2 billion to $3 billion | 0.750% |
| $3 billion and over | 0.700% |
| Columbia Thermostat Fund |
| | Annual
fee rate |
| All Average Daily Net Assets | 0.100% |
| Columbia Acorn Emerging Markets Fund |
| Average daily net assets | Annual
fee rate |
| Up to $100 million | 1.250% |
| $100 million to $500 million | 1.000% |
| $500 million and over | 0.800% |
Columbia Acorn Family of Funds | Annual Report 2016
| 129 |
Notes to Financial Statements (continued)
December 31, 2016
| Columbia Acorn European Fund |
| Average daily net assets | Annual
fee rate |
| Up to $100 million | 1.190% |
| $100 million to $500 million | 0.940% |
| $500 million and over | 0.740% |
Through April 30, 2017, CWAM has contractually agreed to waive 0.20% of the advisory fee otherwise payable to it by Columbia Acorn Select. When determining whether the Fund’s total expenses exceed the voluntary expense cap described below, the Fund’s net advisory fee, reflecting application of the 0.20% waiver, will be used to calculate the Fund’s total expenses. This arrangement may be modified or amended with approval from all parties to the arrangement, including the Fund and CWAM.
For the year ended December 31, 2016, the effective investment advisory fee rates (net of the advisory fee waiver for Columbia Acorn Select) were as follows:
| Fund | Effective investment advisory fee rate |
| Columbia Acorn® Fund | 0.663% |
| Columbia Acorn International® | 0.762% |
| Columbia Acorn USA® | 0.891% |
| Columbia Acorn International SelectSM | 0.916% |
| Columbia Acorn SelectSM | 0.650% |
| Columbia Thermostat FundSM | 0.100% |
| Columbia Acorn Emerging Markets FundSM | 1.147% |
| Columbia Acorn European FundSM | 1.190% |
Administration fees
CWAM provides administrative services and receives an administration fee from the Funds at the following annual rates:
| Columbia Acorn Trust |
Aggregate average daily
net assets of the trust | Annual
fee rate |
| Up to $8 billion | 0.050% |
| $8 billion to $16 billion | 0.040% |
| $16 billion to $35 billion | 0.030% |
| $35 billion to $45 billion | 0.025% |
| $45 billion and over | 0.015% |
For the year ended December 31, 2016, the effective administration fee rate was 0.046% of each Fund’s average daily net assets. CWAM has delegated to Columbia Management responsibility to provide certain sub-administrative services to the Funds.
Compensation of board members
Certain officers and trustees of the Trust are also officers of CWAM or Columbia Management. The Trust makes no direct payments to its officers and trustees who are affiliated with CWAM or Columbia Management. The Trust offers a deferred compensation plan for its independent trustees. Under that plan, a trustee may elect to defer all or a portion of his or her compensation. Amounts deferred are retained by the Trust and may represent an unfunded obligation of the Trust. The value of amounts deferred is determined by reference to the change in value of Class Z shares of one or more series of Columbia Acorn Trust or a money market fund as specified by the trustee. Benefits under the deferred compensation plan are payable in accordance with the plan.
| 130 | Columbia Acorn Family of Funds | Annual Report 2016 |
Notes to Financial Statements (continued)
December 31, 2016
Compensation of Chief Compliance Officer
The Board has appointed a Chief Compliance Officer of the Trust in accordance with federal securities regulations. The Funds, along with other affiliated funds are allocated a portion of certain of the expenses associated with the office of the Chief Compliance Officer based on relative net assets of each fund.
Transactions with affiliates
An affiliated person of a Fund may include any company in which a Fund owns five percent or more of its outstanding voting shares during the year. On December 31, 2016, Columbia Acorn® Fund and Columbia Thermostat FundSM each held five percent or more of the outstanding voting securities of one or more companies or a company which is under common ownership or control with the Funds. Details of investments in those affiliated companies are presented in the Notes to Statement of Investments of each Fund listed above.
For the year ended December 31, 2016, the Funds engaged in purchase and sales transactions with funds that have a common investment manager (or affiliated investment managers), common directors/trustees, and/or common officers. Those transactions complied with Rule 17a-7 under the 1940 Act and totaled as follows.
| Fund | Purchases ($) | Sales ($) | Realized
loss
from sale
transactions ($) |
| Columbia Acorn® Fund | 43,059,057 | — | — |
| Columbia Acorn International® | 7,346,843 | 32,723,033 | (2,682,111) |
| Columbia Acorn USA® | — | 17,716,509 | 1,729,819 |
| Columbia Acorn International SelectSM | 229,440 | — | — |
| Columbia Acorn Emerging Markets FundSM | 559,014 | 357,940 | (320,047) |
| Columbia Acorn European FundSM | 651,366 | — | — |
Transfer agency fees
Columbia Management Investment Services Corp. (CMIS), a wholly owned subsidiary of Ameriprise Financial, is the transfer agent of the Funds. CMIS receives monthly account-based service fees based on the number of open Fund accounts. Each Fund pays CMIS a monthly fee at the annual rate of $20.00 per open account. Subject to certain limitations, the Funds reimburse payments made by CMIS to financial intermediaries for the shareholder services that the intermediaries provide, in amounts that vary by share class and with the type of intermediary and type of shareholder services provided.
The Transfer Agent also receives compensation from fees for various shareholder services and reimbursements for certain out-of-pocket fees. Total transfer agency fees for Class R5 shares are subject to an annual limitation of not more than 0.05% of the average daily net assets attributable to Class R5 shares. Class I shares and Class Y shares do not pay transfer agency fees.
For the year ended December 31, 2016, the Funds’ effective transfer agency fee rates, excluding any voluntary transfer agency fee waivers, as a percentage of average daily net assets of each class were as follows:
| Fund | Class A (%) | Class B (%) | Class C (%) | Class R (%) | Class R4 (%) | Class R5 (%) | Class Z(%) |
| Columbia Acorn® Fund | 0.09 | — | 0.08 | — | 0.13 | 0.05 | 0.06 |
| Columbia Acorn International® | 0.14 | 0.29 (a) | 0.12 | 0.17 | 0.16 | 0.05 | 0.10 |
| Columbia Acorn USA® | 0.14 | — | 0.12 | — | 0.16 | 0.05 | 0.14 |
| Columbia Acorn International SelectSM | 0.14 | — | 0.16 | — | 0.13 | 0.05 | 0.11 |
| Columbia Acorn SelectSM | 0.13 | — | 0.11 | — | 0.13 | 0.05 | 0.11 |
| Columbia Thermostat FundSM | 0.07 | — | 0.07 | — | 0.09 | 0.05 | 0.07 |
| Columbia Acorn Emerging Markets FundSM | 0.15 | — | 0.15 | — | 0.13 | 0.05 | 0.14 |
| Columbia Acorn European FundSM | 0.12 | — | 0.12 | — | 0.16 | 0.05 | 0.10 |
| (a) | Net of contractual transfer agency fee waiver. |
Columbia Acorn Family of Funds | Annual Report 2016
| 131 |
Notes to Financial Statements (continued)
December 31, 2016
Columbia Acorn International and certain other associated investment companies, have severally, but not jointly, guaranteed the performance and observance of all the terms and conditions of a lease entered into by Seligman Data Corp. (SDC), the former transfer agent to certain associated investment companies, including the payment of rent by SDC (the Guaranty). The lease and the Guaranty expire in January 2019. At December 31, 2016, Columbia Acorn International’s total potential future obligation over the life of the Guaranty is $42,531. The liability remaining at December 31, 2016 for non-recurring charges associated with the lease amounted to $30,346 and is included within the payable for other liabilities in the Statements of Assets and Liabilities.
CMIS has contractually agreed to waive transfer agency fees payable by Class B shares of Columbia Acorn International through April 30, 2017. This fee waiver may only be modified or amended with approval from the Fund’s Board and CMIS. CMIS also has voluntarily agreed to waive a portion of the total annual Fund operating expenses attributable to transfer agency fees incurred by Class A and Class C shares of Columbia Acorn International such that the Fund’s total annual Fund operating expenses will be reduced by 0.04% and 0.02% for Class A and Class C shares of the Fund, respectively. Prior to March 18, 2016, CMIS voluntarily agreed to waive a portion of the total annual Fund operating expenses attributable to transfer agency fees incurred by Class B shares of Columbia Acorn International such that the Fund’s total annual Fund operating expenses was reduced by 0.03%.
Distribution and service fees
CMID, a wholly owned subsidiary of Ameriprise Financial, is the distributor of the Funds. Each Fund has adopted a distribution and service plan which requires it to pay CMID a monthly service fee equal to 0.25% annually of the average daily net assets attributable to Class A, Class B and Class C shares and a monthly distribution fee equal to 0.50%, 0.75% and 0.50%, annually, of the average daily net assets attributable to Class B, Class C and Class R shares, respectively. CMID receives no compensation with respect to Class R4, Class R5, Class Y and Class Z shares.
Sales charges (Unaudited)
Sales charges, including front-end charges and CDSCs, received by the Distributor for distributing each Fund’s shares for the year ended December 31, 2016 are listed below:
| | Underwriting Discounts ($) | | CDSCs ($) | |
| Fund | Class A | Class A | Class B | Class C |
| Columbia Acorn® Fund | 323,564 | 920 | 53 | 10,524 |
| Columbia Acorn International® | 237,802 | 168 | 6 | 2,991 |
| Columbia Acorn USA® | 30,963 | 59 | — | 50 |
| Columbia Acorn International SelectSM | 13,165 | 1 | — | 290 |
| Columbia Acorn SelectSM | 31,096 | 170 | — | 131 |
| Columbia Thermostat FundSM | 732,045 | 63 | — | 23,771 |
| Columbia Acorn Emerging Markets FundSM | 21,489 | 22 | — | 677 |
| Columbia Acorn European FundSM | 29,673 | — | — | — |
Expenses waived/reimbursed by the Investment Manager and its affiliates
Effective July 1, 2016, CWAM has contractually agreed to waive fees indefinitely and reimburse expenses so that the Funds’ ordinary operating expenses (excluding transaction costs and certain other investment-related expenses, interest and fees on borrowings and expenses associated with the Fund’s investments in other investment companies, if any) do not exceed the following annual rates as a percentage of each class’ average daily net assets:
| Fund | Class A | Class C | Class I | Class R4 | Class R5 | Class Y | Class Z | |
| Columbia Acorn International Select | 1.40% | 2.15% | 1.02% | 1.15% | 1.07% | 1.02% | 1.15% | |
This arrangement may not be modified or terminated, except by a vote of the Fund’s Board and CWAM.
| 132 | Columbia Acorn Family of Funds | Annual Report 2016 |
Notes to Financial Statements (continued)
December 31, 2016
Effective May 1, 2016, CWAM has voluntarily agreed to reimburse expenses so that the Funds’ ordinary operating expenses (excluding transaction costs and certain other investment-related expenses, interest and fees on borrowings and expenses associated with each Fund’s investments in other investment companies, if any) after giving effect to any balance credits or overdraft charges from the Funds’ custodian, do not exceed the following annual rates as a percentage of each class’ average daily net assets:
| Fund | Class A | Class C | Class I | Class R4 | Class R5 | Class Y | Class Z |
| Columbia Acorn International Select | 1.70% | 2.45% | 1.34% | 1.45% | 1.39% | 1.34% | 1.45% |
| Columbia Acorn Select | 1.60% | 2.35% | 1.25% | 1.35% | 1.30% | 1.25% | 1.35% |
These arrangements may be modified or terminated by either the Funds or CWAM on 30 days notice.
Through April 30, 2016, CWAM voluntarily agreed to reimburse expenses so that the Funds’ ordinary operating expenses (excluding transaction costs and certain other investment-related expenses, interest and fees on borrowings and expenses associated with each Fund’s investments in other investment companies, if any) after giving effect to any balance credits or overdraft charges from the Funds’ custodian, do not exceed the following annual rates as a percentage of each class’ average daily net assets:
| Fund | Class A | Class C | Class I | Class R4 | Class R5 | Class Y | Class Z | |
| Columbia Acorn International Select | 1.70% | 2.45% | 1.37% | 1.45% | 1.42% | 1.37% | 1.45% | |
| Columbia Acorn Select | 1.60% | 2.35% | 1.25% | 1.35% | 1.30% | 1.25% | 1.35% | |
Effective May 1, 2016, CWAM has contractually agreed to waive fees and/or reimburse expenses through April 30, 2017, so that the Funds’ ordinary operating expenses (excluding transaction costs and certain other investment-related expenses, interest and fees on borrowings and expenses associated with each Fund’s investments in other investment companies, if any, and in the case of Columbia Thermostat Fund its underlying portfolio funds), do not exceed the following annual rates as a percentage of each class’ average daily net assets:
| Fund | Class A | Class C | Class I | Class R4 | Class R5 | Class Y | Class Z | |
| Columbia Thermostat Fund | 0.50% | 1.25% | — | 0.25% | 0.24% | 0.19% | 0.25% | |
| Columbia Acorn Emerging Markets Fund | 1.85% | 2.60% | 1.45% | 1.60% | 1.50% | 1.45% | 1.60% | |
| Columbia Acorn European Fund | 1.75% | 2.50% | 1.42% | 1.50% | 1.47% | — | 1.50% | |
There is no guarantee that these agreements will continue thereafter.
Through April 30, 2016, CWAM contractually waived fees and/or reimburse expenses so that the Funds’ ordinary operating expenses (excluding transaction costs and certain other investment-related expenses, interest and fees on borrowings and expenses associated with each Fund’s investments in other investment companies, if any, and in the case of Columbia Thermostat Fund its underlying portfolio funds), did not exceed the following annual rates as a percentage of each class’ average daily net assets:
| Fund | Class A | Class C | Class I | Class R4 | Class R5 | Class Y | Class Z | |
| Columbia Thermostat Fund | 0.50% | 1.25% | — | 0.25% | 0.24% | 0.19% | 0.25% | |
| Columbia Acorn Emerging Markets Fund | 1.85% | 2.60% | 1.48% | 1.60% | 1.53% | 1.48% | 1.60% | |
| Columbia Acorn European Fund | 1.75% | 2.50% | 1.41% | 1.50% | 1.46% | — | 1.50% | |
Expenses waived and/or reimbursed by CWAM and its affiliates for the year ended December 31, 2016, were as follows:
| Fund | Expenses
reimbursed |
| Columbia Acorn International® | 297,187 |
| Columbia Acorn International SelectSM | 85,117 |
| Columbia Acorn SelectSM | 694,365 |
| Columbia Thermostat FundSM | 388,322 |
| Columbia Acorn Emerging Markets FundSM | 9,954 |
| Columbia Acorn European FundSM | 141,465 |
Columbia Acorn Family of Funds | Annual Report 2016
| 133 |
Notes to Financial Statements (continued)
December 31, 2016
CWAM is contractually entitled to recoup from each of Columbia Acorn Emerging Markets Fund and Columbia Acorn European Fund any fees waived and/or expenses reimbursed with respect to any share class offered by Columbia Acorn Emerging Markets Fund and Columbia Acorn European Fund for a one year period following the date of such fee waiver and/or reimbursement, if such recovery does not cause the ordinary operating expenses of the Fund (excluding transaction costs and certain other investment-related expenses, interest and fees on borrowings and expenses associated with the Fund’s investment in other investment companies, if any) to exceed the annual rates set forth above, or to exceed such annual rate as may be in place at the time of the recoupment, whichever is less. For Columbia Acorn Emerging Markets Fund, the potential recoupment of fees is $9,502. For the year ended December 31, 2016, there was no recoupment of fees.
Note 4. Federal tax information
The timing and character of income and capital gain distributions are determined in accordance with income tax regulations, which may differ from GAAP because of temporary or permanent book to tax differences.
At December 31, 2016, these differences are primarily due to differing treatment for deferral/reversal of wash sale losses, passive foreign investment company (PFIC) holdings, re-characterization of distributions for investments, derivative investments, late-year ordinary losses, capital loss carryforwards, Trustees’ deferred compensation, foreign currency transactions, distribution reclassifications, net operating loss reclassification, earnings and profits distributed to shareholders on the redemption of shares, investments in partnerships, former PFIC holdings, foreign capital gains tax and excess distributions. To the extent these differences are permanent, reclassifications are made among the components of the Fund’s net assets in the Statement of Assets and Liabilities. Temporary differences do not require reclassifications.
In the Statement of Assets and Liabilities the following reclassifications were made:
| Fund | Undistributed
(excess of distributions over)
net investment income ($) | Accumulated
net realized
gain (loss) ($) | Paid-In Capital
Increase
(Decrease) ($) |
| Columbia Acorn® Fund | 2,685,733 | (213,459,778) | 210,774,045 |
| Columbia Acorn International® | 32,850,182 | (17,260,731) | (15,589,451) |
| Columbia Acorn USA® | 2,258,391 | 11,173 | (2,269,564) |
| Columbia Acorn International SelectSM | 95,800 | (24,824) | (70,976) |
| Columbia Acorn SelectSM | 645,215 | 52,685 | (697,900) |
| Columbia Thermostat FundSM | 2,253,509 | (2,547,324) | 293,815 |
| Columbia Acorn Emerging Markets FundSM | (65,434) | 91,408 | (25,974) |
| Columbia Acorn European FundSM | 80,637 | (80,637) | — |
Net investment income (loss) and net realized gains (losses), as disclosed in the Statement of Operations, and net assets were not affected by these reclassifications.
| 134 | Columbia Acorn Family of Funds | Annual Report 2016 |
Notes to Financial Statements (continued)
December 31, 2016
The tax character of distributions paid during the years indicated was as follows:
| | Year Ended December 31, 2016 | Year Ended December 31, 2015 |
| Fund | Ordinary
income ($) | Long-term
capital gains ($) | Tax return
of capital ($) | Total ($) | Ordinary
income ($) | Long-term
capital gains ($) | Tax return
of capital ($) | Total ($) |
| Columbia Acorn® Fund | — | 1,778,266,515 | — | 1,778,266,515 | — | 3,585,084,598 | — | 3,585,084,598 |
| Columbia Acorn International® | 29,981,674 | 39,664,002 | — | 69,645,676 | 84,310,276 | 271,338,817 | — | 355,649,093 |
| Columbia Acorn USA® | — | 238,540,555 | — | 238,540,555 | — | 299,435,943 | — | 299,435,943 |
| Columbia Acorn International SelectSM | 834,655 | — | 102,686 | 937,341 | 3,693,352 | — | 53,469 | 3,746,821 |
| Columbia Acorn SelectSM | — | 55,197,227 | — | 55,197,227 | 16,453,889 | 148,151,227 | — | 164,605,116 |
| Columbia Thermostat FundSM | 6,194,754 | 21,063,441 | — | 27,258,195 | 29,188,757 | 13,167,986 | — | 42,356,743 |
| Columbia Acorn Emerging Markets FundSM | 544,142 | — | 404,319 | 948,461 | 4,455,103 | — | 203,958 | 4,659,061 |
| Columbia Acorn European FundSM | 419,336 | — | — | 419,336 | 747,168 | — | — | 747,168 |
Short-term capital gain distributions, if any, are considered ordinary income distributions for tax purposes.
At December 31, 2016, the components of distributable earnings on a tax basis were as follows:
| Fund | Undistributed
ordinary
income ($) | Undistributed
long-term
capital gains ($) | Capital loss
carryforwards ($) | Net unrealized
appreciation
(depreciation) ($) |
| Columbia Acorn® Fund | 22,321,407 | 149,863,584 | — | 1,401,757,695 |
| Columbia Acorn International® | 43,466,648 | — | (46,821,711) | 832,097,391 |
| Columbia Acorn USA® | — | 19,336,705 | — | 183,642,595 |
| Columbia Acorn International SelectSM | — | — | (14,662,013) | 15,401,840 |
| Columbia Acorn SelectSM | — | 25,549,240 | — | 49,526,149 |
| Columbia Thermostat FundSM | 13,648,908 | 3,913,220 | — | 15,287,870 |
| Columbia Acorn Emerging Markets FundSM | — | — | (85,699,518) | (2,961,098) |
| Columbia Acorn European FundSM | 174,167 | — | (9,443,844) | 4,723,387 |
At December 31, 2016, the cost of investments for federal income tax purposes along with the aggregate gross unrealized appreciation and depreciation based on that cost was:
| Fund | Tax cost ($) | Gross
unrealized
appreciation ($) | Gross
unrealized
(depreciation) ($) | Net unrealized
appreciation
(depreciation) ($) |
| Columbia Acorn® Fund | 3,502,338,923 | 1,479,513,155 | (77,755,460) | 1,401,757,695 |
| Columbia Acorn International® | 3,982,689,795 | 1,082,599,234 | (250,501,843) | 832,097,391 |
| Columbia Acorn USA® | 484,362,652 | 194,048,244 | (10,405,649) | 183,642,595 |
| Columbia Acorn International SelectSM | 89,234,209 | 21,141,621 | (5,739,781) | 15,401,840 |
| Columbia Acorn SelectSM | 258,855,537 | 53,651,673 | (4,125,524) | 49,526,149 |
| Columbia Thermostat FundSM | 1,090,554,326 | 21,642,970 | (6,355,100) | 15,287,870 |
| Columbia Acorn Emerging Markets FundSM | 110,127,305 | 13,111,522 | (16,072,620) | (2,961,098) |
| Columbia Acorn European FundSM | 44,527,887 | 6,729,040 | (2,005,653) | 4,723,387 |
Columbia Acorn Family of Funds | Annual Report 2016
| 135 |
Notes to Financial Statements (continued)
December 31, 2016
The following capital loss carryforwards, determined at December 31, 2016, may be available to reduce taxable income arising from future net realized gains on investments, if any, to the extent permitted by the Internal Revenue Code. Capital loss carryforwards with no expiration are required to be utilized prior to any capital losses which carry an expiration date. As a result of this ordering rule, capital loss carryforwards which carry an expiration date may be more likely to expire unused. In addition, for the year ended December 31, 2016, capital loss carryforwards utilized, expired unused and permanently lost were as follows:
| Fund | 2017 ($) | 2018 ($) | 2019 ($) | No expiration
short-term ($) | No expiration
long-term ($) | Total ($) | Utilized ($) | Expired ($) | Permanently
lost ($) |
| Columbia Acorn International® | — | — | — | 46,821,711 | — | 46,821,711 | — | 15,589,450 | — |
| Columbia Acorn International SelectSM | — | — | — | 14,662,013 | — | 14,662,013 | 361,514 | — | — |
| Columbia Acorn Emerging Markets FundSM | — | — | — | 44,001,715 | 41,697,803 | 85,699,518 | — | — | — |
| Columbia Acorn European FundSM | — | — | — | 5,868,008 | 3,575,836 | 9,443,844 | — | — | — |
Under current tax rules, regulated investment companies can elect to treat certain late-year ordinary losses incurred and post-October capital losses (capital losses realized after October 31) as arising on the first day of the following taxable year. As of December 31, 2016, the Funds will elect to treat the following late-year ordinary losses and post-October capital losses as arising on January 1, 2017.
| Fund | Late year
ordinary losses ($) | Post-october
capital losses ($) |
| Columbia Acorn International SelectSM | 8,631 | — |
| Columbia Acorn Emerging Markets FundSM | 297,319 | — |
Management of the Funds has concluded that there are no significant uncertain tax positions in the Funds that would require recognition in the financial statements. However, management’s conclusion may be subject to review and adjustment at a later date based on factors including, but not limited to, new tax laws, regulations, and administrative interpretations (including relevant court decisions). Generally, the Funds’ federal tax returns for the prior three fiscal years remain subject to examination by the Internal Revenue Service.
Note 5. Line of credit
During the period January 1, 2016 through April 28, 2016, the Trust participated in a revolving credit facility in the amount of $400 million with a syndicate of banks led by JPMorgan Chase Bank, N.A., along with Wanger Advisors Trust, another trust managed by CWAM. Effective April 28, 2016, the credit facility was renewed in the amount of $200 million with a syndicate of banks led by JPMorgan Chase Bank, N.A. Under each facility, interest is charged to each participating Fund based on its borrowings at a rate per annum equal to the Federal Funds Rate plus 1.00%. In addition, a commitment fee of 0.08% (before April 28, 2016) and 0.15% (after April 28, 2016) per annum of the unutilized line of credit is accrued and apportioned among the participating Funds based on their relative net assets. The commitment fee is disclosed as a part of other expenses in the Statement of Operations. Interest expense incurred by the Fund is recorded as interest expense in the Statements of Operations. The Trust expects to renew this line of credit for one year durations each April at then current market rates and terms.
For the year ended December 31, 2016, the average daily loan balance outstanding on days when borrowing existed was as follows.
| Fund name | Average daily loan
balance outstanding | Weighted average
interest rate |
| Columbia Acorn® Fund | $ 9,500,000 | 1.44 % |
| Columbia Acorn Emerging Markets FundSM | $ 8,800,000 | 1.37 % |
| 136 | Columbia Acorn Family of Funds | Annual Report 2016 |
Notes to Financial Statements (continued)
December 31, 2016
Note 6. Portfolio information
The aggregate cost of purchases and proceeds from sales, other than short-term obligations, for the year ended December 31, 2016, were:
| | Purchases
($) | Proceeds
from sales
($) | Purchases
of U.S.
Government
securities
($) | Proceeds
from Sales
of U.S.
Government
securities
($) |
| Columbia Acorn® Fund | 4,754,585,619 | 6,925,966,545 | — | — |
| Columbia Acorn International® | 2,550,415,285 | 4,200,382,575 | — | — |
| Columbia Acorn USA® | 651,348,456 | 946,651,264 | — | — |
| Columbia Acorn International SelectSM | 54,462,162 | 92,883,267 | — | — |
| Columbia Acorn SelectSM | 253,820,139 | 380,325,911 | — | — |
| Columbia Thermostat FundSM | 1,061,310,219 | 1,087,974,321 | — | — |
| Columbia Acorn Emerging Markets FundSM | 68,672,780 | 222,415,474 | — | — |
| Columbia Acorn European FundSM | 22,104,565 | 35,249,174 | — | — |
The amount of purchase and sales activity impacts the portfolio turnover rate reported in the Financial Highlights.
Note 7. Regulatory settlements
During the period ended December 31, 2015, Columbia Acorn International Select recorded a receivable of $33,279 as a result of a regulatory settlement proceeding brought by the Securities and Exchange Commission against third parties relating to market timing and/or late trading of mutual funds. This amount represented the Fund’s portion of the proceeds from the settlement (neither the Fund nor the Investment Manager were a party to the proceeding). The payments have been included in Proceeds from regulatory settlements in the Statement of Changes in Net Assets.
Note 8. Significant risks
Consumer discretionary sector risk
Columbia Acorn International®, Columbia Acorn SelectSM and Columbia Acorn Emerging Markets FundSM may be more susceptible to the particular risks that may affect companies in the consumer discretionary sector than if it were invested in a wider variety of companies in unrelated sectors. Companies in the discretionary sector are subject to certain risks, including fluctuations in the performance of the overall domestic and international economy, interest rate changes, increased competition and consumer confidence. Performance of such companies may be affected by factors including reduced disposable household income, reduced consumer spending, changing demographics and consumer tastes.
Health Care Sector Risk
Columbia Acorn® Fund and Columbia Acorn USA® may be more susceptible to the particular risks that may affect companies in the health care sector than if it were invested in a wider variety of companies in unrelated sectors. Companies in the health care sector are subject to certain risks, including restrictions on government reimbursement for medical expenses, government approval of medical products and services, competitive pricing pressures, and the rising cost of medical products and services (especially for companies dependent upon a relatively limited number of products or services). Performance of such companies may be affected by factors including, government regulation, obtaining and protecting patents (or the failure to do so), product liability and other similar litigation as well as product obsolescence.
Industrial sector risk
Columbia Acorn International®, Columbia Acorn International SelectSM, Columbia Acorn SelectSM and Columbia European FundSM may be more susceptible to the particular risks that may affect companies in the industrials sector than if it were invested in a wider variety of companies in unrelated sectors. Companies in the industrials sector are subject to certain risks, including changes in supply and demand for their specific product or service and for industrial sector products in general,
Columbia Acorn Family of Funds | Annual Report 2016
| 137 |
Notes to Financial Statements (continued)
December 31, 2016
including decline in demand for such products due to rapid technological developments and frequent new product introduction. Performance of such companies may be affected by factors including government regulation, world events and economic conditions and risks for environmental damage and product liability claims.
Shareholder concentration risk
At December 31, 2016, the table below details the affiliated and significant unaffiliated shareholder account ownership of outstanding shares of each Fund. The Funds have no knowledge about whether any portion of these unaffiliated shares were owned beneficially. Subscription and redemption activity of these accounts may have a significant effect on the operations of the Funds.
| Fund | Number of
unaffiliated
accounts | Percentage of
shares
outstanding
held —
unaffiliated (%) | Percentage of
shares
outstanding
held —
affiliated (%) |
| Columbia Acorn International® | 1 | 20.3 | — |
| Columbia Acorn USA® | 2 | 59.4 | — |
| Columbia Acorn International SelectSM | 2 | 31.2 | 11.5 |
| Columbia Acorn SelectSM | 1 | 18.5 | 13.3 |
| Columbia Thermostat FundSM | 1 | 19.7 | 24.4 |
| Columbia Acorn Emerging Markets FundSM | 1 | 10.1 | 33.7 |
| Columbia Acorn European FundSM | 1 | 10.9 | 43.8 |
Technology and technology-related investment risk
Columbia Acorn European FundSM may be more susceptible to the particular risks that may affect companies in the information technology sector, as well as other technology-related sectors (collectively, the technology sectors) than if it were invested in a wider variety of companies in unrelated sectors. Companies in the technology sectors are subject to certain risks, including the risk that new services, equipment or technologies will not be accepted by consumers and businesses or will become rapidly obsolete. Performance of such companies may be affected by factors including obtaining and protecting patents (or the failure to do so) and significant competitive pressures, including aggressive pricing of their products or services, new market entrants, competition for market share and short product cycles due to an accelerated rate of technological developments. Such competitive pressures may lead to limited earnings and/or falling profit margins. As a result, the value of their securities may fall or fail to rise. In addition, many technology sector companies have limited operating histories and prices of these companies’ securities historically have been more volatile than other securities, especially over the short term.
Note 9. Subsequent events
Management has evaluated the events and transactions that have occurred through the date the financial statements were issued and noted no items requiring adjustment of the financial statements or additional disclosure.
Note 10. Information regarding pending and settled legal proceedings
Ameriprise Financial and certain of its affiliates have historically been involved in a number of legal, arbitration and regulatory proceedings, including routine litigation, class actions, and governmental actions, concerning matters arising in connection with the conduct of their business activities. Ameriprise Financial believes that the Funds are not currently the subject of, and that neither Ameriprise Financial nor any of its affiliates are the subject of, any pending legal, arbitration or regulatory proceedings that are likely to have a material adverse effect on the Funds or the ability of Ameriprise Financial or its affiliates to perform under their contracts with the Funds. Ameriprise Financial is required to make quarterly (10-Q), annual (10-K) and, as necessary, 8-K filings with the Securities and Exchange Commission (SEC) on legal and regulatory matters that relate to Ameriprise Financial and its affiliates. Copies of these filings may be obtained by accessing the SEC website at www.sec.gov.
| 138 | Columbia Acorn Family of Funds | Annual Report 2016 |
Notes to Financial Statements (continued)
December 31, 2016
There can be no assurance that these matters, or the adverse publicity associated with them, will not result in increased fund redemptions, reduced sale of fund shares or other adverse consequences to the Funds. Further, although we believe proceedings are not likely to have a material adverse effect on the Funds or the ability of Ameriprise Financial or its affiliates to perform under their contracts with the Funds, these proceedings are subject to uncertainties and, as such, we are unable to estimate the possible loss or range of loss that may result. An adverse outcome in one or more of these proceedings could result in adverse judgments, settlements, fines, penalties or other relief that could have a material adverse effect on the consolidated financial condition or results of operations of Ameriprise Financial.
Columbia Acorn Family of Funds | Annual Report 2016
| 139 |
Report of Independent Registered Public Accounting Firm
To the Board of Trustees of Columbia Acorn Trust and Shareholders of Columbia Acorn Fund, Columbia Acorn International, Columbia Acorn USA, Columbia Acorn International Select, Columbia Acorn Select, Columbia Thermostat Fund, Columbia Acorn Emerging Markets Fund and Columbia Acorn European Fund:
In our opinion, the accompanying statements of assets and liabilities, including the portfolio of investments, and the related statements of operations and of changes in net assets and the financial highlights present fairly, in all material respects, the financial position of Columbia Acorn Fund, Columbia Acorn International, Columbia Acorn USA, Columbia Acorn International Select, Columbia Acorn Select, Columbia Thermostat Fund, Columbia Acorn Emerging Markets Fund and Columbia Acorn European Fund (each a series of the Columbia Acorn Trust, hereinafter referred to as the "Funds") as of December 31, 2016, the results of each of their operations for the year then ended, the changes in each of their net assets for each of the two years in the period then ended and the financial highlights for each of the periods presented, in conformity with accounting principles generally accepted in the United States of America. These financial statements and financial highlights (hereafter referred to as "financial statements") are the responsibility of the Funds’ management. Our responsibility is to express an opinion on these financial statements based on our audits. We conducted our audits of these financial statements in accordance with the standards of the Public Company Accounting Oversight Board (United States). Those standards require that we plan and perform the audit to obtain reasonable assurance about whether the financial statements are free of material misstatement. An audit includes examining, on a test basis, evidence supporting the amounts and disclosures in the financial statements, assessing the accounting principles used and significant estimates made by management, and evaluating the overall financial statement presentation. We believe that our audits, which included confirmation of securities as of December 31, 2016 by correspondence with the custodian and brokers, provide a reasonable basis for our opinion.
PricewaterhouseCoopers LLP
Chicago, IL
February 21, 2017
| 140 | Columbia Acorn Family of Funds | Annual Report 2016 |
Federal Income Tax Information
(Unaudited)
The Funds hereby designate the following tax attributes for the fiscal year ended December 31, 2016. Shareholders were notified in early 2017 of the amounts for use in preparing 2016 income tax returns.
| | Qualified
dividend
income | Dividends
received
deduction | Capital
gain
dividend | Foreign
taxes paid | Foreign
taxes paid
per share | Foreign
source
income | Foreign
source
income per
share |
| Columbia Acorn® Fund | 0.00% | 0.00% | $1,522,583,839 | $0 | $0.00 | $0 | $0.00 |
| Columbia Acorn International® | 100.00% | 0.00% | $0 | $10,588,165 | $0.09 | $114,405,379 | $0.93 |
| Columbia Acorn USA® | 0.00% | 0.00% | $182,446,714 | $0 | $0.00 | $0 | $0.00 |
| Columbia Acorn International SelectSM | 100.00% | 0.79% | $0 | $158,903 | $0.03 | $1,885,280 | $0.41 |
| Columbia Acorn SelectSM | 0.00% | 0.00% | $53,086,026 | $0 | $0.00 | $0 | $0.00 |
| Columbia Thermostat FundSM | 28.44% | 24.61% | $4,340,706 | $69,323 | $0.00 | $250,704 | $0.00 |
| Columbia Acorn Emerging Markets FundSM | 100.00% | 0.00% | $0 | $555,341 | $0.05 | $2,939,296 | $0.27 |
| Columbia Acorn European FundSM | 100.00% | 0.00% | $0 | $136,427 | $0.04 | $1,517,428 | $0.46 |
Qualified Dividend Income. For taxable, non-corporate shareholders, the percentage of ordinary income distributed during the fiscal year that represents qualified dividend income subject to reduced tax rates.
Dividends Received Deduction. The percentage of ordinary income distributed during the fiscal year that qualifies for the corporate dividends received deduction.
Capital Gain Dividend. The Fund designates as a capital gain dividend the amount reflected above, or if subsequently determined to be different, the net capital gain of such fiscal period.
Foreign Taxes. The Fund makes the election to pass through to shareholders the foreign taxes paid. Eligible shareholders may claim a foreign tax credit. These taxes, and the corresponding foreign source income, are provided.
Columbia Acorn Family of Funds | Annual Report 2016
| 141 |
Board of Trustees and Management of the Columbia Acorn Family of Funds
Each trustee may serve a term of unlimited duration. The Trust’s Bylaws generally require that a trustee retire at the end of the calendar year in which the trustee attains the age of 75 years. The trustees appoint their own successors, provided that at least two-thirds of the trustees, after such appointment, have been elected by shareholders. Shareholders may remove a trustee, with or without cause, upon the vote of two-thirds of the Trust’s outstanding shares at any meeting called for that purpose. A trustee may be removed, with or without cause, upon the vote of a majority of the trustees. The names of the trustees and officers of the Trust, the date each was first elected or appointed to office and the principal business occupations of each during at least the last five years, and for the trustees, the number of portfolios in the fund complex they oversee and other directorships they hold, are shown below. Each trustee and officer serves in such capacity for each of the eight series of Columbia Acorn Trust and for each of the three series of Wanger Advisors Trust.
The address for the trustees and officers of the Trust is Columbia Wanger Asset Management, LLC, 227 West Monroe Street, Suite 3000, Chicago, Illinois 60606. The Funds’ Statement of Additional Information includes additional information about the Funds’ trustees and officers. You may obtain a free copy of the Statement of Additional Information by writing or calling toll-free:
Columbia Wanger Asset Management, LLC
Shareholder Services Group
227 W. Monroe, Suite 3000
800.922.6769
Independent trustees
Name and age at
December 31, 2016 | Year first appointed or elected to a Board in the Columbia Funds Complex | Principal occupation(s)
during the past five years | Number of
Funds in the
Columbia
Funds
Complex
overseen (1) | Other directorships
held by the Trustee
during the past five years
in addition to
Columbia Acorn Trust and
Wanger Advisors Trust |
Laura M. Born, 51,
Chair | 2007 | Adjunct Associate Professor of Finance, University of Chicago Booth School of Business since 2007; Director, Carlson Inc. (private global hospitalities and travel company) since 2015; Managing Director – Investment Banking, JP Morgan Chase & Co. (broker-dealer) 2002-2007. | 11 | None. |
| Maureen M. Culhane, 68 | 2007 | Retired. Formerly, Vice President, Goldman Sachs Asset Management, L.P. (investment adviser), 2005-2007; Vice President (Consultant) – Strategic Relationship Management, Goldman, Sachs & Co., 1999-2005. | 11 | None. |
| Margaret M. Eisen, 63 | 2002 | Trustee, Smith College since 2012; Chief Investment Officer, EAM International LLC (corporate finance and asset management), 2003-2013; Managing Director, CFA Institute, 2005-2008. | 11 | RMB Investors Trust (formerly Burnham Investors Trust) (3 series). |
| Thomas M. Goldstein, 57 | 2014 | Retired. Formerly, Chief Financial Officer, Allstate Protection Division, 2011-2014; Founding Partner, The GRG Group LLC, 2009-2011; Managing Director and Chief Financial Officer, Madison Dearborn Partners, 2007-2009. | 11 | Federal Home Loan Bank – Chicago;
Federal Home Loan Mortgage
Corporation. |
| John C. Heaton, 57 | 2010 | Deputy Dean for Faculty, University of Chicago Booth School of Business; Joseph L. Gidwitz Professor of Finance, University of Chicago Booth School of Business since July 2000. | 11 | None. |
| 142 | Columbia Acorn Family of Funds | Annual Report 2016 |
Board of Trustees and Management of the Columbia Acorn Family of Funds
Independent trustees (continued)
Name and age at
December 31, 2016 | Year first appointed or elected to a Board in the Columbia Funds Complex | Principal occupation(s)
during the past five years | Number of
Funds in the
Columbia
Funds
Complex
overseen (1) | Other directorships
held by the Trustee
during the past five years
in addition to
Columbia Acorn Trust and
Wanger Advisors Trust |
| Charles R. Phillips, 60 | 2015 | Retired. Director, University of North Carolina School of Law Foundation since 2010. Formerly, Vice Chairman, J.P. Morgan Private Bank, 2011-2014; Managing Director, J.P. Morgan Private Bank, 2001-2011. | 11 | None. |
David J. Rudis, 63,
Vice Chair | 2010 | Retired. Formerly, National Checking and Debit Executive, and Illinois President, Bank of America, 2007-2009; President, Consumer Banking Group, LaSalle National Bank, 2004-2007. | 11 | None. |
Interested trustees affiliated with Investment Manager
Name and age at
December 31, 2016 | Year first
appointed or
elected to a
Board in the
Columbia
Funds
Complex | Principal occupation(s)
during the past five years | Number of
Funds in the
Columbia
Funds
Complex
overseen (1) | Other directorships
held by the Trustee
during the past five years
in addition to
Columbia Acorn Trust and
Wanger Advisors Trust |
| P. Zachary Egan, 48 (2) | 2015 | President, CWAM and President, Columbia Acorn Trust and Wanger Advisors Trust since April 2014; Global Chief Investment Officer, CWAM since October 2015; International Chief Investment Officer, CWAM, April 2014-September 2015; Director of International Research, CWAM, December 2004-March 2014; Vice President of Columbia Acorn Trust, 2003-2014, and Wanger Advisors Trust, 2007-2014; portfolio manager and analyst, CWAM or its predecessors, since 1999. | 11 | None. |
| Ralph Wanger, 82 (3) | 1970 (4) | Founder, CWAM. Formerly, President, Chief Investment Officer and portfolio manager, CWAM or its predecessors, July 1992-September 2003; Director, Wanger Investment Company PLC; Consultant to CWAM or its predecessors, September 2003-September 2005. | 11 | None. |
| (1) | The Trustees oversee the series of Wanger Advisors Trust and Columbia Acorn Trust. |
| (2) | Mr. Egan is an "interested person" of Wanger Advisers Trust and Columbia Acorn Trust, and of CWAM, as defined in the 1940 Act, because he is an officer of each Trust and an employee of CWAM. |
| (3) | As permitted under the Trust’s Bylaws, Mr. Wanger serves as a non-voting Trustee Emeritus of Columbia Acorn Trust and Wanger Advisors Trust. |
| (4) | Dates prior to 1992 relate to the Acorn Fund, Inc., the predecessor trust to Columbia Acorn Trust. |
Columbia Acorn Family of Funds | Annual Report 2016
| 143 |
Board of Trustees and Management of the Columbia Acorn Family of Funds (continued)
Fund officers
Name and age at
December 31, 2016 | Position
held with
Columbia
Acorn
Trust and
Wanger
Advisors Trust | Year first
appointed
or elected
to office | Principal occupation(s) during
the past five years |
| Alan G. Berkshire, 56 | Vice President | 2015 | Chief Operating Officer, CWAM since April 2015. Formerly, Independent Director, ValueQuest India Moat Fund Limited (Mauritius), April 2014-March 2015; President – North America, Religare Global Asset Management, Inc., June 2011-November 2013; Partner, Estancia Capital Management LLC, September 2009-June 2011. |
| Michael G. Clarke, 47 | Assistant Treasurer | 2004 | Vice President – Mutual Fund Administration, Columbia Management Investment Advisers, LLC since May 2010; Managing Director of Fund Administration, Columbia Management Advisors, LLC, September 2004-April 2010; Senior officer of Columbia funds and affiliated funds since 2002. |
| William J. Doyle, 52 | Vice President | 2014 | Portfolio manager and/or analyst, CWAM or its predecessors since 2006; Vice President, Columbia Acorn Trust and Wanger Advisors Trust since 2014. |
| P. Zachary Egan, 48 | President | 2007 | President, CWAM and President, Columbia Acorn Trust and Wanger Advisors Trust since April 2014; Global Chief Investment Officer, CWAM since October 2015; International Chief Investment Officer, CWAM, April 2014-September 2015; Director of International Research, CWAM, December 2004-March 2014; Vice President of Columbia Acorn Trust, 2003-2014, and Wanger Advisors Trust, 2007-2014; portfolio manager and analyst, CWAM or its predecessors, since 1999. |
| David L. Frank, 53 | Vice President | 2014 | Portfolio manager and/or analyst, CWAM or its predecessors since 2002; Vice President, Columbia Acorn Trust and Wanger Advisors Trust since 2014. |
| Paul B. Goucher, 48 | Assistant Secretary | 2015 | Senior Vice President and Assistant General Cousel, Ameriprise Financial, Inc. since January 2017 (previously Vice President and Lead Chief Counsel, November 2008 - January 2017 and January 2013 - January 2017, respectively, and Chief Counsel, January 2010 - January 2013); Vice President, Chief Legal Counsel and Assistant Secretary, Columbia Management Investment Advisers, LLC since May 2010. |
| Fritz Kaegi, 45 | Vice President | 2011 | Portfolio manager and/or analyst, CWAM or its predecessors since 2004; Vice President, Columbia Acorn Trust and Wanger Advisors Trust since 2011. |
| John Kunka, 46 | Vice President, Treasurer and
Principal Accounting and Financial Officer | 2006 | Treasurer and Principal Accounting and Financial Officer, Columbia Acorn Trust and Wanger Advisors Trust since 2014; Vice President of Accounting and Operations, CWAM since May 2006; formerly, Assistant Treasurer, Columbia Acorn Trust and Wanger Advisors Trust 2006-2014. |
| Stephen Kusmierczak, 49 | Vice President | 2011 | Portfolio manager and/or analyst, CWAM or its predecessors since 2001; Vice President, Columbia Acorn Trust and Wanger Advisors Trust since 2011. |
| Joseph C. LaPalm, 47 | Vice President | 2006 | Chief Compliance Officer, CWAM since 2005. |
| Ryan C. Larrenaga, 46 | Assistant Secretary | 2015 | Vice President and Group Counsel, Ameriprise Financial, Inc. since August 2011 (previously, Counsel, May 2010-August 2011); Assistant General Counsel, Bank of America, 2005-April 2010; officer of Columbia funds and affiliated funds since 2005. |
| Matthew A. Litfin, 45 | Vice President | 2016 | Director of Research (U.S.) and portfolio manager, CWAM since December 2015; formerly, portfolio manager, William Blair & Company 1993-2015; Vice President, Columbia Acorn Trust and Wanger Advisors Trust since 2016. |
| Satoshi Matsunaga, 45 | Vice President | 2015 | Portfolio manager and/or analyst, CWAM or its predecessors since 2005; Vice President, Columbia Acorn Trust and Wanger Advisors Trust since 2015. |
| 144 | Columbia Acorn Family of Funds | Annual Report 2016 |
Board of Trustees and Management of the Columbia Acorn Family of Funds (continued)
Fund officers (continued)
Name and age at
December 31, 2016 | Position
held with
Columbia
Acorn
Trust and
Wanger
Advisors Trust | Year first
appointed
or elected
to office | Principal occupation(s) during
the past five years |
| Thomas P. McGuire, 44 | Chief Compliance Officer | 2015 | Chief Compliance Officer of the Columbia family of mutual funds for which Columbia Management Investment Advisers, LLC serves as investment adviser since 2012; Vice President – Asset Management Compliance, Ameriprise Financial, Inc., since May 2010; Chief Compliance Officer, Ameriprise Certificate Company since September 2010; Compliance Executive, Bank of America, 2005-April 2010. |
| Louis J. Mendes III, 52 | Vice President | 2003 | International Director of Research, CWAM, since 2015; portfolio manager and/or analyst, CWAM or its predecessors since 2001; Vice President, Columbia Acorn Trust since 2003 and Wanger Advisors Trust since 2005. |
| Julian Quero, 49 | Assistant Treasurer | 2015 | Vice President – Tax, Columbia Management Investment Advisers, LLC since 2009. |
| Martha A. Skinner, 42 | Assistant Treasurer | 2016 | Vice President of Financial Reporting and Administration, Columbia Management since November 2015; Director of Financial Reporting, Columbia Management, April 2013-November 2015; Manager of Financial Reporting, Columbia Management, August 2010-April 2013. |
| Matthew S. Szafranski, 39 | Vice President | 2015 | Portfolio manager and/or analyst, CWAM or its predecessors since 2008; Vice President, Columbia Acorn Trust and Wanger Advisors Trust since 2015. |
| Andreas Waldburg-Wolfegg, 51 | Vice President | 2011 | Portfolio manager and/or analyst, CWAM or its predecessors since 2002; Vice President, Columbia Acorn Trust and Wanger Advisors Trust since 2011. |
| Linda Roth-Wiszowaty, 47 | Secretary | 2006 | Business support analyst, CWAM since April 2007; Secretary, Columbia Acorn Trust and Wanger Advisors Trust since 2014; Assistant Secretary, Columbia Acorn Trust and Wanger Advisors Trust, 2006-2014. |
Columbia Acorn Family of Funds | Annual Report 2016
| 145 |
Expense Information
as of December 31, 2016
| Columbia Acorn® Fund | Class A | Class B(a) | Class C | Class I | Class R | Class R4 | Class R5 | Class Y | Class Z |
| Investment advisory fee | 0.66% | | 0.66% | 0.66% | | 0.66% | 0.66% | 0.66% | 0.66% |
| Distribution and/or service fees | 0.25% | | 1.00% | 0.00% | | 0.00% | 0.00% | 0.00% | 0.00% |
| Other expenses | 0.19% | | 0.18% | 0.10% | | 0.23% | 0.15% | 0.10% | 0.16% |
| Net expense ratio | 1.10% | | 1.84% | 0.76% | | 0.89% | 0.81% | 0.76% | 0.82% |
| Columbia Acorn International® |
| Investment advisory fee | 0.76% | 0.76% | 0.76% | 0.76% | 0.76% | 0.76% | 0.76% | 0.76% | 0.76% |
| Distribution and/or service fees | 0.25% | 0.75% | 1.00% | 0.00% | 0.50% | 0.00% | 0.00% | 0.00% | 0.00% |
| Other expenses | 0.22% | 0.40% | 0.23% | 0.12% | 0.29% | 0.29% | 0.17% | 0.12% | 0.22% |
| Net expense ratio | 1.23% | 1.91% | 1.99% | 0.88% | 1.55% | 1.05% | 0.93% | 0.88% | 0.98% |
| Columbia Acorn USA® |
| Investment advisory fee | 0.89% | | 0.89% | 0.89% | | 0.89% | 0.89% | 0.89% | 0.89% |
| Distribution and/or service fees | 0.25% | | 1.00% | 0.00% | | 0.00% | 0.00% | 0.00% | 0.00% |
| Other expenses | 0.27% | | 0.24% | 0.09% | | 0.29% | 0.18% | 0.12% | 0.27% |
| Net expense ratio | 1.41% | | 2.13% | 0.98% | | 1.18% | 1.07% | 1.01% | 1.16% |
| Columbia Acorn International SelectSM |
| Investment advisory fee | 0.92% | | 0.92% | 0.92% | | 0.92% | 0.92% | 0.92% | 0.92% |
| Distribution and/or service fees | 0.25% | | 1.00% | 0.00% | | 0.00% | 0.00% | 0.00% | 0.00% |
| Other expenses | 0.31% | | 0.31% | 0.11% | | 0.29% | 0.27% | 0.12% | 0.27% |
| Net expense ratio | 1.48% | | 2.23% | 1.03% | | 1.21% | 1.19% | 1.04% | 1.19% |
| Columbia Acorn SelectSM |
| Investment advisory fee | 0.65% | | 0.65% | 0.65% | | 0.65% | 0.65% | 0.65% | 0.65% |
| Distribution and/or service fees | 0.25% | | 1.00% | 0.00% | | 0.00% | 0.00% | 0.00% | 0.00% |
| Other expenses | 0.27% | | 0.26% | 0.15% | | 0.28% | 0.20% | 0.15% | 0.25% |
| Net expense ratio | 1.17% | | 1.91% | 0.80% | | 0.93% | 0.85% | 0.80% | 0.90% |
| Columbia Thermostat FundSM |
| Investment advisory fee | 0.10% | | 0.10% | | | 0.10% | 0.10% | 0.10% | 0.10% |
| Distribution and/or service fees | 0.25% | | 1.00% | | | 0.00% | 0.00% | 0.00% | 0.00% |
| Other expenses | 0.15% | | 0.15% | | | 0.15% | 0.14% | 0.09% | 0.15% |
| Net expense ratio(b) | 0.50% | | 1.25% | | | 0.25% | 0.24% | 0.19% | 0.25% |
| Columbia Acorn Emerging Markets FundSM |
| Investment advisory fee | 1.15% | | 1.15% | 1.15% | | 1.15% | 1.15% | 1.15% | 1.15% |
| Distribution and/or service fees | 0.25% | | 1.00% | 0.00% | | 0.00% | 0.00% | 0.00% | 0.00% |
| Other expenses | 0.44% | | 0.44% | 0.30% | | 0.42% | 0.31% | 0.30% | 0.43% |
| Net expense ratio | 1.84% | | 2.59% | 1.45% | | 1.57% | 1.46% | 1.45% | 1.58% |
| Columbia Acorn European FundSM |
| Investment advisory fee | 1.19% | | 1.19% | 1.19% | | 1.19% | 1.19% | | 1.19% |
| Distribution and/or service fees | 0.25% | | 1.00% | 0.00% | | 0.00% | 0.00% | | 0.00% |
| Other expenses | 0.31% | | 0.31% | 0.23% | | 0.31% | 0.28% | | 0.31% |
| Net expense ratio | 1.75% | | 2.50% | 1.42% | | 1.50% | 1.47% | | 1.50% |
See the Funds’ prospectuses for information on minimum initial investment amounts and other details of buying, selling and exchanging shares of the Funds.
Fees and expenses are for the year ended December 31, 2016. Please see Note 3, “Fees and Other Transactions With Affiliates” in the Notes to Financial Statements of this report for information on fee waivers and/or expense reimbursements in place for Columbia Acorn International, Columbia Acorn International Select, Columbia Acorn Select, Columbia Acorn Emerging Markets Fund, Columbia Acorn European Fund and Columbia Thermostat Fund.
| (a) | Effective April 26, 2016, only Columbia Acorn International continues to offer Class B shares. |
| (b) | Does not include estimated fees and expenses of 0.51% incurred by Columbia Thermostat Fund from the underlying portfolio funds in which it invests. |
| 146 | Columbia Acorn Family of Funds | Annual Report 2016 |
The Fund mails one shareholder report to each shareholder address. If you would like more than one report, please call shareholder services at 800.345.6611 and additional reports will be sent to you.
Proxy voting policies and procedures
The policy of the Board is to vote the proxies of the companies in which the Fund holds investments consistent with the procedures as stated in the Statement of Additional Information (SAI). You may obtain a copy of the SAI without charge by calling 800.345.6611; contacting your financial intermediary; visiting investor.columbiathreadneedleus.com; or searching the website of the Securities and Exchange Commission (SEC) at sec.gov. Information regarding how each fund voted proxies relating to portfolio securities is filed with the SEC by August 31st for the most recent 12-month period ending June 30th of that year, and is available without charge by visiting investor.columbiathreadneedleus.com, or searching the website of the SEC at sec.gov.
Quarterly schedule of investments
The Fund files a complete schedule of portfolio holdings with the SEC for the first and third quarters of each fiscal year on Form N-Q. The Fund’s Form N-Q is available on the SEC’s website at sec.gov and may be reviewed and copied at the SEC’s Public Reference Room in Washington, D.C. Information on the operation of the Public Reference Room may be obtained by calling 800.SEC.0330. The Fund’s complete schedule of portfolio holdings, as filed on Form N-Q, can also be obtained without charge, upon request, by calling 800.345.6611.
Additional Fund information
For more information about the Fund, please visit investor.columbiathreadneedleus.com or call 800.345.6611. Customer Service Representatives are available to answer your questions Monday through Friday from 8 a.m. to 7 p.m. Eastern time.
Fund investment manager
Columbia Wanger Asset Management, LLC
227 West Monroe, Suite 3000
Chicago, IL 60606
888.4.WANGER
(888.492.6437)
Fund distributor
Columbia Management Investment Distributors, Inc.
225 Franklin Street
Boston, MA 02110
Fund transfer agent
Columbia Management Investment Services Corp.
P.O. Box 8081
Boston, MA 02266-8081
Columbia Acorn Family of Funds | Annual Report 2016
| 147 |
Columbia Acorn Family of Funds
P.O. Box 8081
Boston, MA 02266-8081
Please read and consider the investment objectives, risks, charges and expenses for any fund carefully before investing. For a prospectus and summary prospectus, which contains this and other important information about the Fund, go to investor.columbiathreadneedleus.com. Columbia Acorn Family of Funds are distributed by Columbia Management Investment Distributors, Inc., member FINRA and managed by Columbia Wanger Asset Management, LLC.
Columbia Threadneedle Investments (Columbia Threadneedle) is the global brand name of the Columbia and Threadneedle group of companies. All rights reserved. Columbia Management Investment Distributors, Inc., 225 Franklin Street, Boston, MA 02110-2804
© 2017 Columbia Management Investment Advisers, LLC.
investor.columbiathreadneedleus.com
Item 2. Code of Ethics.
| | (a) | The registrant has adopted a code of ethics that applies to the registrant’s principal executive officer, principal financial officer, principal accounting officer or controller, or persons performing similar functions, regardless of whether these individuals are employed by the registrant or a third party. |
| | (b) | During the period covered by this report, there were not any amendments to a provision of the code of ethics adopted in 2(a) above. |
| | (c) | During the period covered by this report, there were no waivers, including any implicit waivers, from a provision of the code of ethics described in 2(a) above that relates to one or more of the items set forth in paragraph (b) of this item’s instructions. |
Item 3. Audit Committee Financial Expert.
The registrant’s Board of Trustees has determined that Thomas Goldstein, a member of the registrant’s Board of Trustees and Audit Committee, qualifies as an audit committee financial expert. Mr. Goldstein is an independent trustee, as defined in paragraph (a)(2) of this item’s instructions.
Item 4. Principal Accountant Fees and Services.
(a) Audit Fees. Aggregate Audit Fees billed by the principal accountant for professional services rendered during the fiscal years ended December 31, 2016 and December 31, 2015 are approximately as follows:
| | |
2016 | | 2015 |
$295,800 | | $287,200 |
Audit Fees include amounts related to the audit of the registrant’s annual financial statements or services that are normally provided by the accountant in connection with statutory and regulatory filings or engagements for those fiscal years.
(b) Audit-Related Fees. Aggregate Audit-Related Fees billed to the registrant by the principal accountant for professional services rendered during the fiscal years ended December 31, 2016 and December 31, 2015 are approximately as follows:
Audit-Related Fees include amounts for assurance and related services by the principal accountant that are reasonably related to the performance of the audit of the registrant’s financial statements and are not reported in Audit Fees above. In fiscal years 2016 and 2015, Audit-Related Fees consist of agreed-upon procedures performed for other audit-related additional testing.
During the fiscal years ended December 31, 2016 and December 31, 2015, there were no Audit-Related Fees billed by the registrant’s principal accountant to the registrant’s investment adviser (not including any sub-adviser whose role is primarily portfolio management and is subcontracted with or overseen by another investment adviser) and any entity controlling, controlled by, or under common control with the adviser that provides ongoing services to the registrant for an engagement that related directly to the operations and financial reporting of the registrant.
(c) Tax Fees. Aggregate Tax Fees billed by the principal accountant to the registrant for professional services rendered during the fiscal years ended December 31, 2016 and December 31, 2015 are approximately as follows:
Tax Fees incurred in both fiscal years 2016 and 2015 relate to the review of annual tax returns, the review of required shareholder distribution calculations and include amounts for professional services by the principal accountant for tax compliance, tax advice and tax planning.
During the fiscal years ended December 31, 2016 and December 31, 2015, there were no Tax Fees billed by the registrant’s principal accountant to the registrant’s investment adviser (not including any sub-adviser whose role is primarily portfolio management and is subcontracted with or overseen by another investment adviser) and any entity controlling, controlled by, or under common control with the adviser that provides ongoing services to the registrant for an engagement that related directly to the operations and financial reporting of the registrant.
(d) All Other Fees. Aggregate All Other Fees billed by the principal accountant to the registrant for professional services rendered during the fiscal years ended December 31, 2016 and December 31, 2015 are as follows:
All Other Fees include amounts for products and services provided by the principal accountant, other than the services reported in paragraphs (a) through (c) above.
Aggregate All Other Fees billed by the registrant’s principal accountant to the registrant’s investment adviser (not including any sub-adviser whose role is primarily portfolio management and is subcontracted with or overseen by another investment adviser) and any entity controlling, controlled by, or under common control with the adviser that provides ongoing services to the registrant for an engagement that related directly to the operations and financial reporting of the registrant during the fiscal years ended December 31, 2016 and December 31, 2015 are approximately as follows:
| | |
2016 | | 2015 |
$225,000 | | $225,000 |
In both fiscal years 2016 and 2015, All Other Fees primarily consist of professional services rendered for internal control reviews.
(e)(1) Audit Committee Pre-Approval Policies and Procedures
The policy of the registrant’s Audit Committee is to specifically pre-approve (i) all audit and non-audit (including audit related, tax and all other) services provided by the registrant’s independent auditor to the registrant and individual funds (collectively “Fund Services”) and (ii) all non-audit services provided by the registrant’s independent auditor to the funds’ adviser or a control affiliate of the adviser, that relate directly to the funds’ operations and financial reporting (collectively “Fund-related Adviser Services”). A “control affiliate” is an entity controlling, controlled by, or under common control with the adviser that provides ongoing services to the funds, and the term “adviser” is deemed to exclude any unaffiliated sub-adviser whose role is primarily portfolio management and is sub-contracted or overseen by another investment adviser.
If such Fund Services or Fund-related Adviser Services are required during the period between the Audit Committee’s regularly scheduled meetings, the Chairman of the Audit Committee has the authority to pre-approve the service, with reporting to the full Audit Committee at the next regularly scheduled meeting.
The Audit Committee will waive pre-approval of Fund Services or Fund-related Adviser Services provided that the requirements under paragraph (c)(7)(i)(C) of Rule 2-01 of Regulation S-X are met.
(e)(2) The percentage of services described in paragraphs (b) through (d) of this Item approved pursuant to the “de minimis” exception under paragraph (c)(7)(i)(C) of Rule 2-01 of Regulation S-X during both fiscal years ended December 31, 2016 and December 31, 2015 was zero.
(g) The aggregate non-audit fees billed by the registrant’s accountant for services rendered to the registrant, and rendered to the registrant’s investment adviser (not including any sub-adviser whose role is primarily portfolio management and is subcontracted with or overseen by another investment adviser), and any entity controlling, controlled by, or under common control with the adviser that provides ongoing services to the registrant for the fiscal years ended December 31, 2016 and December 31, 2015 are approximately as follows:
| | |
2016 | | 2015 |
$320,800 | | $343,300 |
(h) The registrant’s Audit Committee of the Board of Directors has considered whether the provision of non-audit services that were rendered to the registrant’s adviser (not including any sub-adviser whose role is primarily portfolio management and is subcontracted with or overseen by another investment adviser), and any entity controlling, controlled by, or under common control with the investment adviser that provides ongoing services to the registrant that were not pre-approved pursuant to paragraph (c)(7)(ii) of Rule 2-01 of Regulation S-X, is compatible with maintaining the principal accountant’s independence.
Item 5. Audit Committee of Listed Registrants.
Not applicable.
Item 6. Investments
| | (a) | The registrant’s “Schedule I – Investments in securities of unaffiliated issuers” (as set forth in 17 CFR 210.12-12) is included in Item 1 of this Form N-CSR. |
Item 7. Disclosure of Proxy Voting Policies and Procedures for Closed-End Management Investment Companies.
Not applicable.
Item 8. Portfolio Managers of Closed-End Management Investment Companies.
Not applicable.
Item 9. Purchases of Equity Securities by Closed-End Management Investment Company and Affiliated Purchasers.
Not applicable.
Item 10. Submission of Matters to a Vote of Security Holders.
There were no material changes to the procedures by which shareholders may recommend nominees to the registrant’s board of directors.
Item 11. Controls and Procedures.
| | (a) | The registrant’s principal executive officer and principal financial officer, based on their evaluation of the registrant’s disclosure controls and procedures as of a date within 90 days of the filing of this report, have concluded that such controls and procedures are adequately designed to ensure that material information required to be disclosed by the registrant in Form N-CSR is accumulated and communicated to the registrant’s management, including the principal executive officer and principal financial officer, or persons performing similar functions, as appropriate to allow timely decisions regarding required disclosure. |
| | (b) | There was no change in the registrant’s internal control over financial reporting that occurred during the registrant’s second fiscal quarter of the period covered by this report that has materially affected, or is reasonably likely to materially affect, the registrant’s internal control over financial reporting. |
Item 12. Exhibits.
(a)(1) Code of ethics required to be disclosed under Item 2 of Form N-CSR attached hereto as Exhibit 99.CODE ETH.
(a)(2) Certifications pursuant to Rule 30a-2(a) under the Investment Company Act of 1940 (17 CFR 270.30a-2(a)) attached hereto as Exhibit 99.CERT.
(a)(3) Not applicable.
(b) Certification pursuant to Rule 30a-2(b) under the Investment Company Act of 1940 (17 CFR 270.30a-2(b)) attached hereto as Exhibit 99.906CERT.
SIGNATURES
Pursuant to the requirements of the Securities Exchange Act of 1934 and the Investment Company Act of 1940, the registrant has duly caused this report to be signed on its behalf by the undersigned, thereunto duly authorized.
| | | | |
| (registrant) | | Columbia Acorn Trust | | |
| | |
| |
| By (Signature and Title) | | /s/ P. Zachary Egan |
| | P. Zachary Egan, President and Principal Executive Officer |
Pursuant to the requirements of the Securities Exchange Act of 1934 and the Investment Company Act of 1940, this report has been signed below by the following persons on behalf of the registrant and in the capacities and on the dates indicated.
| | |
| |
| By (Signature and Title) | | /s/ P. Zachary Egan |
| | P. Zachary Egan, President and Principal Executive Officer |
| | |
| |
| By (Signature and Title) | | /s/ John M. Kunka |
| | John M. Kunka, Treasurer and Principal Accounting and Financial Officer |