UNITED STATES
SECURITIES AND EXCHANGE COMMISSION
Washington, D.C. 20549
FORMN-CSR
CERTIFIED SHAREHOLDER REPORT OF REGISTERED
MANAGEMENT INVESTMENT COMPANIES
Investment Company Act file number811-01829
Columbia Acorn Trust
(Exact name of registrant as specified in charter)
227 W. Monroe Street
Suite 3000
Chicago, IL 60606
(Address of principal executive offices) (Zip code)
Ryan C. Larrenaga
c/o Columbia Management
Investment Advisers, LLC
225 Franklin Street
Boston, MA 02110
Alan Berkshire
Columbia Acorn Trust
227 West Monroe Street, Suite 3000
Chicago, Illinois 60606
Mary C. Moynihan
Perkins Coie LLP
700 13th Street, NW
Suite 600
Washington, DC 20005
(Name and address of agent for service)
Registrant’s telephone number, including area code: (312)634-9200
Date of fiscal year end: December 31
Date of reporting period: December 31, 2018
FormN-CSR is to be used by management investment companies to file reports with the Commission not later than 10 days after the transmission to stockholders of any report that is required to be transmitted to stockholders under Rule30e-1 under the Investment Company Act of 1940 (17 CFR270.30e-1). The Commission may use the information provided on FormN-CSR in its regulatory, disclosure review, inspection, and policymaking roles.
A registrant is required to disclose the information specified by FormN-CSR, and the Commission will make this information public. A registrant is not required to respond to the collection of information contained in FormN-CSR unless the Form displays a currently valid Office of Management and Budget (“OMB”) control number. Please direct comments concerning the accuracy of the information collection burden estimate and any suggestions for reducing the burden to Secretary, Securities and Exchange Commission, 100 F Street, NE, Washington, DC 20549. The OMB has reviewed this collection of information under the clearance requirements of 44 U.S.C. § 3507.
Item 1. Reports to Stockholders.

Annual Report
December 31, 2018
Columbia Acorn® Fund
Columbia Acorn International®
Columbia Acorn USA®
Columbia Acorn International SelectSM
Columbia Acorn SelectSM
Columbia Thermostat FundSM
Columbia Acorn Emerging Markets FundSM
Columbia Acorn European FundSM
Beginning on January 1, 2021, as permitted by regulations adopted by the Securities and Exchange Commission, paper copies of the Funds’ shareholder reports will no longer be sent by mail, unless you specifically request paper copies of the reports from the Fund or from your financial intermediary, such as a broker-dealer or bank. Instead, the reports will be made available on a website, and you will be notified by mail each time a report is posted to that website and provided with a website link to access the report.
If you already elected to receive shareholder reports electronically, you will not be affected by this change and you need not take any action. You may elect to receive shareholder reports and other communications from the Fund electronically for Fund shares held directly with the Fund by calling 800.345.6611 or by electing to enroll in eDelivery by logging into your account at columbiathreadneedleus.com/investor/ or, if your Fund shares are held through a financial intermediary, by contacting that intermediary directly.
You may elect to receive all future reports in paper free of charge. You can inform the Funds (if you hold Fund shares directly with the Funds) or your financial intermediary (if you hold Fund shares through a financial intermediary) that you wish to continue receiving paper copies of your shareholder reports in the same manner as described in the above paragraph. Your election to receive reports in paper will apply to all Columbia Funds, including the Columbia Acorn Funds, where held (i.e., if held directly with the Columbia Funds Complex, then your election will apply to all Columbia Funds held there, or, if your Fund shares are held through a financial intermediary, then your election will apply to all Funds held there).
Not FDIC Insured • No bank guarantee • May lose value
| 3 |
| 5 |
| 7 |
| 10 |
| 12 |
| 14 |
| 16 |
| 19 |
| 21 |
| 23 |
| 25 |
| 27 |
| 29 |
| 32 |
| 34 |
| 37 |
| 39 |
| 41 |
| 44 |
| 83 |
| 87 |
| 91 |
| 100 |
| 132 |
| 151 |
| 152 |
| 153 |
| 156 |
| 157 |
Columbia Acorn Family of Funds | Annual Report 2018
Fund at a glance
Columbia Acorn® Fund
Investment objective
Columbia Acorn® Fund (the Fund) seeks long-term capital appreciation.
Portfolio management
Matthew A. Litfin, CFA
Lead Portfolio Manager since 2016
Service with Fund since 2015
Morningstar style boxTM
The Morningstar Style Box is based on a fund’s portfolio holdings. For equity funds, the vertical axis shows the market capitalization of the stocks owned, and the horizontal axis shows investment style (value, blend, or growth). Information shown is based on the most recent data provided by Morningstar.
© 2019 Morningstar, Inc. All rights reserved. The Morningstar information contained herein: (1) is proprietary to Morningstar and/or its content providers; (2) may not be copied or distributed; and (3) is not warranted to be accurate, complete or timely. Neither Morningstar nor its content providers are responsible for any damages or losses arising from any use of this information.
| Average annual total returns (%) (for the period ended December 31, 2018) |
| | | Inception | 1 Year | 5 Years | 10 Years | Life |
| Class A | Excluding sales charges | 10/16/00 | -5.22 | 5.15 | 12.62 | 13.55 |
| | Including sales charges | | -10.68 | 3.92 | 11.96 | 13.41 |
| Advisor Class | 11/08/12 | -5.00 | 5.38 | 12.90 | 13.90 |
| Class C | Excluding sales charges | 10/16/00 | -5.86 | 4.39 | 11.79 | 12.69 |
| | Including sales charges | | -6.58 | 4.39 | 11.79 | 12.69 |
| Institutional Class | 06/10/70 | -5.09 | 5.42 | 12.93 | 13.91 |
| Institutional 2 Class | 11/08/12 | -5.00 | 5.45 | 12.95 | 13.91 |
| Institutional 3 Class | 11/08/12 | -4.98 | 5.51 | 12.99 | 13.92 |
| Russell 2500 Growth Index | | -7.47 | 6.19 | 14.76 | - |
Performance numbers reflect all Fund expenses. Returns for Class A shares are shown with and without the maximum initial sales charge of 5.75%. Returns for Class C shares are shown with and without the maximum contingent deferred sales charge of 1.00% for the first year after purchase. The Fund’s other classes are not subject to sales charges, but may be subject to other fees and expenses, and have limited eligibility. Please see the Fund’s prospectus for details. Performance for different share classes will vary based on differences in sales charges and certain fees and expenses associated with each class.
As stated in the May 1, 2018 prospectus, the Fund’s annual operating expense ratio is 0.86% for Institutional Class shares and 1.11% for Class A shares.
All results shown assume reinvestment of distributions during the period. Returns do not reflect the deduction of taxes that a shareholder may pay on Fund distributions or on the redemption of Fund shares. Performance results may reflect the effect of any fee waivers or reimbursements of Fund expenses by the investment manager and/or any of its affiliates. Absent these fee waivers and/or expense reimbursement arrangements, performance results may have been lower.
The performance information shown represents past performance and is not a guarantee of future results. The investment return and principal value of your investment will fluctuate so that shares, when redeemed, may be worth more or less than their original cost. Current performance may be lower or higher than the performance data shown. You may obtain performance information current to the most recent month-end by contacting your financial intermediary, visiting columbiathreadneedleus.com/investor/ or calling 800.922.6769.
The returns shown for periods prior to the share class inception date (including returns for the Life of the Fund, if shown, which are since Fund inception) include the returns of the Fund’s oldest share class. These returns are adjusted to reflect any higher class-related operating expenses of the newer share classes, as applicable. Please visit columbiathreadneedleus.com/investor/investment-products/mutual-funds/appended-performance for more information.
The Russell 2500 Growth Index measures the performance of those Russell 2500 companies with higher price-to-book ratios and higher forecasted growth values.
Unlike mutual funds, indexes are not managed and do not incur fees or expenses. It is not possible to invest directly in an index.
Columbia Acorn Family of Funds | Annual Report 2018
| 3 |
Fund at a glance (continued)
Columbia Acorn® Fund
The Growth of a $10,000 Investment in Columbia Acorn® Fund Institutional Class Shares
December 31, 2008 through December 31, 2018
This chart shows the change in value of a hypothetical $10,000 investment in Institutional Class (formerly Class Z) shares of the Fund during the stated time period. Although the index is provided for use in assessing the Fund’s performance, the Fund’s holdings may differ significantly from those in an index. Performance numbers reflect all Fund expenses.
| Top ten holdings (%) (at December 31, 2018) | |
Old Dominion Freight Line, Inc.
Inter-regional and multi-regional motor carrier | 1.9 |
Pool Corp.
Swimming pool supplies, equipment and leisure products | 1.6 |
Toro Co. (The)
Turf equipment | 1.6 |
Jones Lang LaSalle, Inc.
Real estate and investment management services | 1.6 |
EPAM Systems, Inc.
Provides software development, outsourcing services, e-business, enterprise relationship management and content management solutions | 1.5 |
Texas Roadhouse, Inc.
Moderately priced, full service restaurant chain | 1.4 |
Masimo Corp.
Medical signal processing and sensor technology for non-invasive monitoring of physiological parameters | 1.4 |
Inter Parfums, Inc.
Fragrances and related products | 1.3 |
Chemed Corp.
Hospice and palliative care services | 1.3 |
Booz Allen Hamilton Holdings Corp.
Technology consulting services to the U.S. government in the defense, intelligence, and civil markets | 1.2 |
Percentages indicated are based upon total investments (excluding Money Market Funds, Derivatives and Securities Lending Collateral, if any).
For further detail about these holdings, please refer to the section entitled “Portfolio of Investments."
Fund holdings are as of the date given, are subject to change at any time, and are not recommendations to buy or sell any security.
| Portfolio breakdown (%) (at December 31, 2018) |
| Common Stocks | 98.5 |
| Money Market Funds | 1.1 |
| Securities Lending Collateral | 0.4 |
| Total | 100.0 |
Percentages indicated are based upon total investments and exclude investments in derivatives, if any. The Fund’s portfolio composition is subject to change.
| Equity sector breakdown (%) (at December 31, 2018) |
| Communication Services | 0.8 |
| Consumer Discretionary | 21.2 |
| Consumer Staples | 2.8 |
| Energy | 1.5 |
| Financials | 9.4 |
| Health Care | 20.1 |
| Industrials | 16.7 |
| Information Technology | 20.2 |
| Materials | 3.2 |
| Real Estate | 4.1 |
| Total | 100.0 |
Percentages indicated are based upon total equity investments and exclude investments in derivatives, if any. The Fund’s portfolio composition is subject to change.
| 4 | Columbia Acorn Family of Funds | Annual Report 2018 |
Manager Discussion of Fund Performance
Columbia Acorn® Fund
Matthew A. Litfin, CFA
Lead Portfolio Manager
Columbia Acorn® Fund Institutional Class shares returned -5.09% for the 12-month period ended December 31, 2018, outperforming the -7.47% return of its benchmark, the Russell 2500 Growth Index.
After performing well in the first nine months of the year, the U.S. equity market fell sharply in the fourth quarter. Through the end of September, stocks were boosted by favorable trends in both economic growth and corporate earnings. In the fourth quarter, however, the combination of weaker-than-expected economic data, uncertainty surrounding U.S. trade policy, and continued interest-rate hikes by the U.S. Federal Reserve stoked increasing pessimism regarding the outlook for 2019. The resulting decline in investors’ risk appetites sparked a sell-off that erased all of the earlier gains and caused total returns to fall into negative territory for the full year. Growth stocks — which had led the market on the way up — were hit hard in the downturn, as were small- and mid-sized companies. The Russell 2500 Growth Index fell 20.08% in the fourth quarter as a result.
Although the Fund experienced a loss for 2018, our emphasis on intensive fundamental research and disciplined valuation techniques helped cushion some of the market’s downside. Consistent with our bottom-up approach, stock selection was the primary driver of the Fund’s outperformance in 2018. We generated the strongest results in the health care sector, particularly in the pharmaceuticals, biotechnology & life sciences industry group. Six of the top ten individual contributors to performance in the 12-month period were health care stocks. Bioverativ, Inc., an orphan-drug company specializing in hemophilia treatments, was the top contributor in both the sector and the Fund as a whole. The stock surged in the first calendar quarter after receiving an $11.5 billion bid from the French pharmaceutical giant Sanofi, which represented a 65% premium to its market value at the time. Amedisys, Inc., a leading provider of home health, hospice and personal care services, also helped performance. Home health continues to gain traction as a cost-effective and high-quality option for medical care. The company’s patient-volume growth accelerated, fueling an improvement in its profit margins. The Fund’s investment in Amedisys reflected our belief that the company is well positioned to benefit from an aging population and several other long-term trends in the health care industry. Alteryx, Inc. Masimo Corp., and Haemonetics Corp. were additional contributors of note.
The consumer discretionary sector was another area of strength for the Fund, highlighted by a position in Dorman Products, Inc., which was a top contributor to relative returns. The company, a leading supplier of automotive replacement parts and hardware to the auto and heavy-vehicle aftermarkets, reported strong earnings behind the robust growth for its customers in the auto-parts retail space. The company also experienced less of an impact from tariffs than was initially feared, and its new chief executive officer was well received. Our stock selection in the industrials, materials and consumer staples sectors further contributed to the Fund’s outperformance.
On the negative side, stock selection in the information technology sector hindered Fund performance. IPG Photonics Corp., a world leader in industrial fiber laser technology used in materials processing, was among the Fund’s chief detractors from relative returns. The firm has a wide competitive moat (sustainable competitive advantages that make it difficult for rivals to wear down a company’s market share) and a strong multi-year growth outlook, but the company’s short-term results were affected by the softer environment for spending on capital goods in China during the summer. GreenSky, Inc. and Cognex Corp. also weighed on the Fund’s return in technology, but we made up for some of the shortfall through a position in Veeva Systems Inc., a health care cloud-computing company that reported better-than-expected earnings. The Fund also lagged somewhat in the financial sector, largely as a result of positions in asset managers Eaton Vance Corp. and Lazard Ltd. Both stocks underperformed due to their exposure to weakness in the broader financial markets.
Concerns about a possible recession and growth moving into negative territory appeared to mount late in 2018, but we believe growth is more likely to slow to a more sustainable level than it is to move into negative territory. We view this as a positive development because a more moderate economic expansion could act as a tailwind for small- to mid-sized growth stocks. We believe it’s reasonable to
Columbia Acorn Family of Funds | Annual Report 2018
| 5 |
Manager Discussion of Fund Performance (continued)
Columbia Acorn® Fund
anticipate slower earnings growth and continued market volatility in 2019, as trade policy between the United States and China — the world’s two largest economies — continue to be a source of uncertainty for the economy and markets. At the same time, we are also encouraged by the improvement in valuations that was brought about by the fourth-quarter sell-off. What’s more, we think that elevated volatility has the potential to create fertile conditions for individual stock selection. We believe our investment philosophy, which favors higher quality and structural growth (growth derived from structural shifts or changes in the economy) — as gauged by metrics such as return on invested capital, revenue and earnings growth and low levels of debt — is well suited for this environment.
Market risk may affect a single issuer, sector of the economy, industry or the market as a whole. Investments insmall- and mid-cap companies involve risks and volatility and possible illiquidity greater than investments in larger, more established companies.Foreign investments subject the Fund to political, economic, market, social and other risks within a particular country, as well as to potential currency instabilities and less stringent financial and accounting standards generally applicable to U.S. issuers. Risks are enhanced foremerging market issuers. The Fund may invest significantly in issuers within a particularsector, which may be negatively affected by market, economic or other conditions, making the Fund more vulnerable to unfavorable developments in the sector. See the Fund’s prospectus for more information on these and other risks.
The views expressed in this report reflect the current views of the respective parties. These views are not guarantees of future performance and involve certain risks, uncertainties and assumptions that are difficult to predict, so actual outcomes and results may differ significantly from the views expressed. These views are subject to change at any time based upon economic, market or other conditions and the respective parties disclaim any responsibility to update such views. These views may not be relied on as investment advice and, because investment decisions for a Columbia Acorn Fund are based on numerous factors, may not be relied on as an indication of trading intent on behalf of any particular Columbia Acorn Fund. References to specific securities should not be construed as a recommendation or investment advice.
| 6 | Columbia Acorn Family of Funds | Annual Report 2018 |
Fund at a glance
Columbia Acorn International®
Investment objective
Columbia Acorn International® (the Fund) seeks long-term capital appreciation.
Portfolio management
Louis J. Mendes, CFA
Co-Portfolio Manager since 2003
Service with Fund since 2001
Tae Han (Simon) Kim, CFA
Co-Portfolio Manager since 2017
Service with Fund since 2011
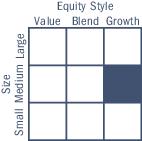
Morningstar style boxTM
The Morningstar Style Box is based on a fund’s portfolio holdings. For equity funds, the vertical axis shows the market capitalization of the stocks owned, and the horizontal axis shows investment style (value, blend, or growth). Information shown is based on the most recent data provided by Morningstar.
© 2019 Morningstar, Inc. All rights reserved. The Morningstar information contained herein: (1) is proprietary to Morningstar and/or its content providers; (2) may not be copied or distributed; and (3) is not warranted to be accurate, complete or timely. Neither Morningstar nor its content providers are responsible for any damages or losses arising from any use of this information.
| Average annual total returns (%) (for the period ended December 31, 2018) |
| | | Inception | 1 Year | 5 Years | 10 Years | Life |
| Class A | Excluding sales charges | 10/16/00 | -16.13 | 0.26 | 8.95 | 9.04 |
| | Including sales charges | | -20.96 | -0.92 | 8.31 | 8.80 |
| Advisor Class | 11/08/12 | -15.90 | 0.47 | 9.26 | 9.43 |
| Class C | Excluding sales charges | 10/16/00 | -16.76 | -0.49 | 8.13 | 8.23 |
| | Including sales charges | | -17.38 | -0.49 | 8.13 | 8.23 |
| Institutional Class | 09/23/92 | -15.93 | 0.52 | 9.28 | 9.44 |
| Institutional 2 Class | 08/02/11 | -15.85 | 0.57 | 9.31 | 9.44 |
| Institutional 3 Class | 11/08/12 | -15.82 | 0.62 | 9.35 | 9.46 |
| Class R | 08/02/11 | -16.32 | -0.06 | 8.62 | 8.76 |
| MSCI ACWI ex USA SMID Cap Index (Net) | | -17.06 | 1.75 | 8.84 | - |
| MSCI ACWI ex USA SMID Cap Growth Index (Net) | | -17.28 | 2.09 | 8.72 | - |
Performance numbers reflect all Fund expenses. Returns for Class A shares are shown with and without the maximum initial sales charge of 5.75%. Returns for Class C shares are shown with and without the maximum contingent deferred sales charge of 1.00% for the first year after purchase. The Fund’s other classes are not subject to sales charges, but may be subject to other fees and expenses, and have limited eligibility. Please see the Fund’s prospectus for details. Performance for different share classes will vary based on differences in sales charges and certain fees and expenses associated with each class.
As stated in the May 1, 2018 prospectus, the Fund’s annual operating expense ratio is 0.99% for Institutional Class shares and 1.24% for Class A shares.
All results shown assume reinvestment of distributions during the period. Returns do not reflect the deduction of taxes that a shareholder may pay on Fund distributions or on the redemption of Fund shares. Performance results may reflect the effect of any fee waivers or reimbursements of Fund expenses by the investment manager and/or any of its affiliates. Absent these fee waivers and/or expense reimbursement arrangements, performance results may have been lower.
The performance information shown represents past performance and is not a guarantee of future results. The investment return and principal value of your investment will fluctuate so that shares, when redeemed, may be worth more or less than their original cost. Current performance may be lower or higher than the performance data shown. You may obtain performance information current to the most recent month-end by contacting your financial intermediary, visiting columbiathreadneedleus.com/investor/ or calling 800.922.6769.
The returns shown for periods prior to the share class inception date (including returns for the Life of the Fund, if shown, which are since Fund inception) include the returns of the Fund’s oldest share class. These returns are adjusted to reflect any higher class-related operating expenses of the newer share classes, as applicable. Please visit columbiathreadneedleus.com/investor/investment-products/mutual-funds/appended-performance for more information.
The MSCI ACWI ex USA SMID Cap Index (Net) captures a mid- and small-cap representation across 22 of 23 developed market countries (excluding the U.S.) and 24 emerging market countries. The index covers approximately 28% of the free float-adjusted market capitalization in each country.
The MSCI ACWI ex USA SMID Cap Growth Index (Net) captures mid-and small cap representation across 22 developed markets countries and 24 emerging markets countries.
Unlike mutual funds, indexes are not managed and do not incur fees or expenses. It is not possible to invest directly in an index.
Columbia Acorn Family of Funds | Annual Report 2018
| 7 |
Fund at a glance (continued)
Columbia Acorn International®
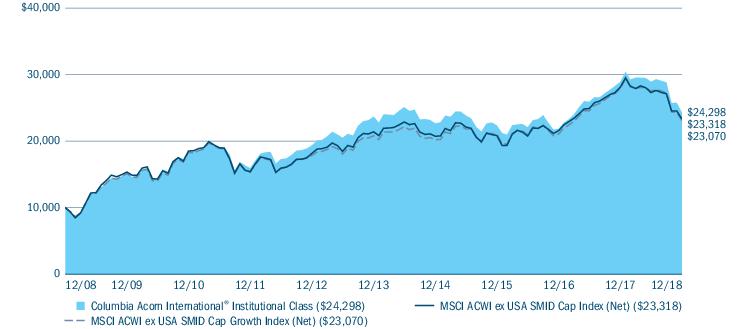
The Growth of a $10,000 Investment in Columbia Acorn International® Institutional Class Shares
December 31, 2008 through December 31, 2018
This chart shows the change in value of a hypothetical $10,000 investment in Institutional Class (formerly Class Z) shares of the Fund during the stated time period. Although the indexes are provided for use in assessing the Fund’s performance, the Fund’s holdings may differ significantly from those in an index. Performance numbers reflect all Fund expenses.
| Top ten holdings (%) (at December 31, 2018) | |
SimCorp AS (Denmark)
Global provider of highly specialised software for the investment management industry | 2.3 |
CCL Industries, Inc. (Canada)
Manufacturing services and specialty packaging products for the non-durable consumer products market | 2.3 |
Brembo SpA (Italy)
Braking systems and components | 2.2 |
Rentokil Initial PLC (United Kingdom)
Fully integrated facilities management and essential support services | 2.1 |
Unibet Group PLC (Malta)
Online gambling services | 2.1 |
Hexagon AB, Class B (Sweden)
Design, measurement and visualisation technologies | 2.1 |
Grupo Aeroportuario del Sureste SAB de CV, ADR (Mexico)
Operates airports in Mexico | 1.9 |
Hikari Tsushin, Inc. (Japan)
Distribution network, telecommunication, office automation equipment, in-house products and individual insurance plans | 1.8 |
Rational AG (Germany)
Food preparation appliances/processors and kitchen accessories | 1.8 |
Trelleborg AB, Class B (Sweden)
Manufactures and distributes industrial products | 1.7 |
Percentages indicated are based upon total investments (excluding Money Market Funds, Derivatives and Securities Lending Collateral, if any).
For further detail about these holdings, please refer to the section entitled “Portfolio of Investments."
Fund holdings are as of the date given, are subject to change at any time, and are not recommendations to buy or sell any security.
| 8 | Columbia Acorn Family of Funds | Annual Report 2018 |
Fund at a glance (continued)
Columbia Acorn International®
| Equity sector breakdown (%) (at December 31, 2018) |
| Communication Services | 5.9 |
| Consumer Discretionary | 14.8 |
| Consumer Staples | 7.4 |
| Energy | 1.0 |
| Financials | 9.9 |
| Health Care | 5.2 |
| Industrials | 25.2 |
| Information Technology | 16.7 |
| Materials | 10.5 |
| Real Estate | 3.4 |
| Total | 100.0 |
Percentages indicated are based upon total equity investments. The Fund’s portfolio composition is subject to change.
| Country breakdown (%) (at December 31, 2018) |
| Australia | 3.1 |
| Belgium | 0.3 |
| Brazil | 2.1 |
| Cambodia | 1.1 |
| Canada | 6.4 |
| China | 2.1 |
| Denmark | 3.6 |
| France | 0.5 |
| Germany | 8.2 |
| Hong Kong | 1.1 |
| India | 2.4 |
| Indonesia | 0.5 |
| Ireland | 1.0 |
| Italy | 3.9 |
| Japan | 20.7 |
| Malta | 2.1 |
| Mexico | 1.9 |
| Netherlands | 1.5 |
| Norway | 0.4 |
| Philippines | 0.5 |
| Poland | 0.4 |
| Russian Federation | 0.9 |
| Singapore | 1.3 |
| South Africa | 1.4 |
| South Korea | 4.0 |
| Spain | 1.3 |
| Sweden | 4.4 |
| Switzerland | 2.5 |
| Taiwan | 3.0 |
| Thailand | 0.4 |
| United Kingdom | 14.5 |
| United States(a) | 2.5 |
| Total | 100.0 |
| (a) | Includes investments in Money Market Funds. |
Country breakdown is based primarily on issuer’s place of organization/incorporation. Percentages indicated are based upon total investments and exclude investments in derivatives, if any. The Fund’s portfolio composition is subject to change.
Columbia Acorn Family of Funds | Annual Report 2018
| 9 |
Manager Discussion of Fund Performance
Columbia Acorn International®
Louis J. Mendes, CFA
Co-Portfolio Manager
Tae Han (Simon) Kim, CFA
Co-Portfolio Manager
Columbia Acorn International® Institutional Class shares returned -15.93% for the 12-month period ended December 31, 2018, outperforming the Fund’s primary benchmark, the MSCI ACWI ex USA SMID Cap Index (Net), which returned -17.06% for the same time period. The Fund’s secondary benchmark, the MSCI ACWI ex USA SMID Cap Growth Index (Net) returned -17.28% for the same 12-month period.
Small- and mid-cap international stocks faced meaningful challenges in 2018, leading to poor absolute returns and underperformance relative to both the U.S. market and large-cap global equities. The divergences in economic and market performance were a departure from the synchronized global growth that helped support equities in 2017. After rising in January of 2018, the global manufacturing Purchasing Managers Index — a proxy for gross domestic product growth — declined in each month thereafter. This represented the most successive monthly declines since 2008. The slowdown in growth was accompanied by tighter monetary policy from the U.S. Federal Reserve and other major central banks, which further weighed on sentiment. The markets also had to contend with negative headlines regarding issues such as U.S. trade policy, the ongoing Brexit negotiations, Italy’s rising government debt, and economic instability in Turkey and Argentina. Taken together, these developments led to a sharp drop for stocks in general, and for smaller companies in particular. The weakness in foreign currencies relative to the U.S. dollar was an additional factor weighing on the performance of international equities for U.S.-based investors.
Consistent with the broader market environment, the Fund posted a sizable loss for 2018. Nevertheless, we were able to cushion some of the impact of falling stock prices through favorable security selection. Our stock selections outperformed the corresponding benchmark components in the information technology, materials and financials sectors. However, we gave back some ground from weaker stock selection in the consumer discretionary and health care sectors.
Among individual stocks, FamilyMart UNY Holdings Co. Ltd., Japan’s second largest convenience store operator, was the leading contributor to Fund performance. The company benefited from its exposure to Japan’s improving domestic economy and its announcement of plans to restructure its business, helping the stock post a robust gain for the year. Holdings in several other Japanese companies appeared among the Fund’s top contributors for 2018, including Nissan Chemical Corporation (Japanese chemical manufacturer), MonotaRO Co., Ltd. (Japanese e-Commerce company of industrial supply products), and CyberAgent, Inc. (Japanese internet media services company). Wirecard AG, a German company that provides outsourcing solutions for electronic payment transactions, was the top performer in the information technology sector. The company’s end markets continued to grow in conjunction with the expansion of e-commerce. In addition, we believe Wirecard demonstrated strong organic growth and an encouraging sales pipeline.
Kindred Group PLC was the largest detractor in both the consumer discretionary sector and the Fund as a whole. The Sweden-based company, which operates a number of online gambling brands across Europe, saw its shares decline due to rising competition and higher-than-expected marketing costs. Brembo SpA (Italian auto-parts supplier) and PT Matahari Department Store Tbk (Indonesia) were additional detractors in the consumer discretionary sector. A Japanese technology company, Disco Corp., was another detractor of note. After having performed very well in recent years, the stock lost ground in response to the broader semiconductor industry in the second half of 2018. Stock selection in Latin America was an additional detractor, largely as a result of an investment in the Brazilian healthcare benefits administrator Qualicorp Consultoria e Corretora de Seguros SA.
Our investment approach focuses on adding value through security selection instead of making significant region or sector bets. Nevertheless, allocation can have an effect on performance. This proved to be the case in the past year, when an underweight in real estate and a lack of exposure to utilities hurt results. Both are defensive market segments that held up well amid the “flight to safety” sparked by the fourth-quarter market downturn, but the Fund was below-benchmark positions in each
| 10 | Columbia Acorn Family of Funds | Annual Report 2018 |
Manager Discussion of Fund Performance (continued)
Columbia Acorn International®
due to its growth orientation. The Fund’s overweight in information technology was a further performance detractor. In combination, these aspects of the Fund’s positioning reduced some of the benefit from selection.
Our investment process, while cognizant of macroeconomic trends, uses a bottom-up methodology that relies on intensive fundamental research and disciplined valuation techniques. Overall, we believe international markets provide an abundance of fast-growing small- and mid-sized companies whose positive attributes have not yet been reflected in their valuations.
We continued to see a number of important risks at the close of the period, including headlines related to Brexit and U.S.-China trade talks, as well as high corporate debt levels and slowing global growth. Despite these potential headwinds, bank oversight has been enhanced, and a majority of countries have stronger current account balances, higher foreign exchange reserves and lower external debt balances. we believe that relatively higher volatility can create attractive opportunities for individual stock selection. We believe our investment philosophy, which favors higher quality and structural growth (growth derived from structural shifts or changes in the economy) — as measured by metrics such as return on invested capital, revenue and earnings growth and superior debt ratios — can be particularly advantageous in this environment.
Marketrisk may affect a single issuer, sector of the economy, industry or the market as a whole.Internationalinvesting involves certain risks and volatility due to potential political, economic or currency instabilities and different, potentially less stringent, financial and accounting standards than those generally applicable to U.S. issuers. Risks are enhanced foremerging market issuers. Investments in small- and mid-cap companies involve risks and volatility and possible illiquidity greater than investments in larger, more established companies. The Fund may invest significantly in issuers within a particular sector, which may be negatively affected by market, economic or other conditions, making the Fund more vulnerable to unfavorable developments in the sector. See the Fund’s prospectus for more information on these and other risks.
The views expressed in this report reflect the current views of the respective parties. These views are not guarantees of future performance and involve certain risks, uncertainties and assumptions that are difficult to predict, so actual outcomes and results may differ significantly from the views expressed. These views are subject to change at any time based upon economic, market or other conditions and the respective parties disclaim any responsibility to update such views. These views may not be relied on as investment advice and, because investment decisions for a Columbia Acorn Fund are based on numerous factors, may not be relied on as an indication of trading intent on behalf of any particular Columbia Acorn Fund. References to specific securities should not be construed as a recommendation or investment advice.
Columbia Acorn Family of Funds | Annual Report 2018
| 11 |
Fund at a glance
Columbia Acorn USA®
Investment objective
Columbia Acorn USA® (the Fund) seeks long-term capital appreciation.
Portfolio management
Matthew A. Litfin, CFA
Lead Portfolio Manager since 2016
Service with Fund since 2015
Richard Watson, CFA
Co-Portfolio Manager since 2017
Service with Fund since 2006
Morningstar style boxTM
The Morningstar Style Box is based on a fund’s portfolio holdings. For equity funds, the vertical axis shows the market capitalization of the stocks owned, and the horizontal axis shows investment style (value, blend, or growth). Information shown is based on the most recent data provided by Morningstar.
© 2019 Morningstar, Inc. All rights reserved. The Morningstar information contained herein: (1) is proprietary to Morningstar and/or its content providers; (2) may not be copied or distributed; and (3) is not warranted to be accurate, complete or timely. Neither Morningstar nor its content providers are responsible for any damages or losses arising from any use of this information.
| Average annual total returns (%) (for the period ended December 31, 2018) |
| | | Inception | 1 Year | 5 Years | 10 Years | Life |
| Class A | Excluding sales charges | 10/16/00 | -2.15 | 5.97 | 13.17 | 9.75 |
| | Including sales charges | | -7.77 | 4.72 | 12.50 | 9.46 |
| Advisor Class | 11/08/12 | -1.91 | 6.22 | 13.47 | 10.10 |
| Class C | Excluding sales charges | 10/16/00 | -2.92 | 5.22 | 12.35 | 8.95 |
| | Including sales charges | | -3.61 | 5.22 | 12.35 | 8.95 |
| Institutional Class | 09/04/96 | -1.98 | 6.22 | 13.46 | 10.10 |
| Institutional 2 Class | 11/08/12 | -1.89 | 6.32 | 13.52 | 10.12 |
| Institutional 3 Class | 11/08/12 | -1.86 | 6.37 | 13.56 | 10.14 |
| Russell 2000 Growth Index | | -9.31 | 5.13 | 13.52 | - |
Performance numbers reflect all Fund expenses. Returns for Class A shares are shown with and without the maximum initial sales charge of 5.75%. Returns for Class C shares are shown with and without the maximum contingent deferred sales charge of 1.00% for the first year after purchase. The Fund’s other classes are not subject to sales charges, but may be subject to other fees and expenses, and have limited eligibility. Please see the Fund’s prospectus for details. Performance for different share classes will vary based on differences in sales charges and certain fees and expenses associated with each class.
As stated in the May 1, 2018 prospectus, the Fund’s annual operating expense ratio is 1.17% for Institutional Class shares and 1.42% for Class A shares.
All results shown assume reinvestment of distributions during the period. Returns do not reflect the deduction of taxes that a shareholder may pay on Fund distributions or on the redemption of Fund shares. Performance results may reflect the effect of any fee waivers or reimbursements of Fund expenses by the investment manager and/or any of its affiliates. Absent these fee waivers and/or expense reimbursement arrangements, performance results may have been lower.
The performance information shown represents past performance and is not a guarantee of future results. The investment return and principal value of your investment will fluctuate so that shares, when redeemed, may be worth more or less than their original cost. Current performance may be lower or higher than the performance data shown. You may obtain performance information current to the most recent month-end by contacting your financial intermediary, visiting columbiathreadneedleus.com/investor/ or calling 800.922.6769.
The returns shown for periods prior to the share class inception date (including returns for the Life of the Fund, if shown, which are since Fund inception) include the returns of the Fund’s oldest share class. These returns are adjusted to reflect any higher class-related operating expenses of the newer share classes, as applicable. Please visit columbiathreadneedleus.com/investor/investment-products/mutual-funds/appended-performance for more information.
The Russell 2000 Growth Index, an unmanaged index, measures the performance of those Russell 2000 Index companies with higher price-to-book ratios and higher forecasted growth values.
Unlike mutual funds, indexes are not managed and do not incur fees or expenses. It is not possible to invest directly in an index.
| 12 | Columbia Acorn Family of Funds | Annual Report 2018 |
Fund at a glance (continued)
Columbia Acorn USA®
The Growth of a $10,000 Investment in Columbia Acorn USA® Institutional Class Shares
December 31, 2008 through December 31, 2018
This chart shows the change in value of a hypothetical $10,000 investment in Institutional Class (formerly Class Z) shares of the Fund during the stated time period. Although the index is provided for use in assessing the Fund’s performance, the Fund’s holdings may differ significantly from those in an index. Performance numbers reflect all Fund expenses.
| Top ten holdings (%) (at December 31, 2018) | |
Unifirst Corp.
Workplace uniforms and protective clothing | 1.9 |
CyberArk Software Ltd.
IT security solutions | 1.8 |
Houlihan Lokey, Inc.
Investment bank | 1.7 |
Inter Parfums, Inc.
Fragrances and related products | 1.7 |
Chemed Corp.
Hospice and palliative care services | 1.7 |
Cedar Fair LP
Owns and operates amusement parks | 1.6 |
Dave & Buster’s Entertainment, Inc.
Venues that combine dining and entertainment for adults and families | 1.6 |
Central Garden & Pet Co.
Lawn, garden & pet supply products | 1.5 |
Dorman Products, Inc.
Automotive products and home hardware | 1.5 |
Alteryx, Inc., Class A
Data storage, retrieval, management, reporting, and analytics solutions | 1.5 |
Percentages indicated are based upon total investments (excluding Money Market Funds, Derivatives and Securities Lending Collateral, if any).
For further detail about these holdings, please refer to the section entitled “Portfolio of Investments."
Fund holdings are as of the date given, are subject to change at any time, and are not recommendations to buy or sell any security.
| Portfolio breakdown (%) (at December 31, 2018) |
| Common Stocks | 94.7 |
| Limited Partnerships | 1.5 |
| Money Market Funds | 2.3 |
| Securities Lending Collateral | 1.5 |
| Total | 100.0 |
Percentages indicated are based upon total investments and exclude investments in derivatives, if any. The Fund’s portfolio composition is subject to change.
| Equity sector breakdown (%) (at December 31, 2018) |
| Communication Services | 0.8 |
| Consumer Discretionary | 19.7 |
| Consumer Staples | 6.3 |
| Energy | 1.1 |
| Financials | 13.3 |
| Health Care | 20.1 |
| Industrials | 11.2 |
| Information Technology | 21.0 |
| Materials | 2.6 |
| Real Estate | 3.9 |
| Total | 100.0 |
Percentages indicated are based upon total equity investments. The Fund’s portfolio composition is subject to change.
Columbia Acorn Family of Funds | Annual Report 2018
| 13 |
Manager Discussion of Fund Performance
Columbia Acorn USA®
Matthew A. Litfin, CFA
Lead Portfolio Manager
Richard Watson, CFA
Co-Portfolio Manager
Columbia Acorn USA® Institutional Class shares returned -1.98% for the 12-month period ended December 31, 2018. In a very difficult year for stocks, the Fund held up better than its benchmark, the Russell 2000 Growth Index, which returned -9.31% for the year. Stock selection generally accounted for the Fund’s relative performance advantage over the benchmark in this down year, with especially good results from health care and information technology holdings.
Investors kicked off 2018 with soaring optimism, buoyed by positive global economic conditions, fiscal stimulus in the form of broad corporate tax cuts and moves to reduce regulation in a number of industries. The pace of economic growth in the United States averaged more than 3.0% as the labor markets added an average of 220,000 jobs per month, wages increased on the order of 3.0% and manufacturing activity remained solid. Unemployment rose modestly in December 2018, but even that figure was positive for the economy, as it reflected an increase in the number of Americans seeking employment.
In contrast to the acceleration in the U.S. economy, the global economy lost momentum and showed mixed performance among regions during the year. In December 2018, global manufacturing slowed to the lowest level in eleven months impacted by escalating threats of a trade war between the United States and its largest trading partners as well as a maturing economic cycle. The U.S. Dollar Index (a widely-used benchmark for the international value of the U.S. dollar) gained 4.9% in the second quarter, also weighing on overseas markets. While the global economy remained on solid footing, the divergences in economic and market performance were a departure from the synchronized global growth that helped support equities in 2017.
In December 2018, the U.S. Federal Reserve (Fed) rattled investors when it raised the target on its key short-term interest rate, the federal funds rate, to a range from 2.25% to 2.50%. It was the fourth increase for the year and the ninth increase since the Fed began raising rates from close to 0.00% three years ago. As uncertainties rose, investors backed away from riskier assets. Technology stocks, which had been global market leaders, stumbled in the third quarter and triggered a broader market sell-off of stocks and high-yield bonds in the fourth quarter. By year end, both U.S. and overseas equities had given back earlier gains and ended in negative territory.
Also late in 2018, the Fed announced that it anticipated two instead of three 2019 rate increases, and would continue to monitor global economic and financial developments and to assess their implications for the economic outlook.
The Fund’s relative performance advantage over its benchmark in this down year was generally the result of stock selection. Alteryx, Inc., Amedisys and Reata Pharaceuticals, Inc. were the top contributors to Fund results. Investors responded favorably to computer software company Alteryx, Inc. after a slew of earnings and revenue announcements that exceeded expectations. Amedisys, a major provider of home health care and hospice services, enjoyed substantial earnings growth in 2018. Shares of Reata Pharmaceuticals, Inc., which focuses on oral antioxidative and anti-inflammatory drugs, rose in value after the company reported encouraging mid-stage trial results for a drug for rare forms of chronic kidney disease.
Stock selection in the consumer discretionary sector partially offset some of these good results. Within the consumer discretionary sector Cooper Standard Holdings, Inc. and LCI Industries were top detractors. Cooper Standard Holdings, Inc., a global supplier of systems and components to the auto industry, slumped after the company fell short of third quarter earnings estimates. Slowing revenue growth, declining margins and falling RV shipments weighed on LCI Industries, which supplies engineered components to manufacturers in the recreational and industrial products market. OptiNose, Inc., a specialty pharmaceutical company focused on creating and bringing to market innovative products for patients with diseases treated by ear, nose, throat and allergy physicians, was another
| 14 | Columbia Acorn Family of Funds | Annual Report 2018 |
Manager Discussion of Fund Performance (continued)
Columbia Acorn USA®
major detractor. OptiNose, Inc. shares dropped sharply despite reasonably good news on revenues. Metrics showed a downtrend in market penetration by the company’s Xhance nasal spray, and the company lowered earnings guidance for the year.
We noted the significant divergences between the global and U.S. economies and equity markets. Historically, the United States has been able to maintain business cycles that occur independent of the rest of the world. However, there is also precedent for international events triggering U.S. stock market reactions. Thus, weakness abroad can create vulnerabilities for domestic equities. A weaker U.S. dollar could help stabilize key markets.
We believe that the stock market’s recent record of relatively high volatility and number of economic and market divergences have the potential to create good opportunities for stock pickers. As a result, we are confident that our investment philosophy, which favors higher quality and structural growth (growth derived from structural shifts or changes in the economy), as measured across metrics such as return on invested capital, revenue and earnings growth, and superior debt ratios, has the potential to be particularly advantageous in the environment that prevailed at the end of the year.
Marketrisk may affect a single issuer, sector of the economy, industry or the market as a whole. Investments insmall- and mid-cap companies involve risks and volatility greater than investments in larger, more established companies. The Fund may invest significantly in issuers within a particularsector, which may be negatively affected by market, economic or other conditions, making the fund more vulnerable to unfavorable developments in the sector. See the Fund’s prospectus for more information on these and other risks.
The views expressed in this report reflect the current views of the respective parties. These views are not guarantees of future performance and involve certain risks, uncertainties and assumptions that are difficult to predict, so actual outcomes and results may differ significantly from the views expressed. These views are subject to change at any time based upon economic, market or other conditions and the respective parties disclaim any responsibility to update such views. These views may not be relied on as investment advice and, because investment decisions for a Columbia Acorn Fund are based on numerous factors, may not be relied on as an indication of trading intent on behalf of any particular Columbia Acorn Fund. References to specific securities should not be construed as a recommendation or investment advice.
Columbia Acorn Family of Funds | Annual Report 2018
| 15 |
Fund at a glance
Columbia Acorn International SelectSM
Investment objective
Columbia Acorn International SelectSM (the Fund) seeks long-term capital appreciation.
Portfolio management
Stephen Kusmierczak, CFA
Portfolio Manager or Co-Portfolio Manager since 2016
Service with Fund since 2001
Morningstar style boxTM
The Morningstar Style Box is based on a fund’s portfolio holdings. For equity funds, the vertical axis shows the market capitalization of the stocks owned, and the horizontal axis shows investment style (value, blend, or growth). Information shown is based on the most recent data provided by Morningstar.
© 2019 Morningstar, Inc. All rights reserved. The Morningstar information contained herein: (1) is proprietary to Morningstar and/or its content providers; (2) may not be copied or distributed; and (3) is not warranted to be accurate, complete or timely. Neither Morningstar nor its content providers are responsible for any damages or losses arising from any use of this information.
| Average annual total returns (%) (for the period ended December 31, 2018) |
| | | Inception | 1 Year | 5 Years | 10 Years | Life |
| Class A | Excluding sales charges | 10/16/00 | -12.46 | 1.86 | 8.15 | 7.58 |
| | Including sales charges | | -17.49 | 0.66 | 7.51 | 7.27 |
| Advisor Class | 11/08/12 | -12.26 | 2.12 | 8.47 | 7.92 |
| Class C | Excluding sales charges | 10/16/00 | -13.11 | 1.09 | 7.32 | 6.77 |
| | Including sales charges | | -13.91 | 1.09 | 7.32 | 6.77 |
| Institutional Class | 11/23/98 | -12.28 | 2.13 | 8.49 | 7.92 |
| Institutional 2 Class | 11/08/12 | -12.16 | 2.20 | 8.52 | 7.94 |
| Institutional 3 Class | 11/08/12 | -12.14 | 2.25 | 8.55 | 7.96 |
| MSCI ACWI ex USA Index (Net) | | -14.20 | 0.68 | 6.57 | - |
| MSCI ACWI ex USA Growth Index (Net) | | -14.43 | 1.69 | 7.15 | - |
Performance numbers reflect all Fund expenses. Returns for Class A shares are shown with and without the maximum initial sales charge of 5.75%. Returns for Class C shares are shown with and without the maximum contingent deferred sales charge of 1.00% for the first year after purchase. The Fund’s other classes are not subject to sales charges, but may be subject to other fees and expenses, and have limited eligibility. Please see the Fund’s prospectus for details. Performance for different share classes will vary based on differences in sales charges and certain fees and expenses associated with each class.
As stated in the May 1, 2018 prospectus, the Fund’s annual operating expense ratio is 1.15% for Institutional Class shares and 1.40% for Class A shares.
All results shown assume reinvestment of distributions during the period. Returns do not reflect the deduction of taxes that a shareholder may pay on Fund distributions or on the redemption of Fund shares. Performance results may reflect the effect of any fee waivers or reimbursements of Fund expenses by the investment manager and/or any of its affiliates. Absent these fee waivers and/or expense reimbursement arrangements, performance results may have been lower.
The performance information shown represents past performance and is not a guarantee of future results. The investment return and principal value of your investment will fluctuate so that shares, when redeemed, may be worth more or less than their original cost. Current performance may be lower or higher than the performance data shown. You may obtain performance information current to the most recent month-end by contacting your financial intermediary, visiting columbiathreadneedleus.com/investor/ or calling 800.922.6769.
The returns shown for periods prior to the share class inception date (including returns for the Life of the Fund, if shown, which are since Fund inception) include the returns of the Fund’s oldest share class. These returns are adjusted to reflect any higher class-related operating expenses of the newer share classes, as applicable. Please visit columbiathreadneedleus.com/investor/investment-products/mutual-funds/appended-performance for more information.
The MSCI ACWI ex USA Index (Net) captures a large- and mid-cap representation across 22 of 23 developed market countries (excluding the U.S.) and 24 emerging market countries. The index covers approximately 85% of the global equity opportunity set outside the United States.
The MSCI ACWI ex USA Growth Index (Net) captures large-and mid-cap representation across 22 developed markets countries and 24 emerging markets countries.
Unlike mutual funds, indexes are not managed and do not incur fees or expenses. It is not possible to invest directly in an index.
| 16 | Columbia Acorn Family of Funds | Annual Report 2018 |
Fund at a glance (continued)
Columbia Acorn International SelectSM
The Growth of a $10,000 Investment in Columbia Acorn International SelectSM Institutional Class Shares
December 31, 2008 through December 31, 2018
This chart shows the change in value of a hypothetical $10,000 investment in Institutional Class (formerly Class Z) shares of the Fund during the stated time period. Although the indexes are provided for use in assessing the Fund’s performance, the Fund’s holdings may differ significantly from those in an index. Performance numbers reflect all Fund expenses.
| Top ten holdings (%) (at December 31, 2018) | |
Recruit Holdings Co., Ltd. (Japan)
Information providing services in human resource, housing, bridal, travel, restaurants, beauty, automobiles, and education and more | 4.5 |
Koninklijke Philips NV (Netherlands)
Health technology focused on improving people’s health | 4.4 |
Hexagon AB, Class B (Sweden)
Design, measurement and visualisation technologies | 4.3 |
CCL Industries, Inc. (Canada)
Manufacturing services and specialty packaging products for the non-durable consumer products market | 3.9 |
Novozymes AS, Class B (Denmark)
Enzymes for industrial use | 3.9 |
MTU Aero Engines AG (Germany)
Develops and manufactures engines and offers commercial engine services and support | 3.7 |
Korea Zinc Co. Ltd. (South Korea)
Non-ferrous metal smelting | 3.7 |
New Oriental Education & Technology Group, Inc., ADR (China)
Educational services | 3.5 |
Aeon Mall Co., Ltd. (Japan)
Large-scale shopping malls | 3.3 |
Nemetschek SE (Germany)
Standard software for designing, constructing and managing buildings and real estate | 3.3 |
Percentages indicated are based upon total investments (excluding Money Market Funds, Derivatives and Securities Lending Collateral, if any).
For further detail about these holdings, please refer to the section entitled “Portfolio of Investments."
Fund holdings are as of the date given, are subject to change at any time, and are not recommendations to buy or sell any security.
Columbia Acorn Family of Funds | Annual Report 2018
| 17 |
Fund at a glance (continued)
Columbia Acorn International SelectSM
| Equity sector breakdown (%) (at December 31, 2018) |
| Communication Services | 9.3 |
| Consumer Discretionary | 10.0 |
| Consumer Staples | 2.2 |
| Financials | 10.3 |
| Health Care | 9.2 |
| Industrials | 24.6 |
| Information Technology | 15.4 |
| Materials | 13.4 |
| Real Estate | 5.6 |
| Total | 100.0 |
Percentages indicated are based upon total equity investments. The Fund’s portfolio composition is subject to change.
| Country breakdown (%) (at December 31, 2018) |
| Australia | 1.9 |
| Canada | 5.7 |
| China | 5.6 |
| Denmark | 3.7 |
| France | 2.1 |
| Germany | 11.9 |
| India | 5.0 |
| Italy | 4.5 |
| Japan | 16.6 |
| Mexico | 2.3 |
| Netherlands | 6.4 |
| Singapore | 2.2 |
| South Africa | 2.0 |
| South Korea | 5.5 |
| Sweden | 6.2 |
| Switzerland | 2.7 |
| Taiwan | 1.8 |
| United Kingdom | 10.7 |
| United States(a) | 3.2 |
| Total | 100.0 |
| (a) | Includes investments in Money Market Funds. |
Country breakdown is based primarily on issuer’s place of organization/incorporation. Percentages indicated are based upon total investments and exclude investments in derivatives, if any. The Fund’s portfolio composition is subject to change.
| 18 | Columbia Acorn Family of Funds | Annual Report 2018 |
Manager Discussion of Fund Performance
Columbia Acorn International SelectSM
Stephen Kusmierczak, CFA
Portfolio Manager
Columbia Acorn International SelectSM Institutional Class shares returned -12.28% for the 12-month period ended December 31, 2018, outperforming its primary benchmark, the MSCI ACWI ex USA Index (Net), which returned -14.20% for the same time period. The Fund’s secondary benchmark, the MSCI ACWI ex USA Growth Index (Net) returned -14.43% for the same 12-month period.
After beginning the year on a strong note, international equities moved steadily lower from February 2018 onward. The bulk of the loss for the year occurred in the fourth quarter, when markets across the world fell sharply due to fears about slowing economic growth, rising interest rates and increased geopolitical tensions. The downturn was broad based, with all regions finishing in the red and all sectors posting losses with the exception of utilities. The weakness in global currencies relative to the U.S. dollar was an additional factor weighing on returns for U.S. investors.
While the Fund posted a loss in 2018, as would be expected given the extent of the downturn in the broader world equity markets, we were able to cushion some of the losses through individual stock selection. The Fund’s investments in the financials sector declined much less than the sector as a whole in the primary benchmark, due in part to the Fund’s position in the Japanese company Sony Financial Holdings, Inc. Our stock selection process also worked well in the information technology sector, highlighted by an investment in Wirecard AG, a German provider of outsourcing solutions for electronic payment transactions. Wirecard AG benefited as its end markets continued to grow in conjunction with the expansion of e-commerce. In addition, we believed Wirecard AG demonstrated strong organic growth and an encouraging sales pipeline.
The health care sector was another area of relative strength for the Fund during 2018. Sartorius AG (Germany), a leading supplier of biomanufacturing equipment and lab products, was the largest contributor in the sector. The stock rallied due to better-than-expected results and the release of a well-received plan to generate growth through 2025. The French life sciences company Ipsen SA was an additional contributor in the health care sector.
On the other side of the ledger, the Fund lost some ground through the weaker showing of its investments in the consumer discretionary sector. New Oriental Education & Technology Group, Inc., China’s largest after-school tutoring service provider, was the leading detractor among consumer discretionary holdings. The stock was negatively affected by the prospect of new regulatory requirements regarding education services in China. Believing investor worries were exaggerated and that the company was well positioned to capitalize on long-term trends in education, we maintained the position. Brembo SpA, an Italian auto-parts supplier whose shares fell in response to the wider automotive industry on concerns about future demand, also weighed on the Fund’s performance in the sector. Outside of consumer discretionary, NetEase, Inc., a China-based online game and content developer, was the largest detractor. The company’s share price declined due to lackluster performance for its mobile gaming business and the broader weakness in China’s stock market.
The Fund’s sector allocations, which are a by-product of our bottom-up investment process, also had an adverse effect on performance. The Fund had an underweight position in the consumer staples sector and held no utilities stocks, both of which outperformed in the fourth quarter once investors gravitated to defensive companies with stable business models. While this hurt results in the short-term, the underweight is consistent with the Fund’s emphasis on faster growing companies.
At the close of 2018, we expected slowing global economic growth in the year ahead. Other risks to the fundamental outlook that we saw included rising corporate debt levels, the potential for lower profit margins, and the ongoing trade tensions between the United States and China. While there are significant incentives for the United States and China to normalize relations, trade policy continues to be a source of uncertainty for the global economy and financial markets. At the same time, valuations closed the year well below their highs of mid-2018. We saw this as an indication that quite a bit of bad
Columbia Acorn Family of Funds | Annual Report 2018
| 19 |
Manager Discussion of Fund Performance (continued)
Columbia Acorn International SelectSM
news had already been reflected in prices. In addition, we were encouraged by the potential for the U.S. Federal Reserve to pause or slow the pace of its interest rate increases, which could lessen the headwind from U.S. dollar strength.
We believe the volatility of the past year serves as a reminder that both economic and market cycles are to be expected in long-term investing. Moreover, in our view, increased volatility and greater divergences in economic trends across regions and countries can create compelling opportunities for individual stock selection. With this as the backdrop, we believe international markets provide an abundance of fast-growing small- and mid-sized companies whose positive attributes have not yet been reflected in their valuations.
Marketrisk may affect a single issuer, sector of the economy, industry or the market as a whole.Foreigninvestments subject the Fund to political, economic, market, social and other risks within a particular country, as well as to potential currency instabilities and less stringent financial and accounting standards generally applicable to U.S. issuers. Risks are enhanced foremerging market issuers. Investments in small- and mid-cap companies involve risks and volatility and possible illiquidity greater than investments in larger, more established companies. The Fund may invest significantly in issuers within a particularsector, which may be negatively affected by market, economic or other conditions, making the Fund more vulnerable to unfavorable developments in the sector. See the Fund’s prospectus for more information on these and other risks.
The views expressed in this report reflect the current views of the respective parties. These views are not guarantees of future performance and involve certain risks, uncertainties and assumptions that are difficult to predict, so actual outcomes and results may differ significantly from the views expressed. These views are subject to change at any time based upon economic, market or other conditions and the respective parties disclaim any responsibility to update such views. These views may not be relied on as investment advice and, because investment decisions for a Columbia Acorn Fund are based on numerous factors, may not be relied on as an indication of trading intent on behalf of any particular Columbia Acorn Fund. References to specific securities should not be construed as a recommendation or investment advice.
| 20 | Columbia Acorn Family of Funds | Annual Report 2018 |
Fund at a glance
Columbia Acorn SelectSM
Investment objective
Columbia Acorn SelectSM (the Fund) seeks long-term capital appreciation.
Portfolio management
David L. Frank, CFA
Portfolio Manager since 2015
Service with Fund since 2002
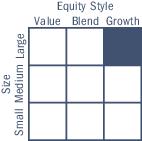
Morningstar style boxTM
The Morningstar Style Box is based on a fund’s portfolio holdings. For equity funds, the vertical axis shows the market capitalization of the stocks owned, and the horizontal axis shows investment style (value, blend, or growth). Information shown is based on the most recent data provided by Morningstar.
© 2019 Morningstar, Inc. All rights reserved. The Morningstar information contained herein: (1) is proprietary to Morningstar and/or its content providers; (2) may not be copied or distributed; and (3) is not warranted to be accurate, complete or timely. Neither Morningstar nor its content providers are responsible for any damages or losses arising from any use of this information.
| Average annual total returns (%) (for the period ended December 31, 2018) |
| | | Inception | 1 Year | 5 Years | 10 Years | Life |
| Class A | Excluding sales charges | 10/16/00 | -12.71 | 4.54 | 12.68 | 8.96 |
| | Including sales charges | | -17.72 | 3.31 | 12.02 | 8.64 |
| Advisor Class | 11/08/12 | -12.50 | 4.78 | 12.98 | 9.29 |
| Class C | Excluding sales charges | 10/16/00 | -13.32 | 3.76 | 11.83 | 8.15 |
| | Including sales charges | | -13.94 | 3.76 | 11.83 | 8.15 |
| Institutional Class | 11/23/98 | -12.45 | 4.82 | 13.00 | 9.30 |
| Institutional 2 Class | 11/08/12 | -12.46 | 4.86 | 13.03 | 9.31 |
| Institutional 3 Class | 11/08/12 | -12.31 | 4.93 | 13.08 | 9.33 |
| Russell 2500 Growth Index | | -7.47 | 6.19 | 14.76 | - |
Performance numbers reflect all Fund expenses. Returns for Class A shares are shown with and without the maximum initial sales charge of 5.75%. Returns for Class C shares are shown with and without the maximum contingent deferred sales charge of 1.00% for the first year after purchase. The Fund’s other classes are not subject to sales charges, but may be subject to other fees and expenses, and have limited eligibility. Please see the Fund’s prospectus for details. Performance for different share classes will vary based on differences in sales charges and certain fees and expenses associated with each class.
As stated in the May 1, 2018 prospectus, the Fund’s annual operating expense ratio is 0.92% for Institutional Class shares and 1.17% for Class A shares.
All results shown assume reinvestment of distributions during the period. Returns do not reflect the deduction of taxes that a shareholder may pay on Fund distributions or on the redemption of Fund shares. Performance results may reflect the effect of any fee waivers or reimbursements of Fund expenses by the investment manager and/or any of its affiliates. Absent these fee waivers and/or expense reimbursement arrangements, performance results may have been lower.
The performance information shown represents past performance and is not a guarantee of future results. The investment return and principal value of your investment will fluctuate so that shares, when redeemed, may be worth more or less than their original cost. Current performance may be lower or higher than the performance data shown. You may obtain performance information current to the most recent month-end by contacting your financial intermediary, visiting columbiathreadneedleus.com/investor/ or calling 800.922.6769.
The returns shown for periods prior to the share class inception date (including returns for the Life of the Fund, if shown, which are since Fund inception) include the returns of the Fund’s oldest share class. These returns are adjusted to reflect any higher class-related operating expenses of the newer share classes, as applicable. Please visit columbiathreadneedleus.com/investor/investment-products/mutual-funds/appended-performance for more information.
The Russell 2500 Growth Index measures the performance of those Russell 2500 companies with higher price-to-book ratios and higher forecasted growth values.
Unlike mutual funds, indexes are not managed and do not incur fees or expenses. It is not possible to invest directly in an index.
Columbia Acorn Family of Funds | Annual Report 2018
| 21 |
Fund at a glance (continued)
Columbia Acorn SelectSM
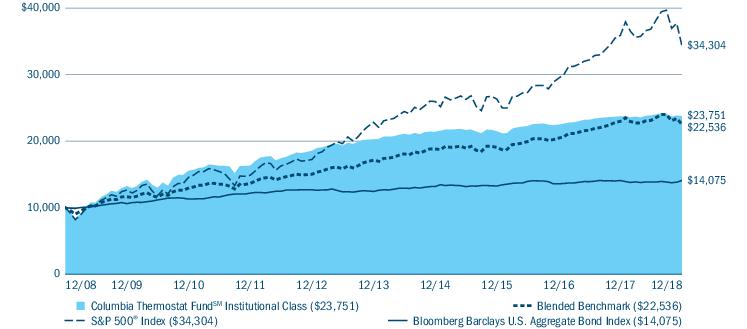
The Growth of a $10,000 Investment in Columbia Acorn SelectSM Institutional Class Shares
December 31, 2008 through December 31, 2018
This chart shows the change in value of a hypothetical $10,000 investment in Institutional Class (formerly Class Z) shares of the Fund during the stated time period. Although the index is provided for use in assessing the Fund’s performance, the Fund’s holdings may differ significantly from those in an index. Performance numbers reflect all Fund expenses.
| Top ten holdings (%) (at December 31, 2018) | |
Masimo Corp.
Medical signal processing and sensor technology for non-invasive monitoring of physiological parameters | 6.0 |
GoDaddy, Inc., Class A
Cloud-based web platform for small businesses, web design professionals and individuals | 5.4 |
ANSYS, Inc.
Software solutions for design analysis and optimization | 5.4 |
JB Hunt Transport Services, Inc.
Logistics services | 5.1 |
Encompass Health Corp.
Inpatient rehabilitative healthcare services | 4.7 |
VeriSign, Inc.
Domain names and Internet security services | 4.5 |
SVB Financial Group
Holding company for Silicon Valley Bank | 4.5 |
Vail Resorts, Inc.
Operates resorts globally | 4.5 |
LCI Industries
Recreational vehicles and equipment | 4.4 |
LKQ Corp.
Automotive products and services | 3.9 |
Percentages indicated are based upon total investments (excluding Money Market Funds, Derivatives and Securities Lending Collateral, if any).
For further detail about these holdings, please refer to the section entitled “Portfolio of Investments."
Fund holdings are as of the date given, are subject to change at any time, and are not recommendations to buy or sell any security.
| Portfolio breakdown (%) (at December 31, 2018) |
| Common Stocks | 95.8 |
| Limited Partnerships | 1.8 |
| Money Market Funds | 2.4 |
| Total | 100.0 |
Percentages indicated are based upon total investments and exclude investments in derivatives, if any. The Fund’s portfolio composition is subject to change.
| Equity sector breakdown (%) (at December 31, 2018) |
| Consumer Discretionary | 18.3 |
| Financials | 14.2 |
| Health Care | 20.0 |
| Industrials | 10.8 |
| Information Technology | 22.0 |
| Materials | 7.4 |
| Real Estate | 7.3 |
| Total | 100.0 |
Percentages indicated are based upon total equity investments. The Fund’s portfolio composition is subject to change.
| 22 | Columbia Acorn Family of Funds | Annual Report 2018 |
Manager Discussion of Fund Performance
Columbia Acorn SelectSM
David L. Frank, CFA
Portfolio Manager
Columbia Acorn SelectSMInstitutional Class shares returned -12.45% for the 12-month period ended December 31, 2018. The Fund underperformed its benchmark, the Russell 2500 Growth Index, which returned -7.47% for the same time period.
The sizable loss for the benchmark obscures the fact that the growth style performed quite well for much of 2018. Until the end of September, growth stocks were well supported by the combination of unusually strong economic conditions, better-than-expected corporate earnings, and robust investor sentiment. As a result, the year-to-date total return for the Russell 2500 Growth Index stood at 15.78% as of the last trading day of September.
These favorable conditions changed considerably in the final three months of the year, leading to a sharp sell-off in U.S. equities. During this time, the markets were pressured by the trade dispute between the United States and China, evidence of slowing growth across the globe, and uncertainty about the outlook for corporate profits in 2019. Small- and mid-cap stocks were hit particularly hard as investors’ appetite for risk seemed to evaporate. The fourth quarter downturn in stock prices erased all the prior gains and caused the benchmark to finish the year in the red.
Individual stock selection was the primary driver of the Fund’s shortfall in the 12-month period. Although we added significant value through the outperformance of Fund investments in the health care and information technology sectors, the benefit was outweighed by weaker selection in the industrials and consumer discretionary sectors.
The Fund’s positions in the heavy-vehicle manufacturer Oshkosh Corp. and the trucking and logistics company J.B. Hunt Transport Services, Inc. played the largest role in its underperformance in the industrials sector. Both companies were hurt by the broader worries about economic growth and its possible effect on their respective end markets. Positions in Middleby Corp., a manufacturer of commercial and residential cooking equipment, and SiteOne Landscape Supply, Inc. the largest wholesale distributor of landscaping supplies in the United States, also detracted from the Fund’s returns from industrials investments.
LCI Industries, a supplier of components to recreational vehicle manufacturers, was the largest detractor in both the consumer discretionary sector and the Fund as a whole. The stock sold off sharply on concerns that the company would be unable to pass along higher steel and aluminum prices to its customers. In addition, rising RV inventories raised fears of slowing demand among LCI Industries’ customers. LKQ Corp., which sells specialty repair parts and accessories to the automotive industry, was another key detractor in consumer discretionary. The company reported disappointing quarterly results in April due to rising freight and labor costs, and it faced challenges in ramping up a new, large distribution center.
On the positive side, a number of holdings in the health care sector contributed to Fund performance in 2018. Shares of Genomic Health, Inc. a leader in cancer diagnostics, rallied after a successful study expanded the market for its flagship breast cancer treatment. Masimo Corp., which developed finger sensors to measure patients’ blood oxygen concentration and other key vital signs, also contributed positively to performance. Shipments for its newer, more comprehensive patient monitors rose to a record level in the third quarter, as the company’s expanding suite of technology — which allows more efficient and better patient care — benefited from strongly increasing demand. Encompass Health, a leading provider of inpatient rehabilitation, home health care and hospice services, was an additional contributor of note which we attribute to its consistent execution, steady market share gains and the stabilizing environment for Medicare reimbursement.
GoDaddy, Inc. was the top contributor to performance in the information technology sector. GoDaddy, Inc. provides domain name registrations, which it leverages to sell digital marketing solutions to its large base of customers. The stock rallied after the company reported strong earnings results,
Columbia Acorn Family of Funds | Annual Report 2018
| 23 |
Manager Discussion of Fund Performance (continued)
Columbia Acorn SelectSM
demonstrating its ability to maintain double-digit revenue growth with solid cash flow return on invested capital. We chose to capitalize on the strength of GoDaddy, Inc. by trimming the position. SPS Commerce, Inc. and VeriSign, Inc. were also key contributors in technology.
We expect that U.S. economic growth will likely moderate in 2019, but the extent of economic deceleration will depend primarily on the impact of the U.S. Federal Reserve’s recent interest rate increases and future policy. Still, we do not currently see signs of a recession on the near-term horizon. We view these conditions as broadly supportive, since a backdrop of slow, but positive, economic growth typically acts as a tailwind for small- to mid-sized growth stocks. We are also encouraged by the decline in valuations to more attractive levels following the fourth-quarter sell-off. However, we believe that the likelihood of slowing earnings growth may represent an obstacle for the markets, as could higher corporate debt levels, the ongoing trade tensions between the United States and China, and the potential for profit-margin compression. We welcome the disruptions that may result from these developments as we believe that increased volatility can provide fertile ground for individual stock selection.
While we always look for high-quality growth stocks, in 2018 we moved the Fund even further in favor of companies with strong balance sheets, and we remained strongly committed to our valuation discipline. We believe this approach, which favors companies with higher quality and structural growth (growth derived from structural shifts or changes in the economy) — as gauged by metrics such as return on invested capital, revenue and earnings growth, and low levels of debt — is well suited for a backdrop of higher interest rates and elevated market volatility.
Marketrisk may affect a single issuer, sector of the economy, industry or the market as a whole. Investments insmall- and mid-cap companies involve risks and volatility and possible illiquidity greater than investments in larger, more established companies.Foreigninvestments subject the Fund to risks, including political, economic, market, social and other risks, within a particular country, as well as to potential currency instabilities and less stringent financial and accounting standards generally applicable to U.S. issuers. Risks are enhanced foremerging market issuers. The Fund may invest significantly in issuers within a particularsector, which may be negatively affected by market, economic or other conditions, making the Fund more vulnerable to unfavorable developments in the sector. See the Fund’s prospectus for more information on these and other risks.
The views expressed in this report reflect the current views of the respective parties. These views are not guarantees of future performance and involve certain risks, uncertainties and assumptions that are difficult to predict, so actual outcomes and results may differ significantly from the views expressed. These views are subject to change at any time based upon economic, market or other conditions and the respective parties disclaim any responsibility to update such views. These views may not be relied on as investment advice and, because investment decisions for a Columbia Acorn Fund are based on numerous factors, may not be relied on as an indication of trading intent on behalf of any particular Columbia Acorn Fund. References to specific securities should not be construed as a recommendation or investment advice.
| 24 | Columbia Acorn Family of Funds | Annual Report 2018 |
Fund at a glance
Columbia Thermostat FundSM
Investment objective
Columbia Thermostat FundSM (the Fund) seeks long-term capital appreciation.
Portfolio management
Anwiti Bahuguna, Ph.D.
Co-Portfolio Manager since 2018
Service with Fund since 2018
Joshua Kutin, CFA
Co-Portfolio Manager since 2018
Service with Fund since 2018
| Average annual total returns (%) (for the period ended December 31, 2018) |
| | | Inception | 1 Year | 5 Years | 10 Years | Life |
| Class A | Excluding sales charges | 03/03/03 | -0.13 | 2.95 | 8.76 | 6.38 |
| | Including sales charges | | -5.86 | 1.74 | 8.12 | 5.99 |
| Advisor Class | 11/08/12 | 0.12 | 3.22 | 9.03 | 6.64 |
| Class C | Excluding sales charges | 03/03/03 | -0.88 | 2.19 | 7.95 | 5.59 |
| | Including sales charges | | -1.83 | 2.19 | 7.95 | 5.59 |
| Institutional Class | 09/25/02 | 0.12 | 3.22 | 9.04 | 6.65 |
| Institutional 2 Class | 11/08/12 | 0.16 | 3.25 | 9.05 | 6.66 |
| Institutional 3 Class | 11/08/12 | 0.21 | 3.29 | 9.08 | 6.68 |
| Blended Benchmark | | -1.90 | 5.65 | 8.46 | - |
| S&P 500® Index | | -4.38 | 8.49 | 13.12 | - |
| Bloomberg Barclays U.S. Aggregate Bond Index | | 0.01 | 2.52 | 3.48 | - |
Performance numbers reflect all Fund expenses. Returns for Class A shares are shown with and without the maximum initial sales charge of 5.75%. Returns for Class C shares are shown with and without the maximum contingent deferred sales charge of 1.00% for the first year after purchase. The Fund’s other classes are not subject to sales charges, but may be subject to other fees and expenses, and have limited eligibility. Please see the Fund’s prospectus for details. Performance for different share classes will vary based on differences in sales charges and certain fees and expenses associated with each class
As stated in the May 1, 2018 prospectus, the Fund’s annual operating expense ratio is 0.60% for Institutional Class shares and 0.85% for Class A shares.
All results shown assume reinvestment of distributions during the period. Returns do not reflect the deduction of taxes that a shareholder may pay on Fund distributions or on the redemption of Fund shares. Performance results may reflect the effect of any fee waivers or reimbursements of Fund expenses by the investment manager and/or any of its affiliates. Absent these fee waivers and/or expense reimbursement arrangements, performance results may have been lower.
The performance information shown represents past performance and is not a guarantee of future results. The investment return and principal value of your investment will fluctuate so that shares, when redeemed, may be worth more or less than their original cost. Current performance may be lower or higher than the performance data shown. You may obtain performance information current to the most recent month-end by contacting your financial intermediary, visiting columbiathreadneedleus.com/investor/ or calling 800.922.6769.
The returns shown for periods prior to the share class inception date (including returns for the Life of the Fund, if shown, which are since Fund inception) include the returns of the Fund’s oldest share class. These returns are adjusted to reflect any higher class-related operating expenses of the newer share classes, as applicable. Please visit columbiathreadneedleus.com/investor/investment-products/mutual-funds/appended-performance for more information.
The Fund’s performance prior to May 1, 2018 reflects returns achieved following a principal investment strategy pursuant to which day-to-day investment decisions for the Fund were made according to only one potential form of predetermined asset allocation table. Effective May 1, 2018, the Fund follows a principal investment strategy that calls for the Investment Manager, on at least an annual basis, to determine whether the Fund’s assets should be allocated according to one of two different forms of allocation table based on the Investment Manager’s assessment of the equity market. The form of the Fund’s allocation table in its current prospectus was in place throughout 2018 and has been in place since the Fund’s inception in 2002. The Fund’s performance prior to May 2018 reflects the current form of allocation table.
The Blended Benchmark, established by the Fund’s investment manager, is an equally weighted custom composite of Columbia Thermostat Fund’s primary equity and primary debt benchmarks, the S&P 500® Index and the Bloomberg Barclays U.S. Aggregate Bond Index, respectively. The percentage of the Fund’s assets allocated to underlying stock and bond portfolio funds will vary, and accordingly the composition of the Fund’s portfolio will not always reflect the composition of the Blended Benchmark.
The Standard & Poor’s (S&P) 500®Index tracks the performance of 500 widely held, large-capitalization U.S. stocks.
The Bloomberg Barclays U.S. Aggregate Bond Index is a market value-weighted index that tracks the daily price, coupon, pay-downs and total return performance of fixed-rate, publicly placed, dollar-denominated and non-convertible investment-grade debt issues with at least $250 million par amount outstanding and with at least one year to final maturity.
Columbia Acorn Family of Funds | Annual Report 2018
| 25 |
Fund at a glance (continued)
Columbia Thermostat FundSM
Unlike mutual funds, indexes are not managed and do not incur fees or expenses. It is not possible to invest directly in an index.
The Growth of a $10,000 Investment in Columbia Thermostat FundSM Institutional Class Shares
December 31, 2008 through December 31, 2018
This chart shows the change in value of a hypothetical $10,000 investment in Institutional Class (formerly Class Z) shares of the Fund during the stated time period. Although the indexes are provided for use in assessing the Fund’s performance, the Fund’s holdings may differ significantly from those in an index. Performance numbers reflect all Fund expenses.
| Portfolio breakdown (%) (at December 31, 2018) |
| Equity Funds | 13.8 |
| Exchange-Traded Funds | 8.6 |
| Fixed-Income Funds | 77.6 |
| Total | 100.0 |
Percentages indicated are based upon total investments and exclude investments in derivatives, if any. The Fund’s portfolio composition is subject to change.
| 26 | Columbia Acorn Family of Funds | Annual Report 2018 |
Manager Discussion of Fund Performance
Columbia Thermostat FundSM
Anwiti Bahuguna, Ph.D.
Co-Portfolio Manager
Joshua Kutin, CFA
Co-Portfolio Manager
Columbia Thermostat FundSM Institutional Class shares gained 0.12% for the 12-month period ended December 31, 2018. During the same time period, the Fund’s primary equity benchmark, the S&P 500® Index, returned -4.38%, and the Fund’s primary debt benchmark, the Bloomberg Barclays U.S. Aggregate Bond Index, returned 0.01%. The Fund outperformed its custom Blended Benchmark, which returned -1.90% during 2018.
2018 got off to a fast start, as the S&P 500® Index posted its best January in 21 years. Volatility across capital markets increased substantially in February and March 2018, slowing equity momentum. A pickup in U.S. economic growth, however, helped boost investor confidence through the first three quarters of the year. Cooling global growth, protracted tariff disputes and lackluster Chinese economic data all contributed to investor pessimism as the year drew to a close. The S&P 500® Index lost 13.52% in the fourth quarter alone. The Fund benefitted from a high allocation to relatively conservative short-term bond portfolios during a period in which equities sold off and more conservative assets such as high-quality fixed income performed well.
The Fund’s equity portfolio had a weighted average return of -6.50% in 2018. All seven underlying equity funds posted negative returns for the period. Columbia Dividend Income Fund was the equity portfolio’s top performer, returning -4.28%. Columbia Acorn International® was the equity portfolio’s worst performer, with a return of -15.82% for the year.
Columbia Thermostat Fund’s bond portfolio ended the year with a weighted average gain of 0.59%. Of five underlying funds in the bond portfolio, Columbia Quality Income Fund was the strongest performer, returning 2.11% for the year. Columbia Corporate Income Fund the worst performer in the bond portfolio, returning -3.48% for the year.
There were 13 reallocation triggers in 2018 following the Fund’s prospectus allocation table. Columbia Thermostat Fund began 2018 with an allocation of 10% to stocks and 90% to bonds.
| • | On February 8, the S&P 500® Index fell below the 2,592 threshold, triggering a reallocation to 15% stocks and 85% bonds on February 9. |
| • | On March 9, the S&P 500® Index rose above 2,592 and the Fund reallocated back to 10% stocks and 90% bonds on March 12. |
| • | On May 1, the Fund reset its stock/bond allocation table in connection with the annual review called for by the prospectus. This annual reset caused the stock/bond allocation to move to 25% stocks and 75% bonds. |
| • | On May 31, the S&P 500® Index rose above the 2,672 threshold, triggering a reallocation to 20% stocks and 80% bonds on June 1. |
| • | On June 8, the S&P 500® Index rose above 2,779 and the Fund reallocated back to 15% stocks and 85% bonds on June 11. |
| • | On July 11, the S&P 500® Index fell below the 2,779 threshold, triggering a reallocation to 20% stocks and 80% bonds on July 12. |
| • | On August 10, the S&P 500® Index rose above 2,779 and the Fund reallocated to 15% stocks and 85% bonds on August 13. |
| • | On August 27, the S&P 500® Index rose above 2,890 and the Fund reallocated to 10% stocks and 90% bonds on August 28. |
| • | On October 5, the S&P 500® Index fell below 2,890 and the Fund reallocated back to 15% stocks and 85% bonds on October 8. |
| • | On October 11, the S&P 500® Index fell below 2,779 and the Fund reallocated to 20% stocks and 80% bonds on October 12. |
Columbia Acorn Family of Funds | Annual Report 2018
| 27 |
Manager Discussion of Fund Performance (continued)
Columbia Thermostat FundSM
| • | On October 24, the S&P 500® Index fell below 2,672 and the Fund reallocated to 25% stocks and 75% bonds on October 25. |
| • | On November 26, the S&P 500® Index rose above 2,672 and the Fund reallocated back to 20% stocks and 80% bonds on November 27. |
| • | On December 3, the S&P 500® Index rose above 2,779 and the Fund reallocated to 15% stocks and 85% bonds on December 4. |
Results of the Fund’s Portfolio Funds as of December 31, 2018
| Stock Funds | Weightings
in category | 4th quarter
performance | 1 year
performance |
| Columbia Large Cap Index Fund, Institutional 3 Class | 40% | -13.58% | -4.59% |
| Columbia Acorn Fund®, Institutional 3 Class | 10% | -19.74% | -4.98% |
| Columbia Acorn International®, Institutional 3 Class | 10% | -15.67% | -15.82% |
| Columbia Acorn SelectSM, Institutional 3 Class | 10% | -21.93% | -12.31% |
| Columbia Contrarian Core Fund, Institutional 3 Class | 10% | -14.78% | -8.81% |
| Columbia Dividend Income Fund, Institutional 3 Class | 10% | -9.64% | -4.28% |
| Columbia Large Cap Enhanced Core Fund, Institutional 3 Class | 10% | -14.11% | -4.68% |
| Weighted Average Equity Gain/Loss | 100% | -15.03% | -6.50% |
| Bond Funds | Weightings
in category | 4th quarter
performance | 1 year
performance |
| Columbia U.S. Treasury Index Fund, Institutional 3 Class | 35% | 2.50% | 0.69% |
| Columbia Short Term Bond Fund, Institutional 3 Class | 25% | 0.32% | 0.76% |
| Columbia Quality Income Fund, Institutional 3 Class | 20% | 2.42% | 2.11% |
| Columbia Corporate Income Fund, Institutional 3 Class | 10% | -1.55% | -3.48% |
| Columbia Diversified Fixed Income Allocation ETF | 10% | -0.17% | -1.53% |
| Weighted Average Income Gain/Loss | 100% | 1.26% | 0.59% |
A “fund of fund” bears its allocable share of the costs and expenses of the underlying funds in which it invests. Such funds are thus subject to two levels of fees and potentially higher expense ratios than would be associated with a fund that invests and trades directly in financial instruments under the direction of a single manager.
The Fund’s investments in the underlying funds may present certain risks, including the following.Marketrisk may affect a single issuer, sector of the economy, industry or the market as a whole. The Fund’s investment in other funds subjects it to the investment performance (positive or negative), risks and expenses of these underlying funds. Investments insmall- and mid-cap companies involve risks and volatility and possible illiquidity greater than in investments in larger, more established companies. There are risks associated withfixed-income investments, including credit risk, market risk, interest rate risk and prepayment and extension risk. In general, bond prices fall when interest rates rise and vice versa. This effect is more pronounced for longer term securities.Non-investment-grade (high-yield or junk) securities present greater price volatility and more risk to principal and income than higher rated securities.Foreigninvestments subject the Fund to political, economic, market, social and other risks within a particular country, as well as to potential currency instabilities and less stringent financial and accounting standards generally applicable to U.S. issuers. Risks are enhanced foremerging market issuers. See the Fund’s prospectus for more information on these and other risks.
The views expressed in this report reflect the current views of the respective parties. These views are not guarantees of future performance and involve certain risks, uncertainties and assumptions that are difficult to predict, so actual outcomes and results may differ significantly from the views expressed. These views are subject to change at any time based upon economic, market or other conditions and the respective parties disclaim any responsibility to update such views. These views may not be relied on as investment advice and, because investment decisions for a Columbia Acorn Fund are based on numerous factors, may not be relied on as an indication of trading intent on behalf of any particular Columbia Acorn Fund. References to specific securities should not be construed as a recommendation or investment advice.
The value of an investment in the Fund is based primarily on the performance of the underlying funds in which it invests. The Fund is subject to the risk that the investment manager’s decisions regarding asset classes and underlying funds will not anticipate market trends successfully, resulting in a failure to reserve capital or lower total return. The Investment Manager may prefer an underlying fund in the Columbia Acorn Family of Funds over alternative investments. There can be no assurance that the Columbia Acorn Funds will outperform similar funds managed by the Investment Manager’s affiliates. This is not an offer of the shares of any other mutual fund mentioned herein.
| 28 | Columbia Acorn Family of Funds | Annual Report 2018 |
Fund at a glance
Columbia Acorn Emerging Markets FundSM
Investment objective
Columbia Acorn Emerging Markets FundSM (the Fund) seeks long-term capital appreciation.
Portfolio management
Satoshi Matsunaga, CFA
Co-Portfolio Manager since 2015
Service with Fund since 2011
Charles C. Young
Co-Portfolio Manager since 2017
Service with Fund since 2011
Morningstar style boxTM
The Morningstar Style Box is based on a fund’s portfolio holdings. For equity funds, the vertical axis shows the market capitalization of the stocks owned, and the horizontal axis shows investment style (value, blend, or growth). Information shown is based on the most recent data provided by Morningstar.
© 2019 Morningstar, Inc. All rights reserved. The Morningstar information contained herein: (1) is proprietary to Morningstar and/or its content providers; (2) may not be copied or distributed; and (3) is not warranted to be accurate, complete or timely. Neither Morningstar nor its content providers are responsible for any damages or losses arising from any use of this information.
| Average annual total returns (%) (for the period ended December 31, 2018) |
| | | Inception | 1 Year | 5 Years | Life |
| Class A | Excluding sales charges | 08/19/11 | -17.58 | -3.43 | 1.76 |
| | Including sales charges | | -22.33 | -4.57 | 0.95 |
| Advisor Class | 11/08/12 | -17.39 | -3.18 | 2.07 |
| Class C | Excluding sales charges | 08/19/11 | -18.20 | -4.15 | 1.02 |
| | Including sales charges | | -19.01 | -4.15 | 1.02 |
| Institutional Class | 08/19/11 | -17.28 | -3.17 | 2.05 |
| Institutional 2 Class | 11/08/12 | -17.24 | -3.10 | 2.12 |
| Institutional 3 Class | 06/13/13 | -17.27 | -3.06 | 2.15 |
| MSCI Emerging Markets SMID Cap Index (Net) | | -15.83 | 0.87 | - |
Performance numbers reflect all Fund expenses. Returns for Class A shares are shown with and without the maximum initial sales charge of 5.75%. Returns for Class C shares are shown with and without the maximum contingent deferred sales charge of 1.00% for the first year after purchase. The Fund’s other classes are not subject to sales charges, but may be subject to other fees and expenses, and have limited eligibility. Please see the Fund’s prospectus for details. Performance for different share classes will vary based on differences in sales charges and certain fees and expenses associated with each class.
As stated in the May 1, 2018 prospectus, the Fund’s annual operating expense ratio is 1.30% for Institutional Class shares and 1.55% for Class A shares.
All results shown assume reinvestment of distributions during the period. Returns do not reflect the deduction of taxes that a shareholder may pay on Fund distributions or on the redemption of Fund shares. Performance results may reflect the effect of any fee waivers or reimbursements of Fund expenses by the investment manager and/or any of its affiliates. Absent these fee waivers and/or expense reimbursement arrangements, performance results may have been lower.
The performance information shown represents past performance and is not a guarantee of future results. The investment return and principal value of your investment will fluctuate so that shares, when redeemed, may be worth more or less than their original cost. Current performance may be lower or higher than the performance data shown. You may obtain performance information current to the most recent month-end by contacting your financial intermediary, visiting columbiathreadneedleus.com/investor/ or calling 800.922.6769.
The returns shown for periods prior to the share class inception date (including returns for the Life of the Fund, if shown, which are since Fund inception) include the returns of the Fund’s oldest share class. These returns are adjusted to reflect any higher class-related operating expenses of the newer share classes, as applicable. Please visit columbiathreadneedleus.com/investor/investment-products/mutual-funds/appended-performance for more information.
The MSCI Emerging Markets SMID Cap Index (Net) captures a mid- and small-cap representation across 24 emerging market countries. The index covers approximately 29% of the free float-adjusted market capitalization in each country.
Unlike mutual funds, indexes are not managed and do not incur fees or expenses. It is not possible to invest directly in an index.
Columbia Acorn Family of Funds | Annual Report 2018
| 29 |
Fund at a glance (continued)
Columbia Acorn Emerging Markets FundSM
The Growth of a $10,000 Investment in Columbia Acorn Emerging Markets FundSM Institutional Class Shares
August 19, 2011 (Fund inception) through December 31, 2018
This chart shows the change in value of a hypothetical $10,000 investment in Institutional Class (formerly Class Z) shares of the Fund during the stated time period. Although the index is provided for use in assessing the Fund’s performance, the Fund’s holdings may differ significantly from those in an index. Performance numbers reflect all Fund expenses.
| Top ten holdings (%) (at December 31, 2018) | |
Korea Zinc Co. Ltd. (South Korea)
Non-ferrous metal smelting | 4.1 |
Zee Entertainment Enterprises Ltd. (India)
Hindi films, serials, game shows and children’s programs | 3.7 |
Korea Investment Holdings Co., Ltd. (South Korea)
Financial holding company | 3.6 |
Vitasoy International Holdings Ltd. (Hong Kong)
Food and beverages | 3.4 |
Koh Young Technology, Inc. (South Korea)
3D measurement and inspection equipment for testing various machineries | 3.3 |
PSG Group Ltd. (South Africa)
Diversified financial services | 3.2 |
GS Retail Co., Ltd. (South Korea)
Chain of retail stores | 3.1 |
Sinbon Electronics Co., Ltd. (Taiwan)
Cable, connectors & modems | 3.0 |
NagaCorp Ltd. (Cambodia)
Leisure and tourism company | 3.0 |
Modetour Network, Inc. (South Korea)
Travel services | 2.9 |
Percentages indicated are based upon total investments (excluding Money Market Funds, Derivatives and Securities Lending Collateral, if any).
For further detail about these holdings, please refer to the section entitled “Portfolio of Investments."
Fund holdings are as of the date given, are subject to change at any time, and are not recommendations to buy or sell any security.
| Equity sector breakdown (%) (at December 31, 2018) |
| Communication Services | 7.0 |
| Consumer Discretionary | 20.8 |
| Consumer Staples | 11.2 |
| Financials | 26.6 |
| Health Care | 2.2 |
| Industrials | 9.9 |
| Information Technology | 15.2 |
| Materials | 6.5 |
| Real Estate | 0.6 |
| Total | 100.0 |
Percentages indicated are based upon total equity investments. The Fund’s portfolio composition is subject to change.
| 30 | Columbia Acorn Family of Funds | Annual Report 2018 |
Fund at a glance (continued)
Columbia Acorn Emerging Markets FundSM
| Country breakdown (%) (at December 31, 2018) |
| Brazil | 7.9 |
| Cambodia | 2.9 |
| China | 6.4 |
| Egypt | 1.3 |
| Hong Kong | 5.8 |
| India | 10.7 |
| Indonesia | 4.7 |
| Japan | 1.3 |
| Malaysia | 1.1 |
| Mexico | 3.5 |
| Philippines | 2.4 |
| Poland | 1.0 |
| Russian Federation | 1.7 |
| South Africa | 7.8 |
| South Korea | 16.6 |
| Taiwan | 16.5 |
| Thailand | 4.0 |
| Turkey | 1.1 |
| United Kingdom | 1.4 |
| United States(a) | 1.9 |
| Total | 100.0 |
| (a) | Includes investments in Money Market Funds. |
Country breakdown is based primarily on issuer’s place of organization/incorporation. Percentages indicated are based upon total investments and exclude investments in derivatives, if any. The Fund’s portfolio composition is subject to change.
Columbia Acorn Family of Funds | Annual Report 2018
| 31 |
Manager Discussion of Fund Performance
Columbia Acorn Emerging Markets FundSM
Satoshi Matsunaga, CFA
Co-Portfolio Manager
Charles C. Young
Co-Portfolio Manager
Columbia Acorn Emerging Markets FundSM Institutional Class shares returned -17.28% for the 12-month period ended December 31, 2018, compared with the Fund’s benchmark, the MSCI Emerging Markets SMID Cap Index (Net), which returned -15.83% for the same time period.
Emerging-market equities experienced weak performance in 2018, as investors responded negatively to slowing global growth, tighter monetary policy by the world’s major central banks, and a series of country-specific political events. The weakness in emerging market currencies relative to the U.S. dollar also weighed on returns for U.S. based investors.
The shifting outlook for global trade was an additional headwind for equities. Trade policy between the United States and China, the world’s two largest economies, continued to be a source of significant uncertainty for the global economy. The effects of tariffs were still viewed as generally manageable, but the impact on business planning and investment, as well as the potential for supply-chain disruption, proved difficult for investors to estimate. The lack of visibility on trade contributed to decelerating growth in China and the Asia region as a whole. In the fourth quarter, China’s real gross domestic product grew at the weakest pace since 1990 and experienced its third consecutive quarterly slowdown. However, the Chinese government has vowed to take the necessary steps to stabilize the economy and maintain a positive growth trajectory.
The Fund’s performance shortfall in 2018 was the result of both asset allocation and stock selection. With regard to the former, a lack of exposure to utilities stocks and overweight positions in the financials and information technology sectors were key detractors. In terms of regional allocations, the Fund was hurt by its underweight in Latin America and overweights in China and Southeast Asia. Stock selection was a further detractor, with underperformance in the consumer discretionary, health care, and other sectors outweighing the Fund’s stronger positions from industrials and financials sector holdings.
At the individual stock level, Vitasoy International Holdings Ltd. — a Hong Kong-based soy and health-drink producer that is expanding its business to mainland China — was the leading contributor to performance. The company gained share in the large Chinese domestic market, providing a significant boost to its stock price. NagaCorp Ltd., an operator of casinos and resorts in Cambodia whose shares are listed in Hong Kong, was another top contributor in 2018. The company, which recently opened its second casino in Phnom Penh, continues to see robust underlying demand for its leisure offerings, helping the stock to advance in the fourth quarter even as the broader global markets fell sharply. Qualitas Controladora SAB CV, Mexico’s largest auto insurer, rallied on strong results and its increased share of the country’s underpenetrated market for auto insurance.
The Turkish software company Logo Yazilim Sanayi ve Ticaret AS was the largest detractor from the Fund’s performance for the year, followed by two retail stocks: Beauty Community PCL (Thailand) and Raia Drogasil SA (Brazil). New Oriental Education & Technology Group, Inc., China’s leading after-school tutoring service provider, was another detractor of note. The stock was negatively affected by the prospect of new regulatory requirements regarding education services in China. Believing investor worries were exaggerated and that the company was well positioned to capitalize on long-term trends in education, we maintained the position. Stock selection in the health care sector also had an adverse effect on results. The sector is not heavily represented in the Fund, but it nonetheless affected performance.
Although emerging markets suffered significant declines in 2018, we believe that it’s important to keep in mind that corrections have been fairly typical over the history of the asset class. In addition, we are encouraged that the emerging markets appear to be more fundamentally sound than they were in past downturns. Bank oversight has been enhanced and a majority of countries have what we view as prudent economic policies in place, as demonstrated by relatively improved current account balances, foreign exchange reserves and external debt balances. We also see valuations as having fallen to compelling levels in the wake of the sell-off. At year end, the price-earnings ratio of emerging-market
| 32 | Columbia Acorn Family of Funds | Annual Report 2018 |
Manager Discussion of Fund Performance (continued)
Columbia Acorn Emerging Markets FundSM
stocks stood at its most attractive level relative to the S&P 500® Index in more than ten years. A reversal in the U.S. dollar uptrend that was in place throughout 2018 would be a further positive for the asset class. If the U.S. Federal Reserve were to pause or slow the pace of interest rate hikes, it would remove a driver of U.S. dollar appreciation and take away a key obstacle for emerging-market equities.
On a longer term basis, we believe emerging markets offer unique opportunities to discover small- and mid-cap companies in the early phases of market development and capital formation. We also anticipate that growth in the emerging markets will outpace that of the developed world over time, translating to stronger absolute gains in corporate earnings. Demographic trends, including increasing populations and rising middle class consumption, we see as additional long-term tailwinds. At the same time, emerging market stocks are trading at more attractive valuations than most developed regions, especially among small- and mid-cap stocks. We therefore welcome market volatility, as it creates a wider range of opportunities for bottom-up stock selection. We believe our investment philosophy, which favors higher quality companies exhibiting structural growth (growth derived from structural shifts or changes in the economy) — as measured by metrics such as return on invested capital, revenue and earnings growth, and superior debt ratios — can be particularly advantageous in this environment.
Marketrisk may affect a single issuer, sector of the economy, industry or the market as a whole.Internationalinvesting involves certain risks and volatility due to potential political, economic or currency instabilities and different, potentially less stringent, financial and accounting standards than those generally applicable to U.S. issuers. Risks are enhanced foremerging and frontier market issuers. Investments insmall- and mid-cap companies involve risks and volatility and possible illiquidity greater than investments in larger, more established companies. See the Fund’s prospectus for more information on these and other risks.
The views expressed in this report reflect the current views of the respective parties. These views are not guarantees of future performance and involve certain risks, uncertainties and assumptions that are difficult to predict, so actual outcomes and results may differ significantly from the views expressed. These views are subject to change at any time based upon economic, market or other conditions and the respective parties disclaim any responsibility to update such views. These views may not be relied on as investment advice and, because investment decisions for a Columbia Acorn Fund are based on numerous factors, may not be relied on as an indication of trading intent on behalf of any particular Columbia Acorn Fund. References to specific securities should not be construed as a recommendation or investment advice.
Columbia Acorn Family of Funds | Annual Report 2018
| 33 |
Fund at a glance
Columbia Acorn European FundSM
Investment objective
Columbia Acorn European FundSM (the Fund) seeks long-term capital appreciation.
Portfolio management
Stephen Kusmierczak, CFA
Portfolio Manager since 2011
Service with Fund since 2011
Morningstar style boxTM
The Morningstar Style Box is based on a fund’s portfolio holdings. For equity funds, the vertical axis shows the market capitalization of the stocks owned, and the horizontal axis shows investment style (value, blend, or growth). Information shown is based on the most recent data provided by Morningstar.
© 2019 Morningstar, Inc. All rights reserved. The Morningstar information contained herein: (1) is proprietary to Morningstar and/or its content providers; (2) may not be copied or distributed; and (3) is not warranted to be accurate, complete or timely. Neither Morningstar nor its content providers are responsible for any damages or losses arising from any use of this information.
| Average annual total returns (%) (for the period ended December 31, 2018) |
| | | Inception | 1 Year | 5 Years | Life |
| Class A | Excluding sales charges | 08/19/11 | -18.78 | 0.76 | 7.08 |
| | Including sales charges | | -23.46 | -0.43 | 6.22 |
| Advisor Class | 06/25/14 | -18.53 | 1.04 | 7.37 |
| Class C | Excluding sales charges | 08/19/11 | -19.34 | 0.04 | 6.30 |
| | Including sales charges | | -20.15 | 0.04 | 6.30 |
| Institutional Class | 08/19/11 | -18.57 | 1.02 | 7.35 |
| Institutional 2 Class | 11/08/12 | -18.44 | 1.07 | 7.38 |
| Institutional 3 Class | 03/01/17 | -18.51 | 1.05 | 7.37 |
| MSCI AC Europe Small Cap Index (Net) | | -20.10 | 1.83 | - |
Performance numbers reflect all Fund expenses. Returns for Class A shares are shown with and without the maximum initial sales charge of 5.75%. Returns for Class C shares are shown with and without the maximum contingent deferred sales charge of 1.00% for the first year after purchase. The Fund’s other classes are not subject to sales charges, but may be subject to other fees and expenses, and have limited eligibility. Please see the Fund’s prospectus for details. Performance for different share classes will vary based on differences in sales charges and certain fees and expenses associated with each class.
As stated in the May 1, 2018 prospectus, the Fund’s annual operating expense ratio is 1.21% for Institutional Class shares and 1.46% for Class A shares.
All results shown assume reinvestment of distributions during the period. Returns do not reflect the deduction of taxes that a shareholder may pay on Fund distributions or on the redemption of Fund shares. Performance results may reflect the effect of any fee waivers or reimbursements of Fund expenses by the investment manager and/or any of its affiliates. Absent these fee waivers and/or expense reimbursement arrangements, performance results may have been lower.
The performance information shown represents past performance and is not a guarantee of future results. The investment return and principal value of your investment will fluctuate so that shares, when redeemed, may be worth more or less than their original cost. Current performance may be lower or higher than the performance data shown. You may obtain performance information current to the most recent month-end by contacting your financial intermediary, visiting columbiathreadneedleus.com/investor/ or calling 800.922.6769.
The returns shown for periods prior to the share class inception date (including returns for the Life of the Fund, if shown, which are since Fund inception) include the returns of the Fund’s oldest share class. These returns are adjusted to reflect any higher class-related operating expenses of the newer share classes, as applicable. Please visit columbiathreadneedleus.com/investor/investment-products/mutual-funds/appended-performance for more information.
The MSCI AC Europe Small Cap Index (Net) captures a small-cap representation across 21 markets in Europe. The index covers approximately 14% of the free float-adjusted market capitalization across each market country in Europe.
Unlike mutual funds, indexes are not managed and do not incur fees or expenses. It is not possible to invest directly in an index.
| 34 | Columbia Acorn Family of Funds | Annual Report 2018 |
Fund at a glance (continued)
Columbia Acorn European FundSM
The Growth of a $10,000 Investment in Columbia Acorn European FundSM Institutional Class Shares
August 19, 2011 (Fund inception) through December 31, 2018
This chart shows the change in value of a hypothetical $10,000 investment in Institutional Class (formerly Class Z) shares of the Fund during the stated time period. Although the index is provided for use in assessing the Fund’s performance, the Fund’s holdings may differ significantly from those in an index. Performance numbers reflect all Fund expenses.
| Top ten holdings (%) (at December 31, 2018) | |
Nemetschek SE (Germany)
Standard software for designing, constructing and managing buildings and real estate | 3.5 |
Rational AG (Germany)
Food preparation appliances/processors and kitchen accessories | 3.5 |
Halma PLC (United Kingdom)
Products that detect hazards and protect assets and people in public and commercial buildings | 3.4 |
Rentokil Initial PLC (United Kingdom)
Fully integrated facilities management and essential support services | 3.3 |
Sectra AB, Class B (Sweden)
Medical and communication systems | 3.3 |
Sweco AB, Class B (Sweden)
Consulting company specializing in engineering, environmental technology, and architecture | 3.3 |
Wirecard AG (Germany)
Internet payment and processing services | 3.3 |
MTU Aero Engines AG (Germany)
Develops and manufactures engines and offers commercial engine services and support | 3.2 |
Spirax-Sarco Engineering PLC (United Kingdom)
Consultation, service and products for the control and efficient management of steam and industrial fluids | 3.0 |
Unibet Group PLC (Malta)
Online gambling services | 3.0 |
Percentages indicated are based upon total investments (excluding Money Market Funds, Derivatives and Securities Lending Collateral, if any).
For further detail about these holdings, please refer to the section entitled “Portfolio of Investments."
Fund holdings are as of the date given, are subject to change at any time, and are not recommendations to buy or sell any security.
Columbia Acorn Family of Funds | Annual Report 2018
| 35 |
Fund at a glance (continued)
Columbia Acorn European FundSM
| Equity sector breakdown (%) (at December 31, 2018) |
| Communication Services | 5.7 |
| Consumer Discretionary | 11.4 |
| Consumer Staples | 1.5 |
| Financials | 10.0 |
| Health Care | 10.1 |
| Industrials | 35.3 |
| Information Technology | 22.7 |
| Materials | 1.4 |
| Real Estate | 1.9 |
| Total | 100.0 |
Percentages indicated are based upon total equity investments. The Fund’s portfolio composition is subject to change.
| Country breakdown (%) (at December 31, 2018) |
| Belgium | 1.4 |
| Denmark | 4.2 |
| France | 1.8 |
| Germany | 22.1 |
| Ireland | 2.2 |
| Italy | 6.9 |
| Malta | 3.0 |
| Netherlands | 1.7 |
| Norway | 2.4 |
| Poland | 1.0 |
| Russian Federation | 1.0 |
| Spain | 3.8 |
| Sweden | 14.0 |
| Switzerland | 9.3 |
| Turkey | 0.7 |
| United Kingdom | 24.3 |
| United States(a) | 0.2 |
| Total | 100.0 |
| (a) | Includes investments in Money Market Funds. |
Country breakdown is based primarily on issuer’s place of organization/incorporation. Percentages indicated are based upon total investments and exclude investments in derivatives, if any. The Fund’s portfolio composition is subject to change.
| 36 | Columbia Acorn Family of Funds | Annual Report 2018 |
Manager Discussion of Fund Performance
Columbia Acorn European FundSM
Stephen Kusmierczak, CFA
Portfolio Manager
Columbia Acorn European FundSM Institutional Class shares returned -18.57% for the 12-month period ended December 31, 2018, outperforming the Fund’s primary benchmark, the MSCI AC Europe Small Cap Index (Net), which returned -20.10% for the same time period.
Concerns about political uncertainty and slowing economic growth weighed heavily on investor sentiment in 2018, leading to a large downturn in stock prices. The eurozone economy lost momentum after reaching some of the highest levels in a decade in 2017. The eurozone Purchasing Managers’ Index (PMI), a proxy for gross domestic product growth, fell in 11 of 12 months in 2018 and reached its lowest level since February 2016 in December. Germany, Europe’s largest economy, posted the lowest PMI level in thirty-three months, also in December. The Organisation for Economic Co-operation and Development Composite Leading Indicator also pointed to below-trend growth, and business sentiment worsened with confidence about the future receding to multi-year lows.
Inflation expectations increased, which is a positive sign in the context of the deflation fears that have persisted since the 2007-2008 financial crisis. However, rising inflation prompted the European Central Bank and other major central banks to begin tightening monetary policy. This marked a significant change in the investment landscape compared to the past decade.
Heightened geopolitical tensions further affected the Fund’s performance. The trade dispute between the United States and China, while not specifically a European issue, was nonetheless a source of uncertainty for the global economy and markets. At various points, stocks were also pressured by the ongoing Brexit negotiations, violent protests in France, and concerns about Italy’s rising government debt.
As would be expected in this challenging environment, the Fund experienced a loss in absolute terms. However, we were able to cushion some of the market’s downside through individual stock selection. Our stock picks outpaced the corresponding benchmark components in the industrials, information technology and materials sectors, among others, outweighing weaker positions in financials and consumer discretionary.
Wirecard AG, a German provider of outsourcing solutions for electronic payment transactions, was the top performer in both the information technology sector and the Fund as a whole. The company’s end markets continued to grow swiftly in conjunction with the expansion of e-commerce. In addition, we believe Wirecard AG demonstrated strong organic growth and an encouraging sales pipeline. Nemetsheck SE, a leader in software used in engineering and architecture, was another key contributor. The German company reported solid results, highlighted by accelerating revenues and improving operating margins.
Stock selection in the United Kingdom aided relative performance, as well. The pest-control specialist Rentokil Initial PLC, which successfully expanded its service model to identify and treat insect and rodent infestation problems before they occur, was the top U.K. contributor in the Fund’s portfolio. The company exhibited strong revenue growth, rising profit margins and a solid pipeline of new business.
eDreams ODIGEO, a leading European online travel agent based in Luxembourg, was the largest detractor from the Fund’s performance. The stock had been bid up in anticipation of a takeover, so the company’s announcement that it intended to remain independent led to a sharp decline in its shares. Kindred Group PLC, a Swedish company that operates a number of online gambling platforms across Europe, detracted from performance as concerns about new regulations in the U.K. compressed valuations for the gaming sector, sending its shares lower. The Fund’s investment in Vapiano SE, a fast-casual restaurant operator based in Germany, was another detractor of note. The stock declined after the company reported slowing growth and negative same-store sales for the first half of the year. At the regional level, stock selection in the Nordic and Southern European regions was the most notable detractor.
Columbia Acorn Family of Funds | Annual Report 2018
| 37 |
Manager Discussion of Fund Performance (continued)
Columbia Acorn European FundSM
Sector allocations, while a by-product of our bottom-up stock selection process, can nonetheless affect results. This proved to be the case in the past year, as the Fund was hurt by the combination of its overweight positions in the economically sensitive industrials and information technology sectors, together with its underweight in the defensive real estate sector and a lack of exposure to utilities. We remain focused on companies with sustainable competitive advantages, entrepreneurial management and the potential to gain market share. We believe that niche companies in Europe that address changing circumstances in their end markets caused by technology, aging populations, tight labor markets or environmental and safety regulations can serve as a source of opportunity.
While 2018 was a difficult year for the markets, the economic situation in Europe looked to be less fragile than it was a decade ago. Enhanced bank oversight, improved current account balances and modest-to-significant economic reforms in several countries may lessen the impact of the next downturn. In addition, European equities continued to trade at a discount to their U.S. peers as well as their own historical valuations. As a result, we were able to find an abundance of opportunities for the Fund in fast-growing companies at compelling valuations. We believe our investment philosophy, which favors higher quality and structural growth (growth derived from structural shifts or changes in the economy) — as gauged by metrics such as return on invested capital, revenue and earnings growth and low levels of debt — is well suited for this environment.
Marketrisk may affect a single issuer, sector of the economy, industry or the market as a whole.Internationalinvesting involves certain risks and volatility due to potential political, economic or currency instabilities and different, potentially less stringent, financial and accounting standards than those generally applicable to U.S. issuers. Investments insmall- and mid-cap companies involve risks and volatility and possible illiquidity greater than investments in larger, more established companies. See the Fund’s prospectus for more information on these and other risks.
The views expressed in this report reflect the current views of the respective parties. These views are not guarantees of future performance and involve certain risks, uncertainties and assumptions that are difficult to predict, so actual outcomes and results may differ significantly from the views expressed. These views are subject to change at any time based upon economic, market or other conditions and the respective parties disclaim any responsibility to update such views. These views may not be relied on as investment advice and, because investment decisions for a Columbia Acorn Fund are based on numerous factors, may not be relied on as an indication of trading intent on behalf of any particular Columbia Acorn Fund. References to specific securities should not be construed as a recommendation or investment advice.
| 38 | Columbia Acorn Family of Funds | Annual Report 2018 |
2018 Year-End Distributions
The following table details the year-end distributions for the Columbia Acorn Funds. The information is provided on a per share basis for each share class of the Funds.
| Fund | Ordinary
income | Short-term
capital
gain | Long-term
capital
gain | Record
date | Ex-dividend
date | Payable
date |
| Columbia Acorn® Fund | | | | | | |
| Class A | None | None | 1.10962 | 12/10/2018 | 12/11/2018 | 12/11/2018 |
| Advisor Class | None | None | 1.10962 | 12/10/2018 | 12/11/2018 | 12/11/2018 |
| Class C | None | None | 1.10962 | 12/10/2018 | 12/11/2018 | 12/11/2018 |
| Institutional Class | None | None | 1.10962 | 12/10/2018 | 12/11/2018 | 12/11/2018 |
| Institutional 2 Class | None | None | 1.10962 | 12/10/2018 | 12/11/2018 | 12/11/2018 |
| Institutional 3 Class | None | None | 1.10962 | 12/10/2018 | 12/11/2018 | 12/11/2018 |
| Columbia Acorn International® | | | | | | |
| Class A | 0.04809 | None | 8.18055 | 12/17/2018 | 12/18/2018 | 12/18/2018 |
| Advisor Class | 0.16183 | None | 8.18055 | 12/17/2018 | 12/18/2018 | 12/18/2018 |
| Class C | None | None | 8.18055 | 12/17/2018 | 12/18/2018 | 12/18/2018 |
| Institutional Class | 0.16183 | None | 8.18055 | 12/17/2018 | 12/18/2018 | 12/18/2018 |
| Institutional 2 Class | 0.18913 | None | 8.18055 | 12/17/2018 | 12/18/2018 | 12/18/2018 |
| Institutional 3 Class | 0.21188 | None | 8.18055 | 12/17/2018 | 12/18/2018 | 12/18/2018 |
| Class R | None | None | 8.18055 | 12/17/2018 | 12/18/2018 | 12/18/2018 |
| Columbia Acorn USA® | | | | | | |
| Class A | None | 0.02122 | 1.59600 | 12/10/2018 | 12/11/2018 | 12/11/2018 |
| Advisor Class | None | 0.06105 | 1.59600 | 12/10/2018 | 12/11/2018 | 12/11/2018 |
| Class C | None | None | 1.59600 | 12/10/2018 | 12/11/2018 | 12/11/2018 |
| Institutional Class | None | 0.06105 | 1.59600 | 12/10/2018 | 12/11/2018 | 12/11/2018 |
| Institutional 2 Class | None | 0.07379 | 1.59600 | 12/10/2018 | 12/11/2018 | 12/11/2018 |
| Institutional 3 Class | None | 0.08175 | 1.59600 | 12/10/2018 | 12/11/2018 | 12/11/2018 |
| Columbia Acorn International SelectSM | | | | | | |
| Class A | None | None | 1.85474 | 12/17/2018 | 12/18/2018 | 12/18/2018 |
| Advisor Class | None | None | 1.85474 | 12/17/2018 | 12/18/2018 | 12/18/2018 |
| Class C | None | None | 1.85474 | 12/17/2018 | 12/18/2018 | 12/18/2018 |
| Institutional Class | None | None | 1.85474 | 12/17/2018 | 12/18/2018 | 12/18/2018 |
| Institutional 2 Class | None | None | 1.85474 | 12/17/2018 | 12/18/2018 | 12/18/2018 |
| Institutional 3 Class | None | None | 1.85474 | 12/17/2018 | 12/18/2018 | 12/18/2018 |
| Columbia Acorn SelectSM | | | | | | |
| Class A | None | 0.11555 | 1.43219 | 12/10/2018 | 12/11/2018 | 12/11/2018 |
| Advisor Class | None | 0.11555 | 1.43219 | 12/10/2018 | 12/11/2018 | 12/11/2018 |
| Class C | None | 0.11555 | 1.43219 | 12/10/2018 | 12/11/2018 | 12/11/2018 |
| Institutional Class | None | 0.11555 | 1.43219 | 12/10/2018 | 12/11/2018 | 12/11/2018 |
| Institutional 2 Class | None | 0.11555 | 1.43219 | 12/10/2018 | 12/11/2018 | 12/11/2018 |
| Institutional 3 Class | None | 0.11555 | 1.43219 | 12/10/2018 | 12/11/2018 | 12/11/2018 |
| Columbia Thermostat FundSM | | | | | | |
| Class A | 0.25408 | 0.10241 | 0.19687 | 12/20/2018 | 12/21/2018 | 12/21/2018 |
| Advisor Class | 0.29031 | 0.10241 | 0.19687 | 12/20/2018 | 12/21/2018 | 12/21/2018 |
| Class C | 0.14539 | 0.10241 | 0.19687 | 12/20/2018 | 12/21/2018 | 12/21/2018 |
| Institutional Class | 0.29031 | 0.10241 | 0.19687 | 12/20/2018 | 12/21/2018 | 12/21/2018 |
| Institutional 2 Class | 0.29610 | 0.10241 | 0.19687 | 12/20/2018 | 12/21/2018 | 12/21/2018 |
| Institutional 3 Class | 0.30335 | 0.10241 | 0.19687 | 12/20/2018 | 12/21/2018 | 12/21/2018 |
Columbia Acorn Family of Funds | Annual Report 2018
| 39 |
2018 Year-End Distributions (continued)
| Fund | Ordinary
income | Short-term
capital
gain | Long-term
capital
gain | Record
date | Ex-dividend
date | Payable
date |
| Columbia Acorn Emerging Markets FundSM | | | | | | |
| Class A | 0.17166 | None | None | 12/17/2018 | 12/18/2018 | 12/18/2018 |
| Advisor Class | 0.20305 | None | None | 12/17/2018 | 12/18/2018 | 12/18/2018 |
| Class C | 0.07750 | None | None | 12/17/2018 | 12/18/2018 | 12/18/2018 |
| Institutional Class | 0.20305 | None | None | 12/17/2018 | 12/18/2018 | 12/18/2018 |
| Institutional 2 Class | 0.21184 | None | None | 12/17/2018 | 12/18/2018 | 12/18/2018 |
| Institutional 3 Class | 0.21812 | None | None | 12/17/2018 | 12/18/2018 | 12/18/2018 |
| Columbia Acorn European FundSM | | | | | | |
| Class A | None | None | None | 12/17/2018 | 12/18/2018 | 12/18/2018 |
| Advisor Class | None | None | None | 12/17/2018 | 12/18/2018 | 12/18/2018 |
| Class C | None | None | None | 12/17/2018 | 12/18/2018 | 12/18/2018 |
| Institutional Class | None | None | None | 12/17/2018 | 12/18/2018 | 12/18/2018 |
| Institutional 2 Class | None | None | None | 12/17/2018 | 12/18/2018 | 12/18/2018 |
| Institutional 3 Class | None | None | None | 12/17/2018 | 12/18/2018 | 12/18/2018 |
| 40 | Columbia Acorn Family of Funds | Annual Report 2018 |
Understanding Your Fund’s Expenses
(Unaudited)
As a shareholder, you incur two types of costs. There are shareholder transaction costs, which generally include sales charges on purchases and may include redemption fees. There are also ongoing fund costs, which generally include investment advisory fees, distribution and service (Rule 12b-1) fees, and other Fund expenses. The following information is intended to help you understand your ongoing costs (in dollars) of investing in the Fund and to help you compare these costs with the ongoing costs of investing in other mutual funds.
Analyzing your Fund’s expenses
To illustrate these ongoing costs, we have provided examples and calculated the expenses paid by investors in each share class of the Funds during the period. The actual and hypothetical information in the tables is based on an initial investment of $1,000 at the beginning of the period indicated and held for the entire period. Expense information is calculated two ways and each method provides you with different information. The amount listed in the “Actual” column is calculated using the Funds’ actual operating expenses and total return for the period. You may use the Actual information, together with the amount invested, to estimate the expenses that you paid over the period. Simply divide your account value by $1,000 (for example, an $8,600 account value divided by $1,000 = 8.6), then multiply the results by the expenses paid during the period under the Actual column. The amount listed in the “Hypothetical” column assumes a 5% annual rate of return before expenses (which is not the Funds’ actual return) and then applies the Funds’ actual expense ratio for the period to the hypothetical return. You should not use the hypothetical account values and expenses to estimate either your actual account balance at the end of the period or the expenses you paid during the period. See “Compare with other funds” below for details on how to use the hypothetical data.
In addition to the ongoing expenses which the Funds bear directly, Columbia Thermostat Fund’s shareholders indirectly bear the Fund’s allocable share of the costs and expenses of each underlying fund in which the Fund invests. You can also estimate the effective expenses paid during the period, which includes the indirect fees associated with investing in the underlying funds, by using the amounts listed in the effective expenses paid during the period column in the “Fund of Funds” table.
Compare with other funds
Since all mutual funds are required to include the same hypothetical calculations about expenses in shareholder reports, you can use this information to compare the ongoing cost of investing in the Funds with other funds. To do so, compare the hypothetical example with the 5% hypothetical examples that appear in the shareholder reports of other funds. As you compare hypothetical examples of other funds, it is important to note that hypothetical examples are meant to highlight the ongoing costs of investing in a fund only and do not reflect any transaction costs, such as sales charges, or redemption or exchange fees. Therefore, the hypothetical calculations are useful in comparing ongoing costs only, and will not help you determine the relative total costs of owning different funds. If transaction costs were included in these calculations, your costs would be higher.
| July 1, 2018 — December 31, 2018 |
| | Account value at the
beginning of the
period ($) | Account value at the
end of the
period ($) | Expenses paid during
the period ($) | Fund’s annualized
expense ratio (%) |
| | Actual | Hypothetical | Actual | Hypothetical | Actual | Hypothetical | Actual |
| Columbia Acorn® Fund |
| Class A | 1,000.00 | 1,000.00 | 860.00 | 1,019.92 | 5.04 | 5.48 | 1.07 |
| Advisor Class | 1,000.00 | 1,000.00 | 860.70 | 1,021.19 | 3.87 | 4.20 | 0.82 |
| Class C | 1,000.00 | 1,000.00 | 857.20 | 1,016.12 | 8.57 | 9.30 | 1.82 |
| Institutional Class | 1,000.00 | 1,000.00 | 860.40 | 1,021.19 | 3.87 | 4.20 | 0.82 |
| Institutional 2 Class | 1,000.00 | 1,000.00 | 860.80 | 1,021.29 | 3.77 | 4.10 | 0.80 |
| Institutional 3 Class | 1,000.00 | 1,000.00 | 860.80 | 1,021.54 | 3.54 | 3.84 | 0.75 |
Columbia Acorn Family of Funds | Annual Report 2018
| 41 |
Understanding Your Fund’s Expenses (continued)
(Unaudited)
| July 1, 2018 — December 31, 2018 |
| | Account value at the
beginning of the
period ($) | Account value at the
end of the
period ($) | Expenses paid during
the period ($) | Fund’s annualized
expense ratio (%) |
| | Actual | Hypothetical | Actual | Hypothetical | Actual | Hypothetical | Actual |
| Columbia Acorn International® |
| Class A | 1,000.00 | 1,000.00 | 839.20 | 1,019.01 | 5.83 | 6.40 | 1.25 |
| Advisor Class | 1,000.00 | 1,000.00 | 840.50 | 1,020.32 | 4.62 | 5.07 | 0.99 |
| Class C | 1,000.00 | 1,000.00 | 836.00 | 1,015.21 | 9.31 | 10.21 | 2.00 |
| Institutional Class | 1,000.00 | 1,000.00 | 840.20 | 1,020.27 | 4.66 | 5.12 | 1.00 |
| Institutional 2 Class | 1,000.00 | 1,000.00 | 840.50 | 1,020.58 | 4.38 | 4.81 | 0.94 |
| Institutional 3 Class | 1,000.00 | 1,000.00 | 840.70 | 1,020.83 | 4.15 | 4.56 | 0.89 |
| Class R | 1,000.00 | 1,000.00 | 838.20 | 1,017.74 | 6.99 | 7.67 | 1.50 |
| Columbia Acorn USA® |
| Class A | 1,000.00 | 1,000.00 | 849.10 | 1,018.20 | 6.61 | 7.21 | 1.41 |
| Advisor Class | 1,000.00 | 1,000.00 | 849.80 | 1,019.46 | 5.44 | 5.94 | 1.16 |
| Class C | 1,000.00 | 1,000.00 | 845.80 | 1,014.39 | 10.10 | 11.03 | 2.16 |
| Institutional Class | 1,000.00 | 1,000.00 | 849.60 | 1,019.46 | 5.44 | 5.94 | 1.16 |
| Institutional 2 Class | 1,000.00 | 1,000.00 | 849.90 | 1,019.87 | 5.06 | 5.53 | 1.08 |
| Institutional 3 Class | 1,000.00 | 1,000.00 | 850.00 | 1,020.12 | 4.83 | 5.27 | 1.03 |
| Columbia Acorn International SelectSM |
| Class A | 1,000.00 | 1,000.00 | 859.90 | 1,018.25 | 6.60 | 7.16 | 1.40 |
| Advisor Class | 1,000.00 | 1,000.00 | 861.10 | 1,019.51 | 5.42 | 5.89 | 1.15 |
| Class C | 1,000.00 | 1,000.00 | 857.10 | 1,014.45 | 10.12 | 10.98 | 2.15 |
| Institutional Class | 1,000.00 | 1,000.00 | 861.10 | 1,019.51 | 5.42 | 5.89 | 1.15 |
| Institutional 2 Class | 1,000.00 | 1,000.00 | 861.40 | 1,019.97 | 5.00 | 5.43 | 1.06 |
| Institutional 3 Class | 1,000.00 | 1,000.00 | 861.60 | 1,020.22 | 4.76 | 5.17 | 1.01 |
| Columbia Acorn SelectSM |
| Class A | 1,000.00 | 1,000.00 | 822.20 | 1,019.56 | 5.26 | 5.83 | 1.14 |
| Advisor Class | 1,000.00 | 1,000.00 | 823.50 | 1,020.83 | 4.11 | 4.56 | 0.89 |
| Class C | 1,000.00 | 1,000.00 | 819.20 | 1,015.76 | 8.71 | 9.65 | 1.89 |
| Institutional Class | 1,000.00 | 1,000.00 | 823.50 | 1,020.83 | 4.11 | 4.56 | 0.89 |
| Institutional 2 Class | 1,000.00 | 1,000.00 | 823.30 | 1,021.14 | 3.84 | 4.25 | 0.83 |
| Institutional 3 Class | 1,000.00 | 1,000.00 | 824.40 | 1,021.39 | 3.61 | 4.00 | 0.78 |
| Columbia Acorn Emerging Markets FundSM |
| Class A | 1,000.00 | 1,000.00 | 872.30 | 1,017.64 | 7.21 | 7.77 | 1.52 |
| Advisor Class | 1,000.00 | 1,000.00 | 873.10 | 1,018.91 | 6.03 | 6.50 | 1.27 |
| Class C | 1,000.00 | 1,000.00 | 869.10 | 1,013.84 | 10.75 | 11.59 | 2.27 |
| Institutional Class | 1,000.00 | 1,000.00 | 873.90 | 1,018.91 | 6.03 | 6.50 | 1.27 |
| Institutional 2 Class | 1,000.00 | 1,000.00 | 873.90 | 1,019.31 | 5.65 | 6.09 | 1.19 |
| Institutional 3 Class | 1,000.00 | 1,000.00 | 873.40 | 1,019.56 | 5.41 | 5.83 | 1.14 |
| Columbia Acorn European FundSM |
| Class A | 1,000.00 | 1,000.00 | 807.50 | 1,017.99 | 6.64 | 7.42 | 1.45 |
| Advisor Class | 1,000.00 | 1,000.00 | 808.70 | 1,019.26 | 5.50 | 6.14 | 1.20 |
| Class C | 1,000.00 | 1,000.00 | 804.70 | 1,014.19 | 10.06 | 11.23 | 2.20 |
| Institutional Class | 1,000.00 | 1,000.00 | 808.70 | 1,019.26 | 5.50 | 6.14 | 1.20 |
| Institutional 2 Class | 1,000.00 | 1,000.00 | 809.20 | 1,019.62 | 5.18 | 5.78 | 1.13 |
| Institutional 3 Class | 1,000.00 | 1,000.00 | 809.30 | 1,019.82 | 5.00 | 5.58 | 1.09(a) |
| 42 | Columbia Acorn Family of Funds | Annual Report 2018 |
Understanding Your Fund’s Expenses (continued)
(Unaudited)
Fund of Funds—Columbia Thermostat Fund
| July 1, 2018 — December 31, 2018 |
| | Account value at the
beginning of the
period ($) | Account value at the
end of the
period ($) | Expenses paid during
the period ($) | Fund’s annualized
expense ratio (%) | Effective expenses
paid during the
period ($) | Fund’s effective
annualized
expense ratio (%) |
| | Actual | Hypothetical | Actual | Hypothetical | Actual | Hypothetical | Actual | Actual | Hypothetical | Actual |
| Class A | 1,000.00 | 1,000.00 | 993.70 | 1,022.81 | 2.53 | 2.56 | 0.50 | 4.40 | 4.46 | 0.87 |
| Advisor Class | 1,000.00 | 1,000.00 | 995.50 | 1,024.08 | 1.26 | 1.28 | 0.25 | 3.14 | 3.18 | 0.62 |
| Class C | 1,000.00 | 1,000.00 | 991.00 | 1,019.01 | 6.31 | 6.40 | 1.25 | 8.17 | 8.29 | 1.62 |
| Institutional Class | 1,000.00 | 1,000.00 | 995.40 | 1,024.08 | 1.26 | 1.28 | 0.25 | 3.14 | 3.18 | 0.62 |
| Institutional 2 Class | 1,000.00 | 1,000.00 | 995.90 | 1,024.33 | 1.01 | 1.03 | 0.20 | 2.88 | 2.92 | 0.57 |
| Institutional 3 Class | 1,000.00 | 1,000.00 | 996.40 | 1,024.58 | 0.76 | 0.77 | 0.15 | 2.63 | 2.67 | 0.52 |
(a) For the period July 1, 2018 through December 31, 2018, the Fund’s annualized expense ratio based on actual expenses paid during the period was 1.09%. The Fund’s expense ratio may fluctuate during the period; however, it will not exceed its annual expense cap of 1.08% for the fiscal year.
Expenses paid during the period are equal to the annualized expense ratio, multiplied by the average account value over the period and then multiplied by the number of days in the Fund’s most recent fiscal half year and divided by 365.
Except with respect to Columbia Thermostat Fund, expenses do not include any fees and expenses incurred indirectly by a Fund from the underlying funds in which the Fund may invest (also referred to as “acquired funds”), including affiliated and non-affiliated pooled investments vehicles (including mutual funds and exchange traded funds).
In the case of Columbia Thermostat Fund, effective expenses paid during the period and the Fund’s effective annualized expense ratio include expenses borne directly by the class plus the Fund’s pro rata portion of the ongoing expenses charged by the underlying funds in which it invests using the expense ratio of each class of each underlying fund as of the underlying fund’s most recent shareholder report.
Had the investment manager and/or certain of its affiliates not waived/reimbursed certain fees and expenses for the Funds, account value at the end of the period would have been reduced.
Columbia Acorn Family of Funds | Annual Report 2018
| 43 |
Portfolio of Investments
Columbia Acorn® Fund, December 31, 2018
(Percentages represent value of investments compared to net assets)
Investments in securities
| Common Stocks 98.9% |
| Issuer | Shares | Value ($) |
| Communication Services 0.8% |
| Media 0.8% |
Cable One, Inc.
Cable company | 35,546 | 29,151,275 |
| Total Communication Services | 29,151,275 |
| Consumer Discretionary 21.0% |
| Auto Components 2.8% |
Dorman Products, Inc.(a)
Automotive products and home hardware | 482,776 | 43,459,496 |
Gentex Corp.
Products that use electro-optic technology | 1,142,654 | 23,093,037 |
LCI Industries
Recreational vehicles and equipment | 309,638 | 20,683,819 |
Tenneco, Inc.
Emission control and ride control products and systems | 656,316 | 17,976,495 |
| Total | | 105,212,847 |
| Distributors 1.6% |
Pool Corp.
Swimming pool supplies, equipment and leisure products | 412,603 | 61,333,436 |
| Diversified Consumer Services 3.7% |
Adtalem Global Education, Inc.(a)
Higher education institutions | 651,126 | 30,811,282 |
Bright Horizons Family Solutions, Inc.(a)
Child care and early education services | 405,058 | 45,143,714 |
Grand Canyon Education, Inc.(a)
Online post secondary education | 482,511 | 46,388,608 |
Weight Watchers International, Inc.(a)
Weight control programs | 507,140 | 19,550,247 |
| Total | | 141,893,851 |
| Hotels, Restaurants & Leisure 5.1% |
Dave & Buster’s Entertainment, Inc.
Venues that combine dining and entertainment for adults and families | 668,512 | 29,788,895 |
Domino’s Pizza, Inc.
Network of company-owned and franchise Domino’s Pizza stores | 91,833 | 22,773,665 |
Dunkin’ Brands Group, Inc.
Quick service restaurants serving hot and cold coffee and baked goods | 471,539 | 30,235,081 |
Extended Stay America, Inc.
Hotels and motels | 1,680,793 | 26,052,291 |
| Common Stocks (continued) |
| Issuer | Shares | Value ($) |
Texas Roadhouse, Inc.
Moderately priced, full service restaurant chain | 906,671 | 54,128,259 |
Vail Resorts, Inc.
Operates resorts globally | 142,334 | 30,006,854 |
| Total | | 192,985,045 |
| Household Durables 2.3% |
Cavco Industries, Inc.(a)
Designs and manufactures systems-built structures | 166,456 | 21,702,533 |
iRobot Corp.(a),(b)
Manufactures robots for cleaning | 309,745 | 25,938,046 |
NVR, Inc.(a)
Builds and markets homes and conducts mortgage banking activities | 16,440 | 40,064,116 |
| Total | | 87,704,695 |
| Internet & Direct Marketing Retail 2.1% |
Liberty Expedia Holdings, Inc., Class A(a)
Tools and information to research, plan, book and experience travel | 765,000 | 29,919,150 |
Quotient Technology, Inc.(a)
Operates a promotion platform | 2,037,710 | 21,762,743 |
Wayfair, Inc., Class A(a)
Retails household goods online | 291,219 | 26,233,007 |
| Total | | 77,914,900 |
| Leisure Products 0.8% |
Brunswick Corp.
Consumer products serving the outdoor and indoor active recreation markets | 680,497 | 31,609,086 |
| Specialty Retail 1.7% |
Five Below, Inc.(a)
Specialty value retailer | 186,284 | 19,060,579 |
Monro, Inc.
Automotive undercar repair and tire services | 394,826 | 27,144,287 |
Tractor Supply Co.
Retail farm store chain | 228,556 | 19,070,713 |
| Total | | 65,275,579 |
| Textiles, Apparel & Luxury Goods 0.9% |
Carter’s, Inc.
Markets baby and young children’s apparel | 398,200 | 32,501,084 |
| Total Consumer Discretionary | 796,430,523 |
The accompanying Notes to Financial Statements are an integral part of this statement.
| 44 | Columbia Acorn Family of Funds | Annual Report 2018 |
Portfolio of Investments (continued)
Columbia Acorn® Fund, December 31, 2018
| Common Stocks (continued) |
| Issuer | Shares | Value ($) |
| Consumer Staples 2.8% |
| Household Products 1.5% |
Central Garden & Pet Co.(a),(c)
Lawn, garden & pet supply products | 683,522 | 23,547,333 |
WD-40 Co.
Multi-purpose lubricant products and heavy-duty hand cleaners | 178,785 | 32,764,139 |
| Total | | 56,311,472 |
| Personal Products 1.3% |
Inter Parfums, Inc.
Fragrances and related products | 745,630 | 48,890,959 |
| Total Consumer Staples | 105,202,431 |
| Energy 1.4% |
| Energy Equipment & Services 0.4% |
Core Laboratories NV
Reservoir description, production enhancement, and reservoir management services | 256,000 | 15,272,960 |
| Oil, Gas & Consumable Fuels 1.0% |
Diamondback Energy, Inc.
Independent oil and natural gas company | 283,894 | 26,316,974 |
Parsley Energy, Inc., Class A(a)
Oil and natural gas company | 875,000 | 13,982,500 |
| Total | | 40,299,474 |
| Total Energy | 55,572,434 |
| Financials 9.3% |
| Banks 1.5% |
BOK Financial Corp.
Multi-bank holding company | 539,361 | 39,551,342 |
SVB Financial Group(a)
Holding company for Silicon Valley Bank | 94,722 | 17,989,603 |
| Total | | 57,540,945 |
| Capital Markets 6.2% |
Affiliated Managers Group, Inc.
Global asset management company that invests in boutique investment management firms | 386,344 | 37,645,359 |
Ares Management Corp., Class A
Asset management firm | 2,295,000 | 40,805,100 |
Eaton Vance Corp.
Creates, markets, and manages mutual funds | 839,859 | 29,546,240 |
Factset Research Systems, Inc.
Global economic and financial data to analysts, investment bankers, and financial professionals | 90,205 | 18,052,727 |
Houlihan Lokey, Inc.
Investment bank | 630,844 | 23,215,059 |
| Common Stocks (continued) |
| Issuer | Shares | Value ($) |
Lazard Ltd., Class A
Corporate Advisory & Asset Management | 818,411 | 30,207,550 |
MarketAxess Holdings, Inc.
Electronic, multi-dealer to client platform for bond trading | 119,765 | 25,307,542 |
Raymond James Financial, Inc.
Financial services to individuals, corporations, and municipalities | 430,571 | 32,038,788 |
| Total | | 236,818,365 |
| Consumer Finance 0.7% |
Credit Acceptance Corp.(a)
Funding, receivables management, collection, sales training, and related services to automobile dealers | 66,304 | 25,312,215 |
| Insurance 0.9% |
Primerica, Inc.
Distributes financial products to middle income households | 338,320 | 33,057,247 |
| Total Financials | 352,728,772 |
| Health Care 19.9% |
| Biotechnology 4.0% |
Agios Pharmaceuticals, Inc.(a)
Therapeutics in the field of cancer metabolism | 470,809 | 21,709,003 |
Alkermes PLC(a)
Develops treatments for central nervous system disorders | 735,000 | 21,689,850 |
Exact Sciences Corp.(a)
Developing and commercializing a test for the early detection and prevention of colorectal cancer | 401,500 | 25,334,650 |
Ligand Pharmaceuticals, Inc.(a)
Drugs that regulate hormone activated intracellular receptors | 242,158 | 32,860,841 |
Loxo Oncology, Inc.(a)
Researches and develops cancer drugs | 187,805 | 26,305,846 |
Seattle Genetics, Inc.(a)
Monoclonal antibody-based drugs to treat cancer and related diseases | 447,127 | 25,334,216 |
| Total | | 153,234,406 |
The accompanying Notes to Financial Statements are an integral part of this statement.
Columbia Acorn Family of Funds | Annual Report 2018
| 45 |
Portfolio of Investments (continued)
Columbia Acorn® Fund, December 31, 2018
| Common Stocks (continued) |
| Issuer | Shares | Value ($) |
| Health Care Equipment & Supplies 6.4% |
AxoGen, Inc.(a)
Technologies for peripheral nerve reconstruction and regeneration | 1,032,339 | 21,090,686 |
Haemonetics Corp.(a)
Automated blood processing systems | 228,474 | 22,858,824 |
Insulet Corp.(a)
Insulin infusion systems | 210,000 | 16,657,200 |
iRhythm Technologies, Inc.(a)
Medical instruments | 525,987 | 36,545,577 |
LivaNova PLC(a)
Medical technology focusing on neuromodulation, cardiac surgery and rhythm management | 253,377 | 23,176,394 |
Masimo Corp.(a)
Medical signal processing and sensor technology for non-invasive monitoring of physiological parameters | 490,627 | 52,678,621 |
Penumbra, Inc.(a)
Peripheral vascular & neurovascular devices | 240,118 | 29,342,419 |
Tactile Systems Technology, Inc.(a)
Technology for treating lymphedema, chronic swelling & venous ulcers | 475,273 | 21,648,685 |
Varian Medical Systems, Inc.(a)
Medical equipment | 175,856 | 19,926,243 |
| Total | | 243,924,649 |
| Health Care Providers & Services 5.4% |
Amedisys, Inc.(a)
Provider of alternate-site health care services | 131,053 | 15,347,617 |
AMN Healthcare Services, Inc.(a)
Temporary healthcare staffing | 476,056 | 26,973,333 |
Chemed Corp.
Hospice and palliative care services | 167,778 | 47,528,152 |
Encompass Health Corp.
Inpatient rehabilitative healthcare services | 647,630 | 39,958,771 |
HealthEquity, Inc.(a)
Technology-enabled services platforms for consumers to make healthcare saving and spending decisions | 255,855 | 15,261,751 |
LHC Group, Inc.(a)
Post-acute healthcare services | 207,075 | 19,440,201 |
Premier, Inc.(a)
Healthcare services | 1,074,376 | 40,127,943 |
| Total | | 204,637,768 |
| Common Stocks (continued) |
| Issuer | Shares | Value ($) |
| Health Care Technology 1.4% |
Evolent Health, Inc., Class A(a)
Purpose-built platform enables providers to migrate their payment models | 909,064 | 18,135,827 |
Veeva Systems Inc., Class A(a)
Cloud-based business services | 365,366 | 32,634,491 |
| Total | | 50,770,318 |
| Life Sciences Tools & Services 2.1% |
Bio-Techne Corp.
Biotechnology products and clinical diagnostic controls | 238,311 | 34,488,368 |
Pra Health Sciences, Inc.(a)
Global contract research organization | 490,930 | 45,145,923 |
| Total | | 79,634,291 |
| Pharmaceuticals 0.6% |
Jazz Pharmaceuticals PLC(a)
Specialty biopharmaceuticals | 191,946 | 23,793,626 |
| Total Health Care | 755,995,058 |
| Industrials 16.5% |
| Aerospace & Defense 0.6% |
HEICO Corp., Class A
Aerospace products and services | 367,072 | 23,125,536 |
| Air Freight & Logistics 0.6% |
Expeditors International of Washington, Inc.
Global logistics company | 318,502 | 21,686,801 |
| Commercial Services & Supplies 1.2% |
Copart, Inc.(a)
Services to process and sell salvage vehicles through auctions | 422,925 | 20,207,357 |
Unifirst Corp.
Workplace uniforms and protective clothing | 193,302 | 27,655,717 |
| Total | | 47,863,074 |
The accompanying Notes to Financial Statements are an integral part of this statement.
| 46 | Columbia Acorn Family of Funds | Annual Report 2018 |
Portfolio of Investments (continued)
Columbia Acorn® Fund, December 31, 2018
| Common Stocks (continued) |
| Issuer | Shares | Value ($) |
| Machinery 8.0% |
Gardner Denver Holdings, Inc.(a)
Vacuum systems, bottle blowers, pumps and air & gas compressors | 1,818,560 | 37,189,552 |
Graco, Inc.
Technology for the management of fluids in industrial and commercial applications | 893,030 | 37,373,306 |
ITT, Inc.
Engineered components & customized technology solutions | 736,968 | 35,573,445 |
Nordson Corp.
Systems that apply adhesives, sealants, and coatings to products during manufacturing | 277,134 | 33,075,943 |
Oshkosh Corp.
Fire and emergency apparatuses and specialty commercial, and military trucks | 241,762 | 14,822,428 |
Toro Co. (The)
Turf equipment | 1,094,231 | 61,145,628 |
WABCO Holdings, Inc.(a)
Electronic braking, stability, suspension, and transmission control systems commercial vehicles | 371,655 | 39,893,448 |
Woodward, Inc.
Energy control systems and components for aircraft, industrial engines and turbines | 605,374 | 44,973,234 |
| Total | | 304,046,984 |
| Professional Services 2.5% |
CoStar Group, Inc.(a)
Provides building-specific information to the United States commercial real estate industry and related industries | 46,316 | 15,624,239 |
Exponent, Inc.
Science and engineering consulting firm | 412,000 | 20,892,520 |
ICF International, Inc.
Management, technology, policy consulting, and implementation services | 297,984 | 19,303,403 |
ManpowerGroup, Inc.
Non-governmental employment services | 290,452 | 18,821,290 |
Robert Half International, Inc.
Temporary and permanent staffing services | 357,119 | 20,427,207 |
| Total | | 95,068,659 |
| Road & Rail 2.3% |
JB Hunt Transport Services, Inc.
Logistics services | 161,937 | 15,066,619 |
Old Dominion Freight Line, Inc.
Inter-regional and multi-regional motor carrier | 581,778 | 71,843,765 |
| Total | | 86,910,384 |
| Common Stocks (continued) |
| Issuer | Shares | Value ($) |
| Trading Companies & Distributors 1.3% |
SiteOne Landscape Supply, Inc.(a)
Landscape supplies | 349,614 | 19,323,166 |
Watsco, Inc.
Air conditioning, heating, and refrigeration equipment | 221,628 | 30,837,320 |
| Total | | 50,160,486 |
| Total Industrials | 628,861,924 |
| Information Technology 20.0% |
| Electronic Equipment, Instruments & Components 1.7% |
Cognex Corp.
Machine vision systems | 407,000 | 15,738,690 |
Coherent, Inc.(a)
Laser-based photonic products | 140,000 | 14,799,400 |
ePlus, Inc.(a)
Provides IT hardware, software and services | 205,657 | 14,636,609 |
IPG Photonics Corp.(a)
High-power fiber lasers and amplifiers | 168,125 | 19,046,881 |
| Total | | 64,221,580 |
| IT Services 4.6% |
Black Knight, Inc.(a)
Integrated technology, work flow automation, data and analytic solutions | 832,215 | 37,499,608 |
Booz Allen Hamilton Holdings Corp.
Technology consulting services to the U.S. government in the defense, intelligence, and civil markets | 1,030,728 | 46,454,911 |
Broadridge Financial Solutions, Inc.
Technology-based outsourcing solutions to the financial services industry | 198,382 | 19,094,267 |
EPAM Systems, Inc.(a)
Provides software development, outsourcing services, e-business, enterprise relationship management and content management solutions | 481,460 | 55,854,175 |
Science Applications International Corp.
Scientific, Engineering and technology consulting services | 255,000 | 16,243,500 |
| Total | | 175,146,461 |
The accompanying Notes to Financial Statements are an integral part of this statement.
Columbia Acorn Family of Funds | Annual Report 2018
| 47 |
Portfolio of Investments (continued)
Columbia Acorn® Fund, December 31, 2018
| Common Stocks (continued) |
| Issuer | Shares | Value ($) |
| Semiconductors & Semiconductor Equipment 4.0% |
Brooks Automation, Inc.
Automation solutions for the global semiconductor and related industries | 626,080 | 16,390,774 |
Inphi Corp.(a)
Analog semiconductor solutions | 765,916 | 24,624,199 |
MKS Instruments, Inc.
Instruments and components used to control and analyze gases in semiconductor manufacturing | 392,824 | 25,380,359 |
Monolithic Power Systems, Inc.
Power management solutions | 241,726 | 28,100,648 |
Semtech Corp.(a)
Analog and mixed-signal semiconductors | 568,617 | 26,082,462 |
Teradyne, Inc.
Semiconductor test products and services | 1,017,317 | 31,923,407 |
| Total | | 152,501,849 |
| Software 9.7% |
Alteryx, Inc., Class A(a)
Data storage, retrieval, management, reporting, and analytics solutions | 435,444 | 25,895,855 |
ANSYS, Inc.(a)
Software solutions for design analysis and optimization | 142,041 | 20,303,341 |
Blackline, Inc.(a)
Develops and markets enterprise software | 497,540 | 20,374,263 |
Cadence Design Systems, Inc.(a)
Software technology, design and consulting services and technology | 855,340 | 37,190,183 |
CyberArk Software Ltd.(a)
IT security solutions | 339,075 | 25,139,020 |
Guidewire Software, Inc.(a)
Enterprise software for the property and casualty insurance industry | 217,874 | 17,480,031 |
Mimecast Ltd.(a)
Cloud security and risk management services for corporate information and email | 866,150 | 29,128,624 |
MINDBODY, Inc., Class A(a)
Business management software | 554,360 | 20,178,704 |
Nutanix, Inc., Class A(a)
Enterprise cloud platforms | 598,803 | 24,904,217 |
Paylocity Holding Corp.(a)
Cloud-based payroll and human capital management | 332,000 | 19,989,720 |
Q2 Holdings, Inc.(a)
Secure, cloud-based virtual banking solutions | 524,168 | 25,972,524 |
Qualys, Inc.(a)
Information technology security risk and compliance management solutions | 570,134 | 42,611,815 |
| Common Stocks (continued) |
| Issuer | Shares | Value ($) |
Synopsys, Inc.(a)
Electronic design automation solutions | 189,948 | 16,001,220 |
Ultimate Software Group, Inc. (The)(a)
Software solutions | 86,686 | 21,226,801 |
Zuora, Inc., Class A(a)
Develops cloud based software | 1,125,000 | 20,407,500 |
| Total | | 366,803,818 |
| Total Information Technology | 758,673,708 |
| Materials 3.2% |
| Chemicals 2.0% |
Celanese Corp., Class A
Global integrated producer of chemicals and advanced materials | 261,463 | 23,523,826 |
Orion Engineered Carbons SA
Global supplier of Carbon Black | 705,000 | 17,822,400 |
Quaker Chemical Corp.
Custom-formulated chemical specialty products | 189,772 | 33,724,382 |
| Total | | 75,070,608 |
| Containers & Packaging 1.2% |
Avery Dennison Corp.
Pressure-sensitive materials and a variety of tickets, tags and labels | 515,799 | 46,334,224 |
| Total Materials | 121,404,832 |
| Real Estate 4.0% |
| Equity Real Estate Investment Trusts (REITS) 2.0% |
Coresite Realty Corp.
Develops, owns & operates data centers | 413,743 | 36,090,802 |
Lamar Advertising Co., Class A
Outdoor advertising structures | 582,133 | 40,271,961 |
| Total | | 76,362,763 |
| Real Estate Management & Development 2.0% |
Colliers International Group, Inc.
Commercial real estate, residential property management and property services | 331,000 | 18,218,240 |
Jones Lang LaSalle, Inc.
Real estate and investment management services | 465,756 | 58,964,709 |
| Total | | 77,182,949 |
| Total Real Estate | 153,545,712 |
Total Common Stocks
(Cost: $3,182,316,690) | 3,757,566,669 |
|
The accompanying Notes to Financial Statements are an integral part of this statement.
| 48 | Columbia Acorn Family of Funds | Annual Report 2018 |
Portfolio of Investments (continued)
Columbia Acorn® Fund, December 31, 2018
| Securities Lending Collateral 0.4% |
| | Shares | Value ($) |
Dreyfus Government Cash Management Fund, Institutional Shares, 2.372%(d),(e)
| 15,645,500 | 15,645,500 |
Total Securities Lending Collateral
(Cost: $15,645,500) | 15,645,500 |
|
| Money Market Funds 1.1% |
| | |
| Columbia Short-Term Cash Fund, 2.459%(c),(d) | 41,013,366 | 41,009,265 |
Total Money Market Funds
(Cost: $41,009,265) | 41,009,265 |
Total Investments in Securities
(Cost $3,238,971,455) | 3,814,221,434 |
| Obligation to Return Collateral for Securities Loaned | | (15,645,500) |
| Other Assets & Liabilities, Net | | (210,879) |
| Net Assets | $3,798,365,055 |
Notes to Portfolio of Investments
| (a) | Non-income producing security. |
| (b) | All or a portion of this security was on loan at December 31, 2018. The total market value of securities on loan at December 31, 2018 was $15,784,990. |
| (c) | As defined in the Investment Company Act of 1940, an affiliated company is one in which the Fund owns 5% or more of the company’s outstanding voting securities, or a company which is under common ownership or control with the Fund. Holdings and transactions in these affiliated companies during the year ended December 31, 2018 are as follows: |
| Issuer | Beginning
shares | Shares
purchased | Shares
sold | Ending
shares | Realized gain
(loss) —
affiliated
issuers ($) | Net change in
unrealized
appreciation
(depreciation) —
affiliated
issuers ($) | Dividend —
affiliated issuers
($) | Value —
affiliated
issuers
at end of
period ($) |
| Celldex Therapeutics, Inc† |
| | 8,126,489 | — | (8,126,489) | — | (17,193,753) | 1,501,758 | — | — |
| Central Garden & Pet Co.‡ |
| | — | 876,522 | (193,000) | 683,522 | (1,317,892) | (2,815,890) | — | 23,547,333 |
| Columbia Short-Term Cash Fund, 2.459% |
| | — | 911,010,611 | (869,997,245) | 41,013,366 | — | — | 626,471 | 41,009,265 |
| Total of Affiliated Transactions | | | | | (18,511,645) | (1,314,132) | 626,471 | 64,556,598 |
| † | Issuer was not an affiliate at the end of period. |
| ‡ | Issuer was not an affiliate at the beginning of period. |
| (d) | The rate shown is the seven-day current annualized yield at December 31, 2018. |
| (e) | Investment made with cash collateral received from securities lending activity. |
Fair value measurements
Various inputs are used in determining the value of the Fund’s investments, following the input prioritization hierarchy established by accounting principles generally accepted in the United States of America (GAAP). These inputs are summarized in the three broad levels listed below:
| ■ | Level 1 – quoted prices in active markets for identical securities |
| ■ | Level 2 – prices determined using other significant observable inputs (including quoted prices for similar securities, interest rates, prepayment speeds, credit risk and others) |
| ■ | Level 3 – prices determined using significant unobservable inputs where quoted prices or observable inputs are unavailable or less reliable (including management’s own assumptions about the factors market participants would use in pricing an investment) |
The accompanying Notes to Financial Statements are an integral part of this statement.
Columbia Acorn Family of Funds | Annual Report 2018
| 49 |
Portfolio of Investments (continued)
Columbia Acorn® Fund, December 31, 2018
Fair value measurements (continued)
The inputs or methodology used for valuing securities are not necessarily an indication of the risk associated with investing in those securities.
Examples of the types of securities in which the Fund would typically invest and how they are classified within this hierarchy are as follows. Typical Level 1 securities include exchange traded domestic equities, mutual funds whose net asset values are published each day and exchange traded foreign equities that are not typically statistically fair valued. Typical Level 2 securities include exchange traded foreign equities that are traded in the European region or Asia Pacific region time zones which are typically statistically fair valued, forward foreign currency exchange contracts and short-term investments valued at amortized cost. Additionally, securities fair valued by Columbia Wanger Asset Management’s Valuation Committee (the Committee) that rely on significant observable inputs are also included in Level 2. Typical Level 3 securities include any security fair valued by the Committee that relies on significant unobservable inputs.
Certain investments that have been measured at fair value using the net asset value (NAV) per share (or its equivalent) are not categorized in the fair value hierarchy. The fair value amounts presented in the table are intended to reconcile the fair value hierarchy to the amounts presented in the Portfolio of Investments. The Columbia Short-Term Cash Fund seeks to provide shareholders with maximum current income consistent with liquidity and stability of principal. Columbia Short-Term Cash Fund prices its shares with a floating NAV and no longer seeks to maintain a stable NAV.
The Committee is responsible for applying the Columbia Acorn Trust Portfolio Pricing Policy and the Columbia Wanger Asset Management pricing procedures (the Policies), which are approved by and subject to the oversight of the Board of Trustees.
The Committee meets as necessary, and no less frequently than quarterly, to determine fair values for securities for which market quotations are not readily available or for which Columbia Wanger Asset Management believes that available market quotations are unreliable. The Committee also reviews the continuing appropriateness of the Policies. In circumstances where a security has been fair valued, the Committee will also review the continuing appropriateness of the current value of the security. The Policies address, among other things: circumstances under which market quotations will be deemed readily available; selection of third party pricing vendors; appropriate pricing methodologies; events that require fair valuation and fair value techniques; circumstances under which securities will be deemed to pose a potential for stale pricing, including when securities are illiquid, restricted, or in default; and certain delegations of authority to determine fair values to the Fund’s investment manager. The Committee may also meet to discuss additional valuation matters, which may include review of back-testing results, review of time-sensitive information or approval of other valuation related actions, and to review the appropriateness of the Policies.
For investments categorized as Level 3, the significant unobservable inputs used in the fair value measurement of the Fund’s securities may include: (i) data specific to the issuer or comparable issuers, (ii) general market or specific sector news and (iii) quoted prices and specific or similar security transactions. The Committee considers this data and any changes from prior periods in order to assess the reasonableness of observable and unobservable inputs, any assumptions or internal models used to value those securities and changes in fair value. Significant changes in any of these factors could result in lower or higher fair value measurements. Various factors impact the frequency of monitoring (which may occur as often as daily), however the Committee may determine that changes to inputs, assumptions and models are not required with the same frequency.
The following table is a summary of the inputs used to value the Fund’s investments at December 31, 2018:
| | Level 1
quoted prices
in active
markets for
identical
assets ($) | Level 2
other
significant
observable
inputs ($) | Level 3
significant
unobservable
inputs ($) | Investments
measured at
net asset
value ($) | Total ($) |
| Investments in Securities | | | | | |
| Common Stocks | | | | | |
| Communication Services | 29,151,275 | — | — | — | 29,151,275 |
| Consumer Discretionary | 796,430,523 | — | — | — | 796,430,523 |
| Consumer Staples | 105,202,431 | — | — | — | 105,202,431 |
| Energy | 55,572,434 | — | — | — | 55,572,434 |
| Financials | 352,728,772 | — | — | — | 352,728,772 |
| Health Care | 755,995,058 | — | — | — | 755,995,058 |
| Industrials | 628,861,924 | — | — | — | 628,861,924 |
| Information Technology | 758,673,708 | — | — | — | 758,673,708 |
| Materials | 121,404,832 | — | — | — | 121,404,832 |
| Real Estate | 153,545,712 | — | — | — | 153,545,712 |
| Total Common Stocks | 3,757,566,669 | — | — | — | 3,757,566,669 |
| Securities Lending Collateral | 15,645,500 | — | — | — | 15,645,500 |
| Money Market Funds | — | — | — | 41,009,265 | 41,009,265 |
| Total Investments in Securities | 3,773,212,169 | — | — | 41,009,265 | 3,814,221,434 |
There were no transfers of financial assets between levels during the period.
The accompanying Notes to Financial Statements are an integral part of this statement.
| 50 | Columbia Acorn Family of Funds | Annual Report 2018 |
Portfolio of Investments
Columbia Acorn International®, December 31, 2018
(Percentages represent value of investments compared to net assets)
Investments in securities
| Common Stocks 97.2% |
| Issuer | Shares | Value ($) |
| Australia 3.1% |
carsales.com Ltd.
Automotive & related industry websites | 2,576,672 | 19,974,268 |
Costa Group Holdings Ltd.
Fruits and vegetables | 3,284,000 | 17,175,174 |
DuluxGroup Ltd.
Manufactures and supplies paints and other surface coatings | 5,257,000 | 24,294,526 |
National Storage REIT
Owns self storage facilities | 14,039,881 | 17,357,982 |
| Total | 78,801,950 |
| Belgium 0.3% |
Melexis NV
Advanced integrated semiconductors, sensor ICs, and programmable sensor IC systems | 114,030 | 6,636,118 |
| Brazil 2.0% |
CVC Brasil Operadora e Agencia de Viagens SA
Travel services | 879,000 | 13,875,307 |
Localiza Rent a Car SA
Rents automobiles | 1,907,100 | 14,638,773 |
Raia Drogasil SA
Chain of pharmaceutical stores | 477,000 | 7,033,619 |
Sul America SA
Full service insurance company | 2,200,900 | 16,240,919 |
| Total | 51,788,618 |
| Cambodia 1.1% |
NagaCorp Ltd.
Leisure and tourism company | 25,806,000 | 27,726,048 |
| Canada 6.4% |
CAE, Inc.
Training solutions based on simulation technology and integrated training services | 1,874,424 | 34,448,651 |
CCL Industries, Inc.
Manufacturing services and specialty packaging products for the non-durable consumer products market | 1,527,489 | 56,010,914 |
CES Energy Solutions Corp.
Oil and natural gas industry | 6,003,704 | 13,852,672 |
Osisko Gold Royalties Ltd.
Precious metal royalty and stream company | 1,817,605 | 15,936,663 |
ShawCor Ltd.
Energy services company | 920,156 | 11,175,056 |
| Common Stocks (continued) |
| Issuer | Shares | Value ($) |
Winpak Ltd.
Packaging materials and machines for the protection of perishables | 842,770 | 29,477,195 |
| Total | 160,901,151 |
| China 2.1% |
51job, Inc., ADR(a)
Integrated human resource services | 173,235 | 10,816,794 |
Minth Group Ltd.
Exterior automobile body parts | 2,421,000 | 7,812,496 |
New Oriental Education & Technology Group, Inc., ADR(a)
Educational services | 419,014 | 22,966,157 |
Shenzhou International Group Holdings Ltd.
Manufactures and processes textiles | 1,005,000 | 11,422,682 |
| Total | 53,018,129 |
| Denmark 3.5% |
Novozymes AS, Class B
Enzymes for industrial use | 739,159 | 33,027,415 |
SimCorp AS
Global provider of highly specialised software for the investment management industry | 818,342 | 56,122,928 |
| Total | 89,150,343 |
| France 0.5% |
Akka Technologies
High-technology engineering consulting services | 258,246 | 13,073,631 |
| Germany 7.6% |
AURELIUS Equity Opportunities SE & Co. KGaA
Loans to distressed companies | 209,007 | 7,599,336 |
MTU Aero Engines AG
Develops and manufactures engines and offers commercial engine services and support | 202,357 | 36,748,361 |
Nemetschek SE
Standard software for designing, constructing and managing buildings and real estate | 238,010 | 26,183,973 |
Norma Group SE
Plastic and metal-based components and systems in connecting technology | 408,568 | 20,255,094 |
Rational AG
Food preparation appliances/processors and kitchen accessories | 77,835 | 44,230,076 |
Stroeer SE & Co. KGaA
Digital multi-channel media company | 604,421 | 29,295,175 |
The accompanying Notes to Financial Statements are an integral part of this statement.
Columbia Acorn Family of Funds | Annual Report 2018
| 51 |
Portfolio of Investments (continued)
Columbia Acorn International®, December 31, 2018
| Common Stocks (continued) |
| Issuer | Shares | Value ($) |
Wirecard AG
Internet payment and processing services | 179,230 | 27,019,321 |
| Total | 191,331,336 |
| Hong Kong 1.1% |
Value Partners Group Ltd.
Independent, value oriented asset management group | 21,941,000 | 15,234,813 |
Vitasoy International Holdings Ltd.
Food and beverages | 3,312,000 | 12,607,708 |
| Total | 27,842,521 |
| India 2.4% |
Cholamandalam Investment and Finance Co., Ltd.
Financial services provider | 694,000 | 12,513,731 |
Havells India Ltd.
Manufactures electrical products | 1,590,907 | 15,741,968 |
Zee Entertainment Enterprises Ltd.
Hindi films, serials, game shows and children’s programs | 4,656,780 | 31,765,005 |
| Total | 60,020,704 |
| Indonesia 0.5% |
PT Matahari Department Store Tbk
Retail clothes, accessories, bags, shoes, cosmetics, household appliances, and management consulting services. | 30,711,200 | 11,953,196 |
| Ireland 1.0% |
UDG Healthcare PLC
Commercialisation solutions for health care companies | 3,459,938 | 26,341,261 |
| Italy 3.9% |
Brembo SpA
Braking systems and components | 5,385,271 | 54,960,935 |
Davide Campari-Milano SpA
Global producer & distributor of branded spirits, wines and soft drinks | 3,165,856 | 26,809,712 |
Industria Macchine Automatiche SpA
Packaging machinery for the food, pharmaceuticals, and cosmetics industries | 261,370 | 16,316,713 |
| Total | 98,087,360 |
| Common Stocks (continued) |
| Issuer | Shares | Value ($) |
| Japan 20.5% |
Aeon Credit Service Co., Ltd.
Credit card company | 1,113,000 | 19,745,555 |
Aeon Mall Co., Ltd.
Large-scale shopping malls | 2,007,700 | 31,986,134 |
Aica Kogyo Co., Ltd.
Manufactures adhesives, melamine boards, and housing materials | 320,000 | 10,700,317 |
Amano Corp.
Electronic time recorders and information systems | 485,000 | 9,357,297 |
Azbil Corp.
Provides measurement and control technologies | 1,238,440 | 24,476,264 |
cocokara fine, Inc.
Drug chain stores | 390,200 | 19,006,593 |
Daiseki Co., Ltd.
Waste Disposal & Recycling | 582,400 | 12,027,372 |
Disco Corp.
Abrasive and precision industrial machinery for cutting and grinding purposes | 112,600 | 13,091,850 |
Fuji Oil Holdings, Inc.
Specialty vegetable oils and fats | 640,800 | 20,456,369 |
Glory Ltd.
Vending machines, coin-operated lockers, money handling machines, and data processing terminals | 995,400 | 22,384,674 |
Hikari Tsushin, Inc.
Distribution network, telecommunication, office automation equipment, in-house products and individual insurance plans | 286,628 | 44,801,679 |
Hoshizaki Corp.
Commercial Kitchen Equipment | 123,000 | 7,463,486 |
KH Neochem Co., Ltd.
Manufactures and sells petroleum chemical products | 614,800 | 12,932,574 |
Mandom Corp.
Cosmetic products for men and women | 827,200 | 22,537,886 |
Milbon Co., Ltd.
Hair Products for Salons | 140,000 | 5,698,993 |
Miura Co., Ltd.
Industrial boilers and related equipment | 564,400 | 12,820,025 |
Nakanishi, Inc.
Dental Tools & Machinery | 490,000 | 8,355,528 |
Nissan Chemical Industries Ltd.
Variety of chemical products | 257,300 | 13,426,672 |
Obic Co., Ltd.
Computer system integration, office automation, consultation, and system support services | 334,500 | 25,819,554 |
Persol Holdings Co., Ltd.
Human resource solutions | 1,162,200 | 17,239,450 |
The accompanying Notes to Financial Statements are an integral part of this statement.
| 52 | Columbia Acorn Family of Funds | Annual Report 2018 |
Portfolio of Investments (continued)
Columbia Acorn International®, December 31, 2018
| Common Stocks (continued) |
| Issuer | Shares | Value ($) |
Santen Pharmaceutical Co., Ltd.
Ophthalmic medicine | 1,656,500 | 23,900,416 |
SCSK Corp.
IT services | 410,900 | 14,559,666 |
Sekisui Chemical Co., Ltd.
Unit residential houses in addition to parcels of land | 1,763,000 | 26,208,123 |
Seria Co., Ltd.(b)
Operates 100 yen chain stores | 1,201,100 | 40,846,722 |
Sohgo Security Services Co., Ltd.
Around the clock security services | 451,400 | 21,090,612 |
Sony Financial Holdings, Inc.
Financial holding company | 459,000 | 8,554,196 |
TechnoPro Holdings, Inc.
Medical & electronic design and IT & software development | 176,000 | 7,230,466 |
Ushio, Inc.
Lamps and optical equipment | 1,174,000 | 12,437,849 |
Valqua Ltd.
Rubber, fiber and resin products | 396,000 | 7,959,653 |
| Total | 517,115,975 |
| Malta 2.1% |
Unibet Group PLC
Online gambling services | 5,676,638 | 52,183,641 |
| Mexico 1.9% |
Grupo Aeroportuario del Sureste SAB de CV, ADR
Operates airports in Mexico | 311,000 | 46,836,600 |
| Netherlands 1.5% |
Aalberts Industries NV
Industrial services and flow control systems | 1,140,709 | 37,938,182 |
| Norway 0.4% |
Atea ASA
Nordic and Baltic supplier of IT infrastructure | 738,000 | 9,490,714 |
| Philippines 0.5% |
Universal Robina Corp.
Branded consumer foods | 5,173,340 | 12,465,559 |
| Poland 0.4% |
KRUK SA
Debt collection services | 214,000 | 8,970,233 |
| Russian Federation 0.9% |
TCS Group Holding PLC, GDR
Online retail financial services | 1,430,130 | 22,252,823 |
| Singapore 1.3% |
| Common Stocks (continued) |
| Issuer | Shares | Value ($) |
Mapletree Commercial Trust
Singapore-focused real estate investment trust | 13,953,300 | 16,883,488 |
Singapore Exchange
Singapore’s Securities and derivatives exchange and clearing houses | 3,156,000 | 16,540,003 |
| Total | 33,423,491 |
| South Africa 1.4% |
Clicks Group Ltd.
Owns and operates chains of retail stores | 596,748 | 7,933,418 |
PSG Group Ltd.
Diversified financial services | 1,579,507 | 26,782,450 |
| Total | 34,715,868 |
| South Korea 3.9% |
GS Retail Co., Ltd.
Chain of retail stores | 465,563 | 16,871,999 |
Koh Young Technology, Inc.
3D measurement and inspection equipment for testing various machineries | 318,715 | 23,595,451 |
Korea Investment Holdings Co., Ltd.
Financial holding company | 319,916 | 17,109,841 |
Korea Zinc Co. Ltd.
Non-ferrous metal smelting | 96,746 | 37,460,732 |
Modetour Network, Inc.
Travel services | 180,585 | 3,897,762 |
| Total | 98,935,785 |
| Spain 1.3% |
Fluidra SA(a)
Irrigation and swimming pool equipment | 730,694 | 8,196,113 |
Prosegur Cia de Seguridad SA, Registered Shares
Security and transportation services | 4,818,009 | 24,382,325 |
| Total | 32,578,438 |
| Sweden 4.3% |
Hexagon AB, Class B
Design, measurement and visualisation technologies | 1,110,108 | 51,317,572 |
Sweco AB, Class B
Consulting company specializing in engineering, environmental technology, and architecture | 744,328 | 16,573,033 |
Trelleborg AB, Class B
Manufactures and distributes industrial products | 2,611,927 | 41,152,561 |
| Total | 109,043,166 |
The accompanying Notes to Financial Statements are an integral part of this statement.
Columbia Acorn Family of Funds | Annual Report 2018
| 53 |
Portfolio of Investments (continued)
Columbia Acorn International®, December 31, 2018
| Common Stocks (continued) |
| Issuer | Shares | Value ($) |
| Switzerland 2.4% |
Belimo Holding AG, Registered Shares
Manufactures heating, ventilation and air conditioning equipment | 2,200 | 8,824,354 |
Bossard Holding AG, Class A, Registered Shares
Fastening devices, industrial adhesives & tools | 62,500 | 8,921,647 |
Inficon Holding AG
Vacuum instruments used to monitor and control production processes | 18,750 | 9,506,290 |
Kardex AG
Storage, warehouse and materials handling systems | 72,000 | 8,325,455 |
Partners Group Holding AG(b)
Global private markets asset management firm | 43,073 | 26,203,315 |
| Total | 61,781,061 |
| Taiwan 2.9% |
Gourmet Master Co., Ltd.
Coffee & bakery cafes | 1,495,656 | 10,013,640 |
Parade Technologies Ltd.
Fabless semiconductor company | 1,502,000 | 21,126,495 |
Silergy Corp.
High performance analog integrated circuits | 1,071,000 | 15,760,491 |
Silicon Motion Technology Corp., ADR
Semiconductor products | 322,703 | 11,133,254 |
Sinbon Electronics Co., Ltd.
Cable, connectors & modems | 5,946,000 | 16,016,985 |
| Total | 74,050,865 |
| Thailand 0.4% |
Muangthai Capital PCL, Foreign Registered Shares
Commercial lending company | 7,444,200 | 11,218,899 |
| United Kingdom 14.3% |
Ascential PLC
Media and consultancy services | 5,036,056 | 24,199,406 |
Croda International PLC
Chemicals and chemical products | 492,098 | 29,388,541 |
Dechra Pharmaceuticals PLC
International veterinary pharmaceuticals | 783,027 | 20,688,439 |
Domino’s Pizza Group PLC
Pizza delivery stores | 2,441,242 | 7,255,473 |
GW Pharmaceuticals PLC, ADR(a)
Cannabinoid prescription medicines | 195,000 | 18,991,050 |
Halma PLC
Products that detect hazards and protect assets and people in public and commercial buildings | 2,166,921 | 37,748,700 |
Intermediate Capital Group PLC
Private equity firm | 2,995,287 | 35,728,434 |
| Common Stocks (continued) |
| Issuer | Shares | Value ($) |
Renishaw PLC
High technology precision measuring and calibration equipment | 235,000 | 12,723,431 |
Rentokil Initial PLC
Fully integrated facilities management and essential support services | 12,190,346 | 52,442,835 |
Rightmove PLC
Website that lists properties across Britain | 7,174,517 | 39,539,447 |
Safestore Holdings PLC
Self storage facilities | 2,605,580 | 16,821,228 |
Spirax-Sarco Engineering PLC
Consultation, service and products for the control and efficient management of steam and industrial fluids | 478,199 | 38,062,673 |
WH Smith PLC
Retails books, magazines, newspapers, and periodicals | 1,309,564 | 28,727,345 |
| Total | 362,317,002 |
| United States 1.3% |
Inter Parfums, Inc.
Fragrances and related products | 210,851 | 13,825,500 |
Ultragenyx Pharmaceutical, Inc.(a)
Therapeutics and sialic acid for treating metabolic, body myopathy, glucuronidase, and rare genetic diseases | 430,153 | 18,703,053 |
| Total | 32,528,553 |
Total Common Stocks
(Cost: $2,049,675,096) | 2,454,519,221 |
| Preferred Stocks 0.5% |
| Issuer | | Shares | Value ($) |
| Germany 0.5% |
Sartorius AG
Precision electronic equipment and components | | 99,747 | 12,414,214 |
Total Preferred Stocks
(Cost: $9,748,894) | 12,414,214 |
The accompanying Notes to Financial Statements are an integral part of this statement.
| 54 | Columbia Acorn Family of Funds | Annual Report 2018 |
Portfolio of Investments (continued)
Columbia Acorn International®, December 31, 2018
| Securities Lending Collateral 1.2% |
| | Shares | Value ($) |
Dreyfus Government Cash Management Fund, Institutional Shares, 2.372%(c),(d)
| 30,272,040 | 30,272,040 |
Total Securities Lending Collateral
(Cost: $30,272,040) | 30,272,040 |
Total Investments in Securities(e)
(Cost: $2,089,696,030) | 2,497,205,475 |
| Obligation to Return Collateral for Securities Loaned | | (30,272,040) |
| Other Assets & Liabilities, Net | | 58,497,908 |
| Net Assets | $2,525,431,343 |
Notes to Portfolio of Investments
| (a) | Non-income producing security. |
| (b) | All or a portion of this security was on loan at December 31, 2018. The total market value of securities on loan at December 31, 2018 was $29,435,320. |
| (c) | The rate shown is the seven-day current annualized yield at December 31, 2018. |
| (d) | Investment made with cash collateral received from securities lending activity. |
| (e) | As defined in the Investment Company Act of 1940, an affiliated company is one in which the Fund owns 5% or more of the company’s outstanding voting securities, or a company which is under common ownership or control with the Fund. Holdings and transactions in these affiliated companies during the year ended December 31, 2018 are as follows: |
| Issuer | Beginning
shares | Shares
purchased | Shares
sold | Ending
shares | Realized gain
(loss) —
affiliated
issuers ($) | Net change in
unrealized
appreciation
(depreciation) —
affiliated
issuers ($) | Dividend —
affiliated issuers
($) | Value —
affiliated
issuers
at end of
period ($) |
| Columbia Short-Term Cash Fund, 2.459% |
| | — | 586,517,692 | (586,517,692) | — | — | — | 536,387 | — |
Abbreviation Legend
| ADR | American Depositary Receipt |
| GDR | Global Depositary Receipt |
Fair value measurements
Various inputs are used in determining the value of the Fund’s investments, following the input prioritization hierarchy established by accounting principles generally accepted in the United States of America (GAAP). These inputs are summarized in the three broad levels listed below:
| ■ | Level 1 – quoted prices in active markets for identical securities |
| ■ | Level 2 – prices determined using other significant observable inputs (including quoted prices for similar securities, interest rates, prepayment speeds, credit risk and others) |
| ■ | Level 3 – prices determined using significant unobservable inputs where quoted prices or observable inputs are unavailable or less reliable (including management’s own assumptions about the factors market participants would use in pricing an investment) |
The inputs or methodology used for valuing securities are not necessarily an indication of the risk associated with investing in those securities.
Examples of the types of securities in which the Fund would typically invest and how they are classified within this hierarchy are as follows. Typical Level 1 securities include exchange traded domestic equities, mutual funds whose net asset values are published each day and exchange traded foreign equities that are not typically statistically fair valued. Typical Level 2 securities include exchange traded foreign equities that are traded in the European region or Asia Pacific region time zones which are typically statistically fair valued, forward foreign currency exchange contracts and short-term investments valued at amortized cost. Additionally, securities fair valued by Columbia Wanger Asset Management’s Valuation Committee (the Committee) that rely on significant observable inputs are also included in Level 2. Typical Level 3 securities include any security fair valued by the Committee that relies on significant unobservable inputs.
The Committee is responsible for applying the Columbia Acorn Trust Portfolio Pricing Policy and the Columbia Wanger Asset Management pricing procedures (the Policies), which are approved by and subject to the oversight of the Board of Trustees.
The accompanying Notes to Financial Statements are an integral part of this statement.
Columbia Acorn Family of Funds | Annual Report 2018
| 55 |
Portfolio of Investments (continued)
Columbia Acorn International®, December 31, 2018
Fair value measurements (continued)
The Committee meets as necessary, and no less frequently than quarterly, to determine fair values for securities for which market quotations are not readily available or for which Columbia Wanger Asset Management believes that available market quotations are unreliable. The Committee also reviews the continuing appropriateness of the Policies. In circumstances where a security has been fair valued, the Committee will also review the continuing appropriateness of the current value of the security. The Policies address, among other things: circumstances under which market quotations will be deemed readily available; selection of third party pricing vendors; appropriate pricing methodologies; events that require fair valuation and fair value techniques; circumstances under which securities will be deemed to pose a potential for stale pricing, including when securities are illiquid, restricted, or in default; and certain delegations of authority to determine fair values to the Fund’s investment manager. The Committee may also meet to discuss additional valuation matters, which may include review of back-testing results, review of time-sensitive information or approval of other valuation related actions, and to review the appropriateness of the Policies.
For investments categorized as Level 3, the significant unobservable inputs used in the fair value measurement of the Fund’s securities may include: (i) data specific to the issuer or comparable issuers, (ii) general market or specific sector news and (iii) quoted prices and specific or similar security transactions. The Committee considers this data and any changes from prior periods in order to assess the reasonableness of observable and unobservable inputs, any assumptions or internal models used to value those securities and changes in fair value. Significant changes in any of these factors could result in lower or higher fair value measurements. Various factors impact the frequency of monitoring (which may occur as often as daily), however the Committee may determine that changes to inputs, assumptions and models are not required with the same frequency.
The following table is a summary of the inputs used to value the Fund’s investments at December 31, 2018:
| | Level 1
quoted prices in active
markets for identical
assets ($) | Level 2
other significant
observable inputs ($) | Level 3
significant
unobservable inputs ($) | Total ($) |
| Investments in Securities | | | | |
| Common Stocks | | | | |
| Australia | — | 78,801,950 | — | 78,801,950 |
| Belgium | — | 6,636,118 | — | 6,636,118 |
| Brazil | 51,788,618 | — | — | 51,788,618 |
| Cambodia | — | 27,726,048 | — | 27,726,048 |
| Canada | 160,901,151 | — | — | 160,901,151 |
| China | 33,782,951 | 19,235,178 | — | 53,018,129 |
| Denmark | — | 89,150,343 | — | 89,150,343 |
| France | — | 13,073,631 | — | 13,073,631 |
| Germany | — | 191,331,336 | — | 191,331,336 |
| Hong Kong | — | 27,842,521 | — | 27,842,521 |
| India | — | 60,020,704 | — | 60,020,704 |
| Indonesia | — | 11,953,196 | — | 11,953,196 |
| Ireland | — | 26,341,261 | — | 26,341,261 |
| Italy | — | 98,087,360 | — | 98,087,360 |
| Japan | — | 517,115,975 | — | 517,115,975 |
| Malta | — | 52,183,641 | — | 52,183,641 |
| Mexico | 46,836,600 | — | — | 46,836,600 |
| Netherlands | — | 37,938,182 | — | 37,938,182 |
| Norway | — | 9,490,714 | — | 9,490,714 |
| Philippines | — | 12,465,559 | — | 12,465,559 |
| Poland | — | 8,970,233 | — | 8,970,233 |
| Russian Federation | — | 22,252,823 | — | 22,252,823 |
| Singapore | — | 33,423,491 | — | 33,423,491 |
| South Africa | — | 34,715,868 | — | 34,715,868 |
| South Korea | — | 98,935,785 | — | 98,935,785 |
| Spain | — | 32,578,438 | — | 32,578,438 |
| Sweden | — | 109,043,166 | — | 109,043,166 |
| Switzerland | — | 61,781,061 | — | 61,781,061 |
| Taiwan | 11,133,254 | 62,917,611 | — | 74,050,865 |
| Thailand | — | 11,218,899 | — | 11,218,899 |
| United Kingdom | 18,991,050 | 343,325,952 | — | 362,317,002 |
| United States | 32,528,553 | — | — | 32,528,553 |
| Total Common Stocks | 355,962,177 | 2,098,557,044 | — | 2,454,519,221 |
| Preferred Stocks | | | | |
| Germany | — | 12,414,214 | — | 12,414,214 |
| Total Preferred Stocks | — | 12,414,214 | — | 12,414,214 |
| Securities Lending Collateral | 30,272,040 | — | — | 30,272,040 |
| Total Investments in Securities | 386,234,217 | 2,110,971,258 | — | 2,497,205,475 |
The accompanying Notes to Financial Statements are an integral part of this statement.
| 56 | Columbia Acorn Family of Funds | Annual Report 2018 |
Portfolio of Investments (continued)
Columbia Acorn International®, December 31, 2018
Fair value measurements (continued)
The Fund’s assets assigned to the Level 2 input category are generally valued using a market approach, in which a security’s value is determined through its correlation to prices and information from observable market transactions for similar or identical assets. Foreign equities are generally valued at the last sale price on the foreign exchange or market on which they trade. The Fund may use a statistical fair valuation model, in accordance with the policy adopted by the Board of Trustees, provided by an independent third party to value securities principally traded in foreign markets in order to adjust for possible stale pricing that may occur between the close of the foreign exchanges and the time for valuation. These models take into account available market data including intraday index, ADR, and ETF movements.
There were no transfers of financial assets between levels during the period.
The accompanying Notes to Financial Statements are an integral part of this statement.
Columbia Acorn Family of Funds | Annual Report 2018
| 57 |
Portfolio of Investments
Columbia Acorn USA®, December 31, 2018
(Percentages represent value of investments compared to net assets)
Investments in securities
| Common Stocks 96.1% |
| Issuer | Shares | Value ($) |
| Communication Services 0.8% |
| Interactive Media & Services 0.8% |
Care.com, Inc.(a)
Child, adult, senior, pet and home care services | 115,119 | 2,222,948 |
| Total Communication Services | 2,222,948 |
| Consumer Discretionary 17.7% |
| Auto Components 3.5% |
Cooper-Standard Holding, Inc.(a)
Sealing, fuel and brake delivery, fluid transfer systems, anti-vibration systems components, subsystems, and modules | 27,020 | 1,678,482 |
Dorman Products, Inc.(a)
Automotive products and home hardware | 44,962 | 4,047,479 |
LCI Industries
Recreational vehicles and equipment | 40,956 | 2,735,861 |
Visteon Corp.(a)
Automotive systems, modules and components | 20,359 | 1,227,241 |
| Total | | 9,689,063 |
| Distributors 0.9% |
Pool Corp.
Swimming pool supplies, equipment and leisure products | 16,235 | 2,413,333 |
| Diversified Consumer Services 0.8% |
Adtalem Global Education, Inc.(a)
Higher education institutions | 49,721 | 2,352,798 |
| Hotels, Restaurants & Leisure 7.6% |
Choice Hotels International, Inc.
Vacation rental properties, travel tips and other services | 26,916 | 1,926,647 |
Churchill Downs, Inc.
Horse racing company, home of the Kentucky Derby | 12,538 | 3,058,520 |
Dave & Buster’s Entertainment, Inc.
Venues that combine dining and entertainment for adults and families | 96,842 | 4,315,280 |
Extended Stay America, Inc.
Hotels and motels | 250,248 | 3,878,844 |
Red Rock Resorts, Inc., Class A
Casino & entertainment properties | 125,621 | 2,551,362 |
Six Flags Entertainment Corp.
Theme parks across North America | 25,704 | 1,429,914 |
| Common Stocks (continued) |
| Issuer | Shares | Value ($) |
Texas Roadhouse, Inc.
Moderately priced, full service restaurant chain | 33,606 | 2,006,278 |
Wingstop, Inc.
Cooked-to-order chicken wings | 28,338 | 1,819,016 |
| Total | | 20,985,861 |
| Household Durables 2.4% |
Cavco Industries, Inc.(a)
Designs and manufactures systems-built structures | 12,102 | 1,577,859 |
Helen of Troy Ltd.(a)
Brand-name hair and comfort products | 13,251 | 1,738,266 |
iRobot Corp.(a),(b)
Manufactures robots for cleaning | 25,419 | 2,128,587 |
Skyline Champion Corp.
Factory-built housing | 82,302 | 1,209,016 |
| Total | | 6,653,728 |
| Leisure Products 1.8% |
Brunswick Corp.
Consumer products serving the outdoor and indoor active recreation markets | 43,110 | 2,002,459 |
MasterCraft Boat Holdings, Inc.(a)
Recreational powerboats | 157,000 | 2,935,900 |
| Total | | 4,938,359 |
| Specialty Retail 0.7% |
Boot Barn Holdings, Inc.(a)
Western and work gear | 110,000 | 1,873,300 |
| Total Consumer Discretionary | 48,906,442 |
| Consumer Staples 6.1% |
| Beverages 0.8% |
MGP Ingredients, Inc.
Distillery ingredients and products | 40,503 | 2,310,696 |
| Food & Staples Retailing 0.9% |
BJ’s Wholesale Club Holdings, Inc.(a)
Warehouse club | 116,508 | 2,581,817 |
| Household Products 2.7% |
Central Garden & Pet Co.(a)
Lawn, garden & pet supply products | 119,159 | 4,105,028 |
WD-40 Co.
Multi-purpose lubricant products and heavy-duty hand cleaners | 18,343 | 3,361,538 |
| Total | | 7,466,566 |
The accompanying Notes to Financial Statements are an integral part of this statement.
| 58 | Columbia Acorn Family of Funds | Annual Report 2018 |
Portfolio of Investments (continued)
Columbia Acorn USA®, December 31, 2018
| Common Stocks (continued) |
| Issuer | Shares | Value ($) |
| Personal Products 1.7% |
Inter Parfums, Inc.
Fragrances and related products | 69,416 | 4,551,607 |
| Total Consumer Staples | 16,910,686 |
| Energy 1.1% |
| Energy Equipment & Services 0.5% |
Core Laboratories NV
Reservoir description, production enhancement, and reservoir management services | 21,287 | 1,269,982 |
| Oil, Gas & Consumable Fuels 0.6% |
Callon Petroleum Co.(a)
Independent energy company | 251,416 | 1,631,690 |
| Total Energy | 2,901,672 |
| Financials 12.9% |
| Banks 5.8% |
First Busey Corp.
Multi-bank holding company | 124,292 | 3,050,126 |
Great Southern Bancorp, Inc.
Real estate, commercial real estate, commercial business, consumer, and construction loans | 53,511 | 2,463,111 |
Lakeland Financial Corp.
Bank holding company | 77,026 | 3,093,364 |
OFG Bancorp
Holding company for Oriental Bank | 168,694 | 2,776,703 |
Sandy Spring Bancorp, Inc.
Holding company for Sandy Spring Bank | 79,368 | 2,487,393 |
Trico Bancshares
Holding company for Tri Counties Bank | 64,874 | 2,192,093 |
| Total | | 16,062,790 |
| Capital Markets 3.9% |
Ares Management Corp., Class A
Asset management firm | 132,856 | 2,362,180 |
Hamilton Lane, Inc., Class A
Private market investment solutions | 43,093 | 1,594,441 |
Houlihan Lokey, Inc.
Investment bank | 125,793 | 4,629,182 |
OM Asset Management Plc
Asset management company | 196,982 | 2,103,768 |
| Total | | 10,689,571 |
| Consumer Finance 0.7% |
FirstCash, Inc.
Owns and operates pawn stores | 27,591 | 1,996,209 |
| Common Stocks (continued) |
| Issuer | Shares | Value ($) |
| Thrifts & Mortgage Finance 2.5% |
Merchants Bancorp
Bank holding company | 99,844 | 1,992,886 |
OceanFirst Financial Corp.
New Jersey banks | 117,313 | 2,640,716 |
Walker & Dunlop, Inc.
Commercial real estate financial services | 54,382 | 2,352,021 |
| Total | | 6,985,623 |
| Total Financials | 35,734,193 |
| Health Care 19.6% |
| Biotechnology 7.0% |
Agios Pharmaceuticals, Inc.(a)
Therapeutics in the field of cancer metabolism | 45,060 | 2,077,717 |
Amicus Therapeutics, Inc.(a)
Orally-administered, small molecule drugs to treat human genetic diseases | 257,532 | 2,467,156 |
Enanta Pharmaceuticals, Inc.(a)
Pharmaceutical products | 30,827 | 2,183,476 |
Kiniksa Pharmaceuticals Ltd., Class A(a),(b)
Clinical-stage biopharmaceutical company | 80,085 | 2,249,588 |
Ligand Pharmaceuticals, Inc.(a)
Drugs that regulate hormone activated intracellular receptors | 19,052 | 2,585,356 |
Loxo Oncology, Inc.(a)
Researches and develops cancer drugs | 17,232 | 2,413,686 |
MacroGenics, Inc.(a)
Treatments for autoimmune disorders, cancer and infectious diseases | 164,378 | 2,087,601 |
Repligen Corp.(a)
Supplier to Biopharma Industry | 29,635 | 1,562,950 |
Ultragenyx Pharmaceutical, Inc.(a)
Therapeutics and sialic acid for treating metabolic, body myopathy, glucuronidase, and rare genetic diseases | 38,095 | 1,656,371 |
| Total | | 19,283,901 |
| Health Care Equipment & Supplies 6.8% |
Atrion Corp.
Medical products and components | 4,707 | 3,488,263 |
AxoGen, Inc.(a)
Technologies for peripheral nerve reconstruction and regeneration | 133,013 | 2,717,455 |
Cerus Corp.(a)
Systems to enhance the safety of blood transfusions | 285,000 | 1,444,950 |
iRhythm Technologies, Inc.(a)
Medical instruments | 32,696 | 2,271,718 |
The accompanying Notes to Financial Statements are an integral part of this statement.
Columbia Acorn Family of Funds | Annual Report 2018
| 59 |
Portfolio of Investments (continued)
Columbia Acorn USA®, December 31, 2018
| Common Stocks (continued) |
| Issuer | Shares | Value ($) |
Orthofix Medical, Inc.(a)
Spine fixation, biological, and other orthopedic and spine solutions | 40,883 | 2,145,949 |
Sientra, Inc.(a)
Plastic surgery implantable devices | 107,211 | 1,362,652 |
Tactile Systems Technology, Inc.(a)
Technology for treating lymphedema, chronic swelling & venous ulcers | 55,560 | 2,530,758 |
Tandem Diabetes Care, Inc.(a)
Produces medical devices | 75,913 | 2,882,417 |
| Total | | 18,844,162 |
| Health Care Providers & Services 3.7% |
AMN Healthcare Services, Inc.(a)
Temporary healthcare staffing | 39,952 | 2,263,681 |
Chemed Corp.
Hospice and palliative care services | 15,694 | 4,445,796 |
HealthEquity, Inc.(a)
Technology-enabled services platforms for consumers to make healthcare saving and spending decisions | 32,335 | 1,928,783 |
Tivity Health, Inc.(a)
Health fitness solutions | 65,655 | 1,628,901 |
| Total | | 10,267,161 |
| Pharmaceuticals 2.1% |
GW Pharmaceuticals PLC, ADR(a)
Cannabinoid prescription medicines | 19,253 | 1,875,050 |
Optinose, Inc.(a),(b)
Health care services | 268,539 | 1,664,942 |
Reata Pharmaceuticals, Inc., Class A(a)
Biopharmaceutical company | 38,006 | 2,132,136 |
| Total | | 5,672,128 |
| Total Health Care | 54,067,352 |
| Industrials 11.0% |
| Aerospace & Defense 0.8% |
BWX Technologies, Inc.
Nuclear components and fuel | 56,066 | 2,143,403 |
| Commercial Services & Supplies 3.3% |
Brink’s Co. (The)
Provides security services globally | 24,128 | 1,559,875 |
Healthcare Services Group, Inc.(b)
Housekeeping, laundry, linen, facility maintenance, and food services | 57,386 | 2,305,770 |
Unifirst Corp.
Workplace uniforms and protective clothing | 35,687 | 5,105,739 |
| Total | | 8,971,384 |
| Common Stocks (continued) |
| Issuer | Shares | Value ($) |
| Machinery 2.5% |
ITT, Inc.
Engineered components & customized technology solutions | 54,040 | 2,608,511 |
Toro Co. (The)
Turf equipment | 31,383 | 1,753,682 |
Woodward, Inc.
Energy control systems and components for aircraft, industrial engines and turbines | 35,023 | 2,601,859 |
| Total | | 6,964,052 |
| Professional Services 1.8% |
Exponent, Inc.
Science and engineering consulting firm | 58,076 | 2,945,034 |
ICF International, Inc.
Management, technology, policy consulting, and implementation services | 31,904 | 2,066,741 |
| Total | | 5,011,775 |
| Road & Rail 1.7% |
Landstar System, Inc.
Truckload carrier | 19,877 | 1,901,633 |
Saia, Inc.(a)
Trucking transportation | 50,659 | 2,827,785 |
| Total | | 4,729,418 |
| Trading Companies & Distributors 0.9% |
SiteOne Landscape Supply, Inc.(a)
Landscape supplies | 44,703 | 2,470,735 |
| Total Industrials | 30,290,767 |
| Information Technology 20.5% |
| Electronic Equipment, Instruments & Components 1.7% |
ePlus, Inc.(a)
Provides IT hardware, software and services | 40,707 | 2,897,117 |
Novanta, Inc.(a)
Precision photonics and motion control components and subsystems | 29,298 | 1,845,774 |
| Total | | 4,742,891 |
The accompanying Notes to Financial Statements are an integral part of this statement.
| 60 | Columbia Acorn Family of Funds | Annual Report 2018 |
Portfolio of Investments (continued)
Columbia Acorn USA®, December 31, 2018
| Common Stocks (continued) |
| Issuer | Shares | Value ($) |
| IT Services 2.3% |
CoreLogic, Inc.(a)
Consumer, financial and property information, analytics and services to business and government | 37,239 | 1,244,527 |
Endava PLC, ADR(a)
IT services | 75,554 | 1,831,429 |
Hackett Group
Business consulting and technology implementation | 107,666 | 1,723,733 |
Science Applications International Corp.
Scientific, Engineering and technology consulting services | 24,846 | 1,582,690 |
| Total | | 6,382,379 |
| Semiconductors & Semiconductor Equipment 3.6% |
Advanced Energy Industries, Inc.(a)
Engineered precision power conversion, measurement and control solutions | 49,349 | 2,118,553 |
Entegris, Inc.
Microelectronics materials management | 64,185 | 1,790,441 |
Inphi Corp.(a)
Analog semiconductor solutions | 64,327 | 2,068,113 |
MKS Instruments, Inc.
Instruments and components used to control and analyze gases in semiconductor manufacturing | 25,881 | 1,672,171 |
Semtech Corp.(a)
Analog and mixed-signal semiconductors | 45,892 | 2,105,066 |
| Total | | 9,754,344 |
| Software 12.9% |
Alteryx, Inc., Class A(a)
Data storage, retrieval, management, reporting, and analytics solutions | 67,594 | 4,019,815 |
Anaplan, Inc.(a)
Cloud platform for business applications | 70,085 | 1,860,056 |
Blackline, Inc.(a)
Develops and markets enterprise software | 70,291 | 2,878,416 |
CyberArk Software Ltd.(a)
IT security solutions | 65,210 | 4,834,669 |
j2 Global, Inc.
Cloud-based communications and storage messaging services | 35,205 | 2,442,523 |
Manhattan Associates, Inc.(a)
Information technology solutions for distribution centers | 67,394 | 2,855,484 |
Mimecast Ltd.(a)
Cloud security and risk management services for corporate information and email | 97,221 | 3,269,542 |
MINDBODY, Inc., Class A(a)
Business management software | 57,779 | 2,103,156 |
| Common Stocks (continued) |
| Issuer | Shares | Value ($) |
Q2 Holdings, Inc.(a)
Secure, cloud-based virtual banking solutions | 38,675 | 1,916,346 |
Qualys, Inc.(a)
Information technology security risk and compliance management solutions | 50,844 | 3,800,081 |
Zscaler, Inc.(a)
Cloud-based internet security platform | 74,502 | 2,921,223 |
Zuora, Inc., Class A(a)
Develops cloud based software | 151,340 | 2,745,308 |
| Total | | 35,646,619 |
| Total Information Technology | 56,526,233 |
| Materials 2.6% |
| Chemicals 2.6% |
Orion Engineered Carbons SA
Global supplier of Carbon Black | 124,013 | 3,135,049 |
PolyOne Corp.
International polymer services company | 64,910 | 1,856,426 |
Quaker Chemical Corp.
Custom-formulated chemical specialty products | 12,069 | 2,144,782 |
| Total | | 7,136,257 |
| Total Materials | 7,136,257 |
| Real Estate 3.8% |
| Equity Real Estate Investment Trusts (REITS) 2.1% |
Coresite Realty Corp.
Develops, owns & operates data centers | 34,445 | 3,004,638 |
UMH Properties, Inc.
Real estate investment trust | 248,655 | 2,944,075 |
| Total | | 5,948,713 |
| Real Estate Management & Development 1.7% |
Colliers International Group, Inc.
Commercial real estate, residential property management and property services | 40,266 | 2,216,241 |
FirstService Corp.
Real estate services | 34,415 | 2,356,739 |
| Total | | 4,572,980 |
| Total Real Estate | 10,521,693 |
Total Common Stocks
(Cost: $251,994,876) | 265,218,243 |
|
The accompanying Notes to Financial Statements are an integral part of this statement.
Columbia Acorn Family of Funds | Annual Report 2018
| 61 |
Portfolio of Investments (continued)
Columbia Acorn USA®, December 31, 2018
| Limited Partnerships 1.5% |
| Issuer | Shares | Value ($) |
| Consumer Discretionary 1.5% |
| Hotels, Restaurants & Leisure 1.5% |
Cedar Fair LP
Owns and operates amusement parks | 91,301 | 4,318,537 |
| Total Consumer Discretionary | 4,318,537 |
Total Limited Partnerships
(Cost: $5,072,954) | 4,318,537 |
|
| Securities Lending Collateral 1.5% |
| | Shares | Value ($) |
Dreyfus Government Cash Management Fund, Institutional Shares, 2.372%(c),(d)
| 4,068,915 | 4,068,915 |
Total Securities Lending Collateral
(Cost: $4,068,915) | 4,068,915 |
|
| Money Market Funds 2.4% |
| | Shares | Value ($) |
| Columbia Short-Term Cash Fund, 2.459%(c),(e) | 6,552,142 | 6,551,486 |
Total Money Market Funds
(Cost: $6,551,486) | 6,551,486 |
Total Investments in Securities
(Cost $267,688,231) | 280,157,181 |
| Obligation to Return Collateral for Securities Loaned | | (4,068,915) |
| Other Assets & Liabilities, Net | | (94,502) |
| Net Assets | $275,993,764 |
Notes to Portfolio of Investments
| (a) | Non-income producing security. |
| (b) | All or a portion of this security was on loan at December 31, 2018. The total market value of securities on loan at December 31, 2018 was $3,898,417. |
| (c) | The rate shown is the seven-day current annualized yield at December 31, 2018. |
| (d) | Investment made with cash collateral received from securities lending activity. |
| (e) | As defined in the Investment Company Act of 1940, an affiliated company is one in which the Fund owns 5% or more of the company’s outstanding voting securities, or a company which is under common ownership or control with the Fund. Holdings and transactions in these affiliated companies during the year ended December 31, 2018 are as follows: |
| Issuer | Beginning
shares | Shares
purchased | Shares
sold | Ending
shares | Realized gain
(loss) —
affiliated
issuers ($) | Net change in
unrealized
appreciation
(depreciation) —
affiliated
issuers ($) | Dividend —
affiliated issuers
($) | Value —
affiliated
issuers
at end of
period ($) |
| Columbia Short-Term Cash Fund, 2.459% |
| | — | 97,052,141 | (90,499,999) | 6,552,142 | — | — | 84,599 | 6,551,486 |
Abbreviation Legend
| ADR | American Depositary Receipt |
Fair value measurements
Various inputs are used in determining the value of the Fund’s investments, following the input prioritization hierarchy established by accounting principles generally accepted in the United States of America (GAAP). These inputs are summarized in the three broad levels listed below:
| ■ | Level 1 – quoted prices in active markets for identical securities |
| ■ | Level 2 – prices determined using other significant observable inputs (including quoted prices for similar securities, interest rates, prepayment speeds, credit risk and others) |
| ■ | Level 3 – prices determined using significant unobservable inputs where quoted prices or observable inputs are unavailable or less reliable (including management’s own assumptions about the factors market participants would use in pricing an investment) |
The inputs or methodology used for valuing securities are not necessarily an indication of the risk associated with investing in those securities.
Examples of the types of securities in which the Fund would typically invest and how they are classified within this hierarchy are as follows. Typical Level 1 securities include exchange traded domestic equities, mutual funds whose net asset values are published each day and exchange traded foreign equities that are not typically statistically fair valued. Typical Level 2 securities include exchange traded foreign equities that are traded in the European region or Asia Pacific region time zones which are typically statistically fair valued, forward
The accompanying Notes to Financial Statements are an integral part of this statement.
| 62 | Columbia Acorn Family of Funds | Annual Report 2018 |
Portfolio of Investments (continued)
Columbia Acorn USA®, December 31, 2018
Fair value measurements (continued)
foreign currency exchange contracts and short-term investments valued at amortized cost. Additionally, securities fair valued by Columbia Wanger Asset Management’s Valuation Committee (the Committee) that rely on significant observable inputs are also included in Level 2. Typical Level 3 securities include any security fair valued by the Committee that relies on significant unobservable inputs.
Certain investments that have been measured at fair value using the net asset value (NAV) per share (or its equivalent) are not categorized in the fair value hierarchy. The fair value amounts presented in the table are intended to reconcile the fair value hierarchy to the amounts presented in the Portfolio of Investments. The Columbia Short-Term Cash Fund seeks to provide shareholders with maximum current income consistent with liquidity and stability of principal. Columbia Short-Term Cash Fund prices its shares with a floating NAV and no longer seeks to maintain a stable NAV.
The Committee is responsible for applying the Columbia Acorn Trust Portfolio Pricing Policy and the Columbia Wanger Asset Management pricing procedures (the Policies), which are approved by and subject to the oversight of the Board of Trustees.
The Committee meets as necessary, and no less frequently than quarterly, to determine fair values for securities for which market quotations are not readily available or for which Columbia Wanger Asset Management believes that available market quotations are unreliable. The Committee also reviews the continuing appropriateness of the Policies. In circumstances where a security has been fair valued, the Committee will also review the continuing appropriateness of the current value of the security. The Policies address, among other things: circumstances under which market quotations will be deemed readily available; selection of third party pricing vendors; appropriate pricing methodologies; events that require fair valuation and fair value techniques; circumstances under which securities will be deemed to pose a potential for stale pricing, including when securities are illiquid, restricted, or in default; and certain delegations of authority to determine fair values to the Fund’s investment manager. The Committee may also meet to discuss additional valuation matters, which may include review of back-testing results, review of time-sensitive information or approval of other valuation related actions, and to review the appropriateness of the Policies.
For investments categorized as Level 3, the significant unobservable inputs used in the fair value measurement of the Fund’s securities may include: (i) data specific to the issuer or comparable issuers, (ii) general market or specific sector news and (iii) quoted prices and specific or similar security transactions. The Committee considers this data and any changes from prior periods in order to assess the reasonableness of observable and unobservable inputs, any assumptions or internal models used to value those securities and changes in fair value. Significant changes in any of these factors could result in lower or higher fair value measurements. Various factors impact the frequency of monitoring (which may occur as often as daily), however the Committee may determine that changes to inputs, assumptions and models are not required with the same frequency.
The following table is a summary of the inputs used to value the Fund’s investments at December 31, 2018:
| | Level 1
quoted prices
in active
markets for
identical
assets ($) | Level 2
other
significant
observable
inputs ($) | Level 3
significant
unobservable
inputs ($) | Investments
measured at
net asset
value ($) | Total ($) |
| Investments in Securities | | | | | |
| Common Stocks | | | | | |
| Communication Services | 2,222,948 | — | — | — | 2,222,948 |
| Consumer Discretionary | 48,906,442 | — | — | — | 48,906,442 |
| Consumer Staples | 16,910,686 | — | — | — | 16,910,686 |
| Energy | 2,901,672 | — | — | — | 2,901,672 |
| Financials | 35,734,193 | — | — | — | 35,734,193 |
| Health Care | 54,067,352 | — | — | — | 54,067,352 |
| Industrials | 30,290,767 | — | — | — | 30,290,767 |
| Information Technology | 56,526,233 | — | — | — | 56,526,233 |
| Materials | 7,136,257 | — | — | — | 7,136,257 |
| Real Estate | 10,521,693 | — | — | — | 10,521,693 |
| Total Common Stocks | 265,218,243 | — | — | — | 265,218,243 |
| Limited Partnerships | | | | | |
| Consumer Discretionary | 4,318,537 | — | — | — | 4,318,537 |
| Securities Lending Collateral | 4,068,915 | — | — | — | 4,068,915 |
| Money Market Funds | — | — | — | 6,551,486 | 6,551,486 |
| Total Investments in Securities | 273,605,695 | — | — | 6,551,486 | 280,157,181 |
There were no transfers of financial assets between levels during the period.
The accompanying Notes to Financial Statements are an integral part of this statement.
Columbia Acorn Family of Funds | Annual Report 2018
| 63 |
Portfolio of Investments
Columbia Acorn International SelectSM, December 31, 2018
(Percentages represent value of investments compared to net assets)
Investments in securities
| Common Stocks 94.2% |
| Issuer | Shares | Value ($) |
| Australia 1.9% |
DuluxGroup Ltd.
Manufactures and supplies paints and other surface coatings | 454,738 | 2,101,511 |
| Canada 5.7% |
CAE, Inc.
Training solutions based on simulation technology and integrated training services | 113,000 | 2,076,743 |
CCL Industries, Inc.
Manufacturing services and specialty packaging products for the non-durable consumer products market | 111,624 | 4,093,098 |
| Total | 6,169,841 |
| China 5.6% |
NetEase, Inc., ADR
Internet technology company that develops applications, services and Internet technologies | 10,293 | 2,422,663 |
New Oriental Education & Technology Group, Inc., ADR(a)
Educational services | 67,508 | 3,700,114 |
| Total | 6,122,777 |
| Denmark 3.7% |
Novozymes AS, Class B
Enzymes for industrial use | 90,956 | 4,064,135 |
| France 2.1% |
Legrand SA
Products and systems for electrical installations and information networks | 39,673 | 2,242,812 |
| Germany 9.5% |
MTU Aero Engines AG
Develops and manufactures engines and offers commercial engine services and support | 21,697 | 3,940,210 |
Nemetschek SE
Standard software for designing, constructing and managing buildings and real estate | 31,629 | 3,479,572 |
Wirecard AG
Internet payment and processing services | 19,216 | 2,896,855 |
| Total | 10,316,637 |
| Common Stocks (continued) |
| Issuer | Shares | Value ($) |
| India 5.0% |
Cholamandalam Investment and Finance Co., Ltd.
Financial services provider | 145,516 | 2,623,844 |
Zee Entertainment Enterprises Ltd.
Hindi films, serials, game shows and children’s programs | 416,338 | 2,839,941 |
| Total | 5,463,785 |
| Italy 4.5% |
Brembo SpA
Braking systems and components | 259,154 | 2,644,871 |
Davide Campari-Milano SpA
Global producer & distributor of branded spirits, wines and soft drinks | 269,811 | 2,284,865 |
| Total | 4,929,736 |
| Japan 16.5% |
Aeon Mall Co., Ltd.
Large-scale shopping malls | 219,200 | 3,492,235 |
Hikari Tsushin, Inc.
Distribution network, telecommunication, office automation equipment, in-house products and individual insurance plans | 13,800 | 2,157,023 |
Recruit Holdings Co., Ltd.
Information providing services in human resource, housing, bridal, travel, restaurants, beauty, automobiles, and education and more | 196,600 | 4,749,607 |
Santen Pharmaceutical Co., Ltd.
Ophthalmic medicine | 163,500 | 2,359,021 |
Sekisui Chemical Co., Ltd.
Unit residential houses in addition to parcels of land | 137,500 | 2,044,025 |
Sony Financial Holdings, Inc.
Financial holding company | 174,600 | 3,253,949 |
| Total | 18,055,860 |
| Mexico 2.3% |
Grupo Aeroportuario del Sureste SAB de CV, ADR
Operates airports in Mexico | 16,879 | 2,541,978 |
| Netherlands 6.3% |
Aalberts Industries NV
Industrial services and flow control systems | 67,200 | 2,234,966 |
Koninklijke Philips NV
Health technology focused on improving people’s health | 133,716 | 4,688,015 |
| Total | 6,922,981 |
The accompanying Notes to Financial Statements are an integral part of this statement.
| 64 | Columbia Acorn Family of Funds | Annual Report 2018 |
Portfolio of Investments (continued)
Columbia Acorn International SelectSM, December 31, 2018
| Common Stocks (continued) |
| Issuer | Shares | Value ($) |
| Singapore 2.2% |
Mapletree Commercial Trust
Singapore-focused real estate investment trust | 2,018,800 | 2,442,747 |
| South Africa 2.0% |
Naspers Ltd., Class N
Electronic and print media industries | 11,061 | 2,214,594 |
| South Korea 5.5% |
Korea Investment Holdings Co., Ltd.
Financial holding company | 38,200 | 2,043,024 |
Korea Zinc Co. Ltd.
Non-ferrous metal smelting | 10,090 | 3,906,919 |
| Total | 5,949,943 |
| Sweden 6.2% |
Hexagon AB, Class B
Design, measurement and visualisation technologies | 98,952 | 4,574,309 |
Trelleborg AB, Class B
Manufactures and distributes industrial products | 138,696 | 2,185,243 |
| Total | 6,759,552 |
| Switzerland 2.7% |
Partners Group Holding AG
Global private markets asset management firm | 4,785 | 2,910,939 |
| Taiwan 1.8% |
Largan Precision Co., Ltd.
Optical lens modules and optoelectronic components | 19,000 | 1,982,555 |
| United Kingdom 10.7% |
Halma PLC
Products that detect hazards and protect assets and people in public and commercial buildings | 193,191 | 3,365,471 |
Rentokil Initial PLC
Fully integrated facilities management and essential support services | 779,714 | 3,354,327 |
| Common Stocks (continued) |
| Issuer | Shares | Value ($) |
Rightmove PLC
Website that lists properties across Britain | 433,244 | 2,387,649 |
Spirax-Sarco Engineering PLC
Consultation, service and products for the control and efficient management of steam and industrial fluids | 32,642 | 2,598,169 |
| Total | 11,705,616 |
Total Common Stocks
(Cost: $92,474,929) | 102,897,999 |
| Preferred Stocks 2.4% |
| Issuer | | Shares | Value ($) |
| Germany 2.4% |
Sartorius AG
Precision electronic equipment and components | | 21,266 | 2,646,703 |
Total Preferred Stocks
(Cost: $2,108,325) | 2,646,703 |
| Money Market Funds 3.2% |
| | Shares | Value ($) |
Columbia Short-Term Cash Fund, 2.459%(b),(c)
| 3,482,775 | 3,482,426 |
Total Money Market Funds
(Cost: $3,482,426) | 3,482,426 |
Total Investments in Securities
(Cost: $98,065,680) | 109,027,128 |
| Other Assets & Liabilities, Net | | 239,053 |
| Net Assets | $109,266,181 |
The accompanying Notes to Financial Statements are an integral part of this statement.
Columbia Acorn Family of Funds | Annual Report 2018
| 65 |
Portfolio of Investments (continued)
Columbia Acorn International SelectSM, December 31, 2018
Notes to Portfolio of Investments
| (a) | Non-income producing security. |
| (b) | The rate shown is the seven-day current annualized yield at December 31, 2018. |
| (c) | As defined in the Investment Company Act of 1940, an affiliated company is one in which the Fund owns 5% or more of the company’s outstanding voting securities, or a company which is under common ownership or control with the Fund. Holdings and transactions in these affiliated companies during the year ended December 31, 2018 are as follows: |
| Issuer | Beginning
shares | Shares
purchased | Shares
sold | Ending
shares | Realized gain
(loss) —
affiliated
issuers ($) | Net change in
unrealized
appreciation
(depreciation) —
affiliated
issuers ($) | Dividend —
affiliated issuers
($) | Value —
affiliated
issuers
at end of
period ($) |
| Columbia Short-Term Cash Fund, 2.459% |
| | — | 23,901,675 | (20,418,900) | 3,482,775 | — | — | 34,282 | 3,482,426 |
Abbreviation Legend
| ADR | American Depositary Receipt |
Fair value measurements
Various inputs are used in determining the value of the Fund’s investments, following the input prioritization hierarchy established by accounting principles generally accepted in the United States of America (GAAP). These inputs are summarized in the three broad levels listed below:
| ■ | Level 1 – quoted prices in active markets for identical securities |
| ■ | Level 2 – prices determined using other significant observable inputs (including quoted prices for similar securities, interest rates, prepayment speeds, credit risk and others) |
| ■ | Level 3 – prices determined using significant unobservable inputs where quoted prices or observable inputs are unavailable or less reliable (including management’s own assumptions about the factors market participants would use in pricing an investment) |
The inputs or methodology used for valuing securities are not necessarily an indication of the risk associated with investing in those securities.
Examples of the types of securities in which the Fund would typically invest and how they are classified within this hierarchy are as follows. Typical Level 1 securities include exchange traded domestic equities, mutual funds whose net asset values are published each day and exchange traded foreign equities that are not typically statistically fair valued. Typical Level 2 securities include exchange traded foreign equities that are traded in the European region or Asia Pacific region time zones which are typically statistically fair valued, forward foreign currency exchange contracts and short-term investments valued at amortized cost. Additionally, securities fair valued by Columbia Wanger Asset Management’s Valuation Committee (the Committee) that rely on significant observable inputs are also included in Level 2. Typical Level 3 securities include any security fair valued by the Committee that relies on significant unobservable inputs.
Certain investments that have been measured at fair value using the net asset value (NAV) per share (or its equivalent) are not categorized in the fair value hierarchy. The fair value amounts presented in the table are intended to reconcile the fair value hierarchy to the amounts presented in the Portfolio of Investments. The Columbia Short-Term Cash Fund seeks to provide shareholders with maximum current income consistent with liquidity and stability of principal. Columbia Short-Term Cash Fund prices its shares with a floating NAV and no longer seeks to maintain a stable NAV.
The Committee is responsible for applying the Columbia Acorn Trust Portfolio Pricing Policy and the Columbia Wanger Asset Management pricing procedures (the Policies), which are approved by and subject to the oversight of the Board of Trustees.
The Committee meets as necessary, and no less frequently than quarterly, to determine fair values for securities for which market quotations are not readily available or for which Columbia Wanger Asset Management believes that available market quotations are unreliable. The Committee also reviews the continuing appropriateness of the Policies. In circumstances where a security has been fair valued, the Committee will also review the continuing appropriateness of the current value of the security. The Policies address, among other things: circumstances under which market quotations will be deemed readily available; selection of third party pricing vendors; appropriate pricing methodologies; events that require fair valuation and fair value techniques; circumstances under which securities will be deemed to pose a potential for stale pricing, including when securities are illiquid, restricted, or in default; and certain delegations of authority to determine fair values to the Fund’s investment manager. The Committee may also meet to discuss additional valuation matters, which may include review of back-testing results, review of time-sensitive information or approval of other valuation related actions, and to review the appropriateness of the Policies.
For investments categorized as Level 3, the significant unobservable inputs used in the fair value measurement of the Fund’s securities may include: (i) data specific to the issuer or comparable issuers, (ii) general market or specific sector news and (iii) quoted prices and specific or similar security transactions. The Committee considers this data and any changes from prior periods in order to assess the reasonableness of observable and unobservable inputs, any assumptions or internal models used to value those securities and changes in fair value. Significant changes in any of these factors could result in lower or higher fair value measurements. Various factors impact the frequency of monitoring (which may occur as often as daily), however the Committee may determine that changes to inputs, assumptions and models are not required with the same frequency.
The accompanying Notes to Financial Statements are an integral part of this statement.
| 66 | Columbia Acorn Family of Funds | Annual Report 2018 |
Portfolio of Investments (continued)
Columbia Acorn International SelectSM, December 31, 2018
Fair value measurements (continued)
The following table is a summary of the inputs used to value the Fund’s investments at December 31, 2018:
| | Level 1
quoted prices
in active
markets for
identical
assets ($) | Level 2
other
significant
observable
inputs ($) | Level 3
significant
unobservable
inputs ($) | Investments
measured at
net asset
value ($) | Total ($) |
| Investments in Securities | | | | | |
| Common Stocks | | | | | |
| Australia | — | 2,101,511 | — | — | 2,101,511 |
| Canada | 6,169,841 | — | — | — | 6,169,841 |
| China | 6,122,777 | — | — | — | 6,122,777 |
| Denmark | — | 4,064,135 | — | — | 4,064,135 |
| France | — | 2,242,812 | — | — | 2,242,812 |
| Germany | — | 10,316,637 | — | — | 10,316,637 |
| India | — | 5,463,785 | — | — | 5,463,785 |
| Italy | — | 4,929,736 | — | — | 4,929,736 |
| Japan | — | 18,055,860 | — | — | 18,055,860 |
| Mexico | 2,541,978 | — | — | — | 2,541,978 |
| Netherlands | — | 6,922,981 | — | — | 6,922,981 |
| Singapore | — | 2,442,747 | — | — | 2,442,747 |
| South Africa | — | 2,214,594 | — | — | 2,214,594 |
| South Korea | — | 5,949,943 | — | — | 5,949,943 |
| Sweden | — | 6,759,552 | — | — | 6,759,552 |
| Switzerland | — | 2,910,939 | — | — | 2,910,939 |
| Taiwan | — | 1,982,555 | — | — | 1,982,555 |
| United Kingdom | — | 11,705,616 | — | — | 11,705,616 |
| Total Common Stocks | 14,834,596 | 88,063,403 | — | — | 102,897,999 |
| Preferred Stocks | | | | | |
| Germany | — | 2,646,703 | — | — | 2,646,703 |
| Total Preferred Stocks | — | 2,646,703 | — | — | 2,646,703 |
| Money Market Funds | — | — | — | 3,482,426 | 3,482,426 |
| Total Investments in Securities | 14,834,596 | 90,710,106 | — | 3,482,426 | 109,027,128 |
The Fund’s assets assigned to the Level 2 input category are generally valued using a market approach, in which a security’s value is determined through its correlation to prices and information from observable market transactions for similar or identical assets. Foreign equities are generally valued at the last sale price on the foreign exchange or market on which they trade. The Fund may use a statistical fair valuation model, in accordance with the policy adopted by the Board of Trustees, provided by an independent third party to value securities principally traded in foreign markets in order to adjust for possible stale pricing that may occur between the close of the foreign exchanges and the time for valuation. These models take into account available market data including intraday index, ADR, and ETF movements.
There were no transfers of financial assets between levels during the period.
The accompanying Notes to Financial Statements are an integral part of this statement.
Columbia Acorn Family of Funds | Annual Report 2018
| 67 |
Portfolio of Investments
Columbia Acorn SelectSM, December 31, 2018
(Percentages represent value of investments compared to net assets)
Investments in securities
| Common Stocks 96.1% |
| Issuer | Shares | Value ($) |
| Consumer Discretionary 17.9% |
| Auto Components 4.4% |
LCI Industries
Recreational vehicles and equipment | 153,182 | 10,232,558 |
| Distributors 3.8% |
LKQ Corp.(a)
Automotive products and services | 378,404 | 8,979,527 |
| Hotels, Restaurants & Leisure 4.4% |
Vail Resorts, Inc.
Operates resorts globally | 49,136 | 10,358,851 |
| Household Durables 4.4% |
Cavco Industries, Inc.(a)
Designs and manufactures systems-built structures | 41,822 | 5,452,752 |
NVR, Inc.(a)
Builds and markets homes and conducts mortgage banking activities | 2,050 | 4,995,830 |
| Total | | 10,448,582 |
| Specialty Retail 0.9% |
Boot Barn Holdings, Inc.(a)
Western and work gear | 120,000 | 2,043,600 |
| Total Consumer Discretionary | 42,063,118 |
| Financials 12.1% |
| Banks 4.4% |
SVB Financial Group(a)
Holding company for Silicon Valley Bank | 54,849 | 10,416,922 |
| Capital Markets 5.0% |
Ares Management Corp., Class A
Asset management firm | 296,416 | 5,270,277 |
Raymond James Financial, Inc.
Financial services to individuals, corporations, and municipalities | 87,800 | 6,533,198 |
| Total | | 11,803,475 |
| Thrifts & Mortgage Finance 2.7% |
OceanFirst Financial Corp.
New Jersey banks | 281,000 | 6,325,310 |
| Total Financials | 28,545,707 |
| Common Stocks (continued) |
| Issuer | Shares | Value ($) |
| Health Care 19.6% |
| Biotechnology 2.6% |
Seattle Genetics, Inc.(a)
Monoclonal antibody-based drugs to treat cancer and related diseases | 65,300 | 3,699,898 |
Ultragenyx Pharmaceutical, Inc.(a)
Therapeutics and sialic acid for treating metabolic, body myopathy, glucuronidase, and rare genetic diseases | 54,290 | 2,360,529 |
| Total | | 6,060,427 |
| Health Care Equipment & Supplies 7.0% |
Anika Therapeutics, Inc.(a)
Integrated orthopedic medicines company | 81,300 | 2,732,493 |
Masimo Corp.(a)
Medical signal processing and sensor technology for non-invasive monitoring of physiological parameters | 129,102 | 13,861,682 |
| Total | | 16,594,175 |
| Health Care Providers & Services 8.0% |
Encompass Health Corp.
Inpatient rehabilitative healthcare services | 176,917 | 10,915,779 |
Premier, Inc.(a)
Healthcare services | 212,800 | 7,948,080 |
| Total | | 18,863,859 |
| Life Sciences Tools & Services 2.0% |
Pra Health Sciences, Inc.(a)
Global contract research organization | 50,800 | 4,671,568 |
| Total Health Care | 46,190,029 |
| Industrials 10.6% |
| Machinery 5.6% |
Gardner Denver Holdings, Inc.(a)
Vacuum systems, bottle blowers, pumps and air & gas compressors | 234,000 | 4,785,300 |
Nordson Corp.
Systems that apply adhesives, sealants, and coatings to products during manufacturing | 70,520 | 8,416,562 |
| Total | | 13,201,862 |
| Road & Rail 5.0% |
JB Hunt Transport Services, Inc.
Logistics services | 125,270 | 11,655,121 |
| Total Industrials | 24,856,983 |
The accompanying Notes to Financial Statements are an integral part of this statement.
| 68 | Columbia Acorn Family of Funds | Annual Report 2018 |
Portfolio of Investments (continued)
Columbia Acorn SelectSM, December 31, 2018
| Common Stocks (continued) |
| Issuer | Shares | Value ($) |
| Information Technology 21.5% |
| Electronic Equipment, Instruments & Components 5.7% |
CDW Corp.
IT products and services | 96,811 | 7,846,531 |
Coherent, Inc.(a)
Laser-based photonic products | 54,167 | 5,725,994 |
| Total | | 13,572,525 |
| IT Services 10.5% |
GoDaddy, Inc., Class A(a)
Cloud-based web platform for small businesses, web design professionals and individuals | 190,509 | 12,501,201 |
GreenSky, Inc., Class A(a)
Technology company | 175,500 | 1,679,535 |
VeriSign, Inc.(a)
Domain names and Internet security services | 70,573 | 10,465,270 |
| Total | | 24,646,006 |
| Software 5.3% |
ANSYS, Inc.(a)
Software solutions for design analysis and optimization | 87,056 | 12,443,784 |
| Total Information Technology | 50,662,315 |
| Materials 7.2% |
| Chemicals 7.2% |
Celanese Corp., Class A
Global integrated producer of chemicals and advanced materials | 90,152 | 8,110,975 |
Orion Engineered Carbons SA
Global supplier of Carbon Black | 350,900 | 8,870,752 |
| Total | | 16,981,727 |
| Total Materials | 16,981,727 |
| Real Estate 7.2% |
| Equity Real Estate Investment Trusts (REITS) 7.2% |
Coresite Realty Corp.
Develops, owns & operates data centers | 94,817 | 8,270,887 |
UMH Properties, Inc.
Real estate investment trust | 728,350 | 8,623,664 |
| Total | | 16,894,551 |
| Total Real Estate | 16,894,551 |
Total Common Stocks
(Cost: $214,263,158) | 226,194,430 |
|
| Limited Partnerships 1.8% |
| Issuer | Shares | Value ($) |
| Financials 1.8% |
| Capital Markets 1.8% |
Oaktree Capital Group LLC
Investment management firm focused on alternative markets | 105,500 | 4,193,625 |
| Total Financials | 4,193,625 |
Total Limited Partnerships
(Cost: $4,491,286) | 4,193,625 |
|
| Money Market Funds 2.4% |
| | Shares | Value ($) |
| Columbia Short-Term Cash Fund, 2.459%(b),(c) | 5,598,686 | 5,598,126 |
Total Money Market Funds
(Cost: $5,598,126) | 5,598,126 |
Total Investments in Securities
(Cost $224,352,570) | 235,986,181 |
| Other Assets & Liabilities, Net | | (591,536) |
| Net Assets | $235,394,645 |
The accompanying Notes to Financial Statements are an integral part of this statement.
Columbia Acorn Family of Funds | Annual Report 2018
| 69 |
Portfolio of Investments (continued)
Columbia Acorn SelectSM, December 31, 2018
Notes to Portfolio of Investments
| (a) | Non-income producing security. |
| (b) | The rate shown is the seven-day current annualized yield at December 31, 2018. |
| (c) | As defined in the Investment Company Act of 1940, an affiliated company is one in which the Fund owns 5% or more of the company’s outstanding voting securities, or a company which is under common ownership or control with the Fund. Holdings and transactions in these affiliated companies during the year ended December 31, 2018 are as follows: |
| Issuer | Beginning
shares | Shares
purchased | Shares
sold | Ending
shares | Realized gain
(loss) —
affiliated
issuers ($) | Net change in
unrealized
appreciation
(depreciation) —
affiliated
issuers ($) | Dividend —
affiliated issuers
($) | Value —
affiliated
issuers
at end of
period ($) |
| Columbia Short-Term Cash Fund, 2.459% |
| | — | 57,519,079 | (51,920,393) | 5,598,686 | — | — | 58,197 | 5,598,126 |
Fair value measurements
Various inputs are used in determining the value of the Fund’s investments, following the input prioritization hierarchy established by accounting principles generally accepted in the United States of America (GAAP). These inputs are summarized in the three broad levels listed below:
| ■ | Level 1 – quoted prices in active markets for identical securities |
| ■ | Level 2 – prices determined using other significant observable inputs (including quoted prices for similar securities, interest rates, prepayment speeds, credit risk and others) |
| ■ | Level 3 – prices determined using significant unobservable inputs where quoted prices or observable inputs are unavailable or less reliable (including management’s own assumptions about the factors market participants would use in pricing an investment) |
The inputs or methodology used for valuing securities are not necessarily an indication of the risk associated with investing in those securities.
Examples of the types of securities in which the Fund would typically invest and how they are classified within this hierarchy are as follows. Typical Level 1 securities include exchange traded domestic equities, mutual funds whose net asset values are published each day and exchange traded foreign equities that are not typically statistically fair valued. Typical Level 2 securities include exchange traded foreign equities that are traded in the European region or Asia Pacific region time zones which are typically statistically fair valued, forward foreign currency exchange contracts and short-term investments valued at amortized cost. Additionally, securities fair valued by Columbia Wanger Asset Management’s Valuation Committee (the Committee) that rely on significant observable inputs are also included in Level 2. Typical Level 3 securities include any security fair valued by the Committee that relies on significant unobservable inputs.
Certain investments that have been measured at fair value using the net asset value (NAV) per share (or its equivalent) are not categorized in the fair value hierarchy. The fair value amounts presented in the table are intended to reconcile the fair value hierarchy to the amounts presented in the Portfolio of Investments. The Columbia Short-Term Cash Fund seeks to provide shareholders with maximum current income consistent with liquidity and stability of principal. Columbia Short-Term Cash Fund prices its shares with a floating NAV and no longer seeks to maintain a stable NAV.
The Committee is responsible for applying the Columbia Acorn Trust Portfolio Pricing Policy and the Columbia Wanger Asset Management pricing procedures (the Policies), which are approved by and subject to the oversight of the Board of Trustees.
The Committee meets as necessary, and no less frequently than quarterly, to determine fair values for securities for which market quotations are not readily available or for which Columbia Wanger Asset Management believes that available market quotations are unreliable. The Committee also reviews the continuing appropriateness of the Policies. In circumstances where a security has been fair valued, the Committee will also review the continuing appropriateness of the current value of the security. The Policies address, among other things: circumstances under which market quotations will be deemed readily available; selection of third party pricing vendors; appropriate pricing methodologies; events that require fair valuation and fair value techniques; circumstances under which securities will be deemed to pose a potential for stale pricing, including when securities are illiquid, restricted, or in default; and certain delegations of authority to determine fair values to the Fund’s investment manager. The Committee may also meet to discuss additional valuation matters, which may include review of back-testing results, review of time-sensitive information or approval of other valuation related actions, and to review the appropriateness of the Policies.
For investments categorized as Level 3, the significant unobservable inputs used in the fair value measurement of the Fund’s securities may include: (i) data specific to the issuer or comparable issuers, (ii) general market or specific sector news and (iii) quoted prices and specific or similar security transactions. The Committee considers this data and any changes from prior periods in order to assess the reasonableness of observable and unobservable inputs, any assumptions or internal models used to value those securities and changes in fair value. Significant changes in any of these factors could result in lower or higher fair value measurements. Various factors impact the frequency of monitoring (which may occur as often as daily), however the Committee may determine that changes to inputs, assumptions and models are not required with the same frequency.
The accompanying Notes to Financial Statements are an integral part of this statement.
| 70 | Columbia Acorn Family of Funds | Annual Report 2018 |
Portfolio of Investments (continued)
Columbia Acorn SelectSM, December 31, 2018
Fair value measurements (continued)
The following table is a summary of the inputs used to value the Fund’s investments at December 31, 2018:
| | Level 1
quoted prices
in active
markets for
identical
assets ($) | Level 2
other
significant
observable
inputs ($) | Level 3
significant
unobservable
inputs ($) | Investments
measured at
net asset
value ($) | Total ($) |
| Investments in Securities | | | | | |
| Common Stocks | | | | | |
| Consumer Discretionary | 42,063,118 | — | — | — | 42,063,118 |
| Financials | 28,545,707 | — | — | — | 28,545,707 |
| Health Care | 46,190,029 | — | — | — | 46,190,029 |
| Industrials | 24,856,983 | — | — | — | 24,856,983 |
| Information Technology | 50,662,315 | — | — | — | 50,662,315 |
| Materials | 16,981,727 | — | — | — | 16,981,727 |
| Real Estate | 16,894,551 | — | — | — | 16,894,551 |
| Total Common Stocks | 226,194,430 | — | — | — | 226,194,430 |
| Limited Partnerships | | | | | |
| Financials | 4,193,625 | — | — | — | 4,193,625 |
| Money Market Funds | — | — | — | 5,598,126 | 5,598,126 |
| Total Investments in Securities | 230,388,055 | — | — | 5,598,126 | 235,986,181 |
There were no transfers of financial assets between levels during the period.
The accompanying Notes to Financial Statements are an integral part of this statement.
Columbia Acorn Family of Funds | Annual Report 2018
| 71 |
Portfolio of Investments
Columbia Thermostat FundSM, December 31, 2018
(Percentages represent value of investments compared to net assets)
Investments in securities
| Equity Funds 13.9% |
| Issuer | Shares | Value ($) |
| Dividend Income 1.4% |
Columbia Dividend Income Fund, Institutional 3 Class(a)
| 453,812 | 9,080,772 |
| Total Dividend Income | 9,080,772 |
| International Small Mid Cap 1.4% |
Columbia Acorn International®, Institutional 3 Class(a)
| 310,169 | 9,252,339 |
| Total International Small Mid Cap | 9,252,339 |
| U.S. Large Cap 8.4% |
Columbia Contrarian Core Fund, Institutional 3 Class(a)
| 405,496 | 8,868,206 |
Columbia Large Cap Enhanced Core Fund, Institutional 3 Class(a)
| 425,513 | 8,935,764 |
Columbia Large Cap Index Fund, Institutional 3 Class(a)
| 834,492 | 35,799,703 |
| Total U.S. Large Cap | 53,603,673 |
| U.S. Mid Cap 1.3% |
Columbia Acorn SelectSM, Institutional 3 Class(a),(b)
| 675,954 | 8,665,733 |
| Total U.S. Mid Cap | 8,665,733 |
| U.S. Small Mid Cap 1.4% |
Columbia Acorn® Fund, Institutional 3 Class(a),(b)
| 626,508 | 8,702,202 |
| Total U.S. Small Mid Cap | 8,702,202 |
Total Equity Funds
(Cost: $89,505,476) | 89,304,719 |
|
| Exchange-Traded Funds 8.6% |
| Issuer | Shares | Value ($) |
Columbia Diversified Fixed Income Allocation ETF(a)
| 2,936,569 | 55,413,057 |
Total Exchange-Traded Funds
(Cost: $56,815,707) | 55,413,057 |
|
| Fixed-Income Funds 78.0% |
| | |
| Investment Grade 78.0% |
Columbia Corporate Income Fund, Institutional 3 Class(a)
| 5,784,658 | 55,648,413 |
Columbia Quality Income Fund, Institutional 3 Class(a)
| 20,836,213 | 111,473,738 |
Columbia Short Term Bond Fund, Institutional 3 Class(a)
| 14,104,862 | 138,791,841 |
Columbia U.S. Treasury Index Fund, Institutional 3 Class(a)
| 17,758,369 | 194,631,722 |
| Total Investment Grades | 500,545,714 |
Total Fixed-Income Funds
(Cost: $502,603,371) | 500,545,714 |
Total Investments in Securities
(Cost $648,924,554) | 645,263,490 |
| Other Assets & Liabilities, Net | | (3,410,608) |
| Net Assets | $641,852,882 |
The accompanying Notes to Financial Statements are an integral part of this statement.
| 72 | Columbia Acorn Family of Funds | Annual Report 2018 |
Portfolio of Investments (continued)
Columbia Thermostat FundSM, December 31, 2018
Notes to Portfolio of Investments
| (a) | As defined in the Investment Company Act of 1940, an affiliated company is one in which the Fund owns 5% or more of the company’s outstanding voting securities, or a company which is under common ownership or control with the Fund. Holdings and transactions in these affiliated companies during the year ended December 31, 2018 are as follows: |
| Issuer | Beginning
shares | Shares
purchased | Shares
sold | Ending
shares | Realized gain
(loss) —
affiliated
issuers ($) | Net change in
unrealized
appreciation
(depreciation) —
affiliated
issuers ($) | Dividend —
affiliated
issuers ($) | Capital gain
distributions —
affiliated
issuers ($) | Value —
affiliated
issuers
at end of
period ($) |
| Columbia Acorn International®, Institutional 3 Class |
| | 364,288 | 887,730 | (941,849) | 310,169 | 2,697,722 | (5,859,756) | 106,587 | 2,302,914 | 9,252,339 |
| Columbia Acorn SelectSM, Institutional 3 Class |
| | 487,249 | 1,985,785 | (1,797,080) | 675,954 | 1,031,031 | (2,714,823) | — | 1,684,028 | 8,665,733 |
| Columbia Acorn® Fund, Institutional 3 Class |
| | 519,202 | 1,965,073 | (1,857,767) | 626,508 | 983,805 | (1,101,780) | — | 1,077,762 | 8,702,202 |
| Columbia Contrarian Core Fund, Institutional 3 Class |
| | 323,920 | 1,226,247 | (1,144,671) | 405,496 | 1,465,203 | (2,537,859) | 120,465 | 701,285 | 8,868,206 |
| Columbia Corporate Income Fund, Institutional 3 Class |
| | — | 9,635,083 | (3,850,425) | 5,784,658 | (534,317) | (1,572,715) | 1,651,038 | — | 55,648,413 |
| Columbia Diversified Fixed Income Allocation ETF |
| | — | 4,851,268 | (1,914,699) | 2,936,569 | (882,908) | (1,402,651) | 1,808,254 | — | 55,413,057 |
| Columbia Dividend Income Fund, Institutional 3 Class |
| | 759,793 | 1,643,587 | (1,949,568) | 453,812 | 4,740,549 | (4,596,821) | 185,099 | 457,730 | 9,080,772 |
| Columbia Income Opportunities Fund, Institutional 3 Class |
| | 7,774,323 | 59,913 | (7,834,236) | — | 2,103,636 | (3,913,900) | 696,670 | — | — |
| Columbia Large Cap Enhanced Core Fund, Institutional 3 Class |
| | 345,654 | 1,314,270 | (1,234,411) | 425,513 | 1,528,052 | (2,330,223) | 137,052 | 969,978 | 8,935,764 |
| Columbia Large Cap Index Fund, Institutional 3 Class |
| | — | 2,843,203 | (2,008,711) | 834,492 | 2,392 | (4,908,597) | 764,736 | 2,706,588 | 35,799,703 |
| Columbia Quality Income Fund, Institutional 3 Class |
| | 28,648,549 | 9,836,816 | (17,649,152) | 20,836,213 | (1,722,301) | (210,216) | 3,639,432 | — | 111,473,738 |
| Columbia Select Large Cap Equity Fund, Institutional 3 Class |
| | 595,505 | 330,247 | (925,752) | — | 1,195,080 | (595,150) | — | — | — |
| Columbia Select Large Cap Growth Fund, Institutional 3 Class |
| | 492,597 | 265,317 | (757,914) | — | 3,424,753 | (1,924,787) | — | — | — |
| Columbia Short Term Bond Fund, Institutional 3 Class |
| | 31,104,620 | 5,601,572 | (22,601,330) | 14,104,862 | (1,829,652) | (312,909) | 2,723,852 | — | 138,791,841 |
| Columbia Short-Term Cash Fund, 2.459% |
| | — | 55,337,290 | (55,337,290) | — | — | — | 17,487 | — | — |
| Columbia Total Return Bond Fund, Institutional 3 Class |
| | 17,065,809 | 71,871 | (17,137,680) | — | (2,138,391) | (854,368) | 764,183 | — | — |
| Columbia U.S. Treasury Index Fund, Institutional 3 Class |
| | 6,949,835 | 24,121,919 | (13,313,385) | 17,758,369 | (2,697,300) | 2,412,676 | 3,707,127 | — | 194,631,722 |
| Total of Affiliated Transactions | | | | | 9,367,354 | (32,423,879) | 16,321,982 | 9,900,285 | 645,263,490 |
| (b) | Non-income producing security. |
Fair value measurements
Various inputs are used in determining the value of the Fund’s investments, following the input prioritization hierarchy established by accounting principles generally accepted in the United States of America (GAAP). These inputs are summarized in the three broad levels listed below:
| ■ | Level 1 – quoted prices in active markets for identical securities |
The accompanying Notes to Financial Statements are an integral part of this statement.
Columbia Acorn Family of Funds | Annual Report 2018
| 73 |
Portfolio of Investments (continued)
Columbia Thermostat FundSM, December 31, 2018
Fair value measurements (continued)
| ■ | Level 2 – prices determined using other significant observable inputs (including quoted prices for similar securities, interest rates, prepayment speeds, credit risk and others) |
| ■ | Level 3 – prices determined using significant unobservable inputs where quoted prices or observable inputs are unavailable or less reliable (including management’s own assumptions about the factors market participants would use in pricing an investment) |
The inputs or methodology used for valuing securities are not necessarily an indication of the risk associated with investing in those securities.
Examples of the types of securities in which the Fund would typically invest and how they are classified within this hierarchy are as follows. Typical Level 1 securities include mutual funds whose net asset values are published each day.
The Committee is responsible for applying the Columbia Acorn Trust Portfolio Pricing Policy and the Columbia Wanger Asset Management pricing procedures (the Policies), which are approved by and subject to the oversight of the Board of Trustees.
The Committee meets as necessary, and no less frequently than quarterly, to determine fair values for securities for which market quotations are not readily available or for which Columbia Wanger Asset Management believes that available market quotations are unreliable. The Committee also reviews the continuing appropriateness of the Policies. In circumstances where a security has been fair valued, the Committee will also review the continuing appropriateness of the current value of the security. The Policies address, among other things: circumstances under which market quotations will be deemed readily available; selection of third party pricing vendors; appropriate pricing methodologies; events that require fair valuation and fair value techniques; circumstances under which securities will be deemed to pose a potential for stale pricing, including when securities are illiquid, restricted, or in default; and certain delegations of authority to determine fair values to the Fund’s investment manager. The Committee may also meet to discuss additional valuation matters, which may include review of back-testing results, review of time-sensitive information or approval of other valuation related actions, and to review the appropriateness of the Policies.
For investments categorized as Level 3, the significant unobservable inputs used in the fair value measurement of the Fund’s securities may include: (i) data specific to the issuer or comparable issuers, (ii) general market or specific sector news and (iii) quoted prices and specific or similar security transactions. The Committee considers this data and any changes from prior periods in order to assess the reasonableness of observable and unobservable inputs, any assumptions or internal models used to value those securities and changes in fair value. Significant changes in any of these factors could result in lower or higher fair value measurements. Various factors impact the frequency of monitoring (which may occur as often as daily), however the Committee may determine that changes to inputs, assumptions and models are not required with the same frequency.
The following table is a summary of the inputs used to value the Fund’s investments at December 31, 2018:
| | Level 1
quoted prices in active
markets for identical
assets ($) | Level 2
other significant
observable inputs ($) | Level 3
significant
unobservable inputs ($) | Total ($) |
| Investments in Securities | | | | |
| Equity Funds | 89,304,719 | — | — | 89,304,719 |
| Exchange-Traded Funds | 55,413,057 | — | — | 55,413,057 |
| Fixed-Income Funds | 500,545,714 | — | — | 500,545,714 |
| Total Investments in Securities | 645,263,490 | — | — | 645,263,490 |
There were no transfers of financial assets between levels during the period.
The accompanying Notes to Financial Statements are an integral part of this statement.
| 74 | Columbia Acorn Family of Funds | Annual Report 2018 |
Portfolio of Investments
Columbia Acorn Emerging Markets FundSM, December 31, 2018
(Percentages represent value of investments compared to net assets)
Investments in securities
| Common Stocks 98.1% |
| Issuer | Shares | Value ($) |
| Brazil 7.9% |
CVC Brasil Operadora e Agencia de Viagens SA
Travel services | 62,000 | 978,690 |
Localiza Rent a Car SA
Rents automobiles | 219,100 | 1,681,797 |
Raia Drogasil SA
Chain of pharmaceutical stores | 39,900 | 588,347 |
Sul America SA
Full service insurance company | 194,000 | 1,431,568 |
| Total | 4,680,402 |
| Cambodia 2.9% |
NagaCorp Ltd.
Leisure and tourism company | 1,617,000 | 1,737,310 |
| China 6.4% |
51job, Inc., ADR(a)
Integrated human resource services | 10,377 | 647,940 |
Huazhu Group Ltd., ADR
Hotel operator and franchisor | 11,600 | 332,108 |
Minth Group Ltd.
Exterior automobile body parts | 148,000 | 477,592 |
New Oriental Education & Technology Group, Inc., ADR(a)
Educational services | 22,131 | 1,213,000 |
TravelSky Technology Ltd., Class H
IT solutions for China’s air travel and tourism industries | 131,000 | 335,748 |
Xiabuxiabu Catering Management China Holdings Co., Ltd.
Chain of restaurants in China | 504,000 | 787,908 |
| Total | 3,794,296 |
| Egypt 1.3% |
Commercial International Bank of Egypt
Provides a range of financial services | 185,273 | 766,333 |
| Hong Kong 5.8% |
ASM Pacific Technology Ltd.
Machines, tools & materials used in the semiconductor industry | 34,700 | 335,000 |
Value Partners Group Ltd.
Independent, value oriented asset management group | 1,628,000 | 1,130,408 |
Vitasoy International Holdings Ltd.
Food and beverages | 522,000 | 1,987,084 |
| Total | 3,452,492 |
| Common Stocks (continued) |
| Issuer | Shares | Value ($) |
| India 10.7% |
Care Ratings Ltd.
Credit rating services | 51,439 | 726,749 |
Cholamandalam Investment and Finance Co., Ltd.
Financial services provider | 71,351 | 1,286,552 |
GRUH Finance Ltd.
Provides a range of home loans as well as insurance products | 196,230 | 887,518 |
Havells India Ltd.
Manufactures electrical products | 66,528 | 658,292 |
PI Industries Ltd.
Agricultural and fine chemicals and polymers | 49,962 | 617,064 |
Zee Entertainment Enterprises Ltd.
Hindi films, serials, game shows and children’s programs | 313,889 | 2,141,112 |
| Total | 6,317,287 |
| Indonesia 4.7% |
PT Link Net Tbk
High-speed internet connection through fiber optic lines | 3,135,800 | 1,068,527 |
PT Matahari Department Store Tbk
Retail clothes, accessories, bags, shoes, cosmetics, household appliances, and management consulting services. | 2,166,700 | 843,308 |
PT Tower Bersama Infrastructure Tbk
Telecommunication infrastructure services to Indonesian wireless carriers | 3,344,300 | 835,828 |
| Total | 2,747,663 |
| Japan 1.3% |
Mandom Corp.
Cosmetic products for men and women | 27,400 | 746,540 |
| Malaysia 1.1% |
AEON Credit Service M Bhd
Consumer financing products | 175,000 | 647,846 |
| Mexico 3.5% |
Corporación Inmobiliaria Vesta SAB de CV
Real estate owner, developer and asset administrator | 249,000 | 334,885 |
Grupo Aeroportuario del Sureste SAB de CV, ADR
Operates airports in Mexico | 7,420 | 1,117,452 |
Qualitas Controladora SAB de CV
Insurance holding company | 280,700 | 590,775 |
| Total | 2,043,112 |
The accompanying Notes to Financial Statements are an integral part of this statement.
Columbia Acorn Family of Funds | Annual Report 2018
| 75 |
Portfolio of Investments (continued)
Columbia Acorn Emerging Markets FundSM, December 31, 2018
| Common Stocks (continued) |
| Issuer | Shares | Value ($) |
| Philippines 2.4% |
D&L Industries, Inc.
Customized raw materials | 3,785,900 | 790,514 |
Security Bank Corp.
Financial products & services | 215,730 | 636,139 |
| Total | 1,426,653 |
| Poland 1.0% |
KRUK SA
Debt collection services | 14,131 | 592,329 |
| Russian Federation 1.7% |
TCS Group Holding PLC, GDR
Online retail financial services | 65,474 | 1,018,775 |
| South Africa 7.8% |
Clicks Group Ltd.
Owns and operates chains of retail stores | 80,044 | 1,064,139 |
Famous Brands Ltd.(a)
Food and beverage company | 243,938 | 1,657,168 |
PSG Group Ltd.
Diversified financial services | 110,879 | 1,880,087 |
| Total | 4,601,394 |
| South Korea 16.6% |
GS Retail Co., Ltd.
Chain of retail stores | 49,172 | 1,781,993 |
Koh Young Technology, Inc.
3D measurement and inspection equipment for testing various machineries | 25,500 | 1,887,843 |
Korea Investment Holdings Co., Ltd.
Financial holding company | 38,649 | 2,067,037 |
Korea Zinc Co. Ltd.
Non-ferrous metal smelting | 6,167 | 2,387,906 |
Modetour Network, Inc.
Travel services | 78,370 | 1,691,545 |
| Total | 9,816,324 |
| Taiwan 16.5% |
Basso Industry Corp.
Pneumatic nailers and staplers | 659,000 | 974,132 |
Chailease Holding Co., Ltd.
Financing services | 114,000 | 359,575 |
Gourmet Master Co., Ltd.
Coffee & bakery cafes | 131,088 | 877,654 |
Grape King Bio Ltd.
Beverages, nutrition, pharmaceuticals, syrups and hair care products | 52,000 | 322,273 |
| Common Stocks (continued) |
| Issuer | Shares | Value ($) |
Largan Precision Co., Ltd.
Optical lens modules and optoelectronic components | 10,000 | 1,043,450 |
Parade Technologies Ltd.
Fabless semiconductor company | 89,000 | 1,251,836 |
Silergy Corp.
High performance analog integrated circuits | 81,000 | 1,191,970 |
Silicon Motion Technology Corp., ADR
Semiconductor products | 9,710 | 334,995 |
Sinbon Electronics Co., Ltd.
Cable, connectors & modems | 650,000 | 1,750,932 |
Voltronic Power Technology Corp.
Uninterruptible power supply products, inverters, multiple surface mounted devices and other power products | 94,000 | 1,642,255 |
| Total | 9,749,072 |
| Thailand 4.0% |
Bangkok Chain Hospital PCL, Foreign Registered Shares
Chain of hospitals in Thailand | 1,090,000 | 559,410 |
Beauty Community PCL
Cosmetic and beauty products | 2,294,900 | 462,353 |
Mega Lifesciences PCL, Foreign Registered Shares
Nutritional and herbal supplement, OTC and ethical drugs | 844,000 | 745,306 |
Muangthai Capital PCL, Foreign Registered Shares
Commercial lending company | 384,700 | 579,768 |
| Total | 2,346,837 |
| Turkey 1.1% |
Logo Yazilim Sanayi Ve Ticaret AS(a)
Enterprise resource planning software | 130,949 | 671,508 |
| United Kingdom 1.4% |
ASA International Group PLC(a)
Micro financing company | 149,000 | 796,315 |
Total Common Stocks
(Cost: $57,098,961) | 57,952,488 |
|
| Money Market Funds 1.9% |
| | Shares | Value ($) |
Columbia Short-Term Cash Fund, 2.459%(b),(c)
| 1,107,016 | 1,106,905 |
Total Money Market Funds
(Cost: $1,106,905) | 1,106,905 |
Total Investments in Securities
(Cost: $58,205,866) | 59,059,393 |
| Other Assets & Liabilities, Net | | 26,876 |
| Net Assets | $59,086,269 |
The accompanying Notes to Financial Statements are an integral part of this statement.
| 76 | Columbia Acorn Family of Funds | Annual Report 2018 |
Portfolio of Investments (continued)
Columbia Acorn Emerging Markets FundSM, December 31, 2018
Notes to Portfolio of Investments
| (a) | Non-income producing security. |
| (b) | The rate shown is the seven-day current annualized yield at December 31, 2018. |
| (c) | As defined in the Investment Company Act of 1940, an affiliated company is one in which the Fund owns 5% or more of the company’s outstanding voting securities, or a company which is under common ownership or control with the Fund. Holdings and transactions in these affiliated companies during the year ended December 31, 2018 are as follows: |
| Issuer | Beginning
shares | Shares
purchased | Shares
sold | Ending
shares | Realized gain
(loss) —
affiliated
issuers ($) | Net change in
unrealized
appreciation
(depreciation) —
affiliated
issuers ($) | Dividend —
affiliated issuers
($) | Value —
affiliated
issuers
at end of
period ($) |
| Columbia Short-Term Cash Fund, 2.459% |
| | — | 19,123,347 | (18,016,331) | 1,107,016 | — | — | 17,928 | 1,106,905 |
Abbreviation Legend
| ADR | American Depositary Receipt |
| GDR | Global Depositary Receipt |
Fair value measurements
Various inputs are used in determining the value of the Fund’s investments, following the input prioritization hierarchy established by accounting principles generally accepted in the United States of America (GAAP). These inputs are summarized in the three broad levels listed below:
| ■ | Level 1 – quoted prices in active markets for identical securities |
| ■ | Level 2 – prices determined using other significant observable inputs (including quoted prices for similar securities, interest rates, prepayment speeds, credit risk and others) |
| ■ | Level 3 – prices determined using significant unobservable inputs where quoted prices or observable inputs are unavailable or less reliable (including management’s own assumptions about the factors market participants would use in pricing an investment) |
The inputs or methodology used for valuing securities are not necessarily an indication of the risk associated with investing in those securities.
Examples of the types of securities in which the Fund would typically invest and how they are classified within this hierarchy are as follows. Typical Level 1 securities include exchange traded domestic equities, mutual funds whose net asset values are published each day and exchange traded foreign equities that are not typically statistically fair valued. Typical Level 2 securities include exchange traded foreign equities that are traded in the European region or Asia Pacific region time zones which are typically statistically fair valued, forward foreign currency exchange contracts and short-term investments valued at amortized cost. Additionally, securities fair valued by Columbia Wanger Asset Management’s Valuation Committee (the Committee) that rely on significant observable inputs are also included in Level 2. Typical Level 3 securities include any security fair valued by the Committee that relies on significant unobservable inputs.
Certain investments that have been measured at fair value using the net asset value (NAV) per share (or its equivalent) are not categorized in the fair value hierarchy. The fair value amounts presented in the table are intended to reconcile the fair value hierarchy to the amounts presented in the Portfolio of Investments. The Columbia Short-Term Cash Fund seeks to provide shareholders with maximum current income consistent with liquidity and stability of principal. Columbia Short-Term Cash Fund prices its shares with a floating NAV and no longer seeks to maintain a stable NAV.
The Committee is responsible for applying the Columbia Acorn Trust Portfolio Pricing Policy and the Columbia Wanger Asset Management pricing procedures (the Policies), which are approved by and subject to the oversight of the Board of Trustees.
The Committee meets as necessary, and no less frequently than quarterly, to determine fair values for securities for which market quotations are not readily available or for which Columbia Wanger Asset Management believes that available market quotations are unreliable. The Committee also reviews the continuing appropriateness of the Policies. In circumstances where a security has been fair valued, the Committee will also review the continuing appropriateness of the current value of the security. The Policies address, among other things: circumstances under which market quotations will be deemed readily available; selection of third party pricing vendors; appropriate pricing methodologies; events that require fair valuation and fair value techniques; circumstances under which securities will be deemed to pose a potential for stale pricing, including when securities are illiquid, restricted, or in default; and certain delegations of authority to determine fair values to the Fund’s investment manager. The Committee may also meet to discuss additional valuation matters, which may include review of back-testing results, review of time-sensitive information or approval of other valuation related actions, and to review the appropriateness of the Policies.
For investments categorized as Level 3, the significant unobservable inputs used in the fair value measurement of the Fund’s securities may include: (i) data specific to the issuer or comparable issuers, (ii) general market or specific sector news and (iii) quoted prices and specific or similar security transactions. The Committee considers this data and any changes from prior periods in order to assess the reasonableness of observable and unobservable inputs, any assumptions or internal models used to value those securities and changes in fair value. Significant changes in any of these factors could result in lower or higher fair value measurements. Various factors impact the frequency of monitoring (which may occur as often as daily), however the Committee may determine that changes to inputs, assumptions and models are not required with the same frequency.
The accompanying Notes to Financial Statements are an integral part of this statement.
Columbia Acorn Family of Funds | Annual Report 2018
| 77 |
Portfolio of Investments (continued)
Columbia Acorn Emerging Markets FundSM, December 31, 2018
Fair value measurements (continued)
The following table is a summary of the inputs used to value the Fund’s investments at December 31, 2018:
| | Level 1
quoted prices
in active
markets for
identical
assets ($) | Level 2
other
significant
observable
inputs ($) | Level 3
significant
unobservable
inputs ($) | Investments
measured at
net asset
value ($) | Total ($) |
| Investments in Securities | | | | | |
| Common Stocks | | | | | |
| Brazil | 4,680,402 | — | — | — | 4,680,402 |
| Cambodia | — | 1,737,310 | — | — | 1,737,310 |
| China | 2,193,048 | 1,601,248 | — | — | 3,794,296 |
| Egypt | — | 766,333 | — | — | 766,333 |
| Hong Kong | — | 3,452,492 | — | — | 3,452,492 |
| India | — | 6,317,287 | — | — | 6,317,287 |
| Indonesia | — | 2,747,663 | — | — | 2,747,663 |
| Japan | — | 746,540 | — | — | 746,540 |
| Malaysia | — | 647,846 | — | — | 647,846 |
| Mexico | 2,043,112 | — | — | — | 2,043,112 |
| Philippines | — | 1,426,653 | — | — | 1,426,653 |
| Poland | — | 592,329 | — | — | 592,329 |
| Russian Federation | — | 1,018,775 | — | — | 1,018,775 |
| South Africa | — | 4,601,394 | — | — | 4,601,394 |
| South Korea | — | 9,816,324 | — | — | 9,816,324 |
| Taiwan | 334,995 | 9,414,077 | — | — | 9,749,072 |
| Thailand | — | 2,346,837 | — | — | 2,346,837 |
| Turkey | — | 671,508 | — | — | 671,508 |
| United Kingdom | — | 796,315 | — | — | 796,315 |
| Total Common Stocks | 9,251,557 | 48,700,931 | — | — | 57,952,488 |
| Money Market Funds | — | — | — | 1,106,905 | 1,106,905 |
| Total Investments in Securities | 9,251,557 | 48,700,931 | — | 1,106,905 | 59,059,393 |
The Fund’s assets assigned to the Level 2 input category are generally valued using a market approach, in which a security’s value is determined through its correlation to prices and information from observable market transactions for similar or identical assets. Foreign equities are generally valued at the last sale price on the foreign exchange or market on which they trade. The Fund may use a statistical fair valuation model, in accordance with the policy adopted by the Board of Trustees, provided by an independent third party to value securities principally traded in foreign markets in order to adjust for possible stale pricing that may occur between the close of the foreign exchanges and the time for valuation. These models take into account available market data including intraday index, ADR, and ETF movements.
There were no transfers of financial assets between levels during the period.
The accompanying Notes to Financial Statements are an integral part of this statement.
| 78 | Columbia Acorn Family of Funds | Annual Report 2018 |
Portfolio of Investments
Columbia Acorn European FundSM, December 31, 2018
(Percentages represent value of investments compared to net assets)
Investments in securities
| Common Stocks 98.3% |
| Issuer | Shares | Value ($) |
| Belgium 1.4% |
Melexis NV
Advanced integrated semiconductors, sensor ICs, and programmable sensor IC systems | 16,065 | 934,923 |
| Denmark 4.2% |
ALK-Abello AS
Pharmaceuticals for allergy vaccinations | 5,694 | 841,973 |
SimCorp AS
Global provider of highly specialised software for the investment management industry | 29,598 | 2,029,869 |
| Total | 2,871,842 |
| France 1.8% |
Akka Technologies
High-technology engineering consulting services | 24,780 | 1,254,481 |
| Germany 20.6% |
AURELIUS Equity Opportunities SE & Co. KGaA
Loans to distressed companies | 24,888 | 904,909 |
Deutsche Beteiligungs AG
Private equity company, investing in domestic medium-sized companies | 21,603 | 832,101 |
MTU Aero Engines AG
Develops and manufactures engines and offers commercial engine services and support | 12,044 | 2,187,210 |
Nemetschek SE
Standard software for designing, constructing and managing buildings and real estate | 21,541 | 2,369,770 |
Norma Group SE
Plastic and metal-based components and systems in connecting technology | 17,437 | 864,453 |
Rational AG
Food preparation appliances/processors and kitchen accessories | 4,163 | 2,365,643 |
Stroeer SE & Co. KGaA
Digital multi-channel media company | 27,210 | 1,318,819 |
Varta AG(a)
Manufactures and markets a wide range of industrial, commercial and miniaturized batteries | 35,624 | 1,015,507 |
Wirecard AG
Internet payment and processing services | 14,771 | 2,226,761 |
| Total | 14,085,173 |
| Ireland 2.2% |
UDG Healthcare PLC
Commercialisation solutions for health care companies | 194,722 | 1,482,461 |
| Common Stocks (continued) |
| Issuer | Shares | Value ($) |
| Italy 6.9% |
Brembo SpA
Braking systems and components | 189,133 | 1,930,251 |
Carel Industries SpA(a)
Control solutions for HVAC and humidification systems | 79,640 | 822,874 |
Davide Campari-Milano SpA
Global producer & distributor of branded spirits, wines and soft drinks | 120,359 | 1,019,247 |
Industria Macchine Automatiche SpA
Packaging machinery for the food, pharmaceuticals, and cosmetics industries | 15,573 | 972,186 |
| Total | 4,744,558 |
| Malta 3.0% |
Unibet Group PLC
Online gambling services | 224,836 | 2,066,850 |
| Netherlands 1.7% |
Aalberts Industries NV
Industrial services and flow control systems | 35,973 | 1,196,405 |
| Norway 2.4% |
Atea ASA
Nordic and Baltic supplier of IT infrastructure | 126,182 | 1,622,706 |
| Poland 1.0% |
KRUK SA
Debt collection services | 16,292 | 682,911 |
| Russian Federation 1.0% |
TCS Group Holding PLC, GDR
Online retail financial services | 45,582 | 709,256 |
| Spain 3.8% |
eDreams ODIGEO SA(a)
Online travel company | 386,373 | 1,051,381 |
Fluidra SA(a)
Irrigation and swimming pool equipment | 63,618 | 713,596 |
Prosegur Cia de Seguridad SA, Registered Shares
Security and transportation services | 161,960 | 819,625 |
| Total | 2,584,602 |
The accompanying Notes to Financial Statements are an integral part of this statement.
Columbia Acorn Family of Funds | Annual Report 2018
| 79 |
Portfolio of Investments (continued)
Columbia Acorn European FundSM, December 31, 2018
| Common Stocks (continued) |
| Issuer | Shares | Value ($) |
| Sweden 14.0% |
AddTech AB, Class B
High-tech industrial components and systems | 61,942 | 1,107,037 |
Hexagon AB, Class B
Design, measurement and visualisation technologies | 31,857 | 1,472,671 |
NetEnt AB
Develops and markets computer gaming software | 210,936 | 868,403 |
Sectra AB, Class B
Medical and communication systems | 104,190 | 2,237,222 |
Sweco AB, Class B
Consulting company specializing in engineering, environmental technology, and architecture | 100,375 | 2,234,926 |
Trelleborg AB, Class B
Manufactures and distributes industrial products | 106,262 | 1,674,225 |
| Total | 9,594,484 |
| Switzerland 9.3% |
Belimo Holding AG, Registered Shares
Manufactures heating, ventilation and air conditioning equipment | 373 | 1,496,129 |
Bossard Holding AG, Class A, Registered Shares
Fastening devices, industrial adhesives & tools | 4,784 | 682,898 |
Inficon Holding AG
Vacuum instruments used to monitor and control production processes | 2,479 | 1,256,858 |
Kardex AG
Storage, warehouse and materials handling systems | 10,500 | 1,214,129 |
Partners Group Holding AG
Global private markets asset management firm | 2,823 | 1,717,363 |
| Total | 6,367,377 |
| Turkey 0.7% |
Logo Yazilim Sanayi Ve Ticaret AS(a)
Enterprise resource planning software | 94,094 | 482,515 |
| United Kingdom 24.3% |
Ascential PLC
Media and consultancy services | 247,033 | 1,187,050 |
Croda International PLC
Chemicals and chemical products | 16,269 | 971,600 |
Dechra Pharmaceuticals PLC
International veterinary pharmaceuticals | 27,832 | 735,352 |
Domino’s Pizza Group PLC
Pizza delivery stores | 240,130 | 713,676 |
GW Pharmaceuticals PLC, ADR(a)
Cannabinoid prescription medicines | 5,880 | 572,653 |
| Common Stocks (continued) |
| Issuer | Shares | Value ($) |
Halma PLC
Products that detect hazards and protect assets and people in public and commercial buildings | 131,904 | 2,297,825 |
Hastings Group Holdings PLC
General insurance services to the automobile and home insurance products | 282,649 | 672,699 |
Intermediate Capital Group PLC
Private equity firm | 111,779 | 1,333,324 |
Rentokil Initial PLC
Fully integrated facilities management and essential support services | 525,198 | 2,259,400 |
Rightmove PLC
Website that lists properties across Britain | 250,884 | 1,382,646 |
Safestore Holdings PLC
Self storage facilities | 206,175 | 1,331,034 |
Spirax-Sarco Engineering PLC
Consultation, service and products for the control and efficient management of steam and industrial fluids | 25,983 | 2,068,140 |
WH Smith PLC
Retails books, magazines, newspapers, and periodicals | 51,922 | 1,138,991 |
| Total | 16,664,390 |
Total Common Stocks
(Cost: $63,748,175) | 67,344,934 |
| Preferred Stocks 1.5% |
| Issuer | | Shares | Value ($) |
| Germany 1.5% |
Sartorius AG
Precision electronic equipment and components | | 8,266 | 1,028,762 |
Total Preferred Stocks
(Cost: $807,485) | 1,028,762 |
| Money Market Funds 0.2% |
| | Shares | Value ($) |
Columbia Short-Term Cash Fund, 2.459%(b),(c)
| 133,396 | 133,382 |
Total Money Market Funds
(Cost: $133,382) | 133,382 |
Total Investments in Securities
(Cost: $64,689,042) | 68,507,078 |
| Other Assets & Liabilities, Net | | (1,497) |
| Net Assets | $68,505,581 |
The accompanying Notes to Financial Statements are an integral part of this statement.
| 80 | Columbia Acorn Family of Funds | Annual Report 2018 |
Portfolio of Investments (continued)
Columbia Acorn European FundSM, December 31, 2018
Notes to Portfolio of Investments
| (a) | Non-income producing security. |
| (b) | The rate shown is the seven-day current annualized yield at December 31, 2018. |
| (c) | As defined in the Investment Company Act of 1940, an affiliated company is one in which the Fund owns 5% or more of the company’s outstanding voting securities, or a company which is under common ownership or control with the Fund. Holdings and transactions in these affiliated companies during the year ended December 31, 2018 are as follows: |
| Issuer | Beginning
shares | Shares
purchased | Shares
sold | Ending
shares | Realized gain
(loss) —
affiliated
issuers ($) | Net change in
unrealized
appreciation
(depreciation) —
affiliated
issuers ($) | Dividend —
affiliated issuers
($) | Value —
affiliated
issuers
at end of
period ($) |
| Columbia Short-Term Cash Fund, 2.459% |
| | — | 15,561,882 | (15,428,486) | 133,396 | — | — | 11,604 | 133,382 |
Abbreviation Legend
| ADR | American Depositary Receipt |
| GDR | Global Depositary Receipt |
Fair value measurements
Various inputs are used in determining the value of the Fund’s investments, following the input prioritization hierarchy established by accounting principles generally accepted in the United States of America (GAAP). These inputs are summarized in the three broad levels listed below:
| ■ | Level 1 – quoted prices in active markets for identical securities |
| ■ | Level 2 – prices determined using other significant observable inputs (including quoted prices for similar securities, interest rates, prepayment speeds, credit risk and others) |
| ■ | Level 3 – prices determined using significant unobservable inputs where quoted prices or observable inputs are unavailable or less reliable (including management’s own assumptions about the factors market participants would use in pricing an investment) |
The inputs or methodology used for valuing securities are not necessarily an indication of the risk associated with investing in those securities.
Examples of the types of securities in which the Fund would typically invest and how they are classified within this hierarchy are as follows. Typical Level 1 securities include exchange traded domestic equities, mutual funds whose net asset values are published each day and exchange traded foreign equities that are not typically statistically fair valued. Typical Level 2 securities include exchange traded foreign equities that are traded in the European region or Asia Pacific region time zones which are typically statistically fair valued, forward foreign currency exchange contracts and short-term investments valued at amortized cost. Additionally, securities fair valued by Columbia Wanger Asset Management’s Valuation Committee (the Committee) that rely on significant observable inputs are also included in Level 2. Typical Level 3 securities include any security fair valued by the Committee that relies on significant unobservable inputs.
Certain investments that have been measured at fair value using the net asset value (NAV) per share (or its equivalent) are not categorized in the fair value hierarchy. The fair value amounts presented in the table are intended to reconcile the fair value hierarchy to the amounts presented in the Portfolio of Investments. The Columbia Short-Term Cash Fund seeks to provide shareholders with maximum current income consistent with liquidity and stability of principal. Columbia Short-Term Cash Fund prices its shares with a floating NAV and no longer seeks to maintain a stable NAV.
The Committee is responsible for applying the Columbia Acorn Trust Portfolio Pricing Policy and the Columbia Wanger Asset Management pricing procedures (the Policies), which are approved by and subject to the oversight of the Board of Trustees.
The Committee meets as necessary, and no less frequently than quarterly, to determine fair values for securities for which market quotations are not readily available or for which Columbia Wanger Asset Management believes that available market quotations are unreliable. The Committee also reviews the continuing appropriateness of the Policies. In circumstances where a security has been fair valued, the Committee will also review the continuing appropriateness of the current value of the security. The Policies address, among other things: circumstances under which market quotations will be deemed readily available; selection of third party pricing vendors; appropriate pricing methodologies; events that require fair valuation and fair value techniques; circumstances under which securities will be deemed to pose a potential for stale pricing, including when securities are illiquid, restricted, or in default; and certain delegations of authority to determine fair values to the Fund’s investment manager. The Committee may also meet to discuss additional valuation matters, which may include review of back-testing results, review of time-sensitive information or approval of other valuation related actions, and to review the appropriateness of the Policies.
For investments categorized as Level 3, the significant unobservable inputs used in the fair value measurement of the Fund’s securities may include: (i) data specific to the issuer or comparable issuers, (ii) general market or specific sector news and (iii) quoted prices and specific or similar security transactions. The Committee considers this data and any changes from prior periods in order to assess the reasonableness of observable and unobservable inputs, any assumptions or internal models used to value those securities and changes in fair value. Significant changes in any of these factors could result in lower or higher fair value measurements. Various factors impact the frequency of monitoring (which may occur as often as daily), however the Committee may determine that changes to inputs, assumptions and models are not required with the same frequency.
The accompanying Notes to Financial Statements are an integral part of this statement.
Columbia Acorn Family of Funds | Annual Report 2018
| 81 |
Portfolio of Investments (continued)
Columbia Acorn European FundSM, December 31, 2018
Fair value measurements (continued)
The following table is a summary of the inputs used to value the Fund’s investments at December 31, 2018:
| | Level 1
quoted prices
in active
markets for
identical
assets ($) | Level 2
other
significant
observable
inputs ($) | Level 3
significant
unobservable
inputs ($) | Investments
measured at
net asset
value ($) | Total ($) |
| Investments in Securities | | | | | |
| Common Stocks | | | | | |
| Belgium | — | 934,923 | — | — | 934,923 |
| Denmark | — | 2,871,842 | — | — | 2,871,842 |
| France | — | 1,254,481 | — | — | 1,254,481 |
| Germany | — | 14,085,173 | — | — | 14,085,173 |
| Ireland | — | 1,482,461 | — | — | 1,482,461 |
| Italy | — | 4,744,558 | — | — | 4,744,558 |
| Malta | — | 2,066,850 | — | — | 2,066,850 |
| Netherlands | — | 1,196,405 | — | — | 1,196,405 |
| Norway | — | 1,622,706 | — | — | 1,622,706 |
| Poland | — | 682,911 | — | — | 682,911 |
| Russian Federation | — | 709,256 | — | — | 709,256 |
| Spain | — | 2,584,602 | — | — | 2,584,602 |
| Sweden | — | 9,594,484 | — | — | 9,594,484 |
| Switzerland | — | 6,367,377 | — | — | 6,367,377 |
| Turkey | — | 482,515 | — | — | 482,515 |
| United Kingdom | 572,653 | 16,091,737 | — | — | 16,664,390 |
| Total Common Stocks | 572,653 | 66,772,281 | — | — | 67,344,934 |
| Preferred Stocks | | | | | |
| Germany | — | 1,028,762 | — | — | 1,028,762 |
| Total Preferred Stocks | — | 1,028,762 | — | — | 1,028,762 |
| Money Market Funds | — | — | — | 133,382 | 133,382 |
| Total Investments in Securities | 572,653 | 67,801,043 | — | 133,382 | 68,507,078 |
The Fund’s assets assigned to the Level 2 input category are generally valued using a market approach, in which a security’s value is determined through its correlation to prices and information from observable market transactions for similar or identical assets. Foreign equities are generally valued at the last sale price on the foreign exchange or market on which they trade. The Fund may use a statistical fair valuation model, in accordance with the policy adopted by the Board of Trustees, provided by an independent third party to value securities principally traded in foreign markets in order to adjust for possible stale pricing that may occur between the close of the foreign exchanges and the time for valuation. These models take into account available market data including intraday index, ADR, and ETF movements.
There were no transfers of financial assets between levels during the period.
The accompanying Notes to Financial Statements are an integral part of this statement.
| 82 | Columbia Acorn Family of Funds | Annual Report 2018 |
Statement of Assets and Liabilities
December 31, 2018
| | Columbia
Acorn®
Fund | Columbia
Acorn
International® | Columbia
Acorn
USA® | Columbia
Acorn
International
SelectSM |
| Assets | | | | |
| Investments in securities, at value* | | | | |
| Unaffiliated issuers (cost $3,171,598,967, $2,089,696,030, $261,136,745, $94,583,254, respectively) | $3,749,664,836 | $2,497,205,475 | $273,605,695 | $105,544,702 |
| Affiliated issuers (cost $67,372,488, $—, $6,551,486, $3,482,426, respectively) | 64,556,598 | — | 6,551,486 | 3,482,426 |
| Cash | — | 881,393 | — | — |
| Receivable for: | | | | |
| Investments sold | 4,386,731 | 93,079,902 | — | — |
| Capital shares sold | 1,590,680 | 2,218,588 | 429,796 | 577,678 |
| Dividends | 1,802,158 | 3,428,676 | 207,917 | 146,848 |
| Securities lending income | 931 | 2,686 | 2,192 | — |
| Foreign tax reclaims | 1,655 | 3,721,154 | 666 | 90,220 |
| Expense reimbursement due from Investment Manager | — | — | 113 | 823 |
| Prepaid expenses | 109,536 | 79,140 | 8,265 | 2,627 |
| Trustees’ deferred compensation plan | 2,835,892 | 1,504,437 | 276,041 | — |
| Total assets | 3,824,949,017 | 2,602,121,451 | 281,082,171 | 109,845,324 |
| Liabilities | | | | |
| Due upon return of securities on loan | 15,645,500 | 30,949,500 | 4,068,915 | — |
| Payable for: | | | | |
| Investments purchased | — | 1,554,956 | — | — |
| Capital shares purchased | 7,153,106 | 15,192,880 | 611,722 | 434,662 |
| Distributions to shareholders | — | — | — | 290 |
| Investment advisory fee | 209,609 | 164,564 | 20,836 | 7,948 |
| Distribution and/or service fees | 22,301 | 8,423 | 1,373 | 763 |
| Transfer agent fees | 413,846 | 333,921 | 37,896 | 12,675 |
| Administration fees | 15,509 | 10,425 | 1,124 | 447 |
| Trustees’ fees | — | 1,196 | — | 54,676 |
| Compensation of chief compliance officer | 7,825 | 7,005 | 566 | 201 |
| Audit fees | 50,745 | 71,565 | 42,555 | 47,115 |
| Line of credit borrowings | — | 26,500,000 | — | — |
| Other expenses | 229,629 | 391,236 | 27,379 | 20,366 |
| Trustees’ deferred compensation plan | 2,835,892 | 1,504,437 | 276,041 | — |
| Total liabilities | 26,583,962 | 76,690,108 | 5,088,407 | 579,143 |
| Net assets applicable to outstanding capital stock | $3,798,365,055 | $2,525,431,343 | $275,993,764 | $109,266,181 |
| Represented by | | | | |
| Paid in capital | 3,028,984,376 | 1,956,301,316 | 254,180,717 | 96,794,836 |
| Total distributable earnings (loss) (Note 2) | 769,380,679 | 569,130,027 | 21,813,047 | 12,471,345 |
| Total - representing net assets applicable to outstanding capital stock | $3,798,365,055 | $2,525,431,343 | $275,993,764 | $109,266,181 |
| * Includes the value of securities on loan | 15,784,990 | 29,435,320 | 3,898,417 | — |
The accompanying Notes to Financial Statements are an integral part of this statement.
Columbia Acorn Family of Funds | Annual Report 2018
| 83 |
Statement of Assets and Liabilities (continued)
December 31, 2018
| | Columbia
Acorn®
Fund | Columbia
Acorn
International® | Columbia
Acorn
USA® | Columbia
Acorn
International
SelectSM |
| Class A | | | | |
| Net assets | $768,031,089 | $296,348,606 | $49,178,788 | $26,072,692 |
| Shares outstanding | 72,139,876 | 10,051,829 | 4,784,721 | 1,112,431 |
| Net asset value per share(a) | $10.65 | $29.48 | $10.28 | $23.44 |
| Maximum sales charge | 5.75% | 5.75% | 5.75% | 5.75% |
| Maximum offering price per share(b) (calculated by dividing the net asset value per share by 1.0 minus the maximum sales charge for Class A shares) | $11.30 | $31.28 | $10.91 | $24.87 |
| Advisor Class | | | | |
| Net assets | $40,425,118 | $12,739,847 | $14,578,534 | $1,201,169 |
| Shares outstanding | 2,966,578 | 427,006 | 1,058,459 | 50,042 |
| Net asset value per share(c) | $13.63 | $29.84 | $13.77 | $24.00 |
| Class C | | | | |
| Net assets | $81,148,832 | $22,816,836 | $4,608,374 | $2,752,067 |
| Shares outstanding | 17,315,664 | 825,742 | 1,020,158 | 128,151 |
| Net asset value per share(a) | $4.69 | $27.63 | $4.52 | $21.48 |
| Institutional Class | | | | |
| Net assets | $2,816,947,535 | $1,824,055,421 | $149,048,190 | $69,412,599 |
| Shares outstanding | 216,971,605 | 61,805,503 | 11,550,958 | 2,915,082 |
| Net asset value per share(c) | $12.98 | $29.51 | $12.90 | $23.81 |
| Institutional 2 Class | | | | |
| Net assets | $37,124,324 | $160,488,316 | $3,331,598 | $1,200,215 |
| Shares outstanding | 2,698,576 | 5,442,302 | 240,150 | 49,992 |
| Net asset value per share(c) | $13.76 | $29.49 | $13.87 | $24.01 |
| Institutional 3 Class | | | | |
| Net assets | $54,688,157 | $198,933,497 | $55,248,280 | $8,627,439 |
| Shares outstanding | 3,936,739 | 6,668,546 | 3,942,177 | 359,474 |
| Net asset value per share(c) | $13.89 | $29.83 | $14.01 | $24.00 |
| Class R | | | | |
| Net assets | $— | $10,048,820 | $— | $— |
| Shares outstanding | — | 341,363 | — | — |
| Net asset value per share(c) | $— | $29.44 | $— | $— |
| (a) | Redemption price per share is equal to net asset value less any applicable contingent deferred sales charge. |
| (b) | On sales of $50,000 or more the offering price is reduced. |
| (c) | Redemption price per share is equal to net asset value. |
The accompanying Notes to Financial Statements are an integral part of this statement.
| 84 | Columbia Acorn Family of Funds | Annual Report 2018 |
Statement of Assets and Liabilities (continued)
December 31, 2018
| | Columbia
Acorn
SelectSM | Columbia
Thermostat
FundSM | Columbia
Acorn
Emerging Markets
FundSM | Columbia
Acorn
European
FundSM |
| Assets | | | | |
| Investments in securities, at value | | | | |
| Unaffiliated issuers (cost $218,754,444, $—, $57,098,961, $64,555,660, respectively) | $230,388,055 | $— | $57,952,488 | $68,373,696 |
| Affiliated issuers (cost $5,598,126, $648,924,554, $1,106,905, $133,382, respectively) | 5,598,126 | 645,263,490 | 1,106,905 | 133,382 |
| Cash | — | 91,999 | — | — |
| Foreign currency (cost $—, $—, $67,088, $—, respectively) | — | — | 67,389 | — |
| Receivable for: | | | | |
| Investments sold | — | 4,104,364 | 308,319 | 11,585 |
| Capital shares sold | 163,091 | 773,879 | 83,568 | 212,414 |
| Dividends | 257,610 | 1,154,819 | 160,858 | 26,315 |
| Securities lending income | 103 | — | — | — |
| Foreign tax reclaims | — | — | 10,310 | 163,345 |
| Expense reimbursement due from Investment Manager | — | 2,158 | 2,829 | 2,900 |
| Reimbursement due from affiliates | — | — | 34,559 | — |
| Prepaid expenses | 6,886 | 15,615 | 1,703 | 2,317 |
| Trustees’ deferred compensation plan | 224,321 | — | — | — |
| Total assets | 236,638,192 | 651,406,324 | 59,728,928 | 68,925,954 |
| Liabilities | | | | |
| Payable for: | | | | |
| Investments purchased | — | 1,150,770 | 154,489 | — |
| Capital shares purchased | 905,354 | 7,130,394 | 218,393 | 320,904 |
| Distributions to shareholders | 726 | — | — | — |
| Foreign capital gains taxes deferred | — | — | 135,319 | — |
| Investment advisory fee | 12,522 | 5,321 | 6,060 | 6,684 |
| Distribution and/or service fees | 2,183 | 17,728 | 1,213 | 1,186 |
| Transfer agent fees | 28,692 | 81,274 | 9,973 | 8,281 |
| Administration fees | 963 | 2,660 | 242 | 281 |
| Trustees’ fees | — | 188,422 | 36,705 | 11,215 |
| Compensation of chief compliance officer | 506 | 1,261 | 151 | 184 |
| Audit fees | 42,555 | 29,275 | 46,555 | 46,555 |
| Line of credit borrowings | — | 900,000 | — | — |
| Other expenses | 25,725 | 46,337 | 33,559 | 25,083 |
| Trustees’ deferred compensation plan | 224,321 | — | — | — |
| Total liabilities | 1,243,547 | 9,553,442 | 642,659 | 420,373 |
| Net assets applicable to outstanding capital stock | $235,394,645 | $641,852,882 | $59,086,269 | $68,505,581 |
| Represented by | | | | |
| Paid in capital | 218,476,056 | 643,710,407 | 132,797,066 | 73,645,664 |
| Total distributable earnings (loss) (Note 2) | 16,918,589 | (1,857,525) | (73,710,797) | (5,140,083) |
| Total - representing net assets applicable to outstanding capital stock | $235,394,645 | $641,852,882 | $59,086,269 | $68,505,581 |
The accompanying Notes to Financial Statements are an integral part of this statement.
Columbia Acorn Family of Funds | Annual Report 2018
| 85 |
Statement of Assets and Liabilities (continued)
December 31, 2018
| | Columbia
Acorn
SelectSM | Columbia
Thermostat
FundSM | Columbia
Acorn
Emerging Markets
FundSM | Columbia
Acorn
European
FundSM |
| Class A | | | | |
| Net assets | $90,910,517 | $193,683,129 | $22,442,224 | $22,869,836 |
| Shares outstanding | 8,792,082 | 13,981,533 | 2,090,050 | 1,469,338 |
| Net asset value per share(a) | $10.34 | $13.85 | $10.74 | $15.56 |
| Maximum sales charge | 5.75% | 5.75% | 5.75% | 5.75% |
| Maximum offering price per share(b) (calculated by dividing the net asset value per share by 1.0 minus the maximum sales charge for Class A shares) | $10.97 | $14.69 | $11.40 | $16.51 |
| Advisor Class | | | | |
| Net assets | $4,303,906 | $11,815,825 | $827,541 | $1,496,254 |
| Shares outstanding | 341,793 | 861,043 | 76,280 | 95,426 |
| Net asset value per share(c) | $12.59 | $13.72 | $10.85 | $15.68 |
| Class C | | | | |
| Net assets | $3,854,873 | $166,291,602 | $9,137,920 | $8,770,220 |
| Shares outstanding | 644,600 | 11,916,020 | 859,659 | 572,257 |
| Net asset value per share(a) | $5.98 | $13.96 | $10.63 | $15.33 |
| Institutional Class | | | | |
| Net assets | $119,464,556 | $253,123,490 | $25,476,033 | $32,812,674 |
| Shares outstanding | 9,930,227 | 18,549,554 | 2,361,942 | 2,103,001 |
| Net asset value per share(c) | $12.03 | $13.65 | $10.79 | $15.60 |
| Institutional 2 Class | | | | |
| Net assets | $2,026,841 | $16,477,695 | $509,088 | $2,554,012 |
| Shares outstanding | 159,922 | 1,199,450 | 46,881 | 161,896 |
| Net asset value per share(c) | $12.67 | $13.74 | $10.86 | $15.78 |
| Institutional 3 Class | | | | |
| Net assets | $14,833,952 | $461,141 | $693,463 | $2,585 |
| Shares outstanding | 1,157,432 | 33,622 | 64,444 | 166 |
| Net asset value per share(c) | $12.82 | $13.72 | $10.76 | $15.53(d) |
| (a) | Redemption price per share is equal to net asset value less any applicable contingent deferred sales charge. |
| (b) | On sales of $50,000 or more the offering price is reduced. |
| (c) | Redemption price per share is equal to net asset value. |
| (d) | Net asset value per share rounds to this amount due to fractional shares outstanding. |
The accompanying Notes to Financial Statements are an integral part of this statement.
| 86 | Columbia Acorn Family of Funds | Annual Report 2018 |
Statement of Operations
Year Ended December 31, 2018
| | Columbia
Acorn®
Fund | Columbia
Acorn
International® | Columbia
Acorn
USA® | Columbia
Acorn
International
SelectSM |
| Net investment income | | | | |
| Income: | | | | |
| Dividends — unaffiliated issuers | $40,215,192 | $78,585,732 | $2,972,412 | $2,099,316 |
| Dividends — affiliated issuers | 626,471 | 536,387 | 84,599 | 34,282 |
| Income from securities lending — net | 502,608 | 342,516 | 91,717 | 5,971 |
| Foreign taxes withheld | (57,682) | (6,663,081) | (27,973) | (181,289) |
| Total income | 41,286,589 | 72,801,554 | 3,120,755 | 1,958,280 |
| Expenses: | | | | |
| Investment advisory fee | 31,455,072 | 31,457,852 | 3,140,973 | 1,078,537 |
| Distribution and/or service fees | | | | |
| Class A | 2,213,309 | 1,045,019 | 131,655 | 69,152 |
| Class C | 1,801,003 | 475,857 | 78,536 | 44,592 |
| Class R | — | 62,582 | — | — |
| Transfer agent fees | | | | |
| Class A | 827,283 | 493,300 | 69,469 | 40,116 |
| Advisor Class | 44,227 | 70,199 | 24,394 | 1,732 |
| Class C | 169,788 | 56,660 | 10,414 | 6,464 |
| Institutional Class | 3,250,553 | 3,199,384 | 259,819 | 113,281 |
| Institutional 2 Class | 26,443 | 182,441 | 4,517 | 586 |
| Institutional 3 Class | 1,036 | 3,933 | 479 | 72 |
| Class R | — | 14,752 | — | — |
| Administration fees | 2,242,562 | 1,942,209 | 162,955 | 57,783 |
| Trustees’ fees | 439,810 | 416,578 | 30,279 | 11,552 |
| Custodian fees | 33,494 | 721,391 | 9,636 | 27,812 |
| Printing and postage fees | 291,152 | 370,546 | 41,675 | 26,720 |
| Registration fees | 101,887 | 123,067 | 86,514 | 87,348 |
| Audit fees | 59,296 | 135,947 | 46,378 | 57,848 |
| Legal fees | 680,107 | 596,467 | 49,255 | 17,628 |
| Line of credit interest | — | 39 | 4,314 | — |
| Compensation of chief compliance officer | 15,223 | 14,746 | 789 | 430 |
| Other | 197,785 | 214,665 | 24,892 | 16,344 |
| Total expenses | 43,850,030 | 41,597,634 | 4,176,943 | 1,657,997 |
| Fees waived or expenses reimbursed by Investment Manager and its affiliates | — | — | (55,563) | (162,309) |
| Fees waived by transfer agent | | | | |
| Class A | (207,556) | (33,492) | — | — |
| Advisor Class | (11,155) | (5,914) | — | — |
| Class C | (43,718) | (4,316) | — | — |
| Institutional Class | (818,422) | (217,251) | — | — |
| Institutional 2 Class | (844) | (12,355) | (491) | (127) |
| Institutional 3 Class | (1,036) | (3,933) | (479) | (72) |
| Class R | — | (983) | — | — |
| Expense reduction | (7,700) | (8,672) | (1,420) | (640) |
| Total net expenses | 42,759,599 | 41,310,718 | 4,118,990 | 1,494,849 |
| Net investment income (loss) | (1,473,010) | 31,490,836 | (998,235) | 463,431 |
The accompanying Notes to Financial Statements are an integral part of this statement.
Columbia Acorn Family of Funds | Annual Report 2018
| 87 |
Statement of Operations (continued)
Year Ended December 31, 2018
| | Columbia
Acorn®
Fund | Columbia
Acorn
International® | Columbia
Acorn
USA® | Columbia
Acorn
International
SelectSM |
| Realized and unrealized gain (loss) — net | | | | |
| Net realized gain (loss) on: | | | | |
| Investments — unaffiliated issuers | $587,314,313 | $781,221,077 | $51,544,360 | $15,599,401 |
| Investments — affiliated issuers | (18,511,645) | — | — | — |
| Foreign currency translations | — | (1,618,469) | — | (50,130) |
| Futures contracts | — | (11,785,180) | — | — |
| Net realized gain | 568,802,668 | 767,817,428 | 51,544,360 | 15,549,271 |
| Net change in unrealized appreciation (depreciation) on: | | | | |
| Investments — unaffiliated issuers | (728,314,990) | (1,335,717,769) | (53,702,262) | (30,643,125) |
| Investments — affiliated issuers | (1,314,132) | — | — | — |
| Foreign currency translations | — | (194,316) | — | (2,994) |
| Foreign capital gains tax | — | — | — | 14,814 |
| Net change in unrealized appreciation (depreciation) | (729,629,122) | (1,335,912,085) | (53,702,262) | (30,631,305) |
| Net realized and unrealized loss | (160,826,454) | (568,094,657) | (2,157,902) | (15,082,034) |
| Net decrease in net assets resulting from operations | $(162,299,464) | $(536,603,821) | $(3,156,137) | $(14,618,603) |
The accompanying Notes to Financial Statements are an integral part of this statement.
| 88 | Columbia Acorn Family of Funds | Annual Report 2018 |
Statement of Operations (continued)
Year Ended December 31, 2018
| | Columbia
Acorn
SelectSM | Columbia
Thermostat
FundSM | Columbia
Acorn
Emerging Markets
FundSM | Columbia
Acorn
European
FundSM |
| Net investment income | | | | |
| Income: | | | | |
| Dividends — unaffiliated issuers | $3,347,404 | $19,032 | $1,922,434 | $2,340,365 |
| Dividends — affiliated issuers | 58,197 | 16,321,982 | 17,928 | 11,604 |
| Interest | — | 222 | — | — |
| Income from securities lending — net | 2,667 | — | 16,126 | 23,913 |
| Foreign taxes withheld | (16,284) | — | (147,060) | (204,779) |
| Total income | 3,391,984 | 16,341,236 | 1,809,428 | 2,171,103 |
| Expenses: | | | | |
| Investment advisory fee | 2,574,956 | 757,511 | 1,095,287 | 1,249,377 |
| Distribution and/or service fees | | | | |
| Class A | 272,434 | 570,205 | 73,655 | 83,804 |
| Class C | 142,517 | 2,074,515 | 131,023 | 142,068 |
| Transfer agent fees | | | | |
| Class A | 151,648 | 233,742 | 36,608 | 37,977 |
| Advisor Class | 7,574 | 14,440 | 1,369 | 3,943 |
| Class C | 19,909 | 212,564 | 16,233 | 16,086 |
| Institutional Class | 214,329 | 299,164 | 52,690 | 57,968 |
| Institutional 2 Class | 1,199 | 8,682 | 479 | 2,714 |
| Institutional 3 Class | 188 | 54 | 25 | 5 |
| Administration fees | 144,437 | 361,110 | 41,876 | 51,074 |
| Trustees’ fees | 28,573 | 73,555 | 8,905 | 10,316 |
| Custodian fees | 4,306 | 2,338 | 84,447 | 44,363 |
| Printing and postage fees | 43,796 | 82,466 | 23,034 | 24,079 |
| Registration fees | 84,884 | 97,154 | 81,387 | 88,525 |
| Audit fees | 43,878 | 30,598 | 77,069 | 47,878 |
| Legal fees | 43,777 | 108,120 | 12,747 | 16,374 |
| Line of credit interest | — | — | 869 | 1,991 |
| Compensation of chief compliance officer | 1,003 | 2,476 | 318 | 396 |
| Other | 21,822 | 41,293 | 16,237 | 19,910 |
| Total expenses | 3,801,230 | 4,969,987 | 1,754,258 | 1,898,848 |
| Fees waived or expenses reimbursed by Investment Manager and its affiliates | (605,872) | (436,701) | (438,089) | (394,003) |
| Fees waived by transfer agent | | | | |
| Class A | (31,777) | — | — | — |
| Advisor Class | (1,594) | — | — | — |
| Class C | (4,232) | — | — | — |
| Institutional Class | (44,979) | — | — | — |
| Institutional 2 Class | (155) | (912) | (86) | (295) |
| Institutional 3 Class | (188) | (54) | (25) | (5) |
| Expense reduction | (1,320) | (580) | (40) | — |
| Total net expenses | 3,111,113 | 4,531,740 | 1,316,018 | 1,504,545 |
| Net investment income | 280,871 | 11,809,496 | 493,410 | 666,558 |
The accompanying Notes to Financial Statements are an integral part of this statement.
Columbia Acorn Family of Funds | Annual Report 2018
| 89 |
Statement of Operations (continued)
Year Ended December 31, 2018
| | Columbia
Acorn
SelectSM | Columbia
Thermostat
FundSM | Columbia
Acorn
Emerging Markets
FundSM | Columbia
Acorn
European
FundSM |
| Realized and unrealized gain (loss) — net | | | | |
| Net realized gain (loss) on: | | | | |
| Investments — unaffiliated issuers | $38,584,900 | $— | $8,429,566 | $(558,557) |
| Investments — affiliated issuers | — | 9,367,354 | — | — |
| Capital gain distributions from underlying affiliated funds | — | 9,900,285 | — | — |
| Foreign currency translations | — | — | (57,359) | (18,012) |
| Net realized gain (loss) | 38,584,900 | 19,267,639 | 8,372,207 | (576,569) |
| Net change in unrealized appreciation (depreciation) on: | | | | |
| Investments — unaffiliated issuers | (71,032,642) | — | (23,982,311) | (18,942,300) |
| Investments — affiliated issuers | — | (32,423,879) | — | — |
| Foreign currency translations | — | — | 1,350 | (4,741) |
| Foreign capital gains tax | — | — | (101,472) | — |
| Net change in unrealized appreciation (depreciation) | (71,032,642) | (32,423,879) | (24,082,433) | (18,947,041) |
| Net realized and unrealized loss | (32,447,742) | (13,156,240) | (15,710,226) | (19,523,610) |
| Net decrease in net assets resulting from operations | $(32,166,871) | $(1,346,744) | $(15,216,816) | $(18,857,052) |
The accompanying Notes to Financial Statements are an integral part of this statement.
| 90 | Columbia Acorn Family of Funds | Annual Report 2018 |
Statement of Changes in Net Assets
| | Columbia
Acorn® Fund | Columbia Acorn
International® |
| | Year Ended
December 31, 2018 | Year Ended
December 31, 2017 | Year Ended
December 31, 2018 | Year Ended
December 31, 2017 |
| Operations | | | | |
| Net investment income (loss) | $(1,473,010) | $1,039,192 | $31,490,836 | $39,851,045 |
| Net realized gain | 568,802,668 | 1,176,258,449 | 767,817,428 | 451,888,883 |
| Net change in unrealized appreciation (depreciation) | (729,629,122) | (110,071,852) | (1,335,912,085) | 880,348,446 |
| Net increase (decrease) in net assets resulting from operations | (162,299,464) | 1,067,225,789 | (536,603,821) | 1,372,088,374 |
| Distributions to shareholders | | | | |
| Net investment income and net realized gains | | | | |
| Class A | (112,814,791) | | (82,964,499) | |
| Advisor Class | (5,081,826) | | (5,904,555) | |
| Class C | (34,387,755) | | (7,690,257) | |
| Institutional Class | (373,295,790) | | (540,013,173) | |
| Institutional 2 Class | (5,204,282) | | (57,983,593) | |
| Institutional 3 Class | (6,583,918) | | (62,135,761) | |
| Class R | — | | (2,658,425) | |
| Net investment income | | | | |
| Class A | | — | | (7,118,778) |
| Advisor Class | | — | | (1,687,012) |
| Class B | | — | | (2,069) |
| Class C | | — | | (387,660) |
| Institutional Class | | — | | (57,030,081) |
| Institutional 2 Class | | — | | (7,070,007) |
| Institutional 3 Class | | — | | (8,860,457) |
| Class R | | — | | (149,105) |
| Net realized gains | | | | |
| Class A | | (198,597,993) | | (23,914,812) |
| Advisor Class | | (7,546,403) | | (5,256,918) |
| Class C | | (98,221,494) | | (3,412,394) |
| Institutional Class | | (708,224,553) | | (160,560,346) |
| Institutional 2 Class | | (13,004,610) | | (21,942,004) |
| Institutional 3 Class | | (11,007,435) | | (35,892,439) |
| Class R | | — | | (676,321) |
| Total distributions to shareholders (Note 2) | (537,368,362) | (1,036,602,488) | (759,350,263) | (333,960,403) |
| Decrease in net assets from capital stock activity | (140,140,835) | (221,183,341) | (1,085,574,576) | (784,106,134) |
| Total increase (decrease) in net assets | (839,808,661) | (190,560,040) | (2,381,528,660) | 254,021,837 |
| Net assets at beginning of year | 4,638,173,716 | 4,828,733,756 | 4,906,960,003 | 4,652,938,166 |
| Net assets at end of year | $3,798,365,055 | $4,638,173,716 | $2,525,431,343 | $4,906,960,003 |
| Undistributed (excess of distributions over) net investment income | $(1,994,706) | $(2,220,754) | $5,300,099 | $4,411,242 |
The accompanying Notes to Financial Statements are an integral part of this statement.
Columbia Acorn Family of Funds | Annual Report 2018
| 91 |
Statement of Changes in Net Assets (continued)
| | Columbia
Acorn USA® | Columbia Acorn
International SelectSM |
| | Year Ended
December 31, 2018 | Year Ended
December 31, 2017 | Year Ended
December 31, 2018 | Year Ended
December 31, 2017 |
| Operations | | | | |
| Net investment income (loss) | $(998,235) | $(1,573,689) | $463,431 | $298,210 |
| Net realized gain | 51,544,360 | 212,362,115 | 15,549,271 | 8,192,558 |
| Net change in unrealized appreciation (depreciation) | (53,702,262) | (119,147,241) | (30,631,305) | 26,161,018 |
| Net increase (decrease) in net assets resulting from operations | (3,156,137) | 91,641,185 | (14,618,603) | 34,651,786 |
| Distributions to shareholders | | | | |
| Net investment income and net realized gains | | | | |
| Class A | (8,375,728) | | (1,884,728) | |
| Advisor Class | (2,089,581) | | (88,392) | |
| Class C | (1,803,921) | | (230,740) | |
| Institutional Class | (23,581,038) | | (5,035,667) | |
| Institutional 2 Class | (718,944) | | (87,496) | |
| Institutional 3 Class | (7,584,575) | | (622,521) | |
| Net investment income | | | | |
| Class A | | — | | (9,521) |
| Advisor Class | | — | | (4,562) |
| Institutional Class | | — | | (228,058) |
| Institutional 2 Class | | — | | (1,921) |
| Institutional 3 Class | | — | | (26,734) |
| Net realized gains | | | | |
| Class A | | (15,531,538) | | — |
| Advisor Class | | (4,118,797) | | — |
| Class C | | (4,827,537) | | — |
| Institutional Class | | (61,910,319) | | — |
| Institutional 2 Class | | (3,183,971) | | — |
| Institutional 3 Class | | (12,346,845) | | — |
| Total distributions to shareholders (Note 2) | (44,153,787) | (101,919,007) | (7,949,544) | (270,796) |
| Increase (decrease) in net assets from capital stock activity | 626,090 | (310,665,005) | 1,039,524 | (3,597,759) |
| Total increase (decrease) in net assets | (46,683,834) | (320,942,827) | (21,528,623) | 30,783,231 |
| Net assets at beginning of year | 322,677,598 | 643,620,425 | 130,794,804 | 100,011,573 |
| Net assets at end of year | $275,993,764 | $322,677,598 | $109,266,181 | $130,794,804 |
| Undistributed (excess of distributions over) net investment income | $(736,167) | $(254,453) | $359,960 | $(53,622) |
The accompanying Notes to Financial Statements are an integral part of this statement.
| 92 | Columbia Acorn Family of Funds | Annual Report 2018 |
Statement of Changes in Net Assets (continued)
| | Columbia
Acorn SelectSM | Columbia
Thermostat FundSM |
| | Year Ended
December 31, 2018 | Year Ended
December 31, 2017 | Year Ended
December 31, 2018 | Year Ended
December 31, 2017 |
| Operations | | | | |
| Net investment income (loss) | $280,871 | $(353,608) | $11,809,496 | $15,437,578 |
| Net realized gain | 38,584,900 | 40,516,594 | 19,267,639 | 23,654,073 |
| Net change in unrealized appreciation (depreciation) | (71,032,642) | 32,742,921 | (32,423,879) | 10,450,897 |
| Net increase (decrease) in net assets resulting from operations | (32,166,871) | 72,905,907 | (1,346,744) | 49,542,548 |
| Distributions to shareholders | | | | |
| Net investment income and net realized gains | | | | |
| Class A | (20,308,218) | | (10,673,840) | |
| Advisor Class | (881,008) | | (708,559) | |
| Class C | (3,272,890) | | (8,158,095) | |
| Institutional Class | (25,262,616) | | (15,036,009) | |
| Institutional 2 Class | (361,405) | | (900,690) | |
| Institutional 3 Class | (2,802,824) | | (26,585) | |
| Net investment income | | | | |
| Class A | | — | | (9,278,829) |
| Advisor Class | | — | | (559,209) |
| Class C | | — | | (5,769,999) |
| Institutional Class | | — | | (12,343,315) |
| Institutional 2 Class | | — | | (468,756) |
| Institutional 3 Class | | — | | (17,424) |
| Net realized gains | | | | |
| Class A | | (13,531,635) | | (3,927,704) |
| Advisor Class | | (268,631) | | (231,441) |
| Class C | | (4,068,306) | | (3,875,776) |
| Institutional Class | | (17,384,449) | | (4,913,074) |
| Institutional 2 Class | | (135,711) | | (192,959) |
| Institutional 3 Class | | (2,568,205) | | (7,159) |
| Total distributions to shareholders (Note 2) | (52,888,961) | (37,956,937) | (35,503,778) | (41,585,645) |
| Increase (decrease) in net assets from capital stock activity | 11,572,541 | (34,460,018) | (180,527,642) | (256,152,474) |
| Total increase (decrease) in net assets | (73,483,291) | 488,952 | (217,378,164) | (248,195,571) |
| Net assets at beginning of year | 308,877,936 | 308,388,984 | 859,231,046 | 1,107,426,617 |
| Net assets at end of year | $235,394,645 | $308,877,936 | $641,852,882 | $859,231,046 |
| Undistributed (excess of distributions over) net investment income | $(125,238) | $(231,199) | $(188,699) | $731,622 |
The accompanying Notes to Financial Statements are an integral part of this statement.
Columbia Acorn Family of Funds | Annual Report 2018
| 93 |
Statement of Changes in Net Assets (continued)
| | Columbia Acorn
Emerging Markets FundSM | Columbia Acorn
European FundSM |
| | Year Ended
December 31, 2018 | Year Ended
December 31, 2017 | Year Ended
December 31, 2018 | Year Ended
December 31, 2017(a) |
| Operations | | | | |
| Net investment income (loss) | $493,410 | $(23,854) | $666,558 | $318,469 |
| Net realized gain (loss) | 8,372,207 | 4,959,333 | (576,569) | 2,113,437 |
| Net change in unrealized appreciation (depreciation) | (24,082,433) | 26,081,316 | (18,947,041) | 17,443,548 |
| Net increase (decrease) in net assets resulting from operations | (15,216,816) | 31,016,795 | (18,857,052) | 19,875,454 |
| Distributions to shareholders | | | | |
| Net investment income and net realized gains | | | | |
| Class A | (348,800) | | (219,414) | |
| Advisor Class | (15,124) | | (17,370) | |
| Class C | (56,171) | | (95,170) | |
| Institutional Class | (452,975) | | (336,429) | |
| Institutional 2 Class | (9,169) | | (31,742) | |
| Institutional 3 Class | (13,183) | | (20) | |
| Net investment income | | | | |
| Class A | | — | | (276,319) |
| Advisor Class | | — | | (26,878) |
| Class C | | — | | (21,994) |
| Institutional Class | | — | | (555,415) |
| Institutional 2 Class | | — | | (51,520) |
| Institutional 3 Class | | — | | (2,414) |
| Return of capital | | | | |
| Class A | (28,167) | — | — | — |
| Advisor Class | (1,020) | — | — | — |
| Class C | (11,141) | — | — | — |
| Institutional Class | (30,545) | — | — | — |
| Institutional 2 Class | (591) | — | — | — |
| Institutional 3 Class | (823) | — | — | — |
| Total distributions to shareholders (Note 2) | (967,709) | — | (700,145) | (934,540) |
| Increase (decrease) in net assets from capital stock activity | (30,986,000) | (30,554,959) | (14,494,645) | 37,264,196 |
| Increase from payment by affiliate (Note 6) | 34,559 | — | — | — |
| Total increase (decrease) in net assets | (47,135,966) | 461,836 | (34,051,842) | 56,205,110 |
| Net assets at beginning of year | 106,222,235 | 105,760,399 | 102,557,423 | 46,352,313 |
| Net assets at end of year | $59,086,269 | $106,222,235 | $68,505,581 | $102,557,423 |
| Excess of distributions over net investment income | $(319,394) | $(572,645) | $(139,042) | $(202,643) |
| (a) | Institutional 3 Class shares are based on operations from March 1, 2017 (commencement of operations) through the stated period end. |
The accompanying Notes to Financial Statements are an integral part of this statement.
| 94 | Columbia Acorn Family of Funds | Annual Report 2018 |
Statement of Changes in Net Assets (continued)
| | Columbia
Acorn® Fund | Columbia Acorn
International® |
| | Year Ended | Year Ended | Year Ended | Year Ended |
| | December 31, 2018 | December 31, 2017 | December 31, 2018 | December 31, 2017 |
| | Shares | Dollars ($) | Shares | Dollars ($) | Shares | Dollars ($) | Shares | Dollars ($) |
| Capital stock activity |
| Class A | | | | | | | | |
| Subscriptions | 14,482,087 | 199,117,901 | 5,214,954 | 73,286,260 | 1,204,707 | 53,366,756 | 1,610,233 | 69,246,137 |
| Distributions reinvested | 8,565,521 | 103,282,789 | 13,895,471 | 179,901,741 | 2,517,943 | 79,449,411 | 650,590 | 29,823,976 |
| Redemptions | (15,172,354) | (202,514,211) | (24,594,980) | (349,452,663) | (3,686,910) | (156,642,002) | (7,526,663) | (320,009,215) |
| Net increase (decrease) | 7,875,254 | 99,886,479 | (5,484,555) | (96,264,662) | 35,740 | (23,825,835) | (5,265,840) | (220,939,102) |
| Advisor Class | | | | | | | | |
| Subscriptions | 1,389,865 | 23,281,479 | 1,188,440 | 20,475,315 | 370,989 | 17,261,530 | 507,657 | 22,001,991 |
| Distributions reinvested | 286,808 | 4,437,619 | 404,423 | 6,463,098 | 162,265 | 5,894,237 | 149,964 | 6,941,523 |
| Redemptions | (1,112,297) | (18,894,372) | (1,298,639) | (22,111,783) | (2,227,246) | (101,932,993) | (1,218,557) | (52,979,195) |
| Net increase (decrease) | 564,376 | 8,824,726 | 294,224 | 4,826,630 | (1,693,992) | (78,777,226) | (560,936) | (24,035,681) |
| Class B | | | | | | | | |
| Distributions reinvested | — | — | — | — | — | — | 48 | 2,052 |
| Redemptions | — | — | — | — | — | — | (13,438) | (556,263) |
| Net decrease | — | — | — | — | — | — | (13,390) | (554,211) |
| Class C | | | | | | | | |
| Subscriptions | 1,447,676 | 9,225,458 | 1,151,804 | 9,081,597 | 65,481 | 2,775,489 | 90,241 | 3,793,139 |
| Distributions reinvested | 5,636,603 | 32,972,060 | 14,018,509 | 94,772,247 | 241,578 | 7,481,172 | 83,543 | 3,674,876 |
| Redemptions | (27,200,903) | (186,297,980) | (13,966,397) | (120,313,372) | (912,454) | (38,562,522) | (526,608) | (21,906,351) |
| Net increase (decrease) | (20,116,624) | (144,100,462) | 1,203,916 | (16,459,528) | (605,395) | (28,305,861) | (352,824) | (14,438,336) |
| Class I | | | | | | | | |
| Redemptions | — | — | (704,360) | (11,413,339) | — | — | (587,108) | (24,144,151) |
| Net decrease | — | — | (704,360) | (11,413,339) | — | — | (587,108) | (24,144,151) |
| Institutional Class | | | | | | | | |
| Subscriptions | 7,560,930 | 122,219,111 | 11,660,704 | 189,841,275 | 2,947,643 | 124,432,793 | 7,013,514 | 296,426,276 |
| Distributions reinvested | 23,112,853 | 341,236,718 | 41,736,204 | 640,071,038 | 13,084,488 | 412,927,075 | 3,676,468 | 168,682,272 |
| Redemptions | (35,160,985) | (557,342,383) | (55,995,598) | (919,152,154) | (21,151,836) | (898,058,188) | (32,696,730) | (1,462,774,955) |
| Net decrease | (4,487,202) | (93,886,554) | (2,598,690) | (89,239,841) | (5,119,705) | (360,698,320) | (22,006,748) | (997,666,407) |
| Institutional 2 Class | | | | | | | | |
| Subscriptions | 973,489 | 16,597,800 | 1,892,132 | 34,420,349 | 1,564,761 | 72,479,772 | 4,209,934 | 183,599,629 |
| Distributions reinvested | 328,128 | 5,203,420 | 809,341 | 13,002,370 | 1,121,675 | 36,095,844 | 525,236 | 24,092,915 |
| Redemptions | (2,796,573) | (48,203,357) | (1,361,035) | (23,541,410) | (6,330,859) | (270,594,603) | (3,251,747) | (145,206,557) |
| Net increase (decrease) | (1,494,956) | (26,402,137) | 1,340,438 | 23,881,309 | (3,644,423) | (162,018,987) | 1,483,423 | 62,485,987 |
| Institutional 3 Class | | | | | | | | |
| Subscriptions | 3,490,426 | 59,038,867 | 3,152,141 | 55,149,044 | 4,105,290 | 192,225,142 | 14,596,689 | 678,353,931 |
| Distributions reinvested | 417,329 | 6,583,918 | 669,887 | 11,007,435 | 1,430,787 | 47,433,802 | 964,050 | 44,705,035 |
| Redemptions | (2,880,541) | (50,085,672) | (5,871,346) | (102,670,389) | (14,314,023) | (673,079,067) | (6,419,328) | (294,475,318) |
| Net increase (decrease) | 1,027,214 | 15,537,113 | (2,049,318) | (36,513,910) | (8,777,946) | (433,420,123) | 9,141,411 | 428,583,648 |
| Class R | | | | | | | | |
| Subscriptions | — | — | — | — | 111,819 | 4,932,695 | 247,904 | 10,356,515 |
| Distributions reinvested | — | — | — | — | 81,344 | 2,552,399 | 17,022 | 780,530 |
| Redemptions | — | — | — | — | (135,987) | (6,013,318) | (103,693) | (4,534,926) |
| Net increase | — | — | — | — | 57,176 | 1,471,776 | 161,233 | 6,602,119 |
| Total net decrease | (16,631,938) | (140,140,835) | (7,998,345) | (221,183,341) | (19,748,545) | (1,085,574,576) | (18,000,779) | (784,106,134) |
The accompanying Notes to Financial Statements are an integral part of this statement.
Columbia Acorn Family of Funds | Annual Report 2018
| 95 |
Statement of Changes in Net Assets (continued)
| | Columbia
Acorn USA® | Columbia Acorn
International SelectSM |
| | Year Ended | Year Ended | Year Ended | Year Ended |
| | December 31, 2018 | December 31, 2017 | December 31, 2018 | December 31, 2017 |
| | Shares | Dollars ($) | Shares | Dollars ($) | Shares | Dollars ($) | Shares | Dollars ($) |
| Capital stock activity |
| Class A | | | | | | | | |
| Subscriptions | 1,376,744 | 18,267,295 | 488,025 | 7,442,932 | 375,760 | 10,651,053 | 433,475 | 11,022,848 |
| Distributions reinvested | 699,793 | 7,935,061 | 1,137,099 | 14,397,674 | 77,655 | 1,824,896 | 318 | 9,147 |
| Redemptions | (1,134,480) | (14,506,433) | (3,181,282) | (49,739,118) | (252,530) | (7,123,558) | (466,338) | (11,345,132) |
| Net increase (decrease) | 942,057 | 11,695,923 | (1,556,158) | (27,898,512) | 200,885 | 5,352,391 | (32,545) | (313,137) |
| Advisor Class | | | | | | | | |
| Subscriptions | 837,779 | 15,358,547 | 591,993 | 11,469,434 | 38,028 | 1,123,008 | 22,202 | 594,789 |
| Distributions reinvested | 136,861 | 2,089,581 | 255,091 | 4,118,796 | 3,664 | 88,202 | 156 | 4,554 |
| Redemptions | (933,018) | (16,954,707) | (174,410) | (3,344,051) | (53,440) | (1,565,189) | (11,360) | (303,363) |
| Net increase (decrease) | 41,622 | 493,421 | 672,674 | 12,244,179 | (11,748) | (353,979) | 10,998 | 295,980 |
| Class C | | | | | | | | |
| Subscriptions | 313,173 | 2,077,318 | 99,275 | 974,077 | 36,333 | 979,251 | 27,511 | 676,101 |
| Distributions reinvested | 334,238 | 1,774,726 | 703,494 | 4,761,201 | 10,568 | 227,625 | — | — |
| Redemptions | (1,122,430) | (7,883,868) | (510,499) | (5,076,159) | (105,985) | (2,845,286) | (57,659) | (1,371,955) |
| Net increase (decrease) | (475,019) | (4,031,824) | 292,270 | 659,119 | (59,084) | (1,638,410) | (30,148) | (695,854) |
| Class I | | | | | | | | |
| Redemptions | — | — | (70) | (1,266) | — | — | (92) | (2,211) |
| Net decrease | — | — | (70) | (1,266) | — | — | (92) | (2,211) |
| Institutional Class | | | | | | | | |
| Subscriptions | 1,614,982 | 26,732,776 | 1,272,209 | 22,899,278 | 793,679 | 22,244,906 | 632,322 | 15,614,831 |
| Distributions reinvested | 1,536,419 | 22,101,744 | 3,701,495 | 58,121,333 | 184,011 | 4,394,183 | 5,869 | 170,675 |
| Redemptions | (4,055,929) | (65,587,290) | (21,166,533) | (389,628,621) | (1,114,888) | (32,550,369) | (992,393) | (25,627,432) |
| Net decrease | (904,528) | (16,752,770) | (16,192,829) | (308,608,010) | (137,198) | (5,911,280) | (354,202) | (9,841,926) |
| Institutional 2 Class | | | | | | | | |
| Subscriptions | 265,478 | 4,960,411 | 494,678 | 10,218,003 | 29,291 | 879,117 | 6,125 | 155,951 |
| Distributions reinvested | 44,378 | 718,791 | 194,941 | 3,183,608 | 3,628 | 87,329 | 65 | 1,913 |
| Redemptions | (694,916) | (12,588,773) | (828,227) | (15,512,332) | (3,773) | (108,283) | (5,576) | (139,156) |
| Net increase (decrease) | (385,060) | (6,909,571) | (138,608) | (2,110,721) | 29,146 | 858,163 | 614 | 18,708 |
| Institutional 3 Class | | | | | | | | |
| Subscriptions | 1,017,530 | 18,563,862 | 540,484 | 10,276,457 | 131,427 | 3,864,719 | 268,318 | 7,467,361 |
| Distributions reinvested | 486,992 | 7,516,430 | 694,408 | 11,402,230 | 25,856 | 622,353 | 914 | 26,725 |
| Redemptions | (559,482) | (9,949,381) | (340,563) | (6,628,481) | (60,597) | (1,754,433) | (21,261) | (553,405) |
| Net increase | 945,040 | 16,130,911 | 894,329 | 15,050,206 | 96,686 | 2,732,639 | 247,971 | 6,940,681 |
| Total net increase (decrease) | 164,112 | 626,090 | (16,028,392) | (310,665,005) | 118,687 | 1,039,524 | (157,404) | (3,597,759) |
The accompanying Notes to Financial Statements are an integral part of this statement.
| 96 | Columbia Acorn Family of Funds | Annual Report 2018 |
Statement of Changes in Net Assets (continued)
| | Columbia
Acorn SelectSM | Columbia
Thermostat FundSM |
| | Year Ended | Year Ended | Year Ended | Year Ended |
| | December 31, 2018 | December 31, 2017 | December 31, 2018 | December 31, 2017 |
| | Shares | Dollars ($) | Shares | Dollars ($) | Shares | Dollars ($) | Shares | Dollars ($) |
| Capital stock activity |
| Class A | | | | | | | | |
| Subscriptions | 1,647,135 | 23,680,572 | 831,684 | 11,552,003 | 1,333,900 | 19,378,036 | 1,609,689 | 23,841,063 |
| Distributions reinvested | 1,474,425 | 18,023,829 | 859,784 | 11,678,407 | 720,600 | 10,054,448 | 840,860 | 12,338,875 |
| Redemptions | (1,604,835) | (22,562,970) | (3,504,699) | (48,437,824) | (5,687,410) | (82,591,620) | (12,154,415) | (179,914,818) |
| Net increase (decrease) | 1,516,725 | 19,141,431 | (1,813,231) | (25,207,414) | (3,632,910) | (53,159,136) | (9,703,866) | (143,734,880) |
| Advisor Class | | | | | | | | |
| Subscriptions | 81,585 | 1,421,965 | 297,546 | 4,898,165 | 151,388 | 2,184,819 | 565,162 | 8,354,290 |
| Distributions reinvested | 59,074 | 881,008 | 16,388 | 268,631 | 51,274 | 708,407 | 54,380 | 790,505 |
| Redemptions | (124,115) | (2,084,875) | (45,047) | (730,797) | (460,433) | (6,620,916) | (582,985) | (8,576,681) |
| Net increase (decrease) | 16,544 | 218,098 | 268,887 | 4,435,999 | (257,771) | (3,727,690) | 36,557 | 568,114 |
| Class C | | | | | | | | |
| Subscriptions | 88,638 | 780,854 | 86,931 | 825,976 | 511,824 | 7,413,115 | 1,107,876 | 16,440,929 |
| Distributions reinvested | 367,957 | 3,083,783 | 428,882 | 3,895,445 | 477,573 | 6,731,929 | 536,248 | 7,916,684 |
| Redemptions | (2,163,962) | (20,060,290) | (1,148,372) | (11,025,586) | (6,092,400) | (88,882,083) | (7,807,143) | (116,029,441) |
| Net decrease | (1,707,367) | (16,195,653) | (632,559) | (6,304,165) | (5,103,003) | (74,737,039) | (6,163,019) | (91,671,828) |
| Class I | | | | | | | | |
| Redemptions | — | — | (738,244) | (11,402,065) | — | — | — | — |
| Net decrease | — | — | (738,244) | (11,402,065) | — | — | — | — |
| Institutional Class | | | | | | | | |
| Subscriptions | 532,047 | 8,619,479 | 1,381,191 | 21,252,498 | 3,997,657 | 57,171,246 | 8,573,428 | 125,070,056 |
| Distributions reinvested | 1,656,299 | 23,698,931 | 1,040,184 | 15,939,038 | 792,087 | 10,877,990 | 844,055 | 12,217,159 |
| Redemptions | (1,788,491) | (28,387,175) | (2,758,485) | (43,032,113) | (8,455,329) | (120,813,058) | (10,927,093) | (160,162,349) |
| Net increase (decrease) | 399,855 | 3,931,235 | (337,110) | (5,840,577) | (3,665,585) | (52,763,822) | (1,509,610) | (22,875,134) |
| Institutional 2 Class | | | | | | | | |
| Subscriptions | 57,873 | 1,009,610 | 61,419 | 987,353 | 474,655 | 6,839,482 | 385,136 | 5,673,263 |
| Distributions reinvested | 24,396 | 361,145 | 8,423 | 135,545 | 65,250 | 900,690 | 45,470 | 661,715 |
| Redemptions | (22,767) | (390,419) | (37,575) | (614,799) | (267,887) | (3,847,004) | (333,143) | (4,893,764) |
| Net increase | 59,502 | 980,336 | 32,267 | 508,099 | 272,018 | 3,893,168 | 97,463 | 1,441,214 |
| Institutional 3 Class | | | | | | | | |
| Subscriptions | 1,992,595 | 33,938,673 | 1,808,898 | 29,600,372 | 6,170 | 89,446 | 36,425 | 537,605 |
| Distributions reinvested | 185,160 | 2,802,564 | 161,019 | 2,568,039 | 1,918 | 26,442 | 1,683 | 24,446 |
| Redemptions | (1,880,769) | (33,244,143) | (1,396,136) | (22,818,306) | (10,380) | (149,011) | (29,767) | (442,011) |
| Net increase (decrease) | 296,986 | 3,497,094 | 573,781 | 9,350,105 | (2,292) | (33,123) | 8,341 | 120,040 |
| Total net increase (decrease) | 582,245 | 11,572,541 | (2,646,209) | (34,460,018) | (12,389,543) | (180,527,642) | (17,234,134) | (256,152,474) |
The accompanying Notes to Financial Statements are an integral part of this statement.
Columbia Acorn Family of Funds | Annual Report 2018
| 97 |
Statement of Changes in Net Assets (continued)
| | Columbia Acorn
Emerging Markets FundSM | Columbia Acorn
European FundSM |
| | Year Ended | Year Ended | Year Ended | Year Ended |
| | December 31, 2018 | December 31, 2017 | December 31, 2018 | December 31, 2017(a) |
| | Shares | Dollars ($) | Shares | Dollars ($) | Shares | Dollars ($) | Shares | Dollars ($) |
| Capital stock activity |
| Class A | | | | | | | | |
| Subscriptions | 359,020 | 4,465,310 | 441,162 | 5,127,794 | 802,766 | 15,619,783 | 1,140,391 | 20,187,059 |
| Distributions reinvested | 34,864 | 373,040 | — | — | 10,793 | 219,313 | 14,776 | 276,319 |
| Redemptions | (870,709) | (10,745,642) | (2,868,148) | (31,102,071) | (1,030,128) | (19,193,737) | (1,330,219) | (21,179,443) |
| Net decrease | (476,825) | (5,907,292) | (2,426,986) | (25,974,277) | (216,569) | (3,354,641) | (175,052) | (716,065) |
| Advisor Class | | | | | | | | |
| Subscriptions | 23,068 | 293,516 | 47,248 | 568,561 | 187,846 | 3,709,574 | 126,977 | 2,378,990 |
| Distributions reinvested | 1,489 | 16,102 | — | — | 849 | 17,351 | 1,412 | 26,840 |
| Redemptions | (48,209) | (606,821) | (78,974) | (905,107) | (245,227) | (4,686,268) | (1,986) | (33,180) |
| Net increase (decrease) | (23,652) | (297,203) | (31,726) | (336,546) | (56,532) | (959,343) | 126,403 | 2,372,650 |
| Class C | | | | | | | | |
| Subscriptions | 51,305 | 644,223 | 86,043 | 990,408 | 198,850 | 3,839,604 | 337,990 | 5,828,257 |
| Distributions reinvested | 6,305 | 66,771 | — | — | 4,735 | 95,138 | 1,230 | 21,994 |
| Redemptions | (385,778) | (4,633,912) | (483,515) | (5,492,520) | (361,749) | (6,657,723) | (117,103) | (1,947,925) |
| Net increase (decrease) | (328,168) | (3,922,918) | (397,472) | (4,502,112) | (158,164) | (2,722,981) | 222,117 | 3,902,326 |
| Class I | | | | | | | | |
| Redemptions | — | — | (205) | (2,252) | — | — | (173) | (2,700) |
| Net decrease | — | — | (205) | (2,252) | — | — | (173) | (2,700) |
| Institutional Class | | | | | | | | |
| Subscriptions | 339,519 | 4,283,831 | 2,164,060 | 23,600,425 | 1,355,100 | 26,110,809 | 2,162,206 | 36,835,519 |
| Distributions reinvested | 42,914 | 460,898 | — | — | 16,480 | 335,198 | 29,529 | 554,395 |
| Redemptions | (2,038,425) | (25,173,138) | (2,100,848) | (24,137,744) | (1,809,806) | (33,173,356) | (454,340) | (7,965,911) |
| Net increase (decrease) | (1,655,992) | (20,428,409) | 63,212 | (537,319) | (438,226) | (6,727,349) | 1,737,395 | 29,424,003 |
| Institutional 2 Class | | | | | | | | |
| Subscriptions | 7,090 | 91,329 | 34,601 | 400,968 | 168,588 | 3,341,522 | 283,318 | 5,035,710 |
| Distributions reinvested | 903 | 9,760 | — | — | 1,543 | 31,723 | 2,733 | 51,481 |
| Redemptions | (38,077) | (485,026) | (38,991) | (455,733) | (213,125) | (3,888,136) | (169,753) | (2,999,705) |
| Net increase (decrease) | (30,084) | (383,937) | (4,390) | (54,765) | (42,994) | (514,891) | 116,298 | 2,087,486 |
| Institutional 3 Class | | | | | | | | |
| Subscriptions | 20,711 | 263,504 | 72,757 | 905,959 | 39 | 763 | 11,313 | 202,597 |
| Distributions reinvested | 1,303 | 13,965 | — | — | — | — | 126 | 2,367 |
| Redemptions | (26,296) | (323,710) | (4,221) | (53,647) | (10,843) | (216,203) | (469) | (8,468) |
| Net increase (decrease) | (4,282) | (46,241) | 68,536 | 852,312 | (10,804) | (215,440) | 10,970 | 196,496 |
| Total net increase (decrease) | (2,519,003) | (30,986,000) | (2,729,031) | (30,554,959) | (923,289) | (14,494,645) | 2,037,958 | 37,264,196 |
| (a) | Institutional 3 Class shares are based on operations from March 1, 2017 (commencement of operations) through the stated period end. |
The accompanying Notes to Financial Statements are an integral part of this statement.
| 98 | Columbia Acorn Family of Funds | Annual Report 2018 |
[THIS PAGE INTENTIONALLY LEFT BLANK]
Columbia Acorn Family of Funds | Annual Report 2018
| 99 |
Financial Highlights
Columbia Acorn® Fund
The following tables are intended to help you understand the Funds’ financial performance. Certain information reflects financial results for a single share of a class held for the periods shown. Per share net investment income (loss) amounts are calculated based on average shares outstanding during the period. Total return assumes reinvestment of all dividends and distributions, if any. Total return does not reflect payment of sales charges, if any. Total return and portfolio turnover are not annualized for periods of less than one year. The portfolio turnover rate is calculated without regard to purchase and sales transactions of short-term instruments and certain derivatives, if any. If such transactions were included, a Fund’s portfolio turnover rate may be higher.
| | Net asset value,
beginning of
period | Net
investment
income
(loss) | Net
realized
and
unrealized
gain (loss) | Total from
investment
operations | Distributions
from net
realized
gains | Total
distributions to
shareholders |
| Class A |
| Year Ended 12/31/2018 | $12.92 | (0.03) | (0.48) | (0.51) | (1.76) | (1.76) |
| Year Ended 12/31/2017 | $13.35 | (0.02) | 3.23 | 3.21 | (3.64) | (3.64) |
| Year Ended 12/31/2016 | $17.63 | (0.03) | 1.73 | 1.70 | (5.98) | (5.98) |
| Year Ended 12/31/2015 | $30.30 | (0.12) | (0.27)(e) | (0.39) | (12.28) | (12.28) |
| Year Ended 12/31/2014 | $35.78 | (0.08) | 0.21 | 0.13 | (5.61) | (5.61) |
| Advisor Class |
| Year Ended 12/31/2018 | $16.06 | 0.01 | (0.64) | (0.63) | (1.80) | (1.80) |
| Year Ended 12/31/2017 | $15.83 | 0.02 | 3.85 | 3.87 | (3.64) | (3.64) |
| Year Ended 12/31/2016 | $19.84 | 0.00(f) | 1.97 | 1.97 | (5.98) | (5.98) |
| Year Ended 12/31/2015 | $32.51 | (0.07) | (0.32)(e) | (0.39) | (12.28) | (12.28) |
| Year Ended 12/31/2014 | $37.88 | 0.02 | 0.22 | 0.24 | (5.61) | (5.61) |
| Class C |
| Year Ended 12/31/2018 | $6.58 | (0.06) | (0.17) | (0.23) | (1.66) | (1.66) |
| Year Ended 12/31/2017 | $8.34 | (0.08) | 1.96 | 1.88 | (3.64) | (3.64) |
| Year Ended 12/31/2016 | $13.16 | (0.11) | 1.27 | 1.16 | (5.98) | (5.98) |
| Year Ended 12/31/2015 | $25.92 | (0.27) | (0.21)(e) | (0.48) | (12.28) | (12.28) |
| Year Ended 12/31/2014 | $31.64 | (0.28) | 0.17 | (0.11) | (5.61) | (5.61) |
| Institutional Class |
| Year Ended 12/31/2018 | $15.39 | 0.01 | (0.62) | (0.61) | (1.80) | (1.80) |
| Year Ended 12/31/2017 | $15.29 | 0.02 | 3.72 | 3.74 | (3.64) | (3.64) |
| Year Ended 12/31/2016 | $19.34 | 0.01 | 1.92 | 1.93 | (5.98) | (5.98) |
| Year Ended 12/31/2015 | $31.95 | (0.04) | (0.29)(e) | (0.33) | (12.28) | (12.28) |
| Year Ended 12/31/2014 | $37.32 | 0.02 | 0.22 | 0.24 | (5.61) | (5.61) |
| Institutional 2 Class |
| Year Ended 12/31/2018 | $16.20 | 0.01 | (0.65) | (0.64) | (1.80) | (1.80) |
| Year Ended 12/31/2017 | $15.94 | 0.02 | 3.88 | 3.90 | (3.64) | (3.64) |
| Year Ended 12/31/2016 | $19.92 | 0.01 | 1.99 | 2.00 | (5.98) | (5.98) |
| Year Ended 12/31/2015 | $32.55 | (0.04) | (0.31)(e) | (0.35) | (12.28) | (12.28) |
| Year Ended 12/31/2014 | $37.89 | 0.04 | 0.23 | 0.27 | (5.61) | (5.61) |
The accompanying Notes to Financial Statements are an integral part of this statement.
| 100 | Columbia Acorn Family of Funds | Annual Report 2018 |
Financial Highlights (continued)
Columbia Acorn® Fund
| | Net
asset
value,
end of
period | Total
return | Total gross
expense
ratio to
average
net assets(a) | Total net
expense
ratio to
average
net assets(a) | Net investment
income (loss)
ratio to
average
net assets | Portfolio
turnover | Net
assets,
end of
period
(000’s) |
| Class A |
| Year Ended 12/31/2018 | $10.65 | (5.22%)(b) | 1.10% | 1.08%(c) | (0.20%) | 66% | $768,031 |
| Year Ended 12/31/2017 | $12.92 | 24.91% | 1.09% | 1.08%(c) | (0.13%) | 72% | $830,454 |
| Year Ended 12/31/2016 | $13.35 | 10.06% | 1.10%(d) | 1.10%(d) | (0.21%) | 85% | $931,460 |
| Year Ended 12/31/2015 | $17.63 | (1.87%) | 1.08% | 1.08% | (0.39%) | 21% | $1,388,893 |
| Year Ended 12/31/2014 | $30.30 | 0.55% | 1.08% | 1.08% | (0.22%) | 17% | $2,694,610 |
| Advisor Class |
| Year Ended 12/31/2018 | $13.63 | (5.00%)(b) | 0.85% | 0.83%(c) | 0.05% | 66% | $40,425 |
| Year Ended 12/31/2017 | $16.06 | 25.19% | 0.84% | 0.83%(c) | 0.12% | 72% | $38,588 |
| Year Ended 12/31/2016 | $15.83 | 10.32% | 0.89%(d) | 0.89%(d) | 0.00%(f) | 85% | $33,378 |
| Year Ended 12/31/2015 | $19.84 | (1.75%) | 0.89% | 0.89% | (0.23%) | 21% | $50,335 |
| Year Ended 12/31/2014 | $32.51 | 0.81% | 0.84% | 0.84% | 0.05% | 17% | $250,457 |
| Class C |
| Year Ended 12/31/2018 | $4.69 | (5.86%)(b) | 1.85% | 1.82%(c) | (0.94%) | 66% | $81,149 |
| Year Ended 12/31/2017 | $6.58 | 23.88% | 1.84% | 1.83%(c) | (0.88%) | 72% | $246,450 |
| Year Ended 12/31/2016 | $8.34 | 9.29% | 1.84%(d) | 1.84%(d) | (0.95%) | 85% | $302,119 |
| Year Ended 12/31/2015 | $13.16 | (2.57%) | 1.80% | 1.80% | (1.11%) | 21% | $456,348 |
| Year Ended 12/31/2014 | $25.92 | (0.16%) | 1.77% | 1.77% | (0.92%) | 17% | $776,370 |
| Institutional Class |
| Year Ended 12/31/2018 | $12.98 | (5.09%)(b) | 0.85% | 0.83%(c) | 0.05% | 66% | $2,816,948 |
| Year Ended 12/31/2017 | $15.39 | 25.24% | 0.84% | 0.83%(c) | 0.12% | 72% | $3,407,214 |
| Year Ended 12/31/2016 | $15.29 | 10.39% | 0.82%(d) | 0.82%(d) | 0.07% | 85% | $3,425,935 |
| Year Ended 12/31/2015 | $19.34 | (1.57%) | 0.80% | 0.80% | (0.11%) | 21% | $5,062,313 |
| Year Ended 12/31/2014 | $31.95 | 0.82% | 0.79% | 0.79% | 0.07% | 17% | $11,340,770 |
| Institutional 2 Class |
| Year Ended 12/31/2018 | $13.76 | (5.00%)(b) | 0.81% | 0.80% | 0.08% | 66% | $37,124 |
| Year Ended 12/31/2017 | $16.20 | 25.21% | 0.82% | 0.81% | 0.14% | 72% | $67,932 |
| Year Ended 12/31/2016 | $15.94 | 10.43% | 0.81%(d) | 0.81%(d) | 0.08% | 85% | $45,475 |
| Year Ended 12/31/2015 | $19.92 | (1.60%) | 0.77% | 0.77% | (0.11%) | 21% | $76,412 |
| Year Ended 12/31/2014 | $32.55 | 0.89% | 0.76% | 0.76% | 0.10% | 17% | $458,223 |
The accompanying Notes to Financial Statements are an integral part of this statement.
Columbia Acorn Family of Funds | Annual Report 2018
| 101 |
Financial Highlights (continued)
Columbia Acorn® Fund
| | Net asset value,
beginning of
period | Net
investment
income
(loss) | Net
realized
and
unrealized
gain (loss) | Total from
investment
operations | Distributions
from net
realized
gains | Total
distributions to
shareholders |
| Institutional 3 Class |
| Year Ended 12/31/2018 | $16.34 | 0.02 | (0.66) | (0.64) | (1.81) | (1.81) |
| Year Ended 12/31/2017 | $16.04 | 0.03 | 3.91 | 3.94 | (3.64) | (3.64) |
| Year Ended 12/31/2016 | $20.00 | 0.02 | 2.00 | 2.02 | (5.98) | (5.98) |
| Year Ended 12/31/2015 | $32.61 | (0.02) | (0.31)(e) | (0.33) | (12.28) | (12.28) |
| Year Ended 12/31/2014 | $37.93 | 0.05 | 0.24 | 0.29 | (5.61) | (5.61) |
| Notes to Financial Highlights |
| (a) | In addition to the fees and expenses that the Fund bears directly, the Fund indirectly bears a pro rata share of the fees and expenses of any other funds in which it invests, if any. Such indirect expenses are not included in the Fund’s reported expense ratios. |
| (b) | Had the Investment Manager and/or Transfer Agent not waived fees and/or reimbursed a portion of expenses, total return would have been reduced. |
| (c) | The benefits derived from expense reductions had an impact of less than 0.01%. |
| (d) | Ratios include line of credit interest expense which is less than 0.01%. |
| (e) | Calculation of the net gain (loss) per share (both realized and unrealized) does not correlate to the aggregate realized and unrealized gain (loss) presented in the Statement of Operations due to the timing of subscriptions and redemptions of Fund shares in relation to fluctuations in the market value of the portfolio. |
| (f) | Rounds to zero. |
The accompanying Notes to Financial Statements are an integral part of this statement.
| 102 | Columbia Acorn Family of Funds | Annual Report 2018 |
Financial Highlights (continued)
Columbia Acorn® Fund
| | Net
asset
value,
end of
period | Total
return | Total gross
expense
ratio to
average
net assets(a) | Total net
expense
ratio to
average
net assets(a) | Net investment
income (loss)
ratio to
average
net assets | Portfolio
turnover | Net
assets,
end of
period
(000’s) |
| Institutional 3 Class |
| Year Ended 12/31/2018 | $13.89 | (4.98%)(b) | 0.76% | 0.76% | 0.13% | 66% | $54,688 |
| Year Ended 12/31/2017 | $16.34 | 25.31% | 0.76% | 0.76% | 0.19% | 72% | $47,536 |
| Year Ended 12/31/2016 | $16.04 | 10.50% | 0.76%(d) | 0.76%(d) | 0.12% | 85% | $79,518 |
| Year Ended 12/31/2015 | $20.00 | (1.54%) | 0.73% | 0.73% | (0.06%) | 21% | $130,546 |
| Year Ended 12/31/2014 | $32.61 | 0.94% | 0.70% | 0.70% | 0.13% | 17% | $378,780 |
The accompanying Notes to Financial Statements are an integral part of this statement.
Columbia Acorn Family of Funds | Annual Report 2018
| 103 |
Financial Highlights
Columbia Acorn International®
| | Net asset value,
beginning of
period | Net
investment
income
(loss) | Net
realized
and
unrealized
gain (loss) | Total from
investment
operations | Distributions
from net
investment
income | Distributions
from net
realized
gains | Total
distributions to
shareholders |
| Class A |
| Year Ended 12/31/2018 | $46.51 | 0.23 | (7.41) | (7.18) | (0.29) | (9.56) | (9.85) |
| Year Ended 12/31/2017 | $37.71 | 0.25 | 11.71 | 11.96 | (0.67) | (2.49) | (3.16) |
| Year Ended 12/31/2016 | $39.08 | 0.35 | (1.31) | (0.96) | (0.15) | (0.26) | (0.41) |
| Year Ended 12/31/2015 | $41.68 | 0.39 | (1.02) | (0.63) | (0.40) | (1.57) | (1.97) |
| Year Ended 12/31/2014 | $46.63 | 0.42 | (2.51) | (2.09) | (0.55) | (2.31) | (2.86) |
| Advisor Class |
| Year Ended 12/31/2018 | $46.95 | 0.46 | (7.61) | (7.15) | (0.40) | (9.56) | (9.96) |
| Year Ended 12/31/2017 | $38.03 | 0.36 | 11.82 | 12.18 | (0.77) | (2.49) | (3.26) |
| Year Ended 12/31/2016 | $39.41 | 0.48 | (1.38) | (0.90) | (0.22) | (0.26) | (0.48) |
| Year Ended 12/31/2015 | $42.02 | 0.47 | (1.03) | (0.56) | (0.48) | (1.57) | (2.05) |
| Year Ended 12/31/2014 | $46.99 | 0.50 | (2.52) | (2.02) | (0.64) | (2.31) | (2.95) |
| Class C |
| Year Ended 12/31/2018 | $44.57 | (0.05) | (7.09) | (7.14) | (0.24) | (9.56) | (9.80) |
| Year Ended 12/31/2017 | $36.18 | (0.06) | 11.20 | 11.14 | (0.26) | (2.49) | (2.75) |
| Year Ended 12/31/2016 | $37.65 | 0.05 | (1.26) | (1.21) | — | (0.26) | (0.26) |
| Year Ended 12/31/2015 | $40.20 | 0.07 | (0.97) | (0.90) | (0.08) | (1.57) | (1.65) |
| Year Ended 12/31/2014 | $45.04 | 0.07 | (2.40) | (2.33) | (0.20) | (2.31) | (2.51) |
| Institutional Class |
| Year Ended 12/31/2018 | $46.57 | 0.34 | (7.44) | (7.10) | (0.40) | (9.56) | (9.96) |
| Year Ended 12/31/2017 | $37.74 | 0.37 | 11.73 | 12.10 | (0.78) | (2.49) | (3.27) |
| Year Ended 12/31/2016 | $39.12 | 0.44 | (1.32) | (0.88) | (0.24) | (0.26) | (0.50) |
| Year Ended 12/31/2015 | $41.73 | 0.51 | (1.03) | (0.52) | (0.52) | (1.57) | (2.09) |
| Year Ended 12/31/2014 | $46.68 | 0.56 | (2.51) | (1.95) | (0.69) | (2.31) | (3.00) |
| Institutional 2 Class |
| Year Ended 12/31/2018 | $46.54 | 0.37 | (7.43) | (7.06) | (0.43) | (9.56) | (9.99) |
| Year Ended 12/31/2017 | $37.72 | 0.38 | 11.72 | 12.10 | (0.79) | (2.49) | (3.28) |
| Year Ended 12/31/2016 | $39.10 | 0.44 | (1.30) | (0.86) | (0.26) | (0.26) | (0.52) |
| Year Ended 12/31/2015 | $41.71 | 0.54 | (1.05) | (0.51) | (0.53) | (1.57) | (2.10) |
| Year Ended 12/31/2014 | $46.66 | 0.57 | (2.51) | (1.94) | (0.70) | (2.31) | (3.01) |
| Institutional 3 Class |
| Year Ended 12/31/2018 | $46.95 | 0.51 | (7.62) | (7.11) | (0.45) | (9.56) | (10.01) |
| Year Ended 12/31/2017 | $38.02 | 0.40 | 11.83 | 12.23 | (0.81) | (2.49) | (3.30) |
| Year Ended 12/31/2016 | $39.41 | 0.47 | (1.32) | (0.85) | (0.28) | (0.26) | (0.54) |
| Year Ended 12/31/2015 | $42.02 | 0.53 | (1.01) | (0.48) | (0.56) | (1.57) | (2.13) |
| Year Ended 12/31/2014 | $46.99 | 0.58 | (2.52) | (1.94) | (0.72) | (2.31) | (3.03) |
The accompanying Notes to Financial Statements are an integral part of this statement.
| 104 | Columbia Acorn Family of Funds | Annual Report 2018 |
Financial Highlights (continued)
Columbia Acorn International®
| | Net
asset
value,
end of
period | Total
return | Total gross
expense
ratio to
average
net assets(a) | Total net
expense
ratio to
average
net assets(a) | Net investment
income (loss)
ratio to
average
net assets | Portfolio
turnover | Net
assets,
end of
period
(000’s) |
| Class A |
| Year Ended 12/31/2018 | $29.48 | (16.13%)(b) | 1.25%(c) | 1.24%(c),(d) | 0.51% | 32% | $296,349 |
| Year Ended 12/31/2017 | $46.51 | 31.91%(b) | 1.23% | 1.20%(d) | 0.56% | 37% | $465,830 |
| Year Ended 12/31/2016 | $37.71 | (2.51%)(b) | 1.27% | 1.23% | 0.90% | 46% | $576,235 |
| Year Ended 12/31/2015 | $39.08 | (1.59%)(b) | 1.28% | 1.24% | 0.93% | 50% | $812,479 |
| Year Ended 12/31/2014 | $41.68 | (4.58%)(b) | 1.26% | 1.22% | 0.91% | 28% | $946,553 |
| Advisor Class |
| Year Ended 12/31/2018 | $29.84 | (15.90%)(b) | 1.00%(c) | 0.99%(c),(d) | 0.97% | 32% | $12,740 |
| Year Ended 12/31/2017 | $46.95 | 32.21% | 0.98% | 0.98%(d) | 0.81% | 37% | $99,578 |
| Year Ended 12/31/2016 | $38.03 | (2.32%) | 1.05% | 1.05% | 1.22% | 46% | $101,988 |
| Year Ended 12/31/2015 | $39.41 | (1.41%) | 1.06% | 1.06% | 1.10% | 50% | $486,763 |
| Year Ended 12/31/2014 | $42.02 | (4.39%) | 1.04% | 1.04% | 1.07% | 28% | $424,425 |
| Class C |
| Year Ended 12/31/2018 | $27.63 | (16.76%)(b) | 2.00%(c) | 1.99%(c),(d) | (0.11%) | 32% | $22,817 |
| Year Ended 12/31/2017 | $44.57 | 30.93%(b) | 1.98% | 1.97%(d) | (0.15%) | 37% | $63,787 |
| Year Ended 12/31/2016 | $36.18 | (3.26%)(b) | 2.01% | 1.99% | 0.13% | 46% | $64,548 |
| Year Ended 12/31/2015 | $37.65 | (2.33%)(b) | 2.01% | 1.99% | 0.18% | 50% | $88,606 |
| Year Ended 12/31/2014 | $40.20 | (5.27%)(b) | 1.99% | 1.97% | 0.16% | 28% | $103,691 |
| Institutional Class |
| Year Ended 12/31/2018 | $29.51 | (15.93%)(b) | 1.00%(c) | 0.99%(c),(d) | 0.76% | 32% | $1,824,055 |
| Year Ended 12/31/2017 | $46.57 | 32.24% | 0.98% | 0.98%(d) | 0.85% | 37% | $3,116,383 |
| Year Ended 12/31/2016 | $37.74 | (2.28%) | 0.98% | 0.98% | 1.13% | 46% | $3,356,348 |
| Year Ended 12/31/2015 | $39.12 | (1.33%) | 0.97% | 0.97% | 1.21% | 50% | $4,645,797 |
| Year Ended 12/31/2014 | $41.73 | (4.28%) | 0.93% | 0.93% | 1.20% | 28% | $5,585,035 |
| Institutional 2 Class |
| Year Ended 12/31/2018 | $29.49 | (15.85%)(b) | 0.93%(c) | 0.93%(c) | 0.81% | 32% | $160,488 |
| Year Ended 12/31/2017 | $46.54 | 32.27% | 0.93% | 0.93% | 0.87% | 37% | $422,916 |
| Year Ended 12/31/2016 | $37.72 | (2.23%) | 0.93% | 0.93% | 1.15% | 46% | $286,786 |
| Year Ended 12/31/2015 | $39.10 | (1.29%) | 0.92% | 0.92% | 1.26% | 50% | $320,252 |
| Year Ended 12/31/2014 | $41.71 | (4.25%) | 0.90% | 0.90% | 1.23% | 28% | $397,882 |
| Institutional 3 Class |
| Year Ended 12/31/2018 | $29.83 | (15.82%)(b) | 0.88%(c) | 0.88%(c) | 1.10% | 32% | $198,933 |
| Year Ended 12/31/2017 | $46.95 | 32.36% | 0.88% | 0.88% | 0.89% | 37% | $725,247 |
| Year Ended 12/31/2016 | $38.02 | (2.19%) | 0.88% | 0.88% | 1.20% | 46% | $239,733 |
| Year Ended 12/31/2015 | $39.41 | (1.23%) | 0.88% | 0.88% | 1.26% | 50% | $318,326 |
| Year Ended 12/31/2014 | $42.02 | (4.21%) | 0.85% | 0.85% | 1.25% | 28% | $225,012 |
The accompanying Notes to Financial Statements are an integral part of this statement.
Columbia Acorn Family of Funds | Annual Report 2018
| 105 |
Financial Highlights (continued)
Columbia Acorn International®
| | Net asset value,
beginning of
period | Net
investment
income
(loss) | Net
realized
and
unrealized
gain (loss) | Total from
investment
operations | Distributions
from net
investment
income | Distributions
from net
realized
gains | Total
distributions to
shareholders |
| Class R |
| Year Ended 12/31/2018 | $46.51 | 0.12 | (7.39) | (7.27) | (0.24) | (9.56) | (9.80) |
| Year Ended 12/31/2017 | $37.71 | 0.21 | 11.63 | 11.84 | (0.55) | (2.49) | (3.04) |
| Year Ended 12/31/2016 | $39.07 | 0.21 | (1.30) | (1.09) | (0.01) | (0.26) | (0.27) |
| Year Ended 12/31/2015 | $41.67 | 0.23 | (1.02) | (0.79) | (0.24) | (1.57) | (1.81) |
| Year Ended 12/31/2014 | $46.60 | 0.24 | (2.50) | (2.26) | (0.36) | (2.31) | (2.67) |
| Notes to Financial Highlights |
| (a) | In addition to the fees and expenses that the Fund bears directly, the Fund indirectly bears a pro rata share of the fees and expenses of any other funds in which it invests, if any. Such indirect expenses are not included in the Fund’s reported expense ratios. |
| (b) | Had the Investment Manager and/or Transfer Agent not waived fees and/or reimbursed a portion of expenses, total return would have been reduced. |
| (c) | Ratios include line of credit interest expense which is less than 0.01%. |
| (d) | The benefits derived from expense reductions had an impact of less than 0.01%. |
The accompanying Notes to Financial Statements are an integral part of this statement.
| 106 | Columbia Acorn Family of Funds | Annual Report 2018 |
Financial Highlights (continued)
Columbia Acorn International®
| | Net
asset
value,
end of
period | Total
return | Total gross
expense
ratio to
average
net assets(a) | Total net
expense
ratio to
average
net assets(a) | Net investment
income (loss)
ratio to
average
net assets | Portfolio
turnover | Net
assets,
end of
period
(000’s) |
| Class R |
| Year Ended 12/31/2018 | $29.44 | (16.32%)(b) | 1.50%(c) | 1.49%(c),(d) | 0.26% | 32% | $10,049 |
| Year Ended 12/31/2017 | $46.51 | 31.58% | 1.49% | 1.48%(d) | 0.46% | 37% | $13,218 |
| Year Ended 12/31/2016 | $37.71 | (2.82%) | 1.55% | 1.55% | 0.55% | 46% | $4,637 |
| Year Ended 12/31/2015 | $39.07 | (1.98%) | 1.62% | 1.62% | 0.54% | 50% | $4,945 |
| Year Ended 12/31/2014 | $41.67 | (4.95%) | 1.63% | 1.63% | 0.52% | 28% | $5,560 |
The accompanying Notes to Financial Statements are an integral part of this statement.
Columbia Acorn Family of Funds | Annual Report 2018
| 107 |
Financial Highlights
Columbia Acorn USA®
| | Net asset value,
beginning of
period | Net
investment
income
(loss) | Net
realized
and
unrealized
gain (loss) | Total from
investment
operations | Distributions
from net
realized
gains | Total
distributions to
shareholders |
| Class A |
| Year Ended 12/31/2018 | $12.48 | (0.07) | (0.04) | (0.11) | (2.09) | (2.09) |
| Year Ended 12/31/2017 | $14.95 | (0.09) | 2.84 | 2.75 | (5.22) | (5.22) |
| Year Ended 12/31/2016 | $20.25 | (0.11) | 2.43 | 2.32 | (7.62) | (7.62) |
| Year Ended 12/31/2015 | $29.13 | (0.18) | (0.18)(e) | (0.36) | (8.52) | (8.52) |
| Year Ended 12/31/2014 | $34.15 | (0.20) | 1.22 | 1.02 | (6.04) | (6.04) |
| Advisor Class |
| Year Ended 12/31/2018 | $16.08 | (0.05) | (0.09) | (0.14) | (2.17) | (2.17) |
| Year Ended 12/31/2017 | $17.93 | (0.06) | 3.43 | 3.37 | (5.22) | (5.22) |
| Year Ended 12/31/2016 | $22.85 | (0.07) | 2.77 | 2.70 | (7.62) | (7.62) |
| Year Ended 12/31/2015 | $31.70 | (0.13) | (0.20)(e) | (0.33) | (8.52) | (8.52) |
| Year Ended 12/31/2014 | $36.55 | (0.11) | 1.30 | 1.19 | (6.04) | (6.04) |
| Class C |
| Year Ended 12/31/2018 | $6.56 | (0.09) | 0.04(e) | (0.05) | (1.99) | (1.99) |
| Year Ended 12/31/2017 | $10.05 | (0.13) | 1.86 | 1.73 | (5.22) | (5.22) |
| Year Ended 12/31/2016 | $16.00 | (0.18) | 1.85 | 1.67 | (7.62) | (7.62) |
| Year Ended 12/31/2015 | $24.98 | (0.33) | (0.13)(e) | (0.46) | (8.52) | (8.52) |
| Year Ended 12/31/2014 | $30.33 | (0.37) | 1.06 | 0.69 | (6.04) | (6.04) |
| Institutional Class |
| Year Ended 12/31/2018 | $15.21 | (0.04) | (0.09) | (0.13) | (2.18) | (2.18) |
| Year Ended 12/31/2017 | $17.20 | (0.05) | 3.28 | 3.23 | (5.22) | (5.22) |
| Year Ended 12/31/2016 | $22.19 | (0.07) | 2.70 | 2.63 | (7.62) | (7.62) |
| Year Ended 12/31/2015 | $31.03 | (0.12) | (0.20)(e) | (0.32) | (8.52) | (8.52) |
| Year Ended 12/31/2014 | $35.90 | (0.12) | 1.29 | 1.17 | (6.04) | (6.04) |
| Institutional 2 Class |
| Year Ended 12/31/2018 | $16.21 | (0.03) | (0.11) | (0.14) | (2.20) | (2.20) |
| Year Ended 12/31/2017 | $18.02 | (0.03) | 3.44 | 3.41 | (5.22) | (5.22) |
| Year Ended 12/31/2016 | $22.90 | (0.06) | 2.80 | 2.74 | (7.62) | (7.62) |
| Year Ended 12/31/2015 | $31.71 | (0.10) | (0.19)(e) | (0.29) | (8.52) | (8.52) |
| Year Ended 12/31/2014 | $36.53 | (0.06) | 1.28 | 1.22 | (6.04) | (6.04) |
The accompanying Notes to Financial Statements are an integral part of this statement.
| 108 | Columbia Acorn Family of Funds | Annual Report 2018 |
Financial Highlights (continued)
Columbia Acorn USA®
| | Net
asset
value,
end of
period | Total
return | Total gross
expense
ratio to
average
net assets(a) | Total net
expense
ratio to
average
net assets(a) | Net investment
income (loss)
ratio to
average
net assets | Portfolio
turnover | Net
assets,
end of
period
(000’s) |
| Class A |
| Year Ended 12/31/2018 | $10.28 | (2.15%)(b) | 1.44%(c) | 1.42%(c),(d) | (0.49%) | 86% | $49,179 |
| Year Ended 12/31/2017 | $12.48 | 19.14%(b) | 1.44% | 1.43%(d) | (0.55%) | 84% | $47,960 |
| Year Ended 12/31/2016 | $14.95 | 12.70% | 1.41% | 1.41% | (0.58%) | 98% | $80,721 |
| Year Ended 12/31/2015 | $20.25 | (1.60%) | 1.34% | 1.34% | (0.63%) | 35% | $95,048 |
| Year Ended 12/31/2014 | $29.13 | 3.35% | 1.33% | 1.33% | (0.60%) | 12% | $148,089 |
| Advisor Class |
| Year Ended 12/31/2018 | $13.77 | (1.91%)(b) | 1.18%(c) | 1.17%(c),(d) | (0.27%) | 86% | $14,579 |
| Year Ended 12/31/2017 | $16.08 | 19.42%(b) | 1.21% | 1.20%(d) | (0.31%) | 84% | $16,355 |
| Year Ended 12/31/2016 | $17.93 | 12.93% | 1.18% | 1.18% | (0.35%) | 98% | $6,172 |
| Year Ended 12/31/2015 | $22.85 | (1.36%) | 1.12% | 1.12% | (0.40%) | 35% | $8,224 |
| Year Ended 12/31/2014 | $31.70 | 3.60% | 1.07% | 1.07% | (0.32%) | 12% | $7,952 |
| Class C |
| Year Ended 12/31/2018 | $4.52 | (2.92%)(b) | 2.19%(c) | 2.17%(c),(d) | (1.30%) | 86% | $4,608 |
| Year Ended 12/31/2017 | $6.56 | 18.30%(b) | 2.19% | 2.19%(d) | (1.31%) | 84% | $9,802 |
| Year Ended 12/31/2016 | $10.05 | 11.92% | 2.13% | 2.13% | (1.31%) | 98% | $12,088 |
| Year Ended 12/31/2015 | $16.00 | (2.28%) | 2.02% | 2.02% | (1.32%) | 35% | $17,255 |
| Year Ended 12/31/2014 | $24.98 | 2.67% | 2.00% | 2.00% | (1.26%) | 12% | $36,476 |
| Institutional Class |
| Year Ended 12/31/2018 | $12.90 | (1.98%)(b) | 1.18%(c) | 1.17%(c),(d) | (0.26%) | 86% | $149,048 |
| Year Ended 12/31/2017 | $15.21 | 19.44%(b) | 1.16% | 1.16%(d) | (0.27%) | 84% | $189,408 |
| Year Ended 12/31/2016 | $17.20 | 13.00% | 1.16% | 1.16% | (0.34%) | 98% | $492,739 |
| Year Ended 12/31/2015 | $22.19 | (1.36%) | 1.10% | 1.10% | (0.40%) | 35% | $768,658 |
| Year Ended 12/31/2014 | $31.03 | 3.61% | 1.08% | 1.08% | (0.34%) | 12% | $1,132,223 |
| Institutional 2 Class |
| Year Ended 12/31/2018 | $13.87 | (1.89%)(b) | 1.11%(c) | 1.09%(c) | (0.19%) | 86% | $3,332 |
| Year Ended 12/31/2017 | $16.21 | 19.56%(b) | 1.08% | 1.08% | (0.17%) | 84% | $10,133 |
| Year Ended 12/31/2016 | $18.02 | 13.09% | 1.07% | 1.07% | (0.27%) | 98% | $13,764 |
| Year Ended 12/31/2015 | $22.90 | (1.23%) | 1.01% | 1.01% | (0.30%) | 35% | $27,112 |
| Year Ended 12/31/2014 | $31.71 | 3.68% | 0.99% | 0.99% | (0.17%) | 12% | $36,689 |
The accompanying Notes to Financial Statements are an integral part of this statement.
Columbia Acorn Family of Funds | Annual Report 2018
| 109 |
Financial Highlights (continued)
Columbia Acorn USA®
| | Net asset value,
beginning of
period | Net
investment
income
(loss) | Net
realized
and
unrealized
gain (loss) | Total from
investment
operations | Distributions
from net
realized
gains | Total
distributions to
shareholders |
| Institutional 3 Class |
| Year Ended 12/31/2018 | $16.36 | (0.02) | (0.11) | (0.13) | (2.22) | (2.22) |
| Year Ended 12/31/2017 | $18.14 | (0.03) | 3.47 | 3.44 | (5.22) | (5.22) |
| Year Ended 12/31/2016 | $22.99 | (0.04) | 2.81 | 2.77 | (7.62) | (7.62) |
| Year Ended 12/31/2015 | $31.80 | (0.08) | (0.21)(e) | (0.29) | (8.52) | (8.52) |
| Year Ended 12/31/2014 | $36.59 | (0.07) | 1.32 | 1.25 | (6.04) | (6.04) |
| Notes to Financial Highlights |
| (a) | In addition to the fees and expenses that the Fund bears directly, the Fund indirectly bears a pro rata share of the fees and expenses of any other funds in which it invests, if any. Such indirect expenses are not included in the Fund’s reported expense ratios. |
| (b) | Had the Investment Manager and/or Transfer Agent not waived fees and/or reimbursed a portion of expenses, total return would have been reduced. |
| (c) | Ratios include line of credit interest expense which is less than 0.01%. |
| (d) | The benefits derived from expense reductions had an impact of less than 0.01%. |
| (e) | Calculation of the net gain (loss) per share (both realized and unrealized) does not correlate to the aggregate realized and unrealized gain (loss) presented in the Statement of Operations due to the timing of subscriptions and redemptions of Fund shares in relation to fluctuations in the market value of the portfolio. |
The accompanying Notes to Financial Statements are an integral part of this statement.
| 110 | Columbia Acorn Family of Funds | Annual Report 2018 |
Financial Highlights (continued)
Columbia Acorn USA®
| | Net
asset
value,
end of
period | Total
return | Total gross
expense
ratio to
average
net assets(a) | Total net
expense
ratio to
average
net assets(a) | Net investment
income (loss)
ratio to
average
net assets | Portfolio
turnover | Net
assets,
end of
period
(000’s) |
| Institutional 3 Class |
| Year Ended 12/31/2018 | $14.01 | (1.86%)(b) | 1.06%(c) | 1.04%(c) | (0.11%) | 86% | $55,248 |
| Year Ended 12/31/2017 | $16.36 | 19.60%(b) | 1.05% | 1.05% | (0.17%) | 84% | $49,019 |
| Year Ended 12/31/2016 | $18.14 | 13.18% | 1.01% | 1.01% | (0.18%) | 98% | $38,136 |
| Year Ended 12/31/2015 | $22.99 | (1.23%) | 0.97% | 0.97% | (0.25%) | 35% | $41,658 |
| Year Ended 12/31/2014 | $31.80 | 3.76% | 0.93% | 0.93% | (0.19%) | 12% | $35,551 |
The accompanying Notes to Financial Statements are an integral part of this statement.
Columbia Acorn Family of Funds | Annual Report 2018
| 111 |
Financial Highlights
Columbia Acorn International SelectSM
| | Net asset value,
beginning of
period | Net
investment
income
(loss) | Net
realized
and
unrealized
gain (loss) | Total from
investment
operations | Distributions
from net
investment
income | Distributions
from net
realized
gains | Tax
return of
capital | Total
distributions to
shareholders |
| Class A |
| Year Ended 12/31/2018 | $28.89 | 0.06 | (3.66) | (3.60) | — | (1.85) | — | (1.85) |
| Year Ended 12/31/2017 | $21.36 | 0.02 | 7.52 | 7.54 | (0.01) | — | — | (0.01) |
| Year Ended 12/31/2016 | $21.33 | 0.10 | 0.09(d) | 0.19 | (0.14) | — | (0.02) | (0.16) |
| Year Ended 12/31/2015 | $22.04 | 0.17 | (0.45) | (0.28) | (0.42) | — | (0.01) | (0.43) |
| Year Ended 12/31/2014 | $26.91 | 0.29 | (2.17) | (1.88) | (0.10) | (2.89) | — | (2.99) |
| Advisor Class |
| Year Ended 12/31/2018 | $29.46 | 0.09 | (3.70) | (3.61) | — | (1.85) | — | (1.85) |
| Year Ended 12/31/2017 | $21.77 | 0.08 | 7.68 | 7.76 | (0.07) | — | — | (0.07) |
| Year Ended 12/31/2016 | $21.74 | 0.17 | 0.08(d) | 0.25 | (0.20) | — | (0.02) | (0.22) |
| Year Ended 12/31/2015 | $22.45 | 0.22 | (0.44) | (0.22) | (0.48) | — | (0.01) | (0.49) |
| Year Ended 12/31/2014 | $27.36 | 0.37 | (2.22) | (1.85) | (0.17) | (2.89) | — | (3.06) |
| Class C |
| Year Ended 12/31/2018 | $26.85 | (0.12) | (3.40) | (3.52) | — | (1.85) | — | (1.85) |
| Year Ended 12/31/2017 | $19.99 | (0.15) | 7.01 | 6.86 | — | — | — | — |
| Year Ended 12/31/2016 | $19.96 | (0.06) | 0.09(d) | 0.03 | — | — | — | — |
| Year Ended 12/31/2015 | $20.54 | (0.01) | (0.41) | (0.42) | (0.15) | — | (0.01) | (0.16) |
| Year Ended 12/31/2014 | $25.39 | 0.07 | (2.03) | (1.96) | — | (2.89) | — | (2.89) |
| Institutional Class |
| Year Ended 12/31/2018 | $29.25 | 0.14 | (3.73) | (3.59) | — | (1.85) | — | (1.85) |
| Year Ended 12/31/2017 | $21.61 | 0.09 | 7.62 | 7.71 | (0.07) | — | — | (0.07) |
| Year Ended 12/31/2016 | $21.58 | 0.16 | 0.09(d) | 0.25 | (0.20) | — | (0.02) | (0.22) |
| Year Ended 12/31/2015 | $22.30 | 0.24 | (0.46) | (0.22) | (0.49) | — | (0.01) | (0.50) |
| Year Ended 12/31/2014 | $27.20 | 0.38 | (2.21) | (1.83) | (0.18) | (2.89) | — | (3.07) |
| Institutional 2 Class |
| Year Ended 12/31/2018 | $29.44 | 0.11 | (3.69) | (3.58) | — | (1.85) | — | (1.85) |
| Year Ended 12/31/2017 | $21.76 | 0.11 | 7.66 | 7.77 | (0.09) | — | — | (0.09) |
| Year Ended 12/31/2016 | $21.72 | 0.16 | 0.11(d) | 0.27 | (0.21) | — | (0.02) | (0.23) |
| Year Ended 12/31/2015 | $22.43 | 0.22 | (0.42) | (0.20) | (0.50) | — | (0.01) | (0.51) |
| Year Ended 12/31/2014 | $27.34 | 0.36 | (2.19) | (1.83) | (0.19) | (2.89) | — | (3.08) |
The accompanying Notes to Financial Statements are an integral part of this statement.
| 112 | Columbia Acorn Family of Funds | Annual Report 2018 |
Financial Highlights (continued)
Columbia Acorn International SelectSM
| | Proceeds from
regulatory
settlements | Net
asset
value,
end of
period | Total
return | Total gross
expense
ratio to
average
net assets(a) | Total net
expense
ratio to
average
net assets(a) | Net investment
income (loss)
ratio to
average
net assets | Portfolio
turnover | Net
assets,
end of
period
(000’s) |
| Class A |
| Year Ended 12/31/2018 | — | $23.44 | (12.46%)(b) | 1.54% | 1.40%(c) | 0.20% | 48% | $26,073 |
| Year Ended 12/31/2017 | — | $28.89 | 35.30%(b) | 1.54% | 1.40%(c) | 0.07% | 49% | $26,336 |
| Year Ended 12/31/2016 | — | $21.36 | 0.90%(b) | 1.55%(e) | 1.48%(e) | 0.49% | 49% | $20,165 |
| Year Ended 12/31/2015 | 0.00(f) | $21.33 | (1.30%)(g) | 1.55% | 1.55% | 0.74% | 59% | $33,772 |
| Year Ended 12/31/2014 | — | $22.04 | (7.06%) | 1.47% | 1.47% | 1.05% | 58% | $53,419 |
| Advisor Class |
| Year Ended 12/31/2018 | — | $24.00 | (12.26%)(b) | 1.29% | 1.15%(c) | 0.31% | 48% | $1,201 |
| Year Ended 12/31/2017 | — | $29.46 | 35.67%(b) | 1.29% | 1.15%(c) | 0.30% | 49% | $1,820 |
| Year Ended 12/31/2016 | — | $21.77 | 1.15%(b) | 1.29%(e) | 1.21%(e) | 0.77% | 49% | $1,106 |
| Year Ended 12/31/2015 | 0.00(f) | $21.74 | (1.00%)(g) | 1.27% | 1.27% | 0.97% | 59% | $898 |
| Year Ended 12/31/2014 | — | $22.45 | (6.83%) | 1.21% | 1.21% | 1.33% | 58% | $974 |
| Class C |
| Year Ended 12/31/2018 | — | $21.48 | (13.11%)(b) | 2.28% | 2.15%(c) | (0.43%) | 48% | $2,752 |
| Year Ended 12/31/2017 | — | $26.85 | 34.32%(b) | 2.29% | 2.15%(c) | (0.64%) | 49% | $5,027 |
| Year Ended 12/31/2016 | — | $19.99 | 0.15%(b) | 2.31%(e) | 2.23%(e) | (0.29%) | 49% | $4,346 |
| Year Ended 12/31/2015 | 0.00(f) | $19.96 | (2.05%)(g) | 2.32% | 2.32% | (0.06%) | 59% | $5,390 |
| Year Ended 12/31/2014 | — | $20.54 | (7.80%) | 2.23% | 2.23% | 0.29% | 58% | $8,057 |
| Institutional Class |
| Year Ended 12/31/2018 | — | $23.81 | (12.28%)(b) | 1.28% | 1.15%(c) | 0.47% | 48% | $69,413 |
| Year Ended 12/31/2017 | — | $29.25 | 35.70%(b) | 1.29% | 1.15%(c) | 0.36% | 49% | $89,266 |
| Year Ended 12/31/2016 | — | $21.61 | 1.18%(b) | 1.26%(e) | 1.19%(e) | 0.74% | 49% | $73,631 |
| Year Ended 12/31/2015 | 0.00(f) | $21.58 | (1.03%)(g) | 1.24% | 1.24% | 1.05% | 59% | $96,311 |
| Year Ended 12/31/2014 | — | $22.30 | (6.79%) | 1.17% | 1.17% | 1.36% | 58% | $175,764 |
| Institutional 2 Class |
| Year Ended 12/31/2018 | — | $24.01 | (12.16%)(b) | 1.21% | 1.06% | 0.36% | 48% | $1,200 |
| Year Ended 12/31/2017 | — | $29.44 | 35.72%(b) | 1.22% | 1.08% | 0.41% | 49% | $614 |
| Year Ended 12/31/2016 | — | $21.76 | 1.25%(b) | 1.23%(e) | 1.19%(e) | 0.76% | 49% | $440 |
| Year Ended 12/31/2015 | 0.00(f) | $21.72 | (0.94%)(g) | 1.21% | 1.21% | 0.96% | 59% | $2,268 |
| Year Ended 12/31/2014 | — | $22.43 | (6.77%) | 1.15% | 1.15% | 1.30% | 58% | $2,593 |
The accompanying Notes to Financial Statements are an integral part of this statement.
Columbia Acorn Family of Funds | Annual Report 2018
| 113 |
Financial Highlights (continued)
Columbia Acorn International SelectSM
| | Net asset value,
beginning of
period | Net
investment
income
(loss) | Net
realized
and
unrealized
gain (loss) | Total from
investment
operations | Distributions
from net
investment
income | Distributions
from net
realized
gains | Tax
return of
capital | Total
distributions to
shareholders |
| Institutional 3 Class |
| Year Ended 12/31/2018 | $29.42 | 0.17 | (3.74) | (3.57) | — | (1.85) | — | (1.85) |
| Year Ended 12/31/2017 | $21.74 | (0.07) | 7.86 | 7.79 | (0.11) | — | — | (0.11) |
| Year Ended 12/31/2016 | $21.71 | 0.16 | 0.12(d) | 0.28 | (0.23) | — | (0.02) | (0.25) |
| Year Ended 12/31/2015 | $22.42 | 0.28 | (0.47) | (0.19) | (0.51) | — | (0.01) | (0.52) |
| Year Ended 12/31/2014 | $27.33 | 0.40 | (2.21) | (1.81) | (0.21) | (2.89) | — | (3.10) |
| Notes to Financial Highlights |
| (a) | In addition to the fees and expenses that the Fund bears directly, the Fund indirectly bears a pro rata share of the fees and expenses of any other funds in which it invests, if any. Such indirect expenses are not included in the Fund’s reported expense ratios. |
| (b) | Had the Investment Manager and/or Transfer Agent not waived fees and/or reimbursed a portion of expenses, total return would have been reduced. |
| (c) | The benefits derived from expense reductions had an impact of less than 0.01%. |
| (d) | Calculation of the net gain (loss) per share (both realized and unrealized) does not correlate to the aggregate realized and unrealized gain (loss) presented in the Statement of Operations due to the timing of subscriptions and redemptions of Fund shares in relation to fluctuations in the market value of the portfolio. |
| (e) | Expenses have been reduced due to a reimbursement of expenses overbilled by a third party. If the reimbursement had been excluded, the expense ratios would have been higher by the percentages shown for each class in the table below. All fee waivers and expense reimbursements by the Investment Manager and its affiliates were applied before giving effect to this third party reimbursement. |
| Year Ended | Class A | Advisor
Class | Class C | Institutional
Class | Institutional 2
Class | Institutional 3
Class |
| 12/31/2016 | 0.06% | 0.06% | 0.06% | 0.06% | 0.04% | 0.09% |
| (f) | Rounds to zero. |
| (g) | The Fund received proceeds from regulatory settlements. Had the Fund not received these proceeds, the total return would have been lower by 0.02%. |
The accompanying Notes to Financial Statements are an integral part of this statement.
| 114 | Columbia Acorn Family of Funds | Annual Report 2018 |
Financial Highlights (continued)
Columbia Acorn International SelectSM
| | Proceeds from
regulatory
settlements | Net
asset
value,
end of
period | Total
return | Total gross
expense
ratio to
average
net assets(a) | Total net
expense
ratio to
average
net assets(a) | Net investment
income (loss)
ratio to
average
net assets | Portfolio
turnover | Net
assets,
end of
period
(000’s) |
| Institutional 3 Class |
| Year Ended 12/31/2018 | — | $24.00 | (12.14%)(b) | 1.14% | 1.02% | 0.58% | 48% | $8,627 |
| Year Ended 12/31/2017 | — | $29.42 | 35.81%(b) | 1.17% | 1.03% | (0.24%) | 49% | $7,732 |
| Year Ended 12/31/2016 | — | $21.74 | 1.29%(b) | 1.12%(e) | 1.04%(e) | 0.74% | 49% | $322 |
| Year Ended 12/31/2015 | 0.00(f) | $21.71 | (0.89%)(g) | 1.14% | 1.14% | 1.21% | 59% | $660 |
| Year Ended 12/31/2014 | — | $22.42 | (6.71%) | 1.09% | 1.09% | 1.43% | 58% | $11,755 |
The accompanying Notes to Financial Statements are an integral part of this statement.
Columbia Acorn Family of Funds | Annual Report 2018
| 115 |
Financial Highlights
Columbia Acorn SelectSM
| | Net asset value,
beginning of
period | Net
investment
income
(loss) | Net
realized
and
unrealized
gain (loss) | Total from
investment
operations | Distributions
from net
realized
gains | Total
distributions to
shareholders |
| Class A |
| Year Ended 12/31/2018 | $14.62 | (0.00)(b) | (1.52) | (1.52) | (2.76) | (2.76) |
| Year Ended 12/31/2017 | $13.13 | (0.03) | 3.31 | 3.28 | (1.79) | (1.79) |
| Year Ended 12/31/2016 | $13.94 | (0.04) | 1.56 | 1.52 | (2.33) | (2.33) |
| Year Ended 12/31/2015 | $21.03 | (0.09) | 0.14 | 0.05 | (7.14) | (7.14) |
| Year Ended 12/31/2014 | $25.57 | (0.14) | 0.64 | 0.50 | (5.04) | (5.04) |
| Advisor Class |
| Year Ended 12/31/2018 | $17.19 | 0.04 | (1.85) | (1.81) | (2.79) | (2.79) |
| Year Ended 12/31/2017 | $15.13 | 0.01 | 3.84 | 3.85 | (1.79) | (1.79) |
| Year Ended 12/31/2016 | $15.69 | (0.00)(f) | 1.77 | 1.77 | (2.33) | (2.33) |
| Year Ended 12/31/2015 | $22.75 | (0.04) | 0.12 | 0.08 | (7.14) | (7.14) |
| Year Ended 12/31/2014 | $27.20 | (0.10) | 0.69 | 0.59 | (5.04) | (5.04) |
| Class C |
| Year Ended 12/31/2018 | $9.59 | (0.08) | (0.88) | (0.96) | (2.65) | (2.65) |
| Year Ended 12/31/2017 | $9.22 | (0.09) | 2.25 | 2.16 | (1.79) | (1.79) |
| Year Ended 12/31/2016 | $10.51 | (0.10) | 1.14 | 1.04 | (2.33) | (2.33) |
| Year Ended 12/31/2015 | $17.69 | (0.19) | 0.15 | (0.04) | (7.14) | (7.14) |
| Year Ended 12/31/2014 | $22.46 | (0.28) | 0.55 | 0.27 | (5.04) | (5.04) |
| Institutional Class |
| Year Ended 12/31/2018 | $16.54 | 0.04 | (1.76) | (1.72) | (2.79) | (2.79) |
| Year Ended 12/31/2017 | $14.63 | 0.01 | 3.69 | 3.70 | (1.79) | (1.79) |
| Year Ended 12/31/2016 | $15.24 | (0.00)(f) | 1.72 | 1.72 | (2.33) | (2.33) |
| Year Ended 12/31/2015 | $22.28 | (0.03) | 0.13 | 0.10 | (7.14) | (7.14) |
| Year Ended 12/31/2014 | $26.72 | (0.08) | 0.68 | 0.60 | (5.04) | (5.04) |
| Institutional 2 Class |
| Year Ended 12/31/2018 | $17.28 | 0.05 | (1.86) | (1.81) | (2.80) | (2.80) |
| Year Ended 12/31/2017 | $15.20 | 0.02 | 3.85 | 3.87 | (1.79) | (1.79) |
| Year Ended 12/31/2016 | $15.74 | 0.01 | 1.78 | 1.79 | (2.33) | (2.33) |
| Year Ended 12/31/2015 | $22.78 | (0.08) | 0.18 | 0.10 | (7.14) | (7.14) |
| Year Ended 12/31/2014 | $27.20 | (0.07) | 0.69 | 0.62 | (5.04) | (5.04) |
The accompanying Notes to Financial Statements are an integral part of this statement.
| 116 | Columbia Acorn Family of Funds | Annual Report 2018 |
Financial Highlights (continued)
Columbia Acorn SelectSM
| | Net
asset
value,
end of
period | Total
return | Total gross
expense
ratio to
average
net assets(a) | Total net
expense
ratio to
average
net assets(a) | Net investment
income (loss)
ratio to
average
net assets | Portfolio
turnover | Net
assets,
end of
period
(000’s) |
| Class A |
| Year Ended 12/31/2018 | $10.34 | (12.71%)(c) | 1.38% | 1.15%(d) | (0.02%) | 60% | $90,911 |
| Year Ended 12/31/2017 | $14.62 | 26.42%(c) | 1.37% | 1.16%(d) | (0.20%) | 41% | $106,330 |
| Year Ended 12/31/2016 | $13.13 | 11.54%(c) | 1.37% | 1.17% | (0.27%) | 75% | $119,364 |
| Year Ended 12/31/2015 | $13.94 | (0.73%)(c) | 1.35%(e) | 1.22%(e) | (0.42%) | 55% | $146,864 |
| Year Ended 12/31/2014 | $21.03 | 2.17% | 1.32% | 1.32% | (0.58%) | 17% | $264,234 |
| Advisor Class |
| Year Ended 12/31/2018 | $12.59 | (12.50%)(c) | 1.13% | 0.90%(d) | 0.22% | 60% | $4,304 |
| Year Ended 12/31/2017 | $17.19 | 26.71%(c) | 1.14% | 0.91%(d) | 0.05% | 41% | $5,590 |
| Year Ended 12/31/2016 | $15.13 | 11.86%(c) | 1.13% | 0.93% | (0.02%) | 75% | $853 |
| Year Ended 12/31/2015 | $15.69 | (0.53%)(c) | 1.12%(e) | 0.99%(e) | (0.18%) | 55% | $932 |
| Year Ended 12/31/2014 | $22.75 | 2.39% | 1.12% | 1.12% | (0.37%) | 17% | $1,193 |
| Class C |
| Year Ended 12/31/2018 | $5.98 | (13.32%)(c) | 2.13% | 1.90%(d) | (0.83%) | 60% | $3,855 |
| Year Ended 12/31/2017 | $9.59 | 25.40%(c) | 2.12% | 1.91%(d) | (0.95%) | 41% | $22,559 |
| Year Ended 12/31/2016 | $9.22 | 10.67%(c) | 2.11% | 1.91% | (1.01%) | 75% | $27,524 |
| Year Ended 12/31/2015 | $10.51 | (1.41%)(c) | 2.08%(e) | 1.95%(e) | (1.15%) | 55% | $34,589 |
| Year Ended 12/31/2014 | $17.69 | 1.42% | 2.04% | 2.04% | (1.30%) | 17% | $48,591 |
| Institutional Class |
| Year Ended 12/31/2018 | $12.03 | (12.45%)(c) | 1.13% | 0.90%(d) | 0.22% | 60% | $119,465 |
| Year Ended 12/31/2017 | $16.54 | 26.59%(c) | 1.13% | 0.91%(d) | 0.04% | 41% | $157,664 |
| Year Ended 12/31/2016 | $14.63 | 11.88%(c) | 1.10% | 0.90% | (0.02%) | 75% | $144,313 |
| Year Ended 12/31/2015 | $15.24 | (0.44%)(c) | 1.07%(e) | 0.95%(e) | (0.15%) | 55% | $183,642 |
| Year Ended 12/31/2014 | $22.28 | 2.47% | 1.04% | 1.04% | (0.30%) | 17% | $318,487 |
| Institutional 2 Class |
| Year Ended 12/31/2018 | $12.67 | (12.46%)(c) | 1.05% | 0.84% | 0.31% | 60% | $2,027 |
| Year Ended 12/31/2017 | $17.28 | 26.72%(c) | 1.06% | 0.85% | 0.11% | 41% | $1,735 |
| Year Ended 12/31/2016 | $15.20 | 11.96%(c) | 1.05% | 0.85% | 0.07% | 75% | $1,036 |
| Year Ended 12/31/2015 | $15.74 | (0.44%)(c) | 1.02%(e) | 0.95%(e) | (0.33%) | 55% | $911 |
| Year Ended 12/31/2014 | $22.78 | 2.50% | 1.00% | 1.00% | (0.26%) | 17% | $10,697 |
The accompanying Notes to Financial Statements are an integral part of this statement.
Columbia Acorn Family of Funds | Annual Report 2018
| 117 |
Financial Highlights (continued)
Columbia Acorn SelectSM
| | Net asset value,
beginning of
period | Net
investment
income
(loss) | Net
realized
and
unrealized
gain (loss) | Total from
investment
operations | Distributions
from net
realized
gains | Total
distributions to
shareholders |
| Institutional 3 Class |
| Year Ended 12/31/2018 | $17.43 | 0.06 | (1.86) | (1.80) | (2.81) | (2.81) |
| Year Ended 12/31/2017 | $15.31 | 0.02 | 3.89 | 3.91 | (1.79) | (1.79) |
| Year Ended 12/31/2016 | $15.83 | 0.02 | 1.79 | 1.81 | (2.33) | (2.33) |
| Year Ended 12/31/2015 | $22.86 | 0.00(f) | 0.11 | 0.11 | (7.14) | (7.14) |
| Year Ended 12/31/2014 | $27.27 | (0.06) | 0.69 | 0.63 | (5.04) | (5.04) |
| Notes to Financial Highlights |
| (a) | In addition to the fees and expenses that the Fund bears directly, the Fund indirectly bears a pro rata share of the fees and expenses of any other funds in which it invests, if any. Such indirect expenses are not included in the Fund’s reported expense ratios. |
| (b) | Rounds to zero. |
| (c) | Had the Investment Manager and/or Transfer Agent not waived fees and/or reimbursed a portion of expenses, total return would have been reduced. |
| (d) | The benefits derived from expense reductions had an impact of less than 0.01%. |
| (e) | Ratios include line of credit interest expense which is less than 0.01%. |
| (f) | Rounds to zero. |
The accompanying Notes to Financial Statements are an integral part of this statement.
| 118 | Columbia Acorn Family of Funds | Annual Report 2018 |
Financial Highlights (continued)
Columbia Acorn SelectSM
| | Net
asset
value,
end of
period | Total
return | Total gross
expense
ratio to
average
net assets(a) | Total net
expense
ratio to
average
net assets(a) | Net investment
income (loss)
ratio to
average
net assets | Portfolio
turnover | Net
assets,
end of
period
(000’s) |
| Institutional 3 Class |
| Year Ended 12/31/2018 | $12.82 | (12.31%)(c) | 0.99% | 0.79% | 0.33% | 60% | $14,834 |
| Year Ended 12/31/2017 | $17.43 | 26.79%(c) | 1.00% | 0.80% | 0.15% | 41% | $15,001 |
| Year Ended 12/31/2016 | $15.31 | 12.02%(c) | 1.00% | 0.80% | 0.10% | 75% | $4,389 |
| Year Ended 12/31/2015 | $15.83 | (0.39%)(c) | 0.98%(e) | 0.85%(e) | 0.02% | 55% | $5,056 |
| Year Ended 12/31/2014 | $22.86 | 2.53% | 0.95% | 0.95% | (0.22%) | 17% | $3,644 |
The accompanying Notes to Financial Statements are an integral part of this statement.
Columbia Acorn Family of Funds | Annual Report 2018
| 119 |
Financial Highlights
Columbia Thermostat FundSM
| | Net asset value,
beginning of
period | Net
investment
income | Net
realized
and
unrealized
gain (loss) | Total from
investment
operations | Distributions
from net
investment
income | Distributions
from net
realized
gains | Total
distributions to
shareholders |
| Class A |
| Year Ended 12/31/2018 | $14.63 | 0.24 | (0.26) | (0.02) | (0.28) | (0.48) | (0.76) |
| Year Ended 12/31/2017 | $14.60 | 0.25 | 0.50 | 0.75 | (0.50) | (0.22) | (0.72) |
| Year Ended 12/31/2016 | $14.31 | 0.20 | 0.44 | 0.64 | (0.08) | (0.27) | (0.35) |
| Year Ended 12/31/2015 | $14.86 | 0.27 | (0.26) | 0.01 | (0.28) | (0.28) | (0.56) |
| Year Ended 12/31/2014 | $14.58 | 0.28 | 0.49 | 0.77 | (0.28) | (0.21) | (0.49) |
| Advisor Class |
| Year Ended 12/31/2018 | $14.50 | 0.28 | (0.27) | 0.01 | (0.31) | (0.48) | (0.79) |
| Year Ended 12/31/2017 | $14.47 | 0.29 | 0.50 | 0.79 | (0.54) | (0.22) | (0.76) |
| Year Ended 12/31/2016 | $14.19 | 0.24 | 0.42 | 0.66 | (0.11) | (0.27) | (0.38) |
| Year Ended 12/31/2015 | $14.74 | 0.30 | (0.25) | 0.05 | (0.32) | (0.28) | (0.60) |
| Year Ended 12/31/2014 | $14.46 | 0.32 | 0.49 | 0.81 | (0.32) | (0.21) | (0.53) |
| Class C |
| Year Ended 12/31/2018 | $14.74 | 0.13 | (0.26) | (0.13) | (0.17) | (0.48) | (0.65) |
| Year Ended 12/31/2017 | $14.62 | 0.14 | 0.51 | 0.65 | (0.31) | (0.22) | (0.53) |
| Year Ended 12/31/2016 | $14.41 | 0.09 | 0.44 | 0.53 | (0.05) | (0.27) | (0.32) |
| Year Ended 12/31/2015 | $14.96 | 0.16 | (0.26) | (0.10) | (0.17) | (0.28) | (0.45) |
| Year Ended 12/31/2014 | $14.68 | 0.17 | 0.49 | 0.66 | (0.17) | (0.21) | (0.38) |
| Institutional Class |
| Year Ended 12/31/2018 | $14.43 | 0.28 | (0.27) | 0.01 | (0.31) | (0.48) | (0.79) |
| Year Ended 12/31/2017 | $14.40 | 0.29 | 0.50 | 0.79 | (0.54) | (0.22) | (0.76) |
| Year Ended 12/31/2016 | $14.12 | 0.23 | 0.43 | 0.66 | (0.11) | (0.27) | (0.38) |
| Year Ended 12/31/2015 | $14.67 | 0.31 | (0.26) | 0.05 | (0.32) | (0.28) | (0.60) |
| Year Ended 12/31/2014 | $14.40 | 0.32 | 0.48 | 0.80 | (0.32) | (0.21) | (0.53) |
| Institutional 2 Class |
| Year Ended 12/31/2018 | $14.52 | 0.29 | (0.27) | 0.02 | (0.32) | (0.48) | (0.80) |
| Year Ended 12/31/2017 | $14.49 | 0.29 | 0.50 | 0.79 | (0.54) | (0.22) | (0.76) |
| Year Ended 12/31/2016 | $14.20 | 0.24 | 0.43 | 0.67 | (0.11) | (0.27) | (0.38) |
| Year Ended 12/31/2015 | $14.75 | 0.31 | (0.26) | 0.05 | (0.32) | (0.28) | (0.60) |
| Year Ended 12/31/2014 | $14.47 | 0.31 | 0.50 | 0.81 | (0.32) | (0.21) | (0.53) |
The accompanying Notes to Financial Statements are an integral part of this statement.
| 120 | Columbia Acorn Family of Funds | Annual Report 2018 |
Financial Highlights (continued)
Columbia Thermostat FundSM
| | Net
asset
value,
end of
period | Total
return(a) | Total gross
expense
ratio to
average
net assets(b) | Total net
expense
ratio to
average
net assets(b) | Net investment
income
ratio to
average
net assets | Portfolio
turnover | Net
assets,
end of
period
(000’s) |
| Class A |
| Year Ended 12/31/2018 | $13.85 | (0.13%) | 0.56% | 0.50%(c) | 1.66% | 122% | $193,683 |
| Year Ended 12/31/2017 | $14.63 | 5.19% | 0.54% | 0.50%(c) | 1.70% | 33% | $257,752 |
| Year Ended 12/31/2016 | $14.60 | 4.47% | 0.54% | 0.50% | 1.39% | 95% | $398,781 |
| Year Ended 12/31/2015 | $14.31 | 0.07% | 0.52% | 0.50% | 1.82% | 69% | $387,967 |
| Year Ended 12/31/2014 | $14.86 | 5.30% | 0.51% | 0.50% | 1.88% | 95% | $450,258 |
| Advisor Class |
| Year Ended 12/31/2018 | $13.72 | 0.12% | 0.31% | 0.25%(c) | 1.91% | 122% | $11,816 |
| Year Ended 12/31/2017 | $14.50 | 5.49% | 0.29% | 0.25%(c) | 1.98% | 33% | $16,227 |
| Year Ended 12/31/2016 | $14.47 | 4.69% | 0.30% | 0.25% | 1.64% | 95% | $15,664 |
| Year Ended 12/31/2015 | $14.19 | 0.33% | 0.28% | 0.25% | 2.06% | 69% | $17,453 |
| Year Ended 12/31/2014 | $14.74 | 5.61% | 0.26% | 0.25% | 2.14% | 95% | $23,412 |
| Class C |
| Year Ended 12/31/2018 | $13.96 | (0.88%) | 1.31% | 1.25%(c) | 0.90% | 122% | $166,292 |
| Year Ended 12/31/2017 | $14.74 | 4.48% | 1.29% | 1.25%(c) | 0.96% | 33% | $250,784 |
| Year Ended 12/31/2016 | $14.62 | 3.69% | 1.28% | 1.25% | 0.63% | 95% | $338,930 |
| Year Ended 12/31/2015 | $14.41 | (0.68%) | 1.27% | 1.25% | 1.08% | 69% | $364,684 |
| Year Ended 12/31/2014 | $14.96 | 4.50% | 1.26% | 1.25% | 1.14% | 95% | $404,456 |
| Institutional Class |
| Year Ended 12/31/2018 | $13.65 | 0.12% | 0.31% | 0.25%(c) | 1.91% | 122% | $253,123 |
| Year Ended 12/31/2017 | $14.43 | 5.52% | 0.29% | 0.25%(c) | 1.97% | 33% | $320,483 |
| Year Ended 12/31/2016 | $14.40 | 4.72% | 0.28% | 0.25% | 1.64% | 95% | $341,629 |
| Year Ended 12/31/2015 | $14.12 | 0.33% | 0.26% | 0.25% | 2.08% | 69% | $325,159 |
| Year Ended 12/31/2014 | $14.67 | 5.57% | 0.25% | 0.24% | 2.16% | 95% | $377,119 |
| Institutional 2 Class |
| Year Ended 12/31/2018 | $13.74 | 0.16% | 0.26% | 0.21% | 1.97% | 122% | $16,478 |
| Year Ended 12/31/2017 | $14.52 | 5.51% | 0.26% | 0.23% | 1.97% | 33% | $13,464 |
| Year Ended 12/31/2016 | $14.49 | 4.77% | 0.27% | 0.24% | 1.66% | 95% | $12,024 |
| Year Ended 12/31/2015 | $14.20 | 0.33% | 0.25% | 0.24% | 2.14% | 69% | $6,114 |
| Year Ended 12/31/2014 | $14.75 | 5.62% | 0.24% | 0.23% | 2.11% | 95% | $3,536 |
The accompanying Notes to Financial Statements are an integral part of this statement.
Columbia Acorn Family of Funds | Annual Report 2018
| 121 |
Financial Highlights (continued)
Columbia Thermostat FundSM
| | Net asset value,
beginning of
period | Net
investment
income | Net
realized
and
unrealized
gain (loss) | Total from
investment
operations | Distributions
from net
investment
income | Distributions
from net
realized
gains | Total
distributions to
shareholders |
| Institutional 3 Class |
| Year Ended 12/31/2018 | $14.50 | 0.30 | (0.27) | 0.03 | (0.33) | (0.48) | (0.81) |
| Year Ended 12/31/2017 | $14.46 | 0.30 | 0.51 | 0.81 | (0.55) | (0.22) | (0.77) |
| Year Ended 12/31/2016 | $14.18 | 0.25 | 0.42 | 0.67 | (0.12) | (0.27) | (0.39) |
| Year Ended 12/31/2015 | $14.74 | 0.31 | (0.26) | 0.05 | (0.33) | (0.28) | (0.61) |
| Year Ended 12/31/2014 | $14.46 | 0.32 | 0.50 | 0.82 | (0.33) | (0.21) | (0.54) |
| Notes to Financial Highlights |
| (a) | Had the Investment Manager and/or Transfer Agent not waived fees and/or reimbursed a portion of expenses, total return would have been reduced. |
| (b) | In addition to the fees and expenses that the Fund bears directly, the Fund indirectly bears a pro rata share of the fees and expenses of any other funds in which it invests, if any. Such indirect expenses are not included in the Fund’s reported expense ratios. |
| (c) | The benefits derived from expense reductions had an impact of less than 0.01%. |
The accompanying Notes to Financial Statements are an integral part of this statement.
| 122 | Columbia Acorn Family of Funds | Annual Report 2018 |
Financial Highlights (continued)
Columbia Thermostat FundSM
| | Net
asset
value,
end of
period | Total
return(a) | Total gross
expense
ratio to
average
net assets(b) | Total net
expense
ratio to
average
net assets(b) | Net investment
income
ratio to
average
net assets | Portfolio
turnover | Net
assets,
end of
period
(000’s) |
| Institutional 3 Class |
| Year Ended 12/31/2018 | $13.72 | 0.21% | 0.22% | 0.16% | 2.04% | 122% | $461 |
| Year Ended 12/31/2017 | $14.50 | 5.64% | 0.21% | 0.18% | 2.04% | 33% | $521 |
| Year Ended 12/31/2016 | $14.46 | 4.76% | 0.21% | 0.19% | 1.71% | 95% | $399 |
| Year Ended 12/31/2015 | $14.18 | 0.32% | 0.20% | 0.19% | 2.08% | 69% | $352 |
| Year Ended 12/31/2014 | $14.74 | 5.68% | 0.19% | 0.18% | 2.19% | 95% | $401 |
The accompanying Notes to Financial Statements are an integral part of this statement.
Columbia Acorn Family of Funds | Annual Report 2018
| 123 |
Financial Highlights
Columbia Acorn Emerging Markets FundSM
| | Net asset value,
beginning of
period | Net
investment
income
(loss) | Net
realized
and
unrealized
gain (loss) | Total from
investment
operations | Distributions
from net
investment
income | Tax
return of
capital | Total
distributions to
shareholders |
| Class A |
| Year Ended 12/31/2018 | $13.24 | 0.07 | (2.40) | (2.33) | (0.16) | (0.01) | (0.17) |
| Year Ended 12/31/2017 | $9.84 | (0.02) | 3.42 | 3.40 | — | — | — |
| Year Ended 12/31/2016 | $10.24 | (0.01) | (0.32) | (0.33) | (0.03) | (0.04) | (0.07) |
| Year Ended 12/31/2015 | $12.72 | 0.10 | (2.42) | (2.32) | (0.15) | (0.01) | (0.16) |
| Year Ended 12/31/2014 | $13.37 | 0.06 | (0.63) | (0.57) | (0.08) | — | (0.08) |
| Advisor Class |
| Year Ended 12/31/2018 | $13.38 | 0.10 | (2.43) | (2.33) | (0.19) | (0.01) | (0.20) |
| Year Ended 12/31/2017 | $9.92 | 0.02 | 3.44 | 3.46 | — | — | — |
| Year Ended 12/31/2016 | $10.32 | 0.01 | (0.31) | (0.30) | (0.06) | (0.04) | (0.10) |
| Year Ended 12/31/2015 | $12.83 | 0.17 | (2.49) | (2.32) | (0.18) | (0.01) | (0.19) |
| Year Ended 12/31/2014 | $13.49 | 0.09 | (0.63) | (0.54) | (0.12) | — | (0.12) |
| Class C |
| Year Ended 12/31/2018 | $13.09 | (0.02) | (2.37) | (2.39) | (0.07) | (0.01) | (0.08) |
| Year Ended 12/31/2017 | $9.80 | (0.09) | 3.38 | 3.29 | — | — | — |
| Year Ended 12/31/2016 | $10.20 | (0.09) | (0.31) | (0.40) | — | — | — |
| Year Ended 12/31/2015 | $12.65 | 0.01 | (2.39) | (2.38) | (0.06) | (0.01) | (0.07) |
| Year Ended 12/31/2014 | $13.32 | (0.05) | (0.62) | (0.67) | — | — | — |
| Institutional Class |
| Year Ended 12/31/2018 | $13.29 | 0.10 | (2.41) | (2.31) | (0.19) | (0.01) | (0.20) |
| Year Ended 12/31/2017 | $9.85 | 0.03 | 3.41 | 3.44 | — | — | — |
| Year Ended 12/31/2016 | $10.26 | (0.00)(i) | (0.31) | (0.31) | (0.06) | (0.04) | (0.10) |
| Year Ended 12/31/2015 | $12.74 | 0.13 | (2.42) | (2.29) | (0.18) | (0.01) | (0.19) |
| Year Ended 12/31/2014 | $13.40 | 0.08 | (0.63) | (0.55) | (0.11) | — | (0.11) |
| Institutional 2 Class |
| Year Ended 12/31/2018 | $13.38 | 0.11 | (2.43) | (2.32) | (0.20) | (0.01) | (0.21) |
| Year Ended 12/31/2017 | $9.91 | 0.04 | 3.43 | 3.47 | — | — | — |
| Year Ended 12/31/2016 | $10.32 | (0.02) | (0.28) | (0.30) | (0.07) | (0.04) | (0.11) |
| Year Ended 12/31/2015 | $12.82 | 0.15 | (2.45) | (2.30) | (0.19) | (0.01) | (0.20) |
| Year Ended 12/31/2014 | $13.48 | 0.10 | (0.64) | (0.54) | (0.12) | — | (0.12) |
The accompanying Notes to Financial Statements are an integral part of this statement.
| 124 | Columbia Acorn Family of Funds | Annual Report 2018 |
Financial Highlights (continued)
Columbia Acorn Emerging Markets FundSM
| | Reimbursement
from affiliate | Net
asset
value,
end of
period | Total
return | Total gross
expense
ratio to
average
net assets(a) | Total net
expense
ratio to
average
net assets(a) | Net investment
income (loss)
ratio to
average
net assets | Portfolio
turnover | Net
assets,
end of
period
(000’s) |
| Class A |
| Year Ended 12/31/2018 | — | $10.74 | (17.58%)(b),(c) | 2.02%(d) | 1.52%(d),(e) | 0.54% | 53% | $22,442 |
| Year Ended 12/31/2017 | — | $13.24 | 34.55%(b) | 1.98% | 1.70%(e) | (0.14%) | 47% | $33,982 |
| Year Ended 12/31/2016 | — | $9.84 | (3.20%)(b) | 1.84%(d) | 1.84%(d) | (0.11%) | 43% | $49,141 |
| Year Ended 12/31/2015 | — | $10.24 | (18.25%) | 1.67% | 1.67% | 0.88% | 58% | $88,574 |
| Year Ended 12/31/2014 | — | $12.72 | (4.28%) | 1.56% | 1.56% | 0.42% | 45% | $160,969 |
| Advisor Class |
| Year Ended 12/31/2018 | — | $10.85 | (17.39%)(b),(f) | 1.77%(d) | 1.27%(d),(e) | 0.79% | 53% | $828 |
| Year Ended 12/31/2017 | — | $13.38 | 34.88%(b) | 1.73% | 1.43%(e) | 0.19% | 47% | $1,337 |
| Year Ended 12/31/2016 | — | $9.92 | (2.91%) | 1.57%(d) | 1.57%(d) | 0.09% | 43% | $1,306 |
| Year Ended 12/31/2015 | — | $10.32 | (18.04%) | 1.36% | 1.36% | 1.37% | 58% | $3,459 |
| Year Ended 12/31/2014 | — | $12.83 | (4.03%) | 1.28% | 1.28% | 0.66% | 45% | $15,467 |
| Class C |
| Year Ended 12/31/2018 | 0.01 | $10.63 | (18.20%)(b),(g) | 2.76%(d) | 2.26%(d),(e) | (0.20%) | 53% | $9,138 |
| Year Ended 12/31/2017 | — | $13.09 | 33.57%(b) | 2.74% | 2.43%(e) | (0.78%) | 47% | $15,546 |
| Year Ended 12/31/2016 | — | $9.80 | (3.92%)(b) | 2.60%(d) | 2.59%(d) | (0.87%) | 43% | $15,534 |
| Year Ended 12/31/2015 | — | $10.20 | (18.83%) | 2.42% | 2.42% | 0.12% | 58% | $22,953 |
| Year Ended 12/31/2014 | — | $12.65 | (5.03%) | 2.33% | 2.33% | (0.36%) | 45% | $41,208 |
| Institutional Class |
| Year Ended 12/31/2018 | 0.01 | $10.79 | (17.28%)(b),(h) | 1.76%(d) | 1.26%(d),(e) | 0.79% | 53% | $25,476 |
| Year Ended 12/31/2017 | — | $13.29 | 34.92%(b) | 1.74% | 1.42%(e) | 0.28% | 47% | $53,415 |
| Year Ended 12/31/2016 | — | $9.85 | (3.04%)(b) | 1.59%(d) | 1.58%(d) | (0.04%) | 43% | $38,969 |
| Year Ended 12/31/2015 | — | $10.26 | (17.98%) | 1.42% | 1.42% | 1.12% | 58% | $147,688 |
| Year Ended 12/31/2014 | — | $12.74 | (4.12%) | 1.33% | 1.33% | 0.62% | 45% | $245,053 |
| Institutional 2 Class |
| Year Ended 12/31/2018 | 0.01 | $10.86 | (17.24%)(b),(j) | 1.69%(d) | 1.19%(d) | 0.88% | 53% | $509 |
| Year Ended 12/31/2017 | — | $13.38 | 35.02%(b) | 1.65% | 1.33% | 0.33% | 47% | $1,030 |
| Year Ended 12/31/2016 | — | $9.91 | (2.90%) | 1.46%(d) | 1.46%(d) | (0.23%) | 43% | $806 |
| Year Ended 12/31/2015 | — | $10.32 | (17.96%) | 1.34% | 1.34% | 1.22% | 58% | $12,643 |
| Year Ended 12/31/2014 | — | $12.82 | (4.02%) | 1.26% | 1.26% | 0.72% | 45% | $19,632 |
The accompanying Notes to Financial Statements are an integral part of this statement.
Columbia Acorn Family of Funds | Annual Report 2018
| 125 |
Financial Highlights (continued)
Columbia Acorn Emerging Markets FundSM
| | Net asset value,
beginning of
period | Net
investment
income
(loss) | Net
realized
and
unrealized
gain (loss) | Total from
investment
operations | Distributions
from net
investment
income | Tax
return of
capital | Total
distributions to
shareholders |
| Institutional 3 Class |
| Year Ended 12/31/2018 | $13.27 | 0.12 | (2.41) | (2.29) | (0.21) | (0.01) | (0.22) |
| Year Ended 12/31/2017 | $9.82 | 0.02 | 3.43 | 3.45 | — | — | — |
| Year Ended 12/31/2016 | $10.23 | 0.03 | (0.33) | (0.30) | (0.07) | (0.04) | (0.11) |
| Year Ended 12/31/2015 | $12.71 | 0.15 | (2.43) | (2.28) | (0.19) | (0.01) | (0.20) |
| Year Ended 12/31/2014 | $13.36 | 0.09 | (0.62) | (0.53) | (0.12) | — | (0.12) |
| Notes to Financial Highlights |
| (a) | In addition to the fees and expenses that the Fund bears directly, the Fund indirectly bears a pro rata share of the fees and expenses of any other funds in which it invests, if any. Such indirect expenses are not included in the Fund’s reported expense ratios. |
| (b) | Had the Investment Manager and/or Transfer Agent not waived fees and/or reimbursed a portion of expenses, total return would have been reduced. |
| (c) | The Fund received a payment from an affiliate. Had the Fund not received this payment, the total return would have been lower by 0.03%. |
| (d) | Ratios include line of credit interest expense which is less than 0.01%. |
| (e) | The benefits derived from expense reductions had an impact of less than 0.01%. |
| (f) | The Fund received a payment from an affiliate. Had the Fund not received this payment, the total return would have been lower by 0.02%. |
| (g) | The Fund received a payment from an affiliate. Had the Fund not received this payment, the total return would have been lower by 0.06%. |
| (h) | The Fund received a payment from an affiliate. Had the Fund not received this payment, the total return would have been lower by 0.09%. |
| (i) | Rounds to zero. |
| (j) | The Fund received a payment from an affiliate. Had the Fund not received this payment, the total return would have been lower by 0.07%. |
The accompanying Notes to Financial Statements are an integral part of this statement.
| 126 | Columbia Acorn Family of Funds | Annual Report 2018 |
Financial Highlights (continued)
Columbia Acorn Emerging Markets FundSM
| | Reimbursement
from affiliate | Net
asset
value,
end of
period | Total
return | Total gross
expense
ratio to
average
net assets(a) | Total net
expense
ratio to
average
net assets(a) | Net investment
income (loss)
ratio to
average
net assets | Portfolio
turnover | Net
assets,
end of
period
(000’s) |
| Institutional 3 Class |
| Year Ended 12/31/2018 | — | $10.76 | (17.27%)(b),(c) | 1.65%(d) | 1.14%(d) | 0.94% | 53% | $693 |
| Year Ended 12/31/2017 | — | $13.27 | 35.13%(b) | 1.59% | 1.14% | 0.16% | 47% | $912 |
| Year Ended 12/31/2016 | — | $9.82 | (2.92%)(b) | 1.45% | 1.45% | 0.29% | 43% | $2 |
| Year Ended 12/31/2015 | — | $10.23 | (17.90%) | 1.27% | 1.27% | 1.24% | 58% | $2 |
| Year Ended 12/31/2014 | — | $12.71 | (3.95%) | 1.22% | 1.22% | 0.68% | 45% | $2 |
The accompanying Notes to Financial Statements are an integral part of this statement.
Columbia Acorn Family of Funds | Annual Report 2018
| 127 |
Financial Highlights
Columbia Acorn European FundSM
| | Net asset value,
beginning of
period | Net
investment
income
(loss) | Net
realized
and
unrealized
gain (loss) | Total from
investment
operations | Distributions
from net
investment
income | Distributions
from net
realized
gains | Total
distributions to
shareholders |
| Class A |
| Year Ended 12/31/2018 | $19.27 | 0.11 | (3.70) | (3.59) | (0.12) | — | (0.12) |
| Year Ended 12/31/2017 | $14.12 | 0.06 | 5.28 | 5.34 | (0.19) | — | (0.19) |
| Year Ended 12/31/2016 | $14.75 | 0.16 | (0.67) | (0.51) | (0.12) | — | (0.12) |
| Year Ended 12/31/2015 | $14.34 | 0.10 | 0.50 | 0.60 | (0.19) | — | (0.19) |
| Year Ended 12/31/2014 | $15.68 | 0.13 | (1.34) | (1.21) | (0.05) | (0.08) | (0.13) |
| Advisor Class |
| Year Ended 12/31/2018 | $19.36 | 0.19 | (3.75) | (3.56) | (0.12) | — | (0.12) |
| Year Ended 12/31/2017 | $14.18 | 0.10 | 5.32 | 5.42 | (0.24) | — | (0.24) |
| Year Ended 12/31/2016 | $14.82 | 0.17 | (0.65) | (0.48) | (0.16) | — | (0.16) |
| Year Ended 12/31/2015 | $14.40 | 0.24 | 0.41 | 0.65 | (0.23) | — | (0.23) |
| Year Ended 12/31/2014(e) | $15.85 | (0.02) | (1.34) | (1.36) | (0.09) | — | (0.09) |
| Class C |
| Year Ended 12/31/2018 | $19.12 | (0.02) | (3.65) | (3.67) | (0.12) | — | (0.12) |
| Year Ended 12/31/2017 | $13.99 | (0.04) | 5.21 | 5.17 | (0.04) | — | (0.04) |
| Year Ended 12/31/2016 | $14.63 | 0.03 | (0.64) | (0.61) | (0.03) | — | (0.03) |
| Year Ended 12/31/2015 | $14.16 | (0.00)(g) | 0.48 | 0.48 | (0.01) | — | (0.01) |
| Year Ended 12/31/2014 | $15.54 | (0.01) | (1.29) | (1.30) | — | (0.08) | (0.08) |
| Institutional Class |
| Year Ended 12/31/2018 | $19.27 | 0.15 | (3.70) | (3.55) | (0.12) | — | (0.12) |
| Year Ended 12/31/2017 | $14.11 | 0.14 | 5.26 | 5.40 | (0.24) | — | (0.24) |
| Year Ended 12/31/2016 | $14.75 | 0.19 | (0.67) | (0.48) | (0.16) | — | (0.16) |
| Year Ended 12/31/2015 | $14.34 | 0.15 | 0.49 | 0.64 | (0.23) | — | (0.23) |
| Year Ended 12/31/2014 | $15.68 | 0.15 | (1.32) | (1.17) | (0.09) | (0.08) | (0.17) |
| Institutional 2 Class |
| Year Ended 12/31/2018 | $19.46 | 0.19 | (3.75) | (3.56) | (0.12) | — | (0.12) |
| Year Ended 12/31/2017 | $14.25 | 0.20 | 5.25 | 5.45 | (0.24) | — | (0.24) |
| Year Ended 12/31/2016 | $14.89 | 0.18 | (0.66) | (0.48) | (0.16) | — | (0.16) |
| Year Ended 12/31/2015 | $14.47 | 0.15 | 0.50 | 0.65 | (0.23) | — | (0.23) |
| Year Ended 12/31/2014 | $15.82 | 0.14 | (1.32) | (1.18) | (0.09) | (0.08) | (0.17) |
The accompanying Notes to Financial Statements are an integral part of this statement.
| 128 | Columbia Acorn Family of Funds | Annual Report 2018 |
Financial Highlights (continued)
Columbia Acorn European FundSM
| | Net
asset
value,
end of
period | Total
return(a) | Total gross
expense
ratio to
average
net assets(b) | Total net
expense
ratio to
average
net assets(b) | Net investment
income (loss)
ratio to
average
net assets | Portfolio
turnover | Net
assets,
end of
period
(000’s) |
| Class A |
| Year Ended 12/31/2018 | $15.56 | (18.78%) | 1.81%(c) | 1.45%(c) | 0.57% | 39% | $22,870 |
| Year Ended 12/31/2017 | $19.27 | 37.89% | 1.94% | 1.58%(d) | 0.33% | 34% | $32,487 |
| Year Ended 12/31/2016 | $14.12 | (3.47%) | 2.00% | 1.75% | 1.07% | 40% | $26,269 |
| Year Ended 12/31/2015 | $14.75 | 4.17% | 2.06% | 1.75% | 0.67% | 37% | $40,368 |
| Year Ended 12/31/2014 | $14.34 | (7.77%) | 2.05% | 1.75% | 0.86% | 74% | $21,101 |
| Advisor Class |
| Year Ended 12/31/2018 | $15.68 | (18.53%) | 1.55%(c) | 1.19%(c) | 0.97% | 39% | $1,496 |
| Year Ended 12/31/2017 | $19.36 | 38.29% | 1.71% | 1.28%(d) | 0.55% | 34% | $2,942 |
| Year Ended 12/31/2016 | $14.18 | (3.27%) | 1.79% | 1.50% | 1.15% | 40% | $362 |
| Year Ended 12/31/2015 | $14.82 | 4.48% | 1.81% | 1.50% | 1.59% | 37% | $408 |
| Year Ended 12/31/2014(e) | $14.40 | (8.60%) | 1.87%(f) | 1.50%(f) | (0.30%)(f) | 74% | $302 |
| Class C |
| Year Ended 12/31/2018 | $15.33 | (19.34%) | 2.56%(c) | 2.20%(c) | (0.12%) | 39% | $8,770 |
| Year Ended 12/31/2017 | $19.12 | 36.95% | 2.69% | 2.31%(d) | (0.25%) | 34% | $13,965 |
| Year Ended 12/31/2016 | $13.99 | (4.21%) | 2.75% | 2.50% | 0.18% | 40% | $7,112 |
| Year Ended 12/31/2015 | $14.63 | 3.41% | 2.82% | 2.50% | (0.02%) | 37% | $7,220 |
| Year Ended 12/31/2014 | $14.16 | (8.44%) | 2.84% | 2.50% | (0.10%) | 74% | $5,096 |
| Institutional Class |
| Year Ended 12/31/2018 | $15.60 | (18.57%) | 1.56%(c) | 1.20%(c) | 0.80% | 39% | $32,813 |
| Year Ended 12/31/2017 | $19.27 | 38.35% | 1.69% | 1.29%(d) | 0.77% | 34% | $48,965 |
| Year Ended 12/31/2016 | $14.11 | (3.29%) | 1.73% | 1.50% | 1.29% | 40% | $11,345 |
| Year Ended 12/31/2015 | $14.75 | 4.43% | 1.78% | 1.50% | 1.01% | 37% | $11,766 |
| Year Ended 12/31/2014 | $14.34 | (7.52%) | 1.79% | 1.50% | 0.97% | 74% | $8,499 |
| Institutional 2 Class |
| Year Ended 12/31/2018 | $15.78 | (18.44%) | 1.50%(c) | 1.13%(c) | 0.96% | 39% | $2,554 |
| Year Ended 12/31/2017 | $19.46 | 38.32% | 1.64% | 1.28% | 1.14% | 34% | $3,988 |
| Year Ended 12/31/2016 | $14.25 | (3.23%) | 1.68% | 1.47% | 1.26% | 40% | $1,262 |
| Year Ended 12/31/2015 | $14.89 | 4.48% | 1.75% | 1.48% | 0.98% | 37% | $2,122 |
| Year Ended 12/31/2014 | $14.47 | (7.54%) | 1.75% | 1.52% | 0.92% | 74% | $1,633 |
The accompanying Notes to Financial Statements are an integral part of this statement.
Columbia Acorn Family of Funds | Annual Report 2018
| 129 |
Financial Highlights (continued)
Columbia Acorn European FundSM
| | Net asset value,
beginning of
period | Net
investment
income
(loss) | Net
realized
and
unrealized
gain (loss) | Total from
investment
operations | Distributions
from net
investment
income | Distributions
from net
realized
gains | Total
distributions to
shareholders |
| Institutional 3 Class |
| Year Ended 12/31/2018 | $19.17 | (0.04) | (3.48) | (3.52) | (0.12) | — | (0.12) |
| Year Ended 12/31/2017(h) | $15.02 | 0.03 | 4.40 | 4.43 | (0.28) | — | (0.28) |
| Notes to Financial Highlights |
| (a) | Had the Investment Manager and/or Transfer Agent not waived fees and/or reimbursed a portion of expenses, total return would have been reduced. |
| (b) | In addition to the fees and expenses that the Fund bears directly, the Fund indirectly bears a pro rata share of the fees and expenses of any other funds in which it invests, if any. Such indirect expenses are not included in the Fund’s reported expense ratios. |
| (c) | Ratios include line of credit interest expense which is less than 0.01%. |
| (d) | The benefits derived from expense reductions had an impact of less than 0.01%. |
| (e) | Advisor Class shares commenced operations on June 25, 2014. Per share data and total return reflect activity from that date. |
| (f) | Annualized. |
| (g) | Rounds to zero. |
| (h) | Institutional 3 Class shares commenced operations on March 1, 2017. Per share data and total return reflect activity from that date. |
The accompanying Notes to Financial Statements are an integral part of this statement.
| 130 | Columbia Acorn Family of Funds | Annual Report 2018 |
Financial Highlights (continued)
Columbia Acorn European FundSM
| | Net
asset
value,
end of
period | Total
return(a) | Total gross
expense
ratio to
average
net assets(b) | Total net
expense
ratio to
average
net assets(b) | Net investment
income (loss)
ratio to
average
net assets | Portfolio
turnover | Net
assets,
end of
period
(000’s) |
| Institutional 3 Class |
| Year Ended 12/31/2018 | $15.53 | (18.51%) | 1.41%(c) | 1.08%(c) | (0.21%) | 39% | $3 |
| Year Ended 12/31/2017(h) | $19.17 | 29.55% | 1.58%(f) | 1.09%(f) | 0.17%(f) | 34% | $210 |
The accompanying Notes to Financial Statements are an integral part of this statement.
Columbia Acorn Family of Funds | Annual Report 2018
| 131 |
Notes to Financial Statements
December 31, 2018
Note 1. Organization
Columbia Acorn® Fund, Columbia Acorn International®, Columbia Acorn USA®, Columbia Acorn International SelectSM, Columbia Acorn SelectSM, Columbia Thermostat FundSM, Columbia Acorn Emerging Markets FundSM and Columbia Acorn European FundSM (each a Fund and collectively, the Funds) are each a series of Columbia Acorn Trust (the Trust). The Trust is registered under the Investment Company Act of 1940, as amended (the 1940 Act), as an open-end management investment company organized as a Massachusetts business trust. The investment objective of each Fund is to seek long-term capital appreciation.
Columbia Thermostat FundSM pursues its investment objective by investing in shares of other mutual funds. As a “fund of funds”, under normal circumstances, the Fund allocates at least 95% of its net assets among a selected group of affiliated stock and bond mutual funds (underlying funds) according to the current level of the Standard & Poor’s (S&P) 500 Index in relation to predetermined ranges set by Columbia Wanger Asset Management, LLC (the Investment Manager or CWAM). The Fund may invest up to 5% of its net assets plus any cash received that day in cash, repurchase agreements, high quality short-term paper and government securities.
Fund shares
Each Fund may issue an unlimited number of shares. Each of Columbia Acorn® Fund, Columbia Acorn USA®, Columbia Acorn International SelectSM, Columbia Acorn SelectSM, Columbia Thermostat FundSM, Columbia Acorn Emerging Markets FundSM and Columbia Acorn European FundSM currently offers Class A, Advisor Class, Class C, Institutional Class, Institutional 2 Class and Institutional 3 Class shares. Columbia Acorn International® currently offers Class A, Advisor Class, Class C, Institutional Class, Institutional 2 Class, Institutional 3 Class and Class R shares.
Class A shares are sold with a front-end sales charge. Class A shares bought without an initial sales charge in accounts aggregating $1 million to $50 million at the time of purchase are subject to a 1.00% contingent deferred sales charge (CDSC) if the shares are redeemed within 12 months after purchase, and a 0.50% CDSC if the shares are redeemed more than 12, but less than 18, months after purchase, with certain limited exceptions.
Advisor Class shares are offered at net asset value. There are certain restrictions on who may purchase these shares.
Class C shares are offered at net asset value but are subject to a CDSC on redemptions made within one year after purchase. Effective July 1, 2018, Class C shares will automatically convert to Class A shares of the same Fund in the month of or the month following the 10-year anniversary of the Class C shares purchase date.
Institutional Class shares are offered at net asset value. There are certain restrictions on who may purchase Institutional Class shares. Generally, Institutional Class shares of a Fund may be exchanged for shares of another fund distributed by Columbia Management Investment Distributors, Inc. (CMID) at no additional charge.
Institutional 2 Class shares are offered at net asset value. There are certain restrictions on who may purchase these shares.
Institutional 3 Class shares are offered at net asset value. There are certain restrictions on who may purchase these shares.
Class R shares are not subject to sales charges and are generally available only to certain retirement plans and other investors as described in the Fund’s prospectus.
Investment income, realized and unrealized gains and losses, and certain fund-level expenses are allocated pro rata on the basis of the relative net assets of all classes, except that each class bears certain expenses specific to that class such as distribution services, transfer agent fees, and certain other class specific expenses. Differences in class expenses may result in payment of different dividend distributions for each class. All of the Funds’ share classes have equal rights with respect to voting, subject to Fund or class-specific matters.
| 132 | Columbia Acorn Family of Funds | Annual Report 2018 |
Notes to Financial Statements (continued)
December 31, 2018
Note 2. Summary of significant accounting policies
Basis of preparation
Each Fund is an investment company that applies the accounting and reporting guidance in the Financial Accounting Standards Board (FASB) Accounting Standards Codification Topic 946, Financial Services - Investment Companies (ASC 946). The financial statements are prepared in accordance with U.S. generally accepted accounting principles (GAAP), which requires management to make certain estimates and assumptions that affect the reported amounts of assets and liabilities, the disclosure of contingent assets and liabilities at the date of the financial statements and the reported amounts of income and expenses during the reporting period. Actual results could differ from those estimates.
The following is a summary of significant accounting policies followed by the Funds in the preparation of their financial statements.
Security valuation
Securities of the Funds are valued at market value or, if a market quotation for a security is not readily available or is deemed not to be reliable because of events or circumstances that have occurred between the market quotation and the time as of which the security is to be valued, the security is valued at a fair value determined in good faith under consistently applied procedures established by the Board of Trustees. With respect to Columbia Thermostat FundSM, investments in underlying funds are valued at their net asset values as reported by the underlying funds. A security traded on a securities exchange or in an over-the-counter market in which transaction prices are reported is valued at the last sales price at the time of valuation. A security traded principally on NASDAQ is valued at the NASDAQ official closing price. Exchange traded funds are valued at their official close net asset value as reported on the applicable exchange. A security for which there is no reported sale on the valuation date is valued by comparison of the mean of the latest bid and ask quotations.
Foreign equity securities are generally valued based on the closing price on the foreign exchange in which such securities are primarily traded. If any foreign equity security closing prices are not readily available, the securities are valued at the mean of the latest quoted bid and ask prices on such exchanges or markets. Foreign currency exchange rates are generally determined at 4:00 p.m. Eastern (U.S.) time. Many securities markets and exchanges outside the U.S. close prior to the close of the New York Stock Exchange; therefore, the closing prices for securities in such markets or on such exchanges may not fully reflect events that occur after such close but before the close of the New York Stock Exchange. In situations where foreign markets are closed, where a significant event has occurred after the foreign exchange closes but before the time at which the Fund’s share price is calculated, and in the event of significant movement in the trigger index for the statistical fair valuation process established by the Board of Trustees, foreign securities will be fair valued pursuant to a policy adopted by the Board of Trustees. The Trust has retained an independent statistical fair value pricing service that employs a systematic methodology to assist in the fair valuation process for securities principally traded in a foreign market in order to adjust for possible changes in value that may occur between the close of the foreign market and the time as of which the securities are to be valued. If a security is valued at a fair value, that value may be different from the last quoted market price for the security.
Short-term investments maturing in 60 days or less are valued at amortized cost, which approximates market value.
Foreign currency transactions and translations
Values of investments denominated in foreign currencies are converted into U.S. dollars using the New York spot market rate of exchange at the time of valuation. Purchases and sales of investments and dividend and interest income are translated into U.S. dollars using the spot market rate of exchange prevailing on the respective dates of such transactions. The gain or loss resulting from changes in foreign exchange rates is included with net realized and unrealized gain or loss from investments, as appropriate.
Columbia Acorn Family of Funds | Annual Report 2018
| 133 |
Notes to Financial Statements (continued)
December 31, 2018
Derivative instruments
Columbia Acorn International® invested in futures contracts on a limited basis during the year ended December 31, 2018, as detailed below. Derivatives may involve various risks, including the potential inability of the counterparty to fulfill its obligation under the terms of the contract, the potential for an illiquid secondary market (making it difficult for the Fund to sell, including at favorable prices) and the potential for market movements which may expose the Fund to gains or losses in excess of the amount shown in the Statements of Assets and Liabilities.
For financial reporting purposes, the Funds do not offset derivative assets and derivative liabilities that are subject to netting arrangements in the Statements of Assets and Liabilities.
Futures contracts
Futures contracts are exchange-traded and represent commitments for the future purchase or sale of an asset at a specified price on a specified date. Columbia Acorn International® bought and sold futures contracts to maintain appropriate equity market exposure while keeping sufficient cash to accommodate daily redemptions. These instruments may be used for other purposes in future periods. Upon entering into futures contracts, the Fund bears risks that it may not achieve the anticipated benefits of the futures contracts and may realize a loss. Additional risks include counterparty credit risk, the possibility of an illiquid market, and that a change in the value of the contract or option may not correlate with changes in the value of the underlying asset.
Upon entering into a futures contract, the Fund deposits cash or securities with the broker, known as a futures commission merchant (FCM), in an amount sufficient to meet the initial margin requirement. The initial margin deposit must be maintained at an established level over the life of the contract. Cash deposited as initial margin is recorded in the Statement of Assets and Liabilities as margin deposits. Securities deposited as initial margin are designated in the Portfolio of Investments. Subsequent payments (variation margin) are made or received by the Fund each day. The variation margin payments are equal to the daily change in the contract value and are recorded as variation margin receivable or payable and are offset in unrealized gains or losses. The Fund recognizes a realized gain or loss when the contract is closed or expires. Futures contracts involve, to varying degrees, risk of loss in excess of the variation margin disclosed in the Statement of Assets and Liabilities.
Effects of derivative transactions in the financial statements
The following tables are intended to provide additional information about the effect of derivatives on the financial statements of Columbia Acorn International® including: the fair value of derivatives by risk category and the location of those fair values in the Statements of Assets and Liabilities; and the impact of derivative transactions over the period in the Statements of Operations, including realized gains or losses and unrealized gains or losses. The derivative schedules following the Portfolio of Investments present additional information regarding derivative instruments outstanding at the end of the period, if any.
Columbia Acorn International®
At December 31, 2018, the Fund had no outstanding derivatives.
The following table indicates the effect of derivative instruments (not considered to be hedging instruments for accounting disclosure purposes) in the Statement of Operations for the year ended December 31, 2018:
| Amount of realized gain (loss) on derivatives recognized in income |
| Risk exposure category | Futures
contracts
($) |
| Equity risk | (11,785,180) |
| 134 | Columbia Acorn Family of Funds | Annual Report 2018 |
Notes to Financial Statements (continued)
December 31, 2018
The following table is a summary of the average outstanding volume by derivative instrument for the year ended December 31, 2018:
| Derivative instrument | Average notional
amounts ($)* |
| Futures contracts — long | 38,694,968 |
| * | Based on the ending quarterly outstanding amounts for the year ended December 31, 2018. |
Security transactions and investment income
Security transactions, investment income and shareholder fund transactions are accounted for on the trade date (date the order to buy or sell is executed) and dividend income and realized gain distributions from other funds are recorded on the ex-dividend date, except that certain dividends from foreign securities are recorded as soon as the information is available to the Funds. Interest income is recorded on the accrual basis and includes amortization of discounts on debt obligations when required for federal income tax purposes. Realized gains and losses from security transactions are recorded on an identified cost basis.
Awards, if any, from class action litigation related to securities owned may be recorded as a reduction of cost of those securities. If the applicable securities are no longer owned, the proceeds are recorded as realized gains.
The Funds may receive distributions from holdings in exchange-traded funds (ETFs), limited partnerships (LPs), other regulated investment companies (RICs), and real estate investment trusts (REITs), which report information on the character of their distributions annually. These distributions are allocated to dividend income, capital gain and return of capital based on actual information reported. To the extent actual information has not yet been reported by the REITs, estimates for return of capital may be made by the Funds’ management. Return of capital is recorded as a reduction of the cost basis of securities held. If the Funds no longer own the applicable securities, return of capital is recorded as a realized gain. Management’s estimates are subsequently adjusted when the actual character of the distributions is disclosed by the REITs, which could result in a proportionate change in return of capital to shareholders. No estimates are made for ETFs and RICs.
Fund share valuation
Fund shares are sold and redeemed on a daily basis at net asset value, subject to any applicable sales charge. Net asset value per share is determined daily as of the close of trading on the New York Stock Exchange (NYSE) on each day the NYSE is open for trading. Generally, income, expenses and realized and unrealized gain/(losses) of a Fund are allocated to each class proportionately on a daily basis for purposes of determining the net asset value of each class. The distribution and service fees and transfer agent fees are charged to each specific class as expenses are incurred. Redemption fees are accounted for as an addition to paid in capital for purposes of determining the net asset value of each class.
Securities lending
Each Fund, except Columbia Thermostat FundSM, may lend securities up to one-third of the value of its total assets to certain approved brokers, dealers and other financial institutions to earn additional income. The Funds retain the benefits of owning the securities, including the economic equivalent of dividends or interest generated by the security. The Funds also receive a fee for the loan. The Funds have the ability to recall the loans at any time and could do so in order to vote proxies or to sell the loaned securities. Each loan is collateralized by cash that exceeds the value of the securities on loan. The market value of the loaned securities is determined daily at the close of business of a Fund and any additional required collateral is delivered to the Fund on the next business day. The Funds have elected to invest the cash collateral in the Dreyfus Government Cash Management Fund. The income earned from the securities lending program is paid to each Fund, net of any fees remitted to Goldman Sachs Agency Lending, the Funds’ lending agent, and net of any borrower rebates. The Investment Manager does not retain any fees earned by the lending program. Generally, in the event of borrower default, a Fund has the right to use the collateral to offset any losses incurred. In the event a Fund is delayed or prevented from exercising its right to dispose of the collateral, there may be a potential loss to the Fund. Some of these losses may be indemnified by the lending agent. The Funds bear the risk of loss with respect to the investment of collateral. The net securities lending income earned as of December 31, 2018 by each Fund is included in the Statements of Operations.
Columbia Acorn Family of Funds | Annual Report 2018
| 135 |
Notes to Financial Statements (continued)
December 31, 2018
Offsetting of assets and liabilities
The following table presents the Funds’ gross and net amount of assets and liabilities available for offset under netting agreements and under a securities lending agreement as well as the related collateral received by each Fund with securities on loan as of December 31, 2018:
| | Columbia
Acorn® Fund | Columbia Acorn
International® | Columbia
Acorn USA® |
| | Goldman
Sachs ($) | Goldman
Sachs ($) | Goldman
Sachs ($) |
| Liabilities | | | |
| Collateral on Securities Loaned | 15,645,500 | 30,949,500 | 4,068,915 |
| Total Liabilities | 15,645,500 | 30,949,500 | 4,068,915 |
| Total Financial and Derivative Net Assets | (15,645,500) | (30,949,500) | (4,068,915) |
| Financial Instruments | 15,784,990 | 29,435,320 | 3,898,417 |
| Net Amount(a) | 139,490 | (1,514,180) | (170,498) |
| (a) | Represents the net amount due from/(to) counterparties in the event of default. |
Securities lending transactions
The following table indicates the total amount of securities loaned by type, reconciled to gross liability payable upon return of the securities loaned by the Funds as of December 31, 2018:
| | Overnight and
continuous | Up to
30 days | 30-90
days | Greater than
90 days | Total |
| Columbia Acorn® Fund | | | | | |
| Securities lending transactions | | | | | |
| Equity securities | $15,784,990 | $— | $— | $— | $15,784,990 |
| Gross amount of recognized liabilities for securities lending (collateral received) | | | | | 15,645,500 |
| Amounts due to counterparty in the event of default | | | | | $(139,490) |
| Columbia Acorn International® | | | | | |
| Securities lending transactions | | | | | |
| Equity securities | $29,435,320 | $— | $— | $— | $29,435,320 |
| Gross amount of recognized liabilities for securities lending (collateral received) | | | | | 30,949,500 |
| Amounts due to counterparty in the event of default | | | | | $1,514,180 |
| Columbia Acorn USA® | | | | | |
| Securities lending transactions | | | | | |
| Equity securities | $3,898,417 | $— | $— | $— | $3,898,417 |
| Gross amount of recognized liabilities for securities lending (collateral received) | | | | | 4,068,915 |
| Amounts due to counterparty in the event of default | | | | | $170,498 |
Federal income tax status
It is each Fund’s policy to comply with the provisions of the Internal Revenue Code available to regulated investment companies and, in the manner provided therein, distribute substantially all their taxable income, as well as any net realized gain on sales of investments and foreign currency transactions reportable for federal income tax purposes. Columbia Thermostat FundSM distributes all of its taxable income, as well as any net realized gain on sales of portfolio fund shares and any distributions of net realized gains received by the Fund from its portfolio funds, reportable for federal income tax purposes. Accordingly, the Funds paid no federal income taxes and no federal income tax provision was required.
Foreign taxes
Realized gains in certain countries may be subject to foreign taxes at the fund level. The Funds accrue for such foreign taxes on realized and unrealized gains at the appropriate rate for each jurisdiction. The amount, if any, is disclosed as a liability on the Statements of Assets and Liabilities.
| 136 | Columbia Acorn Family of Funds | Annual Report 2018 |
Notes to Financial Statements (continued)
December 31, 2018
Distributions to shareholders
Distributions to shareholders are recorded on the ex-dividend date.
Guarantees and indemnification
In the normal course of business, the Trust on behalf of the Funds enters into contracts that contain a variety of representations and warranties and that provide general indemnities. A Fund’s maximum exposure under these arrangements is unknown, as this would involve future claims against the Fund. Also, under the Trust’s organizational documents, the trustees and officers of the Trust are indemnified against certain liabilities that may arise out of their duties to the Trust. However, based on experience, the Funds expect the risk of loss due to these warranties and indemnities to be remote.
Recent accounting pronouncements
Accounting Standards Update 2017-08 Premium Amortization on Purchased Callable Debt Securities
In March 2017, the Financial Accounting Standards Board issued Accounting Standards Update (ASU) No. 2017-08 Premium Amortization on Purchased Callable Debt Securities. ASU No. 2017-08 updates the accounting standards to shorten the amortization period for certain purchased callable debt securities, held at a premium, to be amortized to the earliest call date. The update applies to securities with explicit, noncontingent call features that are callable at fixed prices and on preset dates. The standard is effective for annual periods beginning after December 15, 2018 and interim periods within those fiscal years. Management does not expect the implementation of this guidance to have a material impact on the financial statement amounts and footnote disclosures.
Accounting Standards Update 2018-13 Disclosure Framework - Changes to the Disclosure Requirements for Fair Value Measurement
In August 2018, the Financial Accounting Standards Board issued Accounting Standards Update (ASU) No. 2018-13 Disclosure Framework - Changes to the Disclosure Requirements for Fair Value Measurement. ASU No. 2018-13, in addition to other modifications and additions, removes the requirement to disclose the amount and reasons for transfers between Level 1 and Level 2 of the fair value hierarchy and the policy for the timing of transfers between levels. The standard is effective for annual periods beginning after December 15, 2019 and interim periods within those fiscal years. At this time, management is evaluating the implication of this guidance and the impact it will have on the financial statement disclosures, if any.
Disclosure Update and Simplification
In September 2018, the Securities and Exchange Commission (SEC) released Final Rule 33-10532, Disclosure Update and Simplification, which amends certain financial statement disclosure requirements that the SEC determined to be redundant, outdated, or superseded in light of other SEC disclosure requirements, GAAP, or changes in the information environment. As a result of the amendments, Management implemented disclosure changes which included removing the components of distributable earnings presented on the Statement of Assets and Liabilities and combining income and gain distributions paid to shareholders as presented on the Statement of Changes in Net Assets. Any values presented to meet prior year requirements were left unchanged. The amendments had no effect on the Funds’ net assets or results of operation.
Note 3. Fees and other transactions with affiliates
Investment management fees
CWAM is a wholly-owned subsidiary of Columbia Management Investment Advisers, LLC (Columbia Management), which is a wholly-owned subsidiary of Ameriprise Financial, Inc. (Ameriprise Financial). CWAM furnishes continuing investment supervision to the Funds and is responsible for the overall management of the Funds’ business affairs.
Columbia Acorn Family of Funds | Annual Report 2018
| 137 |
Notes to Financial Statements (continued)
December 31, 2018
CWAM receives a monthly advisory fee based on each Fund’s daily net assets at the following annual rates:
| Columbia Acorn® Fund |
| Average daily net assets | Annual
fee rate |
| Up to $700 million | 0.74% |
| $700 million to $2 billion | 0.69% |
| $2 billion to $6 billion | 0.64% |
| $6 billion and over | 0.63% |
| Columbia Acorn International® |
| Average daily net assets | Annual
fee rate |
| Up to $100 million | 1.19% |
| $100 million to $500 million | 0.94% |
| $500 million and over | 0.74% |
| Columbia Acorn USA® |
| Average daily net assets | Annual
fee rate |
| Up to $200 million | 0.94% |
| $200 million to $500 million | 0.89% |
| $500 million to $2 billion | 0.84% |
| $2 billion to $3 billion | 0.80% |
| $3 billion and over | 0.70% |
| Columbia Acorn International SelectSM |
| Average daily net assets | Annual
fee rate |
| Up to $500 million | 0.89% |
| $500 million and over | 0.85% |
| Columbia Acorn SelectSM |
| Average daily net assets | Annual
fee rate |
| Up to $700 million | 0.85% |
| $700 million to $2 billion | 0.80% |
| $2 billion to $3 billion | 0.75% |
| $3 billion and over | 0.70% |
| Columbia Thermostat FundSM |
| | Annual
fee rate |
| All average daily net assets | 0.10% |
| Columbia Acorn Emerging Markets FundSM |
| Average daily net assets | Annual
fee rate |
| Up to $100 million | 1.25% |
| $100 million to $500 million | 1.00% |
| $500 million and over | 0.80% |
| 138 | Columbia Acorn Family of Funds | Annual Report 2018 |
Notes to Financial Statements (continued)
December 31, 2018
| Columbia Acorn European FundSM |
| Average daily net assets | Annual
fee rate |
| Up to $100 million | 1.19% |
| $100 million to $500 million | 0.94% |
| $500 million and over | 0.74% |
Through April 30, 2019, CWAM has contractually agreed to waive 0.20% of the advisory fee otherwise payable to it by Columbia Acorn Select. When determining whether the Fund’s total expenses exceed the voluntary expense cap described below, the Fund’s net advisory fee, reflecting application of the 0.20% waiver, will be used to calculate the Fund’s total expenses. This arrangement may only be amended or terminated with approval from the Fund’s Board of Trustees and the Investment Manager.
For the year ended December 31, 2018, the effective investment advisory fee rates (net of the advisory fee waiver for Columbia Acorn SelectSM) were as follows:
| Fund | Effective investment advisory fee rate (%) |
| Columbia Acorn® Fund | 0.67 |
| Columbia Acorn International® | 0.77 |
| Columbia Acorn USA® | 0.92 |
| Columbia Acorn International SelectSM | 0.89 |
| Columbia Acorn SelectSM | 0.65 |
| Columbia Thermostat FundSM | 0.10 |
| Columbia Acorn Emerging Markets FundSM | 1.24 |
| Columbia Acorn European FundSM | 1.16 |
Advisory Affiliates
The Investment Manager and its investment advisory affiliates, including Columbia Management (Affiliates), may coordinate in providing services to their clients. These Affiliates, like the Investment Manager, are direct or indirect subsidiaries of Ameriprise Financial and are registered with the appropriate respective regulators and, where required, the Securities and Exchange Commission and the Commodity Futures Trading Commission in the United States. From time to time, the Investment Manager may engage employees of its Columbia Management to provide portfolio management services to certain accounts managed by the Investment Manager, including Columbia Thermostat FundSM. These employees will provide services to the Investment Manager pursuant to personnel-sharing agreements or similar inter-company arrangements and the Fund will pay no additional fees and expenses as a result of any such arrangements.
Pursuant to such arrangements, employees of Columbia Management may serve as “associated persons” of the Investment Manager and, in this capacity, may provide portfolio management services to the Fund on behalf of the Investment Manager subject to the oversight and supervision of the Investment Manager and consistent with the investment objectives, policies and limitations set forth in the Fund’s prospectus and SAI, and the Investment Manager’s and the Funds’ compliance policies and procedures.
Administration fees
CWAM provides administrative services and receives an administration fee from the Funds at the following annual rates:
| Columbia Acorn Trust |
Aggregate average daily
net assets of the trust | Annual
fee rate |
| Up to $8 billion | 0.050% |
| $8 billion to $16 billion | 0.040% |
| $16 billion to $35 billion | 0.030% |
| $35 billion to $45 billion | 0.025% |
| $45 billion and over | 0.015% |
Columbia Acorn Family of Funds | Annual Report 2018
| 139 |
Notes to Financial Statements (continued)
December 31, 2018
For the year ended December 31, 2018, the effective administration fee rate was 0.048% of each Fund’s average daily net assets. CWAM has contractually delegated to Columbia Management responsibility to provide certain sub-administrative services to the Funds.
Compensation of board members
Certain officers and trustees of the Trust are also officers of CWAM or Columbia Management. The Trust makes no direct payments to its officers and trustees who are affiliated with CWAM or Columbia Management. The Trust offers a Deferred Compensation Plan (the Deferred Plan) for its independent trustees. Under the Deferred Plan, a trustee may elect to defer all or a portion of his or her compensation. Amounts deferred are retained by the Trust and may represent an unfunded obligation of the Trust. The value of amounts deferred is determined by reference to the change in value of Institutional Class shares of one or more series of Columbia Acorn Trust or a money market fund as specified by the trustee. Benefits under the Deferred Plan are payable in accordance with the Deferred Plan.
Compensation of Chief Compliance Officer
The Board of Trustees has appointed a Chief Compliance Officer to the Funds in accordance with federal securities regulations. As disclosed in the Statement of Operations, a portion of the Chief Compliance Officer’s total compensation is allocated to the Funds, along with other allocations to affiliated funds governed by the Board of Trustees, based on relative net assets.
Transactions with affiliates
An affiliated person of a Fund may include any company in which a Fund owns five percent or more of its outstanding voting shares during the year. On December 31, 2018, Columbia Acorn® Fund, Columbia Acorn USA®, Columbia Acorn International SelectSM, Columbia Acorn SelectSM, Columbia Thermostat FundSM, Columbia Acorn Emerging Markets FundSMand Columbia Acorn European FundSM held five percent or more of the outstanding voting securities of one or more companies or a company which is under common ownership or control with the Funds. Details of investments in those affiliated companies are presented in the Notes to Portfolio of Investments of each Fund listed above.
For the year ended December 31, 2018, the Funds engaged in purchase and sales transactions with funds that have a common investment manager (or affiliated investment managers), common directors/trustees, and/or common officers. Those transactions complied with Rule 17a-7 under the 1940 Act and totaled as follows.
| Fund | Purchases ($) | Sales ($) | Realized
gain/(loss)
from sale
transactions ($) |
| Columbia Acorn International® | — | 2,485,568 | (11,943) |
Transfer agency fees
Under a Transfer, Dividend Disbursing and Shareholders’ Servicing Agent Agreement, Columbia Management Investment Services Corp. (the Transfer Agent), an affiliate of the Investment Manager and a wholly-owned subsidiary of Ameriprise Financial, is responsible for providing transfer agency, dividend disbursing and shareholder services to the Funds for which the Funds pay transfer agency fees. The Transfer Agent has contracted with DST Asset Manager Solutions, Inc. (DST) to provide certain services and assist the Transfer Agent carrying out its duties. The Transfer Agent pays the fees of DST for its services and DST is not entitled to reimbursement for such fees from the Fund (with the exception of out-of-pocket fees). In addition, the Transfer Agent enters into agreements with various financial intermediaries through which investors may hold Fund shares, including Ameriprise Financial and its affiliates. These intermediaries also may provide shareholder services (Additional Shareholder Services) for which they are compensated by the Transfer Agent, which is in turn compensated by the Funds. Additional Shareholder Services may include sub-accounting, sub-transfer agency, participant recordkeeping, shareholder or participant reporting, shareholder or participant transaction processing, shareholder or participant tax monitoring and reporting and/or the provision of call center support and other customer services.
| 140 | Columbia Acorn Family of Funds | Annual Report 2018 |
Notes to Financial Statements (continued)
December 31, 2018
The Funds pay the Transfer Agent a monthly transfer agency fee that varies by account type (on a per account or asset-based basis) based on the cost of servicing the Funds. In addition, subject to certain limitations described in the Funds’ prospectuses and except with respect to Institutional 3 Class shares, the Funds pay a fee to the Transfer Agent for the Additional Shareholder Services provided by financial intermediaries who maintain shares through omnibus or networked accounts in amounts that vary by share class and with the distribution channel, type of intermediary and type of services provided.
The Funds compensate the Transfer Agent for certain out-of-pocket expenses as approved by the Board from time to time. Such out-of-pocket expenses may include networking account fees paid to dealer firms by the Transfer Agent with respect to shareholder accounts established or maintained pursuant to the National Securities Clearing Corporation’s (NSCC) networking system. A significant portion of such networking account fees are paid by the Transfer Agent to dealer firms affiliated with Ameriprise Financial and its affiliates.
Effective July 1, 2017, the Transfer Agent also receives compensation from the Fund for various shareholder services and reimbursements for certain out-of-pocket fees. Total transfer agency fees for Institutional 2 Class and Institutional 3 Class shares are subject to an annual limitation of not more than 0.07% and 0.02%, respectively, of the average daily net assets attributable to each share class.
Through June 30, 2019, the Transfer Agent has contractually agreed to limit the total fees payable to it by Institutional 2 Class and Institutional 3 Class shares of the Funds to not more than 0.05% and 0.00%, respectively, of the average daily net assets attributable to each share class.
Through June 30, 2019, the Transfer Agent has contractually agreed to limit the total fees payable to it by Columbia Acorn® Fund to an annual rate of not more than 0.07% for all share classes of the Fund other than Institutional 2 Class and Institutional 3 Class. This agreement may be terminated at the sole discretion of the Board of Trustees.
Through June 30, 2019, the Transfer Agent has contractually agreed to limit the total fees payable to it by Columbia Acorn International® to an annual rate of not more than 0.11% for all share classes of the Fund other than Institutional 2 Class and Institutional 3 Class. This agreement may be terminated at the sole discretion of the Board of Trustees.
Through June 30, 2019, the Transfer Agent has contractually agreed to limit the total fees payable to it by Columbia Acorn SelectSM to an annual rate of not more than 0.11% for all share classes of the Fund other than Institutional 2 Class and Institutional 3 Class. This agreement may be terminated at the sole discretion of the Board of Trustees.
Through June 30, 2019, the Transfer Agent has contractually agreed to limit the total fees payable to it by Columbia Acorn USA® to an annual rate of not more than 0.14% for all share classes of the Fund other than Institutional 2 Class and Institutional 3 Class. This agreement may be terminated at the sole discretion of the Board of Trustees.
For the year ended December 31, 2018, the Funds’ effective transfer agency fee rates, as a percentage of average daily net assets of each class were as follows:
| Fund | Class A
(%) | Advisor
Class (%) | Class C
(%) | Institutional
Class (%) | Institutional 2
Class (%) | Institutional 3
Class (%) | Class R
(%) |
| Columbia Acorn® Fund | 0.07 | 0.07 | 0.07 | 0.07 | 0.05 | — | — |
| Columbia Acorn International® | 0.11 | 0.11 | 0.11 | 0.11 | 0.05 | — | 0.11 |
| Columbia Acorn USA® | 0.13 | 0.13 | 0.13 | 0.13 | 0.05 | — | — |
| Columbia Acorn International SelectSM | 0.15 | 0.15 | 0.14 | 0.14 | 0.05 | — | — |
| Columbia Acorn SelectSM | 0.11 | 0.11 | 0.11 | 0.11 | 0.05 | — | — |
| Columbia Thermostat FundSM | 0.10 | 0.10 | 0.10 | 0.10 | 0.05 | — | — |
| Columbia Acorn Emerging Markets FundSM | 0.12 | 0.12 | 0.12 | 0.12 | 0.05 | — | — |
| Columbia Acorn European FundSM | 0.11 | 0.11 | 0.11 | 0.11 | 0.05 | — | — |
Columbia Acorn International® and certain other affiliated investment companies, have severally, but not jointly, guaranteed the performance and observance of all the terms and conditions of a lease entered into by Seligman Data Corp. (SDC), the former transfer agent to certain associated investment companies, including the payment of rent by SDC (the Guaranty). The
Columbia Acorn Family of Funds | Annual Report 2018
| 141 |
Notes to Financial Statements (continued)
December 31, 2018
lease and the Guaranty expired on January 31, 2019. The liability remaining at December 31, 2018 for non-recurring charges associated with the lease amounted to $1,793 and was included within the payable for other expenses in the Statements of Assets and Liabilities.
An annual minimum account balance fee of $20 may apply to certain accounts with a value below the applicable share class’s initial minimum investment requirements to reduce the impact of small accounts on transfer agency fees. These minimum account balance fees are remitted to the Funds and recorded as part of expense reductions in the Statement of Operations.
For the year ended December 31, 2018, these minimum account balance fees reduced total expenses as follows:
| Fund | Amount ($) |
| Columbia Acorn® Fund | 7,700 |
| Columbia Acorn International® | 8,672 |
| Columbia Acorn USA® | 1,420 |
| Columbia Acorn International SelectSM | 640 |
| Columbia Acorn SelectSM | 1,320 |
| Columbia Thermostat FundSM | 580 |
| Columbia Acorn Emerging Markets FundSM | 40 |
| Columbia Acorn European FundSM | — |
Distribution and service fees
CMID, a wholly owned subsidiary of Ameriprise Financial, is the distributor of the Funds. Each Fund has adopted a distribution and service plan which requires it to pay CMID a monthly service fee equal to 0.25% annually of the average daily net assets attributable to Class A and Class C shares and a monthly distribution fee equal to 0.75% and 0.50%, annually, of the average daily net assets attributable to Class C and Class R shares, respectively. CMID receives no compensation with respect to Advisor Class, Institutional Class, Institutional 2 Class and Institutional 3 Class shares.
Sales charges (unaudited)
Sales charges, including front-end charges and CDSCs, received by the Distributor for distributing Fund shares for the year ended December 31, 2018, if any, are listed below:
| | Underwriting discounts ($) | CDSCs ($) | |
| Fund | Class A | Class A | Class C |
| Columbia Acorn® Fund | 423,053 | 1,543 | 2,415 |
| Columbia Acorn International® | 122,471 | 446 | 1,963 |
| Columbia Acorn USA® | 64,855 | 42 | 1,322 |
| Columbia Acorn International SelectSM | 73,351 | 370 | 157 |
| Columbia Acorn SelectSM | 35,268 | 198 | 27 |
| Columbia Thermostat FundSM | 163,349 | 695 | 5,166 |
| Columbia Acorn Emerging Markets FundSM | 19,868 | 196 | 233 |
| Columbia Acorn European FundSM | 97,102 | 44 | 12,986 |
Expenses waived/reimbursed by the Investment Manager and its affiliates
Effective July 1, 2017 through June 30, 2019, CWAM has contractually agreed to waive fees and/or reimburse expenses so that the Funds’ ordinary operating expenses (excluding transaction costs and certain other investment-related expenses, interest and fees on borrowings and expenses associated with the Fund’s investments in other investment companies, if any) do not exceed the following annual rates as a percentage of each class’ average daily net assets:
| Fund | Class A | Advisor | Class C | Institutional | Institutional 2 | Institutional 3 |
| Columbia Acorn Emerging Markets FundSM | 1.55% | 1.30% | 2.30% | 1.30% | 1.19% | 1.14% |
| Columbia Acorn European FundSM | 1.45% | 1.20% | 2.20% | 1.20% | 1.13% | 1.08% |
| 142 | Columbia Acorn Family of Funds | Annual Report 2018 |
Notes to Financial Statements (continued)
December 31, 2018
This arrangement may not be modified or terminated, except by a vote of the Fund’s Board and CWAM. With respect to Institutional 2 Class and Institutional 3 Class shares of Columbia Acorn Emerging Markets Fund and Columbia Acorn European Fund, this arrangement reflects a contractual agreement by the Transfer Agent, effective July 1, 2017, to waive a portion of the fees payable by each Fund such that through June 30, 2019, fees paid by each Fund to the Transfer Agent do not exceed (i) 0.05% of the average daily net assets of Institutional 2 Class shares of the Fund and (ii) 0.00% of the average daily net assets of Institutional 3 Class shares of the Fund.
Effective May 1, 2018 through April 30, 2019, CWAM contractually agreed to waive fees and/or reimburse expenses so that the Funds’ ordinary operating expenses (excluding transaction costs and certain other investment-related expenses, interest and fees on borrowings, if any), do not exceed the following annual rates as a percentage of each class’ average daily net assets:
| Fund | Class A | Advisor | Class C | Institutional Class | Institutional Class 2 | Institutional Class 3 |
| Columbia Acorn Fund® | 1.11% | 0.86% | 1.86% | 0.86% | 0.84% | 0.79% |
| Columbia Acorn USA ® | 1.42% | 1.17% | 2.17% | 1.17% | 1.08% | 1.03% |
These agreements may not be modified or terminated, except by a vote of the Fund’s Board and CWAM. There is no guarantee that these agreements will continue after April 30, 2019. With respect to Columbia Acorn Fund, this arrangement reflects a contractual agreement by the Transfer Agent, effective July 1, 2017, to waive a portion of the fees payable by the Fund such that through June 30, 2019, fees paid by the Fund to the Transfer Agent do not exceed (i) 0.07% of the average daily net assets of all share classes of the Fund, other than Institutional 2 Class shares and Institutional 3 Class shares, (ii) 0.05% of the average daily net assets of Institutional 2 Class shares of the Fund and (iii) 0.00% of the average daily net assets of Institutional 3 Class shares of the Fund. With respect to Columbia Acorn USA, this arrangement reflects a contractual agreement by the Transfer Agent, effective July 1, 2017, to waive a portion of the fees payable by the Fund such that through June 30, 2019, fees paid by the Fund to the Transfer Agent do not exceed (i) 0.14% of the average daily net assets of all share classes of the Fund, other than Institutional 2 Class shares and Institutional 3 Class shares, (ii) 0.05% of the average daily net assets of Institutional 2 Class shares of the Fund and (iii) 0.00% of the average daily net assets of Institutional 3 Class shares of the Fund.
Effective May 1, 2018 through April 30, 2019, CWAM has contractually agreed to waive fees and/or reimburse expenses, so that the Funds’ ordinary operating expenses (excluding transaction costs and certain other investment-related expenses, interest and fees on borrowings and expenses associated with each Fund’s investments in other investment companies, if any, and in the case of Columbia Thermostat FundSM its underlying portfolio funds), do not exceed the following annual rates as a percentage of each class’ average daily net assets:
| Fund | Class A | Advisor | Class C | Institutional | Institutional Class 2 | Institutional Class 3 |
| Columbia Acorn International SelectSM | 1.40% | 1.15% | 2.15% | 1.15% | 1.06% | 1.01% |
| Columbia Thermostat FundSM | 0.50% | 0.25% | 1.25% | 0.25% | 0.20% | 0.15% |
These agreements may not be modified or terminated, except by a vote of the Fund’s Board and CWAM. There is no guarantee that these agreements will continue after April 30, 2019. With respect to Institutional 2 Class and Institutional 3 Class shares of Columbia Acorn International Select and Columbia Acorn Thermostat Fund, this arrangement reflects a contractual agreement by the Transfer Agent, effective July 1, 2017, to waive a portion of the fees payable by each Fund such that through June 30, 2019, fees paid by each Fund to the Transfer Agent do not exceed (i) 0.05% of the average daily net assets of Institutional 2 Class shares of the Fund and (ii) 0.00% of the average daily net assets of Institutional 3 Class shares of the Fund.
Prior to May 1, 2018, CWAM voluntarily agreed to reimburse expenses so that the Funds’ ordinary operating expenses (excluding transaction costs and certain other investment-related expenses, interest and fees on borrowings and expenses associated with each Fund’s investments in other investment companies, if any) after giving effect to any balance credits or overdraft charges from the Funds’ custodian, did not exceed the following annual rates as a percentage of each class’ average daily net assets:
| Fund | Class A | Advisor | Class C | Institutional | Institutional Class 2 | Institutional Class 3 |
| Columbia Acorn SelectSM | 1.60% | 1.35% | 2.35% | 1.35% | 1.29% | 1.24% |
Columbia Acorn Family of Funds | Annual Report 2018
| 143 |
Notes to Financial Statements (continued)
December 31, 2018
With respect to Columbia Acorn Select, this arrangement reflects a contractual agreement by the Transfer Agent, effective July 1, 2017, to waive a portion of the fees payable by the Fund such that through June 30, 2019, fees paid by the Fund to the Transfer Agent do not exceed (i) 0.11% of the average daily net assets of all share classes of the Fund, other than Institutional Class 2 shares and Institutional Class 3 shares, (ii) 0.05% of the average daily net assets of Institutional Class 2 shares of the Fund and (iii) 0.00% of the average daily net assets of Institutional Class 3 shares of the Fund.
Prior to May 1, 2018, CWAM had contractually agreed to waive fees and/or reimburse expenses so that the Funds’ ordinary operating expenses (excluding transaction costs and certain other investment-related expenses, interest and fees on borrowings and expenses associated with each Fund’s investments in other investment companies, if any, and in the case of Columbia Thermostat FundSM its underlying portfolio funds), did not exceed the following annual rates as a percentage of each class’ average daily net assets:
| Fund | Class A | Advisor | Class C | Institutional Class | Institutional Class 2 | Institutional Class 3 |
| Columbia Acorn International SelectSM | 1.40% | 1.15% | 2.15% | 1.15% | 1.08% | 1.03% |
| Columbia Thermostat FundSM | 0.50% | 0.25% | 1.25% | 0.25% | 0.23% | 0.18% |
With respect to Columbia Acorn International Select and Columbia Thermostat Fund, this arrangement reflects a contractual agreement by the Transfer Agent, effective July 1, 2017, to waive a portion of the fees payable by each Fund such that through June 30, 2019, fees paid by each Fund to the Transfer Agent do not exceed, (i) 0.05% of the average daily net assets of Institutional 2 Class shares of the Fund and (ii) 0.00% of the average daily net assets of Institutional 3 Class shares of the Fund.
Prior to May 1, 2018, Columbia Acorn Fund and Columbia Acorn USA did not have a contractual agreement to waive fees and/or reimburse expenses.
In addition to these contractual agreements, CWAM has voluntarily agreed to waive fees and/or reimburse Fund expenses (excluding certain fees and expenses described above) so that Columbia Acorn USA®, Columbia Acorn Emerging Markets FundSM and Columbia Acorn European FundSM Fund level expenses (expenses directly attributable to the Fund and not to a specific share class) are waived proportionately across all share classes, but each Fund’s net operating expenses shall not exceed the contractual annual rates listed in the table above. This arrangement may be revised or discontinued at any time. Any fees waived and/or expenses reimbursed under the expense reimbursement arrangements described above are not recoverable by the Investment Manager or its affiliates in future periods.
Expenses waived and/or reimbursed by CWAM and its affiliates for the year ended December 31, 2018, were as follows:
| Fund | Expenses waived and/or
reimbursed ($) |
| Columbia Acorn® Fund | 1,082,731 |
| Columbia Acorn International® | 278,244 |
| Columbia Acorn USA® | 56,533 |
| Columbia Acorn International SelectSM | 162,508 |
| Columbia Acorn SelectSM | 688,797 |
| Columbia Thermostat FundSM | 437,667 |
| Columbia Acorn Emerging Markets FundSM | 438,200 |
| Columbia Acorn European FundSM | 394,303 |
Note 4. Federal tax information
The timing and character of income and capital gain distributions are determined in accordance with income tax regulations, which may differ from GAAP because of temporary or permanent book to tax differences.
At December 31, 2018, these differences were primarily due to differing treatment for deferral/reversal of wash sale losses, passive foreign investment company (PFIC) holdings, derivative investments, post-October capital losses, late-year ordinary losses, capital loss carryforwards, trustees’ deferred compensation, foreign currency transactions, distribution reclassifications, foreign capital gains tax reclass, non-deductible expenses, net operating loss reclassification, earnings and profits
| 144 | Columbia Acorn Family of Funds | Annual Report 2018 |
Notes to Financial Statements (continued)
December 31, 2018
distributed to shareholders on the redemption of shares, investments in partnerships and excess distributions. To the extent these differences were permanent, reclassifications were made among the components of the Fund’s net assets. Temporary differences do not require reclassifications.
The following reclassifications were made:
| Fund | Undistributed
(excess of distributions over)
net investment income ($) | Accumulated
net realized
gain (loss) ($) | Paid in capital
increase
(decrease) ($) |
| Columbia Acorn® Fund | 1,699,058 | (33,134,259) | 31,435,201 |
| Columbia Acorn International® | 1,455,958 | (1,455,958) | — |
| Columbia Acorn USA® | 516,521 | (7,372,097) | 6,855,576 |
| Columbia Acorn International SelectSM | (49,849) | 49,849 | — |
| Columbia Acorn SelectSM | (174,910) | (3,523,893) | 3,698,803 |
| Columbia Thermostat FundSM | (625,713) | (1,953,421) | 2,579,134 |
| Columbia Acorn Emerging Markets FundSM | 655,263 | (617,430) | (37,833) |
| Columbia Acorn European FundSM | 97,188 | (63,066) | (34,122) |
Net investment income (loss) and net realized gains (losses), as disclosed in the Statement of Operations, and net assets were not affected by these reclassifications.
The tax character of distributions paid during the years indicated was as follows:
| | Year Ended December 31, 2018 | Year Ended December 31, 2017 |
| Fund | Ordinary
income ($) | Long-term
capital gains ($) | Tax return
of capital ($) | Total ($) | Ordinary
income ($) | Long-term
capital gains ($) | Total ($) |
| Columbia Acorn® Fund | 37,915,020 | 499,453,341 | — | 537,368,361 | 131,865,579 | 904,736,909 | 1,036,602,488 |
| Columbia Acorn International® | 32,057,937 | 727,292,326 | — | 759,350,263 | 82,305,169 | 251,655,234 | 333,960,403 |
| Columbia Acorn USA® | 3,405,694 | 40,748,093 | — | 44,153,787 | 14,725,782 | 87,193,225 | 101,919,007 |
| Columbia Acorn International SelectSM | — | 7,949,544 | — | 7,949,544 | 270,796 | — | 270,796 |
| Columbia Acorn SelectSM | 6,598,354 | 46,290,607 | — | 52,888,961 | — | 37,956,937 | 37,956,937 |
| Columbia Thermostat FundSM | 18,363,013 | 17,140,765 | — | 35,503,778 | 30,150,540 | 11,435,105 | 41,585,645 |
| Columbia Acorn Emerging Markets FundSM | 895,420 | — | 72,290 | 967,710 | — | — | — |
| Columbia Acorn European FundSM | 700,145 | — | — | 700,145 | 934,540 | — | 934,540 |
Short-term capital gain distributions, if any, are considered ordinary income distributions for tax purposes.
At December 31, 2018, the components of distributable earnings on a tax basis were as follows:
| Fund | Undistributed
ordinary
income ($) | Undistributed
long-term
capital gains ($) | Capital loss
carryforwards ($) | Net unrealized
appreciation
(depreciation) ($) |
| Columbia Acorn® Fund | — | 200,034,216 | — | 571,867,183 |
| Columbia Acorn International® | 8,592,533 | 156,572,797 | — | 405,383,823 |
| Columbia Acorn USA® | 2,298,139 | 9,714,180 | — | 10,028,865 |
| Columbia Acorn International SelectSM | 448,079 | 1,196,283 | — | 10,881,738 |
| Columbia Acorn SelectSM | — | 5,416,093 | — | 11,701,584 |
| Columbia Thermostat FundSM | — | 5,150,839 | — | (5,028,711) |
| Columbia Acorn Emerging Markets FundSM | — | — | (73,789,265) | 352,254 |
| Columbia Acorn European FundSM | — | — | (8,459,096) | 3,361,860 |
Columbia Acorn Family of Funds | Annual Report 2018
| 145 |
Notes to Financial Statements (continued)
December 31, 2018
At December 31, 2018, the cost of all investments for federal income tax purposes along with the aggregate gross unrealized appreciation and depreciation based on that cost was:
| Fund | Tax cost ($) | Gross
unrealized
appreciation ($) | Gross
unrealized
(depreciation) ($) | Net unrealized
appreciation
(depreciation) ($) |
| Columbia Acorn® Fund | 3,242,354,251 | 813,426,412 | (241,559,229) | 571,867,183 |
| Columbia Acorn International® | 2,091,821,652 | 637,935,652 | (232,551,829) | 405,383,823 |
| Columbia Acorn USA® | 270,128,316 | 38,740,563 | (28,711,698) | 10,028,865 |
| Columbia Acorn International SelectSM | 98,146,447 | 20,044,670 | (9,162,932) | 10,881,738 |
| Columbia Acorn SelectSM | 224,284,597 | 39,414,365 | (27,712,781) | 11,701,584 |
| Columbia Thermostat FundSM | 650,292,201 | 8,551,939 | (13,580,650) | (5,028,711) |
| Columbia Acorn Emerging Markets FundSM | 58,707,138 | 8,809,465 | (8,457,211) | 352,254 |
| Columbia Acorn European FundSM | 65,145,218 | 11,004,756 | (7,642,896) | 3,361,860 |
Tax cost of investments and unrealized appreciation/(depreciation) may also include timing differences that do not constitute adjustments to tax basis.
The following capital loss carryforwards, determined at December 31, 2018, may be available to reduce taxable income arising from future net realized gains on investments, if any, to the extent permitted by the Internal Revenue Code. Capital loss carryforwards with no expiration are required to be utilized prior to any capital losses which carry an expiration date. As a result of this ordering rule, capital loss carryforwards which carry an expiration date may be more likely to expire unused. In addition, for the year ended December 31, 2018, capital loss carryforwards utilized, expired unused and permanently lost, if any, were as follows:
| Fund | 2019 ($) | No expiration
short-term ($) | No expiration
long-term ($) | Total ($) | Utilized ($) | Expired ($) | Permanently
lost ($) |
| Columbia Acorn International SelectSM | — | — | — | — | 6,453,644 | — | — |
| Columbia Acorn Emerging Markets FundSM | — | 47,094,479 | 26,694,786 | 73,789,265 | 7,425,513 | — | — |
| Columbia Acorn European FundSM | — | 8,459,096 | — | 8,459,096 | — | — | — |
Under current tax rules, regulated investment companies can elect to treat certain late-year ordinary losses incurred and post-October capital losses (capital losses realized after October 31) as arising on the first day of the following taxable year. As of December 31, 2018, the Funds will elect to treat the following late-year ordinary losses and post-October capital losses as arising on January 1, 2019.
| Fund | Late year
ordinary losses ($) | Post-October
capital losses ($) |
| Columbia Thermostat FundSM | — | 1,790,953 |
| Columbia Acorn Emerging Markets FundSM | 103,544 | — |
| Columbia Acorn European FundSM | 29,882 | — |
Management of the Funds has concluded that there are no significant uncertain tax positions in the Funds that would require recognition in the financial statements. However, management’s conclusion may be subject to review and adjustment at a later date based on factors including, but not limited to, new tax laws, regulations, and administrative interpretations (including relevant court decisions). Generally, the Funds’ federal tax returns for the prior three fiscal years remain subject to examination by the Internal Revenue Service.
| 146 | Columbia Acorn Family of Funds | Annual Report 2018 |
Notes to Financial Statements (continued)
December 31, 2018
Note 5. Portfolio information
The aggregate cost of purchases and proceeds from sales, other than short-term obligations, for the year ended December 31, 2018, were:
| | Purchases
($) | Proceeds
from sales
($) |
| Columbia Acorn® Fund | 3,020,609,804 | 3,708,609,289 |
| Columbia Acorn International® | 1,257,641,424 | 3,034,455,170 |
| Columbia Acorn USA® | 281,184,119 | 334,784,018 |
| Columbia Acorn International SelectSM | 55,759,328 | 60,438,484 |
| Columbia Acorn SelectSM | 176,408,137 | 217,073,071 |
| Columbia Thermostat FundSM | 917,204,315 | 1,115,049,131 |
| Columbia Acorn Emerging Markets FundSM | 45,335,258 | 74,710,345 |
| Columbia Acorn European FundSM | 39,665,254 | 50,456,450 |
The amount of purchase and sales activity impacts the portfolio turnover rate reported in the Financial Highlights.
Note 6. Payments by affiliates
During the year ended December 31, 2018, Columbia Acorn Emerging Markets FundSM received a payment of $34,559 from Columbia Management as a reimbursement for certain shareholder transactions processed at an incorrect price. The payment has been included in Increase from payment by affiliate on the Statement of Changes in Net Assets.
Note 7. Line of credit
Each Fund has access to a revolving credit facility with a syndicate of banks led by Citibank, N.A., HSBC Bank USA, N.A. and JPMorgan Chase Bank, N.A. whereby the Funds may borrow for the temporary funding of shareholder redemptions or for other temporary or emergency purposes. The credit facility, which is a collective agreement between the Fund and certain other funds managed by the Investment Manager or an affiliated investment manager, severally and not jointly, permits collective borrowings up to $1 billion. Interest is charged to each participating fund based on its borrowings at a rate equal to the higher of (i) the federal funds effective rate, (ii) the one-month LIBOR rate and (iii) the overnight bank funding rate, plus in each case, 1.00%. Each borrowing under the credit facility matures no later than 60 days after the date of borrowing. The Fund also pays a commitment fee equal to its pro rata share of the unused amount of the credit facility at a rate of 0.15% per annum. The commitment fee is included in other expenses in the Statement of Operations. This agreement expires annually in December unless extended or renewed.
During the year ended December 31, 2018, the following fund(s) had borrowings:
| Fund | Average loan
balance ($) | Weighted average
interest rate (%) | Days
outstanding |
| Columbia Acorn International® | 18,040,000 | 3.51 | 5 |
| Columbia Acorn USA® | 6,871,429 | 3.16 | 7 |
| Columbia Thermostat FundSM | 900,000 | 3.50 | 1 |
| Columbia Acorn Emerging Markets FundSM | 1,187,500 | 3.32 | 8 |
| Columbia Acorn European FundSM | 788,889 | 3.26 | 27 |
Interest expense incurred by the Funds is recorded as a line of credit interest expense in the Statement of Operations. Columbia Acorn International®and Columbia ThermostatSM Fund had outstanding borrowings at December 31, 2018 as shown on the Statement of Assets and Liabilities.
Columbia Acorn Family of Funds | Annual Report 2018
| 147 |
Notes to Financial Statements (continued)
December 31, 2018
Note 8. Significant risks
Consumer discretionary sector risk
Columbia Acorn® Fund and Columbia Acorn Emerging Markets FundSM may be more susceptible to the particular risks that may affect companies in the consumer discretionary sector than if they were invested in a wider variety of companies in unrelated sectors. Companies in the discretionary sector are subject to certain risks, including fluctuations in the performance of the overall domestic and international economy, interest rate changes, increased competition and consumer confidence. Performance of such companies may be affected by factors including reduced disposable household income, reduced consumer spending, changing demographics and consumer tastes.
Financial sector risk
Columbia Acorn Emerging Markets FundSM may be more susceptible to the particular risks that may affect companies in the financial services sector than if it were invested in a wider variety of companies in unrelated sectors. Companies in the financial services sector are subject to certain risks, including the risk of regulatory change, decreased liquidity in credit markets and unstable interest rates. Such companies may have concentrated portfolios, such as a high level of loans to real estate developers, which makes them vulnerable to economic conditions that affect that industry. Performance of such companies may be affected by competitive pressures and exposure to investments or agreements that, under certain circumstances, may lead to losses (e.g., subprime loans). Companies in the financial services sector are subject to extensive governmental regulation that may limit the amount and types of loans and other financial commitments they can make, and interest rates and fees that they may charge. In addition, profitability of such companies is largely dependent upon the availability and the cost of capital.
Foreign securities and emerging market countries risk
Investing in foreign securities may include certain risks and considerations not typically associated with investing in U.S. securities, such as fluctuating currency values and changing local and regional economic, political and social conditions, which may result in greater market volatility. In addition, certain foreign securities may not be as liquid as U.S. securities. Investing in emerging markets may accentuate these risks. These countries are also more likely to experience high levels of inflation, deflation or currency devaluation which could hurt their economies and securities markets. To the extent that Columbia Acorn International® , Columbia Acorn International SelectSM, Columbia Acorn Emerging Markets FundSM and Columbia Acorn European FundSM concentrates their investment exposure to any one or a few specific countries, the Funds will be particularly susceptible to the various conditions, events or other factors impacting those countries and may, therefore, have a greater risk than that of a fund which is more geographically diversified.
Health care sector risk
Columbia Acorn® Fund, Columbia Acorn USA® and Columbia Acorn SelectSM may be more susceptible to the particular risks that may affect companies in the health care sector than if they were invested in a wider variety of companies in unrelated sectors. Companies in the health care sector are subject to certain risks, including restrictions on government reimbursement for medical expenses, government approval of medical products and services, competitive pricing pressures, and the rising cost of medical products and services (especially for companies dependent upon a relatively limited number of products or services). Performance of such companies may be affected by factors including, government regulation, obtaining and protecting patents (or the failure to do so), product liability and other similar litigation as well as product obsolescence.
Industrial sector risk
Columbia Acorn International®, Columbia Acorn International SelectSM and Columbia Acorn European FundSM may be more susceptible to the particular risks that may affect companies in the industrials sector than if they were invested in a wider variety of companies in unrelated sectors. Companies in the industrials sector are subject to certain risks, including changes in supply and demand for their specific product or service and for industrial sector products in general, including decline in demand for such products due to rapid technological developments and frequent new product introduction. Performance of such companies may be affected by factors including government regulation, world events and economic conditions and risks for environmental damage and product liability claims.
| 148 | Columbia Acorn Family of Funds | Annual Report 2018 |
Notes to Financial Statements (continued)
December 31, 2018
Shareholder concentration risk
At December 31, 2018, the table below details the affiliated and significant unaffiliated shareholder account ownership of outstanding shares of each Fund. The Funds have no knowledge about whether any portion of these unaffiliated shares were owned beneficially. Subscription and redemption activity of these accounts may have a significant effect on the operations of the Funds.
| Fund | Number of
unaffiliated
accounts | Percentage of
shares
outstanding
held —
unaffiliated (%) | Percentage of
shares
outstanding
held —
affiliated (%) |
| Columbia Acorn® Fund | — | — | — |
| Columbia Acorn International® | 1 | 14.4 | — |
| Columbia Acorn USA® | 1 | 24.2 | — |
| Columbia Acorn International SelectSM | 1 | 10.4 | 27.4 |
| Columbia Acorn SelectSM | 1 | 20.3 | 12.7 |
| Columbia Thermostat FundSM | 1 | 15.6 | 22.8 |
| Columbia Acorn Emerging Markets FundSM | 1 | 14.3 | 33.3 |
| Columbia Acorn European FundSM | 2 | 23.9 | 30.7 |
Technology and technology-related investment risk
Columbia Acorn® Fund, Columbia Acorn USA®, Columbia Acorn SelectSM and Columbia Acorn European FundSM may be more susceptible to the particular risks that may affect companies in the information technology sector, as well as other technology-related sectors (collectively, the technology sectors) than if they were invested in a wider variety of companies in unrelated sectors. Companies in the technology sectors are subject to certain risks, including the risk that new services, equipment or technologies will not be accepted by consumers and businesses or will become rapidly obsolete. Performance of such companies may be affected by factors including obtaining and protecting patents (or the failure to do so) and significant competitive pressures, including aggressive pricing of their products or services, new market entrants, competition for market share and short product cycles due to an accelerated rate of technological developments. Such competitive pressures may lead to limited earnings and/or falling profit margins. As a result, the value of their securities may fall or fail to rise. In addition, many technology sector companies have limited operating histories and prices of these companies’ securities historically have been more volatile than other securities, especially over the short term.
Note 9. Subsequent events
Management has evaluated the events and transactions that have occurred through the date the financial statements were issued and noted no items requiring adjustment of the financial statements or additional disclosure.
Note 10. Information regarding pending and settled legal proceedings
Ameriprise Financial and certain of its affiliates have historically been involved in a number of legal, arbitration and regulatory proceedings, including routine litigation, class actions, and governmental actions, concerning matters arising in connection with the conduct of their business activities. Ameriprise Financial believes that the Funds are not currently the subject of, and that neither Ameriprise Financial nor any of its affiliates are the subject of, any pending legal, arbitration or regulatory proceedings that are likely to have a material adverse effect on the Funds or the ability of Ameriprise Financial or its affiliates to perform under their contracts with the Funds. Ameriprise Financial is required to make quarterly (10-Q), annual (10-K) and, as necessary, 8-K filings with the Securities and Exchange Commission (SEC) on legal and regulatory matters that relate to Ameriprise Financial and its affiliates. Copies of these filings may be obtained by accessing the SEC website at www.sec.gov.
There can be no assurance that these matters, or the adverse publicity associated with them, will not result in increased Fund redemptions, reduced sale of Fund shares or other adverse consequences to the Funds. Further, although we believe proceedings are not likely to have a material adverse effect on the Funds or the ability of Ameriprise Financial or its affiliates to perform under their contracts with the Funds, these proceedings are subject to uncertainties and, as such, we are unable
Columbia Acorn Family of Funds | Annual Report 2018
| 149 |
Notes to Financial Statements (continued)
December 31, 2018
to estimate the possible loss or range of loss that may result. An adverse outcome in one or more of these proceedings could result in adverse judgments, settlements, fines, penalties or other relief that could have a material adverse effect on the consolidated financial condition or results of operations of Ameriprise Financial.
| 150 | Columbia Acorn Family of Funds | Annual Report 2018 |
Report of Independent Registered Public Accounting Firm
To the Board of Trustees of Columbia Acorn Trust and Shareholders of Columbia Acorn Fund, Columbia Acorn International, Columbia Acorn USA, Columbia Acorn International Select, Columbia Acorn Select, Columbia Thermostat Fund, Columbia Acorn Emerging Markets Fund and Columbia Acorn European Fund:
Opinion on the Financial Statements
We have audited the accompanying statements of assets and liabilities, including the portfolios of investments, of Columbia Acorn Fund, Columbia Acorn International, Columbia Acorn USA, Columbia Acorn International Select, Columbia Acorn Select, Columbia Thermostat Fund, Columbia Acorn Emerging Markets Fund and Columbia Acorn European Fund (constituting Columbia Acorn Trust, hereafter collectively referred to as the "Funds") as of December 31, 2018, the related statements of operations for the year ended December 31, 2018, the statements of changes in net assets for each of the two years in the period ended December 31, 2018, including the related notes, and the financial highlights for each of the periods indicated therein (collectively referred to as the “financial statements”). In our opinion, the financial statements present fairly, in all material respects, the financial position of each of the Funds as of December 31, 2018, the results of each of their operations for the year then ended, the changes in each of their net assets for each of the two years in the period ended December 31, 2018 and each of the financial highlights for each of the periods indicated therein in conformity with accounting principles generally accepted in the United States of America.
Basis for Opinion
These financial statements are the responsibility of the Funds’ management. Our responsibility is to express an opinion on the Funds’ financial statements based on our audits. We are a public accounting firm registered with the Public Company Accounting Oversight Board (United States) (PCAOB) and are required to be independent with respect to the Funds in accordance with the U.S. federal securities laws and the applicable rules and regulations of the Securities and Exchange Commission and the PCAOB.
We conducted our audits of these financial statements in accordance with the standards of the PCAOB. Those standards require that we plan and perform the audit to obtain reasonable assurance about whether the financial statements are free of material misstatement, whether due to error or fraud.
Our audits included performing procedures to assess the risks of material misstatement of the financial statements, whether due to error or fraud, and performing procedures that respond to those risks. Such procedures included examining, on a test basis, evidence regarding the amounts and disclosures in the financial statements. Our audits also included evaluating the accounting principles used and significant estimates made by management, as well as evaluating the overall presentation of the financial statements. Our procedures included confirmation of securities owned as of December 31, 2018 by correspondence with the custodian, transfer agent, and brokers; when replies were not received from brokers, we performed other auditing procedures. We believe that our audits provide a reasonable basis for our opinions.
/s/PricewaterhouseCoopers LLP
Chicago, Illinois
February 21, 2019
We have served as the auditor of one or more investment companies in Columbia Acorn Trust since 2004.
Columbia Acorn Family of Funds | Annual Report 2018
| 151 |
Federal Income Tax Information
(Unaudited)
The Funds hereby designate the following tax attributes for the fiscal year ended December 31, 2018. Shareholders were notified in early 2019 of the amounts for use in preparing 2018 income tax returns.
| | Qualified
dividend
income | Dividends
received
deduction | Capital
gain
dividend | Foreign
taxes paid
to foreign
countries | Foreign
taxes paid
per share
to foreign
countries | Foreign
source
income | Foreign
source
income per
share |
| Columbia Acorn® Fund | 16.48% | 16.48% | $592,699,923 | $0 | $0.00 | $0 | $0.00 |
| Columbia Acorn International® | 100.00% | 0.00% | $801,363,368 | $5,921,547 | $0.07 | $72,574,846 | $0.85 |
| Columbia Acorn USA® | 72.06% | 64.38% | $49,961,863 | $0 | $0.00 | $0 | $0.00 |
| Columbia Acorn International SelectSM | 0.00% | 0.00% | $9,603,118 | $150,714 | $0.03 | $1,910,065 | $0.41 |
| Columbia Acorn SelectSM | 48.78% | 47.43% | $39,685,639 | $0 | $0.00 | $0 | $0.00 |
| Columbia Thermostat FundSM | 8.33% | 7.73% | $17,705,011 | $17,769 | $0.00 | $170,200 | $0.00 |
| Columbia Acorn Emerging Markets FundSM | 67.07% | 0.00% | $0 | $173,052 | $0.03 | $1,885,184 | $0.34 |
| Columbia Acorn European FundSM | 66.27% | 0.00% | $0 | $167,085 | $0.04 | $2,129,096 | $0.48 |
Qualified dividend income. For taxable, non-corporate shareholders, the percentage of ordinary income distributed during the fiscal year that represents qualified dividend income subject to reduced tax rates.
Dividends received deduction. The percentage of ordinary income distributed during the fiscal year that qualifies for the corporate dividends received deduction.
Capital gain dividend. The Fund designates as a capital gain dividend the amount reflected above, or if subsequently determined to be different, the net capital gain of such fiscal period.
Foreign taxes. The Fund makes the election to pass through to shareholders the foreign taxes paid. Eligible shareholders may claim a foreign tax credit. These taxes, and the corresponding foreign source income, are provided.
| 152 | Columbia Acorn Family of Funds | Annual Report 2018 |
Board of Trustees and Management of the Columbia Acorn Family of Funds
Each trustee may serve a term of unlimited duration. The Trust’s Bylaws generally require that a trustee retire at the end of the calendar year in which the trustee attains the age of 75 years. The trustees appoint their own successors, provided that at least two-thirds of the trustees, after such appointment, have been elected by shareholders. Shareholders may remove a trustee, with or without cause, upon the vote of two-thirds of the Trust’s outstanding shares at any meeting called for that purpose. A trustee may be removed, with or without cause, upon the vote of a majority of the trustees. The names of the trustees and officers of the Trust, the date each was first elected or appointed to office and the principal business occupations of each during at least the last five years, and for the trustees, the number of portfolios in the fund complex they oversee and other directorships they hold, are shown below. Each trustee and officer serves in such capacity for each of the eight series of Columbia Acorn Trust and for each of the three series of Wanger Advisors Trust.
The address for the trustees and officers of the Trust is Columbia Wanger Asset Management, LLC, 227 West Monroe Street, Suite 3000, Chicago, Illinois 60606. The Funds’ Statement of Additional Information includes additional information about the Funds’ trustees and officers. You may obtain a free copy of the Statement of Additional Information by writing or calling toll-free:
Columbia Wanger Asset Management, LLC
Shareholder Services Group
227 W. Monroe, Suite 3000
Chicago, IL 60606
800.922.6769
Independent trustees
Name and age at
December 31, 2018 | Year first appointed or elected to a Board in the Columbia Funds Complex | Principal occupation(s)
during the past five years | Number of
Funds in the
Columbia
Funds
Complex
overseen (1) | Other directorships
held by the Trustee
during the past five years
in addition to
Columbia Acorn Trust and
Wanger Advisors Trust |
Laura M. Born, 53,
Chair | 2007 | Adjunct Associate Professor of Finance, University of Chicago Booth School of Business since 2007; Advisory Board Member, Driehaus Capital Management since 2018; Director, Carlson Inc. (private global hospitalities and travel company) since 2015; Managing Director – Investment Banking, JP Morgan Chase & Co. (broker-dealer) 2002-2007. | 11 | None. |
| Maureen M. Culhane, 70 | 2007 | Retired. Formerly, Vice President, Goldman Sachs Asset Management, L.P. (investment adviser), 2005-2007; Vice President (Consultant) – Strategic Relationship Management, Goldman, Sachs & Co., 1999-2005. | 11 | None. |
| Margaret M. Eisen, 65 | 2002 | Trustee, Smith College, 2012-2016; Chief Investment Officer, EAM International LLC (corporate finance and asset management), 2003-2013; Managing Director, CFA Institute, 2005-2008. | 11 | Chair, RMB Investors Trust (formerly Burnham Investors Trust) (6 series). |
| Eric A. Feldstein, 59 | 2018 | Chief Financial Officer, Health Care Service Corporation (HCSC) since 2016; Executive Vice President, American Express Company, 2010-2016. | 11 | Board Member, Northern Trust Mutual Fund Complex (51 series), 2015-2016. |
| John C. Heaton, 59 | 2010 | Deputy Dean for Faculty, University of Chicago Booth School of Business; Joseph L. Gidwitz Professor of Finance, University of Chicago Booth School of Business since July 2000. | 11 | None. |
| Charles R. Phillips, 62 | 2015 | Retired. Formerly, Vice Chairman, J.P. Morgan Private Bank, 2011-2014; Managing Director, J.P. Morgan Private Bank, 2001-2011. | 11 | None. |
Columbia Acorn Family of Funds | Annual Report 2018
| 153 |
Board of Trustees and Management of the Columbia Acorn Family of Funds (continued)
Independent trustees (continued)
Name and age at
December 31, 2018 | Year first appointed or elected to a Board in the Columbia Funds Complex | Principal occupation(s)
during the past five years | Number of
Funds in the
Columbia
Funds
Complex
overseen (1) | Other directorships
held by the Trustee
during the past five years
in addition to
Columbia Acorn Trust and
Wanger Advisors Trust |
David J. Rudis, 65,
Vice Chair | 2010 | Consultant, Finger Rock, LLC (strategic consulting business). Formerly, National Checking and Debit Executive, and Illinois President, Bank of America, 2007-2009; President, Consumer Banking Group, LaSalle National Bank, 2004-2007. | 11 | None. |
Trustee Emeritus
Name and age at
December 31, 2018 | Year first
appointed or
elected to a
Board in the
Columbia
Funds
Complex | Principal occupation(s)
during the past five years | Number of
Funds in the
Columbia
Funds
Complex
overseen (1) | Other directorships
held by the Trustee
during the past five years
in addition to
Columbia Acorn Trust and
Wanger Advisors Trust |
| Ralph Wanger, 84 (2) | 1970 (3) | Founder, CWAM. Formerly, President, Chief Investment Officer and portfolio manager, CWAM or its predecessors, July 1992-September 2003; Director, Wanger Investment Company PLC; Consultant to CWAM or its predecessors, September 2003-September 2005. | 11 | None. |
| (1) | The Trustees oversee the series of Wanger Advisors Trust and Columbia Acorn Trust. |
| (2) | As permitted under the Trust’s Bylaws, Mr. Wanger serves as a non-voting Trustee Emeritus of Columbia Acorn Trust and Wanger Advisors Trust. |
| (3) | Dates prior to 1992 relate to the Acorn Fund, Inc., the predecessor trust to Columbia Acorn Trust. |
Fund officers
Name and age at
December 31, 2018 | Position
held with
Columbia
Acorn
Trust and
Wanger
Advisors Trust | Year first
appointed
or elected
to office | Principal occupation(s) during
the past five years |
| Alan G. Berkshire, 58 | President | 2015 | Global Chief Operating Officer - Investments, Columbia Threadneedle Inc. since 2017 and Chief Operating Officer, CWAM since April 2015. Formerly, Independent Director, ValueQuest India Moat Fund Limited (Mauritius), April 2014-March 2015; President – North America, Religare Global Asset Management, Inc., June 2011-November 2013. |
| Michael G. Clarke, 49 | Assistant Treasurer | 2004 | Vice President – Mutual Fund Administration, Columbia Management Investment Advisers, LLC since May 2010; senior officer of Columbia Funds and affiliated funds since 2002. |
| David L. Frank, 55 | Vice President | 2014 | Portfolio manager and/or analyst, CWAM or its predecessors since 2002; Vice President, Columbia Acorn Trust and Wanger Advisors Trust since 2014. |
| 154 | Columbia Acorn Family of Funds | Annual Report 2018 |
Board of Trustees and Management of the Columbia Acorn Family of Funds (continued)
Fund officers (continued)
Name and age at
December 31, 2018 | Position
held with
Columbia
Acorn
Trust and
Wanger
Advisors Trust | Year first
appointed
or elected
to office | Principal occupation(s) during
the past five years |
| Paul B. Goucher, 50 | Assistant Secretary | 2015 | Senior Vice President and Assistant General Counsel, Ameriprise Financial, Inc. since January 2017 (previously Vice President and Lead Chief Counsel, November 2008 - January 2017 and January 2013 - January 2017, respectively; Chief Counsel, January 2010 - January 2013); Vice President, Chief Legal Counsel and Assistant Secretary, Columbia Management Investment Advisers, LLC since May 2010. |
| Tae Han (Simon) Kim, 38 | Vice President | 2018 | Portfolio manager and/or analyst, CWAM since 2011. |
| John Kunka, 48 | Treasurer | 2006 | Vice President, Treasurer and Principal Accounting and Financial Officer, Columbia Acorn Trust and Wanger Advisors Trust since 2014; Treasurer and Chief Financial Officer, CWAM since 2014; Vice President of Accounting and Operations, CWAM since May 2006; formerly, Assistant Treasurer, Columbia Acorn Trust and Wanger Advisors Trust 2006-2014. |
| Stephen Kusmierczak, 51 | Vice President | 2011 | Portfolio manager and/or analyst, CWAM or its predecessors since 2001. |
| Joseph C. LaPalm, 49 | Vice President | 2006 | Chief Compliance Officer, CWAM since 2005. |
| Ryan C. Larrenaga, 48 | Assistant Secretary | 2015 | Vice President and Group Counsel, Ameriprise Financial, Inc. since August 2011 (previously, Counsel, May 2010-August 2011); officer of Columbia Funds and affiliated funds since 2005. |
| Matthew A. Litfin, 47 | Vice President | 2016 | Director of Research (U.S.) and portfolio manager, CWAM since December 2015; formerly, portfolio manager, William Blair & Company 1997-2015. |
| Satoshi Matsunaga, 47 | Vice President | 2015 | Portfolio manager and/or analyst, CWAM or its predecessors since 2005. |
| Thomas P. McGuire, 46 | Chief Compliance Officer | 2015 | Senior Vice President and Chief Compliance Officer of the Columbia Funds since 2012; Vice President – Asset Management Compliance, Ameriprise Financial, Inc., since May 2010; Chief Compliance Officer, Ameriprise Certificate Company since September 2010. |
| Louis J. Mendes III, 54 | Vice President | 2005 | Director of International Research, CWAM, since 2015; portfolio manager and/or analyst, CWAM or its predecessors since 2001; Vice President, Columbia Acorn Trust since 2003 and Wanger Advisors Trust since 2005. |
| Julian Quero, 51 | Assistant Treasurer | 2015 | Vice President – Tax, Columbia Management Investment Advisers, LLC since 2009. |
| Martha A. Skinner, 44 | Assistant Treasurer | 2016 | Vice President of Financial Reporting and Administration, Columbia Management since November 2015; Director of Financial Reporting, Columbia Management, April 2013-November 2015; Manager of Financial Reporting, Columbia Management, August 2010-April 2013. |
| Richard Watson, 49 | Vice President | 2018 | Portfolio manager and/or analyst, CWAM or its predecessors since 2006. |
| Linda Roth-Wiszowaty, 49 | Secretary | 2006 | Business support analyst, CWAM since April 2007; Secretary, Columbia Acorn Trust and Wanger Advisors Trust since 2014; Assistant Secretary, Columbia Acorn Trust and Wanger Advisors Trust, 2006-2014. |
| Charles C. Young, 50 | Vice President | 2018 | Portfolio manager and/or analyst, CWAM since 2011. |
Columbia Acorn Family of Funds | Annual Report 2018
| 155 |
Expense Information
as of December 31, 2018
| Columbia Acorn® Fund | Class A | Class AD | Class C | Class I1 | Class I2 | Class I3 | Class R |
| Investment advisory fee | 0.67% | 0.67% | 0.67% | 0.67% | 0.67% | 0.67% | | | |
| Distribution and/or service fees | 0.25% | 0.00% | 1.00% | 0.00% | 0.00% | 0.00% | | | |
| Other expenses(a) | 0.16% | 0.16% | 0.15% | 0.16% | 0.13% | 0.09% | | | |
| Net expense ratio | 1.08% | 0.83% | 1.82% | 0.83% | 0.80% | 0.76% | | | |
| Columbia Acorn International® |
| Investment advisory fee | 0.77% | 0.77% | 0.77% | 0.77% | 0.77% | 0.77% | 0.77% | | |
| Distribution and/or service fees | 0.25% | 0.00% | 1.00% | 0.00% | 0.00% | 0.00% | 0.50% | | |
| Other expenses(a) | 0.22% | 0.22% | 0.22% | 0.22% | 0.16% | 0.11% | 0.22% | | |
| Net expense ratio | 1.24% | 0.99% | 1.99% | 0.99% | 0.93% | 0.88% | 1.49% | | |
| Columbia Acorn USA® |
| Investment advisory fee | 0.92% | 0.92% | 0.92% | 0.92% | 0.92% | 0.92% | | | |
| Distribution and/or service fees | 0.25% | 0.00% | 1.00% | 0.00% | 0.00% | 0.00% | | | |
| Other expenses(a) | 0.25% | 0.25% | 0.25% | 0.25% | 0.17% | 0.12% | | | |
| Net expense ratio | 1.42% | 1.17% | 2.17% | 1.17% | 1.09% | 1.04% | | | |
| Columbia Acorn International SelectSM |
| Investment advisory fee | 0.89% | 0.89% | 0.89% | 0.89% | 0.89% | 0.89% | | | |
| Distribution and/or service fees | 0.25% | 0.00% | 1.00% | 0.00% | 0.00% | 0.00% | | | |
| Other expenses(a) | 0.26% | 0.26% | 0.26% | 0.26% | 0.17% | 0.13% | | | |
| Net expense ratio | 1.40% | 1.15% | 2.15% | 1.15% | 1.06% | 1.02% | | | |
| Columbia Acorn SelectSM |
| Investment advisory fee | 0.65% | 0.65% | 0.65% | 0.65% | 0.65% | 0.65% | | | |
| Distribution and/or service fees | 0.25% | 0.00% | 1.00% | 0.00% | 0.00% | 0.00% | | | |
| Other expenses(a) | 0.25% | 0.25% | 0.25% | 0.25% | 0.19% | 0.14% | | | |
| Net expense ratio | 1.15% | 0.90% | 1.90% | 0.90% | 0.84% | 0.79% | | | |
| Columbia Thermostat FundSM |
| Investment advisory fee | 0.10% | 0.10% | 0.10% | 0.10% | 0.10% | 0.10% | | | |
| Distribution and/or service fees | 0.25% | 0.00% | 1.00% | 0.00% | 0.00% | 0.00% | | | |
| Other expenses(a) | 0.15% | 0.15% | 0.15% | 0.15% | 0.11% | 0.06% | | | |
| Net expense ratio(b) | 0.50% | 0.25% | 1.25% | 0.25% | 0.21% | 0.16% | | | |
| Columbia Acorn Emerging Markets FundSM |
| Investment advisory fee | 1.24% | 1.24% | 1.24% | 1.24% | 1.24% | 1.24% | | | |
| Distribution and/or service fees | 0.25% | 0.00% | 1.00% | 0.00% | 0.00% | 0.00% | | | |
| Other expenses(a) | 0.03% | 0.03% | 0.02% | 0.02% | -0.05% | -0.10% | | | |
| Net expense ratio | 1.52% | 1.27% | 2.26% | 1.26% | 1.19% | 1.14% | | | |
| Columbia Acorn European FundSM |
| Investment advisory fee | 1.16% | 1.16% | 1.16% | 1.16% | 1.16% | 1.16% | | | |
| Distribution and/or service fees | 0.25% | 0.00% | 1.00% | 0.00% | 0.00% | 0.00% | | | |
| Other expenses(a) | 0.04% | 0.03% | 0.04% | 0.04% | -0.03% | -0.08% | | | |
| Net expense ratio | 1.45% | 1.19% | 2.20% | 1.20% | 1.13% | 1.08% | | | |
See the Funds’ prospectuses for information on minimum initial investment amounts and other details of buying, selling and exchanging shares of the Funds.
Fees and expenses are for the year ended December 31, 2018. Please see Note 3, “Fees and Other Transactions With Affiliates” in the Notes to Financial Statements of this report for information on fee waivers and/or expense reimbursements in place for the Funds.
| (a) | Other expenses include certain fee waivers and/or reimbursements, if applicable, which can potentially exceed other expenses charged. |
| (b) | Does not include estimated fees and expenses of 0.40% incurred by the Fund from the underlying portfolio funds in which it invests. |
| 156 | Columbia Acorn Family of Funds | Annual Report 2018 |
The Fund mails one shareholder report to each shareholder address. If you would like more than one report, please call shareholder services at 800.345.6611 and additional reports will be sent to you.
Proxy voting policies and procedures
The policy of the Board of Trustees is to vote the proxies of the companies in which the Fund holds investments consistent with the procedures as stated in the Statement of Additional Information (SAI). You may obtain a copy of the SAI without charge by calling 800.345.6611; contacting your financial intermediary; visiting columbiathreadneedleus.com/investor/; or searching the website of the Securities and Exchange Commission (SEC) at sec.gov. Information regarding how the Fund voted proxies relating to portfolio securities is filed with the SEC by August 31st for the most recent 12-month period ending June 30th of that year, and is available without charge by visiting columbiathreadneedleus.com/investor/, or searching the website of the SEC at sec.gov.
Quarterly schedule of investments
The Fund files a complete schedule of portfolio holdings with the SEC for the first and third quarters of each fiscal year on Form N-Q or Form N-PORT (available for filings after March 31, 2019). The Fund’s Form N-Q or Form N-PORT is available on the SEC’s website at sec.gov. The Fund’s complete schedule of portfolio holdings, as filed on Form N-Q or Form N-PORT, can also be obtained without charge, upon request, by calling 800.345.6611.
Additional Fund information
For more information about the Fund, please visit columbiathreadneedleus.com/investor/ or call 800.345.6611. Customer Service Representatives are available to answer your questions Monday through Friday from 8 a.m. to 7 p.m. Eastern time.
Fund investment manager
Columbia Wanger Asset Management, LLC
227 West Monroe, Suite 3000
Chicago, IL 60606
888.4.WANGER
(888.492.6437)
Fund distributor
Columbia Management Investment Distributors, Inc.
225 Franklin Street
Boston, MA 02110
Fund transfer agent
Columbia Management Investment Services Corp.
P.O. Box 8081
Boston, MA 02266-8081
Columbia Acorn Family of Funds | Annual Report 2018
| 157 |
[THIS PAGE INTENTIONALLY LEFT BLANK]
[THIS PAGE INTENTIONALLY LEFT BLANK]
Columbia Acorn Family of Funds
P.O. Box 219104
Kansas City, MO 64121-9104
Please read and consider the investment objectives, risks, charges and expenses for any fund carefully before investing. For a prospectus and summary prospectus, which contains this and other important information about the Funds, go to columbiathreadneedleus.com/investor/. The Funds are distributed by Columbia Management Investment Distributors, Inc., member FINRA, and managed by Columbia Wanger Asset Management, LLC.
Columbia Threadneedle Investments (Columbia Threadneedle) is the global brand name of the Columbia and Threadneedle group of companies. All rights reserved. Columbia Management Investment Distributors, Inc., 225 Franklin Street, Boston, MA 02110-2804
© 2019 Columbia Management Investment Advisers, LLC.
columbiathreadneedleus.com/investor/
Item 2. Code of Ethics.
| | (a) | The registrant has adopted a code of ethics that applies to the registrant’s principal executive officer, principal financial officer, principal accounting officer or controller, or persons performing similar functions, regardless of whether these individuals are employed by the registrant or a third party. |
| | (b) | During the period covered by this report, there were not any amendments to a provision of the code of ethics that applies to the registrant’s principal executive officer, principal financial officer, principal accounting officer or controller, or persons performing similar functions, regardless of whether these individuals are employed by the registrant or a third party, and that relates to any element of the code of ethics definition enumerated in paragraph (b) of this Item. |
| | (c) | During the period covered by this report, there were no waivers, including any implicit waivers, from a provision of the code of ethics to the registrant’s principal executive officer, principal financial officer, principal accounting officer or controller, or persons performing similar functions, regardless of whether these individuals are employed by the registrant or a third party that relates to one or more of the items set forth in paragraph (b) of this Item. |
Item 3. Audit Committee Financial Expert.
The registrant’s Board of Trustees has determined that Eric Feldstein, a member of the registrant’s Board of Trustees and Audit Committee, qualifies as an audit committee financial expert. Mr. Feldstein is an independent trustee, as defined in paragraph (a)(2) of this item’s instructions.
Item 4. Principal Accountant Fees and Services.
Fee information below is disclosed for the eight series of the registrant whose reports to stockholders are included in this annual filing.
(a)Audit Fees. Aggregate Audit Fees billed by the principal accountant for professional services rendered during the fiscal years ended December 31, 2018 and December 31, 2017 are approximately as follows:
| | | | |
| 2018 | | 2017 | |
$272,000 | | $ | 304,700 | |
Audit Fees include amounts related to the audit of the registrant’s annual financial statements or services that are normally provided by the accountant in connection with statutory and regulatory filings or engagements for those fiscal years.
(b)Audit-Related Fees. Aggregate Audit-Related Fees billed to the registrant by the principal accountant for professional services rendered during the fiscal years ended December 31, 2018 and December 31, 2017 are approximately as follows:
| | | | |
| 2018 | | 2017 | |
$26,500 | | $ | 25,700 | |
Audit-Related Fees include amounts for assurance and related services by the principal accountant that are reasonably related to the performance of the audit of the registrant’s financial statements and are not reported in Audit Fees above. In fiscal years 2018 and 2017, Audit-Related Fees consist of agreed-upon procedures performed for other audit-related additional testing.
During the fiscal years ended December 31, 2018 and December 31, 2017, there were no Audit-Related Fees billed by the registrant’s principal accountant to the registrant’s investment adviser (not including anysub-adviser whose role is primarily portfolio management and is subcontracted with or overseen by another investment adviser) and any entity controlling, controlled by, or under common control with the adviser that provides ongoing services to the registrant for an engagement that related directly to the operations and financial reporting of the registrant.
(c)Tax Fees. Aggregate Tax Fees billed by the principal accountant to the registrant for professional services rendered during the fiscal years ended December 31, 2018 and December 31, 2017 are approximately as follows:
| | | | |
| 2018 | | 2017 | |
$75,400 | | $ | 72,900 | |
Tax Fees incurred in both fiscal years 2018 and 2017 relate to the review of annual tax returns, the review of required shareholder distribution calculations and include amounts for professional services by the principal accountant for tax compliance, tax advice and tax planning.
During the fiscal years ended December 31, 2018 and December 31, 2017, there were no Tax Fees billed by the registrant’s principal accountant to the registrant’s investment adviser (not including anysub-adviser whose role is primarily portfolio management and is subcontracted with or overseen by another investment adviser) and any entity controlling, controlled by, or under common control with the adviser that provides ongoing services to the registrant for an engagement that related directly to the operations and financial reporting of the registrant.
(d)All Other Fees. Aggregate All Other Fees billed by the principal accountant to the registrant for professional services rendered during the fiscal years ended December 31, 2018 and December 31, 2017 are as follows:
All Other Fees include amounts for products and services provided by the principal accountant, other than the services reported in paragraphs (a) through (c) above. Aggregate All Other Fees billed by the registrant’s principal accountant to the registrant’s investment adviser (not including anysub-adviser whose role is primarily portfolio management and is subcontracted with or overseen by another investment adviser) and any entity controlling, controlled by, or under common control with the adviser that provides ongoing services to the registrant for an engagement that related directly to the operations and financial reporting of the registrant during the fiscal years ended December 31, 2018 and December 31, 2018 are approximately as follows:
| | | | |
| 2018 | | 2017 | |
$225,000 | | $ | 225,000 | |
In both fiscal years 2018 and 2017, All Other Fees primarily consist of professional services rendered for internal control reviews.
(e)(1) Audit CommitteePre-Approval Policies and Procedures
The policy of the registrant’s Audit Committee is to specificallypre-approve (i) all audit andnon-audit (including audit related, tax and all other) services provided by the registrant’s independent auditor to the registrant and individual funds (collectively “Fund Services”) and (ii) allnon-audit services provided by the registrant’s independent auditor to the funds’ adviser or a control affiliate of the adviser, that relate directly to the funds’ operations and financial reporting (collectively “Fund-related Adviser Services”). A “control affiliate” is an entity controlling, controlled by, or under common control with the adviser that provides ongoing services to the funds, and the term “adviser” is deemed to exclude any unaffiliatedsub-adviser whose role is primarily portfolio management and issub-contracted or overseen by another investment adviser.
If such Fund Services or Fund-related Adviser Services are required during the period between the Audit Committee’s regularly scheduled meetings, the Chairman of the Audit Committee has the authority topre-approve the service, with reporting to the full Audit Committee at the next regularly scheduled meeting.
The Audit Committee will waivepre-approval of Fund Services or Fund-related Adviser Services provided that the requirements under paragraph (c)(7)(i)(C) of Rule2-01 of RegulationS-X are met.
(e)(2) The percentage of services described in paragraphs (b) through (d) of this Item approved pursuant to the “de minimis” exception under paragraph (c)(7)(i)(C) of Rule 2-01 of RegulationS-X during both fiscal years ended December 31, 2018 and December 31, 2018 was zero.
(f) Not applicable.
(g) The aggregatenon-audit fees billed by the registrant’s accountant for services rendered to the registrant, and rendered to the registrant’s investment adviser (not including anysub-adviser whose role is primarily portfolio management and is subcontracted with or overseen by another investment adviser), and any entity controlling, controlled by, or under common control with the adviser that provides ongoing services to the registrant for the fiscal years ended December 31, 2018 and December 31, 2017 are approximately as follows:
| | | | |
| 2018 | | 2017 | |
$326,900 | | $ | 323,700 | |
(h) The registrant’s Audit Committee of the Board of Directors has considered whether the provision ofnon-audit services that were rendered to the registrant’s adviser (not including anysub-adviser whose role is primarily portfolio management and is subcontracted with or overseen by another investment adviser), and any entity controlling, controlled by, or under common control with the investment adviser that provides ongoing services to the registrant that were notpre-approved pursuant to paragraph (c)(7)(ii) of Rule2-01 of RegulationS-X, is compatible with maintaining the principal accountant’s independence.
Item 5. Audit Committee of Listed Registrants.
Not applicable.
Item 6. Investments
| | (a) | The registrant’s “Schedule I – Investments in securities of unaffiliated issuers” (as set forth in 17 CFR210.12-12) is included in Item 1 of this FormN-CSR. |
Item 7. Disclosure of Proxy Voting Policies and Procedures forClosed-End Management Investment Companies.
Not applicable.
Item 8. Portfolio Managers ofClosed-End Management Investment Companies.
Not applicable.
Item 9. Purchases of Equity Securities byClosed-End Management Investment Company and Affiliated Purchasers.
Not applicable.
Item 10. Submission of Matters to a Vote of Security Holders.
There were no material changes to the procedures by which shareholders may recommend nominees to the registrant’s board of directors.
Item 11. Controls and Procedures.
| | (a) | The registrant’s principal executive officer and principal financial officer, based on their evaluation of the registrant’s disclosure controls and procedures as of a date within 90 days of the filing of this report, have concluded that such controls and procedures are adequately designed to ensure that information required to be disclosed by the registrant in FormN-CSR is accumulated and communicated to the registrant’s management, including the principal executive officer and principal financial officer, or persons performing similar functions, as appropriate to allow timely decisions regarding required disclosure. |
| | (b) | There was no change in the registrant’s internal control over financial reporting that occurred during the period covered by this report that has materially affected, or is reasonably likely to materially affect, the registrant’s internal control over financial reporting. |
Item 12. Disclosure of Securities Lending Activities forClosed-End Management Investment Companies
Not applicable.
Item 13. Exhibits.
(a)(1) Code of ethics required to be disclosed under Item 2 of FormN-CSR attached hereto as Exhibit 99.CODE ETH.
(a)(2) Certifications pursuant to Rule30a-2(a) under the Investment Company Act of 1940 (17 CFR270.30a-2(a)) attached hereto as Exhibit 99.CERT.
(a)(3) Not applicable.
(b) Certification pursuant to Rule30a-2(b) under the Investment Company Act of 1940 (17 CFR270.30a-2(b)) attached hereto as Exhibit 99.906CERT.
SIGNATURES
Pursuant to the requirements of the Securities Exchange Act of 1934 and the Investment Company Act of 1940, the registrant has duly caused this report to be signed on its behalf by the undersigned, thereunto duly authorized.
| | |
(registrant) | | Columbia Acorn Trust |
| | |
By (Signature and Title) | | /s/ Alan Berkshire |
| | Alan Berkshire, President and Principal Executive Officer |
Pursuant to the requirements of the Securities Exchange Act of 1934 and the Investment Company Act of 1940, this report has been signed below by the following persons on behalf of the registrant and in the capacities and on the dates indicated.
| | |
By (Signature and Title) | | /s/ Alan Berkshire |
| | Alan Berkshire, President and Principal Executive Officer |
| | |
By (Signature and Title) | | /s/ John M. Kunka |
| | John M. Kunka, Treasurer and Principal Accounting and Financial Officer |